SK TELECOM CO LTD Form 20-F Filed 2020-04-29
747
Business Address 11, EULJIRO2-GA JUNG-GU SEOUL KOREA M5 100-999 82-2-6100-1639 Mailing Address 11, EULJIRO2-GA JUNG-GU SEOUL M5 100-999 SECURITIES AND EXCHANGE COMMISSION FORM 20-F Annual and transition report of foreign private issuers pursuant to sections 13 or 15(d) Filing Date: 2020-04-29 | Period of Report: 2019-12-31 SEC Accession No. 0001193125-20-124200 (HTML Version on secdatabase.com) FILER SK TELECOM CO LTD CIK:1015650| IRS No.: 999999999 | Fiscal Year End: 1231 Type: 20-F | Act: 34 | File No.: 333-04906 | Film No.: 20827187 SIC: 4812 Radiotelephone communications Copyright © 2020 www.secdatabase.com . All Rights Reserved. Please Consider the Environment Before Printing This Document
-
Upload
khangminh22 -
Category
Documents
-
view
0 -
download
0
Transcript of SK TELECOM CO LTD Form 20-F Filed 2020-04-29
Business Address11, EULJIRO2-GAJUNG-GUSEOUL KOREA M5 100-99982-2-6100-1639
Mailing Address11, EULJIRO2-GAJUNG-GUSEOUL M5 100-999
SECURITIES AND EXCHANGE COMMISSION
FORM 20-FAnnual and transition report of foreign private issuers pursuant to sections 13 or 15(d)
Filing Date: 2020-04-29 | Period of Report: 2019-12-31SEC Accession No. 0001193125-20-124200
(HTML Version on secdatabase.com)
FILERSK TELECOM CO LTDCIK:1015650| IRS No.: 999999999 | Fiscal Year End: 1231Type: 20-F | Act: 34 | File No.: 333-04906 | Film No.: 20827187SIC: 4812 Radiotelephone communications
Copyright © 2020 www.secdatabase.com. All Rights Reserved.Please Consider the Environment Before Printing This Document
Table of ContentsAs filed with the Securities and Exchange Commission on April 29, 2020
UNITED STATES SECURITIES AND EXCHANGE COMMISSIONWashington, D.C. 20549
Form 20-F(Mark One)
☐ REGISTRATION STATEMENT PURSUANT TO SECTION 12(b) OR (g) OF THE SECURITIES EXCHANGE ACT OF1934
OR☒ ANNUAL REPORT PURSUANT TO SECTION 13 OR 15(d) OF THE SECURITIES EXCHANGE ACT OF 1934
For the fiscal year ended December 31, 2019OR
☐ TRANSITION REPORT PURSUANT TO SECTION 13 OR 15(d) OF THE SECURITIES EXCHANGE ACT OF 1934OR
☐ SHELL COMPANY REPORT PURSUANT TO SECTION 13 OR 15(d) OF THE SECURITIES EXCHANGE ACT OF 1934Date of event requiring this shell company report
For the transition period from toCommission file number 1-14418
SK Telecom Co., Ltd.(Exact name of Registrant as specified in its charter)
SK Telecom Co., Ltd.(Translation of Registrant�s name into English)
The Republic of Korea(Jurisdiction of incorporation or organization)
SK T-Tower65, Eulji-ro, Jung-gu, Seoul, Korea
(Address of principal executive offices)Mr. Jae Kyu Kwak
65, Eulji-ro, Jung-gu, Seoul, KoreaTelephone No.: +82-2-6100-2114Facsimile No.: +82-2-6100-7830
(Name, telephone, email and/or facsimile number and address of company contact person)Securities registered or to be registered pursuant to Section 12(b) of the Act.
Title of Each Class Trading Symbol(s) Name of Each Exchange on Which RegisteredAmerican Depositary Shares, each representing
one-ninth of one share of Common StockSKM New York Stock Exchange
Common Stock, par value ₩500 per share SKM New York Stock Exchange** Not for trading, but only in connection with the registration of the American Depositary Shares.
Securities registered or to be registered pursuant to Section 12(g) of the Act.None
Securities for which there is a reporting obligation pursuant to Section 15(d) of the Act.None
Indicate the number of outstanding shares of each of the issuer�s classes of capital or common stock as of the close of the period covered by the annual report.73,136,448 shares of common stock, par value₩500 per share (not including 7,609,263 shares of common stock held by the company as treasury shares).Indicate by check mark if the registrant is a well-known seasoned issuer, as defined in Rule 405 of the Securities Act. Yes ☒ No ☐If this report is an annual or transition report, indicate by check mark if the registrant is not required to file reports pursuant to Section 13 or 15(d) of the Securities Exchange Act of
1934. Yes ☐ No ☒Indicate by check mark whether the registrant (1) has filed all reports required to be filed by Section 13 or 15(d) of the Securities Exchange Act of 1934 during the preceding
12 months (or for such shorter period that the registrant was required to file such reports), and (2) has been subject to such filing requirements for the past 90 days. Yes ☒ No ☐Indicate by check mark whether the registrant has submitted electronically every Interactive Data File required to be submitted pursuant to Rule 405 of Regulation S-T during the
preceding 12 months (or for such shorter period that the registrant was required to submit such files). Yes ☒ No ☐Indicate by check mark whether the registrant is a large accelerated filer, an accelerated filer, a non-accelerated filer or an emerging growth company. See definitions of �accelerated
filer,� �large accelerated filer� and �emerging growth company� in Rule 12b-2 of the Exchange Act.Large accelerated filer ☒ Accelerated filer ☐ Non-accelerated filer ☐ Emerging growth company ☐
If an emerging growth company that prepares its financial statements in accordance with U.S. GAAP, indicate by check mark if the registrant has elected not to use the extendedtransition period for complying with any new or revised financial accounting standards provided pursuant to Section 13(a) of the Exchange Act. ☐
Indicate by check mark whether the registrant has filed a report on and attestation to its management�s assessment of the effectiveness of its internal control over financial reportingunder Section 404(b) of the Sarbanes-Oxley Act (15 U.S.C. 7262(b)) by the registered public accounting firm that prepared or issued its audit report. Yes ☒ No ☐
Copyright © 2020 www.secdatabase.com. All Rights Reserved.Please Consider the Environment Before Printing This Document

Indicate by check mark which basis of accounting the registrant has used to prepare the financial statements included in this filing:U.S. GAAP ☐ International Financial Reporting Standards as issued by the International Accounting Standards Board ☒ Other ☐
If �Other� has been checked in response to the previous question, indicate by check mark which financial statement item the registrant has elected to follow. Item 17 ☐ Item 18 ☐
If this is an annual report, indicate by check mark whether the registrant is a shell company (as defined in Rule 12b-2 of the Exchange Act). Yes ☐ No ☒
Copyright © 2020 www.secdatabase.com. All Rights Reserved.Please Consider the Environment Before Printing This Document

Table of ContentsTABLE OF CONTENTS
CERTAIN DEFINED TERMS AND CONVENTIONS USED IN THIS ANNUAL REPORT 1FORWARD-LOOKING STATEMENTS 1
Part I 3Item 1. IDENTITY OF DIRECTORS, SENIOR MANAGEMENT AND ADVISERS 3
Item 1.A. Directors and Senior Management 3Item 1.B. Advisers 3Item 1.C. Auditors 3
Item 2. OFFER STATISTICS AND EXPECTED TIMETABLE 3Item 3. KEY INFORMATION 3
Item 3.A. Selected Financial Data 3Item 3.B. Capitalization and Indebtedness 6Item 3.C. Reasons for the Offer and Use of Proceeds 6Item 3.D. Risk Factors 6
Item 4. INFORMATION ON THE COMPANY 22Item 4.A. History and Development of the Company 22Item 4.B. Business Overview 24Item 4.C. Organizational Structure 48Item 4.D. Property, Plants and Equipment 48
Item 4A. UNRESOLVED STAFF COMMENTS 49Item 5. OPERATING AND FINANCIAL REVIEW AND PROSPECTS 49
Item 5.A. Operating Results 49Item 5.B. Liquidity and Capital Resources 67Item 5.C. Research and Development, Patents and Licenses, etc. 72Item 5.D. Trend Information 73Item 5.E. Off-Balance Sheet Arrangements 73Item 5.F. Tabular Disclosure of Contractual Obligations 73Item 5.G. Safe Harbor 74
Item 6. DIRECTORS, SENIOR MANAGEMENT AND EMPLOYEES 74Item 6.A. Directors and Senior Management 74Item 6.B. Compensation 79Item 6.C. Board Practices 81Item 6.D. Employees 82Item 6.E. Share Ownership 83
Item 7. MAJOR SHAREHOLDERS AND RELATED PARTY TRANSACTIONS 84Item 7.A. Major Shareholders 84Item 7.B. Related Party Transactions 85Item 7.C. Interests of Experts and Counsel 85
Item 8. FINANCIAL INFORMATION 86Item 8.A. Consolidated Statements and Other Financial Information 86Item 8.B. Significant Changes 88
Item 9. THE OFFER AND LISTING 88Item 9.A. Offering and Listing Details 88Item 9.B. Plan of Distribution 88Item 9.C. Markets 88Item 9.D. Selling Shareholders 88Item 9.E. Dilution 88Item 9.F. Expenses of the Issue 88
Item 10. ADDITIONAL INFORMATION 88Item 10.A. Share Capital 88Item 10.B. Memorandum and Articles of Association 88
(i)
Copyright © 2020 www.secdatabase.com. All Rights Reserved.Please Consider the Environment Before Printing This Document
Table of ContentsItem 10.C. Material Contracts 94Item 10.D. Exchange Controls 94Item 10.E. Taxation 98Item 10.F. Dividends and Paying Agents 104Item 10.G. Statements by Experts 104Item 10.H. Documents on Display 104Item 10.I. Subsidiary Information 104
Item 11. QUANTITATIVE AND QUALITATIVE DISCLOSURES ABOUT MARKET RISK 104Item 12. DESCRIPTION OF SECURITIES OTHER THAN EQUITY SECURITIES 105
Item 12.A. Debt Securities 105Item 12.B. Warrants and Rights 105Item 12.C. Other Securities 105Item 12.D. American Depositary Shares 105
Part II 107Item 13. DEFAULTS, DIVIDEND ARREARAGES AND DELINQUENCIES 107Item 14. MATERIAL MODIFICATIONS TO THE RIGHTS OF SECURITY HOLDERS AND USE OF PROCEEDS 107Item 15. CONTROLS AND PROCEDURES 107Item 16. RESERVED 108Item 16A. AUDIT COMMITTEE FINANCIAL EXPERT 108Item 16B. CODE OF ETHICS 108Item 16C. PRINCIPAL ACCOUNTANT FEES AND SERVICES 108Item 16D. EXEMPTIONS FROM THE LISTING STANDARDS FOR AUDIT COMMITTEES 109Item 16E. PURCHASES OF EQUITY SECURITIES BY THE ISSUER AND AFFILIATED PURCHASERS 109Item 16F. CHANGE IN REGISTRANT�S CERTIFYING ACCOUNTANT 109Item 16G. CORPORATE GOVERNANCE 109Item 16H. MINE SAFETY DISCLOSURE 110
Part III 111Item 17. FINANCIAL STATEMENTS 111Item 18. FINANCIAL STATEMENTS 111Item 19. EXHIBITS 112
(ii)
Copyright © 2020 www.secdatabase.com. All Rights Reserved.Please Consider the Environment Before Printing This Document
Table of ContentsCERTAIN DEFINED TERMS AND CONVENTIONS USED IN THIS ANNUAL REPORT
All references to �Korea� contained in this annual report shall mean The Republic of Korea. All references to the �Government� shall mean thegovernment of The Republic of Korea. All references to �we,� �us,� or �our� shall mean SK Telecom Co., Ltd. and, unless the context otherwiserequires, its consolidated subsidiaries. References to �SK Telecom� shall mean SK Telecom Co., Ltd., but shall not include its consolidated subsidiaries.All references to �U.S.� shall mean the United States of America.
All references to �MHz� contained in this annual report shall mean megahertz, a unit of frequency denoting one million cycles per second. Allreferences to �GHz� shall mean gigahertz, a unit of frequency denoting one billion cycles per second. All references to �Mbps� shall mean one millionbits per second and all references to �Gbps� shall mean one billion bits per second. All references to �GB� shall mean gigabytes, which is one billionbytes. Any discrepancies in any table between totals and the sums of the amounts listed are due to rounding.
All references to �Won,� or �₩� in this annual report are to the currency of Korea and all references to �Dollars�, �U.S. dollar� or �US$� are tothe currency of the United States of America.
The Ministry of Science and ICT (the �MSIT�) is charged with regulating information and telecommunications, and the Korea CommunicationsCommission (the �KCC�) is charged with regulating the public interest aspects of and fairness in broadcasting. Subscriber information for the wirelessand fixed-line telecommunications industry set forth in this annual report are derived from information published by the MSIT unless expressly statedotherwise.
The consolidated financial statements included in this annual report are prepared in accordance with International Financial Reporting Standards(�IFRS�), as issued by the International Accounting Standards Board (the �IASB�). As such, we make an explicit and unreserved statement ofcompliance with IFRS, as issued by the IASB, with respect to our consolidated financial statements as of December 31, 2019 and 2018, and for theyears ended December 31, 2019, 2018 and 2017 included in this annual report.
Unless expressly stated otherwise, all financial data included in this annual report are presented on a consolidated basis.
FORWARD-LOOKING STATEMENTS
This report contains �forward-looking statements,� as defined in Section 27A of the U.S. Securities Act of 1933, as amended (the �SecuritiesAct�), and Section 21E of the U.S. Securities Exchange Act of 1934, as amended (the �Exchange Act�), that are based on our current expectations,assumptions, estimates and projections about our company and our industry. The forward-looking statements are subject to various risks anduncertainties. Generally, these forward-looking statements can be identified by the use of forward-looking terminology such as �anticipate,� �believe,��considering,� �depends,� �estimate,� �expect,� �intend,� �plan,� �planning,� �planned,� �project� and similar expressions, or that certain events,actions or results �may,� �might,� �should� or �could� occur, be taken or be achieved.
Forward-looking statements in this annual report include, but are not limited to, statements about the following:
� our ability to anticipate and respond to various competitive factors affecting the telecommunications industry, including new services thatmay be introduced, changes in consumer preferences, economic conditions and discount pricing strategies by competitors;
� our implementation of fifth generation wireless technology, which we call �5G� technology;
� our plans for capital expenditures in 2020 for a range of projects, including investments to expand and improve our newly implemented 5Gnetwork, investments to maintain our fourth generation long-term evolution (�LTE�) network and long-term evolution advanced (�LTE-A�)services, investments to improve and expand our Wi-Fi network, investments to develop our Internet of Things (�IoT�) solutions and
1
Copyright © 2020 www.secdatabase.com. All Rights Reserved.Please Consider the Environment Before Printing This Document
Table of Contentsplatform services business portfolio, including artificial intelligence (�AI�) solutions, investments in research and development of 5Gtechnology, investments in businesses that can potentially leverage our 5G network, and funding for mid- to long-term research anddevelopment projects, as well as other initiatives, primarily related to the development of new growth businesses, as well as initiatives relatedto our ongoing businesses in the ordinary course;
� our efforts to make significant investments to build, develop and broaden our businesses, including developing our next-generation growthbusinesses in media, security, commerce, IoT solutions and other innovative products and services offered through our platform services,including AI solutions;
� our ability to comply with governmental rules and regulations, including the regulations of the Government related to telecommunicationsproviders, the Mobile Device Distribution Improvement Act (�MDDIA�), rules related to our status as a �market-dominating business entity�under the Korean Monopoly Regulation and Fair Trade Act (the �Fair Trade Act�) and the effectiveness of steps we have taken to complywith such regulations;
� our ability to effectively manage our bandwidth and to timely and efficiently implement new bandwidth-efficient technologies and ourintention to participate in, and acquire additional bandwidth pursuant to, frequency bandwidth auctions held by the MSIT;
� our expectations and estimates related to interconnection fees, rates charged by our competitors, regulatory fees, operating costs andexpenditures, working capital requirements, principal repayment obligations with respect to long-term borrowings, bonds and obligationsunder capital leases, and research and development expenditures and other financial estimates;
� the success of our various joint ventures and investments, including SK Hynix, Inc. (�SK Hynix�), a memory-chip maker;
� our ability to successfully attract and retain subscribers of our telecommunications-related businesses and customers of our otherbusinesses; and
� the growth of the telecommunications and other industries in which we operate in Korea and other markets and the effect that economic,political or social conditions have on our number of subscribers and customers and results of operations.
We caution you that reliance on any forward-looking statement involves risks and uncertainties, and that although we believe that theassumptions on which our forward-looking statements are based are reasonable, any of those assumptions could prove to be inaccurate, and, as aresult, the forward-looking statements based on those assumptions could be incorrect. Risks and uncertainties associated with our businessinclude, but are not limited to, risks related to changes in the regulatory environment, technology changes, potential litigation and governmentalactions, changes in the competitive environment, political changes, foreign exchange currency risks, foreign ownership limitations, credit risksand other risks and uncertainties that are more fully described under the heading �Item 3.D. Risk Factors� and elsewhere in this annual report. Inlight of these and other uncertainties, you should not conclude that we will necessarily achieve any plans and objectives or projected financialresults referred to in any of the forward-looking statements. We do not undertake to release the results of any revisions of these forward-lookingstatements to reflect future events or circumstances.
2
Copyright © 2020 www.secdatabase.com. All Rights Reserved.Please Consider the Environment Before Printing This Document
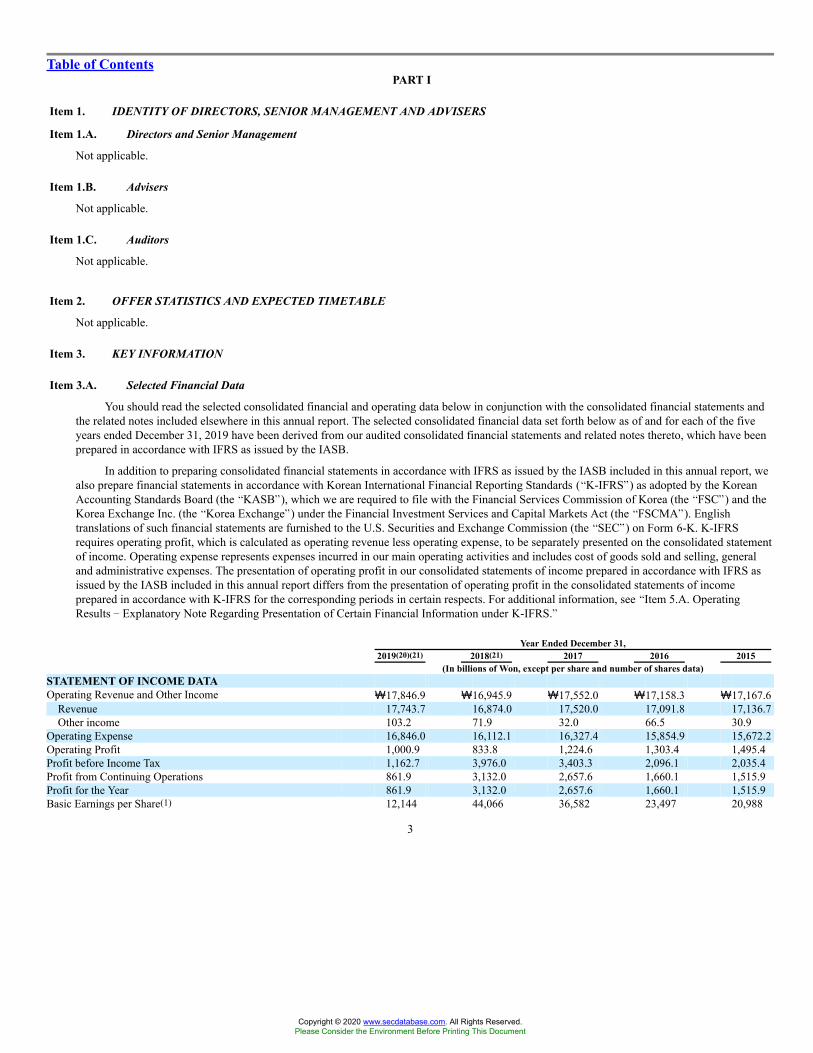
Table of ContentsPART I
Item 1. IDENTITY OF DIRECTORS, SENIOR MANAGEMENT AND ADVISERS
Item 1.A. Directors and Senior Management
Not applicable.
Item 1.B. Advisers
Not applicable.
Item 1.C. Auditors
Not applicable.
Item 2. OFFER STATISTICS AND EXPECTED TIMETABLE
Not applicable.
Item 3. KEY INFORMATION
Item 3.A. Selected Financial Data
You should read the selected consolidated financial and operating data below in conjunction with the consolidated financial statements andthe related notes included elsewhere in this annual report. The selected consolidated financial data set forth below as of and for each of the fiveyears ended December 31, 2019 have been derived from our audited consolidated financial statements and related notes thereto, which have beenprepared in accordance with IFRS as issued by the IASB.
In addition to preparing consolidated financial statements in accordance with IFRS as issued by the IASB included in this annual report, wealso prepare financial statements in accordance with Korean International Financial Reporting Standards (�K-IFRS�) as adopted by the KoreanAccounting Standards Board (the �KASB�), which we are required to file with the Financial Services Commission of Korea (the �FSC�) and theKorea Exchange Inc. (the �Korea Exchange�) under the Financial Investment Services and Capital Markets Act (the �FSCMA�). Englishtranslations of such financial statements are furnished to the U.S. Securities and Exchange Commission (the �SEC�) on Form 6-K. K-IFRSrequires operating profit, which is calculated as operating revenue less operating expense, to be separately presented on the consolidated statementof income. Operating expense represents expenses incurred in our main operating activities and includes cost of goods sold and selling, generaland administrative expenses. The presentation of operating profit in our consolidated statements of income prepared in accordance with IFRS asissued by the IASB included in this annual report differs from the presentation of operating profit in the consolidated statements of incomeprepared in accordance with K-IFRS for the corresponding periods in certain respects. For additional information, see �Item 5.A. OperatingResults � Explanatory Note Regarding Presentation of Certain Financial Information under K-IFRS.�
Year Ended December 31,2019(20)(21) 2018(21) 2017 2016 2015
(In billions of Won, except per share and number of shares data)STATEMENT OF INCOME DATAOperating Revenue and Other Income ₩17,846.9 ₩16,945.9 ₩17,552.0 ₩17,158.3 ₩17,167.6
Revenue 17,743.7 16,874.0 17,520.0 17,091.8 17,136.7Other income 103.2 71.9 32.0 66.5 30.9
Operating Expense 16,846.0 16,112.1 16,327.4 15,854.9 15,672.2Operating Profit 1,000.9 833.8 1,224.6 1,303.4 1,495.4Profit before Income Tax 1,162.7 3,976.0 3,403.3 2,096.1 2,035.4Profit from Continuing Operations 861.9 3,132.0 2,657.6 1,660.1 1,515.9Profit for the Year 861.9 3,132.0 2,657.6 1,660.1 1,515.9Basic Earnings per Share(1) 12,144 44,066 36,582 23,497 20,988
3
Copyright © 2020 www.secdatabase.com. All Rights Reserved.Please Consider the Environment Before Printing This Document

Table of ContentsYear Ended December 31,
2019(20)(21) 2018(21) 2017 2016 2015(In billions of Won, except per share and number of shares data)
Diluted Earnings per Share(2) 12,144 44,066 36,582 23,497 20,988Basic Earnings per Share from Continuing
Operations(1) 12,144 44,066 36,582 23,497 20,988Diluted Earnings per Share from Continuing
Operations(2) 12,144 44,066 36,582 23,497 20,988Dividends Declared per Share (Won) 10,000 10,000 10,000 10,000 10,000Dividends Declared per Share (US$)(3) 8.7 9.0 9.4 8.3 8.6Weighted Average Number of Shares 72,064,159 70,622,976 70,609,160 70,609,160 71,551,966
As of December 31,2019(20)(21) 2018(21) 2017 2016 2015
(In billions of Won)STATEMENT OF FINANCIAL POSITION
DATAWorking Capital (Deficit)(4) ₩314.6 ₩1,111.3 ₩(907.3 ) ₩(447.5 ) ₩(96.3 )Property and Equipment, Net 12,334.3 10,718.4 10,144.9 10,374.2 10,371.3Total Assets 44,611.6 42,369.1 33,428.7 31,297.7 28,581.4Non-current Liabilities(5) 14,000.4 13,172.3 8,290.4 8,737.1 7,950.8Share Capital 44.6 44.6 44.6 44.6 44.6Total Equity 22,823.5 22,349.3 18,029.2 16,116.4 15,374.1
As of December 31,2019(20)(21) 2018(21) 2017 2016 2015
(In billions of Won, except percentage data)OTHER FINANCIAL DATACapital Expenditures(6) ₩ 3,375.9 ₩ 2,792.4 ₩ 2,715.9 ₩ 2,490.5 ₩ 2,478.8Research and Development Expense 391.3 387.7 395.3 344.8 315.8Depreciation and Amortization Expense(7) 3,771.5 3,126.1 3,097.5 2,941.9 2,845.3Net Cash Provided by Operating Activities 3,986.1 4,332.6 3,855.8 4,243.2 3,778.1Net Cash Used in Investing Activities (3,582.5 ) (4,047.7 ) (3,070.6 ) (2,462.2 ) (2,880.5 )Net Cash Used in Financing Activities (636.8 ) (238.3 ) (826.6 ) (1,044.8 ) (964.6 )Margins (% of Operating Revenue and Other
Income):Operating Margin(8) 5.6 % 4.9 % 7.0 % 7.6 % 8.7 %Net Margin(9) 4.8 % 18.5 % 15.1 % 9.7 % 8.8 %
As of or for the year ended December 31,2019 2018 2017 2016 2015
SELECTED OPERATING DATAPopulation of Korea (in millions)(10) 51.8 51.8 51.8 51.7 51.5Our Wireless Penetration(11) 60.8 % 59.6 % 58.3 % 57.2 % 55.6 %Number of Employees(12) 40,543 39,909 30,608 25,844 25,992Our Wireless Subscribers (in thousands)(13) 31,535 30,882 30,195 29,595 28,626Our 5G Subscribers (in thousands) 2,084 � � � �Our 5G Penetration(14) 6.6 % � � � �Our LTE Subscribers (in thousands)(15) 25,022 24,796 22,865 21,078 18,980Our LTE Penetration(16) 79.3 % 80.3 % 75.7 % 71.2 % 66.3 %Average Monthly Data Usage per 5G Subscriber(17) 28.0 GB � � � �Average Monthly Data Usage per LTE Subscriber(18) 8.2 GB 7.1 GB 6.0 GB 5.2 GB 3.9 GBAverage Monthly Churn Rate(19) 1.2 % 1.2 % 1.5 % 1.5 % 1.5 %Cell Sites 63,066 54,203 52,132 54,986 55,085
4
Copyright © 2020 www.secdatabase.com. All Rights Reserved.Please Consider the Environment Before Printing This Document
Table of Contents
(1) Basic earnings per share is calculated by dividing profit attributable to owners of SK Telecom by the weighted average number of commonshares outstanding during the period. Basic earnings per share from continuing operations is calculated by dividing profit from continuingoperations attributable to owners of SK Telecom by the weighted average number of common shares outstanding during the period.
(2) Diluted earnings per share is calculated by dividing profit attributable to owners of SK Telecom adjusted for dilution by the potential dilutiveweighted average number of common shares outstanding during the period, taking into account the conversion of outstanding convertible bonds.Diluted earnings per share from continuing operations is calculated by dividing profit from continuing operations attributable to owners of SKTelecom adjusted for dilution by the potential dilutive weighted average number of common shares outstanding during the period, taking intoaccount the conversion of outstanding convertible bonds.
(3) The Dollar amounts shown for the years ended December 31, 2019, 2018, 2017, 2016 and 2015 were translated at the rate of Won 1,155.5 toUS$1.00, Won 1,112.9 to US$1.00, Won 1,067.4 to US$1.00, Won 1,203.7 to US$1.00 and Won 1,169.3 to US$1.00, respectively, the noonbuying rates for cable transfers in New York City certified for customs purposes by the Federal Reserve Bank of New York in effect at the end ofthe respective years.
(4) Working capital means current assets minus current liabilities.(5) Our monetary assets and liabilities denominated in foreign currencies are valued at the exchange rates prevailing at the end of each reporting
period. See note 4(19) of the notes to our consolidated financial statements.(6) Consists of cash outflows for the acquisition of property and equipment.(7) Derived from our consolidated statements of income.(8) Operating revenue and other income and operating profit used in the calculation of these ratios exclude the operating revenue and other income
and operating profit from discontinued operations.(9) Net margin represents profit for the year divided by operating revenue and other income.(10) Population numbers reflect the number of registered residents as published by the Ministry of the Interior and Safety of Korea.(11) Our wireless penetration is determined by dividing our wireless subscribers by total estimated population, as of the end of the period.(12) Includes regular employees and temporary employees. See �Item 6.D. Employees.�(13) Wireless subscribers include those subscribers who are temporarily deactivated, including (i) subscribers who voluntarily deactivate temporarily
for a period of up to three months no more than twice a year and (ii) subscribers with delinquent accounts who may be involuntarily deactivatedup to two months before permanent deactivation, which we determine based on various factors, including prior payment history. The number ofsubscribers as of December 31, 2019, 2018, 2017, 2016 and 2015 include 2.9 million subscribers, 3.5 million subscribers, 3.4 millionsubscribers, 3.2 million subscribers and 2.7 million subscribers, respectively, of mobile virtual network operators (�MVNO�) that lease ourwireless networks.
(14) Our 5G wireless penetration is determined by dividing our 5G subscribers by our total wireless subscribers, as of the end of the period.(15) The number of LTE subscribers as of December 31, 2019, 2018, 2017, 2016 and 2015 include 0.6 million subscribers, 0.6 million subscribers,
0.5 million subscribers, 0.3 million subscribers and 0.1 million subscribers, respectively, of MVNOs that lease our LTE network.(16) Our LTE wireless penetration is determined by dividing our LTE subscribers by our total wireless subscribers, as of the end of the period.(17) Average monthly data usage per 5G subscriber is determined by dividing the total GBs of data usage for the last month of the period by the
average number of 5G subscribers for such month.(18) Average monthly data usage per LTE subscriber is determined by dividing the total GBs of data usage for the last month of the period by the
average number of LTE subscribers for such month.
5
Copyright © 2020 www.secdatabase.com. All Rights Reserved.Please Consider the Environment Before Printing This Document
Table of Contents(19) The average monthly churn rate for a period is the number calculated by dividing the sum of voluntary and involuntary deactivations during the
period by the simple average of the number of subscribers at the beginning and end of the period, then dividing that number by the number ofmonths in the period. Churn includes subscribers who upgrade to a next-generation service, such as 5G, by terminating their service and openinga new subscriber account.
(20) We adopted IFRS 16, Leases, in the fiscal year beginning on January 1, 2019 using the modified retrospective method by recognizing thecumulative effect of initially applying IFRS 16 as an adjustment to the opening balance of retained earnings as of such date. The comparativeinformation presented for 2018, 2017, 2016 and 2015 has not been restated. See �Item 5.A. Operating Results � Recently Adopted InternationalFinancial Reporting Standards� and note 3 of the notes to our consolidated financial statements.
(21) We adopted IFRS 15, Revenue from Contracts with Customers, and IFRS 9, Financial Instruments, in the fiscal year beginning on January 1,2018. We adopted IFRS 15 and IFRS 9 by recognizing the cumulative effect of initially applying IFRS 15 and IFRS 9 as adjustments to theopening balance of retained earnings as of January 1, 2018. The comparative information presented for 2017, 2016 and 2015 has not beenrestated. See �Item 5.A. Operating Results � Recently Adopted International Financial Reporting Standards.�
Item 3.B. Capitalization and Indebtedness
Not applicable.
Item 3.C. Reasons for the Offer and Use of Proceeds
Not applicable.
Item 3.D. Risk Factors
Risks Relating to Our Business
Competition may reduce our market share and harm our results of operations and financial condition.
We face substantial competition across all our businesses, including our wireless telecommunications business. We expect competition to intensifyas a result of the development of new technologies, products and services. We expect that such trends will continue to put downward pressure on therates we can charge our subscribers.
Historically, there has been considerable consolidation in the telecommunications industry, resulting in the current competitive landscapecomprising three mobile and fixed network operators in the Korean market, us, KT Corporation (�KT�) and LG Uplus Corp. (�LG U+�). Each of ourcompetitors has substantial financial, technical, marketing and other resources to respond to our business offerings. The collective market share of KTand LG U+ amounts to approximately 53.6%, in terms of number of wireless subscribers (including an aggregate of 7.2% attributable to MVNOs thatlease KT�s and LG U+�s respective networks), as of December 31, 2019.
Our competitors for subscriber activations include MVNOs, including MVNOs that lease our networks. MVNOs generally provide rate plans thatare relatively cheaper than similar rate plans of the wireless network providers from which they lease their networks, including us. In addition, othercompanies may enter the wireless network services market. While new entries into such market have historically required obtaining requisite licensesfrom the MSIT, pursuant to an amendment to the Telecommunications Business Act that went into effect in June 2019, companies meeting certainregulatory criteria may become a network service provider by registering with the MSIT without a separate license requirement. Although suchamendment has not yet resulted in any new entries into the Korean wireless network services market, it may have the effect of encouraging new entriesin the future.
We believe that an increase in market share of MVNOs and the entrance of new mobile network operators, if any, in the wirelesstelecommunications market may further increase competition in the telecommunications sector, as well as cause downward price pressure on the fees wecharge for our services, which, in turn, may have a material adverse effect on our results of operations, financial position and cash flows.
Our fixed-line telephone service competes with KT and LG U+, as well as other providers of voice over Internet protocol (�VoIP�) services. As ofDecember 31, 2019, our market share of the fixed-line telephone and VoIP service market was 15.9% (including the services provided by SK BroadbandCo., Ltd. (�SK Broadband�) and
6
Copyright © 2020 www.secdatabase.com. All Rights Reserved.Please Consider the Environment Before Printing This Document

Table of ContentsSK Telink Co., Ltd. (�SK Telink�)) in terms of number of subscribers compared to KT with 57.2% and LG U+ with 17.5%. In addition, our broadbandInternet access and Internet protocol TV (�IPTV�) services provided through SK Broadband compete with other providers of such services, includingKT, LG U+ and cable companies. As of December 31, 2019, our market share of the broadband Internet market was 25.6% in terms of number ofsubscribers compared to KT with 40.9% and LG U+ with 19.6%. As of December 31, 2019, our market share of the pay TV market (which includesIPTV, cable TV and satellite TV) was 14.9% compared to KT with 31.4% (including its IPTV and satellite TV services) and LG U+ with 24.9%(including its IPTV and cable TV services), and the collective market share of other pay TV providers was 28.8%.
Recently, the Korean fixed-line telecommunications industry has been going through significant consolidation involving major pay televisionservice providers. In December 2019, LG U+ acquired a majority equity stake in CJ Hello Co., Ltd. and changed the acquired company�s name to LGHelloVision Co., Ltd. (�LG HelloVision�) to collectively become the second-largest pay TV provider in Korea in terms of number of subscribers. InApril 2019, SK Broadband entered into an agreement with Tbroad Co., Ltd., a leading cable television and other fixed-line telecommunication servicesprovider in Korea with consolidated total assets of Won 973.2 billion and consolidated total revenue of Won 655.1 billion as of and for the year endedDecember 31, 2019, and two of its subsidiaries, Tbroad Dongdaemun Broadcasting Co., Ltd. and Korea Digital Cable Media Center Co. Ltd.,(collectively, �Tbroad�), pursuant to which Tbroad will merge with and into SK Broadband. Upon the completion of such merger, we expect to ownapproximately 74.4% of SK Broadband�s total outstanding shares following the issuance of SK Broadband�s shares to Tbroad�s shareholders. Inaddition, SK Telecom signed a separate share purchase agreement with Tbroad Co., Ltd. to acquire a 55.0% equity interest in Tbroad NowonBroadcasting Co., Ltd. (�Tbroad Nowon�), another subsidiary of Tbroad Co., Ltd., for a purchase price of Won 10.4 billion in cash. Both transactionshave obtained all requisite regulatory and shareholder approvals and are expected to be completed as of April 30, 2020 and April 29, 2020, respectively.Such transactions, as well as further consolidation in the fixed-line telecommunications industry, may result in increased competition, as the entitiesemerging from such consolidation and other remaining players in the industry may actively pursue expanding or protecting their respective marketshares.
Furthermore, the Government has historically enforced regulations on cable TV and IPTV service providers that prohibited them from having amarket share of more than one-third of the total number of subscribers in the relevant pay TV market on each of their respective platforms. In June2015, the Government amended the regulation to impose the same limit on the market share of the entire pay TV market, including satellite TV serviceproviders as well. Such amended regulation, however, expired in June 2018. While the expiration of such regulation has prompted the submission of anumber of bills in the National Assembly to extend its application, it is uncertain whether any of such bills will be passed. An extension of suchregulation may restrict our and our major competitors� abilities to engage in further consolidation or otherwise significantly increase market share in thepay TV market. In addition, there is a pending bill in the National Assembly which proposes to require IPTV service providers to obtain approvals fromthe MSIT for any mergers or acquisitions or change-of-control transactions.
Continued competition from other wireless and fixed-line service providers has also resulted in, and may continue to result in, a substantial levelof deactivations among our subscribers. Subscriber deactivations, or churn, may significantly harm our business and results of operations. In 2019, themonthly churn rate in our wireless telecommunications business ranged from 1.0% to 1.4%, with an average monthly churn rate of 1.2%, whichremained unchanged from 2018. Intensification of competition in the future may cause our churn rates to increase, which in turn may cause us toincrease our marketing expenses as a percentage of sales to attract and retain subscribers.
Our physical security business primarily operated by ADT CAPS Co., Ltd. competes with other large physical security service providers,including S-1 Corporation (�S-1�) and KT Telecop Co., Ltd. (�KT Telecop�). As of December 31, 2019, our market share of the physical securityservices market was 32.4% in terms of the aggregate revenue of these three companies, compared to S-1 with 55.9% and KT Telecop with 11.6%. SKInfosec�s information security services compete with other providers of similar products and services, such as Ahnlab, Inc., SECUi Corp. and WINSCo., Ltd.
With respect to the e-commerce business operated by Eleven Street Co., Ltd. (�Eleven Street�), 11st, our marketplace business, faces intensecompetition from various e-commerce providers, including online open
7
Copyright © 2020 www.secdatabase.com. All Rights Reserved.Please Consider the Environment Before Printing This Document
Table of Contentsmarketplaces and social commerce operators such as Gmarket, Auction, Interpark, Coupang, Wemakeprice and TMon. We also face competition fromtraditional retailers with online and mobile shopping portals such as SSG.com and Lotte.com, home shopping providers with online and mobileshopping portals such as CJ Mall by CJ O Shopping, GS Shop by GS Homeshopping and Hyundai Hmall by Hyundai Homeshopping, and variousonline marketplaces for specific consumer segments or product groups. Our television shopping (�T-commerce�) business, SK stoa, primarily competeswith other home shopping providers such as those listed above, as well as with various e-commerce providers and traditional retailers. The industries inwhich 11st and SK stoa compete are evolving rapidly and are intensely competitive, and we face a broad array of competitors domestically andincreasingly, internationally.
Our ability to compete successfully in all of the businesses in which we operate will depend on our ability to anticipate and respond to variouscompetitive factors affecting the respective industries, including new services that may be introduced, changes in consumer preferences, economicconditions and discount pricing strategies by competitors.
Inability to successfully implement or adapt our network and technology to meet the continuing technological advancements affecting thewireless telecommunications industry will likely have a material adverse effect on our financial condition, results of operation, cash flows andbusiness.
The telecommunications industry has been characterized by continual improvement and advances in technology, and this trend is expected tocontinue. We and our competitors have continually implemented technology upgrades from our basic code division multiple access (�CDMA�) networkto our wideband code division multiple access (�WCDMA�) network, and subsequently to LTE and 5G technologies. Our business could be harmed ifwe fail to implement, or adapt to, future technological advancements in the telecommunications sector in a timely manner, such as the continuedimplementation of 5G technology. We launched wireless service plans using the 5G network in April 2019 following the commencement of sales of thefirst 5G-compatible smartphones, and we are in the process of expanding our 5G network coverage, focusing on major commercial districts and otherdensely-populated areas in the Seoul metropolitan area and other major cities. KT and LG U+ have also rolled out their respective 5G wireless serviceplans in April 2019. The more successful operation of a 5G network or development of improved 5G technology by a competitor, including bettermarket acceptance of a competitor�s 5G services, could materially and adversely affect our existing wireless telecommunications businesses as well asthe returns on future investments we may make in our 5G network or our other businesses.
In addition to introducing new technologies and offerings, we must phase out outdated and unprofitable technologies and services. For example,as of January 2019, we discontinued our wireless broadband Internet access (�WiBro�) services, and we also plan to phase out our second generationCDMA wireless services upon receipt of the requisite approval from the MSIT. If we are unable to do so on a cost-effective basis, our results ofoperations could be adversely affected.
Implementation of new wireless technology and enhancement of existing wireless technology have required, and may continue to require,significant capital and other expenditures, which we may not recoup.
We have made, and intend to continue to make, capital investments to develop, launch and enhance our wireless service. In 2019, 2018 and 2017,we spent Won 2,514.3 billion, Won 1,735.6 billion and Won 1,597.0 billion, respectively, in capital expenditures to build and enhance our wirelessnetworks. Our continued implementation and expansion of 5G services, which use a higher frequency spectrum than our LTE services, will requireadditional cell sites and other infrastructure, which may result in an increase in our capital expenditures in the future. We also plan to make furthercapital investments related to our wireless services in the future, including services that can potentially leverage our 5G network. In addition, we plan tocontinue maintaining our LTE network, which we expect will continue to be used broadly by our subscriber base during the near future, as we and ourcompetitors continue to build up 5G networks and services and wireless service users gradually migrate to the 5G network over time. Our wirelesstechnology-related investment plans are subject to change, and will depend, in part, on market demand for 5G and LTE services, the competitivelandscape for provision of such services and the development of competing technologies. There may not be sufficient demand for services based on ourlatest wireless technologies, as a result of competition or otherwise, to permit us to recoup or profit from our wireless technology-related capitalinvestments.
8
Copyright © 2020 www.secdatabase.com. All Rights Reserved.Please Consider the Environment Before Printing This Document
Table of ContentsOur businesses are subject to extensive Government regulation and any change in Government policy relating to the telecommunicationsindustry could have a material adverse effect on our results of operations, financial condition and cash flows.
Most of our businesses are subject to extensive governmental supervision and regulation.
Rate Regulation. The Government has periodically reviewed the rates charged by wireless telecommunications service providers and has, fromtime to time, released public policy guidelines or suggested rate reductions. Although these guidelines or suggestions were not binding, we haveimplemented some rate reductions in response to them. For example, under the MDDIA, wireless telecommunications service providers are obliged toprovide certain benefits, such as discounted rates, to subscribers who subscribe to their service without receiving subsidies. In June 2017, the StateAffairs Planning Advisory Committee of Korea announced that it would encourage wireless telecommunications service providers, including us, toincrease the applicable discount rate offered to subscribers from 20% to 25%, which we adopted in September 2017, and to offer additional discounts tolow income customers, including those on government welfare programs and senior citizen recipients of the basic pension, which we implemented inDecember 2017 and July 2018, respectively. See �Item 4.B. Business Overview � Law and Regulation � Rate Regulation� and �Item 5.A. OperatingResults � Overview � New Rate Regulations.� Such discounts have contributed to a decrease in the monthly revenue per subscriber of our wirelesstelecommunications services. See �Item 5.A. Operating Results � Overview � Decrease in Monthly Revenue per Subscriber.� The Government maysuggest other rate reductions in the future, including more affordable subscription plans for 5G wireless services, and any further rate reductions wemake in response to such suggestion may adversely affect our results of operations.
Technology Standards. The Government also plays an active role in setting the timetable and quality standards for the adoption andimplementation of new technologies to be used by telecommunications operators in Korea. For example, the Government provided such guidance inconnection with the introduction of LTE and 5G technologies in the past. The Government may provide similar guidance or recommendations inconnection with the adoption and implementation of technologies to be used in future telecommunications services, and it is possible that adherence tosuch guidance or recommendations promoted by the Government in the future may not provide the best commercial returns for us.
Frequency Allocation. The Government sets the policies regarding the use of frequencies and allocates the spectrum of frequencies used forwireless telecommunications. See �Item 4.B. Business Overview � Law and Regulation � Frequency Allocation.� The reallocation of the spectrum toour existing competitors could increase competition among wireless telecommunications service providers, which may have an adverse effect on ourbusiness.
MVNOs. Pursuant to the Telecommunications Business Act, certain wireless telecommunications service providers designated by the MSIT, whichincluded only us, were required to lease their networks or allow use of their networks (collectively, a �wholesale lease�) to other network serviceproviders, such as an MVNO, that have requested such a wholesale lease in order to provide their own services using the leased networks untilSeptember 2019. The expiration of such requirement has prompted the submission of a bill in the National Assembly to extend its application. While itis uncertain whether such bill will be passed, we plan to continue allowing MVNOs to use our networks. Currently, thirteen MVNOs provide wirelesstelecommunications services using the networks leased from us. We believe that leasing a portion of our bandwidth capacity to an MVNO impairs ourability to use our bandwidth in ways that would generate maximum revenues and strengthens our MVNO competitors by granting them access andlowering their costs to enter into and operate in our markets. Accordingly, our profitability has and may continue to be adversely affected.
Interconnection. Our wireless telecommunications services depend, in part, on our interconnection arrangements with domestic and internationalfixed-line and other wireless networks. Our interconnection arrangements, including the interconnection rates we pay and interconnection rates wecharge, affect our revenues and operating results. The MSIT determines the basic framework for interconnection arrangements, including policiesrelating to interconnection rates in Korea. The KCC, which determined such basic framework under the previous Government, changed the basicframework for interconnection arrangements several times. We cannot
9
Copyright © 2020 www.secdatabase.com. All Rights Reserved.Please Consider the Environment Before Printing This Document
Table of Contentsassure you that we will not be adversely affected by the MSIT�s interconnection policies and future changes to such policies. See �Item 4.B. BusinessOverview � Interconnection � Domestic Calls.�
Regulatory Action. The MSIT may revoke our licenses or suspend any of our businesses if we fail to comply with its rules, regulations andcorrective orders, including the rules restricting beneficial ownership and control or any violation of the conditions of our licenses. Alternatively, in lieuof suspension of our business, the KCC may levy a monetary penalty of up to 3.0% of the average of our annual revenue for the preceding three fiscalyears. For information about the penalties imposed on us for violating Governmental regulations, see �Item 8.A. Consolidated Statements and OtherFinancial Information � Legal Proceedings � KCC Proceedings.� Such penalties, which may include the revocation of cellular licenses, suspension ofbusiness or imposition of monetary penalties by the KCC, could have a material adverse effect on our business. We believe we are currently incompliance with the material terms of all our cellular licenses.
We are subject to additional regulations as a result of our dominant market position in the wireless telecommunications sector, which could harmour ability to compete effectively.
The Government endeavors to promote competition in the Korean telecommunications markets through measures designed to prevent a dominantservice provider from exercising its market power and deterring the emergence and development of viable competitors. We have been designated by theMSIT as the �dominant network service provider� in respect of our wireless telecommunications business. As such, we are subject to additionalregulations to which certain of our competitors are not subject. For example, under current Government regulations, we must obtain prior approval fromthe MSIT to raise our existing rates or introduce new rates. Multiple bills have been proposed to the National Assembly to change the approvalrequirement to a simple reporting requirement, which is the requirement for our competitors. However, there is no assurance as to which of these bills, ifany, will be passed. See �Item 4.B. Business Overview � Law and Regulation � Rate Regulation.� The MSIT could also require us to charge higherusage rates than our competitors for future services or to take certain actions earlier than our competitors, as when the KCC required us to introducenumber portability earlier than our competitors, KT and LG U+.
We also qualify as a �market-dominating business entity� under the Fair Trade Act, which subjects us to additional regulations and we areprohibited from engaging in any act of abusing our position as a market-dominating entity. See �Item 4.B. Business Overview � Law and Regulation �Competition Regulation.� The additional regulations to which we are subject has affected our competitiveness in the past and may materially hurt ourprofitability and impede our ability to compete effectively against our competitors in the future.
The ongoing global pandemic of a new strain of coronavirus (��COVID-19��) and any possible recurrence of other types of widespread infectiousdiseases may adversely affect our business, financial condition or results of operations.
The COVID-19, an infectious disease caused by severe acute respiratory syndrome coronavirus 2 that was first reported to have been transmittedto humans in late 2019 and has since spread globally over the course of 2020 to date, has materially and adversely affected the global economy andfinancial markets in recent months as well as disrupted our business operations. The World Health Organization declared the COVID-19 as a pandemicin March 2020. From late February to early April, we implemented remote work arrangements for most of our employees at our headquarters andcertain other locations due to an isolated incident of contraction of COVID-19 by one of our employees and in light of the Government�srecommendation for social distancing. While we do not believe that such temporary arrangements have had a material adverse impact on our business, aprolonged outbreak of COVID-19 may result in further disruption in the normal operations of our business, including implementation of further workarrangements requiring employees to work remotely and/or temporary closures of our facilities, which may lead to a reduction in labor productivity.
Other risks associated with a prolonged outbreak of COVID-19 or other types of widespread infectious diseases include:
� an increase in unemployment among, and/or a decrease in disposable income of, our customers, who may not be able to meet paymentobligations or otherwise choose to decrease their spending levels, which in turn
10
Copyright © 2020 www.secdatabase.com. All Rights Reserved.Please Consider the Environment Before Printing This Document
Table of Contentsmay decrease demand for some of our products and services or cause an increase in delinquent subscriber accounts;
� a slowdown in the rate of subscriber migration to our 5G service, which generally entails higher-priced subscription plans and wirelessdevices;
� disruptions in operations, and/or a decrease in the demand for products and services, of our corporate customers, which in turn may decreasesuch customers� demand for our services and products;
� service disruptions, outages and performance problems due to capacity constraints caused by an overwhelming number of people accessingour services simultaneously;
� disruptions in supply of mobile handsets or telecommunications equipment from our vendors as well as in the installation of our networkinfrastructure;
� unstable global and Korean financial markets, which may adversely affect our ability to meet capital funding needs on a timely and cost-effective basis;
� a decrease in the fair value of our investments in companies that may be adversely affected by the pandemic; and
� depreciation of the Won against major foreign currencies, which in turn may increase the cost of imported equipment necessary for expansionand enhancement of our telecommunications infrastructure.
It is not possible to predict the duration or full magnitude of harm from COVID-19. In the event that COVID-19 or other types of widespreadinfectious diseases cannot be effectively and timely contained, our business, financial condition and results of operations may be adversely affected.
Declines in the market value of our equity holdings in SK Hynix and the results of operations of SK Hynix could have a material adverse effecton the market price of our common shares and American Depositary Shares (��ADSs��) as well as our results of operation.
As of December 31, 2019, we held a 20.1% equity interest in SK Hynix, which is listed on the KRX KOSPI Market of the Korea Exchange (the�KRX KOSPI Market�) and is one of the world�s largest memory-chip makers by revenue. As of December 31, 2019, the fair value of our holding inSK Hynix was Won 13,748.0 billion. We received dividend payments of Won 219.2 billion in 2019, Won 146.1 billion in 2018 and Won 87.7 billion in2017 related to such shareholding.
From time to time, the memory semiconductor industry has experienced significant and sometimes prolonged downturns, which often occur inconnection with a deterioration of global economic conditions, and is subject to intense competition. For example, SK Hynix and its subsidiaries, on aconsolidated basis, incurred net losses of Won 158.8 billion and Won 56.0 billion in 2012 and 2011, respectively, primarily due to increased supply andweak demand for semiconductor products. Although the memory semiconductor industry has recovered since then and SK Hynix has been reporting netprofits since 2013, its consolidated profit decreased significantly from Won 15,540.0 billion in 2018 to Won 2,016.4 billion in 2019, mainly due toadverse market conditions and an overcapacity in the industry. The global memory semiconductor industry, which is sensitive to general conditions inthe global economy, is subject to cyclical fluctuations, and we expect that there may be future downturns in the industry. Uncertainty in the globaleconomy has increased in recent years, especially with global financial and capital markets experiencing substantial volatility in light of the ongoingglobal COVID-19 pandemic. Accordingly, SK Hynix�s operating results would be adversely affected if it fails to compete successfully or decreasemanufacturing costs at an adequate level. Our share of any net losses incurred by SK Hynix would be reflected in our income statement as share oflosses related to investments in associates.
Accordingly, declines in the market value of our equity holdings in SK Hynix and the results of operations of SK Hynix could have a materialadverse effect on the market price of our common shares and ADSs as well as our results of operation.
11
Copyright © 2020 www.secdatabase.com. All Rights Reserved.Please Consider the Environment Before Printing This Document
Table of ContentsWe may fail to successfully complete, integrate or realize the anticipated benefits of our new acquisitions, joint ventures or other strategicalternatives, and such transactions may negatively impact our business.
We continue to seek opportunities to develop new businesses that we believe are complementary to our existing product and service portfolio andexpand our global business through selective acquisitions. Accordingly, we are often engaged in evaluating potential transactions and other strategicalternatives, some of which may be significant in size.
For example, in April 2019, SK Broadband entered into an agreement to merge with Tbroad, a leading cable television and other fixed-linetelecommunication services provider in Korea, and a separate share purchase agreement to acquire a 55.0% interest in another subsidiary of Tbroad,which transactions have received all requisite regulatory and shareholder approvals and are expected to be completed as of April 30, 2020 and April 29,2020, respectively. In addition, in June 2019, we acquired a 34.6% interest in Incross Co., Ltd. (�Incross�), a digital advertising company, for anaggregate purchase price of Won 53.7 billion, in light of potential synergies with our media and commerce businesses. Furthermore, in order tostrengthen our security business and explore potential synergies with our wireless and fixed-line business portfolio, we acquired a 55.0% interest inLife & Security Holdings Co., Ltd. (�LSH�), which owns 100% of ADT CAPS Co., Ltd., a leading Korean physical security service company, and twosister companies, CAPSTEC Co., Ltd. and ADT SECURITY Co., Ltd. (which subsequently merged with and into ADT CAPS Co., Ltd.) (collectively,�ADT Caps�), for Won 696.7 billion in October 2018; a 100% interest in SK Infosec Co., Ltd. (�SK Infosec�), Korea�s leading information securitycompany, in a share exchange transaction pursuant to which we issued 1,260,668 treasury shares with an aggregate book value of Won 281.2 billion inexchange for all of the outstanding common shares of SK Infosec in December 2018 from SK Holdings Co., Ltd. (�SK Holdings�), our largestshareholder; and additional shares of id Quantique SA (�id Quantique�), a leading provider of quantum cryptography solutions for data security based inSwitzerland, in 2018 with Won 55.2 billion in cash and Won 5.7 billion in contribution-in-kind through which we increased our interest in id Quantiqueto 65.6%. Following our participation in id Quantique�s capital increase in 2019, our equity interest in id Quantique increased to 66.8% as ofDecember 31, 2019.
We have also pursued other strategic alternatives, such as forming a strategic alliance in October 2019 with Kakao Corp. (�Kakao�), a KoreanInternet company and the operator of Korea�s most popular mobile messaging application, to collaborate in the information and communicationtechnologies (�ICT�) sector through the sale of 1,266,620 of our treasury shares to Kakao, representing a 1.6% interest, for approximately Won300.0 billion and a concurrent issuance by Kakao of 2,177,401 of its shares, representing a 2.5% interest, to us for approximately Won 302.3 billion. Inaddition, in September 2019, in furtherance of our efforts to enhance the competitiveness of our media business and to promote its future growth, weacquired a minority equity stake in Content Wavve Co., Ltd. (formerly known as Content Alliance Platform Inc.) (�Content Wavve�), a joint ventureestablished by the three major terrestrial broadcasters in Korea that operated the mobile over-the-top (�OTT�) service �POOQ,� by investing Won90.9 billion in cash and transferring our former mobile OTT service business �oksusu� to Content Wavve. Content Wavve combined oksusu and POOQto launch a new integrated mobile OTT service �wavve� in September 2019. As of December 31, 2019, we held 30.0% of the total outstanding shares ofContent Wavve. For a more detailed description of our recent investments in new businesses, see �Item 5.B. Liquidity and Capital Resources � CapitalRequirements � Investments in New Growth Businesses.�
While we are hoping to benefit from a range of synergies from our recent or future acquisitions as well as develop new growth engines for ourbusiness, we may not be able to successfully complete or integrate such acquisitions or new businesses and may fail to realize the expected benefits inthe near term, or at all. For example, in June 2019, we disposed of our entire interest in our consolidated subsidiaries Shopkick Management Company,Inc. (�SMC�) and Shopkick, Inc. (�Shopkick�), a wholly-owned subsidiary of SMC which operates �shopkick,� a mobile reward points-based in-storeshopping application, which we had acquired in October 2014, following a prolonged period of unprofitability of the shopkick business. Previously in2018, we also recognized Won 153.4 billion and Won 52.4 billion of impairment losses for goodwill and intangible assets, respectively, in connectionwith Shopkick. In addition, when we enter into new businesses with partners through joint ventures or other strategic alliances, we and those partnersmay have disagreements with respect to strategic directions or other aspects of business, or may otherwise be unable to coordinate or cooperate witheach other, any of which
12
Copyright © 2020 www.secdatabase.com. All Rights Reserved.Please Consider the Environment Before Printing This Document

Table of Contentscould materially and adversely affect our operations in such businesses. Our business may be negatively impacted if we fail to successfully integrate orrealize the anticipated benefits of such transactions.
Due to the existing high penetration rate of wireless telecommunications services in Korea, we are unlikely to maintain our subscriber growthrate, which could adversely affect our results of operations.
According to data published by the MSIT and the historical population data published by the Ministry of the Interior and Safety, the penetrationrate for the Korean wireless telecommunications industry as of December 31, 2019 was approximately 131.0%, which is relatively high compared tomany industrialized countries. Therefore, we expect that the penetration rate for wireless telecommunications service in Korea will remain relativelystable. As a result of the already high penetration rate in Korea for wireless telecommunications services coupled with our leading market share, weexpect our subscriber growth rate to decrease. Slowed growth in the penetration rate without a commensurate increase in revenues through theintroduction of new services and increased use of our services by existing subscribers would likely have a material adverse effect on our financialcondition, results of operations and cash flows.
Our business and results of operations may be adversely affected if we fail to acquire adequate additional frequency usage rights or use ourbandwidth efficiently to accommodate subscriber growth and subscriber usage.
One of the principal limitations on a wireless network�s subscriber capacity is the amount of frequency spectrum available for use by the network.We have acquired a number of frequency usage rights to secure bandwidth capacity to provide our broad range of services, for which we typically makean initial payment as well as pay usage fees during the license period. We made frequency usage right fee payments of Won 133.1 billion in 2019, Won151.7 billion in 2018 and Won 150.3 billion in 2017. For more information regarding the usage right fees for the various bandwidths that we use, see�Item 5.B. Liquidity and Capital Resources � Capital Requirements � Capital Expenditures� and note 16 of the notes to our consolidated financialstatements.
The growth of our wireless data businesses has been a significant factor in the increased utilization of our bandwidth, since wireless dataapplications are generally more bandwidth-intensive than voice services. In particular, the increasing popularity of smartphones and data intensiveapplications among smartphone users has been a major factor for the high utilization of our bandwidth in recent years. Although such trend has beenoffset in part by the implementation of new technologies that enable more efficient usage of our bandwidth, we expect that the current trend of increaseddata transmission use by our subscribers will accelerate in the near future as more subscribers migrate to our 5G network and the volume andsophistication of the multimedia content we offer through our wireless data services continue to grow in the 5G environment. While we believe that wecan address the capacity constraint issue through system upgrades and efficient allocation of bandwidth, inability to address such capacity constraints ina timely manner may adversely affect our business, results of operations, financial position and cash flows. In the event we are unable to maintainsufficient bandwidth capacity, our subscribers may perceive a general slowdown of wireless telecommunications services. Growth of our wirelesstelecommunications business will depend in part upon our ability to effectively manage our bandwidth capacity and to implement efficiently and in atimely manner new bandwidth-efficient technologies if they become available. We cannot assure you that bandwidth constraints will not adversely affectthe growth of our wireless telecommunications business. Furthermore, we may be required to pay a substantial amount to acquire additional bandwidthcapacity in the future in order to meet increasing bandwidth demand or renew the rights to use our existing bandwidth, and we may not be successful inacquiring the necessary bandwidth to meet such demand at commercially attractive terms or at all, which may adversely affect our financial conditionand results of operations.
We rely on key researchers and engineers and senior management, and the loss of the services of any such personnel or the inability to attractand retain them may negatively affect our business.
Our success depends to a significant extent upon the continued service of our research and development and engineering personnel, and on ourability to continue to attract, retain and motivate qualified researchers and engineers. In particular, our focus on leading the market in introducing newservices has meant that we must aggressively recruit engineers with expertise in cutting-edge technologies. We also depend on the services of
13
Copyright © 2020 www.secdatabase.com. All Rights Reserved.Please Consider the Environment Before Printing This Document

Table of Contentsexperienced key senior management, and if we lose their services, it would be difficult to find and integrate replacement personnel in a timely manner,or at all.
The loss of the services of any of our key research and development and engineering personnel or senior management without adequatereplacement, or the inability to attract new qualified personnel, would have a material adverse effect on our operations.
We need to observe certain financial and other covenants under the terms of our debt instruments, the failure to comply with which would put usin default under those instruments.
Certain of our debt instruments contain financial and other covenants with which we are required to comply on an annual and semi-annual basis.The financial covenants with respect to SK Telecom�s debt instruments include, but are not limited to, a maximum net debt-to-EBITDA ratio of 3.50and a minimum interest coverage ratio of 4.00, each as determined on a separate financial statement basis. The debt arrangements also contain negativepledge provisions limiting our ability to provide liens on our assets as well as cross-default and cross-acceleration clauses, which give related creditorsthe right to accelerate the amounts due under such debt if an event of default or acceleration has occurred with respect to our existing or futureindebtedness, or if any material part of our indebtedness or indebtedness of our subsidiaries is capable of being declared payable before the statedmaturity date. In addition, such covenants restrict our ability to raise future debt financing.
If we breach our financial or other covenants, our financial condition will be adversely affected to the extent we are not able to cure such breachesor repay the relevant debt.
We may have to make further financing arrangements to meet our capital expenditure requirements and debt payment obligations.
We have had, and expect to continue to have, significant capital expenditure requirements as we continue to build out, maintain and upgrade ournetworks and invest in businesses that complement our wireless and fixed-line telecommunication businesses. We spent Won 3,375.9 billion for capitalexpenditures in 2019. We expect to spend a lower amount for capital expenditures in 2020 compared to 2019 for a range of projects, includinginvestments to expand and improve our newly implemented 5G network, investments to maintain our LTE network and LTE-A services, investments toimprove and expand our Wi-Fi network, investments to develop our IoT solutions and platform services business portfolio, including AI solutions,investments in research and development of 5G technology, investments in businesses that can potentially leverage our 5G network, and funding formid- to long-term research and development projects, as well as other initiatives, primarily related to the development of new growth businesses, as wellas initiatives related to our ongoing businesses in the ordinary course.
In particular, we continue to make significant capital investments to expand and upgrade our wireless networks in response to growing bandwidthdemand by our subscribers. Bandwidth usage by our subscribers has rapidly increased in recent years primarily due to the increasing popularity ofsmartphones and data intensive applications among smartphone users. If heavy usage of bandwidth-intensive services grows beyond our currentexpectations, we may need to invest more capital than currently anticipated to expand the bandwidth capacity of our networks or our customers mayhave a suboptimal experience when using our services. Any of these events could adversely affect our competitive position and have a material adverseeffect on our business, financial condition, results of operation and cash flow. For a more detailed discussion of our capital expenditure plans and adiscussion of other factors that may affect our future capital expenditures, see �Item 5.B. Liquidity and Capital Resources � Capital Requirements �Capital Expenditures.�
As of December 31, 2019, we had Won 2,255.2 billion in contractual payment obligations due in 2020, which mostly involve repayment of debtobligations, payments related to lease liabilities and other short-term leases and leases of low-value assets and payments related to frequency licenses.See �Item 5.B. Liquidity and Capital Resources � Contractual Obligations and Commitments.�
We have not arranged firm financing for all of our current or future capital expenditure plans and contractual payment obligations. We have, in thepast, obtained funds for our proposed capital expenditure and payment obligations from various sources, including our cash flow from operations as wellas from financings, primarily debt
14
Copyright © 2020 www.secdatabase.com. All Rights Reserved.Please Consider the Environment Before Printing This Document
Table of Contentsand equity financings. Any material adverse change in our operational or financial condition could impact our ability to fund our capital expenditureplans and contractual payment obligations. Still volatile financial market conditions may also curtail our ability to obtain adequate funding. Inability tofund such capital expenditure requirements may have a material adverse effect on our financial condition, results of operations and business. In addition,although we currently anticipate that the capital expenditure levels estimated by us will be adequate to meet our business needs, such estimates mayneed to be adjusted based on developments in technology and markets. In the event we are unable to meet any such increased expenditure requirementsor to obtain adequate financing for such requirements, on terms acceptable to us, or at all, this may have a material adverse effect on our financialcondition, results of operations and business.
Termination or impairment of our relationship with a small number of key suppliers for network equipment and for leased lines could adverselyaffect our results of operations, financial position and cash flows.
We purchase wireless network equipment from a small number of suppliers. To date, we have purchased substantially all of the equipment for ournetworks from Samsung Electronics Co., Ltd. (�Samsung Electronics�), Ericsson-LG Co., Ltd. (�Ericsson-LG�) and Nokia Corporation (�Nokia�). Webelieve Samsung Electronics currently manufactures more than half of the wireless handsets sold to our subscribers. Although other manufacturers sellthe equipment we require, sourcing such equipment from other manufacturers could result in unanticipated costs in the maintenance and enhancement ofour wireless networks. Inability to obtain the equipment needed for our networks in a timely manner may have an adverse effect on our business,financial condition, results of operations and cash flows.
We cannot assure you that we will be able to continue to obtain the necessary equipment from one or more of our suppliers. Any discontinuationor interruption in the availability of equipment from our suppliers for any reason could have an adverse effect on our results of operations. In addition,inability to lease adequate lines at commercially reasonable rates may impact the quality of the services we offer and may also damage our reputationand our business.
Our business relies on technology developed by us, and our business will suffer if we are unable to protect our proprietary rights.
We own numerous patents and trademarks worldwide, and have applications for patents pending in many countries. In addition to active researchand development efforts, our success depends in part on our ability to obtain patents and other intellectual property rights covering our services.
We may be required to defend against charges of infringement of patent or other proprietary rights of third parties. Although we have notexperienced any significant patent or other intellectual property disputes, we cannot be certain that any significant patent or other intellectual propertydisputes will not occur in the future. Defending our patent and other proprietary rights could require us to incur substantial expense and to divertsignificant resources of our technical and management personnel, and could result in our loss of rights to employ certain technologies to provideservices.
Malicious and abusive Internet practices could impair our services and we may be subject to significant legal and financial exposure, damage toour reputation and a loss of confidence of our customers.
Our business involves the storage and transmission of large amounts of confidential information, and cybersecurity breaches expose us to a risk ofloss of this information, which may lead to improper use or disclosure of such information, ensuing potential liability and litigation, any of which couldharm our reputation and adversely affect our business.
Our cybersecurity measures may also be breached due to employee error, malfeasance or otherwise. Instituting appropriate access controls andsafeguards across all our information technology infrastructure is challenging. Furthermore, outside parties may attempt to fraudulently induceemployees to disclose sensitive information in order to gain access to our data or our customers� data or accounts, or may otherwise obtain access tosuch data or accounts. Because the techniques used to obtain unauthorized access, disable or degrade service or sabotage systems change frequently andoften are not recognized until launched against a target, we may be unable to anticipate these
15
Copyright © 2020 www.secdatabase.com. All Rights Reserved.Please Consider the Environment Before Printing This Document
Table of Contentstechniques or to implement adequate preventative measures. If an actual or perceived breach of our cybersecurity occurs or the market perception of theeffectiveness of our cybersecurity measures is harmed, we may incur significant legal and financial exposure, including legal claims and regulatory finesand penalties, damage to our reputation and a loss of confidence of our customers, which could have an adverse effect on our business, financialcondition and results of operations.
In addition, our wireless and fixed-line subscribers increasingly utilize our network to access the Internet and, as a consequence, we or they maybecome victim to common malicious and abusive Internet activities, such as unsolicited mass advertising (i.e., �spam�), hacking of personal informationand dissemination of viruses, worms and other destructive or disruptive software. These activities could have adverse consequences on our network andour customers, including degradation of service, excessive call volume to call centers and damage to our or our customers� equipment and data.Significant incidents could lead to customer dissatisfaction and, ultimately, loss of customers or revenue, in addition to increased costs to us to serviceour customers and protect our network. Any significant loss of our subscribers or revenue due to incidents of malicious and abusive Internet practices orsignificant increase in costs of serving those subscribers could adversely affect our business, financial condition and results of operations.
Labor disputes may disrupt our operations.
Although we are not experiencing any significant labor disputes, there can be no assurance that we will not experience labor disputes in the future,including protests and strikes, which could disrupt our business operations and have an adverse effect on our financial condition and results of operation.
Every two years, the union and management negotiate and enter into a new collective bargaining agreement that has a two-year duration, which isfocused on employee benefits and welfare. Employee wages are separately negotiated on an annual basis. Although we consider our relations with ouremployees to be good, there can be no assurance that we will be able to maintain such a working relationship with our employees and will notexperience labor disputes resulting from disagreements with the labor union in the future.
Concerns that radio frequency emissions may be linked to various health concerns could adversely affect our business and we could be subject tolitigation relating to these health concerns.
In the past, allegations that serious health risks may result from the use of wireless telecommunications devices or other transmission equipmenthave adversely affected share prices of some wireless telecommunications companies in the United States. In May 2011, the International Agency forResearch on Cancer (the �IARC�), a part of the World Health Organization, announced that it has classified radiofrequency electromagnetic fieldsassociated with wireless phone use as possibly carcinogenic to humans, based on an increased risk for glioma, a malignant type of brain cancer. TheIARC conducts research on the causes of human cancer and the mechanisms of carcinogenesis and aims to develop scientific strategies for cancercontrol. We cannot assure you that these health concerns will not adversely affect our business. Several class action and personal injury lawsuits havebeen filed in the United States against several wireless phone manufacturers and carriers, asserting product liability, breach of warranty and other claimsrelating to radio transmissions to and from wireless phones. Certain of these lawsuits have been dismissed. We could be subject to liability or incursignificant costs defending lawsuits brought by our subscribers or other parties who claim to have been harmed by or as a result of our services. Inaddition, the actual or perceived risk of wireless telecommunications devices could have an adverse effect on our business by reducing the number ofour subscribers or the usage per subscriber.
Our ability to deliver services may be disrupted due to a systems failure, shutdown in our networks or natural disaster.
Our services are currently carried through our wireless and fixed-line networks, which could be vulnerable to damage or interruptions inoperations due to fires, floods, earthquakes, power losses, telecommunication failures, network software flaws, unauthorized access, computer virusesand similar events, which may occur from time to time. The occurrence of any of these events could impact our ability to deliver services, we may beliable for damages to our customers caused by such interruptions, our reputation may be damaged and our customers may lose confidence in us, whichcould have a negative effect on our results of operations.
16
Copyright © 2020 www.secdatabase.com. All Rights Reserved.Please Consider the Environment Before Printing This Document
Table of ContentsDepreciation of the value of the Won against the Dollar and other major foreign currencies may have a material adverse effect on our results ofoperations and the market value of our common shares and ADSs.
Substantially all of our revenues are denominated in Won. Depreciation of the Won may materially affect our results of operations because, amongother things, it causes:
� an increase in the amount of Won required by us to make interest and principal payments on our foreign currency-denominated debt; and
� an increase, in Won terms, of the costs of equipment that we purchase from overseas sources which we pay for in Dollars or other foreigncurrencies.
Fluctuations in the exchange rate between the Won and the Dollar will affect the Dollar equivalent of the Won price of the our common shares onthe KRX KOSPI Market. These fluctuations also will affect:
� the amounts a registered holder or beneficial owner of ADSs will receive from the American Depositary Receipt (�ADR�) depositary inrespect of dividends, which will be paid in Won to the ADR depositary and converted by the ADR depositary into Dollars;
� the Dollar value of the proceeds that a holder will receive upon sale in Korea of our common shares; and
� the secondary market price of our ADSs.
If SK Holdings causes us to breach the foreign ownership limitations on our common shares by being deemed to be a foreign entity, we mayexperience a change of control.
The Telecommunications Business Act currently sets a 49.0% limit on the aggregate foreign ownership of our issued shares. Under theTelecommunications Business Act, as amended, a Korean entity, such as SK Holdings, is deemed to be a foreign entity if its largest shareholder(determined by aggregating the shareholdings of such shareholder and its related parties) is a foreigner and such shareholder (together with theshareholdings of its related parties) holds 15.0% or more of the issued voting stock of the Korean entity. As of December 31, 2019, SK Holdings owned21,624,120 shares of our common stock, or 26.8%, of our issued shares. SK Holdings is currently not deemed to be a foreign entity. However, shouldSK Holdings be considered to be a foreign shareholder in the future, then its shareholding in us would be included in the calculation of our aggregateforeign shareholding and our aggregate foreign shareholding (based on our foreign ownership level as of December 31, 2019, which we believe was37.2%) would exceed the 49.0% ceiling on foreign shareholding. As of December 31, 2019, the two largest foreign shareholders of SK Holdings eachheld a 3.5% stake therein.
If our aggregate foreign shareholding limit is exceeded, the MSIT may issue a corrective order to us, the breaching shareholder (including SKHoldings if the breach is caused by an increase in foreign ownership of SK Holdings) and the foreign shareholder which owns in the aggregate 15.0% ormore of SK Holdings. Furthermore, if SK Holdings is considered a foreign shareholder, it will be prohibited from exercising its voting rights withrespect to the shares held in excess of the 49.0% ceiling, which may result in a change in control of us. In addition, the MSIT will be prohibited fromgranting us licenses or permits necessary for entering into new telecommunications businesses until our aggregate foreign shareholding is reduced tobelow 49.0%. For a description of further actions that the MSIT could take, see �Item 4.B. Business Overview � Law and Regulation � ForeignOwnership and Investment Restrictions and Requirements.�
Risks Relating to Korea
Unfavorable financial and economic developments in Korea may have an adverse effect on us.
We are incorporated in Korea, and a substantial portion of our operations and assets are located in Korea. As a result, we are subject to political,economic, legal and regulatory risks specific to Korea. The economic indicators in Korea in recent years have shown mixed signs, and future growth ofthe Korean economy is subject to many factors beyond our control, including developments in the global economy.
In recent years, adverse conditions and volatility in the worldwide financial markets, fluctuations in oil and commodity prices, increases in interestrates globally and the general weakness of the global economy have
17
Copyright © 2020 www.secdatabase.com. All Rights Reserved.Please Consider the Environment Before Printing This Document
Table of Contentscontributed to the uncertainty of global economic prospects in general and have adversely affected, and may continue to adversely affect, the Koreaneconomy. The value of the Won relative to major foreign currencies has fluctuated significantly. Furthermore, as a result of adverse global and Koreaneconomic conditions, there has been volatility in the stock prices of Korean companies in recent years. Future declines in the Korea Composite StockPrice Index (known as the �KOSPI�) and large amounts of sales of Korean securities by foreign investors and subsequent repatriation of the proceeds ofsuch sales may continue to adversely affect the value of the Won, the foreign currency reserves held by financial institutions in Korea and the ability ofKorean companies to raise capital. Any future deterioration of the Korean or global economy could adversely affect our business, financial conditionand results of operations.
Developments that could have an adverse impact on Korea�s economy include:
� adverse conditions or developments in the economies of countries and regions that are important export markets for Korea, such as China, theUnited States, Europe and Japan, or in emerging market economies in Asia or elsewhere, including as a result of deteriorating economic andtrade relations between the United States and China as well as increased uncertainties resulting from the United Kingdom�s exit from theEuropean Union on January 31, 2020;
� increased sovereign default risks in select countries and the resulting adverse effects on the global financial markets;
� adverse changes or volatility in foreign currency reserve levels, commodity prices (including oil prices), exchange rates (including fluctuationof the U.S. dollar, Euro or Japanese Yen exchange rates or revaluation of the Chinese Renminbi), interest rates, inflation rates or stockmarkets;
� the occurrence of severe health epidemics in Korea and other parts of the world (such as the ongoing COVID-19 pandemic);
� a continuing rise in the level of household debt and increasing delinquencies and credit defaults by retail or small-and medium-sizedenterprise borrowers in Korea;
� declines in consumer confidence and a slowdown in consumer spending;
� the continued growth of the Chinese economy, to the extent its benefits (such as increased exports to China) are outweighed by its costs (suchas competition in export markets or for foreign investment and the relocation of the manufacturing base from Korea to China);
� investigations of large Korean conglomerates and their senior management for possible misconduct;
� social and labor unrest;
� decreases in the market prices of Korean real estate;
� a decrease in tax revenues or a substantial increase in the Government�s expenditures for fiscal stimulus measures, unemploymentcompensation and other economic and social programs that would lead to an increased Government budget deficit;
� financial problems or lack of progress in the restructuring of Korean conglomerates, other large troubled companies, their suppliers or thefinancial sector;
� loss of investor confidence arising from corporate accounting irregularities and corporate governance issues concerning certain Koreanconglomerates;
� increases in social expenditures to support an aging population in Korea or decreases in economic productivity due to the decliningpopulation size in Korea;
� the economic impact of any pending or future free trade agreements or changes in existing free trade agreements;
� geo-political uncertainty and the risk of further attacks by terrorist groups around the world;
� natural or man-made disasters that have a significant adverse economic or other impact on Korea or its major trading partners;
18
Copyright © 2020 www.secdatabase.com. All Rights Reserved.Please Consider the Environment Before Printing This Document
Table of Contents� deterioration in economic or diplomatic relations between Korea and its trading partners or allies, including deterioration resulting from
territorial or trade disputes or disagreements in foreign policy (such as the ongoing trade disputes with Japan);
� political uncertainty or increasing strife among or within political parties in Korea;
� hostilities or political or social tensions involving oil producing countries in the Middle East (including a potential escalation of hostilitiesbetween the U.S. and Iran) and North Africa and any material disruption in the global supply of oil or sudden increase in the price of oil;
� increased reliance on exports to service foreign currency debts, which could cause friction with Korea�s trading partners;
� political or social tensions involving Russia and any resulting adverse effects on the global supply of oil or the global financial markets; and
� an increase in the level of tensions or an outbreak of hostilities between North Korea and Korea or the United States.
Escalations in tensions with North Korea could have an adverse effect on us and the market value of our common shares and ADSs.
Relations between Korea and North Korea have been tense throughout Korea�s modern history. The level of tension between the two Koreas hasfluctuated and may increase abruptly as a result of future events. In particular, there have been heightened security concerns in recent years stemmingfrom North Korea�s nuclear weapon and ballistic missile programs as well as its hostile military actions against Korea. Some of the significant incidentsin recent years include the following:
� North Korea renounced its obligations under the Nuclear Non-Proliferation Treaty in January 2003 and has conducted six rounds of nucleartests since October 2006, including claimed detonations of hydrogen bombs, which are more powerful than plutonium bombs, and warheadsthat can be mounted on ballistic missiles. Over the years, North Korea has also conducted a series of ballistic missile tests, including missileslaunched from submarines and intercontinental ballistic missiles that it claims can reach the United States mainland. In response, theGovernment has repeatedly condemned the provocations and flagrant violations of relevant United Nations Security Council resolutions. InFebruary 2016, the Government also closed the inter-Korea Gaesong Industrial Complex in response to North Korea�s fourth nuclear test inJanuary 2016. Internationally, the United Nations Security Council has passed a series of resolutions condemning North Korea�s actions andsignificantly expanding the scope of sanctions applicable to North Korea, most recently in December 2017 in response to North Korea�sintercontinental ballistic missile test in November 2017. Over the years, the United States and the European Union have also expanded theirsanctions applicable to North Korea.
� In March 2010, a Korean naval vessel was destroyed by an underwater explosion, killing many of the crewmen on board. The Governmentformally accused North Korea of causing the sinking, while North Korea denied responsibility. Moreover, in November 2010, North Koreafired more than one hundred artillery shells that hit Korea�s Yeonpyeong Island near the Northern Limit Line, which acts as the de factomaritime boundary between Korea and North Korea on the west coast of the Korean peninsula, causing casualties and significant propertydamage. The Government condemned North Korea for the attack and vowed stern retaliation should there be further provocation.
North Korea�s economy also faces severe challenges, which may further aggravate social and political pressures within North Korea. Althoughbilateral summit meetings were held between Korea and North Korea in April, May and September 2018 and between the United States and NorthKorea in June 2018, February 2019 and June 2019, there can be no assurance that the level of tensions affecting the Korean peninsula will not escalatein the future. Any increase in tensions, which may occur, for example, if North Korea experiences a leadership crisis, high-level contacts between Koreaor the United States and North Korea break down or military hostilities occur, could have a material adverse effect on our business, results of operationsand financial condition and the market value of our common shares and ADSs.
19
Copyright © 2020 www.secdatabase.com. All Rights Reserved.Please Consider the Environment Before Printing This Document
Table of ContentsKorea��s legislation allowing class action suits related to securities transactions may expose us to additional litigation risk.
The Securities-related Class Action Act of Korea enacted in January 2004 allows class action suits to be brought by shareholders of companies(including us) listed on the KRX KOSPI Market for losses incurred in connection with purchases and sales of securities and other securities transactionsarising from (1) false or inaccurate statements provided in the registration statements, prospectuses, business reports, audit reports, semi-annual orquarterly reports and material fact reports and omission of material information in such documents, (2) insider trading, (3) market manipulation and(4) unfair trading. This law permits 50 or more shareholders who collectively hold 0.01% of the shares of a company to bring a class action suit against,among others, the issuer and its directors and officers. Because of the relatively recent enactment of the act, there is not enough judicial precedent topredict how the courts will apply the law. Litigation can be time-consuming and expensive to resolve, and can divert management time and attentionfrom the operation of a business. We are not aware of any basis upon which such suit may be brought against us, nor are any such suits pending orthreatened. Any such litigation brought against us could have a material adverse effect on our business, financial condition and results of operations.
There are special risks involved with investing in securities of Korean companies, including the possibility of restrictions being imposed by theGovernment in emergency circumstances.
As we are a Korean company and operate in a business and cultural environment that is different from that of other countries, there are risksassociated with investing in our securities that are not typical for investments in securities of companies in other jurisdictions.
Under the Korean Foreign Exchange Transactions Act, if the Government deems that certain emergency circumstances, including a significantdisruption in the international balance of payments and international financial markets or extreme difficulty in carrying out currency, exchange rate orother macroeconomic policies due to the movement of capital between Korea and other countries, are likely to occur, it may impose any necessaryrestriction such as requiring Korean or foreign investors to obtain prior approval from the Ministry of Economy and Finance (the �MOEF�) for theacquisition of Korean securities or for the repatriation of interest, dividends or sales proceeds arising from Korean securities or from disposition of suchsecurities or other transactions involving foreign exchange. See �Item 10.D. Exchange Controls � Korean Foreign Exchange Controls and SecuritiesRegulations.�
Risks Relating to Securities
Sales of our shares by SK Holdings and/or other large shareholders may adversely affect the market value of our common shares and ADSs.
Sales of substantial amounts of our common shares, or the perception that such sales may occur, could adversely affect the prevailing marketvalue of our common shares or ADSs or our ability to raise capital through an offering of our common shares.
As of December 31, 2019, SK Holdings owned 26.8% of our total issued common shares and has not agreed to any restrictions on its ability todispose of our shares. See �Item 7.A. Major Shareholders.� We can make no prediction as to the timing or amount of any sales of our common shares.We cannot assure you that future sales of our common shares, or the availability of our common shares for future sale, will not adversely affect theprevailing market value of our common shares or ADSs from time to time.
If an investor surrenders his or her ADSs to withdraw the underlying shares, he or she may not be allowed to deposit the shares again to obtainADSs.
Under the deposit agreement, holders of our common shares may deposit those shares with the ADR depositary�s custodian in Korea and obtainADSs, and holders of ADSs may surrender ADSs to the ADR depositary and receive our common shares. However, under the terms of the depositagreement, as amended, the depositary bank is required to obtain our prior consent to any such deposit if, after giving effect to such deposit, the totalnumber of our common shares represented by ADSs, which was 7,982,904 shares as of March 31, 2020, exceeds a specified maximum, which was24,321,893 shares as of March 31, 2020, subject to adjustment under certain
20
Copyright © 2020 www.secdatabase.com. All Rights Reserved.Please Consider the Environment Before Printing This Document
Table of Contentscircumstances. In addition, the depositary bank or the custodian may not accept deposits of our common shares for issuance of ADSs under certaincircumstances, including (1) if it has been determined by us that we should block the deposit to prevent a violation of applicable Korean laws andregulations or our articles of incorporation or (2) if a person intending to make a deposit has been identified as a holder of at least 4.0% of our commonshares. It is possible that we may not give the consent. Consequently, an investor who has surrendered his or her ADSs and withdrawn the underlyingshares may not be allowed to deposit the shares again to obtain ADSs.
An investor in our ADSs may not be able to exercise preemptive rights for additional new shares and may suffer dilution of his or her equityinterest in us.
The Korean Commercial Code and our articles of incorporation require us, with some exceptions, to offer shareholders the right to subscribe fornew shares in proportion to their existing ownership percentage whenever new shares are issued. If we offer a right to subscribe for additional newcommon shares or any other rights of similar nature, the ADR depositary, after consultation with us, may make the rights available to an ADS holder oruse reasonable efforts to dispose of the rights on behalf of the ADS holder and make the net proceeds available to the ADS holder. The ADR depositary,however, is not required to make available to an ADS holder any rights to purchase any additional shares unless it deems that doing so is lawful andfeasible and:
� a registration statement filed by us under the Securities Act is in effect with respect to those shares; or
� the offering and sale of those shares is exempt from, or is not subject to, the registration requirements of the Securities Act.
We are under no obligation to file any registration statement with respect to any ADSs. If a registration statement is required for an ADS holder toexercise preemptive rights but is not filed by us, the ADS holder will not be able to exercise his or her preemptive rights for additional shares. As aresult, ADS holders may suffer dilution of their equity interest in us.
Short selling of our ADSs by purchasers of securities convertible or exchangeable into our ADSs could materially adversely affect the marketprice of our ADSs.
SK Holdings, through one or more special purpose vehicles, has engaged and may in the future engage in monetization transactions relating to itsownership interest in us. These transactions have included and may include offerings of securities that are convertible or exchangeable into our ADSs.Many investors in convertible or exchangeable securities seek to hedge their exposure in the underlying equity securities at the time of acquisition of theconvertible or exchangeable securities, often through short selling of the underlying equity securities or similar transactions. Since a monetizationtransaction could involve debt securities linked to a significant number of our ADSs, we expect that a sufficient quantity of ADSs may not beimmediately available for borrowing in the market to facilitate settlement of the likely volume of short selling activity that would accompany thecommencement of a monetization transaction. This short selling and similar hedging activity could place significant downward pressure on the marketprice of our ADSs, thereby having a material adverse effect on the market value of ADSs owned by you.
A holder of our ADSs may not be able to enforce a judgment of a foreign court against us.
We are a corporation with limited liability organized under the laws of Korea. Substantially all of our directors and officers and other personsnamed in this document reside in Korea, and all or a significant portion of the assets of our directors and officers and other persons named in thisdocument and substantially all of our assets are located in Korea. As a result, it may not be possible for holders of our ADSs to effect service of processwithin the United States, or to enforce against us any judgments obtained from the United States courts based on the civil liability provisions of thefederal securities laws of the United States. There is doubt as to the enforceability in Korea, either in original actions or in actions for enforcement ofjudgments of United States courts, of civil liabilities predicated on the United States federal securities laws.
21
Copyright © 2020 www.secdatabase.com. All Rights Reserved.Please Consider the Environment Before Printing This Document
Table of ContentsWe are generally subject to Korean corporate governance and disclosure standards, which may differ from those in other countries.
Companies in Korea, including us, are subject to corporate governance standards applicable to Korean public companies, which may differ insome respects from standards applicable in other countries, including the United States. As a reporting company registered with the SEC and listed onthe New York Stock Exchange (the �NYSE�), we are subject to certain corporate governance standards as mandated by the Sarbanes-Oxley Act of 2002(the �Sarbanes-Oxley Act�). However, foreign private issuers, including us, are exempt from certain corporate governance requirements under theSarbanes-Oxley Act or under the rules of the NYSE. There may also be less publicly available information about Korean companies, such as us, than isregularly made available by public or non-public companies in other countries. Such differences in corporate governance standards and less publicinformation available could result in corporate governance practices or disclosures that are perceived as less than satisfactory by investors in certaincountries.
Item 4. INFORMATION ON THE COMPANY
Item 4.A. History and Development of the Company
As Korea�s first wireless telecommunications service provider, we have a recognized history of leadership and innovation in the domestictelecommunications sector. Today, we remain Korea�s leading wireless telecommunications services provider and have continued to pioneer thecommercial development and implementation of state-of-the-art wireless technologies. We had 31.5 million wireless subscribers, including MVNOsubscribers leasing our networks, as of December 31, 2019, representing a market share of 46.4%, the largest market share among Korean wirelesstelecommunications service providers. We believe we are also a leader in developing new products and services that reflect the increasing convergenceof telecommunications technologies, as well as the growing synergies between the telecommunications sector and other industries, and are well-positioned to become Korea�s leading platform service provider through our next-generation growth businesses in media, security, commerce, IoTsolutions and other innovative products offered through our platform services, including AI solutions.
In February 2012, we acquired an equity stake in SK Hynix, one of the world�s largest memory-chip makers by revenue, for an aggregatepurchase price of Won 3.4 trillion, and became its largest shareholder. As of December 31, 2019, we held a 20.1% equity interest in SK Hynix.
On March 31, 2020, we had a market capitalization of approximately Won 14.3 trillion (US$11.7 billion, as translated at the noon buying rate ofMarch 31, 2020) or approximately 1.2% of the total market capitalization on the KRX KOSPI Market, making us the 15th largest company listed on theKRX KOSPI Market based on market capitalization on that date. Our ADSs, each representing one-ninth of one share of our common stock, have tradedon the NYSE since June 27, 1996.
We are a corporation with limited liability organized under the laws of Korea. We established our telecommunications business in March 1984under the name Korea Mobile Telecommunications Co., Ltd. We changed our name to SK Telecom Co., Ltd., effective March 21, 1997. In January2002, we merged with Shinsegi Telecom Co., Ltd. (�Shinsegi�), which was then the third-largest wireless telecommunications service provider inKorea. Our registered office is at SK T-Tower, 65, Eulji-ro, Jung-gu, Seoul 04539, Korea and our telephone number is +82-2-6100-2114. Our websiteaddress is http://www.sktelecom.com.
The SEC maintains a website (http://www.sec.gov), which contains reports, proxy and information statements and other information regardingissuers that file electronically with the SEC.
Korean Telecommunications Industry
Established in March 1984, we became the first wireless telecommunications service provider in Korea. We remained the sole provider of wirelesstelecommunications services until April 1996, when Shinsegi commenced cellular service. The Government began to introduce competition into thefixed-line and wireless telecommunications services markets in the early 1990�s. During this period, the Government allowed new competitors to enterthe fixed-line sector, sold a controlling stake in us to the SK Group, and granted a cellular
22
Copyright © 2020 www.secdatabase.com. All Rights Reserved.Please Consider the Environment Before Printing This Document
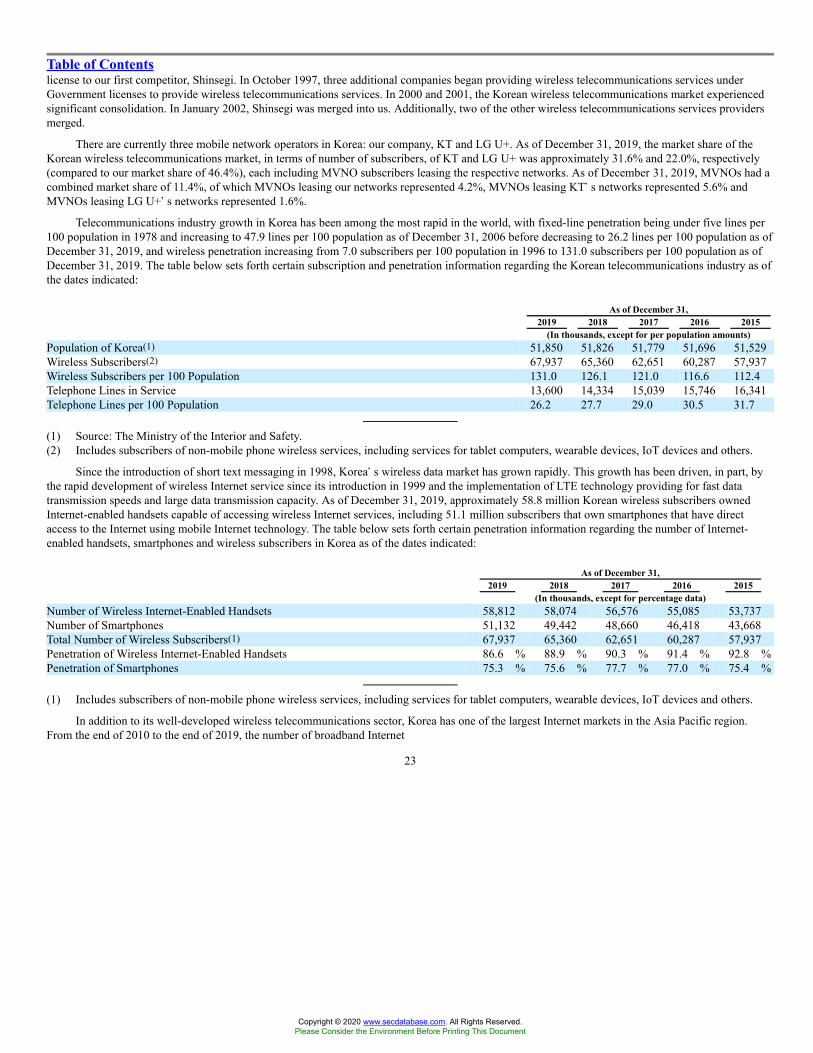
Table of Contentslicense to our first competitor, Shinsegi. In October 1997, three additional companies began providing wireless telecommunications services underGovernment licenses to provide wireless telecommunications services. In 2000 and 2001, the Korean wireless telecommunications market experiencedsignificant consolidation. In January 2002, Shinsegi was merged into us. Additionally, two of the other wireless telecommunications services providersmerged.
There are currently three mobile network operators in Korea: our company, KT and LG U+. As of December 31, 2019, the market share of theKorean wireless telecommunications market, in terms of number of subscribers, of KT and LG U+ was approximately 31.6% and 22.0%, respectively(compared to our market share of 46.4%), each including MVNO subscribers leasing the respective networks. As of December 31, 2019, MVNOs had acombined market share of 11.4%, of which MVNOs leasing our networks represented 4.2%, MVNOs leasing KT�s networks represented 5.6% andMVNOs leasing LG U+�s networks represented 1.6%.
Telecommunications industry growth in Korea has been among the most rapid in the world, with fixed-line penetration being under five lines per100 population in 1978 and increasing to 47.9 lines per 100 population as of December 31, 2006 before decreasing to 26.2 lines per 100 population as ofDecember 31, 2019, and wireless penetration increasing from 7.0 subscribers per 100 population in 1996 to 131.0 subscribers per 100 population as ofDecember 31, 2019. The table below sets forth certain subscription and penetration information regarding the Korean telecommunications industry as ofthe dates indicated:
As of December 31,2019 2018 2017 2016 2015
(In thousands, except for per population amounts)Population of Korea(1) 51,850 51,826 51,779 51,696 51,529Wireless Subscribers(2) 67,937 65,360 62,651 60,287 57,937Wireless Subscribers per 100 Population 131.0 126.1 121.0 116.6 112.4Telephone Lines in Service 13,600 14,334 15,039 15,746 16,341Telephone Lines per 100 Population 26.2 27.7 29.0 30.5 31.7
(1) Source: The Ministry of the Interior and Safety.(2) Includes subscribers of non-mobile phone wireless services, including services for tablet computers, wearable devices, IoT devices and others.
Since the introduction of short text messaging in 1998, Korea�s wireless data market has grown rapidly. This growth has been driven, in part, bythe rapid development of wireless Internet service since its introduction in 1999 and the implementation of LTE technology providing for fast datatransmission speeds and large data transmission capacity. As of December 31, 2019, approximately 58.8 million Korean wireless subscribers ownedInternet-enabled handsets capable of accessing wireless Internet services, including 51.1 million subscribers that own smartphones that have directaccess to the Internet using mobile Internet technology. The table below sets forth certain penetration information regarding the number of Internet-enabled handsets, smartphones and wireless subscribers in Korea as of the dates indicated:
As of December 31,2019 2018 2017 2016 2015
(In thousands, except for percentage data)Number of Wireless Internet-Enabled Handsets 58,812 58,074 56,576 55,085 53,737Number of Smartphones 51,132 49,442 48,660 46,418 43,668Total Number of Wireless Subscribers(1) 67,937 65,360 62,651 60,287 57,937Penetration of Wireless Internet-Enabled Handsets 86.6 % 88.9 % 90.3 % 91.4 % 92.8 %Penetration of Smartphones 75.3 % 75.6 % 77.7 % 77.0 % 75.4 %
(1) Includes subscribers of non-mobile phone wireless services, including services for tablet computers, wearable devices, IoT devices and others.
In addition to its well-developed wireless telecommunications sector, Korea has one of the largest Internet markets in the Asia Pacific region.From the end of 2010 to the end of 2019, the number of broadband Internet
23
Copyright © 2020 www.secdatabase.com. All Rights Reserved.Please Consider the Environment Before Printing This Document
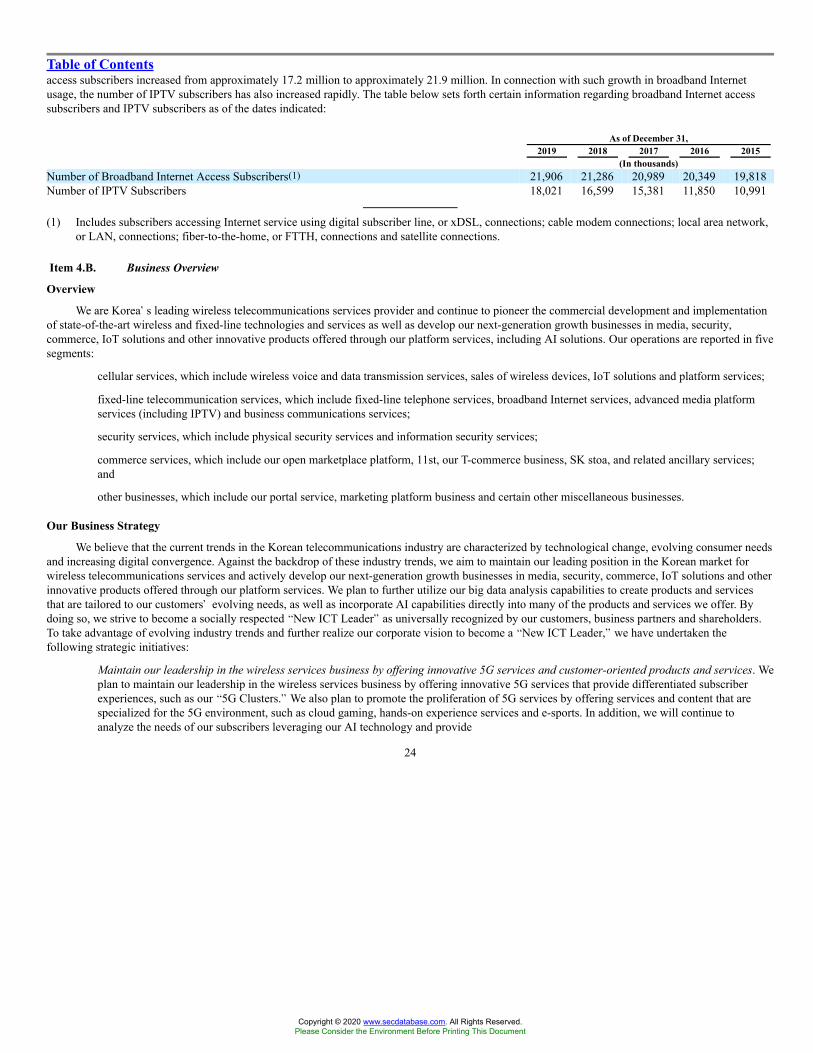
Table of Contentsaccess subscribers increased from approximately 17.2 million to approximately 21.9 million. In connection with such growth in broadband Internetusage, the number of IPTV subscribers has also increased rapidly. The table below sets forth certain information regarding broadband Internet accesssubscribers and IPTV subscribers as of the dates indicated:
As of December 31,2019 2018 2017 2016 2015
(In thousands)Number of Broadband Internet Access Subscribers(1) 21,906 21,286 20,989 20,349 19,818Number of IPTV Subscribers 18,021 16,599 15,381 11,850 10,991
(1) Includes subscribers accessing Internet service using digital subscriber line, or xDSL, connections; cable modem connections; local area network,or LAN, connections; fiber-to-the-home, or FTTH, connections and satellite connections.
Item 4.B. Business Overview
Overview
We are Korea�s leading wireless telecommunications services provider and continue to pioneer the commercial development and implementationof state-of-the-art wireless and fixed-line technologies and services as well as develop our next-generation growth businesses in media, security,commerce, IoT solutions and other innovative products offered through our platform services, including AI solutions. Our operations are reported in fivesegments:
� cellular services, which include wireless voice and data transmission services, sales of wireless devices, IoT solutions and platform services;
� fixed-line telecommunication services, which include fixed-line telephone services, broadband Internet services, advanced media platformservices (including IPTV) and business communications services;
� security services, which include physical security services and information security services;
� commerce services, which include our open marketplace platform, 11st, our T-commerce business, SK stoa, and related ancillary services;and
� other businesses, which include our portal service, marketing platform business and certain other miscellaneous businesses.
Our Business Strategy
We believe that the current trends in the Korean telecommunications industry are characterized by technological change, evolving consumer needsand increasing digital convergence. Against the backdrop of these industry trends, we aim to maintain our leading position in the Korean market forwireless telecommunications services and actively develop our next-generation growth businesses in media, security, commerce, IoT solutions and otherinnovative products offered through our platform services. We plan to further utilize our big data analysis capabilities to create products and servicesthat are tailored to our customers� evolving needs, as well as incorporate AI capabilities directly into many of the products and services we offer. Bydoing so, we strive to become a socially respected �New ICT Leader� as universally recognized by our customers, business partners and shareholders.To take advantage of evolving industry trends and further realize our corporate vision to become a �New ICT Leader,� we have undertaken thefollowing strategic initiatives:
� Maintain our leadership in the wireless services business by offering innovative 5G services and customer-oriented products and services. Weplan to maintain our leadership in the wireless services business by offering innovative 5G services that provide differentiated subscriberexperiences, such as our �5G Clusters.� We also plan to promote the proliferation of 5G services by offering services and content that arespecialized for the 5G environment, such as cloud gaming, hands-on experience services and e-sports. In addition, we will continue toanalyze the needs of our subscribers leveraging our AI technology and provide
24
Copyright © 2020 www.secdatabase.com. All Rights Reserved.Please Consider the Environment Before Printing This Document

Table of Contentsproducts and services that meet such needs. We also plan to strengthen our customer relationships with our diverse range of offerings thatintegrate our wireless services with our products and services in our media, security and commerce businesses.
� Develop our next-generation growth businesses through hyper-collaboration. We believe that we have evolved from being a domestictelecommunications provider in Korea to possessing the fundamental capabilities that enable us to pursue a broad range of collaboration inthe field of ICT with both domestic and international partners. We have formed strategic partnerships with industry leaders to create synergiesin various areas, such as 5G cloud gaming, mobile edge computing (�MEC�) and e-sports, and we are continually expanding the areas forcollaboration. We aim to create an environment for �hyper-collaboration� to develop and foster our next-generation growth businesses.
� Develop our technological capabilities and new products and services to support our 5G network. We aim to continue developing cutting-edge technologies that will be adopted as the technological standard for 5G services. In addition, we will seek to apply our 5G infrastructureand capabilities to our various other key businesses such as media, security and commerce to create unique new products and services gearedto serve evolving customer needs. Furthermore, we aim to collaborate with various partners to identify new business opportunities that canpotentially leverage our 5G network.
� Pursue sustainable management to seek mutual growth with the broader society. The SK Management System, which is the businessphilosophy and foundation of corporate culture of the SK Group, includes as a key component the goal of growing together with the broadersociety by contributing to its economic growth and creating social value. Based on a socially accountable governance system led by theCorporate Citizenship Committee of our board of directors, we aim to pursue the �double bottom line� of achieving long-term shareholdervalue as well as creating social value by leveraging our business capabilities, thereby contributing to the well-being of all stakeholders andthe enhancement of our corporate value in the long-term. We have also amended our articles of incorporation at our annual general meeting ofshareholders held on March 26, 2020 to incorporate such goal as a core business purpose.
Cellular Services
We offer wireless voice and data transmission services, sell wireless devices and provide IoT solutions and innovative platform services throughour cellular services segment. Our wireless voice and data transmission services are offered through our backbone networks that collectively can beaccessed by approximately 99.0% of the Korean population. We had 31.5 million wireless subscribers, including MVNO subscribers leasing ournetworks, as of December 31, 2019, representing a market share of 46.4%, the largest market share among Korean wireless telecommunications serviceproviders. We launched our wireless services using our 5G network in April 2019, and we are continually expanding our 5G network coverage andenhancing service quality. The table below sets forth the number of subscribers, including subscribers of MVNOs that lease our wireless networks, usingour various digital wireless networks as of the dates indicated:
As of December 31,2019 2018 2017 2016 2015
(in thousands)Network5G 2,084 � � � �LTE 25,022 24,796 22,865 21,078 18,980WCDMA 3,986 5,174 5,842 6,491 7,008CDMA(1) 443 912 1,488 2,026 2,638Total 31,535 30,882 30,195 29,595 28,626
(1) In November 2019, we submitted an application to the MSIT to terminate our second generation wireless services using our CDMA network,which is pending approval by the MSIT.
25
Copyright © 2020 www.secdatabase.com. All Rights Reserved.Please Consider the Environment Before Printing This Document
Table of ContentsIn 2019, 2018 and 2017, our cellular services segment revenue was Won 12,172.4 billion, Won 12,378.9 billion and Won 13,262.1 billion,
respectively, representing 68.6%, 73.4% and 75.7%, respectively, of our consolidated revenue.
Wireless Services
We offer wireless voice transmission and data transmission services to our subscribers through our backbone networks. Our wirelesstelecommunications services are available to our subscribers receiving service under the SK Telecom brand. In addition, customers can obtain wirelesstelecommunications services that operate on our network from MVNOs that lease our wireless networks. We derive revenues from our wirelesstelecommunications service principally through monthly plan-based fees as described in �� Rate Plans� below.
We provide a voice-over-LTE service, known as our �HD Voice� service, to all of our LTE and 5G subscribers featuring high-quality voicetransmission, fast call connection, voice-to-video call switching and digital content sharing during calls. We also offer our subscribers a wide range ofwireless data transmissions services. Our messaging service allows our subscribers to send and receive text, graphic, audio and video messages. Inaddition, our subscribers can access a wide variety of digital content and services through mobile applications providing music, video, gaming, news,commerce and financial services as well as solutions that enable subscribers to access the Internet and e-mail. We intend to continue to build ourwireless data services as a platform for growth, extending our portfolio of wireless data services and developing new content for our subscribers.
Through service agreements with various foreign wireless telecommunications service providers, we offer cellular global roaming services,branded as our �T-Roaming� service. Global roaming services allow subscribers traveling abroad to make and receive calls using their regular mobilephone numbers. In addition, we provide global roaming service to foreigners traveling to Korea. In such cases, we generally receive a fee from thetraveler�s local wireless telecommunications service provider.
Through SK Telink, we also operate our MVNO business under the brand �SK 7Mobile,� which we believe offers excellent quality at reasonablerates utilizing SK Telecom�s wireless networks. SK Telink is focused on developing low-cost distribution channels and targeting niche customersegments that have a lower average revenue per user than that of SK Telecom�s subscriber base.
In addition, we provide interconnection service to connect our networks to domestic and international fixed-line and other wireless networks. See�� Interconnection� below.
Wireless Device Sales
We offer several categories of wireless devices, including smartphones and basic phones, tablets and other Internet access devices and wearabledevices that are sold through an extensive distribution network, which consists of authorized exclusive dealers and independent retailers, as well asbranch offices and stores directly operated by us through our wholly-owned subsidiary, PS&Marketing Co., Ltd. (�PS&Marketing�). As ofDecember 31, 2019, approximately 23.6 million, or 74.8%, of our subscribers (including MVNO subscribers leasing our networks) owned smartphonesthat have direct access to the Internet compared to approximately 23.1 million subscribers, or 74.7%, as of December 31, 2018. We purchase asubstantial majority of our wireless devices from Samsung Electronics, Apple and LG Electronics.
Smartphones and Basic Phones. We offer smartphones that are enabled to utilize our digital wireless networks and run on various operatingsystems, such as Apple iOS and Google Android. We also offer basic phones that have the ability to access wireless Internet services.
Tablets and Other Internet Devices. We offer tablets which can access the Internet via our digital wireless networks and a Wi-Fi connection. Thetablets run primarily on the Apple iOS and Google Android operating systems. In addition, we also offer �T Pocket-Fi� devices that provide a mobileLTE connection and are capable of connecting multiple Wi-Fi enabled devices to the Internet at one time. We offer targeted rate plans for our TPocket-Fi device. See �� Rate Plans� below.
Wearable Devices. We offer various wearable devices including smart watches and �T kids� phone-Joon.� These devices utilize our digitalwireless networks and have specific features for the relevant target customer. For
26
Copyright © 2020 www.secdatabase.com. All Rights Reserved.Please Consider the Environment Before Printing This Document
Table of Contentsexample, T kids� phone-Joon is a wearable phone targeted towards children and provides simple calling, messaging and chat services as well as globalpositioning system (�GPS�) tracking capabilities. We offer targeted rate plans that are specific to these wearable devices. See �� Rate Plans� below.
IoT Solutions
Through our IoT solutions business, we provide network access and enhanced services to support telemetry-type applications, which arecharacterized by machine-to-machine (�M2M�) wireless connections, to business customers. In order to promote the growth of our IoT solutionsbusiness, we deployed networks nationwide that are designed to support IoT devices, namely our high-speed LTE-M network in March 2016 and ourlow-cost Low-Power Wide-Area network based on LoRa technology (our �LoRa network�) in July 2016. In April 2018, we increased the batteryefficiency of our IoT devices by launching our LTE Cat.M1 technology and further enhanced our competitiveness in this business.
We provide network access and customized IoT solutions to our business customers. Our M2M services support devices that are used in a varietyof market segments, including retail, utilities, security, automotive, agriculture and data analytics. For example, our Cloud Energy Management Solution(�Cloud EMS�) business provides a one-stop cloud computing-based energy management platform that collects and analyzes energy usage data frombusiness customers and offers solutions to optimize and reduce their energy consumption. As of December 31, 2019, Cloud EMS had approximately 210customers, mostly from energy-intensive industries such as the petrochemical and cement industries.
Platform Services
Through our platform services business, we seek to provide innovative products and services that meet our customers� evolving needs in anincreasingly connected world. For example, we provide location-based services such as T map, which we provide to our and our competitors� wirelesssubscribers free of charge. T map uses GPS technology to transmit driving directions, real-time traffic updates and emergency rescue assistance towireless devices. As of December 31, 2019, there were approximately 12.5 million monthly average users of our T map service. In September 2017, wealso integrated NUGU, described in more detail below, into our T map service enabling users to use voice commands to operate their mobile deviceswhile driving. In May 2018, we added calling and text messaging functions to the NUGU capabilities available on T map to enhance the convenienceand safety of T map users. In January 2019, we formed Grab Geo Holdings PTE. LTD., a joint venture in which we hold a 30.0% interest, with Grab, theleading ride-hailing service provider in Southeast Asia. Through this joint venture, we plan to launch a navigation service for Grab drivers based on Tmap�s key technologies, including big data analysis algorithms and ultra-precise GPS solutions.
T map also offers a taxi-hailing service called �T map Taxi,� as well as �T map Parking,� a parking service launched in June 2019 that combinesour ICT technology with ADT Caps� parking management and security solutions to provide users with real-time information related to parking lotlocations, availability, rates and discounts, in addition to automatic payment services in the case of select parking lots, including those operated by ADTCaps, through a dedicated mobile application. As of December 31, 2019, T map Taxi and T map Parking had approximately 0.8 million and 0.2 millionmonthly active users, respectively.
We also offer AI solutions through our platform services business. For example, in September 2016, we launched NUGU, the first intelligentvirtual assistant service launched in Korea with Korean language capabilities based on advanced voice recognition technologies. NUGU currently offersa wide range of services including music streaming, connectivity with �Smart Home� and other IoT solutions for the home, educational contents forchildren, food deliveries, and informational and other personal assistance services, and we plan to continually enhance its functionalities throughsoftware updates. Through cloud-based deep-learning technology, NUGU is designed to evolve on its own as it collects more data about its users overtime. We have integrated NUGU into our T map service as discussed above as well as our B tv service as further discussed in �� Fixed-lineTelecommunication Services � Advanced Media Platform (including IPTV).�
We offer a variety of smart devices based on NUGU, such as �NUGU candle,� an AI light that offers NUGU-based services and changes its colorand brightness based on the user�s needs and preferences, �NUGU nemo,� a
27
Copyright © 2020 www.secdatabase.com. All Rights Reserved.Please Consider the Environment Before Printing This Document
Table of Contentssmart speaker with a touchscreen, �NUGU CHIPS,� a wireless charging dock compatible with certain Samsung Galaxy smartphones that automaticallylaunches a mobile application converting the smartphone being charged into a NUGU-capable device, and �albert AI,� an educational device thatteaches children how to code.
In October 2018, we launched �NUGU developers,� a platform on which third-party developers can create and launch new services based onNUGU technology. Through NUGU developers, we provide the �NUGU SDK� service, which enables third-party developers to incorporate NUGUcapabilities into their applications or devices. We continue to explore ways in which we can leverage our NUGU technology to enhance our existingproducts and services.
We also provide a �T phone� service, which offers our customers a number of convenient call functions, such as a spam-call blocking functionand a search function that informs customers of the phone numbers of shops, hospitals and other facilities closest to the customer�s current location.
Other New Businesses
We are preparing to launch integrated cloud services based on our advanced 5G MEC technology and platform for business customers that requiresecure and ultra-low latency communications, focusing on the media, logistics, healthcare, finance and manufacturing industries. In connection withsuch preparation, we have entered into strategic partnerships with Amazon Web Services and other leading cloud service providers to pursuecollaboration on MEC-based cloud services. We also plan to provide smart factory solutions that can leverage our 5G technology and MEC-based cloudservices, beginning with SK Hynix, which we expect to result in enhanced efficiency for its semiconductor manufacturing process.
Rate Plans
We offer our wireless telecommunications services on both a postpaid and prepaid basis. Approximately 94.7% of our subscribers received ourwireless telecommunications services on a postpaid basis as of December 31, 2019. Postpaid accounts primarily represent retail subscribers undercontract with SK Telecom under which a subscriber is billed in advance a monthly fixed rate in return for a monthly network service allowance andusage for outgoing voice calls and wireless data services beyond the allowance is billed in arrears, where payment of the total amount of the bill is dueat the end of the month. The standard contract period for our rate plans is 24 months, although our subscribers have the option to enter into shorter termcontracts or no fixed-term contract at all. We provide various subsidies and discounts, including handset subsidies, depending on the length of thecontract and the subscriber�s chosen rate plan. Our prepaid service enables individuals to obtain wireless telecommunications services without a fixed-term contract by paying for all services in advance according to expected usage. We do not charge our customers for incoming calls, although we doreceive interconnection charges from KT and other companies for calls from the fixed-line network terminating on our networks and interconnectionrevenues from other wireless network operators. See �� Interconnection� below.
We also charge our customers a 10.0% value-added tax, which is included in the price of all of our rate plans. We can offset the value-added taxwe collect from our customers against value-added tax refundable to us by the Korean tax authorities. We remit taxes we collect from our customers tothe Korean tax authorities. We record revenues in our financial statements net of such taxes.
Basic Rate Plans. We offer various postpaid account plans for smartphones and basic phones that are designed to meet a wide range ofsubscriber needs and interests. Our 5G services are provided through the �5GX� plans, which offer unlimited domestic voice minutes and textmessaging and a fixed or unlimited data transmission allowance per month and range from Won 55,000 to Won 125,000 per month. As of December 31,2019, approximately 2.1 million subscribers have subscribed to the �5GX� plans. Our representative smartphone rate plans for our LTE services are the�T� plans, which feature unlimited domestic voice minutes and text messaging and a fixed or unlimited data transmission allowance per month andrange from Won 33,000 to Won 100,000 per month. In 2019, a majority of our new LTE subscribers have subscribed to the �T� plans. Our �Voice Free�plans are available for our basic phones and feature a fixed allowance of voice minutes and 50 text messages per month with rates that range from Won20,900 to Won 103,400 per month. We also offer a standard rate plan for Won 12,100 per month, through which the subscriber is charged per usageamount, other than on text message usage up to 50 messages per month.
28
Copyright © 2020 www.secdatabase.com. All Rights Reserved.Please Consider the Environment Before Printing This Document
Table of ContentsIn addition, we provide a variety of differentiated rate plans for our customer segments such as our �0� plans for smartphone users who are 24
years old or younger featuring greater data allowance and premium benefits tailored for younger demographics, our �ZEM� plan for children who are12 years old or younger, our �T Global� rate plans for foreigners featuring unlimited domestic voice minutes and text messaging, a fixed allowance ofinternational voice minutes and data transmission per month and our �Weekend Ting� rate plans for teenagers featuring more data transmissionallowance on weekends.
For our T Pocket-Fi device, we provide a fixed monthly data transmission allowance of 10 GB for Won 16,500 per month and 20 GB for Won24,750 per month. With respect to the wearable devices that we offer, we offer targeted rate plans for smart watches that range from Won 11,000 to Won12,100 per month, and the �ZEM� rate plans for our T kids� phone-Joon devices that range from Won 8,800 to Won 19,800 per month.
Data Add-on Rate Plans. We offer a variety of optional �add-on� rate plans that are designed to meet a wide range of subscriber needs withrespect to increased data usage that followed the widespread use of smartphones and faster transmission speeds made possible by LTE technology. Forexample, we offer data plans that offer unlimited data based on time, place and occasion such as our �Subway Free� plan, which offers unlimitedwireless data usage on subway platforms and inside subways and our �Commuter Free� plan, which offers unlimited wireless data usage during rushhour, each for a fixed rate of Won 9,900 per month. For certain rate plan subscribers, we also offer unlimited access to wavve through our �wavve andData Plus� plan at no additional cost or for Won 2,400 or Won 12,300 per month, depending on the subscribers� basic rate plan. �Safe Option Premium�offers an additional daily data transmission allowance of 50 MB to subscribers who have used the maximum data transmission on their existing planwithout incurring additional data transmission fees for a fixed rate of Won 8,800 per month. We also offer �T Data Coupons,� through which subscriberscan purchase a fixed amount of data for a fixed price and can also be sent as �gifts� to family and friends that need additional data allowance. Webelieve that our data add-on rate plan offerings have contributed to the increase in data usage to 8.2 GB of average monthly data usage per LTEsubscriber as of December 31, 2019 from 7.1 GB as of December 31, 2018.
Roaming Plans. Our representative international roaming service plans include our �baro OnePass 300� and �baro OnePass 500� plans, whichare fixed rate plans that provide data roaming of 300 MB for Won 9,900 per day and 500 MB for Won 16,500 per day, respectively, and are available in175 countries. We also offer our �baro OnePass VIP� and �baro OnePass Data VIP� plans, which provide unlimited data roaming, 30 minutes of voicecalls and 30 text messages per day for Won 19,000 per day and unlimited data roaming for Won 17,600 per day, respectively, in 89 countries, as well asour �baro� plans, which provide fixed data transmission allowances of 3 GB, 4 GB or 7 GB that can be used over a specified number of days inapproximately 110 countries, ranging from Won 29,000 to Won 59,000. Our �baro� plans include free high-quality data voice calls to Korea through ourT phone application. We also provide an automatic roaming service called �Safe Automatic T Roaming,� which provides 30 minutes of voice calls perday (including three minutes of free voice calls) for a maximum of Won 10,000 (with voice calls in excess of 30 minutes per day incurring additionalcharges) and data transmission at a rate of Won 563 per MB with a daily data transmission charge ceiling of Won 5,000. With respect to internationalcalls placed by a subscriber, unless the subscriber uses one of our fixed-rate international roaming plans, we bill the subscriber the international ratecharged by the Korean international telephone service provider through which the call is routed. We remit to that provider the international charge lessour usage charges. See �� Interconnection� below.
Digital Wireless Network
We offer wireless voice and data transmission services throughout Korea using digital wireless networks, primarily consisting of our 5G network,LTE network, WCDMA network, CDMA network, Wi-Fi network and LoRa network. We continually upgrade and increase the capacity of our wirelessnetworks to keep pace with advancements in technology, the growth of our subscriber base and the increased usage of voice and wireless data servicesby our subscribers. For more information about our capital expenditures relating to our wireless networks, see �Item 5.B. Liquidity and CapitalResources � Capital Requirements � Capital Expenditures.�
5G Network. 5G is the next generation wireless network that enables data to be transmitted at speeds faster than our LTE network with lowerlatency. We began the operation of our 5G network in December 2018 on a
29
Copyright © 2020 www.secdatabase.com. All Rights Reserved.Please Consider the Environment Before Printing This Document
Table of Contentslimited basis for business customers, beginning with a few major commercial districts in Seoul and other metropolitan areas. In April 2019, we launchedwireless service plans using the 5G network following the commencement of sales of the first 5G-compatible smartphones, and we are in the process ofexpanding our 5G network coverage, focusing on major commercial districts and other densely-populated areas in the Seoul metropolitan area and othermajor cities. As part of this coverage expansion, as of December 31, 2019, we have established approximately 70 �5G Clusters� with high 5Gconnectivity at strategic locations where customers are able to experience the full potential of our 5G network through augmented reality and virtualreality services, cloud gaming and other ICT products. Our 5G services provide a maximum data transmission speed of 2.7 Gbps, and our 5Gpenetration was 6.6% as of December 31, 2019.
LTE Network. LTE technology has become widely accepted globally as the standard fourth generation technology and enables data to betransmitted at speeds faster than our CDMA and WCDMA networks. Since first commencing our LTE services in July 2011 and LTE-A services, whichuse carrier aggregation technology that combines spectrum frequencies to improve data transmission speeds, in June 2013, we have developed andlaunched various upgraded LTE networks and services providing faster network speeds, enhanced connectivity and broader coverage areas. In February2018, we launched four-band LTE-A services utilizing 4x4 multiple-input multiple-output (�MIMO�) technology providing for data transmission speedsof up to 1 Gbps, and in March 2019, we commenced five-band LTE-A services using 4x4 MIMO technology that provide data transmission speeds of upto 1.2 Gbps. With these developments in LTE technology, our LTE penetration increased to 79.3% as of December 31, 2019 compared to 49.3% as ofDecember 31, 2013. We expect that wireless services based on LTE technology will continue to be used broadly by our users in the near future, as weand our competitors continue to build up 5G networks and services and wireless service users gradually migrate to the 5G network over time, and planto continue to deploy improved LTE-A technology to increase the maximum data transmission speed of our services. For M2M connections relating toour IoT solutions, we launched our LTE-M services at speeds of up to 10 Mbps in March 2016, as well as our LTE Cat.M1 services at speeds of up to0.03 Mbps in April 2018. Upgrades to our LTE technology in recent years have enabled even faster data transmission speeds, as shown below.
Wireless network technology Date of commencement of services Maximum data transmission speedLTE July 2011 75 MbpsLTE-A June 2013 150 MbpsWideband LTE-A June 2014 225 MbpsTri-band LTE-A December 2014 300 MbpsFive-band LTE-A June 2017 700 MbpsTri-band LTE-A with 4x4 MIMO June 2017 900 MbpsFour-band LTE-A with 4x4 MIMO February 2018 1 GbpsFive-band LTE-A with 4x4 MIMO March 2019 1.2 Gbps
We believe that our advanced LTE technology and dense network infrastructure enable us to provide the fastest LTE data transmission networknationwide. In December 2019, the MSIT announced that our LTE network provided the fastest upload and download speeds among the three mobilenetwork operators, KT, LG U+ and us. The nationwide average download speed of our LTE network was 211.4 Mbps compared to 153.6 Mbps for KT�sLTE network and 110.6 Mbps for LG U+�s LTE network.
The faster data transmission speed of our LTE network has allowed us to offer significantly improved wireless data transmission services,providing our subscribers with faster wireless access to multimedia content. We have been building new access networks and evolved packet cores forour LTE network, while we utilize our existing WCDMA network for other parts of our LTE network.
CDMA and WCDMA Networks. CDMA technology is a continuous digital transmission technology that accommodates higher throughput thananalog technology by using various coding sequences to allow concurrent transmission of voice and data signals for wireless communication. In January1996, we launched our first wireless network based on CDMA technology and became the world�s first to commercialize second generation cellularservices using the CDMA network. As a result of declining usage and the increasing difficulty of maintaining the network, we submitted an applicationto the MSIT in November 2019 to terminate our second generation CDMA wireless services, which is pending approval by the MSIT.
30
Copyright © 2020 www.secdatabase.com. All Rights Reserved.Please Consider the Environment Before Printing This Document
Table of ContentsWCDMA technology enables us to offer significantly faster and higher-quality voice and data transmission and supports more sophisticated
wireless data transmission services than is possible through our CDMA network. Since first commencing our WCDMA services in Seoul in 2003, wehave expanded our WCDMA network nationwide and implemented various technologies to improve data transmission speeds within our WCDMAnetwork.
Wi-Fi Network. Wi-Fi technology enables our subscribers with Wi-Fi-capable devices such as smartphones, laptops and tablet computers toaccess mobile Internet. We started to build Wi-Fi access points in 2010 and, as of December 31, 2019, we had more than 112,000 Wi-Fi access points inpublic areas such as shopping malls, restaurants, coffee shops, subways and airports where, generally, the demand for high-speed wireless Internetservice is high. While each Wi-Fi access point typically has a radius of approximately 20-30 meters, some of our Wi-Fi hot zones, which have multipleWi-Fi access points, including those installed at public transportation facilities and amusement parks, have much wider service areas.
LoRa Networks. A Low-Power Wide-Area network based on LoRa technology is a type of telecommunications network designed to supportcommunication among IoT devices. It can transmit data over tens of kilometers while consuming much less power than LTE networks, lowering costsfor connectivity as well as lowering battery power usage. We completed the nationwide deployment of our LoRa network in July 2016. We expect thatour LoRa network will provide the infrastructure necessary for the growth of not only our own IoT solutions business but also the IoT industry as awhole.
Network Infrastructure
The principal components of our wireless networks are:
� cell sites, which are physical locations equipped with transmitters, receivers and other equipment that communicate by radio signals withwireless handsets within range of the cell (typically a 3 to 40 kilometer radius);
� switching stations, which switch voice and data transmissions to their proper destinations, which may be, for instance, a mobile phone of oneof our subscribers (for which transmissions would originate and terminate on our wireless networks), a mobile phone of a KT or LG U+subscriber (for which transmissions would be routed to KT�s or LG U+�s wireless networks, as applicable), a fixed-line telephone number(for which calls would be routed to the public switched telephone network of a fixed-line network operator), an international number (forwhich calls would be routed to the network of a long distance service provider) or an Internet site; and
� transmission lines, which link cell sites to switching stations and switching stations with other switching stations.
As of December 31, 2019, our 5G, LTE, WCDMA and CDMA networks had an aggregate of 63,066 cell sites. As we continue to expand our 5Gnetwork coverage, the number of our cell sites is expected to increase accordingly.
We have purchased substantially all of the equipment for our networks from Samsung Electronics, Ericsson�LG and Nokia. Most of thetransmission lines we use, including virtually all of the lines linking switching stations, as well as a portion of the lines linking cell sites to switchingstations, comprise optical fiber lines that we own and operate directly. However, we have not undertaken to install optical fiber lines to link every cellsite and switching station. In places where we have not installed our own transmission lines, we have leased lines from KT and LG U+. We intend toincrease the efficiency of our network utilization and provide optimal services by internalizing transmission lines.
We use a wireless network surveillance system. This system oversees the operation of cell sites and allows us to monitor our main equipmentlocated throughout the country from one monitoring station. The automatic inspection and testing provided to the cell sites lets the system immediatelyrebalance to the most suitable setting, and the surveillance system provides for automatic dispatch of repair teams and quick recovery in emergencysituations.
31
Copyright © 2020 www.secdatabase.com. All Rights Reserved.Please Consider the Environment Before Printing This Document
Table of ContentsMarketing, Distribution and Customer Service
Marketing. Our marketing strategy is focused on offering solutions tailored to the needs of our various customer segments, promoting our brandand leveraging our extensive distribution network. Our marketing plan includes a coordinated program of television, print, radio, outdoor signage,Internet and point-of-sale media promotions designed to relay a consistent message across all of our markets. We market our wireless products andservices under the �T� brand, which signifies the centrality of �Telecommunications� and �Technology� to our business and also seeks to emphasizeour commitment to providing �Top� quality, �Trustworthy� products and services to our customers.
We have implemented certain information technology improvements in connection with our marketing strategy, including customer managementsystems, as well as more effective information security controls. We believe these upgrades have enhanced our ability to process and utilize marketing-and subscriber-related data, which, in turn, has helped us to develop more effective and targeted marketing strategies. We currently operate a customerinformation system designed to provide us with an extensive customer database. Our customer information system includes a billing system thatprovides us with comprehensive account information for internal purposes and enables us to efficiently respond to customer requests. Our customers canalso change their rate plans, verify the charges accrued on their accounts, receive their bills online and send text messages to our other subscribersthrough our website at www.tworld.co.kr and through our �T world� mobile application.
We strive to improve subscriber retention through our T Membership program, which is a membership service available to our wirelesssubscribers. Our T Membership program provides various membership benefits to its members such as discounts with our membership partners fordining, shopping, entertainment and travel, access to our online membership shopping mall and invitations to various promotional events. Although ourcompetitors also have similar membership programs, we believe that our T Membership program has a competitive advantage over our competitors�membership programs due to our large subscriber base and breadth of membership benefits.
Distribution. We use a combination of an extensive network, including branch offices and stores, directly operated by us through our subsidiary,PS&Marketing, more than 3,300 authorized exclusive dealers and an extensive network of independent retailers in order to increase subscriber growthwhile reducing subscriber acquisition costs.
As part of our initiative to provide a differentiated customer service experience, we operate T Premium Stores that allow our potential and existingsubscribers to experience certain of our services such as services that are available through our IoT solutions and platform services. As of December 31,2019, we operated more than 560 T Premium Stores.
In addition, we operate an online distribution channel, �T World Direct,� through which subscribers can conveniently purchase wireless devicesand subscribe to our services online. We also operate a dedicated online shop on 11st, our e-commerce marketplace. We intend to continue to developour online distribution channel to leverage our offline distribution capabilities to provide convenience and additional value to our subscribers. Forexample, subscribers purchasing wireless devices through T World Direct can opt to pick up their devices at one of our offline stores.
Currently, authorized dealers are entitled to an initial commission for each new subscriber registered by the dealer, as well as an average ongoingcommission calculated as a percentage of that subscriber�s monthly plan-based rate for the first five years. In order to strengthen our relationships withour exclusive dealers, we offer a dealer financing plan, pursuant to which we provide to each authorized dealer a loan of up to Won 4.0 billion with arepayment period of up to three years. As of December 31, 2019, we had an aggregate of Won 65.7 billion outstanding in loans to authorized dealers.
Customer Service. We provide high-quality customer service directly through our two subsidiaries, Service Ace Co., Ltd. and Service Top Co.,Ltd., rather than rely on outsourcing. Network O&S Co., Ltd. operates our switching stations and related transmission and power facilities and offersquality customer service primarily to our business customers. We have held the top position with respect to our telecommunications service and retailsales service in Korea�s leading three customer satisfaction indices, the National Customer Satisfaction Index, the Korean Customer Satisfaction Indexand the Korean Standard Service Quality Index, for 23 years, 22 years and 20 years, respectively.
32
Copyright © 2020 www.secdatabase.com. All Rights Reserved.Please Consider the Environment Before Printing This Document
Table of ContentsFixed-line Telecommunication Services
We offer fixed-line telephone, broadband Internet and advanced media platform services (including IPTV) and business communications servicesthrough our fixed-line telecommunication services segment. Our fixed-line telecommunications services are provided by our subsidiaries, SKBroadband and SK Telink. The following table sets forth historical information about our subscriber base for our fixed-line telecommunication servicesfor the periods indicated:
As of December 31,2019 2018 2017
Fixed-Line Telephone (including VoIP)(1) 3,913,274 4,132,265 4,322,767Broadband Internet 5,613,200 5,404,866 5,232,648IPTV(2) 5,193,329 4,729,238 4,370,416
(1) Includes subscribers to VoIP services of SK Broadband and SK Telink.(2) Includes subscribers to SK Broadband�s B tv service and video-on-demand only service subscribers.
In 2019, 2018 and 2017, our fixed-line telecommunication services segment revenue was Won 2,948.2 billion, Won 2,822.3 billion and Won2,719.4 billion, respectively, representing 16.6%, 16.7% and 15.5%, respectively, of our consolidated revenue. Following the entry into an agreement totransfer SK Broadband�s 100% equity interest in SK stoa Co., Ltd. (�SK Stoa�) to SK Telecom in April 2019 (which transaction was completed inJanuary 2020), the T-commerce business operations of SK Stoa, which were previously part of our fixed-line telecommunications services segment in2018 and 2017, were reclassified as part of our commerce services segment for 2019. See �� Commerce Services.�
As part of our efforts to enhance our capabilities and increase our market share in the fixed-line business, in April 2019, we entered into anagreement with Tbroad, a leading cable television and other fixed-line telecommunication services provider in Korea, pursuant to which Tbroad willmerge with and into SK Broadband. Upon the completion of such merger, we expect to own approximately 74.4% of SK Broadband�s total outstandingshares. In addition, SK Telecom signed a separate share purchase agreement with Tbroad Co., Ltd. to acquire a 55.0% equity interest in Tbroad Nowon.The transactions have obtained all requisite regulatory and shareholder approvals and are expected to be completed as of April 30, 2020 and April 29,2020, respectively.
Fixed-line Telephone Services
Our fixed-line telephone services comprise local, domestic long distance, international long distance and VoIP services. VoIP is a technology thattransmits voice data through an Internet Protocol network. As of December 31, 2019, we had approximately 3.9 million fixed-line telephone subscribers(including subscribers to VoIP services of SK Broadband and SK Telink). Our fixed-line telephone services are primarily offered under the �B phone�brand name. SK Telink also provides affordable international calling services under the brand name �00700.�
Broadband Internet Access Services
Our broadband Internet access network covered more than 86% of households in Korea as of December 31, 2019. As of December 31, 2019, wehad approximately 5.6 million broadband Internet access subscribers. We offer broadband Internet access products with various throughput speeds,ranging from �Giga Premium,� which is up to 10 times faster than data transmission speeds on networks utilizing FTTH technology and allows for datatransmission at a maximum speed of 1 Gbps, to �Giga Premium×10,� which provides data transmission speeds of up to 10 Gbps.
Advanced Media Platform (including IPTV)
As part of our initiative to be the leading next-generation platform provider, we aim to provide an advanced media platform with various mediacontent and service offerings.
We have offered video-on-demand services since 2006 and launched real-time IPTV services in 2009. We currently offer IPTV services under thebrand name �B tv� with access to as many as 260 high definition channels
33
Copyright © 2020 www.secdatabase.com. All Rights Reserved.Please Consider the Environment Before Printing This Document

Table of Contentsdepending on the subscription service as of December 31, 2019, as well as video-on-demand service providing a wide range of media content, includingrecent box office movie releases, popular U.S. and other foreign TV shows and various children�s TV programs. We also offer �B tv UHD,� which is anultra-high definition IPTV service and has a resolution that is four times as high as the standard high definition broadcasting service in the IPTVindustry. As of December 31, 2019, we had approximately 5.2 million IPTV subscribers. In January 2018, we launched B tv NUGU, which is anall-in-one set top box that incorporates NUGU voice recognition technology and can search for and play media content as well as connect to our SmartHome service through voice commands. In July 2019 and August 2019, respectively, we launched an updated set top box called �Smart 3� set top box,which provides Google Assistant capabilities in addition to our NUGU technology, and �AI 2,� which integrates a stereo system with enhanced audioquality and improved NUGU voice recognition capabilities using beam forming technology.
In September 2019, we acquired a minority equity stake in Content Wavve, which operated the mobile OTT service �POOQ,� and transferred ourformer mobile OTT service business �oksusu� to Content Wavve. Content Wavve combined oksusu and POOQ to launch a new integrated mobile OTTservice �wavve� in September 2019. See �� Other Investments and Relationships � Wavve� below.
We continue to expand the scope of our media services and content offerings to provide our subscribers with a vast library of high-quality contentthat can be accessed through our wireless networks and our fixed-line network.
Business Communications Services
We offer other business communications services to our business customers, including corporations and government entities. Our businesscommunications services include leased line solutions, Internet data center solutions and network solution services.
Our leased line solutions are exclusive lines that allow point-to-point connection for voice and data traffic between two or more geographicallyseparate points. We hold a license to operate leased line services on a nationwide basis in Korea and also use international transmission lines to provideleased line services to other countries. Our leased line services enable high volumes of data to be transmitted swiftly and reliably. We also provideback-up storage for transmitted data. Through our Internet data center, we provide our business subscribers with server-based support includingco-location, dedicated server hosting and cloud computing services. Our network solution service utilizes our network infrastructure and voice platformto provide 24-hour monitoring and control of our customers� networks. Through this service, we conduct remote monitoring of our customers� data andvoice communications infrastructure and network and traffic conditions, and carry out preventive examinations and on-site visits.
Rate Plans
For our residential customers, we offer both bundled rate plans for a combination of our fixed-line service offerings as well as individual rateplans for each separate service offering. Bundled rate plans are offered at a discount compared to subscribing to the same services through individualrate plans. Approximately 77% of subscribers to our fixed-line services subscribe to two or more of our services through our bundled rate plans.Bundled rate plans for a combination of fixed-line telephone, broadband Internet access and IPTV services, which are subject to a contract of one tothree years, range from Won 30,800 to Won 123,750 per month, depending on the services included and the length of the contract. We also offer bundledrate plans combining our fixed-line communication services with our wireless services and physical security services, respectively.
Our �Unlimited Home Phone� plan for subscribers to our fixed-line telephone service features unlimited domestic land-to-land voice minutes fora fixed rate and range from Won 7,700 to Won 11,550 per month depending on whether or not the subscriber opts for a contract and if so, the length ofthe contract period. We offer individual fixed-rate plans for our broadband Internet access service that range from Won 36,300 to Won 82,500 per monthdepending on the data throughput speed and existence and length of a contract. We offer individual fixed-rate plans for our IPTV service that range fromWon 11,000 to Won 16,500 per month depending on the number of channels provided and existence and length of a contract. In addition, subscriberscan purchase individual videos on demand or subscribe to certain paid content on a periodic basis.
34
Copyright © 2020 www.secdatabase.com. All Rights Reserved.Please Consider the Environment Before Printing This Document
Table of ContentsWith respect to our business communications services, we offer rates that are tailored to the specific needs of our business customers. We also
charge certain installation fees and equipment rental fees as well as other ancillary fees with respect to certain of our fixed-line telecommunicationsservices.
Marketing, Distribution and Customer Service
We focus on bringing our fixed-line telephone, broadband Internet and advanced media platform services (including IPTV) to residential users,and various business communications services to corporate users. We market our fixed-line telecommunications products and services under the �B�brand. Our �B� brand signifies the centrality of �Broadband� to our business and also seeks to emphasize our commitment to providing the �Best�quality products and services to our customers that go �Beyond� expectations, leading to a �Bravo� response. Our �B� brand also strengthens ourshared identity with our wireless service�s �T� brand.
We currently outsource a significant portion of our retail sales force needs. We market our services and provide after-sales service support tocustomers through more than 70 customer centers and a network of more than 170 authorized exclusive dealers located throughout Korea. In addition,SK Telecom�s direct retail stores and authorized dealers for wireless telecommunications services also market our fixed-line telephone, broadbandInternet and advanced media platform services (including IPTV), which we believe has contributed to the increase in the number of subscribers to suchservices. We have contracts with our customer centers to sell our services exclusively. These centers receive a commission for each service contract andinstallation contract secured. In addition, we pay these centers for the maintenance and repair work that they perform for our subscribers. Customer andservice centers often enter into sub-contracts with smaller distribution outlets within their area to increase their sales coverage and engage intelemarketing efforts. Authorized dealers are entitled to an initial commission for each new subscriber registered by the dealer.
Sales to business subscribers are handled through our in-house sales group. Our sales teams focus on securing contracts with large commercialcomplexes, allowing us to install our remote terminals at their premises. After installation, sales teams direct their attention to individual business clientswithin these premises. Sales teams that have secured contracts with business clients remain the primary contacts for all aspects of the client�s needs,including further installation and customer and follow-up service.
Security Services
Our security business consists of physical security services provided by ADT Caps and information security services provided by SK Infosec. In2019, 2018 and 2017, our security services segment revenue was Won 1,109.5 billion, Won 284.3 billion and Won 92.0 billion, respectively,representing 6.3%, 1.7% and 0.5%, respectively, of our consolidated revenue.
Our security services businesses, which were previously part of our other businesses segment in 2018 and 2017, were reclassified as a newsecurity services segment in 2019.
Physical Security
ADT Caps provides a variety of physical security services utilizing its flagship unmanned surveillance and dispatch platform called the CentralMonitoring Services (�CMS�). CMS-based services, which accounted for approximately 71% and 70% of ADT Caps� revenues in 2019 and 2018,respectively, are tailored for residential and commercial needs and operate through a centralized monitoring system that provides offsite surveillancethrough cameras, sensors and emergency alarms. Upon detecting any suspicious activity through such system or upon request, security personnel isdispatched to the relevant subscriber location to provide further onsite manned security.
Following our acquisition of ADT Caps, we have explored and continue to explore synergies between our security business and other key businesssegments. For example, we launched �T Safe Security,� a CMS-based video surveillance and security guard dispatch service offered through thedistribution channels for our wireless services, in October 2018. In addition, we introduced our bundle-based discounted rate plans �T&Caps� inNovember 2018 and �B&Caps� in January 2019, which bundle our wireless service and broadband Internet service,
35
Copyright © 2020 www.secdatabase.com. All Rights Reserved.Please Consider the Environment Before Printing This Document
Table of Contentsrespectively, with ADT Caps� security service. Beginning in June 2019, with the launch of T map Parking, ADT Caps also operates a parkingmanagement and security solutions business. See �� Cellular Services � Platform Services� above.
We acquired ADT Caps in October 2018 by acquiring a 55.0% interest in LSH, which owns 100% of ADT Caps, for Won 696.7 billion. InDecember 2018, we merged NSOK Co., Ltd. (�NSOK�), which became our consolidated subsidiary in 2014 and provided residential and small businesselectronic security and other related alarm monitoring services, with and into ADT CAPS Co., Ltd.
Information Security
We offer information security solutions through our subsidiary SK Infosec. SK Infosec provides information security consulting services,managed security services as well as cyber threat intelligence solutions. SK Infosec�s representative product is �Secudium IoT,� a convergence securityservice that combines information, physical and operational technology security services into a single platform.
We acquired SK Infosec from SK Holdings, our largest shareholder, in a share exchange transaction in December 2018, pursuant to which wetransferred 1,260,668 treasury shares with an aggregate book value of Won 281.2 billion to SK Holdings in exchange for all of the issued andoutstanding common shares of SK Infosec.
Commerce Services
Our commerce services segment consists primarily of �11st,� our online marketplace business operated by Eleven Street, and �T stoa,� ourinteractive T-commerce network. In 2019, 2018 and 2017, our commerce services segment revenue was Won 710.7 billion, Won 728.4 billion and Won651.8 billion, respectively, representing 4.0%, 4.3% and 3.7%, respectively, of our consolidated revenue. Following the entry into an agreement totransfer SK Broadband�s 100% equity interest in SK Stoa to SK Telecom in April 2019 (which transaction was completed in January 2020), theT-commerce business operations of SK Stoa, which were previously part of our fixed-line telecommunications services segment in 2018 and 2017, werereclassified as part of our commerce services segment for 2019.
E-Commerce
11st is an online open marketplace that offers a wide range of products through an online and mobile platform. Individual consumers can buy avast array of products such as clothes and accessories, beauty products, groceries, baby products, books, office supplies, furniture, home goods, outdoorand sporting goods, appliances, electronics, travel packages, entertainment tickets and local deals for restaurants and other services from small- tolarge-sized retailers that operate �mini malls� on the 11st platform. Eleven Street also operates SK Pay, a convenient and secure payment servicethrough which users can register their credit card to simplify payments for online and mobile purchases for many of our services, including 11st.
As of December 31, 2019, 11st was the leading commerce platform in terms of the total number of unique visitors to its mobile and desktopversions, according to Nielsen Koreanclick. The mobile version of 11st is continuing to grow with an increase in the percentage of annual grossmerchandise volume, which represents the total annual monetary value of customer purchases of goods and services, net of estimated refunds, derivedfrom the mobile platform to 68% in 2019 from 65% in 2018 and 61% in 2017. We intend to continue our efforts to increase usage of the mobile versionof 11st, enhance the convenience of our 11st mobile and web user interface and create synergies with our other products and services.
Eleven Street was spun-off as our new consolidated subsidiary from SK Planet Co., Ltd. (�SK Planet�) in September 2018. In connection withsuch spin-off, Eleven Street received a Won 500 billion equity investment in the form of redeemable convertible preferred shares from a group offinancial investors led by H&Q Korea Partners, LLC, pursuant to which such financial investors held an 18.2% equity interest in Eleven Street as ofDecember 31, 2019.
T-Commerce
We also operate a T-commerce network, �SK stoa,� through our consolidated subsidiary SK Stoa, which offers a broad assortment of goods andservices through pre-recorded television programming. The goods and services
36
Copyright © 2020 www.secdatabase.com. All Rights Reserved.Please Consider the Environment Before Printing This Document
Table of Contentspromoted on SK stoa�s T-commerce programming can be purchased through telephone orders, SK stoa�s mobile application or online openmarketplace, or a virtual application appearing on the television screen using the viewer�s remote controller. In March 2019, SK Stoa launched �SK stoaON,� which offers searchable shopping programming that is available to viewers at their convenience by utilizing video-on-demand capabilities. InSeptember 2019, SK Stoa launched �Hellen Karen,� its own private fashion brand. SK stoa also acts as the exclusive T-commerce distributor for certainproducts and services of SK Group companies, such as food, electronics, home appliances and car rentals.
Other Businesses
We strive to continually diversify our products and services and develop new growth engines that we believe are complementary to our existingproducts and services, such as our portal service and other miscellaneous businesses, which we include in our other businesses segment. In 2019, 2018and 2017, our other businesses segment revenue was Won 802.9 billion, Won 660.1 billion and Won 794.7 billion, respectively, representing 4.5%, 3.9%and 4.5%, respectively, of our consolidated revenue.
Portal Service
We offer a portal service under our �Nate� brand name through SK Communications. Nate can be accessed through its website, www.nate.com, orthrough its mobile application. Nate offers a wide variety of content and services, including Nate Search, an Internet search engine, Nate News, whichprovides a library of articles about current events, sports, entertainment and culture, Nate Pann, a user-generated content service as well as access to freee-mail accounts through Nate Mail.
Miscellaneous Businesses
Marketing Platform Business. We provide marketing platform services through SK Planet, which include the following:
� Syrup Wallet, a mobile wallet service that is the successor to our Smart Wallet service, allows users to conveniently manage membership cardpoints and payment methods such as coupons, credit cards and gift vouchers on their mobile devices for both online and offline purchases andprovides shopping information to users in certain shopping areas using advanced location-based technology; and
� OK Cashbag, a loyalty points program which allows members to collect and redeem loyalty points at its partnering merchants and offersdifferentiated marketing services to such partnering merchants.
Others. We offer high-end audio devices under the brand name �Astell&Kern� that are manufactured by our subsidiary, Dreamus Company(�Dreamus�). Dreamus also operates our personalized music platform �FLO,� which provides a music streaming service with customized musicrecommendations and user interfaces by analyzing individual user preferences with our AI technology. In 2017 and 2018, we acquired additional equityinterests in Dreamus for Won 25.0 billion and Won 65.0 billion, respectively, and as of December 31, 2019, we had a 51.4% equity interest in Dreamus.
We also operate a mobile application marketplace, �One Store,� in collaboration with KT, LG U+ and NAVER Corporation. Through this jointcollaboration, we expect to increase the competitiveness of One Store to compete with Google Playstore, the leading mobile application marketplace inKorea. In recent years, we have made offerings of mobile games as the focus of One Store in response to the rapid growth of the mobile game market inKorea. In November 2019, One Store Co., Ltd., our consolidated subsidiary that operates One Store, undertook a capital increase of approximately Won97.5 billion by issuing convertible preferred shares to a consortium of financial investors including Kiwoom Investment and SKS Private Equity. As ofDecember 31, 2019, we held 52.7% of the total outstanding shares of One Store Co., Ltd.
In addition, in order to strengthen our data security capabilities in light of expected increases in data transmission by wireless service subscribersand users of our IoT solutions through our 5G network, we acquired a controlling equity interest in id Quantique, a leading provider of quantumcryptography solutions for data security based in Switzerland, in 2018. As of December 31, 2019, we held a 66.8% equity interest in id Quantique.
37
Copyright © 2020 www.secdatabase.com. All Rights Reserved.Please Consider the Environment Before Printing This Document
Table of ContentsIn June 2019, we acquired a 34.6% interest in Incross, a digital advertising company that provides mobile, online and other forms of digital
advertising solutions, for an aggregate purchase price of Won 53.7 billion, in light of potential synergies with our media and commerce businesses.Although we own less than a majority of Incross�s outstanding equity interest, Incross is deemed to be our consolidated subsidiary based on ourmanagement�s determination that we have sufficient control.
We also provide freight and logistics consulting services to corporate customers through FSK L&S Co. Ltd. (�FSK L&S�), a joint venture with asubsidiary of Foxconn Technology Group of Taiwan, in which we hold a 60.0% equity interest as of December 31, 2019. We acquired such 60.0%equity interest from SK Holdings in February 2018 for approximately Won 18.0 billion. We accounted for FSK L&S as an associate under the equitymethod in 2018, but following our determination that we have obtained control of FSK L&S during 2019, FSK L&S has become a consolidatedsubsidiary beginning in 2019.
Interconnection
Our wireless and fixed-line networks interconnect with the public switched telephone networks operated by KT and SK Broadband and, throughtheir networks, with the international gateways of KT and LG U+, as well as the networks of the other wireless telecommunications service providers inKorea. These connections enable our subscribers to make and receive calls from telephones outside our networks. Under Korean law, certain serviceproviders, including us, are required to permit other service providers to interconnect to their networks. If a new service provider desires interconnectionwith the networks of an existing service provider but the parties are unable to reach an agreement within 90 days, the new service provider can appeal tothe KCC.
Domestic Calls
Guidelines issued by the MSIT require that all interconnection charges levied by a regulated carrier take into account (i) the actual costs to thatcarrier of carrying a call or (ii) imputed costs. The MSIT determines interconnection rates applicable to each carrier based on changes in traffic volume,taking into account other factors such as research results, competition and trends in technology development.
Wireless-to-Fixed-line. According to our interconnection arrangement with KT, for a call from our wireless network to KT�s fixed-line network,we collect the usage rate from our wireless subscriber and in turn pay KT the interconnection charges. Similarly, KT pays interconnection charges to SKBroadband for a call from KT�s wireless network to SK Broadband�s fixed-line network. The interconnection rate applicable to both KT and SKBroadband was Won 9.15 per minute, Won 9.99 per minute and Won 10.86 per minute for 2019, 2018 and 2017, respectively.
Fixed-line-to-Wireless. The MSIT determines interconnection arrangements for calls from a fixed-line network to a wireless network. For a callinitiated by a fixed-line user to one of our wireless subscribers, the fixed-line network operator collects our usage fee from the fixed-line user and remitsto us an interconnection charge. Interconnection with KT accounts for substantially all of our fixed-line-to-wireless interconnection revenue andexpenses. The interconnection rate paid by fixed-line network service providers to each wireless network service provider was Won 11.64 per minute,Won 13.07 per minute and Won 14.56 per minute for 2019, 2018 and 2017, respectively.
Wireless-to-Wireless. Interconnection charges also apply to calls between wireless telephone networks in Korea. Under these arrangements, theoperator originating the call pays an interconnection charge to the operator terminating the call. The applicable interconnection rate is the same as thefixed-line-to-wireless interconnection rate set out in the table above.
Our revenues from the wireless-to-wireless charge were Won 463.8 billion in 2019, Won 498.5 billion in 2018 and Won 505.1 billion in 2017. Ourexpenses from these charges were Won 464.1 billion in 2019, Won 494.2 billion in 2018 and Won 512.2 billion in 2017. The charges above were agreedamong the parties involved and confirmed by the KCC.
International Calls and International Roaming Arrangements
With respect to international calls, if a call is initiated by our wireless subscribers, we bill the wireless subscriber for the international charges ofKT, LG U+ or SK Broadband, and we receive interconnection charges
38
Copyright © 2020 www.secdatabase.com. All Rights Reserved.Please Consider the Environment Before Printing This Document
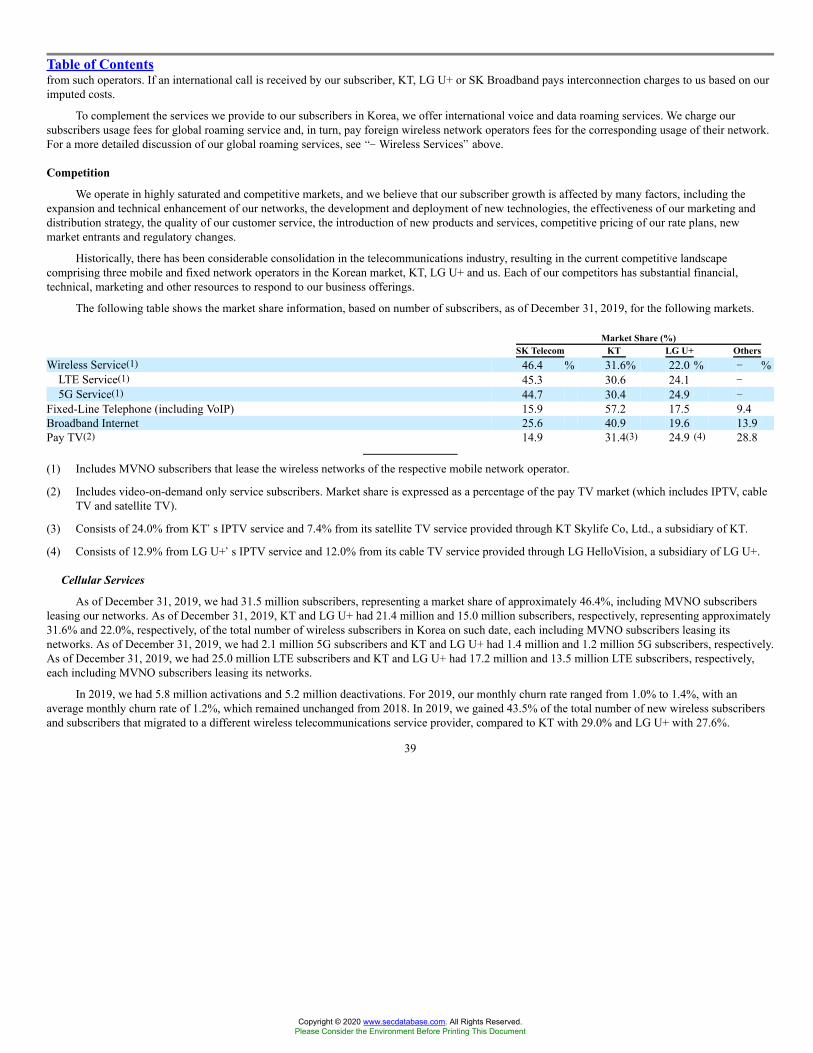
Table of Contentsfrom such operators. If an international call is received by our subscriber, KT, LG U+ or SK Broadband pays interconnection charges to us based on ourimputed costs.
To complement the services we provide to our subscribers in Korea, we offer international voice and data roaming services. We charge oursubscribers usage fees for global roaming service and, in turn, pay foreign wireless network operators fees for the corresponding usage of their network.For a more detailed discussion of our global roaming services, see ��Wireless Services� above.
Competition
We operate in highly saturated and competitive markets, and we believe that our subscriber growth is affected by many factors, including theexpansion and technical enhancement of our networks, the development and deployment of new technologies, the effectiveness of our marketing anddistribution strategy, the quality of our customer service, the introduction of new products and services, competitive pricing of our rate plans, newmarket entrants and regulatory changes.
Historically, there has been considerable consolidation in the telecommunications industry, resulting in the current competitive landscapecomprising three mobile and fixed network operators in the Korean market, KT, LG U+ and us. Each of our competitors has substantial financial,technical, marketing and other resources to respond to our business offerings.
The following table shows the market share information, based on number of subscribers, as of December 31, 2019, for the following markets.
Market Share (%)SK Telecom KT LG U+ Others
Wireless Service(1) 46.4 % 31.6% 22.0 % � %LTE Service(1) 45.3 30.6 24.1 �5G Service(1) 44.7 30.4 24.9 �
Fixed-Line Telephone (including VoIP) 15.9 57.2 17.5 9.4Broadband Internet 25.6 40.9 19.6 13.9Pay TV(2) 14.9 31.4(3) 24.9 (4) 28.8
(1) Includes MVNO subscribers that lease the wireless networks of the respective mobile network operator.
(2) Includes video-on-demand only service subscribers. Market share is expressed as a percentage of the pay TV market (which includes IPTV, cableTV and satellite TV).
(3) Consists of 24.0% from KT�s IPTV service and 7.4% from its satellite TV service provided through KT Skylife Co, Ltd., a subsidiary of KT.
(4) Consists of 12.9% from LG U+�s IPTV service and 12.0% from its cable TV service provided through LG HelloVision, a subsidiary of LG U+.
Cellular Services
As of December 31, 2019, we had 31.5 million subscribers, representing a market share of approximately 46.4%, including MVNO subscribersleasing our networks. As of December 31, 2019, KT and LG U+ had 21.4 million and 15.0 million subscribers, respectively, representing approximately31.6% and 22.0%, respectively, of the total number of wireless subscribers in Korea on such date, each including MVNO subscribers leasing itsnetworks. As of December 31, 2019, we had 2.1 million 5G subscribers and KT and LG U+ had 1.4 million and 1.2 million 5G subscribers, respectively.As of December 31, 2019, we had 25.0 million LTE subscribers and KT and LG U+ had 17.2 million and 13.5 million LTE subscribers, respectively,each including MVNO subscribers leasing its networks.
In 2019, we had 5.8 million activations and 5.2 million deactivations. For 2019, our monthly churn rate ranged from 1.0% to 1.4%, with anaverage monthly churn rate of 1.2%, which remained unchanged from 2018. In 2019, we gained 43.5% of the total number of new wireless subscribersand subscribers that migrated to a different wireless telecommunications service provider, compared to KT with 29.0% and LG U+ with 27.6%.
39
Copyright © 2020 www.secdatabase.com. All Rights Reserved.Please Consider the Environment Before Printing This Document
Table of ContentsOur competitors for subscriber activations include MVNOs, including MVNOs that lease our networks. MVNOs generally provide rate plans that
are relatively cheaper than similar rate plans of the wireless network providers from which they lease their networks, including us. Currently, thirteenMVNOs provide wireless telecommunications services using the networks leased from us. As of December 31, 2019, MVNOs had a combined marketshare of 11.4%, of which MVNOs leasing our networks represented 4.2%, MVNOs leasing KT�s networks represented 5.6% and MVNOs leasing LGU+�s networks represented 1.6%.
In addition, other companies may enter the wireless network services market. New entries in such market have historically required obtainingrequisite licenses from the MSIT. However, pursuant to an amendment to the Telecommunications Business Act that went into effect in June 2019,companies meeting certain regulatory criteria may become a network service provider by registering with the MSIT without a separate licenserequirement, which may have the effect of encouraging new entries into the Korean wireless network services market in the future. For a description ofthe risks associated with the competitive environment in which we operate, see �Item 3.D. Risk Factors � Risks Relating to Our Business � Competitionmay reduce our market share and harm our results of operations and financial condition.�
Historically, competition in the wireless telecommunications business had caused us to significantly increase our marketing and advertisingexpenses from time to time depending on the prevailing competitive landscape, with our marketing expenses as a percentage of SK Telecom�s revenue,on a separate basis, reaching a peak of 28.2% in 2012. Such percentage was 25.0% in 2017, 24.5% in 2018 and 25.7% in 2019. We attribute suchstabilization to the maturity of the overall wireless telecommunication market and the implementation of the MDDIA, which prohibits wirelesstelecommunications service providers from unfairly providing discriminatory subsidies based on certain criteria and from providing subsidies exceedinga maximum limit established by the KCC for the purchase of mobile phone models that were launched within the last 15 months, among otherrestrictions and requirements. However, the prohibition from providing handset subsidies exceeding the amount set by the KCC expired in September2017 pursuant to the expiration of the three-year effective period of the relevant provision of the MDDIA. For a more detailed discussion of theMDDIA, see �� Law and Regulation � Rate Regulation� below.
We face competition from KT and LG U+ as well as other platform service providers in our other cellular service businesses. For example, ourSmart Home service competes with KT�s Giga IoT Home service and LG U+�s IoT@Home service.
Fixed-Line Telecommunication Services
Our fixed-line telephone service competes with KT and LG U+ as well as providers of other VoIP services. As of December 31, 2019, our marketshare of the fixed-line telephone and VoIP service market was 15.9% (including the services provided by SK Broadband and SK Telink) in terms ofnumber of subscribers compared to KT with 57.2% and LG U+ with 17.5%.
We are the second largest provider of broadband Internet access services in Korea in terms of both revenue and subscribers, and our networkcovered more than 86% of households in Korea as of December 31, 2019. As of December 31, 2019, our market share of the broadband Internet marketwas 25.6% in terms of number of subscribers compared to KT with 40.9% and LG U+ with 19.6%.
Our IPTV service competes with other providers of pay TV services, including KT, LG U+ and cable companies. As of December 31, 2019, ourmarket share of the pay TV market (which includes IPTV, cable TV and satellite TV) in terms of number of subscribers was 14.9% compared to KTwith 31.4% (including its IPTV and satellite TV services) and LG U+ with 24.9% (including its IPTV and cable TV services), and the collective marketshare of other pay TV providers was 28.8%. We also face increasing competition from global media streaming service providers such as Amazon Videoand Netflix, which launched its services in Korea in January 2016.
Recently, the Korean fixed-line telecommunications industry has been going through significant consolidation involving major pay televisionservice providers. In December 2019, LG U+ acquired a majority equity stake in LG HelloVision to become the second-largest pay TV provider inKorea in terms of number of subscribers. In April 2019, SK Broadband entered into an agreement with Tbroad, pursuant to which Tbroad will mergewith and into SK Broadband. Upon the completion of such merger, we expect to own approximately 74.4% of SK Broadband�s total
40
Copyright © 2020 www.secdatabase.com. All Rights Reserved.Please Consider the Environment Before Printing This Document
Table of Contentsoutstanding shares following the issuance of SK Broadband�s shares to Tbroad�s shareholders. In addition, SK Telecom signed a separate sharepurchase agreement with Tbroad Co., Ltd. to acquire a 55.0% equity interest in Tbroad Nowon for a purchase price of Won 10.4 billion in cash. Bothtransactions have obtained all requisite regulatory and shareholder approvals and are expected to be completed as of April 30, 2020 and April 29, 2020,respectively. Such transactions, as well as further consolidation in the fixed-line telecommunications industry, may result in increased competition, asthe entities emerging from such consolidation and other remaining players in the industry may actively pursue expanding or protecting their respectivemarket shares.
Furthermore, the Government has historically enforced regulations on cable TV and IPTV service providers that prohibited them from having amarket share of more than one-third of the total number of subscribers in the relevant pay TV market on each of their respective platforms. In June2015, the Government amended the regulation to impose the same limit on the market share of the entire pay TV market, including satellite TV serviceproviders as well. Such amended regulation, however, expired in June 2018. While the expiration of such regulation has prompted the submission of anumber of bills in the National Assembly to extend its application, it is uncertain whether any of such bills will be passed. An extension of suchregulation may restrict our and our major competitors� abilities to engage in further consolidation or otherwise significantly increase market share in thepay TV market. In addition, there is a pending bill in the National Assembly which proposes to require IPTV service providers to obtain approvals fromthe MSIT for any mergers or acquisitions or change-of-control transactions.
Security Services
The physical security services industry in Korea is expanding rapidly due to the relatively low penetration of physical security services ascompared to other developed countries, growing demand for residential security services and the popularization of unmanned services. Our physicalsecurity business operated by ADT Caps competes with other large physical security service providers, including S-1 and KT Telecop. As ofDecember 31, 2019, our market share of the physical security services market was 32.4% in terms of the aggregate revenue of these three companies,compared to S-1 with 55.9% and KT Telecop with 11.6%.
The information security services market in Korea is also undergoing rapid growth as various industries become more digitalized and the risk ofcybersecurity breaches heightens. SK Infosec�s information security services compete with other providers of similar products and services, such asAhnlab, Inc., SECUi Corp. and WINS Co., Ltd.
Commerce Services
The commerce industry is evolving rapidly and is intensely competitive, and we face a broad array of competitors domestically and increasingly,internationally. Our marketplace business, 11st, faces intense competition from various e-commerce providers, including online open marketplaces andsocial commerce operators such as Gmarket, Auction, Interpark, Coupang, Wemakeprice and TMon. We also face competition from traditional retailerswith online and mobile shopping portals such as SSG.com and Lotte.com, home shopping providers with online and mobile shopping portals such as CJMall by CJ O Shopping, GS Shop by GS Homeshopping and Hyundai Hmall by Hyundai Homeshopping, and various online marketplaces for specificconsumer segments or product groups. Our T-commerce business, SK stoa, primarily competes with other home shopping providers such as those listedabove, as well as with various e-commerce providers and traditional retailers.
Other Investments and Relationships
We have investments in several other businesses and companies and have entered into various business arrangements with other companies. Ourprincipal investments fall into the following categories:
SK Hynix
As of December 31, 2019, we held a 20.1% equity interest in SK Hynix, one of the world�s largest memory-chip makers by revenue. SK Hynixdesigns, manufactures and sells advanced memory semiconductor products, including DRAM and NAND flash products, used in various electronicdevices. SK Hynix operates four wafer fabrication facilities in Korea and China.
41
Copyright © 2020 www.secdatabase.com. All Rights Reserved.Please Consider the Environment Before Printing This Document
Table of ContentsAs of December 31, 2019, the fair value of our holding in SK Hynix was Won 13,748.0 billion. We received dividend payments of Won 219.2
billion in 2019, Won 146.1 billion in 2018 and Won 87.7 billion in 2017 related to such shareholding. In 2019, 2018 and 2017, SK Hynix and itssubsidiaries, on a consolidated basis, reported revenues of Won 26,990.7 billion, Won 40,445.1 billion and Won 30,109.4 billion, respectively, profitbefore income tax of Won 2,442.7 billion, Won 21,341.0 billion and Won 13,439.6 billion, respectively, and profit for the year of Won 2,016.4 billion,Won 15,540.0 billion and Won 10,642.2 billion, respectively. The decrease in SK Hynix�s revenues in 2019 was primarily due to decreases in thedemand for and average selling prices of DRAM and NAND flash products. As of December 31, 2019, 2018 and 2017, SK Hynix and its subsidiaries,on a consolidated basis, reported total assets of Won 64,789.5 billion, Won 63,658.3 billion and Won 45,418.5 billion, respectively, and total equity ofWon 47,943.2 billion, Won 46,852.3 billion and Won 33,820.9 billion, respectively. For a more detailed discussion of the risks relating to ourshareholding in SK Hynix, see �Item 3.D. Risk Factors � Risks Relating to Our Business � Declines in the market value of our equity holdings in SKHynix and the results of operations of SK Hynix could have a material adverse effect on the market price of our common shares and ADSs as well asour results of operation.�
KEB HanaCard
In February 2010, we purchased shares newly issued by Hana SK Card Co., Ltd. (which was subsequently merged into KEB Card Co., Ltd. andrenamed KEB HanaCard Co., Ltd. (�KEB HanaCard�) in November 2014), a credit card services provider, for a total purchase price of Won400.0 billion. As of December 31, 2019, we held 15.0% of the total outstanding shares of KEB HanaCard. KEB HanaCard offers certain credit cardproducts that provide for discounts on some of our wireless network services and integrate T Membership benefits, among other features.
Wavve
In September 2019, in furtherance of our efforts to enhance the competitiveness of our media business and to promote its future growth, weacquired a minority equity stake in Content Wavve (formerly known as Content Alliance Platform Inc.), a joint venture established by the three majorterrestrial broadcasters in Korea that operated the mobile OTT service �POOQ,� by investing Won 90.9 billion in cash and transferring our formermobile OTT service business �oksusu� to Content Wavve. Content Wavve combined oksusu and POOQ to launch a new integrated mobile OTT service�wavve� in September 2019. As of December 31, 2019, we held 30.0% of the total outstanding shares of Content Wavve.
Wavve offers over 240,000 titles of video-on-demand contents, including a wide variety of real-time and on-demand terrestrial broadcastprograms, movies, popular U.S. and other foreign TV shows and professional sporting events, to its subscribers that can be played on mobile devices,television, personal computer and/or Google�s Chromecast. Monthly subscription plans range from Won 7,900 to Won 13,900 per month, depending onthe type and number of accessible devices. We also offer wavve-specific data add-on plans for our wireless service subscribers. Certain types ofcontents, such as movies, can also be purchased individually.
Law and Regulation
Overview
Korea�s telecommunications industry is subject to comprehensive regulation by the MSIT, which is responsible for information andtelecommunications policies. The MSIT regulates and supervises a broad range of communications issues, including:
� entry into the telecommunications industry;
� scope of services provided by telecommunications service providers;
� allocation of radio spectrum;
� setting of technical standards and promotion of technical standardization;
� rates, terms and practices of telecommunications service providers;
42
Copyright © 2020 www.secdatabase.com. All Rights Reserved.Please Consider the Environment Before Printing This Document

Table of Contents� interconnection and revenue-sharing between telecommunications service providers;
� research and development of policy formulation for information and telecommunications; and
� competition among telecommunications service providers.
The MSIT is charged with regulating information and telecommunications and the KCC is charged with regulating the public interest aspects ofand fairness in broadcasting.
Telecommunications service providers are currently classified into two categories: network service providers and value-added service providers.We are classified as a network service provider because we provide telecommunications services with our own telecommunications networks andrelated facilities. As a network service provider, we were previously required to obtain a license from the MSIT for the services we provide. However,an amendment to the Telecommunications Business Act, pursuant to which companies meeting certain regulatory criteria may become a network serviceprovider without a separate license requirement, went into effect in June 2019. Our licenses permit us to provide cellular services, third generationwireless telecommunications services using WCDMA and WiBro technologies, fourth generation wireless telecommunications services using LTEtechnology and fifth generation wireless telecommunication services using 5G technology.
The MSIT may revoke our licenses or suspend any of our businesses if we fail to comply with its rules, regulations and corrective orders,including the rules restricting beneficial ownership and control and corrective orders issued in connection with any violation of rules restrictingbeneficial ownership and control or any violation of the conditions of our licenses. Alternatively, in lieu of suspension of our business, the KCC maylevy a monetary penalty of up to 3.0% of the average of our annual revenue for the preceding three fiscal years. A network service provider that wants tocease its business or dissolve must notify its users 60 days prior to the scheduled date of cessation or dissolution and obtain MSIT approval.
In the past, the Government has stated that its policy was to promote competition in the Korean telecommunications market through measuresdesigned to prevent the dominant service provider in any such market from exercising its market power in such a way as to prevent the emergence anddevelopment of viable competitors. While all network service providers are subject to MSIT regulation, we are subject to increased regulation becauseof our position as the dominant wireless telecommunications services provider in Korea.
Competition Regulation
The KCC is charged with ensuring that network service providers engage in fair competition and has broad powers to carry out this goal. If anetwork service provider is found to be in violation of the fair competition requirement, the KCC may take corrective measures it deems necessary,including, but not limited to, prohibiting further violations, requiring amendments to the articles of incorporation or to service contracts with customers,requiring the execution or performance of, or amendments to, interconnection agreements with other network service providers and prohibitingadvertisements to solicit new subscribers. The KCC is required to notify the Minister of the MSIT before it takes certain corrective measures.
In addition, we qualify as a �market-dominating business entity� under the Fair Trade Act. Accordingly, we are prohibited from engaging in anyact of abusing our position as a market-dominating entity, such as unreasonably determining, maintaining or altering service rates, unreasonablycontrolling the rendering of services, unreasonably interfering with business activities of other business entities, hindering unfairly the entry ofnewcomers or substantially restricting competition to the detriment of the interests of consumers.
Because we are a member company of the SK Group, which is a large business group as designated by the FTC, we are subject to the followingrestrictions under the Fair Trade Act:
� Restriction on debt guarantee among affiliates. Any affiliate within the SK Group may not guarantee the debts of another domestic affiliate,except for certain guarantees prescribed in the Fair Trade Act, such as those relating to the debts of a company acquired for purposes ofindustrial rationalization, bid deposits for overseas construction work or technology development funds.
� Restriction on cross-investment. A member company of the SK Group may not acquire or hold shares in an affiliate belonging to the SKGroup that owns shares in the member company.
43
Copyright © 2020 www.secdatabase.com. All Rights Reserved.Please Consider the Environment Before Printing This Document
Table of Contents� Restrictions on circular investments. A member company of the SK Group may not acquire or hold shares which would constitute �circular
investments� in an affiliate company which also forms part of the SK Group where �circular investments� refer to a cross-affiliateshareholding relationship under which three or more affiliate companies become connected through cross affiliate shareholdings by owningshares in other affiliates or by becoming an entity whose shares are owned by other affiliates.
� Public notice of board resolution on large-scale transactions with specially related persons. If a member company of the SK Groupengages in a transaction with a specially related person in the amount of 5.0% or more of the member company�s capital or paid-in capital orfor Won 5.0 billion or more, the transaction must be approved by a resolution of the member company�s board of directors and the membercompany must publicly disclose the transaction.
� Restrictions on investments by subsidiaries and sub-subsidiaries of holding companies. The Fair Trade Act prohibits subsidiaries ofholding companies from investing in, or holding shares of common stock of, domestic affiliates that belong to the same large business group,unless such domestic affiliates are their own subsidiaries. Furthermore, any subsidiaries of a holding company�s subsidiaries(�sub-subsidiaries�) are prohibited from investing in, or holding shares of common stock of, domestic affiliates that belong to the same largebusiness group, unless all shares issued by the affiliates are held by the sub-subsidiary. Therefore, we and other subsidiaries of SK Holdingsmay not invest in any domestic affiliate that is also a member company of the SK Group, except in the case where we invest in our ownsubsidiary or where another subsidiary of SK Holdings invests in its own subsidiary.
� Public notice of the current status of a business group. Under the Fair Trade Act and the Enforcement Decree thereof, a member companyof the SK Group must publicly disclose the general status of the SK Group, including the name, business scope and financial status ofaffiliates, information on the officers of affiliates, information on shareholding and cross-investments between member companies of the SKGroup, information on transactions with certain related persons and, if a member company engages in a transaction with an affiliatedcompany in the amount of 5.0% or more of the member company�s quarterly sales or Won 5.0 billion or more, information on transactionswith such affiliated company on a quarterly basis.
Rate Regulation
Network service providers whose sales proceeds exceed the amount prescribed by law must report to the MSIT the rates and contractual terms foreach type of service they provide. However, as the dominant network service provider for specific services (based on having the largest market share interms of number of subscribers and meeting certain revenue thresholds), we must obtain prior approval of the MSIT on our rates and terms of service;provided, however, that such pre-approval of the MSIT is not required, if we are planning to reduce the rates for any type of services that we provideunder the MSIT-approved contractual terms. The MSIT�s policy is to approve rates if they are appropriate, fair and reasonable (that is, if the rates havebeen reasonably calculated, considering supply costs, profits, classification of costs and profits for each service, cost savings through changes in the wayservices are provided and the influence on fair competition, among others). The MSIT may order changes in the submitted rates if it deems the rates tobe significantly unreasonable or against public policy. Multiple bills have been proposed to the National Assembly to change the approval requirementto a simple reporting requirement, which is the requirement for our competitors. However, there is no assurance as to which of these bills, if any, will bepassed.
Furthermore, in 2007, the Government announced a �road map� highlighting revisions in regulations to promote deregulation of thetelecommunications industry. In accordance with the road map and pursuant to the Combined Sales Regulation, promulgated in May 2007,telecommunications service providers are now permitted to bundle their services, such as wireless data transmission service, wireless voice transmissionservice, broadband Internet access service, fixed-line telephone service and IPTV service, at a discounted rate; provided, however, that we and KT, asmarket-dominating business entities under the Telecommunications Business Act, allow other competitors to employ the services provided by us andKT, respectively, so that such competitors can provide similar discounted package services. In September 2007, the regulations and provisions under theTelecommunications Business Act were amended to permit licensed transmission service providers to offer local, domestic long-distance andinternational telephone services, as well as broadband Internet access and Internet phone services, without additional business licenses.
44
Copyright © 2020 www.secdatabase.com. All Rights Reserved.Please Consider the Environment Before Printing This Document
Table of ContentsMoreover, an MVNO system under which the MSIT may designate and obligate certain wireless telecommunications services providers to allow
an MVNO, at such MVNO�s request, to use their telecommunication network facilities at a rate mutually agreed upon that complies with the standardsset by the MSIT became effective on March 14, 2017 under the amended Telecommunications Business Act. We were designated as the only wirelesstelecommunications services provider obligated to allow the other wireless telecommunications services provider to use our telecommunicationsnetwork facilities. Such system, however, expired on September 22, 2019, which has prompted the submission of a bill in the National Assembly toextend its application. While it is uncertain whether such bill will be passed, we plan to continue allowing MVNOs to use our networks. Currently,thirteen MVNOs provide wireless telecommunications services using the networks leased from us.
On October 1, 2014, the MDDIA, enacted for the purpose of establishing a transparent and fair mobile distribution practice, became effective. TheMDDIA limits the amount of subsidies a wireless telecommunications service provider can provide to subscribers in order to prevent excessivecompetition among wireless telecommunications service providers. Pursuant to the MDDIA, wireless telecommunications service providers areprohibited from (i) unfairly providing discriminatory subsidies based on criteria such as type of subscription, subscription plan and characteristics of thesubscriber and (ii) entering into a separate agreement with subscribers imposing obligations to use a specific subscription plan as a condition forproviding subsidies. The MDDIA also prohibited providing subsidies exceeding a maximum limit established by the KCC for the purchase of mobilephone models that were launched within the last 15 months, which prohibition expired in September 2017. See �Item 5.A. Operating Results �Overview � New Rate Regulations.�
In addition, under the MDDIA, wireless telecommunications service providers are obliged to provide certain benefits, such as discounted rates, tosubscribers who subscribe to their service without receiving subsidies. In June 2017, the State Affairs Planning Advisory Committee of Koreaannounced that it would encourage wireless telecommunications service providers, including us, to increase the applicable discount rate offered tosubscribers from 20% to 25%, which we adopted in September 2017, and to offer additional discounts to low income customers, including those ongovernment welfare programs and senior citizen recipients of the basic pension, which we implemented in December 2017 and July 2018, respectively.We cannot provide assurance that we will not provide other rate discounts in the future to comply with the Government�s public policy guidelines orsuggestions.
Interconnection
Dominant network service providers such as ourselves that own essential infrastructure facilities or possess a certain market share are required toprovide interconnection of their telecommunications network facilities to other service providers upon request. The MSIT sets and announces thestandards for determining the scope, procedures, compensation and other terms and conditions of such provision, interconnection or co-use. We haveentered into interconnection agreements with KT, LG U+ and other network service providers permitting these entities to interconnect with our network.We expect that we will be required to enter into additional agreements with new operators as the MSIT grants permits to additional telecommunicationsservice providers.
Frequency Allocation
The MSIT has the discretion to allocate and adjust the frequency bandwidths for each type of service and may auction off the rights to certainfrequency bandwidths. Upon allocation of new frequency bandwidths or adjustment of frequency bandwidths, the MSIT is required to give a publicnotice. The MSIT also regulates the frequency to be used by each radio station, including the transmission frequency used by equipment in our cell sites.All of our frequency allocations are for a definite term. We pay fees to the MSIT for our frequency usage that are determined based upon our number ofsubscribers, frequency usage by our networks and other factors. For 2019, 2018 and 2017, the fee amounted to Won 133.1 billion, Won 151.7 billion andWon 150.3 billion, respectively.
We currently use 10 MHz of bandwidth in the 800 MHz spectrum for our CDMA services, 10 MHz of bandwidth in the 2.1 GHz spectrum for ourWCDMA services, 30 MHz of bandwidth in the 2.1 GHz spectrum, 20 MHz of bandwidth in the 800 MHz spectrum, 35 MHz of bandwidth in the 1.8GHz spectrum and 60 MHz of
45
Copyright © 2020 www.secdatabase.com. All Rights Reserved.Please Consider the Environment Before Printing This Document
Table of Contentsbandwidth in the 2.6 GHz spectrum for our LTE services, as well as 100 MHz of bandwidth in the 3.5 GHz spectrum for our 5G services. We also planto use 800 MHz of bandwidth in the 28 GHz spectrum for our 5G services in the future. For more information regarding the license fees for the variousbandwidths that we use, see �Item 5.B. Liquidity and Capital Resources � Capital Requirements � Capital Expenditures� and note 16 of the notes to ourconsolidated financial statements.
For risks relating to the maintenance of adequate bandwidth capacity, see �Item 3.D. Risk Factors � Risks Relating to Our Business � Ourbusiness and results of operations may be adversely affected if we fail to acquire adequate additional frequency usage rights or use our bandwidthefficiently to accommodate subscriber growth and subscriber usage.�
Mandatory Contributions and Obligations
All telecommunications service providers other than value-added service providers and regional paging service providers or anytelecommunications service providers whose net annual revenue is less than an amount determined by the MSIT (currently set at Won 30.0 billion) arerequired to provide �universal� telecommunications services including local telephone services, local public telephone services, telecommunicationsservices for remote islands and wireless communication services for ships and telephone services for handicapped and low-income citizens, orcontribute toward the supply of such universal services. The MSIT designates universal services and the service provider who is required to provideeach service. Currently, under the MSIT guidelines, we are required to offer free subscription and a discount of between 30.0% to 50.0% of our monthlyfee for wireless telecommunications services to handicapped and low-income citizens.
In addition to such universal services for handicapped and low-income citizens, we are also required to make certain annual monetarycontributions to compensate for other service providers� costs for the universal services. The size of a service provider�s contribution is based on its netannual revenue for the previous year (calculated pursuant to the MSIT guidelines, which differ from our accounting practices). We paid suchcontributions amounting to Won 16.1 billion, Won 16.7 billion and Won 13.6 billion in 2019, 2018 and 2017, respectively. As a wirelesstelecommunications services provider, we are not considered a provider of universal telecommunications services and do not receive funds for providinguniversal service. Other network service providers that do provide universal services make all or a portion of their �contribution� in the form ofexpenses related to the universal services they provide.
Foreign Ownership and Investment Restrictions and Requirements
Because we are a network service provider, and the exception for the foreign shareholding limit under the amended Telecommunications BusinessAct, which became effective on August 13, 2013, does not apply to us, foreign governments, individuals, and entities (including Korean entities that aredeemed foreigners, as discussed below) are prohibited from owning more than 49.0% of our voting stock. Korean entities whose largest shareholder is aforeign government or a foreigner (together with any of its related parties) that owns 15.0% or more of the outstanding voting stock of such Koreanentities are also deemed foreigners. If this 49.0% ownership limitation is violated, certain of our foreign shareholders will not be permitted to exercisevoting rights in excess of the limitation, and the MSIT may require other corrective action.
As of December 31, 2019, SK Holdings owned 21,624,120 shares of our common stock, or 26.8% of our issued shares. As of December 31, 2019,the two largest foreign shareholders of SK Holdings each held a 3.5% stake therein. If such foreign shareholders increase their shareholdings in SKHoldings to 15% or more and any such foreign shareholder constitutes the largest shareholder of SK Holdings, SK Holdings will be considered a foreignshareholder, and its shareholding in us would be included in the calculation of our aggregate foreign shareholding. If SK Holdings� shareholding in us isincluded in the calculation of our aggregate foreign shareholding, then our aggregate foreign shareholding, assuming the foreign ownership level as ofDecember 31, 2019 (which we believe was 37.2%), would reach 63.4%, exceeding the 49.0% ceiling on foreign shareholding.
If our aggregate foreign shareholding limit is exceeded, the MSIT may issue a corrective order to us, the breaching shareholder (including SKHoldings if the breach is caused by an increase in foreign ownership of SK Holdings) and the foreign shareholder which owns in the aggregate 15.0% ormore of SK Holdings.
46
Copyright © 2020 www.secdatabase.com. All Rights Reserved.Please Consider the Environment Before Printing This Document
Table of ContentsFurthermore, SK Holdings will be prohibited from exercising its voting rights with respect to the shares held in excess of the 49.0% ceiling, which mayresult in a change in control of us. In addition, the MSIT will be prohibited from granting us licenses or permits necessary for entering into newtelecommunications businesses until our aggregate foreign shareholding is reduced to below 49.0%. If a corrective order is issued to us by the MSITarising from the violation of the foregoing foreign ownership limit, and we do not comply within the prescribed period under such corrective order, theMSIT may:
� revoke our business license;
� suspend all or part of our business; or
� if the suspension of business is deemed to result in significant inconvenience to our customers or to be detrimental to the public interest,impose a one-time administrative penalty of up to 3.0% of the average of our annual revenue for the preceding three fiscal years.
Additionally, the Telecommunications Business Act also authorizes the MSIT to assess monetary penalties of up to 0.3% of the purchase price ofthe shares for each day the corrective order is not complied with, as well as a prison term of up to three years or a penalty of Won 150 million. See�Item 3.D. Risk Factors � Risks Relating to Our Business � If SK Holdings causes us to breach the foreign ownership limitations on our commonshares, we may experience a change of control.�
We are required under the Foreign Exchange Transaction Act to file a report with a designated foreign exchange bank or with the MOEF, inconnection with any issue of foreign currency denominated securities by us in foreign countries. Issuances of US$30 million or less require the filing ofa report with a designated foreign exchange bank, and issuances that are over US$30 million in the aggregate within one year from the filing of a reportwith a designated foreign exchange bank require the filing of a report with the MOEF.
The Telecommunications Business Act provides for the creation of a Public Interest Review Committee under the MSIT to review investments inor changes in the control of network service providers. The following events would be subject to review by the Public Interest Review Committee:
� the acquisition by an entity (and its related parties) of 15.0% or more of the equity of a network service provider;
� a change in the largest shareholder of a network service provider;
� agreements by a network service provider or its shareholders with foreign governments or parties regarding important business matters ofsuch network service provider, such as the appointment of officers and directors and transfer of businesses; and
� a change in the shareholder that actually controls a network service provider.
If the Public Interest Review Committee determines that any of the foregoing transactions or events would be detrimental to the public interest,then the MSIT may issue orders to stop the transaction, amend any agreements, suspend voting rights, or divest the shares of the relevant networkservice provider. Additionally, if a dominant network service provider (which would currently include us and KT), together with its specially relatedpersons (as defined under the FSCMA), holds more than 5.0% of the equity of another dominant network service provider, the voting rights on theshares held in excess of the 5.0% limit may not be exercised.
Patents and Licensed Technology
Access to the latest relevant technology is critical to our ability to offer the most advanced wireless telecommunications services and to design andmanufacture competitive products. In addition to active internal and external research and development efforts as described in �Item 5.C. Research andDevelopment, Patents and Licenses, etc.,� our success depends in part on our ability to obtain patents, licenses and other intellectual property rightscovering our products. We own numerous patents and trademarks worldwide, and have applications for patents pending in many countries. Our patentsare mainly related to LTE and 5G technology and wireless Internet applications. We have also acquired a number of patents related to WCDMA andCDMA technologies. There are no licensed patents that are material to our business.
47
Copyright © 2020 www.secdatabase.com. All Rights Reserved.Please Consider the Environment Before Printing This Document

Table of ContentsWe are not currently involved in any material litigation regarding patent infringement. For a description of the risks associated with our reliance
on intellectual property, see �Item 3.D. Risk Factors � Risks Relating to Our Business � Our business relies on technology developed by us, and ourbusiness will suffer if we are unable to protect our proprietary rights.�
Seasonality of the Business
Our business is not affected by seasonality.
Item 4.C. Organizational Structure
Organizational Structure
We are a member of the SK Group, based on the definition of �group� under the Fair Trade Act. As of December 31, 2019, SK Group membersowned in aggregate 26.8% of the shares of our issued common stock. The SK Group is a diversified group of companies incorporated in Korea withinterests in, among other things, telecommunications, trading, energy, chemicals, engineering and leisure industries.
Significant Subsidiaries
For information regarding our subsidiaries, see note 1(2) of the notes to our consolidated financial statements.
Item 4.D. Property, Plants and Equipment
The following table sets forth certain information concerning our principal properties as of December 31, 2019:
Location Primary UseApproximate Area
in Square FeetSeoul Metropolitan Area Corporate Headquarters 988,447
Regional Headquarters 608,670Customer Service Centers 107,277Training Centers 443,648Central Research and Development Center 482,719Others(1) 1,777,105
Busan Regional Headquarters 363,422Others(1) 509,510
Daegu Regional Headquarters 20,978Others(1) 458,833
Jeolla and Jeju Provinces Regional Headquarters 265,614Others(1) 739,459
Chungcheong Province Regional Headquarters 565,643Others(1) 774,905
(1) Includes cell sites.
Our registered office and corporate headquarters, of which we have full ownership, are located at SK T-Tower, 65, Eulji-ro, Jung-gu, Seoul 04539,Korea, which occupy a total land area of approximately 64,515 square feet. In addition, we own or lease various locations for cell sites and switchingequipment. We do not anticipate that we will encounter material difficulties in meeting our future needs for any existing or prospective leased space forour cell sites. See �Item 4.B. Business Overview � Cellular Services � Network Infrastructure.�
We maintain a range of insurance policies to cover our assets and employees, including our directors and officers. We are insured against businessinterruption, fire, lightning, flooding, theft, vandalism, public liability and certain other risks that may affect our assets and employees. We believe thatthe types and amounts of our insurance coverage are in accordance with general business practices in Korea.
48
Copyright © 2020 www.secdatabase.com. All Rights Reserved.Please Consider the Environment Before Printing This Document
Table of ContentsItem 4A. UNRESOLVED STAFF COMMENTS
We do not have any unresolved comments from the SEC staff regarding our periodic reports under the Exchange Act.
Item 5. OPERATING AND FINANCIAL REVIEW AND PROSPECTS
You should read the following discussion together with our consolidated financial statements and the related notes thereto which appear elsewherein this annual report. We prepare our consolidated financial statements in accordance with IFRS as issued by the IASB. In addition, you should readcarefully the section titled �� Critical Accounting Policies, Estimates and Judgments� as well as notes 2(4) and 4 of the notes to our consolidatedfinancial statements which provide summaries of certain critical accounting policies that require our management to make difficult, complex orsubjective judgments relating to matters which are highly uncertain and that may have a material impact on our financial conditions and results ofoperations.
Item 5.A. Operating Results
Overview
Our operations are reported in five segments: (1) cellular services, which include wireless voice and data transmission services, sales of wirelessdevices, IoT solutions and platform services, (2) fixed-line telecommunication services, which include fixed-line telephone services, broadband Internetservices, advanced media platform services (including IPTV) and business communications services, (3) security services, which include physical andinformation security services, (4) commerce services, which include our open marketplace platform, 11st, our T-commerce business, SK stoa, andrelated ancillary services, and (5) other businesses, which include our portal service, marketing platform business and certain other miscellaneousbusinesses that do not meet the quantitative thresholds to be separately considered reportable segments.
In our cellular services segment, we earn revenue principally from our wireless voice and data transmission services through monthly plan-basedfees, usage charges for outgoing voice calls, usage charges for wireless data services and value-added service fees paid by our wireless subscribers aswell as interconnection fees paid to us by other telecommunications operators for use of our wireless network by their customers and subscribers. Wealso derive revenue from sales of wireless devices by PS&Marketing. Other sources of revenue include revenue from our IoT solutions and platformservices, including AI solutions, as well as other miscellaneous cellular services.
In our fixed-line telecommunication services segment, we earn revenue principally from our fixed-line telephone services and broadband Internetservices and advanced media platform services (including IPTV) through monthly plan-based fees and usage charges as well as interconnection feespaid to us by other telecommunications operators for use of our fixed-line network by their customers and subscribers. In addition, we derive revenuefrom international calling services and our business communications services through customized fee arrangements with our business customers.
In our security services segment, we generate revenue from our physical and information security services businesses through our subsidiariesADT Caps (which we acquired in October 2018 and subsequently merged with our former subsidiary NSOK) and SK Infosec (which we acquired inDecember 2018), respectively. ADT Caps earns revenue principally from physical security services through monthly plan-based fees and usage chargesfor value-added services paid by its subscribers. SK Infosec generates revenue primarily through consideration paid by customers under contracts for itsinformation security platform and consulting services and solutions.
In our commerce services segment, we derive revenue from our subsidiaries Eleven Street, which was spun-off as our new consolidated subsidiaryfrom SK Planet in September 2018, and SK Stoa. Eleven Street generates revenue principally through third-party seller fees earned (includingcommissions) for transactions in which it acts as a selling agent to the �mini malls� on 11st, its online open marketplace platform, as well as advertisingrevenue and other commerce solutions from 11st. SK Stoa derives revenues through third-party seller fees earned (including commissions) fortransactions in which it acts as a selling agent on SK stoa, its T-commerce network.
In our others segment, we earn revenue from the marketing platform business of SK Planet, the music streaming service and audio devicemanufacturing businesses of Dreamus and our �Nate� portal service operated by our subsidiary, SK Communications.
49
Copyright © 2020 www.secdatabase.com. All Rights Reserved.Please Consider the Environment Before Printing This Document
Table of ContentsFollowing the entry into an agreement to transfer SK Broadband�s 100% equity interest in SK Stoa to SK Telecom in April 2019 (which
transaction was completed in January 2020), the T-commerce business operations of SK Stoa, which were previously part of our fixed-linetelecommunication services segment in the years ended December 31, 2018 and 2017, were reclassified as part of our commerce services segment forthe year ended December 31, 2019. In addition, our security services businesses, which were previously part of our others segment in the years endedDecember 31, 2018 and 2017, were reclassified as a new security services segment for the year ended December 31, 2019. The breakdown of our resultsof operations by operating segment for the years ended December 31, 2018 and 2017 in our consolidated audited financial statements have been recastto retroactively apply such changes in segmentation.
Furthermore, following the spin-off of Eleven Street from SK Planet, the remaining marketing platform business operations of SK Planet, whichwere previously part of our commerce services segment in the year ended December 31, 2017, were reclassified as part of our others segment for theyear ended December 31, 2018. As a result, the breakdown of our results of operations by operating segment for the year ended December 31, 2017 inour consolidated audited financial statements have been recast to retroactively apply such change in segmentation.
Our cellular service revenue and fixed-line telecommunications service revenue depend principally upon the number of our subscribers, the rateswe charge for our services, the frequency and volume of subscriber usage of our services and the terms of our interconnection with othertelecommunications operators. Our security service revenue depends principally upon the number of our subscribers and customers and the rates wecharge for our physical security services as well as the number and terms of the contracts pursuant to which our information security services areprovided. Our commerce service revenue depends principally upon the gross merchandise volume, which is the total monetary value of customerpurchases of goods and services, net of estimated refunds, of 11st and SK stoa and the number of merchants that utilize 11st and SK stoa to advertiseand promote their products and services and the extent of such advertisement and promotion.
Among other factors, management uses operating profit of each reportable segment presented in accordance with K-IFRS (�segment operatingprofit�) in its assessment of the profitability of each reportable segment. The sum of segment operating profit for all four reportable segments differsfrom our operating profit presented in accordance with IFRS as issued by the IASB as segment operating profit does not include certain items such asdonations, gain and loss from disposal of property and equipment and intangible assets and impairment loss on property and equipment and intangibleassets. For a reconciliation of operating profit presented in accordance with IFRS as issued by the IASB and operating profit presented in accordancewith K-IFRS, see �� Explanatory Note Regarding Presentation of Certain Financial Information under K-IFRS.� In addition to the information set forthbelow, see note 5 of the notes to our consolidated financial statements for more detailed information regarding each of our reportable segments.
A number of recent developments have had or are expected to have a material impact on our results of operations, financial condition and capitalexpenditures. These developments include:
New Rate Regulations. Under the MDDIA, wireless telecommunications service providers are obliged to provide certain benefits, such asdiscounted rates, to subscribers who subscribe to their service without receiving handset subsidies. Handset subsidies are provided to subscribers whoagree to use our service for a predetermined service period and purchase handsets on an installment basis. In June 2017, the State Affairs PlanningAdvisory Committee of Korea announced that it would encourage wireless telecommunications service providers, including us, to increase theapplicable discount rate offered to subscribers from 20% to 25%, which we adopted in September 2017, and to offer additional discounts to low incomecustomers, including those on government welfare programs and senior citizen recipients of the basic pension, which we implemented in December2017 and July 2018, respectively.
In 2019, the total number of subscribers who had elected to receive discounted rates in lieu of receiving handset subsidies pursuant to the MDDIAincreased due to greater public awareness of the availability of such discounted rates as well as the increase in the applicable discount rate to 25%. In2019, approximately 55% of our new subscribers elected to receive discounted rates in lieu of handset subsidies compared to 60% in 2018. As ofDecember 31, 2019, a substantial majority of our subscribers who elected to receive these discounted rates are receiving the increased 25% ratediscount. These Government measures have adversely affected our revenues and
50
Copyright © 2020 www.secdatabase.com. All Rights Reserved.Please Consider the Environment Before Printing This Document
Table of Contentsresults of operations as more subscribers elected to receive the 25% rate discount. On the other hand, this has also led to a reduction of, or partiallyoffset increases in, our marketing expenses as the number of subscribers who have elected to receive handset subsidies has declined, and has contributedto maintaining a stable churn rate.
Failure to comply with the MDDIA may lead to suspension of our business or imposition of monetary penalties. For more information about theMDDIA and the penalties imposed for violating Government regulations, see �Item 4.B. Business Overview � Law and Regulation � Rate Regulation�and �Item 8.A. Consolidated Statements and Other Financial Information � Legal Proceedings � KCC Proceedings.�
Decrease in Interconnection Fees. Our wireless telecommunications services depend, in part, on our interconnection arrangements withdomestic and international fixed-line and other wireless networks. Charges for interconnection affect our revenues and operating results. The MSITdetermines the basic framework for interconnection arrangements, including policies relating to interconnection rates in Korea. Under ourinterconnection agreements, we are required to make payments in respect of calls which originate from our networks and terminate in the networks ofother Korean telecommunications operators, and the other operators are required to make payments to us in respect of calls which originate in theirnetworks and terminate in our network. The MSIT has continued to gradually decrease the interconnection rates in Korea, which has led to a continueddecrease in our interconnection revenue as well as interconnection expenses from 2012 to 2019 and any further reduction in interconnection rates by theMSIT may continue to impact our results of operations. Beginning in 2017, a single interconnection rate paid by fixed-line network service providers forfixed-line to wireless calls applies to all wireless telecommunications service providers. For more information about our interconnection revenue andexpenses, see �Item 4.B. Business Overview � Interconnection.�
Decrease in Monthly Revenue per Subscriber. We measure monthly average revenue per subscriber using two metrics: average monthly revenueper subscriber excluding MVNO subscribers leasing our networks (�ARPU�) and average monthly revenue per subscriber including such MVNOsubscribers (�ARPU including MVNO�). ARPU is derived by dividing the sum of total SK Telecom revenues on a separate basis from voice service anddata service for the period (excluding revenue derived from MVNO subscribers leasing our networks) by the monthly average number of subscribers(excluding the number of MVNO subscribers) for the period, then dividing that number by the number of months in the period. ARPU including MVNOis derived by dividing the sum of total SK Telecom revenues on a separate basis from voice service and data service for the period (including revenuederived from MVNO subscribers) by the monthly average number of subscribers (including the number of MVNO subscribers) for the period, thendividing that number by the number of months in the period.
Our ARPU decreased by 3.6% to Won 31,076 in 2019 from Won 32,247 in 2018, which represented a decrease of 7.6% from Won 34,901 in 2017.Our ARPU including MVNO decreased by 4.2% to Won 27,414 in 2019 from Won 28,615 in 2018, which represented a decrease of 8.2% from Won31,171 in 2017. The decreases in ARPU and ARPU including MVNO in 2019 and 2018 were primarily due to a decrease in revenue attributable to anincrease in the number of subscribers who elected to receive discounted rates in lieu of receiving handset subsidies and the increase in such discount ratefrom 20% to 25% starting in September 2017, as well as the additional rate discounts offered to low income customers, including those on governmentwelfare programs and senior citizen recipients of the basic pension, starting in December 2017 and July 2018, respectively. Such decreases were offsetin part by an increase in subscribers that subscribe to our higher-priced unlimited data usage plans and 5G plans.
Potential Effects of COVID-19. Demand for our products and services may fluctuate in light of the overall economic conditions in Korea. Theoverall prospects for the Korean economy and, in turn, the market conditions for the industries in which we operate, remain uncertain, especially in lightof the ongoing global COVID-19 pandemic, which is likely to have a significant negative effect on the Korean economy. For example, an increase inunemployment among, and/or a decrease in disposable income of, our customers resulting from a deterioration of the Korean economy due toCOVID-19 may decrease demand for some of our products and services or cause an increase in delinquent subscriber accounts. While it is not possibleto predict the duration or full magnitude of harm from COVID-19, a continued and prolonged outbreak of COVID-19 may have a material adverseeffect on our business, financial condition and results of operations. See �Item 3.D. Risk Factors�Risks Relating to Our Business � The ongoing globalpandemic of COVID-19 and any possible recurrence of other types of widespread infectious diseases may adversely affect our business, financialcondition or results of operations.�
51
Copyright © 2020 www.secdatabase.com. All Rights Reserved.Please Consider the Environment Before Printing This Document
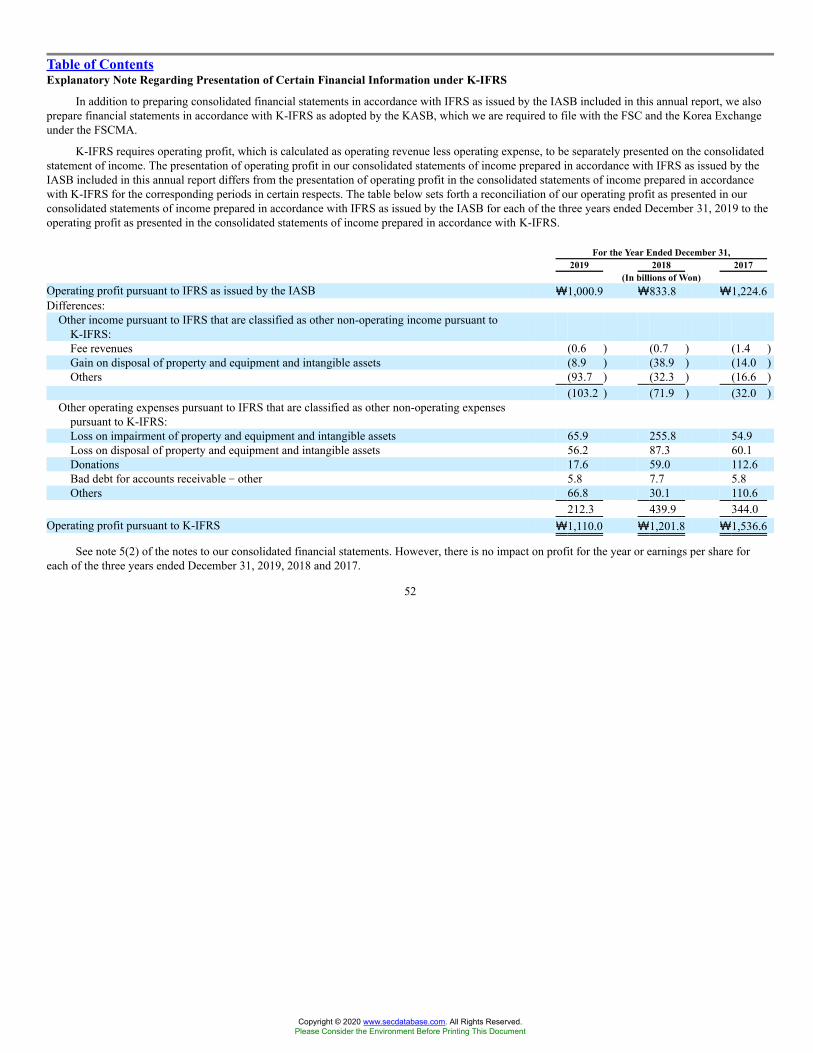
Table of ContentsExplanatory Note Regarding Presentation of Certain Financial Information under K-IFRS
In addition to preparing consolidated financial statements in accordance with IFRS as issued by the IASB included in this annual report, we alsoprepare financial statements in accordance with K-IFRS as adopted by the KASB, which we are required to file with the FSC and the Korea Exchangeunder the FSCMA.
K-IFRS requires operating profit, which is calculated as operating revenue less operating expense, to be separately presented on the consolidatedstatement of income. The presentation of operating profit in our consolidated statements of income prepared in accordance with IFRS as issued by theIASB included in this annual report differs from the presentation of operating profit in the consolidated statements of income prepared in accordancewith K-IFRS for the corresponding periods in certain respects. The table below sets forth a reconciliation of our operating profit as presented in ourconsolidated statements of income prepared in accordance with IFRS as issued by the IASB for each of the three years ended December 31, 2019 to theoperating profit as presented in the consolidated statements of income prepared in accordance with K-IFRS.
For the Year Ended December 31,2019 2018 2017
(In billions of Won)Operating profit pursuant to IFRS as issued by the IASB ₩1,000.9 ₩833.8 ₩1,224.6Differences:
Other income pursuant to IFRS that are classified as other non-operating income pursuant toK-IFRS:Fee revenues (0.6 ) (0.7 ) (1.4 )Gain on disposal of property and equipment and intangible assets (8.9 ) (38.9 ) (14.0 )Others (93.7 ) (32.3 ) (16.6 )
(103.2 ) (71.9 ) (32.0 )Other operating expenses pursuant to IFRS that are classified as other non-operating expenses
pursuant to K-IFRS:Loss on impairment of property and equipment and intangible assets 65.9 255.8 54.9Loss on disposal of property and equipment and intangible assets 56.2 87.3 60.1Donations 17.6 59.0 112.6Bad debt for accounts receivable � other 5.8 7.7 5.8Others 66.8 30.1 110.6
212.3 439.9 344.0Operating profit pursuant to K-IFRS ₩1,110.0 ₩1,201.8 ₩1,536.6
See note 5(2) of the notes to our consolidated financial statements. However, there is no impact on profit for the year or earnings per share foreach of the three years ended December 31, 2019, 2018 and 2017.
52
Copyright © 2020 www.secdatabase.com. All Rights Reserved.Please Consider the Environment Before Printing This Document

Table of ContentsCritical Accounting Policies, Estimates And Judgments
Our consolidated financial statements are prepared in accordance with IFRS as issued by the IASB. The preparation of the consolidated financialstatements requires us to make estimates and judgments that affect the reported amounts of assets, liabilities, revenue and expenses as well as thedisclosure of contingent assets and liabilities. We continually evaluate our estimates and judgments including those related to loss allowances, fair valuemeasurements of financial instruments, estimated useful lives and impairment of long-lived assets, impairment of goodwill, provisions, retirementbenefit plans and income taxes. We base our estimates and judgments on historical experience and other factors that are believed to be reasonable underthe circumstances. Actual results may differ from these estimates under different assumptions or conditions. We believe that of our significantaccounting policies, the following may involve a higher degree of judgment or complexity:
Loss Allowances
A loss allowance is provided based on a review of the status of individual receivable accounts at the end of the year. We maintain loss allowancesfor estimated losses that result from the inability of our customers to make required payments. We base our allowances on the likelihood ofrecoverability of accounts receivable based on the aging of accounts receivable at the end of the period, past customer default experience and their creditstatus, and economic and industrial factors. In addition, following our adoption of IFRS 9, Financial Instruments, in the fiscal year beginningJanuary 1, 2018, we use an �expected credit loss� impairment model to estimate our loss allowances based on the above-described criteria. Under suchmodel, loss allowances are recorded prior to experiencing delinquency on our receivable accounts rather than upon actual delinquency, which was thecase under the previously applicable accounting standards. See �� Recently Adopted International Financial Reporting Standards � IFRS 9.� Lossallowance amounted to Won 346.4 billion as of December 31, 2019 and Won 376.0 billion as of December 31, 2018. If economic or specific industrytrends worsen beyond our estimates, the loss allowances we have recorded may be materially adjusted in the future.
Fair Value Measurement of Financial Instruments
Subsequent to initial recognition, financial assets at fair value through profit or loss, financial assets at fair value through other comprehensiveincome and derivative financial assets are stated at fair value with any gains or losses arising on remeasurement recognized in profit for the period orother comprehensive income. When measuring fair value, we use quoted prices in active markets to the extent such prices exist. The fair values offinancial instruments, including derivative instruments, that are not traded in an active market are determined using valuation techniques that requiremanagement�s estimates of future cash flows and discount rates. Our management uses its judgment to select a variety of methods and makesassumptions that are mainly based on market conditions existing at the end of each reporting period. See notes 2(4) and 35(3) of the notes to ourconsolidated financial statements.
Impairment of Long-lived Assets Including Frequency Usage Rights
Long-lived assets generally consist of property and equipment and definite-lived intangible assets. We review our depreciation and amortizationmethods, estimated useful lives and residual values of long-lived assets at the end of each annual reporting period. If any such asset or cash-generatingunit is considered to be impaired, the impairment to be recognized is measured as the amount by which the carrying amount of the asset or cash-generating unit exceeds the estimated recoverable amount. The recoverable amount of a long-lived asset is the greater of an asset�s fair value less coststo sell and its value in use. For the purpose of assessing impairment, we review the recoverable amount of an individual asset or, if it is not possible tomeasure the individual recoverable amount of an asset, at the level of a cash-generating unit. The recoverable amounts of assets or cash-generating unitsmay be determined based on value-in-use calculations, which require the use of estimates.
Our definite-lived intangible assets include our frequency usage rights, which have contractual lives of 5 to 10.25 years and are amortized fromthe date commercial service is initiated through the end of their contractual lives. Because the use of frequency usage rights is exposed to risks andchallenges associated with our business, any or all of which, if realized or not properly addressed, may have a material adverse effect on our financialcondition,
53
Copyright © 2020 www.secdatabase.com. All Rights Reserved.Please Consider the Environment Before Printing This Document
Table of Contentsresults of operations and cash flows, we review the frequency usage rights for any indication of impairment on an annual basis. If any such indicationexists, we test for impairment utilizing the estimated long-term revenue and cash flow forecasts. The use of different assumptions within our cash flowmodel could result in different recoverable amounts for our frequency usage rights. The results of our review using the testing method described aboveresulted in no impairment of our frequency usage rights in 2019. See note 16 of the notes to our consolidated financial statements.
Impairment of Goodwill
Goodwill is measured as the excess of the sum of: (1) the consideration transferred, (2) the amount of any non-controlling interests in the acquireeand (3) the fair value of the acquirer�s previously held equity interest in the acquiree (if any), over the net fair value of the acquisition-date amounts ofthe identifiable assets acquired and the liabilities assumed. Goodwill is not amortized, but tested for impairment at the end of each annual reportingperiod or whenever there is an indication that the asset may be impaired. Goodwill is carried at cost less accumulated impairment losses and theimpairment losses are not reversed. For the purpose of impairment testing, we review the recoverable amount of an individual asset or, if it is notpossible to measure the individual recoverable amount of an asset, at the level of a cash-generating unit. The recoverable amount of an asset or cash-generating unit to which goodwill has been allocated is the greater of its value in use and its fair value less costs to sell. The value in use calculationrequires our management to estimate the future cash flows expected related to the respective cash-generating unit and the determination of anappropriate discount rate in order to calculate present value.
In 2019, we recognized Won 21.1 billion of impairment losses on goodwill compared to Won 166.8 billion of impairment losses on goodwill in2018. Impairment losses on goodwill in 2019 were mainly due to our recognition of impairment losses on goodwill relating to our consolidatedsubsidiary Life Design Company Inc. (�Life Design Company�), which operates a celebrity-related merchandise business in Japan. Impairment losseson goodwill in 2018 were mainly due to our recognition of impairment losses on goodwill relating to our former consolidated subsidiary Shopkick,which operated a mobile reward points-based in-store shopping application. We disposed of our entire equity interest in Shopkick in June 2019.
As of December 31, 2019, the amount of goodwill allocated to our security services cash-genearting unit, which is primarily derived from theacquisition of LSH, was Won 1,173.0 billion, which remained unchanged from December 31, 2018. Our management calculated the recoverable amountof such cash-generating unit based on its value in use using a discounted cash flow method. The discounted cash flow method was based on certain keyassumptions with respect to relevant revenue growth rates, labor costs, perpetual growth rate and cash flow discount rate that were primarily derivedfrom internal sources as well as historical performance, external market data and industry reports. The estimated revenue growth rates and labor costswere based on 5-year financial budgets that have been approved by management, which took into account external market data, market trends andexpectations as well as historical performance. Cash flows beyond 2024 were projected to grow at a perpetual growth rate estimated at 1.0%. Estimatinga perpetual growth rate requires significant management judgment about future business strategies as well as micro- and macro-economic environmentsthat are inherently uncertain. Our 5-year cash flow projections with a terminal value were discounted at an appropriate weighted average cost of capitalto 7.3%. Based on such calculation, the recoverable amount of the cash-generating unit exceeded its carrying amount, and no impairment loss wasrecognized on such goodwill in 2019. Future changes in one or more of such assumptions may cause the carrying amount of the cash-generating unit toexceed its recoverable amount, which would require us to recognize impairment losses on goodwill relating to such cash-generating unit as discussed innote 15(2) of the notes to our consolidated financial statements.
See notes 4(12) and 15 of the notes to our consolidated financial statements.
Income Taxes
We are required to estimate the amount of tax payable or refundable for the current year and the deferred income tax liabilities and assets for thefuture tax consequences of events that have been reflected in our financial statements or tax returns. This process requires management to makeassessments regarding the timing and probability of the tax impact. Actual income taxes could vary from these estimates due to future changes inincome
54
Copyright © 2020 www.secdatabase.com. All Rights Reserved.Please Consider the Environment Before Printing This Document
Table of Contentstax law or unpredicted results from the final determination of each year�s liability by taxing authorities. We believe that the accounting estimate relatedto assessment of deferred tax assets for recoverability is a �critical accounting estimate� because (1) it requires management to make assessments aboutthe timing of future events, including the probability of expected future taxable income and available tax planning opportunities and (2) the impact thatchanges in actual performance versus these estimates could have on the realization of tax benefits as reported in our results of operations could bematerial. Management�s assumptions require significant judgment because actual performance has fluctuated in the past and may continue to do so. Asof December 31, 2019 and 2018, unused tax loss carryforwards of Won 1,023.9 billion and Won 849.9 billion, respectively, were not recognized asdeferred tax assets because we did not believe that their realization would be probable. The increase of Won 174.0 billion in unrecognized tax losscarryforwards in 2019 compared to 2018 was primarily related to the effects of consolidation of FSK L&S as well as the net loss incurred by some ofour consolidated subsidiaries. See notes 4(26) and 31 of the notes to our consolidated financial statements.
Prepaid Expenses
We pay commissions to our retail stores and authorized dealers in connection with acquiring wireless and fixed-line telecommunicationssubscriber contracts, which would not have been paid if there were no binding contracts with subscribers. Following our adoption of IFRS 15, Revenuefrom Contracts with Customers, in the fiscal year beginning January 1, 2018, we capitalize certain costs associated with such commissions as prepaidexpenses and amortize them over the expected periods over which we expect to maintain such subscribers under contract. Our management assessessuch expected contract periods based on our historical experience on the duration of subscriber contracts. If we experience any changes in suchhistorical experience, or if our management decides to use other factors for the determination of the expected contract periods, our estimate of theexpected contract period will change, which in turn will affect the rate at which the applicable prepaid expenses are amortized and recognized as ouroperating expenses. See note 8 of the notes to our consolidated financial statements.
Determination of Stand-Alone Selling Prices in Recognition of Revenue from Cellular Services
Following our adoption of IFRS 15 in the fiscal year beginning January 1, 2018, for contracts where we sell both a wireless device andsubscription plan together to a single customer through our subsidiary PS&Marketing, we allocate revenue proportionately based on the relative stand-alone selling prices of the subscription plan and the device, and we recognize unbilled receivables from wireless device sales as contract assets. See note9 of the notes to our consolidated financial statements. In determining the stand-alone selling price for the subscription plan, we apply the publishedprice of such subscription plan net of any applicable rate discounts, based on our management�s judgment that such discounted price represents theappropriate stand-alone selling price of such plan. A significant change in the facts and circumstances upon which we made such judgment on thedetermination of stand-alone selling prices may have an impact on the allocation of revenues from our cellular services segment.
Recently Adopted International Financial Reporting Standards
IFRS 16
We adopted IFRS 16, Leases, in the fiscal year beginning on January 1, 2019 using the modified retrospective method by recognizing thecumulative effect of initially applying IFRS 16 as an adjustment to the opening balance of retained earnings as of such date.
IFRS 16 introduces a single, on-balance sheet accounting model for lessees. Pursuant to IFRS 16, we recognize right-of-use assets representingour rights to use the underlying assets and lease liabilities representing our obligation to make lease payments in relation to substantially all of our leasearrangements, except for certain short-term leases and leases of low-value assets. As a result, we recognized right-of-use assets (as part of our propertyand equipment) of Won 654.4 billion and Won 709.4 billion and lease liabilities (as part of our financial liabilities) of Won 663.8 billion and Won712.7 billion, in each case as of January 1, 2019 and December 31, 2019, respectively. For the year ended December 31, 2019, we recognized Won360.6 billion of depreciation expenses relating to our right-of-use assets and Won 15.5 billion of interest expenses relating to our lease liabilities. Lessoraccounting remains similar to previous accounting policies.
55
Copyright © 2020 www.secdatabase.com. All Rights Reserved.Please Consider the Environment Before Printing This Document

Table of ContentsAs of December 31, 2019, we assess the lease term of a lease contract based on the assumption that the right to extend or terminate the lease is not
enforceable if the lease contract requires the counterparty�s consent for its termination or extension. In December 2019, International FinancialReporting Interpretations Committee (�IFRIC�) issued its final agenda decision that the concept of penalty that should be considered in determining theenforceable period of a lease under IFRS 16 must be determined considering broader economics of the lease contract, rather than just the contractualtermination payments. Furthermore, under such agenda, a lease is no longer enforceable when each of the parties to it has the right to terminate the leasewithout permission from the other party with no more than an insignificant penalty. Considering the type and number of lease contracts entered into asof and from January 1, 2019, we believe that we did not have sufficient time to complete the analysis on our lease portfolios to reflect the impact of suchIFRIC agenda decision in our consolidated financial statements as of and for the year ended December 31, 2019. We are in the process of conductingsuch analysis, which we expect to complete during the first half of 2020, and we plan to apply such IFRIC agenda decision beginning in 2020 as achange in our accounting policies. We expect such application to have the effect of increasing the lease term for certain of our lease contracts, and toresult in an increase in our right-of-use assets and lease liabilities.
See notes 3, 4(13) and 4(14) of the notes to our consolidated financial statements for further details regarding the effects of our adoption of IFRS16 and significant accounting policies related to leases prior to and following the adoption of IFRS 16.
IFRS 15
We adopted IFRS 15, Revenue from Contracts with Customers, in the fiscal year beginning on January 1, 2018. We adopted IFRS 15 byrecognizing the cumulative effect of initially applying IFRS 15 as an adjustment to the opening balance of retained earnings as of January 1, 2018. Weelected to apply IFRS 15 retrospectively only to contracts that were not completed as of January 1, 2018.
IFRS 15 is an accounting standard issued by the IASB that provides a comprehensive framework for determining whether, how much and whenrevenue is recognized. Pursuant to IFRS 15, we allocate revenue generated from our wireless and fixed-line telecommunication services based on ouridentification and satisfaction of our stand-alone performance obligations under applicable customer contracts. For example, in the case of contractswhere we sell both a wireless device and subscription plan together to a single customer, from which a substantial portion of our overall revenue isgenerated, we allocate the portion of the overall transaction price related to the wireless device and immediately recognize such portion as revenue,whereas the portion related to the wireless subscription plan is allocated and recognized as revenue over the course of the customer contract period.Under IFRS 15, such allocation is made proportionately based on the stand-alone selling prices of the wireless device and subscription plan.
In addition to the revenue recognition model, IFRS 15 specifies how to account for the incremental costs of obtaining a contract, which in our caseincludes certain of our commissions paid to our retail stores and authorized dealers in connection with acquiring new customer contracts. IFRS 15requires certain of such costs to be capitalized as assets and subsequently amortized over the applicable expected contract periods calculated based onour historical experience on the duration of subscriber contracts.
In the case of our consolidated statement of income for the year ended December 31, 2018, the adoption of IFRS 15 had the effect of decreasingour operating revenue by Won 85.8 billion, and decreasing advertising expenses and commission expenses by Won 51.2 billion and Won 12.7 billion,respectively, for a total decrease in our operating expense by Won 66.1 billion. Therefore, the adoption of IFRS 15 resulted in decreases in operatingprofit and profit before income tax by Won 19.7 billion each. In addition, the adoption had the effect of decreasing our profit for the year by Won88.2 billion and increasing our income tax expense by Won 68.5 billion. The adoption of IFRS 15 did not have a material impact on our consolidatedstatement of cash flows for the year ended December 31, 2018. See notes 4(23) and 4(24) of the notes to our consolidated financial statements forfurther details regarding significant accounting policies related to revenue prior to and following the adoption of IFRS 15.
56
Copyright © 2020 www.secdatabase.com. All Rights Reserved.Please Consider the Environment Before Printing This Document
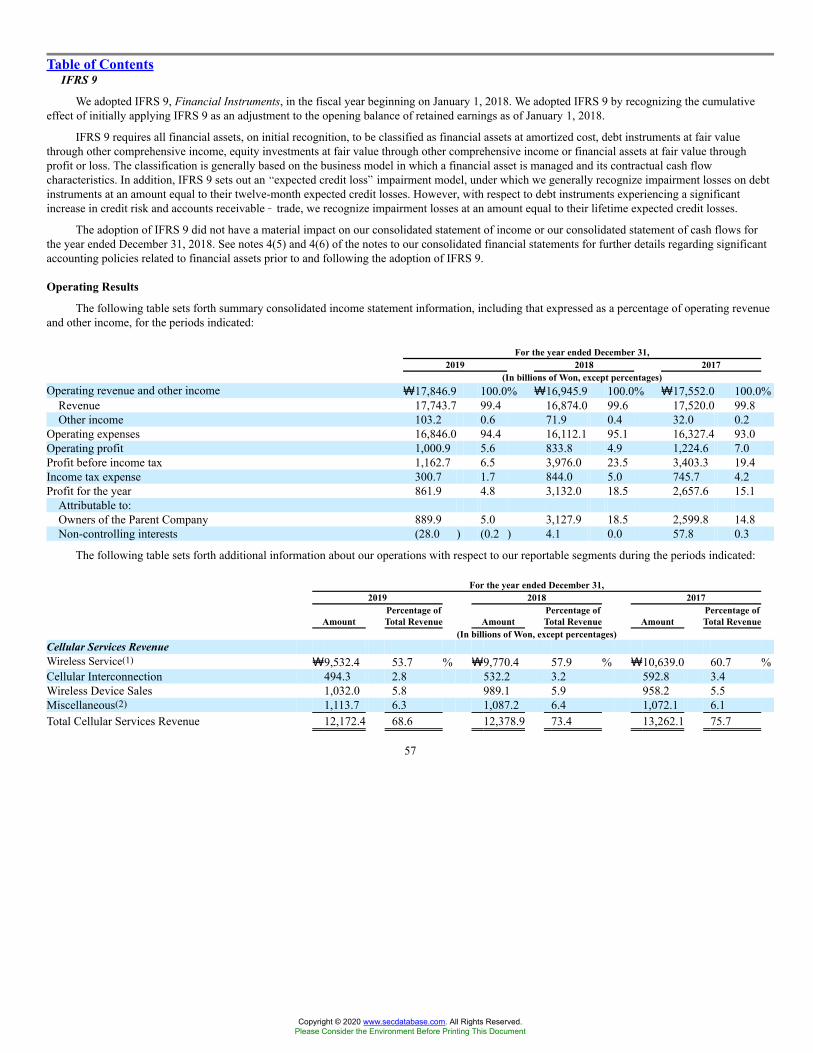
Table of ContentsIFRS 9
We adopted IFRS 9, Financial Instruments, in the fiscal year beginning on January 1, 2018. We adopted IFRS 9 by recognizing the cumulativeeffect of initially applying IFRS 9 as an adjustment to the opening balance of retained earnings as of January 1, 2018.
IFRS 9 requires all financial assets, on initial recognition, to be classified as financial assets at amortized cost, debt instruments at fair valuethrough other comprehensive income, equity investments at fair value through other comprehensive income or financial assets at fair value throughprofit or loss. The classification is generally based on the business model in which a financial asset is managed and its contractual cash flowcharacteristics. In addition, IFRS 9 sets out an �expected credit loss� impairment model, under which we generally recognize impairment losses on debtinstruments at an amount equal to their twelve-month expected credit losses. However, with respect to debt instruments experiencing a significantincrease in credit risk and accounts receivable � trade, we recognize impairment losses at an amount equal to their lifetime expected credit losses.
The adoption of IFRS 9 did not have a material impact on our consolidated statement of income or our consolidated statement of cash flows forthe year ended December 31, 2018. See notes 4(5) and 4(6) of the notes to our consolidated financial statements for further details regarding significantaccounting policies related to financial assets prior to and following the adoption of IFRS 9.
Operating Results
The following table sets forth summary consolidated income statement information, including that expressed as a percentage of operating revenueand other income, for the periods indicated:
For the year ended December 31,2019 2018 2017
(In billions of Won, except percentages)Operating revenue and other income ₩17,846.9 100.0% ₩16,945.9 100.0% ₩17,552.0 100.0%
Revenue 17,743.7 99.4 16,874.0 99.6 17,520.0 99.8Other income 103.2 0.6 71.9 0.4 32.0 0.2
Operating expenses 16,846.0 94.4 16,112.1 95.1 16,327.4 93.0Operating profit 1,000.9 5.6 833.8 4.9 1,224.6 7.0Profit before income tax 1,162.7 6.5 3,976.0 23.5 3,403.3 19.4Income tax expense 300.7 1.7 844.0 5.0 745.7 4.2Profit for the year 861.9 4.8 3,132.0 18.5 2,657.6 15.1
Attributable to:Owners of the Parent Company 889.9 5.0 3,127.9 18.5 2,599.8 14.8Non-controlling interests (28.0 ) (0.2 ) 4.1 0.0 57.8 0.3
The following table sets forth additional information about our operations with respect to our reportable segments during the periods indicated:
For the year ended December 31,2019 2018 2017
AmountPercentage ofTotal Revenue Amount
Percentage ofTotal Revenue Amount
Percentage ofTotal Revenue
(In billions of Won, except percentages)Cellular Services RevenueWireless Service(1) ₩9,532.4 53.7 % ₩9,770.4 57.9 % ₩10,639.0 60.7 %Cellular Interconnection 494.3 2.8 532.2 3.2 592.8 3.4Wireless Device Sales 1,032.0 5.8 989.1 5.9 958.2 5.5Miscellaneous(2) 1,113.7 6.3 1,087.2 6.4 1,072.1 6.1Total Cellular Services Revenue 12,172.4 68.6 12,378.9 73.4 13,262.1 75.7
57
Copyright © 2020 www.secdatabase.com. All Rights Reserved.Please Consider the Environment Before Printing This Document
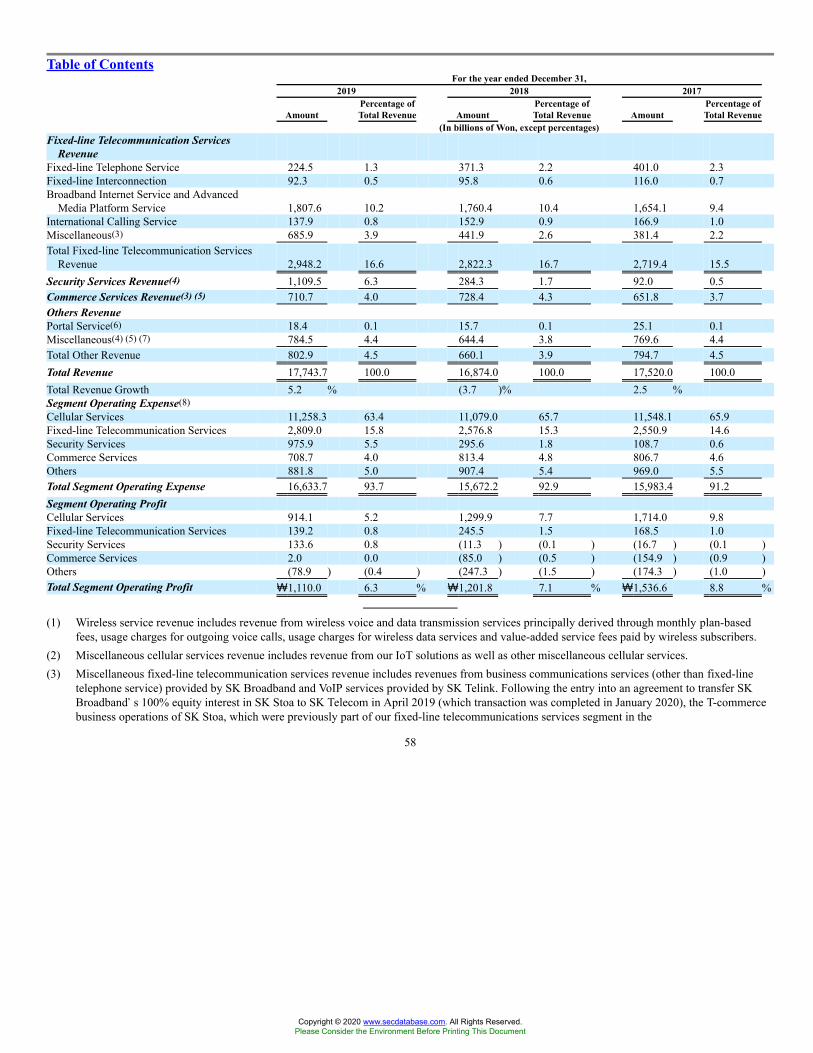
Table of ContentsFor the year ended December 31,
2019 2018 2017
AmountPercentage ofTotal Revenue Amount
Percentage ofTotal Revenue Amount
Percentage ofTotal Revenue
(In billions of Won, except percentages)Fixed-line Telecommunication Services
RevenueFixed-line Telephone Service 224.5 1.3 371.3 2.2 401.0 2.3Fixed-line Interconnection 92.3 0.5 95.8 0.6 116.0 0.7Broadband Internet Service and Advanced
Media Platform Service 1,807.6 10.2 1,760.4 10.4 1,654.1 9.4International Calling Service 137.9 0.8 152.9 0.9 166.9 1.0Miscellaneous(3) 685.9 3.9 441.9 2.6 381.4 2.2Total Fixed-line Telecommunication Services
Revenue 2,948.2 16.6 2,822.3 16.7 2,719.4 15.5Security Services Revenue(4) 1,109.5 6.3 284.3 1.7 92.0 0.5Commerce Services Revenue(3) (5) 710.7 4.0 728.4 4.3 651.8 3.7Others RevenuePortal Service(6) 18.4 0.1 15.7 0.1 25.1 0.1Miscellaneous(4) (5) (7) 784.5 4.4 644.4 3.8 769.6 4.4Total Other Revenue 802.9 4.5 660.1 3.9 794.7 4.5Total Revenue 17,743.7 100.0 16,874.0 100.0 17,520.0 100.0Total Revenue Growth 5.2 % (3.7 )% 2.5 %Segment Operating Expense(8)Cellular Services 11,258.3 63.4 11,079.0 65.7 11,548.1 65.9Fixed-line Telecommunication Services 2,809.0 15.8 2,576.8 15.3 2,550.9 14.6Security Services 975.9 5.5 295.6 1.8 108.7 0.6Commerce Services 708.7 4.0 813.4 4.8 806.7 4.6Others 881.8 5.0 907.4 5.4 969.0 5.5Total Segment Operating Expense 16,633.7 93.7 15,672.2 92.9 15,983.4 91.2Segment Operating ProfitCellular Services 914.1 5.2 1,299.9 7.7 1,714.0 9.8Fixed-line Telecommunication Services 139.2 0.8 245.5 1.5 168.5 1.0Security Services 133.6 0.8 (11.3 ) (0.1 ) (16.7 ) (0.1 )Commerce Services 2.0 0.0 (85.0 ) (0.5 ) (154.9 ) (0.9 )Others (78.9 ) (0.4 ) (247.3 ) (1.5 ) (174.3 ) (1.0 )Total Segment Operating Profit ₩1,110.0 6.3 % ₩1,201.8 7.1 % ₩1,536.6 8.8 %
(1) Wireless service revenue includes revenue from wireless voice and data transmission services principally derived through monthly plan-basedfees, usage charges for outgoing voice calls, usage charges for wireless data services and value-added service fees paid by wireless subscribers.
(2) Miscellaneous cellular services revenue includes revenue from our IoT solutions as well as other miscellaneous cellular services.(3) Miscellaneous fixed-line telecommunication services revenue includes revenues from business communications services (other than fixed-line
telephone service) provided by SK Broadband and VoIP services provided by SK Telink. Following the entry into an agreement to transfer SKBroadband�s 100% equity interest in SK Stoa to SK Telecom in April 2019 (which transaction was completed in January 2020), the T-commercebusiness operations of SK Stoa, which were previously part of our fixed-line telecommunications services segment in the
58
Copyright © 2020 www.secdatabase.com. All Rights Reserved.Please Consider the Environment Before Printing This Document
Table of Contentsyears ended December 31, 2018 and 2017, were reclassified as part of our commerce services segment for the year ended December 31, 2019. Asa result, our results of operations for the years ended December 31, 2018 and 2017 have been restated to retroactively apply such reclassification.
(4) Security services revenue includes revenues from ADT Caps and SK Infosec. Such revenues, which were previously part of our others segment inthe years ended December 31, 2018 and 2017, were separated into a new security services segment for the year ended December 31, 2019. As aresult, our results of operations for the years ended December 31, 2018 and 2017 have been restated to retroactively apply such new segmentation.
(5) Commerce services revenue includes revenues from Eleven Street and SK Stoa, in each case as described above. Eleven Street was spun-off asour new consolidated subsidiary from SK Planet in September 2018. Following such spin-off, the remaining marketing platform businessoperations of SK Planet, which were previously part of our commerce services segment in the year ended December 31, 2017, were reclassified aspart of our others segment for the year ended December 31, 2018. As a result, our results of operations for the year ended December 31, 2017have been restated to retroactively apply such reclassification.
(6) Portal service revenue includes revenues from �Nate,� our online portal service operated by SK Communications.(7) Miscellaneous others revenue includes revenues from the marketing platform business operations of SK Planet as described above and other
businesses.(8) �Segment operating expense� means operating expense for each reportable segment presented in accordance with K-IFRS and therefore does not
include certain expenses that are classified as other non-operating expenses under K-IFRS. For more information on the differences between ourconsolidated operating expense pursuant to K-IFRS and pursuant to IFRS as issued by the IASB, see �� Explanatory Note Regarding Presentationof Certain Financial Information under K-IFRS.�
2019 Compared to 2018
Operating Revenue and Other Income. Our consolidated operating revenue and other income increased by 5.3% to Won 17,846.9 billion in 2019from Won 16,945.9 billion in 2018, due to increases in both operating revenue and other income, as discussed below.
Our consolidated operating revenue increased by 5.2% to Won 17,743.7 billion in 2019 from Won 16,874.0 billion in 2018, primarily due to anincrease in security services revenue, and to a much smaller extent, increases in others revenue and fixed-line telecommunications services revenue,which were partially offset by decreases in cellular services revenue and commerce services revenue.
Our consolidated other income increased by 43.5% to Won 103.2 billion in 2019 from Won 71.9 billion in 2018, primarily due to the gain on thetransfer of our e-sports business to SK Telecom CS T1 Co., Ltd., a joint venture with Comcast Spectacor that was newly established in February 2019,as well as on the transfer of our former mobile OTT service business, �oksusu,� to Content Wavve in September 2019.
The following sets forth additional information about our operating revenues with respect to each of our reportable segments.
� Cellular services: The revenue of our cellular services segment, which is composed of revenues from wireless service, cellularinterconnection, wireless device sales and miscellaneous cellular services, decreased by 1.7% to Won 12,172.4 billion in 2019 from Won12,378.9 billion in 2018. The decrease in our cellular services revenue was due to decreases in wireless service revenue and cellularinterconnection revenue, partially offset by increases in wireless device sales revenue and miscellaneous cellular services revenue.
� Wireless service revenue decreased by 2.4% to Won 9,532.4 billion in 2019 from Won 9,770.4 billion in 2018, primarilyattributable to the continued increase in the percentage of wireless service subscribers who elected to receive discountedrates in lieu of receiving handset subsidies pursuant to the MDDIA. The impact of such decrease was partially offset by anincrease in the number of subscribers that subscribe to our higher-priced unlimited data usage plans and 5G plans.
59
Copyright © 2020 www.secdatabase.com. All Rights Reserved.Please Consider the Environment Before Printing This Document

Table of Contents� Cellular interconnection revenue decreased by 7.1% to Won 494.3 billion in 2019 from Won 532.2 billion in 2018. The
decrease was primarily attributable to continued decreases in interconnection rates and land-to-mobile call volume.
� Wireless device sales revenue increased by 4.3% to Won 1,032.0 billion in 2019 from Won 989.1 billion in 2018, primarilydue to the launch of our 5G services in April 2019 and the ensuing sales of higher-priced 5G-compatible smartphones.
� Miscellaneous cellular services revenue increased by 2.4% to Won 1,113.7 billion in 2019 from Won 1,087.2 billion in2018, primarily because of an increase in rental income from SK Telecom�s real properties, which is recognized as part ofour cellular services segment revenue.
� Fixed-line telecommunications services: The revenue of our fixed-line telecommunication services segment, which is composed of revenuesfrom broadband Internet service and advanced media platform service (including IPTV), fixed-line telephone service, international callingservice, fixed-line interconnection and miscellaneous fixed-line telecommunication services, increased by 4.5% to Won 2,948.2 billion in2019 from Won 2,822.3 billion in 2018, primarily due to increases in our broadband Internet service and advanced media platform servicerevenue and miscellaneous fixed-line telecommunications services revenue, partially offset by a decrease in fixed-line telephone servicerevenue.
� Miscellaneous fixed-line telecommunication services revenue increased by 55.2% to Won 685.9 billion in 2019 from Won441.9 billion in 2018, primarily due to an increase in revenue from our business communications services.
� Revenue from our broadband Internet service and advanced media platform service (including our IPTV service and formermobile OTT service, which was transferred to Content Wavve in September 2019) increased by 2.7% to Won1,807.6 billion in 2019 from Won 1,760.4 billion in 2018, primarily due to an increase in the number of IPTV subscribersto 5.2 million subscribers as of December 31, 2019 from 4.7 million subscribers as of December 31, 2018 and an increasein the number of premium subscriptions with higher monthly rates and purchases of premium video-on-demand content.
� Fixed-line telephone service revenue decreased by 39.5% to Won 224.5 billion in 2019 from Won 371.3 billion in 2018,primarily due to decreases in the number of fixed-line telephone subscribers (including subscribers to VoIP services of SKBroadband and SK Telink) to 3.9 million as of December 31, 2019 from 4.1 million as of December 31, 2018 andresidential calling volume as a result of shifting consumer preferences toward wireless communication.
� Security services: The revenue of our security services segment, which is composed of revenues from ADT Caps and SK Infosec, increasedby 290.3% to Won 1,109.5 billion in 2019 from Won 284.3 billion in 2018. A substantial majority of such increase was due to the inclusion ofrevenues of ADT Caps for a full year in 2019 compared to a partial year in 2018 following the addition of the entities comprising ADT Capsas new consolidated subsidiaries in October 2018 and, to a much smaller extent, the inclusion of revenue of SK Infosec as a new consolidatedsubsidiary starting at the end of December 2018.
� Commerce services: The revenue of our commerce services segment, which is composed of revenues from 11st, our open marketplaceplatform, and SK stoa, our T-commerce network, decreased by 2.4% to Won 710.7 billion in 2019 from Won 728.4 billion in 2018, primarilydue to our continued strategic focus to optimize and improve the profitability of our 11st business.
� Others: The revenue of our others segment, which is composed of revenue from our portal service and miscellaneous other revenue, increasedby 21.6% to Won 802.9 billion in 2019 from Won 660.1 billion in 2018, primarily due to the inclusion of revenues of newly consolidatedsubsidiaries, such as FSK L&S and Incross.
Operating Expense. Our consolidated operating expense increased by 4.6% to Won 16,846.0 billion in 2019 from Won 16,112.1 billion in 2018,primarily due to a 20.6% increase in depreciation and amortization expenses to Won 3,771.5 billion in 2019 from Won 3,126.1 billion in 2018 and a23.3% increase in labor costs to Won
60
Copyright © 2020 www.secdatabase.com. All Rights Reserved.Please Consider the Environment Before Printing This Document

Table of Contents2,822.7 billion from Won 2,288.7 billion in 2018, partially offset by a 56.2% decrease in rent expenses to Won 231.9 billion in 2019 from Won529.5 billion in 2018, a 3.2% decrease in other operating expenses to Won 1,724.9 billion in 2019 from Won 1,782.4 billion in 2018 and a 6.9%decrease in network interconnection expenses from Won 752.3 billion in 2019 from Won 808.4 billion in 2018.
The increase in depreciation and amortization expenses was primarily due to the recognition of depreciation expenses relating to our right-of-useassets following our adoption of IFRS 16, as well as the commencement of amortization of our frequency usage rights for our 5G services. See ��Recently Adopted International Financial Reporting Standards � IFRS 16.�
The increase in labor costs was primarily due to the additional personnel on payroll in connection with our acquisitions of ADT Caps in October2018 and SK Infosec in December 2018, as well as the expansion of new businesses such as AI solutions and other platform services.
The decrease in rent expenses was primarily due to the adoption of IFRS 16, pursuant to which we recognized payments on certain of our leasedreal properties in 2019 as depreciation expenses on right-of-use assets instead of as rent expenses. See �� Recently Adopted International FinancialReporting Standards � IFRS 16.�
The decrease in other operating expenses was primarily due to a decrease in impairment loss on property and equipment and intangible assets toWon 65.9 billion in 2019 from Won 255.8 billion in 2018, which amount in 2018 mainly reflected impairment losses we recognized on the goodwill andintangible assets of our former subsidiary Shopkick.
The decrease in network interconnection expenses was mainly attributable to decreases in wireless-to-fixed-line and fixed-line-to-wirelessinterconnection rates, as well as decreases in the number of fixed-line telephone subscribers and calling volume.
The following sets forth additional information about our segment operating expense with respect to each of our reportable segments, which donot include certain expenses that are classified as other non-operating expenses under K-IFRS. For more information on the difference between ourconsolidated operating expense pursuant to K-IFRS and pursuant to IFRS as issued by the IASB, see �� Explanatory Note Regarding Presentation ofCertain Financial Information under K-IFRS� and note 5(2) of the notes to our consolidated financial statements.
� Cellular services: The segment operating expense for our cellular services segment increased by 1.6% to Won 11,258.3 billion in 2019 fromWon 11,079.0 billion in 2018, mainly attributable to an increase in marketing costs to promote our 5G services and the commencement ofamortization of our frequency usage rights for our 5G services.
� Fixed-line telecommunication services: The segment operating expense for our fixed-line telecommunication services segment increased by9.0% to Won 2,809.0 billion in 2019 from Won 2,576.8 billion in 2018, primarily due to increases in labor costs, marketing costs to gain moresubscribers to our ultra-high definition IPTV and high speed broadband Internet services and depreciation and amortization expenses.
� Security services: The segment operating expense for our security services segment increased by 230.1% to Won 975.9 billion in 2019 fromWon 295.6 billion in 2018, primarily due to the inclusion of operating expenses of ADT Caps for a full year in 2019 compared to a partialyear in 2018 following the addition of the entities comprising ADT Caps as new consolidated subsidiaries in October 2018 and, to a muchsmaller extent, the inclusion of operating expenses of SK Infosec as a new consolidated subsidiary starting at the end of December 2018.
� Commerce services: The segment operating expense for our commerce services segment decreased by 12.9% to Won 708.7 billion in 2019from Won 813.4 billion in 2018, primarily due to our continued strategic focus to optimize and improve the profitability of our 11st business.
� Others: The segment operating expense for our others segment decreased by 2.8% to Won 881.8 billion in 2019 from Won 907.4 billion in2018, primarily as a result of cost-cutting efforts by SK Planet and other subsidiaries in this segment.
61
Copyright © 2020 www.secdatabase.com. All Rights Reserved.Please Consider the Environment Before Printing This Document
Table of ContentsOperating Profit. Our consolidated operating profit increased by 20.0% to Won 1,000.9 billion in 2019 from Won 833.8 billion in 2018, as the
increase in operating revenue and other income outpaced the increase in operating expense in 2019.
The following sets forth additional information about our segment operating profit with respect to each of our reportable segments. Our segmentoperating profit with respect to each of our reportable segments is based on K-IFRS and the sum of segment operating profit for all five reportablesegments differs from our consolidated operating profit presented in accordance with IFRS as issued by the IASB. For a reconciliation of operatingprofit presented in accordance with IFRS as issued by the IASB and operating profit presented in accordance with K-IFRS, see �� Explanatory NoteRegarding Presentation of Certain Financial Information under K-IFRS� and note 5(2) of the notes to our consolidated financial statements.
� Cellular services: The segment operating profit of our cellular services segment decreased by 29.7% to Won 914.1 billion in 2019 from Won1,299.9 billion in 2018, due to the decrease in segment operating revenue and the increase in segment operating expense, for the variousreasons described above. As a result, the segment operating margin (which, with respect to each reportable segment, is segment operatingprofit (loss) divided by revenue from such segment, expressed as a percentage) of our cellular services segment decreased to 7.5% in 2019from 10.5% in 2018.
� Fixed-line telecommunication services: The segment operating profit of our fixed-line telecommunication services segment decreased by43.3% to Won 139.2 billion in 2019 from Won 245.5 billion in 2018, due to the greater increase in segment operating expense as compared tothe increase in segment operating revenue, for the reasons described above. As a result, the segment operating margin of our fixed-linetelecommunication services segment decreased to 4.7% in 2019 from 8.7% in 2018.
� Security services: Our security services segment had a segment operating profit of Won 133.6 billion in 2019 compared to a segmentoperating loss of Won 11.3 billion in 2018, due to the aggregate impact of our acquisitions of ADT Caps and SK Infosec as described above.As a result, the segment operating margin of our security services segment improved to 12.0% in 2019 from (4.0)% in 2018.
� Commerce services: Our commerce services segment had a segment operating profit of Won 2.0 billion in 2019 compared to a segmentoperating loss of Won 85.0 billion in 2018, due to the greater decrease in segment operating expense as compared to the decrease in segmentoperating revenue, for the reasons described above. As a result, the segment operating margin of our commerce services segment improved to0.3% in 2019 from (11.7)% in 2018.
� Others: The segment operating loss of our others segment decreased by 68.1% to Won 78.9 billion in 2019 from Won 247.3 billion in 2018,due to the increase in segment operating revenue and the decrease in segment operating expense as described above. As a result, the segmentoperating margin of our others segment improved to (9.8)% in 2019 from (37.5)% in 2018.
Finance Income and Finance Costs. Our finance income decreased by 44.6% to Won 142.0 billion in 2019 from Won 256.4 billion in 2018,primarily due to a decrease in gain relating to financial assets at fair value through profit or loss to Won 4.5 billion in 2019 from Won 83.6 billion in2018, primarily relating to our disposal of 200,000 redeemable convertible preference shares of KRAFTON Co., Ltd. (formerly known as Bluehole Inc.)(�Krafton�) in 2018, as well as a decrease in dividends to Won 10.0 billion in 2019 from Won 35.1 billion in 2018, which was primarily related to adecrease in dividend payments following SK Planet�s disposal of investments in certain real estate funds as well as our disposal of all of our shares ofKB Financial Group Inc. in 2018. The effect of such decrease was partially offset by an increase in gain on settlement of derivatives to Won 29.3 billionin 2019 from Won 20.4 billion in 2018, primarily as a result of exchange rate fluctuations.
Our finance costs increased by 11.6% to Won 429.8 billion in 2019 from Won 385.2 billion in 2018, primarily due to an increase in interestexpense to Won 397.9 billion in 2019 from Won 307.3 billion in 2018 as a result of an increase in the aggregate amount of our outstanding debentures,which was partially offset by a decrease in loss on foreign currency transactions to Won 12.7 billion in 2019 from Won 38.9 billion in 2018.
Gains (Losses) Related to Investments in Associates and Joint Ventures. Gains related to investments in associates and joint ventures decreasedby 86.3% to Won 449.5 billion in 2019 from Won 3,270.9 billion in 2018,
62
Copyright © 2020 www.secdatabase.com. All Rights Reserved.Please Consider the Environment Before Printing This Document
Table of Contentsprimarily due to a decrease in share of profits of SK Hynix to Won 416.2 billion in 2019 from Won 3,238.1 billion in 2018. Such decrease was primarilydue to a decrease in SK Hynix�s profit for the year to Won 2,016.4 billion in 2019 from Won 15,540.0 billion in 2018.
Income Tax. Income tax expense decreased by 64.4% to Won 300.7 billion in 2019 from Won 844.0 billion in 2018 primarily due to a 70.8%decrease in profit before income tax to Won 1,162.7 billion in 2019 from Won 3,976.0 billion in 2018. Our effective tax rate in 2019 increased to 25.9%from 21.2% in 2018. Our effective tax rates in 2019 and 2018 were lower than the maximum statutory tax rate of 27.5% for both years, primarily due tonon-taxable income in 2019 and changes in unrecognized deferred taxes in 2018.
Profit for the Year. Principally as a result of the factors discussed above, our profit for the year decreased by 72.5% to Won 861.9 billion in 2019from Won 3,132.0 billion in 2018. Profit for the year as a percentage of operating revenue and other income was 4.8% in 2019 compared to 18.5% in2018.
2018 Compared to 2017
Operating Revenue and Other Income. Our consolidated operating revenue and other income decreased by 3.5% to Won 16,945.9 billion in2018 from Won 17,552.0 billion in 2017, due to a decrease in operating revenue, offset in small part by an increase in other income, as discussed below.
Our consolidated operating revenue decreased by 3.7% to Won 16,874.0 billion in 2018 from Won 17,520.0 billion in 2017, primarily due to adecrease in cellular services revenue, and to a much smaller extent, a decrease in others revenue, which were partially offset by increases in securityservices revenue, fixed-line telecommunication services revenue and commerce services revenue.
Our consolidated other income increased by 124.7% to Won 71.9 billion in 2018 from Won 32.0 billion in 2017, primarily due to the gain on thedisposal of SK Broadband�s internet data center in Seoul.
The following sets forth additional information about our operating revenues with respect to each of our reportable segments.
� Cellular services: The revenue of our cellular services segment, which is composed of revenues from wireless service, cellularinterconnection, wireless device sales and miscellaneous cellular services, decreased by 6.7% to Won 12,378.9 billion in 2018 from Won13,262.1 billion in 2017. The decrease in our cellular services revenue was due to decreases in wireless service revenue and cellularinterconnection revenue, partially offset by increases in wireless device sales revenue and miscellaneous cellular services revenue.
� Wireless service revenue decreased by 8.2% to Won 9,770.4 billion in 2018 from Won 10,639.0 billion in 2017, primarilyattributable to the continued increase in the percentage of wireless service subscribers who elected to receive discountedrates in lieu of receiving handset subsidies pursuant to the MDDIA and the decrease in revenues from our roaming servicessubsequent to the launch of our �Safe Automatic T Roaming� service in March 2018. Such decrease was also partlyattributable to the adoption of IFRS 15, which caused us to recognize a smaller portion of the overall transaction price ofcontracts under which we sell both a wireless device and subscription plan together to a single customer as wireless servicerevenue than under the previously applicable accounting standards. See �� Recently Adopted International FinancialReporting Standards � IFRS 15.�
� Cellular interconnection revenue decreased by 10.2% to Won 532.2 billion in 2018 from Won 592.8 billion in 2017. Thedecrease was primarily attributable to continued decreases in interconnection rates and land-to-mobile call volume.
� Wireless device sales revenue increased by 3.2% to Won 989.1 billion in 2018 from Won 958.2 billion in 2017, primarilydue to the adoption of IFRS 15, which caused us to recognize a greater portion of the overall transaction price of contractsunder which we sell both a wireless device and subscription plan together to a single customer as wireless device salesrevenue than under the previously applicable accounting standards, partly offset by a decrease in sales of
63
Copyright © 2020 www.secdatabase.com. All Rights Reserved.Please Consider the Environment Before Printing This Document
Table of Contentshandsets due to lower customer demand for new devices. See �� Recently Adopted International Financial ReportingStandards � IFRS 15.�
� Miscellaneous cellular services revenue increased by 1.4% to Won 1,087.2 billion in 2018 from Won 1,072.1 billion in2017, primarily because of an increase in revenue from our IoT solutions business.
� Fixed-line telecommunications services: The revenue of our fixed-line telecommunication services segment, which is composed of revenuesfrom broadband Internet service and advanced media platform service (including IPTV), fixed-line telephone service, international callingservice, fixed-line interconnection and miscellaneous fixed-line telecommunication services, increased by 3.8% to Won 2,822.3 billion in2018 from Won 2,719.4 billion in 2017, primarily due to increases in our broadband Internet service and advanced media platform servicerevenue and miscellaneous fixed-line telecommunications services revenue, partially offset by decreases in fixed-line interconnection revenueand fixed-line telephone service revenue.
� Revenue from our broadband Internet service and advanced media platform service (including our IPTV service and formermobile OTT service, which was transferred to Content Wavve in September 2019) increased by 6.4% to Won1,760.4 billion in 2018 from Won 1,654.1 billion in 2017, primarily due to an increase in the number of IPTV subscribersto 4.7 million subscribers as of December 31, 2018 from 4.4 million subscribers as of December 31, 2017 and an increasein the number of premium subscriptions with higher monthly rates and purchases of premium video-on-demand content.
� Miscellaneous fixed-line telecommunication services revenue increased by 15.9% to Won 441.9 billion in 2018 from Won381.4 billion in 2017, primarily due to an increase in revenue from our business communications services.
� Fixed-line telephone service revenue decreased by 7.4% to Won 371.3 billion in 2018 from Won 401.0 billion in 2017,primarily due to a decrease in the number of fixed-line telephone subscribers and residential calling volume as discussedabove.
� Fixed-line interconnection revenue decreased by 17.4% to Won 95.8 billion in 2018 from Won 116.0 billion in 2017,primarily due to a decrease in interconnection rates, as well as decreases in the number of fixed-line telephone subscribers(including subscribers to VoIP services of SK Broadband and SK Telink) to 4.1 million as of December 31, 2018 from4.3 million as of December 31, 2017 and residential calling volume as a result of shifting consumer preferences towardwireless communication.
� Security services: The revenue of our security services segment increased by 209.0% to Won 284.3 billion in 2018 from Won 92.0 billion in2017, primarily due to the consolidation of revenues of ADT Caps starting in October 2018.
� Commerce services: The revenue of our commerce services segment, which is primarily composed of revenues from 11st, our openmarketplace platform, and SK stoa, our T-commerce network, increased by 11.8% to Won 728.4 billion in 2018 from Won 651.8 billion in2017, primarily due to an increase in revenue from SK stoa as a result of increased volume of merchandise sold through such channel.
� Others: The revenue of our others segment, which is composed of revenue from our portal service and miscellaneous other revenue,decreased by 16.9% to Won 660.1 billion in 2018 from Won 794.7 billion in 2017, primarily due to the effects of the reorganization of SKPlanet�s business operations.
Operating Expense. Our consolidated operating expense decreased by 1.3% to Won 16,112.1 billion in 2018 from Won 16,327.4 billion in2017, primarily due to an 8.8% decrease in commissions to Won 5,002.6 billion in 2018 from Won 5,486.3 billion in 2017, a 4.8% decrease in cost ofgoods sold to Won 1,796.1 billion in 2018 from Won 1,886.5 billion in 2017 and a 7.6% decrease in network interconnection expenses to Won808.4 billion in 2018 from Won 875.0 billion in 2017, partially offset by a 16.4% increase in labor costs to Won 2,288.7 billion in 2018 from Won1,966.2 billion in 2017 and a 9.3% increase in other operating expenses to Won 1,782.4 billion in 2018 from Won 1,630.7 billion in 2017.
64
Copyright © 2020 www.secdatabase.com. All Rights Reserved.Please Consider the Environment Before Printing This Document
Table of ContentsThe decrease in commissions was attributable mainly to a decrease in marketing costs relating to our cellular services primarily caused by the
continued maturing of the market for new wireless devices in 2018, partially offset by an increase in marketing costs relating to our fixed-linetelecommunication services.
The decrease in cost of goods sold was primarily due to a decrease in the number of wireless devices resold in 2018.
The decrease in network interconnection expenses was mainly attributable to decreases in wireless-to-fixed-line and fixed-line-to-wirelessinterconnection rates, as well as decreases in the number of fixed-line telephone subscribers and calling volume.
The increase in labor costs was primarily due to the additional personnel on payroll in connection with our acquisition of ADT Caps in October2018, as well as the establishment in June 2017 of our subsidiary, Home & Service Co., Ltd. (�Home & Service�), which provides in-home customerservices primarily to our fixed-line telecommunication service subscribers that were previously outsourced to a third party vendor and the costs forwhich were classified as commissions prior to the establishment of Home & Service, and the expansion of new businesses such as AI solutions.
The increase in other operating expenses was primarily due to an increase in impairment loss on property and equipment and intangible assets toWon 255.8 billion in 2018, which mainly reflected impairment losses we recognized on the goodwill and intangible assets of Shopkick, from Won54.9 billion in 2017.
The following sets forth additional information about our segment operating expense with respect to each of our reportable segments, which donot include certain expenses that are classified as other non-operating expenses under K-IFRS. For more information on the difference between ourconsolidated operating expense pursuant to K-IFRS and pursuant to IFRS as issued by the IASB, see �� Explanatory Note Regarding Presentation ofCertain Financial Information under K-IFRS� and note 5(2) of the notes to our consolidated financial statements.
� Cellular services: The segment operating expense for our cellular services segment decreased by 4.1% to Won 11,079.0 billion in 2018 fromWon 11,548.1 billion in 2017, attributable mainly to a decrease in marketing costs in light of lower customer demand for new wirelessdevices and the completion of depreciation for some of our property and equipment.
� Fixed-line telecommunication services: The segment operating expense for our fixed-line telecommunication services segment increased by1.0% to Won 2,576.8 billion in 2018 from Won 2,550.9 billion in 2017, primarily due to an increase in marketing costs to gain moresubscribers to our ultra-high definition IPTV and high speed broadband Internet services and an increase in depreciation and amortizationexpenses.
� Security services: The segment operating expense for our security services segment increased by 171.9% to Won 295.6 billion in 2018 fromWon 108.7 billion in 2017, primarily due to the recognition of operating expenses related to ADT Caps following our acquisition thereof inOctober 2018.
� Commerce services: The segment operating expense for our commerce services segment increased by 0.8% to Won 813.4 billion in 2018from Won 806.7 billion in 2017, primarily due to the increase in the volume of merchandise sold through SK stoa.
� Others: The segment operating expense for our others segment decreased by 6.4% to Won 907.4 billion in 2018 from Won 969.0 billion in2017, primarily due to the effects of the reorganization of SK Planet�s business operations.
Operating Profit. Our consolidated operating profit decreased by 31.9% to Won 833.8 billion in 2018 from Won 1,224.6 billion in 2017, as thedecrease in operating revenue and other income outpaced the decrease in operating expense in 2018.
The following sets forth additional information about our segment operating profit with respect to each of our reportable segments. Our segmentoperating profit with respect to each of our reportable segments is based on K-IFRS and the sum of segment operating profit for all five reportablesegments differs from our consolidated operating profit presented in accordance with IFRS as issued by the IASB. For a reconciliation of operatingprofit
65
Copyright © 2020 www.secdatabase.com. All Rights Reserved.Please Consider the Environment Before Printing This Document
Table of Contentspresented in accordance with IFRS as issued by the IASB and operating profit presented in accordance with K-IFRS, see �� Explanatory NoteRegarding Presentation of Certain Financial Information under K-IFRS� and note 5(2) of the notes to our consolidated financial statements.
� Cellular services: The segment operating profit of our cellular services segment decreased by 24.2% to Won 1,299.9 billion in 2018 fromWon 1,714.0 billion in 2017, due to the greater decrease in segment operating revenue as compared to the decrease in segment operatingexpense, for the various reasons described above. As a result, the segment operating margin (which, with respect to each reportable segment,is segment operating profit (loss) divided by revenue from such segment, expressed as a percentage) of our cellular services segmentdecreased to 10.5% in 2018 from 12.9% in 2017.
� Fixed-line telecommunication services: The segment operating profit of our fixed-line telecommunication services segment increased by45.7% to Won 245.5 billion in 2018 from Won 168.5 billion in 2017, due to the greater increase in segment operating revenue as compared tothe increase in segment operating expense, for the reasons described above. As a result, the segment operating margin of our fixed-linetelecommunication services segment increased to 8.7% in 2018 from 6.2% in 2017.
� Security services: The segment operating loss of our security services segment decreased by 32.3% to Won 11.3 billion in 2018 from Won16.7 billion in 2017, due to the greater increase in segment operating revenue as compared to the increase in segment operating expense, forthe reasons described above. As a result, the segment operating margin of our security services segment improved to (4.0)% in 2018 from(18.2)% in 2017.
� Commerce services: The segment operating loss of our commerce services segment decreased by 45.1% to Won 85.0 billion in 2018 fromWon 154.9 billion in 2017, due to the greater increase in segment operating revenue as compared to the increase in segment operatingexpense, for the reasons described above. As a result, the segment operating margin of our commerce services segment improved to (11.7)%in 2018 from (23.8)% in 2017.
� Others: The segment operating loss of our others segment increased by 41.9% to Won 247.3 billion in 2018 from Won 174.3 billion in 2017,due to the greater decrease in segment operating revenue as compared to the decrease in segment operating expense as described above. As aresult, the segment operating margin of our others segment worsened to (37.5)% in 2018 from (21.9)% in 2017.
Finance Income and Finance Costs. Our finance income decreased by 30.1% to Won 256.4 billion in 2018 from Won 366.6 billion in 2017,primarily due to a significant decrease in gain on valuation of derivatives to Won 6.5 billion in 2018 from Won 223.9 billion in 2017, which primarilyrelated to a significant increase in valuation of redeemable convertible preferred shares issued by Krafton in 2017. The effect of such decrease waspartially offset by a significant increase in gain relating to financial assets at fair value through profit or loss to Won 83.6 billion in 2018, primarilyrelating to our disposal of 200,000 redeemable convertible preference shares of Krafton in 2018, from less than Won 0.1 billion in 2017.
Our finance costs decreased by 11.2% to Won 385.2 billion in 2018 from Won 433.6 billion in 2017, primarily due to a decrease in loss ondisposal of long-term investment securities from Won 36.0 billion in 2017, which was primarily due to the disposal of our shares of Kakao, to nil in2018, and a decrease in other finance costs from Won 35.9 billion in 2017, relating to management fees paid in connection with our investment inKrafton�s securities, to nil in 2018.
Gains (Losses) Related to Investments in Associates and Joint Ventures. Gains related to investments in associates and joint ventures increasedby 45.7% to Won 3,270.9 billion in 2018 from Won 2,245.8 billion in 2017, primarily due to an increase in share of profits of SK Hynix to Won3,238.1 billion in 2018 from Won 2,175.9 billion in 2017. Such increase was primarily due to an increase in SK Hynix�s profit for the year to Won15,540.0 billion in 2018 from Won 10,642.2 billion in 2017.
Income Tax. Income tax expense increased by 13.2% to Won 844.0 billion in 2018 from Won 745.7 billion in 2017 primarily due to a 16.8%increase in profit before income tax to Won 3,976.0 billion in 2018 from Won 3,403.3 billion in 2017. Our effective tax rate in 2018 decreased to 21.2%from 21.9% in 2017. Our effective tax
66
Copyright © 2020 www.secdatabase.com. All Rights Reserved.Please Consider the Environment Before Printing This Document
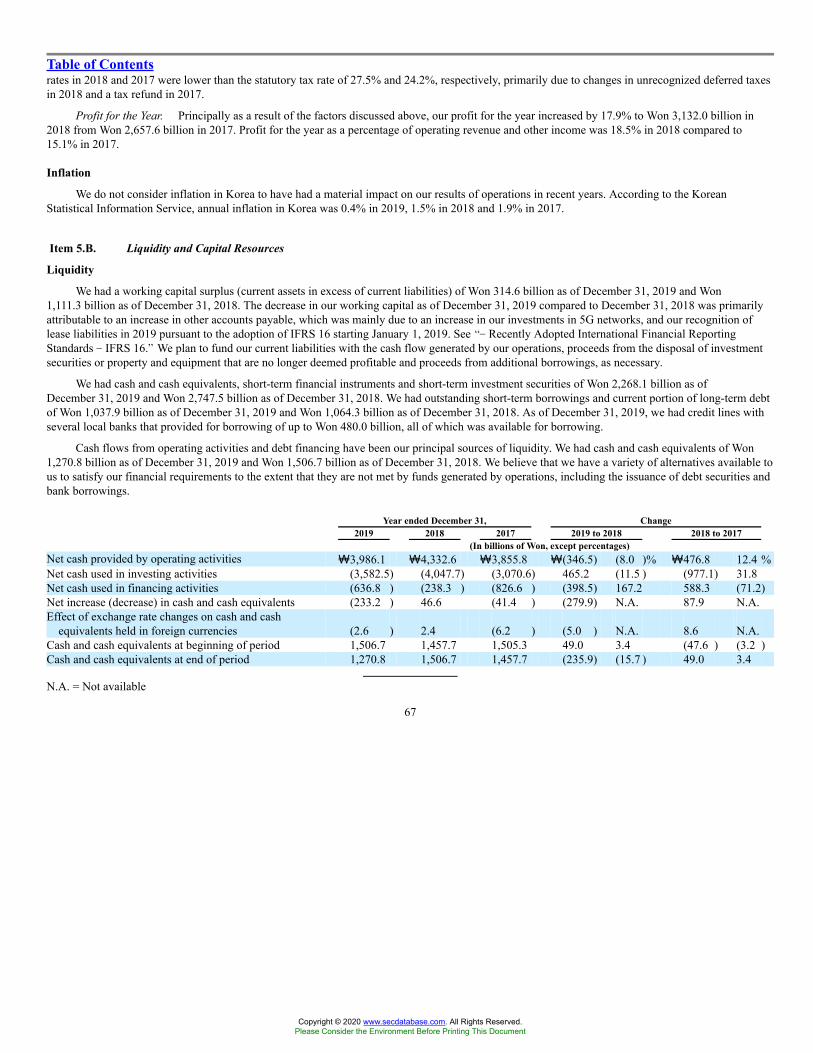
Table of Contentsrates in 2018 and 2017 were lower than the statutory tax rate of 27.5% and 24.2%, respectively, primarily due to changes in unrecognized deferred taxesin 2018 and a tax refund in 2017.
Profit for the Year. Principally as a result of the factors discussed above, our profit for the year increased by 17.9% to Won 3,132.0 billion in2018 from Won 2,657.6 billion in 2017. Profit for the year as a percentage of operating revenue and other income was 18.5% in 2018 compared to15.1% in 2017.
Inflation
We do not consider inflation in Korea to have had a material impact on our results of operations in recent years. According to the KoreanStatistical Information Service, annual inflation in Korea was 0.4% in 2019, 1.5% in 2018 and 1.9% in 2017.
Item 5.B. Liquidity and Capital Resources
Liquidity
We had a working capital surplus (current assets in excess of current liabilities) of Won 314.6 billion as of December 31, 2019 and Won1,111.3 billion as of December 31, 2018. The decrease in our working capital as of December 31, 2019 compared to December 31, 2018 was primarilyattributable to an increase in other accounts payable, which was mainly due to an increase in our investments in 5G networks, and our recognition oflease liabilities in 2019 pursuant to the adoption of IFRS 16 starting January 1, 2019. See �� Recently Adopted International Financial ReportingStandards � IFRS 16.� We plan to fund our current liabilities with the cash flow generated by our operations, proceeds from the disposal of investmentsecurities or property and equipment that are no longer deemed profitable and proceeds from additional borrowings, as necessary.
We had cash and cash equivalents, short-term financial instruments and short-term investment securities of Won 2,268.1 billion as ofDecember 31, 2019 and Won 2,747.5 billion as of December 31, 2018. We had outstanding short-term borrowings and current portion of long-term debtof Won 1,037.9 billion as of December 31, 2019 and Won 1,064.3 billion as of December 31, 2018. As of December 31, 2019, we had credit lines withseveral local banks that provided for borrowing of up to Won 480.0 billion, all of which was available for borrowing.
Cash flows from operating activities and debt financing have been our principal sources of liquidity. We had cash and cash equivalents of Won1,270.8 billion as of December 31, 2019 and Won 1,506.7 billion as of December 31, 2018. We believe that we have a variety of alternatives available tous to satisfy our financial requirements to the extent that they are not met by funds generated by operations, including the issuance of debt securities andbank borrowings.
Year ended December 31, Change2019 2018 2017 2019 to 2018 2018 to 2017
(In billions of Won, except percentages)Net cash provided by operating activities ₩3,986.1 ₩4,332.6 ₩3,855.8 ₩(346.5) (8.0 )% ₩476.8 12.4 %Net cash used in investing activities (3,582.5) (4,047.7) (3,070.6) 465.2 (11.5 ) (977.1) 31.8Net cash used in financing activities (636.8 ) (238.3 ) (826.6 ) (398.5) 167.2 588.3 (71.2)Net increase (decrease) in cash and cash equivalents (233.2 ) 46.6 (41.4 ) (279.9) N.A. 87.9 N.A.Effect of exchange rate changes on cash and cash
equivalents held in foreign currencies (2.6 ) 2.4 (6.2 ) (5.0 ) N.A. 8.6 N.A.Cash and cash equivalents at beginning of period 1,506.7 1,457.7 1,505.3 49.0 3.4 (47.6 ) (3.2 )Cash and cash equivalents at end of period 1,270.8 1,506.7 1,457.7 (235.9) (15.7 ) 49.0 3.4
N.A. = Not available
67
Copyright © 2020 www.secdatabase.com. All Rights Reserved.Please Consider the Environment Before Printing This Document
Table of ContentsCash Flows from Operating Activities. Net cash provided by operating activities was Won 3,986.1 billion in 2019, Won 4,332.6 billion in 2018
and Won 3,855.8 billion in 2017. Profit for the year was Won 861.9 billion in 2019, Won 3,132.0 billion in 2018 and Won 2,657.6 billion in 2017. Netcash provided by operating activities in 2019 decreased by 8.0% from 2018 primarily due to an increase in prepaid expenses at the year-end 2019compared to the year-end 2018. Net cash provided by operating activities in 2018 increased by 12.4% from 2017 primarily due to a decrease in ouroutstanding other accounts receivable at the year-end 2018 compared to the year-end 2017.
Cash Flows from Investing Activities. Net cash used in investing activities was Won 3,582.5 billion in 2019, Won 4,047.7 billion in 2018 andWon 3,070.6 billion in 2017. Cash inflows from investing activities were Won 754.2 billion in 2019, Won 686.1 billion in 2018 and Won 456.8 billion in2017. Cash inflows in 2019 were primarily attributable to a decrease in short-term financial instruments, net of Won 254.0 billion, which was mainly inconnection with funding our investments in property and equipment, and proceeds from disposals of long-term investment securities of Won234.7 billion, which was primarily in connection with the disposal of 6,109,000 common shares of Hana Financial Group Inc. for Won 221.1 billion incash. Cash inflows in 2018 were primarily attributable to proceeds from disposals of long-term investment securities of Won 371.8 billion, primarily inconnection with the disposal of all of our shares of KB Financial Group Inc. for Won 179.6 billion in cash and the disposal of redeemable convertiblepreferred shares of Krafton for Won 130.0 billion in cash and the collection of short-term loans of Won 117.6 billion. Cash inflows in 2017 wereprimarily attributable to the collection of short-term loans of Won 216.7 billion and proceeds from disposals of long-term investment securities of Won129.7 billion, mostly in connection with the disposal of our shares of Kakao for Won 112.6 billion in cash in April 2017.
Cash outflows for investing activities were Won 4,336.7 billion in 2019, Won 4,733.8 billion in 2018 and Won 3,527.4 billion in 2017. Cashoutflows in 2019, 2018 and 2017 were primarily attributable to expenditures related to the acquisition of property and equipment of Won 3,375.9 billion,Won 2,792.4 billion and Won 2,715.9 billion, respectively, primarily in connection with the acquisition of 5G and LTE equipment, the expansion of our5G network and the maintenance of our LTE network.
Cash Flows from Financing Activities. Net cash used in financing activities was Won 636.8 billion in 2019, Won 238.3 billion in 2018 and Won826.6 billion in 2017. Cash inflows from financing activities were Won 2,047.3 billion in 2019, Won 4,651.7 billion in 2018 and Won 1,261.8 billion in2017. Such inflows were primarily driven by the issuance of debentures, which provided cash of Won 1,633.4 billion in 2019, Won 1,809.6 billion in2018 and Won 973.3 billion in 2017, and proceeds from long-term borrowings, which provided cash of nil in 2019, Won 1,920.1 billion in 2018 andWon 120.0 billion in 2017. In 2019, we also received proceeds of Won 300.0 billion from the disposal of our treasury shares to Kakao. In 2018, wereceived net proceeds of Won 499.9 billion from the transfer of interests in subsidiaries to non-controlling interests and of Won 398.8 billion from theissuance of hybrid securities.
Cash outflows for financing activities were Won 2,684.1 billion in 2019, Won 4,890.0 billion in 2018 and Won 2,088.4 billion in 2017. Cashoutflows for financing activities included repayment of debentures, payment of dividends, repayments of other long-term payables, repayments of leaseliabilities and repayment of long-term borrowings, among other items. Repayment of debentures were Won 940.0 billion in 2019, Won 1,488.0 billion in2018 and Won 842.7 billion in 2017. Payment of dividends were Won 718.7 billion in 2019, Won 706.1 billion in 2018 and Won 706.1 billion in 2017.Repayments of other long-term payables were Won 428.2 billion in 2019, Won 305.6 billion in 2018 and Won 305.5 billion in 2017. Repayments oflease liabilities was Won 393.4 billion in 2019. Repayment of long-term borrowings were Won 89.9 billion in 2019, Won 1,780.7 billion in 2018 andWon 32.7 billion in 2017.
As of December 31, 2019, we had total long-term debt (excluding current portion) outstanding of Won 9,226.0 billion, which included debenturesin the amount of Won 7,253.9 billion and bank and institutional borrowings in the amount of Won 1,972.1 billion. As of December 31, 2018, we hadtotal long-term debt (excluding current portion) outstanding of Won 8,587.6 billion, which included debentures in the amount of Won 6,572.2 billionand bank and institutional borrowings in the amount of Won 2,015.4 billion. For a description of our long-term debt, see note 17 of the notes to ourconsolidated financial statements.
68
Copyright © 2020 www.secdatabase.com. All Rights Reserved.Please Consider the Environment Before Printing This Document
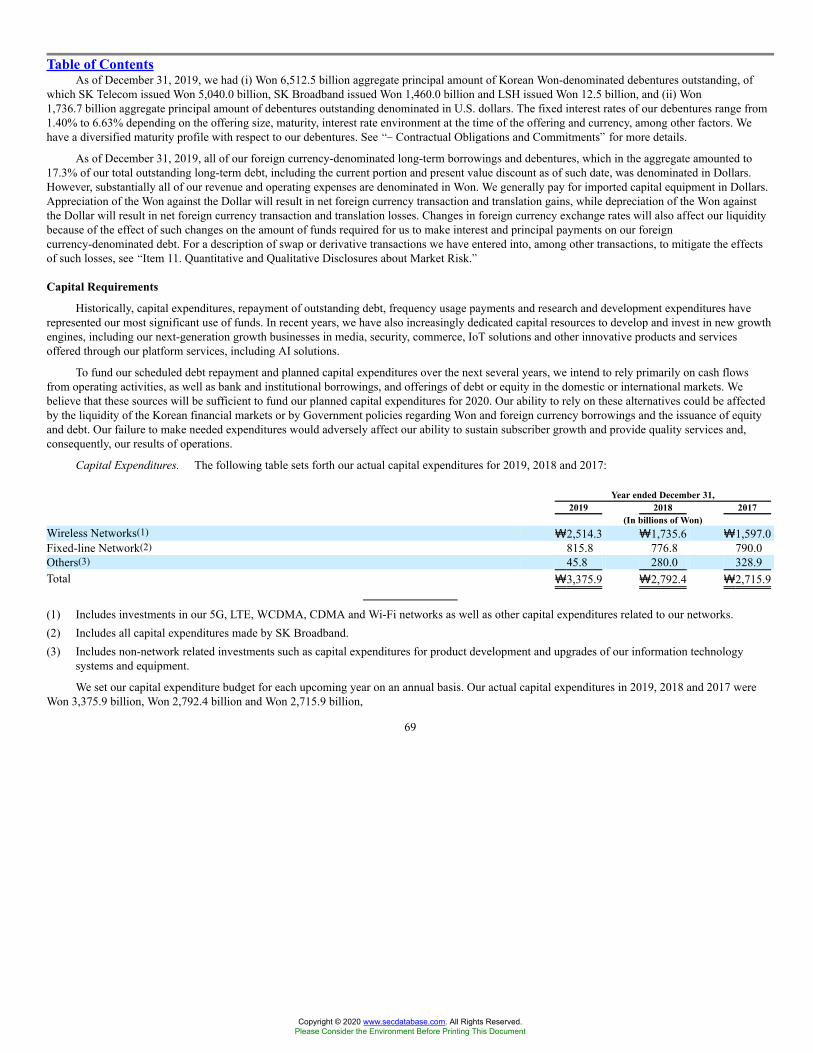
Table of ContentsAs of December 31, 2019, we had (i) Won 6,512.5 billion aggregate principal amount of Korean Won-denominated debentures outstanding, of
which SK Telecom issued Won 5,040.0 billion, SK Broadband issued Won 1,460.0 billion and LSH issued Won 12.5 billion, and (ii) Won1,736.7 billion aggregate principal amount of debentures outstanding denominated in U.S. dollars. The fixed interest rates of our debentures range from1.40% to 6.63% depending on the offering size, maturity, interest rate environment at the time of the offering and currency, among other factors. Wehave a diversified maturity profile with respect to our debentures. See �� Contractual Obligations and Commitments� for more details.
As of December 31, 2019, all of our foreign currency-denominated long-term borrowings and debentures, which in the aggregate amounted to17.3% of our total outstanding long-term debt, including the current portion and present value discount as of such date, was denominated in Dollars.However, substantially all of our revenue and operating expenses are denominated in Won. We generally pay for imported capital equipment in Dollars.Appreciation of the Won against the Dollar will result in net foreign currency transaction and translation gains, while depreciation of the Won againstthe Dollar will result in net foreign currency transaction and translation losses. Changes in foreign currency exchange rates will also affect our liquiditybecause of the effect of such changes on the amount of funds required for us to make interest and principal payments on our foreigncurrency-denominated debt. For a description of swap or derivative transactions we have entered into, among other transactions, to mitigate the effectsof such losses, see �Item 11. Quantitative and Qualitative Disclosures about Market Risk.�
Capital Requirements
Historically, capital expenditures, repayment of outstanding debt, frequency usage payments and research and development expenditures haverepresented our most significant use of funds. In recent years, we have also increasingly dedicated capital resources to develop and invest in new growthengines, including our next-generation growth businesses in media, security, commerce, IoT solutions and other innovative products and servicesoffered through our platform services, including AI solutions.
To fund our scheduled debt repayment and planned capital expenditures over the next several years, we intend to rely primarily on cash flowsfrom operating activities, as well as bank and institutional borrowings, and offerings of debt or equity in the domestic or international markets. Webelieve that these sources will be sufficient to fund our planned capital expenditures for 2020. Our ability to rely on these alternatives could be affectedby the liquidity of the Korean financial markets or by Government policies regarding Won and foreign currency borrowings and the issuance of equityand debt. Our failure to make needed expenditures would adversely affect our ability to sustain subscriber growth and provide quality services and,consequently, our results of operations.
Capital Expenditures. The following table sets forth our actual capital expenditures for 2019, 2018 and 2017:
Year ended December 31,2019 2018 2017
(In billions of Won)Wireless Networks(1) ₩2,514.3 ₩1,735.6 ₩1,597.0Fixed-line Network(2) 815.8 776.8 790.0Others(3) 45.8 280.0 328.9Total ₩3,375.9 ₩2,792.4 ₩2,715.9
(1) Includes investments in our 5G, LTE, WCDMA, CDMA and Wi-Fi networks as well as other capital expenditures related to our networks.(2) Includes all capital expenditures made by SK Broadband.(3) Includes non-network related investments such as capital expenditures for product development and upgrades of our information technology
systems and equipment.
We set our capital expenditure budget for each upcoming year on an annual basis. Our actual capital expenditures in 2019, 2018 and 2017 wereWon 3,375.9 billion, Won 2,792.4 billion and Won 2,715.9 billion,
69
Copyright © 2020 www.secdatabase.com. All Rights Reserved.Please Consider the Environment Before Printing This Document

Table of Contentsrespectively. Of such amounts, we spent approximately 74.5%, 62.2% and 58.8% in 2019, 2018 and 2017, respectively, on capital expenditures relatedto building and enhancing our wireless networks. Our other non-network related capital expenditures in 2019, 2018 and 2017 primarily related todeveloping new products and upgrades to our information technology systems and equipment.
In particular, we have been making capital expenditures to build and expand our 5G network. We commenced commercial 5G services in April2019. We have also been making capital expenditures to improve our LTE network. For a more detailed description of our 5G and LTE networks, see�Item 4.B. Business Overview � Cellular Services � Digital Wireless Network.� We plan to continue to make capital investments in 2020 to build andexpand our 5G network and develop related technologies, as well as to further improve our LTE network.
The following table sets forth our payment obligations relating to our acquisitions of frequency usage rights.
Spectrum Technology (width) Date of Acquisition
Initial PaymentAmount
(in billions of Won)Initial
Payment Year
Annual PaymentAmount
(in billions of Won)Annual
Payment Term20 MHz Dec. 2011 ₩ 248.8 2011 ₩ 74.6 2012-20211.8 GHz LTE (35 MHz)15 MHz Sept. 2013 115.3 2013 43.2 2014-2021
LTE (30 MHz)2.1 GHz WCDMA (10 MHz) Dec. 2016 141.2 2016 85.3 2017-2021
2.6 GHz LTE (40 MHz + 20 MHz) Aug. 2016 332.5 2016 99.8 2017-20263.5 GHz 5G (100 MHz) Dec. 2018 304.6 2018 91.4 2019-202828 GHz 5G (800 MHz) Dec. 2018 51.8 2018 15.5 2019-2023
In case of the 800 MHz spectrum, for which our frequency usage rights were acquired in June 2011 and will expire in June 2021, we make annualpayments amounting to 1.6% of the revenues generated from such spectrum in the previous year. In 2019, we made such annual payment in the amountof Won 29.2 billion. For more information, see note 16 of the notes to our consolidated financial statements.
We expect that our capital expenditure amount in 2020 will be lower than that of 2019. Our expenditures will be for a range of projects, includinginvestments to expand and improve our newly implemented 5G network, investments to maintain our LTE network and LTE-A services, investments toimprove and expand our Wi-Fi network, investments to develop our IoT solutions and platform services business portfolio, including AI solutions,investments in research and development of 5G technology, investments in businesses that can potentially leverage our 5G network, and funding formid- to long-term research and development projects, as well as other initiatives, primarily related to the development of new growth businesses, as wellas initiatives related to our ongoing businesses in the ordinary course. However, our overall expenditure levels and our allocation among projects remainsubject to many uncertainties. We may increase, reduce or suspend our planned capital expenditures for 2020 or change the timing and area of ourcapital expenditure spending from the estimates described above in response to market conditions or for other reasons. We may also make additionalcapital expenditure investments as opportunities arise. Accordingly, we periodically review the amount of our capital expenditures and may makeadjustments based on the current progress of capital expenditure projects and market conditions. No assurance can be given that we will be able to meetany such increased expenditure requirements or obtain adequate financing for such requirements, on terms acceptable to us, or at all.
Repayment of Outstanding Debt. As of December 31, 2019, our principal repayment obligations with respect to long-term borrowings, bondsand short-term borrowings outstanding were as follows for the periods indicated:
Year Ending December 31, Total(In billions of Won)
2020 ₩ 1,038.52021 940.62022 1,421.62023 and thereafter 6,914.4
Investments in New Growth Businesses. We may also require capital for investments to support our development of new growth businesses.
70
Copyright © 2020 www.secdatabase.com. All Rights Reserved.Please Consider the Environment Before Printing This Document
Table of ContentsWe made capital contributions of Won 25.0 billion and Won 65.0 billion in 2017 and 2018, respectively, to Dreamus (formerly known as IRIVER
LIMITED), a manufacturer of digital audio players and other portable media devices of which we had acquired a 39.3% equity interest in August 2014and increased our equity interest to 49.0% in December 2014. Dreamus also operates our music streaming service platform, FLO. As of December 31,2019, we had a 51.4% equity interest in Dreamus.
In 2017, we acquired Life Design Company (formerly known as S.M. Life Design Company Japan Inc.) for Won 30.0 billion, in light of potentialsynergies that may be achieved through the entertainment business.
In October 2018, we acquired ADT Caps by acquiring a 55.0% interest in LSH, which owns 100% of ADT Caps, for Won 696.7 billion. InDecember 2018, we merged NSOK with and into ADT CAPS Co., Ltd. In December 2018, we acquired SK Infosec, Korea�s leading informationsecurity company, in a share exchange transaction pursuant to which we issued 1,260,668 treasury shares with an aggregate book value of Won281.2 billion in exchange for all of the outstanding common shares of SK Infosec from SK Holdings. In 2018, we also increased our interest in idQuantique from 4.6% as of December 31, 2017 to 65.6% as of December 31, 2018, through the acquisition of additional shares with Won 55.2 billion incash and Won 5.7 billion in contribution-in-kind. Following our capital contribution in cash amounting to Won 12.2 billion in 2019, our equity interestin id Quantique increased to 66.8% as of December 31, 2019.
In June 2019, we acquired a 34.6% interest in Incross, a digital advertising company, for an aggregate purchase price of Won 53.7 billion, in lightof potential synergies with our media and commerce businesses.
From time to time, we may make other investments in telecommunications or other businesses, in Korea or abroad, where we perceive attractiveopportunities for investment. From time to time, we may also dispose of existing investments when we believe that doing so would be in our bestinterest.
Severance Payments. The defined benefit obligation, which is the total accrued and unpaid retirement and severance benefits for our employees,as of December 31, 2019 was Won 172.3 billion. This amount was reflected in our consolidated financial statements as a liability, which is net ofdeposits with insurance companies totaling Won 965.7 billion to fund a portion of the employees� severance indemnities.
Also see �Item 6.D. Employees � Employee Benefits� and note 20 of the notes to our consolidated financial statements.
Dividends. Total cash outflows for payments of dividends amounted to Won 718.7 billion in 2019, Won 706.1 billion in 2018 and Won706.1 billion in 2017.
In April 2020, we distributed annual dividends at Won 9,000 per share (exclusive of an interim dividend of Won 1,000 per share) to ourshareholders for an aggregate payout amount of Won 658.2 billion.
71
Copyright © 2020 www.secdatabase.com. All Rights Reserved.Please Consider the Environment Before Printing This Document

Table of ContentsContractual Obligations and Commitments
The following summarizes our contractual cash obligations at December 31, 2019, and the effect such obligations are expected to have onliquidity and cash flow in future periods:
Payments Due by Period(1)
TotalLess Than
1 Year 1-3 Years 4-5 YearsMore Than
5 Years(In billions of Won)
BondsPrincipal ₩8,249.2 ₩967.3 ₩2,280.0 ₩2,348.8 ₩2,653.1Interest 1,244.0 217.0 368.6 240.0 418.4
Long-term borrowingsPrincipal 2,045.3 50.6 82.2 1,912.5 �Interest 346.8 88.2 180.2 78.4 �
Lease liabilitiesPrincipal 754.0 314.0 296.2 64.5 106.3Interest 3.8 1.7 1.3 0.7 0.1
Short-term leases and leases of low-value assets 144.3 144.3 � � �Facility deposits 15.0 10.8 � � 4.2Derivatives 1.0 � 0.5 0.5 �Other long-term payables(2)
Principal 2,051.4 425.3 647.6 413.4 565.1Interest 58.5 15.3 21.1 13.0 9.1
Short-term borrowings 20.6 20.6 � 3,850.7 �
Total contractual cash obligations ₩14,933.9 ₩2,255.2 ₩3,850.7 ₩5,071.8 ₩3,756.2
(1) We are contractually obligated to make severance payments to eligible employees we have employed for more than one year, upon termination oftheir employment, regardless of whether such termination is voluntary or involuntary. Accruals for severance indemnities are recorded based onthe amount we would be required to pay in the event the employment of all our employees were to terminate at the balance date. However, wehave not yet estimated cash flows for future periods. Accordingly, payments due in connection with severance indemnities have been excludedfrom this table.
(2) Related to acquisition of frequency licenses. See note 18 of the notes to our consolidated financial statements.
See note 37 of the notes to our consolidated financial statements for details related to our other commitments and contingencies.
Item 5.C. Research and Development, Patents and Licenses, etc.
We maintain a high level of spending on our research and development activity. We also donate funds to several Korean research institutes andeducational organizations that focus on research and development activity. We believe that we must maintain a substantial in-house technologycapability to achieve our strategic goals.
72
Copyright © 2020 www.secdatabase.com. All Rights Reserved.Please Consider the Environment Before Printing This Document

Table of ContentsThe main focus of our research and development activity is the development of new wireless technologies and services and value-added
technologies and services for our 5G network and LTE network, such as wireless data communications, as well as the development of new technologiesthat reflect the growing convergence between telecommunications and other industries, such as AI, big data analytics, media, security and mobility. SKTelecom�s research and development activity is centered at our AIX Center, located at our SK T-Tower corporate headquarters in Seoul and ourBundang office in Bundang-gu, Seongnam-si, Gyeonggi-do, Korea, which we established in December 2019 by combining our former ICT R&DCenter, AI Center and Digital Transformation Center into one organization. To more efficiently manage our research and development resources, ourAIX Center is organized into the following groups and labs:
Organization Recent Areas of FocusTech Innovation Group Competitiveness of new technologies
Enterprise AI Platform Group Creation of business synergies through enterprise AI platform support
Enterprise AI Solution Group Creation of business synergies through enterprise AI solution support
Data Intelligence Group Measurement of foot traffic congestion in subways using data from cell sites and WiFi network
Global AI Development Group Multimodal communication technology
T-Brain AI research & development capabilities and source technology; conversational AI technology
5GX Labs Wireless and fixed-line network infrastructure; solution business; development of mid- to long-termkey technologies
Data Labs Data analytics, big data platforms and other business solutions
Media Labs Improvement of competitiveness of media services; internalization of elemental next-generation mediatechnologies
Cloud Labs Software-defined data center technologies; machine learning and AI infrastructure technologies; smartoperation and control technologies of cloud infrastructure; commercialization and businessdevelopment of 5G MEC platform; enterprise blockchain technologies
Security Labs Competitiveness of security platform and services; development of new video security solutions;information security technologies
Mobility Labs Autonomous driving technologies; commercialization of mobility platform
Each business unit also has its own research team that can concentrate on specific short-term research needs, and some of our consolidatedsubsidiaries also have their own research and development organizations to focus on activities related to their respective business areas. Such researchteams permit our research center to concentrate on long-term, technology-intensive research projects. We aim to establish strategic alliances withselected domestic and foreign companies with a view to exchanging or jointly developing technologies, products and services.
Item 5.D. Trend Information
These matters are discussed under �Item 5.A. Operating Results� and �Item 5.B. Liquidity and Capital Resources� above where relevant.
Item 5.E. Off-Balance Sheet Arrangements
None.
Item 5.F. Tabular Disclosure of Contractual Obligations
These matters are discussed under �Item 5.B. Liquidity and Capital Resources� above where relevant.
73
Copyright © 2020 www.secdatabase.com. All Rights Reserved.Please Consider the Environment Before Printing This Document
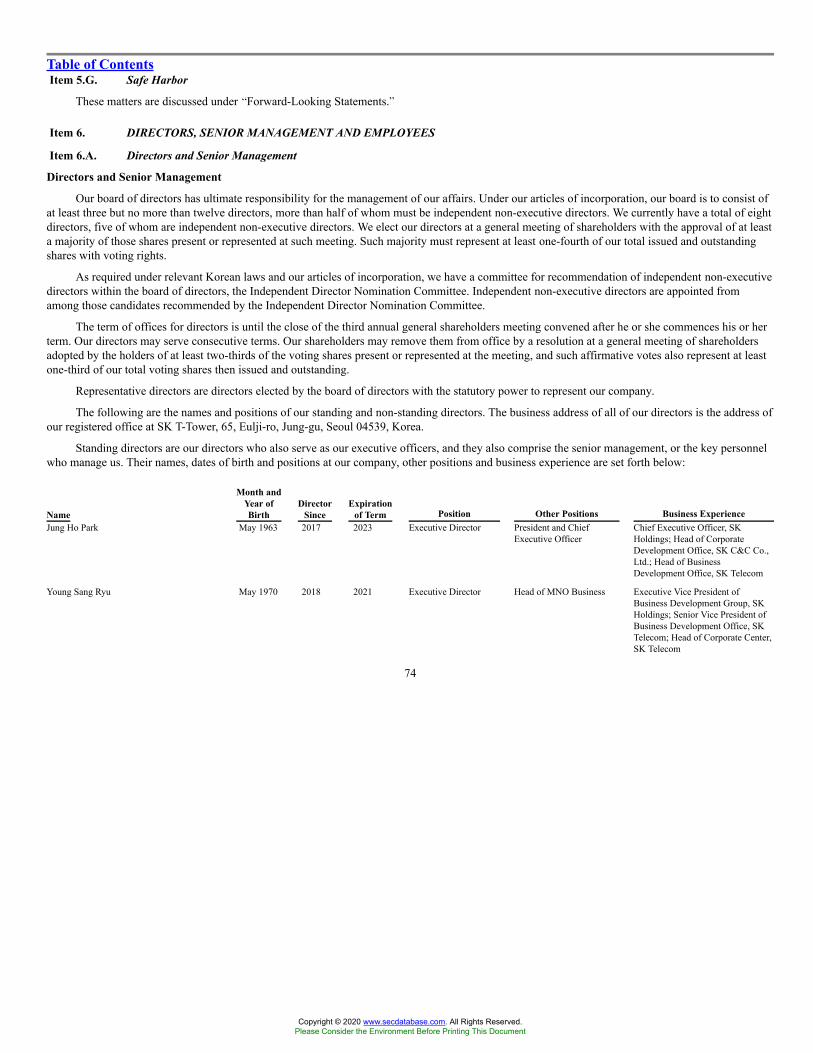
Table of ContentsItem 5.G. Safe Harbor
These matters are discussed under �Forward-Looking Statements.�
Item 6. DIRECTORS, SENIOR MANAGEMENT AND EMPLOYEES
Item 6.A. Directors and Senior Management
Directors and Senior Management
Our board of directors has ultimate responsibility for the management of our affairs. Under our articles of incorporation, our board is to consist ofat least three but no more than twelve directors, more than half of whom must be independent non-executive directors. We currently have a total of eightdirectors, five of whom are independent non-executive directors. We elect our directors at a general meeting of shareholders with the approval of at leasta majority of those shares present or represented at such meeting. Such majority must represent at least one-fourth of our total issued and outstandingshares with voting rights.
As required under relevant Korean laws and our articles of incorporation, we have a committee for recommendation of independent non-executivedirectors within the board of directors, the Independent Director Nomination Committee. Independent non-executive directors are appointed fromamong those candidates recommended by the Independent Director Nomination Committee.
The term of offices for directors is until the close of the third annual general shareholders meeting convened after he or she commences his or herterm. Our directors may serve consecutive terms. Our shareholders may remove them from office by a resolution at a general meeting of shareholdersadopted by the holders of at least two-thirds of the voting shares present or represented at the meeting, and such affirmative votes also represent at leastone-third of our total voting shares then issued and outstanding.
Representative directors are directors elected by the board of directors with the statutory power to represent our company.
The following are the names and positions of our standing and non-standing directors. The business address of all of our directors is the address ofour registered office at SK T-Tower, 65, Eulji-ro, Jung-gu, Seoul 04539, Korea.
Standing directors are our directors who also serve as our executive officers, and they also comprise the senior management, or the key personnelwho manage us. Their names, dates of birth and positions at our company, other positions and business experience are set forth below:
Name
Month andYear ofBirth
DirectorSince
Expirationof Term Position Other Positions Business Experience
Jung Ho Park May 1963 2017 2023 Executive Director President and ChiefExecutive Officer
Chief Executive Officer, SKHoldings; Head of CorporateDevelopment Office, SK C&C Co.,Ltd.; Head of BusinessDevelopment Office, SK Telecom
Young Sang Ryu May 1970 2018 2021 Executive Director Head of MNO Business Executive Vice President ofBusiness Development Group, SKHoldings; Senior Vice President ofBusiness Development Office, SKTelecom; Head of Corporate Center,SK Telecom
74
Copyright © 2020 www.secdatabase.com. All Rights Reserved.Please Consider the Environment Before Printing This Document

Table of ContentsOur current non-standing directors are as set forth below:
Name
Month andYear ofBirth
DirectorSince
Expirationof Term Position Other Positions Business Experience
Dae Sik Cho Nov. 1960 2017 2023 Non-executive Director Chairman, SK SUPEXCouncil
Chief Executive Officer, SKHoldings; Chief Finance Officer,Head of Finance Division and RiskManagement & Corporate AuditingOffice, SK Holdings; Head ofBusiness Management, SK Holdings
Jung Ho Ahn Feb. 1978 2017 2023 IndependentNon-executive Director
Professor, Graduate Schoolof Convergence Scienceand Technology, SeoulNational University
Visiting Scholar, Google Inc.;Senior Research Scientist, ExascaleComputing Lab, HP Labs
Youngmin Yoon Dec. 1963 2018 2021 IndependentNon-executive Director
Dean of School of Mediaand Communications andGraduate School ofJournalism and MassCommunication, KoreaUniversity
Professor, School of Media &Communication, Korea University;Vice-chair, Korean AcademicSociety for Public Relations;Advisor, Ministry of Land,Infrastructure and Transport PublicRelations Division; Advisor, KoreaMedia Rating Board
Seok-Dong Kim May 1953 2019 2022 IndependentNon-executive Director
Chairman, JIPYONGInstitute of Humanities andSociety
Chairman, Financial ServicesCommission; Vice Minister,Ministry of Finance and Economy;Vice Chairman, FinancialSupervisory Commission
Yong-Hak Kim Jan. 1953 2020 2023 IndependentNon-executive Director
Professor Emeritus, YonseiUniversity
President, Yonsei University; BKPlanning Committee, Ministry ofEducation; Member, PresidentialAdvisory Council of PolicyPlanning; Professor of Sociology,Yonsei University
Junmo Kim Sept. 1976 2020 2023 IndependentNon-executive Director
Associate Professor ofElectrical Engineering,KAIST
Assistant Professor of ElectricalEngineering, KAIST; SeniorResearcher, Samsung AdvancedInstitute of Technology
Other Executive Officers
In addition to our standing directors, we currently have the following executive officers:
Name
Month andYear ofBirth Position Business Experience
Jong Ryeol Kang Oct. 1964 Head of ICT Infra Center Head of Corporate Culture DivisionChungsik Kang Nov. 1971 Public Relations Office 1 Project Leader, Communication Committee PR
Team
75
Copyright © 2020 www.secdatabase.com. All Rights Reserved.Please Consider the Environment Before Printing This Document
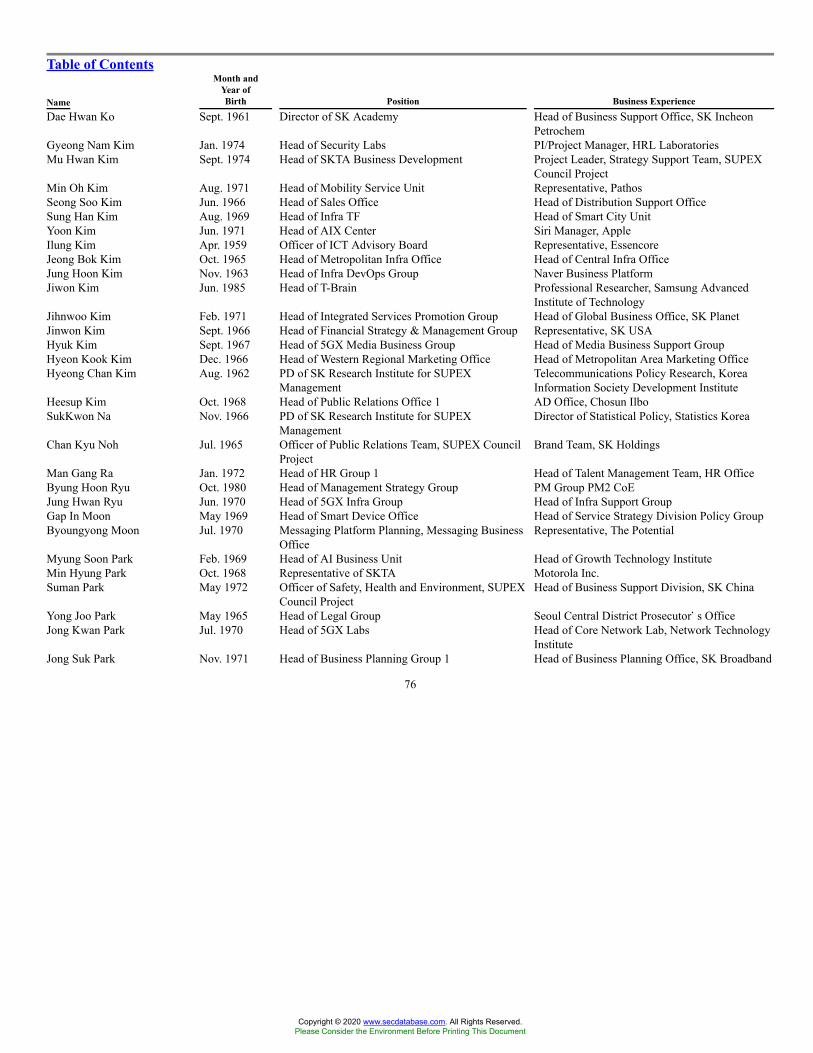
Table of Contents
Name
Month andYear ofBirth Position Business Experience
Dae Hwan Ko Sept. 1961 Director of SK Academy Head of Business Support Office, SK IncheonPetrochem
Gyeong Nam Kim Jan. 1974 Head of Security Labs PI/Project Manager, HRL LaboratoriesMu Hwan Kim Sept. 1974 Head of SKTA Business Development Project Leader, Strategy Support Team, SUPEX
Council ProjectMin Oh Kim Aug. 1971 Head of Mobility Service Unit Representative, PathosSeong Soo Kim Jun. 1966 Head of Sales Office Head of Distribution Support OfficeSung Han Kim Aug. 1969 Head of Infra TF Head of Smart City UnitYoon Kim Jun. 1971 Head of AIX Center Siri Manager, AppleIlung Kim Apr. 1959 Officer of ICT Advisory Board Representative, EssencoreJeong Bok Kim Oct. 1965 Head of Metropolitan Infra Office Head of Central Infra OfficeJung Hoon Kim Nov. 1963 Head of Infra DevOps Group Naver Business PlatformJiwon Kim Jun. 1985 Head of T-Brain Professional Researcher, Samsung Advanced
Institute of TechnologyJihnwoo Kim Feb. 1971 Head of Integrated Services Promotion Group Head of Global Business Office, SK PlanetJinwon Kim Sept. 1966 Head of Financial Strategy & Management Group Representative, SK USAHyuk Kim Sept. 1967 Head of 5GX Media Business Group Head of Media Business Support GroupHyeon Kook Kim Dec. 1966 Head of Western Regional Marketing Office Head of Metropolitan Area Marketing OfficeHyeong Chan Kim Aug. 1962 PD of SK Research Institute for SUPEX
ManagementTelecommunications Policy Research, KoreaInformation Society Development Institute
Heesup Kim Oct. 1968 Head of Public Relations Office 1 AD Office, Chosun IlboSukKwon Na Nov. 1966 PD of SK Research Institute for SUPEX
ManagementDirector of Statistical Policy, Statistics Korea
Chan Kyu Noh Jul. 1965 Officer of Public Relations Team, SUPEX CouncilProject
Brand Team, SK Holdings
Man Gang Ra Jan. 1972 Head of HR Group 1 Head of Talent Management Team, HR OfficeByung Hoon Ryu Oct. 1980 Head of Management Strategy Group PM Group PM2 CoEJung Hwan Ryu Jun. 1970 Head of 5GX Infra Group Head of Infra Support GroupGap In Moon May 1969 Head of Smart Device Office Head of Service Strategy Division Policy GroupByoungyong Moon Jul. 1970 Messaging Platform Planning, Messaging Business
OfficeRepresentative, The Potential
Myung Soon Park Feb. 1969 Head of AI Business Unit Head of Growth Technology InstituteMin Hyung Park Oct. 1968 Representative of SKTA Motorola Inc.Suman Park May 1972 Officer of Safety, Health and Environment, SUPEX
Council ProjectHead of Business Support Division, SK China
Yong Joo Park May 1965 Head of Legal Group Seoul Central District Prosecutor�s OfficeJong Kwan Park Jul. 1970 Head of 5GX Labs Head of Core Network Lab, Network Technology
InstituteJong Suk Park Nov. 1971 Head of Business Planning Group 1 Head of Business Planning Office, SK Broadband
76
Copyright © 2020 www.secdatabase.com. All Rights Reserved.Please Consider the Environment Before Printing This Document

Table of Contents
Name
Month andYear ofBirth Position Business Experience
Jin Woo So Dec. 1961 Chairman of Talent Development Committee,SUPEX Council Project
Representative, SK Planet
Sukham Sung Apr. 1970 Growth Business Support, CR & Growth BusinessSupport Office
Evaluation Manager of Performance EvaluationOffice, MSIT
Jin Soo Seong May 1968 Head of Infra Solution Group Head of Daegu Infra OfficeGwang Hyeon Song Mar. 1970 Head of Public Relations Office 2 Head of Business PR Team, Communication
OfficeJaeseung Song Mar. 1979 Head of Strategic Investment Group Director, Praxis Capital PartnersSang Kyu Shin Nov. 1970 Head of Corporate Culture Center Head of HR OfficeYongsik Shin Aug. 1971 Head of Massive IoT Business Office Head of Energy Business TeamSang Soo Sim Aug. 1965 Head of Infra Business Office Head of Infra Division Network Business Support
GroupJeong Yeol Ahn Aug. 1969 Head of Supply Chain Management Group 1 Head of Corporate Center, Eleven StreetJunehyeon Ahn Nov. 1969 Officer of Corporate Relations Team, SUPEX
Council ProjectCorporate Relations Team, SUPEX CouncilProject Communication Committee
Maeng Seog Yang Mar. 1969 5GX Service Business, 5GX Service BusinessOffice
Head of 5GX MNO Business Group
Ji Young Yeo Sept. 1966 Head of Open Collaboration Group Head of New Business Promotion DivisionDesign Thinking Team
Sung Jin Yeum Oct. 1972 Head of CR Support, CR & Growth BusinessSupport Office
Head of CR Support Team
Yong-Seop Yum Oct. 1962 Head of SK Research Institute for SUPEXManagement
Head of Future Research Office
Hui Gang Ye Jan. 1970 Head of Brand Marketing Group Head of Brand 2 Office, Hyundai CardSehyeon Oh Jul. 1963 Head of Blockchain/Authentication Business
OfficeHead of C&C DT Business DevelopmentDivision
Woong Hwan Ryu May 1971 Head of Social Value Innovation Center Head of Open Collaboration CenterSung Eun Yoon Jan. 1973 Head of CR Innovation TF Head of Corporate Relations Strategy Office
Policy System TeamYong Chul Yoon May 1965 Head of Communication Center Head of Department, MBC NewsroomPoong Young Yoon Nov. 1974 Head of Corporate Center 1 Head of PM GroupKang Won Lee Feb. 1970 Head of Cloud Labs Manager of Mobile N/W Analytics, IBM T.J.
Watson Research CenterKiyoon Lee Dec. 1969 Head of Customer Value Innovation Office PL of Customer Value Innovation OfficeSang Gu Lee Jul. 1970 Head of Messaging Business Office Head of MNO Data Business TeamSang Heon Lee Aug. 1965 Head of Policy Development Office Head of Corporate Relations Strategy OfficeJongmin Lee Jul. 1978 Head of Technology Innovation Group Head of Media Technology InstituteJong Ho Lee Apr. 1969 Head of Mobility Business Division Head of Global Business OfficeJoon Ho Lee Aug. 1968 Head of Social Value Group Head of Public Relation Office 2Joong Ho Lee Nov. 1967 Head of Metropolitan Area Marketing Office Head of Busan Marketing Office
77
Copyright © 2020 www.secdatabase.com. All Rights Reserved.Please Consider the Environment Before Printing This Document
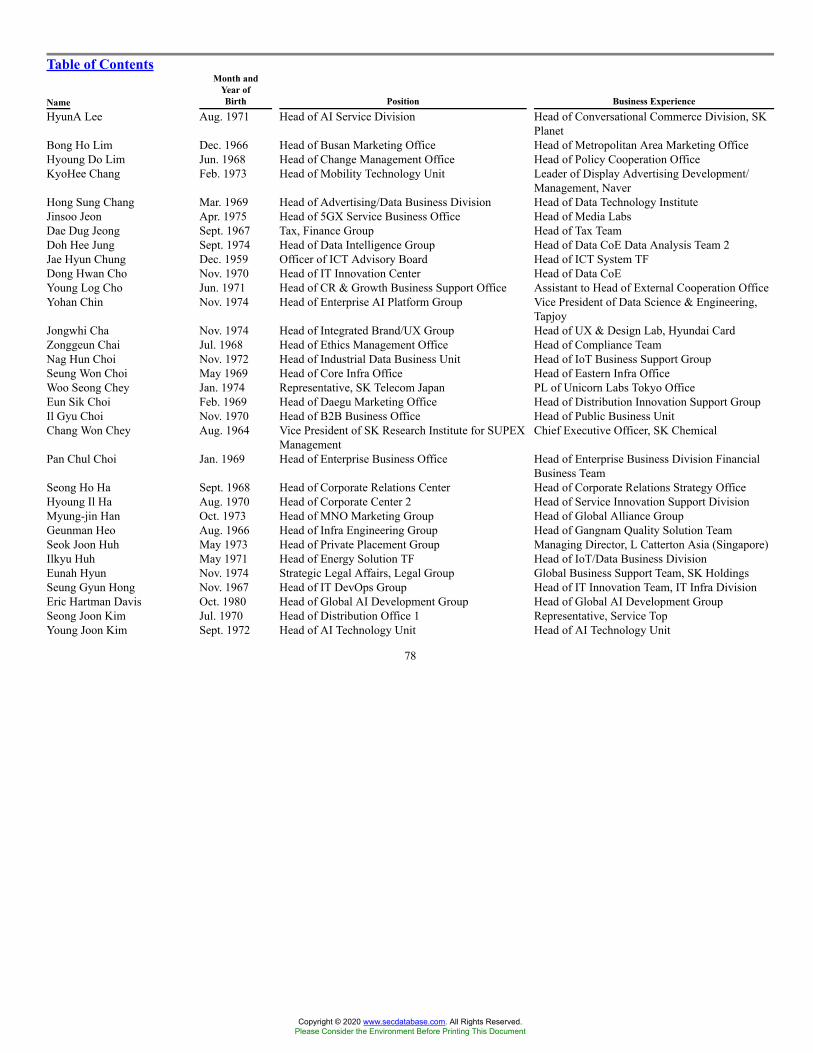
Table of Contents
Name
Month andYear ofBirth Position Business Experience
HyunA Lee Aug. 1971 Head of AI Service Division Head of Conversational Commerce Division, SKPlanet
Bong Ho Lim Dec. 1966 Head of Busan Marketing Office Head of Metropolitan Area Marketing OfficeHyoung Do Lim Jun. 1968 Head of Change Management Office Head of Policy Cooperation OfficeKyoHee Chang Feb. 1973 Head of Mobility Technology Unit Leader of Display Advertising Development/
Management, NaverHong Sung Chang Mar. 1969 Head of Advertising/Data Business Division Head of Data Technology InstituteJinsoo Jeon Apr. 1975 Head of 5GX Service Business Office Head of Media LabsDae Dug Jeong Sept. 1967 Tax, Finance Group Head of Tax TeamDoh Hee Jung Sept. 1974 Head of Data Intelligence Group Head of Data CoE Data Analysis Team 2Jae Hyun Chung Dec. 1959 Officer of ICT Advisory Board Head of ICT System TFDong Hwan Cho Nov. 1970 Head of IT Innovation Center Head of Data CoEYoung Log Cho Jun. 1971 Head of CR & Growth Business Support Office Assistant to Head of External Cooperation OfficeYohan Chin Nov. 1974 Head of Enterprise AI Platform Group Vice President of Data Science & Engineering,
TapjoyJongwhi Cha Nov. 1974 Head of Integrated Brand/UX Group Head of UX & Design Lab, Hyundai CardZonggeun Chai Jul. 1968 Head of Ethics Management Office Head of Compliance TeamNag Hun Choi Nov. 1972 Head of Industrial Data Business Unit Head of IoT Business Support GroupSeung Won Choi May 1969 Head of Core Infra Office Head of Eastern Infra OfficeWoo Seong Chey Jan. 1974 Representative, SK Telecom Japan PL of Unicorn Labs Tokyo OfficeEun Sik Choi Feb. 1969 Head of Daegu Marketing Office Head of Distribution Innovation Support GroupIl Gyu Choi Nov. 1970 Head of B2B Business Office Head of Public Business UnitChang Won Chey Aug. 1964 Vice President of SK Research Institute for SUPEX
ManagementChief Executive Officer, SK Chemical
Pan Chul Choi Jan. 1969 Head of Enterprise Business Office Head of Enterprise Business Division FinancialBusiness Team
Seong Ho Ha Sept. 1968 Head of Corporate Relations Center Head of Corporate Relations Strategy OfficeHyoung Il Ha Aug. 1970 Head of Corporate Center 2 Head of Service Innovation Support DivisionMyung-jin Han Oct. 1973 Head of MNO Marketing Group Head of Global Alliance GroupGeunman Heo Aug. 1966 Head of Infra Engineering Group Head of Gangnam Quality Solution TeamSeok Joon Huh May 1973 Head of Private Placement Group Managing Director, L Catterton Asia (Singapore)Ilkyu Huh May 1971 Head of Energy Solution TF Head of IoT/Data Business DivisionEunah Hyun Nov. 1974 Strategic Legal Affairs, Legal Group Global Business Support Team, SK HoldingsSeung Gyun Hong Nov. 1967 Head of IT DevOps Group Head of IT Innovation Team, IT Infra DivisionEric Hartman Davis Oct. 1980 Head of Global AI Development Group Head of Global AI Development GroupSeong Joon Kim Jul. 1970 Head of Distribution Office 1 Representative, Service TopYoung Joon Kim Sept. 1972 Head of AI Technology Unit Head of AI Technology Unit
78
Copyright © 2020 www.secdatabase.com. All Rights Reserved.Please Consider the Environment Before Printing This Document

Table of Contents
Name
Month andYear ofBirth Position Business Experience
Jeong Gyu Kim Sept. 1976 Officer of Malaysia Regional HQ PL, Global Business Development, SUPEXCouncil Project
Ji Soo Park Jun. 1976 Head of Talent Development CoE, SUPEX CouncilProject
PL, HR Support Team, SUPEX Council Project
Kyung Sik Oh Mar. 1966 Head of Sports Marketing Group Head of Sports Marketing GroupGap Jae Lee Feb. 1973 Head of Central Regional Marketing Office Head of Central Regional Marketing OfficeChang Kwon Jeong Jul. 1970 Head of Western Infra Office Head of Infra Engineering GroupJeong Hwan Choi Jun. 1968 Head of Investor Relations Office 2 Investor Relations, Corporate Development
CenterMin Yong Ha Sept. 1970 Head of Business Planning Group 2 Head of Global Alliance GroupChang Gook Ko Jan. 1966 Officer of PR Team, SUPEX Council Project Head of CPR Office 1, SK C&C
Item 6.B. Compensation
The aggregate of the remuneration paid and in-kind benefits granted to our directors (all standing directors, who also serve as our executiveofficers, and non-standing directors) during the year ended December 31, 2019 totaled approximately Won 6.0 billion.
The compensation of our directors who received total annual compensation exceeding Won 500 million in 2019 was as follows:
Composition of Total Compensation
Name Position Salary BonusOther Earned
Income SeveranceTotal
Compensation(in millions of Won)
Jung Ho Park Executive Director, President andChief Executive Officer ₩ 1,300 ₩ 3,228 ₩ 3 � ₩ 4,531
Young Sang Ryu Executive Director and Head ofMNO Business 460 553 4 � 1,017
Remuneration for our directors is determined by shareholder resolution. Severance allowances for our directors are determined by the board ofdirectors in accordance with our regulation on severance allowances for officers, which was adopted by shareholder resolution. The regulation providesfor monthly salary, performance bonus, severance payment and fringe benefits. The amount of performance bonuses is independently decided by aresolution of the board of directors.
The aggregate of the remuneration paid and in-kind benefits granted to our executive officers (excluding all standing directors, who also serve asour executive officers) during the year ended December 31, 2019 totaled approximately Won 42.5 billion.
79
Copyright © 2020 www.secdatabase.com. All Rights Reserved.Please Consider the Environment Before Printing This Document

Table of ContentsThe compensation of the five individuals who received the highest compensation among those who received total annual compensation exceeding
Won 500 million in 2019 was as follows:
Composition of Total Compensation
Name Position Salary BonusOther Earned
Income SeveranceTotal
Compensation(in millions of Won)
Jung Ho Park Executive Director, President and ChiefExecutive Officer ₩1,300 ₩3,228 ₩ 3 ₩ � ₩ 4,531
Jin Woo So Chairman of Talent Development Committee,SUPEX Council Project 830 1,137 5 � 1,972
Garth Moon Former Officer of Self-Management·ResponsibleManagement Support Team, SUPEX CouncilProject 662 727 44 � 1,433
Sung Won Suh Former Head of MNO Business 700 710 6 � 1,416Yong-Seop Yum Head of SK Research Institute for SUPEX
Management 515 505 2 � 1,022
On February 22, 2019, our board of directors resolved to grant options to purchase shares of our common stock to certain directors and executiveofficers, which was approved by shareholder resolution on March 26, 2019. On February 20, 2020, our board of directors resolved to grant options topurchase shares of our common stock to certain directors and executive officers, which was approved by shareholder resolution on March 26, 2020. Thefollowing table summarizes the exercisable stock options granted to our directors and executive officers as of March 31, 2020:
Exercise periodRecipient Position Grant date From To
Exercise price(per share)
Number ofshares issuable
March 25, 2019 March 24, 2022 ₩ 246,750 22,168March 25, 2020 March 24, 2023 266,490 22,168
March 24, 2017
March 25, 2021 March 24, 2024 287,810 22,168
Jung Ho Park Executive Director,President andChief ExecutiveOfficer March 26, 2020 March 27, 2023 March 26, 2027 192,260 111,106
February 20, 2018 February 21, 2020 February 20, 2023 254,120 1,358March 26, 2019 March 27, 2021 March 26, 2024 254,310 1,734
Young Sang Ryu Executive Directorand Head of MNOBusiness March 26, 2020 March 27, 2023 March 26, 2027 192,260 2,353
February 22, 2019 February 23, 2021 February 22, 2024 265,260 1,369Seong Ho Ha Head of CorporateRelations Center March 26, 2020 March 27, 2023 March 26, 2027 192,260 1,656
February 22, 2019 February 23, 2021 February 22, 2024 265,260 1,564Hyoung Il Ha Head of CorporateCenter 2 March 26, 2020 March 27, 2023 March 26, 2027 192,260 1,961
February 22, 2019 February 23, 2021 February 22, 2024 265,260 1,244Poong Young Yoon Head of CorporateCenter 1 March 26, 2020 March 27, 2023 March 26, 2027 192,260 1,743
Jong Ryeol Kang Head of ICT InfraCenter
March 26, 2020 March 27, 2023 March 26, 2027 192,260 2,048
Yoon Kim Head of AIXCenter
March 26, 2020 March 27, 2023 March 26, 2027 192,260 1,874
Seok Joon Huh Head of PrivatePlacement Group
March 26, 2020 March 27, 2023 March 26, 2027 192,260 1,852
Dong Hwan Cho Head of ITInnovation Center
March 26, 2020 March 27, 2023 March 26, 2027 192,260 1,525
HyunA Lee Head of AI ServiceUnit
March 26, 2020 March 27, 2023 March 26, 2027 192,260 1,525
80
Copyright © 2020 www.secdatabase.com. All Rights Reserved.Please Consider the Environment Before Printing This Document
Table of ContentsItem 6.C. Board Practices
For information regarding the expiration of each director�s term of appointment, as well as the period from which each director has served in suchcapacity, see the table set out under �Item 6.A. Directors and Senior Management� above.
Termination of Directors�� Services
Directors are given a retirement and severance payment upon termination of employment in accordance with our internal regulations on severancepayments. Upon retirement, directors who have made significant contributions to our company during their term may be appointed to serve either as anadvisor to us or as an officer of an affiliate company.
Audit Committee
Under relevant Korean laws and our articles of incorporation, we are required to have an audit committee under the board of directors. Thecommittee is composed of at least three members, two-thirds of whom must be independent non-executive directors in accordance with applicable rules.The members of the audit committee are appointed annually by a resolution of the general meeting of shareholders. They are required to:
� examine the agenda for the general meeting of shareholders;
� examine financial statements and other reports to be submitted by the board of directors to the general meeting of shareholders;
� review the administration by the board of directors of our affairs; and
� examine the operations and asset status of us and our subsidiaries.
In addition, the audit committee must appoint independent auditors to examine our financial statements. An audit and review of our financialstatements by independent auditors is required for the purposes of a securities report. Listed companies must provide such report on an annual, semi-annual and quarterly basis to the FSC and the KRX KOSPI Market.
Our audit committee is composed of four independent non-executive directors: Seok-Dong Kim, Yong-Hak Kim, Jung Ho Ahn and YoungminYoon, each of whom is financially literate and independent under the rules of the NYSE as applicable. The board of directors has determined that Seok-Dong Kim is an �audit committee financial expert� as defined under the applicable rules of the SEC. See �Item 16A. Audit Committee FinancialExpert.�
Independent Director Nomination Committee
This committee is devoted to recommending independent non-executive directors for the board of directors. The objective of the committee is tohelp promote fairness and transparency in the nomination of candidates for these positions. The board of directors decides from time to time who willcomprise the members of this committee. The committee is comprised of one executive director, Jung Ho Park, and two independent directors, Seok-Dong Kim and Jung Ho Ahn.
Capex Review Committee
This committee is responsible for reviewing our business plan (including the budget). It also examines major capital expenditure revisions, androutinely monitors capital expenditure decisions that have already been executed. The committee is comprised of one executive director, Young SangRyu, and five independent directors, Yong-Hak Kim, Seok-Dong Kim, Jung Ho Ahn and Youngmin Yoon and Junmo Kim.
Compensation Review Committee
This committee oversees our overall compensation scheme for top-level executives and directors. It is responsible for reviewing both the criteriafor and level of compensation. It is comprised of three independent directors, Yong-Hak Kim, Seok-Dong Kim and Junmo Kim.
81
Copyright © 2020 www.secdatabase.com. All Rights Reserved.Please Consider the Environment Before Printing This Document
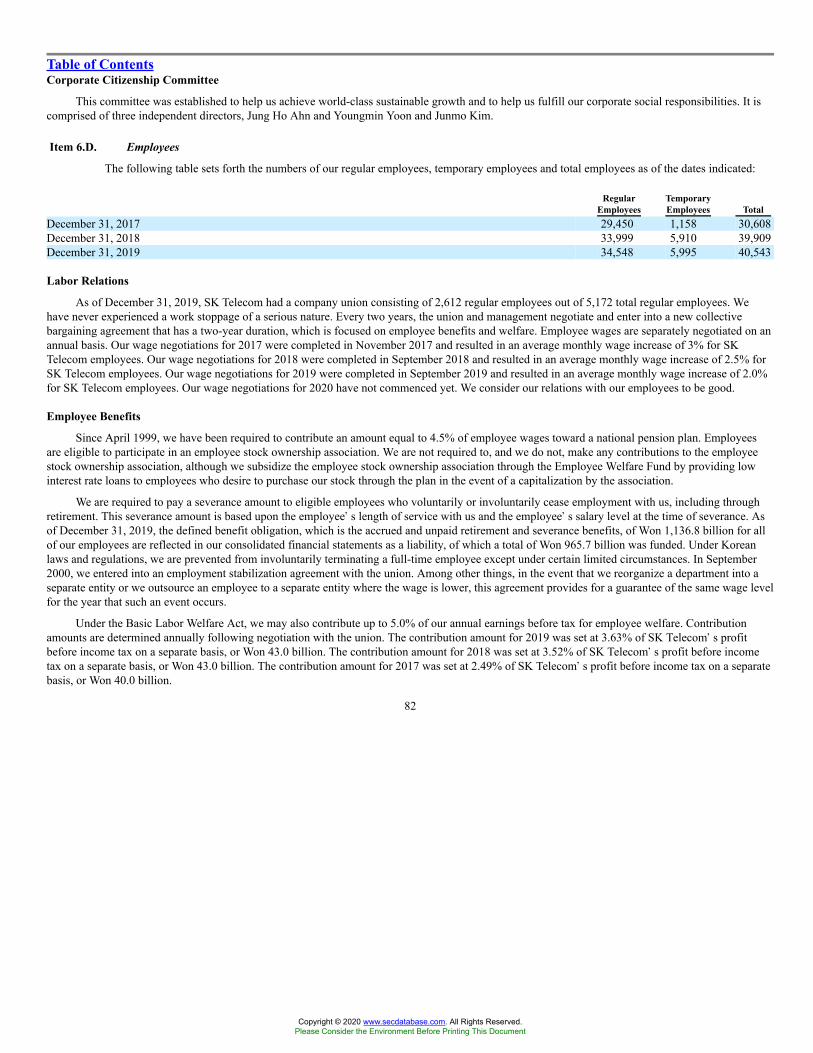
Table of ContentsCorporate Citizenship Committee
This committee was established to help us achieve world-class sustainable growth and to help us fulfill our corporate social responsibilities. It iscomprised of three independent directors, Jung Ho Ahn and Youngmin Yoon and Junmo Kim.
Item 6.D. Employees
The following table sets forth the numbers of our regular employees, temporary employees and total employees as of the dates indicated:
RegularEmployees
TemporaryEmployees Total
December 31, 2017 29,450 1,158 30,608December 31, 2018 33,999 5,910 39,909December 31, 2019 34,548 5,995 40,543
Labor Relations
As of December 31, 2019, SK Telecom had a company union consisting of 2,612 regular employees out of 5,172 total regular employees. Wehave never experienced a work stoppage of a serious nature. Every two years, the union and management negotiate and enter into a new collectivebargaining agreement that has a two-year duration, which is focused on employee benefits and welfare. Employee wages are separately negotiated on anannual basis. Our wage negotiations for 2017 were completed in November 2017 and resulted in an average monthly wage increase of 3% for SKTelecom employees. Our wage negotiations for 2018 were completed in September 2018 and resulted in an average monthly wage increase of 2.5% forSK Telecom employees. Our wage negotiations for 2019 were completed in September 2019 and resulted in an average monthly wage increase of 2.0%for SK Telecom employees. Our wage negotiations for 2020 have not commenced yet. We consider our relations with our employees to be good.
Employee Benefits
Since April 1999, we have been required to contribute an amount equal to 4.5% of employee wages toward a national pension plan. Employeesare eligible to participate in an employee stock ownership association. We are not required to, and we do not, make any contributions to the employeestock ownership association, although we subsidize the employee stock ownership association through the Employee Welfare Fund by providing lowinterest rate loans to employees who desire to purchase our stock through the plan in the event of a capitalization by the association.
We are required to pay a severance amount to eligible employees who voluntarily or involuntarily cease employment with us, including throughretirement. This severance amount is based upon the employee�s length of service with us and the employee�s salary level at the time of severance. Asof December 31, 2019, the defined benefit obligation, which is the accrued and unpaid retirement and severance benefits, of Won 1,136.8 billion for allof our employees are reflected in our consolidated financial statements as a liability, of which a total of Won 965.7 billion was funded. Under Koreanlaws and regulations, we are prevented from involuntarily terminating a full-time employee except under certain limited circumstances. In September2000, we entered into an employment stabilization agreement with the union. Among other things, in the event that we reorganize a department into aseparate entity or we outsource an employee to a separate entity where the wage is lower, this agreement provides for a guarantee of the same wage levelfor the year that such an event occurs.
Under the Basic Labor Welfare Act, we may also contribute up to 5.0% of our annual earnings before tax for employee welfare. Contributionamounts are determined annually following negotiation with the union. The contribution amount for 2019 was set at 3.63% of SK Telecom�s profitbefore income tax on a separate basis, or Won 43.0 billion. The contribution amount for 2018 was set at 3.52% of SK Telecom�s profit before incometax on a separate basis, or Won 43.0 billion. The contribution amount for 2017 was set at 2.49% of SK Telecom�s profit before income tax on a separatebasis, or Won 40.0 billion.
82
Copyright © 2020 www.secdatabase.com. All Rights Reserved.Please Consider the Environment Before Printing This Document
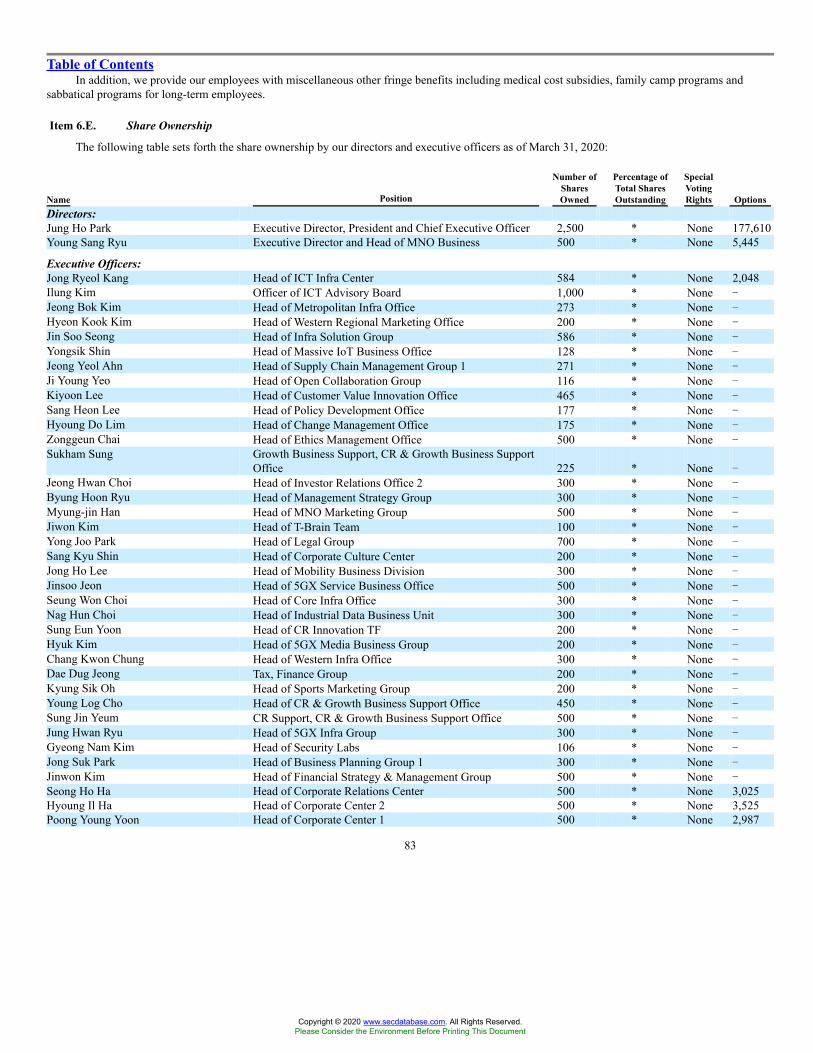
Table of ContentsIn addition, we provide our employees with miscellaneous other fringe benefits including medical cost subsidies, family camp programs and
sabbatical programs for long-term employees.
Item 6.E. Share Ownership
The following table sets forth the share ownership by our directors and executive officers as of March 31, 2020:
Name Position
Number ofSharesOwned
Percentage ofTotal SharesOutstanding
SpecialVotingRights Options
Directors:Jung Ho Park Executive Director, President and Chief Executive Officer 2,500 * None 177,610Young Sang Ryu Executive Director and Head of MNO Business 500 * None 5,445
Executive Officers:Jong Ryeol Kang Head of ICT Infra Center 584 * None 2,048Ilung Kim Officer of ICT Advisory Board 1,000 * None �Jeong Bok Kim Head of Metropolitan Infra Office 273 * None �Hyeon Kook Kim Head of Western Regional Marketing Office 200 * None �Jin Soo Seong Head of Infra Solution Group 586 * None �Yongsik Shin Head of Massive IoT Business Office 128 * None �Jeong Yeol Ahn Head of Supply Chain Management Group 1 271 * None �Ji Young Yeo Head of Open Collaboration Group 116 * None �Kiyoon Lee Head of Customer Value Innovation Office 465 * None �Sang Heon Lee Head of Policy Development Office 177 * None �Hyoung Do Lim Head of Change Management Office 175 * None �Zonggeun Chai Head of Ethics Management Office 500 * None �Sukham Sung Growth Business Support, CR & Growth Business Support
Office 225 * None �Jeong Hwan Choi Head of Investor Relations Office 2 300 * None �Byung Hoon Ryu Head of Management Strategy Group 300 * None �Myung-jin Han Head of MNO Marketing Group 500 * None �Jiwon Kim Head of T-Brain Team 100 * None �Yong Joo Park Head of Legal Group 700 * None �Sang Kyu Shin Head of Corporate Culture Center 200 * None �Jong Ho Lee Head of Mobility Business Division 300 * None �Jinsoo Jeon Head of 5GX Service Business Office 500 * None �Seung Won Choi Head of Core Infra Office 300 * None �Nag Hun Choi Head of Industrial Data Business Unit 300 * None �Sung Eun Yoon Head of CR Innovation TF 200 * None �Hyuk Kim Head of 5GX Media Business Group 200 * None �Chang Kwon Chung Head of Western Infra Office 300 * None �Dae Dug Jeong Tax, Finance Group 200 * None �Kyung Sik Oh Head of Sports Marketing Group 200 * None �Young Log Cho Head of CR & Growth Business Support Office 450 * None �Sung Jin Yeum CR Support, CR & Growth Business Support Office 500 * None �Jung Hwan Ryu Head of 5GX Infra Group 300 * None �Gyeong Nam Kim Head of Security Labs 106 * None �Jong Suk Park Head of Business Planning Group 1 300 * None �Jinwon Kim Head of Financial Strategy & Management Group 500 * None �Seong Ho Ha Head of Corporate Relations Center 500 * None 3,025Hyoung Il Ha Head of Corporate Center 2 500 * None 3,525Poong Young Yoon Head of Corporate Center 1 500 * None 2,987
83
Copyright © 2020 www.secdatabase.com. All Rights Reserved.Please Consider the Environment Before Printing This Document
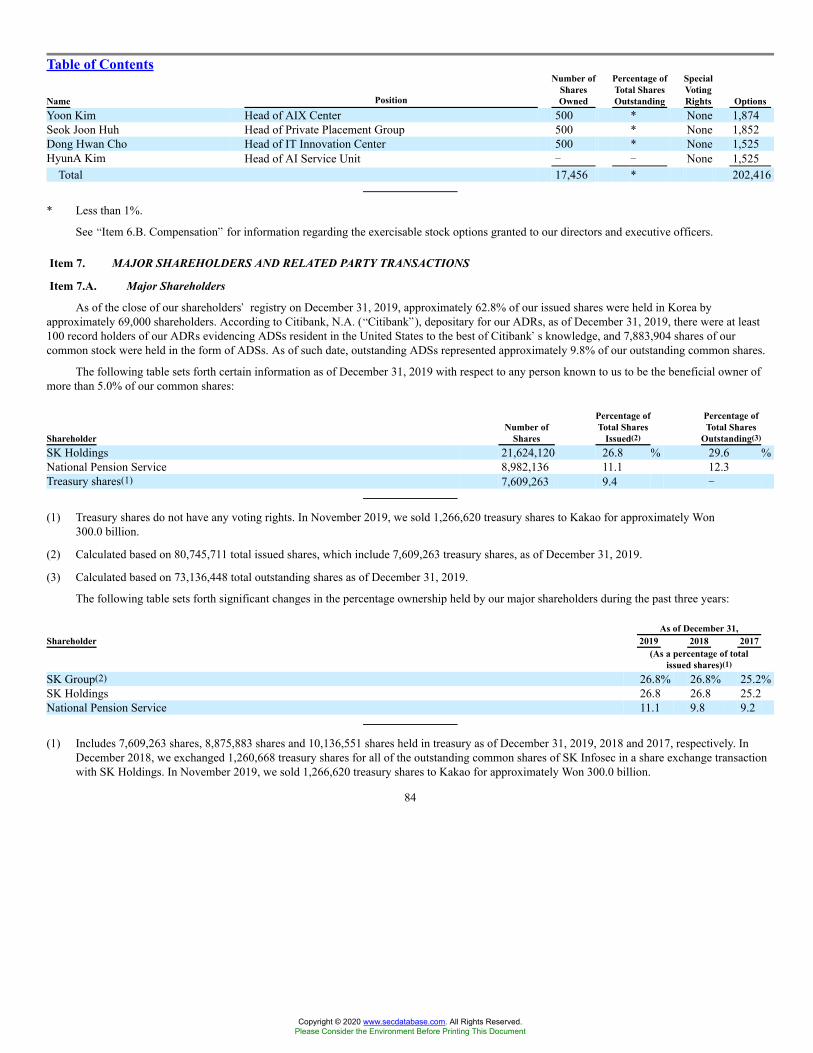
Table of Contents
Name Position
Number ofSharesOwned
Percentage ofTotal SharesOutstanding
SpecialVotingRights Options
Yoon Kim Head of AIX Center 500 * None 1,874Seok Joon Huh Head of Private Placement Group 500 * None 1,852Dong Hwan Cho Head of IT Innovation Center 500 * None 1,525HyunA Kim Head of AI Service Unit � � None 1,525
Total 17,456 * 202,416
* Less than 1%.
See �Item 6.B. Compensation� for information regarding the exercisable stock options granted to our directors and executive officers.
Item 7. MAJOR SHAREHOLDERS AND RELATED PARTY TRANSACTIONS
Item 7.A. Major Shareholders
As of the close of our shareholders� registry on December 31, 2019, approximately 62.8% of our issued shares were held in Korea byapproximately 69,000 shareholders. According to Citibank, N.A. (�Citibank�), depositary for our ADRs, as of December 31, 2019, there were at least100 record holders of our ADRs evidencing ADSs resident in the United States to the best of Citibank�s knowledge, and 7,883,904 shares of ourcommon stock were held in the form of ADSs. As of such date, outstanding ADSs represented approximately 9.8% of our outstanding common shares.
The following table sets forth certain information as of December 31, 2019 with respect to any person known to us to be the beneficial owner ofmore than 5.0% of our common shares:
ShareholderNumber of
Shares
Percentage ofTotal Shares
Issued(2)
Percentage ofTotal Shares
Outstanding(3)
SK Holdings 21,624,120 26.8 % 29.6 %National Pension Service 8,982,136 11.1 12.3Treasury shares(1) 7,609,263 9.4 �
(1) Treasury shares do not have any voting rights. In November 2019, we sold 1,266,620 treasury shares to Kakao for approximately Won300.0 billion.
(2) Calculated based on 80,745,711 total issued shares, which include 7,609,263 treasury shares, as of December 31, 2019.
(3) Calculated based on 73,136,448 total outstanding shares as of December 31, 2019.
The following table sets forth significant changes in the percentage ownership held by our major shareholders during the past three years:
As of December 31,Shareholder 2019 2018 2017
(As a percentage of totalissued shares)(1)
SK Group(2) 26.8% 26.8% 25.2%SK Holdings 26.8 26.8 25.2National Pension Service 11.1 9.8 9.2
(1) Includes 7,609,263 shares, 8,875,883 shares and 10,136,551 shares held in treasury as of December 31, 2019, 2018 and 2017, respectively. InDecember 2018, we exchanged 1,260,668 treasury shares for all of the outstanding common shares of SK Infosec in a share exchange transactionwith SK Holdings. In November 2019, we sold 1,266,620 treasury shares to Kakao for approximately Won 300.0 billion.
84
Copyright © 2020 www.secdatabase.com. All Rights Reserved.Please Consider the Environment Before Printing This Document

Table of Contents(2) SK Group�s ownership interest as of December 31, 2019, 2018 and 2017 consisted of the ownership interest of SK Holdings only.
Except as described above, other than companies in the SK Group, no other persons or entities known by us to be acting in concert, directly orindirectly, jointly or severally, own in excess of 5.0% of our total shares outstanding or exercise control or could exercise control over our business.
As of March 31, 2020, SK Holdings held 26.8% of our total issued shares of common stock. For a description of our foreign ownership limitation,see �Item 3.D. Risk Factors � Risks Relating to Our Business � If SK Holdings causes us to breach the foreign ownership limitations on our commonshares, we may experience a change of control.� and �Item 4.B. Business Overview � Law and Regulation � Foreign Ownership and InvestmentRestrictions and Requirements.� In the event that SK Holdings announces plans of a sale of our shares, we expect to be able to discuss the details ofsuch sale with them in advance and will endeavor to minimize any adverse effects on our share prices as a result of such sale.
As of March 31, 2020, the total number of our common shares outstanding was 73,136,448.
Other than as disclosed herein, there are no other arrangements, to the best of our knowledge, which would result in a material change in thecontrol of us. Our major shareholders do not have different voting rights.
Item 7.B. Related Party Transactions
We are part of the SK Group of affiliated companies. See �Item 7.A. Major Shareholders.� As disclosed in note 36 of the notes to our consolidatedfinancial statements, we had related party transactions with a number of affiliated companies of the SK Group during the year ended December 31,2019.
SK Networks
As of December 31, 2019, we had Won 3.5 billion of accounts receivable from SK Networks. As of the same date, we had Won 85.4 billion ofaccounts payable to SK Networks, mainly relating to payments for wireless devices by PS&Marketing. The aggregate fees we paid to SK Networks fordealer commissions amounted to Won 1,088.4 billion in 2019, Won 1,189.4 billion in 2018 and Won 1,220.3 billion in 2017.
SK Holdings
We enter into agreements with SK Holdings from time to time for specific information technology-related projects, and we also pay SK Holdingsfor use of the SK brand. The aggregate fees we paid to SK Holdings for such information technology services and the use of the SK brand amounted toWon 396.0 billion in 2019, Won 397.5 billion in 2018 and Won 397.0 billion in 2017. We also purchase various information technology-relatedequipment from SK Holdings from time to time. The total amount of such purchases was Won 95.4 billion in 2019, Won 151.5 billion in 2018 and Won283.6 billion in 2017. We are a party to several service agreements with SK Holdings relating to the development and maintenance of our informationtechnologies systems.
In December 2018, we acquired SK Infosec from SK Holdings in a share exchange transaction, pursuant to which we transferred 1,260,668treasury shares with an aggregate book value of Won 281.2 billion to SK Holdings in exchange for all of the issued and outstanding common shares ofSK Infosec.
SK TNS
SK TNS Co., Ltd. (�SK TNS�) provides us with network construction and maintenance services and related equipment. The total amount ofnetwork equipment purchased from SK TNS was Won 607.5 billion in 2019, Won 493.8 billion in 2018 and Won 494.6 billion in 2017. As ofDecember 31, 2019, we had Won 200.7 billion of accounts payable to SK TNS, mainly relating to payments for such services and equipment.
Item 7.C. Interests of Experts and Counsel
Not applicable.
85
Copyright © 2020 www.secdatabase.com. All Rights Reserved.Please Consider the Environment Before Printing This Document
Table of ContentsItem 8. FINANCIAL INFORMATION
Item 8.A. Consolidated Statements and Other Financial Information
See �Item 18. Financial Statements� and pages F-1 through G-94.
Legal Proceedings
FTC Proceedings
In March 2012, the FTC fined us Won 21.9 billion for allegedly colluding with KT, LG U+, Samsung Electronics, LG Electronics and Pantech(which were also assessed separate fines) to inflate the prices of handsets while advertising that the handsets are offered at a discount through subsidyplans. We paid such fine in September 2012 and filed an appeal at the Seoul High Court, which ruled against us in October 2014, and subsequently tothe Supreme Court of Korea, which also ruled against us in September 2019.
KCC Proceedings
On March 21, 2017, the KCC imposed a fine of Won 794 million on us for providing subsidies to foreign subscribers in excess of the amountspermitted under the MDDIA. On December 6, 2017, the KCC issued a correctional order relating to restrictions on cancelling broadband Internet andbundled service subscriptions.
On January 24, 2018, the KCC imposed an aggregate fine of Won 21.4 billion on us for providing discriminatory subsidies in violation of theMDDIA.
On March 20, 2019, the KCC imposed a fine of Won 975 million on us and issued a correctional order for providing discriminatory subsidies inviolation of the MDDIA. On June 26, 2019, the KCC imposed a fine of Won 231 million on us and issued a correctional order relating to restrictions onsubscription cancelations. On July 9, 2019, the KCC imposed a fine of Won 1.5 million on us and issued a correctional order for failing to maintain theamount of subsidies for the minimum period in violation of the MDDIA.
With respect to the correctional orders issued by the KCC set forth above, we have implemented remedial measures pursuant to such correctionalorders and reported to the KCC on the implementation of such measures.
We, KT and LG U+ are currently under investigation by the KCC for allegedly providing handset subsidies that were in excess of their officiallyannounced amounts and were discriminatory in nature, as well as allegedly unlawfully requiring subscribers to enroll to certain subscription plans orpurchase certain value-added services in return, in connection with attracting new subscribers of 5G wireless services during the period between April2019 and August 2019. While the results of such investigation are still pending, the KCC may impose a significant amount of fine on us in connectionwith such alleged activities.
Except as described above, neither we nor any of our subsidiaries are involved in any litigation, arbitration or administrative proceedings relatingto claims which may have, or have had during the twelve months preceding the date hereof, a significant effect on our financial position or the financialposition of our subsidiaries taken as a whole, and, so far as we are aware, no such litigation, arbitration or administrative proceedings are pending orthreatened.
Dividends
Annual dividends, if any, on our outstanding shares must be approved at the annual general meeting of shareholders. This meeting is generallyheld in March of the following year, and the annual dividend is generally paid shortly after the meeting. Since our shareholders have discretion todeclare annual dividends, we cannot give any assurance as to the amount of dividends per share or that any dividends will be declared at all. Interimdividends, if any, can be approved by a resolution of our board of directors. Once declared, dividends must be claimed within five years, after which theright to receive the dividends is extinguished and reverted to us.
We pay cash dividends to the ADR depositary in Won. Under the terms of the deposit agreement, cash dividends received by the ADR depositarygenerally are to be converted by the ADR depositary into Dollars and distributed to the holders of the ADSs, less withholding tax, other governmentalcharges and the ADR depositary�s
86
Copyright © 2020 www.secdatabase.com. All Rights Reserved.Please Consider the Environment Before Printing This Document

Table of Contentsfees and expenses. The ADR depositary�s designated bank in Korea must approve this conversion and remittance of cash dividends. See �Item 10.D.Exchange Controls � Korean Foreign Exchange Controls and Securities Regulations.�
The following table sets forth the dividend per share and the aggregate total amount of dividends declared (including any interim dividends), aswell as the number of outstanding shares entitled to dividends, with respect to the years indicated. The dividends set out for each of the years belowwere paid in the immediately following year.
Year Ended December 31,Dividendper Share
Total Amount ofDividends
Number ofShares Entitled
to Dividend(In Won) (In billions of Won)
2015 ₩10,000 ₩ 708.1 70,609,160 (1)2016 10,000 706.1 70,609,1602017 10,000 706.1 70,609,1602018 10,000 717.4 71,869,828 (2)2019 10,000 730.1 73,136,448 (3)
(1) The number of shares entitled to the interim dividend was 72,629,160.
(2) The number of shares entitled to the interim dividend was 70,609,160.
(3) The number of shares entitled to the interim dividend was 71,869,828.
We distribute dividends to our shareholders in proportion to the number of shares owned by each shareholder. Our common shares represented bythe ADSs have the same dividend rights as other outstanding common shares.
Holders of non-voting shares are entitled to receive dividends in priority to the holders of common shares. The dividend on the non-voting sharesis between 9.0% and 25.0% of the par value as determined by the board of directors at the time of their issuance. If the dividends for common sharesexceed the dividends for non-voting shares, the holders of non-voting shares will be entitled to participate in the distribution of such excess amount withthe holders of common shares. If the amount available for dividends is less than the aggregate amount of the minimum required dividend, holders ofnon-voting shares will be entitled to receive such accumulated unpaid dividend from dividends payable in the next fiscal year before holders of commonshares. There are no non-voting shares issued or outstanding.
We declare dividends annually at the annual general meeting of shareholders which is generally held within three months after the end of the fiscalyear. We pay the annual dividend shortly after the annual general meeting to the shareholders of record or registered pledges as of the end of thepreceding fiscal year. We may distribute the annual dividend in cash or in shares. However, a dividend of shares must be distributed at par value.Dividends in shares may not exceed one-half of the annual dividend. Our obligation to pay dividend expires if no claim to dividend is made for fiveyears from the payment date.
Under the Korean Commercial Code, we may pay an annual dividend only out of the excess of our net assets, on a non-consolidated basis, overthe sum of (1) our stated capital, (2) the total amount of our capital surplus reserve, (3) legal reserve accumulated up to the end of the relevant dividendperiod and (4) the increase in our net asset value resulting from the evaluation of our assets and liabilities that has not been offset against unrealizedlosses. In addition, we may not pay an annual dividend unless we have set aside as a legal reserve an amount equal to at least 10.0% of the cash portionof the annual dividend or until we have accumulated a legal reserve of not less than one-half of our stated capital. We may not use our legal reserve topay cash dividends but may transfer amounts from our legal reserve to capital stock or use our legal reserve to reduce an accumulated deficit.
In addition, the Korean Commercial Code and our articles of incorporation provide that, in addition to annual dividends, we may pay interimdividends once during each fiscal year. Unlike annual dividends, the decision to pay interim dividends can be made by a resolution of the board ofdirectors and is not subject to shareholder approval. Any interim dividends must be paid in cash to the shareholders of record as of June 30 of therelevant fiscal year.
Under the Korean Commercial Code, the total amount of interim dividends payable in a fiscal year shall not be more than the net assets on thebalance sheet of the immediately preceding fiscal year, after deducting (1) a
87
Copyright © 2020 www.secdatabase.com. All Rights Reserved.Please Consider the Environment Before Printing This Document
Table of Contentscompany�s capital in the immediately preceding fiscal year, (2) the aggregate amount of its capital reserves and legal reserves accumulated up to theimmediately preceding fiscal year, (3) the amount of earnings for dividend payments confirmed at the general shareholders� meeting with respect to theimmediately preceding fiscal year and (4) the amount of legal reserve that should be set aside for the current fiscal year following the interim dividendpayment. Furthermore, the rate of interim dividends for non-voting shares must be the same as that for our common shares.
Our obligation to pay interim dividends expires if no claims to such dividends are made for a period of five years from the payment date.
Item 8.B. Significant Changes
None.
Item 9. THE OFFER AND LISTING
Item 9.A. Offering and Listing Details
These matters are described under �Item 9.C. Markets� below where relevant.
Item 9.B. Plan of Distribution
Not applicable.
Item 9.C. Markets
The principal trading market for our common shares is the KRX KOSPI Market. Our common shares are traded on the KRX KOSPI Market underthe identification code 017670. As of March 31, 2020, 73,136,448 shares of our common stock were outstanding.
The ADSs are traded on the NYSE and the London Stock Exchange. The ADSs have been issued by the ADR depositary and are traded on theNYSE under the ticker symbol �SKM.� Each ADS represents one-ninth of one share of our common stock. As of March 31, 2020, ADSs representing7,982,904 shares of our common stock were outstanding.
Item 9.D. Selling Shareholders
Not applicable.
Item 9.E. Dilution
Not applicable.
Item 9.F. Expenses of the Issue
Not applicable.
Item 10. ADDITIONAL INFORMATION
Item 10.A. Share Capital
Not applicable.
Item 10.B. Memorandum and Articles of Association
Description of Capital Stock
This section provides information relating to our capital stock, including brief summaries of material provisions of our articles of incorporation,the FSCMA, the Korean Commercial Code, the Telecommunications Business Act and related laws of Korea, all as currently in effect. The followingsummaries are subject to, and are
88
Copyright © 2020 www.secdatabase.com. All Rights Reserved.Please Consider the Environment Before Printing This Document
Table of Contentsqualified in their entirety by reference to, our articles of incorporation and the applicable provisions of the FSCMA, the Korean Commercial Code andthe Telecommunications Business Act. We have filed a copy of our articles of incorporation as an exhibit to our annual reports on Form 20-F.
General
The name of our company is SK Telecom Co., Ltd. We are registered under the laws of Korea under the commercial registry number of110111-0371346. As specified in Article 2 (Objectives) of our articles of incorporation, as amended, our objectives are the rational management of thetelecommunications business, development of telecommunications technology, and contribution to public welfare and convenience. In order to achievethese objectives, we are engaged in the following:
� information and communication business;
� sale and lease of subscriber handsets;
� new media business;
� advertising business;
� mail order sales business;
� real estate business (development, management and leasing, etc.) and chattel leasing business;
� research and technology development relating to the first four items above;
� overseas and import/export business relating to the first four items above;
� manufacture and distribution business relating to the first four items above;
� travel business;
� electronic financial services business;
� film business (production, import, distribution and screening);
� lifetime education and management of lifetime educational facilities;
� electric engineering business;
� information- and communication-related engineering business;
� ubiquitous city construction and related service business;
� any related business through investment, management and operation of our Korean or offshore subsidiaries and investment companies;
� construction business, including the machine and equipment business;
� export/import business and export/import intermediation/agency business;
� electrical business such as intelligent electrical grid business; and
� any business or undertaking incidental or conducive to the attainment of the objectives stated above.
Currently, our authorized share capital is 220,000,000 shares, which consists of shares of common stock, par value Won 500 per share, and sharesof non-voting stock, par value Won 500 per share (common shares and non-voting shares together are referred to as �shares�). Under our articles ofincorporation, we are authorized to issue up to 5,500,000 non-voting preferred shares. As of March 31, 2020, 80,745,711 common shares were issued, ofwhich 7,609,263 shares were held by us in treasury. In November 2019, we sold 1,266,620 treasury shares to Kakao for approximately Won300.0 billion. We have never issued any non-voting preferred shares. All of the issued and outstanding common shares are fully-paid and non-assessableand are in registered form.
Board of Directors
Meetings of the board of directors are convened by the representative director as he or she deems necessary or upon the request of three or moredirectors. The board of directors determines all important matters relating to our
89
Copyright © 2020 www.secdatabase.com. All Rights Reserved.Please Consider the Environment Before Printing This Document
Table of Contentsbusiness. In addition, the prior approval of the majority of the independent non-executive directors is required for certain matters, which include:
� investment by us or any of our subsidiaries in a foreign company in equity or acquisition of such foreign company�s other overseas assets inan amount equal to 5.0% or more of our equity under our most recent balance sheet; and
� contribution of capital, loans or guarantees, acquisition of our subsidiaries� assets or similar transactions with our affiliated companies inexcess of Won 10.0 billion through one or a series of transactions.
Resolutions of the board are adopted in the presence of a majority of the directors in office and by the affirmative vote of a majority of thedirectors present. No director who has an interest in a matter for resolution may exercise his or her vote upon such matter.
There are no specific shareholding requirements for director�s qualification. Directors are elected at a general meeting of shareholders if theapproval of the holders of the majority of the voting shares present at such meeting is obtained and if such majority also represents at least one-fourth ofthe total number of shares outstanding. Under the Korean Commercial Code, unless otherwise stated in the articles of incorporation, holders of anaggregate of 1.0% or more of the outstanding shares with voting rights may request cumulative voting in any election for two or more directors. Ourarticles of incorporation permit cumulative voting for the election of directors.
The term of office for directors is until the close of the third annual general shareholders meeting convened after he or she commences his or herterm. Our directors may serve consecutive terms and our shareholders may remove them from office at any time by a special resolution adopted at ageneral meeting of shareholders.
Dividends
We distribute dividends to our shareholders in proportion to the number of shares owned by each shareholder. Our common shares represented bythe ADSs have the same dividend rights as other outstanding common shares. For a detailed discussion of our dividend policy, see �Item 8.A.Consolidated Statements and Other Financial Information � Dividends.�
Distribution of Free Shares
In addition to paying dividends in shares out of our retained or current earnings, we may also distribute to our shareholders an amount transferredfrom our capital surplus or legal reserve to our stated capital in the form of free shares. We must distribute such free shares to all our shareholders inproportion to their existing shareholdings.
Preemptive Rights and Issuance of Additional Shares
We may at times issue authorized but unissued shares, unless otherwise provided in the Korean Commercial Code, on terms determined by ourboard of directors. All our shareholders are generally entitled to subscribe to any newly-issued shares in proportion to their existing shareholdings. Wemust offer new shares on uniform terms to all shareholders who have preemptive rights and are listed on our shareholders� registry as of the relevantrecord date. We must give public notice of the preemptive rights regarding new shares and their transferability at least two weeks before the relevantrecord date. Our board of directors may determine how to distribute shares for which preemptive rights have not been exercised or where fractions ofshares occur.
Under the Korean Commercial Code and our articles of incorporation, we may issue new shares pursuant to a board resolution to persons otherthan existing shareholders only if (1) the new shares are issued for the purpose of issuing depositary receipts in accordance with the relevant regulationsor through an offering to public investors and (2) the purpose of such issuance is deemed necessary by us to achieve a business purpose, including, butnot limited to, the introduction of new technology or the improvement of our financial condition. If we make an allotment of new shares to persons otherthan our existing shareholders, we are required by the Korean Commercial Code to notify our existing shareholders of (a) the class and number of newshares, (b) the issuance price of new shares and the date set for the payment thereof, (c) in cases of no par value shares, the amount to be included in thepaid-up capital out of the issuance price of new shares and (d) the method of subscription to new shares by no later than two
90
Copyright © 2020 www.secdatabase.com. All Rights Reserved.Please Consider the Environment Before Printing This Document
Table of Contentsweeks before the date of payment of the subscription price, or publicly announce such information. Under our articles of incorporation, only our boardof directors is authorized to set the terms and conditions with respect to such issuance of new shares.
In addition, under our articles of incorporation, we may issue convertible bonds or bonds with warrants, each up to an aggregate principal amountof Won 400.0 billion, to persons other than existing shareholders, where such issuance is deemed necessary by us to achieve a business purpose,including, but not limited to, the introduction of new technology or the improvement of our financial condition.
Members of our employee stock ownership association, whether or not they are our shareholders, generally have a preemptive right to subscribefor up to 20.0% of the shares publicly offered pursuant to the FSCMA. This right is exercisable only to the extent that the total number of shares soacquired and held by members of our employee stock ownership association does not exceed 20.0% of the sum of the number of shares then outstandingand the number of newly-issued shares.
General Meeting of Shareholders
We generally hold the annual general meeting of shareholders within three months after the end of each fiscal year. Subject to a board resolutionor court approval, we may hold an extraordinary general meeting of shareholders:
� as necessary;
� at the request of holders of an aggregate of 3.0% or more of our outstanding common shares;
� at the request of shareholders holding an aggregate of 1.5% or more of our outstanding shares and preferred shares for at least six months; or
� at the request of our audit committee.
Holders of non-voting preferred shares may request a general meeting of shareholders only after the non-voting shares become entitled to vote or�enfranchised,� as described under �� Voting Rights� below.
We must give shareholders written notice setting out the date, place and agenda of the meeting at least two weeks before the date of the generalmeeting of shareholders. However, for holders of less than 1.0% of the total number of issued and outstanding voting shares, we may give notice byplacing at least two public notices in at least two daily newspapers at least two weeks in advance of the meeting. Currently, we use The Korea EconomicDaily News and Maeil Business Newspaper, both published in Seoul, for this purpose, but we may give notice in the future through electronic means.Shareholders who are not on the shareholders� registry as of the record date are not entitled to receive notice of the general meeting of shareholders orattend or vote at the meeting. Holders of non-voting preferred shares, unless enfranchised, are not entitled to receive notice of or vote at generalmeetings of shareholders.
Our general meetings of shareholders have historically been held in or near Seoul.
Voting Rights
Holders of our common shares are entitled to one vote for each common share, except that voting rights of common shares held by us (includingtreasury shares and shares held by bank trust funds controlled by us), or by a corporate shareholder in which we own more than 10.0% equity interest,either directly or indirectly, may not be exercised. The Korean Commercial Code, unless otherwise stated in the articles of incorporation, permitscumulative voting, which would allow each shareholder to have multiple voting rights corresponding to the number of directors to be appointed in thevoting and to exercise all voting rights cumulatively to elect one director. Our articles of incorporation permit cumulative voting for the election ofdirectors.
Our shareholders may adopt resolutions at a general meeting by an affirmative majority vote of the voting shares present or represented at themeeting if such affirmative votes also represent at least one-fourth of our total voting shares then issued and outstanding. However, under the KoreanCommercial Code and our articles of incorporation, the following matters, among others, require approval by the holders of at least two-thirds of the
91
Copyright © 2020 www.secdatabase.com. All Rights Reserved.Please Consider the Environment Before Printing This Document
Table of Contentsvoting shares present or represented at a meeting, and such affirmative votes must also represent at least one-third of our total voting shares then issuedand outstanding:
� amending our articles of incorporation;
� removing a director;
� effecting any dissolution, merger or consolidation of us;
� transferring the whole or any significant part of our business;
� effecting our acquisition of all of the business of any other company or a part of the business of any other company having a material effecton our business;
� reducing our capital; or
� issuing any new shares at a price lower than their par value.
In general, holders of non-voting preferred shares are not entitled to vote on any resolution or receive notice of any general meeting ofshareholders.
However, in case of amendments to our articles of incorporation, or any merger or consolidation of us, or in some other cases which affect therights or interests of the non-voting preferred shares, approval of the holders of non-voting preferred shares is required. We may obtain the approval by aresolution of holders of at least two-thirds of the non-voting preferred shares present or represented at a class meeting of the holders of non-votingpreferred shares, where the affirmative votes also represent at least one-third of our total issued and outstanding non-voting shares. In addition, if we areunable to pay dividends on non-voting preferred shares as provided in our articles of incorporation, the holders of non-voting shares will becomeenfranchised and will be entitled to exercise voting rights beginning at the next general meeting of shareholders to be held after the declaration ofnon-payment of dividends is made until such dividends are paid. The holders of enfranchised non-voting preferred shares will have the same rights asholders of common shares to request, receive notice of, attend and vote at a general meeting of shareholders.
Shareholders may exercise their voting rights by proxy. A shareholder may give proxies only to another shareholder, except that a corporateshareholder may give proxies to its officers or employees.
Holders of ADRs exercise their voting rights through the ADR depositary, an agent of which is the record holder of the underlying commonshares. Subject to the provisions of the deposit agreement, ADR holders are entitled to instruct the ADR depositary how to vote our common sharesunderlying their ADSs.
Limitation on Shareholdings
The Telecommunications Business Act prohibits foreign governments, individuals, and entities (including Korean entities that are deemedforeigners, as discussed below) from owning more than 49.0% of our voting stock. Korean entities whose largest shareholder is a foreign government ora foreigner (together with any of its related parties) that owns 15.0% or more of such Korean entities� outstanding voting stock are deemed foreigners.A foreigner who has acquired shares of our voting stock in excess of such limitation may not exercise the voting rights with respect to the sharesexceeding such limitation and may be subject to the MSIT�s corrective orders.
Rights of Dissenting Shareholders
Under Financial Investment Services and Capital Market Act, in some limited circumstances, including the transfer of all or a significant part ofour business or our merger or consolidation with another company (with certain exceptions), dissenting shareholders have the right to require us topurchase their shares. To exercise this right, shareholders, including holders of non-voting shares, must submit to us a written notice of their intention todissent before the general meeting of shareholders. Then, within 20 days after the relevant resolution is passed at a meeting, the dissenting shareholdersmust request us in writing to purchase their shares. We are obligated to purchase the shares of such dissenting shareholders within one month after theexpiration of the 20-day period. The purchase price for the shares is required to be determined through negotiation between the dissenting shareholders
92
Copyright © 2020 www.secdatabase.com. All Rights Reserved.Please Consider the Environment Before Printing This Document
Table of Contentsand us. If we cannot agree on a price through negotiation, the purchase price will be the average of (1) the weighted average of the daily share prices onthe KRX KOSPI Market for the two-month period before the date of the adoption of the relevant board resolution, (2) the weighted average of the dailyshare price on the KRX KOSPI Market for the one month period before the date of the adoption of the relevant resolution and (3) the weighted averageof the daily share price on the KRX KOSPI Market for the one week period before the date of the adoption of the relevant resolution. However, a courtmay determine the purchase price if we or dissenting shareholders do not accept the purchase price.
Registry of Shareholders and Record Dates
Our transfer agent, Kookmin Bank, maintains the register of our shareholders at its office in Seoul, Korea. It records and registers transfers ofshares on the register of shareholders.
The record date for annual dividends is December 31. Further, for the purpose of determining the shareholders entitled to some other rightspertaining to the shares, we may set a record date with at least two weeks� prior public notice by a resolution of our board of directors.
Annual Report
At least one week before the annual general meeting of shareholders, we must make our annual reports and audited non-consolidated financialstatements available for inspection at our principal office and at all of our branch offices. In addition, copies of annual reports, the auditednon-consolidated financial statements and any resolutions adopted at the general meeting of shareholders will be available to our shareholders.
Under the FSCMA, we must file with the FSC and the Korea Exchange (1) an annual securities report within 90 days after the end of our fiscalyear, (2) a mid-year report within 45 days after the end of the first six months of our fiscal year, and (3) quarterly reports within 45 days after the end ofthe third month and the ninth month of our fiscal year. Copies of these reports are or will be available for public inspection at the FSC and the KoreaExchange.
Transfer of Shares
Under the Korean Commercial Code and the Act on Electronic Registration of Stocks, Bonds, etc., the transfer of shares is effected by registrationon the electronic registration ledger. However, to assert shareholders� rights against us, the transferee must have his or her name, seal and addressregistered on our registry of shareholders, maintained by our transfer agent. A non-Korean shareholder may file a sample signature in place of a seal,unless he or she is a citizen of a country with a sealing system similar to that of Korea. In addition, a non-resident shareholder must appoint an agent inKorea authorized to receive notices on his or her behalf and file his or her mailing address in Korea.
Under current Korean regulations, the Korea Securities Depository, foreign exchange banks (including domestic branches of foreign banks),financial investment companies with a dealing, brokerage or collective investment license and internationally recognized custodians may act as agentsand provide related services for foreign shareholders. Certain foreign exchange controls and securities regulations apply to the transfer of shares bynon-residents or non-Korean citizens. See �Item 10.D. Exchange Controls � Korean Foreign Exchange Controls and Securities Regulations.�
Our transfer agent is Kookmin Bank, located at 24, Gukjegeumyung-ro, Yeongdeungpo-gu, Seoul, Korea.
Restrictions Applicable to Shares
Pursuant to the Telecommunications Business Act, the maximum aggregate foreign shareholding in us is limited to 49.0%. See �Item 4.B.Business Overview � Law and Regulation � Foreign Ownership and Investment Restrictions and Requirements.� In addition, certain foreign exchangecontrols and securities regulations apply to the acquisition of securities by non-residents or non-Korean citizens. See �Item 10.D. Exchange Controls �Korean Foreign Exchange Controls and Securities Regulations.�
93
Copyright © 2020 www.secdatabase.com. All Rights Reserved.Please Consider the Environment Before Printing This Document

Table of ContentsAcquisition of Shares by Us
We may acquire our own shares pursuant to an approval at the general meeting of shareholders, through purchases on the Korea Exchange or atender offer, or by acquiring the interests in a trust account holding our own shares through agreements with trust companies and asset managementcompanies. The aggregate purchase price for the shares may not exceed the total amount available for distribution as dividends as of the end of thepreceding fiscal year less the amount of dividends and mandatory reserves required to be set aside for that fiscal year, subject to certain proceduralrequirements.
Under the Korean Commercial Code, we may resell or transfer any shares acquired by us to a third party pursuant to an approval by the Board ofDirectors. In general, corporate entities in which we own a 50.0% or more equity interest may not acquire our common stock. Under the FSCMA, weare subject to certain selling restrictions with respect to the shares acquired by us.
Liquidation Rights
In the event of our liquidation, remaining assets after payment of all debts, liquidation expenses and taxes will be distributed among shareholdersin proportion to their shareholdings. Holders of non-voting preferred shares have no preference in liquidation. Holders of debt securities have nopreference over other creditors in the event of liquidation.
Item 10.C. Material Contracts
We have not entered into any material contracts during the two years immediately preceding the date of this annual report, other than in theordinary course of our business. For information regarding our agreements and transactions with entities affiliated with the SK Group, see �Item 7.B.Related Party Transactions� and note 36 of the notes to our consolidated financial statements. For a description of certain agreements entered into duringthe past three years related to our capital commitments and obligations, see �Item 5.B. Liquidity and Capital Resources.�
Item 10.D. Exchange Controls
Korean Foreign Exchange Controls and Securities Regulations
General
The Foreign Exchange Transaction Act and the Presidential Decree and regulations under that Act and Decree, collectively referred to as theForeign Exchange Transaction Laws, regulate investment in Korean securities by non-residents and issuance of securities outside Korea by Koreancompanies. Non-residents may invest in Korean securities pursuant to the Foreign Exchange Transaction Laws. The FSC has also adopted, pursuant toits authority under the FSCMA, regulations that restrict investment by foreigners in Korean securities and regulate issuance of securities outside Koreaby Korean companies.
Subject to certain limitations, the MOEF has authority to take the following actions under the Foreign Exchange Transaction Laws:
� if the Government deems it necessary on account of war, armed conflict, natural disaster or grave and sudden and significant changes indomestic or foreign economic circumstances or similar events or circumstances, the MOEF may temporarily suspend performance under anyor all foreign exchange transactions, in whole or in part, to which the Foreign Exchange Transaction Laws apply (including suspension ofpayment and receipt of foreign exchange), impose an obligation to deposit, safe-keep or sell any means of payment to The Bank of Korea, aforeign exchange stabilization fund, certain other governmental agencies or financial companies or impose an obligation on a resident thatholds a claim against a non-resident to collect such claim to enable the recovery of the relevant debt back to Korea; and
� if the Government concludes that the international balance of payments and international financial markets are experiencing or are likely toexperience significant disruption or that the movement of capital between Korea and other countries are likely to adversely affect the Won,exchange rate or other macroeconomic
94
Copyright © 2020 www.secdatabase.com. All Rights Reserved.Please Consider the Environment Before Printing This Document
Table of Contentspolicies, the MOEF may take action to require any person who intends to effect or effects a capital transaction to deposit all or a portion ofthe means of payment acquired in such transactions with The Bank of Korea, a foreign exchange stabilization fund, certain othergovernmental agencies or financial companies.
Under the regulations of the FSC amended on February 4, 2009, (1) if a company listed on the KRX KOSPI Market or a company listed on theKRX KOSDAQ Market has submitted a public disclosure of material matters to a foreign financial investment supervisory authority pursuant to thelaws of the foreign jurisdiction, then it must submit a copy of the public disclosure and a Korean translation thereof to the FSC and the Korea Exchange,and (2) if a KRX KOSPI Market-listed company or KRX KOSDAQ Market-listed company is approved for listing on a foreign stock market ordetermined to be de-listed from the foreign stock market or actually listed on, or de-listed from a foreign stock market, then it must submit a copy of anydocument, which it submitted to or received from the relevant foreign government, foreign financial investment supervisory authority or the foreignstock market, and a Korean translation thereof to the FSC and the Korea Exchange.
Government Review of Issuances of ADSs
In order for us to issue ADSs in excess of US$30 million, we are required to submit a report to the MOEF with respect to the issuance of theADSs prior to and after such issuance; provided that such US$30 million threshold amount would be reduced by the aggregate principal amount of anyforeign currency loans borrowed, and any securities offered and issued, outside Korea during the one-year period immediately preceding the report�ssubmission date. The MOEF may at its discretion direct us to take necessary measures to avoid exchange rate fluctuation in connection with itsacceptance of report of the issuance of the ADSs.
� Under current Korean laws and regulations, the depositary is required to obtain our prior consent for any proposed deposit of common sharesif the number of shares to be deposited in such proposed deposit exceeds the number of common shares initially deposited by us for theissuance of ADSs (including deposits in connection with the initial and all subsequent issuances of ADSs by us or with our consent and stockdividends or other distributions related to the ADSs).
� In addition to such restrictions under Korean laws and regulations, there are also restrictions on the deposits of our common shares forissuance of ADSs. Therefore, a holder of ADRs who surrenders ADRs and withdraws shares may not be permitted subsequently to depositthose shares and obtain ADRs.
We submitted a report to and obtained acceptance thereof by the MOEF for the issuance of ADSs up to an amount corresponding to 24,321,893common shares. No additional Korean governmental approval is necessary for the issuance of ADSs except that if the total number of our commonshares on deposit for conversion into ADSs exceeds 24,321,893 common shares, we may be required to file a report to and obtain acceptance thereof bythe MOEF with respect to the increase of such limit and the issuance of additional ADSs.
Reporting Requirements for Holders of Substantial Interests
Under the FSCMA, any person whose direct or beneficial ownership of shares with voting rights, certificates representing the rights to subscribefor shares and equity-related debt securities including convertible bonds and bonds with warrants (collectively referred to as �equity securities�),together with the equity securities beneficially owned by certain related persons or by any person acting in concert with the person, accounts for 5.0% ormore of the total outstanding equity securities is required to report the status and purpose (in terms of whether the purpose of shareholding is to affectcontrol over management of the issuer) of the holdings to the FSC and the Korea Exchange within five business days after reaching the 5.0% ownershipinterest threshold and promptly deliver a copy of such report to the issuer. In addition, any change (1) in the ownership interest subsequent to the reportwhich equals or exceeds 1.0% of the total outstanding equity securities, or (2) in the shareholding purpose is required to be reported to the FSC and theKorea Exchange within five business days from the date of the change. However, the reporting deadline of such reporting requirement is extended for(1) certain professional investors, as specified under the FSCMA, or (2) persons who hold shares for purposes other than management control by up tothe tenth day of the month immediately following the last month of the quarter in which the share acquisition or change in their shareholding occurred.Those who reported the purpose of shareholding is to affect control over management of the issuer are prohibited from exercising their voting rights andacquiring additional shares for five days subsequent to the report under the FSCMA.
95
Copyright © 2020 www.secdatabase.com. All Rights Reserved.Please Consider the Environment Before Printing This Document

Table of ContentsViolation of these reporting requirements may subject a person to criminal sanctions such as fines or imprisonment and may result in a loss of
voting rights with respect to the ownership of unreported equity securities exceeding 5.0%. Furthermore, the FSC may issue an order to dispose of suchnon-reported equity securities.
In addition to the reporting requirements described above, any person whose direct or beneficial ownership of our common shares accounts for10.0% or more of the total issued and outstanding shares with voting rights (a �major shareholder�) must report the status of his or her shareholding tothe Securities and Futures Commission and the Korea Exchange within five business days after he or she becomes a major shareholder. In addition, anychange in the ownership interest subsequent to the report must be reported to the Securities and Futures Commission and the Korea Exchange by thefifth business day of any changes in his or her shareholding. Violations of these reporting requirements may subject a person to criminal sanctions, suchas fines or imprisonment.
Restrictions Applicable to ADSs
No Korean governmental approval is necessary for the sale and purchase of ADSs in the secondary market outside Korea or for the withdrawal ofshares underlying ADSs and the delivery of shares in Korea in connection with the withdrawal, provided that a foreigner who intends to acquire theshares must obtain an investment registration card from the Financial Supervisory Service of Korea (the �FSS�), as described below. The acquisition ofthe shares by a foreigner must be reported by the foreigner or his or her standing proxy in Korea immediately to the Governor of the FSS (the�Governor�).
Persons who have acquired shares as a result of the withdrawal of shares underlying the ADSs may exercise their preemptive rights for newshares, participate in free distributions and receive dividends on shares without any further governmental approval.
In addition, we are required to file a securities registration statement with the FSC and such securities registration statement has to becomeeffective pursuant to the FSCMA in order for us to issue shares represented by ADSs, except in certain limited circumstances.
Restrictions Applicable to Shares
As a result of amendments to the Foreign Exchange Transaction Laws and the regulations of the FSC, together referred to as the InvestmentRules, adopted in connection with the stock market opening from January 1992 and after that date, foreigners may invest, with limited exceptions andsubject to procedural requirements, in all shares of Korean companies, whether listed on the KRX KOSPI Market or the KRX KOSDAQ Market, unlessprohibited by specific laws. Foreign investors may trade shares listed on the KRX KOSPI Market or the KRX KOSDAQ Market only through the KRXKOSPI Market or the KRX KOSDAQ Market, except in limited circumstances, including, among others:
� odd-lot trading of shares;
� acquisition of shares by a foreign company as a result of a merger;
� acquisition or disposal of shares in connection with a tender offer;
� acquisition of shares by exercise of warrant, conversion right under convertible bonds, exchange right under exchangeable bonds orwithdrawal right under depositary receipts issued outside of Korea by a Korean company (�converted shares�);
� acquisition of shares through exercise of rights under securities issued outside of Korea;
� acquisition of shares as a result of inheritance, donation, bequest or exercise of shareholders� rights, including preemptive rights or rights toparticipate in free distributions and receive dividends;
� over-the-counter transactions between foreigners of a class of shares for which the ceiling on aggregate acquisition by foreigners, asexplained below, has been reached or exceeded;
� acquisition of shares by direct investment under the Foreign Investment Promotion Law;
� acquisition and disposal of shares on an overseas stock exchange market, if such shares are simultaneously listed on the KRX KOSPI Marketor KRX KOSDAQ Market and such overseas stock exchange;
96
Copyright © 2020 www.secdatabase.com. All Rights Reserved.Please Consider the Environment Before Printing This Document
Table of Contents� arm�s length transactions between foreigners in the event all such foreigners belong to an investment group managed by the same person; and
� acquisition and disposal of shares through alternative trading systems.
For over-the-counter transactions of shares between foreigners outside the KRX KOSPI Market or the KRX KOSDAQ Market for shares withrespect to which the limit on aggregate foreign ownership has been reached or exceeded, a financial investment company with a brokerage license inKorea must act as an intermediary. Odd-lot trading of shares outside the KRX KOSPI Market or the KRX KOSDAQ Market must involve a financialinvestment company with a dealing license in Korea as the other party. Foreign investors are prohibited from engaging in margin transactions throughborrowing shares from financial investment companies with respect to shares which are subject to a foreign ownership limit.
The Investment Rules require a foreign investor who wishes to invest in shares for the first time on the KRX KOSPI Market or the KRXKOSDAQ Market (including converted shares) and shares being publicly offered for initial listing on the KRX KOSPI Market or the KRX KOSDAQMarket to register its identity with the FSS prior to making any such investment; however, the registration requirement does not apply to foreigninvestors who acquire converted shares with the intention of selling such converted shares within three months from the date of acquisition of theconverted shares or who acquire the shares in an over-the-counter transaction or dispose of shares where such acquisition or disposal is deemed to be aforeign direct investment pursuant to the Foreign Investment Promotion Law. Upon registration, the FSS will issue to the foreign investor an investmentregistration card which must be presented each time the foreign investor opens a brokerage account with a financial investment company or financialinstitution in Korea. Foreigners eligible to obtain an investment registration card include foreign nationals who have not been residing in Korea for aconsecutive period of six months or longer, foreign governments, foreign municipal authorities, foreign public institutions, international financialinstitutions or similar international organizations, corporations incorporated under foreign laws and any person in any additional category designated bydecree promulgated under the FSCMA. All Korean offices of a foreign corporation as a group are treated as a separate foreigner from the offices of thecorporation outside Korea for the purpose of investment registration. However, a foreign corporation or depositary issuing depositary receipts mayobtain one or more investment registration cards in its name in certain circumstances as described in the relevant regulations.
Upon a foreign investor�s purchase of shares through the KRX KOSPI Market or the KRX KOSDAQ Market, no separate report by the investoris required because the investment registration card system is designed to control and oversee foreign investment through a computer system. However,where a foreign investor acquires or sells shares outside the KRX KOSPI Market and the KRX KOSDAQ Market, such acquisition or sale of sharesmust be reported by the foreign investor or such foreign investor�s standing proxy to the Governor at the time of each such acquisition or sale; provided,however, that a foreign investor must ensure that any acquisition or sale of shares outside the KRX KOSPI Market or the KRX KOSDAQ Market in thecase of trades in connection with a tender offer, odd-lot trading of shares or trades of a class of shares for which the aggregate foreign ownership limithas been reached or exceeded, is reported to the Governor by the Korea Securities Depository, financial investment companies with a dealing orbrokerage license or securities finance companies engaged to facilitate such transaction. In the event a foreign investor desires to acquire or sell sharesoutside the KRX KOSPI Market or the KRX KOSDAQ Market and the circumstances in connection with such sale or acquisition do not fall within theexceptions made for certain limited circumstances described above, then the foreign investor must obtain the prior approval of the Governor. In addition,in the event a foreign investor acquires or sells shares outside the KRX KOSPI Market or the KRX KOSDAQ Market, a prior report to the Bank ofKorea may also be required in certain circumstances. A foreign investor must appoint one or more standing proxies among the Korea SecuritiesDepository, foreign exchange banks (including domestic branches of foreign banks), financial investment companies with a dealing, brokerage orcollective investment license and certain eligible foreign custodians which will act as a standing proxy to exercise shareholders� rights, or perform anymatters related to the foregoing activities if the foreign investor does not perform these activities himself. Generally, a foreign investor may not permitany person, other than his, her or its standing proxy, to exercise rights relating to its shares or perform any tasks related thereto on his, her or its behalf.However, a foreign investor may be exempted from complying with these standing proxy rules with the approval of the Governor in cases deemedinevitable by reason of conflict between laws of Korea and the home country of the foreign investor.
97
Copyright © 2020 www.secdatabase.com. All Rights Reserved.Please Consider the Environment Before Printing This Document
Table of ContentsShares of Korean companies must be electronically registered with an eligible custodian in Korea. The Korea Securities Depository, foreign
exchange banks (including domestic branches of foreign banks), financial investment companies with a dealing, brokerage or collective investmentlicense and certain eligible foreign custodians are eligible to act as a custodian of shares for a non-resident or foreign investor.
Under the Investment Rules, with certain exceptions, foreign investors may acquire shares of a Korean company without being subject to anyforeign investment ceiling. As one such exception, designated public corporations are subject to a 40.0% ceiling on the acquisition of shares byforeigners in the aggregate. Designated public corporations may set a ceiling on the acquisition of shares by a single person within 3.0% of the totalnumber of shares in their articles of incorporation. Currently, Korea Electric Power Corporation is the only designated public corporation which has setsuch a ceiling. Furthermore, an investment by a foreign investor of not less than 10.0% of the outstanding shares with voting rights of a Koreancompany is defined as a direct foreign investment under the Foreign Investment Promotion Law, which is, in general, subject to the report to, andacceptance by, the Ministry of Trade, Industry and Energy of Korea, which delegates its authority to foreign exchange banks or the Korea Trade-Investment Promotion Agency under the relevant regulations. The acquisition of our shares by a foreign investor is also subject to the restrictionsprescribed in the Telecommunications Business Act. The Telecommunications Business Act generally limits the maximum aggregate foreignshareholdings in us to 49.0% of the outstanding shares. A foreigner who has acquired shares in excess of such restriction described above may notexercise the voting rights with respect to the shares exceeding such limitations and may be subject to corrective orders.
Under the Foreign Exchange Transaction Laws, a foreign investor who intends to make a portfolio investment in shares of a Korean companylisted on the KRX KOSPI Market or the KRX KOSDAQ Market must designate a foreign exchange bank at which he, she or it must open a foreigncurrency account and a Won account exclusively for stock investments. No approval is required for remittance into Korea and deposit of foreigncurrency funds in the foreign currency account. Foreign currency funds may be transferred from the foreign currency account at the time required toplace a deposit for, or settle the purchase price of, a stock purchase transaction to a Won account opened at a securities company. Funds in the foreigncurrency account may be remitted abroad without any governmental approval.
Dividends on shares are paid in Won. No governmental approval is required for foreign investors to receive dividends on, or the Won proceeds ofthe sale of, any such shares to be paid, received and retained in Korea. Dividends paid on, and the Won proceeds of the sale of, any such shares held by anon-resident of Korea must be deposited either in a Won account with the investor�s financial investment companies with a securities dealing, brokerageor collective investment license or the investor�s Won account. Funds in the investor�s Won account may be transferred to such investor�s foreigncurrency account or withdrawn for local living expenses, provided that any withdrawal of local living expenses in excess of a certain amount is reportedto the tax authorities by the foreign exchange bank at which the Won account is maintained. Funds in the investor�s Won account may also be used forfuture investment in shares or for payment of the subscription price of new shares obtained through the exercise of preemptive rights.
Financial investment companies with a securities dealing, brokerage or collective investment license are allowed to open foreign currencyaccounts with foreign exchange banks exclusively for accommodating foreign investors� stock investments in Korea. Through these accounts, thesefinancial investment companies may enter into foreign exchange transactions on a limited basis, such as conversion of foreign currency funds and Wonfunds, either as a counterparty to or on behalf of foreign investors, without the investors having to open their own accounts with foreign exchange banks.
Item 10.E. Taxation
United States Taxation
This summary describes certain material U.S. federal income tax consequences for a U.S. holder (as defined below) of acquiring, owning, anddisposing of common shares or ADSs. This summary applies to you only if you
98
Copyright © 2020 www.secdatabase.com. All Rights Reserved.Please Consider the Environment Before Printing This Document
Table of Contentshold our common shares or ADSs as capital assets for tax purposes. This summary does not apply to you if you are a member of a class of holderssubject to special rules, such as:
� a dealer in securities or currencies;
� a trader in securities that elects to use a mark-to-market method of accounting for securities holdings;
� a bank or other financial institution;
� a life insurance company;
� a tax-exempt organization;
� a person that holds common shares or ADSs that are a hedge or that are hedged against interest rate or currency risks;
� a person that holds common shares or ADSs as part of a straddle or conversion transaction for tax purposes;
� a person whose functional currency for tax purposes is not the U.S. dollar;
� a person that owns or is deemed to own 10.0% or more of any class of our stock (by vote or value); or
� an entity or arrangement that is treated as a partnership for U.S. federal income tax purposes (or partners therein).
This summary is based on the Internal Revenue Code of 1986, as amended, its legislative history, existing and proposed regulations promulgatedthereunder, and published rulings and court decisions, all as currently in effect. These laws are subject to change, possibly on a retroactive basis.
Please consult your own tax advisers concerning the U.S. federal, state, local, and other tax consequences of purchasing, owning, and disposing ofcommon shares or ADSs in your particular circumstances.
For purposes of this summary, you are a �U.S. holder� if you are the beneficial owner of a common share or an ADS and are:
� a citizen or resident of the United States;
� a U.S. domestic corporation; or
� otherwise subject to U.S. federal income tax on a net income basis with respect to income from the common share or ADS.
In general, if you are the beneficial owner of ADSs, you will be treated as the beneficial owner of the common shares represented by those ADSsfor U.S. federal income tax purposes, and no gain or loss will be recognized if you exchange an ADS for the common share represented by that ADS.
Dividends
The gross amount of cash dividends that you receive (prior to deduction of Korean taxes) generally will be subject to U.S. federal income taxationas foreign source �passive income� dividend income and will not be eligible for the dividends received deduction. Dividends paid in Won will beincluded in your income in a U.S. dollar amount calculated by reference to the exchange rate in effect on the date of your receipt of the dividend, in thecase of common shares, or the depositary�s receipt, in the case of ADSs, regardless of whether the payment is in fact converted into U.S. dollars. If sucha dividend is converted into U.S. dollars on the date of receipt, you generally should not be required to recognize foreign currency gain or loss in respectof the dividend income.
Subject to certain exceptions for short-term and hedged positions, the U.S. dollar amount of dividends received by an individual with respect tothe ADSs will be subject to taxation at a preferential rate if the dividends are �qualified dividends�. Dividends paid on the ADSs will be treated asqualified dividends if (1) the ADSs are readily tradable on an established securities market in the United States and (2) we were not, in the year prior tothe year in which the dividend was paid, and are not, in the year in which the dividend is paid, a passive foreign investment company as defined forU.S. federal income tax purposes (�PFIC�), as discussed below under �� Passive Foreign
99
Copyright © 2020 www.secdatabase.com. All Rights Reserved.Please Consider the Environment Before Printing This Document

Table of ContentsInvestment Company Rules.� The ADSs are listed on the NYSE, and will qualify as readily tradable on an established securities market in the UnitedStates so long as they are so listed. Based on our audited financial statements, as well as relevant market and shareholder data, we believe that we werenot a PFIC with respect to our 2018 or 2019 taxable year, but the Internal Revenue Service (�IRS�) could disagree with that conclusion and it is possiblethat we could become a PFIC in 2020 or subsequent taxable years, as discussed below.
Distributions of additional shares in respect of common shares or ADSs that are made as part of a pro-rata distribution to all of our stockholdersgenerally will not be subject to U.S. federal income tax.
Sale or Other Disposition
For U.S. federal income tax purposes, gain or loss you realize on a sale or other disposition of common shares or ADSs generally will be treatedas U.S. source capital gain or loss, and will be long-term capital gain or loss if the common shares or ADSs were held for more than one year. Yourability to offset capital losses against ordinary income is limited. Long-term capital gain recognized by an individual U.S. holder generally is subject totaxation at reduced rates.
Passive Foreign Investment Company Rules
Special U.S. tax rules apply to companies that are considered to be PFICs. We will be classified as a PFIC in a particular taxable year if either (i)75 percent or more of our gross income for the taxable year is passive income; or (ii) the average percentage of the value of our assets that produce orare held for the production of passive income is at least 50 percent. Investments in companies in which we own less than 25 percent of the stock (byvalue) are considered to be assets that produce passive income.
The determination whether we are a PFIC is made annually based on the particular facts and circumstances, such as the composition of ourincome and the valuation of our assets. Although we do not believe that we were a PFIC in 2019, it is possible that the IRS or a court could disagreewith that conclusion, and there is a significant risk that we could be treated as a PFIC in the current year or in future years due to fluctuations in ourstock price and changes in the value and composition of our assets, including our substantial investment in the stock of SK Hynix, which is treated as apassive asset for this purpose. Recent stock market volatility could exacerbate these considerations. See �Item 3.D. Risk Factors � Risks Relating to OurBusiness � The ongoing global pandemic of a new strain of coronavirus (�COVID-19�) and any possible recurrence of other types of widespreadinfectious diseases may adversely affect our business, financial condition or results of operations.� and �Item 3.D. Risk Factors � Risks Relating to OurBusiness � Declines in the market value of our equity holdings in SK Hynix and the results of operations of SK Hynix could have a material adverseeffect on the market price of our common shares and American Depositary Shares (�ADSs�) as well as our results of operation.� Accordingly, there canbe no assurance that we will not be classified as a PFIC for 2019 or in the current or future years.
You should consult your own tax advisors regarding our classification as a PFIC for 2019 or in the current or future years.
If we are classified as a PFIC, and you do not make a mark-to-market election, as described in the following paragraph, you will be subject to aspecial tax at ordinary income tax rates on �excess distributions� (generally, any distributions that you receive in a taxable year that are greater than125 percent of the average annual distributions that you have received in the preceding three taxable years, or your holding period, if shorter), includinggain that you recognize on the sale of your shares or ADSs. The amount of income tax on any excess distributions will be increased by an interest chargeto compensate for tax deferral, calculated as if the excess distributions were earned ratably over the period you hold your shares or ADSs. Classificationas a PFIC may also have other adverse tax consequences, including, in the case of individuals, the denial of a step-up in the basis of your shares orADSs at death.
You can avoid the unfavorable rules described in the preceding paragraph by electing to mark your shares or ADSs to market. If you make thismark-to-market election, you will be required in any year in which we are a PFIC to include as ordinary income the excess of the fair market value ofyour shares at year-end over your basis in those shares. In addition, any gain you recognize upon the sale of your shares will be taxed as ordinaryincome in the year of sale.
100
Copyright © 2020 www.secdatabase.com. All Rights Reserved.Please Consider the Environment Before Printing This Document
Table of ContentsA U.S. holder that owns an equity interest in a PFIC must annually file IRS Form 8621, and may be required to file other IRS forms. A failure to
file one or more of these forms as required may toll the running of the statute of limitations in respect of each of the U.S. holder�s taxable years forwhich such form is required to be filed. As a result, the taxable years with respect to which the U.S. holder fails to file the form may remain open toassessment by the IRS indefinitely, until the form is filed.
You should consult your own tax advisor regarding the U.S. federal income tax considerations discussed above and in particular the desirability ofmaking a mark-to-market election.
Foreign Tax Credit Considerations
You should consult your own tax advisers to determine whether you are subject to any special rules that limit your ability to make effective use offoreign tax credits, including the possible adverse impact of failing to take advantage of benefits under the income tax treaty between the United Statesand Korea. If no such rules apply, you may claim a credit against your U.S. federal income tax liability for Korean taxes withheld from dividends on thecommon shares or ADSs, so long as you have owned our common shares or ADSs (and not entered into specified kinds of hedging transactions) for atleast a 16-day period that includes the ex-dividend date. Instead of claiming a credit, you may, if you so elect, deduct such Korean taxes in computingyour taxable income, subject to generally applicable limitations under U.S. tax law. Korean taxes withheld from a distribution of additional shares that isnot subject to U.S. tax may be treated for U.S. federal income tax purposes as imposed on �general category� income. Such treatment could affect yourability to utilize any available foreign tax credit in respect of such taxes.
Any Korean securities transaction tax or agricultural and fishery special surtax that you pay will not be creditable for foreign tax credit purposes.
Foreign tax credits will not be allowed for withholding taxes imposed in respect of certain short-term or hedged positions in securities and maynot be allowed in respect of arrangements in which a U.S. holder�s expected economic profit is insubstantial.
The calculation of foreign tax credits and, in the case of a U.S. holder that elects to deduct foreign taxes, the availability of deductions involve theapplication of complex rules that depend on a U.S. holder�s particular circumstances. You should consult your own tax advisers regarding thecreditability or deductibility of such taxes.
Specified Foreign Financial Assets
Certain U.S. holders that own �specified foreign financial assets� with an aggregate value in excess of U.S.$50,000 on the last day of the taxableyear or U.S.$75,000 at any time during the taxable year are generally required to file an information statement along with their tax returns, currently onIRS Form 8938, with respect to such assets. �Specified foreign financial assets� include any financial accounts held at a non-U.S. financial institution,as well as securities issued by a non-U.S. issuer (which would include the common shares or ADSs) that are not held in accounts maintained byfinancial institutions. Higher reporting thresholds apply to certain individuals living abroad and to certain married individuals. Regulations extend thisreporting requirement to certain entities that are treated as formed or availed of to hold direct or indirect interests in specified foreign financial assetsbased on certain objective criteria. U.S. holders who fail to report the required information could be subject to substantial penalties. Prospectiveinvestors should consult their own tax advisers concerning the application of these rules to their investment in the common shares or ADSs, includingthe application of the rules to their particular circumstances.
U.S. Information Reporting and Backup Withholding Rules
Payments of dividends and sales proceeds that are made within the United States or through certain U.S.-related financial intermediaries aresubject to information reporting and may be subject to backup withholding unless the holder (1) is a corporation or other exempt recipient anddemonstrates this when required or (2) provides a taxpayer identification number and certifies that no loss of exemption from backup withholding hasoccurred. Holders that are not U.S. persons generally are not subject to information reporting or backup withholding. However, such a holder may berequired to provide a certification of its non-U.S. status in connection with payments received within the United States or through a U.S.-relatedfinancial intermediary.
101
Copyright © 2020 www.secdatabase.com. All Rights Reserved.Please Consider the Environment Before Printing This Document
Table of ContentsKorean Taxation
The following is a summary of the principal Korean tax consequences to owners of the common shares or ADSs, as the case may be, who arenon-resident individuals or non-Korean corporations without a permanent establishment in Korea to which the relevant income is attributable or withwhich the relevant income is effectively connected (�Non-resident Holders�). The statements regarding Korean tax laws set forth below are based on thelaws in force and as interpreted by the Korean taxation authorities as of the date hereof. This summary is not exhaustive of all possible taxconsiderations which may apply to a particular investor and potential investors are advised to satisfy themselves as to the overall tax consequences ofthe acquisition, ownership and disposition of the common shares or ADSs, including specifically the tax consequences under Korean law, the laws of thejurisdiction of which they are resident, and any tax treaty between Korea and their country of residence, by consulting their own tax advisors.
Tax on Dividends
Dividends on the common shares or ADSs paid (whether in cash or in shares) to a Non-resident Holder will be subject to Korean withholdingtaxes at the rate of 22.0% (including local income tax) or such lower rate as is applicable under a treaty between Korea and such Non-resident Holder�scountry of tax residence. Free distributions of shares representing a capitalization of certain capital surplus reserves may be subject to Koreanwithholding taxes.
The tax is withheld by the payer of the dividend. While it is the payer that is required to withhold the tax, Korean law generally entitles the personwho was subject to the withholding of Korean tax to recover from the Government any part of the Korean tax withheld upon providing evidence that itwas entitled to have tax withheld at a lower rate if certain conditions are met.
Tax on Capital Gains
As a general rule, capital gains earned by Non-resident Holders upon transfer of the common shares or ADSs are subject to Korean withholdingtax at the lower of (1) 11.0% (including local income tax) of the gross proceeds realized or (2) 22.0% (including local income tax) of the net realizedgains (subject to the production of satisfactory evidence of the acquisition costs and certain direct transaction costs), unless exempt from Korean incometaxation under the effective Korean tax treaty with the Non-resident Holder�s country of tax residence.
However, a Non-resident Holder will not be subject to Korean income taxation on capital gains realized upon the sale of the common sharesthrough the KRX KOSPI Market if the Non-resident Holder (1) has no permanent establishment in Korea and (2) did not or has not owned (togetherwith any shares owned by any entity with certain special relationship with such Non-resident Holder) 25.0% or more of the total issued and outstandingshares of us at any time during the calendar year in which the sale occurs and during the five calendar years prior to the calendar year in which the saleoccurs.
It should be noted that capital gains earned by you (regardless of whether you have a permanent establishment in Korea) from a transfer of ADSsoutside Korea will generally be exempt from Korean income taxation, provided that the ADSs are deemed to have been issued overseas. If and when anowner of the underlying common shares transfers the ADSs following the conversion of the underlying shares for ADSs, such person will not be exemptfrom Korean income taxation.
Inheritance Tax and Gift Tax
Korean inheritance tax is imposed upon (1) all assets (wherever located) of the deceased if at the time of his death he was a tax resident of Koreaand (2) all property located in Korea which passes on death (irrespective of the domicile of the deceased). Gift tax is imposed in similar circumstancesto the above. The taxes are imposed if the value of the relevant property is above a certain limit and vary depending on the value of the property and theidentity of the parties involved.
Under Korean inheritance and gift tax laws, securities issued by a Korean corporation are deemed to be located in Korea irrespective of wherethey are physically located or by whom they are owned.
102
Copyright © 2020 www.secdatabase.com. All Rights Reserved.Please Consider the Environment Before Printing This Document

Table of ContentsSecurities Transaction Tax
Securities transaction tax is imposed on the transfer of shares issued by a Korean corporation or the right to subscribe for such shares generally atthe rate of 0.5% of the sales price. In the case of the transfer of shares listed on the KRX KOSPI Market (such as our common shares), the securitiestransaction tax is imposed generally at the rate of (1) 0.25% of the sales price of such shares (or 0.3% of the sales price if such shares were sold on orbefore June 3, 2019) (including agricultural and fishery special surtax thereon) if traded on the KRX KOSPI Market or (2) subject to certain exceptions,0.45% of the sales price of such shares (or 0.5% of the sales price of such shares were sold on or before April 1, 2020) if traded outside the KRX KOSPIMarket.
Securities transaction tax or the agricultural and fishery special surtax is not applicable if (1) the shares or rights to subscribe for shares are listedon a designated foreign stock exchange and (2) the sale of the shares takes place on such exchange.
Securities transaction tax, if applicable, must be paid by the transferor of the shares or rights, in principle. When the transfer is effected through asecurities settlement company, such settlement company is generally required to withhold and pay (to the tax authority) the tax, and when such transferis made through a financial investment company with a brokerage license only, such company is required to withhold and pay the tax. Where thetransfer is effected by a Non-resident Holder without a permanent establishment in Korea, other than through a securities settlement company or afinancial investment company with a brokerage license, the transferee is required to withhold the securities transaction tax. Failure to do so will result inthe imposition of penalties equal to the sum of (1) between 10.0% to 40.0% of the tax amount due, depending on the nature of the improper reporting,and (2) 9.125% per annum (or 10.95% per annum for periods before (and including) February 12, 2019) on the tax amount due for the default period.
Tax Treaties
Currently, Korea has income tax treaties with a number of countries, inter alia, Australia, Austria, Belgium, Canada, Denmark, Finland, France,Germany, Italy, Japan, Luxembourg, Ireland, the Netherlands, New Zealand, Norway, Singapore, Sweden, Switzerland, the United Kingdom and theUnited States under which the rate of withholding tax on dividend and interest is reduced, generally to between 5.0% and 16.5% (including local incometax), and the tax on capital gains derived by a non-resident from the transfer of securities issued by a Korean company is often eliminated.
Each Non-resident Holder of common shares should inquire for itself whether it is entitled to the benefits of a tax treaty with Korea. It is theresponsibility of the party claiming the benefits of a tax treaty in respect of interest, dividend, capital gains or �other income� to submit to us (or ouragent), the purchaser or the financial investment company with a brokerage license, as the case may be, prior to or at the time of payment, such evidenceof tax residence of the party claiming the treaty benefit as the Korean tax authorities may require in support of its claim for treaty protection. In theabsence of sufficient proof, we (or our agent), the purchaser or the financial investment company with a brokerage license, as the case may be, mustwithhold tax at the normal rates.
Furthermore, in order for a non-resident of Korea to obtain the benefits of tax exemption on certain Korean source income (e.g., capital gains andinterest) under an applicable tax treaty, Korean tax law requires such non-resident (or its agent) to submit to the payer of such Korean source income anapplication for a tax exemption along with a certificate of tax residency of such non-resident issued by a competent authority of the non-resident�scountry of tax residence, subject to certain exceptions. The payer of such Korean source income, in turn, is required to submit such application to therelevant district tax office by the ninth day of the month following the date of the first payment of such income.
For a non-resident of Korea to obtain the benefits of treaty-reduced tax rates on certain Korean source income (e.g., capital gains and interest)under an applicable tax treaty, Korean tax law requires such non-resident (or its agents) to submit to the payer of such Korean source income anapplication for treaty-reduced tax rates prior to receipt of such Korean source income; provided, however, that an owner of ADSs who is a non-residentof Korea is not required to submit such application, if the Korean source income on the ADSs is paid through an account opened at the Korea SecuritiesDepository by a foreign depository.
103
Copyright © 2020 www.secdatabase.com. All Rights Reserved.Please Consider the Environment Before Printing This Document
Table of ContentsAt present, Korea has not entered into any tax treaty relating to inheritance or gift tax.
Item 10.F. Dividends and Paying Agents
Not applicable.
Item 10.G. Statements by Experts
Not applicable.
Item 10.H. Documents on Display
We file reports, including annual reports on Form 20-F, and other information with the SEC pursuant to the rules and regulations of the SEC thatapply to foreign private issuers. You may read and copy any materials filed with the SEC at the Public Reference Room at 100 F Street, N.E.,Washington, D.C. 20549. You may obtain information on the operation of the Public Reference Room by calling the SEC at 1-800-SEC-0330. Anyfilings we make electronically will be available to the public over the Internet at the SEC�s Website at http://www.sec.gov.
Documents filed with annual reports and documents filed or submitted to the SEC are also available for inspection at our principal business officeduring normal business hours. Our principal business office is located at SK T-Tower, 65, Eulji-ro, Jung-gu, Seoul 04539, Korea.
Item 10.I. Subsidiary Information
Not applicable.
Item 11. QUANTITATIVE AND QUALITATIVE DISCLOSURES ABOUT MARKET RISK
We are exposed to foreign exchange rate and interest rate risk primarily associated with underlying liabilities and to equity price risk as a result ofour investment in equity instruments.
We have entered into a floating-to-fixed cross currency interest rate swap contract to hedge foreign currency and interest rate risks with respect toUS$300 million of bonds issued in March 2013. In addition, we have entered into fixed-to-fixed cross currency swap contracts to hedge the foreigncurrency risks of US$400 million of bonds issued in July 2007, US$28.7 million of borrowings from December 2013, US$500 million of bonds issuedin April 2018 and US$300 million of bonds issued in August 2018. We also entered into floating-to-fixed interest rate swap contracts to hedge interestrate risks with respect to Won 24.5 billion of borrowings from December 2016, Won 37.5 billion of borrowings from December 2017 and Won50.0 billion of borrowings from December 2018. See note 21 of the notes to our consolidated financial statements. We may consider in the futureentering into other such transactions solely for hedging purposes.
The following discussion and tables, which constitute �forward looking statements� that involve risks and uncertainties, summarize our market-sensitive financial instruments including fair value, maturity and contract terms. These tables address market risk only and do not present other riskswhich we face in the normal course of business, including country risk, credit risk and legal risk.
Exchange Rate Risk
Korea is our main market and, therefore, substantially all of our cash flow is denominated in Won. We are exposed to foreign exchange riskrelated to foreign currency denominated liabilities. These liabilities relate primarily to foreign currency denominated debt, primarily in Dollars. A 10.0%increase in the exchange rate between the Won and all foreign currencies would result in an increase in profit before income tax of Won 7.2 billion, witha decrease of 10.0% in the exchange rate having the opposite effect, as of December 31, 2019. For a further discussion of our exchange rate riskexposures, see note 35(1) of the notes to our consolidated financial statements.
104
Copyright © 2020 www.secdatabase.com. All Rights Reserved.Please Consider the Environment Before Printing This Document

Table of ContentsInterest Rate Risk
We are also subject to market risk exposure arising from changing interest rates. The following table summarizes the carrying amounts and fairvalues, maturity and contract terms of our exchange rate and interest sensitive short-term and long-term liabilities as of December 31, 2019:
Maturities2020 2021 2022 2023 2024 Thereafter Total Fair Value
(In billions of Won, except for percentage data)Local currency:
Fixed-rate ₩619.7 ₩888.7 ₩1,386.4 ₩2,448.1 ₩847.6 ₩2,183.3 ₩8,373.8 ₩8,780.8Average weighted rate(1) 2.33 % 2.64 % 2.20 % 4.07 % 2.41 % 2.48 %Variable rate 20.0 24.5 37.5 49.9 � � 131.9 131.9Average weighted rate(1) 3.09 % 2.32 % 2.78 % 2.67 % � �
Sub-total 639.7 913.2 1,423.9 2,498.0 847.6 2,183.3 8,505.7 8,912.7Foreign currency:
Fixed-rate 0.6 � 32.9 919.1 � 458.5 1,411.1 1,645.5Average weighted rate(1) 7.50 % � 1.70 % 3.80 % � 6.63 %Variable rate 347.3 � � � � � 347.3 347.3Average weighted rate(1) 2.80 % � � � � �
Sub-total 347.9 � 32.9 919.1 � 458.5 1,758.4 1,992.8Total ₩987.6 ₩913.2 ₩1,456.8 ₩3,417.1 ₩847.6 ₩2,641.8 ₩10,264.1 ₩10,905.4
(1) Weighted average rates of the portfolio at the period end.
A 1.0% point increase in interest rates would result in a decrease in profit before income tax of Won 0.2 billion with a 1.0% point decrease ininterest rates having the opposite effect, as of December 31, 2019. For a further discussion of our interest rate risk exposures, see note 35(1) of the notesto our consolidated financial statements.
Equity Price Risk
We are also subject to market risk exposure arising from changes in the equity securities market, which affect the fair value of our equity portfolio.As of December 31, 2019, 2018 and 2017, a 10.0% increase in the equity indices where our equity investments at fair value through othercomprehensive income are listed, with all other variables held constant, would have increased our total equity by Won 40.8 billion, Won 29.4 billion andWon 58.9 billion, respectively, with a 10.0% decrease in the equity index having the opposite effect. The foregoing sensitivity analysis assumes that allvariables other than changes in the equity index are held constant, and that our equity investments at fair value through other comprehensive income hadmoved according to the historical correlation to the index, and as such, does not reflect any correlation between the equity index and other variables.
Item 12. DESCRIPTION OF SECURITIES OTHER THAN EQUITY SECURITIES
Item 12.A. Debt Securities
Not applicable.
Item 12.B. Warrants and Rights
Not applicable.
Item 12.C. Other Securities
Not applicable.
Item 12.D. American Depositary Shares
Fees and Charges under Deposit Agreement
The ADR depositary will charge the party receiving ADSs up to US$5.00 per 100 ADSs (or fraction thereof), provided that the ADR depositaryhas agreed to waive such fee as would have been payable by us in the case of
105
Copyright © 2020 www.secdatabase.com. All Rights Reserved.Please Consider the Environment Before Printing This Document
Table of Contents(1) an offering of ADSs by us or (2) any distribution of shares of common stock or any rights to subscribe for additional shares of common stock. TheADR depositary will not charge the party to whom ADSs are delivered against deposits. The ADR depositary will charge the party surrendering ADSsfor delivery of deposited securities up to US$5.00 per 100 ADSs (or fraction thereof) surrendered. The ADR depositary will also charge the party towhom any cash distribution, or for whom the sale or exercise of rights or other corporate action involving distributions to shareholders, is made withrespect to ADSs up to US$0.02 per ADS held plus the expenses of the ADR depositary on a per-ADS basis. We will pay the expenses of the ADRdepositary and any entity acting as registrar for the shares only as specified in the deposit agreement. The ADR depositary will pay any other chargesand expenses of the ADR depositary and the entity acting as registrar for the shares.
Holders of ADRs must pay (1) taxes and other governmental charges, (2) share transfer registration fees on deposits of shares of common stock,(3) such cable, telex, facsimile transmission and delivery expenses as are expressly provided in the deposit agreement to be at the expense of personsdepositing shares of common stock or holders of ADRs and (4) such reasonable expenses as are incurred by the ADR depositary in the conversion offoreign currency into United States dollars.
Notwithstanding any other provision of the deposit agreement, in the event that the ADR depositary determines that any distribution in property(including shares or rights to subscribe therefor or other securities) is subject to any tax or governmental charges which the ADR depositary is obligatedto withhold, the ADR depositary may dispose of all or a portion of such property (including shares and rights to subscribe therefor) in such amounts andin such manner as the ADR depositary deems necessary and practicable to pay such taxes or governmental charges, including by public or private sale,and the ADR depositary will distribute the net proceeds of any such sale or the balance of any such property after deduction of such taxes orgovernmental charges to the holders of ADSs entitled thereto in proportion to the number of ADSs held by them respectively.
All such charges may be changed by agreement between the ADR depositary and us at any time and from time to time, subject to the depositagreement. The right of the ADR depositary to receive payment of fees, charges and expenses shall survive the termination of this deposit agreementand, as to any depositary, the resignation or removal of such depositary pursuant to the deposit agreement.
Payments made by ADR Depositary
The ADR depositary reimburses us for certain expenses we incur in connection with our ADR program, subject to certain ceilings. Thesereimbursable expenses currently include expenses relating to the preparation of SEC filings and submissions, listing fees, education and training fees,corporate action expenses and other miscellaneous fees. In the fiscal year 2019, we received US$6,276,012 from the ADR depositary in connection withsuch reimbursements.
106
Copyright © 2020 www.secdatabase.com. All Rights Reserved.Please Consider the Environment Before Printing This Document
Table of ContentsPART II
Item 13. DEFAULTS, DIVIDEND ARREARAGES AND DELINQUENCIES
None.
Item 14. MATERIAL MODIFICATIONS TO THE RIGHTS OF SECURITY HOLDERS AND USE OF PROCEEDS
None.
Item 15. CONTROLS AND PROCEDURES
Our management has evaluated, with the participation of our Chief Executive Officer and Chief Financial Officer, the effectiveness of ourdisclosure controls and procedures, as such term is defined in Rules 13a-15(e) and 15d-15(e) under the Exchange Act, as of December 31, 2019. Thereare inherent limitations to the effectiveness of any system of disclosure controls and procedures, including the possibility of human error and thecircumvention or overriding of the controls and procedures. Accordingly, even effective disclosure controls and procedures can only provide reasonableassurance of achieving their control objectives. Based upon our evaluation, our Chief Executive Officer and Chief Financial Officer concluded that ourdisclosure controls and procedures were effective as of such date. Our disclosure controls and procedures are designed to ensure that informationrequired to be disclosed by us in the reports that we file or submit under the Exchange Act is recorded, processed, summarized and reported, within thetime periods specified in the SEC�s rules and forms, and that it is accumulated and communicated to our management, including our Chief ExecutiveOfficer and Chief Financial Officer, as appropriate to allow timely decisions regarding required disclosure.
Management��s Annual Report on Internal Control Over Financial Reporting
Our management is responsible for establishing and maintaining adequate internal control over financial reporting, as such term is defined inRules 13a-15(f) and 15d-15(f) under the Exchange Act, as of December 31, 2019. Because of its inherent limitations, internal control over financialreporting is not intended to provide absolute assurance that a misstatement of our consolidated financial statements would be prevented or detected.Also, projections of any evaluation of effectiveness to future periods are subject to the risk that controls may become inadequate because of changes inconditions, or that the degree of compliance with the policies or procedures may deteriorate. Under the supervision and with the participation of ourmanagement, including our Chief Executive Officer and Chief Financial Officer, we conducted an evaluation of the effectiveness of our internal controlover financial reporting based on the framework in Internal Control � Integrated Framework (2013 framework) issued by the Committee of SponsoringOrganizations of the Treadway Commission. Our internal control over financial reporting is a process designed to provide reasonable assuranceregarding the reliability of financial reporting and the preparation of consolidated financial statements for external purposes in accordance with IFRS asissued by the IASB. Based on our evaluation, our management concluded that our internal control over financial reporting was effective as ofDecember 31, 2019.
Report of the Independent Registered Public Accounting Firm on the Effectiveness of Our Internal Control Over Financial Reporting
The report of our independent registered public accounting firm, KPMG Samjong Accounting Corp. (�KPMG Samjong�), on the effectiveness ofour internal control over financial reporting as of December 31, 2019 is included in Item 18 of this Form 20-F.
Changes in Internal Control Over Financial Reporting
Beginning January 1, 2019, we adopted IFRS 16 and implemented significant new systems, processes and internal controls over lease accountingto assist us in the application of IFRS 16. Other than as discussed above, there has been no change in our internal control over financial reporting during2019 that has materially affected, or is reasonably likely to materially affect, our internal control over financial reporting.
107
Copyright © 2020 www.secdatabase.com. All Rights Reserved.Please Consider the Environment Before Printing This Document
Table of ContentsItem 16. RESERVED
Item 16A. AUDIT COMMITTEE FINANCIAL EXPERT
Seok-Dong Kim is the chairman of our audit committee and determined to be an �audit committee financial expert� within the meaning of thisItem 16A by the board of directors. The board of directors have further determined that Seok-Dong Kim is independent within the meaning ofapplicable SEC rules and the listing standards of the NYSE. See �Item 6.C. Board Practices � Audit Committee� for additional information regardingour audit committee.
Item 16B. CODE OF ETHICS
Code of Ethics for Chief Executive Officer, Chief Financial Officer and Controller
We have a code of ethics that applies to our Chief Executive Officer, Chief Financial Officer, senior accounting officers and employees. We alsohave internal control and disclosure policy designed to promote full, fair, accurate, timely and understandable disclosure in all of our reports andpublicly filed documents. A copy of our code of ethics is available on our website at www.sktelecom.com. If we amend the provisions of our code ofethics that apply to our Chief Executive Officer, Chief Financial Officer and persons performing similar functions, or if we grant any waiver of suchprovisions, we will disclose such amendment or waiver on our website.
Item 16C. PRINCIPAL ACCOUNTANT FEES AND SERVICES
The table sets forth the fees we paid to our independent registered public accounting firm KPMG Samjong and its affiliates for the years endedDecember 31, 2019 and 2018:
Year Ended December 31,2019 2018
(In millions of Won)Audit Fees ₩ 4,299 ₩ 3,360Audit-Related Fees 3 222Tax Fees 305 355All Other Fees � 120Total ₩ 4,607 ₩ 4,057
�Audit Fees� are the aggregate fees billed by KPMG Samjong for the audit of our consolidated annual financial statements, reviews of interimfinancial statements and attestation services that are provided in connection with statutory and regulatory filings or engagements.
�Audit-Related Fees� are fees charged by KPMG Samjong for assurance and related services that are reasonably related to the performance of theaudit or review of our financial statements and are not reported under �Audit Fees.� This category comprises fees billed for assurance services,including verification of the consistency of financial information submitted to relevant governmental authorities with our consolidated annual financialstatements, in 2019 and for services related to issuance of comfort letters in connection with our bond offerings in 2018.
�Tax Fees� are fees for professional services rendered by KPMG Samjong for tax compliance, tax advice on actual or contemplated transactionsand tax planning services.
�All Other Fees� are fees billed by KPMG Samjong for consulting services related to the preparation of our investor relations materials in 2018.
Pre-Approval of Audit and Non-Audit Services Provided by Independent Registered Public Accounting Firm
Our audit committee pre-approves all audit services to be provided by KPMG Samjong, our independent registered public accounting firm. Ouraudit committee�s policy regarding the pre-approval of non-audit services to be provided to us by our independent auditors is that all such services shallbe pre-approved by our audit committee. Non-audit services that are prohibited to be provided to us by our independent auditors under the rules of theSEC and applicable law may not be pre-approved. In addition, prior to the granting of any pre-approval, our audit
108
Copyright © 2020 www.secdatabase.com. All Rights Reserved.Please Consider the Environment Before Printing This Document
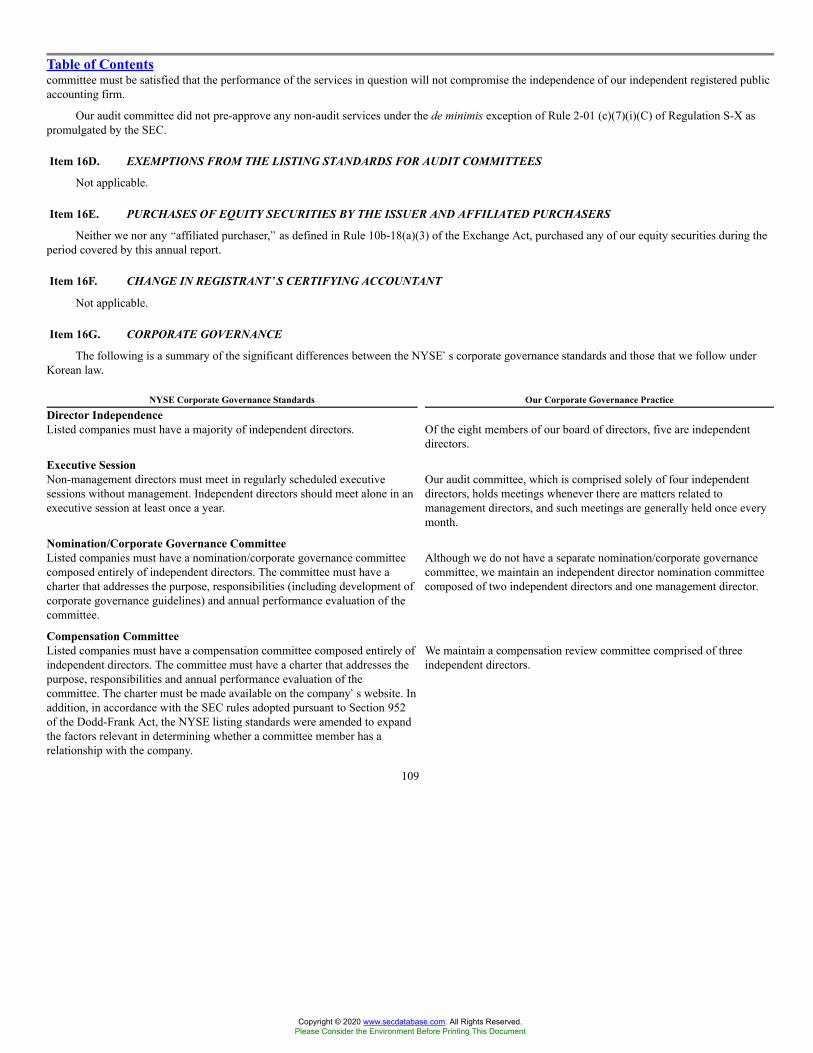
Table of Contentscommittee must be satisfied that the performance of the services in question will not compromise the independence of our independent registered publicaccounting firm.
Our audit committee did not pre-approve any non-audit services under the de minimis exception of Rule 2-01 (c)(7)(i)(C) of Regulation S-X aspromulgated by the SEC.
Item 16D. EXEMPTIONS FROM THE LISTING STANDARDS FOR AUDIT COMMITTEES
Not applicable.
Item 16E. PURCHASES OF EQUITY SECURITIES BY THE ISSUER AND AFFILIATED PURCHASERS
Neither we nor any �affiliated purchaser,� as defined in Rule 10b-18(a)(3) of the Exchange Act, purchased any of our equity securities during theperiod covered by this annual report.
Item 16F. CHANGE IN REGISTRANT��S CERTIFYING ACCOUNTANT
Not applicable.
Item 16G. CORPORATE GOVERNANCE
The following is a summary of the significant differences between the NYSE�s corporate governance standards and those that we follow underKorean law.
NYSE Corporate Governance Standards Our Corporate Governance PracticeDirector IndependenceListed companies must have a majority of independent directors. Of the eight members of our board of directors, five are independent
directors.
Executive SessionNon-management directors must meet in regularly scheduled executivesessions without management. Independent directors should meet alone in anexecutive session at least once a year.
Our audit committee, which is comprised solely of four independentdirectors, holds meetings whenever there are matters related tomanagement directors, and such meetings are generally held once everymonth.
Nomination/Corporate Governance CommitteeListed companies must have a nomination/corporate governance committeecomposed entirely of independent directors. The committee must have acharter that addresses the purpose, responsibilities (including development ofcorporate governance guidelines) and annual performance evaluation of thecommittee.
Although we do not have a separate nomination/corporate governancecommittee, we maintain an independent director nomination committeecomposed of two independent directors and one management director.
Compensation CommitteeListed companies must have a compensation committee composed entirely ofindependent directors. The committee must have a charter that addresses thepurpose, responsibilities and annual performance evaluation of thecommittee. The charter must be made available on the company�s website. Inaddition, in accordance with the SEC rules adopted pursuant to Section 952of the Dodd-Frank Act, the NYSE listing standards were amended to expandthe factors relevant in determining whether a committee member has arelationship with the company.
We maintain a compensation review committee comprised of threeindependent directors.
109
Copyright © 2020 www.secdatabase.com. All Rights Reserved.Please Consider the Environment Before Printing This Document
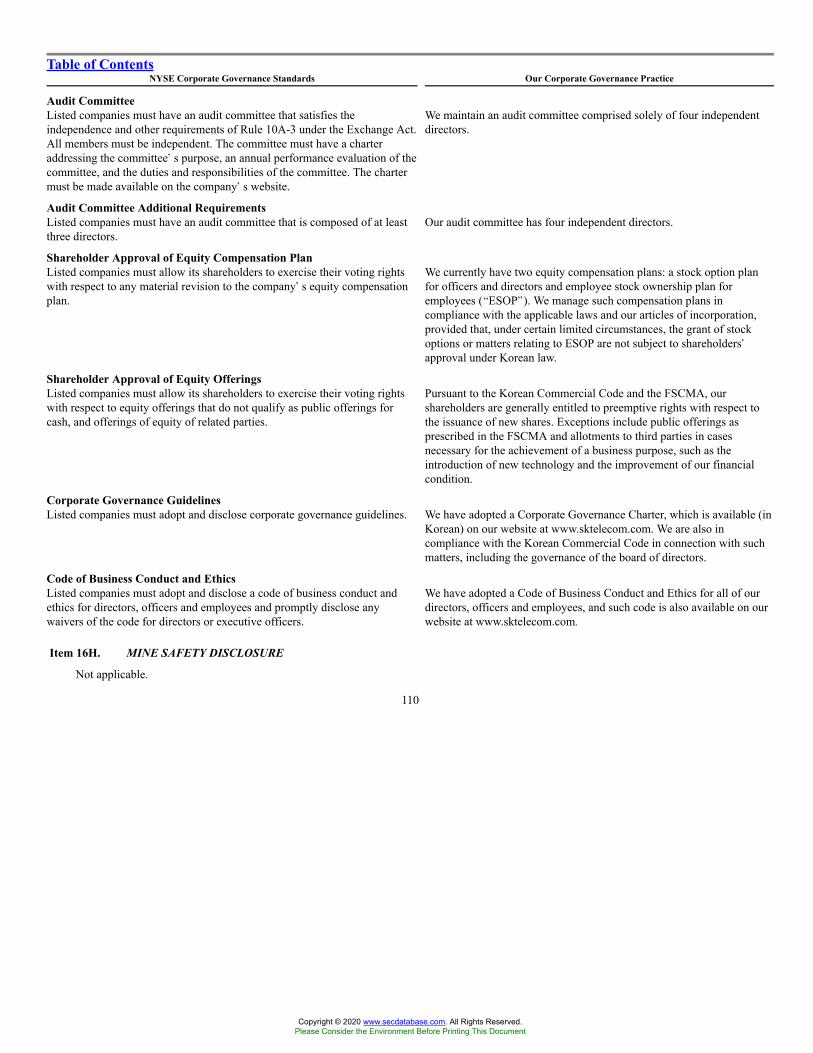
Table of ContentsNYSE Corporate Governance Standards Our Corporate Governance Practice
Audit CommitteeListed companies must have an audit committee that satisfies theindependence and other requirements of Rule 10A-3 under the Exchange Act.All members must be independent. The committee must have a charteraddressing the committee�s purpose, an annual performance evaluation of thecommittee, and the duties and responsibilities of the committee. The chartermust be made available on the company�s website.
We maintain an audit committee comprised solely of four independentdirectors.
Audit Committee Additional RequirementsListed companies must have an audit committee that is composed of at leastthree directors.
Our audit committee has four independent directors.
Shareholder Approval of Equity Compensation PlanListed companies must allow its shareholders to exercise their voting rightswith respect to any material revision to the company�s equity compensationplan.
We currently have two equity compensation plans: a stock option planfor officers and directors and employee stock ownership plan foremployees (�ESOP�). We manage such compensation plans incompliance with the applicable laws and our articles of incorporation,provided that, under certain limited circumstances, the grant of stockoptions or matters relating to ESOP are not subject to shareholders�approval under Korean law.
Shareholder Approval of Equity OfferingsListed companies must allow its shareholders to exercise their voting rightswith respect to equity offerings that do not qualify as public offerings forcash, and offerings of equity of related parties.
Pursuant to the Korean Commercial Code and the FSCMA, ourshareholders are generally entitled to preemptive rights with respect tothe issuance of new shares. Exceptions include public offerings asprescribed in the FSCMA and allotments to third parties in casesnecessary for the achievement of a business purpose, such as theintroduction of new technology and the improvement of our financialcondition.
Corporate Governance GuidelinesListed companies must adopt and disclose corporate governance guidelines. We have adopted a Corporate Governance Charter, which is available (in
Korean) on our website at www.sktelecom.com. We are also incompliance with the Korean Commercial Code in connection with suchmatters, including the governance of the board of directors.
Code of Business Conduct and EthicsListed companies must adopt and disclose a code of business conduct andethics for directors, officers and employees and promptly disclose anywaivers of the code for directors or executive officers.
We have adopted a Code of Business Conduct and Ethics for all of ourdirectors, officers and employees, and such code is also available on ourwebsite at www.sktelecom.com.
Item 16H. MINE SAFETY DISCLOSURE
Not applicable.
110
Copyright © 2020 www.secdatabase.com. All Rights Reserved.Please Consider the Environment Before Printing This Document
Table of ContentsPART III
Item 17. FINANCIAL STATEMENTS
Not applicable.
Item 18. FINANCIAL STATEMENTS
Index to Financial Statements F-1Report of Independent Registered Public Accounting Firm on the Consolidated Financial Statements F-2Report of Independent Registered Public Accounting Firm on Internal Control over Financial
Reporting F-4Consolidated Statements of Financial Position as of December 31, 2019 and 2018 F-5Consolidated Statements of Income for the years ended December 31, 2019, 2018 and 2017 F-7Consolidated Statements of Comprehensive Income for the years ended December 31, 2019, 2018 and 2017 F-8Consolidated Statements of Changes in Equity for the years ended December 31, 2019, 2018 and
2017 F-9Consolidated Statements of Cash Flows for the years ended December 31, 2019, 2018 and 2017 F-12Notes to the Consolidated Financial Statements for the years ended December 31, 2019, 2018 and 2017 F-14
Financial Statements of SK HynixReport of Independent Registered Public Accounting Firm on the Consolidated Financial Statements G-1Consolidated Statements of Financial Position as of December 31, 2019 and 2018 G-2Consolidated Statements of Comprehensive Income for the years ended December 31, 2019, 2018 and 2017 G-4Consolidated Statements of Changes in Equity for the years ended December 31, 2019, 2018 and 2017 G-5Consolidated Statements of Cash Flows for the years ended December 31, 2019, 2018 and 2017 G-7Notes to the Consolidated Financial Statements for the years ended December 31, 2019, 2018 and 2017 G-8
111
Copyright © 2020 www.secdatabase.com. All Rights Reserved.Please Consider the Environment Before Printing This Document
Table of ContentsItem 19. EXHIBITS
Number Description
1.1 Articles of Incorporation
2.1 Deposit Agreement dated as of May 31, 1996, as amended by Amendment No. 1 dated as of March 15, 1999, Amendment No. 2dated as of April 24, 2000 and Amendment No. 3 dated as of July 24, 2002, entered into among SK Telecom Co., Ltd., Citibank,N.A., as Depositary, and all Holders and Beneficial Owners of American Depositary Shares (incorporated by reference to Exhibit 2.1to the Registrant�s Annual Report on Form 20-F filed on June 30, 2006)
2.2 Description of Capital Stock (See Item 10.B. Memorandum and Articles of Association)
2.3 Description of American Depositary Shares
8.1 List of Subsidiaries of SK Telecom Co., Ltd.
12.1 Certification of Principal Executive Officer Pursuant to Section 302 of the Sarbanes-Oxley Act of 2002
12.2 Certification of Principal Financial Officer Pursuant to Section 302 of the Sarbanes-Oxley Act of 2002
13.1 Certification of Principal Executive Officer Pursuant to 18 U.S.C. Section 1350, As Adopted Pursuant to Section 906 of the Sarbanes-Oxley Act of 2002
13.2 Certification of Principal Financial Officer Pursuant to 18 U.S.C. Section 1350, As Adopted Pursuant to Section 906 of the Sarbanes-Oxley Act of 2002
101.INS XBRL Instance Document
101.SCH XBRL Taxonomy Extension Schema Document
101.CAL XBRL Taxonomy Extension Calculation Linkbase Document
101.DEF XBRL Taxonomy Extension Definition Linkbase Document
101.LAB XBRL Taxonomy Extension Label Linkbase Document
101.PRE XBRL Taxonomy Extension Presentation Linkbase Document
112
Copyright © 2020 www.secdatabase.com. All Rights Reserved.Please Consider the Environment Before Printing This Document
Table of ContentsSIGNATURES
The registrant hereby certifies that it meets all of the requirements for filing on Form 20-F and that it has duly caused and authorized theundersigned to sign this annual report on its behalf.
SK TELECOM CO., LTD.(Registrant)
/s/ Jeong Hwan ChoiName: Jeong Hwan ChoiTitle: Senior Vice President, IRO
Date: April 29, 2020
Copyright © 2020 www.secdatabase.com. All Rights Reserved.Please Consider the Environment Before Printing This Document
Table of ContentsINDEX TO FINANCIAL STATEMENTS
PageReport of Independent Registered Public Accounting Firm on the Consolidated Financial Statements F-2
Report of Independent Registered Public Accounting Firm on Internal Control Over Financial Reporting F-4
Consolidated Statements of Financial Position F-5
Consolidated Statements of Income F-7
Consolidated Statements of Comprehensive Income F-8
Consolidated Statements of Changes in Equity F-9
Consolidated Statements of Cash Flows F-12
Notes to the Consolidated Financial Statements F-14
Financial Statements of SK HynixReport of Independent Registered Public Accounting Firm on the Consolidated Financial Statements G-1Consolidated Statements of Financial Position as of December 31, 2019 and 2018 G-2Consolidated Statements of Comprehensive Income for the years ended December 31, 2019, 2018 and 2017 G-4Consolidated Statements of Changes in Equity for the years ended December 31, 2019, 2018 and 2017 G-5Consolidated Statements of Cash Flows for the years ended December 31, 2019, 2018 and 2017 G-7Notes to the Consolidated Financial Statements for the years ended December 31, 2019, 2018 and 2017 G-8
F-1
Copyright © 2020 www.secdatabase.com. All Rights Reserved.Please Consider the Environment Before Printing This Document
Table of ContentsReport of Independent Registered Public Accounting Firm
To the Shareholders and the Board of DirectorsSK Telecom Co., Ltd.:
Opinion on the Consolidated Financial Statements
We have audited the accompanying consolidated statements of financial position of SK Telecom Co., Ltd. and subsidiaries (the Group) as ofDecember 31, 2019 and 2018, the related consolidated statements of income, comprehensive income, changes in equity and cash flows for each of theyears in the three-year period ended December 31, 2019, and the related notes (collectively, the consolidated financial statements). In our opinion, theconsolidated financial statements present fairly, in all material respects, the financial position of the Group as of December 31, 2019 and 2018, and theresults of its operations and its cash flows for each of the years in the three-year period ended December 31, 2019, in conformity with InternationalFinancial Reporting Standards (�IFRS�) as issued by the International Accounting Standards Board.
We also have audited, in accordance with the standards of the Public Company Accounting Oversight Board (United States) (PCAOB), theGroup�s internal control over financial reporting as of December 31, 2019, based on criteria established in Internal Control � Integrated Framework(2013) issued by the Committee of Sponsoring Organizations of the Treadway Commission, and our report dated April 29, 2020 expressed anunqualified opinion on the effectiveness of the Group�s internal control over financial reporting.
Adoption of New Accounting Standards
As discussed in Note 3 to the consolidated financial statements, effective January 1, 2019, the Group changed its method for accounting for leasecontracts as a result of adoption of IFRS 16, Leases, using the modified retrospective method.
As discussed in Note 4 to the consolidated financial statements, effective January 1, 2018, the Group changed its method for recognizing revenueas a result of adoption of IFRS 15, Revenue from Contracts with Customers, using the modified retrospective method.
Basis for Opinion
These consolidated financial statements are the responsibility of the Group�s management. Our responsibility is to express an opinion on theseconsolidated financial statements based on our audits. We are a public accounting firm registered with the PCAOB and are required to be independentwith respect to the Group in accordance with the U.S. federal securities laws and the applicable rules and regulations of the Securities and ExchangeCommission and the PCAOB.
We conducted our audits in accordance with the standards of the PCAOB. Those standards require that we plan and perform the audit to obtainreasonable assurance about whether the consolidated financial statements are free of material misstatement, whether due to error or fraud. Our auditsincluded performing procedures to assess the risks of material misstatement of the consolidated financial statements, whether due to error of fraud, andperforming procedures that respond to those risks. Such procedures included examining, on a test basis, evidence regarding the amounts and disclosuresin the consolidated financial statements. Our audits also included evaluating the accounting principles used and significant estimates made bymanagement, as well as evaluating the overall presentation of the consolidated financial statements. We believe that our audits provide a reasonablebasis for our opinion.
Critical Audit Matter
The critical audit matter communicated below is a matter arising from the current period audit of the financial statements that was communicatedor required to be communicated to the audit committee and that: (1) relates to
F-2
Copyright © 2020 www.secdatabase.com. All Rights Reserved.Please Consider the Environment Before Printing This Document

Table of Contentsaccounts or disclosures that are material to the financial statements and (2) involved our especially challenging, subjective or complex judgments. Thecommunication of a critical audit matter does not alter in any way our opinion on the consolidated financial statements, taken as a whole, and we arenot, by communicating the critical audit matter below, providing a separate opinion on the critical audit matter or on the accounts or disclosures to whichit relates.
Evaluation of impairment analysis for goodwill in the security services cash generating unit
As disclosed in note 4 (12) and 15 to the consolidated financial statements, the amount of goodwill that is allocated to the security services cashgenerating unit (�CGU�) is ₩1,173,382 million as of December 31, 2019. The Group performs impairment test for goodwill at least annually or whenthere is an indication of possible impairment by comparing the recoverable amount and the carrying amount of a CGU to which goodwill is allocated.The recoverable amount of security services CGU was determined based on value-in-use (�VIU�).
We identified the evaluation of impairment analysis for goodwill in the security services CGU as a critical audit matter. The estimated recoverableamount of the security service CGU is not significantly higher than its carrying value, indicating a higher risk that the goodwill may be impaired andtherefore, involved a high degree of challenging and complex auditor judgment. Specifically, the revenue growth rates, labor costs, perpetual growthrate, and discount rate assumptions used to estimate the VIU of the security services CGU were challenging to test as minor changes to thoseassumptions would have had a significant effect on the Group�s goodwill impairment analysis.
The primary procedures we performed to address this critical audit matter included the following. We tested certain internal controls over theGroup�s goodwill impairment assessment process, including controls related to the determination of the VIU of the security services CGU and thedevelopment of revenue growth rates, labor costs, perpetual growth rate, and discount rate assumptions. We evaluated estimated revenue growth ratesand labor costs by comparison with the financial budgets approved by the Group. We performed sensitivity analysis for both the discount rates andperpetual growth rate to assess the impact of changes in these key assumptions on the Group�s determination that the VIU of security services CGUexceeded its carrying value. We compared the revenue growth rates and labor costs assumptions used in forecasting cash flow in prior year to the actualresults to assess the Group�s ability to accurately forecast. In addition, we involved our valuation professionals with specialized skills and knowledge,who assisted in:
� evaluating estimated revenue growth rates, labor costs and perpetual growth rate by comparison with industry reports as well as historicalperformance; and
� evaluating the discount rate by comparing with the discount rate that was independently developed using publicly available market data forcomparable entities.
/s/ KPMG Samjong Accounting Corp.
We have served as the Group�s auditor since 2012.
Seoul, KoreaApril 29, 2020
F-3
Copyright © 2020 www.secdatabase.com. All Rights Reserved.Please Consider the Environment Before Printing This Document
Table of ContentsReport of Independent Registered Public Accounting FirmOn Internal Control Over Financial Reporting
To the Shareholders and the Board of DirectorsSK Telecom Co., Ltd.:
Opinion on Internal Control Over Financial Reporting
We have audited SK Telecom Co., Ltd. and subsidiaries� (the Group) internal control over financial reporting as of December 31, 2019, based oncriteria established in Internal Control � Integrated Framework (2013) issued by the Committee of Sponsoring Organizations of the TreadwayCommission. In our opinion, the Group maintained, in all material respects, effective internal control over financial reporting as of December 31, 2019,based on criteria established in Internal Control � Integrated Framework (2013) issued by the Committee of Sponsoring Organizations of the TreadwayCommission.
We also have audited, in accordance with the standards of the Public Company Accounting Oversight Board (United States) (PCAOB), theconsolidated statements of financial position of the Group as of December 31, 2019 and 2018, the related consolidated statements of income,comprehensive income, changes in equity and cash flows for each of the years in the three-year period ended December 31, 2019, and the related notes(collectively, the consolidated financial statements) and our report dated April 29, 2020, expressed an unqualified opinion on those consolidatedfinancial statements.
Basis for Opinion
The Group�s management is responsible for maintaining effective internal control over financial reporting and for its assessment of theeffectiveness of internal control over financial reporting, included in the accompanying Management�s Annual Report on Internal Control OverFinancial Reporting. Our responsibility is to express an opinion on the Group�s internal control over financial reporting based on our audit. We are apublic accounting firm registered with the PCAOB and are required to be independent with respect to the Group in accordance with the U.S. federalsecurities laws and the applicable rules and regulations of the Securities and Exchange Commission and the PCAOB.
We conducted our audit in accordance with the standards of the PCAOB. Those standards require that we plan and perform the audit to obtainreasonable assurance about whether effective internal control over financial reporting was maintained in all material respects. Our audit of internalcontrol over financial reporting included obtaining an understanding of internal control over financial reporting, assessing the risk that a materialweakness exists, and testing and evaluating the design and operating effectiveness of internal control based on the assessed risk. Our audit also includedperforming such other procedures as we considered necessary in the circumstances. We believe that our audit provides a reasonable basis for ouropinion.
Definition and Limitations of Internal Control Over Financial Reporting
A company�s internal control over financial reporting is a process designed to provide reasonable assurance regarding the reliability of financialreporting and the preparation of financial statements for external purposes in accordance with generally accepted accounting principles. A company�sinternal control over financial reporting includes those policies and procedures that (1) pertain to the maintenance of records that, in reasonable detail,accurately and fairly reflect the transactions and dispositions of the assets of the company; (2) provide reasonable assurance that transactions arerecorded as necessary to permit preparation of financial statements in accordance with generally accepted accounting principles, and that receipts andexpenditures of the company are being made only in accordance with authorizations of management and directors of the company; and (3) providereasonable assurance regarding prevention or timely detection of unauthorized acquisition, use, or disposition of the company�s assets that could have amaterial effect on the financial statements.
Because of its inherent limitations, internal control over financial reporting may not prevent or detect misstatements. Also, projections of anyevaluation of effectiveness to future periods are subject to the risk that controls may become inadequate because of changes in conditions, or that thedegree of compliance with the policies or procedures may deteriorate.
/s/ KPMG Samjong Accounting Corp.
Seoul, KoreaApril 29, 2020
F-4
Copyright © 2020 www.secdatabase.com. All Rights Reserved.Please Consider the Environment Before Printing This Document
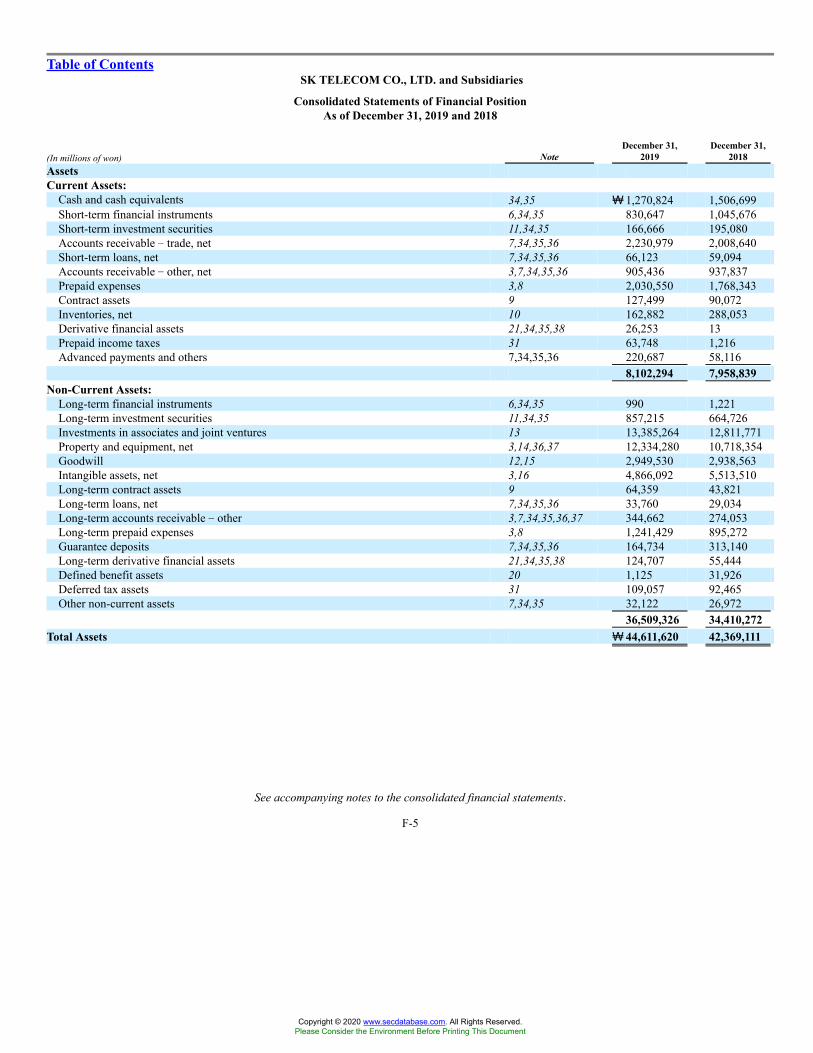
Table of ContentsSK TELECOM CO., LTD. and Subsidiaries
Consolidated Statements of Financial PositionAs of December 31, 2019 and 2018
(In millions of won) NoteDecember 31,
2019December 31,
2018AssetsCurrent Assets:
Cash and cash equivalents 34,35 ₩ 1,270,824 1,506,699Short-term financial instruments 6,34,35 830,647 1,045,676Short-term investment securities 11,34,35 166,666 195,080Accounts receivable � trade, net 7,34,35,36 2,230,979 2,008,640Short-term loans, net 7,34,35,36 66,123 59,094Accounts receivable � other, net 3,7,34,35,36 905,436 937,837Prepaid expenses 3,8 2,030,550 1,768,343Contract assets 9 127,499 90,072Inventories, net 10 162,882 288,053Derivative financial assets 21,34,35,38 26,253 13Prepaid income taxes 31 63,748 1,216Advanced payments and others 7,34,35,36 220,687 58,116
8,102,294 7,958,839Non-Current Assets:
Long-term financial instruments 6,34,35 990 1,221Long-term investment securities 11,34,35 857,215 664,726Investments in associates and joint ventures 13 13,385,264 12,811,771Property and equipment, net 3,14,36,37 12,334,280 10,718,354Goodwill 12,15 2,949,530 2,938,563Intangible assets, net 3,16 4,866,092 5,513,510Long-term contract assets 9 64,359 43,821Long-term loans, net 7,34,35,36 33,760 29,034Long-term accounts receivable � other 3,7,34,35,36,37 344,662 274,053Long-term prepaid expenses 3,8 1,241,429 895,272Guarantee deposits 7,34,35,36 164,734 313,140Long-term derivative financial assets 21,34,35,38 124,707 55,444Defined benefit assets 20 1,125 31,926Deferred tax assets 31 109,057 92,465Other non-current assets 7,34,35 32,122 26,972
36,509,326 34,410,272Total Assets ₩ 44,611,620 42,369,111
See accompanying notes to the consolidated financial statements.
F-5
Copyright © 2020 www.secdatabase.com. All Rights Reserved.Please Consider the Environment Before Printing This Document
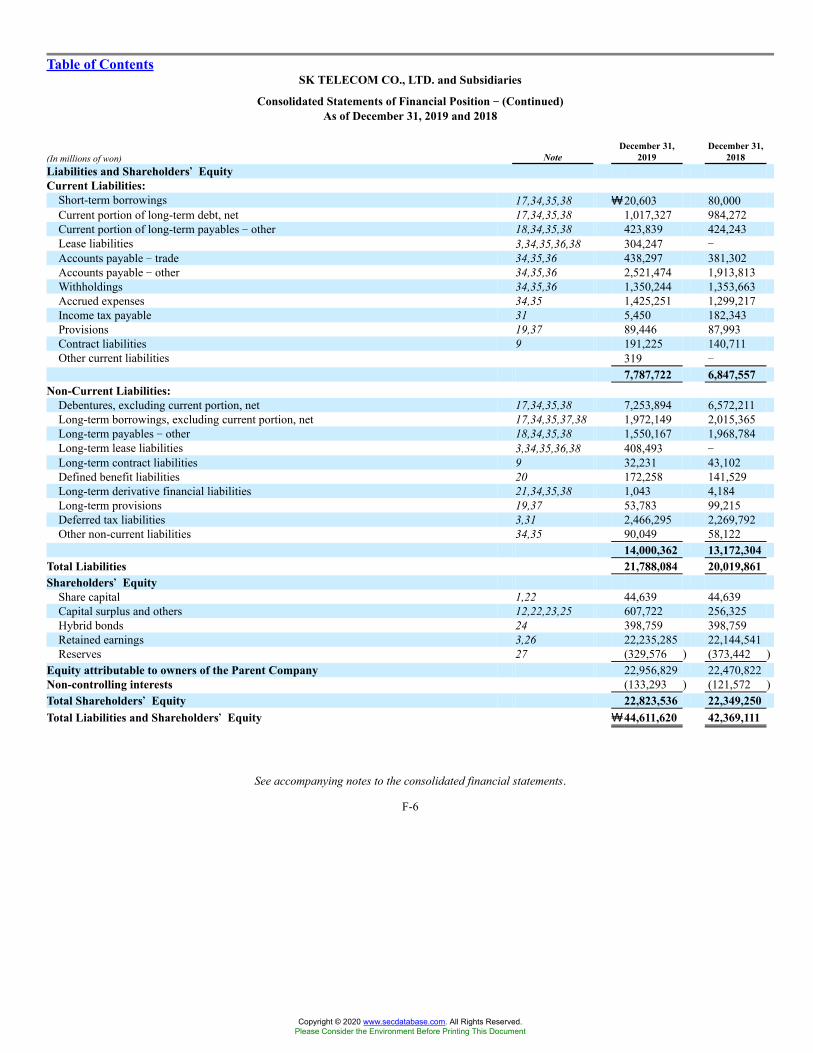
Table of ContentsSK TELECOM CO., LTD. and Subsidiaries
Consolidated Statements of Financial Position �� (Continued)As of December 31, 2019 and 2018
(In millions of won) NoteDecember 31,
2019December 31,
2018Liabilities and Shareholders�� EquityCurrent Liabilities:
Short-term borrowings 17,34,35,38 ₩20,603 80,000Current portion of long-term debt, net 17,34,35,38 1,017,327 984,272Current portion of long-term payables � other 18,34,35,38 423,839 424,243Lease liabilities 3,34,35,36,38 304,247 �Accounts payable � trade 34,35,36 438,297 381,302Accounts payable � other 34,35,36 2,521,474 1,913,813Withholdings 34,35,36 1,350,244 1,353,663Accrued expenses 34,35 1,425,251 1,299,217Income tax payable 31 5,450 182,343Provisions 19,37 89,446 87,993Contract liabilities 9 191,225 140,711Other current liabilities 319 �
7,787,722 6,847,557Non-Current Liabilities:
Debentures, excluding current portion, net 17,34,35,38 7,253,894 6,572,211Long-term borrowings, excluding current portion, net 17,34,35,37,38 1,972,149 2,015,365Long-term payables � other 18,34,35,38 1,550,167 1,968,784Long-term lease liabilities 3,34,35,36,38 408,493 �Long-term contract liabilities 9 32,231 43,102Defined benefit liabilities 20 172,258 141,529Long-term derivative financial liabilities 21,34,35,38 1,043 4,184Long-term provisions 19,37 53,783 99,215Deferred tax liabilities 3,31 2,466,295 2,269,792Other non-current liabilities 34,35 90,049 58,122
14,000,362 13,172,304Total Liabilities 21,788,084 20,019,861Shareholders�� Equity
Share capital 1,22 44,639 44,639Capital surplus and others 12,22,23,25 607,722 256,325Hybrid bonds 24 398,759 398,759Retained earnings 3,26 22,235,285 22,144,541Reserves 27 (329,576 ) (373,442 )
Equity attributable to owners of the Parent Company 22,956,829 22,470,822Non-controlling interests (133,293 ) (121,572 )Total Shareholders�� Equity 22,823,536 22,349,250Total Liabilities and Shareholders�� Equity ₩44,611,620 42,369,111
See accompanying notes to the consolidated financial statements.
F-6
Copyright © 2020 www.secdatabase.com. All Rights Reserved.Please Consider the Environment Before Printing This Document
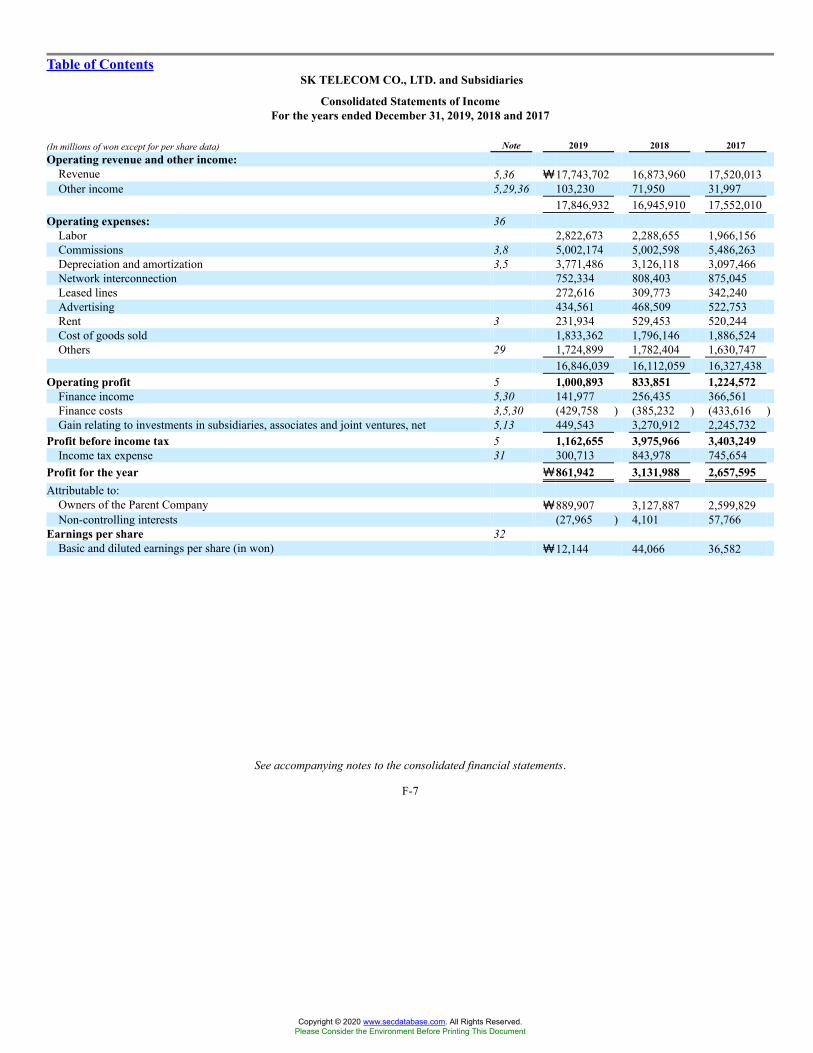
Table of ContentsSK TELECOM CO., LTD. and Subsidiaries
Consolidated Statements of IncomeFor the years ended December 31, 2019, 2018 and 2017
(In millions of won except for per share data) Note 2019 2018 2017Operating revenue and other income:
Revenue 5,36 ₩17,743,702 16,873,960 17,520,013Other income 5,29,36 103,230 71,950 31,997
17,846,932 16,945,910 17,552,010Operating expenses: 36
Labor 2,822,673 2,288,655 1,966,156Commissions 3,8 5,002,174 5,002,598 5,486,263Depreciation and amortization 3,5 3,771,486 3,126,118 3,097,466Network interconnection 752,334 808,403 875,045Leased lines 272,616 309,773 342,240Advertising 434,561 468,509 522,753Rent 3 231,934 529,453 520,244Cost of goods sold 1,833,362 1,796,146 1,886,524Others 29 1,724,899 1,782,404 1,630,747
16,846,039 16,112,059 16,327,438Operating profit 5 1,000,893 833,851 1,224,572
Finance income 5,30 141,977 256,435 366,561Finance costs 3,5,30 (429,758 ) (385,232 ) (433,616 )Gain relating to investments in subsidiaries, associates and joint ventures, net 5,13 449,543 3,270,912 2,245,732
Profit before income tax 5 1,162,655 3,975,966 3,403,249Income tax expense 31 300,713 843,978 745,654
Profit for the year ₩861,942 3,131,988 2,657,595Attributable to:
Owners of the Parent Company ₩889,907 3,127,887 2,599,829Non-controlling interests (27,965 ) 4,101 57,766
Earnings per share 32Basic and diluted earnings per share (in won) ₩12,144 44,066 36,582
See accompanying notes to the consolidated financial statements.
F-7
Copyright © 2020 www.secdatabase.com. All Rights Reserved.Please Consider the Environment Before Printing This Document
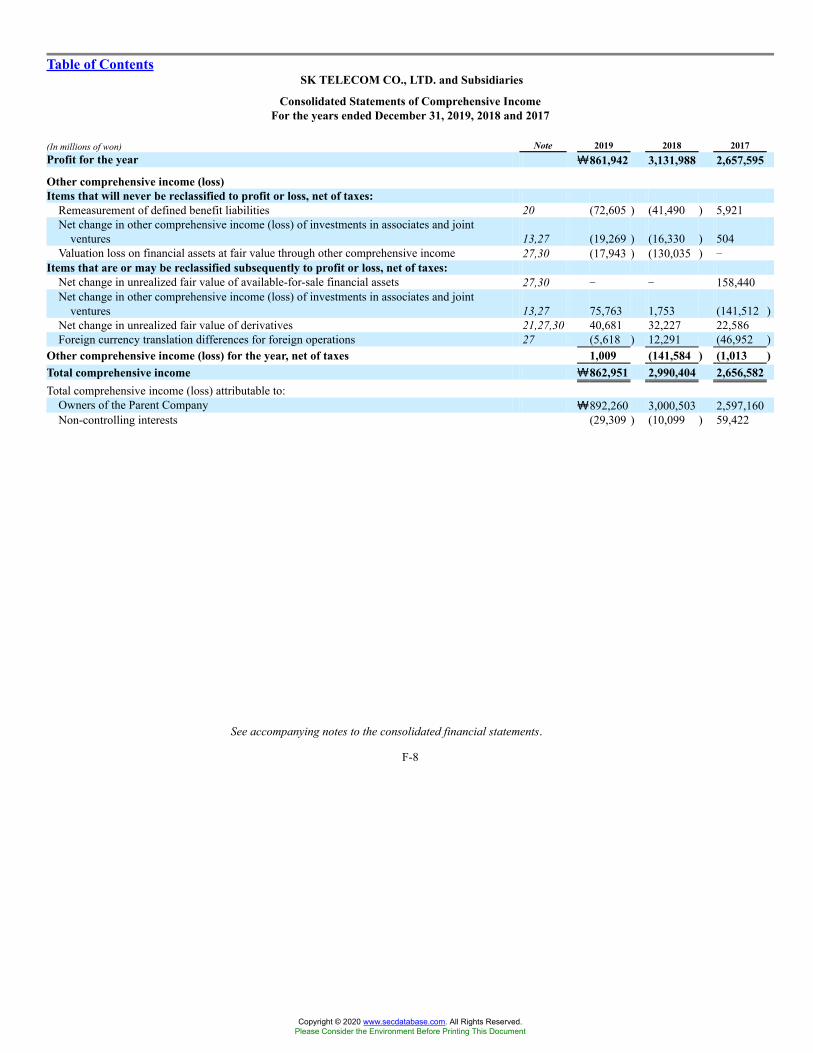
Table of ContentsSK TELECOM CO., LTD. and Subsidiaries
Consolidated Statements of Comprehensive IncomeFor the years ended December 31, 2019, 2018 and 2017
(In millions of won) Note 2019 2018 2017Profit for the year ₩861,942 3,131,988 2,657,595
Other comprehensive income (loss)Items that will never be reclassified to profit or loss, net of taxes:
Remeasurement of defined benefit liabilities 20 (72,605 ) (41,490 ) 5,921Net change in other comprehensive income (loss) of investments in associates and joint
ventures 13,27 (19,269 ) (16,330 ) 504Valuation loss on financial assets at fair value through other comprehensive income 27,30 (17,943 ) (130,035 ) �
Items that are or may be reclassified subsequently to profit or loss, net of taxes:Net change in unrealized fair value of available-for-sale financial assets 27,30 � � 158,440Net change in other comprehensive income (loss) of investments in associates and joint
ventures 13,27 75,763 1,753 (141,512 )Net change in unrealized fair value of derivatives 21,27,30 40,681 32,227 22,586Foreign currency translation differences for foreign operations 27 (5,618 ) 12,291 (46,952 )
Other comprehensive income (loss) for the year, net of taxes 1,009 (141,584 ) (1,013 )Total comprehensive income ₩862,951 2,990,404 2,656,582Total comprehensive income (loss) attributable to:
Owners of the Parent Company ₩892,260 3,000,503 2,597,160Non-controlling interests (29,309 ) (10,099 ) 59,422
See accompanying notes to the consolidated financial statements.
F-8
Copyright © 2020 www.secdatabase.com. All Rights Reserved.Please Consider the Environment Before Printing This Document
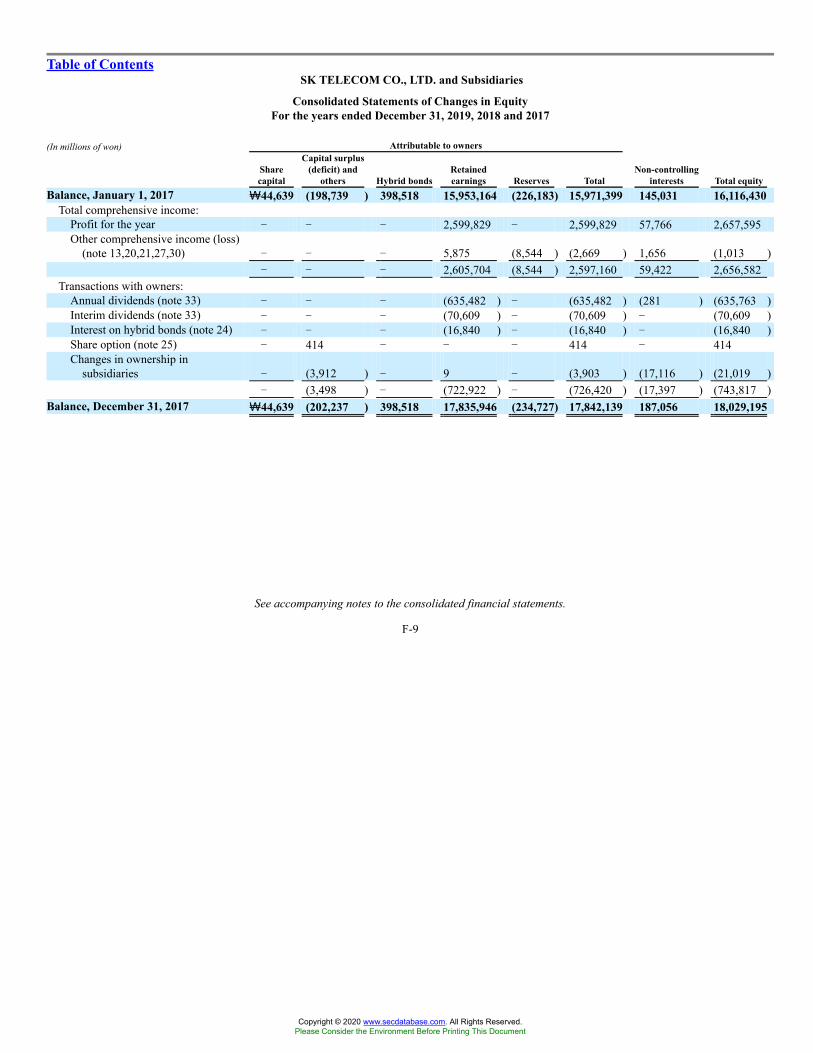
Table of ContentsSK TELECOM CO., LTD. and Subsidiaries
Consolidated Statements of Changes in EquityFor the years ended December 31, 2019, 2018 and 2017
(In millions of won) Attributable to owners
Sharecapital
Capital surplus(deficit) and
others Hybrid bondsRetainedearnings Reserves Total
Non-controllinginterests Total equity
Balance, January 1, 2017 ₩44,639 (198,739 ) 398,518 15,953,164 (226,183) 15,971,399 145,031 16,116,430Total comprehensive income:
Profit for the year � � � 2,599,829 � 2,599,829 57,766 2,657,595Other comprehensive income (loss)
(note 13,20,21,27,30) � � � 5,875 (8,544 ) (2,669 ) 1,656 (1,013 )� � � 2,605,704 (8,544 ) 2,597,160 59,422 2,656,582
Transactions with owners:Annual dividends (note 33) � � � (635,482 ) � (635,482 ) (281 ) (635,763 )Interim dividends (note 33) � � � (70,609 ) � (70,609 ) � (70,609 )Interest on hybrid bonds (note 24) � � � (16,840 ) � (16,840 ) � (16,840 )Share option (note 25) � 414 � � � 414 � 414Changes in ownership in
subsidiaries � (3,912 ) � 9 � (3,903 ) (17,116 ) (21,019 )� (3,498 ) � (722,922 ) � (726,420 ) (17,397 ) (743,817 )
Balance, December 31, 2017 ₩44,639 (202,237 ) 398,518 17,835,946 (234,727) 17,842,139 187,056 18,029,195
See accompanying notes to the consolidated financial statements.
F-9
Copyright © 2020 www.secdatabase.com. All Rights Reserved.Please Consider the Environment Before Printing This Document
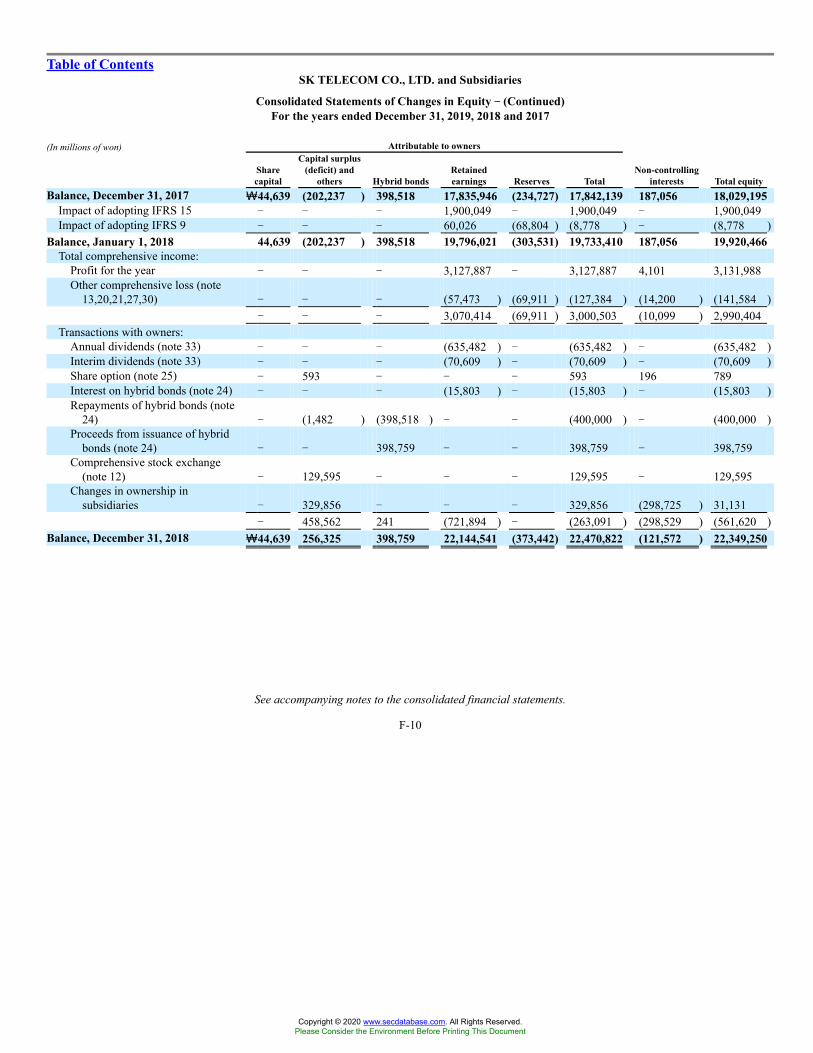
Table of ContentsSK TELECOM CO., LTD. and Subsidiaries
Consolidated Statements of Changes in Equity �� (Continued)For the years ended December 31, 2019, 2018 and 2017
(In millions of won) Attributable to owners
Sharecapital
Capital surplus(deficit) and
others Hybrid bondsRetainedearnings Reserves Total
Non-controllinginterests Total equity
Balance, December 31, 2017 ₩44,639 (202,237 ) 398,518 17,835,946 (234,727) 17,842,139 187,056 18,029,195Impact of adopting IFRS 15 � � � 1,900,049 � 1,900,049 � 1,900,049Impact of adopting IFRS 9 � � � 60,026 (68,804 ) (8,778 ) � (8,778 )
Balance, January 1, 2018 44,639 (202,237 ) 398,518 19,796,021 (303,531) 19,733,410 187,056 19,920,466Total comprehensive income:
Profit for the year � � � 3,127,887 � 3,127,887 4,101 3,131,988Other comprehensive loss (note
13,20,21,27,30) � � � (57,473 ) (69,911 ) (127,384 ) (14,200 ) (141,584 )� � � 3,070,414 (69,911 ) 3,000,503 (10,099 ) 2,990,404
Transactions with owners:Annual dividends (note 33) � � � (635,482 ) � (635,482 ) � (635,482 )Interim dividends (note 33) � � � (70,609 ) � (70,609 ) � (70,609 )Share option (note 25) � 593 � � � 593 196 789Interest on hybrid bonds (note 24) � � � (15,803 ) � (15,803 ) � (15,803 )Repayments of hybrid bonds (note
24) � (1,482 ) (398,518 ) � � (400,000 ) � (400,000 )Proceeds from issuance of hybrid
bonds (note 24) � � 398,759 � � 398,759 � 398,759Comprehensive stock exchange
(note 12) � 129,595 � � � 129,595 � 129,595Changes in ownership in
subsidiaries � 329,856 � � � 329,856 (298,725 ) 31,131� 458,562 241 (721,894 ) � (263,091 ) (298,529 ) (561,620 )
Balance, December 31, 2018 ₩44,639 256,325 398,759 22,144,541 (373,442) 22,470,822 (121,572 ) 22,349,250
See accompanying notes to the consolidated financial statements.
F-10
Copyright © 2020 www.secdatabase.com. All Rights Reserved.Please Consider the Environment Before Printing This Document
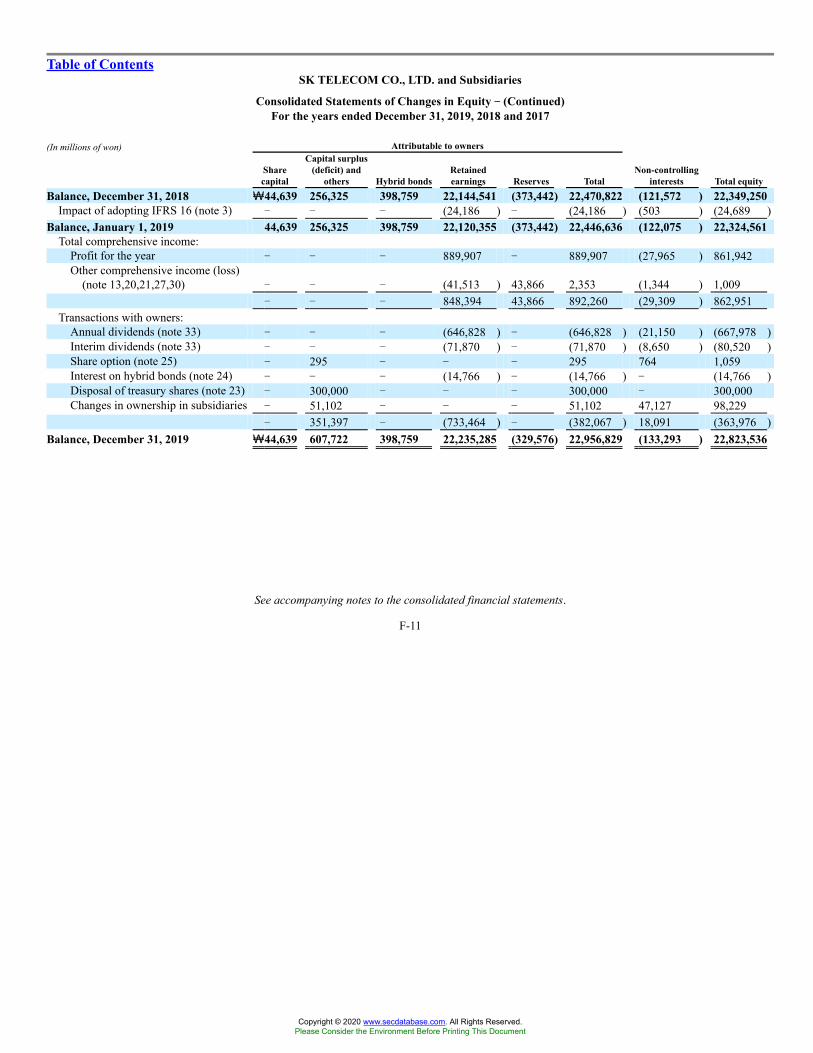
Table of ContentsSK TELECOM CO., LTD. and Subsidiaries
Consolidated Statements of Changes in Equity �� (Continued)For the years ended December 31, 2019, 2018 and 2017
(In millions of won) Attributable to owners
Sharecapital
Capital surplus(deficit) and
others Hybrid bondsRetainedearnings Reserves Total
Non-controllinginterests Total equity
Balance, December 31, 2018 ₩44,639 256,325 398,759 22,144,541 (373,442) 22,470,822 (121,572 ) 22,349,250Impact of adopting IFRS 16 (note 3) � � � (24,186 ) � (24,186 ) (503 ) (24,689 )
Balance, January 1, 2019 44,639 256,325 398,759 22,120,355 (373,442) 22,446,636 (122,075 ) 22,324,561Total comprehensive income:
Profit for the year � � � 889,907 � 889,907 (27,965 ) 861,942Other comprehensive income (loss)
(note 13,20,21,27,30) � � � (41,513 ) 43,866 2,353 (1,344 ) 1,009� � � 848,394 43,866 892,260 (29,309 ) 862,951
Transactions with owners:Annual dividends (note 33) � � � (646,828 ) � (646,828 ) (21,150 ) (667,978 )Interim dividends (note 33) � � � (71,870 ) � (71,870 ) (8,650 ) (80,520 )Share option (note 25) � 295 � � � 295 764 1,059Interest on hybrid bonds (note 24) � � � (14,766 ) � (14,766 ) � (14,766 )Disposal of treasury shares (note 23) � 300,000 � � � 300,000 � 300,000Changes in ownership in subsidiaries � 51,102 � � � 51,102 47,127 98,229
� 351,397 � (733,464 ) � (382,067 ) 18,091 (363,976 )Balance, December 31, 2019 ₩44,639 607,722 398,759 22,235,285 (329,576) 22,956,829 (133,293 ) 22,823,536
See accompanying notes to the consolidated financial statements.
F-11
Copyright © 2020 www.secdatabase.com. All Rights Reserved.Please Consider the Environment Before Printing This Document
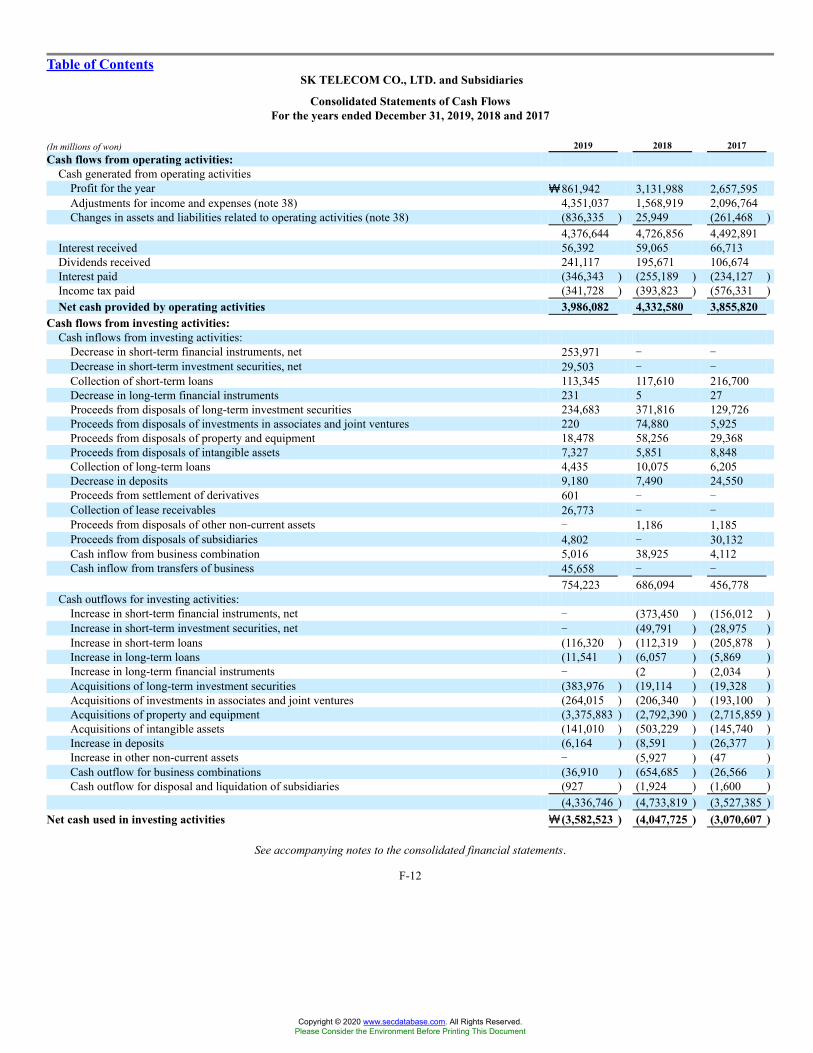
Table of ContentsSK TELECOM CO., LTD. and Subsidiaries
Consolidated Statements of Cash FlowsFor the years ended December 31, 2019, 2018 and 2017
(In millions of won) 2019 2018 2017Cash flows from operating activities:
Cash generated from operating activitiesProfit for the year ₩861,942 3,131,988 2,657,595Adjustments for income and expenses (note 38) 4,351,037 1,568,919 2,096,764Changes in assets and liabilities related to operating activities (note 38) (836,335 ) 25,949 (261,468 )
4,376,644 4,726,856 4,492,891Interest received 56,392 59,065 66,713Dividends received 241,117 195,671 106,674Interest paid (346,343 ) (255,189 ) (234,127 )Income tax paid (341,728 ) (393,823 ) (576,331 )Net cash provided by operating activities 3,986,082 4,332,580 3,855,820
Cash flows from investing activities:Cash inflows from investing activities:
Decrease in short-term financial instruments, net 253,971 � �Decrease in short-term investment securities, net 29,503 � �Collection of short-term loans 113,345 117,610 216,700Decrease in long-term financial instruments 231 5 27Proceeds from disposals of long-term investment securities 234,683 371,816 129,726Proceeds from disposals of investments in associates and joint ventures 220 74,880 5,925Proceeds from disposals of property and equipment 18,478 58,256 29,368Proceeds from disposals of intangible assets 7,327 5,851 8,848Collection of long-term loans 4,435 10,075 6,205Decrease in deposits 9,180 7,490 24,550Proceeds from settlement of derivatives 601 � �Collection of lease receivables 26,773 � �Proceeds from disposals of other non-current assets � 1,186 1,185Proceeds from disposals of subsidiaries 4,802 � 30,132Cash inflow from business combination 5,016 38,925 4,112Cash inflow from transfers of business 45,658 � �
754,223 686,094 456,778Cash outflows for investing activities:
Increase in short-term financial instruments, net � (373,450 ) (156,012 )Increase in short-term investment securities, net � (49,791 ) (28,975 )Increase in short-term loans (116,320 ) (112,319 ) (205,878 )Increase in long-term loans (11,541 ) (6,057 ) (5,869 )Increase in long-term financial instruments � (2 ) (2,034 )Acquisitions of long-term investment securities (383,976 ) (19,114 ) (19,328 )Acquisitions of investments in associates and joint ventures (264,015 ) (206,340 ) (193,100 )Acquisitions of property and equipment (3,375,883 ) (2,792,390 ) (2,715,859 )Acquisitions of intangible assets (141,010 ) (503,229 ) (145,740 )Increase in deposits (6,164 ) (8,591 ) (26,377 )Increase in other non-current assets � (5,927 ) (47 )Cash outflow for business combinations (36,910 ) (654,685 ) (26,566 )Cash outflow for disposal and liquidation of subsidiaries (927 ) (1,924 ) (1,600 )
(4,336,746 ) (4,733,819 ) (3,527,385 )Net cash used in investing activities ₩(3,582,523 ) (4,047,725 ) (3,070,607 )
See accompanying notes to the consolidated financial statements.
F-12
Copyright © 2020 www.secdatabase.com. All Rights Reserved.Please Consider the Environment Before Printing This Document
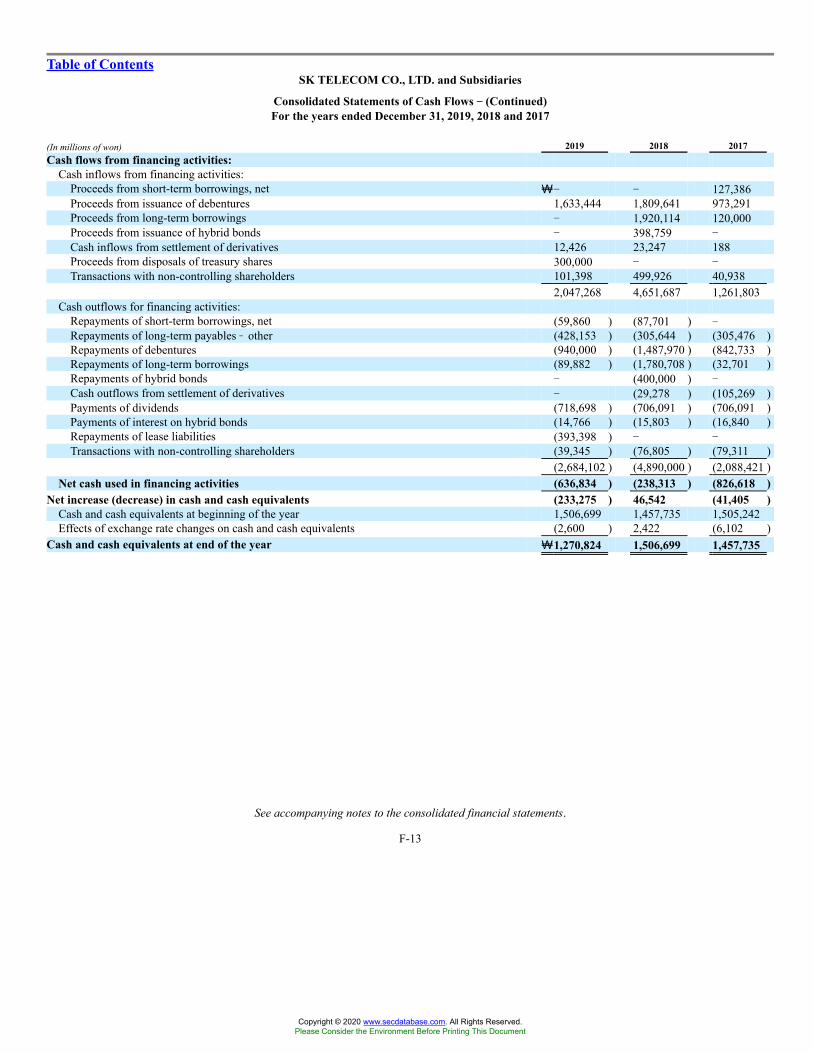
Table of ContentsSK TELECOM CO., LTD. and Subsidiaries
Consolidated Statements of Cash Flows �� (Continued)For the years ended December 31, 2019, 2018 and 2017
(In millions of won) 2019 2018 2017Cash flows from financing activities:
Cash inflows from financing activities:Proceeds from short-term borrowings, net ₩� � 127,386Proceeds from issuance of debentures 1,633,444 1,809,641 973,291Proceeds from long-term borrowings � 1,920,114 120,000Proceeds from issuance of hybrid bonds � 398,759 �Cash inflows from settlement of derivatives 12,426 23,247 188Proceeds from disposals of treasury shares 300,000 � �Transactions with non-controlling shareholders 101,398 499,926 40,938
2,047,268 4,651,687 1,261,803Cash outflows for financing activities:
Repayments of short-term borrowings, net (59,860 ) (87,701 ) �Repayments of long-term payables � other (428,153 ) (305,644 ) (305,476 )Repayments of debentures (940,000 ) (1,487,970 ) (842,733 )Repayments of long-term borrowings (89,882 ) (1,780,708 ) (32,701 )Repayments of hybrid bonds � (400,000 ) �Cash outflows from settlement of derivatives � (29,278 ) (105,269 )Payments of dividends (718,698 ) (706,091 ) (706,091 )Payments of interest on hybrid bonds (14,766 ) (15,803 ) (16,840 )Repayments of lease liabilities (393,398 ) � �Transactions with non-controlling shareholders (39,345 ) (76,805 ) (79,311 )
(2,684,102 ) (4,890,000 ) (2,088,421 )Net cash used in financing activities (636,834 ) (238,313 ) (826,618 )
Net increase (decrease) in cash and cash equivalents (233,275 ) 46,542 (41,405 )Cash and cash equivalents at beginning of the year 1,506,699 1,457,735 1,505,242Effects of exchange rate changes on cash and cash equivalents (2,600 ) 2,422 (6,102 )
Cash and cash equivalents at end of the year ₩1,270,824 1,506,699 1,457,735
See accompanying notes to the consolidated financial statements.
F-13
Copyright © 2020 www.secdatabase.com. All Rights Reserved.Please Consider the Environment Before Printing This Document
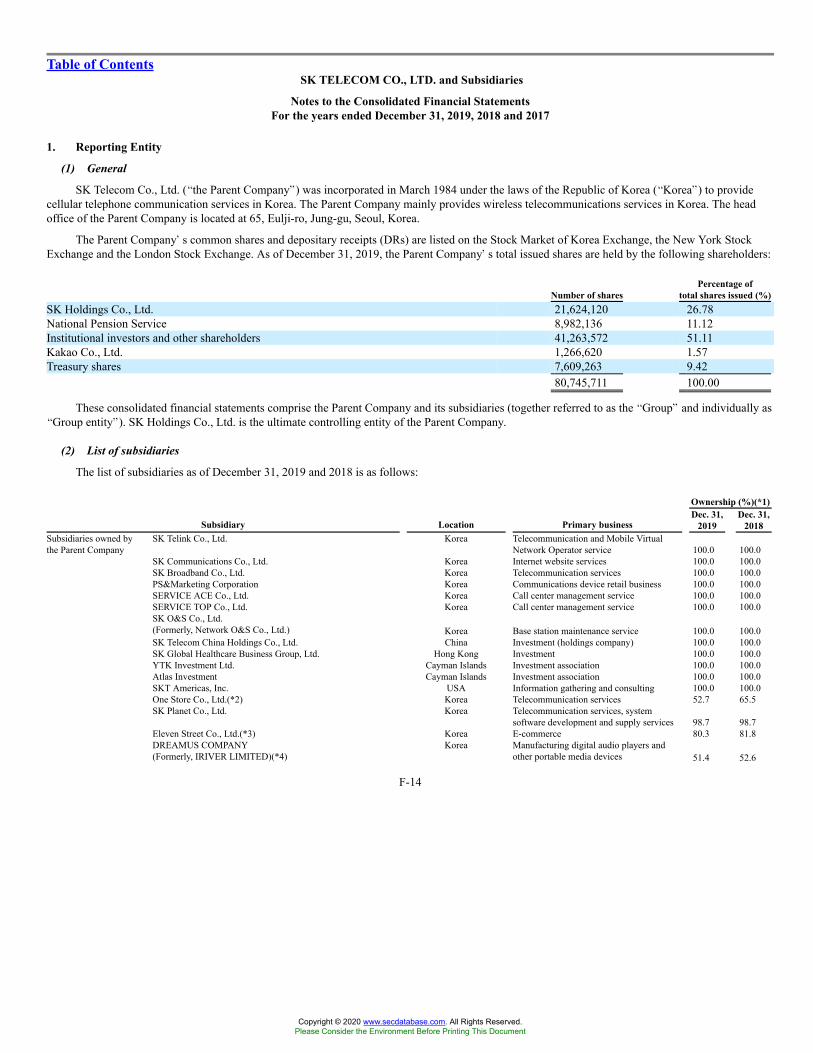
Table of ContentsSK TELECOM CO., LTD. and Subsidiaries
Notes to the Consolidated Financial StatementsFor the years ended December 31, 2019, 2018 and 2017
1. Reporting Entity
(1) General
SK Telecom Co., Ltd. (�the Parent Company�) was incorporated in March 1984 under the laws of the Republic of Korea (�Korea�) to providecellular telephone communication services in Korea. The Parent Company mainly provides wireless telecommunications services in Korea. The headoffice of the Parent Company is located at 65, Eulji-ro, Jung-gu, Seoul, Korea.
The Parent Company�s common shares and depositary receipts (DRs) are listed on the Stock Market of Korea Exchange, the New York StockExchange and the London Stock Exchange. As of December 31, 2019, the Parent Company�s total issued shares are held by the following shareholders:
Number of sharesPercentage of
total shares issued (%)SK Holdings Co., Ltd. 21,624,120 26.78National Pension Service 8,982,136 11.12Institutional investors and other shareholders 41,263,572 51.11Kakao Co., Ltd. 1,266,620 1.57Treasury shares 7,609,263 9.42
80,745,711 100.00
These consolidated financial statements comprise the Parent Company and its subsidiaries (together referred to as the �Group� and individually as�Group entity�). SK Holdings Co., Ltd. is the ultimate controlling entity of the Parent Company.
(2) List of subsidiaries
The list of subsidiaries as of December 31, 2019 and 2018 is as follows:
Ownership (%)(*1)
Subsidiary Location Primary businessDec. 31,
2019Dec. 31,
2018SK Telink Co., Ltd. Korea Telecommunication and Mobile Virtual
Network Operator service 100.0 100.0SK Communications Co., Ltd. Korea Internet website services 100.0 100.0SK Broadband Co., Ltd. Korea Telecommunication services 100.0 100.0PS&Marketing Corporation Korea Communications device retail business 100.0 100.0SERVICE ACE Co., Ltd. Korea Call center management service 100.0 100.0SERVICE TOP Co., Ltd. Korea Call center management service 100.0 100.0SK O&S Co., Ltd.(Formerly, Network O&S Co., Ltd.) Korea Base station maintenance service 100.0 100.0SK Telecom China Holdings Co., Ltd. China Investment (holdings company) 100.0 100.0
Subsidiaries owned bythe Parent Company
SK Global Healthcare Business Group, Ltd. Hong Kong Investment 100.0 100.0YTK Investment Ltd. Cayman Islands Investment association 100.0 100.0Atlas Investment Cayman Islands Investment association 100.0 100.0SKT Americas, Inc. USA Information gathering and consulting 100.0 100.0One Store Co., Ltd.(*2) Korea Telecommunication services 52.7 65.5SK Planet Co., Ltd. Korea Telecommunication services, system
software development and supply services 98.7 98.7Eleven Street Co., Ltd.(*3) Korea E-commerce 80.3 81.8DREAMUS COMPANY(Formerly, IRIVER LIMITED)(*4)
Korea Manufacturing digital audio players andother portable media devices 51.4 52.6
F-14
Copyright © 2020 www.secdatabase.com. All Rights Reserved.Please Consider the Environment Before Printing This Document

Table of ContentsSK TELECOM CO., LTD. and Subsidiaries
Notes to the Consolidated Financial Statements �� (Continued)For the years ended December 31, 2019, 2018 and 2017
Ownership (%)(*1)
Subsidiary Location Primary businessDec. 31,
2019Dec. 31,
2018SK Infosec Co., Ltd. Korea Information security service 100.0 100.0Life & Security Holdings Co., Ltd. Korea Investment(holdings company) 55.0 55.0Quantum Innovation Fund I Korea Investment 59.9 59.9SK Telecom Japan Inc. Japan Information gathering and consulting 100.0 100.0id Quantique SA(*5) Switzerland Quantum information and
communications service 66.8 65.6SK Telecom TMT Investment Corp.(*6) USA Investment 100.0 �FSK L&S Co., Ltd.(*6) Korea Freight and logistics consulting business 60.0 �Incross Co., Ltd.(*6) Korea Media representative business 34.6 �
Subsidiaries owned bythe Parent Company
Happy Hanool Co., Ltd.(*6) Korea Service 100.0 �SK m&service Co., Ltd. Korea Data base and internet website service 100.0 100.0SK Planet Global Holdings Pte. Ltd. Singapore Investment (holdings company) 100.0 100.0SKP America LLC. USA Digital contents sourcing service 100.0 100.0shopkick Management Company, Inc.(*6) USA Investment � 100.0shopkick, Inc.(*6) USA Reward points-based in-store shopping
application development � 100.0
Subsidiaries owned bySK Planet Co., Ltd.
K-net Culture and Contents Venture Fund Korea Capital investing in startups 59.0 59.0
iriver Enterprise Ltd. Hong Kong Management of Chinese subsidiaries 100.0 100.0iriver Inc.(*6) USA Marketing and sales in North America � 100.0iriver China Co., Ltd. China Sales of and manufacturing MP3 and 4 100.0 100.0Dongguan iriver Electronics Co., Ltd. China Sales of and manufacturing e-book 100.0 100.0groovers Japan Co., Ltd.(*6) Japan Digital music contents sourcing and
distribution service � 100.0LIFE DESIGN COMPANY Inc. Japan Sales of goods in Japan 100.0 100.0
Subsidiaries owned byDREAMUS COMPANY(Formerly, IRIVERLIMITED)
groovers Inc.(*6) Korea Sales of contents andMastering Quality Sound album � 100.0
Subsidiary owned by SKInfosec Co., Ltd.
SKinfosec Information Technology(Wuxi) Co., Ltd.(*6) China System software development and
supply services 100.0 �
ADT CAPS Co., Ltd. Korea Unmanned security 100.0 100.0CAPSTEC Co., Ltd. Korea Manned security 100.0 100.0
Subsidiaries owned byLife & Security HoldingsCo., Ltd. ADT SECURITY Co., Ltd. Korea Sales and trade of anti-theft devices and
surveillance devices 100.0 100.0
Subsidiary owned by SKTelink Co., Ltd.
SK TELINK VIETNAM Co., Ltd. Vietnam Communications device retail business 100.0 100.0
Home & Service Co., Ltd. Korea Operation of information andcommunications facility 100.0 100.0
Subsidiaries owned bySK Broadband Co., Ltd.
SK stoa Co., Ltd. Korea Other telecommunication retail business 100.0 100.0
Subsidiary owned by SKTelecom Japan Inc.
SK Planet Japan, K. K. Japan Digital Contents sourcing service 79.8 79.8
Subsidiary owned by idQuantique SA
Id Quantique LLC Korea Quantum information andcommunications service 100.0 100.0
F-15
Copyright © 2020 www.secdatabase.com. All Rights Reserved.Please Consider the Environment Before Printing This Document
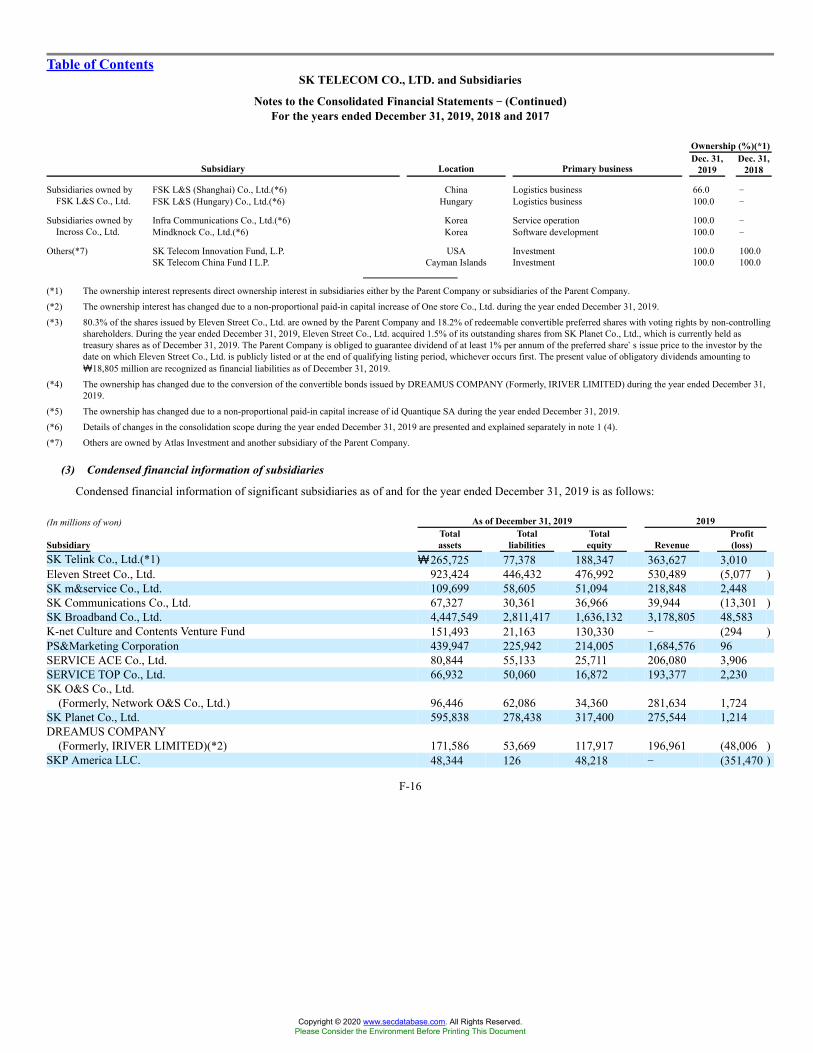
Table of ContentsSK TELECOM CO., LTD. and Subsidiaries
Notes to the Consolidated Financial Statements �� (Continued)For the years ended December 31, 2019, 2018 and 2017
Ownership (%)(*1)
Subsidiary Location Primary businessDec. 31,
2019Dec. 31,
2018
FSK L&S (Shanghai) Co., Ltd.(*6) China Logistics business 66.0 �Subsidiaries owned byFSK L&S Co., Ltd. FSK L&S (Hungary) Co., Ltd.(*6) Hungary Logistics business 100.0 �
Infra Communications Co., Ltd.(*6) Korea Service operation 100.0 �Subsidiaries owned byIncross Co., Ltd. Mindknock Co., Ltd.(*6) Korea Software development 100.0 �
SK Telecom Innovation Fund, L.P. USA Investment 100.0 100.0Others(*7)SK Telecom China Fund I L.P. Cayman Islands Investment 100.0 100.0
(*1) The ownership interest represents direct ownership interest in subsidiaries either by the Parent Company or subsidiaries of the Parent Company.(*2) The ownership interest has changed due to a non-proportional paid-in capital increase of One store Co., Ltd. during the year ended December 31, 2019.(*3) 80.3% of the shares issued by Eleven Street Co., Ltd. are owned by the Parent Company and 18.2% of redeemable convertible preferred shares with voting rights by non-controlling
shareholders. During the year ended December 31, 2019, Eleven Street Co., Ltd. acquired 1.5% of its outstanding shares from SK Planet Co., Ltd., which is currently held astreasury shares as of December 31, 2019. The Parent Company is obliged to guarantee dividend of at least 1% per annum of the preferred share�s issue price to the investor by thedate on which Eleven Street Co., Ltd. is publicly listed or at the end of qualifying listing period, whichever occurs first. The present value of obligatory dividends amounting to₩18,805 million are recognized as financial liabilities as of December 31, 2019.
(*4) The ownership has changed due to the conversion of the convertible bonds issued by DREAMUS COMPANY (Formerly, IRIVER LIMITED) during the year ended December 31,2019.
(*5) The ownership has changed due to a non-proportional paid-in capital increase of id Quantique SA during the year ended December 31, 2019.(*6) Details of changes in the consolidation scope during the year ended December 31, 2019 are presented and explained separately in note 1 (4).(*7) Others are owned by Atlas Investment and another subsidiary of the Parent Company.
(3) Condensed financial information of subsidiaries
Condensed financial information of significant subsidiaries as of and for the year ended December 31, 2019 is as follows:
(In millions of won) As of December 31, 2019 2019
SubsidiaryTotalassets
Totalliabilities
Totalequity Revenue
Profit(loss)
SK Telink Co., Ltd.(*1) ₩265,725 77,378 188,347 363,627 3,010Eleven Street Co., Ltd. 923,424 446,432 476,992 530,489 (5,077 )SK m&service Co., Ltd. 109,699 58,605 51,094 218,848 2,448SK Communications Co., Ltd. 67,327 30,361 36,966 39,944 (13,301 )SK Broadband Co., Ltd. 4,447,549 2,811,417 1,636,132 3,178,805 48,583K-net Culture and Contents Venture Fund 151,493 21,163 130,330 � (294 )PS&Marketing Corporation 439,947 225,942 214,005 1,684,576 96SERVICE ACE Co., Ltd. 80,844 55,133 25,711 206,080 3,906SERVICE TOP Co., Ltd. 66,932 50,060 16,872 193,377 2,230SK O&S Co., Ltd.
(Formerly, Network O&S Co., Ltd.) 96,446 62,086 34,360 281,634 1,724SK Planet Co., Ltd. 595,838 278,438 317,400 275,544 1,214DREAMUS COMPANY
(Formerly, IRIVER LIMITED)(*2) 171,586 53,669 117,917 196,961 (48,006 )SKP America LLC. 48,344 126 48,218 � (351,470 )
F-16
Copyright © 2020 www.secdatabase.com. All Rights Reserved.Please Consider the Environment Before Printing This Document
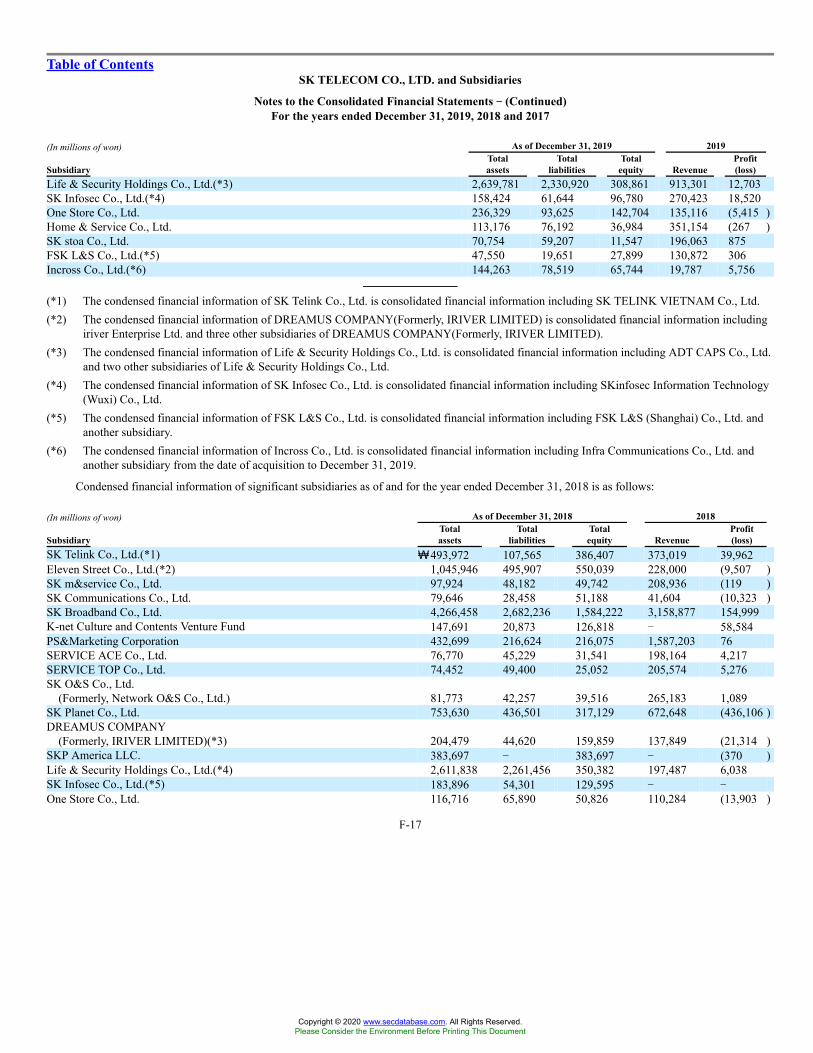
Table of ContentsSK TELECOM CO., LTD. and Subsidiaries
Notes to the Consolidated Financial Statements �� (Continued)For the years ended December 31, 2019, 2018 and 2017
(In millions of won) As of December 31, 2019 2019
SubsidiaryTotalassets
Totalliabilities
Totalequity Revenue
Profit(loss)
Life & Security Holdings Co., Ltd.(*3) 2,639,781 2,330,920 308,861 913,301 12,703SK Infosec Co., Ltd.(*4) 158,424 61,644 96,780 270,423 18,520One Store Co., Ltd. 236,329 93,625 142,704 135,116 (5,415 )Home & Service Co., Ltd. 113,176 76,192 36,984 351,154 (267 )SK stoa Co., Ltd. 70,754 59,207 11,547 196,063 875FSK L&S Co., Ltd.(*5) 47,550 19,651 27,899 130,872 306Incross Co., Ltd.(*6) 144,263 78,519 65,744 19,787 5,756
(*1) The condensed financial information of SK Telink Co., Ltd. is consolidated financial information including SK TELINK VIETNAM Co., Ltd.(*2) The condensed financial information of DREAMUS COMPANY(Formerly, IRIVER LIMITED) is consolidated financial information including
iriver Enterprise Ltd. and three other subsidiaries of DREAMUS COMPANY(Formerly, IRIVER LIMITED).(*3) The condensed financial information of Life & Security Holdings Co., Ltd. is consolidated financial information including ADT CAPS Co., Ltd.
and two other subsidiaries of Life & Security Holdings Co., Ltd.(*4) The condensed financial information of SK Infosec Co., Ltd. is consolidated financial information including SKinfosec Information Technology
(Wuxi) Co., Ltd.(*5) The condensed financial information of FSK L&S Co., Ltd. is consolidated financial information including FSK L&S (Shanghai) Co., Ltd. and
another subsidiary.(*6) The condensed financial information of Incross Co., Ltd. is consolidated financial information including Infra Communications Co., Ltd. and
another subsidiary from the date of acquisition to December 31, 2019.
Condensed financial information of significant subsidiaries as of and for the year ended December 31, 2018 is as follows:
(In millions of won) As of December 31, 2018 2018
SubsidiaryTotalassets
Totalliabilities
Totalequity Revenue
Profit(loss)
SK Telink Co., Ltd.(*1) ₩493,972 107,565 386,407 373,019 39,962Eleven Street Co., Ltd.(*2) 1,045,946 495,907 550,039 228,000 (9,507 )SK m&service Co., Ltd. 97,924 48,182 49,742 208,936 (119 )SK Communications Co., Ltd. 79,646 28,458 51,188 41,604 (10,323 )SK Broadband Co., Ltd. 4,266,458 2,682,236 1,584,222 3,158,877 154,999K-net Culture and Contents Venture Fund 147,691 20,873 126,818 � 58,584PS&Marketing Corporation 432,699 216,624 216,075 1,587,203 76SERVICE ACE Co., Ltd. 76,770 45,229 31,541 198,164 4,217SERVICE TOP Co., Ltd. 74,452 49,400 25,052 205,574 5,276SK O&S Co., Ltd.
(Formerly, Network O&S Co., Ltd.) 81,773 42,257 39,516 265,183 1,089SK Planet Co., Ltd. 753,630 436,501 317,129 672,648 (436,106 )DREAMUS COMPANY
(Formerly, IRIVER LIMITED)(*3) 204,479 44,620 159,859 137,849 (21,314 )SKP America LLC. 383,697 � 383,697 � (370 )Life & Security Holdings Co., Ltd.(*4) 2,611,838 2,261,456 350,382 197,487 6,038SK Infosec Co., Ltd.(*5) 183,896 54,301 129,595 � �One Store Co., Ltd. 116,716 65,890 50,826 110,284 (13,903 )
F-17
Copyright © 2020 www.secdatabase.com. All Rights Reserved.Please Consider the Environment Before Printing This Document
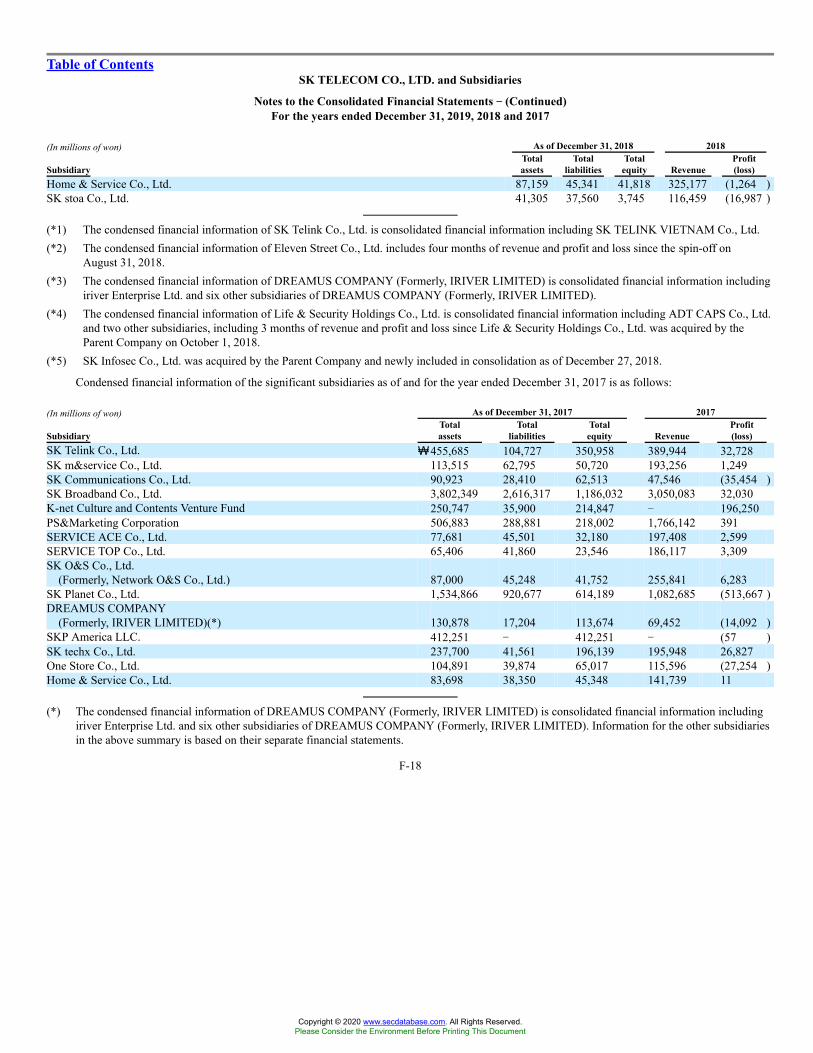
Table of ContentsSK TELECOM CO., LTD. and Subsidiaries
Notes to the Consolidated Financial Statements �� (Continued)For the years ended December 31, 2019, 2018 and 2017
(In millions of won) As of December 31, 2018 2018
SubsidiaryTotalassets
Totalliabilities
Totalequity Revenue
Profit(loss)
Home & Service Co., Ltd. 87,159 45,341 41,818 325,177 (1,264 )SK stoa Co., Ltd. 41,305 37,560 3,745 116,459 (16,987 )
(*1) The condensed financial information of SK Telink Co., Ltd. is consolidated financial information including SK TELINK VIETNAM Co., Ltd.(*2) The condensed financial information of Eleven Street Co., Ltd. includes four months of revenue and profit and loss since the spin-off on
August 31, 2018.(*3) The condensed financial information of DREAMUS COMPANY (Formerly, IRIVER LIMITED) is consolidated financial information including
iriver Enterprise Ltd. and six other subsidiaries of DREAMUS COMPANY (Formerly, IRIVER LIMITED).(*4) The condensed financial information of Life & Security Holdings Co., Ltd. is consolidated financial information including ADT CAPS Co., Ltd.
and two other subsidiaries, including 3 months of revenue and profit and loss since Life & Security Holdings Co., Ltd. was acquired by theParent Company on October 1, 2018.
(*5) SK Infosec Co., Ltd. was acquired by the Parent Company and newly included in consolidation as of December 27, 2018.
Condensed financial information of the significant subsidiaries as of and for the year ended December 31, 2017 is as follows:
(In millions of won) As of December 31, 2017 2017
SubsidiaryTotalassets
Totalliabilities
Totalequity Revenue
Profit(loss)
SK Telink Co., Ltd. ₩455,685 104,727 350,958 389,944 32,728SK m&service Co., Ltd. 113,515 62,795 50,720 193,256 1,249SK Communications Co., Ltd. 90,923 28,410 62,513 47,546 (35,454 )SK Broadband Co., Ltd. 3,802,349 2,616,317 1,186,032 3,050,083 32,030K-net Culture and Contents Venture Fund 250,747 35,900 214,847 � 196,250PS&Marketing Corporation 506,883 288,881 218,002 1,766,142 391SERVICE ACE Co., Ltd. 77,681 45,501 32,180 197,408 2,599SERVICE TOP Co., Ltd. 65,406 41,860 23,546 186,117 3,309SK O&S Co., Ltd.
(Formerly, Network O&S Co., Ltd.) 87,000 45,248 41,752 255,841 6,283SK Planet Co., Ltd. 1,534,866 920,677 614,189 1,082,685 (513,667 )DREAMUS COMPANY
(Formerly, IRIVER LIMITED)(*) 130,878 17,204 113,674 69,452 (14,092 )SKP America LLC. 412,251 � 412,251 � (57 )SK techx Co., Ltd. 237,700 41,561 196,139 195,948 26,827One Store Co., Ltd. 104,891 39,874 65,017 115,596 (27,254 )Home & Service Co., Ltd. 83,698 38,350 45,348 141,739 11
(*) The condensed financial information of DREAMUS COMPANY (Formerly, IRIVER LIMITED) is consolidated financial information includingiriver Enterprise Ltd. and six other subsidiaries of DREAMUS COMPANY (Formerly, IRIVER LIMITED). Information for the other subsidiariesin the above summary is based on their separate financial statements.
F-18
Copyright © 2020 www.secdatabase.com. All Rights Reserved.Please Consider the Environment Before Printing This Document
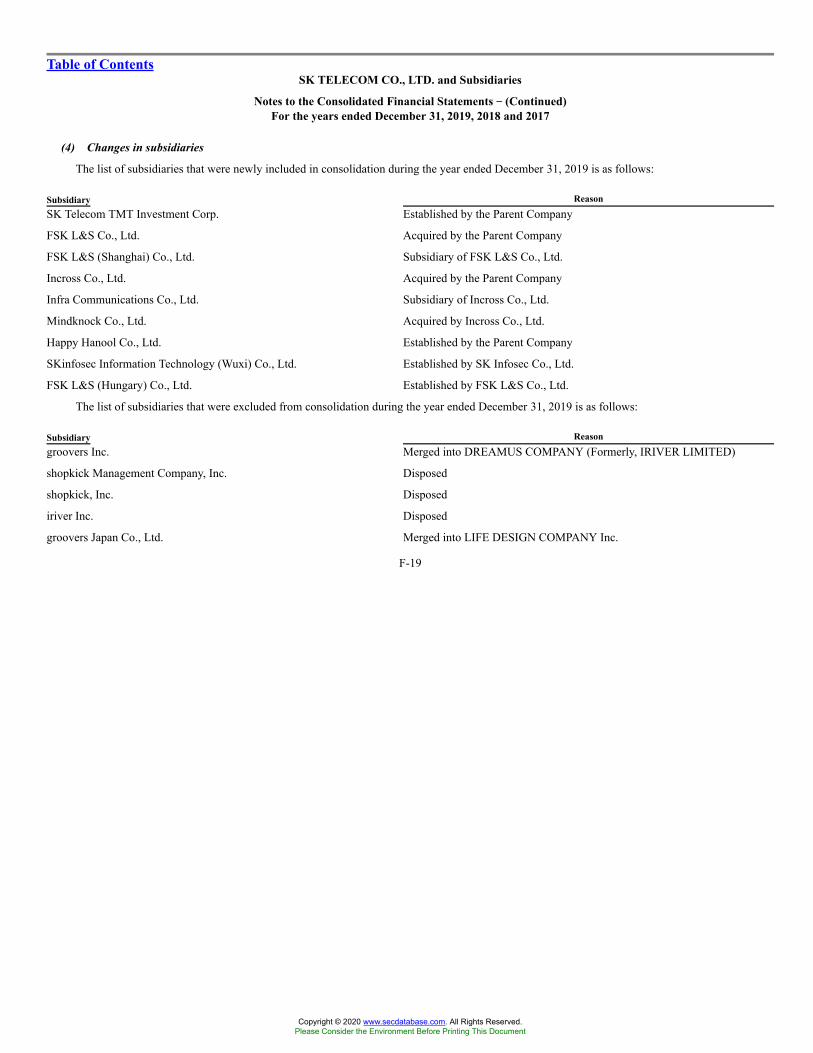
Table of ContentsSK TELECOM CO., LTD. and Subsidiaries
Notes to the Consolidated Financial Statements �� (Continued)For the years ended December 31, 2019, 2018 and 2017
(4) Changes in subsidiaries
The list of subsidiaries that were newly included in consolidation during the year ended December 31, 2019 is as follows:
Subsidiary ReasonSK Telecom TMT Investment Corp. Established by the Parent Company
FSK L&S Co., Ltd. Acquired by the Parent Company
FSK L&S (Shanghai) Co., Ltd. Subsidiary of FSK L&S Co., Ltd.
Incross Co., Ltd. Acquired by the Parent Company
Infra Communications Co., Ltd. Subsidiary of Incross Co., Ltd.
Mindknock Co., Ltd. Acquired by Incross Co., Ltd.
Happy Hanool Co., Ltd. Established by the Parent Company
SKinfosec Information Technology (Wuxi) Co., Ltd. Established by SK Infosec Co., Ltd.
FSK L&S (Hungary) Co., Ltd. Established by FSK L&S Co., Ltd.
The list of subsidiaries that were excluded from consolidation during the year ended December 31, 2019 is as follows:
Subsidiary Reasongroovers Inc. Merged into DREAMUS COMPANY (Formerly, IRIVER LIMITED)
shopkick Management Company, Inc. Disposed
shopkick, Inc. Disposed
iriver Inc. Disposed
groovers Japan Co., Ltd. Merged into LIFE DESIGN COMPANY Inc.
F-19
Copyright © 2020 www.secdatabase.com. All Rights Reserved.Please Consider the Environment Before Printing This Document
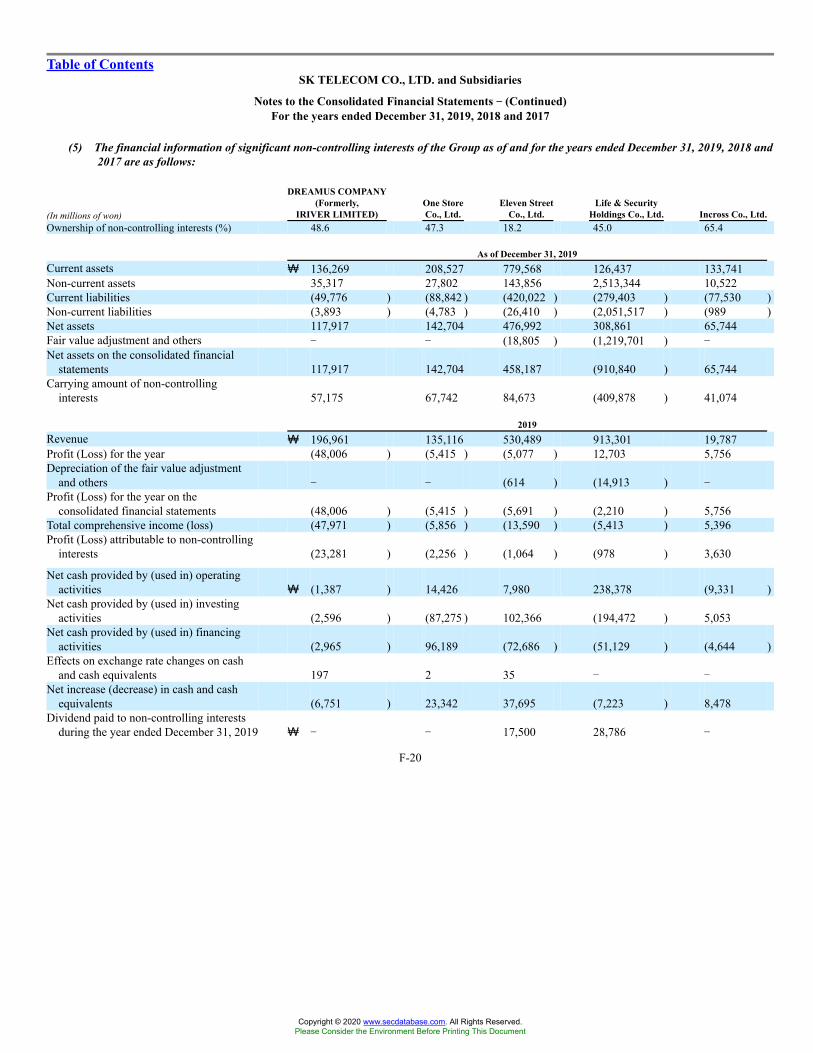
Table of ContentsSK TELECOM CO., LTD. and Subsidiaries
Notes to the Consolidated Financial Statements �� (Continued)For the years ended December 31, 2019, 2018 and 2017
(5) The financial information of significant non-controlling interests of the Group as of and for the years ended December 31, 2019, 2018 and2017 are as follows:
(In millions of won)
DREAMUS COMPANY(Formerly,
IRIVER LIMITED)One StoreCo., Ltd.
Eleven StreetCo., Ltd.
Life & SecurityHoldings Co., Ltd. Incross Co., Ltd.
Ownership of non-controlling interests (%) 48.6 47.3 18.2 45.0 65.4
As of December 31, 2019Current assets ₩ 136,269 208,527 779,568 126,437 133,741Non-current assets 35,317 27,802 143,856 2,513,344 10,522Current liabilities (49,776 ) (88,842 ) (420,022 ) (279,403 ) (77,530 )Non-current liabilities (3,893 ) (4,783 ) (26,410 ) (2,051,517 ) (989 )Net assets 117,917 142,704 476,992 308,861 65,744Fair value adjustment and others � � (18,805 ) (1,219,701 ) �Net assets on the consolidated financial
statements 117,917 142,704 458,187 (910,840 ) 65,744Carrying amount of non-controlling
interests 57,175 67,742 84,673 (409,878 ) 41,074
2019Revenue ₩ 196,961 135,116 530,489 913,301 19,787Profit (Loss) for the year (48,006 ) (5,415 ) (5,077 ) 12,703 5,756Depreciation of the fair value adjustment
and others � � (614 ) (14,913 ) �Profit (Loss) for the year on the
consolidated financial statements (48,006 ) (5,415 ) (5,691 ) (2,210 ) 5,756Total comprehensive income (loss) (47,971 ) (5,856 ) (13,590 ) (5,413 ) 5,396Profit (Loss) attributable to non-controlling
interests (23,281 ) (2,256 ) (1,064 ) (978 ) 3,630
Net cash provided by (used in) operatingactivities ₩ (1,387 ) 14,426 7,980 238,378 (9,331 )
Net cash provided by (used in) investingactivities (2,596 ) (87,275 ) 102,366 (194,472 ) 5,053
Net cash provided by (used in) financingactivities (2,965 ) 96,189 (72,686 ) (51,129 ) (4,644 )
Effects on exchange rate changes on cashand cash equivalents 197 2 35 � �
Net increase (decrease) in cash and cashequivalents (6,751 ) 23,342 37,695 (7,223 ) 8,478
Dividend paid to non-controlling interestsduring the year ended December 31, 2019 ₩ � � 17,500 28,786 �
F-20
Copyright © 2020 www.secdatabase.com. All Rights Reserved.Please Consider the Environment Before Printing This Document
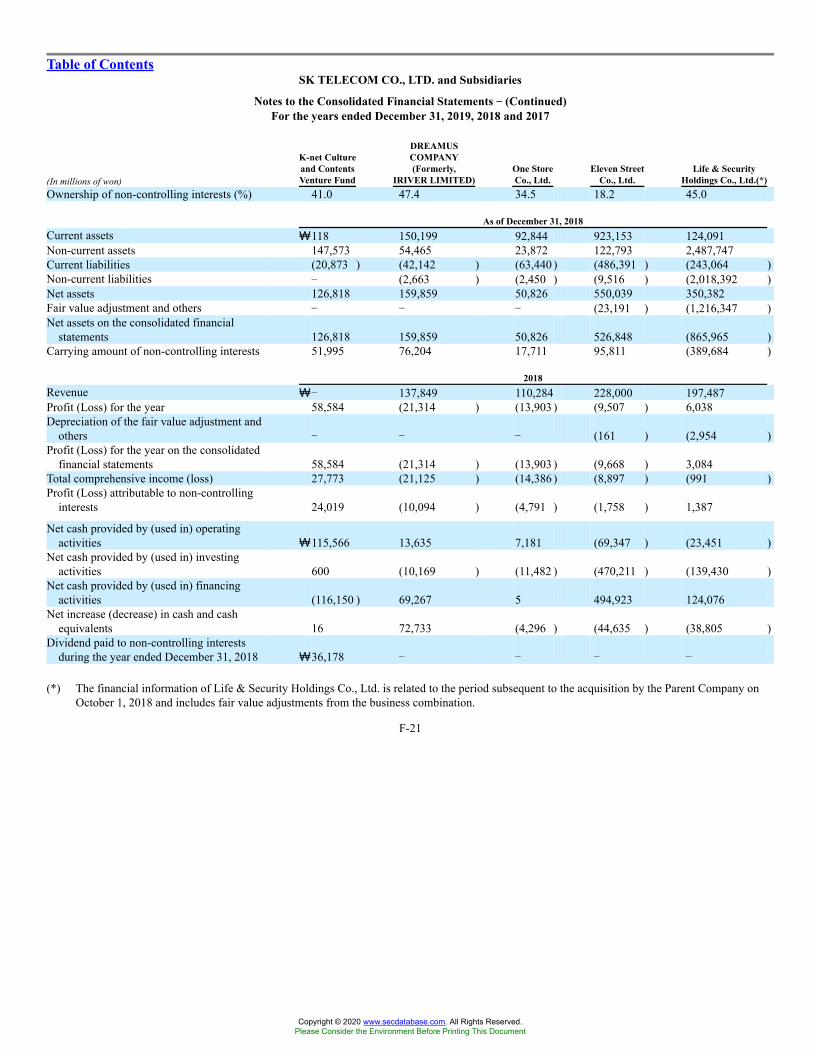
Table of ContentsSK TELECOM CO., LTD. and Subsidiaries
Notes to the Consolidated Financial Statements �� (Continued)For the years ended December 31, 2019, 2018 and 2017
(In millions of won)
K-net Cultureand ContentsVenture Fund
DREAMUSCOMPANY(Formerly,
IRIVER LIMITED)One StoreCo., Ltd.
Eleven StreetCo., Ltd.
Life & SecurityHoldings Co., Ltd.(*)
Ownership of non-controlling interests (%) 41.0 47.4 34.5 18.2 45.0
As of December 31, 2018Current assets ₩118 150,199 92,844 923,153 124,091Non-current assets 147,573 54,465 23,872 122,793 2,487,747Current liabilities (20,873 ) (42,142 ) (63,440 ) (486,391 ) (243,064 )Non-current liabilities � (2,663 ) (2,450 ) (9,516 ) (2,018,392 )Net assets 126,818 159,859 50,826 550,039 350,382Fair value adjustment and others � � � (23,191 ) (1,216,347 )Net assets on the consolidated financial
statements 126,818 159,859 50,826 526,848 (865,965 )Carrying amount of non-controlling interests 51,995 76,204 17,711 95,811 (389,684 )
2018Revenue ₩� 137,849 110,284 228,000 197,487Profit (Loss) for the year 58,584 (21,314 ) (13,903 ) (9,507 ) 6,038Depreciation of the fair value adjustment and
others � � � (161 ) (2,954 )Profit (Loss) for the year on the consolidated
financial statements 58,584 (21,314 ) (13,903 ) (9,668 ) 3,084Total comprehensive income (loss) 27,773 (21,125 ) (14,386 ) (8,897 ) (991 )Profit (Loss) attributable to non-controlling
interests 24,019 (10,094 ) (4,791 ) (1,758 ) 1,387
Net cash provided by (used in) operatingactivities ₩115,566 13,635 7,181 (69,347 ) (23,451 )
Net cash provided by (used in) investingactivities 600 (10,169 ) (11,482 ) (470,211 ) (139,430 )
Net cash provided by (used in) financingactivities (116,150 ) 69,267 5 494,923 124,076
Net increase (decrease) in cash and cashequivalents 16 72,733 (4,296 ) (44,635 ) (38,805 )
Dividend paid to non-controlling interestsduring the year ended December 31, 2018 ₩36,178 � � � �
(*) The financial information of Life & Security Holdings Co., Ltd. is related to the period subsequent to the acquisition by the Parent Company onOctober 1, 2018 and includes fair value adjustments from the business combination.
F-21
Copyright © 2020 www.secdatabase.com. All Rights Reserved.Please Consider the Environment Before Printing This Document
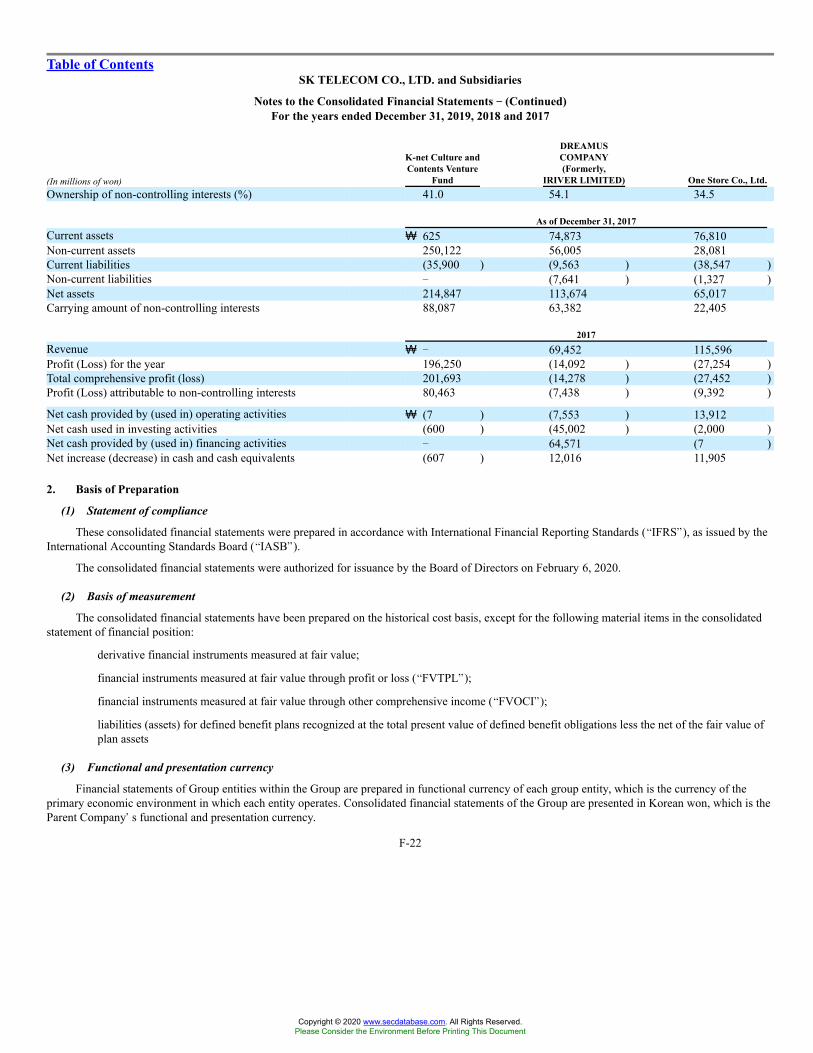
Table of ContentsSK TELECOM CO., LTD. and Subsidiaries
Notes to the Consolidated Financial Statements �� (Continued)For the years ended December 31, 2019, 2018 and 2017
(In millions of won)
K-net Culture andContents Venture
Fund
DREAMUSCOMPANY(Formerly,
IRIVER LIMITED) One Store Co., Ltd.Ownership of non-controlling interests (%) 41.0 54.1 34.5
As of December 31, 2017Current assets ₩ 625 74,873 76,810Non-current assets 250,122 56,005 28,081Current liabilities (35,900 ) (9,563 ) (38,547 )Non-current liabilities � (7,641 ) (1,327 )Net assets 214,847 113,674 65,017Carrying amount of non-controlling interests 88,087 63,382 22,405
2017Revenue ₩ � 69,452 115,596Profit (Loss) for the year 196,250 (14,092 ) (27,254 )Total comprehensive profit (loss) 201,693 (14,278 ) (27,452 )Profit (Loss) attributable to non-controlling interests 80,463 (7,438 ) (9,392 )
Net cash provided by (used in) operating activities ₩ (7 ) (7,553 ) 13,912Net cash used in investing activities (600 ) (45,002 ) (2,000 )Net cash provided by (used in) financing activities � 64,571 (7 )Net increase (decrease) in cash and cash equivalents (607 ) 12,016 11,905
2. Basis of Preparation
(1) Statement of compliance
These consolidated financial statements were prepared in accordance with International Financial Reporting Standards (�IFRS�), as issued by theInternational Accounting Standards Board (�IASB�).
The consolidated financial statements were authorized for issuance by the Board of Directors on February 6, 2020.
(2) Basis of measurement
The consolidated financial statements have been prepared on the historical cost basis, except for the following material items in the consolidatedstatement of financial position:
� derivative financial instruments measured at fair value;
� financial instruments measured at fair value through profit or loss (�FVTPL�);
� financial instruments measured at fair value through other comprehensive income (�FVOCI�);
� liabilities (assets) for defined benefit plans recognized at the total present value of defined benefit obligations less the net of the fair value ofplan assets
(3) Functional and presentation currency
Financial statements of Group entities within the Group are prepared in functional currency of each group entity, which is the currency of theprimary economic environment in which each entity operates. Consolidated financial statements of the Group are presented in Korean won, which is theParent Company�s functional and presentation currency.
F-22
Copyright © 2020 www.secdatabase.com. All Rights Reserved.Please Consider the Environment Before Printing This Document
Table of ContentsSK TELECOM CO., LTD. and Subsidiaries
Notes to the Consolidated Financial Statements �� (Continued)For the years ended December 31, 2019, 2018 and 2017
(4) Use of estimates and judgments
The preparation of the consolidated financial statements in conformity with IFRS requires management to make judgments, estimates andassumptions that affect the application of accounting policies and the reported amounts of assets, liabilities, income and expenses. Actual results maydiffer from these estimates.
Estimates and underlying assumptions are reviewed on an ongoing basis. Revisions to accounting estimates are recognized in the periodprospectively.
1) Critical judgments
Information about critical judgments in applying accounting policies that have the most significant effects on the amounts recognized in theconsolidated financial statements is included in notes for the following areas: consolidation (whether the Group has de facto control over an investee),determination of stand-alone selling prices.
2) Assumptions and estimation uncertainties
Information about assumptions and estimation uncertainties that have a significant risk of resulting in a material adjustment within the nextfinancial year are included in the following notes: loss allowance (notes 7 and 35), estimated useful lives of costs to obtain a contract (notes 8), propertyand equipment and intangible assets (notes 4 (8), (10), 14 and 16), impairment of goodwill (notes 4 (12) and 15), recognition of provision (notes 4 (18)and 19), measurement of defined benefit liabilities (notes 4 (17) and 20), and recognition of deferred tax assets (liabilities) (notes 4 (26) and 31).
A number of the Group�s accounting policies and disclosures require the measurement of fair values, for both financial and non-financial assetsand liabilities. The Group has established policies and processes with respect to the measurement of fair values including Level 3 fair values, and themeasurement of fair values is reviewed and is directly reported to the finance executives.
The Group regularly reviews significant unobservable inputs and valuation adjustments. If third party information, such as broker quotes orpricing services, is used to measure fair values, then the Group assesses the evidence obtained from the third parties to support the conclusion that suchvaluations meet the requirements of IFRS, including the level in the fair value hierarchy in which such valuations should be classified.
When measuring the fair value of an asset or a liability, the Group uses market observable data as far as possible. Fair values are categorized intodifferent levels in a fair value hierarchy based on the inputs used in the valuation techniques as follows.
� Level 1: quoted prices (unadjusted) in active markets for identical assets or liabilities;
� Level 2: inputs other than quoted prices included in Level 1 that are observable for the asset or liability, either directly (i.e. as prices) orindirectly (i.e. derived from prices); and
� Level 3: inputs for the asset or liability that are not based on observable market data (unobservable inputs).
If the inputs used to measure the fair value of an asset or a liability fall into different levels of the fair value hierarchy, then the fair valuemeasurement is categorized in its entirety in the same level of the fair value hierarchy as the lowest level input that is significant to the entiremeasurement. The Group recognizes transfers between levels of the fair value hierarchy at the end of the reporting period during which the change hasoccurred.
Information about assumptions used for fair value measurements are included in note 35.
3. Recently Adopted Accounting Standards
The Group has initially applied IFRS 16, Leases from January 1, 2019. A number of other new or amended standards are also effective fromJanuary 1, 2019, but they do not have a material effect on the Group�s consolidated financial statements.
F-23
Copyright © 2020 www.secdatabase.com. All Rights Reserved.Please Consider the Environment Before Printing This Document
Table of ContentsSK TELECOM CO., LTD. and Subsidiaries
Notes to the Consolidated Financial Statements �� (Continued)For the years ended December 31, 2019, 2018 and 2017
IFRS 16, Leases
IFRS 16, Leases, introduced a single, on-balance sheet accounting model for lessees. As a result, the Group, as a lessee, has recognizedright-of-use assets representing its rights to use the underlying assets and lease liabilities representing its obligation to make lease payments. Lessoraccounting remains similar to previous accounting policies.
The Group has applied IFRS 16, Leases from January 1, 2019 using the modified retrospective method with the cumulative effect of initiallyapplying this standard recognized as an adjustment to the retained earnings as at January 1, 2019. Accordingly, the comparative information presentedfor 2018 and 2017 has been presented, as previously reported, under IAS 17, Leases and has not been restated. Details of the changes in accountingpolicies are disclosed below.
(1) Definition of a lease
Previously, the Group determined at contract inception whether an arrangement was or contained a lease under IFRIC 4, Determining Whether anArrangement Contains a Lease. The Group now assesses whether a contract is or contains a lease based on the new definition of a lease. Under IFRS 16,Leases, a contract is or contains a lease if the contract conveys a right to control the use of an identified asset for a period of time in exchange forconsideration.
(2) As a lessee
The Group leases a number of assets including buildings and vehicles. The terms of leases are negotiated individually and include variousconditions. Each lease contract is entered into with a term of 1~50 years.
As a lessee, the Group previously classified leases as operating or finance leases based on its assessment of whether the lease transferredsubstantially all of the risks and rewards of ownership. Under IFRS 16, Leases, the Group recognizes right-of-use assets and lease liabilities for mostleases � i.e. theses leases are presented on the consolidated statements of financial position.
However, the Group has elected not to recognize right-of-use assets and lease liabilities for leases with the lease term of 12 months or less at thecommencement date and for leases of low-value assets. The Group recognizes the lease payments associated with these leases as an expense on astraight-line basis over the lease term. The Group has also elected to apply the practical expedient which allows a lease and associated non-leasecomponents to be accounted for as a single lease component.
1) Significant accounting policies
The Group recognizes a right-of-use asset and a lease liability at the lease commencement date. The right-of-use asset is initially measured at cost,which comprise the initial amount of lease liability adjusted for any lease payments made at or before the commencement date, plus any initial directcosts incurred and an estimate of costs to dismantle and remove the underlying assets or to restore the underlying asset or the site on which it is located,less any lease incentives received. The right-of-use asset is subsequently measured at cost less any accumulated depreciation and impairment losses andadjusted for certain remeasurements of the lease liability. The Group presents its right-of-use assets in property and equipment on the consolidatedstatements of financial position. The right-of-use asset is subsequently depreciated using the straight-line method from the commencement date to theend of the lease term.
The lease liability is initially measured at the present value of the lease payments that are not paid at the commencement date, discounted usingthe interest rate implicit in the lease or, if that rate cannot be readily determined, the Group�s incremental borrowing rate. Generally, the Group uses itsincremental borrowing rate as the discount rate.
F-24
Copyright © 2020 www.secdatabase.com. All Rights Reserved.Please Consider the Environment Before Printing This Document

Table of ContentsSK TELECOM CO., LTD. and Subsidiaries
Notes to the Consolidated Financial Statements �� (Continued)For the years ended December 31, 2019, 2018 and 2017
The lease liability is subsequently increased by the interest cost on the lease liability and decreased by lease payment made. It is remeasured whenthere is a change in future lease payments arising from a change in an index or rate, a change in the estimate of the amount expected to be payable undera residual value guarantee, or as appropriate, changes in the assessment of whether a purchase or extension option is reasonably certain to be exercisedor a termination option is reasonably certain not to be exercised.
The Group has applied judgment to determine the lease term for some lease contracts in which it is a lessee that include extension options. Theassessment of whether the Group is reasonably certain to exercise such options impacts the lease term, which significantly affects the amount of leaseliabilities and right-of-use assets recognized. The Group has not included the extension option periods in the lease term because it is not reasonablycertain that the Group will exercise such options. After the commencement date, the Group reassesses the lease term upon the occurrence of a significantevent or a significant change in circumstances that is within the control of the Group that affects whether the Group is reasonably certain to exercise theextension option.
2) Transition requirements
At transition, lease liabilities were measured at the present value of the remaining lease payments, discounted at the Group�s incrementalborrowing rate as of January 1, 2019. Right-of-use assets are measured at either:
� their carrying amount as if IFRS 16, Leases, had been applied since the commencement date, discounted using the lessee�s incrementalborrowing rate at the date of initial application; or
� the amount equal to the lease liabilities, adjusted by the amount of any prepaid or accrued lease payments.
The Group used the following practical expedients when applying IFRS 16, Leases, to leases previously classified as operating leases under IAS17, Leases.
� Excluded initial direct costs from measuring the right-of-use assets at the date of initial application.
� Used hindsight when determining the lease term if the contract contains options to extend or terminate the lease.
(3) As a lessor
The accounting policies applicable to the Group as a lessor are not different from those under IAS 17, Leases. However, when the Group is anintermediate lessor the sub-leases are classified with reference to the right-of-use asset arising from the head lease, not with reference to the underlyingasset.
F-25
Copyright © 2020 www.secdatabase.com. All Rights Reserved.Please Consider the Environment Before Printing This Document
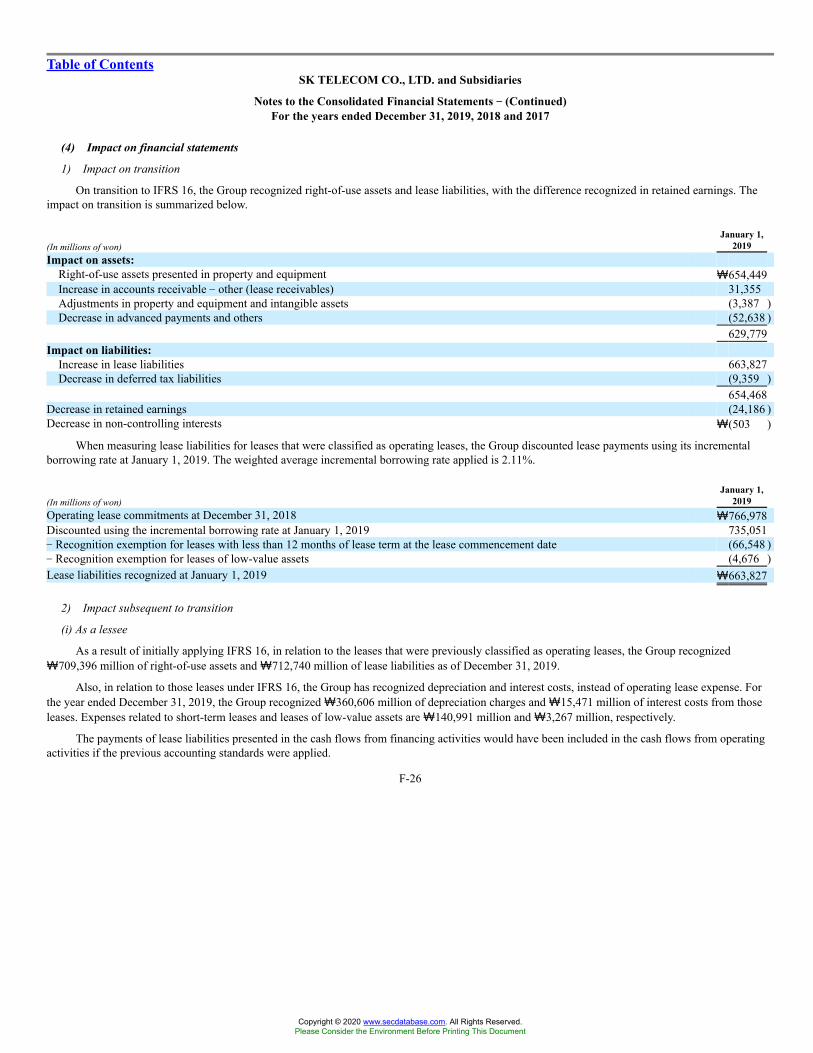
Table of ContentsSK TELECOM CO., LTD. and Subsidiaries
Notes to the Consolidated Financial Statements �� (Continued)For the years ended December 31, 2019, 2018 and 2017
(4) Impact on financial statements
1) Impact on transition
On transition to IFRS 16, the Group recognized right-of-use assets and lease liabilities, with the difference recognized in retained earnings. Theimpact on transition is summarized below.
(In millions of won)January 1,
2019Impact on assets:
Right-of-use assets presented in property and equipment ₩654,449Increase in accounts receivable � other (lease receivables) 31,355Adjustments in property and equipment and intangible assets (3,387 )Decrease in advanced payments and others (52,638 )
629,779Impact on liabilities:
Increase in lease liabilities 663,827Decrease in deferred tax liabilities (9,359 )
654,468Decrease in retained earnings (24,186 )Decrease in non-controlling interests ₩(503 )
When measuring lease liabilities for leases that were classified as operating leases, the Group discounted lease payments using its incrementalborrowing rate at January 1, 2019. The weighted average incremental borrowing rate applied is 2.11%.
(In millions of won)January 1,
2019Operating lease commitments at December 31, 2018 ₩766,978Discounted using the incremental borrowing rate at January 1, 2019 735,051� Recognition exemption for leases with less than 12 months of lease term at the lease commencement date (66,548 )� Recognition exemption for leases of low-value assets (4,676 )Lease liabilities recognized at January 1, 2019 ₩663,827
2) Impact subsequent to transition
(i) As a lessee
As a result of initially applying IFRS 16, in relation to the leases that were previously classified as operating leases, the Group recognized₩709,396 million of right-of-use assets and ₩712,740 million of lease liabilities as of December 31, 2019.
Also, in relation to those leases under IFRS 16, the Group has recognized depreciation and interest costs, instead of operating lease expense. Forthe year ended December 31, 2019, the Group recognized ₩360,606 million of depreciation charges and ₩15,471 million of interest costs from thoseleases. Expenses related to short-term leases and leases of low-value assets are ₩140,991 million and ₩3,267 million, respectively.
The payments of lease liabilities presented in the cash flows from financing activities would have been included in the cash flows from operatingactivities if the previous accounting standards were applied.
F-26
Copyright © 2020 www.secdatabase.com. All Rights Reserved.Please Consider the Environment Before Printing This Document

Table of ContentsSK TELECOM CO., LTD. and Subsidiaries
Notes to the Consolidated Financial Statements �� (Continued)For the years ended December 31, 2019, 2018 and 2017
(ii) As a lessor
① Finance lease
The following table sets out a maturity analysis of lease receivables, presenting the undiscounted lease payments to be received subsequent toDecember 31, 2019. Under IAS 17, the Group did not hold any finance lease as a lessor.
(In millions of won) AmountLess than 1 year ₩24,2861 ~ 2 years 12,6902 ~ 3 years 6,3483 ~ 4 years 3,6834 ~ 5 years 1,589More than 5 years 1Undiscounted lease payments ₩48,597Unrealized finance income 1,822Net investment in the lease 46,775
② Operating lease
The Group recognized lease income of ₩163,355 million for the year ended December 31, 2019, of which income relating to variable leasepayments is ₩20,101 million.
The following table sets out a maturity analysis of lease payments, presenting the undiscounted lease payments to be received subsequent toDecember 31, 2019.
(In millions of won) AmountLess than 1 year ₩129,3101 ~ 2 years 76,6692 ~ 3 years 25,0473 ~ 4 years 1,2434 ~ 5 years 1,218More than 5 year 3
₩233,490
(5) Determining the lease term and assessing the length of the enforceable period of a lease
In December 2019, International Financial Reporting Interpretations Committee(�IFRIC�) issued its final agenda decision that the concept ofpenalty that should be considered in determining the enforceable period under IFRS 16, Leases, shall be determined considering broader economics ofthe contract, and not only contractual termination payments. Further, a lease is no longer enforceable when each of the parties has the right to terminatethe lease without permission from the other party with no more than an insignificant penalty.
As of December 31, 2019, the Group assesses the lease term based on the assumption that the right to extend or terminate the lease is no longerenforceable if a lease contract requires the counterparty�s consent to be extended. Applying the above mentioned IFRIC interpretation may change thejudgment on enforceable period for certain of the Group�s lease contracts.
F-27
Copyright © 2020 www.secdatabase.com. All Rights Reserved.Please Consider the Environment Before Printing This Document
Table of ContentsSK TELECOM CO., LTD. and Subsidiaries
Notes to the Consolidated Financial Statements �� (Continued)For the years ended December 31, 2019, 2018 and 2017
However, considering the type and number of lease contracts entered into as of and from January 1, 2019, the Group does not believe it hadsufficient time to complete the analysis on its lease portfolios to reflect the impact of the above IFRIC agenda decision, if any, in its 2019 consolidatedfinancial statements. The Group plans to analyze and apply the impact of IFRIC�s interpretation in 2020, if any, as changes in accounting policies.
4. Significant Accounting Policies
The significant accounting policies applied by the Group in the preparation of its consolidated financial statements in accordance with IFRS areincluded below. The significant accounting policies applied by the Group in these consolidated financial statements have been consistently applied forall periods presented, except for the changes described in note 3 and below.
(1) Operating segments
An operating segment is a component of the Group that engages in business activities from which it may earn revenues and incur expenses,including revenues and expenses that relate to transactions with any of the Group�s other components. The Group�s operating segments have beendetermined to be each business unit, for which the Group generates separately identifiable financial information that is regularly reported to the chiefoperating decision maker for the purpose of resource allocation and assessment of segment performance. The Group has five reportable segments asdescribed in note 5. Segment results that are reported to the chief operating decision maker include items directly attributable to a segment as well asthose that can be allocated on a reasonable basis.
(2) Basis of consolidation
1) Business combination
A business combination is accounted for by applying the acquisition method, unless it is a combination involving entities or businesses undercommon control.
Consideration transferred is generally measured at fair value, identical to the measurement of identifiable net assets acquired at fair value. Thedifference between the acquired company�s fair value and the consideration transferred is accounted for goodwill. Any goodwill that arises is testedannually for impairment. Any gain on a bargain purchase is recognized in profit or loss immediately. Acquisition-related costs are expensed in theperiods in which the costs are incurred and the services are received excluding costs to issue debt or equity securities recognized based on IAS 32 andIFRS 9.
Consideration transferred does not include the amount settled in relation to the pre-existing relationship and the amount settled in relation to thepre-existing relationship is generally recognized through profit or loss.
Contingent consideration is measured at fair value at the acquisition date. Contingent consideration classified as equity is not remeasured and itssubsequent settlement is accounted for within equity. If contingent consideration is not classified as equity, the Group subsequently recognizes changesin fair value of contingent consideration through profit or loss.
2) Non-controlling interests
Non-controlling interests are measured at their proportionate share of the acquiree�s identifiable net assets at the date of acquisition.
Changes in a Controlling Company�s ownership interest in a subsidiary that do not result in the Controlling Company losing control of thesubsidiary are accounted for as equity transactions.
F-28
Copyright © 2020 www.secdatabase.com. All Rights Reserved.Please Consider the Environment Before Printing This Document
Table of ContentsSK TELECOM CO., LTD. and Subsidiaries
Notes to the Consolidated Financial Statements �� (Continued)For the years ended December 31, 2019, 2018 and 2017
3) Subsidiaries
Subsidiaries are entities controlled by the Group. The Group controls an investee when it is exposed, or has rights, to variable returns from itsinvolvement with the investee and has the ability to affect those returns through its power over the investee. Consolidation of an investee begins fromthe date the Group obtains control of the investee and cease when the Group loses control of the investee.
4) Loss of control
If the Group loses control of a subsidiary, the Group derecognizes the assets and liabilities of the former subsidiary from the consolidatedstatement of financial position and recognizes gain or loss associated with the loss of control attributable to the former controlling interest. Anyinvestment retained in the former subsidiary is recognized at its fair value when control is lost.
5) Interest in investees accounted for using the equity method
Interest in investees accounted for using the equity method composed of interest in associates and joint ventures. An associate is an entity inwhich the Group has significant influence, but not control, over the entity�s financial and operating policies. A joint venture is a joint arrangementwhereby the Group that has joint control of the arrangement has rights to the net assets of the arrangement.
The investment in an associate and a joint venture is initially recognized at cost including transaction costs and the carrying amount is increased ordecreased to recognize the Group�s share of the profit or loss and changes in equity of the associate or the joint venture after the date of acquisition.
The investment in an associate and a joint venture is impaired if objective evidence indicates that a loss event has occurred after the initialrecognition of the asset, and that the loss event had a negative effect on the estimated future cash flows of that asset that can be estimated reliably.
� significant financial difficulty of the associate or joint venture;
� a breach of contract, such as a default or delinquency in payments by the associate or joint venture;
� the entity, for economic or legal reasons relating to its associate�s or joint venture�s financial difficulty, granting to the associate or jointventure a concession that the entity would not otherwise consider;
� it becoming probable that the associate or joint venture will enter bankruptcy or other financial reorganization; or
� the disappearance of an active market for the net investment because of financial difficulties of the associate or joint venture.
6) Intra-group transactions
Intra-group balances and transactions, and any unrealized income and expenses arising from intra-group transactions, are eliminated in preparingthe consolidated financial statements. The Group�s share of unrealized gain incurred from transactions with investees accounted for using the equitymethod are eliminated and unrealized loss are eliminated using the same basis if there are no evidence of asset impairments.
7) Business combinations under common control
SK Holdings Co., Ltd. is the ultimate controlling entity of the Group. The assets and liabilities acquired under business combination undercommon control are recognized at the carrying amounts in the ultimate controlling shareholder�s consolidated financial statements. The differencebetween consideration and carrying amount of net assets acquired is added to or subtracted from capital surplus and others.
F-29
Copyright © 2020 www.secdatabase.com. All Rights Reserved.Please Consider the Environment Before Printing This Document
Table of ContentsSK TELECOM CO., LTD. and Subsidiaries
Notes to the Consolidated Financial Statements �� (Continued)For the years ended December 31, 2019, 2018 and 2017
(3) Cash and cash equivalents
Cash and cash equivalents comprise cash balances, call deposits and investment securities with maturities of three months or less from theacquisition date that are easily convertible to cash and subject to an insignificant risk of changes in their fair value.
(4) Inventories
Inventories are initially recognized at the acquisition cost and subsequently measured using the weighted average method. During the period, aperpetual inventory system is used to track inventory quantities, which is adjusted based on the physical inventory counts performed at the period end.When the net realizable value of inventories is less than cost, the carrying amount is reduced to the net realizable value, and any difference is charged tocurrent period as operating expenses.
(5) Non-derivative financial assets �� Policies applicable from January 1, 2018
1) Recognition and initial measurement
Accounts receivable � trade and debt investments issued are initially recognized when they are originated. All other financial assets and financialliabilities are initially recognized when the Group becomes a party to the contractual provisions of the instrument.
A financial asset (unless an accounts receivable � trade without a significant financing component) or financial liability is initially measured at fairvalue plus, for an item not at FVTPL, transaction costs that are directly attributable to its acquisition or issue. An accounts receivable � trade without asignificant financing component is initially measured at the transaction price.
2) Classification and subsequent measurement
On initial recognition, a financial asset is classified as measured at:
� FVTPL
� FVOCI � equity investment
� FVOCI � debt investment
� Financial assets at amortized cost
A financial asset is classified based on the business model in which a financial asset is managed and its contractual cash flow characteristics.
Financial assets are not reclassified subsequent to their initial recognition unless the Group changes its business model for managing financialassets, in which case all affected financial assets are reclassified on the first day of the first reporting period following the change in the business model.
A financial asset is measured at amortized cost if it meets both of the following conditions and is not designated as at FVTPL:
� it is held within a business model whose objective is to hold assets to collect contractual cash flows; and
� its contractual terms give rise to cash flows that are solely payments of principal and interest on the principal amount outstanding on specifieddates.
A debt investment is measured at FVOCI if it meets both of the following conditions and is not designated as at FVTPL:
� it is held within a business model whose objective is achieved by both collecting contractual cash flows and selling financial assets; and
F-30
Copyright © 2020 www.secdatabase.com. All Rights Reserved.Please Consider the Environment Before Printing This Document
Table of ContentsSK TELECOM CO., LTD. and Subsidiaries
Notes to the Consolidated Financial Statements �� (Continued)For the years ended December 31, 2019, 2018 and 2017
� its contractual terms give rise to cash flows that are solely payments of principal and interest on the principal amount outstanding on specifieddates.
On initial recognition of an equity investment that is not held for trading, the Group may irrevocably elect to present subsequent changes in theinvestment�s fair value in other comprehensive income (�OCI�). This election is made on an investment-by-investment basis.
All financial assets not classified as measured at amortized cost or FVOCI as described above are measured at FVTPL. This includes all derivativefinancial assets. On initial recognition, the Group may irrevocably designate a financial asset that otherwise meets the requirements to be measured atamortized cost or at FVOCI as at FVTPL if doing so eliminates or significantly reduces an accounting mismatch that would otherwise arise.
The following accounting policies are applied to the subsequent measurement of financial assets.
Financial assets at FVTPL These assets are subsequently measured at fair value. Net gains and losses, including any interest ordividend income, are recognized in profit or loss.
Financial assets at amortized cost These assets are subsequently measured at amortized cost using the effective interest method. Theamortized cost is reduced by impairment losses. Interest income, foreign exchange gains and lossesand impairment are recognized in profit or loss. Any gain or loss on derecognition is recognized inprofit or loss.
Debt investments at FVOCI These assets are subsequently measured at fair value. Interest income calculated using the effectiveinterest method, foreign exchange gains and losses and impairment are recognized in profit or loss.Other net gains and losses are recognized in OCI. On derecognition, gains and losses accumulated inOCI are reclassified to profit or loss.
Equity investments at FVOCI These assets are subsequently measured at fair value. Dividends are recognized as income in profit orloss unless the dividend clearly represents a recovery of the cost of the investment. Other net gainsand losses are recognized in OCI and are never reclassified to profit or loss.
3) Impairment
The Group estimates the expected credit losses (ECL) for the debt instruments measured at amortized cost and FVOCI based on the Group�shistorical experience and informed credit assessment that includes forward-looking information. The impairment approach is decided based on theassessment of whether the credit risk of a financial asset has increased significantly since initial recognition.
The Group measures loss allowances at an amount equal to lifetime ECL, except for the following, which are measured at 12-month ECL.
� debt securities that are determined to have low credit risk at the reporting date; and
� other dept securities and bank balances for which credit risk (i.e. the risk of default occurring over the expected life of the financialinstrument) has not increased significantly since initial recognition.
Loss allowances for accounts receivable � trade and lease receivables are always measured at an amount equal to lifetime ECL.
ECL is a probability-weighted estimate of credit losses. Credit losses are measured as the present value of all cash shortfalls (i.e. the differencebetween the cash flows due to the entity in accordance with the contract and the cash flows that the Group expects to receive).
F-31
Copyright © 2020 www.secdatabase.com. All Rights Reserved.Please Consider the Environment Before Printing This Document
Table of ContentsSK TELECOM CO., LTD. and Subsidiaries
Notes to the Consolidated Financial Statements �� (Continued)For the years ended December 31, 2019, 2018 and 2017
At each reporting date, the Group assesses whether financial assets measured at amortized cost and debt investments at FVOCI are credit-impaired. A financial asset is �credit-impaired� when one or more events that have a detrimental impact on the estimated future cash flows of thefinancial asset have occurred.
Loss allowance on financial assets measured at amortized cost is deducted from the carrying amount of the respective assets, while loss allowanceon debt instruments at FVOCI is recognized in OCI, instead of reducing the carrying amount of the assets.
4) Derecognition
Financial assets are derecognized if the Group�s contractual rights to the cash flows from the financial assets expire or if the Group transfers thefinancial asset to another party without retaining control or transfers substantially all the risks and rewards of the asset.
The transferred assets are not derecognized when the Group enters into transactions whereby it transfers assets recognized in its statement offinancial position but retains substantially all of the risks and rewards of the transferred assets.
5) Offsetting
Financial assets and financial liabilities are offset and the net amount is presented in the statement of financial position when the Group currentlyhas a legally enforceable right to offset the recognized amounts and intends either to settle on a net basis or to settle the liability and realize the assetsimultaneously.
A financial asset and a financial liability is offset only when the right to set off the amount is not contingent on future event and legallyenforceable even on the event of default, insolvency or bankruptcy.
(6) Financial assets �� Policies applied before January 1, 2018
The Group recognizes and measures non-derivative financial assets by the following four categories: financial assets at fair value through profit orloss, held-to-maturity investments, loans and receivables and available-for-sale financial assets. The Group recognizes financial assets in theconsolidated statement of financial position when the Group becomes a party to the contractual provisions of the instrument.
Upon initial recognition, non-derivative financial assets not at fair value through profit or loss are measured at their fair value plus transactioncosts that are directly attributable to the acquisition of asset.
1) Financial assets at fair value through profit or loss
A financial asset is classified as financial asset at fair value through profit or loss if it is held for trading or is designated as such upon initialrecognition. Upon initial recognition, transaction costs are recognized in profit or loss when incurred. Financial assets at fair value through profit or lossare measured at fair value, and changes therein are recognized in profit or loss.
2) Held-to-maturity investments
A non-derivative financial asset with a fixed or determinable payment and fixed maturity, for which the Group has the positive intention andability to hold to maturity, is classified as held-to-maturity investment. Subsequent to initial recognition, held-to-maturity investments are measured atamortized cost using the effective interest rate method.
F-32
Copyright © 2020 www.secdatabase.com. All Rights Reserved.Please Consider the Environment Before Printing This Document
Table of ContentsSK TELECOM CO., LTD. and Subsidiaries
Notes to the Consolidated Financial Statements �� (Continued)For the years ended December 31, 2019, 2018 and 2017
3) Loans and receivables
Loans and receivables are financial assets with fixed or determinable payments that are not quoted in an active market. Subsequent to initialrecognition, loans and receivables are measured at amortized cost using the effective interest method except for loans and receivables of which the effectof discounting is immaterial.
4) Available-for-sale financial assets
Available-for-sale financial assets are those non-derivative financial assets that are designated as available-for-sale or are not classified as financialassets at fair value through profit or loss, held-to-maturity investments or loans and receivables. Subsequent to initial recognition, they are measured atfair value, with changes in fair value, net of any tax effect, recorded in other comprehensive income (OCI) in equity. Investments in equity instrumentsthat do not have a quoted market price in an active market and whose fair value cannot be reliably measured are measured at cost.
5) Impairment of financial assets
A financial asset not carried at fair value through profit or loss is assessed at each reporting date to determine whether there is objective evidencethat it is impaired. A financial asset is impaired if objective evidence indicates that a loss event has occurred after the initial recognition of the asset, andthat the loss event had a negative effect on the estimated future cash flows of the asset that can be reliably estimated. However, losses expected as aresult of future events, regardless of likelihood, are not recognized.
Objective evidence that a financial asset is impaired includes following loss events:
� significant financial difficulty of the issuer or obligor;
� a breach of contract, such as default or delinquency in interest or principal payments;
� the lender, for economic or legal reasons relating to the borrower�s financial difficulty, granting to the borrower a concession that the lenderwould not otherwise consider;
� it becoming probable that the borrower will enter bankruptcy or other financial reorganization;
� the disappearance of an active market for that financial asset because of financial difficulties; or
� observable data indicating that there is a measurable decrease in the estimated future cash flows from a group of financial assets since theinitial recognition of those assets, although the decrease cannot yet be identified with the individual financial assets in the group.
In addition, for an investment in an equity security classified as available-for-sale financial asset, a significant or prolonged decline in its fair valuebelow its cost is objective evidence of impairment.
If financial assets have objective evidence that they are impaired, impairment losses are measured and recognized.
(i) Financial assets measured at amortized cost
An impairment loss in respect of a financial asset measured at amortized cost is calculated as the difference between its carrying amount and thepresent value of its estimated future cash flows discounted at the asset�s original effective interest rate. The Group can recognize impairment lossesdirectly or by establishing an allowance account. If, in a subsequent period, the amount of the impairment loss decreases and the decrease can beobjectively related to an event occurring after the impairment was recognized (such as an improvement in the debtor�s credit rating), the previouslyrecognized impairment loss is reversed either directly or by adjusting an allowance account.
F-33
Copyright © 2020 www.secdatabase.com. All Rights Reserved.Please Consider the Environment Before Printing This Document
Table of ContentsSK TELECOM CO., LTD. and Subsidiaries
Notes to the Consolidated Financial Statements �� (Continued)For the years ended December 31, 2019, 2018 and 2017
(ii) Financial assets carried at cost
If there is objective evidence that an impairment loss has occurred on an unquoted equity instrument that is not carried at fair value because its fairvalue cannot be reliably measured, or on a derivative asset that is linked to and must be settled by delivery of such an unquoted equity instrument, theamount of the impairment loss is measured as the difference between the carrying amount of the financial asset and the present value of estimated futurecash flows discounted at the current market rate of return for a similar financial asset. Such impairment losses are not reversed.
(iii) Available-for-sale financial assets
When a decline in the fair value of an available-for-sale financial asset has been recognized in other comprehensive income and there is objectiveevidence that the asset is impaired, the cumulative loss that had been recognized in other comprehensive income is reclassified to profit or loss as areclassification adjustment even though the financial asset has not been derecognized. Impairment losses recognized in profit or loss for an investmentin an equity instrument classified as available-for-sale is not reversed through profit or loss subsequently. If, in a subsequent period, the fair value of adebt instrument classified as available-for-sale increases and the increase can be objectively related to an event occurring after the impairment loss wasrecognized in profit or loss, the impairment loss is reversed to the amount of amortized cost that would otherwise have been recognized as of therecovery date.
6) De-recognition of financial assets
The Group derecognizes a financial asset when the contractual rights to the cash flows from the asset expire or the Group transfers the rights toreceive the cash flows on the financial asset in a transaction in which substantially all the risks and rewards of ownership of the financial asset aretransferred. Any interest in transferred financial assets that is created or retained by the Group is recognized as a separate asset or liability. If the Groupretains substantially all the risks and rewards of ownership of the transferred financial assets, the Group continues to recognize the transferred financialassets and recognizes financial liabilities for the consideration received.
7) Offsetting between financial assets and financial liabilities
Financial assets and liabilities are offset and presented in net in the statement of financial position when, and only when, the Group currently has alegally enforceable right to offset the recognized amounts and intends either to settle on a net basis or to realize the asset and settle the liabilitysimultaneously.
(7) Derivative financial instruments and hedge accounting
Derivatives are initially recognized at fair value. Subsequent to initial recognition, derivatives are measured at fair value at the end of eachreporting period, and changes therein are accounted for as described below.
1) Hedge accounting
The Group holds forward exchange contracts, interest rate swaps, currency swaps and other derivative contracts to manage interest rate risk andforeign exchange risk. The Group designates derivatives as hedging instruments to hedge the foreign currency risk of highly probable forecastedtransactions or firm commitments (a cash flow hedge).
On initial designation of the hedge, the Group formally documents the relationship between the hedging instrument(s) and hedged item(s),including the risk management objectives and strategy in undertaking the hedge transaction, together with the methods that will be used to assess theeffectiveness of the hedging relationship.
F-34
Copyright © 2020 www.secdatabase.com. All Rights Reserved.Please Consider the Environment Before Printing This Document
Table of ContentsSK TELECOM CO., LTD. and Subsidiaries
Notes to the Consolidated Financial Statements �� (Continued)For the years ended December 31, 2019, 2018 and 2017
Cash flow hedge
When a derivative is designated to hedge the variability in cash flows attributable to a particular risk associated with a recognized asset or liabilityor a highly probable forecasted transaction that could affect profit or loss, the effective portion of changes in the fair value of the derivative isrecognized in other comprehensive income, net of tax, and presented in the hedging reserve in equity. Any ineffective portion of changes in the fairvalue of the derivative is recognized immediately in profit or loss. If the hedging instrument no longer meets the criteria for hedge accounting, expires oris sold, terminated, exercised, or the designation is revoked, then hedge accounting is discontinued prospectively. The cumulative gain or loss on thehedging instrument that has been recognized in other comprehensive income is reclassified to profit or loss in the periods during which the forecastedtransaction occurs. If the forecasted transaction is no longer expected to occur, then the balance in other comprehensive income is recognizedimmediately in profit or loss.
2) Other derivative financial instruments
Other derivative financial instrument not designated as a hedging instrument are measured at fair value, and the changes in fair value of thederivative financial instrument is recognized immediately in profit or loss.
(8) Property and equipment
Property and equipment are initially measured at cost. The cost of property and equipment includes expenditures arising directly from theconstruction or acquisition of the asset, any costs directly attributable to bringing the asset to the location and condition necessary for it to be capable ofoperating in the manner intended by management and the initial estimate of the costs of dismantling and removing the item and restoring the site onwhich it is located.
Property and equipment, subsequently, are carried at cost less accumulated depreciation and accumulated impairment losses.
Subsequent costs are recognized in the carrying amount of property and equipment at cost or, if appropriate, as a separate item if it is probable thatfuture economic benefits associated with the item will flow to the Group and the cost of the item can be reliably measured. The carrying amount of thereplaced part is derecognized. The costs of the day-to-day servicing are recognized in profit or loss as incurred.
Property and equipment, except for land, are depreciated on a straight-line basis over estimated useful lives that appropriately reflect the pattern inwhich the asset�s future economic benefits are expected to be consumed. A component that is significant compared to the total cost of property andequipment is depreciated over its separate useful life.
Gains and losses on disposal of an item of property and equipment are determined by comparing the proceeds from disposal with the carryingamount of property and equipment and are recognized as other operating income (loss).
The estimated useful lives of the Group�s property and equipment are as follows:
Useful lives (years)Buildings and structures 15 ~ 40Machinery 3 ~ 15Other property and equipment 2 ~ 10Right-of-use assets 1 ~ 50
Depreciation methods, useful lives, and residual values are reviewed at the end of each reporting date and adjusted, if appropriate. The change isaccounted for as a change in an accounting estimate.
F-35
Copyright © 2020 www.secdatabase.com. All Rights Reserved.Please Consider the Environment Before Printing This Document
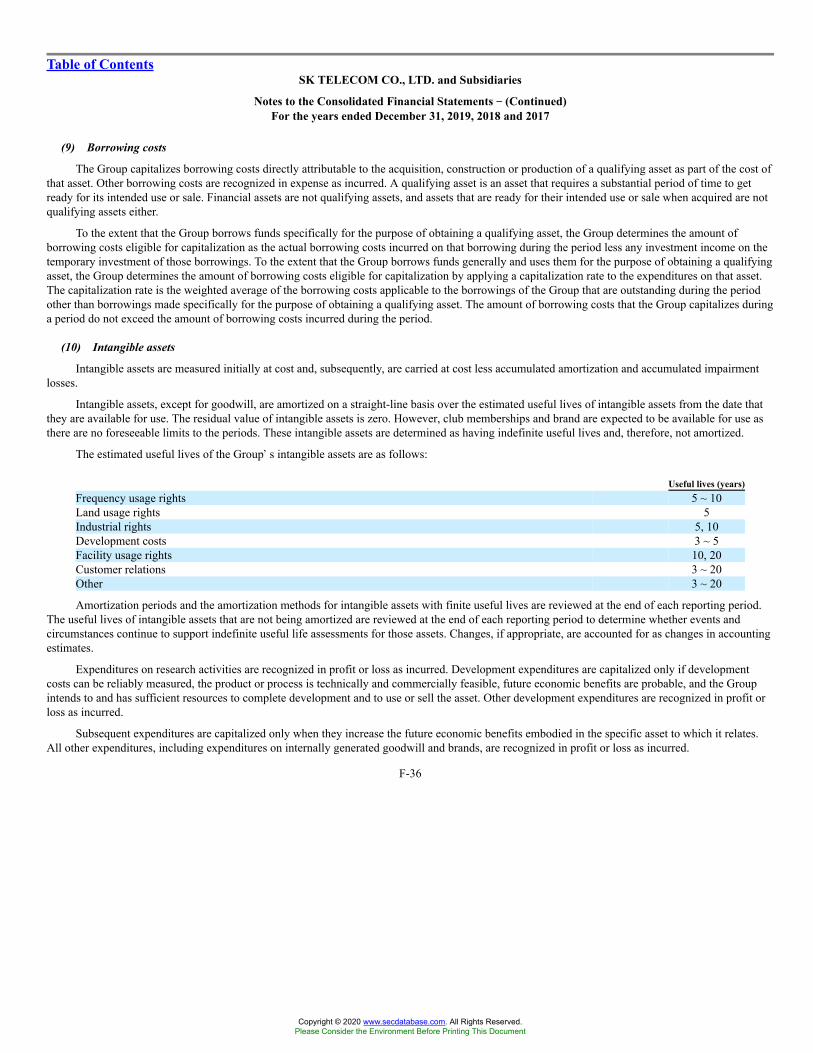
Table of ContentsSK TELECOM CO., LTD. and Subsidiaries
Notes to the Consolidated Financial Statements �� (Continued)For the years ended December 31, 2019, 2018 and 2017
(9) Borrowing costs
The Group capitalizes borrowing costs directly attributable to the acquisition, construction or production of a qualifying asset as part of the cost ofthat asset. Other borrowing costs are recognized in expense as incurred. A qualifying asset is an asset that requires a substantial period of time to getready for its intended use or sale. Financial assets are not qualifying assets, and assets that are ready for their intended use or sale when acquired are notqualifying assets either.
To the extent that the Group borrows funds specifically for the purpose of obtaining a qualifying asset, the Group determines the amount ofborrowing costs eligible for capitalization as the actual borrowing costs incurred on that borrowing during the period less any investment income on thetemporary investment of those borrowings. To the extent that the Group borrows funds generally and uses them for the purpose of obtaining a qualifyingasset, the Group determines the amount of borrowing costs eligible for capitalization by applying a capitalization rate to the expenditures on that asset.The capitalization rate is the weighted average of the borrowing costs applicable to the borrowings of the Group that are outstanding during the periodother than borrowings made specifically for the purpose of obtaining a qualifying asset. The amount of borrowing costs that the Group capitalizes duringa period do not exceed the amount of borrowing costs incurred during the period.
(10) Intangible assets
Intangible assets are measured initially at cost and, subsequently, are carried at cost less accumulated amortization and accumulated impairmentlosses.
Intangible assets, except for goodwill, are amortized on a straight-line basis over the estimated useful lives of intangible assets from the date thatthey are available for use. The residual value of intangible assets is zero. However, club memberships and brand are expected to be available for use asthere are no foreseeable limits to the periods. These intangible assets are determined as having indefinite useful lives and, therefore, not amortized.
The estimated useful lives of the Group�s intangible assets are as follows:
Useful lives (years)Frequency usage rights 5 ~ 10Land usage rights 5Industrial rights 5, 10Development costs 3 ~ 5Facility usage rights 10, 20Customer relations 3 ~ 20Other 3 ~ 20
Amortization periods and the amortization methods for intangible assets with finite useful lives are reviewed at the end of each reporting period.The useful lives of intangible assets that are not being amortized are reviewed at the end of each reporting period to determine whether events andcircumstances continue to support indefinite useful life assessments for those assets. Changes, if appropriate, are accounted for as changes in accountingestimates.
Expenditures on research activities are recognized in profit or loss as incurred. Development expenditures are capitalized only if developmentcosts can be reliably measured, the product or process is technically and commercially feasible, future economic benefits are probable, and the Groupintends to and has sufficient resources to complete development and to use or sell the asset. Other development expenditures are recognized in profit orloss as incurred.
Subsequent expenditures are capitalized only when they increase the future economic benefits embodied in the specific asset to which it relates.All other expenditures, including expenditures on internally generated goodwill and brands, are recognized in profit or loss as incurred.
F-36
Copyright © 2020 www.secdatabase.com. All Rights Reserved.Please Consider the Environment Before Printing This Document

Table of ContentsSK TELECOM CO., LTD. and Subsidiaries
Notes to the Consolidated Financial Statements �� (Continued)For the years ended December 31, 2019, 2018 and 2017
(11) Government grants
Government grants are not recognized unless there is reasonable assurance that the Group will comply with the grant�s conditions and that thegrant will be received.
1) Grants related to assets
Government grants whose primary condition is that the Group purchases, constructs, or otherwise acquires a long-term asset are deducted incalculating the carrying amount of the asset. The grant is recognized in profit or loss over the life of a depreciable asset as a reduction to depreciationexpense.
2) Grants related to income
Government grants which are intended to compensate the Group for expenses incurred are deducted from the related expenses.
(12) Impairment of non-financial assets
The carrying amounts of the Group�s non-financial assets other than contract assets recognized for revenue arising from contracts with acustomer, assets recognized for the costs to obtain or fulfill a contract with a customer, employee benefits, inventories, deferred tax assets, andnon-current assets held for sale are reviewed at the end of the reporting period to determine whether there is any indication of impairment. If any suchindication exists, then the asset�s recoverable amount is estimated. Goodwill and intangible assets that have indefinite useful lives or that are not yetavailable for use, irrespective of whether there is any indication of impairment, are tested for impairment annually by comparing their recoverableamounts to their carrying amounts.
The Group estimates the recoverable amount of an individual asset, and if it is impossible to measure the individual recoverable amount of anasset, the Group estimates the recoverable amount of cash-generating unit (�CGU�). A CGU is the smallest identifiable group of assets that generatescash inflows that are largely independent of the cash inflows from other assets or groups of assets. The recoverable amount of an asset or CGU is thegreater of its value in use and its fair value less costs to sell. The value in use is estimated by applying a pre-tax discount rate that reflects current marketassessments of the time value of money and the risks specific to the asset or CGU for which estimated future cash flows have not been adjusted, to theestimated future cash flows expected to be generated by the asset or CGU.
An impairment loss is recognized in profit or loss to the extent the carrying amount of the asset exceeds its recoverable amount.
Goodwill acquired in a business combination is allocated to each CGU that is expected to benefit from the synergy arising from the businessacquired. Any impairment identified at the CGU level will first reduce the carrying amount of goodwill and then be used to reduce the carrying amountof the other assets in the CGU on a pro rata basis. Except for impairment losses in respect of goodwill which are never reversed, an impairment loss isreversed if there has been a change in the estimates used to determine the recoverable amount. An impairment loss is reversed only to the extent that theasset�s carrying amount does not exceed the carrying amount that would have been determined, net of depreciation or amortization, if no impairmentloss had been recognized.
(13) Leases - Policies applicable from January 1, 2019
The Group has applied IFRS 16, Leases, from January 1, 2019. See note 3 for additional information.
The Group determined at contract inception whether an arrangement was or contained a lease. A contract is, or contains, a lease if the contracttransfers the right to control the identified asset for a period of time in exchange for consideration. To assess whether a contract transfers the right tocontrol the identified asset, the Group uses the definition of a lease in IFRS 16, Leases.
F-37
Copyright © 2020 www.secdatabase.com. All Rights Reserved.Please Consider the Environment Before Printing This Document
Table of ContentsSK TELECOM CO., LTD. and Subsidiaries
Notes to the Consolidated Financial Statements �� (Continued)For the years ended December 31, 2019, 2018 and 2017
1) As a lessee
The Group recognizes a right-of-use asset and a lease liability at the lease commencement date. The right-of-use asset is initially measured at cost,which comprise the initial amount of lease liability adjusted for any lease payments made at or before the commencement date, plus any initial directcosts incurred and an estimate of costs to dismantle and remove the underlying assets or to restore the underlying asset or the site on which it is located,less any lease incentives received. The right-of-use asset is subsequently measured at cost less any accumulated depreciation and impairment losses andadjusted for certain remeasurements of the lease liability. The Group presents its right-of-use assets in property and equipment on the statements offinancial position. The right-of-use asset is subsequently depreciated using the straight-line method from the commencement date to the end of the leaseterm.
The lease liability is initially measured at the present value of the lease payments that are not paid at the commencement date, discounted usingthe interest rate implicit in the lease or, if that rate cannot be readily determined, the Group�s incremental borrowing rate. Generally, the Group uses itsincremental borrowing rate as the discount rate.
The lease liability is subsequently increased by the interest cost on the lease liability and decreased by lease payments made. It is remeasuredwhen there is a change in future lease payments arising from a change in an index or rate, a change in the estimate of the amount expected to be payableunder a residual value guarantee, or as appropriate, changes in the assessment of whether a purchase or extension option is reasonably certain to beexercised or a termination option is reasonably certain not to be exercised.
The Group has applied judgment to determine the lease term for some lease contracts in which it is a lessee that include extension options. Theassessment of whether the Group is reasonably certain to exercise such options impacts the lease term, which significantly affects the amount of leaseliabilities and right-of-use assets recognized. The Group has not included the extension option periods in the lease term because it is not reasonablycertain to exercise such options. After the commencement date, the Group reassesses the lease term upon the occurrence of a significant event or asignificant change in circumstances that is within the control of the Group that affects whether the Group is reasonably certain to exercise the extensionoption.
The Group has elected not to recognize right-of-use assets and lease liabilities for leases with the lease term of 12 months or less at thecommencement date and for leases of low-value assets. The Group recognizes the lease payments associated with these leases as an expense on astraight-line basis over the lease term. The Group has also elected to apply the practical expedient which allows a lease and associated non-leasecomponents to be accounted for as a single lease component.
2) As a lessor
The Group determines whether each lease is a finance lease or an operating lease at inception of a contract. A lease is classified as a finance leasewhen the lease transfers substantially all of the risks and rewards of ownership of the underlying asset. If not, then it is classified as an operating lease.
When the Group is an intermediate lessor, the Group accounts for the head lease and the sublease separately. The sub-leases are classified withreference to the right-of-use assets arising from the head lease, not with reference to the underlying asset.
(14) Leases �� Policies applied before January 1, 2019
The Group classifies and accounts for leases as either a finance or operating lease, depending on the terms. Leases under which the Groupassumes substantially all of the risks and rewards of ownership are classified as finance leases. All other leases are classified as operating leases.
F-38
Copyright © 2020 www.secdatabase.com. All Rights Reserved.Please Consider the Environment Before Printing This Document

Table of ContentsSK TELECOM CO., LTD. and Subsidiaries
Notes to the Consolidated Financial Statements �� (Continued)For the years ended December 31, 2019, 2018 and 2017
1) Finance leases � lessee
At the commencement of the lease term, the Group recognizes as finance assets and finance liabilities in its consolidated statement of financialposition, the lower amount of the fair value of the leased property and the present value of the minimum lease payments, each determined at theinception of the lease. Any initial direct costs are added to the amount recognized as an asset.
Minimum lease payments are apportioned between the finance cost and the reduction of the outstanding liability. The finance cost is allocated toeach period during the lease term so as to produce a constant periodic rate of interest on the remaining balance of the liability. Contingent rents arecharged as expenses in the periods in which they are incurred.
The depreciable amount of a leased asset is allocated to each accounting period during the period of expected use on a systematic basis consistentwith the depreciation policy the Group adopts for depreciable assets that are owned. If there is no reasonable certainty that the Group will obtainownership by the end of the lease term, the asset is fully depreciated over the shorter of the lease term and its useful life. The Group reviews todetermine whether the leased assets are impaired at the reporting date.
2) Operating leases
Leases where the lessor retains a significant portion of the risks and rewards of ownership are classified as operating leases. Payments made underoperating leases (net of any incentives received from the lessor) are recognized in profit or loss on a straight-line basis over the lease term.
3) Determining whether an arrangement contains a lease
Determining whether an arrangement is, or contains, a lease is based on the substance of the arrangement and requires an assessment of whetherfulfillment of the arrangement is dependent on the use of a specific asset and the arrangement conveys a right to use the asset.
At inception or reassessment of the arrangement, the Group separates payments and other consideration required by such an arrangement intothose for the lease and those for other elements on the basis of their relative fair values. If the Group concludes for a financial lease that it isimpracticable to separate the payments reliably, the Group recognizes an asset and a liability at an amount equal to the fair value of the underlying assetthat was identified as the subject of the lease. Subsequently, the liability is reduced as payments are made and an imputed finance charge on the liabilityis recognized using the Group�s incremental borrowing rate of interest.
(15) Non-current assets held for sale
Non-current assets, or disposal groups comprising assets and liabilities, that are expected to be recovered primarily through sales rather thanthrough continuing use, are classified as held for sale. In order to be classified as held for sale, the assets (or disposal groups) must be available forimmediate sale in their present condition and their sale must be highly probable. The assets or disposal groups that are classified as non-current assetsheld for sale are measured at the lower of their carrying amounts and fair value less cost to sell. The Group recognizes an impairment loss for any initialor subsequent write-down of assets (or disposal groups) to fair value less costs to sell and a gain for any subsequent increase in fair value less costs tosell up to the cumulative impairment loss previously recognized in accordance with IAS 36, Impairment of Assets.
A non-current asset that is classified as held for sale or part of a disposal group classified as held for sale is not depreciated (or amortized).
F-39
Copyright © 2020 www.secdatabase.com. All Rights Reserved.Please Consider the Environment Before Printing This Document
Table of ContentsSK TELECOM CO., LTD. and Subsidiaries
Notes to the Consolidated Financial Statements �� (Continued)For the years ended December 31, 2019, 2018 and 2017
(16) Non-derivative financial liabilities
The Group classifies non-derivative financial liabilities into financial liabilities at fair value through profit or loss or other financial liabilities inaccordance with the substance of the contractual arrangement. The Group recognizes financial liabilities in the consolidated statement of financialposition when the Group becomes a party to the contractual provisions of the financial liabilities.
1) Financial liabilities at fair value through profit or loss
Financial liabilities at fair value through profit or loss include financial liabilities held for trading or designated as such upon initial recognition.Subsequent to initial recognition, these liabilities are measured at fair value. The amount of change in fair value of a financial liability that is attributableto changes in the credit risk of that liability shall be presented in other comprehensive income, and the remaining amount of change in the fair value ofthe liability shall be presented in profit or loss. Upon initial recognition, transaction costs that are directly attributable to the issue of the financialliability are recognized in profit or loss as incurred.
2) Other financial liabilities
Non-derivative financial liabilities other than financial liabilities at fair value through profit or loss are classified as other financial liabilities. Atthe date of initial recognition, other financial liabilities are measured at fair value minus transaction costs that are directly attributable to the issue of thefinancial liabilities. Subsequent to initial recognition, other financial liabilities are measured at amortized cost and the interest expenses are recognizedusing the effective interest method.
3) Derecognition of financial liability
The Group extinguishes a financial liability only when the contractual obligation is fulfilled, canceled or expires. The Group recognizes newfinancial liabilities at fair value based on new contracts and eliminates existing liabilities when the contractual terms of the financial liabilities changeand the cash flows change substantially.
When a financial liability is derecognized, the difference between the carrying amount and the consideration paid (including any transferrednon-cash assets or liabilities assumed) is recognized in profit or loss.
(17) Employee benefits
1) Short-term employee benefits
Short-term employee benefits are employee benefits that are due to be settled within 12 months after the end of the period in which the employeesrender related services. When an employee has rendered a service to the Group during an accounting period, the Group recognizes the undiscountedamount of short-term employee benefits expected to be paid in exchange for that service.
2) Other long-term employee benefits
Other long-term employee benefits include employee benefits that are settled beyond 12 months after the end of the period in which theemployees render related services. The Group�s net obligation in respect of long-term employee benefits is the amount of future benefit that employeeshave earned in return for their service in the current and prior periods. That benefit is discounted to determine its present value. Remeasurements arerecognized in profit or loss in the period in which they arise.
3) Retirement benefits: defined contribution plans
When an employee has rendered a service to the Group during a period, the Group recognizes the contribution payable to a defined contributionplan in exchange for that service as a liability (accrued expense), after deducting
F-40
Copyright © 2020 www.secdatabase.com. All Rights Reserved.Please Consider the Environment Before Printing This Document
Table of ContentsSK TELECOM CO., LTD. and Subsidiaries
Notes to the Consolidated Financial Statements �� (Continued)For the years ended December 31, 2019, 2018 and 2017
any contribution already paid. If the contribution already paid exceeds the contribution due for service before the end of the reporting period, the Grouprecognizes that excess as an asset (prepaid expense) to the extent that the prepayment will lead to a reduction in future payments or a cash refund.
4) Retirement benefits: defined benefit plans
At the end of reporting period, defined benefit liabilities relating to defined benefit plans are recognized at present value of defined benefitobligations net of fair value of plan assets.
The calculation is performed annually by an independent actuary using the projected unit credit method. When the fair value of plan assetsexceeds the present value of the defined benefit obligation, the Group recognizes an asset, to the extent of the present value of any economic benefitsavailable in the form of refunds from the plan or reduction in the future contributions to the plan.
Remeasurements of the net defined benefit liability (asset), which comprise actuarial gains and losses, the return on plan assets (excludinginterest) and the effect of the asset ceiling (if any, excluding interest), are recognized immediately in other comprehensive income. The Groupdetermines net interests on net defined benefit liability (asset) by multiplying discount rate determined at the beginning of the annual reporting periodand considers changes in net defined benefit liability (asset) from contributions and benefit payments. Net interest costs and other costs relating to thedefined benefit plan are recognized through profit or loss.
When the plan amendment or curtailment occurs, gains or losses on amendment or curtailment in benefits for the past service provided arerecognized through profit or loss. The Group recognizes a gain or loss on a settlement when the settlement of defined benefit plan occurs.
5) Termination benefits
The Group recognizes a liability and expense for termination benefits at the earlier of the period when the Group can no longer withdraw the offerof those benefits and the period when the Group recognizes costs for a restructuring that involves the payment of termination benefits. If benefits arepayable more than 12 months after the reporting period, they are discounted to their present value.
(18) Provisions
Provisions are recognized when the Group has a present legal or constructive obligation as a result of a past event, it is probable that an outflow ofresources embodying economic benefits will be required to settle the obligation, and a reliable estimate can be made of the amount of the obligation.
The risks and uncertainties that inevitably surround many events and circumstances are taken into account in reaching the best estimate of aprovision. If the effect of the time value of money is material, provisions are determined at the present value of the expected future cash flows.
If some or all of the expenditures required to settle a provision are expected to be reimbursed by another party, the reimbursement is recognizedwhen, and only when, it is virtually certain that reimbursement will be received if the entity settles the obligation. The reimbursement is treated as aseparate asset.
Provisions are reviewed at the end of each reporting period and adjusted to reflect the current best estimates. If it is no longer probable that anoutflow of resources embodying economic benefits will be required to settle the obligation, the provision is reversed.
A provision is used only for expenditures for which the provision was originally recognized.
F-41
Copyright © 2020 www.secdatabase.com. All Rights Reserved.Please Consider the Environment Before Printing This Document
Table of ContentsSK TELECOM CO., LTD. and Subsidiaries
Notes to the Consolidated Financial Statements �� (Continued)For the years ended December 31, 2019, 2018 and 2017
(19) Transactions in foreign currencies
1) Foreign currency transactions
Transactions in foreign currencies are translated to the functional currency of the Group at exchange rates at the dates of the transactions.Monetary assets and liabilities denominated in foreign currencies are retranslated to the functional currency using the exchange rate at the reporting date.Non-monetary assets and liabilities denominated in foreign currencies that are measured at fair value are retranslated to the functional currency at theexchange rate at the date that the fair value was determined.
Foreign currency differences arising on retranslation are recognized in profit or loss, except for the differences arising on the retranslation ofavailable-for-sale equity instruments.
2) Foreign operations
If the presentation currency of the Group is different from a foreign operation�s functional currency, the financial statements of the foreignoperation are translated into the presentation currency using the following methods:
The assets and liabilities of foreign operations, whose functional currency is not the currency of a hyperinflationary economy, are translated topresentation currency at exchange rates at the reporting date. The income and expenses of foreign operations are translated to functional currency atexchange rates at the dates of the transactions. Foreign currency differences are recognized in other comprehensive income.
Any goodwill arising on the acquisition of a foreign operation and any fair value adjustments to the carrying amounts of assets and liabilitiesarising on the acquisition of that foreign operation is treated as assets and liabilities of the foreign operation. Thus, they are expressed in the functionalcurrency of the foreign operation and translated at the closing rate at the reporting date.
When a foreign operation is disposed, the relevant amount in the translation is transferred to profit or loss as part of the profit or loss on disposal.On the partial disposal of a subsidiary that includes a foreign operation, the relevant proportion of such cumulative amount is reattributed tonon-controlling interest. In any other partial disposal of a foreign operation, the relevant proportion is reclassified to profit or loss.
(20) Share capital
Ordinary shares are classified as equity. Incremental costs directly attributable to the issuance of ordinary shares and share options are recognizedas a deduction from equity, net of any tax effects.
When the Parent Company repurchases its own shares, the amount of the consideration paid is recognized as a deduction from equity andclassified as treasury shares. The gains or losses from the purchase, disposal, reissue, or retirement of treasury shares are directly recognized in equitybeing as transaction with owners.
(21) Hybrid bond
The Group recognizes a financial instrument issued by the Group as an equity instrument if it does not include contractual obligation to deliverfinancial assets including cash to the counter party.
(22) Share-based Payment
For equity-settled share-based payment transaction, if the fair value of the goods or services received cannot be reliably estimated, the Groupmeasures the value indirectly by reference to the fair value of the equity instruments granted. The related expense with a corresponding increase incapital surplus and others is recognized over the vesting period of the awards.
F-42
Copyright © 2020 www.secdatabase.com. All Rights Reserved.Please Consider the Environment Before Printing This Document
Table of ContentsSK TELECOM CO., LTD. and Subsidiaries
Notes to the Consolidated Financial Statements �� (Continued)For the years ended December 31, 2019, 2018 and 2017
The amount recognized as an expense is adjusted to reflect the number of awards for which the related service and non-market performanceconditions are expected to be met, such that the amount ultimately recognized is based on the number of awards that meet the related service andnon-market performance conditions at the vesting date.
For cash-settled share-based payment transaction, the Group measures and recognizes the amount payable to employees at fair value as anexpense with a corresponding increase in liabilities, over the period during which the employees become unconditionally entitled to payment. Theliability is remeasured at each reporting date and at settlement date based on the fair value of the share-based payment. Any changes in the liability arerecognized in profit or loss.
(23) Revenue �� Policies applicable from January 1, 2018
The Group adopted IFRS 15, Revenue from Contracts with Customers, on January 1, 2018, using the modified retrospective method. IFRS 15establishes a comprehensive framework for determining whether, how much and when revenue is recognized. It also amends previous guidance for therecognition of costs to obtain contracts with customers such that incremental costs of obtaining contracts with customers are deferred and amortizedconsistent with the transfer of the related good or service.
1) Identification of performance obligations in contracts with customers
The Group identifies the distinct services or goods as performance obligations in contracts with customers such as (1) providing wirelesstelecommunications services, (2) sale of handsets and (3) providing other goods and services. In the case of providing both wireless telecommunicationsservice and selling a handset together to one customer, the Group allocates considerations from the customer between the separate performanceobligations for handset sale and wireless telecommunications service. The handset sale revenue is recognized when handset is delivered, and thewireless telecommunications service revenue is recognized over the period of the contract term as stated in the subscription contract.
2) Allocation of the transaction price to each performance obligation
The Group allocates the transaction price of a contract to each performance obligation identified on a relative stand-alone selling price basis. TheGroup uses �adjusted market assessment approach� for estimating the stand-alone selling price of a good or service. As an exception, the Group uses�expected cost plus a margin approach� for insignificant transactions.
3) Incremental costs of obtaining a contract
The Group pays commissions to its retail stores and authorized dealers in connection with acquiring service contracts. The commissions paid tothese parties constituted a significant portion of the Group�s operating expenses. These commissions would not have been paid if there have been nobinding contracts with subscribers and, therefore, the Group capitalizes certain costs associated with commissions paid to obtain new customer contractsand amortize them over the expected contract periods.
4) Customer loyalty programs
The Group provides customer loyalty points to customers based on the usage of the service to which the Group allocates a portion of considerationreceived as a performance obligation distinct from wireless telecommunications services. The amount to be allocated to the loyalty program is measuredaccording to the relative stand-alone selling price of the customer loyalty points. The amount allocated to the loyalty program is deferred as a contractliability and is recognized as revenue when loyalty points are redeemed.
F-43
Copyright © 2020 www.secdatabase.com. All Rights Reserved.Please Consider the Environment Before Printing This Document
Table of ContentsSK TELECOM CO., LTD. and Subsidiaries
Notes to the Consolidated Financial Statements �� (Continued)For the years ended December 31, 2019, 2018 and 2017
5) Consideration payable to a customer
Based on the subscription contract, a customer who uses the Group�s wireless telecommunications services may receive a discount for purchasinggoods or services from a designated third party. The Group pays a portion of the price discounts that the customer receives to the third party, which isthe consideration payable to a customer. The Group accounts for the amounts payable to the third party as a reduction of the wirelesstelecommunications service revenue.
(24) Revenue �� Policies applied before January 1, 2018
Revenue from the sale of goods, rendering of services or use of assets is measured at the fair value of the consideration received or receivable.Returns, trade discounts and volume rebates are recognized as a reduction of revenue.
When two or more revenue generating activities or deliverables are sold under a single arrangement, each deliverable that is considered to be aseparate unit of account is accounted for separately. The allocation of consideration from a revenue arrangement to its separate units of account is basedon the relative fair values of each unit.
1) Services rendered
Revenue from cellular services consists of revenue from basic charges, voice charges, data charges, data-roaming services and interconnectioncharges. Such revenues are recognized as services are performed. Revenue from fixed-line services includes domestic and long-distance call charges,international phone connection charges, installation service and broadband internet services. Such revenues are recognized as the related services areperformed.
Revenue from other services rendered is recognized in profit or loss in proportion to the stage of completion of the transaction at the reportingdate. The stage of completion is assessed by reference to surveys of work performed.
2) Goods sold
Revenue is recognized when persuasive evidence exists, usually in the form of an executed sales agreement, that the significant risks and rewardsof ownership have been transferred to the buyer, recovery of the consideration is probable, the associated costs and possible return of goods can beestimated reliably, there is no continuing management involvement with the goods, and the amount of revenue can be measured reliably.
3) Commission revenue
In connection with the commission revenue from commerce services, the Group has determined that it is acting as an agent due to the followings:
� The Group does not bear inventory risk or have responsibility for the delivery goods;
� All of the credit risks are borne by suppliers of goods though the Group collects the proceeds from end customers on behalf of the suppliers;and
� The Group has no latitude in establishing prices regarding goods sold in commerce.
4) Customer loyalty programs
For customer loyalty programs, the fair value of the consideration received or receivable in respect of the initial sale is allocated between theaward credits and the other components of the sale. The amount allocated to the award credits is estimated by reference to the fair value of the servicesto be provided with respect to the redeemable award credits. The fair value of the services to be provided with respect to the redeemable portion of theaward
F-44
Copyright © 2020 www.secdatabase.com. All Rights Reserved.Please Consider the Environment Before Printing This Document

Table of ContentsSK TELECOM CO., LTD. and Subsidiaries
Notes to the Consolidated Financial Statements �� (Continued)For the years ended December 31, 2019, 2018 and 2017
credits granted to the customers in accordance with customer loyalty programs is estimated taking into account the expected redemption rate and timingof the expected redemption. Considerations allocated to the award credits are deferred and revenue is recognized when the award credits are recoveredand the Group performs its obligation to provide the service. The amount of revenue recognized is based on the relative size of the total award creditsthat are expected to be redeemed and the redeemed award credits in exchange for services.
(25) Finance income and finance costs
Finance income comprises interest income on funds invested (including financial assets measured at fair value), dividend income, gains ondisposal of financial assets at FVTPL, changes in fair value of financial instruments at FVTPL, and gains on hedging instruments that are recognized inprofit or loss. Interest income is recognized as it accrues in profit or loss, using the effective interest rate method. Dividend income is recognized inprofit or loss when the right to receive the dividend is established.
Finance costs comprise interest expense on borrowings, changes in fair value of financial instruments at FVTPL, and losses on hedginginstruments that are recognized in profit or loss. Interest expense on borrowings and debentures is recognized as it accrues in profit or loss using theeffective interest rate method.
(26) Income taxes
Income tax expense comprises current and deferred tax. Current tax and deferred tax are recognized in profit or loss except to the extent that itrelates to a business combination, or items recognized directly in equity or in OCI.
The Group pays income tax in accordance with the tax-consolidation system when the Parent Company and its subsidiaries are economicallyunified.
1) Current tax
Current tax is the expected tax payable or receivable on the taxable profit or loss for the year, using tax rates enacted or substantively enacted atthe end of the reporting period, and includes interests and fines related to income taxes paid or payable. The taxable profit is different from theaccounting profit for the period since the taxable profit is calculated excluding the temporary differences, which will be taxable or deductible indetermining taxable profit (tax loss) of future periods, and non-taxable or non-deductible items from the accounting profit.
2) Deferred tax
Deferred tax is recognized by using the asset-liability method in respect of temporary differences between the carrying amounts of assets andliabilities for financial reporting purposes and the amounts used for taxation purposes. The Group recognizes a deferred tax liability for all taxabletemporary differences, except for the difference associated with investments in subsidiaries and associates that the Group is able to control the timing ofthe reversal of the temporary difference and it is probable that the temporary difference will not reverse in the foreseeable future. The Group recognizesa deferred tax asset for all deductible temporary differences to the extent that it is probable that the temporary difference will reverse in the foreseeablefuture and taxable profit will be available against which the temporary difference can be utilized.
A deferred tax asset is recognized for the carryforward of unused tax losses and unused tax credits to the extent that it is probable that futuretaxable profit will be available against which the unused tax losses and unused tax credits can be utilized. Future taxable profit is dependent on thereversal of taxable temporary differences. If there are insufficient taxable temporary differences to recognize the deferred tax asset, the business plan ofthe Group and the reversal of existing temporary differences are considered in determining the future taxable profit.
The Group reviews the carrying amount of a deferred tax asset at the end of each reporting period and reduces the carrying amount to the extentthat it is no longer probable that sufficient taxable profit will be available to allow the benefit of part or all of that deferred tax asset to be utilized.
F-45
Copyright © 2020 www.secdatabase.com. All Rights Reserved.Please Consider the Environment Before Printing This Document
Table of ContentsSK TELECOM CO., LTD. and Subsidiaries
Notes to the Consolidated Financial Statements �� (Continued)For the years ended December 31, 2019, 2018 and 2017
Deferred tax assets and liabilities are measured at the tax rates that are expected to apply to the period when the asset is realized, or the liability issettled based on tax rates (and tax laws) that have been enacted or substantively enacted by the end of the reporting period. The measurement of deferredtax liabilities and deferred tax assets reflects the tax consequences that would follow from the manner in which the Group expects, at the end of thereporting period, to recover or settle the carrying amount of its assets and liabilities.
Deferred tax assets and liabilities are offset only if the Group has a legally enforceable right to offset the amount recognized and intends to settlethe current tax liabilities and assets on a net basis. Income tax expense in relation to dividend payments is recognized when liabilities relating to thedividend payments are recognized.
3) Uncertainty over income tax treatments
The Group assesses the uncertainty over income tax treatments pursuant to IAS 12 from January 1, 2019. If the Group concludes it is not probablethat the taxation authority will accept an uncertain tax treatment, the Group reflects the effect of uncertainty for each uncertain tax treatment by usingeither of the following methods, depending on which method the entity expects to better predict the resolution of the uncertainty:
� The most likely amount: the single most likely amount in a range of possible outcomes.
� The expected value: the sum of the probability-weighted amounts in a range of possible outcomes.
(27) Earnings per share
The Group presents basic and diluted earnings per share (EPS) data for its ordinary shares. Basic EPS is calculated by dividing the profit or lossattributable to ordinary shareholders of the Parent Company by the weighted average number of ordinary shares outstanding during the period, adjustedfor own shares held. Diluted EPS is determined by adjusting the profit or loss attributable to ordinary shareholders and the weighted average number ofordinary shares outstanding, adjusted for own shares held, for the effects of all dilutive potential ordinary shares, which comprise share options grantedto employees, if any.
(28) Standards issued but not yet effective
The following amended standards are effective for annual periods beginning after January 1, 2019 and earlier application is permitted. However,the Group has not adopted the following amended standards early in preparing the accompanying consolidated financial statements.
The following amended standards are not expected to have a significant impact on the Group�s consolidated financial statements.
� Amendments to References to Conceptual Framework in IFRS Standards.
� Definition of a Business (Amendments to IFRS 3)
� Definition of Material (Amendments to IAS 1 and IAS 8)
5. Operating Segments
The Group�s operating segments have been identified to be each business unit, by which the Group provides independent services andmerchandise. The Group�s reportable segments are cellular services, which include cellular voice service, wireless data service and wireless internetservices; fixed-line telecommunications services, which include telephone services, internet services and leased line services; security services, whichinclude unmanned security services, manned security services and system software development; commerce services, the open marketplace platform;and all other businesses, which include the Group�s internet portal services and other immaterial operations, each of which does not meet thequantitative threshold to be considered as a reportable segment and are presented collectively as others.
F-46
Copyright © 2020 www.secdatabase.com. All Rights Reserved.Please Consider the Environment Before Printing This Document
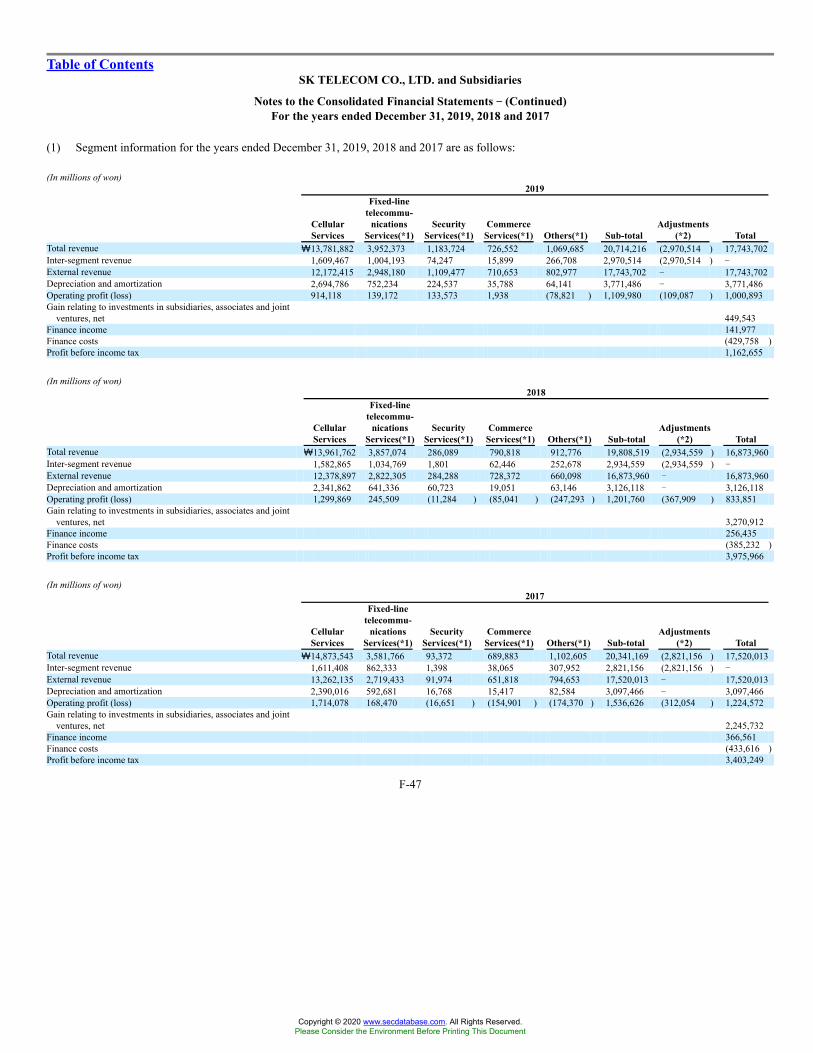
Table of ContentsSK TELECOM CO., LTD. and Subsidiaries
Notes to the Consolidated Financial Statements �� (Continued)For the years ended December 31, 2019, 2018 and 2017
(1) Segment information for the years ended December 31, 2019, 2018 and 2017 are as follows:
(In millions of won)2019
CellularServices
Fixed-linetelecommu-
nicationsServices(*1)
SecurityServices(*1)
CommerceServices(*1) Others(*1) Sub-total
Adjustments(*2) Total
Total revenue ₩13,781,882 3,952,373 1,183,724 726,552 1,069,685 20,714,216 (2,970,514 ) 17,743,702Inter-segment revenue 1,609,467 1,004,193 74,247 15,899 266,708 2,970,514 (2,970,514 ) �External revenue 12,172,415 2,948,180 1,109,477 710,653 802,977 17,743,702 � 17,743,702Depreciation and amortization 2,694,786 752,234 224,537 35,788 64,141 3,771,486 � 3,771,486Operating profit (loss) 914,118 139,172 133,573 1,938 (78,821 ) 1,109,980 (109,087 ) 1,000,893Gain relating to investments in subsidiaries, associates and joint
ventures, net 449,543Finance income 141,977Finance costs (429,758 )Profit before income tax 1,162,655
(In millions of won)2018
CellularServices
Fixed-linetelecommu-
nicationsServices(*1)
SecurityServices(*1)
CommerceServices(*1) Others(*1) Sub-total
Adjustments(*2) Total
Total revenue ₩13,961,762 3,857,074 286,089 790,818 912,776 19,808,519 (2,934,559 ) 16,873,960Inter-segment revenue 1,582,865 1,034,769 1,801 62,446 252,678 2,934,559 (2,934,559 ) �External revenue 12,378,897 2,822,305 284,288 728,372 660,098 16,873,960 � 16,873,960Depreciation and amortization 2,341,862 641,336 60,723 19,051 63,146 3,126,118 � 3,126,118Operating profit (loss) 1,299,869 245,509 (11,284 ) (85,041 ) (247,293 ) 1,201,760 (367,909 ) 833,851Gain relating to investments in subsidiaries, associates and joint
ventures, net 3,270,912Finance income 256,435Finance costs (385,232 )Profit before income tax 3,975,966
(In millions of won)2017
CellularServices
Fixed-linetelecommu-
nicationsServices(*1)
SecurityServices(*1)
CommerceServices(*1) Others(*1) Sub-total
Adjustments(*2) Total
Total revenue ₩14,873,543 3,581,766 93,372 689,883 1,102,605 20,341,169 (2,821,156 ) 17,520,013Inter-segment revenue 1,611,408 862,333 1,398 38,065 307,952 2,821,156 (2,821,156 ) �External revenue 13,262,135 2,719,433 91,974 651,818 794,653 17,520,013 � 17,520,013Depreciation and amortization 2,390,016 592,681 16,768 15,417 82,584 3,097,466 � 3,097,466Operating profit (loss) 1,714,078 168,470 (16,651 ) (154,901 ) (174,370 ) 1,536,626 (312,054 ) 1,224,572Gain relating to investments in subsidiaries, associates and joint
ventures, net 2,245,732Finance income 366,561Finance costs (433,616 )Profit before income tax 3,403,249
F-47
Copyright © 2020 www.secdatabase.com. All Rights Reserved.Please Consider the Environment Before Printing This Document

Table of ContentsSK TELECOM CO., LTD. and Subsidiaries
Notes to the Consolidated Financial Statements �� (Continued)For the years ended December 31, 2019, 2018 and 2017
(*1) During the year ended December 31, 2019, due to the change in the categorization of information reviewed by the chief operating decision makerin 2019, the Group reclassified SK stoa Co., Ltd. from Fixed-line telecommunication Service segment to Commerce Services segment. Inaddition, operating segment for Life & Security Holdings Co., Ltd. and SK Infosec Co., Ltd. was separately presented as a reportable segment(Security Services) and no longer included in Others segment. Segment information for the years ended December 31, 2018 and 2017 was restatedto conform to the 2019 reclassifications.
(*2) Adjustments for operating profit (loss) are the amount differences from operating profit (loss) included in CODM report which is based on KoreanIFRS to operating profit (loss) under IFRS. The reconciliation of these amounts is included in note 5-(2).
(2) Reconciliation of total segment operating profit to consolidated operating profit from continuing operations for the years ended December 31,2019, 2018 and 2017 are as follows:
(In millions of won)2019 2018 2017
Total segment operating profit ₩1,109,980 1,201,760 1,536,626
Other operating income:Gain on disposal of property and equipment and intangible assets 8,942 38,933 13,991Others(*1) 94,288 33,017 18,006
103,230 71,950 31,997
Other operating expenses:Impairment loss on property and equipment and intangible assets (65,935 ) (255,839 ) (54,946 )Loss on disposal of property and equipment and intangible assets (56,248 ) (87,257 ) (60,086 )Donations (17,557 ) (59,012 ) (112,634 )Bad debt for accounts receivable � other (5,802 ) (7,718 ) (5,793 )Others(*2) (66,775 ) (30,033 ) (110,592 )
(212,317 ) (439,859 ) (344,051 )Consolidated operating profit from continuing operations ₩1,000,893 833,851 1,224,572
(*1) Others for the years ended December 31, 2019 includes ₩70 billion of gain on business transfer and others for the years ended December 31,2018 includes ₩11 billion of penalty refund, respectively, various other income with inconsequential amounts.
(*2) Others for the years ended December 31, 2019, 2018 and 2017 include ₩42.4 billion, ₩0.4 billion and ₩21.4 billion of penalties, respectively,and various other expenses with inconsequential amounts.
Since there are no intersegment sales of inventory or depreciable assets, there is no unrealized intersegment profit to be eliminated onconsolidation. Domestic revenue for the years ended December 31, 2019, 2018 and 2017 amounts to ₩17,680 billion, ₩16,656 billion and₩17,374 billion, respectively. Domestic non-current assets (excluding financial assets, investments in associates and joint ventures and deferred taxassets) as of December 31, 2019, 2018 and 2017 amount to ₩20,678 billion, ₩20,040 billion and ₩15,554 billion, and non-current assets outside ofKorea amount to ₩63 billion, ₩72 billion and ₩257 billion, respectively.
No single customer contributed 10% or more to the Group�s total sales for the years ended December 31, 2019, 2018 and 2017.
The Group principally operates its businesses in Korea and the revenue amounts earned outside of Korea are immaterial. Therefore, no entity-wide geographical information is presented.
F-48
Copyright © 2020 www.secdatabase.com. All Rights Reserved.Please Consider the Environment Before Printing This Document
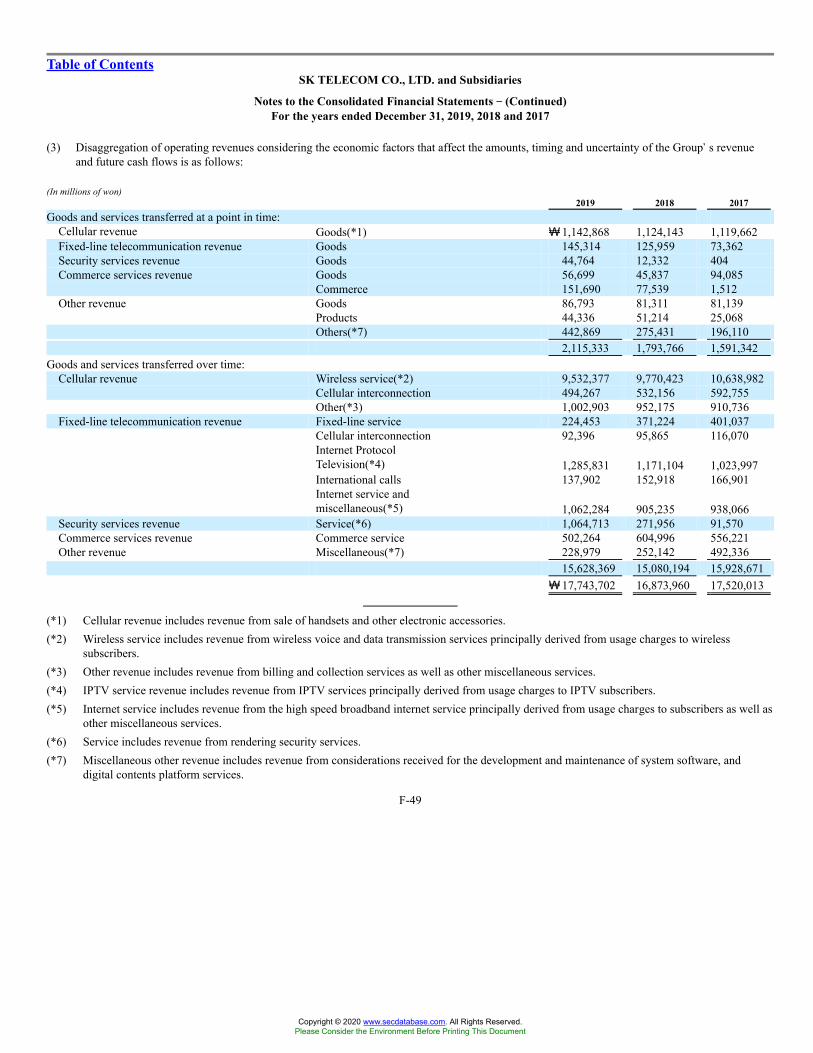
Table of ContentsSK TELECOM CO., LTD. and Subsidiaries
Notes to the Consolidated Financial Statements �� (Continued)For the years ended December 31, 2019, 2018 and 2017
(3) Disaggregation of operating revenues considering the economic factors that affect the amounts, timing and uncertainty of the Group�s revenueand future cash flows is as follows:
(In millions of won)2019 2018 2017
Goods and services transferred at a point in time:Cellular revenue Goods(*1) ₩1,142,868 1,124,143 1,119,662Fixed-line telecommunication revenue Goods 145,314 125,959 73,362Security services revenue Goods 44,764 12,332 404Commerce services revenue Goods 56,699 45,837 94,085
Commerce 151,690 77,539 1,512Goods 86,793 81,311 81,139Other revenueProducts 44,336 51,214 25,068Others(*7) 442,869 275,431 196,110
2,115,333 1,793,766 1,591,342Goods and services transferred over time:
Cellular revenue Wireless service(*2) 9,532,377 9,770,423 10,638,982Cellular interconnection 494,267 532,156 592,755Other(*3) 1,002,903 952,175 910,736
Fixed-line telecommunication revenue Fixed-line service 224,453 371,224 401,037Cellular interconnection 92,396 95,865 116,070Internet ProtocolTelevision(*4) 1,285,831 1,171,104 1,023,997International calls 137,902 152,918 166,901Internet service andmiscellaneous(*5) 1,062,284 905,235 938,066
Security services revenue Service(*6) 1,064,713 271,956 91,570Commerce services revenue Commerce service 502,264 604,996 556,221Other revenue Miscellaneous(*7) 228,979 252,142 492,336
15,628,369 15,080,194 15,928,671₩17,743,702 16,873,960 17,520,013
(*1) Cellular revenue includes revenue from sale of handsets and other electronic accessories.(*2) Wireless service includes revenue from wireless voice and data transmission services principally derived from usage charges to wireless
subscribers.(*3) Other revenue includes revenue from billing and collection services as well as other miscellaneous services.(*4) IPTV service revenue includes revenue from IPTV services principally derived from usage charges to IPTV subscribers.(*5) Internet service includes revenue from the high speed broadband internet service principally derived from usage charges to subscribers as well as
other miscellaneous services.(*6) Service includes revenue from rendering security services.(*7) Miscellaneous other revenue includes revenue from considerations received for the development and maintenance of system software, and
digital contents platform services.
F-49
Copyright © 2020 www.secdatabase.com. All Rights Reserved.Please Consider the Environment Before Printing This Document

Table of ContentsSK TELECOM CO., LTD. and Subsidiaries
Notes to the Consolidated Financial Statements �� (Continued)For the years ended December 31, 2019, 2018 and 2017
6. Restricted Deposits
Deposits which are restricted in use as of December 31, 2019 and 2018 are summarized as follows:
(In millions of won)December 31, 2019 December 31, 2018
Short-term financial instruments(*) ₩ 95,034 79,511Long-term financial instruments(*) 988 1,218
₩ 96,022 80,729
(*) Financial instruments include charitable trust fund established by the Group where profits from the fund are donated to charitable institutions. Asof December 31, 2019, the funds cannot be withdrawn before maturity.
7. Trade and Other Receivables
(1) Details of trade and other receivables as of December 31, 2019 and 2018 are as follows:
(In millions of won)December 31, 2019
Grossamount
Lossallowance
Carryingamount
Current assets:Accounts receivable � trade ₩2,480,419 (249,440 ) 2,230,979Short-term loans 66,706 (583 ) 66,123Accounts receivable � other(*) 953,815 (48,379 ) 905,436Accrued income 3,977 (166 ) 3,811Guarantee deposits (Other current assets) 145,041 � 145,041
3,649,958 (298,568 ) 3,351,390Non-current assets:
Long-term loans 81,231 (47,471 ) 33,760Long-term accounts receivable � other(*) 344,662 � 344,662Guarantee deposits 165,033 (299 ) 164,734Long-term accounts receivable � trade (Other non-current assets) 16,977 (61 ) 16,916
607,903 (47,831 ) 560,072₩4,257,861 (346,399 ) 3,911,462
(*) Gross and carrying amounts of accounts receivable � other as of December 31, 2019 include ₩ 532,225 million of financial instrumentsclassified as FVTPL.
F-50
Copyright © 2020 www.secdatabase.com. All Rights Reserved.Please Consider the Environment Before Printing This Document
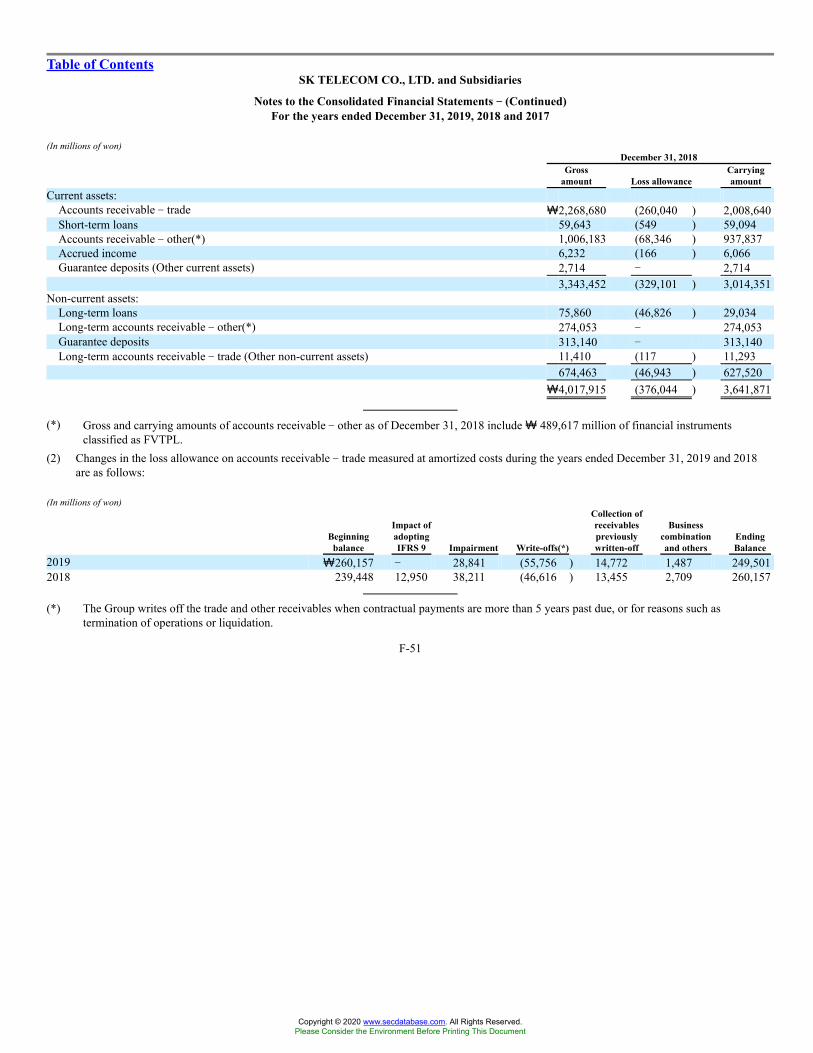
Table of ContentsSK TELECOM CO., LTD. and Subsidiaries
Notes to the Consolidated Financial Statements �� (Continued)For the years ended December 31, 2019, 2018 and 2017
(In millions of won)December 31, 2018
Grossamount Loss allowance
Carryingamount
Current assets:Accounts receivable � trade ₩2,268,680 (260,040 ) 2,008,640Short-term loans 59,643 (549 ) 59,094Accounts receivable � other(*) 1,006,183 (68,346 ) 937,837Accrued income 6,232 (166 ) 6,066Guarantee deposits (Other current assets) 2,714 � 2,714
3,343,452 (329,101 ) 3,014,351Non-current assets:
Long-term loans 75,860 (46,826 ) 29,034Long-term accounts receivable � other(*) 274,053 � 274,053Guarantee deposits 313,140 � 313,140Long-term accounts receivable � trade (Other non-current assets) 11,410 (117 ) 11,293
674,463 (46,943 ) 627,520₩4,017,915 (376,044 ) 3,641,871
(*) Gross and carrying amounts of accounts receivable � other as of December 31, 2018 include ₩ 489,617 million of financial instrumentsclassified as FVTPL.
(2) Changes in the loss allowance on accounts receivable � trade measured at amortized costs during the years ended December 31, 2019 and 2018are as follows:
(In millions of won)
Beginningbalance
Impact ofadoptingIFRS 9 Impairment Write-offs(*)
Collection ofreceivablespreviouslywritten-off
Businesscombinationand others
EndingBalance
2019 ₩260,157 � 28,841 (55,756 ) 14,772 1,487 249,5012018 239,448 12,950 38,211 (46,616 ) 13,455 2,709 260,157
(*) The Group writes off the trade and other receivables when contractual payments are more than 5 years past due, or for reasons such astermination of operations or liquidation.
F-51
Copyright © 2020 www.secdatabase.com. All Rights Reserved.Please Consider the Environment Before Printing This Document
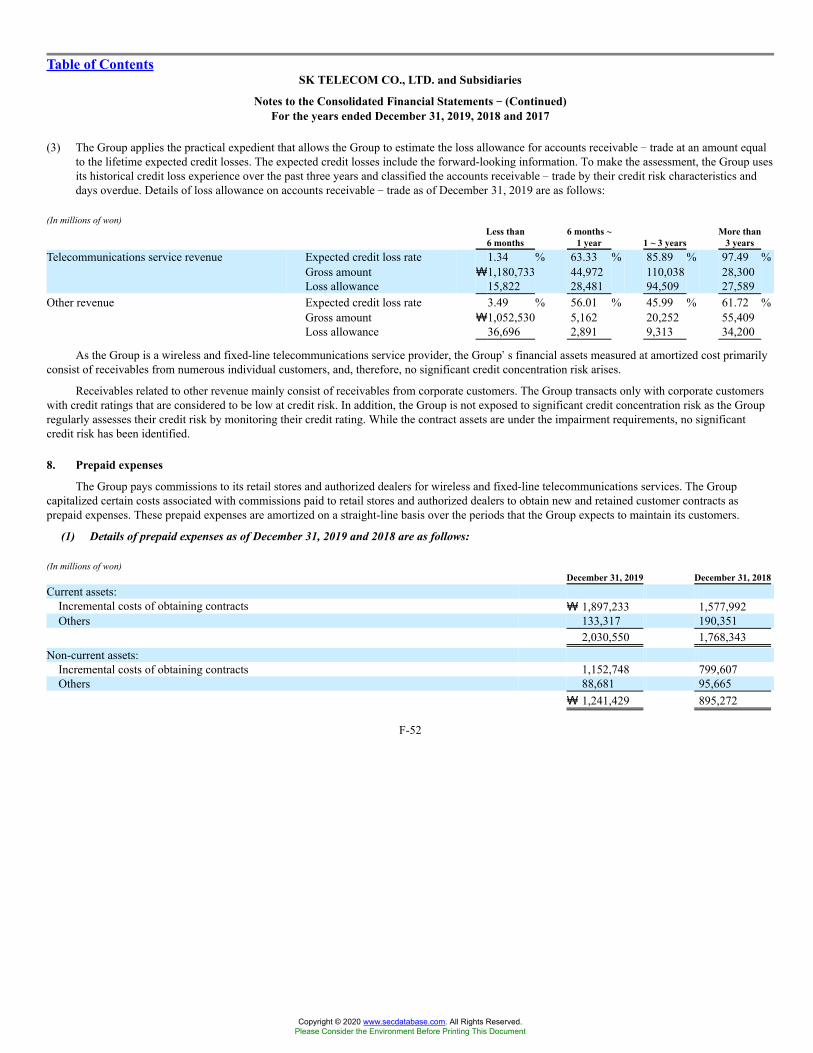
Table of ContentsSK TELECOM CO., LTD. and Subsidiaries
Notes to the Consolidated Financial Statements �� (Continued)For the years ended December 31, 2019, 2018 and 2017
(3) The Group applies the practical expedient that allows the Group to estimate the loss allowance for accounts receivable � trade at an amount equalto the lifetime expected credit losses. The expected credit losses include the forward-looking information. To make the assessment, the Group usesits historical credit loss experience over the past three years and classified the accounts receivable � trade by their credit risk characteristics anddays overdue. Details of loss allowance on accounts receivable � trade as of December 31, 2019 are as follows:
(In millions of won)Less than6 months
6 months ~1 year 1 ~ 3 years
More than3 years
Expected credit loss rate 1.34 % 63.33 % 85.89 % 97.49 %Gross amount ₩1,180,733 44,972 110,038 28,300
Telecommunications service revenue
Loss allowance 15,822 28,481 94,509 27,589Expected credit loss rate 3.49 % 56.01 % 45.99 % 61.72 %Gross amount ₩1,052,530 5,162 20,252 55,409
Other revenue
Loss allowance 36,696 2,891 9,313 34,200
As the Group is a wireless and fixed-line telecommunications service provider, the Group�s financial assets measured at amortized cost primarilyconsist of receivables from numerous individual customers, and, therefore, no significant credit concentration risk arises.
Receivables related to other revenue mainly consist of receivables from corporate customers. The Group transacts only with corporate customerswith credit ratings that are considered to be low at credit risk. In addition, the Group is not exposed to significant credit concentration risk as the Groupregularly assesses their credit risk by monitoring their credit rating. While the contract assets are under the impairment requirements, no significantcredit risk has been identified.
8. Prepaid expenses
The Group pays commissions to its retail stores and authorized dealers for wireless and fixed-line telecommunications services. The Groupcapitalized certain costs associated with commissions paid to retail stores and authorized dealers to obtain new and retained customer contracts asprepaid expenses. These prepaid expenses are amortized on a straight-line basis over the periods that the Group expects to maintain its customers.
(1) Details of prepaid expenses as of December 31, 2019 and 2018 are as follows:
(In millions of won)December 31, 2019 December 31, 2018
Current assets:Incremental costs of obtaining contracts ₩ 1,897,233 1,577,992Others 133,317 190,351
2,030,550 1,768,343Non-current assets:
Incremental costs of obtaining contracts 1,152,748 799,607Others 88,681 95,665
₩ 1,241,429 895,272
F-52
Copyright © 2020 www.secdatabase.com. All Rights Reserved.Please Consider the Environment Before Printing This Document
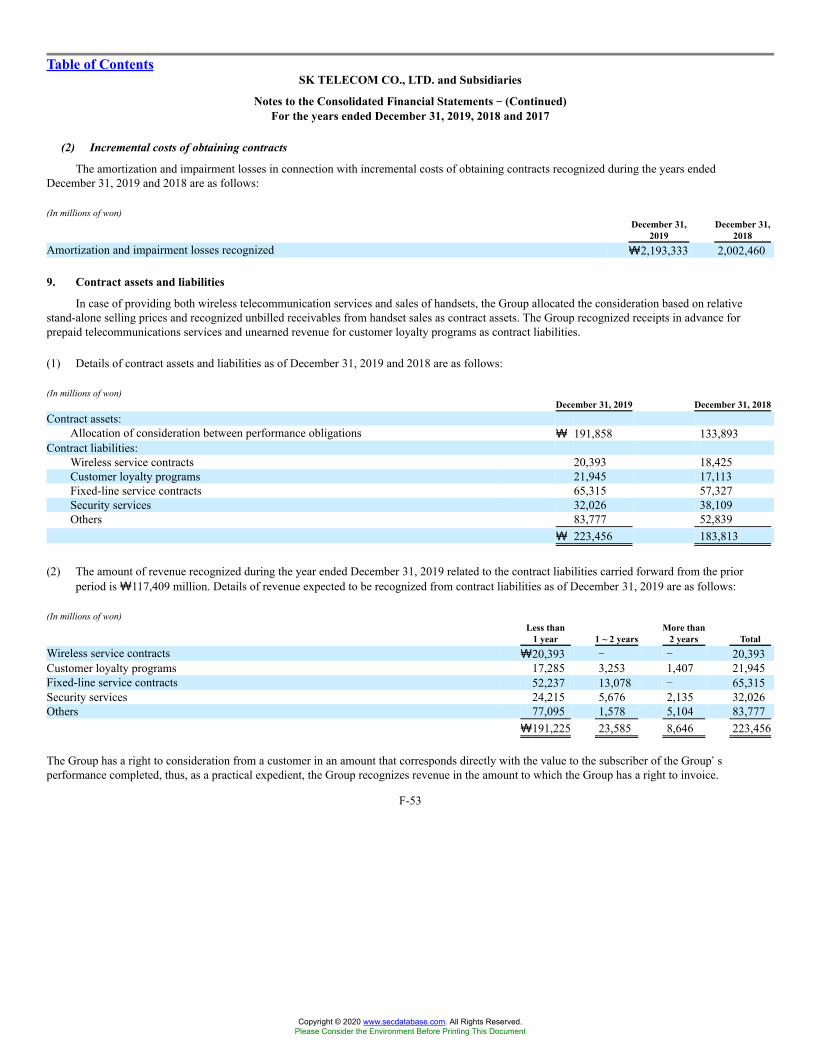
Table of ContentsSK TELECOM CO., LTD. and Subsidiaries
Notes to the Consolidated Financial Statements �� (Continued)For the years ended December 31, 2019, 2018 and 2017
(2) Incremental costs of obtaining contracts
The amortization and impairment losses in connection with incremental costs of obtaining contracts recognized during the years endedDecember 31, 2019 and 2018 are as follows:
(In millions of won)December 31,
2019December 31,
2018Amortization and impairment losses recognized ₩2,193,333 2,002,460
9. Contract assets and liabilities
In case of providing both wireless telecommunication services and sales of handsets, the Group allocated the consideration based on relativestand-alone selling prices and recognized unbilled receivables from handset sales as contract assets. The Group recognized receipts in advance forprepaid telecommunications services and unearned revenue for customer loyalty programs as contract liabilities.
(1) Details of contract assets and liabilities as of December 31, 2019 and 2018 are as follows:
(In millions of won)December 31, 2019 December 31, 2018
Contract assets:Allocation of consideration between performance obligations ₩ 191,858 133,893
Contract liabilities:Wireless service contracts 20,393 18,425Customer loyalty programs 21,945 17,113Fixed-line service contracts 65,315 57,327Security services 32,026 38,109Others 83,777 52,839
₩ 223,456 183,813
(2) The amount of revenue recognized during the year ended December 31, 2019 related to the contract liabilities carried forward from the priorperiod is ₩117,409 million. Details of revenue expected to be recognized from contract liabilities as of December 31, 2019 are as follows:
(In millions of won)Less than
1 year 1 ~ 2 yearsMore than
2 years TotalWireless service contracts ₩20,393 � � 20,393Customer loyalty programs 17,285 3,253 1,407 21,945Fixed-line service contracts 52,237 13,078 � 65,315Security services 24,215 5,676 2,135 32,026Others 77,095 1,578 5,104 83,777
₩191,225 23,585 8,646 223,456
The Group has a right to consideration from a customer in an amount that corresponds directly with the value to the subscriber of the Group�sperformance completed, thus, as a practical expedient, the Group recognizes revenue in the amount to which the Group has a right to invoice.
F-53
Copyright © 2020 www.secdatabase.com. All Rights Reserved.Please Consider the Environment Before Printing This Document
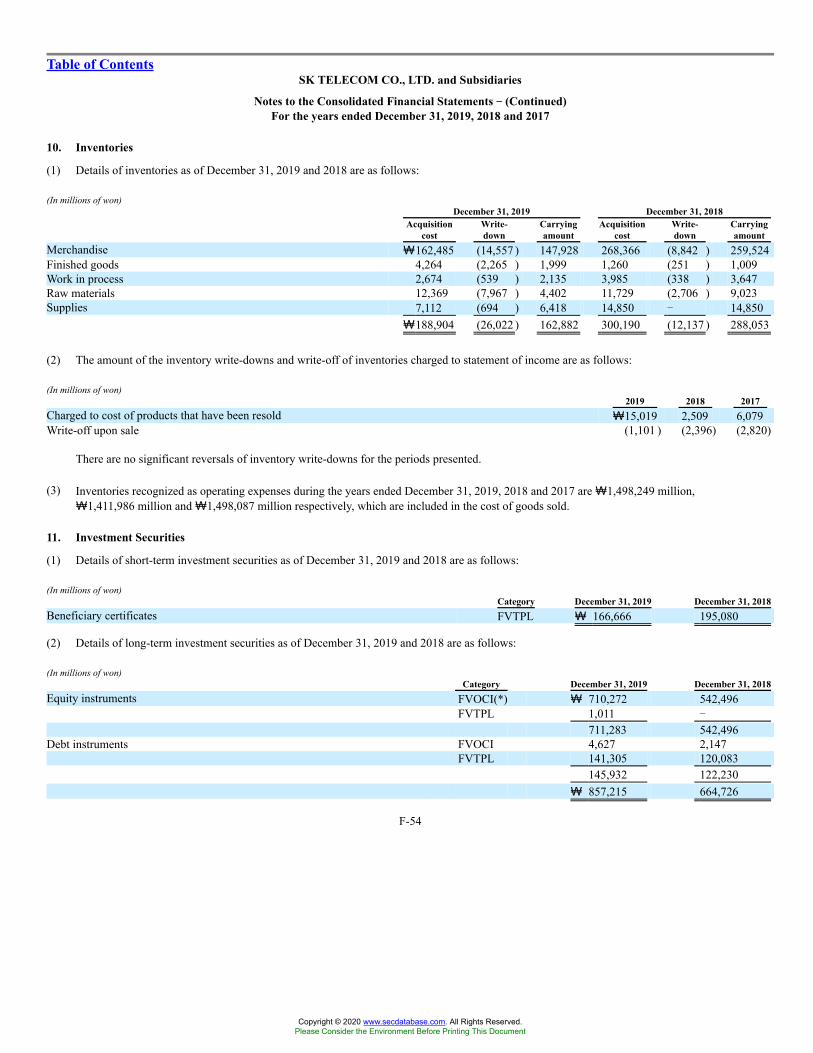
Table of ContentsSK TELECOM CO., LTD. and Subsidiaries
Notes to the Consolidated Financial Statements �� (Continued)For the years ended December 31, 2019, 2018 and 2017
10. Inventories
(1) Details of inventories as of December 31, 2019 and 2018 are as follows:
(In millions of won)December 31, 2019 December 31, 2018
Acquisitioncost
Write-down
Carryingamount
Acquisitioncost
Write-down
Carryingamount
Merchandise ₩162,485 (14,557 ) 147,928 268,366 (8,842 ) 259,524Finished goods 4,264 (2,265 ) 1,999 1,260 (251 ) 1,009Work in process 2,674 (539 ) 2,135 3,985 (338 ) 3,647Raw materials 12,369 (7,967 ) 4,402 11,729 (2,706 ) 9,023Supplies 7,112 (694 ) 6,418 14,850 � 14,850
₩188,904 (26,022 ) 162,882 300,190 (12,137 ) 288,053
(2) The amount of the inventory write-downs and write-off of inventories charged to statement of income are as follows:
(In millions of won)2019 2018 2017
Charged to cost of products that have been resold ₩15,019 2,509 6,079Write-off upon sale (1,101 ) (2,396) (2,820)
There are no significant reversals of inventory write-downs for the periods presented.
(3) Inventories recognized as operating expenses during the years ended December 31, 2019, 2018 and 2017 are ₩1,498,249 million,₩1,411,986 million and ₩1,498,087 million respectively, which are included in the cost of goods sold.
11. Investment Securities
(1) Details of short-term investment securities as of December 31, 2019 and 2018 are as follows:
(In millions of won)Category December 31, 2019 December 31, 2018
Beneficiary certificates FVTPL ₩ 166,666 195,080
(2) Details of long-term investment securities as of December 31, 2019 and 2018 are as follows:
(In millions of won)Category December 31, 2019 December 31, 2018
Equity instruments FVOCI(*) ₩ 710,272 542,496FVTPL 1,011 �
711,283 542,496Debt instruments FVOCI 4,627 2,147
FVTPL 141,305 120,083145,932 122,230
₩ 857,215 664,726
F-54
Copyright © 2020 www.secdatabase.com. All Rights Reserved.Please Consider the Environment Before Printing This Document
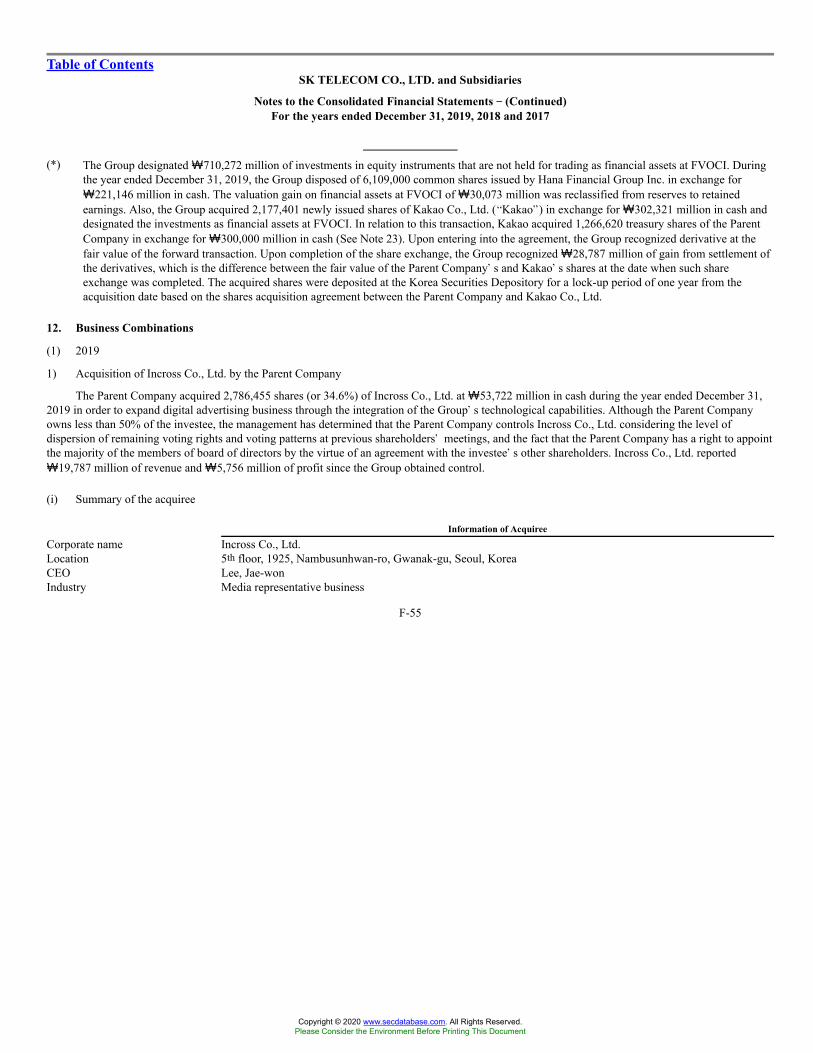
Table of ContentsSK TELECOM CO., LTD. and Subsidiaries
Notes to the Consolidated Financial Statements �� (Continued)For the years ended December 31, 2019, 2018 and 2017
(*) The Group designated ₩710,272 million of investments in equity instruments that are not held for trading as financial assets at FVOCI. Duringthe year ended December 31, 2019, the Group disposed of 6,109,000 common shares issued by Hana Financial Group Inc. in exchange for₩221,146 million in cash. The valuation gain on financial assets at FVOCI of ₩30,073 million was reclassified from reserves to retainedearnings. Also, the Group acquired 2,177,401 newly issued shares of Kakao Co., Ltd. (�Kakao�) in exchange for ₩302,321 million in cash anddesignated the investments as financial assets at FVOCI. In relation to this transaction, Kakao acquired 1,266,620 treasury shares of the ParentCompany in exchange for ₩300,000 million in cash (See Note 23). Upon entering into the agreement, the Group recognized derivative at thefair value of the forward transaction. Upon completion of the share exchange, the Group recognized ₩28,787 million of gain from settlement ofthe derivatives, which is the difference between the fair value of the Parent Company�s and Kakao�s shares at the date when such shareexchange was completed. The acquired shares were deposited at the Korea Securities Depository for a lock-up period of one year from theacquisition date based on the shares acquisition agreement between the Parent Company and Kakao Co., Ltd.
12. Business Combinations
(1) 2019
1) Acquisition of Incross Co., Ltd. by the Parent Company
The Parent Company acquired 2,786,455 shares (or 34.6%) of Incross Co., Ltd. at ₩53,722 million in cash during the year ended December 31,2019 in order to expand digital advertising business through the integration of the Group�s technological capabilities. Although the Parent Companyowns less than 50% of the investee, the management has determined that the Parent Company controls Incross Co., Ltd. considering the level ofdispersion of remaining voting rights and voting patterns at previous shareholders� meetings, and the fact that the Parent Company has a right to appointthe majority of the members of board of directors by the virtue of an agreement with the investee�s other shareholders. Incross Co., Ltd. reported₩19,787 million of revenue and ₩5,756 million of profit since the Group obtained control.
(i) Summary of the acquiree
Information of AcquireeCorporate name Incross Co., Ltd.Location 5th floor, 1925, Nambusunhwan-ro, Gwanak-gu, Seoul, KoreaCEO Lee, Jae-wonIndustry Media representative business
F-55
Copyright © 2020 www.secdatabase.com. All Rights Reserved.Please Consider the Environment Before Printing This Document
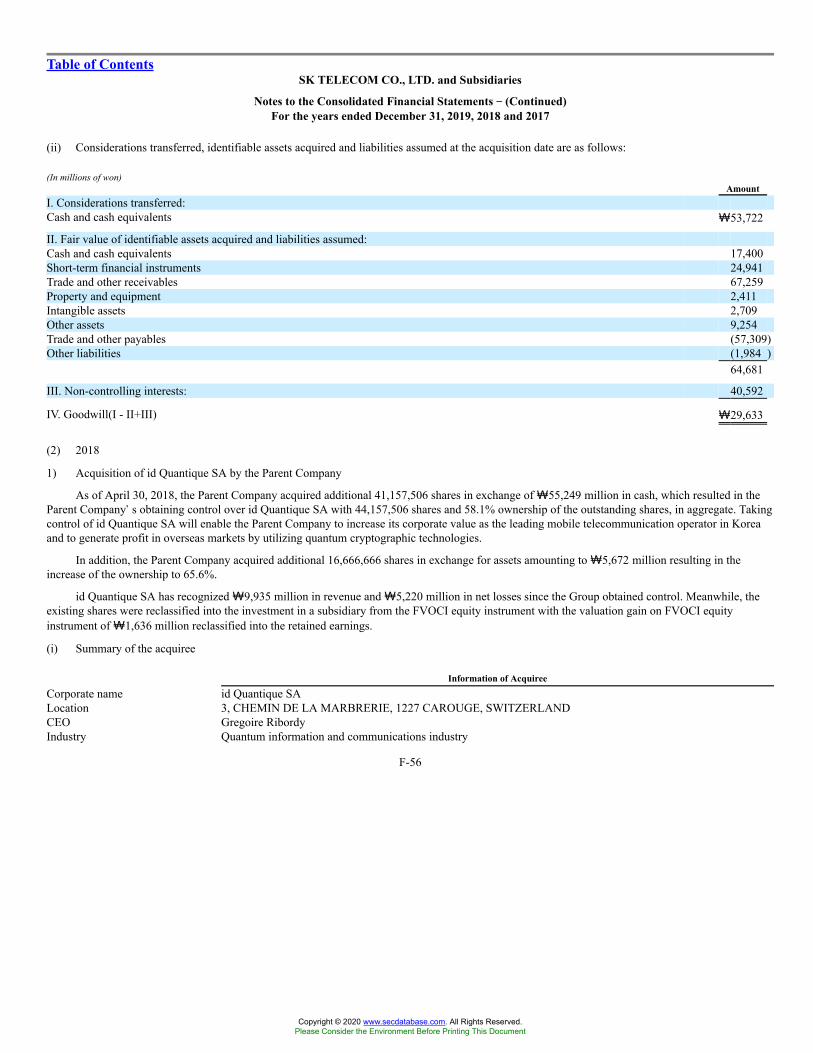
Table of ContentsSK TELECOM CO., LTD. and Subsidiaries
Notes to the Consolidated Financial Statements �� (Continued)For the years ended December 31, 2019, 2018 and 2017
(ii) Considerations transferred, identifiable assets acquired and liabilities assumed at the acquisition date are as follows:
(In millions of won)Amount
I. Considerations transferred:Cash and cash equivalents ₩53,722
II. Fair value of identifiable assets acquired and liabilities assumed:Cash and cash equivalents 17,400Short-term financial instruments 24,941Trade and other receivables 67,259Property and equipment 2,411Intangible assets 2,709Other assets 9,254Trade and other payables (57,309)Other liabilities (1,984 )
64,681
III. Non-controlling interests: 40,592
IV. Goodwill(I - II+III) ₩29,633
(2) 2018
1) Acquisition of id Quantique SA by the Parent Company
As of April 30, 2018, the Parent Company acquired additional 41,157,506 shares in exchange of ₩55,249 million in cash, which resulted in theParent Company�s obtaining control over id Quantique SA with 44,157,506 shares and 58.1% ownership of the outstanding shares, in aggregate. Takingcontrol of id Quantique SA will enable the Parent Company to increase its corporate value as the leading mobile telecommunication operator in Koreaand to generate profit in overseas markets by utilizing quantum cryptographic technologies.
In addition, the Parent Company acquired additional 16,666,666 shares in exchange for assets amounting to ₩5,672 million resulting in theincrease of the ownership to 65.6%.
id Quantique SA has recognized ₩9,935 million in revenue and ₩5,220 million in net losses since the Group obtained control. Meanwhile, theexisting shares were reclassified into the investment in a subsidiary from the FVOCI equity instrument with the valuation gain on FVOCI equityinstrument of ₩1,636 million reclassified into the retained earnings.
(i) Summary of the acquiree
Information of AcquireeCorporate name id Quantique SALocation 3, CHEMIN DE LA MARBRERIE, 1227 CAROUGE, SWITZERLANDCEO Gregoire RibordyIndustry Quantum information and communications industry
F-56
Copyright © 2020 www.secdatabase.com. All Rights Reserved.Please Consider the Environment Before Printing This Document
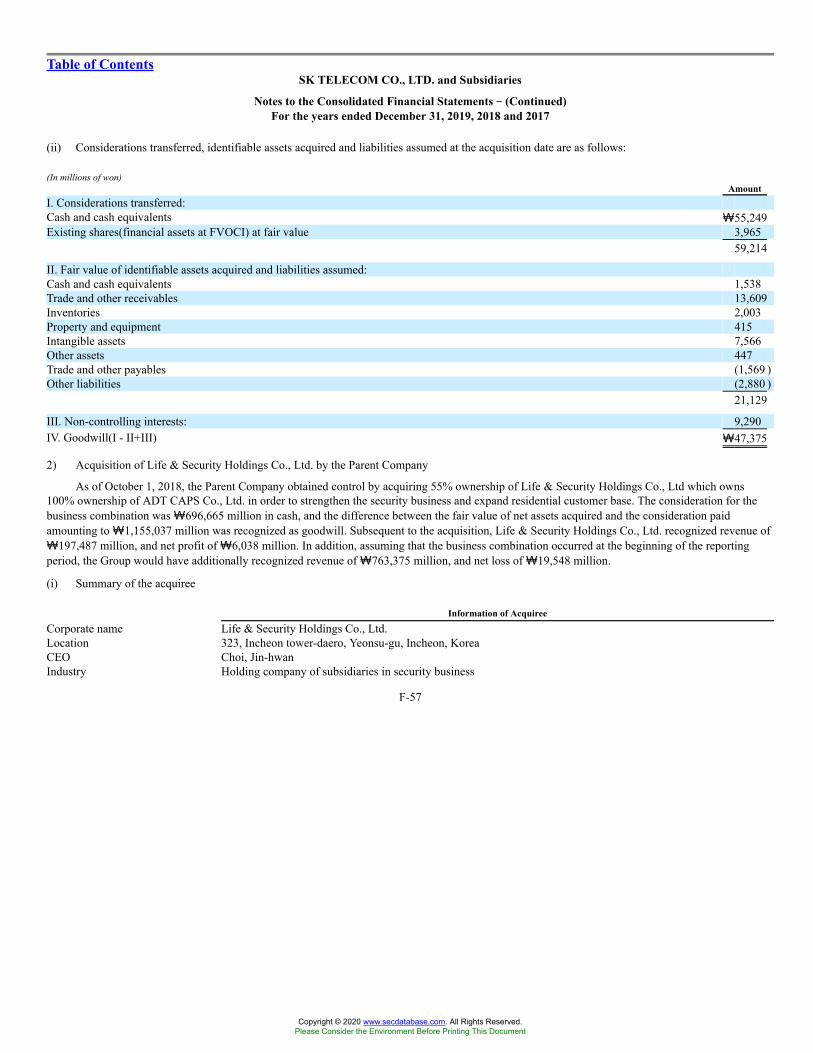
Table of ContentsSK TELECOM CO., LTD. and Subsidiaries
Notes to the Consolidated Financial Statements �� (Continued)For the years ended December 31, 2019, 2018 and 2017
(ii) Considerations transferred, identifiable assets acquired and liabilities assumed at the acquisition date are as follows:
(In millions of won)Amount
I. Considerations transferred:Cash and cash equivalents ₩55,249Existing shares(financial assets at FVOCI) at fair value 3,965
59,214
II. Fair value of identifiable assets acquired and liabilities assumed:Cash and cash equivalents 1,538Trade and other receivables 13,609Inventories 2,003Property and equipment 415Intangible assets 7,566Other assets 447Trade and other payables (1,569 )Other liabilities (2,880 )
21,129
III. Non-controlling interests: 9,290IV. Goodwill(I - II+III) ₩47,375
2) Acquisition of Life & Security Holdings Co., Ltd. by the Parent Company
As of October 1, 2018, the Parent Company obtained control by acquiring 55% ownership of Life & Security Holdings Co., Ltd which owns100% ownership of ADT CAPS Co., Ltd. in order to strengthen the security business and expand residential customer base. The consideration for thebusiness combination was ₩696,665 million in cash, and the difference between the fair value of net assets acquired and the consideration paidamounting to ₩1,155,037 million was recognized as goodwill. Subsequent to the acquisition, Life & Security Holdings Co., Ltd. recognized revenue of₩197,487 million, and net profit of ₩6,038 million. In addition, assuming that the business combination occurred at the beginning of the reportingperiod, the Group would have additionally recognized revenue of ₩763,375 million, and net loss of ₩19,548 million.
(i) Summary of the acquiree
Information of AcquireeCorporate name Life & Security Holdings Co., Ltd.Location 323, Incheon tower-daero, Yeonsu-gu, Incheon, KoreaCEO Choi, Jin-hwanIndustry Holding company of subsidiaries in security business
F-57
Copyright © 2020 www.secdatabase.com. All Rights Reserved.Please Consider the Environment Before Printing This Document
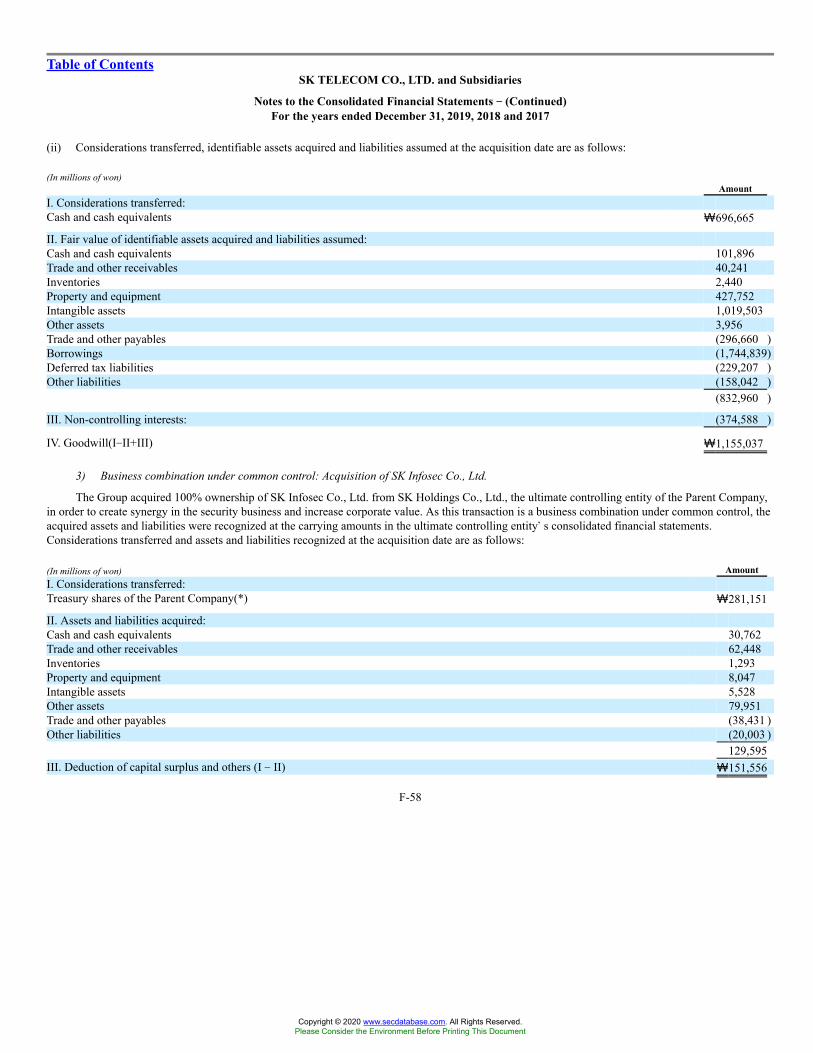
Table of ContentsSK TELECOM CO., LTD. and Subsidiaries
Notes to the Consolidated Financial Statements �� (Continued)For the years ended December 31, 2019, 2018 and 2017
(ii) Considerations transferred, identifiable assets acquired and liabilities assumed at the acquisition date are as follows:
(In millions of won)Amount
I. Considerations transferred:Cash and cash equivalents ₩696,665
II. Fair value of identifiable assets acquired and liabilities assumed:Cash and cash equivalents 101,896Trade and other receivables 40,241Inventories 2,440Property and equipment 427,752Intangible assets 1,019,503Other assets 3,956Trade and other payables (296,660 )Borrowings (1,744,839)Deferred tax liabilities (229,207 )Other liabilities (158,042 )
(832,960 )
III. Non-controlling interests: (374,588 )
IV. Goodwill(I�II+III) ₩1,155,037
3) Business combination under common control: Acquisition of SK Infosec Co., Ltd.
The Group acquired 100% ownership of SK Infosec Co., Ltd. from SK Holdings Co., Ltd., the ultimate controlling entity of the Parent Company,in order to create synergy in the security business and increase corporate value. As this transaction is a business combination under common control, theacquired assets and liabilities were recognized at the carrying amounts in the ultimate controlling entity�s consolidated financial statements.Considerations transferred and assets and liabilities recognized at the acquisition date are as follows:
(In millions of won) AmountI. Considerations transferred:Treasury shares of the Parent Company(*) ₩281,151
II. Assets and liabilities acquired:Cash and cash equivalents 30,762Trade and other receivables 62,448Inventories 1,293Property and equipment 8,047Intangible assets 5,528Other assets 79,951Trade and other payables (38,431 )Other liabilities (20,003 )
129,595III. Deduction of capital surplus and others (I � II) ₩151,556
F-58
Copyright © 2020 www.secdatabase.com. All Rights Reserved.Please Consider the Environment Before Printing This Document
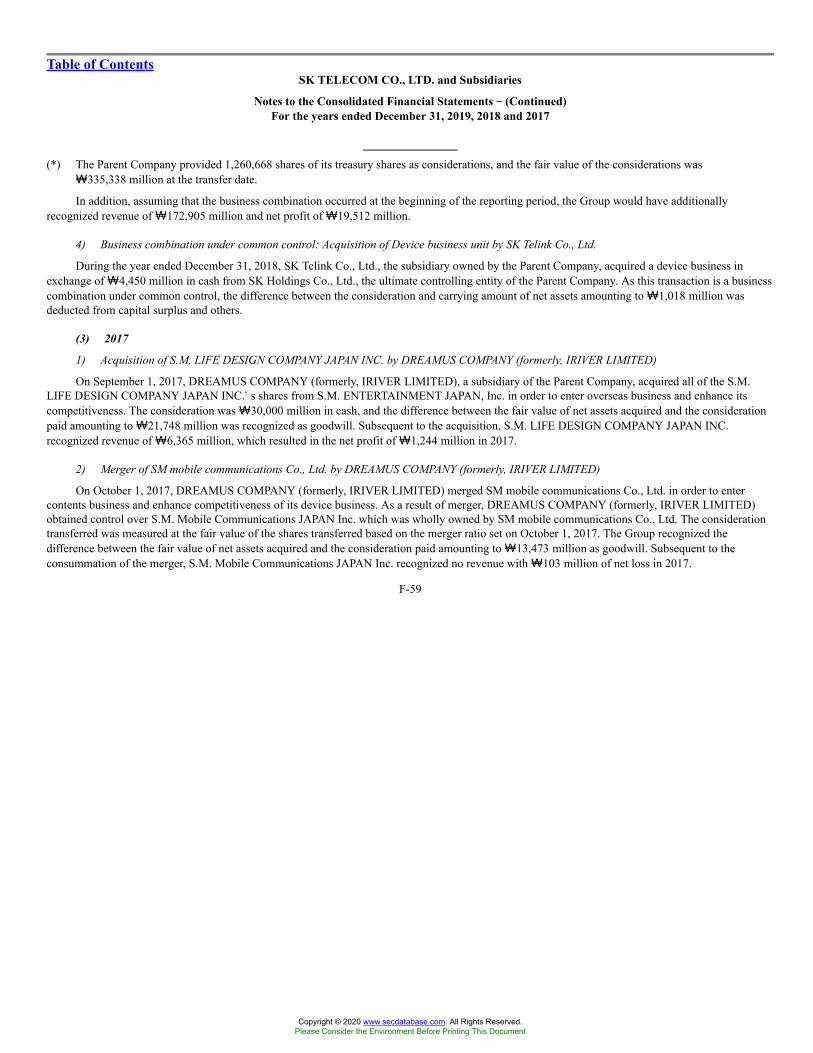
Table of ContentsSK TELECOM CO., LTD. and Subsidiaries
Notes to the Consolidated Financial Statements �� (Continued)For the years ended December 31, 2019, 2018 and 2017
(*) The Parent Company provided 1,260,668 shares of its treasury shares as considerations, and the fair value of the considerations was₩335,338 million at the transfer date.
In addition, assuming that the business combination occurred at the beginning of the reporting period, the Group would have additionallyrecognized revenue of ₩172,905 million and net profit of ₩19,512 million.
4) Business combination under common control: Acquisition of Device business unit by SK Telink Co., Ltd.
During the year ended December 31, 2018, SK Telink Co., Ltd., the subsidiary owned by the Parent Company, acquired a device business inexchange of ₩4,450 million in cash from SK Holdings Co., Ltd., the ultimate controlling entity of the Parent Company. As this transaction is a businesscombination under common control, the difference between the consideration and carrying amount of net assets amounting to ₩1,018 million wasdeducted from capital surplus and others.
(3) 2017
1) Acquisition of S.M. LIFE DESIGN COMPANY JAPAN INC. by DREAMUS COMPANY (formerly, IRIVER LIMITED)
On September 1, 2017, DREAMUS COMPANY (formerly, IRIVER LIMITED), a subsidiary of the Parent Company, acquired all of the S.M.LIFE DESIGN COMPANY JAPAN INC.�s shares from S.M. ENTERTAINMENT JAPAN, Inc. in order to enter overseas business and enhance itscompetitiveness. The consideration was ₩30,000 million in cash, and the difference between the fair value of net assets acquired and the considerationpaid amounting to ₩21,748 million was recognized as goodwill. Subsequent to the acquisition, S.M. LIFE DESIGN COMPANY JAPAN INC.recognized revenue of ₩6,365 million, which resulted in the net profit of ₩1,244 million in 2017.
2) Merger of SM mobile communications Co., Ltd. by DREAMUS COMPANY (formerly, IRIVER LIMITED)
On October 1, 2017, DREAMUS COMPANY (formerly, IRIVER LIMITED) merged SM mobile communications Co., Ltd. in order to entercontents business and enhance competitiveness of its device business. As a result of merger, DREAMUS COMPANY (formerly, IRIVER LIMITED)obtained control over S.M. Mobile Communications JAPAN Inc. which was wholly owned by SM mobile communications Co., Ltd. The considerationtransferred was measured at the fair value of the shares transferred based on the merger ratio set on October 1, 2017. The Group recognized thedifference between the fair value of net assets acquired and the consideration paid amounting to ₩13,473 million as goodwill. Subsequent to theconsummation of the merger, S.M. Mobile Communications JAPAN Inc. recognized no revenue with ₩103 million of net loss in 2017.
F-59
Copyright © 2020 www.secdatabase.com. All Rights Reserved.Please Consider the Environment Before Printing This Document
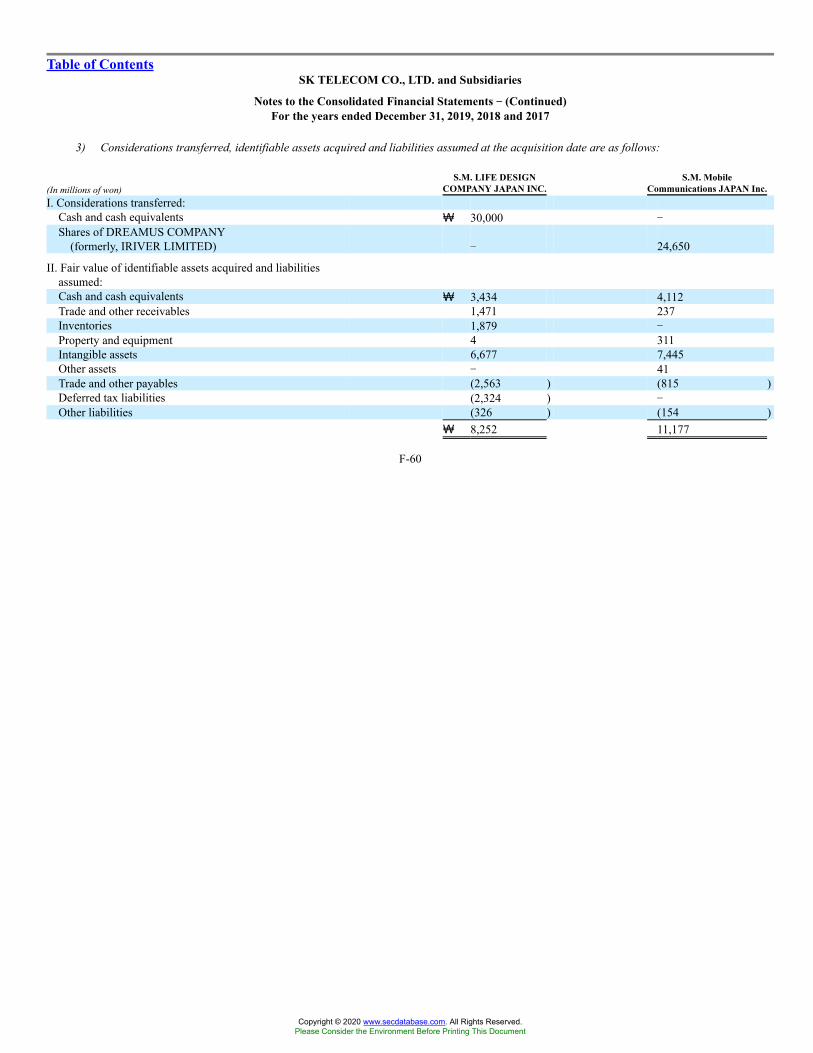
Table of ContentsSK TELECOM CO., LTD. and Subsidiaries
Notes to the Consolidated Financial Statements �� (Continued)For the years ended December 31, 2019, 2018 and 2017
3) Considerations transferred, identifiable assets acquired and liabilities assumed at the acquisition date are as follows:
(In millions of won)S.M. LIFE DESIGN
COMPANY JAPAN INC.S.M. Mobile
Communications JAPAN Inc.I. Considerations transferred:
Cash and cash equivalents ₩ 30,000 �Shares of DREAMUS COMPANY
(formerly, IRIVER LIMITED) � 24,650
II. Fair value of identifiable assets acquired and liabilitiesassumed:Cash and cash equivalents ₩ 3,434 4,112Trade and other receivables 1,471 237Inventories 1,879 �Property and equipment 4 311Intangible assets 6,677 7,445Other assets � 41Trade and other payables (2,563 ) (815 )Deferred tax liabilities (2,324 ) �Other liabilities (326 ) (154 )
₩ 8,252 11,177
F-60
Copyright © 2020 www.secdatabase.com. All Rights Reserved.Please Consider the Environment Before Printing This Document

Table of ContentsSK TELECOM CO., LTD. and Subsidiaries
Notes to the Consolidated Financial Statements �� (Continued)For the years ended December 31, 2019, 2018 and 2017
13. Investments in Associates and Joint Ventures
(1) Investments in associates and joint ventures accounted for using the equity method as of December 31, 2019 and 2018 are as follows:
December 31, 2019 December 31, 2018
(In millions of won) CountryOwnership
(%)Carryingamount
Ownership(%)
Carryingamount
Investments in associates:SK China Company Ltd. China 27.3 ₩568,459 27.3 ₩551,548Korea IT Fund(*1) Korea 63.3 311,552 63.3 281,684KEB HanaCard Co., Ltd.(*2) Korea 15.0 294,756 15.0 288,457SK Telecom CS T1 Co., Ltd.(*1,3) Korea 54.9 60,305 � �NanoEnTek, Inc. Korea 28.6 42,127 28.9 40,974UniSK China 49.0 14,342 49.0 13,486SK Technology Innovation Company Cayman
Islands 49.0 43,997 49.0 42,469SK MENA Investment B.V. Netherlands 32.1 14,904 32.1 14,420SK hynix Inc. Korea 20.1 11,425,325 20.1 11,208,315SK Latin America Investment S.A. Spain 32.1 13,698 32.1 13,313Grab Geo Holdings PTE. LTD.(*4) Singapore 30.0 31,269 � �SK South East Asia Investment Pte. Ltd.(Formerly, SE ASIA
INVESTMENT PTE. LTD.)(*5) Singapore 20.0 250,034 20.0 111,000Pacific Telecom Inc.(*2) USA 15.0 40,016 15.0 37,075S.M. Culture & Contents Co., Ltd. Korea 23.4 63,469 23.4 63,801Content Wavve Co., Ltd.(*6) Korea 30.0 83,640 � �Hello Nature., Ltd. Korea 49.9 13,620 49.9 28,549Health Connect Co., Ltd. and others � � 65,343 � 96,522
13,336,856 12,791,613Investments in joint ventures:
Dogus Planet, Inc.(*7) Turkey 50.0 15,921 50.0 12,487Finnq Co., Ltd.(*7,8) Korea 49.0 22,880 49.0 7,671NEXTGEN BROADCAST SERVICES CO, LLC(*7,9) USA 50.0 7,961 � �NEXTGEN ORCHESTRATION, LLC(*7,10) USA 50.0 1,646 � �Celcom Planet(*11) Malaysia � � 44.7 �
48,408 20,158₩13,385,264 ₩12,811,771
(*1) Investments in Korea IT Fund and SK Telecom CS T1 Co., Ltd. were classified as investment in associates as the Group does not have controlover the investee under the contractual agreement with other shareholders.
(*2) These investments were classified as investments in associates as the Group can exercise significant influence through its right to appoint themembers of board of directors even though the Group has less than 20% of equity interests.
(*3) SK Telecom CS T1 Co., Ltd. was newly established during the year ended December 31, 2019. The Group contributed its e-sports business afterthe establishment.
F-61
Copyright © 2020 www.secdatabase.com. All Rights Reserved.Please Consider the Environment Before Printing This Document
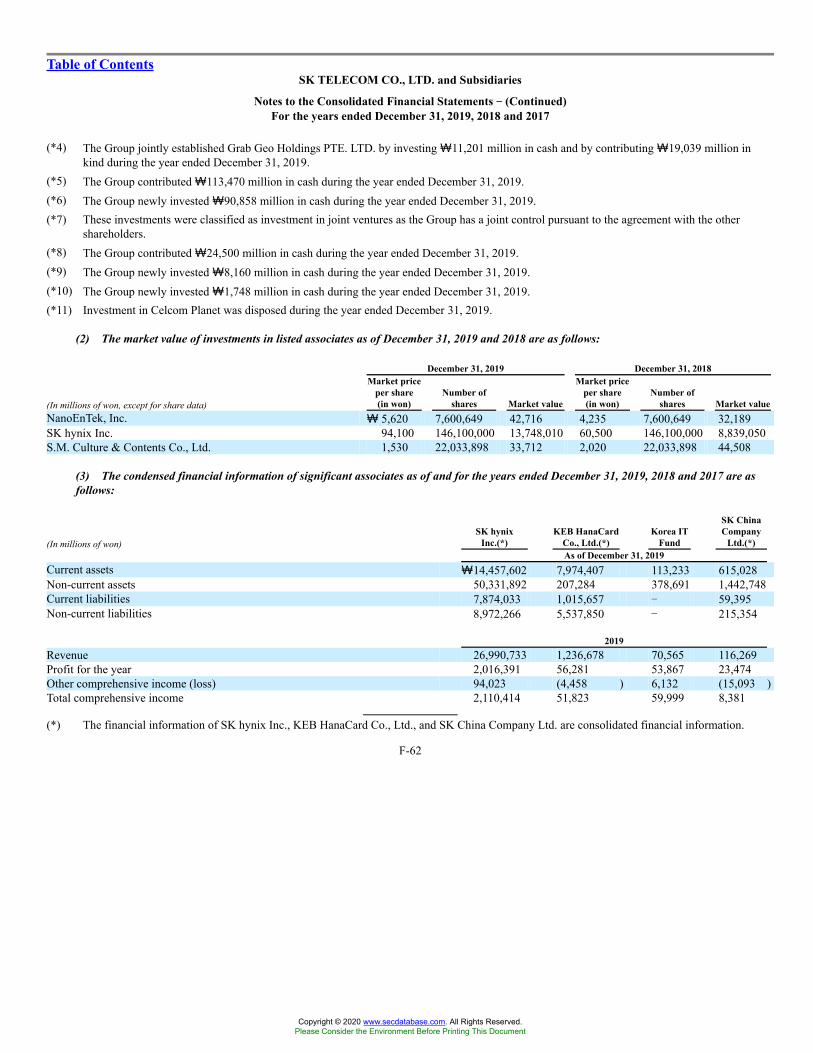
Table of ContentsSK TELECOM CO., LTD. and Subsidiaries
Notes to the Consolidated Financial Statements �� (Continued)For the years ended December 31, 2019, 2018 and 2017
(*4) The Group jointly established Grab Geo Holdings PTE. LTD. by investing ₩11,201 million in cash and by contributing ₩19,039 million inkind during the year ended December 31, 2019.
(*5) The Group contributed ₩113,470 million in cash during the year ended December 31, 2019.(*6) The Group newly invested ₩90,858 million in cash during the year ended December 31, 2019.(*7) These investments were classified as investment in joint ventures as the Group has a joint control pursuant to the agreement with the other
shareholders.(*8) The Group contributed ₩24,500 million in cash during the year ended December 31, 2019.(*9) The Group newly invested ₩8,160 million in cash during the year ended December 31, 2019.(*10) The Group newly invested ₩1,748 million in cash during the year ended December 31, 2019.(*11) Investment in Celcom Planet was disposed during the year ended December 31, 2019.
(2) The market value of investments in listed associates as of December 31, 2019 and 2018 are as follows:
December 31, 2019 December 31, 2018
(In millions of won, except for share data)
Market priceper share(in won)
Number ofshares Market value
Market priceper share(in won)
Number ofshares Market value
NanoEnTek, Inc. ₩ 5,620 7,600,649 42,716 4,235 7,600,649 32,189SK hynix Inc. 94,100 146,100,000 13,748,010 60,500 146,100,000 8,839,050S.M. Culture & Contents Co., Ltd. 1,530 22,033,898 33,712 2,020 22,033,898 44,508
(3) The condensed financial information of significant associates as of and for the years ended December 31, 2019, 2018 and 2017 are asfollows:
(In millions of won)SK hynix
Inc.(*)KEB HanaCard
Co., Ltd.(*)Korea IT
Fund
SK ChinaCompany
Ltd.(*)As of December 31, 2019
Current assets ₩14,457,602 7,974,407 113,233 615,028Non-current assets 50,331,892 207,284 378,691 1,442,748Current liabilities 7,874,033 1,015,657 � 59,395Non-current liabilities 8,972,266 5,537,850 � 215,354
2019Revenue 26,990,733 1,236,678 70,565 116,269Profit for the year 2,016,391 56,281 53,867 23,474Other comprehensive income (loss) 94,023 (4,458 ) 6,132 (15,093 )Total comprehensive income 2,110,414 51,823 59,999 8,381
(*) The financial information of SK hynix Inc., KEB HanaCard Co., Ltd., and SK China Company Ltd. are consolidated financial information.
F-62
Copyright © 2020 www.secdatabase.com. All Rights Reserved.Please Consider the Environment Before Printing This Document
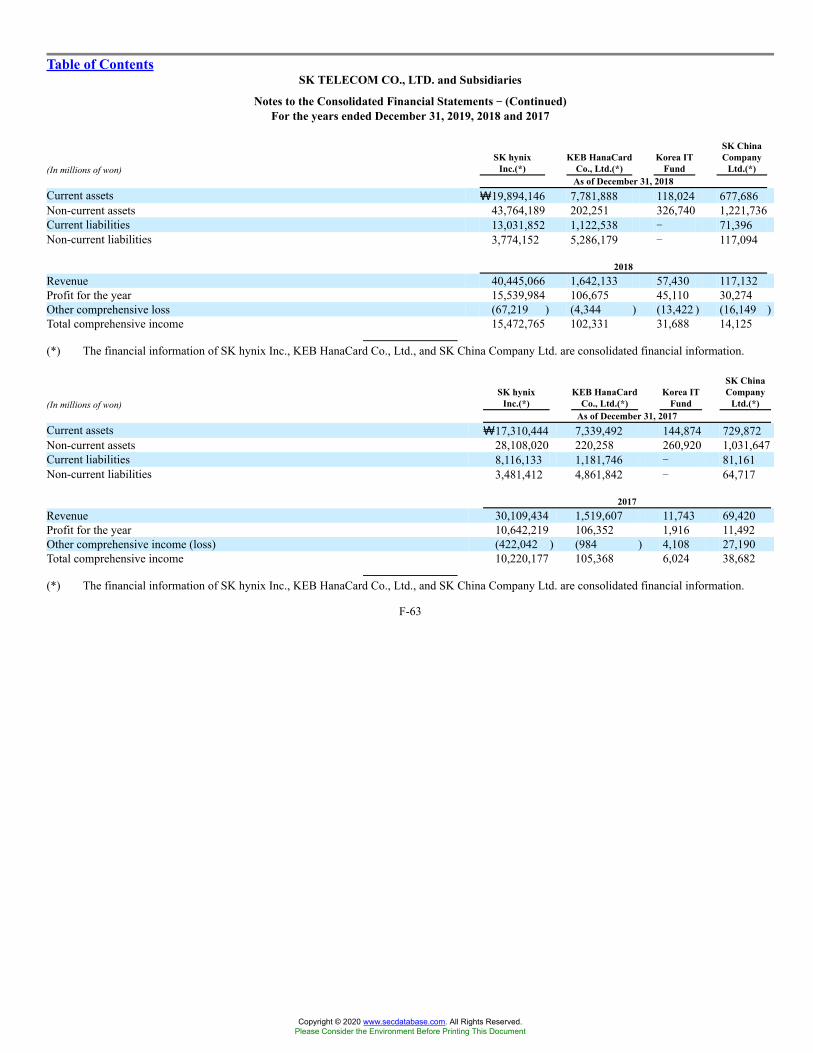
Table of ContentsSK TELECOM CO., LTD. and Subsidiaries
Notes to the Consolidated Financial Statements �� (Continued)For the years ended December 31, 2019, 2018 and 2017
(In millions of won)SK hynix
Inc.(*)KEB HanaCard
Co., Ltd.(*)Korea IT
Fund
SK ChinaCompany
Ltd.(*)As of December 31, 2018
Current assets ₩19,894,146 7,781,888 118,024 677,686Non-current assets 43,764,189 202,251 326,740 1,221,736Current liabilities 13,031,852 1,122,538 � 71,396Non-current liabilities 3,774,152 5,286,179 � 117,094
2018Revenue 40,445,066 1,642,133 57,430 117,132Profit for the year 15,539,984 106,675 45,110 30,274Other comprehensive loss (67,219 ) (4,344 ) (13,422 ) (16,149 )Total comprehensive income 15,472,765 102,331 31,688 14,125
(*) The financial information of SK hynix Inc., KEB HanaCard Co., Ltd., and SK China Company Ltd. are consolidated financial information.
(In millions of won)SK hynix
Inc.(*)KEB HanaCard
Co., Ltd.(*)Korea IT
Fund
SK ChinaCompany
Ltd.(*)As of December 31, 2017
Current assets ₩17,310,444 7,339,492 144,874 729,872Non-current assets 28,108,020 220,258 260,920 1,031,647Current liabilities 8,116,133 1,181,746 � 81,161Non-current liabilities 3,481,412 4,861,842 � 64,717
2017Revenue 30,109,434 1,519,607 11,743 69,420Profit for the year 10,642,219 106,352 1,916 11,492Other comprehensive income (loss) (422,042 ) (984 ) 4,108 27,190Total comprehensive income 10,220,177 105,368 6,024 38,682
(*) The financial information of SK hynix Inc., KEB HanaCard Co., Ltd., and SK China Company Ltd. are consolidated financial information.
F-63
Copyright © 2020 www.secdatabase.com. All Rights Reserved.Please Consider the Environment Before Printing This Document
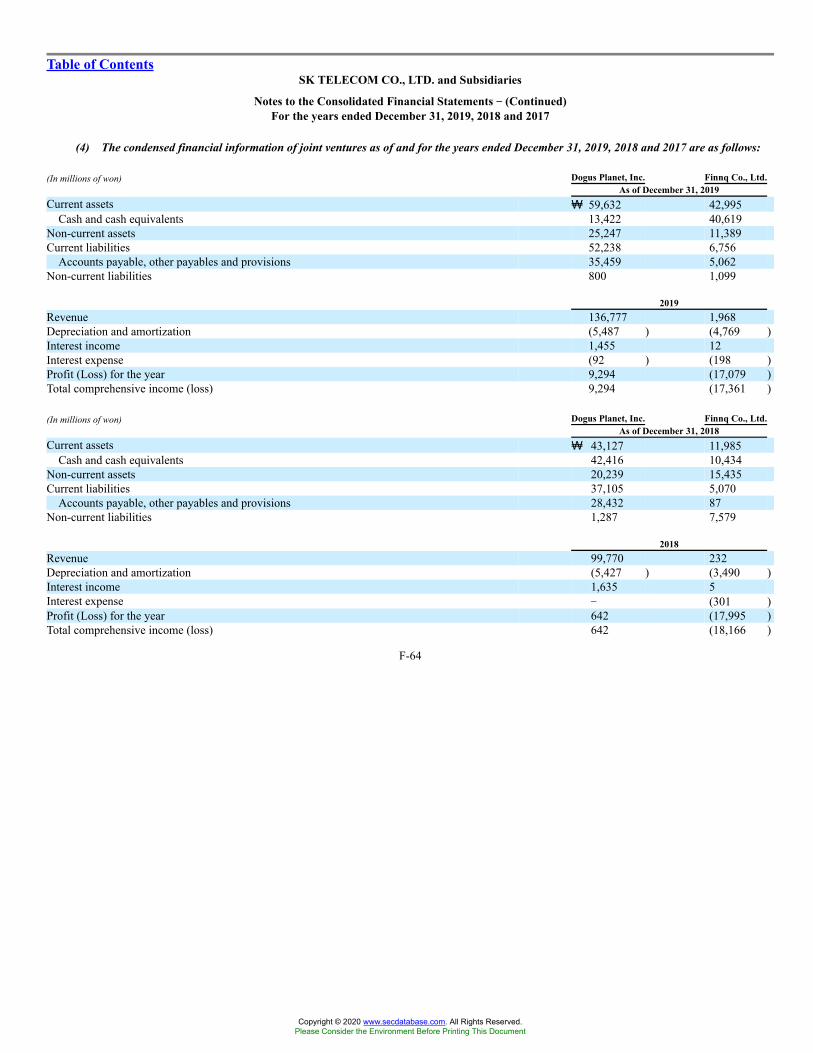
Table of ContentsSK TELECOM CO., LTD. and Subsidiaries
Notes to the Consolidated Financial Statements �� (Continued)For the years ended December 31, 2019, 2018 and 2017
(4) The condensed financial information of joint ventures as of and for the years ended December 31, 2019, 2018 and 2017 are as follows:
(In millions of won) Dogus Planet, Inc. Finnq Co., Ltd.As of December 31, 2019
Current assets ₩ 59,632 42,995Cash and cash equivalents 13,422 40,619
Non-current assets 25,247 11,389Current liabilities 52,238 6,756
Accounts payable, other payables and provisions 35,459 5,062Non-current liabilities 800 1,099
2019Revenue 136,777 1,968Depreciation and amortization (5,487 ) (4,769 )Interest income 1,455 12Interest expense (92 ) (198 )Profit (Loss) for the year 9,294 (17,079 )Total comprehensive income (loss) 9,294 (17,361 )
(In millions of won) Dogus Planet, Inc. Finnq Co., Ltd.As of December 31, 2018
Current assets ₩ 43,127 11,985Cash and cash equivalents 42,416 10,434
Non-current assets 20,239 15,435Current liabilities 37,105 5,070
Accounts payable, other payables and provisions 28,432 87Non-current liabilities 1,287 7,579
2018Revenue 99,770 232Depreciation and amortization (5,427 ) (3,490 )Interest income 1,635 5Interest expense � (301 )Profit (Loss) for the year 642 (17,995 )Total comprehensive income (loss) 642 (18,166 )
F-64
Copyright © 2020 www.secdatabase.com. All Rights Reserved.Please Consider the Environment Before Printing This Document

Table of ContentsSK TELECOM CO., LTD. and Subsidiaries
Notes to the Consolidated Financial Statements �� (Continued)For the years ended December 31, 2019, 2018 and 2017
(In millions of won) Dogus Planet, Inc. Finnq Co., Ltd.As of December 31, 2017
Current assets ₩ 39,656 32,232Cash and cash equivalents 25,818 4,590
Non-current assets 21,159 15,610Current liabilities 32,622 5,685
Accounts payable, other payables and provisions 2,743 2,290Non-current liabilities 212 13,862
(In millions of won) 2017Revenue 82,791 �Depreciation and amortization (6,152 ) (1,077 )Interest income 781 532Interest expense (4 ) (276 )Loss for the year (4,535 ) (15,699 )Total comprehensive loss (4,535 ) (15,699 )
(5) Reconciliations of financial information of significant associates to carrying amounts of investments in associates in the consolidatedfinancial statements as of December 31, 2019 and 2018 are as follows:
December 31, 2019
(In millions of won) Net assets
Ownershipinterests
(%)
Net assetsattributable tothe ownership
interests
Cost-bookvalue
differentialsCarryingamount
SK hynix Inc.(*1,2) ₩47,928,415 20.1 10,237,314 1,188,011 11,425,325KEB HanaCard Co., Ltd. 1,628,184 15.0 244,228 50,528 294,756Korea IT Fund 491,924 63.3 311,552 � 311,552SK China Company Ltd.(*1) 1,772,419 27.3 483,360 85,099 568,459
(In millions of won) December 31, 2018
Net assets
Ownershipinterests
(%)
Net assetsattributable tothe ownership
interests
Cost-bookvalue
differentialsCarryingamount
SK hynix Inc.(*1,2) ₩46,843,742 20.1 10,005,624 1,202,691 11,208,315KEB HanaCard Co., Ltd. 1,575,422 15.0 236,313 52,144 288,457Korea IT Fund 444,764 63.3 281,684 � 281,684SK China Company Ltd.(*1) 1,708,612 27.3 465,959 85,589 551,548
(*1) Net assets of these entities represent net assets excluding those attributable to their non-controlling interests.(*2) The ownership interest is based on the number of shares owned by the Parent Company divided by the total shares issued by the investee
company. The Group applied the equity method using the effective ownership interest which is based on the number of shares owned by theParent Company and the investee�s total shares outstanding. The effective ownership interest applied for the equity method is 21.36% for 2019and 2018.
F-65
Copyright © 2020 www.secdatabase.com. All Rights Reserved.Please Consider the Environment Before Printing This Document
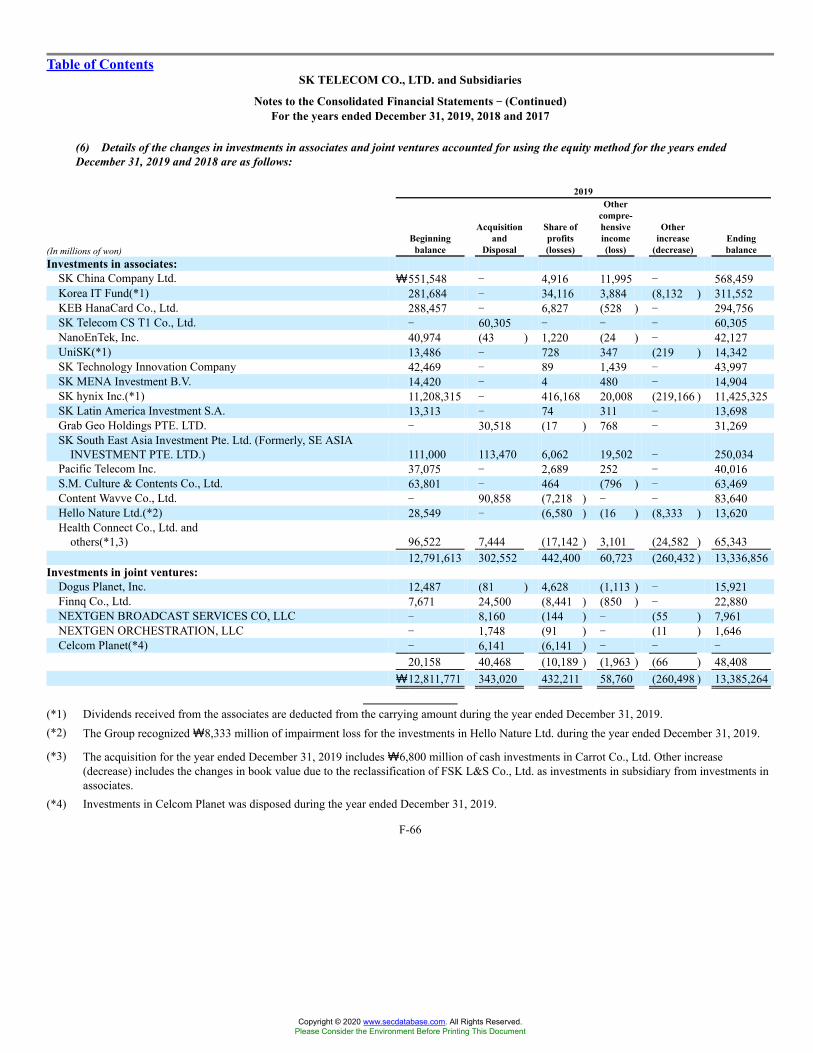
Table of ContentsSK TELECOM CO., LTD. and Subsidiaries
Notes to the Consolidated Financial Statements �� (Continued)For the years ended December 31, 2019, 2018 and 2017
(6) Details of the changes in investments in associates and joint ventures accounted for using the equity method for the years endedDecember 31, 2019 and 2018 are as follows:
2019
(In millions of won)Beginning
balance
Acquisitionand
Disposal
Share ofprofits(losses)
Othercompre-hensiveincome(loss)
Otherincrease
(decrease)Endingbalance
Investments in associates:SK China Company Ltd. ₩551,548 � 4,916 11,995 � 568,459Korea IT Fund(*1) 281,684 � 34,116 3,884 (8,132 ) 311,552KEB HanaCard Co., Ltd. 288,457 � 6,827 (528 ) � 294,756SK Telecom CS T1 Co., Ltd. � 60,305 � � � 60,305NanoEnTek, Inc. 40,974 (43 ) 1,220 (24 ) � 42,127UniSK(*1) 13,486 � 728 347 (219 ) 14,342SK Technology Innovation Company 42,469 � 89 1,439 � 43,997SK MENA Investment B.V. 14,420 � 4 480 � 14,904SK hynix Inc.(*1) 11,208,315 � 416,168 20,008 (219,166 ) 11,425,325SK Latin America Investment S.A. 13,313 � 74 311 � 13,698Grab Geo Holdings PTE. LTD. � 30,518 (17 ) 768 � 31,269SK South East Asia Investment Pte. Ltd. (Formerly, SE ASIA
INVESTMENT PTE. LTD.) 111,000 113,470 6,062 19,502 � 250,034Pacific Telecom Inc. 37,075 � 2,689 252 � 40,016S.M. Culture & Contents Co., Ltd. 63,801 � 464 (796 ) � 63,469Content Wavve Co., Ltd. � 90,858 (7,218 ) � � 83,640Hello Nature Ltd.(*2) 28,549 � (6,580 ) (16 ) (8,333 ) 13,620Health Connect Co., Ltd. and
others(*1,3) 96,522 7,444 (17,142 ) 3,101 (24,582 ) 65,34312,791,613 302,552 442,400 60,723 (260,432 ) 13,336,856
Investments in joint ventures:Dogus Planet, Inc. 12,487 (81 ) 4,628 (1,113 ) � 15,921Finnq Co., Ltd. 7,671 24,500 (8,441 ) (850 ) � 22,880NEXTGEN BROADCAST SERVICES CO, LLC � 8,160 (144 ) � (55 ) 7,961NEXTGEN ORCHESTRATION, LLC � 1,748 (91 ) � (11 ) 1,646Celcom Planet(*4) � 6,141 (6,141 ) � � �
20,158 40,468 (10,189 ) (1,963 ) (66 ) 48,408₩12,811,771 343,020 432,211 58,760 (260,498 ) 13,385,264
(*1) Dividends received from the associates are deducted from the carrying amount during the year ended December 31, 2019.(*2) The Group recognized ₩8,333 million of impairment loss for the investments in Hello Nature Ltd. during the year ended December 31, 2019.
(*3) The acquisition for the year ended December 31, 2019 includes ₩6,800 million of cash investments in Carrot Co., Ltd. Other increase(decrease) includes the changes in book value due to the reclassification of FSK L&S Co., Ltd. as investments in subsidiary from investments inassociates.
(*4) Investments in Celcom Planet was disposed during the year ended December 31, 2019.
F-66
Copyright © 2020 www.secdatabase.com. All Rights Reserved.Please Consider the Environment Before Printing This Document
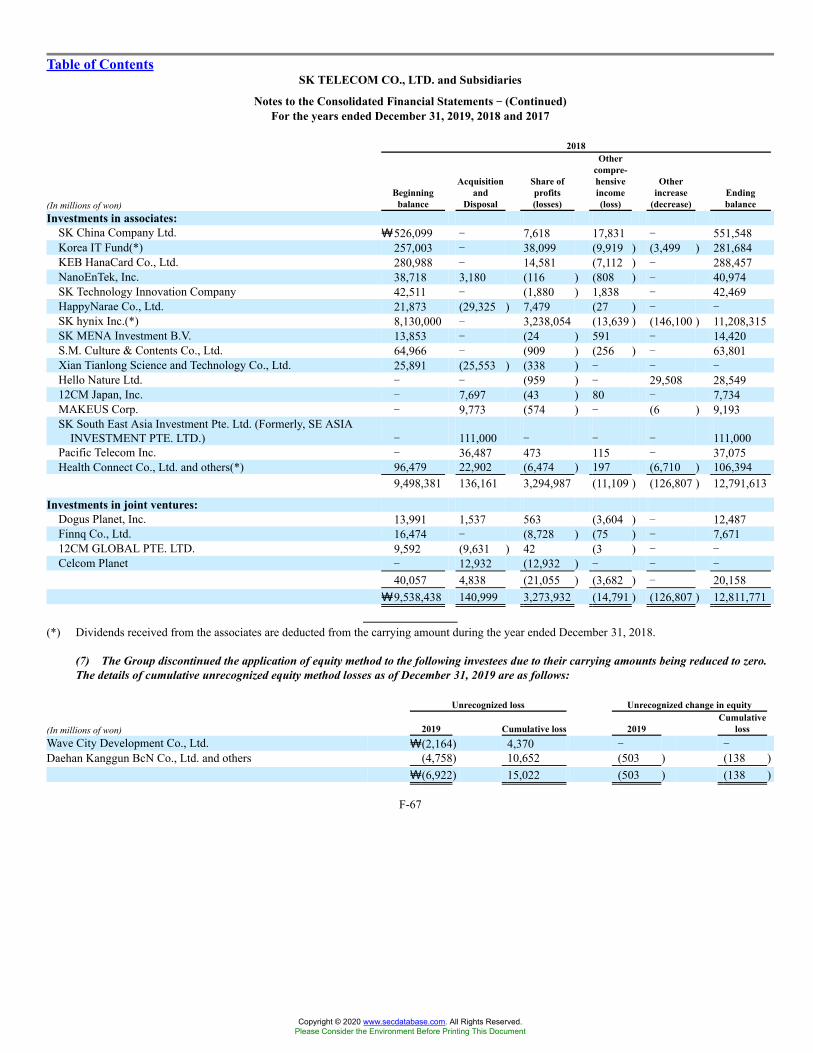
Table of ContentsSK TELECOM CO., LTD. and Subsidiaries
Notes to the Consolidated Financial Statements �� (Continued)For the years ended December 31, 2019, 2018 and 2017
2018
(In millions of won)Beginning
balance
Acquisitionand
Disposal
Share ofprofits(losses)
Othercompre-hensiveincome(loss)
Otherincrease
(decrease)Endingbalance
Investments in associates:SK China Company Ltd. ₩526,099 � 7,618 17,831 � 551,548Korea IT Fund(*) 257,003 � 38,099 (9,919 ) (3,499 ) 281,684KEB HanaCard Co., Ltd. 280,988 � 14,581 (7,112 ) � 288,457NanoEnTek, Inc. 38,718 3,180 (116 ) (808 ) � 40,974SK Technology Innovation Company 42,511 � (1,880 ) 1,838 � 42,469HappyNarae Co., Ltd. 21,873 (29,325 ) 7,479 (27 ) � �SK hynix Inc.(*) 8,130,000 � 3,238,054 (13,639 ) (146,100 ) 11,208,315SK MENA Investment B.V. 13,853 � (24 ) 591 � 14,420S.M. Culture & Contents Co., Ltd. 64,966 � (909 ) (256 ) � 63,801Xian Tianlong Science and Technology Co., Ltd. 25,891 (25,553 ) (338 ) � � �Hello Nature Ltd. � � (959 ) � 29,508 28,54912CM Japan, Inc. � 7,697 (43 ) 80 � 7,734MAKEUS Corp. � 9,773 (574 ) � (6 ) 9,193SK South East Asia Investment Pte. Ltd. (Formerly, SE ASIA
INVESTMENT PTE. LTD.) � 111,000 � � � 111,000Pacific Telecom Inc. � 36,487 473 115 � 37,075Health Connect Co., Ltd. and others(*) 96,479 22,902 (6,474 ) 197 (6,710 ) 106,394
9,498,381 136,161 3,294,987 (11,109 ) (126,807 ) 12,791,613
Investments in joint ventures:Dogus Planet, Inc. 13,991 1,537 563 (3,604 ) � 12,487Finnq Co., Ltd. 16,474 � (8,728 ) (75 ) � 7,67112CM GLOBAL PTE. LTD. 9,592 (9,631 ) 42 (3 ) � �Celcom Planet � 12,932 (12,932 ) � � �
40,057 4,838 (21,055 ) (3,682 ) � 20,158₩9,538,438 140,999 3,273,932 (14,791 ) (126,807 ) 12,811,771
(*) Dividends received from the associates are deducted from the carrying amount during the year ended December 31, 2018.
(7) The Group discontinued the application of equity method to the following investees due to their carrying amounts being reduced to zero.The details of cumulative unrecognized equity method losses as of December 31, 2019 are as follows:
Unrecognized loss Unrecognized change in equity
(In millions of won) 2019 Cumulative loss 2019Cumulative
lossWave City Development Co., Ltd. ₩(2,164) 4,370 � �Daehan Kanggun BcN Co., Ltd. and others (4,758) 10,652 (503 ) (138 )
₩(6,922) 15,022 (503 ) (138 )
F-67
Copyright © 2020 www.secdatabase.com. All Rights Reserved.Please Consider the Environment Before Printing This Document
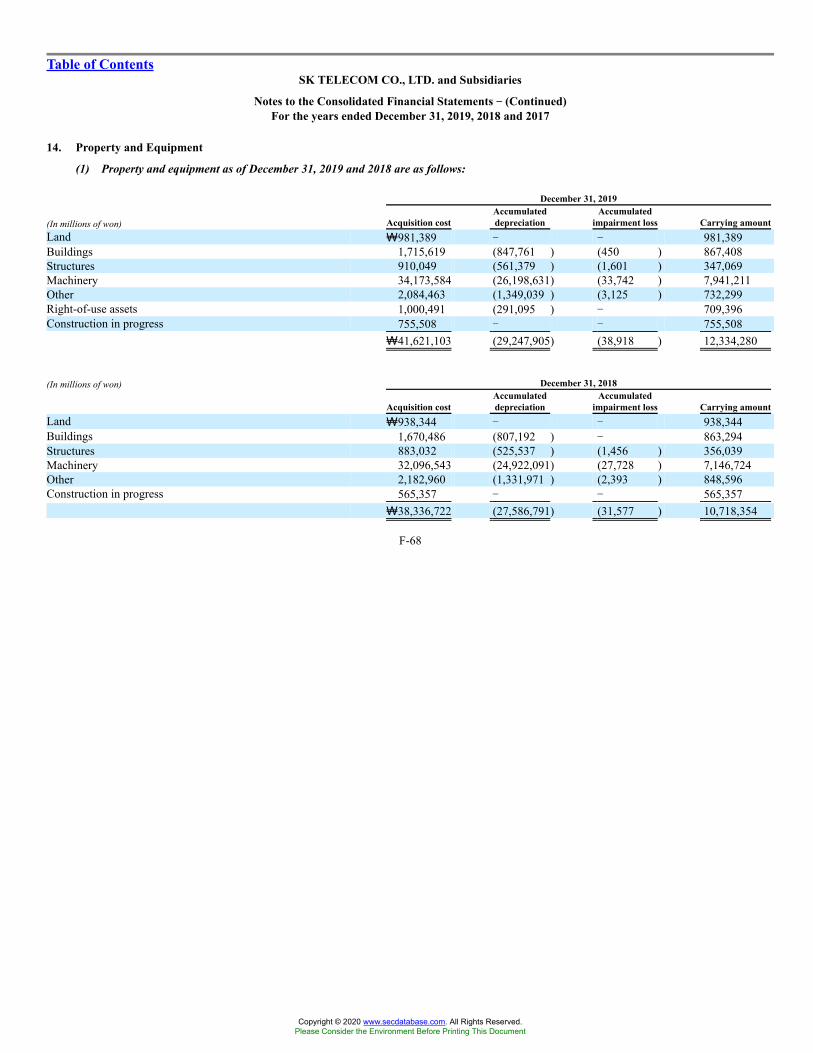
Table of ContentsSK TELECOM CO., LTD. and Subsidiaries
Notes to the Consolidated Financial Statements �� (Continued)For the years ended December 31, 2019, 2018 and 2017
14. Property and Equipment
(1) Property and equipment as of December 31, 2019 and 2018 are as follows:
December 31, 2019
(In millions of won) Acquisition costAccumulateddepreciation
Accumulatedimpairment loss Carrying amount
Land ₩981,389 � � 981,389Buildings 1,715,619 (847,761 ) (450 ) 867,408Structures 910,049 (561,379 ) (1,601 ) 347,069Machinery 34,173,584 (26,198,631) (33,742 ) 7,941,211Other 2,084,463 (1,349,039 ) (3,125 ) 732,299Right-of-use assets 1,000,491 (291,095 ) � 709,396Construction in progress 755,508 � � 755,508
₩41,621,103 (29,247,905) (38,918 ) 12,334,280
(In millions of won) December 31, 2018
Acquisition costAccumulateddepreciation
Accumulatedimpairment loss Carrying amount
Land ₩938,344 � � 938,344Buildings 1,670,486 (807,192 ) � 863,294Structures 883,032 (525,537 ) (1,456 ) 356,039Machinery 32,096,543 (24,922,091) (27,728 ) 7,146,724Other 2,182,960 (1,331,971 ) (2,393 ) 848,596Construction in progress 565,357 � � 565,357
₩38,336,722 (27,586,791) (31,577 ) 10,718,354
F-68
Copyright © 2020 www.secdatabase.com. All Rights Reserved.Please Consider the Environment Before Printing This Document
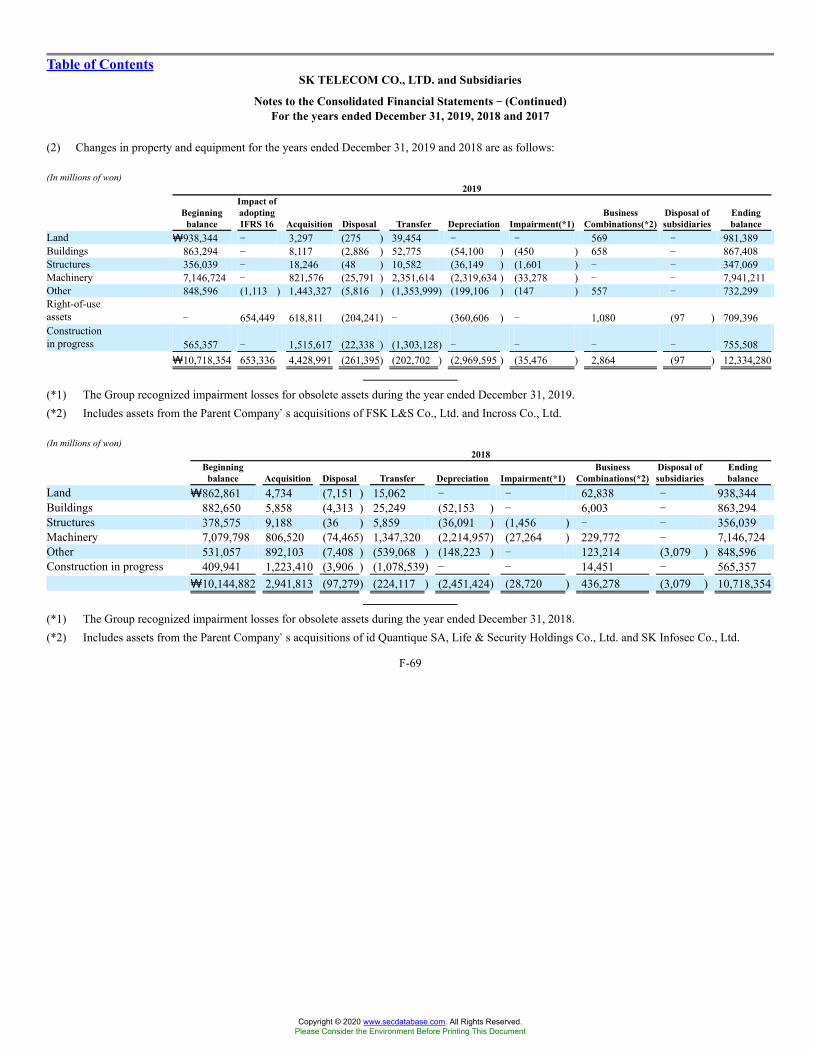
Table of ContentsSK TELECOM CO., LTD. and Subsidiaries
Notes to the Consolidated Financial Statements �� (Continued)For the years ended December 31, 2019, 2018 and 2017
(2) Changes in property and equipment for the years ended December 31, 2019 and 2018 are as follows:
(In millions of won)2019
Beginningbalance
Impact ofadoptingIFRS 16 Acquisition Disposal Transfer Depreciation Impairment(*1)
BusinessCombinations(*2)
Disposal ofsubsidiaries
Endingbalance
Land ₩938,344 � 3,297 (275 ) 39,454 � � 569 � 981,389Buildings 863,294 � 8,117 (2,886 ) 52,775 (54,100 ) (450 ) 658 � 867,408Structures 356,039 � 18,246 (48 ) 10,582 (36,149 ) (1,601 ) � � 347,069Machinery 7,146,724 � 821,576 (25,791 ) 2,351,614 (2,319,634 ) (33,278 ) � � 7,941,211Other 848,596 (1,113 ) 1,443,327 (5,816 ) (1,353,999) (199,106 ) (147 ) 557 � 732,299Right-of-useassets � 654,449 618,811 (204,241) � (360,606 ) � 1,080 (97 ) 709,396Constructionin progress 565,357 � 1,515,617 (22,338 ) (1,303,128) � � � � 755,508
₩10,718,354 653,336 4,428,991 (261,395) (202,702 ) (2,969,595 ) (35,476 ) 2,864 (97 ) 12,334,280
(*1) The Group recognized impairment losses for obsolete assets during the year ended December 31, 2019.(*2) Includes assets from the Parent Company�s acquisitions of FSK L&S Co., Ltd. and Incross Co., Ltd.
(In millions of won)2018
Beginningbalance Acquisition Disposal Transfer Depreciation Impairment(*1)
BusinessCombinations(*2)
Disposal ofsubsidiaries
Endingbalance
Land ₩862,861 4,734 (7,151 ) 15,062 � � 62,838 � 938,344Buildings 882,650 5,858 (4,313 ) 25,249 (52,153 ) � 6,003 � 863,294Structures 378,575 9,188 (36 ) 5,859 (36,091 ) (1,456 ) � � 356,039Machinery 7,079,798 806,520 (74,465) 1,347,320 (2,214,957) (27,264 ) 229,772 � 7,146,724Other 531,057 892,103 (7,408 ) (539,068 ) (148,223 ) � 123,214 (3,079 ) 848,596Construction in progress 409,941 1,223,410 (3,906 ) (1,078,539) � � 14,451 � 565,357
₩10,144,882 2,941,813 (97,279) (224,117 ) (2,451,424) (28,720 ) 436,278 (3,079 ) 10,718,354
(*1) The Group recognized impairment losses for obsolete assets during the year ended December 31, 2018.(*2) Includes assets from the Parent Company�s acquisitions of id Quantique SA, Life & Security Holdings Co., Ltd. and SK Infosec Co., Ltd.
F-69
Copyright © 2020 www.secdatabase.com. All Rights Reserved.Please Consider the Environment Before Printing This Document
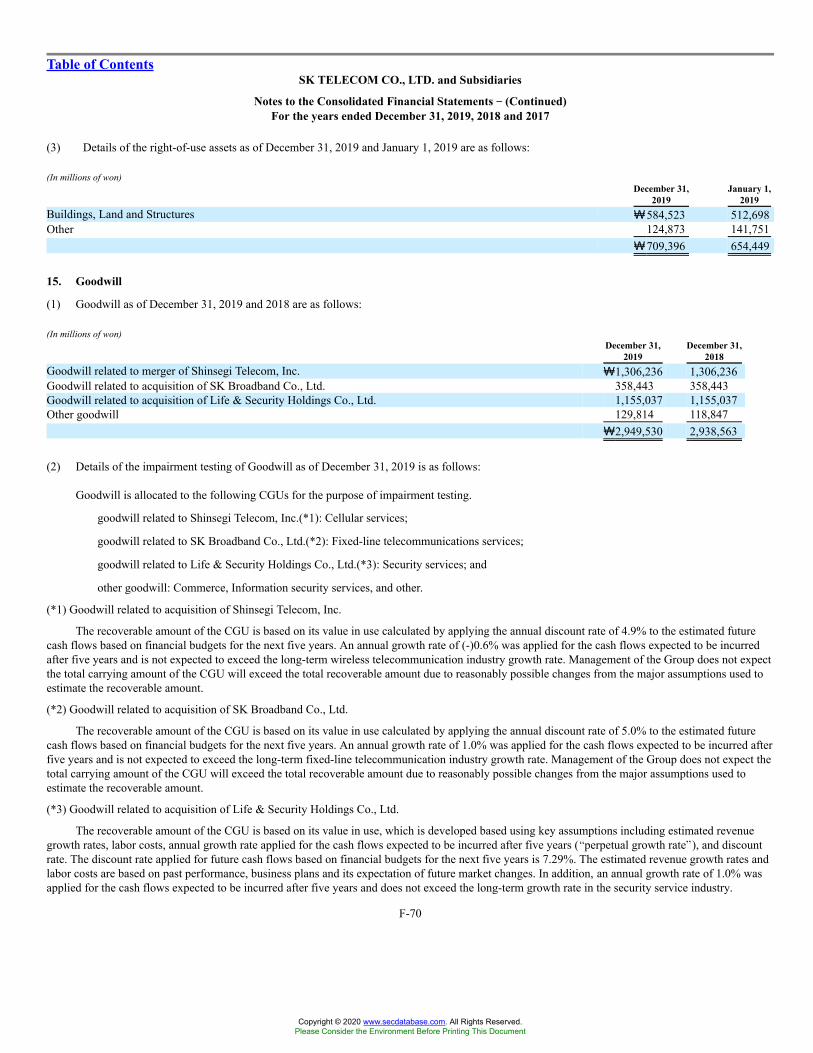
Table of ContentsSK TELECOM CO., LTD. and Subsidiaries
Notes to the Consolidated Financial Statements �� (Continued)For the years ended December 31, 2019, 2018 and 2017
(3) Details of the right-of-use assets as of December 31, 2019 and January 1, 2019 are as follows:
(In millions of won)December 31,
2019January 1,
2019Buildings, Land and Structures ₩584,523 512,698Other 124,873 141,751
₩709,396 654,449
15. Goodwill
(1) Goodwill as of December 31, 2019 and 2018 are as follows:
(In millions of won)December 31,
2019December 31,
2018Goodwill related to merger of Shinsegi Telecom, Inc. ₩1,306,236 1,306,236Goodwill related to acquisition of SK Broadband Co., Ltd. 358,443 358,443Goodwill related to acquisition of Life & Security Holdings Co., Ltd. 1,155,037 1,155,037Other goodwill 129,814 118,847
₩2,949,530 2,938,563
(2) Details of the impairment testing of Goodwill as of December 31, 2019 is as follows:
Goodwill is allocated to the following CGUs for the purpose of impairment testing.
� goodwill related to Shinsegi Telecom, Inc.(*1): Cellular services;
� goodwill related to SK Broadband Co., Ltd.(*2): Fixed-line telecommunications services;
� goodwill related to Life & Security Holdings Co., Ltd.(*3): Security services; and
� other goodwill: Commerce, Information security services, and other.
(*1) Goodwill related to acquisition of Shinsegi Telecom, Inc.
The recoverable amount of the CGU is based on its value in use calculated by applying the annual discount rate of 4.9% to the estimated futurecash flows based on financial budgets for the next five years. An annual growth rate of (-)0.6% was applied for the cash flows expected to be incurredafter five years and is not expected to exceed the long-term wireless telecommunication industry growth rate. Management of the Group does not expectthe total carrying amount of the CGU will exceed the total recoverable amount due to reasonably possible changes from the major assumptions used toestimate the recoverable amount.
(*2) Goodwill related to acquisition of SK Broadband Co., Ltd.
The recoverable amount of the CGU is based on its value in use calculated by applying the annual discount rate of 5.0% to the estimated futurecash flows based on financial budgets for the next five years. An annual growth rate of 1.0% was applied for the cash flows expected to be incurred afterfive years and is not expected to exceed the long-term fixed-line telecommunication industry growth rate. Management of the Group does not expect thetotal carrying amount of the CGU will exceed the total recoverable amount due to reasonably possible changes from the major assumptions used toestimate the recoverable amount.
(*3) Goodwill related to acquisition of Life & Security Holdings Co., Ltd.
The recoverable amount of the CGU is based on its value in use, which is developed based using key assumptions including estimated revenuegrowth rates, labor costs, annual growth rate applied for the cash flows expected to be incurred after five years (�perpetual growth rate�), and discountrate. The discount rate applied for future cash flows based on financial budgets for the next five years is 7.29%. The estimated revenue growth rates andlabor costs are based on past performance, business plans and its expectation of future market changes. In addition, an annual growth rate of 1.0% wasapplied for the cash flows expected to be incurred after five years and does not exceed the long-term growth rate in the security service industry.
F-70
Copyright © 2020 www.secdatabase.com. All Rights Reserved.Please Consider the Environment Before Printing This Document

Table of ContentsSK TELECOM CO., LTD. and Subsidiaries
Notes to the Consolidated Financial Statements �� (Continued)For the years ended December 31, 2019, 2018 and 2017
The recoverable amount of the CGU exceeds the carrying amount by ₩11,276 million. Management has identified that reasonably possiblechanges in two significant assumptions could cause the carrying amount to exceed the recoverable amount. The following table shows the amount bywhich these two assumptions would need to be changed to individually for the estimated recoverable amount of the CGU to be equal to the carryingamount.
2019Annual discount rate 7.31%Annual growth rate applied for the cash flows expected to be incurred after five years 0.97%
(3) Details of the changes in goodwill for the years ended December 31, 2019 and 2018 are as follows:
(In millions of won)2019 2018
Beginning balance ₩2,938,563 1,915,017Acquisition 30,962 1,206,702Disposal � (807 )Impairment loss(*1,2) (21,065 ) (166,838 )Other 1,070 (15,511 )Ending balance ₩2,949,530 2,938,563
(*1) Goodwill related to LIFE DESIGN COMPANY Inc. of DREAMUS COMPANY (formerly, IRIVER LIMITED).The recoverable amount of the CGU is based on its value in use calculated by applying the annual discount rate of 10.1% to the estimated future
cash flows based on financial budgets for the next five years. The cash flows expected to occur in the period exceeding five years were assumed toincrease by 0.0% which is expected to be less than the long-term growth rate of Celebrity MD industry. As a result of the impairment test, the carryingamount of the CGU exceeded the recoverable amount, thus the Group recognized ₩20,594 million of impairment loss.(*2) Goodwill related to Syrup Ad of Incross Co., Ltd.
The recoverable amount of the CGU is based on its value in use calculated by applying the annual discount rate of 13.6% to the estimated futurecash flows based on financial budgets for the next five years. An annual growth rate of 0.0% was applied for the cash flows expected to be incurred afterfive years and is not expected to exceed the long-term advertising industry growth rate. As a result of the impairment test, the carrying amount of theCGU exceeded the recoverable amount, thus the Group recognized ₩471 million of impairment loss.
As of December 31, 2019, 2018 and 2017, accumulated impairment losses are ₩85,245 million, ₩217,548 million and ₩50,710 million,respectively.
F-71
Copyright © 2020 www.secdatabase.com. All Rights Reserved.Please Consider the Environment Before Printing This Document
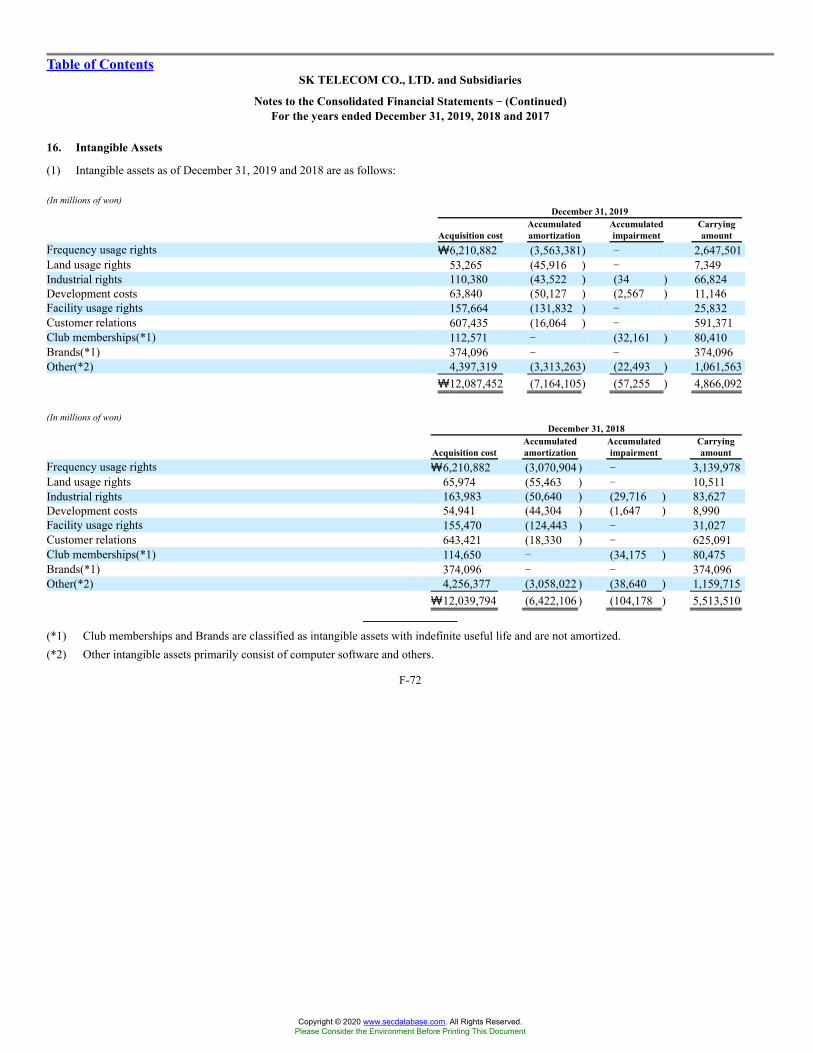
Table of ContentsSK TELECOM CO., LTD. and Subsidiaries
Notes to the Consolidated Financial Statements �� (Continued)For the years ended December 31, 2019, 2018 and 2017
16. Intangible Assets
(1) Intangible assets as of December 31, 2019 and 2018 are as follows:
(In millions of won)December 31, 2019
Acquisition costAccumulatedamortization
Accumulatedimpairment
Carryingamount
Frequency usage rights ₩6,210,882 (3,563,381) � 2,647,501Land usage rights 53,265 (45,916 ) � 7,349Industrial rights 110,380 (43,522 ) (34 ) 66,824Development costs 63,840 (50,127 ) (2,567 ) 11,146Facility usage rights 157,664 (131,832 ) � 25,832Customer relations 607,435 (16,064 ) � 591,371Club memberships(*1) 112,571 � (32,161 ) 80,410Brands(*1) 374,096 � � 374,096Other(*2) 4,397,319 (3,313,263) (22,493 ) 1,061,563
₩12,087,452 (7,164,105) (57,255 ) 4,866,092
(In millions of won)December 31, 2018
Acquisition costAccumulatedamortization
Accumulatedimpairment
Carryingamount
Frequency usage rights ₩6,210,882 (3,070,904 ) � 3,139,978Land usage rights 65,974 (55,463 ) � 10,511Industrial rights 163,983 (50,640 ) (29,716 ) 83,627Development costs 54,941 (44,304 ) (1,647 ) 8,990Facility usage rights 155,470 (124,443 ) � 31,027Customer relations 643,421 (18,330 ) � 625,091Club memberships(*1) 114,650 � (34,175 ) 80,475Brands(*1) 374,096 � � 374,096Other(*2) 4,256,377 (3,058,022 ) (38,640 ) 1,159,715
₩12,039,794 (6,422,106 ) (104,178 ) 5,513,510
(*1) Club memberships and Brands are classified as intangible assets with indefinite useful life and are not amortized.(*2) Other intangible assets primarily consist of computer software and others.
F-72
Copyright © 2020 www.secdatabase.com. All Rights Reserved.Please Consider the Environment Before Printing This Document
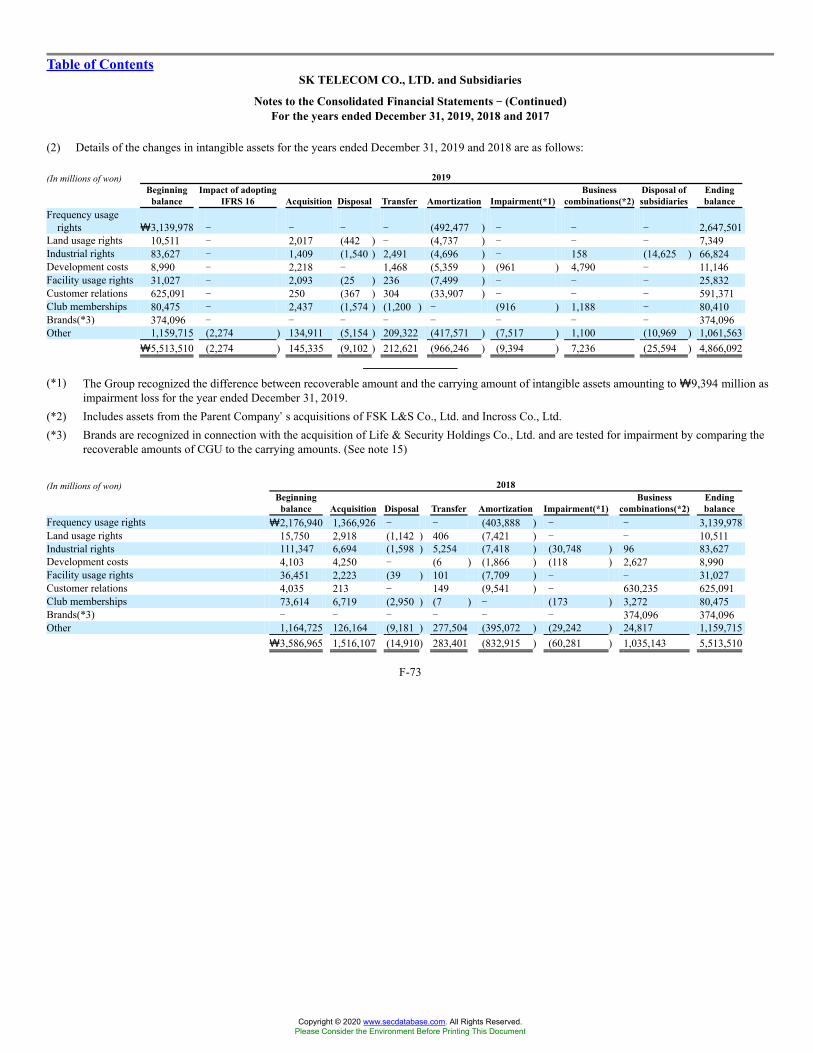
Table of ContentsSK TELECOM CO., LTD. and Subsidiaries
Notes to the Consolidated Financial Statements �� (Continued)For the years ended December 31, 2019, 2018 and 2017
(2) Details of the changes in intangible assets for the years ended December 31, 2019 and 2018 are as follows:
(In millions of won) 2019Beginning
balanceImpact of adopting
IFRS 16 Acquisition Disposal Transfer Amortization Impairment(*1)Business
combinations(*2)Disposal ofsubsidiaries
Endingbalance
Frequency usagerights ₩3,139,978 � � � � (492,477 ) � � � 2,647,501
Land usage rights 10,511 � 2,017 (442 ) � (4,737 ) � � � 7,349Industrial rights 83,627 � 1,409 (1,540 ) 2,491 (4,696 ) � 158 (14,625 ) 66,824Development costs 8,990 � 2,218 � 1,468 (5,359 ) (961 ) 4,790 � 11,146Facility usage rights 31,027 � 2,093 (25 ) 236 (7,499 ) � � � 25,832Customer relations 625,091 � 250 (367 ) 304 (33,907 ) � � � 591,371Club memberships 80,475 � 2,437 (1,574 ) (1,200 ) � (916 ) 1,188 � 80,410Brands(*3) 374,096 � � � � � � � � 374,096Other 1,159,715 (2,274 ) 134,911 (5,154 ) 209,322 (417,571 ) (7,517 ) 1,100 (10,969 ) 1,061,563
₩5,513,510 (2,274 ) 145,335 (9,102 ) 212,621 (966,246 ) (9,394 ) 7,236 (25,594 ) 4,866,092
(*1) The Group recognized the difference between recoverable amount and the carrying amount of intangible assets amounting to ₩9,394 million asimpairment loss for the year ended December 31, 2019.
(*2) Includes assets from the Parent Company�s acquisitions of FSK L&S Co., Ltd. and Incross Co., Ltd.(*3) Brands are recognized in connection with the acquisition of Life & Security Holdings Co., Ltd. and are tested for impairment by comparing the
recoverable amounts of CGU to the carrying amounts. (See note 15)
(In millions of won) 2018Beginning
balance Acquisition Disposal Transfer Amortization Impairment(*1)Business
combinations(*2)Endingbalance
Frequency usage rights ₩2,176,940 1,366,926 � � (403,888 ) � � 3,139,978Land usage rights 15,750 2,918 (1,142 ) 406 (7,421 ) � � 10,511Industrial rights 111,347 6,694 (1,598 ) 5,254 (7,418 ) (30,748 ) 96 83,627Development costs 4,103 4,250 � (6 ) (1,866 ) (118 ) 2,627 8,990Facility usage rights 36,451 2,223 (39 ) 101 (7,709 ) � � 31,027Customer relations 4,035 213 � 149 (9,541 ) � 630,235 625,091Club memberships 73,614 6,719 (2,950 ) (7 ) � (173 ) 3,272 80,475Brands(*3) � � � � � � 374,096 374,096Other 1,164,725 126,164 (9,181 ) 277,504 (395,072 ) (29,242 ) 24,817 1,159,715
₩3,586,965 1,516,107 (14,910) 283,401 (832,915 ) (60,281 ) 1,035,143 5,513,510
F-73
Copyright © 2020 www.secdatabase.com. All Rights Reserved.Please Consider the Environment Before Printing This Document
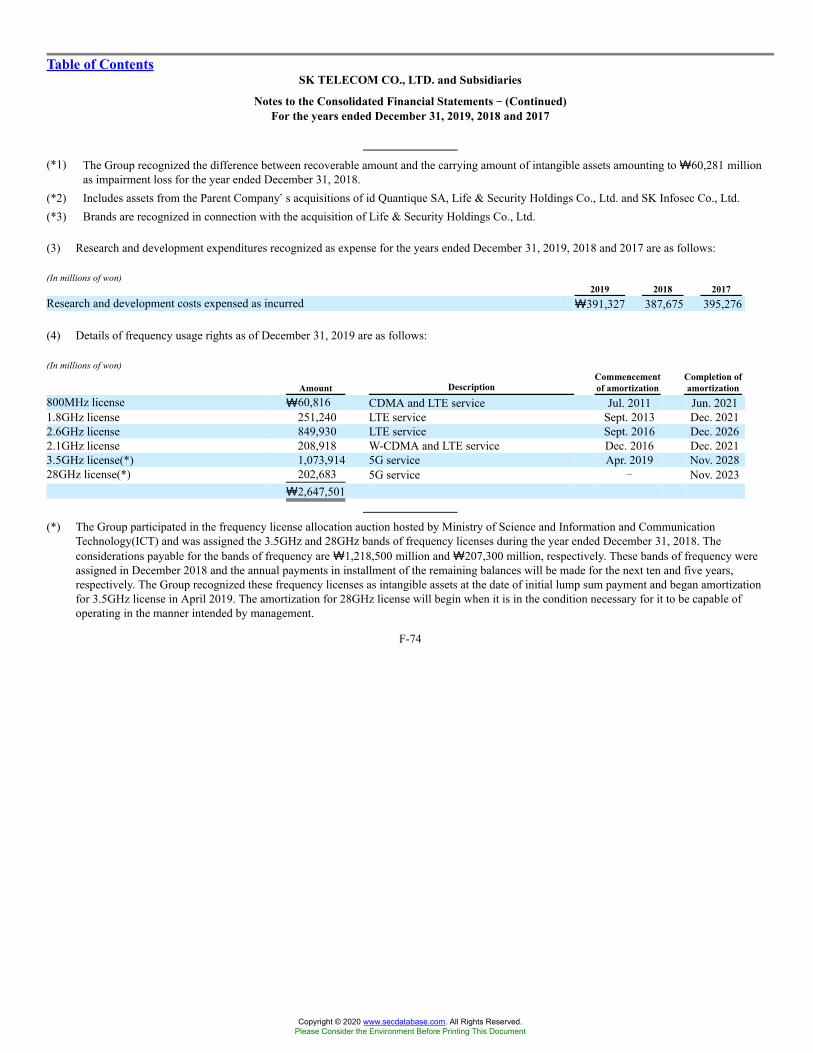
Table of ContentsSK TELECOM CO., LTD. and Subsidiaries
Notes to the Consolidated Financial Statements �� (Continued)For the years ended December 31, 2019, 2018 and 2017
(*1) The Group recognized the difference between recoverable amount and the carrying amount of intangible assets amounting to ₩60,281 millionas impairment loss for the year ended December 31, 2018.
(*2) Includes assets from the Parent Company�s acquisitions of id Quantique SA, Life & Security Holdings Co., Ltd. and SK Infosec Co., Ltd.(*3) Brands are recognized in connection with the acquisition of Life & Security Holdings Co., Ltd.
(3) Research and development expenditures recognized as expense for the years ended December 31, 2019, 2018 and 2017 are as follows:
(In millions of won)2019 2018 2017
Research and development costs expensed as incurred ₩391,327 387,675 395,276
(4) Details of frequency usage rights as of December 31, 2019 are as follows:
(In millions of won)
Amount DescriptionCommencementof amortization
Completion ofamortization
800MHz license ₩60,816 CDMA and LTE service Jul. 2011 Jun. 20211.8GHz license 251,240 LTE service Sept. 2013 Dec. 20212.6GHz license 849,930 LTE service Sept. 2016 Dec. 20262.1GHz license 208,918 W-CDMA and LTE service Dec. 2016 Dec. 20213.5GHz license(*) 1,073,914 5G service Apr. 2019 Nov. 202828GHz license(*) 202,683 5G service � Nov. 2023
₩2,647,501
(*) The Group participated in the frequency license allocation auction hosted by Ministry of Science and Information and CommunicationTechnology(ICT) and was assigned the 3.5GHz and 28GHz bands of frequency licenses during the year ended December 31, 2018. Theconsiderations payable for the bands of frequency are ₩1,218,500 million and ₩207,300 million, respectively. These bands of frequency wereassigned in December 2018 and the annual payments in installment of the remaining balances will be made for the next ten and five years,respectively. The Group recognized these frequency licenses as intangible assets at the date of initial lump sum payment and began amortizationfor 3.5GHz license in April 2019. The amortization for 28GHz license will begin when it is in the condition necessary for it to be capable ofoperating in the manner intended by management.
F-74
Copyright © 2020 www.secdatabase.com. All Rights Reserved.Please Consider the Environment Before Printing This Document
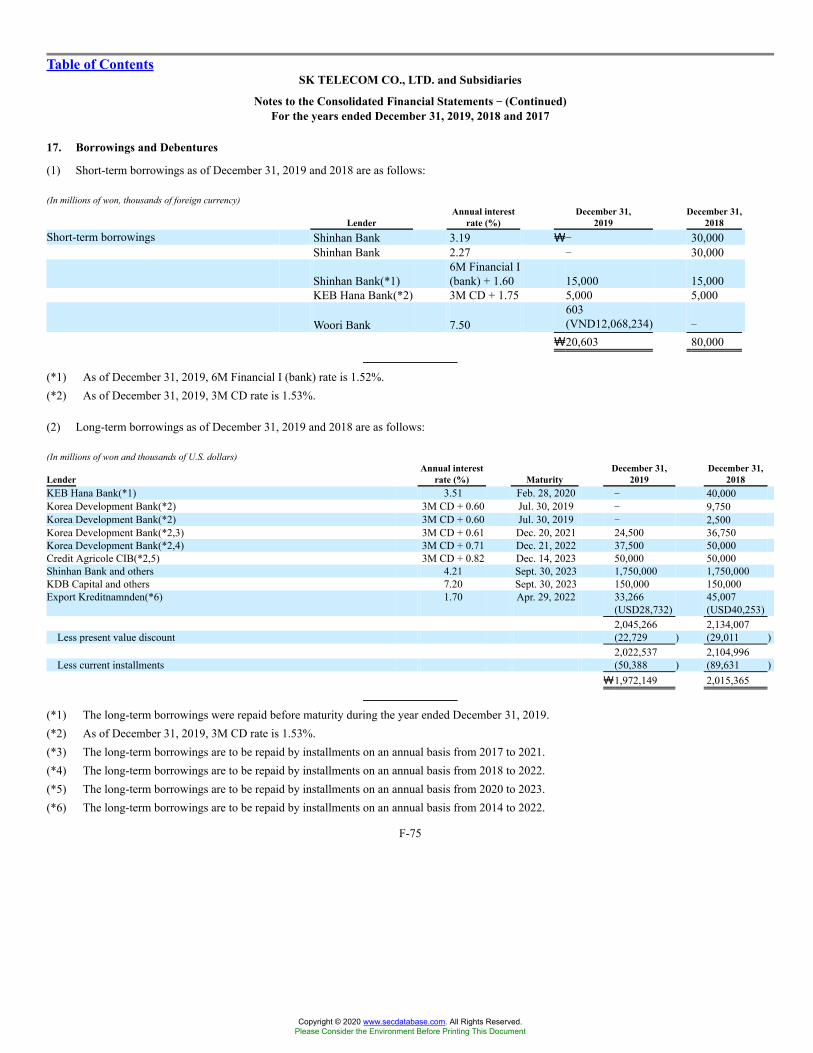
Table of ContentsSK TELECOM CO., LTD. and Subsidiaries
Notes to the Consolidated Financial Statements �� (Continued)For the years ended December 31, 2019, 2018 and 2017
17. Borrowings and Debentures
(1) Short-term borrowings as of December 31, 2019 and 2018 are as follows:
(In millions of won, thousands of foreign currency)
LenderAnnual interest
rate (%)December 31,
2019December 31,
2018Short-term borrowings Shinhan Bank 3.19 ₩� 30,000
Shinhan Bank 2.27 � 30,000
Shinhan Bank(*1)6M Financial I(bank) + 1.60 15,000 15,000
KEB Hana Bank(*2) 3M CD + 1.75 5,000 5,000
Woori Bank 7.50603(VND12,068,234) �
₩20,603 80,000
(*1) As of December 31, 2019, 6M Financial I (bank) rate is 1.52%.(*2) As of December 31, 2019, 3M CD rate is 1.53%.
(2) Long-term borrowings as of December 31, 2019 and 2018 are as follows:
(In millions of won and thousands of U.S. dollars)
LenderAnnual interest
rate (%) MaturityDecember 31,
2019December 31,
2018KEB Hana Bank(*1) 3.51 Feb. 28, 2020 � 40,000Korea Development Bank(*2) 3M CD + 0.60 Jul. 30, 2019 � 9,750Korea Development Bank(*2) 3M CD + 0.60 Jul. 30, 2019 � 2,500Korea Development Bank(*2,3) 3M CD + 0.61 Dec. 20, 2021 24,500 36,750Korea Development Bank(*2,4) 3M CD + 0.71 Dec. 21, 2022 37,500 50,000Credit Agricole CIB(*2,5) 3M CD + 0.82 Dec. 14, 2023 50,000 50,000Shinhan Bank and others 4.21 Sept. 30, 2023 1,750,000 1,750,000KDB Capital and others 7.20 Sept. 30, 2023 150,000 150,000Export Kreditnamnden(*6) 1.70 Apr. 29, 2022 33,266
(USD28,732)45,007(USD40,253)
2,045,266 2,134,007Less present value discount (22,729 ) (29,011 )
2,022,537 2,104,996Less current installments (50,388 ) (89,631 )
₩1,972,149 2,015,365
(*1) The long-term borrowings were repaid before maturity during the year ended December 31, 2019.(*2) As of December 31, 2019, 3M CD rate is 1.53%.(*3) The long-term borrowings are to be repaid by installments on an annual basis from 2017 to 2021.(*4) The long-term borrowings are to be repaid by installments on an annual basis from 2018 to 2022.(*5) The long-term borrowings are to be repaid by installments on an annual basis from 2020 to 2023.(*6) The long-term borrowings are to be repaid by installments on an annual basis from 2014 to 2022.
F-75
Copyright © 2020 www.secdatabase.com. All Rights Reserved.Please Consider the Environment Before Printing This Document
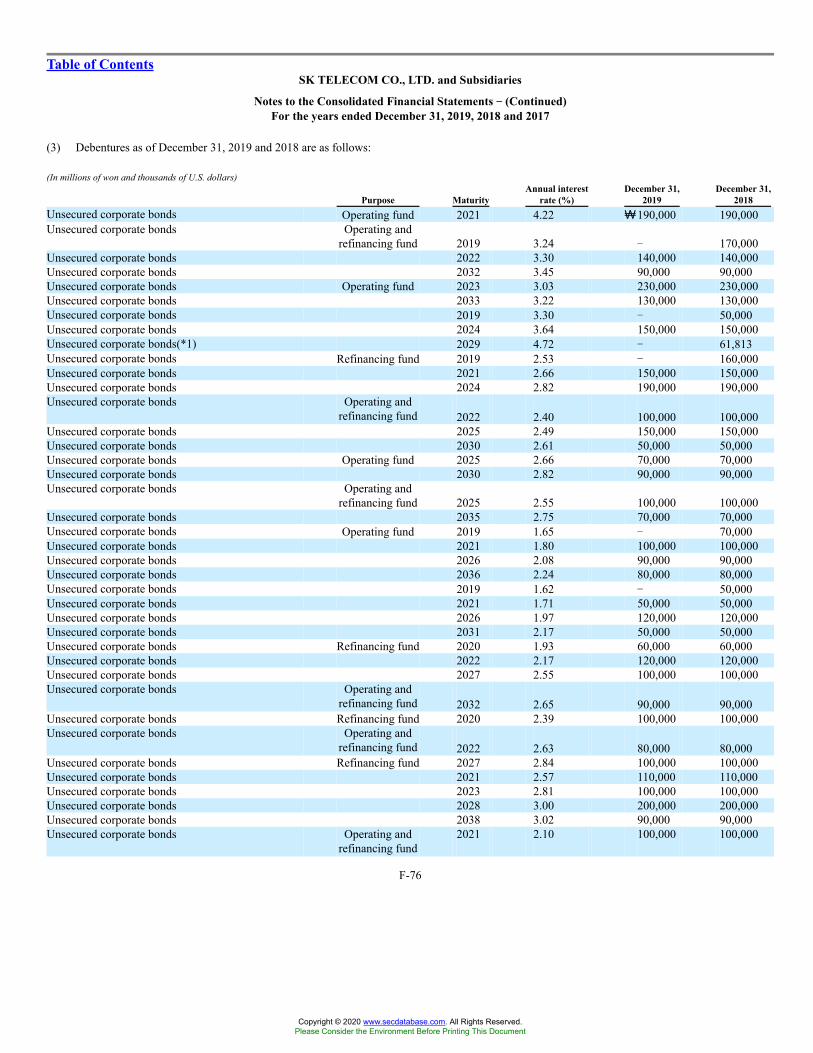
Table of ContentsSK TELECOM CO., LTD. and Subsidiaries
Notes to the Consolidated Financial Statements �� (Continued)For the years ended December 31, 2019, 2018 and 2017
(3) Debentures as of December 31, 2019 and 2018 are as follows:
(In millions of won and thousands of U.S. dollars)
Purpose MaturityAnnual interest
rate (%)December 31,
2019December 31,
2018Unsecured corporate bonds Operating fund 2021 4.22 ₩190,000 190,000Unsecured corporate bonds Operating and
refinancing fund 2019 3.24 � 170,000Unsecured corporate bonds 2022 3.30 140,000 140,000Unsecured corporate bonds 2032 3.45 90,000 90,000Unsecured corporate bonds Operating fund 2023 3.03 230,000 230,000Unsecured corporate bonds 2033 3.22 130,000 130,000Unsecured corporate bonds 2019 3.30 � 50,000Unsecured corporate bonds 2024 3.64 150,000 150,000Unsecured corporate bonds(*1) 2029 4.72 � 61,813Unsecured corporate bonds Refinancing fund 2019 2.53 � 160,000Unsecured corporate bonds 2021 2.66 150,000 150,000Unsecured corporate bonds 2024 2.82 190,000 190,000Unsecured corporate bonds Operating and
refinancing fund 2022 2.40 100,000 100,000Unsecured corporate bonds 2025 2.49 150,000 150,000Unsecured corporate bonds 2030 2.61 50,000 50,000Unsecured corporate bonds Operating fund 2025 2.66 70,000 70,000Unsecured corporate bonds 2030 2.82 90,000 90,000Unsecured corporate bonds Operating and
refinancing fund 2025 2.55 100,000 100,000Unsecured corporate bonds 2035 2.75 70,000 70,000Unsecured corporate bonds Operating fund 2019 1.65 � 70,000Unsecured corporate bonds 2021 1.80 100,000 100,000Unsecured corporate bonds 2026 2.08 90,000 90,000Unsecured corporate bonds 2036 2.24 80,000 80,000Unsecured corporate bonds 2019 1.62 � 50,000Unsecured corporate bonds 2021 1.71 50,000 50,000Unsecured corporate bonds 2026 1.97 120,000 120,000Unsecured corporate bonds 2031 2.17 50,000 50,000Unsecured corporate bonds Refinancing fund 2020 1.93 60,000 60,000Unsecured corporate bonds 2022 2.17 120,000 120,000Unsecured corporate bonds 2027 2.55 100,000 100,000Unsecured corporate bonds Operating and
refinancing fund 2032 2.65 90,000 90,000Unsecured corporate bonds Refinancing fund 2020 2.39 100,000 100,000Unsecured corporate bonds Operating and
refinancing fund 2022 2.63 80,000 80,000Unsecured corporate bonds Refinancing fund 2027 2.84 100,000 100,000Unsecured corporate bonds 2021 2.57 110,000 110,000Unsecured corporate bonds 2023 2.81 100,000 100,000Unsecured corporate bonds 2028 3.00 200,000 200,000Unsecured corporate bonds 2038 3.02 90,000 90,000Unsecured corporate bonds Operating and
refinancing fund2021 2.10 100,000 100,000
F-76
Copyright © 2020 www.secdatabase.com. All Rights Reserved.Please Consider the Environment Before Printing This Document

Table of ContentsSK TELECOM CO., LTD. and Subsidiaries
Notes to the Consolidated Financial Statements �� (Continued)For the years ended December 31, 2019, 2018 and 2017
(In millions of won and thousands of U.S. dollars)
Purpose MaturityAnnual interest
rate (%)December 31,
2019December 31,
2018Unsecured corporate bonds 2023 2.33 150,000 150,000Unsecured corporate bonds 2038 2.44 50,000 50,000Unsecured corporate bonds Operating fund 2022 2.03 180,000 �Unsecured corporate bonds 2024 2.09 120,000 �Unsecured corporate bonds 2029 2.19 50,000 �Unsecured corporate bonds Operating fund 2039 2.23 50,000 �Unsecured corporate bonds Operating and
refinancing fund 2022 1.40 120,000 �Unsecured corporate bonds 2024 1.49 60,000 �Unsecured corporate bonds 2029 1.50 120,000 �Unsecured corporate bonds 2039 1.52 50,000 �Unsecured corporate bonds 2049 1.56 50,000 �Unsecured corporate bonds Operating fund 2022 1.69 230,000 �Unsecured corporate bonds 2024 1.76 70,000 �Unsecured corporate bonds 2029 1.79 40,000 �Unsecured corporate bonds 2039 1.81 60,000 �Unsecured corporate bonds(*2) Operating fund 2019 3.49 � 210,000Unsecured corporate bonds(*2) 2019 2.76 � 130,000Unsecured corporate bonds(*2) 2020 2.49 160,000 160,000Unsecured corporate bonds(*2) 2020 2.43 140,000 140,000Unsecured corporate bonds(*2) 2020 2.18 130,000 130,000Unsecured corporate bonds(*2) 2019 1.58 � 50,000Unsecured corporate bonds(*2) Operating and
refinancing fund 2021 1.77 120,000 120,000Unsecured corporate bonds(*2) Operating fund 2022 2.26 150,000 150,000Unsecured corporate bonds(*2) Refinancing fund 2020 2.34 30,000 30,000Unsecured corporate bonds(*2) Operating and
refinancing fund 2022 2.70 140,000 140,000Unsecured corporate bonds(*2) 2021 2.59 70,000 70,000Unsecured corporate bonds(*2) 2023 2.93 80,000 80,000Unsecured corporate bonds(*2) Refinancing fund 2022 2.00 50,000 �Unsecured corporate bonds(*2) 2024 2.09 160,000 �Unsecured corporate bonds(*2) Operating and
refinancing fund 2022 1.71 80,000 �Unsecured corporate bonds(*2) 2024 1.71 100,000 �
F-77
Copyright © 2020 www.secdatabase.com. All Rights Reserved.Please Consider the Environment Before Printing This Document

Table of ContentsSK TELECOM CO., LTD. and Subsidiaries
Notes to the Consolidated Financial Statements �� (Continued)For the years ended December 31, 2019, 2018 and 2017
(In millions of won and thousands of U.S. dollars)
Purpose MaturityAnnual interest
rate (%)December 31,
2019December 31,
2018Unsecured corporate bonds(*2) 2026 1.86 50,000 �Convertible bonds(*3) Operating
fund2019 1.00 � 5,479
Private placement corporate bonds Operatingfund
2023 � 6,292 �
Private placement corporate bonds Operatingfund 2023 � 6,222 �
Unsecured global bonds Operatingfund
2027 6.63 463,120(USD400,000)
447,240(USD400,000)
Unsecured global bonds2023 3.75
578,900(USD500,000)
559,050(USD500,000)
Unsecured global bonds(*2) Refinancingfund 2023 3.88
347,340(USD300,000)
335,430(USD300,000)
Floating rate notes(*4) Operatingfund 2020
3M LIBOR+ 0.88
347,340(USD300,000)
335,430(USD300,000)
8,249,214 7,494,442Less discounts on bonds (28,381 ) (27,590 )
8,220,833 7,466,852Less current installments of bonds (966,939 ) (894,641 )
₩7,253,894 6,572,211
(*1) The debenture was repaid before maturity during the year ended December 31, 2019.(*2) Unsecured corporate bonds were issued by SK Broadband Co., Ltd.(*3) Convertible bonds were issued by DREAMUS COMPANY (formerly, IRIVER LIMITED).(*4) As of December 31, 2019, 3M LIBOR rate is 1.91%.
18. Long-term Payables �� other
(1) Long-term payables � other as of December 31, 2019 and 2018 are as follows:
(In millions of won)December 31, 2019 December 31, 2018
Payables related to acquisition of frequency usage rights ₩ 1,544,699 1,939,082Other 5,468 29,702
₩ 1,550,167 1,968,784
(2) As of December 31, 2019 and 2018, details of long-term payables � other which consist of payables related to the acquisition of frequency usagerights are as follows (See Note 16):
(In millions of won)December 31, 2019 December 31, 2018
Long-term payables � other ₩ 2,051,389 2,476,738Present value discount on long-term payables � other (82,851 ) (113,772 )Current installments of long-term payables � other (423,839 ) (423,884 )
Carrying amount at December 31 ₩ 1,544,699 1,939,082
F-78
Copyright © 2020 www.secdatabase.com. All Rights Reserved.Please Consider the Environment Before Printing This Document
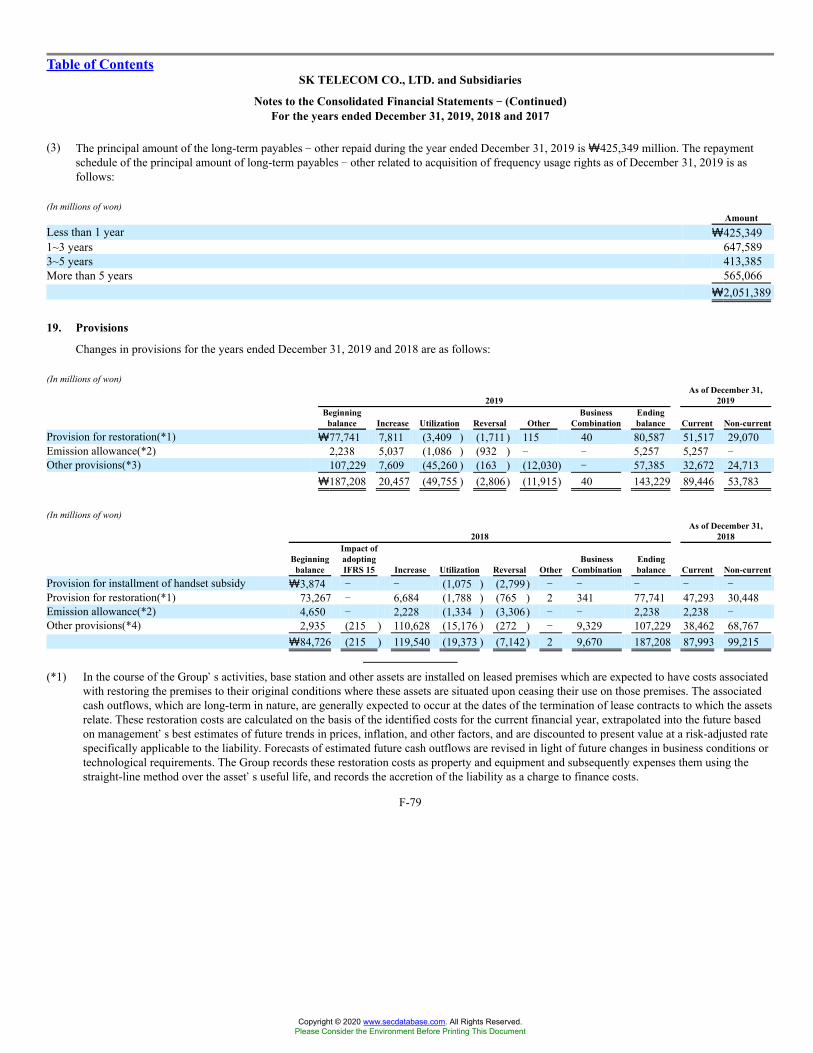
Table of ContentsSK TELECOM CO., LTD. and Subsidiaries
Notes to the Consolidated Financial Statements �� (Continued)For the years ended December 31, 2019, 2018 and 2017
(3) The principal amount of the long-term payables � other repaid during the year ended December 31, 2019 is ₩425,349 million. The repaymentschedule of the principal amount of long-term payables � other related to acquisition of frequency usage rights as of December 31, 2019 is asfollows:
(In millions of won)Amount
Less than 1 year ₩425,3491~3 years 647,5893~5 years 413,385More than 5 years 565,066
₩2,051,389
19. Provisions
Changes in provisions for the years ended December 31, 2019 and 2018 are as follows:
(In millions of won)
2019As of December 31,
2019Beginning
balance Increase Utilization Reversal OtherBusiness
CombinationEndingbalance Current Non-current
Provision for restoration(*1) ₩77,741 7,811 (3,409 ) (1,711 ) 115 40 80,587 51,517 29,070Emission allowance(*2) 2,238 5,037 (1,086 ) (932 ) � � 5,257 5,257 �Other provisions(*3) 107,229 7,609 (45,260 ) (163 ) (12,030) � 57,385 32,672 24,713
₩187,208 20,457 (49,755 ) (2,806) (11,915) 40 143,229 89,446 53,783
(In millions of won)
2018As of December 31,
2018
Beginningbalance
Impact ofadoptingIFRS 15 Increase Utilization Reversal Other
BusinessCombination
Endingbalance Current Non-current
Provision for installment of handset subsidy ₩3,874 � � (1,075 ) (2,799) � � � � �Provision for restoration(*1) 73,267 � 6,684 (1,788 ) (765 ) 2 341 77,741 47,293 30,448Emission allowance(*2) 4,650 � 2,228 (1,334 ) (3,306) � � 2,238 2,238 �Other provisions(*4) 2,935 (215 ) 110,628 (15,176 ) (272 ) � 9,329 107,229 38,462 68,767
₩84,726 (215 ) 119,540 (19,373 ) (7,142) 2 9,670 187,208 87,993 99,215
(*1) In the course of the Group�s activities, base station and other assets are installed on leased premises which are expected to have costs associatedwith restoring the premises to their original conditions where these assets are situated upon ceasing their use on those premises. The associatedcash outflows, which are long-term in nature, are generally expected to occur at the dates of the termination of lease contracts to which the assetsrelate. These restoration costs are calculated on the basis of the identified costs for the current financial year, extrapolated into the future basedon management�s best estimates of future trends in prices, inflation, and other factors, and are discounted to present value at a risk-adjusted ratespecifically applicable to the liability. Forecasts of estimated future cash outflows are revised in light of future changes in business conditions ortechnological requirements. The Group records these restoration costs as property and equipment and subsequently expenses them using thestraight-line method over the asset�s useful life, and records the accretion of the liability as a charge to finance costs.
F-79
Copyright © 2020 www.secdatabase.com. All Rights Reserved.Please Consider the Environment Before Printing This Document
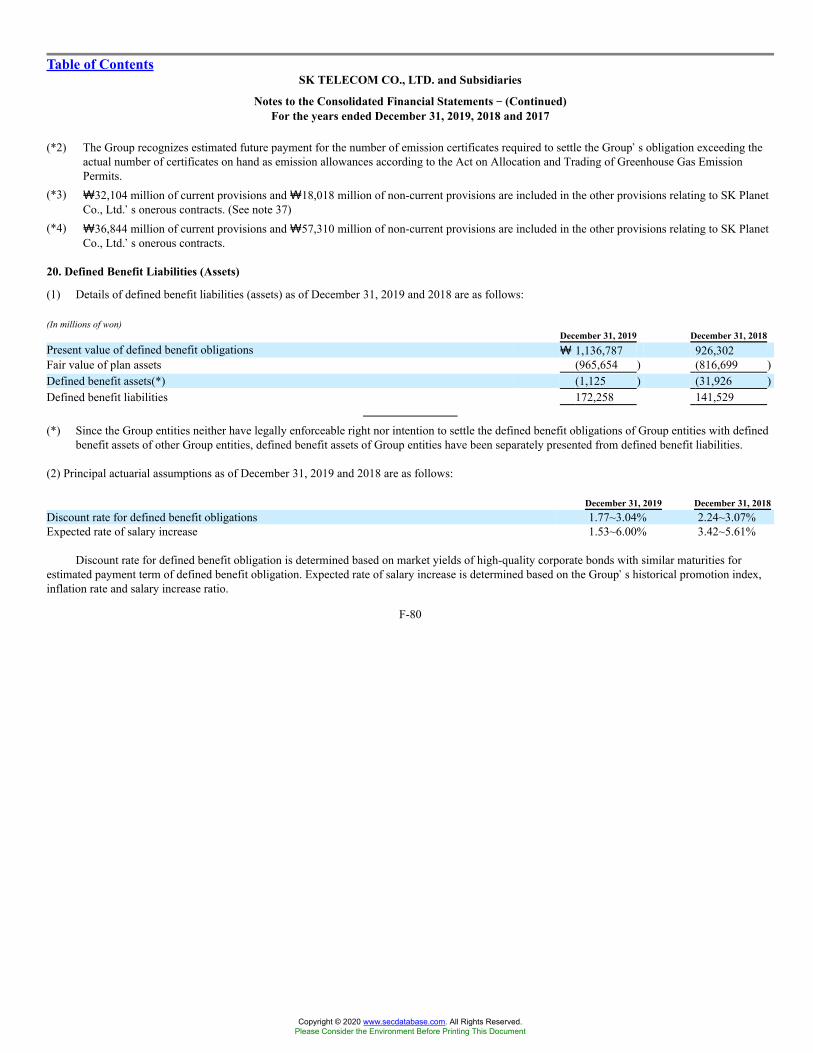
Table of ContentsSK TELECOM CO., LTD. and Subsidiaries
Notes to the Consolidated Financial Statements �� (Continued)For the years ended December 31, 2019, 2018 and 2017
(*2) The Group recognizes estimated future payment for the number of emission certificates required to settle the Group�s obligation exceeding theactual number of certificates on hand as emission allowances according to the Act on Allocation and Trading of Greenhouse Gas EmissionPermits.
(*3) ₩32,104 million of current provisions and ₩18,018 million of non-current provisions are included in the other provisions relating to SK PlanetCo., Ltd.�s onerous contracts. (See note 37)
(*4) ₩36,844 million of current provisions and ₩57,310 million of non-current provisions are included in the other provisions relating to SK PlanetCo., Ltd.�s onerous contracts.
20. Defined Benefit Liabilities (Assets)
(1) Details of defined benefit liabilities (assets) as of December 31, 2019 and 2018 are as follows:
(In millions of won)December 31, 2019 December 31, 2018
Present value of defined benefit obligations ₩ 1,136,787 926,302Fair value of plan assets (965,654 ) (816,699 )Defined benefit assets(*) (1,125 ) (31,926 )Defined benefit liabilities 172,258 141,529
(*) Since the Group entities neither have legally enforceable right nor intention to settle the defined benefit obligations of Group entities with definedbenefit assets of other Group entities, defined benefit assets of Group entities have been separately presented from defined benefit liabilities.
(2) Principal actuarial assumptions as of December 31, 2019 and 2018 are as follows:
December 31, 2019 December 31, 2018Discount rate for defined benefit obligations 1.77~3.04% 2.24~3.07%Expected rate of salary increase 1.53~6.00% 3.42~5.61%
Discount rate for defined benefit obligation is determined based on market yields of high-quality corporate bonds with similar maturities forestimated payment term of defined benefit obligation. Expected rate of salary increase is determined based on the Group�s historical promotion index,inflation rate and salary increase ratio.
F-80
Copyright © 2020 www.secdatabase.com. All Rights Reserved.Please Consider the Environment Before Printing This Document
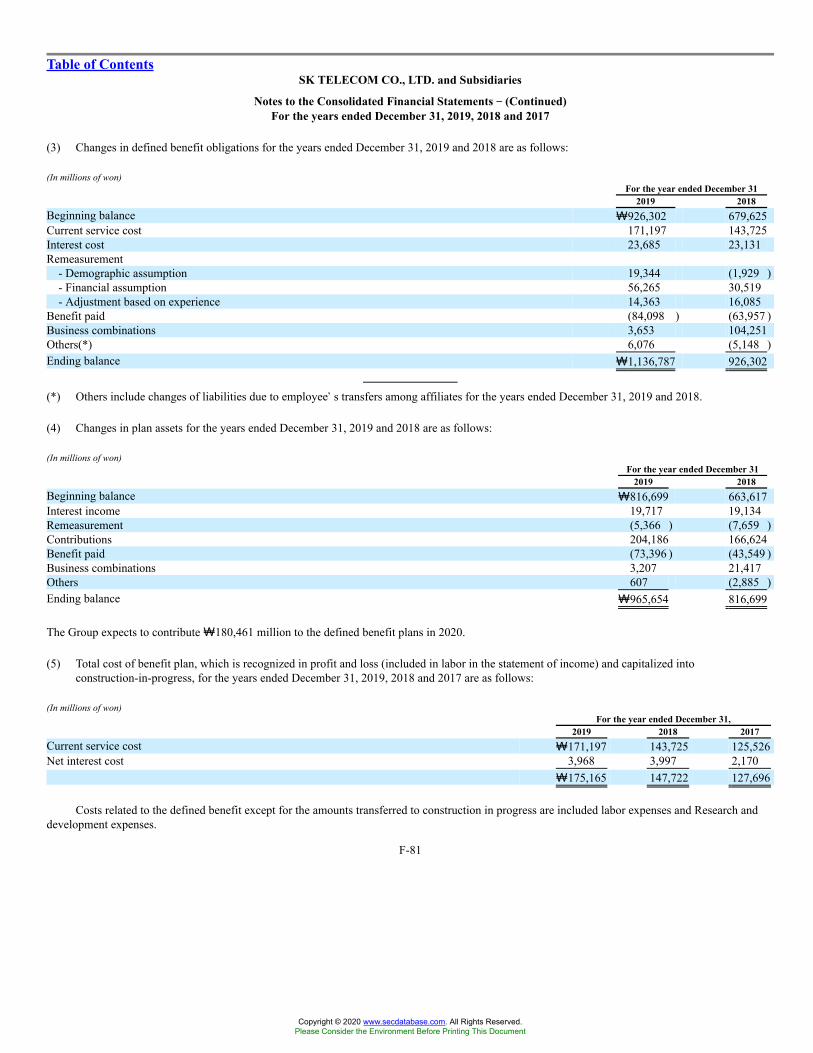
Table of ContentsSK TELECOM CO., LTD. and Subsidiaries
Notes to the Consolidated Financial Statements �� (Continued)For the years ended December 31, 2019, 2018 and 2017
(3) Changes in defined benefit obligations for the years ended December 31, 2019 and 2018 are as follows:
(In millions of won)For the year ended December 31
2019 2018Beginning balance ₩926,302 679,625Current service cost 171,197 143,725Interest cost 23,685 23,131Remeasurement
- Demographic assumption 19,344 (1,929 )- Financial assumption 56,265 30,519- Adjustment based on experience 14,363 16,085
Benefit paid (84,098 ) (63,957 )Business combinations 3,653 104,251Others(*) 6,076 (5,148 )Ending balance ₩1,136,787 926,302
(*) Others include changes of liabilities due to employee�s transfers among affiliates for the years ended December 31, 2019 and 2018.
(4) Changes in plan assets for the years ended December 31, 2019 and 2018 are as follows:
(In millions of won)For the year ended December 31
2019 2018Beginning balance ₩816,699 663,617Interest income 19,717 19,134Remeasurement (5,366 ) (7,659 )Contributions 204,186 166,624Benefit paid (73,396 ) (43,549 )Business combinations 3,207 21,417Others 607 (2,885 )Ending balance ₩965,654 816,699
The Group expects to contribute ₩180,461 million to the defined benefit plans in 2020.
(5) Total cost of benefit plan, which is recognized in profit and loss (included in labor in the statement of income) and capitalized intoconstruction-in-progress, for the years ended December 31, 2019, 2018 and 2017 are as follows:
(In millions of won)For the year ended December 31,
2019 2018 2017Current service cost ₩171,197 143,725 125,526Net interest cost 3,968 3,997 2,170
₩175,165 147,722 127,696
Costs related to the defined benefit except for the amounts transferred to construction in progress are included labor expenses and Research anddevelopment expenses.
F-81
Copyright © 2020 www.secdatabase.com. All Rights Reserved.Please Consider the Environment Before Printing This Document
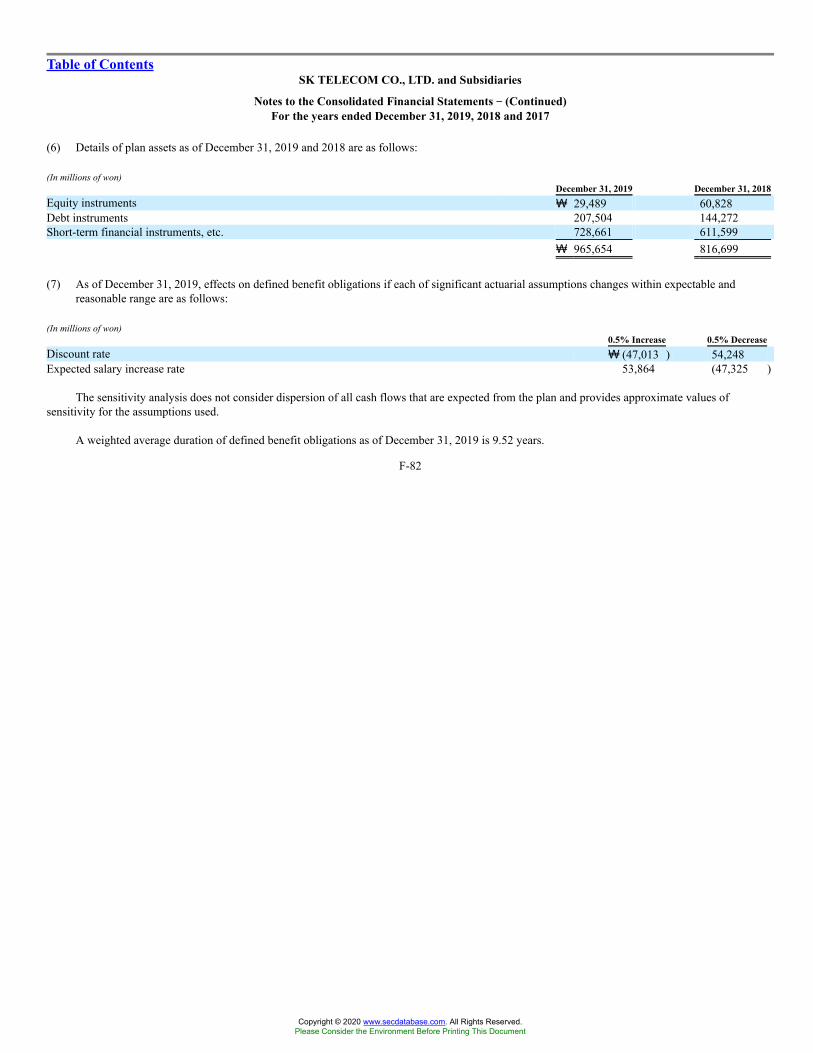
Table of ContentsSK TELECOM CO., LTD. and Subsidiaries
Notes to the Consolidated Financial Statements �� (Continued)For the years ended December 31, 2019, 2018 and 2017
(6) Details of plan assets as of December 31, 2019 and 2018 are as follows:
(In millions of won)December 31, 2019 December 31, 2018
Equity instruments ₩ 29,489 60,828Debt instruments 207,504 144,272Short-term financial instruments, etc. 728,661 611,599
₩ 965,654 816,699
(7) As of December 31, 2019, effects on defined benefit obligations if each of significant actuarial assumptions changes within expectable andreasonable range are as follows:
(In millions of won)0.5% Increase 0.5% Decrease
Discount rate ₩ (47,013 ) 54,248Expected salary increase rate 53,864 (47,325 )
The sensitivity analysis does not consider dispersion of all cash flows that are expected from the plan and provides approximate values ofsensitivity for the assumptions used.
A weighted average duration of defined benefit obligations as of December 31, 2019 is 9.52 years.
F-82
Copyright © 2020 www.secdatabase.com. All Rights Reserved.Please Consider the Environment Before Printing This Document
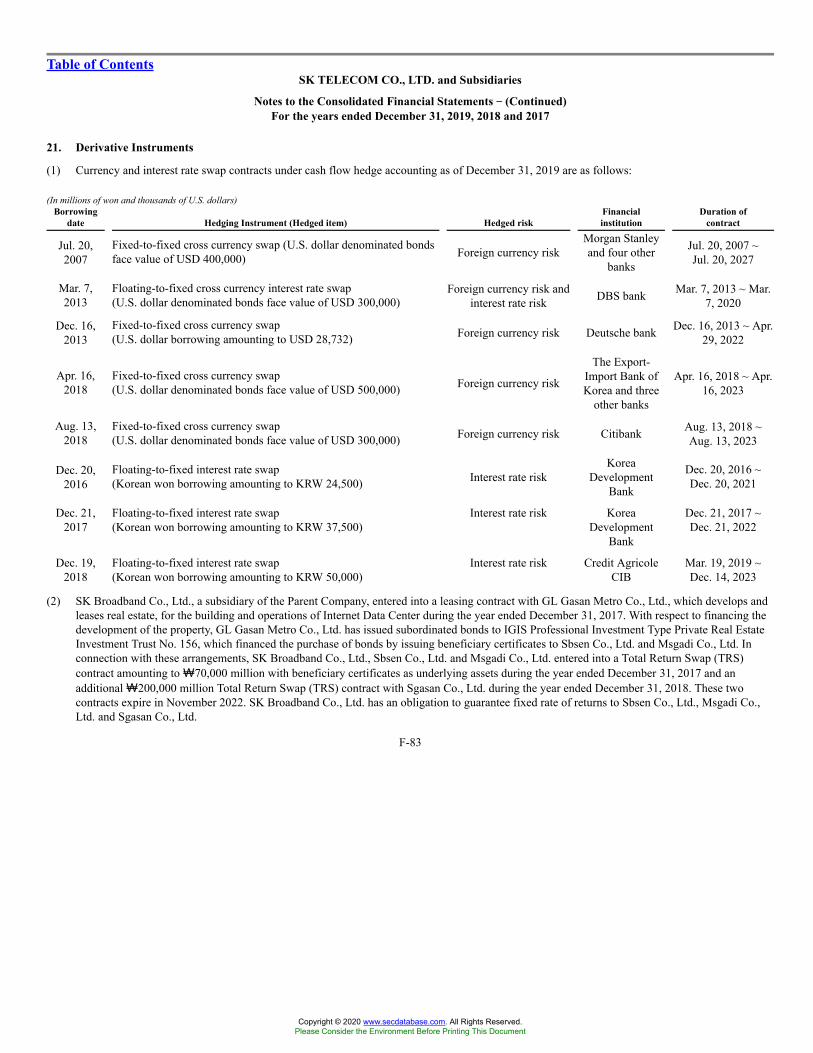
Table of ContentsSK TELECOM CO., LTD. and Subsidiaries
Notes to the Consolidated Financial Statements �� (Continued)For the years ended December 31, 2019, 2018 and 2017
21. Derivative Instruments
(1) Currency and interest rate swap contracts under cash flow hedge accounting as of December 31, 2019 are as follows:
(In millions of won and thousands of U.S. dollars)Borrowing
date Hedging Instrument (Hedged item) Hedged riskFinancialinstitution
Duration ofcontract
Jul. 20,2007
Fixed-to-fixed cross currency swap (U.S. dollar denominated bondsface value of USD 400,000) Foreign currency risk
Morgan Stanleyand four other
banks
Jul. 20, 2007 ~Jul. 20, 2027
Mar. 7,2013
Floating-to-fixed cross currency interest rate swap(U.S. dollar denominated bonds face value of USD 300,000)
Foreign currency risk andinterest rate risk DBS bank Mar. 7, 2013 ~ Mar.
7, 2020
Dec. 16,2013
Fixed-to-fixed cross currency swap(U.S. dollar borrowing amounting to USD 28,732) Foreign currency risk Deutsche bank Dec. 16, 2013 ~ Apr.
29, 2022
Apr. 16,2018
Fixed-to-fixed cross currency swap(U.S. dollar denominated bonds face value of USD 500,000) Foreign currency risk
The Export-Import Bank ofKorea and three
other banks
Apr. 16, 2018 ~ Apr.16, 2023
Aug. 13,2018
Fixed-to-fixed cross currency swap(U.S. dollar denominated bonds face value of USD 300,000) Foreign currency risk Citibank Aug. 13, 2018 ~
Aug. 13, 2023
Dec. 20,2016
Floating-to-fixed interest rate swap(Korean won borrowing amounting to KRW 24,500) Interest rate risk
KoreaDevelopment
Bank
Dec. 20, 2016 ~Dec. 20, 2021
Dec. 21,2017
Floating-to-fixed interest rate swap(Korean won borrowing amounting to KRW 37,500)
Interest rate risk KoreaDevelopment
Bank
Dec. 21, 2017 ~Dec. 21, 2022
Dec. 19,2018
Floating-to-fixed interest rate swap(Korean won borrowing amounting to KRW 50,000)
Interest rate risk Credit AgricoleCIB
Mar. 19, 2019 ~Dec. 14, 2023
(2) SK Broadband Co., Ltd., a subsidiary of the Parent Company, entered into a leasing contract with GL Gasan Metro Co., Ltd., which develops andleases real estate, for the building and operations of Internet Data Center during the year ended December 31, 2017. With respect to financing thedevelopment of the property, GL Gasan Metro Co., Ltd. has issued subordinated bonds to IGIS Professional Investment Type Private Real EstateInvestment Trust No. 156, which financed the purchase of bonds by issuing beneficiary certificates to Sbsen Co., Ltd. and Msgadi Co., Ltd. Inconnection with these arrangements, SK Broadband Co., Ltd., Sbsen Co., Ltd. and Msgadi Co., Ltd. entered into a Total Return Swap (TRS)contract amounting to ₩70,000 million with beneficiary certificates as underlying assets during the year ended December 31, 2017 and anadditional ₩200,000 million Total Return Swap (TRS) contract with Sgasan Co., Ltd. during the year ended December 31, 2018. These twocontracts expire in November 2022. SK Broadband Co., Ltd. has an obligation to guarantee fixed rate of returns to Sbsen Co., Ltd., Msgadi Co.,Ltd. and Sgasan Co., Ltd.
F-83
Copyright © 2020 www.secdatabase.com. All Rights Reserved.Please Consider the Environment Before Printing This Document
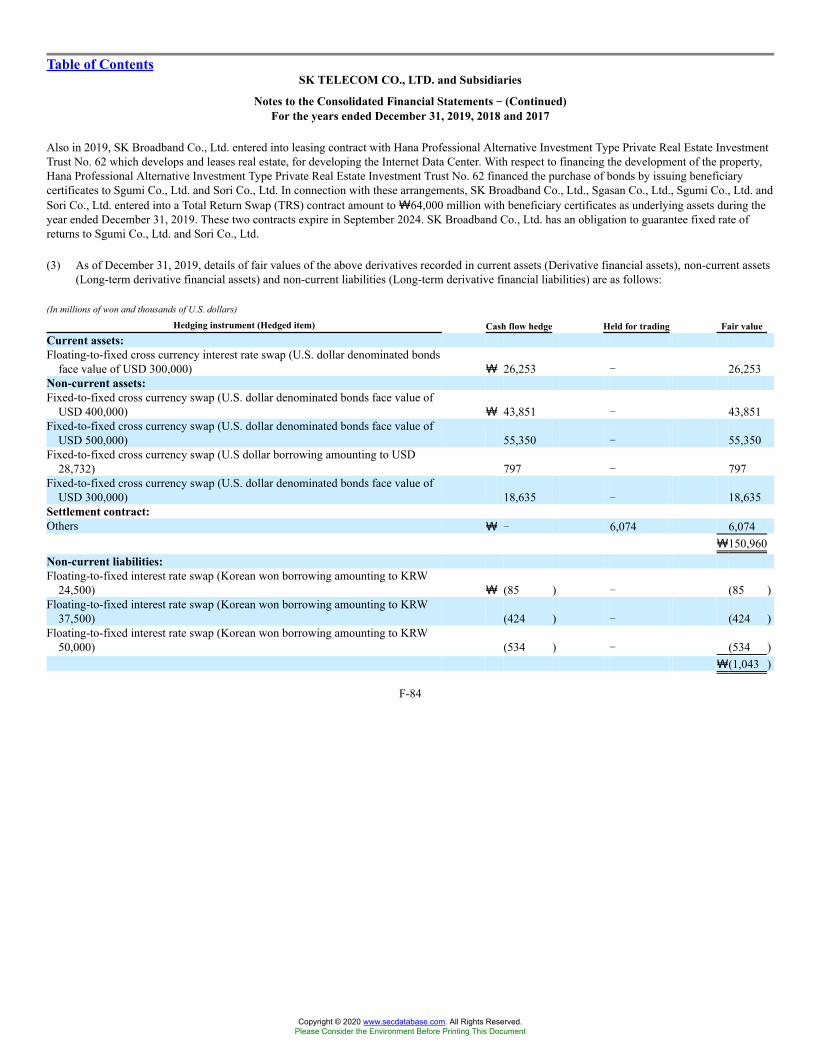
Table of ContentsSK TELECOM CO., LTD. and Subsidiaries
Notes to the Consolidated Financial Statements �� (Continued)For the years ended December 31, 2019, 2018 and 2017
Also in 2019, SK Broadband Co., Ltd. entered into leasing contract with Hana Professional Alternative Investment Type Private Real Estate InvestmentTrust No. 62 which develops and leases real estate, for developing the Internet Data Center. With respect to financing the development of the property,Hana Professional Alternative Investment Type Private Real Estate Investment Trust No. 62 financed the purchase of bonds by issuing beneficiarycertificates to Sgumi Co., Ltd. and Sori Co., Ltd. In connection with these arrangements, SK Broadband Co., Ltd., Sgasan Co., Ltd., Sgumi Co., Ltd. andSori Co., Ltd. entered into a Total Return Swap (TRS) contract amount to ₩64,000 million with beneficiary certificates as underlying assets during theyear ended December 31, 2019. These two contracts expire in September 2024. SK Broadband Co., Ltd. has an obligation to guarantee fixed rate ofreturns to Sgumi Co., Ltd. and Sori Co., Ltd.
(3) As of December 31, 2019, details of fair values of the above derivatives recorded in current assets (Derivative financial assets), non-current assets(Long-term derivative financial assets) and non-current liabilities (Long-term derivative financial liabilities) are as follows:
(In millions of won and thousands of U.S. dollars)
Hedging instrument (Hedged item) Cash flow hedge Held for trading Fair valueCurrent assets:Floating-to-fixed cross currency interest rate swap (U.S. dollar denominated bonds
face value of USD 300,000) ₩ 26,253 � 26,253Non-current assets:Fixed-to-fixed cross currency swap (U.S. dollar denominated bonds face value of
USD 400,000) ₩ 43,851 � 43,851Fixed-to-fixed cross currency swap (U.S. dollar denominated bonds face value of
USD 500,000) 55,350 � 55,350Fixed-to-fixed cross currency swap (U.S dollar borrowing amounting to USD
28,732) 797 � 797Fixed-to-fixed cross currency swap (U.S. dollar denominated bonds face value of
USD 300,000) 18,635 � 18,635Settlement contract:Others ₩ � 6,074 6,074
₩150,960Non-current liabilities:Floating-to-fixed interest rate swap (Korean won borrowing amounting to KRW
24,500) ₩ (85 ) � (85 )Floating-to-fixed interest rate swap (Korean won borrowing amounting to KRW
37,500) (424 ) � (424 )Floating-to-fixed interest rate swap (Korean won borrowing amounting to KRW
50,000) (534 ) � (534 )₩(1,043 )
F-84
Copyright © 2020 www.secdatabase.com. All Rights Reserved.Please Consider the Environment Before Printing This Document
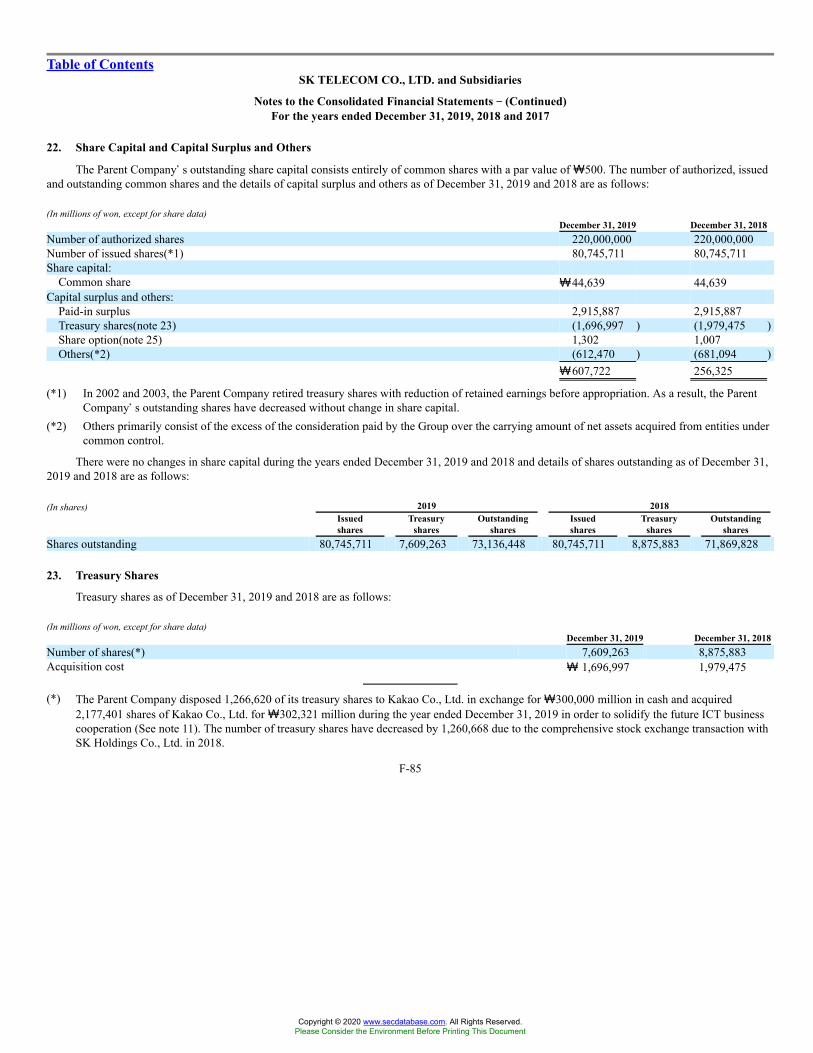
Table of ContentsSK TELECOM CO., LTD. and Subsidiaries
Notes to the Consolidated Financial Statements �� (Continued)For the years ended December 31, 2019, 2018 and 2017
22. Share Capital and Capital Surplus and Others
The Parent Company�s outstanding share capital consists entirely of common shares with a par value of ₩500. The number of authorized, issuedand outstanding common shares and the details of capital surplus and others as of December 31, 2019 and 2018 are as follows:
(In millions of won, except for share data)December 31, 2019 December 31, 2018
Number of authorized shares 220,000,000 220,000,000Number of issued shares(*1) 80,745,711 80,745,711Share capital:
Common share ₩44,639 44,639Capital surplus and others:
Paid-in surplus 2,915,887 2,915,887Treasury shares(note 23) (1,696,997 ) (1,979,475 )Share option(note 25) 1,302 1,007Others(*2) (612,470 ) (681,094 )
₩607,722 256,325
(*1) In 2002 and 2003, the Parent Company retired treasury shares with reduction of retained earnings before appropriation. As a result, the ParentCompany�s outstanding shares have decreased without change in share capital.
(*2) Others primarily consist of the excess of the consideration paid by the Group over the carrying amount of net assets acquired from entities undercommon control.
There were no changes in share capital during the years ended December 31, 2019 and 2018 and details of shares outstanding as of December 31,2019 and 2018 are as follows:
(In shares) 2019 2018Issuedshares
Treasuryshares
Outstandingshares
Issuedshares
Treasuryshares
Outstandingshares
Shares outstanding 80,745,711 7,609,263 73,136,448 80,745,711 8,875,883 71,869,828
23. Treasury Shares
Treasury shares as of December 31, 2019 and 2018 are as follows:
(In millions of won, except for share data)December 31, 2019 December 31, 2018
Number of shares(*) 7,609,263 8,875,883Acquisition cost ₩ 1,696,997 1,979,475
(*) The Parent Company disposed 1,266,620 of its treasury shares to Kakao Co., Ltd. in exchange for ₩300,000 million in cash and acquired2,177,401 shares of Kakao Co., Ltd. for ₩302,321 million during the year ended December 31, 2019 in order to solidify the future ICT businesscooperation (See note 11). The number of treasury shares have decreased by 1,260,668 due to the comprehensive stock exchange transaction withSK Holdings Co., Ltd. in 2018.
F-85
Copyright © 2020 www.secdatabase.com. All Rights Reserved.Please Consider the Environment Before Printing This Document
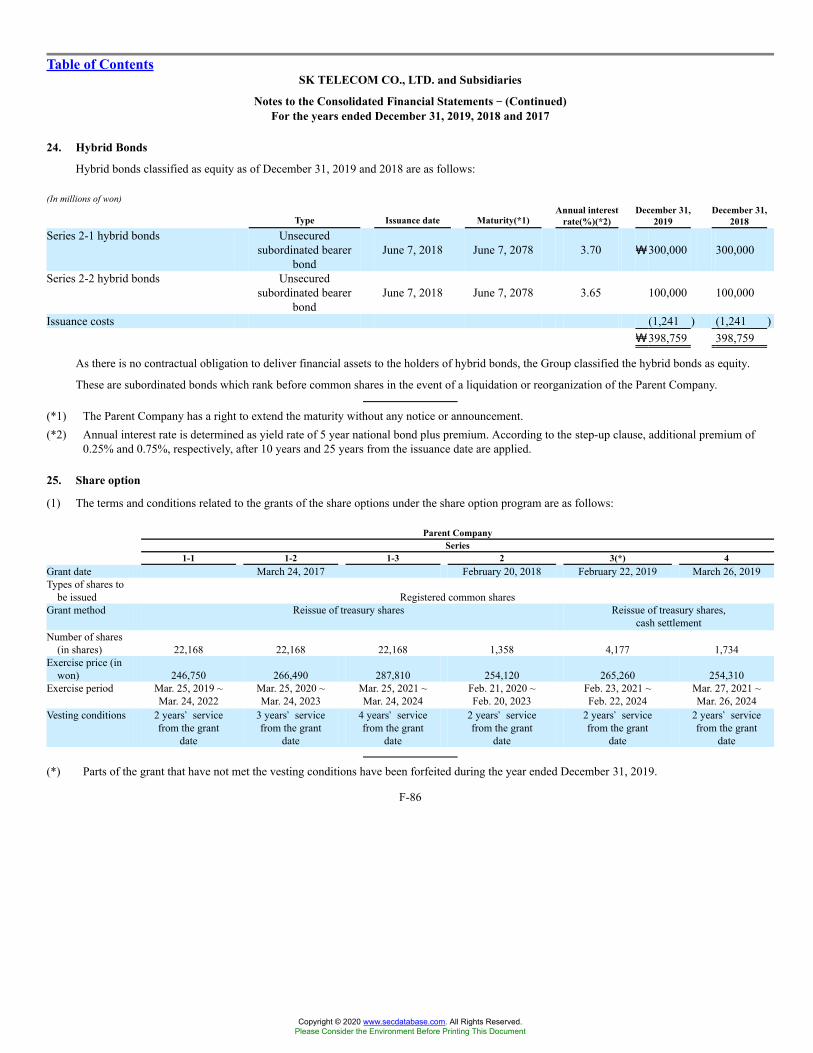
Table of ContentsSK TELECOM CO., LTD. and Subsidiaries
Notes to the Consolidated Financial Statements �� (Continued)For the years ended December 31, 2019, 2018 and 2017
24. Hybrid Bonds
Hybrid bonds classified as equity as of December 31, 2019 and 2018 are as follows:
(In millions of won)
Type Issuance date Maturity(*1)Annual interest
rate(%)(*2)December 31,
2019December 31,
2018Series 2-1 hybrid bonds Unsecured
subordinated bearerbond
June 7, 2018 June 7, 2078 3.70 ₩300,000 300,000
Series 2-2 hybrid bonds Unsecuredsubordinated bearer
bondJune 7, 2018 June 7, 2078 3.65 100,000 100,000
Issuance costs (1,241 ) (1,241 )₩398,759 398,759
As there is no contractual obligation to deliver financial assets to the holders of hybrid bonds, the Group classified the hybrid bonds as equity.
These are subordinated bonds which rank before common shares in the event of a liquidation or reorganization of the Parent Company.
(*1) The Parent Company has a right to extend the maturity without any notice or announcement.(*2) Annual interest rate is determined as yield rate of 5 year national bond plus premium. According to the step-up clause, additional premium of
0.25% and 0.75%, respectively, after 10 years and 25 years from the issuance date are applied.
25. Share option
(1) The terms and conditions related to the grants of the share options under the share option program are as follows:
Parent CompanySeries
1-1 1-2 1-3 2 3(*) 4Grant date March 24, 2017 February 20, 2018 February 22, 2019 March 26, 2019Types of shares to
be issued Registered common sharesGrant method Reissue of treasury shares Reissue of treasury shares,
cash settlementNumber of shares
(in shares) 22,168 22,168 22,168 1,358 4,177 1,734Exercise price (in
won) 246,750 266,490 287,810 254,120 265,260 254,310Exercise period Mar. 25, 2019 ~
Mar. 24, 2022Mar. 25, 2020 ~Mar. 24, 2023
Mar. 25, 2021 ~Mar. 24, 2024
Feb. 21, 2020 ~Feb. 20, 2023
Feb. 23, 2021 ~Feb. 22, 2024
Mar. 27, 2021 ~Mar. 26, 2024
Vesting conditions 2 years� servicefrom the grant
date
3 years� servicefrom the grant
date
4 years� servicefrom the grant
date
2 years� servicefrom the grant
date
2 years� servicefrom the grant
date
2 years� servicefrom the grant
date
(*) Parts of the grant that have not met the vesting conditions have been forfeited during the year ended December 31, 2019.
F-86
Copyright © 2020 www.secdatabase.com. All Rights Reserved.Please Consider the Environment Before Printing This Document
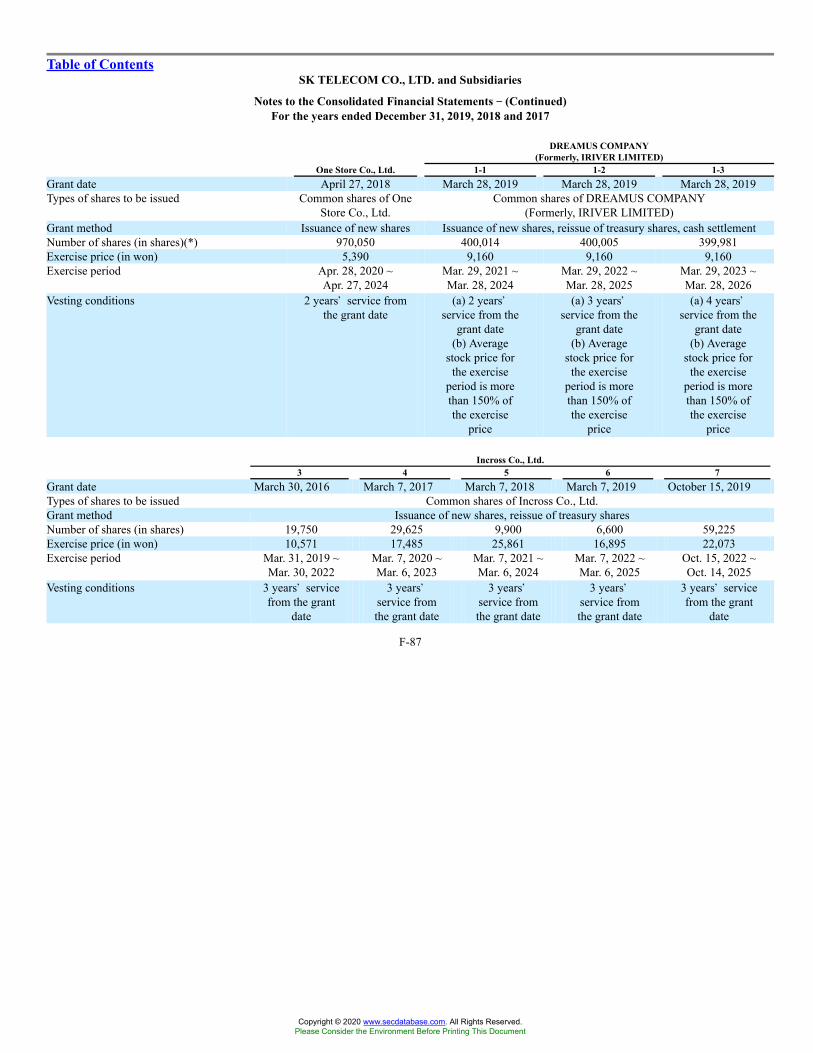
Table of ContentsSK TELECOM CO., LTD. and Subsidiaries
Notes to the Consolidated Financial Statements �� (Continued)For the years ended December 31, 2019, 2018 and 2017
DREAMUS COMPANY(Formerly, IRIVER LIMITED)
One Store Co., Ltd. 1-1 1-2 1-3Grant date April 27, 2018 March 28, 2019 March 28, 2019 March 28, 2019Types of shares to be issued Common shares of One
Store Co., Ltd.Common shares of DREAMUS COMPANY
(Formerly, IRIVER LIMITED)Grant method Issuance of new shares Issuance of new shares, reissue of treasury shares, cash settlementNumber of shares (in shares)(*) 970,050 400,014 400,005 399,981Exercise price (in won) 5,390 9,160 9,160 9,160Exercise period Apr. 28, 2020 ~
Apr. 27, 2024Mar. 29, 2021 ~Mar. 28, 2024
Mar. 29, 2022 ~Mar. 28, 2025
Mar. 29, 2023 ~Mar. 28, 2026
Vesting conditions 2 years� service fromthe grant date
(a) 2 years�service from the
grant date(b) Average
stock price forthe exercise
period is morethan 150% ofthe exercise
price
(a) 3 years�service from the
grant date(b) Average
stock price forthe exercise
period is morethan 150% ofthe exercise
price
(a) 4 years�service from the
grant date(b) Average
stock price forthe exercise
period is morethan 150% ofthe exercise
price
Incross Co., Ltd.3 4 5 6 7
Grant date March 30, 2016 March 7, 2017 March 7, 2018 March 7, 2019 October 15, 2019Types of shares to be issued Common shares of Incross Co., Ltd.Grant method Issuance of new shares, reissue of treasury sharesNumber of shares (in shares) 19,750 29,625 9,900 6,600 59,225Exercise price (in won) 10,571 17,485 25,861 16,895 22,073Exercise period Mar. 31, 2019 ~
Mar. 30, 2022Mar. 7, 2020 ~Mar. 6, 2023
Mar. 7, 2021 ~Mar. 6, 2024
Mar. 7, 2022 ~Mar. 6, 2025
Oct. 15, 2022 ~Oct. 14, 2025
Vesting conditions 3 years� servicefrom the grant
date
3 years�service fromthe grant date
3 years�service fromthe grant date
3 years�service fromthe grant date
3 years� servicefrom the grant
date
F-87
Copyright © 2020 www.secdatabase.com. All Rights Reserved.Please Consider the Environment Before Printing This Document

Table of ContentsSK TELECOM CO., LTD. and Subsidiaries
Notes to the Consolidated Financial Statements �� (Continued)For the years ended December 31, 2019, 2018 and 2017
Life & Security Holdings Co., Ltd.1-1 1-2 1-3 1-4
FSK L&S Co.,Ltd.
Grant date August 22, 2019 May 31, 2019Types of shares to be issued
Common shares of Life & Security Holdings Co., Ltd.
Commonshares of FSKL&S Co., Ltd.
Grant methodcash settlement
Issuance ofnew shares
Number of shares (in shares) 3,506 3,163 6,260 6,245 43,955Exercise price (in won) 949,940 949,940 1,025,935 1,108,010 10,000Exercise period 1st excercise : Applied to 50% of the granted shares and exercisible 6 months after
the listing (June. 30, 2023) of Life & Security Holdings Co., Ltd.June. 1, 2022 ~May. 31, 2025
2nd excercise: Applied to 25% of the granted shares and exercisible 12 monthsafter the listing (June. 30, 2023) of Life & Security Holdings Co., Ltd.
3rd excercise: Applied to 25% of the granted shares and exercisible 18 monthsafter the listing (June. 30, 2023) of Life & Security Holdings Co., Ltd.
Vesting conditions Serviceprovided untilDecember 31,
2019
Serviceprovided untilDecember 31,
2020
Serviceprovided untilDecember 31,
2021
Serviceprovided untilDecember 31,
2022
3 years�service fromthe grant date
(*) Parts of the grant of One Store Co., Ltd. and DREAMUS COMPANY(Formerly, IRIVER LIMITED) that have not met the vesting conditionshave been forfeited during the years ended December 31, 2019 and 2018.
(2) Share compensation expense recognized during the year ended December 31, 2019 and the remaining share compensation to be recognized insubsequent periods are as follows:
(In millions of won)Share
compensation expenseAs of December 31, 2018 ₩ 1,203During the year ended December 31, 2019 2,073In subsequent periods 4,498
₩ 7,774
F-88
Copyright © 2020 www.secdatabase.com. All Rights Reserved.Please Consider the Environment Before Printing This Document
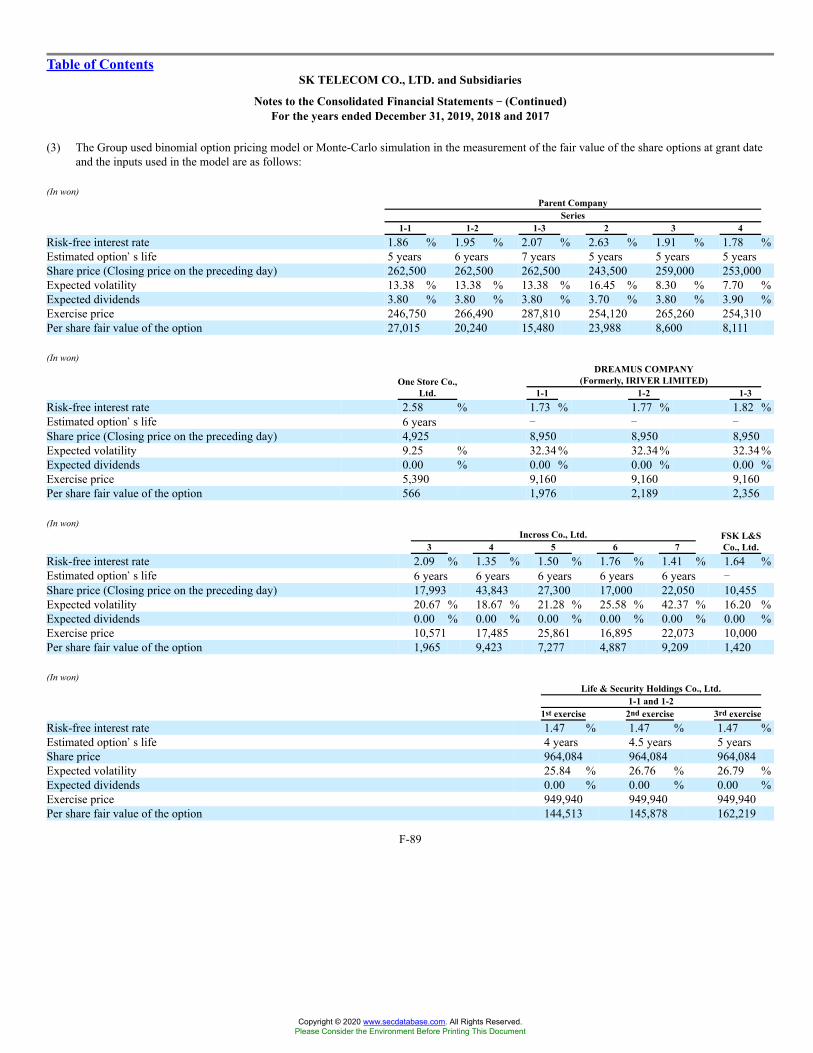
Table of ContentsSK TELECOM CO., LTD. and Subsidiaries
Notes to the Consolidated Financial Statements �� (Continued)For the years ended December 31, 2019, 2018 and 2017
(3) The Group used binomial option pricing model or Monte-Carlo simulation in the measurement of the fair value of the share options at grant dateand the inputs used in the model are as follows:
(In won)Parent Company
Series1-1 1-2 1-3 2 3 4
Risk-free interest rate 1.86 % 1.95 % 2.07 % 2.63 % 1.91 % 1.78 %Estimated option�s life 5 years 6 years 7 years 5 years 5 years 5 yearsShare price (Closing price on the preceding day) 262,500 262,500 262,500 243,500 259,000 253,000Expected volatility 13.38 % 13.38 % 13.38 % 16.45 % 8.30 % 7.70 %Expected dividends 3.80 % 3.80 % 3.80 % 3.70 % 3.80 % 3.90 %Exercise price 246,750 266,490 287,810 254,120 265,260 254,310Per share fair value of the option 27,015 20,240 15,480 23,988 8,600 8,111
(In won)DREAMUS COMPANY
(Formerly, IRIVER LIMITED)One Store Co.,Ltd. 1-1 1-2 1-3
Risk-free interest rate 2.58 % 1.73 % 1.77 % 1.82 %Estimated option�s life 6 years � � �Share price (Closing price on the preceding day) 4,925 8,950 8,950 8,950Expected volatility 9.25 % 32.34 % 32.34 % 32.34 %Expected dividends 0.00 % 0.00 % 0.00 % 0.00 %Exercise price 5,390 9,160 9,160 9,160Per share fair value of the option 566 1,976 2,189 2,356
(In won)Incross Co., Ltd.
3 4 5 6 7FSK L&SCo., Ltd.
Risk-free interest rate 2.09 % 1.35 % 1.50 % 1.76 % 1.41 % 1.64 %Estimated option�s life 6 years 6 years 6 years 6 years 6 years �Share price (Closing price on the preceding day) 17,993 43,843 27,300 17,000 22,050 10,455Expected volatility 20.67 % 18.67 % 21.28 % 25.58 % 42.37 % 16.20 %Expected dividends 0.00 % 0.00 % 0.00 % 0.00 % 0.00 % 0.00 %Exercise price 10,571 17,485 25,861 16,895 22,073 10,000Per share fair value of the option 1,965 9,423 7,277 4,887 9,209 1,420
(In won)Life & Security Holdings Co., Ltd.
1-1 and 1-21st exercise 2nd exercise 3rd exercise
Risk-free interest rate 1.47 % 1.47 % 1.47 %Estimated option�s life 4 years 4.5 years 5 yearsShare price 964,084 964,084 964,084Expected volatility 25.84 % 26.76 % 26.79 %Expected dividends 0.00 % 0.00 % 0.00 %Exercise price 949,940 949,940 949,940Per share fair value of the option 144,513 145,878 162,219
F-89
Copyright © 2020 www.secdatabase.com. All Rights Reserved.Please Consider the Environment Before Printing This Document
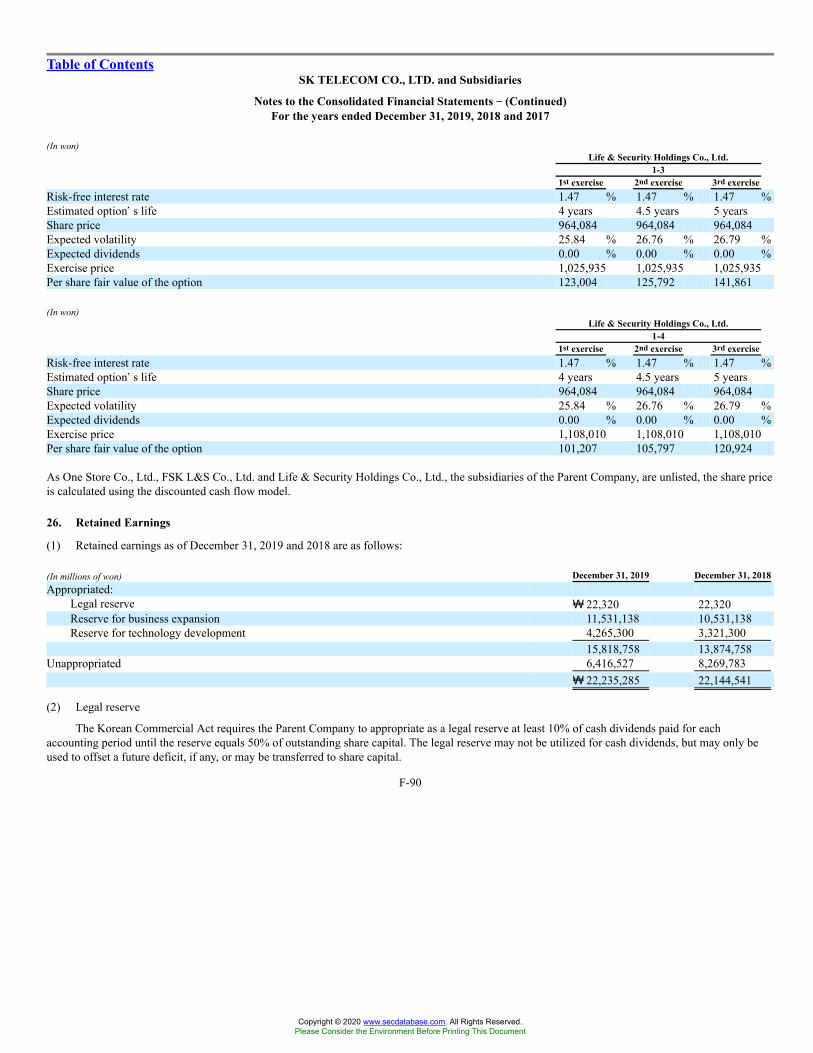
Table of ContentsSK TELECOM CO., LTD. and Subsidiaries
Notes to the Consolidated Financial Statements �� (Continued)For the years ended December 31, 2019, 2018 and 2017
(In won)Life & Security Holdings Co., Ltd.
1-31st exercise 2nd exercise 3rd exercise
Risk-free interest rate 1.47 % 1.47 % 1.47 %Estimated option�s life 4 years 4.5 years 5 yearsShare price 964,084 964,084 964,084Expected volatility 25.84 % 26.76 % 26.79 %Expected dividends 0.00 % 0.00 % 0.00 %Exercise price 1,025,935 1,025,935 1,025,935Per share fair value of the option 123,004 125,792 141,861
(In won)Life & Security Holdings Co., Ltd.
1-41st exercise 2nd exercise 3rd exercise
Risk-free interest rate 1.47 % 1.47 % 1.47 %Estimated option�s life 4 years 4.5 years 5 yearsShare price 964,084 964,084 964,084Expected volatility 25.84 % 26.76 % 26.79 %Expected dividends 0.00 % 0.00 % 0.00 %Exercise price 1,108,010 1,108,010 1,108,010Per share fair value of the option 101,207 105,797 120,924
As One Store Co., Ltd., FSK L&S Co., Ltd. and Life & Security Holdings Co., Ltd., the subsidiaries of the Parent Company, are unlisted, the share priceis calculated using the discounted cash flow model.
26. Retained Earnings
(1) Retained earnings as of December 31, 2019 and 2018 are as follows:
(In millions of won) December 31, 2019 December 31, 2018Appropriated:
Legal reserve ₩ 22,320 22,320Reserve for business expansion 11,531,138 10,531,138Reserve for technology development 4,265,300 3,321,300
15,818,758 13,874,758Unappropriated 6,416,527 8,269,783
₩ 22,235,285 22,144,541
(2) Legal reserve
The Korean Commercial Act requires the Parent Company to appropriate as a legal reserve at least 10% of cash dividends paid for eachaccounting period until the reserve equals 50% of outstanding share capital. The legal reserve may not be utilized for cash dividends, but may only beused to offset a future deficit, if any, or may be transferred to share capital.
F-90
Copyright © 2020 www.secdatabase.com. All Rights Reserved.Please Consider the Environment Before Printing This Document
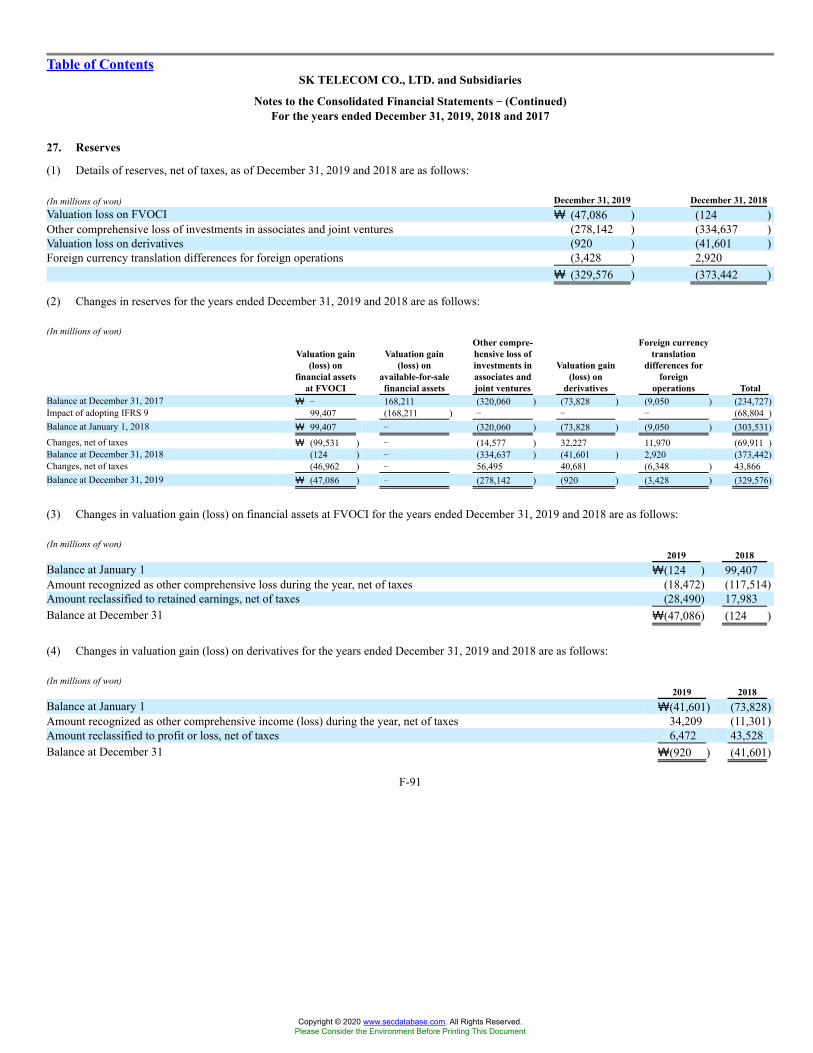
Table of ContentsSK TELECOM CO., LTD. and Subsidiaries
Notes to the Consolidated Financial Statements �� (Continued)For the years ended December 31, 2019, 2018 and 2017
27. Reserves
(1) Details of reserves, net of taxes, as of December 31, 2019 and 2018 are as follows:
(In millions of won) December 31, 2019 December 31, 2018Valuation loss on FVOCI ₩ (47,086 ) (124 )Other comprehensive loss of investments in associates and joint ventures (278,142 ) (334,637 )Valuation loss on derivatives (920 ) (41,601 )Foreign currency translation differences for foreign operations (3,428 ) 2,920
₩ (329,576 ) (373,442 )
(2) Changes in reserves for the years ended December 31, 2019 and 2018 are as follows:
(In millions of won)
Valuation gain(loss) on
financial assetsat FVOCI
Valuation gain(loss) on
available-for-salefinancial assets
Other compre-hensive loss ofinvestments inassociates andjoint ventures
Valuation gain(loss) on
derivatives
Foreign currencytranslation
differences forforeign
operations TotalBalance at December 31, 2017 ₩ � 168,211 (320,060 ) (73,828 ) (9,050 ) (234,727)Impact of adopting IFRS 9 99,407 (168,211 ) � � � (68,804 )Balance at January 1, 2018 ₩ 99,407 � (320,060 ) (73,828 ) (9,050 ) (303,531)Changes, net of taxes ₩ (99,531 ) � (14,577 ) 32,227 11,970 (69,911 )Balance at December 31, 2018 (124 ) � (334,637 ) (41,601 ) 2,920 (373,442)Changes, net of taxes (46,962 ) � 56,495 40,681 (6,348 ) 43,866Balance at December 31, 2019 ₩ (47,086 ) � (278,142 ) (920 ) (3,428 ) (329,576)
(3) Changes in valuation gain (loss) on financial assets at FVOCI for the years ended December 31, 2019 and 2018 are as follows:
(In millions of won)2019 2018
Balance at January 1 ₩(124 ) 99,407Amount recognized as other comprehensive loss during the year, net of taxes (18,472) (117,514)Amount reclassified to retained earnings, net of taxes (28,490) 17,983Balance at December 31 ₩(47,086) (124 )
(4) Changes in valuation gain (loss) on derivatives for the years ended December 31, 2019 and 2018 are as follows:
(In millions of won)2019 2018
Balance at January 1 ₩(41,601) (73,828)Amount recognized as other comprehensive income (loss) during the year, net of taxes 34,209 (11,301)Amount reclassified to profit or loss, net of taxes 6,472 43,528Balance at December 31 ₩(920 ) (41,601)
F-91
Copyright © 2020 www.secdatabase.com. All Rights Reserved.Please Consider the Environment Before Printing This Document
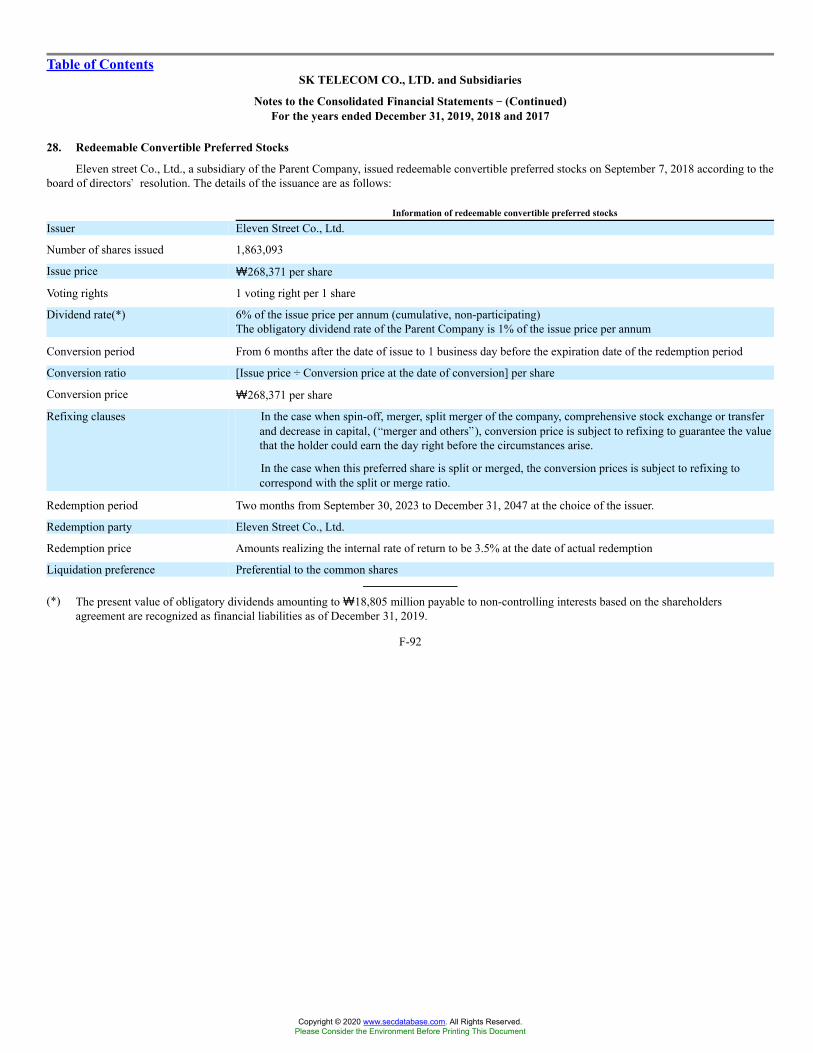
Table of ContentsSK TELECOM CO., LTD. and Subsidiaries
Notes to the Consolidated Financial Statements �� (Continued)For the years ended December 31, 2019, 2018 and 2017
28. Redeemable Convertible Preferred Stocks
Eleven street Co., Ltd., a subsidiary of the Parent Company, issued redeemable convertible preferred stocks on September 7, 2018 according to theboard of directors� resolution. The details of the issuance are as follows:
Information of redeemable convertible preferred stocksIssuer Eleven Street Co., Ltd.
Number of shares issued 1,863,093
Issue price ₩268,371 per share
Voting rights 1 voting right per 1 share
Dividend rate(*) 6% of the issue price per annum (cumulative, non-participating)The obligatory dividend rate of the Parent Company is 1% of the issue price per annum
Conversion period From 6 months after the date of issue to 1 business day before the expiration date of the redemption period
Conversion ratio [Issue price ÷ Conversion price at the date of conversion] per share
Conversion price ₩268,371 per share
Refixing clauses � In the case when spin-off, merger, split merger of the company, comprehensive stock exchange or transferand decrease in capital, (�merger and others�), conversion price is subject to refixing to guarantee the valuethat the holder could earn the day right before the circumstances arise.
� In the case when this preferred share is split or merged, the conversion prices is subject to refixing tocorrespond with the split or merge ratio.
Redemption period Two months from September 30, 2023 to December 31, 2047 at the choice of the issuer.
Redemption party Eleven Street Co., Ltd.
Redemption price Amounts realizing the internal rate of return to be 3.5% at the date of actual redemption
Liquidation preference Preferential to the common shares
(*) The present value of obligatory dividends amounting to ₩18,805 million payable to non-controlling interests based on the shareholdersagreement are recognized as financial liabilities as of December 31, 2019.
F-92
Copyright © 2020 www.secdatabase.com. All Rights Reserved.Please Consider the Environment Before Printing This Document
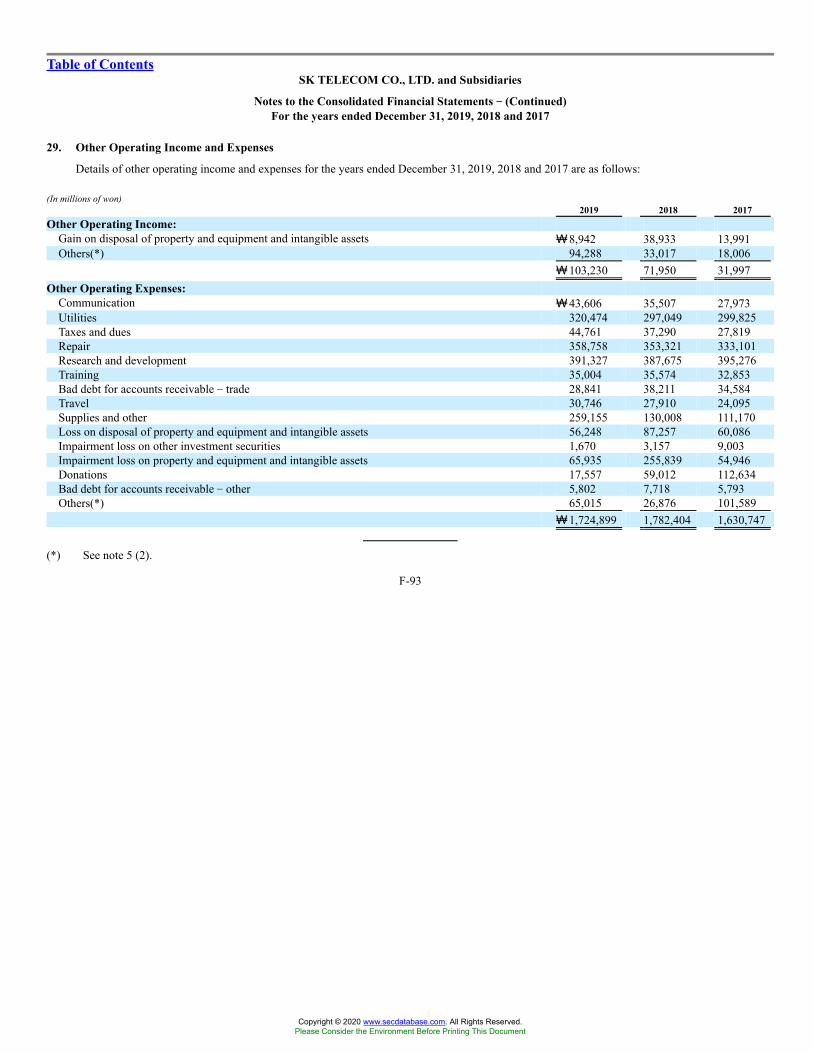
Table of ContentsSK TELECOM CO., LTD. and Subsidiaries
Notes to the Consolidated Financial Statements �� (Continued)For the years ended December 31, 2019, 2018 and 2017
29. Other Operating Income and Expenses
Details of other operating income and expenses for the years ended December 31, 2019, 2018 and 2017 are as follows:
(In millions of won)2019 2018 2017
Other Operating Income:Gain on disposal of property and equipment and intangible assets ₩8,942 38,933 13,991Others(*) 94,288 33,017 18,006
₩103,230 71,950 31,997Other Operating Expenses:
Communication ₩43,606 35,507 27,973Utilities 320,474 297,049 299,825Taxes and dues 44,761 37,290 27,819Repair 358,758 353,321 333,101Research and development 391,327 387,675 395,276Training 35,004 35,574 32,853Bad debt for accounts receivable � trade 28,841 38,211 34,584Travel 30,746 27,910 24,095Supplies and other 259,155 130,008 111,170Loss on disposal of property and equipment and intangible assets 56,248 87,257 60,086Impairment loss on other investment securities 1,670 3,157 9,003Impairment loss on property and equipment and intangible assets 65,935 255,839 54,946Donations 17,557 59,012 112,634Bad debt for accounts receivable � other 5,802 7,718 5,793Others(*) 65,015 26,876 101,589
₩1,724,899 1,782,404 1,630,747
(*) See note 5 (2).
F-93
Copyright © 2020 www.secdatabase.com. All Rights Reserved.Please Consider the Environment Before Printing This Document
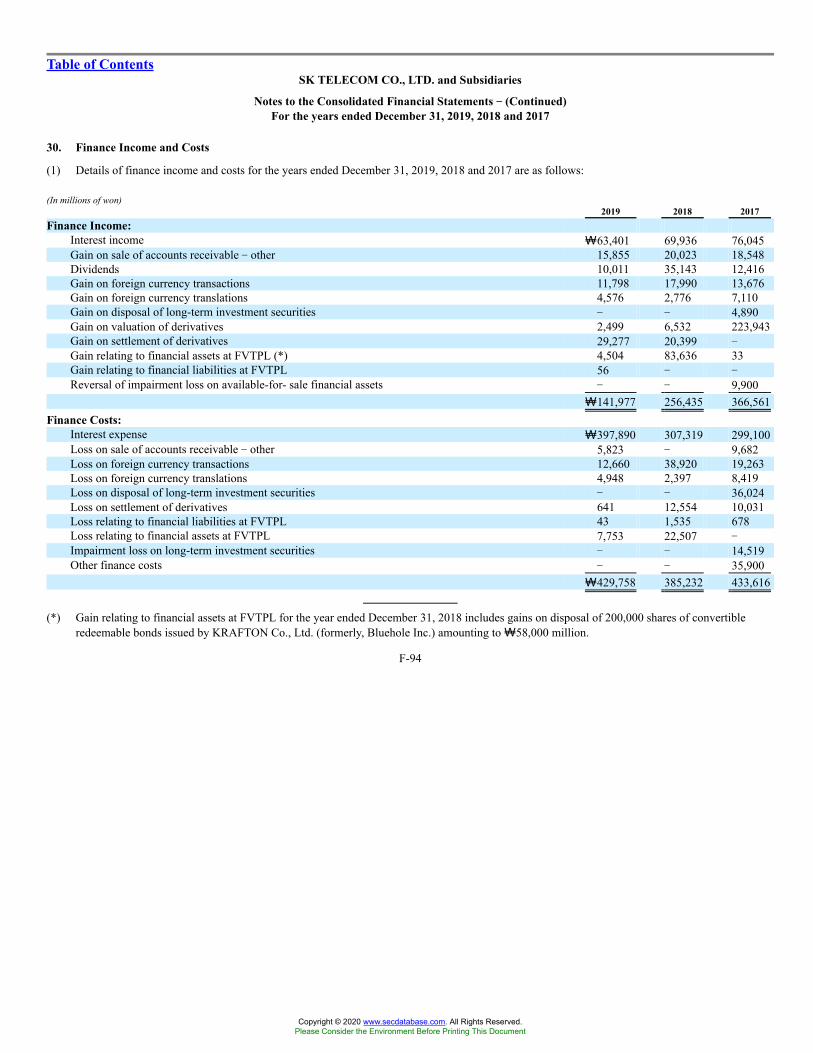
Table of ContentsSK TELECOM CO., LTD. and Subsidiaries
Notes to the Consolidated Financial Statements �� (Continued)For the years ended December 31, 2019, 2018 and 2017
30. Finance Income and Costs
(1) Details of finance income and costs for the years ended December 31, 2019, 2018 and 2017 are as follows:
(In millions of won)2019 2018 2017
Finance Income:Interest income ₩63,401 69,936 76,045Gain on sale of accounts receivable � other 15,855 20,023 18,548Dividends 10,011 35,143 12,416Gain on foreign currency transactions 11,798 17,990 13,676Gain on foreign currency translations 4,576 2,776 7,110Gain on disposal of long-term investment securities � � 4,890Gain on valuation of derivatives 2,499 6,532 223,943Gain on settlement of derivatives 29,277 20,399 �Gain relating to financial assets at FVTPL (*) 4,504 83,636 33Gain relating to financial liabilities at FVTPL 56 � �Reversal of impairment loss on available-for- sale financial assets � � 9,900
₩141,977 256,435 366,561Finance Costs:
Interest expense ₩397,890 307,319 299,100Loss on sale of accounts receivable � other 5,823 � 9,682Loss on foreign currency transactions 12,660 38,920 19,263Loss on foreign currency translations 4,948 2,397 8,419Loss on disposal of long-term investment securities � � 36,024Loss on settlement of derivatives 641 12,554 10,031Loss relating to financial liabilities at FVTPL 43 1,535 678Loss relating to financial assets at FVTPL 7,753 22,507 �Impairment loss on long-term investment securities � � 14,519Other finance costs � � 35,900
₩429,758 385,232 433,616
(*) Gain relating to financial assets at FVTPL for the year ended December 31, 2018 includes gains on disposal of 200,000 shares of convertibleredeemable bonds issued by KRAFTON Co., Ltd. (formerly, Bluehole Inc.) amounting to ₩58,000 million.
F-94
Copyright © 2020 www.secdatabase.com. All Rights Reserved.Please Consider the Environment Before Printing This Document
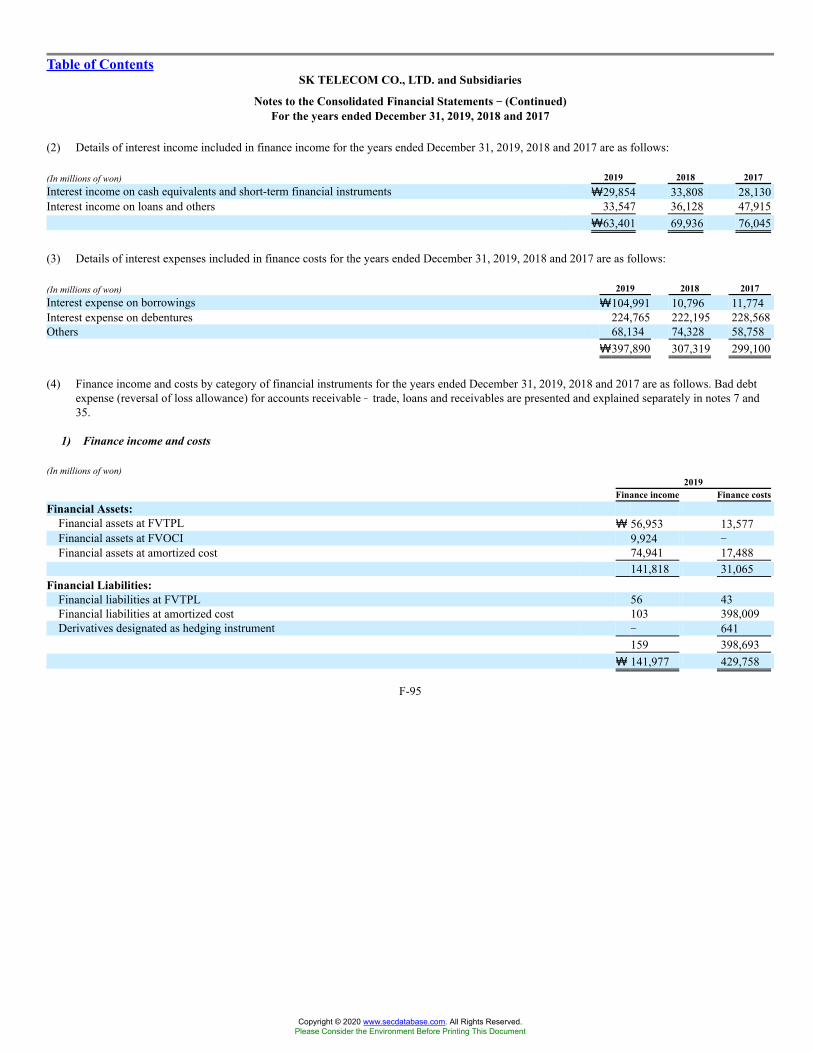
Table of ContentsSK TELECOM CO., LTD. and Subsidiaries
Notes to the Consolidated Financial Statements �� (Continued)For the years ended December 31, 2019, 2018 and 2017
(2) Details of interest income included in finance income for the years ended December 31, 2019, 2018 and 2017 are as follows:
(In millions of won) 2019 2018 2017Interest income on cash equivalents and short-term financial instruments ₩29,854 33,808 28,130Interest income on loans and others 33,547 36,128 47,915
₩63,401 69,936 76,045
(3) Details of interest expenses included in finance costs for the years ended December 31, 2019, 2018 and 2017 are as follows:
(In millions of won) 2019 2018 2017Interest expense on borrowings ₩104,991 10,796 11,774Interest expense on debentures 224,765 222,195 228,568Others 68,134 74,328 58,758
₩397,890 307,319 299,100
(4) Finance income and costs by category of financial instruments for the years ended December 31, 2019, 2018 and 2017 are as follows. Bad debtexpense (reversal of loss allowance) for accounts receivable � trade, loans and receivables are presented and explained separately in notes 7 and35.
1) Finance income and costs
(In millions of won)2019
Finance income Finance costsFinancial Assets:
Financial assets at FVTPL ₩ 56,953 13,577Financial assets at FVOCI 9,924 �Financial assets at amortized cost 74,941 17,488
141,818 31,065Financial Liabilities:
Financial liabilities at FVTPL 56 43Financial liabilities at amortized cost 103 398,009Derivatives designated as hedging instrument � 641
159 398,693₩ 141,977 429,758
F-95
Copyright © 2020 www.secdatabase.com. All Rights Reserved.Please Consider the Environment Before Printing This Document
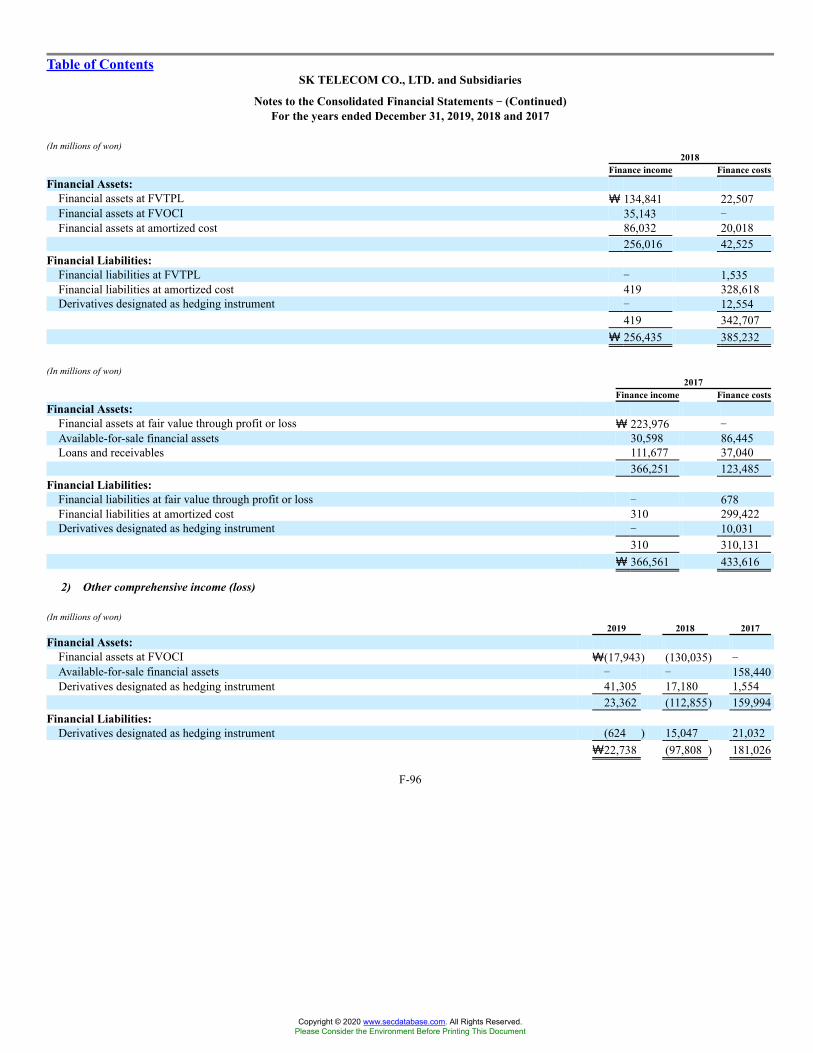
Table of ContentsSK TELECOM CO., LTD. and Subsidiaries
Notes to the Consolidated Financial Statements �� (Continued)For the years ended December 31, 2019, 2018 and 2017
(In millions of won)2018
Finance income Finance costsFinancial Assets:
Financial assets at FVTPL ₩ 134,841 22,507Financial assets at FVOCI 35,143 �Financial assets at amortized cost 86,032 20,018
256,016 42,525Financial Liabilities:
Financial liabilities at FVTPL � 1,535Financial liabilities at amortized cost 419 328,618Derivatives designated as hedging instrument � 12,554
419 342,707₩ 256,435 385,232
(In millions of won)2017
Finance income Finance costsFinancial Assets:
Financial assets at fair value through profit or loss ₩ 223,976 �Available-for-sale financial assets 30,598 86,445Loans and receivables 111,677 37,040
366,251 123,485Financial Liabilities:
Financial liabilities at fair value through profit or loss � 678Financial liabilities at amortized cost 310 299,422Derivatives designated as hedging instrument � 10,031
310 310,131₩ 366,561 433,616
2) Other comprehensive income (loss)
(In millions of won)2019 2018 2017
Financial Assets:Financial assets at FVOCI ₩(17,943) (130,035) �Available-for-sale financial assets � � 158,440Derivatives designated as hedging instrument 41,305 17,180 1,554
23,362 (112,855) 159,994Financial Liabilities:
Derivatives designated as hedging instrument (624 ) 15,047 21,032₩22,738 (97,808 ) 181,026
F-96
Copyright © 2020 www.secdatabase.com. All Rights Reserved.Please Consider the Environment Before Printing This Document
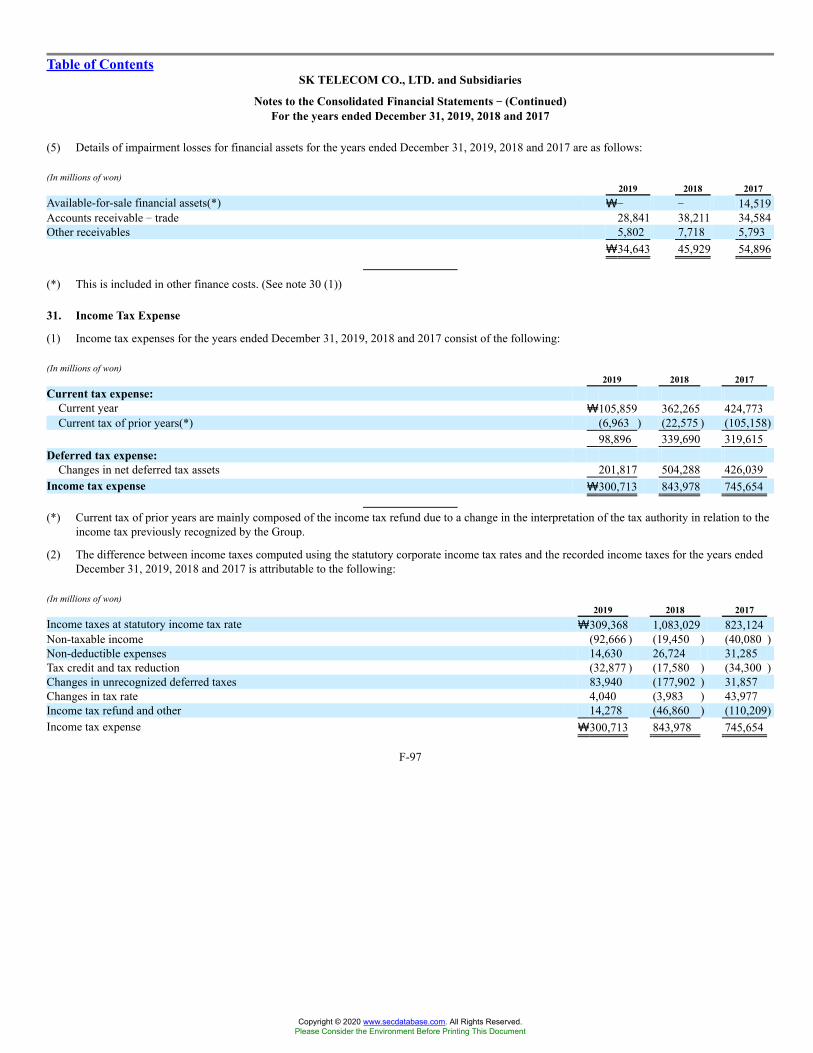
Table of ContentsSK TELECOM CO., LTD. and Subsidiaries
Notes to the Consolidated Financial Statements �� (Continued)For the years ended December 31, 2019, 2018 and 2017
(5) Details of impairment losses for financial assets for the years ended December 31, 2019, 2018 and 2017 are as follows:
(In millions of won)2019 2018 2017
Available-for-sale financial assets(*) ₩� � 14,519Accounts receivable � trade 28,841 38,211 34,584Other receivables 5,802 7,718 5,793
₩34,643 45,929 54,896
(*) This is included in other finance costs. (See note 30 (1))
31. Income Tax Expense
(1) Income tax expenses for the years ended December 31, 2019, 2018 and 2017 consist of the following:
(In millions of won)2019 2018 2017
Current tax expense:Current year ₩105,859 362,265 424,773Current tax of prior years(*) (6,963 ) (22,575 ) (105,158)
98,896 339,690 319,615Deferred tax expense:
Changes in net deferred tax assets 201,817 504,288 426,039Income tax expense ₩300,713 843,978 745,654
(*) Current tax of prior years are mainly composed of the income tax refund due to a change in the interpretation of the tax authority in relation to theincome tax previously recognized by the Group.
(2) The difference between income taxes computed using the statutory corporate income tax rates and the recorded income taxes for the years endedDecember 31, 2019, 2018 and 2017 is attributable to the following:
(In millions of won)2019 2018 2017
Income taxes at statutory income tax rate ₩309,368 1,083,029 823,124Non-taxable income (92,666 ) (19,450 ) (40,080 )Non-deductible expenses 14,630 26,724 31,285Tax credit and tax reduction (32,877 ) (17,580 ) (34,300 )Changes in unrecognized deferred taxes 83,940 (177,902 ) 31,857Changes in tax rate 4,040 (3,983 ) 43,977Income tax refund and other 14,278 (46,860 ) (110,209)Income tax expense ₩300,713 843,978 745,654
F-97
Copyright © 2020 www.secdatabase.com. All Rights Reserved.Please Consider the Environment Before Printing This Document
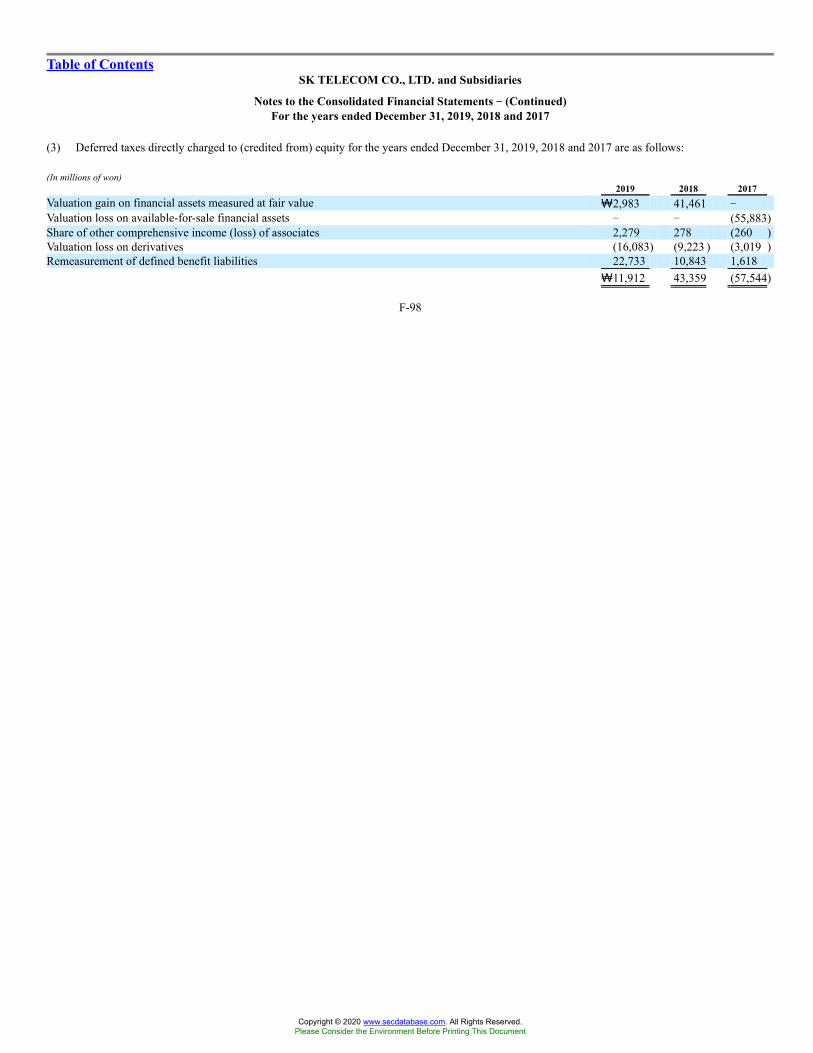
Table of ContentsSK TELECOM CO., LTD. and Subsidiaries
Notes to the Consolidated Financial Statements �� (Continued)For the years ended December 31, 2019, 2018 and 2017
(3) Deferred taxes directly charged to (credited from) equity for the years ended December 31, 2019, 2018 and 2017 are as follows:
(In millions of won)2019 2018 2017
Valuation gain on financial assets measured at fair value ₩2,983 41,461 �Valuation loss on available-for-sale financial assets � � (55,883)Share of other comprehensive income (loss) of associates 2,279 278 (260 )Valuation loss on derivatives (16,083) (9,223 ) (3,019 )Remeasurement of defined benefit liabilities 22,733 10,843 1,618
₩11,912 43,359 (57,544)
F-98
Copyright © 2020 www.secdatabase.com. All Rights Reserved.Please Consider the Environment Before Printing This Document
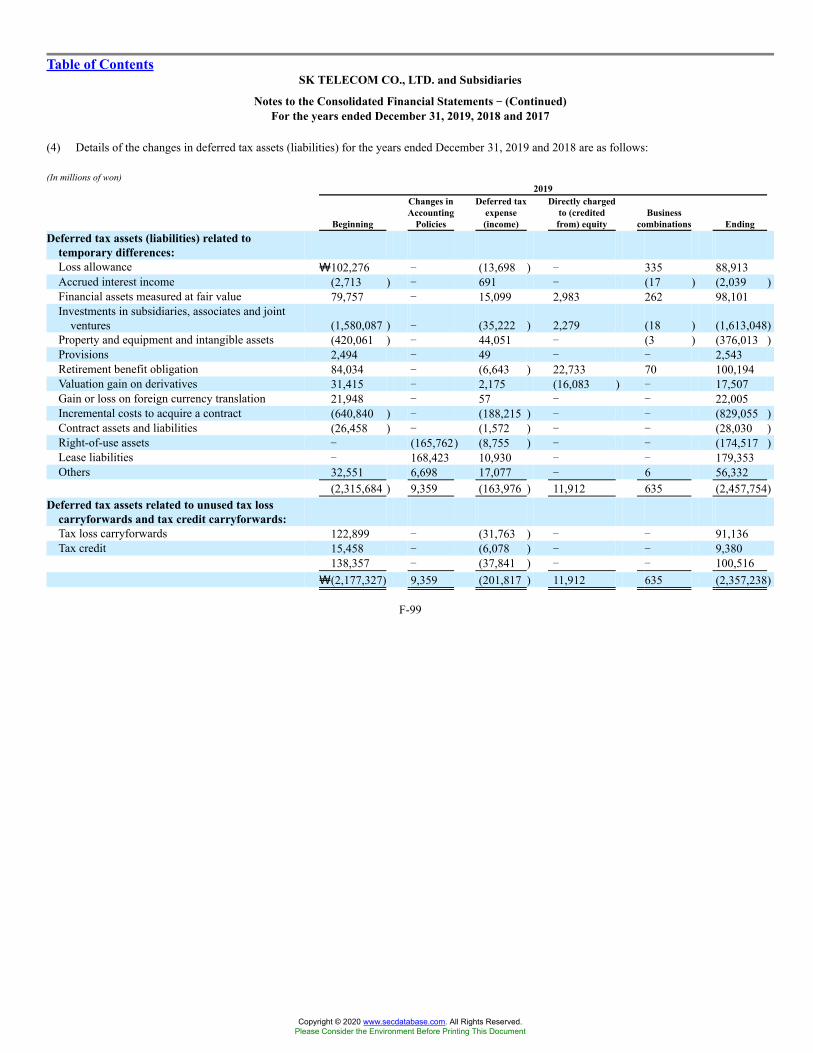
Table of ContentsSK TELECOM CO., LTD. and Subsidiaries
Notes to the Consolidated Financial Statements �� (Continued)For the years ended December 31, 2019, 2018 and 2017
(4) Details of the changes in deferred tax assets (liabilities) for the years ended December 31, 2019 and 2018 are as follows:
(In millions of won)2019
Beginning
Changes inAccounting
Policies
Deferred taxexpense(income)
Directly chargedto (creditedfrom) equity
Businesscombinations Ending
Deferred tax assets (liabilities) related totemporary differences:Loss allowance ₩102,276 � (13,698 ) � 335 88,913Accrued interest income (2,713 ) � 691 � (17 ) (2,039 )Financial assets measured at fair value 79,757 � 15,099 2,983 262 98,101Investments in subsidiaries, associates and joint
ventures (1,580,087 ) � (35,222 ) 2,279 (18 ) (1,613,048)Property and equipment and intangible assets (420,061 ) � 44,051 � (3 ) (376,013 )Provisions 2,494 � 49 � � 2,543Retirement benefit obligation 84,034 � (6,643 ) 22,733 70 100,194Valuation gain on derivatives 31,415 � 2,175 (16,083 ) � 17,507Gain or loss on foreign currency translation 21,948 � 57 � � 22,005Incremental costs to acquire a contract (640,840 ) � (188,215 ) � � (829,055 )Contract assets and liabilities (26,458 ) � (1,572 ) � � (28,030 )Right-of-use assets � (165,762) (8,755 ) � � (174,517 )Lease liabilities � 168,423 10,930 � � 179,353Others 32,551 6,698 17,077 � 6 56,332
(2,315,684 ) 9,359 (163,976 ) 11,912 635 (2,457,754)Deferred tax assets related to unused tax loss
carryforwards and tax credit carryforwards:Tax loss carryforwards 122,899 � (31,763 ) � � 91,136Tax credit 15,458 � (6,078 ) � � 9,380
138,357 � (37,841 ) � � 100,516₩(2,177,327) 9,359 (201,817 ) 11,912 635 (2,357,238)
F-99
Copyright © 2020 www.secdatabase.com. All Rights Reserved.Please Consider the Environment Before Printing This Document
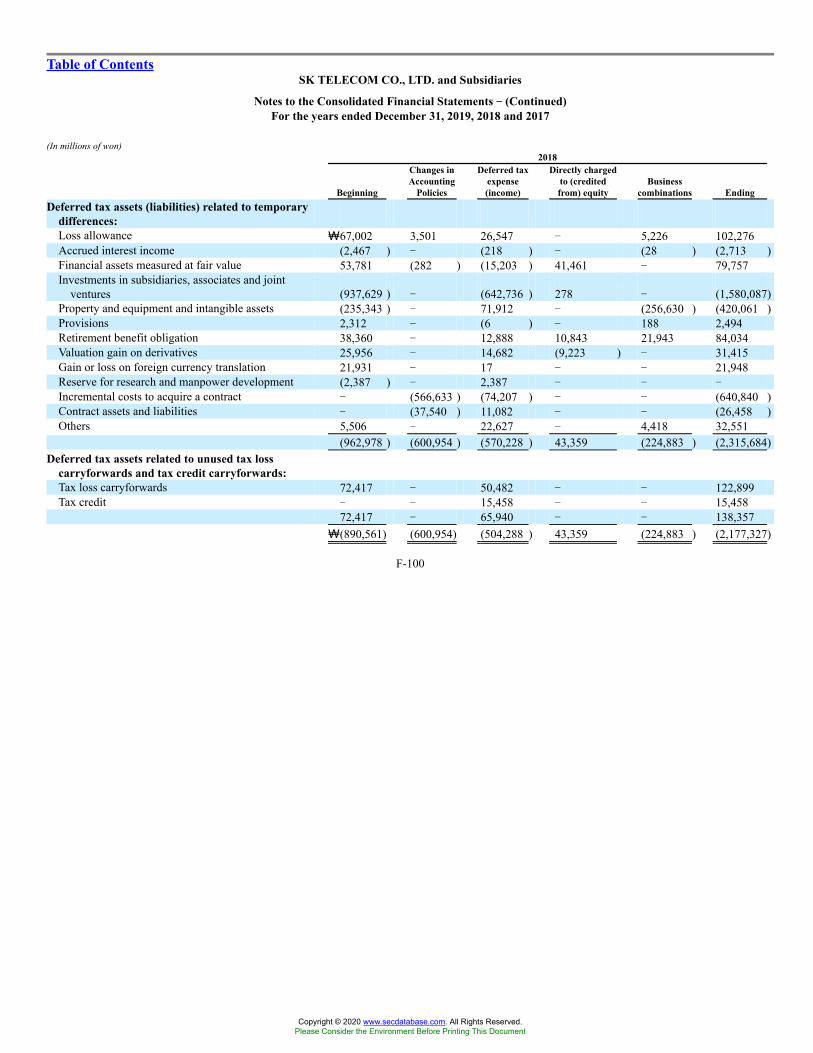
Table of ContentsSK TELECOM CO., LTD. and Subsidiaries
Notes to the Consolidated Financial Statements �� (Continued)For the years ended December 31, 2019, 2018 and 2017
(In millions of won)2018
Beginning
Changes inAccounting
Policies
Deferred taxexpense(income)
Directly chargedto (creditedfrom) equity
Businesscombinations Ending
Deferred tax assets (liabilities) related to temporarydifferences:Loss allowance ₩67,002 3,501 26,547 � 5,226 102,276Accrued interest income (2,467 ) � (218 ) � (28 ) (2,713 )Financial assets measured at fair value 53,781 (282 ) (15,203 ) 41,461 � 79,757Investments in subsidiaries, associates and joint
ventures (937,629 ) � (642,736 ) 278 � (1,580,087)Property and equipment and intangible assets (235,343 ) � 71,912 � (256,630 ) (420,061 )Provisions 2,312 � (6 ) � 188 2,494Retirement benefit obligation 38,360 � 12,888 10,843 21,943 84,034Valuation gain on derivatives 25,956 � 14,682 (9,223 ) � 31,415Gain or loss on foreign currency translation 21,931 � 17 � � 21,948Reserve for research and manpower development (2,387 ) � 2,387 � � �Incremental costs to acquire a contract � (566,633 ) (74,207 ) � � (640,840 )Contract assets and liabilities � (37,540 ) 11,082 � � (26,458 )Others 5,506 � 22,627 � 4,418 32,551
(962,978 ) (600,954 ) (570,228 ) 43,359 (224,883 ) (2,315,684)Deferred tax assets related to unused tax loss
carryforwards and tax credit carryforwards:Tax loss carryforwards 72,417 � 50,482 � � 122,899Tax credit � � 15,458 � � 15,458
72,417 � 65,940 � � 138,357₩(890,561) (600,954) (504,288 ) 43,359 (224,883 ) (2,177,327)
F-100
Copyright © 2020 www.secdatabase.com. All Rights Reserved.Please Consider the Environment Before Printing This Document
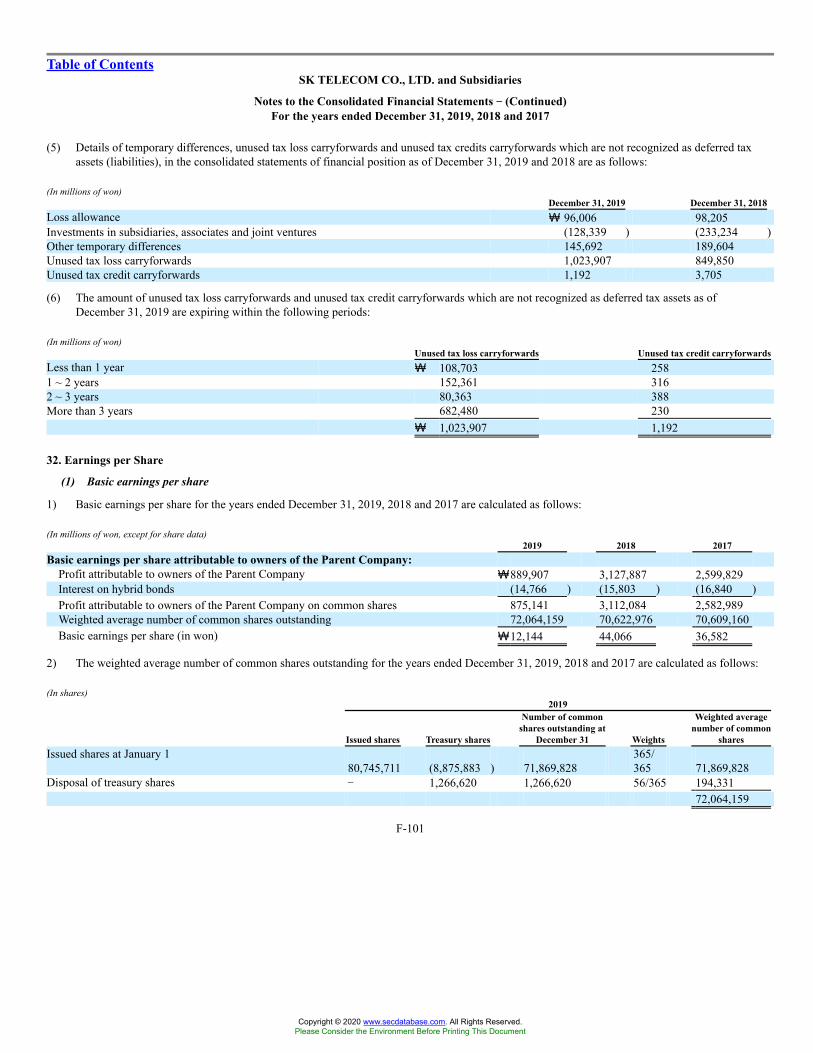
Table of ContentsSK TELECOM CO., LTD. and Subsidiaries
Notes to the Consolidated Financial Statements �� (Continued)For the years ended December 31, 2019, 2018 and 2017
(5) Details of temporary differences, unused tax loss carryforwards and unused tax credits carryforwards which are not recognized as deferred taxassets (liabilities), in the consolidated statements of financial position as of December 31, 2019 and 2018 are as follows:
(In millions of won)December 31, 2019 December 31, 2018
Loss allowance ₩ 96,006 98,205Investments in subsidiaries, associates and joint ventures (128,339 ) (233,234 )Other temporary differences 145,692 189,604Unused tax loss carryforwards 1,023,907 849,850Unused tax credit carryforwards 1,192 3,705
(6) The amount of unused tax loss carryforwards and unused tax credit carryforwards which are not recognized as deferred tax assets as ofDecember 31, 2019 are expiring within the following periods:
(In millions of won)Unused tax loss carryforwards Unused tax credit carryforwards
Less than 1 year ₩ 108,703 2581 ~ 2 years 152,361 3162 ~ 3 years 80,363 388More than 3 years 682,480 230
₩ 1,023,907 1,192
32. Earnings per Share
(1) Basic earnings per share
1) Basic earnings per share for the years ended December 31, 2019, 2018 and 2017 are calculated as follows:
(In millions of won, except for share data)2019 2018 2017
Basic earnings per share attributable to owners of the Parent Company:Profit attributable to owners of the Parent Company ₩889,907 3,127,887 2,599,829Interest on hybrid bonds (14,766 ) (15,803 ) (16,840 )Profit attributable to owners of the Parent Company on common shares 875,141 3,112,084 2,582,989Weighted average number of common shares outstanding 72,064,159 70,622,976 70,609,160Basic earnings per share (in won) ₩12,144 44,066 36,582
2) The weighted average number of common shares outstanding for the years ended December 31, 2019, 2018 and 2017 are calculated as follows:
(In shares)2019
Issued shares Treasury shares
Number of commonshares outstanding at
December 31 Weights
Weighted averagenumber of common
sharesIssued shares at January 1
80,745,711 (8,875,883 ) 71,869,828365/365 71,869,828
Disposal of treasury shares � 1,266,620 1,266,620 56/365 194,33172,064,159
F-101
Copyright © 2020 www.secdatabase.com. All Rights Reserved.Please Consider the Environment Before Printing This Document
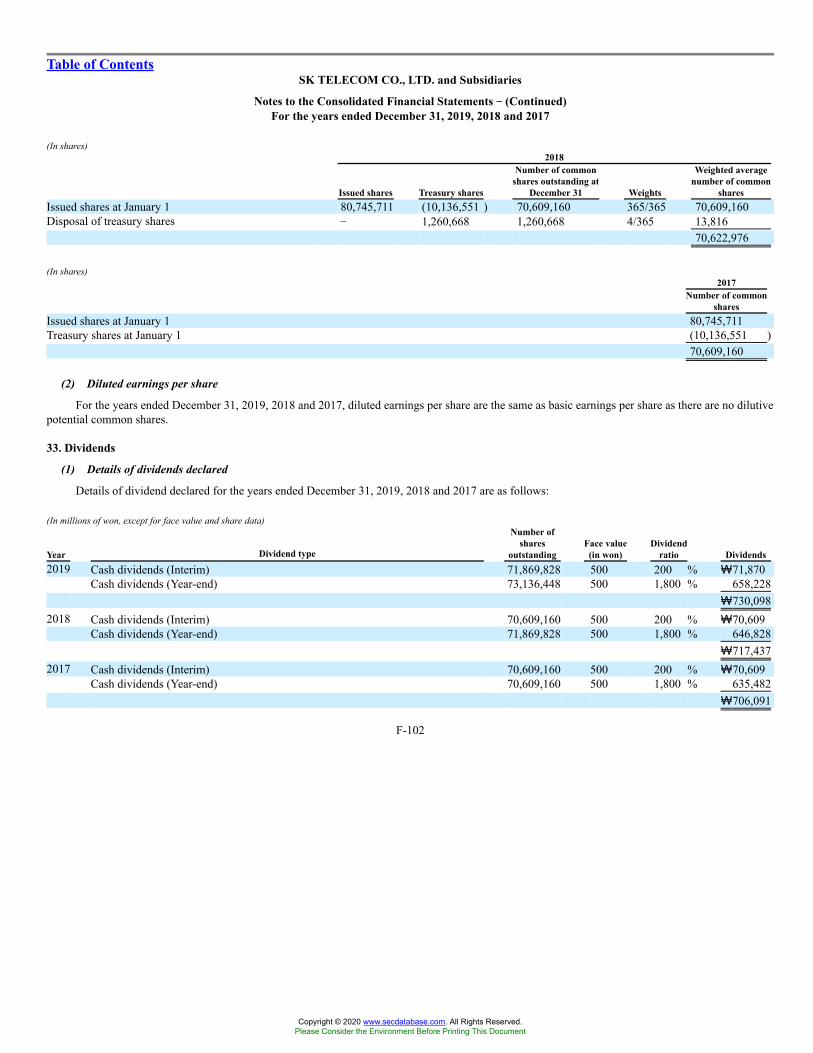
Table of ContentsSK TELECOM CO., LTD. and Subsidiaries
Notes to the Consolidated Financial Statements �� (Continued)For the years ended December 31, 2019, 2018 and 2017
(In shares)2018
Issued shares Treasury shares
Number of commonshares outstanding at
December 31 Weights
Weighted averagenumber of common
sharesIssued shares at January 1 80,745,711 (10,136,551 ) 70,609,160 365/365 70,609,160Disposal of treasury shares � 1,260,668 1,260,668 4/365 13,816
70,622,976
(In shares)2017
Number of commonshares
Issued shares at January 1 80,745,711Treasury shares at January 1 (10,136,551 )
70,609,160
(2) Diluted earnings per share
For the years ended December 31, 2019, 2018 and 2017, diluted earnings per share are the same as basic earnings per share as there are no dilutivepotential common shares.
33. Dividends
(1) Details of dividends declared
Details of dividend declared for the years ended December 31, 2019, 2018 and 2017 are as follows:
(In millions of won, except for face value and share data)
Year Dividend type
Number ofshares
outstandingFace value(in won)
Dividendratio Dividends
2019 Cash dividends (Interim) 71,869,828 500 200 % ₩71,870Cash dividends (Year-end) 73,136,448 500 1,800 % 658,228
₩730,0982018 Cash dividends (Interim) 70,609,160 500 200 % ₩70,609
Cash dividends (Year-end) 71,869,828 500 1,800 % 646,828₩717,437
2017 Cash dividends (Interim) 70,609,160 500 200 % ₩70,609Cash dividends (Year-end) 70,609,160 500 1,800 % 635,482
₩706,091
F-102
Copyright © 2020 www.secdatabase.com. All Rights Reserved.Please Consider the Environment Before Printing This Document
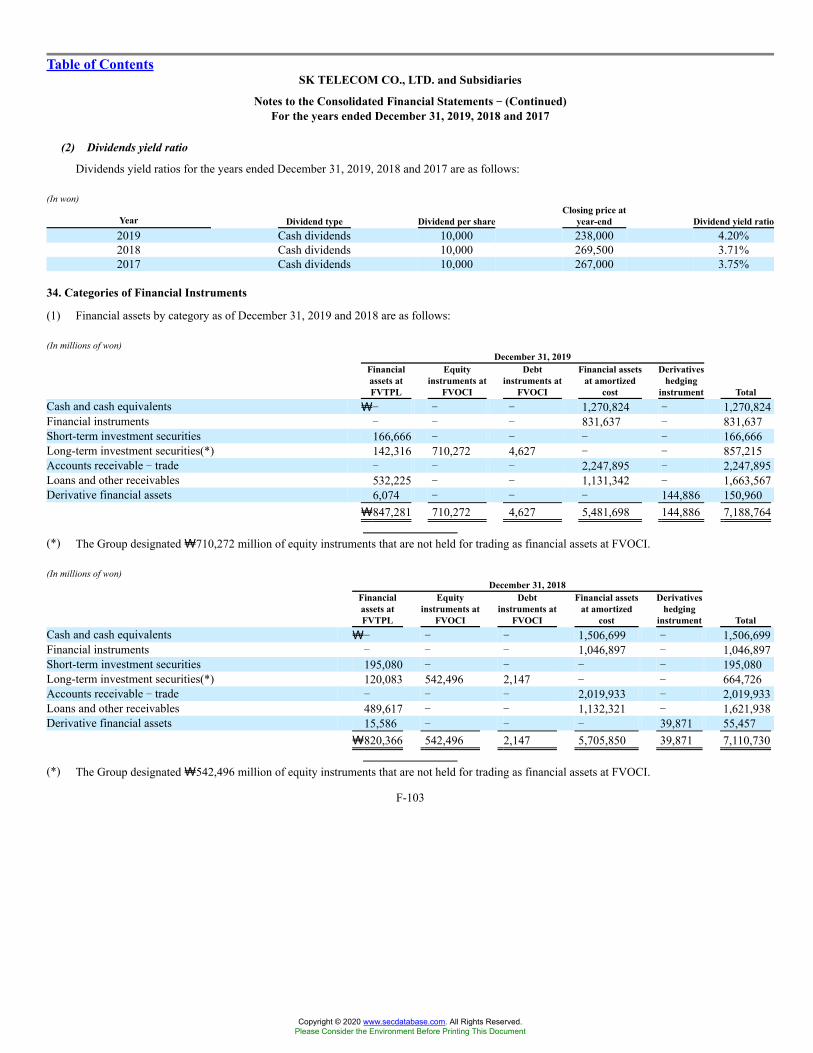
Table of ContentsSK TELECOM CO., LTD. and Subsidiaries
Notes to the Consolidated Financial Statements �� (Continued)For the years ended December 31, 2019, 2018 and 2017
(2) Dividends yield ratio
Dividends yield ratios for the years ended December 31, 2019, 2018 and 2017 are as follows:
(In won)
Year Dividend type Dividend per shareClosing price at
year-end Dividend yield ratio2019 Cash dividends 10,000 238,000 4.20%2018 Cash dividends 10,000 269,500 3.71%2017 Cash dividends 10,000 267,000 3.75%
34. Categories of Financial Instruments
(1) Financial assets by category as of December 31, 2019 and 2018 are as follows:
(In millions of won)December 31, 2019
Financialassets atFVTPL
Equityinstruments at
FVOCI
Debtinstruments at
FVOCI
Financial assetsat amortized
cost
Derivativeshedging
instrument TotalCash and cash equivalents ₩� � � 1,270,824 � 1,270,824Financial instruments � � � 831,637 � 831,637Short-term investment securities 166,666 � � � � 166,666Long-term investment securities(*) 142,316 710,272 4,627 � � 857,215Accounts receivable � trade � � � 2,247,895 � 2,247,895Loans and other receivables 532,225 � � 1,131,342 � 1,663,567Derivative financial assets 6,074 � � � 144,886 150,960
₩847,281 710,272 4,627 5,481,698 144,886 7,188,764
(*) The Group designated ₩710,272 million of equity instruments that are not held for trading as financial assets at FVOCI.
(In millions of won)December 31, 2018
Financialassets atFVTPL
Equityinstruments at
FVOCI
Debtinstruments at
FVOCI
Financial assetsat amortized
cost
Derivativeshedging
instrument TotalCash and cash equivalents ₩� � � 1,506,699 � 1,506,699Financial instruments � � � 1,046,897 � 1,046,897Short-term investment securities 195,080 � � � � 195,080Long-term investment securities(*) 120,083 542,496 2,147 � � 664,726Accounts receivable � trade � � � 2,019,933 � 2,019,933Loans and other receivables 489,617 � � 1,132,321 � 1,621,938Derivative financial assets 15,586 � � � 39,871 55,457
₩820,366 542,496 2,147 5,705,850 39,871 7,110,730
(*) The Group designated ₩542,496 million of equity instruments that are not held for trading as financial assets at FVOCI.
F-103
Copyright © 2020 www.secdatabase.com. All Rights Reserved.Please Consider the Environment Before Printing This Document
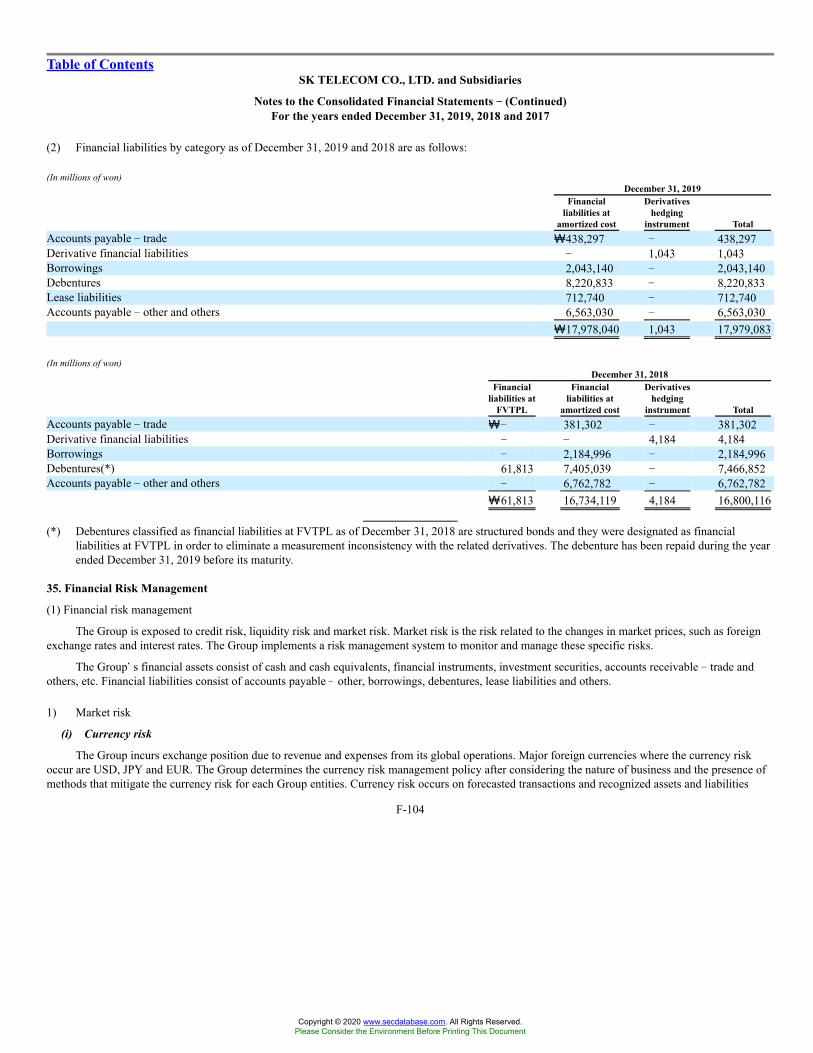
Table of ContentsSK TELECOM CO., LTD. and Subsidiaries
Notes to the Consolidated Financial Statements �� (Continued)For the years ended December 31, 2019, 2018 and 2017
(2) Financial liabilities by category as of December 31, 2019 and 2018 are as follows:
(In millions of won)December 31, 2019
Financialliabilities at
amortized cost
Derivativeshedging
instrument TotalAccounts payable � trade ₩438,297 � 438,297Derivative financial liabilities � 1,043 1,043Borrowings 2,043,140 � 2,043,140Debentures 8,220,833 � 8,220,833Lease liabilities 712,740 � 712,740Accounts payable � other and others 6,563,030 � 6,563,030
₩17,978,040 1,043 17,979,083
(In millions of won)December 31, 2018
Financialliabilities at
FVTPL
Financialliabilities at
amortized cost
Derivativeshedging
instrument TotalAccounts payable � trade ₩� 381,302 � 381,302Derivative financial liabilities � � 4,184 4,184Borrowings � 2,184,996 � 2,184,996Debentures(*) 61,813 7,405,039 � 7,466,852Accounts payable � other and others � 6,762,782 � 6,762,782
₩61,813 16,734,119 4,184 16,800,116
(*) Debentures classified as financial liabilities at FVTPL as of December 31, 2018 are structured bonds and they were designated as financialliabilities at FVTPL in order to eliminate a measurement inconsistency with the related derivatives. The debenture has been repaid during the yearended December 31, 2019 before its maturity.
35. Financial Risk Management
(1) Financial risk management
The Group is exposed to credit risk, liquidity risk and market risk. Market risk is the risk related to the changes in market prices, such as foreignexchange rates and interest rates. The Group implements a risk management system to monitor and manage these specific risks.
The Group�s financial assets consist of cash and cash equivalents, financial instruments, investment securities, accounts receivable � trade andothers, etc. Financial liabilities consist of accounts payable � other, borrowings, debentures, lease liabilities and others.
1) Market risk
(i) Currency risk
The Group incurs exchange position due to revenue and expenses from its global operations. Major foreign currencies where the currency riskoccur are USD, JPY and EUR. The Group determines the currency risk management policy after considering the nature of business and the presence ofmethods that mitigate the currency risk for each Group entities. Currency risk occurs on forecasted transactions and recognized assets and liabilities
F-104
Copyright © 2020 www.secdatabase.com. All Rights Reserved.Please Consider the Environment Before Printing This Document
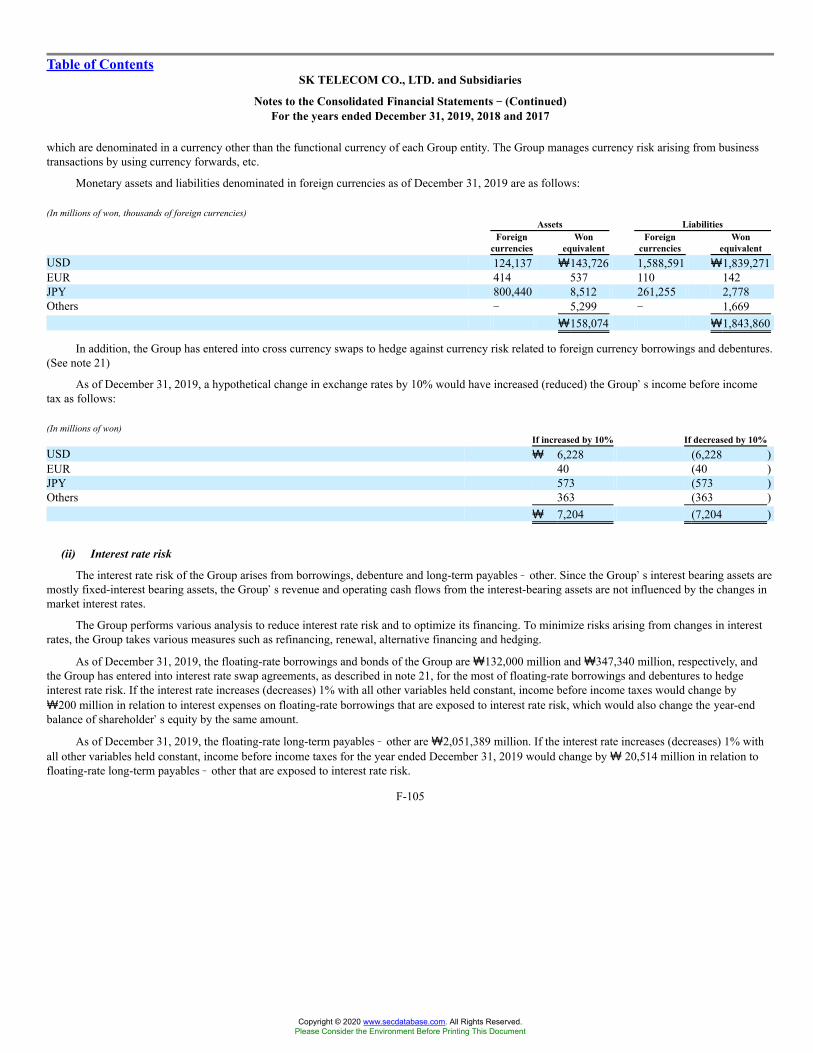
Table of ContentsSK TELECOM CO., LTD. and Subsidiaries
Notes to the Consolidated Financial Statements �� (Continued)For the years ended December 31, 2019, 2018 and 2017
which are denominated in a currency other than the functional currency of each Group entity. The Group manages currency risk arising from businesstransactions by using currency forwards, etc.
Monetary assets and liabilities denominated in foreign currencies as of December 31, 2019 are as follows:
(In millions of won, thousands of foreign currencies)Assets Liabilities
Foreigncurrencies
Wonequivalent
Foreigncurrencies
Wonequivalent
USD 124,137 ₩143,726 1,588,591 ₩1,839,271EUR 414 537 110 142JPY 800,440 8,512 261,255 2,778Others � 5,299 � 1,669
₩158,074 ₩1,843,860
In addition, the Group has entered into cross currency swaps to hedge against currency risk related to foreign currency borrowings and debentures.(See note 21)
As of December 31, 2019, a hypothetical change in exchange rates by 10% would have increased (reduced) the Group�s income before incometax as follows:
(In millions of won)If increased by 10% If decreased by 10%
USD ₩ 6,228 (6,228 )EUR 40 (40 )JPY 573 (573 )Others 363 (363 )
₩ 7,204 (7,204 )
(ii) Interest rate risk
The interest rate risk of the Group arises from borrowings, debenture and long-term payables � other. Since the Group�s interest bearing assets aremostly fixed-interest bearing assets, the Group�s revenue and operating cash flows from the interest-bearing assets are not influenced by the changes inmarket interest rates.
The Group performs various analysis to reduce interest rate risk and to optimize its financing. To minimize risks arising from changes in interestrates, the Group takes various measures such as refinancing, renewal, alternative financing and hedging.
As of December 31, 2019, the floating-rate borrowings and bonds of the Group are ₩132,000 million and ₩347,340 million, respectively, andthe Group has entered into interest rate swap agreements, as described in note 21, for the most of floating-rate borrowings and debentures to hedgeinterest rate risk. If the interest rate increases (decreases) 1% with all other variables held constant, income before income taxes would change by₩200 million in relation to interest expenses on floating-rate borrowings that are exposed to interest rate risk, which would also change the year-endbalance of shareholder�s equity by the same amount.
As of December 31, 2019, the floating-rate long-term payables � other are ₩2,051,389 million. If the interest rate increases (decreases) 1% withall other variables held constant, income before income taxes for the year ended December 31, 2019 would change by ₩ 20,514 million in relation tofloating-rate long-term payables � other that are exposed to interest rate risk.
F-105
Copyright © 2020 www.secdatabase.com. All Rights Reserved.Please Consider the Environment Before Printing This Document
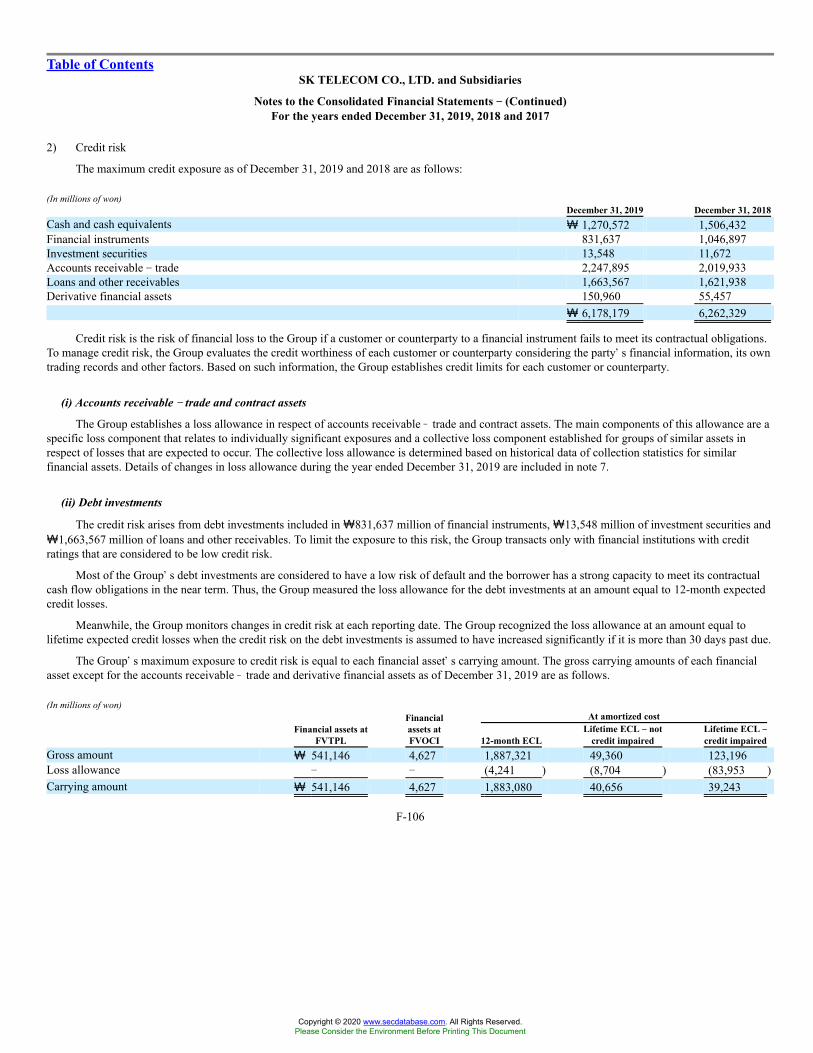
Table of ContentsSK TELECOM CO., LTD. and Subsidiaries
Notes to the Consolidated Financial Statements �� (Continued)For the years ended December 31, 2019, 2018 and 2017
2) Credit risk
The maximum credit exposure as of December 31, 2019 and 2018 are as follows:
(In millions of won)December 31, 2019 December 31, 2018
Cash and cash equivalents ₩ 1,270,572 1,506,432Financial instruments 831,637 1,046,897Investment securities 13,548 11,672Accounts receivable � trade 2,247,895 2,019,933Loans and other receivables 1,663,567 1,621,938Derivative financial assets 150,960 55,457
₩ 6,178,179 6,262,329
Credit risk is the risk of financial loss to the Group if a customer or counterparty to a financial instrument fails to meet its contractual obligations.To manage credit risk, the Group evaluates the credit worthiness of each customer or counterparty considering the party�s financial information, its owntrading records and other factors. Based on such information, the Group establishes credit limits for each customer or counterparty.
(i) Accounts receivable �� trade and contract assets
The Group establishes a loss allowance in respect of accounts receivable � trade and contract assets. The main components of this allowance are aspecific loss component that relates to individually significant exposures and a collective loss component established for groups of similar assets inrespect of losses that are expected to occur. The collective loss allowance is determined based on historical data of collection statistics for similarfinancial assets. Details of changes in loss allowance during the year ended December 31, 2019 are included in note 7.
(ii) Debt investments
The credit risk arises from debt investments included in ₩831,637 million of financial instruments, ₩13,548 million of investment securities and₩1,663,567 million of loans and other receivables. To limit the exposure to this risk, the Group transacts only with financial institutions with creditratings that are considered to be low credit risk.
Most of the Group�s debt investments are considered to have a low risk of default and the borrower has a strong capacity to meet its contractualcash flow obligations in the near term. Thus, the Group measured the loss allowance for the debt investments at an amount equal to 12-month expectedcredit losses.
Meanwhile, the Group monitors changes in credit risk at each reporting date. The Group recognized the loss allowance at an amount equal tolifetime expected credit losses when the credit risk on the debt investments is assumed to have increased significantly if it is more than 30 days past due.
The Group�s maximum exposure to credit risk is equal to each financial asset�s carrying amount. The gross carrying amounts of each financialasset except for the accounts receivable � trade and derivative financial assets as of December 31, 2019 are as follows.
(In millions of won)At amortized cost
Financial assets atFVTPL
Financialassets atFVOCI 12-month ECL
Lifetime ECL �� notcredit impaired
Lifetime ECL ��credit impaired
Gross amount ₩ 541,146 4,627 1,887,321 49,360 123,196Loss allowance � � (4,241 ) (8,704 ) (83,953 )Carrying amount ₩ 541,146 4,627 1,883,080 40,656 39,243
F-106
Copyright © 2020 www.secdatabase.com. All Rights Reserved.Please Consider the Environment Before Printing This Document

Table of ContentsSK TELECOM CO., LTD. and Subsidiaries
Notes to the Consolidated Financial Statements �� (Continued)For the years ended December 31, 2019, 2018 and 2017
Changes in the loss allowance for the debt investments during the year ended December 31, 2019 are as follows:
(In millions of won)
12-month ECLLifetime ECL �� not
credit impairedLifetime ECL �� credit
impaired TotalJanuary 1, 2019 ₩ 3,305 10,760 101,823 115,888
Remeasurement of loss allowance, net 1,316 1,334 3,942 6,592Transfer to lifetime ECL � not credit impaired (380 ) 380 � �Transfer to lifetime ECL � credit impaired � (2,790 ) 2,790 �Amounts written off � (1,515 ) (32,165 ) (33,680 )Recovery of amounts written off � � 7,563 7,563Business combinations � 535 � 535
December 31, 2019 ₩ 4,241 8,704 83,953 96,898
(iii) Cash and cash equivalents
The Group has ₩1,270,572 million of cash and cash equivalents with banks and financial institutions above specific credit ratings as ofDecember 31, 2019. (₩1,506,432 million as of December 31, 2018).
Impairment on cash and cash equivalents has been measured on a 12-month expected loss basis and reflects the short maturities of the exposures.The Group considered that its cash and cash equivalents have low credit risk based on the credit ratings of the counterparties assigned by external creditrating agencies.
3) Liquidity risk
The Group�s approach to managing liquidity is to ensure that it will always maintain sufficient cash and cash equivalents balances and haveenough liquidity through various committed credit lines. The Group maintains enough liquidity within credit lines through active operating activities.
Contractual maturities of financial liabilities as of December 31, 2019 are as follows:
(In millions of won)Carryingamount
Contractualcash flows
Less than1 year 1 - 5 years
More than5 years
Accounts payable � trade ₩ 438,297 438,297 438,297 � �Borrowings(*) 2,043,140 2,412,647 159,416 2,253,231 �Debentures(*) 8,220,833 9,493,178 1,184,309 5,237,357 3,071,512Lease liabilities 712,740 757,871 315,793 335,727 106,351Accounts payable � other and others(*) 6,563,030 6,704,379 5,005,857 1,124,389 574,133
₩ 17,978,040 19,806,372 7,103,672 8,950,704 3,751,996
(*) Includes interest payables.
The Group does not expect that the cash flows included in the maturity analysis could occur significantly earlier or at different amounts.
F-107
Copyright © 2020 www.secdatabase.com. All Rights Reserved.Please Consider the Environment Before Printing This Document
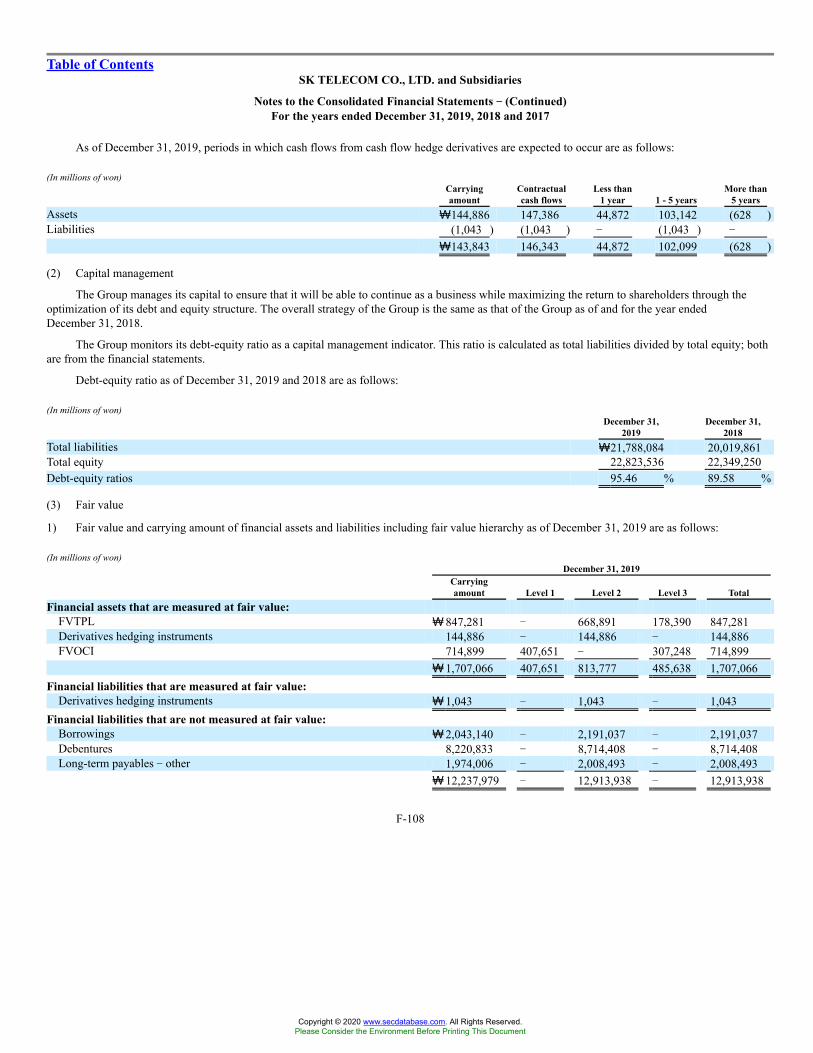
Table of ContentsSK TELECOM CO., LTD. and Subsidiaries
Notes to the Consolidated Financial Statements �� (Continued)For the years ended December 31, 2019, 2018 and 2017
As of December 31, 2019, periods in which cash flows from cash flow hedge derivatives are expected to occur are as follows:
(In millions of won)Carryingamount
Contractualcash flows
Less than1 year 1 - 5 years
More than5 years
Assets ₩144,886 147,386 44,872 103,142 (628 )Liabilities (1,043 ) (1,043 ) � (1,043 ) �
₩143,843 146,343 44,872 102,099 (628 )
(2) Capital management
The Group manages its capital to ensure that it will be able to continue as a business while maximizing the return to shareholders through theoptimization of its debt and equity structure. The overall strategy of the Group is the same as that of the Group as of and for the year endedDecember 31, 2018.
The Group monitors its debt-equity ratio as a capital management indicator. This ratio is calculated as total liabilities divided by total equity; bothare from the financial statements.
Debt-equity ratio as of December 31, 2019 and 2018 are as follows:
(In millions of won)December 31,
2019December 31,
2018Total liabilities ₩21,788,084 20,019,861Total equity 22,823,536 22,349,250Debt-equity ratios 95.46 % 89.58 %
(3) Fair value
1) Fair value and carrying amount of financial assets and liabilities including fair value hierarchy as of December 31, 2019 are as follows:
(In millions of won)December 31, 2019
Carryingamount Level 1 Level 2 Level 3 Total
Financial assets that are measured at fair value:FVTPL ₩847,281 � 668,891 178,390 847,281Derivatives hedging instruments 144,886 � 144,886 � 144,886FVOCI 714,899 407,651 � 307,248 714,899
₩1,707,066 407,651 813,777 485,638 1,707,066Financial liabilities that are measured at fair value:
Derivatives hedging instruments ₩1,043 � 1,043 � 1,043Financial liabilities that are not measured at fair value:
Borrowings ₩2,043,140 � 2,191,037 � 2,191,037Debentures 8,220,833 � 8,714,408 � 8,714,408Long-term payables � other 1,974,006 � 2,008,493 � 2,008,493
₩12,237,979 � 12,913,938 � 12,913,938
F-108
Copyright © 2020 www.secdatabase.com. All Rights Reserved.Please Consider the Environment Before Printing This Document

Table of ContentsSK TELECOM CO., LTD. and Subsidiaries
Notes to the Consolidated Financial Statements �� (Continued)For the years ended December 31, 2019, 2018 and 2017
2) Fair value and carrying amount of financial assets and liabilities including fair value hierarchy as of December 31, 2018 are as follows:
(In millions of won)December 31, 2018
Carryingamount Level 1 Level 2 Level 3 Total
Financial assets that are measured at fair value:FVTPL ₩820,366 � 695,992 124,374 820,366Derivatives hedging instruments 39,871 � 39,871 � 39,871FVOCI 544,643 293,925 � 250,718 544,643
₩1,404,880 293,925 735,863 375,092 1,404,880Financial liabilities that are measured at fair value:
FVTPL ₩61,813 � 61,813 � 61,813Derivatives hedging instruments 4,184 � 4,184 � 4,184
₩65,997 � 65,997 � 65,997Financial liabilities that are not measured at fair value:
Borrowings ₩2,184,996 � 2,378,843 � 2,378,843Debentures 7,405,039 � 7,868,472 � 7,868,472Long-term payables � other 2,393,027 � 2,469,653 � 2,469,653
₩11,983,062 � 12,716,968 � 12,716,968
The above information does not include fair values of financial assets and liabilities of which fair values have not been measured as carryingamounts are reasonable approximation of fair values.
Fair value of the financial instruments that are traded in an active market (financial assets at FVOCI) is measured based on the bid price at the endof the reporting date.
The Group uses various valuation methods for determination of fair value of financial instruments that are not traded in an active market.Derivative financial contracts and long-term liabilities are measured using the discounted present value methods. Other financial assets are determinedusing the methods such as discounted cash flow and market approach. Inputs used to such valuation methods include swap rate, interest rate, and riskpremium, and the Group performs valuation using the inputs which are consistent with natures of assets and liabilities measured.
Interest rates used by the Group for the fair value measurement as of December 31, 2019 are as follows:
Interest rateDerivative instruments 1.68% ~ 1.89%Borrowings and debentures 1.65% ~ 2.41%Long-term payables � other 1.59% ~ 1.90%
F-109
Copyright © 2020 www.secdatabase.com. All Rights Reserved.Please Consider the Environment Before Printing This Document

Table of ContentsSK TELECOM CO., LTD. and Subsidiaries
Notes to the Consolidated Financial Statements �� (Continued)For the years ended December 31, 2019, 2018 and 2017
3) There have been no transfers between Level 2 and Level 1 for year ended December 31, 2019. The changes of financial assets classified asLevel 3 for the year ended December 31, 2019 are as follows:
(In millions of won)Balance atJanuary 1,
2019Loss for the
period OCI Acquisition Disposal Transfer
Balance atDecember 31,
2019FVTPL ₩124,374 (5,417 ) 2,345 58,361 (9,264 ) 7,991 178,390FVOCI 250,718 � (7,716) 92,445 (6,306 ) (21,893) 307,248
₩375,092 (5,417 ) (5,371) 150,806 (15,570) (13,902) 485,638
(4) Enforceable master netting agreement or similar agreement
Carrying amount of financial instruments recognized of which offset agreements are applicable as of December 31, 2019 and 2018 are as follows:
(In millions of won)December 31, 2019
Grossfinancial
instrumentsrecognized
Amountoffset
Net financialinstruments
presented on thestatements of
financial positionRelevant financial
instruments not offsetNet
amountFinancial assets:Accounts receivable � trade and others ₩102,241 (100,895) 1,346 � 1,346Financial liabilities:Accounts payable � other and others ₩100,895 (100,895) � � �
(In millions of won)December 31, 2018
Grossfinancial
instrumentsrecognized
Amountoffset
Net financialinstruments
presented on thestatements of
financial positionRelevant financial
instruments not offsetNet
amountFinancial assets:Derivatives(*) ₩1,867 � 1,867 (1,107 ) 760Accounts receivable � trade and others 95,990 (95,920 ) 70 � 70
₩97,857 (95,920 ) 1,937 (1,107 ) 830Financial liabilities:Derivatives(*) ₩1,107 � 1,107 (1,107 ) �Accounts payable � other and others 95,920 (95,920 ) � � �
₩97,027 (95,920 ) 1,107 (1,107 ) �
(*) The balance represents the net amount under the standard terms and conditions of International Swap and Derivatives Association.
F-110
Copyright © 2020 www.secdatabase.com. All Rights Reserved.Please Consider the Environment Before Printing This Document

Table of ContentsSK TELECOM CO., LTD. and Subsidiaries
Notes to the Consolidated Financial Statements �� (Continued)For the years ended December 31, 2019, 2018 and 2017
36. Transactions with Related Parties
(1) List of related parties
Relationship CompanyUltimate Controlling Entity SK Holdings Co., Ltd.Joint ventures Dogus Planet, Inc. and 3 othersAssociates SK hynix Inc. and 44 othersOthers The Ultimate Controlling Entity�s subsidiaries and associates, etc.
For the periods presented, the Group belongs to SK Group, a conglomerate as defined in the Monopoly Regulation and Fair Trade Act of theRepublic of Korea. All of the other entities included in SK Group are considered related parties of the Group.
(2) Compensation for the key management
The Parent Company considers registered directors (3 executive and 5 non-executive directors) who have substantial role and responsibility inplanning, operations, and relevant controls of the business as key management. The compensation given to such key management for the years endedDecember 31, 2019, 2018 and 2017 are as follows:
(In millions of won)2019 2018 2017
Salaries ₩5,969 4,488 2,169Defined benefits plan expenses 1,237 920 258Share option 325 548 414
₩7,531 5,956 2,841
Compensation for the key management includes salaries, non-monetary salaries and retirement benefits made in relation to the pension plan andcompensation expenses related to share options granted.
F-111
Copyright © 2020 www.secdatabase.com. All Rights Reserved.Please Consider the Environment Before Printing This Document
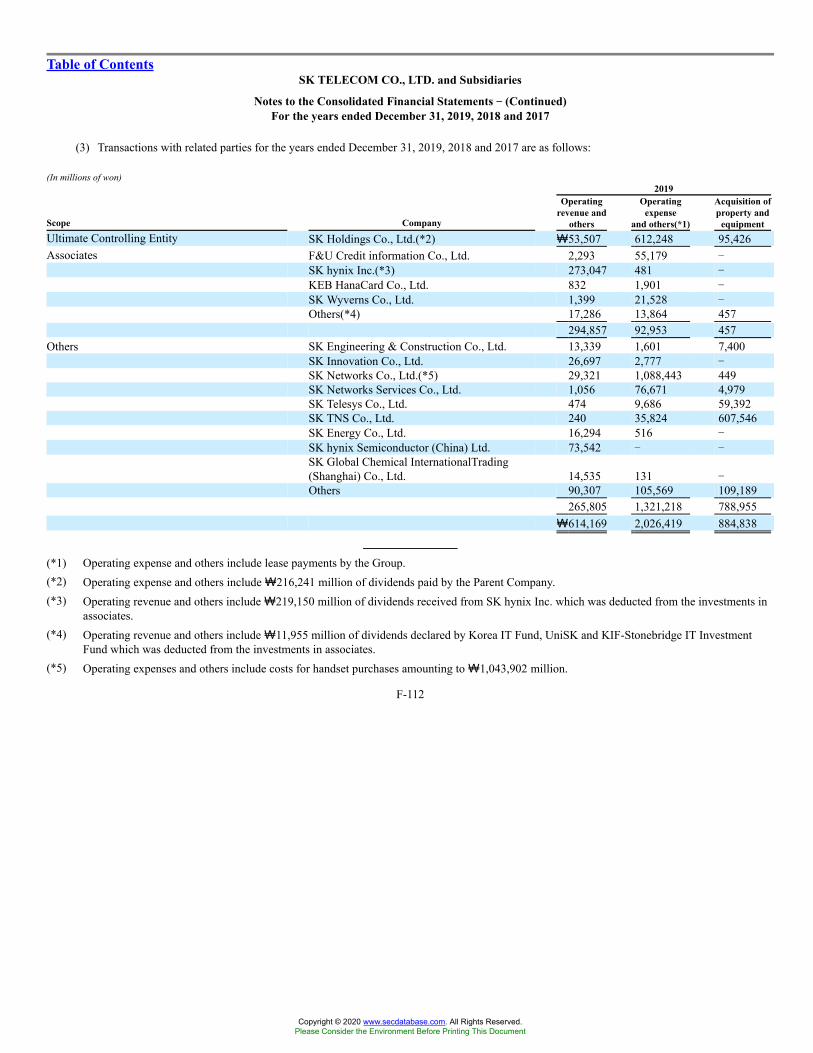
Table of ContentsSK TELECOM CO., LTD. and Subsidiaries
Notes to the Consolidated Financial Statements �� (Continued)For the years ended December 31, 2019, 2018 and 2017
(3) Transactions with related parties for the years ended December 31, 2019, 2018 and 2017 are as follows:
(In millions of won)2019
Scope Company
Operatingrevenue and
others
Operatingexpense
and others(*1)
Acquisition ofproperty and
equipmentUltimate Controlling Entity SK Holdings Co., Ltd.(*2) ₩53,507 612,248 95,426Associates F&U Credit information Co., Ltd. 2,293 55,179 �
SK hynix Inc.(*3) 273,047 481 �
KEB HanaCard Co., Ltd. 832 1,901 �
SK Wyverns Co., Ltd. 1,399 21,528 �Others(*4) 17,286 13,864 457
294,857 92,953 457Others SK Engineering & Construction Co., Ltd. 13,339 1,601 7,400
SK Innovation Co., Ltd. 26,697 2,777 �SK Networks Co., Ltd.(*5) 29,321 1,088,443 449SK Networks Services Co., Ltd. 1,056 76,671 4,979SK Telesys Co., Ltd. 474 9,686 59,392SK TNS Co., Ltd. 240 35,824 607,546SK Energy Co., Ltd. 16,294 516 �
SK hynix Semiconductor (China) Ltd. 73,542 � �SK Global Chemical InternationalTrading(Shanghai) Co., Ltd. 14,535 131 �Others 90,307 105,569 109,189
265,805 1,321,218 788,955₩614,169 2,026,419 884,838
(*1) Operating expense and others include lease payments by the Group.(*2) Operating expense and others include ₩216,241 million of dividends paid by the Parent Company.(*3) Operating revenue and others include ₩219,150 million of dividends received from SK hynix Inc. which was deducted from the investments in
associates.(*4) Operating revenue and others include ₩11,955 million of dividends declared by Korea IT Fund, UniSK and KIF-Stonebridge IT Investment
Fund which was deducted from the investments in associates.(*5) Operating expenses and others include costs for handset purchases amounting to ₩1,043,902 million.
F-112
Copyright © 2020 www.secdatabase.com. All Rights Reserved.Please Consider the Environment Before Printing This Document
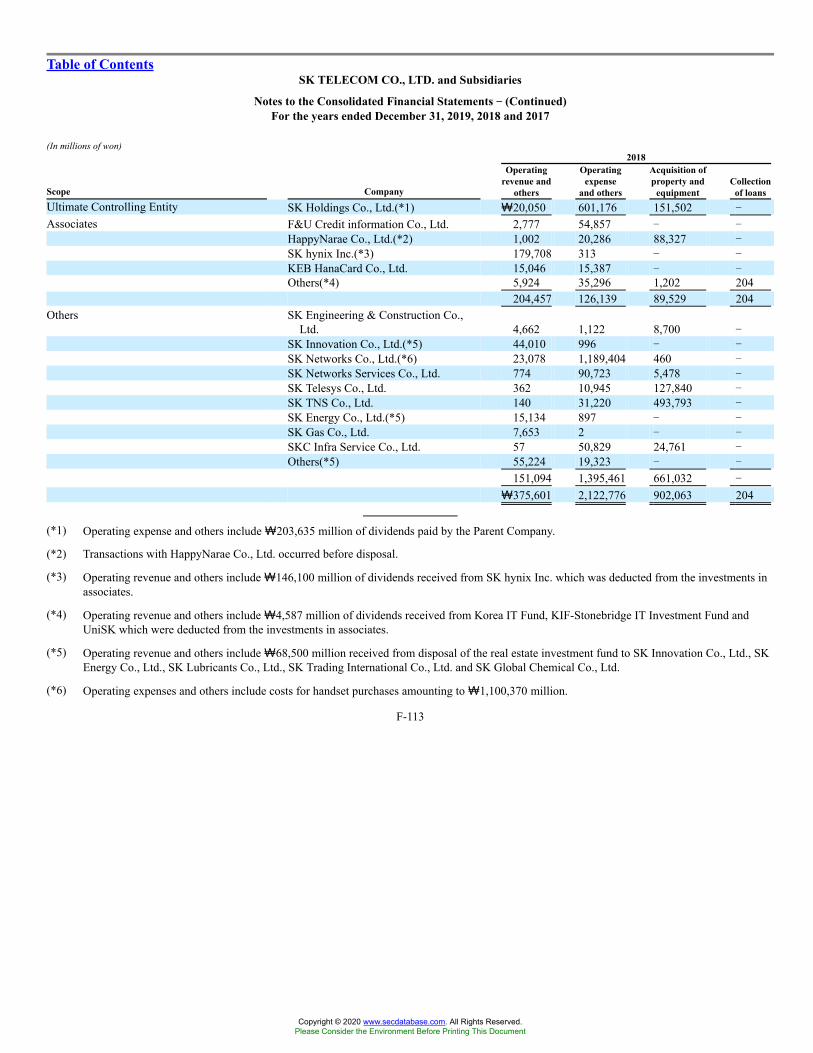
Table of ContentsSK TELECOM CO., LTD. and Subsidiaries
Notes to the Consolidated Financial Statements �� (Continued)For the years ended December 31, 2019, 2018 and 2017
(In millions of won)2018
Scope Company
Operatingrevenue and
others
Operatingexpense
and others
Acquisition ofproperty and
equipmentCollection
of loansUltimate Controlling Entity SK Holdings Co., Ltd.(*1) ₩20,050 601,176 151,502 �
Associates F&U Credit information Co., Ltd. 2,777 54,857 � �
HappyNarae Co., Ltd.(*2) 1,002 20,286 88,327 �
SK hynix Inc.(*3) 179,708 313 � �
KEB HanaCard Co., Ltd. 15,046 15,387 � �Others(*4) 5,924 35,296 1,202 204
204,457 126,139 89,529 204Others SK Engineering & Construction Co.,
Ltd. 4,662 1,122 8,700 �
SK Innovation Co., Ltd.(*5) 44,010 996 � �
SK Networks Co., Ltd.(*6) 23,078 1,189,404 460 �
SK Networks Services Co., Ltd. 774 90,723 5,478 �
SK Telesys Co., Ltd. 362 10,945 127,840 �
SK TNS Co., Ltd. 140 31,220 493,793 �
SK Energy Co., Ltd.(*5) 15,134 897 � �
SK Gas Co., Ltd. 7,653 2 � �
SKC Infra Service Co., Ltd. 57 50,829 24,761 �
Others(*5) 55,224 19,323 � �
151,094 1,395,461 661,032 �
₩375,601 2,122,776 902,063 204
(*1) Operating expense and others include ₩203,635 million of dividends paid by the Parent Company.
(*2) Transactions with HappyNarae Co., Ltd. occurred before disposal.
(*3) Operating revenue and others include ₩146,100 million of dividends received from SK hynix Inc. which was deducted from the investments inassociates.
(*4) Operating revenue and others include ₩4,587 million of dividends received from Korea IT Fund, KIF-Stonebridge IT Investment Fund andUniSK which were deducted from the investments in associates.
(*5) Operating revenue and others include ₩68,500 million received from disposal of the real estate investment fund to SK Innovation Co., Ltd., SKEnergy Co., Ltd., SK Lubricants Co., Ltd., SK Trading International Co., Ltd. and SK Global Chemical Co., Ltd.
(*6) Operating expenses and others include costs for handset purchases amounting to ₩1,100,370 million.
F-113
Copyright © 2020 www.secdatabase.com. All Rights Reserved.Please Consider the Environment Before Printing This Document
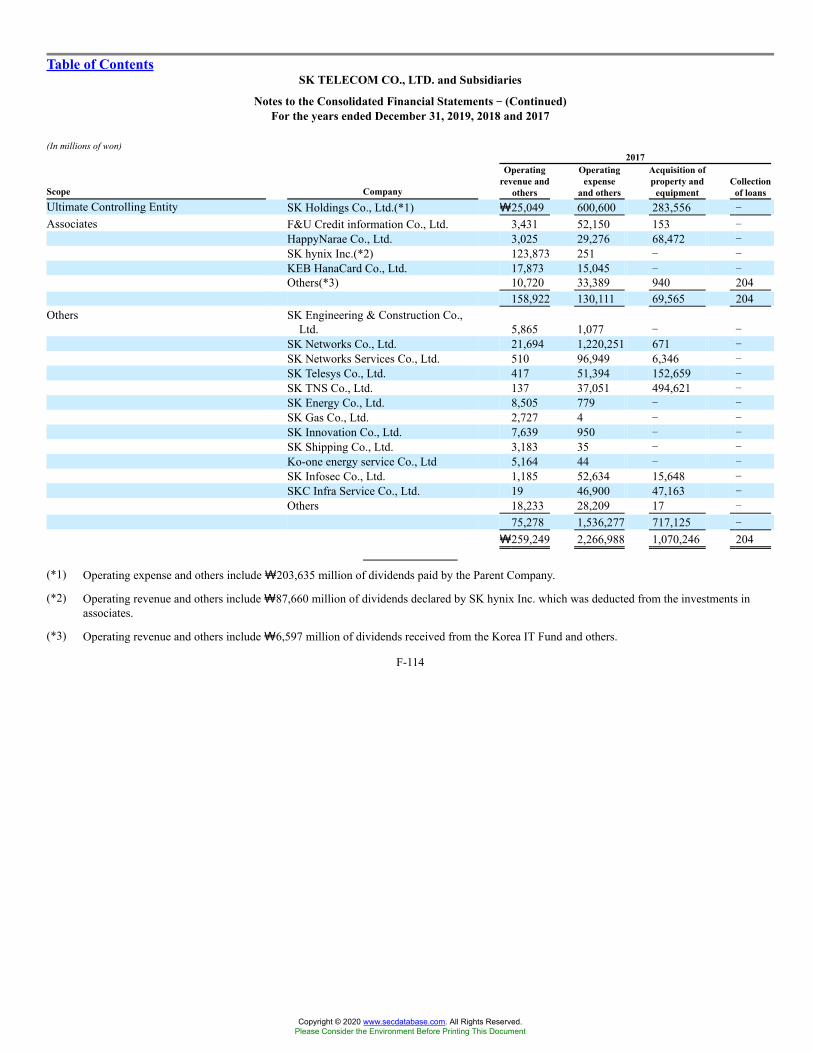
Table of ContentsSK TELECOM CO., LTD. and Subsidiaries
Notes to the Consolidated Financial Statements �� (Continued)For the years ended December 31, 2019, 2018 and 2017
(In millions of won)2017
Scope Company
Operatingrevenue and
others
Operatingexpense
and others
Acquisition ofproperty and
equipmentCollection
of loansUltimate Controlling Entity SK Holdings Co., Ltd.(*1) ₩25,049 600,600 283,556 �
Associates F&U Credit information Co., Ltd. 3,431 52,150 153 �
HappyNarae Co., Ltd. 3,025 29,276 68,472 �
SK hynix Inc.(*2) 123,873 251 � �
KEB HanaCard Co., Ltd. 17,873 15,045 � �Others(*3) 10,720 33,389 940 204
158,922 130,111 69,565 204Others SK Engineering & Construction Co.,
Ltd. 5,865 1,077 � �
SK Networks Co., Ltd. 21,694 1,220,251 671 �
SK Networks Services Co., Ltd. 510 96,949 6,346 �
SK Telesys Co., Ltd. 417 51,394 152,659 �
SK TNS Co., Ltd. 137 37,051 494,621 �
SK Energy Co., Ltd. 8,505 779 � �
SK Gas Co., Ltd. 2,727 4 � �
SK Innovation Co., Ltd. 7,639 950 � �
SK Shipping Co., Ltd. 3,183 35 � �
Ko-one energy service Co., Ltd 5,164 44 � �
SK Infosec Co., Ltd. 1,185 52,634 15,648 �
SKC Infra Service Co., Ltd. 19 46,900 47,163 �
Others 18,233 28,209 17 �
75,278 1,536,277 717,125 �
₩259,249 2,266,988 1,070,246 204
(*1) Operating expense and others include ₩203,635 million of dividends paid by the Parent Company.
(*2) Operating revenue and others include ₩87,660 million of dividends declared by SK hynix Inc. which was deducted from the investments inassociates.
(*3) Operating revenue and others include ₩6,597 million of dividends received from the Korea IT Fund and others.
F-114
Copyright © 2020 www.secdatabase.com. All Rights Reserved.Please Consider the Environment Before Printing This Document
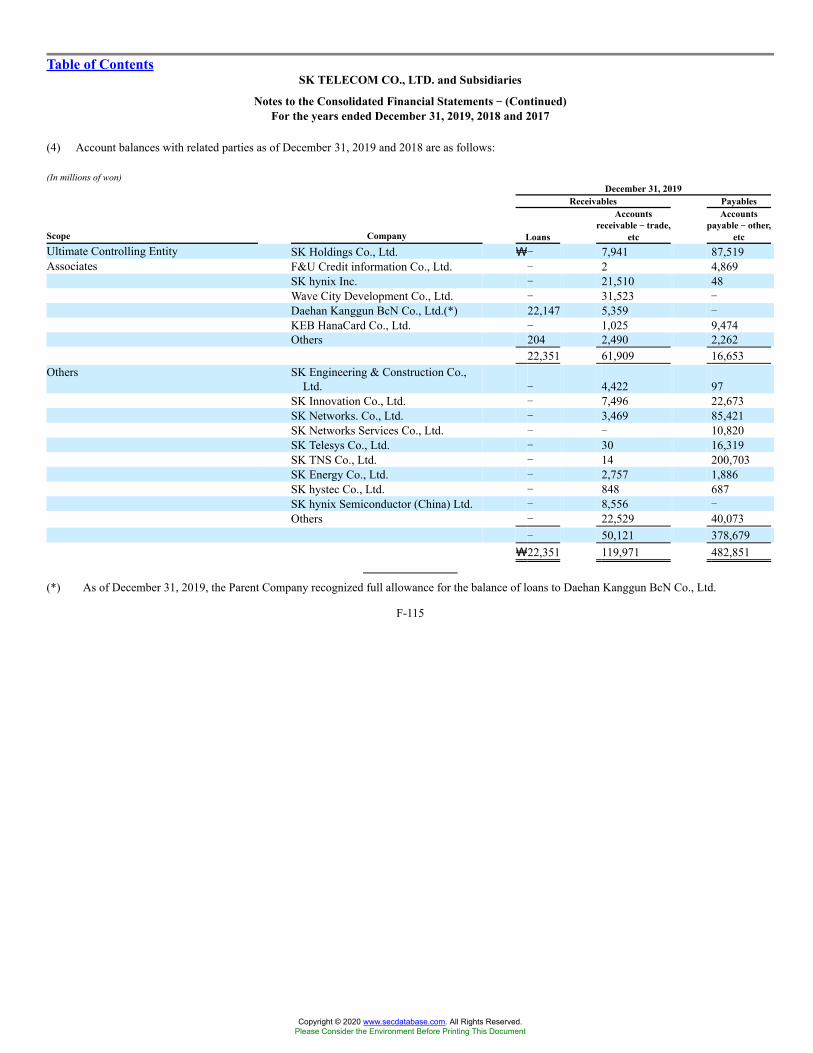
Table of ContentsSK TELECOM CO., LTD. and Subsidiaries
Notes to the Consolidated Financial Statements �� (Continued)For the years ended December 31, 2019, 2018 and 2017
(4) Account balances with related parties as of December 31, 2019 and 2018 are as follows:
(In millions of won)December 31, 2019
Receivables Payables
Scope Company Loans
Accountsreceivable �� trade,
etc
Accountspayable �� other,
etcUltimate Controlling Entity SK Holdings Co., Ltd. ₩� 7,941 87,519Associates F&U Credit information Co., Ltd. � 2 4,869
SK hynix Inc. � 21,510 48Wave City Development Co., Ltd. � 31,523 �
Daehan Kanggun BcN Co., Ltd.(*) 22,147 5,359 �
KEB HanaCard Co., Ltd. � 1,025 9,474Others 204 2,490 2,262
22,351 61,909 16,653Others SK Engineering & Construction Co.,
Ltd. � 4,422 97SK Innovation Co., Ltd. � 7,496 22,673SK Networks. Co., Ltd. � 3,469 85,421SK Networks Services Co., Ltd. � � 10,820SK Telesys Co., Ltd. � 30 16,319SK TNS Co., Ltd. � 14 200,703SK Energy Co., Ltd. � 2,757 1,886SK hystec Co., Ltd. � 848 687SK hynix Semiconductor (China) Ltd. � 8,556 �
Others � 22,529 40,073� 50,121 378,679₩22,351 119,971 482,851
(*) As of December 31, 2019, the Parent Company recognized full allowance for the balance of loans to Daehan Kanggun BcN Co., Ltd.
F-115
Copyright © 2020 www.secdatabase.com. All Rights Reserved.Please Consider the Environment Before Printing This Document
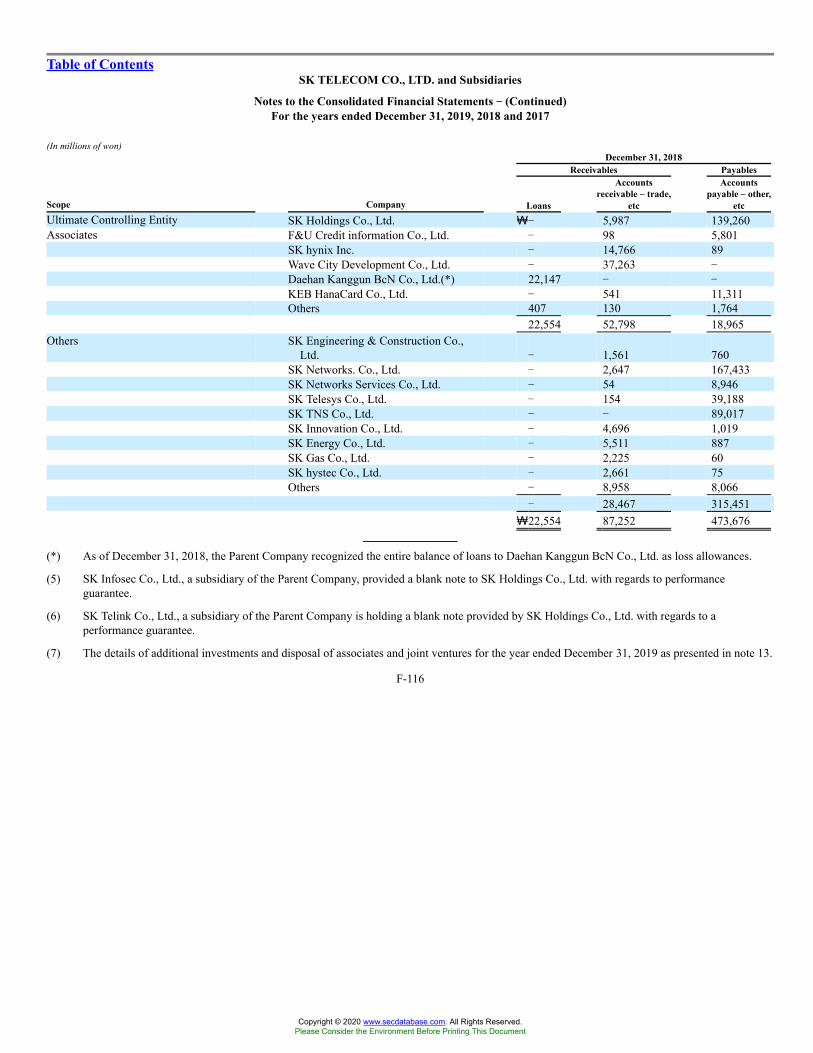
Table of ContentsSK TELECOM CO., LTD. and Subsidiaries
Notes to the Consolidated Financial Statements �� (Continued)For the years ended December 31, 2019, 2018 and 2017
(In millions of won)December 31, 2018
Receivables Payables
Scope Company Loans
Accountsreceivable �� trade,
etc
Accountspayable �� other,
etcUltimate Controlling Entity SK Holdings Co., Ltd. ₩� 5,987 139,260Associates F&U Credit information Co., Ltd. � 98 5,801
SK hynix Inc. � 14,766 89Wave City Development Co., Ltd. � 37,263 �
Daehan Kanggun BcN Co., Ltd.(*) 22,147 � �
KEB HanaCard Co., Ltd. � 541 11,311Others 407 130 1,764
22,554 52,798 18,965Others SK Engineering & Construction Co.,
Ltd. � 1,561 760SK Networks. Co., Ltd. � 2,647 167,433SK Networks Services Co., Ltd. � 54 8,946SK Telesys Co., Ltd. � 154 39,188SK TNS Co., Ltd. � � 89,017SK Innovation Co., Ltd. � 4,696 1,019SK Energy Co., Ltd. � 5,511 887SK Gas Co., Ltd. � 2,225 60SK hystec Co., Ltd. � 2,661 75Others � 8,958 8,066
� 28,467 315,451₩22,554 87,252 473,676
(*) As of December 31, 2018, the Parent Company recognized the entire balance of loans to Daehan Kanggun BcN Co., Ltd. as loss allowances.
(5) SK Infosec Co., Ltd., a subsidiary of the Parent Company, provided a blank note to SK Holdings Co., Ltd. with regards to performanceguarantee.
(6) SK Telink Co., Ltd., a subsidiary of the Parent Company is holding a blank note provided by SK Holdings Co., Ltd. with regards to aperformance guarantee.
(7) The details of additional investments and disposal of associates and joint ventures for the year ended December 31, 2019 as presented in note 13.
F-116
Copyright © 2020 www.secdatabase.com. All Rights Reserved.Please Consider the Environment Before Printing This Document
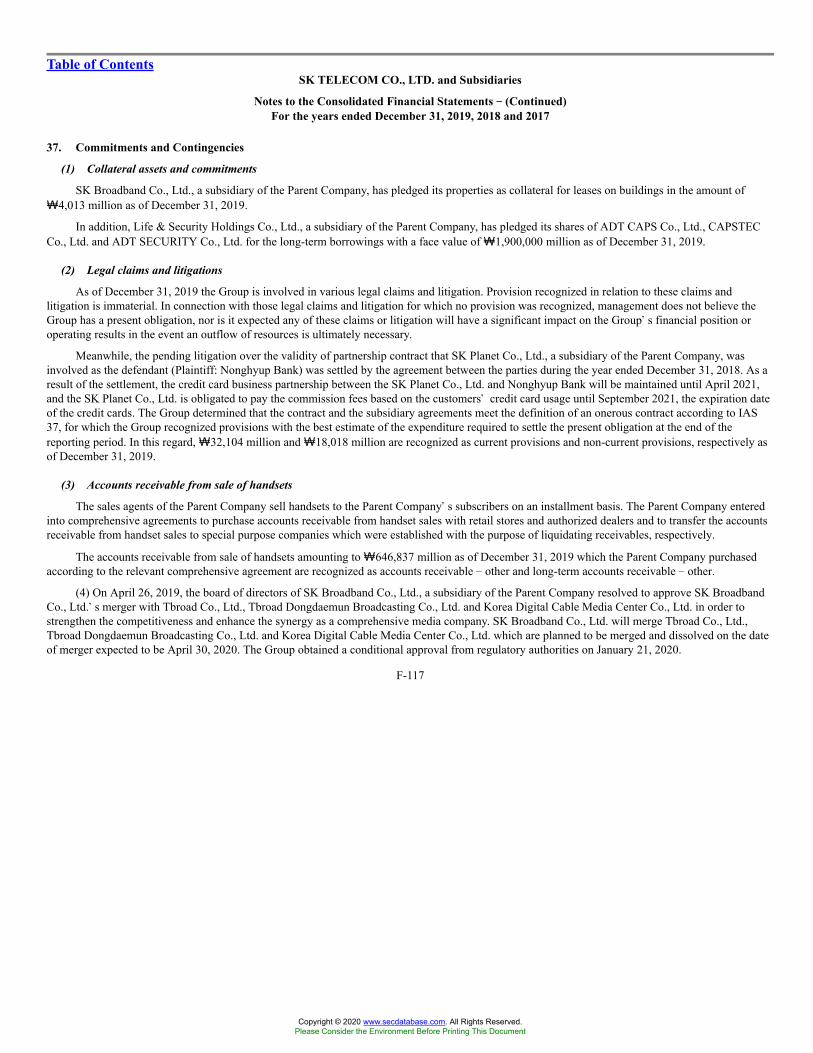
Table of ContentsSK TELECOM CO., LTD. and Subsidiaries
Notes to the Consolidated Financial Statements �� (Continued)For the years ended December 31, 2019, 2018 and 2017
37. Commitments and Contingencies
(1) Collateral assets and commitments
SK Broadband Co., Ltd., a subsidiary of the Parent Company, has pledged its properties as collateral for leases on buildings in the amount of₩4,013 million as of December 31, 2019.
In addition, Life & Security Holdings Co., Ltd., a subsidiary of the Parent Company, has pledged its shares of ADT CAPS Co., Ltd., CAPSTECCo., Ltd. and ADT SECURITY Co., Ltd. for the long-term borrowings with a face value of ₩1,900,000 million as of December 31, 2019.
(2) Legal claims and litigations
As of December 31, 2019 the Group is involved in various legal claims and litigation. Provision recognized in relation to these claims andlitigation is immaterial. In connection with those legal claims and litigation for which no provision was recognized, management does not believe theGroup has a present obligation, nor is it expected any of these claims or litigation will have a significant impact on the Group�s financial position oroperating results in the event an outflow of resources is ultimately necessary.
Meanwhile, the pending litigation over the validity of partnership contract that SK Planet Co., Ltd., a subsidiary of the Parent Company, wasinvolved as the defendant (Plaintiff: Nonghyup Bank) was settled by the agreement between the parties during the year ended December 31, 2018. As aresult of the settlement, the credit card business partnership between the SK Planet Co., Ltd. and Nonghyup Bank will be maintained until April 2021,and the SK Planet Co., Ltd. is obligated to pay the commission fees based on the customers� credit card usage until September 2021, the expiration dateof the credit cards. The Group determined that the contract and the subsidiary agreements meet the definition of an onerous contract according to IAS37, for which the Group recognized provisions with the best estimate of the expenditure required to settle the present obligation at the end of thereporting period. In this regard, ₩32,104 million and ₩18,018 million are recognized as current provisions and non-current provisions, respectively asof December 31, 2019.
(3) Accounts receivable from sale of handsets
The sales agents of the Parent Company sell handsets to the Parent Company�s subscribers on an installment basis. The Parent Company enteredinto comprehensive agreements to purchase accounts receivable from handset sales with retail stores and authorized dealers and to transfer the accountsreceivable from handset sales to special purpose companies which were established with the purpose of liquidating receivables, respectively.
The accounts receivable from sale of handsets amounting to ₩646,837 million as of December 31, 2019 which the Parent Company purchasedaccording to the relevant comprehensive agreement are recognized as accounts receivable � other and long-term accounts receivable � other.
(4) On April 26, 2019, the board of directors of SK Broadband Co., Ltd., a subsidiary of the Parent Company resolved to approve SK BroadbandCo., Ltd.�s merger with Tbroad Co., Ltd., Tbroad Dongdaemun Broadcasting Co., Ltd. and Korea Digital Cable Media Center Co., Ltd. in order tostrengthen the competitiveness and enhance the synergy as a comprehensive media company. SK Broadband Co., Ltd. will merge Tbroad Co., Ltd.,Tbroad Dongdaemun Broadcasting Co., Ltd. and Korea Digital Cable Media Center Co., Ltd. which are planned to be merged and dissolved on the dateof merger expected to be April 30, 2020. The Group obtained a conditional approval from regulatory authorities on January 21, 2020.
F-117
Copyright © 2020 www.secdatabase.com. All Rights Reserved.Please Consider the Environment Before Printing This Document
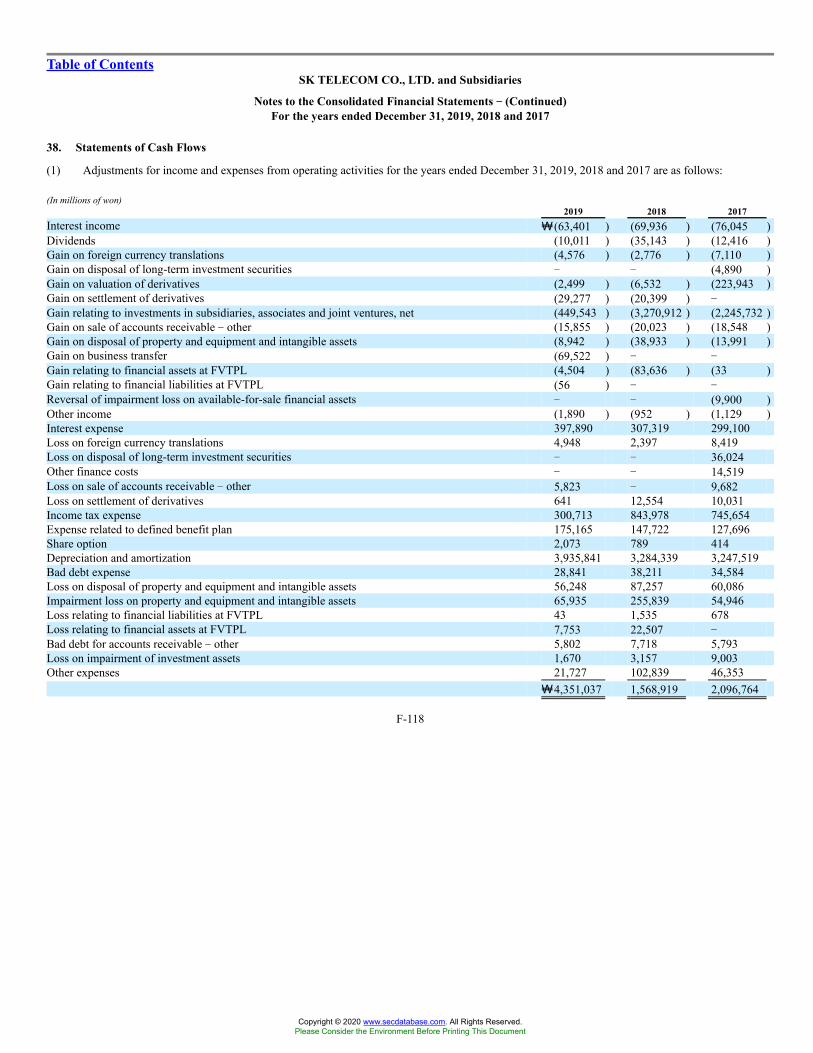
Table of ContentsSK TELECOM CO., LTD. and Subsidiaries
Notes to the Consolidated Financial Statements �� (Continued)For the years ended December 31, 2019, 2018 and 2017
38. Statements of Cash Flows
(1) Adjustments for income and expenses from operating activities for the years ended December 31, 2019, 2018 and 2017 are as follows:
(In millions of won)2019 2018 2017
Interest income ₩(63,401 ) (69,936 ) (76,045 )Dividends (10,011 ) (35,143 ) (12,416 )Gain on foreign currency translations (4,576 ) (2,776 ) (7,110 )Gain on disposal of long-term investment securities � � (4,890 )Gain on valuation of derivatives (2,499 ) (6,532 ) (223,943 )Gain on settlement of derivatives (29,277 ) (20,399 ) �Gain relating to investments in subsidiaries, associates and joint ventures, net (449,543 ) (3,270,912 ) (2,245,732 )Gain on sale of accounts receivable � other (15,855 ) (20,023 ) (18,548 )Gain on disposal of property and equipment and intangible assets (8,942 ) (38,933 ) (13,991 )Gain on business transfer (69,522 ) � �Gain relating to financial assets at FVTPL (4,504 ) (83,636 ) (33 )Gain relating to financial liabilities at FVTPL (56 ) � �Reversal of impairment loss on available-for-sale financial assets � � (9,900 )Other income (1,890 ) (952 ) (1,129 )Interest expense 397,890 307,319 299,100Loss on foreign currency translations 4,948 2,397 8,419Loss on disposal of long-term investment securities � � 36,024Other finance costs � � 14,519Loss on sale of accounts receivable � other 5,823 � 9,682Loss on settlement of derivatives 641 12,554 10,031Income tax expense 300,713 843,978 745,654Expense related to defined benefit plan 175,165 147,722 127,696Share option 2,073 789 414Depreciation and amortization 3,935,841 3,284,339 3,247,519Bad debt expense 28,841 38,211 34,584Loss on disposal of property and equipment and intangible assets 56,248 87,257 60,086Impairment loss on property and equipment and intangible assets 65,935 255,839 54,946Loss relating to financial liabilities at FVTPL 43 1,535 678Loss relating to financial assets at FVTPL 7,753 22,507 �Bad debt for accounts receivable � other 5,802 7,718 5,793Loss on impairment of investment assets 1,670 3,157 9,003Other expenses 21,727 102,839 46,353
₩4,351,037 1,568,919 2,096,764
F-118
Copyright © 2020 www.secdatabase.com. All Rights Reserved.Please Consider the Environment Before Printing This Document
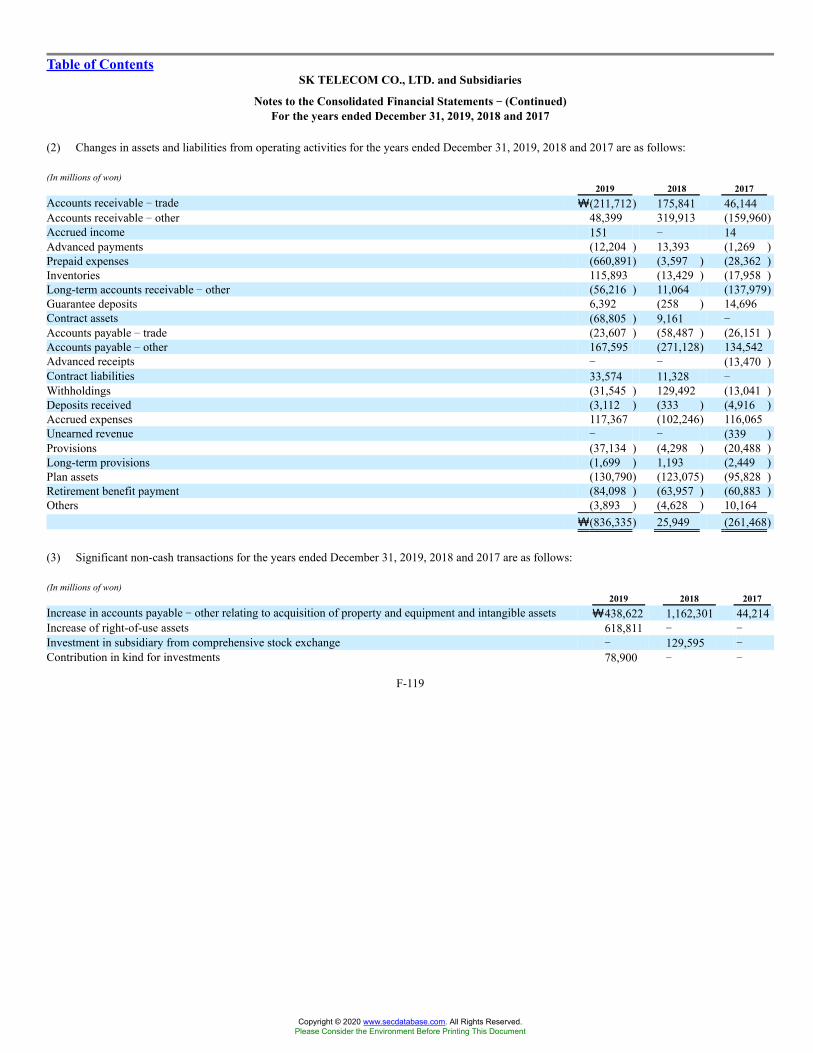
Table of ContentsSK TELECOM CO., LTD. and Subsidiaries
Notes to the Consolidated Financial Statements �� (Continued)For the years ended December 31, 2019, 2018 and 2017
(2) Changes in assets and liabilities from operating activities for the years ended December 31, 2019, 2018 and 2017 are as follows:
(In millions of won)2019 2018 2017
Accounts receivable � trade ₩(211,712) 175,841 46,144Accounts receivable � other 48,399 319,913 (159,960)Accrued income 151 � 14Advanced payments (12,204 ) 13,393 (1,269 )Prepaid expenses (660,891) (3,597 ) (28,362 )Inventories 115,893 (13,429 ) (17,958 )Long-term accounts receivable � other (56,216 ) 11,064 (137,979)Guarantee deposits 6,392 (258 ) 14,696Contract assets (68,805 ) 9,161 �Accounts payable � trade (23,607 ) (58,487 ) (26,151 )Accounts payable � other 167,595 (271,128) 134,542Advanced receipts � � (13,470 )Contract liabilities 33,574 11,328 �Withholdings (31,545 ) 129,492 (13,041 )Deposits received (3,112 ) (333 ) (4,916 )Accrued expenses 117,367 (102,246) 116,065Unearned revenue � � (339 )Provisions (37,134 ) (4,298 ) (20,488 )Long-term provisions (1,699 ) 1,193 (2,449 )Plan assets (130,790) (123,075) (95,828 )Retirement benefit payment (84,098 ) (63,957 ) (60,883 )Others (3,893 ) (4,628 ) 10,164
₩(836,335) 25,949 (261,468)
(3) Significant non-cash transactions for the years ended December 31, 2019, 2018 and 2017 are as follows:
(In millions of won)2019 2018 2017
Increase in accounts payable � other relating to acquisition of property and equipment and intangible assets ₩438,622 1,162,301 44,214Increase of right-of-use assets 618,811 � �Investment in subsidiary from comprehensive stock exchange � 129,595 �Contribution in kind for investments 78,900 � �
F-119
Copyright © 2020 www.secdatabase.com. All Rights Reserved.Please Consider the Environment Before Printing This Document
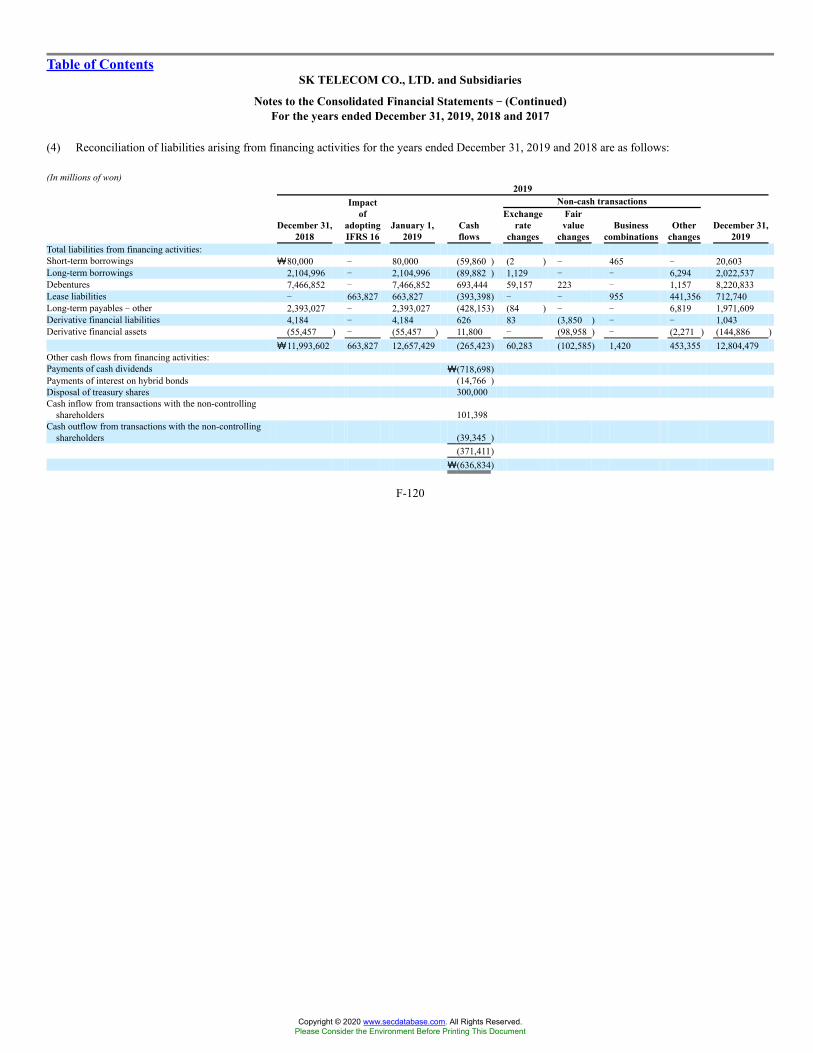
Table of ContentsSK TELECOM CO., LTD. and Subsidiaries
Notes to the Consolidated Financial Statements �� (Continued)For the years ended December 31, 2019, 2018 and 2017
(4) Reconciliation of liabilities arising from financing activities for the years ended December 31, 2019 and 2018 are as follows:
(In millions of won)2019
Non-cash transactions
December 31,2018
Impactof
adoptingIFRS 16
January 1,2019
Cashflows
Exchangerate
changes
Fairvalue
changesBusiness
combinationsOther
changesDecember 31,
2019Total liabilities from financing activities:Short-term borrowings ₩80,000 � 80,000 (59,860 ) (2 ) � 465 � 20,603Long-term borrowings 2,104,996 � 2,104,996 (89,882 ) 1,129 � � 6,294 2,022,537Debentures 7,466,852 � 7,466,852 693,444 59,157 223 � 1,157 8,220,833Lease liabilities � 663,827 663,827 (393,398) � � 955 441,356 712,740Long-term payables � other 2,393,027 � 2,393,027 (428,153) (84 ) � � 6,819 1,971,609Derivative financial liabilities 4,184 � 4,184 626 83 (3,850 ) � � 1,043Derivative financial assets (55,457 ) � (55,457 ) 11,800 � (98,958 ) � (2,271 ) (144,886 )
₩11,993,602 663,827 12,657,429 (265,423) 60,283 (102,585) 1,420 453,355 12,804,479Other cash flows from financing activities:Payments of cash dividends ₩(718,698)Payments of interest on hybrid bonds (14,766 )Disposal of treasury shares 300,000Cash inflow from transactions with the non-controlling
shareholders 101,398Cash outflow from transactions with the non-controlling
shareholders (39,345 )(371,411)
₩(636,834)
F-120
Copyright © 2020 www.secdatabase.com. All Rights Reserved.Please Consider the Environment Before Printing This Document
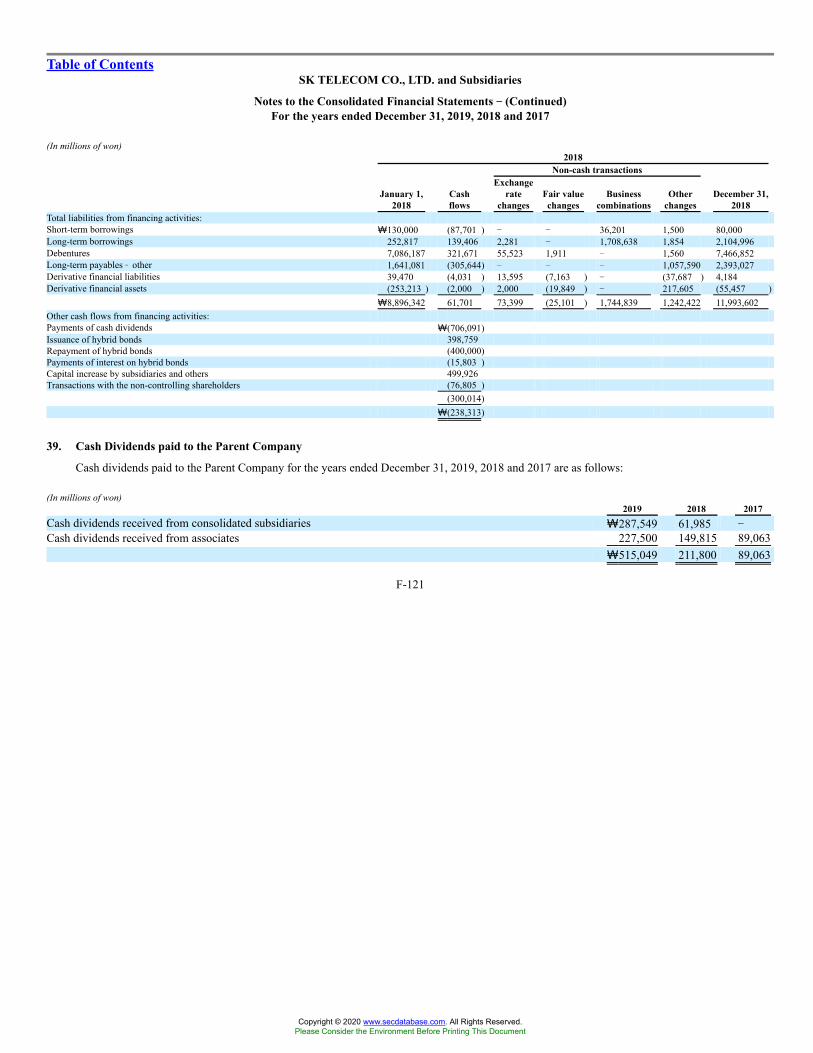
Table of ContentsSK TELECOM CO., LTD. and Subsidiaries
Notes to the Consolidated Financial Statements �� (Continued)For the years ended December 31, 2019, 2018 and 2017
(In millions of won)2018
Non-cash transactions
January 1,2018
Cashflows
Exchangerate
changesFair valuechanges
Businesscombinations
Otherchanges
December 31,2018
Total liabilities from financing activities:Short-term borrowings ₩130,000 (87,701 ) � � 36,201 1,500 80,000Long-term borrowings 252,817 139,406 2,281 � 1,708,638 1,854 2,104,996Debentures 7,086,187 321,671 55,523 1,911 � 1,560 7,466,852Long-term payables � other 1,641,081 (305,644) � � � 1,057,590 2,393,027Derivative financial liabilities 39,470 (4,031 ) 13,595 (7,163 ) � (37,687 ) 4,184Derivative financial assets (253,213 ) (2,000 ) 2,000 (19,849 ) � 217,605 (55,457 )
₩8,896,342 61,701 73,399 (25,101 ) 1,744,839 1,242,422 11,993,602Other cash flows from financing activities:Payments of cash dividends ₩(706,091)Issuance of hybrid bonds 398,759Repayment of hybrid bonds (400,000)Payments of interest on hybrid bonds (15,803 )Capital increase by subsidiaries and others 499,926Transactions with the non-controlling shareholders (76,805 )
(300,014)₩(238,313)
39. Cash Dividends paid to the Parent Company
Cash dividends paid to the Parent Company for the years ended December 31, 2019, 2018 and 2017 are as follows:
(In millions of won)2019 2018 2017
Cash dividends received from consolidated subsidiaries ₩287,549 61,985 �Cash dividends received from associates 227,500 149,815 89,063
₩515,049 211,800 89,063
F-121
Copyright © 2020 www.secdatabase.com. All Rights Reserved.Please Consider the Environment Before Printing This Document

Table of ContentsReport of Independent Registered Public Accounting Firm
To the Board of Directors and ShareholdersSK hynix, Inc.:
Opinion on the Consolidated Financial Statements
We have audited the accompanying consolidated statements of financial position of SK hynix, Inc. and subsidiaries (the Group) as ofDecember 31, 2019 and 2018, the related consolidated statements of comprehensive income, changes in equity and cash flows for each of the years inthe three-year period ended December 31, 2019 and the related notes (collectively, the consolidated financial statements). In our opinion, theconsolidated financial statements present fairly, in all material respects, the financial position of the Group as of December 31, 2019 and 2018, and theresults of its operations and its cash flows for each of the years in the three-year period ended December 31, 2019, in conformity with InternationalFinancial Reporting Standards as issued by the International Accounting Standards Board.
Adoption of New Accounting Standards
As discussed in Note 3 to the consolidated financial statements, effective January 1, 2019, the Group has changed its method for accounting forleases due to the adoption of IFRS 16, Leases.
Basis for Opinion
These consolidated financial statements are the responsibility of the Group�s management. Our responsibility is to express an opinion on theseconsolidated financial statements based on our audits. We are a public accounting firm registered with the Public Company Accounting Oversight Board(United States) (PCAOB) and are required to be independent with respect to the Group in accordance with the U.S. federal securities laws and theapplicable rules and regulations of the Securities and Exchange Commission and the PCAOB.
We conducted our audits in accordance with the standards of the PCAOB. Those standards require that we plan and perform the audit to obtainreasonable assurance about whether the consolidated financial statements are free of material misstatement, whether due to error or fraud. Our auditsincluded performing procedures to assess the risks of material misstatement of the consolidated financial statements, whether due to error or fraud, andperforming procedures that respond to those risks. Such procedures included examining, on a test basis, evidence regarding the amounts and disclosuresin the consolidated financial statements. Our audits also included evaluating the accounting principles used and significant estimates made bymanagement, as well as evaluating the overall presentation of the consolidated financial statements. We believe that our audits provide a reasonablebasis for our opinion.
/s/ KPMG Samjong Accounting Corp.
We have served as the Group�s auditor since 2012.
Seoul, KoreaApril 27, 2020
G-1
Copyright © 2020 www.secdatabase.com. All Rights Reserved.Please Consider the Environment Before Printing This Document
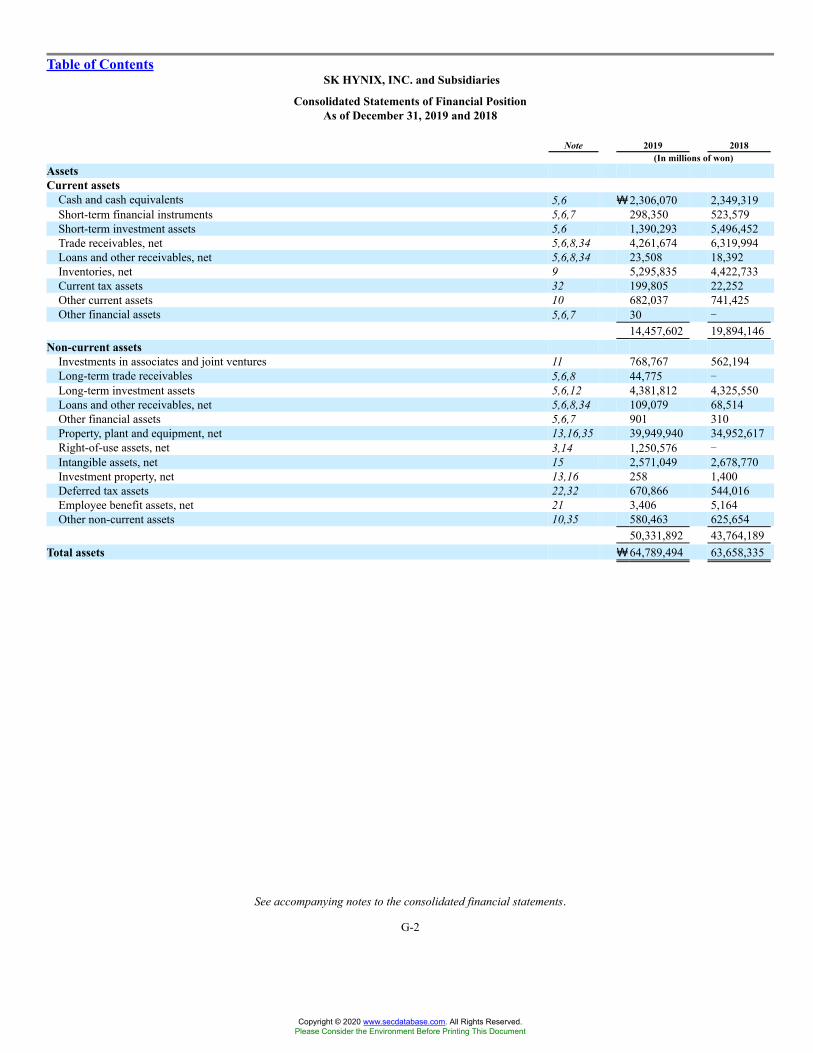
Table of ContentsSK HYNIX, INC. and Subsidiaries
Consolidated Statements of Financial PositionAs of December 31, 2019 and 2018
Note 2019 2018(In millions of won)
AssetsCurrent assets
Cash and cash equivalents 5,6 ₩2,306,070 2,349,319Short-term financial instruments 5,6,7 298,350 523,579Short-term investment assets 5,6 1,390,293 5,496,452Trade receivables, net 5,6,8,34 4,261,674 6,319,994Loans and other receivables, net 5,6,8,34 23,508 18,392Inventories, net 9 5,295,835 4,422,733Current tax assets 32 199,805 22,252Other current assets 10 682,037 741,425Other financial assets 5,6,7 30 �
14,457,602 19,894,146Non-current assets
Investments in associates and joint ventures 11 768,767 562,194Long-term trade receivables 5,6,8 44,775 �Long-term investment assets 5,6,12 4,381,812 4,325,550Loans and other receivables, net 5,6,8,34 109,079 68,514Other financial assets 5,6,7 901 310Property, plant and equipment, net 13,16,35 39,949,940 34,952,617Right-of-use assets, net 3,14 1,250,576 �Intangible assets, net 15 2,571,049 2,678,770Investment property, net 13,16 258 1,400Deferred tax assets 22,32 670,866 544,016Employee benefit assets, net 21 3,406 5,164Other non-current assets 10,35 580,463 625,654
50,331,892 43,764,189Total assets ₩64,789,494 63,658,335
See accompanying notes to the consolidated financial statements.
G-2
Copyright © 2020 www.secdatabase.com. All Rights Reserved.Please Consider the Environment Before Printing This Document
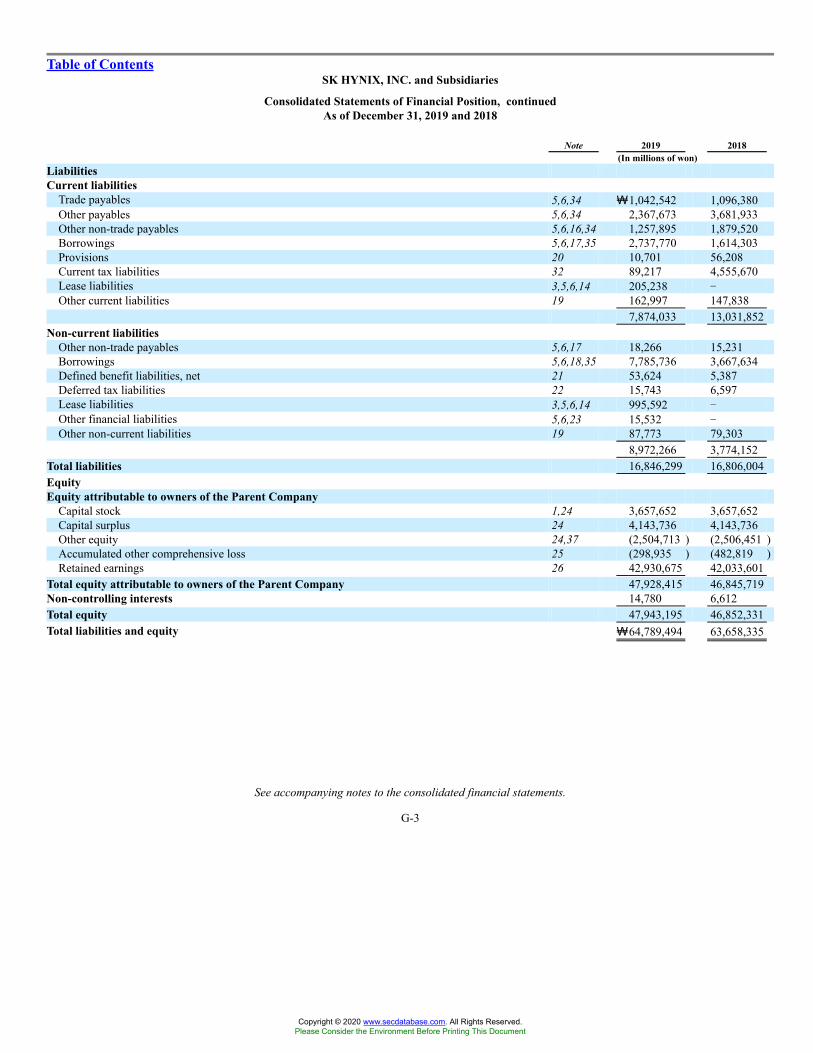
Table of ContentsSK HYNIX, INC. and Subsidiaries
Consolidated Statements of Financial Position, continuedAs of December 31, 2019 and 2018
Note 2019 2018(In millions of won)
LiabilitiesCurrent liabilities
Trade payables 5,6,34 ₩1,042,542 1,096,380Other payables 5,6,34 2,367,673 3,681,933Other non-trade payables 5,6,16,34 1,257,895 1,879,520Borrowings 5,6,17,35 2,737,770 1,614,303Provisions 20 10,701 56,208Current tax liabilities 32 89,217 4,555,670Lease liabilities 3,5,6,14 205,238 �Other current liabilities 19 162,997 147,838
7,874,033 13,031,852Non-current liabilities
Other non-trade payables 5,6,17 18,266 15,231Borrowings 5,6,18,35 7,785,736 3,667,634Defined benefit liabilities, net 21 53,624 5,387Deferred tax liabilities 22 15,743 6,597Lease liabilities 3,5,6,14 995,592 �Other financial liabilities 5,6,23 15,532 �Other non-current liabilities 19 87,773 79,303
8,972,266 3,774,152Total liabilities 16,846,299 16,806,004EquityEquity attributable to owners of the Parent Company
Capital stock 1,24 3,657,652 3,657,652Capital surplus 24 4,143,736 4,143,736Other equity 24,37 (2,504,713 ) (2,506,451 )Accumulated other comprehensive loss 25 (298,935 ) (482,819 )Retained earnings 26 42,930,675 42,033,601
Total equity attributable to owners of the Parent Company 47,928,415 46,845,719Non-controlling interests 14,780 6,612Total equity 47,943,195 46,852,331Total liabilities and equity ₩64,789,494 63,658,335
See accompanying notes to the consolidated financial statements.
G-3
Copyright © 2020 www.secdatabase.com. All Rights Reserved.Please Consider the Environment Before Printing This Document
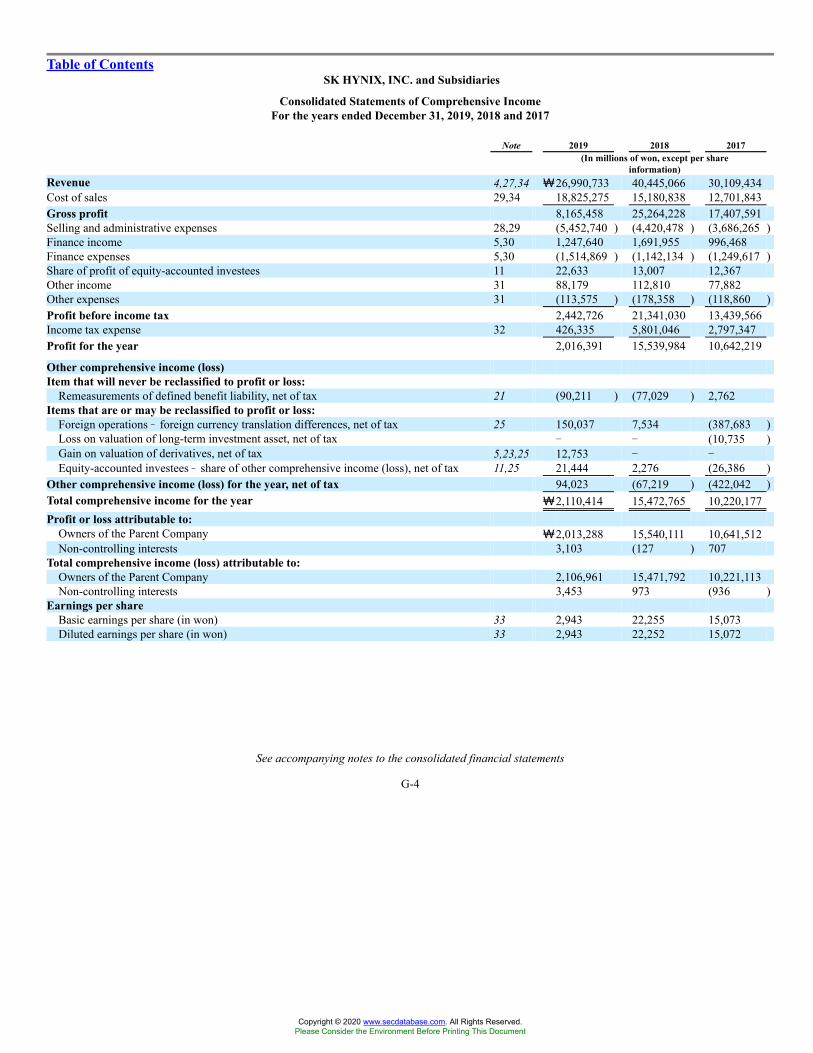
Table of ContentsSK HYNIX, INC. and Subsidiaries
Consolidated Statements of Comprehensive IncomeFor the years ended December 31, 2019, 2018 and 2017
Note 2019 2018 2017(In millions of won, except per share
information)Revenue 4,27,34 ₩26,990,733 40,445,066 30,109,434Cost of sales 29,34 18,825,275 15,180,838 12,701,843Gross profit 8,165,458 25,264,228 17,407,591Selling and administrative expenses 28,29 (5,452,740 ) (4,420,478 ) (3,686,265 )Finance income 5,30 1,247,640 1,691,955 996,468Finance expenses 5,30 (1,514,869 ) (1,142,134 ) (1,249,617 )Share of profit of equity-accounted investees 11 22,633 13,007 12,367Other income 31 88,179 112,810 77,882Other expenses 31 (113,575 ) (178,358 ) (118,860 )Profit before income tax 2,442,726 21,341,030 13,439,566Income tax expense 32 426,335 5,801,046 2,797,347Profit for the year 2,016,391 15,539,984 10,642,219
Other comprehensive income (loss)Item that will never be reclassified to profit or loss:
Remeasurements of defined benefit liability, net of tax 21 (90,211 ) (77,029 ) 2,762Items that are or may be reclassified to profit or loss:
Foreign operations � foreign currency translation differences, net of tax 25 150,037 7,534 (387,683 )Loss on valuation of long-term investment asset, net of tax � � (10,735 )Gain on valuation of derivatives, net of tax 5,23,25 12,753 � �Equity-accounted investees � share of other comprehensive income (loss), net of tax 11,25 21,444 2,276 (26,386 )
Other comprehensive income (loss) for the year, net of tax 94,023 (67,219 ) (422,042 )Total comprehensive income for the year ₩2,110,414 15,472,765 10,220,177Profit or loss attributable to:
Owners of the Parent Company ₩2,013,288 15,540,111 10,641,512Non-controlling interests 3,103 (127 ) 707
Total comprehensive income (loss) attributable to:Owners of the Parent Company 2,106,961 15,471,792 10,221,113Non-controlling interests 3,453 973 (936 )
Earnings per shareBasic earnings per share (in won) 33 2,943 22,255 15,073Diluted earnings per share (in won) 33 2,943 22,252 15,072
See accompanying notes to the consolidated financial statements
G-4
Copyright © 2020 www.secdatabase.com. All Rights Reserved.Please Consider the Environment Before Printing This Document
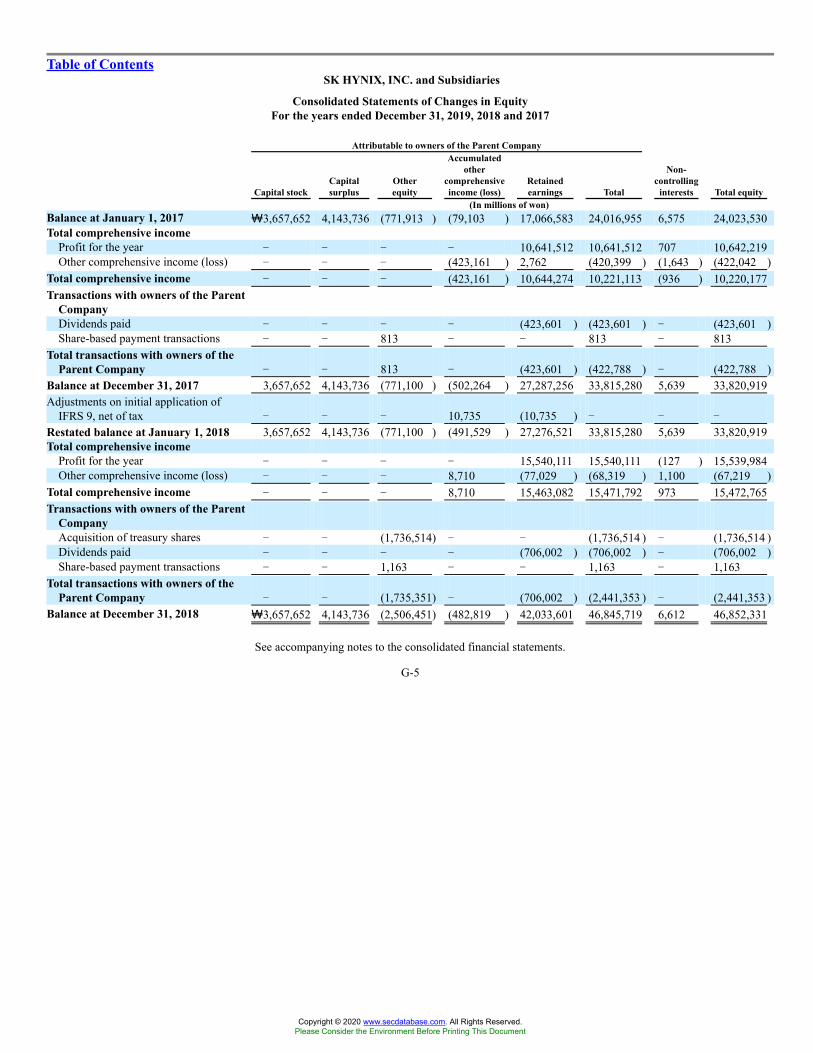
Table of ContentsSK HYNIX, INC. and Subsidiaries
Consolidated Statements of Changes in EquityFor the years ended December 31, 2019, 2018 and 2017
Attributable to owners of the Parent Company
Capital stockCapitalsurplus
Otherequity
Accumulatedother
comprehensiveincome (loss)
Retainedearnings Total
Non-controlling
interests Total equity(In millions of won)
Balance at January 1, 2017 ₩3,657,652 4,143,736 (771,913 ) (79,103 ) 17,066,583 24,016,955 6,575 24,023,530Total comprehensive income
Profit for the year � � � � 10,641,512 10,641,512 707 10,642,219Other comprehensive income (loss) � � � (423,161 ) 2,762 (420,399 ) (1,643 ) (422,042 )
Total comprehensive income � � � (423,161 ) 10,644,274 10,221,113 (936 ) 10,220,177Transactions with owners of the Parent
CompanyDividends paid � � � � (423,601 ) (423,601 ) � (423,601 )Share-based payment transactions � � 813 � � 813 � 813
Total transactions with owners of theParent Company � � 813 � (423,601 ) (422,788 ) � (422,788 )
Balance at December 31, 2017 3,657,652 4,143,736 (771,100 ) (502,264 ) 27,287,256 33,815,280 5,639 33,820,919Adjustments on initial application of
IFRS 9, net of tax � � � 10,735 (10,735 ) � � �
Restated balance at January 1, 2018 3,657,652 4,143,736 (771,100 ) (491,529 ) 27,276,521 33,815,280 5,639 33,820,919Total comprehensive income
Profit for the year � � � � 15,540,111 15,540,111 (127 ) 15,539,984Other comprehensive income (loss) � � � 8,710 (77,029 ) (68,319 ) 1,100 (67,219 )
Total comprehensive income � � � 8,710 15,463,082 15,471,792 973 15,472,765Transactions with owners of the Parent
CompanyAcquisition of treasury shares � � (1,736,514) � � (1,736,514 ) � (1,736,514 )Dividends paid � � � � (706,002 ) (706,002 ) � (706,002 )Share-based payment transactions � � 1,163 � � 1,163 � 1,163
Total transactions with owners of theParent Company � � (1,735,351) � (706,002 ) (2,441,353 ) � (2,441,353 )
Balance at December 31, 2018 ₩3,657,652 4,143,736 (2,506,451) (482,819 ) 42,033,601 46,845,719 6,612 46,852,331
See accompanying notes to the consolidated financial statements.
G-5
Copyright © 2020 www.secdatabase.com. All Rights Reserved.Please Consider the Environment Before Printing This Document
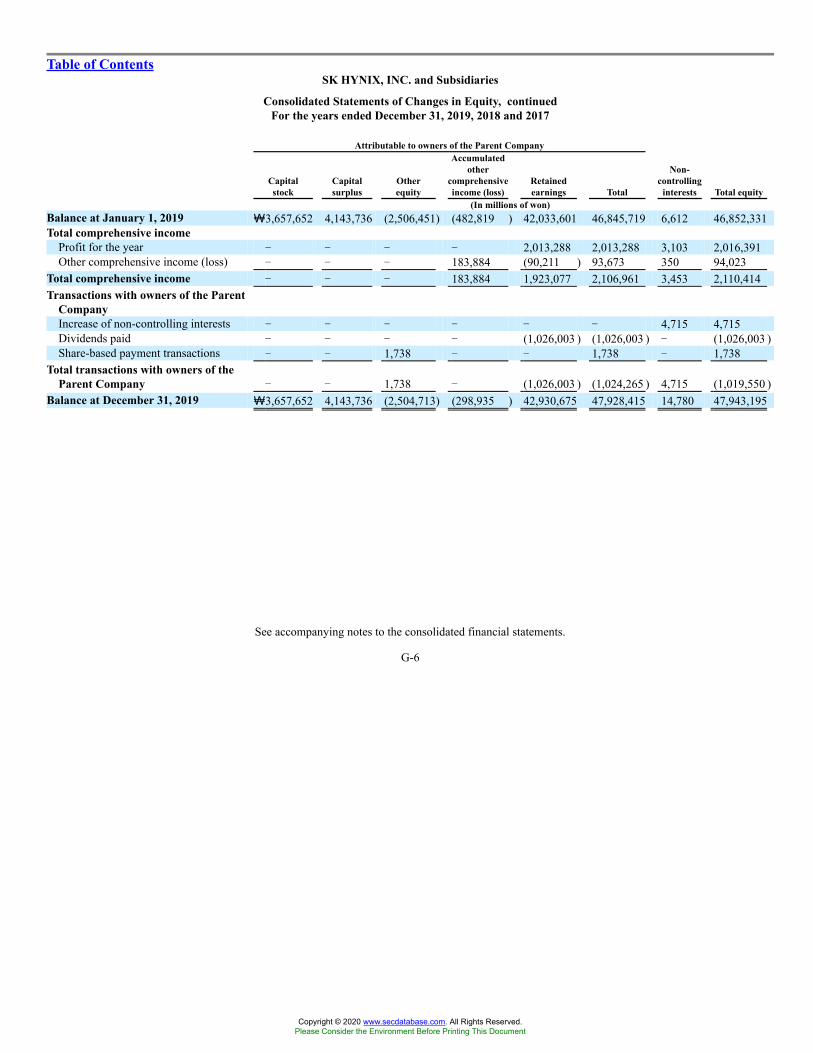
Table of ContentsSK HYNIX, INC. and Subsidiaries
Consolidated Statements of Changes in Equity, continuedFor the years ended December 31, 2019, 2018 and 2017
Attributable to owners of the Parent Company
Capitalstock
Capitalsurplus
Otherequity
Accumulatedother
comprehensiveincome (loss)
Retainedearnings Total
Non-controlling
interests Total equity(In millions of won)
Balance at January 1, 2019 ₩3,657,652 4,143,736 (2,506,451) (482,819 ) 42,033,601 46,845,719 6,612 46,852,331Total comprehensive income
Profit for the year � � � � 2,013,288 2,013,288 3,103 2,016,391Other comprehensive income (loss) � � � 183,884 (90,211 ) 93,673 350 94,023
Total comprehensive income � � � 183,884 1,923,077 2,106,961 3,453 2,110,414Transactions with owners of the Parent
CompanyIncrease of non-controlling interests � � � � � � 4,715 4,715Dividends paid � � � � (1,026,003 ) (1,026,003 ) � (1,026,003 )Share-based payment transactions � � 1,738 � � 1,738 � 1,738
Total transactions with owners of theParent Company � � 1,738 � (1,026,003 ) (1,024,265 ) 4,715 (1,019,550 )
Balance at December 31, 2019 ₩3,657,652 4,143,736 (2,504,713) (298,935 ) 42,930,675 47,928,415 14,780 47,943,195
See accompanying notes to the consolidated financial statements.
G-6
Copyright © 2020 www.secdatabase.com. All Rights Reserved.Please Consider the Environment Before Printing This Document
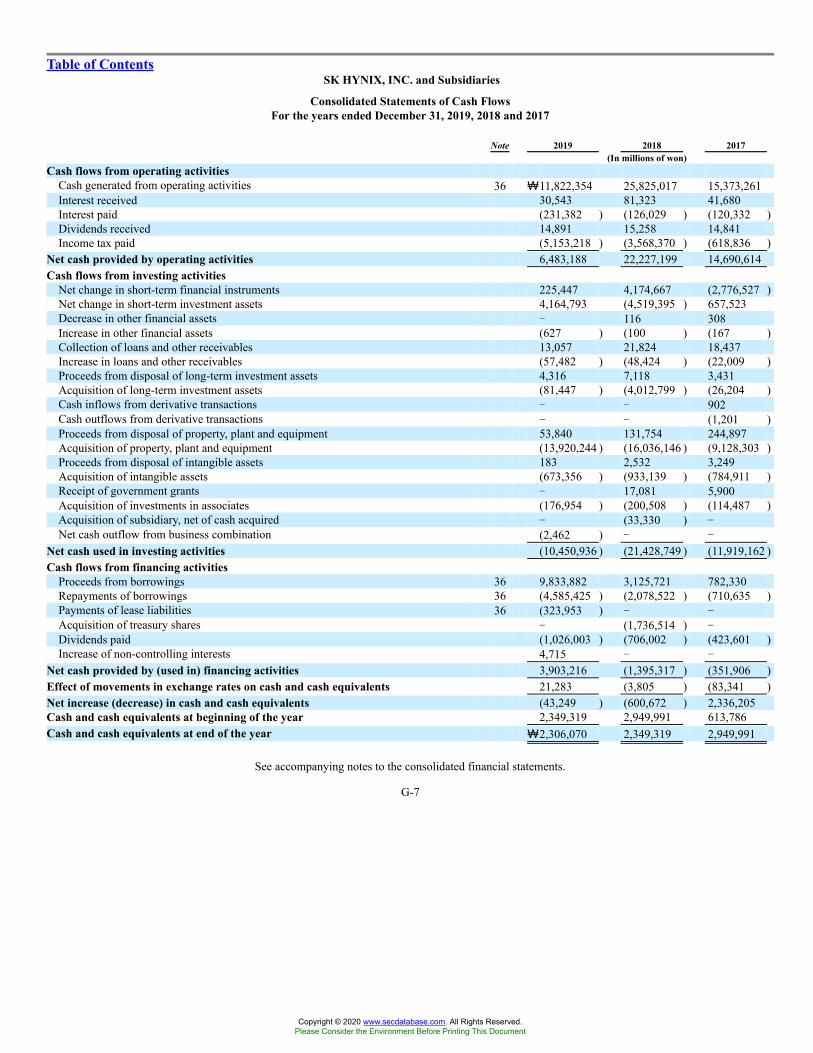
Table of ContentsSK HYNIX, INC. and Subsidiaries
Consolidated Statements of Cash FlowsFor the years ended December 31, 2019, 2018 and 2017
Note 2019 2018 2017(In millions of won)
Cash flows from operating activitiesCash generated from operating activities 36 ₩11,822,354 25,825,017 15,373,261Interest received 30,543 81,323 41,680Interest paid (231,382 ) (126,029 ) (120,332 )Dividends received 14,891 15,258 14,841Income tax paid (5,153,218 ) (3,568,370 ) (618,836 )
Net cash provided by operating activities 6,483,188 22,227,199 14,690,614Cash flows from investing activities
Net change in short-term financial instruments 225,447 4,174,667 (2,776,527 )Net change in short-term investment assets 4,164,793 (4,519,395 ) 657,523Decrease in other financial assets � 116 308Increase in other financial assets (627 ) (100 ) (167 )Collection of loans and other receivables 13,057 21,824 18,437Increase in loans and other receivables (57,482 ) (48,424 ) (22,009 )Proceeds from disposal of long-term investment assets 4,316 7,118 3,431Acquisition of long-term investment assets (81,447 ) (4,012,799 ) (26,204 )Cash inflows from derivative transactions � � 902Cash outflows from derivative transactions � � (1,201 )Proceeds from disposal of property, plant and equipment 53,840 131,754 244,897Acquisition of property, plant and equipment (13,920,244 ) (16,036,146 ) (9,128,303 )Proceeds from disposal of intangible assets 183 2,532 3,249Acquisition of intangible assets (673,356 ) (933,139 ) (784,911 )Receipt of government grants � 17,081 5,900Acquisition of investments in associates (176,954 ) (200,508 ) (114,487 )Acquisition of subsidiary, net of cash acquired � (33,330 ) �Net cash outflow from business combination (2,462 ) � �
Net cash used in investing activities (10,450,936 ) (21,428,749 ) (11,919,162 )Cash flows from financing activities
Proceeds from borrowings 36 9,833,882 3,125,721 782,330Repayments of borrowings 36 (4,585,425 ) (2,078,522 ) (710,635 )Payments of lease liabilities 36 (323,953 ) � �Acquisition of treasury shares � (1,736,514 ) �Dividends paid (1,026,003 ) (706,002 ) (423,601 )Increase of non-controlling interests 4,715 � �
Net cash provided by (used in) financing activities 3,903,216 (1,395,317 ) (351,906 )Effect of movements in exchange rates on cash and cash equivalents 21,283 (3,805 ) (83,341 )Net increase (decrease) in cash and cash equivalents (43,249 ) (600,672 ) 2,336,205Cash and cash equivalents at beginning of the year 2,349,319 2,949,991 613,786Cash and cash equivalents at end of the year ₩2,306,070 2,349,319 2,949,991
See accompanying notes to the consolidated financial statements.
G-7
Copyright © 2020 www.secdatabase.com. All Rights Reserved.Please Consider the Environment Before Printing This Document
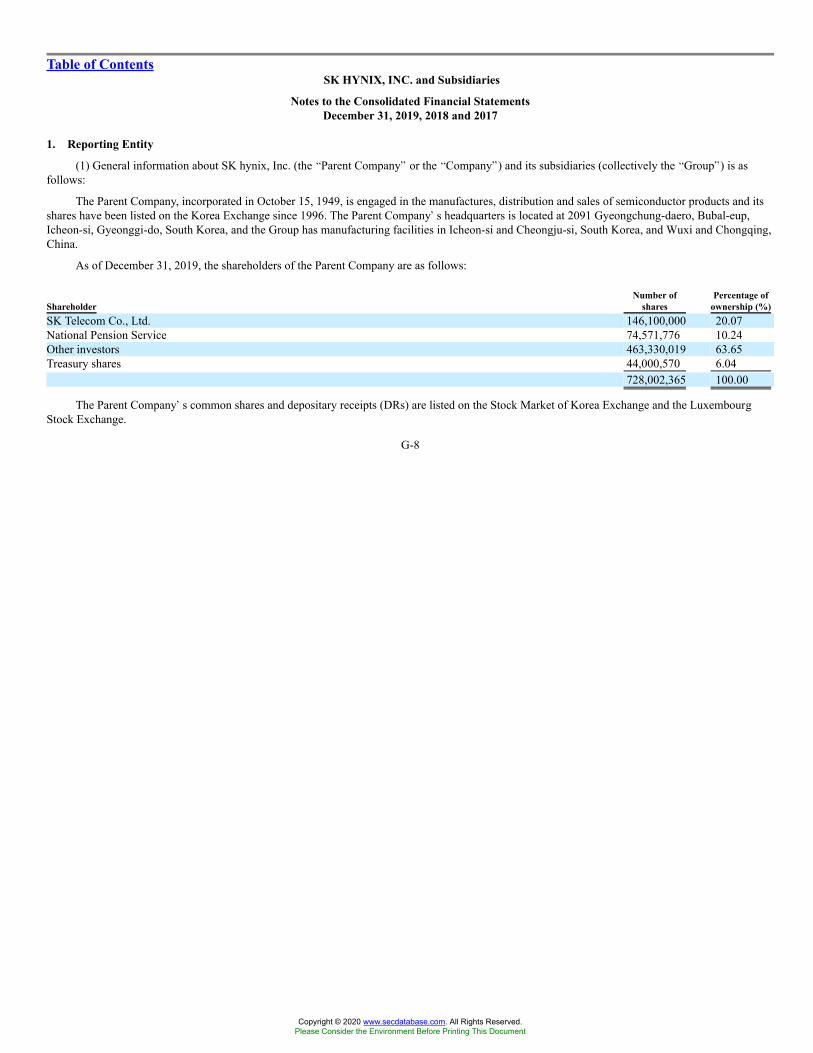
Table of ContentsSK HYNIX, INC. and Subsidiaries
Notes to the Consolidated Financial StatementsDecember 31, 2019, 2018 and 2017
1. Reporting Entity
(1) General information about SK hynix, Inc. (the �Parent Company� or the �Company�) and its subsidiaries (collectively the �Group�) is asfollows:
The Parent Company, incorporated in October 15, 1949, is engaged in the manufactures, distribution and sales of semiconductor products and itsshares have been listed on the Korea Exchange since 1996. The Parent Company�s headquarters is located at 2091 Gyeongchung-daero, Bubal-eup,Icheon-si, Gyeonggi-do, South Korea, and the Group has manufacturing facilities in Icheon-si and Cheongju-si, South Korea, and Wuxi and Chongqing,China.
As of December 31, 2019, the shareholders of the Parent Company are as follows:
ShareholderNumber of
sharesPercentage of
ownership (%)SK Telecom Co., Ltd. 146,100,000 20.07National Pension Service 74,571,776 10.24Other investors 463,330,019 63.65Treasury shares 44,000,570 6.04
728,002,365 100.00
The Parent Company�s common shares and depositary receipts (DRs) are listed on the Stock Market of Korea Exchange and the LuxembourgStock Exchange.
G-8
Copyright © 2020 www.secdatabase.com. All Rights Reserved.Please Consider the Environment Before Printing This Document
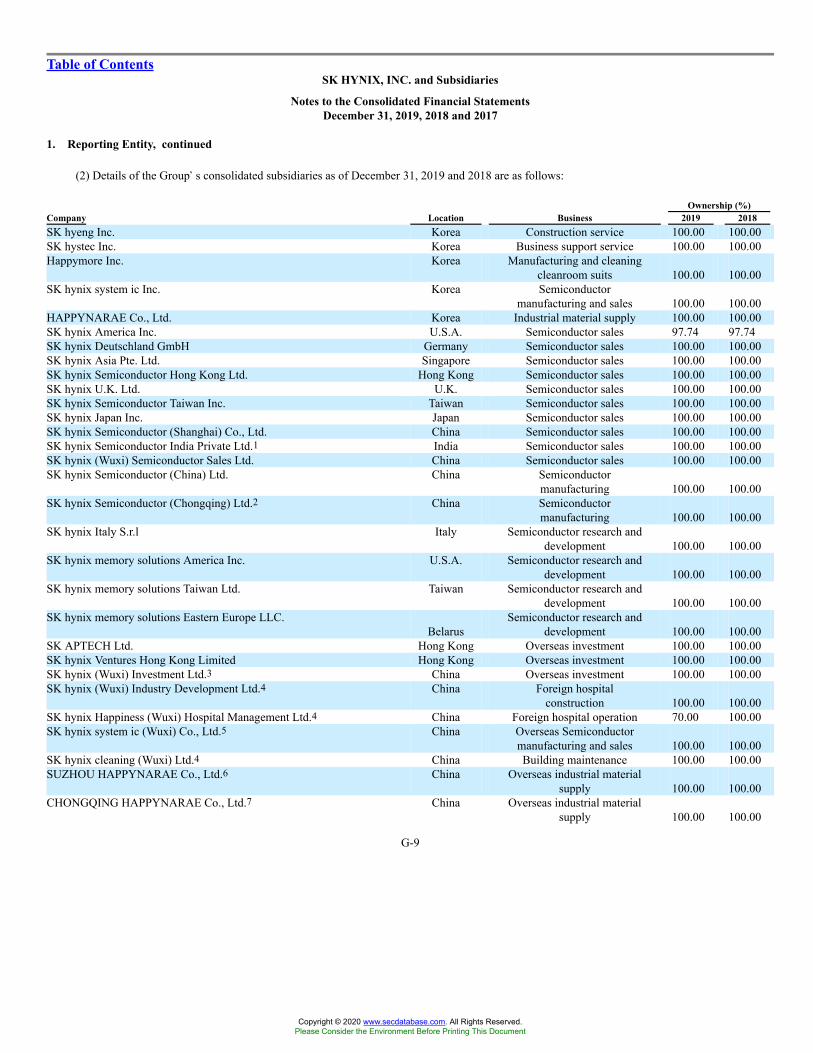
Table of ContentsSK HYNIX, INC. and Subsidiaries
Notes to the Consolidated Financial StatementsDecember 31, 2019, 2018 and 2017
1. Reporting Entity, continued
(2) Details of the Group�s consolidated subsidiaries as of December 31, 2019 and 2018 are as follows:
Ownership (%)Company Location Business 2019 2018SK hyeng Inc. Korea Construction service 100.00 100.00SK hystec Inc. Korea Business support service 100.00 100.00Happymore Inc. Korea Manufacturing and cleaning
cleanroom suits 100.00 100.00SK hynix system ic Inc. Korea Semiconductor
manufacturing and sales 100.00 100.00HAPPYNARAE Co., Ltd. Korea Industrial material supply 100.00 100.00SK hynix America Inc. U.S.A. Semiconductor sales 97.74 97.74SK hynix Deutschland GmbH Germany Semiconductor sales 100.00 100.00SK hynix Asia Pte. Ltd. Singapore Semiconductor sales 100.00 100.00SK hynix Semiconductor Hong Kong Ltd. Hong Kong Semiconductor sales 100.00 100.00SK hynix U.K. Ltd. U.K. Semiconductor sales 100.00 100.00SK hynix Semiconductor Taiwan Inc. Taiwan Semiconductor sales 100.00 100.00SK hynix Japan Inc. Japan Semiconductor sales 100.00 100.00SK hynix Semiconductor (Shanghai) Co., Ltd. China Semiconductor sales 100.00 100.00SK hynix Semiconductor India Private Ltd.1 India Semiconductor sales 100.00 100.00SK hynix (Wuxi) Semiconductor Sales Ltd. China Semiconductor sales 100.00 100.00SK hynix Semiconductor (China) Ltd. China Semiconductor
manufacturing 100.00 100.00SK hynix Semiconductor (Chongqing) Ltd.2 China Semiconductor
manufacturing 100.00 100.00SK hynix Italy S.r.l Italy Semiconductor research and
development 100.00 100.00SK hynix memory solutions America Inc. U.S.A. Semiconductor research and
development 100.00 100.00SK hynix memory solutions Taiwan Ltd. Taiwan Semiconductor research and
development 100.00 100.00SK hynix memory solutions Eastern Europe LLC.
BelarusSemiconductor research and
development 100.00 100.00SK APTECH Ltd. Hong Kong Overseas investment 100.00 100.00SK hynix Ventures Hong Kong Limited Hong Kong Overseas investment 100.00 100.00SK hynix (Wuxi) Investment Ltd.3 China Overseas investment 100.00 100.00SK hynix (Wuxi) Industry Development Ltd.4 China Foreign hospital
construction 100.00 100.00SK hynix Happiness (Wuxi) Hospital Management Ltd.4 China Foreign hospital operation 70.00 100.00SK hynix system ic (Wuxi) Co., Ltd.5 China Overseas Semiconductor
manufacturing and sales 100.00 100.00SK hynix cleaning (Wuxi) Ltd.4 China Building maintenance 100.00 100.00SUZHOU HAPPYNARAE Co., Ltd.6 China Overseas industrial material
supply 100.00 100.00CHONGQING HAPPYNARAE Co., Ltd.7 China Overseas industrial material
supply 100.00 100.00
G-9
Copyright © 2020 www.secdatabase.com. All Rights Reserved.Please Consider the Environment Before Printing This Document
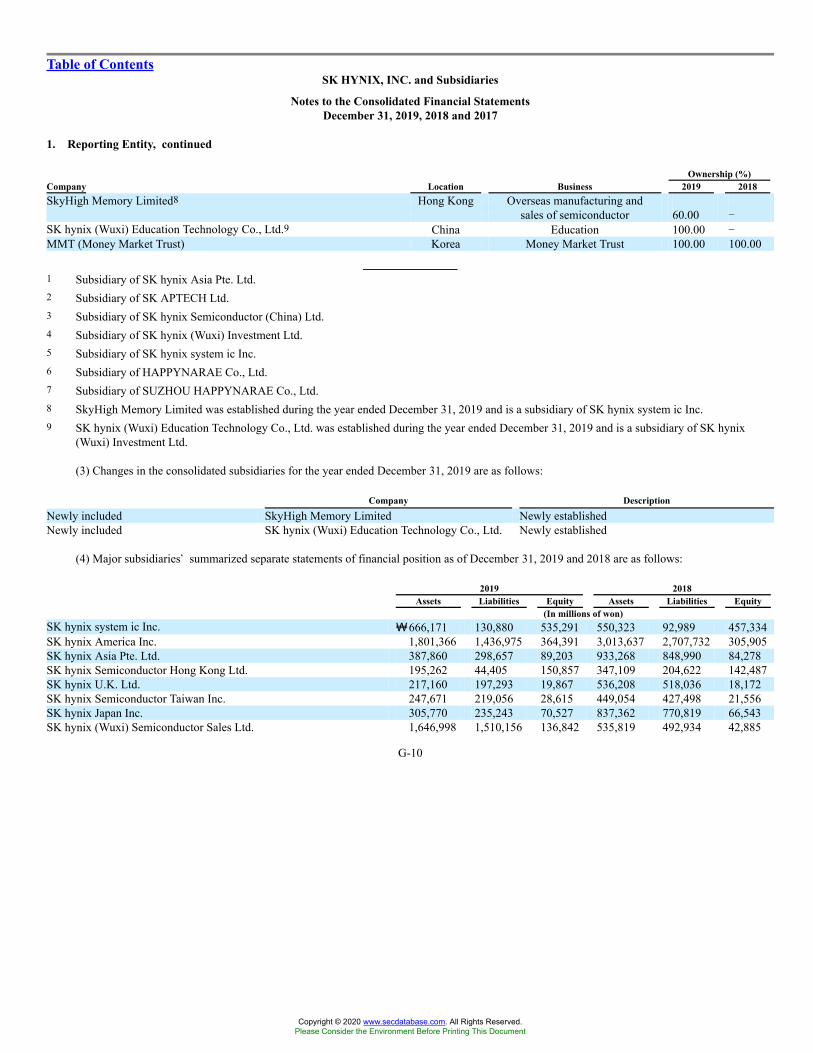
Table of ContentsSK HYNIX, INC. and Subsidiaries
Notes to the Consolidated Financial StatementsDecember 31, 2019, 2018 and 2017
1. Reporting Entity, continued
Ownership (%)Company Location Business 2019 2018SkyHigh Memory Limited8 Hong Kong Overseas manufacturing and
sales of semiconductor 60.00 �SK hynix (Wuxi) Education Technology Co., Ltd.9 China Education 100.00 �MMT (Money Market Trust) Korea Money Market Trust 100.00 100.00
1 Subsidiary of SK hynix Asia Pte. Ltd.2 Subsidiary of SK APTECH Ltd.3 Subsidiary of SK hynix Semiconductor (China) Ltd.4 Subsidiary of SK hynix (Wuxi) Investment Ltd.5 Subsidiary of SK hynix system ic Inc.6 Subsidiary of HAPPYNARAE Co., Ltd.7 Subsidiary of SUZHOU HAPPYNARAE Co., Ltd.8 SkyHigh Memory Limited was established during the year ended December 31, 2019 and is a subsidiary of SK hynix system ic Inc.9 SK hynix (Wuxi) Education Technology Co., Ltd. was established during the year ended December 31, 2019 and is a subsidiary of SK hynix
(Wuxi) Investment Ltd.
(3) Changes in the consolidated subsidiaries for the year ended December 31, 2019 are as follows:
Company DescriptionNewly included SkyHigh Memory Limited Newly establishedNewly included SK hynix (Wuxi) Education Technology Co., Ltd. Newly established
(4) Major subsidiaries� summarized separate statements of financial position as of December 31, 2019 and 2018 are as follows:
2019 2018Assets Liabilities Equity Assets Liabilities Equity
(In millions of won)SK hynix system ic Inc. ₩666,171 130,880 535,291 550,323 92,989 457,334SK hynix America Inc. 1,801,366 1,436,975 364,391 3,013,637 2,707,732 305,905SK hynix Asia Pte. Ltd. 387,860 298,657 89,203 933,268 848,990 84,278SK hynix Semiconductor Hong Kong Ltd. 195,262 44,405 150,857 347,109 204,622 142,487SK hynix U.K. Ltd. 217,160 197,293 19,867 536,208 518,036 18,172SK hynix Semiconductor Taiwan Inc. 247,671 219,056 28,615 449,054 427,498 21,556SK hynix Japan Inc. 305,770 235,243 70,527 837,362 770,819 66,543SK hynix (Wuxi) Semiconductor Sales Ltd. 1,646,998 1,510,156 136,842 535,819 492,934 42,885
G-10
Copyright © 2020 www.secdatabase.com. All Rights Reserved.Please Consider the Environment Before Printing This Document

Table of ContentsSK HYNIX, INC. and Subsidiaries
Notes to the Consolidated Financial StatementsDecember 31, 2019, 2018 and 2017
1. Reporting Entity, continued
2019 2018Assets Liabilities Equity Assets Liabilities Equity
(In millions of won)SK hynix Semiconductor (China) Ltd. ₩ 9,605,890 4,937,517 4,668,373 6,390,490 2,158,715 4,231,775SK hynix Semiconductor (Chongqing) Ltd. 837,339 309,283 528,056 540,284 124,451 415,833HAPPYNARAE Co., Ltd. 186,079 136,257 49,822 185,177 143,517 41,660
(5) Major subsidiaries� summarized separate statements of comprehensive income for the years ended December 31, 2019, 2018 and 2017 are asfollows:
2019
Revenue Profit
Totalcomprehensive
income(In millions of won)
SK hynix system ic Inc. ₩661,511 76,614 77,957SK hynix America Inc. 8,353,658 47,947 47,947SK hynix Asia Pte. Ltd. 1,662,315 1,965 1,965SK hynix Semiconductor Hong Kong Ltd. 1,579,680 2,493 2,493SK hynix U.K. Ltd. 907,945 1,057 1,057SK hynix Semiconductor Taiwan Inc. 1,455,320 8,127 8,127SK hynix Japan Inc. 672,393 701 700SK hynix (Wuxi) Semiconductor Sales Ltd. 10,882,152 94,768 94,768SK hynix Semiconductor (China) Ltd. 3,177,415 18,551 18,551SK hynix Semiconductor (Chongqing) Ltd. 477,849 39,102 39,102HAPPYNARAE Co., Ltd. 1,107,524 8,473 8,162
2018
Revenue Profit (Loss)
Totalcomprehensiveincome (loss)
(In millions of won)SK hynix system ic Inc. ₩554,264 60,649 60,360SK hynix America Inc. 14,296,762 30,800 30,800SK hynix Asia Pte. Ltd. 3,531,313 3,999 3,999SK hynix Semiconductor Hong Kong Ltd. 3,710,359 11,486 11,486SK hynix U.K. Ltd. 1,517,706 1,005 1,005SK hynix Semiconductor Taiwan Inc. 2,955,717 2,475 2,475SK hynix Japan Inc. 1,084,079 (410 ) (467 )SK hynix Semiconductor (Shanghai) Co., Ltd. 7,291,257 49,634 49,634SK hynix (Wuxi) Semiconductor Sales Ltd. 4,832,879 43,163 43,163SK hynix Semiconductor (China) Ltd. 2,518,849 84,089 84,089SK hynix Semiconductor (Chongqing) Ltd. 406,839 27,125 27,125HAPPYNARAE Co., Ltd. 1,094,778 12,117 11,942
G-11
Copyright © 2020 www.secdatabase.com. All Rights Reserved.Please Consider the Environment Before Printing This Document
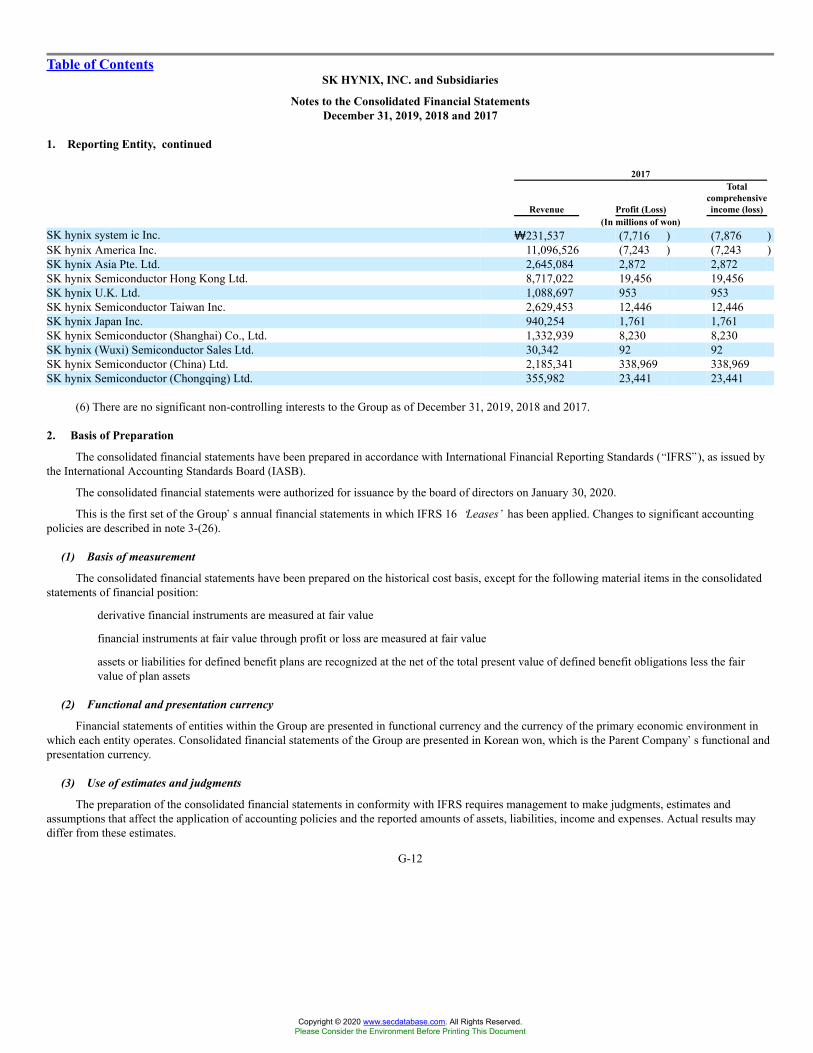
Table of ContentsSK HYNIX, INC. and Subsidiaries
Notes to the Consolidated Financial StatementsDecember 31, 2019, 2018 and 2017
1. Reporting Entity, continued
2017
Revenue Profit (Loss)
Totalcomprehensiveincome (loss)
(In millions of won)SK hynix system ic Inc. ₩231,537 (7,716 ) (7,876 )SK hynix America Inc. 11,096,526 (7,243 ) (7,243 )SK hynix Asia Pte. Ltd. 2,645,084 2,872 2,872SK hynix Semiconductor Hong Kong Ltd. 8,717,022 19,456 19,456SK hynix U.K. Ltd. 1,088,697 953 953SK hynix Semiconductor Taiwan Inc. 2,629,453 12,446 12,446SK hynix Japan Inc. 940,254 1,761 1,761SK hynix Semiconductor (Shanghai) Co., Ltd. 1,332,939 8,230 8,230SK hynix (Wuxi) Semiconductor Sales Ltd. 30,342 92 92SK hynix Semiconductor (China) Ltd. 2,185,341 338,969 338,969SK hynix Semiconductor (Chongqing) Ltd. 355,982 23,441 23,441
(6) There are no significant non-controlling interests to the Group as of December 31, 2019, 2018 and 2017.
2. Basis of Preparation
The consolidated financial statements have been prepared in accordance with International Financial Reporting Standards (�IFRS�), as issued bythe International Accounting Standards Board (IASB).
The consolidated financial statements were authorized for issuance by the board of directors on January 30, 2020.
This is the first set of the Group�s annual financial statements in which IFRS 16 �Leases� has been applied. Changes to significant accountingpolicies are described in note 3-(26).
(1) Basis of measurement
The consolidated financial statements have been prepared on the historical cost basis, except for the following material items in the consolidatedstatements of financial position:
� derivative financial instruments are measured at fair value
� financial instruments at fair value through profit or loss are measured at fair value
� assets or liabilities for defined benefit plans are recognized at the net of the total present value of defined benefit obligations less the fairvalue of plan assets
(2) Functional and presentation currency
Financial statements of entities within the Group are presented in functional currency and the currency of the primary economic environment inwhich each entity operates. Consolidated financial statements of the Group are presented in Korean won, which is the Parent Company�s functional andpresentation currency.
(3) Use of estimates and judgments
The preparation of the consolidated financial statements in conformity with IFRS requires management to make judgments, estimates andassumptions that affect the application of accounting policies and the reported amounts of assets, liabilities, income and expenses. Actual results maydiffer from these estimates.
G-12
Copyright © 2020 www.secdatabase.com. All Rights Reserved.Please Consider the Environment Before Printing This Document

Table of ContentsSK HYNIX, INC. and Subsidiaries
Notes to the Consolidated Financial StatementsDecember 31, 2019, 2018 and 2017
2. Basis of Preparation, continued
Estimates and underlying assumptions are reviewed on an ongoing basis. Revisions to accounting estimates are recognized in the period in whichthe estimates are revised and in any future periods affected.
(a) Judgments
Information about critical judgments in applying accounting policies that have the significant effect on the amounts recognized in the consolidatedfinancial statements is included in the note for investments in associates and joint ventures.
(b) Assumptions and estimation uncertainties
Information about assumptions and estimation uncertainties that have a significant risk of resulting in a material adjustment within the next fiscalyear is included in the accompanying notes for net realizable value of inventories, impairment of development costs and goodwill, recognition andmeasurement of provisions, measurement of defined benefit obligations, recognition of deferred tax assets, and valuation of short and long- terminvestment assets.
(c) Fair value measurement
The Group establishes fair value measurement policies and procedures as its accounting policies and disclosures require fair value measurementsfor various financial and non-financial assets and liabilities. Such policies and procedures are executed by the valuation department, which isresponsible for the review of significant fair value measurements including fair values classified as level 3 in the fair value hierarchy.
The valuation department regularly reviews significant unobservable inputs and valuation adjustments. If third party information, such as brokerquotes or pricing services, is used to measure fair values, then the valuation department assesses the evidence obtained from the third parties to supportthe conclusion that these valuations meet the requirements of IFRS, including the level in the fair value hierarchy in which the valuations should beclassified.
The Group reports significant valuation issues to the audit committee.
When measuring the fair value of an asset or a liability, the Group uses observable market data as far as possible. Fair values are categorized intodifferent levels in a fair value hierarchy based on the inputs used in the valuation techniques as follows.
Level 1: quoted prices (unadjusted) in active markets for identical assets or liabilities
Level 2: inputs other than quoted prices included within Level 1 that are observable for the asset or liability, either directly (i.e. as prices) orindirectly (i.e. derived from prices)
Level 3: inputs for the asset or liability that are not based on observable market data (unobservable inputs)
If various inputs used to measure fair value of assets or liabilities fall into different levels of the fair value hierarchy, the Group classifies the assetsand liabilities at the lowest level of inputs among the fair value hierarchy, which is significant to the entire measured value. The Group recognizestransfers between levels at the end of the reporting period of which such transfers occurred.
Information about assumptions used for fair value measurements is included in note 6 financial risk management.
G-13
Copyright © 2020 www.secdatabase.com. All Rights Reserved.Please Consider the Environment Before Printing This Document

Table of ContentsSK HYNIX, INC. and Subsidiaries
Notes to the Consolidated Financial StatementsDecember 31, 2019, 2018 and 2017
3. Significant Accounting Policies
The significant accounting policies applied by the Group in preparation of its consolidated financial statements are explained below. Except forthe new accounting standards that are effective for annual periods beginning on or after January 1, 2019, the accounting policies set out below have beenapplied consistently to all periods presented in these consolidated financial statements.
(1) Operating Segments
An operating segment is a component of the Group that: 1) engages in business activities from which it may earn revenues and incur expenses,including revenues and expenses that relate to transactions with other components of the Group, 2) whose operating results are reviewed regularly by theGroup�s chief operating decision maker (�CODM�) in order to allocate resources and assess its performance, and 3) for which discrete financialinformation is available. The Group�s CODM is the board of directors, who do not receive and therefore do not review discrete financial information forany component of the Group. Accordingly, no operating segment information is included in these consolidated financial statements. Entity widedisclosures of geographic, product and customer information are provided in note 4 and 27.
(2) Consolidation
(a) Business combination
A business combination is accounted for by applying the acquisition method, unless it is a combination involving entities or businesses undercommon control.
The consideration transferred in the acquisition is generally measured at fair value, as are the identifiable net assets acquired. Any goodwill thatarises is tested annually for impairment. Any gain on a bargain purchase is recognized in profit or loss immediately. Transaction costs are expensed asincurred and during period of service, except if related to the issue of debt or equity securities according to IAS 32 and IFRS 9.
The consideration transferred does not include amounts related to the settlement of pre-existing relationships. Such amounts are generallyrecognized in profit or loss.
Any contingent consideration is measured at fair value at the date of acquisition. If an obligation to pay contingent consideration that meets thedefinition of a financial instrument is classified as equity, then it is not remeasured and settlement is accounted for within equity. Otherwise, subsequentchanges in the fair value of the contingent consideration are recognized in profit or loss.
If share-based payment awards (replacement awards) are required to be exchanged for awards held by the acquiree�s employees (acquiree�sawards), then all or a portion of the amount of the acquirer�s replacement awards is included in measuring the consideration transferred in the businesscombination. This determination is based on the market-based measure of the replacement awards compared with the market-based measure of theacquiree�s awards and the extent to which the replacement awards relate to pre-combination service.
(b) Non-controlling interests
Non-controlling interests are measured at their proportionate share of the acquiree�s identifiable net assets at the date of acquisition.
Changes in the Group�s interest in a subsidiary that do not result in a loss of control are accounted for as equity transactions.
G-14
Copyright © 2020 www.secdatabase.com. All Rights Reserved.Please Consider the Environment Before Printing This Document
Table of ContentsSK HYNIX, INC. and Subsidiaries
Notes to the Consolidated Financial StatementsDecember 31, 2019, 2018 and 2017
3. Significant Accounting Policies, continued
(c) Subsidiaries
Subsidiaries are entities controlled by the Group. The Group controls an entity when it is exposed, or has rights, to variable returns from itsinvolvement with the investee and has the ability to affect those returns through its power over the entity. Consolidation of an investee begins from thedate the Group obtains control of the investee and cease when the Group loses control of the investee.
(d) Loss of control
If the Group loses control of a subsidiary, the Group derecognizes the assets and liabilities of the former subsidiary from the consolidatedstatement of financial position and recognizes gain or loss associated with the loss of control attributable to the former controlling interest. Anyinvestment retained in the former subsidiary is recognized at its fair value when control is lost.
(e) Interests in equity-accounted investees
The Group�s interest in equity-accounted investees comprise interests in an associate and a joint venture. An associate are these entities in whichthe Group has significant influence, but not control or joint control, over the entity�s financial and operating policies. A joint venture is an arrangementin which the Group has joint control, whereby the Group has rights to the net assets of the arrangement, rather than rights to its assets and obligations forits liabilities.
Interests in associates and the joint venture are initially recognized at cost including transaction costs. Subsequent to initial recognition, theircarrying amounts are increased or decreased to recognize the Group�s share of the profit or loss and changes in equity of the associate or the jointventure. Distributions from equity-accounted investees are accounted for as deduction from the carrying amounts.
(f) Transactions eliminated on consolidation
Intra-group balances and transactions, and any unrealized income and expenses arising from intra-group transactions, are eliminated in preparingthe consolidated financial statements. The Group�s share of unrealized gain incurred from transactions with equity-accounted investees are eliminatedand unrealized loss are eliminated using the same basis if there are no evidence of asset impairments.
(g) Business combinations under common control
The assets and liabilities acquired in the combination of entities or business under common control are recognized at the carrying amountsrecognized previously in the consolidated financial statements of the ultimate parent. The difference between consideration transferred and carryingamounts of net assets acquired is added to or deducted from other capital adjustments.
(3) Cash and cash equivalents
Cash and cash equivalents comprise cash balances and call deposits with maturities of three months or less from the acquisition date that aresubject to an insignificant risk of changes in their fair value, and are used by the Group in the management of its short-term commitments.
G-15
Copyright © 2020 www.secdatabase.com. All Rights Reserved.Please Consider the Environment Before Printing This Document
Table of ContentsSK HYNIX, INC. and Subsidiaries
Notes to the Consolidated Financial StatementsDecember 31, 2019, 2018 and 2017
3. Significant Accounting Policies, continued
(4) Inventories
The cost of inventories is based on the weighted average method (except for goods in-transit that is based on the specific identification method),and includes expenditures incurred in acquiring the inventories, production or conversion costs and other costs incurred in bringing inventories to theirexisting location and condition. In the case of manufactured inventories and work-in-process, cost includes an appropriate share of production overheadsbased on the actual capacity of production facilities. However, the normal capacity is used for the allocation of fixed production overheads if the actuallevel of production is lower than the normal capacity.
Inventories are measured at the lower of cost and net realizable value. Net realizable value is the estimated selling price in the ordinary course ofbusiness less the estimated costs of completion and selling expenses. The amount of any write-down of inventories to net realizable value and all lossesof inventories shall be recognized as an expense in the period the write-down or loss occurs. The amount of any reversal of any write-down ofinventories, arising from an increase in net realizable value, shall be recognized as a reduction in the amount of inventories recognized as an expense inthe period in which the reversal occurs.
(5) Non-derivative financial assets
(a) Accounting policies applied from January 1, 2018.
(i) Initial recognition and measurement
Trade and other receivables, and debt investment are initially recognized when they are originated. Other financial assets and financial liabilitiesare recognized when the Group becomes a party to the contractual provisions of the instruments.
A financial asset and financial liability (unless it is an account receivable�trade without a significant financing component that is initiallymeasured at the transaction price) are initially measured at fair value plus, for an item not at fair value through profit or loss (FVTPL), transaction coststhat are directly attributable to its acquisition.
(ii) Classification and subsequent measurements
On initial recognition, a financial asset is classified as measured at: amortized cost; fair value through other comprehensive income (FVOCI)�debtinvestment; FVOCI�equity investment; or FVTPL. The classification of financial assets is generally based on the business model in which a financialasset is managed and its contractual cash flow characteristics. In case of changing its business model, all affected financial asset are reclssified on thefirst day of the first reporting period after the change in the business model.
A financial asset is measured at amortized cost if it meets both of the following conditions and is not designated as at FVTPL:
� it is held within a business model whose objective is to hold assets to collect contractual cash flow; and
� its contractual terms give rise on specified dates to cash flows that are solely payments of principal and interest on the principal amountoutstanding.
A debt investments is measured at FVOCI if it meets both of the following conditions and is not designated as at FVTPL:
� it is held within a business model whose objective is achieved by both collecting contractual cash flows and selling financial assets; and
G-16
Copyright © 2020 www.secdatabase.com. All Rights Reserved.Please Consider the Environment Before Printing This Document
Table of ContentsSK HYNIX, INC. and Subsidiaries
Notes to the Consolidated Financial StatementsDecember 31, 2019, 2018 and 2017
3. Significant Accounting Policies, continued
� its contractual terms give rise on specified dates to cash flows that are solely payments of principal and interest on the principal amountoutstanding.
On initial recognition of an equity investment that is not held for trading, the Group may irrevocably elect to present subsequent changes in theinvestment�s fair value in other comprehensive income. This election is made on an investment-by-investment basis and irrevocable election can bemade at initial recognition.
All financial assets not classified as measured at amortized cost or FVOCI as described above are measured at FVTPL. This includes all derivativefinancial assets. On initial recognition, the Group may irrevocably designate a financial asset that otherwise meets the requirements to be measured atamortized cost or at FVOCI as at FVTPL if doing so eliminates or significantly reduces an accounting mismatch that would otherwise arise.
The Group makes an assessment of the objective of the business model in which, financial assets is held at a portfolio level because this bestreflects the way the business is managed and information is provided to management. The information considered includes:
� the stated policies and objectives for the portfolio and the operation of those policies in practice;
� how the performance of the business model and the financial assets held within that business model are evaluated and reported to the entity�skey management personnel;
� the risks that affect the performance of the business model (and the financial assets held within that business model) and, in particular, theway in which those risks are managed;
� how managers of the business are compensated (e.g. whether the compensation is based on the fair value of the assets managed or on thecontractual cash flows collected); and
� the frequency, volume and timing of sales of financial assets in prior periods, the reason for those sales and expectation about future salesactivity for financial asset.
Transfers of financial assets to third parties in transactions that do not qualify for derecognition are not considered sales for this purpose,consistent with the Group�s continuing recognition of the assets.
For the purposes of this assessment, �principal� is defined as the fair value of the financial assets on initial recognition. �Interest� is defined asconsideration for the time value of money and for the credit risk associated with the principal amount outstanding during a particular period of time andfor other basic lending risks and costs (e.g. liquidity risk and administrative costs), as well as a profit margin.
In assessing whether the contractual cash flows are solely payments of principal and interest, the Group considers the contractual terms of theinstrument. This includes assessing whether the financial asset contains a contractual term that could change the timing or amount of contractual cashflows such that it would not meet this condition. In making this assessment, the Group considers:
� contingent events that would change the amount or timing of cash flows;
� terms that may adjust the contractual coupon rate, including variable-rate features;
� prepayment and extension features; and
� terms that limit the Group�s claim to cash flows from specified assets (e.g. non-recourse features).
A prepayment feature is consistent with the solely payments of principal and interest criterion if the prepayment amount substantially representsunpaid amounts of principal and interest on the principal amount outstanding, which may include reasonable additional compensation for earlytermination of the contract.
G-17
Copyright © 2020 www.secdatabase.com. All Rights Reserved.Please Consider the Environment Before Printing This Document
Table of ContentsSK HYNIX, INC. and Subsidiaries
Notes to the Consolidated Financial StatementsDecember 31, 2019, 2018 and 2017
3. Significant Accounting Policies, continued
Additionally, for a financial asset acquired at a discount or premium to its contractual par amount, a feature that permits or requires prepayment at anamount that substantially represents the contractual par amount plus accrued (but unpaid) contractual interest (which may also include reasonableadditional compensation for early termination) is treated as consistent with this criterion if the fair value of the prepayment feature is insignificant atinitial recognition.
The following accounting policies apply to subsequent measurements of financial assets.
Financial assets at FVTPL These assets are subsequently measured at fair value. Net gains and losses, including any interestor dividend income, are recognized in profit or loss.
Financial assets at amortized cost These assets are subsequently measured at amortized cost using the effective interest method.The amortized cost is reduced by impairment losses. Interest income, foreign exchange gains andlosses and impairment are recognized in profit or loss. Any gain or loss on derecognition isrecognized in profit or loss.
Debt investments at FVOCI These assets are subsequently measured at fair value. Interest income is calculated using theeffective interest method. Foreign exchange gains and losses and impairment are recognized inprofit or loss. Other net gains and losses are recognized in OCI. On derecognition, gains andlosses accumulated in OCI are reclassified to profit or loss.
Equity investments at FVOCI These assets are subsequently measured at fair value. Dividends are recognized as income inprofit or loss unless the dividend clearly represents a recovery of part of the cost of theinvestment. Other net gains and losses are recognized in OCI and are never reclassified to profitor loss.
(iii) De-recognition
The Group derecognizes a financial asset when the contractual rights to the cash flows from the asset expire, or it transfers the rights to receive thecontractual cash flows in a transaction in which substantially all the risks and rewards of ownership of the financial asset are transferred or in which theGroup neither transfers nor retains substantially all of the risks and rewards of ownership and it does not retain control of the financial asset.
The Group enters into transactions whereby it transfers assets recognized in its statement of financial position, but retain either all or substantiallyall of the risks and rewards of the transferred assets. In these cases, the transferred assets are not derecognized.
(iv) Offsetting between financial assets and financial liabilities
Financial assets and financial liabilities are offset and the net amount is presented in the consolidated statement of financial position only when theGroup currently has a legally enforceable right to offset the recognized amounts, and there is the intention to settle on a net basis or to realize the assetand settle the liability simultaneously.
(b) Accounting policies applied before January 1, 2018.
The Group recognizes and measures non-derivative financial assets by the following four categories: financial assets at fair value through profit orloss, held-to-maturity investments, loans and receivables and available-for-sale
G-18
Copyright © 2020 www.secdatabase.com. All Rights Reserved.Please Consider the Environment Before Printing This Document
Table of ContentsSK HYNIX, INC. and Subsidiaries
Notes to the Consolidated Financial StatementsDecember 31, 2019, 2018 and 2017
3. Significant Accounting Policies, continued
financial assets. The Group recognizes financial assets in the consolidated statement of financial position when the Group becomes a party to thecontractual provisions of the instrument.
Upon initial recognition, non-derivative financial assets not at fair value through profit or loss are measured at their fair value plus transactioncosts that are directly attributable to the asset�s acquisition.
(i) Financial assets at fair value through profit or loss
A financial asset is classified as financial assets at fair value through profit or loss if it is held for trading or designated as such upon initialrecognition. Upon initial recognition, transaction costs are recognized in profit or loss when incurred. Financial assets at fair value through profit or lossare measured at fair value, and changes therein are recognized in profit or loss.
(ii) Held-to-maturity investments
A non-derivative financial asset with a fixed or determinable payment and fixed maturity, for which the Group has the positive intention andability to hold to maturity, is classified as held-to-maturity investments. Subsequent to initial recognition, held-to-maturity investments are measured atamortized cost using the effective interest rate method.
(iii) Loans and receivables
Loans and receivables are financial assets with fixed or determinable payments that are not quoted in an active market. Subsequent to initialrecognition, loans and receivables are measured at amortized cost using the effective interest rate method.
(iv) Available-for-sale financial assets
Available-for-sale financial assets are those non-derivative financial assets that are designated as available-for-sale or are not classified as financialassets at fair value through profit or loss, held-to-maturity investments or loans and receivables. Subsequent to initial recognition, they are measured atfair value, and changes in their fair value, net of any tax effect, are recorded in other comprehensive income. Investments in equity instruments that donot have a quoted market price in an active market and whose fair value cannot be reliably measured are measured at cost.
(v) De-recognition of financial assets
The Group derecognizes a financial asset when the contractual rights to the cash flows from the asset expire, or it transfers the rights to receive thecontractual cash flows on the financial asset in a transaction in which substantially all the risks and rewards of ownership of the financial asset aretransferred. If the Group neither transfers nor retains substantially all of the risks and rewards of ownership of the financial assets, it derecognizes thefinancial assets when it does not retain control over the transferred financial assets. If the Group has retained control over the transferred financial assets,it continues to recognize the assets to the extent of its continuing involvement. If the Group retains substantially all the risks and rewards of ownershipof the transferred financial assets, the Group continues to recognize the transferred financial assets and recognizes financial liabilities for theconsideration received.
(vi) Offsetting between financial assets and financial liabilities
Financial assets and financial liabilities are offset and the net amount is presented in the consolidated statement of financial position only when theGroup currently has a legally enforceable right to offset the recognized amounts, and there is the intention to settle on a net basis or to realize the assetand settle the liability simultaneously.
G-19
Copyright © 2020 www.secdatabase.com. All Rights Reserved.Please Consider the Environment Before Printing This Document
Table of ContentsSK HYNIX, INC. and Subsidiaries
Notes to the Consolidated Financial StatementsDecember 31, 2019, 2018 and 2017
3. Significant Accounting Policies, continued
(6) Derivative financial instruments
Derivatives are initially recognized at fair value. Subsequent to initial recognition, derivatives are measured at fair value at the end of eachreporting period, and changes in the fair value of derivatives therein are accounted for as described below.
(a) Hedge accounting
The Group enters into a fixed-to-fixed cross currency swap contract and a floating-to-fixed cross currency interest rate swap contract to hedgeinterest rate risk and currency risk.
On initial designation of the hedge, the Group formally documents the relationship between the hedging instrument(s) and hedged item(s),including the risk management objectives and strategy in undertaking the hedge transaction. In addition, the document includes hedging instruments;hedged items; initial commencement date of those hedge relationship; fair value of hedged items based on hedged risk during the subsequent period; andthe method of valuation on hedging instruments offsetting changes in cash flow.
� Cash flow hedge
When a derivative is designated to hedge the variability in cash flows attributable to a particular risk associated with a recognized asset or liability,the effective portion of changes in the fair value of the derivative is recognized in other comprehensive income, net of tax, and presented in accumulatedother comprehensive income. Any ineffective portion of changes in the fair value of the derivative is recognized immediately in profit or loss. If thehedging instrument no longer meets the criteria for hedge accounting, expires or is sold, terminated, exercised, or the designation is revoked, then hedgeaccounting is discontinued prospectively. The cumulative gain or loss on the hedging instrument that has been recognized in other comprehensiveincome is reclassified to profit or loss in the periods which the forecasted transaction occurs.
(b) Other derivative financial instruments
Other derivative financial instrument not designated as a hedging instrument are measured at fair value, and the changes in fair value of thederivative financial instrument is recognized immediately in profit or loss.
(7) Impairment of financial assets
(a) Recognition of impairment on financial assets
The Group recognizes loss allowances for expected credit losses (ECLs) on:
� financial assets measured at amortized costs; and
� contract assets.
The Group measures impairment losses at an amount equal to lifetime ECLs except for the below assets, which are measured at 12-month ELCs.
� credit risk of debt instruments is low at the end of reporting date
� credit risk has not increased significantly since the initial recognition of debt investment (lifetime ECL: ECL that resulted from all possibledefault events over the expected life of a financial instrument)
The Group adopted an accounting policy to recognize loss allowances at an amount equal to lifetime expected credit losses for trade receivablesand contract assets.
G-20
Copyright © 2020 www.secdatabase.com. All Rights Reserved.Please Consider the Environment Before Printing This Document
Table of ContentsSK HYNIX, INC. and Subsidiaries
Notes to the Consolidated Financial StatementsDecember 31, 2019, 2018 and 2017
3. Significant Accounting Policies, continued
In assessing whether the credit risk on a financial instrument has increased significantly since initial recognition and estimating expected creditloss, the Group considers both quantitative and qualitative information that is reasonable and supportable, including historical experience and forward-looking information that is available without undue cost or effort.
12-month ECLs are the portion of ECLs that result from all default events that are possible within the 12 months after the reporting date (or ashorter period if the expected life of the instrument is less than 12 months).
The maximum period considered when estimating ECLs is the maximum contractual period over which the Group is exposed to credit risk.
(b) Measurement of expected credit loss
ECLs are a probability-weighted estimate of credit losses. Credit losses are measured as the present value of all cash shortfalls (i.e. the differencebetween the cash flows due to the entity in accordance with the contract and the cash flows that the Group expects to receive). ECLs are discounted atthe effective interest rate of financial instrument.
(c) Credit-impaired financial instrument
A debt instrument carried at amortized cost and fair value through other comprehensive income (FVOCI) is assessed at the end of each reportingperiod to determine whether there is objective evidence that it is impaired. A financial asset is credit- impaired when one or more events that have adetrimental impact on the estimated future cash flows of that asset have occurred.
Objective evidence that a financial asset is impaired includes:
� significant financial difficulty of the issuer or borrower;
� a breach of contract, such as default or delinquency in interest or principal payments;
� the Group, for economic or legal reasons relating to the borrower�s financial difficulty, granting to the borrower a concession that the Groupwould not otherwise consider;
� it becoming probable that the borrower will enter bankruptcy or other financial reorganization; or
� the disappearance of an active market for the financial asset because of financial difficulties
(d) Presentation of credit loss allowance on financial position
Loss allowances for financial assets measured at amortized cost are deducted from the gross carrying amount of the assets.
(e) Write-off
The Group writes off a financial asset when it has no reasonable expectations of recovering the contractual cash flows on a financial asset in itsentirety or a portion thereof. For corporate customers, the Group individually makes an assessment with respect to the timing and amount of write-offbased on whether there is a reasonable expectation of recovery. However financial assets that are written off could still be subject to collection activitiesaccording to the Group�s past due collection process.
G-21
Copyright © 2020 www.secdatabase.com. All Rights Reserved.Please Consider the Environment Before Printing This Document
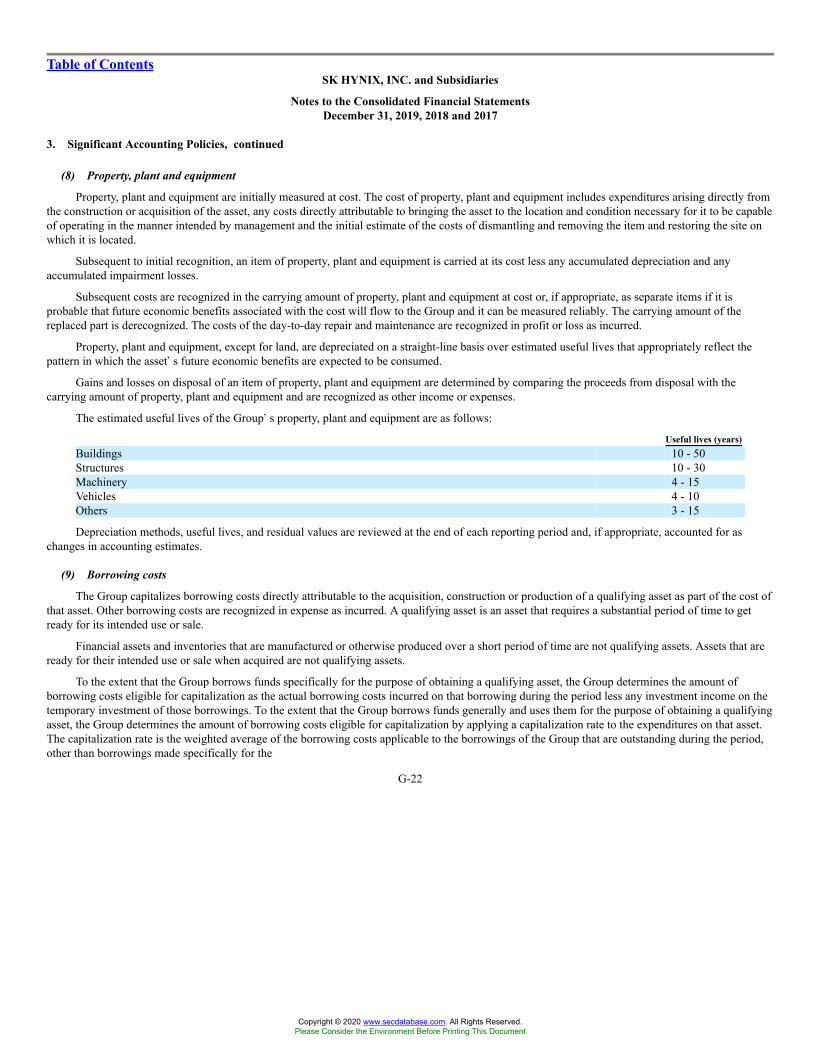
Table of ContentsSK HYNIX, INC. and Subsidiaries
Notes to the Consolidated Financial StatementsDecember 31, 2019, 2018 and 2017
3. Significant Accounting Policies, continued
(8) Property, plant and equipment
Property, plant and equipment are initially measured at cost. The cost of property, plant and equipment includes expenditures arising directly fromthe construction or acquisition of the asset, any costs directly attributable to bringing the asset to the location and condition necessary for it to be capableof operating in the manner intended by management and the initial estimate of the costs of dismantling and removing the item and restoring the site onwhich it is located.
Subsequent to initial recognition, an item of property, plant and equipment is carried at its cost less any accumulated depreciation and anyaccumulated impairment losses.
Subsequent costs are recognized in the carrying amount of property, plant and equipment at cost or, if appropriate, as separate items if it isprobable that future economic benefits associated with the cost will flow to the Group and it can be measured reliably. The carrying amount of thereplaced part is derecognized. The costs of the day-to-day repair and maintenance are recognized in profit or loss as incurred.
Property, plant and equipment, except for land, are depreciated on a straight-line basis over estimated useful lives that appropriately reflect thepattern in which the asset�s future economic benefits are expected to be consumed.
Gains and losses on disposal of an item of property, plant and equipment are determined by comparing the proceeds from disposal with thecarrying amount of property, plant and equipment and are recognized as other income or expenses.
The estimated useful lives of the Group�s property, plant and equipment are as follows:
Useful lives (years)Buildings 10 - 50Structures 10 - 30Machinery 4 - 15Vehicles 4 - 10Others 3 - 15
Depreciation methods, useful lives, and residual values are reviewed at the end of each reporting period and, if appropriate, accounted for aschanges in accounting estimates.
(9) Borrowing costs
The Group capitalizes borrowing costs directly attributable to the acquisition, construction or production of a qualifying asset as part of the cost ofthat asset. Other borrowing costs are recognized in expense as incurred. A qualifying asset is an asset that requires a substantial period of time to getready for its intended use or sale.
Financial assets and inventories that are manufactured or otherwise produced over a short period of time are not qualifying assets. Assets that areready for their intended use or sale when acquired are not qualifying assets.
To the extent that the Group borrows funds specifically for the purpose of obtaining a qualifying asset, the Group determines the amount ofborrowing costs eligible for capitalization as the actual borrowing costs incurred on that borrowing during the period less any investment income on thetemporary investment of those borrowings. To the extent that the Group borrows funds generally and uses them for the purpose of obtaining a qualifyingasset, the Group determines the amount of borrowing costs eligible for capitalization by applying a capitalization rate to the expenditures on that asset.The capitalization rate is the weighted average of the borrowing costs applicable to the borrowings of the Group that are outstanding during the period,other than borrowings made specifically for the
G-22
Copyright © 2020 www.secdatabase.com. All Rights Reserved.Please Consider the Environment Before Printing This Document
Table of ContentsSK HYNIX, INC. and Subsidiaries
Notes to the Consolidated Financial StatementsDecember 31, 2019, 2018 and 2017
3. Significant Accounting Policies, continued
purpose of obtaining a qualifying asset. The amount of borrowing costs that the Group capitalizes during a period does not exceed the amount ofborrowing costs incurred during that period.
(10) Intangible assets
Intangible assets are measured initially at cost and, subsequently, are carried at cost less accumulated amortization and accumulated impairmentlosses.
Goodwill arising from business combinations is recognized as the excess of the consideration transferred in the acquisition over the net fair valueof the identifiable assets acquired and liabilities assumed. Any deficit is a bargain purchase that is recognized in profit or loss. Goodwill is measured atcost less accumulated impairment losses.
Amortization of intangible assets is calculated on a straight-line basis over the estimated useful lives of intangible assets from the date that theyare available for use. The residual value of intangible assets is zero. However, certain intangible assets are determined as having indefinite useful livesand not amortized as there is no foreseeable limit to the period over which the assets are expected to be available for use.
The estimated useful lives of the Group�s intangible assets are as follows:
Useful lives (years)Industrial rights 5 - 10Development costs 2Other intangible assets 4 - 10
Useful lives and the amortization methods for intangible assets with finite useful lives are reviewed at the end of each reporting period. The usefullives of intangible assets that are not being amortized are reviewed at the end of each reporting period to determine whether events and circumstancescontinue to support indefinite useful life assessments for those assets. Changes are accounted for as changes in accounting estimates.
Expenditures on research activities, undertaken with the prospect of gaining new scientific or technical knowledge and understanding, arerecognized in profit or loss as incurred. Development expenditures are capitalized only if development costs can be measured reliably, the product orprocess is technically and commercially feasible, future economic benefits are probable, and the Group intends to and has sufficient resources tocomplete development and to use or sell the asset. Other development expenditures are recognized in profit or loss as incurred.
Subsequent expenditures are capitalized only when they increase the future economic benefits embodied in the specific asset to which it relates.All other expenditures, including expenditures on internally generated goodwill and others, are recognized in profit or loss as incurred.
(11) Government grants
Government grants are not recognized unless there is reasonable assurance that the Group will comply with the grant�s conditions and that thegrant will be received.
(a) Grants related to assets
Government grants whose primary condition is that the Group purchases, constructs or otherwise acquires non-current assets are deducted incalculating the carrying amount of the asset. The grant is recognized in profit or loss over the useful lives of depreciable assets.
G-23
Copyright © 2020 www.secdatabase.com. All Rights Reserved.Please Consider the Environment Before Printing This Document
Table of ContentsSK HYNIX, INC. and Subsidiaries
Notes to the Consolidated Financial StatementsDecember 31, 2019, 2018 and 2017
3. Significant Accounting Policies, continued
(b) Grants related to income
Government grants which are intended to compensate the Group for expenses incurred are recognized in profit or loss by as deduction of therelated expenses.
(12) Investment property
Property held for the purpose of earning rental income or benefiting from capital appreciation is classified as investment property. Investmentproperty is initially measured at its cost. Transaction costs are included in the initial measurement. Subsequently, investment property is carried at costless accumulated depreciation and impairment losses.
Subsequent costs are recognized in the carrying amount of investment property at cost or, if appropriate, as separate items if it is probable thatfuture economic benefits associated with the cost will flow to the Group and it can be measured reliably. The carrying amount of the replaced part isderecognized. The costs of the day-to-day repair and maintenance are recognized in profit or loss as incurred.
Investment property is depreciated on a straight-line basis over 40 years.
Depreciation methods, useful lives and residual values are reviewed at the end of each reporting period and, if appropriate, accounted for aschanges in accounting estimates.
(13) Impairment of non-financial assets
The carrying amounts of the Group�s non-financial assets, other than assets arising from employee benefits, inventories, and deferred tax assets,are reviewed at the end of the reporting period to determine whether there is any indication of impairment. If any such indication exists, then the asset�srecoverable amount is estimated. Goodwill and intangible assets that have indefinite useful lives or that are not yet available for use, irrespective ofwhether there is any indication of impairment, are tested for impairment annually by comparing their recoverable amount to their carrying amount.
The Group estimates the recoverable amount of an individual asset; however if it is impossible to measure the individual recoverable amount of anasset, the Group estimates the recoverable amount of cash-generating unit (�CGU�). A CGU is the smallest identifiable group of assets that generatescash inflows that are largely independent of the cash inflows from other assets or groups of assets. The recoverable amount of an asset or CGU is thegreater of its value in use and its fair value less costs to sell.
The value in use is estimated by applying a pre-tax discount rate that reflects current market assessments of the time value of money and the risksspecific to the asset or CGU for which estimated future cash flows have not been adjusted, to the estimated future cash flows expected to be generatedby the asset or CGU.
An impairment loss is recognized if the carrying amount of an asset or a CGU exceeds its recoverable amount.
Goodwill acquired in a business combination is allocated to each CGU that is expected to benefit from the synergies arising from businesscombination. Any impairment identified at the CGU level will first reduce the carrying value of goodwill and then be used to reduce the carryingamount of the other assets in the CGU on a pro rata basis.
Except for impairment losses in respect of goodwill, which are never reversed, an impairment loss is reversed if there has been a change in theestimates used to determine the recoverable amount. An impairment loss is reversed only to the extent that the asset�s carrying amount does not exceedthe carrying amount that would have been determined, net of depreciation or amortization, if no impairment loss had been recognized.
G-24
Copyright © 2020 www.secdatabase.com. All Rights Reserved.Please Consider the Environment Before Printing This Document
Table of ContentsSK HYNIX, INC. and Subsidiaries
Notes to the Consolidated Financial StatementsDecember 31, 2019, 2018 and 2017
3. Significant Accounting Policies, continued
(14) Leases
The Group has applied IFRS 16 using the modified retrospective approach by recognizing the cumulative effect of initial application of IFRS 16as of January 1, 2019 (the date of initial application). Accordingly, the comparative information presented in accordance with IAS 17 has not beenrestated. The details of the accounting policies applied under IAS 17 and IFRS 16 are as follows:
(a) Accounting policies applied from January 1, 2019.
The Group assesses whether a contract is or contains a lease at inception of a contract. Under IFRS 16, a contract is, or contains, a lease if thecontract conveys a right to control the use of an identified asset for a period of time in exchange for consideration.
(i) As a lessee
The Group recognizes for a right-of-use asset and a lease liability at the lease commencement date. The right-of-use asset is initially measured atcost, the initial amount of the lease liability, adjusted for any lease payments made at or before the commencement date, plus any initial direct costsincurred and an estimate of costs to dismantle and remove of the underlying asset, or to restore the underlying asset or the site on which the underlyingasset is located, less any lease incentives received.
The right-of-use asset is subsequently depreciated using the straight-line method from the commencement date to the end of the lease term. In casethat ownership of the right-of-use asset is transferred at the end of the lease term, or the cost of the right-of-use asset includes the exercise price of apurchase option, the right-of-use asset will be depreciated over the useful life of the underlying asset, which is determined on the same basis as those ofproperty and equipment. In addition, the right-of-use asset may be reduced by an impairment loss or adjusted for remeasurements of the lease liability.
The lease liability is initially measured at the present value of the lease payments that are not paid at the commencement date, discounted usingthe interest rate implicit in the lease or, if that rate cannot be readily determined, the Group�s incremental borrowing rate. The Group generally uses itsincremental borrowing rate as the discount rate.
Lease payments included in the measurement of the lease liability consist of the following:
� fixed payments (including in-substance fixed payments)
� variable lease payments that depend on an index or a rate, initially measured using the index or rate as at the commencement date
� amounts expected to be payable under a residual value guarantee
� the exercise price under a purchase option that the Group is reasonably certain to exercise
� lease payments in an optional renewal period, if the Group is reasonably certain to exercise extension option, and penalties for earlytermination of a lease unless the Group is reasonably certain not to terminate early.
The lease liability is subsequently increased by the interest expense recognized for the lease liability and decreased by reflecting the payment ofthe lease. The lease liability is remeasured when there is a change in future lease payments arising from changes in an index or a rate (interest rate), ifthere�s a change in the Group�s estimate of the amount expected to be paid under a residual value guarantee, or if the Group changes in the assessmentof whether the option to buy or extend is reasonably certain to be exercised or not to exercise the termination option.
G-25
Copyright © 2020 www.secdatabase.com. All Rights Reserved.Please Consider the Environment Before Printing This Document
Table of ContentsSK HYNIX, INC. and Subsidiaries
Notes to the Consolidated Financial StatementsDecember 31, 2019, 2018 and 2017
3. Significant Accounting Policies, continued
When the lease liabilities are remeasured, a corresponding adjustment is made to the carrying amount of the right-of-use asset, or is recorded inprofit or loss if the carrying amount of the right-of-use asset has been reduced to zero.
A lessee shall remeasure the lease liability as an adjustment to the right-of-use asset, if either:
� a change in the lease term or a change in circumstances or significant events that result in a change in the assessment of the exercise of thepurchase option. In such cases, the lease liability is remeasured by discounting the modified lease payment at the revised discount rate;
� the lease payment changes due to changes in the index or rate (interest rate) or the amount expected to be paid according to the residual valueguarantee. In such cases, the lease liability measures the modified lease fee again by discounting it at an unchanged discount rate. However, ifa change in the variable interest rate causes a change in the lease payments, the revised discount rate that reflects the change in interest ratesis used; or
� the lease agreement changes and is not accounted for as a separate lease. In such cases, the lease liability is remeasured by discounting themodified lease payment at the revised discount rate as of the effective date of the lease change, based on the lease term of the modified lease.
The Group has elected not to recognize right-of-use assets and lease liabilities for some leases of low-value assets and short-term leases. TheGroup recognizes the lease payments associated with these leases as an expense on a straight-line basis over the lease term.
At inception or on reassessment of a contract that contains a lease component, the Group allocates the consideration in the contract to each leaseand non-lease component on the basis of their relative stand-alone prices. However, for certain agreements, the Group has elected practical expedientnot to separate non-lease components and account for the lease and non-lease components as a single lease component.
The Group separately presents right-of-use assets that do not meet the definition of investment property in the statement of financial position.
Subsequently, the right-of-use asset is accounted for consistently with the accounting policies applicable to the asset.
(ii) As a lessor
As a lessor, the Group determines whether the lease is a finance lease or an operating lease at the inception of the lease.
To classify each lease, the Group generally determines whether the lease transfers most of the risks and rewards of ownership of the underlyingasset. If most of the risks and rewards of ownership of the underlying asset are transferred to the lessee, the lease is classified as a finance lease,otherwise the lease is classified as an operating lease. As part of this assessment, the Group considers whether the lease term represents a significantportion of the economic life of the underlying asset.
When the Group is an intermediate lessor, it accounts for its interests in the head lease and the sublease separately. In addition, the classification ofa lease is determined by the right-of-use asset arising from the head lease, not the underlying asset. If a head lease is a short-term lease to which theGroup applies the recognition exemption, then the sub-lease is classified as an operating lease.
G-26
Copyright © 2020 www.secdatabase.com. All Rights Reserved.Please Consider the Environment Before Printing This Document
Table of ContentsSK HYNIX, INC. and Subsidiaries
Notes to the Consolidated Financial StatementsDecember 31, 2019, 2018 and 2017
3. Significant Accounting Policies, continued
The Group has applied IFRS 15 �Revenue from Contracts with Customers� to allocate consideration in the contract to each lease and non-leasecomponents.
The Group recognizes the lease payments received from operating leases on a straight-line basis over the lease term as revenue in �otherrevenue�.
The accounting policies that the Group has applied to the comparative period as lessors are not different from those in IFRS 16.
(b) Accounting policies applied before January 1, 2019.
The Group classifies and accounts for leases as either a finance or operating lease, depending on the terms. Leases where the Group assumessubstantially all of the risks and rewards of ownership are classified as finance leases. All other leases are classified as operating leases.
(i) Finance leases
At the commencement of the lease term, the Group recognizes as finance lease assets initially at the lower of their fair value and the present valueof the minimum lease payments. Any initial direct costs are added to the amount recognized as an asset.
Minimum lease payments consist of finance expense and the repayment of lease liabilities. The finance expense is allocated to each period duringthe lease term so as to produce a constant periodic rate of interest on the remaining balance of the liability. Contingent rents are charged as expenses inthe periods in which they are incurred.
The depreciable amount of a leased asset is charged to each accounting period during the period of expected use on a systematic basis consistentwith the depreciation policy the lessee adopts for depreciable assets that are owned. If there is no reasonable certainty that the lessee will obtainownership by the end of the lease term, the asset is fully depreciated over the shorter of the lease term and its useful life. The Group reviews whether theleased asset is impaired.
(ii) Operating leases
Payments made under operating leases are recognized as expenses on straight-line basis over the lease term.
Lease incentives received are recognized as an integral part of the lease expense, over the term of the lease.
(iii) Determining whether an arrangement contains a lease
Determining whether an arrangement is, or contains, a lease is based on the substance of the arrangement and requires an assessment of whetherfulfillment of the arrangement is dependent on the use of a specific asset or assets (the asset) and the arrangement conveys a right to use the asset.
If an arrangement contains lease, at inception or amendment of the arrangement, the Group separates payments and other consideration requiredby such an arrangement into those for the lease and those for other elements on the basis of their relative fair values. If the Group concludes for afinance lease that it is impracticable to separate the payments reliably, the Group recognizes an asset and a liability at an amount equal to the fair valueof the underlying asset that was identified as the subject of the lease. Subsequently, the liability is reduced as payments are made and an imputed financeexpense on the liability recognized using the purchaser�s incremental borrowing rate.
G-27
Copyright © 2020 www.secdatabase.com. All Rights Reserved.Please Consider the Environment Before Printing This Document
Table of ContentsSK HYNIX, INC. and Subsidiaries
Notes to the Consolidated Financial StatementsDecember 31, 2019, 2018 and 2017
3. Significant Accounting Policies, continued
(15) Non-derivative financial liabilities
The Group classifies non-derivative financial liabilities into financial liabilities at fair value through profit or loss or other financial liabilities inaccordance with the substance of the contractual arrangement and the definitions of financial liabilities. The Group recognizes financial liabilities in theconsolidated statement of financial position when the Group becomes a party to the contractual provisions of the financial liability.
(a) Financial liabilities at fair value through profit or loss
Financial liabilities at fair value through profit or loss include financial liabilities held for trading or designated as such upon initial recognition.Subsequent to initial recognition, financial liabilities at fair value through profit or loss are measured at fair value, and changes therein are recognized inprofit or loss. Upon initial recognition, any directly attributable transaction costs are recognized in profit or loss as incurred.
(b) Other financial liabilities
Non-derivative financial liabilities other than financial liabilities at fair value through profit or loss are classified as other financial liabilities. Atthe date of initial recognition, other financial liabilities are measured at fair value less any directly attributable transaction costs. Subsequent to initialrecognition, other financial liabilities are measured at amortized cost using the effective interest rate method.
(c) Derecognition of financial liability
The Group derecognizes financial liability when its contractual obligations are discharged, cancelled or expire. The Group also derecognizes afinancial liability, when its terms are modified and the cash flows of the modified liability are substantially different, in which case a new financialliability based on the modified terms is recognized at fair value. On derecognition of a financial liability, the difference between the carrying amountextinguished and the consideration paid (including any non-cash assets transferred of liabilities assumed) is recognized in profit or loss.
(16) Employee benefits
(a) Short-term employee benefits
Short-term employee benefits are employee benefits that are due to be settled within 12 months after the end of the reporting period in which theemployees render the related service. When an employee has rendered service to the Group during an accounting period, the Group recognizes theundiscounted amount of short-term employee benefits expected to be paid in exchange for that service.
(b) Other long-term employee benefits
Other long-term employee benefits include employee benefits that are settled beyond 12 months after the end of the reporting period in which theemployees render the related service, and are calculated at the present value of the amount of future benefit that employees have earned in return fortheir service in the current and prior periods. Remeasurements are recognized in profit or loss in the period in which they arise.
(c) Retirement benefits: defined benefit plans
As of the end of reporting period, defined benefits liabilities relating to defined benefit plans are recognized as present value of defined benefitobligations, net of fair value of plan assets.
G-28
Copyright © 2020 www.secdatabase.com. All Rights Reserved.Please Consider the Environment Before Printing This Document
Table of ContentsSK HYNIX, INC. and Subsidiaries
Notes to the Consolidated Financial StatementsDecember 31, 2019, 2018 and 2017
3. Significant Accounting Policies, continued
The calculation is performed annually by an independent actuary using the projected unit credit method. When the fair value of plan assetsexceeds the present value of the defined benefit obligation, the Group recognizes an asset, to the extent of the present value of any economic benefitsavailable in the form of refunds from the plan or reduction in the future contributions to the plan.
Remeasurements of the net defined benefit liability (asset) comprise of actuarial gains and losses, the return on plan assets excluding amountsincluded in net interest on the net defined benefit liability (asset), and any change in the effect of the asset ceiling, excluding amounts included in netinterest on the net defined benefit liability (asset), and are recognized in other comprehensive income. The Group determines net interests on net definedbenefit liability (asset) by multiplying discount rate determined at the beginning of the annual reporting period and considers changes in net definedbenefit liability (asset) from contributions and benefit payments. Net interest costs and other costs relating to the defined benefit plan are recognizedthrough profit or loss.
When the benefits of a plan are changed or when a plan is curtailed, the resulting change in benefit that relates to past service or the gain or losson curtailment is recognized immediately in profit or loss. The Group recognizes gains or losses on a settlement of defined benefit plan when thesettlement occurs.
(d) Retirement benefits: defined contribution plans
When an employee has provided service for a certain period of time in relation to the defined contribution plan, the contribution to the definedcontribution plan is recognized in profit or loss except to be included in the cost of the asset. The contributions to be paid are recognized as liabilities(accrued expenses) less the contributions that have been already paid.
(e) Termination benefits
The Group recognizes a liability and expense for termination benefits at the earlier of the period when the Group can no longer withdraw the offerof those benefits and the period when the Group recognizes costs for a restructuring. If benefits are not payable within 12 months after the end of thereporting period, then they are discounted to their present value.
(17) Provisions
Provisions are recognized when the Group has a present legal or constructive obligation as a result of a past event, it is probable that an outflow ofresources embodying economic benefits will be required to settle the obligation and a reliable estimate can be made of the amount of the obligation.
The risks and uncertainties that inevitably surround many events and circumstances are taken into account in reaching the best estimate of aprovision. Where the effect of the time value of money is material, provisions are determined at the present value of the expected future cash flows.
Where some or all of the expenditures required to settle a provision are expected to be reimbursed by another party, the reimbursement isrecognized when, and only when, it is virtually certain that reimbursement will be received if the Group settles the obligation. The reimbursement istreated as a separate asset.
Provisions are reviewed at the end of each reporting period and adjusted to reflect the current best estimates. If it is no longer probable that anoutflow of resources embodying economic benefits will be required to settle the obligation, the provision is reversed.
A provision is used only for expenditures for which the provision was originally recognized.
G-29
Copyright © 2020 www.secdatabase.com. All Rights Reserved.Please Consider the Environment Before Printing This Document
Table of ContentsSK HYNIX, INC. and Subsidiaries
Notes to the Consolidated Financial StatementsDecember 31, 2019, 2018 and 2017
3. Significant Accounting Policies, continued
(18) Emissions Rights
The Group accounts for greenhouse gases emission right and the relevant liability as below pursuant to the Act on Allocation and Trading ofGreenhouse Gas Emission in Korea.
(a) Greenhouse Gases Emission Right
Greenhouse Gases Emission Right consists of emission allowances, which are allocated from the government free of charge or purchased from themarket. The cost includes any directly attributable costs incurred during the normal course of business.
Emission rights held for the purpose of performing the obligation are classified as intangible asset and are initially measured at cost and afterinitial recognition are carried at cost less accumulated impairment losses. Emission rights held for short-swing profits are classified as current asset andare measured at fair value with any changes in fair value recognized as profit or loss in the respective reporting period.
The Group derecognizes an emission right asset when the emission allowance is unusable, disposed or submitted to government in which thefuture economic benefits are no longer expected to be probable.
(b) Emission liability
Emission liability is a present obligation of submitting emission rights to the government with regard to emission of greenhouse gas. Emissionliability is recognized when it is probable that outflows of resources will be required to settle the obligation and the costs required to perform theobligation are reliably estimable. Emission liability is an amount of estimated obligations for emission rights to be submitted to the government for theperforming period. The emission liability is measured based on the expected quantity of emission for the performing period in excess of emissionallowance in possession and the unit price for such emission rights in the market at the end of the reporting period.
(19) Foreign currencies
(a) Foreign currency transactions
Transactions in foreign currencies are translated to the respective functional currencies of Group entities at exchange rates at the dates of thetransactions. Monetary assets and liabilities denominated in foreign currencies are retranslated to the functional currency at the exchange rate at thereporting data. Non-monetary assets and liabilities denominated in foreign currencies that are measured at fair value are translated to the functionalcurrency at the exchange rate at the date that the fair value was determined.
Foreign currency differences arising on the settlement or retranslation of monetary items are recognized in profit or loss, except for differencesarising on the retranslation of the net investment in a foreign operation, which are recognized in other comprehensive income. When a gain or loss on anon-monetary item is recognized in other comprehensive income, any exchange component of that gain or loss is recognized in other comprehensiveincome. Conversely, when a gain or loss on a non-monetary item is recognized in profit or loss, any exchange component of that gain or loss isrecognized in profit or loss.
(b) Foreign operations
If the presentation currency of the Group is different from a foreign operation�s functional currency, the financial statements of the foreignoperation are translated into the presentation currency using the following methods:
The assets and liabilities of foreign operations, whose functional currency is not the currency of a hyperinflationary economy, are translated topresentation currency at exchange rates at the end of reporting period.
G-30
Copyright © 2020 www.secdatabase.com. All Rights Reserved.Please Consider the Environment Before Printing This Document
Table of ContentsSK HYNIX, INC. and Subsidiaries
Notes to the Consolidated Financial StatementsDecember 31, 2019, 2018 and 2017
3. Significant Accounting Policies, continued
The income and expenses of foreign operations are translated to functional currency at exchange rates at the dates of the transactions. Foreign currencydifferences are recognized in other comprehensive income.
Any goodwill arising on the acquisition of a foreign operation and any fair value adjustments to the carrying amounts of assets and liabilitiesarising on the acquisition of that foreign operation is treated as assets and liabilities of the foreign operation. Thus, they are expressed in the functionalcurrency of the foreign operation and translated at the exchange rates at the end of reporting date.
When a foreign operation is disposed of, the relevant amount in the translation is transferred to profit or loss as part of the profit or loss ondisposal. On the partial disposal of a subsidiary that includes a foreign operation, the relevant proportion of such cumulative amount is reattributed tonon-controlling interest. In any other partial disposal of a foreign operation, the relevant proportion is reclassified to profit or loss.
(20) Equity capital
Ordinary shares are classified as equity. Incremental costs directly attributable to the issuance of ordinary shares is recognized as a deduction fromequity, net of any tax effects.
When the Group repurchases its share capital, the amount of the consideration paid is recognized as a deduction from equity and classified astreasury shares. The profits or losses from the purchase, disposal, reissue, or retirement of treasury shares are not recognized as current profit or loss. Ifthe Group acquires and disposes treasury shares, the consideration paid or received is directly recognized in equity.
(21) Share-based payment
The Group has granted shares or share options to its employees. For equity-settled share-based payment transactions, the Group measures thegoods or services received, and the corresponding increase in equity as a capital adjustment at the fair value of the goods or services received, unlessthat fair value cannot be estimated reliably. If the Group cannot reliably estimate the fair value of the goods or services received, the Group measurestheir value, and the corresponding increase in equity, indirectly, by reference to the fair value of the equity instruments granted. If the fair value of theequity instruments cannot be estimated reliably at the measurement date, the Group measures them at their intrinsic value and recognizes the goods orservices received based on the number of equity instruments that ultimately vest.
For cash-settled share-based payment transactions, the Group measures the goods or services acquired and the liability incurred at the fair value ofthe liability. Until the liability is settled, the Group remeasures the fair value of the liability at each reporting date and at the date of settlement, withchanges in fair value recognized in profit or loss for the period.
The Group accounts for share-based payment, with options to choose either cash-settled or equity-settled share-based payment, in accordance withthe substance of transactions.
(22) Revenue from contracts with customers
The Group�s accounting policies relating to revenue from contracts with customers are described in note 27.
(23) Finance income and finance expenses
The Group�s finance income and finance expenses include:
� Interest income;
� Interest expense;
G-31
Copyright © 2020 www.secdatabase.com. All Rights Reserved.Please Consider the Environment Before Printing This Document
Table of ContentsSK HYNIX, INC. and Subsidiaries
Notes to the Consolidated Financial StatementsDecember 31, 2019, 2018 and 2017
3. Significant Accounting Policies, continued
� Dividend income;
� The net gain or loss on financial assets at fair value through profit or loss;
� Gain or loss on foreign exchange(currency) translation for financial asset and liabilities;
� Impairment losses and reversals on investment in debt securities carried at amortized cost method; and
� The gain on the remeasurement to fair value of any pre-existing interest in an acquire in a business combination
The Group uses effective interest rate method for recognizing interest income and expense. Dividend income is recognized in profit or loss on thedate that the Group�s right to receive dividend is established.
The �effective interest rate� is the rate that exactly discounts estimated future cash payments or receipts through the expected life of the financialinstrument to:
� The gross carrying amount of the financial asset; or
� The amortized cost of the financial liability
In calculating interest income and expense, the effective interest rate is applied to the gross carrying amount of the asset (when the asset is notcredit-impaired) or to the amortized cost of the liability. However, for financial assets that have become credit-impaired subsequent to initial recognition,interest income is calculated by applying the effective interest rate to the amortized cost of the financial asset. If the asset is no longer credit-impaired,then the calculation of interest income reverts to the gross basis.
(24) Income taxes
Income tax expense comprises current and deferred tax. Current and deferred tax are recognized in profit or loss except to the extent that it relatesto a business combination, or items recognized directly in equity or in other comprehensive income.
(a) Current tax
Current tax is the expected tax payable or refundable on the taxable income or loss for the year, using tax rates enacted or substantively enacted atthe end of the reporting period and any adjustment to tax payable in respect of previous years. The amount of current tax payable or receivable is thebest estimate of tax amount expected to be paid or received that reflects uncertainty related to income taxes. The taxable income is different from theaccounting profit for the period since the taxable profit is calculated excluding the temporary differences, which will be taxable or deductible indetermining taxable profit (tax loss) of future periods, and non-taxable or non-deductible items from the accounting profit. The tax expense is calculatedon the basis of the tax laws enacted or substantively enacted at the end of the reporting period.
(b) Deferred tax
Deferred tax is recognized, using the asset-liability method, in respect of temporary differences between the carrying amounts of assets andliabilities for financial reporting purposes and the amounts used for taxation purposes.
The Group recognizes a deferred tax liability for all taxable temporary differences associated with investments in subsidiaries, associates andinterests in joint ventures except to the extent that the Group is able to control the
G-32
Copyright © 2020 www.secdatabase.com. All Rights Reserved.Please Consider the Environment Before Printing This Document
Table of ContentsSK HYNIX, INC. and Subsidiaries
Notes to the Consolidated Financial StatementsDecember 31, 2019, 2018 and 2017
3. Significant Accounting Policies, continued
timing of the reversal of the temporary difference and it is probable that the temporary difference will not reverse in the foreseeable future. The Grouprecognizes deferred tax assets for all deductible temporary differences including unused tax loss and tax credit to the extent that it is probable that thetemporary difference will reverse in the foreseeable future and taxable profit will be available against which the temporary difference can be utilized.
The carrying amount of a deferred tax asset is reviewed at the end of each reporting period and reduces the carrying amount to the extent that it isno longer probable that sufficient taxable profit will be available to allow the benefit of part or all of that deferred tax asset to be utilized.
Deferred tax assets and liabilities are measured at the tax rates that are expected to apply to the period when the asset is realized or the liability issettled, based on tax rates (and tax laws) that have been enacted or substantively enacted by the end of the reporting period.
The measurement of deferred tax liabilities and deferred tax assets reflects the tax consequences that would follow from the manner in which theGroup expects, at the end of the reporting period to recover or settle the carrying amount of its assets and liabilities.
Deferred tax assets and liabilities are offset only if there is a legally enforceable right to offset the related current tax liabilities and assets, and theyrelate to income taxes levied by the same tax authority and they intend to settle current tax liabilities and assets on a net basis. If there are any additionalincome tax expense incurred in accordance with dividend payments, such income tax expense is recognized when liabilities relating to the dividendpayments are recognized.
(25) Earnings per share
The Group presents basic and diluted earnings per share (EPS) data for its ordinary shares. Basic EPS is calculated by dividing the profit or lossattributable to ordinary shareholders of the Parent Company by the weighted average number of ordinary shares outstanding during the period, adjustedfor own shares held. Diluted EPS is determined by adjusting the profit or loss attributable to ordinary shareholders and the weighted average number ofoutstanding ordinary shares, adjusted for own shares held, for the effects of all dilutive potential ordinary shares including stock options.
(26) Changes in accounting policies
The Group has initially adopted IFRS 16 �Leases� from January 1, 2019. A number of other new standards are effective from January 1, 2019 andthey do not have significant impact on the Group�s consolidated financial statements.
IFRS 16 introduced a single, on-balance sheet accounting model for lessees. As a result, the Group, as a lessee, has recognized right-of-use assetsrepresenting its rights to use the underlying assets and lease liabilities representing its obligation to make lease payments. Lessor accounting remainssimilar to previous accounting policies.
The Group recognized the cumulative effect of the initial application of IFRS 16 in right-of-use assets and lease liabilities as of January 1, 2019(the date of initial application). Accordingly, the comparative information presented for the prior year has not been restated � i.e. it is presented, aspreviously reported, under IAS 17 and related interpretations. Details of changes to the accounting policies are disclosed below.
(a) Definition of a lease
Previously, the Group determined at contract inception whether an arrangement was or contained a lease under IFRIC 4, �Determining Whetheran Arrangement contains a Lease�. The Group now assesses whether a contract is
G-33
Copyright © 2020 www.secdatabase.com. All Rights Reserved.Please Consider the Environment Before Printing This Document
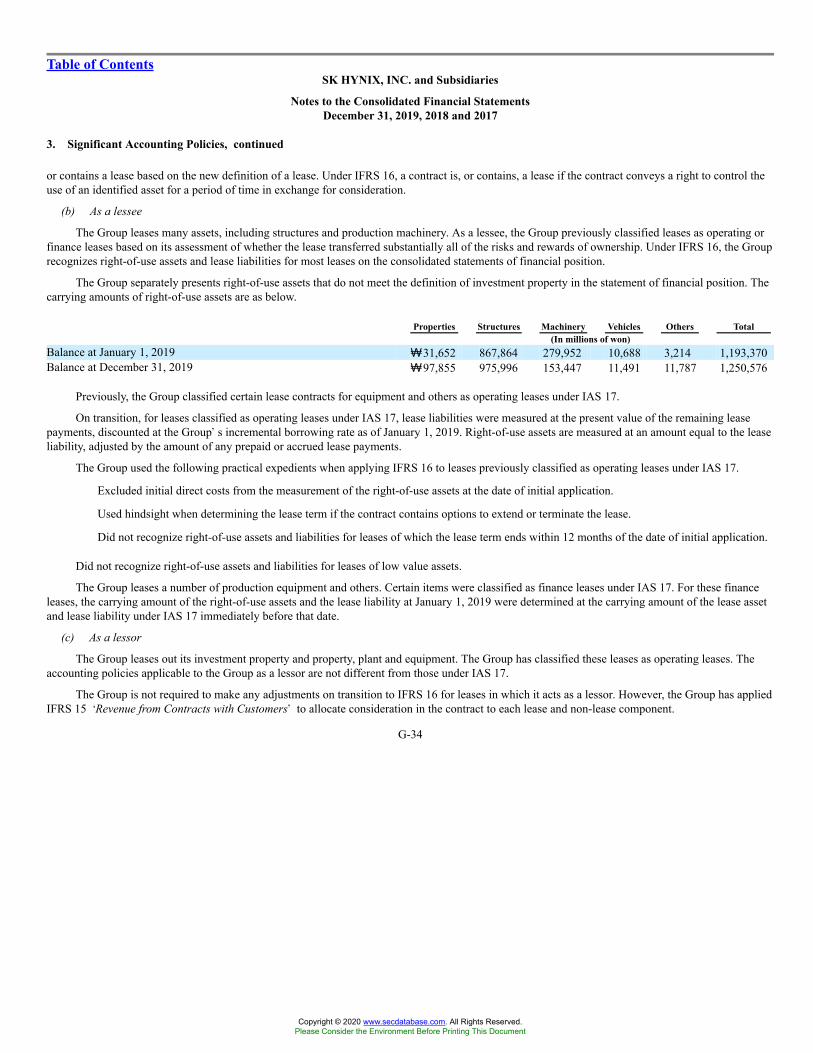
Table of ContentsSK HYNIX, INC. and Subsidiaries
Notes to the Consolidated Financial StatementsDecember 31, 2019, 2018 and 2017
3. Significant Accounting Policies, continued
or contains a lease based on the new definition of a lease. Under IFRS 16, a contract is, or contains, a lease if the contract conveys a right to control theuse of an identified asset for a period of time in exchange for consideration.
(b) As a lessee
The Group leases many assets, including structures and production machinery. As a lessee, the Group previously classified leases as operating orfinance leases based on its assessment of whether the lease transferred substantially all of the risks and rewards of ownership. Under IFRS 16, the Grouprecognizes right-of-use assets and lease liabilities for most leases on the consolidated statements of financial position.
The Group separately presents right-of-use assets that do not meet the definition of investment property in the statement of financial position. Thecarrying amounts of right-of-use assets are as below.
Properties Structures Machinery Vehicles Others Total(In millions of won)
Balance at January 1, 2019 ₩31,652 867,864 279,952 10,688 3,214 1,193,370Balance at December 31, 2019 ₩97,855 975,996 153,447 11,491 11,787 1,250,576
Previously, the Group classified certain lease contracts for equipment and others as operating leases under IAS 17.
On transition, for leases classified as operating leases under IAS 17, lease liabilities were measured at the present value of the remaining leasepayments, discounted at the Group�s incremental borrowing rate as of January 1, 2019. Right-of-use assets are measured at an amount equal to the leaseliability, adjusted by the amount of any prepaid or accrued lease payments.
The Group used the following practical expedients when applying IFRS 16 to leases previously classified as operating leases under IAS 17.
� Excluded initial direct costs from the measurement of the right-of-use assets at the date of initial application.
� Used hindsight when determining the lease term if the contract contains options to extend or terminate the lease.
� Did not recognize right-of-use assets and liabilities for leases of which the lease term ends within 12 months of the date of initial application.
Did not recognize right-of-use assets and liabilities for leases of low value assets.
The Group leases a number of production equipment and others. Certain items were classified as finance leases under IAS 17. For these financeleases, the carrying amount of the right-of-use assets and the lease liability at January 1, 2019 were determined at the carrying amount of the lease assetand lease liability under IAS 17 immediately before that date.
(c) As a lessor
The Group leases out its investment property and property, plant and equipment. The Group has classified these leases as operating leases. Theaccounting policies applicable to the Group as a lessor are not different from those under IAS 17.
The Group is not required to make any adjustments on transition to IFRS 16 for leases in which it acts as a lessor. However, the Group has appliedIFRS 15 �Revenue from Contracts with Customers� to allocate consideration in the contract to each lease and non-lease component.
G-34
Copyright © 2020 www.secdatabase.com. All Rights Reserved.Please Consider the Environment Before Printing This Document
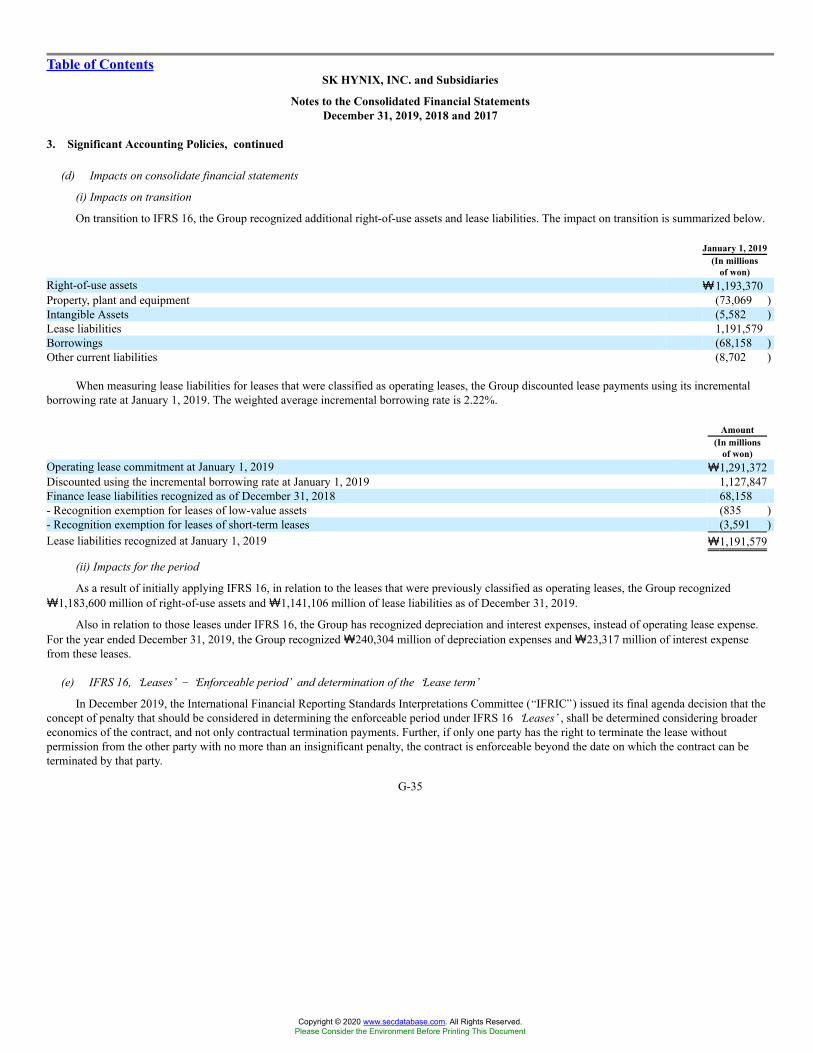
Table of ContentsSK HYNIX, INC. and Subsidiaries
Notes to the Consolidated Financial StatementsDecember 31, 2019, 2018 and 2017
3. Significant Accounting Policies, continued
(d) Impacts on consolidate financial statements
(i) Impacts on transition
On transition to IFRS 16, the Group recognized additional right-of-use assets and lease liabilities. The impact on transition is summarized below.
January 1, 2019(In millions
of won)Right-of-use assets ₩1,193,370Property, plant and equipment (73,069 )Intangible Assets (5,582 )Lease liabilities 1,191,579Borrowings (68,158 )Other current liabilities (8,702 )
When measuring lease liabilities for leases that were classified as operating leases, the Group discounted lease payments using its incrementalborrowing rate at January 1, 2019. The weighted average incremental borrowing rate is 2.22%.
Amount(In millions
of won)Operating lease commitment at January 1, 2019 ₩1,291,372Discounted using the incremental borrowing rate at January 1, 2019 1,127,847Finance lease liabilities recognized as of December 31, 2018 68,158- Recognition exemption for leases of low-value assets (835 )- Recognition exemption for leases of short-term leases (3,591 )Lease liabilities recognized at January 1, 2019 ₩1,191,579
(ii) Impacts for the period
As a result of initially applying IFRS 16, in relation to the leases that were previously classified as operating leases, the Group recognized₩1,183,600 million of right-of-use assets and ₩1,141,106 million of lease liabilities as of December 31, 2019.
Also in relation to those leases under IFRS 16, the Group has recognized depreciation and interest expenses, instead of operating lease expense.For the year ended December 31, 2019, the Group recognized ₩240,304 million of depreciation expenses and ₩23,317 million of interest expensefrom these leases.
(e) IFRS 16, �Leases� � �Enforceable period� and determination of the �Lease term�
In December 2019, the International Financial Reporting Standards Interpretations Committee (�IFRIC�) issued its final agenda decision that theconcept of penalty that should be considered in determining the enforceable period under IFRS 16 �Leases�, shall be determined considering broadereconomics of the contract, and not only contractual termination payments. Further, if only one party has the right to terminate the lease withoutpermission from the other party with no more than an insignificant penalty, the contract is enforceable beyond the date on which the contract can beterminated by that party.
G-35
Copyright © 2020 www.secdatabase.com. All Rights Reserved.Please Consider the Environment Before Printing This Document
Table of ContentsSK HYNIX, INC. and Subsidiaries
Notes to the Consolidated Financial StatementsDecember 31, 2019, 2018 and 2017
3. Significant Accounting Policies, continued
In preparing the 2019 consolidated financial statements, the Group only considered the specified amount of termination payments in the contractin determining enforceable period. Therefore, applying the above-mentioned agenda decision may change the judgment of the enforceable period forcertain lease contracts the Group has entered into.
However, considering the type, number and complexity of lease contracts entered into as of and from January 1, 2019, the Group does not believeit had sufficient time to complete the analysis on its lease portfolios to reflect the impact of the above IFRIC agenda decision, if any, in its 2019consolidated financial statements. The Group plans to complete the assessment and reflect the impact, if any, in its consolidated financial statements andrelated notes during 2020. Any change as a result will be accounted for as an accounting policy change in the 2020 consolidated financial statements.
(27) Standards issued but not yet effective
The following new standards and amendments to standards are effective for accounting periods beginning on or after January 1, 2020 and earlierapplication is permitted; however, the Group has not early adopted them in preparing these consolidated financial statements. The impacts on theconsolidated financial statements in adopting the following new standards are not expected to be significant.
(a) IFRS 3, ��Business Combinations�� (Amendment)
This amendment clarifies that a business generally has outputs, but that an integrated set of activities and assets is not essential to meet thedefinition of a business. For acquired activities and groups of assets to be considered business, they should include at least inputs and substantiveprocesses with the ability to contribute significantly together to the generation of output. It also provides judgment guidelines to help determine whethera substantive process has been acquired.
This amendment introduces optional concentration tests that provide a brief assessment of whether acquired activities and groups of assets are notbusiness. This is an assessment that results in an asset acquisition if substantially all of the fair value of the gross assets acquired is concentrated in asingle identifiable asset or a similar identifiable group of assets.
This amendment applies prospectively to all business combinations and acquisitions of assets beginning the accounting period on or afterJanuary 1, 2020, and early application is permitted.
(b) IFRS Conceptual Framework for Financial Reporting (Amendment)
In addition to the revised �Framework (2018)�, which was introduced with the announcement on December 21, 2018, the InternationalAccounting Standards Board also published �Amendments to the Conceptual Framework Reference� in the International Accounting Standards. Thisdocument includes amendments to IFRS 2, IFRS 3, IFRS 6, IFRS 14, IAS 1, IAS 8, IAS 34, IAS 37, IAS 38, IFRIC 12, IFRIC 19, IFRIC 20, IFRIC 22,and SIC 32.
However, not all amendments require such references or references to the revised �Framework (2018)�. Some statements have been amended toclarify whether the referenced �Conceptual Framework� is a �Conceptual Framework for the Preparation and Presentation of Financial Statements(2007)�, the �Conceptual Framework (2010)�, or the newly revised �Conceptual Framework (2018)�, and some other wordings have been amended tostate that the definition in International Accounting Standards has not changed to the new definition developed in the revised �Conceptual Framework(2018)�.
The amendment shall be applied prospectively for accounting periods beginning on or after January 1, 2020, if any changes are made, and earlyapplication is permitted.
G-36
Copyright © 2020 www.secdatabase.com. All Rights Reserved.Please Consider the Environment Before Printing This Document
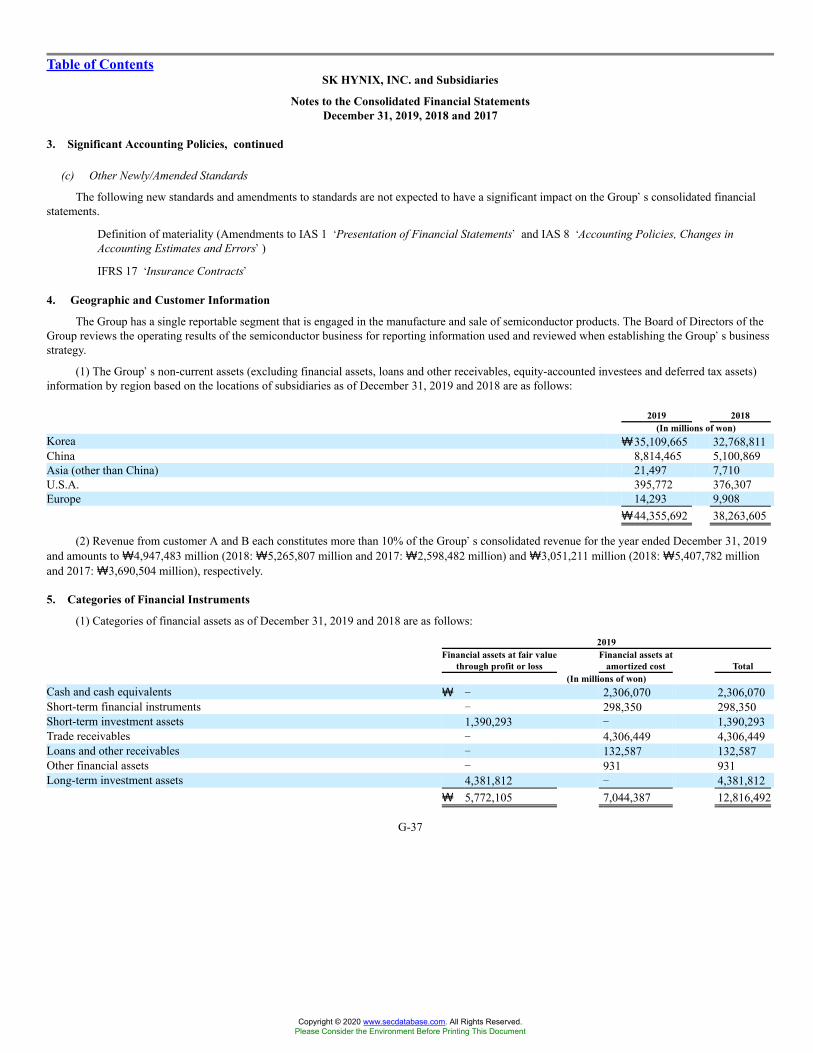
Table of ContentsSK HYNIX, INC. and Subsidiaries
Notes to the Consolidated Financial StatementsDecember 31, 2019, 2018 and 2017
3. Significant Accounting Policies, continued
(c) Other Newly/Amended Standards
The following new standards and amendments to standards are not expected to have a significant impact on the Group�s consolidated financialstatements.
� Definition of materiality (Amendments to IAS 1 �Presentation of Financial Statements� and IAS 8 �Accounting Policies, Changes inAccounting Estimates and Errors�)
� IFRS 17 �Insurance Contracts�
4. Geographic and Customer Information
The Group has a single reportable segment that is engaged in the manufacture and sale of semiconductor products. The Board of Directors of theGroup reviews the operating results of the semiconductor business for reporting information used and reviewed when establishing the Group�s businessstrategy.
(1) The Group�s non-current assets (excluding financial assets, loans and other receivables, equity-accounted investees and deferred tax assets)information by region based on the locations of subsidiaries as of December 31, 2019 and 2018 are as follows:
2019 2018(In millions of won)
Korea ₩35,109,665 32,768,811China 8,814,465 5,100,869Asia (other than China) 21,497 7,710U.S.A. 395,772 376,307Europe 14,293 9,908
₩44,355,692 38,263,605
(2) Revenue from customer A and B each constitutes more than 10% of the Group�s consolidated revenue for the year ended December 31, 2019and amounts to ₩4,947,483 million (2018: ₩5,265,807 million and 2017: ₩2,598,482 million) and ₩3,051,211 million (2018: ₩5,407,782 millionand 2017: ₩3,690,504 million), respectively.
5. Categories of Financial Instruments
(1) Categories of financial assets as of December 31, 2019 and 2018 are as follows:
2019Financial assets at fair value
through profit or lossFinancial assets at
amortized cost Total(In millions of won)
Cash and cash equivalents ₩ � 2,306,070 2,306,070Short-term financial instruments � 298,350 298,350Short-term investment assets 1,390,293 � 1,390,293Trade receivables � 4,306,449 4,306,449Loans and other receivables � 132,587 132,587Other financial assets � 931 931Long-term investment assets 4,381,812 � 4,381,812
₩ 5,772,105 7,044,387 12,816,492
G-37
Copyright © 2020 www.secdatabase.com. All Rights Reserved.Please Consider the Environment Before Printing This Document

Table of ContentsSK HYNIX, INC. and Subsidiaries
Notes to the Consolidated Financial StatementsDecember 31, 2019, 2018 and 2017
5. Categories of Financial Instruments, continued
2018Financial assets at fair value
through profit or lossFinancial assets at
amortized cost Total(In millions of won)
Cash and cash equivalents ₩ � 2,349,319 2,349,319Short-term financial instruments � 523,579 523,579Short-term investment assets 5,496,452 � 5,496,452Trade receivables � 6,319,994 6,319,994Loans and other receivables � 86,906 86,906Other financial assets � 310 310Long-term investment assets 4,325,550 � 4,325,550
₩ 9,822,002 9,280,108 19,102,110
(2) Categories of financial liabilities as of December 31, 2019 and 2018 are as follows:
2019Financial liabilities at fair
value through profitor loss
Financial liabilitiesmeasured at amortized cost Total
(In millions of won)Trade payables ₩ � 1,042,542 1,042,542Other payables 13,006 2,354,667 2,367,673Other non-trade payables � 1,276,161 1,276,161Borrowings � 10,523,506 10,523,506Lease liabilities � 1,200,830 1,200,830Other financial liabilities 15,532 � 15,532
₩ 28,538 16,397,706 16,426,244
2018Financial liabilities measured
at amortized cost(In millions of won)
Trade payables ₩ 1,096,380Other payables 3,681,933Other non-trade payables 1,894,751Borrowings1 5,281,937
₩ 11,955,001
1 As of December 31, 2018, borrowings include finance lease liabilities amounting to ₩68,158 million in accordance with IAS 17. Upon adoptionof IFRS 16, lease liabilities are presented separately from borrowings in the consolidated statement of financial position as of December 31, 2019.
G-38
Copyright © 2020 www.secdatabase.com. All Rights Reserved.Please Consider the Environment Before Printing This Document
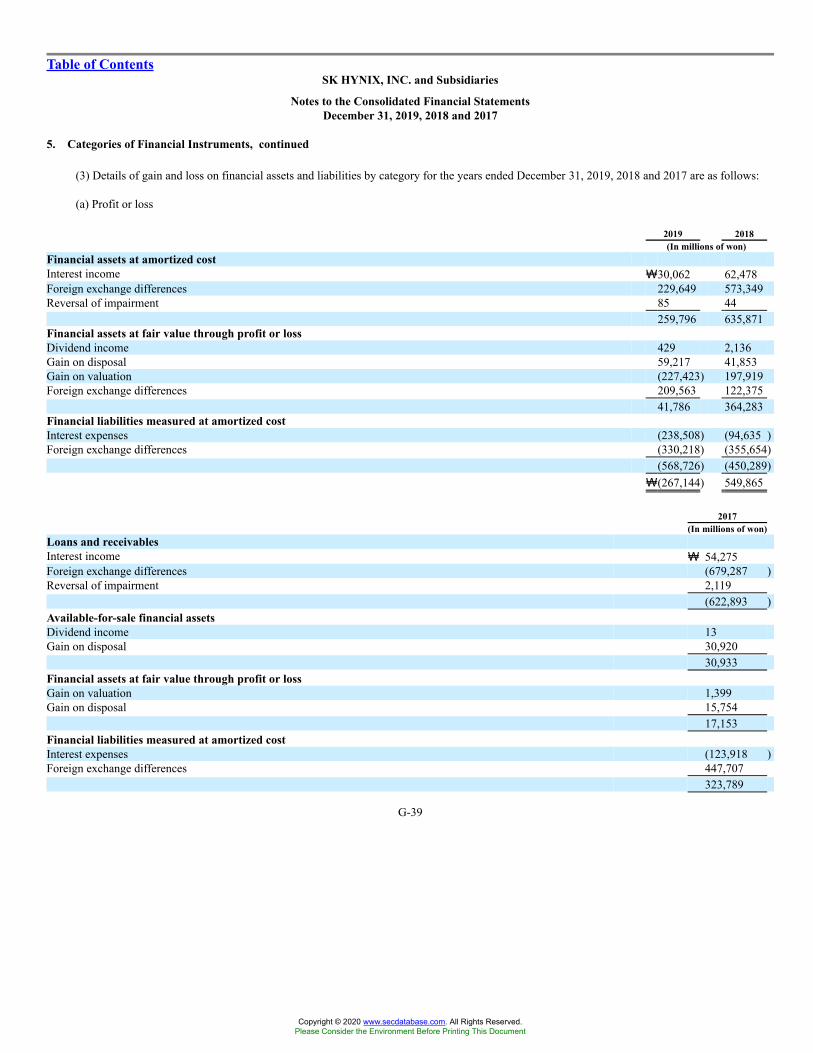
Table of ContentsSK HYNIX, INC. and Subsidiaries
Notes to the Consolidated Financial StatementsDecember 31, 2019, 2018 and 2017
5. Categories of Financial Instruments, continued
(3) Details of gain and loss on financial assets and liabilities by category for the years ended December 31, 2019, 2018 and 2017 are as follows:
(a) Profit or loss
2019 2018(In millions of won)
Financial assets at amortized costInterest income ₩30,062 62,478Foreign exchange differences 229,649 573,349Reversal of impairment 85 44
259,796 635,871Financial assets at fair value through profit or lossDividend income 429 2,136Gain on disposal 59,217 41,853Gain on valuation (227,423) 197,919Foreign exchange differences 209,563 122,375
41,786 364,283Financial liabilities measured at amortized costInterest expenses (238,508) (94,635 )Foreign exchange differences (330,218) (355,654)
(568,726) (450,289)₩(267,144) 549,865
2017(In millions of won)
Loans and receivablesInterest income ₩ 54,275Foreign exchange differences (679,287 )Reversal of impairment 2,119
(622,893 )Available-for-sale financial assetsDividend income 13Gain on disposal 30,920
30,933Financial assets at fair value through profit or lossGain on valuation 1,399Gain on disposal 15,754
17,153Financial liabilities measured at amortized costInterest expenses (123,918 )Foreign exchange differences 447,707
323,789
G-39
Copyright © 2020 www.secdatabase.com. All Rights Reserved.Please Consider the Environment Before Printing This Document
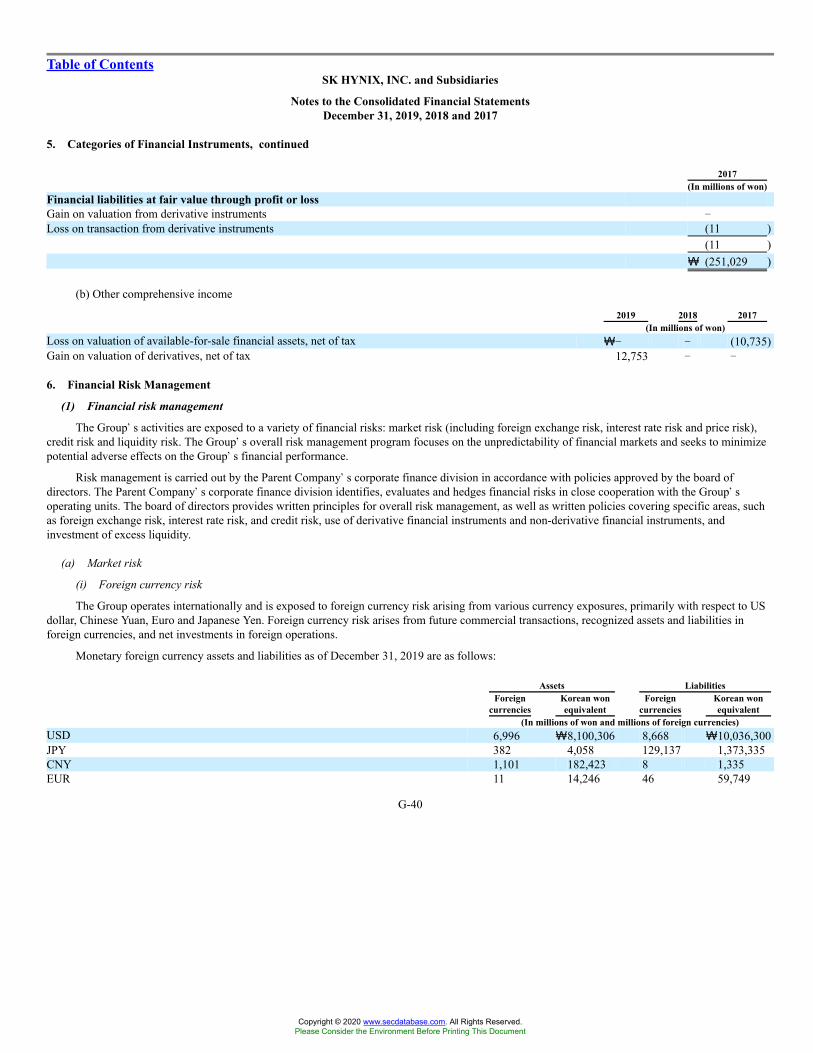
Table of ContentsSK HYNIX, INC. and Subsidiaries
Notes to the Consolidated Financial StatementsDecember 31, 2019, 2018 and 2017
5. Categories of Financial Instruments, continued
2017(In millions of won)
Financial liabilities at fair value through profit or lossGain on valuation from derivative instruments �Loss on transaction from derivative instruments (11 )
(11 )₩ (251,029 )
(b) Other comprehensive income
2019 2018 2017(In millions of won)
Loss on valuation of available-for-sale financial assets, net of tax ₩� � (10,735)Gain on valuation of derivatives, net of tax 12,753 � �
6. Financial Risk Management
(1) Financial risk management
The Group�s activities are exposed to a variety of financial risks: market risk (including foreign exchange risk, interest rate risk and price risk),credit risk and liquidity risk. The Group�s overall risk management program focuses on the unpredictability of financial markets and seeks to minimizepotential adverse effects on the Group�s financial performance.
Risk management is carried out by the Parent Company�s corporate finance division in accordance with policies approved by the board ofdirectors. The Parent Company�s corporate finance division identifies, evaluates and hedges financial risks in close cooperation with the Group�soperating units. The board of directors provides written principles for overall risk management, as well as written policies covering specific areas, suchas foreign exchange risk, interest rate risk, and credit risk, use of derivative financial instruments and non-derivative financial instruments, andinvestment of excess liquidity.
(a) Market risk
(i) Foreign currency risk
The Group operates internationally and is exposed to foreign currency risk arising from various currency exposures, primarily with respect to USdollar, Chinese Yuan, Euro and Japanese Yen. Foreign currency risk arises from future commercial transactions, recognized assets and liabilities inforeign currencies, and net investments in foreign operations.
Monetary foreign currency assets and liabilities as of December 31, 2019 are as follows:
Assets LiabilitiesForeign
currenciesKorean wonequivalent
Foreigncurrencies
Korean wonequivalent
(In millions of won and millions of foreign currencies)USD 6,996 ₩8,100,306 8,668 ₩10,036,300JPY 382 4,058 129,137 1,373,335CNY 1,101 182,423 8 1,335EUR 11 14,246 46 59,749
G-40
Copyright © 2020 www.secdatabase.com. All Rights Reserved.Please Consider the Environment Before Printing This Document
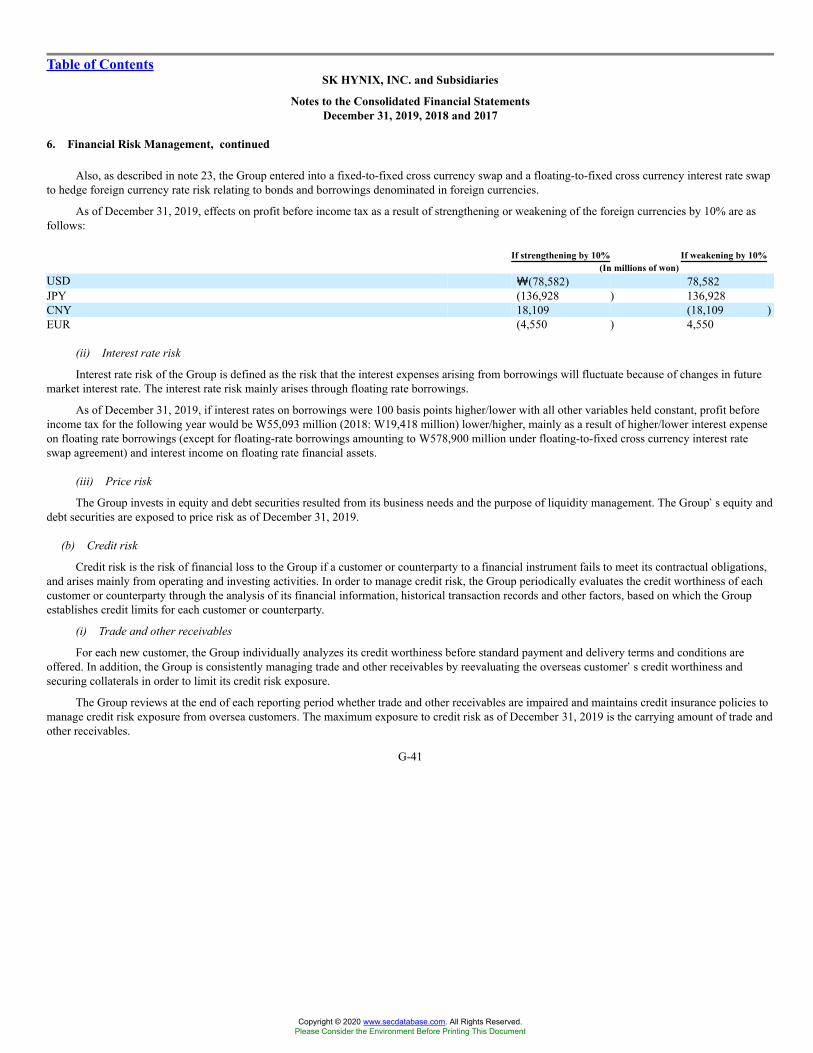
Table of ContentsSK HYNIX, INC. and Subsidiaries
Notes to the Consolidated Financial StatementsDecember 31, 2019, 2018 and 2017
6. Financial Risk Management, continued
Also, as described in note 23, the Group entered into a fixed-to-fixed cross currency swap and a floating-to-fixed cross currency interest rate swapto hedge foreign currency rate risk relating to bonds and borrowings denominated in foreign currencies.
As of December 31, 2019, effects on profit before income tax as a result of strengthening or weakening of the foreign currencies by 10% are asfollows:
If strengthening by 10% If weakening by 10%(In millions of won)
USD ₩(78,582) 78,582JPY (136,928 ) 136,928CNY 18,109 (18,109 )EUR (4,550 ) 4,550
(ii) Interest rate risk
Interest rate risk of the Group is defined as the risk that the interest expenses arising from borrowings will fluctuate because of changes in futuremarket interest rate. The interest rate risk mainly arises through floating rate borrowings.
As of December 31, 2019, if interest rates on borrowings were 100 basis points higher/lower with all other variables held constant, profit beforeincome tax for the following year would be W55,093 million (2018: W19,418 million) lower/higher, mainly as a result of higher/lower interest expenseon floating rate borrowings (except for floating-rate borrowings amounting to W578,900 million under floating-to-fixed cross currency interest rateswap agreement) and interest income on floating rate financial assets.
(iii) Price risk
The Group invests in equity and debt securities resulted from its business needs and the purpose of liquidity management. The Group�s equity anddebt securities are exposed to price risk as of December 31, 2019.
(b) Credit risk
Credit risk is the risk of financial loss to the Group if a customer or counterparty to a financial instrument fails to meet its contractual obligations,and arises mainly from operating and investing activities. In order to manage credit risk, the Group periodically evaluates the credit worthiness of eachcustomer or counterparty through the analysis of its financial information, historical transaction records and other factors, based on which the Groupestablishes credit limits for each customer or counterparty.
(i) Trade and other receivables
For each new customer, the Group individually analyzes its credit worthiness before standard payment and delivery terms and conditions areoffered. In addition, the Group is consistently managing trade and other receivables by reevaluating the overseas customer�s credit worthiness andsecuring collaterals in order to limit its credit risk exposure.
The Group reviews at the end of each reporting period whether trade and other receivables are impaired and maintains credit insurance policies tomanage credit risk exposure from oversea customers. The maximum exposure to credit risk as of December 31, 2019 is the carrying amount of trade andother receivables.
G-41
Copyright © 2020 www.secdatabase.com. All Rights Reserved.Please Consider the Environment Before Printing This Document
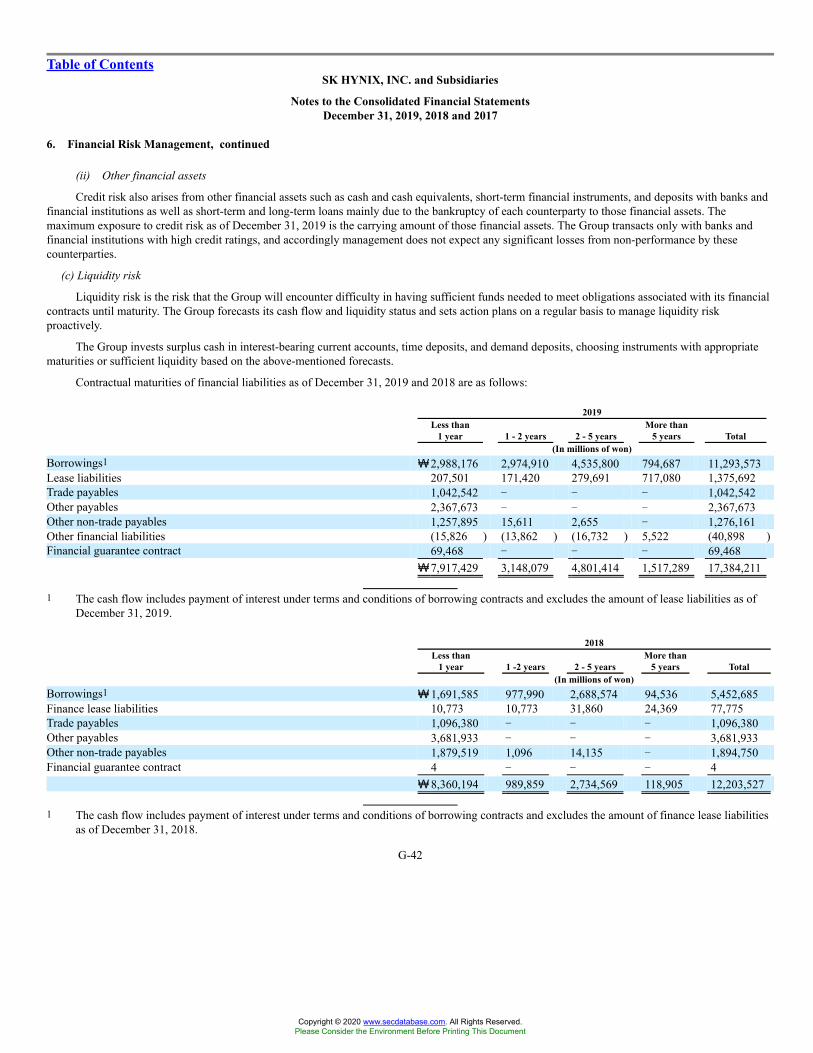
Table of ContentsSK HYNIX, INC. and Subsidiaries
Notes to the Consolidated Financial StatementsDecember 31, 2019, 2018 and 2017
6. Financial Risk Management, continued
(ii) Other financial assets
Credit risk also arises from other financial assets such as cash and cash equivalents, short-term financial instruments, and deposits with banks andfinancial institutions as well as short-term and long-term loans mainly due to the bankruptcy of each counterparty to those financial assets. Themaximum exposure to credit risk as of December 31, 2019 is the carrying amount of those financial assets. The Group transacts only with banks andfinancial institutions with high credit ratings, and accordingly management does not expect any significant losses from non-performance by thesecounterparties.
(c) Liquidity risk
Liquidity risk is the risk that the Group will encounter difficulty in having sufficient funds needed to meet obligations associated with its financialcontracts until maturity. The Group forecasts its cash flow and liquidity status and sets action plans on a regular basis to manage liquidity riskproactively.
The Group invests surplus cash in interest-bearing current accounts, time deposits, and demand deposits, choosing instruments with appropriatematurities or sufficient liquidity based on the above-mentioned forecasts.
Contractual maturities of financial liabilities as of December 31, 2019 and 2018 are as follows:
2019Less than
1 year 1 - 2 years 2 - 5 yearsMore than
5 years Total(In millions of won)
Borrowings1 ₩2,988,176 2,974,910 4,535,800 794,687 11,293,573Lease liabilities 207,501 171,420 279,691 717,080 1,375,692Trade payables 1,042,542 � � � 1,042,542Other payables 2,367,673 � � � 2,367,673Other non-trade payables 1,257,895 15,611 2,655 � 1,276,161Other financial liabilities (15,826 ) (13,862 ) (16,732 ) 5,522 (40,898 )Financial guarantee contract 69,468 � � � 69,468
₩7,917,429 3,148,079 4,801,414 1,517,289 17,384,211
1 The cash flow includes payment of interest under terms and conditions of borrowing contracts and excludes the amount of lease liabilities as ofDecember 31, 2019.
2018Less than
1 year 1 -2 years 2 - 5 yearsMore than
5 years Total(In millions of won)
Borrowings1 ₩1,691,585 977,990 2,688,574 94,536 5,452,685Finance lease liabilities 10,773 10,773 31,860 24,369 77,775Trade payables 1,096,380 � � � 1,096,380Other payables 3,681,933 � � � 3,681,933Other non-trade payables 1,879,519 1,096 14,135 � 1,894,750Financial guarantee contract 4 � � � 4
₩8,360,194 989,859 2,734,569 118,905 12,203,527
1 The cash flow includes payment of interest under terms and conditions of borrowing contracts and excludes the amount of finance lease liabilitiesas of December 31, 2018.
G-42
Copyright © 2020 www.secdatabase.com. All Rights Reserved.Please Consider the Environment Before Printing This Document
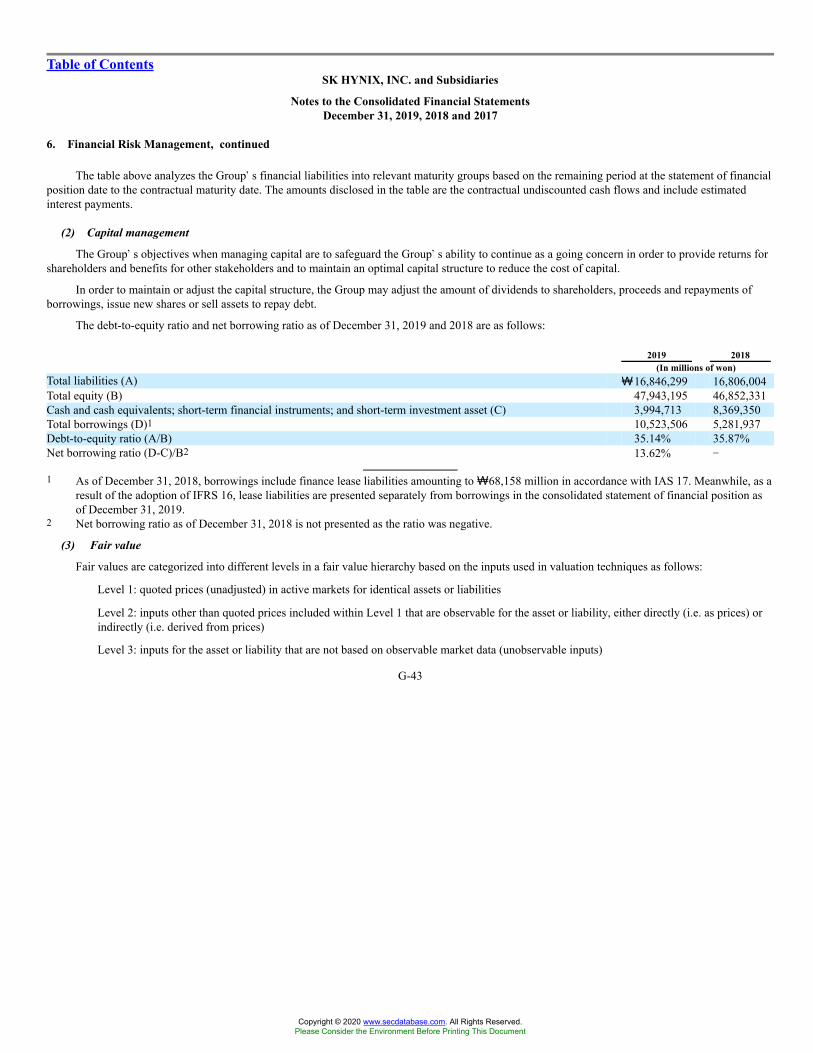
Table of ContentsSK HYNIX, INC. and Subsidiaries
Notes to the Consolidated Financial StatementsDecember 31, 2019, 2018 and 2017
6. Financial Risk Management, continued
The table above analyzes the Group�s financial liabilities into relevant maturity groups based on the remaining period at the statement of financialposition date to the contractual maturity date. The amounts disclosed in the table are the contractual undiscounted cash flows and include estimatedinterest payments.
(2) Capital management
The Group�s objectives when managing capital are to safeguard the Group�s ability to continue as a going concern in order to provide returns forshareholders and benefits for other stakeholders and to maintain an optimal capital structure to reduce the cost of capital.
In order to maintain or adjust the capital structure, the Group may adjust the amount of dividends to shareholders, proceeds and repayments ofborrowings, issue new shares or sell assets to repay debt.
The debt-to-equity ratio and net borrowing ratio as of December 31, 2019 and 2018 are as follows:
2019 2018(In millions of won)
Total liabilities (A) ₩16,846,299 16,806,004Total equity (B) 47,943,195 46,852,331Cash and cash equivalents; short-term financial instruments; and short-term investment asset (C) 3,994,713 8,369,350Total borrowings (D)1 10,523,506 5,281,937Debt-to-equity ratio (A/B) 35.14% 35.87%Net borrowing ratio (D-C)/B2 13.62% �
1 As of December 31, 2018, borrowings include finance lease liabilities amounting to ₩68,158 million in accordance with IAS 17. Meanwhile, as aresult of the adoption of IFRS 16, lease liabilities are presented separately from borrowings in the consolidated statement of financial position asof December 31, 2019.
2 Net borrowing ratio as of December 31, 2018 is not presented as the ratio was negative.
(3) Fair value
Fair values are categorized into different levels in a fair value hierarchy based on the inputs used in valuation techniques as follows:
� Level 1: quoted prices (unadjusted) in active markets for identical assets or liabilities
� Level 2: inputs other than quoted prices included within Level 1 that are observable for the asset or liability, either directly (i.e. as prices) orindirectly (i.e. derived from prices)
� Level 3: inputs for the asset or liability that are not based on observable market data (unobservable inputs)
G-43
Copyright © 2020 www.secdatabase.com. All Rights Reserved.Please Consider the Environment Before Printing This Document
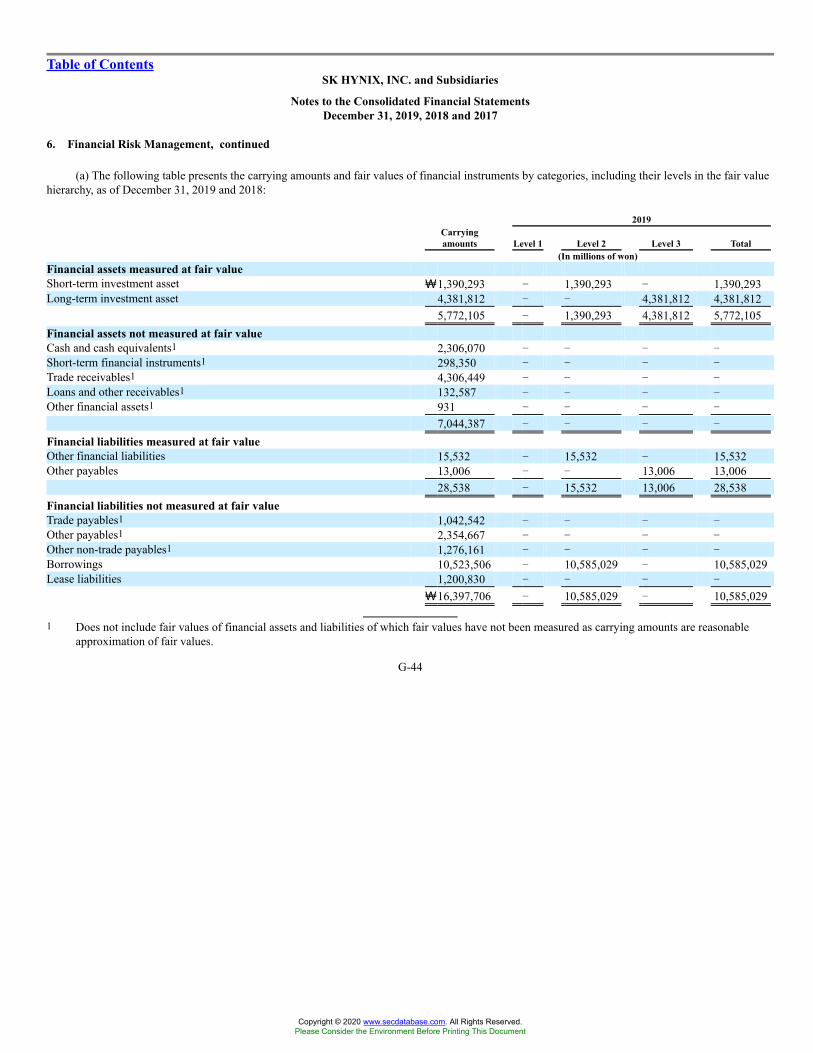
Table of ContentsSK HYNIX, INC. and Subsidiaries
Notes to the Consolidated Financial StatementsDecember 31, 2019, 2018 and 2017
6. Financial Risk Management, continued
(a) The following table presents the carrying amounts and fair values of financial instruments by categories, including their levels in the fair valuehierarchy, as of December 31, 2019 and 2018:
2019Carryingamounts Level 1 Level 2 Level 3 Total
(In millions of won)Financial assets measured at fair valueShort-term investment asset ₩1,390,293 � 1,390,293 � 1,390,293Long-term investment asset 4,381,812 � � 4,381,812 4,381,812
5,772,105 � 1,390,293 4,381,812 5,772,105Financial assets not measured at fair valueCash and cash equivalents1 2,306,070 � � � �Short-term financial instruments1 298,350 � � � �Trade receivables1 4,306,449 � � � �Loans and other receivables1 132,587 � � � �Other financial assets1 931 � � � �
7,044,387 � � � �
Financial liabilities measured at fair valueOther financial liabilities 15,532 � 15,532 � 15,532Other payables 13,006 � � 13,006 13,006
28,538 � 15,532 13,006 28,538Financial liabilities not measured at fair valueTrade payables1 1,042,542 � � � �Other payables1 2,354,667 � � � �Other non-trade payables1 1,276,161 � � � �Borrowings 10,523,506 � 10,585,029 � 10,585,029Lease liabilities 1,200,830 � � � �
₩16,397,706 � 10,585,029 � 10,585,029
1 Does not include fair values of financial assets and liabilities of which fair values have not been measured as carrying amounts are reasonableapproximation of fair values.
G-44
Copyright © 2020 www.secdatabase.com. All Rights Reserved.Please Consider the Environment Before Printing This Document
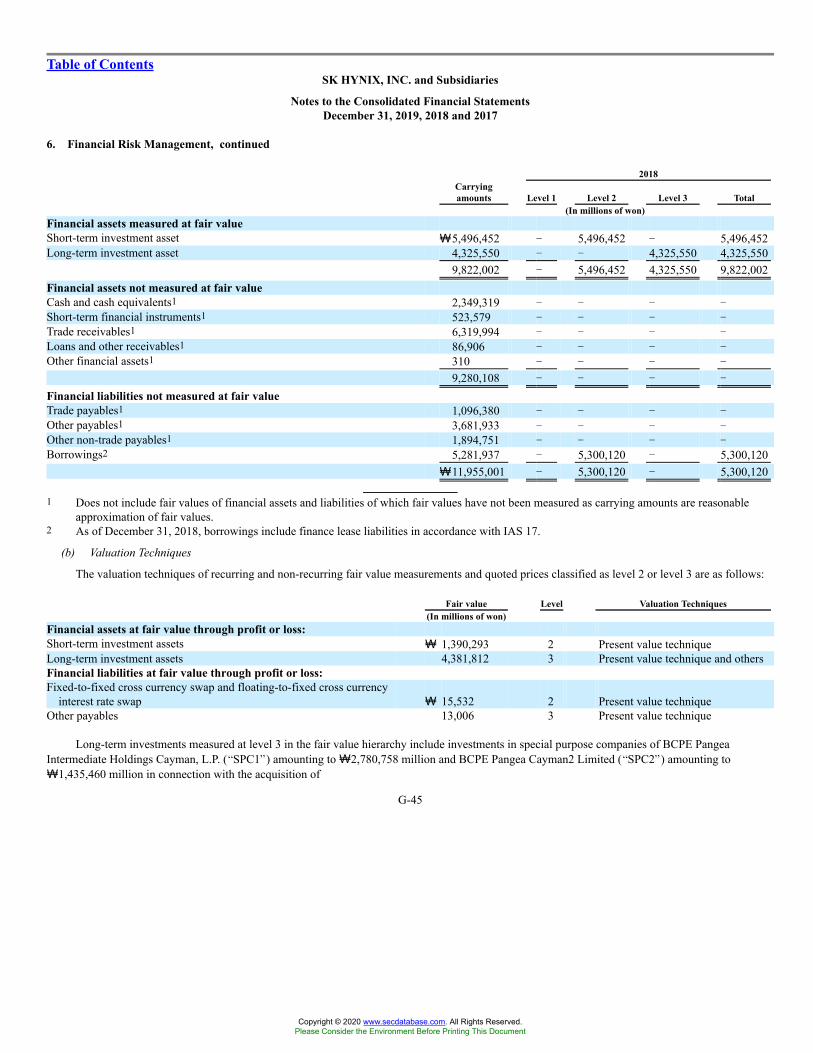
Table of ContentsSK HYNIX, INC. and Subsidiaries
Notes to the Consolidated Financial StatementsDecember 31, 2019, 2018 and 2017
6. Financial Risk Management, continued
2018Carryingamounts Level 1 Level 2 Level 3 Total
(In millions of won)Financial assets measured at fair valueShort-term investment asset ₩5,496,452 � 5,496,452 � 5,496,452Long-term investment asset 4,325,550 � � 4,325,550 4,325,550
9,822,002 � 5,496,452 4,325,550 9,822,002Financial assets not measured at fair valueCash and cash equivalents1 2,349,319 � � � �Short-term financial instruments1 523,579 � � � �Trade receivables1 6,319,994 � � � �Loans and other receivables1 86,906 � � � �Other financial assets1 310 � � � �
9,280,108 � � � �
Financial liabilities not measured at fair valueTrade payables1 1,096,380 � � � �Other payables1 3,681,933 � � � �Other non-trade payables1 1,894,751 � � � �Borrowings2 5,281,937 � 5,300,120 � 5,300,120
₩11,955,001 � 5,300,120 � 5,300,120
1 Does not include fair values of financial assets and liabilities of which fair values have not been measured as carrying amounts are reasonableapproximation of fair values.
2 As of December 31, 2018, borrowings include finance lease liabilities in accordance with IAS 17.
(b) Valuation Techniques
The valuation techniques of recurring and non-recurring fair value measurements and quoted prices classified as level 2 or level 3 are as follows:
Fair value Level Valuation Techniques(In millions of won)
Financial assets at fair value through profit or loss:Short-term investment assets ₩ 1,390,293 2 Present value techniqueLong-term investment assets 4,381,812 3 Present value technique and othersFinancial liabilities at fair value through profit or loss:Fixed-to-fixed cross currency swap and floating-to-fixed cross currency
interest rate swap ₩ 15,532 2 Present value techniqueOther payables 13,006 3 Present value technique
Long-term investments measured at level 3 in the fair value hierarchy include investments in special purpose companies of BCPE PangeaIntermediate Holdings Cayman, L.P. (�SPC1�) amounting to ₩2,780,758 million and BCPE Pangea Cayman2 Limited (�SPC2�) amounting to₩1,435,460 million in connection with the acquisition of
G-45
Copyright © 2020 www.secdatabase.com. All Rights Reserved.Please Consider the Environment Before Printing This Document

Table of ContentsSK HYNIX, INC. and Subsidiaries
Notes to the Consolidated Financial StatementsDecember 31, 2019, 2018 and 2017
6. Financial Risk Management, continued
KIOXIA Holdings Corporation (�KIOXIA�, formerly Toshiba Memory Corporation) (see note 12). The fair value of the long-term investments ismeasured based on the equity value of the underlying asset, KIOXIA.
The fair value of equity investment in SPC1 is measured using probability-weighted expected return method that represents the probability-weighted average of possible future cash flows. The fair values of different scenarios (such as initial public offering, merger and acquisition, andliquidation) are determined based on the KIOXIA�s equity value, calculated using either market approach, option-pricing method or present valuemethod. KIOXIA�s estimated equity value is allocated to shareholder�s value of each class of shares depending the capital structure of the investment.For the allocation, a waterfall approach is used, which allocates value based on the distribution priority described in SPC1 investment agreementdepending on the nature of liquidity transaction or an ultimate liquidation.
The fair value of debt investment in SPC2 convertible bonds is measured based on KIOXIA�s equity value, using binomial model.
The valuation techniques and key inputs used in valuation of the equity investment in SPC1 and investment in SPC2 convertible bonds are asfollows:
Fair value Valuation Techniques Level 3 inputsInputRange
(In millions of won)Terminal growth rate 0 %Weighted-average capital cost 8.6 %EV/EBITDA multiples 4.7 ~ 5.3
Equity investment in SPC1 ₩ 2,780,758 Present value technique,probability-weightedexpected return method,market approach,and option-pricing method
Cost of equity10.3 %
Terminal growth rate 0 %Weighted-average capital cost 8.6 %Volatility 21.3 %
SPC2 convertible bonds 1,435,460 Present value techniqueand binomial model
Risk free rate -0.13 %
In these level 3 significant unobservable inputs, an increase in terminal growth rate, and EV/EBITDA multiples or a decrease in weighted-averagecapital cost, cost of equity will result in higher fair value of the equity investment in SPC1. In addition, an increase in terminal growth rate and volatilityand a decrease in weighted-average capital cost will result in higher fair value of the investment in SPC2 convertible bonds, while any change in riskfree rate may have either positive or negative impact on the fair value of the investment in SPC2 convertible bonds.
Any positive or negative changes in the above inputs will have a significant and direct impact on the fair value of investments in SPC1 and SPC2,respectively. They are significant, but unobservable. Accordingly, the investments are classified as fair value hierarchy level 3.
G-46
Copyright © 2020 www.secdatabase.com. All Rights Reserved.Please Consider the Environment Before Printing This Document
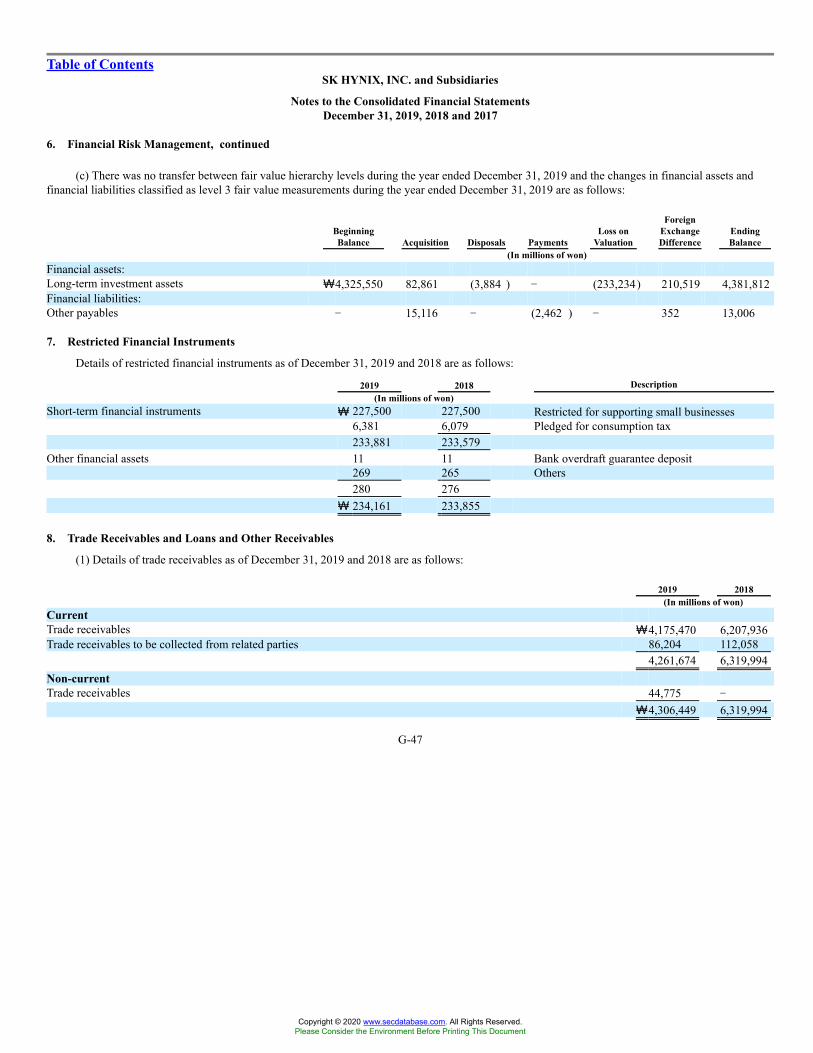
Table of ContentsSK HYNIX, INC. and Subsidiaries
Notes to the Consolidated Financial StatementsDecember 31, 2019, 2018 and 2017
6. Financial Risk Management, continued
(c) There was no transfer between fair value hierarchy levels during the year ended December 31, 2019 and the changes in financial assets andfinancial liabilities classified as level 3 fair value measurements during the year ended December 31, 2019 are as follows:
BeginningBalance Acquisition Disposals Payments
Loss onValuation
ForeignExchangeDifference
EndingBalance
(In millions of won)Financial assets:Long-term investment assets ₩4,325,550 82,861 (3,884 ) � (233,234) 210,519 4,381,812Financial liabilities:Other payables � 15,116 � (2,462 ) � 352 13,006
7. Restricted Financial Instruments
Details of restricted financial instruments as of December 31, 2019 and 2018 are as follows:
2019 2018 Description(In millions of won)
Short-term financial instruments ₩ 227,500 227,500 Restricted for supporting small businesses6,381 6,079 Pledged for consumption tax233,881 233,579
Other financial assets 11 11 Bank overdraft guarantee deposit269 265 Others280 276
₩ 234,161 233,855
8. Trade Receivables and Loans and Other Receivables
(1) Details of trade receivables as of December 31, 2019 and 2018 are as follows:
2019 2018(In millions of won)
CurrentTrade receivables ₩4,175,470 6,207,936Trade receivables to be collected from related parties 86,204 112,058
4,261,674 6,319,994Non-currentTrade receivables 44,775 �
₩4,306,449 6,319,994
G-47
Copyright © 2020 www.secdatabase.com. All Rights Reserved.Please Consider the Environment Before Printing This Document
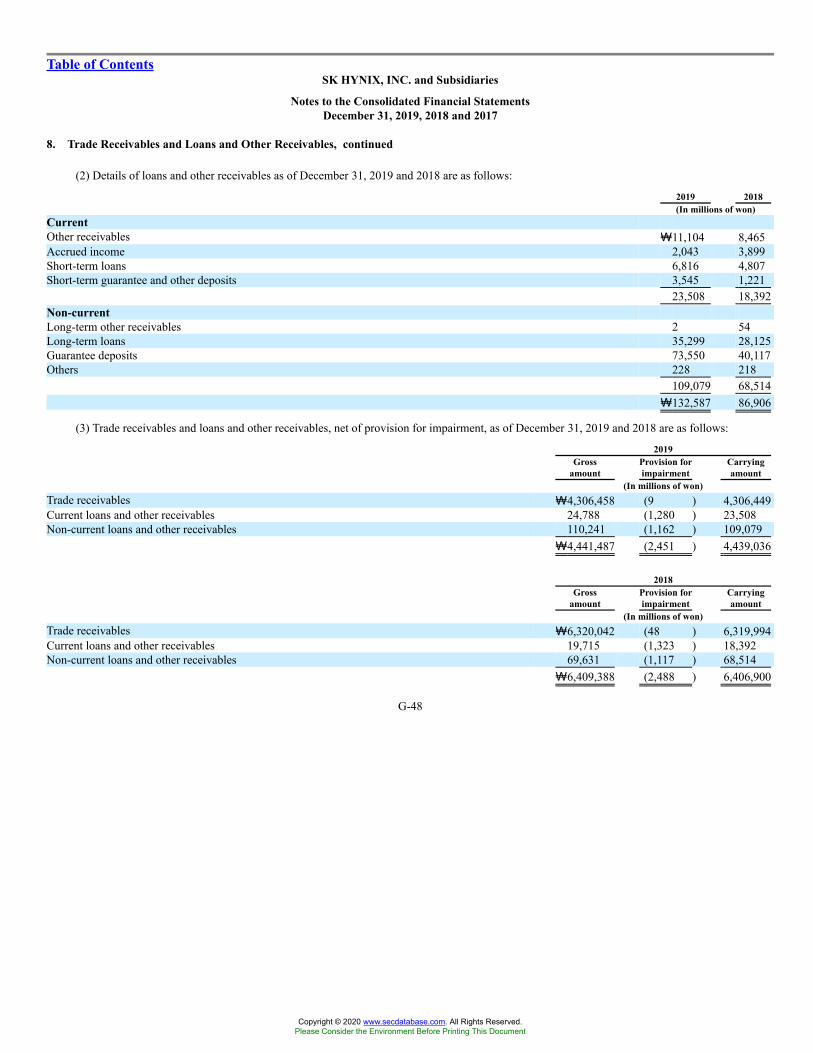
Table of ContentsSK HYNIX, INC. and Subsidiaries
Notes to the Consolidated Financial StatementsDecember 31, 2019, 2018 and 2017
8. Trade Receivables and Loans and Other Receivables, continued
(2) Details of loans and other receivables as of December 31, 2019 and 2018 are as follows:
2019 2018(In millions of won)
CurrentOther receivables ₩11,104 8,465Accrued income 2,043 3,899Short-term loans 6,816 4,807Short-term guarantee and other deposits 3,545 1,221
23,508 18,392Non-currentLong-term other receivables 2 54Long-term loans 35,299 28,125Guarantee deposits 73,550 40,117Others 228 218
109,079 68,514₩132,587 86,906
(3) Trade receivables and loans and other receivables, net of provision for impairment, as of December 31, 2019 and 2018 are as follows:
2019Gross
amountProvision forimpairment
Carryingamount
(In millions of won)Trade receivables ₩4,306,458 (9 ) 4,306,449Current loans and other receivables 24,788 (1,280 ) 23,508Non-current loans and other receivables 110,241 (1,162 ) 109,079
₩4,441,487 (2,451 ) 4,439,036
2018Gross
amountProvision forimpairment
Carryingamount
(In millions of won)Trade receivables ₩6,320,042 (48 ) 6,319,994Current loans and other receivables 19,715 (1,323 ) 18,392Non-current loans and other receivables 69,631 (1,117 ) 68,514
₩6,409,388 (2,488 ) 6,406,900
G-48
Copyright © 2020 www.secdatabase.com. All Rights Reserved.Please Consider the Environment Before Printing This Document
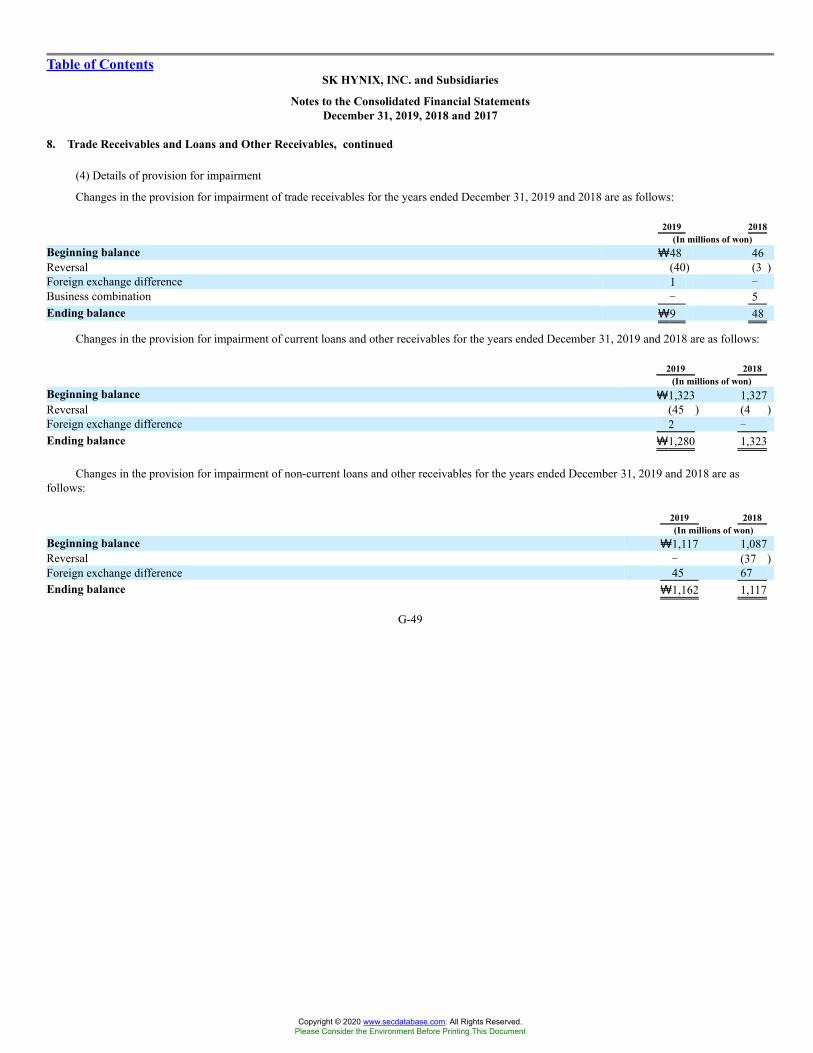
Table of ContentsSK HYNIX, INC. and Subsidiaries
Notes to the Consolidated Financial StatementsDecember 31, 2019, 2018 and 2017
8. Trade Receivables and Loans and Other Receivables, continued
(4) Details of provision for impairment
Changes in the provision for impairment of trade receivables for the years ended December 31, 2019 and 2018 are as follows:
2019 2018(In millions of won)
Beginning balance ₩48 46Reversal (40) (3 )Foreign exchange difference 1 �Business combination � 5Ending balance ₩9 48
Changes in the provision for impairment of current loans and other receivables for the years ended December 31, 2019 and 2018 are as follows:
2019 2018(In millions of won)
Beginning balance ₩1,323 1,327Reversal (45 ) (4 )Foreign exchange difference 2 �
Ending balance ₩1,280 1,323
Changes in the provision for impairment of non-current loans and other receivables for the years ended December 31, 2019 and 2018 are asfollows:
2019 2018(In millions of won)
Beginning balance ₩1,117 1,087Reversal � (37 )Foreign exchange difference 45 67Ending balance ₩1,162 1,117
G-49
Copyright © 2020 www.secdatabase.com. All Rights Reserved.Please Consider the Environment Before Printing This Document
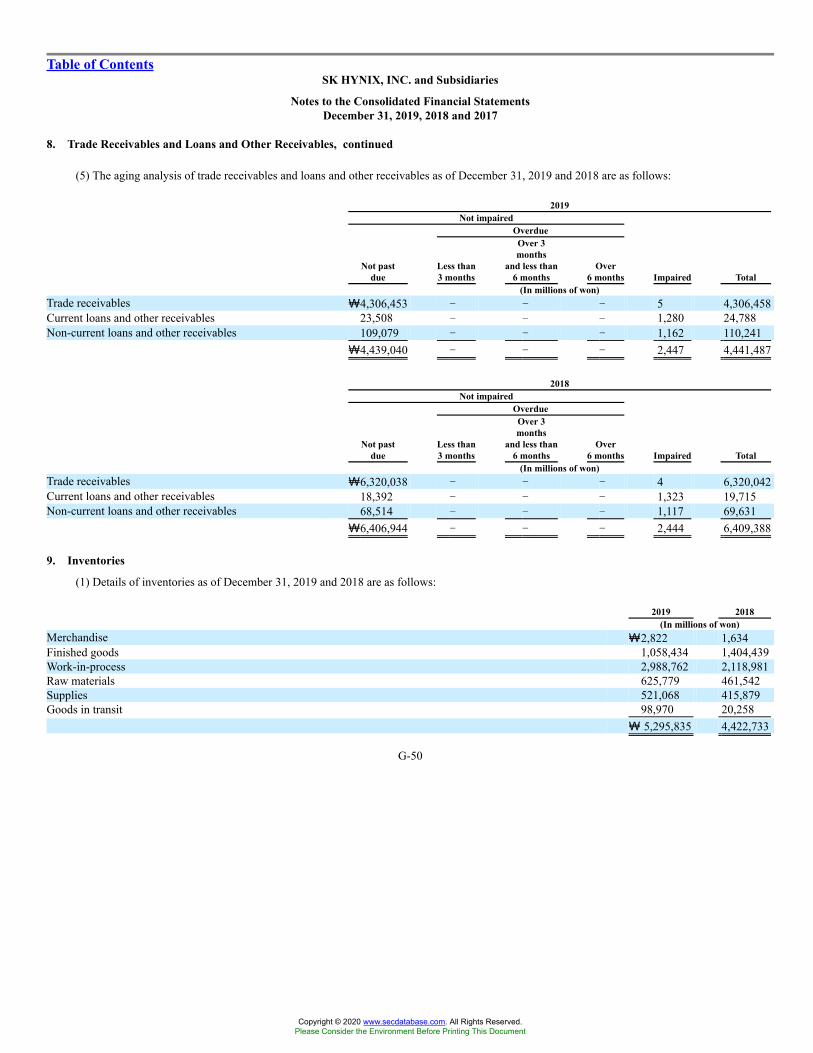
Table of ContentsSK HYNIX, INC. and Subsidiaries
Notes to the Consolidated Financial StatementsDecember 31, 2019, 2018 and 2017
8. Trade Receivables and Loans and Other Receivables, continued
(5) The aging analysis of trade receivables and loans and other receivables as of December 31, 2019 and 2018 are as follows:
2019Not impaired
Overdue
Not pastdue
Less than3 months
Over 3months
and less than6 months
Over6 months Impaired Total
(In millions of won)Trade receivables ₩4,306,453 � � � 5 4,306,458Current loans and other receivables 23,508 � � � 1,280 24,788Non-current loans and other receivables 109,079 � � � 1,162 110,241
₩4,439,040 � � � 2,447 4,441,487
2018Not impaired
Overdue
Not pastdue
Less than3 months
Over 3months
and less than6 months
Over6 months Impaired Total
(In millions of won)Trade receivables ₩6,320,038 � � � 4 6,320,042Current loans and other receivables 18,392 � � � 1,323 19,715Non-current loans and other receivables 68,514 � � � 1,117 69,631
₩6,406,944 � � � 2,444 6,409,388
9. Inventories
(1) Details of inventories as of December 31, 2019 and 2018 are as follows:
2019 2018(In millions of won)
Merchandise ₩2,822 1,634Finished goods 1,058,434 1,404,439Work-in-process 2,988,762 2,118,981Raw materials 625,779 461,542Supplies 521,068 415,879Goods in transit 98,970 20,258
₩ 5,295,835 4,422,733
G-50
Copyright © 2020 www.secdatabase.com. All Rights Reserved.Please Consider the Environment Before Printing This Document
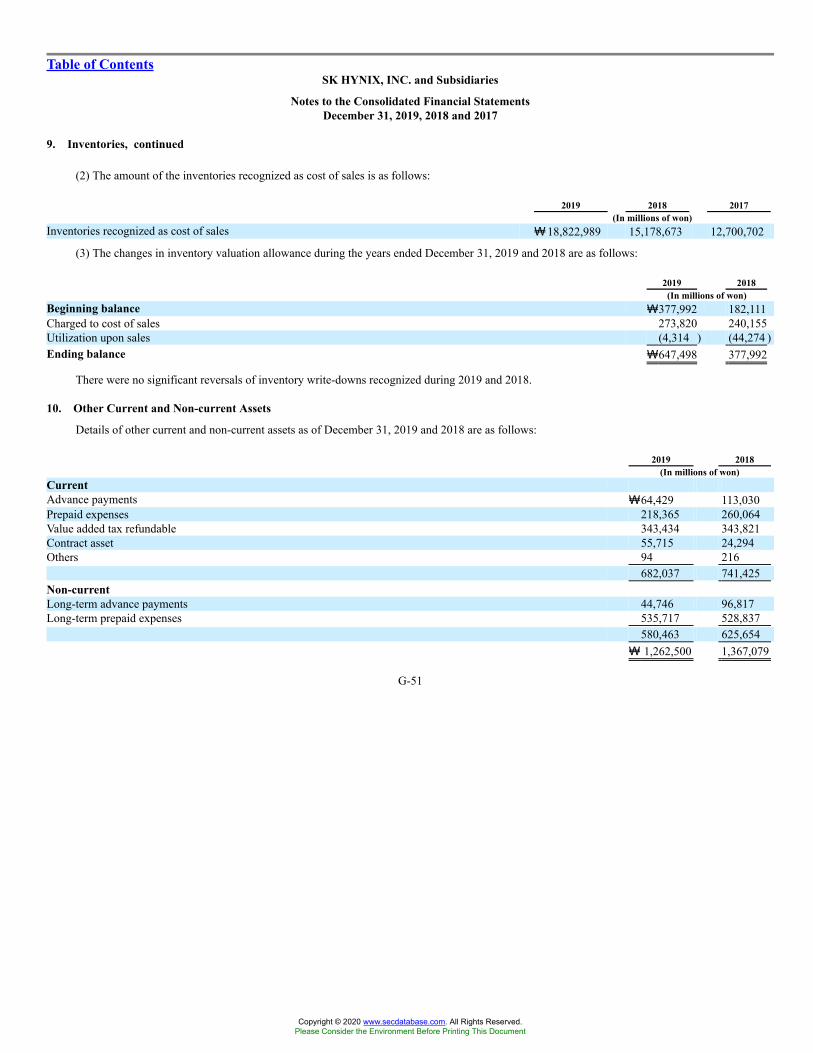
Table of ContentsSK HYNIX, INC. and Subsidiaries
Notes to the Consolidated Financial StatementsDecember 31, 2019, 2018 and 2017
9. Inventories, continued
(2) The amount of the inventories recognized as cost of sales is as follows:
2019 2018 2017(In millions of won)
Inventories recognized as cost of sales ₩18,822,989 15,178,673 12,700,702
(3) The changes in inventory valuation allowance during the years ended December 31, 2019 and 2018 are as follows:
2019 2018(In millions of won)
Beginning balance ₩377,992 182,111Charged to cost of sales 273,820 240,155Utilization upon sales (4,314 ) (44,274 )Ending balance ₩647,498 377,992
There were no significant reversals of inventory write-downs recognized during 2019 and 2018.
10. Other Current and Non-current Assets
Details of other current and non-current assets as of December 31, 2019 and 2018 are as follows:
2019 2018(In millions of won)
CurrentAdvance payments ₩64,429 113,030Prepaid expenses 218,365 260,064Value added tax refundable 343,434 343,821Contract asset 55,715 24,294Others 94 216
682,037 741,425Non-currentLong-term advance payments 44,746 96,817Long-term prepaid expenses 535,717 528,837
580,463 625,654₩ 1,262,500 1,367,079
G-51
Copyright © 2020 www.secdatabase.com. All Rights Reserved.Please Consider the Environment Before Printing This Document
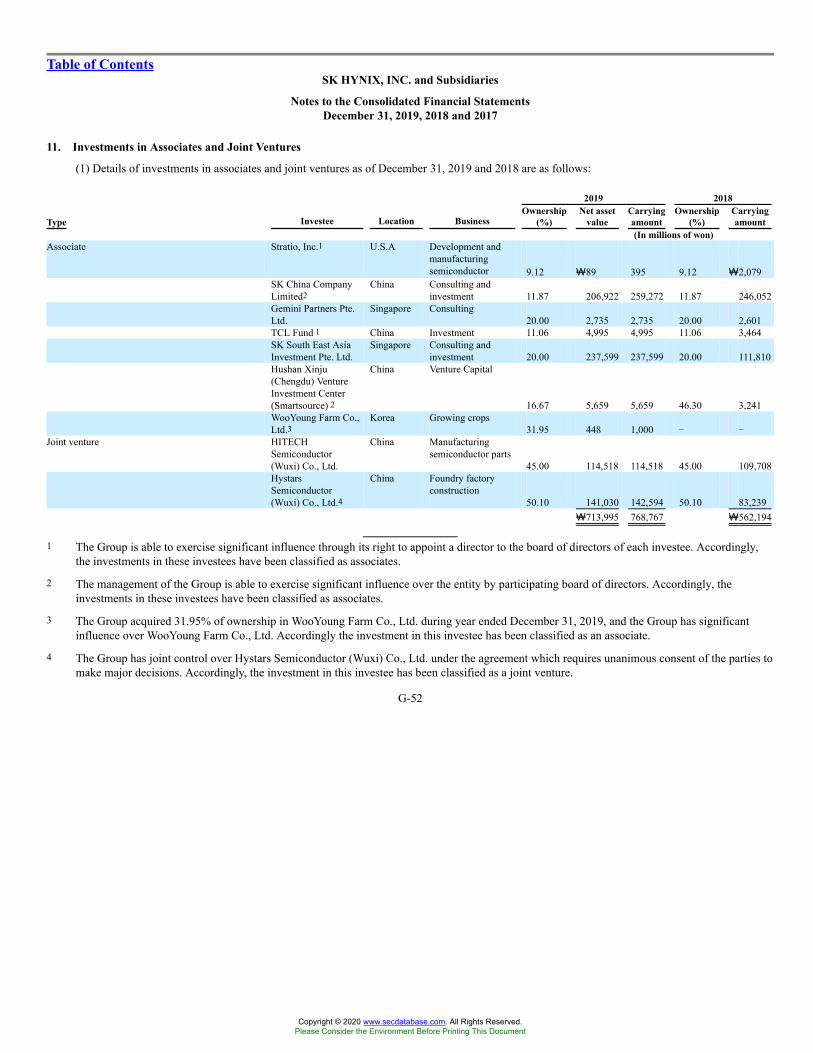
Table of ContentsSK HYNIX, INC. and Subsidiaries
Notes to the Consolidated Financial StatementsDecember 31, 2019, 2018 and 2017
11. Investments in Associates and Joint Ventures
(1) Details of investments in associates and joint ventures as of December 31, 2019 and 2018 are as follows:
2019 2018
Type Investee Location BusinessOwnership
(%)Net asset
valueCarryingamount
Ownership(%)
Carryingamount
(In millions of won)Associate Stratio, Inc.1 U.S.A Development and
manufacturingsemiconductor 9.12 ₩89 395 9.12 ₩2,079
SK China CompanyLimited2
China Consulting andinvestment 11.87 206,922 259,272 11.87 246,052
Gemini Partners Pte.Ltd.
Singapore Consulting20.00 2,735 2,735 20.00 2,601
TCL Fund 1 China Investment 11.06 4,995 4,995 11.06 3,464SK South East AsiaInvestment Pte. Ltd.
Singapore Consulting andinvestment 20.00 237,599 237,599 20.00 111,810
Hushan Xinju(Chengdu) VentureInvestment Center(Smartsource) 2
China Venture Capital
16.67 5,659 5,659 46.30 3,241WooYoung Farm Co.,Ltd.3
Korea Growing crops31.95 448 1,000 � �
Joint venture HITECHSemiconductor(Wuxi) Co., Ltd.
China Manufacturingsemiconductor parts
45.00 114,518 114,518 45.00 109,708HystarsSemiconductor(Wuxi) Co., Ltd.4
China Foundry factoryconstruction
50.10 141,030 142,594 50.10 83,239₩713,995 768,767 ₩562,194
1 The Group is able to exercise significant influence through its right to appoint a director to the board of directors of each investee. Accordingly,the investments in these investees have been classified as associates.
2 The management of the Group is able to exercise significant influence over the entity by participating board of directors. Accordingly, theinvestments in these investees have been classified as associates.
3 The Group acquired 31.95% of ownership in WooYoung Farm Co., Ltd. during year ended December 31, 2019, and the Group has significantinfluence over WooYoung Farm Co., Ltd. Accordingly the investment in this investee has been classified as an associate.
4 The Group has joint control over Hystars Semiconductor (Wuxi) Co., Ltd. under the agreement which requires unanimous consent of the parties tomake major decisions. Accordingly, the investment in this investee has been classified as a joint venture.
G-52
Copyright © 2020 www.secdatabase.com. All Rights Reserved.Please Consider the Environment Before Printing This Document
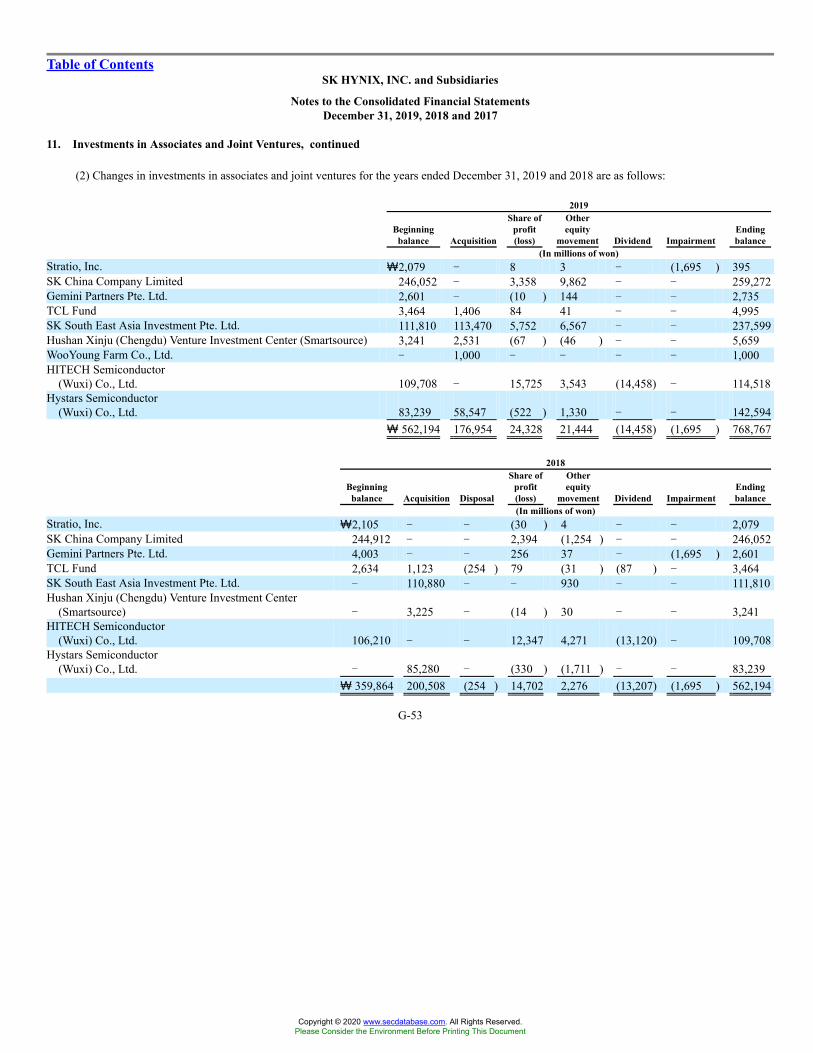
Table of ContentsSK HYNIX, INC. and Subsidiaries
Notes to the Consolidated Financial StatementsDecember 31, 2019, 2018 and 2017
11. Investments in Associates and Joint Ventures, continued
(2) Changes in investments in associates and joint ventures for the years ended December 31, 2019 and 2018 are as follows:
2019
Beginningbalance Acquisition
Share ofprofit(loss)
Otherequity
movement Dividend ImpairmentEndingbalance
(In millions of won)Stratio, Inc. ₩2,079 � 8 3 � (1,695 ) 395SK China Company Limited 246,052 � 3,358 9,862 � � 259,272Gemini Partners Pte. Ltd. 2,601 � (10 ) 144 � � 2,735TCL Fund 3,464 1,406 84 41 � � 4,995SK South East Asia Investment Pte. Ltd. 111,810 113,470 5,752 6,567 � � 237,599Hushan Xinju (Chengdu) Venture Investment Center (Smartsource) 3,241 2,531 (67 ) (46 ) � � 5,659WooYoung Farm Co., Ltd. � 1,000 � � � � 1,000HITECH Semiconductor
(Wuxi) Co., Ltd. 109,708 � 15,725 3,543 (14,458) � 114,518Hystars Semiconductor
(Wuxi) Co., Ltd. 83,239 58,547 (522 ) 1,330 � � 142,594₩ 562,194 176,954 24,328 21,444 (14,458) (1,695 ) 768,767
2018
Beginningbalance Acquisition Disposal
Share ofprofit(loss)
Otherequity
movement Dividend ImpairmentEndingbalance
(In millions of won)Stratio, Inc. ₩2,105 � � (30 ) 4 � � 2,079SK China Company Limited 244,912 � � 2,394 (1,254 ) � � 246,052Gemini Partners Pte. Ltd. 4,003 � � 256 37 � (1,695 ) 2,601TCL Fund 2,634 1,123 (254 ) 79 (31 ) (87 ) � 3,464SK South East Asia Investment Pte. Ltd. � 110,880 � � 930 � � 111,810Hushan Xinju (Chengdu) Venture Investment Center
(Smartsource) � 3,225 � (14 ) 30 � � 3,241HITECH Semiconductor
(Wuxi) Co., Ltd. 106,210 � � 12,347 4,271 (13,120) � 109,708Hystars Semiconductor
(Wuxi) Co., Ltd. � 85,280 � (330 ) (1,711 ) � � 83,239₩ 359,864 200,508 (254 ) 14,702 2,276 (13,207) (1,695 ) 562,194
G-53
Copyright © 2020 www.secdatabase.com. All Rights Reserved.Please Consider the Environment Before Printing This Document

Table of ContentsSK HYNIX, INC. and Subsidiaries
Notes to the Consolidated Financial StatementsDecember 31, 2019, 2018 and 2017
11. Investments in Associates and Joint Ventures, continued
(3) Associates and joint ventures� summarized consolidated statements of financial position as of December 31, 2019 and 2018 are as follows:
2019
Currentassets
Non-currentassets
Currentliabilities
Non-current
liabilities(In millions of won)
Stratio, Inc. ₩431 715 169 �SK China Company Limited 604,127 1,357,238 46,747 170,812Gemini Partners Pte. Ltd. 6,851 6,912 54 33TCL Fund 12,652 35,809 3,256 �SK South East Asia Investment Pte. Ltd. 108,465 1,705,297 91 �Hushan Xinju (Chengdu) Venture Investment Center (Smartsource) 20,623 13,657 329 �WooYoung Farm Co., Ltd. 1,016 610 2 222HITECH Semiconductor (Wuxi) Co., Ltd. 193,377 442,510 84,071 297,330Hystars Semiconductor (Wuxi) Co., Ltd. 167,238 388,318 48,984 225,075
2018
Currentassets
Non-currentassets
Currentliabilities
Non-current
liabilities(In millions of won)
Stratio, Inc. ₩403 617 159 �SK China Company Limited 646,779 1,148,281 65,037 97,633Gemini Partners Pte. Ltd. 5,357 7,649 � �TCL Fund 915 33,596 3,188 �SK South East Asia Investment Pte. Ltd. 559,050 � � �Hushan Xinju (Chengdu) Venture Investment Center (Smartsource) 6,187 814 � �HITECH Semiconductor (Wuxi) Co., Ltd. 211,273 376,266 114,756 228,987Hystars Semiconductor (Wuxi) Co., Ltd. 145,509 19,295 1,490 �
(4) Associates and joint ventures� summarized consolidated statements of income (loss) for the years ended December 31, 2019, 2018 and 2017are as follows:
2019 2018 2017
RevenueProfit (loss)for the year Revenue
Profit (loss)for the year Revenue
Profit (loss)for the year
(In millions of won)Stratio, Inc. ₩242 81 88 (330 ) 33 (339 )SK China Company Limited 120,317 28,309 94,966 20,176 � �Gemini Partners Pte. Ltd. � (49 ) � 1,279 183 (5,423 )TCL Fund � 759 � 713 � 152SK South East Asia Investment Pte. Ltd. 10,294 28,763 � � � �Hushan Xinju (Chengdu) Venture Investment Center (Smartsource) � (837 ) � (31 ) � �WooYoung Farm Co., Ltd. 19 (105 ) � � � �HITECH Semiconductor (Wuxi) Co., Ltd. 657,741 36,398 621,528 27,438 585,904 29,923Hystars Semiconductor (Wuxi) Co., Ltd. � (1,044 ) � (658 ) � �
G-54
Copyright © 2020 www.secdatabase.com. All Rights Reserved.Please Consider the Environment Before Printing This Document

Table of ContentsSK HYNIX, INC. and Subsidiaries
Notes to the Consolidated Financial StatementsDecember 31, 2019, 2018 and 2017
12. Long-term Investment Assets
(1) Details of long-term investment assets as of December 31, 2019 and 2018 are as follows:
2019 2018Ownership (%)/
TypeAcquisition
costBookvalue
Bookvalue
(In millions of won)ProMOS Technologies Inc. 13.34 ₩21,847 � �Intellectual Discovery 4.80 4,000 2,392 1,376MEMS DRIVE, INC. 3.25 2,397 1,251 919Semiconductor Growth Fund Certificate 25,000 24,480 24,878China Walden Venture Investments II, L.P. Certificate 7,895 9,138 7,611China Walden Venture Investments III, L.P. Certificate 5,448 5,790 3,487Keyssa,Inc 2.81 6,174 822 838AutoTech Fund I, L.P. Certificate 3,152 3,198 2,789RENO SUB-SYSTEM, INC. 4.09 2,597 657 226TransLink Capital Partners IV, L.P. Certificate 2,386 2,175 1,627Impact Venture Capital I, L.P. Certificate 3,174 4,010 2,707BCPE Pangea Intermediate Holdings Cayman, L.P.1 Certificate 2,694,692 2,780,758 2,721,554BCPE Pangea Cayman2, Ltd.1 Convertible
bond 1,280,294 1,435,460 1,461,451FemtoMetrix, Inc. Convertible
bond 4,387 4,387 3,209TidalScale, Inc. 4.79 3,360 1,278 3,360GigaIO Networks, Inc. 8.97 4,066 4,066 1,678Aeye, Inc. 1.46 2,819 1,187 2,819Lion Semiconductor Inc. 6.55 3,539 3,474 �TetraMem Holdings, Incorporation Convertible
bond 2,349 2,349 �Beijing Starblaze Technology Co., Ltd. 5.43 3,315 2,143 3,255Shanghai Natlinear Electronics Co., Ltd. 3.67 1,657 2,010 1,628Shanghai IoT Phase II Venture Capital Fund Partnership, L.P Certificate 8,287 7,729 5,909Beijing Horizon Robotics Technology Co., Ltd. 2.57 58,340 63,550 56,029Shanghi Sitrus Microelectronics Technology Co., Ltd. 4.55 4,144 1,360 4,069Shinhan AIM Social Enterprise Private Equity I Certificate 3,550 3,162 585Others � 14,605 14,986 13,546
₩4,173,474 4,381,812 4,325,550
1 In 2017, the Group participated in a consortium that includes Bain Capital in connection with acquisition of a stake in Toshiba MemoryCorporation (�TMC�). On March 1, 2019 Toshiba Memory Holdings Corporation (�TMCHD�) was established as the holding company for TMC.Subsequently TMCHD and TMC were renamed KIOXIA Holdings Corporation (�KIOXIA�) and KIOXIA Corporation respectively. As ofDecember 31, 2019, the Group holds equity interests in SPC1, which holds equity interests in KIOXIA, and convertible bonds issued by SPC2,which may be later convertible to 15% stake in KIOXIA upon certain events. Management and decision-making rights of the Group for SPC1 andSPC2 are limited. Accordingly, the Group does not control or have any significant influence on SPC1 and SPC2. The investments in SPC1 andSPC2 are classified as financial assets which are debt instruments measured at fair value through profit or loss.
G-55
Copyright © 2020 www.secdatabase.com. All Rights Reserved.Please Consider the Environment Before Printing This Document
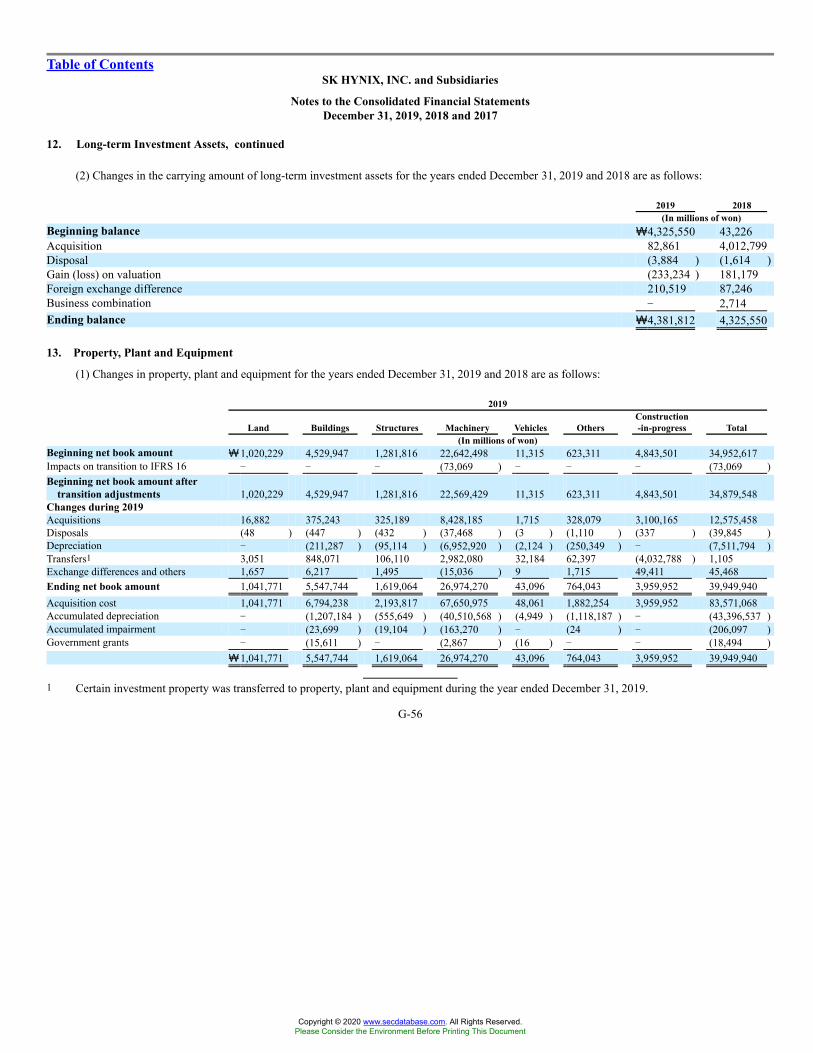
Table of ContentsSK HYNIX, INC. and Subsidiaries
Notes to the Consolidated Financial StatementsDecember 31, 2019, 2018 and 2017
12. Long-term Investment Assets, continued
(2) Changes in the carrying amount of long-term investment assets for the years ended December 31, 2019 and 2018 are as follows:
2019 2018(In millions of won)
Beginning balance ₩4,325,550 43,226Acquisition 82,861 4,012,799Disposal (3,884 ) (1,614 )Gain (loss) on valuation (233,234 ) 181,179Foreign exchange difference 210,519 87,246Business combination � 2,714Ending balance ₩4,381,812 4,325,550
13. Property, Plant and Equipment
(1) Changes in property, plant and equipment for the years ended December 31, 2019 and 2018 are as follows:
2019
Land Buildings Structures Machinery Vehicles OthersConstruction-in-progress Total
(In millions of won)Beginning net book amount ₩1,020,229 4,529,947 1,281,816 22,642,498 11,315 623,311 4,843,501 34,952,617Impacts on transition to IFRS 16 � � � (73,069 ) � � � (73,069 )Beginning net book amount after
transition adjustments 1,020,229 4,529,947 1,281,816 22,569,429 11,315 623,311 4,843,501 34,879,548Changes during 2019Acquisitions 16,882 375,243 325,189 8,428,185 1,715 328,079 3,100,165 12,575,458Disposals (48 ) (447 ) (432 ) (37,468 ) (3 ) (1,110 ) (337 ) (39,845 )Depreciation � (211,287 ) (95,114 ) (6,952,920 ) (2,124 ) (250,349 ) � (7,511,794 )Transfers1 3,051 848,071 106,110 2,982,080 32,184 62,397 (4,032,788 ) 1,105Exchange differences and others 1,657 6,217 1,495 (15,036 ) 9 1,715 49,411 45,468Ending net book amount 1,041,771 5,547,744 1,619,064 26,974,270 43,096 764,043 3,959,952 39,949,940Acquisition cost 1,041,771 6,794,238 2,193,817 67,650,975 48,061 1,882,254 3,959,952 83,571,068Accumulated depreciation � (1,207,184 ) (555,649 ) (40,510,568 ) (4,949 ) (1,118,187 ) � (43,396,537 )Accumulated impairment � (23,699 ) (19,104 ) (163,270 ) � (24 ) � (206,097 )Government grants � (15,611 ) � (2,867 ) (16 ) � � (18,494 )
₩1,041,771 5,547,744 1,619,064 26,974,270 43,096 764,043 3,959,952 39,949,940
1 Certain investment property was transferred to property, plant and equipment during the year ended December 31, 2019.
G-56
Copyright © 2020 www.secdatabase.com. All Rights Reserved.Please Consider the Environment Before Printing This Document
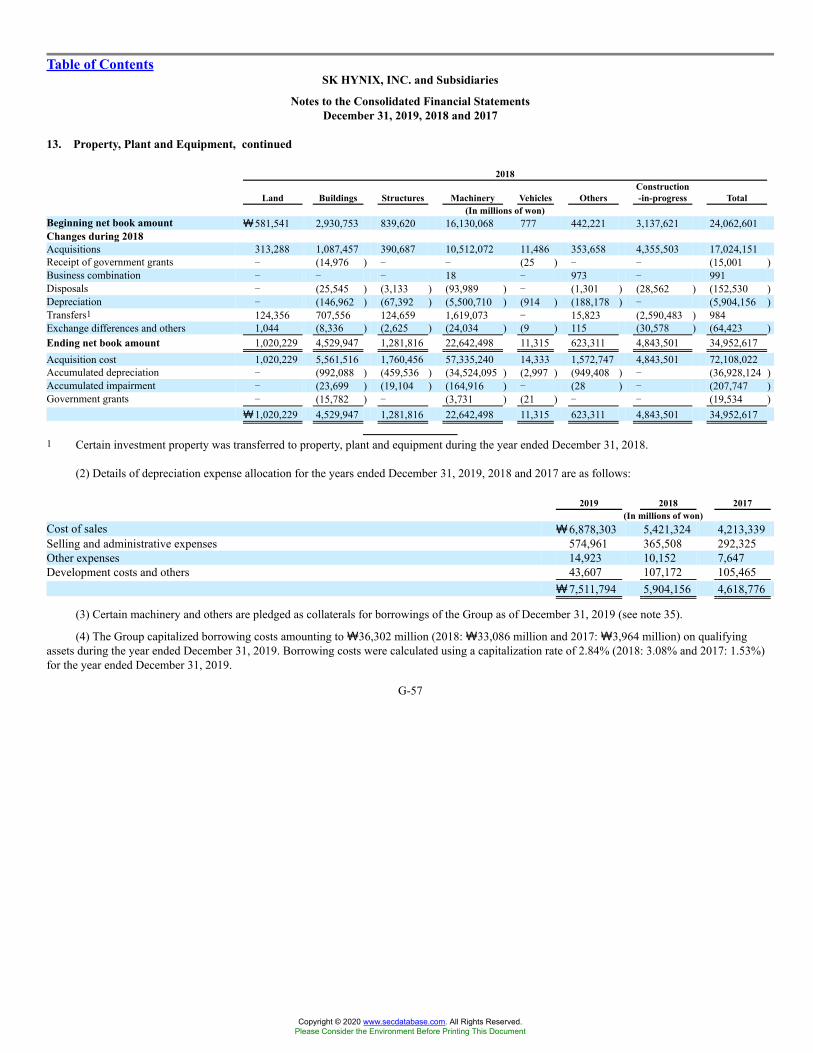
Table of ContentsSK HYNIX, INC. and Subsidiaries
Notes to the Consolidated Financial StatementsDecember 31, 2019, 2018 and 2017
13. Property, Plant and Equipment, continued
2018
Land Buildings Structures Machinery Vehicles OthersConstruction-in-progress Total
(In millions of won)Beginning net book amount ₩581,541 2,930,753 839,620 16,130,068 777 442,221 3,137,621 24,062,601Changes during 2018Acquisitions 313,288 1,087,457 390,687 10,512,072 11,486 353,658 4,355,503 17,024,151Receipt of government grants � (14,976 ) � � (25 ) � � (15,001 )Business combination � � � 18 � 973 � 991Disposals � (25,545 ) (3,133 ) (93,989 ) � (1,301 ) (28,562 ) (152,530 )Depreciation � (146,962 ) (67,392 ) (5,500,710 ) (914 ) (188,178 ) � (5,904,156 )Transfers1 124,356 707,556 124,659 1,619,073 � 15,823 (2,590,483 ) 984Exchange differences and others 1,044 (8,336 ) (2,625 ) (24,034 ) (9 ) 115 (30,578 ) (64,423 )Ending net book amount 1,020,229 4,529,947 1,281,816 22,642,498 11,315 623,311 4,843,501 34,952,617Acquisition cost 1,020,229 5,561,516 1,760,456 57,335,240 14,333 1,572,747 4,843,501 72,108,022Accumulated depreciation � (992,088 ) (459,536 ) (34,524,095 ) (2,997 ) (949,408 ) � (36,928,124 )Accumulated impairment � (23,699 ) (19,104 ) (164,916 ) � (28 ) � (207,747 )Government grants � (15,782 ) � (3,731 ) (21 ) � � (19,534 )
₩1,020,229 4,529,947 1,281,816 22,642,498 11,315 623,311 4,843,501 34,952,617
1 Certain investment property was transferred to property, plant and equipment during the year ended December 31, 2018.
(2) Details of depreciation expense allocation for the years ended December 31, 2019, 2018 and 2017 are as follows:
2019 2018 2017(In millions of won)
Cost of sales ₩6,878,303 5,421,324 4,213,339Selling and administrative expenses 574,961 365,508 292,325Other expenses 14,923 10,152 7,647Development costs and others 43,607 107,172 105,465
₩7,511,794 5,904,156 4,618,776
(3) Certain machinery and others are pledged as collaterals for borrowings of the Group as of December 31, 2019 (see note 35).
(4) The Group capitalized borrowing costs amounting to ₩36,302 million (2018: ₩33,086 million and 2017: ₩3,964 million) on qualifyingassets during the year ended December 31, 2019. Borrowing costs were calculated using a capitalization rate of 2.84% (2018: 3.08% and 2017: 1.53%)for the year ended December 31, 2019.
G-57
Copyright © 2020 www.secdatabase.com. All Rights Reserved.Please Consider the Environment Before Printing This Document
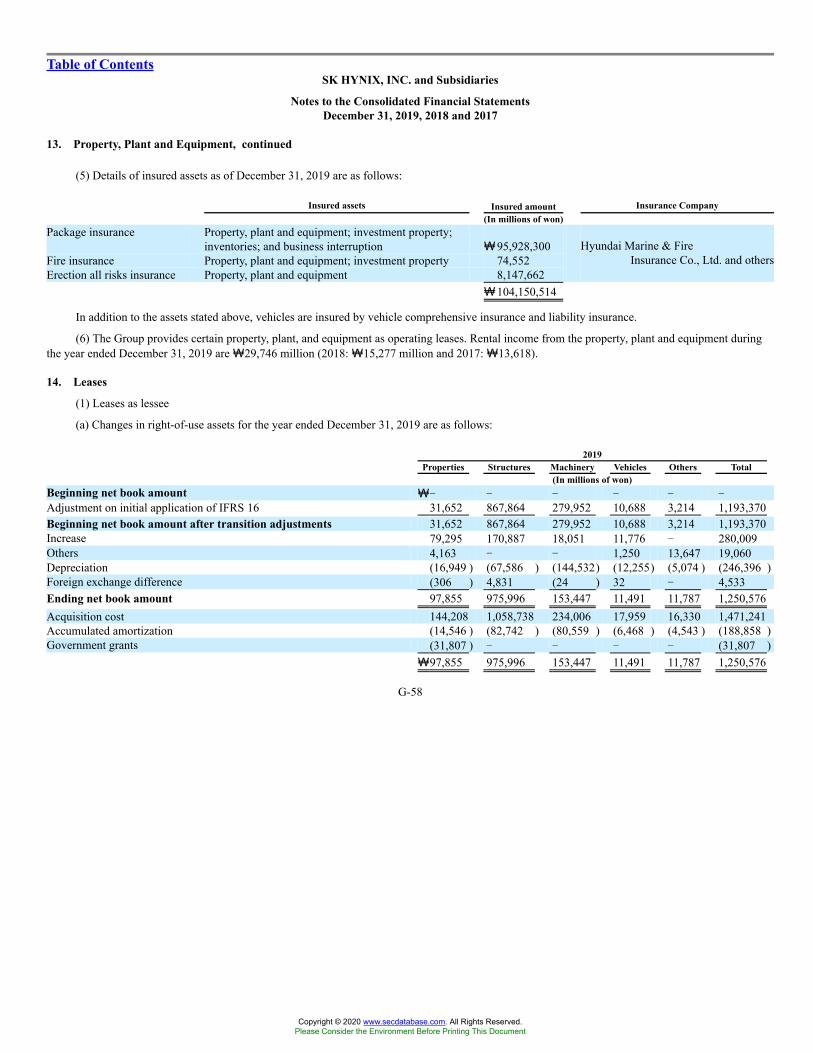
Table of ContentsSK HYNIX, INC. and Subsidiaries
Notes to the Consolidated Financial StatementsDecember 31, 2019, 2018 and 2017
13. Property, Plant and Equipment, continued
(5) Details of insured assets as of December 31, 2019 are as follows:
Insured assets Insured amount Insurance Company(In millions of won)
Package insurance Property, plant and equipment; investment property;inventories; and business interruption ₩95,928,300
Fire insurance Property, plant and equipment; investment property 74,552Erection all risks insurance Property, plant and equipment 8,147,662
Hyundai Marine & FireInsurance Co., Ltd. and others
₩104,150,514
In addition to the assets stated above, vehicles are insured by vehicle comprehensive insurance and liability insurance.
(6) The Group provides certain property, plant, and equipment as operating leases. Rental income from the property, plant and equipment duringthe year ended December 31, 2019 are ₩29,746 million (2018: ₩15,277 million and 2017: ₩13,618).
14. Leases
(1) Leases as lessee
(a) Changes in right-of-use assets for the year ended December 31, 2019 are as follows:
2019Properties Structures Machinery Vehicles Others Total
(In millions of won)Beginning net book amount ₩� � � � � �Adjustment on initial application of IFRS 16 31,652 867,864 279,952 10,688 3,214 1,193,370Beginning net book amount after transition adjustments 31,652 867,864 279,952 10,688 3,214 1,193,370Increase 79,295 170,887 18,051 11,776 � 280,009Others 4,163 � � 1,250 13,647 19,060Depreciation (16,949 ) (67,586 ) (144,532) (12,255) (5,074 ) (246,396 )Foreign exchange difference (306 ) 4,831 (24 ) 32 � 4,533Ending net book amount 97,855 975,996 153,447 11,491 11,787 1,250,576Acquisition cost 144,208 1,058,738 234,006 17,959 16,330 1,471,241Accumulated amortization (14,546 ) (82,742 ) (80,559 ) (6,468 ) (4,543 ) (188,858 )Government grants (31,807 ) � � � � (31,807 )
₩97,855 975,996 153,447 11,491 11,787 1,250,576
G-58
Copyright © 2020 www.secdatabase.com. All Rights Reserved.Please Consider the Environment Before Printing This Document
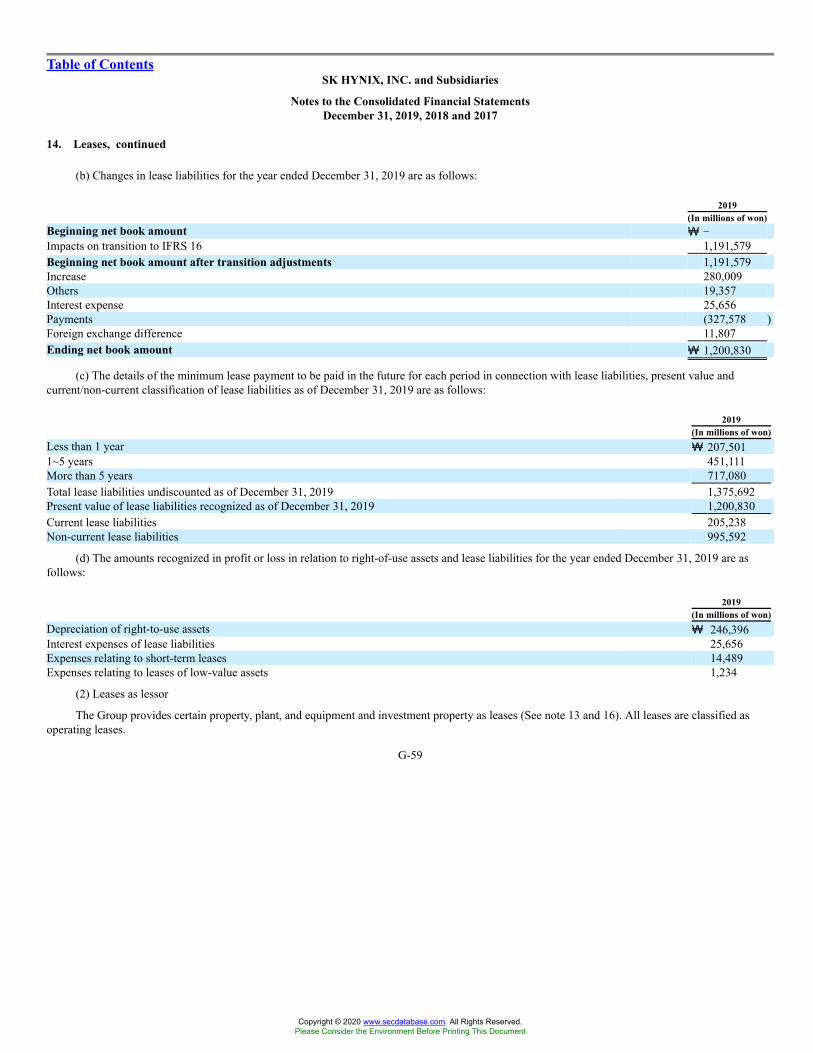
Table of ContentsSK HYNIX, INC. and Subsidiaries
Notes to the Consolidated Financial StatementsDecember 31, 2019, 2018 and 2017
14. Leases, continued
(b) Changes in lease liabilities for the year ended December 31, 2019 are as follows:
2019(In millions of won)
Beginning net book amount ₩ �Impacts on transition to IFRS 16 1,191,579Beginning net book amount after transition adjustments 1,191,579Increase 280,009Others 19,357Interest expense 25,656Payments (327,578 )Foreign exchange difference 11,807Ending net book amount ₩ 1,200,830
(c) The details of the minimum lease payment to be paid in the future for each period in connection with lease liabilities, present value andcurrent/non-current classification of lease liabilities as of December 31, 2019 are as follows:
2019(In millions of won)
Less than 1 year ₩ 207,5011~5 years 451,111More than 5 years 717,080Total lease liabilities undiscounted as of December 31, 2019 1,375,692Present value of lease liabilities recognized as of December 31, 2019 1,200,830Current lease liabilities 205,238Non-current lease liabilities 995,592
(d) The amounts recognized in profit or loss in relation to right-of-use assets and lease liabilities for the year ended December 31, 2019 are asfollows:
2019(In millions of won)
Depreciation of right-to-use assets ₩ 246,396Interest expenses of lease liabilities 25,656Expenses relating to short-term leases 14,489Expenses relating to leases of low-value assets 1,234
(2) Leases as lessor
The Group provides certain property, plant, and equipment and investment property as leases (See note 13 and 16). All leases are classified asoperating leases.
G-59
Copyright © 2020 www.secdatabase.com. All Rights Reserved.Please Consider the Environment Before Printing This Document
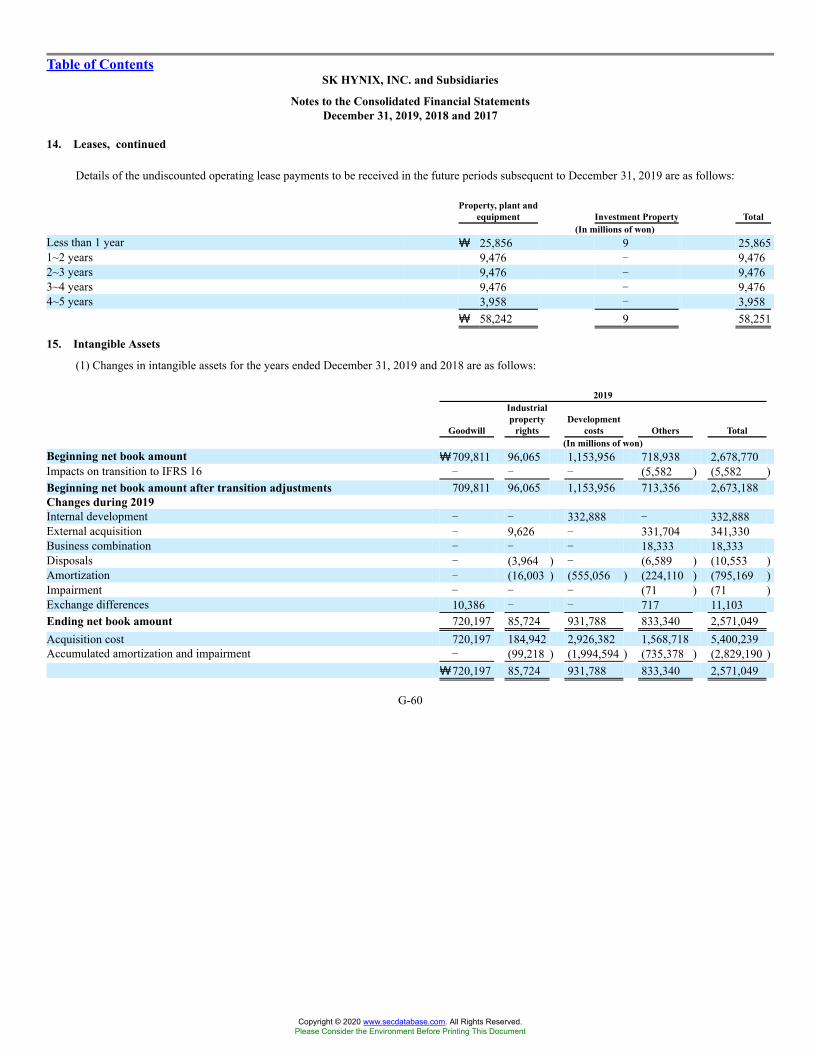
Table of ContentsSK HYNIX, INC. and Subsidiaries
Notes to the Consolidated Financial StatementsDecember 31, 2019, 2018 and 2017
14. Leases, continued
Details of the undiscounted operating lease payments to be received in the future periods subsequent to December 31, 2019 are as follows:
Property, plant andequipment Investment Property Total
(In millions of won)Less than 1 year ₩ 25,856 9 25,8651~2 years 9,476 � 9,4762~3 years 9,476 � 9,4763~4 years 9,476 � 9,4764~5 years 3,958 � 3,958
₩ 58,242 9 58,251
15. Intangible Assets
(1) Changes in intangible assets for the years ended December 31, 2019 and 2018 are as follows:
2019
Goodwill
Industrialproperty
rightsDevelopment
costs Others Total(In millions of won)
Beginning net book amount ₩709,811 96,065 1,153,956 718,938 2,678,770Impacts on transition to IFRS 16 � � � (5,582 ) (5,582 )Beginning net book amount after transition adjustments 709,811 96,065 1,153,956 713,356 2,673,188Changes during 2019Internal development � � 332,888 � 332,888External acquisition � 9,626 � 331,704 341,330Business combination � � � 18,333 18,333Disposals � (3,964 ) � (6,589 ) (10,553 )Amortization � (16,003 ) (555,056 ) (224,110 ) (795,169 )Impairment � � � (71 ) (71 )Exchange differences 10,386 � � 717 11,103Ending net book amount 720,197 85,724 931,788 833,340 2,571,049Acquisition cost 720,197 184,942 2,926,382 1,568,718 5,400,239Accumulated amortization and impairment � (99,218 ) (1,994,594 ) (735,378 ) (2,829,190 )
₩720,197 85,724 931,788 833,340 2,571,049
G-60
Copyright © 2020 www.secdatabase.com. All Rights Reserved.Please Consider the Environment Before Printing This Document
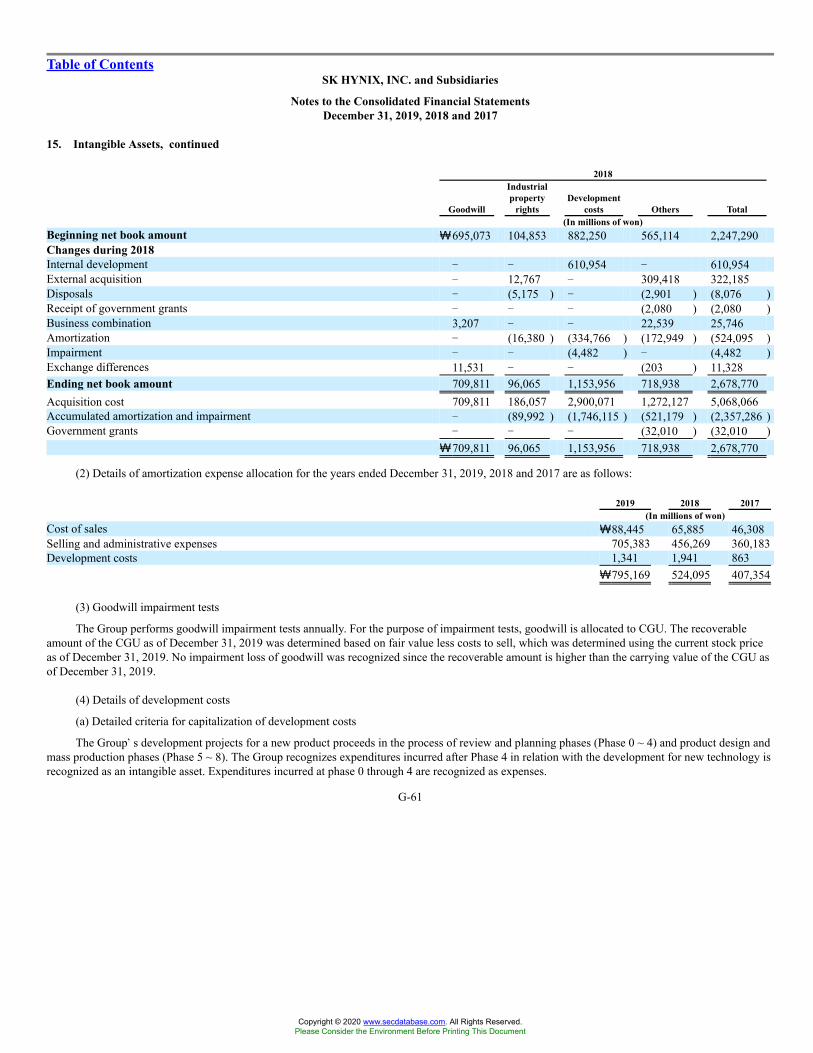
Table of ContentsSK HYNIX, INC. and Subsidiaries
Notes to the Consolidated Financial StatementsDecember 31, 2019, 2018 and 2017
15. Intangible Assets, continued
2018
Goodwill
Industrialproperty
rightsDevelopment
costs Others Total(In millions of won)
Beginning net book amount ₩695,073 104,853 882,250 565,114 2,247,290Changes during 2018Internal development � � 610,954 � 610,954External acquisition � 12,767 � 309,418 322,185Disposals � (5,175 ) � (2,901 ) (8,076 )Receipt of government grants � � � (2,080 ) (2,080 )Business combination 3,207 � � 22,539 25,746Amortization � (16,380 ) (334,766 ) (172,949 ) (524,095 )Impairment � � (4,482 ) � (4,482 )Exchange differences 11,531 � � (203 ) 11,328Ending net book amount 709,811 96,065 1,153,956 718,938 2,678,770Acquisition cost 709,811 186,057 2,900,071 1,272,127 5,068,066Accumulated amortization and impairment � (89,992 ) (1,746,115 ) (521,179 ) (2,357,286 )Government grants � � � (32,010 ) (32,010 )
₩709,811 96,065 1,153,956 718,938 2,678,770
(2) Details of amortization expense allocation for the years ended December 31, 2019, 2018 and 2017 are as follows:
2019 2018 2017(In millions of won)
Cost of sales ₩88,445 65,885 46,308Selling and administrative expenses 705,383 456,269 360,183Development costs 1,341 1,941 863
₩795,169 524,095 407,354
(3) Goodwill impairment tests
The Group performs goodwill impairment tests annually. For the purpose of impairment tests, goodwill is allocated to CGU. The recoverableamount of the CGU as of December 31, 2019 was determined based on fair value less costs to sell, which was determined using the current stock priceas of December 31, 2019. No impairment loss of goodwill was recognized since the recoverable amount is higher than the carrying value of the CGU asof December 31, 2019.
(4) Details of development costs
(a) Detailed criteria for capitalization of development costs
The Group�s development projects for a new product proceeds in the process of review and planning phases (Phase 0 ~ 4) and product design andmass production phases (Phase 5 ~ 8). The Group recognizes expenditures incurred after Phase 4 in relation with the development for new technology isrecognized as an intangible asset. Expenditures incurred at phase 0 through 4 are recognized as expenses.
G-61
Copyright © 2020 www.secdatabase.com. All Rights Reserved.Please Consider the Environment Before Printing This Document
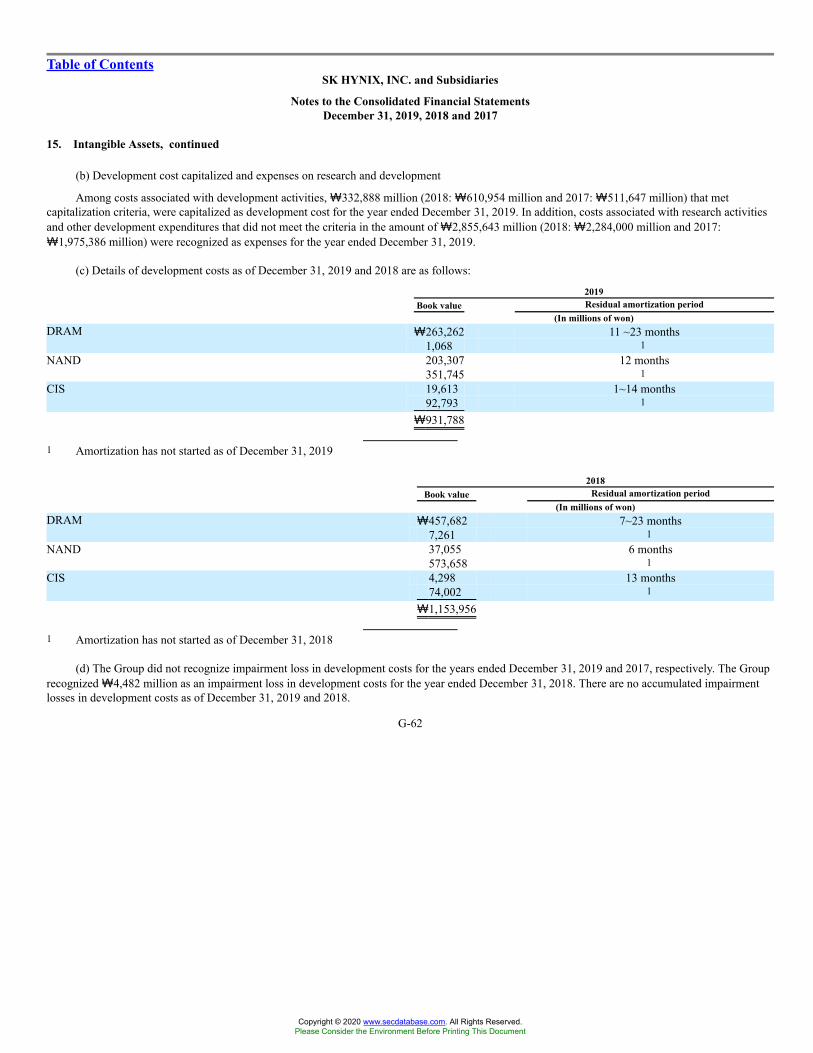
Table of ContentsSK HYNIX, INC. and Subsidiaries
Notes to the Consolidated Financial StatementsDecember 31, 2019, 2018 and 2017
15. Intangible Assets, continued
(b) Development cost capitalized and expenses on research and development
Among costs associated with development activities, ₩332,888 million (2018: ₩610,954 million and 2017: ₩511,647 million) that metcapitalization criteria, were capitalized as development cost for the year ended December 31, 2019. In addition, costs associated with research activitiesand other development expenditures that did not meet the criteria in the amount of ₩2,855,643 million (2018: ₩2,284,000 million and 2017:₩1,975,386 million) were recognized as expenses for the year ended December 31, 2019.
(c) Details of development costs as of December 31, 2019 and 2018 are as follows:
2019Book value Residual amortization period
(In millions of won)₩263,262 11 ~23 monthsDRAM
1,068 1203,307 12 monthsNAND351,745 119,613 1~14 monthsCIS92,793 1
₩931,788
1 Amortization has not started as of December 31, 2019
2018Book value Residual amortization period
(In millions of won)₩457,682 7~23 monthsDRAM
7,261 1NAND 37,055 6 months
573,658 14,298 13 monthsCIS74,002 1
₩1,153,956
1 Amortization has not started as of December 31, 2018
(d) The Group did not recognize impairment loss in development costs for the years ended December 31, 2019 and 2017, respectively. The Grouprecognized ₩4,482 million as an impairment loss in development costs for the year ended December 31, 2018. There are no accumulated impairmentlosses in development costs as of December 31, 2019 and 2018.
G-62
Copyright © 2020 www.secdatabase.com. All Rights Reserved.Please Consider the Environment Before Printing This Document
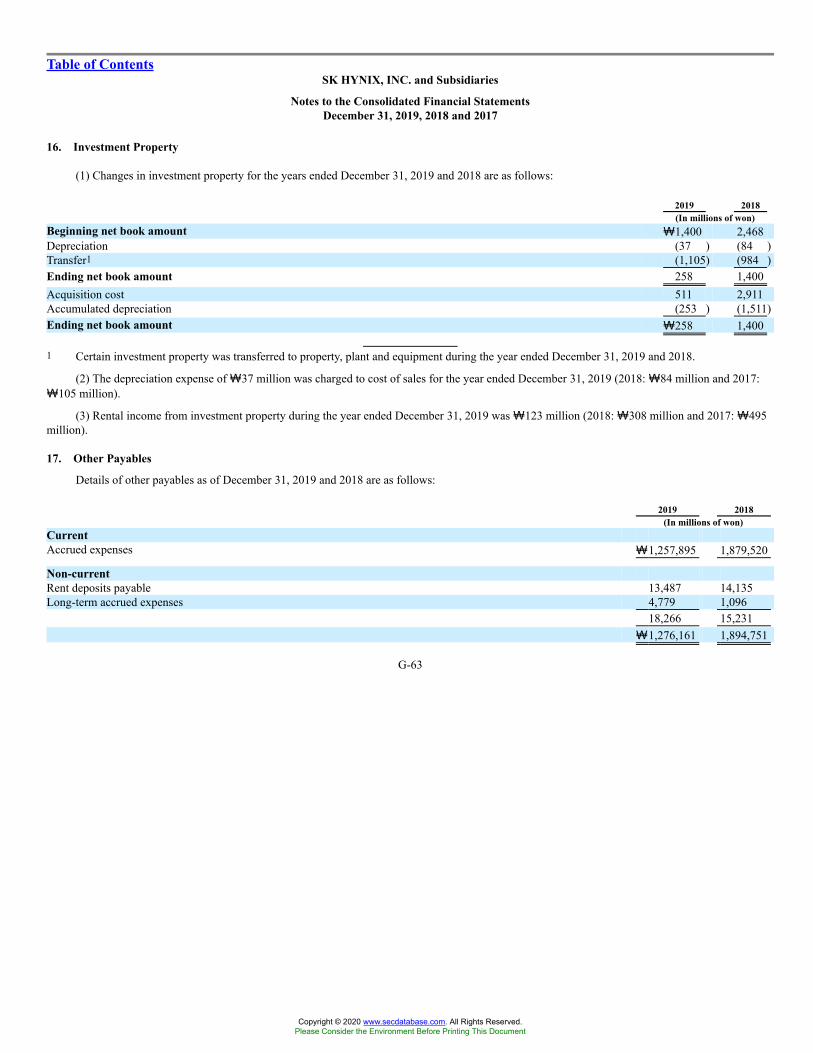
Table of ContentsSK HYNIX, INC. and Subsidiaries
Notes to the Consolidated Financial StatementsDecember 31, 2019, 2018 and 2017
16. Investment Property
(1) Changes in investment property for the years ended December 31, 2019 and 2018 are as follows:
2019 2018(In millions of won)
Beginning net book amount ₩1,400 2,468Depreciation (37 ) (84 )Transfer1 (1,105) (984 )Ending net book amount 258 1,400Acquisition cost 511 2,911Accumulated depreciation (253 ) (1,511)Ending net book amount ₩258 1,400
1 Certain investment property was transferred to property, plant and equipment during the year ended December 31, 2019 and 2018.
(2) The depreciation expense of ₩37 million was charged to cost of sales for the year ended December 31, 2019 (2018: ₩84 million and 2017:₩105 million).
(3) Rental income from investment property during the year ended December 31, 2019 was ₩123 million (2018: ₩308 million and 2017: ₩495million).
17. Other Payables
Details of other payables as of December 31, 2019 and 2018 are as follows:
2019 2018(In millions of won)
CurrentAccrued expenses ₩1,257,895 1,879,520
Non-currentRent deposits payable 13,487 14,135Long-term accrued expenses 4,779 1,096
18,266 15,231₩1,276,161 1,894,751
G-63
Copyright © 2020 www.secdatabase.com. All Rights Reserved.Please Consider the Environment Before Printing This Document
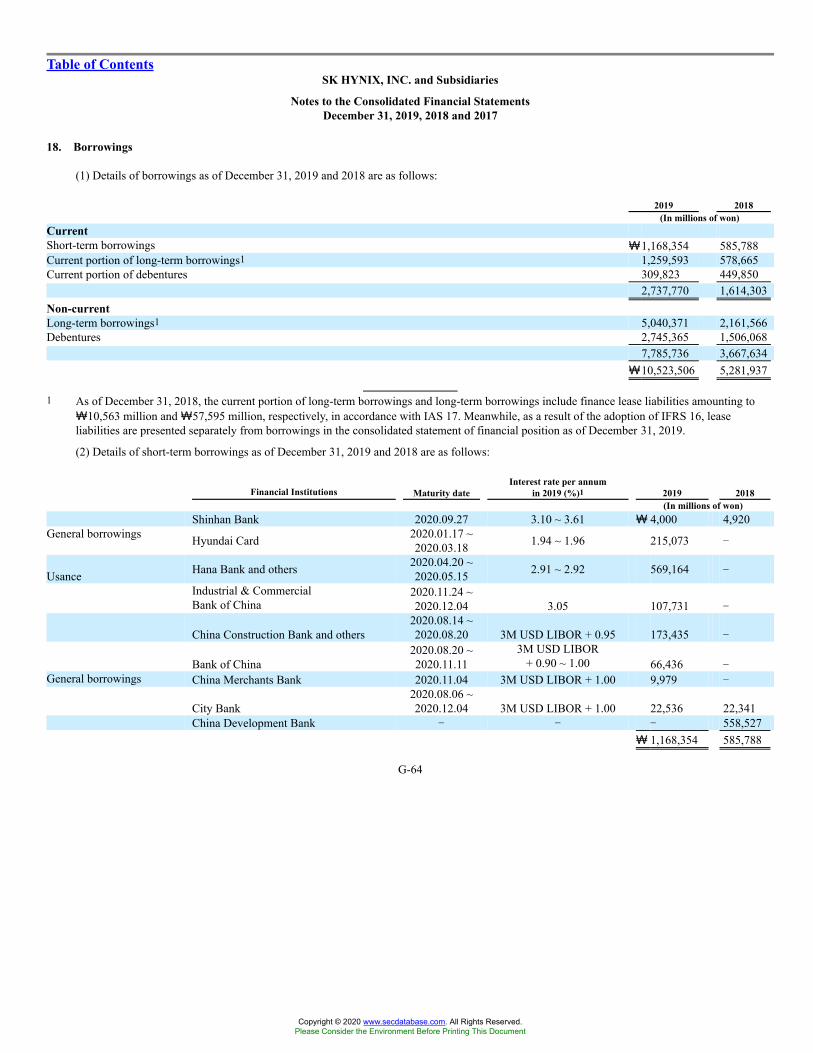
Table of ContentsSK HYNIX, INC. and Subsidiaries
Notes to the Consolidated Financial StatementsDecember 31, 2019, 2018 and 2017
18. Borrowings
(1) Details of borrowings as of December 31, 2019 and 2018 are as follows:
2019 2018(In millions of won)
CurrentShort-term borrowings ₩1,168,354 585,788Current portion of long-term borrowings1 1,259,593 578,665Current portion of debentures 309,823 449,850
2,737,770 1,614,303Non-currentLong-term borrowings1 5,040,371 2,161,566Debentures 2,745,365 1,506,068
7,785,736 3,667,634₩10,523,506 5,281,937
1 As of December 31, 2018, the current portion of long-term borrowings and long-term borrowings include finance lease liabilities amounting to₩10,563 million and ₩57,595 million, respectively, in accordance with IAS 17. Meanwhile, as a result of the adoption of IFRS 16, leaseliabilities are presented separately from borrowings in the consolidated statement of financial position as of December 31, 2019.
(2) Details of short-term borrowings as of December 31, 2019 and 2018 are as follows:
Financial Institutions Maturity dateInterest rate per annum
in 2019 (%)1 2019 2018(In millions of won)
Shinhan Bank 2020.09.27 3.10 ~ 3.61 ₩ 4,000 4,920General borrowings Hyundai Card 2020.01.17 ~
2020.03.18 1.94 ~ 1.96 215,073 �
Usance Hana Bank and others 2020.04.20 ~2020.05.15 2.91 ~ 2.92 569,164 �
Industrial & CommercialBank of China
2020.11.24 ~2020.12.04 3.05 107,731 �
China Construction Bank and others2020.08.14 ~2020.08.20 3M USD LIBOR + 0.95 173,435 �
Bank of China2020.08.20 ~2020.11.11
3M USD LIBOR+ 0.90 ~ 1.00 66,436 �
General borrowings China Merchants Bank 2020.11.04 3M USD LIBOR + 1.00 9,979 �
City Bank2020.08.06 ~2020.12.04 3M USD LIBOR + 1.00 22,536 22,341
China Development Bank � � � 558,527₩ 1,168,354 585,788
G-64
Copyright © 2020 www.secdatabase.com. All Rights Reserved.Please Consider the Environment Before Printing This Document
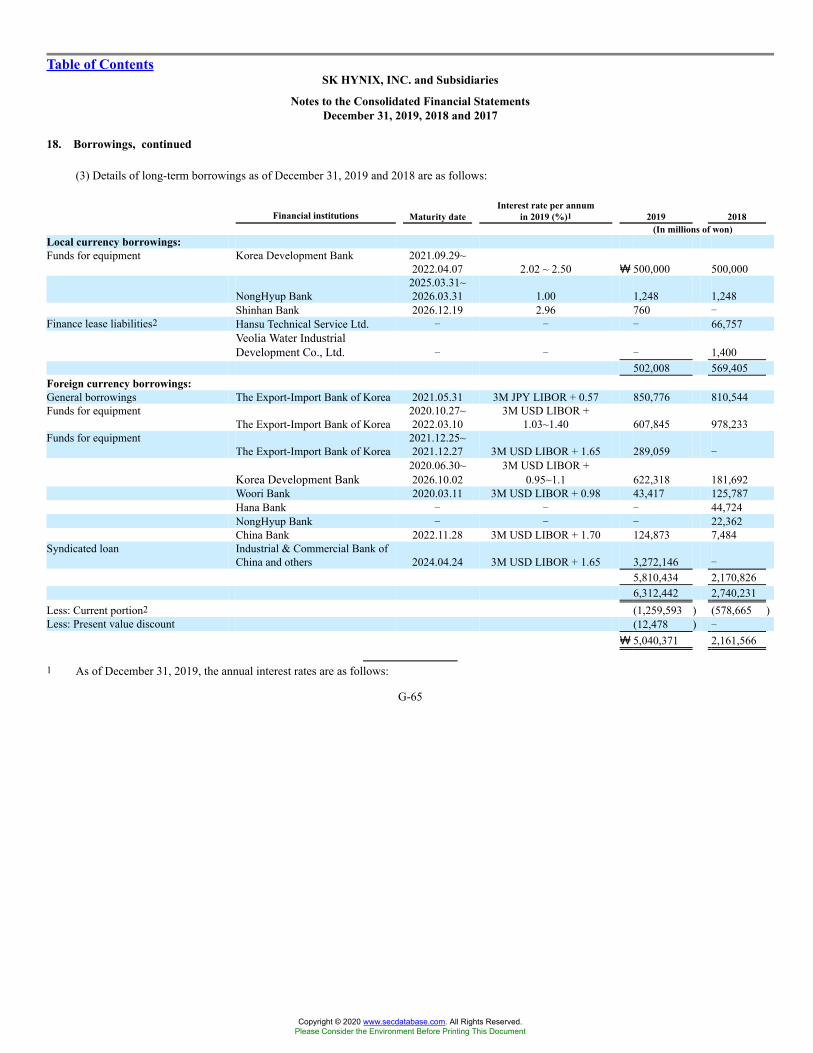
Table of ContentsSK HYNIX, INC. and Subsidiaries
Notes to the Consolidated Financial StatementsDecember 31, 2019, 2018 and 2017
18. Borrowings, continued
(3) Details of long-term borrowings as of December 31, 2019 and 2018 are as follows:
Financial institutions Maturity dateInterest rate per annum
in 2019 (%)1 2019 2018(In millions of won)
Local currency borrowings:Funds for equipment Korea Development Bank 2021.09.29~
2022.04.07 2.02 ~ 2.50 ₩ 500,000 500,000
NongHyup Bank2025.03.31~2026.03.31 1.00 1,248 1,248
Shinhan Bank 2026.12.19 2.96 760 �Finance lease liabilities2 Hansu Technical Service Ltd. � � � 66,757
Veolia Water IndustrialDevelopment Co., Ltd. � � � 1,400
502,008 569,405Foreign currency borrowings:General borrowings The Export-Import Bank of Korea 2021.05.31 3M JPY LIBOR + 0.57 850,776 810,544Funds for equipment
The Export-Import Bank of Korea2020.10.27~2022.03.10
3M USD LIBOR +1.03~1.40 607,845 978,233
Funds for equipmentThe Export-Import Bank of Korea
2021.12.25~2021.12.27 3M USD LIBOR + 1.65 289,059 �
Korea Development Bank2020.06.30~2026.10.02
3M USD LIBOR +0.95~1.1 622,318 181,692
Woori Bank 2020.03.11 3M USD LIBOR + 0.98 43,417 125,787Hana Bank � � � 44,724NongHyup Bank � � � 22,362China Bank 2022.11.28 3M USD LIBOR + 1.70 124,873 7,484
Syndicated loan Industrial & Commercial Bank ofChina and others 2024.04.24 3M USD LIBOR + 1.65 3,272,146 �
5,810,434 2,170,8266,312,442 2,740,231
Less: Current portion2 (1,259,593 ) (578,665 )Less: Present value discount (12,478 ) �
₩ 5,040,371 2,161,566
1 As of December 31, 2019, the annual interest rates are as follows:
G-65
Copyright © 2020 www.secdatabase.com. All Rights Reserved.Please Consider the Environment Before Printing This Document
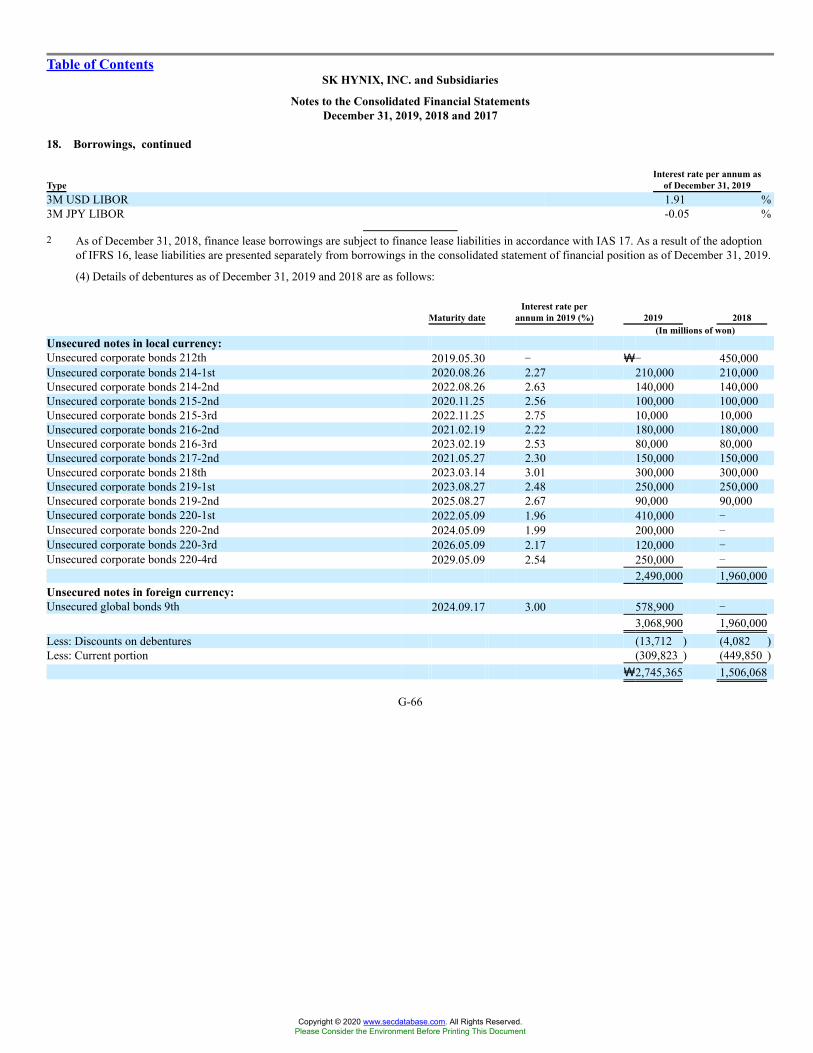
Table of ContentsSK HYNIX, INC. and Subsidiaries
Notes to the Consolidated Financial StatementsDecember 31, 2019, 2018 and 2017
18. Borrowings, continued
TypeInterest rate per annum as
of December 31, 20193M USD LIBOR 1.91 %3M JPY LIBOR -0.05 %
2 As of December 31, 2018, finance lease borrowings are subject to finance lease liabilities in accordance with IAS 17. As a result of the adoptionof IFRS 16, lease liabilities are presented separately from borrowings in the consolidated statement of financial position as of December 31, 2019.
(4) Details of debentures as of December 31, 2019 and 2018 are as follows:
Maturity dateInterest rate per
annum in 2019 (%) 2019 2018(In millions of won)
Unsecured notes in local currency:Unsecured corporate bonds 212th 2019.05.30 � ₩� 450,000Unsecured corporate bonds 214-1st 2020.08.26 2.27 210,000 210,000Unsecured corporate bonds 214-2nd 2022.08.26 2.63 140,000 140,000Unsecured corporate bonds 215-2nd 2020.11.25 2.56 100,000 100,000Unsecured corporate bonds 215-3rd 2022.11.25 2.75 10,000 10,000Unsecured corporate bonds 216-2nd 2021.02.19 2.22 180,000 180,000Unsecured corporate bonds 216-3rd 2023.02.19 2.53 80,000 80,000Unsecured corporate bonds 217-2nd 2021.05.27 2.30 150,000 150,000Unsecured corporate bonds 218th 2023.03.14 3.01 300,000 300,000Unsecured corporate bonds 219-1st 2023.08.27 2.48 250,000 250,000Unsecured corporate bonds 219-2nd 2025.08.27 2.67 90,000 90,000Unsecured corporate bonds 220-1st 2022.05.09 1.96 410,000 �Unsecured corporate bonds 220-2nd 2024.05.09 1.99 200,000 �Unsecured corporate bonds 220-3rd 2026.05.09 2.17 120,000 �Unsecured corporate bonds 220-4rd 2029.05.09 2.54 250,000 �
2,490,000 1,960,000Unsecured notes in foreign currency:Unsecured global bonds 9th 2024.09.17 3.00 578,900 �
3,068,900 1,960,000Less: Discounts on debentures (13,712 ) (4,082 )Less: Current portion (309,823 ) (449,850 )
₩2,745,365 1,506,068
G-66
Copyright © 2020 www.secdatabase.com. All Rights Reserved.Please Consider the Environment Before Printing This Document
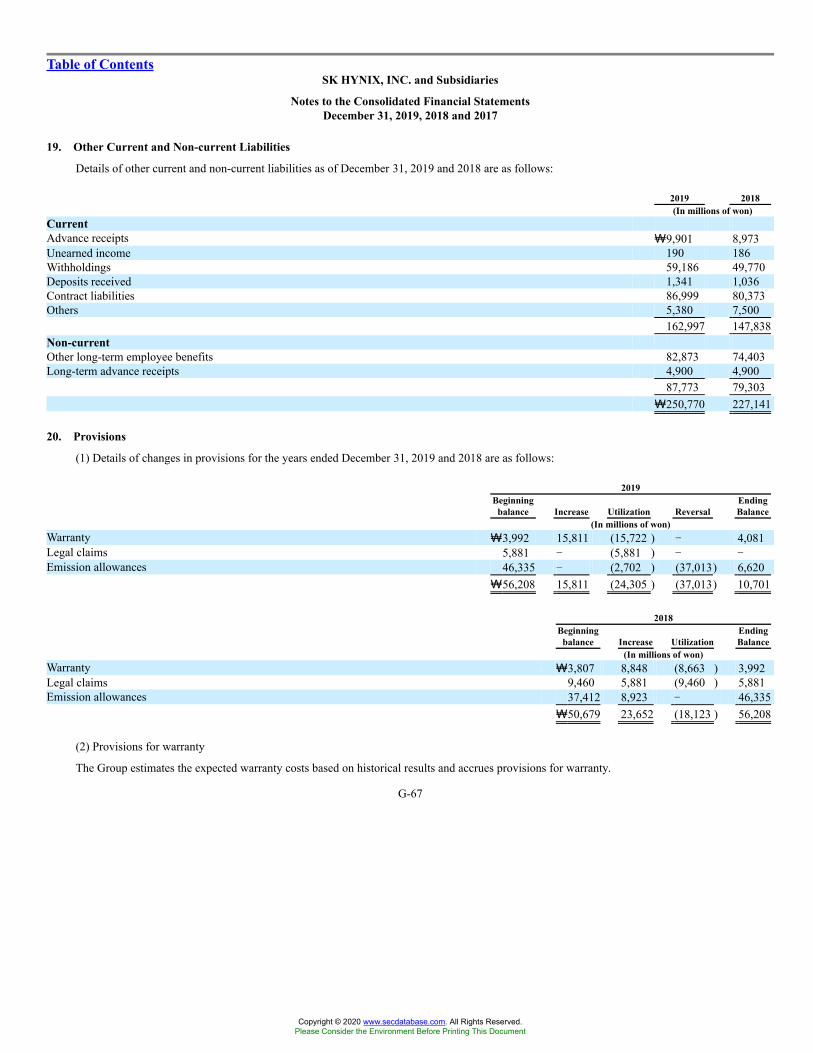
Table of ContentsSK HYNIX, INC. and Subsidiaries
Notes to the Consolidated Financial StatementsDecember 31, 2019, 2018 and 2017
19. Other Current and Non-current Liabilities
Details of other current and non-current liabilities as of December 31, 2019 and 2018 are as follows:
2019 2018(In millions of won)
CurrentAdvance receipts ₩9,901 8,973Unearned income 190 186Withholdings 59,186 49,770Deposits received 1,341 1,036Contract liabilities 86,999 80,373Others 5,380 7,500
162,997 147,838Non-currentOther long-term employee benefits 82,873 74,403Long-term advance receipts 4,900 4,900
87,773 79,303₩250,770 227,141
20. Provisions
(1) Details of changes in provisions for the years ended December 31, 2019 and 2018 are as follows:
2019Beginning
balance Increase Utilization ReversalEndingBalance
(In millions of won)Warranty ₩3,992 15,811 (15,722 ) � 4,081Legal claims 5,881 � (5,881 ) � �Emission allowances 46,335 � (2,702 ) (37,013) 6,620
₩56,208 15,811 (24,305 ) (37,013) 10,701
2018Beginning
balance Increase UtilizationEndingBalance
(In millions of won)Warranty ₩3,807 8,848 (8,663 ) 3,992Legal claims 9,460 5,881 (9,460 ) 5,881Emission allowances 37,412 8,923 � 46,335
₩50,679 23,652 (18,123 ) 56,208
(2) Provisions for warranty
The Group estimates the expected warranty costs based on historical results and accrues provisions for warranty.
G-67
Copyright © 2020 www.secdatabase.com. All Rights Reserved.Please Consider the Environment Before Printing This Document

Table of ContentsSK HYNIX, INC. and Subsidiaries
Notes to the Consolidated Financial StatementsDecember 31, 2019, 2018 and 2017
20. Provisions, continued
(3) Provisions for legal claims
The Group recognizes provisions for legal claims when the Group has a present legal or constructive obligation as a result of past events and anoutflow of resources required to settle the obligation is probable and the amount can be reliably estimated.
(4) Provision for emission allowances
The Group recognizes estimated future payment for the number of emission certificates required to settle the Group�s obligation exceeding theactual number of certificates on hand as emission allowances according to the Act on Allocation and Trading of Greenhouse Gas Emission Permits.
21. Defined Benefit Liabilities
Under the defined benefit plan, the Group pays employee benefits to retired employees in the form of a lump sum based on their salaries and yearsof service at the time of their retirement. Accordingly, the Group is exposed to a variety of actuarial assumption risks such as risk associated withexpected years of service, interest risk, and market (investment) risk.
(1) Details of defined benefit liabilities (assets) as of December 31, 2019 and 2018 are as follows:
2019 2018(In millions of won)
Present value of defined benefit obligations ₩1,936,868 1,609,055Fair value of plan assets (1,886,650) (1,608,832)Net defined benefit liabilities ₩50,218 223Defined benefit liabilities 53,624 5,387Defined benefit assets1 (3,406 ) (5,164 )
1 The Parent Company and certain subsidiaries� fair value of plan assets in excess of the present value of defined benefit obligations amounted to₩3,406 million and ₩5,164 million as of December 31, 2019 and 2018 are presented as defined benefit assets.
(2) Principal actuarial assumptions as of December 31, 2019 and 2018 are as follows:
2019 (%) 2018 (%)Discount rate for defined benefit obligations 1.92 ~ 3.47 2.64 ~ 3.78Expected rate of salary increase 2.70 ~ 5.94 2.70 ~ 5.83
(3) Weighted average durations of defined benefit obligations as of December 31, 2019 and 2018 are 11.48 and 11.64 years, respectively.
G-68
Copyright © 2020 www.secdatabase.com. All Rights Reserved.Please Consider the Environment Before Printing This Document
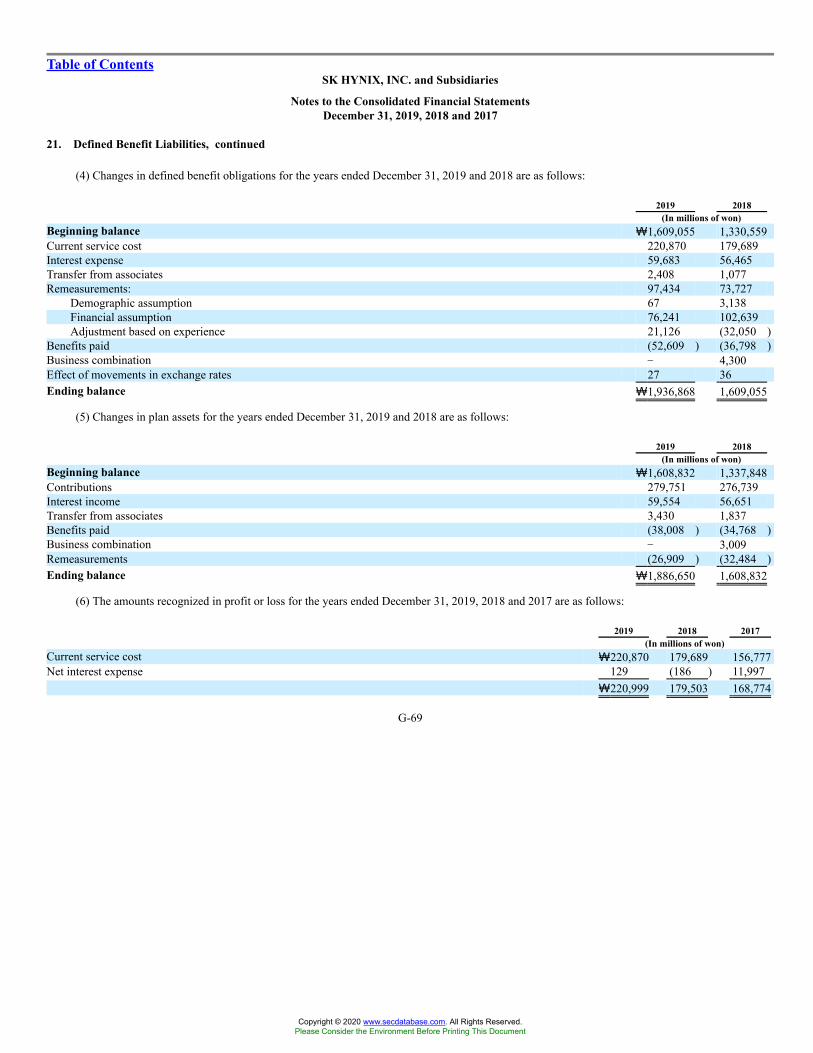
Table of ContentsSK HYNIX, INC. and Subsidiaries
Notes to the Consolidated Financial StatementsDecember 31, 2019, 2018 and 2017
21. Defined Benefit Liabilities, continued
(4) Changes in defined benefit obligations for the years ended December 31, 2019 and 2018 are as follows:
2019 2018(In millions of won)
Beginning balance ₩1,609,055 1,330,559Current service cost 220,870 179,689Interest expense 59,683 56,465Transfer from associates 2,408 1,077Remeasurements: 97,434 73,727
Demographic assumption 67 3,138Financial assumption 76,241 102,639Adjustment based on experience 21,126 (32,050 )
Benefits paid (52,609 ) (36,798 )Business combination � 4,300Effect of movements in exchange rates 27 36Ending balance ₩1,936,868 1,609,055
(5) Changes in plan assets for the years ended December 31, 2019 and 2018 are as follows:
2019 2018(In millions of won)
Beginning balance ₩1,608,832 1,337,848Contributions 279,751 276,739Interest income 59,554 56,651Transfer from associates 3,430 1,837Benefits paid (38,008 ) (34,768 )Business combination � 3,009Remeasurements (26,909 ) (32,484 )Ending balance ₩1,886,650 1,608,832
(6) The amounts recognized in profit or loss for the years ended December 31, 2019, 2018 and 2017 are as follows:
2019 2018 2017(In millions of won)
Current service cost ₩220,870 179,689 156,777Net interest expense 129 (186 ) 11,997
₩220,999 179,503 168,774
G-69
Copyright © 2020 www.secdatabase.com. All Rights Reserved.Please Consider the Environment Before Printing This Document
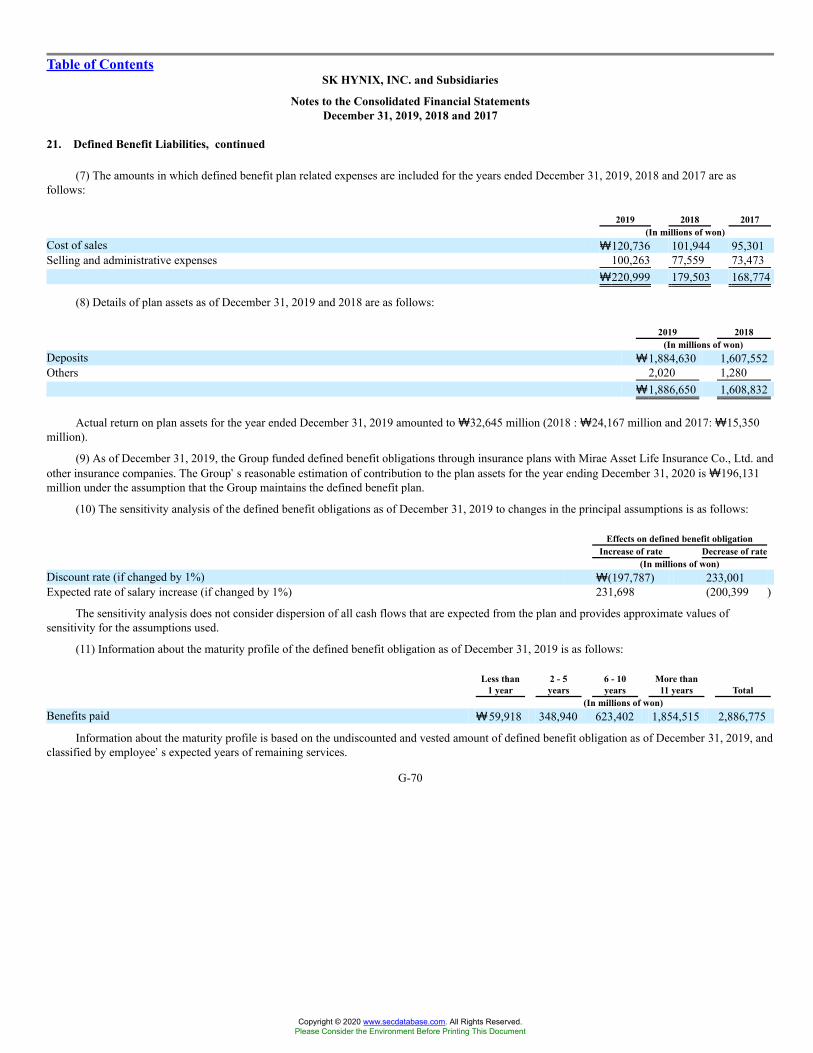
Table of ContentsSK HYNIX, INC. and Subsidiaries
Notes to the Consolidated Financial StatementsDecember 31, 2019, 2018 and 2017
21. Defined Benefit Liabilities, continued
(7) The amounts in which defined benefit plan related expenses are included for the years ended December 31, 2019, 2018 and 2017 are asfollows:
2019 2018 2017(In millions of won)
Cost of sales ₩120,736 101,944 95,301Selling and administrative expenses 100,263 77,559 73,473
₩220,999 179,503 168,774
(8) Details of plan assets as of December 31, 2019 and 2018 are as follows:
2019 2018(In millions of won)
Deposits ₩1,884,630 1,607,552Others 2,020 1,280
₩1,886,650 1,608,832
Actual return on plan assets for the year ended December 31, 2019 amounted to ₩32,645 million (2018 : ₩24,167 million and 2017: ₩15,350million).
(9) As of December 31, 2019, the Group funded defined benefit obligations through insurance plans with Mirae Asset Life Insurance Co., Ltd. andother insurance companies. The Group�s reasonable estimation of contribution to the plan assets for the year ending December 31, 2020 is ₩196,131million under the assumption that the Group maintains the defined benefit plan.
(10) The sensitivity analysis of the defined benefit obligations as of December 31, 2019 to changes in the principal assumptions is as follows:
Effects on defined benefit obligationIncrease of rate Decrease of rate
(In millions of won)Discount rate (if changed by 1%) ₩(197,787) 233,001Expected rate of salary increase (if changed by 1%) 231,698 (200,399 )
The sensitivity analysis does not consider dispersion of all cash flows that are expected from the plan and provides approximate values ofsensitivity for the assumptions used.
(11) Information about the maturity profile of the defined benefit obligation as of December 31, 2019 is as follows:
Less than1 year
2 - 5years
6 - 10years
More than11 years Total
(In millions of won)Benefits paid ₩59,918 348,940 623,402 1,854,515 2,886,775
Information about the maturity profile is based on the undiscounted and vested amount of defined benefit obligation as of December 31, 2019, andclassified by employee�s expected years of remaining services.
G-70
Copyright © 2020 www.secdatabase.com. All Rights Reserved.Please Consider the Environment Before Printing This Document

Table of ContentsSK HYNIX, INC. and Subsidiaries
Notes to the Consolidated Financial StatementsDecember 31, 2019, 2018 and 2017
21. Defined Benefit Liabilities, continued
(12) The Group adopted defined contribution plan for retirement benefit for employees subject to peak wage system. Contributions to definedcontribution plans amounting to ₩455 million (2018: ₩216 million) was expensed for the year ended December 31, 2019.
22. Deferred Income Tax
(1) Changes in deferred income tax assets and liabilities for the years ended December 31, 2019 and 2018 without taking into consideration theoffsetting of balances within the same tax authority, are as follows:
2019
January 1,2019 Profit or loss Equity
Foreignexchange
differencesDecember 31,
2019(In millions of won)
Inventories, net ₩102,812 73,691 � 240 176,743Property, plant and equipment, net 140,762 71,659 � (6,718 ) 205,703Defined benefits liabilities, net (609 ) (25,776 ) 34,132 10 7,757Short-term and long-term investment assets and others (32,984 ) 5,429 � � (27,555 )Employee benefits 39,954 6,583 � � 46,537Provisions 19,169 (15,599 ) � 19 3,589Other assets and other liabilities 24,583 (12,872 ) � (82 ) 11,629Accrued expenses 48,883 43,526 � � 92,409Others 56,653 (35,239 ) � (6,734 ) 14,680Deferred tax assets for temporary differences, net 399,223 111,402 34,132 (13,265 ) 531,492Tax credit carryforwards recognized 15,189 (9,542 ) � 604 6,251Tax loss carryforwards recognized 123,007 (10,023 ) � 4,396 117,380Deferred tax assets recognized, net ₩537,419 91,837 34,132 (8,265 ) 655,123
G-71
Copyright © 2020 www.secdatabase.com. All Rights Reserved.Please Consider the Environment Before Printing This Document

Table of ContentsSK HYNIX, INC. and Subsidiaries
Notes to the Consolidated Financial StatementsDecember 31, 2019, 2018 and 2017
22. Deferred Income Tax, continued
2018
January 1,2018 Profit or loss Equity
Foreignexchange
differencesDecember 31,
2018(In millions of won)
Inventories, net ₩47,169 55,513 � 130 102,812Property, plant and equipment, net 236,870 (96,703 ) � 594 140,761Defined benefits liabilities, net 416 (30,020 ) 29,182 (187 ) (609 )Short-term and long-term investment assets and others 43,191 (76,175 ) � � (32,984 )Employee benefits 34,166 5,785 � 3 39,954Provisions 18,268 794 � 108 19,170Other assets and other liabilities 14,743 9,840 � � 24,583Accrued expenses 13,641 35,242 � � 48,883Others 47,832 17,408 � (8,587 ) 56,653Deferred tax assets for temporary differences, net 456,296 (78,316 ) 29,182 (7,939 ) 399,223Tax credit carryforwards recognized 7,813 6,693 � 684 15,190Tax loss carryforwards recognized 130,120 (14,286 ) � 7,172 123,006Deferred tax assets recognized, net ₩594,229 (85,909 ) 29,182 (83 ) 537,419
(2) As of December 31, 2019 and 2018, the temporary differences that are not recognized as deferred tax assets (liabilities) are as follows:
2019 2018(In millions of won)
Investments in subsidiaries, associates, and joint ventures and others ₩(344,446) (5,139 )Deductible temporary differences and others 18,863 17,756
G-72
Copyright © 2020 www.secdatabase.com. All Rights Reserved.Please Consider the Environment Before Printing This Document
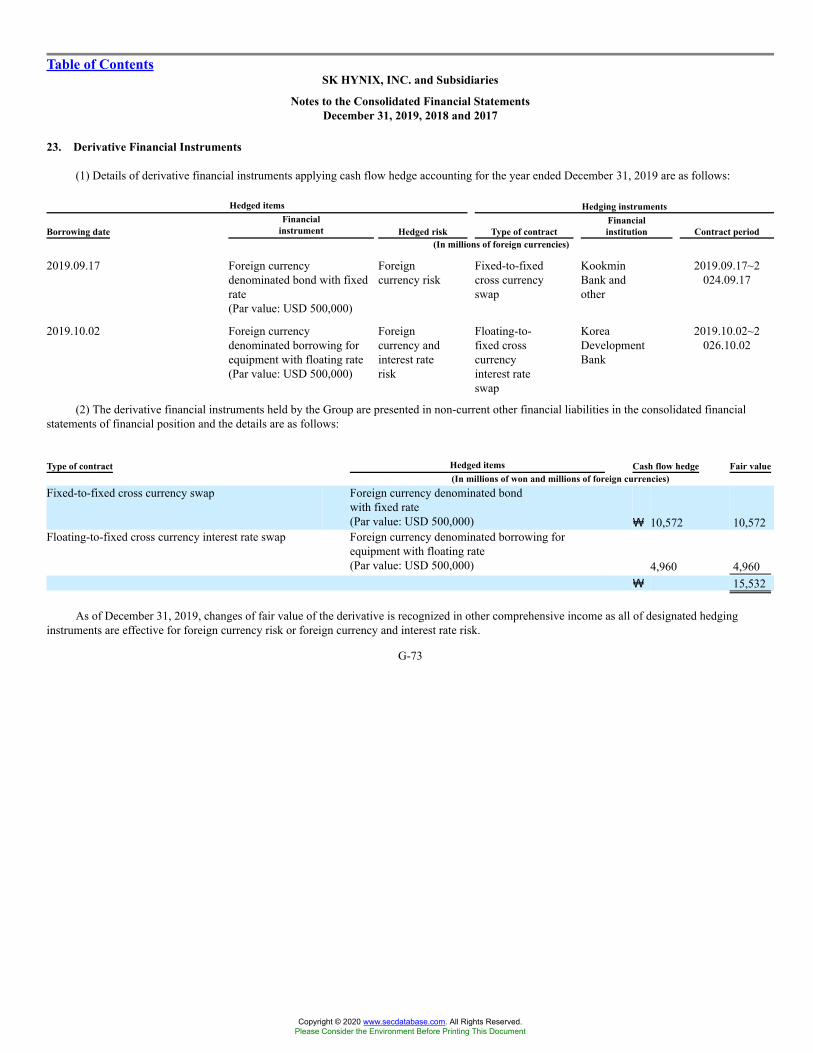
Table of ContentsSK HYNIX, INC. and Subsidiaries
Notes to the Consolidated Financial StatementsDecember 31, 2019, 2018 and 2017
23. Derivative Financial Instruments
(1) Details of derivative financial instruments applying cash flow hedge accounting for the year ended December 31, 2019 are as follows:
Hedged items Hedging instruments
Borrowing dateFinancial
instrument Hedged risk Type of contractFinancialinstitution Contract period
(In millions of foreign currencies)
2019.09.17 Foreign currencydenominated bond with fixedrate(Par value: USD 500,000)
Foreigncurrency risk
Fixed-to-fixedcross currencyswap
KookminBank andother
2019.09.17~2024.09.17
2019.10.02 Foreign currencydenominated borrowing forequipment with floating rate(Par value: USD 500,000)
Foreigncurrency andinterest raterisk
Floating-to-fixed crosscurrencyinterest rateswap
KoreaDevelopmentBank
2019.10.02~2026.10.02
(2) The derivative financial instruments held by the Group are presented in non-current other financial liabilities in the consolidated financialstatements of financial position and the details are as follows:
Type of contract Hedged items Cash flow hedge Fair value(In millions of won and millions of foreign currencies)
Fixed-to-fixed cross currency swap Foreign currency denominated bondwith fixed rate(Par value: USD 500,000) ₩ 10,572 10,572
Floating-to-fixed cross currency interest rate swap Foreign currency denominated borrowing forequipment with floating rate(Par value: USD 500,000) 4,960 4,960
₩ 15,532
As of December 31, 2019, changes of fair value of the derivative is recognized in other comprehensive income as all of designated hedginginstruments are effective for foreign currency risk or foreign currency and interest rate risk.
G-73
Copyright © 2020 www.secdatabase.com. All Rights Reserved.Please Consider the Environment Before Printing This Document
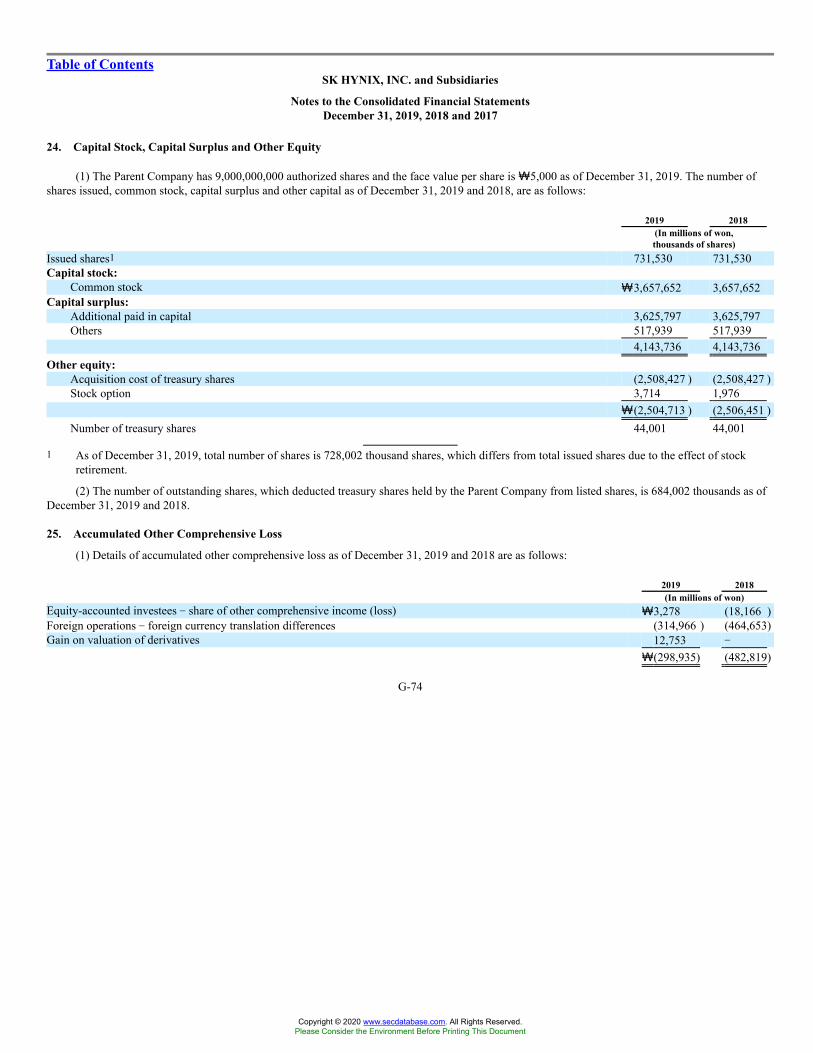
Table of ContentsSK HYNIX, INC. and Subsidiaries
Notes to the Consolidated Financial StatementsDecember 31, 2019, 2018 and 2017
24. Capital Stock, Capital Surplus and Other Equity
(1) The Parent Company has 9,000,000,000 authorized shares and the face value per share is ₩5,000 as of December 31, 2019. The number ofshares issued, common stock, capital surplus and other capital as of December 31, 2019 and 2018, are as follows:
2019 2018(In millions of won,thousands of shares)
Issued shares1 731,530 731,530Capital stock:
Common stock ₩3,657,652 3,657,652Capital surplus:
Additional paid in capital 3,625,797 3,625,797Others 517,939 517,939
4,143,736 4,143,736Other equity:
Acquisition cost of treasury shares (2,508,427 ) (2,508,427 )Stock option 3,714 1,976
₩(2,504,713 ) (2,506,451 )Number of treasury shares 44,001 44,001
1 As of December 31, 2019, total number of shares is 728,002 thousand shares, which differs from total issued shares due to the effect of stockretirement.
(2) The number of outstanding shares, which deducted treasury shares held by the Parent Company from listed shares, is 684,002 thousands as ofDecember 31, 2019 and 2018.
25. Accumulated Other Comprehensive Loss
(1) Details of accumulated other comprehensive loss as of December 31, 2019 and 2018 are as follows:
2019 2018(In millions of won)
Equity-accounted investees � share of other comprehensive income (loss) ₩3,278 (18,166 )Foreign operations � foreign currency translation differences (314,966 ) (464,653)Gain on valuation of derivatives 12,753 �
₩(298,935) (482,819)
G-74
Copyright © 2020 www.secdatabase.com. All Rights Reserved.Please Consider the Environment Before Printing This Document
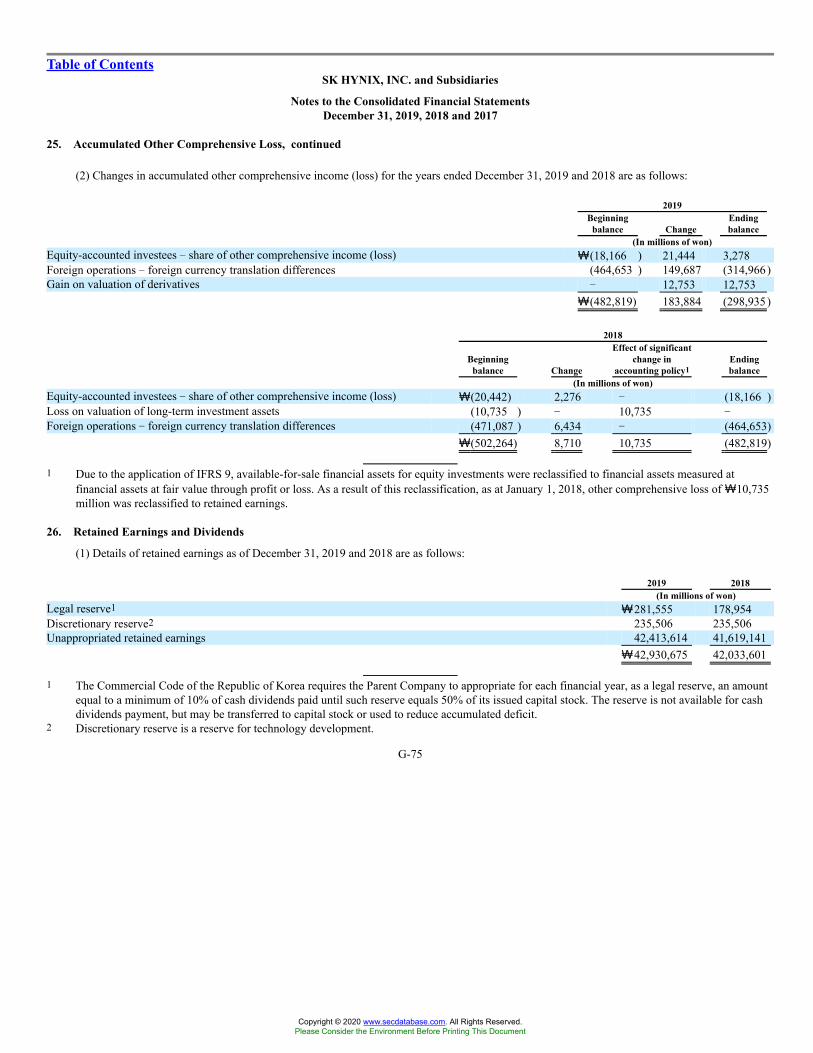
Table of ContentsSK HYNIX, INC. and Subsidiaries
Notes to the Consolidated Financial StatementsDecember 31, 2019, 2018 and 2017
25. Accumulated Other Comprehensive Loss, continued
(2) Changes in accumulated other comprehensive income (loss) for the years ended December 31, 2019 and 2018 are as follows:
2019Beginning
balance ChangeEndingbalance
(In millions of won)Equity-accounted investees � share of other comprehensive income (loss) ₩(18,166 ) 21,444 3,278Foreign operations � foreign currency translation differences (464,653 ) 149,687 (314,966)Gain on valuation of derivatives � 12,753 12,753
₩(482,819) 183,884 (298,935)
2018
Beginningbalance Change
Effect of significantchange in
accounting policy1Endingbalance
(In millions of won)Equity-accounted investees � share of other comprehensive income (loss) ₩(20,442) 2,276 � (18,166 )Loss on valuation of long-term investment assets (10,735 ) � 10,735 �Foreign operations � foreign currency translation differences (471,087 ) 6,434 � (464,653)
₩(502,264) 8,710 10,735 (482,819)
1 Due to the application of IFRS 9, available-for-sale financial assets for equity investments were reclassified to financial assets measured atfinancial assets at fair value through profit or loss. As a result of this reclassification, as at January 1, 2018, other comprehensive loss of ₩10,735million was reclassified to retained earnings.
26. Retained Earnings and Dividends
(1) Details of retained earnings as of December 31, 2019 and 2018 are as follows:
2019 2018(In millions of won)
Legal reserve1 ₩281,555 178,954Discretionary reserve2 235,506 235,506Unappropriated retained earnings 42,413,614 41,619,141
₩42,930,675 42,033,601
1 The Commercial Code of the Republic of Korea requires the Parent Company to appropriate for each financial year, as a legal reserve, an amountequal to a minimum of 10% of cash dividends paid until such reserve equals 50% of its issued capital stock. The reserve is not available for cashdividends payment, but may be transferred to capital stock or used to reduce accumulated deficit.
2 Discretionary reserve is a reserve for technology development.
G-75
Copyright © 2020 www.secdatabase.com. All Rights Reserved.Please Consider the Environment Before Printing This Document
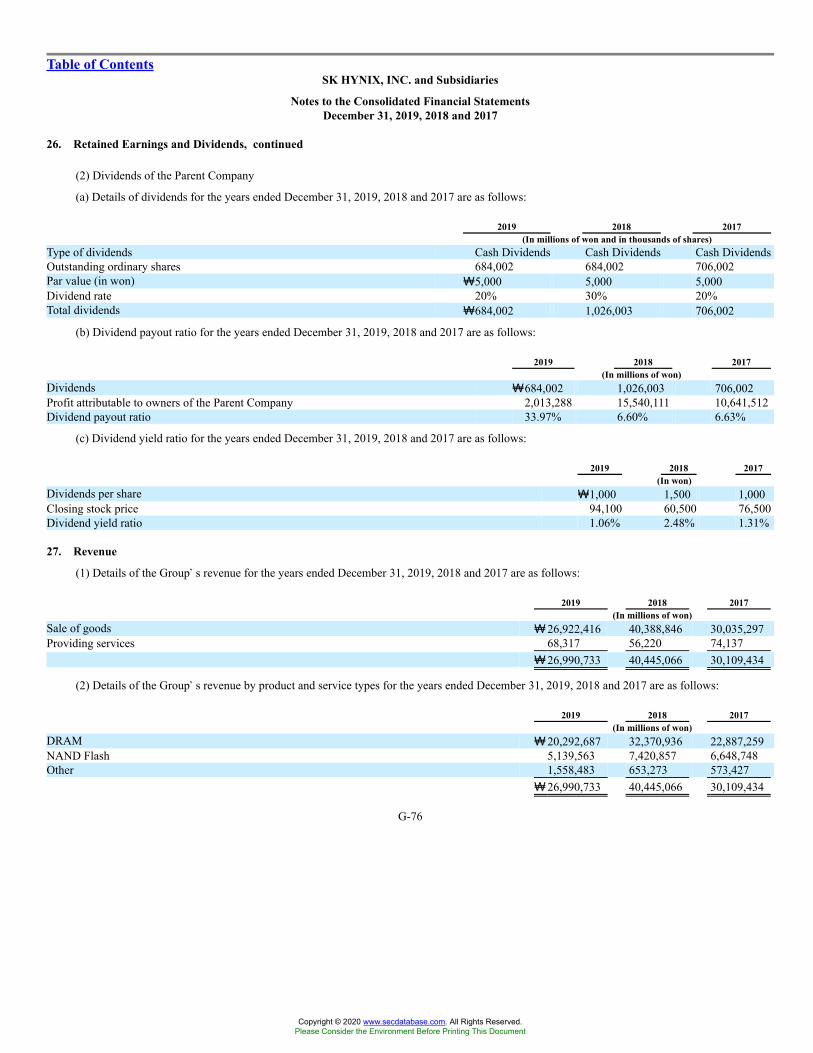
Table of ContentsSK HYNIX, INC. and Subsidiaries
Notes to the Consolidated Financial StatementsDecember 31, 2019, 2018 and 2017
26. Retained Earnings and Dividends, continued
(2) Dividends of the Parent Company
(a) Details of dividends for the years ended December 31, 2019, 2018 and 2017 are as follows:
2019 2018 2017(In millions of won and in thousands of shares)
Type of dividends Cash Dividends Cash Dividends Cash DividendsOutstanding ordinary shares 684,002 684,002 706,002Par value (in won) ₩5,000 5,000 5,000Dividend rate 20% 30% 20%Total dividends ₩684,002 1,026,003 706,002
(b) Dividend payout ratio for the years ended December 31, 2019, 2018 and 2017 are as follows:
2019 2018 2017(In millions of won)
Dividends ₩684,002 1,026,003 706,002Profit attributable to owners of the Parent Company 2,013,288 15,540,111 10,641,512Dividend payout ratio 33.97% 6.60% 6.63%
(c) Dividend yield ratio for the years ended December 31, 2019, 2018 and 2017 are as follows:
2019 2018 2017(In won)
Dividends per share ₩1,000 1,500 1,000Closing stock price 94,100 60,500 76,500Dividend yield ratio 1.06% 2.48% 1.31%
27. Revenue
(1) Details of the Group�s revenue for the years ended December 31, 2019, 2018 and 2017 are as follows:
2019 2018 2017(In millions of won)
Sale of goods ₩26,922,416 40,388,846 30,035,297Providing services 68,317 56,220 74,137
₩26,990,733 40,445,066 30,109,434
(2) Details of the Group�s revenue by product and service types for the years ended December 31, 2019, 2018 and 2017 are as follows:
2019 2018 2017(In millions of won)
DRAM ₩20,292,687 32,370,936 22,887,259NAND Flash 5,139,563 7,420,857 6,648,748Other 1,558,483 653,273 573,427
₩26,990,733 40,445,066 30,109,434
G-76
Copyright © 2020 www.secdatabase.com. All Rights Reserved.Please Consider the Environment Before Printing This Document
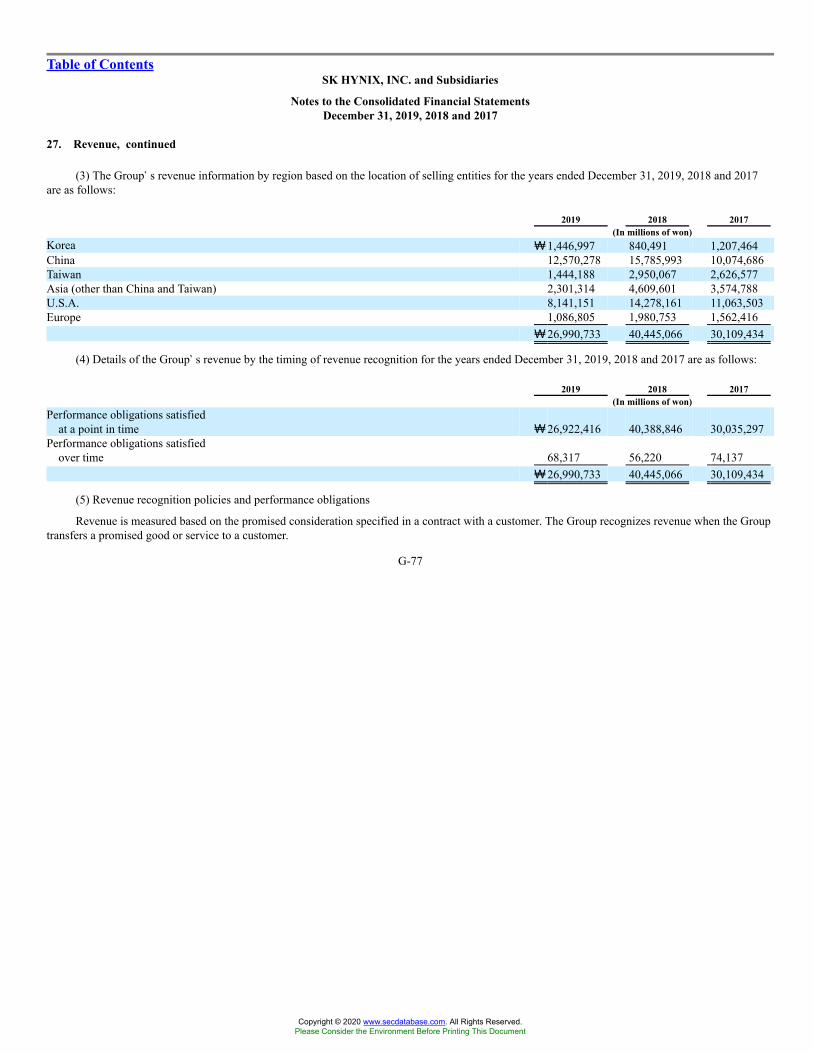
Table of ContentsSK HYNIX, INC. and Subsidiaries
Notes to the Consolidated Financial StatementsDecember 31, 2019, 2018 and 2017
27. Revenue, continued
(3) The Group�s revenue information by region based on the location of selling entities for the years ended December 31, 2019, 2018 and 2017are as follows:
2019 2018 2017(In millions of won)
Korea ₩1,446,997 840,491 1,207,464China 12,570,278 15,785,993 10,074,686Taiwan 1,444,188 2,950,067 2,626,577Asia (other than China and Taiwan) 2,301,314 4,609,601 3,574,788U.S.A. 8,141,151 14,278,161 11,063,503Europe 1,086,805 1,980,753 1,562,416
₩26,990,733 40,445,066 30,109,434
(4) Details of the Group�s revenue by the timing of revenue recognition for the years ended December 31, 2019, 2018 and 2017 are as follows:
2019 2018 2017(In millions of won)
Performance obligations satisfiedat a point in time ₩26,922,416 40,388,846 30,035,297
Performance obligations satisfiedover time 68,317 56,220 74,137
₩26,990,733 40,445,066 30,109,434
(5) Revenue recognition policies and performance obligations
Revenue is measured based on the promised consideration specified in a contract with a customer. The Group recognizes revenue when the Grouptransfers a promised good or service to a customer.
G-77
Copyright © 2020 www.secdatabase.com. All Rights Reserved.Please Consider the Environment Before Printing This Document
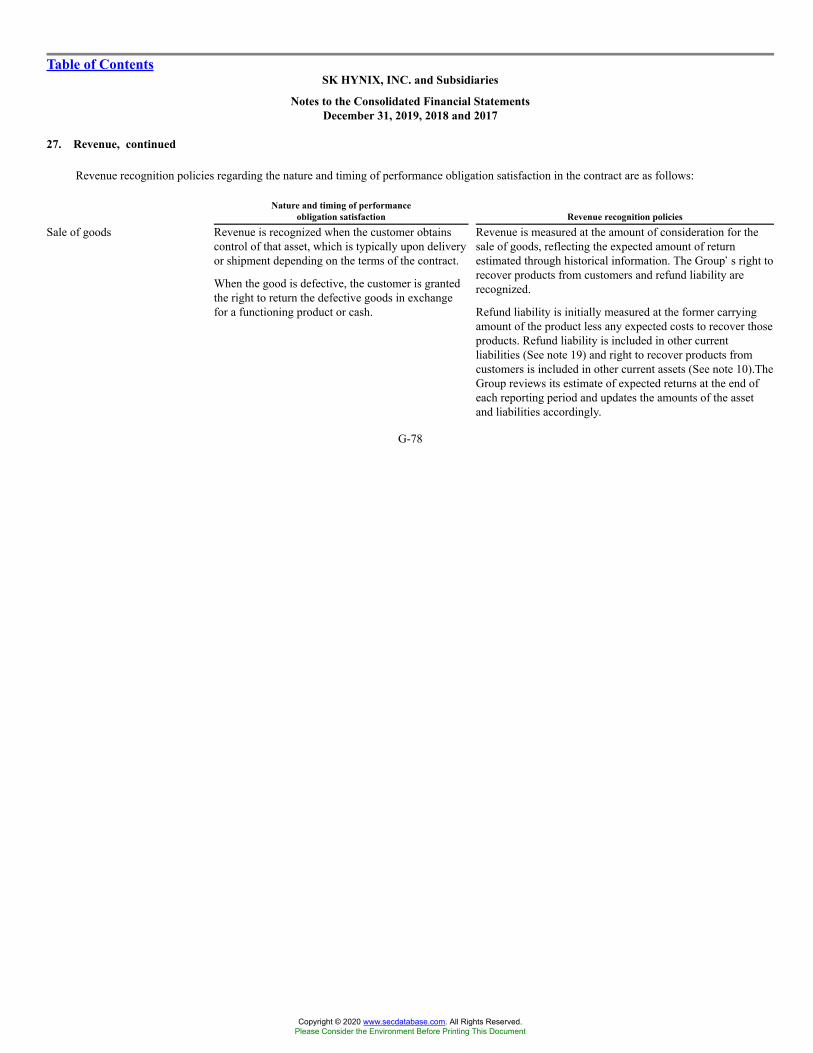
Table of ContentsSK HYNIX, INC. and Subsidiaries
Notes to the Consolidated Financial StatementsDecember 31, 2019, 2018 and 2017
27. Revenue, continued
Revenue recognition policies regarding the nature and timing of performance obligation satisfaction in the contract are as follows:
Nature and timing of performanceobligation satisfaction Revenue recognition policies
Sale of goods Revenue is recognized when the customer obtainscontrol of that asset, which is typically upon deliveryor shipment depending on the terms of the contract.
When the good is defective, the customer is grantedthe right to return the defective goods in exchangefor a functioning product or cash.
Revenue is measured at the amount of consideration for thesale of goods, reflecting the expected amount of returnestimated through historical information. The Group�s right torecover products from customers and refund liability arerecognized.
Refund liability is initially measured at the former carryingamount of the product less any expected costs to recover thoseproducts. Refund liability is included in other currentliabilities (See note 19) and right to recover products fromcustomers is included in other current assets (See note 10).TheGroup reviews its estimate of expected returns at the end ofeach reporting period and updates the amounts of the assetand liabilities accordingly.
G-78
Copyright © 2020 www.secdatabase.com. All Rights Reserved.Please Consider the Environment Before Printing This Document
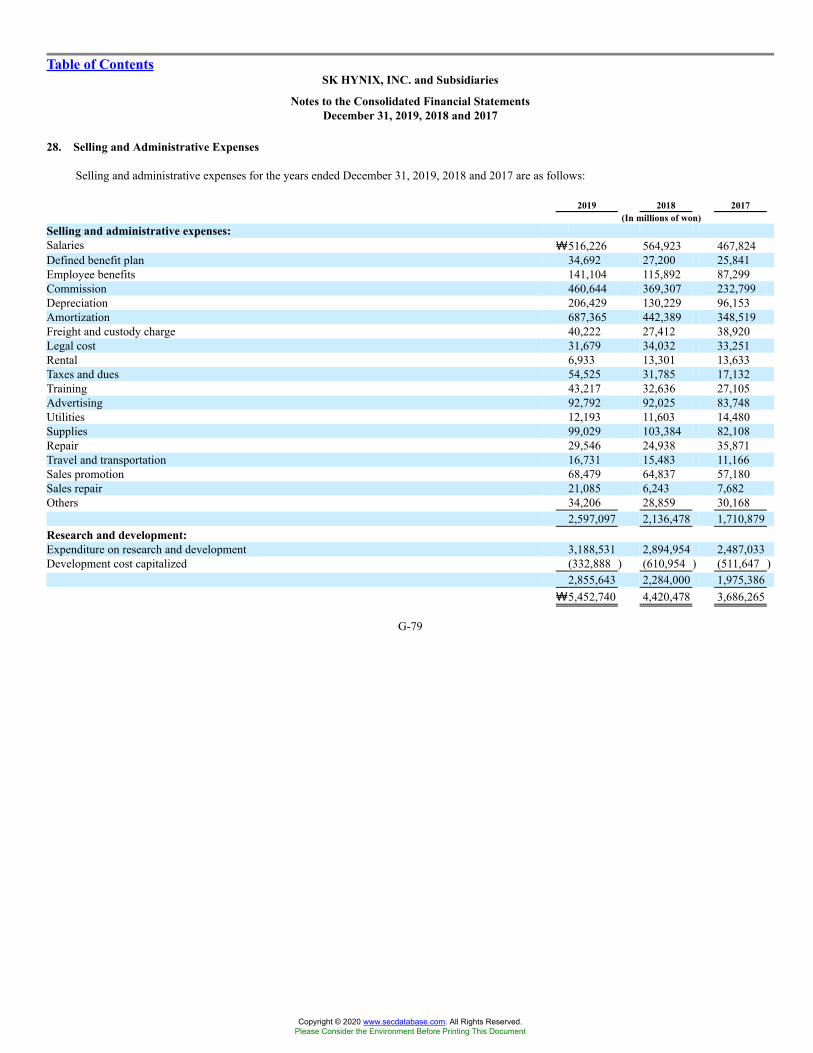
Table of ContentsSK HYNIX, INC. and Subsidiaries
Notes to the Consolidated Financial StatementsDecember 31, 2019, 2018 and 2017
28. Selling and Administrative Expenses
Selling and administrative expenses for the years ended December 31, 2019, 2018 and 2017 are as follows:
2019 2018 2017(In millions of won)
Selling and administrative expenses:Salaries ₩516,226 564,923 467,824Defined benefit plan 34,692 27,200 25,841Employee benefits 141,104 115,892 87,299Commission 460,644 369,307 232,799Depreciation 206,429 130,229 96,153Amortization 687,365 442,389 348,519Freight and custody charge 40,222 27,412 38,920Legal cost 31,679 34,032 33,251Rental 6,933 13,301 13,633Taxes and dues 54,525 31,785 17,132Training 43,217 32,636 27,105Advertising 92,792 92,025 83,748Utilities 12,193 11,603 14,480Supplies 99,029 103,384 82,108Repair 29,546 24,938 35,871Travel and transportation 16,731 15,483 11,166Sales promotion 68,479 64,837 57,180Sales repair 21,085 6,243 7,682Others 34,206 28,859 30,168
2,597,097 2,136,478 1,710,879Research and development:Expenditure on research and development 3,188,531 2,894,954 2,487,033Development cost capitalized (332,888 ) (610,954 ) (511,647 )
2,855,643 2,284,000 1,975,386₩5,452,740 4,420,478 3,686,265
G-79
Copyright © 2020 www.secdatabase.com. All Rights Reserved.Please Consider the Environment Before Printing This Document
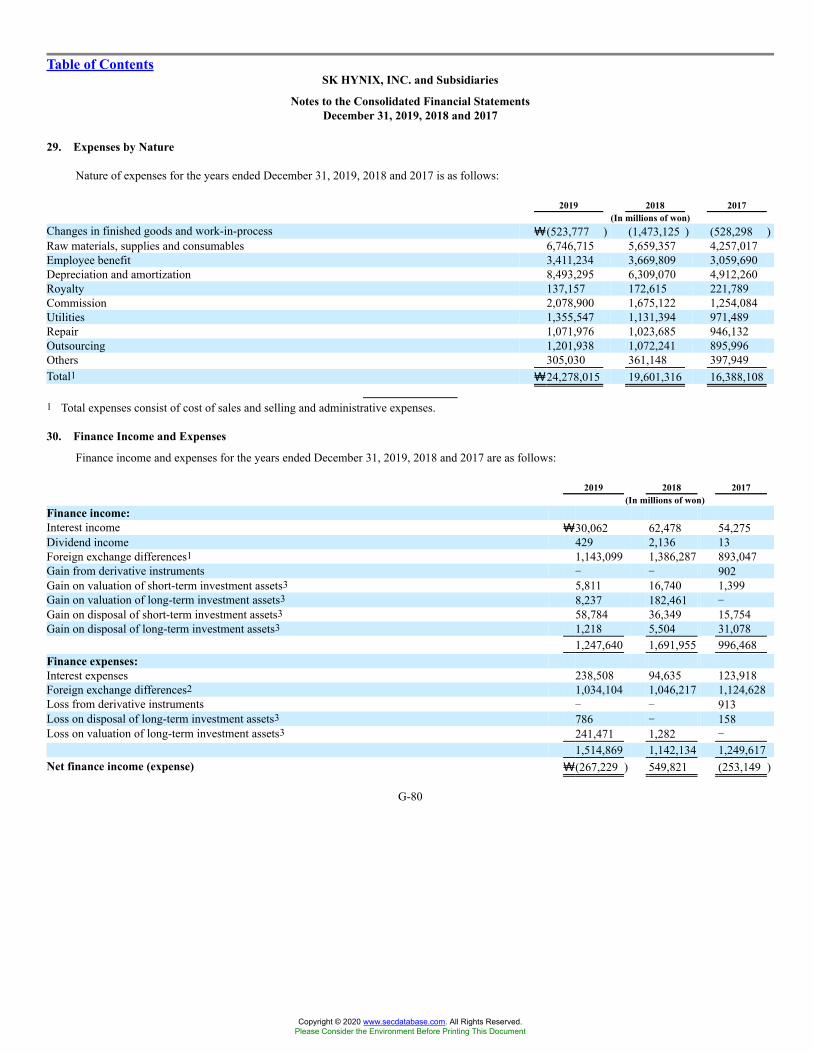
Table of ContentsSK HYNIX, INC. and Subsidiaries
Notes to the Consolidated Financial StatementsDecember 31, 2019, 2018 and 2017
29. Expenses by Nature
Nature of expenses for the years ended December 31, 2019, 2018 and 2017 is as follows:
2019 2018 2017(In millions of won)
Changes in finished goods and work-in-process ₩(523,777 ) (1,473,125 ) (528,298 )Raw materials, supplies and consumables 6,746,715 5,659,357 4,257,017Employee benefit 3,411,234 3,669,809 3,059,690Depreciation and amortization 8,493,295 6,309,070 4,912,260Royalty 137,157 172,615 221,789Commission 2,078,900 1,675,122 1,254,084Utilities 1,355,547 1,131,394 971,489Repair 1,071,976 1,023,685 946,132Outsourcing 1,201,938 1,072,241 895,996Others 305,030 361,148 397,949Total1 ₩24,278,015 19,601,316 16,388,108
1 Total expenses consist of cost of sales and selling and administrative expenses.
30. Finance Income and Expenses
Finance income and expenses for the years ended December 31, 2019, 2018 and 2017 are as follows:
2019 2018 2017(In millions of won)
Finance income:Interest income ₩30,062 62,478 54,275Dividend income 429 2,136 13Foreign exchange differences1 1,143,099 1,386,287 893,047Gain from derivative instruments � � 902Gain on valuation of short-term investment assets3 5,811 16,740 1,399Gain on valuation of long-term investment assets3 8,237 182,461 �Gain on disposal of short-term investment assets3 58,784 36,349 15,754Gain on disposal of long-term investment assets3 1,218 5,504 31,078
1,247,640 1,691,955 996,468Finance expenses:Interest expenses 238,508 94,635 123,918Foreign exchange differences2 1,034,104 1,046,217 1,124,628Loss from derivative instruments � � 913Loss on disposal of long-term investment assets3 786 � 158Loss on valuation of long-term investment assets3 241,471 1,282 �
1,514,869 1,142,134 1,249,617Net finance income (expense) ₩(267,229 ) 549,821 (253,149 )
G-80
Copyright © 2020 www.secdatabase.com. All Rights Reserved.Please Consider the Environment Before Printing This Document
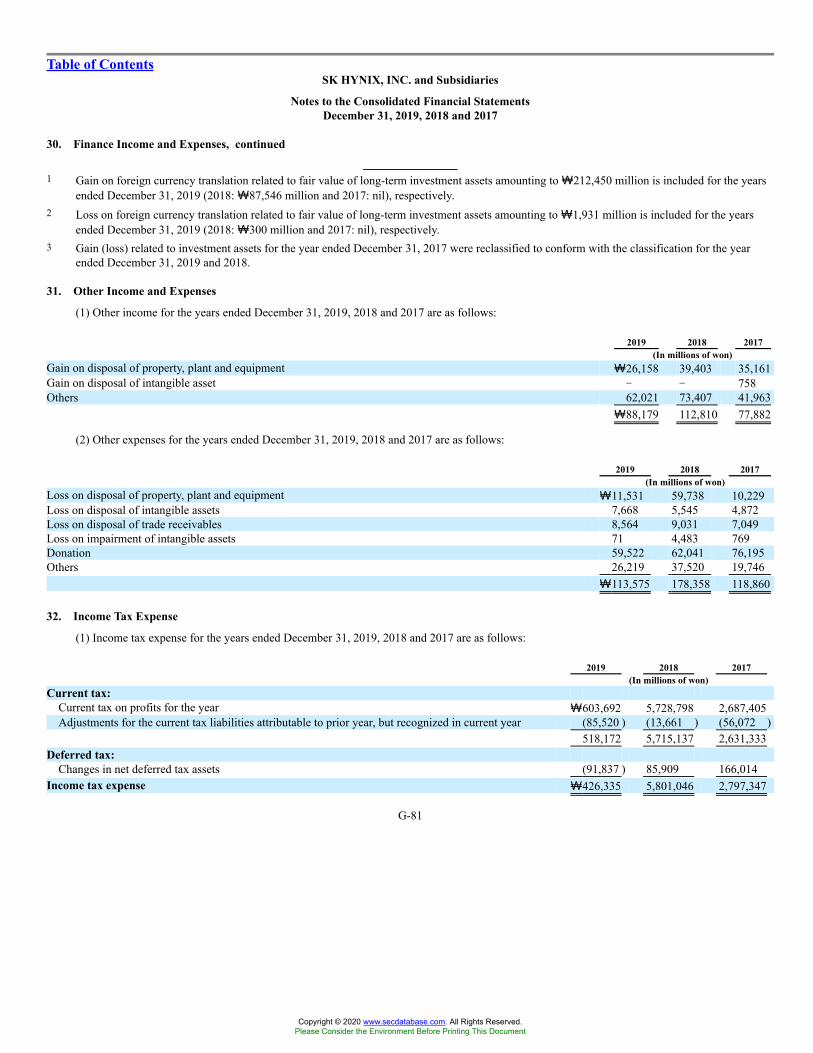
Table of ContentsSK HYNIX, INC. and Subsidiaries
Notes to the Consolidated Financial StatementsDecember 31, 2019, 2018 and 2017
30. Finance Income and Expenses, continued
1 Gain on foreign currency translation related to fair value of long-term investment assets amounting to ₩212,450 million is included for the yearsended December 31, 2019 (2018: ₩87,546 million and 2017: nil), respectively.
2 Loss on foreign currency translation related to fair value of long-term investment assets amounting to ₩1,931 million is included for the yearsended December 31, 2019 (2018: ₩300 million and 2017: nil), respectively.
3 Gain (loss) related to investment assets for the year ended December 31, 2017 were reclassified to conform with the classification for the yearended December 31, 2019 and 2018.
31. Other Income and Expenses
(1) Other income for the years ended December 31, 2019, 2018 and 2017 are as follows:
2019 2018 2017(In millions of won)
Gain on disposal of property, plant and equipment ₩26,158 39,403 35,161Gain on disposal of intangible asset � � 758Others 62,021 73,407 41,963
₩88,179 112,810 77,882
(2) Other expenses for the years ended December 31, 2019, 2018 and 2017 are as follows:
2019 2018 2017(In millions of won)
Loss on disposal of property, plant and equipment ₩11,531 59,738 10,229Loss on disposal of intangible assets 7,668 5,545 4,872Loss on disposal of trade receivables 8,564 9,031 7,049Loss on impairment of intangible assets 71 4,483 769Donation 59,522 62,041 76,195Others 26,219 37,520 19,746
₩113,575 178,358 118,860
32. Income Tax Expense
(1) Income tax expense for the years ended December 31, 2019, 2018 and 2017 are as follows:
2019 2018 2017(In millions of won)
Current tax:Current tax on profits for the year ₩603,692 5,728,798 2,687,405Adjustments for the current tax liabilities attributable to prior year, but recognized in current year (85,520 ) (13,661 ) (56,072 )
518,172 5,715,137 2,631,333Deferred tax:
Changes in net deferred tax assets (91,837 ) 85,909 166,014Income tax expense ₩426,335 5,801,046 2,797,347
G-81
Copyright © 2020 www.secdatabase.com. All Rights Reserved.Please Consider the Environment Before Printing This Document
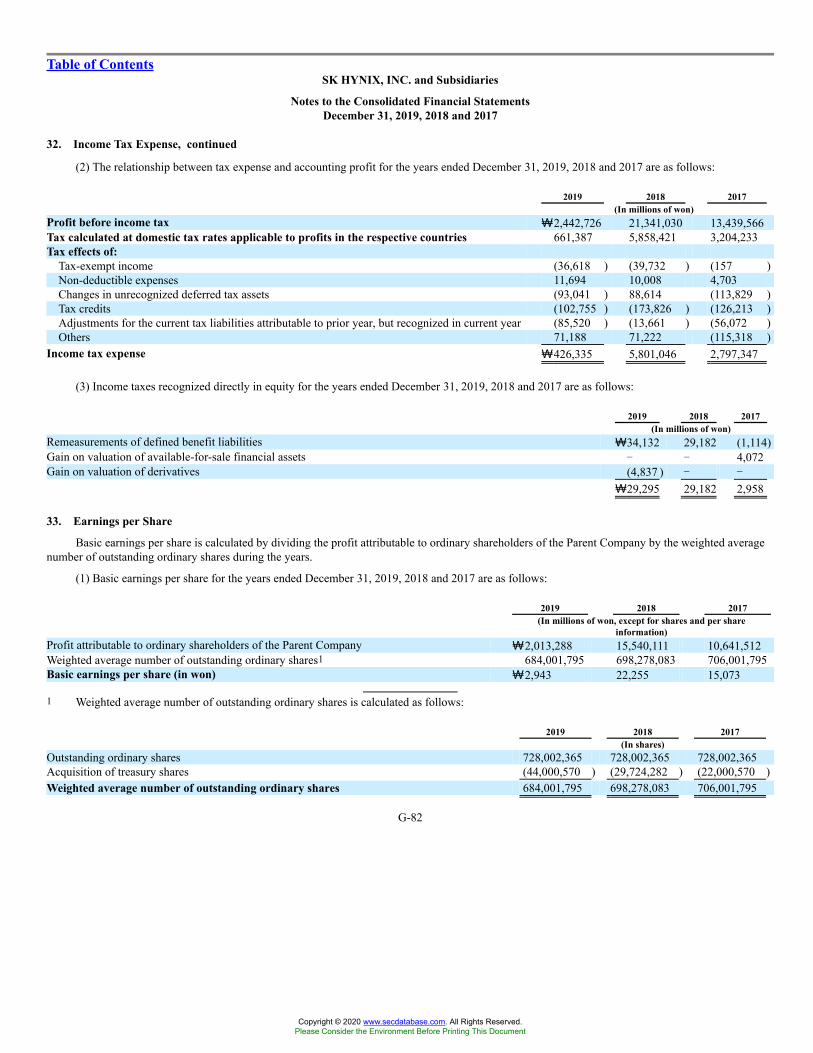
Table of ContentsSK HYNIX, INC. and Subsidiaries
Notes to the Consolidated Financial StatementsDecember 31, 2019, 2018 and 2017
32. Income Tax Expense, continued
(2) The relationship between tax expense and accounting profit for the years ended December 31, 2019, 2018 and 2017 are as follows:
2019 2018 2017(In millions of won)
Profit before income tax ₩2,442,726 21,341,030 13,439,566Tax calculated at domestic tax rates applicable to profits in the respective countries 661,387 5,858,421 3,204,233Tax effects of:
Tax-exempt income (36,618 ) (39,732 ) (157 )Non-deductible expenses 11,694 10,008 4,703Changes in unrecognized deferred tax assets (93,041 ) 88,614 (113,829 )Tax credits (102,755 ) (173,826 ) (126,213 )Adjustments for the current tax liabilities attributable to prior year, but recognized in current year (85,520 ) (13,661 ) (56,072 )Others 71,188 71,222 (115,318 )
Income tax expense ₩426,335 5,801,046 2,797,347
(3) Income taxes recognized directly in equity for the years ended December 31, 2019, 2018 and 2017 are as follows:
2019 2018 2017(In millions of won)
Remeasurements of defined benefit liabilities ₩34,132 29,182 (1,114)Gain on valuation of available-for-sale financial assets � � 4,072Gain on valuation of derivatives (4,837 ) � �
₩29,295 29,182 2,958
33. Earnings per Share
Basic earnings per share is calculated by dividing the profit attributable to ordinary shareholders of the Parent Company by the weighted averagenumber of outstanding ordinary shares during the years.
(1) Basic earnings per share for the years ended December 31, 2019, 2018 and 2017 are as follows:
2019 2018 2017(In millions of won, except for shares and per share
information)Profit attributable to ordinary shareholders of the Parent Company ₩2,013,288 15,540,111 10,641,512Weighted average number of outstanding ordinary shares1 684,001,795 698,278,083 706,001,795Basic earnings per share (in won) ₩2,943 22,255 15,073
1 Weighted average number of outstanding ordinary shares is calculated as follows:
2019 2018 2017(In shares)
Outstanding ordinary shares 728,002,365 728,002,365 728,002,365Acquisition of treasury shares (44,000,570 ) (29,724,282 ) (22,000,570 )Weighted average number of outstanding ordinary shares 684,001,795 698,278,083 706,001,795
G-82
Copyright © 2020 www.secdatabase.com. All Rights Reserved.Please Consider the Environment Before Printing This Document
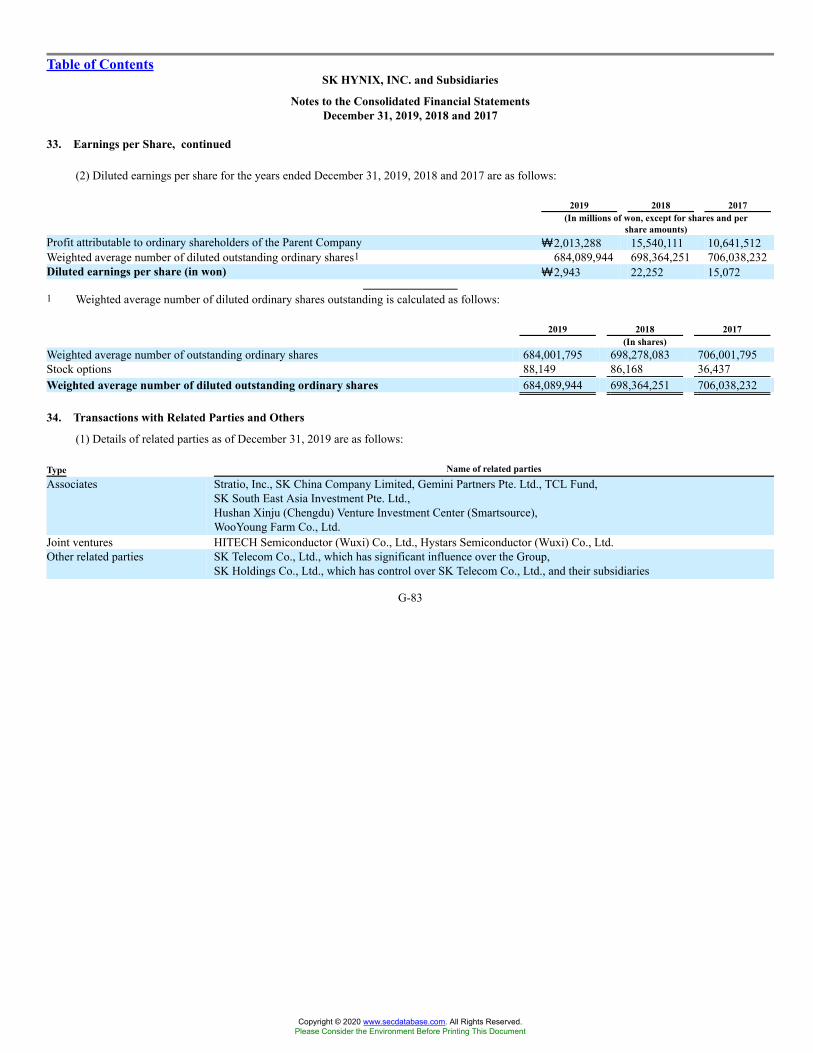
Table of ContentsSK HYNIX, INC. and Subsidiaries
Notes to the Consolidated Financial StatementsDecember 31, 2019, 2018 and 2017
33. Earnings per Share, continued
(2) Diluted earnings per share for the years ended December 31, 2019, 2018 and 2017 are as follows:
2019 2018 2017(In millions of won, except for shares and per
share amounts)Profit attributable to ordinary shareholders of the Parent Company ₩2,013,288 15,540,111 10,641,512Weighted average number of diluted outstanding ordinary shares1 684,089,944 698,364,251 706,038,232Diluted earnings per share (in won) ₩2,943 22,252 15,072
1 Weighted average number of diluted ordinary shares outstanding is calculated as follows:
2019 2018 2017(In shares)
Weighted average number of outstanding ordinary shares 684,001,795 698,278,083 706,001,795Stock options 88,149 86,168 36,437Weighted average number of diluted outstanding ordinary shares 684,089,944 698,364,251 706,038,232
34. Transactions with Related Parties and Others
(1) Details of related parties as of December 31, 2019 are as follows:
Type Name of related partiesAssociates Stratio, Inc., SK China Company Limited, Gemini Partners Pte. Ltd., TCL Fund,
SK South East Asia Investment Pte. Ltd.,Hushan Xinju (Chengdu) Venture Investment Center (Smartsource),WooYoung Farm Co., Ltd.
Joint ventures HITECH Semiconductor (Wuxi) Co., Ltd., Hystars Semiconductor (Wuxi) Co., Ltd.Other related parties SK Telecom Co., Ltd., which has significant influence over the Group,
SK Holdings Co., Ltd., which has control over SK Telecom Co., Ltd., and their subsidiaries
G-83
Copyright © 2020 www.secdatabase.com. All Rights Reserved.Please Consider the Environment Before Printing This Document
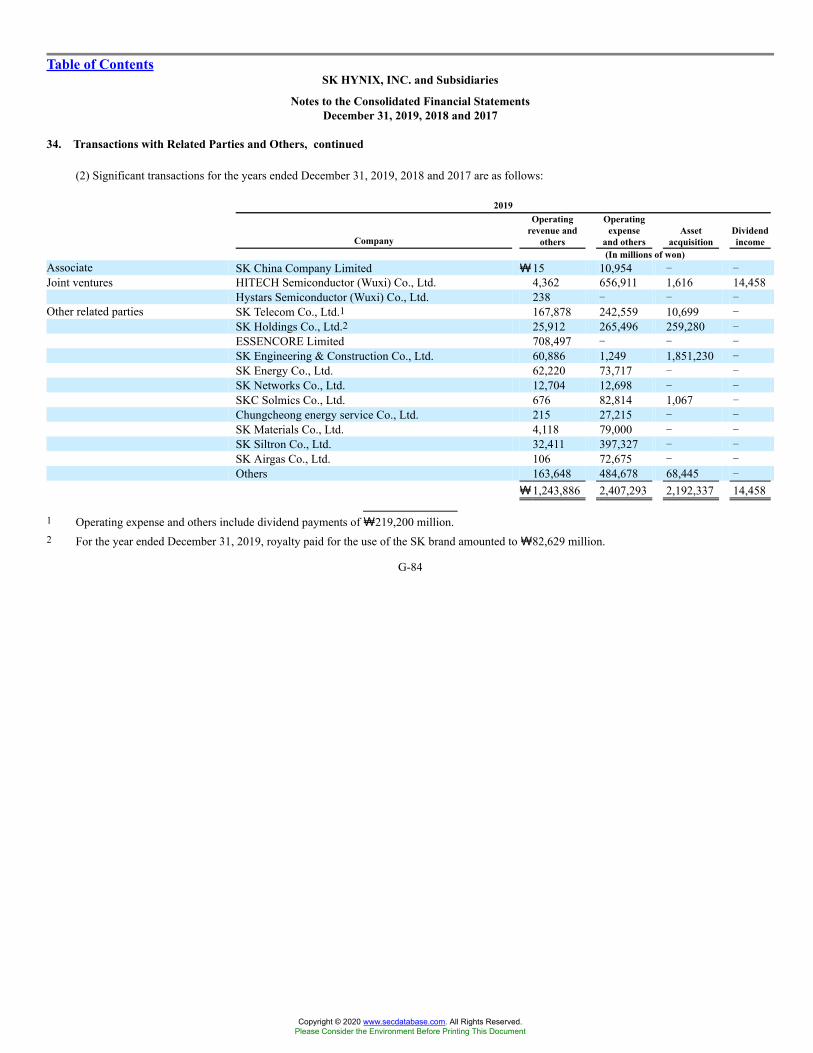
Table of ContentsSK HYNIX, INC. and Subsidiaries
Notes to the Consolidated Financial StatementsDecember 31, 2019, 2018 and 2017
34. Transactions with Related Parties and Others, continued
(2) Significant transactions for the years ended December 31, 2019, 2018 and 2017 are as follows:
2019
Company
Operatingrevenue and
others
Operatingexpense
and othersAsset
acquisitionDividendincome
(In millions of won)Associate SK China Company Limited ₩15 10,954 � �Joint ventures HITECH Semiconductor (Wuxi) Co., Ltd. 4,362 656,911 1,616 14,458
Hystars Semiconductor (Wuxi) Co., Ltd. 238 � � �Other related parties SK Telecom Co., Ltd.1 167,878 242,559 10,699 �
SK Holdings Co., Ltd.2 25,912 265,496 259,280 �
ESSENCORE Limited 708,497 � � �
SK Engineering & Construction Co., Ltd. 60,886 1,249 1,851,230 �
SK Energy Co., Ltd. 62,220 73,717 � �
SK Networks Co., Ltd. 12,704 12,698 � �
SKC Solmics Co., Ltd. 676 82,814 1,067 �
Chungcheong energy service Co., Ltd. 215 27,215 � �
SK Materials Co., Ltd. 4,118 79,000 � �
SK Siltron Co., Ltd. 32,411 397,327 � �
SK Airgas Co., Ltd. 106 72,675 � �
Others 163,648 484,678 68,445 �
₩1,243,886 2,407,293 2,192,337 14,458
1 Operating expense and others include dividend payments of ₩219,200 million.2 For the year ended December 31, 2019, royalty paid for the use of the SK brand amounted to ₩82,629 million.
G-84
Copyright © 2020 www.secdatabase.com. All Rights Reserved.Please Consider the Environment Before Printing This Document

Table of ContentsSK HYNIX, INC. and Subsidiaries
Notes to the Consolidated Financial StatementsDecember 31, 2019, 2018 and 2017
34. Transactions with Related Parties and Others, continued
2018
Company
Operatingrevenue and
others
Operatingexpense
and othersAsset
acquisitionDividendincome
(In millions of won)Associate SK China Company Limited ₩� 9,699 � �Joint ventures HITECH Semiconductor (Wuxi) Co., Ltd. 3,442 621,986 1,901 13,120
Hystars Semiconductor (Wuxi) Co., Ltd. 162 � � �Other related parties SK Telecom Co., Ltd.1 313 162,342 46,122 �
SK Holdings Co., Ltd.2 1,465 231,180 539,447 �ESSENCORE Limited 917,320 � � �
SK Engineering & Construction Co., Ltd. 4,038 25,882 2,484,366 �
SK Energy Co., Ltd. 4,040 71,059 � �
SK Networks Co., Ltd. � 7,190 10,600 �
SKC Solmics Co., Ltd. � 21,724 1,439 �
Chungcheong energy service Co., Ltd. � 19,112 203 �
SK Materials Co., Ltd. � 68,957 � �
SK Siltron Co., Ltd. 4,392 338,741 � �
SK Airgas Co., Ltd. 2 37,610 259 �
Others 459 321,325 68,205 �Other HAPPYNARAE Co., Ltd.3 39 576,043 68,630 �
₩935,672 2,512,850 3,221,172 13,120
1 Operating expense and others include dividend payments of ₩146,100 million.2 For the year ended December 31, 2018, royalty paid for the use of the SK brand amounted to ₩61,955 million.3 The amounts represent the transactions prior to the date of acquisition of HAPPYNARAE Co., Ltd.
G-85
Copyright © 2020 www.secdatabase.com. All Rights Reserved.Please Consider the Environment Before Printing This Document
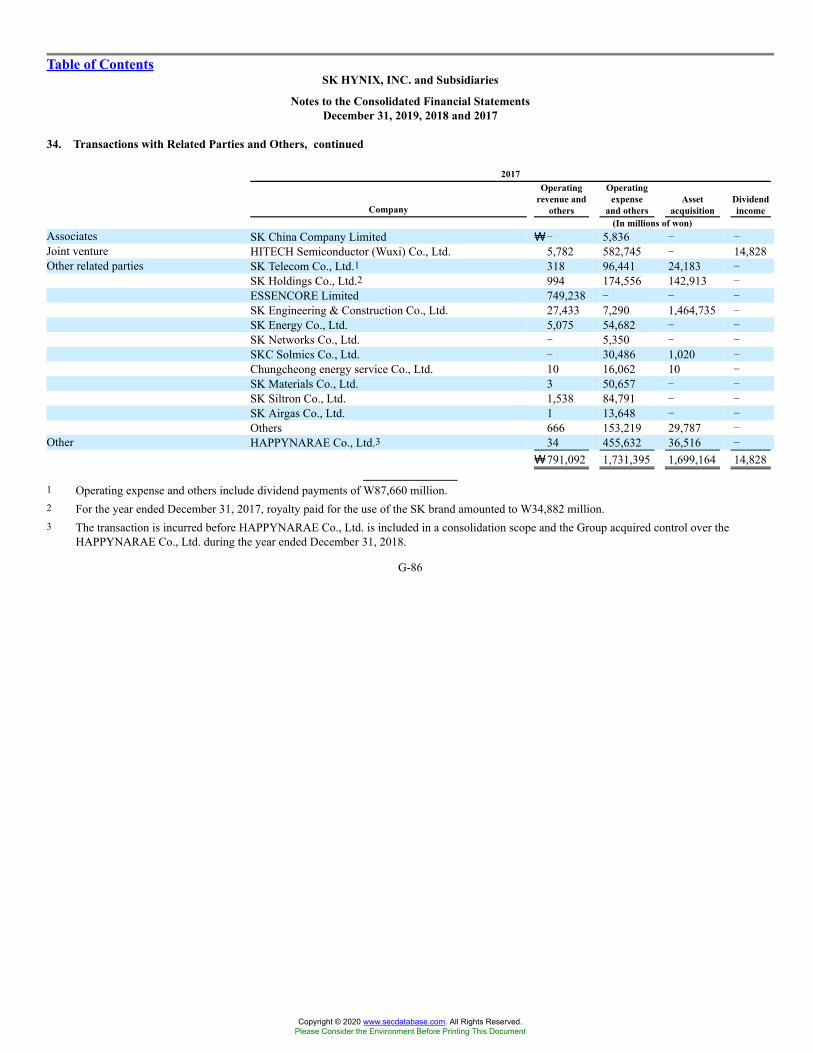
Table of ContentsSK HYNIX, INC. and Subsidiaries
Notes to the Consolidated Financial StatementsDecember 31, 2019, 2018 and 2017
34. Transactions with Related Parties and Others, continued
2017
Company
Operatingrevenue and
others
Operatingexpense
and othersAsset
acquisitionDividendincome
(In millions of won)Associates SK China Company Limited ₩� 5,836 � �Joint venture HITECH Semiconductor (Wuxi) Co., Ltd. 5,782 582,745 � 14,828Other related parties SK Telecom Co., Ltd.1 318 96,441 24,183 �
SK Holdings Co., Ltd.2 994 174,556 142,913 �
ESSENCORE Limited 749,238 � � �
SK Engineering & Construction Co., Ltd. 27,433 7,290 1,464,735 �
SK Energy Co., Ltd. 5,075 54,682 � �
SK Networks Co., Ltd. � 5,350 � �
SKC Solmics Co., Ltd. � 30,486 1,020 �
Chungcheong energy service Co., Ltd. 10 16,062 10 �
SK Materials Co., Ltd. 3 50,657 � �
SK Siltron Co., Ltd. 1,538 84,791 � �
SK Airgas Co., Ltd. 1 13,648 � �
Others 666 153,219 29,787 �Other HAPPYNARAE Co., Ltd.3 34 455,632 36,516 �
₩791,092 1,731,395 1,699,164 14,828
1 Operating expense and others include dividend payments of W87,660 million.2 For the year ended December 31, 2017, royalty paid for the use of the SK brand amounted to W34,882 million.3 The transaction is incurred before HAPPYNARAE Co., Ltd. is included in a consolidation scope and the Group acquired control over the
HAPPYNARAE Co., Ltd. during the year ended December 31, 2018.
G-86
Copyright © 2020 www.secdatabase.com. All Rights Reserved.Please Consider the Environment Before Printing This Document
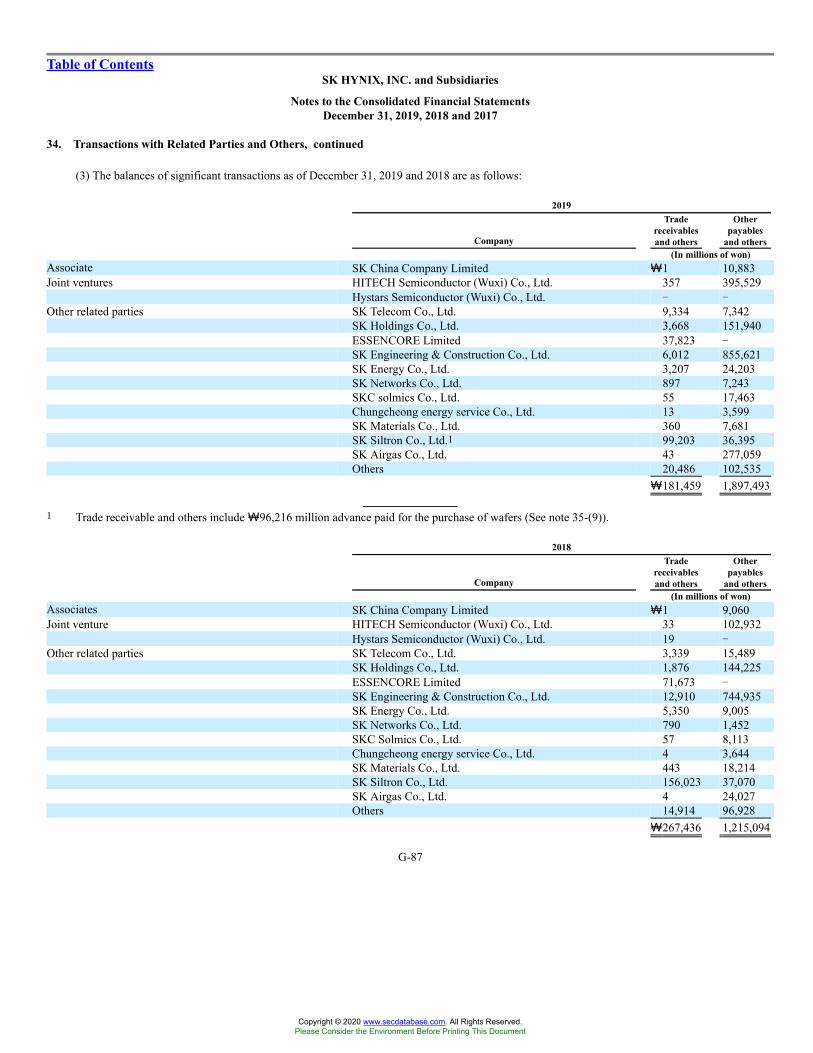
Table of ContentsSK HYNIX, INC. and Subsidiaries
Notes to the Consolidated Financial StatementsDecember 31, 2019, 2018 and 2017
34. Transactions with Related Parties and Others, continued
(3) The balances of significant transactions as of December 31, 2019 and 2018 are as follows:
2019
Company
Tradereceivablesand others
Otherpayables
and others(In millions of won)
Associate SK China Company Limited ₩1 10,883Joint ventures HITECH Semiconductor (Wuxi) Co., Ltd. 357 395,529
Hystars Semiconductor (Wuxi) Co., Ltd. � �Other related parties SK Telecom Co., Ltd. 9,334 7,342
SK Holdings Co., Ltd. 3,668 151,940ESSENCORE Limited 37,823 �SK Engineering & Construction Co., Ltd. 6,012 855,621SK Energy Co., Ltd. 3,207 24,203SK Networks Co., Ltd. 897 7,243SKC solmics Co., Ltd. 55 17,463Chungcheong energy service Co., Ltd. 13 3,599SK Materials Co., Ltd. 360 7,681SK Siltron Co., Ltd.1 99,203 36,395SK Airgas Co., Ltd. 43 277,059Others 20,486 102,535
₩181,459 1,897,493
1 Trade receivable and others include ₩96,216 million advance paid for the purchase of wafers (See note 35-(9)).
2018
Company
Tradereceivablesand others
Otherpayables
and others(In millions of won)
Associates SK China Company Limited ₩1 9,060Joint venture HITECH Semiconductor (Wuxi) Co., Ltd. 33 102,932
Hystars Semiconductor (Wuxi) Co., Ltd. 19 �Other related parties SK Telecom Co., Ltd. 3,339 15,489
SK Holdings Co., Ltd. 1,876 144,225ESSENCORE Limited 71,673 �SK Engineering & Construction Co., Ltd. 12,910 744,935SK Energy Co., Ltd. 5,350 9,005SK Networks Co., Ltd. 790 1,452SKC Solmics Co., Ltd. 57 8,113Chungcheong energy service Co., Ltd. 4 3,644SK Materials Co., Ltd. 443 18,214SK Siltron Co., Ltd. 156,023 37,070SK Airgas Co., Ltd. 4 24,027Others 14,914 96,928
₩267,436 1,215,094
G-87
Copyright © 2020 www.secdatabase.com. All Rights Reserved.Please Consider the Environment Before Printing This Document

Table of ContentsSK HYNIX, INC. and Subsidiaries
Notes to the Consolidated Financial StatementsDecember 31, 2019, 2018 and 2017
34. Transactions with Related Parties and Others, continued
(4) Key management compensation
The Group considers registered directors who have authority and responsibility for planning, directing and controlling the activities of the Groupas key management. The compensation paid to key management for the years ended December 31, 2019, 2018 and 2017 are as follows:
Details 2019 2018 2017(In millions of won)
Salaries ₩3,849 2,999 6,033Defined benefit plan related expenses 406 351 774Share-based payment 954 51 �
₩5,209 3,401 6,807
(5) The Group provides payment guarantee amounting to RMB 702 million for Hystars Semiconductor (Wuxi) Co., Ltd., a joint venture of theGroup. (See note 35-(7))
(6) The Group�s establishments of subsidiaries during the year ended December 31, 2019 are presented in note 1 and the Group�s acquisitionsand additional contributions to associates during the year ended December 31, 2019 are presented in note 11.
35. Commitments and Contingencies
(1) The details of litigations and claims of the Group as of December 31, 2019 are as follows:
(a) Lawsuit from Netlist, Inc.
Netlist, Inc. filed lawsuits against the Parent Company, and its subsidiaries, SK hynix America Inc. and SK hynix memory solutions America Inc.alleging infringement of multiple patents to the U.S. District Court for the Central District of California, on August 31, 2016 and June 14, 2017, to theU.S. International Trade Commission (�ITC�) on September 1, 2016 and October 31, 2017.
Meanwhile, the lawsuit filed to the U.S. ITC on September 1, 2016 was provisionally concluded on January 16, 2018 that the Parent Companyand its subsidiaries, SK hynix America Inc. and SK hynix memory solutions America Inc., did not infringe the patents of Netlist, Inc. Against theconclusion, Netlist, Inc. filed a petition on March 26, 2018. As the U.S. Federal Court of Appeals rejected Netlist, Inc.�s appeal on December 12, 2019,the ruling that the Parent Company and its subsidiaries, SK hynix America Inc. and SK hynix memory solutions America Inc., did not infringe thepatent was finalized.
Regarding the lawsuit filed to the U.S. ITC on October 31, 2017, the U.S. ITC issued an initial determination on October 21, 2019, finding theParent Company and its subsidiaries, SK hynix America Inc. and SK hynix memory solutions America Inc., violated one patent of Netlist, Inc. Adecision on whether to have a rehearing the tentative decision will be made. As of December 31, 2019, the final result cannot be predicted.
Meanwhile, Netlist, Inc. filed a lawsuit against the Parent Company for infringement of one German patent to the District Court of Munich onJuly 11, 2017. The District Court of Munich rendered its decision finding no infringement by the Parent Company on January 31, 2019. Netlist, Inc.filed a notice of appeal against the decision to the Higher Regional Court of Munich on March 5, 2019 but withdrew the notice of appeal on June 11,2019, thus the non-infringement decision of the District Court of Munich became the final and conclusive ruling.
G-88
Copyright © 2020 www.secdatabase.com. All Rights Reserved.Please Consider the Environment Before Printing This Document
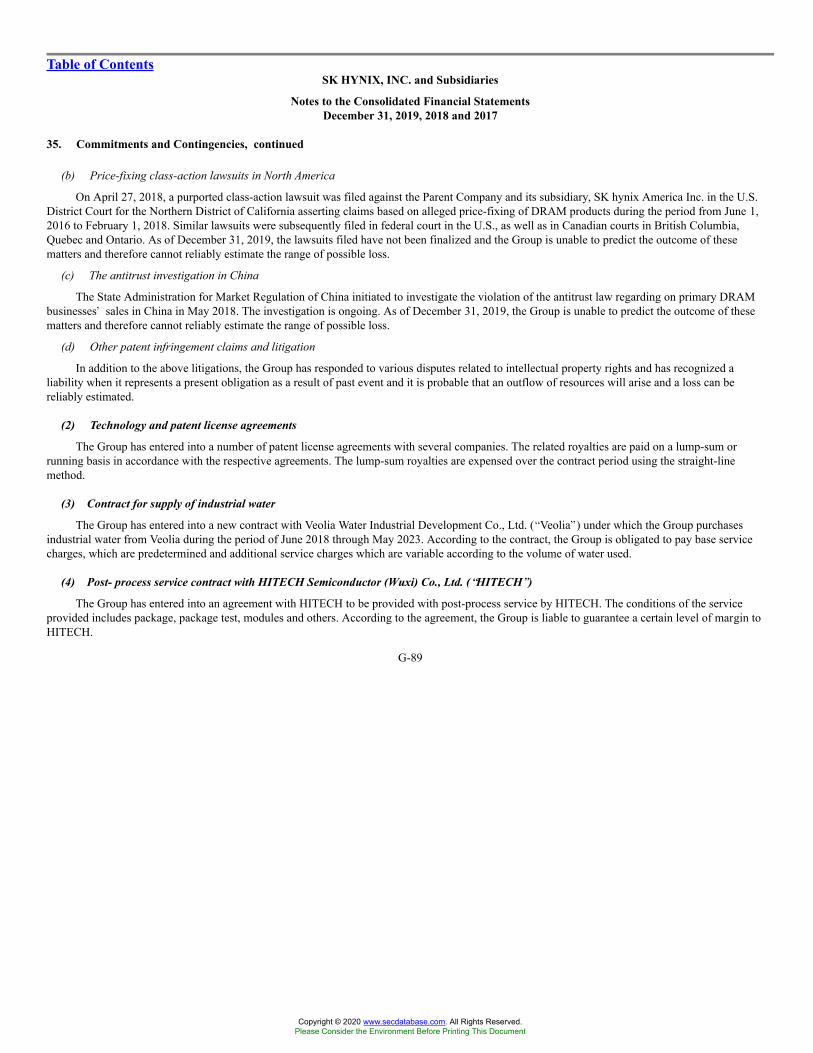
Table of ContentsSK HYNIX, INC. and Subsidiaries
Notes to the Consolidated Financial StatementsDecember 31, 2019, 2018 and 2017
35. Commitments and Contingencies, continued
(b) Price-fixing class-action lawsuits in North America
On April 27, 2018, a purported class-action lawsuit was filed against the Parent Company and its subsidiary, SK hynix America Inc. in the U.S.District Court for the Northern District of California asserting claims based on alleged price-fixing of DRAM products during the period from June 1,2016 to February 1, 2018. Similar lawsuits were subsequently filed in federal court in the U.S., as well as in Canadian courts in British Columbia,Quebec and Ontario. As of December 31, 2019, the lawsuits filed have not been finalized and the Group is unable to predict the outcome of thesematters and therefore cannot reliably estimate the range of possible loss.
(c) The antitrust investigation in China
The State Administration for Market Regulation of China initiated to investigate the violation of the antitrust law regarding on primary DRAMbusinesses� sales in China in May 2018. The investigation is ongoing. As of December 31, 2019, the Group is unable to predict the outcome of thesematters and therefore cannot reliably estimate the range of possible loss.
(d) Other patent infringement claims and litigation
In addition to the above litigations, the Group has responded to various disputes related to intellectual property rights and has recognized aliability when it represents a present obligation as a result of past event and it is probable that an outflow of resources will arise and a loss can bereliably estimated.
(2) Technology and patent license agreements
The Group has entered into a number of patent license agreements with several companies. The related royalties are paid on a lump-sum orrunning basis in accordance with the respective agreements. The lump-sum royalties are expensed over the contract period using the straight-linemethod.
(3) Contract for supply of industrial water
The Group has entered into a new contract with Veolia Water Industrial Development Co., Ltd. (�Veolia�) under which the Group purchasesindustrial water from Veolia during the period of June 2018 through May 2023. According to the contract, the Group is obligated to pay base servicecharges, which are predetermined and additional service charges which are variable according to the volume of water used.
(4) Post- process service contract with HITECH Semiconductor (Wuxi) Co., Ltd. (��HITECH��)
The Group has entered into an agreement with HITECH to be provided with post-process service by HITECH. The conditions of the serviceprovided includes package, package test, modules and others. According to the agreement, the Group is liable to guarantee a certain level of margin toHITECH.
G-89
Copyright © 2020 www.secdatabase.com. All Rights Reserved.Please Consider the Environment Before Printing This Document

Table of ContentsSK HYNIX, INC. and Subsidiaries
Notes to the Consolidated Financial StatementsDecember 31, 2019, 2018 and 2017
35. Commitments and Contingencies, continued
(5) Assets provided as collateral
Details of assets provided as collateral as of December 31, 2019 are as follows:
Book value Pledged amount
Category Currency Amount CurrencyAmountin USD
Amountin KRW Remark
(In millions of won and millions of foreign currencies)Land and buildings KRW 55,479 USD 53 61,587
KRW � 5,864Machinery KRW 5,375,555 USD 6,258 7,245,003
Borrowings forequipment andothers
KRW � 600,000USD 6,311 7,306,590
KRW 5,431,034 KRW � 605,864
(6) Financing agreements
Details of credit lines with financial institutions as of December 31, 2019 are as follows:
FinancialInstitution Commitment Currency Amount
(In millions of won andmillions of foreign currencies)
The Parent Company Import finance including usance USD 275Hana Bankand others Comprehensive limit contract for import and
export including usance USD 1,060Commitment as form of issuance
for commercial paper KRW 400,000Overdrafts with banks KRW 20,000Accounts receivable factoring contracts which
have no right to recourse KRW 140,000
SK hynix Semiconductor (China) Ltd.
AgriculturalBank of Chinaand others
Import finance including usance RMBUSD
2,3004,447
SK hynix America Inc. and other sales entitiesCitibank andothers
Accounts receivable factoring contracts whichhave no right to recourse USD 757
Import finance including bills bought USD 45Domestic subsidiaries Hana Bank
and others Finance secured by accounts receivables KRW 53,820Agent agreement for payment of goods received KRW 12,500
G-90
Copyright © 2020 www.secdatabase.com. All Rights Reserved.Please Consider the Environment Before Printing This Document
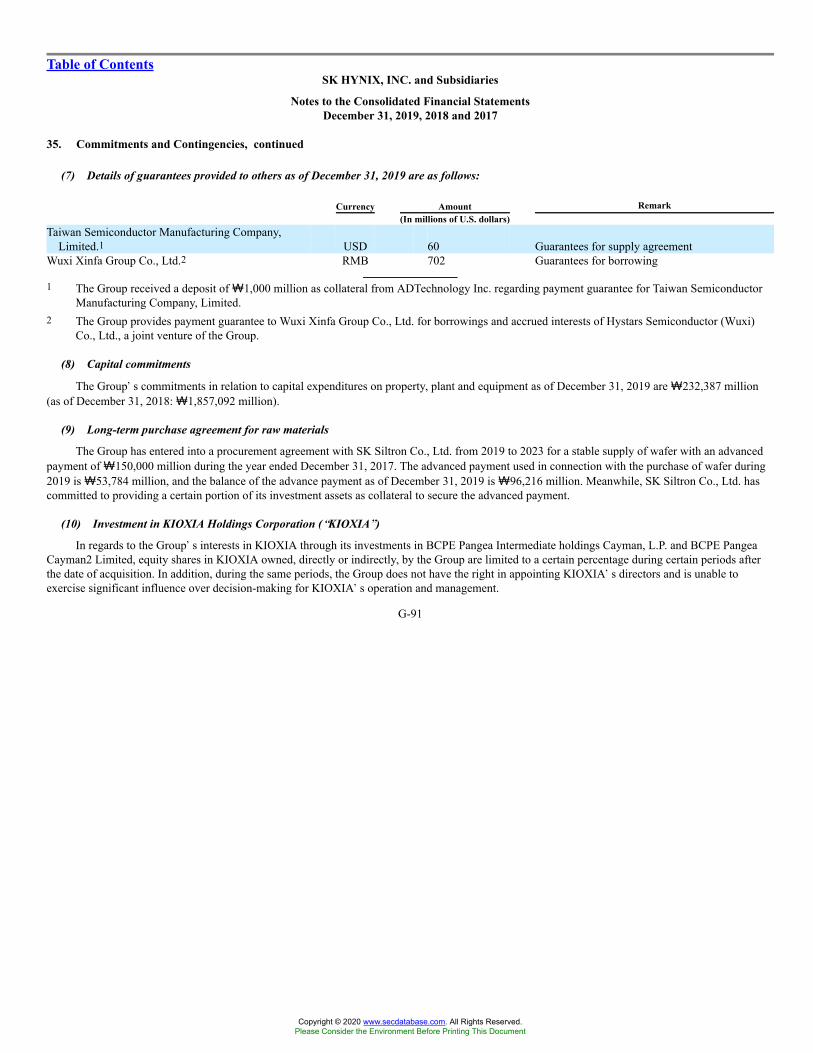
Table of ContentsSK HYNIX, INC. and Subsidiaries
Notes to the Consolidated Financial StatementsDecember 31, 2019, 2018 and 2017
35. Commitments and Contingencies, continued
(7) Details of guarantees provided to others as of December 31, 2019 are as follows:
Currency Amount Remark(In millions of U.S. dollars)
Taiwan Semiconductor Manufacturing Company,Limited.1 USD 60 Guarantees for supply agreement
Wuxi Xinfa Group Co., Ltd.2 RMB 702 Guarantees for borrowing
1 The Group received a deposit of ₩1,000 million as collateral from ADTechnology Inc. regarding payment guarantee for Taiwan SemiconductorManufacturing Company, Limited.
2 The Group provides payment guarantee to Wuxi Xinfa Group Co., Ltd. for borrowings and accrued interests of Hystars Semiconductor (Wuxi)Co., Ltd., a joint venture of the Group.
(8) Capital commitments
The Group�s commitments in relation to capital expenditures on property, plant and equipment as of December 31, 2019 are ₩232,387 million(as of December 31, 2018: ₩1,857,092 million).
(9) Long-term purchase agreement for raw materials
The Group has entered into a procurement agreement with SK Siltron Co., Ltd. from 2019 to 2023 for a stable supply of wafer with an advancedpayment of ₩150,000 million during the year ended December 31, 2017. The advanced payment used in connection with the purchase of wafer during2019 is ₩53,784 million, and the balance of the advance payment as of December 31, 2019 is ₩96,216 million. Meanwhile, SK Siltron Co., Ltd. hascommitted to providing a certain portion of its investment assets as collateral to secure the advanced payment.
(10) Investment in KIOXIA Holdings Corporation (��KIOXIA��)
In regards to the Group�s interests in KIOXIA through its investments in BCPE Pangea Intermediate holdings Cayman, L.P. and BCPE PangeaCayman2 Limited, equity shares in KIOXIA owned, directly or indirectly, by the Group are limited to a certain percentage during certain periods afterthe date of acquisition. In addition, during the same periods, the Group does not have the right in appointing KIOXIA�s directors and is unable toexercise significant influence over decision-making for KIOXIA�s operation and management.
G-91
Copyright © 2020 www.secdatabase.com. All Rights Reserved.Please Consider the Environment Before Printing This Document
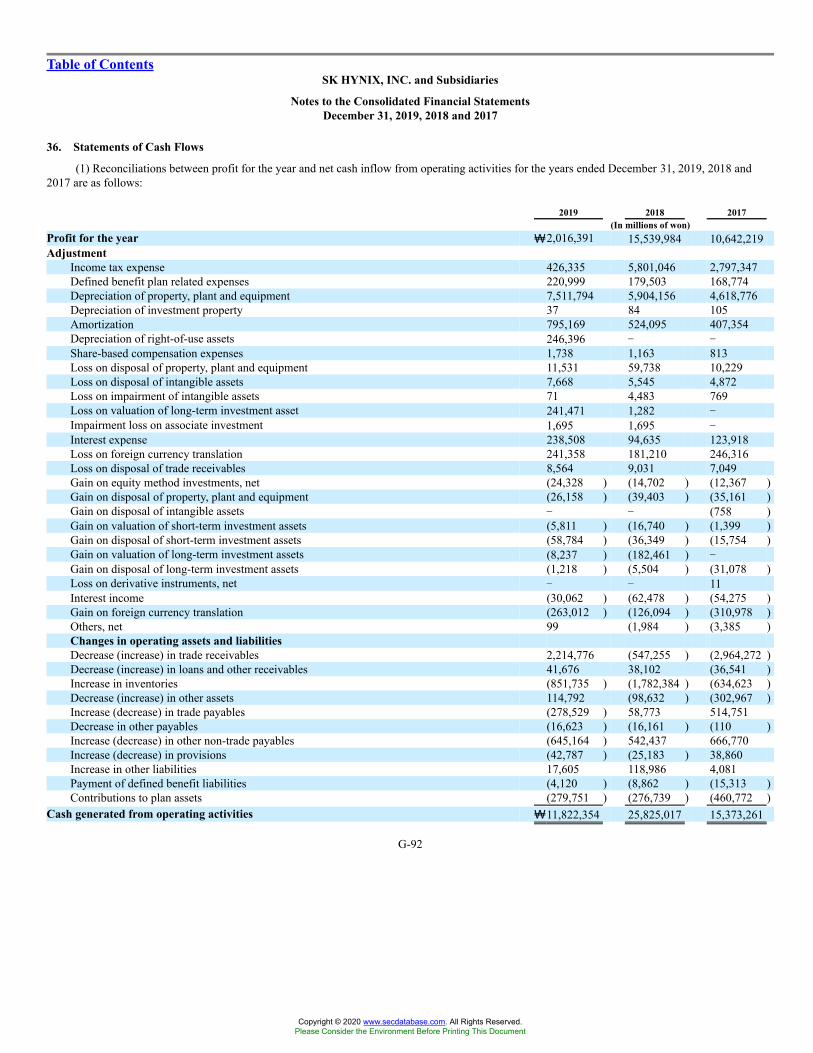
Table of ContentsSK HYNIX, INC. and Subsidiaries
Notes to the Consolidated Financial StatementsDecember 31, 2019, 2018 and 2017
36. Statements of Cash Flows
(1) Reconciliations between profit for the year and net cash inflow from operating activities for the years ended December 31, 2019, 2018 and2017 are as follows:
2019 2018 2017(In millions of won)
Profit for the year ₩2,016,391 15,539,984 10,642,219Adjustment
Income tax expense 426,335 5,801,046 2,797,347Defined benefit plan related expenses 220,999 179,503 168,774Depreciation of property, plant and equipment 7,511,794 5,904,156 4,618,776Depreciation of investment property 37 84 105Amortization 795,169 524,095 407,354Depreciation of right-of-use assets 246,396 � �Share-based compensation expenses 1,738 1,163 813Loss on disposal of property, plant and equipment 11,531 59,738 10,229Loss on disposal of intangible assets 7,668 5,545 4,872Loss on impairment of intangible assets 71 4,483 769Loss on valuation of long-term investment asset 241,471 1,282 �Impairment loss on associate investment 1,695 1,695 �Interest expense 238,508 94,635 123,918Loss on foreign currency translation 241,358 181,210 246,316Loss on disposal of trade receivables 8,564 9,031 7,049Gain on equity method investments, net (24,328 ) (14,702 ) (12,367 )Gain on disposal of property, plant and equipment (26,158 ) (39,403 ) (35,161 )Gain on disposal of intangible assets � � (758 )Gain on valuation of short-term investment assets (5,811 ) (16,740 ) (1,399 )Gain on disposal of short-term investment assets (58,784 ) (36,349 ) (15,754 )Gain on valuation of long-term investment assets (8,237 ) (182,461 ) �Gain on disposal of long-term investment assets (1,218 ) (5,504 ) (31,078 )Loss on derivative instruments, net � � 11Interest income (30,062 ) (62,478 ) (54,275 )Gain on foreign currency translation (263,012 ) (126,094 ) (310,978 )Others, net 99 (1,984 ) (3,385 )Changes in operating assets and liabilitiesDecrease (increase) in trade receivables 2,214,776 (547,255 ) (2,964,272 )Decrease (increase) in loans and other receivables 41,676 38,102 (36,541 )Increase in inventories (851,735 ) (1,782,384 ) (634,623 )Decrease (increase) in other assets 114,792 (98,632 ) (302,967 )Increase (decrease) in trade payables (278,529 ) 58,773 514,751Decrease in other payables (16,623 ) (16,161 ) (110 )Increase (decrease) in other non-trade payables (645,164 ) 542,437 666,770Increase (decrease) in provisions (42,787 ) (25,183 ) 38,860Increase in other liabilities 17,605 118,986 4,081Payment of defined benefit liabilities (4,120 ) (8,862 ) (15,313 )Contributions to plan assets (279,751 ) (276,739 ) (460,772 )
Cash generated from operating activities ₩11,822,354 25,825,017 15,373,261
G-92
Copyright © 2020 www.secdatabase.com. All Rights Reserved.Please Consider the Environment Before Printing This Document
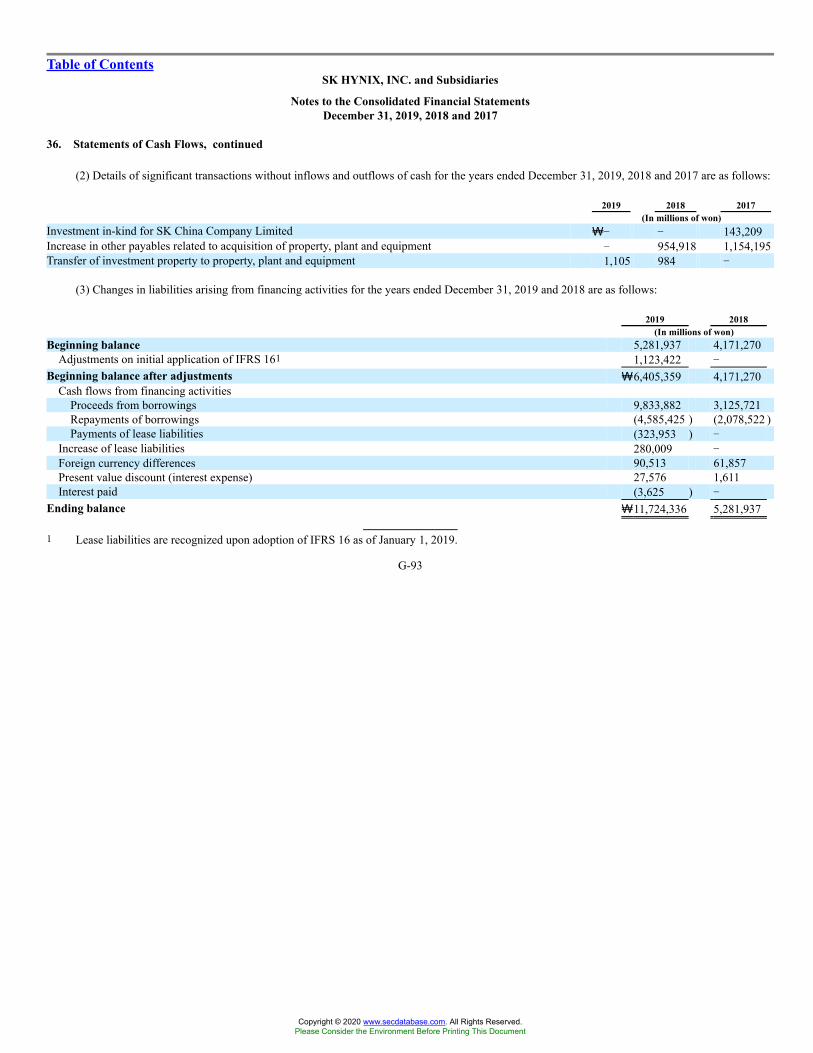
Table of ContentsSK HYNIX, INC. and Subsidiaries
Notes to the Consolidated Financial StatementsDecember 31, 2019, 2018 and 2017
36. Statements of Cash Flows, continued
(2) Details of significant transactions without inflows and outflows of cash for the years ended December 31, 2019, 2018 and 2017 are as follows:
2019 2018 2017(In millions of won)
Investment in-kind for SK China Company Limited ₩� � 143,209Increase in other payables related to acquisition of property, plant and equipment � 954,918 1,154,195Transfer of investment property to property, plant and equipment 1,105 984 �
(3) Changes in liabilities arising from financing activities for the years ended December 31, 2019 and 2018 are as follows:
2019 2018(In millions of won)
Beginning balance 5,281,937 4,171,270Adjustments on initial application of IFRS 161 1,123,422 �
Beginning balance after adjustments ₩6,405,359 4,171,270Cash flows from financing activities
Proceeds from borrowings 9,833,882 3,125,721Repayments of borrowings (4,585,425 ) (2,078,522 )Payments of lease liabilities (323,953 ) �
Increase of lease liabilities 280,009 �Foreign currency differences 90,513 61,857Present value discount (interest expense) 27,576 1,611Interest paid (3,625 ) �
Ending balance ₩11,724,336 5,281,937
1 Lease liabilities are recognized upon adoption of IFRS 16 as of January 1, 2019.
G-93
Copyright © 2020 www.secdatabase.com. All Rights Reserved.Please Consider the Environment Before Printing This Document

Table of ContentsSK HYNIX, INC. and Subsidiaries
Notes to the Consolidated Financial StatementsDecember 31, 2019, 2018 and 2017
37. Share-based payment
(1) The Parent Company accounts for share-based payment in which the Parent Company has a choice of either cash-settled payment or equity-settled payment in accordance with its substance. The details of share options as of December 31, 2019 are as follows:
Total numbers of shareoption granted Exercised Forfeited or Cancelled
Outstanding atDecember 31, 2019
(In shares)1st 99,600 � � 99,6002nd 99,600 � � 99,6003rd 99,600 � � 99,6004th 7,747 � � 7,7475th 7,223 � � 7,2236th 8,171 � � 8,1717th 61,487 � � 61,4878th 61,487 � � 61,4879th 61,487 � � 61,487
506,402 � � 506,402
Grant date Service Period for Vesting Exercisable PeriodExercise
price1st March 24, 2017 March 24, 2017�March 24, 2019 March 25, 2019�March 24, 2022 ₩ 48,4002nd March 24, 2017 March 24, 2017�March 24, 2020 March 25, 2020�March 24, 2023 52,2803rd March 24, 2017 March 24, 2017�March 24, 2021 March 25, 2021�March 24, 2024 56,4604th January 1, 2018 January 1, 2018�December 31, 2019 January 1, 2020�December 31, 2022 77,4405th March 28, 2018 March 28, 2018�March 28, 2020 March 29, 2020�March 28, 2023 83,0606th Feb 28, 2019 February 28, 2019�February 28, 2021 March 1, 2021�February 29, 2024 73,4307th March 22, 2019 March 22, 2019�March 22, 2021 March 23, 2021�March 22, 2024 71,5608th March 22, 2019 March 22, 2019�March 22, 2022 March 23, 2022�March 22, 2025 77,2909th March 22, 2019 March 22, 2019�March 22, 2023 March 23, 2023�March 22, 2026 83,470
(2) Measurement of fair value
The compensation cost is calculated by applying a binomial option-pricing model in estimating the fair value of the option at grant date. Theinputs used are as follows:
1st 2nd 3rd 4th 5th 6th 7th 8th 9th
Expected volatility 23.23 % 23.23% 23.23% 22.50 % 25.30 % 25.60 % 26.20 % 26.20 % 26.20 %Estimated fair value of share options ₩10,026 9,613 9,296 16,687 18,362 16,505 17,744 16,888 16,093Dividend yield ratio 1.20 % 1.20 % 1.20 % 0.78 % 1.23 % 2.04 % 1.98 % 1.98 % 1.98 %Risk free rate 1.86 % 1.95 % 2.07 % 2.38 % 2.46 % 1.89 % 1.82 % 1.88 % 1.91 %
(3) The compensation expense for the year ended December 31, 2019 was ₩1,738 million (2018: ₩1,163 million and 2017: ₩813 million).
G-94
Copyright © 2020 www.secdatabase.com. All Rights Reserved.Please Consider the Environment Before Printing This Document
Exhibit 1.1
ARTICLES OF INCORPORATION
PREMISE
The Company will pursue the happiness of its members as the ultimate purpose of business management, and the members will contribute to thesustainability of long-term benefits for the shareholders and the happiness of the stakeholders. For this purpose, the Company will establish itsmanagement philosophy as follows and carry out its management activities based thereon.
To pursue the sustainable happiness of the members, the Company must maintain stability and growth and continuously survive and develop. Toachieve this, the members will simultaneously pursue the happiness of the members and of the stakeholders. All value that the company creates for thehappiness of its stakeholders is social value. The company will elevate its economic value and develop a relationship of trust with its stakeholders.
Earn customers� trust by offering and satisfying them with a variety of values and ultimately develop together with the customers.
Build a fair and competitive business ecosystem with business partners, and achieve mutual development through cooperation based on thisecosystem.
Raise the company value by continuously creating shareholder value.
Grow together with our society while making various contributions such as environmental protection, job creation, improvement in the quality oflife, and the support of local communities.
The members will make consistent efforts to keep the happiness of the stakeholders in harmonious balance and at the same time consider thepresent and future happiness in order to ensure the longevity of the stakeholders (wholly amended on March 26, 2020).
CHAPTER 1. GENERAL PROVISIONS
Article 1. Corporate Name
The name of the Company shall be �SK Telecom Chusik Hoesa� (hereafter �Company�), which shall be written in English as �SK Telecom Co.,Ltd.� (amended on March 21, 1997).
Article 2. Objectives
(1) The objectives of the Company are as follows: rational management of the telecommunications business, development of thetelecommunications technology and contribution to public welfare and convenience (amended on March 20, 1992).
(2) In order to achieve the above objectives, the Company carries on the following businesses:
1. Information and communication business (amended on March 17, 2000);
2. Sale and lease of handsets business;
3. New media business;
4. Advertising business;
5. Mail order sales business;
6. Real estate business (development, management, leasing, etc.) and chattel leasing business (amended on March 12, 2010);
1
Copyright © 2020 www.secdatabase.com. All Rights Reserved.Please Consider the Environment Before Printing This Document

7. Research and technology development relating to Items 1 through 4;
8. Overseas and import/export business relating to Items 1 through 4;
9. Manufacturing and distribution business relating to Items 1 through 4;
10. Travel business (established on March 10, 2006);
11. Electronic financial business (amended on March 14, 2008);
12. Film industry (production, import, distribution and showing) (established on March 14, 2008);
13. Lifetime education and lifetime educational facilities management (established on March 12, 2010);
14. Electric engineering business (established on March 12, 2010);
15. Information and communication related engineering business (established on March 12, 2010);
16. Ubiquitous city construction and related services business (established on March 12, 2010);
17. Related businesses through investment in, management and operation of, domestic and foreign subsidiaries and invested companies(established on August 31, 2011);
18. Construction business including machine equipment work, etc. (newly established on March 22, 2013);
19. Import/export business, import/export brokerage and/or agency business (established on March 20, 2015);
20. Electric utility business including smart grid business, etc. (newly established on March 18, 2016); and
21. Any other incidental businesses relating to the foregoing activities (amended on March 18, 2016).
(3) To accomplish the above businesses effectively, parts of the businesses could be delegated in accordance with resolutions of the Board ofDirectors (established on August 14, 1989).
Article 3. Head Office and Other Offices
The Company shall have its head office in Seoul and may establish sub-organizations in the place as required by a resolution of the Board ofDirectors.
Article 4. Method of Public Notice
Public notices by the Company shall be given on the Company�s Internet homepage (http://www.sktelecom.com). However, if public noticescannot be given on such homepage due to network failure or other inevitable reasons, they shall be given by publication in �Hankuk KyungjeShinmoon�, a daily newspaper published in Seoul (amended on March 21, 2014).
CHAPTER 2. SHARES
Article 5. Total Number of Shares to be Issued
The total number of shares to be issued by the Company shall be two hundred twenty Million (220,000,000) shares (amended on March 17, 2000).
Article 6. Par Value of a Share
The par value of a share issued by the Company shall be five hundred (500) Won per share (amended on March 17, 2000).
Article 7. Classes Shares
The classes of shares to be issued by the Company shall be common shares and preferred shares (amended on March 26, 2019).
2
Copyright © 2020 www.secdatabase.com. All Rights Reserved.Please Consider the Environment Before Printing This Document
Article 8. Number and Characteristics of Preferred Shares
(1) The preferred shares to be issued by the Company shall be of non-voting right, and the number thereof shall be Five Million Five HundredThousand (5,500,000) shares (amended on March 21, 1997).
(2) The dividend on the preferred shares shall be an amount not less than 9% and not more than 25% of par value, as determined by the Board ofDirectors at the time of issuance of the relevant shares (amended on March 21, 1997).
(3) In case the dividend ratio of the common shares exceeds that of the preferred shares, the Shareholder of the preferred shares shall be allotted atthe dividend ratio of the common shares (established on March 21, 1997).
(4) If any dividends on preferred shares cannot be paid from the profits of the fiscal year concerned, then the holders of such preferred shares shallhave the right of preference to receive accumulated dividends unpaid for such year at the time of distribution of dividends on preferred shares for thesucceeding fiscal year (amended on March 21, 1997).
(5) If a resolution not to pay dividends on preferred shares is adopted, then the preferred shares shall be deemed to have voting rights from thetime of the General Meeting of Shareholders following the General Meeting at which such resolution not to pay dividends on preferred shares is adoptedto the time of the end of the General Meeting of the Shareholders at which a resolution to pay dividends on such preferred shares is adopted (establishedon August 14, 1989).
(6) In case the Company issues new shares by paid-in capital increase or non-paid-in capital increase, then the new shares issued with respect tothe preferred shares shall be common shares in the case of paid-in capital increase and shall be the shares of same type in the case of non-paid-in capitalincrease (established on March 21, 1997).
(7) The existing period of the preferred shares shall be for ten (10) years from the date of issuance, and the preferred shares shall be converted intocommon shares upon the expiry thereof; provided, that if the holders of the preferred shares do not receive the dividends entitled to them before theexpiry date, then the existing period shall be extended until such holders.
Article 9. No Issuance of Shares Certificates (deleted on March 26, 2019)
Article 9-2. Electronic Registration of Rights Indicated in Shares and Subscription Rights Certificates
Instead of issuing the share certificates and subscription right certificates, the Company electronically registers in the electronic register of theelectronic registry the rights that shall be indicated in the shares and subscription right certificates (newly established on March 26, 2019).
Article10. Preemptive Right
(1) The Company�s Shareholders shall have the preemptive right to subscribe to new shares in proportion to their respective shareholdings.However, in the case of abandonment or loss of the preemptive right of the Shareholders to subscribe for new shares, or if fractional shares remain at thetime of allocation of new shares, such shares shall be disposed of by a resolution of the Board of Directors (amended on August 14, 1989).
(2) Notwithstanding Paragraph (1) above, if the Company issues new shares by public offering or depositary receipts in accordance with theOverseas Securities Issuance Regulation, or issues new shares to increase the Company�s capital through public offerings, the decision on preemptiveright and other conditions on issuance of new shares are determined by a resolution of the Board of Directors (amended on March 20, 1989).
Article10-2. Base Date for Calculation of Dividends for New Shares
When the Company issues new shares by paid-in capital increase, non-paid-in capital increase or stock dividend, with respect to the distribution ofdividends on the new shares, the new shares shall be deemed to have been issued at the end of the fiscal year immediately preceding the fiscal year inwhich the new shares are issued (established on March 15, 1996).
3
Copyright © 2020 www.secdatabase.com. All Rights Reserved.Please Consider the Environment Before Printing This Document
Article 10-3. Stock Option
(1) The Company may grant the Stock Options up to the limit as permitted by relevant laws and regulations to its officers and employees orofficers and employees of an affiliated company as defined in relevant laws and regulations (in this Article referred to as �Officers and Employees�) bya special resolution of the General Meeting of Shareholders. Provided that, the Company may grant Officers and Employees the stock option by aresolution of the Board of Directors up to the limit as permitted by relevant laws and regulations (amended on March 8, 2002).
(2) Officers and Employers who may be granted Stock Options shall be such person who has contributed to profit maximization or technicalinnovation of the Company or is capable of such contribution; provided, that a person who is prohibited from being granted Stock Options by relevantlaws and regulations shall be excluded from the foregoing (amended on March 8, 2002).
1. (deleted on March 8, 2002)
2. (deleted on March 8, 2002)
3. (deleted on March 8, 2002)
(3) The shares to be delivered upon exercise of Stock Option shall be common shares in registered form (amended on March 17, 2000).
(4) The number of officers and employees to be granted with Stock Option shall not exceed 50% of the total number of officers and employees.The Stock Option that can be granted to each person shall not exceed 1/100 of total issued and outstanding shares (amended on March 24, 2017).
(5) (deleted on March 17, 2000).
(6) The Stock Option may be exercised by the date set at the General Meeting of Shareholders or by the Board of Directors within a period ofseven (7) years commencing from the date when the relevant officer or employee is entitled to exercise such Stock Option (amended on March 16,2001).
(7) The Stock Option may be canceled by the resolution of Board of Directors if any of the following occurs (amended on March 17, 2000):
1. When the relevant officer or employee voluntarily retires or resign from the Company within three (3) years from the date of grant of StockOption (amended on March 17, 2000);
2. When the relevant officer or employee causes loss to the Company due to his/her gross negligence or willful misconduct (amended onMarch 17, 2000); or
3. When there occur any other conditions for cancellation of Stock Option specified in the Stock Option agreement (amended on March 17, 2000).
Article 10-4. Redemption of Shares
(1) Shares may be redeemed with profits to be distributed to Shareholders by a resolution at the Board of Directors in accordance with relevantlaws and regulations (established on March 16, 2001).
(2) Details of cancellation of shares with profits including the type and numbers of shares to be cancelled, total acquisition amount, period andmethod of acquisition, etc. shall be determined by the resolution of the Board of Directors in accordance with relevant laws and regulations (establishedon March 16, 2001).
Article 11. Issuance at Current Market Price
(1) All or a part of new shares to be issued by the Company may be issued at the then-current market price, in which case the price of new sharesshall be determined by a resolution of the Board of Directors (established on August 14, 1989).
4
Copyright © 2020 www.secdatabase.com. All Rights Reserved.Please Consider the Environment Before Printing This Document

(2) In case of Paragraph (1), notwithstanding the provisions of Article 10, the Board of Directors may offer publicly or cause a person who hassubscribed for new shares to underwrite new shares to be issued at the then-current market price in accordance with the relevant provisions of theCapital Market and Financial Investment Business Act (amended on March 23, 2012).
Article 12. Transfer Agent
(1) The company shall designate a transfer agent (amended on August 14, 1989).
(2) The transfer agent, the location where its services are to be rendered and the scope of its duties shall be determined by the Board of Directorsof the Company and shall be publicly announced (amended on August 14, 1989).
(3) The Company shall keep the Register of Shareholders, or a duplicate thereof, at the location where the transfer agent performs its duties. Thetransfer agent shall handle the activities of electronic registration, the management of the shareholder list, and other matters related to the stock(amended on March 26, 2019).
(4) The procedures for the activities referred to in Paragraph (3) above will comply with the relevant regulations on the Transfer Agent (amendedMarch 23, 2012).
Article 13. Report of Name, Address and Seal or Signature of Shareholders, etc. (deleted on March 26, 2019)
Article 14. Record Date
(1) (deleted on March 26, 2020)
(2) The Company shall cause the Shareholders whose names appear in the Register of Shareholders on the last day of each fiscal year to exercisethe rights as Shareholders at the Ordinary General Meeting of Shareholders (amended on March 16, 2001).
(3) If necessary for convening of an Extraordinary General Meeting of Shareholders or any other cause, the Company may set a record date uponat least two week prior public notice (amended on March 26, 2020).
CHAPTER 3. BONDS
Article 15. Issuance of Convertible Bonds
(1) The Company may issue convertible bonds to persons other than the Shareholders of the Company to the extent that the aggregate par value ofthe bonds shall not exceed Four Hundred Billion (400,000,000,000) Won (amended on March 15, 1996).
(2) The convertible bonds referred to in Paragraph (1) may be issued with conversion rights to a part of the bonds by a resolution of the Board ofDirectors.
(3) Upon conversion, from the aggregate par value of convertible bonds, common shares may be issued up to Three Hundred Billion(300,000,000,000) Won and preferred shares may be issued up to One Hundred Billion (100,000,000,000) Won, and the conversion price, which shallnot be less than the par value of each share, shall be determined by a resolution of the Board of Directors at the time of issuance of the convertible bonds(amended on March 15, 1996).
(4) The period during which conversion rights may be exercised shall commence on one (1) month after the issuance date of the relevantconvertible bonds and end on the date immediately preceding the redemption date thereof. However, the Board of Directors may adjust the conversionright period within the above period by a resolution.
(5) With respect to the distribution of dividends or interest on the shares issued upon conversion of the convertible bonds described in Paragraph(1), the convertible bonds shall be deemed to have been converted into shares at the end of the fiscal year immediately preceding the fiscal year in whichthe relevant conversion rights are exercised (amended on March 15, 1996).
5
Copyright © 2020 www.secdatabase.com. All Rights Reserved.Please Consider the Environment Before Printing This Document
Article 16. Issuance of Bonds with Warrants
(1) The Company may issue bonds with warrants to persons other than the Shareholders of the Company to the extent that the aggregate par valueof the bonds shall not exceed Four Hundred Billion (400,000,000,000) Won (amended on March 15, 1996).
(2) The aggregate value of new shares which may be subscribed for by the holders of the bonds with warrants shall be determined by the Board ofDirectors, provided that the amount of such new shares shall not exceed the aggregate par value of the bonds with warrants.
(3) Upon exercising preemptive rights, from the aggregate par amount of bonds with warrants, common shares may be issued up to ThreeHundred Billion (300,000,000,000) Won and preferred shares may be issued up to One Hundred Billion (100,000,000,000) Won, and the issue price,which shall not be less than the par value of each share, shall be determined by a resolution of the Board of Directors at the time of issuance of the bondswith warrants (amended on March 15, 1996).
(4) The period during which preemptive rights may be exercised shall commence on one (1) month after the issuance date of the relevant bondswith warrants and end on the date immediately preceding the redemption date thereof. However, the Board of Directors may adjust the exercise periodwithin the above period by a resolution.
(5) With respect to the distribution of dividends or interest of Shareholders who exercise the preemptive rights described in Paragraph (1), sharesshall be deemed to have been issued at the end of the fiscal year immediately preceding the fiscal year in which the subscription price therefor are fullypaid (amended on March 15, 1996).
Article 17. Applicable Provisions regarding Issuance of Bonds
The provisions of Articles 12 shall apply mutatis mutandis to the issuance of bonds (amended on March 26, 2019).
Article 17-2. Issuance of Bonds
(1) The Company may issue bonds in accordance with a resolution of the Board of Directors (established on March 23, 2012).
(2) Subject to the determination by the Board of Directors of the amount and classes of bonds, the Board of Directors may authorize theRepresentative Director to issue bonds within a period not exceeding one (1) year from the date of such determination (established on March 23, 2012).
Article 17-3. Electronic Registration of Rights Indicated in Bonds and Subscription Warrants
Instead of issuing the bond certificates and subscription warrants, the Company electronically registers in the electronic register of the electronicregistry the rights that shall be indicated in the bonds and subscription warrants (newly established on March 26, 2019).
CHAPTER 4. GENERAL MEETING OF SHAREHOLDERS
Article 18. Types of General Meeting
(1) General Meetings of the Shareholders of the Company shall be of two types: Ordinary and Extraordinary.
(2) The Ordinary General Meeting of Shareholders shall be convened within three (3) months after the end of each fiscal year and ExtraordinaryGeneral Meetings of Shareholders shall be convened at any time if necessary (amended on July 7, 1994).
Article 19. Convening of General Meeting
(1) Except as otherwise provided by the relevant laws and regulations, General Meetings of Shareholders shall be convened by the RepresentativeDirector in accordance with a resolution of the Board of Directors (amended on August 14, 1989).
6
Copyright © 2020 www.secdatabase.com. All Rights Reserved.Please Consider the Environment Before Printing This Document

(2) In the absence of the Representative Director, the provision of Article 35, Paragraph (2) shall apply mutatis mutandis (amended on August 14,1989).
Article 20. Notice and Public Notice of Convening of General Meeting
(1) In convening a General Meeting of Shareholders, a written or digital notice thereof setting forth the time, date, place and agenda of theMeeting, shall be sent to each Shareholder at least two (2) weeks prior to the date of the Meeting (amended on March 8, 2002).
(2) The written or digital notice of convening General Meeting of Shareholders to Shareholders holding not more than one (1) percent of the totalnumber of shares with voting rights issued and outstanding shall be replaced by public notices given respectively at least twice in �Hankuk KyungjeShinmoon� and �Maeil Kyungje Shinmoon� published in Seoul, two (2) weeks prior to the Meeting, or by public notices via electronic means asprescribed by the relevant laws and regulations. Public notice of a Meeting shall include the statement that a General Meeting will be held and theagenda of the Meeting (amended on March 22, 2013).
Article 21. Place of General Meeting
General Meetings of Shareholders shall be held at the place where the head office of the Company is located but may be held at a near-by place ifnecessary (amended on August 14, 1989).
Article 22. Chairman of General Meeting
The Chairman of the General Meeting of Shareholders shall be the Representative Director. In the absence of the Representative Director, theother Directors shall preside at the Meeting in the order previously determined by the Board of Directors (amended on July 7, 1994).
Article 23. Chairman of General Meeting
(1) The chairman of a General Meeting of Shareholders may order any person who intentionally speaks or behaves obstructively or who disturbthe proceedings of the Meeting to stop or retract a speech or to leave the place of Meeting, and such person shall comply with his/her order (establishedon August 14, 1989).
(2) The Chairman of a General Meeting of Shareholders may restrict time and number of speeches by a Shareholder as deemed necessary for thepurpose of smooth proceeding (established on March 27, 1998).
Article 24. voting Rights of Shareholders
Every Shareholder shall have one (1) vote per share registered by his own name.
Article 25. Limitation to Voting Rights of Cross-Held Shares
If the Company, its parent company and its subsidiary, or its subsidiary holds shares exceeding ten (10) percent of the total number of sharesissued and outstanding of another company, the shares of the Company held by such other company shall not have voting rights (amended onAugust 14, 1989).
Article 26. Disunitary Exercise of Voting Rights
(1) If a Shareholder who holds two (2) or more shares with voting rights wishes to exercise them in disunity, such Shareholder shall notify theCompany in writing of his intention and reason for disunitary voting at least three (3) days prior to the Meeting (amended on August 14, 1989).
(2) The Company may reject an exercise of vote in disunity by a Shareholder except in the event that he/she has accepted a trust of shares or he/she holds the shares on behalf of another person (amended on August 14, 1989).
Article 27. Exercise of Voting Rights by Proxy
(1) Shareholders may exercise their voting rights by proxy.
7
Copyright © 2020 www.secdatabase.com. All Rights Reserved.Please Consider the Environment Before Printing This Document
(2) The proxy shall be a Shareholder of the Company and must present documents evidencing his power of representation prior to the opening ofthe General Meeting of Shareholders; provided, however, the proxy for a corporate Shareholder must be an employee of such corporation authorized bythe corporation�s representative (established on July 7, 1994).
Article 28. Matters for Resolution (deleted on July 7, 1994)
Article 29. Method of Resolution of General Meeting of Shareholders
All resolutions of General Meetings of Shareholders, except as otherwise provided by the relevant laws and regulations, shall be adopted byaffirmative votes of the majority of the voting rights of Shareholders present thereat and at least one-fourth (1/4) of the total number of shares issued andoutstanding (amended on March 15, 1996).
Article 30. Minutes of General Meeting of Shareholders
The substance of the course and proceedings of a General Meeting of Shareholders and the results thereof shall be recorded in minutes on whichthe names and seals of the chairman and the Directors present at the Meeting shall be affixed or which shall be signed by such persons, and shall be keptat the head office and branches of the Company (amended on March 15, 1996).
CHAPTER 5. DIRECTORS (amended on March 17, 2000)
Article 31. Number of Directors
(1) The Company shall have a minimum of three (3) but not more than twelve (12) Directors, and more than a half of Directors shall be outsideDirectors (amended on March 11, 2005).
(2) (deleted on March 17, 2000).
Article 32. Appointment of Directors
(1) The Directors shall be elected at a General Meeting of Shareholders (amended on March 17, 2000).
(2) The Directors shall be appointed at a General Meeting of Shareholders by affirmative votes of the majority of the voting rights of Shareholderspresent and such majority also represents at least one-fourth (1/4) of the total number of shares issued and outstanding (amended on March 17, 2000).
(3) For appointment of Directors, the cumulative voting system pursuant to Article 382-2 of the Commercial Act shall not be applied (establishedon March 20, 1999).
(4) (deleted on July 7, 1994).
(5) The Directors shall consist of standing Director(s), non-standing Director(s) and outside Director(s) who do(es) not participate in generaloperation of the Company (established on March 27, 1998).
(6) (deleted on March 17, 2000).
Article 32-2. Committee for Recommendation of Outside Director
(1) The Company shall have the committee for recommendation of Outside Director (the �Recommendation Committee�) at the Board ofDirectors.
(2) An outside Director shall be appointed from among those candidates who were recommended by the Recommendation Committee.
(3) The Recommendation Committee shall consist of two (2) or more Directors and a half or more of such Directors shall be composed of outsideDirectors already appointed.
8
Copyright © 2020 www.secdatabase.com. All Rights Reserved.Please Consider the Environment Before Printing This Document
(4) All matters necessary for the constitution and operation of the Recommendation Committee shall be decided separately by the Board ofDirectors (established on March 17, 2000).
Article 32-3. Qualification of Director
(1) A person who falls under any of the following items shall not be a Director of the Company, and a Director who falls under any of thefollowing items after his/her appointment shall be dismissed (amended on March 17, 2000):
1. Person who controls a company having competitive relationship with the Company, as specified in the Monopoly Regulation and Fair TradeLaw (hereinafter, the �FTL�) or any person relating to such a person (amended on March 17, 2000);
2. Person who is, or has been within last two (2) years, an officer or an employee of a company having competitive relationship with theCompany, or a company which belongs to the same enterprise group as such competitor under the FTL (amended on March 17, 2000); or
3. Person who is, or has been within last two (2) years, an officer or an employee of a corporation which is the largest Shareholder or the 2ndlargest Shareholder of a company having competitive relationship with the Company, or a company which belongs to the same enterprise group as suchcorporation under the FTL (amended on March 17, 2000).
(2) The outside Director of the Company shall be such person who has expert knowledge in management, economy, accounting, law or relevanttechnology, or substantial experience in such areas, and who may contribute to the development of the Company and protection of interests of theShareholders. A person who falls under any of causes for disqualification as specified in the Commercial Act or other relevant laws and regulations,shall not become an outside Director of the Company (amended on March 23, 2012).
(3) If an outside Director who falls under any of causes for disqualification in any of items specified in Paragraph (1) above or in the Paragraph(2) above, he/she shall be dismissed from his/her office when there occurs any of such causes. In such case, any vacancy in the office of the outsideDirector shall be filled at the Ordinary General Meeting of Shareholders following the occurrence of such causes for disqualification (amended onMarch 17, 2000).
Article 33. Term of office of Directors
The term of office of the Directors (including Representative Director) shall be until the close of the 3rd Ordinary General Meeting ofShareholders convened after he/she office (amended on March 16, 2001).
Article 34. Appointment of Directors in case of Vacancy
(1) If a Director falls under one of the following items, his/her position is deemed to be vacant (amended on March 17, 2000):
1. When dead;
2. When adjudicated insolvent;
3. When declared incapacitated person or quasi- incapacitated person; and
4. When sentenced to a punishment heavier than imprisonment without prison labor.
(2) Any vacancy in the office of Director shall be filled by a resolution of an Extraordinary General Meeting of Shareholders. However, if thenumber of Directors required by these Articles of Incorporation or applicable laws are met and there is no difficulty in the administration of business, aappointment may be withheld temporarily or postponed until the next following Ordinary General Meeting of Shareholders (amended on March 17,2000).
(3) The terms of office of a Director appointed to fill a vacancy or increase the number of Directors shall commence on the date of taking office(amended on March 17, 2000).
9
Copyright © 2020 www.secdatabase.com. All Rights Reserved.Please Consider the Environment Before Printing This Document
Article 35. Duties of Directors
(1) The Company shall appoint more than one (1) representative Directors among Directors by a resolution of the Board of Directors. TheRepresentative Director shall represent the Company and manage all affairs of the Company (amended July 7, 1994).
(2) The Directors shall assist the Representative Director and shall carry out their respective responsibilities as determined by the Board ofDirectors. In the absence of the Representative Director, they shall perform his duty in the order determined by the provisions of the Board of Directors(amended July 7, 1994).
Article 35-2. Reporting Duty of Directors
A Director shall immediately report to the Audit Committee when such a Director finds matters which could materially cause damage to theCompany (amended on March 17, 2000).
Article 35-3. Duties of Directors to be faithful
The Directors shall faithfully perform their respective duties for the benefits of the Company (amended on March 17, 2000).
Article 36. Duties of Auditors (deleted on March 17, 2000)
Article 37. Auditors�� Records (deleted on March 17, 2000)
Article 38. Disqualification of Directors and Auditors (deleted on July 7, 1994)
Article 39. Assurance of Employee��s Employment
The Company shall assure its employees� employment with the Company except for discharge or removal pursuant to the Company�s Rules ofEmployment (amended on July 7, 1994).
Article 40. Restriction on the Representation Right of the Representative Director (deleted on July 7, 1994)
Article 41. Agent
Representative Director may appoint agents among employees of the Company to be delegated rights with respect to the Company�s business,including any litigation involving the Company except otherwise prohibited by any laws or regulation, or the Articles of Incorporation (amended onJuly 7, 1994).
Article 42. Consultant
Representative Director may have consultants or advisory institutions to refer important matters on business administration (amended on July 7,1994).
CHAPTER 6. BOARD OF DIRECTORS
Article 43. Constitution of the Board of Directors
The Board of Directors of the Company shall consist of Directors. The Board of Directors shall resolve all important matters relating to theexecution of business (amended on July 7, 1994).
Article 44. Convening of the Board of Directors�� Meeting
(1) Meetings of the Board of Directors shall be convened by the Representative Director as he deems necessary or upon the request of more thanthree (3) Directors (amended on July 7, 1994).
(2) A Director who does not have the right to convene the Meeting of Board of Directors may demand to convene the Meeting of Board ofDirectors to a Director with a right to convene the Meeting. If a Director with such a right rejects to the demand without reasonable cause, other Directormay convene the Meeting of Board of Directors (established on March 8, 2002).
10
Copyright © 2020 www.secdatabase.com. All Rights Reserved.Please Consider the Environment Before Printing This Document
(3) In convening a Meeting of the Board of Directors, a notice thereof setting forth agenda of the Meeting shall be given to each Director two(2) days prior to the date of the Meeting (amended on March 8, 2002).
(4) The procedure of Paragraph (3) may be dispensed with upon the consent of all Directors (amended on March 8, 2002).
Article 45. Resolutions of the Board of Directors
(1) Resolutions of the Board of Directors shall be adopted by the presence of a majority of the Directors in office and by the affirmative vote of amajority of the Directors present.
(2) No Director who has an interest in a matter for resolution may exercise his or her vote upon such matter.
Article 45-2. Matters Subject to Prior Approval of Majority of the Outside Directors
Notwithstanding the provisions to the contrary in the Articles of Incorporation, the Company shall obtain approval from the majority of theoutside Directors in order to effect the following acts (established on March 27, 1998).
(1) Acquisition by the Company of, or causing its subsidiary to acquire, such stock or equity of a foreign company or corporation or otheroverseas assets, equivalent to 5% or more of its capital under the most recent balance sheet; or
(2) Contribution of capital to, providing loan or guarantee to, acquisition of assets of, or any similar transaction with, the affiliated companies ofthe Company (as defined in the FTL) equivalent to 10 billion Won or more through single or more transactions.
Article 45-3. Approval of the Board of Directors with regard to the Plan of Safety and Health, etc.
(1) The Representative Director of the Company shall establish a safety and health plan of the Company in accordance with the relevant laws andregulation, including the Occupational Safety and Health Act (established on March 26, 2020).
(2) The Company shall report to and obtain approval from the Board of Directors for the safety and health plan under paragraph (1) (establishedon March 26, 2020).
Article 46. Function (deleted on July 7, 1994)
Article 46-2. Internal Trading
The Board of Directors shall establish and amend the regulations for internal trading in order to insure the fairness of transactions with affiliatedcompanies (as defined in the FTL) of the Company (established on March 27, 1998).
Article 47. Management
Matters necessary for management of the Board of Directors shall be determined by the provisions of the Board of Directors.
Article 47-2. Auditors�� Council (deleted on March 17, 2000)
Article 47-3. Audit Committee (established on March 17, 2000)
(1) The Company shall have the Audit Committee in the Board of Directors.
(2) The Audit Committee shall consist of three (3) or more directors and two-thirds (2/3) or more of the committee members shall be composed ofoutside Directors.
(3) The committee members shall be appointed at a General Meeting of Shareholders and all matters necessary for the operation of the AuditCommittee shall be decided separately at the Board of Directors (amended on March 23, 2012).
11
Copyright © 2020 www.secdatabase.com. All Rights Reserved.Please Consider the Environment Before Printing This Document
Article 48. Minutes of the Meeting of the Board of Directors
All agenda of the Board of Directors, the substance of the proceedings of the Board and the result thereof, name(s) of Director(s) who raise(s) anobjection to the Board resolution and the reason therefor, shall be recorded in the minutes on which the names and seals of the Chairman and allDirectors present shall be affixed or which shall be signed by such persons, and shall be kept at the head office (amended on March 17, 2000).
Article 49. Remuneration and Severance Allowance of Directors
(1) Remuneration for the Directors shall be determined by a resolution of the General Meeting of Shareholders (amended on March 17, 2000).
(2) Severance allowances for Directors shall be handled in accordance with the Regulation on Remuneration for Officers as adopted by aresolution of the General Meeting of Shareholders (amended on March 17, 2000).
The Company may pay to outside Directors the expense incurred during the performance of their duties (amended on March 17, 2000).
Article 49-2. Treatment for Outside Directors
The Company may pay to outside Directors the expense incurred during the performance of their duties (amended on March 17, 2000).
CHAPTER 7. ACCOUNTING
Article 50. Fiscal Year
The fiscal year of the Company shall commence on January 1 and end on December 31 of each year (amended on August 14, 1988).
Article 51. Safe (deleted on July 7, 1994)
Article 52. Preparation and Preservation of Financial Statements and Business Report
(1) The Representative Director of the Company shall prepare the following documents, supplementary documents thereto and the business reportfor obtaining the audit of the Audit Committee six (6) weeks prior to the day set for the Ordinary General Meeting of Shareholders, for audit by theAudit Committee, and the Representative Director shall submit the following documents and the business report to the Ordinary General Meeting ofShareholders (amended on March 17, 2000).
1. Balance sheet;
2. Profit and loss statement; and
3. Any other documents indicating the financial status and management results of the Company as defined in the Presidential Decree to implementthe Commercial Act (amended on March 23, 2012).
(2) A consolidated financial statement shall be included in the documents as specified in Paragraph (1) above if the Company falls within thescope of the company which is required to prepare the consolidated financial statement as defined in the Presidential Decree to implement theCommercial Act (established on March 23, 2012).
(3) The Audit Committee shall submit the audit report on the documents described in Paragraph (1) above to the Representative Director withinfour (4) weeks from the day of receipt thereof (amended on March 23, 2012).
(4) The Representative Director shall keep the documents described in Items of Paragraph (1) above, together with the business report, and theaudit report at the head office of the Company for five (5) years and certified copies of all of such documents at the branches of the Company for three(3) years beginning from one (1) week prior to the day of the Ordinary General Meeting of Shareholders (amended on March 23, 2012).
12
Copyright © 2020 www.secdatabase.com. All Rights Reserved.Please Consider the Environment Before Printing This Document
(5) The Representative Director shall give public notice of the balance sheet and the independent auditors� opinion immediately after thedocuments described in Items of Paragraph (1) above have been approved by the General Meeting of Shareholders (amended on March 23, 2012).
Article 53. Disposition of Surplus
The Company shall dispose of the earned surplus which is unappropriated as of the end of each fiscal year according to the following method(amended on March 21, 1997).
(1) Earned surplus Reserves (required to be more than one-tenth of cash dividends paid for the pertinent fiscal year);
(2) Other Statutory reserves;
(3) Dividends;
(4) Discretionary reserves;
(5) Bonus for officers;
(6) Other appropriation of retained earnings; and
(7) Earned surplus carried forward to next fiscal year.
Article 54. Dividends
(1) Dividends may be paid in cash or shares (amended on July 7, 1994).
(2) In the case of stock dividends, the classes and types of new shares to be allotted may be determined by resolution of the General Meetings ofShareholders if the Company has issued different classes and types of shares (established on March 15, 1996).
(3) Dividends under Paragraph (1) shall be paid to the Shareholders or pledgees who are registered in the Register of Shareholders as of the end ofeach fiscal year (established on August 14, 1989).
(4) If there is no claim for the payment of dividends for five (5) years from the date when the allotment starts, the right to claim dividends inParagraph (1) shall be deemed to be waived and the dividend shall be deemed to be the earning of the Company (amended on August 14, 1989).
Article 54-2. Interim Dividends
(1) The Company may pay dividends in cash to the Shareholders registered in the Register of Shareholders as of June 30, by resolution of theBoard of Directors, one time during each fiscal year (established on March 12, 2004).
(2) All other matters relevant to the Interim Dividends under Paragraph (1), including the limitation amount of the Interim Dividends and/or thepayment time of the Interim Dividends, shall comply with the relevant laws and regulations, including the Commercial Act (amended on March 23,2012).
(3) In case of the payment of the Interim Dividends, the rate of the Interim Dividends to common shares shall also apply to the Interim Dividendsto preferred shares under Article 8 (established on March 12, 2004).
(4) The provisions of Article 10 Paragraph (2) and Article 54 Paragraph (4) shall apply mutatis mutandis to this Article (established on March 12,2004).
CHAPTER 8. SUPPLEMENTARY PROVISIONS
Article 55. Duty of Keeping Secret
(1) The employees, or the former employees of the Company shall not disclose or embezzle secrets which are obtained on his duty (amended onMarch 27, 1998).
13
Copyright © 2020 www.secdatabase.com. All Rights Reserved.Please Consider the Environment Before Printing This Document
(2) If any officer or any person who was the officer of the Company discloses or misappropriates the information concerning the management ofthe Company, he/she shall be liable for the loss incurred to the Company (established on March 27, 1998).
Addendum No. 5 (as of August 14, 1989)
Article 1. Date of Enforcement
These Articles of Incorporation shall take effect as of August 14, 1989.
Article 2. Provisions of the Company
The provisions needed for the undertaking and management of the Company�s business shall be determined and enforced by the Board ofDirectors.
Article 3. Matters Not Specified in These Articles of Incorporation
Matters not specified in these Articles of Incorporation shall comply with resolutions of the General Meeting of Shareholders, the Commercial Actand other laws or regulations.
Addendum No. 6 (as of March 15, 1991)
These Articles of Incorporation shall take effect as of March 15, 1991.
Addendum No. 7 (as of March 20, 1992)
These Articles of Incorporation shall take effect as of March 20, 1992.
Addendum No. 8 (as of July 7, 1994)
These Articles of Incorporation shall take effect as of July 7, 1994.
Addendum No. 9 (as of March 15, 1996)
Article 1. Date of Enforcement
These Articles of Incorporation shall take effect as of March 15, 1996. However, the amended Articles of 10-2, 13, 17, 29,30, 32, 33, 35-2, 36, 37,48 and 54 shall take effect as of October 1, 1996.
Article 2. Interim Measures for Terms of Office of Auditors
The terms of office of auditors who are holding office of the Company when these Articles of Incorporation become effective, shall be determinedby the previous Articles of Incorporation of the Company.
Addendum No. 10 (as of March 21, 1997)
Article 1. Date of Enforcement
These Articles of Incorporation shall take effect as of March 21, 1997.
14
Copyright © 2020 www.secdatabase.com. All Rights Reserved.Please Consider the Environment Before Printing This Document

Addendum No. 11 (as of March 27, 1998)
Article 1. Effective Date
These Articles of Incorporation shall become effective from March 27, 1998.
Article 2. Interim Measures for appointing outside Director
Notwithstanding the amended provision of Article 31 Paragraph (1), the Company may appoint at most three (3) outside Director(s).
Addendum No. 12 (as of March 20, 1999)
Article 1. Effective Date
These Articles of Incorporation shall become effective from March 20, 1999.
Article 2. Issuance of New Shares
The Company shall issue 160,210 common shares by June 17, 1999.
Article 3. Manner to Issue New Shares
At the time of issuance of new shares under Article 2 of the Addendum, the Company shall, notwithstanding the provision of Article 10,paragraph (1) of the text, allocate all of such new shares to the stockholders, except foreigners who are restricted from the acquisition of securitiesbeyond a certain limit according to Article 6, Item 3 of the Telecommunication Business Act, in proportion to stocks which the stockholder owns.Provided, however that the issue price and manner of subscription shall be determined by resolution of the Board of Directors.
Article 4. Transient Provision
The provision of Article 32, paragraph (3) of the text shall be effective to the date immediately preceding the date set for the Ordinary GeneralMeeting of Shareholders in 2003 (amended on March 17, 2000).
Addendum No. 13 (as of March 17, 2000)
Article 1. Date of Effectiveness
These Articles of Incorporation shall take effect as of March 17, 2000. However, the amended Article 31 shall take effect from the date ofconvening the Ordinary General Meeting of Shareholders following the close of the 2000 business year.
Article 2. Allocation of New Shares to a Third Party
Notwithstanding the provisions of Article 10, Paragraph (1) of the text, the Company may allocate 579,492 new shares (on the basis of 5,000 Wonas par value of a share) to Pohang Iron & Steel Co., Ltd., once or more within year 2000 by a resolution of the Board of Directors in the manner of theissuance of new shares to a third party.
Addendum No. 14 (as of March 16, 2001)
Article 1. Date of Effectiveness
These Articles of Incorporation shall take effect as of March 16, 2001.
15
Copyright © 2020 www.secdatabase.com. All Rights Reserved.Please Consider the Environment Before Printing This Document
Article 2. Transient Provision
Article 33 shall also be applied to the Directors who have been elected prior to the effective date of these Articles of Incorporation.
Addendum No. 15 (as of March 12, 2004)
Article 1. Date of Effectiveness
These Articles of Incorporation shall take effect as of March 12, 2004.
Addendum No. 16 (as of March 11, 2005)
Article 1. Date of Effectiveness
These Articles of Incorporation shall take effect as of March 11, 2005.
Addendum No. 17 (as of March 10, 2006)
Article 1. Date of Effectiveness
These Articles of Incorporation shall take effect as of March 10, 2006.
Addendum No. 18 (as of March 14, 2008)
Article 1. Date of Effectiveness
These Articles of Incorporation shall take effect as of March 14, 2008.
Addendum No. 19 (as of March 12, 2010)
Article 1. Date of Effectiveness
These Articles of Incorporation shall take effect as of March 12, 2010.
Addendum No. 20 (as of August 31, 2011)
Article 1. Date of Effectiveness
These Articles of Incorporation shall take effect as of October 1, 2011.
Addendum No. 21 (as of March 23, 2012)
Article 1. Date of Effectiveness
These Articles of Incorporation shall take effect as of March 23, 2012. However, the amended provisions of Article 17-2 and Article 52,Paragraph (1), Item 3 and Paragraph (2) shall take effect as of April 15, 2012.
Addendum No. 22 (as of March 22, 2013)
Article 1. Date of Effectiveness
These Articles of Incorporation shall take effect as of March 22, 2013.
16
Copyright © 2020 www.secdatabase.com. All Rights Reserved.Please Consider the Environment Before Printing This Document
Addendum No. 23 (as of March 21, 2014)
Article 1. Date of Effectiveness
These Articles of Incorporation shall take effect as of March 21, 2014.
Addendum No. 24 (as of March 20, 2015)
Article 1. Date of Effectiveness
These Articles of Incorporation shall take effect as of March 20, 2015.
Addendum No. 25 (as of March 18, 2016)
Article 1. Date of Effectiveness
These Articles of Incorporation shall take effect as of March 18, 2016.
Addendum No. 26 (as of March 24, 2017)
Article 1. Date of Effectiveness
These Articles of Incorporation shall take effect as of March 24, 2017.
Addendum No. 27 (as of March 26, 2019)
Article 1. Date of Effectiveness
These Articles of Incorporation shall take effect as of March 26, 2019. However, the amended provisions of Articles 7, 9, 9-2, 12, 13, 17, 17-3(except those translated to Korean) shall take effect as of the effective date of the [Act on Electronic Registration of Stocks, Bonds, Etc.].
Addendum No. 28 (as of March 26, 2020)
Article 1. Date of Effectiveness
These Articles of Incorporation shall take effect as of March 26, 2020. However, Article 45-3 shall take effect as of January 1, 2021.
17
Copyright © 2020 www.secdatabase.com. All Rights Reserved.Please Consider the Environment Before Printing This Document
Exhibit 2.3
Description of American Depositary Shares
The following is a summary of the deposit agreement dated as of May 31, 1996, as amended by amendment no. 1 dated as of March 15, 1999,amendment no. 2 dated as of April 24, 2000 and amendment no. 3 dated as of July 24, 2002, among SK Telecom Co., Ltd., Citibank, N.A. (�Citibank�),as ADR depositary, and all holders and beneficial owners of ADSs. Unless otherwise indicated, all references in this exhibit to the terms �we,� �us,��our� and �SK Telecom� refer to SK Telecom Co., Ltd., all references in this exhibit to �ADSs� are to our American depositary shares, and allreferences to �ADRs� are to the American depositary receipts issued under our ADSs. The deposit agreement is governed by the laws of the State ofNew York. Because it is a summary, this description does not contain all the information that may be important to you as an owner of our ADSs. Formore complete information, you should read the entire deposit agreement and the ADR. The deposit agreement has been filed as Exhibit 2.1 to ourannual report on Form 20-F. Copies of the deposit agreement are available for inspection at the principal New York office of the ADR depositary,currently located at 388 Greenwich Street, 14th Floor, New York, NY 10013, United States of America, and at the principal London office of the ADRdepositary, currently located at Canada Square, Canary Wharf, London, E14 5LB, England.
American Depositary Receipts
The ADR depositary may execute and deliver ADRs evidencing the ADSs. Each ADR evidences a specified number of ADSs, each ADSrepresenting one-ninth of one share of our common stock to be deposited with the ADR depositary�s custodian in Seoul. Korea Securities Depository isthe institution authorized under applicable law to effect book-entry transfers of our common shares, known as the �Custodian.� The Custodian is locatedat 23, Yeouinaru-ro 4-gil, Yeongdeungpo-gu, Seoul 07330, Korea. An ADR may represent any number of ADSs. We and the ADR depositary will treatonly persons in whose names ADRs are registered on the books of the registrar as holders of ADRs.
Uncertificated Form of ADSs
Pursuant to a side letter agreement dated as of October 1, 2007, the ADR depositary may also issue ADSs that are not evidenced by ADRs (the�uncertificated ADSs�) on its direct registration system, unless otherwise specifically instructed in writing by the applicable holder. The uncertificatedADSs are not represented by any instrument(s) but are evidenced only by the registration of �uncertificated securities� on the books and records of theADR depositary maintained for such purpose. Uncertificated ADSs are in all material respects identical to certificated ADSs of the same type and class,except that (i) no ADR(s) are, nor need to be, issued to evidence uncertificated ADSs, (ii) uncertificated ADSs are, subject to the terms of the depositagreement (as supplemented by the side letter agreement), transferable upon the same terms and conditions as uncertificated securities under New Yorklaw, (iii) each holder�s ownership of uncertificated ADSs are recorded on the books and records of the ADR depositary maintained for such purpose andevidence of such holder�s ownership are reflected in periodic statements provided by the ADR depositary to each such holder in accordance withapplicable law, (iv) the ADR depositary may from time to time, upon notice to the holders of uncertificated ADSs affected thereby, establish rules andamend or supplement existing rules, as may be deemed reasonably necessary to maintain the direct registration system for the ADSs and for the issuanceof uncertificated ADSs on behalf of holders, provided that such rules do not conflict with the terms of the deposit agreement (as supplemented by theside letter agreement) and applicable law, (v) the holder of uncertificated ADSs are not entitled to any benefits under the deposit agreement (assupplemented by the side letter agreement) and such holder�s uncertificated ADSs shall not be valid or enforceable for any purpose against the ADRdepositary or us unless such holder is registered on the books and records of the ADR depositary maintained for such purpose, (vi) the ADR depositarymay, in connection with any deposit of shares resulting in the issuance of uncertificated ADSs and with any transfer, pledge, release and cancellation ofuncertificated ADSs, require the prior receipt of such documentation as the ADR depositary may reasonably request, and (vii) upon termination of thedeposit agreement (as supplemented by the side letter agreement), the ADR depositary does not require holders of uncertificated ADSs to affirmativelyinstruct the ADR depositary or to take other action before remitting proceeds from the sale of the deposited securities represented by such holders�uncertificated ADSs under the terms of the deposit agreement.
Copyright © 2020 www.secdatabase.com. All Rights Reserved.Please Consider the Environment Before Printing This Document
Holders of uncertificated ADSs that are not subject to any registered pledges, liens, restrictions or adverse claims, of which the ADR depositaryhas written notice at such time, may exchange the uncertificated ADSs (or any portion thereof) for ADRs of the same type and class, subject in eachcase to applicable laws and any rules the ADR depositary may establish from time to time in respect of the uncertificated ADSs. In addition, so long asthe ADR depositary maintains its direct registration system for the ADSs, the holders of ADRs have the right to exchange the ADRs (or any portionthereof) for uncertificated ADSs upon (i) the due surrender of the ADRs to the ADR depositary for such purpose, and (ii) the presentation of a writtenrequest to such effect to the ADR depositary, subject in each case to all liens and restrictions noted on the ADR evidencing the ADS(s) and all adverseclaims of which the ADR depositary then has written notice, the terms of the deposit agreement (as supplemented by the side letter agreement) and therules that the ADR depositary may establish from time to time for such purposes thereunder, and applicable law. Moreover, holders of uncertificatedADSs may also request the sale of ADSs through the ADR depositary, subject to the terms and conditions generally applicable to the sale of ADSsthrough the ADR depositary from time to time (which may be changed by the ADR depositary).
Deposit and Withdrawal of Shares of Common Stock
Notwithstanding the provisions described below, under the terms of the deposit agreement, the deposit of shares and issuance of ADSs may onlybe made if the total number of shares represented by ADSs after such deposit does not exceed a specified maximum. See �Item 3.D. Risk Factors �Risks Relating to Securities � If an investor surrenders his or her ADSs to withdraw the underlying shares, he or she may not be allowed to deposit theshares again to obtain ADSs.� of our most recent annual report on Form 20-F. This limit will be adjusted in certain circumstances, including (1) uponthe cancellation of existing ADSs, (2) upon future offerings of ADSs by us or our shareholders, (3) rights offerings and (4) adjustments for sharereclassifications. The limit also may be decreased in certain circumstances. Notwithstanding the foregoing, the ADR depositary and the Custodian maynot accept deposits of shares of common stock for issuance of ADSs if it has been notified by us in writing that we block deposits to prevent a violationof applicable Korean laws or regulations or a violation of our articles of incorporation. In addition, the ADR depositary may not accept deposits ofshares of common stock for issuance of ADSs from a person who identifies him-, her- or itself to the ADR depositary, and has been identified in writingby us, as a holder of at least 4.0% of our shares of common stock.
The shares of common stock underlying the ADSs are delivered to the ADR depositary�s Custodian in book-entry form. Accordingly, no sharecertificates will be issued but the ADR depositary will hold the shares of common stock through the book-entry settlement system of the Custodian. Thedelivery of the shares of common stock pursuant to the deposit agreement will take place through the facilities of the Custodian in accordance with itsapplicable settlement procedures. The ADR depositary will execute and deliver ADSs if you or your broker deposit shares or evidence of rights toreceive shares of common stock with the Custodian. Upon payment of fees and expenses and any taxes or charges, such as stamp taxes or stock transfertaxes, the ADR depositary will register the appropriate number of ADSs in the names you designate. The ADR depositary and the ADR depositary�sCustodian will refuse to accept shares of common stock for deposit whenever we restrict transfer of shares of common stock to comply with ownershiprestrictions under applicable law or our articles of incorporation or whenever the deposit would cause the total number of shares of common stockdeposited to exceed a level we determine from time to time. We may instruct the ADR depositary to take certain actions with respect to a holder ofADSs who holds in excess of the ownership limitation set forth in the deposit agreement, including the mandatory sale or disposition of the sharesrepresented by the ADSs in excess of such ownership limitations if, and to the extent, permitted by applicable law.
You may surrender your ADRs to the ADR depositary to withdraw the underlying shares of our common stock. Upon payment of the fees and anygovernmental charges and taxes provided in the deposit agreement, and subject to applicable laws and regulations of Korea and our articles ofincorporation, you will be entitled to physical delivery or electronic delivery to an account in Korea or, if permissible under applicable Korean law,outside the United States, of the shares of common stock evidenced by the ADRs and any other property at the time represented by ADR yousurrendered. If you surrender an ADR evidencing a number of ADSs not evenly divisible by nine, the ADR depositary will deliver the appropriatewhole number of shares of common stock represented by the surrendered ADSs and will execute and deliver to you a new ADR evidencing ADSsrepresenting any remaining fractional shares of common stock.
2
Copyright © 2020 www.secdatabase.com. All Rights Reserved.Please Consider the Environment Before Printing This Document

If you request withdrawal of shares of common stock, you must deliver to the ADR depositary a written order directing the ADR depositary tocause the shares of common stock being withdrawn to be delivered or to cause such delivery upon the written order of the person designated in yourorder, subject to applicable Korean laws and the provisions of the deposit agreement.
Under the provisions of the deposit agreement, the ADR depositary may not lend shares of common stock or ADSs. However, subject to theprovisions of the deposit agreement and limitations established by the ADR depositary, the ADR depositary may execute and deliver ADSs beforedeposit of the underlying shares of common stock. This is called a pre-release of the ADS. The ADR depositary may also deliver shares of commonstock upon cancellation of pre-released ADSs (even if the cancellation occurs before the termination of the pre-release). The ADR depositary maypre-release ADSs only under the following circumstances:
� before or at the time of the pre-release, the person to whom the pre-release is being made must represent to the ADR depositary in writingthat the person, or, in case of an institution its customer, owns the shares of common stock or ADSs to be deposited and show evidence of theownership to the ADR depositary�s satisfaction;
� before or at the time of such pre-release, the person to whom the pre-release is being made must agree in writing that he or she will hold theshares of common stock or ADSs in trust for the ADR depositary until their delivery to the ADR depositary or Custodian, reflect on his or herrecords the ADR depositary as owner of such shares of common stock or ADSs and deliver such shares of common stock upon the ADRdepositary�s request;
� the pre-release must be fully collateralized with cash or U.S. government securities;
� the ADR depositary must be able to terminate the pre-release on not more than five business days� notice; and
� the pre-release is subject to further indemnities and credit regulations as the ADR depositary deems appropriate.
The ADR depositary may retain for its own account any compensation received by it in connection with the pre-release, such as earnings on thecollateral.
If you want to withdraw the shares of common stock from the depositary facility, you must register your identity with the Financial SupervisoryService of Korea (the �FSS�) before you acquire the shares of common stock unless you intend to sell the shares of common stock within three months.See �Item 10.D. Exchange Controls � Korean Foreign Exchange Controls and Securities Regulations � Restrictions Applicable to Shares� of our mostrecent annual report on Form 20-F.
Dividends, Other Distributions and Rights
If the ADR depositary can, in its judgment and pursuant to applicable law, convert Won (or any other foreign currency) into Dollars on areasonable basis and transfer the resulting Dollars to the United States, the ADR depositary will as promptly as practicable convert all cash dividendsand other cash distributions received by it on the deposited shares of common stock into Dollars and distribute the Dollars to you in proportion to thenumber of ADSs representing shares of common stock held by you, after deduction of the fees and expenses of the ADR depositary. If the ADRdepositary determines that in its judgment any currency other than Dollars it receives from us cannot be converted and distributed on a reasonable basis,the ADR depositary may distribute the currency it receives to the extent permitted under applicable law or hold the currency for your account if you areentitled to receive the distribution. The ADR depositary will not be liable for any interest. Before making a distribution, the ADR depositary will deductany withholding taxes that must be paid.
In the event that the ADR depositary or the Custodian receives any distribution upon any deposited shares of common stock in property orsecurities (other than shares of common stock, non-voting preferred stock or rights to receive shares of common stock or non-voting preferred stock),the ADR depositary will distribute the property or securities to you in proportion to your holdings in any manner that the ADR depositary deems, afterconsultation with us, equitable and practicable. If the ADR depositary determines that any distribution of property or securities
3
Copyright © 2020 www.secdatabase.com. All Rights Reserved.Please Consider the Environment Before Printing This Document
(other than shares of common stock, non-voting preferred stock or rights to receive shares of common stock or non-voting preferred stock) cannot bemade proportionally, or if for any other reason the ADR depositary deems the distribution not to be feasible, the ADR depositary may, after consultationwith us, dispose of all or a portion of the property or securities in such amounts and in such manner, including by public or private sale, as the ADRdepositary deems equitable or practicable. The ADR depositary will distribute to you the net proceeds of any such sale, or the balance of the property orsecurities, after the deduction of the fees and expenses of the ADR depositary.
If a distribution by us consists of a dividend in, or free distribution of, our shares of common stock, the ADR depositary may, with our approval,and will, if we request, deposit the shares of common stock and either (1) distribute to you, in proportion to your holdings, additional ADSs representingthose shares of common stock, or (2) reflect on the records of the ADR depositary the increase in the aggregate number of ADSs representing thosenumber of shares of common stock, in both cases, after the deduction of the fees and expenses of the ADR depositary. If the ADR depositary deems thatsuch distribution for any reason is not feasible, the ADR depositary may adopt, after consultation with us, any method as it may deem equitable andpracticable, including by public or private sale of all or part of the shares of common stock received. The ADR depositary will distribute to you the netproceeds of any such sale in the same way as it does with cash. The ADR depositary will only distribute whole ADSs. If the ADR depositary does notdistribute additional ADSs, then each outstanding ADS will also represent the new shares so distributed.
If a distribution by us consists of a dividend in, or free distribution of, shares of non-voting preferred stock, the ADR depositary will deposit suchshares of non-voting preferred stock under a non-voting preferred stock deposit agreement to be entered into among us, the ADR depositary and allholders and beneficial owners of depositary shares. The ADR depositary will deliver to you, in proportion to your holdings of ADSs, depositary sharesissued under the non-voting preferred stock deposit agreement representing the number of non-voting shares received as such dividend or distribution. Ifthe ADR depositary deems such distribution for any reason is not feasible, the ADR depositary may adopt, after consultation with us, any method as itmay deem equitable and practicable, including by public or private sale of all or part of the non-voting shares received. The ADR depositary willdistribute to you the net proceeds of any such sale in the same way as it does with cash. The ADR depositary will only distribute whole depositaryshares. We are not obligated to list depositary shares representing non-voting shares on any exchange.
If we offer holders of our securities any rights to subscribe for additional shares of common stock or any other rights, the ADR depositary maymake these rights available to you. The ADR depositary must first determine whether it is lawful and feasible to do so. If the ADR depositarydetermines that it is not lawful or feasible to make these rights available to you, then upon our request, the ADR depositary will sell the rights anddistribute the proceeds in the same way as it would do with cash. The ADR depositary may allow these rights that are not distributed or sold to lapse. Inthat case, you will receive no value for these rights.
If we issue any rights with respect to non-voting shares, the securities issuable upon any exercise of such rights by holders or beneficial ownerswill be depositary shares representing those non-voting shares issued under the provisions of a non-voting preferred stock deposit agreement.
If a registration statement under the U.S. Securities Act of 1933, as amended (the �Securities Act�) is required with respect to the securities towhich any rights relate in order for us to offer the rights to you and to sell the securities represented by these rights, the ADR depositary will not offersuch rights to you until such a registration is in effect, or unless the offering and sale of such securities and such rights to you are exempt from theregistration requirements of the Securities Act or any required filing, report, approval or consent has been submitted, obtained or granted. We or theADR depositary will not be obligated to register the rights or securities under the Securities Act or to submit, obtain or request any filing, report,approval or consent.
The ADR depositary may not be able to convert any currency or to sell or dispose of any distributed or offered property or rights in a timelymanner or at a specified price, or at all.
Record Dates
The ADR depositary will fix a record date, after consultation with us, in each of the following situations:
� any cash dividend or other cash distribution becomes payable;
4
Copyright © 2020 www.secdatabase.com. All Rights Reserved.Please Consider the Environment Before Printing This Document
� any distribution other than cash is made;
� rights are issued with respect to deposited shares of common stock;
� the ADR depositary causes a change in the number of shares of common stock that are represented by each ADS; or
� the ADR depositary receives notice of any shareholders� meeting.
The record date will, to the extent practicable, be as near as the record date fixed by us for the shares of common stock. The record date willdetermine (1) the ADR holders who are entitled to receive the dividend, distribution or rights, or the net proceeds of the sale of the rights; or (2) theADR holders who are entitled to receive notices or exercise rights.
Voting of the Underlying Shares of Common Stock
We will give the ADR depositary a notice of any meeting or solicitation of shareholder proxies immediately after we finalize the form andsubstance of such notice but not less than 14 days before the meeting. As soon as practicable after it receives our notice, the ADR depositary will fix arecord date, and upon our written request, the ADR depositary will mail to you a notice that will contain the following:
� the information contained in our notice to the ADR depositary including an English translation, or, if requested by us, a summary of theinformation provided by us;
� a statement that the ADR holders as of the close of business on a specified record date will be entitled to instruct the ADR depositary as tohow to exercise their voting rights for the number of shares of deposited shares of common stock, subject to the provisions of applicableKorean law and our articles of incorporation, which provisions, if any, will be summarized in the notice to the extent that they arematerial; and
� a statement as to the manner in which the ADR holders may give their instructions.
Upon your written request received on or before the date set by the ADR depositary for this purpose, the ADR depositary will endeavor, in so faras practicable, to vote or cause to be voted the deposited shares of common stock in accordance with the instructions set forth in your written requests.The ADR depositary may not itself exercise any voting discretion over any deposited shares of common stock. You may only exercise the voting rightsin respect of nine ADSs or multiples of nine ADSs. ADR holders may not be entitled to give instruction to vote the shares represented by the ADSs if,and to the extent, the total number of shares represented by the ADSs of an ADR holder exceeds the limit set under applicable law. We can give noassurance to you, however, that we will notify the ADR depositary sufficiently in advance of the scheduled date of a meeting or solicitation of consentsor proxies to enable the ADR depositary to make a timely mailing of notices to you, or that you will receive the notices sufficiently in advance of ameeting or solicitation of consents or proxies to give instructions to the ADR depositary.
Inspection of Transfer Books
The ADR depositary will keep books at its principal New York office, which is currently located at 388 Greenwich Street, 14th Floor, New York,NY 10013, for the registration and transfer of ADRs. You may inspect the books of the ADR depositary as long as the inspection is not for the purposeof communicating with holders in the interest of a business or object other than our business or a matter related to the deposit agreement or the ADRs.
Reports and Notices
On or before the first date on which we give notice, by publication or otherwise, of any meeting of shareholders, or of any adjourned meeting ofshareholders, or of the taking of any action in respect of any cash or other distributions or the offering of any rights in respect of the shares of commonstock, we will transmit to the Custodian and the ADR depositary sufficient copies of the notice in English in the form given or to be given toshareholders. We will furnish to the ADR depositary English language versions of any reports, notices and other communications that we generallytransmit to holders of our common stock, including our annual reports, with
5
Copyright © 2020 www.secdatabase.com. All Rights Reserved.Please Consider the Environment Before Printing This Document
annual audited consolidated financial statements prepared in conformity with International Financial Reporting Standards (�IFRS�) and unauditednon-consolidated semiannual financial statements prepared in conformity with IFRS. The ADR depositary will arrange for the prompt mailing of copiesof these documents, or, if we request, a summary of any such notice provided by us to you or, at our request, make notices, reports (other than the annualreports and semiannual financial statements) and other communications available to you on a basis similar to that for the holders of our common stockor on such other basis as we may advise the ADR depositary according to any applicable law, regulation or stock exchange requirement.
Notices to you under the deposit agreement will be deemed to have been duly given if personally delivered or sent by mail or cable, telegraph orfacsimile transmission, confirmed by letter, addressed to you at your address as it appears on the transfer books of the ADR depositary or at such otheraddress as you have notified the ADR depositary.
In addition, the ADR depositary will make available for inspection by holders at its principal New York office and its principal London office anynotices, reports or communications, including any proxy soliciting materials, received from us that we generally transmit to the holders of our commonstock or other deposited securities, including the ADR depositary. The ADR depositary will also send to you copies of reports and communications wewill provide as provided in the deposit agreement.
Changes Affecting Deposited Shares of Common Stock
In case of a change in the par value, or a split-up, consolidation or any other reclassification of our common shares or upon any recapitalization,reorganization, merger or consolidation or sale of assets affecting us, any securities received by the ADR depositary or the Custodian in exchange for, inconversion of or in respect of deposited shares of our common stock will be treated as new deposited shares of common stock under the depositagreement. In that case, ADSs will, subject to the terms of the deposit agreement and applicable laws and regulations, including any registrationrequirements under the Securities Act, represent the right to receive the new deposited shares of common stock, unless additional ADRs are issued, as inthe case of a stock dividend, or unless the ADR depositary calls for the surrender of outstanding ADRs to be exchanged for new ADRs.
Amendment and Termination of the Deposit Agreement
We may agree with the ADR depositary to amend the deposit agreement and the ADSs without your consent for any reason. If the amendmentadds or increases fees or charges, except for taxes and other governmental charges or certain expenses of the ADR depositary, or prejudices anysubstantial existing right of ADR holders, it will only become effective 30 days after the ADR depositary notifies you of the amendment. If you continueto hold your ADSs at the time an amendment becomes effective, you will be considered to have agreed to the amendment and to be bound by the depositagreement as amended. Except as otherwise required by any mandatory provisions of applicable law, no amendment may impair your right to surrenderyour ADSs and to receive the underlying deposited securities.
The ADR depositary will terminate the deposit agreement if we ask it to do so with 90 days� prior written notice. The ADR depositary may alsoterminate the deposit agreement if the ADR depositary has notified us at least 90 days in advance that it would like to resign and we have not appointeda new depositary. In both cases, the ADR depositary must notify you at least 30 days before the termination date.
If any ADRs remain outstanding after the date of termination, the ADR depositary will stop performing any further acts under the depositagreement, except:
� to collect dividends and other distributions pertaining to the deposited shares of common stock;
� to sell property and rights and the conversion of deposited shares of common stock into cash as provided in the deposit agreement; and
� to deliver deposited shares of common stock, together with any dividends or other distributions received with respect to the deposited sharesof common stock and the net proceeds of the sale of any rights or other property represented by those ADSs in exchange for surrenderedADRs.
6
Copyright © 2020 www.secdatabase.com. All Rights Reserved.Please Consider the Environment Before Printing This Document
At any time after the expiration of six months from the date of termination, the ADR depositary may sell any remaining deposited shares ofcommon stock and hold uninvested the net proceeds in an unsegregated account, together with any other cash or property then held, without liability forinterest, for the pro rata benefit of the holders of ADSs that have not been surrendered by then.
Charges of ADR Depositary
The fees and expenses of the ADR depositary as agreed between us and the ADR depositary include:
� taxes and other governmental charges;
� registration fees applicable to transfers of shares of common stock on our shareholders� register, or that of any entity acting as registrar forthe shares, to the name of the ADR depositary or its nominee, or the Custodian or its nominee, when making deposits or withdrawals underthe deposit agreement;
� cable, telex and facsimile transmission expenses that are expressly provided in the deposit agreement;
� expenses incurred by the ADR depositary in the conversion of foreign currency into Dollars under the deposit agreement;
� a fee of up to US$5.00 per 100 ADSs, or portion thereof, for execution and delivery of ADSs and the surrender of ADRs under the depositagreement; and
� a fee of up to US$0.02 per ADS held for cash distributions, a sale or exercise of rights or the taking of any other corporate action involvingdistributions to shareholders.
For a detailed description of fees and charges payable by the holders of ADSs under the deposit agreement, see �Item 12.D. American DepositaryShares � Fees and Charges under Deposit Agreement� of our most recent annual report on Form 20-F.
General
Neither we nor the ADR depositary will be liable to you if prevented or delayed by any present or future law, governmental authority, anyprovision of our articles of incorporation or any circumstances beyond our or its control in performing our or its obligations under the depositagreement. The deposit agreement provides that the ADR depositary will hold the shares of common stock for your sole benefit. Our obligations andthose of the ADR depositary under the deposit agreement are expressly limited to performing, in good faith and without negligence, our and itsrespective duties specified in the deposit agreement.
The ADSs are transferable on the books of the ADR depositary, provided that the ADR depositary may, after consultation with us, close thetransfer books at any time or from time to time, when deemed expedient by it in connection with the performance of its duties. As a condition precedentto the execution and delivery of any ADSs, registration of transfer, split-up, combination of any ADR or surrender of any ADS for the purpose ofwithdrawal of deposited shares of common stock, the ADR depositary or the Custodian may require payment from the depositor of the shares ofcommon stock or a holder of ADSs of a sum sufficient to reimburse the ADR depositary for any tax or other governmental charge and any stock transferor registration fee and payment of any applicable fees payable by the holders of ADSs.
Any person depositing shares of common stock, any holder of an ADS or any beneficial owner may be required from time to time to file with theADR depositary or the Custodian a proof of citizenship, residence, exchange control approval, payment of applicable Korean or other taxes orgovernmental charges, or legal or beneficial ownership and the nature of their interest, to provide information relating to the registration on ourshareholders� register (or our appointed agent for the transfer and registration of shares of common stock) of the shares of common stock presented fordeposit or other information, to execute certificates and to make representations and warranties as we or the ADR depositary may deem necessary orproper or to enable us or the ADR depositary to perform our and its obligations under the deposit agreement. The ADR depositary may withhold theexecution or delivery or registration of transfer of all or part of any ADR or the distribution or sale of any dividend or other distribution of rights or ofthe proceeds from their sale or the delivery of any shares deposited
7
Copyright © 2020 www.secdatabase.com. All Rights Reserved.Please Consider the Environment Before Printing This Document
under the deposit agreement and any other securities, property and cash received by the ADR depositary or the Custodian until the proof or otherinformation is filed or the certificates are executed or the representations and warranties are made. The ADR depositary shall provide us, unlessotherwise instructed by us, in a timely manner, with copies of any of these proofs and certificates and these written representations and warranties.
The delivery and surrender of ADSs and transfer of ADSs generally may be suspended during any period when our or the ADR depositary�stransfer books are closed or, if that action is deemed necessary or advisable by us or the ADR depositary, at any time or from time to time in accordancewith the deposit agreement. We may restrict, in a manner as we deem appropriate, transfers of shares of common stock where the transfers may result inownership of shares of common stock in excess of limits under applicable law. Except as described in �Deposit and Withdrawal of Shares of CommonStock� above, notwithstanding any other provision of the deposit agreement, the surrender of outstanding ADRs and withdrawal of Deposited Securities(as defined in the deposit agreement) represented by the ADRs may be suspended, but only as required in connection with (1) temporary delays causedby closing the transfer books of the ADR depositary or the issuer of any Deposited Securities (or the appointed agent or agents for such issuer for thetransfer and registration of such Deposited Securities) in connection with voting at a shareholders� meeting or the payment of dividends, (2) payment offees, taxes and similar charges, or (3) compliance with any United States or foreign laws or governmental regulations relating to the ADRs or to thewithdrawal of the Deposited Securities.
Governing Law
The deposit agreement and the ADRs will be interpreted under, and all rights under the deposit agreement or the ADRs are governed by, the lawsof the State of New York.
We have irrevocably submitted to the non-exclusive jurisdiction of New York State or United States Federal Courts located in New York City andwaived any objection to legal actions or proceedings in these courts whether on the ground of venue or on the ground that the proceedings have beenbrought in an inconvenient forum.
This submission was made for the benefit of the ADR depositary and the holders and will not limit the right of any of them to take legal actions orproceedings in any other court of competent jurisdiction nor will the taking of legal actions or proceedings in one or more jurisdictions preclude thetaking of legal actions or proceedings in any other jurisdiction (whether concurrently or not), to the extent permitted under applicable law.
Information Relating to the ADR Depositary
Citibank has been appointed as ADR depositary pursuant to the deposit agreement. Citibank is an indirect wholly-owned subsidiary of CitigroupInc., a Delaware corporation whose principal office is located in New York, New York. Citibank is a global financial services organization servingindividuals, businesses, governments and financial institutions in approximately 100 countries around the world.
Citibank was originally organized on June 16, 1812, and now is a national banking association organized under the National Bank Act of 1864 ofthe United States of America. Citibank is primarily regulated by the United States Office of the Comptroller of the Currency. Its principal office is at 388Greenwich Street, 14th Floor, New York, NY 10013.
The consolidated balance sheets of Citibank are set forth in Citigroup�s most recent annual report on Form 10-K and quarterly report onForm 10-Q, each on file with the SEC.
Citibank�s articles of association and by-laws, each as currently in effect, together with Citigroup�s most recent annual and quarterly reports willbe available for inspection at the Depositary Receipt office of Citibank, N.A., 388 Greenwich Street, 14th Floor, New York, NY 10013.
8
Copyright © 2020 www.secdatabase.com. All Rights Reserved.Please Consider the Environment Before Printing This Document

Exhibit 8.1
List of Subsidiaries of SK Telecom Co., Ltd.(As of December 31, 2019)
Subsidiary Name Jurisdiction of Incorporation
SK Telink Co., Ltd. Korea
SK Communications Co., Ltd. Korea
SK Broadband Co., Ltd. Korea
PS&Marketing Corporation Korea
SERVICE ACE Co., Ltd. Korea
SERVICE TOP Co., Ltd. Korea
SK O&S Co., Ltd. Korea
SK Telecom China Holdings Co., Ltd. China
SK Global Healthcare Business Group, Ltd. Hong Kong
YTK Investment Ltd. Cayman Islands
Atlas Investment Cayman Islands
SKT Americas, Inc. USA
One Store Co., Ltd. Korea
SK Planet Co., Ltd. Korea
Eleven Street Co., Ltd. Korea
DREAMUS COMPANY Korea
SK Infosec Co., Ltd. Korea
Life & Security Holdings Co., Ltd. Korea
Quantum Innovation Fund I Korea
SK Telecom Japan Inc. Japan
id Quantique SA Switzerland
SK Telecom TMT Investment Corp. USA
FSK L&S Co., Ltd. Korea
Incross Co., Ltd. Korea
Happy Hanool Co., Ltd. Korea
SK m&service Co., Ltd. Korea
SK Planet Global Holdings Pte. Ltd. Singapore
SKP America LLC. USA
K-net Culture and Contents Venture Fund Korea
iriver Enterprise Ltd. Hong Kong
iriver China Co., Ltd. China
Dongguan iriver Electronics Co., Ltd. China
Copyright © 2020 www.secdatabase.com. All Rights Reserved.Please Consider the Environment Before Printing This Document
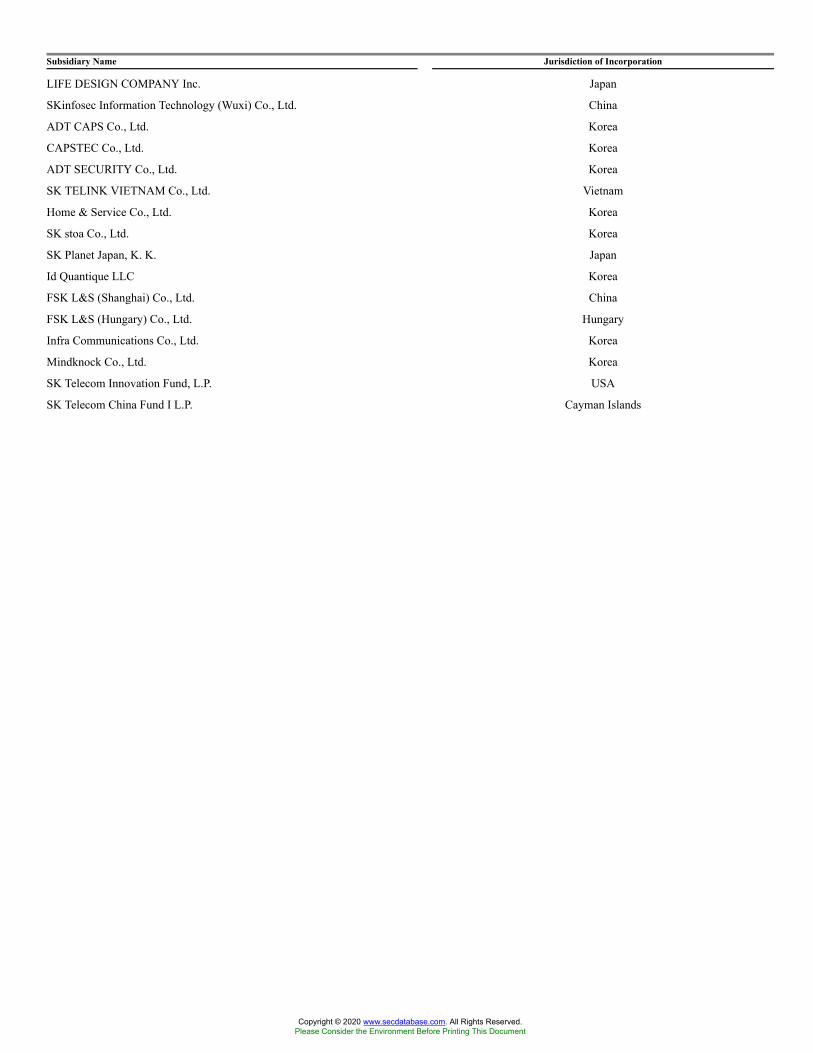
Subsidiary Name Jurisdiction of Incorporation
LIFE DESIGN COMPANY Inc. Japan
SKinfosec Information Technology (Wuxi) Co., Ltd. China
ADT CAPS Co., Ltd. Korea
CAPSTEC Co., Ltd. Korea
ADT SECURITY Co., Ltd. Korea
SK TELINK VIETNAM Co., Ltd. Vietnam
Home & Service Co., Ltd. Korea
SK stoa Co., Ltd. Korea
SK Planet Japan, K. K. Japan
Id Quantique LLC Korea
FSK L&S (Shanghai) Co., Ltd. China
FSK L&S (Hungary) Co., Ltd. Hungary
Infra Communications Co., Ltd. Korea
Mindknock Co., Ltd. Korea
SK Telecom Innovation Fund, L.P. USA
SK Telecom China Fund I L.P. Cayman Islands
Copyright © 2020 www.secdatabase.com. All Rights Reserved.Please Consider the Environment Before Printing This Document

Exhibit 12.1
CERTIFICATION
Pursuant to Section 302 of the Sarbanes-Oxley Act 2002
I, Jung Ho Park, certify that:
1. I have reviewed this annual report on Form 20-F of SK Telecom Co., Ltd.;
2. Based on my knowledge, this report does not contain any untrue statement of a material fact or omit to state a material fact necessary to make thestatements made, in light of the circumstances under which such statements were made, not misleading with respect to the period covered by thisreport;
3. Based on my knowledge, the financial statements, and other financial information included in this report, fairly present in all material respects thefinancial condition, results of operations and cash flows of the company as of, and for, the periods presented in this report;
4. The company�s other certifying officer and I are responsible for establishing and maintaining disclosure controls and procedures (as defined inExchange Act Rules 13a-15(e) and 15d-15(e)) and internal control over financial reporting (as defined in Exchange Act Rules 13a-15(f) and15d-15(f)) for the company and have:
(a) Designed such disclosure controls and procedures, or caused such disclosure controls and procedures to be designed under our supervision, toensure that material information relating to the company, including its consolidated subsidiaries, is made known to us by others within thoseentities, particularly during the period in which this report is being prepared;
(b) Designed such internal control over financial reporting, or caused such internal control over financial reporting to be designed under oursupervision, to provide reasonable assurance regarding the reliability of financial reporting and the preparation of financial statements forexternal purposes in accordance with generally accepted accounting principles;
(c) Evaluated the effectiveness of the company�s disclosure controls and procedures and presented in this report our conclusions about theeffectiveness of the disclosure controls and procedures, as of the end of the period covered by this report based on such evaluation; and
(d) Disclosed in this report any change in the company�s internal control over financial reporting that occurred during the period covered by theannual report that has materially affected, or is reasonably likely to materially affect, the company�s internal control over financial reporting;and
5. The company�s other certifying officer and I have disclosed, based on our most recent evaluation of internal control over financial reporting, tothe company�s auditors and the audit committee of the company�s board of directors (or persons performing the equivalent functions):
(a) All significant deficiencies and material weaknesses in the design or operation of internal control over financial reporting which arereasonably likely to adversely affect the company�s ability to record, process, summarize and report financial information; and
(b) Any fraud, whether or not material, that involves management or other employees who have a significant role in the company�s internalcontrol over financial reporting.
Date: April 29, 2020
/s/ Jung Ho ParkJung Ho Park
President and Chief Executive Officer
Copyright © 2020 www.secdatabase.com. All Rights Reserved.Please Consider the Environment Before Printing This Document
Exhibit 12.2
CERTIFICATION
Pursuant to Section 302 of the Sarbanes-Oxley Act of 2002
I, Poong Young Yoon, certify that:
1. I have reviewed this annual report on Form 20-F of SK Telecom Co., Ltd.;
2. Based on my knowledge, this report does not contain any untrue statement of a material fact or omit to state a material fact necessary to make thestatements made, in light of the circumstances under which such statements were made, not misleading with respect to the period covered by thisreport;
3. Based on my knowledge, the financial statements, and other financial information included in this report, fairly present in all material respects thefinancial condition, results of operations and cash flows of the company as of, and for, the periods presented in this report;
4. The company�s other certifying officer and I are responsible for establishing and maintaining disclosure controls and procedures (as defined inExchange Act Rules 13a-15(e) and 15d-15(e)) and internal control over financial reporting (as defined in Exchange Act Rules 13a-15(f) and15d-15(f)) for the company and have:
(a) Designed such disclosure controls and procedures, or caused such disclosure controls and procedures to be designed under our supervision, toensure that material information relating to the company, including its consolidated subsidiaries, is made known to us by others within thoseentities, particularly during the period in which this report is being prepared;
(b) Designed such internal control over financial reporting, or caused such internal control over financial reporting to be designed under oursupervision, to provide reasonable assurance regarding the reliability of financial reporting and the preparation of financial statements forexternal purposes in accordance with generally accepted accounting principles;
(c) Evaluated the effectiveness of the company�s disclosure controls and procedures and presented in this report our conclusions about theeffectiveness of the disclosure controls and procedures, as of the end of the period covered by this report based on such evaluation; and
(d) Disclosed in this report any change in the company�s internal control over financial reporting that occurred during the period covered by theannual report that has materially affected, or is reasonably likely to materially affect, the company�s internal control over financial reporting;and
5. The company�s other certifying officer and I have disclosed, based on our most recent evaluation of internal control over financial reporting, tothe company�s auditors and the audit committee of the company�s board of directors (or persons performing the equivalent functions):
(a) All significant deficiencies and material weaknesses in the design or operation of internal control over financial reporting which arereasonably likely to adversely affect the company�s ability to record, process, summarize and report financial information; and
(b) Any fraud, whether or not material, that involves management or other employees who have a significant role in the company�s internalcontrol over financial reporting.
Date: April 29, 2020
/s/ Poong Young YoonPoong Young Yoon
Chief Financial Officer
Copyright © 2020 www.secdatabase.com. All Rights Reserved.Please Consider the Environment Before Printing This Document
Exhibit 13.1
Certification
Pursuant to Section 906 of the Sarbanes-Oxley Act of 2002(Subsection (a) and (b) of Section 1350, Chapter 63 of Title 18, United States Code)
Pursuant to section 906 of the Sarbanes-Oxley Act of 2002 (subsection (a) and (b) of section 1350, chapter 63 of title 18, United States Code), theundersigned officer of SK Telecom Co., Ltd., a corporation organized under the laws of the Republic of Korea (the �Company�), does hereby certify, tosuch officer�s knowledge, that:
The annual report on Form 20-F for the year ended December 31, 2019 (the �Form 20-F�) fully complies with the requirements of section 13(a)or 15(d) of the Securities Exchange Act of 1934 and that information contained in the Form 20-F fairly presents, in all material respects, the financialcondition and results of operation of the Company.
Dated: April 29, 2020 /s/ Jung Ho ParkJung Ho Park
President and Chief Executive Officer
A signed original of this written statement required by Section 906 of the Sarbanes-Oxley Act of 2002 has been provided to the Company and willbe retained by the Company and furnished to the U.S. Securities and Exchange Commission or its staff upon request.
Copyright © 2020 www.secdatabase.com. All Rights Reserved.Please Consider the Environment Before Printing This Document

Exhibit 13.2
Certification
Pursuant to Section 906 of the Sarbanes-Oxley Act of 2002(Subsection (a) and (b) of Section 1350, Chapter 63 of Title 18, United States Code)
Pursuant to section 906 of the Sarbanes-Oxley Act of 2002 (subsection (a) and (b) of section 1350, chapter 63 of title 18, United States Code), theundersigned officer of SK Telecom Co., Ltd., a corporation organized under the laws of the Republic of Korea (the �Company�), does hereby certify, tosuch officer�s knowledge, that:
The annual report on Form 20-F for the year ended December 31, 2019 (the �Form 20-F�) fully complies with the requirements of section 13(a)or 15(d) of the Securities Exchange Act of 1934 and that information contained in the Form 20-F fairly presents, in all material respects, the financialcondition and results of operation of the Company.
Dated: April 29, 2020 /s/ Poong Young YoonPoong Young Yoon
Chief Financial Officer
A signed original of this written statement required by Section 906 of the Sarbanes-Oxley Act of 2002 has been provided to the Company and willbe retained by the Company and furnished to the U.S. Securities and Exchange Commission or its staff upon request.
Copyright © 2020 www.secdatabase.com. All Rights Reserved.Please Consider the Environment Before Printing This Document
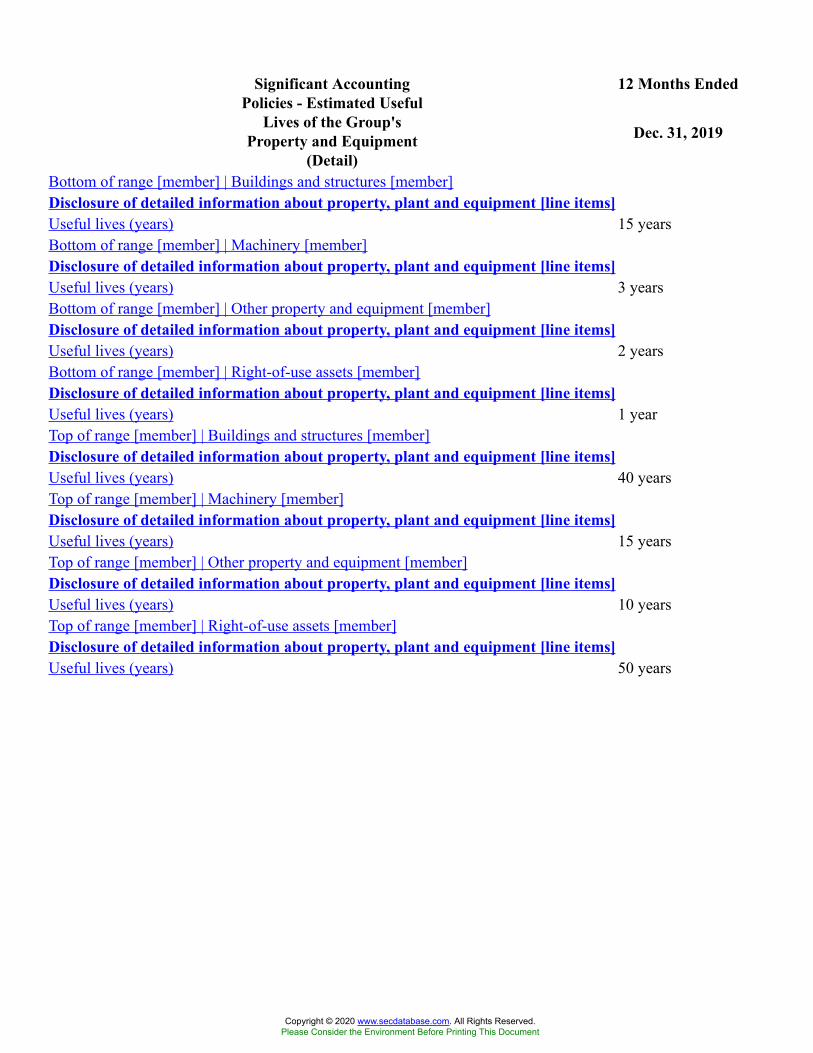
12 Months EndedSignificant AccountingPolicies - Estimated Useful
Lives of the Group'sProperty and Equipment
(Detail)
Dec. 31, 2019
Bottom of range [member] | Buildings and structures [member]Disclosure of detailed information about property, plant and equipment [line items]Useful lives (years) 15 yearsBottom of range [member] | Machinery [member]Disclosure of detailed information about property, plant and equipment [line items]Useful lives (years) 3 yearsBottom of range [member] | Other property and equipment [member]Disclosure of detailed information about property, plant and equipment [line items]Useful lives (years) 2 yearsBottom of range [member] | Right-of-use assets [member]Disclosure of detailed information about property, plant and equipment [line items]Useful lives (years) 1 yearTop of range [member] | Buildings and structures [member]Disclosure of detailed information about property, plant and equipment [line items]Useful lives (years) 40 yearsTop of range [member] | Machinery [member]Disclosure of detailed information about property, plant and equipment [line items]Useful lives (years) 15 yearsTop of range [member] | Other property and equipment [member]Disclosure of detailed information about property, plant and equipment [line items]Useful lives (years) 10 yearsTop of range [member] | Right-of-use assets [member]Disclosure of detailed information about property, plant and equipment [line items]Useful lives (years) 50 years
Copyright © 2020 www.secdatabase.com. All Rights Reserved.Please Consider the Environment Before Printing This Document
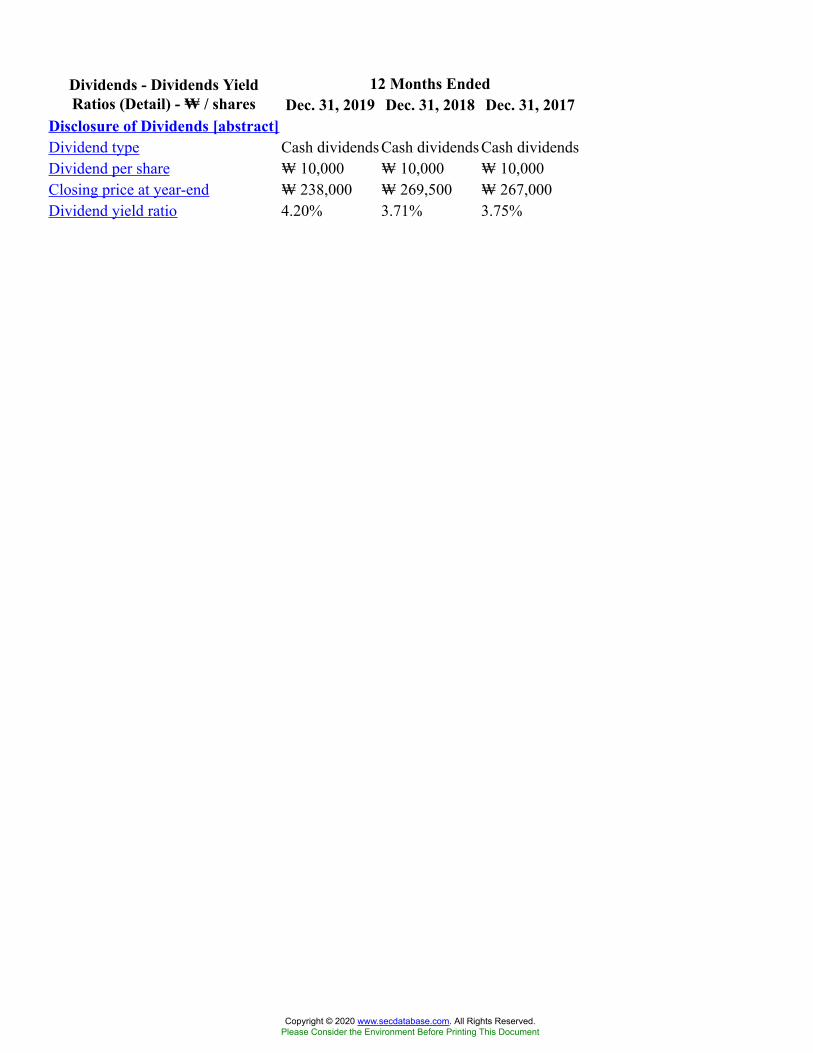
12 Months EndedDividends - Dividends YieldRatios (Detail) - ₩ / shares Dec. 31, 2019 Dec. 31, 2018 Dec. 31, 2017
Disclosure of Dividends [abstract]Dividend type Cash dividends Cash dividends Cash dividendsDividend per share ₩ 10,000 ₩ 10,000 ₩ 10,000Closing price at year-end ₩ 238,000 ₩ 269,500 ₩ 267,000Dividend yield ratio 4.20% 3.71% 3.75%
Copyright © 2020 www.secdatabase.com. All Rights Reserved.Please Consider the Environment Before Printing This Document
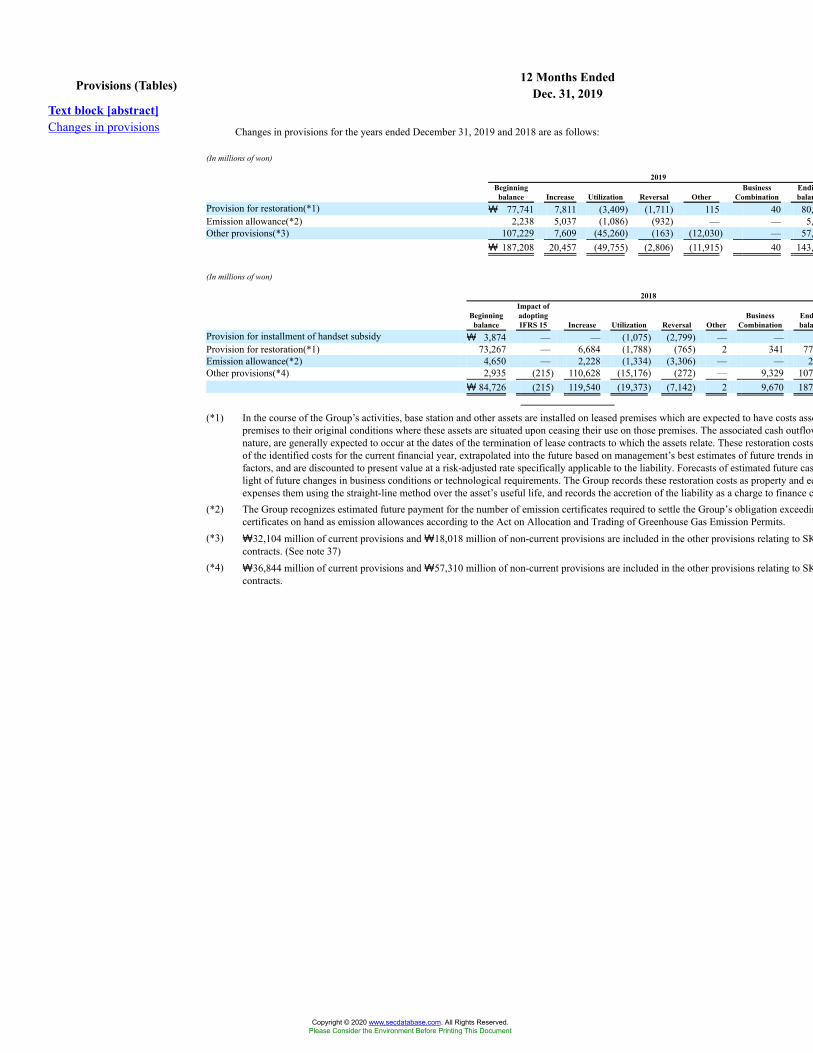
12 Months EndedProvisions (Tables) Dec. 31, 2019Text block [abstract]Changes in provisions Changes in provisions for the years ended December 31, 2019 and 2018 are as follows:
(In millions of won)
2019As of December 31,
2019Beginning
balance Increase Utilization Reversal OtherBusiness
CombinationEndingbalance Current Non-current
Provision for restoration(*1) ₩ 77,741 7,811 (3,409) (1,711) 115 40 80,587 51,517 29,070Emission allowance(*2) 2,238 5,037 (1,086) (932) — — 5,257 5,257 —Other provisions(*3) 107,229 7,609 (45,260) (163) (12,030) — 57,385 32,672 24,713
₩ 187,208 20,457 (49,755) (2,806) (11,915) 40 143,229 89,446 53,783
(In millions of won)
2018As of December 31,
2018
Beginningbalance
Impact ofadoptingIFRS 15 Increase Utilization Reversal Other
BusinessCombination
Endingbalance Current Non-current
Provision for installment of handset subsidy ₩ 3,874 — — (1,075) (2,799) — — — — —Provision for restoration(*1) 73,267 — 6,684 (1,788) (765) 2 341 77,741 47,293 30,448Emission allowance(*2) 4,650 — 2,228 (1,334) (3,306) — — 2,238 2,238 —Other provisions(*4) 2,935 (215) 110,628 (15,176) (272) — 9,329 107,229 38,462 68,767
₩ 84,726 (215) 119,540 (19,373) (7,142) 2 9,670 187,208 87,993 99,215
(*1) In the course of the Group’s activities, base station and other assets are installed on leased premises which are expected to have costs associated with restoring thepremises to their original conditions where these assets are situated upon ceasing their use on those premises. The associated cash outflows, which are long-term innature, are generally expected to occur at the dates of the termination of lease contracts to which the assets relate. These restoration costs are calculated on the basisof the identified costs for the current financial year, extrapolated into the future based on management’s best estimates of future trends in prices, inflation, and otherfactors, and are discounted to present value at a risk-adjusted rate specifically applicable to the liability. Forecasts of estimated future cash outflows are revised inlight of future changes in business conditions or technological requirements. The Group records these restoration costs as property and equipment and subsequentlyexpenses them using the straight-line method over the asset’s useful life, and records the accretion of the liability as a charge to finance costs.
(*2) The Group recognizes estimated future payment for the number of emission certificates required to settle the Group’s obligation exceeding the actual number ofcertificates on hand as emission allowances according to the Act on Allocation and Trading of Greenhouse Gas Emission Permits.
(*3) ₩32,104 million of current provisions and ₩18,018 million of non-current provisions are included in the other provisions relating to SK Planet Co., Ltd.’s onerouscontracts. (See note 37)
(*4) ₩36,844 million of current provisions and ₩57,310 million of non-current provisions are included in the other provisions relating to SK Planet Co., Ltd.’s onerouscontracts.
Copyright © 2020 www.secdatabase.com. All Rights Reserved.Please Consider the Environment Before Printing This Document
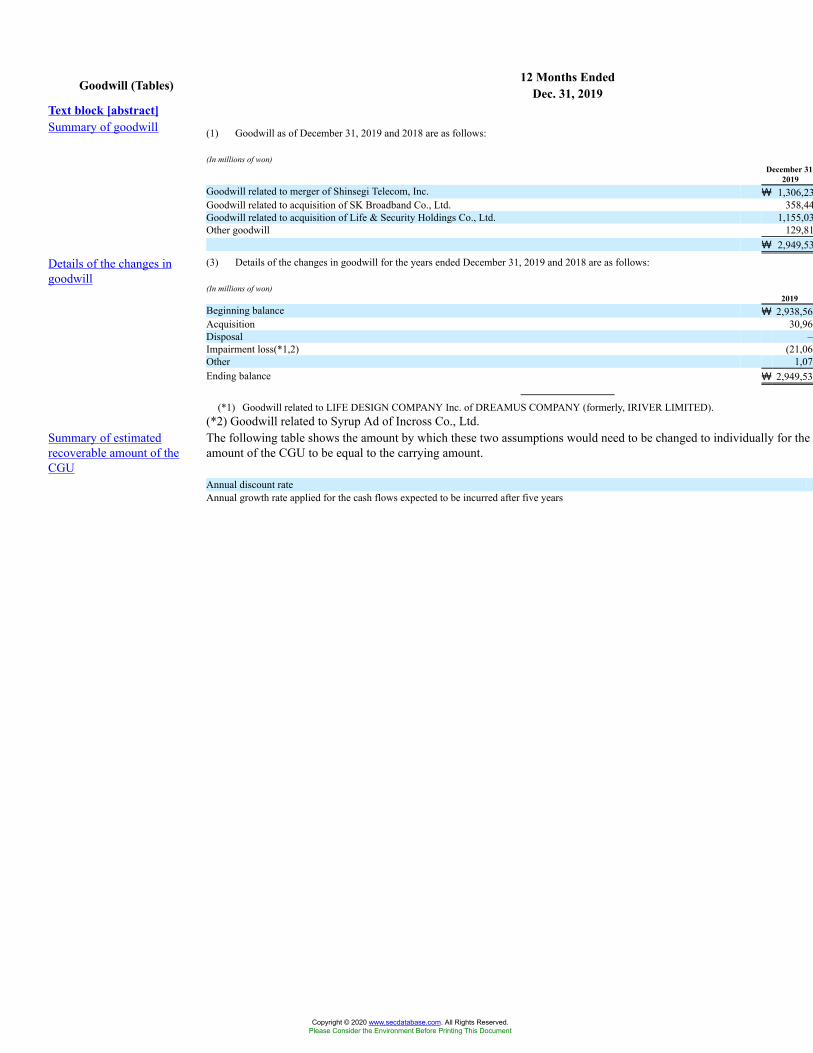
12 Months EndedGoodwill (Tables) Dec. 31, 2019Text block [abstract]Summary of goodwill (1) Goodwill as of December 31, 2019 and 2018 are as follows:
(In millions of won)December 31,
2019December 31,
2018Goodwill related to merger of Shinsegi Telecom, Inc. ₩ 1,306,236 1,306,236Goodwill related to acquisition of SK Broadband Co., Ltd. 358,443 358,443Goodwill related to acquisition of Life & Security Holdings Co., Ltd. 1,155,037 1,155,037Other goodwill 129,814 118,847
₩ 2,949,530 2,938,563
Details of the changes ingoodwill
(3) Details of the changes in goodwill for the years ended December 31, 2019 and 2018 are as follows:
(In millions of won)2019 2018
Beginning balance ₩ 2,938,563 1,915,017Acquisition 30,962 1,206,702Disposal — (807)Impairment loss(*1,2) (21,065) (166,838)Other 1,070 (15,511)Ending balance ₩ 2,949,530 2,938,563
(*1) Goodwill related to LIFE DESIGN COMPANY Inc. of DREAMUS COMPANY (formerly, IRIVER LIMITED).(*2) Goodwill related to Syrup Ad of Incross Co., Ltd.
Summary of estimatedrecoverable amount of theCGU
The following table shows the amount by which these two assumptions would need to be changed to individually for the estimated recoverableamount of the CGU to be equal to the carrying amount.
2019Annual discount rate 7.31%Annual growth rate applied for the cash flows expected to be incurred after five years 0.97%
Copyright © 2020 www.secdatabase.com. All Rights Reserved.Please Consider the Environment Before Printing This Document
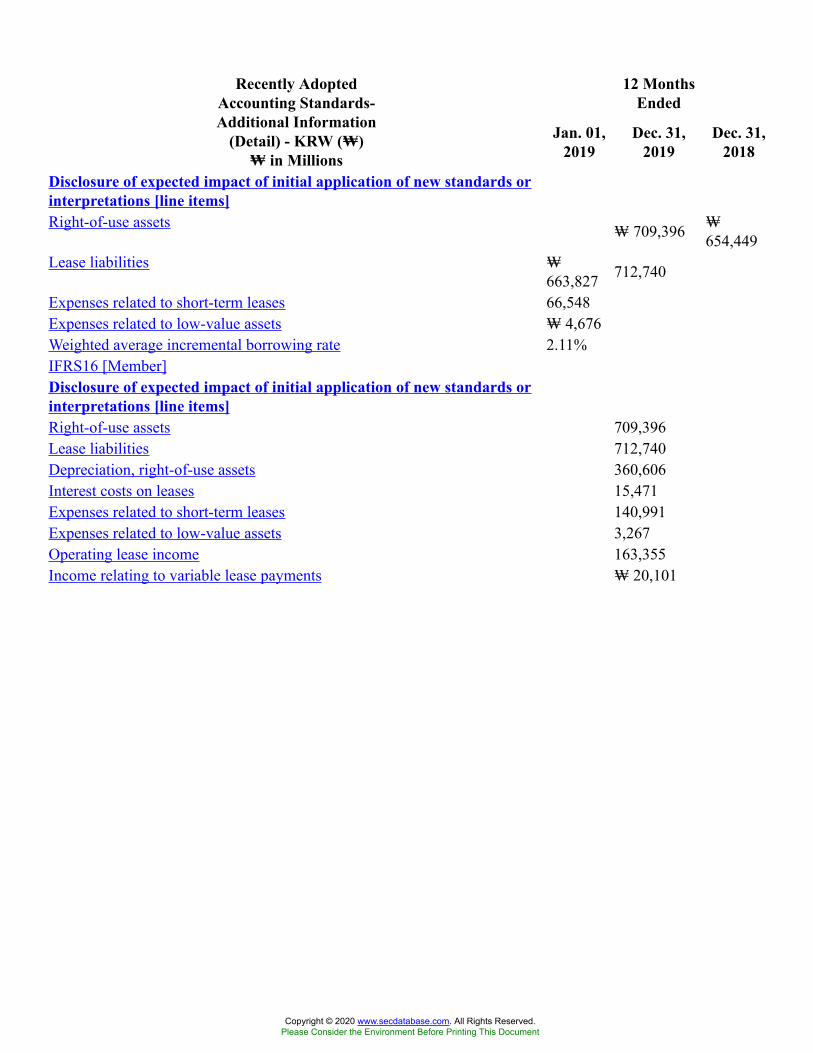
12 MonthsEnded
Recently AdoptedAccounting Standards-Additional Information
(Detail) - KRW (₩)₩ in Millions
Jan. 01,2019
Dec. 31,2019
Dec. 31,2018
Disclosure of expected impact of initial application of new standards orinterpretations [line items]Right-of-use assets ₩ 709,396 ₩
654,449Lease liabilities ₩
663,827 712,740
Expenses related to short-term leases 66,548Expenses related to low-value assets ₩ 4,676Weighted average incremental borrowing rate 2.11%IFRS16 [Member]Disclosure of expected impact of initial application of new standards orinterpretations [line items]Right-of-use assets 709,396Lease liabilities 712,740Depreciation, right-of-use assets 360,606Interest costs on leases 15,471Expenses related to short-term leases 140,991Expenses related to low-value assets 3,267Operating lease income 163,355Income relating to variable lease payments ₩ 20,101
Copyright © 2020 www.secdatabase.com. All Rights Reserved.Please Consider the Environment Before Printing This Document
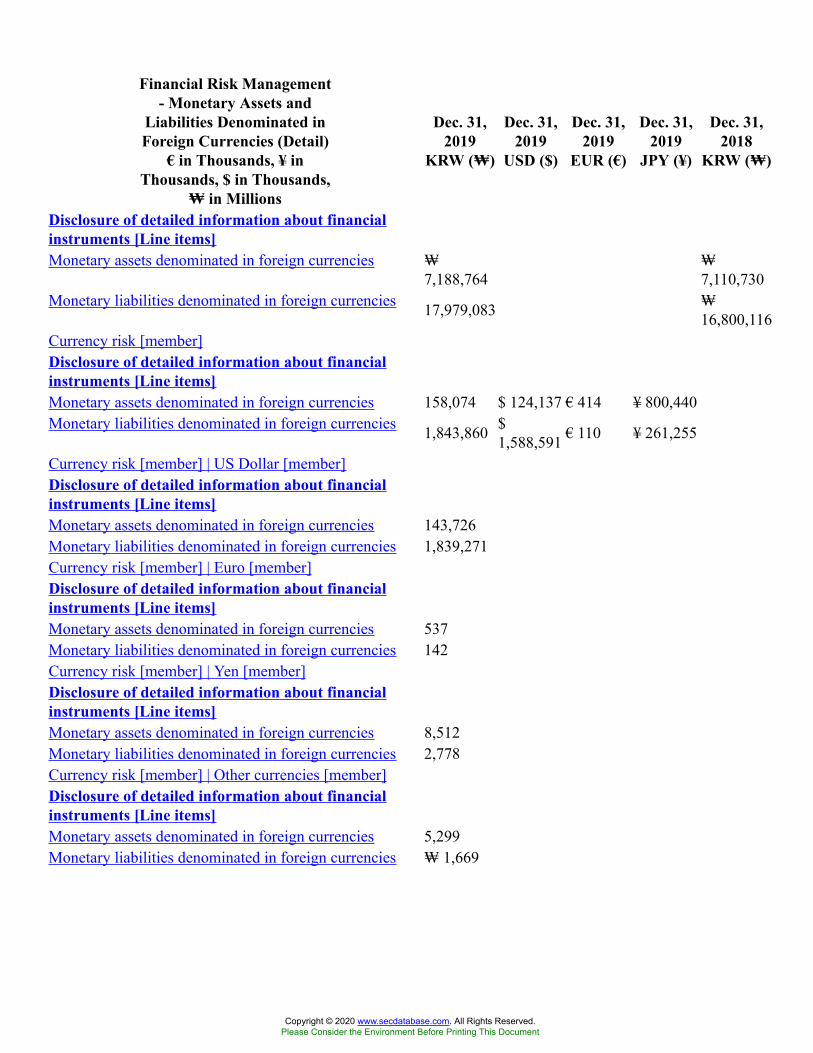
Financial Risk Management- Monetary Assets and
Liabilities Denominated inForeign Currencies (Detail)
€ in Thousands, ¥ inThousands, $ in Thousands,
₩ in Millions
Dec. 31,2019
KRW (₩)
Dec. 31,2019
USD ($)
Dec. 31,2019
EUR (€)
Dec. 31,2019
JPY (¥)
Dec. 31,2018
KRW (₩)
Disclosure of detailed information about financialinstruments [Line items]Monetary assets denominated in foreign currencies ₩
7,188,764₩7,110,730
Monetary liabilities denominated in foreign currencies 17,979,083 ₩16,800,116
Currency risk [member]Disclosure of detailed information about financialinstruments [Line items]Monetary assets denominated in foreign currencies 158,074 $ 124,137 € 414 ¥ 800,440Monetary liabilities denominated in foreign currencies 1,843,860 $
1,588,591 € 110 ¥ 261,255
Currency risk [member] | US Dollar [member]Disclosure of detailed information about financialinstruments [Line items]Monetary assets denominated in foreign currencies 143,726Monetary liabilities denominated in foreign currencies 1,839,271Currency risk [member] | Euro [member]Disclosure of detailed information about financialinstruments [Line items]Monetary assets denominated in foreign currencies 537Monetary liabilities denominated in foreign currencies 142Currency risk [member] | Yen [member]Disclosure of detailed information about financialinstruments [Line items]Monetary assets denominated in foreign currencies 8,512Monetary liabilities denominated in foreign currencies 2,778Currency risk [member] | Other currencies [member]Disclosure of detailed information about financialinstruments [Line items]Monetary assets denominated in foreign currencies 5,299Monetary liabilities denominated in foreign currencies ₩ 1,669
Copyright © 2020 www.secdatabase.com. All Rights Reserved.Please Consider the Environment Before Printing This Document
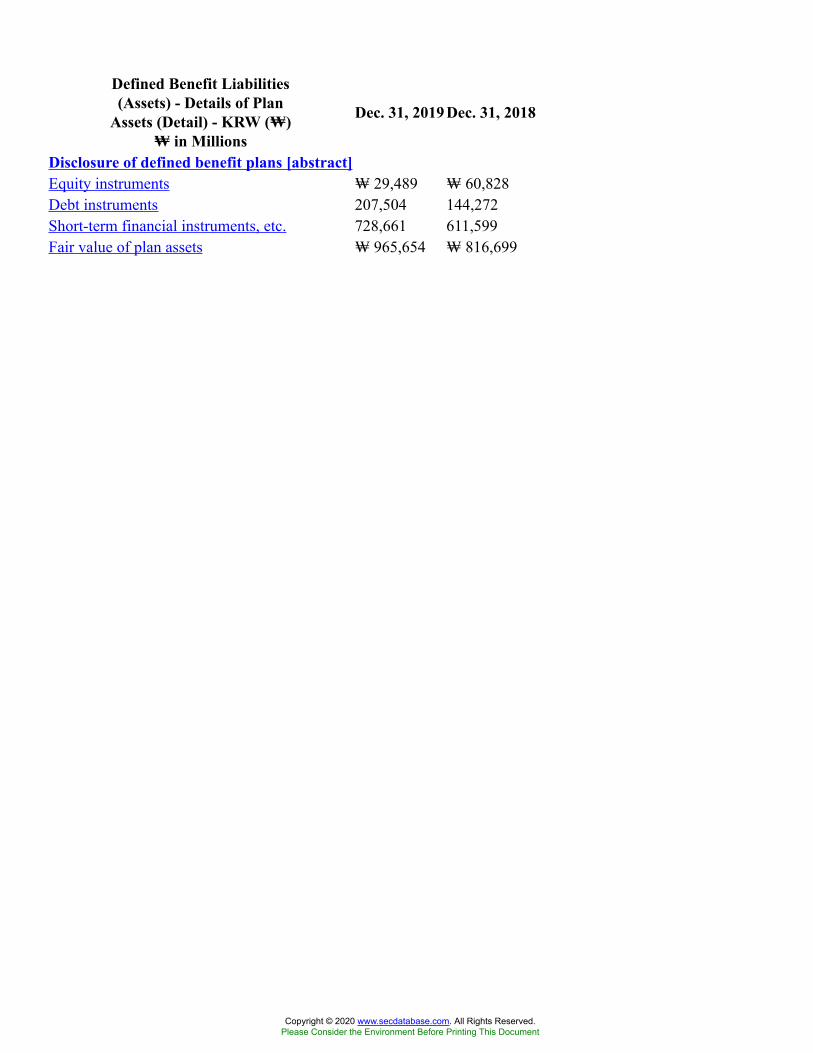
Defined Benefit Liabilities(Assets) - Details of Plan
Assets (Detail) - KRW (₩)₩ in Millions
Dec. 31, 2019 Dec. 31, 2018
Disclosure of defined benefit plans [abstract]Equity instruments ₩ 29,489 ₩ 60,828Debt instruments 207,504 144,272Short-term financial instruments, etc. 728,661 611,599Fair value of plan assets ₩ 965,654 ₩ 816,699
Copyright © 2020 www.secdatabase.com. All Rights Reserved.Please Consider the Environment Before Printing This Document
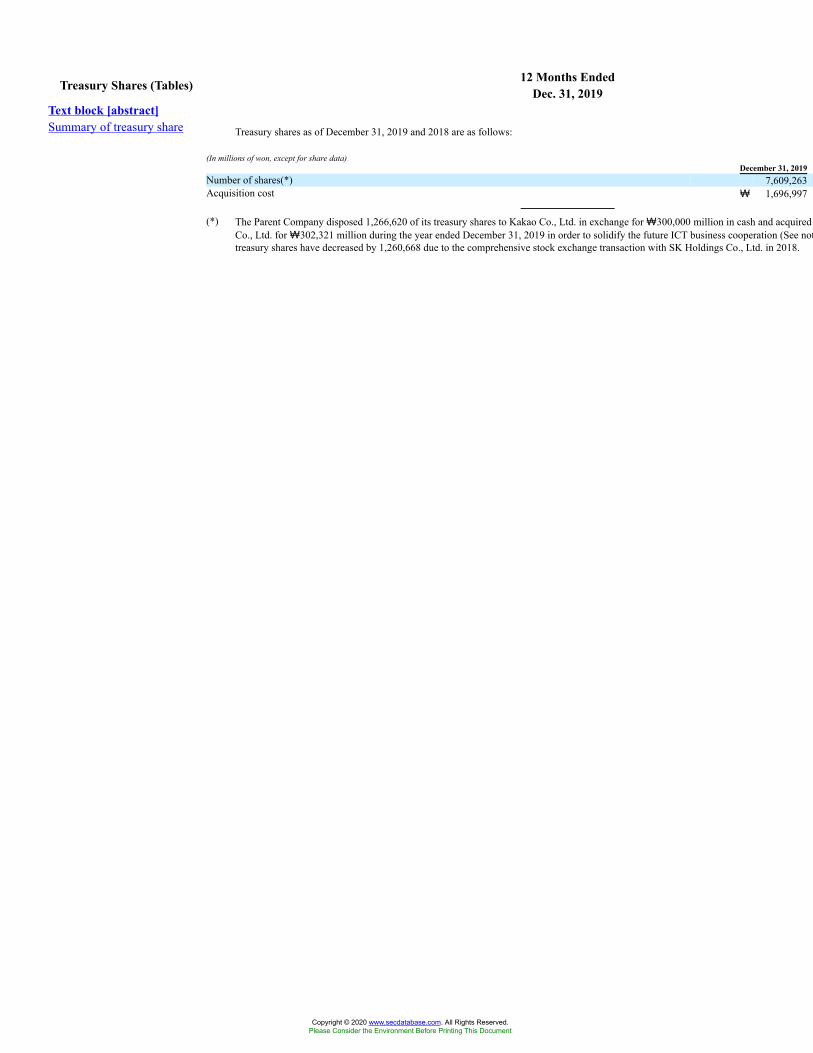
12 Months EndedTreasury Shares (Tables) Dec. 31, 2019Text block [abstract]Summary of treasury share Treasury shares as of December 31, 2019 and 2018 are as follows:
(In millions of won, except for share data)December 31, 2019 December 31, 2018
Number of shares(*) 7,609,263 8,875,883Acquisition cost ₩ 1,696,997 1,979,475
(*) The Parent Company disposed 1,266,620 of its treasury shares to Kakao Co., Ltd. in exchange for ₩300,000 million in cash and acquired 2,177,401 shares of KakaoCo., Ltd. for ₩302,321 million during the year ended December 31, 2019 in order to solidify the future ICT business cooperation (See note 11). The number oftreasury shares have decreased by 1,260,668 due to the comprehensive stock exchange transaction with SK Holdings Co., Ltd. in 2018.
Copyright © 2020 www.secdatabase.com. All Rights Reserved.Please Consider the Environment Before Printing This Document
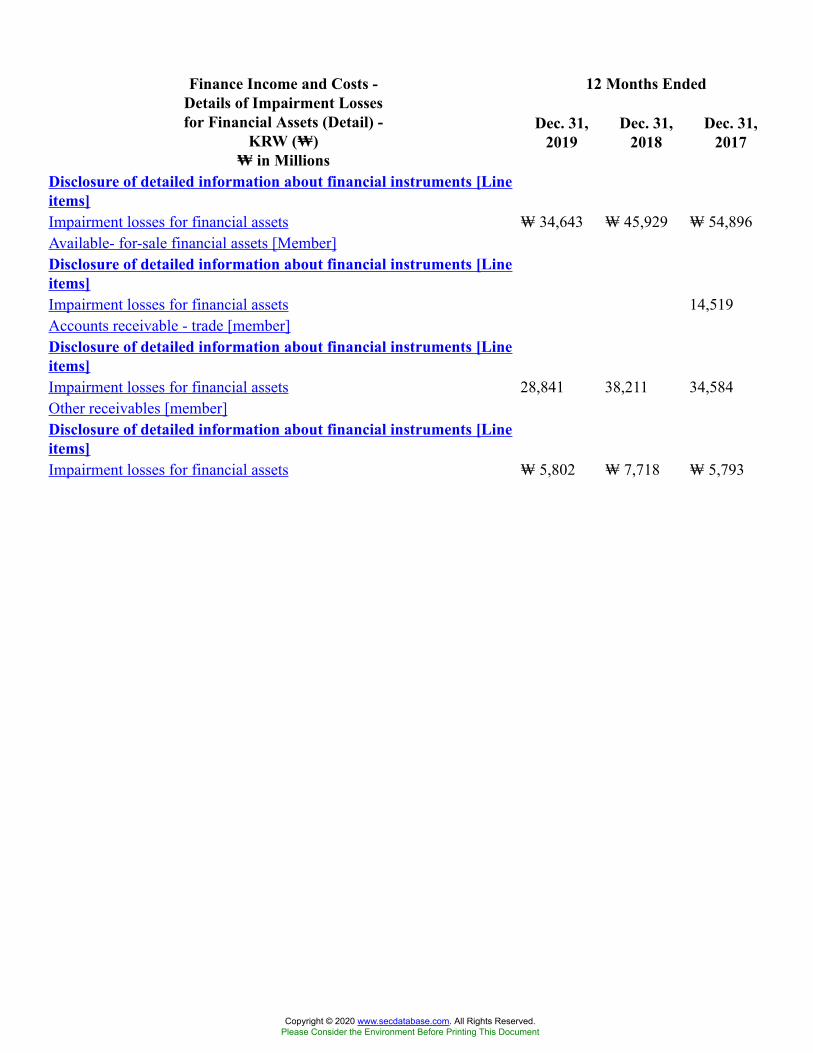
12 Months EndedFinance Income and Costs -Details of Impairment Lossesfor Financial Assets (Detail) -
KRW (₩)₩ in Millions
Dec. 31,2019
Dec. 31,2018
Dec. 31,2017
Disclosure of detailed information about financial instruments [Lineitems]Impairment losses for financial assets ₩ 34,643 ₩ 45,929 ₩ 54,896Available- for-sale financial assets [Member]Disclosure of detailed information about financial instruments [Lineitems]Impairment losses for financial assets 14,519Accounts receivable - trade [member]Disclosure of detailed information about financial instruments [Lineitems]Impairment losses for financial assets 28,841 38,211 34,584Other receivables [member]Disclosure of detailed information about financial instruments [Lineitems]Impairment losses for financial assets ₩ 5,802 ₩ 7,718 ₩ 5,793
Copyright © 2020 www.secdatabase.com. All Rights Reserved.Please Consider the Environment Before Printing This Document
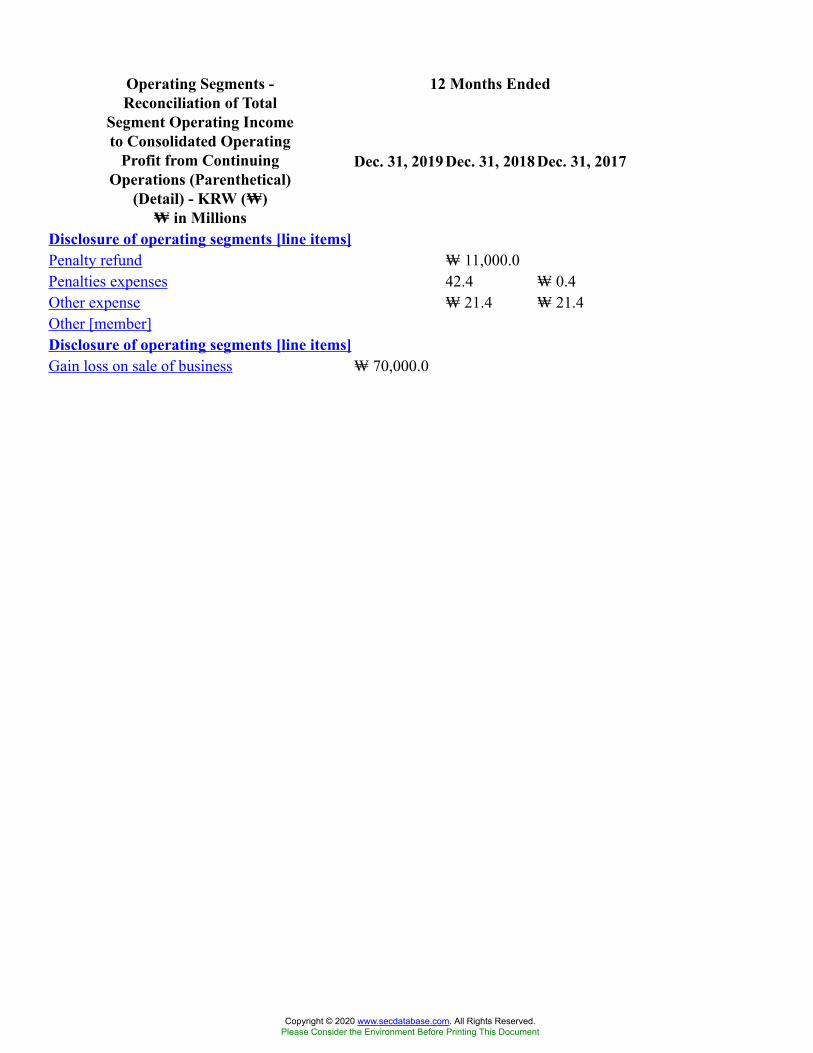
12 Months EndedOperating Segments -Reconciliation of Total
Segment Operating Incometo Consolidated Operating
Profit from ContinuingOperations (Parenthetical)
(Detail) - KRW (₩)₩ in Millions
Dec. 31, 2019 Dec. 31, 2018 Dec. 31, 2017
Disclosure of operating segments [line items]Penalty refund ₩ 11,000.0Penalties expenses 42.4 ₩ 0.4Other expense ₩ 21.4 ₩ 21.4Other [member]Disclosure of operating segments [line items]Gain loss on sale of business ₩ 70,000.0
Copyright © 2020 www.secdatabase.com. All Rights Reserved.Please Consider the Environment Before Printing This Document

12 Months EndedIncome Tax Expense -Details of the Changes in
Deferred Tax Assets(Liabilities) (Detail) - KRW
(₩)₩ in Millions
Dec. 31,2019
Dec. 31,2018
Dec. 31,2017
Disclosure of temporary difference, unused tax losses and unused taxcredits [Line Items]Beginning ₩
(2,177,327)₩(890,561)
Changes in Accounting Policies 9,359 (600,954)Deferred tax expense (income) (201,817) (504,288)Directly charged to (credited from) equity 11,912 43,359 ₩
(57,544)Business combinations 635 (224,883)Ending (2,357,238) (2,177,327) (890,561)Loss allowance [member]Disclosure of temporary difference, unused tax losses and unused taxcredits [Line Items]Beginning 102,276 67,002Changes in Accounting Policies 3,501Deferred tax expense (income) (13,698) 26,547Business combinations 335 5,226Ending 88,913 102,276 67,002Accrued interest income [Member]Disclosure of temporary difference, unused tax losses and unused taxcredits [Line Items]Beginning (2,713) (2,467)Deferred tax expense (income) 691 (218)Business combinations (17) (28)Ending (2,039) (2,713) (2,467)Financial assets measured at fair value [member]Disclosure of temporary difference, unused tax losses and unused taxcredits [Line Items]Beginning 79,757 53,781Changes in Accounting Policies (282)Deferred tax expense (income) 15,099 (15,203)Directly charged to (credited from) equity 2,983 41,461Business combinations 262Ending 98,101 79,757 53,781Investments in subsidiaries, associates and joint ventures [Member]Disclosure of temporary difference, unused tax losses and unused taxcredits [Line Items]Beginning (1,580,087) (937,629)
Copyright © 2020 www.secdatabase.com. All Rights Reserved.Please Consider the Environment Before Printing This Document

Deferred tax expense (income) (35,222) (642,736)Directly charged to (credited from) equity 2,279 278Business combinations (18)Ending (1,613,048) (1,580,087) (937,629)Property equipment and intangible assets [member]Disclosure of temporary difference, unused tax losses and unused taxcredits [Line Items]Beginning (420,061) (235,343)Deferred tax expense (income) 44,051 71,912Business combinations (3) (256,630)Ending (376,013) (420,061) (235,343)Provisions [Member]Disclosure of temporary difference, unused tax losses and unused taxcredits [Line Items]Beginning 2,494 2,312Deferred tax expense (income) 49 (6)Business combinations 188Ending 2,543 2,494 2,312Retirement benefit obligation [Member]Disclosure of temporary difference, unused tax losses and unused taxcredits [Line Items]Beginning 84,034 38,360Deferred tax expense (income) (6,643) 12,888Directly charged to (credited from) equity 22,733 10,843Business combinations 70 21,943Ending 100,194 84,034 38,360Valuation gain (loss) on derivatives [Member]Disclosure of temporary difference, unused tax losses and unused taxcredits [Line Items]Beginning 31,415 25,956Deferred tax expense (income) 2,175 14,682Directly charged to (credited from) equity (16,083) (9,223)Ending 17,507 31,415 25,956Foreign currency translation differences for foreign operations [Member]Disclosure of temporary difference, unused tax losses and unused taxcredits [Line Items]Beginning 21,948 21,931Deferred tax expense (income) 57 17Ending 22,005 21,948 21,931Reserve for research and manpower development [Member]Disclosure of temporary difference, unused tax losses and unused taxcredits [Line Items]Beginning (2,387)Deferred tax expense (income) 2,387Ending (2,387)
Copyright © 2020 www.secdatabase.com. All Rights Reserved.Please Consider the Environment Before Printing This Document
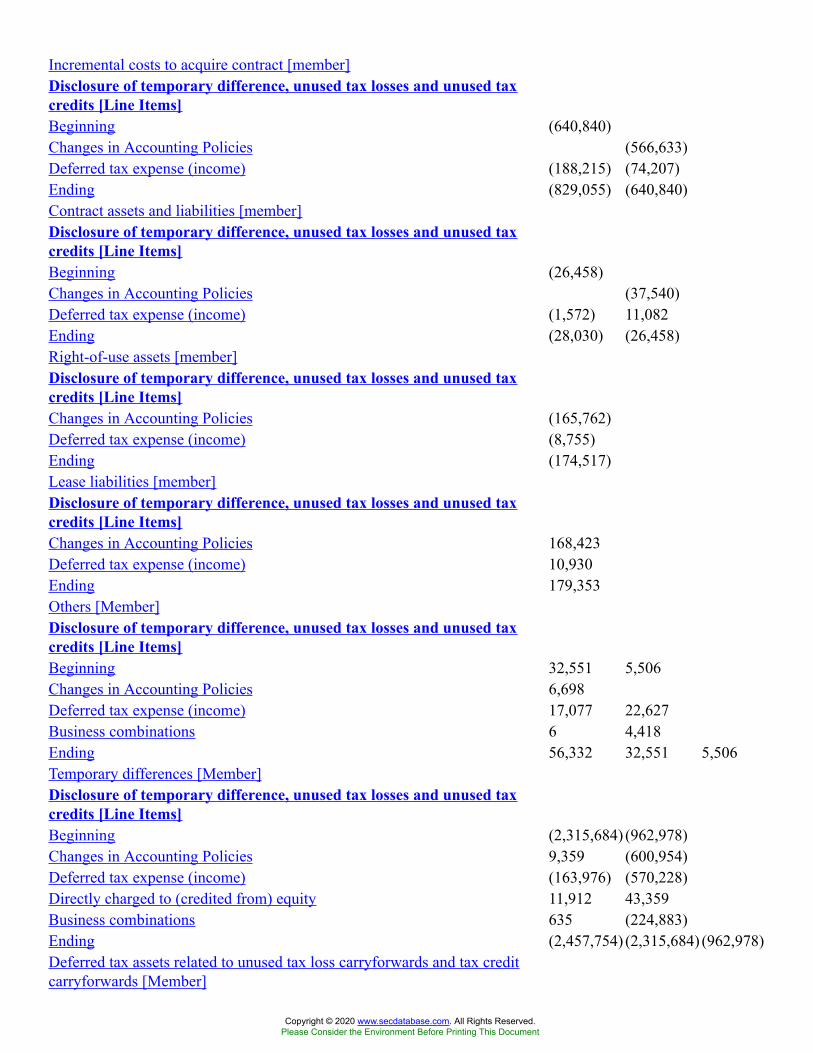
Incremental costs to acquire contract [member]Disclosure of temporary difference, unused tax losses and unused taxcredits [Line Items]Beginning (640,840)Changes in Accounting Policies (566,633)Deferred tax expense (income) (188,215) (74,207)Ending (829,055) (640,840)Contract assets and liabilities [member]Disclosure of temporary difference, unused tax losses and unused taxcredits [Line Items]Beginning (26,458)Changes in Accounting Policies (37,540)Deferred tax expense (income) (1,572) 11,082Ending (28,030) (26,458)Right-of-use assets [member]Disclosure of temporary difference, unused tax losses and unused taxcredits [Line Items]Changes in Accounting Policies (165,762)Deferred tax expense (income) (8,755)Ending (174,517)Lease liabilities [member]Disclosure of temporary difference, unused tax losses and unused taxcredits [Line Items]Changes in Accounting Policies 168,423Deferred tax expense (income) 10,930Ending 179,353Others [Member]Disclosure of temporary difference, unused tax losses and unused taxcredits [Line Items]Beginning 32,551 5,506Changes in Accounting Policies 6,698Deferred tax expense (income) 17,077 22,627Business combinations 6 4,418Ending 56,332 32,551 5,506Temporary differences [Member]Disclosure of temporary difference, unused tax losses and unused taxcredits [Line Items]Beginning (2,315,684) (962,978)Changes in Accounting Policies 9,359 (600,954)Deferred tax expense (income) (163,976) (570,228)Directly charged to (credited from) equity 11,912 43,359Business combinations 635 (224,883)Ending (2,457,754) (2,315,684) (962,978)Deferred tax assets related to unused tax loss carryforwards and tax creditcarryforwards [Member]
Copyright © 2020 www.secdatabase.com. All Rights Reserved.Please Consider the Environment Before Printing This Document
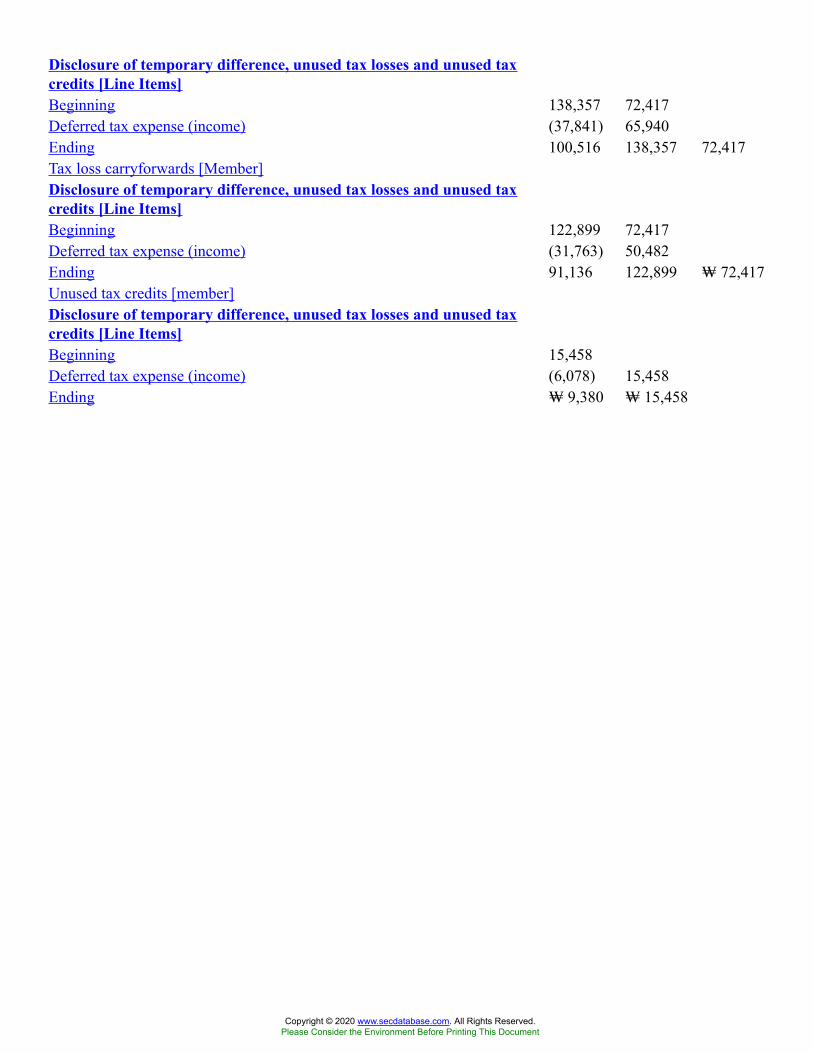
Disclosure of temporary difference, unused tax losses and unused taxcredits [Line Items]Beginning 138,357 72,417Deferred tax expense (income) (37,841) 65,940Ending 100,516 138,357 72,417Tax loss carryforwards [Member]Disclosure of temporary difference, unused tax losses and unused taxcredits [Line Items]Beginning 122,899 72,417Deferred tax expense (income) (31,763) 50,482Ending 91,136 122,899 ₩ 72,417Unused tax credits [member]Disclosure of temporary difference, unused tax losses and unused taxcredits [Line Items]Beginning 15,458Deferred tax expense (income) (6,078) 15,458Ending ₩ 9,380 ₩ 15,458
Copyright © 2020 www.secdatabase.com. All Rights Reserved.Please Consider the Environment Before Printing This Document
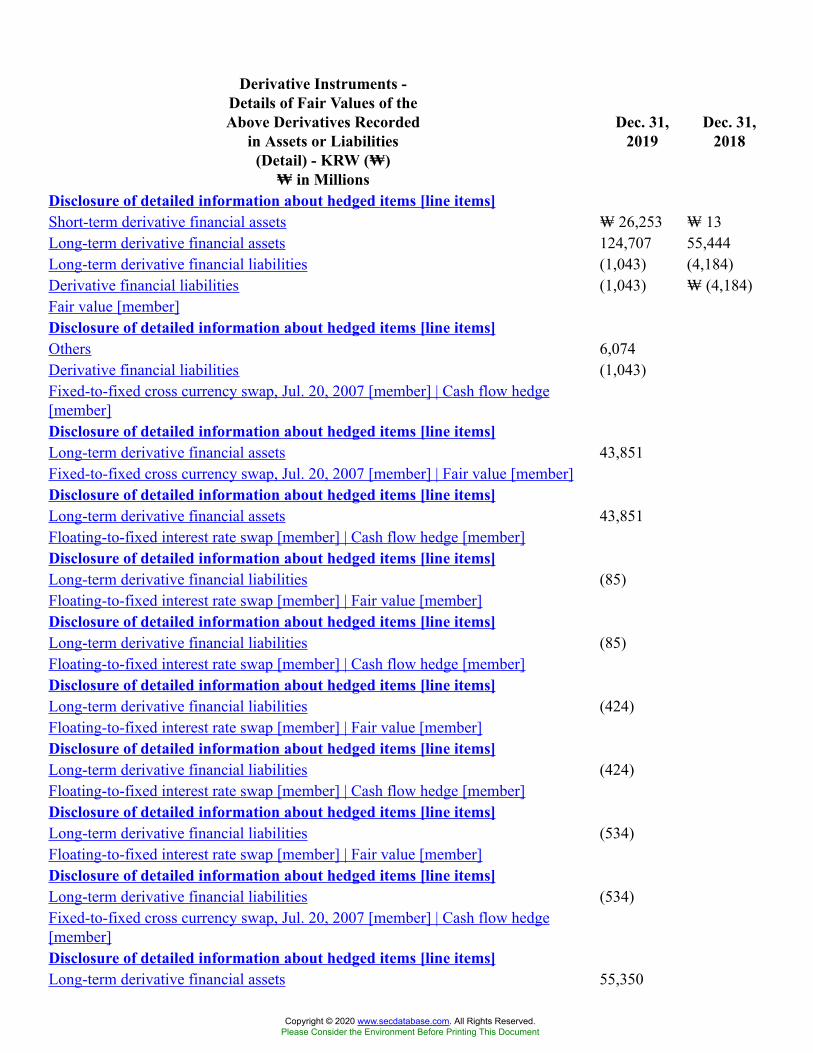
Derivative Instruments -Details of Fair Values of theAbove Derivatives Recorded
in Assets or Liabilities(Detail) - KRW (₩)
₩ in Millions
Dec. 31,2019
Dec. 31,2018
Disclosure of detailed information about hedged items [line items]Short-term derivative financial assets ₩ 26,253 ₩ 13Long-term derivative financial assets 124,707 55,444Long-term derivative financial liabilities (1,043) (4,184)Derivative financial liabilities (1,043) ₩ (4,184)Fair value [member]Disclosure of detailed information about hedged items [line items]Others 6,074Derivative financial liabilities (1,043)Fixed-to-fixed cross currency swap, Jul. 20, 2007 [member] | Cash flow hedge[member]Disclosure of detailed information about hedged items [line items]Long-term derivative financial assets 43,851Fixed-to-fixed cross currency swap, Jul. 20, 2007 [member] | Fair value [member]Disclosure of detailed information about hedged items [line items]Long-term derivative financial assets 43,851Floating-to-fixed interest rate swap [member] | Cash flow hedge [member]Disclosure of detailed information about hedged items [line items]Long-term derivative financial liabilities (85)Floating-to-fixed interest rate swap [member] | Fair value [member]Disclosure of detailed information about hedged items [line items]Long-term derivative financial liabilities (85)Floating-to-fixed interest rate swap [member] | Cash flow hedge [member]Disclosure of detailed information about hedged items [line items]Long-term derivative financial liabilities (424)Floating-to-fixed interest rate swap [member] | Fair value [member]Disclosure of detailed information about hedged items [line items]Long-term derivative financial liabilities (424)Floating-to-fixed interest rate swap [member] | Cash flow hedge [member]Disclosure of detailed information about hedged items [line items]Long-term derivative financial liabilities (534)Floating-to-fixed interest rate swap [member] | Fair value [member]Disclosure of detailed information about hedged items [line items]Long-term derivative financial liabilities (534)Fixed-to-fixed cross currency swap, Jul. 20, 2007 [member] | Cash flow hedge[member]Disclosure of detailed information about hedged items [line items]Long-term derivative financial assets 55,350
Copyright © 2020 www.secdatabase.com. All Rights Reserved.Please Consider the Environment Before Printing This Document
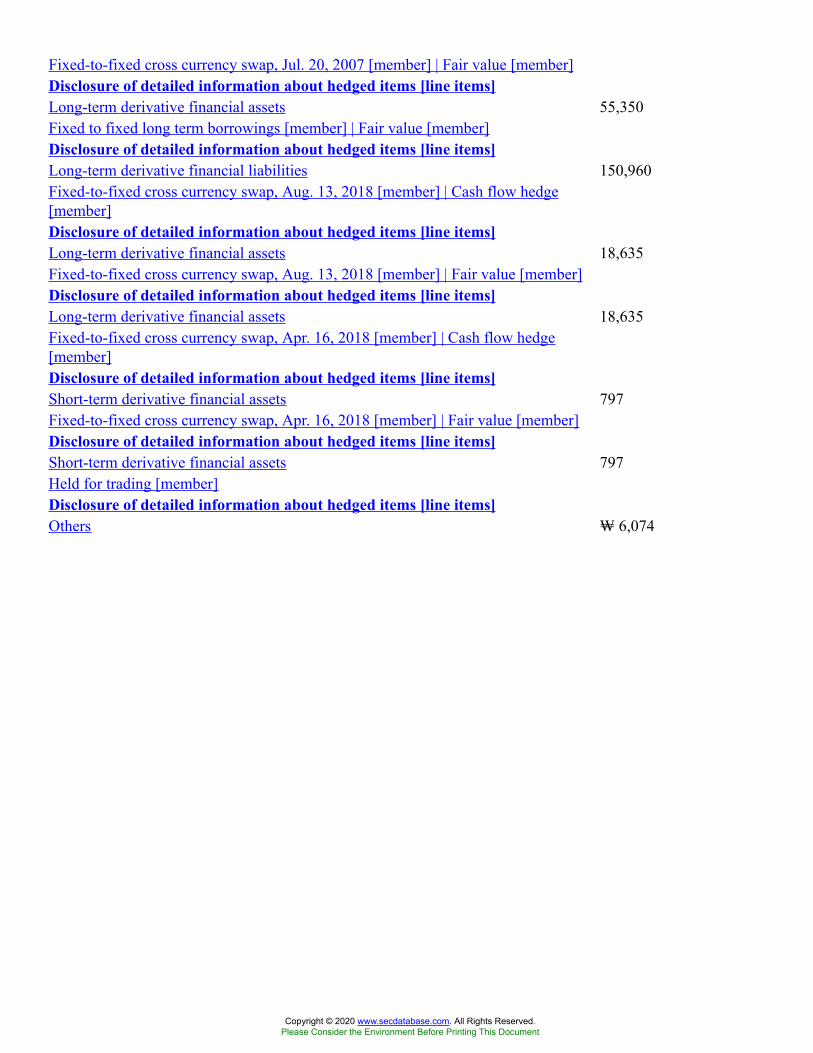
Fixed-to-fixed cross currency swap, Jul. 20, 2007 [member] | Fair value [member]Disclosure of detailed information about hedged items [line items]Long-term derivative financial assets 55,350Fixed to fixed long term borrowings [member] | Fair value [member]Disclosure of detailed information about hedged items [line items]Long-term derivative financial liabilities 150,960Fixed-to-fixed cross currency swap, Aug. 13, 2018 [member] | Cash flow hedge[member]Disclosure of detailed information about hedged items [line items]Long-term derivative financial assets 18,635Fixed-to-fixed cross currency swap, Aug. 13, 2018 [member] | Fair value [member]Disclosure of detailed information about hedged items [line items]Long-term derivative financial assets 18,635Fixed-to-fixed cross currency swap, Apr. 16, 2018 [member] | Cash flow hedge[member]Disclosure of detailed information about hedged items [line items]Short-term derivative financial assets 797Fixed-to-fixed cross currency swap, Apr. 16, 2018 [member] | Fair value [member]Disclosure of detailed information about hedged items [line items]Short-term derivative financial assets 797Held for trading [member]Disclosure of detailed information about hedged items [line items]Others ₩ 6,074
Copyright © 2020 www.secdatabase.com. All Rights Reserved.Please Consider the Environment Before Printing This Document
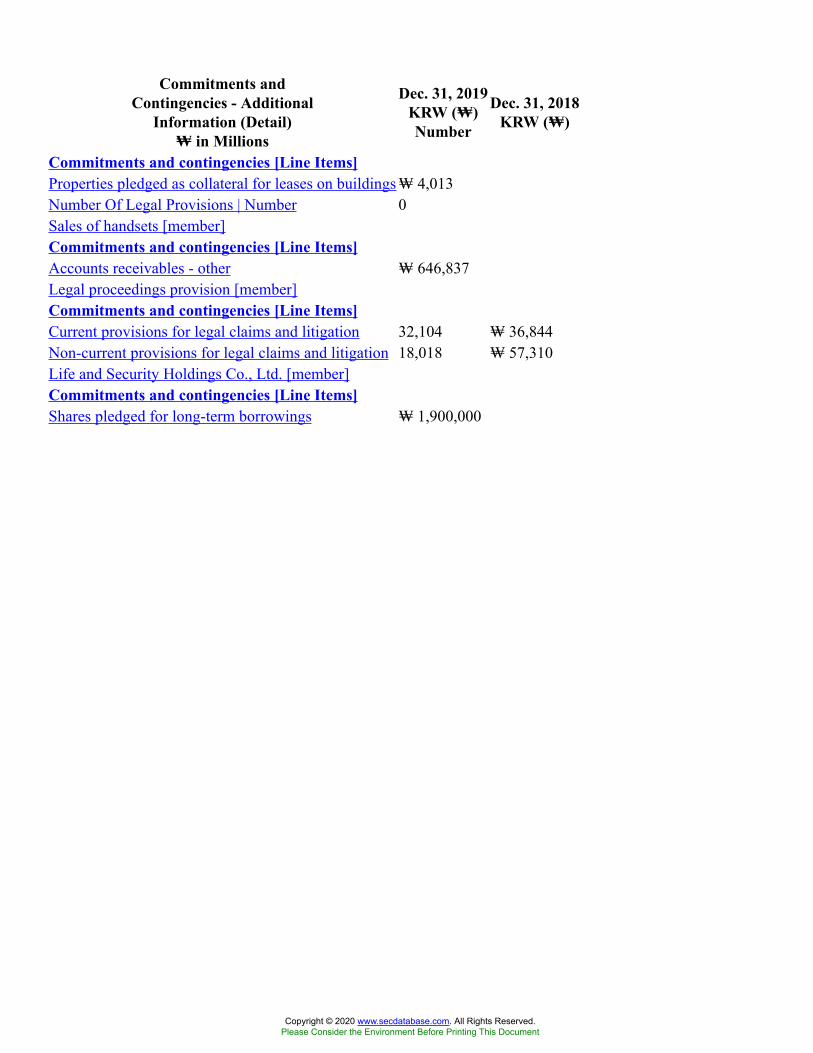
Commitments andContingencies - Additional
Information (Detail)₩ in Millions
Dec. 31, 2019KRW (₩)Number
Dec. 31, 2018KRW (₩)
Commitments and contingencies [Line Items]Properties pledged as collateral for leases on buildings ₩ 4,013Number Of Legal Provisions | Number 0Sales of handsets [member]Commitments and contingencies [Line Items]Accounts receivables - other ₩ 646,837Legal proceedings provision [member]Commitments and contingencies [Line Items]Current provisions for legal claims and litigation 32,104 ₩ 36,844Non-current provisions for legal claims and litigation 18,018 ₩ 57,310Life and Security Holdings Co., Ltd. [member]Commitments and contingencies [Line Items]Shares pledged for long-term borrowings ₩ 1,900,000
Copyright © 2020 www.secdatabase.com. All Rights Reserved.Please Consider the Environment Before Printing This Document
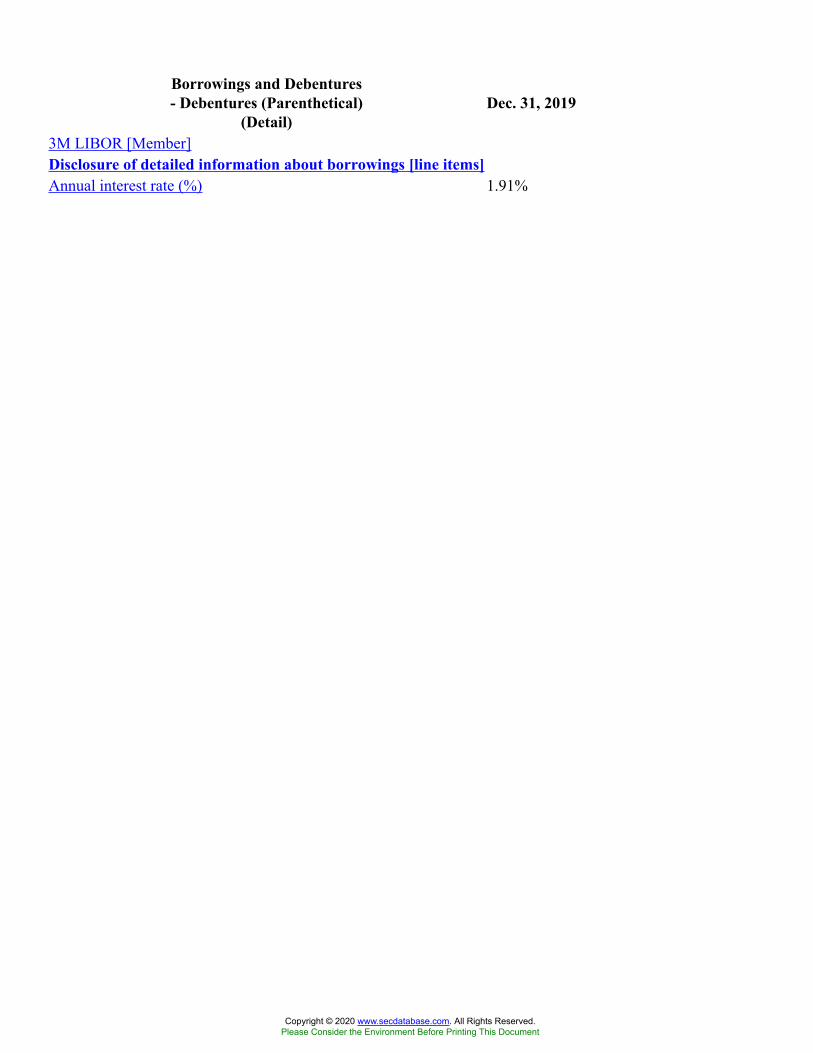
Borrowings and Debentures- Debentures (Parenthetical)
(Detail)Dec. 31, 2019
3M LIBOR [Member]Disclosure of detailed information about borrowings [line items]Annual interest rate (%) 1.91%
Copyright © 2020 www.secdatabase.com. All Rights Reserved.Please Consider the Environment Before Printing This Document

12 Months EndedCommitments andContingencies Dec. 31, 2019
Text block [abstract]Commitments andContingencies
37. Commitments and Contingencies
(1) Collateral assets and commitments
SK Broadband Co., Ltd., a subsidiary of the Parent Company, has pledged its properties as collateral for leases on buildings in the amount of ₩4,013 million as ofDecember 31, 2019.
In addition, Life & Security Holdings Co., Ltd., a subsidiary of the Parent Company, has pledged its shares of ADT CAPS Co., Ltd., CAPSTEC Co., Ltd. and ADTSECURITY Co., Ltd. for the long-term borrowings with a face value of ₩1,900,000 million as of December 31, 2019.
(2) Legal claims and litigations
As of December 31, 2019 the Group is involved in various legal claims and litigation. Provision recognized in relation to these claims and litigation is immaterial. Inconnection with those legal claims and litigation for which no provision was recognized, management does not believe the Group has a present obligation, nor is it expectedany of these claims or litigation will have a significant impact on the Group’s financial position or operating results in the event an outflow of resources is ultimatelynecessary.
Meanwhile, the pending litigation over the validity of partnership contract that SK Planet Co., Ltd., a subsidiary of the Parent Company, was involved as thedefendant (Plaintiff: Nonghyup Bank) was settled by the agreement between the parties during the year ended December 31, 2018. As a result of the settlement, the creditcard business partnership between the SK Planet Co., Ltd. and Nonghyup Bank will be maintained until April 2021, and the SK Planet Co., Ltd. is obligated to pay thecommission fees based on the customers’ credit card usage until September 2021, the expiration date of the credit cards. The Group determined that the contract and thesubsidiary agreements meet the definition of an onerous contract according to IAS 37, for which the Group recognized provisions with the best estimate of the expenditurerequired to settle the present obligation at the end of the reporting period. In this regard, ₩32,104 million and ₩18,018 million are recognized as current provisions andnon-current provisions, respectively as of December 31, 2019.
(3) Accounts receivable from sale of handsets
The sales agents of the Parent Company sell handsets to the Parent Company’s subscribers on an installment basis. The Parent Company entered into comprehensiveagreements to purchase accounts receivable from handset sales with retail stores and authorized dealers and to transfer the accounts receivable from handset sales to specialpurpose companies which were established with the purpose of liquidating receivables, respectively.
The accounts receivable from sale of handsets amounting to ₩646,837 million as of December 31, 2019 which the Parent Company purchased according to therelevant comprehensive agreement are recognized as accounts receivable — other and long-term accounts receivable — other.
(4) On April 26, 2019, the board of directors of SK Broadband Co., Ltd., a subsidiary of the Parent Company resolved to approve SK Broadband Co., Ltd.’s mergerwith Tbroad Co., Ltd., Tbroad Dongdaemun Broadcasting Co., Ltd. and Korea Digital Cable Media Center Co., Ltd. in order to strengthen the competitiveness and enhancethe synergy as a comprehensive media company. SK Broadband Co., Ltd. will merge Tbroad Co., Ltd., Tbroad Dongdaemun Broadcasting Co., Ltd. and Korea DigitalCable Media Center Co., Ltd. which are planned to be merged and dissolved on the date of merger expected to be April 30, 2020. The Group obtained a conditionalapproval from regulatory authorities on January 21, 2020.
Copyright © 2020 www.secdatabase.com. All Rights Reserved.Please Consider the Environment Before Printing This Document
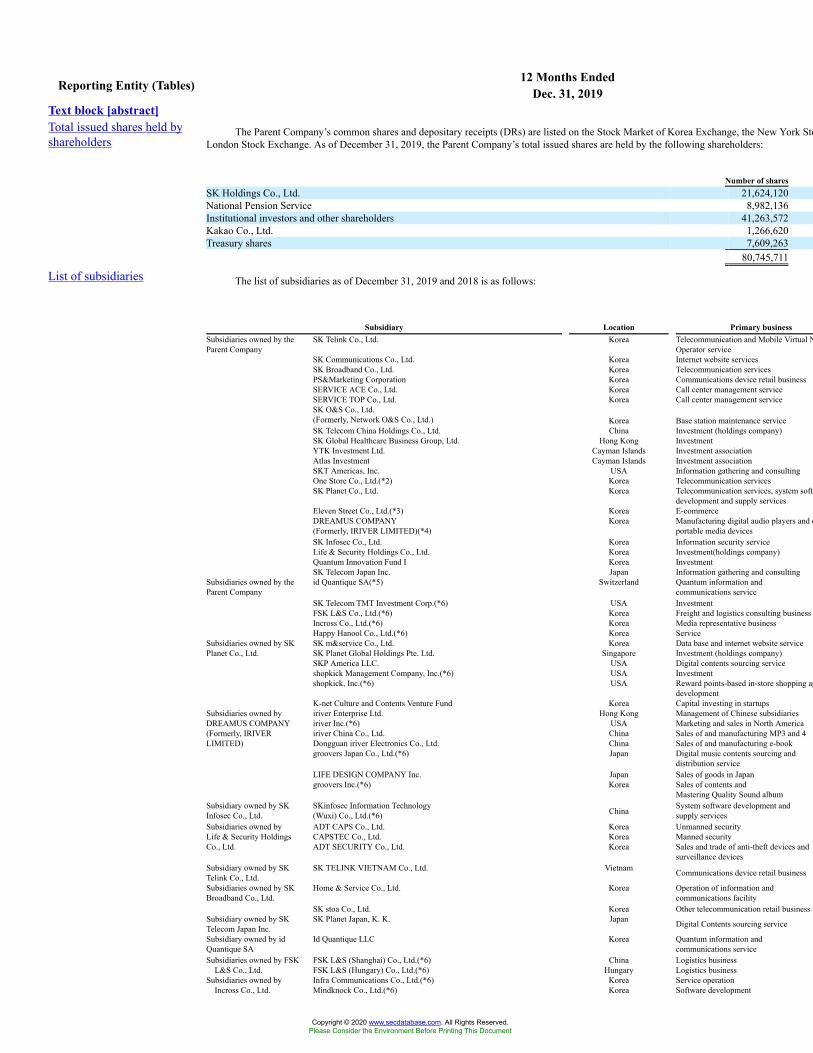
12 Months EndedReporting Entity (Tables) Dec. 31, 2019Text block [abstract]Total issued shares held byshareholders
The Parent Company’s common shares and depositary receipts (DRs) are listed on the Stock Market of Korea Exchange, the New York Stock Exchange and theLondon Stock Exchange. As of December 31, 2019, the Parent Company’s total issued shares are held by the following shareholders:
Number of sharesPercentage of
total shares issued (%)SK Holdings Co., Ltd. 21,624,120 26.78National Pension Service 8,982,136 11.12Institutional investors and other shareholders 41,263,572 51.11Kakao Co., Ltd. 1,266,620 1.57Treasury shares 7,609,263 9.42
80,745,711 100.00
List of subsidiaries The list of subsidiaries as of December 31, 2019 and 2018 is as follows:
Ownership (%)(*1)
Subsidiary Location Primary businessDec. 31,
2019Dec. 31,
2018SK Telink Co., Ltd. Korea Telecommunication and Mobile Virtual Network
Operator service 100.0 100.0SK Communications Co., Ltd. Korea Internet website services 100.0 100.0SK Broadband Co., Ltd. Korea Telecommunication services 100.0 100.0PS&Marketing Corporation Korea Communications device retail business 100.0 100.0SERVICE ACE Co., Ltd. Korea Call center management service 100.0 100.0SERVICE TOP Co., Ltd. Korea Call center management service 100.0 100.0SK O&S Co., Ltd.(Formerly, Network O&S Co., Ltd.) Korea Base station maintenance service 100.0 100.0SK Telecom China Holdings Co., Ltd. China Investment (holdings company) 100.0 100.0
Subsidiaries owned by theParent Company
SK Global Healthcare Business Group, Ltd. Hong Kong Investment 100.0 100.0YTK Investment Ltd. Cayman Islands Investment association 100.0 100.0Atlas Investment Cayman Islands Investment association 100.0 100.0SKT Americas, Inc. USA Information gathering and consulting 100.0 100.0One Store Co., Ltd.(*2) Korea Telecommunication services 52.7 65.5SK Planet Co., Ltd. Korea Telecommunication services, system software
development and supply services 98.7 98.7Eleven Street Co., Ltd.(*3) Korea E-commerce 80.3 81.8DREAMUS COMPANY(Formerly, IRIVER LIMITED)(*4)
Korea Manufacturing digital audio players and otherportable media devices 51.4 52.6
SK Infosec Co., Ltd. Korea Information security service 100.0 100.0Life & Security Holdings Co., Ltd. Korea Investment(holdings company) 55.0 55.0Quantum Innovation Fund I Korea Investment 59.9 59.9SK Telecom Japan Inc. Japan Information gathering and consulting 100.0 100.0id Quantique SA(*5) Switzerland Quantum information and
communications service 66.8 65.6SK Telecom TMT Investment Corp.(*6) USA Investment 100.0 —FSK L&S Co., Ltd.(*6) Korea Freight and logistics consulting business 60.0 —Incross Co., Ltd.(*6) Korea Media representative business 34.6 —
Subsidiaries owned by theParent Company
Happy Hanool Co., Ltd.(*6) Korea Service 100.0 —SK m&service Co., Ltd. Korea Data base and internet website service 100.0 100.0SK Planet Global Holdings Pte. Ltd. Singapore Investment (holdings company) 100.0 100.0SKP America LLC. USA Digital contents sourcing service 100.0 100.0shopkick Management Company, Inc.(*6) USA Investment — 100.0shopkick, Inc.(*6) USA Reward points-based in-store shopping application
development — 100.0
Subsidiaries owned by SKPlanet Co., Ltd.
K-net Culture and Contents Venture Fund Korea Capital investing in startups 59.0 59.0iriver Enterprise Ltd. Hong Kong Management of Chinese subsidiaries 100.0 100.0iriver Inc.(*6) USA Marketing and sales in North America — 100.0iriver China Co., Ltd. China Sales of and manufacturing MP3 and 4 100.0 100.0Dongguan iriver Electronics Co., Ltd. China Sales of and manufacturing e-book 100.0 100.0groovers Japan Co., Ltd.(*6) Japan Digital music contents sourcing and
distribution service — 100.0LIFE DESIGN COMPANY Inc. Japan Sales of goods in Japan 100.0 100.0
Subsidiaries owned byDREAMUS COMPANY(Formerly, IRIVERLIMITED)
groovers Inc.(*6) Korea Sales of contents andMastering Quality Sound album — 100.0
Subsidiary owned by SKInfosec Co., Ltd.
SKinfosec Information Technology(Wuxi) Co., Ltd.(*6) China System software development and
supply services 100.0 —
ADT CAPS Co., Ltd. Korea Unmanned security 100.0 100.0CAPSTEC Co., Ltd. Korea Manned security 100.0 100.0
Subsidiaries owned byLife & Security HoldingsCo., Ltd. ADT SECURITY Co., Ltd. Korea Sales and trade of anti-theft devices and
surveillance devices 100.0 100.0Subsidiary owned by SKTelink Co., Ltd.
SK TELINK VIETNAM Co., Ltd. Vietnam Communications device retail business 100.0 100.0
Home & Service Co., Ltd. Korea Operation of information andcommunications facility 100.0 100.0
Subsidiaries owned by SKBroadband Co., Ltd.
SK stoa Co., Ltd. Korea Other telecommunication retail business 100.0 100.0Subsidiary owned by SKTelecom Japan Inc.
SK Planet Japan, K. K. Japan Digital Contents sourcing service 79.8 79.8
Subsidiary owned by idQuantique SA
Id Quantique LLC Korea Quantum information andcommunications service 100.0 100.0
FSK L&S (Shanghai) Co., Ltd.(*6) China Logistics business 66.0 —Subsidiaries owned by FSKL&S Co., Ltd. FSK L&S (Hungary) Co., Ltd.(*6) Hungary Logistics business 100.0 —
Infra Communications Co., Ltd.(*6) Korea Service operation 100.0 —Subsidiaries owned byIncross Co., Ltd. Mindknock Co., Ltd.(*6) Korea Software development 100.0 —
Copyright © 2020 www.secdatabase.com. All Rights Reserved.Please Consider the Environment Before Printing This Document
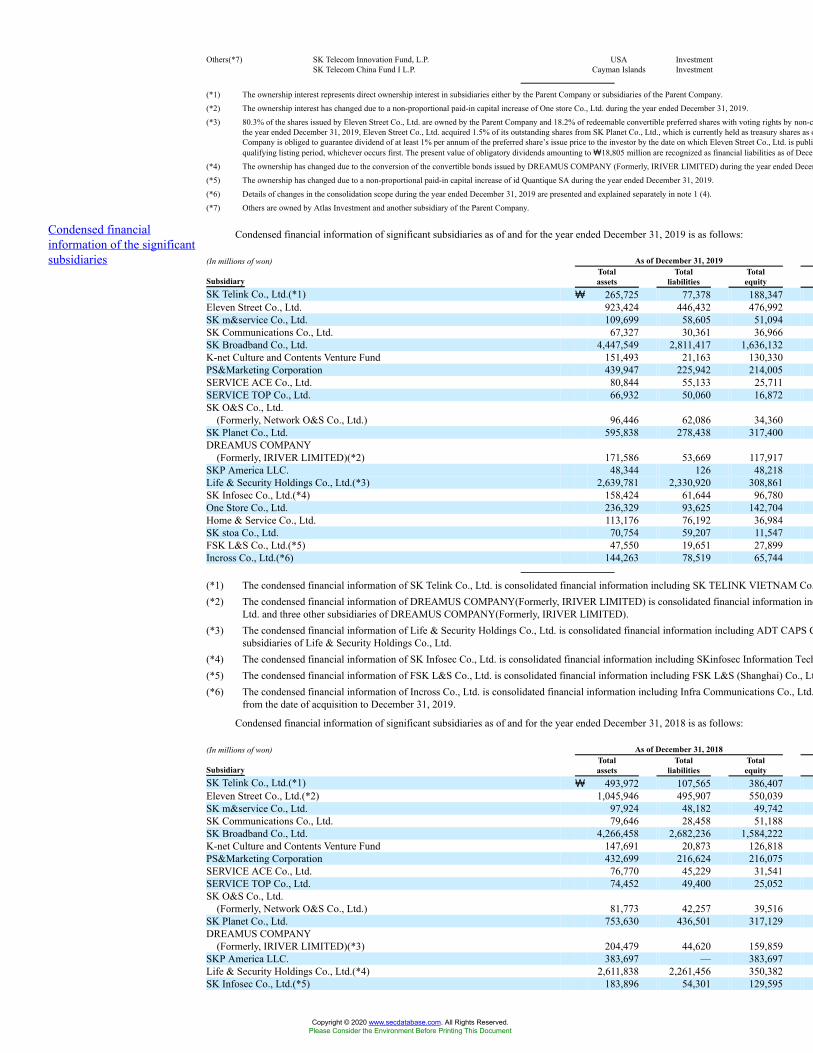
SK Telecom Innovation Fund, L.P. USA Investment 100.0 100.0Others(*7)SK Telecom China Fund I L.P. Cayman Islands Investment 100.0 100.0
(*1) The ownership interest represents direct ownership interest in subsidiaries either by the Parent Company or subsidiaries of the Parent Company.(*2) The ownership interest has changed due to a non-proportional paid-in capital increase of One store Co., Ltd. during the year ended December 31, 2019.(*3) 80.3% of the shares issued by Eleven Street Co., Ltd. are owned by the Parent Company and 18.2% of redeemable convertible preferred shares with voting rights by non-controlling shareholders. During
the year ended December 31, 2019, Eleven Street Co., Ltd. acquired 1.5% of its outstanding shares from SK Planet Co., Ltd., which is currently held as treasury shares as of December 31, 2019. The ParentCompany is obliged to guarantee dividend of at least 1% per annum of the preferred share’s issue price to the investor by the date on which Eleven Street Co., Ltd. is publicly listed or at the end ofqualifying listing period, whichever occurs first. The present value of obligatory dividends amounting to ₩18,805 million are recognized as financial liabilities as of December 31, 2019.
(*4) The ownership has changed due to the conversion of the convertible bonds issued by DREAMUS COMPANY (Formerly, IRIVER LIMITED) during the year ended December 31, 2019.(*5) The ownership has changed due to a non-proportional paid-in capital increase of id Quantique SA during the year ended December 31, 2019.(*6) Details of changes in the consolidation scope during the year ended December 31, 2019 are presented and explained separately in note 1 (4).(*7) Others are owned by Atlas Investment and another subsidiary of the Parent Company.
Condensed financialinformation of the significantsubsidiaries
Condensed financial information of significant subsidiaries as of and for the year ended December 31, 2019 is as follows:
(In millions of won) As of December 31, 2019 2019
SubsidiaryTotalassets
Totalliabilities
Totalequity Revenue
Profit(loss)
SK Telink Co., Ltd.(*1) ₩ 265,725 77,378 188,347 363,627 3,010Eleven Street Co., Ltd. 923,424 446,432 476,992 530,489 (5,077)SK m&service Co., Ltd. 109,699 58,605 51,094 218,848 2,448SK Communications Co., Ltd. 67,327 30,361 36,966 39,944 (13,301)SK Broadband Co., Ltd. 4,447,549 2,811,417 1,636,132 3,178,805 48,583K-net Culture and Contents Venture Fund 151,493 21,163 130,330 — (294)PS&Marketing Corporation 439,947 225,942 214,005 1,684,576 96SERVICE ACE Co., Ltd. 80,844 55,133 25,711 206,080 3,906SERVICE TOP Co., Ltd. 66,932 50,060 16,872 193,377 2,230SK O&S Co., Ltd.
(Formerly, Network O&S Co., Ltd.) 96,446 62,086 34,360 281,634 1,724SK Planet Co., Ltd. 595,838 278,438 317,400 275,544 1,214DREAMUS COMPANY
(Formerly, IRIVER LIMITED)(*2) 171,586 53,669 117,917 196,961 (48,006)SKP America LLC. 48,344 126 48,218 — (351,470)Life & Security Holdings Co., Ltd.(*3) 2,639,781 2,330,920 308,861 913,301 12,703SK Infosec Co., Ltd.(*4) 158,424 61,644 96,780 270,423 18,520One Store Co., Ltd. 236,329 93,625 142,704 135,116 (5,415)Home & Service Co., Ltd. 113,176 76,192 36,984 351,154 (267)SK stoa Co., Ltd. 70,754 59,207 11,547 196,063 875FSK L&S Co., Ltd.(*5) 47,550 19,651 27,899 130,872 306Incross Co., Ltd.(*6) 144,263 78,519 65,744 19,787 5,756
(*1) The condensed financial information of SK Telink Co., Ltd. is consolidated financial information including SK TELINK VIETNAM Co., Ltd.(*2) The condensed financial information of DREAMUS COMPANY(Formerly, IRIVER LIMITED) is consolidated financial information including iriver Enterprise
Ltd. and three other subsidiaries of DREAMUS COMPANY(Formerly, IRIVER LIMITED).(*3) The condensed financial information of Life & Security Holdings Co., Ltd. is consolidated financial information including ADT CAPS Co., Ltd. and two other
subsidiaries of Life & Security Holdings Co., Ltd.(*4) The condensed financial information of SK Infosec Co., Ltd. is consolidated financial information including SKinfosec Information Technology (Wuxi) Co., Ltd.(*5) The condensed financial information of FSK L&S Co., Ltd. is consolidated financial information including FSK L&S (Shanghai) Co., Ltd. and another subsidiary.(*6) The condensed financial information of Incross Co., Ltd. is consolidated financial information including Infra Communications Co., Ltd. and another subsidiary
from the date of acquisition to December 31, 2019.
Condensed financial information of significant subsidiaries as of and for the year ended December 31, 2018 is as follows:
(In millions of won) As of December 31, 2018 2018
SubsidiaryTotalassets
Totalliabilities
Totalequity Revenue
Profit(loss)
SK Telink Co., Ltd.(*1) ₩ 493,972 107,565 386,407 373,019 39,962Eleven Street Co., Ltd.(*2) 1,045,946 495,907 550,039 228,000 (9,507)SK m&service Co., Ltd. 97,924 48,182 49,742 208,936 (119)SK Communications Co., Ltd. 79,646 28,458 51,188 41,604 (10,323)SK Broadband Co., Ltd. 4,266,458 2,682,236 1,584,222 3,158,877 154,999K-net Culture and Contents Venture Fund 147,691 20,873 126,818 — 58,584PS&Marketing Corporation 432,699 216,624 216,075 1,587,203 76SERVICE ACE Co., Ltd. 76,770 45,229 31,541 198,164 4,217SERVICE TOP Co., Ltd. 74,452 49,400 25,052 205,574 5,276SK O&S Co., Ltd.
(Formerly, Network O&S Co., Ltd.) 81,773 42,257 39,516 265,183 1,089SK Planet Co., Ltd. 753,630 436,501 317,129 672,648 (436,106)DREAMUS COMPANY
(Formerly, IRIVER LIMITED)(*3) 204,479 44,620 159,859 137,849 (21,314)SKP America LLC. 383,697 — 383,697 — (370)Life & Security Holdings Co., Ltd.(*4) 2,611,838 2,261,456 350,382 197,487 6,038SK Infosec Co., Ltd.(*5) 183,896 54,301 129,595 — —
Copyright © 2020 www.secdatabase.com. All Rights Reserved.Please Consider the Environment Before Printing This Document

One Store Co., Ltd. 116,716 65,890 50,826 110,284 (13,903)Home & Service Co., Ltd. 87,159 45,341 41,818 325,177 (1,264)SK stoa Co., Ltd. 41,305 37,560 3,745 116,459 (16,987)
(*1) The condensed financial information of SK Telink Co., Ltd. is consolidated financial information including SK TELINK VIETNAM Co., Ltd.(*2) The condensed financial information of Eleven Street Co., Ltd. includes four months of revenue and profit and loss since the spin-off on August 31, 2018.(*3) The condensed financial information of DREAMUS COMPANY (Formerly, IRIVER LIMITED) is consolidated financial information including iriver Enterprise
Ltd. and six other subsidiaries of DREAMUS COMPANY (Formerly, IRIVER LIMITED).(*4) The condensed financial information of Life & Security Holdings Co., Ltd. is consolidated financial information including ADT CAPS Co., Ltd. and two other
subsidiaries, including 3 months of revenue and profit and loss since Life & Security Holdings Co., Ltd. was acquired by the Parent Company on October 1, 2018.(*5) SK Infosec Co., Ltd. was acquired by the Parent Company and newly included in consolidation as of December 27, 2018.
Condensed financial information of the significant subsidiaries as of and for the year ended December 31, 2017 is as follows:
(In millions of won) As of December 31, 2017 2017
SubsidiaryTotalassets
Totalliabilities
Totalequity Revenue
Profit(loss)
SK Telink Co., Ltd. ₩ 455,685 104,727 350,958 389,944 32,728SK m&service Co., Ltd. 113,515 62,795 50,720 193,256 1,249SK Communications Co., Ltd. 90,923 28,410 62,513 47,546 (35,454)SK Broadband Co., Ltd. 3,802,349 2,616,317 1,186,032 3,050,083 32,030K-net Culture and Contents Venture Fund 250,747 35,900 214,847 — 196,250PS&Marketing Corporation 506,883 288,881 218,002 1,766,142 391SERVICE ACE Co., Ltd. 77,681 45,501 32,180 197,408 2,599SERVICE TOP Co., Ltd. 65,406 41,860 23,546 186,117 3,309SK O&S Co., Ltd.
(Formerly, Network O&S Co., Ltd.) 87,000 45,248 41,752 255,841 6,283SK Planet Co., Ltd. 1,534,866 920,677 614,189 1,082,685 (513,667)DREAMUS COMPANY
(Formerly, IRIVER LIMITED)(*) 130,878 17,204 113,674 69,452 (14,092)SKP America LLC. 412,251 — 412,251 — (57)SK techx Co., Ltd. 237,700 41,561 196,139 195,948 26,827One Store Co., Ltd. 104,891 39,874 65,017 115,596 (27,254)Home & Service Co., Ltd. 83,698 38,350 45,348 141,739 11
(*) The condensed financial information of DREAMUS COMPANY (Formerly, IRIVER LIMITED) is consolidated financial information including iriver EnterpriseLtd. and six other subsidiaries of DREAMUS COMPANY (Formerly, IRIVER LIMITED). Information for the other subsidiaries in the above summary is based ontheir separate financial statements.
(4) Changes in subsidiaries
The list of subsidiaries that were newly included in consolidation during the year ended December 31, 2019 is as follows:
Subsidiary ReasonSK Telecom TMT Investment Corp. Established by the Parent CompanyFSK L&S Co., Ltd. Acquired by the Parent CompanyFSK L&S (Shanghai) Co., Ltd. Subsidiary of FSK L&S Co., Ltd.Incross Co., Ltd. Acquired by the Parent CompanyInfra Communications Co., Ltd. Subsidiary of Incross Co., Ltd.Mindknock Co., Ltd. Acquired by Incross Co., Ltd.Happy Hanool Co., Ltd. Established by the Parent CompanySKinfosec Information Technology (Wuxi) Co., Ltd. Established by SK Infosec Co., Ltd.FSK L&S (Hungary) Co., Ltd. Established by FSK L&S Co., Ltd.
The list of subsidiaries that were excluded from consolidation during the year ended December 31, 2019 is as follows:
Subsidiary Reasongroovers Inc. Merged into DREAMUS COMPANY (Formerly, IRIVER LIMITED)shopkick Management Company, Inc. Disposedshopkick, Inc. Disposediriver Inc. Disposedgroovers Japan Co., Ltd. Merged into LIFE DESIGN COMPANY Inc.
Information of significant non-controlling interests of thegroup
(5) The financial information of significant non-controlling interests of the Group as of and for the years ended December 31, 2019, 2018 and 2017 are asfollows:
(In millions of won)
DREAMUS COMPANY(Formerly,
IRIVER LIMITED)One StoreCo., Ltd.
Eleven StreetCo., Ltd.
Life & SecurityHoldings Co., Ltd. Incross Co., Ltd.
Ownership of non-controlling interests (%) 48.6 47.3 18.2 45.0 65.4As of December 31, 2019
Current assets ₩ 136,269 208,527 779,568 126,437 133,741Non-current assets 35,317 27,802 143,856 2,513,344 10,522Current liabilities (49,776) (88,842) (420,022) (279,403) (77,530)Non-current liabilities (3,893) (4,783) (26,410) (2,051,517) (989)Net assets 117,917 142,704 476,992 308,861 65,744
Copyright © 2020 www.secdatabase.com. All Rights Reserved.Please Consider the Environment Before Printing This Document
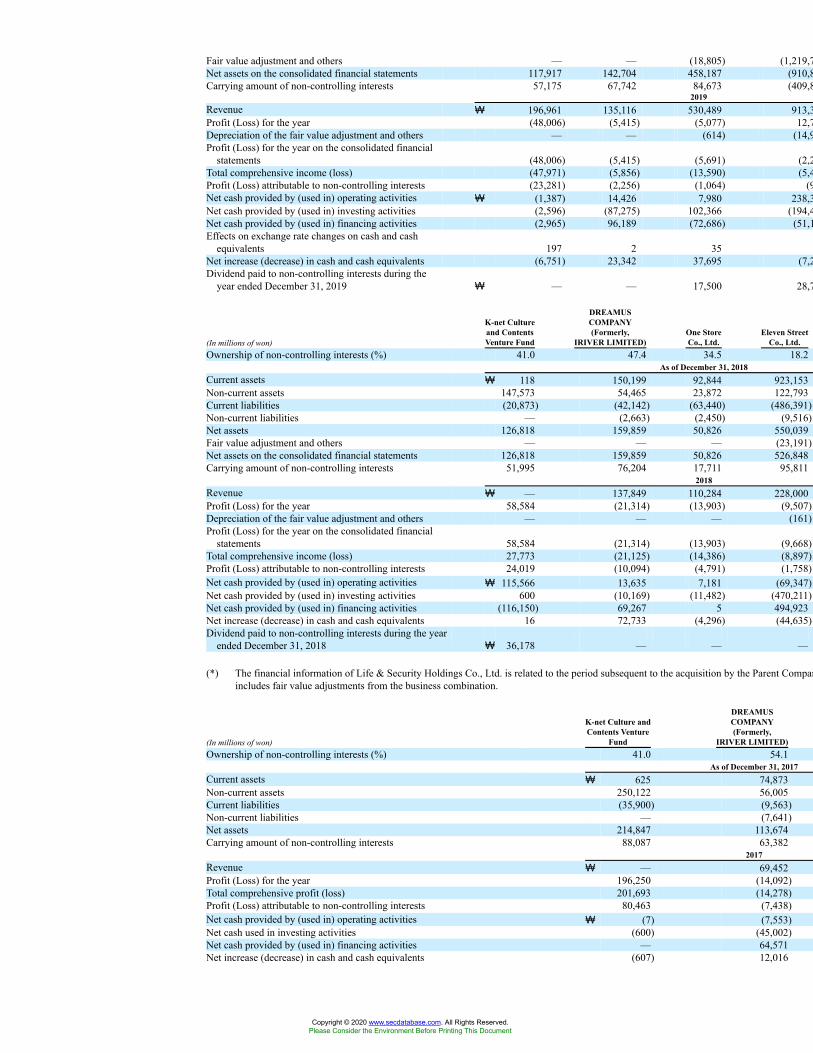
Fair value adjustment and others — — (18,805) (1,219,701) —Net assets on the consolidated financial statements 117,917 142,704 458,187 (910,840) 65,744Carrying amount of non-controlling interests 57,175 67,742 84,673 (409,878) 41,074
2019Revenue ₩ 196,961 135,116 530,489 913,301 19,787Profit (Loss) for the year (48,006) (5,415) (5,077) 12,703 5,756Depreciation of the fair value adjustment and others — — (614) (14,913) —Profit (Loss) for the year on the consolidated financial
statements (48,006) (5,415) (5,691) (2,210) 5,756Total comprehensive income (loss) (47,971) (5,856) (13,590) (5,413) 5,396Profit (Loss) attributable to non-controlling interests (23,281) (2,256) (1,064) (978) 3,630Net cash provided by (used in) operating activities ₩ (1,387) 14,426 7,980 238,378 (9,331)Net cash provided by (used in) investing activities (2,596) (87,275) 102,366 (194,472) 5,053Net cash provided by (used in) financing activities (2,965) 96,189 (72,686) (51,129) (4,644)Effects on exchange rate changes on cash and cash
equivalents 197 2 35 — —Net increase (decrease) in cash and cash equivalents (6,751) 23,342 37,695 (7,223) 8,478Dividend paid to non-controlling interests during the
year ended December 31, 2019 ₩ — — 17,500 28,786 —
(In millions of won)
K-net Cultureand ContentsVenture Fund
DREAMUSCOMPANY(Formerly,
IRIVER LIMITED)One StoreCo., Ltd.
Eleven StreetCo., Ltd.
Life & SecurityHoldings Co., Ltd.(*)
Ownership of non-controlling interests (%) 41.0 47.4 34.5 18.2 45.0As of December 31, 2018
Current assets ₩ 118 150,199 92,844 923,153 124,091Non-current assets 147,573 54,465 23,872 122,793 2,487,747Current liabilities (20,873) (42,142) (63,440) (486,391) (243,064)Non-current liabilities — (2,663) (2,450) (9,516) (2,018,392)Net assets 126,818 159,859 50,826 550,039 350,382Fair value adjustment and others — — — (23,191) (1,216,347)Net assets on the consolidated financial statements 126,818 159,859 50,826 526,848 (865,965)Carrying amount of non-controlling interests 51,995 76,204 17,711 95,811 (389,684)
2018Revenue ₩ — 137,849 110,284 228,000 197,487Profit (Loss) for the year 58,584 (21,314) (13,903) (9,507) 6,038Depreciation of the fair value adjustment and others — — — (161) (2,954)Profit (Loss) for the year on the consolidated financial
statements 58,584 (21,314) (13,903) (9,668) 3,084Total comprehensive income (loss) 27,773 (21,125) (14,386) (8,897) (991)Profit (Loss) attributable to non-controlling interests 24,019 (10,094) (4,791) (1,758) 1,387Net cash provided by (used in) operating activities ₩ 115,566 13,635 7,181 (69,347) (23,451)Net cash provided by (used in) investing activities 600 (10,169) (11,482) (470,211) (139,430)Net cash provided by (used in) financing activities (116,150) 69,267 5 494,923 124,076Net increase (decrease) in cash and cash equivalents 16 72,733 (4,296) (44,635) (38,805)Dividend paid to non-controlling interests during the year
ended December 31, 2018 ₩ 36,178 — — — —
(*) The financial information of Life & Security Holdings Co., Ltd. is related to the period subsequent to the acquisition by the Parent Company on October 1, 2018 andincludes fair value adjustments from the business combination.
(In millions of won)
K-net Culture andContents Venture
Fund
DREAMUSCOMPANY(Formerly,
IRIVER LIMITED) One Store Co., Ltd.Ownership of non-controlling interests (%) 41.0 54.1 34.5
As of December 31, 2017Current assets ₩ 625 74,873 76,810Non-current assets 250,122 56,005 28,081Current liabilities (35,900) (9,563) (38,547)Non-current liabilities — (7,641) (1,327)Net assets 214,847 113,674 65,017Carrying amount of non-controlling interests 88,087 63,382 22,405
2017Revenue ₩ — 69,452 115,596Profit (Loss) for the year 196,250 (14,092) (27,254)Total comprehensive profit (loss) 201,693 (14,278) (27,452)Profit (Loss) attributable to non-controlling interests 80,463 (7,438) (9,392)Net cash provided by (used in) operating activities ₩ (7) (7,553) 13,912Net cash used in investing activities (600) (45,002) (2,000)Net cash provided by (used in) financing activities — 64,571 (7)Net increase (decrease) in cash and cash equivalents (607) 12,016 11,905
Copyright © 2020 www.secdatabase.com. All Rights Reserved.Please Consider the Environment Before Printing This Document
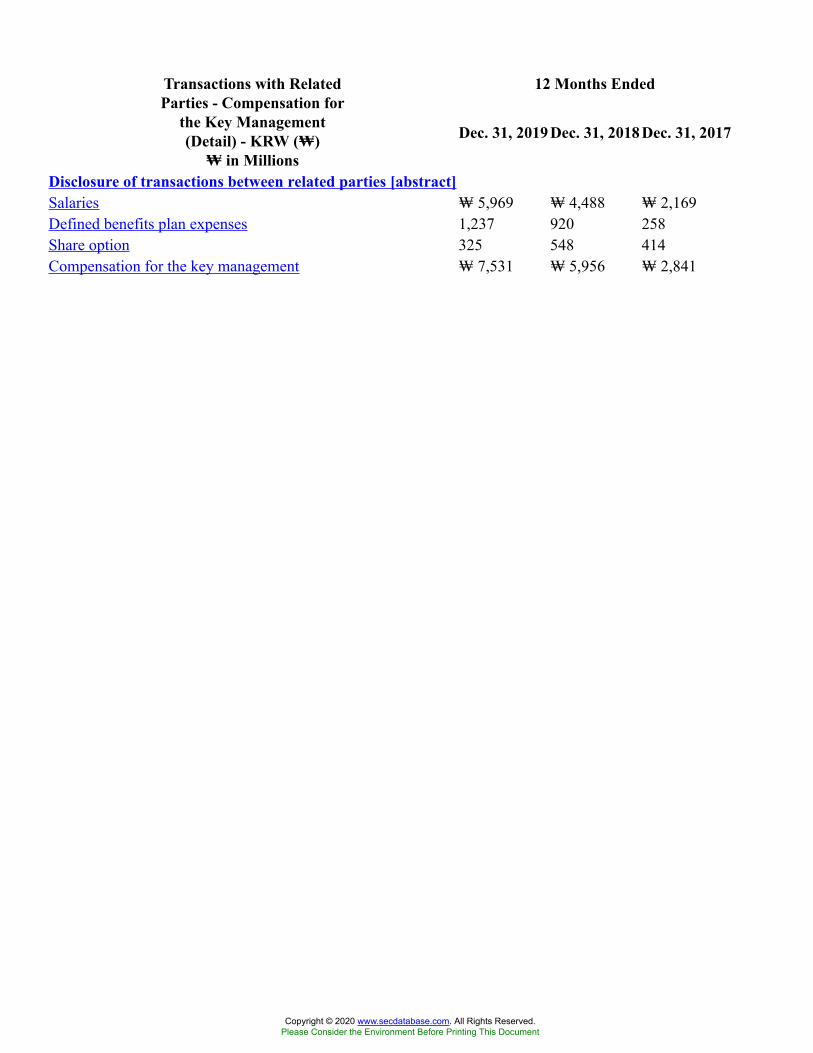
12 Months EndedTransactions with RelatedParties - Compensation for
the Key Management(Detail) - KRW (₩)
₩ in Millions
Dec. 31, 2019 Dec. 31, 2018 Dec. 31, 2017
Disclosure of transactions between related parties [abstract]Salaries ₩ 5,969 ₩ 4,488 ₩ 2,169Defined benefits plan expenses 1,237 920 258Share option 325 548 414Compensation for the key management ₩ 7,531 ₩ 5,956 ₩ 2,841
Copyright © 2020 www.secdatabase.com. All Rights Reserved.Please Consider the Environment Before Printing This Document
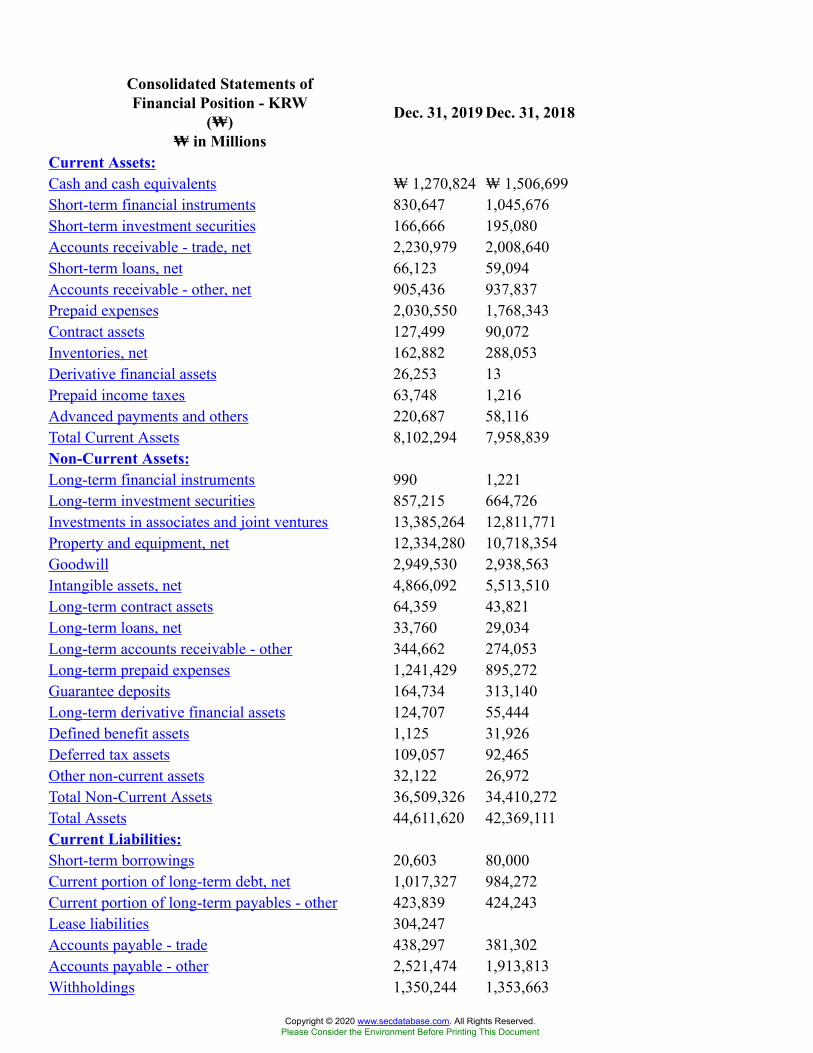
Consolidated Statements ofFinancial Position - KRW
(₩)₩ in Millions
Dec. 31, 2019 Dec. 31, 2018
Current Assets:Cash and cash equivalents ₩ 1,270,824 ₩ 1,506,699Short-term financial instruments 830,647 1,045,676Short-term investment securities 166,666 195,080Accounts receivable - trade, net 2,230,979 2,008,640Short-term loans, net 66,123 59,094Accounts receivable - other, net 905,436 937,837Prepaid expenses 2,030,550 1,768,343Contract assets 127,499 90,072Inventories, net 162,882 288,053Derivative financial assets 26,253 13Prepaid income taxes 63,748 1,216Advanced payments and others 220,687 58,116Total Current Assets 8,102,294 7,958,839Non-Current Assets:Long-term financial instruments 990 1,221Long-term investment securities 857,215 664,726Investments in associates and joint ventures 13,385,264 12,811,771Property and equipment, net 12,334,280 10,718,354Goodwill 2,949,530 2,938,563Intangible assets, net 4,866,092 5,513,510Long-term contract assets 64,359 43,821Long-term loans, net 33,760 29,034Long-term accounts receivable - other 344,662 274,053Long-term prepaid expenses 1,241,429 895,272Guarantee deposits 164,734 313,140Long-term derivative financial assets 124,707 55,444Defined benefit assets 1,125 31,926Deferred tax assets 109,057 92,465Other non-current assets 32,122 26,972Total Non-Current Assets 36,509,326 34,410,272Total Assets 44,611,620 42,369,111Current Liabilities:Short-term borrowings 20,603 80,000Current portion of long-term debt, net 1,017,327 984,272Current portion of long-term payables - other 423,839 424,243Lease liabilities 304,247Accounts payable - trade 438,297 381,302Accounts payable - other 2,521,474 1,913,813Withholdings 1,350,244 1,353,663
Copyright © 2020 www.secdatabase.com. All Rights Reserved.Please Consider the Environment Before Printing This Document

Accrued expenses 1,425,251 1,299,217Income tax payable 5,450 182,343Provisions 89,446 87,993Contract liabilities 191,225 140,711Other current liabilities 319Total Current Liabilities 7,787,722 6,847,557Non-Current Liabilities:Debentures, excluding current portion, net 7,253,894 6,572,211Long-term borrowings, excluding current portion, net 1,972,149 2,015,365Long-term payables — other 1,550,167 1,968,784Long-term lease liabilities 408,493Long-term contract liabilities 32,231 43,102Defined benefit liabilities 172,258 141,529Long-term derivative financial liabilities 1,043 4,184Long-term provisions 53,783 99,215Deferred tax liabilities 2,466,295 2,269,792Other non-current liabilities 90,049 58,122Total Non-Current Liabilities 14,000,362 13,172,304Total Liabilities 21,788,084 20,019,861Shareholders' EquityShare capital 44,639 44,639Capital surplus and others 607,722 256,325Hybrid bonds 398,759 398,759Retained earnings 22,235,285 22,144,541Reserves (329,576) (373,442)Equity attributable to owners of the Parent Company 22,956,829 22,470,822Non-controlling interests (133,293) (121,572)Total Shareholders' Equity 22,823,536 22,349,250Total Liabilities and Shareholders' Equity ₩ 44,611,620₩ 42,369,111
Copyright © 2020 www.secdatabase.com. All Rights Reserved.Please Consider the Environment Before Printing This Document

Borrowings and Debentures- Short-term Borrowings(Parenthetical) (Detail)
Dec. 31, 2019
Short term Borrowings From Shinhan Bank [Member]Disclosure of detailed information about borrowings [line items]Borrowings, interest rate 1.52%Short term borrowings from KEB Hana Bank [member]Disclosure of detailed information about borrowings [line items]Borrowings, interest rate 1.53%
Copyright © 2020 www.secdatabase.com. All Rights Reserved.Please Consider the Environment Before Printing This Document

12 Months EndedStatements of Cash Flows -Reconciliation of Liabilities
Arising from FinancingActivities (Detail) - KRW
(₩)₩ in Millions
Dec. 31,2019
Dec. 31,2018
Jan. 01,2019
Disclosure of reconciliation of liabilities arising from financingactivities [line items]Lease liabilities ₩ 712,740 ₩ 663,827Beginning balance 11,993,602 ₩
8,896,342Cash flows (265,423) 61,701Exchange rate changes 60,283 73,399Fair value changes (102,585) (25,101)Business Combinations 1,420 1,744,839Other changes 453,355 1,242,422Ending balance 12,804,479 11,993,602Previously stated [member]Disclosure of reconciliation of liabilities arising from financingactivities [line items]Beginning balance 11,993,602Ending balance 11,993,602Impact of adopting K-IFRS No.1116Disclosure of reconciliation of liabilities arising from financingactivities [line items]Lease liabilities 663,827Short-term borrowings [Member]Disclosure of reconciliation of liabilities arising from financingactivities [line items]Beginning balance 80,000 130,000Cash flows (59,860) (87,701)Exchange rate changes (2)Business Combinations 465 36,201Other changes 1,500Ending balance 20,603 80,000Short-term borrowings [Member] | Previously stated [member]Disclosure of reconciliation of liabilities arising from financingactivities [line items]Beginning balance 80,000Ending balance 80,000Long-term borrowings [member]Disclosure of reconciliation of liabilities arising from financingactivities [line items]Beginning balance 2,104,996 252,817
Copyright © 2020 www.secdatabase.com. All Rights Reserved.Please Consider the Environment Before Printing This Document
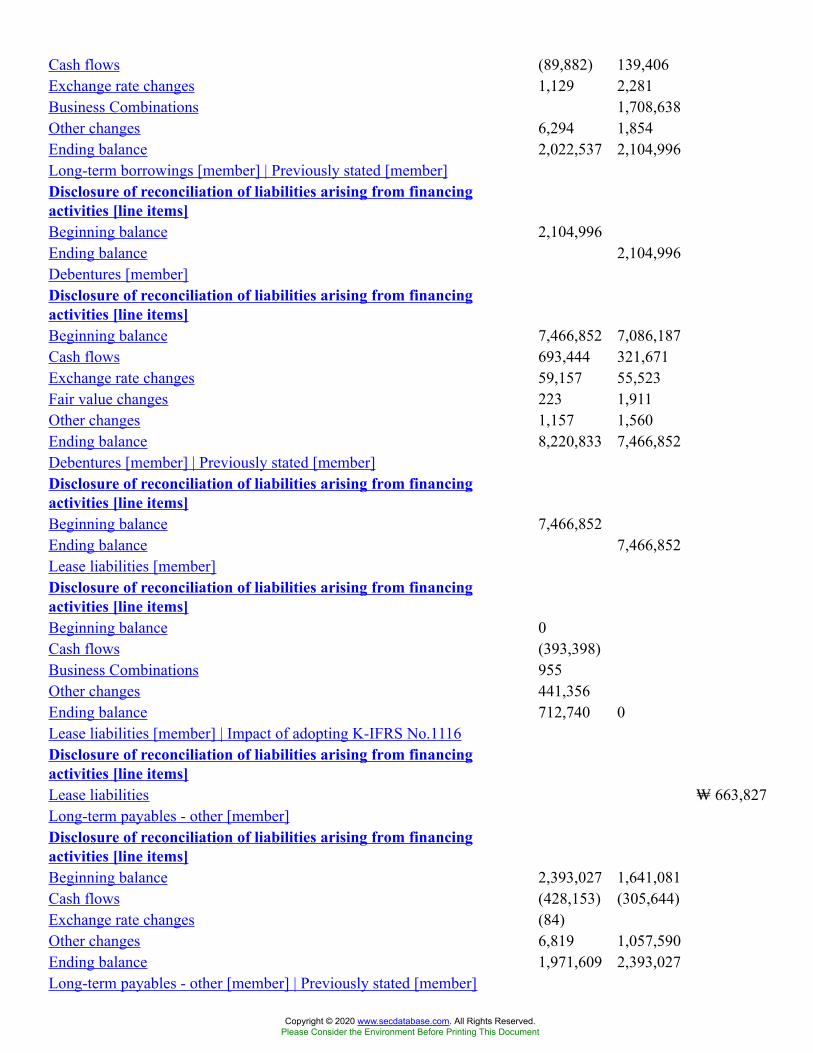
Cash flows (89,882) 139,406Exchange rate changes 1,129 2,281Business Combinations 1,708,638Other changes 6,294 1,854Ending balance 2,022,537 2,104,996Long-term borrowings [member] | Previously stated [member]Disclosure of reconciliation of liabilities arising from financingactivities [line items]Beginning balance 2,104,996Ending balance 2,104,996Debentures [member]Disclosure of reconciliation of liabilities arising from financingactivities [line items]Beginning balance 7,466,852 7,086,187Cash flows 693,444 321,671Exchange rate changes 59,157 55,523Fair value changes 223 1,911Other changes 1,157 1,560Ending balance 8,220,833 7,466,852Debentures [member] | Previously stated [member]Disclosure of reconciliation of liabilities arising from financingactivities [line items]Beginning balance 7,466,852Ending balance 7,466,852Lease liabilities [member]Disclosure of reconciliation of liabilities arising from financingactivities [line items]Beginning balance 0Cash flows (393,398)Business Combinations 955Other changes 441,356Ending balance 712,740 0Lease liabilities [member] | Impact of adopting K-IFRS No.1116Disclosure of reconciliation of liabilities arising from financingactivities [line items]Lease liabilities ₩ 663,827Long-term payables - other [member]Disclosure of reconciliation of liabilities arising from financingactivities [line items]Beginning balance 2,393,027 1,641,081Cash flows (428,153) (305,644)Exchange rate changes (84)Other changes 6,819 1,057,590Ending balance 1,971,609 2,393,027Long-term payables - other [member] | Previously stated [member]
Copyright © 2020 www.secdatabase.com. All Rights Reserved.Please Consider the Environment Before Printing This Document
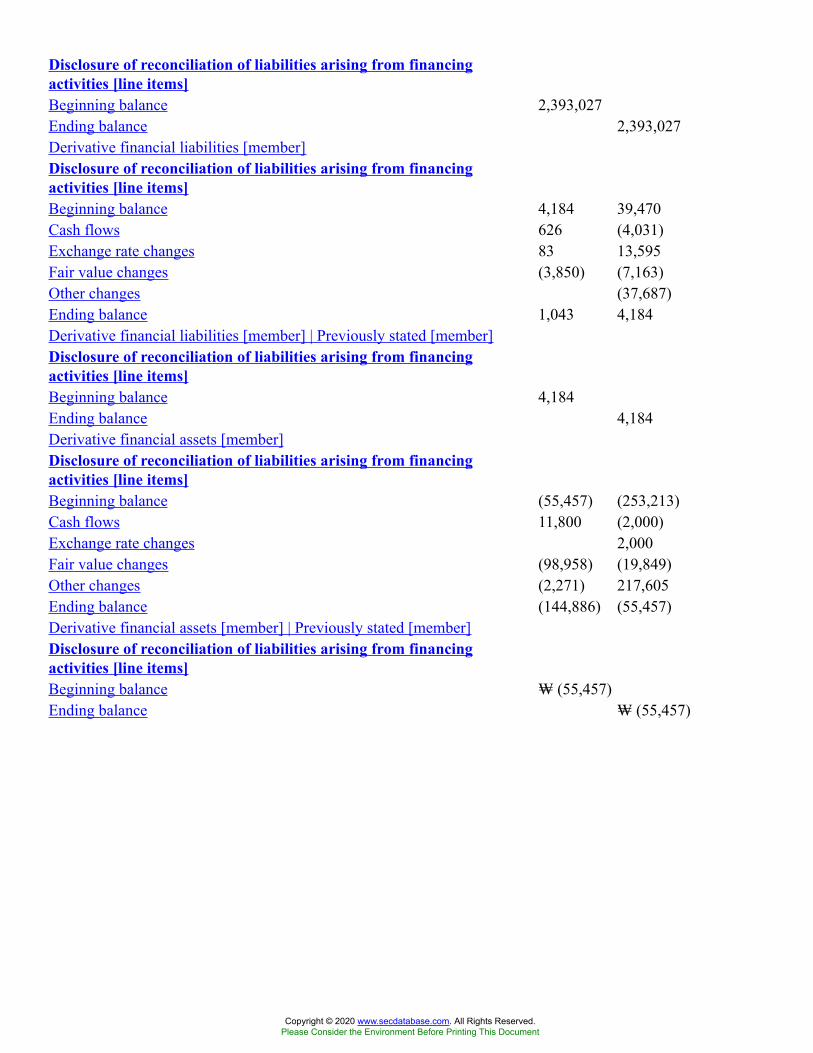
Disclosure of reconciliation of liabilities arising from financingactivities [line items]Beginning balance 2,393,027Ending balance 2,393,027Derivative financial liabilities [member]Disclosure of reconciliation of liabilities arising from financingactivities [line items]Beginning balance 4,184 39,470Cash flows 626 (4,031)Exchange rate changes 83 13,595Fair value changes (3,850) (7,163)Other changes (37,687)Ending balance 1,043 4,184Derivative financial liabilities [member] | Previously stated [member]Disclosure of reconciliation of liabilities arising from financingactivities [line items]Beginning balance 4,184Ending balance 4,184Derivative financial assets [member]Disclosure of reconciliation of liabilities arising from financingactivities [line items]Beginning balance (55,457) (253,213)Cash flows 11,800 (2,000)Exchange rate changes 2,000Fair value changes (98,958) (19,849)Other changes (2,271) 217,605Ending balance (144,886) (55,457)Derivative financial assets [member] | Previously stated [member]Disclosure of reconciliation of liabilities arising from financingactivities [line items]Beginning balance ₩ (55,457)Ending balance ₩ (55,457)
Copyright © 2020 www.secdatabase.com. All Rights Reserved.Please Consider the Environment Before Printing This Document
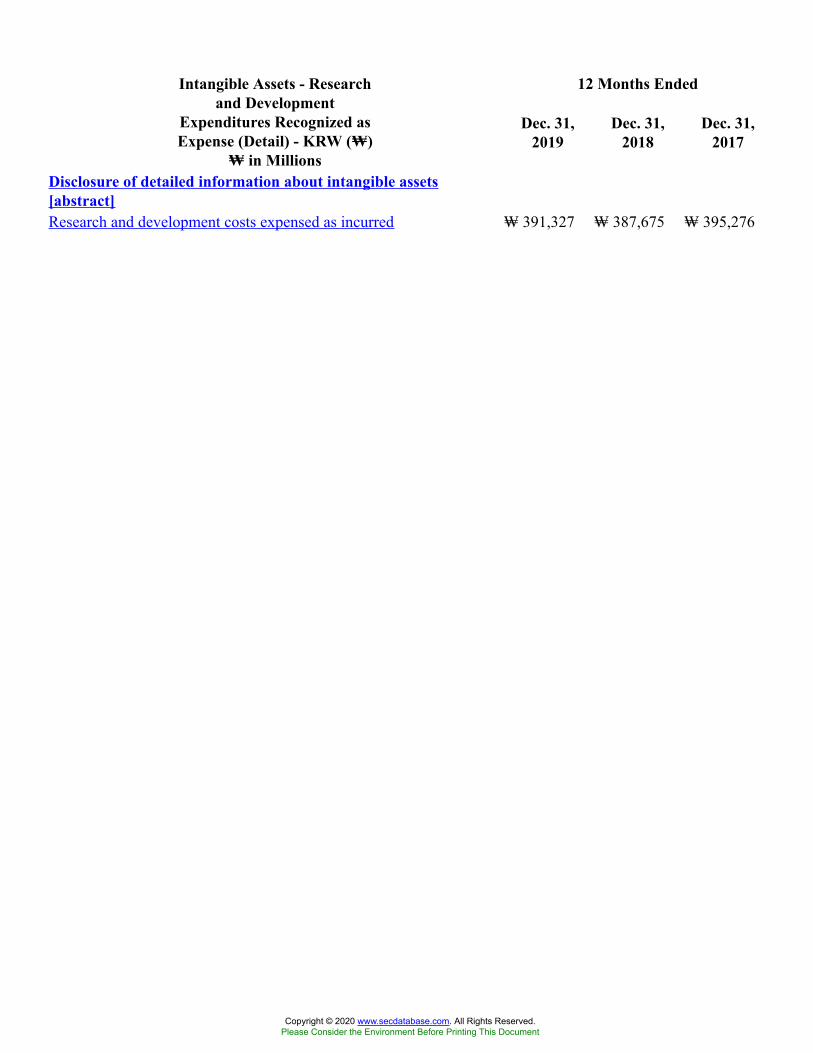
12 Months EndedIntangible Assets - Researchand Development
Expenditures Recognized asExpense (Detail) - KRW (₩)
₩ in Millions
Dec. 31,2019
Dec. 31,2018
Dec. 31,2017
Disclosure of detailed information about intangible assets[abstract]Research and development costs expensed as incurred ₩ 391,327 ₩ 387,675 ₩ 395,276
Copyright © 2020 www.secdatabase.com. All Rights Reserved.Please Consider the Environment Before Printing This Document

12 Months EndedConsolidated Statements ofCash Flows - KRW (₩)
₩ in MillionsDec. 31,
2019Dec. 31,
2018Dec. 31,
2017Cash generated from operating activitiesProfit for the year ₩ 861,942 ₩ 3,131,988 ₩ 2,657,595Adjustments for income and expenses (note 38) 4,351,037 1,568,919 2,096,764Changes in assets and liabilities related to operating activities (note38) (836,335) 25,949 (261,468)
Sub-total 4,376,644 4,726,856 4,492,891Interest received 56,392 59,065 66,713Dividends received 241,117 195,671 106,674Interest paid (346,343) (255,189) (234,127)Income tax paid (341,728) (393,823) (576,331)Net cash provided by operating activities 3,986,082 4,332,580 3,855,820Cash inflows from investing activities:Decrease in short-term financial instruments, net 253,971Decrease in short-term investment securities, net 29,503Collection of short-term loans 113,345 117,610 216,700Decrease in long-term financial instruments 231 5 27Proceeds from disposals of long-term investment securities 234,683 371,816 129,726Proceeds from disposals of investments in associates and jointventures 220 74,880 5,925
Proceeds from disposals of property and equipment 18,478 58,256 29,368Proceeds from disposals of intangible assets 7,327 5,851 8,848Collection of long-term loans 4,435 10,075 6,205Decrease in deposits 9,180 7,490 24,550Proceeds from settlement of derivatives 601Collection of lease receivables 26,773Proceeds from disposals of other non-current assets 1,186 1,185Proceeds from disposals of subsidiaries 4,802 30,132Cash inflow from business combination 5,016 38,925 4,112Cash inflow from transfers of business 45,658Sub-total 754,223 686,094 456,778Cash outflows for investing activities:Increase in short-term financial instruments, net (373,450) (156,012)Increase in short-term investment securities, net (49,791) (28,975)Increase in short-term loans (116,320) (112,319) (205,878)Increase in long-term loans (11,541) (6,057) (5,869)Increase in long-term financial instruments (2) (2,034)Acquisitions of long-term investment securities (383,976) (19,114) (19,328)Acquisitions of investments in associates and joint ventures (264,015) (206,340) (193,100)Acquisitions of property and equipment (3,375,883) (2,792,390) (2,715,859)Acquisitions of intangible assets (141,010) (503,229) (145,740)Increase in deposits (6,164) (8,591) (26,377)
Copyright © 2020 www.secdatabase.com. All Rights Reserved.Please Consider the Environment Before Printing This Document
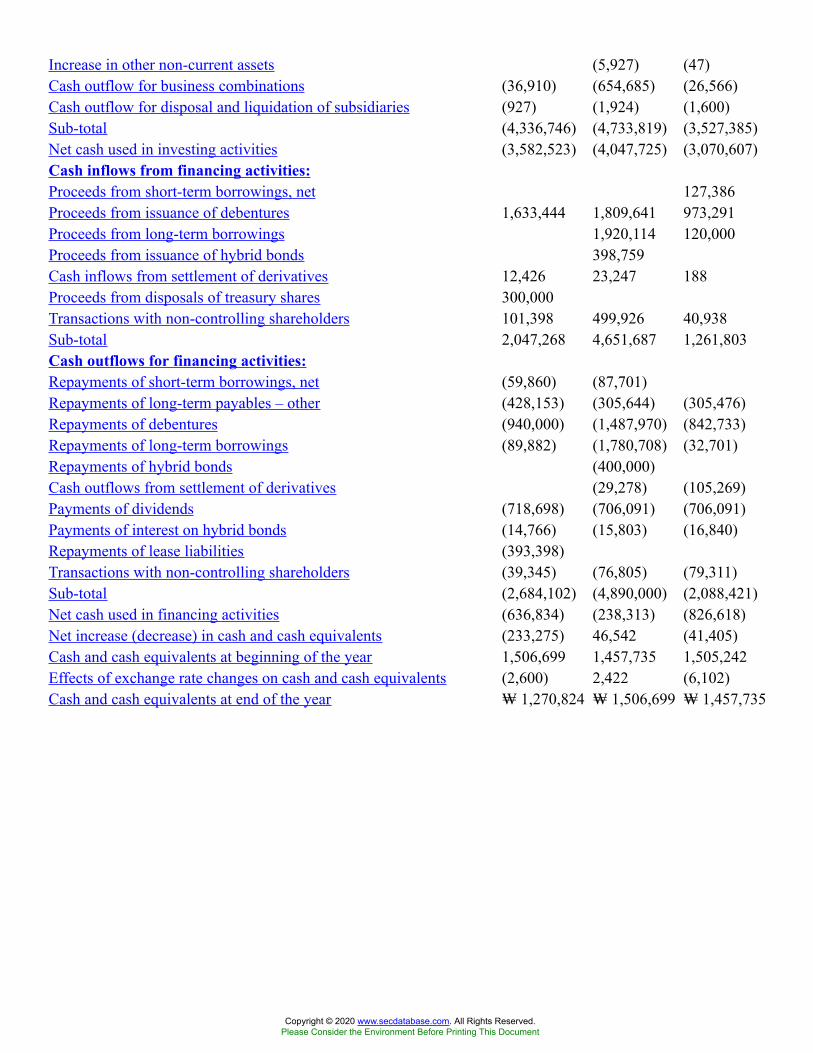
Increase in other non-current assets (5,927) (47)Cash outflow for business combinations (36,910) (654,685) (26,566)Cash outflow for disposal and liquidation of subsidiaries (927) (1,924) (1,600)Sub-total (4,336,746) (4,733,819) (3,527,385)Net cash used in investing activities (3,582,523) (4,047,725) (3,070,607)Cash inflows from financing activities:Proceeds from short-term borrowings, net 127,386Proceeds from issuance of debentures 1,633,444 1,809,641 973,291Proceeds from long-term borrowings 1,920,114 120,000Proceeds from issuance of hybrid bonds 398,759Cash inflows from settlement of derivatives 12,426 23,247 188Proceeds from disposals of treasury shares 300,000Transactions with non-controlling shareholders 101,398 499,926 40,938Sub-total 2,047,268 4,651,687 1,261,803Cash outflows for financing activities:Repayments of short-term borrowings, net (59,860) (87,701)Repayments of long-term payables – other (428,153) (305,644) (305,476)Repayments of debentures (940,000) (1,487,970) (842,733)Repayments of long-term borrowings (89,882) (1,780,708) (32,701)Repayments of hybrid bonds (400,000)Cash outflows from settlement of derivatives (29,278) (105,269)Payments of dividends (718,698) (706,091) (706,091)Payments of interest on hybrid bonds (14,766) (15,803) (16,840)Repayments of lease liabilities (393,398)Transactions with non-controlling shareholders (39,345) (76,805) (79,311)Sub-total (2,684,102) (4,890,000) (2,088,421)Net cash used in financing activities (636,834) (238,313) (826,618)Net increase (decrease) in cash and cash equivalents (233,275) 46,542 (41,405)Cash and cash equivalents at beginning of the year 1,506,699 1,457,735 1,505,242Effects of exchange rate changes on cash and cash equivalents (2,600) 2,422 (6,102)Cash and cash equivalents at end of the year ₩ 1,270,824 ₩ 1,506,699 ₩ 1,457,735
Copyright © 2020 www.secdatabase.com. All Rights Reserved.Please Consider the Environment Before Printing This Document
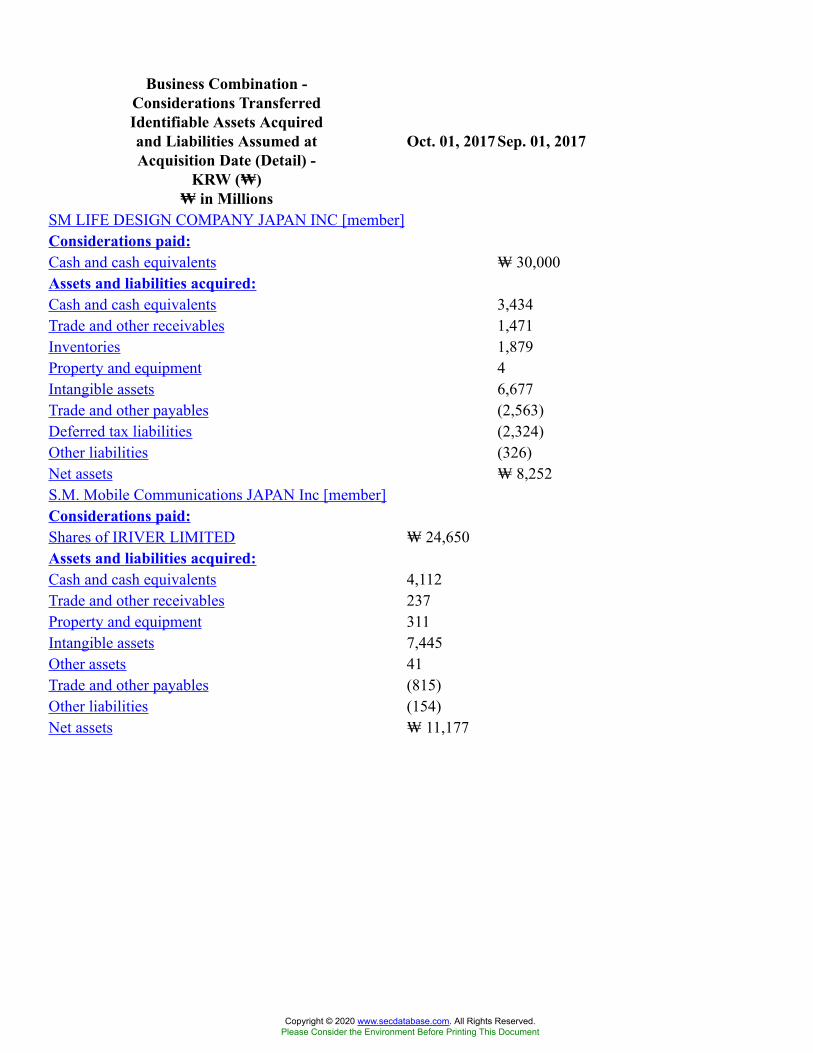
Business Combination -Considerations TransferredIdentifiable Assets Acquiredand Liabilities Assumed atAcquisition Date (Detail) -
KRW (₩)₩ in Millions
Oct. 01, 2017 Sep. 01, 2017
SM LIFE DESIGN COMPANY JAPAN INC [member]Considerations paid:Cash and cash equivalents ₩ 30,000Assets and liabilities acquired:Cash and cash equivalents 3,434Trade and other receivables 1,471Inventories 1,879Property and equipment 4Intangible assets 6,677Trade and other payables (2,563)Deferred tax liabilities (2,324)Other liabilities (326)Net assets ₩ 8,252S.M. Mobile Communications JAPAN Inc [member]Considerations paid:Shares of IRIVER LIMITED ₩ 24,650Assets and liabilities acquired:Cash and cash equivalents 4,112Trade and other receivables 237Property and equipment 311Intangible assets 7,445Other assets 41Trade and other payables (815)Other liabilities (154)Net assets ₩ 11,177
Copyright © 2020 www.secdatabase.com. All Rights Reserved.Please Consider the Environment Before Printing This Document
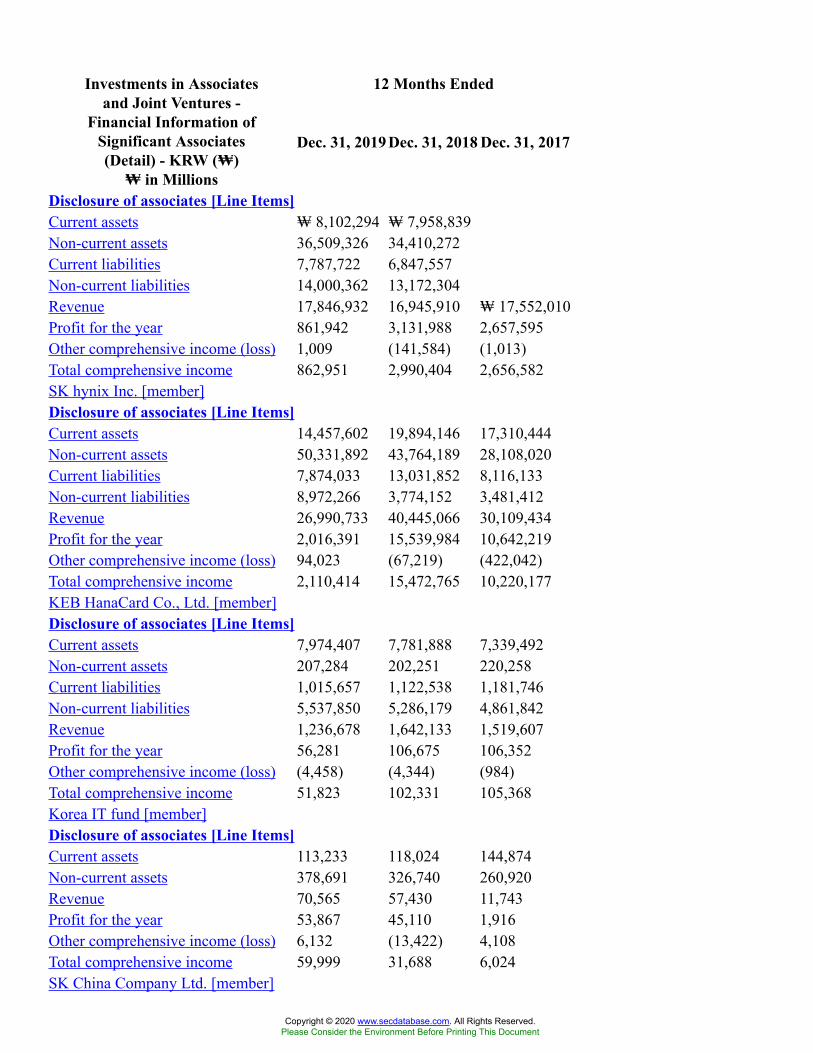
12 Months EndedInvestments in Associatesand Joint Ventures -
Financial Information ofSignificant Associates(Detail) - KRW (₩)
₩ in Millions
Dec. 31, 2019 Dec. 31, 2018 Dec. 31, 2017
Disclosure of associates [Line Items]Current assets ₩ 8,102,294 ₩ 7,958,839Non-current assets 36,509,326 34,410,272Current liabilities 7,787,722 6,847,557Non-current liabilities 14,000,362 13,172,304Revenue 17,846,932 16,945,910 ₩ 17,552,010Profit for the year 861,942 3,131,988 2,657,595Other comprehensive income (loss) 1,009 (141,584) (1,013)Total comprehensive income 862,951 2,990,404 2,656,582SK hynix Inc. [member]Disclosure of associates [Line Items]Current assets 14,457,602 19,894,146 17,310,444Non-current assets 50,331,892 43,764,189 28,108,020Current liabilities 7,874,033 13,031,852 8,116,133Non-current liabilities 8,972,266 3,774,152 3,481,412Revenue 26,990,733 40,445,066 30,109,434Profit for the year 2,016,391 15,539,984 10,642,219Other comprehensive income (loss) 94,023 (67,219) (422,042)Total comprehensive income 2,110,414 15,472,765 10,220,177KEB HanaCard Co., Ltd. [member]Disclosure of associates [Line Items]Current assets 7,974,407 7,781,888 7,339,492Non-current assets 207,284 202,251 220,258Current liabilities 1,015,657 1,122,538 1,181,746Non-current liabilities 5,537,850 5,286,179 4,861,842Revenue 1,236,678 1,642,133 1,519,607Profit for the year 56,281 106,675 106,352Other comprehensive income (loss) (4,458) (4,344) (984)Total comprehensive income 51,823 102,331 105,368Korea IT fund [member]Disclosure of associates [Line Items]Current assets 113,233 118,024 144,874Non-current assets 378,691 326,740 260,920Revenue 70,565 57,430 11,743Profit for the year 53,867 45,110 1,916Other comprehensive income (loss) 6,132 (13,422) 4,108Total comprehensive income 59,999 31,688 6,024SK China Company Ltd. [member]
Copyright © 2020 www.secdatabase.com. All Rights Reserved.Please Consider the Environment Before Printing This Document
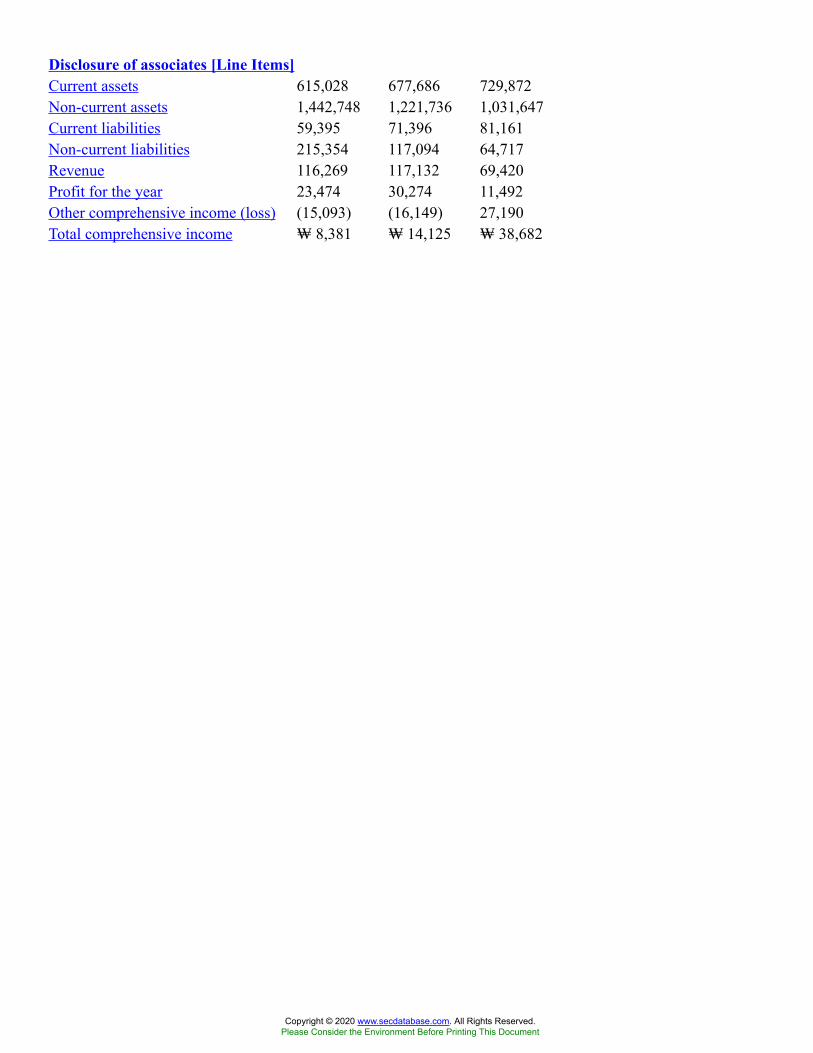
Disclosure of associates [Line Items]Current assets 615,028 677,686 729,872Non-current assets 1,442,748 1,221,736 1,031,647Current liabilities 59,395 71,396 81,161Non-current liabilities 215,354 117,094 64,717Revenue 116,269 117,132 69,420Profit for the year 23,474 30,274 11,492Other comprehensive income (loss) (15,093) (16,149) 27,190Total comprehensive income ₩ 8,381 ₩ 14,125 ₩ 38,682
Copyright © 2020 www.secdatabase.com. All Rights Reserved.Please Consider the Environment Before Printing This Document
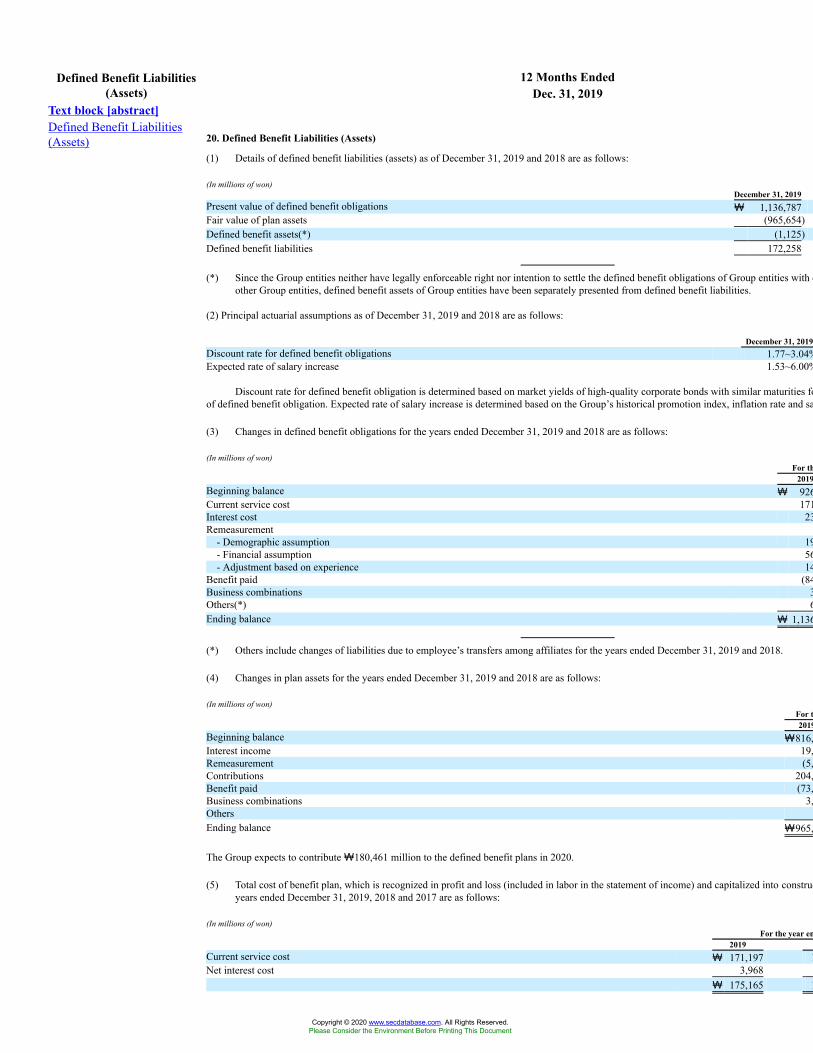
12 Months EndedDefined Benefit Liabilities(Assets) Dec. 31, 2019
Text block [abstract]Defined Benefit Liabilities(Assets) 20. Defined Benefit Liabilities (Assets)
(1) Details of defined benefit liabilities (assets) as of December 31, 2019 and 2018 are as follows:
(In millions of won)December 31, 2019 December 31, 2018
Present value of defined benefit obligations ₩ 1,136,787 926,302Fair value of plan assets (965,654) (816,699)Defined benefit assets(*) (1,125) (31,926)Defined benefit liabilities 172,258 141,529
(*) Since the Group entities neither have legally enforceable right nor intention to settle the defined benefit obligations of Group entities with defined benefit assets ofother Group entities, defined benefit assets of Group entities have been separately presented from defined benefit liabilities.
(2) Principal actuarial assumptions as of December 31, 2019 and 2018 are as follows:
December 31, 2019 December 31, 2018Discount rate for defined benefit obligations 1.77~3.04% 2.24~3.07%Expected rate of salary increase 1.53~6.00% 3.42~5.61%
Discount rate for defined benefit obligation is determined based on market yields of high-quality corporate bonds with similar maturities for estimated payment termof defined benefit obligation. Expected rate of salary increase is determined based on the Group’s historical promotion index, inflation rate and salary increase ratio.
(3) Changes in defined benefit obligations for the years ended December 31, 2019 and 2018 are as follows:
(In millions of won)For the year ended December 31
2019 2018Beginning balance ₩ 926,302 679,625Current service cost 171,197 143,725Interest cost 23,685 23,131Remeasurement
- Demographic assumption 19,344 (1,929)- Financial assumption 56,265 30,519- Adjustment based on experience 14,363 16,085
Benefit paid (84,098) (63,957)Business combinations 3,653 104,251Others(*) 6,076 (5,148)Ending balance ₩ 1,136,787 926,302
(*) Others include changes of liabilities due to employee’s transfers among affiliates for the years ended December 31, 2019 and 2018.
(4) Changes in plan assets for the years ended December 31, 2019 and 2018 are as follows:
(In millions of won)For the year ended December 312019 2018
Beginning balance ₩816,699 663,617Interest income 19,717 19,134Remeasurement (5,366) (7,659)Contributions 204,186 166,624Benefit paid (73,396) (43,549)Business combinations 3,207 21,417Others 607 (2,885)Ending balance ₩965,654 816,699
The Group expects to contribute ₩180,461 million to the defined benefit plans in 2020.
(5) Total cost of benefit plan, which is recognized in profit and loss (included in labor in the statement of income) and capitalized into construction-in-progress, for theyears ended December 31, 2019, 2018 and 2017 are as follows:
(In millions of won)For the year ended December 31,
2019 2018 2017Current service cost ₩ 171,197 143,725 125,526Net interest cost 3,968 3,997 2,170
₩ 175,165 147,722 127,696
Copyright © 2020 www.secdatabase.com. All Rights Reserved.Please Consider the Environment Before Printing This Document
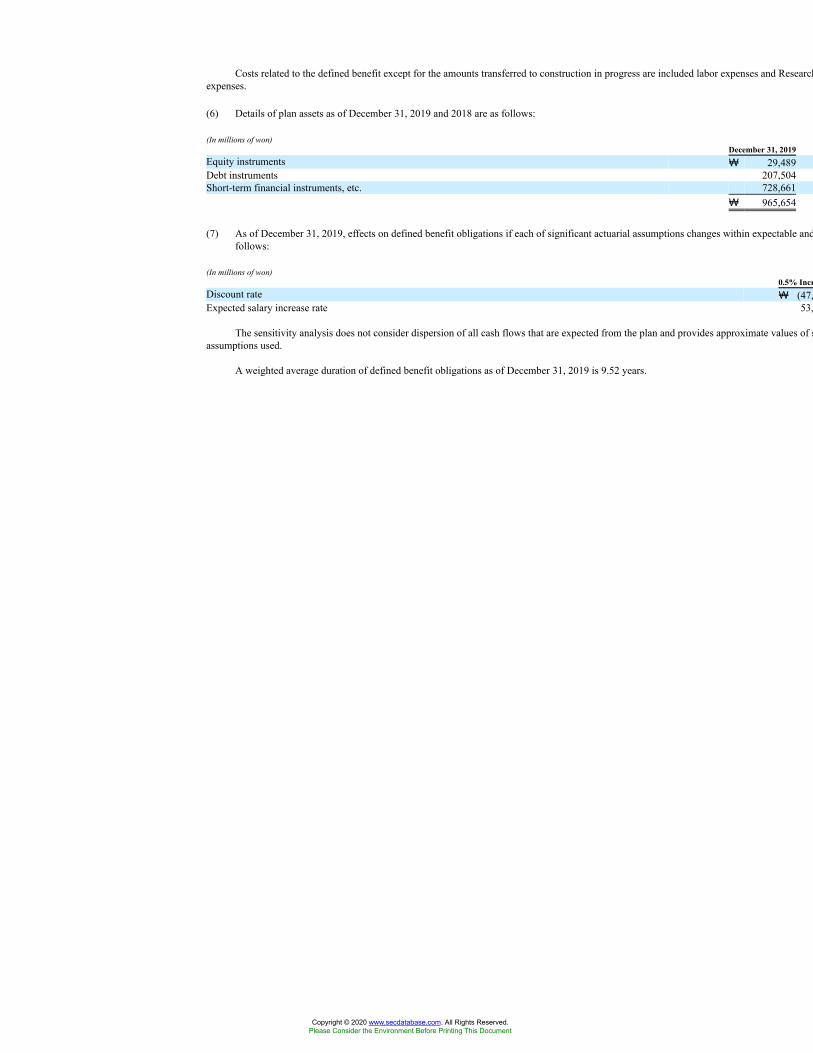
Costs related to the defined benefit except for the amounts transferred to construction in progress are included labor expenses and Research and developmentexpenses.
(6) Details of plan assets as of December 31, 2019 and 2018 are as follows:
(In millions of won)December 31, 2019 December 31, 2018
Equity instruments ₩ 29,489 60,828Debt instruments 207,504 144,272Short-term financial instruments, etc. 728,661 611,599
₩ 965,654 816,699
(7) As of December 31, 2019, effects on defined benefit obligations if each of significant actuarial assumptions changes within expectable and reasonable range are asfollows:
(In millions of won)0.5% Increase 0.5% Decrease
Discount rate ₩ (47,013) 54,248Expected salary increase rate 53,864 (47,325)
The sensitivity analysis does not consider dispersion of all cash flows that are expected from the plan and provides approximate values of sensitivity for theassumptions used.
A weighted average duration of defined benefit obligations as of December 31, 2019 is 9.52 years.
Copyright © 2020 www.secdatabase.com. All Rights Reserved.Please Consider the Environment Before Printing This Document
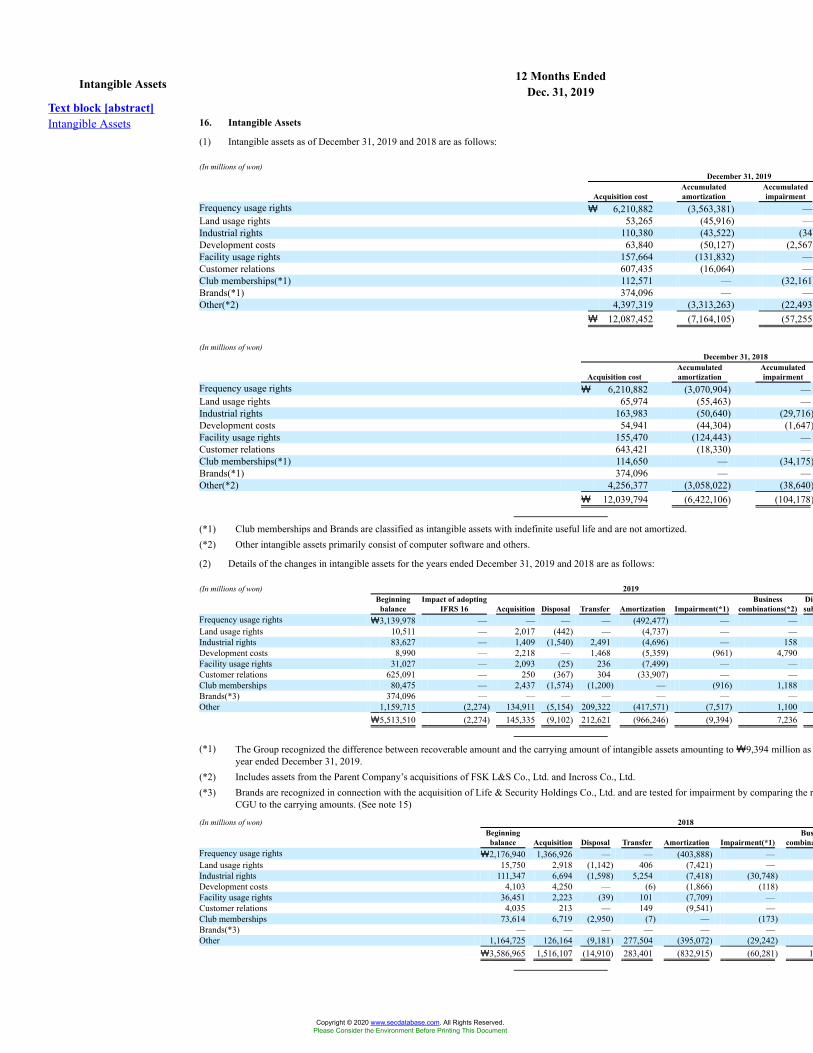
12 Months EndedIntangible Assets Dec. 31, 2019Text block [abstract]Intangible Assets 16. Intangible Assets
(1) Intangible assets as of December 31, 2019 and 2018 are as follows:
(In millions of won)December 31, 2019
Acquisition costAccumulatedamortization
Accumulatedimpairment
Carryingamount
Frequency usage rights ₩ 6,210,882 (3,563,381) — 2,647,501Land usage rights 53,265 (45,916) — 7,349Industrial rights 110,380 (43,522) (34) 66,824Development costs 63,840 (50,127) (2,567) 11,146Facility usage rights 157,664 (131,832) — 25,832Customer relations 607,435 (16,064) — 591,371Club memberships(*1) 112,571 — (32,161) 80,410Brands(*1) 374,096 — — 374,096Other(*2) 4,397,319 (3,313,263) (22,493) 1,061,563
₩ 12,087,452 (7,164,105) (57,255) 4,866,092
(In millions of won)December 31, 2018
Acquisition costAccumulatedamortization
Accumulatedimpairment
Carryingamount
Frequency usage rights ₩ 6,210,882 (3,070,904) — 3,139,978Land usage rights 65,974 (55,463) — 10,511Industrial rights 163,983 (50,640) (29,716) 83,627Development costs 54,941 (44,304) (1,647) 8,990Facility usage rights 155,470 (124,443) — 31,027Customer relations 643,421 (18,330) — 625,091Club memberships(*1) 114,650 — (34,175) 80,475Brands(*1) 374,096 — — 374,096Other(*2) 4,256,377 (3,058,022) (38,640) 1,159,715
₩ 12,039,794 (6,422,106) (104,178) 5,513,510
(*1) Club memberships and Brands are classified as intangible assets with indefinite useful life and are not amortized.(*2) Other intangible assets primarily consist of computer software and others.
(2) Details of the changes in intangible assets for the years ended December 31, 2019 and 2018 are as follows:
(In millions of won) 2019Beginning
balanceImpact of adopting
IFRS 16 Acquisition Disposal Transfer Amortization Impairment(*1)Business
combinations(*2)Disposal ofsubsidiaries
Endingbalance
Frequency usage rights ₩3,139,978 — — — — (492,477) — — — 2,647,501Land usage rights 10,511 — 2,017 (442) — (4,737) — — — 7,349Industrial rights 83,627 — 1,409 (1,540) 2,491 (4,696) — 158 (14,625) 66,824Development costs 8,990 — 2,218 — 1,468 (5,359) (961) 4,790 — 11,146Facility usage rights 31,027 — 2,093 (25) 236 (7,499) — — — 25,832Customer relations 625,091 — 250 (367) 304 (33,907) — — — 591,371Club memberships 80,475 — 2,437 (1,574) (1,200) — (916) 1,188 — 80,410Brands(*3) 374,096 — — — — — — — — 374,096Other 1,159,715 (2,274) 134,911 (5,154) 209,322 (417,571) (7,517) 1,100 (10,969) 1,061,563
₩5,513,510 (2,274) 145,335 (9,102) 212,621 (966,246) (9,394) 7,236 (25,594) 4,866,092
(*1) The Group recognized the difference between recoverable amount and the carrying amount of intangible assets amounting to ₩9,394 million as impairment loss for theyear ended December 31, 2019.
(*2) Includes assets from the Parent Company’s acquisitions of FSK L&S Co., Ltd. and Incross Co., Ltd.(*3) Brands are recognized in connection with the acquisition of Life & Security Holdings Co., Ltd. and are tested for impairment by comparing the recoverable amounts of
CGU to the carrying amounts. (See note 15)
(In millions of won) 2018Beginning
balance Acquisition Disposal Transfer Amortization Impairment(*1)Business
combinations(*2)Endingbalance
Frequency usage rights ₩2,176,940 1,366,926 — — (403,888) — — 3,139,978Land usage rights 15,750 2,918 (1,142) 406 (7,421) — — 10,511Industrial rights 111,347 6,694 (1,598) 5,254 (7,418) (30,748) 96 83,627Development costs 4,103 4,250 — (6) (1,866) (118) 2,627 8,990Facility usage rights 36,451 2,223 (39) 101 (7,709) — — 31,027Customer relations 4,035 213 — 149 (9,541) — 630,235 625,091Club memberships 73,614 6,719 (2,950) (7) — (173) 3,272 80,475Brands(*3) — — — — — — 374,096 374,096Other 1,164,725 126,164 (9,181) 277,504 (395,072) (29,242) 24,817 1,159,715
₩3,586,965 1,516,107 (14,910) 283,401 (832,915) (60,281) 1,035,143 5,513,510
Copyright © 2020 www.secdatabase.com. All Rights Reserved.Please Consider the Environment Before Printing This Document
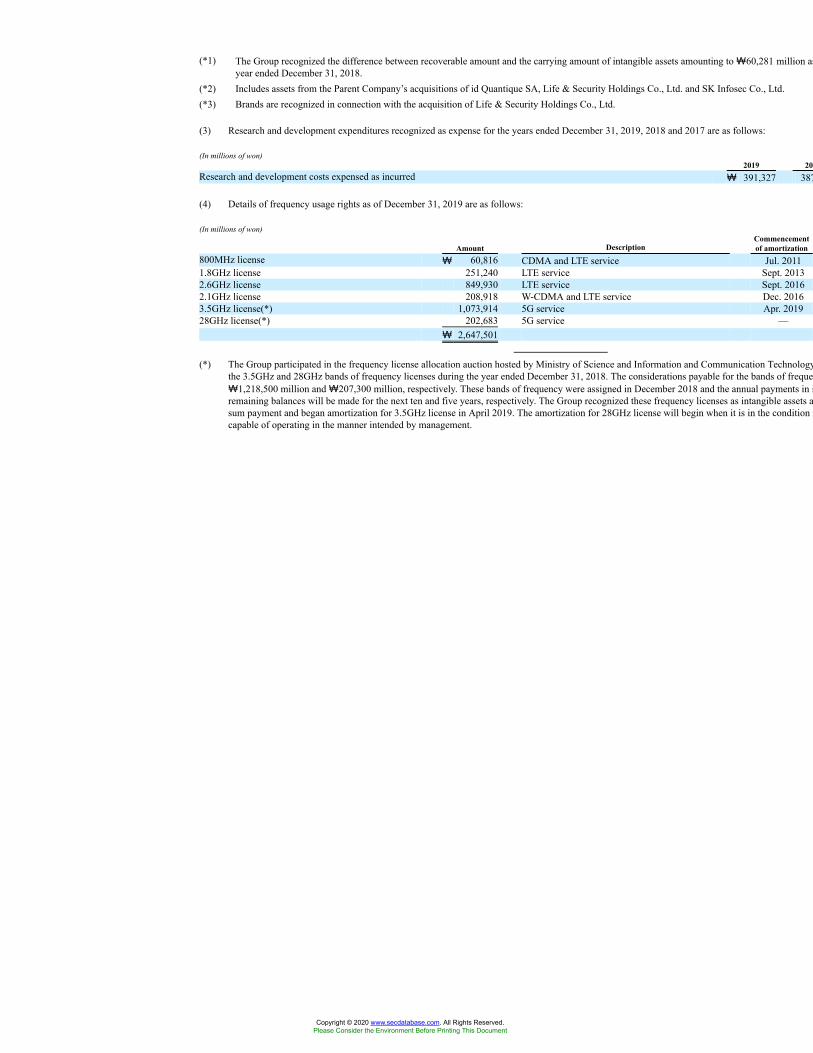
(*1) The Group recognized the difference between recoverable amount and the carrying amount of intangible assets amounting to ₩60,281 million as impairment loss for theyear ended December 31, 2018.
(*2) Includes assets from the Parent Company’s acquisitions of id Quantique SA, Life & Security Holdings Co., Ltd. and SK Infosec Co., Ltd.(*3) Brands are recognized in connection with the acquisition of Life & Security Holdings Co., Ltd.
(3) Research and development expenditures recognized as expense for the years ended December 31, 2019, 2018 and 2017 are as follows:
(In millions of won)2019 2018 2017
Research and development costs expensed as incurred ₩ 391,327 387,675 395,276
(4) Details of frequency usage rights as of December 31, 2019 are as follows:
(In millions of won)
Amount DescriptionCommencementof amortization
Completion ofamortization
800MHz license ₩ 60,816 CDMA and LTE service Jul. 2011 Jun. 20211.8GHz license 251,240 LTE service Sept. 2013 Dec. 20212.6GHz license 849,930 LTE service Sept. 2016 Dec. 20262.1GHz license 208,918 W-CDMA and LTE service Dec. 2016 Dec. 20213.5GHz license(*) 1,073,914 5G service Apr. 2019 Nov. 202828GHz license(*) 202,683 5G service — Nov. 2023
₩ 2,647,501
(*) The Group participated in the frequency license allocation auction hosted by Ministry of Science and Information and Communication Technology(ICT) and was assignedthe 3.5GHz and 28GHz bands of frequency licenses during the year ended December 31, 2018. The considerations payable for the bands of frequency are₩1,218,500 million and ₩207,300 million, respectively. These bands of frequency were assigned in December 2018 and the annual payments in installment of theremaining balances will be made for the next ten and five years, respectively. The Group recognized these frequency licenses as intangible assets at the date of initial lumpsum payment and began amortization for 3.5GHz license in April 2019. The amortization for 28GHz license will begin when it is in the condition necessary for it to becapable of operating in the manner intended by management.
Copyright © 2020 www.secdatabase.com. All Rights Reserved.Please Consider the Environment Before Printing This Document

12 Months EndedInvestments in Associatesand Joint Ventures - Details
of the Changes inInvestments in Associates
and Joint VenturesAccounted for using theEquity Method (Detail) -
KRW (₩)₩ in Millions
Dec. 31, 2019 Dec. 31, 2018
Disclosure of investments in associates and joint ventures [Line Items]Beginning balance ₩ 12,811,771₩ 9,538,438Acquisition and disposition 343,020 140,999Share of profit (loss) 432,211 3,273,932Other comprehensive income (loss) 58,760 (14,791)Other increase (decrease) (260,498) (126,807)Ending balance 13,385,264 12,811,771SK China Company Ltd. [member]Disclosure of investments in associates and joint ventures [Line Items]Beginning balance 551,548 526,099Share of profit (loss) 4,916 7,618Other comprehensive income (loss) 11,995 17,831Ending balance 568,459 551,548Korea IT fund [member]Disclosure of investments in associates and joint ventures [Line Items]Beginning balance 281,684 257,003Share of profit (loss) 34,116 38,099Other comprehensive income (loss) 3,884 (9,919)Other increase (decrease) (8,132) (3,499)Ending balance 311,552 281,684KEB HanaCard Co., Ltd. [member]Disclosure of investments in associates and joint ventures [Line Items]Beginning balance 288,457 280,988Share of profit (loss) 6,827 14,581Other comprehensive income (loss) (528) (7,112)Ending balance 294,756 288,457SK Telecom CS T1 Co Ltd [Member]Disclosure of investments in associates and joint ventures [Line Items]Acquisition and disposition 60,305Ending balance 60,305NanoEnTek, Inc. [member]Disclosure of investments in associates and joint ventures [Line Items]Beginning balance 40,974 38,718Acquisition and disposition (43) 3,180Share of profit (loss) 1,220 (116)
Copyright © 2020 www.secdatabase.com. All Rights Reserved.Please Consider the Environment Before Printing This Document

Other comprehensive income (loss) (24) (808)Ending balance 42,127 40,974UniSK [Member]Disclosure of investments in associates and joint ventures [Line Items]Beginning balance 13,486Share of profit (loss) 728Other comprehensive income (loss) 347Other increase (decrease) (219)Ending balance 14,342 13,486SK Technology Innovation Company [member]Disclosure of investments in associates and joint ventures [Line Items]Beginning balance 42,469 42,511Share of profit (loss) 89 (1,880)Other comprehensive income (loss) 1,439 1,838Ending balance 43,997 42,469SK MENA Investment B.V. [member]Disclosure of investments in associates and joint ventures [Line Items]Beginning balance 14,420 13,853Share of profit (loss) 4 (24)Other comprehensive income (loss) 480 591Ending balance 14,904 14,420HappyNarae Co., Ltd. [member]Disclosure of investments in associates and joint ventures [Line Items]Beginning balance 21,873Acquisition and disposition (29,325)Share of profit (loss) 7,479Other comprehensive income (loss) (27)SK hynix Inc. [member]Disclosure of investments in associates and joint ventures [Line Items]Beginning balance 11,208,315 8,130,000Share of profit (loss) 416,168 3,238,054Other comprehensive income (loss) 20,008 (13,639)Other increase (decrease) (219,166) (146,100)Ending balance 11,425,325 11,208,315SK Latin America Investment SA [Member]Disclosure of investments in associates and joint ventures [Line Items]Beginning balance 13,313Share of profit (loss) 74Other comprehensive income (loss) 311Ending balance 13,698 13,313Grab Geo Holdings PTE LTD [Member]Disclosure of investments in associates and joint ventures [Line Items]Acquisition and disposition 30,518Share of profit (loss) (17)
Copyright © 2020 www.secdatabase.com. All Rights Reserved.Please Consider the Environment Before Printing This Document

Other comprehensive income (loss) 768Ending balance 31,269Associates [member]Disclosure of investments in associates and joint ventures [Line Items]Beginning balance 12,791,613 9,498,381Acquisition and disposition 302,552 136,161Share of profit (loss) 442,400 3,294,987Other comprehensive income (loss) 60,723 (11,109)Other increase (decrease) (260,432) (126,807)Ending balance 13,336,856 12,791,613Xian Tianlong Science and Technology Co., Ltd. [member]Disclosure of investments in associates and joint ventures [Line Items]Beginning balance 25,891Acquisition and disposition (25,553)Share of profit (loss) (338)Makeus Corp.[member]Disclosure of investments in associates and joint ventures [Line Items]Beginning balance 9,193Acquisition and disposition 9,773Share of profit (loss) (574)Other increase (decrease) (6)Ending balance 9,193SK South East Asia Investment Pte Ltd [member]Disclosure of investments in associates and joint ventures [Line Items]Beginning balance 111,000Acquisition and disposition 113,470 111,000Share of profit (loss) 6,062Other comprehensive income (loss) 19,502Ending balance 250,034 111,000S.M. Culture & Contents Co., Ltd [member]Disclosure of investments in associates and joint ventures [Line Items]Beginning balance 63,801 64,966Share of profit (loss) 464 (909)Other comprehensive income (loss) (796) (256)Ending balance 63,469 63,801Pacific Telecom Inc [member]Disclosure of investments in associates and joint ventures [Line Items]Beginning balance 37,075Acquisition and disposition 36,487Share of profit (loss) 2,689 473Other comprehensive income (loss) 252 115Ending balance 40,016 37,075Twelve CM Japan Inc [member]Disclosure of investments in associates and joint ventures [Line Items]
Copyright © 2020 www.secdatabase.com. All Rights Reserved.Please Consider the Environment Before Printing This Document
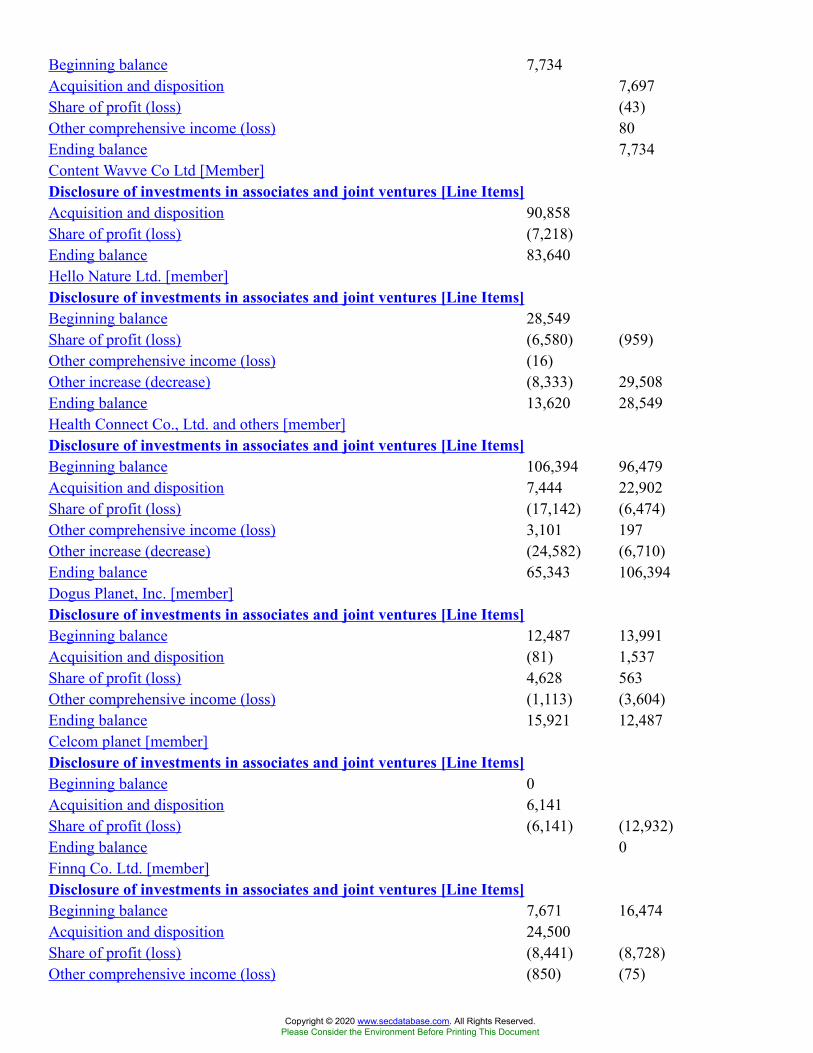
Beginning balance 7,734Acquisition and disposition 7,697Share of profit (loss) (43)Other comprehensive income (loss) 80Ending balance 7,734Content Wavve Co Ltd [Member]Disclosure of investments in associates and joint ventures [Line Items]Acquisition and disposition 90,858Share of profit (loss) (7,218)Ending balance 83,640Hello Nature Ltd. [member]Disclosure of investments in associates and joint ventures [Line Items]Beginning balance 28,549Share of profit (loss) (6,580) (959)Other comprehensive income (loss) (16)Other increase (decrease) (8,333) 29,508Ending balance 13,620 28,549Health Connect Co., Ltd. and others [member]Disclosure of investments in associates and joint ventures [Line Items]Beginning balance 106,394 96,479Acquisition and disposition 7,444 22,902Share of profit (loss) (17,142) (6,474)Other comprehensive income (loss) 3,101 197Other increase (decrease) (24,582) (6,710)Ending balance 65,343 106,394Dogus Planet, Inc. [member]Disclosure of investments in associates and joint ventures [Line Items]Beginning balance 12,487 13,991Acquisition and disposition (81) 1,537Share of profit (loss) 4,628 563Other comprehensive income (loss) (1,113) (3,604)Ending balance 15,921 12,487Celcom planet [member]Disclosure of investments in associates and joint ventures [Line Items]Beginning balance 0Acquisition and disposition 6,141Share of profit (loss) (6,141) (12,932)Ending balance 0Finnq Co. Ltd. [member]Disclosure of investments in associates and joint ventures [Line Items]Beginning balance 7,671 16,474Acquisition and disposition 24,500Share of profit (loss) (8,441) (8,728)Other comprehensive income (loss) (850) (75)
Copyright © 2020 www.secdatabase.com. All Rights Reserved.Please Consider the Environment Before Printing This Document
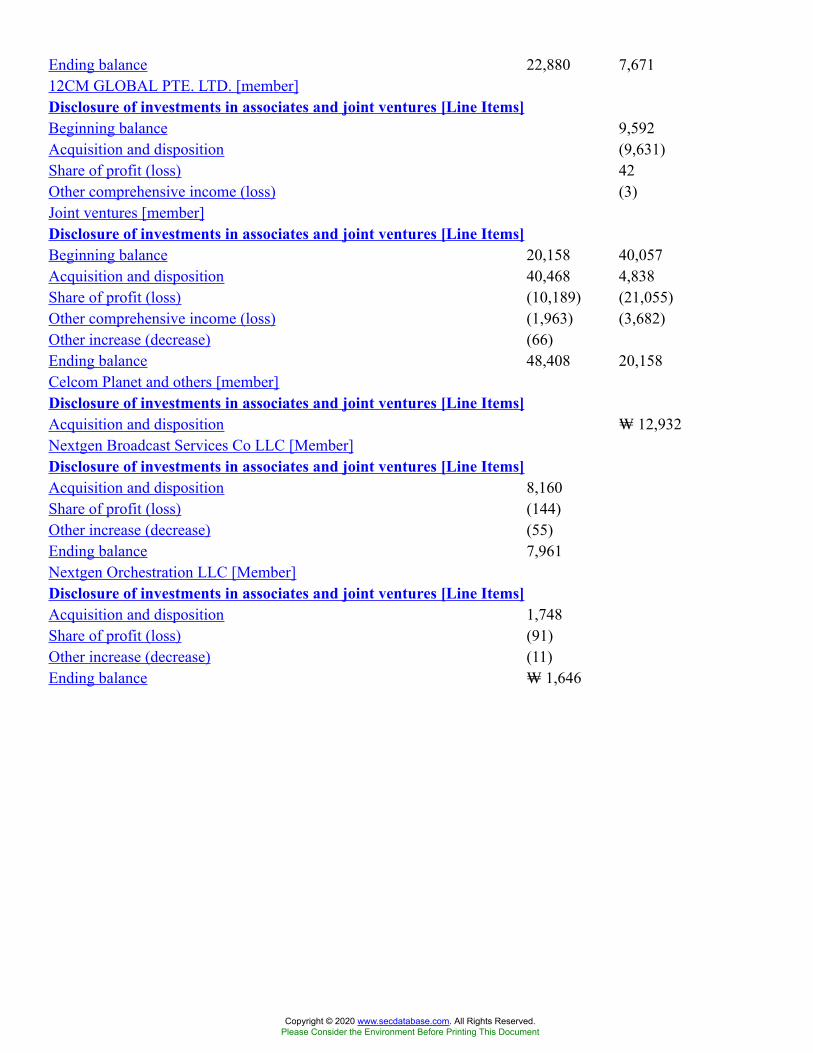
Ending balance 22,880 7,67112CM GLOBAL PTE. LTD. [member]Disclosure of investments in associates and joint ventures [Line Items]Beginning balance 9,592Acquisition and disposition (9,631)Share of profit (loss) 42Other comprehensive income (loss) (3)Joint ventures [member]Disclosure of investments in associates and joint ventures [Line Items]Beginning balance 20,158 40,057Acquisition and disposition 40,468 4,838Share of profit (loss) (10,189) (21,055)Other comprehensive income (loss) (1,963) (3,682)Other increase (decrease) (66)Ending balance 48,408 20,158Celcom Planet and others [member]Disclosure of investments in associates and joint ventures [Line Items]Acquisition and disposition ₩ 12,932Nextgen Broadcast Services Co LLC [Member]Disclosure of investments in associates and joint ventures [Line Items]Acquisition and disposition 8,160Share of profit (loss) (144)Other increase (decrease) (55)Ending balance 7,961Nextgen Orchestration LLC [Member]Disclosure of investments in associates and joint ventures [Line Items]Acquisition and disposition 1,748Share of profit (loss) (91)Other increase (decrease) (11)Ending balance ₩ 1,646
Copyright © 2020 www.secdatabase.com. All Rights Reserved.Please Consider the Environment Before Printing This Document
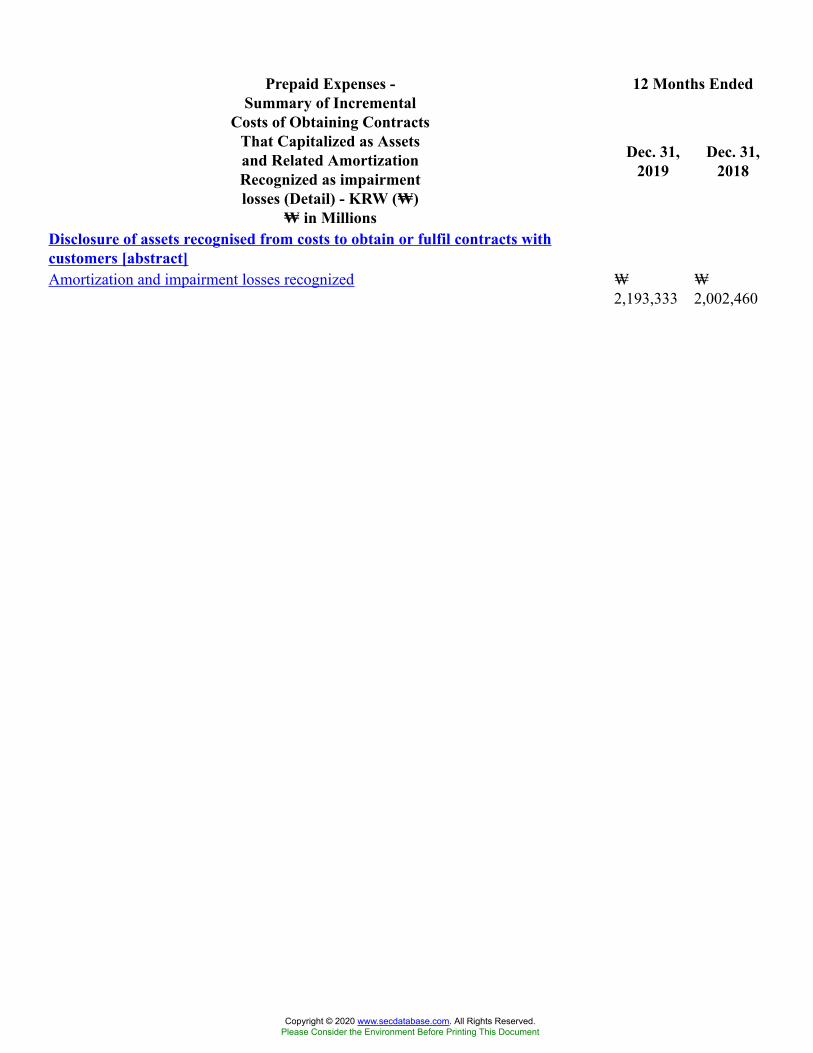
12 Months EndedPrepaid Expenses -Summary of Incremental
Costs of Obtaining ContractsThat Capitalized as Assetsand Related AmortizationRecognized as impairmentlosses (Detail) - KRW (₩)
₩ in Millions
Dec. 31,2019
Dec. 31,2018
Disclosure of assets recognised from costs to obtain or fulfil contracts withcustomers [abstract]Amortization and impairment losses recognized ₩
2,193,333₩2,002,460
Copyright © 2020 www.secdatabase.com. All Rights Reserved.Please Consider the Environment Before Printing This Document
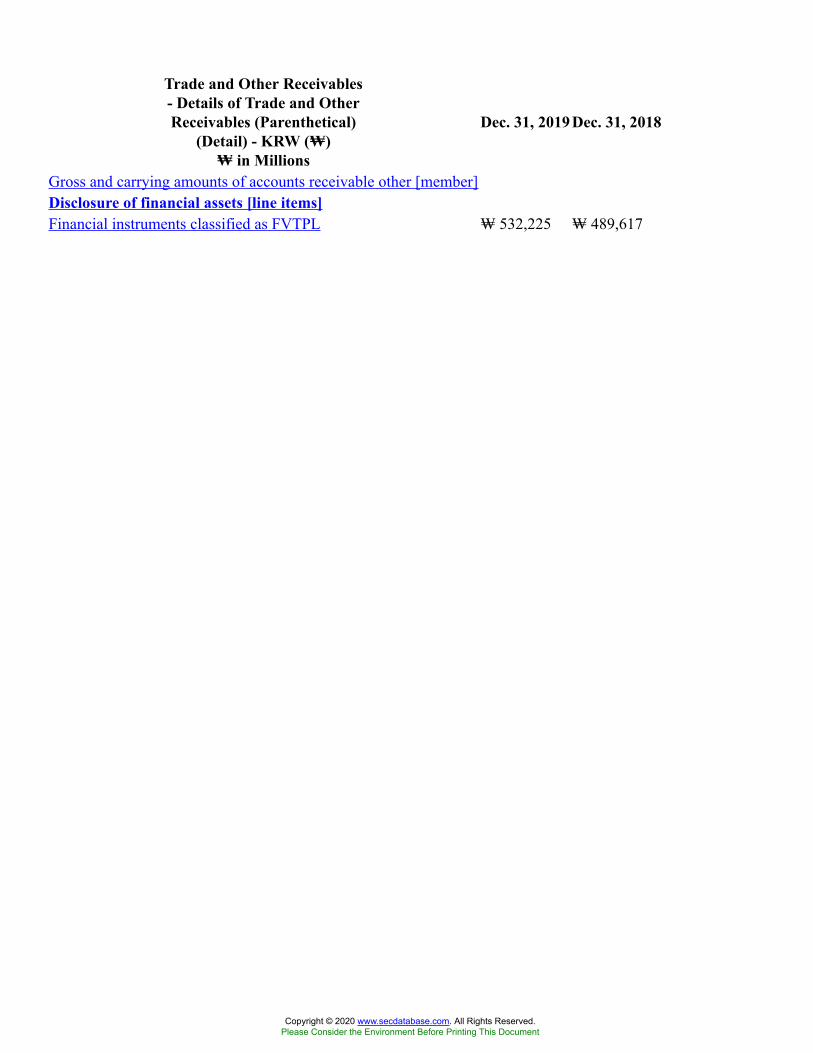
Trade and Other Receivables- Details of Trade and OtherReceivables (Parenthetical)
(Detail) - KRW (₩)₩ in Millions
Dec. 31, 2019 Dec. 31, 2018
Gross and carrying amounts of accounts receivable other [member]Disclosure of financial assets [line items]Financial instruments classified as FVTPL ₩ 532,225 ₩ 489,617
Copyright © 2020 www.secdatabase.com. All Rights Reserved.Please Consider the Environment Before Printing This Document

12 Months EndedReserves Dec. 31, 2019Text block [abstract]Reserves 27. Reserves
(1) Details of reserves, net of taxes, as of December 31, 2019 and 2018 are as follows:
(In millions of won) December 31, 2019 December 31, 2018Valuation loss on FVOCI ₩ (47,086) (124)Other comprehensive loss of investments in associates and joint ventures (278,142) (334,637)Valuation loss on derivatives (920) (41,601)Foreign currency translation differences for foreign operations (3,428) 2,920
₩ (329,576) (373,442)
(2) Changes in reserves for the years ended December 31, 2019 and 2018 are as follows:
(In millions of won)
Valuation gain(loss) on
financial assetsat FVOCI
Valuation gain(loss) on
available-for-salefinancial assets
Othercompre-
hensive lossof
investmentsin
associatesandjoint
ventures
Valuation gain(loss) on
derivatives
Foreign currencytranslation
differences forforeign
operations TotalBalance at December 31, 2017 ₩ — 168,211 (320,060) (73,828) (9,050) (234,727)Impact of adopting IFRS 9 99,407 (168,211) — — — (68,804)Balance at January 1, 2018 ₩ 99,407 — (320,060) (73,828) (9,050) (303,531)Changes, net of taxes ₩ (99,531) — (14,577) 32,227 11,970 (69,911)Balance at December 31, 2018 (124) — (334,637) (41,601) 2,920 (373,442)Changes, net of taxes (46,962) — 56,495 40,681 (6,348) 43,866Balance at December 31, 2019 ₩ (47,086) — (278,142) (920) (3,428) (329,576)
(3) Changes in valuation gain (loss) on financial assets at FVOCI for the years ended December 31, 2019 and 2018 are as follows:
(In millions of won)2019 2018
Balance at January 1 ₩ (124) 99,407Amount recognized as other comprehensive loss during the year, net of taxes (18,472) (117,514)Amount reclassified to retained earnings, net of taxes (28,490) 17,983Balance at December 31 ₩ (47,086) (124)
(4) Changes in valuation gain (loss) on derivatives for the years ended December 31, 2019 and 2018 are as follows:
(In millions of won)2019 2018
Balance at January 1 ₩ (41,601) (73,828)Amount recognized as other comprehensive income (loss) during the year, net of taxes 34,209 (11,301)Amount reclassified to profit or loss, net of taxes 6,472 43,528Balance at December 31 ₩ (920) (41,601)
Copyright © 2020 www.secdatabase.com. All Rights Reserved.Please Consider the Environment Before Printing This Document
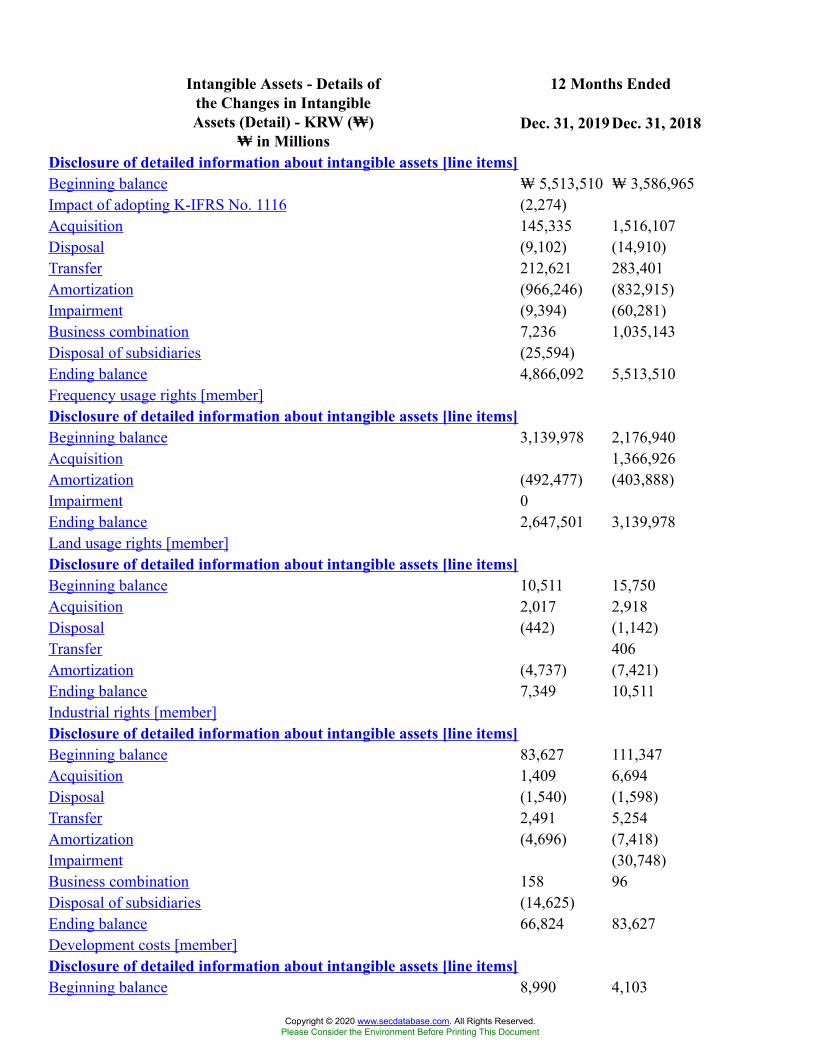
12 Months EndedIntangible Assets - Details ofthe Changes in IntangibleAssets (Detail) - KRW (₩)
₩ in MillionsDec. 31, 2019 Dec. 31, 2018
Disclosure of detailed information about intangible assets [line items]Beginning balance ₩ 5,513,510 ₩ 3,586,965Impact of adopting K-IFRS No. 1116 (2,274)Acquisition 145,335 1,516,107Disposal (9,102) (14,910)Transfer 212,621 283,401Amortization (966,246) (832,915)Impairment (9,394) (60,281)Business combination 7,236 1,035,143Disposal of subsidiaries (25,594)Ending balance 4,866,092 5,513,510Frequency usage rights [member]Disclosure of detailed information about intangible assets [line items]Beginning balance 3,139,978 2,176,940Acquisition 1,366,926Amortization (492,477) (403,888)Impairment 0Ending balance 2,647,501 3,139,978Land usage rights [member]Disclosure of detailed information about intangible assets [line items]Beginning balance 10,511 15,750Acquisition 2,017 2,918Disposal (442) (1,142)Transfer 406Amortization (4,737) (7,421)Ending balance 7,349 10,511Industrial rights [member]Disclosure of detailed information about intangible assets [line items]Beginning balance 83,627 111,347Acquisition 1,409 6,694Disposal (1,540) (1,598)Transfer 2,491 5,254Amortization (4,696) (7,418)Impairment (30,748)Business combination 158 96Disposal of subsidiaries (14,625)Ending balance 66,824 83,627Development costs [member]Disclosure of detailed information about intangible assets [line items]Beginning balance 8,990 4,103
Copyright © 2020 www.secdatabase.com. All Rights Reserved.Please Consider the Environment Before Printing This Document
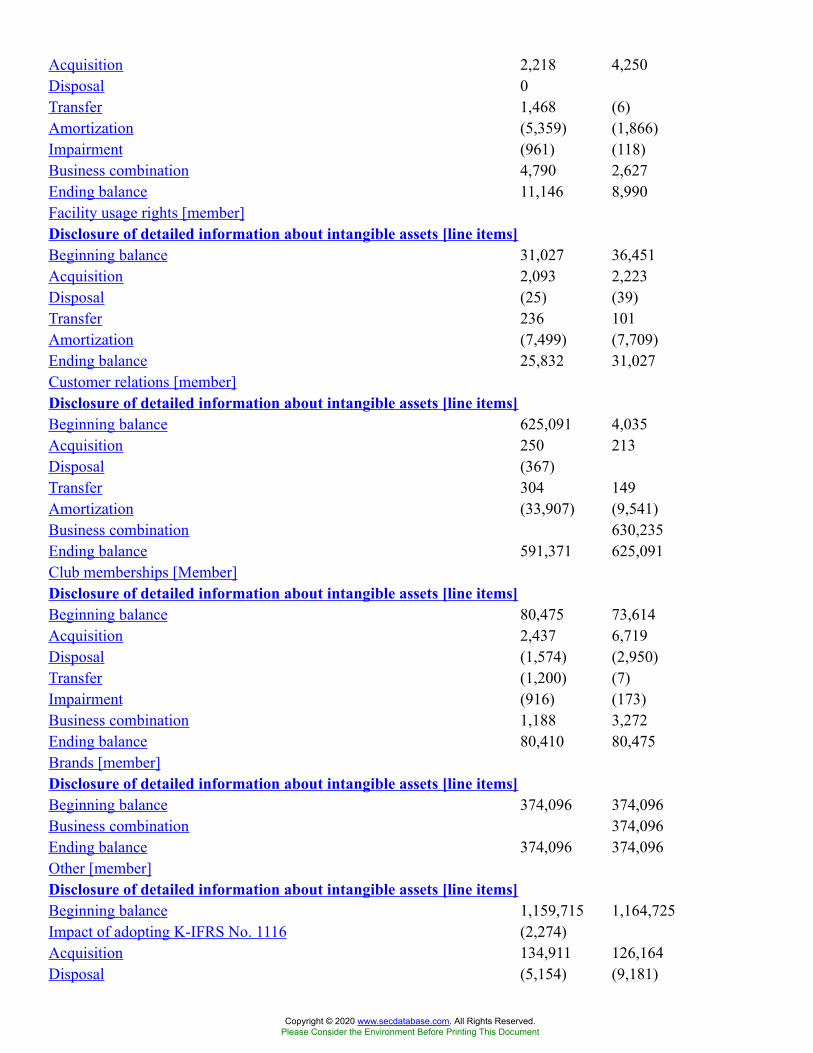
Acquisition 2,218 4,250Disposal 0Transfer 1,468 (6)Amortization (5,359) (1,866)Impairment (961) (118)Business combination 4,790 2,627Ending balance 11,146 8,990Facility usage rights [member]Disclosure of detailed information about intangible assets [line items]Beginning balance 31,027 36,451Acquisition 2,093 2,223Disposal (25) (39)Transfer 236 101Amortization (7,499) (7,709)Ending balance 25,832 31,027Customer relations [member]Disclosure of detailed information about intangible assets [line items]Beginning balance 625,091 4,035Acquisition 250 213Disposal (367)Transfer 304 149Amortization (33,907) (9,541)Business combination 630,235Ending balance 591,371 625,091Club memberships [Member]Disclosure of detailed information about intangible assets [line items]Beginning balance 80,475 73,614Acquisition 2,437 6,719Disposal (1,574) (2,950)Transfer (1,200) (7)Impairment (916) (173)Business combination 1,188 3,272Ending balance 80,410 80,475Brands [member]Disclosure of detailed information about intangible assets [line items]Beginning balance 374,096 374,096Business combination 374,096Ending balance 374,096 374,096Other [member]Disclosure of detailed information about intangible assets [line items]Beginning balance 1,159,715 1,164,725Impact of adopting K-IFRS No. 1116 (2,274)Acquisition 134,911 126,164Disposal (5,154) (9,181)
Copyright © 2020 www.secdatabase.com. All Rights Reserved.Please Consider the Environment Before Printing This Document
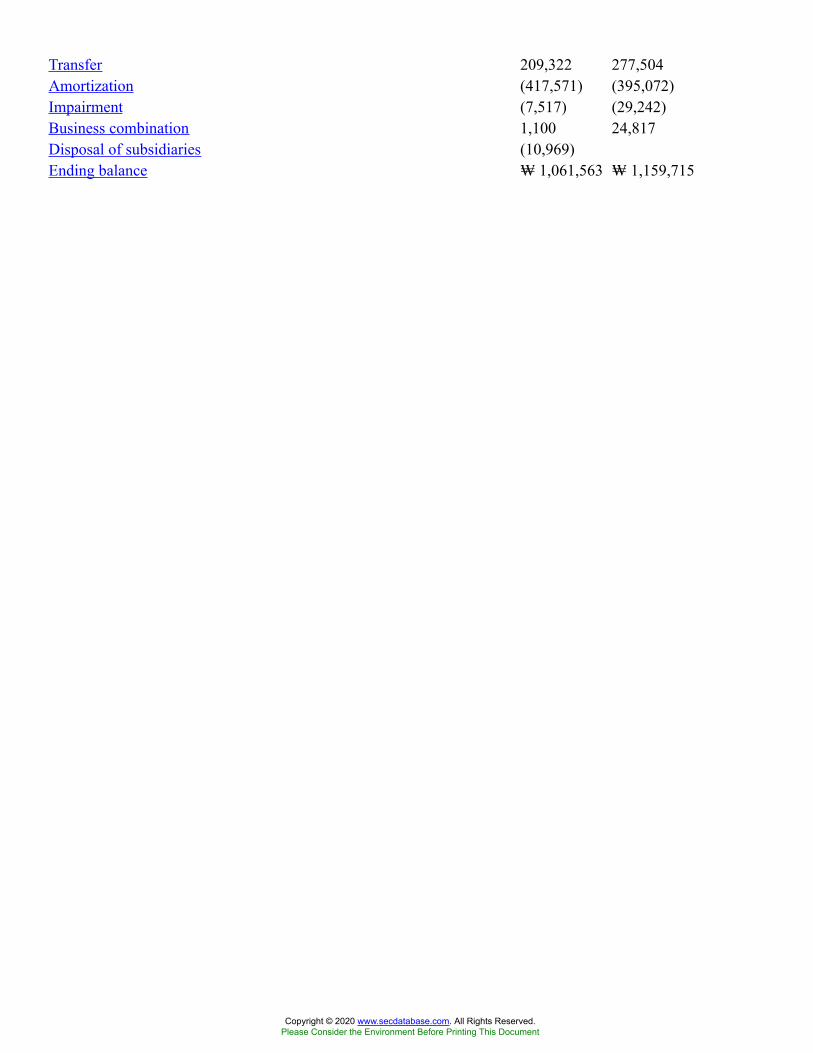
Transfer 209,322 277,504Amortization (417,571) (395,072)Impairment (7,517) (29,242)Business combination 1,100 24,817Disposal of subsidiaries (10,969)Ending balance ₩ 1,061,563 ₩ 1,159,715
Copyright © 2020 www.secdatabase.com. All Rights Reserved.Please Consider the Environment Before Printing This Document
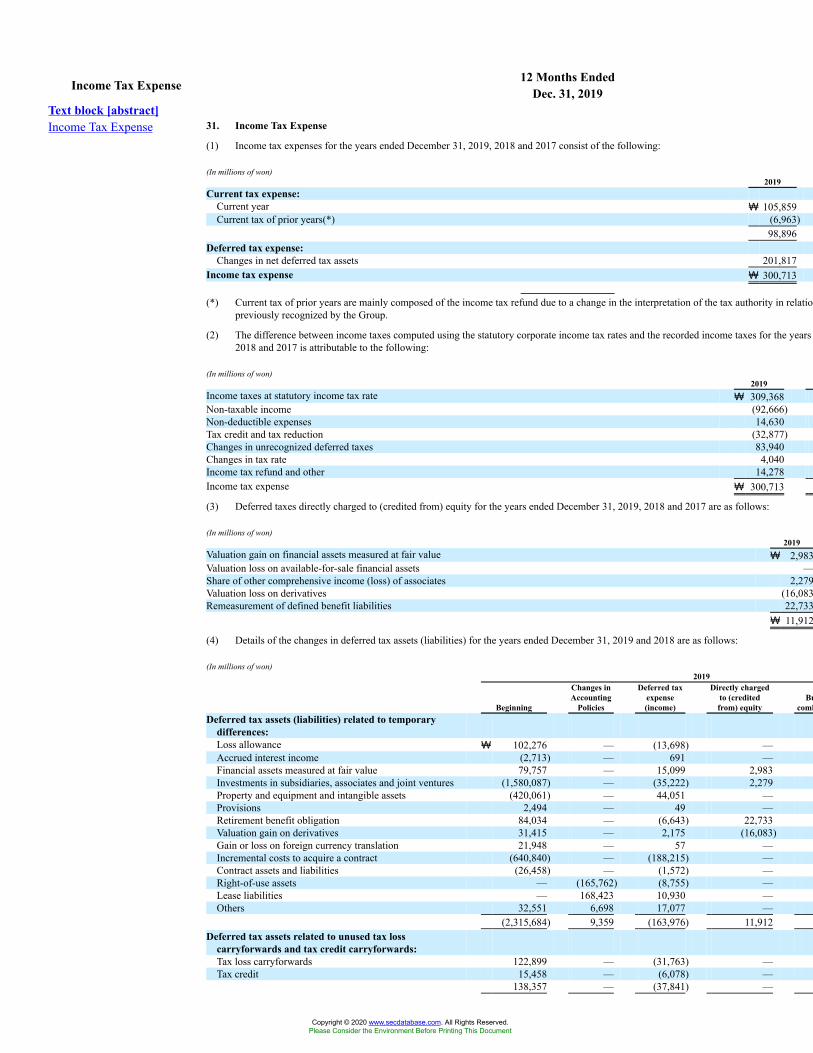
12 Months EndedIncome Tax Expense Dec. 31, 2019Text block [abstract]Income Tax Expense 31. Income Tax Expense
(1) Income tax expenses for the years ended December 31, 2019, 2018 and 2017 consist of the following:
(In millions of won)2019 2018 2017
Current tax expense:Current year ₩ 105,859 362,265 424,773Current tax of prior years(*) (6,963) (22,575) (105,158)
98,896 339,690 319,615Deferred tax expense:
Changes in net deferred tax assets 201,817 504,288 426,039Income tax expense ₩ 300,713 843,978 745,654
(*) Current tax of prior years are mainly composed of the income tax refund due to a change in the interpretation of the tax authority in relation to the income taxpreviously recognized by the Group.
(2) The difference between income taxes computed using the statutory corporate income tax rates and the recorded income taxes for the years ended December 31, 2019,2018 and 2017 is attributable to the following:
(In millions of won)2019 2018 2017
Income taxes at statutory income tax rate ₩ 309,368 1,083,029 823,124Non-taxable income (92,666) (19,450) (40,080)Non-deductible expenses 14,630 26,724 31,285Tax credit and tax reduction (32,877) (17,580) (34,300)Changes in unrecognized deferred taxes 83,940 (177,902) 31,857Changes in tax rate 4,040 (3,983) 43,977Income tax refund and other 14,278 (46,860) (110,209)Income tax expense ₩ 300,713 843,978 745,654
(3) Deferred taxes directly charged to (credited from) equity for the years ended December 31, 2019, 2018 and 2017 are as follows:
(In millions of won)2019 2018 2017
Valuation gain on financial assets measured at fair value ₩ 2,983 41,461 —Valuation loss on available-for-sale financial assets — — (55,883)Share of other comprehensive income (loss) of associates 2,279 278 (260)Valuation loss on derivatives (16,083) (9,223) (3,019)Remeasurement of defined benefit liabilities 22,733 10,843 1,618
₩ 11,912 43,359 (57,544)
(4) Details of the changes in deferred tax assets (liabilities) for the years ended December 31, 2019 and 2018 are as follows:
(In millions of won)2019
Beginning
Changes inAccounting
Policies
Deferred taxexpense(income)
Directly chargedto (creditedfrom) equity
Businesscombinations Ending
Deferred tax assets (liabilities) related to temporarydifferences:Loss allowance ₩ 102,276 — (13,698) — 335 88,913Accrued interest income (2,713) — 691 — (17) (2,039)Financial assets measured at fair value 79,757 — 15,099 2,983 262 98,101Investments in subsidiaries, associates and joint ventures (1,580,087) — (35,222) 2,279 (18) (1,613,048)Property and equipment and intangible assets (420,061) — 44,051 — (3) (376,013)Provisions 2,494 — 49 — — 2,543Retirement benefit obligation 84,034 — (6,643) 22,733 70 100,194Valuation gain on derivatives 31,415 — 2,175 (16,083) — 17,507Gain or loss on foreign currency translation 21,948 — 57 — — 22,005Incremental costs to acquire a contract (640,840) — (188,215) — — (829,055)Contract assets and liabilities (26,458) — (1,572) — — (28,030)Right-of-use assets — (165,762) (8,755) — — (174,517)Lease liabilities — 168,423 10,930 — — 179,353Others 32,551 6,698 17,077 — 6 56,332
(2,315,684) 9,359 (163,976) 11,912 635 (2,457,754)Deferred tax assets related to unused tax loss
carryforwards and tax credit carryforwards:Tax loss carryforwards 122,899 — (31,763) — — 91,136Tax credit 15,458 — (6,078) — — 9,380
138,357 — (37,841) — — 100,516
Copyright © 2020 www.secdatabase.com. All Rights Reserved.Please Consider the Environment Before Printing This Document
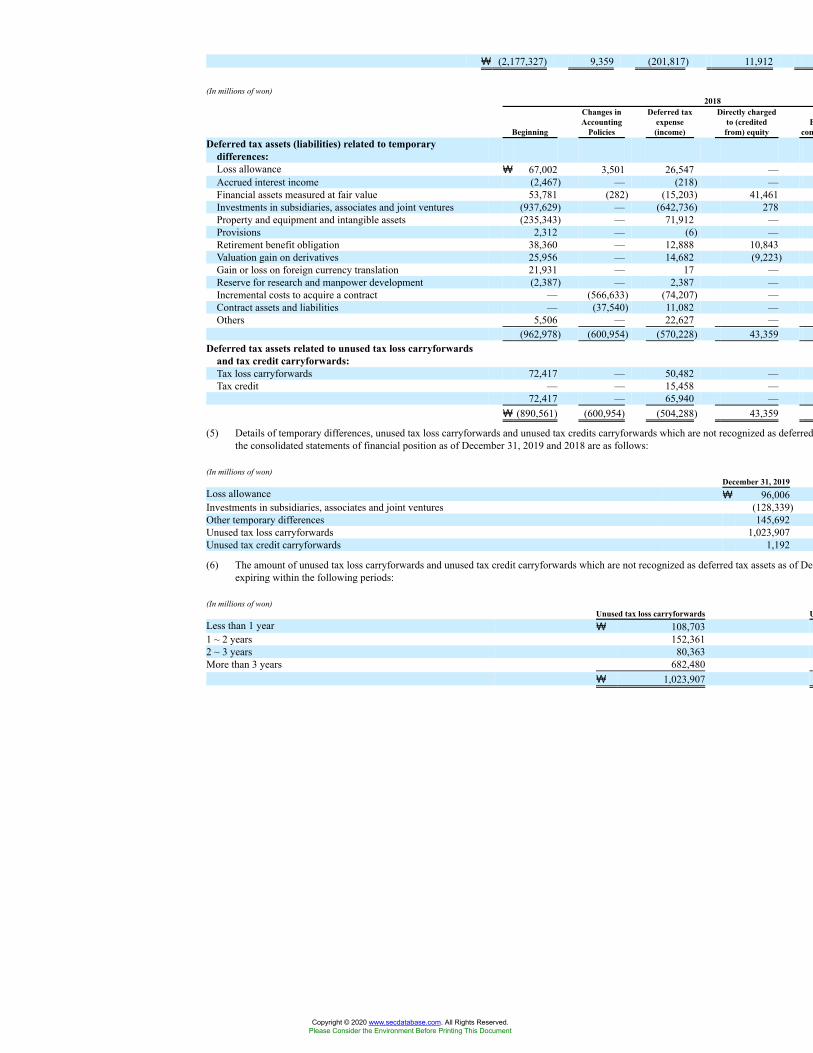
₩ (2,177,327) 9,359 (201,817) 11,912 635 (2,357,238)
(In millions of won)2018
Beginning
Changes inAccounting
Policies
Deferred taxexpense(income)
Directly chargedto (creditedfrom) equity
Businesscombinations Ending
Deferred tax assets (liabilities) related to temporarydifferences:Loss allowance ₩ 67,002 3,501 26,547 — 5,226 102,276Accrued interest income (2,467) — (218) — (28) (2,713)Financial assets measured at fair value 53,781 (282) (15,203) 41,461 — 79,757Investments in subsidiaries, associates and joint ventures (937,629) — (642,736) 278 — (1,580,087)Property and equipment and intangible assets (235,343) — 71,912 — (256,630) (420,061)Provisions 2,312 — (6) — 188 2,494Retirement benefit obligation 38,360 — 12,888 10,843 21,943 84,034Valuation gain on derivatives 25,956 — 14,682 (9,223) — 31,415Gain or loss on foreign currency translation 21,931 — 17 — — 21,948Reserve for research and manpower development (2,387) — 2,387 — — —Incremental costs to acquire a contract — (566,633) (74,207) — — (640,840)Contract assets and liabilities — (37,540) 11,082 — — (26,458)Others 5,506 — 22,627 — 4,418 32,551
(962,978) (600,954) (570,228) 43,359 (224,883) (2,315,684)Deferred tax assets related to unused tax loss carryforwards
and tax credit carryforwards:Tax loss carryforwards 72,417 — 50,482 — — 122,899Tax credit — — 15,458 — — 15,458
72,417 — 65,940 — — 138,357₩ (890,561) (600,954) (504,288) 43,359 (224,883) (2,177,327)
(5) Details of temporary differences, unused tax loss carryforwards and unused tax credits carryforwards which are not recognized as deferred tax assets (liabilities), inthe consolidated statements of financial position as of December 31, 2019 and 2018 are as follows:
(In millions of won)December 31, 2019 December 31, 2018
Loss allowance ₩ 96,006 98,205Investments in subsidiaries, associates and joint ventures (128,339) (233,234)Other temporary differences 145,692 189,604Unused tax loss carryforwards 1,023,907 849,850Unused tax credit carryforwards 1,192 3,705
(6) The amount of unused tax loss carryforwards and unused tax credit carryforwards which are not recognized as deferred tax assets as of December 31, 2019 areexpiring within the following periods:
(In millions of won)Unused tax loss carryforwards Unused tax credit carryforwards
Less than 1 year ₩ 108,703 2581 ~ 2 years 152,361 3162 ~ 3 years 80,363 388More than 3 years 682,480 230
₩ 1,023,907 1,192
Copyright © 2020 www.secdatabase.com. All Rights Reserved.Please Consider the Environment Before Printing This Document
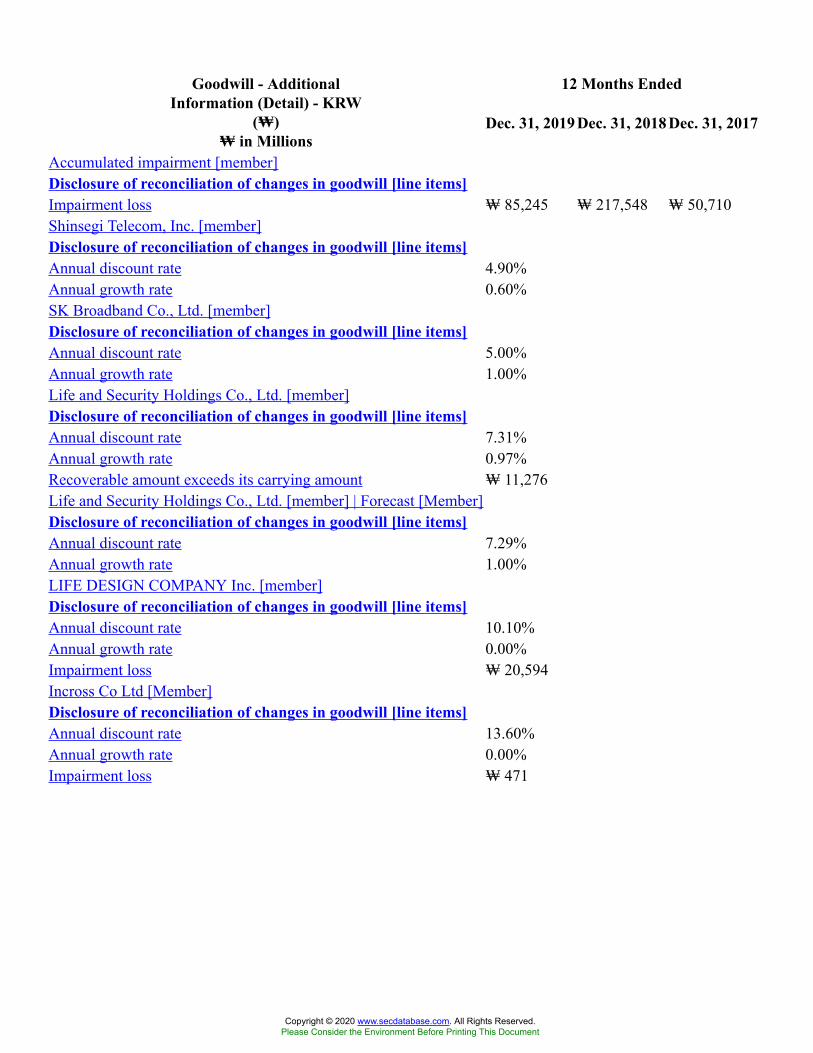
12 Months EndedGoodwill - AdditionalInformation (Detail) - KRW
(₩)₩ in Millions
Dec. 31, 2019 Dec. 31, 2018 Dec. 31, 2017
Accumulated impairment [member]Disclosure of reconciliation of changes in goodwill [line items]Impairment loss ₩ 85,245 ₩ 217,548 ₩ 50,710Shinsegi Telecom, Inc. [member]Disclosure of reconciliation of changes in goodwill [line items]Annual discount rate 4.90%Annual growth rate 0.60%SK Broadband Co., Ltd. [member]Disclosure of reconciliation of changes in goodwill [line items]Annual discount rate 5.00%Annual growth rate 1.00%Life and Security Holdings Co., Ltd. [member]Disclosure of reconciliation of changes in goodwill [line items]Annual discount rate 7.31%Annual growth rate 0.97%Recoverable amount exceeds its carrying amount ₩ 11,276Life and Security Holdings Co., Ltd. [member] | Forecast [Member]Disclosure of reconciliation of changes in goodwill [line items]Annual discount rate 7.29%Annual growth rate 1.00%LIFE DESIGN COMPANY Inc. [member]Disclosure of reconciliation of changes in goodwill [line items]Annual discount rate 10.10%Annual growth rate 0.00%Impairment loss ₩ 20,594Incross Co Ltd [Member]Disclosure of reconciliation of changes in goodwill [line items]Annual discount rate 13.60%Annual growth rate 0.00%Impairment loss ₩ 471
Copyright © 2020 www.secdatabase.com. All Rights Reserved.Please Consider the Environment Before Printing This Document
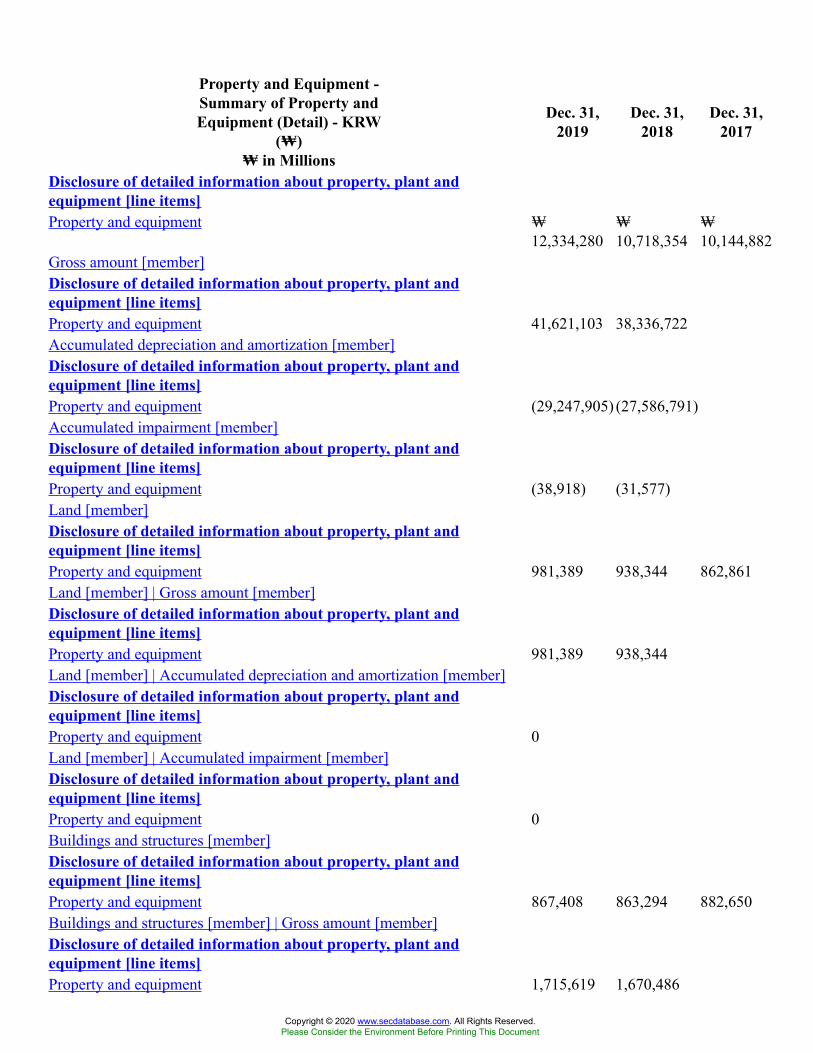
Property and Equipment -Summary of Property andEquipment (Detail) - KRW
(₩)₩ in Millions
Dec. 31,2019
Dec. 31,2018
Dec. 31,2017
Disclosure of detailed information about property, plant andequipment [line items]Property and equipment ₩
12,334,280₩10,718,354
₩10,144,882
Gross amount [member]Disclosure of detailed information about property, plant andequipment [line items]Property and equipment 41,621,103 38,336,722Accumulated depreciation and amortization [member]Disclosure of detailed information about property, plant andequipment [line items]Property and equipment (29,247,905) (27,586,791)Accumulated impairment [member]Disclosure of detailed information about property, plant andequipment [line items]Property and equipment (38,918) (31,577)Land [member]Disclosure of detailed information about property, plant andequipment [line items]Property and equipment 981,389 938,344 862,861Land [member] | Gross amount [member]Disclosure of detailed information about property, plant andequipment [line items]Property and equipment 981,389 938,344Land [member] | Accumulated depreciation and amortization [member]Disclosure of detailed information about property, plant andequipment [line items]Property and equipment 0Land [member] | Accumulated impairment [member]Disclosure of detailed information about property, plant andequipment [line items]Property and equipment 0Buildings and structures [member]Disclosure of detailed information about property, plant andequipment [line items]Property and equipment 867,408 863,294 882,650Buildings and structures [member] | Gross amount [member]Disclosure of detailed information about property, plant andequipment [line items]Property and equipment 1,715,619 1,670,486
Copyright © 2020 www.secdatabase.com. All Rights Reserved.Please Consider the Environment Before Printing This Document
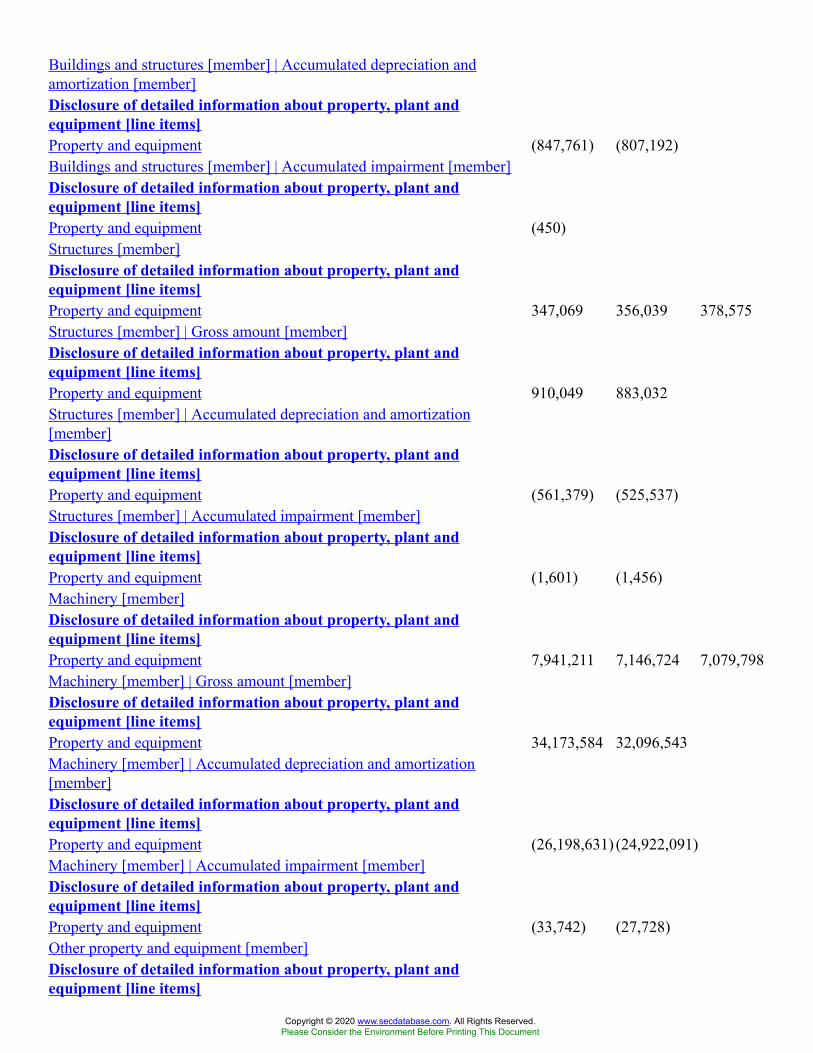
Buildings and structures [member] | Accumulated depreciation andamortization [member]Disclosure of detailed information about property, plant andequipment [line items]Property and equipment (847,761) (807,192)Buildings and structures [member] | Accumulated impairment [member]Disclosure of detailed information about property, plant andequipment [line items]Property and equipment (450)Structures [member]Disclosure of detailed information about property, plant andequipment [line items]Property and equipment 347,069 356,039 378,575Structures [member] | Gross amount [member]Disclosure of detailed information about property, plant andequipment [line items]Property and equipment 910,049 883,032Structures [member] | Accumulated depreciation and amortization[member]Disclosure of detailed information about property, plant andequipment [line items]Property and equipment (561,379) (525,537)Structures [member] | Accumulated impairment [member]Disclosure of detailed information about property, plant andequipment [line items]Property and equipment (1,601) (1,456)Machinery [member]Disclosure of detailed information about property, plant andequipment [line items]Property and equipment 7,941,211 7,146,724 7,079,798Machinery [member] | Gross amount [member]Disclosure of detailed information about property, plant andequipment [line items]Property and equipment 34,173,584 32,096,543Machinery [member] | Accumulated depreciation and amortization[member]Disclosure of detailed information about property, plant andequipment [line items]Property and equipment (26,198,631) (24,922,091)Machinery [member] | Accumulated impairment [member]Disclosure of detailed information about property, plant andequipment [line items]Property and equipment (33,742) (27,728)Other property and equipment [member]Disclosure of detailed information about property, plant andequipment [line items]
Copyright © 2020 www.secdatabase.com. All Rights Reserved.Please Consider the Environment Before Printing This Document
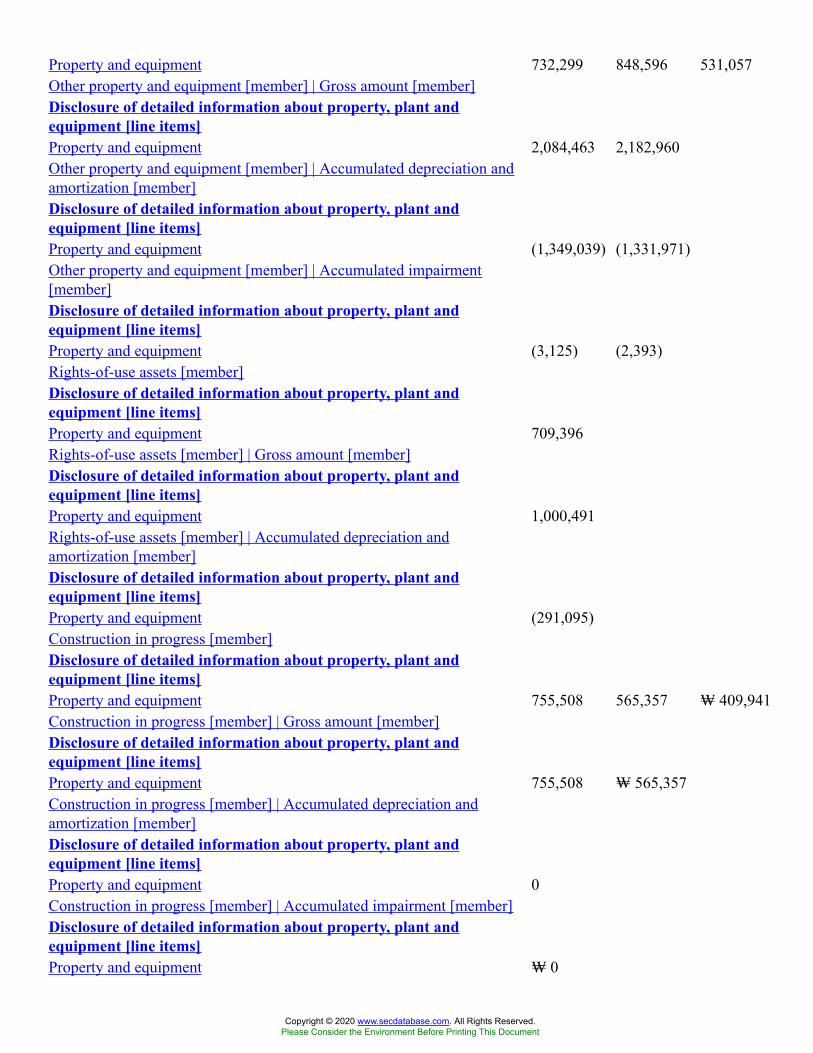
Property and equipment 732,299 848,596 531,057Other property and equipment [member] | Gross amount [member]Disclosure of detailed information about property, plant andequipment [line items]Property and equipment 2,084,463 2,182,960Other property and equipment [member] | Accumulated depreciation andamortization [member]Disclosure of detailed information about property, plant andequipment [line items]Property and equipment (1,349,039) (1,331,971)Other property and equipment [member] | Accumulated impairment[member]Disclosure of detailed information about property, plant andequipment [line items]Property and equipment (3,125) (2,393)Rights-of-use assets [member]Disclosure of detailed information about property, plant andequipment [line items]Property and equipment 709,396Rights-of-use assets [member] | Gross amount [member]Disclosure of detailed information about property, plant andequipment [line items]Property and equipment 1,000,491Rights-of-use assets [member] | Accumulated depreciation andamortization [member]Disclosure of detailed information about property, plant andequipment [line items]Property and equipment (291,095)Construction in progress [member]Disclosure of detailed information about property, plant andequipment [line items]Property and equipment 755,508 565,357 ₩ 409,941Construction in progress [member] | Gross amount [member]Disclosure of detailed information about property, plant andequipment [line items]Property and equipment 755,508 ₩ 565,357Construction in progress [member] | Accumulated depreciation andamortization [member]Disclosure of detailed information about property, plant andequipment [line items]Property and equipment 0Construction in progress [member] | Accumulated impairment [member]Disclosure of detailed information about property, plant andequipment [line items]Property and equipment ₩ 0
Copyright © 2020 www.secdatabase.com. All Rights Reserved.Please Consider the Environment Before Printing This Document
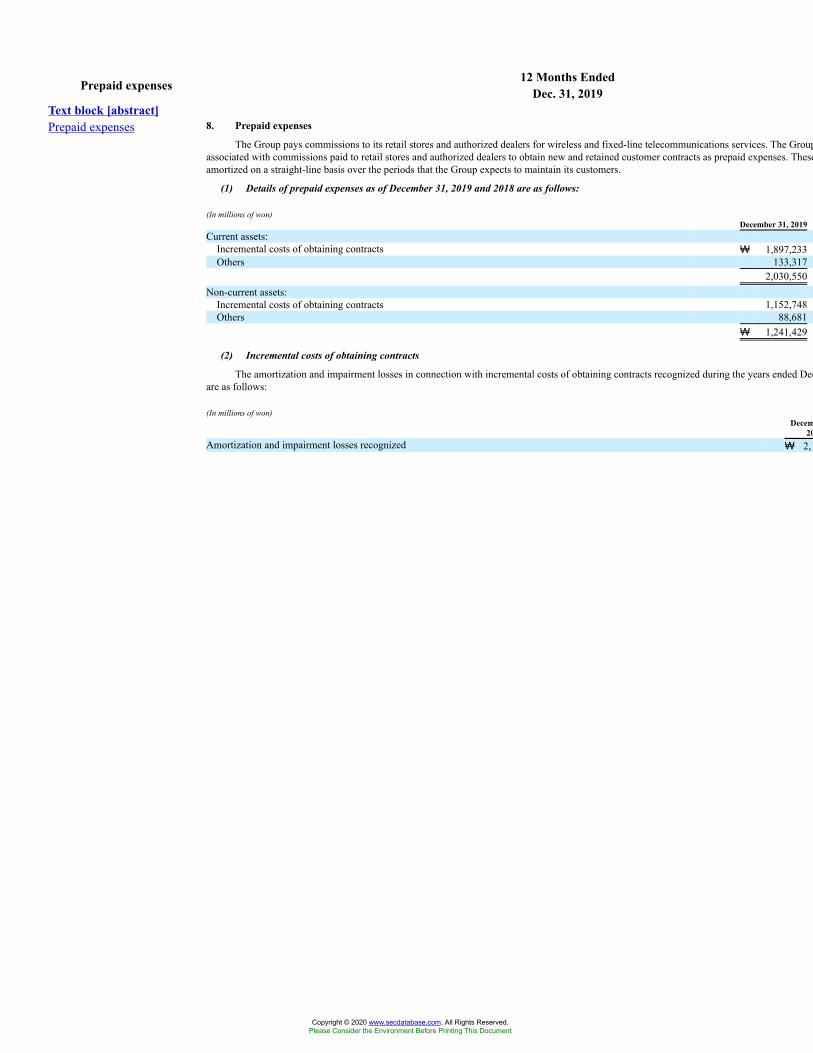
12 Months EndedPrepaid expenses Dec. 31, 2019Text block [abstract]Prepaid expenses 8. Prepaid expenses
The Group pays commissions to its retail stores and authorized dealers for wireless and fixed-line telecommunications services. The Group capitalized certain costsassociated with commissions paid to retail stores and authorized dealers to obtain new and retained customer contracts as prepaid expenses. These prepaid expenses areamortized on a straight-line basis over the periods that the Group expects to maintain its customers.
(1) Details of prepaid expenses as of December 31, 2019 and 2018 are as follows:
(In millions of won)December 31, 2019 December 31, 2018
Current assets:Incremental costs of obtaining contracts ₩ 1,897,233 1,577,992Others 133,317 190,351
2,030,550 1,768,343Non-current assets:
Incremental costs of obtaining contracts 1,152,748 799,607Others 88,681 95,665
₩ 1,241,429 895,272
(2) Incremental costs of obtaining contracts
The amortization and impairment losses in connection with incremental costs of obtaining contracts recognized during the years ended December 31, 2019 and 2018are as follows:
(In millions of won)December 31,
2019December 31,
2018Amortization and impairment losses recognized ₩ 2,193,333 2,002,460
Copyright © 2020 www.secdatabase.com. All Rights Reserved.Please Consider the Environment Before Printing This Document
12 Months EndedSignificant AccountingPolicies Dec. 31, 2019
Text block [abstract]Significant AccountingPolicies
4. Significant Accounting Policies
The significant accounting policies applied by the Group in the preparation of its consolidated financial statements in accordance with IFRS are included below. Thesignificant accounting policies applied by the Group in these consolidated financial statements have been consistently applied for all periods presented, except for thechanges described in note 3 and below.
(1) Operating segments
An operating segment is a component of the Group that engages in business activities from which it may earn revenues and incur expenses, including revenues andexpenses that relate to transactions with any of the Group’s other components. The Group’s operating segments have been determined to be each business unit, for which theGroup generates separately identifiable financial information that is regularly reported to the chief operating decision maker for the purpose of resource allocation andassessment of segment performance. The Group has five reportable segments as described in note 5. Segment results that are reported to the chief operating decision makerinclude items directly attributable to a segment as well as those that can be allocated on a reasonable basis.
(2) Basis of consolidation
1) Business combination
A business combination is accounted for by applying the acquisition method, unless it is a combination involving entities or businesses under common control.
Consideration transferred is generally measured at fair value, identical to the measurement of identifiable net assets acquired at fair value. The difference between theacquired company’s fair value and the consideration transferred is accounted for goodwill. Any goodwill that arises is tested annually for impairment. Any gain on a bargainpurchase is recognized in profit or loss immediately. Acquisition-related costs are expensed in the periods in which the costs are incurred and the services are receivedexcluding costs to issue debt or equity securities recognized based on IAS 32 and IFRS 9.
Consideration transferred does not include the amount settled in relation to the pre-existing relationship and the amount settled in relation to the pre-existingrelationship is generally recognized through profit or loss.
Contingent consideration is measured at fair value at the acquisition date. Contingent consideration classified as equity is not remeasured and its subsequentsettlement is accounted for within equity. If contingent consideration is not classified as equity, the Group subsequently recognizes changes in fair value of contingentconsideration through profit or loss.
2) Non-controlling interests
Non-controlling interests are measured at their proportionate share of the acquiree’s identifiable net assets at the date of acquisition.
Changes in a Controlling Company’s ownership interest in a subsidiary that do not result in the Controlling Company losing control of the subsidiary are accountedfor as equity transactions.
3) Subsidiaries
Subsidiaries are entities controlled by the Group. The Group controls an investee when it is exposed, or has rights, to variable returns from its involvement with theinvestee and has the ability to affect those returns through its power over the investee. Consolidation of an investee begins from the date the Group obtains control of theinvestee and cease when the Group loses control of the investee.
4) Loss of control
If the Group loses control of a subsidiary, the Group derecognizes the assets and liabilities of the former subsidiary from the consolidated statement of financialposition and recognizes gain or loss associated with the loss of control attributable to the former controlling interest. Any investment retained in the former subsidiary isrecognized at its fair value when control is lost.
5) Interest in investees accounted for using the equity method
Interest in investees accounted for using the equity method composed of interest in associates and joint ventures. An associate is an entity in which the Group hassignificant influence, but not control, over the entity’s financial and operating policies. A joint venture is a joint arrangement whereby the Group that has joint control of thearrangement has rights to the net assets of the arrangement.
The investment in an associate and a joint venture is initially recognized at cost including transaction costs and the carrying amount is increased or decreased torecognize the Group’s share of the profit or loss and changes in equity of the associate or the joint venture after the date of acquisition.
The investment in an associate and a joint venture is impaired if objective evidence indicates that a loss event has occurred after the initial recognition of the asset,and that the loss event had a negative effect on the estimated future cash flows of that asset that can be estimated reliably.
• significant financial difficulty of the associate or joint venture;
• a breach of contract, such as a default or delinquency in payments by the associate or joint venture;
• the entity, for economic or legal reasons relating to its associate’s or joint venture’s financial difficulty, granting to the associate or joint venture a concessionthat the entity would not otherwise consider;
• it becoming probable that the associate or joint venture will enter bankruptcy or other financial reorganization; or
• the disappearance of an active market for the net investment because of financial difficulties of the associate or joint venture.
6) Intra-group transactions
Intra-group balances and transactions, and any unrealized income and expenses arising from intra-group transactions, are eliminated in preparing the consolidatedfinancial statements. The Group’s share of unrealized gain incurred from transactions with investees accounted for using the equity method are eliminated and unrealizedloss are eliminated using the same basis if there are no evidence of asset impairments.
Copyright © 2020 www.secdatabase.com. All Rights Reserved.Please Consider the Environment Before Printing This Document

7) Business combinations under common control
SK Holdings Co., Ltd. is the ultimate controlling entity of the Group. The assets and liabilities acquired under business combination under common control arerecognized at the carrying amounts in the ultimate controlling shareholder’s consolidated financial statements. The difference between consideration and carrying amount ofnet assets acquired is added to or subtracted from capital surplus and others.
(3) Cash and cash equivalents
Cash and cash equivalents comprise cash balances, call deposits and investment securities with maturities of three months or less from the acquisition date that areeasily convertible to cash and subject to an insignificant risk of changes in their fair value.
(4) Inventories
Inventories are initially recognized at the acquisition cost and subsequently measured using the weighted average method. During the period, a perpetual inventorysystem is used to track inventory quantities, which is adjusted based on the physical inventory counts performed at the period end. When the net realizable value ofinventories is less than cost, the carrying amount is reduced to the net realizable value, and any difference is charged to current period as operating expenses.
(5) Non-derivative financial assets — Policies applicable from January 1, 2018
1) Recognition and initial measurement
Accounts receivable — trade and debt investments issued are initially recognized when they are originated. All other financial assets and financial liabilities areinitially recognized when the Group becomes a party to the contractual provisions of the instrument.
A financial asset (unless an accounts receivable — trade without a significant financing component) or financial liability is initially measured at fair value plus, for anitem not at FVTPL, transaction costs that are directly attributable to its acquisition or issue. An accounts receivable — trade without a significant financing component isinitially measured at the transaction price.
2) Classification and subsequent measurement
On initial recognition, a financial asset is classified as measured at:
• FVTPL
• FVOCI — equity investment
• FVOCI — debt investment
• Financial assets at amortized cost
A financial asset is classified based on the business model in which a financial asset is managed and its contractual cash flow characteristics.
Financial assets are not reclassified subsequent to their initial recognition unless the Group changes its business model for managing financial assets, in which caseall affected financial assets are reclassified on the first day of the first reporting period following the change in the business model.
A financial asset is measured at amortized cost if it meets both of the following conditions and is not designated as at FVTPL:
• it is held within a business model whose objective is to hold assets to collect contractual cash flows; and
• its contractual terms give rise to cash flows that are solely payments of principal and interest on the principal amount outstanding on specified dates.
A debt investment is measured at FVOCI if it meets both of the following conditions and is not designated as at FVTPL:
• it is held within a business model whose objective is achieved by both collecting contractual cash flows and selling financial assets; and
• its contractual terms give rise to cash flows that are solely payments of principal and interest on the principal amount outstanding on specified dates.
On initial recognition of an equity investment that is not held for trading, the Group may irrevocably elect to present subsequent changes in the investment’s fairvalue in other comprehensive income (“OCI”). This election is made on an investment-by-investment basis.
All financial assets not classified as measured at amortized cost or FVOCI as described above are measured at FVTPL. This includes all derivative financial assets.On initial recognition, the Group may irrevocably designate a financial asset that otherwise meets the requirements to be measured at amortized cost or at FVOCI as atFVTPL if doing so eliminates or significantly reduces an accounting mismatch that would otherwise arise.
The following accounting policies are applied to the subsequent measurement of financial assets.
Financial assets at FVTPL These assets are subsequently measured at fair value. Net gains and losses, including any interest or dividendincome, are recognized in profit or loss.
Financial assets at amortized cost These assets are subsequently measured at amortized cost using the effective interest method. The amortized cost isreduced by impairment losses. Interest income, foreign exchange gains and losses and impairment are recognizedin profit or loss. Any gain or loss on derecognition is recognized in profit or loss.
Debt investments at FVOCI These assets are subsequently measured at fair value. Interest income calculated using the effective interest method,foreign exchange gains and losses and impairment are recognized in profit or loss. Other net gains and losses arerecognized in OCI. On derecognition, gains and losses accumulated in OCI are reclassified to profit or loss.
Equity investments at FVOCI These assets are subsequently measured at fair value. Dividends are recognized as income in profit or loss unlessthe dividend clearly represents a recovery of the cost of the investment. Other net gains and losses are recognized inOCI and are never reclassified to profit or loss.
3) Impairment
The Group estimates the expected credit losses (ECL) for the debt instruments measured at amortized cost and FVOCI based on the Group’s historical experience andinformed credit assessment that includes forward-looking information. The impairment approach is decided based on the assessment of whether the credit risk of a financialasset has increased significantly since initial recognition.
The Group measures loss allowances at an amount equal to lifetime ECL, except for the following, which are measured at 12-month ECL.
Copyright © 2020 www.secdatabase.com. All Rights Reserved.Please Consider the Environment Before Printing This Document

• debt securities that are determined to have low credit risk at the reporting date; and
• other dept securities and bank balances for which credit risk (i.e. the risk of default occurring over the expected life of the financial instrument) has notincreased significantly since initial recognition.
Loss allowances for accounts receivable — trade and lease receivables are always measured at an amount equal to lifetime ECL.
ECL is a probability-weighted estimate of credit losses. Credit losses are measured as the present value of all cash shortfalls (i.e. the difference between the cashflows due to the entity in accordance with the contract and the cash flows that the Group expects to receive).
At each reporting date, the Group assesses whether financial assets measured at amortized cost and debt investments at FVOCI are credit-impaired. A financial assetis ‘credit-impaired’ when one or more events that have a detrimental impact on the estimated future cash flows of the financial asset have occurred.
Loss allowance on financial assets measured at amortized cost is deducted from the carrying amount of the respective assets, while loss allowance on debtinstruments at FVOCI is recognized in OCI, instead of reducing the carrying amount of the assets.
4) Derecognition
Financial assets are derecognized if the Group’s contractual rights to the cash flows from the financial assets expire or if the Group transfers the financial asset toanother party without retaining control or transfers substantially all the risks and rewards of the asset.
The transferred assets are not derecognized when the Group enters into transactions whereby it transfers assets recognized in its statement of financial position butretains substantially all of the risks and rewards of the transferred assets.
5) Offsetting
Financial assets and financial liabilities are offset and the net amount is presented in the statement of financial position when the Group currently has a legallyenforceable right to offset the recognized amounts and intends either to settle on a net basis or to settle the liability and realize the asset simultaneously.
A financial asset and a financial liability is offset only when the right to set off the amount is not contingent on future event and legally enforceable even on the eventof default, insolvency or bankruptcy.
(6) Financial assets — Policies applied before January 1, 2018
The Group recognizes and measures non-derivative financial assets by the following four categories: financial assets at fair value through profit or loss,held-to-maturity investments, loans and receivables and available-for-sale financial assets. The Group recognizes financial assets in the consolidated statement of financialposition when the Group becomes a party to the contractual provisions of the instrument.
Upon initial recognition, non-derivative financial assets not at fair value through profit or loss are measured at their fair value plus transaction costs that are directlyattributable to the acquisition of asset.
1) Financial assets at fair value through profit or loss
A financial asset is classified as financial asset at fair value through profit or loss if it is held for trading or is designated as such upon initial recognition. Upon initialrecognition, transaction costs are recognized in profit or loss when incurred. Financial assets at fair value through profit or loss are measured at fair value, and changestherein are recognized in profit or loss.
2) Held-to-maturity investments
A non-derivative financial asset with a fixed or determinable payment and fixed maturity, for which the Group has the positive intention and ability to hold tomaturity, is classified as held-to-maturity investment. Subsequent to initial recognition, held-to-maturity investments are measured at amortized cost using the effectiveinterest rate method.
3) Loans and receivables
Loans and receivables are financial assets with fixed or determinable payments that are not quoted in an active market. Subsequent to initial recognition, loans andreceivables are measured at amortized cost using the effective interest method except for loans and receivables of which the effect of discounting is immaterial.
4) Available-for-sale financial assets
Available-for-sale financial assets are those non-derivative financial assets that are designated as available-for-sale or are not classified as financial assets at fair valuethrough profit or loss, held-to-maturity investments or loans and receivables. Subsequent to initial recognition, they are measured at fair value, with changes in fair value,net of any tax effect, recorded in other comprehensive income (OCI) in equity. Investments in equity instruments that do not have a quoted market price in an active marketand whose fair value cannot be reliably measured are measured at cost.
5) Impairment of financial assets
A financial asset not carried at fair value through profit or loss is assessed at each reporting date to determine whether there is objective evidence that it is impaired.A financial asset is impaired if objective evidence indicates that a loss event has occurred after the initial recognition of the asset, and that the loss event had a negativeeffect on the estimated future cash flows of the asset that can be reliably estimated. However, losses expected as a result of future events, regardless of likelihood, are notrecognized.
Objective evidence that a financial asset is impaired includes following loss events:
• significant financial difficulty of the issuer or obligor;
• a breach of contract, such as default or delinquency in interest or principal payments;
• the lender, for economic or legal reasons relating to the borrower’s financial difficulty, granting to the borrower a concession that the lender would not otherwiseconsider;
• it becoming probable that the borrower will enter bankruptcy or other financial reorganization;
Copyright © 2020 www.secdatabase.com. All Rights Reserved.Please Consider the Environment Before Printing This Document
• the disappearance of an active market for that financial asset because of financial difficulties; or
• observable data indicating that there is a measurable decrease in the estimated future cash flows from a group of financial assets since the initial recognition ofthose assets, although the decrease cannot yet be identified with the individual financial assets in the group.
In addition, for an investment in an equity security classified as available-for-sale financial asset, a significant or prolonged decline in its fair value below its cost isobjective evidence of impairment.
If financial assets have objective evidence that they are impaired, impairment losses are measured and recognized.
(i) Financial assets measured at amortized cost
An impairment loss in respect of a financial asset measured at amortized cost is calculated as the difference between its carrying amount and the present value of itsestimated future cash flows discounted at the asset’s original effective interest rate. The Group can recognize impairment losses directly or by establishing an allowanceaccount. If, in a subsequent period, the amount of the impairment loss decreases and the decrease can be objectively related to an event occurring after the impairment wasrecognized (such as an improvement in the debtor’s credit rating), the previously recognized impairment loss is reversed either directly or by adjusting an allowanceaccount.
(ii) Financial assets carried at cost
If there is objective evidence that an impairment loss has occurred on an unquoted equity instrument that is not carried at fair value because its fair value cannot bereliably measured, or on a derivative asset that is linked to and must be settled by delivery of such an unquoted equity instrument, the amount of the impairment loss ismeasured as the difference between the carrying amount of the financial asset and the present value of estimated future cash flows discounted at the current market rate ofreturn for a similar financial asset. Such impairment losses are not reversed.
(iii) Available-for-sale financial assets
When a decline in the fair value of an available-for-sale financial asset has been recognized in other comprehensive income and there is objective evidence that theasset is impaired, the cumulative loss that had been recognized in other comprehensive income is reclassified to profit or loss as a reclassification adjustment even thoughthe financial asset has not been derecognized. Impairment losses recognized in profit or loss for an investment in an equity instrument classified as available-for-sale is notreversed through profit or loss subsequently. If, in a subsequent period, the fair value of a debt instrument classified as available-for-sale increases and the increase can beobjectively related to an event occurring after the impairment loss was recognized in profit or loss, the impairment loss is reversed to the amount of amortized cost thatwould otherwise have been recognized as of the recovery date.
6) De-recognition of financial assets
The Group derecognizes a financial asset when the contractual rights to the cash flows from the asset expire or the Group transfers the rights to receive the cash flowson the financial asset in a transaction in which substantially all the risks and rewards of ownership of the financial asset are transferred. Any interest in transferred financialassets that is created or retained by the Group is recognized as a separate asset or liability. If the Group retains substantially all the risks and rewards of ownership of thetransferred financial assets, the Group continues to recognize the transferred financial assets and recognizes financial liabilities for the consideration received.
7) Offsetting between financial assets and financial liabilities
Financial assets and liabilities are offset and presented in net in the statement of financial position when, and only when, the Group currently has a legally enforceableright to offset the recognized amounts and intends either to settle on a net basis or to realize the asset and settle the liability simultaneously.
(7) Derivative financial instruments and hedge accounting
Derivatives are initially recognized at fair value. Subsequent to initial recognition, derivatives are measured at fair value at the end of each reporting period, andchanges therein are accounted for as described below.
1) Hedge accounting
The Group holds forward exchange contracts, interest rate swaps, currency swaps and other derivative contracts to manage interest rate risk and foreign exchangerisk. The Group designates derivatives as hedging instruments to hedge the foreign currency risk of highly probable forecasted transactions or firm commitments (a cashflow hedge).
On initial designation of the hedge, the Group formally documents the relationship between the hedging instrument(s) and hedged item(s), including the riskmanagement objectives and strategy in undertaking the hedge transaction, together with the methods that will be used to assess the effectiveness of the hedging relationship.
Cash flow hedge
When a derivative is designated to hedge the variability in cash flows attributable to a particular risk associated with a recognized asset or liability or a highlyprobable forecasted transaction that could affect profit or loss, the effective portion of changes in the fair value of the derivative is recognized in other comprehensiveincome, net of tax, and presented in the hedging reserve in equity. Any ineffective portion of changes in the fair value of the derivative is recognized immediately in profit orloss. If the hedging instrument no longer meets the criteria for hedge accounting, expires or is sold, terminated, exercised, or the designation is revoked, then hedgeaccounting is discontinued prospectively. The cumulative gain or loss on the hedging instrument that has been recognized in other comprehensive income is reclassified toprofit or loss in the periods during which the forecasted transaction occurs. If the forecasted transaction is no longer expected to occur, then the balance in othercomprehensive income is recognized immediately in profit or loss.
2) Other derivative financial instruments
Other derivative financial instrument not designated as a hedging instrument are measured at fair value, and the changes in fair value of the derivative financialinstrument is recognized immediately in profit or loss.
(8) Property and equipment
Property and equipment are initially measured at cost. The cost of property and equipment includes expenditures arising directly from the construction or acquisitionof the asset, any costs directly attributable to bringing the asset to the location and condition necessary for it to be capable of operating in the manner intended bymanagement and the initial estimate of the costs of dismantling and removing the item and restoring the site on which it is located.
Copyright © 2020 www.secdatabase.com. All Rights Reserved.Please Consider the Environment Before Printing This Document
Property and equipment, subsequently, are carried at cost less accumulated depreciation and accumulated impairment losses.
Subsequent costs are recognized in the carrying amount of property and equipment at cost or, if appropriate, as a separate item if it is probable that future economicbenefits associated with the item will flow to the Group and the cost of the item can be reliably measured. The carrying amount of the replaced part is derecognized. Thecosts of the day-to-day servicing are recognized in profit or loss as incurred.
Property and equipment, except for land, are depreciated on a straight-line basis over estimated useful lives that appropriately reflect the pattern in which the asset’sfuture economic benefits are expected to be consumed. A component that is significant compared to the total cost of property and equipment is depreciated over its separateuseful life.
Gains and losses on disposal of an item of property and equipment are determined by comparing the proceeds from disposal with the carrying amount of property andequipment and are recognized as other operating income (loss).
The estimated useful lives of the Group’s property and equipment are as follows:
Useful lives (years)Buildings and structures 15 ~ 40Machinery 3 ~ 15Other property and equipment 2 ~ 10Right-of-use assets 1 ~ 50
Depreciation methods, useful lives, and residual values are reviewed at the end of each reporting date and adjusted, if appropriate. The change is accounted for as achange in an accounting estimate.
(9) Borrowing costs
The Group capitalizes borrowing costs directly attributable to the acquisition, construction or production of a qualifying asset as part of the cost of that asset. Otherborrowing costs are recognized in expense as incurred. A qualifying asset is an asset that requires a substantial period of time to get ready for its intended use or sale.Financial assets are not qualifying assets, and assets that are ready for their intended use or sale when acquired are not qualifying assets either.
To the extent that the Group borrows funds specifically for the purpose of obtaining a qualifying asset, the Group determines the amount of borrowing costs eligiblefor capitalization as the actual borrowing costs incurred on that borrowing during the period less any investment income on the temporary investment of those borrowings.To the extent that the Group borrows funds generally and uses them for the purpose of obtaining a qualifying asset, the Group determines the amount of borrowing costseligible for capitalization by applying a capitalization rate to the expenditures on that asset. The capitalization rate is the weighted average of the borrowing costs applicableto the borrowings of the Group that are outstanding during the period other than borrowings made specifically for the purpose of obtaining a qualifying asset. The amount ofborrowing costs that the Group capitalizes during a period do not exceed the amount of borrowing costs incurred during the period.
(10) Intangible assets
Intangible assets are measured initially at cost and, subsequently, are carried at cost less accumulated amortization and accumulated impairment losses.
Intangible assets, except for goodwill, are amortized on a straight-line basis over the estimated useful lives of intangible assets from the date that they are availablefor use. The residual value of intangible assets is zero. However, club memberships and brand are expected to be available for use as there are no foreseeable limits to theperiods. These intangible assets are determined as having indefinite useful lives and, therefore, not amortized.
The estimated useful lives of the Group’s intangible assets are as follows:
Useful lives (years)Frequency usage rights 5 ~ 10Land usage rights 5Industrial rights 5, 10Development costs 3 ~ 5Facility usage rights 10, 20Customer relations 3 ~ 20Other 3 ~ 20
Amortization periods and the amortization methods for intangible assets with finite useful lives are reviewed at the end of each reporting period. The useful lives ofintangible assets that are not being amortized are reviewed at the end of each reporting period to determine whether events and circumstances continue to support indefiniteuseful life assessments for those assets. Changes, if appropriate, are accounted for as changes in accounting estimates.
Expenditures on research activities are recognized in profit or loss as incurred. Development expenditures are capitalized only if development costs can be reliablymeasured, the product or process is technically and commercially feasible, future economic benefits are probable, and the Group intends to and has sufficient resources tocomplete development and to use or sell the asset. Other development expenditures are recognized in profit or loss as incurred.
Subsequent expenditures are capitalized only when they increase the future economic benefits embodied in the specific asset to which it relates. All otherexpenditures, including expenditures on internally generated goodwill and brands, are recognized in profit or loss as incurred.
(11) Government grants
Government grants are not recognized unless there is reasonable assurance that the Group will comply with the grant’s conditions and that the grant will be received.
1) Grants related to assets
Government grants whose primary condition is that the Group purchases, constructs, or otherwise acquires a long-term asset are deducted in calculating the carryingamount of the asset. The grant is recognized in profit or loss over the life of a depreciable asset as a reduction to depreciation expense.
2) Grants related to income
Government grants which are intended to compensate the Group for expenses incurred are deducted from the related expenses.
(12) Impairment of non-financial assets
Copyright © 2020 www.secdatabase.com. All Rights Reserved.Please Consider the Environment Before Printing This Document
The carrying amounts of the Group’s non-financial assets other than contract assets recognized for revenue arising from contracts with a customer, assets recognizedfor the costs to obtain or fulfill a contract with a customer, employee benefits, inventories, deferred tax assets, and non-current assets held for sale are reviewed at the end ofthe reporting period to determine whether there is any indication of impairment. If any such indication exists, then the asset’s recoverable amount is estimated. Goodwill andintangible assets that have indefinite useful lives or that are not yet available for use, irrespective of whether there is any indication of impairment, are tested for impairmentannually by comparing their recoverable amounts to their carrying amounts.
The Group estimates the recoverable amount of an individual asset, and if it is impossible to measure the individual recoverable amount of an asset, the Groupestimates the recoverable amount of cash-generating unit (“CGU”). A CGU is the smallest identifiable group of assets that generates cash inflows that are largelyindependent of the cash inflows from other assets or groups of assets. The recoverable amount of an asset or CGU is the greater of its value in use and its fair value lesscosts to sell. The value in use is estimated by applying a pre-tax discount rate that reflects current market assessments of the time value of money and the risks specific tothe asset or CGU for which estimated future cash flows have not been adjusted, to the estimated future cash flows expected to be generated by the asset or CGU.
An impairment loss is recognized in profit or loss to the extent the carrying amount of the asset exceeds its recoverable amount.
Goodwill acquired in a business combination is allocated to each CGU that is expected to benefit from the synergy arising from the business acquired. Anyimpairment identified at the CGU level will first reduce the carrying amount of goodwill and then be used to reduce the carrying amount of the other assets in the CGU on apro rata basis. Except for impairment losses in respect of goodwill which are never reversed, an impairment loss is reversed if there has been a change in the estimates usedto determine the recoverable amount. An impairment loss is reversed only to the extent that the asset’s carrying amount does not exceed the carrying amount that wouldhave been determined, net of depreciation or amortization, if no impairment loss had been recognized.
(13) Leases - Policies applicable from January 1, 2019
The Group has applied IFRS 16, Leases, from January 1, 2019. See note 3 for additional information.
The Group determined at contract inception whether an arrangement was or contained a lease. A contract is, or contains, a lease if the contract transfers the right tocontrol the identified asset for a period of time in exchange for consideration. To assess whether a contract transfers the right to control the identified asset, the Group usesthe definition of a lease in IFRS 16, Leases.
1) As a lessee
The Group recognizes a right-of-use asset and a lease liability at the lease commencement date. The right-of-use asset is initially measured at cost, which comprisethe initial amount of lease liability adjusted for any lease payments made at or before the commencement date, plus any initial direct costs incurred and an estimate of coststo dismantle and remove the underlying assets or to restore the underlying asset or the site on which it is located, less any lease incentives received. The right-of-use asset issubsequently measured at cost less any accumulated depreciation and impairment losses and adjusted for certain remeasurements of the lease liability. The Group presentsits right-of-use assets in property and equipment on the statements of financial position. The right-of-use asset is subsequently depreciated using the straight-line methodfrom the commencement date to the end of the lease term.
The lease liability is initially measured at the present value of the lease payments that are not paid at the commencement date, discounted using the interest rateimplicit in the lease or, if that rate cannot be readily determined, the Group’s incremental borrowing rate. Generally, the Group uses its incremental borrowing rate as thediscount rate.
The lease liability is subsequently increased by the interest cost on the lease liability and decreased by lease payments made. It is remeasured when there is a changein future lease payments arising from a change in an index or rate, a change in the estimate of the amount expected to be payable under a residual value guarantee, or asappropriate, changes in the assessment of whether a purchase or extension option is reasonably certain to be exercised or a termination option is reasonably certain not to beexercised.
The Group has applied judgment to determine the lease term for some lease contracts in which it is a lessee that include extension options. The assessment of whetherthe Group is reasonably certain to exercise such options impacts the lease term, which significantly affects the amount of lease liabilities and right-of-use assets recognized.The Group has not included the extension option periods in the lease term because it is not reasonably certain to exercise such options. After the commencement date, theGroup reassesses the lease term upon the occurrence of a significant event or a significant change in circumstances that is within the control of the Group that affectswhether the Group is reasonably certain to exercise the extension option.
The Group has elected not to recognize right-of-use assets and lease liabilities for leases with the lease term of 12 months or less at the commencement date and forleases of low-value assets. The Group recognizes the lease payments associated with these leases as an expense on a straight-line basis over the lease term. The Group hasalso elected to apply the practical expedient which allows a lease and associated non-lease components to be accounted for as a single lease component.
2) As a lessor
The Group determines whether each lease is a finance lease or an operating lease at inception of a contract. A lease is classified as a finance lease when the leasetransfers substantially all of the risks and rewards of ownership of the underlying asset. If not, then it is classified as an operating lease.
When the Group is an intermediate lessor, the Group accounts for the head lease and the sublease separately. The sub-leases are classified with reference to theright-of-use assets arising from the head lease, not with reference to the underlying asset.
(14) Leases — Policies applied before January 1, 2019
The Group classifies and accounts for leases as either a finance or operating lease, depending on the terms. Leases under which the Group assumes substantially all ofthe risks and rewards of ownership are classified as finance leases. All other leases are classified as operating leases.
1) Finance leases — lessee
At the commencement of the lease term, the Group recognizes as finance assets and finance liabilities in its consolidated statement of financial position, the loweramount of the fair value of the leased property and the present value of the minimum lease payments, each determined at the inception of the lease. Any initial direct costsare added to the amount recognized as an asset.
Minimum lease payments are apportioned between the finance cost and the reduction of the outstanding liability. The finance cost is allocated to each period duringthe lease term so as to produce a constant periodic rate of interest on the remaining balance of the liability. Contingent rents are charged as expenses in the periods in whichthey are incurred.
The depreciable amount of a leased asset is allocated to each accounting period during the period of expected use on a systematic basis consistent with thedepreciation policy the Group adopts for depreciable assets that are owned. If there is no reasonable certainty that the Group will obtain ownership by the end of the lease
Copyright © 2020 www.secdatabase.com. All Rights Reserved.Please Consider the Environment Before Printing This Document
term, the asset is fully depreciated over the shorter of the lease term and its useful life. The Group reviews to determine whether the leased assets are impaired at thereporting date.
2) Operating leases
Leases where the lessor retains a significant portion of the risks and rewards of ownership are classified as operating leases. Payments made under operating leases(net of any incentives received from the lessor) are recognized in profit or loss on a straight-line basis over the lease term.
3) Determining whether an arrangement contains a lease
Determining whether an arrangement is, or contains, a lease is based on the substance of the arrangement and requires an assessment of whether fulfillment of thearrangement is dependent on the use of a specific asset and the arrangement conveys a right to use the asset.
At inception or reassessment of the arrangement, the Group separates payments and other consideration required by such an arrangement into those for the lease andthose for other elements on the basis of their relative fair values. If the Group concludes for a financial lease that it is impracticable to separate the payments reliably, theGroup recognizes an asset and a liability at an amount equal to the fair value of the underlying asset that was identified as the subject of the lease. Subsequently, the liabilityis reduced as payments are made and an imputed finance charge on the liability is recognized using the Group’s incremental borrowing rate of interest.
(15) Non-current assets held for sale
Non-current assets, or disposal groups comprising assets and liabilities, that are expected to be recovered primarily through sales rather than through continuing use,are classified as held for sale. In order to be classified as held for sale, the assets (or disposal groups) must be available for immediate sale in their present condition andtheir sale must be highly probable. The assets or disposal groups that are classified as non-current assets held for sale are measured at the lower of their carrying amountsand fair value less cost to sell. The Group recognizes an impairment loss for any initial or subsequent write-down of assets (or disposal groups) to fair value less costs to selland a gain for any subsequent increase in fair value less costs to sell up to the cumulative impairment loss previously recognized in accordance with IAS 36, Impairment ofAssets.
A non-current asset that is classified as held for sale or part of a disposal group classified as held for sale is not depreciated (or amortized).
(16) Non-derivative financial liabilities
The Group classifies non-derivative financial liabilities into financial liabilities at fair value through profit or loss or other financial liabilities in accordance with thesubstance of the contractual arrangement. The Group recognizes financial liabilities in the consolidated statement of financial position when the Group becomes a party tothe contractual provisions of the financial liabilities.
1) Financial liabilities at fair value through profit or loss
Financial liabilities at fair value through profit or loss include financial liabilities held for trading or designated as such upon initial recognition. Subsequent to initialrecognition, these liabilities are measured at fair value. The amount of change in fair value of a financial liability that is attributable to changes in the credit risk of thatliability shall be presented in other comprehensive income, and the remaining amount of change in the fair value of the liability shall be presented in profit or loss. Uponinitial recognition, transaction costs that are directly attributable to the issue of the financial liability are recognized in profit or loss as incurred.
2) Other financial liabilities
Non-derivative financial liabilities other than financial liabilities at fair value through profit or loss are classified as other financial liabilities. At the date of initialrecognition, other financial liabilities are measured at fair value minus transaction costs that are directly attributable to the issue of the financial liabilities. Subsequent toinitial recognition, other financial liabilities are measured at amortized cost and the interest expenses are recognized using the effective interest method.
3) Derecognition of financial liability
The Group extinguishes a financial liability only when the contractual obligation is fulfilled, canceled or expires. The Group recognizes new financial liabilities atfair value based on new contracts and eliminates existing liabilities when the contractual terms of the financial liabilities change and the cash flows change substantially.
When a financial liability is derecognized, the difference between the carrying amount and the consideration paid (including any transferred non-cash assets orliabilities assumed) is recognized in profit or loss.
(17) Employee benefits
1) Short-term employee benefits
Short-term employee benefits are employee benefits that are due to be settled within 12 months after the end of the period in which the employees render relatedservices. When an employee has rendered a service to the Group during an accounting period, the Group recognizes the undiscounted amount of short-term employeebenefits expected to be paid in exchange for that service.
2) Other long-term employee benefits
Other long-term employee benefits include employee benefits that are settled beyond 12 months after the end of the period in which the employees render relatedservices. The Group’s net obligation in respect of long-term employee benefits is the amount of future benefit that employees have earned in return for their service in thecurrent and prior periods. That benefit is discounted to determine its present value. Remeasurements are recognized in profit or loss in the period in which they arise.
3) Retirement benefits: defined contribution plans
When an employee has rendered a service to the Group during a period, the Group recognizes the contribution payable to a defined contribution plan in exchange forthat service as a liability (accrued expense), after deducting any contribution already paid. If the contribution already paid exceeds the contribution due for service before theend of the reporting period, the Group recognizes that excess as an asset (prepaid expense) to the extent that the prepayment will lead to a reduction in future payments or acash refund.
4) Retirement benefits: defined benefit plans
At the end of reporting period, defined benefit liabilities relating to defined benefit plans are recognized at present value of defined benefit obligations net of fairvalue of plan assets.
Copyright © 2020 www.secdatabase.com. All Rights Reserved.Please Consider the Environment Before Printing This Document
The calculation is performed annually by an independent actuary using the projected unit credit method. When the fair value of plan assets exceeds the present valueof the defined benefit obligation, the Group recognizes an asset, to the extent of the present value of any economic benefits available in the form of refunds from the plan orreduction in the future contributions to the plan.
Remeasurements of the net defined benefit liability (asset), which comprise actuarial gains and losses, the return on plan assets (excluding interest) and the effect ofthe asset ceiling (if any, excluding interest), are recognized immediately in other comprehensive income. The Group determines net interests on net defined benefit liability(asset) by multiplying discount rate determined at the beginning of the annual reporting period and considers changes in net defined benefit liability (asset) fromcontributions and benefit payments. Net interest costs and other costs relating to the defined benefit plan are recognized through profit or loss.
When the plan amendment or curtailment occurs, gains or losses on amendment or curtailment in benefits for the past service provided are recognized through profitor loss. The Group recognizes a gain or loss on a settlement when the settlement of defined benefit plan occurs.
5) Termination benefits
The Group recognizes a liability and expense for termination benefits at the earlier of the period when the Group can no longer withdraw the offer of those benefitsand the period when the Group recognizes costs for a restructuring that involves the payment of termination benefits. If benefits are payable more than 12 months after thereporting period, they are discounted to their present value.
(18) Provisions
Provisions are recognized when the Group has a present legal or constructive obligation as a result of a past event, it is probable that an outflow of resourcesembodying economic benefits will be required to settle the obligation, and a reliable estimate can be made of the amount of the obligation.
The risks and uncertainties that inevitably surround many events and circumstances are taken into account in reaching the best estimate of a provision. If the effect ofthe time value of money is material, provisions are determined at the present value of the expected future cash flows.
If some or all of the expenditures required to settle a provision are expected to be reimbursed by another party, the reimbursement is recognized when, and onlywhen, it is virtually certain that reimbursement will be received if the entity settles the obligation. The reimbursement is treated as a separate asset.
Provisions are reviewed at the end of each reporting period and adjusted to reflect the current best estimates. If it is no longer probable that an outflow of resourcesembodying economic benefits will be required to settle the obligation, the provision is reversed.
A provision is used only for expenditures for which the provision was originally recognized.
(19) Transactions in foreign currencies
1) Foreign currency transactions
Transactions in foreign currencies are translated to the functional currency of the Group at exchange rates at the dates of the transactions. Monetary assets andliabilities denominated in foreign currencies are retranslated to the functional currency using the exchange rate at the reporting date. Non-monetary assets and liabilitiesdenominated in foreign currencies that are measured at fair value are retranslated to the functional currency at the exchange rate at the date that the fair value wasdetermined.
Foreign currency differences arising on retranslation are recognized in profit or loss, except for the differences arising on the retranslation of available-for-sale equityinstruments.
2) Foreign operations
If the presentation currency of the Group is different from a foreign operation’s functional currency, the financial statements of the foreign operation are translatedinto the presentation currency using the following methods:
The assets and liabilities of foreign operations, whose functional currency is not the currency of a hyperinflationary economy, are translated to presentation currencyat exchange rates at the reporting date. The income and expenses of foreign operations are translated to functional currency at exchange rates at the dates of the transactions.Foreign currency differences are recognized in other comprehensive income.
Any goodwill arising on the acquisition of a foreign operation and any fair value adjustments to the carrying amounts of assets and liabilities arising on theacquisition of that foreign operation is treated as assets and liabilities of the foreign operation. Thus, they are expressed in the functional currency of the foreign operationand translated at the closing rate at the reporting date.
When a foreign operation is disposed, the relevant amount in the translation is transferred to profit or loss as part of the profit or loss on disposal. On the partialdisposal of a subsidiary that includes a foreign operation, the relevant proportion of such cumulative amount is reattributed to non-controlling interest. In any other partialdisposal of a foreign operation, the relevant proportion is reclassified to profit or loss.
(20) Share capital
Ordinary shares are classified as equity. Incremental costs directly attributable to the issuance of ordinary shares and share options are recognized as a deduction fromequity, net of any tax effects.
When the Parent Company repurchases its own shares, the amount of the consideration paid is recognized as a deduction from equity and classified as treasuryshares. The gains or losses from the purchase, disposal, reissue, or retirement of treasury shares are directly recognized in equity being as transaction with owners.
(21) Hybrid bond
The Group recognizes a financial instrument issued by the Group as an equity instrument if it does not include contractual obligation to deliver financial assetsincluding cash to the counter party.
(22) Share-based Payment
For equity-settled share-based payment transaction, if the fair value of the goods or services received cannot be reliably estimated, the Group measures the valueindirectly by reference to the fair value of the equity instruments granted. The related expense with a corresponding increase in capital surplus and others is recognized overthe vesting period of the awards.
Copyright © 2020 www.secdatabase.com. All Rights Reserved.Please Consider the Environment Before Printing This Document
The amount recognized as an expense is adjusted to reflect the number of awards for which the related service and non-market performance conditions are expectedto be met, such that the amount ultimately recognized is based on the number of awards that meet the related service and non-market performance conditions at the vestingdate.
For cash-settled share-based payment transaction, the Group measures and recognizes the amount payable to employees at fair value as an expense with acorresponding increase in liabilities, over the period during which the employees become unconditionally entitled to payment. The liability is remeasured at each reportingdate and at settlement date based on the fair value of the share-based payment. Any changes in the liability are recognized in profit or loss.
(23) Revenue — Policies applicable from January 1, 2018
The Group adopted IFRS 15, Revenue from Contracts with Customers, on January 1, 2018, using the modified retrospective method. IFRS 15 establishes acomprehensive framework for determining whether, how much and when revenue is recognized. It also amends previous guidance for the recognition of costs to obtaincontracts with customers such that incremental costs of obtaining contracts with customers are deferred and amortized consistent with the transfer of the related good orservice.
1) Identification of performance obligations in contracts with customers
The Group identifies the distinct services or goods as performance obligations in contracts with customers such as (1) providing wireless telecommunicationsservices, (2) sale of handsets and (3) providing other goods and services. In the case of providing both wireless telecommunications service and selling a handset together toone customer, the Group allocates considerations from the customer between the separate performance obligations for handset sale and wireless telecommunications service.The handset sale revenue is recognized when handset is delivered, and the wireless telecommunications service revenue is recognized over the period of the contract term asstated in the subscription contract.
2) Allocation of the transaction price to each performance obligation
The Group allocates the transaction price of a contract to each performance obligation identified on a relative stand-alone selling price basis. The Group uses“adjusted market assessment approach” for estimating the stand-alone selling price of a good or service. As an exception, the Group uses “expected cost plus a marginapproach” for insignificant transactions.
3) Incremental costs of obtaining a contract
The Group pays commissions to its retail stores and authorized dealers in connection with acquiring service contracts. The commissions paid to these partiesconstituted a significant portion of the Group’s operating expenses. These commissions would not have been paid if there have been no binding contracts with subscribersand, therefore, the Group capitalizes certain costs associated with commissions paid to obtain new customer contracts and amortize them over the expected contract periods.
4) Customer loyalty programs
The Group provides customer loyalty points to customers based on the usage of the service to which the Group allocates a portion of consideration received as aperformance obligation distinct from wireless telecommunications services. The amount to be allocated to the loyalty program is measured according to the relative stand-alone selling price of the customer loyalty points. The amount allocated to the loyalty program is deferred as a contract liability and is recognized as revenue when loyaltypoints are redeemed.
5) Consideration payable to a customer
Based on the subscription contract, a customer who uses the Group’s wireless telecommunications services may receive a discount for purchasing goods or servicesfrom a designated third party. The Group pays a portion of the price discounts that the customer receives to the third party, which is the consideration payable to a customer.The Group accounts for the amounts payable to the third party as a reduction of the wireless telecommunications service revenue.
(24) Revenue — Policies applied before January 1, 2018
Revenue from the sale of goods, rendering of services or use of assets is measured at the fair value of the consideration received or receivable. Returns, tradediscounts and volume rebates are recognized as a reduction of revenue.
When two or more revenue generating activities or deliverables are sold under a single arrangement, each deliverable that is considered to be a separate unit ofaccount is accounted for separately. The allocation of consideration from a revenue arrangement to its separate units of account is based on the relative fair values of eachunit.
1) Services rendered
Revenue from cellular services consists of revenue from basic charges, voice charges, data charges, data-roaming services and interconnection charges. Suchrevenues are recognized as services are performed. Revenue from fixed-line services includes domestic and long-distance call charges, international phone connectioncharges, installation service and broadband internet services. Such revenues are recognized as the related services are performed.
Revenue from other services rendered is recognized in profit or loss in proportion to the stage of completion of the transaction at the reporting date. The stage ofcompletion is assessed by reference to surveys of work performed.
2) Goods sold
Revenue is recognized when persuasive evidence exists, usually in the form of an executed sales agreement, that the significant risks and rewards of ownership havebeen transferred to the buyer, recovery of the consideration is probable, the associated costs and possible return of goods can be estimated reliably, there is no continuingmanagement involvement with the goods, and the amount of revenue can be measured reliably.
3) Commission revenue
In connection with the commission revenue from commerce services, the Group has determined that it is acting as an agent due to the followings:
• The Group does not bear inventory risk or have responsibility for the delivery goods;
• All of the credit risks are borne by suppliers of goods though the Group collects the proceeds from end customers on behalf of the suppliers; and
• The Group has no latitude in establishing prices regarding goods sold in commerce.
Copyright © 2020 www.secdatabase.com. All Rights Reserved.Please Consider the Environment Before Printing This Document
4) Customer loyalty programs
For customer loyalty programs, the fair value of the consideration received or receivable in respect of the initial sale is allocated between the award credits and theother components of the sale. The amount allocated to the award credits is estimated by reference to the fair value of the services to be provided with respect to theredeemable award credits. The fair value of the services to be provided with respect to the redeemable portion of the award credits granted to the customers in accordancewith customer loyalty programs is estimated taking into account the expected redemption rate and timing of the expected redemption. Considerations allocated to the awardcredits are deferred and revenue is recognized when the award credits are recovered and the Group performs its obligation to provide the service. The amount of revenuerecognized is based on the relative size of the total award credits that are expected to be redeemed and the redeemed award credits in exchange for services.
(25) Finance income and finance costs
Finance income comprises interest income on funds invested (including financial assets measured at fair value), dividend income, gains on disposal of financialassets at FVTPL, changes in fair value of financial instruments at FVTPL, and gains on hedging instruments that are recognized in profit or loss. Interest income isrecognized as it accrues in profit or loss, using the effective interest rate method. Dividend income is recognized in profit or loss when the right to receive the dividend isestablished.
Finance costs comprise interest expense on borrowings, changes in fair value of financial instruments at FVTPL, and losses on hedging instruments that arerecognized in profit or loss. Interest expense on borrowings and debentures is recognized as it accrues in profit or loss using the effective interest rate method.
(26) Income taxes
Income tax expense comprises current and deferred tax. Current tax and deferred tax are recognized in profit or loss except to the extent that it relates to a businesscombination, or items recognized directly in equity or in OCI.
The Group pays income tax in accordance with the tax-consolidation system when the Parent Company and its subsidiaries are economically unified.
1) Current tax
Current tax is the expected tax payable or receivable on the taxable profit or loss for the year, using tax rates enacted or substantively enacted at the end of thereporting period, and includes interests and fines related to income taxes paid or payable. The taxable profit is different from the accounting profit for the period since thetaxable profit is calculated excluding the temporary differences, which will be taxable or deductible in determining taxable profit (tax loss) of future periods, andnon-taxable or non-deductible items from the accounting profit.
2) Deferred tax
Deferred tax is recognized by using the asset-liability method in respect of temporary differences between the carrying amounts of assets and liabilities for financialreporting purposes and the amounts used for taxation purposes. The Group recognizes a deferred tax liability for all taxable temporary differences, except for the differenceassociated with investments in subsidiaries and associates that the Group is able to control the timing of the reversal of the temporary difference and it is probable that thetemporary difference will not reverse in the foreseeable future. The Group recognizes a deferred tax asset for all deductible temporary differences to the extent that it isprobable that the temporary difference will reverse in the foreseeable future and taxable profit will be available against which the temporary difference can be utilized.
A deferred tax asset is recognized for the carryforward of unused tax losses and unused tax credits to the extent that it is probable that future taxable profit will beavailable against which the unused tax losses and unused tax credits can be utilized. Future taxable profit is dependent on the reversal of taxable temporary differences. Ifthere are insufficient taxable temporary differences to recognize the deferred tax asset, the business plan of the Group and the reversal of existing temporary differences areconsidered in determining the future taxable profit.
The Group reviews the carrying amount of a deferred tax asset at the end of each reporting period and reduces the carrying amount to the extent that it is no longerprobable that sufficient taxable profit will be available to allow the benefit of part or all of that deferred tax asset to be utilized.
Deferred tax assets and liabilities are measured at the tax rates that are expected to apply to the period when the asset is realized, or the liability is settled based on taxrates (and tax laws) that have been enacted or substantively enacted by the end of the reporting period. The measurement of deferred tax liabilities and deferred tax assetsreflects the tax consequences that would follow from the manner in which the Group expects, at the end of the reporting period, to recover or settle the carrying amount ofits assets and liabilities.
Deferred tax assets and liabilities are offset only if the Group has a legally enforceable right to offset the amount recognized and intends to settle the current taxliabilities and assets on a net basis. Income tax expense in relation to dividend payments is recognized when liabilities relating to the dividend payments are recognized.
3) Uncertainty over income tax treatments
The Group assesses the uncertainty over income tax treatments pursuant to IAS 12 from January 1, 2019. If the Group concludes it is not probable that the taxationauthority will accept an uncertain tax treatment, the Group reflects the effect of uncertainty for each uncertain tax treatment by using either of the following methods,depending on which method the entity expects to better predict the resolution of the uncertainty:
• The most likely amount: the single most likely amount in a range of possible outcomes.
• The expected value: the sum of the probability-weighted amounts in a range of possible outcomes.
(27) Earnings per share
The Group presents basic and diluted earnings per share (EPS) data for its ordinary shares. Basic EPS is calculated by dividing the profit or loss attributable toordinary shareholders of the Parent Company by the weighted average number of ordinary shares outstanding during the period, adjusted for own shares held. Diluted EPSis determined by adjusting the profit or loss attributable to ordinary shareholders and the weighted average number of ordinary shares outstanding, adjusted for own sharesheld, for the effects of all dilutive potential ordinary shares, which comprise share options granted to employees, if any.
(28) Standards issued but not yet effective
The following amended standards are effective for annual periods beginning after January 1, 2019 and earlier application is permitted. However, the Group has notadopted the following amended standards early in preparing the accompanying consolidated financial statements.
The following amended standards are not expected to have a significant impact on the Group’s consolidated financial statements.
• Amendments to References to Conceptual Framework in IFRS Standards.
Copyright © 2020 www.secdatabase.com. All Rights Reserved.Please Consider the Environment Before Printing This Document
• Definition of a Business (Amendments to IFRS 3)
• Definition of Material (Amendments to IAS 1 and IAS 8)
Copyright © 2020 www.secdatabase.com. All Rights Reserved.Please Consider the Environment Before Printing This Document
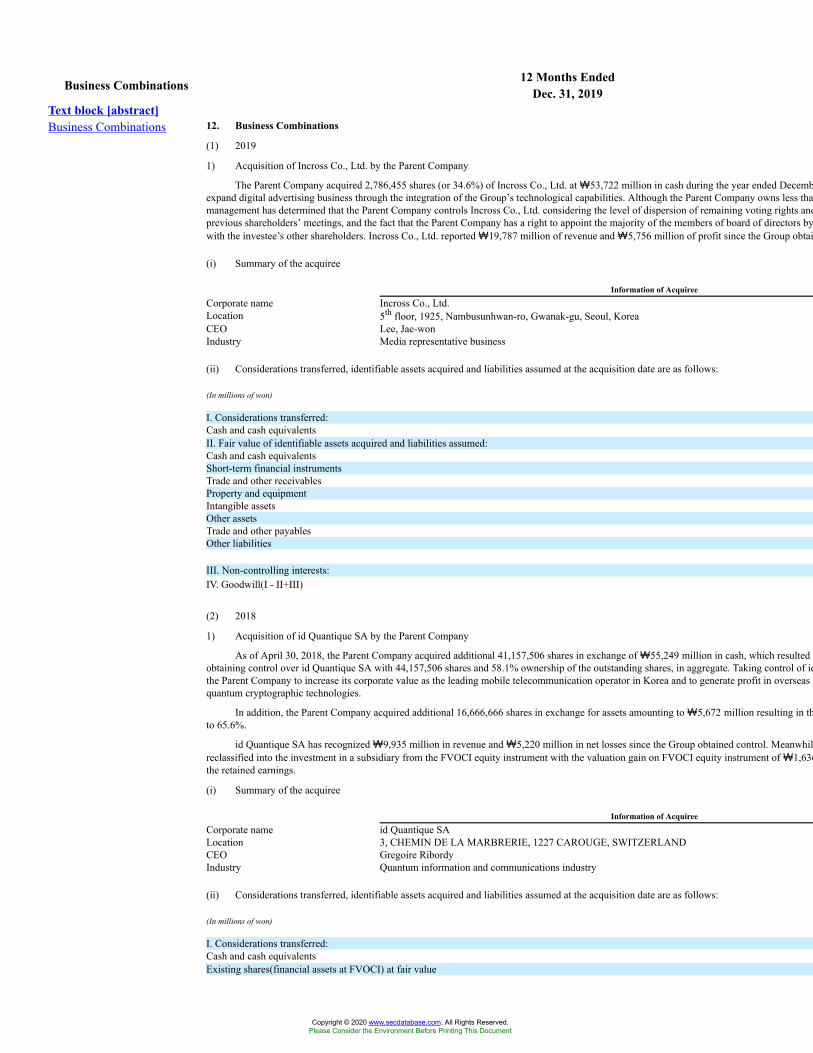
12 Months EndedBusiness Combinations Dec. 31, 2019Text block [abstract]Business Combinations 12. Business Combinations
(1) 2019
1) Acquisition of Incross Co., Ltd. by the Parent Company
The Parent Company acquired 2,786,455 shares (or 34.6%) of Incross Co., Ltd. at ₩53,722 million in cash during the year ended December 31, 2019 in order toexpand digital advertising business through the integration of the Group’s technological capabilities. Although the Parent Company owns less than 50% of the investee, themanagement has determined that the Parent Company controls Incross Co., Ltd. considering the level of dispersion of remaining voting rights and voting patterns atprevious shareholders’ meetings, and the fact that the Parent Company has a right to appoint the majority of the members of board of directors by the virtue of an agreementwith the investee’s other shareholders. Incross Co., Ltd. reported ₩19,787 million of revenue and ₩5,756 million of profit since the Group obtained control.
(i) Summary of the acquiree
Information of AcquireeCorporate name Incross Co., Ltd.Location 5th floor, 1925, Nambusunhwan-ro, Gwanak-gu, Seoul, KoreaCEO Lee, Jae-wonIndustry Media representative business
(ii) Considerations transferred, identifiable assets acquired and liabilities assumed at the acquisition date are as follows:
(In millions of won)Amount
I. Considerations transferred:Cash and cash equivalents ₩ 53,722II. Fair value of identifiable assets acquired and liabilities assumed:Cash and cash equivalents 17,400Short-term financial instruments 24,941Trade and other receivables 67,259Property and equipment 2,411Intangible assets 2,709Other assets 9,254Trade and other payables (57,309)Other liabilities (1,984)
64,681III. Non-controlling interests: 40,592IV. Goodwill(I - II+III) ₩ 29,633
(2) 2018
1) Acquisition of id Quantique SA by the Parent Company
As of April 30, 2018, the Parent Company acquired additional 41,157,506 shares in exchange of ₩55,249 million in cash, which resulted in the Parent Company’sobtaining control over id Quantique SA with 44,157,506 shares and 58.1% ownership of the outstanding shares, in aggregate. Taking control of id Quantique SA will enablethe Parent Company to increase its corporate value as the leading mobile telecommunication operator in Korea and to generate profit in overseas markets by utilizingquantum cryptographic technologies.
In addition, the Parent Company acquired additional 16,666,666 shares in exchange for assets amounting to ₩5,672 million resulting in the increase of the ownershipto 65.6%.
id Quantique SA has recognized ₩9,935 million in revenue and ₩5,220 million in net losses since the Group obtained control. Meanwhile, the existing shares werereclassified into the investment in a subsidiary from the FVOCI equity instrument with the valuation gain on FVOCI equity instrument of ₩1,636 million reclassified intothe retained earnings.
(i) Summary of the acquiree
Information of AcquireeCorporate name id Quantique SALocation 3, CHEMIN DE LA MARBRERIE, 1227 CAROUGE, SWITZERLANDCEO Gregoire RibordyIndustry Quantum information and communications industry
(ii) Considerations transferred, identifiable assets acquired and liabilities assumed at the acquisition date are as follows:
(In millions of won)Amount
I. Considerations transferred:Cash and cash equivalents ₩55,249Existing shares(financial assets at FVOCI) at fair value 3,965
59,214
Copyright © 2020 www.secdatabase.com. All Rights Reserved.Please Consider the Environment Before Printing This Document
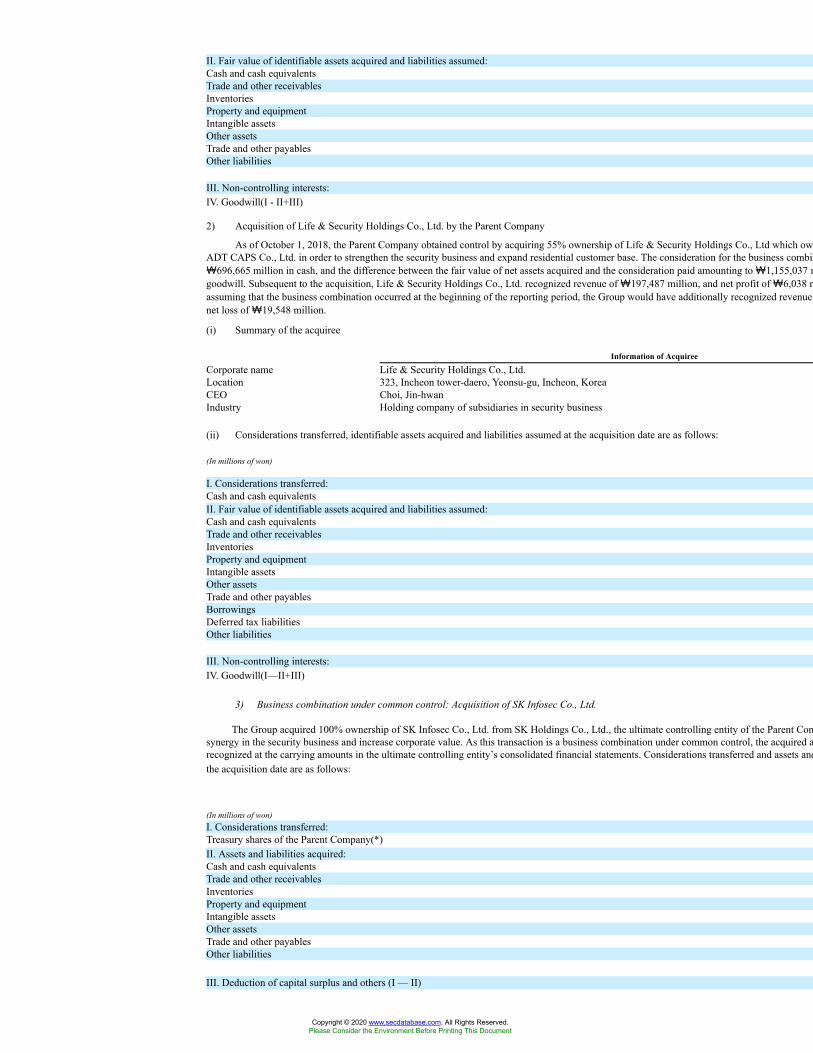
II. Fair value of identifiable assets acquired and liabilities assumed:Cash and cash equivalents 1,538Trade and other receivables 13,609Inventories 2,003Property and equipment 415Intangible assets 7,566Other assets 447Trade and other payables (1,569)Other liabilities (2,880)
21,129III. Non-controlling interests: 9,290IV. Goodwill(I - II+III) ₩47,375
2) Acquisition of Life & Security Holdings Co., Ltd. by the Parent Company
As of October 1, 2018, the Parent Company obtained control by acquiring 55% ownership of Life & Security Holdings Co., Ltd which owns 100% ownership ofADT CAPS Co., Ltd. in order to strengthen the security business and expand residential customer base. The consideration for the business combination was₩696,665 million in cash, and the difference between the fair value of net assets acquired and the consideration paid amounting to ₩1,155,037 million was recognized asgoodwill. Subsequent to the acquisition, Life & Security Holdings Co., Ltd. recognized revenue of ₩197,487 million, and net profit of ₩6,038 million. In addition,assuming that the business combination occurred at the beginning of the reporting period, the Group would have additionally recognized revenue of ₩763,375 million, andnet loss of ₩19,548 million.
(i) Summary of the acquiree
Information of AcquireeCorporate name Life & Security Holdings Co., Ltd.Location 323, Incheon tower-daero, Yeonsu-gu, Incheon, KoreaCEO Choi, Jin-hwanIndustry Holding company of subsidiaries in security business
(ii) Considerations transferred, identifiable assets acquired and liabilities assumed at the acquisition date are as follows:
(In millions of won)Amount
I. Considerations transferred:Cash and cash equivalents ₩ 696,665II. Fair value of identifiable assets acquired and liabilities assumed:Cash and cash equivalents 101,896Trade and other receivables 40,241Inventories 2,440Property and equipment 427,752Intangible assets 1,019,503Other assets 3,956Trade and other payables (296,660)Borrowings (1,744,839)Deferred tax liabilities (229,207)Other liabilities (158,042)
(832,960)III. Non-controlling interests: (374,588)IV. Goodwill(I—II+III) ₩ 1,155,037
3) Business combination under common control: Acquisition of SK Infosec Co., Ltd.
The Group acquired 100% ownership of SK Infosec Co., Ltd. from SK Holdings Co., Ltd., the ultimate controlling entity of the Parent Company, in order to createsynergy in the security business and increase corporate value. As this transaction is a business combination under common control, the acquired assets and liabilities wererecognized at the carrying amounts in the ultimate controlling entity’s consolidated financial statements. Considerations transferred and assets and liabilities recognized atthe acquisition date are as follows:
(In millions of won) AmountI. Considerations transferred:Treasury shares of the Parent Company(*) ₩281,151II. Assets and liabilities acquired:Cash and cash equivalents 30,762Trade and other receivables 62,448Inventories 1,293Property and equipment 8,047Intangible assets 5,528Other assets 79,951Trade and other payables (38,431)Other liabilities (20,003)
129,595III. Deduction of capital surplus and others (I — II) ₩151,556
Copyright © 2020 www.secdatabase.com. All Rights Reserved.Please Consider the Environment Before Printing This Document
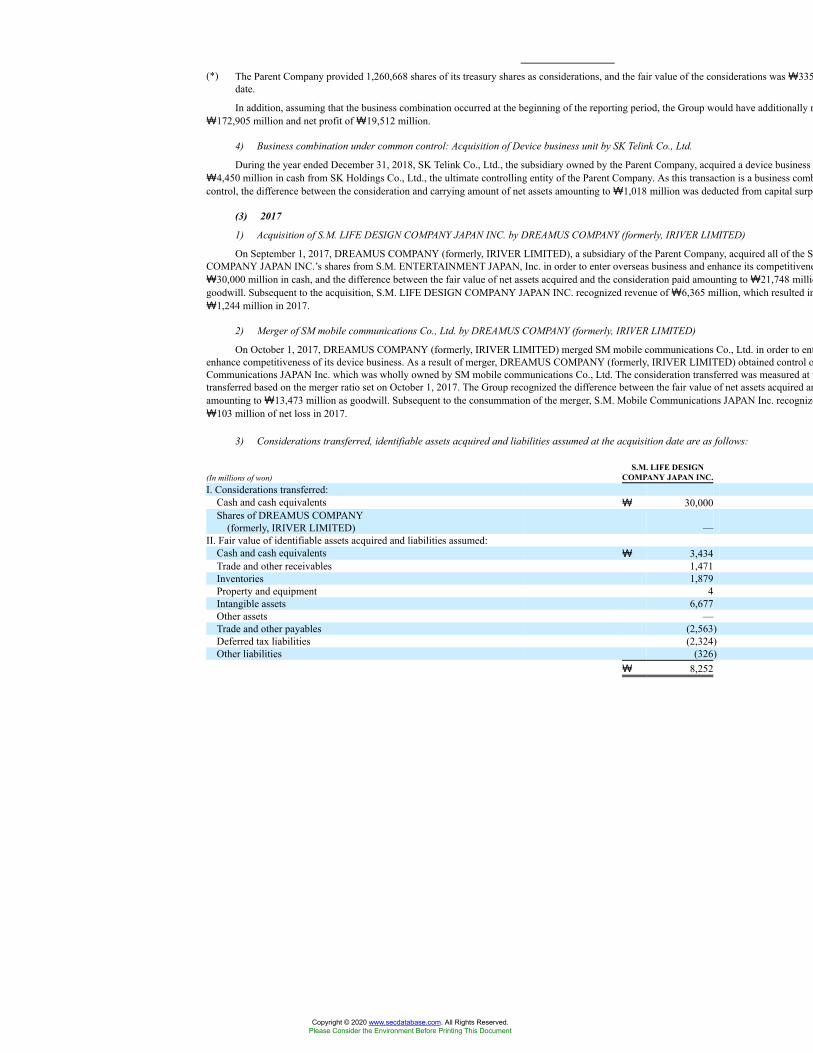
(*) The Parent Company provided 1,260,668 shares of its treasury shares as considerations, and the fair value of the considerations was ₩335,338 million at the transferdate.
In addition, assuming that the business combination occurred at the beginning of the reporting period, the Group would have additionally recognized revenue of₩172,905 million and net profit of ₩19,512 million.
4) Business combination under common control: Acquisition of Device business unit by SK Telink Co., Ltd.
During the year ended December 31, 2018, SK Telink Co., Ltd., the subsidiary owned by the Parent Company, acquired a device business in exchange of₩4,450 million in cash from SK Holdings Co., Ltd., the ultimate controlling entity of the Parent Company. As this transaction is a business combination under commoncontrol, the difference between the consideration and carrying amount of net assets amounting to ₩1,018 million was deducted from capital surplus and others.
(3) 2017
1) Acquisition of S.M. LIFE DESIGN COMPANY JAPAN INC. by DREAMUS COMPANY (formerly, IRIVER LIMITED)
On September 1, 2017, DREAMUS COMPANY (formerly, IRIVER LIMITED), a subsidiary of the Parent Company, acquired all of the S.M. LIFE DESIGNCOMPANY JAPAN INC.’s shares from S.M. ENTERTAINMENT JAPAN, Inc. in order to enter overseas business and enhance its competitiveness. The consideration was₩30,000 million in cash, and the difference between the fair value of net assets acquired and the consideration paid amounting to ₩21,748 million was recognized asgoodwill. Subsequent to the acquisition, S.M. LIFE DESIGN COMPANY JAPAN INC. recognized revenue of ₩6,365 million, which resulted in the net profit of₩1,244 million in 2017.
2) Merger of SM mobile communications Co., Ltd. by DREAMUS COMPANY (formerly, IRIVER LIMITED)
On October 1, 2017, DREAMUS COMPANY (formerly, IRIVER LIMITED) merged SM mobile communications Co., Ltd. in order to enter contents business andenhance competitiveness of its device business. As a result of merger, DREAMUS COMPANY (formerly, IRIVER LIMITED) obtained control over S.M. MobileCommunications JAPAN Inc. which was wholly owned by SM mobile communications Co., Ltd. The consideration transferred was measured at the fair value of the sharestransferred based on the merger ratio set on October 1, 2017. The Group recognized the difference between the fair value of net assets acquired and the consideration paidamounting to ₩13,473 million as goodwill. Subsequent to the consummation of the merger, S.M. Mobile Communications JAPAN Inc. recognized no revenue with₩103 million of net loss in 2017.
3) Considerations transferred, identifiable assets acquired and liabilities assumed at the acquisition date are as follows:
(In millions of won)S.M. LIFE DESIGN
COMPANY JAPAN INC.S.M. Mobile
Communications JAPAN Inc.I. Considerations transferred:
Cash and cash equivalents ₩ 30,000 —Shares of DREAMUS COMPANY
(formerly, IRIVER LIMITED) — 24,650II. Fair value of identifiable assets acquired and liabilities assumed:
Cash and cash equivalents ₩ 3,434 4,112Trade and other receivables 1,471 237Inventories 1,879 —Property and equipment 4 311Intangible assets 6,677 7,445Other assets — 41Trade and other payables (2,563) (815)Deferred tax liabilities (2,324) —Other liabilities (326) (154)
₩ 8,252 11,177
Copyright © 2020 www.secdatabase.com. All Rights Reserved.Please Consider the Environment Before Printing This Document

12 Months EndedInventories - AdditionalInformation (Detail) - KRW
(₩)₩ in Millions
Dec. 31, 2019 Dec. 31, 2018 Dec. 31, 2017
Inventories [line items]Reversals of inventory write-downs ₩ 0 ₩ 0 ₩ 0Inventories recognized as operating expenses 15,019 2,509 6,079Cost of goods sold [member]Inventories [line items]Inventories recognized as operating expenses ₩ 1,498,249 ₩ 1,411,986 ₩ 1,498,087
Copyright © 2020 www.secdatabase.com. All Rights Reserved.Please Consider the Environment Before Printing This Document
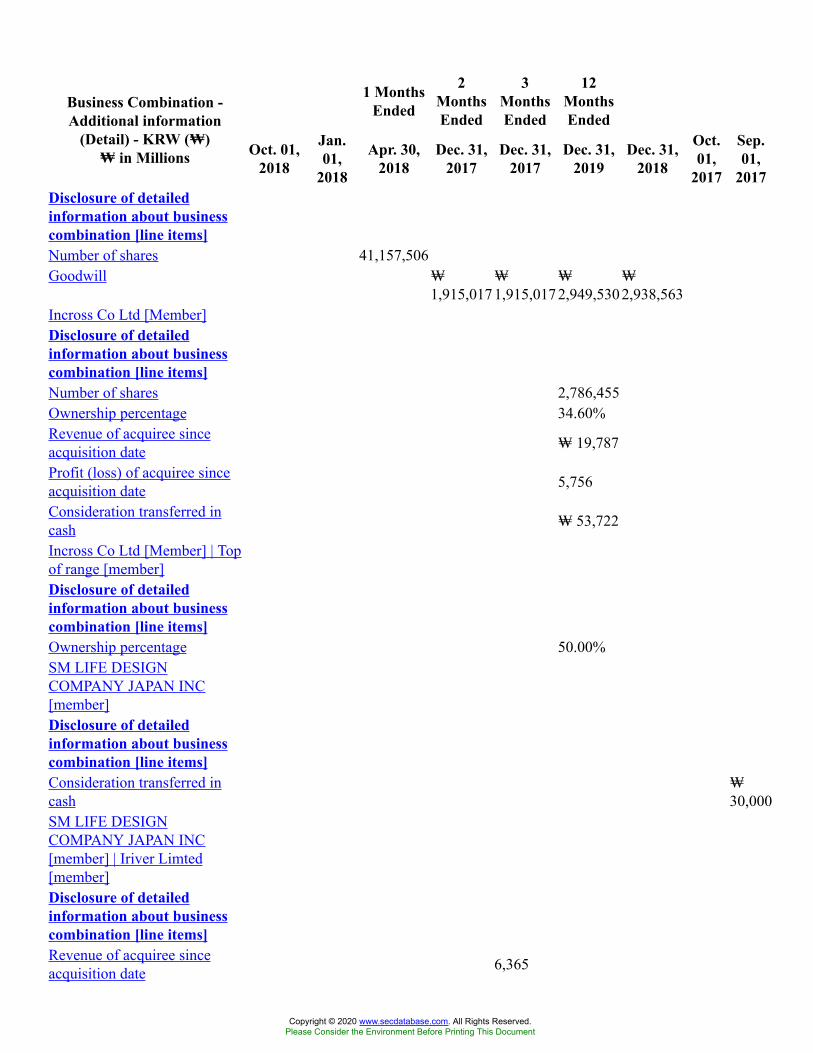
1 MonthsEnded
2MonthsEnded
3MonthsEnded
12MonthsEnded
Business Combination -Additional information
(Detail) - KRW (₩)₩ in Millions Oct. 01,
2018
Jan.01,
2018
Apr. 30,2018
Dec. 31,2017
Dec. 31,2017
Dec. 31,2019
Dec. 31,2018
Oct.01,
2017
Sep.01,
2017Disclosure of detailedinformation about businesscombination [line items]Number of shares 41,157,506Goodwill ₩
1,915,017₩1,915,017
₩2,949,530
₩2,938,563
Incross Co Ltd [Member]Disclosure of detailedinformation about businesscombination [line items]Number of shares 2,786,455Ownership percentage 34.60%Revenue of acquiree sinceacquisition date ₩ 19,787
Profit (loss) of acquiree sinceacquisition date 5,756
Consideration transferred incash ₩ 53,722
Incross Co Ltd [Member] | Topof range [member]Disclosure of detailedinformation about businesscombination [line items]Ownership percentage 50.00%SM LIFE DESIGNCOMPANY JAPAN INC[member]Disclosure of detailedinformation about businesscombination [line items]Consideration transferred incash
₩30,000
SM LIFE DESIGNCOMPANY JAPAN INC[member] | Iriver Limted[member]Disclosure of detailedinformation about businesscombination [line items]Revenue of acquiree sinceacquisition date 6,365
Copyright © 2020 www.secdatabase.com. All Rights Reserved.Please Consider the Environment Before Printing This Document
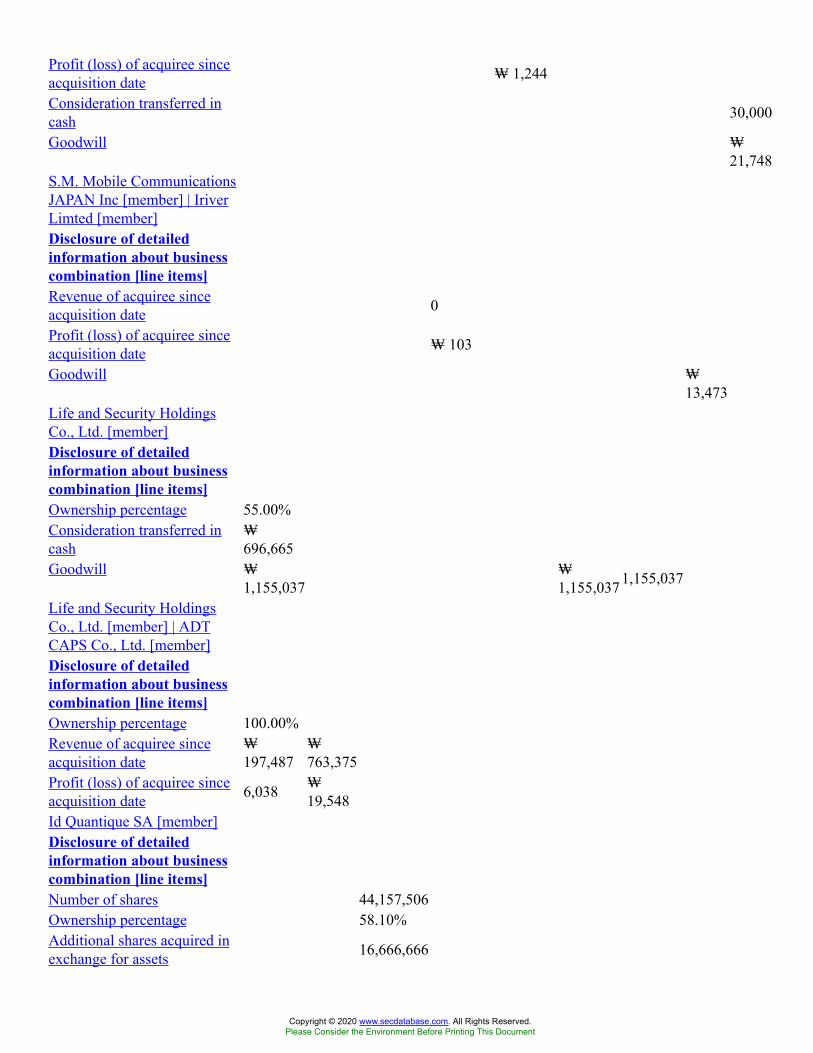
Profit (loss) of acquiree sinceacquisition date ₩ 1,244
Consideration transferred incash 30,000
Goodwill ₩21,748
S.M. Mobile CommunicationsJAPAN Inc [member] | IriverLimted [member]Disclosure of detailedinformation about businesscombination [line items]Revenue of acquiree sinceacquisition date 0
Profit (loss) of acquiree sinceacquisition date ₩ 103
Goodwill ₩13,473
Life and Security HoldingsCo., Ltd. [member]Disclosure of detailedinformation about businesscombination [line items]Ownership percentage 55.00%Consideration transferred incash
₩696,665
Goodwill ₩1,155,037
₩1,155,0371,155,037
Life and Security HoldingsCo., Ltd. [member] | ADTCAPS Co., Ltd. [member]Disclosure of detailedinformation about businesscombination [line items]Ownership percentage 100.00%Revenue of acquiree sinceacquisition date
₩197,487
₩763,375
Profit (loss) of acquiree sinceacquisition date 6,038 ₩
19,548Id Quantique SA [member]Disclosure of detailedinformation about businesscombination [line items]Number of shares 44,157,506Ownership percentage 58.10%Additional shares acquired inexchange for assets 16,666,666
Copyright © 2020 www.secdatabase.com. All Rights Reserved.Please Consider the Environment Before Printing This Document
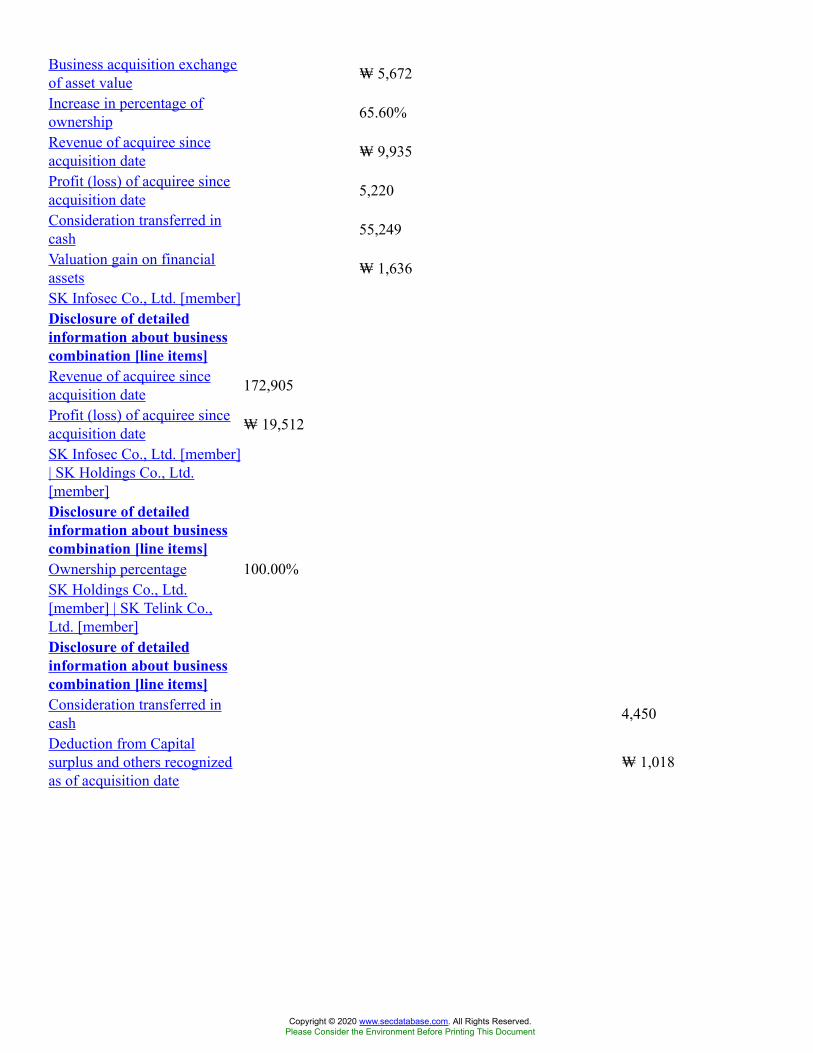
Business acquisition exchangeof asset value ₩ 5,672
Increase in percentage ofownership 65.60%
Revenue of acquiree sinceacquisition date ₩ 9,935
Profit (loss) of acquiree sinceacquisition date 5,220
Consideration transferred incash 55,249
Valuation gain on financialassets ₩ 1,636
SK Infosec Co., Ltd. [member]Disclosure of detailedinformation about businesscombination [line items]Revenue of acquiree sinceacquisition date 172,905
Profit (loss) of acquiree sinceacquisition date ₩ 19,512
SK Infosec Co., Ltd. [member]| SK Holdings Co., Ltd.[member]Disclosure of detailedinformation about businesscombination [line items]Ownership percentage 100.00%SK Holdings Co., Ltd.[member] | SK Telink Co.,Ltd. [member]Disclosure of detailedinformation about businesscombination [line items]Consideration transferred incash 4,450
Deduction from Capitalsurplus and others recognizedas of acquisition date
₩ 1,018
Copyright © 2020 www.secdatabase.com. All Rights Reserved.Please Consider the Environment Before Printing This Document
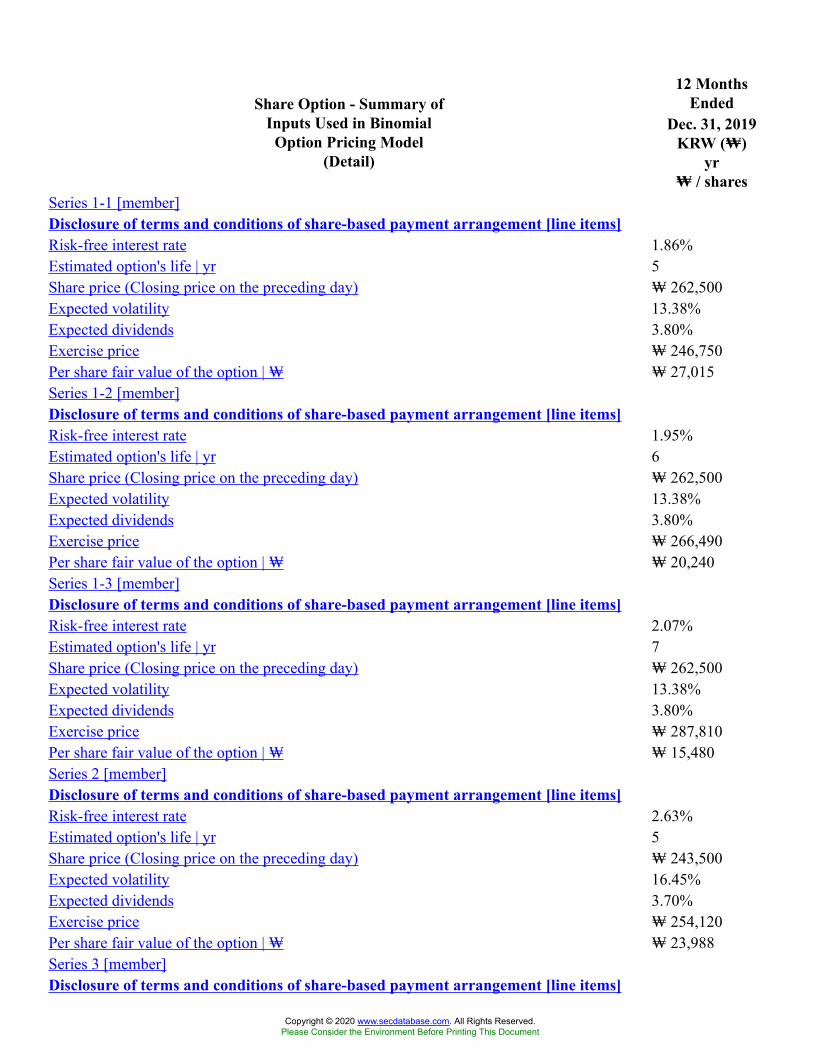
12 MonthsEndedShare Option - Summary of
Inputs Used in BinomialOption Pricing Model
(Detail)
Dec. 31, 2019KRW (₩)
yr₩ / shares
Series 1-1 [member]Disclosure of terms and conditions of share-based payment arrangement [line items]Risk-free interest rate 1.86%Estimated option's life | yr 5Share price (Closing price on the preceding day) ₩ 262,500Expected volatility 13.38%Expected dividends 3.80%Exercise price ₩ 246,750Per share fair value of the option | ₩ ₩ 27,015Series 1-2 [member]Disclosure of terms and conditions of share-based payment arrangement [line items]Risk-free interest rate 1.95%Estimated option's life | yr 6Share price (Closing price on the preceding day) ₩ 262,500Expected volatility 13.38%Expected dividends 3.80%Exercise price ₩ 266,490Per share fair value of the option | ₩ ₩ 20,240Series 1-3 [member]Disclosure of terms and conditions of share-based payment arrangement [line items]Risk-free interest rate 2.07%Estimated option's life | yr 7Share price (Closing price on the preceding day) ₩ 262,500Expected volatility 13.38%Expected dividends 3.80%Exercise price ₩ 287,810Per share fair value of the option | ₩ ₩ 15,480Series 2 [member]Disclosure of terms and conditions of share-based payment arrangement [line items]Risk-free interest rate 2.63%Estimated option's life | yr 5Share price (Closing price on the preceding day) ₩ 243,500Expected volatility 16.45%Expected dividends 3.70%Exercise price ₩ 254,120Per share fair value of the option | ₩ ₩ 23,988Series 3 [member]Disclosure of terms and conditions of share-based payment arrangement [line items]
Copyright © 2020 www.secdatabase.com. All Rights Reserved.Please Consider the Environment Before Printing This Document

Risk-free interest rate 1.91%Estimated option's life | yr 5Share price (Closing price on the preceding day) ₩ 259,000Expected volatility 8.30%Expected dividends 3.80%Exercise price ₩ 265,260Per share fair value of the option | ₩ ₩ 8,600Series 4 [member]Disclosure of terms and conditions of share-based payment arrangement [line items]Risk-free interest rate 1.78%Estimated option's life | yr 5Share price (Closing price on the preceding day) ₩ 253,000Expected volatility 7.70%Expected dividends 3.90%Exercise price ₩ 254,310Per share fair value of the option | ₩ ₩ 8,111One Store Co., Ltd. [member]Disclosure of terms and conditions of share-based payment arrangement [line items]Risk-free interest rate 2.58%Estimated option's life | yr 6Share price (Closing price on the preceding day) ₩ 4,925Expected volatility 9.25%Expected dividends 0.00%Exercise price ₩ 5,390Per share fair value of the option | ₩ ₩ 566DREAMUS COMPANY [member] | Series 1-1 [member]Disclosure of terms and conditions of share-based payment arrangement [line items]Risk-free interest rate 1.73%Share price (Closing price on the preceding day) ₩ 8,950Expected volatility 32.34%Expected dividends 0.00%Exercise price ₩ 9,160Per share fair value of the option | ₩ ₩ 1,976DREAMUS COMPANY [member] | Series 1-2 [member]Disclosure of terms and conditions of share-based payment arrangement [line items]Risk-free interest rate 1.77%Share price (Closing price on the preceding day) ₩ 8,950Expected volatility 32.34%Expected dividends 0.00%Exercise price ₩ 9,160Per share fair value of the option | ₩ ₩ 2,189DREAMUS COMPANY [member] | Series 1-3 [member]Disclosure of terms and conditions of share-based payment arrangement [line items]Risk-free interest rate 1.82%
Copyright © 2020 www.secdatabase.com. All Rights Reserved.Please Consider the Environment Before Printing This Document
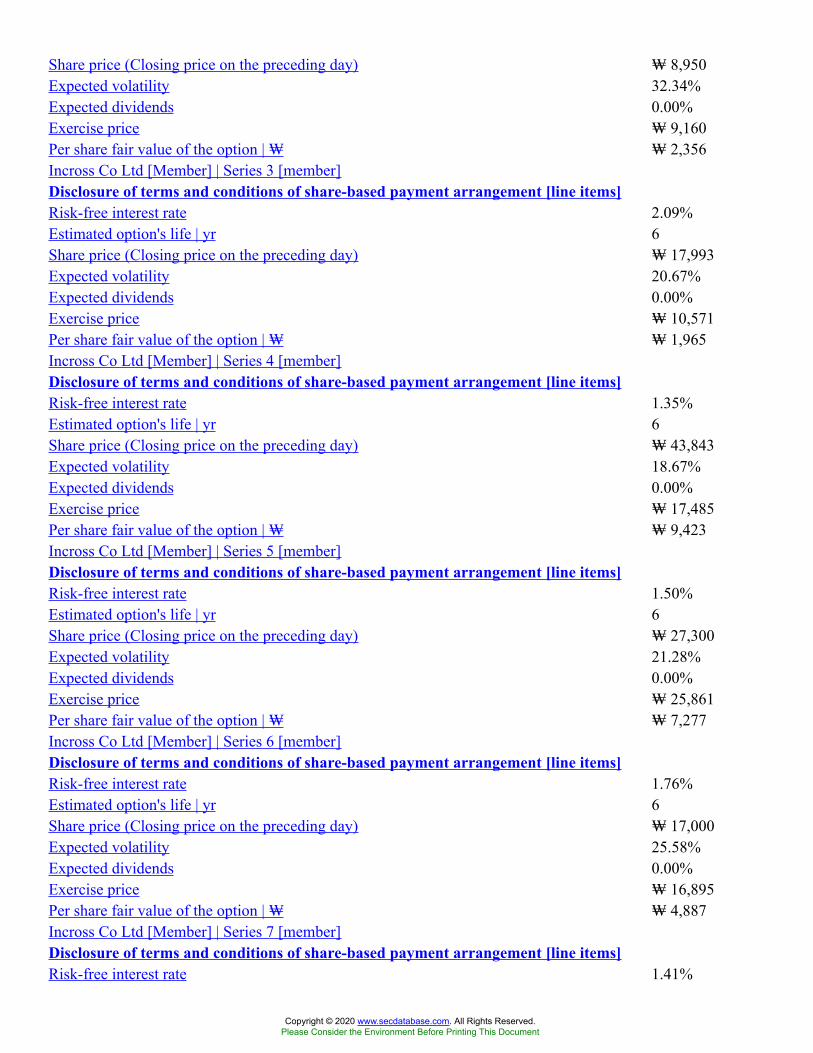
Share price (Closing price on the preceding day) ₩ 8,950Expected volatility 32.34%Expected dividends 0.00%Exercise price ₩ 9,160Per share fair value of the option | ₩ ₩ 2,356Incross Co Ltd [Member] | Series 3 [member]Disclosure of terms and conditions of share-based payment arrangement [line items]Risk-free interest rate 2.09%Estimated option's life | yr 6Share price (Closing price on the preceding day) ₩ 17,993Expected volatility 20.67%Expected dividends 0.00%Exercise price ₩ 10,571Per share fair value of the option | ₩ ₩ 1,965Incross Co Ltd [Member] | Series 4 [member]Disclosure of terms and conditions of share-based payment arrangement [line items]Risk-free interest rate 1.35%Estimated option's life | yr 6Share price (Closing price on the preceding day) ₩ 43,843Expected volatility 18.67%Expected dividends 0.00%Exercise price ₩ 17,485Per share fair value of the option | ₩ ₩ 9,423Incross Co Ltd [Member] | Series 5 [member]Disclosure of terms and conditions of share-based payment arrangement [line items]Risk-free interest rate 1.50%Estimated option's life | yr 6Share price (Closing price on the preceding day) ₩ 27,300Expected volatility 21.28%Expected dividends 0.00%Exercise price ₩ 25,861Per share fair value of the option | ₩ ₩ 7,277Incross Co Ltd [Member] | Series 6 [member]Disclosure of terms and conditions of share-based payment arrangement [line items]Risk-free interest rate 1.76%Estimated option's life | yr 6Share price (Closing price on the preceding day) ₩ 17,000Expected volatility 25.58%Expected dividends 0.00%Exercise price ₩ 16,895Per share fair value of the option | ₩ ₩ 4,887Incross Co Ltd [Member] | Series 7 [member]Disclosure of terms and conditions of share-based payment arrangement [line items]Risk-free interest rate 1.41%
Copyright © 2020 www.secdatabase.com. All Rights Reserved.Please Consider the Environment Before Printing This Document
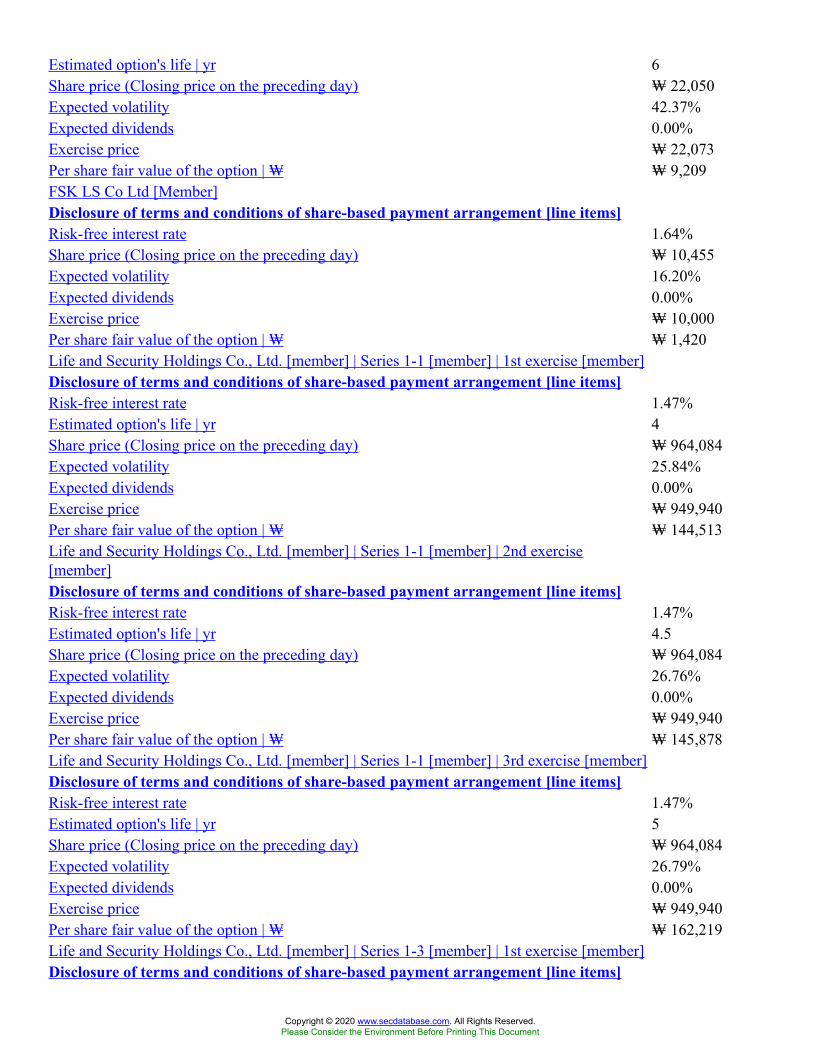
Estimated option's life | yr 6Share price (Closing price on the preceding day) ₩ 22,050Expected volatility 42.37%Expected dividends 0.00%Exercise price ₩ 22,073Per share fair value of the option | ₩ ₩ 9,209FSK LS Co Ltd [Member]Disclosure of terms and conditions of share-based payment arrangement [line items]Risk-free interest rate 1.64%Share price (Closing price on the preceding day) ₩ 10,455Expected volatility 16.20%Expected dividends 0.00%Exercise price ₩ 10,000Per share fair value of the option | ₩ ₩ 1,420Life and Security Holdings Co., Ltd. [member] | Series 1-1 [member] | 1st exercise [member]Disclosure of terms and conditions of share-based payment arrangement [line items]Risk-free interest rate 1.47%Estimated option's life | yr 4Share price (Closing price on the preceding day) ₩ 964,084Expected volatility 25.84%Expected dividends 0.00%Exercise price ₩ 949,940Per share fair value of the option | ₩ ₩ 144,513Life and Security Holdings Co., Ltd. [member] | Series 1-1 [member] | 2nd exercise[member]Disclosure of terms and conditions of share-based payment arrangement [line items]Risk-free interest rate 1.47%Estimated option's life | yr 4.5Share price (Closing price on the preceding day) ₩ 964,084Expected volatility 26.76%Expected dividends 0.00%Exercise price ₩ 949,940Per share fair value of the option | ₩ ₩ 145,878Life and Security Holdings Co., Ltd. [member] | Series 1-1 [member] | 3rd exercise [member]Disclosure of terms and conditions of share-based payment arrangement [line items]Risk-free interest rate 1.47%Estimated option's life | yr 5Share price (Closing price on the preceding day) ₩ 964,084Expected volatility 26.79%Expected dividends 0.00%Exercise price ₩ 949,940Per share fair value of the option | ₩ ₩ 162,219Life and Security Holdings Co., Ltd. [member] | Series 1-3 [member] | 1st exercise [member]Disclosure of terms and conditions of share-based payment arrangement [line items]
Copyright © 2020 www.secdatabase.com. All Rights Reserved.Please Consider the Environment Before Printing This Document

Risk-free interest rate 1.47%Estimated option's life | yr 4Share price (Closing price on the preceding day) ₩ 964,084Expected volatility 25.84%Expected dividends 0.00%Exercise price ₩ 1,025,935Per share fair value of the option | ₩ ₩ 123,004Life and Security Holdings Co., Ltd. [member] | Series 1-3 [member] | 2nd exercise[member]Disclosure of terms and conditions of share-based payment arrangement [line items]Risk-free interest rate 1.47%Estimated option's life | yr 4.5Share price (Closing price on the preceding day) ₩ 964,084Expected volatility 26.76%Expected dividends 0.00%Exercise price ₩ 1,025,935Per share fair value of the option | ₩ ₩ 125,792Life and Security Holdings Co., Ltd. [member] | Series 1-3 [member] | 3rd exercise [member]Disclosure of terms and conditions of share-based payment arrangement [line items]Risk-free interest rate 1.47%Estimated option's life | yr 5Share price (Closing price on the preceding day) ₩ 964,084Expected volatility 26.79%Expected dividends 0.00%Exercise price ₩ 1,025,935Per share fair value of the option | ₩ ₩ 141,861Life and Security Holdings Co., Ltd. [member] | Series 1-4 [member] | 1st exercise [member]Disclosure of terms and conditions of share-based payment arrangement [line items]Risk-free interest rate 1.47%Estimated option's life | yr 4Share price (Closing price on the preceding day) ₩ 964,084Expected volatility 25.84%Expected dividends 0.00%Exercise price ₩ 1,108,010Per share fair value of the option | ₩ ₩ 101,207Life and Security Holdings Co., Ltd. [member] | Series 1-4 [member] | 2nd exercise[member]Disclosure of terms and conditions of share-based payment arrangement [line items]Risk-free interest rate 1.47%Estimated option's life | yr 4.5Share price (Closing price on the preceding day) ₩ 964,084Expected volatility 26.76%Expected dividends 0.00%Exercise price ₩ 1,108,010
Copyright © 2020 www.secdatabase.com. All Rights Reserved.Please Consider the Environment Before Printing This Document
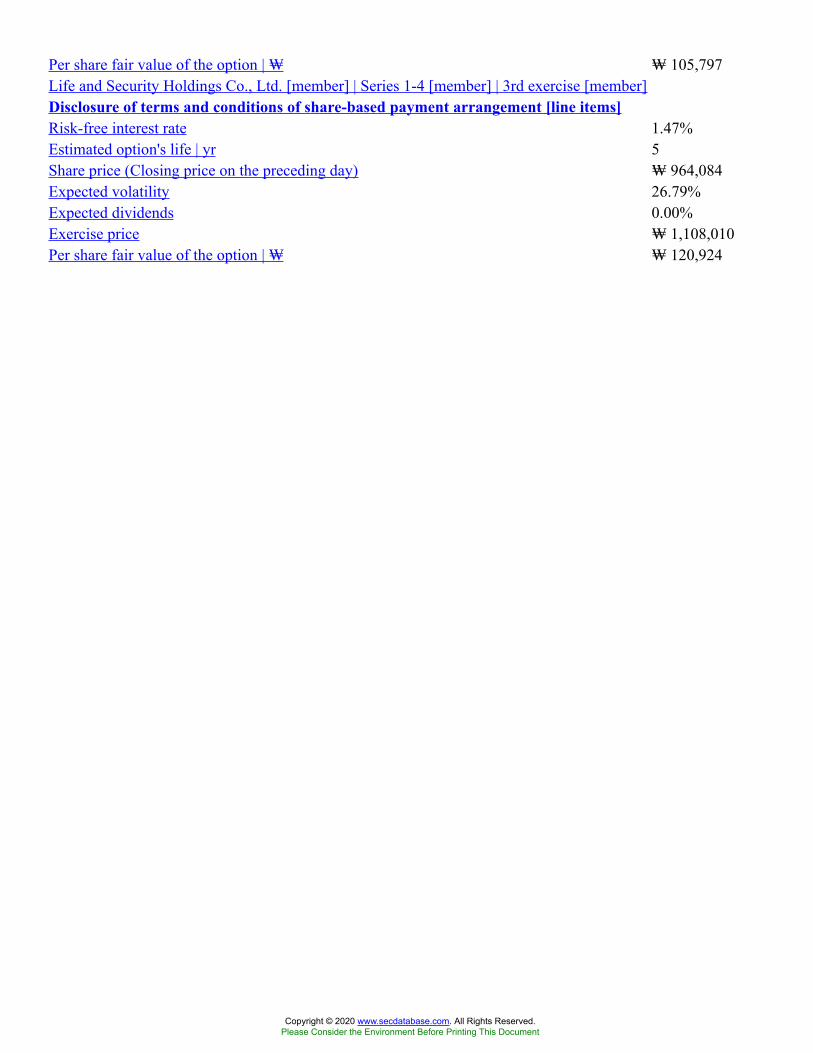
Per share fair value of the option | ₩ ₩ 105,797Life and Security Holdings Co., Ltd. [member] | Series 1-4 [member] | 3rd exercise [member]Disclosure of terms and conditions of share-based payment arrangement [line items]Risk-free interest rate 1.47%Estimated option's life | yr 5Share price (Closing price on the preceding day) ₩ 964,084Expected volatility 26.79%Expected dividends 0.00%Exercise price ₩ 1,108,010Per share fair value of the option | ₩ ₩ 120,924
Copyright © 2020 www.secdatabase.com. All Rights Reserved.Please Consider the Environment Before Printing This Document
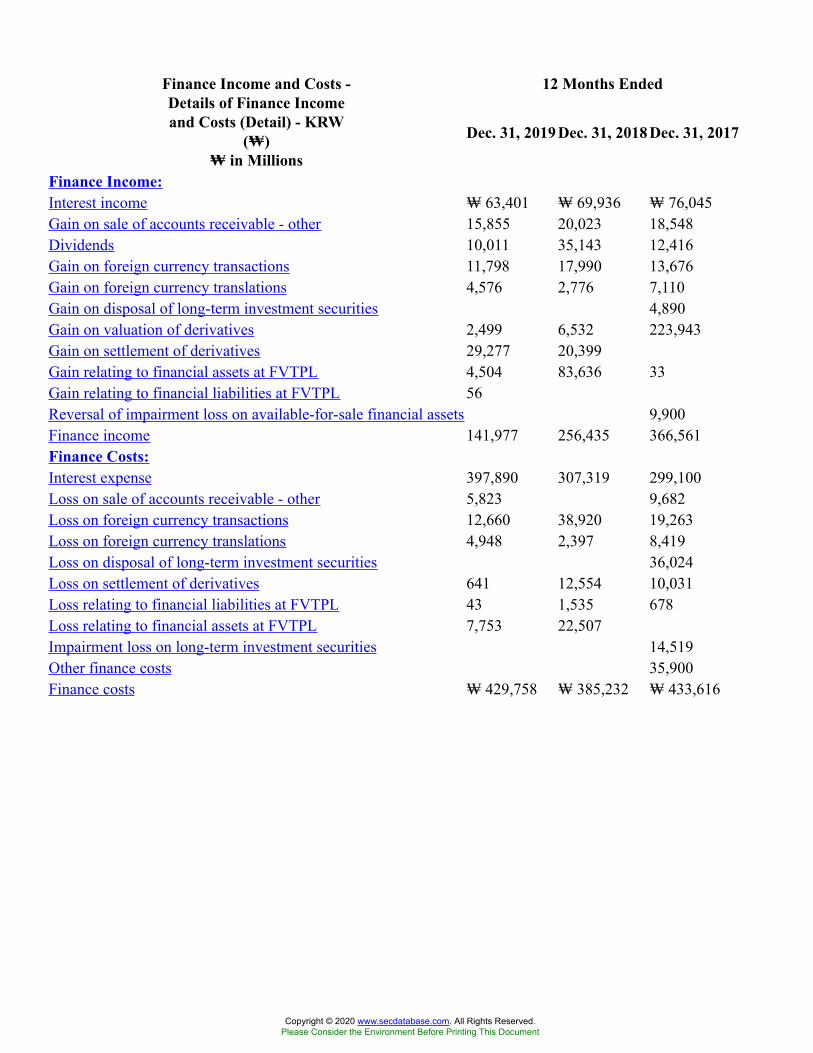
12 Months EndedFinance Income and Costs -Details of Finance Incomeand Costs (Detail) - KRW
(₩)₩ in Millions
Dec. 31, 2019 Dec. 31, 2018 Dec. 31, 2017
Finance Income:Interest income ₩ 63,401 ₩ 69,936 ₩ 76,045Gain on sale of accounts receivable - other 15,855 20,023 18,548Dividends 10,011 35,143 12,416Gain on foreign currency transactions 11,798 17,990 13,676Gain on foreign currency translations 4,576 2,776 7,110Gain on disposal of long-term investment securities 4,890Gain on valuation of derivatives 2,499 6,532 223,943Gain on settlement of derivatives 29,277 20,399Gain relating to financial assets at FVTPL 4,504 83,636 33Gain relating to financial liabilities at FVTPL 56Reversal of impairment loss on available-for-sale financial assets 9,900Finance income 141,977 256,435 366,561Finance Costs:Interest expense 397,890 307,319 299,100Loss on sale of accounts receivable - other 5,823 9,682Loss on foreign currency transactions 12,660 38,920 19,263Loss on foreign currency translations 4,948 2,397 8,419Loss on disposal of long-term investment securities 36,024Loss on settlement of derivatives 641 12,554 10,031Loss relating to financial liabilities at FVTPL 43 1,535 678Loss relating to financial assets at FVTPL 7,753 22,507Impairment loss on long-term investment securities 14,519Other finance costs 35,900Finance costs ₩ 429,758 ₩ 385,232 ₩ 433,616
Copyright © 2020 www.secdatabase.com. All Rights Reserved.Please Consider the Environment Before Printing This Document
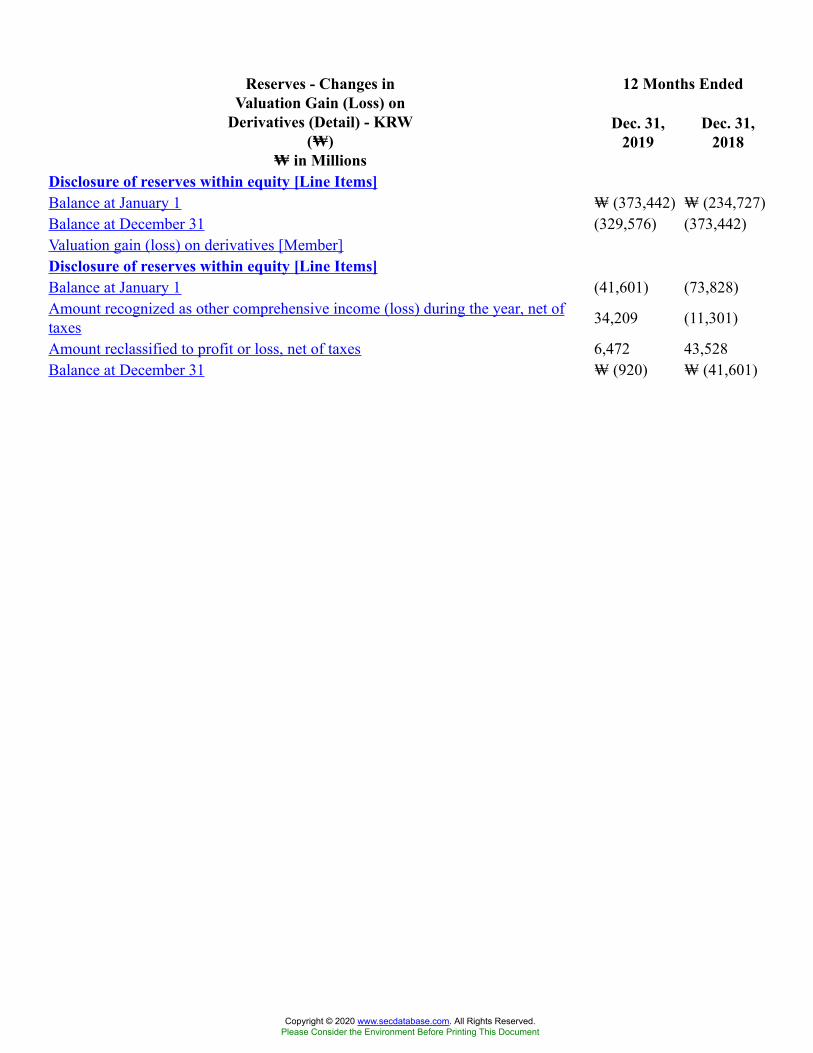
12 Months EndedReserves - Changes inValuation Gain (Loss) on
Derivatives (Detail) - KRW(₩)
₩ in Millions
Dec. 31,2019
Dec. 31,2018
Disclosure of reserves within equity [Line Items]Balance at January 1 ₩ (373,442) ₩ (234,727)Balance at December 31 (329,576) (373,442)Valuation gain (loss) on derivatives [Member]Disclosure of reserves within equity [Line Items]Balance at January 1 (41,601) (73,828)Amount recognized as other comprehensive income (loss) during the year, net oftaxes 34,209 (11,301)
Amount reclassified to profit or loss, net of taxes 6,472 43,528Balance at December 31 ₩ (920) ₩ (41,601)
Copyright © 2020 www.secdatabase.com. All Rights Reserved.Please Consider the Environment Before Printing This Document
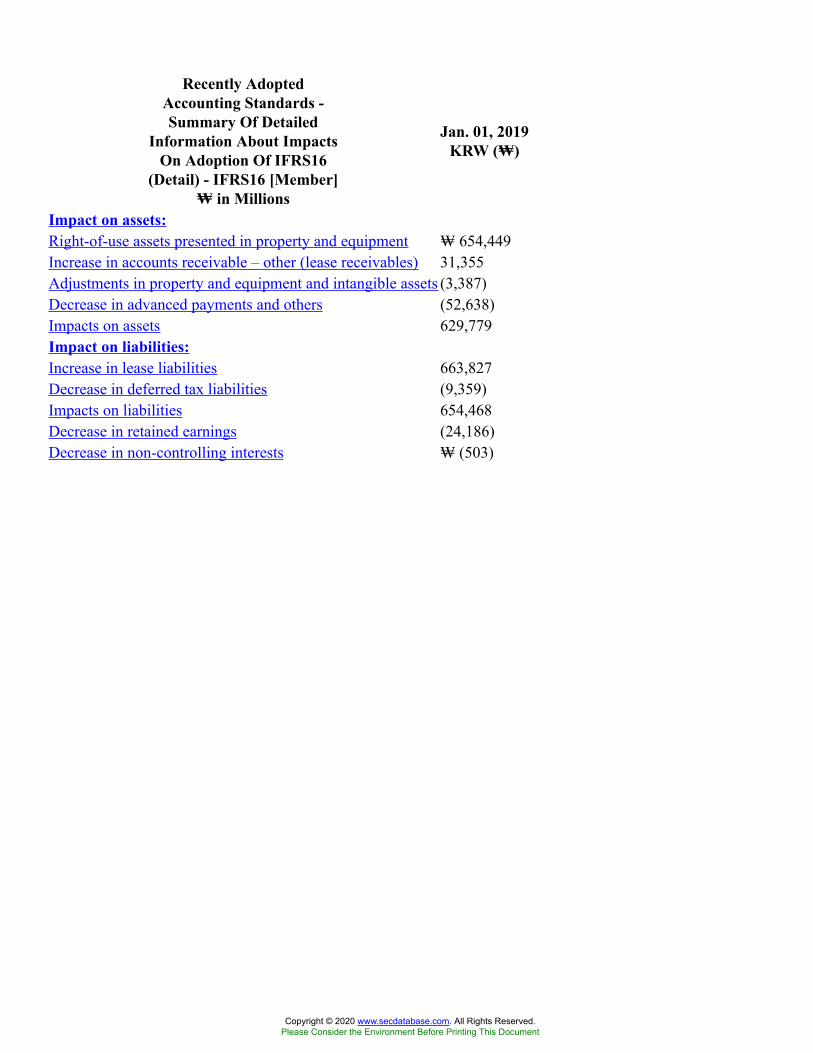
Recently AdoptedAccounting Standards -Summary Of Detailed
Information About ImpactsOn Adoption Of IFRS16
(Detail) - IFRS16 [Member]₩ in Millions
Jan. 01, 2019KRW (₩)
Impact on assets:Right-of-use assets presented in property and equipment ₩ 654,449Increase in accounts receivable – other (lease receivables) 31,355Adjustments in property and equipment and intangible assets (3,387)Decrease in advanced payments and others (52,638)Impacts on assets 629,779Impact on liabilities:Increase in lease liabilities 663,827Decrease in deferred tax liabilities (9,359)Impacts on liabilities 654,468Decrease in retained earnings (24,186)Decrease in non-controlling interests ₩ (503)
Copyright © 2020 www.secdatabase.com. All Rights Reserved.Please Consider the Environment Before Printing This Document

12 Months EndedHybrid Bonds - Summary ofHybrid Bonds (Detail) -
KRW (₩)₩ in Millions
Dec. 31, 2019 Dec. 31, 2018
Series hybrid bonds ₩ 398,759 ₩ 398,759Series 2-1 hybrid bonds [member]Type Unsecured subordinated bearer bondIssuance date Jun. 07, 2018Maturity June 7, 2078Annual interest rate(%) 3.70%Series hybrid bonds ₩ 300,000 300,000Series 2-2 hybrid bonds [member]Type Unsecured subordinated bearer bondIssuance date Jun. 07, 2018Maturity June 7, 2078Annual interest rate(%) 3.65%Series hybrid bonds ₩ 100,000 100,000Issuance costs [Member]Series hybrid bonds ₩ (1,241) ₩ (1,241)
Copyright © 2020 www.secdatabase.com. All Rights Reserved.Please Consider the Environment Before Printing This Document
12 Months EndedCategories of FinancialInstruments (Tables) Dec. 31, 2019
Statement [LineItems]Summary of financial assets (1) Financial assets by category as of December 31, 2019 and 2018 are as follows:
(In millions of won)December 31, 2019
Financialassets atFVTPL
Equityinstruments at
FVOCI
Debtinstruments at
FVOCI
Financial assetsat amortized
cost
Derivativeshedging
instrument TotalCash and cash equivalents ₩ — — — 1,270,824 — 1,270,824Financial instruments — — — 831,637 — 831,637Short-term investment securities 166,666 — — — — 166,666Long-term investment securities(*) 142,316 710,272 4,627 — — 857,215Accounts receivable — trade — — — 2,247,895 — 2,247,895Loans and other receivables 532,225 — — 1,131,342 — 1,663,567Derivative financial assets 6,074 — — — 144,886 150,960
₩847,281 710,272 4,627 5,481,698 144,886 7,188,764
(*) The Group designated ₩710,272 million of equity instruments that are not held for trading as financial assets at FVOCI.
(In millions of won)December 31, 2018
Financialassets atFVTPL
Equityinstruments at
FVOCI
Debtinstruments at
FVOCI
Financial assetsat amortized
cost
Derivativeshedging
instrument TotalCash and cash equivalents ₩ — — — 1,506,699 — 1,506,699Financial instruments — — — 1,046,897 — 1,046,897Short-term investment securities 195,080 — — — — 195,080Long-term investment securities(*) 120,083 542,496 2,147 — — 664,726Accounts receivable — trade — — — 2,019,933 — 2,019,933Loans and other receivables 489,617 — — 1,132,321 — 1,621,938Derivative financial assets 15,586 — — — 39,871 55,457
₩ 820,366 542,496 2,147 5,705,850 39,871 7,110,730
(*) The Group designated ₩542,496 million of equity instruments that are not held for trading as financial assets at FVOCI.Summary of financialliabilities
(2) Financial liabilities by category as of December 31, 2019 and 2018 are as follows:
(In millions of won)December 31, 2019
Financialliabilities at
amortized cost
Derivativeshedging
instrument TotalAccounts payable — trade ₩ 438,297 — 438,297Derivative financial liabilities — 1,043 1,043Borrowings 2,043,140 — 2,043,140Debentures 8,220,833 — 8,220,833Lease liabilities 712,740 — 712,740Accounts payable — other and others 6,563,030 — 6,563,030
₩ 17,978,040 1,043 17,979,083
(In millions of won)December 31, 2018
Financialliabilities at
FVTPL
Financialliabilities at
amortized cost
Derivativeshedging
instrument TotalAccounts payable — trade ₩ — 381,302 — 381,302Derivative financial liabilities — — 4,184 4,184Borrowings — 2,184,996 — 2,184,996Debentures(*) 61,813 7,405,039 — 7,466,852Accounts payable — other and others — 6,762,782 — 6,762,782
₩ 61,813 16,734,119 4,184 16,800,116
(*) Debentures classified as financial liabilities at FVTPL as of December 31, 2018 are structured bonds and they were designated as financial liabilities at FVTPL inorder to eliminate a measurement inconsistency with the related derivatives. The debenture has been repaid during the year ended December 31, 2019 before itsmaturity.
Copyright © 2020 www.secdatabase.com. All Rights Reserved.Please Consider the Environment Before Printing This Document
Financial Risk - Fair Valueand Carrying Amount of
Financial Assets andLiabilities Including FairValue Hierarchy (Detail) -
KRW (₩)₩ in Millions
Dec. 31, 2019 Dec. 31, 2018
Disclosure of detailed information about financial instruments [Line items]Borrowings ₩ 2,043,140 ₩ 2,184,996Debentures 8,220,833 7,466,852Assets 7,188,764 7,110,730Financial liabilities 17,979,083 16,800,116Measured at fair value [member]Disclosure of detailed information about financial instruments [Line items]FVTPL 847,281 820,366Derivatives hedging instruments 144,886 39,871FVOCI 714,899 544,643Assets 1,707,066 1,404,880FVTPL 61,813Derivatives hedging instruments 1,043 4,184Financial liabilities 65,997Not measured at fair value [member]Disclosure of detailed information about financial instruments [Line items]Borrowings 2,191,037 2,378,843Debentures 8,714,408 7,868,472Long-term payables - other 2,008,493 2,469,653Financial liabilities 12,913,938 12,716,968Carrying amount [member] | Measured at fair value [member]Disclosure of detailed information about financial instruments [Line items]FVTPL 847,281 820,366Derivatives hedging instruments 144,886 39,871FVOCI 714,899 544,643Assets 1,707,066 1,404,880FVTPL 61,813Derivatives hedging instruments 1,043 4,184Financial liabilities 65,997Carrying amount [member] | Not measured at fair value [member]Disclosure of detailed information about financial instruments [Line items]Borrowings 2,043,140 2,184,996Debentures 8,220,833 7,405,039Long-term payables - other 1,974,006 2,393,027Financial liabilities 12,237,979 11,983,062Level 1 [member] | Measured at fair value [member]Disclosure of detailed information about financial instruments [Line items]
Copyright © 2020 www.secdatabase.com. All Rights Reserved.Please Consider the Environment Before Printing This Document

FVOCI 407,651 293,925Assets 407,651 293,925Level 2 [member] | Measured at fair value [member]Disclosure of detailed information about financial instruments [Line items]FVTPL 668,891 695,992Derivatives hedging instruments 144,886 39,871Assets 813,777 735,863FVTPL 61,813Derivatives hedging instruments 1,043 4,184Financial liabilities 65,997Level 2 [member] | Not measured at fair value [member]Disclosure of detailed information about financial instruments [Line items]Borrowings 2,191,037 2,378,843Debentures 8,714,408 7,868,472Long-term payables - other 2,008,493 2,469,653Financial liabilities 12,913,938 12,716,968Level 3 [member] | Measured at fair value [member]Disclosure of detailed information about financial instruments [Line items]FVTPL 178,390 124,374FVOCI 307,248 250,718Assets ₩ 485,638 ₩ 375,092
Copyright © 2020 www.secdatabase.com. All Rights Reserved.Please Consider the Environment Before Printing This Document
12 Months EndedTransactions with RelatedParties (Tables) Dec. 31, 2019
Text block [abstract]Compensation for the keymanagement
The compensation given to such key management for the years ended December 31, 2019, 2018 and 2017 are as follows:(In millions of won)
2019 2018 2017Salaries ₩ 5,969 4,488 2,169Defined benefits plan expenses 1,237 920 258Share option 325 548 414
₩ 7,531 5,956 2,841
Transactions with relatedparties
(3) Transactions with related parties for the years ended December 31, 2019, 2018 and 2017 are as follows:
(In millions of won)2019
Scope Company
Operatingrevenue and
others
Operatingexpense
and others(*1)
Acquisition ofproperty and
equipmentUltimate Controlling Entity SK Holdings Co., Ltd.(*2) ₩ 53,507 612,248 95,426Associates F&U Credit information Co., Ltd. 2,293 55,179 —
SK hynix Inc.(*3) 273,047 481 —KEB HanaCard Co., Ltd. 832 1,901 —SK Wyverns Co., Ltd. 1,399 21,528 —Others(*4) 17,286 13,864 457
294,857 92,953 457Others SK Engineering & Construction Co., Ltd. 13,339 1,601 7,400
SK Innovation Co., Ltd. 26,697 2,777 —SK Networks Co., Ltd.(*5) 29,321 1,088,443 449SK Networks Services Co., Ltd. 1,056 76,671 4,979SK Telesys Co., Ltd. 474 9,686 59,392SK TNS Co., Ltd. 240 35,824 607,546SK Energy Co., Ltd. 16,294 516 —SK hynix Semiconductor (China) Ltd. 73,542 — —SK Global Chemical InternationalTrading (Shanghai)Co., Ltd. 14,535 131 —Others 90,307 105,569 109,189
265,805 1,321,218 788,955₩614,169 2,026,419 884,838
(*1) Operating expense and others include lease payments by the Group.(*2) Operating expense and others include ₩216,241 million of dividends paid by the Parent Company.(*3) Operating revenue and others include ₩219,150 million of dividends received from SK hynix Inc. which was deducted from the investments in associates.(*4) Operating revenue and others include ₩11,955 million of dividends declared by Korea IT Fund, UniSK and KIF-Stonebridge IT Investment Fund which was
deducted from the investments in associates.(*5) Operating expenses and others include costs for handset purchases amounting to ₩1,043,902 million.
(In millions of won)2018
Scope Company
Operatingrevenue and
others
Operatingexpense
and others
Acquisition ofproperty and
equipmentCollection
of loansUltimate Controlling Entity SK Holdings Co., Ltd.(*1) ₩ 20,050 601,176 151,502 —Associates F&U Credit information Co., Ltd. 2,777 54,857 — —
HappyNarae Co., Ltd.(*2) 1,002 20,286 88,327 —SK hynix Inc.(*3) 179,708 313 — —KEB HanaCard Co., Ltd. 15,046 15,387 — —Others(*4) 5,924 35,296 1,202 204
204,457 126,139 89,529 204Others SK Engineering & Construction Co., Ltd. 4,662 1,122 8,700 —
SK Innovation Co., Ltd.(*5) 44,010 996 — —SK Networks Co., Ltd.(*6) 23,078 1,189,404 460 —SK Networks Services Co., Ltd. 774 90,723 5,478 —SK Telesys Co., Ltd. 362 10,945 127,840 —SK TNS Co., Ltd. 140 31,220 493,793 —SK Energy Co., Ltd.(*5) 15,134 897 — —SK Gas Co., Ltd. 7,653 2 — —SKC Infra Service Co., Ltd. 57 50,829 24,761 —Others(*5) 55,224 19,323 — —
151,094 1,395,461 661,032 —₩375,601 2,122,776 902,063 204
Copyright © 2020 www.secdatabase.com. All Rights Reserved.Please Consider the Environment Before Printing This Document

(*1) Operating expense and others include ₩203,635 million of dividends paid by the Parent Company.
(*2) Transactions with HappyNarae Co., Ltd. occurred before disposal.
(*3) Operating revenue and others include ₩146,100 million of dividends received from SK hynix Inc. which was deducted from the investments in associates.
(*4) Operating revenue and others include ₩4,587 million of dividends received from Korea IT Fund, KIF-Stonebridge IT Investment Fund and UniSK which werededucted from the investments in associates.
(*5) Operating revenue and others include ₩68,500 million received from disposal of the real estate investment fund to SK Innovation Co., Ltd., SK Energy Co., Ltd.,SK Lubricants Co., Ltd., SK Trading International Co., Ltd. and SK Global Chemical Co., Ltd.
(*6) Operating expenses and others include costs for handset purchases amounting to ₩1,100,370 million.
(In millions of won)2017
Scope Company
Operatingrevenue and
others
Operatingexpense
and others
Acquisition ofproperty and
equipmentCollection
of loansUltimate Controlling Entity SK Holdings Co., Ltd.(*1) ₩ 25,049 600,600 283,556 —Associates F&U Credit information Co., Ltd. 3,431 52,150 153 —
HappyNarae Co., Ltd. 3,025 29,276 68,472 —SK hynix Inc.(*2) 123,873 251 — —KEB HanaCard Co., Ltd. 17,873 15,045 — —Others(*3) 10,720 33,389 940 204
158,922 130,111 69,565 204Others SK Engineering & Construction Co., Ltd. 5,865 1,077 — —
SK Networks Co., Ltd. 21,694 1,220,251 671 —SK Networks Services Co., Ltd. 510 96,949 6,346 —SK Telesys Co., Ltd. 417 51,394 152,659 —SK TNS Co., Ltd. 137 37,051 494,621 —SK Energy Co., Ltd. 8,505 779 — —SK Gas Co., Ltd. 2,727 4 — —SK Innovation Co., Ltd. 7,639 950 — —SK Shipping Co., Ltd. 3,183 35 — —Ko-one energy service Co., Ltd 5,164 44 — —SK Infosec Co., Ltd. 1,185 52,634 15,648 —SKC Infra Service Co., Ltd. 19 46,900 47,163 —Others 18,233 28,209 17 —
75,278 1,536,277 717,125 —₩ 259,249 2,266,988 1,070,246 204
(*1) Operating expense and others include ₩203,635 million of dividends paid by the Parent Company.
(*2) Operating revenue and others include ₩87,660 million of dividends declared by SK hynix Inc. which was deducted from the investments in associates.
(*3) Operating revenue and others include ₩6,597 million of dividends received from the Korea IT Fund and others.Account balances with relatedparties
(4) Account balances with related parties as of December 31, 2019 and 2018 are as follows:
(In millions of won)December 31, 2019
Receivables Payables
Scope Company Loans
Accountsreceivable — trade,
etc
Accountspayable — other,
etcUltimate Controlling Entity SK Holdings Co., Ltd. ₩ — 7,941 87,519Associates F&U Credit information Co., Ltd. — 2 4,869
SK hynix Inc. — 21,510 48Wave City Development Co., Ltd. — 31,523 —Daehan Kanggun BcN Co., Ltd.(*) 22,147 5,359 —KEB HanaCard Co., Ltd. — 1,025 9,474Others 204 2,490 2,262
22,351 61,909 16,653Others SK Engineering & Construction Co., Ltd. — 4,422 97
SK Innovation Co., Ltd. — 7,496 22,673SK Networks. Co., Ltd. — 3,469 85,421SK Networks Services Co., Ltd. — — 10,820SK Telesys Co., Ltd. — 30 16,319SK TNS Co., Ltd. — 14 200,703SK Energy Co., Ltd. — 2,757 1,886SK hystec Co., Ltd. — 848 687SK hynix Semiconductor (China) Ltd. — 8,556 —Others — 22,529 40,073
— 50,121 378,679₩22,351 119,971 482,851
Copyright © 2020 www.secdatabase.com. All Rights Reserved.Please Consider the Environment Before Printing This Document
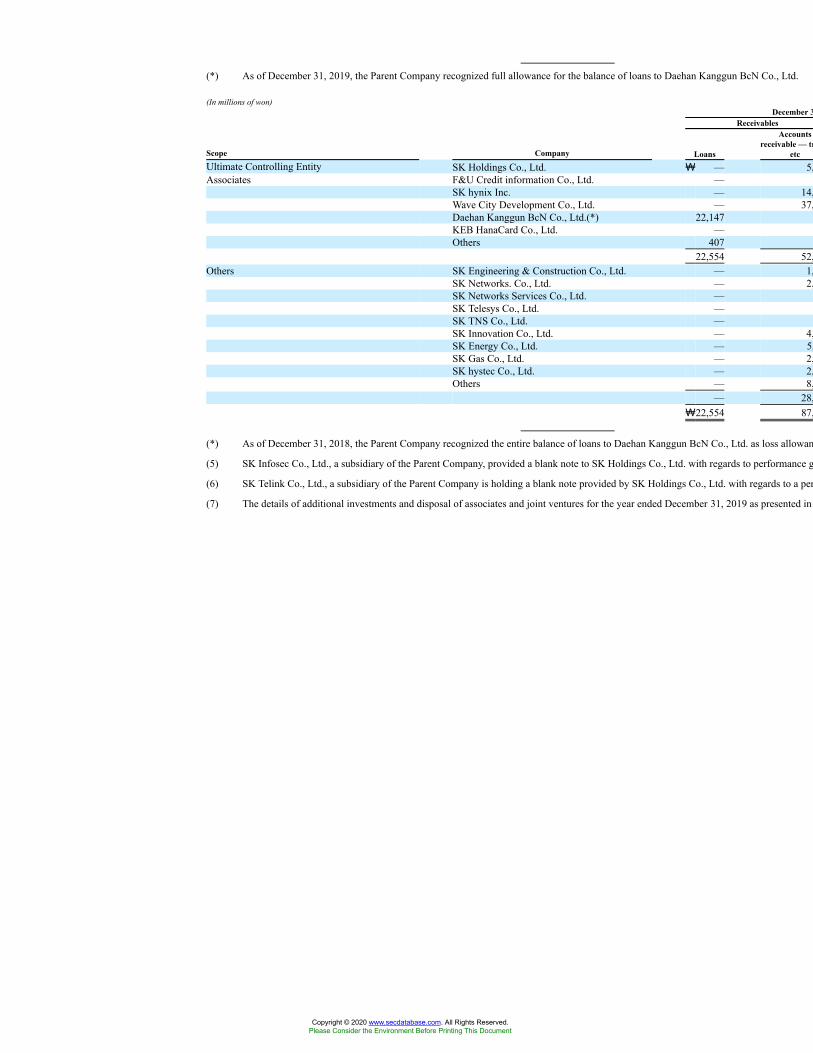
(*) As of December 31, 2019, the Parent Company recognized full allowance for the balance of loans to Daehan Kanggun BcN Co., Ltd.
(In millions of won)December 31, 2018
Receivables Payables
Scope Company Loans
Accountsreceivable — trade,
etc
Accountspayable — other,
etcUltimate Controlling Entity SK Holdings Co., Ltd. ₩ — 5,987 139,260Associates F&U Credit information Co., Ltd. — 98 5,801
SK hynix Inc. — 14,766 89Wave City Development Co., Ltd. — 37,263 —Daehan Kanggun BcN Co., Ltd.(*) 22,147 — —KEB HanaCard Co., Ltd. — 541 11,311Others 407 130 1,764
22,554 52,798 18,965Others SK Engineering & Construction Co., Ltd. — 1,561 760
SK Networks. Co., Ltd. — 2,647 167,433SK Networks Services Co., Ltd. — 54 8,946SK Telesys Co., Ltd. — 154 39,188SK TNS Co., Ltd. — — 89,017SK Innovation Co., Ltd. — 4,696 1,019SK Energy Co., Ltd. — 5,511 887SK Gas Co., Ltd. — 2,225 60SK hystec Co., Ltd. — 2,661 75Others — 8,958 8,066
— 28,467 315,451₩22,554 87,252 473,676
(*) As of December 31, 2018, the Parent Company recognized the entire balance of loans to Daehan Kanggun BcN Co., Ltd. as loss allowances.
(5) SK Infosec Co., Ltd., a subsidiary of the Parent Company, provided a blank note to SK Holdings Co., Ltd. with regards to performance guarantee.
(6) SK Telink Co., Ltd., a subsidiary of the Parent Company is holding a blank note provided by SK Holdings Co., Ltd. with regards to a performance guarantee.
(7) The details of additional investments and disposal of associates and joint ventures for the year ended December 31, 2019 as presented in note 13.
Copyright © 2020 www.secdatabase.com. All Rights Reserved.Please Consider the Environment Before Printing This Document
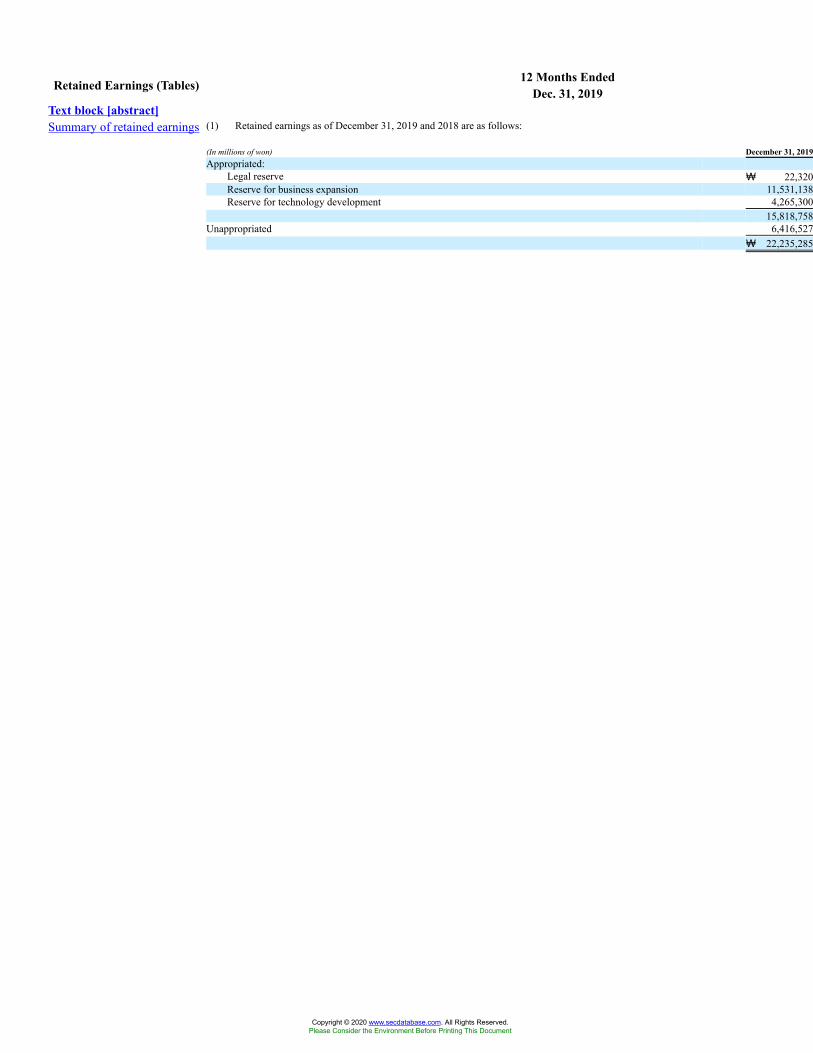
12 Months EndedRetained Earnings (Tables) Dec. 31, 2019Text block [abstract]Summary of retained earnings (1) Retained earnings as of December 31, 2019 and 2018 are as follows:
(In millions of won) December 31, 2019 December 31, 2018Appropriated:
Legal reserve ₩ 22,320 22,320Reserve for business expansion 11,531,138 10,531,138Reserve for technology development 4,265,300 3,321,300
15,818,758 13,874,758Unappropriated 6,416,527 8,269,783
₩ 22,235,285 22,144,541
Copyright © 2020 www.secdatabase.com. All Rights Reserved.Please Consider the Environment Before Printing This Document

12 Months EndedFinance Income and Costs(Tables) Dec. 31, 2019
Text block [abstract]Details of finance income andcosts
(1) Details of finance income and costs for the years ended December 31, 2019, 2018 and 2017 are as follows:
(In millions of won)2019 2018 2017
Finance Income:Interest income ₩ 63,401 69,936 76,045Gain on sale of accounts receivable — other 15,855 20,023 18,548Dividends 10,011 35,143 12,416Gain on foreign currency transactions 11,798 17,990 13,676Gain on foreign currency translations 4,576 2,776 7,110Gain on disposal of long-term investment securities — — 4,890Gain on valuation of derivatives 2,499 6,532 223,943Gain on settlement of derivatives 29,277 20,399 —Gain relating to financial assets at FVTPL (*) 4,504 83,636 33Gain relating to financial liabilities at FVTPL 56 — —Reversal of impairment loss on available-for- sale financial assets — — 9,900
₩ 141,977 256,435 366,561Finance Costs:
Interest expense ₩ 397,890 307,319 299,100Loss on sale of accounts receivable — other 5,823 — 9,682Loss on foreign currency transactions 12,660 38,920 19,263Loss on foreign currency translations 4,948 2,397 8,419Loss on disposal of long-term investment securities — — 36,024Loss on settlement of derivatives 641 12,554 10,031Loss relating to financial liabilities at FVTPL 43 1,535 678Loss relating to financial assets at FVTPL 7,753 22,507 —Impairment loss on long-term investment securities — — 14,519Other finance costs — — 35,900
₩ 429,758 385,232 433,616
(*) Gain relating to financial assets at FVTPL for the year ended December 31, 2018 includes gains on disposal of 200,000 shares of convertible redeemable bondsissued by KRAFTON Co., Ltd. (formerly, Bluehole Inc.) amounting to ₩58,000 million.
Details of interest incomeincluded in finance income
(2) Details of interest income included in finance income for the years ended December 31, 2019, 2018 and 2017 are as follows:
(In millions of won) 2019 2018 2017Interest income on cash equivalents and short-term financial instruments ₩ 29,854 33,808 28,130Interest income on loans and others 33,547 36,128 47,915
₩ 63,401 69,936 76,045
Details of interest expensesincluded in finance costs
(3) Details of interest expenses included in finance costs for the years ended December 31, 2019, 2018 and 2017 are as follows:
(In millions of won) 2019 2018 2017Interest expense on borrowings ₩ 104,991 10,796 11,774Interest expense on debentures 224,765 222,195 228,568Others 68,134 74,328 58,758
₩ 397,890 307,319 299,100
Finance income and costs bycategory of financialinstruments
(4) Finance income and costs by category of financial instruments for the years ended December 31, 2019, 2018 and 2017 are as follows. Bad debt expense (reversal ofloss allowance) for accounts receivable – trade, loans and receivables are presented and explained separately in notes 7 and 35.
1) Finance income and costs
(In millions of won)2019
Finance income Finance costsFinancial Assets:
Financial assets at FVTPL ₩ 56,953 13,577Financial assets at FVOCI 9,924 —Financial assets at amortized cost 74,941 17,488
141,818 31,065Financial Liabilities:
Financial liabilities at FVTPL 56 43Financial liabilities at amortized cost 103 398,009Derivatives designated as hedging instrument — 641
159 398,693₩ 141,977 429,758
Copyright © 2020 www.secdatabase.com. All Rights Reserved.Please Consider the Environment Before Printing This Document
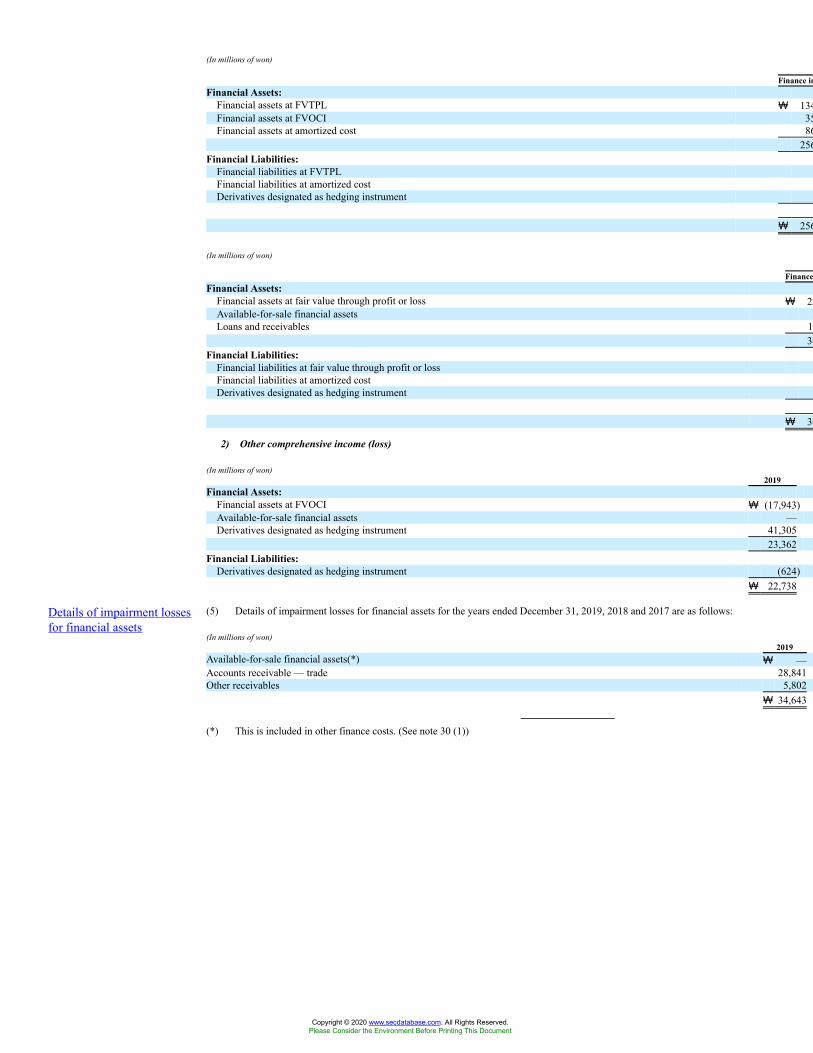
(In millions of won)2018
Finance income Finance costsFinancial Assets:
Financial assets at FVTPL ₩ 134,841 22,507Financial assets at FVOCI 35,143 —Financial assets at amortized cost 86,032 20,018
256,016 42,525Financial Liabilities:
Financial liabilities at FVTPL — 1,535Financial liabilities at amortized cost 419 328,618Derivatives designated as hedging instrument — 12,554
419 342,707₩ 256,435 385,232
(In millions of won)2017
Finance income Finance costsFinancial Assets:
Financial assets at fair value through profit or loss ₩ 223,976 —Available-for-sale financial assets 30,598 86,445Loans and receivables 111,677 37,040
366,251 123,485Financial Liabilities:
Financial liabilities at fair value through profit or loss — 678Financial liabilities at amortized cost 310 299,422Derivatives designated as hedging instrument — 10,031
310 310,131₩ 366,561 433,616
2) Other comprehensive income (loss)
(In millions of won)2019 2018 2017
Financial Assets:Financial assets at FVOCI ₩ (17,943) (130,035) —Available-for-sale financial assets — — 158,440Derivatives designated as hedging instrument 41,305 17,180 1,554
23,362 (112,855) 159,994Financial Liabilities:
Derivatives designated as hedging instrument (624) 15,047 21,032₩ 22,738 (97,808) 181,026
Details of impairment lossesfor financial assets
(5) Details of impairment losses for financial assets for the years ended December 31, 2019, 2018 and 2017 are as follows:
(In millions of won)2019 2018 2017
Available-for-sale financial assets(*) ₩ — — 14,519Accounts receivable — trade 28,841 38,211 34,584Other receivables 5,802 7,718 5,793
₩ 34,643 45,929 54,896
(*) This is included in other finance costs. (See note 30 (1))
Copyright © 2020 www.secdatabase.com. All Rights Reserved.Please Consider the Environment Before Printing This Document
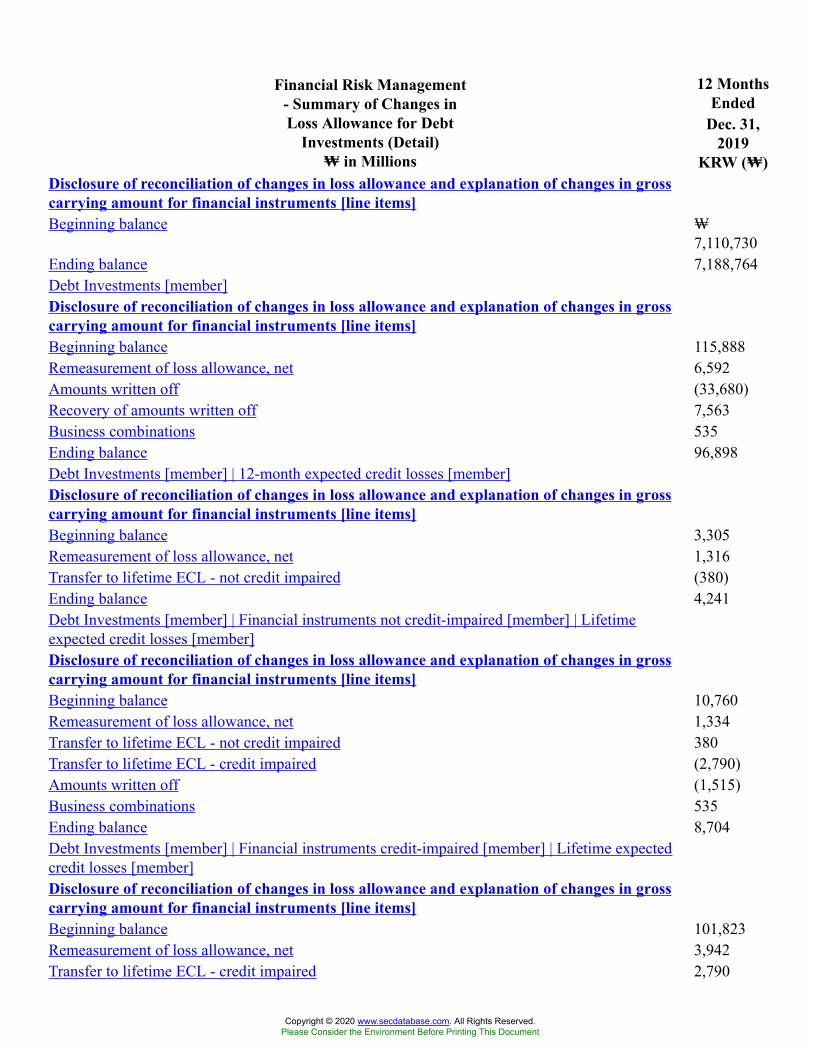
12 MonthsEnded
Financial Risk Management- Summary of Changes inLoss Allowance for Debt
Investments (Detail)₩ in Millions
Dec. 31,2019
KRW (₩)Disclosure of reconciliation of changes in loss allowance and explanation of changes in grosscarrying amount for financial instruments [line items]Beginning balance ₩
7,110,730Ending balance 7,188,764Debt Investments [member]Disclosure of reconciliation of changes in loss allowance and explanation of changes in grosscarrying amount for financial instruments [line items]Beginning balance 115,888Remeasurement of loss allowance, net 6,592Amounts written off (33,680)Recovery of amounts written off 7,563Business combinations 535Ending balance 96,898Debt Investments [member] | 12-month expected credit losses [member]Disclosure of reconciliation of changes in loss allowance and explanation of changes in grosscarrying amount for financial instruments [line items]Beginning balance 3,305Remeasurement of loss allowance, net 1,316Transfer to lifetime ECL - not credit impaired (380)Ending balance 4,241Debt Investments [member] | Financial instruments not credit-impaired [member] | Lifetimeexpected credit losses [member]Disclosure of reconciliation of changes in loss allowance and explanation of changes in grosscarrying amount for financial instruments [line items]Beginning balance 10,760Remeasurement of loss allowance, net 1,334Transfer to lifetime ECL - not credit impaired 380Transfer to lifetime ECL - credit impaired (2,790)Amounts written off (1,515)Business combinations 535Ending balance 8,704Debt Investments [member] | Financial instruments credit-impaired [member] | Lifetime expectedcredit losses [member]Disclosure of reconciliation of changes in loss allowance and explanation of changes in grosscarrying amount for financial instruments [line items]Beginning balance 101,823Remeasurement of loss allowance, net 3,942Transfer to lifetime ECL - credit impaired 2,790
Copyright © 2020 www.secdatabase.com. All Rights Reserved.Please Consider the Environment Before Printing This Document
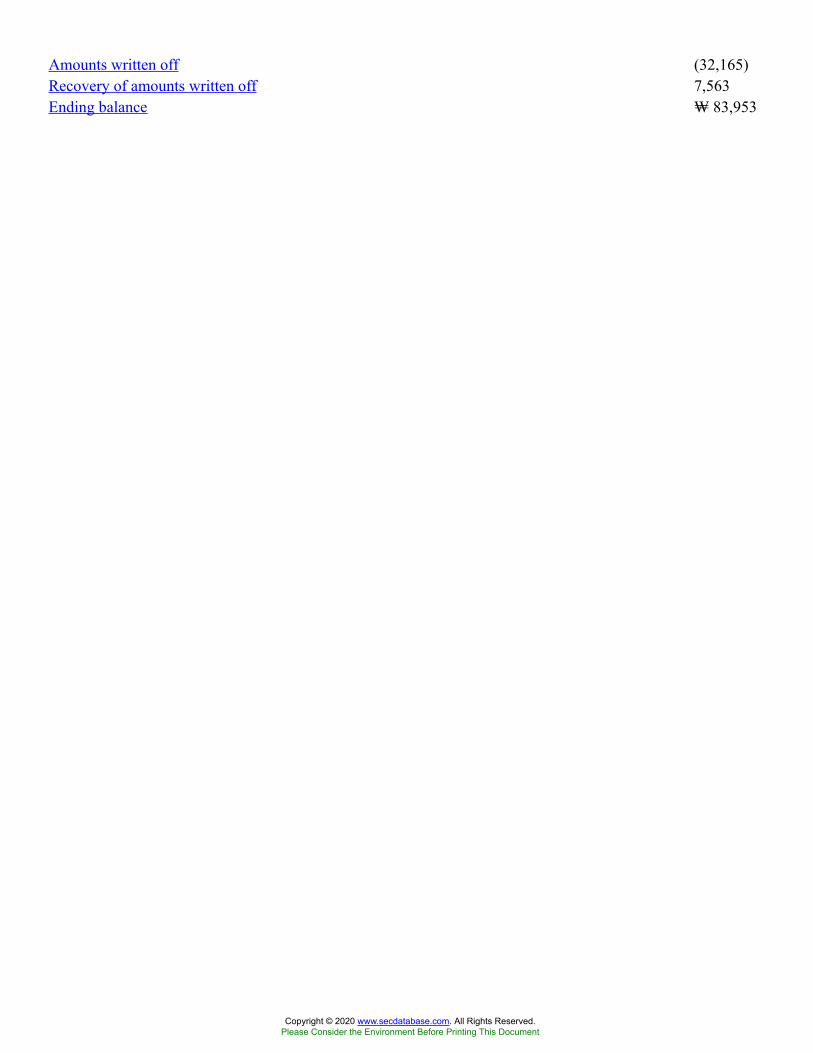
Amounts written off (32,165)Recovery of amounts written off 7,563Ending balance ₩ 83,953
Copyright © 2020 www.secdatabase.com. All Rights Reserved.Please Consider the Environment Before Printing This Document
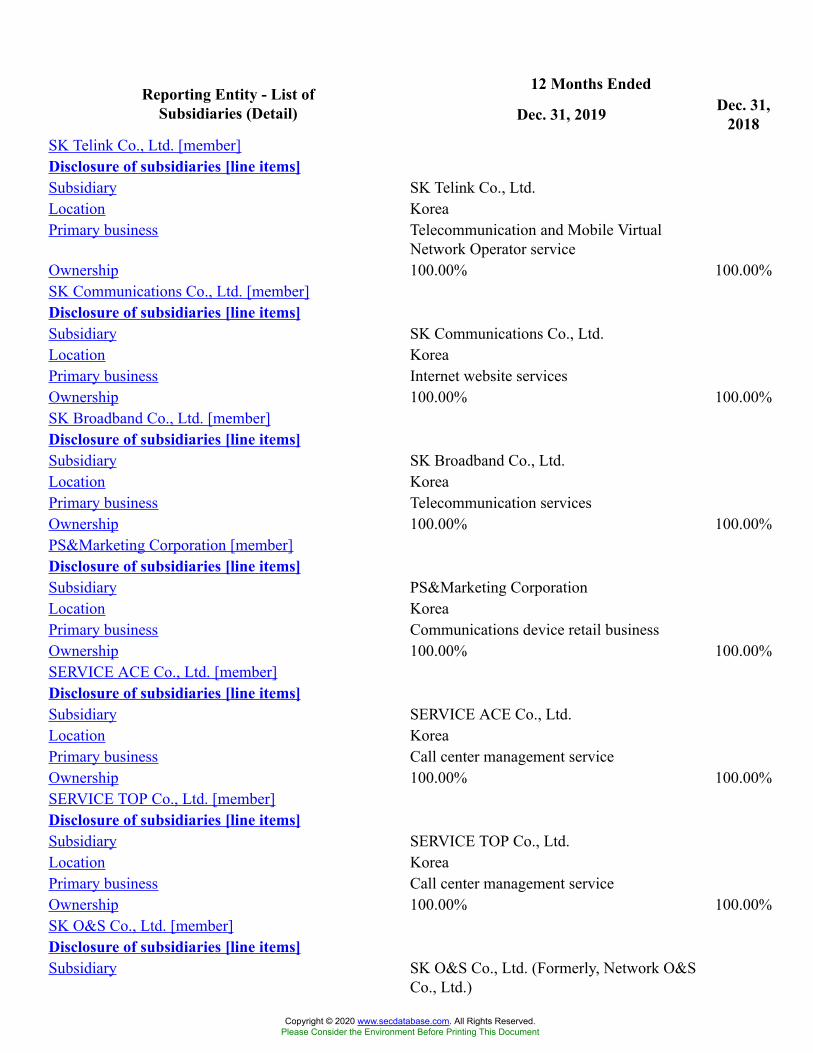
12 Months EndedReporting Entity - List ofSubsidiaries (Detail) Dec. 31, 2019 Dec. 31,
2018SK Telink Co., Ltd. [member]Disclosure of subsidiaries [line items]Subsidiary SK Telink Co., Ltd.Location KoreaPrimary business Telecommunication and Mobile Virtual
Network Operator serviceOwnership 100.00% 100.00%SK Communications Co., Ltd. [member]Disclosure of subsidiaries [line items]Subsidiary SK Communications Co., Ltd.Location KoreaPrimary business Internet website servicesOwnership 100.00% 100.00%SK Broadband Co., Ltd. [member]Disclosure of subsidiaries [line items]Subsidiary SK Broadband Co., Ltd.Location KoreaPrimary business Telecommunication servicesOwnership 100.00% 100.00%PS&Marketing Corporation [member]Disclosure of subsidiaries [line items]Subsidiary PS&Marketing CorporationLocation KoreaPrimary business Communications device retail businessOwnership 100.00% 100.00%SERVICE ACE Co., Ltd. [member]Disclosure of subsidiaries [line items]Subsidiary SERVICE ACE Co., Ltd.Location KoreaPrimary business Call center management serviceOwnership 100.00% 100.00%SERVICE TOP Co., Ltd. [member]Disclosure of subsidiaries [line items]Subsidiary SERVICE TOP Co., Ltd.Location KoreaPrimary business Call center management serviceOwnership 100.00% 100.00%SK O&S Co., Ltd. [member]Disclosure of subsidiaries [line items]Subsidiary SK O&S Co., Ltd. (Formerly, Network O&S
Co., Ltd.)
Copyright © 2020 www.secdatabase.com. All Rights Reserved.Please Consider the Environment Before Printing This Document
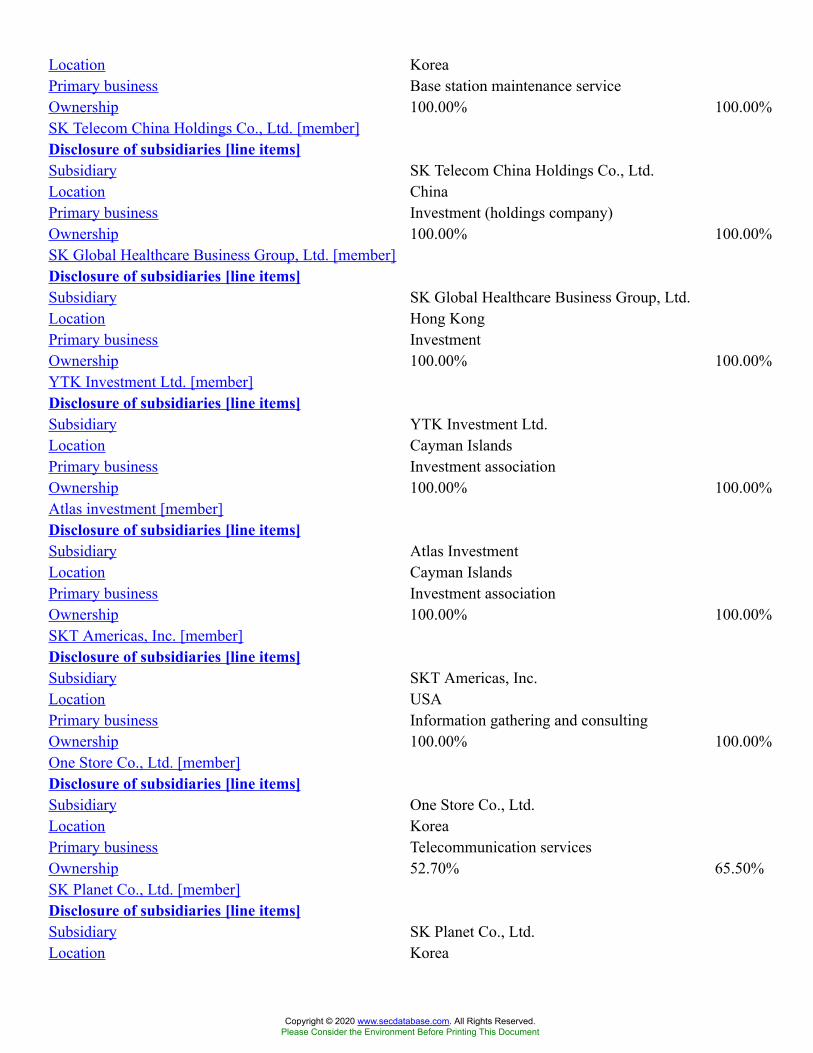
Location KoreaPrimary business Base station maintenance serviceOwnership 100.00% 100.00%SK Telecom China Holdings Co., Ltd. [member]Disclosure of subsidiaries [line items]Subsidiary SK Telecom China Holdings Co., Ltd.Location ChinaPrimary business Investment (holdings company)Ownership 100.00% 100.00%SK Global Healthcare Business Group, Ltd. [member]Disclosure of subsidiaries [line items]Subsidiary SK Global Healthcare Business Group, Ltd.Location Hong KongPrimary business InvestmentOwnership 100.00% 100.00%YTK Investment Ltd. [member]Disclosure of subsidiaries [line items]Subsidiary YTK Investment Ltd.Location Cayman IslandsPrimary business Investment associationOwnership 100.00% 100.00%Atlas investment [member]Disclosure of subsidiaries [line items]Subsidiary Atlas InvestmentLocation Cayman IslandsPrimary business Investment associationOwnership 100.00% 100.00%SKT Americas, Inc. [member]Disclosure of subsidiaries [line items]Subsidiary SKT Americas, Inc.Location USAPrimary business Information gathering and consultingOwnership 100.00% 100.00%One Store Co., Ltd. [member]Disclosure of subsidiaries [line items]Subsidiary One Store Co., Ltd.Location KoreaPrimary business Telecommunication servicesOwnership 52.70% 65.50%SK Planet Co., Ltd. [member]Disclosure of subsidiaries [line items]Subsidiary SK Planet Co., Ltd.Location Korea
Copyright © 2020 www.secdatabase.com. All Rights Reserved.Please Consider the Environment Before Printing This Document
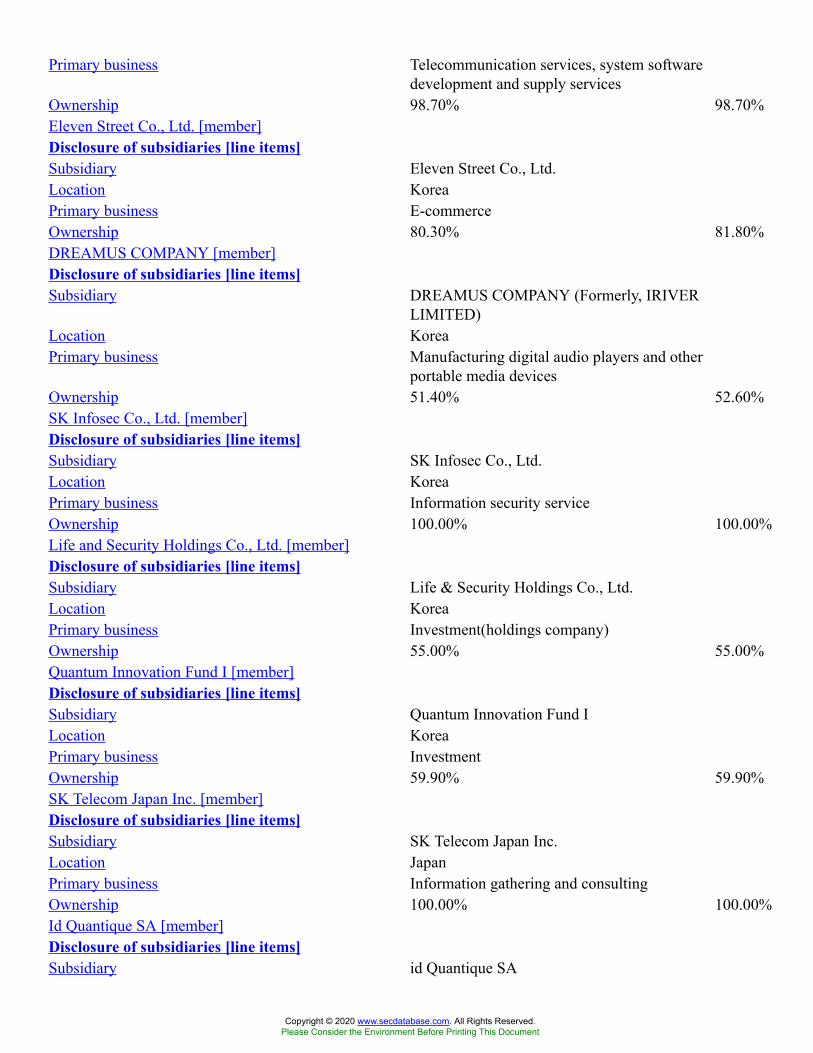
Primary business Telecommunication services, system softwaredevelopment and supply services
Ownership 98.70% 98.70%Eleven Street Co., Ltd. [member]Disclosure of subsidiaries [line items]Subsidiary Eleven Street Co., Ltd.Location KoreaPrimary business E-commerceOwnership 80.30% 81.80%DREAMUS COMPANY [member]Disclosure of subsidiaries [line items]Subsidiary DREAMUS COMPANY (Formerly, IRIVER
LIMITED)Location KoreaPrimary business Manufacturing digital audio players and other
portable media devicesOwnership 51.40% 52.60%SK Infosec Co., Ltd. [member]Disclosure of subsidiaries [line items]Subsidiary SK Infosec Co., Ltd.Location KoreaPrimary business Information security serviceOwnership 100.00% 100.00%Life and Security Holdings Co., Ltd. [member]Disclosure of subsidiaries [line items]Subsidiary Life & Security Holdings Co., Ltd.Location KoreaPrimary business Investment(holdings company)Ownership 55.00% 55.00%Quantum Innovation Fund I [member]Disclosure of subsidiaries [line items]Subsidiary Quantum Innovation Fund ILocation KoreaPrimary business InvestmentOwnership 59.90% 59.90%SK Telecom Japan Inc. [member]Disclosure of subsidiaries [line items]Subsidiary SK Telecom Japan Inc.Location JapanPrimary business Information gathering and consultingOwnership 100.00% 100.00%Id Quantique SA [member]Disclosure of subsidiaries [line items]Subsidiary id Quantique SA
Copyright © 2020 www.secdatabase.com. All Rights Reserved.Please Consider the Environment Before Printing This Document
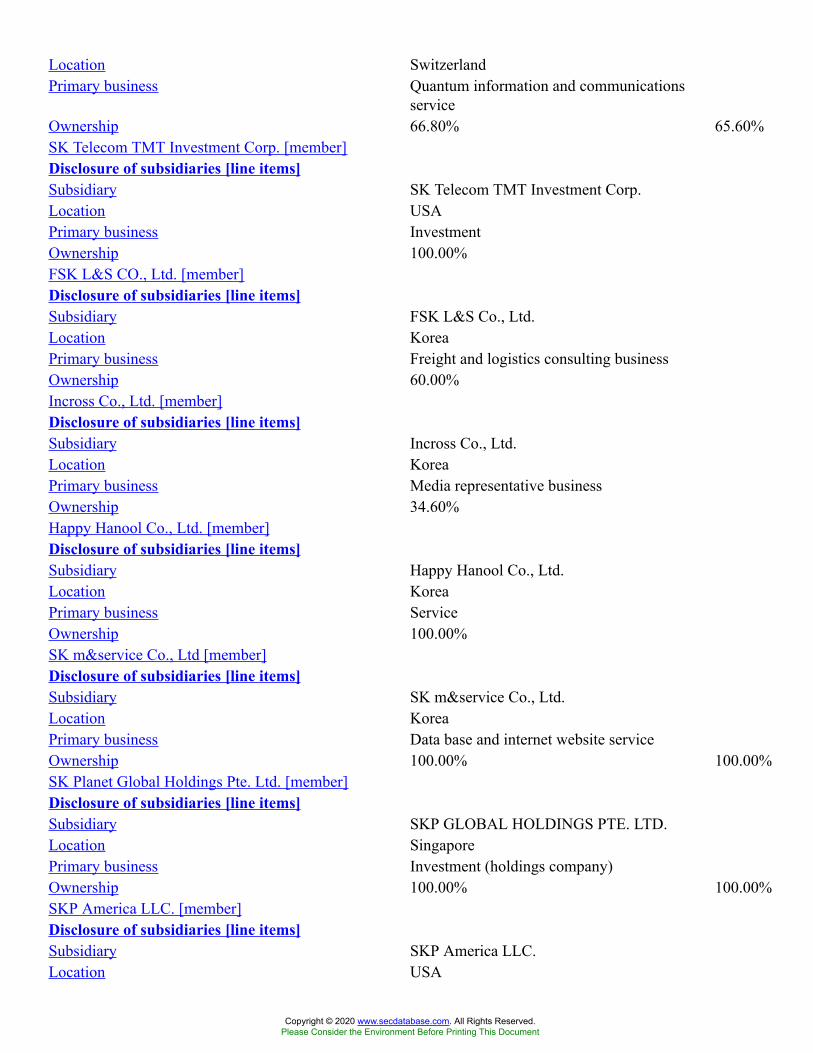
Location SwitzerlandPrimary business Quantum information and communications
serviceOwnership 66.80% 65.60%SK Telecom TMT Investment Corp. [member]Disclosure of subsidiaries [line items]Subsidiary SK Telecom TMT Investment Corp.Location USAPrimary business InvestmentOwnership 100.00%FSK L&S CO., Ltd. [member]Disclosure of subsidiaries [line items]Subsidiary FSK L&S Co., Ltd.Location KoreaPrimary business Freight and logistics consulting businessOwnership 60.00%Incross Co., Ltd. [member]Disclosure of subsidiaries [line items]Subsidiary Incross Co., Ltd.Location KoreaPrimary business Media representative businessOwnership 34.60%Happy Hanool Co., Ltd. [member]Disclosure of subsidiaries [line items]Subsidiary Happy Hanool Co., Ltd.Location KoreaPrimary business ServiceOwnership 100.00%SK m&service Co., Ltd [member]Disclosure of subsidiaries [line items]Subsidiary SK m&service Co., Ltd.Location KoreaPrimary business Data base and internet website serviceOwnership 100.00% 100.00%SK Planet Global Holdings Pte. Ltd. [member]Disclosure of subsidiaries [line items]Subsidiary SKP GLOBAL HOLDINGS PTE. LTD.Location SingaporePrimary business Investment (holdings company)Ownership 100.00% 100.00%SKP America LLC. [member]Disclosure of subsidiaries [line items]Subsidiary SKP America LLC.Location USA
Copyright © 2020 www.secdatabase.com. All Rights Reserved.Please Consider the Environment Before Printing This Document
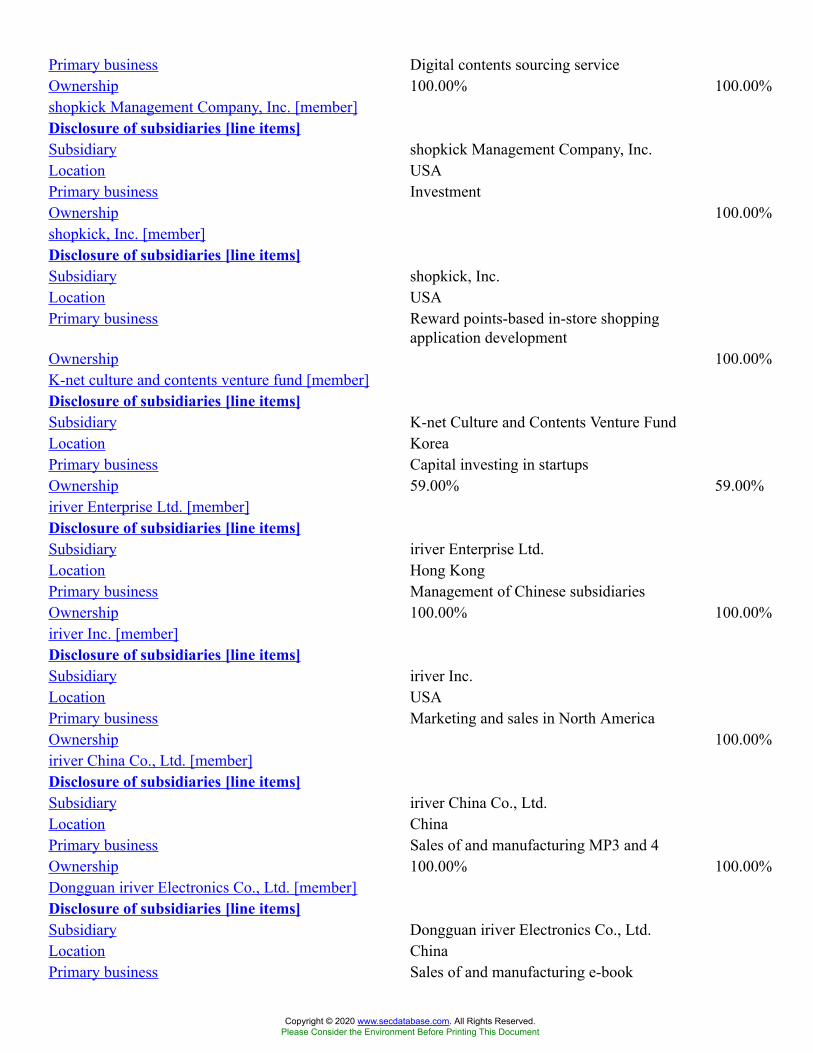
Primary business Digital contents sourcing serviceOwnership 100.00% 100.00%shopkick Management Company, Inc. [member]Disclosure of subsidiaries [line items]Subsidiary shopkick Management Company, Inc.Location USAPrimary business InvestmentOwnership 100.00%shopkick, Inc. [member]Disclosure of subsidiaries [line items]Subsidiary shopkick, Inc.Location USAPrimary business Reward points-based in-store shopping
application developmentOwnership 100.00%K-net culture and contents venture fund [member]Disclosure of subsidiaries [line items]Subsidiary K-net Culture and Contents Venture FundLocation KoreaPrimary business Capital investing in startupsOwnership 59.00% 59.00%iriver Enterprise Ltd. [member]Disclosure of subsidiaries [line items]Subsidiary iriver Enterprise Ltd.Location Hong KongPrimary business Management of Chinese subsidiariesOwnership 100.00% 100.00%iriver Inc. [member]Disclosure of subsidiaries [line items]Subsidiary iriver Inc.Location USAPrimary business Marketing and sales in North AmericaOwnership 100.00%iriver China Co., Ltd. [member]Disclosure of subsidiaries [line items]Subsidiary iriver China Co., Ltd.Location ChinaPrimary business Sales of and manufacturing MP3 and 4Ownership 100.00% 100.00%Dongguan iriver Electronics Co., Ltd. [member]Disclosure of subsidiaries [line items]Subsidiary Dongguan iriver Electronics Co., Ltd.Location ChinaPrimary business Sales of and manufacturing e-book
Copyright © 2020 www.secdatabase.com. All Rights Reserved.Please Consider the Environment Before Printing This Document
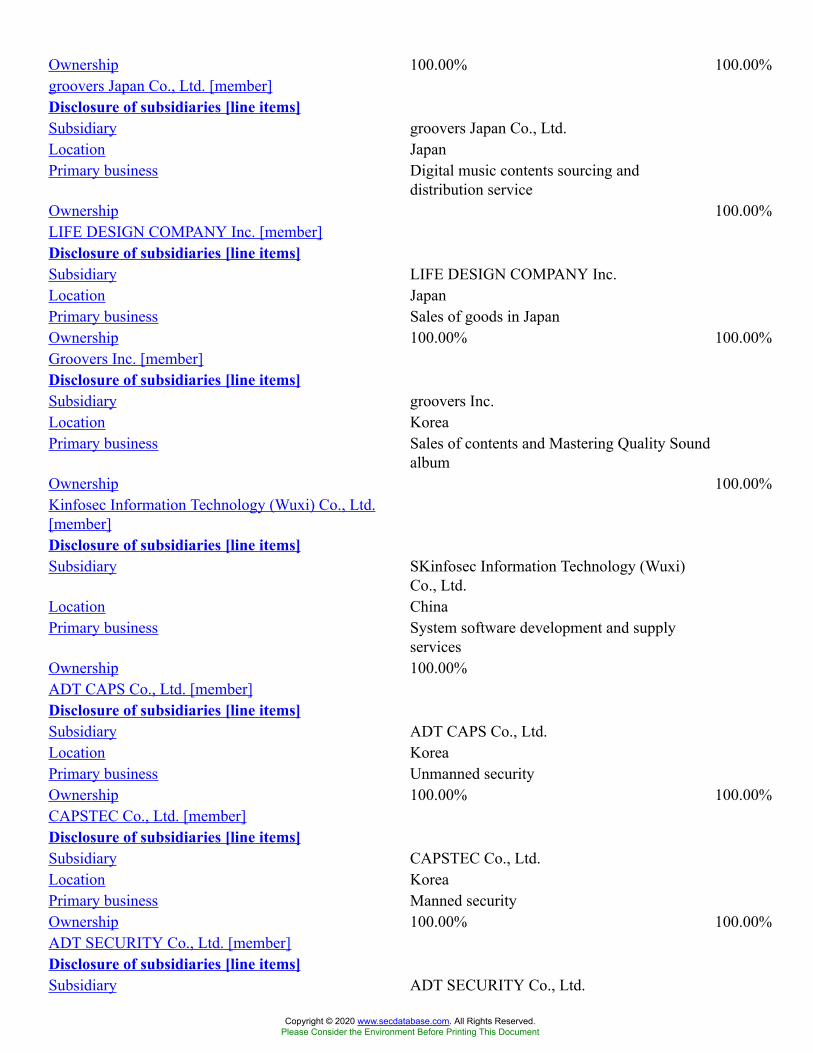
Ownership 100.00% 100.00%groovers Japan Co., Ltd. [member]Disclosure of subsidiaries [line items]Subsidiary groovers Japan Co., Ltd.Location JapanPrimary business Digital music contents sourcing and
distribution serviceOwnership 100.00%LIFE DESIGN COMPANY Inc. [member]Disclosure of subsidiaries [line items]Subsidiary LIFE DESIGN COMPANY Inc.Location JapanPrimary business Sales of goods in JapanOwnership 100.00% 100.00%Groovers Inc. [member]Disclosure of subsidiaries [line items]Subsidiary groovers Inc.Location KoreaPrimary business Sales of contents and Mastering Quality Sound
albumOwnership 100.00%Kinfosec Information Technology (Wuxi) Co., Ltd.[member]Disclosure of subsidiaries [line items]Subsidiary SKinfosec Information Technology (Wuxi)
Co., Ltd.Location ChinaPrimary business System software development and supply
servicesOwnership 100.00%ADT CAPS Co., Ltd. [member]Disclosure of subsidiaries [line items]Subsidiary ADT CAPS Co., Ltd.Location KoreaPrimary business Unmanned securityOwnership 100.00% 100.00%CAPSTEC Co., Ltd. [member]Disclosure of subsidiaries [line items]Subsidiary CAPSTEC Co., Ltd.Location KoreaPrimary business Manned securityOwnership 100.00% 100.00%ADT SECURITY Co., Ltd. [member]Disclosure of subsidiaries [line items]Subsidiary ADT SECURITY Co., Ltd.
Copyright © 2020 www.secdatabase.com. All Rights Reserved.Please Consider the Environment Before Printing This Document
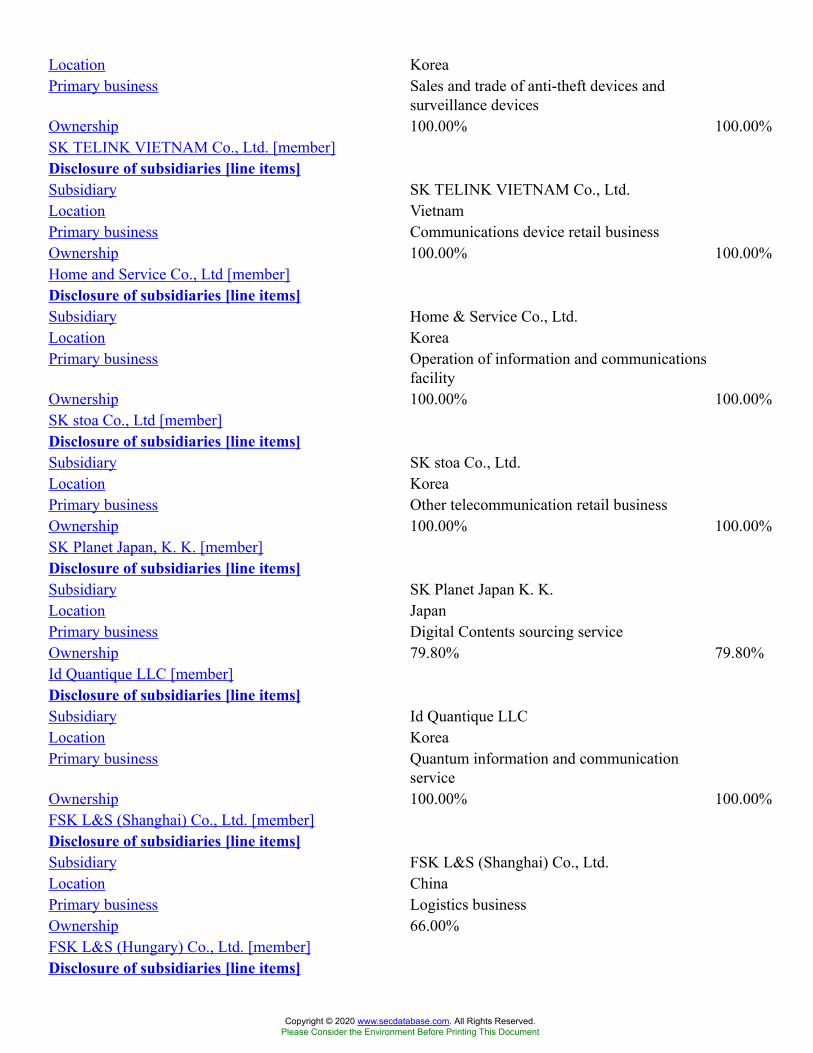
Location KoreaPrimary business Sales and trade of anti-theft devices and
surveillance devicesOwnership 100.00% 100.00%SK TELINK VIETNAM Co., Ltd. [member]Disclosure of subsidiaries [line items]Subsidiary SK TELINK VIETNAM Co., Ltd.Location VietnamPrimary business Communications device retail businessOwnership 100.00% 100.00%Home and Service Co., Ltd [member]Disclosure of subsidiaries [line items]Subsidiary Home & Service Co., Ltd.Location KoreaPrimary business Operation of information and communications
facilityOwnership 100.00% 100.00%SK stoa Co., Ltd [member]Disclosure of subsidiaries [line items]Subsidiary SK stoa Co., Ltd.Location KoreaPrimary business Other telecommunication retail businessOwnership 100.00% 100.00%SK Planet Japan, K. K. [member]Disclosure of subsidiaries [line items]Subsidiary SK Planet Japan K. K.Location JapanPrimary business Digital Contents sourcing serviceOwnership 79.80% 79.80%Id Quantique LLC [member]Disclosure of subsidiaries [line items]Subsidiary Id Quantique LLCLocation KoreaPrimary business Quantum information and communication
serviceOwnership 100.00% 100.00%FSK L&S (Shanghai) Co., Ltd. [member]Disclosure of subsidiaries [line items]Subsidiary FSK L&S (Shanghai) Co., Ltd.Location ChinaPrimary business Logistics businessOwnership 66.00%FSK L&S (Hungary) Co., Ltd. [member]Disclosure of subsidiaries [line items]
Copyright © 2020 www.secdatabase.com. All Rights Reserved.Please Consider the Environment Before Printing This Document
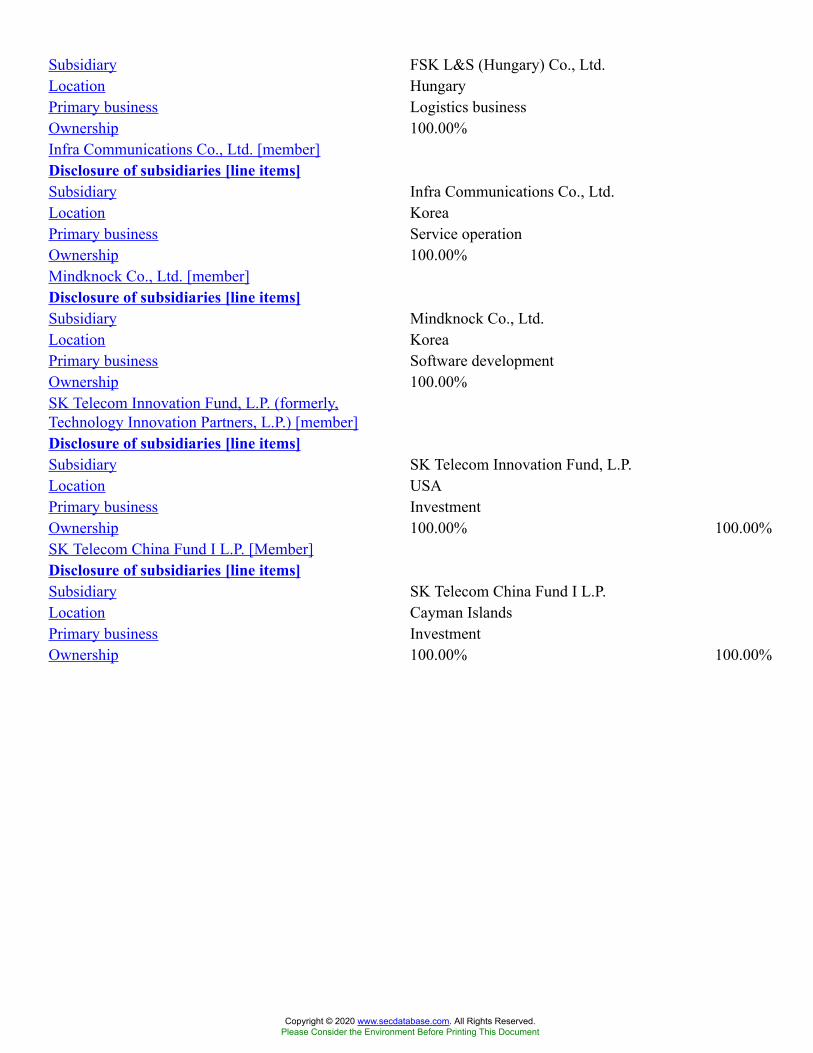
Subsidiary FSK L&S (Hungary) Co., Ltd.Location HungaryPrimary business Logistics businessOwnership 100.00%Infra Communications Co., Ltd. [member]Disclosure of subsidiaries [line items]Subsidiary Infra Communications Co., Ltd.Location KoreaPrimary business Service operationOwnership 100.00%Mindknock Co., Ltd. [member]Disclosure of subsidiaries [line items]Subsidiary Mindknock Co., Ltd.Location KoreaPrimary business Software developmentOwnership 100.00%SK Telecom Innovation Fund, L.P. (formerly,Technology Innovation Partners, L.P.) [member]Disclosure of subsidiaries [line items]Subsidiary SK Telecom Innovation Fund, L.P.Location USAPrimary business InvestmentOwnership 100.00% 100.00%SK Telecom China Fund I L.P. [Member]Disclosure of subsidiaries [line items]Subsidiary SK Telecom China Fund I L.P.Location Cayman IslandsPrimary business InvestmentOwnership 100.00% 100.00%
Copyright © 2020 www.secdatabase.com. All Rights Reserved.Please Consider the Environment Before Printing This Document
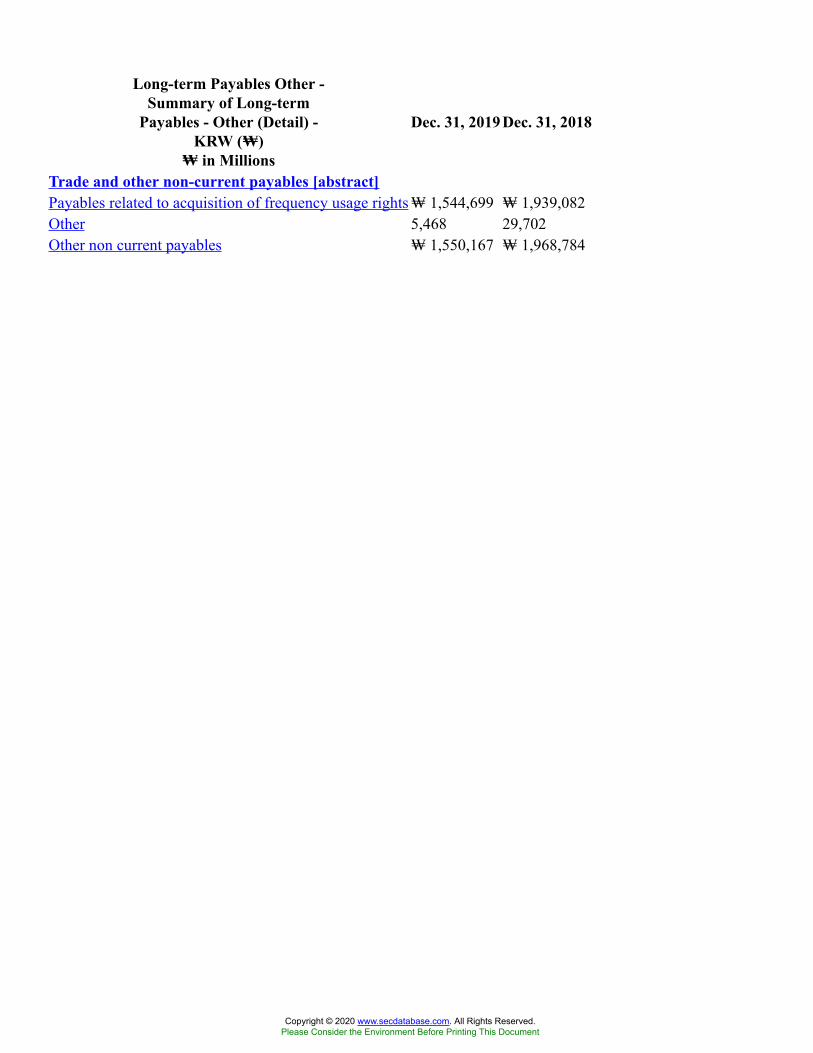
Long-term Payables Other -Summary of Long-term
Payables - Other (Detail) -KRW (₩)
₩ in Millions
Dec. 31, 2019 Dec. 31, 2018
Trade and other non-current payables [abstract]Payables related to acquisition of frequency usage rights ₩ 1,544,699 ₩ 1,939,082Other 5,468 29,702Other non current payables ₩ 1,550,167 ₩ 1,968,784
Copyright © 2020 www.secdatabase.com. All Rights Reserved.Please Consider the Environment Before Printing This Document
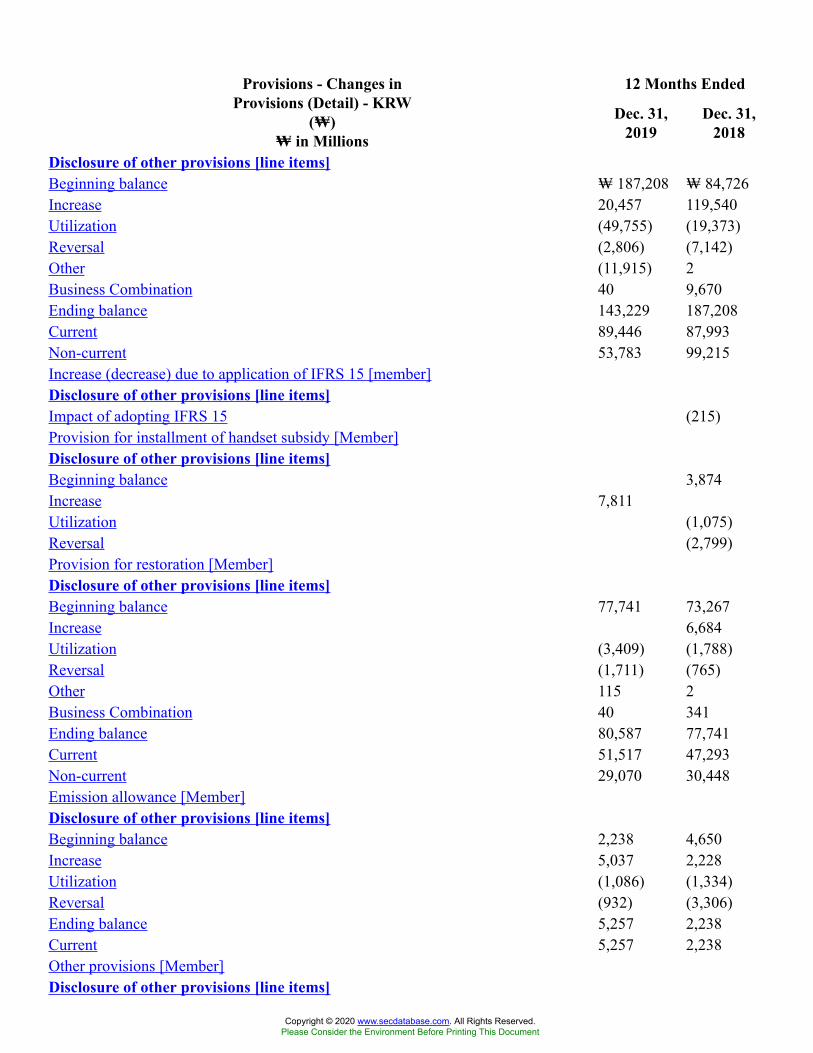
12 Months EndedProvisions - Changes inProvisions (Detail) - KRW
(₩)₩ in Millions
Dec. 31,2019
Dec. 31,2018
Disclosure of other provisions [line items]Beginning balance ₩ 187,208 ₩ 84,726Increase 20,457 119,540Utilization (49,755) (19,373)Reversal (2,806) (7,142)Other (11,915) 2Business Combination 40 9,670Ending balance 143,229 187,208Current 89,446 87,993Non-current 53,783 99,215Increase (decrease) due to application of IFRS 15 [member]Disclosure of other provisions [line items]Impact of adopting IFRS 15 (215)Provision for installment of handset subsidy [Member]Disclosure of other provisions [line items]Beginning balance 3,874Increase 7,811Utilization (1,075)Reversal (2,799)Provision for restoration [Member]Disclosure of other provisions [line items]Beginning balance 77,741 73,267Increase 6,684Utilization (3,409) (1,788)Reversal (1,711) (765)Other 115 2Business Combination 40 341Ending balance 80,587 77,741Current 51,517 47,293Non-current 29,070 30,448Emission allowance [Member]Disclosure of other provisions [line items]Beginning balance 2,238 4,650Increase 5,037 2,228Utilization (1,086) (1,334)Reversal (932) (3,306)Ending balance 5,257 2,238Current 5,257 2,238Other provisions [Member]Disclosure of other provisions [line items]
Copyright © 2020 www.secdatabase.com. All Rights Reserved.Please Consider the Environment Before Printing This Document
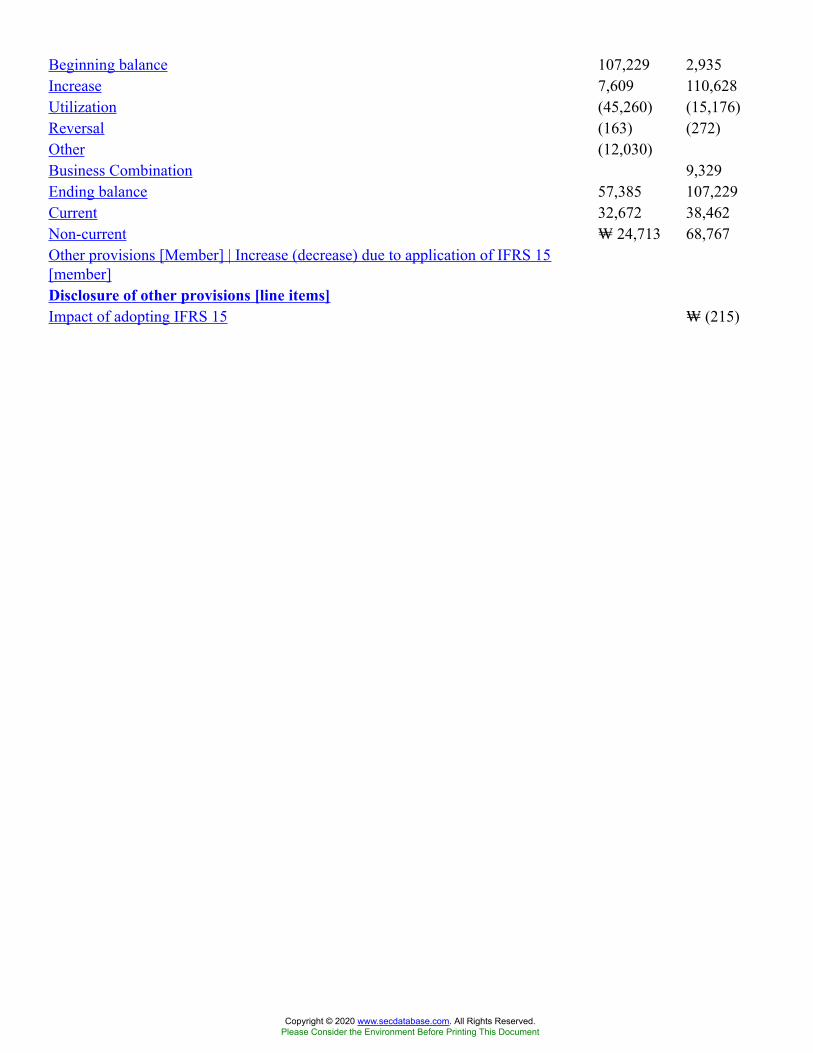
Beginning balance 107,229 2,935Increase 7,609 110,628Utilization (45,260) (15,176)Reversal (163) (272)Other (12,030)Business Combination 9,329Ending balance 57,385 107,229Current 32,672 38,462Non-current ₩ 24,713 68,767Other provisions [Member] | Increase (decrease) due to application of IFRS 15[member]Disclosure of other provisions [line items]Impact of adopting IFRS 15 ₩ (215)
Copyright © 2020 www.secdatabase.com. All Rights Reserved.Please Consider the Environment Before Printing This Document
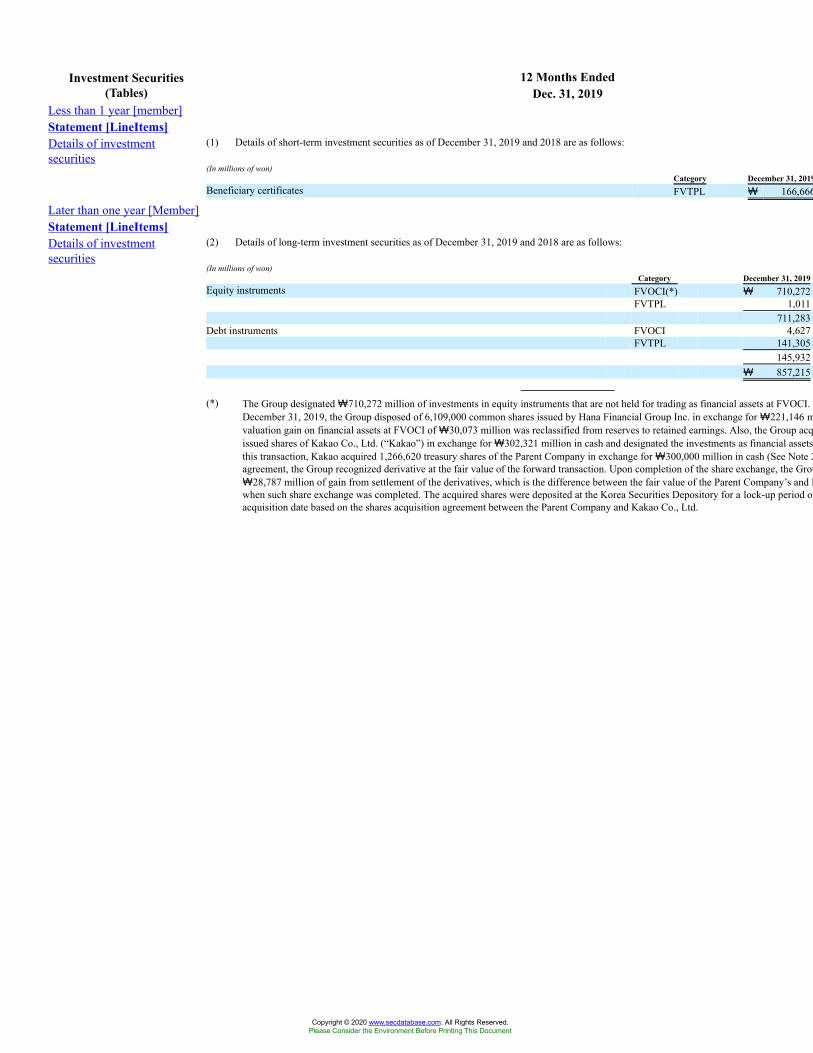
12 Months EndedInvestment Securities(Tables) Dec. 31, 2019
Less than 1 year [member]Statement [LineItems]Details of investmentsecurities
(1) Details of short-term investment securities as of December 31, 2019 and 2018 are as follows:
(In millions of won)Category December 31, 2019 December 31, 2018
Beneficiary certificates FVTPL ₩ 166,666 195,080
Later than one year [Member]Statement [LineItems]Details of investmentsecurities
(2) Details of long-term investment securities as of December 31, 2019 and 2018 are as follows:
(In millions of won)Category December 31, 2019 December 31, 2018
Equity instruments FVOCI(*) ₩ 710,272 542,496FVTPL 1,011 —
711,283 542,496Debt instruments FVOCI 4,627 2,147
FVTPL 141,305 120,083145,932 122,230
₩ 857,215 664,726
(*) The Group designated ₩710,272 million of investments in equity instruments that are not held for trading as financial assets at FVOCI. During the year endedDecember 31, 2019, the Group disposed of 6,109,000 common shares issued by Hana Financial Group Inc. in exchange for ₩221,146 million in cash. Thevaluation gain on financial assets at FVOCI of ₩30,073 million was reclassified from reserves to retained earnings. Also, the Group acquired 2,177,401 newlyissued shares of Kakao Co., Ltd. (“Kakao”) in exchange for ₩302,321 million in cash and designated the investments as financial assets at FVOCI. In relation tothis transaction, Kakao acquired 1,266,620 treasury shares of the Parent Company in exchange for ₩300,000 million in cash (See Note 23). Upon entering into theagreement, the Group recognized derivative at the fair value of the forward transaction. Upon completion of the share exchange, the Group recognized₩28,787 million of gain from settlement of the derivatives, which is the difference between the fair value of the Parent Company’s and Kakao’s shares at the datewhen such share exchange was completed. The acquired shares were deposited at the Korea Securities Depository for a lock-up period of one year from theacquisition date based on the shares acquisition agreement between the Parent Company and Kakao Co., Ltd.
Copyright © 2020 www.secdatabase.com. All Rights Reserved.Please Consider the Environment Before Printing This Document
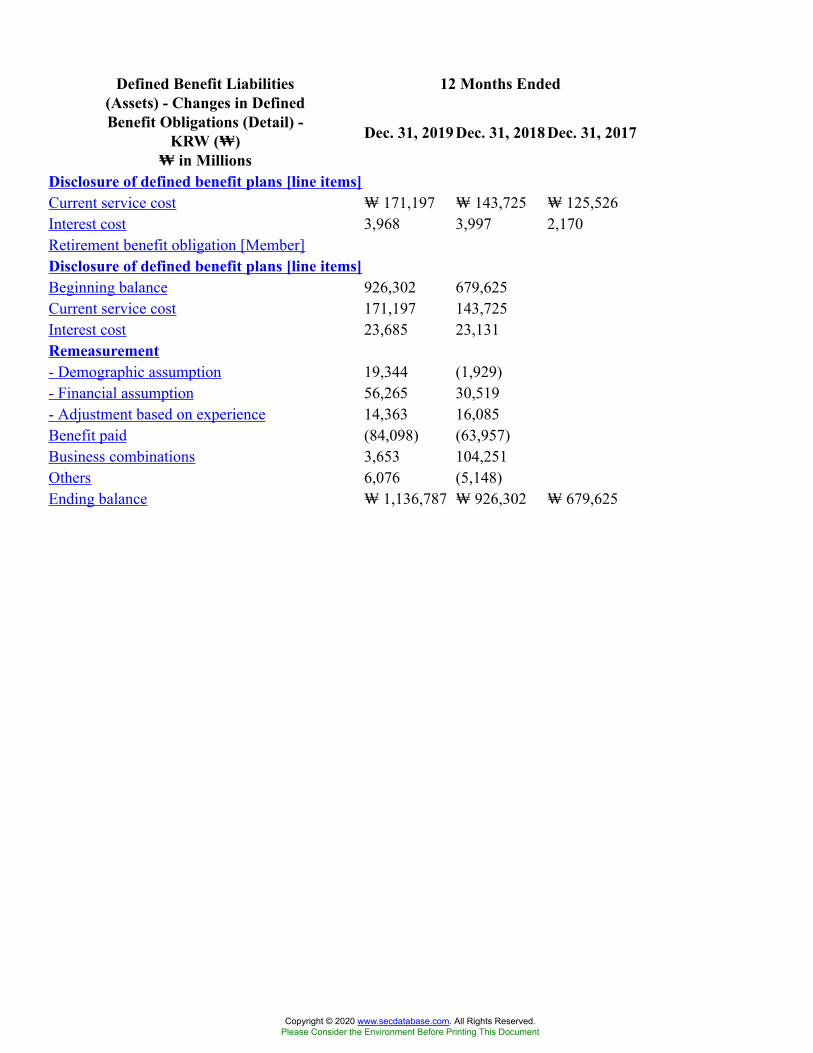
12 Months EndedDefined Benefit Liabilities(Assets) - Changes in DefinedBenefit Obligations (Detail) -
KRW (₩)₩ in Millions
Dec. 31, 2019 Dec. 31, 2018 Dec. 31, 2017
Disclosure of defined benefit plans [line items]Current service cost ₩ 171,197 ₩ 143,725 ₩ 125,526Interest cost 3,968 3,997 2,170Retirement benefit obligation [Member]Disclosure of defined benefit plans [line items]Beginning balance 926,302 679,625Current service cost 171,197 143,725Interest cost 23,685 23,131Remeasurement- Demographic assumption 19,344 (1,929)- Financial assumption 56,265 30,519- Adjustment based on experience 14,363 16,085Benefit paid (84,098) (63,957)Business combinations 3,653 104,251Others 6,076 (5,148)Ending balance ₩ 1,136,787 ₩ 926,302 ₩ 679,625
Copyright © 2020 www.secdatabase.com. All Rights Reserved.Please Consider the Environment Before Printing This Document

12 Months EndedTrade and Other Receivables(Tables) Dec. 31, 2019
Text block [abstract]Disclosure of DetailedInformation About Trade andOther Receivables Explanatory
(1) Details of trade and other receivables as of December 31, 2019 and 2018 are as follows:
(In millions of won)December 31, 2019
Grossamount
Lossallowance
Carryingamount
Current assets:Accounts receivable — trade ₩ 2,480,419 (249,440) 2,230,979Short-term loans 66,706 (583) 66,123Accounts receivable — other(*) 953,815 (48,379) 905,436Accrued income 3,977 (166) 3,811Guarantee deposits (Other current assets) 145,041 — 145,041
3,649,958 (298,568) 3,351,390Non-current assets:
Long-term loans 81,231 (47,471) 33,760Long-term accounts receivable — other(*) 344,662 — 344,662Guarantee deposits 165,033 (299) 164,734Long-term accounts receivable — trade (Other non-current assets) 16,977 (61) 16,916
607,903 (47,831) 560,072₩ 4,257,861 (346,399) 3,911,462
(*) Gross and carrying amounts of accounts receivable — other as of December 31, 2019 include ₩ 532,225 million of financial instruments classified as FVTPL.
(In millions of won)December 31, 2018
Grossamount Loss allowance
Carryingamount
Current assets:Accounts receivable — trade ₩ 2,268,680 (260,040) 2,008,640Short-term loans 59,643 (549) 59,094Accounts receivable — other(*) 1,006,183 (68,346) 937,837Accrued income 6,232 (166) 6,066Guarantee deposits (Other current assets) 2,714 — 2,714
3,343,452 (329,101) 3,014,351Non-current assets:
Long-term loans 75,860 (46,826) 29,034Long-term accounts receivable — other(*) 274,053 — 274,053Guarantee deposits 313,140 — 313,140Long-term accounts receivable — trade (Other non-current assets) 11,410 (117) 11,293
674,463 (46,943) 627,520₩ 4,017,915 (376,044) 3,641,871
(*) Gross and carrying amounts of accounts receivable — other as of December 31, 2018 include ₩ 489,617 million of financial instruments classified as FVTPL.Changes in Loss Allowance onAccounts Receivable - TradeMeasured at Amortized Costs
(2) Changes in the loss allowance on accounts receivable — trade measured at amortized costs during the years ended December 31, 2019 and 2018 are as follows:
(In millions of won)
Beginningbalance
Impact ofadoptingIFRS 9 Impairment Write-offs(*)
Collection ofreceivablespreviouslywritten-off
Businesscombinationand others
EndingBalance
2019 ₩ 260,157 — 28,841 (55,756) 14,772 1,487 249,5012018 239,448 12,950 38,211 (46,616) 13,455 2,709 260,157
(*) The Group writes off the trade and other receivables when contractual payments are more than 5 years past due, or for reasons such as termination of operations orliquidation.
Summary of Loss Allowanceon Accounts Receivable -Trade
(3) The Group applies the practical expedient that allows the Group to estimate the loss allowance for accounts receivable — trade at an amount equal to the lifetimeexpected credit losses. The expected credit losses include the forward-looking information. To make the assessment, the Group uses its historical credit lossexperience over the past three years and classified the accounts receivable — trade by their credit risk characteristics and days overdue. Details of loss allowance onaccounts receivable — trade as of December 31, 2019 are as follows:
(In millions of won)Less than6 months
6 months ~1 year 1 ~ 3 years
More than3 years
Expected credit loss rate 1.34% 63.33% 85.89% 97.49%Gross amount ₩1,180,733 44,972 110,038 28,300
Telecommunications service revenue
Loss allowance 15,822 28,481 94,509 27,589Expected credit loss rate 3.49% 56.01% 45.99% 61.72%Gross amount ₩1,052,530 5,162 20,252 55,409
Other revenue
Loss allowance 36,696 2,891 9,313 34,200
Copyright © 2020 www.secdatabase.com. All Rights Reserved.Please Consider the Environment Before Printing This Document
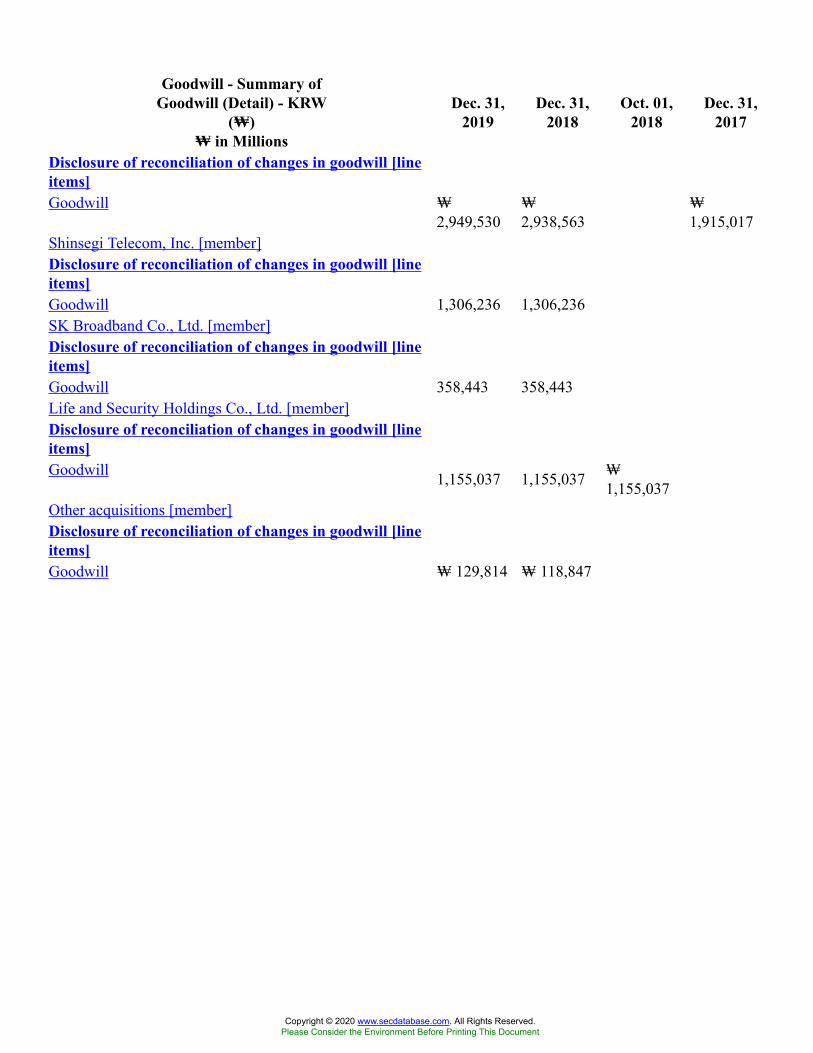
Goodwill - Summary ofGoodwill (Detail) - KRW
(₩)₩ in Millions
Dec. 31,2019
Dec. 31,2018
Oct. 01,2018
Dec. 31,2017
Disclosure of reconciliation of changes in goodwill [lineitems]Goodwill ₩
2,949,530₩2,938,563
₩1,915,017
Shinsegi Telecom, Inc. [member]Disclosure of reconciliation of changes in goodwill [lineitems]Goodwill 1,306,236 1,306,236SK Broadband Co., Ltd. [member]Disclosure of reconciliation of changes in goodwill [lineitems]Goodwill 358,443 358,443Life and Security Holdings Co., Ltd. [member]Disclosure of reconciliation of changes in goodwill [lineitems]Goodwill 1,155,037 1,155,037 ₩
1,155,037Other acquisitions [member]Disclosure of reconciliation of changes in goodwill [lineitems]Goodwill ₩ 129,814 ₩ 118,847
Copyright © 2020 www.secdatabase.com. All Rights Reserved.Please Consider the Environment Before Printing This Document

12 Months EndedInvestments in Associatesand Joint Ventures - Detailsof Cumulative Unrecognized
Equity Method Losses(Detail)
₩ in Millions
Dec. 31, 2019KRW (₩)
Disclosure of associates [Line Items]Unrecognized loss (profit) ₩ (6,922)Unrecognized loss (profit), cumulative loss 15,022Unrecognized change in equity (503)Unrecognized change in equity, cumulative loss (138)Wave City Development Co., Ltd. [member]Disclosure of associates [Line Items]Unrecognized loss (profit) (2,164)Unrecognized loss (profit), cumulative loss 4,370Daehan Kanggun BcN Co., Ltd. and others [member]Disclosure of associates [Line Items]Unrecognized loss (profit) (4,758)Unrecognized loss (profit), cumulative loss 10,652Unrecognized change in equity (503)Unrecognized change in equity, cumulative loss ₩ (138)
Copyright © 2020 www.secdatabase.com. All Rights Reserved.Please Consider the Environment Before Printing This Document

Intangible Assets - Summaryof Intangible Assets (Detail) -
KRW (₩)₩ in Millions
Dec. 31,2019
Dec. 31,2018
Dec. 31,2017
Disclosure of detailed information about intangible assets [line items]Intangible assets ₩
4,866,092₩5,513,510
₩3,586,965
Gross amount [member]Disclosure of detailed information about intangible assets [line items]Intangible assets 12,087,452 12,039,794Accumulated depreciation and amortization [member]Disclosure of detailed information about intangible assets [line items]Intangible assets (7,164,105) (6,422,106)Accumulated impairment [member]Disclosure of detailed information about intangible assets [line items]Intangible assets (57,255) (104,178)Frequency usage rights [member]Disclosure of detailed information about intangible assets [line items]Intangible assets 2,647,501 3,139,978 2,176,940Frequency usage rights [member] | Gross amount [member]Disclosure of detailed information about intangible assets [line items]Intangible assets 6,210,882 6,210,882Frequency usage rights [member] | Accumulated depreciation andamortization [member]Disclosure of detailed information about intangible assets [line items]Intangible assets (3,563,381) (3,070,904)Land usage rights [member]Disclosure of detailed information about intangible assets [line items]Intangible assets 7,349 10,511 15,750Land usage rights [member] | Gross amount [member]Disclosure of detailed information about intangible assets [line items]Intangible assets 53,265 65,974Land usage rights [member] | Accumulated depreciation and amortization[member]Disclosure of detailed information about intangible assets [line items]Intangible assets (45,916) (55,463)Industrial rights [member]Disclosure of detailed information about intangible assets [line items]Intangible assets 66,824 83,627 111,347Industrial rights [member] | Gross amount [member]Disclosure of detailed information about intangible assets [line items]Intangible assets 110,380 163,983Industrial rights [member] | Accumulated depreciation and amortization[member]
Copyright © 2020 www.secdatabase.com. All Rights Reserved.Please Consider the Environment Before Printing This Document
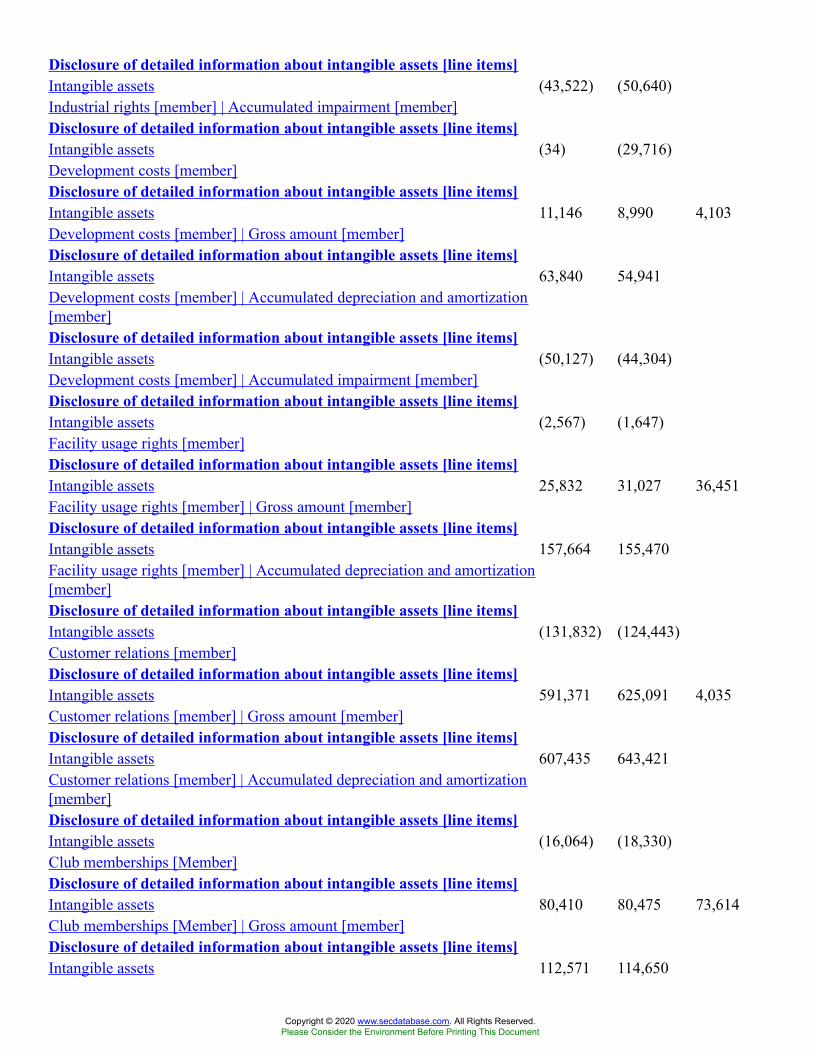
Disclosure of detailed information about intangible assets [line items]Intangible assets (43,522) (50,640)Industrial rights [member] | Accumulated impairment [member]Disclosure of detailed information about intangible assets [line items]Intangible assets (34) (29,716)Development costs [member]Disclosure of detailed information about intangible assets [line items]Intangible assets 11,146 8,990 4,103Development costs [member] | Gross amount [member]Disclosure of detailed information about intangible assets [line items]Intangible assets 63,840 54,941Development costs [member] | Accumulated depreciation and amortization[member]Disclosure of detailed information about intangible assets [line items]Intangible assets (50,127) (44,304)Development costs [member] | Accumulated impairment [member]Disclosure of detailed information about intangible assets [line items]Intangible assets (2,567) (1,647)Facility usage rights [member]Disclosure of detailed information about intangible assets [line items]Intangible assets 25,832 31,027 36,451Facility usage rights [member] | Gross amount [member]Disclosure of detailed information about intangible assets [line items]Intangible assets 157,664 155,470Facility usage rights [member] | Accumulated depreciation and amortization[member]Disclosure of detailed information about intangible assets [line items]Intangible assets (131,832) (124,443)Customer relations [member]Disclosure of detailed information about intangible assets [line items]Intangible assets 591,371 625,091 4,035Customer relations [member] | Gross amount [member]Disclosure of detailed information about intangible assets [line items]Intangible assets 607,435 643,421Customer relations [member] | Accumulated depreciation and amortization[member]Disclosure of detailed information about intangible assets [line items]Intangible assets (16,064) (18,330)Club memberships [Member]Disclosure of detailed information about intangible assets [line items]Intangible assets 80,410 80,475 73,614Club memberships [Member] | Gross amount [member]Disclosure of detailed information about intangible assets [line items]Intangible assets 112,571 114,650
Copyright © 2020 www.secdatabase.com. All Rights Reserved.Please Consider the Environment Before Printing This Document

Club memberships [Member] | Accumulated impairment [member]Disclosure of detailed information about intangible assets [line items]Intangible assets (32,161) (34,175)Brands [member]Disclosure of detailed information about intangible assets [line items]Intangible assets 374,096 374,096 374,096Brands [member] | Gross amount [member]Disclosure of detailed information about intangible assets [line items]Intangible assets 374,096 374,096Other [member]Disclosure of detailed information about intangible assets [line items]Intangible assets 1,061,563 1,159,715 ₩
1,164,725Other [member] | Gross amount [member]Disclosure of detailed information about intangible assets [line items]Intangible assets 4,397,319 4,256,377Other [member] | Accumulated depreciation and amortization [member]Disclosure of detailed information about intangible assets [line items]Intangible assets (3,313,263) (3,058,022)Other [member] | Accumulated impairment [member]Disclosure of detailed information about intangible assets [line items]Intangible assets ₩ (22,493) ₩ (38,640)
Copyright © 2020 www.secdatabase.com. All Rights Reserved.Please Consider the Environment Before Printing This Document

12 Months EndedRetained Earnings Dec. 31, 2019Text block [abstract]Retained Earnings 26. Retained Earnings
(1) Retained earnings as of December 31, 2019 and 2018 are as follows:
(In millions of won) December 31, 2019 December 31, 2018Appropriated:
Legal reserve ₩ 22,320 22,320Reserve for business expansion 11,531,138 10,531,138Reserve for technology development 4,265,300 3,321,300
15,818,758 13,874,758Unappropriated 6,416,527 8,269,783
₩ 22,235,285 22,144,541
(2) Legal reserve
The Korean Commercial Act requires the Parent Company to appropriate as a legal reserve at least 10% of cash dividends paid for each accounting period until thereserve equals 50% of outstanding share capital. The legal reserve may not be utilized for cash dividends, but may only be used to offset a future deficit, if any, or may betransferred to share capital.
Copyright © 2020 www.secdatabase.com. All Rights Reserved.Please Consider the Environment Before Printing This Document
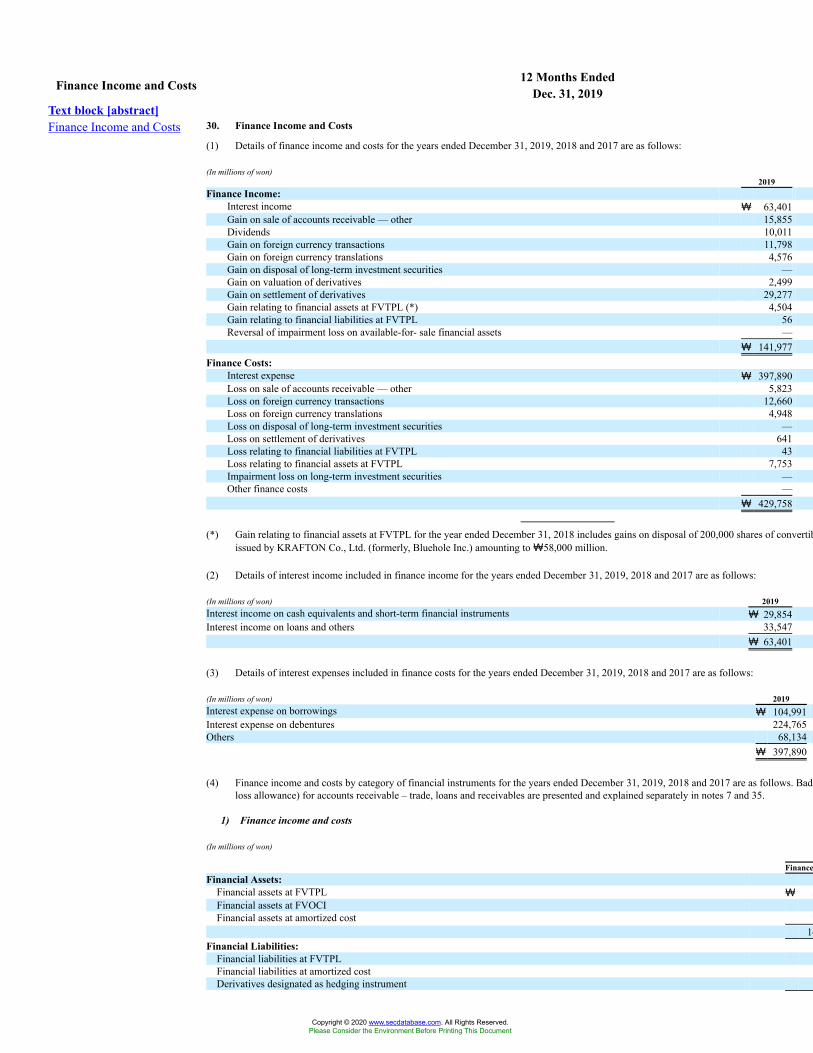
12 Months EndedFinance Income and Costs Dec. 31, 2019Text block [abstract]Finance Income and Costs 30. Finance Income and Costs
(1) Details of finance income and costs for the years ended December 31, 2019, 2018 and 2017 are as follows:
(In millions of won)2019 2018 2017
Finance Income:Interest income ₩ 63,401 69,936 76,045Gain on sale of accounts receivable — other 15,855 20,023 18,548Dividends 10,011 35,143 12,416Gain on foreign currency transactions 11,798 17,990 13,676Gain on foreign currency translations 4,576 2,776 7,110Gain on disposal of long-term investment securities — — 4,890Gain on valuation of derivatives 2,499 6,532 223,943Gain on settlement of derivatives 29,277 20,399 —Gain relating to financial assets at FVTPL (*) 4,504 83,636 33Gain relating to financial liabilities at FVTPL 56 — —Reversal of impairment loss on available-for- sale financial assets — — 9,900
₩ 141,977 256,435 366,561Finance Costs:
Interest expense ₩ 397,890 307,319 299,100Loss on sale of accounts receivable — other 5,823 — 9,682Loss on foreign currency transactions 12,660 38,920 19,263Loss on foreign currency translations 4,948 2,397 8,419Loss on disposal of long-term investment securities — — 36,024Loss on settlement of derivatives 641 12,554 10,031Loss relating to financial liabilities at FVTPL 43 1,535 678Loss relating to financial assets at FVTPL 7,753 22,507 —Impairment loss on long-term investment securities — — 14,519Other finance costs — — 35,900
₩ 429,758 385,232 433,616
(*) Gain relating to financial assets at FVTPL for the year ended December 31, 2018 includes gains on disposal of 200,000 shares of convertible redeemable bondsissued by KRAFTON Co., Ltd. (formerly, Bluehole Inc.) amounting to ₩58,000 million.
(2) Details of interest income included in finance income for the years ended December 31, 2019, 2018 and 2017 are as follows:
(In millions of won) 2019 2018 2017Interest income on cash equivalents and short-term financial instruments ₩ 29,854 33,808 28,130Interest income on loans and others 33,547 36,128 47,915
₩ 63,401 69,936 76,045
(3) Details of interest expenses included in finance costs for the years ended December 31, 2019, 2018 and 2017 are as follows:
(In millions of won) 2019 2018 2017Interest expense on borrowings ₩ 104,991 10,796 11,774Interest expense on debentures 224,765 222,195 228,568Others 68,134 74,328 58,758
₩ 397,890 307,319 299,100
(4) Finance income and costs by category of financial instruments for the years ended December 31, 2019, 2018 and 2017 are as follows. Bad debt expense (reversal ofloss allowance) for accounts receivable – trade, loans and receivables are presented and explained separately in notes 7 and 35.
1) Finance income and costs
(In millions of won)2019
Finance income Finance costsFinancial Assets:
Financial assets at FVTPL ₩ 56,953 13,577Financial assets at FVOCI 9,924 —Financial assets at amortized cost 74,941 17,488
141,818 31,065Financial Liabilities:
Financial liabilities at FVTPL 56 43Financial liabilities at amortized cost 103 398,009Derivatives designated as hedging instrument — 641
Copyright © 2020 www.secdatabase.com. All Rights Reserved.Please Consider the Environment Before Printing This Document
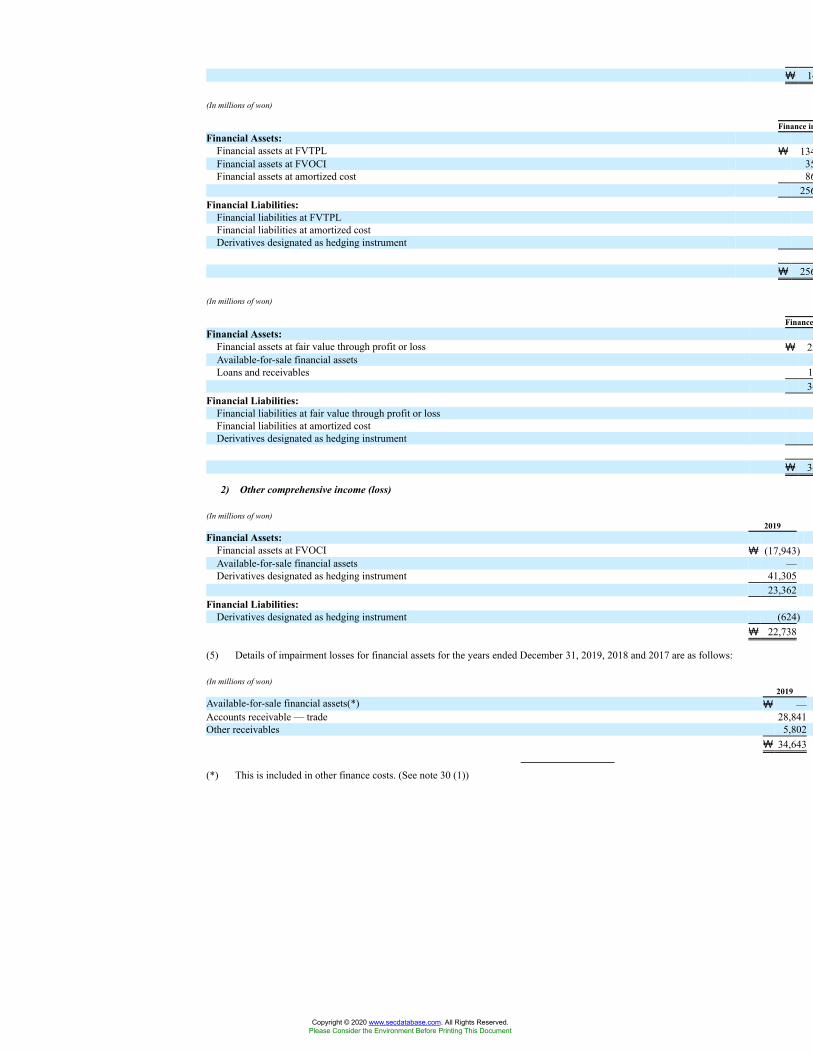
159 398,693₩ 141,977 429,758
(In millions of won)2018
Finance income Finance costsFinancial Assets:
Financial assets at FVTPL ₩ 134,841 22,507Financial assets at FVOCI 35,143 —Financial assets at amortized cost 86,032 20,018
256,016 42,525Financial Liabilities:
Financial liabilities at FVTPL — 1,535Financial liabilities at amortized cost 419 328,618Derivatives designated as hedging instrument — 12,554
419 342,707₩ 256,435 385,232
(In millions of won)2017
Finance income Finance costsFinancial Assets:
Financial assets at fair value through profit or loss ₩ 223,976 —Available-for-sale financial assets 30,598 86,445Loans and receivables 111,677 37,040
366,251 123,485Financial Liabilities:
Financial liabilities at fair value through profit or loss — 678Financial liabilities at amortized cost 310 299,422Derivatives designated as hedging instrument — 10,031
310 310,131₩ 366,561 433,616
2) Other comprehensive income (loss)
(In millions of won)2019 2018 2017
Financial Assets:Financial assets at FVOCI ₩ (17,943) (130,035) —Available-for-sale financial assets — — 158,440Derivatives designated as hedging instrument 41,305 17,180 1,554
23,362 (112,855) 159,994Financial Liabilities:
Derivatives designated as hedging instrument (624) 15,047 21,032₩ 22,738 (97,808) 181,026
(5) Details of impairment losses for financial assets for the years ended December 31, 2019, 2018 and 2017 are as follows:
(In millions of won)2019 2018 2017
Available-for-sale financial assets(*) ₩ — — 14,519Accounts receivable — trade 28,841 38,211 34,584Other receivables 5,802 7,718 5,793
₩ 34,643 45,929 54,896
(*) This is included in other finance costs. (See note 30 (1))
Copyright © 2020 www.secdatabase.com. All Rights Reserved.Please Consider the Environment Before Printing This Document
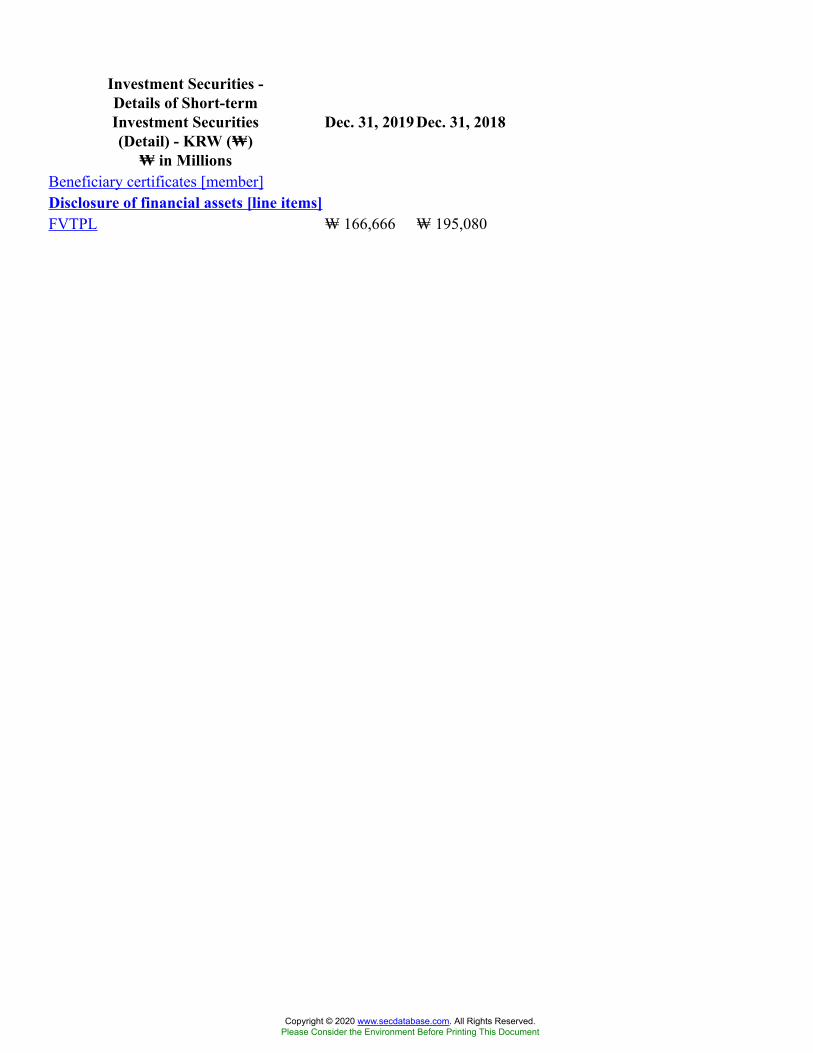
Investment Securities -Details of Short-termInvestment Securities(Detail) - KRW (₩)
₩ in Millions
Dec. 31, 2019 Dec. 31, 2018
Beneficiary certificates [member]Disclosure of financial assets [line items]FVTPL ₩ 166,666 ₩ 195,080
Copyright © 2020 www.secdatabase.com. All Rights Reserved.Please Consider the Environment Before Printing This Document
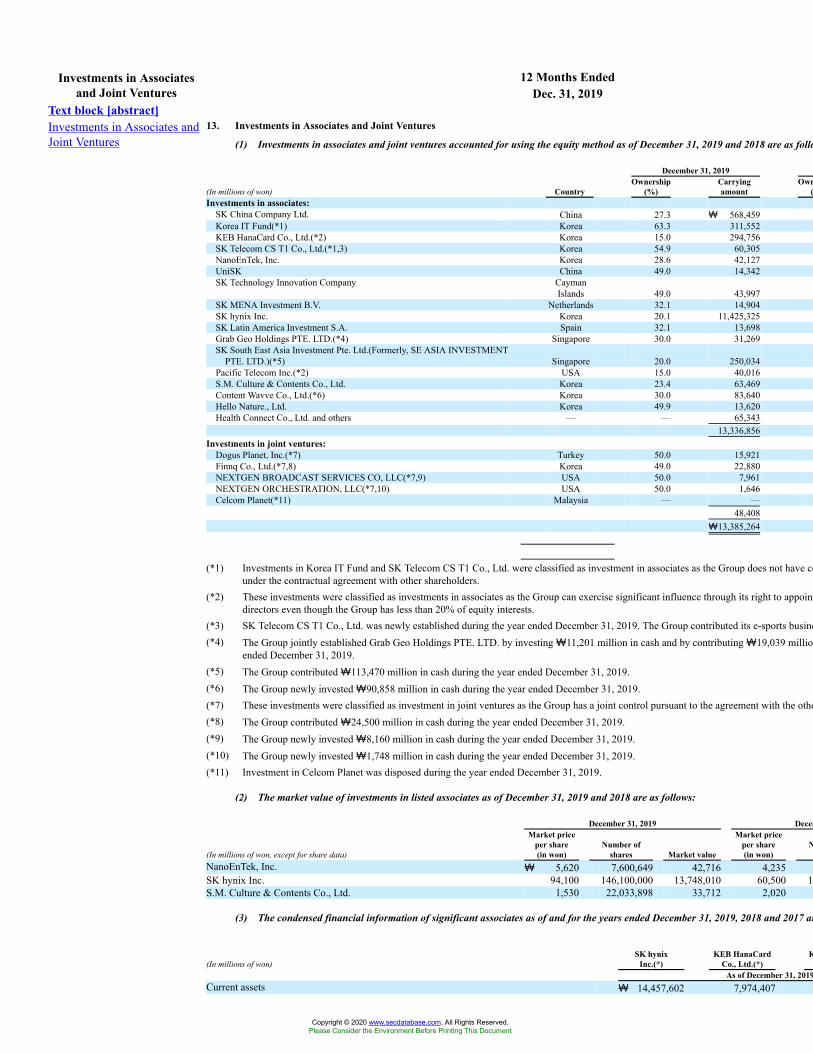
12 Months EndedInvestments in Associatesand Joint Ventures Dec. 31, 2019
Text block [abstract]Investments in Associates andJoint Ventures
13. Investments in Associates and Joint Ventures
(1) Investments in associates and joint ventures accounted for using the equity method as of December 31, 2019 and 2018 are as follows:
December 31, 2019 December 31, 2018
(In millions of won) CountryOwnership
(%)Carryingamount
Ownership(%)
Carryingamount
Investments in associates:SK China Company Ltd. China 27.3 ₩ 568,459 27.3 ₩ 551,548Korea IT Fund(*1) Korea 63.3 311,552 63.3 281,684KEB HanaCard Co., Ltd.(*2) Korea 15.0 294,756 15.0 288,457SK Telecom CS T1 Co., Ltd.(*1,3) Korea 54.9 60,305 — —NanoEnTek, Inc. Korea 28.6 42,127 28.9 40,974UniSK China 49.0 14,342 49.0 13,486SK Technology Innovation Company Cayman
Islands 49.0 43,997 49.0 42,469SK MENA Investment B.V. Netherlands 32.1 14,904 32.1 14,420SK hynix Inc. Korea 20.1 11,425,325 20.1 11,208,315SK Latin America Investment S.A. Spain 32.1 13,698 32.1 13,313Grab Geo Holdings PTE. LTD.(*4) Singapore 30.0 31,269 — —SK South East Asia Investment Pte. Ltd.(Formerly, SE ASIA INVESTMENT
PTE. LTD.)(*5) Singapore 20.0 250,034 20.0 111,000Pacific Telecom Inc.(*2) USA 15.0 40,016 15.0 37,075S.M. Culture & Contents Co., Ltd. Korea 23.4 63,469 23.4 63,801Content Wavve Co., Ltd.(*6) Korea 30.0 83,640 — —Hello Nature., Ltd. Korea 49.9 13,620 49.9 28,549Health Connect Co., Ltd. and others — — 65,343 — 96,522
13,336,856 12,791,613Investments in joint ventures:
Dogus Planet, Inc.(*7) Turkey 50.0 15,921 50.0 12,487Finnq Co., Ltd.(*7,8) Korea 49.0 22,880 49.0 7,671NEXTGEN BROADCAST SERVICES CO, LLC(*7,9) USA 50.0 7,961 — —NEXTGEN ORCHESTRATION, LLC(*7,10) USA 50.0 1,646 — —Celcom Planet(*11) Malaysia — — 44.7 —
48,408 20,158₩13,385,264 ₩12,811,771
(*1) Investments in Korea IT Fund and SK Telecom CS T1 Co., Ltd. were classified as investment in associates as the Group does not have control over the investeeunder the contractual agreement with other shareholders.
(*2) These investments were classified as investments in associates as the Group can exercise significant influence through its right to appoint the members of board ofdirectors even though the Group has less than 20% of equity interests.
(*3) SK Telecom CS T1 Co., Ltd. was newly established during the year ended December 31, 2019. The Group contributed its e-sports business after the establishment.(*4) The Group jointly established Grab Geo Holdings PTE. LTD. by investing ₩11,201 million in cash and by contributing ₩19,039 million in kind during the year
ended December 31, 2019.(*5) The Group contributed ₩113,470 million in cash during the year ended December 31, 2019.(*6) The Group newly invested ₩90,858 million in cash during the year ended December 31, 2019.(*7) These investments were classified as investment in joint ventures as the Group has a joint control pursuant to the agreement with the other shareholders.(*8) The Group contributed ₩24,500 million in cash during the year ended December 31, 2019.(*9) The Group newly invested ₩8,160 million in cash during the year ended December 31, 2019.(*10) The Group newly invested ₩1,748 million in cash during the year ended December 31, 2019.(*11) Investment in Celcom Planet was disposed during the year ended December 31, 2019.
(2) The market value of investments in listed associates as of December 31, 2019 and 2018 are as follows:
December 31, 2019 December 31, 2018
(In millions of won, except for share data)
Market priceper share(in won)
Number ofshares Market value
Market priceper share(in won)
Number ofshares Market value
NanoEnTek, Inc. ₩ 5,620 7,600,649 42,716 4,235 7,600,649 32,189SK hynix Inc. 94,100 146,100,000 13,748,010 60,500 146,100,000 8,839,050S.M. Culture & Contents Co., Ltd. 1,530 22,033,898 33,712 2,020 22,033,898 44,508
(3) The condensed financial information of significant associates as of and for the years ended December 31, 2019, 2018 and 2017 are as follows:
(In millions of won)SK hynix
Inc.(*)KEB HanaCard
Co., Ltd.(*)Korea IT
Fund
SK ChinaCompany
Ltd.(*)As of December 31, 2019
Current assets ₩ 14,457,602 7,974,407 113,233 615,028
Copyright © 2020 www.secdatabase.com. All Rights Reserved.Please Consider the Environment Before Printing This Document
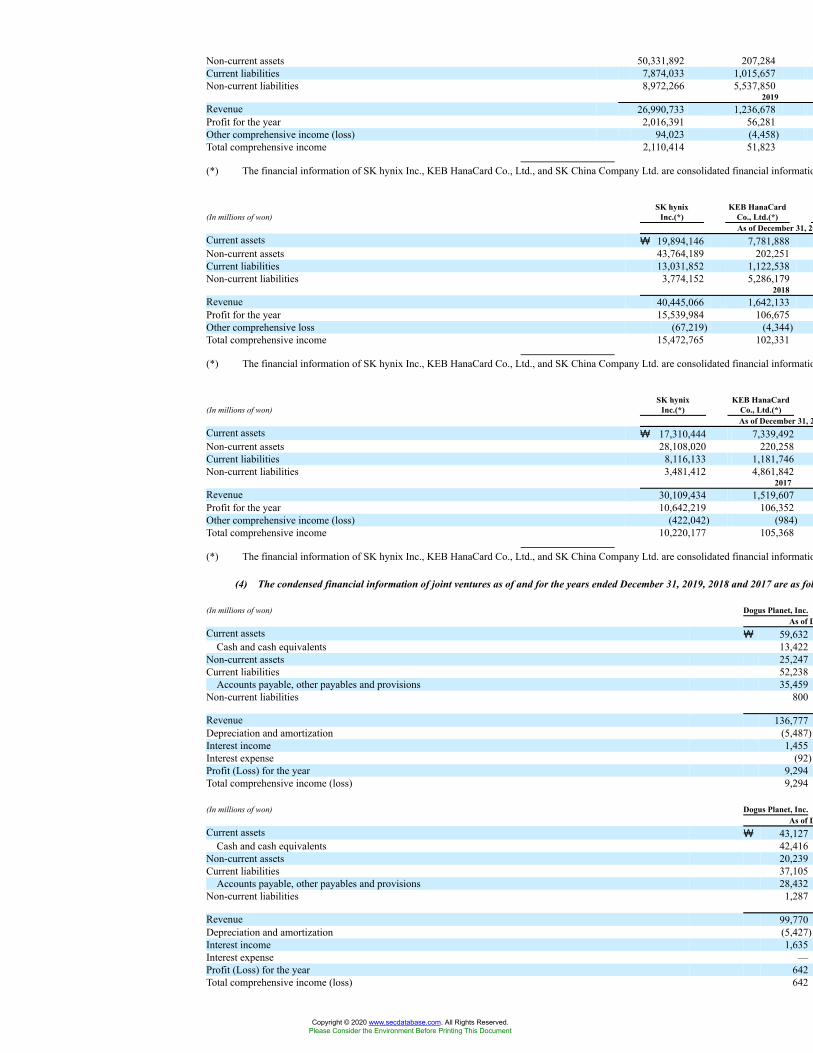
Non-current assets 50,331,892 207,284 378,691 1,442,748Current liabilities 7,874,033 1,015,657 — 59,395Non-current liabilities 8,972,266 5,537,850 — 215,354
2019Revenue 26,990,733 1,236,678 70,565 116,269Profit for the year 2,016,391 56,281 53,867 23,474Other comprehensive income (loss) 94,023 (4,458) 6,132 (15,093)Total comprehensive income 2,110,414 51,823 59,999 8,381
(*) The financial information of SK hynix Inc., KEB HanaCard Co., Ltd., and SK China Company Ltd. are consolidated financial information.
(In millions of won)SK hynix
Inc.(*)KEB HanaCard
Co., Ltd.(*)Korea IT
Fund
SK ChinaCompany
Ltd.(*)As of December 31, 2018
Current assets ₩ 19,894,146 7,781,888 118,024 677,686Non-current assets 43,764,189 202,251 326,740 1,221,736Current liabilities 13,031,852 1,122,538 — 71,396Non-current liabilities 3,774,152 5,286,179 — 117,094
2018Revenue 40,445,066 1,642,133 57,430 117,132Profit for the year 15,539,984 106,675 45,110 30,274Other comprehensive loss (67,219) (4,344) (13,422) (16,149)Total comprehensive income 15,472,765 102,331 31,688 14,125
(*) The financial information of SK hynix Inc., KEB HanaCard Co., Ltd., and SK China Company Ltd. are consolidated financial information.
(In millions of won)SK hynix
Inc.(*)KEB HanaCard
Co., Ltd.(*)Korea IT
Fund
SK ChinaCompany
Ltd.(*)As of December 31, 2017
Current assets ₩ 17,310,444 7,339,492 144,874 729,872Non-current assets 28,108,020 220,258 260,920 1,031,647Current liabilities 8,116,133 1,181,746 — 81,161Non-current liabilities 3,481,412 4,861,842 — 64,717
2017Revenue 30,109,434 1,519,607 11,743 69,420Profit for the year 10,642,219 106,352 1,916 11,492Other comprehensive income (loss) (422,042) (984) 4,108 27,190Total comprehensive income 10,220,177 105,368 6,024 38,682
(*) The financial information of SK hynix Inc., KEB HanaCard Co., Ltd., and SK China Company Ltd. are consolidated financial information.
(4) The condensed financial information of joint ventures as of and for the years ended December 31, 2019, 2018 and 2017 are as follows:
(In millions of won) Dogus Planet, Inc. Finnq Co., Ltd.As of December 31, 2019
Current assets ₩ 59,632 42,995Cash and cash equivalents 13,422 40,619
Non-current assets 25,247 11,389Current liabilities 52,238 6,756
Accounts payable, other payables and provisions 35,459 5,062Non-current liabilities 800 1,099
2019Revenue 136,777 1,968Depreciation and amortization (5,487) (4,769)Interest income 1,455 12Interest expense (92) (198)Profit (Loss) for the year 9,294 (17,079)Total comprehensive income (loss) 9,294 (17,361)
(In millions of won) Dogus Planet, Inc. Finnq Co., Ltd.As of December 31, 2018
Current assets ₩ 43,127 11,985Cash and cash equivalents 42,416 10,434
Non-current assets 20,239 15,435Current liabilities 37,105 5,070
Accounts payable, other payables and provisions 28,432 87Non-current liabilities 1,287 7,579
2018Revenue 99,770 232Depreciation and amortization (5,427) (3,490)Interest income 1,635 5Interest expense — (301)Profit (Loss) for the year 642 (17,995)Total comprehensive income (loss) 642 (18,166)
Copyright © 2020 www.secdatabase.com. All Rights Reserved.Please Consider the Environment Before Printing This Document
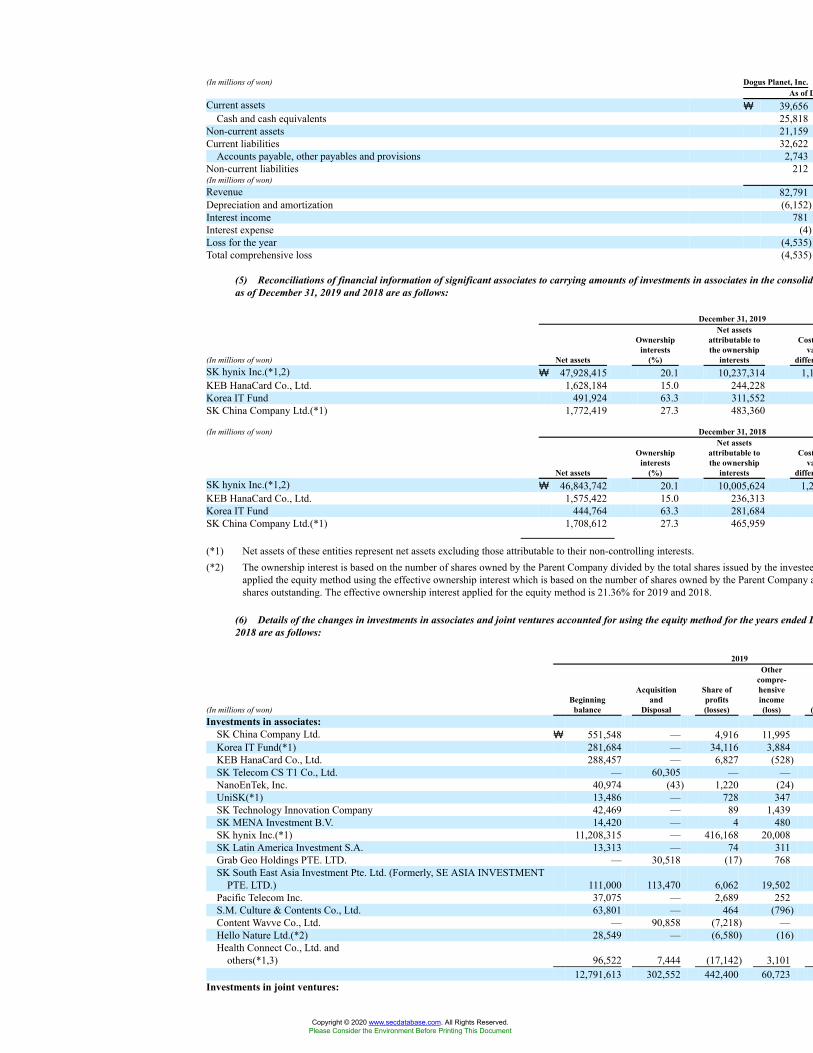
(In millions of won) Dogus Planet, Inc. Finnq Co., Ltd.As of December 31, 2017
Current assets ₩ 39,656 32,232Cash and cash equivalents 25,818 4,590
Non-current assets 21,159 15,610Current liabilities 32,622 5,685
Accounts payable, other payables and provisions 2,743 2,290Non-current liabilities 212 13,862(In millions of won) 2017Revenue 82,791 —Depreciation and amortization (6,152) (1,077)Interest income 781 532Interest expense (4) (276)Loss for the year (4,535) (15,699)Total comprehensive loss (4,535) (15,699)
(5) Reconciliations of financial information of significant associates to carrying amounts of investments in associates in the consolidated financial statementsas of December 31, 2019 and 2018 are as follows:
December 31, 2019
(In millions of won) Net assets
Ownershipinterests
(%)
Net assetsattributable tothe ownership
interests
Cost-bookvalue
differentialsCarryingamount
SK hynix Inc.(*1,2) ₩ 47,928,415 20.1 10,237,314 1,188,011 11,425,325KEB HanaCard Co., Ltd. 1,628,184 15.0 244,228 50,528 294,756Korea IT Fund 491,924 63.3 311,552 — 311,552SK China Company Ltd.(*1) 1,772,419 27.3 483,360 85,099 568,459
(In millions of won) December 31, 2018
Net assets
Ownershipinterests
(%)
Net assetsattributable tothe ownership
interests
Cost-bookvalue
differentialsCarryingamount
SK hynix Inc.(*1,2) ₩ 46,843,742 20.1 10,005,624 1,202,691 11,208,315KEB HanaCard Co., Ltd. 1,575,422 15.0 236,313 52,144 288,457Korea IT Fund 444,764 63.3 281,684 — 281,684SK China Company Ltd.(*1) 1,708,612 27.3 465,959 85,589 551,548
(*1) Net assets of these entities represent net assets excluding those attributable to their non-controlling interests.(*2) The ownership interest is based on the number of shares owned by the Parent Company divided by the total shares issued by the investee company. The Group
applied the equity method using the effective ownership interest which is based on the number of shares owned by the Parent Company and the investee’s totalshares outstanding. The effective ownership interest applied for the equity method is 21.36% for 2019 and 2018.
(6) Details of the changes in investments in associates and joint ventures accounted for using the equity method for the years ended December 31, 2019 and2018 are as follows:
2019
(In millions of won)Beginning
balance
Acquisitionand
Disposal
Share ofprofits(losses)
Othercompre-hensiveincome(loss)
Otherincrease
(decrease)Endingbalance
Investments in associates:SK China Company Ltd. ₩ 551,548 — 4,916 11,995 — 568,459Korea IT Fund(*1) 281,684 — 34,116 3,884 (8,132) 311,552KEB HanaCard Co., Ltd. 288,457 — 6,827 (528) — 294,756SK Telecom CS T1 Co., Ltd. — 60,305 — — — 60,305NanoEnTek, Inc. 40,974 (43) 1,220 (24) — 42,127UniSK(*1) 13,486 — 728 347 (219) 14,342SK Technology Innovation Company 42,469 — 89 1,439 — 43,997SK MENA Investment B.V. 14,420 — 4 480 — 14,904SK hynix Inc.(*1) 11,208,315 — 416,168 20,008 (219,166) 11,425,325SK Latin America Investment S.A. 13,313 — 74 311 — 13,698Grab Geo Holdings PTE. LTD. — 30,518 (17) 768 — 31,269SK South East Asia Investment Pte. Ltd. (Formerly, SE ASIA INVESTMENT
PTE. LTD.) 111,000 113,470 6,062 19,502 — 250,034Pacific Telecom Inc. 37,075 — 2,689 252 — 40,016S.M. Culture & Contents Co., Ltd. 63,801 — 464 (796) — 63,469Content Wavve Co., Ltd. — 90,858 (7,218) — — 83,640Hello Nature Ltd.(*2) 28,549 — (6,580) (16) (8,333) 13,620Health Connect Co., Ltd. and
others(*1,3) 96,522 7,444 (17,142) 3,101 (24,582) 65,34312,791,613 302,552 442,400 60,723 (260,432) 13,336,856
Investments in joint ventures:
Copyright © 2020 www.secdatabase.com. All Rights Reserved.Please Consider the Environment Before Printing This Document
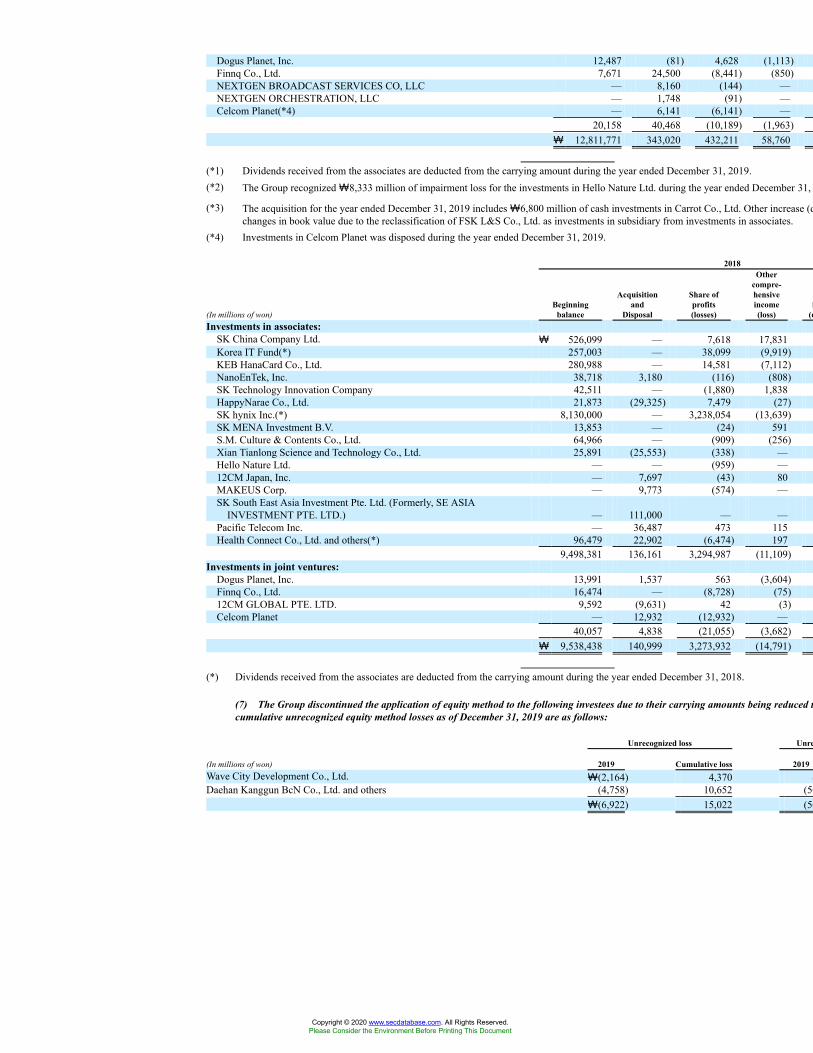
Dogus Planet, Inc. 12,487 (81) 4,628 (1,113) — 15,921Finnq Co., Ltd. 7,671 24,500 (8,441) (850) — 22,880NEXTGEN BROADCAST SERVICES CO, LLC — 8,160 (144) — (55) 7,961NEXTGEN ORCHESTRATION, LLC — 1,748 (91) — (11) 1,646Celcom Planet(*4) — 6,141 (6,141) — — —
20,158 40,468 (10,189) (1,963) (66) 48,408₩ 12,811,771 343,020 432,211 58,760 (260,498) 13,385,264
(*1) Dividends received from the associates are deducted from the carrying amount during the year ended December 31, 2019.(*2) The Group recognized ₩8,333 million of impairment loss for the investments in Hello Nature Ltd. during the year ended December 31, 2019.
(*3) The acquisition for the year ended December 31, 2019 includes ₩6,800 million of cash investments in Carrot Co., Ltd. Other increase (decrease) includes thechanges in book value due to the reclassification of FSK L&S Co., Ltd. as investments in subsidiary from investments in associates.
(*4) Investments in Celcom Planet was disposed during the year ended December 31, 2019.
2018
(In millions of won)Beginning
balance
Acquisitionand
Disposal
Share ofprofits(losses)
Othercompre-hensiveincome(loss)
Otherincrease
(decrease)Endingbalance
Investments in associates:SK China Company Ltd. ₩ 526,099 — 7,618 17,831 — 551,548Korea IT Fund(*) 257,003 — 38,099 (9,919) (3,499) 281,684KEB HanaCard Co., Ltd. 280,988 — 14,581 (7,112) — 288,457NanoEnTek, Inc. 38,718 3,180 (116) (808) — 40,974SK Technology Innovation Company 42,511 — (1,880) 1,838 — 42,469HappyNarae Co., Ltd. 21,873 (29,325) 7,479 (27) — —SK hynix Inc.(*) 8,130,000 — 3,238,054 (13,639) (146,100) 11,208,315SK MENA Investment B.V. 13,853 — (24) 591 — 14,420S.M. Culture & Contents Co., Ltd. 64,966 — (909) (256) — 63,801Xian Tianlong Science and Technology Co., Ltd. 25,891 (25,553) (338) — — —Hello Nature Ltd. — — (959) — 29,508 28,54912CM Japan, Inc. — 7,697 (43) 80 — 7,734MAKEUS Corp. — 9,773 (574) — (6) 9,193SK South East Asia Investment Pte. Ltd. (Formerly, SE ASIA
INVESTMENT PTE. LTD.) — 111,000 — — — 111,000Pacific Telecom Inc. — 36,487 473 115 — 37,075Health Connect Co., Ltd. and others(*) 96,479 22,902 (6,474) 197 (6,710) 106,394
9,498,381 136,161 3,294,987 (11,109) (126,807) 12,791,613Investments in joint ventures:
Dogus Planet, Inc. 13,991 1,537 563 (3,604) — 12,487Finnq Co., Ltd. 16,474 — (8,728) (75) — 7,67112CM GLOBAL PTE. LTD. 9,592 (9,631) 42 (3) — —Celcom Planet — 12,932 (12,932) — — —
40,057 4,838 (21,055) (3,682) — 20,158₩ 9,538,438 140,999 3,273,932 (14,791) (126,807) 12,811,771
(*) Dividends received from the associates are deducted from the carrying amount during the year ended December 31, 2018.
(7) The Group discontinued the application of equity method to the following investees due to their carrying amounts being reduced to zero. The details ofcumulative unrecognized equity method losses as of December 31, 2019 are as follows:
Unrecognized loss Unrecognized change in equity
(In millions of won) 2019 Cumulative loss 2019Cumulative
lossWave City Development Co., Ltd. ₩(2,164) 4,370 — —Daehan Kanggun BcN Co., Ltd. and others (4,758) 10,652 (503) (138)
₩(6,922) 15,022 (503) (138)
Copyright © 2020 www.secdatabase.com. All Rights Reserved.Please Consider the Environment Before Printing This Document
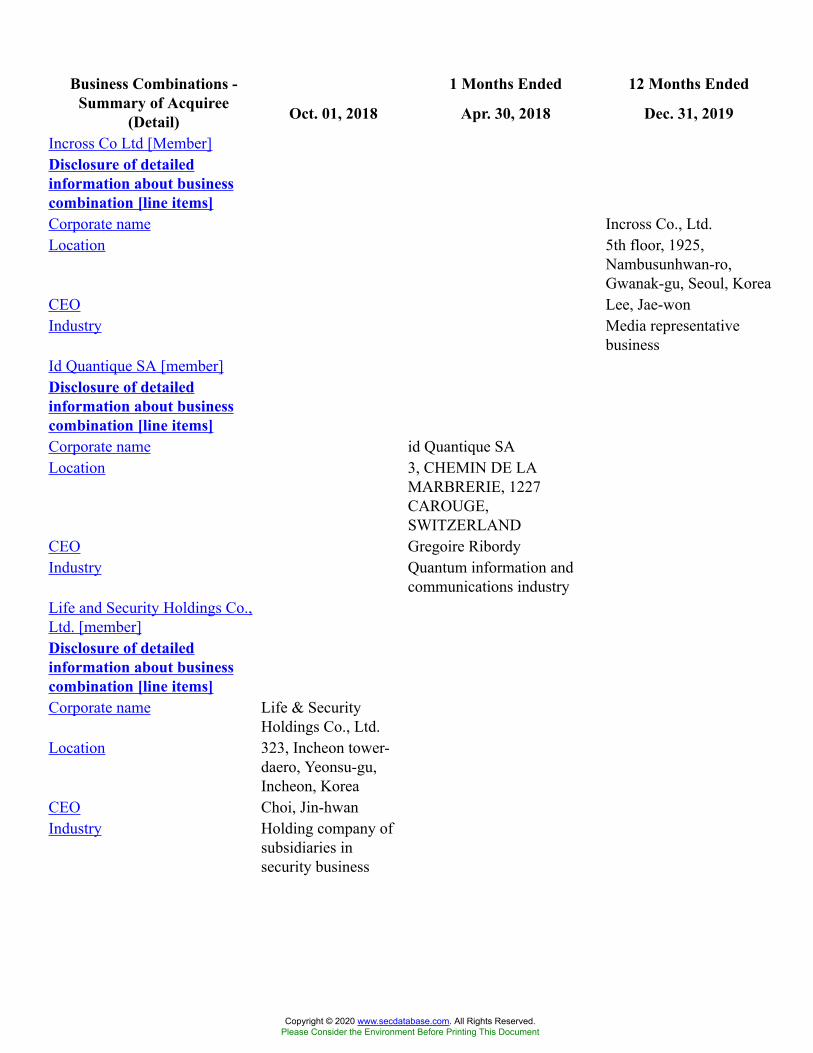
1 Months Ended 12 Months EndedBusiness Combinations -Summary of Acquiree
(Detail) Oct. 01, 2018 Apr. 30, 2018 Dec. 31, 2019
Incross Co Ltd [Member]Disclosure of detailedinformation about businesscombination [line items]Corporate name Incross Co., Ltd.Location 5th floor, 1925,
Nambusunhwan-ro,Gwanak-gu, Seoul, Korea
CEO Lee, Jae-wonIndustry Media representative
businessId Quantique SA [member]Disclosure of detailedinformation about businesscombination [line items]Corporate name id Quantique SALocation 3, CHEMIN DE LA
MARBRERIE, 1227CAROUGE,SWITZERLAND
CEO Gregoire RibordyIndustry Quantum information and
communications industryLife and Security Holdings Co.,Ltd. [member]Disclosure of detailedinformation about businesscombination [line items]Corporate name Life & Security
Holdings Co., Ltd.Location 323, Incheon tower-
daero, Yeonsu-gu,Incheon, Korea
CEO Choi, Jin-hwanIndustry Holding company of
subsidiaries insecurity business
Copyright © 2020 www.secdatabase.com. All Rights Reserved.Please Consider the Environment Before Printing This Document
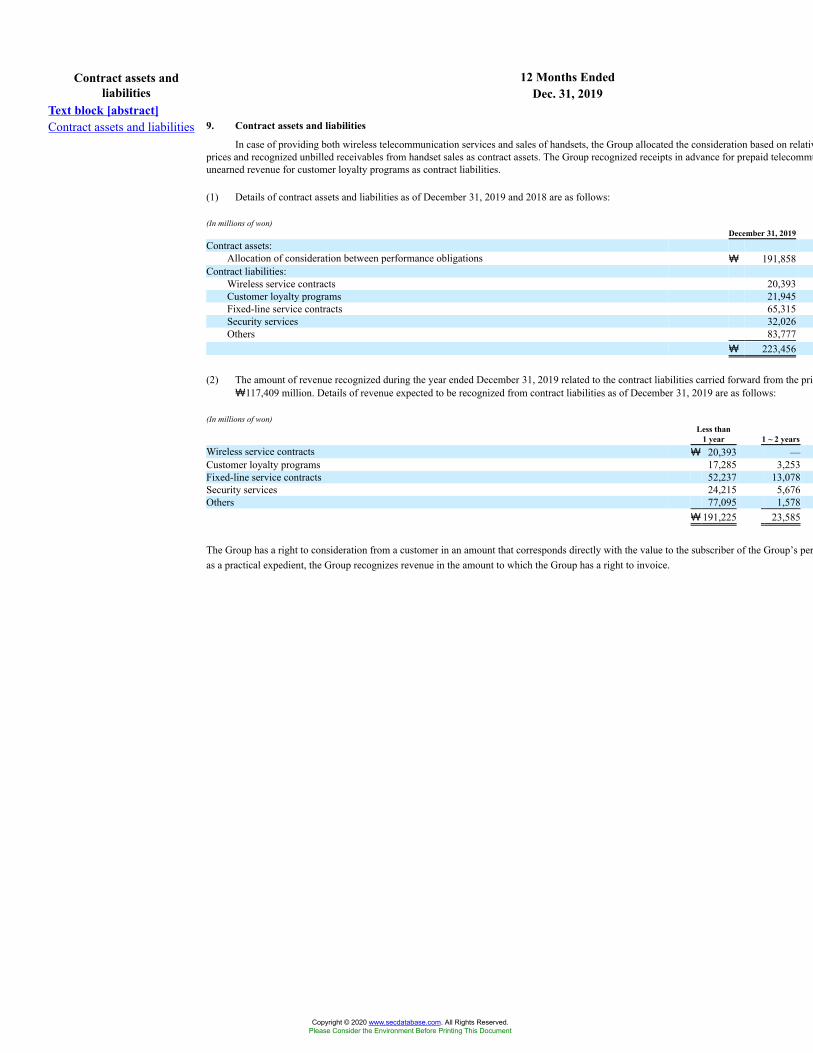
12 Months EndedContract assets andliabilities Dec. 31, 2019
Text block [abstract]Contract assets and liabilities 9. Contract assets and liabilities
In case of providing both wireless telecommunication services and sales of handsets, the Group allocated the consideration based on relative stand-alone sellingprices and recognized unbilled receivables from handset sales as contract assets. The Group recognized receipts in advance for prepaid telecommunications services andunearned revenue for customer loyalty programs as contract liabilities.
(1) Details of contract assets and liabilities as of December 31, 2019 and 2018 are as follows:
(In millions of won)December 31, 2019 December 31, 2018
Contract assets:Allocation of consideration between performance obligations ₩ 191,858 133,893
Contract liabilities:Wireless service contracts 20,393 18,425Customer loyalty programs 21,945 17,113Fixed-line service contracts 65,315 57,327Security services 32,026 38,109Others 83,777 52,839
₩ 223,456 183,813
(2) The amount of revenue recognized during the year ended December 31, 2019 related to the contract liabilities carried forward from the prior period is₩117,409 million. Details of revenue expected to be recognized from contract liabilities as of December 31, 2019 are as follows:
(In millions of won)Less than
1 year 1 ~ 2 yearsMore than
2 years TotalWireless service contracts ₩ 20,393 — — 20,393Customer loyalty programs 17,285 3,253 1,407 21,945Fixed-line service contracts 52,237 13,078 — 65,315Security services 24,215 5,676 2,135 32,026Others 77,095 1,578 5,104 83,777
₩ 191,225 23,585 8,646 223,456
The Group has a right to consideration from a customer in an amount that corresponds directly with the value to the subscriber of the Group’s performance completed, thus,as a practical expedient, the Group recognizes revenue in the amount to which the Group has a right to invoice.
Copyright © 2020 www.secdatabase.com. All Rights Reserved.Please Consider the Environment Before Printing This Document

12 Months EndedOperating Segments Dec. 31, 2019Text block [abstract]Operating Segments 5. Operating Segments
The Group’s operating segments have been identified to be each business unit, by which the Group provides independent services and merchandise. The Group’sreportable segments are cellular services, which include cellular voice service, wireless data service and wireless internet services; fixed-line telecommunications services,which include telephone services, internet services and leased line services; security services, which include unmanned security services, manned security services andsystem software development; commerce services, the open marketplace platform; and all other businesses, which include the Group’s internet portal services and otherimmaterial operations, each of which does not meet the quantitative threshold to be considered as a reportable segment and are presented collectively as others.
(1) Segment information for the years ended December 31, 2019, 2018 and 2017 are as follows:
(In millions of won)2019
CellularServices
Fixed-linetelecommu-
nicationsServices(*1)
SecurityServices(*1)
CommerceServices(*1) Others(*1) Sub-total
Adjustments(*2) Total
Total revenue ₩ 13,781,882 3,952,373 1,183,724 726,552 1,069,685 20,714,216 (2,970,514) 17,743,702Inter-segment revenue 1,609,467 1,004,193 74,247 15,899 266,708 2,970,514 (2,970,514) —External revenue 12,172,415 2,948,180 1,109,477 710,653 802,977 17,743,702 — 17,743,702Depreciation and amortization 2,694,786 752,234 224,537 35,788 64,141 3,771,486 — 3,771,486Operating profit (loss) 914,118 139,172 133,573 1,938 (78,821) 1,109,980 (109,087) 1,000,893Gain relating to investments in subsidiaries, associates and joint
ventures, net 449,543Finance income 141,977Finance costs (429,758)Profit before income tax 1,162,655
(In millions of won)2018
CellularServices
Fixed-linetelecommu-
nicationsServices(*1)
SecurityServices(*1)
CommerceServices(*1) Others(*1) Sub-total
Adjustments(*2) Total
Total revenue ₩ 13,961,762 3,857,074 286,089 790,818 912,776 19,808,519 (2,934,559) 16,873,960Inter-segment revenue 1,582,865 1,034,769 1,801 62,446 252,678 2,934,559 (2,934,559) —External revenue 12,378,897 2,822,305 284,288 728,372 660,098 16,873,960 — 16,873,960Depreciation and amortization 2,341,862 641,336 60,723 19,051 63,146 3,126,118 — 3,126,118Operating profit (loss) 1,299,869 245,509 (11,284) (85,041) (247,293) 1,201,760 (367,909) 833,851Gain relating to investments in subsidiaries, associates and joint ventures,
net 3,270,912Finance income 256,435Finance costs (385,232)Profit before income tax 3,975,966
(In millions of won)2017
CellularServices
Fixed-linetelecommu-
nicationsServices(*1)
SecurityServices(*1)
CommerceServices(*1) Others(*1) Sub-total
Adjustments(*2) Total
Total revenue ₩ 14,873,543 3,581,766 93,372 689,883 1,102,605 20,341,169 (2,821,156) 17,520,013Inter-segment revenue 1,611,408 862,333 1,398 38,065 307,952 2,821,156 (2,821,156) —External revenue 13,262,135 2,719,433 91,974 651,818 794,653 17,520,013 — 17,520,013Depreciation and amortization 2,390,016 592,681 16,768 15,417 82,584 3,097,466 — 3,097,466Operating profit (loss) 1,714,078 168,470 (16,651) (154,901) (174,370) 1,536,626 (312,054) 1,224,572Gain relating to investments in subsidiaries, associates and joint
ventures, net 2,245,732Finance income 366,561Finance costs (433,616)Profit before income tax 3,403,249
(*1) During the year ended December 31, 2019, due to the change in the categorization of information reviewed by the chief operating decision maker in 2019, the Groupreclassified SK stoa Co., Ltd. from Fixed-line telecommunication Service segment to Commerce Services segment. In addition, operating segment for Life &Security Holdings Co., Ltd. and SK Infosec Co., Ltd. was separately presented as a reportable segment (Security Services) and no longer included in Others segment.Segment information for the years ended December 31, 2018 and 2017 was restated to conform to the 2019 reclassifications.
(*2) Adjustments for operating profit (loss) are the amount differences from operating profit (loss) included in CODM report which is based on Korean IFRS to operatingprofit (loss) under IFRS. The reconciliation of these amounts is included in note 5-(2).
(2) Reconciliation of total segment operating profit to consolidated operating profit from continuing operations for the years ended December 31, 2019, 2018 and 2017are as follows:
(In millions of won)2019 2018 2017
Total segment operating profit ₩ 1,109,980 1,201,760 1,536,626Other operating income:
Gain on disposal of property and equipment and intangible assets 8,942 38,933 13,991Others(*1) 94,288 33,017 18,006
103,230 71,950 31,997
Copyright © 2020 www.secdatabase.com. All Rights Reserved.Please Consider the Environment Before Printing This Document

Other operating expenses:Impairment loss on property and equipment and intangible assets (65,935) (255,839) (54,946)Loss on disposal of property and equipment and intangible assets (56,248) (87,257) (60,086)Donations (17,557) (59,012) (112,634)Bad debt for accounts receivable — other (5,802) (7,718) (5,793)Others(*2) (66,775) (30,033) (110,592)
(212,317) (439,859) (344,051)Consolidated operating profit from continuing operations ₩ 1,000,893 833,851 1,224,572
(*1) Others for the years ended December 31, 2019 includes ₩70 billion of gain on business transfer and others for the years ended December 31, 2018 includes₩11 billion of penalty refund, respectively, various other income with inconsequential amounts.
(*2) Others for the years ended December 31, 2019, 2018 and 2017 include ₩42.4 billion, ₩0.4 billion and ₩21.4 billion of penalties, respectively, and various otherexpenses with inconsequential amounts.
Since there are no intersegment sales of inventory or depreciable assets, there is no unrealized intersegment profit to be eliminated on consolidation. Domesticrevenue for the years ended December 31, 2019, 2018 and 2017 amounts to ₩17,680 billion, ₩16,656 billion and ₩17,374 billion, respectively. Domestic non-currentassets (excluding financial assets, investments in associates and joint ventures and deferred tax assets) as of December 31, 2019, 2018 and 2017 amount to ₩20,678 billion,₩20,040 billion and ₩15,554 billion, and non-current assets outside of Korea amount to ₩63 billion, ₩72 billion and ₩257 billion, respectively.
No single customer contributed 10% or more to the Group’s total sales for the years ended December 31, 2019, 2018 and 2017.
The Group principally operates its businesses in Korea and the revenue amounts earned outside of Korea are immaterial. Therefore, no entity-wide geographicalinformation is presented.
(3) Disaggregation of operating revenues considering the economic factors that affect the amounts, timing and uncertainty of the Group’s revenue and future cash flowsis as follows:
(In millions of won)2019 2018 2017
Goods and services transferred at a point in time:Cellular revenue Goods(*1) ₩ 1,142,868 1,124,143 1,119,662Fixed-line telecommunication revenue Goods 145,314 125,959 73,362Security services revenue Goods 44,764 12,332 404Commerce services revenue Goods 56,699 45,837 94,085
Commerce 151,690 77,539 1,512Goods 86,793 81,311 81,139Other revenueProducts 44,336 51,214 25,068Others(*7) 442,869 275,431 196,110
2,115,333 1,793,766 1,591,342Goods and services transferred over time:
Cellular revenue Wireless service(*2) 9,532,377 9,770,423 10,638,982Cellular interconnection 494,267 532,156 592,755Other(*3) 1,002,903 952,175 910,736
Fixed-line telecommunication revenue Fixed-line service 224,453 371,224 401,037Cellular interconnection 92,396 95,865 116,070Internet ProtocolTelevision(*4) 1,285,831 1,171,104 1,023,997International calls 137,902 152,918 166,901Internet service andmiscellaneous(*5) 1,062,284 905,235 938,066
Security services revenue Service(*6) 1,064,713 271,956 91,570Commerce services revenue Commerce service 502,264 604,996 556,221Other revenue Miscellaneous(*7) 228,979 252,142 492,336
15,628,369 15,080,194 15,928,671₩ 17,743,702 16,873,960 17,520,013
(*1) Cellular revenue includes revenue from sale of handsets and other electronic accessories.(*2) Wireless service includes revenue from wireless voice and data transmission services principally derived from usage charges to wireless subscribers.(*3) Other revenue includes revenue from billing and collection services as well as other miscellaneous services.(*4) IPTV service revenue includes revenue from IPTV services principally derived from usage charges to IPTV subscribers.(*5) Internet service includes revenue from the high speed broadband internet service principally derived from usage charges to subscribers as well as other
miscellaneous services.(*6) Service includes revenue from rendering security services.(*7) Miscellaneous other revenue includes revenue from considerations received for the development and maintenance of system software, and digital contents platform
services.
Copyright © 2020 www.secdatabase.com. All Rights Reserved.Please Consider the Environment Before Printing This Document
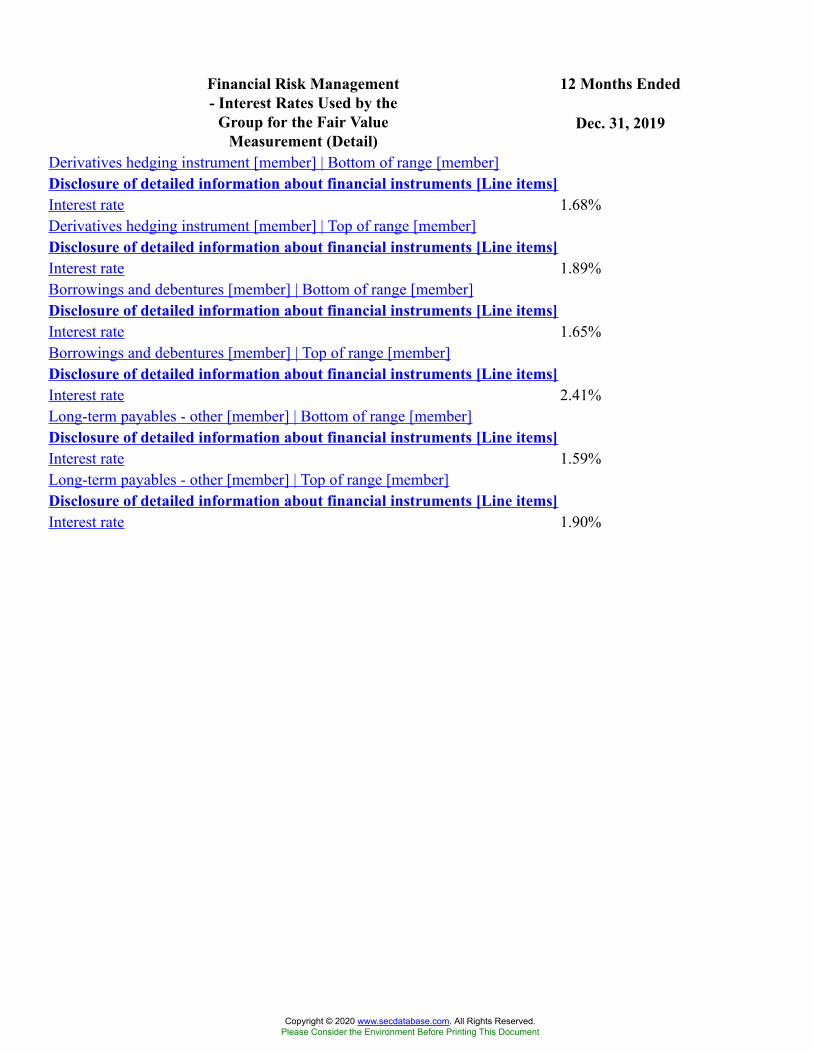
12 Months EndedFinancial Risk Management- Interest Rates Used by the
Group for the Fair ValueMeasurement (Detail)
Dec. 31, 2019
Derivatives hedging instrument [member] | Bottom of range [member]Disclosure of detailed information about financial instruments [Line items]Interest rate 1.68%Derivatives hedging instrument [member] | Top of range [member]Disclosure of detailed information about financial instruments [Line items]Interest rate 1.89%Borrowings and debentures [member] | Bottom of range [member]Disclosure of detailed information about financial instruments [Line items]Interest rate 1.65%Borrowings and debentures [member] | Top of range [member]Disclosure of detailed information about financial instruments [Line items]Interest rate 2.41%Long-term payables - other [member] | Bottom of range [member]Disclosure of detailed information about financial instruments [Line items]Interest rate 1.59%Long-term payables - other [member] | Top of range [member]Disclosure of detailed information about financial instruments [Line items]Interest rate 1.90%
Copyright © 2020 www.secdatabase.com. All Rights Reserved.Please Consider the Environment Before Printing This Document

12 Months EndedFinancial Risk Management(Tables) Dec. 31, 2019
Statement [LineItems]Maximum credit exposure The maximum credit exposure as of December 31, 2019 and 2018 are as follows:
(In millions of won)December 31, 2019 December 31, 2018
Cash and cash equivalents ₩ 1,270,572 1,506,432Financial instruments 831,637 1,046,897Investment securities 13,548 11,672Accounts receivable — trade 2,247,895 2,019,933Loans and other receivables 1,663,567 1,621,938Derivative financial assets 150,960 55,457
₩ 6,178,179 6,262,329
Summary of gross carryingamounts of each financial assetexcept for accounts receivabletrade and derivative financialasset
The gross carrying amounts of each financial asset except for the accounts receivable – trade and derivative financial assets as of December 31, 2019 are as follows.
(In millions of won)At amortized cost
Financial assets atFVTPL
Financialassets atFVOCI 12-month ECL
Lifetime ECL — notcredit impaired
Lifetime ECL —credit impaired
Gross amount ₩ 541,146 4,627 1,887,321 49,360 123,196Loss allowance — — (4,241) (8,704) (83,953)Carrying amount ₩ 541,146 4,627 1,883,080 40,656 39,243
Summary of changes in lossallowance for debt investments
Changes in the loss allowance for the debt investments during the year ended December 31, 2019 are as follows:
(In millions of won)
12-month ECLLifetime ECL — not
credit impairedLifetime ECL — credit
impaired TotalJanuary 1, 2019 ₩ 3,305 10,760 101,823 115,888
Remeasurement of loss allowance, net 1,316 1,334 3,942 6,592Transfer to lifetime ECL — not credit impaired (380) 380 — —Transfer to lifetime ECL — credit impaired — (2,790) 2,790 —Amounts written off — (1,515) (32,165) (33,680)Recovery of amounts written off — — 7,563 7,563Business combinations — 535 — 535
December 31, 2019 ₩ 4,241 8,704 83,953 96,898
Contractual maturities offinancial liabilities
Contractual maturities of financial liabilities as of December 31, 2019 are as follows:
(In millions of won)Carryingamount
Contractualcash flows
Less than1 year 1 - 5 years
More than5 years
Accounts payable — trade ₩ 438,297 438,297 438,297 — —Borrowings(*) 2,043,140 2,412,647 159,416 2,253,231 —Debentures(*) 8,220,833 9,493,178 1,184,309 5,237,357 3,071,512Lease liabilities 712,740 757,871 315,793 335,727 106,351Accounts payable — other and others(*) 6,563,030 6,704,379 5,005,857 1,124,389 574,133
₩ 17,978,040 19,806,372 7,103,672 8,950,704 3,751,996
(*) Includes interest payables.Periods in which cash flowsfrom cash flow hedgederivatives are expected tooccur
As of December 31, 2019, periods in which cash flows from cash flow hedge derivatives are expected to occur are as follows:
(In millions of won)Carryingamount
Contractualcash flows
Less than1 year 1 - 5 years
More than5 years
Assets ₩144,886 147,386 44,872 103,142 (628)Liabilities (1,043) (1,043) — (1,043) —
₩143,843 146,343 44,872 102,099 (628)
Debt-equity ratio Debt-equity ratio as of December 31, 2019 and 2018 are as follows:
(In millions of won)December 31,
2019December 31,
2018Total liabilities ₩21,788,084 20,019,861Total equity 22,823,536 22,349,250Debt-equity ratios 95.46% 89.58%
Fair value and carryingamount of financial assets and
1) Fair value and carrying amount of financial assets and liabilities including fair value hierarchy as of December 31, 2019 are as follows:
(In millions of won)December 31, 2019
Copyright © 2020 www.secdatabase.com. All Rights Reserved.Please Consider the Environment Before Printing This Document
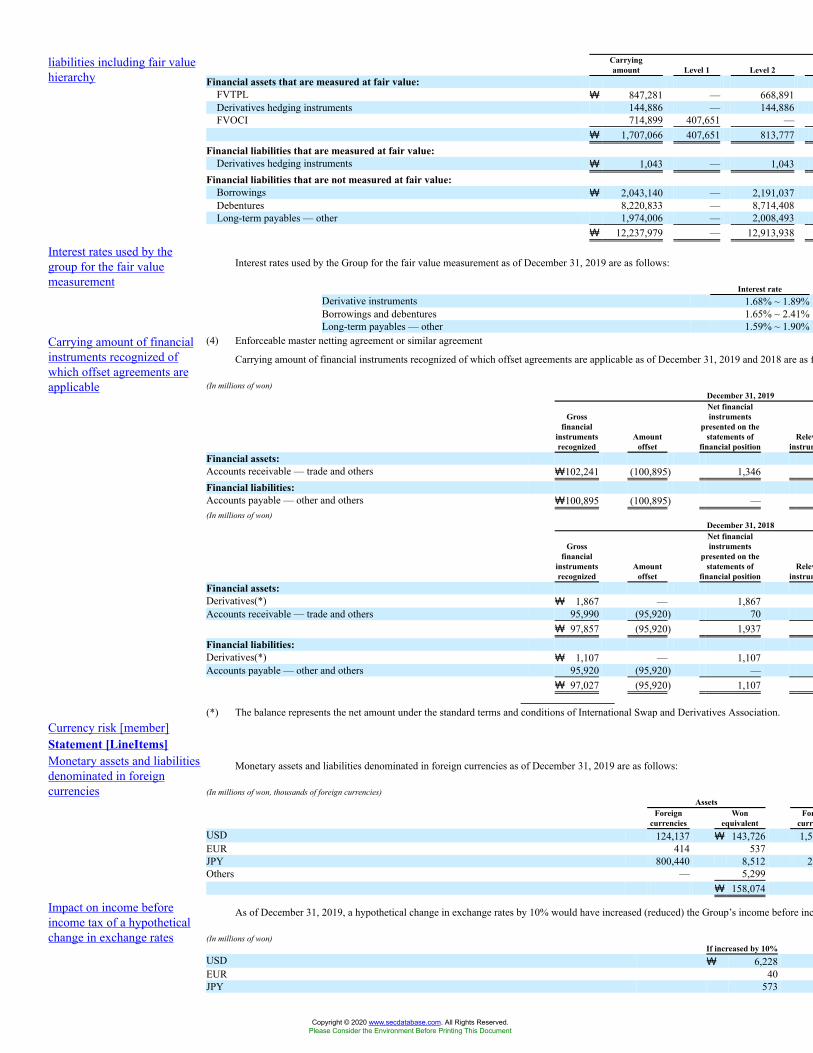
liabilities including fair valuehierarchy
Carryingamount Level 1 Level 2 Level 3 Total
Financial assets that are measured at fair value:FVTPL ₩ 847,281 — 668,891 178,390 847,281Derivatives hedging instruments 144,886 — 144,886 — 144,886FVOCI 714,899 407,651 — 307,248 714,899
₩ 1,707,066 407,651 813,777 485,638 1,707,066Financial liabilities that are measured at fair value:
Derivatives hedging instruments ₩ 1,043 — 1,043 — 1,043Financial liabilities that are not measured at fair value:
Borrowings ₩ 2,043,140 — 2,191,037 — 2,191,037Debentures 8,220,833 — 8,714,408 — 8,714,408Long-term payables — other 1,974,006 — 2,008,493 — 2,008,493
₩ 12,237,979 — 12,913,938 — 12,913,938
Interest rates used by thegroup for the fair valuemeasurement
Interest rates used by the Group for the fair value measurement as of December 31, 2019 are as follows:
Interest rateDerivative instruments 1.68% ~ 1.89%Borrowings and debentures 1.65% ~ 2.41%Long-term payables — other 1.59% ~ 1.90%
Carrying amount of financialinstruments recognized ofwhich offset agreements areapplicable
(4) Enforceable master netting agreement or similar agreement
Carrying amount of financial instruments recognized of which offset agreements are applicable as of December 31, 2019 and 2018 are as follows:
(In millions of won)December 31, 2019
Grossfinancial
instrumentsrecognized
Amountoffset
Net financialinstruments
presented on thestatements of
financial positionRelevant financial
instruments not offsetNet
amountFinancial assets:Accounts receivable — trade and others ₩102,241 (100,895) 1,346 — 1,346Financial liabilities:Accounts payable — other and others ₩100,895 (100,895) — — —(In millions of won)
December 31, 2018
Grossfinancial
instrumentsrecognized
Amountoffset
Net financialinstruments
presented on thestatements of
financial positionRelevant financial
instruments not offsetNet
amountFinancial assets:Derivatives(*) ₩ 1,867 — 1,867 (1,107) 760Accounts receivable — trade and others 95,990 (95,920) 70 — 70
₩ 97,857 (95,920) 1,937 (1,107) 830Financial liabilities:Derivatives(*) ₩ 1,107 — 1,107 (1,107) —Accounts payable — other and others 95,920 (95,920) — — —
₩ 97,027 (95,920) 1,107 (1,107) —
(*) The balance represents the net amount under the standard terms and conditions of International Swap and Derivatives Association.Currency risk [member]Statement [LineItems]Monetary assets and liabilitiesdenominated in foreigncurrencies
Monetary assets and liabilities denominated in foreign currencies as of December 31, 2019 are as follows:
(In millions of won, thousands of foreign currencies)Assets Liabilities
Foreigncurrencies
Wonequivalent
Foreigncurrencies
Wonequivalent
USD 124,137 ₩ 143,726 1,588,591 ₩ 1,839,271EUR 414 537 110 142JPY 800,440 8,512 261,255 2,778Others — 5,299 — 1,669
₩ 158,074 ₩ 1,843,860
Impact on income beforeincome tax of a hypotheticalchange in exchange rates
As of December 31, 2019, a hypothetical change in exchange rates by 10% would have increased (reduced) the Group’s income before income tax as follows:
(In millions of won)If increased by 10% If decreased by 10%
USD ₩ 6,228 (6,228)EUR 40 (40)JPY 573 (573)
Copyright © 2020 www.secdatabase.com. All Rights Reserved.Please Consider the Environment Before Printing This Document
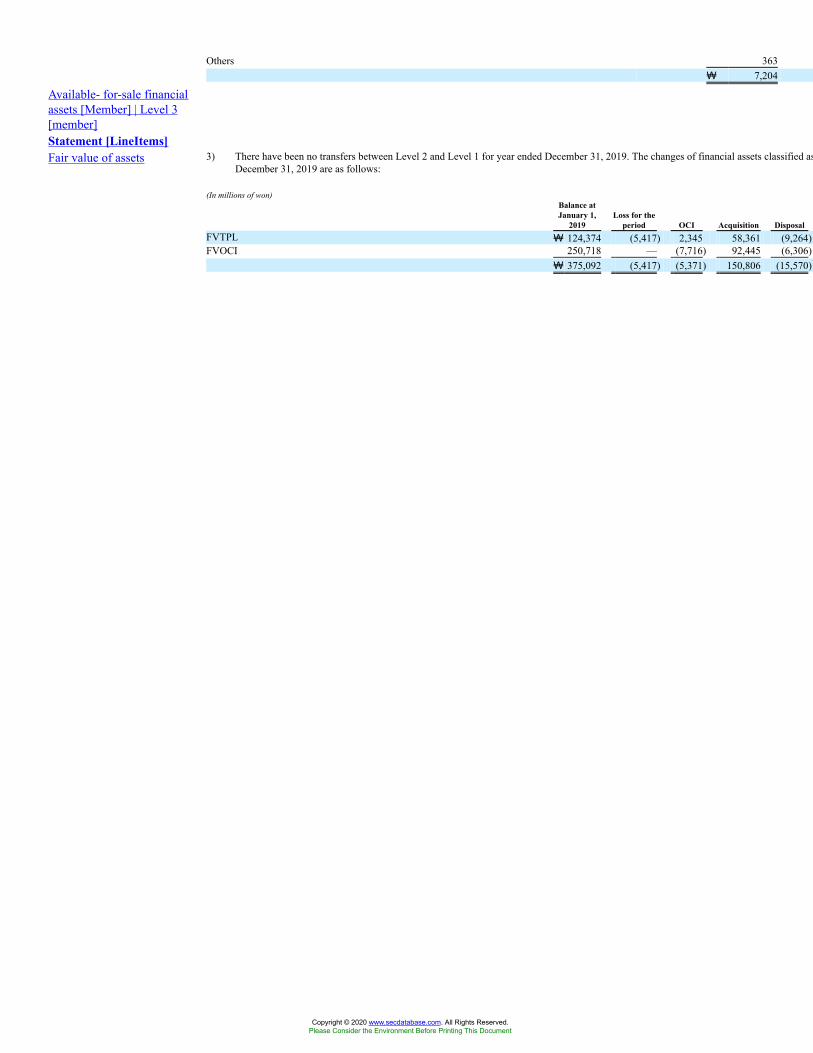
Others 363 (363)₩ 7,204 (7,204)
Available- for-sale financialassets [Member] | Level 3[member]Statement [LineItems]Fair value of assets 3) There have been no transfers between Level 2 and Level 1 for year ended December 31, 2019. The changes of financial assets classified as Level 3 for the year ended
December 31, 2019 are as follows:
(In millions of won)Balance atJanuary 1,
2019Loss for the
period OCI Acquisition Disposal Transfer
Balance atDecember 31,
2019FVTPL ₩ 124,374 (5,417) 2,345 58,361 (9,264) 7,991 178,390FVOCI 250,718 — (7,716) 92,445 (6,306) (21,893) 307,248
₩ 375,092 (5,417) (5,371) 150,806 (15,570) (13,902) 485,638
Copyright © 2020 www.secdatabase.com. All Rights Reserved.Please Consider the Environment Before Printing This Document
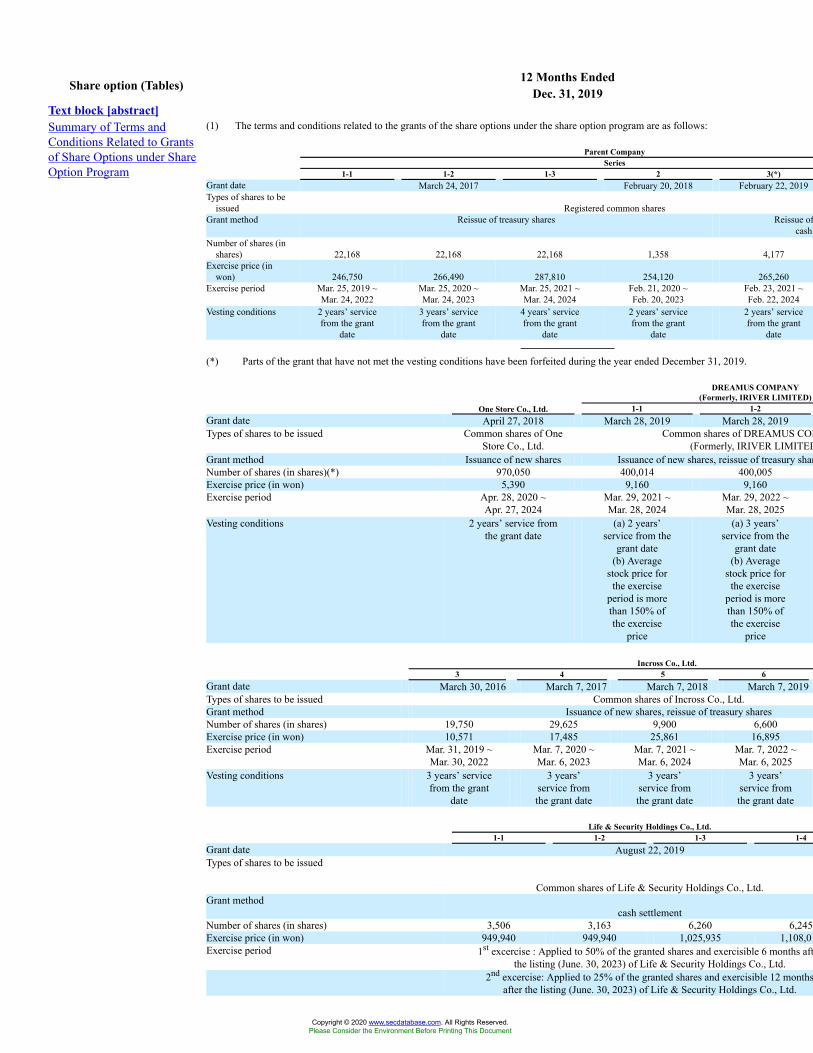
12 Months EndedShare option (Tables) Dec. 31, 2019Text block [abstract]Summary of Terms andConditions Related to Grantsof Share Options under ShareOption Program
(1) The terms and conditions related to the grants of the share options under the share option program are as follows:
Parent CompanySeries
1-1 1-2 1-3 2 3(*) 4Grant date March 24, 2017 February 20, 2018 February 22, 2019 March 26, 2019Types of shares to be
issued Registered common sharesGrant method Reissue of treasury shares Reissue of treasury shares,
cash settlementNumber of shares (in
shares) 22,168 22,168 22,168 1,358 4,177 1,734Exercise price (in
won) 246,750 266,490 287,810 254,120 265,260 254,310Exercise period Mar. 25, 2019 ~
Mar. 24, 2022Mar. 25, 2020 ~Mar. 24, 2023
Mar. 25, 2021 ~Mar. 24, 2024
Feb. 21, 2020 ~Feb. 20, 2023
Feb. 23, 2021 ~Feb. 22, 2024
Mar. 27, 2021 ~Mar. 26, 2024
Vesting conditions 2 years’ servicefrom the grant
date
3 years’ servicefrom the grant
date
4 years’ servicefrom the grant
date
2 years’ servicefrom the grant
date
2 years’ servicefrom the grant
date
2 years’ servicefrom the grant
date
(*) Parts of the grant that have not met the vesting conditions have been forfeited during the year ended December 31, 2019.
DREAMUS COMPANY(Formerly, IRIVER LIMITED)
One Store Co., Ltd. 1-1 1-2 1-3Grant date April 27, 2018 March 28, 2019 March 28, 2019 March 28, 2019Types of shares to be issued Common shares of One
Store Co., Ltd.Common shares of DREAMUS COMPANY
(Formerly, IRIVER LIMITED)Grant method Issuance of new shares Issuance of new shares, reissue of treasury shares, cash settlementNumber of shares (in shares)(*) 970,050 400,014 400,005 399,981Exercise price (in won) 5,390 9,160 9,160 9,160Exercise period Apr. 28, 2020 ~
Apr. 27, 2024Mar. 29, 2021 ~Mar. 28, 2024
Mar. 29, 2022 ~Mar. 28, 2025
Mar. 29, 2023 ~Mar. 28, 2026
Vesting conditions 2 years’ service fromthe grant date
(a) 2 years’service from the
grant date(b) Average
stock price forthe exercise
period is morethan 150% ofthe exercise
price
(a) 3 years’service from the
grant date(b) Average
stock price forthe exercise
period is morethan 150% ofthe exercise
price
(a) 4 years’service from the
grant date(b) Average
stock price forthe exercise
period is morethan 150% ofthe exercise
price
Incross Co., Ltd.3 4 5 6 7
Grant date March 30, 2016 March 7, 2017 March 7, 2018 March 7, 2019 October 15, 2019Types of shares to be issued Common shares of Incross Co., Ltd.Grant method Issuance of new shares, reissue of treasury sharesNumber of shares (in shares) 19,750 29,625 9,900 6,600 59,225Exercise price (in won) 10,571 17,485 25,861 16,895 22,073Exercise period Mar. 31, 2019 ~
Mar. 30, 2022Mar. 7, 2020 ~Mar. 6, 2023
Mar. 7, 2021 ~Mar. 6, 2024
Mar. 7, 2022 ~Mar. 6, 2025
Oct. 15, 2022 ~Oct. 14, 2025
Vesting conditions 3 years’ servicefrom the grant
date
3 years’service fromthe grant date
3 years’service fromthe grant date
3 years’service fromthe grant date
3 years’ servicefrom the grant
date
Life & Security Holdings Co., Ltd.1-1 1-2 1-3 1-4
FSK L&S Co.,Ltd.
Grant date August 22, 2019 May 31, 2019Types of shares to be issued
Common shares of Life & Security Holdings Co., Ltd.
Commonshares of FSKL&S Co., Ltd.
Grant methodcash settlement
Issuance ofnew shares
Number of shares (in shares) 3,506 3,163 6,260 6,245 43,955Exercise price (in won) 949,940 949,940 1,025,935 1,108,010 10,000Exercise period 1st excercise : Applied to 50% of the granted shares and exercisible 6 months after
the listing (June. 30, 2023) of Life & Security Holdings Co., Ltd.June. 1, 2022 ~May. 31, 2025
2nd excercise: Applied to 25% of the granted shares and exercisible 12 monthsafter the listing (June. 30, 2023) of Life & Security Holdings Co., Ltd.
Copyright © 2020 www.secdatabase.com. All Rights Reserved.Please Consider the Environment Before Printing This Document
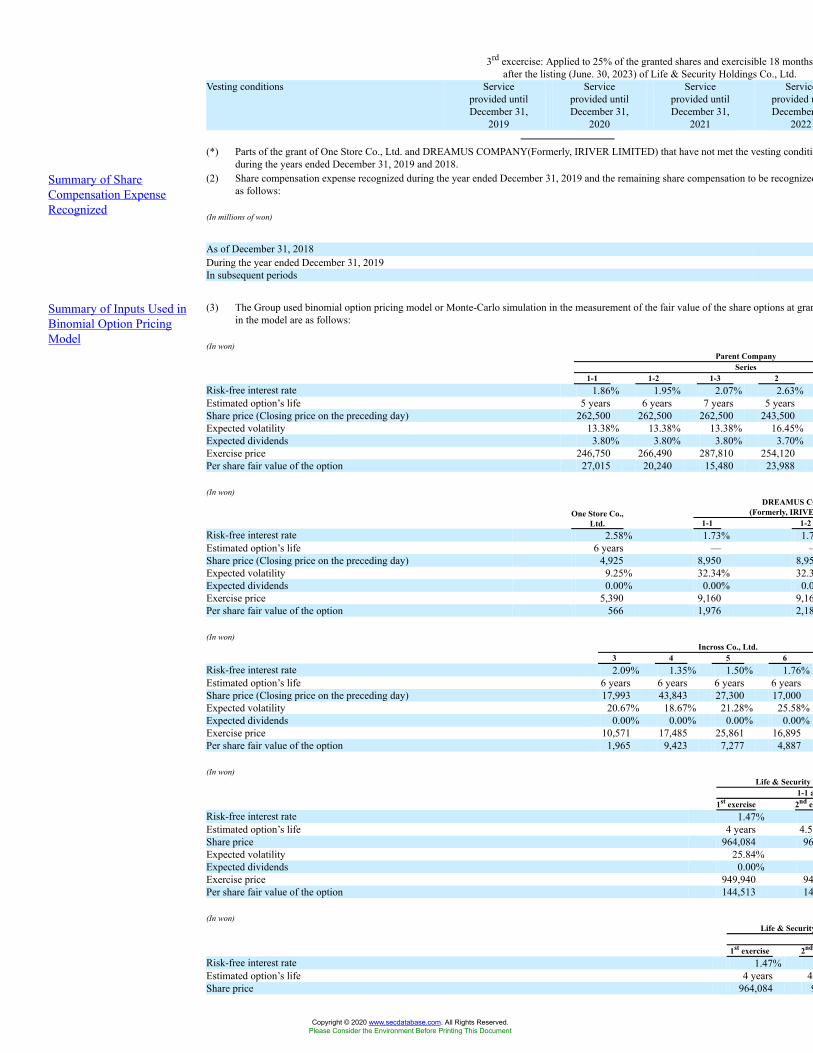
3rd excercise: Applied to 25% of the granted shares and exercisible 18 monthsafter the listing (June. 30, 2023) of Life & Security Holdings Co., Ltd.
Vesting conditions Serviceprovided untilDecember 31,
2019
Serviceprovided untilDecember 31,
2020
Serviceprovided untilDecember 31,
2021
Serviceprovided untilDecember 31,
2022
3 years’service fromthe grant date
(*) Parts of the grant of One Store Co., Ltd. and DREAMUS COMPANY(Formerly, IRIVER LIMITED) that have not met the vesting conditions have been forfeitedduring the years ended December 31, 2019 and 2018.
Summary of ShareCompensation ExpenseRecognized
(2) Share compensation expense recognized during the year ended December 31, 2019 and the remaining share compensation to be recognized in subsequent periods areas follows:
(In millions of won)Share
compensation expenseAs of December 31, 2018 ₩ 1,203During the year ended December 31, 2019 2,073In subsequent periods 4,498
₩ 7,774
Summary of Inputs Used inBinomial Option PricingModel
(3) The Group used binomial option pricing model or Monte-Carlo simulation in the measurement of the fair value of the share options at grant date and the inputs usedin the model are as follows:
(In won)Parent Company
Series1-1 1-2 1-3 2 3 4
Risk-free interest rate 1.86% 1.95% 2.07% 2.63% 1.91% 1.78%Estimated option’s life 5 years 6 years 7 years 5 years 5 years 5 yearsShare price (Closing price on the preceding day) 262,500 262,500 262,500 243,500 259,000 253,000Expected volatility 13.38% 13.38% 13.38% 16.45% 8.30% 7.70%Expected dividends 3.80% 3.80% 3.80% 3.70% 3.80% 3.90%Exercise price 246,750 266,490 287,810 254,120 265,260 254,310Per share fair value of the option 27,015 20,240 15,480 23,988 8,600 8,111
(In won)DREAMUS COMPANY
(Formerly, IRIVER LIMITED)One Store Co.,Ltd. 1-1 1-2 1-3
Risk-free interest rate 2.58% 1.73% 1.77% 1.82%Estimated option’s life 6 years — — —Share price (Closing price on the preceding day) 4,925 8,950 8,950 8,950Expected volatility 9.25% 32.34% 32.34% 32.34%Expected dividends 0.00% 0.00% 0.00% 0.00%Exercise price 5,390 9,160 9,160 9,160Per share fair value of the option 566 1,976 2,189 2,356
(In won)Incross Co., Ltd.
3 4 5 6 7FSK L&SCo., Ltd.
Risk-free interest rate 2.09% 1.35% 1.50% 1.76% 1.41% 1.64%Estimated option’s life 6 years 6 years 6 years 6 years 6 years —Share price (Closing price on the preceding day) 17,993 43,843 27,300 17,000 22,050 10,455Expected volatility 20.67% 18.67% 21.28% 25.58% 42.37% 16.20%Expected dividends 0.00% 0.00% 0.00% 0.00% 0.00% 0.00%Exercise price 10,571 17,485 25,861 16,895 22,073 10,000Per share fair value of the option 1,965 9,423 7,277 4,887 9,209 1,420
(In won)Life & Security Holdings Co., Ltd.
1-1 and 1-21st exercise 2nd exercise 3rd exercise
Risk-free interest rate 1.47% 1.47% 1.47%Estimated option’s life 4 years 4.5 years 5 yearsShare price 964,084 964,084 964,084Expected volatility 25.84% 26.76% 26.79%Expected dividends 0.00% 0.00% 0.00%Exercise price 949,940 949,940 949,940Per share fair value of the option 144,513 145,878 162,219
(In won)Life & Security Holdings Co., Ltd.
1-31st exercise 2nd exercise 3rd exercise
Risk-free interest rate 1.47% 1.47% 1.47%Estimated option’s life 4 years 4.5 years 5 yearsShare price 964,084 964,084 964,084
Copyright © 2020 www.secdatabase.com. All Rights Reserved.Please Consider the Environment Before Printing This Document

Expected volatility 25.84% 26.76% 26.79%Expected dividends 0.00% 0.00% 0.00%Exercise price 1,025,935 1,025,935 1,025,935Per share fair value of the option 123,004 125,792 141,861
(In won)Life & Security Holdings Co., Ltd.
1-41st exercise 2nd exercise 3rd exercise
Risk-free interest rate 1.47% 1.47% 1.47%Estimated option’s life 4 years 4.5 years 5 yearsShare price 964,084 964,084 964,084Expected volatility 25.84% 26.76% 26.79%Expected dividends 0.00% 0.00% 0.00%Exercise price 1,108,010 1,108,010 1,108,010Per share fair value of the option 101,207 105,797 120,924
Copyright © 2020 www.secdatabase.com. All Rights Reserved.Please Consider the Environment Before Printing This Document
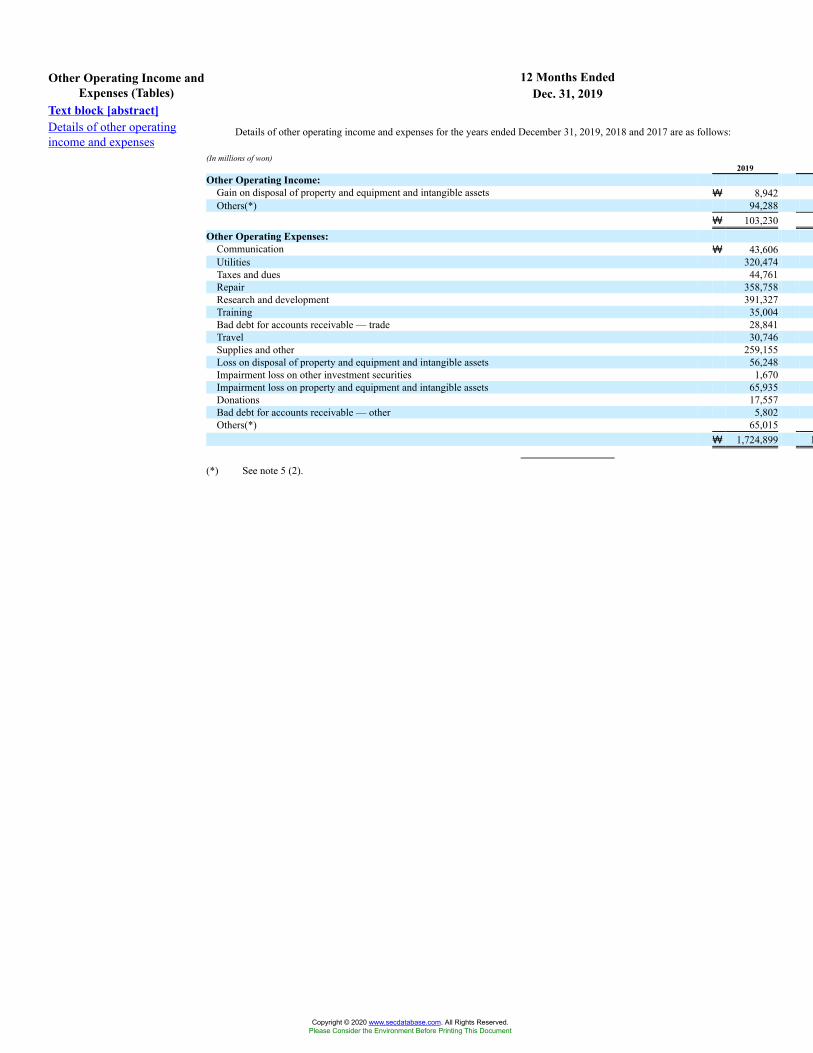
12 Months EndedOther Operating Income andExpenses (Tables) Dec. 31, 2019
Text block [abstract]Details of other operatingincome and expenses
Details of other operating income and expenses for the years ended December 31, 2019, 2018 and 2017 are as follows:
(In millions of won)2019 2018 2017
Other Operating Income:Gain on disposal of property and equipment and intangible assets ₩ 8,942 38,933 13,991Others(*) 94,288 33,017 18,006
₩ 103,230 71,950 31,997Other Operating Expenses:
Communication ₩ 43,606 35,507 27,973Utilities 320,474 297,049 299,825Taxes and dues 44,761 37,290 27,819Repair 358,758 353,321 333,101Research and development 391,327 387,675 395,276Training 35,004 35,574 32,853Bad debt for accounts receivable — trade 28,841 38,211 34,584Travel 30,746 27,910 24,095Supplies and other 259,155 130,008 111,170Loss on disposal of property and equipment and intangible assets 56,248 87,257 60,086Impairment loss on other investment securities 1,670 3,157 9,003Impairment loss on property and equipment and intangible assets 65,935 255,839 54,946Donations 17,557 59,012 112,634Bad debt for accounts receivable — other 5,802 7,718 5,793Others(*) 65,015 26,876 101,589
₩ 1,724,899 1,782,404 1,630,747
(*) See note 5 (2).
Copyright © 2020 www.secdatabase.com. All Rights Reserved.Please Consider the Environment Before Printing This Document

Financial Risk Management- Contractual Maturities ofFinancial Liabilities (Detail)
- KRW (₩)₩ in Millions
Dec. 31,2019
Jan. 01,2019
Dec. 31,2018
Disclosure of maturity analysis for non-derivative financial liabilities[line items]Accounts payable - trade, carrying amount ₩ 438,297 ₩ 381,302Borrowings, carrying amount 2,043,140 2,184,996Debentures, carrying amount 8,220,833 7,466,852Accounts payable - other and others, carrying amount 6,563,030 ₩
6,762,782Non-derivative financial liabilities, carrying amount 17,978,040Accounts payable - trade, contractual cash flows 438,297Borrowings, contractual cash flows 2,412,647Debentures, contractual cash flows 9,493,178Lease liabilities-Carrying amount 712,740 ₩ 663,827Lease liabilities-Contractual cash flows 757,871Accounts payable - other and others, contractual cash flows 6,704,379Non-derivative financial liabilities, contractual cash flows 19,806,372Less than 1 year [member]Disclosure of maturity analysis for non-derivative financial liabilities[line items]Accounts payable - trade, contractual cash flows 438,297Borrowings, contractual cash flows 159,416Debentures, contractual cash flows 1,184,309Lease liabilities-Contractual cash flows 315,793Accounts payable - other and others, contractual cash flows 5,005,857Non-derivative financial liabilities, contractual cash flows 7,103,6721-5 years [member]Disclosure of maturity analysis for non-derivative financial liabilities[line items]Borrowings, contractual cash flows 2,253,231Debentures, contractual cash flows 5,237,357Lease liabilities-Contractual cash flows 335,727Accounts payable - other and others, contractual cash flows 1,124,389Non-derivative financial liabilities, contractual cash flows 8,950,704More than 5 years [member]Disclosure of maturity analysis for non-derivative financial liabilities[line items]Debentures, contractual cash flows 3,071,512Lease liabilities-Contractual cash flows 106,351Accounts payable - other and others, contractual cash flows 574,133
Copyright © 2020 www.secdatabase.com. All Rights Reserved.Please Consider the Environment Before Printing This Document
Non-derivative financial liabilities, contractual cash flows ₩3,751,996
Copyright © 2020 www.secdatabase.com. All Rights Reserved.Please Consider the Environment Before Printing This Document
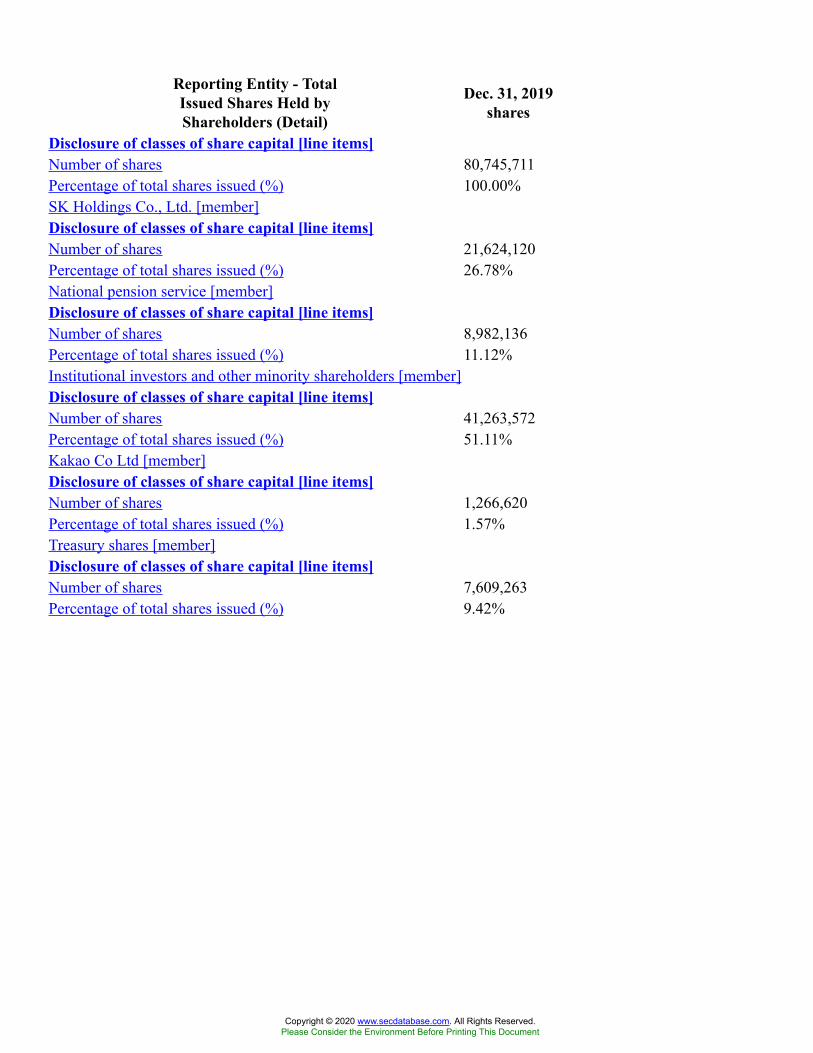
Reporting Entity - TotalIssued Shares Held byShareholders (Detail)
Dec. 31, 2019shares
Disclosure of classes of share capital [line items]Number of shares 80,745,711Percentage of total shares issued (%) 100.00%SK Holdings Co., Ltd. [member]Disclosure of classes of share capital [line items]Number of shares 21,624,120Percentage of total shares issued (%) 26.78%National pension service [member]Disclosure of classes of share capital [line items]Number of shares 8,982,136Percentage of total shares issued (%) 11.12%Institutional investors and other minority shareholders [member]Disclosure of classes of share capital [line items]Number of shares 41,263,572Percentage of total shares issued (%) 51.11%Kakao Co Ltd [member]Disclosure of classes of share capital [line items]Number of shares 1,266,620Percentage of total shares issued (%) 1.57%Treasury shares [member]Disclosure of classes of share capital [line items]Number of shares 7,609,263Percentage of total shares issued (%) 9.42%
Copyright © 2020 www.secdatabase.com. All Rights Reserved.Please Consider the Environment Before Printing This Document
12 Months EndedShare Option - Summary ofShare Compensation
Expense Recognized (Detail)- KRW (₩)
₩ in Millions
Dec. 31, 2019 Dec. 31, 2018
Disclosure Of Share Based Compensation Expense [line items]Share compensation expense ₩ 7,774 ₩ 1,203Major Share Options Transactions [member]Disclosure Of Share Based Compensation Expense [line items]Share compensation expense 2,073Events including and after reporting period [member]Disclosure Of Share Based Compensation Expense [line items]Share compensation expense ₩ 4,498
Copyright © 2020 www.secdatabase.com. All Rights Reserved.Please Consider the Environment Before Printing This Document
12 Months EndedOther Operating Income andExpenses - Details of Other
Operating Income andExpenses (Detail) - KRW
(₩)₩ in Millions
Dec. 31, 2019 Dec. 31, 2018 Dec. 31, 2017
Other Operating Income:Gain on disposal of property and equipment and intangible assets ₩ 8,942 ₩ 38,933 ₩ 13,991Others 94,288 33,017 18,006Other operating income 103,230 71,950 31,997Other Operating Expenses:Communication 43,606 35,507 27,973Utilities 320,474 297,049 299,825Taxes and dues 44,761 37,290 27,819Repair 358,758 353,321 333,101Research and development 391,327 387,675 395,276Training 35,004 35,574 32,853Bad debt for accounts receivable - trade 28,841 38,211 34,584Travel 30,746 27,910 24,095Supplies and other 259,155 130,008 111,170Loss on disposal of property and equipment and intangible assets 56,248 87,257 60,086Impairment loss on other investment securities 1,670 3,157 9,003Impairment loss on property and equipment and intangible assets 65,935 255,839 54,946Donations 17,557 59,012 112,634Bad debt for accounts receivable - other 5,802 7,718 5,793Others 65,015 26,876 101,589Other operating expenses ₩ 1,724,899 ₩ 1,782,404 ₩ 1,630,747
Copyright © 2020 www.secdatabase.com. All Rights Reserved.Please Consider the Environment Before Printing This Document
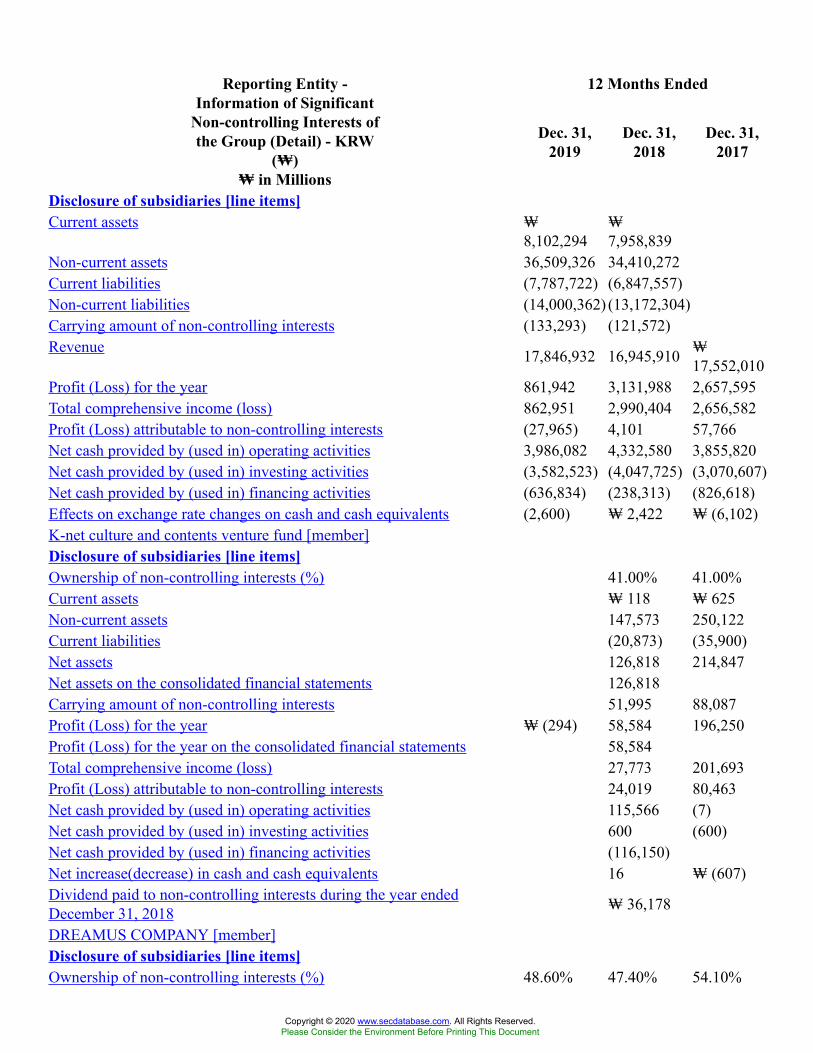
12 Months EndedReporting Entity -Information of Significant
Non-controlling Interests ofthe Group (Detail) - KRW
(₩)₩ in Millions
Dec. 31,2019
Dec. 31,2018
Dec. 31,2017
Disclosure of subsidiaries [line items]Current assets ₩
8,102,294₩7,958,839
Non-current assets 36,509,326 34,410,272Current liabilities (7,787,722) (6,847,557)Non-current liabilities (14,000,362) (13,172,304)Carrying amount of non-controlling interests (133,293) (121,572)Revenue 17,846,932 16,945,910 ₩
17,552,010Profit (Loss) for the year 861,942 3,131,988 2,657,595Total comprehensive income (loss) 862,951 2,990,404 2,656,582Profit (Loss) attributable to non-controlling interests (27,965) 4,101 57,766Net cash provided by (used in) operating activities 3,986,082 4,332,580 3,855,820Net cash provided by (used in) investing activities (3,582,523) (4,047,725) (3,070,607)Net cash provided by (used in) financing activities (636,834) (238,313) (826,618)Effects on exchange rate changes on cash and cash equivalents (2,600) ₩ 2,422 ₩ (6,102)K-net culture and contents venture fund [member]Disclosure of subsidiaries [line items]Ownership of non-controlling interests (%) 41.00% 41.00%Current assets ₩ 118 ₩ 625Non-current assets 147,573 250,122Current liabilities (20,873) (35,900)Net assets 126,818 214,847Net assets on the consolidated financial statements 126,818Carrying amount of non-controlling interests 51,995 88,087Profit (Loss) for the year ₩ (294) 58,584 196,250Profit (Loss) for the year on the consolidated financial statements 58,584Total comprehensive income (loss) 27,773 201,693Profit (Loss) attributable to non-controlling interests 24,019 80,463Net cash provided by (used in) operating activities 115,566 (7)Net cash provided by (used in) investing activities 600 (600)Net cash provided by (used in) financing activities (116,150)Net increase(decrease) in cash and cash equivalents 16 ₩ (607)Dividend paid to non-controlling interests during the year endedDecember 31, 2018 ₩ 36,178
DREAMUS COMPANY [member]Disclosure of subsidiaries [line items]Ownership of non-controlling interests (%) 48.60% 47.40% 54.10%
Copyright © 2020 www.secdatabase.com. All Rights Reserved.Please Consider the Environment Before Printing This Document
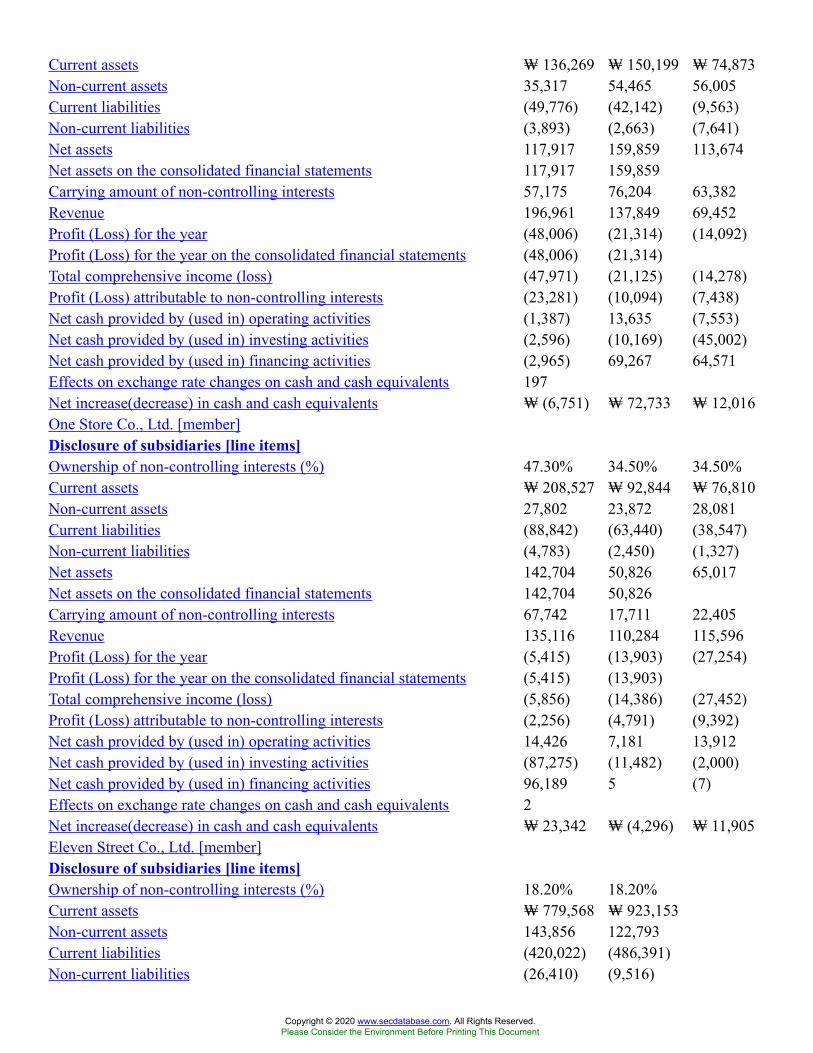
Current assets ₩ 136,269 ₩ 150,199 ₩ 74,873Non-current assets 35,317 54,465 56,005Current liabilities (49,776) (42,142) (9,563)Non-current liabilities (3,893) (2,663) (7,641)Net assets 117,917 159,859 113,674Net assets on the consolidated financial statements 117,917 159,859Carrying amount of non-controlling interests 57,175 76,204 63,382Revenue 196,961 137,849 69,452Profit (Loss) for the year (48,006) (21,314) (14,092)Profit (Loss) for the year on the consolidated financial statements (48,006) (21,314)Total comprehensive income (loss) (47,971) (21,125) (14,278)Profit (Loss) attributable to non-controlling interests (23,281) (10,094) (7,438)Net cash provided by (used in) operating activities (1,387) 13,635 (7,553)Net cash provided by (used in) investing activities (2,596) (10,169) (45,002)Net cash provided by (used in) financing activities (2,965) 69,267 64,571Effects on exchange rate changes on cash and cash equivalents 197Net increase(decrease) in cash and cash equivalents ₩ (6,751) ₩ 72,733 ₩ 12,016One Store Co., Ltd. [member]Disclosure of subsidiaries [line items]Ownership of non-controlling interests (%) 47.30% 34.50% 34.50%Current assets ₩ 208,527 ₩ 92,844 ₩ 76,810Non-current assets 27,802 23,872 28,081Current liabilities (88,842) (63,440) (38,547)Non-current liabilities (4,783) (2,450) (1,327)Net assets 142,704 50,826 65,017Net assets on the consolidated financial statements 142,704 50,826Carrying amount of non-controlling interests 67,742 17,711 22,405Revenue 135,116 110,284 115,596Profit (Loss) for the year (5,415) (13,903) (27,254)Profit (Loss) for the year on the consolidated financial statements (5,415) (13,903)Total comprehensive income (loss) (5,856) (14,386) (27,452)Profit (Loss) attributable to non-controlling interests (2,256) (4,791) (9,392)Net cash provided by (used in) operating activities 14,426 7,181 13,912Net cash provided by (used in) investing activities (87,275) (11,482) (2,000)Net cash provided by (used in) financing activities 96,189 5 (7)Effects on exchange rate changes on cash and cash equivalents 2Net increase(decrease) in cash and cash equivalents ₩ 23,342 ₩ (4,296) ₩ 11,905Eleven Street Co., Ltd. [member]Disclosure of subsidiaries [line items]Ownership of non-controlling interests (%) 18.20% 18.20%Current assets ₩ 779,568 ₩ 923,153Non-current assets 143,856 122,793Current liabilities (420,022) (486,391)Non-current liabilities (26,410) (9,516)
Copyright © 2020 www.secdatabase.com. All Rights Reserved.Please Consider the Environment Before Printing This Document
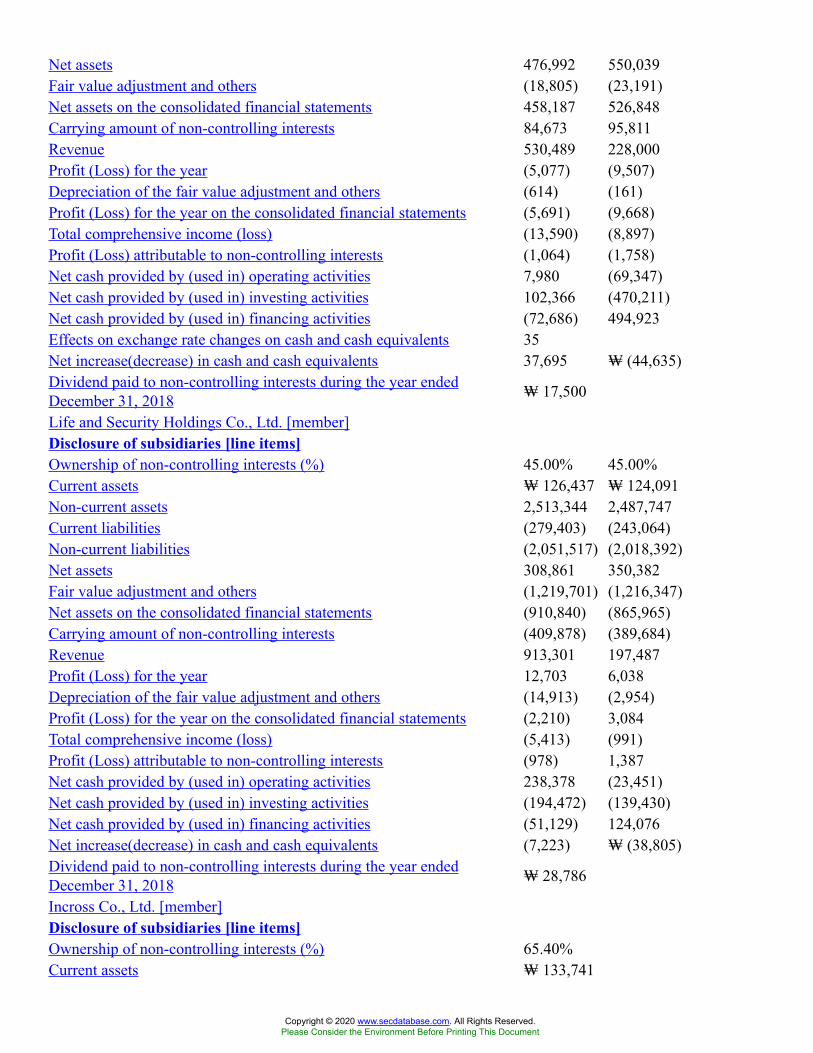
Net assets 476,992 550,039Fair value adjustment and others (18,805) (23,191)Net assets on the consolidated financial statements 458,187 526,848Carrying amount of non-controlling interests 84,673 95,811Revenue 530,489 228,000Profit (Loss) for the year (5,077) (9,507)Depreciation of the fair value adjustment and others (614) (161)Profit (Loss) for the year on the consolidated financial statements (5,691) (9,668)Total comprehensive income (loss) (13,590) (8,897)Profit (Loss) attributable to non-controlling interests (1,064) (1,758)Net cash provided by (used in) operating activities 7,980 (69,347)Net cash provided by (used in) investing activities 102,366 (470,211)Net cash provided by (used in) financing activities (72,686) 494,923Effects on exchange rate changes on cash and cash equivalents 35Net increase(decrease) in cash and cash equivalents 37,695 ₩ (44,635)Dividend paid to non-controlling interests during the year endedDecember 31, 2018 ₩ 17,500
Life and Security Holdings Co., Ltd. [member]Disclosure of subsidiaries [line items]Ownership of non-controlling interests (%) 45.00% 45.00%Current assets ₩ 126,437 ₩ 124,091Non-current assets 2,513,344 2,487,747Current liabilities (279,403) (243,064)Non-current liabilities (2,051,517) (2,018,392)Net assets 308,861 350,382Fair value adjustment and others (1,219,701) (1,216,347)Net assets on the consolidated financial statements (910,840) (865,965)Carrying amount of non-controlling interests (409,878) (389,684)Revenue 913,301 197,487Profit (Loss) for the year 12,703 6,038Depreciation of the fair value adjustment and others (14,913) (2,954)Profit (Loss) for the year on the consolidated financial statements (2,210) 3,084Total comprehensive income (loss) (5,413) (991)Profit (Loss) attributable to non-controlling interests (978) 1,387Net cash provided by (used in) operating activities 238,378 (23,451)Net cash provided by (used in) investing activities (194,472) (139,430)Net cash provided by (used in) financing activities (51,129) 124,076Net increase(decrease) in cash and cash equivalents (7,223) ₩ (38,805)Dividend paid to non-controlling interests during the year endedDecember 31, 2018 ₩ 28,786
Incross Co., Ltd. [member]Disclosure of subsidiaries [line items]Ownership of non-controlling interests (%) 65.40%Current assets ₩ 133,741
Copyright © 2020 www.secdatabase.com. All Rights Reserved.Please Consider the Environment Before Printing This Document
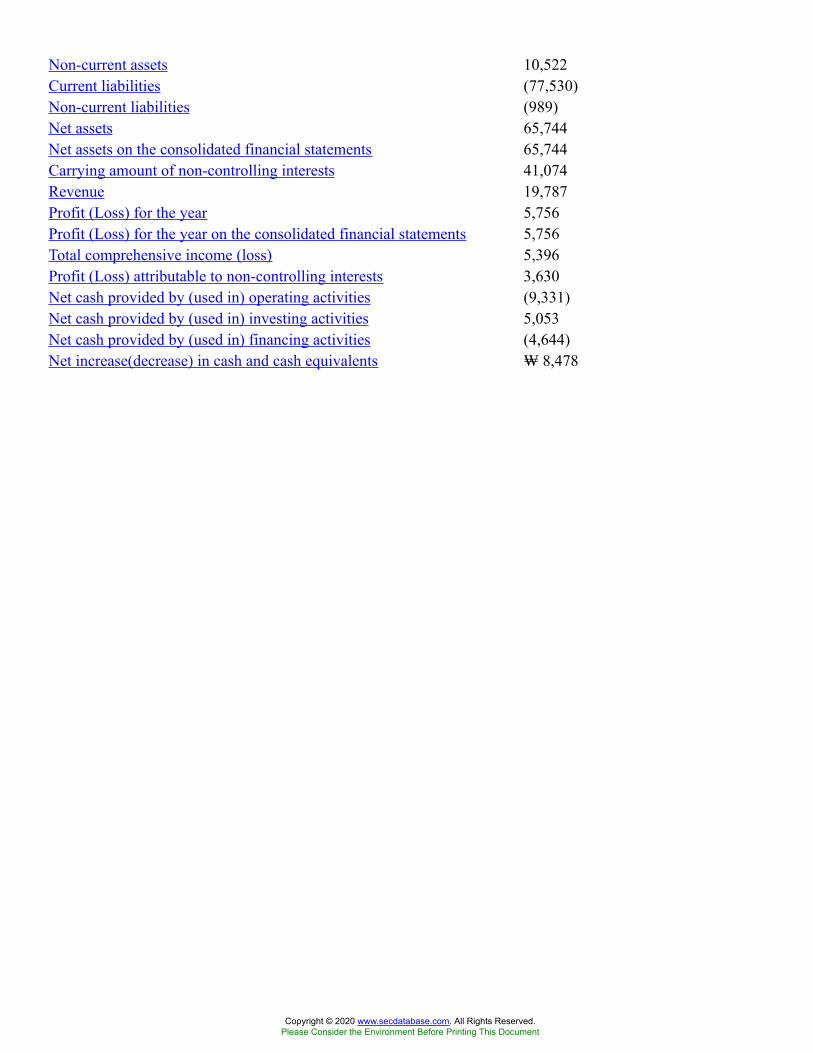
Non-current assets 10,522Current liabilities (77,530)Non-current liabilities (989)Net assets 65,744Net assets on the consolidated financial statements 65,744Carrying amount of non-controlling interests 41,074Revenue 19,787Profit (Loss) for the year 5,756Profit (Loss) for the year on the consolidated financial statements 5,756Total comprehensive income (loss) 5,396Profit (Loss) attributable to non-controlling interests 3,630Net cash provided by (used in) operating activities (9,331)Net cash provided by (used in) investing activities 5,053Net cash provided by (used in) financing activities (4,644)Net increase(decrease) in cash and cash equivalents ₩ 8,478
Copyright © 2020 www.secdatabase.com. All Rights Reserved.Please Consider the Environment Before Printing This Document
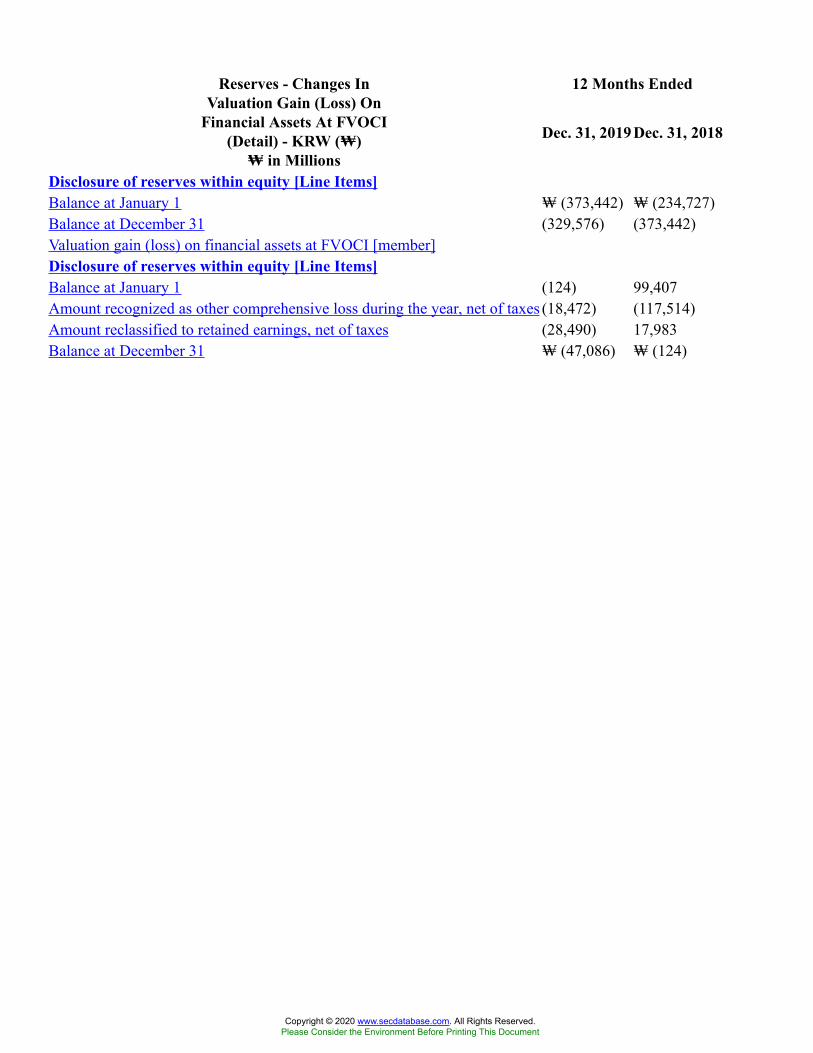
12 Months EndedReserves - Changes InValuation Gain (Loss) On
Financial Assets At FVOCI(Detail) - KRW (₩)
₩ in Millions
Dec. 31, 2019 Dec. 31, 2018
Disclosure of reserves within equity [Line Items]Balance at January 1 ₩ (373,442) ₩ (234,727)Balance at December 31 (329,576) (373,442)Valuation gain (loss) on financial assets at FVOCI [member]Disclosure of reserves within equity [Line Items]Balance at January 1 (124) 99,407Amount recognized as other comprehensive loss during the year, net of taxes (18,472) (117,514)Amount reclassified to retained earnings, net of taxes (28,490) 17,983Balance at December 31 ₩ (47,086) ₩ (124)
Copyright © 2020 www.secdatabase.com. All Rights Reserved.Please Consider the Environment Before Printing This Document
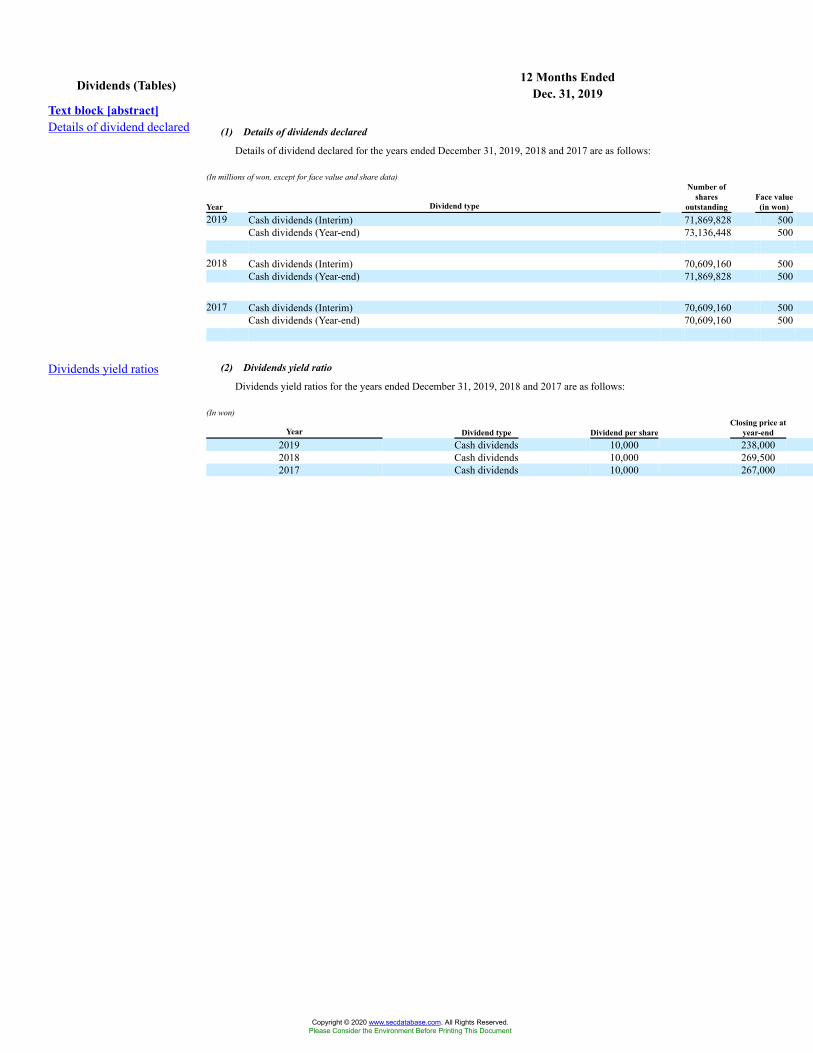
12 Months EndedDividends (Tables) Dec. 31, 2019Text block [abstract]Details of dividend declared (1) Details of dividends declared
Details of dividend declared for the years ended December 31, 2019, 2018 and 2017 are as follows:
(In millions of won, except for face value and share data)
Year Dividend type
Number ofshares
outstandingFace value(in won)
Dividendratio Dividends
2019 Cash dividends (Interim) 71,869,828 500 200% ₩ 71,870Cash dividends (Year-end) 73,136,448 500 1,800% 658,228
₩730,0982018 Cash dividends (Interim) 70,609,160 500 200% ₩ 70,609
Cash dividends (Year-end) 71,869,828 500 1,800% 646,828₩717,437
2017 Cash dividends (Interim) 70,609,160 500 200% ₩ 70,609Cash dividends (Year-end) 70,609,160 500 1,800% 635,482
₩706,091
Dividends yield ratios (2) Dividends yield ratio
Dividends yield ratios for the years ended December 31, 2019, 2018 and 2017 are as follows:
(In won)
Year Dividend type Dividend per shareClosing price at
year-end Dividend yield ratio2019 Cash dividends 10,000 238,000 4.20%2018 Cash dividends 10,000 269,500 3.71%2017 Cash dividends 10,000 267,000 3.75%
Copyright © 2020 www.secdatabase.com. All Rights Reserved.Please Consider the Environment Before Printing This Document
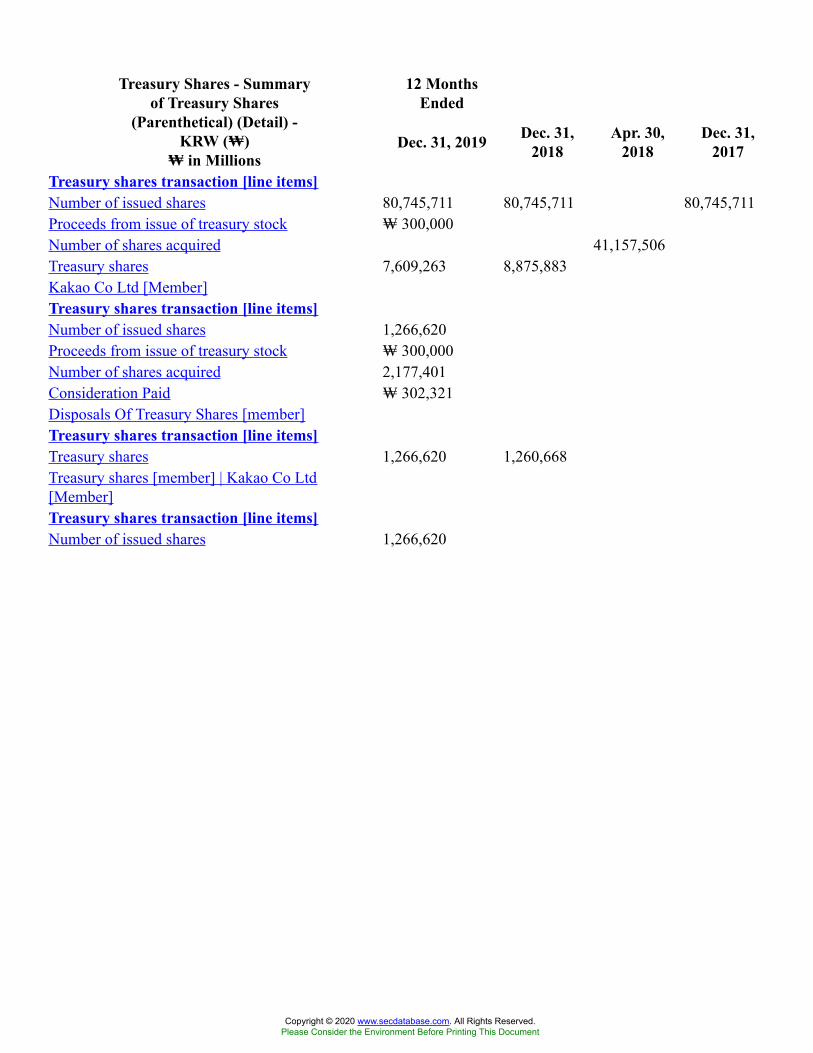
12 MonthsEnded
Treasury Shares - Summaryof Treasury Shares
(Parenthetical) (Detail) -KRW (₩)
₩ in MillionsDec. 31, 2019 Dec. 31,
2018Apr. 30,
2018Dec. 31,
2017
Treasury shares transaction [line items]Number of issued shares 80,745,711 80,745,711 80,745,711Proceeds from issue of treasury stock ₩ 300,000Number of shares acquired 41,157,506Treasury shares 7,609,263 8,875,883Kakao Co Ltd [Member]Treasury shares transaction [line items]Number of issued shares 1,266,620Proceeds from issue of treasury stock ₩ 300,000Number of shares acquired 2,177,401Consideration Paid ₩ 302,321Disposals Of Treasury Shares [member]Treasury shares transaction [line items]Treasury shares 1,266,620 1,260,668Treasury shares [member] | Kakao Co Ltd[Member]Treasury shares transaction [line items]Number of issued shares 1,266,620
Copyright © 2020 www.secdatabase.com. All Rights Reserved.Please Consider the Environment Before Printing This Document
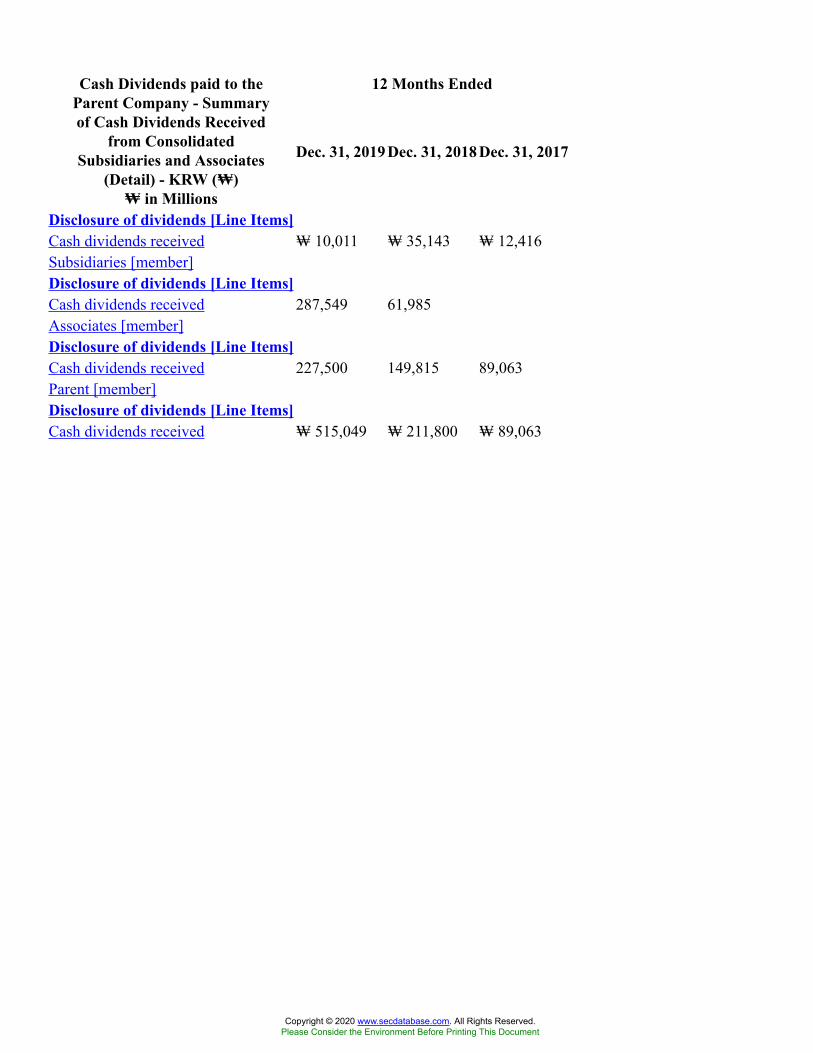
12 Months EndedCash Dividends paid to theParent Company - Summaryof Cash Dividends Received
from ConsolidatedSubsidiaries and Associates
(Detail) - KRW (₩)₩ in Millions
Dec. 31, 2019 Dec. 31, 2018 Dec. 31, 2017
Disclosure of dividends [Line Items]Cash dividends received ₩ 10,011 ₩ 35,143 ₩ 12,416Subsidiaries [member]Disclosure of dividends [Line Items]Cash dividends received 287,549 61,985Associates [member]Disclosure of dividends [Line Items]Cash dividends received 227,500 149,815 89,063Parent [member]Disclosure of dividends [Line Items]Cash dividends received ₩ 515,049 ₩ 211,800 ₩ 89,063
Copyright © 2020 www.secdatabase.com. All Rights Reserved.Please Consider the Environment Before Printing This Document
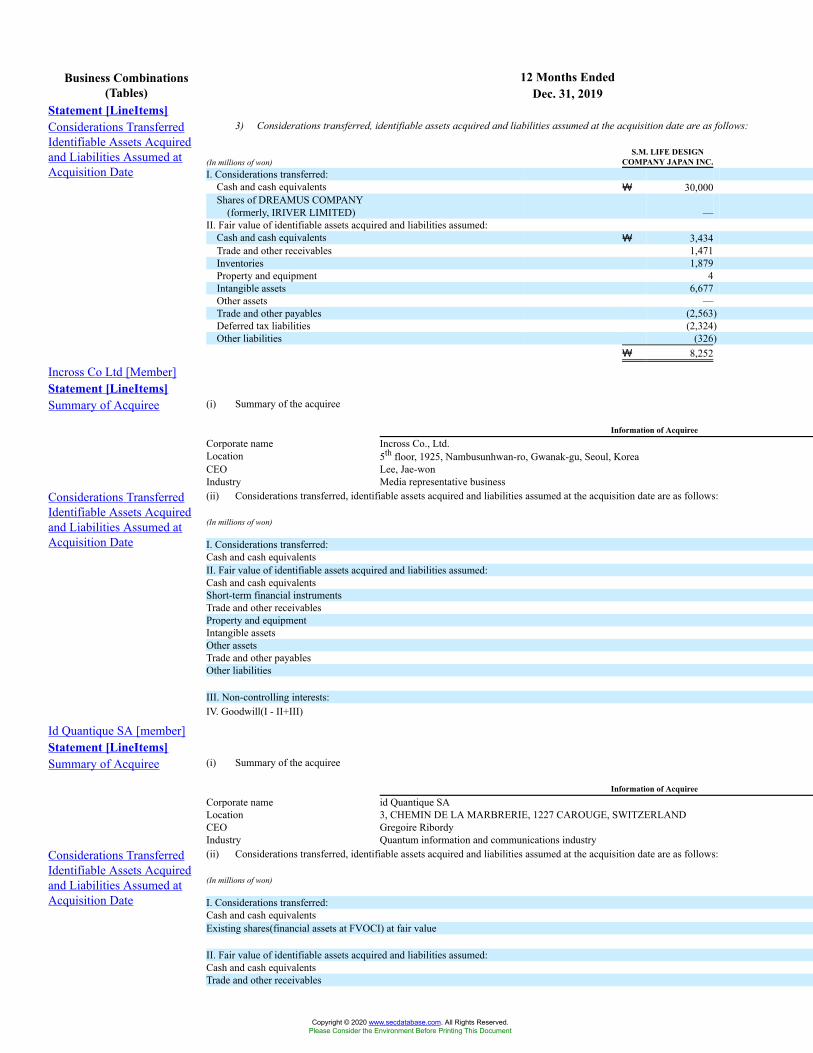
12 Months EndedBusiness Combinations(Tables) Dec. 31, 2019
Statement [LineItems]Considerations TransferredIdentifiable Assets Acquiredand Liabilities Assumed atAcquisition Date
3) Considerations transferred, identifiable assets acquired and liabilities assumed at the acquisition date are as follows:
(In millions of won)S.M. LIFE DESIGN
COMPANY JAPAN INC.S.M. Mobile
Communications JAPAN Inc.I. Considerations transferred:
Cash and cash equivalents ₩ 30,000 —Shares of DREAMUS COMPANY
(formerly, IRIVER LIMITED) — 24,650II. Fair value of identifiable assets acquired and liabilities assumed:
Cash and cash equivalents ₩ 3,434 4,112Trade and other receivables 1,471 237Inventories 1,879 —Property and equipment 4 311Intangible assets 6,677 7,445Other assets — 41Trade and other payables (2,563) (815)Deferred tax liabilities (2,324) —Other liabilities (326) (154)
₩ 8,252 11,177
Incross Co Ltd [Member]Statement [LineItems]Summary of Acquiree (i) Summary of the acquiree
Information of AcquireeCorporate name Incross Co., Ltd.Location 5th floor, 1925, Nambusunhwan-ro, Gwanak-gu, Seoul, KoreaCEO Lee, Jae-wonIndustry Media representative business
Considerations TransferredIdentifiable Assets Acquiredand Liabilities Assumed atAcquisition Date
(ii) Considerations transferred, identifiable assets acquired and liabilities assumed at the acquisition date are as follows:
(In millions of won)Amount
I. Considerations transferred:Cash and cash equivalents ₩ 53,722II. Fair value of identifiable assets acquired and liabilities assumed:Cash and cash equivalents 17,400Short-term financial instruments 24,941Trade and other receivables 67,259Property and equipment 2,411Intangible assets 2,709Other assets 9,254Trade and other payables (57,309)Other liabilities (1,984)
64,681III. Non-controlling interests: 40,592IV. Goodwill(I - II+III) ₩ 29,633
Id Quantique SA [member]Statement [LineItems]Summary of Acquiree (i) Summary of the acquiree
Information of AcquireeCorporate name id Quantique SALocation 3, CHEMIN DE LA MARBRERIE, 1227 CAROUGE, SWITZERLANDCEO Gregoire RibordyIndustry Quantum information and communications industry
Considerations TransferredIdentifiable Assets Acquiredand Liabilities Assumed atAcquisition Date
(ii) Considerations transferred, identifiable assets acquired and liabilities assumed at the acquisition date are as follows:
(In millions of won)Amount
I. Considerations transferred:Cash and cash equivalents ₩55,249Existing shares(financial assets at FVOCI) at fair value 3,965
59,214II. Fair value of identifiable assets acquired and liabilities assumed:Cash and cash equivalents 1,538Trade and other receivables 13,609
Copyright © 2020 www.secdatabase.com. All Rights Reserved.Please Consider the Environment Before Printing This Document
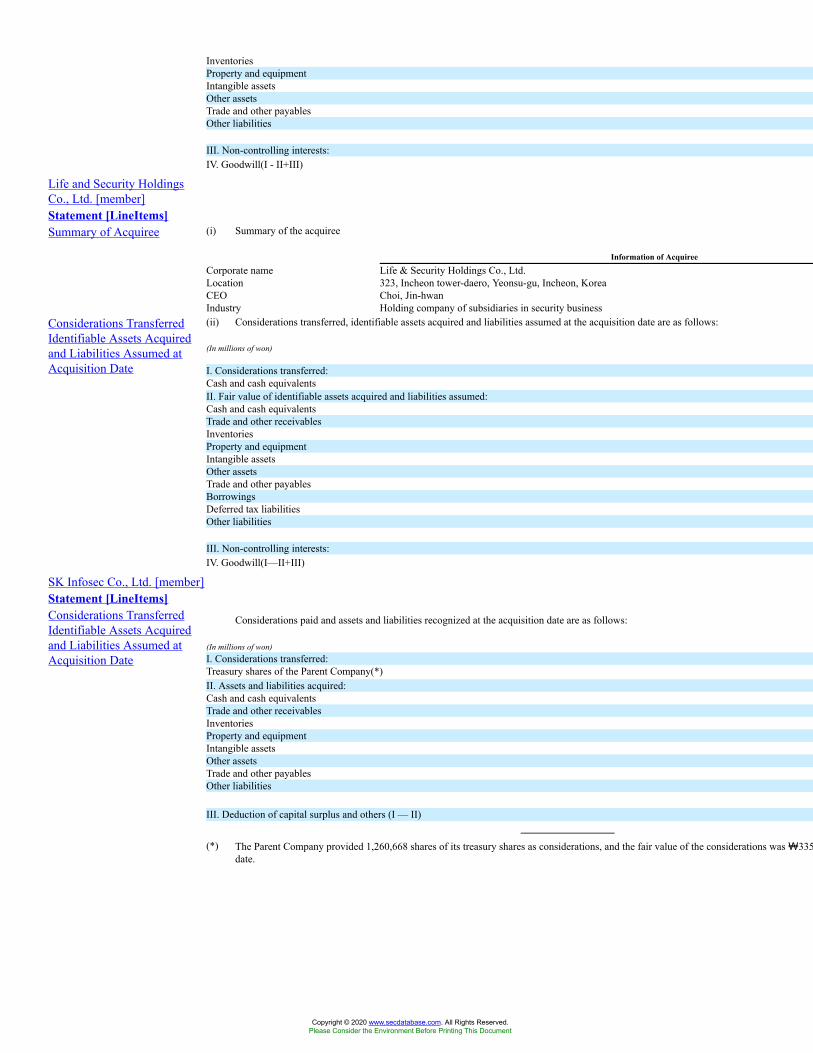
Inventories 2,003Property and equipment 415Intangible assets 7,566Other assets 447Trade and other payables (1,569)Other liabilities (2,880)
21,129III. Non-controlling interests: 9,290IV. Goodwill(I - II+III) ₩47,375
Life and Security HoldingsCo., Ltd. [member]Statement [LineItems]Summary of Acquiree (i) Summary of the acquiree
Information of AcquireeCorporate name Life & Security Holdings Co., Ltd.Location 323, Incheon tower-daero, Yeonsu-gu, Incheon, KoreaCEO Choi, Jin-hwanIndustry Holding company of subsidiaries in security business
Considerations TransferredIdentifiable Assets Acquiredand Liabilities Assumed atAcquisition Date
(ii) Considerations transferred, identifiable assets acquired and liabilities assumed at the acquisition date are as follows:
(In millions of won)Amount
I. Considerations transferred:Cash and cash equivalents ₩ 696,665II. Fair value of identifiable assets acquired and liabilities assumed:Cash and cash equivalents 101,896Trade and other receivables 40,241Inventories 2,440Property and equipment 427,752Intangible assets 1,019,503Other assets 3,956Trade and other payables (296,660)Borrowings (1,744,839)Deferred tax liabilities (229,207)Other liabilities (158,042)
(832,960)III. Non-controlling interests: (374,588)IV. Goodwill(I—II+III) ₩ 1,155,037
SK Infosec Co., Ltd. [member]Statement [LineItems]Considerations TransferredIdentifiable Assets Acquiredand Liabilities Assumed atAcquisition Date
Considerations paid and assets and liabilities recognized at the acquisition date are as follows:
(In millions of won) AmountI. Considerations transferred:Treasury shares of the Parent Company(*) ₩281,151II. Assets and liabilities acquired:Cash and cash equivalents 30,762Trade and other receivables 62,448Inventories 1,293Property and equipment 8,047Intangible assets 5,528Other assets 79,951Trade and other payables (38,431)Other liabilities (20,003)
129,595III. Deduction of capital surplus and others (I — II) ₩151,556
(*) The Parent Company provided 1,260,668 shares of its treasury shares as considerations, and the fair value of the considerations was ₩335,338 million at the transferdate.
Copyright © 2020 www.secdatabase.com. All Rights Reserved.Please Consider the Environment Before Printing This Document
12 Months EndedPrepaid expenses (Tables) Dec. 31, 2019Text block [abstract]Summary of Prepaid Expenses (1) Details of prepaid expenses as of December 31, 2019 and 2018 are as follows:
(In millions of won)December 31, 2019 December 31, 2018
Current assets:Incremental costs of obtaining contracts ₩ 1,897,233 1,577,992Others 133,317 190,351
2,030,550 1,768,343Non-current assets:
Incremental costs of obtaining contracts 1,152,748 799,607Others 88,681 95,665
₩ 1,241,429 895,272
Summary of Incremental Costsof Obtaining Contracts ThatCapitalized as Assets andRelated AmortizationRecognized as Commissions
(2) Incremental costs of obtaining contracts
The amortization and impairment losses in connection with incremental costs of obtaining contracts recognized during the years ended December 31, 2019 and 2018are as follows:
(In millions of won)December 31,
2019December 31,
2018Amortization and impairment losses recognized ₩ 2,193,333 2,002,460
Copyright © 2020 www.secdatabase.com. All Rights Reserved.Please Consider the Environment Before Printing This Document
12 Months EndedDefined Benefit Liabilities(Assets) - Changes in PlanAssets (Detail) - KRW (₩)
₩ in MillionsDec. 31, 2019 Dec. 31, 2018 Dec. 31, 2017
Disclosure of fair value of plan assets [line items]Interest income ₩ (3,968) ₩ (3,997) ₩ (2,170)Plan assets [member]Disclosure of fair value of plan assets [line items]Beginning balance 816,699 663,617Interest income 19,717 19,134Remeasurement (5,366) (7,659)Contributions 204,186 166,624Benefit paid (73,396) (43,549)Business combinations 3,207 21,417Others 607 (2,885)Ending balance ₩ 965,654 ₩ 816,699 ₩ 663,617
Copyright © 2020 www.secdatabase.com. All Rights Reserved.Please Consider the Environment Before Printing This Document
Long-term Payables Other -Details of Long-term
Payables - Other, WhichConsist of Payables Related
to the Acquisition ofFrequency Usage Rights
(Detail) - KRW (₩)₩ in Millions
Dec. 31, 2019 Dec. 31, 2018
Disclosure of financial liabilities [line items]Current installments of long-term payables - other ₩ (423,839) ₩ (423,884)Carrying amount at December 31 1,544,699 1,939,082Gross amount [member]Disclosure of financial liabilities [line items]Long-term payables-other 2,051,389 2,476,738Present value discount [Member]Disclosure of financial liabilities [line items]Long-term payables-other ₩ (82,851) ₩ (113,772)
Copyright © 2020 www.secdatabase.com. All Rights Reserved.Please Consider the Environment Before Printing This Document
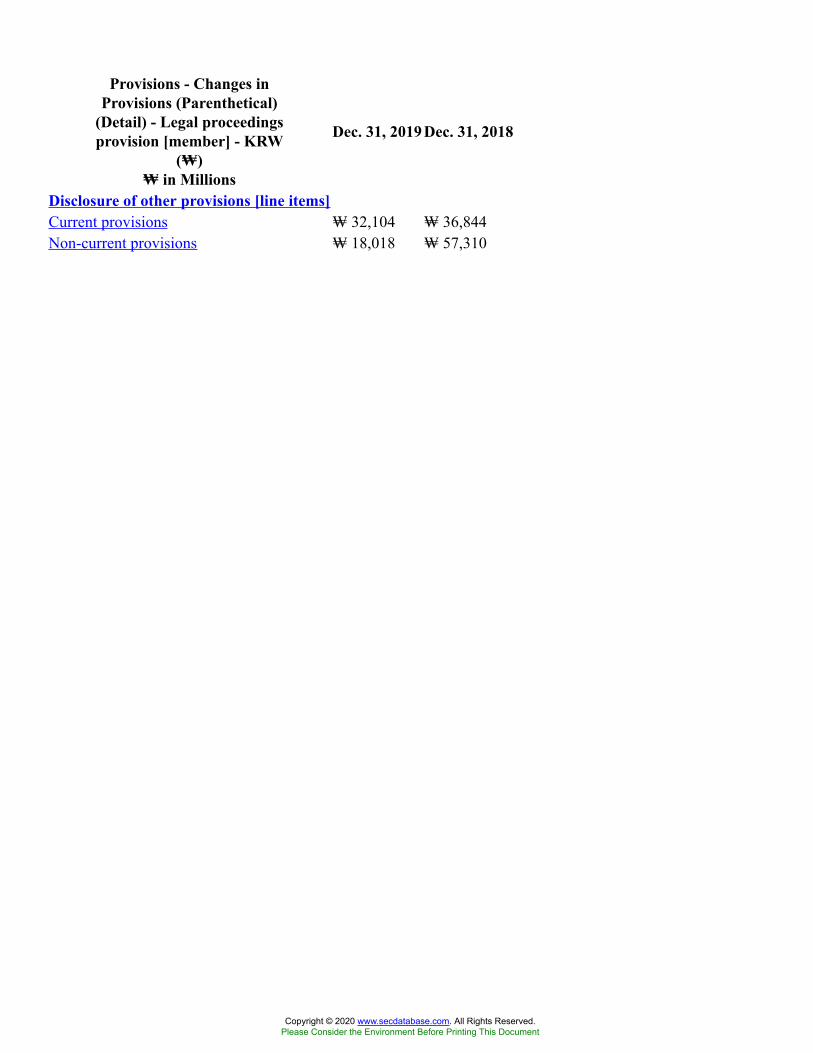
Provisions - Changes inProvisions (Parenthetical)
(Detail) - Legal proceedingsprovision [member] - KRW
(₩)₩ in Millions
Dec. 31, 2019 Dec. 31, 2018
Disclosure of other provisions [line items]Current provisions ₩ 32,104 ₩ 36,844Non-current provisions ₩ 18,018 ₩ 57,310
Copyright © 2020 www.secdatabase.com. All Rights Reserved.Please Consider the Environment Before Printing This Document
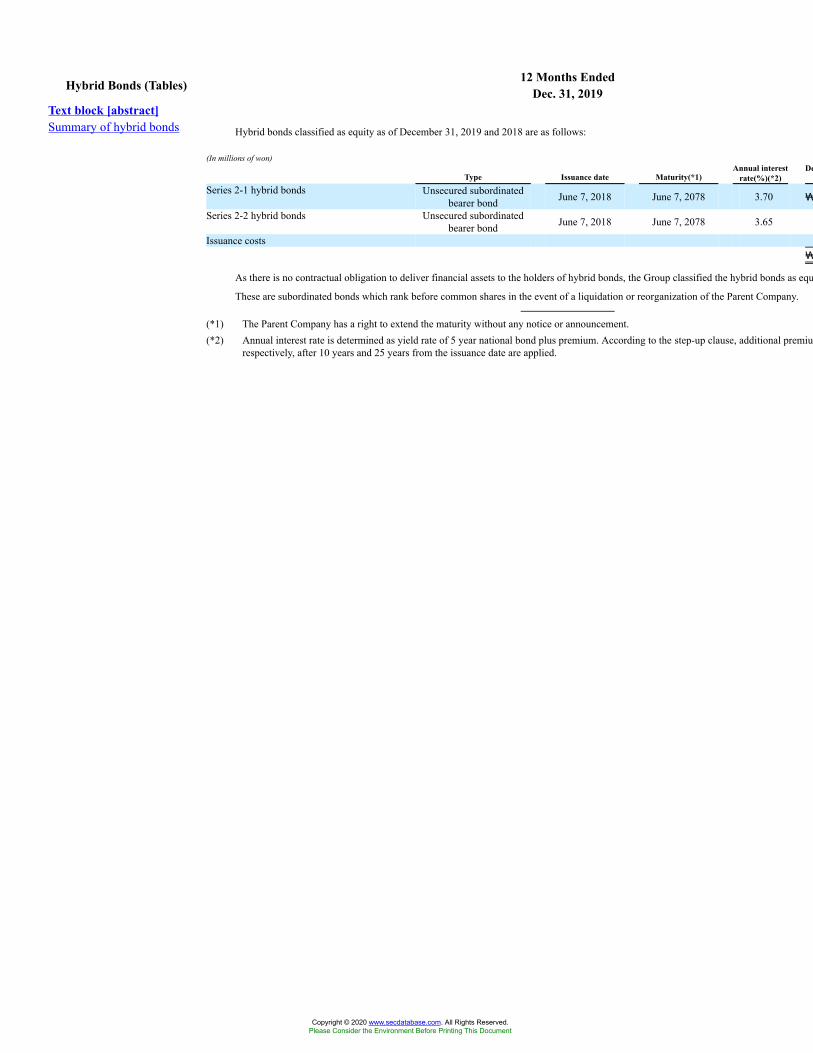
12 Months EndedHybrid Bonds (Tables) Dec. 31, 2019Text block [abstract]Summary of hybrid bonds Hybrid bonds classified as equity as of December 31, 2019 and 2018 are as follows:
(In millions of won)
Type Issuance date Maturity(*1)Annual interest
rate(%)(*2)December 31,
2019December 31,
2018Series 2-1 hybrid bonds Unsecured subordinated
bearer bond June 7, 2018 June 7, 2078 3.70 ₩ 300,000 300,000
Series 2-2 hybrid bonds Unsecured subordinatedbearer bond June 7, 2018 June 7, 2078 3.65 100,000 100,000
Issuance costs (1,241) (1,241)₩ 398,759 398,759
As there is no contractual obligation to deliver financial assets to the holders of hybrid bonds, the Group classified the hybrid bonds as equity.
These are subordinated bonds which rank before common shares in the event of a liquidation or reorganization of the Parent Company.
(*1) The Parent Company has a right to extend the maturity without any notice or announcement.(*2) Annual interest rate is determined as yield rate of 5 year national bond plus premium. According to the step-up clause, additional premium of 0.25% and 0.75%,
respectively, after 10 years and 25 years from the issuance date are applied.
Copyright © 2020 www.secdatabase.com. All Rights Reserved.Please Consider the Environment Before Printing This Document
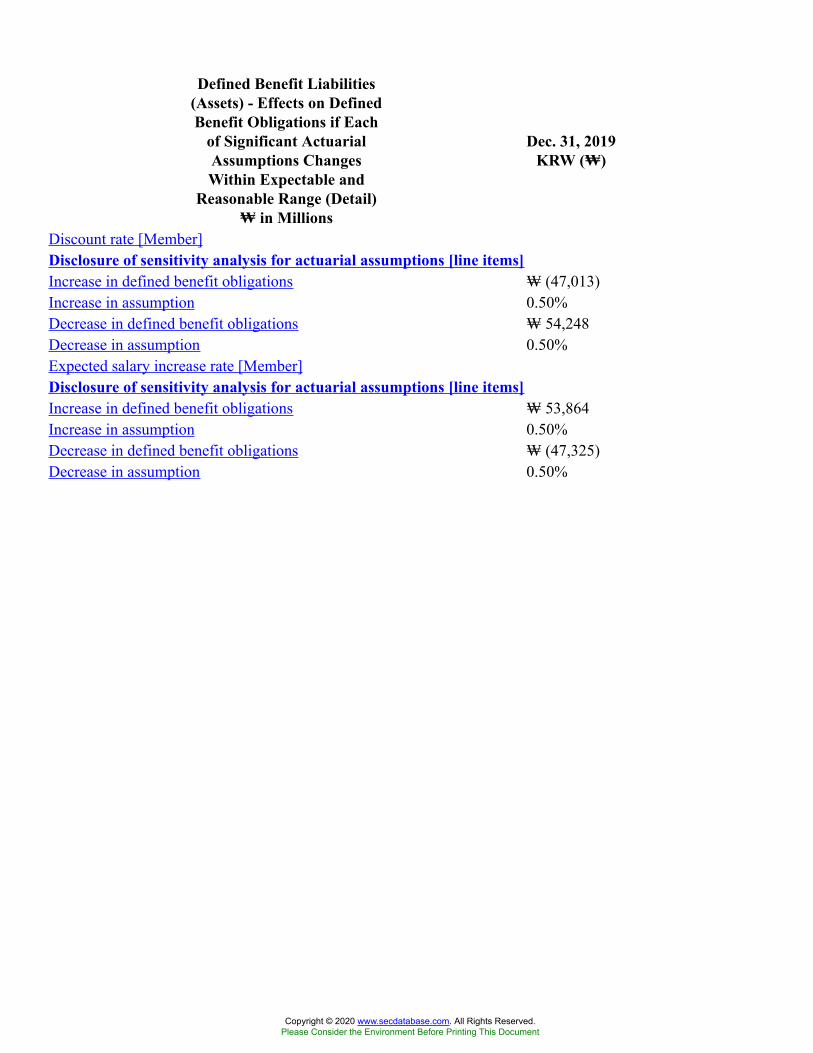
Defined Benefit Liabilities(Assets) - Effects on DefinedBenefit Obligations if Each
of Significant ActuarialAssumptions ChangesWithin Expectable and
Reasonable Range (Detail)₩ in Millions
Dec. 31, 2019KRW (₩)
Discount rate [Member]Disclosure of sensitivity analysis for actuarial assumptions [line items]Increase in defined benefit obligations ₩ (47,013)Increase in assumption 0.50%Decrease in defined benefit obligations ₩ 54,248Decrease in assumption 0.50%Expected salary increase rate [Member]Disclosure of sensitivity analysis for actuarial assumptions [line items]Increase in defined benefit obligations ₩ 53,864Increase in assumption 0.50%Decrease in defined benefit obligations ₩ (47,325)Decrease in assumption 0.50%
Copyright © 2020 www.secdatabase.com. All Rights Reserved.Please Consider the Environment Before Printing This Document

12 Months EndedOperating Segments -Additional Information
(Detail) - KRW (₩)₩ in Millions
Dec. 31, 2019 Dec. 31, 2018 Dec. 31, 2017
Disclosure of operating segments [line items]Revenue ₩ 17,743,702 ₩ 16,873,960 ₩ 17,520,013Domestic [member]Disclosure of operating segments [line items]Revenue 17,680,000 16,656,000 17,374,000Non-current assets 20,678,000 20,040,000 15,554,000Outside of Korea [member]Disclosure of operating segments [line items]Non-current assets ₩ 63,000 ₩ 72,000 ₩ 257,000
Copyright © 2020 www.secdatabase.com. All Rights Reserved.Please Consider the Environment Before Printing This Document
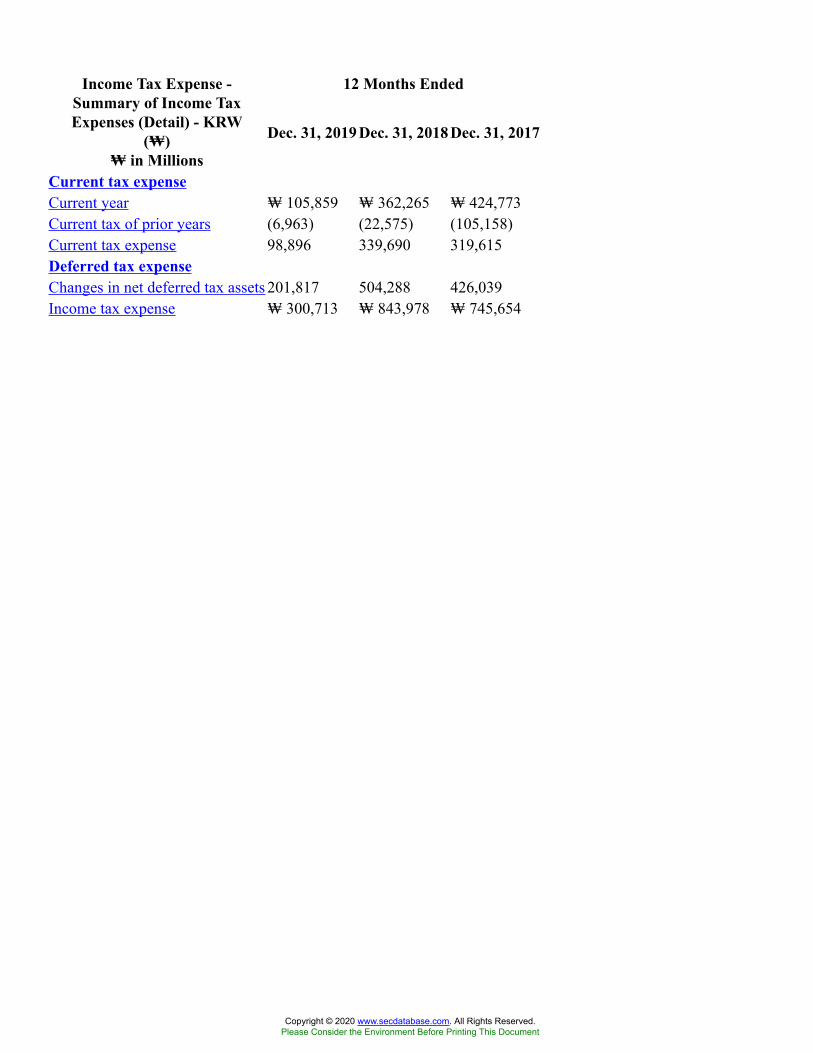
12 Months EndedIncome Tax Expense -Summary of Income TaxExpenses (Detail) - KRW
(₩)₩ in Millions
Dec. 31, 2019 Dec. 31, 2018 Dec. 31, 2017
Current tax expenseCurrent year ₩ 105,859 ₩ 362,265 ₩ 424,773Current tax of prior years (6,963) (22,575) (105,158)Current tax expense 98,896 339,690 319,615Deferred tax expenseChanges in net deferred tax assets 201,817 504,288 426,039Income tax expense ₩ 300,713 ₩ 843,978 ₩ 745,654
Copyright © 2020 www.secdatabase.com. All Rights Reserved.Please Consider the Environment Before Printing This Document

Income Tax Expense -Details of Temporary
Differences, Unused TaxLoss Carryforwards and
Unused Tax CreditsCarryforwards Which are
Not Recognized as DeferredTax Assets (Detail) - KRW
(₩)₩ in Millions
Dec. 31,2019
Dec. 31,2018
Disclosure of temporary difference, unused tax losses and unused tax credits[Line Items]Unused tax loss carryforwards ₩
1,023,907 ₩ 849,850
Unused tax credit carryforwards 1,192 3,705Loss allowance [Member]Disclosure of temporary difference, unused tax losses and unused tax credits[Line Items]Temporary differences 96,006 98,205Investments in subsidiaries, associates and joint ventures [Member]Disclosure of temporary difference, unused tax losses and unused tax credits[Line Items]Temporary differences (128,339) (233,234)Others [Member]Disclosure of temporary difference, unused tax losses and unused tax credits[Line Items]Temporary differences ₩ 145,692 ₩ 189,604
Copyright © 2020 www.secdatabase.com. All Rights Reserved.Please Consider the Environment Before Printing This Document
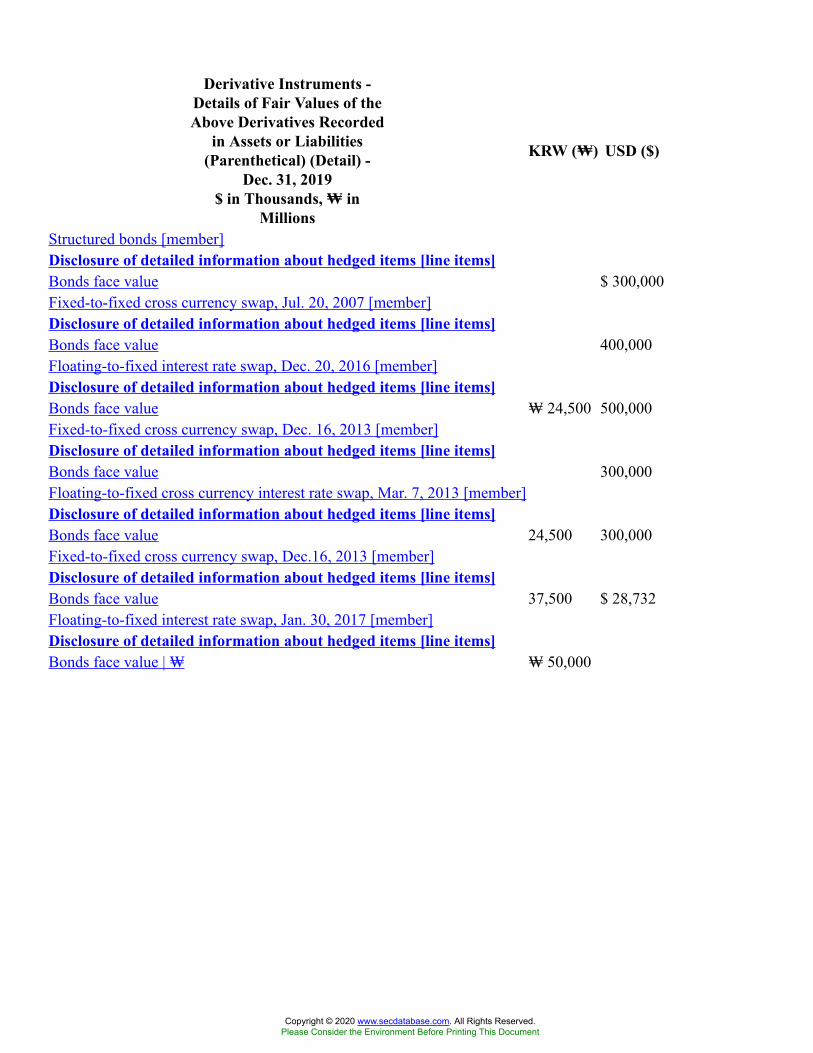
Derivative Instruments -Details of Fair Values of theAbove Derivatives Recorded
in Assets or Liabilities(Parenthetical) (Detail) -
Dec. 31, 2019$ in Thousands, ₩ in
Millions
KRW (₩) USD ($)
Structured bonds [member]Disclosure of detailed information about hedged items [line items]Bonds face value $ 300,000Fixed-to-fixed cross currency swap, Jul. 20, 2007 [member]Disclosure of detailed information about hedged items [line items]Bonds face value 400,000Floating-to-fixed interest rate swap, Dec. 20, 2016 [member]Disclosure of detailed information about hedged items [line items]Bonds face value ₩ 24,500 500,000Fixed-to-fixed cross currency swap, Dec. 16, 2013 [member]Disclosure of detailed information about hedged items [line items]Bonds face value 300,000Floating-to-fixed cross currency interest rate swap, Mar. 7, 2013 [member]Disclosure of detailed information about hedged items [line items]Bonds face value 24,500 300,000Fixed-to-fixed cross currency swap, Dec.16, 2013 [member]Disclosure of detailed information about hedged items [line items]Bonds face value 37,500 $ 28,732Floating-to-fixed interest rate swap, Jan. 30, 2017 [member]Disclosure of detailed information about hedged items [line items]Bonds face value | ₩ ₩ 50,000
Copyright © 2020 www.secdatabase.com. All Rights Reserved.Please Consider the Environment Before Printing This Document
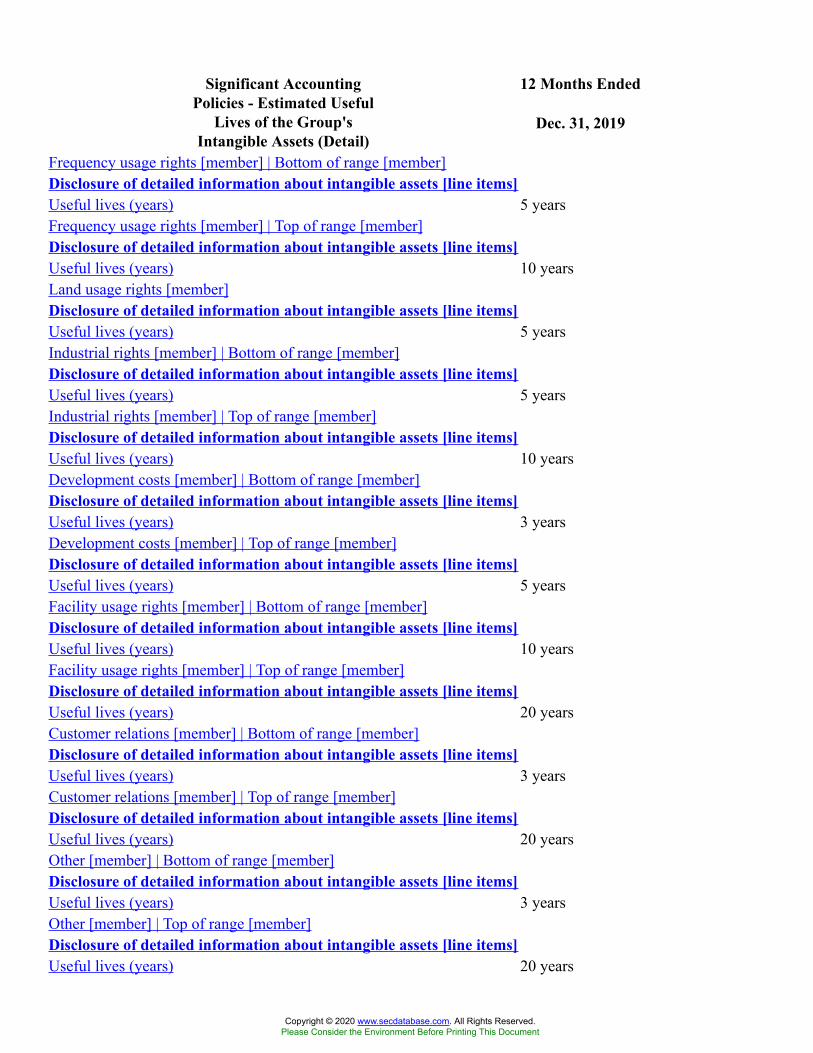
12 Months EndedSignificant AccountingPolicies - Estimated Useful
Lives of the Group'sIntangible Assets (Detail)
Dec. 31, 2019
Frequency usage rights [member] | Bottom of range [member]Disclosure of detailed information about intangible assets [line items]Useful lives (years) 5 yearsFrequency usage rights [member] | Top of range [member]Disclosure of detailed information about intangible assets [line items]Useful lives (years) 10 yearsLand usage rights [member]Disclosure of detailed information about intangible assets [line items]Useful lives (years) 5 yearsIndustrial rights [member] | Bottom of range [member]Disclosure of detailed information about intangible assets [line items]Useful lives (years) 5 yearsIndustrial rights [member] | Top of range [member]Disclosure of detailed information about intangible assets [line items]Useful lives (years) 10 yearsDevelopment costs [member] | Bottom of range [member]Disclosure of detailed information about intangible assets [line items]Useful lives (years) 3 yearsDevelopment costs [member] | Top of range [member]Disclosure of detailed information about intangible assets [line items]Useful lives (years) 5 yearsFacility usage rights [member] | Bottom of range [member]Disclosure of detailed information about intangible assets [line items]Useful lives (years) 10 yearsFacility usage rights [member] | Top of range [member]Disclosure of detailed information about intangible assets [line items]Useful lives (years) 20 yearsCustomer relations [member] | Bottom of range [member]Disclosure of detailed information about intangible assets [line items]Useful lives (years) 3 yearsCustomer relations [member] | Top of range [member]Disclosure of detailed information about intangible assets [line items]Useful lives (years) 20 yearsOther [member] | Bottom of range [member]Disclosure of detailed information about intangible assets [line items]Useful lives (years) 3 yearsOther [member] | Top of range [member]Disclosure of detailed information about intangible assets [line items]Useful lives (years) 20 years
Copyright © 2020 www.secdatabase.com. All Rights Reserved.Please Consider the Environment Before Printing This Document

12 Months EndedDividends - Details ofDividend Declared (Detail) -
KRW (₩)₩ / shares in Units, ₩ in
Millions
Dec. 31, 2019 Dec. 31, 2018 Dec. 31, 2017
Disclosure of dividends [LineItems]Dividend type Cash dividends Cash dividends Cash dividendsNumber of shares outstanding 73,136,448 71,869,828Face value (in won) ₩ 500Dividends ₩ 730,098 ₩ 717,437 ₩ 706,091Interim [Member]Disclosure of dividends [LineItems]Dividend type Cash dividends (Interim) Cash dividends (Interim) Cash dividends (Interim)Number of shares outstanding 71,869,828 70,609,160 70,609,160Face value (in won) ₩ 500 ₩ 500 ₩ 500Dividend ratio 200.00% 200.00% 200.00%Dividends ₩ 71,870 ₩ 70,609 ₩ 70,609Year-end [Member]Disclosure of dividends [LineItems]Dividend type Cash dividends (Year-
end)Cash dividends (Year-end)
Cash dividends (Year-end)
Number of shares outstanding 73,136,448 71,869,828 70,609,160Face value (in won) ₩ 500Dividend ratio 1800.00% 1800.00% 1800.00%Dividends ₩ 658,228 ₩ 646,828 ₩ 635,482
Copyright © 2020 www.secdatabase.com. All Rights Reserved.Please Consider the Environment Before Printing This Document
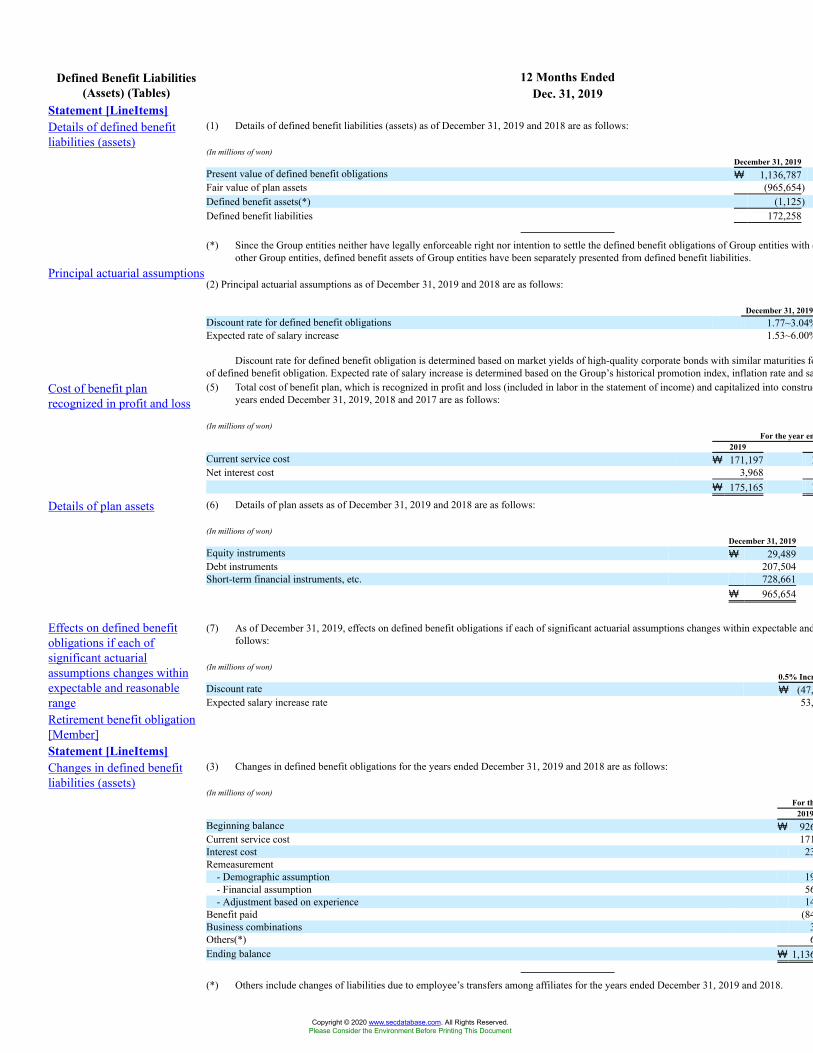
12 Months EndedDefined Benefit Liabilities(Assets) (Tables) Dec. 31, 2019
Statement [LineItems]Details of defined benefitliabilities (assets)
(1) Details of defined benefit liabilities (assets) as of December 31, 2019 and 2018 are as follows:
(In millions of won)December 31, 2019 December 31, 2018
Present value of defined benefit obligations ₩ 1,136,787 926,302Fair value of plan assets (965,654) (816,699)Defined benefit assets(*) (1,125) (31,926)Defined benefit liabilities 172,258 141,529
(*) Since the Group entities neither have legally enforceable right nor intention to settle the defined benefit obligations of Group entities with defined benefit assets ofother Group entities, defined benefit assets of Group entities have been separately presented from defined benefit liabilities.
Principal actuarial assumptions(2) Principal actuarial assumptions as of December 31, 2019 and 2018 are as follows:
December 31, 2019 December 31, 2018Discount rate for defined benefit obligations 1.77~3.04% 2.24~3.07%Expected rate of salary increase 1.53~6.00% 3.42~5.61%
Discount rate for defined benefit obligation is determined based on market yields of high-quality corporate bonds with similar maturities for estimated payment termof defined benefit obligation. Expected rate of salary increase is determined based on the Group’s historical promotion index, inflation rate and salary increase ratio.
Cost of benefit planrecognized in profit and loss
(5) Total cost of benefit plan, which is recognized in profit and loss (included in labor in the statement of income) and capitalized into construction-in-progress, for theyears ended December 31, 2019, 2018 and 2017 are as follows:
(In millions of won)For the year ended December 31,
2019 2018 2017Current service cost ₩ 171,197 143,725 125,526Net interest cost 3,968 3,997 2,170
₩ 175,165 147,722 127,696
Details of plan assets (6) Details of plan assets as of December 31, 2019 and 2018 are as follows:
(In millions of won)December 31, 2019 December 31, 2018
Equity instruments ₩ 29,489 60,828Debt instruments 207,504 144,272Short-term financial instruments, etc. 728,661 611,599
₩ 965,654 816,699
Effects on defined benefitobligations if each ofsignificant actuarialassumptions changes withinexpectable and reasonablerange
(7) As of December 31, 2019, effects on defined benefit obligations if each of significant actuarial assumptions changes within expectable and reasonable range are asfollows:
(In millions of won)0.5% Increase 0.5% Decrease
Discount rate ₩ (47,013) 54,248Expected salary increase rate 53,864 (47,325)
Retirement benefit obligation[Member]Statement [LineItems]Changes in defined benefitliabilities (assets)
(3) Changes in defined benefit obligations for the years ended December 31, 2019 and 2018 are as follows:
(In millions of won)For the year ended December 31
2019 2018Beginning balance ₩ 926,302 679,625Current service cost 171,197 143,725Interest cost 23,685 23,131Remeasurement
- Demographic assumption 19,344 (1,929)- Financial assumption 56,265 30,519- Adjustment based on experience 14,363 16,085
Benefit paid (84,098) (63,957)Business combinations 3,653 104,251Others(*) 6,076 (5,148)Ending balance ₩ 1,136,787 926,302
(*) Others include changes of liabilities due to employee’s transfers among affiliates for the years ended December 31, 2019 and 2018.
Copyright © 2020 www.secdatabase.com. All Rights Reserved.Please Consider the Environment Before Printing This Document
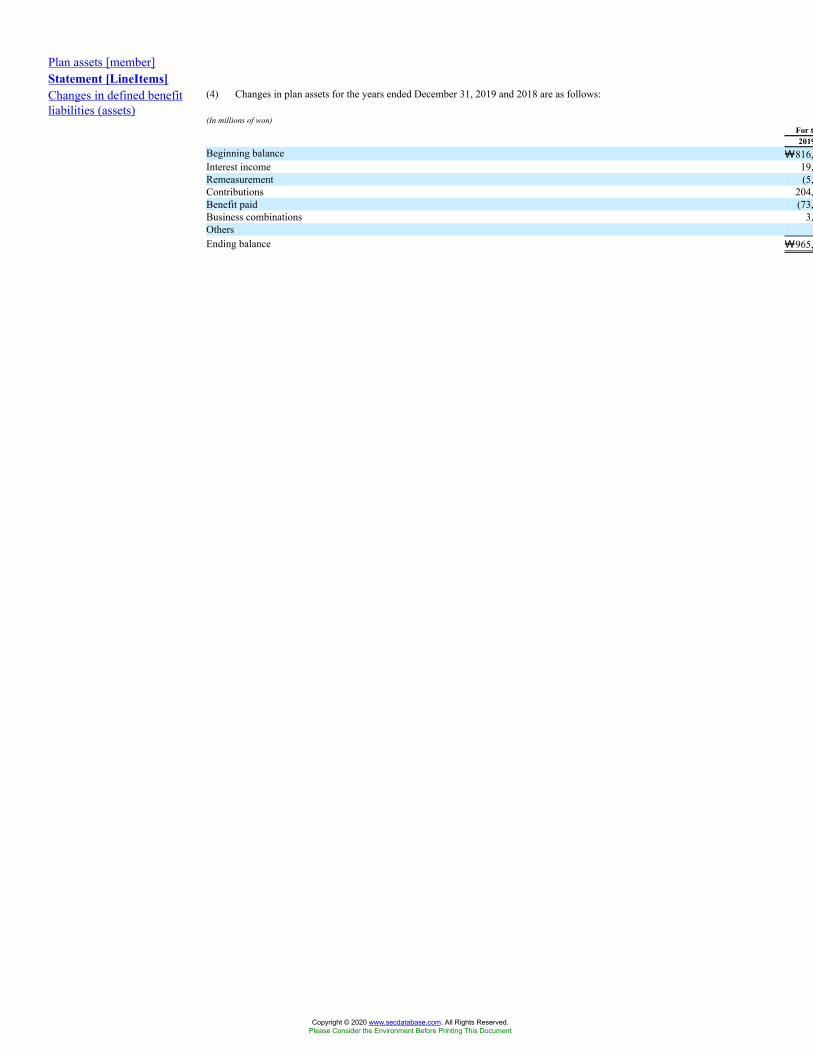
Plan assets [member]Statement [LineItems]Changes in defined benefitliabilities (assets)
(4) Changes in plan assets for the years ended December 31, 2019 and 2018 are as follows:
(In millions of won)For the year ended December 312019 2018
Beginning balance ₩816,699 663,617Interest income 19,717 19,134Remeasurement (5,366) (7,659)Contributions 204,186 166,624Benefit paid (73,396) (43,549)Business combinations 3,207 21,417Others 607 (2,885)Ending balance ₩965,654 816,699
Copyright © 2020 www.secdatabase.com. All Rights Reserved.Please Consider the Environment Before Printing This Document

12 Months EndedIntangible Assets (Tables) Dec. 31, 2019Statement [LineItems]Summary of intangible assets (1) Intangible assets as of December 31, 2019 and 2018 are as follows:
(In millions of won)December 31, 2019
Acquisition costAccumulatedamortization
Accumulatedimpairment
Carryingamount
Frequency usage rights ₩ 6,210,882 (3,563,381) — 2,647,501Land usage rights 53,265 (45,916) — 7,349Industrial rights 110,380 (43,522) (34) 66,824Development costs 63,840 (50,127) (2,567) 11,146Facility usage rights 157,664 (131,832) — 25,832Customer relations 607,435 (16,064) — 591,371Club memberships(*1) 112,571 — (32,161) 80,410Brands(*1) 374,096 — — 374,096Other(*2) 4,397,319 (3,313,263) (22,493) 1,061,563
₩ 12,087,452 (7,164,105) (57,255) 4,866,092
(In millions of won)December 31, 2018
Acquisition costAccumulatedamortization
Accumulatedimpairment
Carryingamount
Frequency usage rights ₩ 6,210,882 (3,070,904) — 3,139,978Land usage rights 65,974 (55,463) — 10,511Industrial rights 163,983 (50,640) (29,716) 83,627Development costs 54,941 (44,304) (1,647) 8,990Facility usage rights 155,470 (124,443) — 31,027Customer relations 643,421 (18,330) — 625,091Club memberships(*1) 114,650 — (34,175) 80,475Brands(*1) 374,096 — — 374,096Other(*2) 4,256,377 (3,058,022) (38,640) 1,159,715
₩ 12,039,794 (6,422,106) (104,178) 5,513,510
(*1) Club memberships and Brands are classified as intangible assets with indefinite useful life and are not amortized.(*2) Other intangible assets primarily consist of computer software and others.
Details of the changes inintangible assets
(3) Research and development expenditures recognized as expense for the years ended December 31, 2019, 2018 and 2017 are as follows:
(In millions of won)2019 2018 2017
Research and development costs expensed as incurred ₩ 391,327 387,675 395,276
Intangible assets other thangoodwill [Member]Statement [LineItems]Details of the changes inintangible assets
(2) Details of the changes in intangible assets for the years ended December 31, 2019 and 2018 are as follows:
(In millions of won) 2019Beginning
balanceImpact of adopting
IFRS 16 Acquisition Disposal Transfer Amortization Impairment(*1)Business
combinations(*2)Disposal ofsubsidiaries
Endingbalance
Frequency usage rights ₩3,139,978 — — — — (492,477) — — — 2,647,501Land usage rights 10,511 — 2,017 (442) — (4,737) — — — 7,349Industrial rights 83,627 — 1,409 (1,540) 2,491 (4,696) — 158 (14,625) 66,824Development costs 8,990 — 2,218 — 1,468 (5,359) (961) 4,790 — 11,146Facility usage rights 31,027 — 2,093 (25) 236 (7,499) — — — 25,832Customer relations 625,091 — 250 (367) 304 (33,907) — — — 591,371Club memberships 80,475 — 2,437 (1,574) (1,200) — (916) 1,188 — 80,410Brands(*3) 374,096 — — — — — — — — 374,096Other 1,159,715 (2,274) 134,911 (5,154) 209,322 (417,571) (7,517) 1,100 (10,969) 1,061,563
₩5,513,510 (2,274) 145,335 (9,102) 212,621 (966,246) (9,394) 7,236 (25,594) 4,866,092
(*1) The Group recognized the difference between recoverable amount and the carrying amount of intangible assets amounting to ₩9,394 million as impairment loss for theyear ended December 31, 2019.
(*2) Includes assets from the Parent Company’s acquisitions of FSK L&S Co., Ltd. and Incross Co., Ltd.(*3) Brands are recognized in connection with the acquisition of Life & Security Holdings Co., Ltd. and are tested for impairment by comparing the recoverable amounts of
CGU to the carrying amounts. (See note 15)
(In millions of won) 2018Beginning
balance Acquisition Disposal Transfer Amortization Impairment(*1)Business
combinations(*2)Endingbalance
Frequency usage rights ₩2,176,940 1,366,926 — — (403,888) — — 3,139,978Land usage rights 15,750 2,918 (1,142) 406 (7,421) — — 10,511Industrial rights 111,347 6,694 (1,598) 5,254 (7,418) (30,748) 96 83,627Development costs 4,103 4,250 — (6) (1,866) (118) 2,627 8,990
Copyright © 2020 www.secdatabase.com. All Rights Reserved.Please Consider the Environment Before Printing This Document
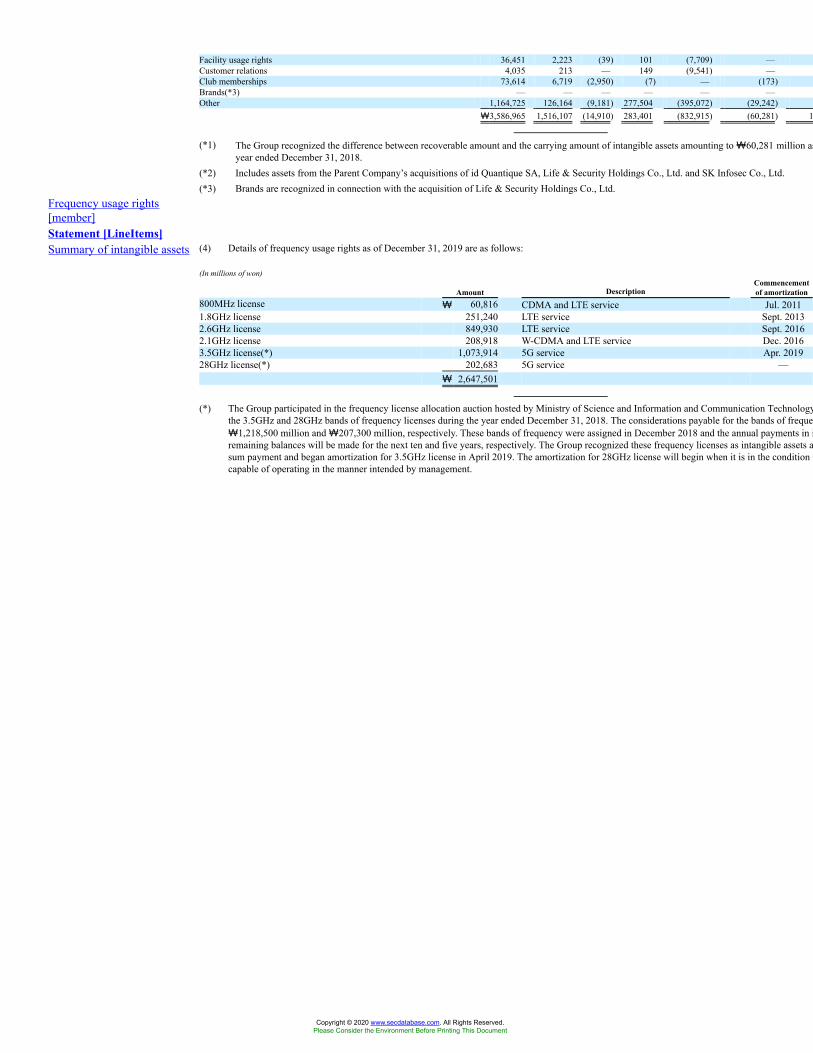
Facility usage rights 36,451 2,223 (39) 101 (7,709) — — 31,027Customer relations 4,035 213 — 149 (9,541) — 630,235 625,091Club memberships 73,614 6,719 (2,950) (7) — (173) 3,272 80,475Brands(*3) — — — — — — 374,096 374,096Other 1,164,725 126,164 (9,181) 277,504 (395,072) (29,242) 24,817 1,159,715
₩3,586,965 1,516,107 (14,910) 283,401 (832,915) (60,281) 1,035,143 5,513,510
(*1) The Group recognized the difference between recoverable amount and the carrying amount of intangible assets amounting to ₩60,281 million as impairment loss for theyear ended December 31, 2018.
(*2) Includes assets from the Parent Company’s acquisitions of id Quantique SA, Life & Security Holdings Co., Ltd. and SK Infosec Co., Ltd.(*3) Brands are recognized in connection with the acquisition of Life & Security Holdings Co., Ltd.
Frequency usage rights[member]Statement [LineItems]Summary of intangible assets (4) Details of frequency usage rights as of December 31, 2019 are as follows:
(In millions of won)
Amount DescriptionCommencementof amortization
Completion ofamortization
800MHz license ₩ 60,816 CDMA and LTE service Jul. 2011 Jun. 20211.8GHz license 251,240 LTE service Sept. 2013 Dec. 20212.6GHz license 849,930 LTE service Sept. 2016 Dec. 20262.1GHz license 208,918 W-CDMA and LTE service Dec. 2016 Dec. 20213.5GHz license(*) 1,073,914 5G service Apr. 2019 Nov. 202828GHz license(*) 202,683 5G service — Nov. 2023
₩ 2,647,501
(*) The Group participated in the frequency license allocation auction hosted by Ministry of Science and Information and Communication Technology(ICT) and was assignedthe 3.5GHz and 28GHz bands of frequency licenses during the year ended December 31, 2018. The considerations payable for the bands of frequency are₩1,218,500 million and ₩207,300 million, respectively. These bands of frequency were assigned in December 2018 and the annual payments in installment of theremaining balances will be made for the next ten and five years, respectively. The Group recognized these frequency licenses as intangible assets at the date of initial lumpsum payment and began amortization for 3.5GHz license in April 2019. The amortization for 28GHz license will begin when it is in the condition necessary for it to becapable of operating in the manner intended by management.
Copyright © 2020 www.secdatabase.com. All Rights Reserved.Please Consider the Environment Before Printing This Document
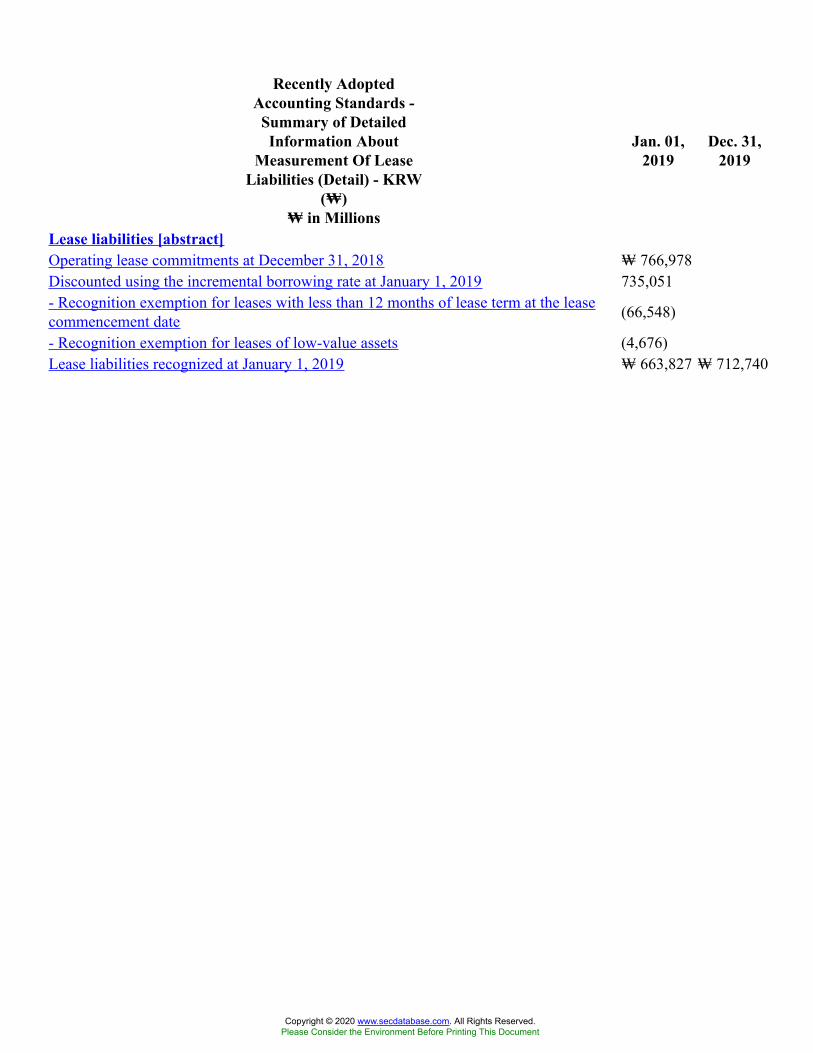
Recently AdoptedAccounting Standards -
Summary of DetailedInformation About
Measurement Of LeaseLiabilities (Detail) - KRW
(₩)₩ in Millions
Jan. 01,2019
Dec. 31,2019
Lease liabilities [abstract]Operating lease commitments at December 31, 2018 ₩ 766,978Discounted using the incremental borrowing rate at January 1, 2019 735,051- Recognition exemption for leases with less than 12 months of lease term at the leasecommencement date (66,548)
- Recognition exemption for leases of low-value assets (4,676)Lease liabilities recognized at January 1, 2019 ₩ 663,827 ₩ 712,740
Copyright © 2020 www.secdatabase.com. All Rights Reserved.Please Consider the Environment Before Printing This Document
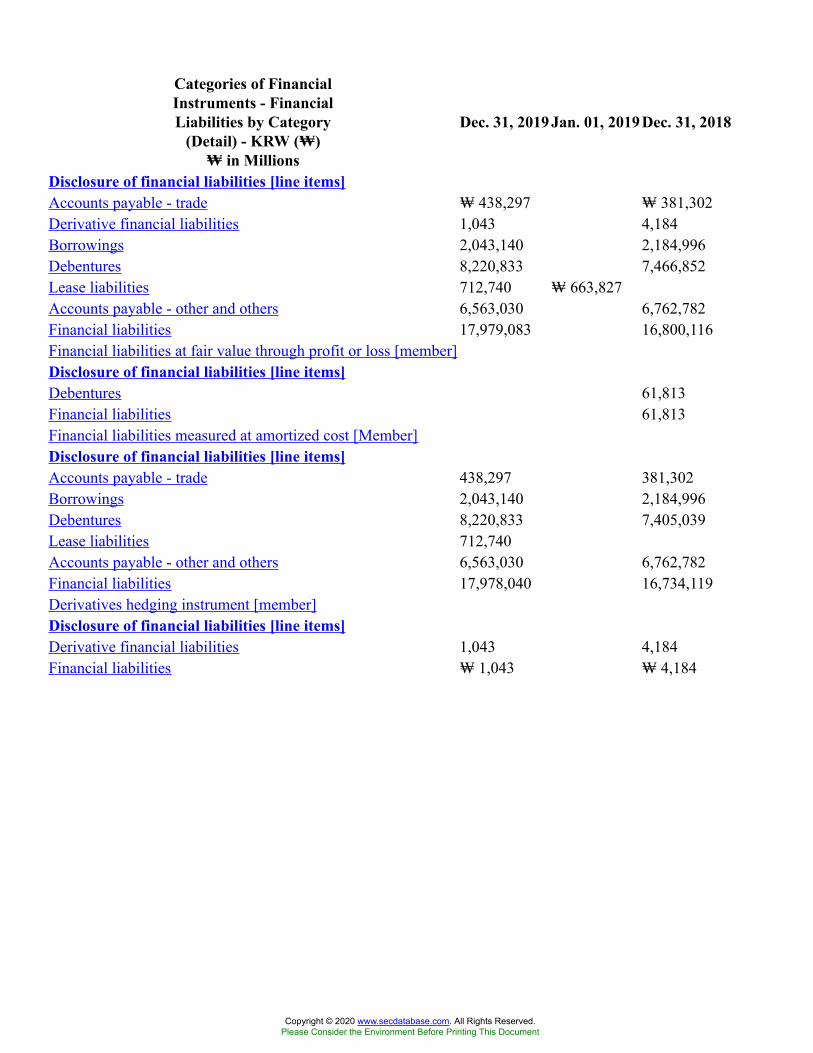
Categories of FinancialInstruments - FinancialLiabilities by Category
(Detail) - KRW (₩)₩ in Millions
Dec. 31, 2019 Jan. 01, 2019 Dec. 31, 2018
Disclosure of financial liabilities [line items]Accounts payable - trade ₩ 438,297 ₩ 381,302Derivative financial liabilities 1,043 4,184Borrowings 2,043,140 2,184,996Debentures 8,220,833 7,466,852Lease liabilities 712,740 ₩ 663,827Accounts payable - other and others 6,563,030 6,762,782Financial liabilities 17,979,083 16,800,116Financial liabilities at fair value through profit or loss [member]Disclosure of financial liabilities [line items]Debentures 61,813Financial liabilities 61,813Financial liabilities measured at amortized cost [Member]Disclosure of financial liabilities [line items]Accounts payable - trade 438,297 381,302Borrowings 2,043,140 2,184,996Debentures 8,220,833 7,405,039Lease liabilities 712,740Accounts payable - other and others 6,563,030 6,762,782Financial liabilities 17,978,040 16,734,119Derivatives hedging instrument [member]Disclosure of financial liabilities [line items]Derivative financial liabilities 1,043 4,184Financial liabilities ₩ 1,043 ₩ 4,184
Copyright © 2020 www.secdatabase.com. All Rights Reserved.Please Consider the Environment Before Printing This Document
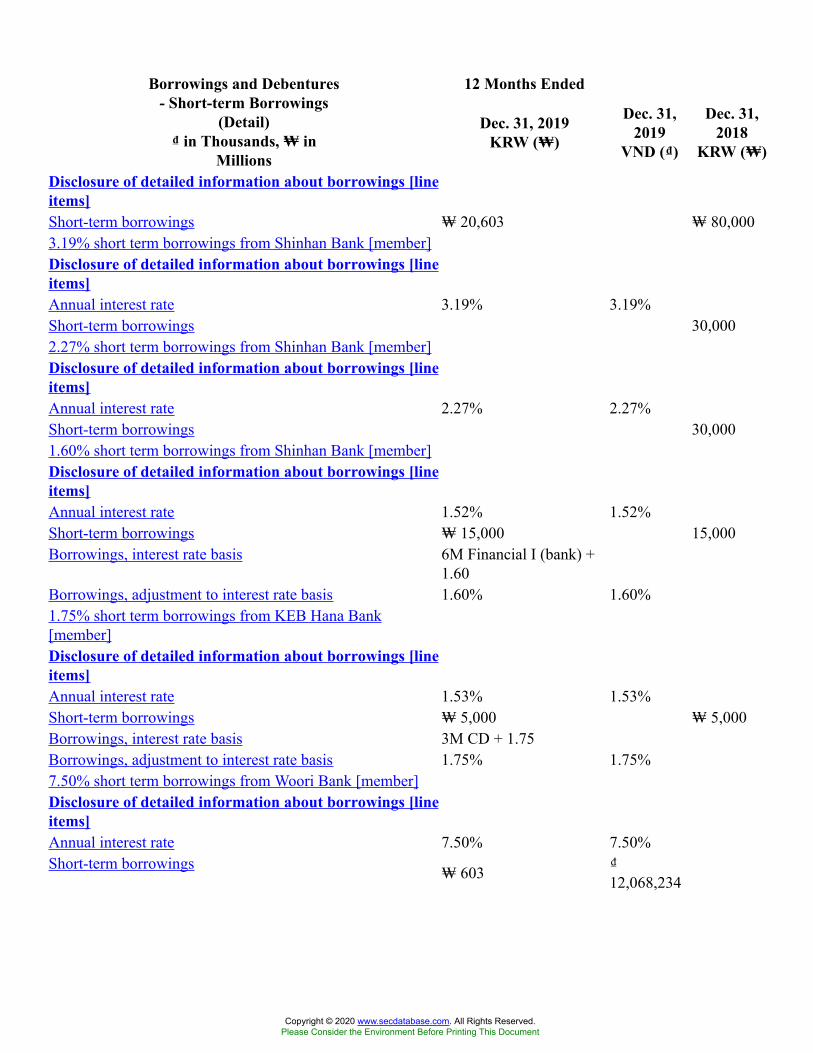
12 Months EndedBorrowings and Debentures- Short-term Borrowings
(Detail)₫ in Thousands, ₩ in
Millions
Dec. 31, 2019KRW (₩)
Dec. 31,2019
VND (₫)
Dec. 31,2018
KRW (₩)
Disclosure of detailed information about borrowings [lineitems]Short-term borrowings ₩ 20,603 ₩ 80,0003.19% short term borrowings from Shinhan Bank [member]Disclosure of detailed information about borrowings [lineitems]Annual interest rate 3.19% 3.19%Short-term borrowings 30,0002.27% short term borrowings from Shinhan Bank [member]Disclosure of detailed information about borrowings [lineitems]Annual interest rate 2.27% 2.27%Short-term borrowings 30,0001.60% short term borrowings from Shinhan Bank [member]Disclosure of detailed information about borrowings [lineitems]Annual interest rate 1.52% 1.52%Short-term borrowings ₩ 15,000 15,000Borrowings, interest rate basis 6M Financial I (bank) +
1.60Borrowings, adjustment to interest rate basis 1.60% 1.60%1.75% short term borrowings from KEB Hana Bank[member]Disclosure of detailed information about borrowings [lineitems]Annual interest rate 1.53% 1.53%Short-term borrowings ₩ 5,000 ₩ 5,000Borrowings, interest rate basis 3M CD + 1.75Borrowings, adjustment to interest rate basis 1.75% 1.75%7.50% short term borrowings from Woori Bank [member]Disclosure of detailed information about borrowings [lineitems]Annual interest rate 7.50% 7.50%Short-term borrowings ₩ 603 ₫
12,068,234
Copyright © 2020 www.secdatabase.com. All Rights Reserved.Please Consider the Environment Before Printing This Document

12 Months EndedConsolidated Statements ofIncome - KRW (₩)
₩ in MillionsDec. 31,
2019Dec. 31,
2018Dec. 31,
2017Operating revenue and other income:Revenue ₩
17,743,702₩16,873,960
₩17,520,013
Other income 103,230 71,950 31,997Operating revenue and other income 17,846,932 16,945,910 17,552,010Operating expenses:Labor 2,822,673 2,288,655 1,966,156Commissions 5,002,174 5,002,598 5,486,263Depreciation and amortization 3,771,486 3,126,118 3,097,466Network interconnection 752,334 808,403 875,045Leased lines 272,616 309,773 342,240Advertising 434,561 468,509 522,753Rent 231,934 529,453 520,244Cost of goods sold 1,833,362 1,796,146 1,886,524Others 1,724,899 1,782,404 1,630,747Operating expenses 16,846,039 16,112,059 16,327,438Operating profit 1,000,893 833,851 1,224,572Finance income 141,977 256,435 366,561Finance costs (429,758) (385,232) (433,616)Gain relating to investments in subsidiaries, associates and jointventures, net 449,543 3,270,912 2,245,732
Profit before income tax 1,162,655 3,975,966 3,403,249Income tax expense 300,713 843,978 745,654Profit for the year 861,942 3,131,988 2,657,595Attributable to :Owners of the Parent Company 889,907 3,127,887 2,599,829Non-controlling interests ₩ (27,965) ₩ 4,101 ₩ 57,766Earnings per shareBasic and diluted earnings per share (in won) ₩ 12,144 ₩ 44,066 ₩ 36,582
Copyright © 2020 www.secdatabase.com. All Rights Reserved.Please Consider the Environment Before Printing This Document
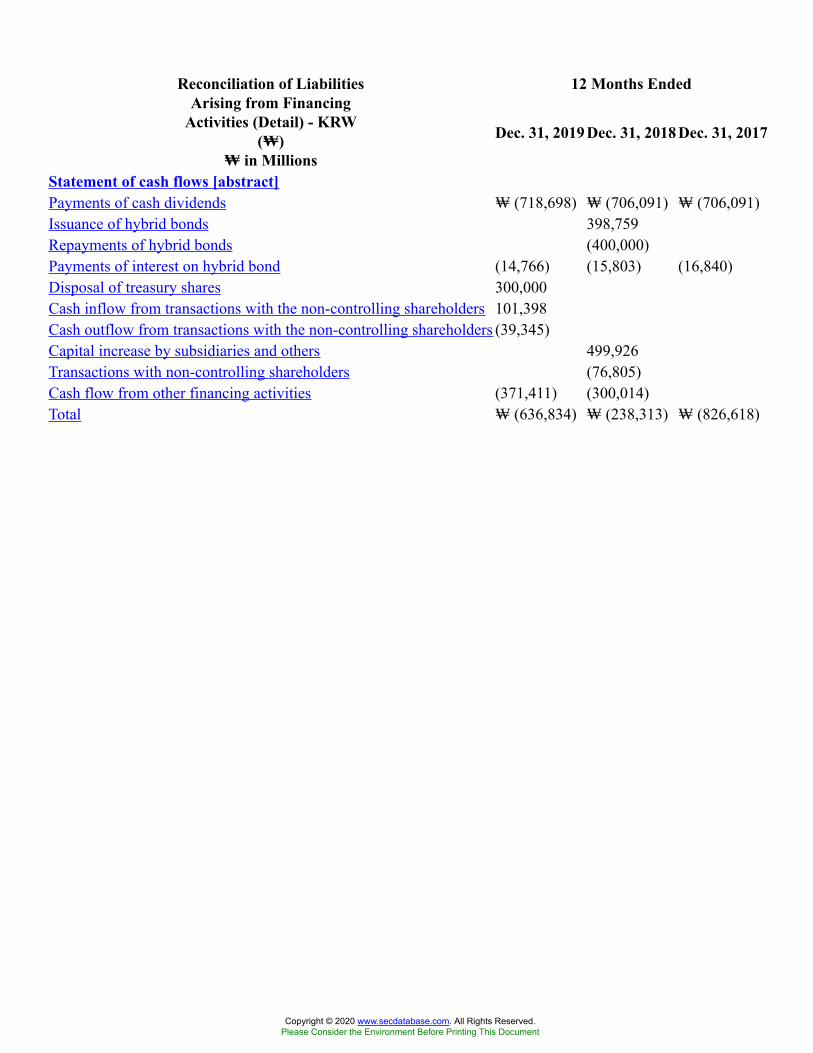
12 Months EndedReconciliation of LiabilitiesArising from Financing
Activities (Detail) - KRW(₩)
₩ in Millions
Dec. 31, 2019 Dec. 31, 2018 Dec. 31, 2017
Statement of cash flows [abstract]Payments of cash dividends ₩ (718,698) ₩ (706,091) ₩ (706,091)Issuance of hybrid bonds 398,759Repayments of hybrid bonds (400,000)Payments of interest on hybrid bond (14,766) (15,803) (16,840)Disposal of treasury shares 300,000Cash inflow from transactions with the non-controlling shareholders 101,398Cash outflow from transactions with the non-controlling shareholders (39,345)Capital increase by subsidiaries and others 499,926Transactions with non-controlling shareholders (76,805)Cash flow from other financing activities (371,411) (300,014)Total ₩ (636,834) ₩ (238,313) ₩ (826,618)
Copyright © 2020 www.secdatabase.com. All Rights Reserved.Please Consider the Environment Before Printing This Document
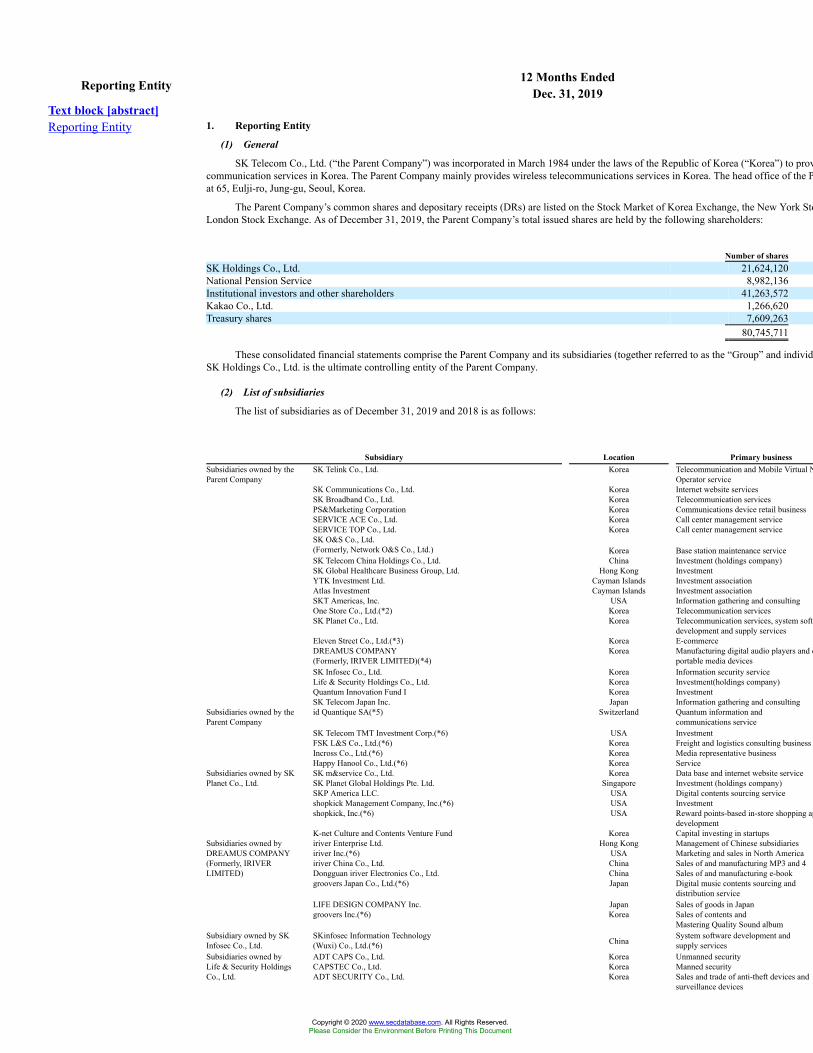
12 Months EndedReporting Entity Dec. 31, 2019Text block [abstract]Reporting Entity 1. Reporting Entity
(1) General
SK Telecom Co., Ltd. (“the Parent Company”) was incorporated in March 1984 under the laws of the Republic of Korea (“Korea”) to provide cellular telephonecommunication services in Korea. The Parent Company mainly provides wireless telecommunications services in Korea. The head office of the Parent Company is locatedat 65, Eulji-ro, Jung-gu, Seoul, Korea.
The Parent Company’s common shares and depositary receipts (DRs) are listed on the Stock Market of Korea Exchange, the New York Stock Exchange and theLondon Stock Exchange. As of December 31, 2019, the Parent Company’s total issued shares are held by the following shareholders:
Number of sharesPercentage of
total shares issued (%)SK Holdings Co., Ltd. 21,624,120 26.78National Pension Service 8,982,136 11.12Institutional investors and other shareholders 41,263,572 51.11Kakao Co., Ltd. 1,266,620 1.57Treasury shares 7,609,263 9.42
80,745,711 100.00
These consolidated financial statements comprise the Parent Company and its subsidiaries (together referred to as the “Group” and individually as “Group entity”).SK Holdings Co., Ltd. is the ultimate controlling entity of the Parent Company.
(2) List of subsidiaries
The list of subsidiaries as of December 31, 2019 and 2018 is as follows:
Ownership (%)(*1)
Subsidiary Location Primary businessDec. 31,
2019Dec. 31,
2018SK Telink Co., Ltd. Korea Telecommunication and Mobile Virtual Network
Operator service 100.0 100.0SK Communications Co., Ltd. Korea Internet website services 100.0 100.0SK Broadband Co., Ltd. Korea Telecommunication services 100.0 100.0PS&Marketing Corporation Korea Communications device retail business 100.0 100.0SERVICE ACE Co., Ltd. Korea Call center management service 100.0 100.0SERVICE TOP Co., Ltd. Korea Call center management service 100.0 100.0SK O&S Co., Ltd.(Formerly, Network O&S Co., Ltd.) Korea Base station maintenance service 100.0 100.0SK Telecom China Holdings Co., Ltd. China Investment (holdings company) 100.0 100.0
Subsidiaries owned by theParent Company
SK Global Healthcare Business Group, Ltd. Hong Kong Investment 100.0 100.0YTK Investment Ltd. Cayman Islands Investment association 100.0 100.0Atlas Investment Cayman Islands Investment association 100.0 100.0SKT Americas, Inc. USA Information gathering and consulting 100.0 100.0One Store Co., Ltd.(*2) Korea Telecommunication services 52.7 65.5SK Planet Co., Ltd. Korea Telecommunication services, system software
development and supply services 98.7 98.7Eleven Street Co., Ltd.(*3) Korea E-commerce 80.3 81.8DREAMUS COMPANY(Formerly, IRIVER LIMITED)(*4)
Korea Manufacturing digital audio players and otherportable media devices 51.4 52.6
SK Infosec Co., Ltd. Korea Information security service 100.0 100.0Life & Security Holdings Co., Ltd. Korea Investment(holdings company) 55.0 55.0Quantum Innovation Fund I Korea Investment 59.9 59.9SK Telecom Japan Inc. Japan Information gathering and consulting 100.0 100.0id Quantique SA(*5) Switzerland Quantum information and
communications service 66.8 65.6SK Telecom TMT Investment Corp.(*6) USA Investment 100.0 —FSK L&S Co., Ltd.(*6) Korea Freight and logistics consulting business 60.0 —Incross Co., Ltd.(*6) Korea Media representative business 34.6 —
Subsidiaries owned by theParent Company
Happy Hanool Co., Ltd.(*6) Korea Service 100.0 —SK m&service Co., Ltd. Korea Data base and internet website service 100.0 100.0SK Planet Global Holdings Pte. Ltd. Singapore Investment (holdings company) 100.0 100.0SKP America LLC. USA Digital contents sourcing service 100.0 100.0shopkick Management Company, Inc.(*6) USA Investment — 100.0shopkick, Inc.(*6) USA Reward points-based in-store shopping application
development — 100.0
Subsidiaries owned by SKPlanet Co., Ltd.
K-net Culture and Contents Venture Fund Korea Capital investing in startups 59.0 59.0iriver Enterprise Ltd. Hong Kong Management of Chinese subsidiaries 100.0 100.0iriver Inc.(*6) USA Marketing and sales in North America — 100.0iriver China Co., Ltd. China Sales of and manufacturing MP3 and 4 100.0 100.0Dongguan iriver Electronics Co., Ltd. China Sales of and manufacturing e-book 100.0 100.0groovers Japan Co., Ltd.(*6) Japan Digital music contents sourcing and
distribution service — 100.0LIFE DESIGN COMPANY Inc. Japan Sales of goods in Japan 100.0 100.0
Subsidiaries owned byDREAMUS COMPANY(Formerly, IRIVERLIMITED)
groovers Inc.(*6) Korea Sales of contents andMastering Quality Sound album — 100.0
Subsidiary owned by SKInfosec Co., Ltd.
SKinfosec Information Technology(Wuxi) Co., Ltd.(*6) China System software development and
supply services 100.0 —
ADT CAPS Co., Ltd. Korea Unmanned security 100.0 100.0CAPSTEC Co., Ltd. Korea Manned security 100.0 100.0
Subsidiaries owned byLife & Security HoldingsCo., Ltd. ADT SECURITY Co., Ltd. Korea Sales and trade of anti-theft devices and
surveillance devices 100.0 100.0
Copyright © 2020 www.secdatabase.com. All Rights Reserved.Please Consider the Environment Before Printing This Document
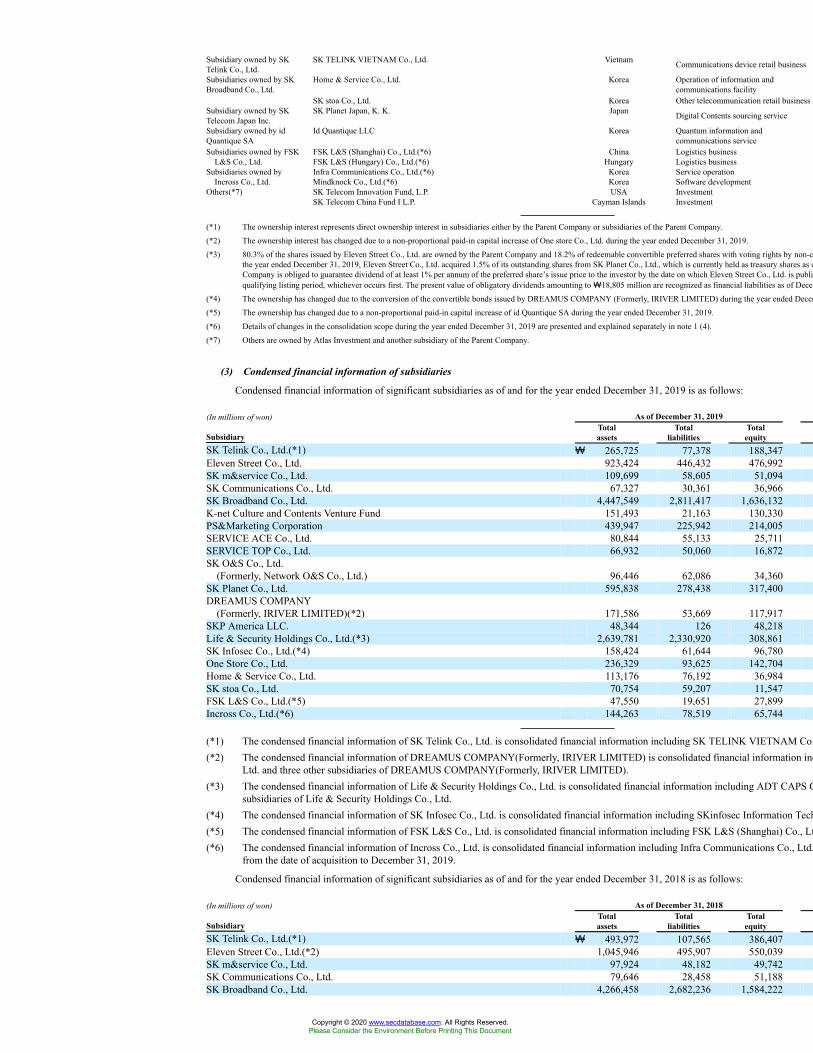
Subsidiary owned by SKTelink Co., Ltd.
SK TELINK VIETNAM Co., Ltd. Vietnam Communications device retail business 100.0 100.0
Home & Service Co., Ltd. Korea Operation of information andcommunications facility 100.0 100.0
Subsidiaries owned by SKBroadband Co., Ltd.
SK stoa Co., Ltd. Korea Other telecommunication retail business 100.0 100.0Subsidiary owned by SKTelecom Japan Inc.
SK Planet Japan, K. K. Japan Digital Contents sourcing service 79.8 79.8
Subsidiary owned by idQuantique SA
Id Quantique LLC Korea Quantum information andcommunications service 100.0 100.0
FSK L&S (Shanghai) Co., Ltd.(*6) China Logistics business 66.0 —Subsidiaries owned by FSKL&S Co., Ltd. FSK L&S (Hungary) Co., Ltd.(*6) Hungary Logistics business 100.0 —
Infra Communications Co., Ltd.(*6) Korea Service operation 100.0 —Subsidiaries owned byIncross Co., Ltd. Mindknock Co., Ltd.(*6) Korea Software development 100.0 —
SK Telecom Innovation Fund, L.P. USA Investment 100.0 100.0Others(*7)SK Telecom China Fund I L.P. Cayman Islands Investment 100.0 100.0
(*1) The ownership interest represents direct ownership interest in subsidiaries either by the Parent Company or subsidiaries of the Parent Company.(*2) The ownership interest has changed due to a non-proportional paid-in capital increase of One store Co., Ltd. during the year ended December 31, 2019.(*3) 80.3% of the shares issued by Eleven Street Co., Ltd. are owned by the Parent Company and 18.2% of redeemable convertible preferred shares with voting rights by non-controlling shareholders. During
the year ended December 31, 2019, Eleven Street Co., Ltd. acquired 1.5% of its outstanding shares from SK Planet Co., Ltd., which is currently held as treasury shares as of December 31, 2019. The ParentCompany is obliged to guarantee dividend of at least 1% per annum of the preferred share’s issue price to the investor by the date on which Eleven Street Co., Ltd. is publicly listed or at the end ofqualifying listing period, whichever occurs first. The present value of obligatory dividends amounting to ₩18,805 million are recognized as financial liabilities as of December 31, 2019.
(*4) The ownership has changed due to the conversion of the convertible bonds issued by DREAMUS COMPANY (Formerly, IRIVER LIMITED) during the year ended December 31, 2019.(*5) The ownership has changed due to a non-proportional paid-in capital increase of id Quantique SA during the year ended December 31, 2019.(*6) Details of changes in the consolidation scope during the year ended December 31, 2019 are presented and explained separately in note 1 (4).(*7) Others are owned by Atlas Investment and another subsidiary of the Parent Company.
(3) Condensed financial information of subsidiaries
Condensed financial information of significant subsidiaries as of and for the year ended December 31, 2019 is as follows:
(In millions of won) As of December 31, 2019 2019
SubsidiaryTotalassets
Totalliabilities
Totalequity Revenue
Profit(loss)
SK Telink Co., Ltd.(*1) ₩ 265,725 77,378 188,347 363,627 3,010Eleven Street Co., Ltd. 923,424 446,432 476,992 530,489 (5,077)SK m&service Co., Ltd. 109,699 58,605 51,094 218,848 2,448SK Communications Co., Ltd. 67,327 30,361 36,966 39,944 (13,301)SK Broadband Co., Ltd. 4,447,549 2,811,417 1,636,132 3,178,805 48,583K-net Culture and Contents Venture Fund 151,493 21,163 130,330 — (294)PS&Marketing Corporation 439,947 225,942 214,005 1,684,576 96SERVICE ACE Co., Ltd. 80,844 55,133 25,711 206,080 3,906SERVICE TOP Co., Ltd. 66,932 50,060 16,872 193,377 2,230SK O&S Co., Ltd.
(Formerly, Network O&S Co., Ltd.) 96,446 62,086 34,360 281,634 1,724SK Planet Co., Ltd. 595,838 278,438 317,400 275,544 1,214DREAMUS COMPANY
(Formerly, IRIVER LIMITED)(*2) 171,586 53,669 117,917 196,961 (48,006)SKP America LLC. 48,344 126 48,218 — (351,470)Life & Security Holdings Co., Ltd.(*3) 2,639,781 2,330,920 308,861 913,301 12,703SK Infosec Co., Ltd.(*4) 158,424 61,644 96,780 270,423 18,520One Store Co., Ltd. 236,329 93,625 142,704 135,116 (5,415)Home & Service Co., Ltd. 113,176 76,192 36,984 351,154 (267)SK stoa Co., Ltd. 70,754 59,207 11,547 196,063 875FSK L&S Co., Ltd.(*5) 47,550 19,651 27,899 130,872 306Incross Co., Ltd.(*6) 144,263 78,519 65,744 19,787 5,756
(*1) The condensed financial information of SK Telink Co., Ltd. is consolidated financial information including SK TELINK VIETNAM Co., Ltd.(*2) The condensed financial information of DREAMUS COMPANY(Formerly, IRIVER LIMITED) is consolidated financial information including iriver Enterprise
Ltd. and three other subsidiaries of DREAMUS COMPANY(Formerly, IRIVER LIMITED).(*3) The condensed financial information of Life & Security Holdings Co., Ltd. is consolidated financial information including ADT CAPS Co., Ltd. and two other
subsidiaries of Life & Security Holdings Co., Ltd.(*4) The condensed financial information of SK Infosec Co., Ltd. is consolidated financial information including SKinfosec Information Technology (Wuxi) Co., Ltd.(*5) The condensed financial information of FSK L&S Co., Ltd. is consolidated financial information including FSK L&S (Shanghai) Co., Ltd. and another subsidiary.(*6) The condensed financial information of Incross Co., Ltd. is consolidated financial information including Infra Communications Co., Ltd. and another subsidiary
from the date of acquisition to December 31, 2019.
Condensed financial information of significant subsidiaries as of and for the year ended December 31, 2018 is as follows:
(In millions of won) As of December 31, 2018 2018
SubsidiaryTotalassets
Totalliabilities
Totalequity Revenue
Profit(loss)
SK Telink Co., Ltd.(*1) ₩ 493,972 107,565 386,407 373,019 39,962Eleven Street Co., Ltd.(*2) 1,045,946 495,907 550,039 228,000 (9,507)SK m&service Co., Ltd. 97,924 48,182 49,742 208,936 (119)SK Communications Co., Ltd. 79,646 28,458 51,188 41,604 (10,323)SK Broadband Co., Ltd. 4,266,458 2,682,236 1,584,222 3,158,877 154,999
Copyright © 2020 www.secdatabase.com. All Rights Reserved.Please Consider the Environment Before Printing This Document
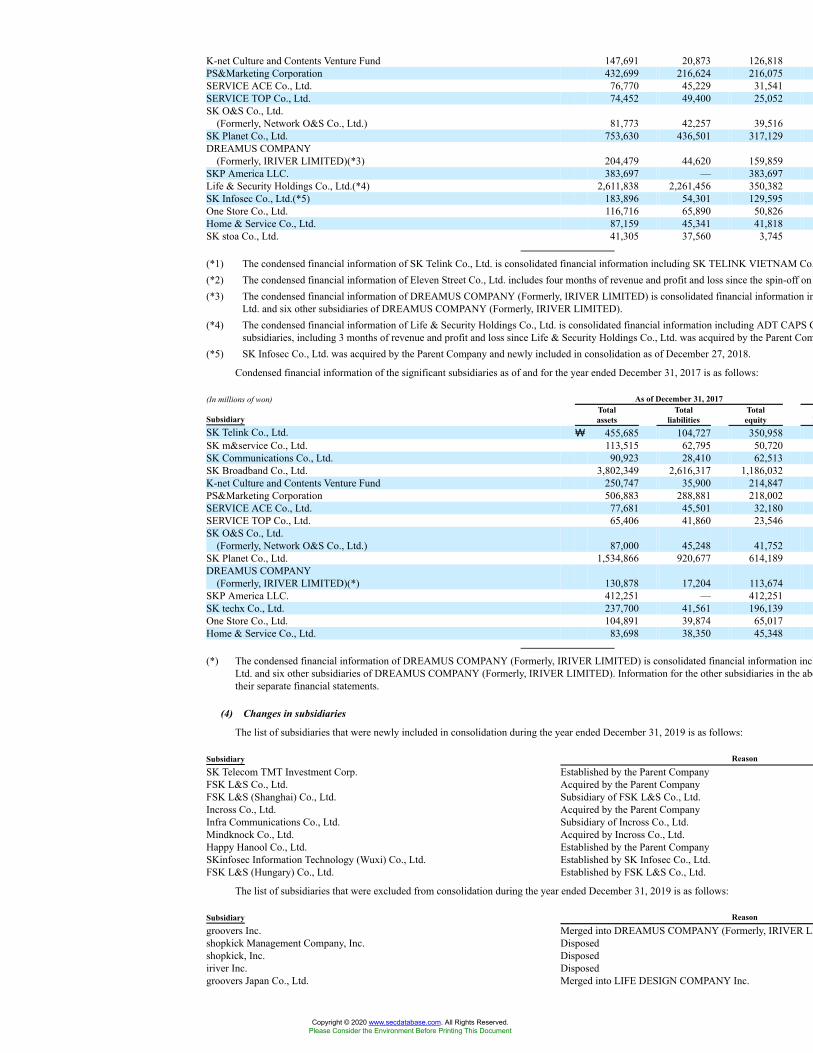
K-net Culture and Contents Venture Fund 147,691 20,873 126,818 — 58,584PS&Marketing Corporation 432,699 216,624 216,075 1,587,203 76SERVICE ACE Co., Ltd. 76,770 45,229 31,541 198,164 4,217SERVICE TOP Co., Ltd. 74,452 49,400 25,052 205,574 5,276SK O&S Co., Ltd.
(Formerly, Network O&S Co., Ltd.) 81,773 42,257 39,516 265,183 1,089SK Planet Co., Ltd. 753,630 436,501 317,129 672,648 (436,106)DREAMUS COMPANY
(Formerly, IRIVER LIMITED)(*3) 204,479 44,620 159,859 137,849 (21,314)SKP America LLC. 383,697 — 383,697 — (370)Life & Security Holdings Co., Ltd.(*4) 2,611,838 2,261,456 350,382 197,487 6,038SK Infosec Co., Ltd.(*5) 183,896 54,301 129,595 — —One Store Co., Ltd. 116,716 65,890 50,826 110,284 (13,903)Home & Service Co., Ltd. 87,159 45,341 41,818 325,177 (1,264)SK stoa Co., Ltd. 41,305 37,560 3,745 116,459 (16,987)
(*1) The condensed financial information of SK Telink Co., Ltd. is consolidated financial information including SK TELINK VIETNAM Co., Ltd.(*2) The condensed financial information of Eleven Street Co., Ltd. includes four months of revenue and profit and loss since the spin-off on August 31, 2018.(*3) The condensed financial information of DREAMUS COMPANY (Formerly, IRIVER LIMITED) is consolidated financial information including iriver Enterprise
Ltd. and six other subsidiaries of DREAMUS COMPANY (Formerly, IRIVER LIMITED).(*4) The condensed financial information of Life & Security Holdings Co., Ltd. is consolidated financial information including ADT CAPS Co., Ltd. and two other
subsidiaries, including 3 months of revenue and profit and loss since Life & Security Holdings Co., Ltd. was acquired by the Parent Company on October 1, 2018.(*5) SK Infosec Co., Ltd. was acquired by the Parent Company and newly included in consolidation as of December 27, 2018.
Condensed financial information of the significant subsidiaries as of and for the year ended December 31, 2017 is as follows:
(In millions of won) As of December 31, 2017 2017
SubsidiaryTotalassets
Totalliabilities
Totalequity Revenue
Profit(loss)
SK Telink Co., Ltd. ₩ 455,685 104,727 350,958 389,944 32,728SK m&service Co., Ltd. 113,515 62,795 50,720 193,256 1,249SK Communications Co., Ltd. 90,923 28,410 62,513 47,546 (35,454)SK Broadband Co., Ltd. 3,802,349 2,616,317 1,186,032 3,050,083 32,030K-net Culture and Contents Venture Fund 250,747 35,900 214,847 — 196,250PS&Marketing Corporation 506,883 288,881 218,002 1,766,142 391SERVICE ACE Co., Ltd. 77,681 45,501 32,180 197,408 2,599SERVICE TOP Co., Ltd. 65,406 41,860 23,546 186,117 3,309SK O&S Co., Ltd.
(Formerly, Network O&S Co., Ltd.) 87,000 45,248 41,752 255,841 6,283SK Planet Co., Ltd. 1,534,866 920,677 614,189 1,082,685 (513,667)DREAMUS COMPANY
(Formerly, IRIVER LIMITED)(*) 130,878 17,204 113,674 69,452 (14,092)SKP America LLC. 412,251 — 412,251 — (57)SK techx Co., Ltd. 237,700 41,561 196,139 195,948 26,827One Store Co., Ltd. 104,891 39,874 65,017 115,596 (27,254)Home & Service Co., Ltd. 83,698 38,350 45,348 141,739 11
(*) The condensed financial information of DREAMUS COMPANY (Formerly, IRIVER LIMITED) is consolidated financial information including iriver EnterpriseLtd. and six other subsidiaries of DREAMUS COMPANY (Formerly, IRIVER LIMITED). Information for the other subsidiaries in the above summary is based ontheir separate financial statements.
(4) Changes in subsidiaries
The list of subsidiaries that were newly included in consolidation during the year ended December 31, 2019 is as follows:
Subsidiary ReasonSK Telecom TMT Investment Corp. Established by the Parent CompanyFSK L&S Co., Ltd. Acquired by the Parent CompanyFSK L&S (Shanghai) Co., Ltd. Subsidiary of FSK L&S Co., Ltd.Incross Co., Ltd. Acquired by the Parent CompanyInfra Communications Co., Ltd. Subsidiary of Incross Co., Ltd.Mindknock Co., Ltd. Acquired by Incross Co., Ltd.Happy Hanool Co., Ltd. Established by the Parent CompanySKinfosec Information Technology (Wuxi) Co., Ltd. Established by SK Infosec Co., Ltd.FSK L&S (Hungary) Co., Ltd. Established by FSK L&S Co., Ltd.
The list of subsidiaries that were excluded from consolidation during the year ended December 31, 2019 is as follows:
Subsidiary Reasongroovers Inc. Merged into DREAMUS COMPANY (Formerly, IRIVER LIMITED)shopkick Management Company, Inc. Disposedshopkick, Inc. Disposediriver Inc. Disposedgroovers Japan Co., Ltd. Merged into LIFE DESIGN COMPANY Inc.
Copyright © 2020 www.secdatabase.com. All Rights Reserved.Please Consider the Environment Before Printing This Document
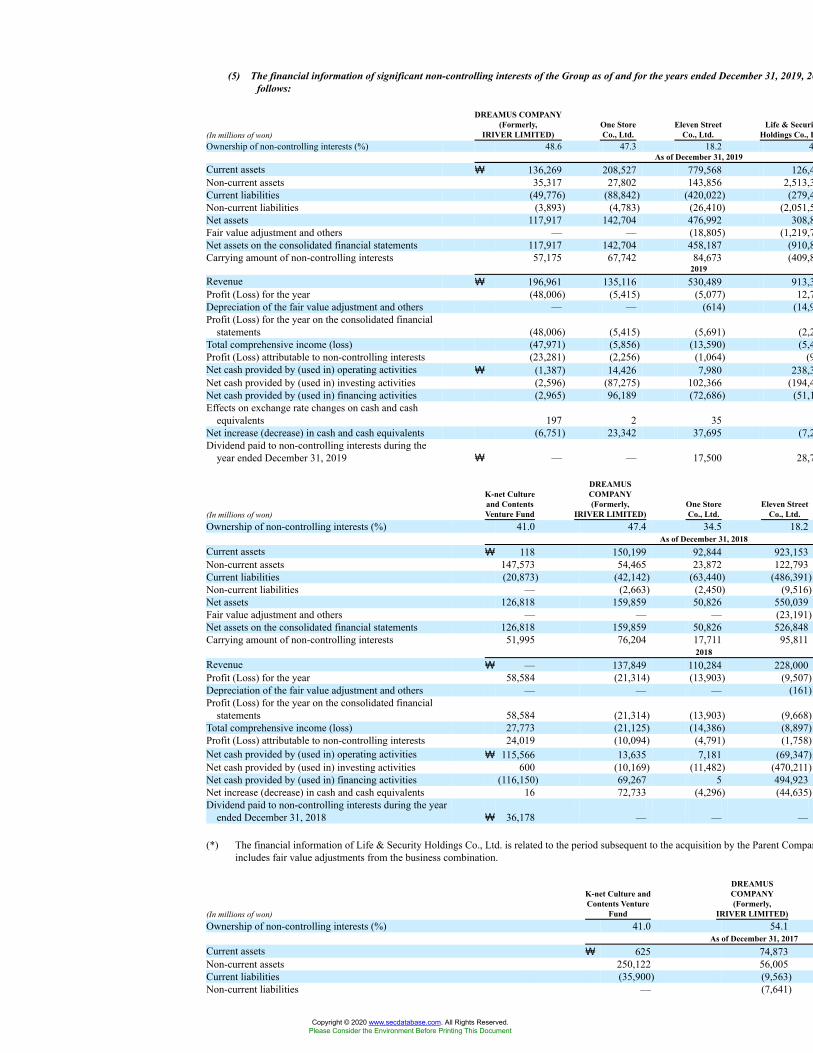
(5) The financial information of significant non-controlling interests of the Group as of and for the years ended December 31, 2019, 2018 and 2017 are asfollows:
(In millions of won)
DREAMUS COMPANY(Formerly,
IRIVER LIMITED)One StoreCo., Ltd.
Eleven StreetCo., Ltd.
Life & SecurityHoldings Co., Ltd. Incross Co., Ltd.
Ownership of non-controlling interests (%) 48.6 47.3 18.2 45.0 65.4As of December 31, 2019
Current assets ₩ 136,269 208,527 779,568 126,437 133,741Non-current assets 35,317 27,802 143,856 2,513,344 10,522Current liabilities (49,776) (88,842) (420,022) (279,403) (77,530)Non-current liabilities (3,893) (4,783) (26,410) (2,051,517) (989)Net assets 117,917 142,704 476,992 308,861 65,744Fair value adjustment and others — — (18,805) (1,219,701) —Net assets on the consolidated financial statements 117,917 142,704 458,187 (910,840) 65,744Carrying amount of non-controlling interests 57,175 67,742 84,673 (409,878) 41,074
2019Revenue ₩ 196,961 135,116 530,489 913,301 19,787Profit (Loss) for the year (48,006) (5,415) (5,077) 12,703 5,756Depreciation of the fair value adjustment and others — — (614) (14,913) —Profit (Loss) for the year on the consolidated financial
statements (48,006) (5,415) (5,691) (2,210) 5,756Total comprehensive income (loss) (47,971) (5,856) (13,590) (5,413) 5,396Profit (Loss) attributable to non-controlling interests (23,281) (2,256) (1,064) (978) 3,630Net cash provided by (used in) operating activities ₩ (1,387) 14,426 7,980 238,378 (9,331)Net cash provided by (used in) investing activities (2,596) (87,275) 102,366 (194,472) 5,053Net cash provided by (used in) financing activities (2,965) 96,189 (72,686) (51,129) (4,644)Effects on exchange rate changes on cash and cash
equivalents 197 2 35 — —Net increase (decrease) in cash and cash equivalents (6,751) 23,342 37,695 (7,223) 8,478Dividend paid to non-controlling interests during the
year ended December 31, 2019 ₩ — — 17,500 28,786 —
(In millions of won)
K-net Cultureand ContentsVenture Fund
DREAMUSCOMPANY(Formerly,
IRIVER LIMITED)One StoreCo., Ltd.
Eleven StreetCo., Ltd.
Life & SecurityHoldings Co., Ltd.(*)
Ownership of non-controlling interests (%) 41.0 47.4 34.5 18.2 45.0As of December 31, 2018
Current assets ₩ 118 150,199 92,844 923,153 124,091Non-current assets 147,573 54,465 23,872 122,793 2,487,747Current liabilities (20,873) (42,142) (63,440) (486,391) (243,064)Non-current liabilities — (2,663) (2,450) (9,516) (2,018,392)Net assets 126,818 159,859 50,826 550,039 350,382Fair value adjustment and others — — — (23,191) (1,216,347)Net assets on the consolidated financial statements 126,818 159,859 50,826 526,848 (865,965)Carrying amount of non-controlling interests 51,995 76,204 17,711 95,811 (389,684)
2018Revenue ₩ — 137,849 110,284 228,000 197,487Profit (Loss) for the year 58,584 (21,314) (13,903) (9,507) 6,038Depreciation of the fair value adjustment and others — — — (161) (2,954)Profit (Loss) for the year on the consolidated financial
statements 58,584 (21,314) (13,903) (9,668) 3,084Total comprehensive income (loss) 27,773 (21,125) (14,386) (8,897) (991)Profit (Loss) attributable to non-controlling interests 24,019 (10,094) (4,791) (1,758) 1,387Net cash provided by (used in) operating activities ₩ 115,566 13,635 7,181 (69,347) (23,451)Net cash provided by (used in) investing activities 600 (10,169) (11,482) (470,211) (139,430)Net cash provided by (used in) financing activities (116,150) 69,267 5 494,923 124,076Net increase (decrease) in cash and cash equivalents 16 72,733 (4,296) (44,635) (38,805)Dividend paid to non-controlling interests during the year
ended December 31, 2018 ₩ 36,178 — — — —
(*) The financial information of Life & Security Holdings Co., Ltd. is related to the period subsequent to the acquisition by the Parent Company on October 1, 2018 andincludes fair value adjustments from the business combination.
(In millions of won)
K-net Culture andContents Venture
Fund
DREAMUSCOMPANY(Formerly,
IRIVER LIMITED) One Store Co., Ltd.Ownership of non-controlling interests (%) 41.0 54.1 34.5
As of December 31, 2017Current assets ₩ 625 74,873 76,810Non-current assets 250,122 56,005 28,081Current liabilities (35,900) (9,563) (38,547)Non-current liabilities — (7,641) (1,327)
Copyright © 2020 www.secdatabase.com. All Rights Reserved.Please Consider the Environment Before Printing This Document
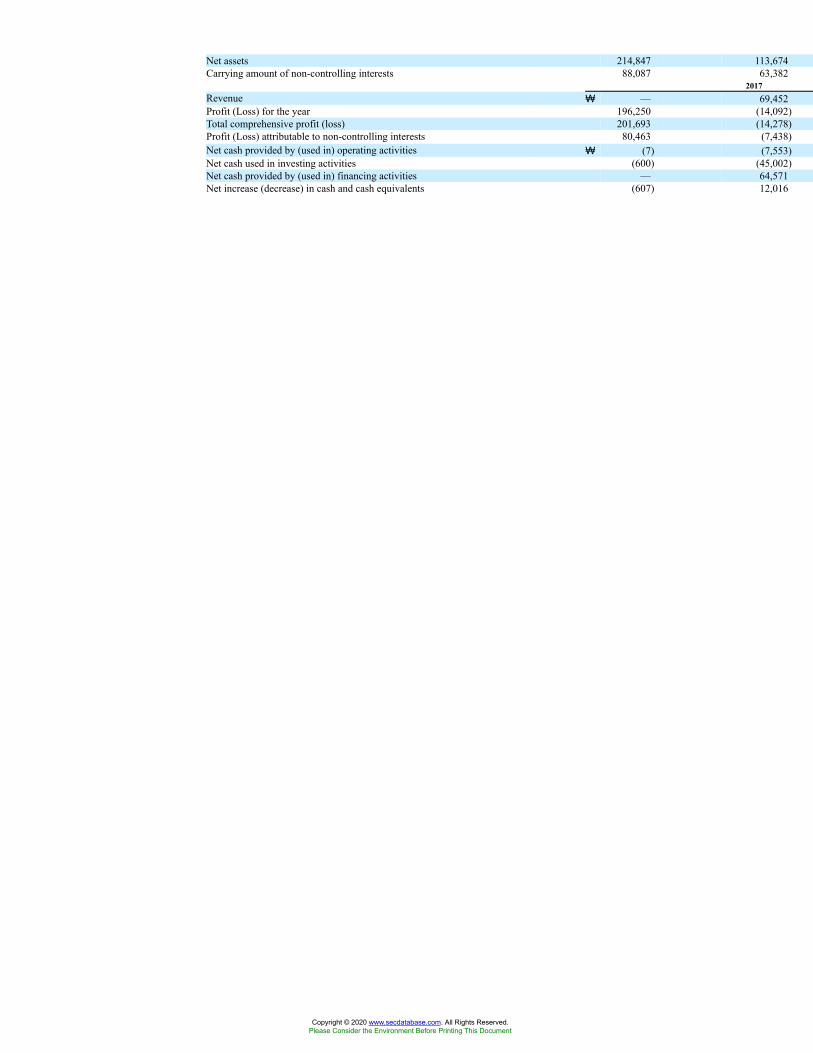
Net assets 214,847 113,674 65,017Carrying amount of non-controlling interests 88,087 63,382 22,405
2017Revenue ₩ — 69,452 115,596Profit (Loss) for the year 196,250 (14,092) (27,254)Total comprehensive profit (loss) 201,693 (14,278) (27,452)Profit (Loss) attributable to non-controlling interests 80,463 (7,438) (9,392)Net cash provided by (used in) operating activities ₩ (7) (7,553) 13,912Net cash used in investing activities (600) (45,002) (2,000)Net cash provided by (used in) financing activities — 64,571 (7)Net increase (decrease) in cash and cash equivalents (607) 12,016 11,905
Copyright © 2020 www.secdatabase.com. All Rights Reserved.Please Consider the Environment Before Printing This Document
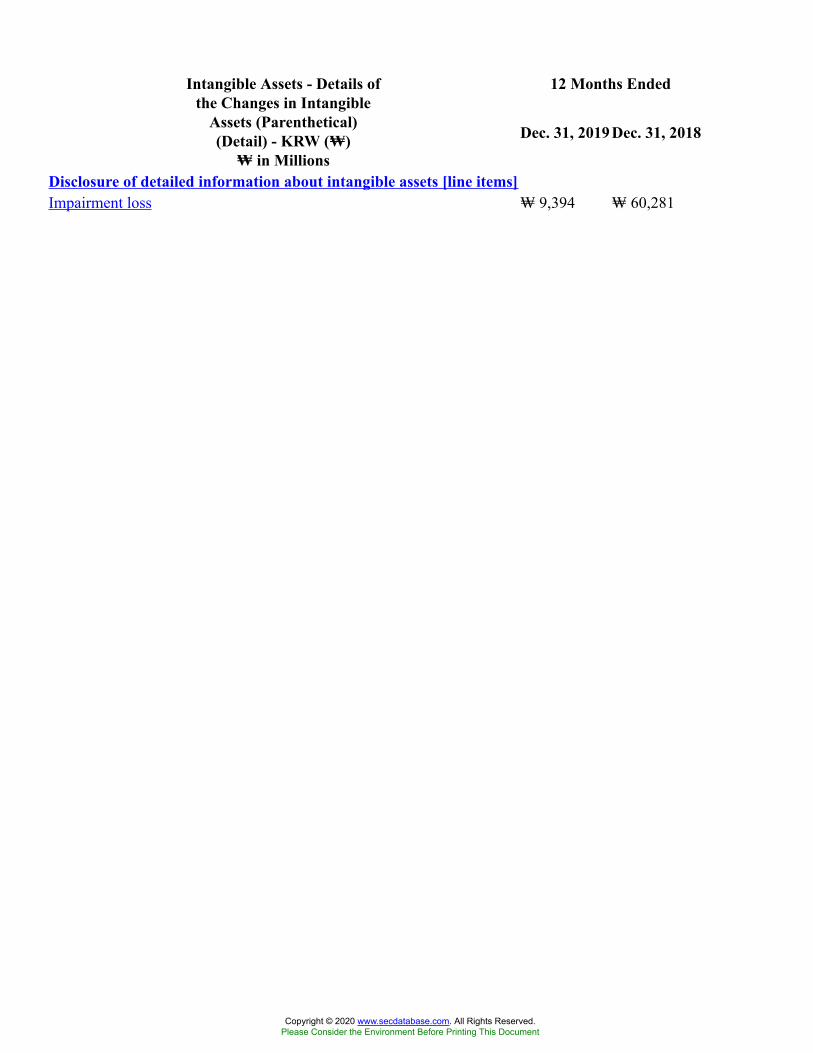
12 Months EndedIntangible Assets - Details ofthe Changes in Intangible
Assets (Parenthetical)(Detail) - KRW (₩)
₩ in Millions
Dec. 31, 2019 Dec. 31, 2018
Disclosure of detailed information about intangible assets [line items]Impairment loss ₩ 9,394 ₩ 60,281
Copyright © 2020 www.secdatabase.com. All Rights Reserved.Please Consider the Environment Before Printing This Document
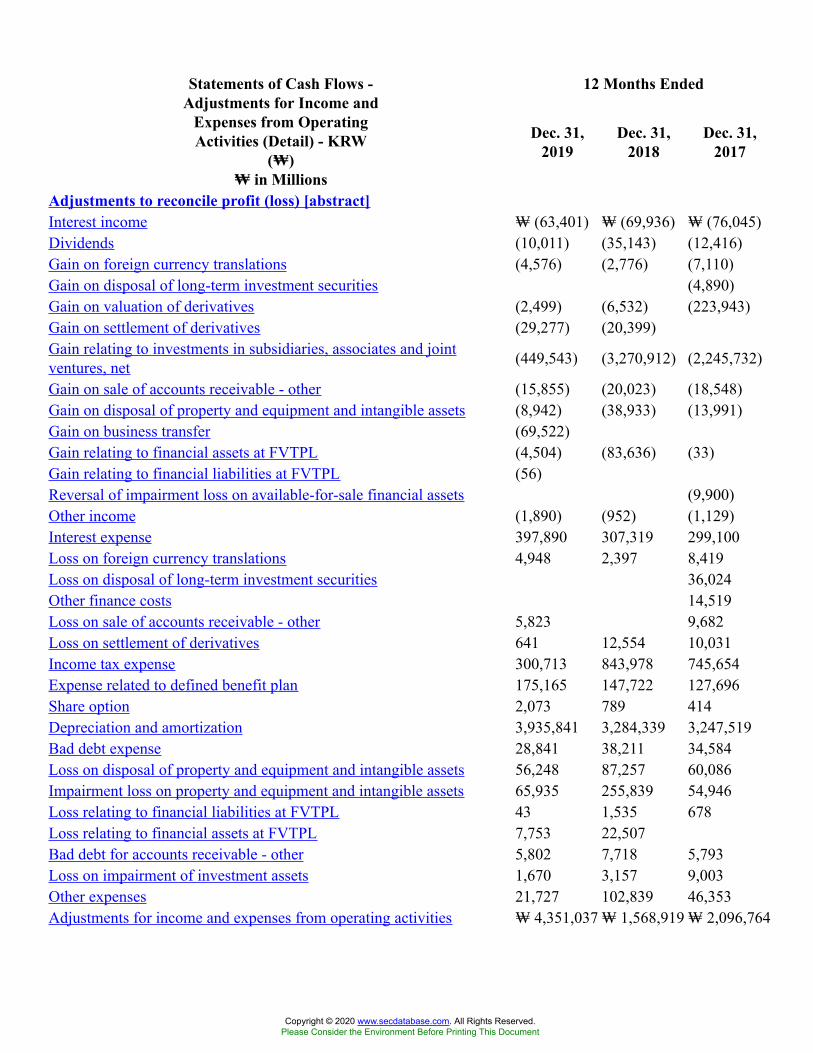
12 Months EndedStatements of Cash Flows -Adjustments for Income and
Expenses from OperatingActivities (Detail) - KRW
(₩)₩ in Millions
Dec. 31,2019
Dec. 31,2018
Dec. 31,2017
Adjustments to reconcile profit (loss) [abstract]Interest income ₩ (63,401) ₩ (69,936) ₩ (76,045)Dividends (10,011) (35,143) (12,416)Gain on foreign currency translations (4,576) (2,776) (7,110)Gain on disposal of long-term investment securities (4,890)Gain on valuation of derivatives (2,499) (6,532) (223,943)Gain on settlement of derivatives (29,277) (20,399)Gain relating to investments in subsidiaries, associates and jointventures, net (449,543) (3,270,912) (2,245,732)
Gain on sale of accounts receivable - other (15,855) (20,023) (18,548)Gain on disposal of property and equipment and intangible assets (8,942) (38,933) (13,991)Gain on business transfer (69,522)Gain relating to financial assets at FVTPL (4,504) (83,636) (33)Gain relating to financial liabilities at FVTPL (56)Reversal of impairment loss on available-for-sale financial assets (9,900)Other income (1,890) (952) (1,129)Interest expense 397,890 307,319 299,100Loss on foreign currency translations 4,948 2,397 8,419Loss on disposal of long-term investment securities 36,024Other finance costs 14,519Loss on sale of accounts receivable - other 5,823 9,682Loss on settlement of derivatives 641 12,554 10,031Income tax expense 300,713 843,978 745,654Expense related to defined benefit plan 175,165 147,722 127,696Share option 2,073 789 414Depreciation and amortization 3,935,841 3,284,339 3,247,519Bad debt expense 28,841 38,211 34,584Loss on disposal of property and equipment and intangible assets 56,248 87,257 60,086Impairment loss on property and equipment and intangible assets 65,935 255,839 54,946Loss relating to financial liabilities at FVTPL 43 1,535 678Loss relating to financial assets at FVTPL 7,753 22,507Bad debt for accounts receivable - other 5,802 7,718 5,793Loss on impairment of investment assets 1,670 3,157 9,003Other expenses 21,727 102,839 46,353Adjustments for income and expenses from operating activities ₩ 4,351,037 ₩ 1,568,919 ₩ 2,096,764
Copyright © 2020 www.secdatabase.com. All Rights Reserved.Please Consider the Environment Before Printing This Document
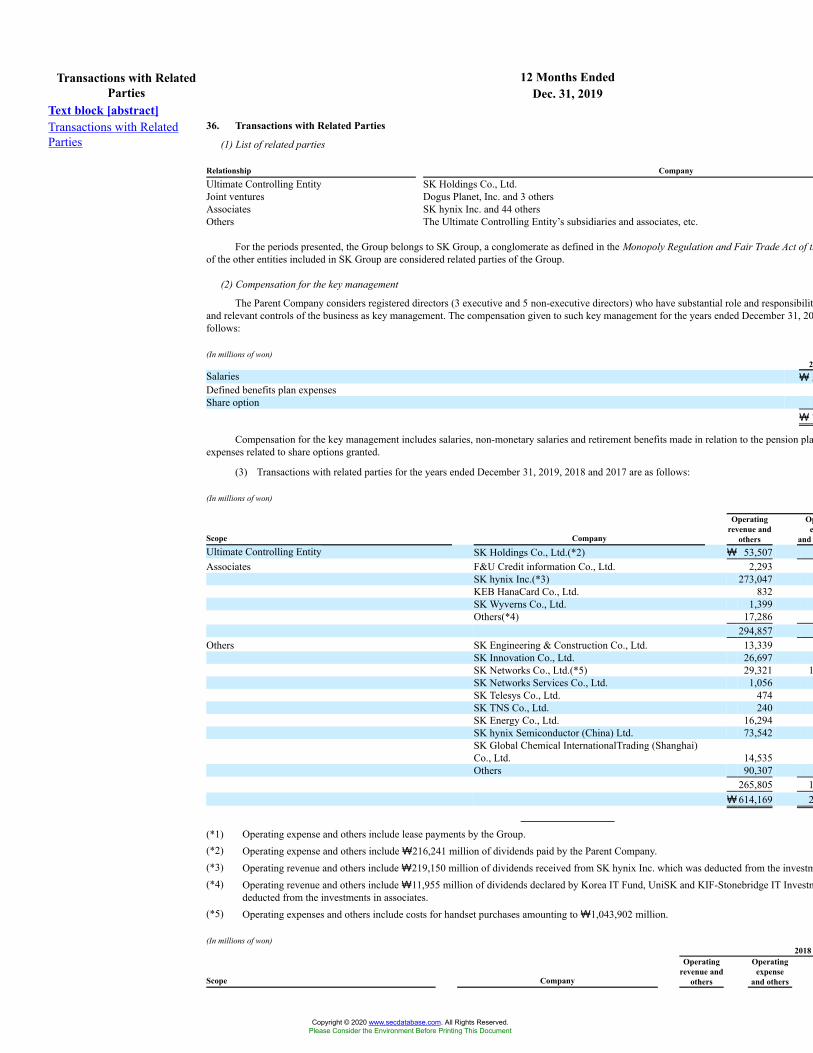
12 Months EndedTransactions with RelatedParties Dec. 31, 2019
Text block [abstract]Transactions with RelatedParties
36. Transactions with Related Parties
(1) List of related parties
Relationship CompanyUltimate Controlling Entity SK Holdings Co., Ltd.Joint ventures Dogus Planet, Inc. and 3 othersAssociates SK hynix Inc. and 44 othersOthers The Ultimate Controlling Entity’s subsidiaries and associates, etc.
For the periods presented, the Group belongs to SK Group, a conglomerate as defined in the Monopoly Regulation and Fair Trade Act of the Republic of Korea. Allof the other entities included in SK Group are considered related parties of the Group.
(2) Compensation for the key management
The Parent Company considers registered directors (3 executive and 5 non-executive directors) who have substantial role and responsibility in planning, operations,and relevant controls of the business as key management. The compensation given to such key management for the years ended December 31, 2019, 2018 and 2017 are asfollows:
(In millions of won)2019 2018 2017
Salaries ₩ 5,969 4,488 2,169Defined benefits plan expenses 1,237 920 258Share option 325 548 414
₩ 7,531 5,956 2,841
Compensation for the key management includes salaries, non-monetary salaries and retirement benefits made in relation to the pension plan and compensationexpenses related to share options granted.
(3) Transactions with related parties for the years ended December 31, 2019, 2018 and 2017 are as follows:
(In millions of won)2019
Scope Company
Operatingrevenue and
others
Operatingexpense
and others(*1)
Acquisition ofproperty and
equipmentUltimate Controlling Entity SK Holdings Co., Ltd.(*2) ₩ 53,507 612,248 95,426Associates F&U Credit information Co., Ltd. 2,293 55,179 —
SK hynix Inc.(*3) 273,047 481 —KEB HanaCard Co., Ltd. 832 1,901 —SK Wyverns Co., Ltd. 1,399 21,528 —Others(*4) 17,286 13,864 457
294,857 92,953 457Others SK Engineering & Construction Co., Ltd. 13,339 1,601 7,400
SK Innovation Co., Ltd. 26,697 2,777 —SK Networks Co., Ltd.(*5) 29,321 1,088,443 449SK Networks Services Co., Ltd. 1,056 76,671 4,979SK Telesys Co., Ltd. 474 9,686 59,392SK TNS Co., Ltd. 240 35,824 607,546SK Energy Co., Ltd. 16,294 516 —SK hynix Semiconductor (China) Ltd. 73,542 — —SK Global Chemical InternationalTrading (Shanghai)Co., Ltd. 14,535 131 —Others 90,307 105,569 109,189
265,805 1,321,218 788,955₩614,169 2,026,419 884,838
(*1) Operating expense and others include lease payments by the Group.(*2) Operating expense and others include ₩216,241 million of dividends paid by the Parent Company.(*3) Operating revenue and others include ₩219,150 million of dividends received from SK hynix Inc. which was deducted from the investments in associates.(*4) Operating revenue and others include ₩11,955 million of dividends declared by Korea IT Fund, UniSK and KIF-Stonebridge IT Investment Fund which was
deducted from the investments in associates.(*5) Operating expenses and others include costs for handset purchases amounting to ₩1,043,902 million.
(In millions of won)2018
Scope Company
Operatingrevenue and
others
Operatingexpense
and others
Acquisition ofproperty and
equipmentCollection
of loans
Copyright © 2020 www.secdatabase.com. All Rights Reserved.Please Consider the Environment Before Printing This Document
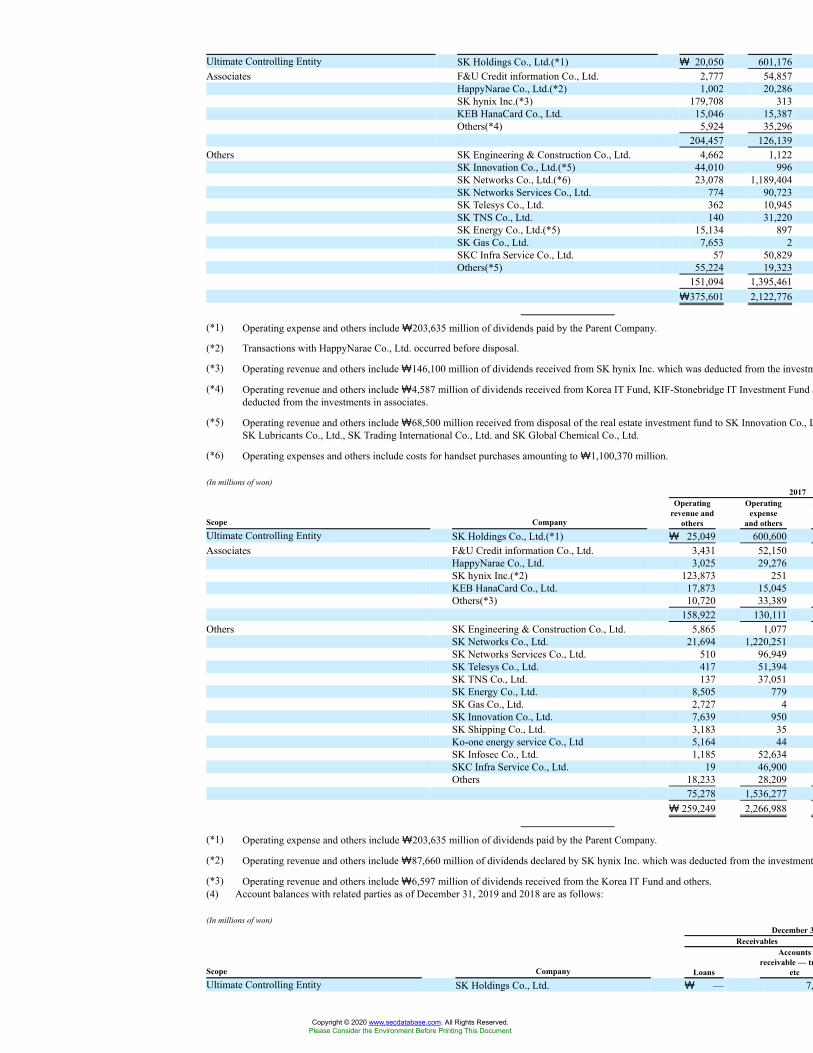
Ultimate Controlling Entity SK Holdings Co., Ltd.(*1) ₩ 20,050 601,176 151,502 —Associates F&U Credit information Co., Ltd. 2,777 54,857 — —
HappyNarae Co., Ltd.(*2) 1,002 20,286 88,327 —SK hynix Inc.(*3) 179,708 313 — —KEB HanaCard Co., Ltd. 15,046 15,387 — —Others(*4) 5,924 35,296 1,202 204
204,457 126,139 89,529 204Others SK Engineering & Construction Co., Ltd. 4,662 1,122 8,700 —
SK Innovation Co., Ltd.(*5) 44,010 996 — —SK Networks Co., Ltd.(*6) 23,078 1,189,404 460 —SK Networks Services Co., Ltd. 774 90,723 5,478 —SK Telesys Co., Ltd. 362 10,945 127,840 —SK TNS Co., Ltd. 140 31,220 493,793 —SK Energy Co., Ltd.(*5) 15,134 897 — —SK Gas Co., Ltd. 7,653 2 — —SKC Infra Service Co., Ltd. 57 50,829 24,761 —Others(*5) 55,224 19,323 — —
151,094 1,395,461 661,032 —₩375,601 2,122,776 902,063 204
(*1) Operating expense and others include ₩203,635 million of dividends paid by the Parent Company.
(*2) Transactions with HappyNarae Co., Ltd. occurred before disposal.
(*3) Operating revenue and others include ₩146,100 million of dividends received from SK hynix Inc. which was deducted from the investments in associates.
(*4) Operating revenue and others include ₩4,587 million of dividends received from Korea IT Fund, KIF-Stonebridge IT Investment Fund and UniSK which werededucted from the investments in associates.
(*5) Operating revenue and others include ₩68,500 million received from disposal of the real estate investment fund to SK Innovation Co., Ltd., SK Energy Co., Ltd.,SK Lubricants Co., Ltd., SK Trading International Co., Ltd. and SK Global Chemical Co., Ltd.
(*6) Operating expenses and others include costs for handset purchases amounting to ₩1,100,370 million.
(In millions of won)2017
Scope Company
Operatingrevenue and
others
Operatingexpense
and others
Acquisition ofproperty and
equipmentCollection
of loansUltimate Controlling Entity SK Holdings Co., Ltd.(*1) ₩ 25,049 600,600 283,556 —Associates F&U Credit information Co., Ltd. 3,431 52,150 153 —
HappyNarae Co., Ltd. 3,025 29,276 68,472 —SK hynix Inc.(*2) 123,873 251 — —KEB HanaCard Co., Ltd. 17,873 15,045 — —Others(*3) 10,720 33,389 940 204
158,922 130,111 69,565 204Others SK Engineering & Construction Co., Ltd. 5,865 1,077 — —
SK Networks Co., Ltd. 21,694 1,220,251 671 —SK Networks Services Co., Ltd. 510 96,949 6,346 —SK Telesys Co., Ltd. 417 51,394 152,659 —SK TNS Co., Ltd. 137 37,051 494,621 —SK Energy Co., Ltd. 8,505 779 — —SK Gas Co., Ltd. 2,727 4 — —SK Innovation Co., Ltd. 7,639 950 — —SK Shipping Co., Ltd. 3,183 35 — —Ko-one energy service Co., Ltd 5,164 44 — —SK Infosec Co., Ltd. 1,185 52,634 15,648 —SKC Infra Service Co., Ltd. 19 46,900 47,163 —Others 18,233 28,209 17 —
75,278 1,536,277 717,125 —₩ 259,249 2,266,988 1,070,246 204
(*1) Operating expense and others include ₩203,635 million of dividends paid by the Parent Company.
(*2) Operating revenue and others include ₩87,660 million of dividends declared by SK hynix Inc. which was deducted from the investments in associates.
(*3) Operating revenue and others include ₩6,597 million of dividends received from the Korea IT Fund and others.(4) Account balances with related parties as of December 31, 2019 and 2018 are as follows:
(In millions of won)December 31, 2019
Receivables Payables
Scope Company Loans
Accountsreceivable — trade,
etc
Accountspayable — other,
etcUltimate Controlling Entity SK Holdings Co., Ltd. ₩ — 7,941 87,519
Copyright © 2020 www.secdatabase.com. All Rights Reserved.Please Consider the Environment Before Printing This Document
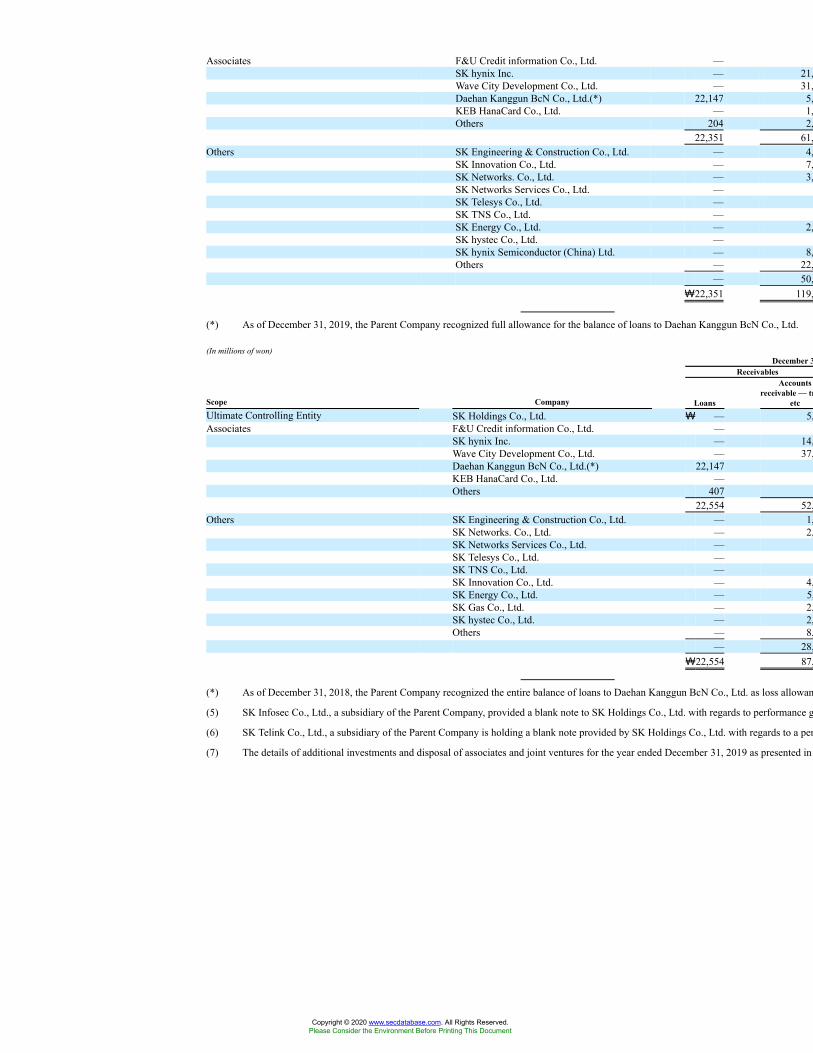
Associates F&U Credit information Co., Ltd. — 2 4,869SK hynix Inc. — 21,510 48Wave City Development Co., Ltd. — 31,523 —Daehan Kanggun BcN Co., Ltd.(*) 22,147 5,359 —KEB HanaCard Co., Ltd. — 1,025 9,474Others 204 2,490 2,262
22,351 61,909 16,653Others SK Engineering & Construction Co., Ltd. — 4,422 97
SK Innovation Co., Ltd. — 7,496 22,673SK Networks. Co., Ltd. — 3,469 85,421SK Networks Services Co., Ltd. — — 10,820SK Telesys Co., Ltd. — 30 16,319SK TNS Co., Ltd. — 14 200,703SK Energy Co., Ltd. — 2,757 1,886SK hystec Co., Ltd. — 848 687SK hynix Semiconductor (China) Ltd. — 8,556 —Others — 22,529 40,073
— 50,121 378,679₩22,351 119,971 482,851
(*) As of December 31, 2019, the Parent Company recognized full allowance for the balance of loans to Daehan Kanggun BcN Co., Ltd.
(In millions of won)December 31, 2018
Receivables Payables
Scope Company Loans
Accountsreceivable — trade,
etc
Accountspayable — other,
etcUltimate Controlling Entity SK Holdings Co., Ltd. ₩ — 5,987 139,260Associates F&U Credit information Co., Ltd. — 98 5,801
SK hynix Inc. — 14,766 89Wave City Development Co., Ltd. — 37,263 —Daehan Kanggun BcN Co., Ltd.(*) 22,147 — —KEB HanaCard Co., Ltd. — 541 11,311Others 407 130 1,764
22,554 52,798 18,965Others SK Engineering & Construction Co., Ltd. — 1,561 760
SK Networks. Co., Ltd. — 2,647 167,433SK Networks Services Co., Ltd. — 54 8,946SK Telesys Co., Ltd. — 154 39,188SK TNS Co., Ltd. — — 89,017SK Innovation Co., Ltd. — 4,696 1,019SK Energy Co., Ltd. — 5,511 887SK Gas Co., Ltd. — 2,225 60SK hystec Co., Ltd. — 2,661 75Others — 8,958 8,066
— 28,467 315,451₩22,554 87,252 473,676
(*) As of December 31, 2018, the Parent Company recognized the entire balance of loans to Daehan Kanggun BcN Co., Ltd. as loss allowances.
(5) SK Infosec Co., Ltd., a subsidiary of the Parent Company, provided a blank note to SK Holdings Co., Ltd. with regards to performance guarantee.
(6) SK Telink Co., Ltd., a subsidiary of the Parent Company is holding a blank note provided by SK Holdings Co., Ltd. with regards to a performance guarantee.
(7) The details of additional investments and disposal of associates and joint ventures for the year ended December 31, 2019 as presented in note 13.
Copyright © 2020 www.secdatabase.com. All Rights Reserved.Please Consider the Environment Before Printing This Document
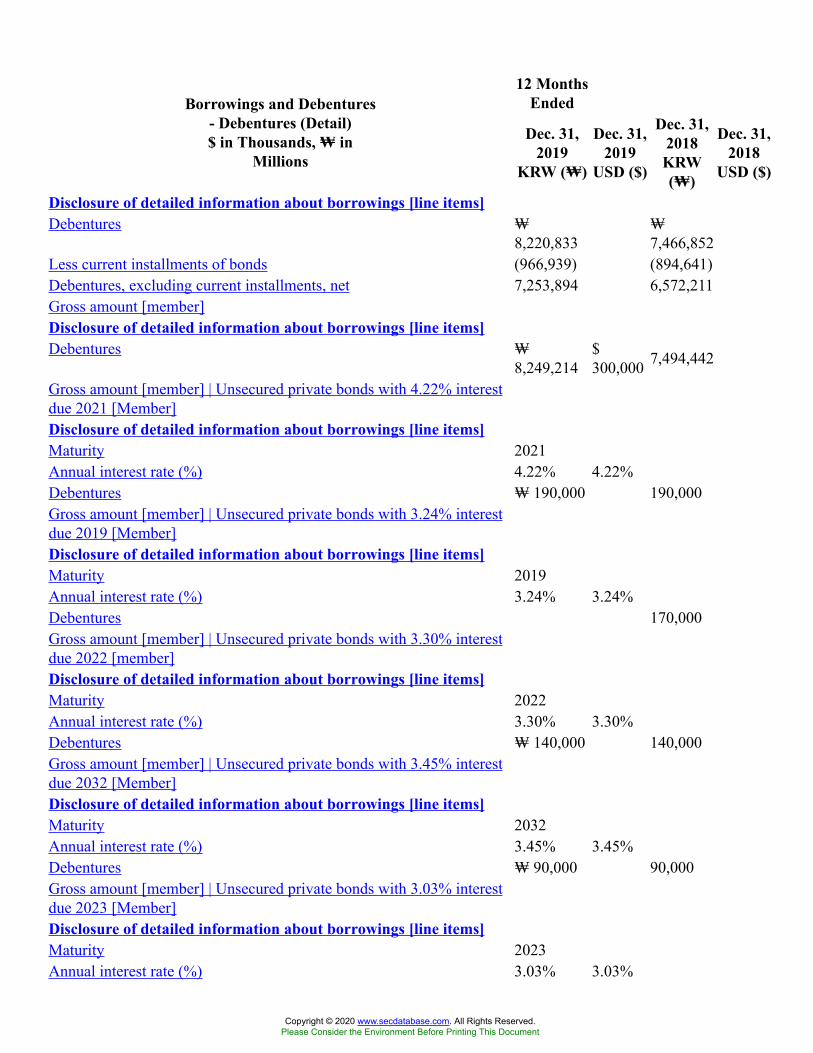
12 MonthsEndedBorrowings and Debentures
- Debentures (Detail)$ in Thousands, ₩ in
Millions
Dec. 31,2019
KRW (₩)
Dec. 31,2019
USD ($)
Dec. 31,2018KRW(₩)
Dec. 31,2018
USD ($)
Disclosure of detailed information about borrowings [line items]Debentures ₩
8,220,833₩7,466,852
Less current installments of bonds (966,939) (894,641)Debentures, excluding current installments, net 7,253,894 6,572,211Gross amount [member]Disclosure of detailed information about borrowings [line items]Debentures ₩
8,249,214$300,000 7,494,442
Gross amount [member] | Unsecured private bonds with 4.22% interestdue 2021 [Member]Disclosure of detailed information about borrowings [line items]Maturity 2021Annual interest rate (%) 4.22% 4.22%Debentures ₩ 190,000 190,000Gross amount [member] | Unsecured private bonds with 3.24% interestdue 2019 [Member]Disclosure of detailed information about borrowings [line items]Maturity 2019Annual interest rate (%) 3.24% 3.24%Debentures 170,000Gross amount [member] | Unsecured private bonds with 3.30% interestdue 2022 [member]Disclosure of detailed information about borrowings [line items]Maturity 2022Annual interest rate (%) 3.30% 3.30%Debentures ₩ 140,000 140,000Gross amount [member] | Unsecured private bonds with 3.45% interestdue 2032 [Member]Disclosure of detailed information about borrowings [line items]Maturity 2032Annual interest rate (%) 3.45% 3.45%Debentures ₩ 90,000 90,000Gross amount [member] | Unsecured private bonds with 3.03% interestdue 2023 [Member]Disclosure of detailed information about borrowings [line items]Maturity 2023Annual interest rate (%) 3.03% 3.03%
Copyright © 2020 www.secdatabase.com. All Rights Reserved.Please Consider the Environment Before Printing This Document
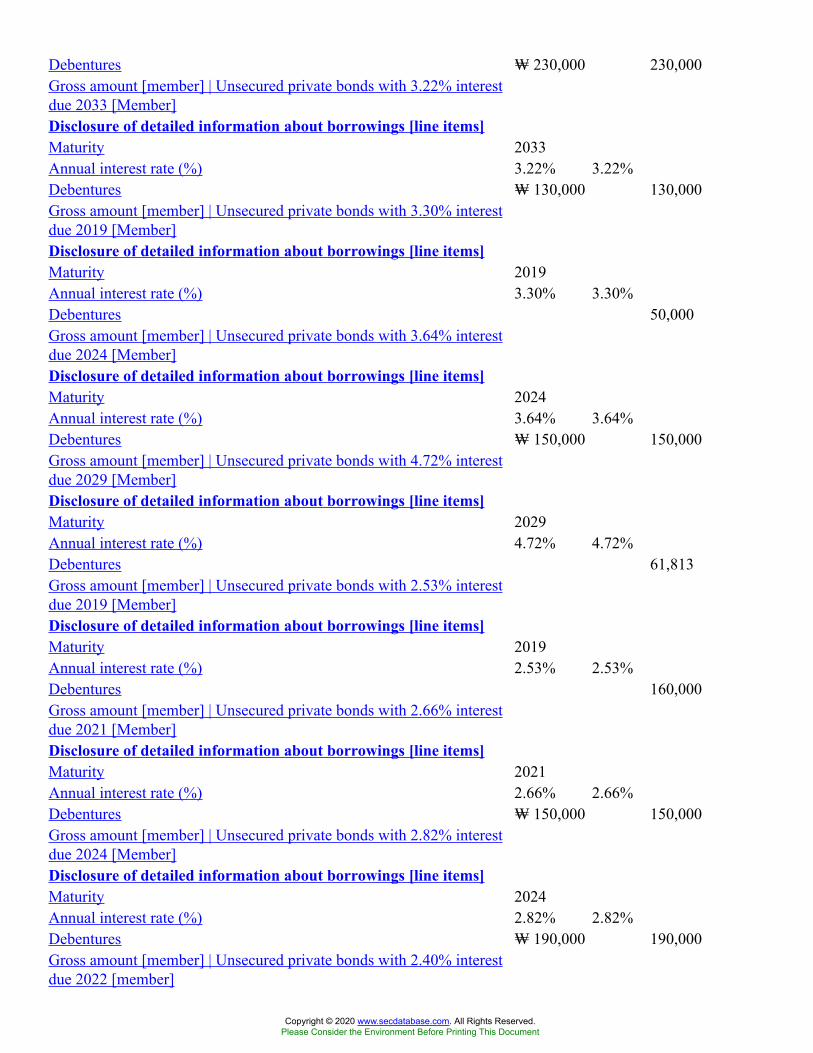
Debentures ₩ 230,000 230,000Gross amount [member] | Unsecured private bonds with 3.22% interestdue 2033 [Member]Disclosure of detailed information about borrowings [line items]Maturity 2033Annual interest rate (%) 3.22% 3.22%Debentures ₩ 130,000 130,000Gross amount [member] | Unsecured private bonds with 3.30% interestdue 2019 [Member]Disclosure of detailed information about borrowings [line items]Maturity 2019Annual interest rate (%) 3.30% 3.30%Debentures 50,000Gross amount [member] | Unsecured private bonds with 3.64% interestdue 2024 [Member]Disclosure of detailed information about borrowings [line items]Maturity 2024Annual interest rate (%) 3.64% 3.64%Debentures ₩ 150,000 150,000Gross amount [member] | Unsecured private bonds with 4.72% interestdue 2029 [Member]Disclosure of detailed information about borrowings [line items]Maturity 2029Annual interest rate (%) 4.72% 4.72%Debentures 61,813Gross amount [member] | Unsecured private bonds with 2.53% interestdue 2019 [Member]Disclosure of detailed information about borrowings [line items]Maturity 2019Annual interest rate (%) 2.53% 2.53%Debentures 160,000Gross amount [member] | Unsecured private bonds with 2.66% interestdue 2021 [Member]Disclosure of detailed information about borrowings [line items]Maturity 2021Annual interest rate (%) 2.66% 2.66%Debentures ₩ 150,000 150,000Gross amount [member] | Unsecured private bonds with 2.82% interestdue 2024 [Member]Disclosure of detailed information about borrowings [line items]Maturity 2024Annual interest rate (%) 2.82% 2.82%Debentures ₩ 190,000 190,000Gross amount [member] | Unsecured private bonds with 2.40% interestdue 2022 [member]
Copyright © 2020 www.secdatabase.com. All Rights Reserved.Please Consider the Environment Before Printing This Document
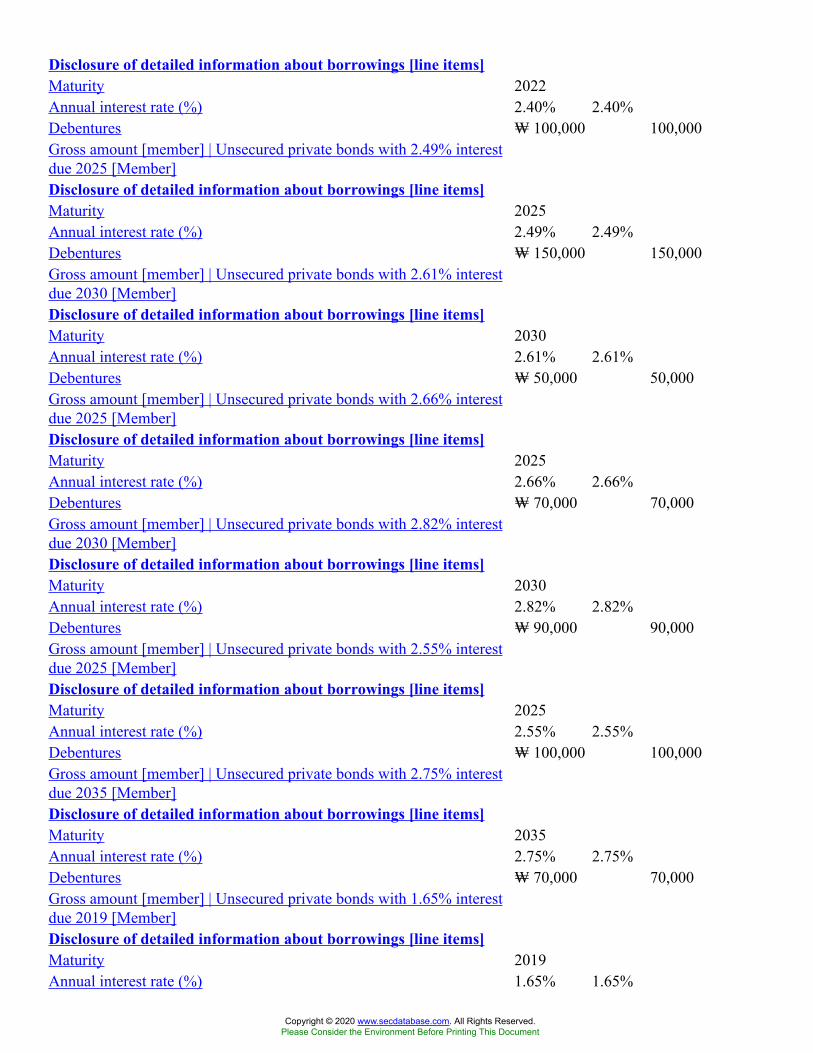
Disclosure of detailed information about borrowings [line items]Maturity 2022Annual interest rate (%) 2.40% 2.40%Debentures ₩ 100,000 100,000Gross amount [member] | Unsecured private bonds with 2.49% interestdue 2025 [Member]Disclosure of detailed information about borrowings [line items]Maturity 2025Annual interest rate (%) 2.49% 2.49%Debentures ₩ 150,000 150,000Gross amount [member] | Unsecured private bonds with 2.61% interestdue 2030 [Member]Disclosure of detailed information about borrowings [line items]Maturity 2030Annual interest rate (%) 2.61% 2.61%Debentures ₩ 50,000 50,000Gross amount [member] | Unsecured private bonds with 2.66% interestdue 2025 [Member]Disclosure of detailed information about borrowings [line items]Maturity 2025Annual interest rate (%) 2.66% 2.66%Debentures ₩ 70,000 70,000Gross amount [member] | Unsecured private bonds with 2.82% interestdue 2030 [Member]Disclosure of detailed information about borrowings [line items]Maturity 2030Annual interest rate (%) 2.82% 2.82%Debentures ₩ 90,000 90,000Gross amount [member] | Unsecured private bonds with 2.55% interestdue 2025 [Member]Disclosure of detailed information about borrowings [line items]Maturity 2025Annual interest rate (%) 2.55% 2.55%Debentures ₩ 100,000 100,000Gross amount [member] | Unsecured private bonds with 2.75% interestdue 2035 [Member]Disclosure of detailed information about borrowings [line items]Maturity 2035Annual interest rate (%) 2.75% 2.75%Debentures ₩ 70,000 70,000Gross amount [member] | Unsecured private bonds with 1.65% interestdue 2019 [Member]Disclosure of detailed information about borrowings [line items]Maturity 2019Annual interest rate (%) 1.65% 1.65%
Copyright © 2020 www.secdatabase.com. All Rights Reserved.Please Consider the Environment Before Printing This Document
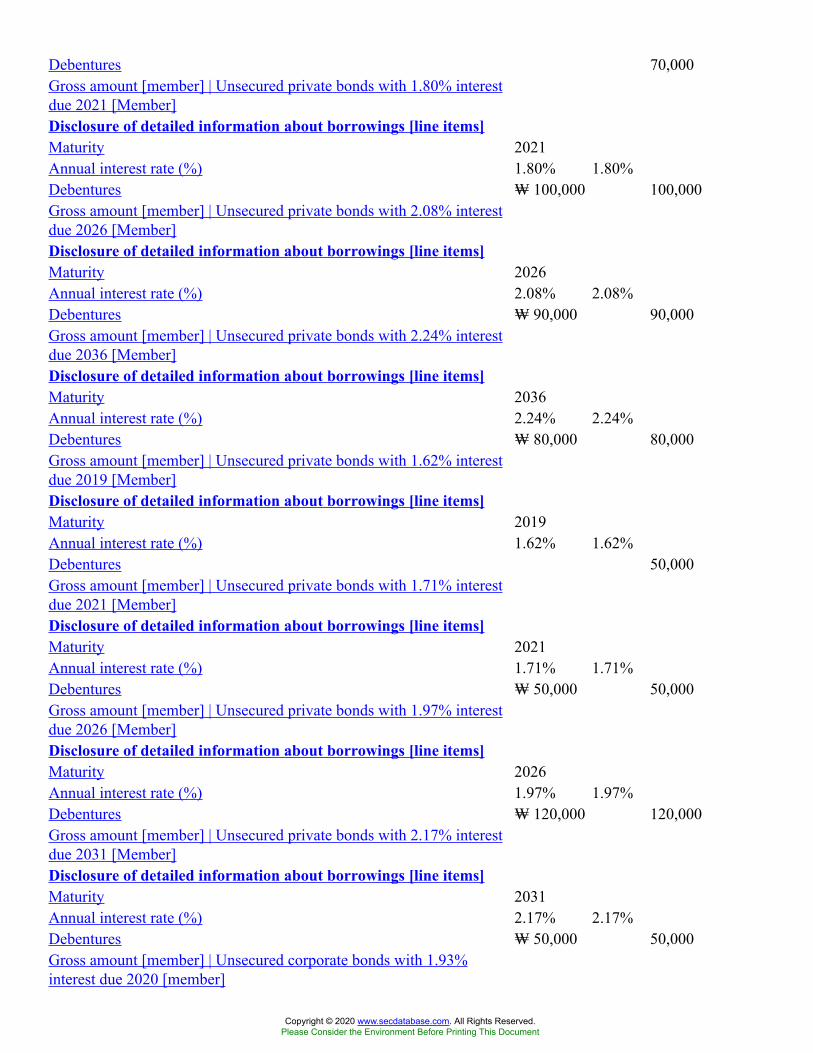
Debentures 70,000Gross amount [member] | Unsecured private bonds with 1.80% interestdue 2021 [Member]Disclosure of detailed information about borrowings [line items]Maturity 2021Annual interest rate (%) 1.80% 1.80%Debentures ₩ 100,000 100,000Gross amount [member] | Unsecured private bonds with 2.08% interestdue 2026 [Member]Disclosure of detailed information about borrowings [line items]Maturity 2026Annual interest rate (%) 2.08% 2.08%Debentures ₩ 90,000 90,000Gross amount [member] | Unsecured private bonds with 2.24% interestdue 2036 [Member]Disclosure of detailed information about borrowings [line items]Maturity 2036Annual interest rate (%) 2.24% 2.24%Debentures ₩ 80,000 80,000Gross amount [member] | Unsecured private bonds with 1.62% interestdue 2019 [Member]Disclosure of detailed information about borrowings [line items]Maturity 2019Annual interest rate (%) 1.62% 1.62%Debentures 50,000Gross amount [member] | Unsecured private bonds with 1.71% interestdue 2021 [Member]Disclosure of detailed information about borrowings [line items]Maturity 2021Annual interest rate (%) 1.71% 1.71%Debentures ₩ 50,000 50,000Gross amount [member] | Unsecured private bonds with 1.97% interestdue 2026 [Member]Disclosure of detailed information about borrowings [line items]Maturity 2026Annual interest rate (%) 1.97% 1.97%Debentures ₩ 120,000 120,000Gross amount [member] | Unsecured private bonds with 2.17% interestdue 2031 [Member]Disclosure of detailed information about borrowings [line items]Maturity 2031Annual interest rate (%) 2.17% 2.17%Debentures ₩ 50,000 50,000Gross amount [member] | Unsecured corporate bonds with 1.93%interest due 2020 [member]
Copyright © 2020 www.secdatabase.com. All Rights Reserved.Please Consider the Environment Before Printing This Document
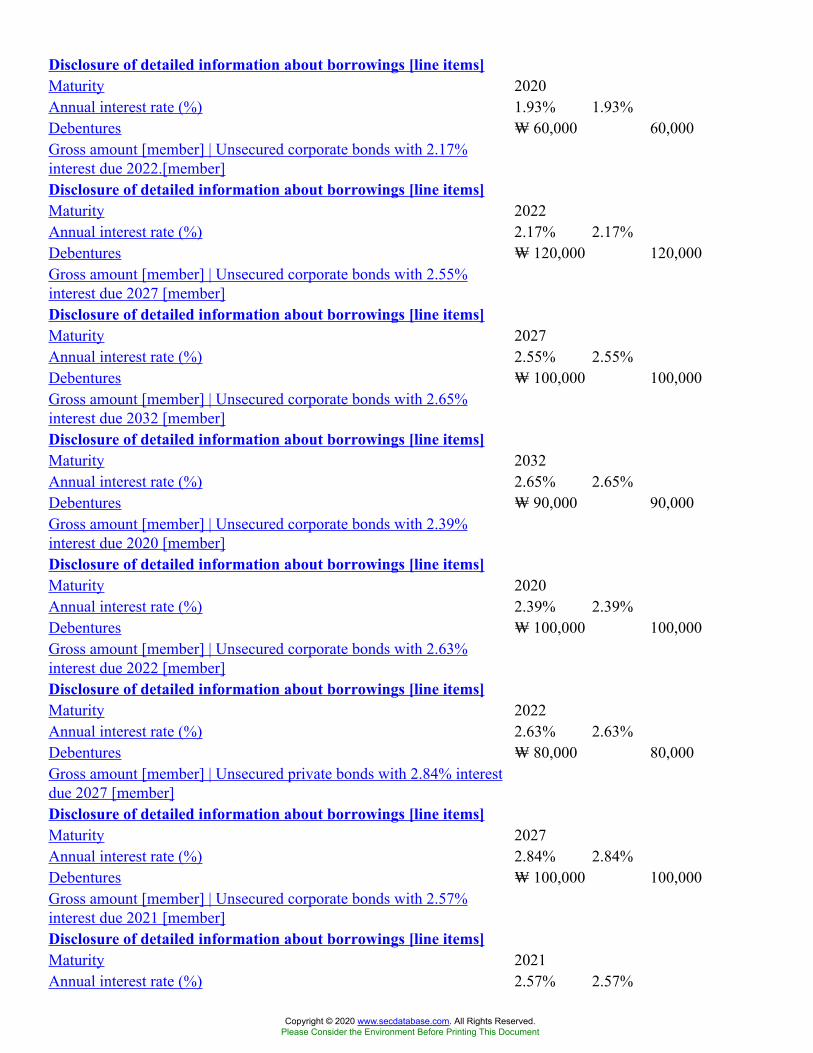
Disclosure of detailed information about borrowings [line items]Maturity 2020Annual interest rate (%) 1.93% 1.93%Debentures ₩ 60,000 60,000Gross amount [member] | Unsecured corporate bonds with 2.17%interest due 2022.[member]Disclosure of detailed information about borrowings [line items]Maturity 2022Annual interest rate (%) 2.17% 2.17%Debentures ₩ 120,000 120,000Gross amount [member] | Unsecured corporate bonds with 2.55%interest due 2027 [member]Disclosure of detailed information about borrowings [line items]Maturity 2027Annual interest rate (%) 2.55% 2.55%Debentures ₩ 100,000 100,000Gross amount [member] | Unsecured corporate bonds with 2.65%interest due 2032 [member]Disclosure of detailed information about borrowings [line items]Maturity 2032Annual interest rate (%) 2.65% 2.65%Debentures ₩ 90,000 90,000Gross amount [member] | Unsecured corporate bonds with 2.39%interest due 2020 [member]Disclosure of detailed information about borrowings [line items]Maturity 2020Annual interest rate (%) 2.39% 2.39%Debentures ₩ 100,000 100,000Gross amount [member] | Unsecured corporate bonds with 2.63%interest due 2022 [member]Disclosure of detailed information about borrowings [line items]Maturity 2022Annual interest rate (%) 2.63% 2.63%Debentures ₩ 80,000 80,000Gross amount [member] | Unsecured private bonds with 2.84% interestdue 2027 [member]Disclosure of detailed information about borrowings [line items]Maturity 2027Annual interest rate (%) 2.84% 2.84%Debentures ₩ 100,000 100,000Gross amount [member] | Unsecured corporate bonds with 2.57%interest due 2021 [member]Disclosure of detailed information about borrowings [line items]Maturity 2021Annual interest rate (%) 2.57% 2.57%
Copyright © 2020 www.secdatabase.com. All Rights Reserved.Please Consider the Environment Before Printing This Document
Debentures ₩ 110,000 110,000Gross amount [member] | Unsecured corporate bonds with 2.81%interest due 2023 [member]Disclosure of detailed information about borrowings [line items]Maturity 2023Annual interest rate (%) 2.81% 2.81%Debentures ₩ 100,000 100,000Gross amount [member] | Unsecured corporate bonds with 3 % interestdue 2028 [member]Disclosure of detailed information about borrowings [line items]Maturity 2028Annual interest rate (%) 3.00% 3.00%Debentures ₩ 200,000 200,000Gross amount [member] | Unsecured corporate bonds with 3.2% interestdue 2038 [member]Disclosure of detailed information about borrowings [line items]Maturity 2038Annual interest rate (%) 3.02% 3.02%Debentures ₩ 90,000 90,000Gross amount [member] | Unsecured corporate bonds with 2.1% interestdue 2021 [member]Disclosure of detailed information about borrowings [line items]Maturity 2021Annual interest rate (%) 2.10% 2.10%Debentures ₩ 100,000 100,000Gross amount [member] | Unsecured corporate bonds with 2.33%interest due 2023 [member]Disclosure of detailed information about borrowings [line items]Maturity 2023Annual interest rate (%) 2.33% 2.33%Debentures ₩ 150,000 150,000Gross amount [member] | Unsecured corporate bonds with 2.44%interest due 2038 [member]Disclosure of detailed information about borrowings [line items]Maturity 2038Annual interest rate (%) 2.44% 2.44%Debentures ₩ 50,000 50,000Gross amount [member] | Unsecured corporate bonds with 2.03%interest due 2022 [member]Disclosure of detailed information about borrowings [line items]Maturity 2022Annual interest rate (%) 2.03% 2.03%Debentures ₩ 180,000Gross amount [member] | Unsecured corporate bonds with 2.09%interest due 2024 [member]
Copyright © 2020 www.secdatabase.com. All Rights Reserved.Please Consider the Environment Before Printing This Document
Disclosure of detailed information about borrowings [line items]Maturity 2024Annual interest rate (%) 2.09% 2.09%Debentures ₩ 120,000Gross amount [member] | Unsecured corporate bonds with 2.19%interest due 2029 [member]Disclosure of detailed information about borrowings [line items]Maturity 2029Annual interest rate (%) 2.19% 2.19%Debentures ₩ 50,000Gross amount [member] | Unsecured corporate bonds with 2.23%interest due 2039 [member]Disclosure of detailed information about borrowings [line items]Maturity 2039Annual interest rate (%) 2.23% 2.23%Debentures ₩ 50,000Gross amount [member] | Unsecured corporate bonds with 1.40%interest due 2022 [member]Disclosure of detailed information about borrowings [line items]Maturity 2022Annual interest rate (%) 1.40% 1.40%Debentures ₩ 120,000Gross amount [member] | Unsecured corporate bonds with 1.49%interest due 2024 [member]Disclosure of detailed information about borrowings [line items]Maturity 2024Annual interest rate (%) 1.49% 1.49%Debentures ₩ 60,000Gross amount [member] | Unsecured corporate bonds with 1.50%interest due 2029 [member]Disclosure of detailed information about borrowings [line items]Maturity 2029Annual interest rate (%) 1.50% 1.50%Debentures ₩ 120,000Gross amount [member] | Unsecured corporate bonds with 1.52%interest due 2039 [member]Disclosure of detailed information about borrowings [line items]Maturity 2039Annual interest rate (%) 1.52% 1.52%Debentures ₩ 50,000Gross amount [member] | Unsecured corporate bonds with 1.56%interest due 2049 [member]Disclosure of detailed information about borrowings [line items]Maturity 2049Annual interest rate (%) 1.56% 1.56%
Copyright © 2020 www.secdatabase.com. All Rights Reserved.Please Consider the Environment Before Printing This Document
Debentures ₩ 50,000Gross amount [member] | Unsecured corporate bonds with 1.69%interest due 2022 [member]Disclosure of detailed information about borrowings [line items]Maturity 2022Annual interest rate (%) 1.69% 1.69%Debentures ₩ 230,000Gross amount [member] | Unsecured corporate bonds with 1.76%interest due 2024 [member]Disclosure of detailed information about borrowings [line items]Maturity 2024Annual interest rate (%) 1.76% 1.76%Debentures ₩ 70,000Gross amount [member] | Unsecured corporate bonds with 1.79%interest due 2029 [member]Disclosure of detailed information about borrowings [line items]Maturity 2029Annual interest rate (%) 1.79% 1.79%Debentures ₩ 40,000Gross amount [member] | Unsecured corporate bonds with 1.81%interest due 2039 [member]Disclosure of detailed information about borrowings [line items]Maturity 2039Annual interest rate (%) 1.81% 1.81%Debentures ₩ 60,000Gross amount [member] | Unsecured corporate bonds with 3.49%interest due 2019 [member]Disclosure of detailed information about borrowings [line items]Maturity 2019Annual interest rate (%) 3.49% 3.49%Debentures 210,000Gross amount [member] | Unsecured corporate bonds with 2.76%interest due 2019 [Member]Disclosure of detailed information about borrowings [line items]Maturity 2019Annual interest rate (%) 2.76% 2.76%Debentures 130,000Gross amount [member] | Unsecured corporate bonds with 2.49%interest due 2020 [Member]Disclosure of detailed information about borrowings [line items]Maturity 2020Annual interest rate (%) 2.49% 2.49%Debentures ₩ 160,000 160,000Gross amount [member] | Unsecured corporate bonds with 2.43%interest due 2020 [Member]
Copyright © 2020 www.secdatabase.com. All Rights Reserved.Please Consider the Environment Before Printing This Document
Disclosure of detailed information about borrowings [line items]Maturity 2020Annual interest rate (%) 2.43% 2.43%Debentures ₩ 140,000 140,000Gross amount [member] | Unsecured corporate bonds with 2.18%interest due 2020 [Member]Disclosure of detailed information about borrowings [line items]Maturity 2020Annual interest rate (%) 2.18% 2.18%Debentures ₩ 130,000 130,000Gross amount [member] | Unsecured corporate bonds with 1.58%interest due 2019 [Member]Disclosure of detailed information about borrowings [line items]Maturity 2019Annual interest rate (%) 1.58% 1.58%Debentures 50,000Gross amount [member] | Unsecured corporate bonds with 1.77%interest due 2021Disclosure of detailed information about borrowings [line items]Maturity 2021Annual interest rate (%) 1.77% 1.77%Debentures ₩ 120,000 120,000Gross amount [member] | Unsecured corporate bonds with 2.26%interest due 2022 [Member]Disclosure of detailed information about borrowings [line items]Maturity 2022Annual interest rate (%) 2.26% 2.26%Debentures ₩ 150,000 150,000Gross amount [member] | Unsecured corporate bonds with 2.34%interest due 2020 [Member]Disclosure of detailed information about borrowings [line items]Maturity 2020Annual interest rate (%) 2.34% 2.34%Debentures ₩ 30,000 30,000Gross amount [member] | Unsecured corporate bonds with 2.70%interest due 2022 [Member]Disclosure of detailed information about borrowings [line items]Maturity 2022Annual interest rate (%) 2.70% 2.70%Debentures ₩ 140,000 140,000Gross amount [member] | Unsecured corporate bonds with 2.59%interest due 2021 [Member]Disclosure of detailed information about borrowings [line items]Maturity 2021Annual interest rate (%) 2.59% 2.59%
Copyright © 2020 www.secdatabase.com. All Rights Reserved.Please Consider the Environment Before Printing This Document
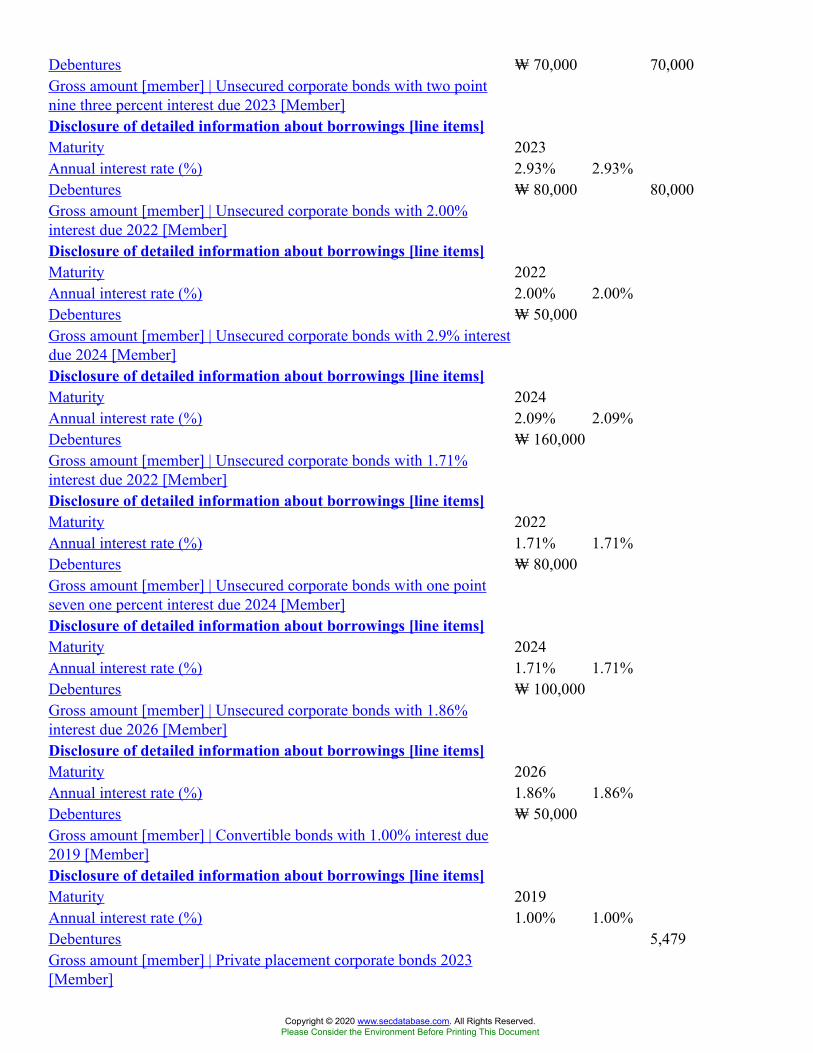
Debentures ₩ 70,000 70,000Gross amount [member] | Unsecured corporate bonds with two pointnine three percent interest due 2023 [Member]Disclosure of detailed information about borrowings [line items]Maturity 2023Annual interest rate (%) 2.93% 2.93%Debentures ₩ 80,000 80,000Gross amount [member] | Unsecured corporate bonds with 2.00%interest due 2022 [Member]Disclosure of detailed information about borrowings [line items]Maturity 2022Annual interest rate (%) 2.00% 2.00%Debentures ₩ 50,000Gross amount [member] | Unsecured corporate bonds with 2.9% interestdue 2024 [Member]Disclosure of detailed information about borrowings [line items]Maturity 2024Annual interest rate (%) 2.09% 2.09%Debentures ₩ 160,000Gross amount [member] | Unsecured corporate bonds with 1.71%interest due 2022 [Member]Disclosure of detailed information about borrowings [line items]Maturity 2022Annual interest rate (%) 1.71% 1.71%Debentures ₩ 80,000Gross amount [member] | Unsecured corporate bonds with one pointseven one percent interest due 2024 [Member]Disclosure of detailed information about borrowings [line items]Maturity 2024Annual interest rate (%) 1.71% 1.71%Debentures ₩ 100,000Gross amount [member] | Unsecured corporate bonds with 1.86%interest due 2026 [Member]Disclosure of detailed information about borrowings [line items]Maturity 2026Annual interest rate (%) 1.86% 1.86%Debentures ₩ 50,000Gross amount [member] | Convertible bonds with 1.00% interest due2019 [Member]Disclosure of detailed information about borrowings [line items]Maturity 2019Annual interest rate (%) 1.00% 1.00%Debentures 5,479Gross amount [member] | Private placement corporate bonds 2023[Member]
Copyright © 2020 www.secdatabase.com. All Rights Reserved.Please Consider the Environment Before Printing This Document
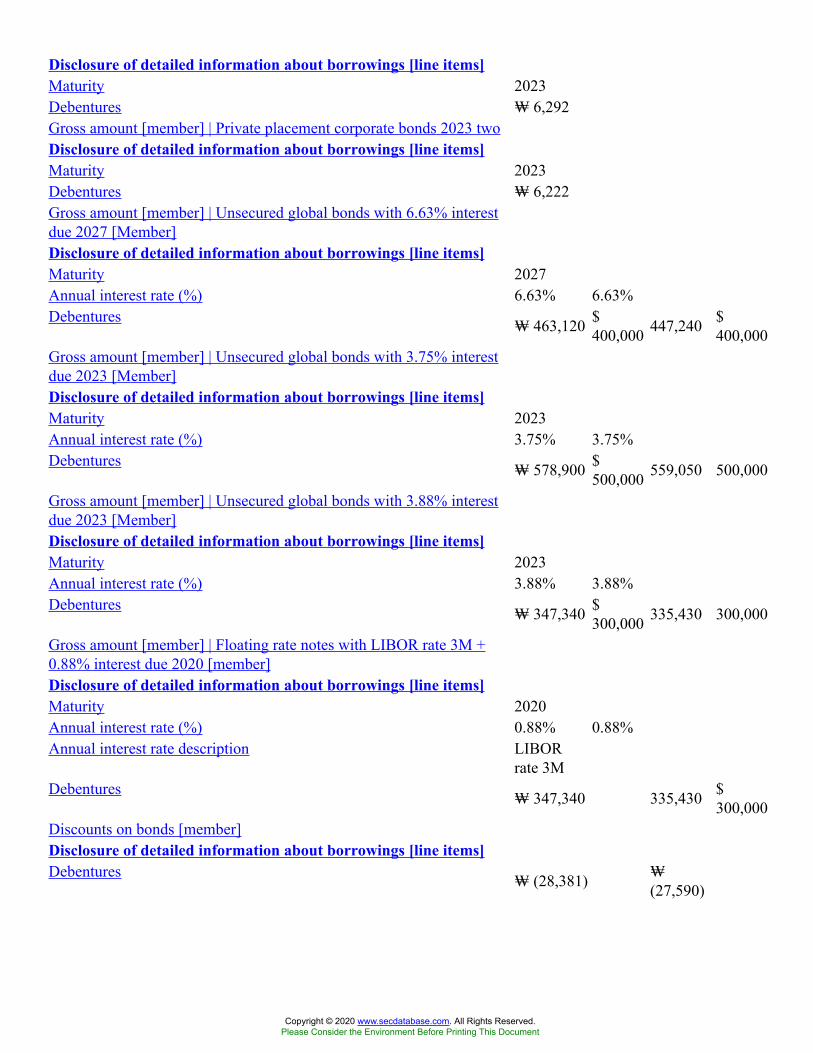
Disclosure of detailed information about borrowings [line items]Maturity 2023Debentures ₩ 6,292Gross amount [member] | Private placement corporate bonds 2023 twoDisclosure of detailed information about borrowings [line items]Maturity 2023Debentures ₩ 6,222Gross amount [member] | Unsecured global bonds with 6.63% interestdue 2027 [Member]Disclosure of detailed information about borrowings [line items]Maturity 2027Annual interest rate (%) 6.63% 6.63%Debentures ₩ 463,120 $
400,000 447,240 $400,000
Gross amount [member] | Unsecured global bonds with 3.75% interestdue 2023 [Member]Disclosure of detailed information about borrowings [line items]Maturity 2023Annual interest rate (%) 3.75% 3.75%Debentures ₩ 578,900 $
500,000 559,050 500,000
Gross amount [member] | Unsecured global bonds with 3.88% interestdue 2023 [Member]Disclosure of detailed information about borrowings [line items]Maturity 2023Annual interest rate (%) 3.88% 3.88%Debentures ₩ 347,340 $
300,000 335,430 300,000
Gross amount [member] | Floating rate notes with LIBOR rate 3M +0.88% interest due 2020 [member]Disclosure of detailed information about borrowings [line items]Maturity 2020Annual interest rate (%) 0.88% 0.88%Annual interest rate description LIBOR
rate 3MDebentures ₩ 347,340 335,430 $
300,000Discounts on bonds [member]Disclosure of detailed information about borrowings [line items]Debentures ₩ (28,381) ₩
(27,590)
Copyright © 2020 www.secdatabase.com. All Rights Reserved.Please Consider the Environment Before Printing This Document
12 Months EndedSignificant AccountingPolicies (Policies) Dec. 31, 2019
Statement [LineItems]Operating segments
(1) Operating segments
An operating segment is a component of the Group that engages in business activities from which it may earn revenues and incur expenses, including revenues andexpenses that relate to transactions with any of the Group’s other components. The Group’s operating segments have been determined to be each business unit, for which theGroup generates separately identifiable financial information that is regularly reported to the chief operating decision maker for the purpose of resource allocation andassessment of segment performance. The Group has five reportable segments as described in note 5. Segment results that are reported to the chief operating decision makerinclude items directly attributable to a segment as well as those that can be allocated on a reasonable basis.
Basis of consolidation(2) Basis of consolidation
1) Business combination
A business combination is accounted for by applying the acquisition method, unless it is a combination involving entities or businesses under common control.
Consideration transferred is generally measured at fair value, identical to the measurement of identifiable net assets acquired at fair value. The difference between theacquired company’s fair value and the consideration transferred is accounted for goodwill. Any goodwill that arises is tested annually for impairment. Any gain on a bargainpurchase is recognized in profit or loss immediately. Acquisition-related costs are expensed in the periods in which the costs are incurred and the services are receivedexcluding costs to issue debt or equity securities recognized based on IAS 32 and IFRS 9.
Consideration transferred does not include the amount settled in relation to the pre-existing relationship and the amount settled in relation to the pre-existingrelationship is generally recognized through profit or loss.
Contingent consideration is measured at fair value at the acquisition date. Contingent consideration classified as equity is not remeasured and its subsequentsettlement is accounted for within equity. If contingent consideration is not classified as equity, the Group subsequently recognizes changes in fair value of contingentconsideration through profit or loss.
2) Non-controlling interests
Non-controlling interests are measured at their proportionate share of the acquiree’s identifiable net assets at the date of acquisition.
Changes in a Controlling Company’s ownership interest in a subsidiary that do not result in the Controlling Company losing control of the subsidiary are accountedfor as equity transactions.
3) Subsidiaries
Subsidiaries are entities controlled by the Group. The Group controls an investee when it is exposed, or has rights, to variable returns from its involvement with theinvestee and has the ability to affect those returns through its power over the investee. Consolidation of an investee begins from the date the Group obtains control of theinvestee and cease when the Group loses control of the investee.
4) Loss of control
If the Group loses control of a subsidiary, the Group derecognizes the assets and liabilities of the former subsidiary from the consolidated statement of financialposition and recognizes gain or loss associated with the loss of control attributable to the former controlling interest. Any investment retained in the former subsidiary isrecognized at its fair value when control is lost.
5) Interest in investees accounted for using the equity method
Interest in investees accounted for using the equity method composed of interest in associates and joint ventures. An associate is an entity in which the Group hassignificant influence, but not control, over the entity’s financial and operating policies. A joint venture is a joint arrangement whereby the Group that has joint control of thearrangement has rights to the net assets of the arrangement.
The investment in an associate and a joint venture is initially recognized at cost including transaction costs and the carrying amount is increased or decreased torecognize the Group’s share of the profit or loss and changes in equity of the associate or the joint venture after the date of acquisition.
The investment in an associate and a joint venture is impaired if objective evidence indicates that a loss event has occurred after the initial recognition of the asset,and that the loss event had a negative effect on the estimated future cash flows of that asset that can be estimated reliably.
• significant financial difficulty of the associate or joint venture;
• a breach of contract, such as a default or delinquency in payments by the associate or joint venture;
• the entity, for economic or legal reasons relating to its associate’s or joint venture’s financial difficulty, granting to the associate or joint venture a concessionthat the entity would not otherwise consider;
• it becoming probable that the associate or joint venture will enter bankruptcy or other financial reorganization; or
• the disappearance of an active market for the net investment because of financial difficulties of the associate or joint venture.
6) Intra-group transactions
Intra-group balances and transactions, and any unrealized income and expenses arising from intra-group transactions, are eliminated in preparing the consolidatedfinancial statements. The Group’s share of unrealized gain incurred from transactions with investees accounted for using the equity method are eliminated and unrealizedloss are eliminated using the same basis if there are no evidence of asset impairments.
7) Business combinations under common control
Copyright © 2020 www.secdatabase.com. All Rights Reserved.Please Consider the Environment Before Printing This Document
SK Holdings Co., Ltd. is the ultimate controlling entity of the Group. The assets and liabilities acquired under business combination under common control arerecognized at the carrying amounts in the ultimate controlling shareholder’s consolidated financial statements. The difference between consideration and carrying amount ofnet assets acquired is added to or subtracted from capital surplus and others.
Cash and cash equivalents (3) Cash and cash equivalents
Cash and cash equivalents comprise cash balances, call deposits and investment securities with maturities of three months or less from the acquisition date that areeasily convertible to cash and subject to an insignificant risk of changes in their fair value.
Inventories(4) Inventories
Inventories are initially recognized at the acquisition cost and subsequently measured using the weighted average method. During the period, a perpetual inventorysystem is used to track inventory quantities, which is adjusted based on the physical inventory counts performed at the period end. When the net realizable value ofinventories is less than cost, the carrying amount is reduced to the net realizable value, and any difference is charged to current period as operating expenses.
Financial assets - Policiesapplicable from January 1,2018
(6) Financial assets — Policies applied before January 1, 2018
The Group recognizes and measures non-derivative financial assets by the following four categories: financial assets at fair value through profit or loss,held-to-maturity investments, loans and receivables and available-for-sale financial assets. The Group recognizes financial assets in the consolidated statement of financialposition when the Group becomes a party to the contractual provisions of the instrument.
Upon initial recognition, non-derivative financial assets not at fair value through profit or loss are measured at their fair value plus transaction costs that are directlyattributable to the acquisition of asset.
1) Financial assets at fair value through profit or loss
A financial asset is classified as financial asset at fair value through profit or loss if it is held for trading or is designated as such upon initial recognition. Upon initialrecognition, transaction costs are recognized in profit or loss when incurred. Financial assets at fair value through profit or loss are measured at fair value, and changestherein are recognized in profit or loss.
2) Held-to-maturity investments
A non-derivative financial asset with a fixed or determinable payment and fixed maturity, for which the Group has the positive intention and ability to hold tomaturity, is classified as held-to-maturity investment. Subsequent to initial recognition, held-to-maturity investments are measured at amortized cost using the effectiveinterest rate method.
3) Loans and receivables
Loans and receivables are financial assets with fixed or determinable payments that are not quoted in an active market. Subsequent to initial recognition, loans andreceivables are measured at amortized cost using the effective interest method except for loans and receivables of which the effect of discounting is immaterial.
4) Available-for-sale financial assets
Available-for-sale financial assets are those non-derivative financial assets that are designated as available-for-sale or are not classified as financial assets at fair valuethrough profit or loss, held-to-maturity investments or loans and receivables. Subsequent to initial recognition, they are measured at fair value, with changes in fair value,net of any tax effect, recorded in other comprehensive income (OCI) in equity. Investments in equity instruments that do not have a quoted market price in an active marketand whose fair value cannot be reliably measured are measured at cost.
5) Impairment of financial assets
A financial asset not carried at fair value through profit or loss is assessed at each reporting date to determine whether there is objective evidence that it is impaired.A financial asset is impaired if objective evidence indicates that a loss event has occurred after the initial recognition of the asset, and that the loss event had a negativeeffect on the estimated future cash flows of the asset that can be reliably estimated. However, losses expected as a result of future events, regardless of likelihood, are notrecognized.
Objective evidence that a financial asset is impaired includes following loss events:
• significant financial difficulty of the issuer or obligor;
• a breach of contract, such as default or delinquency in interest or principal payments;
• the lender, for economic or legal reasons relating to the borrower’s financial difficulty, granting to the borrower a concession that the lender would not otherwiseconsider;
• it becoming probable that the borrower will enter bankruptcy or other financial reorganization;
• the disappearance of an active market for that financial asset because of financial difficulties; or
• observable data indicating that there is a measurable decrease in the estimated future cash flows from a group of financial assets since the initial recognition ofthose assets, although the decrease cannot yet be identified with the individual financial assets in the group.
In addition, for an investment in an equity security classified as available-for-sale financial asset, a significant or prolonged decline in its fair value below its cost isobjective evidence of impairment.
If financial assets have objective evidence that they are impaired, impairment losses are measured and recognized.
(i) Financial assets measured at amortized cost
An impairment loss in respect of a financial asset measured at amortized cost is calculated as the difference between its carrying amount and the present value of itsestimated future cash flows discounted at the asset’s original effective interest rate. The Group can recognize impairment losses directly or by establishing an allowanceaccount. If, in a subsequent period, the amount of the impairment loss decreases and the decrease can be objectively related to an event occurring after the impairment wasrecognized (such as an improvement in the debtor’s credit rating), the previously recognized impairment loss is reversed either directly or by adjusting an allowanceaccount.
Copyright © 2020 www.secdatabase.com. All Rights Reserved.Please Consider the Environment Before Printing This Document
(ii) Financial assets carried at cost
If there is objective evidence that an impairment loss has occurred on an unquoted equity instrument that is not carried at fair value because its fair value cannot bereliably measured, or on a derivative asset that is linked to and must be settled by delivery of such an unquoted equity instrument, the amount of the impairment loss ismeasured as the difference between the carrying amount of the financial asset and the present value of estimated future cash flows discounted at the current market rate ofreturn for a similar financial asset. Such impairment losses are not reversed.
(iii) Available-for-sale financial assets
When a decline in the fair value of an available-for-sale financial asset has been recognized in other comprehensive income and there is objective evidence that theasset is impaired, the cumulative loss that had been recognized in other comprehensive income is reclassified to profit or loss as a reclassification adjustment even thoughthe financial asset has not been derecognized. Impairment losses recognized in profit or loss for an investment in an equity instrument classified as available-for-sale is notreversed through profit or loss subsequently. If, in a subsequent period, the fair value of a debt instrument classified as available-for-sale increases and the increase can beobjectively related to an event occurring after the impairment loss was recognized in profit or loss, the impairment loss is reversed to the amount of amortized cost thatwould otherwise have been recognized as of the recovery date.
6) De-recognition of financial assets
The Group derecognizes a financial asset when the contractual rights to the cash flows from the asset expire or the Group transfers the rights to receive the cash flowson the financial asset in a transaction in which substantially all the risks and rewards of ownership of the financial asset are transferred. Any interest in transferred financialassets that is created or retained by the Group is recognized as a separate asset or liability. If the Group retains substantially all the risks and rewards of ownership of thetransferred financial assets, the Group continues to recognize the transferred financial assets and recognizes financial liabilities for the consideration received.
7) Offsetting between financial assets and financial liabilities
Financial assets and liabilities are offset and presented in net in the statement of financial position when, and only when, the Group currently has a legally enforceableright to offset the recognized amounts and intends either to settle on a net basis or to realize the asset and settle the liability simultaneously.
Derivative financialinstruments, including hedgeaccounting
(7) Derivative financial instruments and hedge accounting
Derivatives are initially recognized at fair value. Subsequent to initial recognition, derivatives are measured at fair value at the end of each reporting period, andchanges therein are accounted for as described below.
1) Hedge accounting
The Group holds forward exchange contracts, interest rate swaps, currency swaps and other derivative contracts to manage interest rate risk and foreign exchangerisk. The Group designates derivatives as hedging instruments to hedge the foreign currency risk of highly probable forecasted transactions or firm commitments (a cashflow hedge).
On initial designation of the hedge, the Group formally documents the relationship between the hedging instrument(s) and hedged item(s), including the riskmanagement objectives and strategy in undertaking the hedge transaction, together with the methods that will be used to assess the effectiveness of the hedging relationship.
Cash flow hedge
When a derivative is designated to hedge the variability in cash flows attributable to a particular risk associated with a recognized asset or liability or a highlyprobable forecasted transaction that could affect profit or loss, the effective portion of changes in the fair value of the derivative is recognized in other comprehensiveincome, net of tax, and presented in the hedging reserve in equity. Any ineffective portion of changes in the fair value of the derivative is recognized immediately in profit orloss. If the hedging instrument no longer meets the criteria for hedge accounting, expires or is sold, terminated, exercised, or the designation is revoked, then hedgeaccounting is discontinued prospectively. The cumulative gain or loss on the hedging instrument that has been recognized in other comprehensive income is reclassified toprofit or loss in the periods during which the forecasted transaction occurs. If the forecasted transaction is no longer expected to occur, then the balance in othercomprehensive income is recognized immediately in profit or loss.
2) Other derivative financial instruments
Other derivative financial instrument not designated as a hedging instrument are measured at fair value, and the changes in fair value of the derivative financialinstrument is recognized immediately in profit or loss.
Property and equipment(8) Property and equipment
Property and equipment are initially measured at cost. The cost of property and equipment includes expenditures arising directly from the construction or acquisitionof the asset, any costs directly attributable to bringing the asset to the location and condition necessary for it to be capable of operating in the manner intended bymanagement and the initial estimate of the costs of dismantling and removing the item and restoring the site on which it is located.
Property and equipment, subsequently, are carried at cost less accumulated depreciation and accumulated impairment losses.
Subsequent costs are recognized in the carrying amount of property and equipment at cost or, if appropriate, as a separate item if it is probable that future economicbenefits associated with the item will flow to the Group and the cost of the item can be reliably measured. The carrying amount of the replaced part is derecognized. Thecosts of the day-to-day servicing are recognized in profit or loss as incurred.
Property and equipment, except for land, are depreciated on a straight-line basis over estimated useful lives that appropriately reflect the pattern in which the asset’sfuture economic benefits are expected to be consumed. A component that is significant compared to the total cost of property and equipment is depreciated over its separateuseful life.
Gains and losses on disposal of an item of property and equipment are determined by comparing the proceeds from disposal with the carrying amount of property andequipment and are recognized as other operating income (loss).
The estimated useful lives of the Group’s property and equipment are as follows:
Useful lives (years)Buildings and structures 15 ~ 40Machinery 3 ~ 15
Copyright © 2020 www.secdatabase.com. All Rights Reserved.Please Consider the Environment Before Printing This Document
Other property and equipment 2 ~ 10Right-of-use assets 1 ~ 50
Depreciation methods, useful lives, and residual values are reviewed at the end of each reporting date and adjusted, if appropriate. The change is accounted for as achange in an accounting estimate.
Borrowing costs (9) Borrowing costs
The Group capitalizes borrowing costs directly attributable to the acquisition, construction or production of a qualifying asset as part of the cost of that asset. Otherborrowing costs are recognized in expense as incurred. A qualifying asset is an asset that requires a substantial period of time to get ready for its intended use or sale.Financial assets are not qualifying assets, and assets that are ready for their intended use or sale when acquired are not qualifying assets either.
To the extent that the Group borrows funds specifically for the purpose of obtaining a qualifying asset, the Group determines the amount of borrowing costs eligiblefor capitalization as the actual borrowing costs incurred on that borrowing during the period less any investment income on the temporary investment of those borrowings.To the extent that the Group borrows funds generally and uses them for the purpose of obtaining a qualifying asset, the Group determines the amount of borrowing costseligible for capitalization by applying a capitalization rate to the expenditures on that asset. The capitalization rate is the weighted average of the borrowing costs applicableto the borrowings of the Group that are outstanding during the period other than borrowings made specifically for the purpose of obtaining a qualifying asset. The amount ofborrowing costs that the Group capitalizes during a period do not exceed the amount of borrowing costs incurred during the period.
Intangible assets(10) Intangible assets
Intangible assets are measured initially at cost and, subsequently, are carried at cost less accumulated amortization and accumulated impairment losses.
Intangible assets, except for goodwill, are amortized on a straight-line basis over the estimated useful lives of intangible assets from the date that they are availablefor use. The residual value of intangible assets is zero. However, club memberships and brand are expected to be available for use as there are no foreseeable limits to theperiods. These intangible assets are determined as having indefinite useful lives and, therefore, not amortized.
The estimated useful lives of the Group’s intangible assets are as follows:
Useful lives (years)Frequency usage rights 5 ~ 10Land usage rights 5Industrial rights 5, 10Development costs 3 ~ 5Facility usage rights 10, 20Customer relations 3 ~ 20Other 3 ~ 20
Amortization periods and the amortization methods for intangible assets with finite useful lives are reviewed at the end of each reporting period. The useful lives ofintangible assets that are not being amortized are reviewed at the end of each reporting period to determine whether events and circumstances continue to support indefiniteuseful life assessments for those assets. Changes, if appropriate, are accounted for as changes in accounting estimates.
Expenditures on research activities are recognized in profit or loss as incurred. Development expenditures are capitalized only if development costs can be reliablymeasured, the product or process is technically and commercially feasible, future economic benefits are probable, and the Group intends to and has sufficient resources tocomplete development and to use or sell the asset. Other development expenditures are recognized in profit or loss as incurred.
Subsequent expenditures are capitalized only when they increase the future economic benefits embodied in the specific asset to which it relates. All otherexpenditures, including expenditures on internally generated goodwill and brands, are recognized in profit or loss as incurred.
Government grants (11) Government grants
Government grants are not recognized unless there is reasonable assurance that the Group will comply with the grant’s conditions and that the grant will be received.
1) Grants related to assets
Government grants whose primary condition is that the Group purchases, constructs, or otherwise acquires a long-term asset are deducted in calculating the carryingamount of the asset. The grant is recognized in profit or loss over the life of a depreciable asset as a reduction to depreciation expense.
2) Grants related to income
Government grants which are intended to compensate the Group for expenses incurred are deducted from the related expenses.Impairment of non-financialassets (12) Impairment of non-financial assets
The carrying amounts of the Group’s non-financial assets other than contract assets recognized for revenue arising from contracts with a customer, assets recognizedfor the costs to obtain or fulfill a contract with a customer, employee benefits, inventories, deferred tax assets, and non-current assets held for sale are reviewed at the end ofthe reporting period to determine whether there is any indication of impairment. If any such indication exists, then the asset’s recoverable amount is estimated. Goodwill andintangible assets that have indefinite useful lives or that are not yet available for use, irrespective of whether there is any indication of impairment, are tested for impairmentannually by comparing their recoverable amounts to their carrying amounts.
The Group estimates the recoverable amount of an individual asset, and if it is impossible to measure the individual recoverable amount of an asset, the Groupestimates the recoverable amount of cash-generating unit (“CGU”). A CGU is the smallest identifiable group of assets that generates cash inflows that are largelyindependent of the cash inflows from other assets or groups of assets. The recoverable amount of an asset or CGU is the greater of its value in use and its fair value lesscosts to sell. The value in use is estimated by applying a pre-tax discount rate that reflects current market assessments of the time value of money and the risks specific tothe asset or CGU for which estimated future cash flows have not been adjusted, to the estimated future cash flows expected to be generated by the asset or CGU.
An impairment loss is recognized in profit or loss to the extent the carrying amount of the asset exceeds its recoverable amount.
Goodwill acquired in a business combination is allocated to each CGU that is expected to benefit from the synergy arising from the business acquired. Anyimpairment identified at the CGU level will first reduce the carrying amount of goodwill and then be used to reduce the carrying amount of the other assets in the CGU on apro rata basis. Except for impairment losses in respect of goodwill which are never reversed, an impairment loss is reversed if there has been a change in the estimates usedto determine the recoverable amount. An impairment loss is reversed only to the extent that the asset’s carrying amount does not exceed the carrying amount that wouldhave been determined, net of depreciation or amortization, if no impairment loss had been recognized.
Copyright © 2020 www.secdatabase.com. All Rights Reserved.Please Consider the Environment Before Printing This Document
Leases - Policies applicablefrom January 1, 2019 (13) Leases - Policies applicable from January 1, 2019
The Group has applied IFRS 16, Leases, from January 1, 2019. See note 3 for additional information.
The Group determined at contract inception whether an arrangement was or contained a lease. A contract is, or contains, a lease if the contract transfers the right tocontrol the identified asset for a period of time in exchange for consideration. To assess whether a contract transfers the right to control the identified asset, the Group usesthe definition of a lease in IFRS 16, Leases.
1) As a lessee
The Group recognizes a right-of-use asset and a lease liability at the lease commencement date. The right-of-use asset is initially measured at cost, which comprisethe initial amount of lease liability adjusted for any lease payments made at or before the commencement date, plus any initial direct costs incurred and an estimate of coststo dismantle and remove the underlying assets or to restore the underlying asset or the site on which it is located, less any lease incentives received. The right-of-use asset issubsequently measured at cost less any accumulated depreciation and impairment losses and adjusted for certain remeasurements of the lease liability. The Group presentsits right-of-use assets in property and equipment on the statements of financial position. The right-of-use asset is subsequently depreciated using the straight-line methodfrom the commencement date to the end of the lease term.
The lease liability is initially measured at the present value of the lease payments that are not paid at the commencement date, discounted using the interest rateimplicit in the lease or, if that rate cannot be readily determined, the Group’s incremental borrowing rate. Generally, the Group uses its incremental borrowing rate as thediscount rate.
The lease liability is subsequently increased by the interest cost on the lease liability and decreased by lease payments made. It is remeasured when there is a changein future lease payments arising from a change in an index or rate, a change in the estimate of the amount expected to be payable under a residual value guarantee, or asappropriate, changes in the assessment of whether a purchase or extension option is reasonably certain to be exercised or a termination option is reasonably certain not to beexercised.
The Group has applied judgment to determine the lease term for some lease contracts in which it is a lessee that include extension options. The assessment of whetherthe Group is reasonably certain to exercise such options impacts the lease term, which significantly affects the amount of lease liabilities and right-of-use assets recognized.The Group has not included the extension option periods in the lease term because it is not reasonably certain to exercise such options. After the commencement date, theGroup reassesses the lease term upon the occurrence of a significant event or a significant change in circumstances that is within the control of the Group that affectswhether the Group is reasonably certain to exercise the extension option.
The Group has elected not to recognize right-of-use assets and lease liabilities for leases with the lease term of 12 months or less at the commencement date and forleases of low-value assets. The Group recognizes the lease payments associated with these leases as an expense on a straight-line basis over the lease term. The Group hasalso elected to apply the practical expedient which allows a lease and associated non-lease components to be accounted for as a single lease component.
2) As a lessor
The Group determines whether each lease is a finance lease or an operating lease at inception of a contract. A lease is classified as a finance lease when the leasetransfers substantially all of the risks and rewards of ownership of the underlying asset. If not, then it is classified as an operating lease.
When the Group is an intermediate lessor, the Group accounts for the head lease and the sublease separately. The sub-leases are classified with reference to theright-of-use assets arising from the head lease, not with reference to the underlying asset.
Non-current assets held forsale (15) Non-current assets held for sale
Non-current assets, or disposal groups comprising assets and liabilities, that are expected to be recovered primarily through sales rather than through continuing use,are classified as held for sale. In order to be classified as held for sale, the assets (or disposal groups) must be available for immediate sale in their present condition andtheir sale must be highly probable. The assets or disposal groups that are classified as non-current assets held for sale are measured at the lower of their carrying amountsand fair value less cost to sell. The Group recognizes an impairment loss for any initial or subsequent write-down of assets (or disposal groups) to fair value less costs to selland a gain for any subsequent increase in fair value less costs to sell up to the cumulative impairment loss previously recognized in accordance with IAS 36, Impairment ofAssets.
A non-current asset that is classified as held for sale or part of a disposal group classified as held for sale is not depreciated (or amortized).Non-derivative financialliabilities
(16) Non-derivative financial liabilities
The Group classifies non-derivative financial liabilities into financial liabilities at fair value through profit or loss or other financial liabilities in accordance with thesubstance of the contractual arrangement. The Group recognizes financial liabilities in the consolidated statement of financial position when the Group becomes a party tothe contractual provisions of the financial liabilities.
1) Financial liabilities at fair value through profit or loss
Financial liabilities at fair value through profit or loss include financial liabilities held for trading or designated as such upon initial recognition. Subsequent to initialrecognition, these liabilities are measured at fair value. The amount of change in fair value of a financial liability that is attributable to changes in the credit risk of thatliability shall be presented in other comprehensive income, and the remaining amount of change in the fair value of the liability shall be presented in profit or loss. Uponinitial recognition, transaction costs that are directly attributable to the issue of the financial liability are recognized in profit or loss as incurred.
2) Other financial liabilities
Non-derivative financial liabilities other than financial liabilities at fair value through profit or loss are classified as other financial liabilities. At the date of initialrecognition, other financial liabilities are measured at fair value minus transaction costs that are directly attributable to the issue of the financial liabilities. Subsequent toinitial recognition, other financial liabilities are measured at amortized cost and the interest expenses are recognized using the effective interest method.
3) Derecognition of financial liability
The Group extinguishes a financial liability only when the contractual obligation is fulfilled, canceled or expires. The Group recognizes new financial liabilities atfair value based on new contracts and eliminates existing liabilities when the contractual terms of the financial liabilities change and the cash flows change substantially.
When a financial liability is derecognized, the difference between the carrying amount and the consideration paid (including any transferred non-cash assets orliabilities assumed) is recognized in profit or loss.
Copyright © 2020 www.secdatabase.com. All Rights Reserved.Please Consider the Environment Before Printing This Document
Employee benefits(17) Employee benefits
1) Short-term employee benefits
Short-term employee benefits are employee benefits that are due to be settled within 12 months after the end of the period in which the employees render relatedservices. When an employee has rendered a service to the Group during an accounting period, the Group recognizes the undiscounted amount of short-term employeebenefits expected to be paid in exchange for that service.
2) Other long-term employee benefits
Other long-term employee benefits include employee benefits that are settled beyond 12 months after the end of the period in which the employees render relatedservices. The Group’s net obligation in respect of long-term employee benefits is the amount of future benefit that employees have earned in return for their service in thecurrent and prior periods. That benefit is discounted to determine its present value. Remeasurements are recognized in profit or loss in the period in which they arise.
3) Retirement benefits: defined contribution plans
When an employee has rendered a service to the Group during a period, the Group recognizes the contribution payable to a defined contribution plan in exchange forthat service as a liability (accrued expense), after deducting any contribution already paid. If the contribution already paid exceeds the contribution due for service before theend of the reporting period, the Group recognizes that excess as an asset (prepaid expense) to the extent that the prepayment will lead to a reduction in future payments or acash refund.
4) Retirement benefits: defined benefit plans
At the end of reporting period, defined benefit liabilities relating to defined benefit plans are recognized at present value of defined benefit obligations net of fairvalue of plan assets.
The calculation is performed annually by an independent actuary using the projected unit credit method. When the fair value of plan assets exceeds the present valueof the defined benefit obligation, the Group recognizes an asset, to the extent of the present value of any economic benefits available in the form of refunds from the plan orreduction in the future contributions to the plan.
Remeasurements of the net defined benefit liability (asset), which comprise actuarial gains and losses, the return on plan assets (excluding interest) and the effect ofthe asset ceiling (if any, excluding interest), are recognized immediately in other comprehensive income. The Group determines net interests on net defined benefit liability(asset) by multiplying discount rate determined at the beginning of the annual reporting period and considers changes in net defined benefit liability (asset) fromcontributions and benefit payments. Net interest costs and other costs relating to the defined benefit plan are recognized through profit or loss.
When the plan amendment or curtailment occurs, gains or losses on amendment or curtailment in benefits for the past service provided are recognized through profitor loss. The Group recognizes a gain or loss on a settlement when the settlement of defined benefit plan occurs.
5) Termination benefits
The Group recognizes a liability and expense for termination benefits at the earlier of the period when the Group can no longer withdraw the offer of those benefitsand the period when the Group recognizes costs for a restructuring that involves the payment of termination benefits. If benefits are payable more than 12 months after thereporting period, they are discounted to their present value.
Provisions(18) Provisions
Provisions are recognized when the Group has a present legal or constructive obligation as a result of a past event, it is probable that an outflow of resourcesembodying economic benefits will be required to settle the obligation, and a reliable estimate can be made of the amount of the obligation.
The risks and uncertainties that inevitably surround many events and circumstances are taken into account in reaching the best estimate of a provision. If the effect ofthe time value of money is material, provisions are determined at the present value of the expected future cash flows.
If some or all of the expenditures required to settle a provision are expected to be reimbursed by another party, the reimbursement is recognized when, and onlywhen, it is virtually certain that reimbursement will be received if the entity settles the obligation. The reimbursement is treated as a separate asset.
Provisions are reviewed at the end of each reporting period and adjusted to reflect the current best estimates. If it is no longer probable that an outflow of resourcesembodying economic benefits will be required to settle the obligation, the provision is reversed.
A provision is used only for expenditures for which the provision was originally recognized.Transactions in foreigncurrencies
(19) Transactions in foreign currencies
1) Foreign currency transactions
Transactions in foreign currencies are translated to the functional currency of the Group at exchange rates at the dates of the transactions. Monetary assets andliabilities denominated in foreign currencies are retranslated to the functional currency using the exchange rate at the reporting date. Non-monetary assets and liabilitiesdenominated in foreign currencies that are measured at fair value are retranslated to the functional currency at the exchange rate at the date that the fair value wasdetermined.
Foreign currency differences arising on retranslation are recognized in profit or loss, except for the differences arising on the retranslation of available-for-sale equityinstruments.
2) Foreign operations
If the presentation currency of the Group is different from a foreign operation’s functional currency, the financial statements of the foreign operation are translatedinto the presentation currency using the following methods:
The assets and liabilities of foreign operations, whose functional currency is not the currency of a hyperinflationary economy, are translated to presentation currencyat exchange rates at the reporting date. The income and expenses of foreign operations are translated to functional currency at exchange rates at the dates of the transactions.Foreign currency differences are recognized in other comprehensive income.
Any goodwill arising on the acquisition of a foreign operation and any fair value adjustments to the carrying amounts of assets and liabilities arising on theacquisition of that foreign operation is treated as assets and liabilities of the foreign operation. Thus, they are expressed in the functional currency of the foreign operationand translated at the closing rate at the reporting date.
Copyright © 2020 www.secdatabase.com. All Rights Reserved.Please Consider the Environment Before Printing This Document
When a foreign operation is disposed, the relevant amount in the translation is transferred to profit or loss as part of the profit or loss on disposal. On the partialdisposal of a subsidiary that includes a foreign operation, the relevant proportion of such cumulative amount is reattributed to non-controlling interest. In any other partialdisposal of a foreign operation, the relevant proportion is reclassified to profit or loss.
Share capital(20) Share capital
Ordinary shares are classified as equity. Incremental costs directly attributable to the issuance of ordinary shares and share options are recognized as a deduction fromequity, net of any tax effects.
When the Parent Company repurchases its own shares, the amount of the consideration paid is recognized as a deduction from equity and classified as treasuryshares. The gains or losses from the purchase, disposal, reissue, or retirement of treasury shares are directly recognized in equity being as transaction with owners.
Hybrid bond(21) Hybrid bond
The Group recognizes a financial instrument issued by the Group as an equity instrument if it does not include contractual obligation to deliver financial assetsincluding cash to the counter party.
Share-based Payment(22) Share-based Payment
For equity-settled share-based payment transaction, if the fair value of the goods or services received cannot be reliably estimated, the Group measures the valueindirectly by reference to the fair value of the equity instruments granted. The related expense with a corresponding increase in capital surplus and others is recognized overthe vesting period of the awards.
The amount recognized as an expense is adjusted to reflect the number of awards for which the related service and non-market performance conditions are expectedto be met, such that the amount ultimately recognized is based on the number of awards that meet the related service and non-market performance conditions at the vestingdate.
For cash-settled share-based payment transaction, the Group measures and recognizes the amount payable to employees at fair value as an expense with acorresponding increase in liabilities, over the period during which the employees become unconditionally entitled to payment. The liability is remeasured at each reportingdate and at settlement date based on the fair value of the share-based payment. Any changes in the liability are recognized in profit or loss.
Revenue — Policiesapplicable from January 1,2018
(23) Revenue — Policies applicable from January 1, 2018
The Group adopted IFRS 15, Revenue from Contracts with Customers, on January 1, 2018, using the modified retrospective method. IFRS 15 establishes acomprehensive framework for determining whether, how much and when revenue is recognized. It also amends previous guidance for the recognition of costs to obtaincontracts with customers such that incremental costs of obtaining contracts with customers are deferred and amortized consistent with the transfer of the related good orservice.
1) Identification of performance obligations in contracts with customers
The Group identifies the distinct services or goods as performance obligations in contracts with customers such as (1) providing wireless telecommunicationsservices, (2) sale of handsets and (3) providing other goods and services. In the case of providing both wireless telecommunications service and selling a handset together toone customer, the Group allocates considerations from the customer between the separate performance obligations for handset sale and wireless telecommunications service.The handset sale revenue is recognized when handset is delivered, and the wireless telecommunications service revenue is recognized over the period of the contract term asstated in the subscription contract.
2) Allocation of the transaction price to each performance obligation
The Group allocates the transaction price of a contract to each performance obligation identified on a relative stand-alone selling price basis. The Group uses“adjusted market assessment approach” for estimating the stand-alone selling price of a good or service. As an exception, the Group uses “expected cost plus a marginapproach” for insignificant transactions.
3) Incremental costs of obtaining a contract
The Group pays commissions to its retail stores and authorized dealers in connection with acquiring service contracts. The commissions paid to these partiesconstituted a significant portion of the Group’s operating expenses. These commissions would not have been paid if there have been no binding contracts with subscribersand, therefore, the Group capitalizes certain costs associated with commissions paid to obtain new customer contracts and amortize them over the expected contract periods.
4) Customer loyalty programs
The Group provides customer loyalty points to customers based on the usage of the service to which the Group allocates a portion of consideration received as aperformance obligation distinct from wireless telecommunications services. The amount to be allocated to the loyalty program is measured according to the relative stand-alone selling price of the customer loyalty points. The amount allocated to the loyalty program is deferred as a contract liability and is recognized as revenue when loyaltypoints are redeemed.
5) Consideration payable to a customer
Based on the subscription contract, a customer who uses the Group’s wireless telecommunications services may receive a discount for purchasing goods or servicesfrom a designated third party. The Group pays a portion of the price discounts that the customer receives to the third party, which is the consideration payable to a customer.The Group accounts for the amounts payable to the third party as a reduction of the wireless telecommunications service revenue.
Finance income and financecosts (25) Finance income and finance costs
Finance income comprises interest income on funds invested (including financial assets measured at fair value), dividend income, gains on disposal of financialassets at FVTPL, changes in fair value of financial instruments at FVTPL, and gains on hedging instruments that are recognized in profit or loss. Interest income isrecognized as it accrues in profit or loss, using the effective interest rate method. Dividend income is recognized in profit or loss when the right to receive the dividend isestablished.
Finance costs comprise interest expense on borrowings, changes in fair value of financial instruments at FVTPL, and losses on hedging instruments that arerecognized in profit or loss. Interest expense on borrowings and debentures is recognized as it accrues in profit or loss using the effective interest rate method.
Copyright © 2020 www.secdatabase.com. All Rights Reserved.Please Consider the Environment Before Printing This Document

Income taxes(26) Income taxes
Income tax expense comprises current and deferred tax. Current tax and deferred tax are recognized in profit or loss except to the extent that it relates to a businesscombination, or items recognized directly in equity or in OCI.
The Group pays income tax in accordance with the tax-consolidation system when the Parent Company and its subsidiaries are economically unified.
1) Current tax
Current tax is the expected tax payable or receivable on the taxable profit or loss for the year, using tax rates enacted or substantively enacted at the end of thereporting period, and includes interests and fines related to income taxes paid or payable. The taxable profit is different from the accounting profit for the period since thetaxable profit is calculated excluding the temporary differences, which will be taxable or deductible in determining taxable profit (tax loss) of future periods, andnon-taxable or non-deductible items from the accounting profit.
2) Deferred tax
Deferred tax is recognized by using the asset-liability method in respect of temporary differences between the carrying amounts of assets and liabilities for financialreporting purposes and the amounts used for taxation purposes. The Group recognizes a deferred tax liability for all taxable temporary differences, except for the differenceassociated with investments in subsidiaries and associates that the Group is able to control the timing of the reversal of the temporary difference and it is probable that thetemporary difference will not reverse in the foreseeable future. The Group recognizes a deferred tax asset for all deductible temporary differences to the extent that it isprobable that the temporary difference will reverse in the foreseeable future and taxable profit will be available against which the temporary difference can be utilized.
A deferred tax asset is recognized for the carryforward of unused tax losses and unused tax credits to the extent that it is probable that future taxable profit will beavailable against which the unused tax losses and unused tax credits can be utilized. Future taxable profit is dependent on the reversal of taxable temporary differences. Ifthere are insufficient taxable temporary differences to recognize the deferred tax asset, the business plan of the Group and the reversal of existing temporary differences areconsidered in determining the future taxable profit.
The Group reviews the carrying amount of a deferred tax asset at the end of each reporting period and reduces the carrying amount to the extent that it is no longerprobable that sufficient taxable profit will be available to allow the benefit of part or all of that deferred tax asset to be utilized.
Deferred tax assets and liabilities are measured at the tax rates that are expected to apply to the period when the asset is realized, or the liability is settled based on taxrates (and tax laws) that have been enacted or substantively enacted by the end of the reporting period. The measurement of deferred tax liabilities and deferred tax assetsreflects the tax consequences that would follow from the manner in which the Group expects, at the end of the reporting period, to recover or settle the carrying amount ofits assets and liabilities.
Deferred tax assets and liabilities are offset only if the Group has a legally enforceable right to offset the amount recognized and intends to settle the current taxliabilities and assets on a net basis. Income tax expense in relation to dividend payments is recognized when liabilities relating to the dividend payments are recognized.
3) Uncertainty over income tax treatments
The Group assesses the uncertainty over income tax treatments pursuant to IAS 12 from January 1, 2019. If the Group concludes it is not probable that the taxationauthority will accept an uncertain tax treatment, the Group reflects the effect of uncertainty for each uncertain tax treatment by using either of the following methods,depending on which method the entity expects to better predict the resolution of the uncertainty:
• The most likely amount: the single most likely amount in a range of possible outcomes.
• The expected value: the sum of the probability-weighted amounts in a range of possible outcomes.Earnings per share
(27) Earnings per share
The Group presents basic and diluted earnings per share (EPS) data for its ordinary shares. Basic EPS is calculated by dividing the profit or loss attributable toordinary shareholders of the Parent Company by the weighted average number of ordinary shares outstanding during the period, adjusted for own shares held. Diluted EPSis determined by adjusting the profit or loss attributable to ordinary shareholders and the weighted average number of ordinary shares outstanding, adjusted for own sharesheld, for the effects of all dilutive potential ordinary shares, which comprise share options granted to employees, if any.
Standards issued but not yeteffective (28) Standards issued but not yet effective
The following amended standards are effective for annual periods beginning after January 1, 2019 and earlier application is permitted. However, the Group has notadopted the following amended standards early in preparing the accompanying consolidated financial statements.
The following amended standards are not expected to have a significant impact on the Group’s consolidated financial statements.
• Amendments to References to Conceptual Framework in IFRS Standards.
• Definition of a Business (Amendments to IFRS 3)
• Definition of Material (Amendments to IAS 1 and IAS 8)Previously stated [member]Statement [LineItems]Financial assets - Policiesapplicable from January 1,2018
(5) Non-derivative financial assets — Policies applicable from January 1, 2018
1) Recognition and initial measurement
Accounts receivable — trade and debt investments issued are initially recognized when they are originated. All other financial assets and financial liabilities areinitially recognized when the Group becomes a party to the contractual provisions of the instrument.
A financial asset (unless an accounts receivable — trade without a significant financing component) or financial liability is initially measured at fair value plus, for anitem not at FVTPL, transaction costs that are directly attributable to its acquisition or issue. An accounts receivable — trade without a significant financing component isinitially measured at the transaction price.
2) Classification and subsequent measurement
Copyright © 2020 www.secdatabase.com. All Rights Reserved.Please Consider the Environment Before Printing This Document
On initial recognition, a financial asset is classified as measured at:
• FVTPL
• FVOCI — equity investment
• FVOCI — debt investment
• Financial assets at amortized cost
A financial asset is classified based on the business model in which a financial asset is managed and its contractual cash flow characteristics.
Financial assets are not reclassified subsequent to their initial recognition unless the Group changes its business model for managing financial assets, in which caseall affected financial assets are reclassified on the first day of the first reporting period following the change in the business model.
A financial asset is measured at amortized cost if it meets both of the following conditions and is not designated as at FVTPL:
• it is held within a business model whose objective is to hold assets to collect contractual cash flows; and
• its contractual terms give rise to cash flows that are solely payments of principal and interest on the principal amount outstanding on specified dates.
A debt investment is measured at FVOCI if it meets both of the following conditions and is not designated as at FVTPL:
• it is held within a business model whose objective is achieved by both collecting contractual cash flows and selling financial assets; and
• its contractual terms give rise to cash flows that are solely payments of principal and interest on the principal amount outstanding on specified dates.
On initial recognition of an equity investment that is not held for trading, the Group may irrevocably elect to present subsequent changes in the investment’s fairvalue in other comprehensive income (“OCI”). This election is made on an investment-by-investment basis.
All financial assets not classified as measured at amortized cost or FVOCI as described above are measured at FVTPL. This includes all derivative financial assets.On initial recognition, the Group may irrevocably designate a financial asset that otherwise meets the requirements to be measured at amortized cost or at FVOCI as atFVTPL if doing so eliminates or significantly reduces an accounting mismatch that would otherwise arise.
The following accounting policies are applied to the subsequent measurement of financial assets.
Financial assets at FVTPL These assets are subsequently measured at fair value. Net gains and losses, including any interest or dividendincome, are recognized in profit or loss.
Financial assets at amortized cost These assets are subsequently measured at amortized cost using the effective interest method. The amortized cost isreduced by impairment losses. Interest income, foreign exchange gains and losses and impairment are recognizedin profit or loss. Any gain or loss on derecognition is recognized in profit or loss.
Debt investments at FVOCI These assets are subsequently measured at fair value. Interest income calculated using the effective interest method,foreign exchange gains and losses and impairment are recognized in profit or loss. Other net gains and losses arerecognized in OCI. On derecognition, gains and losses accumulated in OCI are reclassified to profit or loss.
Equity investments at FVOCI These assets are subsequently measured at fair value. Dividends are recognized as income in profit or loss unlessthe dividend clearly represents a recovery of the cost of the investment. Other net gains and losses are recognized inOCI and are never reclassified to profit or loss.
3) Impairment
The Group estimates the expected credit losses (ECL) for the debt instruments measured at amortized cost and FVOCI based on the Group’s historical experience andinformed credit assessment that includes forward-looking information. The impairment approach is decided based on the assessment of whether the credit risk of a financialasset has increased significantly since initial recognition.
The Group measures loss allowances at an amount equal to lifetime ECL, except for the following, which are measured at 12-month ECL.
• debt securities that are determined to have low credit risk at the reporting date; and
• other dept securities and bank balances for which credit risk (i.e. the risk of default occurring over the expected life of the financial instrument) has notincreased significantly since initial recognition.
Loss allowances for accounts receivable — trade and lease receivables are always measured at an amount equal to lifetime ECL.
ECL is a probability-weighted estimate of credit losses. Credit losses are measured as the present value of all cash shortfalls (i.e. the difference between the cashflows due to the entity in accordance with the contract and the cash flows that the Group expects to receive).
At each reporting date, the Group assesses whether financial assets measured at amortized cost and debt investments at FVOCI are credit-impaired. A financial assetis ‘credit-impaired’ when one or more events that have a detrimental impact on the estimated future cash flows of the financial asset have occurred.
Loss allowance on financial assets measured at amortized cost is deducted from the carrying amount of the respective assets, while loss allowance on debtinstruments at FVOCI is recognized in OCI, instead of reducing the carrying amount of the assets.
4) Derecognition
Financial assets are derecognized if the Group’s contractual rights to the cash flows from the financial assets expire or if the Group transfers the financial asset toanother party without retaining control or transfers substantially all the risks and rewards of the asset.
The transferred assets are not derecognized when the Group enters into transactions whereby it transfers assets recognized in its statement of financial position butretains substantially all of the risks and rewards of the transferred assets.
5) Offsetting
Financial assets and financial liabilities are offset and the net amount is presented in the statement of financial position when the Group currently has a legallyenforceable right to offset the recognized amounts and intends either to settle on a net basis or to settle the liability and realize the asset simultaneously.
A financial asset and a financial liability is offset only when the right to set off the amount is not contingent on future event and legally enforceable even on the eventof default, insolvency or bankruptcy.
Copyright © 2020 www.secdatabase.com. All Rights Reserved.Please Consider the Environment Before Printing This Document
Leases - Policies applicablefrom January 1, 2019 (14) Leases — Policies applied before January 1, 2019
The Group classifies and accounts for leases as either a finance or operating lease, depending on the terms. Leases under which the Group assumes substantially all ofthe risks and rewards of ownership are classified as finance leases. All other leases are classified as operating leases.
1) Finance leases — lessee
At the commencement of the lease term, the Group recognizes as finance assets and finance liabilities in its consolidated statement of financial position, the loweramount of the fair value of the leased property and the present value of the minimum lease payments, each determined at the inception of the lease. Any initial direct costsare added to the amount recognized as an asset.
Minimum lease payments are apportioned between the finance cost and the reduction of the outstanding liability. The finance cost is allocated to each period duringthe lease term so as to produce a constant periodic rate of interest on the remaining balance of the liability. Contingent rents are charged as expenses in the periods in whichthey are incurred.
The depreciable amount of a leased asset is allocated to each accounting period during the period of expected use on a systematic basis consistent with thedepreciation policy the Group adopts for depreciable assets that are owned. If there is no reasonable certainty that the Group will obtain ownership by the end of the leaseterm, the asset is fully depreciated over the shorter of the lease term and its useful life. The Group reviews to determine whether the leased assets are impaired at thereporting date.
2) Operating leases
Leases where the lessor retains a significant portion of the risks and rewards of ownership are classified as operating leases. Payments made under operating leases(net of any incentives received from the lessor) are recognized in profit or loss on a straight-line basis over the lease term.
3) Determining whether an arrangement contains a lease
Determining whether an arrangement is, or contains, a lease is based on the substance of the arrangement and requires an assessment of whether fulfillment of thearrangement is dependent on the use of a specific asset and the arrangement conveys a right to use the asset.
At inception or reassessment of the arrangement, the Group separates payments and other consideration required by such an arrangement into those for the lease andthose for other elements on the basis of their relative fair values. If the Group concludes for a financial lease that it is impracticable to separate the payments reliably, theGroup recognizes an asset and a liability at an amount equal to the fair value of the underlying asset that was identified as the subject of the lease. Subsequently, the liabilityis reduced as payments are made and an imputed finance charge on the liability is recognized using the Group’s incremental borrowing rate of interest.
Revenue — Policiesapplicable from January 1,2018
(24) Revenue — Policies applied before January 1, 2018
Revenue from the sale of goods, rendering of services or use of assets is measured at the fair value of the consideration received or receivable. Returns, tradediscounts and volume rebates are recognized as a reduction of revenue.
When two or more revenue generating activities or deliverables are sold under a single arrangement, each deliverable that is considered to be a separate unit ofaccount is accounted for separately. The allocation of consideration from a revenue arrangement to its separate units of account is based on the relative fair values of eachunit.
1) Services rendered
Revenue from cellular services consists of revenue from basic charges, voice charges, data charges, data-roaming services and interconnection charges. Suchrevenues are recognized as services are performed. Revenue from fixed-line services includes domestic and long-distance call charges, international phone connectioncharges, installation service and broadband internet services. Such revenues are recognized as the related services are performed.
Revenue from other services rendered is recognized in profit or loss in proportion to the stage of completion of the transaction at the reporting date. The stage ofcompletion is assessed by reference to surveys of work performed.
2) Goods sold
Revenue is recognized when persuasive evidence exists, usually in the form of an executed sales agreement, that the significant risks and rewards of ownership havebeen transferred to the buyer, recovery of the consideration is probable, the associated costs and possible return of goods can be estimated reliably, there is no continuingmanagement involvement with the goods, and the amount of revenue can be measured reliably.
3) Commission revenue
In connection with the commission revenue from commerce services, the Group has determined that it is acting as an agent due to the followings:
• The Group does not bear inventory risk or have responsibility for the delivery goods;
• All of the credit risks are borne by suppliers of goods though the Group collects the proceeds from end customers on behalf of the suppliers; and
• The Group has no latitude in establishing prices regarding goods sold in commerce.
4) Customer loyalty programs
For customer loyalty programs, the fair value of the consideration received or receivable in respect of the initial sale is allocated between the award credits and theother components of the sale. The amount allocated to the award credits is estimated by reference to the fair value of the services to be provided with respect to theredeemable award credits. The fair value of the services to be provided with respect to the redeemable portion of the award credits granted to the customers in accordancewith customer loyalty programs is estimated taking into account the expected redemption rate and timing of the expected redemption. Considerations allocated to the awardcredits are deferred and revenue is recognized when the award credits are recovered and the Group performs its obligation to provide the service. The amount of revenuerecognized is based on the relative size of the total award credits that are expected to be redeemed and the redeemed award credits in exchange for services.
Copyright © 2020 www.secdatabase.com. All Rights Reserved.Please Consider the Environment Before Printing This Document

12 Months EndedTransactions with RelatedParties - Transactions withRelated Parties (Detail) -
KRW (₩)₩ in Millions
Dec. 31,2019
Dec. 31,2018
Dec. 31,2017
Disclosure of transactions between related parties [Line Items]Operating revenue and others ₩ 614,169 ₩ 375,601 ₩ 259,249Operating expense and others 2,026,419 2,122,776 2,266,988Acquisition of property and equipment 884,838 902,063 1,070,246Collection of loans 204 204SK hynix Inc. [member]Disclosure of transactions between related parties [Line Items]Operating revenue and others 273,047 179,708 123,873Operating expense and others 481 313 251Acquisition of property and equipment 0Other associates [Member]Disclosure of transactions between related parties [Line Items]Operating revenue and others 17,286 5,924 10,720Operating expense and others 13,864 35,296 33,389Acquisition of property and equipment 457 1,202 940Collection of loans 204 204SK Holdings Co., Ltd. [member]Disclosure of transactions between related parties [Line Items]Operating revenue and others 53,507 20,050 25,049Operating expense and others 612,248 601,176 600,600Acquisition of property and equipment 95,426 151,502 283,556F&U Credit information Co., Ltd. [Member]Disclosure of transactions between related parties [Line Items]Operating revenue and others 2,293 2,777 3,431Operating expense and others 55,179 54,857 52,150Acquisition of property and equipment 0 153HappyNarae Co., Ltd. [member]Disclosure of transactions between related parties [Line Items]Operating revenue and others 1,002 3,025Operating expense and others 20,286 29,276Acquisition of property and equipment 88,327 68,472KEB HanaCard Co., Ltd. [member]Disclosure of transactions between related parties [Line Items]Operating revenue and others 832 15,046 17,873Operating expense and others 1,901 15,387 15,045Acquisition of property and equipment 0SK Wyverns Co., Ltd. [member]Disclosure of transactions between related parties [Line Items]Operating revenue and others 1,399
Copyright © 2020 www.secdatabase.com. All Rights Reserved.Please Consider the Environment Before Printing This Document
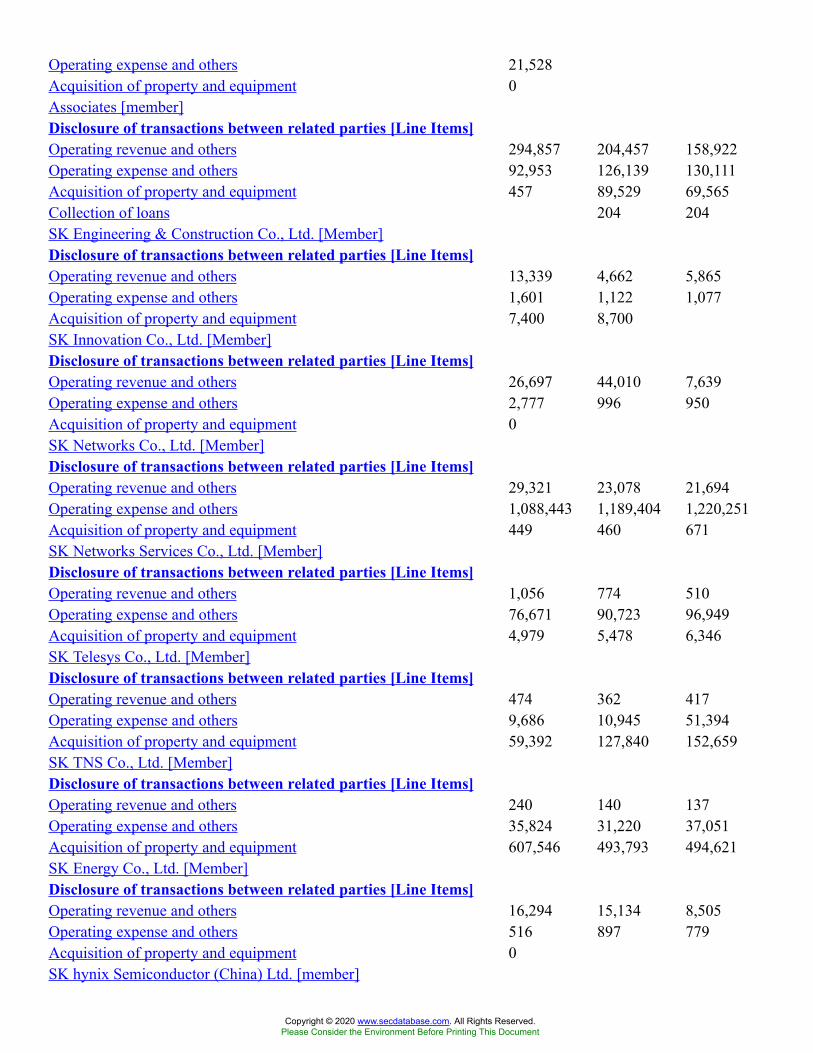
Operating expense and others 21,528Acquisition of property and equipment 0Associates [member]Disclosure of transactions between related parties [Line Items]Operating revenue and others 294,857 204,457 158,922Operating expense and others 92,953 126,139 130,111Acquisition of property and equipment 457 89,529 69,565Collection of loans 204 204SK Engineering & Construction Co., Ltd. [Member]Disclosure of transactions between related parties [Line Items]Operating revenue and others 13,339 4,662 5,865Operating expense and others 1,601 1,122 1,077Acquisition of property and equipment 7,400 8,700SK Innovation Co., Ltd. [Member]Disclosure of transactions between related parties [Line Items]Operating revenue and others 26,697 44,010 7,639Operating expense and others 2,777 996 950Acquisition of property and equipment 0SK Networks Co., Ltd. [Member]Disclosure of transactions between related parties [Line Items]Operating revenue and others 29,321 23,078 21,694Operating expense and others 1,088,443 1,189,404 1,220,251Acquisition of property and equipment 449 460 671SK Networks Services Co., Ltd. [Member]Disclosure of transactions between related parties [Line Items]Operating revenue and others 1,056 774 510Operating expense and others 76,671 90,723 96,949Acquisition of property and equipment 4,979 5,478 6,346SK Telesys Co., Ltd. [Member]Disclosure of transactions between related parties [Line Items]Operating revenue and others 474 362 417Operating expense and others 9,686 10,945 51,394Acquisition of property and equipment 59,392 127,840 152,659SK TNS Co., Ltd. [Member]Disclosure of transactions between related parties [Line Items]Operating revenue and others 240 140 137Operating expense and others 35,824 31,220 37,051Acquisition of property and equipment 607,546 493,793 494,621SK Energy Co., Ltd. [Member]Disclosure of transactions between related parties [Line Items]Operating revenue and others 16,294 15,134 8,505Operating expense and others 516 897 779Acquisition of property and equipment 0SK hynix Semiconductor (China) Ltd. [member]
Copyright © 2020 www.secdatabase.com. All Rights Reserved.Please Consider the Environment Before Printing This Document
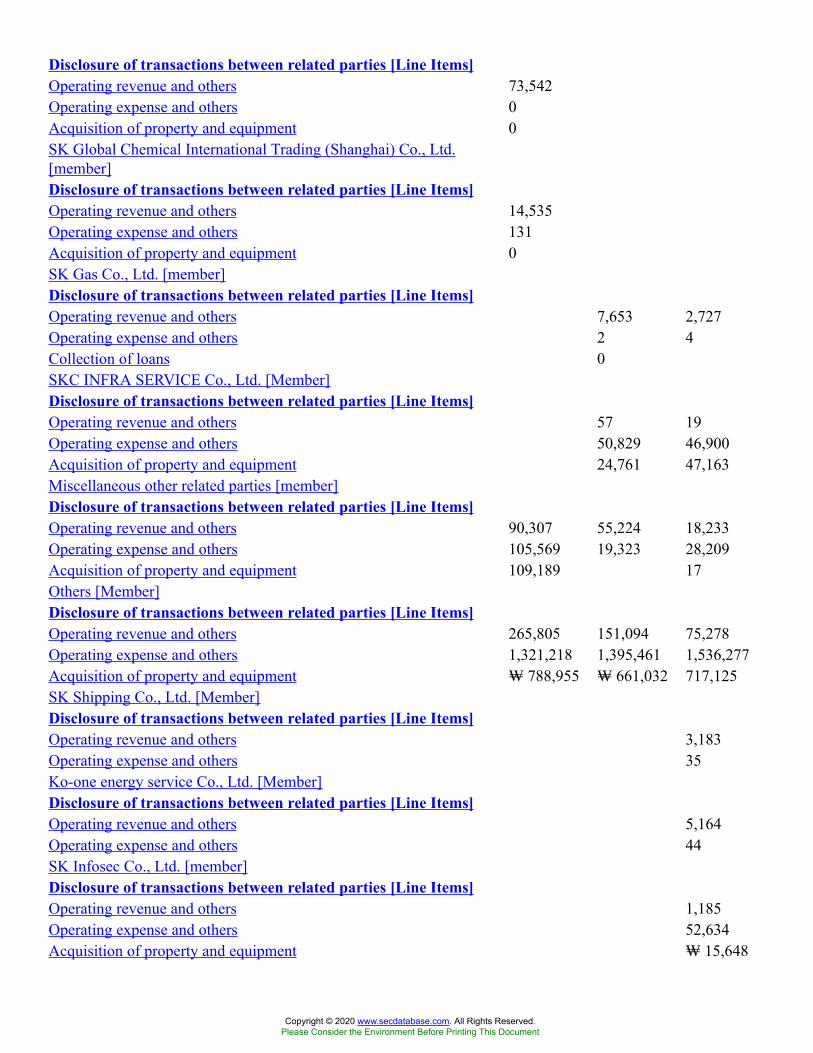
Disclosure of transactions between related parties [Line Items]Operating revenue and others 73,542Operating expense and others 0Acquisition of property and equipment 0SK Global Chemical International Trading (Shanghai) Co., Ltd.[member]Disclosure of transactions between related parties [Line Items]Operating revenue and others 14,535Operating expense and others 131Acquisition of property and equipment 0SK Gas Co., Ltd. [member]Disclosure of transactions between related parties [Line Items]Operating revenue and others 7,653 2,727Operating expense and others 2 4Collection of loans 0SKC INFRA SERVICE Co., Ltd. [Member]Disclosure of transactions between related parties [Line Items]Operating revenue and others 57 19Operating expense and others 50,829 46,900Acquisition of property and equipment 24,761 47,163Miscellaneous other related parties [member]Disclosure of transactions between related parties [Line Items]Operating revenue and others 90,307 55,224 18,233Operating expense and others 105,569 19,323 28,209Acquisition of property and equipment 109,189 17Others [Member]Disclosure of transactions between related parties [Line Items]Operating revenue and others 265,805 151,094 75,278Operating expense and others 1,321,218 1,395,461 1,536,277Acquisition of property and equipment ₩ 788,955 ₩ 661,032 717,125SK Shipping Co., Ltd. [Member]Disclosure of transactions between related parties [Line Items]Operating revenue and others 3,183Operating expense and others 35Ko-one energy service Co., Ltd. [Member]Disclosure of transactions between related parties [Line Items]Operating revenue and others 5,164Operating expense and others 44SK Infosec Co., Ltd. [member]Disclosure of transactions between related parties [Line Items]Operating revenue and others 1,185Operating expense and others 52,634Acquisition of property and equipment ₩ 15,648
Copyright © 2020 www.secdatabase.com. All Rights Reserved.Please Consider the Environment Before Printing This Document
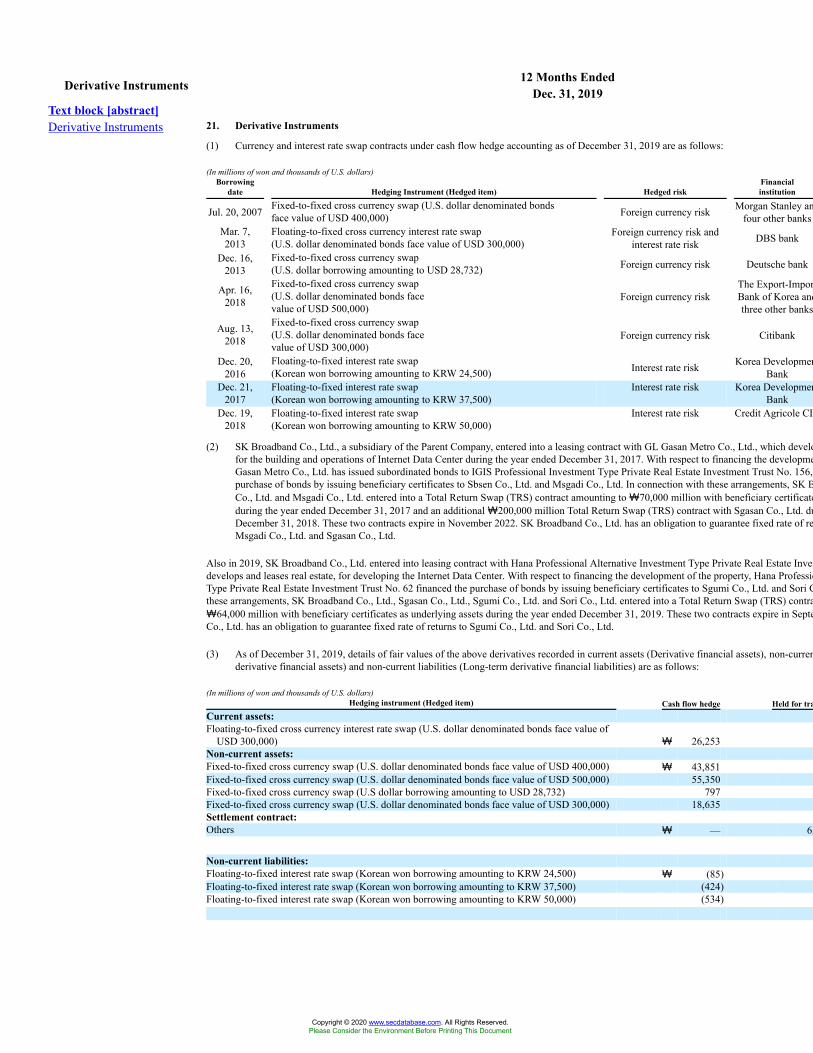
12 Months EndedDerivative Instruments Dec. 31, 2019Text block [abstract]Derivative Instruments 21. Derivative Instruments
(1) Currency and interest rate swap contracts under cash flow hedge accounting as of December 31, 2019 are as follows:
(In millions of won and thousands of U.S. dollars)Borrowing
date Hedging Instrument (Hedged item) Hedged riskFinancialinstitution
Duration ofcontract
Jul. 20, 2007 Fixed-to-fixed cross currency swap (U.S. dollar denominated bondsface value of USD 400,000) Foreign currency risk Morgan Stanley and
four other banksJul. 20, 2007 ~Jul. 20, 2027
Mar. 7,2013
Floating-to-fixed cross currency interest rate swap(U.S. dollar denominated bonds face value of USD 300,000)
Foreign currency risk andinterest rate risk DBS bank Mar. 7, 2013 ~ Mar. 7,
2020Dec. 16,
2013Fixed-to-fixed cross currency swap(U.S. dollar borrowing amounting to USD 28,732) Foreign currency risk Deutsche bank Dec. 16, 2013 ~ Apr.
29, 2022
Apr. 16,2018
Fixed-to-fixed cross currency swap(U.S. dollar denominated bonds facevalue of USD 500,000)
Foreign currency riskThe Export-ImportBank of Korea andthree other banks
Apr. 16, 2018 ~ Apr.16, 2023
Aug. 13,2018
Fixed-to-fixed cross currency swap(U.S. dollar denominated bonds facevalue of USD 300,000)
Foreign currency risk Citibank Aug. 13, 2018 ~ Aug.13, 2023
Dec. 20,2016
Floating-to-fixed interest rate swap(Korean won borrowing amounting to KRW 24,500) Interest rate risk Korea Development
BankDec. 20, 2016 ~Dec. 20, 2021
Dec. 21,2017
Floating-to-fixed interest rate swap(Korean won borrowing amounting to KRW 37,500)
Interest rate risk Korea DevelopmentBank
Dec. 21, 2017 ~Dec. 21, 2022
Dec. 19,2018
Floating-to-fixed interest rate swap(Korean won borrowing amounting to KRW 50,000)
Interest rate risk Credit Agricole CIB Mar. 19, 2019 ~Dec. 14, 2023
(2) SK Broadband Co., Ltd., a subsidiary of the Parent Company, entered into a leasing contract with GL Gasan Metro Co., Ltd., which develops and leases real estate,for the building and operations of Internet Data Center during the year ended December 31, 2017. With respect to financing the development of the property, GLGasan Metro Co., Ltd. has issued subordinated bonds to IGIS Professional Investment Type Private Real Estate Investment Trust No. 156, which financed thepurchase of bonds by issuing beneficiary certificates to Sbsen Co., Ltd. and Msgadi Co., Ltd. In connection with these arrangements, SK Broadband Co., Ltd., SbsenCo., Ltd. and Msgadi Co., Ltd. entered into a Total Return Swap (TRS) contract amounting to ₩70,000 million with beneficiary certificates as underlying assetsduring the year ended December 31, 2017 and an additional ₩200,000 million Total Return Swap (TRS) contract with Sgasan Co., Ltd. during the year endedDecember 31, 2018. These two contracts expire in November 2022. SK Broadband Co., Ltd. has an obligation to guarantee fixed rate of returns to Sbsen Co., Ltd.,Msgadi Co., Ltd. and Sgasan Co., Ltd.
Also in 2019, SK Broadband Co., Ltd. entered into leasing contract with Hana Professional Alternative Investment Type Private Real Estate Investment Trust No. 62 whichdevelops and leases real estate, for developing the Internet Data Center. With respect to financing the development of the property, Hana Professional Alternative InvestmentType Private Real Estate Investment Trust No. 62 financed the purchase of bonds by issuing beneficiary certificates to Sgumi Co., Ltd. and Sori Co., Ltd. In connection withthese arrangements, SK Broadband Co., Ltd., Sgasan Co., Ltd., Sgumi Co., Ltd. and Sori Co., Ltd. entered into a Total Return Swap (TRS) contract amount to₩64,000 million with beneficiary certificates as underlying assets during the year ended December 31, 2019. These two contracts expire in September 2024. SK BroadbandCo., Ltd. has an obligation to guarantee fixed rate of returns to Sgumi Co., Ltd. and Sori Co., Ltd.
(3) As of December 31, 2019, details of fair values of the above derivatives recorded in current assets (Derivative financial assets), non-current assets (Long-termderivative financial assets) and non-current liabilities (Long-term derivative financial liabilities) are as follows:
(In millions of won and thousands of U.S. dollars)Hedging instrument (Hedged item) Cash flow hedge Held for trading Fair value
Current assets:Floating-to-fixed cross currency interest rate swap (U.S. dollar denominated bonds face value of
USD 300,000) ₩ 26,253 — 26,253Non-current assets:Fixed-to-fixed cross currency swap (U.S. dollar denominated bonds face value of USD 400,000) ₩ 43,851 — 43,851Fixed-to-fixed cross currency swap (U.S. dollar denominated bonds face value of USD 500,000) 55,350 — 55,350Fixed-to-fixed cross currency swap (U.S dollar borrowing amounting to USD 28,732) 797 — 797Fixed-to-fixed cross currency swap (U.S. dollar denominated bonds face value of USD 300,000) 18,635 — 18,635Settlement contract:Others ₩ — 6,074 6,074
₩150,960Non-current liabilities:Floating-to-fixed interest rate swap (Korean won borrowing amounting to KRW 24,500) ₩ (85) — (85)Floating-to-fixed interest rate swap (Korean won borrowing amounting to KRW 37,500) (424) — (424)Floating-to-fixed interest rate swap (Korean won borrowing amounting to KRW 50,000) (534) — (534)
₩ (1,043)
Copyright © 2020 www.secdatabase.com. All Rights Reserved.Please Consider the Environment Before Printing This Document
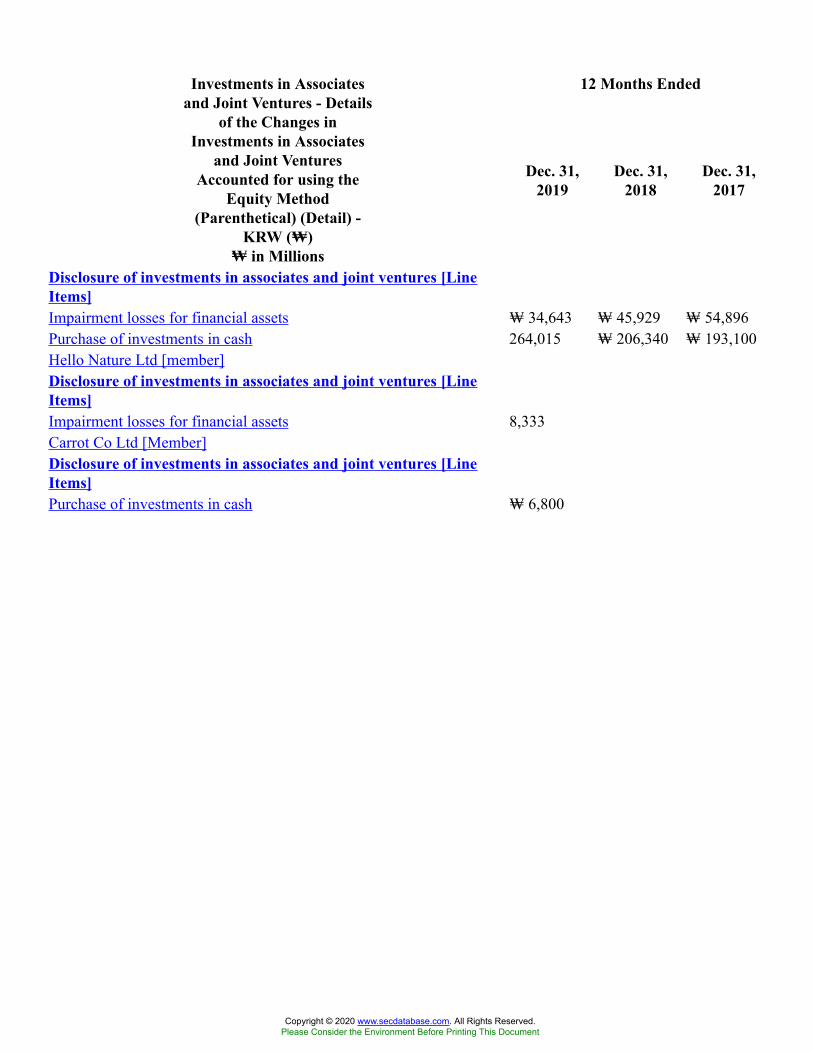
12 Months EndedInvestments in Associatesand Joint Ventures - Details
of the Changes inInvestments in Associates
and Joint VenturesAccounted for using the
Equity Method(Parenthetical) (Detail) -
KRW (₩)₩ in Millions
Dec. 31,2019
Dec. 31,2018
Dec. 31,2017
Disclosure of investments in associates and joint ventures [LineItems]Impairment losses for financial assets ₩ 34,643 ₩ 45,929 ₩ 54,896Purchase of investments in cash 264,015 ₩ 206,340 ₩ 193,100Hello Nature Ltd [member]Disclosure of investments in associates and joint ventures [LineItems]Impairment losses for financial assets 8,333Carrot Co Ltd [Member]Disclosure of investments in associates and joint ventures [LineItems]Purchase of investments in cash ₩ 6,800
Copyright © 2020 www.secdatabase.com. All Rights Reserved.Please Consider the Environment Before Printing This Document

12 Months EndedBorrowings and Debentures Dec. 31, 2019Text block [abstract]Borrowings and Debentures 17. Borrowings and Debentures
(1) Short-term borrowings as of December 31, 2019 and 2018 are as follows:
(In millions of won, thousands of foreign currency)
LenderAnnual interest
rate (%)December 31,
2019December 31,
2018Short-term borrowings Shinhan Bank 3.19 ₩ — 30,000
Shinhan Bank 2.27 — 30,000
Shinhan Bank(*1)6M Financial I
(bank) + 1.60 15,000 15,000KEB Hana Bank(*2) 3M CD + 1.75 5,000 5,000
Woori Bank 7.50603
(VND12,068,234) —₩ 20,603 80,000
(*1) As of December 31, 2019, 6M Financial I (bank) rate is 1.52%.(*2) As of December 31, 2019, 3M CD rate is 1.53%.
(2) Long-term borrowings as of December 31, 2019 and 2018 are as follows:
(In millions of won and thousands of U.S. dollars)
LenderAnnual interest
rate (%) MaturityDecember 31,
2019December 31,
2018KEB Hana Bank(*1) 3.51 Feb. 28, 2020 — 40,000Korea Development Bank(*2) 3M CD + 0.60 Jul. 30, 2019 — 9,750Korea Development Bank(*2) 3M CD + 0.60 Jul. 30, 2019 — 2,500Korea Development Bank(*2,3) 3M CD + 0.61 Dec. 20, 2021 24,500 36,750Korea Development Bank(*2,4) 3M CD + 0.71 Dec. 21, 2022 37,500 50,000Credit Agricole CIB(*2,5) 3M CD + 0.82 Dec. 14, 2023 50,000 50,000Shinhan Bank and others 4.21 Sept. 30, 2023 1,750,000 1,750,000KDB Capital and others 7.20 Sept. 30, 2023 150,000 150,000Export Kreditnamnden(*6) 1.70 Apr. 29, 2022 33,266
(USD28,732)45,007
(USD40,253)2,045,266 2,134,007
Less present value discount (22,729) (29,011)2,022,537 2,104,996
Less current installments (50,388) (89,631)₩ 1,972,149 2,015,365
(*1) The long-term borrowings were repaid before maturity during the year ended December 31, 2019.(*2) As of December 31, 2019, 3M CD rate is 1.53%.(*3) The long-term borrowings are to be repaid by installments on an annual basis from 2017 to 2021.(*4) The long-term borrowings are to be repaid by installments on an annual basis from 2018 to 2022.(*5) The long-term borrowings are to be repaid by installments on an annual basis from 2020 to 2023.(*6) The long-term borrowings are to be repaid by installments on an annual basis from 2014 to 2022.
(3) Debentures as of December 31, 2019 and 2018 are as follows:
(In millions of won and thousands of U.S. dollars)
Purpose MaturityAnnual interest
rate (%)December 31,
2019December 31,
2018Unsecured corporate bonds Operating fund 2021 4.22 ₩ 190,000 190,000Unsecured corporate bonds Operating and
refinancing fund 2019 3.24 — 170,000Unsecured corporate bonds 2022 3.30 140,000 140,000Unsecured corporate bonds 2032 3.45 90,000 90,000Unsecured corporate bonds Operating fund 2023 3.03 230,000 230,000Unsecured corporate bonds 2033 3.22 130,000 130,000Unsecured corporate bonds 2019 3.30 — 50,000Unsecured corporate bonds 2024 3.64 150,000 150,000Unsecured corporate bonds(*1) 2029 4.72 — 61,813Unsecured corporate bonds Refinancing fund 2019 2.53 — 160,000Unsecured corporate bonds 2021 2.66 150,000 150,000Unsecured corporate bonds 2024 2.82 190,000 190,000Unsecured corporate bonds Operating and
refinancing fund 2022 2.40 100,000 100,000Unsecured corporate bonds 2025 2.49 150,000 150,000Unsecured corporate bonds 2030 2.61 50,000 50,000
Copyright © 2020 www.secdatabase.com. All Rights Reserved.Please Consider the Environment Before Printing This Document
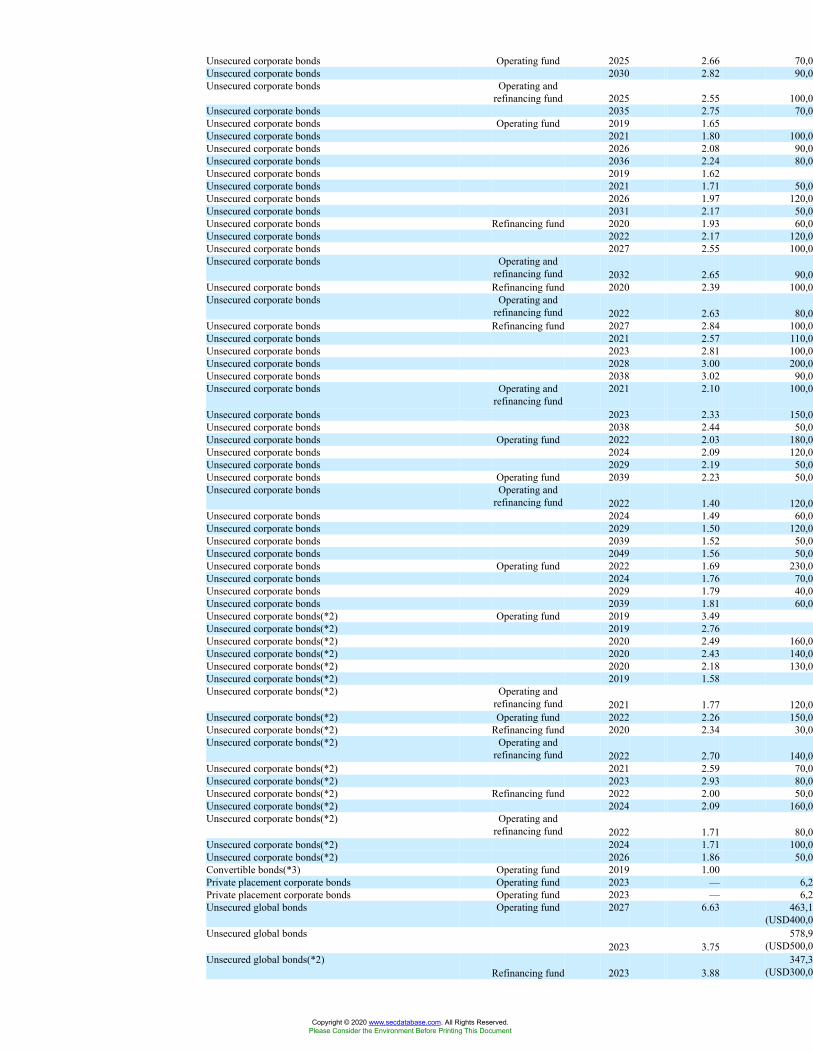
Unsecured corporate bonds Operating fund 2025 2.66 70,000 70,000Unsecured corporate bonds 2030 2.82 90,000 90,000Unsecured corporate bonds Operating and
refinancing fund 2025 2.55 100,000 100,000Unsecured corporate bonds 2035 2.75 70,000 70,000Unsecured corporate bonds Operating fund 2019 1.65 — 70,000Unsecured corporate bonds 2021 1.80 100,000 100,000Unsecured corporate bonds 2026 2.08 90,000 90,000Unsecured corporate bonds 2036 2.24 80,000 80,000Unsecured corporate bonds 2019 1.62 — 50,000Unsecured corporate bonds 2021 1.71 50,000 50,000Unsecured corporate bonds 2026 1.97 120,000 120,000Unsecured corporate bonds 2031 2.17 50,000 50,000Unsecured corporate bonds Refinancing fund 2020 1.93 60,000 60,000Unsecured corporate bonds 2022 2.17 120,000 120,000Unsecured corporate bonds 2027 2.55 100,000 100,000Unsecured corporate bonds Operating and
refinancing fund 2032 2.65 90,000 90,000Unsecured corporate bonds Refinancing fund 2020 2.39 100,000 100,000Unsecured corporate bonds Operating and
refinancing fund 2022 2.63 80,000 80,000Unsecured corporate bonds Refinancing fund 2027 2.84 100,000 100,000Unsecured corporate bonds 2021 2.57 110,000 110,000Unsecured corporate bonds 2023 2.81 100,000 100,000Unsecured corporate bonds 2028 3.00 200,000 200,000Unsecured corporate bonds 2038 3.02 90,000 90,000Unsecured corporate bonds Operating and
refinancing fund2021 2.10 100,000 100,000
Unsecured corporate bonds 2023 2.33 150,000 150,000Unsecured corporate bonds 2038 2.44 50,000 50,000Unsecured corporate bonds Operating fund 2022 2.03 180,000 —Unsecured corporate bonds 2024 2.09 120,000 —Unsecured corporate bonds 2029 2.19 50,000 —Unsecured corporate bonds Operating fund 2039 2.23 50,000 —Unsecured corporate bonds Operating and
refinancing fund 2022 1.40 120,000 —Unsecured corporate bonds 2024 1.49 60,000 —Unsecured corporate bonds 2029 1.50 120,000 —Unsecured corporate bonds 2039 1.52 50,000 —Unsecured corporate bonds 2049 1.56 50,000 —Unsecured corporate bonds Operating fund 2022 1.69 230,000 —Unsecured corporate bonds 2024 1.76 70,000 —Unsecured corporate bonds 2029 1.79 40,000 —Unsecured corporate bonds 2039 1.81 60,000 —Unsecured corporate bonds(*2) Operating fund 2019 3.49 — 210,000Unsecured corporate bonds(*2) 2019 2.76 — 130,000Unsecured corporate bonds(*2) 2020 2.49 160,000 160,000Unsecured corporate bonds(*2) 2020 2.43 140,000 140,000Unsecured corporate bonds(*2) 2020 2.18 130,000 130,000Unsecured corporate bonds(*2) 2019 1.58 — 50,000Unsecured corporate bonds(*2) Operating and
refinancing fund 2021 1.77 120,000 120,000Unsecured corporate bonds(*2) Operating fund 2022 2.26 150,000 150,000Unsecured corporate bonds(*2) Refinancing fund 2020 2.34 30,000 30,000Unsecured corporate bonds(*2) Operating and
refinancing fund 2022 2.70 140,000 140,000Unsecured corporate bonds(*2) 2021 2.59 70,000 70,000Unsecured corporate bonds(*2) 2023 2.93 80,000 80,000Unsecured corporate bonds(*2) Refinancing fund 2022 2.00 50,000 —Unsecured corporate bonds(*2) 2024 2.09 160,000 —Unsecured corporate bonds(*2) Operating and
refinancing fund 2022 1.71 80,000 —Unsecured corporate bonds(*2) 2024 1.71 100,000 —Unsecured corporate bonds(*2) 2026 1.86 50,000 —Convertible bonds(*3) Operating fund 2019 1.00 — 5,479Private placement corporate bonds Operating fund 2023 — 6,292 —Private placement corporate bonds Operating fund 2023 — 6,222 —Unsecured global bonds Operating fund 2027 6.63 463,120
(USD400,000)447,240
(USD400,000)Unsecured global bonds
2023 3.75578,900
(USD500,000)559,050
(USD500,000)Unsecured global bonds(*2)
Refinancing fund 2023 3.88347,340
(USD300,000)335,430
(USD300,000)
Copyright © 2020 www.secdatabase.com. All Rights Reserved.Please Consider the Environment Before Printing This Document
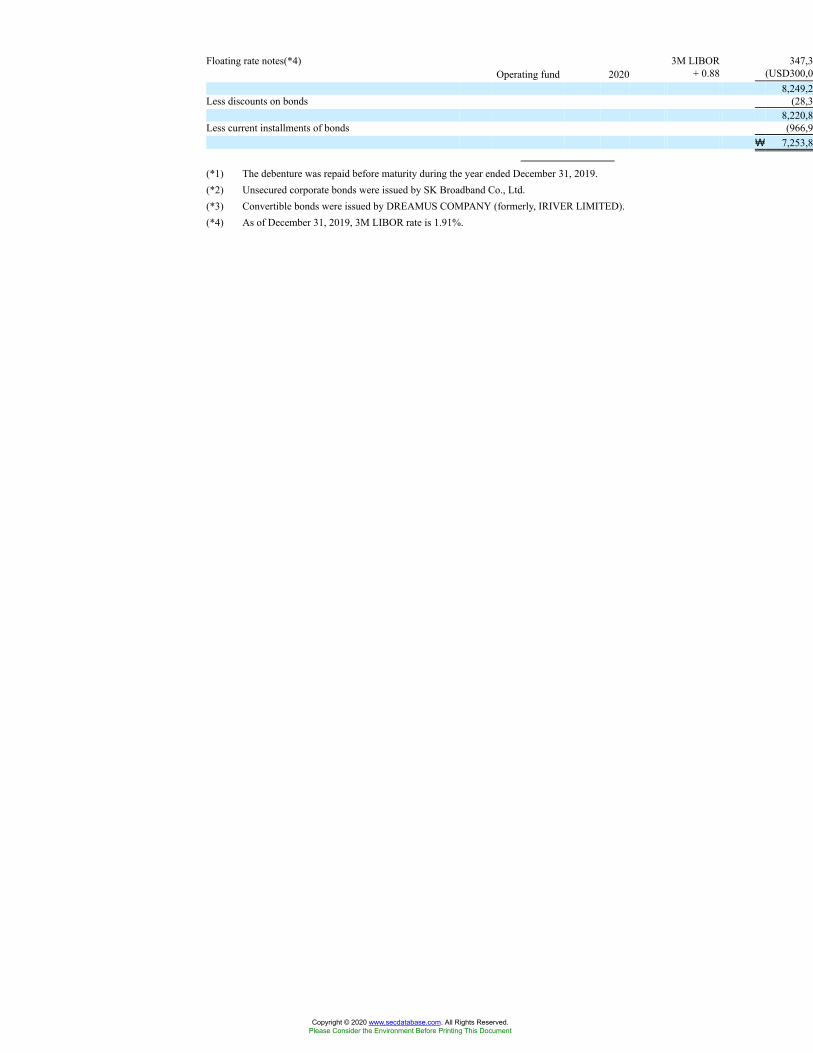
Floating rate notes(*4)Operating fund 2020
3M LIBOR+ 0.88
347,340(USD300,000)
335,430(USD300,000)
8,249,214 7,494,442Less discounts on bonds (28,381) (27,590)
8,220,833 7,466,852Less current installments of bonds (966,939) (894,641)
₩ 7,253,894 6,572,211
(*1) The debenture was repaid before maturity during the year ended December 31, 2019.(*2) Unsecured corporate bonds were issued by SK Broadband Co., Ltd.(*3) Convertible bonds were issued by DREAMUS COMPANY (formerly, IRIVER LIMITED).(*4) As of December 31, 2019, 3M LIBOR rate is 1.91%.
Copyright © 2020 www.secdatabase.com. All Rights Reserved.Please Consider the Environment Before Printing This Document
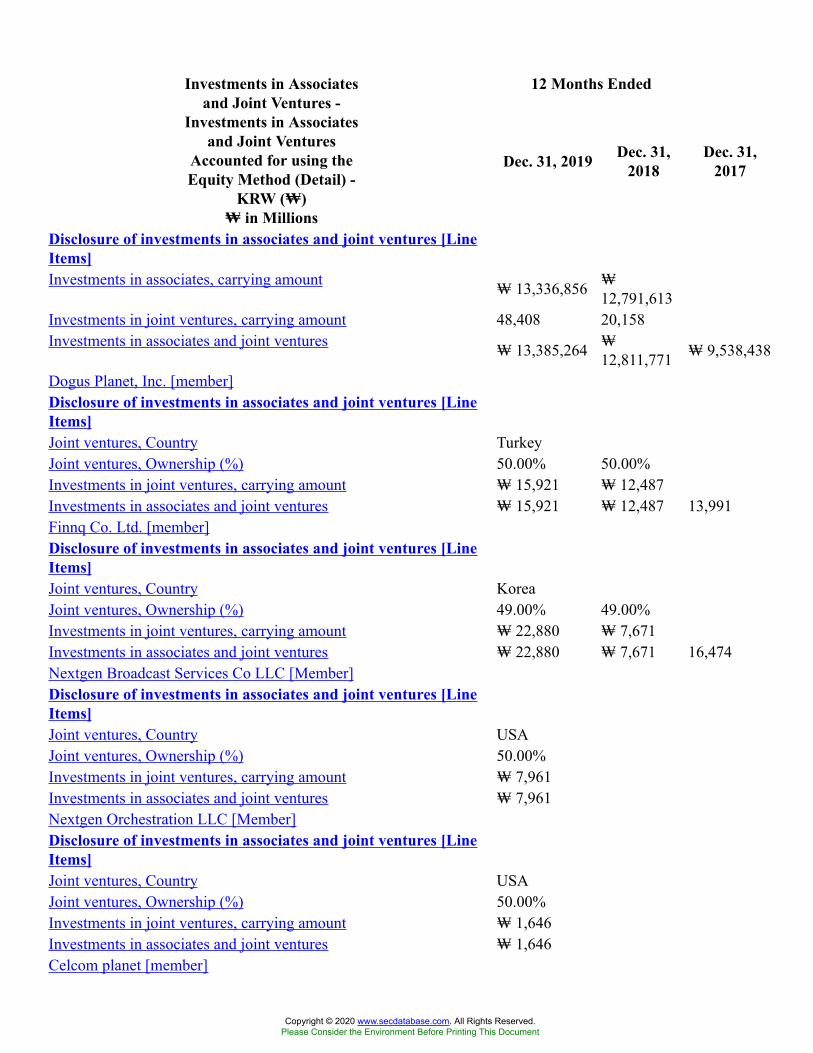
12 Months EndedInvestments in Associatesand Joint Ventures -
Investments in Associatesand Joint Ventures
Accounted for using theEquity Method (Detail) -
KRW (₩)₩ in Millions
Dec. 31, 2019 Dec. 31,2018
Dec. 31,2017
Disclosure of investments in associates and joint ventures [LineItems]Investments in associates, carrying amount ₩ 13,336,856 ₩
12,791,613Investments in joint ventures, carrying amount 48,408 20,158Investments in associates and joint ventures ₩ 13,385,264 ₩
12,811,771 ₩ 9,538,438
Dogus Planet, Inc. [member]Disclosure of investments in associates and joint ventures [LineItems]Joint ventures, Country TurkeyJoint ventures, Ownership (%) 50.00% 50.00%Investments in joint ventures, carrying amount ₩ 15,921 ₩ 12,487Investments in associates and joint ventures ₩ 15,921 ₩ 12,487 13,991Finnq Co. Ltd. [member]Disclosure of investments in associates and joint ventures [LineItems]Joint ventures, Country KoreaJoint ventures, Ownership (%) 49.00% 49.00%Investments in joint ventures, carrying amount ₩ 22,880 ₩ 7,671Investments in associates and joint ventures ₩ 22,880 ₩ 7,671 16,474Nextgen Broadcast Services Co LLC [Member]Disclosure of investments in associates and joint ventures [LineItems]Joint ventures, Country USAJoint ventures, Ownership (%) 50.00%Investments in joint ventures, carrying amount ₩ 7,961Investments in associates and joint ventures ₩ 7,961Nextgen Orchestration LLC [Member]Disclosure of investments in associates and joint ventures [LineItems]Joint ventures, Country USAJoint ventures, Ownership (%) 50.00%Investments in joint ventures, carrying amount ₩ 1,646Investments in associates and joint ventures ₩ 1,646Celcom planet [member]
Copyright © 2020 www.secdatabase.com. All Rights Reserved.Please Consider the Environment Before Printing This Document
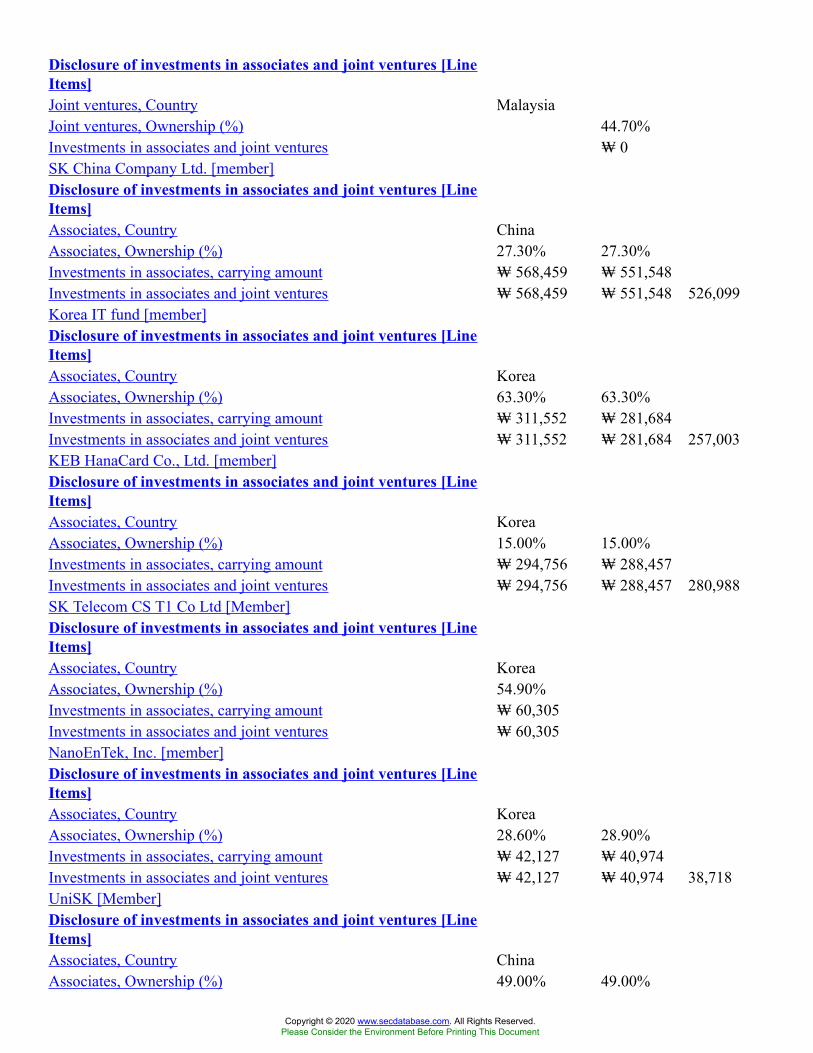
Disclosure of investments in associates and joint ventures [LineItems]Joint ventures, Country MalaysiaJoint ventures, Ownership (%) 44.70%Investments in associates and joint ventures ₩ 0SK China Company Ltd. [member]Disclosure of investments in associates and joint ventures [LineItems]Associates, Country ChinaAssociates, Ownership (%) 27.30% 27.30%Investments in associates, carrying amount ₩ 568,459 ₩ 551,548Investments in associates and joint ventures ₩ 568,459 ₩ 551,548 526,099Korea IT fund [member]Disclosure of investments in associates and joint ventures [LineItems]Associates, Country KoreaAssociates, Ownership (%) 63.30% 63.30%Investments in associates, carrying amount ₩ 311,552 ₩ 281,684Investments in associates and joint ventures ₩ 311,552 ₩ 281,684 257,003KEB HanaCard Co., Ltd. [member]Disclosure of investments in associates and joint ventures [LineItems]Associates, Country KoreaAssociates, Ownership (%) 15.00% 15.00%Investments in associates, carrying amount ₩ 294,756 ₩ 288,457Investments in associates and joint ventures ₩ 294,756 ₩ 288,457 280,988SK Telecom CS T1 Co Ltd [Member]Disclosure of investments in associates and joint ventures [LineItems]Associates, Country KoreaAssociates, Ownership (%) 54.90%Investments in associates, carrying amount ₩ 60,305Investments in associates and joint ventures ₩ 60,305NanoEnTek, Inc. [member]Disclosure of investments in associates and joint ventures [LineItems]Associates, Country KoreaAssociates, Ownership (%) 28.60% 28.90%Investments in associates, carrying amount ₩ 42,127 ₩ 40,974Investments in associates and joint ventures ₩ 42,127 ₩ 40,974 38,718UniSK [Member]Disclosure of investments in associates and joint ventures [LineItems]Associates, Country ChinaAssociates, Ownership (%) 49.00% 49.00%
Copyright © 2020 www.secdatabase.com. All Rights Reserved.Please Consider the Environment Before Printing This Document
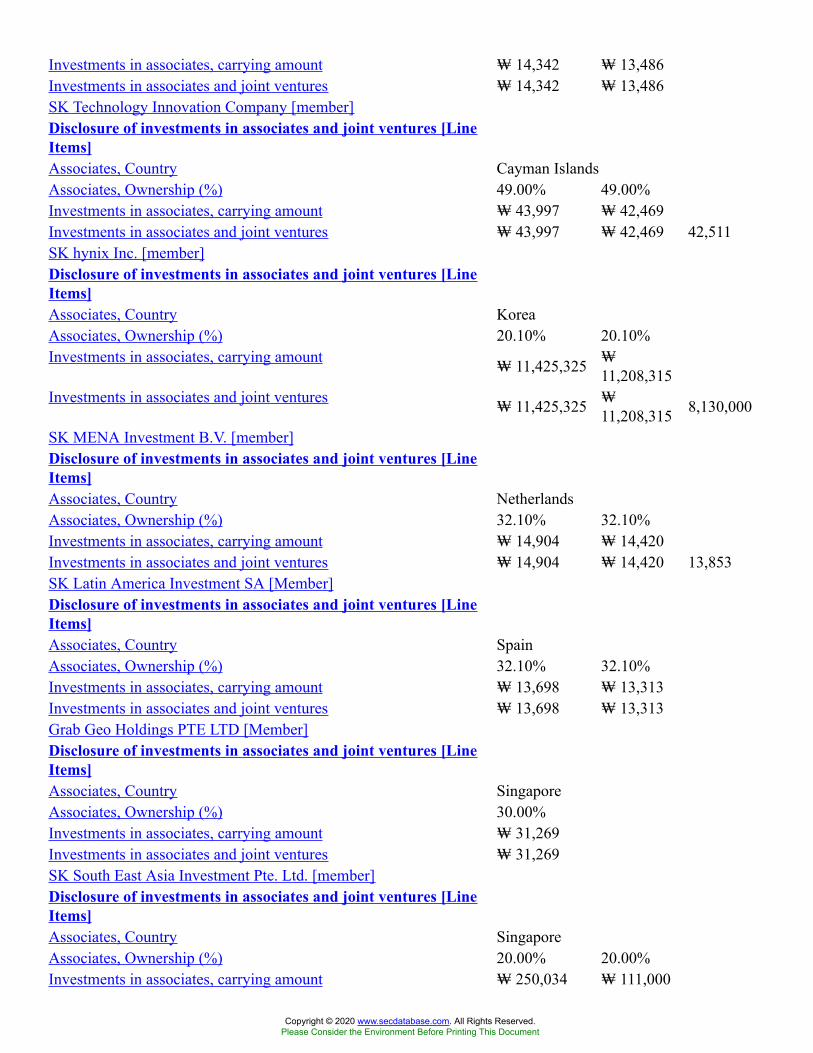
Investments in associates, carrying amount ₩ 14,342 ₩ 13,486Investments in associates and joint ventures ₩ 14,342 ₩ 13,486SK Technology Innovation Company [member]Disclosure of investments in associates and joint ventures [LineItems]Associates, Country Cayman IslandsAssociates, Ownership (%) 49.00% 49.00%Investments in associates, carrying amount ₩ 43,997 ₩ 42,469Investments in associates and joint ventures ₩ 43,997 ₩ 42,469 42,511SK hynix Inc. [member]Disclosure of investments in associates and joint ventures [LineItems]Associates, Country KoreaAssociates, Ownership (%) 20.10% 20.10%Investments in associates, carrying amount ₩ 11,425,325 ₩
11,208,315Investments in associates and joint ventures ₩ 11,425,325 ₩
11,208,315 8,130,000
SK MENA Investment B.V. [member]Disclosure of investments in associates and joint ventures [LineItems]Associates, Country NetherlandsAssociates, Ownership (%) 32.10% 32.10%Investments in associates, carrying amount ₩ 14,904 ₩ 14,420Investments in associates and joint ventures ₩ 14,904 ₩ 14,420 13,853SK Latin America Investment SA [Member]Disclosure of investments in associates and joint ventures [LineItems]Associates, Country SpainAssociates, Ownership (%) 32.10% 32.10%Investments in associates, carrying amount ₩ 13,698 ₩ 13,313Investments in associates and joint ventures ₩ 13,698 ₩ 13,313Grab Geo Holdings PTE LTD [Member]Disclosure of investments in associates and joint ventures [LineItems]Associates, Country SingaporeAssociates, Ownership (%) 30.00%Investments in associates, carrying amount ₩ 31,269Investments in associates and joint ventures ₩ 31,269SK South East Asia Investment Pte. Ltd. [member]Disclosure of investments in associates and joint ventures [LineItems]Associates, Country SingaporeAssociates, Ownership (%) 20.00% 20.00%Investments in associates, carrying amount ₩ 250,034 ₩ 111,000
Copyright © 2020 www.secdatabase.com. All Rights Reserved.Please Consider the Environment Before Printing This Document

Pacific Telecom Inc [member]Disclosure of investments in associates and joint ventures [LineItems]Associates, Country USAAssociates, Ownership (%) 15.00% 15.00%Investments in associates, carrying amount ₩ 40,016 ₩ 37,075Investments in associates and joint ventures ₩ 40,016 ₩ 37,075S.M. Culture & Contents Co., Ltd [member]Disclosure of investments in associates and joint ventures [LineItems]Associates, Country KoreaAssociates, Ownership (%) 23.40% 23.40%Investments in associates, carrying amount ₩ 63,469 ₩ 63,801Investments in associates and joint ventures ₩ 63,469 ₩ 63,801 64,966Content Wavve Co., Ltd. [member]Disclosure of investments in associates and joint ventures [LineItems]Associates, Country KoreaAssociates, Ownership (%) 30.00%Investments in associates, carrying amount ₩ 83,640Investments in associates and joint ventures ₩ 83,640Hello Nature Ltd. [member]Disclosure of investments in associates and joint ventures [LineItems]Associates, Country KoreaAssociates, Ownership (%) 49.90% 49.90%Investments in associates, carrying amount ₩ 13,620 ₩ 28,549Investments in associates and joint ventures 13,620 28,549Health Connect Co., Ltd. and others [member]Disclosure of investments in associates and joint ventures [LineItems]Investments in associates, carrying amount 65,343 96,522Investments in associates and joint ventures ₩ 65,343 ₩ 106,394 ₩ 96,479
Copyright © 2020 www.secdatabase.com. All Rights Reserved.Please Consider the Environment Before Printing This Document

12 Months EndedInvestments in Associatesand Joint Ventures -Condensed FinancialInformation of Joint
Ventures (Detail) - KRW (₩)₩ in Millions
Dec. 31, 2019 Dec. 31, 2018 Dec. 31, 2017 Dec. 31, 2016
Disclosure of joint ventures [line items]Current assets ₩ 8,102,294 ₩ 7,958,839Cash and cash equivalents 1,270,824 1,506,699 ₩ 1,457,735 ₩ 1,505,242Non-current assets 36,509,326 34,410,272Current liabilities 7,787,722 6,847,557Non-current liabilities 14,000,362 13,172,304Revenue 17,846,932 16,945,910 17,552,010Depreciation and amortization (3,771,486) (3,126,118) (3,097,466)Interest income 141,977 256,435 366,561Interest expense (397,890) (307,319) (299,100)Profit (loss) for the year 861,942 3,131,988 2,657,595Total comprehensive income (loss) 862,951 2,990,404 2,656,582Dogus Planet, Inc. [member]Disclosure of joint ventures [line items]Current assets 59,632 43,127 39,656Cash and cash equivalents 13,422 42,416 25,818Non-current assets 25,247 20,239 21,159Current liabilities 52,238 37,105 32,622Accounts payable, other payables and provisions 35,459 28,432 2,743Non-current liabilities 800 1,287 212Revenue 136,777 99,770 82,791Depreciation and amortization (5,487) (5,427) (6,152)Interest income 1,455 1,635 781Interest expense (92) (4)Profit (loss) for the year 9,294 642 (4,535)Total comprehensive income (loss) 9,294 642 (4,535)Finnq Co. Ltd. [member]Disclosure of joint ventures [line items]Current assets 42,995 11,985 32,232Cash and cash equivalents 40,619 10,434 4,590Non-current assets 11,389 15,435 15,610Current liabilities 6,756 5,070 5,685Accounts payable, other payables and provisions 5,062 87 2,290Non-current liabilities 1,099 7,579 13,862Revenue 1,968 232Depreciation and amortization (4,769) (3,490) (1,077)Interest income 12 5 532Interest expense (198) (301) (276)
Copyright © 2020 www.secdatabase.com. All Rights Reserved.Please Consider the Environment Before Printing This Document
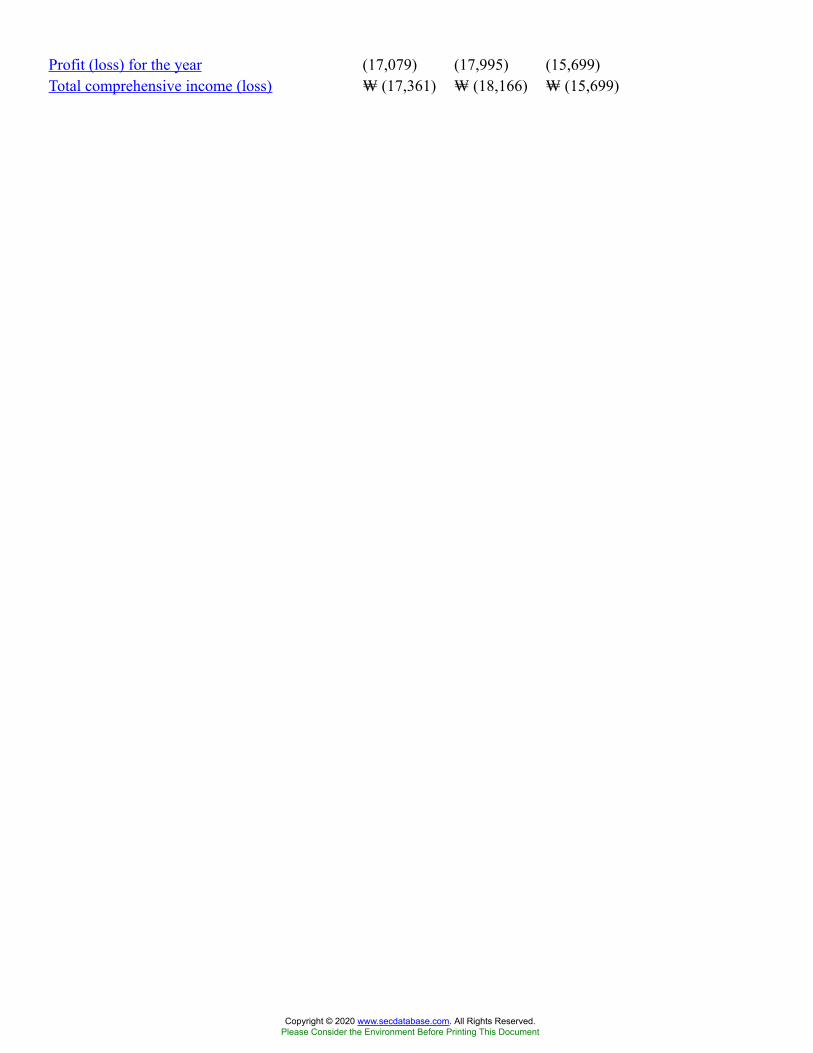
Profit (loss) for the year (17,079) (17,995) (15,699)Total comprehensive income (loss) ₩ (17,361) ₩ (18,166) ₩ (15,699)
Copyright © 2020 www.secdatabase.com. All Rights Reserved.Please Consider the Environment Before Printing This Document
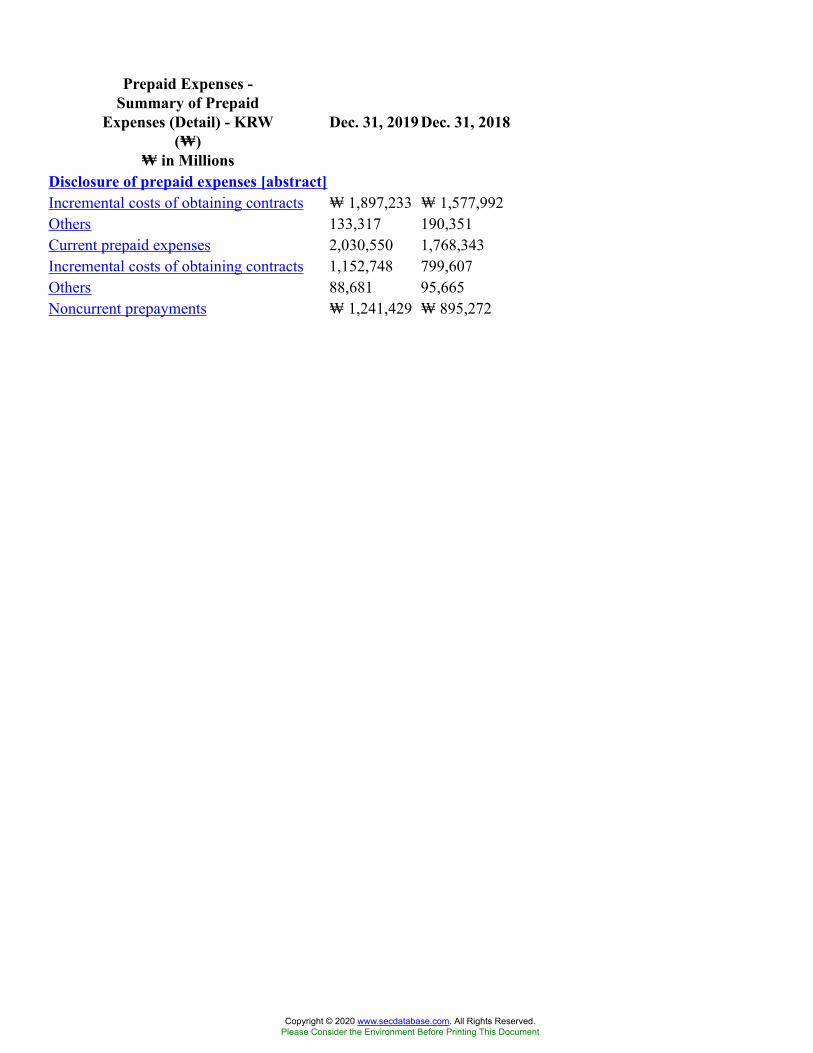
Prepaid Expenses -Summary of Prepaid
Expenses (Detail) - KRW(₩)
₩ in Millions
Dec. 31, 2019 Dec. 31, 2018
Disclosure of prepaid expenses [abstract]Incremental costs of obtaining contracts ₩ 1,897,233 ₩ 1,577,992Others 133,317 190,351Current prepaid expenses 2,030,550 1,768,343Incremental costs of obtaining contracts 1,152,748 799,607Others 88,681 95,665Noncurrent prepayments ₩ 1,241,429 ₩ 895,272
Copyright © 2020 www.secdatabase.com. All Rights Reserved.Please Consider the Environment Before Printing This Document

Trade and Other Receivables- Details of Trade and OtherReceivables (Detail) - KRW
(₩)₩ in Millions
Dec. 31, 2019 Dec. 31, 2018
Disclosure of financial assets [line items]Accounts receivable - trade ₩ 2,230,979 ₩ 2,008,640Short-term loans 66,123 59,094Accounts receivable - other 905,436 937,837Accrued income 3,811 6,066Guarantee deposits (Other current assets) 145,041 2,714Trade and other receivables, current 3,351,390 3,014,351Long-term loans 33,760 29,034Long-term accounts receivable - other 344,662 274,053Guarantee deposits 164,734 313,140Long-term accounts receivable - trade (Other non-current assets) 16,916 11,293Trade and other receivables, noncurrent 560,072 627,520Trade and other receivables 3,911,462 3,641,871Gross amount [member]Disclosure of financial assets [line items]Accounts receivable - trade 2,480,419 2,268,680Short-term loans 66,706 59,643Accounts receivable - other 953,815 1,006,183Accrued income 3,977 6,232Guarantee deposits (Other current assets) 145,041 2,714Trade and other receivables, current 3,649,958 3,343,452Long-term loans 81,231 75,860Long-term accounts receivable - other 344,662 274,053Guarantee deposits 165,033 313,140Long-term accounts receivable - trade (Other non-current assets) 16,977 11,410Trade and other receivables, noncurrent 607,903 674,463Trade and other receivables 4,257,861 4,017,915Loss allowance [member]Disclosure of financial assets [line items]Accounts receivable - trade (249,440) (260,040)Short-term loans (583) (549)Accounts receivable - other (48,379) (68,346)Accrued income (166) (166)Trade and other receivables, current (298,568) (329,101)Long-term loans (47,471) (46,826)Guarantee deposits (299)Long-term accounts receivable - trade (Other non-current assets) (61) (117)Trade and other receivables, noncurrent (47,831) (46,943)Trade and other receivables ₩ (346,399) ₩ (376,044)
Copyright © 2020 www.secdatabase.com. All Rights Reserved.Please Consider the Environment Before Printing This Document
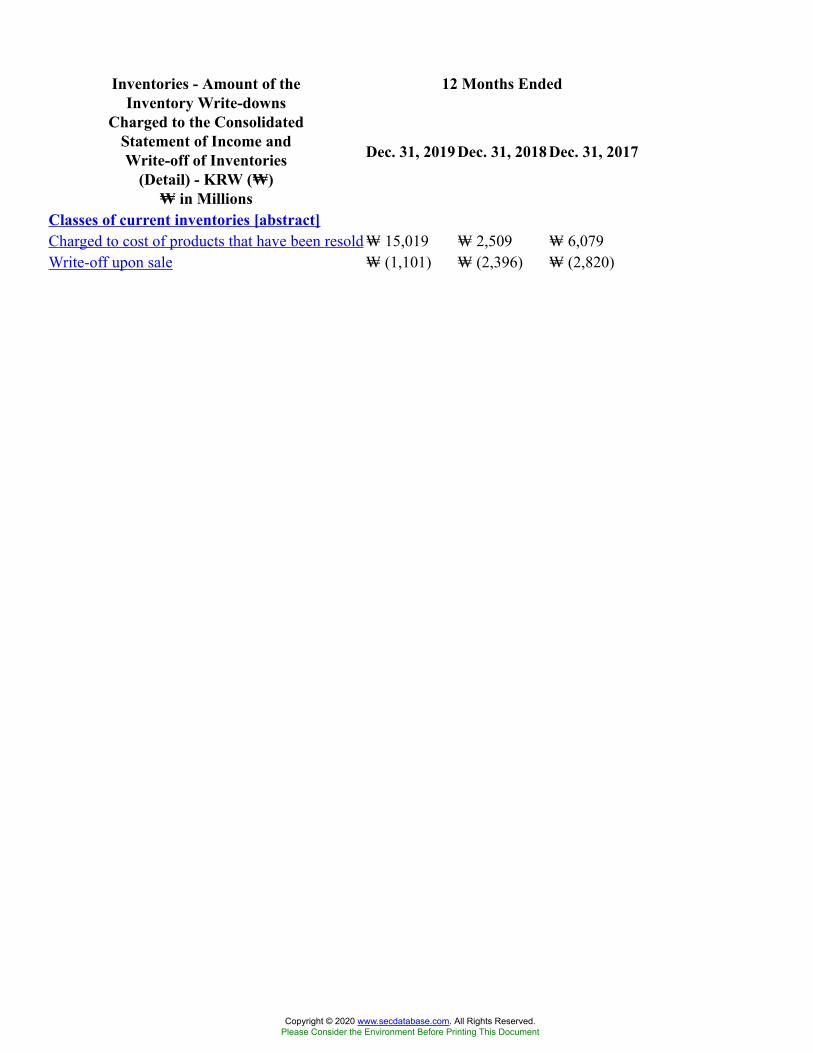
12 Months EndedInventories - Amount of theInventory Write-downs
Charged to the ConsolidatedStatement of Income andWrite-off of Inventories
(Detail) - KRW (₩)₩ in Millions
Dec. 31, 2019 Dec. 31, 2018 Dec. 31, 2017
Classes of current inventories [abstract]Charged to cost of products that have been resold ₩ 15,019 ₩ 2,509 ₩ 6,079Write-off upon sale ₩ (1,101) ₩ (2,396) ₩ (2,820)
Copyright © 2020 www.secdatabase.com. All Rights Reserved.Please Consider the Environment Before Printing This Document
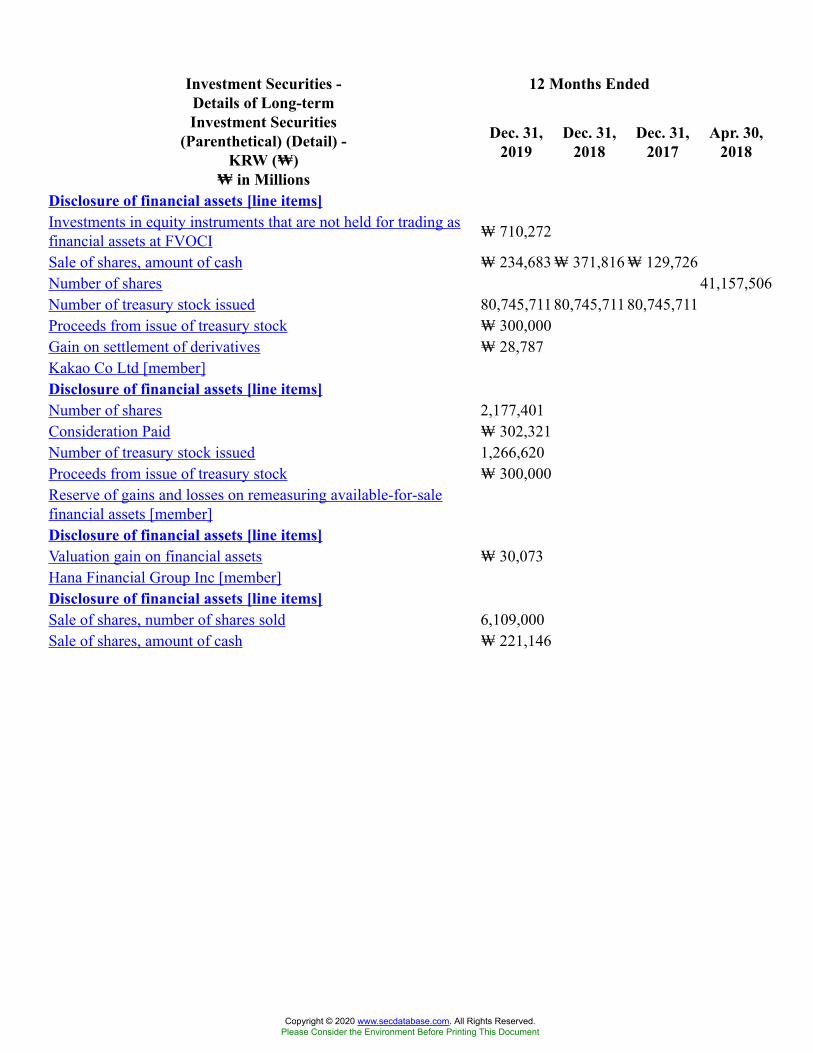
12 Months EndedInvestment Securities -Details of Long-termInvestment Securities
(Parenthetical) (Detail) -KRW (₩)
₩ in Millions
Dec. 31,2019
Dec. 31,2018
Dec. 31,2017
Apr. 30,2018
Disclosure of financial assets [line items]Investments in equity instruments that are not held for trading asfinancial assets at FVOCI ₩ 710,272
Sale of shares, amount of cash ₩ 234,683 ₩ 371,816 ₩ 129,726Number of shares 41,157,506Number of treasury stock issued 80,745,71180,745,711 80,745,711Proceeds from issue of treasury stock ₩ 300,000Gain on settlement of derivatives ₩ 28,787Kakao Co Ltd [member]Disclosure of financial assets [line items]Number of shares 2,177,401Consideration Paid ₩ 302,321Number of treasury stock issued 1,266,620Proceeds from issue of treasury stock ₩ 300,000Reserve of gains and losses on remeasuring available-for-salefinancial assets [member]Disclosure of financial assets [line items]Valuation gain on financial assets ₩ 30,073Hana Financial Group Inc [member]Disclosure of financial assets [line items]Sale of shares, number of shares sold 6,109,000Sale of shares, amount of cash ₩ 221,146
Copyright © 2020 www.secdatabase.com. All Rights Reserved.Please Consider the Environment Before Printing This Document
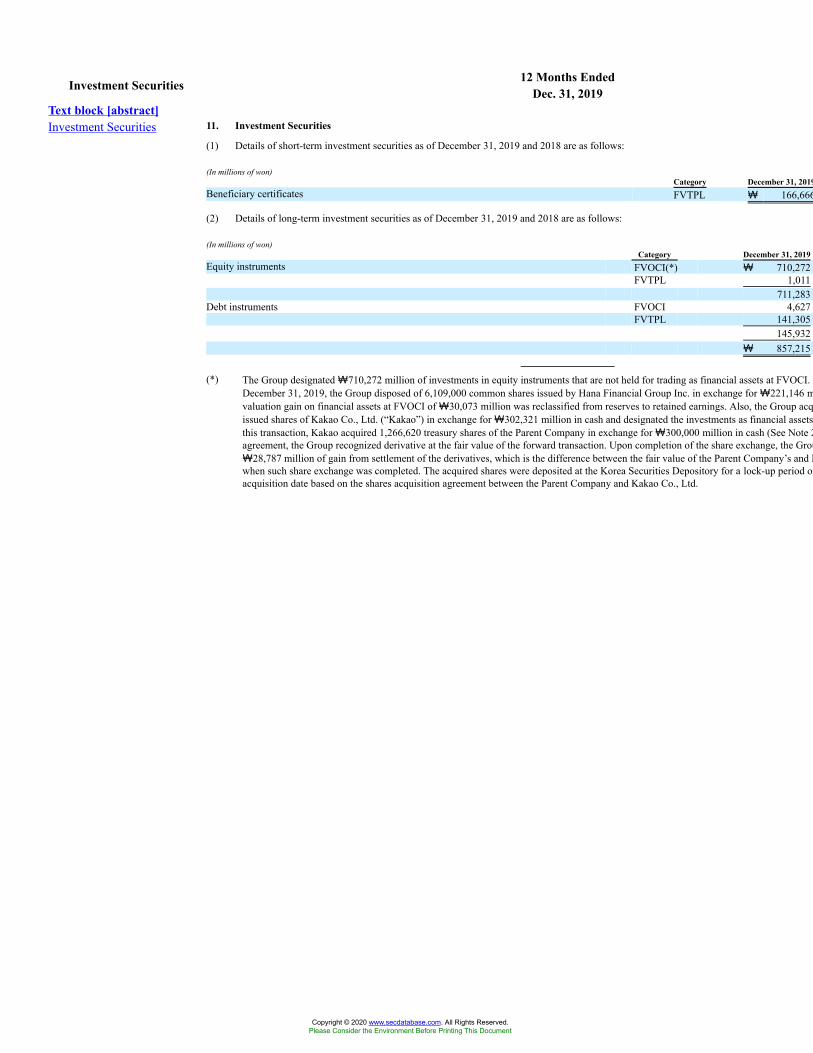
12 Months EndedInvestment Securities Dec. 31, 2019Text block [abstract]Investment Securities 11. Investment Securities
(1) Details of short-term investment securities as of December 31, 2019 and 2018 are as follows:
(In millions of won)Category December 31, 2019 December 31, 2018
Beneficiary certificates FVTPL ₩ 166,666 195,080
(2) Details of long-term investment securities as of December 31, 2019 and 2018 are as follows:
(In millions of won)Category December 31, 2019 December 31, 2018
Equity instruments FVOCI(*) ₩ 710,272 542,496FVTPL 1,011 —
711,283 542,496Debt instruments FVOCI 4,627 2,147
FVTPL 141,305 120,083145,932 122,230
₩ 857,215 664,726
(*) The Group designated ₩710,272 million of investments in equity instruments that are not held for trading as financial assets at FVOCI. During the year endedDecember 31, 2019, the Group disposed of 6,109,000 common shares issued by Hana Financial Group Inc. in exchange for ₩221,146 million in cash. Thevaluation gain on financial assets at FVOCI of ₩30,073 million was reclassified from reserves to retained earnings. Also, the Group acquired 2,177,401 newlyissued shares of Kakao Co., Ltd. (“Kakao”) in exchange for ₩302,321 million in cash and designated the investments as financial assets at FVOCI. In relation tothis transaction, Kakao acquired 1,266,620 treasury shares of the Parent Company in exchange for ₩300,000 million in cash (See Note 23). Upon entering into theagreement, the Group recognized derivative at the fair value of the forward transaction. Upon completion of the share exchange, the Group recognized₩28,787 million of gain from settlement of the derivatives, which is the difference between the fair value of the Parent Company’s and Kakao’s shares at the datewhen such share exchange was completed. The acquired shares were deposited at the Korea Securities Depository for a lock-up period of one year from theacquisition date based on the shares acquisition agreement between the Parent Company and Kakao Co., Ltd.
Copyright © 2020 www.secdatabase.com. All Rights Reserved.Please Consider the Environment Before Printing This Document

Business Combination -Additional information
(Parenthetical) (Detail) - SKInfosec Co., Ltd. [member]
₩ in Millions
Oct. 01, 2018KRW (₩)
shares
Disclosure of detailed information about business combination [line items]Number of treasury shares transferred as consideration | shares 1,260,668Fair value of total consideration transferred | ₩ ₩ 335,338
Copyright © 2020 www.secdatabase.com. All Rights Reserved.Please Consider the Environment Before Printing This Document

12 Months EndedTrade and Other Receivables Dec. 31, 2019Text block [abstract]Trade and Other Receivables 7. Trade and Other Receivables
(1) Details of trade and other receivables as of December 31, 2019 and 2018 are as follows:
(In millions of won)December 31, 2019
Grossamount
Lossallowance
Carryingamount
Current assets:Accounts receivable — trade ₩ 2,480,419 (249,440) 2,230,979Short-term loans 66,706 (583) 66,123Accounts receivable — other(*) 953,815 (48,379) 905,436Accrued income 3,977 (166) 3,811Guarantee deposits (Other current assets) 145,041 — 145,041
3,649,958 (298,568) 3,351,390Non-current assets:
Long-term loans 81,231 (47,471) 33,760Long-term accounts receivable — other(*) 344,662 — 344,662Guarantee deposits 165,033 (299) 164,734Long-term accounts receivable — trade (Other non-current assets) 16,977 (61) 16,916
607,903 (47,831) 560,072₩ 4,257,861 (346,399) 3,911,462
(*) Gross and carrying amounts of accounts receivable — other as of December 31, 2019 include ₩ 532,225 million of financial instruments classified as FVTPL.
(In millions of won)December 31, 2018
Grossamount Loss allowance
Carryingamount
Current assets:Accounts receivable — trade ₩ 2,268,680 (260,040) 2,008,640Short-term loans 59,643 (549) 59,094Accounts receivable — other(*) 1,006,183 (68,346) 937,837Accrued income 6,232 (166) 6,066Guarantee deposits (Other current assets) 2,714 — 2,714
3,343,452 (329,101) 3,014,351Non-current assets:
Long-term loans 75,860 (46,826) 29,034Long-term accounts receivable — other(*) 274,053 — 274,053Guarantee deposits 313,140 — 313,140Long-term accounts receivable — trade (Other non-current assets) 11,410 (117) 11,293
674,463 (46,943) 627,520₩ 4,017,915 (376,044) 3,641,871
(*) Gross and carrying amounts of accounts receivable — other as of December 31, 2018 include ₩ 489,617 million of financial instruments classified as FVTPL.(2) Changes in the loss allowance on accounts receivable — trade measured at amortized costs during the years ended December 31, 2019 and 2018 are as follows:
(In millions of won)
Beginningbalance
Impact ofadoptingIFRS 9 Impairment Write-offs(*)
Collection ofreceivablespreviouslywritten-off
Businesscombinationand others
EndingBalance
2019 ₩ 260,157 — 28,841 (55,756) 14,772 1,487 249,5012018 239,448 12,950 38,211 (46,616) 13,455 2,709 260,157
(*) The Group writes off the trade and other receivables when contractual payments are more than 5 years past due, or for reasons such as termination of operations orliquidation.
(3) The Group applies the practical expedient that allows the Group to estimate the loss allowance for accounts receivable — trade at an amount equal to the lifetimeexpected credit losses. The expected credit losses include the forward-looking information. To make the assessment, the Group uses its historical credit lossexperience over the past three years and classified the accounts receivable — trade by their credit risk characteristics and days overdue. Details of loss allowance onaccounts receivable — trade as of December 31, 2019 are as follows:
(In millions of won)Less than6 months
6 months ~1 year 1 ~ 3 years
More than3 years
Expected credit loss rate 1.34% 63.33% 85.89% 97.49%Gross amount ₩1,180,733 44,972 110,038 28,300
Telecommunications service revenue
Loss allowance 15,822 28,481 94,509 27,589Other revenue Expected credit loss rate 3.49% 56.01% 45.99% 61.72%
Copyright © 2020 www.secdatabase.com. All Rights Reserved.Please Consider the Environment Before Printing This Document
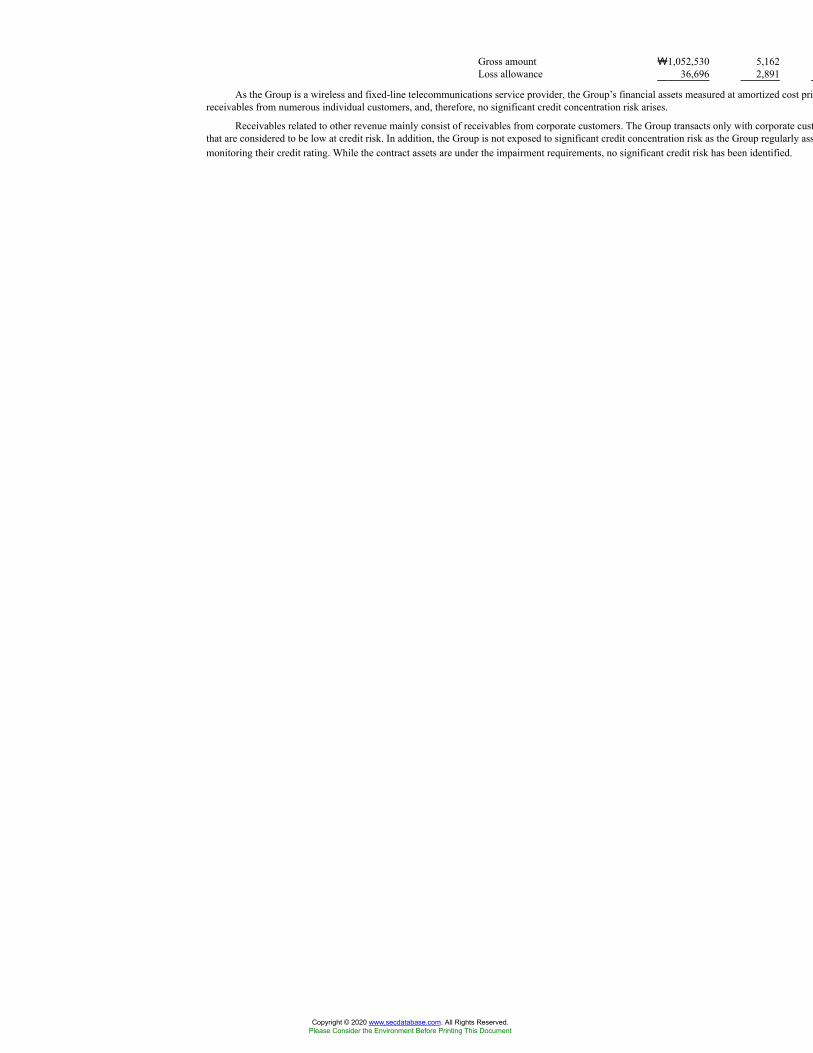
Gross amount ₩1,052,530 5,162 20,252 55,409Loss allowance 36,696 2,891 9,313 34,200
As the Group is a wireless and fixed-line telecommunications service provider, the Group’s financial assets measured at amortized cost primarily consist ofreceivables from numerous individual customers, and, therefore, no significant credit concentration risk arises.
Receivables related to other revenue mainly consist of receivables from corporate customers. The Group transacts only with corporate customers with credit ratingsthat are considered to be low at credit risk. In addition, the Group is not exposed to significant credit concentration risk as the Group regularly assesses their credit risk bymonitoring their credit rating. While the contract assets are under the impairment requirements, no significant credit risk has been identified.
Copyright © 2020 www.secdatabase.com. All Rights Reserved.Please Consider the Environment Before Printing This Document
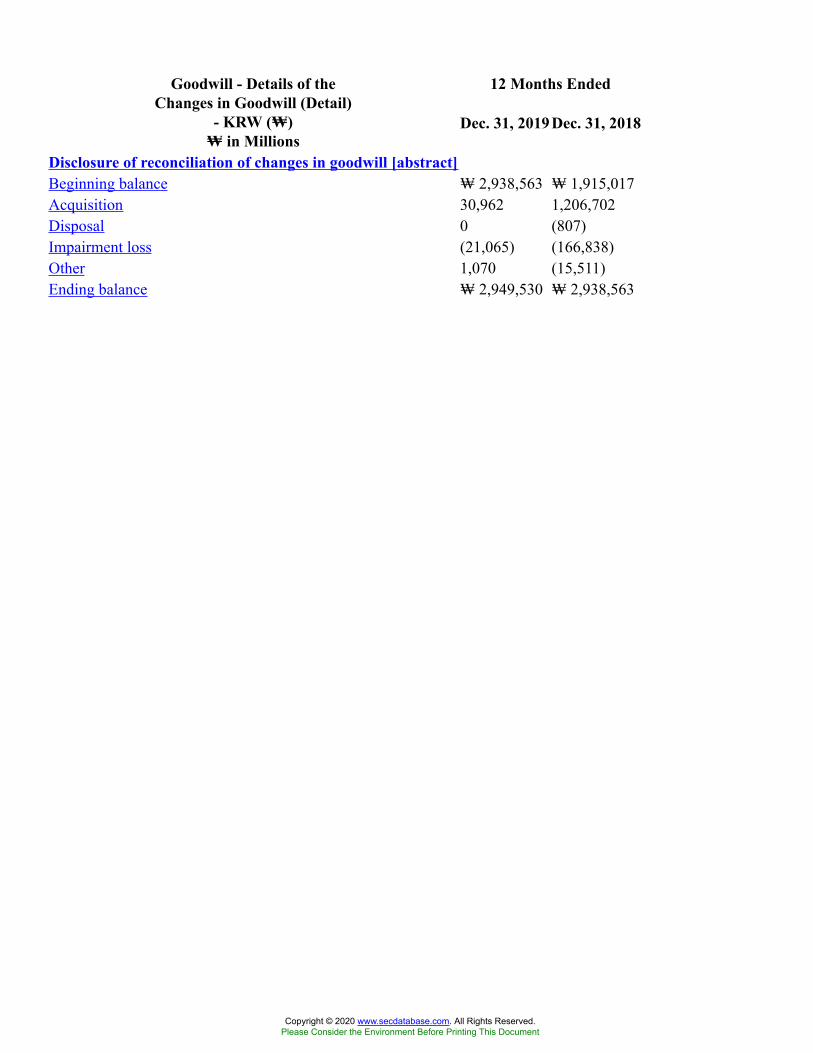
12 Months EndedGoodwill - Details of theChanges in Goodwill (Detail)
- KRW (₩)₩ in Millions
Dec. 31, 2019 Dec. 31, 2018
Disclosure of reconciliation of changes in goodwill [abstract]Beginning balance ₩ 2,938,563 ₩ 1,915,017Acquisition 30,962 1,206,702Disposal 0 (807)Impairment loss (21,065) (166,838)Other 1,070 (15,511)Ending balance ₩ 2,949,530 ₩ 2,938,563
Copyright © 2020 www.secdatabase.com. All Rights Reserved.Please Consider the Environment Before Printing This Document
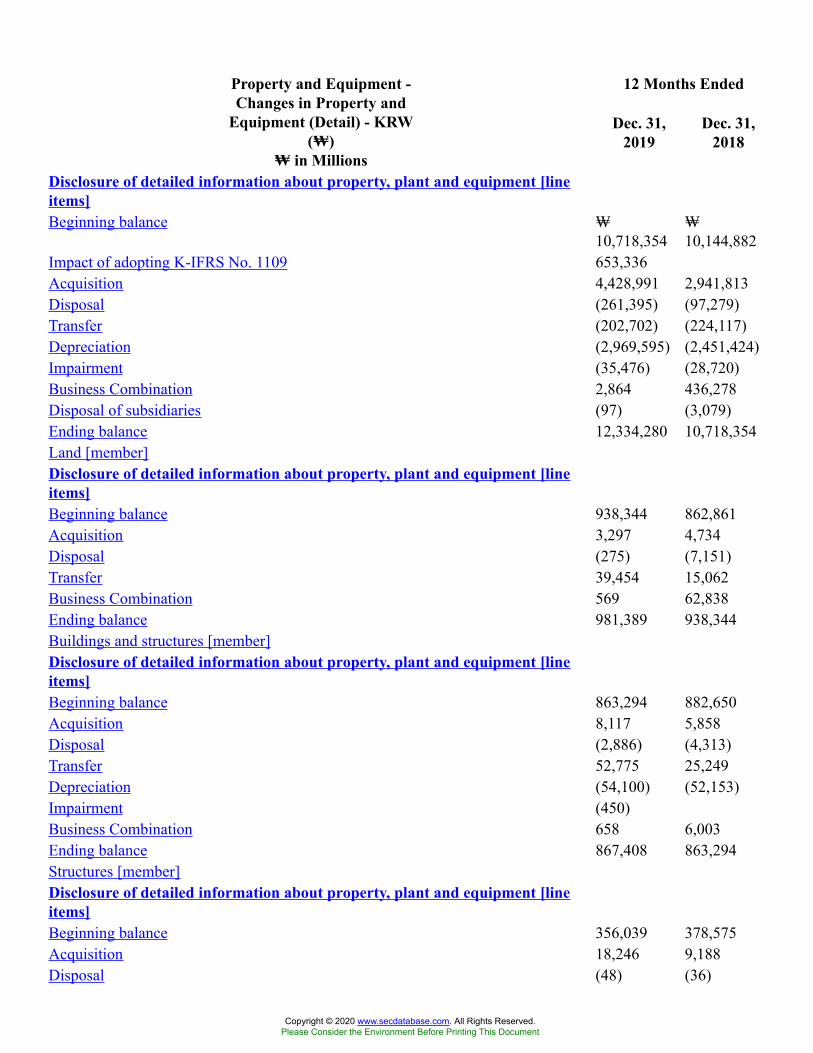
12 Months EndedProperty and Equipment -Changes in Property and
Equipment (Detail) - KRW(₩)
₩ in Millions
Dec. 31,2019
Dec. 31,2018
Disclosure of detailed information about property, plant and equipment [lineitems]Beginning balance ₩
10,718,354₩10,144,882
Impact of adopting K-IFRS No. 1109 653,336Acquisition 4,428,991 2,941,813Disposal (261,395) (97,279)Transfer (202,702) (224,117)Depreciation (2,969,595) (2,451,424)Impairment (35,476) (28,720)Business Combination 2,864 436,278Disposal of subsidiaries (97) (3,079)Ending balance 12,334,280 10,718,354Land [member]Disclosure of detailed information about property, plant and equipment [lineitems]Beginning balance 938,344 862,861Acquisition 3,297 4,734Disposal (275) (7,151)Transfer 39,454 15,062Business Combination 569 62,838Ending balance 981,389 938,344Buildings and structures [member]Disclosure of detailed information about property, plant and equipment [lineitems]Beginning balance 863,294 882,650Acquisition 8,117 5,858Disposal (2,886) (4,313)Transfer 52,775 25,249Depreciation (54,100) (52,153)Impairment (450)Business Combination 658 6,003Ending balance 867,408 863,294Structures [member]Disclosure of detailed information about property, plant and equipment [lineitems]Beginning balance 356,039 378,575Acquisition 18,246 9,188Disposal (48) (36)
Copyright © 2020 www.secdatabase.com. All Rights Reserved.Please Consider the Environment Before Printing This Document
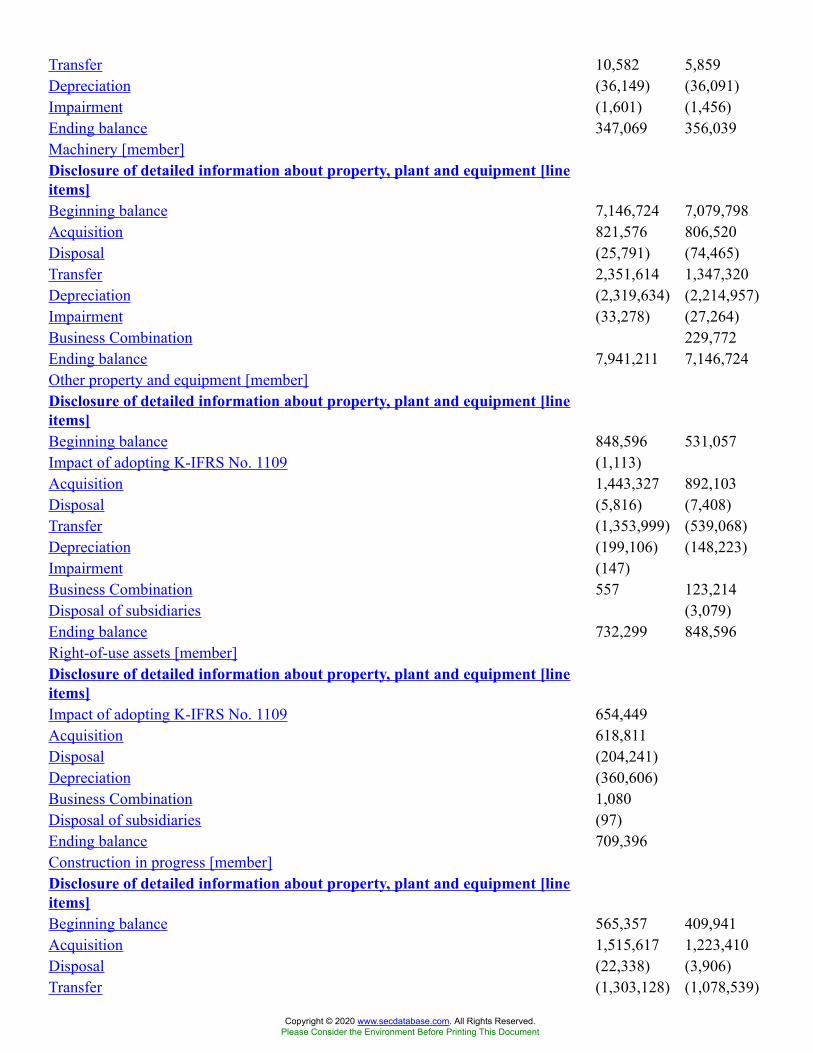
Transfer 10,582 5,859Depreciation (36,149) (36,091)Impairment (1,601) (1,456)Ending balance 347,069 356,039Machinery [member]Disclosure of detailed information about property, plant and equipment [lineitems]Beginning balance 7,146,724 7,079,798Acquisition 821,576 806,520Disposal (25,791) (74,465)Transfer 2,351,614 1,347,320Depreciation (2,319,634) (2,214,957)Impairment (33,278) (27,264)Business Combination 229,772Ending balance 7,941,211 7,146,724Other property and equipment [member]Disclosure of detailed information about property, plant and equipment [lineitems]Beginning balance 848,596 531,057Impact of adopting K-IFRS No. 1109 (1,113)Acquisition 1,443,327 892,103Disposal (5,816) (7,408)Transfer (1,353,999) (539,068)Depreciation (199,106) (148,223)Impairment (147)Business Combination 557 123,214Disposal of subsidiaries (3,079)Ending balance 732,299 848,596Right-of-use assets [member]Disclosure of detailed information about property, plant and equipment [lineitems]Impact of adopting K-IFRS No. 1109 654,449Acquisition 618,811Disposal (204,241)Depreciation (360,606)Business Combination 1,080Disposal of subsidiaries (97)Ending balance 709,396Construction in progress [member]Disclosure of detailed information about property, plant and equipment [lineitems]Beginning balance 565,357 409,941Acquisition 1,515,617 1,223,410Disposal (22,338) (3,906)Transfer (1,303,128) (1,078,539)
Copyright © 2020 www.secdatabase.com. All Rights Reserved.Please Consider the Environment Before Printing This Document
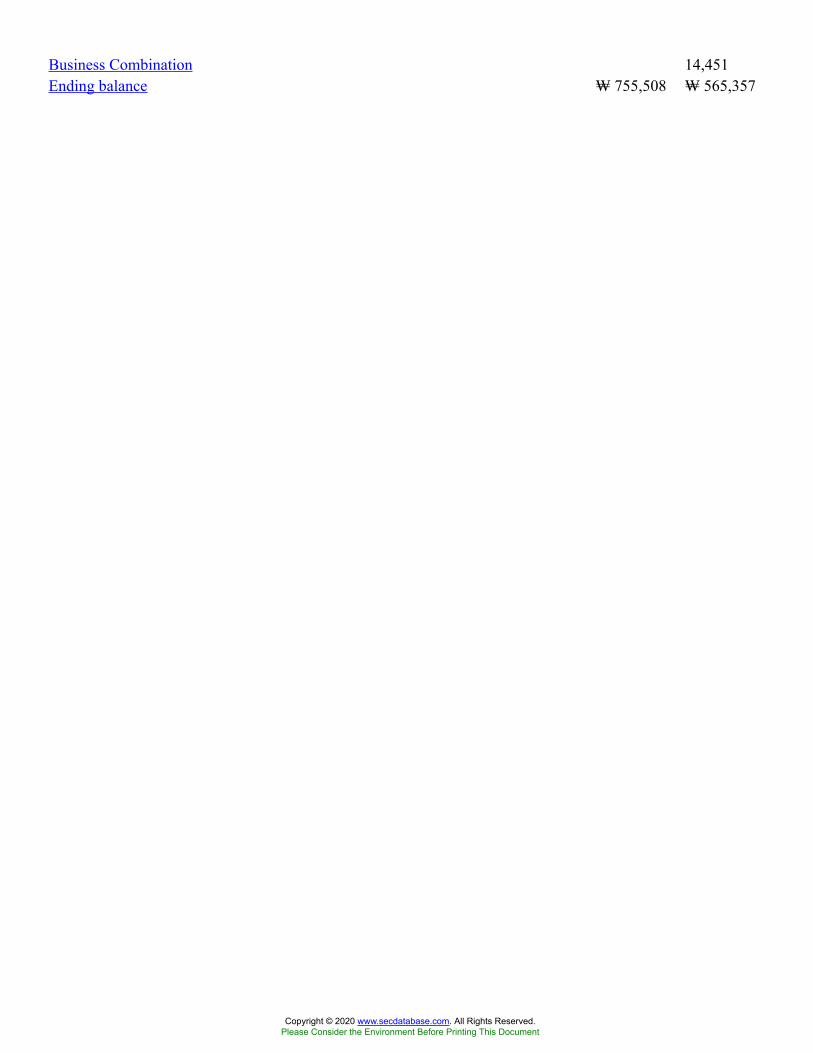
Business Combination 14,451Ending balance ₩ 755,508 ₩ 565,357
Copyright © 2020 www.secdatabase.com. All Rights Reserved.Please Consider the Environment Before Printing This Document
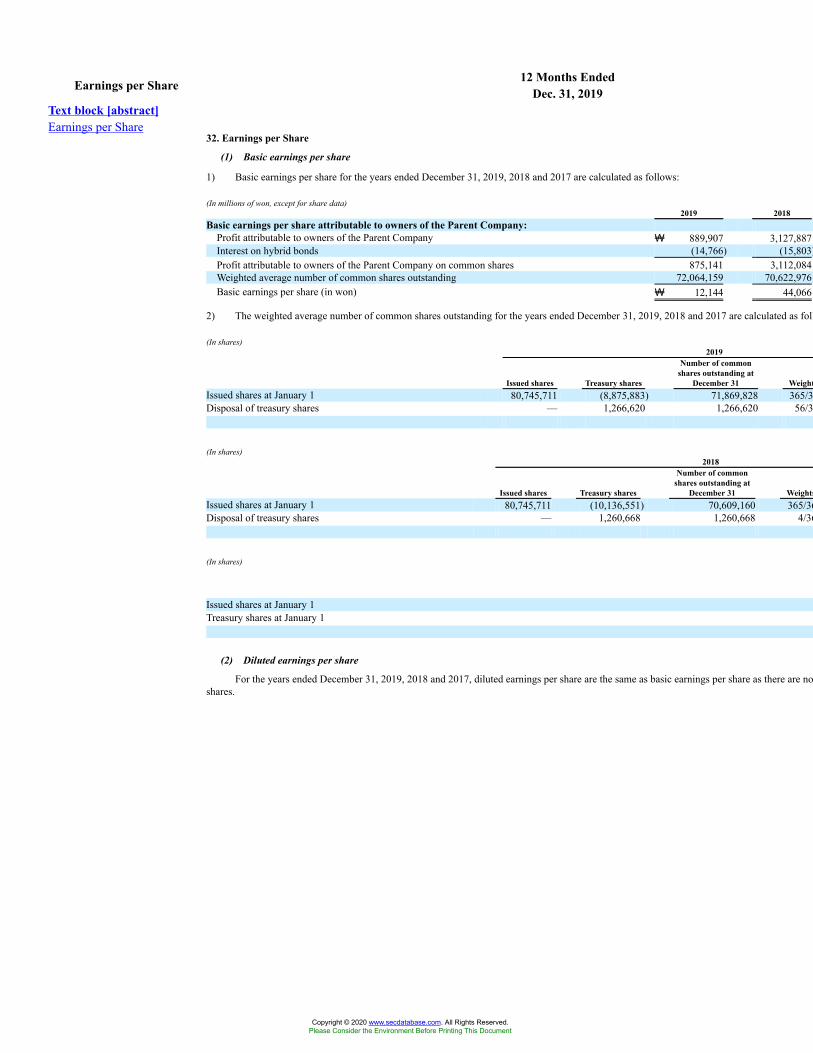
12 Months EndedEarnings per Share Dec. 31, 2019Text block [abstract]Earnings per Share
32. Earnings per Share
(1) Basic earnings per share
1) Basic earnings per share for the years ended December 31, 2019, 2018 and 2017 are calculated as follows:
(In millions of won, except for share data)2019 2018 2017
Basic earnings per share attributable to owners of the Parent Company:Profit attributable to owners of the Parent Company ₩ 889,907 3,127,887 2,599,829Interest on hybrid bonds (14,766) (15,803) (16,840)Profit attributable to owners of the Parent Company on common shares 875,141 3,112,084 2,582,989Weighted average number of common shares outstanding 72,064,159 70,622,976 70,609,160Basic earnings per share (in won) ₩ 12,144 44,066 36,582
2) The weighted average number of common shares outstanding for the years ended December 31, 2019, 2018 and 2017 are calculated as follows:
(In shares)2019
Issued shares Treasury shares
Number of commonshares outstanding at
December 31 Weights
Weighted averagenumber of common
sharesIssued shares at January 1 80,745,711 (8,875,883) 71,869,828 365/365 71,869,828Disposal of treasury shares — 1,266,620 1,266,620 56/365 194,331
72,064,159
(In shares)2018
Issued shares Treasury shares
Number of commonshares outstanding at
December 31 Weights
Weighted averagenumber of common
sharesIssued shares at January 1 80,745,711 (10,136,551) 70,609,160 365/365 70,609,160Disposal of treasury shares — 1,260,668 1,260,668 4/365 13,816
70,622,976
(In shares)2017
Number of commonshares
Issued shares at January 1 80,745,711Treasury shares at January 1 (10,136,551)
70,609,160
(2) Diluted earnings per share
For the years ended December 31, 2019, 2018 and 2017, diluted earnings per share are the same as basic earnings per share as there are no dilutive potential commonshares.
Copyright © 2020 www.secdatabase.com. All Rights Reserved.Please Consider the Environment Before Printing This Document
12 Months EndedHybrid Bonds Dec. 31, 2019Text block [abstract]Hybrid Bonds 24. Hybrid Bonds
Hybrid bonds classified as equity as of December 31, 2019 and 2018 are as follows:
(In millions of won)
Type Issuance date Maturity(*1)Annual interest
rate(%)(*2)December 31,
2019December 31,
2018Series 2-1 hybrid bonds Unsecured subordinated
bearer bond June 7, 2018 June 7, 2078 3.70 ₩ 300,000 300,000
Series 2-2 hybrid bonds Unsecured subordinatedbearer bond June 7, 2018 June 7, 2078 3.65 100,000 100,000
Issuance costs (1,241) (1,241)₩ 398,759 398,759
As there is no contractual obligation to deliver financial assets to the holders of hybrid bonds, the Group classified the hybrid bonds as equity.
These are subordinated bonds which rank before common shares in the event of a liquidation or reorganization of the Parent Company.
(*1) The Parent Company has a right to extend the maturity without any notice or announcement.(*2) Annual interest rate is determined as yield rate of 5 year national bond plus premium. According to the step-up clause, additional premium of 0.25% and 0.75%,
respectively, after 10 years and 25 years from the issuance date are applied.
Copyright © 2020 www.secdatabase.com. All Rights Reserved.Please Consider the Environment Before Printing This Document

12 Months EndedRedeemable ConvertiblePreferred Stocks Dec. 31, 2019
Text block [abstract]Redeemable ConvertiblePreferred Stocks
28. Redeemable Convertible Preferred Stocks
Eleven street Co., Ltd., a subsidiary of the Parent Company, issued redeemable convertible preferred stocks on September 7, 2018 according to the board of directors’resolution. The details of the issuance are as follows:
Information of redeemable convertible preferred stocksIssuer Eleven Street Co., Ltd.Number of shares issued 1,863,093Issue price ₩268,371 per shareVoting rights 1 voting right per 1 shareDividend rate(*) 6% of the issue price per annum (cumulative, non-participating)
The obligatory dividend rate of the Parent Company is 1% of the issue price per annumConversion period From 6 months after the date of issue to 1 business day before the expiration date of the redemption periodConversion ratio [Issue price ÷ Conversion price at the date of conversion] per shareConversion price ₩268,371 per shareRefixing clauses • In the case when spin-off, merger, split merger of the company, comprehensive stock exchange or transfer and decrease in
capital, (“merger and others”), conversion price is subject to refixing to guarantee the value that the holder could earn theday right before the circumstances arise.
• In the case when this preferred share is split or merged, the conversion prices is subject to refixing to correspond with thesplit or merge ratio.
Redemption period Two months from September 30, 2023 to December 31, 2047 at the choice of the issuer.Redemption party Eleven Street Co., Ltd.Redemption price Amounts realizing the internal rate of return to be 3.5% at the date of actual redemptionLiquidation preference Preferential to the common shares
(*) The present value of obligatory dividends amounting to ₩18,805 million payable to non-controlling interests based on the shareholders agreement are recognized asfinancial liabilities as of December 31, 2019.
Copyright © 2020 www.secdatabase.com. All Rights Reserved.Please Consider the Environment Before Printing This Document

12 Months EndedInventories (Tables) Dec. 31, 2019Text block [abstract]Details of inventories (1) Details of inventories as of December 31, 2019 and 2018 are as follows:
(In millions of won)December 31, 2019 December 31, 2018
Acquisitioncost
Write-down
Carryingamount
Acquisitioncost
Write-down
Carryingamount
Merchandise ₩ 162,485 (14,557) 147,928 268,366 (8,842) 259,524Finished goods 4,264 (2,265) 1,999 1,260 (251) 1,009Work in process 2,674 (539) 2,135 3,985 (338) 3,647Raw materials 12,369 (7,967) 4,402 11,729 (2,706) 9,023Supplies 7,112 (694) 6,418 14,850 — 14,850
₩ 188,904 (26,022) 162,882 300,190 (12,137) 288,053
Amount of the inventorywrite-downs charged to theconsolidated statement ofincome and write-off ofinventories
(2) The amount of the inventory write-downs and write-off of inventories charged to statement of income are as follows:
(In millions of won)2019 2018 2017
Charged to cost of products that have been resold ₩ 15,019 2,509 6,079Write-off upon sale (1,101) (2,396) (2,820)
Copyright © 2020 www.secdatabase.com. All Rights Reserved.Please Consider the Environment Before Printing This Document
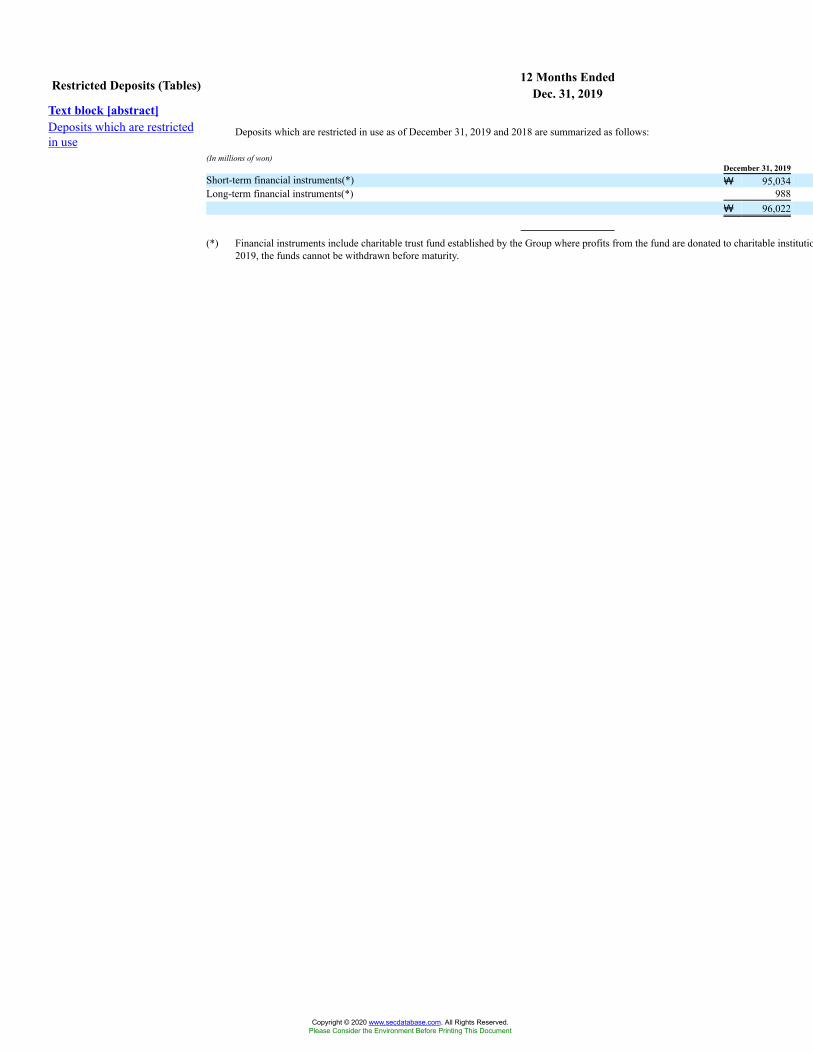
12 Months EndedRestricted Deposits (Tables) Dec. 31, 2019Text block [abstract]Deposits which are restrictedin use
Deposits which are restricted in use as of December 31, 2019 and 2018 are summarized as follows:
(In millions of won)December 31, 2019 December 31, 2018
Short-term financial instruments(*) ₩ 95,034 79,511Long-term financial instruments(*) 988 1,218
₩ 96,022 80,729
(*) Financial instruments include charitable trust fund established by the Group where profits from the fund are donated to charitable institutions. As of December 31,2019, the funds cannot be withdrawn before maturity.
Copyright © 2020 www.secdatabase.com. All Rights Reserved.Please Consider the Environment Before Printing This Document
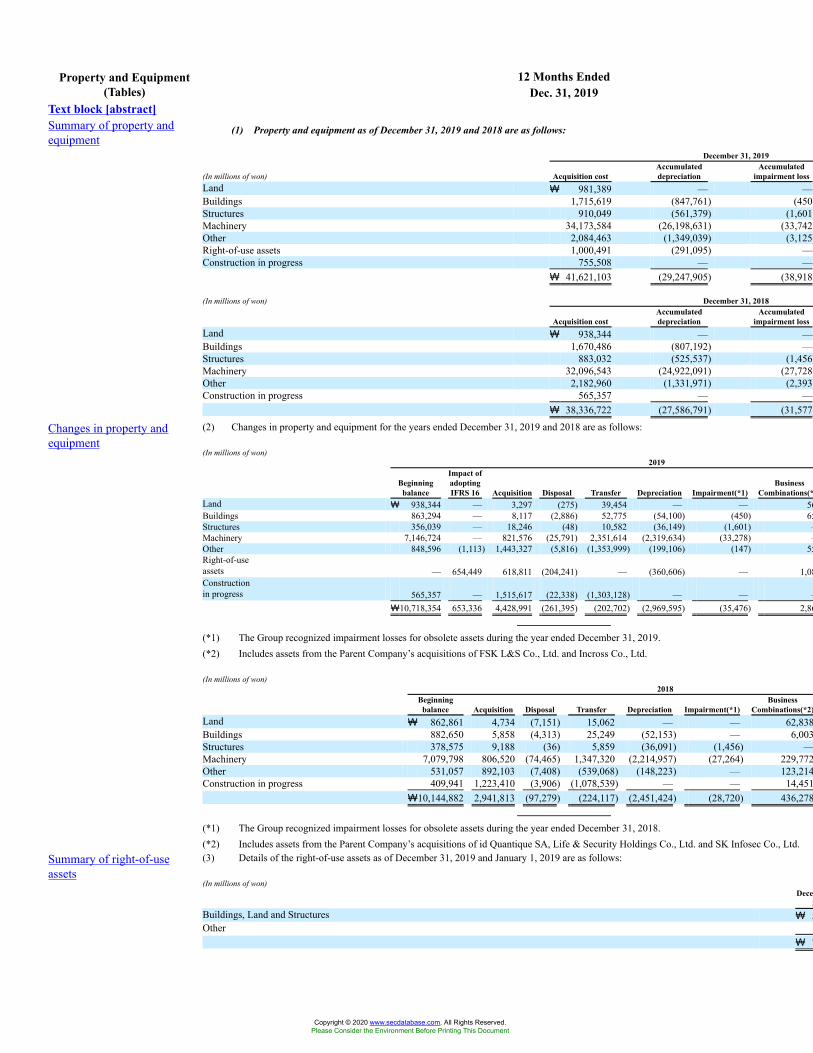
12 Months EndedProperty and Equipment(Tables) Dec. 31, 2019
Text block [abstract]Summary of property andequipment
(1) Property and equipment as of December 31, 2019 and 2018 are as follows:
December 31, 2019
(In millions of won) Acquisition costAccumulateddepreciation
Accumulatedimpairment loss Carrying amount
Land ₩ 981,389 — — 981,389Buildings 1,715,619 (847,761) (450) 867,408Structures 910,049 (561,379) (1,601) 347,069Machinery 34,173,584 (26,198,631) (33,742) 7,941,211Other 2,084,463 (1,349,039) (3,125) 732,299Right-of-use assets 1,000,491 (291,095) — 709,396Construction in progress 755,508 — — 755,508
₩ 41,621,103 (29,247,905) (38,918) 12,334,280
(In millions of won) December 31, 2018
Acquisition costAccumulateddepreciation
Accumulatedimpairment loss Carrying amount
Land ₩ 938,344 — — 938,344Buildings 1,670,486 (807,192) — 863,294Structures 883,032 (525,537) (1,456) 356,039Machinery 32,096,543 (24,922,091) (27,728) 7,146,724Other 2,182,960 (1,331,971) (2,393) 848,596Construction in progress 565,357 — — 565,357
₩ 38,336,722 (27,586,791) (31,577) 10,718,354
Changes in property andequipment
(2) Changes in property and equipment for the years ended December 31, 2019 and 2018 are as follows:
(In millions of won)2019
Beginningbalance
Impact ofadoptingIFRS 16 Acquisition Disposal Transfer Depreciation Impairment(*1)
BusinessCombinations(*2)
Disposal ofsubsidiaries
Endingbalance
Land ₩ 938,344 — 3,297 (275) 39,454 — — 569 — 981,389Buildings 863,294 — 8,117 (2,886) 52,775 (54,100) (450) 658 — 867,408Structures 356,039 — 18,246 (48) 10,582 (36,149) (1,601) — — 347,069Machinery 7,146,724 — 821,576 (25,791) 2,351,614 (2,319,634) (33,278) — — 7,941,211Other 848,596 (1,113) 1,443,327 (5,816) (1,353,999) (199,106) (147) 557 — 732,299Right-of-useassets — 654,449 618,811 (204,241) — (360,606) — 1,080 (97) 709,396Constructionin progress 565,357 — 1,515,617 (22,338) (1,303,128) — — — — 755,508
₩10,718,354 653,336 4,428,991 (261,395) (202,702) (2,969,595) (35,476) 2,864 (97) 12,334,280
(*1) The Group recognized impairment losses for obsolete assets during the year ended December 31, 2019.(*2) Includes assets from the Parent Company’s acquisitions of FSK L&S Co., Ltd. and Incross Co., Ltd.
(In millions of won)2018
Beginningbalance Acquisition Disposal Transfer Depreciation Impairment(*1)
BusinessCombinations(*2)
Disposal ofsubsidiaries
Endingbalance
Land ₩ 862,861 4,734 (7,151) 15,062 — — 62,838 — 938,344Buildings 882,650 5,858 (4,313) 25,249 (52,153) — 6,003 — 863,294Structures 378,575 9,188 (36) 5,859 (36,091) (1,456) — — 356,039Machinery 7,079,798 806,520 (74,465) 1,347,320 (2,214,957) (27,264) 229,772 — 7,146,724Other 531,057 892,103 (7,408) (539,068) (148,223) — 123,214 (3,079) 848,596Construction in progress 409,941 1,223,410 (3,906) (1,078,539) — — 14,451 — 565,357
₩10,144,882 2,941,813 (97,279) (224,117) (2,451,424) (28,720) 436,278 (3,079) 10,718,354
(*1) The Group recognized impairment losses for obsolete assets during the year ended December 31, 2018.(*2) Includes assets from the Parent Company’s acquisitions of id Quantique SA, Life & Security Holdings Co., Ltd. and SK Infosec Co., Ltd.
Summary of right-of-useassets
(3) Details of the right-of-use assets as of December 31, 2019 and January 1, 2019 are as follows:
(In millions of won)December 31,
2019January 1,
2019Buildings, Land and Structures ₩ 584,523 512,698Other 124,873 141,751
₩ 709,396 654,449
Copyright © 2020 www.secdatabase.com. All Rights Reserved.Please Consider the Environment Before Printing This Document
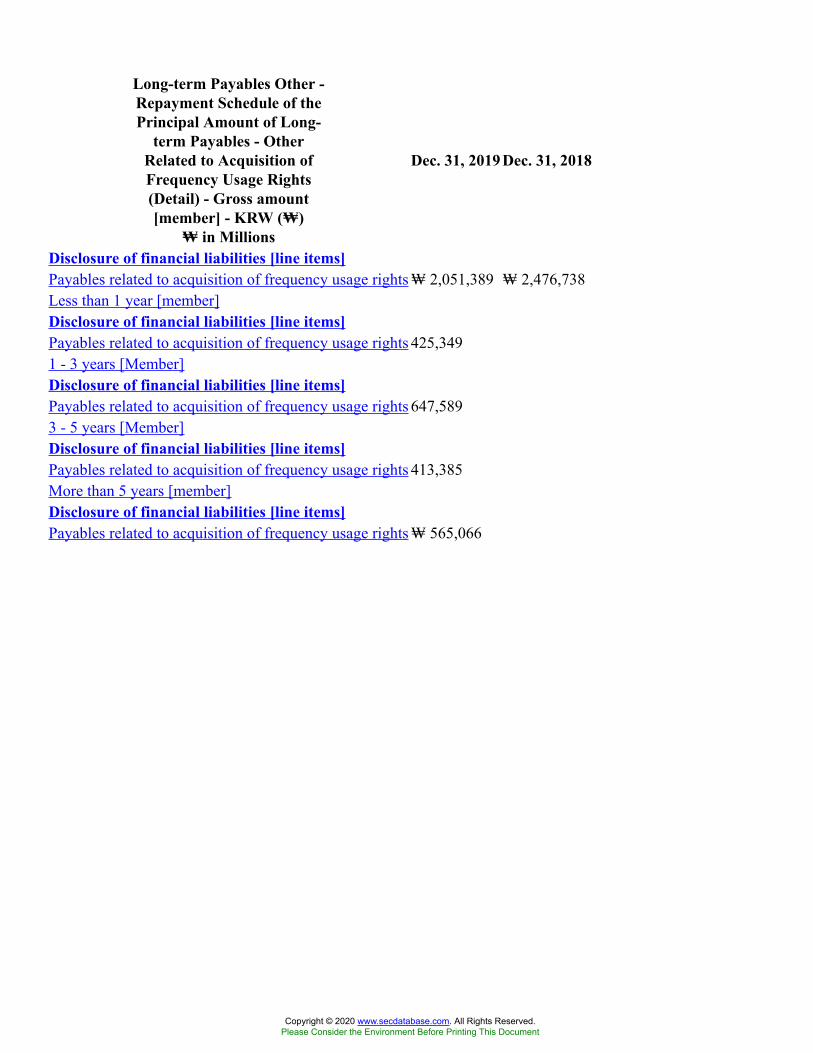
Long-term Payables Other -Repayment Schedule of thePrincipal Amount of Long-
term Payables - OtherRelated to Acquisition ofFrequency Usage Rights(Detail) - Gross amount[member] - KRW (₩)
₩ in Millions
Dec. 31, 2019 Dec. 31, 2018
Disclosure of financial liabilities [line items]Payables related to acquisition of frequency usage rights ₩ 2,051,389 ₩ 2,476,738Less than 1 year [member]Disclosure of financial liabilities [line items]Payables related to acquisition of frequency usage rights 425,3491 - 3 years [Member]Disclosure of financial liabilities [line items]Payables related to acquisition of frequency usage rights 647,5893 - 5 years [Member]Disclosure of financial liabilities [line items]Payables related to acquisition of frequency usage rights 413,385More than 5 years [member]Disclosure of financial liabilities [line items]Payables related to acquisition of frequency usage rights ₩ 565,066
Copyright © 2020 www.secdatabase.com. All Rights Reserved.Please Consider the Environment Before Printing This Document
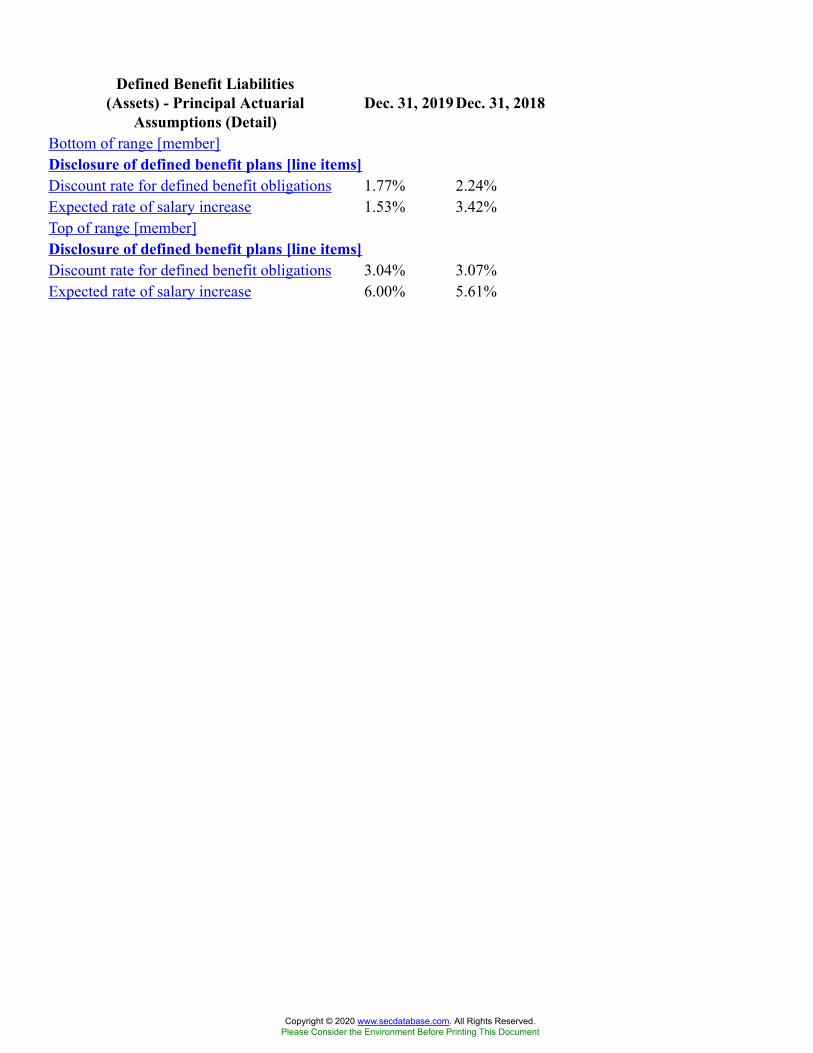
Defined Benefit Liabilities(Assets) - Principal Actuarial
Assumptions (Detail)Dec. 31, 2019 Dec. 31, 2018
Bottom of range [member]Disclosure of defined benefit plans [line items]Discount rate for defined benefit obligations 1.77% 2.24%Expected rate of salary increase 1.53% 3.42%Top of range [member]Disclosure of defined benefit plans [line items]Discount rate for defined benefit obligations 3.04% 3.07%Expected rate of salary increase 6.00% 5.61%
Copyright © 2020 www.secdatabase.com. All Rights Reserved.Please Consider the Environment Before Printing This Document
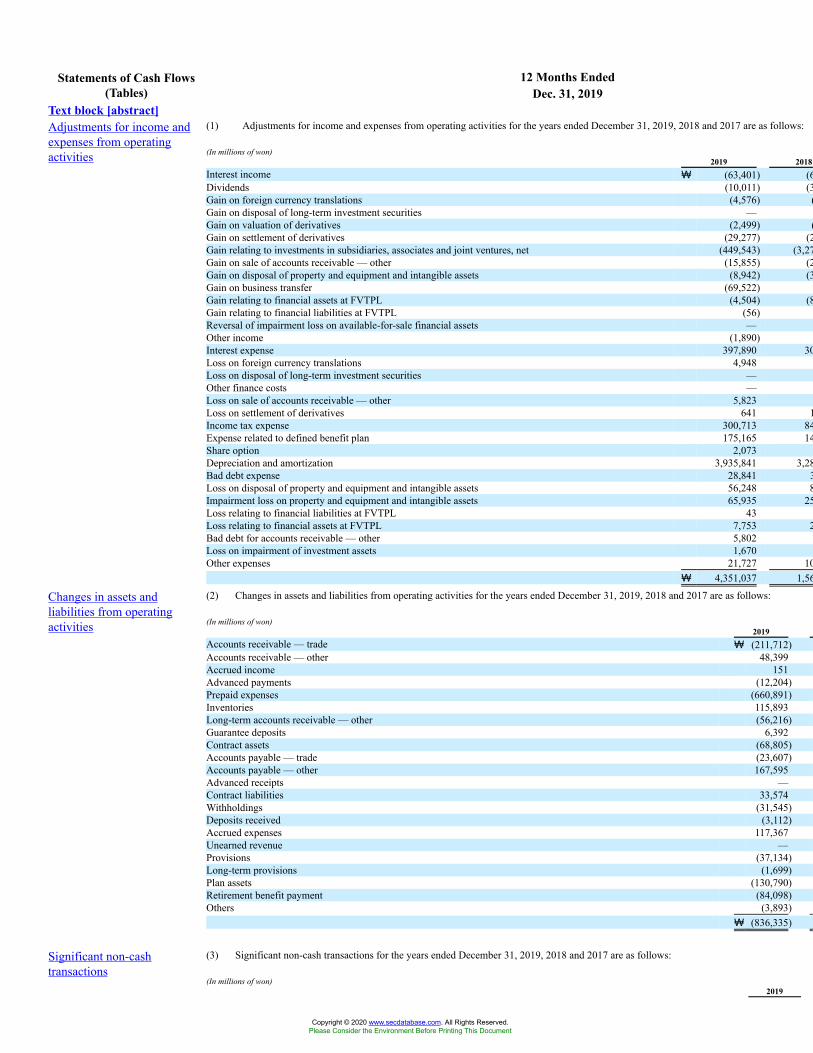
12 Months EndedStatements of Cash Flows(Tables) Dec. 31, 2019
Text block [abstract]Adjustments for income andexpenses from operatingactivities
(1) Adjustments for income and expenses from operating activities for the years ended December 31, 2019, 2018 and 2017 are as follows:
(In millions of won)2019 2018 2017
Interest income ₩ (63,401) (69,936) (76,045)Dividends (10,011) (35,143) (12,416)Gain on foreign currency translations (4,576) (2,776) (7,110)Gain on disposal of long-term investment securities — — (4,890)Gain on valuation of derivatives (2,499) (6,532) (223,943)Gain on settlement of derivatives (29,277) (20,399) —Gain relating to investments in subsidiaries, associates and joint ventures, net (449,543) (3,270,912) (2,245,732)Gain on sale of accounts receivable — other (15,855) (20,023) (18,548)Gain on disposal of property and equipment and intangible assets (8,942) (38,933) (13,991)Gain on business transfer (69,522) — —Gain relating to financial assets at FVTPL (4,504) (83,636) (33)Gain relating to financial liabilities at FVTPL (56) — —Reversal of impairment loss on available-for-sale financial assets — — (9,900)Other income (1,890) (952) (1,129)Interest expense 397,890 307,319 299,100Loss on foreign currency translations 4,948 2,397 8,419Loss on disposal of long-term investment securities — — 36,024Other finance costs — — 14,519Loss on sale of accounts receivable — other 5,823 — 9,682Loss on settlement of derivatives 641 12,554 10,031Income tax expense 300,713 843,978 745,654Expense related to defined benefit plan 175,165 147,722 127,696Share option 2,073 789 414Depreciation and amortization 3,935,841 3,284,339 3,247,519Bad debt expense 28,841 38,211 34,584Loss on disposal of property and equipment and intangible assets 56,248 87,257 60,086Impairment loss on property and equipment and intangible assets 65,935 255,839 54,946Loss relating to financial liabilities at FVTPL 43 1,535 678Loss relating to financial assets at FVTPL 7,753 22,507 —Bad debt for accounts receivable — other 5,802 7,718 5,793Loss on impairment of investment assets 1,670 3,157 9,003Other expenses 21,727 102,839 46,353
₩ 4,351,037 1,568,919 2,096,764
Changes in assets andliabilities from operatingactivities
(2) Changes in assets and liabilities from operating activities for the years ended December 31, 2019, 2018 and 2017 are as follows:
(In millions of won)2019 2018 2017
Accounts receivable — trade ₩ (211,712) 175,841 46,144Accounts receivable — other 48,399 319,913 (159,960)Accrued income 151 — 14Advanced payments (12,204) 13,393 (1,269)Prepaid expenses (660,891) (3,597) (28,362)Inventories 115,893 (13,429) (17,958)Long-term accounts receivable — other (56,216) 11,064 (137,979)Guarantee deposits 6,392 (258) 14,696Contract assets (68,805) 9,161 —Accounts payable — trade (23,607) (58,487) (26,151)Accounts payable — other 167,595 (271,128) 134,542Advanced receipts — — (13,470)Contract liabilities 33,574 11,328 —Withholdings (31,545) 129,492 (13,041)Deposits received (3,112) (333) (4,916)Accrued expenses 117,367 (102,246) 116,065Unearned revenue — — (339)Provisions (37,134) (4,298) (20,488)Long-term provisions (1,699) 1,193 (2,449)Plan assets (130,790) (123,075) (95,828)Retirement benefit payment (84,098) (63,957) (60,883)Others (3,893) (4,628) 10,164
₩ (836,335) 25,949 (261,468)
Significant non-cashtransactions
(3) Significant non-cash transactions for the years ended December 31, 2019, 2018 and 2017 are as follows:
(In millions of won)2019 2018 2017
Copyright © 2020 www.secdatabase.com. All Rights Reserved.Please Consider the Environment Before Printing This Document
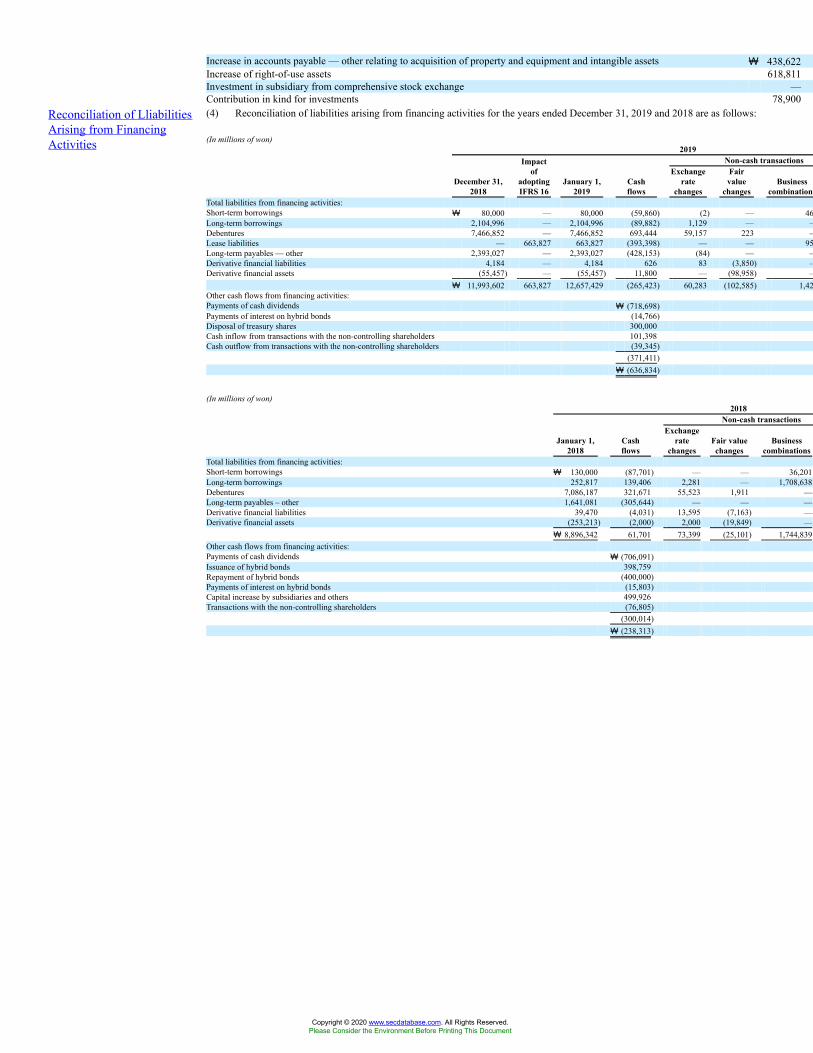
Increase in accounts payable — other relating to acquisition of property and equipment and intangible assets ₩ 438,622 1,162,301 44,214Increase of right-of-use assets 618,811 — —Investment in subsidiary from comprehensive stock exchange — 129,595 —Contribution in kind for investments 78,900 — —
Reconciliation of LliabilitiesArising from FinancingActivities
(4) Reconciliation of liabilities arising from financing activities for the years ended December 31, 2019 and 2018 are as follows:
(In millions of won)2019
Non-cash transactions
December 31,2018
Impactof
adoptingIFRS 16
January 1,2019
Cashflows
Exchangerate
changes
Fairvalue
changesBusiness
combinationsOther
changesDecember 31,
2019Total liabilities from financing activities:Short-term borrowings ₩ 80,000 — 80,000 (59,860) (2) — 465 — 20,603Long-term borrowings 2,104,996 — 2,104,996 (89,882) 1,129 — — 6,294 2,022,537Debentures 7,466,852 — 7,466,852 693,444 59,157 223 — 1,157 8,220,833Lease liabilities — 663,827 663,827 (393,398) — — 955 441,356 712,740Long-term payables — other 2,393,027 — 2,393,027 (428,153) (84) — — 6,819 1,971,609Derivative financial liabilities 4,184 — 4,184 626 83 (3,850) — — 1,043Derivative financial assets (55,457) — (55,457) 11,800 — (98,958) — (2,271) (144,886)
₩ 11,993,602 663,827 12,657,429 (265,423) 60,283 (102,585) 1,420 453,355 12,804,479Other cash flows from financing activities:Payments of cash dividends ₩ (718,698)Payments of interest on hybrid bonds (14,766)Disposal of treasury shares 300,000Cash inflow from transactions with the non-controlling shareholders 101,398Cash outflow from transactions with the non-controlling shareholders (39,345)
(371,411)₩ (636,834)
(In millions of won)2018
Non-cash transactions
January 1,2018
Cashflows
Exchangerate
changesFair valuechanges
Businesscombinations
Otherchanges
December 31,2018
Total liabilities from financing activities:Short-term borrowings ₩ 130,000 (87,701) — — 36,201 1,500 80,000Long-term borrowings 252,817 139,406 2,281 — 1,708,638 1,854 2,104,996Debentures 7,086,187 321,671 55,523 1,911 — 1,560 7,466,852Long-term payables – other 1,641,081 (305,644) — — — 1,057,590 2,393,027Derivative financial liabilities 39,470 (4,031) 13,595 (7,163) — (37,687) 4,184Derivative financial assets (253,213) (2,000) 2,000 (19,849) — 217,605 (55,457)
₩ 8,896,342 61,701 73,399 (25,101) 1,744,839 1,242,422 11,993,602Other cash flows from financing activities:Payments of cash dividends ₩ (706,091)Issuance of hybrid bonds 398,759Repayment of hybrid bonds (400,000)Payments of interest on hybrid bonds (15,803)Capital increase by subsidiaries and others 499,926Transactions with the non-controlling shareholders (76,805)
(300,014)₩ (238,313)
Copyright © 2020 www.secdatabase.com. All Rights Reserved.Please Consider the Environment Before Printing This Document
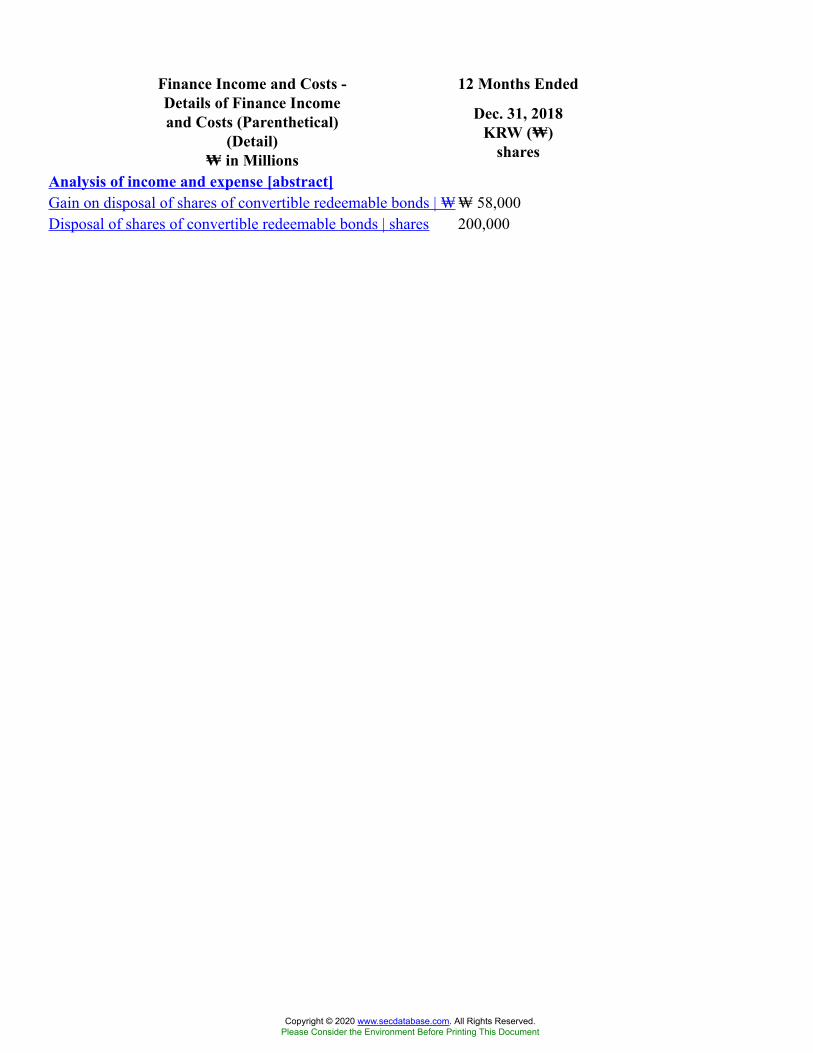
12 Months EndedFinance Income and Costs -Details of Finance Incomeand Costs (Parenthetical)
(Detail)₩ in Millions
Dec. 31, 2018KRW (₩)
shares
Analysis of income and expense [abstract]Gain on disposal of shares of convertible redeemable bonds | ₩ ₩ 58,000Disposal of shares of convertible redeemable bonds | shares 200,000
Copyright © 2020 www.secdatabase.com. All Rights Reserved.Please Consider the Environment Before Printing This Document
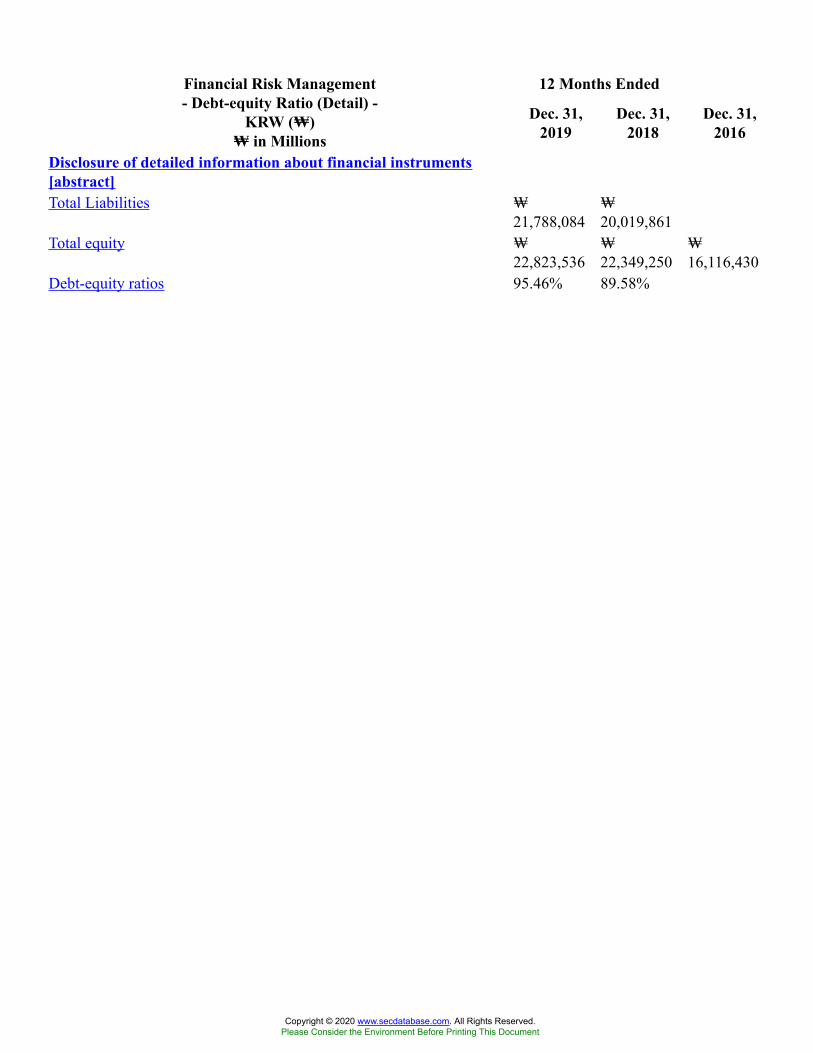
12 Months EndedFinancial Risk Management- Debt-equity Ratio (Detail) -
KRW (₩)₩ in Millions
Dec. 31,2019
Dec. 31,2018
Dec. 31,2016
Disclosure of detailed information about financial instruments[abstract]Total Liabilities ₩
21,788,084₩20,019,861
Total equity ₩22,823,536
₩22,349,250
₩16,116,430
Debt-equity ratios 95.46% 89.58%
Copyright © 2020 www.secdatabase.com. All Rights Reserved.Please Consider the Environment Before Printing This Document
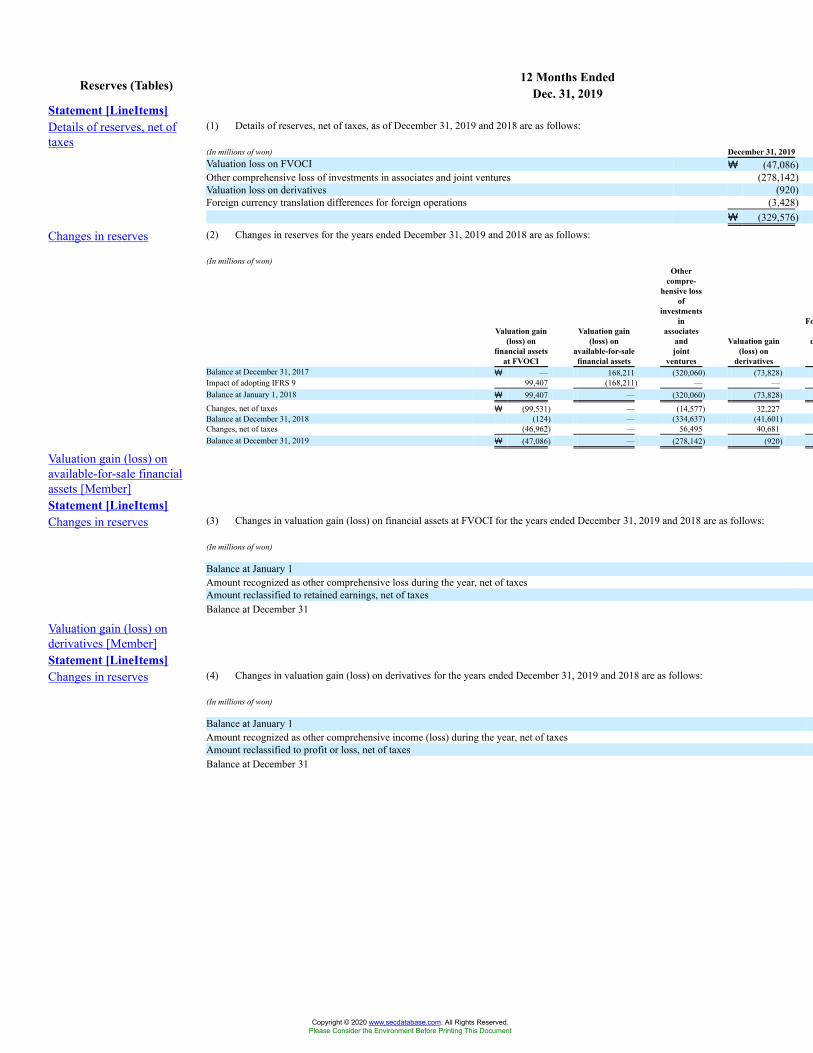
12 Months EndedReserves (Tables) Dec. 31, 2019Statement [LineItems]Details of reserves, net oftaxes
(1) Details of reserves, net of taxes, as of December 31, 2019 and 2018 are as follows:
(In millions of won) December 31, 2019 December 31, 2018Valuation loss on FVOCI ₩ (47,086) (124)Other comprehensive loss of investments in associates and joint ventures (278,142) (334,637)Valuation loss on derivatives (920) (41,601)Foreign currency translation differences for foreign operations (3,428) 2,920
₩ (329,576) (373,442)
Changes in reserves (2) Changes in reserves for the years ended December 31, 2019 and 2018 are as follows:
(In millions of won)
Valuation gain(loss) on
financial assetsat FVOCI
Valuation gain(loss) on
available-for-salefinancial assets
Othercompre-
hensive lossof
investmentsin
associatesandjoint
ventures
Valuation gain(loss) on
derivatives
Foreign currencytranslation
differences forforeign
operations TotalBalance at December 31, 2017 ₩ — 168,211 (320,060) (73,828) (9,050) (234,727)Impact of adopting IFRS 9 99,407 (168,211) — — — (68,804)Balance at January 1, 2018 ₩ 99,407 — (320,060) (73,828) (9,050) (303,531)Changes, net of taxes ₩ (99,531) — (14,577) 32,227 11,970 (69,911)Balance at December 31, 2018 (124) — (334,637) (41,601) 2,920 (373,442)Changes, net of taxes (46,962) — 56,495 40,681 (6,348) 43,866Balance at December 31, 2019 ₩ (47,086) — (278,142) (920) (3,428) (329,576)
Valuation gain (loss) onavailable-for-sale financialassets [Member]Statement [LineItems]Changes in reserves (3) Changes in valuation gain (loss) on financial assets at FVOCI for the years ended December 31, 2019 and 2018 are as follows:
(In millions of won)2019 2018
Balance at January 1 ₩ (124) 99,407Amount recognized as other comprehensive loss during the year, net of taxes (18,472) (117,514)Amount reclassified to retained earnings, net of taxes (28,490) 17,983Balance at December 31 ₩ (47,086) (124)
Valuation gain (loss) onderivatives [Member]Statement [LineItems]Changes in reserves (4) Changes in valuation gain (loss) on derivatives for the years ended December 31, 2019 and 2018 are as follows:
(In millions of won)2019 2018
Balance at January 1 ₩ (41,601) (73,828)Amount recognized as other comprehensive income (loss) during the year, net of taxes 34,209 (11,301)Amount reclassified to profit or loss, net of taxes 6,472 43,528Balance at December 31 ₩ (920) (41,601)
Copyright © 2020 www.secdatabase.com. All Rights Reserved.Please Consider the Environment Before Printing This Document
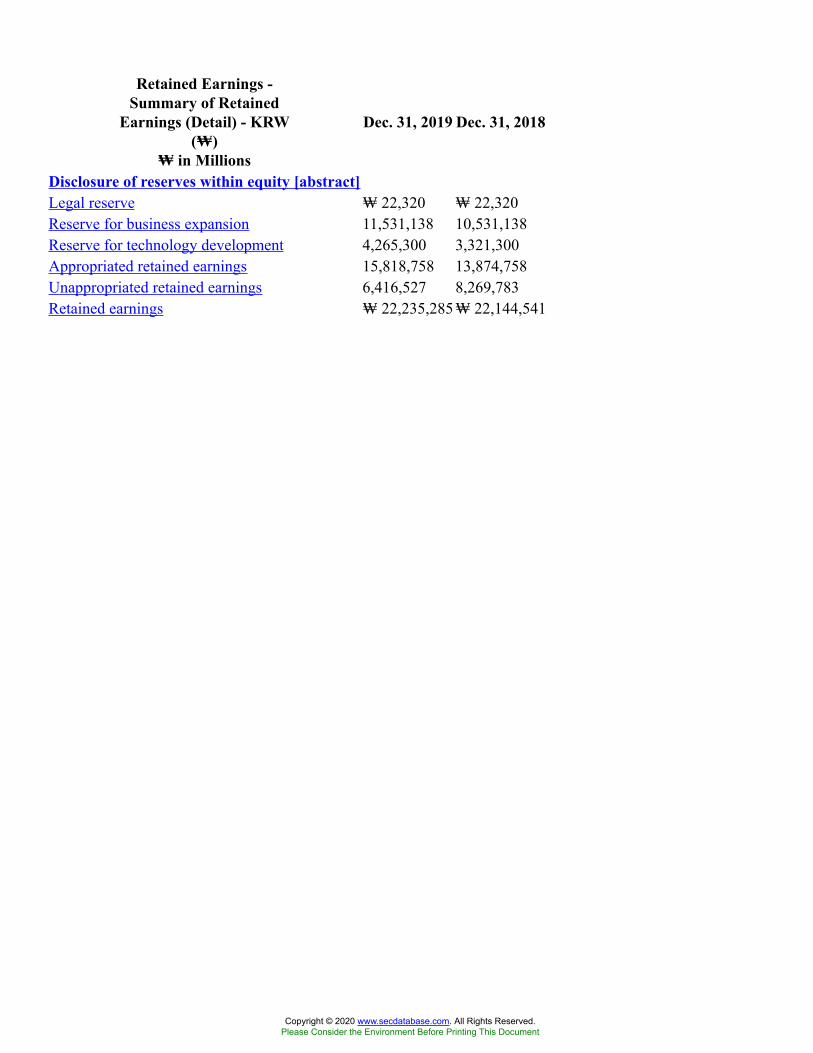
Retained Earnings -Summary of Retained
Earnings (Detail) - KRW(₩)
₩ in Millions
Dec. 31, 2019 Dec. 31, 2018
Disclosure of reserves within equity [abstract]Legal reserve ₩ 22,320 ₩ 22,320Reserve for business expansion 11,531,138 10,531,138Reserve for technology development 4,265,300 3,321,300Appropriated retained earnings 15,818,758 13,874,758Unappropriated retained earnings 6,416,527 8,269,783Retained earnings ₩ 22,235,285 ₩ 22,144,541
Copyright © 2020 www.secdatabase.com. All Rights Reserved.Please Consider the Environment Before Printing This Document
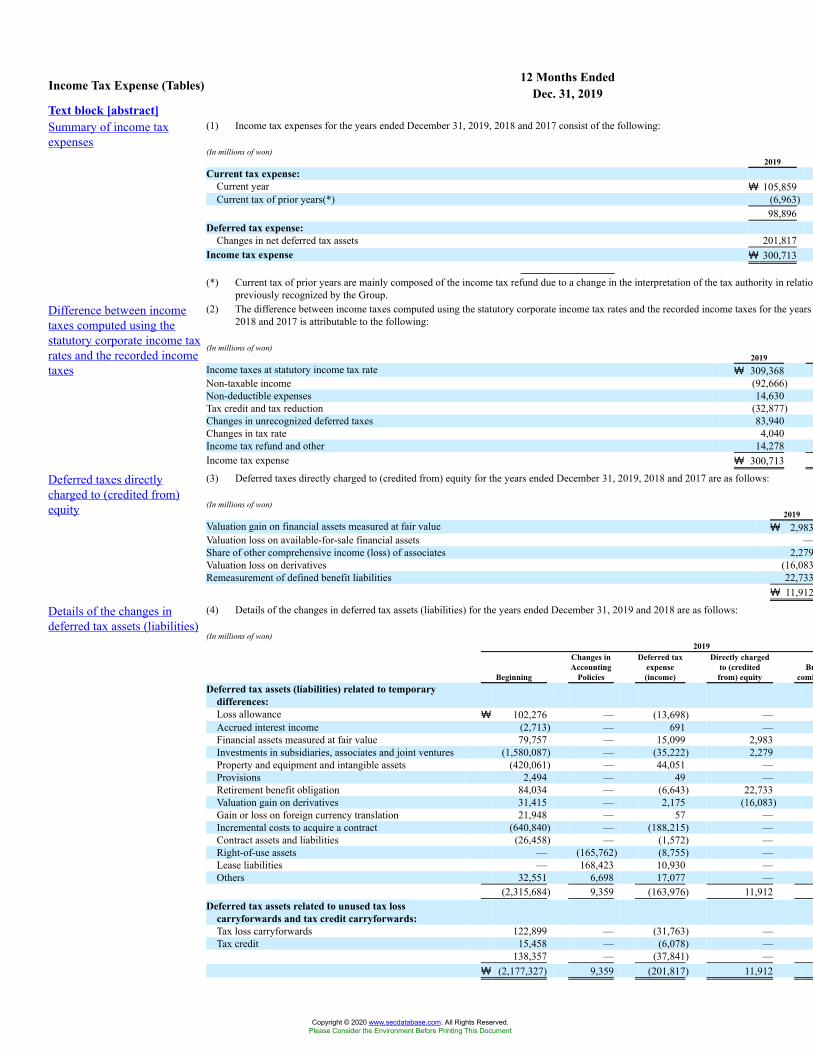
12 Months EndedIncome Tax Expense (Tables) Dec. 31, 2019Text block [abstract]Summary of income taxexpenses
(1) Income tax expenses for the years ended December 31, 2019, 2018 and 2017 consist of the following:
(In millions of won)2019 2018 2017
Current tax expense:Current year ₩ 105,859 362,265 424,773Current tax of prior years(*) (6,963) (22,575) (105,158)
98,896 339,690 319,615Deferred tax expense:
Changes in net deferred tax assets 201,817 504,288 426,039Income tax expense ₩ 300,713 843,978 745,654
(*) Current tax of prior years are mainly composed of the income tax refund due to a change in the interpretation of the tax authority in relation to the income taxpreviously recognized by the Group.
Difference between incometaxes computed using thestatutory corporate income taxrates and the recorded incometaxes
(2) The difference between income taxes computed using the statutory corporate income tax rates and the recorded income taxes for the years ended December 31, 2019,2018 and 2017 is attributable to the following:
(In millions of won)2019 2018 2017
Income taxes at statutory income tax rate ₩ 309,368 1,083,029 823,124Non-taxable income (92,666) (19,450) (40,080)Non-deductible expenses 14,630 26,724 31,285Tax credit and tax reduction (32,877) (17,580) (34,300)Changes in unrecognized deferred taxes 83,940 (177,902) 31,857Changes in tax rate 4,040 (3,983) 43,977Income tax refund and other 14,278 (46,860) (110,209)Income tax expense ₩ 300,713 843,978 745,654
Deferred taxes directlycharged to (credited from)equity
(3) Deferred taxes directly charged to (credited from) equity for the years ended December 31, 2019, 2018 and 2017 are as follows:
(In millions of won)2019 2018 2017
Valuation gain on financial assets measured at fair value ₩ 2,983 41,461 —Valuation loss on available-for-sale financial assets — — (55,883)Share of other comprehensive income (loss) of associates 2,279 278 (260)Valuation loss on derivatives (16,083) (9,223) (3,019)Remeasurement of defined benefit liabilities 22,733 10,843 1,618
₩ 11,912 43,359 (57,544)
Details of the changes indeferred tax assets (liabilities)
(4) Details of the changes in deferred tax assets (liabilities) for the years ended December 31, 2019 and 2018 are as follows:
(In millions of won)2019
Beginning
Changes inAccounting
Policies
Deferred taxexpense(income)
Directly chargedto (creditedfrom) equity
Businesscombinations Ending
Deferred tax assets (liabilities) related to temporarydifferences:Loss allowance ₩ 102,276 — (13,698) — 335 88,913Accrued interest income (2,713) — 691 — (17) (2,039)Financial assets measured at fair value 79,757 — 15,099 2,983 262 98,101Investments in subsidiaries, associates and joint ventures (1,580,087) — (35,222) 2,279 (18) (1,613,048)Property and equipment and intangible assets (420,061) — 44,051 — (3) (376,013)Provisions 2,494 — 49 — — 2,543Retirement benefit obligation 84,034 — (6,643) 22,733 70 100,194Valuation gain on derivatives 31,415 — 2,175 (16,083) — 17,507Gain or loss on foreign currency translation 21,948 — 57 — — 22,005Incremental costs to acquire a contract (640,840) — (188,215) — — (829,055)Contract assets and liabilities (26,458) — (1,572) — — (28,030)Right-of-use assets — (165,762) (8,755) — — (174,517)Lease liabilities — 168,423 10,930 — — 179,353Others 32,551 6,698 17,077 — 6 56,332
(2,315,684) 9,359 (163,976) 11,912 635 (2,457,754)Deferred tax assets related to unused tax loss
carryforwards and tax credit carryforwards:Tax loss carryforwards 122,899 — (31,763) — — 91,136Tax credit 15,458 — (6,078) — — 9,380
138,357 — (37,841) — — 100,516₩ (2,177,327) 9,359 (201,817) 11,912 635 (2,357,238)
Copyright © 2020 www.secdatabase.com. All Rights Reserved.Please Consider the Environment Before Printing This Document
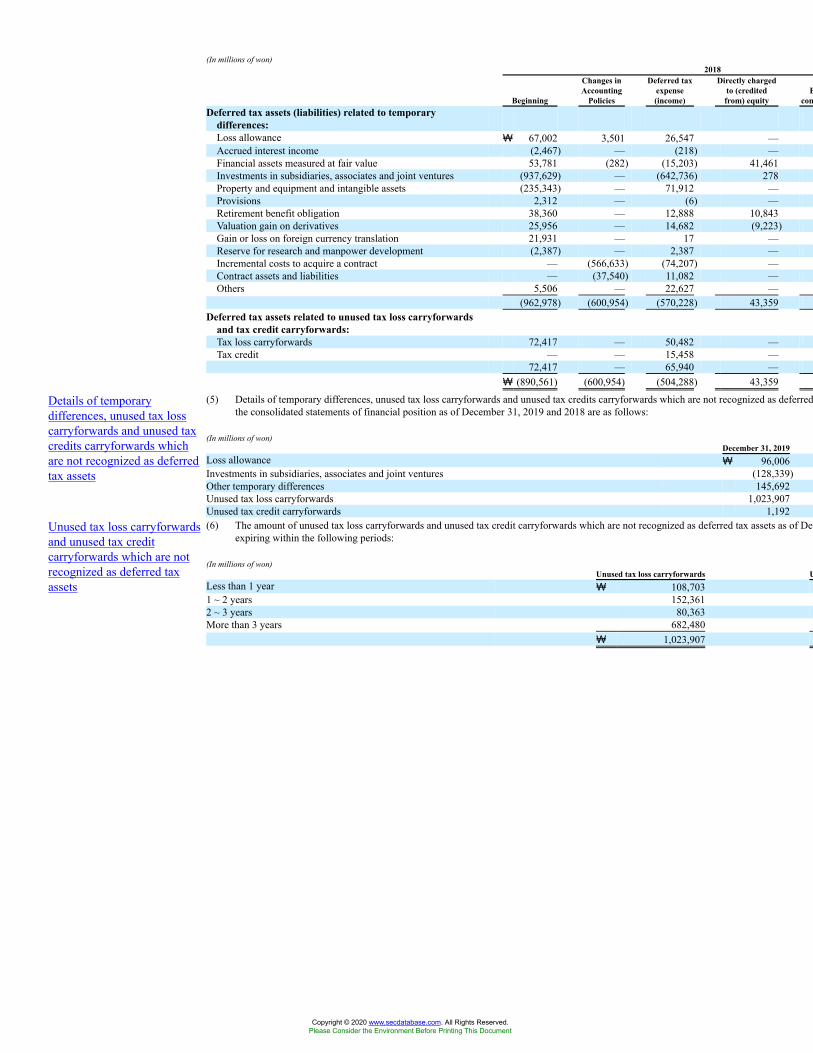
(In millions of won)2018
Beginning
Changes inAccounting
Policies
Deferred taxexpense(income)
Directly chargedto (creditedfrom) equity
Businesscombinations Ending
Deferred tax assets (liabilities) related to temporarydifferences:Loss allowance ₩ 67,002 3,501 26,547 — 5,226 102,276Accrued interest income (2,467) — (218) — (28) (2,713)Financial assets measured at fair value 53,781 (282) (15,203) 41,461 — 79,757Investments in subsidiaries, associates and joint ventures (937,629) — (642,736) 278 — (1,580,087)Property and equipment and intangible assets (235,343) — 71,912 — (256,630) (420,061)Provisions 2,312 — (6) — 188 2,494Retirement benefit obligation 38,360 — 12,888 10,843 21,943 84,034Valuation gain on derivatives 25,956 — 14,682 (9,223) — 31,415Gain or loss on foreign currency translation 21,931 — 17 — — 21,948Reserve for research and manpower development (2,387) — 2,387 — — —Incremental costs to acquire a contract — (566,633) (74,207) — — (640,840)Contract assets and liabilities — (37,540) 11,082 — — (26,458)Others 5,506 — 22,627 — 4,418 32,551
(962,978) (600,954) (570,228) 43,359 (224,883) (2,315,684)Deferred tax assets related to unused tax loss carryforwards
and tax credit carryforwards:Tax loss carryforwards 72,417 — 50,482 — — 122,899Tax credit — — 15,458 — — 15,458
72,417 — 65,940 — — 138,357₩ (890,561) (600,954) (504,288) 43,359 (224,883) (2,177,327)
Details of temporarydifferences, unused tax losscarryforwards and unused taxcredits carryforwards whichare not recognized as deferredtax assets
(5) Details of temporary differences, unused tax loss carryforwards and unused tax credits carryforwards which are not recognized as deferred tax assets (liabilities), inthe consolidated statements of financial position as of December 31, 2019 and 2018 are as follows:
(In millions of won)December 31, 2019 December 31, 2018
Loss allowance ₩ 96,006 98,205Investments in subsidiaries, associates and joint ventures (128,339) (233,234)Other temporary differences 145,692 189,604Unused tax loss carryforwards 1,023,907 849,850Unused tax credit carryforwards 1,192 3,705
Unused tax loss carryforwardsand unused tax creditcarryforwards which are notrecognized as deferred taxassets
(6) The amount of unused tax loss carryforwards and unused tax credit carryforwards which are not recognized as deferred tax assets as of December 31, 2019 areexpiring within the following periods:
(In millions of won)Unused tax loss carryforwards Unused tax credit carryforwards
Less than 1 year ₩ 108,703 2581 ~ 2 years 152,361 3162 ~ 3 years 80,363 388More than 3 years 682,480 230
₩ 1,023,907 1,192
Copyright © 2020 www.secdatabase.com. All Rights Reserved.Please Consider the Environment Before Printing This Document
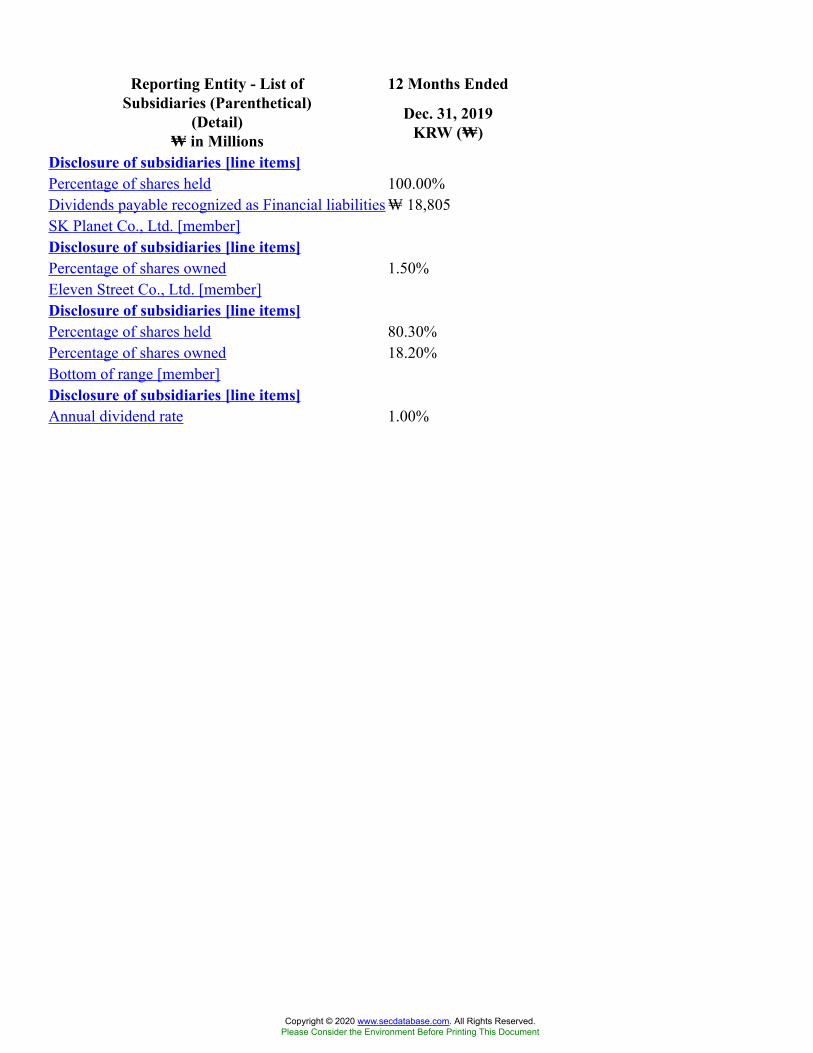
12 Months EndedReporting Entity - List ofSubsidiaries (Parenthetical)
(Detail)₩ in Millions
Dec. 31, 2019KRW (₩)
Disclosure of subsidiaries [line items]Percentage of shares held 100.00%Dividends payable recognized as Financial liabilities ₩ 18,805SK Planet Co., Ltd. [member]Disclosure of subsidiaries [line items]Percentage of shares owned 1.50%Eleven Street Co., Ltd. [member]Disclosure of subsidiaries [line items]Percentage of shares held 80.30%Percentage of shares owned 18.20%Bottom of range [member]Disclosure of subsidiaries [line items]Annual dividend rate 1.00%
Copyright © 2020 www.secdatabase.com. All Rights Reserved.Please Consider the Environment Before Printing This Document
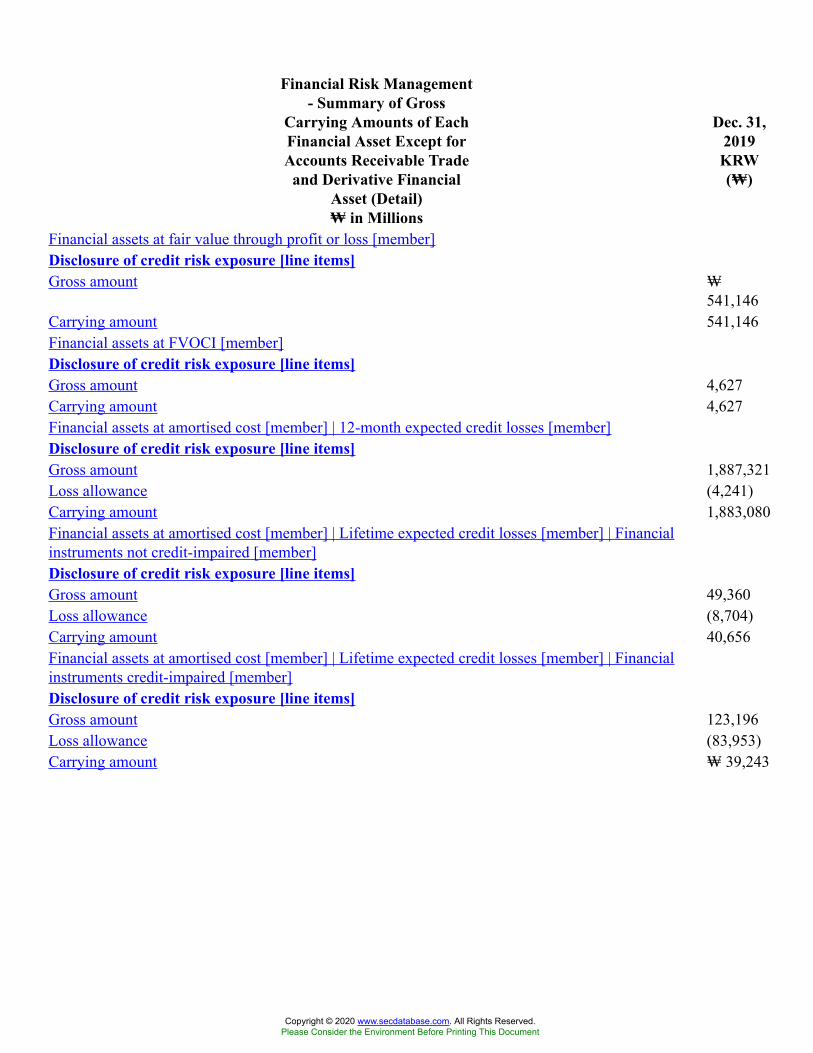
Financial Risk Management- Summary of Gross
Carrying Amounts of EachFinancial Asset Except forAccounts Receivable Trade
and Derivative FinancialAsset (Detail)₩ in Millions
Dec. 31,2019KRW(₩)
Financial assets at fair value through profit or loss [member]Disclosure of credit risk exposure [line items]Gross amount ₩
541,146Carrying amount 541,146Financial assets at FVOCI [member]Disclosure of credit risk exposure [line items]Gross amount 4,627Carrying amount 4,627Financial assets at amortised cost [member] | 12-month expected credit losses [member]Disclosure of credit risk exposure [line items]Gross amount 1,887,321Loss allowance (4,241)Carrying amount 1,883,080Financial assets at amortised cost [member] | Lifetime expected credit losses [member] | Financialinstruments not credit-impaired [member]Disclosure of credit risk exposure [line items]Gross amount 49,360Loss allowance (8,704)Carrying amount 40,656Financial assets at amortised cost [member] | Lifetime expected credit losses [member] | Financialinstruments credit-impaired [member]Disclosure of credit risk exposure [line items]Gross amount 123,196Loss allowance (83,953)Carrying amount ₩ 39,243
Copyright © 2020 www.secdatabase.com. All Rights Reserved.Please Consider the Environment Before Printing This Document
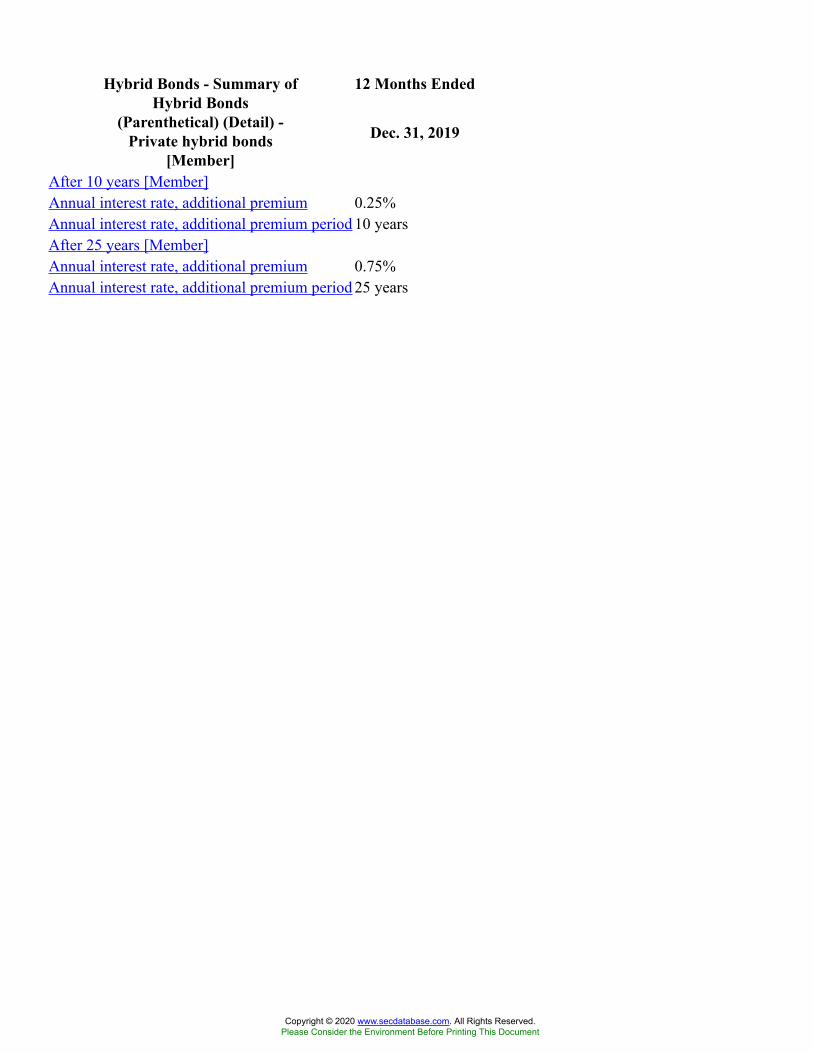
12 Months EndedHybrid Bonds - Summary ofHybrid Bonds
(Parenthetical) (Detail) -Private hybrid bonds
[Member]
Dec. 31, 2019
After 10 years [Member]Annual interest rate, additional premium 0.25%Annual interest rate, additional premium period 10 yearsAfter 25 years [Member]Annual interest rate, additional premium 0.75%Annual interest rate, additional premium period 25 years
Copyright © 2020 www.secdatabase.com. All Rights Reserved.Please Consider the Environment Before Printing This Document
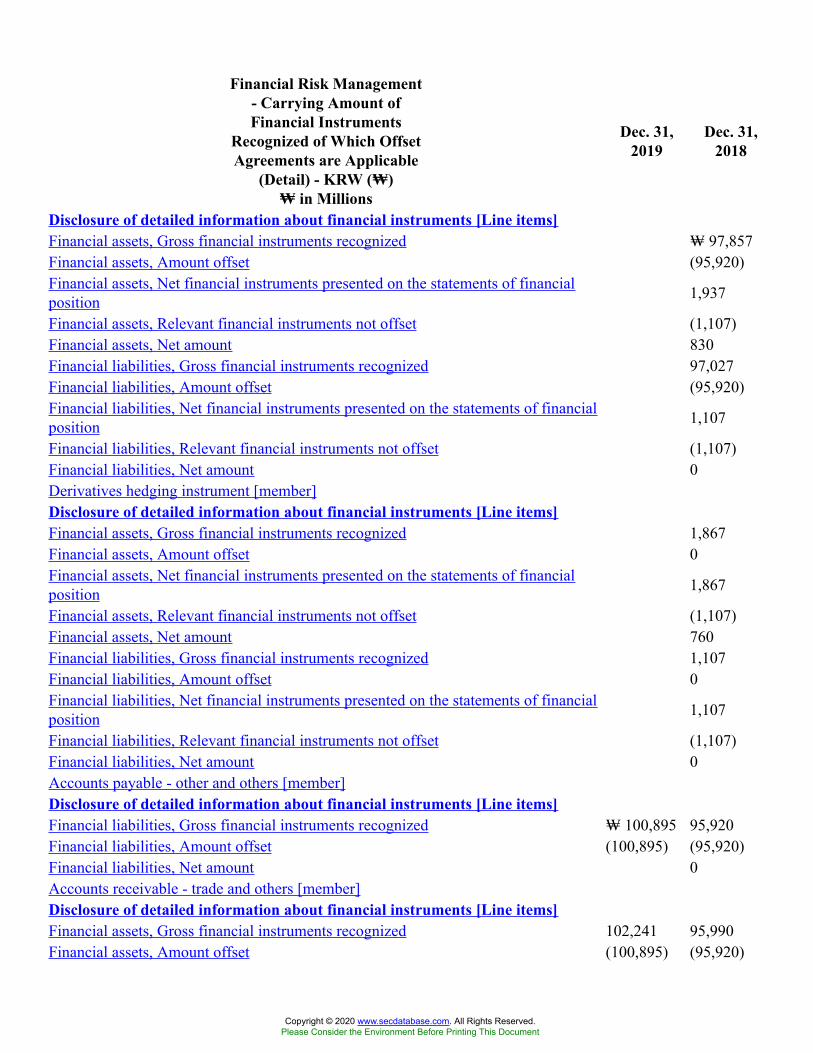
Financial Risk Management- Carrying Amount ofFinancial Instruments
Recognized of Which OffsetAgreements are Applicable
(Detail) - KRW (₩)₩ in Millions
Dec. 31,2019
Dec. 31,2018
Disclosure of detailed information about financial instruments [Line items]Financial assets, Gross financial instruments recognized ₩ 97,857Financial assets, Amount offset (95,920)Financial assets, Net financial instruments presented on the statements of financialposition 1,937
Financial assets, Relevant financial instruments not offset (1,107)Financial assets, Net amount 830Financial liabilities, Gross financial instruments recognized 97,027Financial liabilities, Amount offset (95,920)Financial liabilities, Net financial instruments presented on the statements of financialposition 1,107
Financial liabilities, Relevant financial instruments not offset (1,107)Financial liabilities, Net amount 0Derivatives hedging instrument [member]Disclosure of detailed information about financial instruments [Line items]Financial assets, Gross financial instruments recognized 1,867Financial assets, Amount offset 0Financial assets, Net financial instruments presented on the statements of financialposition 1,867
Financial assets, Relevant financial instruments not offset (1,107)Financial assets, Net amount 760Financial liabilities, Gross financial instruments recognized 1,107Financial liabilities, Amount offset 0Financial liabilities, Net financial instruments presented on the statements of financialposition 1,107
Financial liabilities, Relevant financial instruments not offset (1,107)Financial liabilities, Net amount 0Accounts payable - other and others [member]Disclosure of detailed information about financial instruments [Line items]Financial liabilities, Gross financial instruments recognized ₩ 100,895 95,920Financial liabilities, Amount offset (100,895) (95,920)Financial liabilities, Net amount 0Accounts receivable - trade and others [member]Disclosure of detailed information about financial instruments [Line items]Financial assets, Gross financial instruments recognized 102,241 95,990Financial assets, Amount offset (100,895) (95,920)
Copyright © 2020 www.secdatabase.com. All Rights Reserved.Please Consider the Environment Before Printing This Document
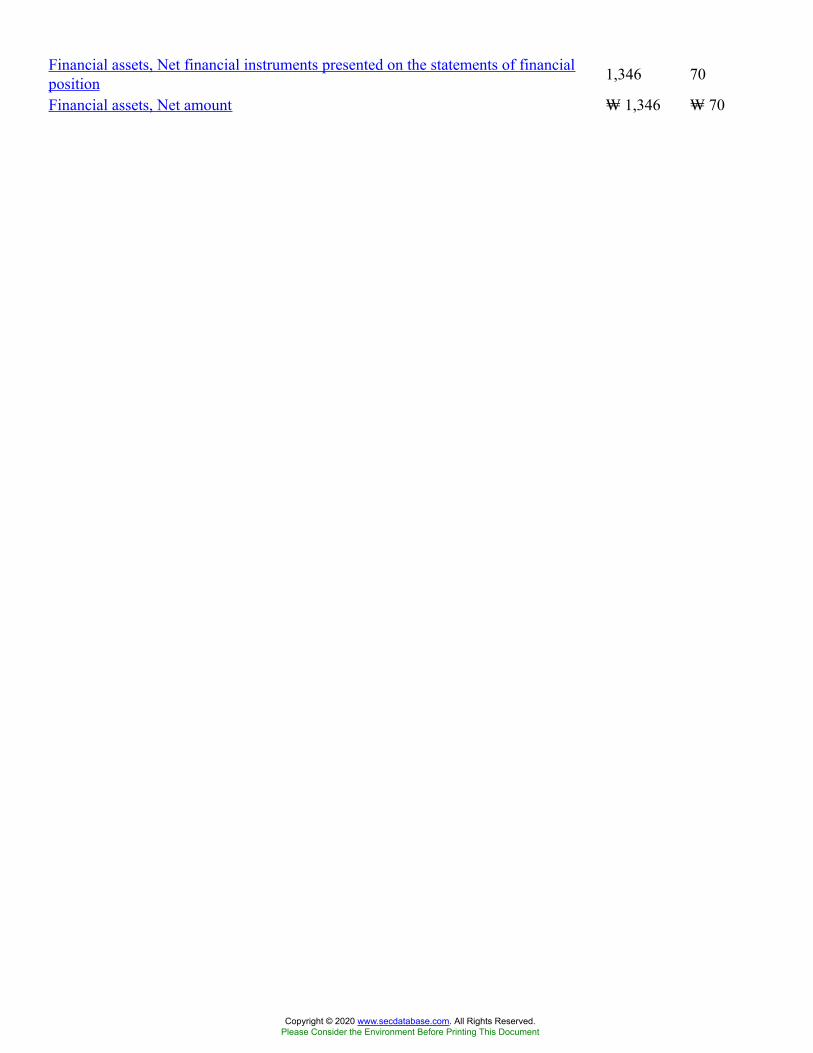
Financial assets, Net financial instruments presented on the statements of financialposition 1,346 70
Financial assets, Net amount ₩ 1,346 ₩ 70
Copyright © 2020 www.secdatabase.com. All Rights Reserved.Please Consider the Environment Before Printing This Document
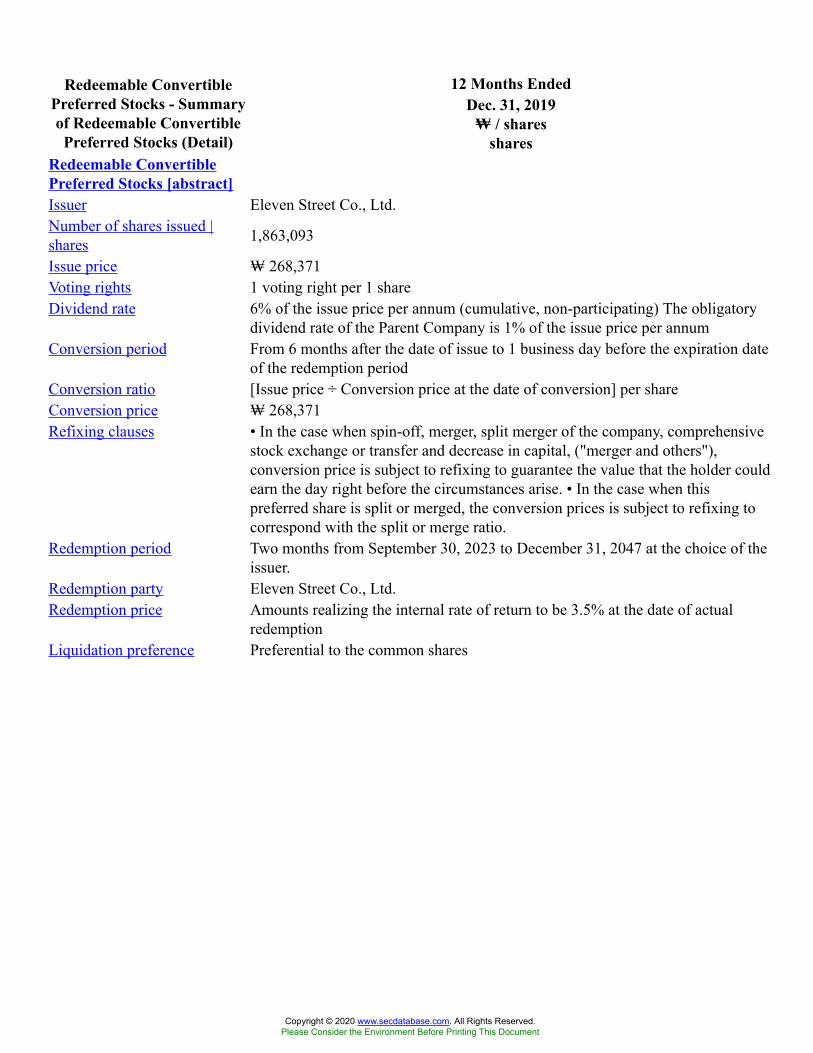
12 Months EndedRedeemable ConvertiblePreferred Stocks - Summaryof Redeemable ConvertiblePreferred Stocks (Detail)
Dec. 31, 2019₩ / shares
sharesRedeemable ConvertiblePreferred Stocks [abstract]Issuer Eleven Street Co., Ltd.Number of shares issued |shares 1,863,093
Issue price ₩ 268,371Voting rights 1 voting right per 1 shareDividend rate 6% of the issue price per annum (cumulative, non-participating) The obligatory
dividend rate of the Parent Company is 1% of the issue price per annumConversion period From 6 months after the date of issue to 1 business day before the expiration date
of the redemption periodConversion ratio [Issue price ÷ Conversion price at the date of conversion] per shareConversion price ₩ 268,371Refixing clauses • In the case when spin-off, merger, split merger of the company, comprehensive
stock exchange or transfer and decrease in capital, ("merger and others"),conversion price is subject to refixing to guarantee the value that the holder couldearn the day right before the circumstances arise. • In the case when thispreferred share is split or merged, the conversion prices is subject to refixing tocorrespond with the split or merge ratio.
Redemption period Two months from September 30, 2023 to December 31, 2047 at the choice of theissuer.
Redemption party Eleven Street Co., Ltd.Redemption price Amounts realizing the internal rate of return to be 3.5% at the date of actual
redemptionLiquidation preference Preferential to the common shares
Copyright © 2020 www.secdatabase.com. All Rights Reserved.Please Consider the Environment Before Printing This Document

Reserves - Details ofReserves, Net of Taxes
(Detail) - KRW (₩)₩ in Millions
Dec. 31,2019
Dec. 31,2018
Dec. 31,2017
Disclosure of reserves within equity [abstract]Valuation loss on FVOCI ₩ (47,086) ₩ (124)Other comprehensive loss of investments in associates and jointventures (278,142) (334,637)
Valuation loss on derivatives (920) (41,601)Foreign currency translation differences for foreign operations (3,428) 2,920Total reserves, net of taxes ₩ (329,576) ₩ (373,442) ₩ (234,727)
Copyright © 2020 www.secdatabase.com. All Rights Reserved.Please Consider the Environment Before Printing This Document
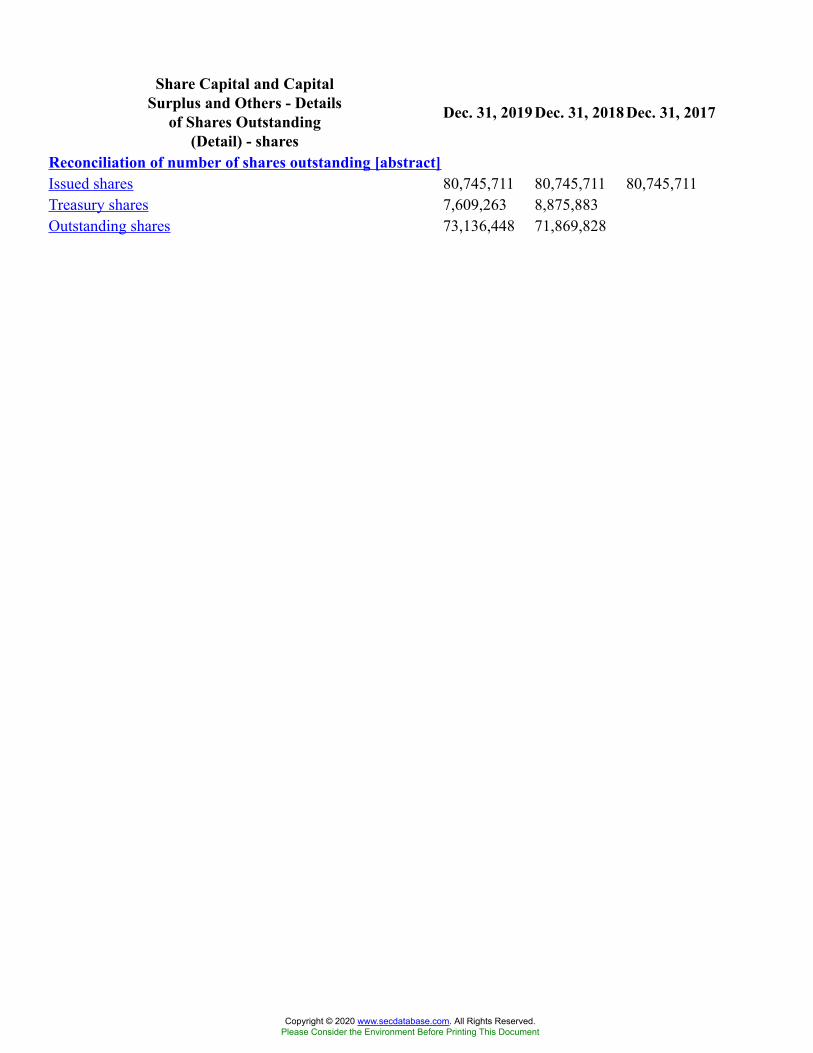
Share Capital and CapitalSurplus and Others - Details
of Shares Outstanding(Detail) - shares
Dec. 31, 2019 Dec. 31, 2018 Dec. 31, 2017
Reconciliation of number of shares outstanding [abstract]Issued shares 80,745,711 80,745,711 80,745,711Treasury shares 7,609,263 8,875,883Outstanding shares 73,136,448 71,869,828
Copyright © 2020 www.secdatabase.com. All Rights Reserved.Please Consider the Environment Before Printing This Document
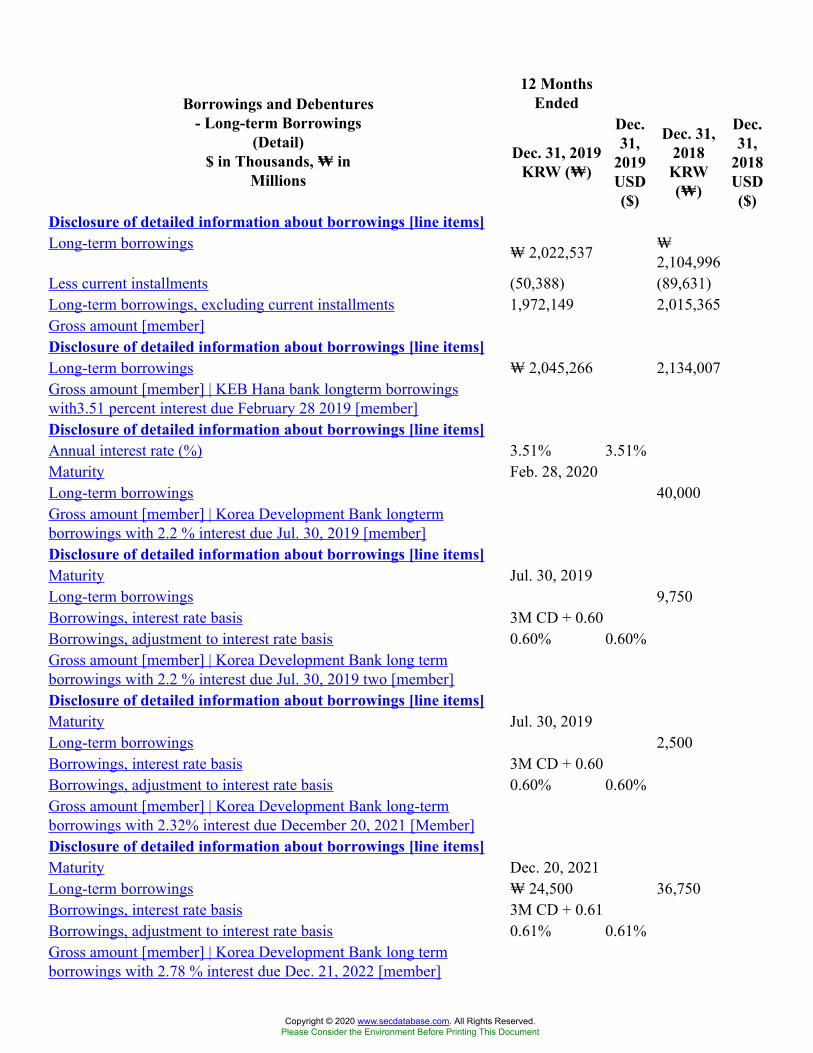
12 MonthsEndedBorrowings and Debentures
- Long-term Borrowings(Detail)
$ in Thousands, ₩ inMillions
Dec. 31, 2019KRW (₩)
Dec.31,
2019USD($)
Dec. 31,2018KRW(₩)
Dec.31,
2018USD($)
Disclosure of detailed information about borrowings [line items]Long-term borrowings ₩ 2,022,537 ₩
2,104,996Less current installments (50,388) (89,631)Long-term borrowings, excluding current installments 1,972,149 2,015,365Gross amount [member]Disclosure of detailed information about borrowings [line items]Long-term borrowings ₩ 2,045,266 2,134,007Gross amount [member] | KEB Hana bank longterm borrowingswith3.51 percent interest due February 28 2019 [member]Disclosure of detailed information about borrowings [line items]Annual interest rate (%) 3.51% 3.51%Maturity Feb. 28, 2020Long-term borrowings 40,000Gross amount [member] | Korea Development Bank longtermborrowings with 2.2 % interest due Jul. 30, 2019 [member]Disclosure of detailed information about borrowings [line items]Maturity Jul. 30, 2019Long-term borrowings 9,750Borrowings, interest rate basis 3M CD + 0.60Borrowings, adjustment to interest rate basis 0.60% 0.60%Gross amount [member] | Korea Development Bank long termborrowings with 2.2 % interest due Jul. 30, 2019 two [member]Disclosure of detailed information about borrowings [line items]Maturity Jul. 30, 2019Long-term borrowings 2,500Borrowings, interest rate basis 3M CD + 0.60Borrowings, adjustment to interest rate basis 0.60% 0.60%Gross amount [member] | Korea Development Bank long-termborrowings with 2.32% interest due December 20, 2021 [Member]Disclosure of detailed information about borrowings [line items]Maturity Dec. 20, 2021Long-term borrowings ₩ 24,500 36,750Borrowings, interest rate basis 3M CD + 0.61Borrowings, adjustment to interest rate basis 0.61% 0.61%Gross amount [member] | Korea Development Bank long termborrowings with 2.78 % interest due Dec. 21, 2022 [member]
Copyright © 2020 www.secdatabase.com. All Rights Reserved.Please Consider the Environment Before Printing This Document
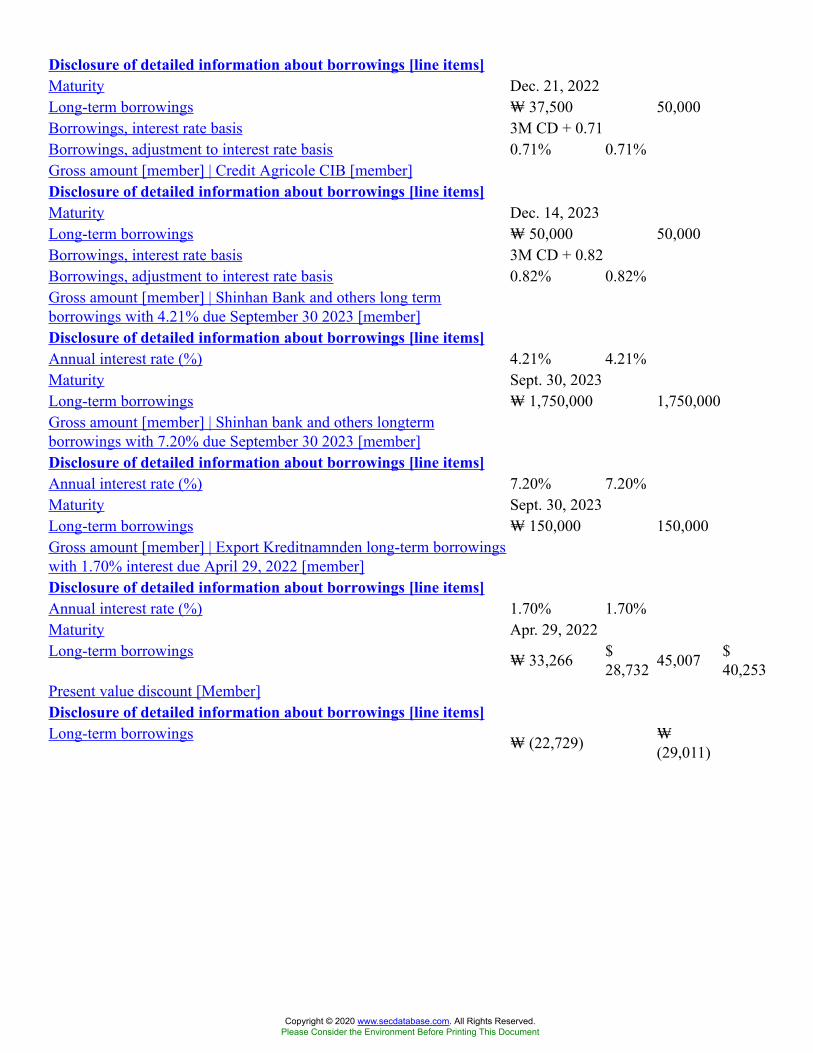
Disclosure of detailed information about borrowings [line items]Maturity Dec. 21, 2022Long-term borrowings ₩ 37,500 50,000Borrowings, interest rate basis 3M CD + 0.71Borrowings, adjustment to interest rate basis 0.71% 0.71%Gross amount [member] | Credit Agricole CIB [member]Disclosure of detailed information about borrowings [line items]Maturity Dec. 14, 2023Long-term borrowings ₩ 50,000 50,000Borrowings, interest rate basis 3M CD + 0.82Borrowings, adjustment to interest rate basis 0.82% 0.82%Gross amount [member] | Shinhan Bank and others long termborrowings with 4.21% due September 30 2023 [member]Disclosure of detailed information about borrowings [line items]Annual interest rate (%) 4.21% 4.21%Maturity Sept. 30, 2023Long-term borrowings ₩ 1,750,000 1,750,000Gross amount [member] | Shinhan bank and others longtermborrowings with 7.20% due September 30 2023 [member]Disclosure of detailed information about borrowings [line items]Annual interest rate (%) 7.20% 7.20%Maturity Sept. 30, 2023Long-term borrowings ₩ 150,000 150,000Gross amount [member] | Export Kreditnamnden long-term borrowingswith 1.70% interest due April 29, 2022 [member]Disclosure of detailed information about borrowings [line items]Annual interest rate (%) 1.70% 1.70%Maturity Apr. 29, 2022Long-term borrowings ₩ 33,266 $
28,732 45,007 $40,253
Present value discount [Member]Disclosure of detailed information about borrowings [line items]Long-term borrowings ₩ (22,729) ₩
(29,011)
Copyright © 2020 www.secdatabase.com. All Rights Reserved.Please Consider the Environment Before Printing This Document
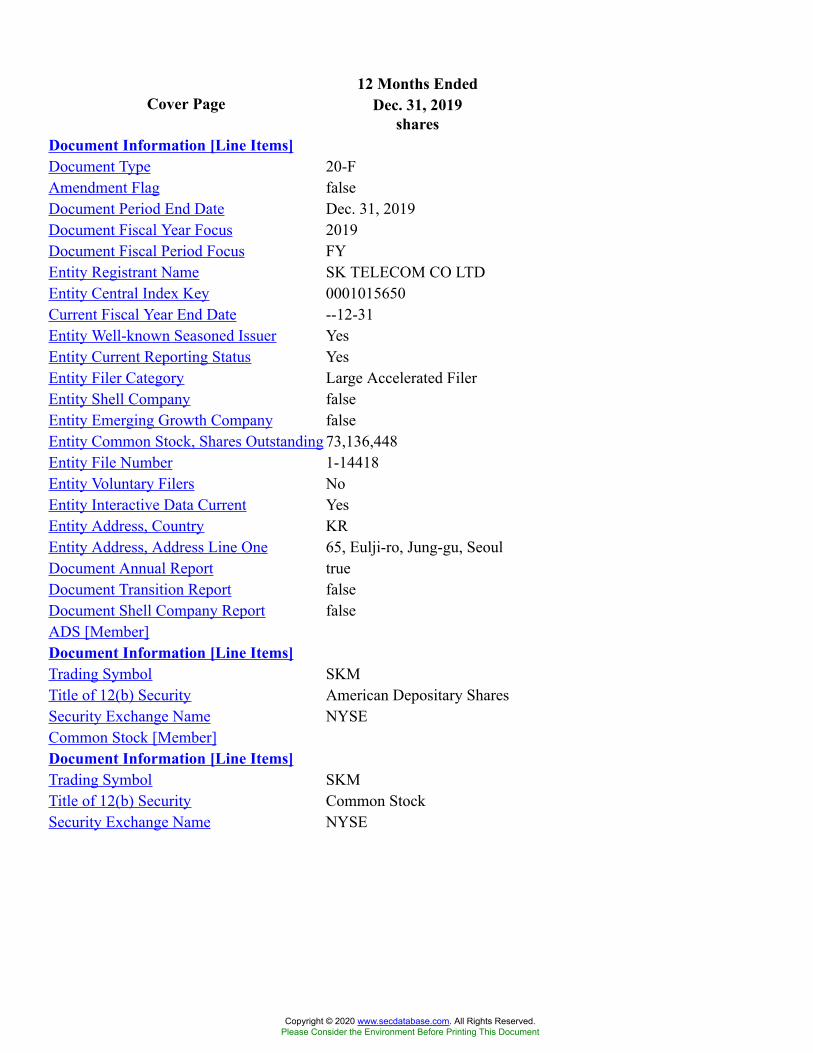
12 Months EndedCover Page Dec. 31, 2019
sharesDocument Information [Line Items]Document Type 20-FAmendment Flag falseDocument Period End Date Dec. 31, 2019Document Fiscal Year Focus 2019Document Fiscal Period Focus FYEntity Registrant Name SK TELECOM CO LTDEntity Central Index Key 0001015650Current Fiscal Year End Date --12-31Entity Well-known Seasoned Issuer YesEntity Current Reporting Status YesEntity Filer Category Large Accelerated FilerEntity Shell Company falseEntity Emerging Growth Company falseEntity Common Stock, Shares Outstanding 73,136,448Entity File Number 1-14418Entity Voluntary Filers NoEntity Interactive Data Current YesEntity Address, Country KREntity Address, Address Line One 65, Eulji-ro, Jung-gu, SeoulDocument Annual Report trueDocument Transition Report falseDocument Shell Company Report falseADS [Member]Document Information [Line Items]Trading Symbol SKMTitle of 12(b) Security American Depositary SharesSecurity Exchange Name NYSECommon Stock [Member]Document Information [Line Items]Trading Symbol SKMTitle of 12(b) Security Common StockSecurity Exchange Name NYSE
Copyright © 2020 www.secdatabase.com. All Rights Reserved.Please Consider the Environment Before Printing This Document
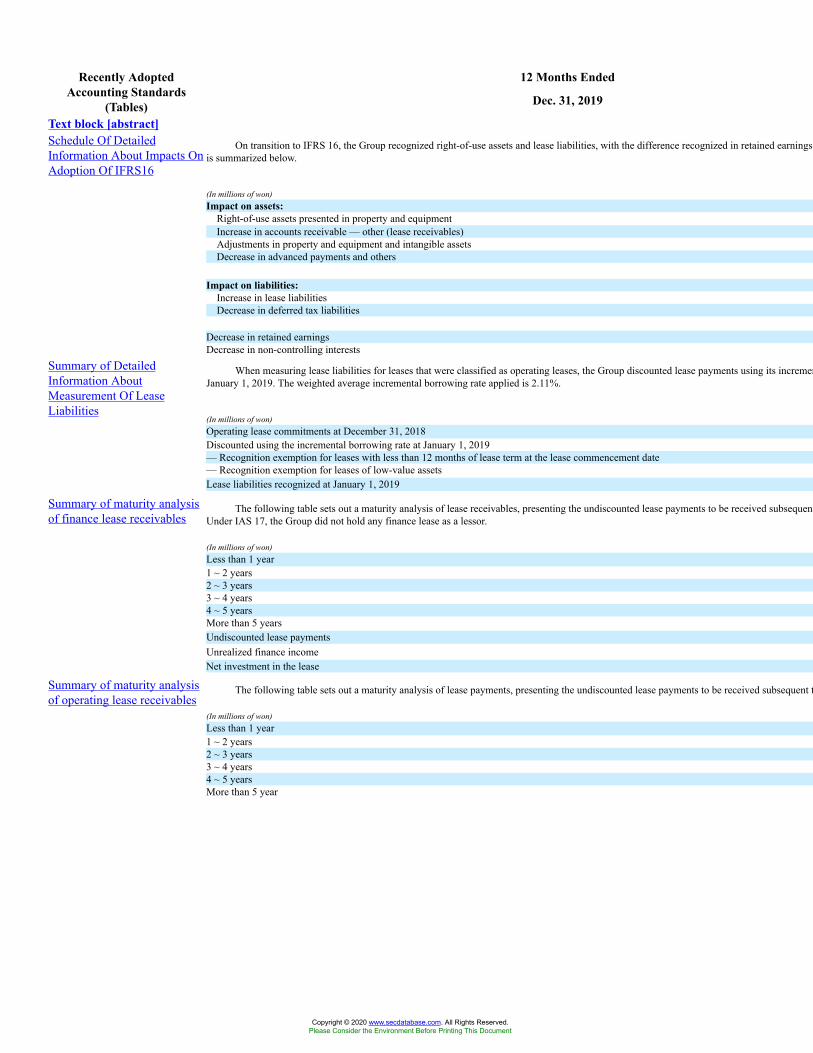
12 Months EndedRecently AdoptedAccounting Standards
(Tables) Dec. 31, 2019
Text block [abstract]Schedule Of DetailedInformation About Impacts OnAdoption Of IFRS16
On transition to IFRS 16, the Group recognized right-of-use assets and lease liabilities, with the difference recognized in retained earnings. The impact on transitionis summarized below.
(In millions of won)January 1,
2019Impact on assets:
Right-of-use assets presented in property and equipment ₩654,449Increase in accounts receivable — other (lease receivables) 31,355Adjustments in property and equipment and intangible assets (3,387)Decrease in advanced payments and others (52,638)
629,779Impact on liabilities:
Increase in lease liabilities 663,827Decrease in deferred tax liabilities (9,359)
654,468Decrease in retained earnings (24,186)Decrease in non-controlling interests ₩ (503)
Summary of DetailedInformation AboutMeasurement Of LeaseLiabilities
When measuring lease liabilities for leases that were classified as operating leases, the Group discounted lease payments using its incremental borrowing rate atJanuary 1, 2019. The weighted average incremental borrowing rate applied is 2.11%.
(In millions of won)January 1,
2019Operating lease commitments at December 31, 2018 ₩766,978Discounted using the incremental borrowing rate at January 1, 2019 735,051— Recognition exemption for leases with less than 12 months of lease term at the lease commencement date (66,548)— Recognition exemption for leases of low-value assets (4,676)Lease liabilities recognized at January 1, 2019 ₩663,827
Summary of maturity analysisof finance lease receivables
The following table sets out a maturity analysis of lease receivables, presenting the undiscounted lease payments to be received subsequent to December 31, 2019.Under IAS 17, the Group did not hold any finance lease as a lessor.
(In millions of won) AmountLess than 1 year ₩24,2861 ~ 2 years 12,6902 ~ 3 years 6,3483 ~ 4 years 3,6834 ~ 5 years 1,589More than 5 years 1Undiscounted lease payments ₩48,597Unrealized finance income 1,822Net investment in the lease 46,775
Summary of maturity analysisof operating lease receivables
The following table sets out a maturity analysis of lease payments, presenting the undiscounted lease payments to be received subsequent to December 31, 2019.
(In millions of won) AmountLess than 1 year ₩129,3101 ~ 2 years 76,6692 ~ 3 years 25,0473 ~ 4 years 1,2434 ~ 5 years 1,218More than 5 year 3
₩233,490
Copyright © 2020 www.secdatabase.com. All Rights Reserved.Please Consider the Environment Before Printing This Document
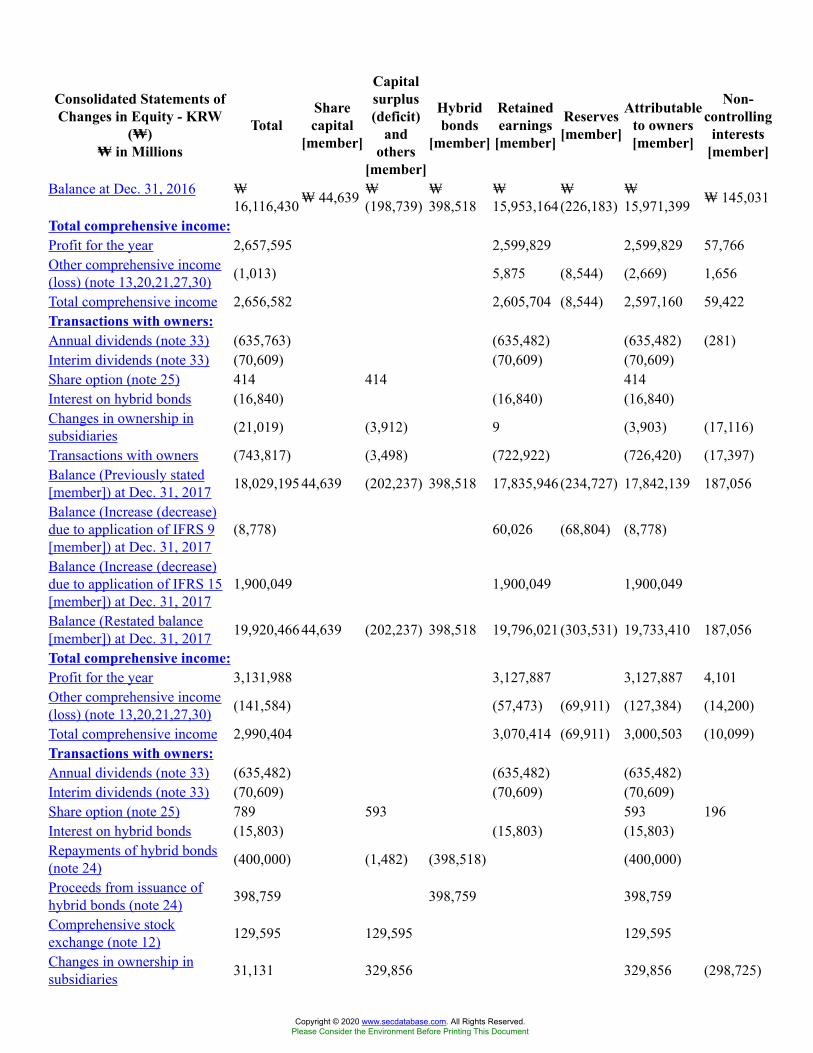
Consolidated Statements ofChanges in Equity - KRW
(₩)₩ in Millions
TotalSharecapital
[member]
Capitalsurplus(deficit)
andothers
[member]
Hybridbonds
[member]
Retainedearnings
[member]
Reserves[member]
Attributableto owners[member]
Non-controlling
interests[member]
Balance at Dec. 31, 2016 ₩16,116,430 ₩ 44,639 ₩
(198,739)₩398,518
₩15,953,164
₩(226,183)
₩15,971,399 ₩ 145,031
Total comprehensive income:Profit for the year 2,657,595 2,599,829 2,599,829 57,766Other comprehensive income(loss) (note 13,20,21,27,30) (1,013) 5,875 (8,544) (2,669) 1,656
Total comprehensive income 2,656,582 2,605,704 (8,544) 2,597,160 59,422Transactions with owners:Annual dividends (note 33) (635,763) (635,482) (635,482) (281)Interim dividends (note 33) (70,609) (70,609) (70,609)Share option (note 25) 414 414 414Interest on hybrid bonds (16,840) (16,840) (16,840)Changes in ownership insubsidiaries (21,019) (3,912) 9 (3,903) (17,116)
Transactions with owners (743,817) (3,498) (722,922) (726,420) (17,397)Balance (Previously stated[member]) at Dec. 31, 2017 18,029,19544,639 (202,237) 398,518 17,835,946 (234,727) 17,842,139 187,056
Balance (Increase (decrease)due to application of IFRS 9[member]) at Dec. 31, 2017
(8,778) 60,026 (68,804) (8,778)
Balance (Increase (decrease)due to application of IFRS 15[member]) at Dec. 31, 2017
1,900,049 1,900,049 1,900,049
Balance (Restated balance[member]) at Dec. 31, 2017 19,920,46644,639 (202,237) 398,518 19,796,021 (303,531) 19,733,410 187,056
Total comprehensive income:Profit for the year 3,131,988 3,127,887 3,127,887 4,101Other comprehensive income(loss) (note 13,20,21,27,30) (141,584) (57,473) (69,911) (127,384) (14,200)
Total comprehensive income 2,990,404 3,070,414 (69,911) 3,000,503 (10,099)Transactions with owners:Annual dividends (note 33) (635,482) (635,482) (635,482)Interim dividends (note 33) (70,609) (70,609) (70,609)Share option (note 25) 789 593 593 196Interest on hybrid bonds (15,803) (15,803) (15,803)Repayments of hybrid bonds(note 24) (400,000) (1,482) (398,518) (400,000)
Proceeds from issuance ofhybrid bonds (note 24) 398,759 398,759 398,759
Comprehensive stockexchange (note 12) 129,595 129,595 129,595
Changes in ownership insubsidiaries 31,131 329,856 329,856 (298,725)
Copyright © 2020 www.secdatabase.com. All Rights Reserved.Please Consider the Environment Before Printing This Document

Transactions with owners (561,620) 458,562 241 (721,894) (263,091) (298,529)Balance (Previously stated[member]) at Dec. 31, 2018 22,349,25044,639 256,325 398,759 22,144,541 (373,442) 22,470,822 (121,572)
Balance (Increase (decrease)due to application of IFRS 16[member]) at Dec. 31, 2018
(24,689) (24,186) (24,186) (503)
Balance (Restated balance[member]) at Dec. 31, 2018 22,324,56144,639 256,325 398,759 22,120,355 (373,442) 22,446,636 (122,075)
Balance at Dec. 31, 2018 22,349,250Total comprehensive income:Profit for the year 861,942 889,907 889,907 (27,965)Other comprehensive income(loss) (note 13,20,21,27,30) 1,009 (41,513) 43,866 2,353 (1,344)
Total comprehensive income 862,951 848,394 43,866 892,260 (29,309)Transactions with owners:Annual dividends (note 33) (667,978) (646,828) (646,828) (21,150)Interim dividends (note 33) (80,520) (71,870) (71,870) (8,650)Share option (note 25) 1,059 295 295 764Interest on hybrid bonds (14,766) (14,766) (14,766)Disposal of treasury shares(note 23) 300,000 300,000 300,000
Changes in ownership insubsidiaries 98,229 51,102 51,102 47,127
Transactions with owners (363,976) 351,397 (733,464) (382,067) 18,091Balance at Dec. 31, 2019 ₩
22,823,536₩ 44,639 ₩607,722
₩398,759
₩22,235,285
₩(329,576)
₩22,956,829
₩(133,293)
Copyright © 2020 www.secdatabase.com. All Rights Reserved.Please Consider the Environment Before Printing This Document

12 Months EndedIntangible Assets - CarryingAmount and Residual Useful
Lives of Frequency UsageRights (Detail) - KRW (₩)
₩ in Millions
Dec. 31, 2019 Dec. 31,2018
Dec. 31,2017
Disclosure of detailed information about intangible assets[line items]Amount ₩ 4,866,092 ₩
5,513,510₩3,586,965
Frequency usage rights [member]Disclosure of detailed information about intangible assets[line items]Amount ₩ 2,647,501800MHz license [Member]Disclosure of detailed information about intangible assets[line items]Commencement of amortization 2011-07Completion of amortization 2021-06800MHz license [Member] | Frequency usage rights [member]Disclosure of detailed information about intangible assets[line items]Amount ₩ 60,816Description CDMA and LTE service1.8GHz license [Member]Disclosure of detailed information about intangible assets[line items]Commencement of amortization 2013-09Completion of amortization 2021-121.8GHz license [Member] | Frequency usage rights [member]Disclosure of detailed information about intangible assets[line items]Amount ₩ 251,240Description LTE service2.6GHz license [Member]Disclosure of detailed information about intangible assets[line items]Commencement of amortization 2016-09Completion of amortization 2026-122.6GHz license [Member] | Frequency usage rights [member]Disclosure of detailed information about intangible assets[line items]Amount ₩ 849,930Description LTE service2.1GHz license [Member]
Copyright © 2020 www.secdatabase.com. All Rights Reserved.Please Consider the Environment Before Printing This Document
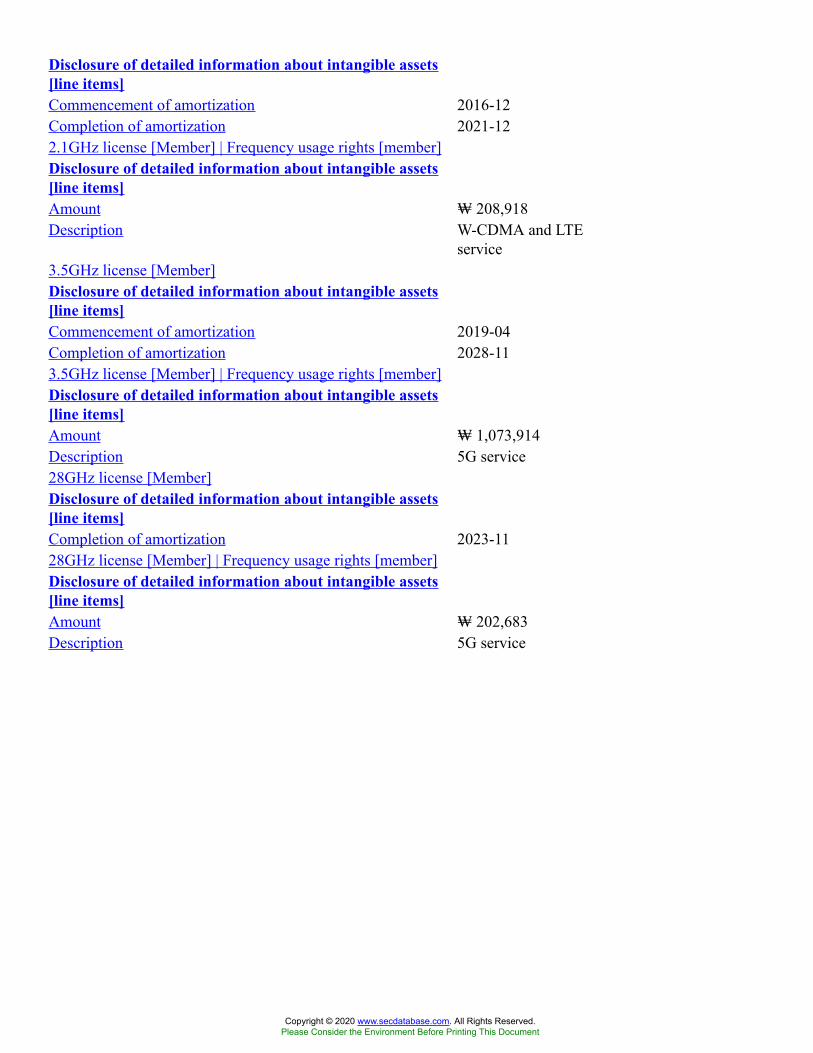
Disclosure of detailed information about intangible assets[line items]Commencement of amortization 2016-12Completion of amortization 2021-122.1GHz license [Member] | Frequency usage rights [member]Disclosure of detailed information about intangible assets[line items]Amount ₩ 208,918Description W-CDMA and LTE
service3.5GHz license [Member]Disclosure of detailed information about intangible assets[line items]Commencement of amortization 2019-04Completion of amortization 2028-113.5GHz license [Member] | Frequency usage rights [member]Disclosure of detailed information about intangible assets[line items]Amount ₩ 1,073,914Description 5G service28GHz license [Member]Disclosure of detailed information about intangible assets[line items]Completion of amortization 2023-1128GHz license [Member] | Frequency usage rights [member]Disclosure of detailed information about intangible assets[line items]Amount ₩ 202,683Description 5G service
Copyright © 2020 www.secdatabase.com. All Rights Reserved.Please Consider the Environment Before Printing This Document
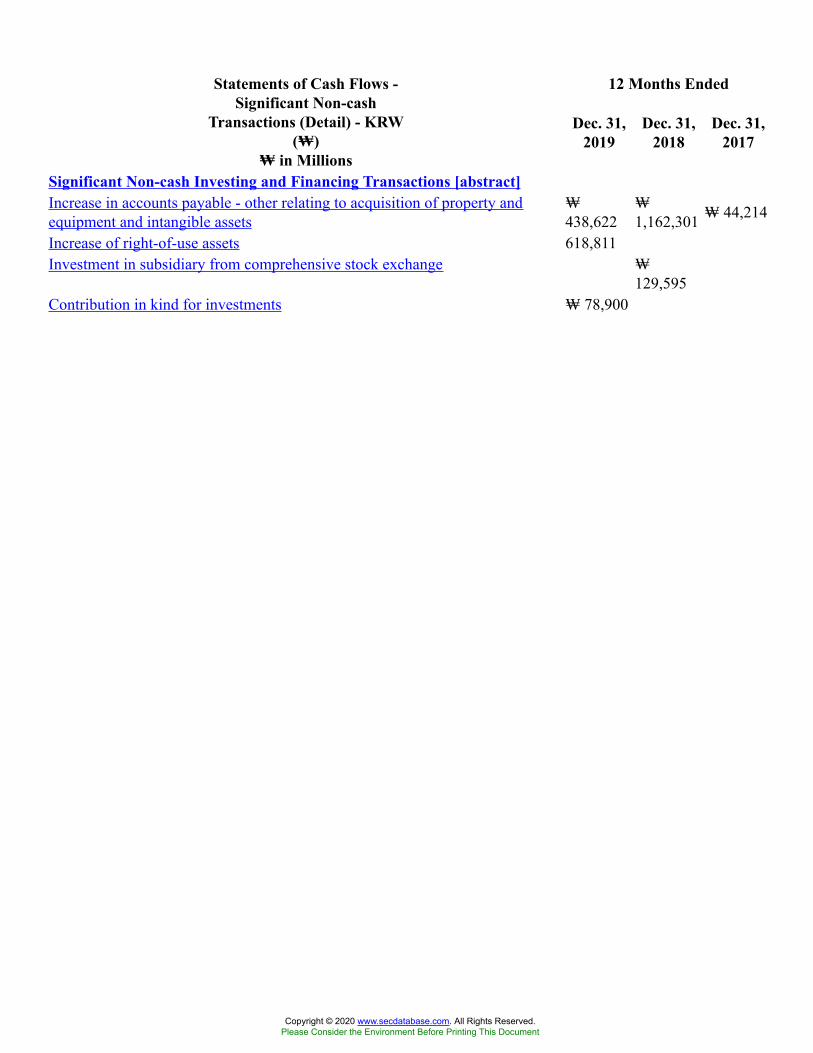
12 Months EndedStatements of Cash Flows -Significant Non-cash
Transactions (Detail) - KRW(₩)
₩ in Millions
Dec. 31,2019
Dec. 31,2018
Dec. 31,2017
Significant Non-cash Investing and Financing Transactions [abstract]Increase in accounts payable - other relating to acquisition of property andequipment and intangible assets
₩438,622
₩1,162,301 ₩ 44,214
Increase of right-of-use assets 618,811Investment in subsidiary from comprehensive stock exchange ₩
129,595Contribution in kind for investments ₩ 78,900
Copyright © 2020 www.secdatabase.com. All Rights Reserved.Please Consider the Environment Before Printing This Document

12 Months EndedCategories of FinancialInstruments Dec. 31, 2019
Text block [abstract]Categories of FinancialInstruments 34. Categories of Financial Instruments
(1) Financial assets by category as of December 31, 2019 and 2018 are as follows:
(In millions of won)December 31, 2019
Financialassets atFVTPL
Equityinstruments at
FVOCI
Debtinstruments at
FVOCI
Financial assetsat amortized
cost
Derivativeshedging
instrument TotalCash and cash equivalents ₩ — — — 1,270,824 — 1,270,824Financial instruments — — — 831,637 — 831,637Short-term investment securities 166,666 — — — — 166,666Long-term investment securities(*) 142,316 710,272 4,627 — — 857,215Accounts receivable — trade — — — 2,247,895 — 2,247,895Loans and other receivables 532,225 — — 1,131,342 — 1,663,567Derivative financial assets 6,074 — — — 144,886 150,960
₩847,281 710,272 4,627 5,481,698 144,886 7,188,764
(*) The Group designated ₩710,272 million of equity instruments that are not held for trading as financial assets at FVOCI.
(In millions of won)December 31, 2018
Financialassets atFVTPL
Equityinstruments at
FVOCI
Debtinstruments at
FVOCI
Financial assetsat amortized
cost
Derivativeshedging
instrument TotalCash and cash equivalents ₩ — — — 1,506,699 — 1,506,699Financial instruments — — — 1,046,897 — 1,046,897Short-term investment securities 195,080 — — — — 195,080Long-term investment securities(*) 120,083 542,496 2,147 — — 664,726Accounts receivable — trade — — — 2,019,933 — 2,019,933Loans and other receivables 489,617 — — 1,132,321 — 1,621,938Derivative financial assets 15,586 — — — 39,871 55,457
₩ 820,366 542,496 2,147 5,705,850 39,871 7,110,730
(*) The Group designated ₩542,496 million of equity instruments that are not held for trading as financial assets at FVOCI.
(2) Financial liabilities by category as of December 31, 2019 and 2018 are as follows:
(In millions of won)December 31, 2019
Financialliabilities at
amortized cost
Derivativeshedging
instrument TotalAccounts payable — trade ₩ 438,297 — 438,297Derivative financial liabilities — 1,043 1,043Borrowings 2,043,140 — 2,043,140Debentures 8,220,833 — 8,220,833Lease liabilities 712,740 — 712,740Accounts payable — other and others 6,563,030 — 6,563,030
₩ 17,978,040 1,043 17,979,083
(In millions of won)December 31, 2018
Financialliabilities at
FVTPL
Financialliabilities at
amortized cost
Derivativeshedging
instrument TotalAccounts payable — trade ₩ — 381,302 — 381,302Derivative financial liabilities — — 4,184 4,184Borrowings — 2,184,996 — 2,184,996Debentures(*) 61,813 7,405,039 — 7,466,852Accounts payable — other and others — 6,762,782 — 6,762,782
₩ 61,813 16,734,119 4,184 16,800,116
(*) Debentures classified as financial liabilities at FVTPL as of December 31, 2018 are structured bonds and they were designated as financial liabilities at FVTPL inorder to eliminate a measurement inconsistency with the related derivatives. The debenture has been repaid during the year ended December 31, 2019 before itsmaturity.
Copyright © 2020 www.secdatabase.com. All Rights Reserved.Please Consider the Environment Before Printing This Document
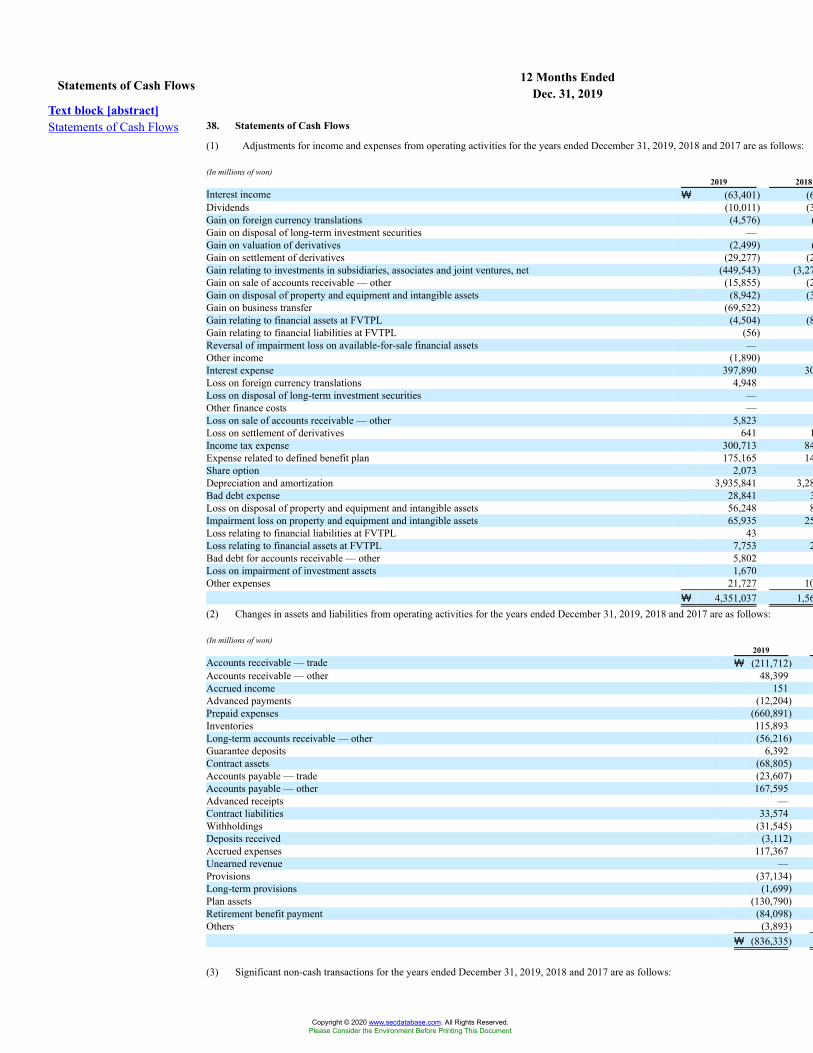
12 Months EndedStatements of Cash Flows Dec. 31, 2019Text block [abstract]Statements of Cash Flows 38. Statements of Cash Flows
(1) Adjustments for income and expenses from operating activities for the years ended December 31, 2019, 2018 and 2017 are as follows:
(In millions of won)2019 2018 2017
Interest income ₩ (63,401) (69,936) (76,045)Dividends (10,011) (35,143) (12,416)Gain on foreign currency translations (4,576) (2,776) (7,110)Gain on disposal of long-term investment securities — — (4,890)Gain on valuation of derivatives (2,499) (6,532) (223,943)Gain on settlement of derivatives (29,277) (20,399) —Gain relating to investments in subsidiaries, associates and joint ventures, net (449,543) (3,270,912) (2,245,732)Gain on sale of accounts receivable — other (15,855) (20,023) (18,548)Gain on disposal of property and equipment and intangible assets (8,942) (38,933) (13,991)Gain on business transfer (69,522) — —Gain relating to financial assets at FVTPL (4,504) (83,636) (33)Gain relating to financial liabilities at FVTPL (56) — —Reversal of impairment loss on available-for-sale financial assets — — (9,900)Other income (1,890) (952) (1,129)Interest expense 397,890 307,319 299,100Loss on foreign currency translations 4,948 2,397 8,419Loss on disposal of long-term investment securities — — 36,024Other finance costs — — 14,519Loss on sale of accounts receivable — other 5,823 — 9,682Loss on settlement of derivatives 641 12,554 10,031Income tax expense 300,713 843,978 745,654Expense related to defined benefit plan 175,165 147,722 127,696Share option 2,073 789 414Depreciation and amortization 3,935,841 3,284,339 3,247,519Bad debt expense 28,841 38,211 34,584Loss on disposal of property and equipment and intangible assets 56,248 87,257 60,086Impairment loss on property and equipment and intangible assets 65,935 255,839 54,946Loss relating to financial liabilities at FVTPL 43 1,535 678Loss relating to financial assets at FVTPL 7,753 22,507 —Bad debt for accounts receivable — other 5,802 7,718 5,793Loss on impairment of investment assets 1,670 3,157 9,003Other expenses 21,727 102,839 46,353
₩ 4,351,037 1,568,919 2,096,764(2) Changes in assets and liabilities from operating activities for the years ended December 31, 2019, 2018 and 2017 are as follows:
(In millions of won)2019 2018 2017
Accounts receivable — trade ₩ (211,712) 175,841 46,144Accounts receivable — other 48,399 319,913 (159,960)Accrued income 151 — 14Advanced payments (12,204) 13,393 (1,269)Prepaid expenses (660,891) (3,597) (28,362)Inventories 115,893 (13,429) (17,958)Long-term accounts receivable — other (56,216) 11,064 (137,979)Guarantee deposits 6,392 (258) 14,696Contract assets (68,805) 9,161 —Accounts payable — trade (23,607) (58,487) (26,151)Accounts payable — other 167,595 (271,128) 134,542Advanced receipts — — (13,470)Contract liabilities 33,574 11,328 —Withholdings (31,545) 129,492 (13,041)Deposits received (3,112) (333) (4,916)Accrued expenses 117,367 (102,246) 116,065Unearned revenue — — (339)Provisions (37,134) (4,298) (20,488)Long-term provisions (1,699) 1,193 (2,449)Plan assets (130,790) (123,075) (95,828)Retirement benefit payment (84,098) (63,957) (60,883)Others (3,893) (4,628) 10,164
₩ (836,335) 25,949 (261,468)
(3) Significant non-cash transactions for the years ended December 31, 2019, 2018 and 2017 are as follows:
Copyright © 2020 www.secdatabase.com. All Rights Reserved.Please Consider the Environment Before Printing This Document
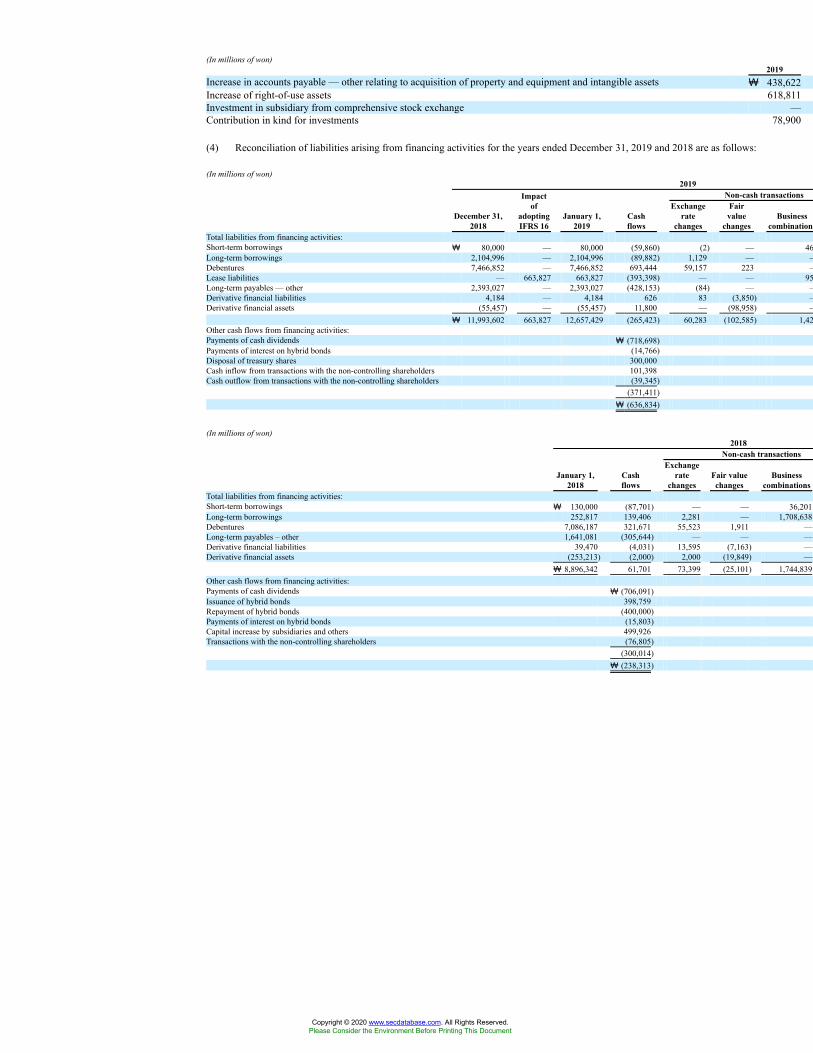
(In millions of won)2019 2018 2017
Increase in accounts payable — other relating to acquisition of property and equipment and intangible assets ₩ 438,622 1,162,301 44,214Increase of right-of-use assets 618,811 — —Investment in subsidiary from comprehensive stock exchange — 129,595 —Contribution in kind for investments 78,900 — —
(4) Reconciliation of liabilities arising from financing activities for the years ended December 31, 2019 and 2018 are as follows:
(In millions of won)2019
Non-cash transactions
December 31,2018
Impactof
adoptingIFRS 16
January 1,2019
Cashflows
Exchangerate
changes
Fairvalue
changesBusiness
combinationsOther
changesDecember 31,
2019Total liabilities from financing activities:Short-term borrowings ₩ 80,000 — 80,000 (59,860) (2) — 465 — 20,603Long-term borrowings 2,104,996 — 2,104,996 (89,882) 1,129 — — 6,294 2,022,537Debentures 7,466,852 — 7,466,852 693,444 59,157 223 — 1,157 8,220,833Lease liabilities — 663,827 663,827 (393,398) — — 955 441,356 712,740Long-term payables — other 2,393,027 — 2,393,027 (428,153) (84) — — 6,819 1,971,609Derivative financial liabilities 4,184 — 4,184 626 83 (3,850) — — 1,043Derivative financial assets (55,457) — (55,457) 11,800 — (98,958) — (2,271) (144,886)
₩ 11,993,602 663,827 12,657,429 (265,423) 60,283 (102,585) 1,420 453,355 12,804,479Other cash flows from financing activities:Payments of cash dividends ₩ (718,698)Payments of interest on hybrid bonds (14,766)Disposal of treasury shares 300,000Cash inflow from transactions with the non-controlling shareholders 101,398Cash outflow from transactions with the non-controlling shareholders (39,345)
(371,411)₩ (636,834)
(In millions of won)2018
Non-cash transactions
January 1,2018
Cashflows
Exchangerate
changesFair valuechanges
Businesscombinations
Otherchanges
December 31,2018
Total liabilities from financing activities:Short-term borrowings ₩ 130,000 (87,701) — — 36,201 1,500 80,000Long-term borrowings 252,817 139,406 2,281 — 1,708,638 1,854 2,104,996Debentures 7,086,187 321,671 55,523 1,911 — 1,560 7,466,852Long-term payables – other 1,641,081 (305,644) — — — 1,057,590 2,393,027Derivative financial liabilities 39,470 (4,031) 13,595 (7,163) — (37,687) 4,184Derivative financial assets (253,213) (2,000) 2,000 (19,849) — 217,605 (55,457)
₩ 8,896,342 61,701 73,399 (25,101) 1,744,839 1,242,422 11,993,602Other cash flows from financing activities:Payments of cash dividends ₩ (706,091)Issuance of hybrid bonds 398,759Repayment of hybrid bonds (400,000)Payments of interest on hybrid bonds (15,803)Capital increase by subsidiaries and others 499,926Transactions with the non-controlling shareholders (76,805)
(300,014)₩ (238,313)
Copyright © 2020 www.secdatabase.com. All Rights Reserved.Please Consider the Environment Before Printing This Document
12 Months EndedRecently AdoptedAccounting Standards Dec. 31, 2019
Text block [abstract]Recently Adopted AccountingStandards
3. Recently Adopted Accounting Standards
The Group has initially applied IFRS 16, Leases from January 1, 2019. A number of other new or amended standards are also effective from January 1, 2019, butthey do not have a material effect on the Group’s consolidated financial statements.
IFRS 16, Leases
IFRS 16, Leases, introduced a single, on-balance sheet accounting model for lessees. As a result, the Group, as a lessee, has recognized right-of-use assetsrepresenting its rights to use the underlying assets and lease liabilities representing its obligation to make lease payments. Lessor accounting remains similar to previousaccounting policies.
The Group has applied IFRS 16, Leases from January 1, 2019 using the modified retrospective method with the cumulative effect of initially applying this standardrecognized as an adjustment to the retained earnings as at January 1, 2019. Accordingly, the comparative information presented for 2018 and 2017 has been presented, aspreviously reported, under IAS 17, Leases and has not been restated. Details of the changes in accounting policies are disclosed below.
(1) Definition of a lease
Previously, the Group determined at contract inception whether an arrangement was or contained a lease under IFRIC 4, Determining Whether an ArrangementContains a Lease. The Group now assesses whether a contract is or contains a lease based on the new definition of a lease. Under IFRS 16, Leases, a contract is or containsa lease if the contract conveys a right to control the use of an identified asset for a period of time in exchange for consideration.
(2) As a lessee
The Group leases a number of assets including buildings and vehicles. The terms of leases are negotiated individually and include various conditions. Each leasecontract is entered into with a term of 1~50 years.
As a lessee, the Group previously classified leases as operating or finance leases based on its assessment of whether the lease transferred substantially all of the risksand rewards of ownership. Under IFRS 16, Leases, the Group recognizes right-of-use assets and lease liabilities for most leases — i.e. theses leases are presented on theconsolidated statements of financial position.
However, the Group has elected not to recognize right-of-use assets and lease liabilities for leases with the lease term of 12 months or less at the commencement dateand for leases of low-value assets. The Group recognizes the lease payments associated with these leases as an expense on a straight-line basis over the lease term. TheGroup has also elected to apply the practical expedient which allows a lease and associated non-lease components to be accounted for as a single lease component.
1) Significant accounting policies
The Group recognizes a right-of-use asset and a lease liability at the lease commencement date. The right-of-use asset is initially measured at cost, which comprisethe initial amount of lease liability adjusted for any lease payments made at or before the commencement date, plus any initial direct costs incurred and an estimate of coststo dismantle and remove the underlying assets or to restore the underlying asset or the site on which it is located, less any lease incentives received. The right-of-use asset issubsequently measured at cost less any accumulated depreciation and impairment losses and adjusted for certain remeasurements of the lease liability. The Group presentsits right-of-use assets in property and equipment on the consolidated statements of financial position. The right-of-use asset is subsequently depreciated using the straight-line method from the commencement date to the end of the lease term.
The lease liability is initially measured at the present value of the lease payments that are not paid at the commencement date, discounted using the interest rateimplicit in the lease or, if that rate cannot be readily determined, the Group’s incremental borrowing rate. Generally, the Group uses its incremental borrowing rate as thediscount rate.
The lease liability is subsequently increased by the interest cost on the lease liability and decreased by lease payment made. It is remeasured when there is a change infuture lease payments arising from a change in an index or rate, a change in the estimate of the amount expected to be payable under a residual value guarantee, or asappropriate, changes in the assessment of whether a purchase or extension option is reasonably certain to be exercised or a termination option is reasonably certain not to beexercised.
The Group has applied judgment to determine the lease term for some lease contracts in which it is a lessee that include extension options. The assessment of whetherthe Group is reasonably certain to exercise such options impacts the lease term, which significantly affects the amount of lease liabilities and right-of-use assets recognized.The Group has not included the extension option periods in the lease term because it is not reasonably certain that the Group will exercise such options. After thecommencement date, the Group reassesses the lease term upon the occurrence of a significant event or a significant change in circumstances that is within the control of theGroup that affects whether the Group is reasonably certain to exercise the extension option.
2) Transition requirements
At transition, lease liabilities were measured at the present value of the remaining lease payments, discounted at the Group’s incremental borrowing rate as ofJanuary 1, 2019. Right-of-use assets are measured at either:
• their carrying amount as if IFRS 16, Leases, had been applied since the commencement date, discounted using the lessee’s incremental borrowing rate at thedate of initial application; or
• the amount equal to the lease liabilities, adjusted by the amount of any prepaid or accrued lease payments.
The Group used the following practical expedients when applying IFRS 16, Leases, to leases previously classified as operating leases under IAS 17, Leases.
• Excluded initial direct costs from measuring the right-of-use assets at the date of initial application.
• Used hindsight when determining the lease term if the contract contains options to extend or terminate the lease.
(3) As a lessor
The accounting policies applicable to the Group as a lessor are not different from those under IAS 17, Leases. However, when the Group is an intermediate lessor thesub-leases are classified with reference to the right-of-use asset arising from the head lease, not with reference to the underlying asset.
Copyright © 2020 www.secdatabase.com. All Rights Reserved.Please Consider the Environment Before Printing This Document

(4) Impact on financial statements
1) Impact on transition
On transition to IFRS 16, the Group recognized right-of-use assets and lease liabilities, with the difference recognized in retained earnings. The impact on transitionis summarized below.
(In millions of won)January 1,
2019Impact on assets:
Right-of-use assets presented in property and equipment ₩654,449Increase in accounts receivable — other (lease receivables) 31,355Adjustments in property and equipment and intangible assets (3,387)Decrease in advanced payments and others (52,638)
629,779Impact on liabilities:
Increase in lease liabilities 663,827Decrease in deferred tax liabilities (9,359)
654,468Decrease in retained earnings (24,186)Decrease in non-controlling interests ₩ (503)
When measuring lease liabilities for leases that were classified as operating leases, the Group discounted lease payments using its incremental borrowing rate atJanuary 1, 2019. The weighted average incremental borrowing rate applied is 2.11%.
(In millions of won)January 1,
2019Operating lease commitments at December 31, 2018 ₩766,978Discounted using the incremental borrowing rate at January 1, 2019 735,051— Recognition exemption for leases with less than 12 months of lease term at the lease commencement date (66,548)— Recognition exemption for leases of low-value assets (4,676)Lease liabilities recognized at January 1, 2019 ₩663,827
2) Impact subsequent to transition
(i) As a lessee
As a result of initially applying IFRS 16, in relation to the leases that were previously classified as operating leases, the Group recognized ₩709,396 million ofright-of-use assets and ₩712,740 million of lease liabilities as of December 31, 2019.
Also, in relation to those leases under IFRS 16, the Group has recognized depreciation and interest costs, instead of operating lease expense. For the year endedDecember 31, 2019, the Group recognized ₩360,606 million of depreciation charges and ₩15,471 million of interest costs from those leases. Expenses related to short-term leases and leases of low-value assets are ₩140,991 million and ₩3,267 million, respectively.
The payments of lease liabilities presented in the cash flows from financing activities would have been included in the cash flows from operating activities if theprevious accounting standards were applied.
(ii) As a lessor
① Finance lease
The following table sets out a maturity analysis of lease receivables, presenting the undiscounted lease payments to be received subsequent to December 31, 2019.Under IAS 17, the Group did not hold any finance lease as a lessor.
(In millions of won) AmountLess than 1 year ₩24,2861 ~ 2 years 12,6902 ~ 3 years 6,3483 ~ 4 years 3,6834 ~ 5 years 1,589More than 5 years 1Undiscounted lease payments ₩48,597Unrealized finance income 1,822Net investment in the lease 46,775
② Operating lease
The Group recognized lease income of ₩163,355 million for the year ended December 31, 2019, of which income relating to variable lease payments is₩20,101 million.
The following table sets out a maturity analysis of lease payments, presenting the undiscounted lease payments to be received subsequent to December 31, 2019.
(In millions of won) AmountLess than 1 year ₩129,3101 ~ 2 years 76,6692 ~ 3 years 25,0473 ~ 4 years 1,243
Copyright © 2020 www.secdatabase.com. All Rights Reserved.Please Consider the Environment Before Printing This Document
4 ~ 5 years 1,218More than 5 year 3
₩233,490
(5) Determining the lease term and assessing the length of the enforceable period of a lease
In December 2019, International Financial Reporting Interpretations Committee(‘IFRIC’) issued its final agenda decision that the concept of penalty that should beconsidered in determining the enforceable period under IFRS 16, Leases, shall be determined considering broader economics of the contract, and not only contractualtermination payments. Further, a lease is no longer enforceable when each of the parties has the right to terminate the lease without permission from the other party with nomore than an insignificant penalty.
As of December 31, 2019, the Group assesses the lease term based on the assumption that the right to extend or terminate the lease is no longer enforceable if a leasecontract requires the counterparty’s consent to be extended. Applying the above mentioned IFRIC interpretation may change the judgment on enforceable period for certainof the Group’s lease contracts.
However, considering the type and number of lease contracts entered into as of and from January 1, 2019, the Group does not believe it had sufficient time tocomplete the analysis on its lease portfolios to reflect the impact of the above IFRIC agenda decision, if any, in its 2019 consolidated financial statements. The Group plansto analyze and apply the impact of IFRIC’s interpretation in 2020, if any, as changes in accounting policies.
Copyright © 2020 www.secdatabase.com. All Rights Reserved.Please Consider the Environment Before Printing This Document
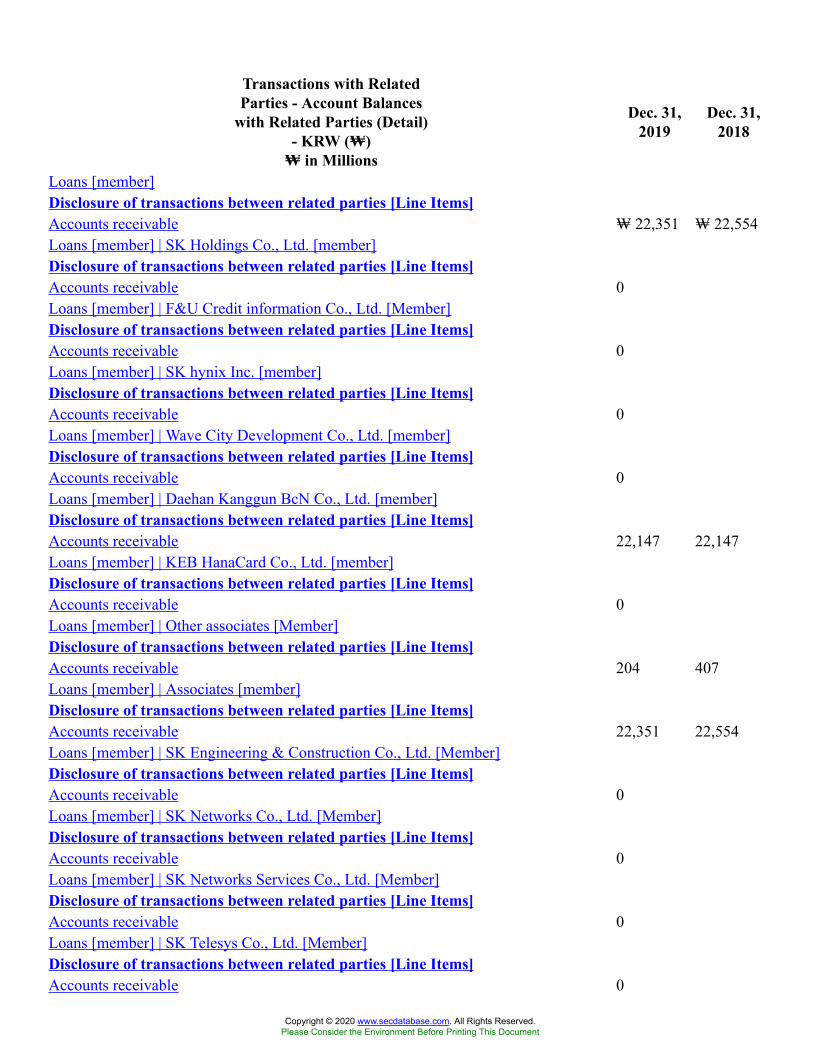
Transactions with RelatedParties - Account Balances
with Related Parties (Detail)- KRW (₩)
₩ in Millions
Dec. 31,2019
Dec. 31,2018
Loans [member]Disclosure of transactions between related parties [Line Items]Accounts receivable ₩ 22,351 ₩ 22,554Loans [member] | SK Holdings Co., Ltd. [member]Disclosure of transactions between related parties [Line Items]Accounts receivable 0Loans [member] | F&U Credit information Co., Ltd. [Member]Disclosure of transactions between related parties [Line Items]Accounts receivable 0Loans [member] | SK hynix Inc. [member]Disclosure of transactions between related parties [Line Items]Accounts receivable 0Loans [member] | Wave City Development Co., Ltd. [member]Disclosure of transactions between related parties [Line Items]Accounts receivable 0Loans [member] | Daehan Kanggun BcN Co., Ltd. [member]Disclosure of transactions between related parties [Line Items]Accounts receivable 22,147 22,147Loans [member] | KEB HanaCard Co., Ltd. [member]Disclosure of transactions between related parties [Line Items]Accounts receivable 0Loans [member] | Other associates [Member]Disclosure of transactions between related parties [Line Items]Accounts receivable 204 407Loans [member] | Associates [member]Disclosure of transactions between related parties [Line Items]Accounts receivable 22,351 22,554Loans [member] | SK Engineering & Construction Co., Ltd. [Member]Disclosure of transactions between related parties [Line Items]Accounts receivable 0Loans [member] | SK Networks Co., Ltd. [Member]Disclosure of transactions between related parties [Line Items]Accounts receivable 0Loans [member] | SK Networks Services Co., Ltd. [Member]Disclosure of transactions between related parties [Line Items]Accounts receivable 0Loans [member] | SK Telesys Co., Ltd. [Member]Disclosure of transactions between related parties [Line Items]Accounts receivable 0
Copyright © 2020 www.secdatabase.com. All Rights Reserved.Please Consider the Environment Before Printing This Document
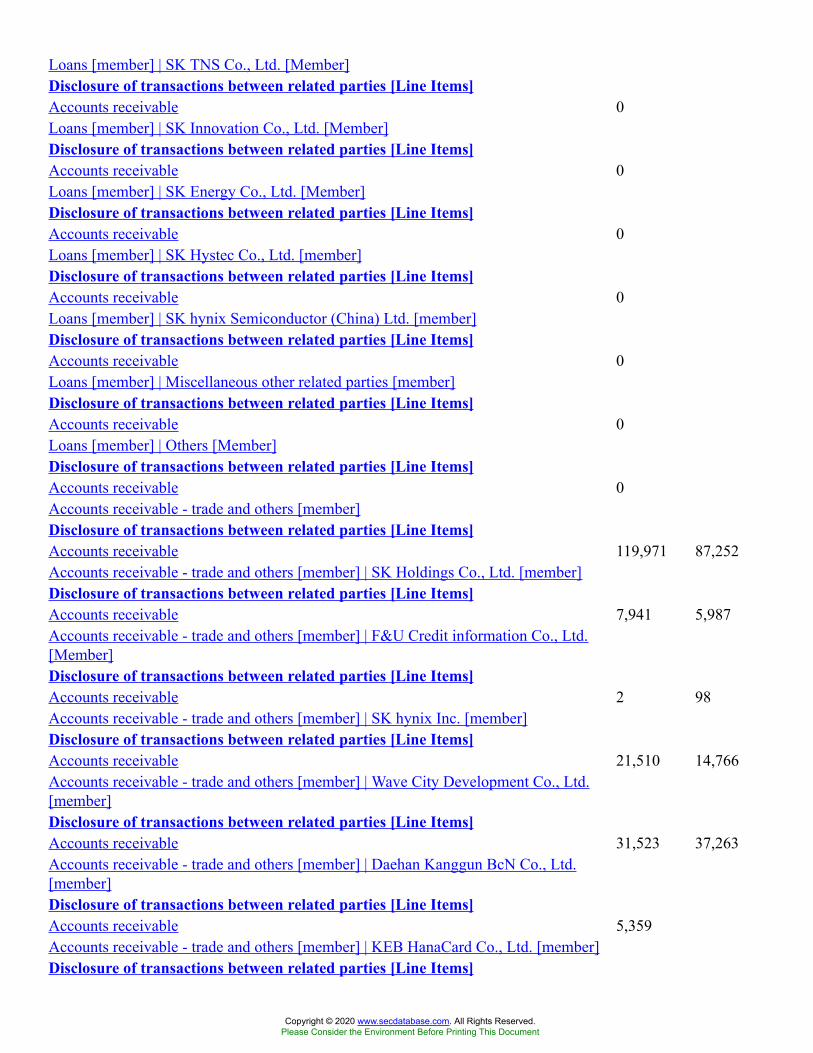
Loans [member] | SK TNS Co., Ltd. [Member]Disclosure of transactions between related parties [Line Items]Accounts receivable 0Loans [member] | SK Innovation Co., Ltd. [Member]Disclosure of transactions between related parties [Line Items]Accounts receivable 0Loans [member] | SK Energy Co., Ltd. [Member]Disclosure of transactions between related parties [Line Items]Accounts receivable 0Loans [member] | SK Hystec Co., Ltd. [member]Disclosure of transactions between related parties [Line Items]Accounts receivable 0Loans [member] | SK hynix Semiconductor (China) Ltd. [member]Disclosure of transactions between related parties [Line Items]Accounts receivable 0Loans [member] | Miscellaneous other related parties [member]Disclosure of transactions between related parties [Line Items]Accounts receivable 0Loans [member] | Others [Member]Disclosure of transactions between related parties [Line Items]Accounts receivable 0Accounts receivable - trade and others [member]Disclosure of transactions between related parties [Line Items]Accounts receivable 119,971 87,252Accounts receivable - trade and others [member] | SK Holdings Co., Ltd. [member]Disclosure of transactions between related parties [Line Items]Accounts receivable 7,941 5,987Accounts receivable - trade and others [member] | F&U Credit information Co., Ltd.[Member]Disclosure of transactions between related parties [Line Items]Accounts receivable 2 98Accounts receivable - trade and others [member] | SK hynix Inc. [member]Disclosure of transactions between related parties [Line Items]Accounts receivable 21,510 14,766Accounts receivable - trade and others [member] | Wave City Development Co., Ltd.[member]Disclosure of transactions between related parties [Line Items]Accounts receivable 31,523 37,263Accounts receivable - trade and others [member] | Daehan Kanggun BcN Co., Ltd.[member]Disclosure of transactions between related parties [Line Items]Accounts receivable 5,359Accounts receivable - trade and others [member] | KEB HanaCard Co., Ltd. [member]Disclosure of transactions between related parties [Line Items]
Copyright © 2020 www.secdatabase.com. All Rights Reserved.Please Consider the Environment Before Printing This Document
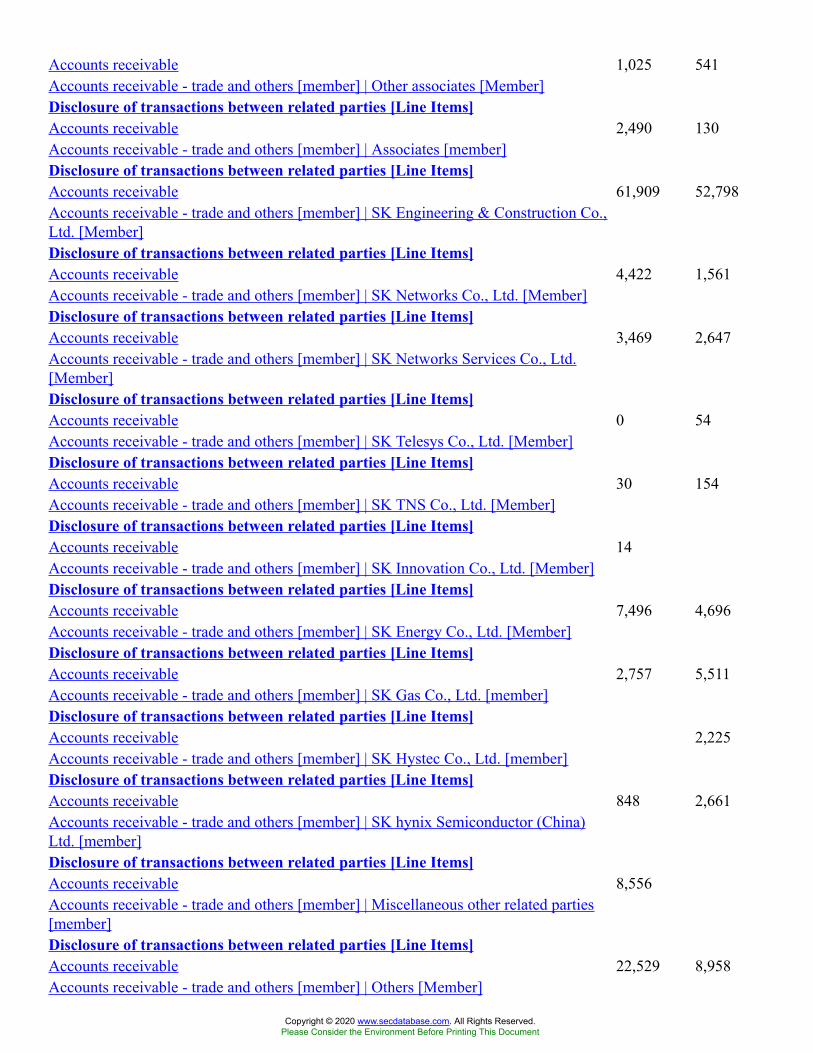
Accounts receivable 1,025 541Accounts receivable - trade and others [member] | Other associates [Member]Disclosure of transactions between related parties [Line Items]Accounts receivable 2,490 130Accounts receivable - trade and others [member] | Associates [member]Disclosure of transactions between related parties [Line Items]Accounts receivable 61,909 52,798Accounts receivable - trade and others [member] | SK Engineering & Construction Co.,Ltd. [Member]Disclosure of transactions between related parties [Line Items]Accounts receivable 4,422 1,561Accounts receivable - trade and others [member] | SK Networks Co., Ltd. [Member]Disclosure of transactions between related parties [Line Items]Accounts receivable 3,469 2,647Accounts receivable - trade and others [member] | SK Networks Services Co., Ltd.[Member]Disclosure of transactions between related parties [Line Items]Accounts receivable 0 54Accounts receivable - trade and others [member] | SK Telesys Co., Ltd. [Member]Disclosure of transactions between related parties [Line Items]Accounts receivable 30 154Accounts receivable - trade and others [member] | SK TNS Co., Ltd. [Member]Disclosure of transactions between related parties [Line Items]Accounts receivable 14Accounts receivable - trade and others [member] | SK Innovation Co., Ltd. [Member]Disclosure of transactions between related parties [Line Items]Accounts receivable 7,496 4,696Accounts receivable - trade and others [member] | SK Energy Co., Ltd. [Member]Disclosure of transactions between related parties [Line Items]Accounts receivable 2,757 5,511Accounts receivable - trade and others [member] | SK Gas Co., Ltd. [member]Disclosure of transactions between related parties [Line Items]Accounts receivable 2,225Accounts receivable - trade and others [member] | SK Hystec Co., Ltd. [member]Disclosure of transactions between related parties [Line Items]Accounts receivable 848 2,661Accounts receivable - trade and others [member] | SK hynix Semiconductor (China)Ltd. [member]Disclosure of transactions between related parties [Line Items]Accounts receivable 8,556Accounts receivable - trade and others [member] | Miscellaneous other related parties[member]Disclosure of transactions between related parties [Line Items]Accounts receivable 22,529 8,958Accounts receivable - trade and others [member] | Others [Member]
Copyright © 2020 www.secdatabase.com. All Rights Reserved.Please Consider the Environment Before Printing This Document

Disclosure of transactions between related parties [Line Items]Accounts receivable 50,121 28,467Accounts payable - other and others [member]Disclosure of transactions between related parties [Line Items]Accounts payable 482,851 473,676Accounts payable - other and others [member] | SK Holdings Co., Ltd. [member]Disclosure of transactions between related parties [Line Items]Accounts payable 87,519 139,260Accounts payable - other and others [member] | F&U Credit information Co., Ltd.[Member]Disclosure of transactions between related parties [Line Items]Accounts payable 4,869 5,801Accounts payable - other and others [member] | SK hynix Inc. [member]Disclosure of transactions between related parties [Line Items]Accounts payable 48 89Accounts payable - other and others [member] | Wave City Development Co., Ltd.[member]Disclosure of transactions between related parties [Line Items]Accounts payable 0Accounts payable - other and others [member] | Daehan Kanggun BcN Co., Ltd.[member]Disclosure of transactions between related parties [Line Items]Accounts payable 0Accounts payable - other and others [member] | KEB HanaCard Co., Ltd. [member]Disclosure of transactions between related parties [Line Items]Accounts payable 9,474 11,311Accounts payable - other and others [member] | Other associates [Member]Disclosure of transactions between related parties [Line Items]Accounts payable 2,262 1,764Accounts payable - other and others [member] | Associates [member]Disclosure of transactions between related parties [Line Items]Accounts payable 16,653 18,965Accounts payable - other and others [member] | SK Engineering & Construction Co.,Ltd. [Member]Disclosure of transactions between related parties [Line Items]Accounts payable 97 760Accounts payable - other and others [member] | SK Networks Co., Ltd. [Member]Disclosure of transactions between related parties [Line Items]Accounts payable 85,421 167,433Accounts payable - other and others [member] | SK Networks Services Co., Ltd.[Member]Disclosure of transactions between related parties [Line Items]Accounts payable 10,820 8,946Accounts payable - other and others [member] | SK Telesys Co., Ltd. [Member]Disclosure of transactions between related parties [Line Items]
Copyright © 2020 www.secdatabase.com. All Rights Reserved.Please Consider the Environment Before Printing This Document
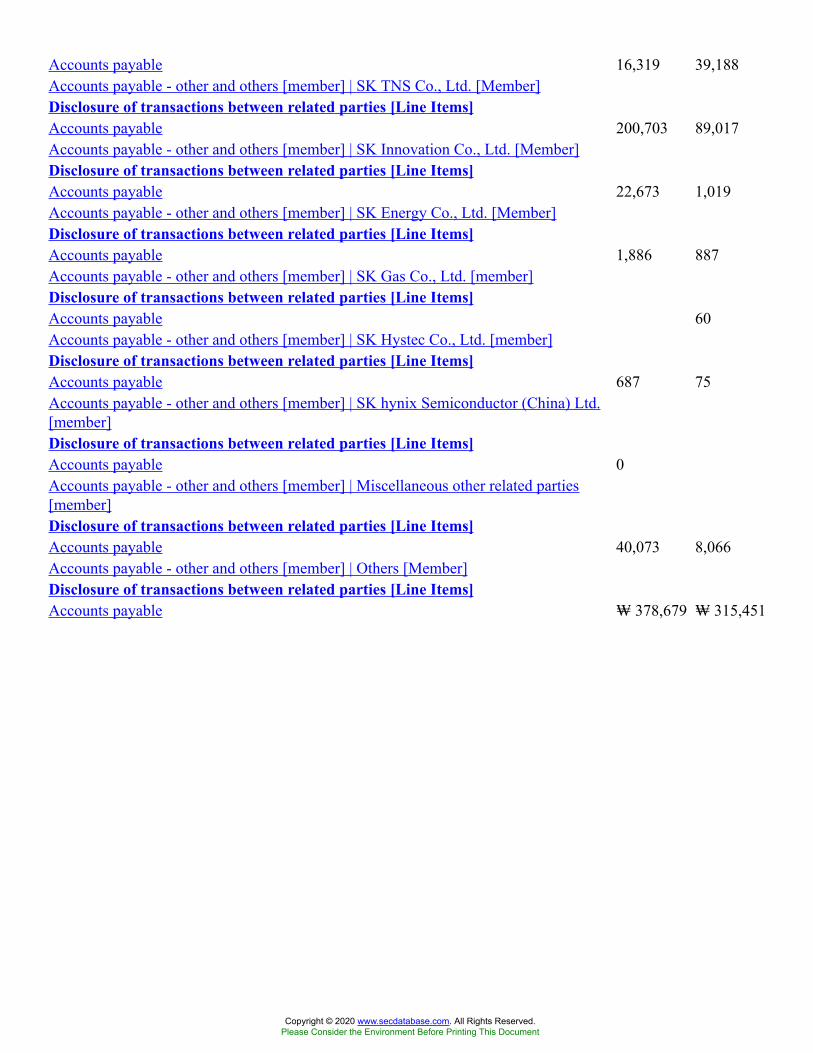
Accounts payable 16,319 39,188Accounts payable - other and others [member] | SK TNS Co., Ltd. [Member]Disclosure of transactions between related parties [Line Items]Accounts payable 200,703 89,017Accounts payable - other and others [member] | SK Innovation Co., Ltd. [Member]Disclosure of transactions between related parties [Line Items]Accounts payable 22,673 1,019Accounts payable - other and others [member] | SK Energy Co., Ltd. [Member]Disclosure of transactions between related parties [Line Items]Accounts payable 1,886 887Accounts payable - other and others [member] | SK Gas Co., Ltd. [member]Disclosure of transactions between related parties [Line Items]Accounts payable 60Accounts payable - other and others [member] | SK Hystec Co., Ltd. [member]Disclosure of transactions between related parties [Line Items]Accounts payable 687 75Accounts payable - other and others [member] | SK hynix Semiconductor (China) Ltd.[member]Disclosure of transactions between related parties [Line Items]Accounts payable 0Accounts payable - other and others [member] | Miscellaneous other related parties[member]Disclosure of transactions between related parties [Line Items]Accounts payable 40,073 8,066Accounts payable - other and others [member] | Others [Member]Disclosure of transactions between related parties [Line Items]Accounts payable ₩ 378,679 ₩ 315,451
Copyright © 2020 www.secdatabase.com. All Rights Reserved.Please Consider the Environment Before Printing This Document
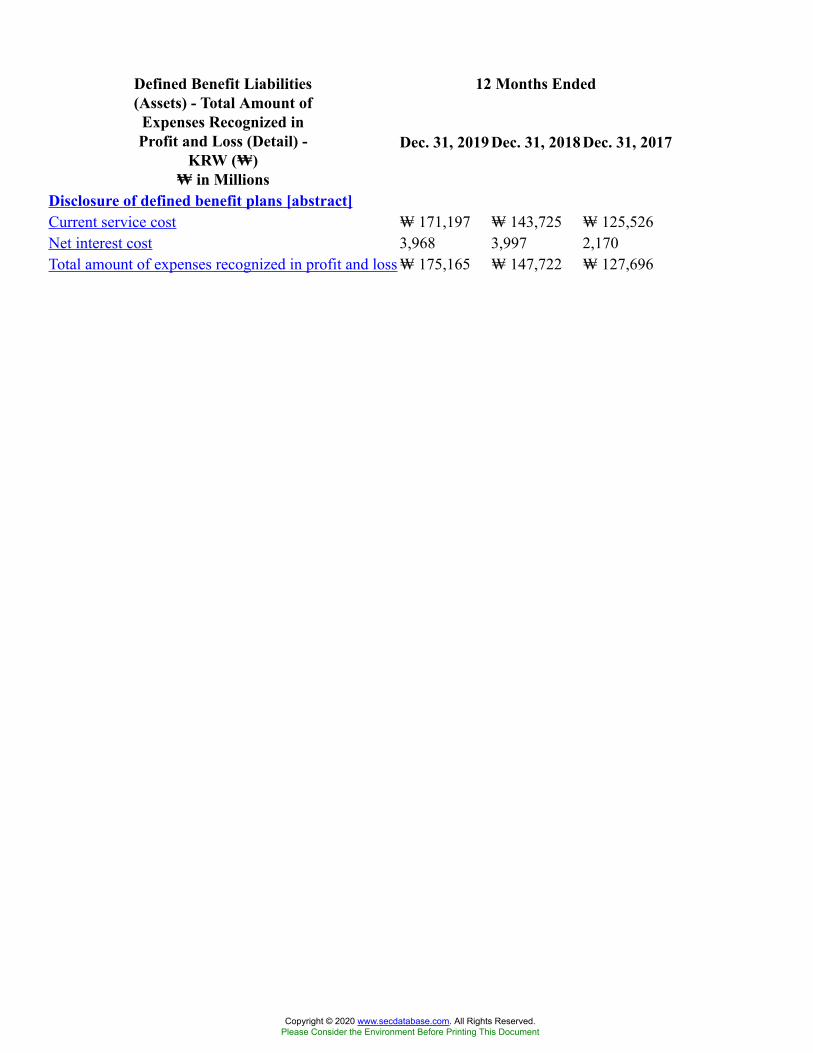
12 Months EndedDefined Benefit Liabilities(Assets) - Total Amount of
Expenses Recognized inProfit and Loss (Detail) -
KRW (₩)₩ in Millions
Dec. 31, 2019 Dec. 31, 2018 Dec. 31, 2017
Disclosure of defined benefit plans [abstract]Current service cost ₩ 171,197 ₩ 143,725 ₩ 125,526Net interest cost 3,968 3,997 2,170Total amount of expenses recognized in profit and loss ₩ 175,165 ₩ 147,722 ₩ 127,696
Copyright © 2020 www.secdatabase.com. All Rights Reserved.Please Consider the Environment Before Printing This Document
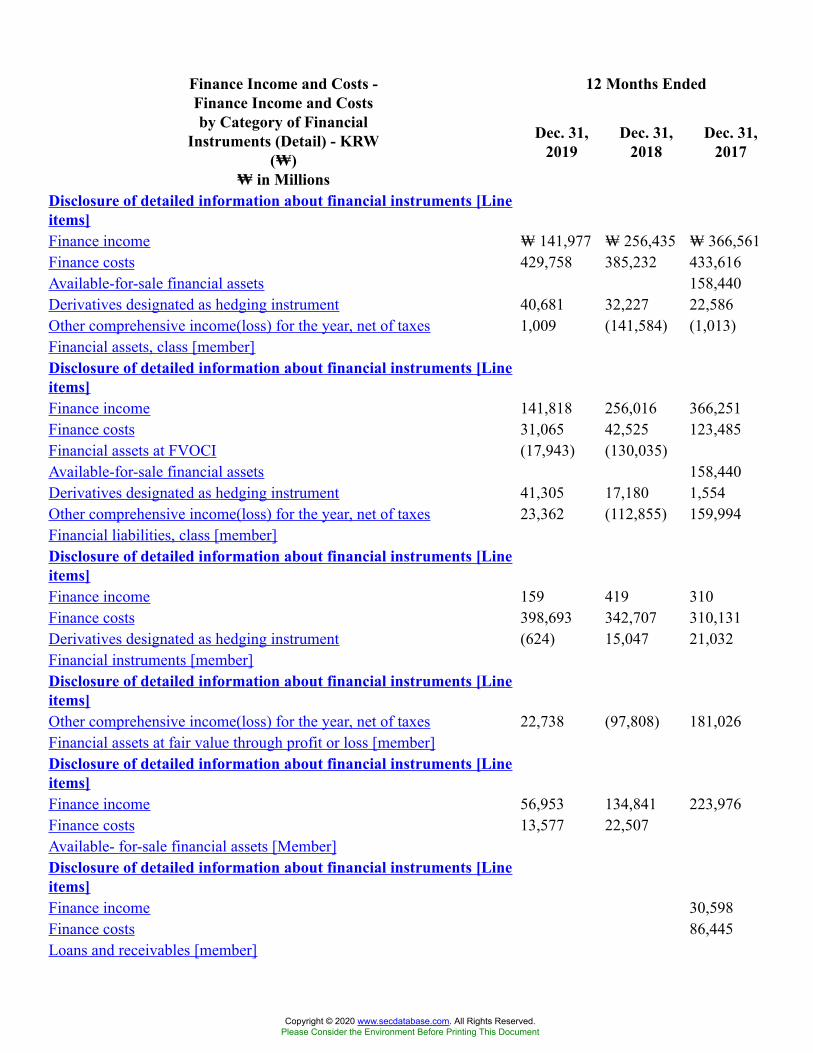
12 Months EndedFinance Income and Costs -Finance Income and Costsby Category of Financial
Instruments (Detail) - KRW(₩)
₩ in Millions
Dec. 31,2019
Dec. 31,2018
Dec. 31,2017
Disclosure of detailed information about financial instruments [Lineitems]Finance income ₩ 141,977 ₩ 256,435 ₩ 366,561Finance costs 429,758 385,232 433,616Available-for-sale financial assets 158,440Derivatives designated as hedging instrument 40,681 32,227 22,586Other comprehensive income(loss) for the year, net of taxes 1,009 (141,584) (1,013)Financial assets, class [member]Disclosure of detailed information about financial instruments [Lineitems]Finance income 141,818 256,016 366,251Finance costs 31,065 42,525 123,485Financial assets at FVOCI (17,943) (130,035)Available-for-sale financial assets 158,440Derivatives designated as hedging instrument 41,305 17,180 1,554Other comprehensive income(loss) for the year, net of taxes 23,362 (112,855) 159,994Financial liabilities, class [member]Disclosure of detailed information about financial instruments [Lineitems]Finance income 159 419 310Finance costs 398,693 342,707 310,131Derivatives designated as hedging instrument (624) 15,047 21,032Financial instruments [member]Disclosure of detailed information about financial instruments [Lineitems]Other comprehensive income(loss) for the year, net of taxes 22,738 (97,808) 181,026Financial assets at fair value through profit or loss [member]Disclosure of detailed information about financial instruments [Lineitems]Finance income 56,953 134,841 223,976Finance costs 13,577 22,507Available- for-sale financial assets [Member]Disclosure of detailed information about financial instruments [Lineitems]Finance income 30,598Finance costs 86,445Loans and receivables [member]
Copyright © 2020 www.secdatabase.com. All Rights Reserved.Please Consider the Environment Before Printing This Document
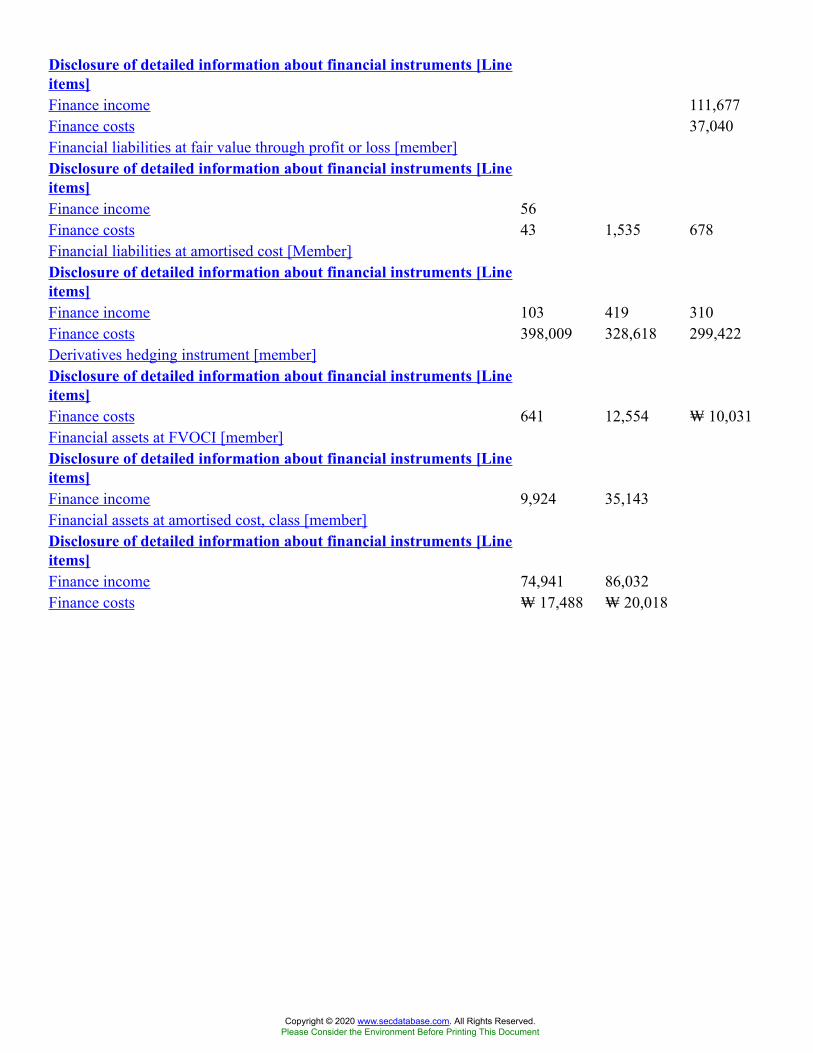
Disclosure of detailed information about financial instruments [Lineitems]Finance income 111,677Finance costs 37,040Financial liabilities at fair value through profit or loss [member]Disclosure of detailed information about financial instruments [Lineitems]Finance income 56Finance costs 43 1,535 678Financial liabilities at amortised cost [Member]Disclosure of detailed information about financial instruments [Lineitems]Finance income 103 419 310Finance costs 398,009 328,618 299,422Derivatives hedging instrument [member]Disclosure of detailed information about financial instruments [Lineitems]Finance costs 641 12,554 ₩ 10,031Financial assets at FVOCI [member]Disclosure of detailed information about financial instruments [Lineitems]Finance income 9,924 35,143Financial assets at amortised cost, class [member]Disclosure of detailed information about financial instruments [Lineitems]Finance income 74,941 86,032Finance costs ₩ 17,488 ₩ 20,018
Copyright © 2020 www.secdatabase.com. All Rights Reserved.Please Consider the Environment Before Printing This Document
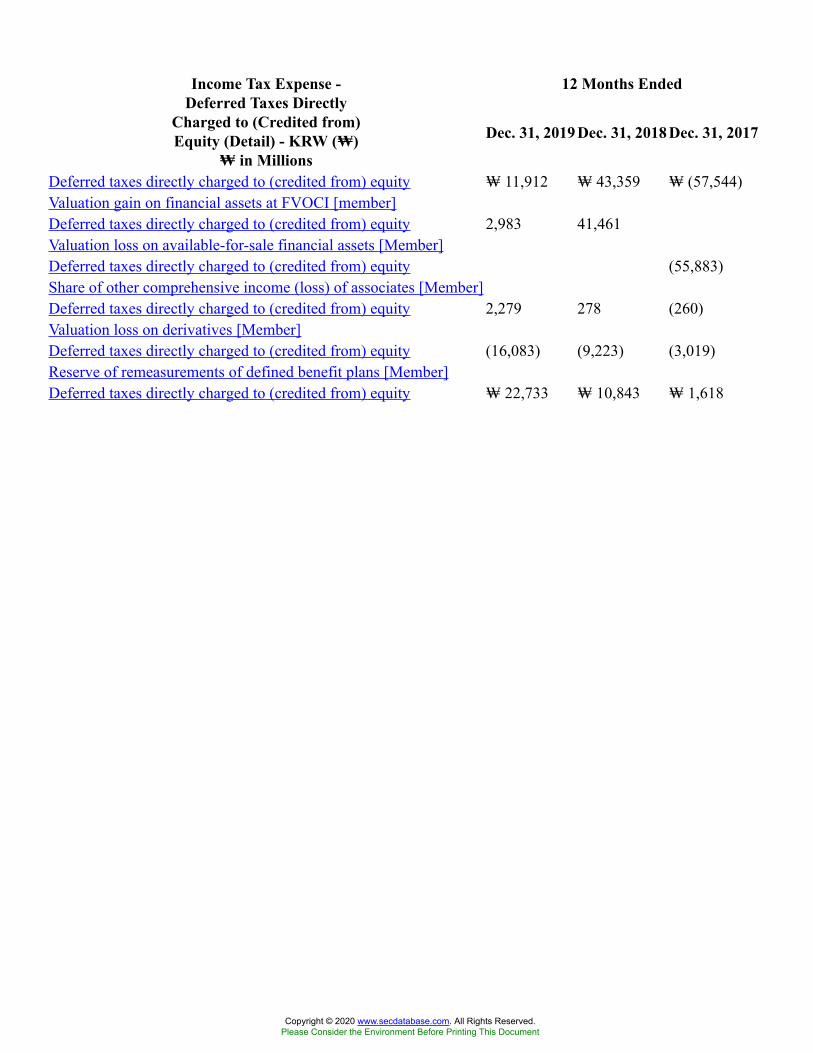
12 Months EndedIncome Tax Expense -Deferred Taxes Directly
Charged to (Credited from)Equity (Detail) - KRW (₩)
₩ in Millions
Dec. 31, 2019 Dec. 31, 2018 Dec. 31, 2017
Deferred taxes directly charged to (credited from) equity ₩ 11,912 ₩ 43,359 ₩ (57,544)Valuation gain on financial assets at FVOCI [member]Deferred taxes directly charged to (credited from) equity 2,983 41,461Valuation loss on available-for-sale financial assets [Member]Deferred taxes directly charged to (credited from) equity (55,883)Share of other comprehensive income (loss) of associates [Member]Deferred taxes directly charged to (credited from) equity 2,279 278 (260)Valuation loss on derivatives [Member]Deferred taxes directly charged to (credited from) equity (16,083) (9,223) (3,019)Reserve of remeasurements of defined benefit plans [Member]Deferred taxes directly charged to (credited from) equity ₩ 22,733 ₩ 10,843 ₩ 1,618
Copyright © 2020 www.secdatabase.com. All Rights Reserved.Please Consider the Environment Before Printing This Document

Financial Risk Management- Impact on Income Before
Income Tax of aHypothetical Change in
Exchange Rates (Detail) -Currency risk [member]
₩ in Millions
Dec. 31, 2019KRW (₩)
If increased by 10% [member]Disclosure of detailed information about financial instruments [Line items]Hypothetical increase (reduce) the Group's income before income tax ₩ 7,204If decreased by 10% [member]Disclosure of detailed information about financial instruments [Line items]Hypothetical increase (reduce) the Group's income before income tax (7,204)US Dollar [member] | If increased by 10% [member]Disclosure of detailed information about financial instruments [Line items]Hypothetical increase (reduce) the Group's income before income tax 6,228US Dollar [member] | If decreased by 10% [member]Disclosure of detailed information about financial instruments [Line items]Hypothetical increase (reduce) the Group's income before income tax (6,228)Euro [member] | If increased by 10% [member]Disclosure of detailed information about financial instruments [Line items]Hypothetical increase (reduce) the Group's income before income tax 40Euro [member] | If decreased by 10% [member]Disclosure of detailed information about financial instruments [Line items]Hypothetical increase (reduce) the Group's income before income tax (40)Yen [member] | If increased by 10% [member]Disclosure of detailed information about financial instruments [Line items]Hypothetical increase (reduce) the Group's income before income tax 573Yen [member] | If decreased by 10% [member]Disclosure of detailed information about financial instruments [Line items]Hypothetical increase (reduce) the Group's income before income tax (573)Other currencies [member] | If increased by 10% [member]Disclosure of detailed information about financial instruments [Line items]Hypothetical increase (reduce) the Group's income before income tax 363Other currencies [member] | If decreased by 10% [member]Disclosure of detailed information about financial instruments [Line items]Hypothetical increase (reduce) the Group's income before income tax ₩ (363)
Copyright © 2020 www.secdatabase.com. All Rights Reserved.Please Consider the Environment Before Printing This Document
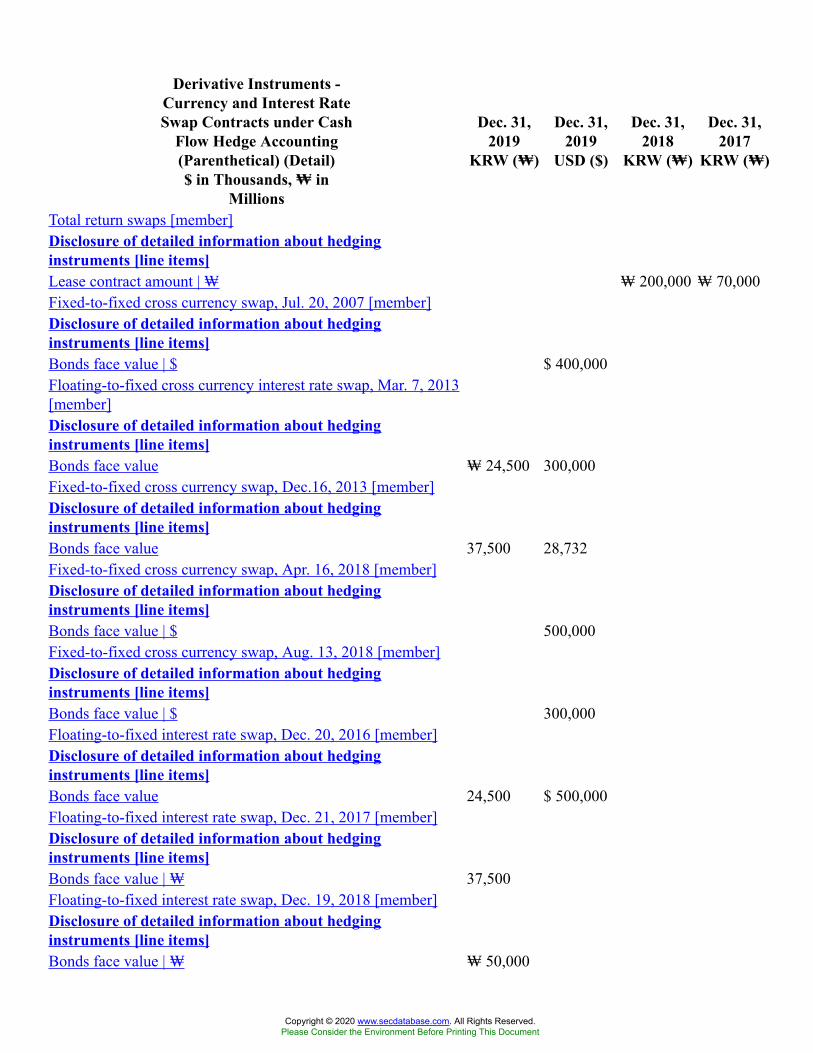
Derivative Instruments -Currency and Interest RateSwap Contracts under Cash
Flow Hedge Accounting(Parenthetical) (Detail)$ in Thousands, ₩ in
Millions
Dec. 31,2019
KRW (₩)
Dec. 31,2019
USD ($)
Dec. 31,2018
KRW (₩)
Dec. 31,2017
KRW (₩)
Total return swaps [member]Disclosure of detailed information about hedginginstruments [line items]Lease contract amount | ₩ ₩ 200,000 ₩ 70,000Fixed-to-fixed cross currency swap, Jul. 20, 2007 [member]Disclosure of detailed information about hedginginstruments [line items]Bonds face value | $ $ 400,000Floating-to-fixed cross currency interest rate swap, Mar. 7, 2013[member]Disclosure of detailed information about hedginginstruments [line items]Bonds face value ₩ 24,500 300,000Fixed-to-fixed cross currency swap, Dec.16, 2013 [member]Disclosure of detailed information about hedginginstruments [line items]Bonds face value 37,500 28,732Fixed-to-fixed cross currency swap, Apr. 16, 2018 [member]Disclosure of detailed information about hedginginstruments [line items]Bonds face value | $ 500,000Fixed-to-fixed cross currency swap, Aug. 13, 2018 [member]Disclosure of detailed information about hedginginstruments [line items]Bonds face value | $ 300,000Floating-to-fixed interest rate swap, Dec. 20, 2016 [member]Disclosure of detailed information about hedginginstruments [line items]Bonds face value 24,500 $ 500,000Floating-to-fixed interest rate swap, Dec. 21, 2017 [member]Disclosure of detailed information about hedginginstruments [line items]Bonds face value | ₩ 37,500Floating-to-fixed interest rate swap, Dec. 19, 2018 [member]Disclosure of detailed information about hedginginstruments [line items]Bonds face value | ₩ ₩ 50,000
Copyright © 2020 www.secdatabase.com. All Rights Reserved.Please Consider the Environment Before Printing This Document
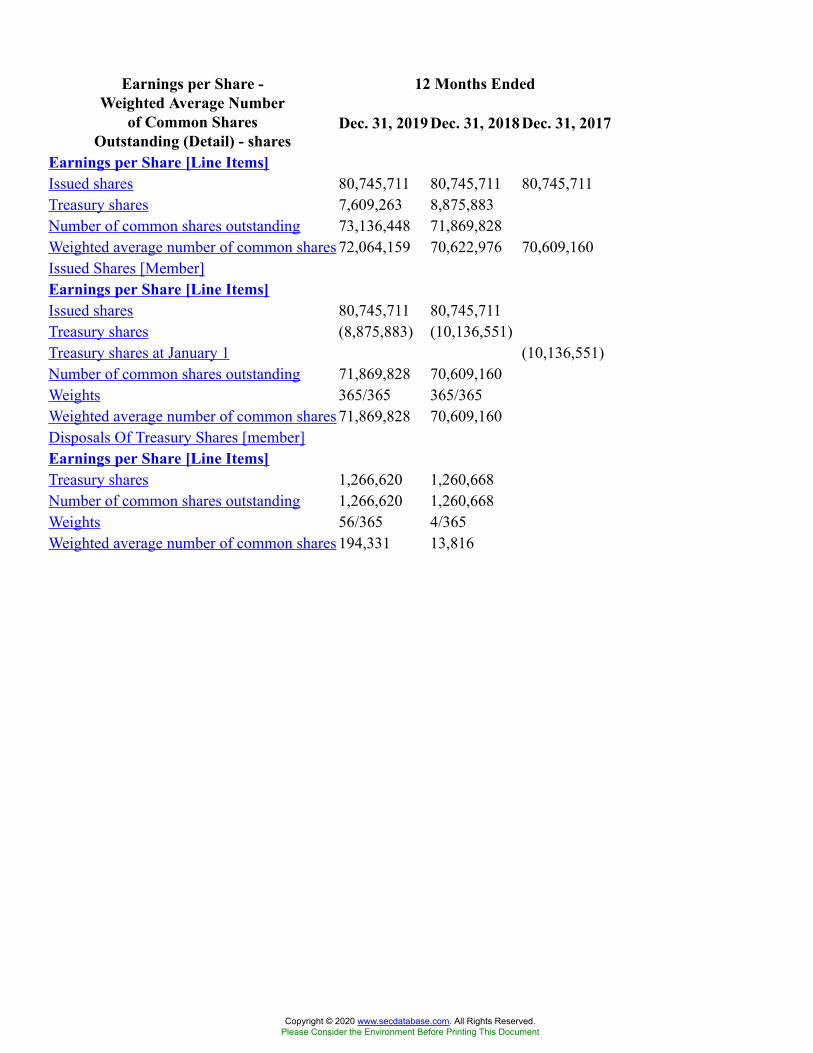
12 Months EndedEarnings per Share -Weighted Average Number
of Common SharesOutstanding (Detail) - shares
Dec. 31, 2019 Dec. 31, 2018 Dec. 31, 2017
Earnings per Share [Line Items]Issued shares 80,745,711 80,745,711 80,745,711Treasury shares 7,609,263 8,875,883Number of common shares outstanding 73,136,448 71,869,828Weighted average number of common shares 72,064,159 70,622,976 70,609,160Issued Shares [Member]Earnings per Share [Line Items]Issued shares 80,745,711 80,745,711Treasury shares (8,875,883) (10,136,551)Treasury shares at January 1 (10,136,551)Number of common shares outstanding 71,869,828 70,609,160Weights 365/365 365/365Weighted average number of common shares 71,869,828 70,609,160Disposals Of Treasury Shares [member]Earnings per Share [Line Items]Treasury shares 1,266,620 1,260,668Number of common shares outstanding 1,266,620 1,260,668Weights 56/365 4/365Weighted average number of common shares 194,331 13,816
Copyright © 2020 www.secdatabase.com. All Rights Reserved.Please Consider the Environment Before Printing This Document
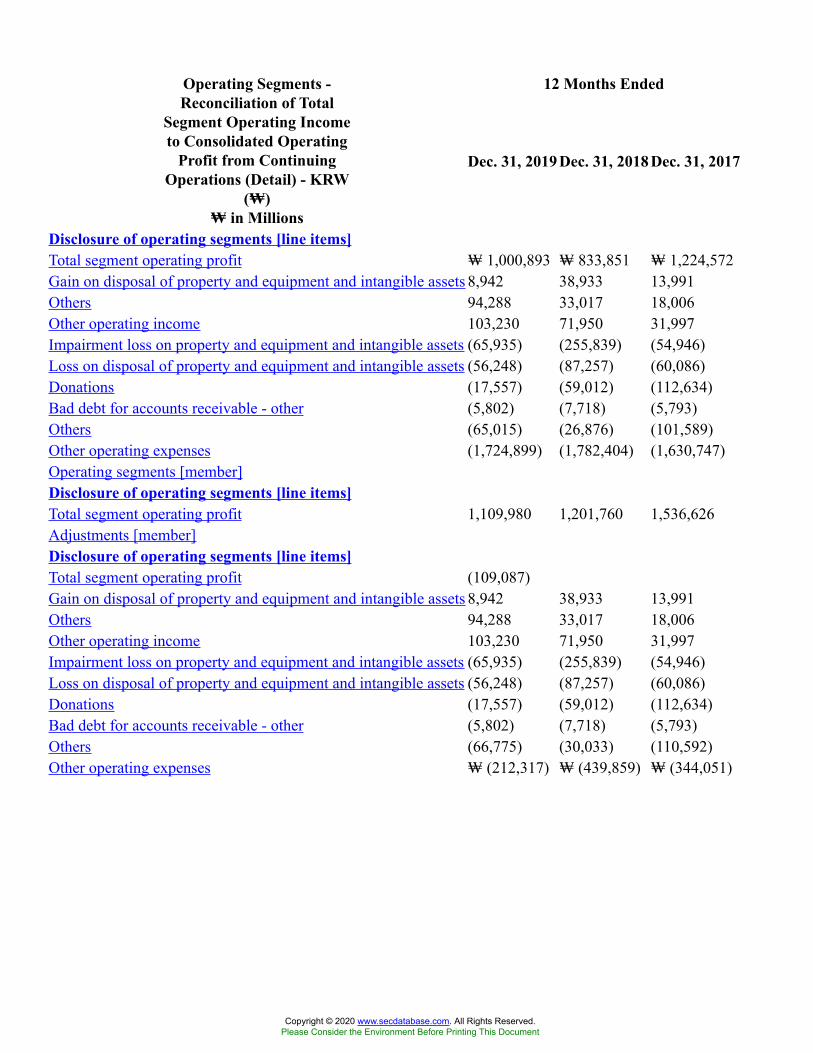
12 Months EndedOperating Segments -Reconciliation of Total
Segment Operating Incometo Consolidated Operating
Profit from ContinuingOperations (Detail) - KRW
(₩)₩ in Millions
Dec. 31, 2019 Dec. 31, 2018 Dec. 31, 2017
Disclosure of operating segments [line items]Total segment operating profit ₩ 1,000,893 ₩ 833,851 ₩ 1,224,572Gain on disposal of property and equipment and intangible assets 8,942 38,933 13,991Others 94,288 33,017 18,006Other operating income 103,230 71,950 31,997Impairment loss on property and equipment and intangible assets (65,935) (255,839) (54,946)Loss on disposal of property and equipment and intangible assets (56,248) (87,257) (60,086)Donations (17,557) (59,012) (112,634)Bad debt for accounts receivable - other (5,802) (7,718) (5,793)Others (65,015) (26,876) (101,589)Other operating expenses (1,724,899) (1,782,404) (1,630,747)Operating segments [member]Disclosure of operating segments [line items]Total segment operating profit 1,109,980 1,201,760 1,536,626Adjustments [member]Disclosure of operating segments [line items]Total segment operating profit (109,087)Gain on disposal of property and equipment and intangible assets 8,942 38,933 13,991Others 94,288 33,017 18,006Other operating income 103,230 71,950 31,997Impairment loss on property and equipment and intangible assets (65,935) (255,839) (54,946)Loss on disposal of property and equipment and intangible assets (56,248) (87,257) (60,086)Donations (17,557) (59,012) (112,634)Bad debt for accounts receivable - other (5,802) (7,718) (5,793)Others (66,775) (30,033) (110,592)Other operating expenses ₩ (212,317) ₩ (439,859) ₩ (344,051)
Copyright © 2020 www.secdatabase.com. All Rights Reserved.Please Consider the Environment Before Printing This Document
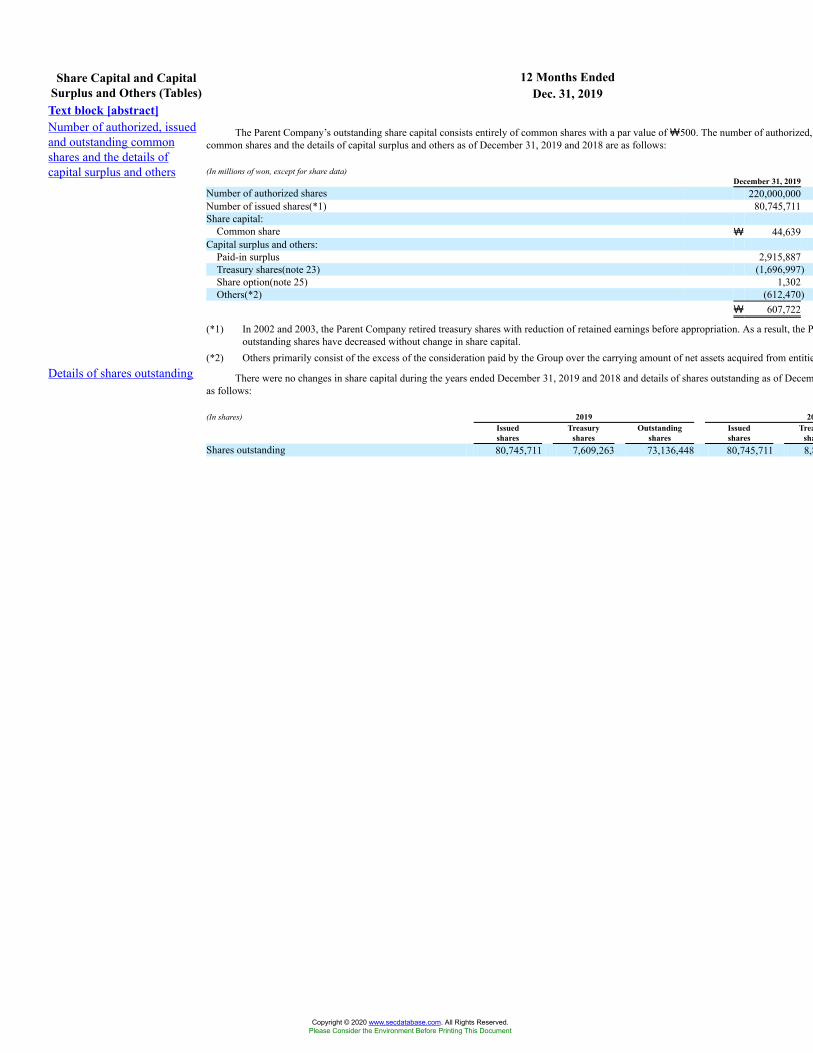
12 Months EndedShare Capital and CapitalSurplus and Others (Tables) Dec. 31, 2019Text block [abstract]Number of authorized, issuedand outstanding commonshares and the details ofcapital surplus and others
The Parent Company’s outstanding share capital consists entirely of common shares with a par value of ₩500. The number of authorized, issued and outstandingcommon shares and the details of capital surplus and others as of December 31, 2019 and 2018 are as follows:
(In millions of won, except for share data)December 31, 2019 December 31, 2018
Number of authorized shares 220,000,000 220,000,000Number of issued shares(*1) 80,745,711 80,745,711Share capital:
Common share ₩ 44,639 44,639Capital surplus and others:
Paid-in surplus 2,915,887 2,915,887Treasury shares(note 23) (1,696,997) (1,979,475)Share option(note 25) 1,302 1,007Others(*2) (612,470) (681,094)
₩ 607,722 256,325
(*1) In 2002 and 2003, the Parent Company retired treasury shares with reduction of retained earnings before appropriation. As a result, the Parent Company’soutstanding shares have decreased without change in share capital.
(*2) Others primarily consist of the excess of the consideration paid by the Group over the carrying amount of net assets acquired from entities under common control.Details of shares outstanding There were no changes in share capital during the years ended December 31, 2019 and 2018 and details of shares outstanding as of December 31, 2019 and 2018 are
as follows:
(In shares) 2019 2018Issuedshares
Treasuryshares
Outstandingshares
Issuedshares
Treasuryshares
Outstandingshares
Shares outstanding 80,745,711 7,609,263 73,136,448 80,745,711 8,875,883 71,869,828
Copyright © 2020 www.secdatabase.com. All Rights Reserved.Please Consider the Environment Before Printing This Document
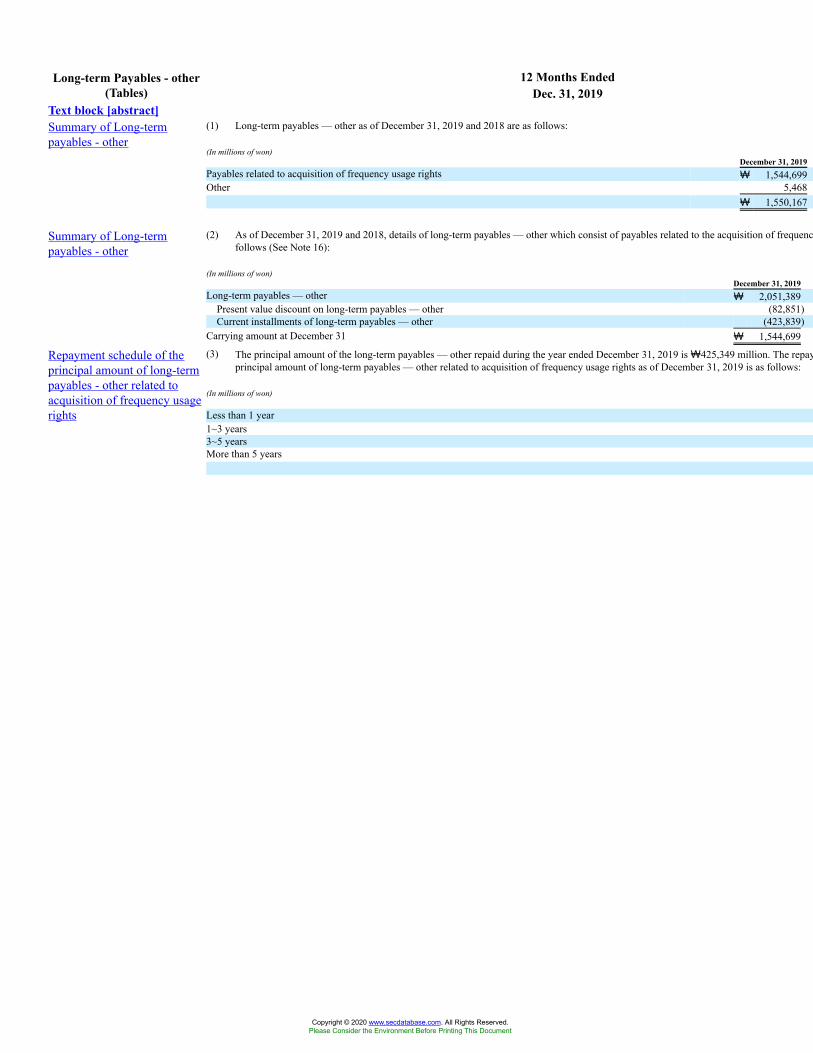
12 Months EndedLong-term Payables - other(Tables) Dec. 31, 2019
Text block [abstract]Summary of Long-termpayables - other
(1) Long-term payables — other as of December 31, 2019 and 2018 are as follows:
(In millions of won)December 31, 2019 December 31, 2018
Payables related to acquisition of frequency usage rights ₩ 1,544,699 1,939,082Other 5,468 29,702
₩ 1,550,167 1,968,784
Summary of Long-termpayables - other
(2) As of December 31, 2019 and 2018, details of long-term payables — other which consist of payables related to the acquisition of frequency usage rights are asfollows (See Note 16):
(In millions of won)December 31, 2019 December 31, 2018
Long-term payables — other ₩ 2,051,389 2,476,738Present value discount on long-term payables — other (82,851) (113,772)Current installments of long-term payables — other (423,839) (423,884)
Carrying amount at December 31 ₩ 1,544,699 1,939,082
Repayment schedule of theprincipal amount of long-termpayables - other related toacquisition of frequency usagerights
(3) The principal amount of the long-term payables — other repaid during the year ended December 31, 2019 is ₩425,349 million. The repayment schedule of theprincipal amount of long-term payables — other related to acquisition of frequency usage rights as of December 31, 2019 is as follows:
(In millions of won)Amount
Less than 1 year ₩ 425,3491~3 years 647,5893~5 years 413,385More than 5 years 565,066
₩ 2,051,389
Copyright © 2020 www.secdatabase.com. All Rights Reserved.Please Consider the Environment Before Printing This Document

Share Capital and CapitalSurplus and Others -
Number of Authorized,Issued and OutstandingCommon Shares and the
Details of Capital Surplus(Deficit) and Others (Detail)
- KRW (₩)₩ in Millions
Dec. 31, 2019 Dec. 31, 2018 Dec. 31, 2017
Disclosure of classes of share capital [abstract]Number of authorized shares 220,000,000 220,000,000Number of issued shares 80,745,711 80,745,711 80,745,711Share capital:Common share ₩ 44,639 ₩ 44,639Capital surplus and others:Paid-in surplus 2,915,887 2,915,887Treasury shares (note 23) (1,696,997) (1,979,475)Share option (note 25) 1,302 1,007Others (612,470) (681,094)Capital Surplus ₩ 607,722 ₩ 256,325
Copyright © 2020 www.secdatabase.com. All Rights Reserved.Please Consider the Environment Before Printing This Document
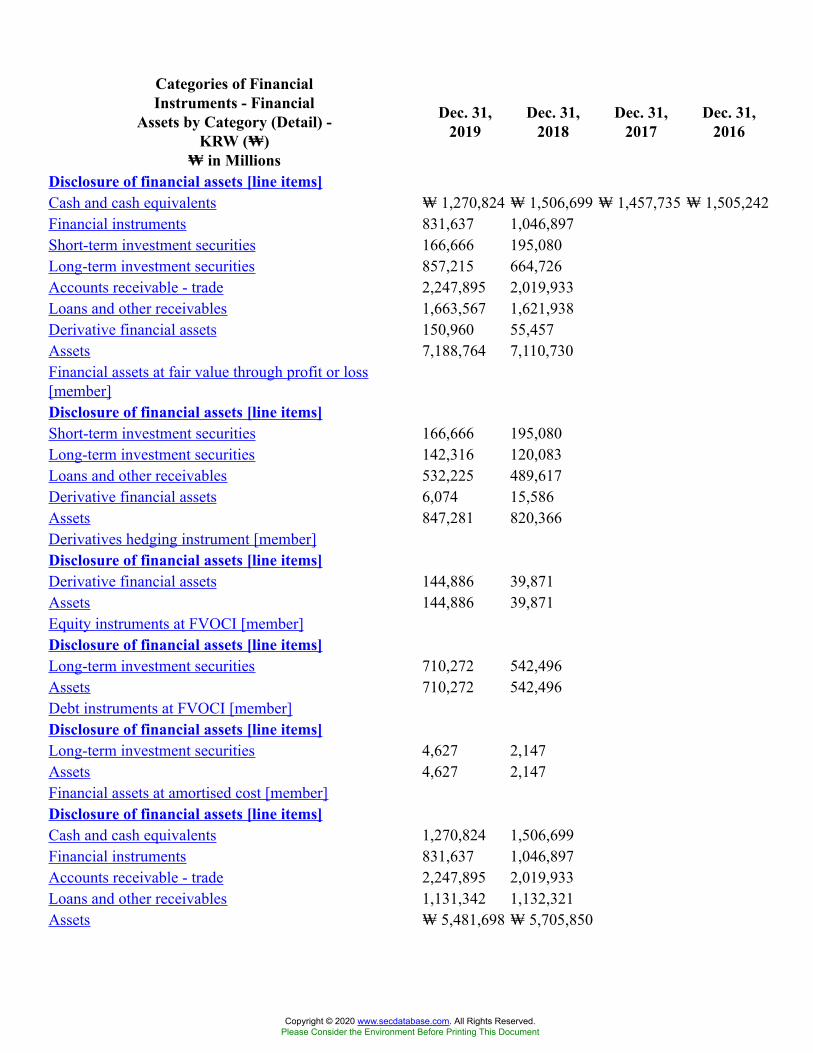
Categories of FinancialInstruments - Financial
Assets by Category (Detail) -KRW (₩)
₩ in Millions
Dec. 31,2019
Dec. 31,2018
Dec. 31,2017
Dec. 31,2016
Disclosure of financial assets [line items]Cash and cash equivalents ₩ 1,270,824 ₩ 1,506,699 ₩ 1,457,735 ₩ 1,505,242Financial instruments 831,637 1,046,897Short-term investment securities 166,666 195,080Long-term investment securities 857,215 664,726Accounts receivable - trade 2,247,895 2,019,933Loans and other receivables 1,663,567 1,621,938Derivative financial assets 150,960 55,457Assets 7,188,764 7,110,730Financial assets at fair value through profit or loss[member]Disclosure of financial assets [line items]Short-term investment securities 166,666 195,080Long-term investment securities 142,316 120,083Loans and other receivables 532,225 489,617Derivative financial assets 6,074 15,586Assets 847,281 820,366Derivatives hedging instrument [member]Disclosure of financial assets [line items]Derivative financial assets 144,886 39,871Assets 144,886 39,871Equity instruments at FVOCI [member]Disclosure of financial assets [line items]Long-term investment securities 710,272 542,496Assets 710,272 542,496Debt instruments at FVOCI [member]Disclosure of financial assets [line items]Long-term investment securities 4,627 2,147Assets 4,627 2,147Financial assets at amortised cost [member]Disclosure of financial assets [line items]Cash and cash equivalents 1,270,824 1,506,699Financial instruments 831,637 1,046,897Accounts receivable - trade 2,247,895 2,019,933Loans and other receivables 1,131,342 1,132,321Assets ₩ 5,481,698 ₩ 5,705,850
Copyright © 2020 www.secdatabase.com. All Rights Reserved.Please Consider the Environment Before Printing This Document
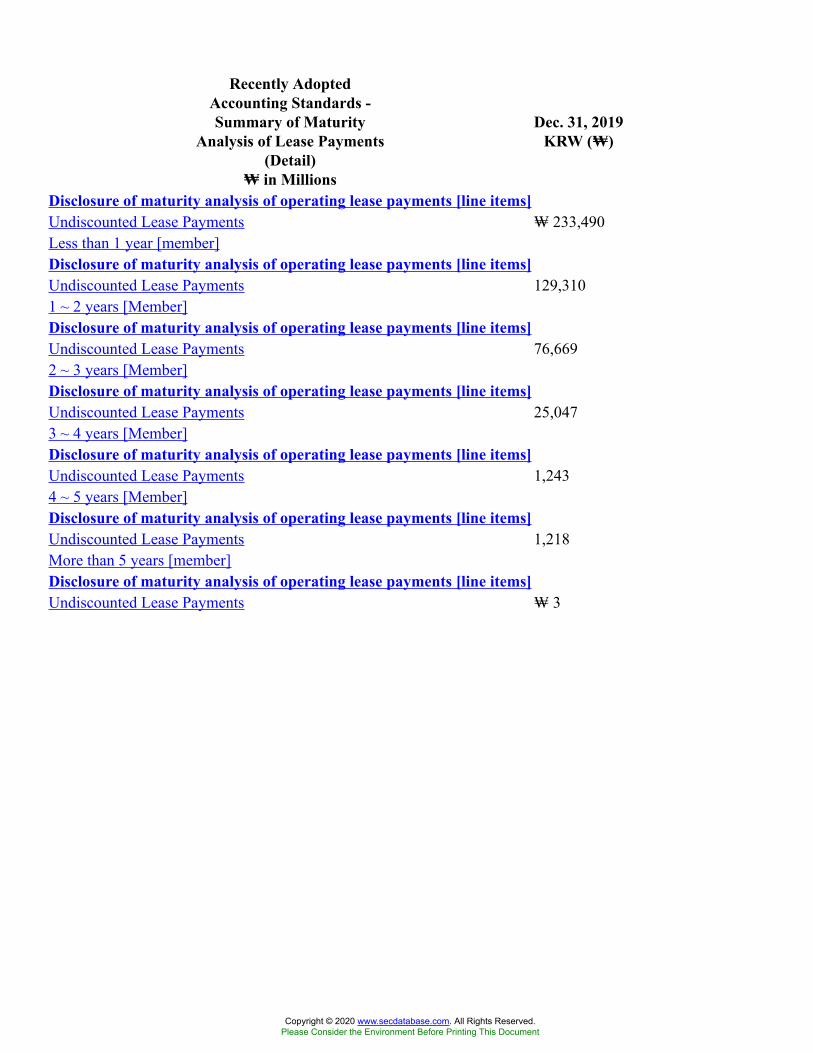
Recently AdoptedAccounting Standards -Summary of Maturity
Analysis of Lease Payments(Detail)
₩ in Millions
Dec. 31, 2019KRW (₩)
Disclosure of maturity analysis of operating lease payments [line items]Undiscounted Lease Payments ₩ 233,490Less than 1 year [member]Disclosure of maturity analysis of operating lease payments [line items]Undiscounted Lease Payments 129,3101 ~ 2 years [Member]Disclosure of maturity analysis of operating lease payments [line items]Undiscounted Lease Payments 76,6692 ~ 3 years [Member]Disclosure of maturity analysis of operating lease payments [line items]Undiscounted Lease Payments 25,0473 ~ 4 years [Member]Disclosure of maturity analysis of operating lease payments [line items]Undiscounted Lease Payments 1,2434 ~ 5 years [Member]Disclosure of maturity analysis of operating lease payments [line items]Undiscounted Lease Payments 1,218More than 5 years [member]Disclosure of maturity analysis of operating lease payments [line items]Undiscounted Lease Payments ₩ 3
Copyright © 2020 www.secdatabase.com. All Rights Reserved.Please Consider the Environment Before Printing This Document
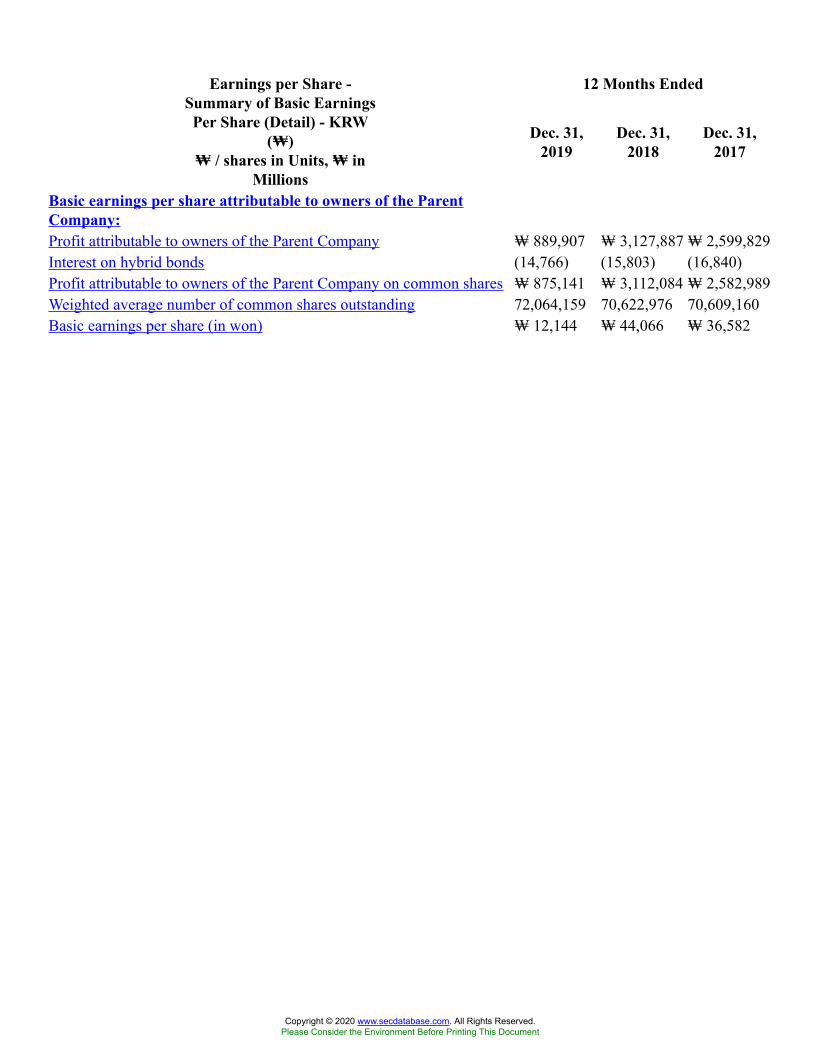
12 Months EndedEarnings per Share -Summary of Basic EarningsPer Share (Detail) - KRW
(₩)₩ / shares in Units, ₩ in
Millions
Dec. 31,2019
Dec. 31,2018
Dec. 31,2017
Basic earnings per share attributable to owners of the ParentCompany:Profit attributable to owners of the Parent Company ₩ 889,907 ₩ 3,127,887 ₩ 2,599,829Interest on hybrid bonds (14,766) (15,803) (16,840)Profit attributable to owners of the Parent Company on common shares ₩ 875,141 ₩ 3,112,084 ₩ 2,582,989Weighted average number of common shares outstanding 72,064,159 70,622,976 70,609,160Basic earnings per share (in won) ₩ 12,144 ₩ 44,066 ₩ 36,582
Copyright © 2020 www.secdatabase.com. All Rights Reserved.Please Consider the Environment Before Printing This Document
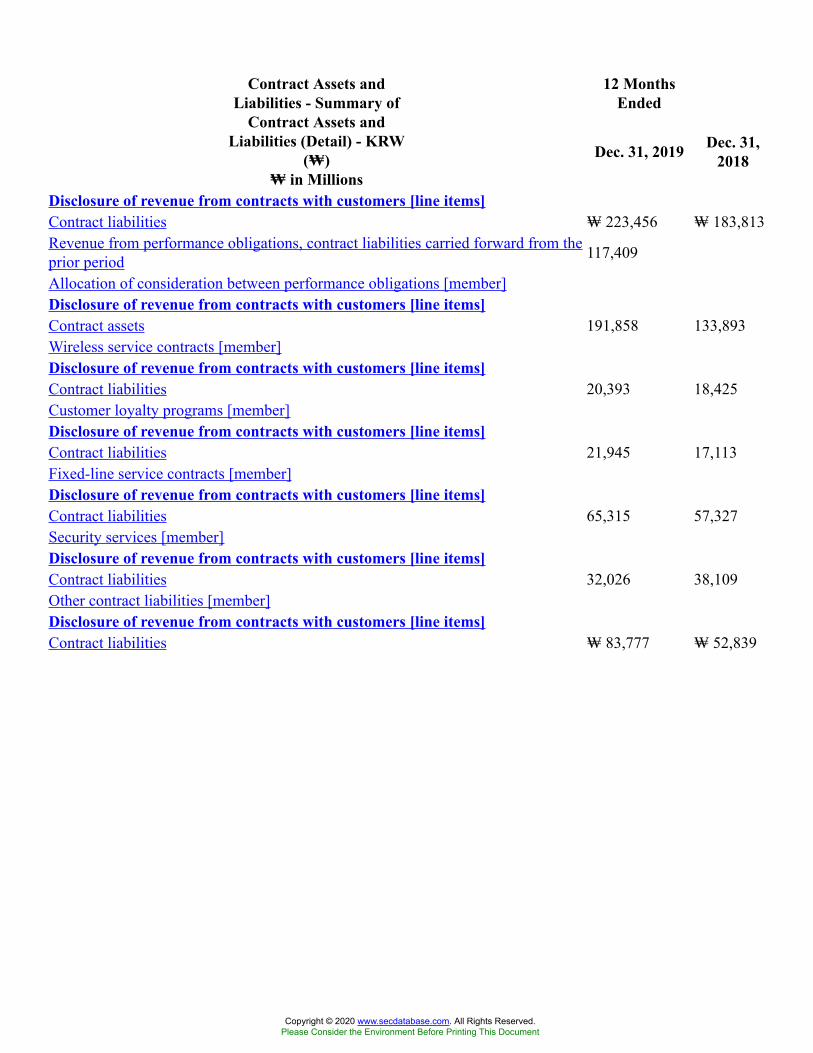
12 MonthsEnded
Contract Assets andLiabilities - Summary of
Contract Assets andLiabilities (Detail) - KRW
(₩)₩ in Millions
Dec. 31, 2019 Dec. 31,2018
Disclosure of revenue from contracts with customers [line items]Contract liabilities ₩ 223,456 ₩ 183,813Revenue from performance obligations, contract liabilities carried forward from theprior period 117,409
Allocation of consideration between performance obligations [member]Disclosure of revenue from contracts with customers [line items]Contract assets 191,858 133,893Wireless service contracts [member]Disclosure of revenue from contracts with customers [line items]Contract liabilities 20,393 18,425Customer loyalty programs [member]Disclosure of revenue from contracts with customers [line items]Contract liabilities 21,945 17,113Fixed-line service contracts [member]Disclosure of revenue from contracts with customers [line items]Contract liabilities 65,315 57,327Security services [member]Disclosure of revenue from contracts with customers [line items]Contract liabilities 32,026 38,109Other contract liabilities [member]Disclosure of revenue from contracts with customers [line items]Contract liabilities ₩ 83,777 ₩ 52,839
Copyright © 2020 www.secdatabase.com. All Rights Reserved.Please Consider the Environment Before Printing This Document
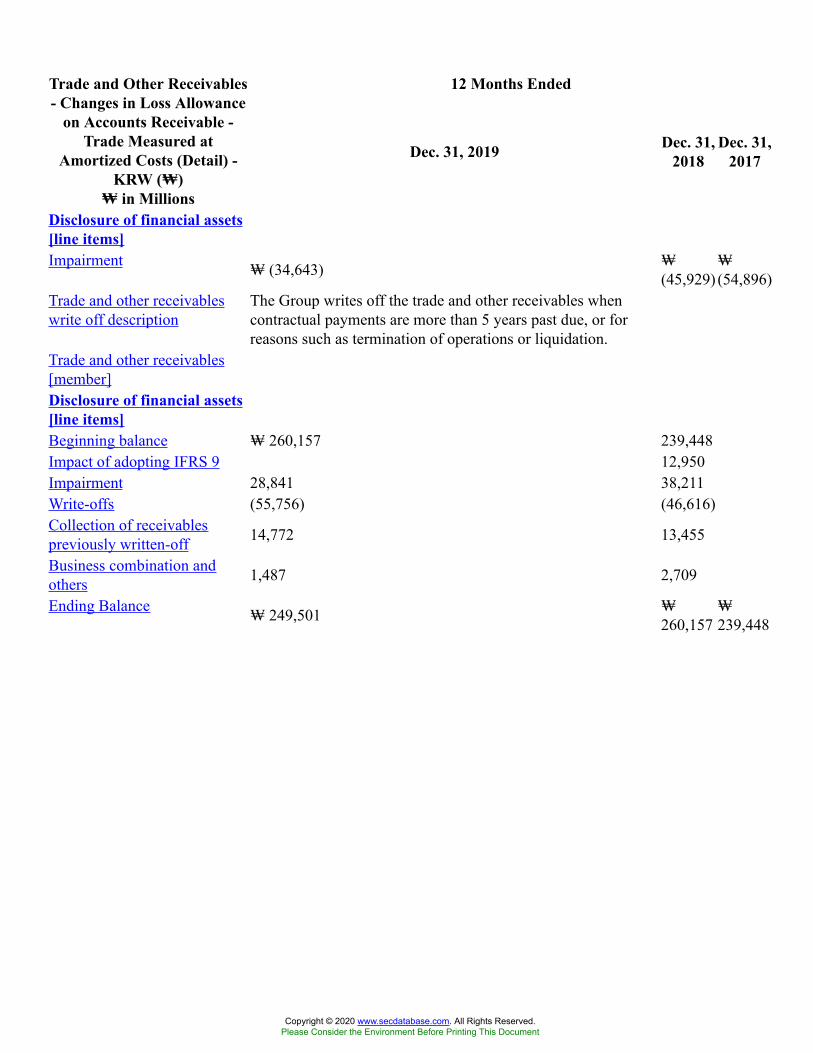
12 Months EndedTrade and Other Receivables- Changes in Loss Allowance
on Accounts Receivable -Trade Measured at
Amortized Costs (Detail) -KRW (₩)
₩ in Millions
Dec. 31, 2019 Dec. 31,2018
Dec. 31,2017
Disclosure of financial assets[line items]Impairment ₩ (34,643) ₩
(45,929)₩(54,896)
Trade and other receivableswrite off description
The Group writes off the trade and other receivables whencontractual payments are more than 5 years past due, or forreasons such as termination of operations or liquidation.
Trade and other receivables[member]Disclosure of financial assets[line items]Beginning balance ₩ 260,157 239,448Impact of adopting IFRS 9 12,950Impairment 28,841 38,211Write-offs (55,756) (46,616)Collection of receivablespreviously written-off 14,772 13,455
Business combination andothers 1,487 2,709
Ending Balance ₩ 249,501 ₩260,157
₩239,448
Copyright © 2020 www.secdatabase.com. All Rights Reserved.Please Consider the Environment Before Printing This Document

12 Months EndedOperating Segments -Summary of Disaggregation
of Operating Revenue(Detail) - KRW (₩)
₩ in Millions
Dec. 31,2019
Dec. 31,2018
Dec. 31,2017
Disclosure of disaggregation of revenue from contracts with customers[line items]Revenue ₩
17,743,702₩16,873,960
₩17,520,013
Goods or services transferred at point in time [member]Disclosure of disaggregation of revenue from contracts with customers[line items]Revenue 2,115,333 1,793,766 1,591,342Goods or services transferred over time [member]Disclosure of disaggregation of revenue from contracts with customers[line items]Revenue 15,628,36915,080,19415,928,671Commerce service [member] | Goods or services transferred over time[member]Disclosure of disaggregation of revenue from contracts with customers[line items]Revenue 502,264 604,996 556,221Cellular revenue [member] | Goods [member] | Goods or services transferredat point in time [member]Disclosure of disaggregation of revenue from contracts with customers[line items]Revenue 1,142,868 1,124,143 1,119,662Cellular revenue [member] | Wireless service [member] | Goods or servicestransferred over time [member]Disclosure of disaggregation of revenue from contracts with customers[line items]Revenue 9,532,377 9,770,423 10,638,982Cellular revenue [member] | Cellular interconnection [member] | Goods orservices transferred over time [member]Disclosure of disaggregation of revenue from contracts with customers[line items]Revenue 494,267 532,156 592,755Cellular revenue [member] | Other [member] | Goods or services transferredover time [member]Disclosure of disaggregation of revenue from contracts with customers[line items]Revenue 1,002,903 952,175 910,736Fixed-line telecommunication services [member] | Goods [member] | Goodsor services transferred at point in time [member]
Copyright © 2020 www.secdatabase.com. All Rights Reserved.Please Consider the Environment Before Printing This Document
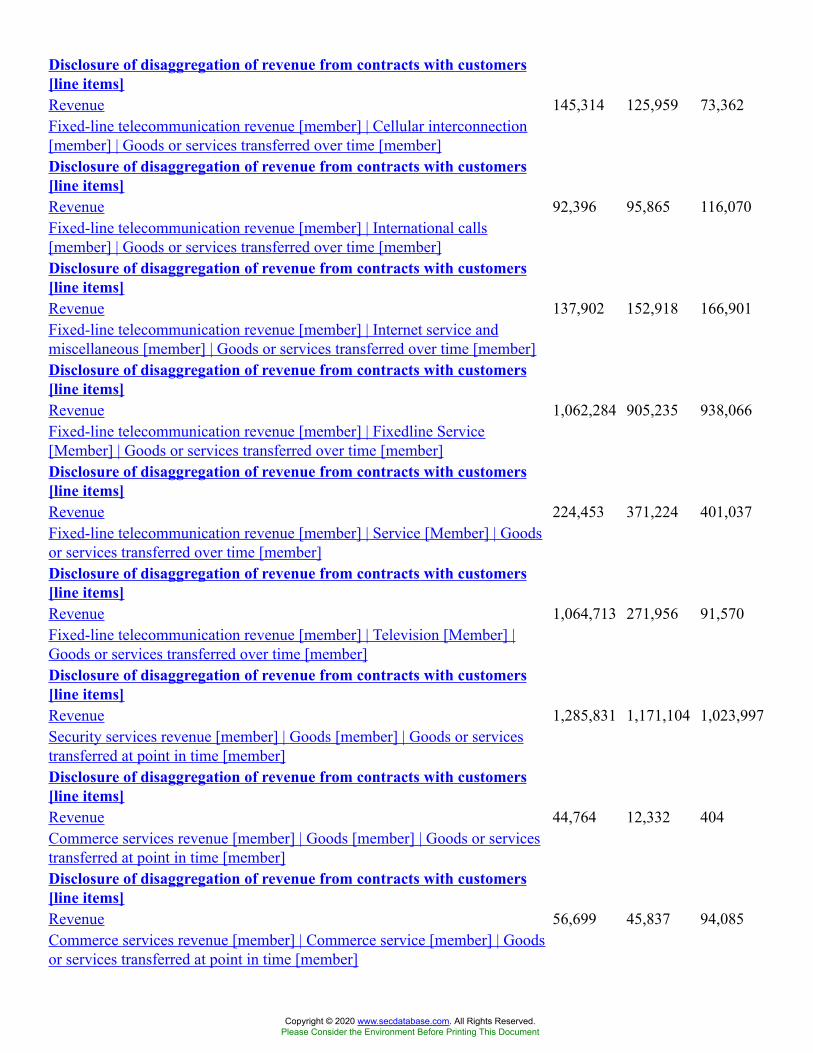
Disclosure of disaggregation of revenue from contracts with customers[line items]Revenue 145,314 125,959 73,362Fixed-line telecommunication revenue [member] | Cellular interconnection[member] | Goods or services transferred over time [member]Disclosure of disaggregation of revenue from contracts with customers[line items]Revenue 92,396 95,865 116,070Fixed-line telecommunication revenue [member] | International calls[member] | Goods or services transferred over time [member]Disclosure of disaggregation of revenue from contracts with customers[line items]Revenue 137,902 152,918 166,901Fixed-line telecommunication revenue [member] | Internet service andmiscellaneous [member] | Goods or services transferred over time [member]Disclosure of disaggregation of revenue from contracts with customers[line items]Revenue 1,062,284 905,235 938,066Fixed-line telecommunication revenue [member] | Fixedline Service[Member] | Goods or services transferred over time [member]Disclosure of disaggregation of revenue from contracts with customers[line items]Revenue 224,453 371,224 401,037Fixed-line telecommunication revenue [member] | Service [Member] | Goodsor services transferred over time [member]Disclosure of disaggregation of revenue from contracts with customers[line items]Revenue 1,064,713 271,956 91,570Fixed-line telecommunication revenue [member] | Television [Member] |Goods or services transferred over time [member]Disclosure of disaggregation of revenue from contracts with customers[line items]Revenue 1,285,831 1,171,104 1,023,997Security services revenue [member] | Goods [member] | Goods or servicestransferred at point in time [member]Disclosure of disaggregation of revenue from contracts with customers[line items]Revenue 44,764 12,332 404Commerce services revenue [member] | Goods [member] | Goods or servicestransferred at point in time [member]Disclosure of disaggregation of revenue from contracts with customers[line items]Revenue 56,699 45,837 94,085Commerce services revenue [member] | Commerce service [member] | Goodsor services transferred at point in time [member]
Copyright © 2020 www.secdatabase.com. All Rights Reserved.Please Consider the Environment Before Printing This Document
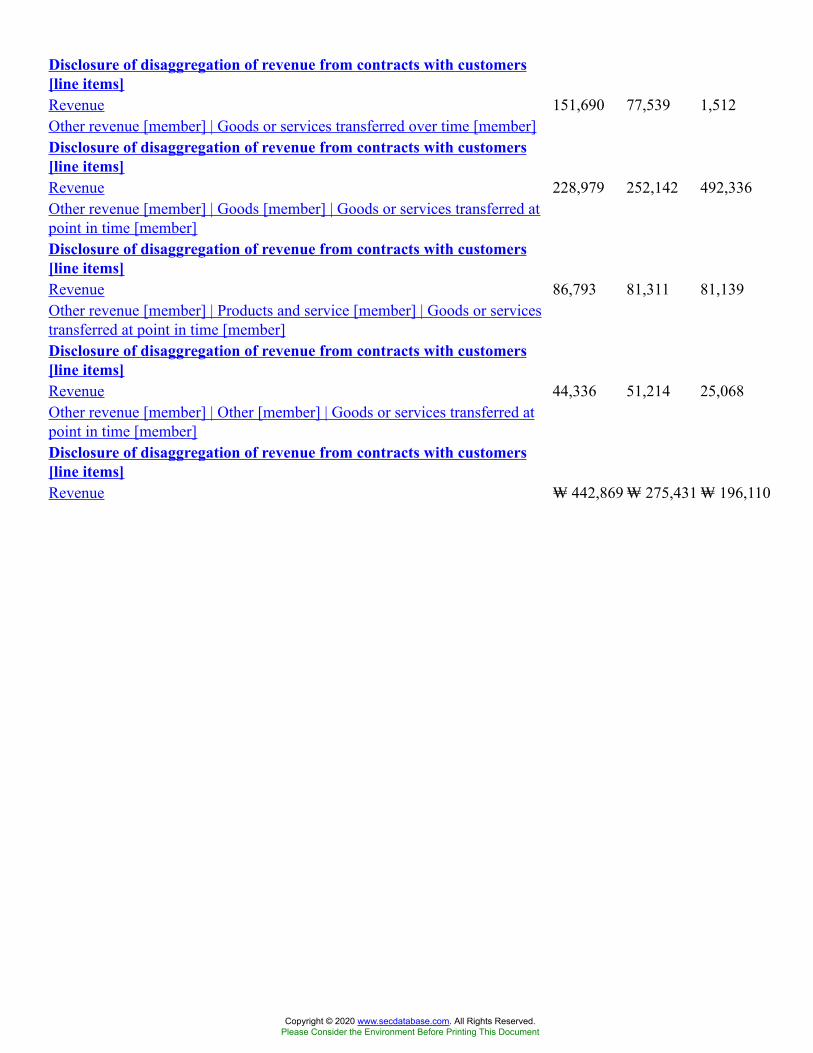
Disclosure of disaggregation of revenue from contracts with customers[line items]Revenue 151,690 77,539 1,512Other revenue [member] | Goods or services transferred over time [member]Disclosure of disaggregation of revenue from contracts with customers[line items]Revenue 228,979 252,142 492,336Other revenue [member] | Goods [member] | Goods or services transferred atpoint in time [member]Disclosure of disaggregation of revenue from contracts with customers[line items]Revenue 86,793 81,311 81,139Other revenue [member] | Products and service [member] | Goods or servicestransferred at point in time [member]Disclosure of disaggregation of revenue from contracts with customers[line items]Revenue 44,336 51,214 25,068Other revenue [member] | Other [member] | Goods or services transferred atpoint in time [member]Disclosure of disaggregation of revenue from contracts with customers[line items]Revenue ₩ 442,869 ₩ 275,431 ₩ 196,110
Copyright © 2020 www.secdatabase.com. All Rights Reserved.Please Consider the Environment Before Printing This Document
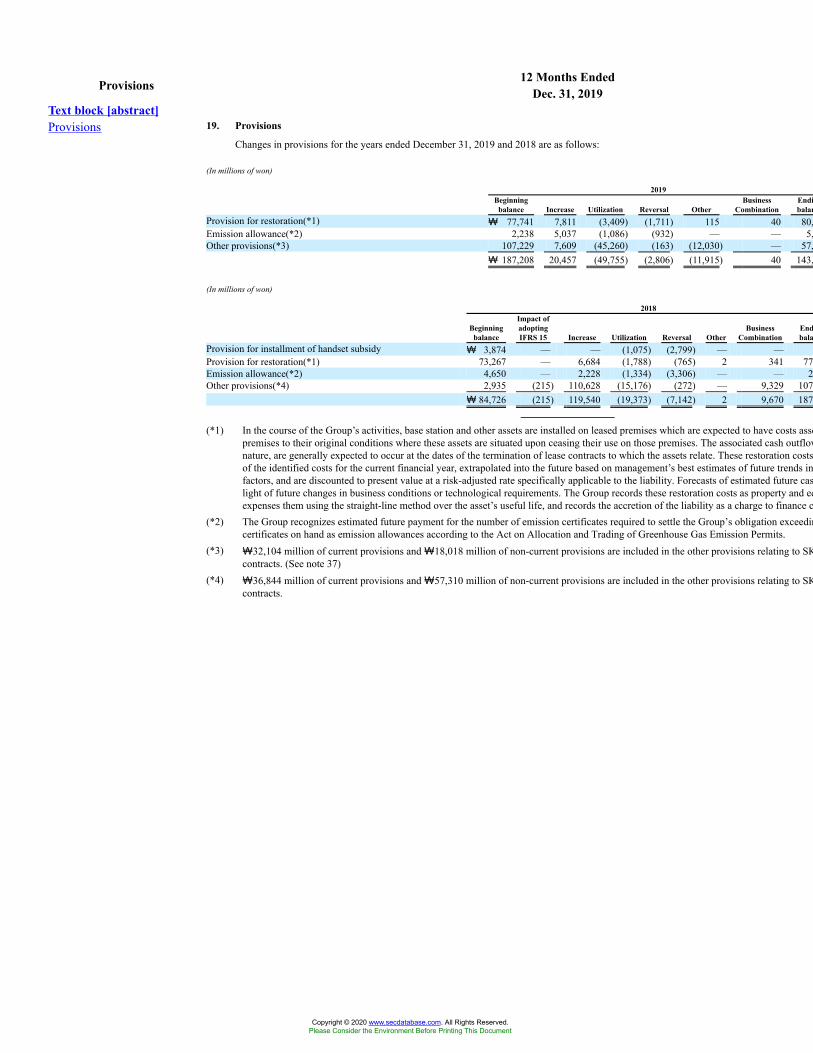
12 Months EndedProvisions Dec. 31, 2019Text block [abstract]Provisions 19. Provisions
Changes in provisions for the years ended December 31, 2019 and 2018 are as follows:
(In millions of won)
2019As of December 31,
2019Beginning
balance Increase Utilization Reversal OtherBusiness
CombinationEndingbalance Current Non-current
Provision for restoration(*1) ₩ 77,741 7,811 (3,409) (1,711) 115 40 80,587 51,517 29,070Emission allowance(*2) 2,238 5,037 (1,086) (932) — — 5,257 5,257 —Other provisions(*3) 107,229 7,609 (45,260) (163) (12,030) — 57,385 32,672 24,713
₩ 187,208 20,457 (49,755) (2,806) (11,915) 40 143,229 89,446 53,783
(In millions of won)
2018As of December 31,
2018
Beginningbalance
Impact ofadoptingIFRS 15 Increase Utilization Reversal Other
BusinessCombination
Endingbalance Current Non-current
Provision for installment of handset subsidy ₩ 3,874 — — (1,075) (2,799) — — — — —Provision for restoration(*1) 73,267 — 6,684 (1,788) (765) 2 341 77,741 47,293 30,448Emission allowance(*2) 4,650 — 2,228 (1,334) (3,306) — — 2,238 2,238 —Other provisions(*4) 2,935 (215) 110,628 (15,176) (272) — 9,329 107,229 38,462 68,767
₩ 84,726 (215) 119,540 (19,373) (7,142) 2 9,670 187,208 87,993 99,215
(*1) In the course of the Group’s activities, base station and other assets are installed on leased premises which are expected to have costs associated with restoring thepremises to their original conditions where these assets are situated upon ceasing their use on those premises. The associated cash outflows, which are long-term innature, are generally expected to occur at the dates of the termination of lease contracts to which the assets relate. These restoration costs are calculated on the basisof the identified costs for the current financial year, extrapolated into the future based on management’s best estimates of future trends in prices, inflation, and otherfactors, and are discounted to present value at a risk-adjusted rate specifically applicable to the liability. Forecasts of estimated future cash outflows are revised inlight of future changes in business conditions or technological requirements. The Group records these restoration costs as property and equipment and subsequentlyexpenses them using the straight-line method over the asset’s useful life, and records the accretion of the liability as a charge to finance costs.
(*2) The Group recognizes estimated future payment for the number of emission certificates required to settle the Group’s obligation exceeding the actual number ofcertificates on hand as emission allowances according to the Act on Allocation and Trading of Greenhouse Gas Emission Permits.
(*3) ₩32,104 million of current provisions and ₩18,018 million of non-current provisions are included in the other provisions relating to SK Planet Co., Ltd.’s onerouscontracts. (See note 37)
(*4) ₩36,844 million of current provisions and ₩57,310 million of non-current provisions are included in the other provisions relating to SK Planet Co., Ltd.’s onerouscontracts.
Copyright © 2020 www.secdatabase.com. All Rights Reserved.Please Consider the Environment Before Printing This Document

12 Months EndedGoodwill Dec. 31, 2019Text block [abstract]Goodwill 15. Goodwill
(1) Goodwill as of December 31, 2019 and 2018 are as follows:
(In millions of won)December 31,
2019December 31,
2018Goodwill related to merger of Shinsegi Telecom, Inc. ₩ 1,306,236 1,306,236Goodwill related to acquisition of SK Broadband Co., Ltd. 358,443 358,443Goodwill related to acquisition of Life & Security Holdings Co., Ltd. 1,155,037 1,155,037Other goodwill 129,814 118,847
₩ 2,949,530 2,938,563
(2) Details of the impairment testing of Goodwill as of December 31, 2019 is as follows:
Goodwill is allocated to the following CGUs for the purpose of impairment testing.
• goodwill related to Shinsegi Telecom, Inc.(*1): Cellular services;
• goodwill related to SK Broadband Co., Ltd.(*2): Fixed-line telecommunications services;
• goodwill related to Life & Security Holdings Co., Ltd.(*3): Security services; and
• other goodwill: Commerce, Information security services, and other.
(*1) Goodwill related to acquisition of Shinsegi Telecom, Inc.
The recoverable amount of the CGU is based on its value in use calculated by applying the annual discount rate of 4.9% to the estimated future cash flows based onfinancial budgets for the next five years. An annual growth rate of (-)0.6% was applied for the cash flows expected to be incurred after five years and is not expected toexceed the long-term wireless telecommunication industry growth rate. Management of the Group does not expect the total carrying amount of the CGU will exceed thetotal recoverable amount due to reasonably possible changes from the major assumptions used to estimate the recoverable amount.
(*2) Goodwill related to acquisition of SK Broadband Co., Ltd.
The recoverable amount of the CGU is based on its value in use calculated by applying the annual discount rate of 5.0% to the estimated future cash flows based onfinancial budgets for the next five years. An annual growth rate of 1.0% was applied for the cash flows expected to be incurred after five years and is not expected to exceedthe long-term fixed-line telecommunication industry growth rate. Management of the Group does not expect the total carrying amount of the CGU will exceed the totalrecoverable amount due to reasonably possible changes from the major assumptions used to estimate the recoverable amount.
(*3) Goodwill related to acquisition of Life & Security Holdings Co., Ltd.
The recoverable amount of the CGU is based on its value in use, which is developed based using key assumptions including estimated revenue growth rates, laborcosts, annual growth rate applied for the cash flows expected to be incurred after five years (“perpetual growth rate”), and discount rate. The discount rate applied for futurecash flows based on financial budgets for the next five years is 7.29%. The estimated revenue growth rates and labor costs are based on past performance, business plansand its expectation of future market changes. In addition, an annual growth rate of 1.0% was applied for the cash flows expected to be incurred after five years and does notexceed the long-term growth rate in the security service industry.
The recoverable amount of the CGU exceeds the carrying amount by ₩11,276 million. Management has identified that reasonably possible changes in twosignificant assumptions could cause the carrying amount to exceed the recoverable amount. The following table shows the amount by which these two assumptions wouldneed to be changed to individually for the estimated recoverable amount of the CGU to be equal to the carrying amount.
2019Annual discount rate 7.31%Annual growth rate applied for the cash flows expected to be incurred after five years 0.97%
(3) Details of the changes in goodwill for the years ended December 31, 2019 and 2018 are as follows:
(In millions of won)2019 2018
Beginning balance ₩ 2,938,563 1,915,017Acquisition 30,962 1,206,702Disposal — (807)Impairment loss(*1,2) (21,065) (166,838)Other 1,070 (15,511)Ending balance ₩ 2,949,530 2,938,563
(*1) Goodwill related to LIFE DESIGN COMPANY Inc. of DREAMUS COMPANY (formerly, IRIVER LIMITED).The recoverable amount of the CGU is based on its value in use calculated by applying the annual discount rate of 10.1% to the estimated future cash flows based on
financial budgets for the next five years. The cash flows expected to occur in the period exceeding five years were assumed to increase by 0.0% which is expected to be lessthan the long-term growth rate of Celebrity MD industry. As a result of the impairment test, the carrying amount of the CGU exceeded the recoverable amount, thus theGroup recognized ₩20,594 million of impairment loss.
(*2) Goodwill related to Syrup Ad of Incross Co., Ltd.
Copyright © 2020 www.secdatabase.com. All Rights Reserved.Please Consider the Environment Before Printing This Document
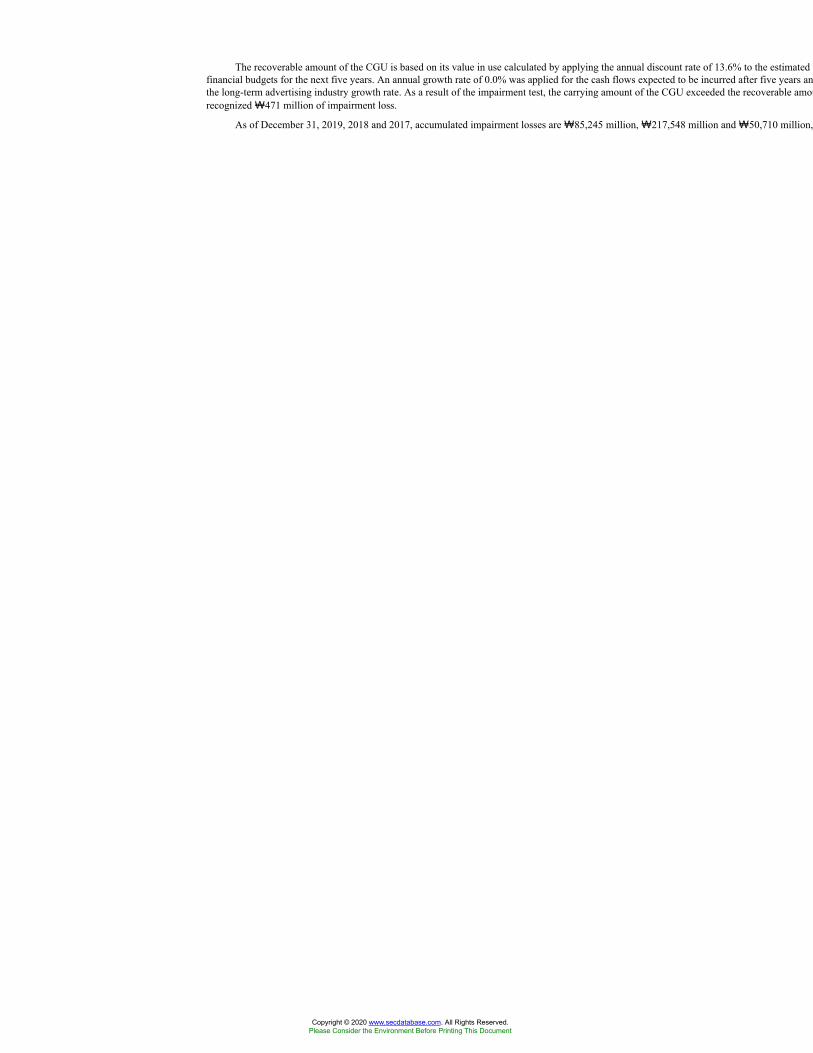
The recoverable amount of the CGU is based on its value in use calculated by applying the annual discount rate of 13.6% to the estimated future cash flows based onfinancial budgets for the next five years. An annual growth rate of 0.0% was applied for the cash flows expected to be incurred after five years and is not expected to exceedthe long-term advertising industry growth rate. As a result of the impairment test, the carrying amount of the CGU exceeded the recoverable amount, thus the Grouprecognized ₩471 million of impairment loss.
As of December 31, 2019, 2018 and 2017, accumulated impairment losses are ₩85,245 million, ₩217,548 million and ₩50,710 million, respectively.
Copyright © 2020 www.secdatabase.com. All Rights Reserved.Please Consider the Environment Before Printing This Document

12 Months EndedInvestments in Associatesand Joint Ventures - Market
Price of Investments inListed Associates (Detail) -
KRW (₩)₩ / shares in Units, ₩ in
Millions
Dec. 31, 2019 Dec. 31, 2018
NanoEnTek, Inc. [member]Disclosure of associates [Line Items]Market price per share ₩ 5,620 ₩ 4,235Number of shares 7,600,649 7,600,649Market value ₩ 42,716 ₩ 32,189SK hynix Inc. [member]Disclosure of associates [Line Items]Market price per share ₩ 94,100 ₩ 60,500Number of shares 146,100,000 146,100,000Market value ₩ 13,748,010 ₩ 8,839,050S.M. Culture & Contents Co., Ltd [member]Disclosure of associates [Line Items]Market price per share ₩ 1,530 ₩ 2,020Number of shares 22,033,898 22,033,898Market value ₩ 33,712 ₩ 44,508
Copyright © 2020 www.secdatabase.com. All Rights Reserved.Please Consider the Environment Before Printing This Document

12 Months EndedTreasury Shares Dec. 31, 2019Text block [abstract]Treasury Shares 23. Treasury Shares
Treasury shares as of December 31, 2019 and 2018 are as follows:
(In millions of won, except for share data)December 31, 2019 December 31, 2018
Number of shares(*) 7,609,263 8,875,883Acquisition cost ₩ 1,696,997 1,979,475
(*) The Parent Company disposed 1,266,620 of its treasury shares to Kakao Co., Ltd. in exchange for ₩300,000 million in cash and acquired 2,177,401 shares of KakaoCo., Ltd. for ₩302,321 million during the year ended December 31, 2019 in order to solidify the future ICT business cooperation (See note 11). The number oftreasury shares have decreased by 1,260,668 due to the comprehensive stock exchange transaction with SK Holdings Co., Ltd. in 2018.
Copyright © 2020 www.secdatabase.com. All Rights Reserved.Please Consider the Environment Before Printing This Document
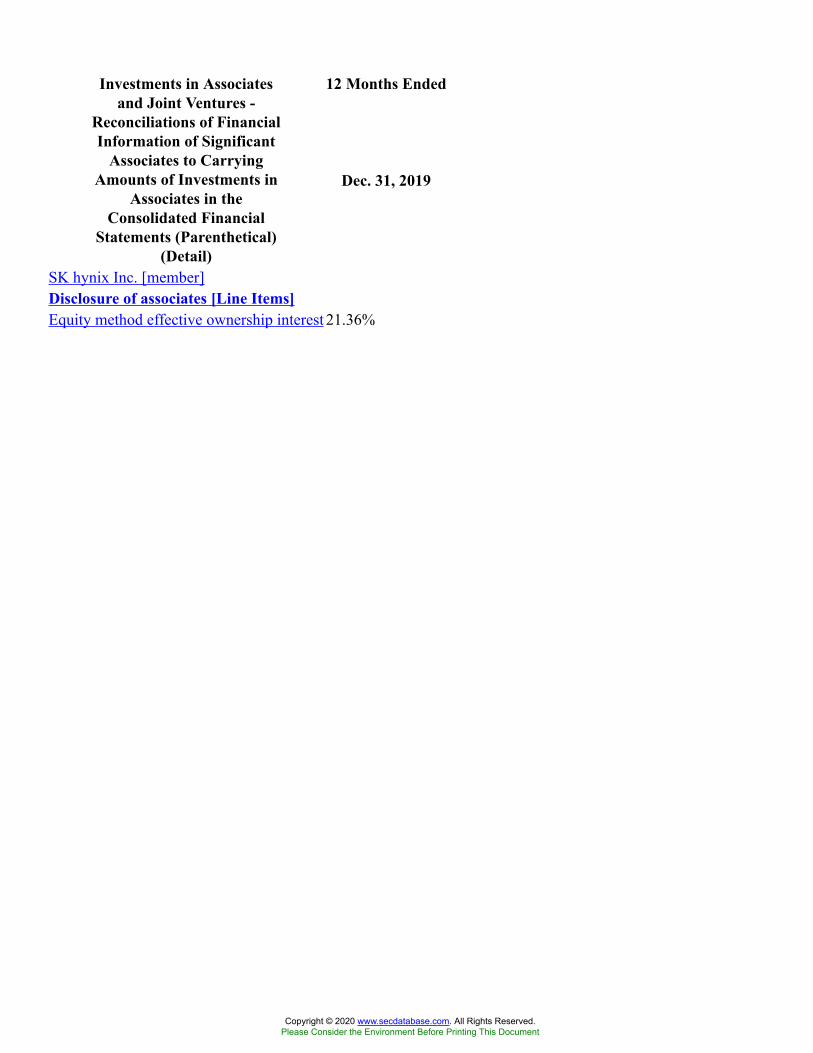
12 Months EndedInvestments in Associatesand Joint Ventures -
Reconciliations of FinancialInformation of Significant
Associates to CarryingAmounts of Investments in
Associates in theConsolidated Financial
Statements (Parenthetical)(Detail)
Dec. 31, 2019
SK hynix Inc. [member]Disclosure of associates [Line Items]Equity method effective ownership interest 21.36%
Copyright © 2020 www.secdatabase.com. All Rights Reserved.Please Consider the Environment Before Printing This Document
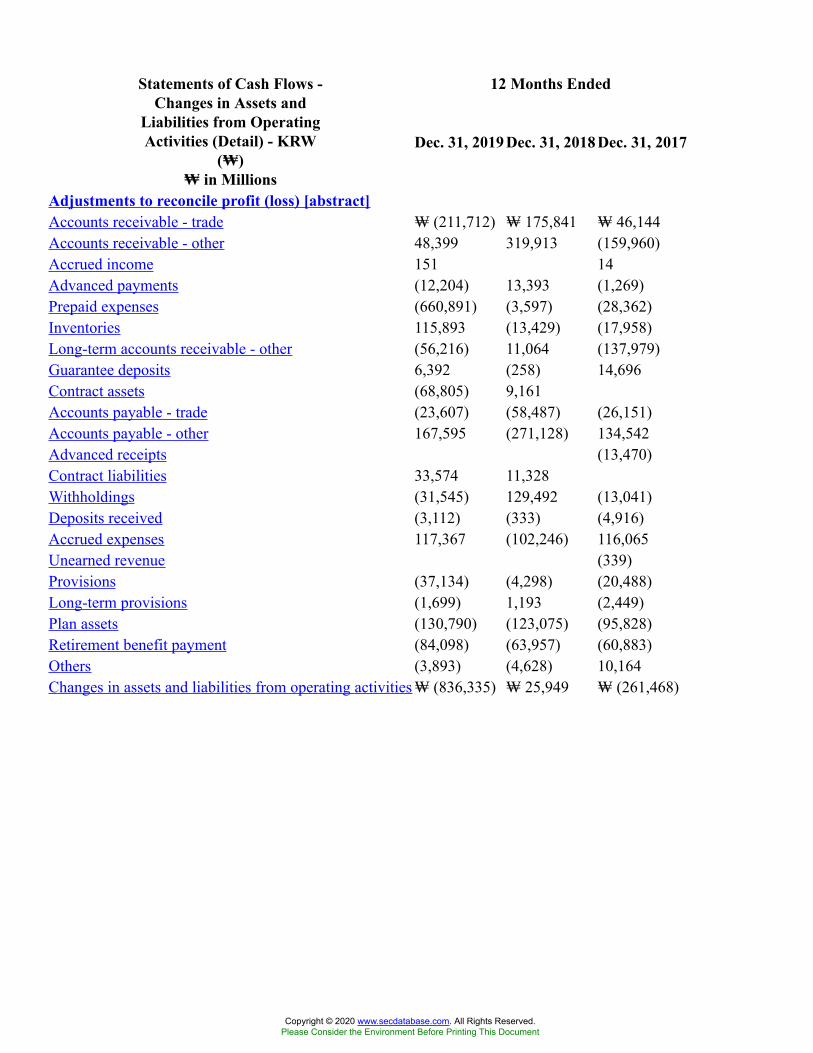
12 Months EndedStatements of Cash Flows -Changes in Assets and
Liabilities from OperatingActivities (Detail) - KRW
(₩)₩ in Millions
Dec. 31, 2019 Dec. 31, 2018 Dec. 31, 2017
Adjustments to reconcile profit (loss) [abstract]Accounts receivable - trade ₩ (211,712) ₩ 175,841 ₩ 46,144Accounts receivable - other 48,399 319,913 (159,960)Accrued income 151 14Advanced payments (12,204) 13,393 (1,269)Prepaid expenses (660,891) (3,597) (28,362)Inventories 115,893 (13,429) (17,958)Long-term accounts receivable - other (56,216) 11,064 (137,979)Guarantee deposits 6,392 (258) 14,696Contract assets (68,805) 9,161Accounts payable - trade (23,607) (58,487) (26,151)Accounts payable - other 167,595 (271,128) 134,542Advanced receipts (13,470)Contract liabilities 33,574 11,328Withholdings (31,545) 129,492 (13,041)Deposits received (3,112) (333) (4,916)Accrued expenses 117,367 (102,246) 116,065Unearned revenue (339)Provisions (37,134) (4,298) (20,488)Long-term provisions (1,699) 1,193 (2,449)Plan assets (130,790) (123,075) (95,828)Retirement benefit payment (84,098) (63,957) (60,883)Others (3,893) (4,628) 10,164Changes in assets and liabilities from operating activities ₩ (836,335) ₩ 25,949 ₩ (261,468)
Copyright © 2020 www.secdatabase.com. All Rights Reserved.Please Consider the Environment Before Printing This Document
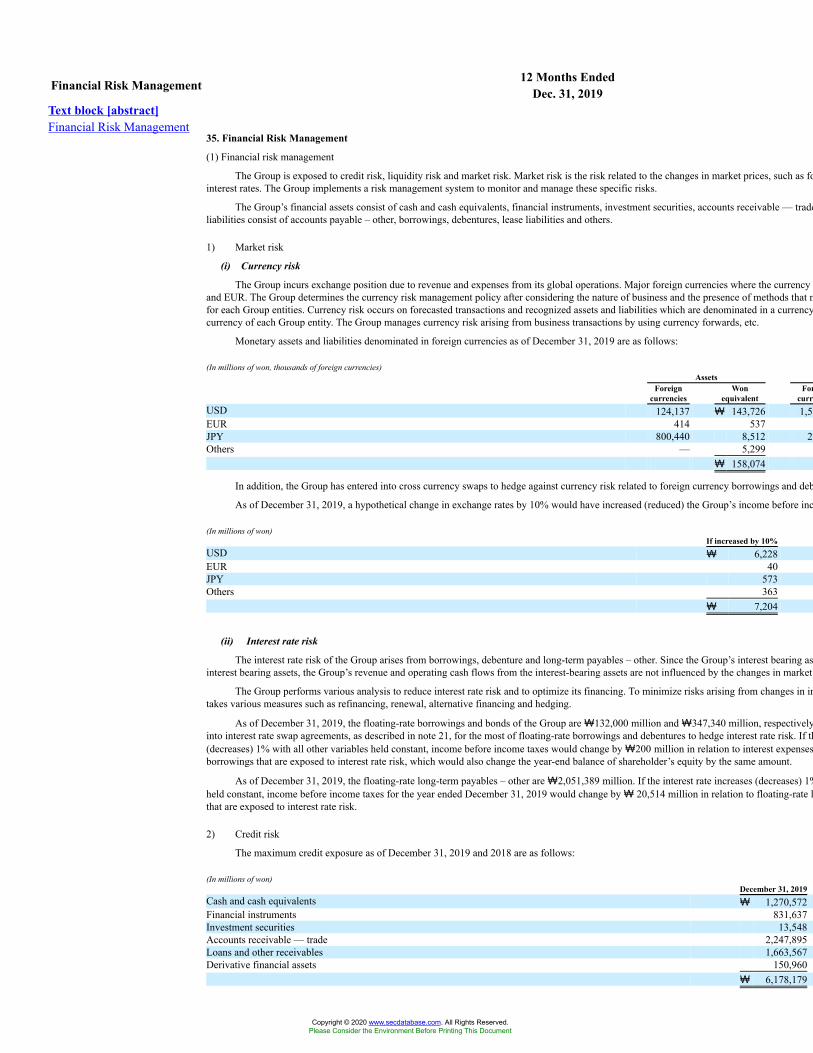
12 Months EndedFinancial Risk Management Dec. 31, 2019Text block [abstract]Financial Risk Management
35. Financial Risk Management
(1) Financial risk management
The Group is exposed to credit risk, liquidity risk and market risk. Market risk is the risk related to the changes in market prices, such as foreign exchange rates andinterest rates. The Group implements a risk management system to monitor and manage these specific risks.
The Group’s financial assets consist of cash and cash equivalents, financial instruments, investment securities, accounts receivable — trade and others, etc. Financialliabilities consist of accounts payable – other, borrowings, debentures, lease liabilities and others.
1) Market risk
(i) Currency risk
The Group incurs exchange position due to revenue and expenses from its global operations. Major foreign currencies where the currency risk occur are USD, JPYand EUR. The Group determines the currency risk management policy after considering the nature of business and the presence of methods that mitigate the currency riskfor each Group entities. Currency risk occurs on forecasted transactions and recognized assets and liabilities which are denominated in a currency other than the functionalcurrency of each Group entity. The Group manages currency risk arising from business transactions by using currency forwards, etc.
Monetary assets and liabilities denominated in foreign currencies as of December 31, 2019 are as follows:
(In millions of won, thousands of foreign currencies)Assets Liabilities
Foreigncurrencies
Wonequivalent
Foreigncurrencies
Wonequivalent
USD 124,137 ₩ 143,726 1,588,591 ₩ 1,839,271EUR 414 537 110 142JPY 800,440 8,512 261,255 2,778Others — 5,299 — 1,669
₩ 158,074 ₩ 1,843,860
In addition, the Group has entered into cross currency swaps to hedge against currency risk related to foreign currency borrowings and debentures. (See note 21)
As of December 31, 2019, a hypothetical change in exchange rates by 10% would have increased (reduced) the Group’s income before income tax as follows:
(In millions of won)If increased by 10% If decreased by 10%
USD ₩ 6,228 (6,228)EUR 40 (40)JPY 573 (573)Others 363 (363)
₩ 7,204 (7,204)
(ii) Interest rate risk
The interest rate risk of the Group arises from borrowings, debenture and long-term payables – other. Since the Group’s interest bearing assets are mostly fixed-interest bearing assets, the Group’s revenue and operating cash flows from the interest-bearing assets are not influenced by the changes in market interest rates.
The Group performs various analysis to reduce interest rate risk and to optimize its financing. To minimize risks arising from changes in interest rates, the Grouptakes various measures such as refinancing, renewal, alternative financing and hedging.
As of December 31, 2019, the floating-rate borrowings and bonds of the Group are ₩132,000 million and ₩347,340 million, respectively, and the Group has enteredinto interest rate swap agreements, as described in note 21, for the most of floating-rate borrowings and debentures to hedge interest rate risk. If the interest rate increases(decreases) 1% with all other variables held constant, income before income taxes would change by ₩200 million in relation to interest expenses on floating-rateborrowings that are exposed to interest rate risk, which would also change the year-end balance of shareholder’s equity by the same amount.
As of December 31, 2019, the floating-rate long-term payables – other are ₩2,051,389 million. If the interest rate increases (decreases) 1% with all other variablesheld constant, income before income taxes for the year ended December 31, 2019 would change by ₩ 20,514 million in relation to floating-rate long-term payables – otherthat are exposed to interest rate risk.
2) Credit risk
The maximum credit exposure as of December 31, 2019 and 2018 are as follows:
(In millions of won)December 31, 2019 December 31, 2018
Cash and cash equivalents ₩ 1,270,572 1,506,432Financial instruments 831,637 1,046,897Investment securities 13,548 11,672Accounts receivable — trade 2,247,895 2,019,933Loans and other receivables 1,663,567 1,621,938Derivative financial assets 150,960 55,457
₩ 6,178,179 6,262,329
Copyright © 2020 www.secdatabase.com. All Rights Reserved.Please Consider the Environment Before Printing This Document
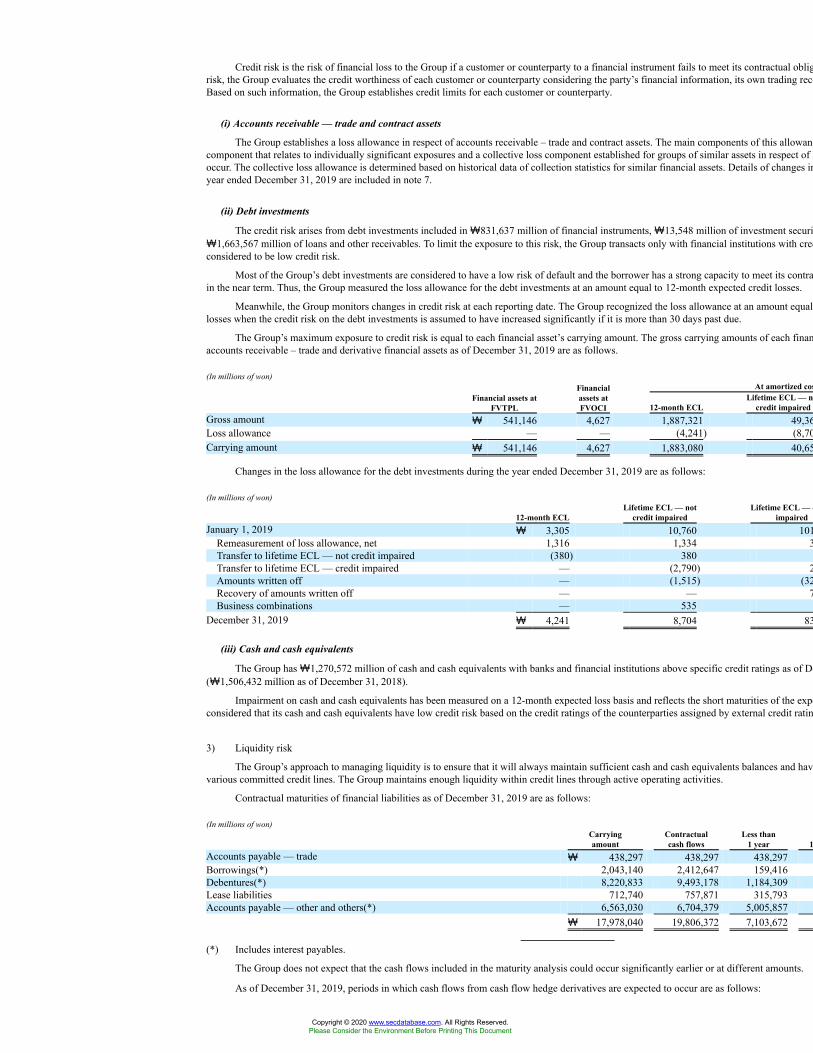
Credit risk is the risk of financial loss to the Group if a customer or counterparty to a financial instrument fails to meet its contractual obligations. To manage creditrisk, the Group evaluates the credit worthiness of each customer or counterparty considering the party’s financial information, its own trading records and other factors.Based on such information, the Group establishes credit limits for each customer or counterparty.
(i) Accounts receivable — trade and contract assets
The Group establishes a loss allowance in respect of accounts receivable – trade and contract assets. The main components of this allowance are a specific losscomponent that relates to individually significant exposures and a collective loss component established for groups of similar assets in respect of losses that are expected tooccur. The collective loss allowance is determined based on historical data of collection statistics for similar financial assets. Details of changes in loss allowance during theyear ended December 31, 2019 are included in note 7.
(ii) Debt investments
The credit risk arises from debt investments included in ₩831,637 million of financial instruments, ₩13,548 million of investment securities and₩1,663,567 million of loans and other receivables. To limit the exposure to this risk, the Group transacts only with financial institutions with credit ratings that areconsidered to be low credit risk.
Most of the Group’s debt investments are considered to have a low risk of default and the borrower has a strong capacity to meet its contractual cash flow obligationsin the near term. Thus, the Group measured the loss allowance for the debt investments at an amount equal to 12-month expected credit losses.
Meanwhile, the Group monitors changes in credit risk at each reporting date. The Group recognized the loss allowance at an amount equal to lifetime expected creditlosses when the credit risk on the debt investments is assumed to have increased significantly if it is more than 30 days past due.
The Group’s maximum exposure to credit risk is equal to each financial asset’s carrying amount. The gross carrying amounts of each financial asset except for theaccounts receivable – trade and derivative financial assets as of December 31, 2019 are as follows.
(In millions of won)At amortized cost
Financial assets atFVTPL
Financialassets atFVOCI 12-month ECL
Lifetime ECL — notcredit impaired
Lifetime ECL —credit impaired
Gross amount ₩ 541,146 4,627 1,887,321 49,360 123,196Loss allowance — — (4,241) (8,704) (83,953)Carrying amount ₩ 541,146 4,627 1,883,080 40,656 39,243
Changes in the loss allowance for the debt investments during the year ended December 31, 2019 are as follows:
(In millions of won)
12-month ECLLifetime ECL — not
credit impairedLifetime ECL — credit
impaired TotalJanuary 1, 2019 ₩ 3,305 10,760 101,823 115,888
Remeasurement of loss allowance, net 1,316 1,334 3,942 6,592Transfer to lifetime ECL — not credit impaired (380) 380 — —Transfer to lifetime ECL — credit impaired — (2,790) 2,790 —Amounts written off — (1,515) (32,165) (33,680)Recovery of amounts written off — — 7,563 7,563Business combinations — 535 — 535
December 31, 2019 ₩ 4,241 8,704 83,953 96,898
(iii) Cash and cash equivalents
The Group has ₩1,270,572 million of cash and cash equivalents with banks and financial institutions above specific credit ratings as of December 31, 2019.(₩1,506,432 million as of December 31, 2018).
Impairment on cash and cash equivalents has been measured on a 12-month expected loss basis and reflects the short maturities of the exposures. The Groupconsidered that its cash and cash equivalents have low credit risk based on the credit ratings of the counterparties assigned by external credit rating agencies.
3) Liquidity risk
The Group’s approach to managing liquidity is to ensure that it will always maintain sufficient cash and cash equivalents balances and have enough liquidity throughvarious committed credit lines. The Group maintains enough liquidity within credit lines through active operating activities.
Contractual maturities of financial liabilities as of December 31, 2019 are as follows:
(In millions of won)Carryingamount
Contractualcash flows
Less than1 year 1 - 5 years
More than5 years
Accounts payable — trade ₩ 438,297 438,297 438,297 — —Borrowings(*) 2,043,140 2,412,647 159,416 2,253,231 —Debentures(*) 8,220,833 9,493,178 1,184,309 5,237,357 3,071,512Lease liabilities 712,740 757,871 315,793 335,727 106,351Accounts payable — other and others(*) 6,563,030 6,704,379 5,005,857 1,124,389 574,133
₩ 17,978,040 19,806,372 7,103,672 8,950,704 3,751,996
(*) Includes interest payables.
The Group does not expect that the cash flows included in the maturity analysis could occur significantly earlier or at different amounts.
As of December 31, 2019, periods in which cash flows from cash flow hedge derivatives are expected to occur are as follows:
Copyright © 2020 www.secdatabase.com. All Rights Reserved.Please Consider the Environment Before Printing This Document

(In millions of won)Carryingamount
Contractualcash flows
Less than1 year 1 - 5 years
More than5 years
Assets ₩144,886 147,386 44,872 103,142 (628)Liabilities (1,043) (1,043) — (1,043) —
₩143,843 146,343 44,872 102,099 (628)(2) Capital management
The Group manages its capital to ensure that it will be able to continue as a business while maximizing the return to shareholders through the optimization of its debtand equity structure. The overall strategy of the Group is the same as that of the Group as of and for the year ended December 31, 2018.
The Group monitors its debt-equity ratio as a capital management indicator. This ratio is calculated as total liabilities divided by total equity; both are from thefinancial statements.
Debt-equity ratio as of December 31, 2019 and 2018 are as follows:
(In millions of won)December 31,
2019December 31,
2018Total liabilities ₩21,788,084 20,019,861Total equity 22,823,536 22,349,250Debt-equity ratios 95.46% 89.58%
(3) Fair value
1) Fair value and carrying amount of financial assets and liabilities including fair value hierarchy as of December 31, 2019 are as follows:
(In millions of won)December 31, 2019
Carryingamount Level 1 Level 2 Level 3 Total
Financial assets that are measured at fair value:FVTPL ₩ 847,281 — 668,891 178,390 847,281Derivatives hedging instruments 144,886 — 144,886 — 144,886FVOCI 714,899 407,651 — 307,248 714,899
₩ 1,707,066 407,651 813,777 485,638 1,707,066Financial liabilities that are measured at fair value:
Derivatives hedging instruments ₩ 1,043 — 1,043 — 1,043Financial liabilities that are not measured at fair value:
Borrowings ₩ 2,043,140 — 2,191,037 — 2,191,037Debentures 8,220,833 — 8,714,408 — 8,714,408Long-term payables — other 1,974,006 — 2,008,493 — 2,008,493
₩ 12,237,979 — 12,913,938 — 12,913,938
2) Fair value and carrying amount of financial assets and liabilities including fair value hierarchy as of December 31, 2018 are as follows:
(In millions of won)December 31, 2018
Carryingamount Level 1 Level 2 Level 3 Total
Financial assets that are measured at fair value:FVTPL ₩ 820,366 — 695,992 124,374 820,366Derivatives hedging instruments 39,871 — 39,871 — 39,871FVOCI 544,643 293,925 — 250,718 544,643
₩ 1,404,880 293,925 735,863 375,092 1,404,880Financial liabilities that are measured at fair value:
FVTPL ₩ 61,813 — 61,813 — 61,813Derivatives hedging instruments 4,184 — 4,184 — 4,184
₩ 65,997 — 65,997 — 65,997Financial liabilities that are not measured at fair value:
Borrowings ₩ 2,184,996 — 2,378,843 — 2,378,843Debentures 7,405,039 — 7,868,472 — 7,868,472Long-term payables — other 2,393,027 — 2,469,653 — 2,469,653
₩ 11,983,062 — 12,716,968 — 12,716,968
The above information does not include fair values of financial assets and liabilities of which fair values have not been measured as carrying amounts are reasonableapproximation of fair values.
Fair value of the financial instruments that are traded in an active market (financial assets at FVOCI) is measured based on the bid price at the end of the reportingdate.
The Group uses various valuation methods for determination of fair value of financial instruments that are not traded in an active market. Derivative financialcontracts and long-term liabilities are measured using the discounted present value methods. Other financial assets are determined using the methods such as discounted
Copyright © 2020 www.secdatabase.com. All Rights Reserved.Please Consider the Environment Before Printing This Document

cash flow and market approach. Inputs used to such valuation methods include swap rate, interest rate, and risk premium, and the Group performs valuation using the inputswhich are consistent with natures of assets and liabilities measured.
Interest rates used by the Group for the fair value measurement as of December 31, 2019 are as follows:
Interest rateDerivative instruments 1.68% ~ 1.89%Borrowings and debentures 1.65% ~ 2.41%Long-term payables — other 1.59% ~ 1.90%
3) There have been no transfers between Level 2 and Level 1 for year ended December 31, 2019. The changes of financial assets classified as Level 3 for the year endedDecember 31, 2019 are as follows:
(In millions of won)Balance atJanuary 1,
2019Loss for the
period OCI Acquisition Disposal Transfer
Balance atDecember 31,
2019FVTPL ₩ 124,374 (5,417) 2,345 58,361 (9,264) 7,991 178,390FVOCI 250,718 — (7,716) 92,445 (6,306) (21,893) 307,248
₩ 375,092 (5,417) (5,371) 150,806 (15,570) (13,902) 485,638
(4) Enforceable master netting agreement or similar agreement
Carrying amount of financial instruments recognized of which offset agreements are applicable as of December 31, 2019 and 2018 are as follows:
(In millions of won)December 31, 2019
Grossfinancial
instrumentsrecognized
Amountoffset
Net financialinstruments
presented on thestatements of
financial positionRelevant financial
instruments not offsetNet
amountFinancial assets:Accounts receivable — trade and others ₩102,241 (100,895) 1,346 — 1,346Financial liabilities:Accounts payable — other and others ₩100,895 (100,895) — — —(In millions of won)
December 31, 2018
Grossfinancial
instrumentsrecognized
Amountoffset
Net financialinstruments
presented on thestatements of
financial positionRelevant financial
instruments not offsetNet
amountFinancial assets:Derivatives(*) ₩ 1,867 — 1,867 (1,107) 760Accounts receivable — trade and others 95,990 (95,920) 70 — 70
₩ 97,857 (95,920) 1,937 (1,107) 830Financial liabilities:Derivatives(*) ₩ 1,107 — 1,107 (1,107) —Accounts payable — other and others 95,920 (95,920) — — —
₩ 97,027 (95,920) 1,107 (1,107) —
(*) The balance represents the net amount under the standard terms and conditions of International Swap and Derivatives Association.
Copyright © 2020 www.secdatabase.com. All Rights Reserved.Please Consider the Environment Before Printing This Document

12 Months EndedBasis of Preparation Dec. 31, 2019Text block [abstract]Basis of Preparation 2. Basis of Preparation
(1) Statement of compliance
These consolidated financial statements were prepared in accordance with International Financial Reporting Standards (“IFRS”), as issued by the InternationalAccounting Standards Board (“IASB”).
The consolidated financial statements were authorized for issuance by the Board of Directors on February 6, 2020.
(2) Basis of measurement
The consolidated financial statements have been prepared on the historical cost basis, except for the following material items in the consolidated statement offinancial position:
• derivative financial instruments measured at fair value;
• financial instruments measured at fair value through profit or loss (“FVTPL”);
• financial instruments measured at fair value through other comprehensive income (“FVOCI”);
• liabilities (assets) for defined benefit plans recognized at the total present value of defined benefit obligations less the net of the fair value of plan assets
(3) Functional and presentation currency
Financial statements of Group entities within the Group are prepared in functional currency of each group entity, which is the currency of the primary economicenvironment in which each entity operates. Consolidated financial statements of the Group are presented in Korean won, which is the Parent Company’s functional andpresentation currency.
(4) Use of estimates and judgments
The preparation of the consolidated financial statements in conformity with IFRS requires management to make judgments, estimates and assumptions that affect theapplication of accounting policies and the reported amounts of assets, liabilities, income and expenses. Actual results may differ from these estimates.
Estimates and underlying assumptions are reviewed on an ongoing basis. Revisions to accounting estimates are recognized in the period prospectively.
1) Critical judgments
Information about critical judgments in applying accounting policies that have the most significant effects on the amounts recognized in the consolidated financialstatements is included in notes for the following areas: consolidation (whether the Group has de facto control over an investee), determination of stand-alone selling prices.
2) Assumptions and estimation uncertainties
Information about assumptions and estimation uncertainties that have a significant risk of resulting in a material adjustment within the next financial year areincluded in the following notes: loss allowance (notes 7 and 35), estimated useful lives of costs to obtain a contract (notes 8), property and equipment and intangible assets(notes 4 (8), (10), 14 and 16), impairment of goodwill (notes 4 (12) and 15), recognition of provision (notes 4 (18) and 19), measurement of defined benefit liabilities (notes4 (17) and 20), and recognition of deferred tax assets (liabilities) (notes 4 (26) and 31).
A number of the Group’s accounting policies and disclosures require the measurement of fair values, for both financial and non-financial assets and liabilities. TheGroup has established policies and processes with respect to the measurement of fair values including Level 3 fair values, and the measurement of fair values is reviewedand is directly reported to the finance executives.
The Group regularly reviews significant unobservable inputs and valuation adjustments. If third party information, such as broker quotes or pricing services, is usedto measure fair values, then the Group assesses the evidence obtained from the third parties to support the conclusion that such valuations meet the requirements of IFRS,including the level in the fair value hierarchy in which such valuations should be classified.
When measuring the fair value of an asset or a liability, the Group uses market observable data as far as possible. Fair values are categorized into different levels in afair value hierarchy based on the inputs used in the valuation techniques as follows.
• Level 1: quoted prices (unadjusted) in active markets for identical assets or liabilities;
• Level 2: inputs other than quoted prices included in Level 1 that are observable for the asset or liability, either directly (i.e. as prices) or indirectly (i.e. derivedfrom prices); and
• Level 3: inputs for the asset or liability that are not based on observable market data (unobservable inputs).
If the inputs used to measure the fair value of an asset or a liability fall into different levels of the fair value hierarchy, then the fair value measurement is categorizedin its entirety in the same level of the fair value hierarchy as the lowest level input that is significant to the entire measurement. The Group recognizes transfers betweenlevels of the fair value hierarchy at the end of the reporting period during which the change has occurred.
Information about assumptions used for fair value measurements are included in note 35.
Copyright © 2020 www.secdatabase.com. All Rights Reserved.Please Consider the Environment Before Printing This Document
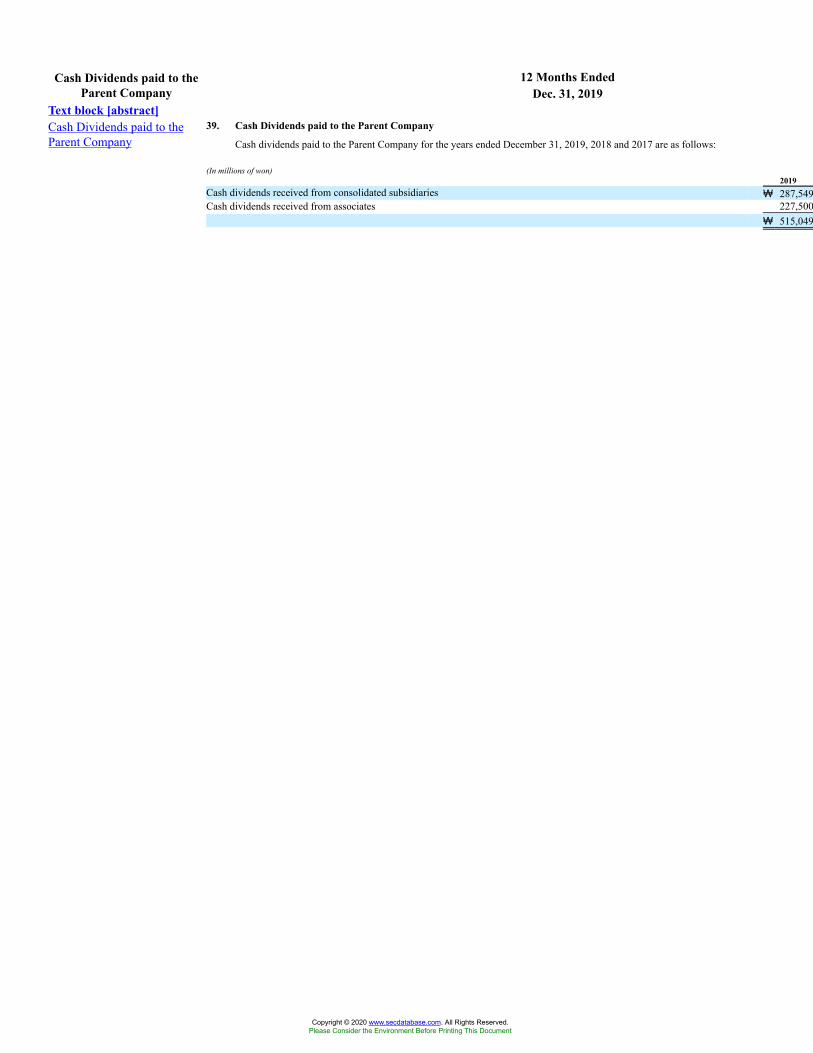
12 Months EndedCash Dividends paid to theParent Company Dec. 31, 2019
Text block [abstract]Cash Dividends paid to theParent Company
39. Cash Dividends paid to the Parent Company
Cash dividends paid to the Parent Company for the years ended December 31, 2019, 2018 and 2017 are as follows:
(In millions of won)2019 2018 2017
Cash dividends received from consolidated subsidiaries ₩ 287,549 61,985 —Cash dividends received from associates 227,500 149,815 89,063
₩ 515,049 211,800 89,063
Copyright © 2020 www.secdatabase.com. All Rights Reserved.Please Consider the Environment Before Printing This Document

12 Months EndedTransactions with RelatedParties - Transactions with
Related Parties(Parenthetical) (Detail)
₩ in Millions, $ in Millions
Dec. 31,2019KRW(₩)
Dec. 31,2018KRW(₩)
Dec.31,
2017KRW(₩)
Dec.31,
2017USD($)
Disclosure of transactions between related parties [Line Items]Dividends paid ₩
216,241Dividends received 10,011 ₩ 35,143 ₩
12,416Korea IT Fund and Others [member]Disclosure of transactions between related parties [Line Items]Dividends received 4,587SK Innovation Co Ltd SK Energy Co Ltd SK Lubricants Co Ltd SKTrading International Co Ltd and SK Global Chemical Co Ltd [member]Disclosure of transactions between related parties [Line Items]Dividends received 68,500SK hynix Inc. [member]Disclosure of transactions between related parties [Line Items]Dividends received 219,150 146,100Dividend declared 87,660Other associates [Member]Disclosure of transactions between related parties [Line Items]Dividend declared 11,955Other associates [Member] | Korea IT fund [member]Disclosure of transactions between related parties [Line Items]Dividends received ₩
6,597SK Holdings Co., Ltd. [member]Disclosure of transactions between related parties [Line Items]Dividends paid 203,635 $
203,635Handset purchases [member]Disclosure of transactions between related parties [Line Items]Dividends paid ₩
1,043,902₩1,100,370
Copyright © 2020 www.secdatabase.com. All Rights Reserved.Please Consider the Environment Before Printing This Document
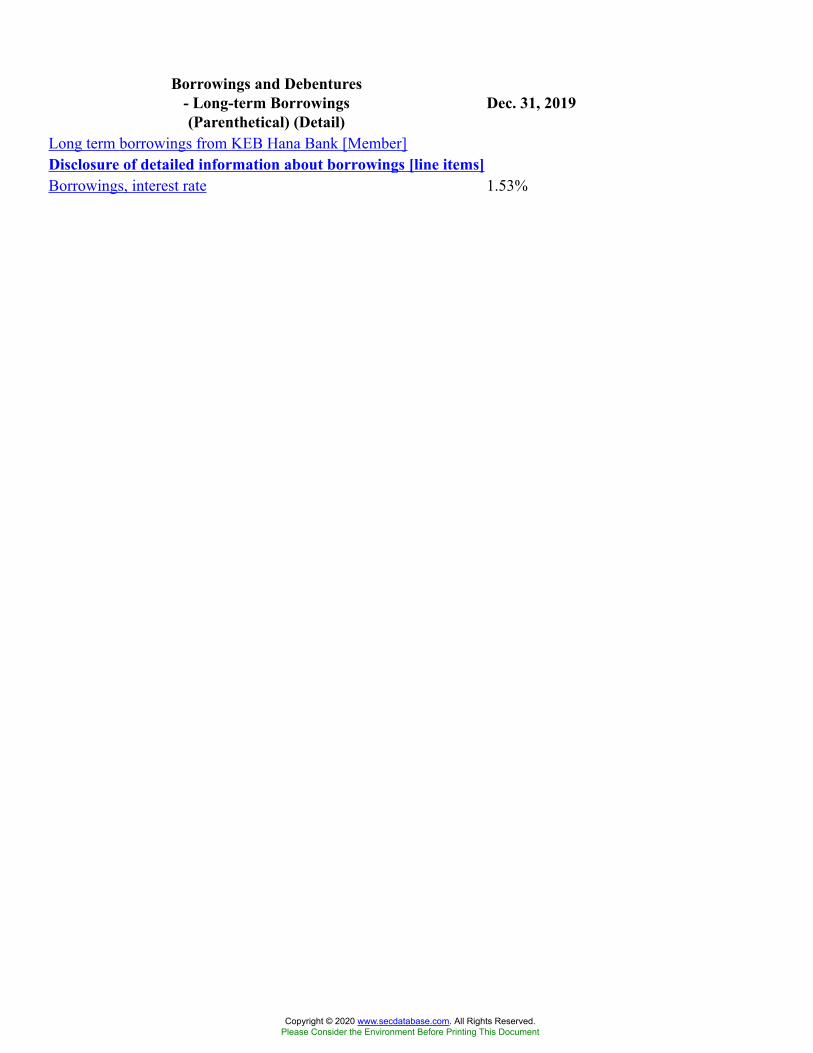
Borrowings and Debentures- Long-term Borrowings(Parenthetical) (Detail)
Dec. 31, 2019
Long term borrowings from KEB Hana Bank [Member]Disclosure of detailed information about borrowings [line items]Borrowings, interest rate 1.53%
Copyright © 2020 www.secdatabase.com. All Rights Reserved.Please Consider the Environment Before Printing This Document
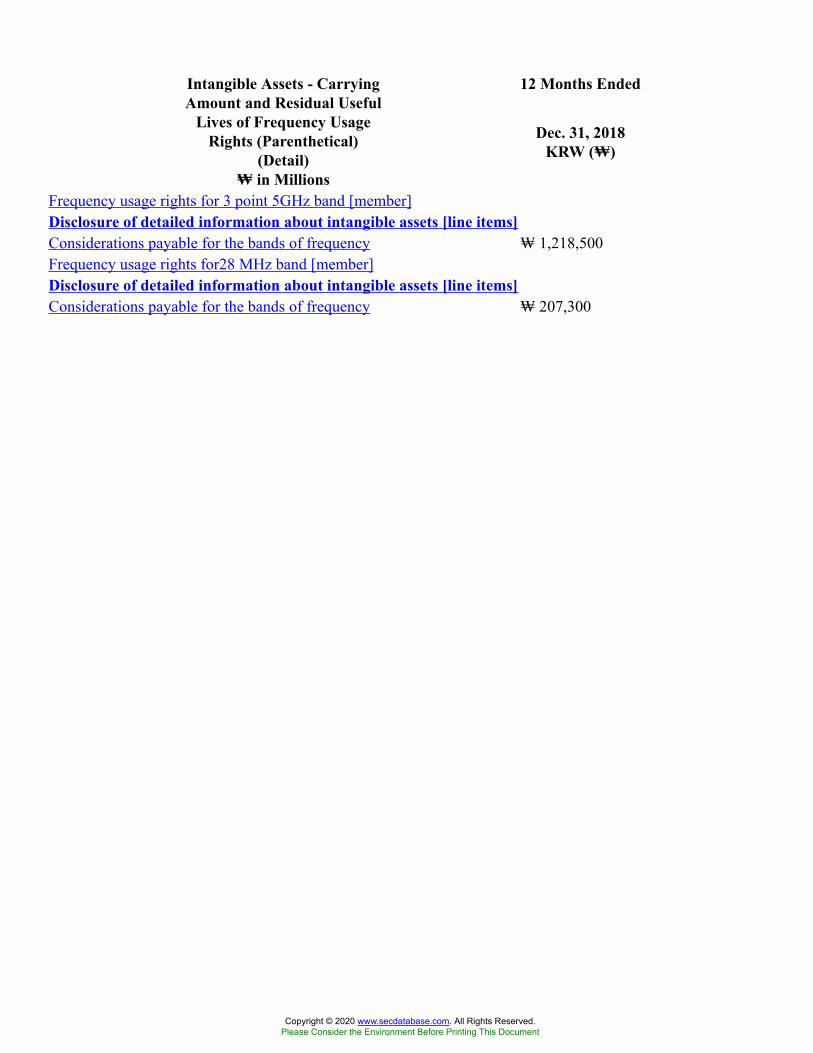
12 Months EndedIntangible Assets - CarryingAmount and Residual Useful
Lives of Frequency UsageRights (Parenthetical)
(Detail)₩ in Millions
Dec. 31, 2018KRW (₩)
Frequency usage rights for 3 point 5GHz band [member]Disclosure of detailed information about intangible assets [line items]Considerations payable for the bands of frequency ₩ 1,218,500Frequency usage rights for28 MHz band [member]Disclosure of detailed information about intangible assets [line items]Considerations payable for the bands of frequency ₩ 207,300
Copyright © 2020 www.secdatabase.com. All Rights Reserved.Please Consider the Environment Before Printing This Document
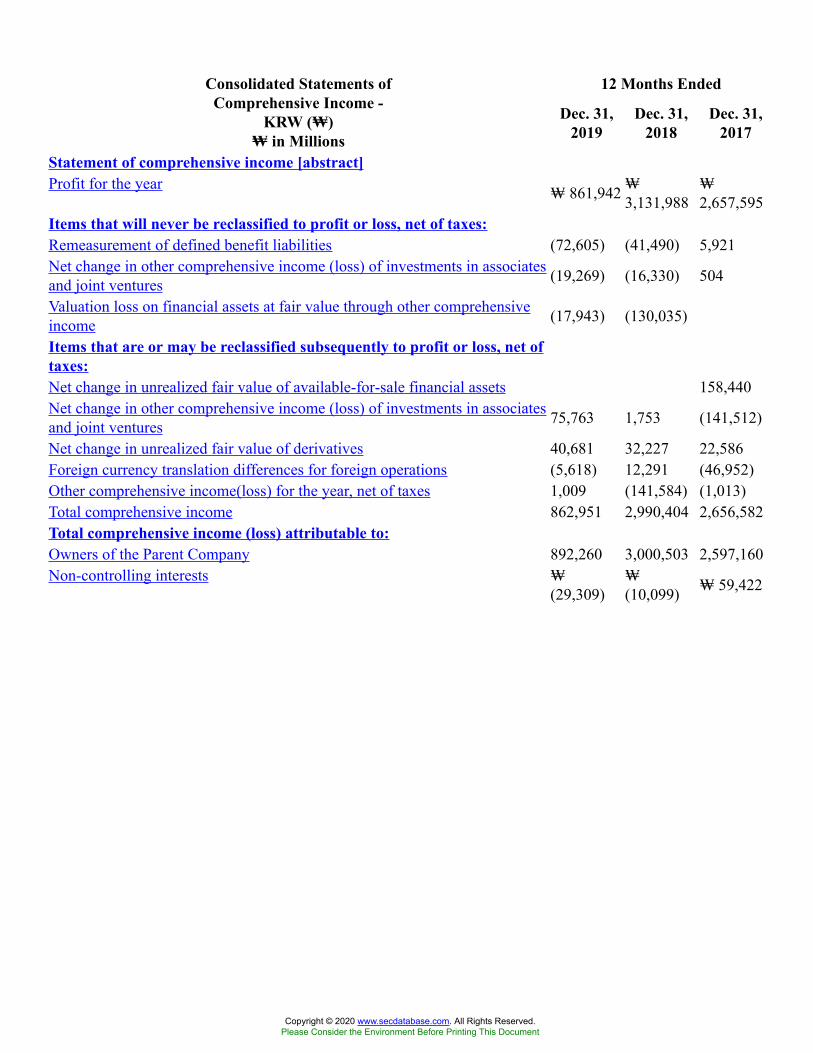
12 Months EndedConsolidated Statements ofComprehensive Income -
KRW (₩)₩ in Millions
Dec. 31,2019
Dec. 31,2018
Dec. 31,2017
Statement of comprehensive income [abstract]Profit for the year ₩ 861,942 ₩
3,131,988₩2,657,595
Items that will never be reclassified to profit or loss, net of taxes:Remeasurement of defined benefit liabilities (72,605) (41,490) 5,921Net change in other comprehensive income (loss) of investments in associatesand joint ventures (19,269) (16,330) 504
Valuation loss on financial assets at fair value through other comprehensiveincome (17,943) (130,035)
Items that are or may be reclassified subsequently to profit or loss, net oftaxes:Net change in unrealized fair value of available-for-sale financial assets 158,440Net change in other comprehensive income (loss) of investments in associatesand joint ventures 75,763 1,753 (141,512)
Net change in unrealized fair value of derivatives 40,681 32,227 22,586Foreign currency translation differences for foreign operations (5,618) 12,291 (46,952)Other comprehensive income(loss) for the year, net of taxes 1,009 (141,584) (1,013)Total comprehensive income 862,951 2,990,404 2,656,582Total comprehensive income (loss) attributable to:Owners of the Parent Company 892,260 3,000,503 2,597,160Non-controlling interests ₩
(29,309)₩(10,099) ₩ 59,422
Copyright © 2020 www.secdatabase.com. All Rights Reserved.Please Consider the Environment Before Printing This Document

12 Months EndedSignificant AccountingPolicies (Tables) Dec. 31, 2019
Text block [abstract]Estimated useful lives of theGroup's property andequipment
The estimated useful lives of the Group’s property and equipment are as follows:
Useful lives (years)Buildings and structures 15 ~ 40Machinery 3 ~ 15Other property and equipment 2 ~ 10Right-of-use assets 1 ~ 50
Estimated useful lives of theGroup's intangible assets
The estimated useful lives of the Group’s intangible assets are as follows:
Useful lives (years)Frequency usage rights 5 ~ 10Land usage rights 5Industrial rights 5, 10Development costs 3 ~ 5Facility usage rights 10, 20Customer relations 3 ~ 20Other 3 ~ 20
Copyright © 2020 www.secdatabase.com. All Rights Reserved.Please Consider the Environment Before Printing This Document
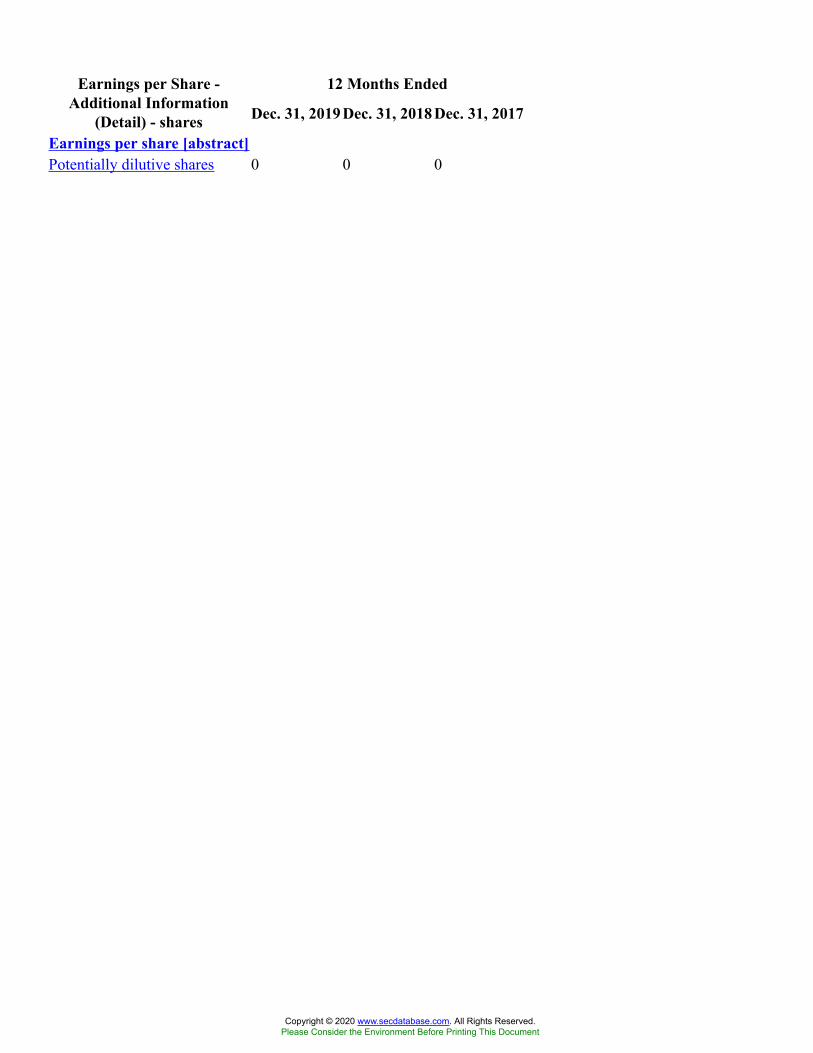
12 Months EndedEarnings per Share -Additional Information
(Detail) - shares Dec. 31, 2019 Dec. 31, 2018 Dec. 31, 2017
Earnings per share [abstract]Potentially dilutive shares 0 0 0
Copyright © 2020 www.secdatabase.com. All Rights Reserved.Please Consider the Environment Before Printing This Document
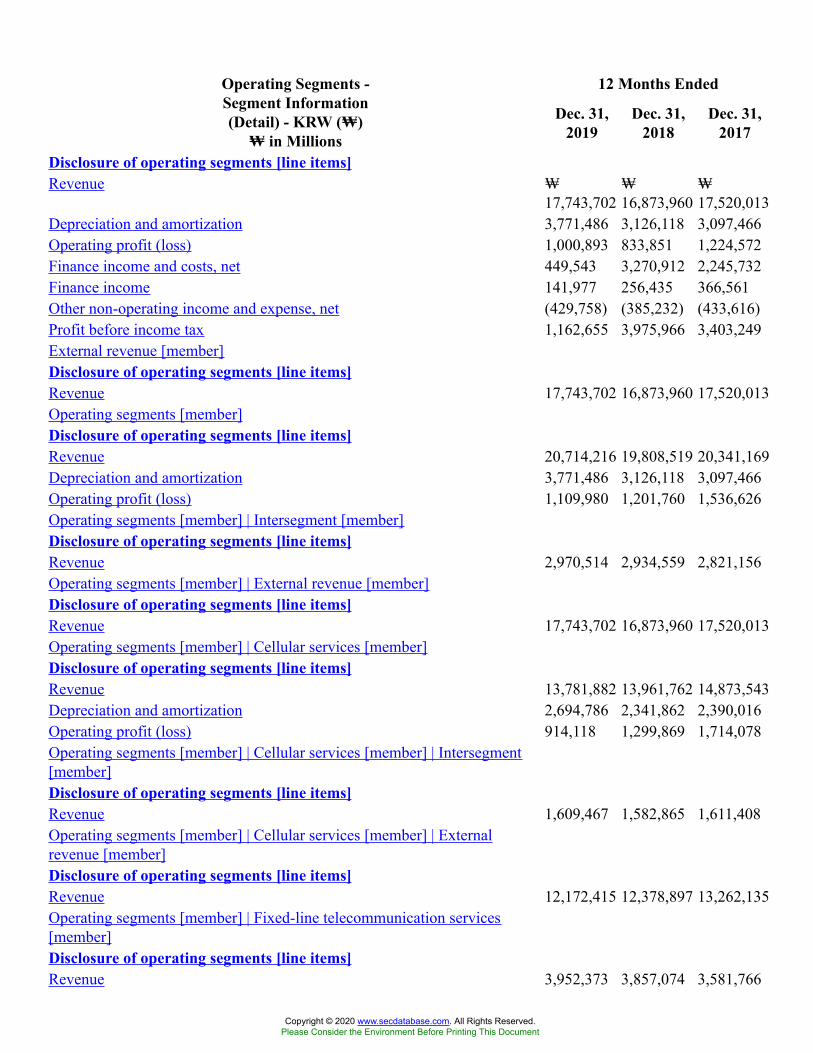
12 Months EndedOperating Segments -Segment Information(Detail) - KRW (₩)
₩ in Millions
Dec. 31,2019
Dec. 31,2018
Dec. 31,2017
Disclosure of operating segments [line items]Revenue ₩
17,743,702₩16,873,960
₩17,520,013
Depreciation and amortization 3,771,486 3,126,118 3,097,466Operating profit (loss) 1,000,893 833,851 1,224,572Finance income and costs, net 449,543 3,270,912 2,245,732Finance income 141,977 256,435 366,561Other non-operating income and expense, net (429,758) (385,232) (433,616)Profit before income tax 1,162,655 3,975,966 3,403,249External revenue [member]Disclosure of operating segments [line items]Revenue 17,743,702 16,873,960 17,520,013Operating segments [member]Disclosure of operating segments [line items]Revenue 20,714,216 19,808,519 20,341,169Depreciation and amortization 3,771,486 3,126,118 3,097,466Operating profit (loss) 1,109,980 1,201,760 1,536,626Operating segments [member] | Intersegment [member]Disclosure of operating segments [line items]Revenue 2,970,514 2,934,559 2,821,156Operating segments [member] | External revenue [member]Disclosure of operating segments [line items]Revenue 17,743,702 16,873,960 17,520,013Operating segments [member] | Cellular services [member]Disclosure of operating segments [line items]Revenue 13,781,882 13,961,762 14,873,543Depreciation and amortization 2,694,786 2,341,862 2,390,016Operating profit (loss) 914,118 1,299,869 1,714,078Operating segments [member] | Cellular services [member] | Intersegment[member]Disclosure of operating segments [line items]Revenue 1,609,467 1,582,865 1,611,408Operating segments [member] | Cellular services [member] | Externalrevenue [member]Disclosure of operating segments [line items]Revenue 12,172,415 12,378,897 13,262,135Operating segments [member] | Fixed-line telecommunication services[member]Disclosure of operating segments [line items]Revenue 3,952,373 3,857,074 3,581,766
Copyright © 2020 www.secdatabase.com. All Rights Reserved.Please Consider the Environment Before Printing This Document
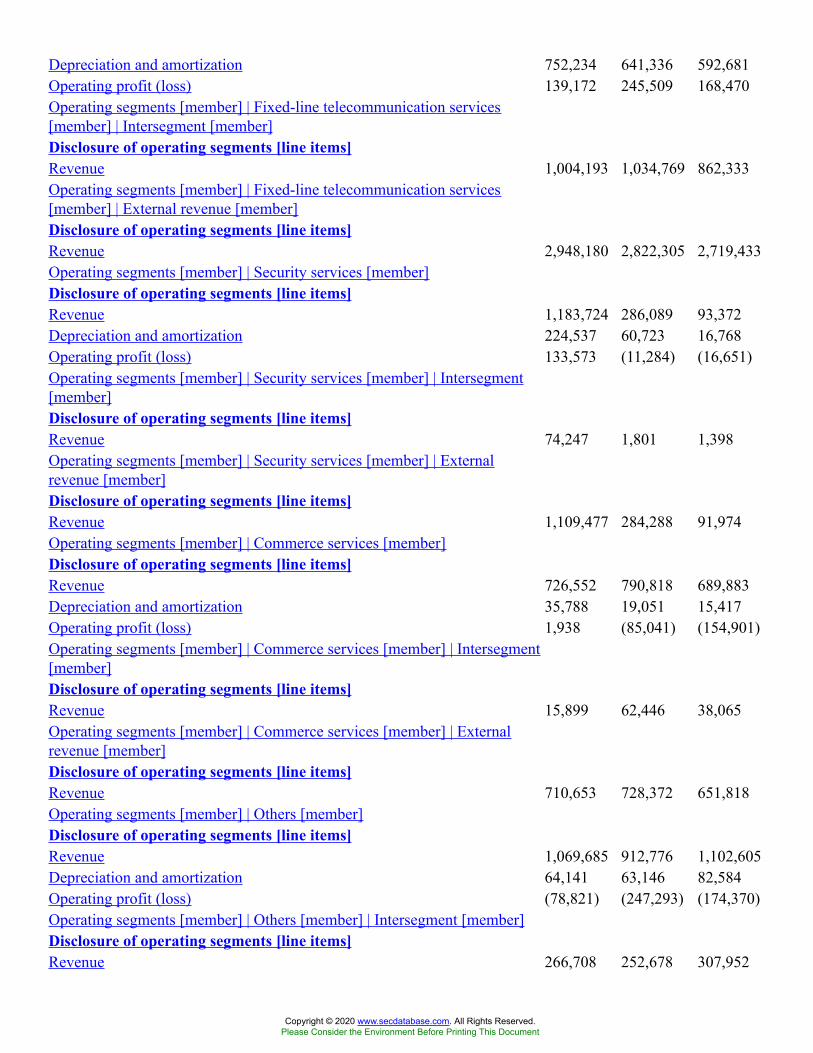
Depreciation and amortization 752,234 641,336 592,681Operating profit (loss) 139,172 245,509 168,470Operating segments [member] | Fixed-line telecommunication services[member] | Intersegment [member]Disclosure of operating segments [line items]Revenue 1,004,193 1,034,769 862,333Operating segments [member] | Fixed-line telecommunication services[member] | External revenue [member]Disclosure of operating segments [line items]Revenue 2,948,180 2,822,305 2,719,433Operating segments [member] | Security services [member]Disclosure of operating segments [line items]Revenue 1,183,724 286,089 93,372Depreciation and amortization 224,537 60,723 16,768Operating profit (loss) 133,573 (11,284) (16,651)Operating segments [member] | Security services [member] | Intersegment[member]Disclosure of operating segments [line items]Revenue 74,247 1,801 1,398Operating segments [member] | Security services [member] | Externalrevenue [member]Disclosure of operating segments [line items]Revenue 1,109,477 284,288 91,974Operating segments [member] | Commerce services [member]Disclosure of operating segments [line items]Revenue 726,552 790,818 689,883Depreciation and amortization 35,788 19,051 15,417Operating profit (loss) 1,938 (85,041) (154,901)Operating segments [member] | Commerce services [member] | Intersegment[member]Disclosure of operating segments [line items]Revenue 15,899 62,446 38,065Operating segments [member] | Commerce services [member] | Externalrevenue [member]Disclosure of operating segments [line items]Revenue 710,653 728,372 651,818Operating segments [member] | Others [member]Disclosure of operating segments [line items]Revenue 1,069,685 912,776 1,102,605Depreciation and amortization 64,141 63,146 82,584Operating profit (loss) (78,821) (247,293) (174,370)Operating segments [member] | Others [member] | Intersegment [member]Disclosure of operating segments [line items]Revenue 266,708 252,678 307,952
Copyright © 2020 www.secdatabase.com. All Rights Reserved.Please Consider the Environment Before Printing This Document
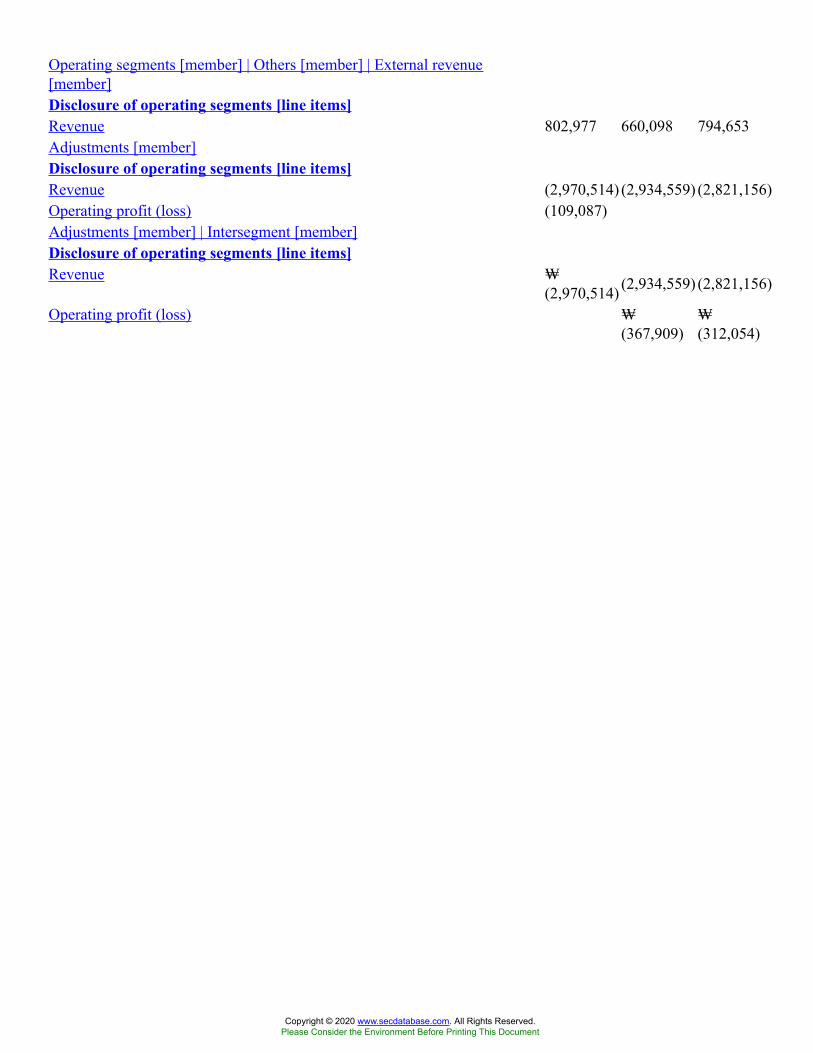
Operating segments [member] | Others [member] | External revenue[member]Disclosure of operating segments [line items]Revenue 802,977 660,098 794,653Adjustments [member]Disclosure of operating segments [line items]Revenue (2,970,514) (2,934,559) (2,821,156)Operating profit (loss) (109,087)Adjustments [member] | Intersegment [member]Disclosure of operating segments [line items]Revenue ₩
(2,970,514) (2,934,559) (2,821,156)
Operating profit (loss) ₩(367,909)
₩(312,054)
Copyright © 2020 www.secdatabase.com. All Rights Reserved.Please Consider the Environment Before Printing This Document
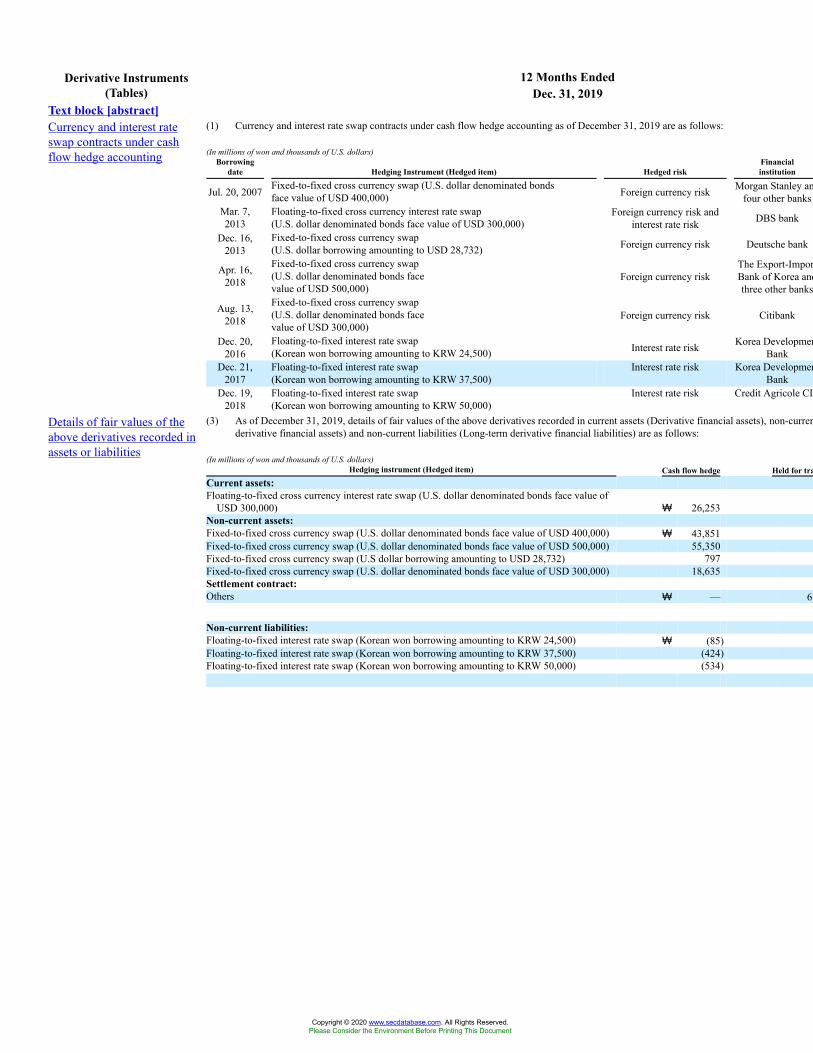
12 Months EndedDerivative Instruments(Tables) Dec. 31, 2019
Text block [abstract]Currency and interest rateswap contracts under cashflow hedge accounting
(1) Currency and interest rate swap contracts under cash flow hedge accounting as of December 31, 2019 are as follows:
(In millions of won and thousands of U.S. dollars)Borrowing
date Hedging Instrument (Hedged item) Hedged riskFinancialinstitution
Duration ofcontract
Jul. 20, 2007 Fixed-to-fixed cross currency swap (U.S. dollar denominated bondsface value of USD 400,000) Foreign currency risk Morgan Stanley and
four other banksJul. 20, 2007 ~Jul. 20, 2027
Mar. 7,2013
Floating-to-fixed cross currency interest rate swap(U.S. dollar denominated bonds face value of USD 300,000)
Foreign currency risk andinterest rate risk DBS bank Mar. 7, 2013 ~ Mar. 7,
2020Dec. 16,
2013Fixed-to-fixed cross currency swap(U.S. dollar borrowing amounting to USD 28,732) Foreign currency risk Deutsche bank Dec. 16, 2013 ~ Apr.
29, 2022
Apr. 16,2018
Fixed-to-fixed cross currency swap(U.S. dollar denominated bonds facevalue of USD 500,000)
Foreign currency riskThe Export-ImportBank of Korea andthree other banks
Apr. 16, 2018 ~ Apr.16, 2023
Aug. 13,2018
Fixed-to-fixed cross currency swap(U.S. dollar denominated bonds facevalue of USD 300,000)
Foreign currency risk Citibank Aug. 13, 2018 ~ Aug.13, 2023
Dec. 20,2016
Floating-to-fixed interest rate swap(Korean won borrowing amounting to KRW 24,500) Interest rate risk Korea Development
BankDec. 20, 2016 ~Dec. 20, 2021
Dec. 21,2017
Floating-to-fixed interest rate swap(Korean won borrowing amounting to KRW 37,500)
Interest rate risk Korea DevelopmentBank
Dec. 21, 2017 ~Dec. 21, 2022
Dec. 19,2018
Floating-to-fixed interest rate swap(Korean won borrowing amounting to KRW 50,000)
Interest rate risk Credit Agricole CIB Mar. 19, 2019 ~Dec. 14, 2023
Details of fair values of theabove derivatives recorded inassets or liabilities
(3) As of December 31, 2019, details of fair values of the above derivatives recorded in current assets (Derivative financial assets), non-current assets (Long-termderivative financial assets) and non-current liabilities (Long-term derivative financial liabilities) are as follows:
(In millions of won and thousands of U.S. dollars)Hedging instrument (Hedged item) Cash flow hedge Held for trading Fair value
Current assets:Floating-to-fixed cross currency interest rate swap (U.S. dollar denominated bonds face value of
USD 300,000) ₩ 26,253 — 26,253Non-current assets:Fixed-to-fixed cross currency swap (U.S. dollar denominated bonds face value of USD 400,000) ₩ 43,851 — 43,851Fixed-to-fixed cross currency swap (U.S. dollar denominated bonds face value of USD 500,000) 55,350 — 55,350Fixed-to-fixed cross currency swap (U.S dollar borrowing amounting to USD 28,732) 797 — 797Fixed-to-fixed cross currency swap (U.S. dollar denominated bonds face value of USD 300,000) 18,635 — 18,635Settlement contract:Others ₩ — 6,074 6,074
₩150,960Non-current liabilities:Floating-to-fixed interest rate swap (Korean won borrowing amounting to KRW 24,500) ₩ (85) — (85)Floating-to-fixed interest rate swap (Korean won borrowing amounting to KRW 37,500) (424) — (424)Floating-to-fixed interest rate swap (Korean won borrowing amounting to KRW 50,000) (534) — (534)
₩ (1,043)
Copyright © 2020 www.secdatabase.com. All Rights Reserved.Please Consider the Environment Before Printing This Document
Share Capital and CapitalSurplus and Others -
Additional Information(Detail)
Dec. 31, 2019₩ / shares
Disclosure of classes of share capital [abstract]Common shares, par value ₩ 500
Copyright © 2020 www.secdatabase.com. All Rights Reserved.Please Consider the Environment Before Printing This Document
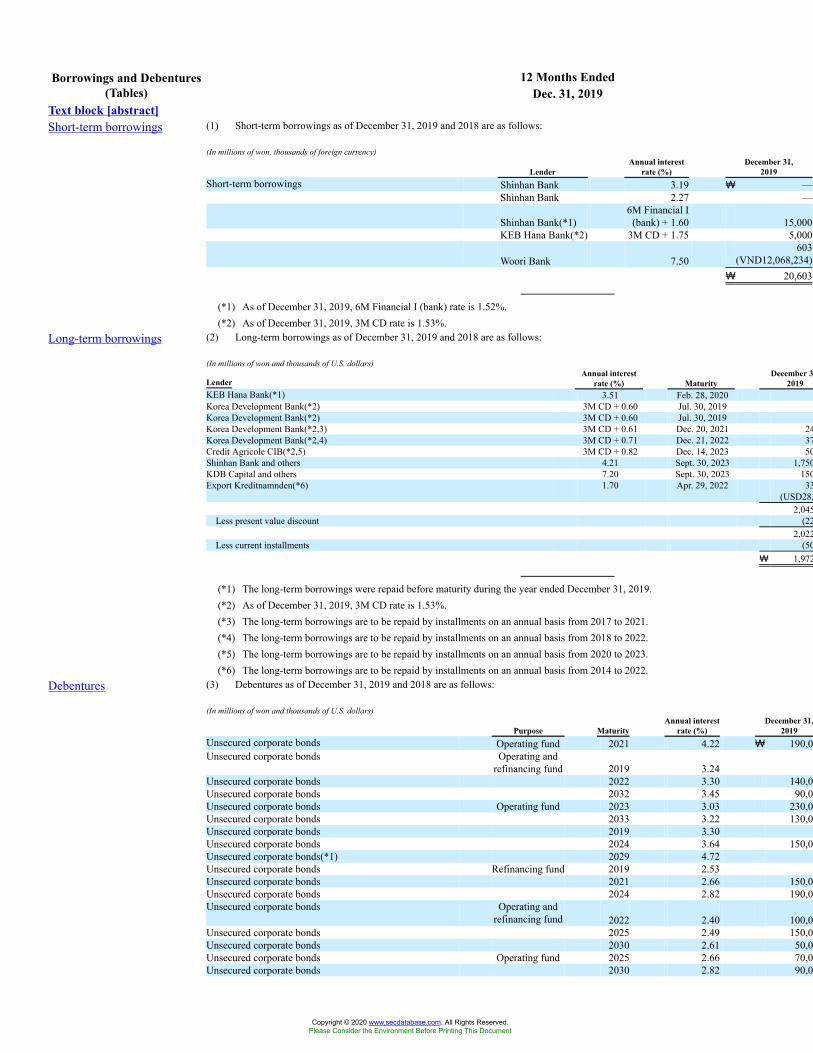
12 Months EndedBorrowings and Debentures(Tables) Dec. 31, 2019
Text block [abstract]Short-term borrowings (1) Short-term borrowings as of December 31, 2019 and 2018 are as follows:
(In millions of won, thousands of foreign currency)
LenderAnnual interest
rate (%)December 31,
2019December 31,
2018Short-term borrowings Shinhan Bank 3.19 ₩ — 30,000
Shinhan Bank 2.27 — 30,000
Shinhan Bank(*1)6M Financial I
(bank) + 1.60 15,000 15,000KEB Hana Bank(*2) 3M CD + 1.75 5,000 5,000
Woori Bank 7.50603
(VND12,068,234) —₩ 20,603 80,000
(*1) As of December 31, 2019, 6M Financial I (bank) rate is 1.52%.(*2) As of December 31, 2019, 3M CD rate is 1.53%.
Long-term borrowings (2) Long-term borrowings as of December 31, 2019 and 2018 are as follows:
(In millions of won and thousands of U.S. dollars)
LenderAnnual interest
rate (%) MaturityDecember 31,
2019December 31,
2018KEB Hana Bank(*1) 3.51 Feb. 28, 2020 — 40,000Korea Development Bank(*2) 3M CD + 0.60 Jul. 30, 2019 — 9,750Korea Development Bank(*2) 3M CD + 0.60 Jul. 30, 2019 — 2,500Korea Development Bank(*2,3) 3M CD + 0.61 Dec. 20, 2021 24,500 36,750Korea Development Bank(*2,4) 3M CD + 0.71 Dec. 21, 2022 37,500 50,000Credit Agricole CIB(*2,5) 3M CD + 0.82 Dec. 14, 2023 50,000 50,000Shinhan Bank and others 4.21 Sept. 30, 2023 1,750,000 1,750,000KDB Capital and others 7.20 Sept. 30, 2023 150,000 150,000Export Kreditnamnden(*6) 1.70 Apr. 29, 2022 33,266
(USD28,732)45,007
(USD40,253)2,045,266 2,134,007
Less present value discount (22,729) (29,011)2,022,537 2,104,996
Less current installments (50,388) (89,631)₩ 1,972,149 2,015,365
(*1) The long-term borrowings were repaid before maturity during the year ended December 31, 2019.(*2) As of December 31, 2019, 3M CD rate is 1.53%.(*3) The long-term borrowings are to be repaid by installments on an annual basis from 2017 to 2021.(*4) The long-term borrowings are to be repaid by installments on an annual basis from 2018 to 2022.(*5) The long-term borrowings are to be repaid by installments on an annual basis from 2020 to 2023.(*6) The long-term borrowings are to be repaid by installments on an annual basis from 2014 to 2022.
Debentures (3) Debentures as of December 31, 2019 and 2018 are as follows:
(In millions of won and thousands of U.S. dollars)
Purpose MaturityAnnual interest
rate (%)December 31,
2019December 31,
2018Unsecured corporate bonds Operating fund 2021 4.22 ₩ 190,000 190,000Unsecured corporate bonds Operating and
refinancing fund 2019 3.24 — 170,000Unsecured corporate bonds 2022 3.30 140,000 140,000Unsecured corporate bonds 2032 3.45 90,000 90,000Unsecured corporate bonds Operating fund 2023 3.03 230,000 230,000Unsecured corporate bonds 2033 3.22 130,000 130,000Unsecured corporate bonds 2019 3.30 — 50,000Unsecured corporate bonds 2024 3.64 150,000 150,000Unsecured corporate bonds(*1) 2029 4.72 — 61,813Unsecured corporate bonds Refinancing fund 2019 2.53 — 160,000Unsecured corporate bonds 2021 2.66 150,000 150,000Unsecured corporate bonds 2024 2.82 190,000 190,000Unsecured corporate bonds Operating and
refinancing fund 2022 2.40 100,000 100,000Unsecured corporate bonds 2025 2.49 150,000 150,000Unsecured corporate bonds 2030 2.61 50,000 50,000Unsecured corporate bonds Operating fund 2025 2.66 70,000 70,000Unsecured corporate bonds 2030 2.82 90,000 90,000
Copyright © 2020 www.secdatabase.com. All Rights Reserved.Please Consider the Environment Before Printing This Document
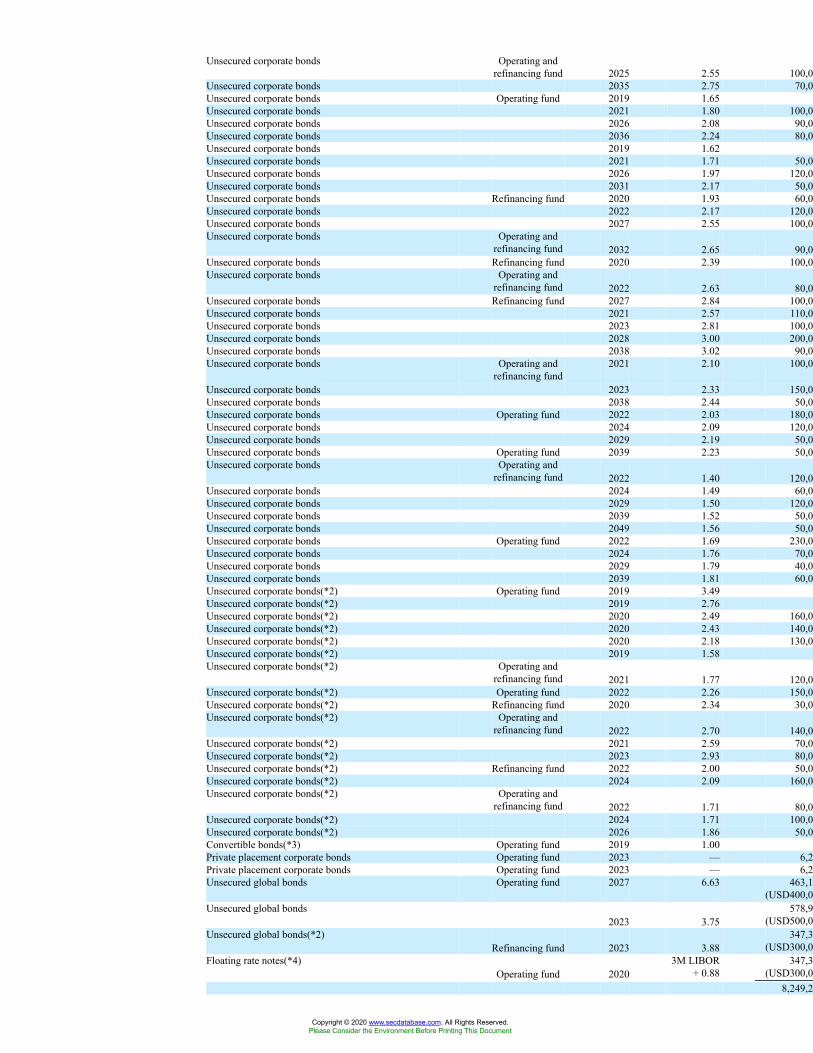
Unsecured corporate bonds Operating andrefinancing fund 2025 2.55 100,000 100,000
Unsecured corporate bonds 2035 2.75 70,000 70,000Unsecured corporate bonds Operating fund 2019 1.65 — 70,000Unsecured corporate bonds 2021 1.80 100,000 100,000Unsecured corporate bonds 2026 2.08 90,000 90,000Unsecured corporate bonds 2036 2.24 80,000 80,000Unsecured corporate bonds 2019 1.62 — 50,000Unsecured corporate bonds 2021 1.71 50,000 50,000Unsecured corporate bonds 2026 1.97 120,000 120,000Unsecured corporate bonds 2031 2.17 50,000 50,000Unsecured corporate bonds Refinancing fund 2020 1.93 60,000 60,000Unsecured corporate bonds 2022 2.17 120,000 120,000Unsecured corporate bonds 2027 2.55 100,000 100,000Unsecured corporate bonds Operating and
refinancing fund 2032 2.65 90,000 90,000Unsecured corporate bonds Refinancing fund 2020 2.39 100,000 100,000Unsecured corporate bonds Operating and
refinancing fund 2022 2.63 80,000 80,000Unsecured corporate bonds Refinancing fund 2027 2.84 100,000 100,000Unsecured corporate bonds 2021 2.57 110,000 110,000Unsecured corporate bonds 2023 2.81 100,000 100,000Unsecured corporate bonds 2028 3.00 200,000 200,000Unsecured corporate bonds 2038 3.02 90,000 90,000Unsecured corporate bonds Operating and
refinancing fund2021 2.10 100,000 100,000
Unsecured corporate bonds 2023 2.33 150,000 150,000Unsecured corporate bonds 2038 2.44 50,000 50,000Unsecured corporate bonds Operating fund 2022 2.03 180,000 —Unsecured corporate bonds 2024 2.09 120,000 —Unsecured corporate bonds 2029 2.19 50,000 —Unsecured corporate bonds Operating fund 2039 2.23 50,000 —Unsecured corporate bonds Operating and
refinancing fund 2022 1.40 120,000 —Unsecured corporate bonds 2024 1.49 60,000 —Unsecured corporate bonds 2029 1.50 120,000 —Unsecured corporate bonds 2039 1.52 50,000 —Unsecured corporate bonds 2049 1.56 50,000 —Unsecured corporate bonds Operating fund 2022 1.69 230,000 —Unsecured corporate bonds 2024 1.76 70,000 —Unsecured corporate bonds 2029 1.79 40,000 —Unsecured corporate bonds 2039 1.81 60,000 —Unsecured corporate bonds(*2) Operating fund 2019 3.49 — 210,000Unsecured corporate bonds(*2) 2019 2.76 — 130,000Unsecured corporate bonds(*2) 2020 2.49 160,000 160,000Unsecured corporate bonds(*2) 2020 2.43 140,000 140,000Unsecured corporate bonds(*2) 2020 2.18 130,000 130,000Unsecured corporate bonds(*2) 2019 1.58 — 50,000Unsecured corporate bonds(*2) Operating and
refinancing fund 2021 1.77 120,000 120,000Unsecured corporate bonds(*2) Operating fund 2022 2.26 150,000 150,000Unsecured corporate bonds(*2) Refinancing fund 2020 2.34 30,000 30,000Unsecured corporate bonds(*2) Operating and
refinancing fund 2022 2.70 140,000 140,000Unsecured corporate bonds(*2) 2021 2.59 70,000 70,000Unsecured corporate bonds(*2) 2023 2.93 80,000 80,000Unsecured corporate bonds(*2) Refinancing fund 2022 2.00 50,000 —Unsecured corporate bonds(*2) 2024 2.09 160,000 —Unsecured corporate bonds(*2) Operating and
refinancing fund 2022 1.71 80,000 —Unsecured corporate bonds(*2) 2024 1.71 100,000 —Unsecured corporate bonds(*2) 2026 1.86 50,000 —Convertible bonds(*3) Operating fund 2019 1.00 — 5,479Private placement corporate bonds Operating fund 2023 — 6,292 —Private placement corporate bonds Operating fund 2023 — 6,222 —Unsecured global bonds Operating fund 2027 6.63 463,120
(USD400,000)447,240
(USD400,000)Unsecured global bonds
2023 3.75578,900
(USD500,000)559,050
(USD500,000)Unsecured global bonds(*2)
Refinancing fund 2023 3.88347,340
(USD300,000)335,430
(USD300,000)Floating rate notes(*4)
Operating fund 20203M LIBOR
+ 0.88347,340
(USD300,000)335,430
(USD300,000)8,249,214 7,494,442
Copyright © 2020 www.secdatabase.com. All Rights Reserved.Please Consider the Environment Before Printing This Document
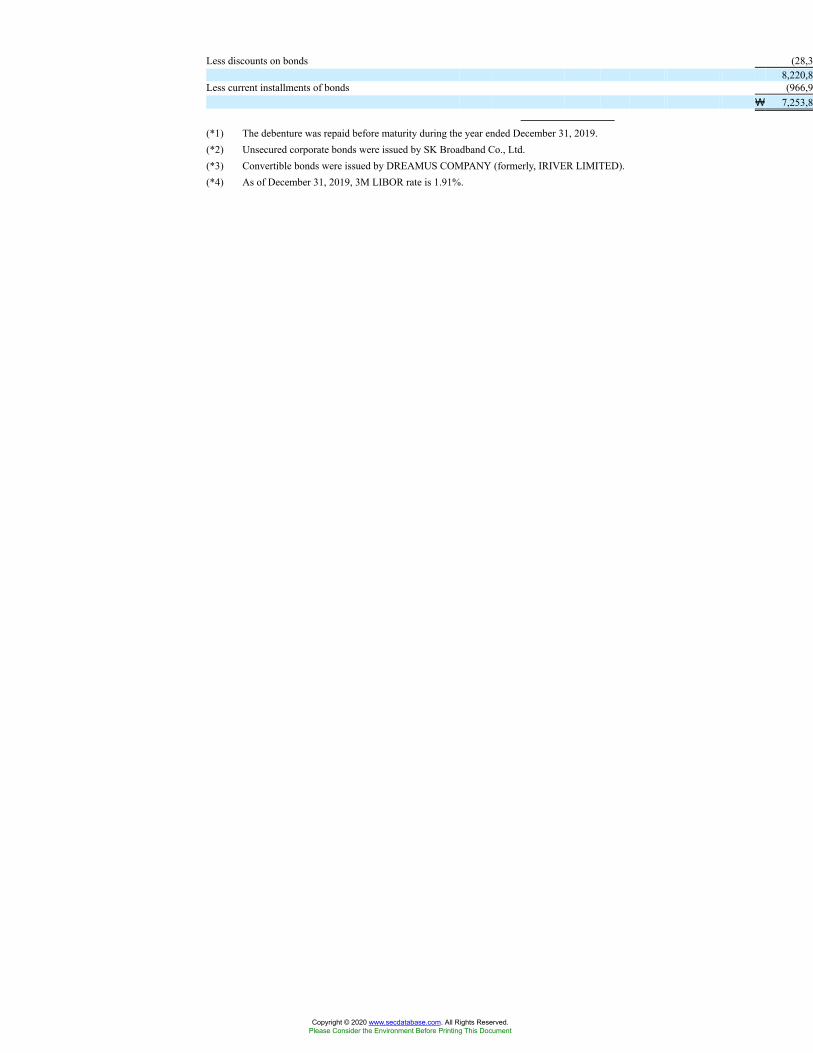
Less discounts on bonds (28,381) (27,590)8,220,833 7,466,852
Less current installments of bonds (966,939) (894,641)₩ 7,253,894 6,572,211
(*1) The debenture was repaid before maturity during the year ended December 31, 2019.(*2) Unsecured corporate bonds were issued by SK Broadband Co., Ltd.(*3) Convertible bonds were issued by DREAMUS COMPANY (formerly, IRIVER LIMITED).(*4) As of December 31, 2019, 3M LIBOR rate is 1.91%.
Copyright © 2020 www.secdatabase.com. All Rights Reserved.Please Consider the Environment Before Printing This Document
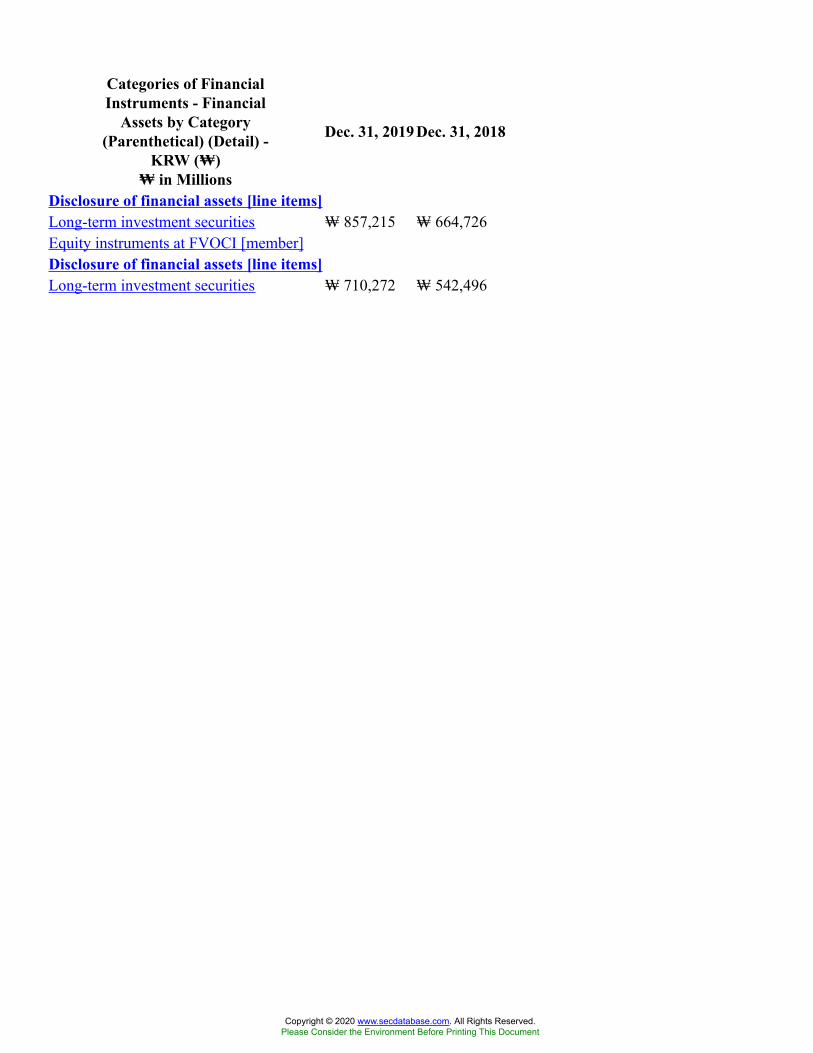
Categories of FinancialInstruments - Financial
Assets by Category(Parenthetical) (Detail) -
KRW (₩)₩ in Millions
Dec. 31, 2019 Dec. 31, 2018
Disclosure of financial assets [line items]Long-term investment securities ₩ 857,215 ₩ 664,726Equity instruments at FVOCI [member]Disclosure of financial assets [line items]Long-term investment securities ₩ 710,272 ₩ 542,496
Copyright © 2020 www.secdatabase.com. All Rights Reserved.Please Consider the Environment Before Printing This Document

Income Tax Expense -Unused Tax Loss
Carryforwards and UnusedTax Credit CarryforwardsWhich are Not Recognized
as Deferred Tax Assets(Detail) - KRW (₩)
₩ in Millions
Dec. 31,2019
Dec. 31,2018
Disclosure of temporary difference, unused tax losses and unused tax credits[Line Items]Unused tax loss carryforwards ₩
1,023,907 ₩ 849,850
Unused tax credit carryforwards 1,192 ₩ 3,705Less than 1 year [member]Disclosure of temporary difference, unused tax losses and unused tax credits[Line Items]Unused tax loss carryforwards 108,703Unused tax credit carryforwards 2581 ~ 2 years [Member]Disclosure of temporary difference, unused tax losses and unused tax credits[Line Items]Unused tax loss carryforwards 152,361Unused tax credit carryforwards 3162 ~ 3 years [Member]Disclosure of temporary difference, unused tax losses and unused tax credits[Line Items]Unused tax loss carryforwards 80,363Unused tax credit carryforwards 388More than 3 years [Member]Disclosure of temporary difference, unused tax losses and unused tax credits[Line Items]Unused tax loss carryforwards 682,480Unused tax credit carryforwards ₩ 230
Copyright © 2020 www.secdatabase.com. All Rights Reserved.Please Consider the Environment Before Printing This Document
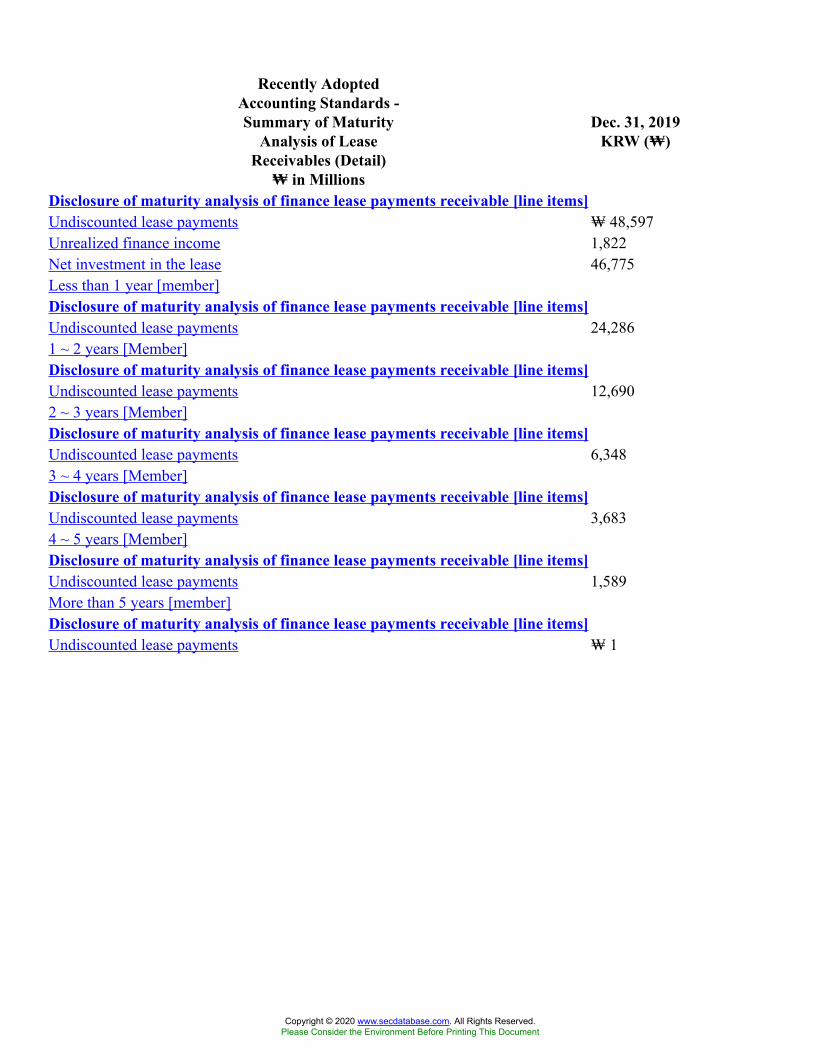
Recently AdoptedAccounting Standards -Summary of Maturity
Analysis of LeaseReceivables (Detail)
₩ in Millions
Dec. 31, 2019KRW (₩)
Disclosure of maturity analysis of finance lease payments receivable [line items]Undiscounted lease payments ₩ 48,597Unrealized finance income 1,822Net investment in the lease 46,775Less than 1 year [member]Disclosure of maturity analysis of finance lease payments receivable [line items]Undiscounted lease payments 24,2861 ~ 2 years [Member]Disclosure of maturity analysis of finance lease payments receivable [line items]Undiscounted lease payments 12,6902 ~ 3 years [Member]Disclosure of maturity analysis of finance lease payments receivable [line items]Undiscounted lease payments 6,3483 ~ 4 years [Member]Disclosure of maturity analysis of finance lease payments receivable [line items]Undiscounted lease payments 3,6834 ~ 5 years [Member]Disclosure of maturity analysis of finance lease payments receivable [line items]Undiscounted lease payments 1,589More than 5 years [member]Disclosure of maturity analysis of finance lease payments receivable [line items]Undiscounted lease payments ₩ 1
Copyright © 2020 www.secdatabase.com. All Rights Reserved.Please Consider the Environment Before Printing This Document
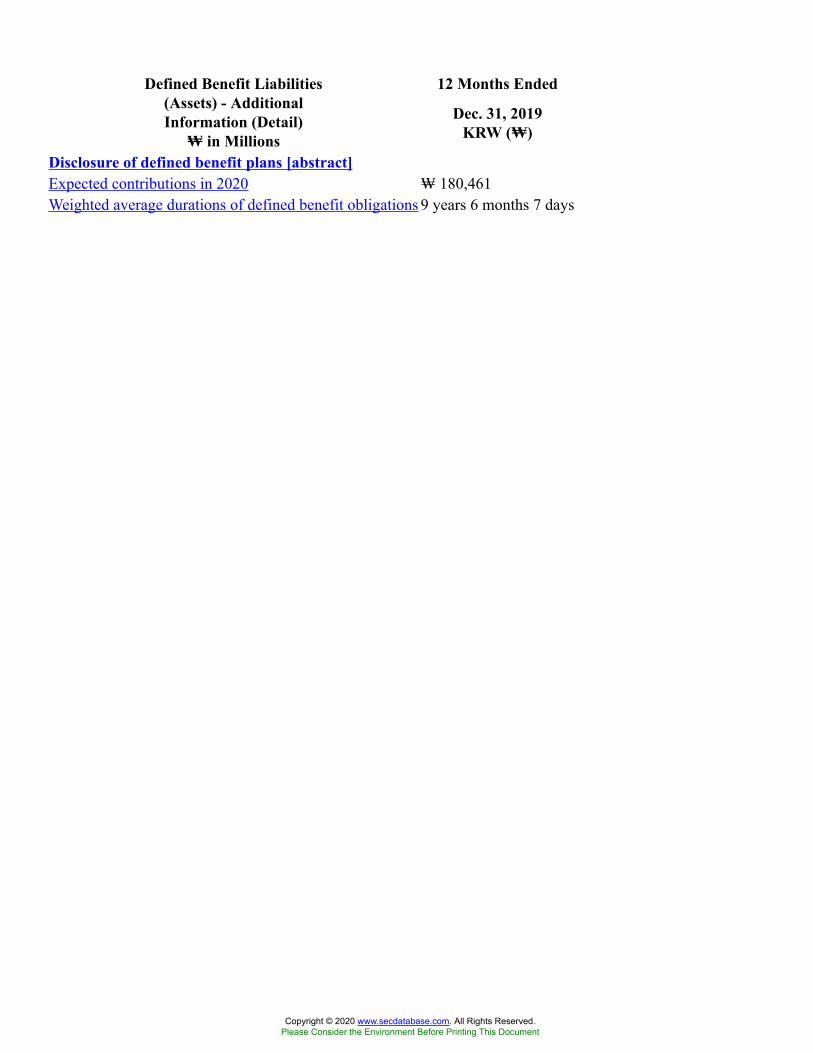
12 Months EndedDefined Benefit Liabilities(Assets) - AdditionalInformation (Detail)
₩ in Millions
Dec. 31, 2019KRW (₩)
Disclosure of defined benefit plans [abstract]Expected contributions in 2020 ₩ 180,461Weighted average durations of defined benefit obligations 9 years 6 months 7 days
Copyright © 2020 www.secdatabase.com. All Rights Reserved.Please Consider the Environment Before Printing This Document
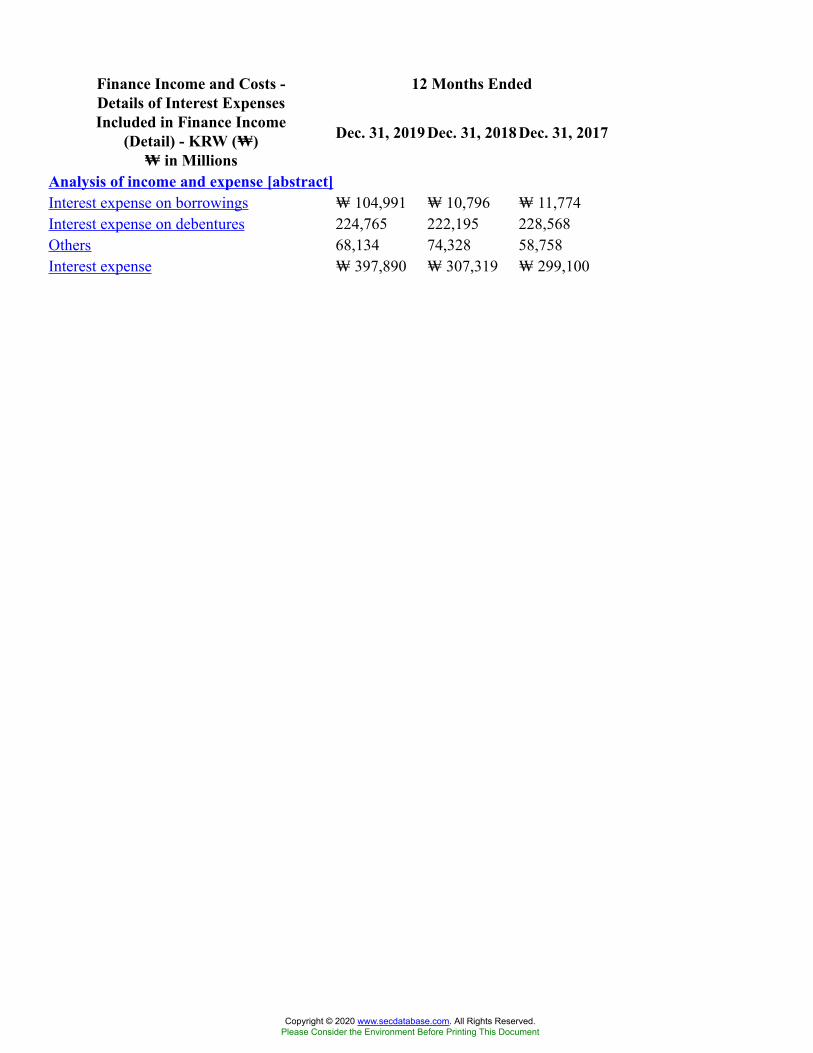
12 Months EndedFinance Income and Costs -Details of Interest ExpensesIncluded in Finance Income
(Detail) - KRW (₩)₩ in Millions
Dec. 31, 2019 Dec. 31, 2018 Dec. 31, 2017
Analysis of income and expense [abstract]Interest expense on borrowings ₩ 104,991 ₩ 10,796 ₩ 11,774Interest expense on debentures 224,765 222,195 228,568Others 68,134 74,328 58,758Interest expense ₩ 397,890 ₩ 307,319 ₩ 299,100
Copyright © 2020 www.secdatabase.com. All Rights Reserved.Please Consider the Environment Before Printing This Document
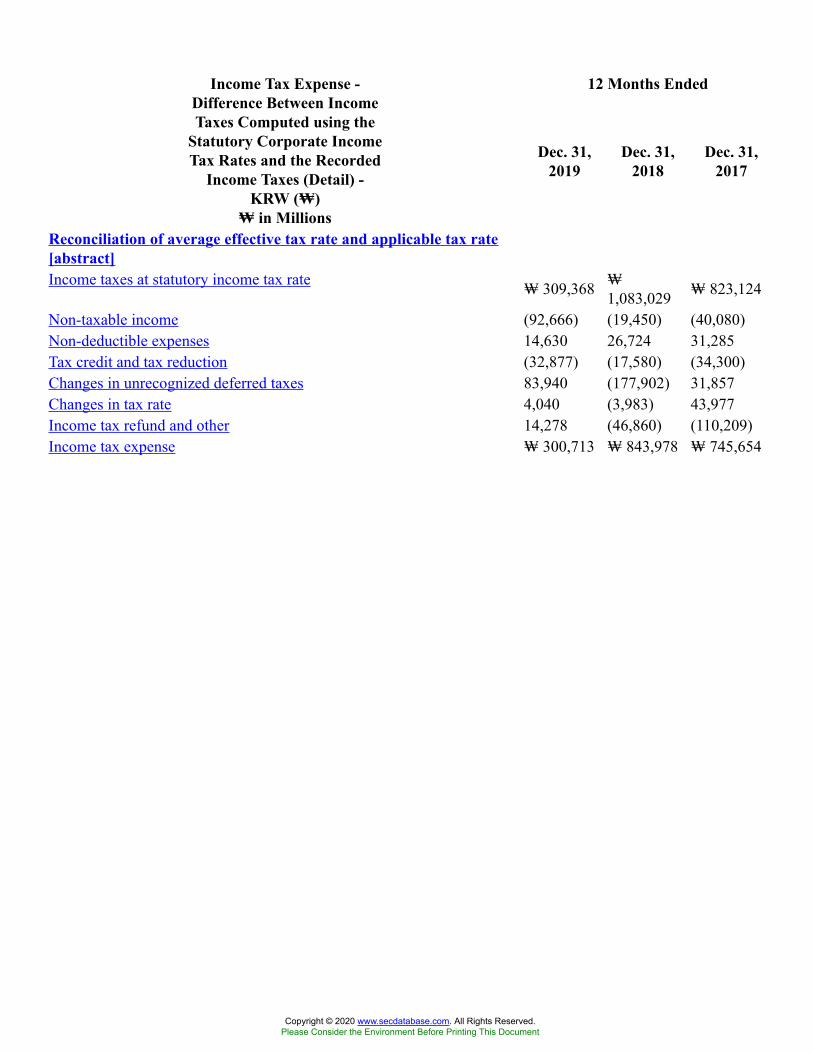
12 Months EndedIncome Tax Expense -Difference Between IncomeTaxes Computed using the
Statutory Corporate IncomeTax Rates and the Recorded
Income Taxes (Detail) -KRW (₩)
₩ in Millions
Dec. 31,2019
Dec. 31,2018
Dec. 31,2017
Reconciliation of average effective tax rate and applicable tax rate[abstract]Income taxes at statutory income tax rate ₩ 309,368 ₩
1,083,029 ₩ 823,124
Non-taxable income (92,666) (19,450) (40,080)Non-deductible expenses 14,630 26,724 31,285Tax credit and tax reduction (32,877) (17,580) (34,300)Changes in unrecognized deferred taxes 83,940 (177,902) 31,857Changes in tax rate 4,040 (3,983) 43,977Income tax refund and other 14,278 (46,860) (110,209)Income tax expense ₩ 300,713 ₩ 843,978 ₩ 745,654
Copyright © 2020 www.secdatabase.com. All Rights Reserved.Please Consider the Environment Before Printing This Document

Financial Risk Management- Additional Information
(Detail) - KRW (₩)Dec. 31, 2019 Dec. 31, 2018
Disclosure of detailed information about financial instruments [Lineitems]Long-term borrowings ₩
2,022,537,000,000₩2,104,996,000,000
Bonds 8,220,833,000,0007,466,852,000,000Long-term payables — other 1,550,167,000,0001,968,784,000,000Maximum credit exposure 6,178,179,000,0006,262,329,000,000Floating-rate [member]Disclosure of detailed information about financial instruments [Lineitems]Long-term borrowings 132,000,000,000Bonds 347,340,000,000Long-term payables — other 2,051,389,000,000Floating-rate [member] | One Percentage Increase Decrease In InterestRates [member] | Forecast [Member]Disclosure of detailed information about financial instruments [Lineitems]Hypothetical increase (decrease) in interest rate, effect on income beforeincome taxes 200,000,000
Interest rate risk [member] | Long-term payables - other [member]Disclosure of detailed information about financial instruments [Lineitems]Hypothetical increase (decrease) in interest rate, effect on income beforeincome taxes ₩ 20,514,000,000
Hypothetical increase (decrease) in interest rate 1.00%Financial instruments [member]Disclosure of detailed information about financial instruments [Lineitems]Maximum credit exposure ₩
831,637,000,000 1,046,897,000,000
Available- for-sale financial assets [Member]Disclosure of detailed information about financial instruments [Lineitems]Maximum credit exposure 13,548,000,000 11,672,000,000Loans and receivables [member]Disclosure of detailed information about financial instruments [Lineitems]Maximum credit exposure 1,663,567,000,0001,621,938,000,000Cash and cash equivalents [Member]Disclosure of detailed information about financial instruments [Lineitems]
Copyright © 2020 www.secdatabase.com. All Rights Reserved.Please Consider the Environment Before Printing This Document
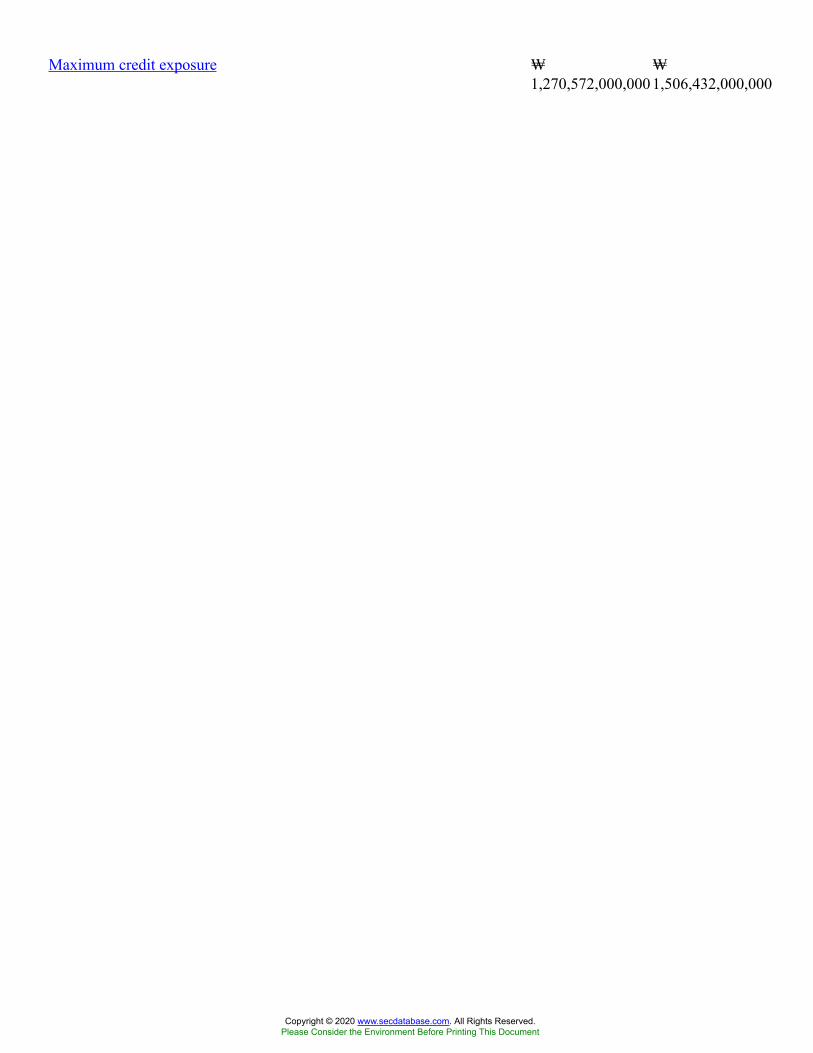
Maximum credit exposure ₩1,270,572,000,000
₩1,506,432,000,000
Copyright © 2020 www.secdatabase.com. All Rights Reserved.Please Consider the Environment Before Printing This Document
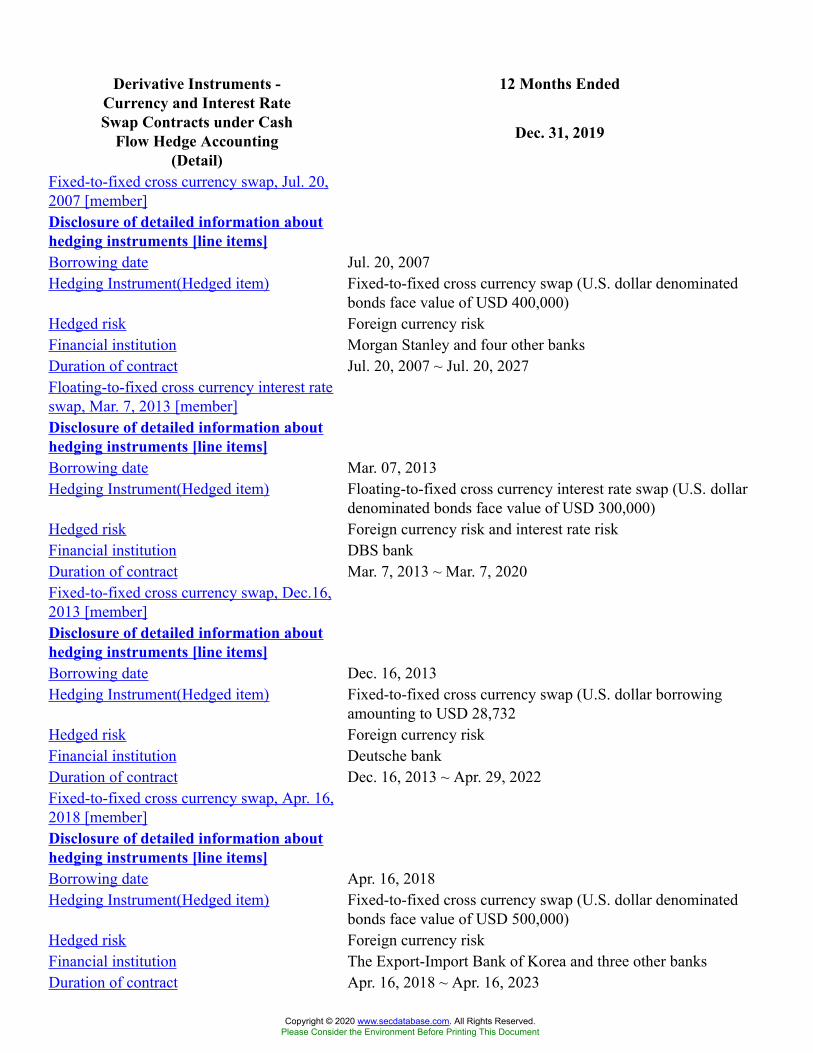
12 Months EndedDerivative Instruments -Currency and Interest RateSwap Contracts under Cash
Flow Hedge Accounting(Detail)
Dec. 31, 2019
Fixed-to-fixed cross currency swap, Jul. 20,2007 [member]Disclosure of detailed information abouthedging instruments [line items]Borrowing date Jul. 20, 2007Hedging Instrument(Hedged item) Fixed-to-fixed cross currency swap (U.S. dollar denominated
bonds face value of USD 400,000)Hedged risk Foreign currency riskFinancial institution Morgan Stanley and four other banksDuration of contract Jul. 20, 2007 ~ Jul. 20, 2027Floating-to-fixed cross currency interest rateswap, Mar. 7, 2013 [member]Disclosure of detailed information abouthedging instruments [line items]Borrowing date Mar. 07, 2013Hedging Instrument(Hedged item) Floating-to-fixed cross currency interest rate swap (U.S. dollar
denominated bonds face value of USD 300,000)Hedged risk Foreign currency risk and interest rate riskFinancial institution DBS bankDuration of contract Mar. 7, 2013 ~ Mar. 7, 2020Fixed-to-fixed cross currency swap, Dec.16,2013 [member]Disclosure of detailed information abouthedging instruments [line items]Borrowing date Dec. 16, 2013Hedging Instrument(Hedged item) Fixed-to-fixed cross currency swap (U.S. dollar borrowing
amounting to USD 28,732Hedged risk Foreign currency riskFinancial institution Deutsche bankDuration of contract Dec. 16, 2013 ~ Apr. 29, 2022Fixed-to-fixed cross currency swap, Apr. 16,2018 [member]Disclosure of detailed information abouthedging instruments [line items]Borrowing date Apr. 16, 2018Hedging Instrument(Hedged item) Fixed-to-fixed cross currency swap (U.S. dollar denominated
bonds face value of USD 500,000)Hedged risk Foreign currency riskFinancial institution The Export-Import Bank of Korea and three other banksDuration of contract Apr. 16, 2018 ~ Apr. 16, 2023
Copyright © 2020 www.secdatabase.com. All Rights Reserved.Please Consider the Environment Before Printing This Document
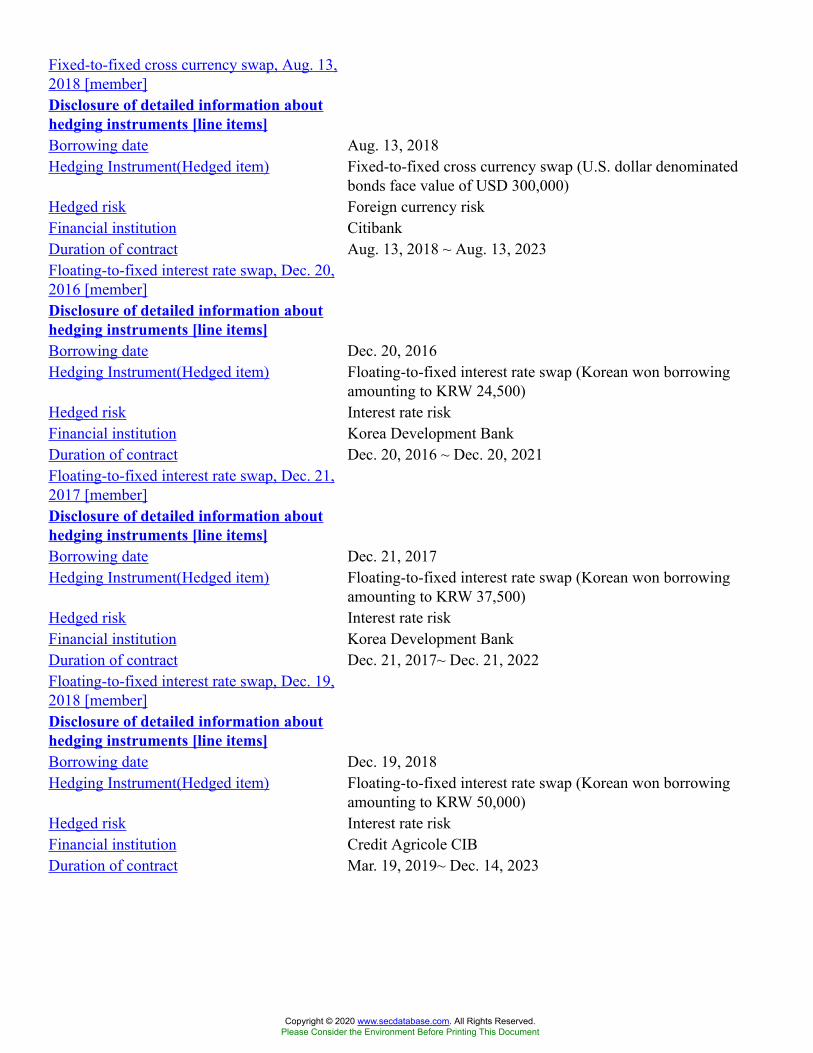
Fixed-to-fixed cross currency swap, Aug. 13,2018 [member]Disclosure of detailed information abouthedging instruments [line items]Borrowing date Aug. 13, 2018Hedging Instrument(Hedged item) Fixed-to-fixed cross currency swap (U.S. dollar denominated
bonds face value of USD 300,000)Hedged risk Foreign currency riskFinancial institution CitibankDuration of contract Aug. 13, 2018 ~ Aug. 13, 2023Floating-to-fixed interest rate swap, Dec. 20,2016 [member]Disclosure of detailed information abouthedging instruments [line items]Borrowing date Dec. 20, 2016Hedging Instrument(Hedged item) Floating-to-fixed interest rate swap (Korean won borrowing
amounting to KRW 24,500)Hedged risk Interest rate riskFinancial institution Korea Development BankDuration of contract Dec. 20, 2016 ~ Dec. 20, 2021Floating-to-fixed interest rate swap, Dec. 21,2017 [member]Disclosure of detailed information abouthedging instruments [line items]Borrowing date Dec. 21, 2017Hedging Instrument(Hedged item) Floating-to-fixed interest rate swap (Korean won borrowing
amounting to KRW 37,500)Hedged risk Interest rate riskFinancial institution Korea Development BankDuration of contract Dec. 21, 2017~ Dec. 21, 2022Floating-to-fixed interest rate swap, Dec. 19,2018 [member]Disclosure of detailed information abouthedging instruments [line items]Borrowing date Dec. 19, 2018Hedging Instrument(Hedged item) Floating-to-fixed interest rate swap (Korean won borrowing
amounting to KRW 50,000)Hedged risk Interest rate riskFinancial institution Credit Agricole CIBDuration of contract Mar. 19, 2019~ Dec. 14, 2023
Copyright © 2020 www.secdatabase.com. All Rights Reserved.Please Consider the Environment Before Printing This Document
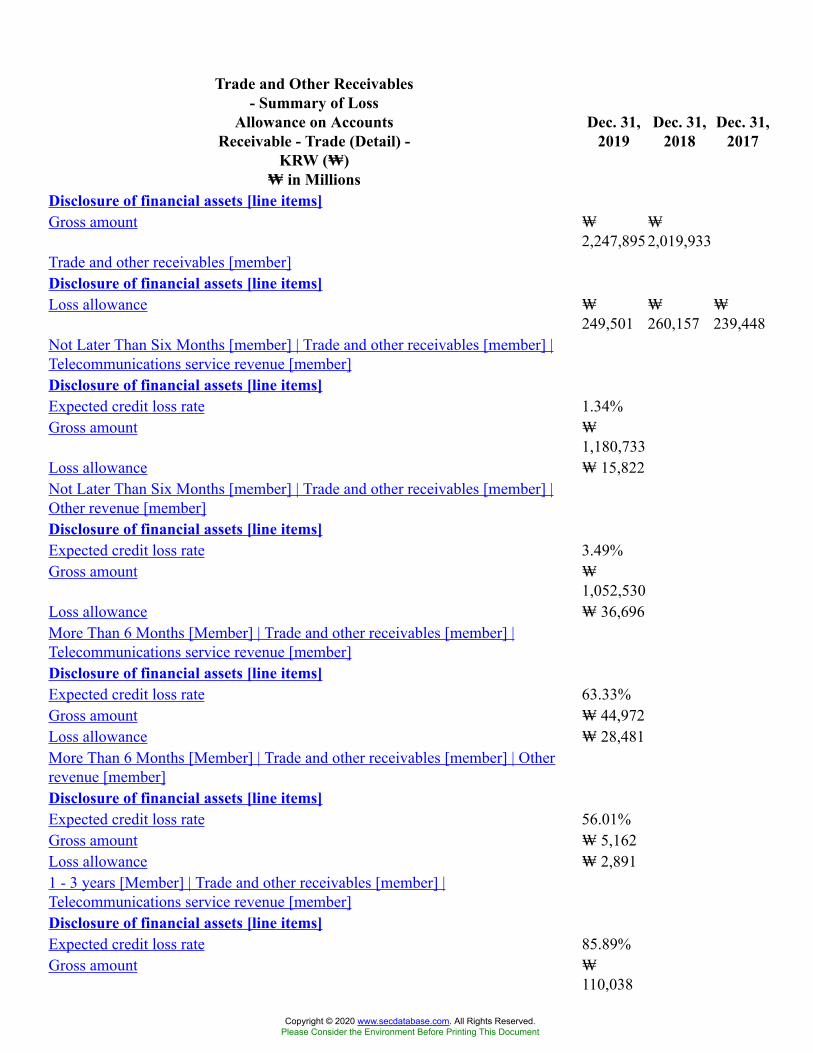
Trade and Other Receivables- Summary of Loss
Allowance on AccountsReceivable - Trade (Detail) -
KRW (₩)₩ in Millions
Dec. 31,2019
Dec. 31,2018
Dec. 31,2017
Disclosure of financial assets [line items]Gross amount ₩
2,247,895₩2,019,933
Trade and other receivables [member]Disclosure of financial assets [line items]Loss allowance ₩
249,501₩260,157
₩239,448
Not Later Than Six Months [member] | Trade and other receivables [member] |Telecommunications service revenue [member]Disclosure of financial assets [line items]Expected credit loss rate 1.34%Gross amount ₩
1,180,733Loss allowance ₩ 15,822Not Later Than Six Months [member] | Trade and other receivables [member] |Other revenue [member]Disclosure of financial assets [line items]Expected credit loss rate 3.49%Gross amount ₩
1,052,530Loss allowance ₩ 36,696More Than 6 Months [Member] | Trade and other receivables [member] |Telecommunications service revenue [member]Disclosure of financial assets [line items]Expected credit loss rate 63.33%Gross amount ₩ 44,972Loss allowance ₩ 28,481More Than 6 Months [Member] | Trade and other receivables [member] | Otherrevenue [member]Disclosure of financial assets [line items]Expected credit loss rate 56.01%Gross amount ₩ 5,162Loss allowance ₩ 2,8911 - 3 years [Member] | Trade and other receivables [member] |Telecommunications service revenue [member]Disclosure of financial assets [line items]Expected credit loss rate 85.89%Gross amount ₩
110,038
Copyright © 2020 www.secdatabase.com. All Rights Reserved.Please Consider the Environment Before Printing This Document
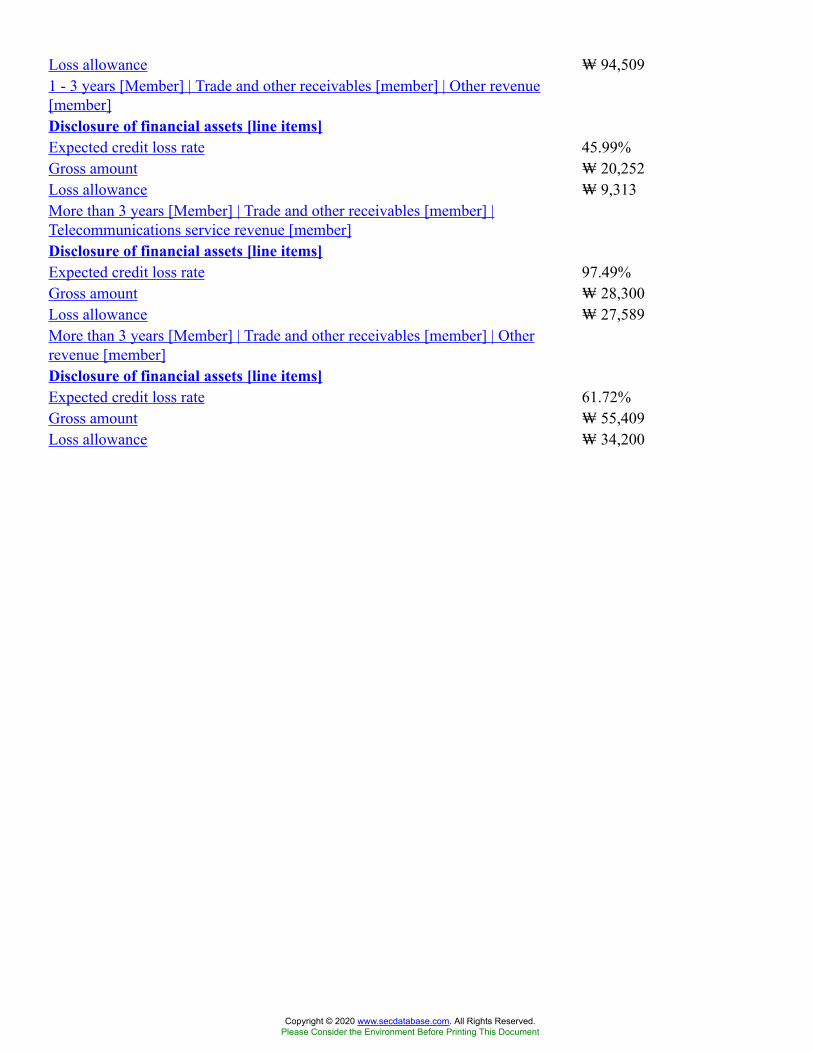
Loss allowance ₩ 94,5091 - 3 years [Member] | Trade and other receivables [member] | Other revenue[member]Disclosure of financial assets [line items]Expected credit loss rate 45.99%Gross amount ₩ 20,252Loss allowance ₩ 9,313More than 3 years [Member] | Trade and other receivables [member] |Telecommunications service revenue [member]Disclosure of financial assets [line items]Expected credit loss rate 97.49%Gross amount ₩ 28,300Loss allowance ₩ 27,589More than 3 years [Member] | Trade and other receivables [member] | Otherrevenue [member]Disclosure of financial assets [line items]Expected credit loss rate 61.72%Gross amount ₩ 55,409Loss allowance ₩ 34,200
Copyright © 2020 www.secdatabase.com. All Rights Reserved.Please Consider the Environment Before Printing This Document
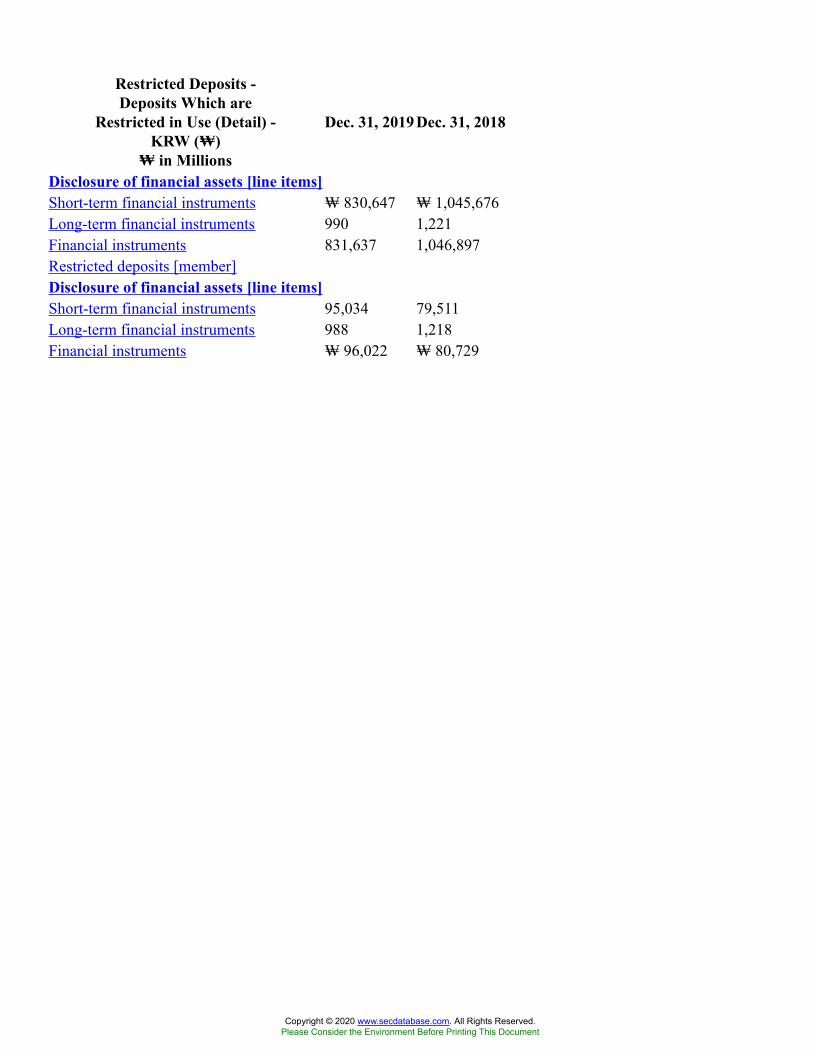
Restricted Deposits -Deposits Which are
Restricted in Use (Detail) -KRW (₩)
₩ in Millions
Dec. 31, 2019 Dec. 31, 2018
Disclosure of financial assets [line items]Short-term financial instruments ₩ 830,647 ₩ 1,045,676Long-term financial instruments 990 1,221Financial instruments 831,637 1,046,897Restricted deposits [member]Disclosure of financial assets [line items]Short-term financial instruments 95,034 79,511Long-term financial instruments 988 1,218Financial instruments ₩ 96,022 ₩ 80,729
Copyright © 2020 www.secdatabase.com. All Rights Reserved.Please Consider the Environment Before Printing This Document
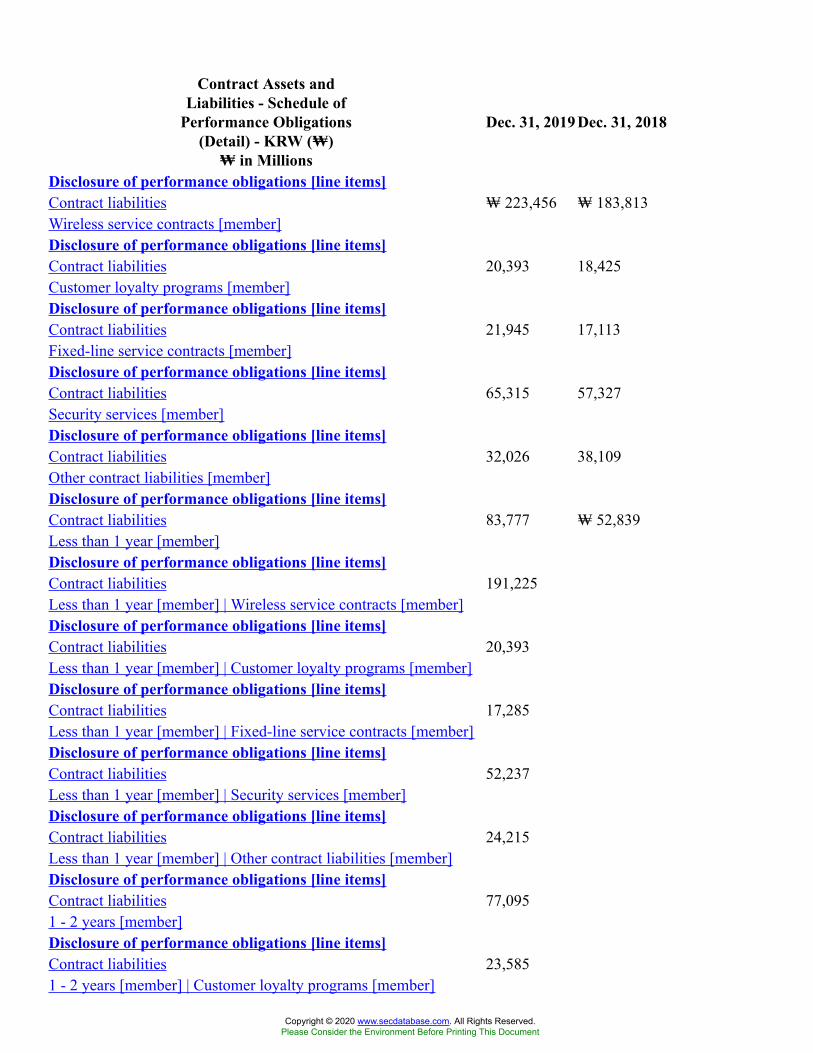
Contract Assets andLiabilities - Schedule of
Performance Obligations(Detail) - KRW (₩)
₩ in Millions
Dec. 31, 2019 Dec. 31, 2018
Disclosure of performance obligations [line items]Contract liabilities ₩ 223,456 ₩ 183,813Wireless service contracts [member]Disclosure of performance obligations [line items]Contract liabilities 20,393 18,425Customer loyalty programs [member]Disclosure of performance obligations [line items]Contract liabilities 21,945 17,113Fixed-line service contracts [member]Disclosure of performance obligations [line items]Contract liabilities 65,315 57,327Security services [member]Disclosure of performance obligations [line items]Contract liabilities 32,026 38,109Other contract liabilities [member]Disclosure of performance obligations [line items]Contract liabilities 83,777 ₩ 52,839Less than 1 year [member]Disclosure of performance obligations [line items]Contract liabilities 191,225Less than 1 year [member] | Wireless service contracts [member]Disclosure of performance obligations [line items]Contract liabilities 20,393Less than 1 year [member] | Customer loyalty programs [member]Disclosure of performance obligations [line items]Contract liabilities 17,285Less than 1 year [member] | Fixed-line service contracts [member]Disclosure of performance obligations [line items]Contract liabilities 52,237Less than 1 year [member] | Security services [member]Disclosure of performance obligations [line items]Contract liabilities 24,215Less than 1 year [member] | Other contract liabilities [member]Disclosure of performance obligations [line items]Contract liabilities 77,0951 - 2 years [member]Disclosure of performance obligations [line items]Contract liabilities 23,5851 - 2 years [member] | Customer loyalty programs [member]
Copyright © 2020 www.secdatabase.com. All Rights Reserved.Please Consider the Environment Before Printing This Document
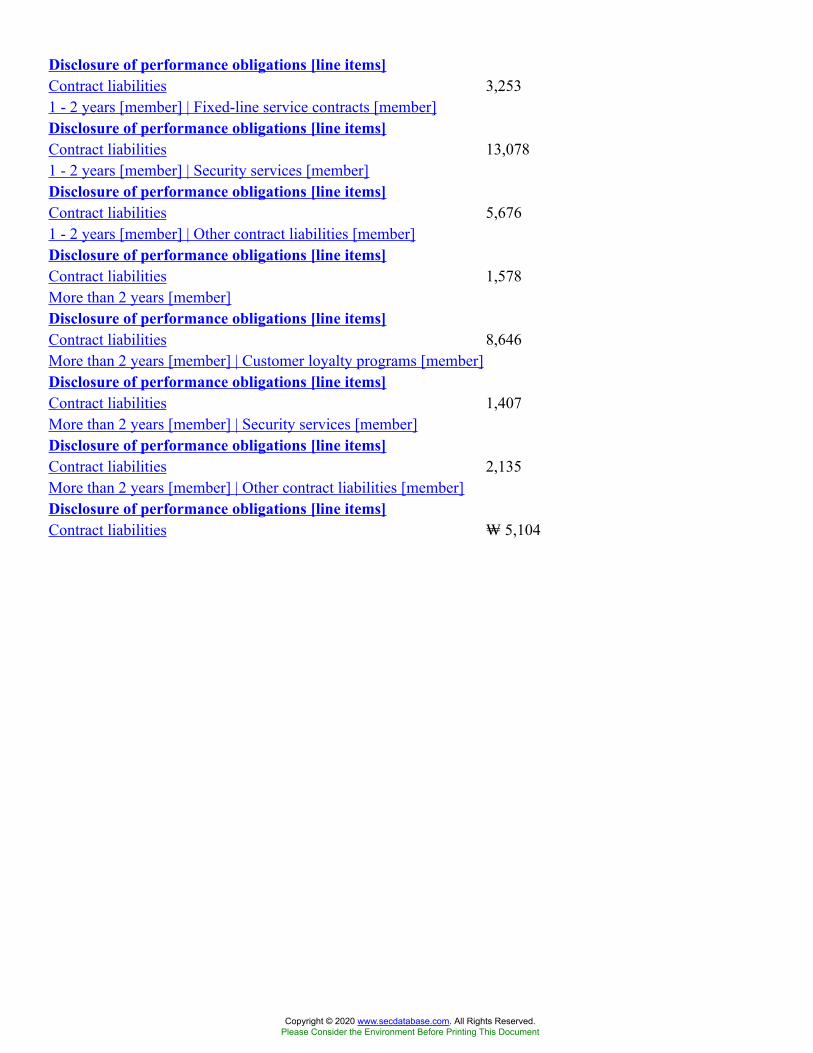
Disclosure of performance obligations [line items]Contract liabilities 3,2531 - 2 years [member] | Fixed-line service contracts [member]Disclosure of performance obligations [line items]Contract liabilities 13,0781 - 2 years [member] | Security services [member]Disclosure of performance obligations [line items]Contract liabilities 5,6761 - 2 years [member] | Other contract liabilities [member]Disclosure of performance obligations [line items]Contract liabilities 1,578More than 2 years [member]Disclosure of performance obligations [line items]Contract liabilities 8,646More than 2 years [member] | Customer loyalty programs [member]Disclosure of performance obligations [line items]Contract liabilities 1,407More than 2 years [member] | Security services [member]Disclosure of performance obligations [line items]Contract liabilities 2,135More than 2 years [member] | Other contract liabilities [member]Disclosure of performance obligations [line items]Contract liabilities ₩ 5,104
Copyright © 2020 www.secdatabase.com. All Rights Reserved.Please Consider the Environment Before Printing This Document
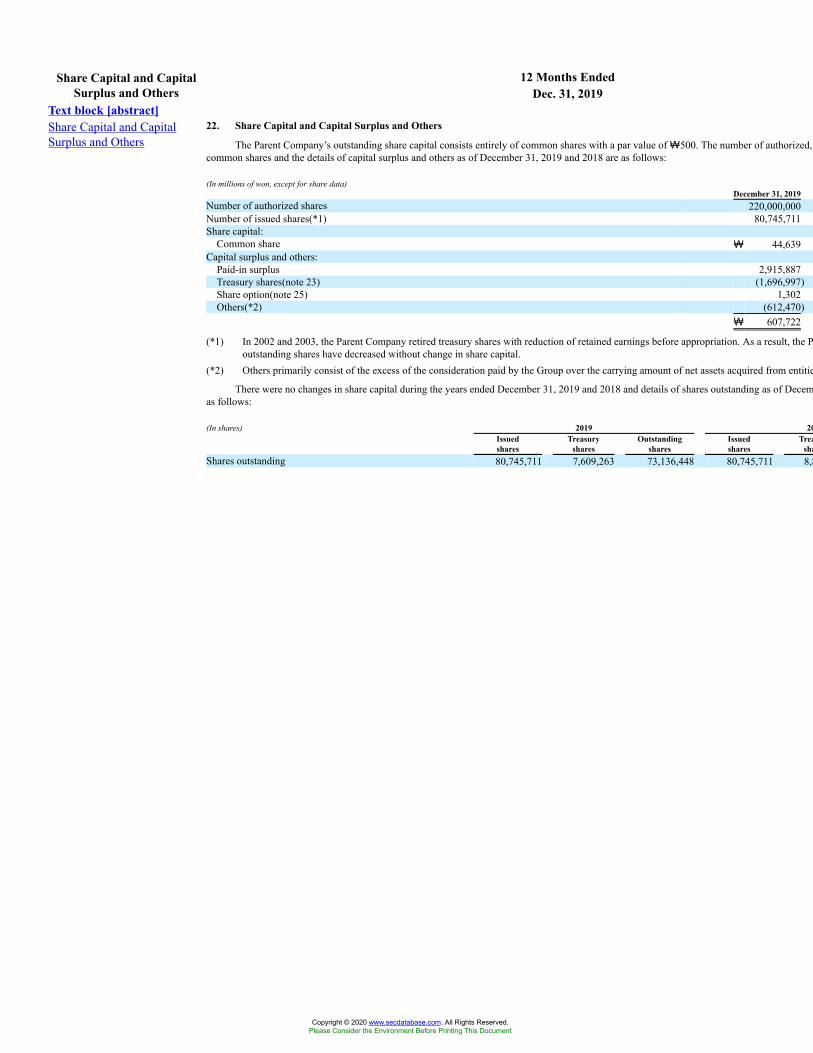
12 Months EndedShare Capital and CapitalSurplus and Others Dec. 31, 2019
Text block [abstract]Share Capital and CapitalSurplus and Others
22. Share Capital and Capital Surplus and Others
The Parent Company’s outstanding share capital consists entirely of common shares with a par value of ₩500. The number of authorized, issued and outstandingcommon shares and the details of capital surplus and others as of December 31, 2019 and 2018 are as follows:
(In millions of won, except for share data)December 31, 2019 December 31, 2018
Number of authorized shares 220,000,000 220,000,000Number of issued shares(*1) 80,745,711 80,745,711Share capital:
Common share ₩ 44,639 44,639Capital surplus and others:
Paid-in surplus 2,915,887 2,915,887Treasury shares(note 23) (1,696,997) (1,979,475)Share option(note 25) 1,302 1,007Others(*2) (612,470) (681,094)
₩ 607,722 256,325
(*1) In 2002 and 2003, the Parent Company retired treasury shares with reduction of retained earnings before appropriation. As a result, the Parent Company’soutstanding shares have decreased without change in share capital.
(*2) Others primarily consist of the excess of the consideration paid by the Group over the carrying amount of net assets acquired from entities under common control.
There were no changes in share capital during the years ended December 31, 2019 and 2018 and details of shares outstanding as of December 31, 2019 and 2018 areas follows:
(In shares) 2019 2018Issuedshares
Treasuryshares
Outstandingshares
Issuedshares
Treasuryshares
Outstandingshares
Shares outstanding 80,745,711 7,609,263 73,136,448 80,745,711 8,875,883 71,869,828
Copyright © 2020 www.secdatabase.com. All Rights Reserved.Please Consider the Environment Before Printing This Document
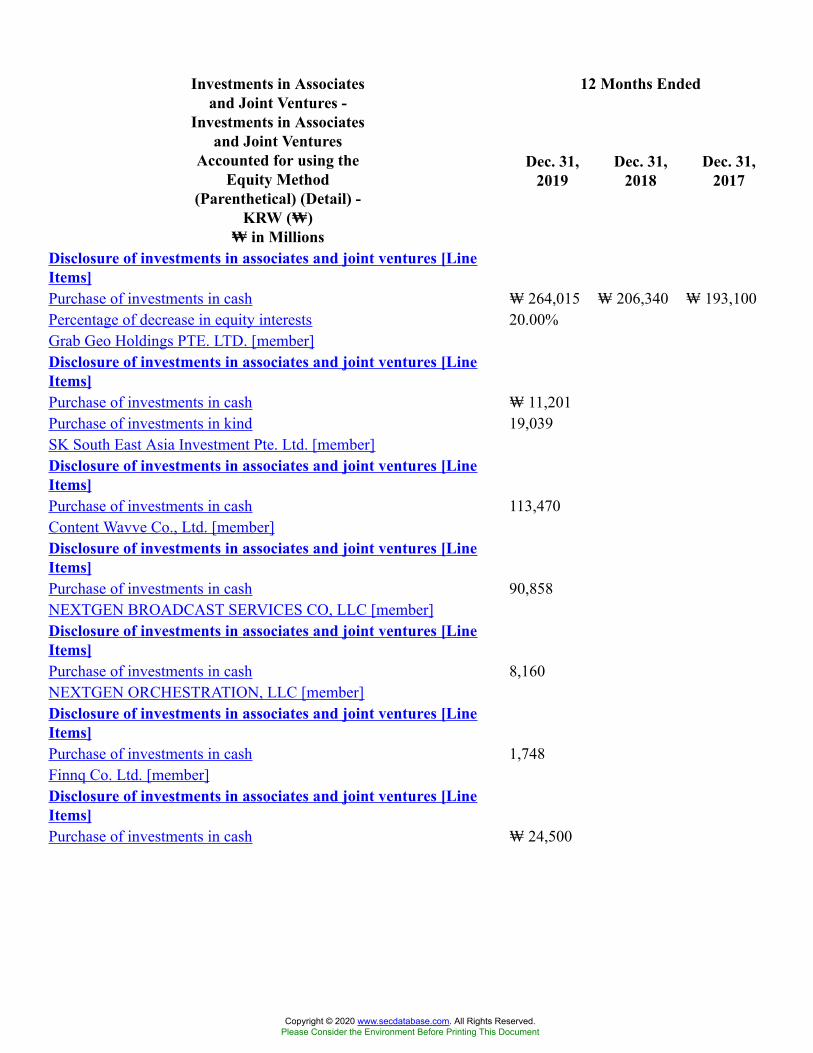
12 Months EndedInvestments in Associatesand Joint Ventures -
Investments in Associatesand Joint Ventures
Accounted for using theEquity Method
(Parenthetical) (Detail) -KRW (₩)
₩ in Millions
Dec. 31,2019
Dec. 31,2018
Dec. 31,2017
Disclosure of investments in associates and joint ventures [LineItems]Purchase of investments in cash ₩ 264,015 ₩ 206,340 ₩ 193,100Percentage of decrease in equity interests 20.00%Grab Geo Holdings PTE. LTD. [member]Disclosure of investments in associates and joint ventures [LineItems]Purchase of investments in cash ₩ 11,201Purchase of investments in kind 19,039SK South East Asia Investment Pte. Ltd. [member]Disclosure of investments in associates and joint ventures [LineItems]Purchase of investments in cash 113,470Content Wavve Co., Ltd. [member]Disclosure of investments in associates and joint ventures [LineItems]Purchase of investments in cash 90,858NEXTGEN BROADCAST SERVICES CO, LLC [member]Disclosure of investments in associates and joint ventures [LineItems]Purchase of investments in cash 8,160NEXTGEN ORCHESTRATION, LLC [member]Disclosure of investments in associates and joint ventures [LineItems]Purchase of investments in cash 1,748Finnq Co. Ltd. [member]Disclosure of investments in associates and joint ventures [LineItems]Purchase of investments in cash ₩ 24,500
Copyright © 2020 www.secdatabase.com. All Rights Reserved.Please Consider the Environment Before Printing This Document
12 Months EndedInvestments in Associatesand Joint Ventures -
Reconciliations of FinancialInformation of Significant
Associates to CarryingAmounts of Investments in
Associates in theConsolidated Financial
Statements (Detail) - KRW(₩)
₩ in Millions
Dec. 31, 2019 Dec. 31, 2018
Disclosure of associates [Line Items]Carrying amount ₩ 13,336,856 ₩ 12,791,613SK hynix Inc. [member]Disclosure of associates [Line Items]Net assets ₩ 47,928,415 ₩ 46,843,742Ownership interests (%) 20.10% 20.10%Net assets attributable to ownership interests ₩ 10,237,314 ₩ 10,005,624Cost-book value differentials 1,188,011 1,202,691Carrying amount 11,425,325 11,208,315KEB HanaCard Co., Ltd. [member]Disclosure of associates [Line Items]Net assets ₩ 1,628,184 ₩ 1,575,422Ownership interests (%) 15.00% 15.00%Net assets attributable to ownership interests ₩ 244,228 ₩ 236,313Cost-book value differentials 50,528 52,144Carrying amount 294,756 288,457Korea IT fund [member]Disclosure of associates [Line Items]Net assets ₩ 491,924 ₩ 444,764Ownership interests (%) 63.30% 63.30%Net assets attributable to ownership interests ₩ 311,552 ₩ 281,684Cost-book value differentials 0Carrying amount 311,552 281,684SK China Company Ltd. [member]Disclosure of associates [Line Items]Net assets ₩ 1,772,419 ₩ 1,708,612Ownership interests (%) 27.30% 27.30%Net assets attributable to ownership interests ₩ 483,360 ₩ 465,959Cost-book value differentials 85,099 85,589Carrying amount ₩ 568,459 ₩ 551,548
Copyright © 2020 www.secdatabase.com. All Rights Reserved.Please Consider the Environment Before Printing This Document
12 Months EndedLong-term Payables - other Dec. 31, 2019Text block [abstract]Long-term Payables - other 18. Long-term Payables — other
(1) Long-term payables — other as of December 31, 2019 and 2018 are as follows:
(In millions of won)December 31, 2019 December 31, 2018
Payables related to acquisition of frequency usage rights ₩ 1,544,699 1,939,082Other 5,468 29,702
₩ 1,550,167 1,968,784
(2) As of December 31, 2019 and 2018, details of long-term payables — other which consist of payables related to the acquisition of frequency usage rights are asfollows (See Note 16):
(In millions of won)December 31, 2019 December 31, 2018
Long-term payables — other ₩ 2,051,389 2,476,738Present value discount on long-term payables — other (82,851) (113,772)Current installments of long-term payables — other (423,839) (423,884)
Carrying amount at December 31 ₩ 1,544,699 1,939,082
(3) The principal amount of the long-term payables — other repaid during the year ended December 31, 2019 is ₩425,349 million. The repayment schedule of theprincipal amount of long-term payables — other related to acquisition of frequency usage rights as of December 31, 2019 is as follows:
(In millions of won)Amount
Less than 1 year ₩ 425,3491~3 years 647,5893~5 years 413,385More than 5 years 565,066
₩ 2,051,389
Copyright © 2020 www.secdatabase.com. All Rights Reserved.Please Consider the Environment Before Printing This Document
12 Months EndedProperty and Equipment Dec. 31, 2019Text block [abstract]Property and Equipment 14. Property and Equipment
(1) Property and equipment as of December 31, 2019 and 2018 are as follows:
December 31, 2019
(In millions of won) Acquisition costAccumulateddepreciation
Accumulatedimpairment loss Carrying amount
Land ₩ 981,389 — — 981,389Buildings 1,715,619 (847,761) (450) 867,408Structures 910,049 (561,379) (1,601) 347,069Machinery 34,173,584 (26,198,631) (33,742) 7,941,211Other 2,084,463 (1,349,039) (3,125) 732,299Right-of-use assets 1,000,491 (291,095) — 709,396Construction in progress 755,508 — — 755,508
₩ 41,621,103 (29,247,905) (38,918) 12,334,280
(In millions of won) December 31, 2018
Acquisition costAccumulateddepreciation
Accumulatedimpairment loss Carrying amount
Land ₩ 938,344 — — 938,344Buildings 1,670,486 (807,192) — 863,294Structures 883,032 (525,537) (1,456) 356,039Machinery 32,096,543 (24,922,091) (27,728) 7,146,724Other 2,182,960 (1,331,971) (2,393) 848,596Construction in progress 565,357 — — 565,357
₩ 38,336,722 (27,586,791) (31,577) 10,718,354
(2) Changes in property and equipment for the years ended December 31, 2019 and 2018 are as follows:
(In millions of won)2019
Beginningbalance
Impact ofadoptingIFRS 16 Acquisition Disposal Transfer Depreciation Impairment(*1)
BusinessCombinations(*2)
Disposal ofsubsidiaries
Endingbalance
Land ₩ 938,344 — 3,297 (275) 39,454 — — 569 — 981,389Buildings 863,294 — 8,117 (2,886) 52,775 (54,100) (450) 658 — 867,408Structures 356,039 — 18,246 (48) 10,582 (36,149) (1,601) — — 347,069Machinery 7,146,724 — 821,576 (25,791) 2,351,614 (2,319,634) (33,278) — — 7,941,211Other 848,596 (1,113) 1,443,327 (5,816) (1,353,999) (199,106) (147) 557 — 732,299Right-of-useassets — 654,449 618,811 (204,241) — (360,606) — 1,080 (97) 709,396Constructionin progress 565,357 — 1,515,617 (22,338) (1,303,128) — — — — 755,508
₩10,718,354 653,336 4,428,991 (261,395) (202,702) (2,969,595) (35,476) 2,864 (97) 12,334,280
(*1) The Group recognized impairment losses for obsolete assets during the year ended December 31, 2019.(*2) Includes assets from the Parent Company’s acquisitions of FSK L&S Co., Ltd. and Incross Co., Ltd.
(In millions of won)2018
Beginningbalance Acquisition Disposal Transfer Depreciation Impairment(*1)
BusinessCombinations(*2)
Disposal ofsubsidiaries
Endingbalance
Land ₩ 862,861 4,734 (7,151) 15,062 — — 62,838 — 938,344Buildings 882,650 5,858 (4,313) 25,249 (52,153) — 6,003 — 863,294Structures 378,575 9,188 (36) 5,859 (36,091) (1,456) — — 356,039Machinery 7,079,798 806,520 (74,465) 1,347,320 (2,214,957) (27,264) 229,772 — 7,146,724Other 531,057 892,103 (7,408) (539,068) (148,223) — 123,214 (3,079) 848,596Construction in progress 409,941 1,223,410 (3,906) (1,078,539) — — 14,451 — 565,357
₩10,144,882 2,941,813 (97,279) (224,117) (2,451,424) (28,720) 436,278 (3,079) 10,718,354
(*1) The Group recognized impairment losses for obsolete assets during the year ended December 31, 2018.(*2) Includes assets from the Parent Company’s acquisitions of id Quantique SA, Life & Security Holdings Co., Ltd. and SK Infosec Co., Ltd.(3) Details of the right-of-use assets as of December 31, 2019 and January 1, 2019 are as follows:
(In millions of won)December 31,
2019January 1,
2019Buildings, Land and Structures ₩ 584,523 512,698Other 124,873 141,751
₩ 709,396 654,449
Copyright © 2020 www.secdatabase.com. All Rights Reserved.Please Consider the Environment Before Printing This Document
12 Months EndedInventories Dec. 31, 2019Text block [abstract]Inventories 10. Inventories
(1) Details of inventories as of December 31, 2019 and 2018 are as follows:
(In millions of won)December 31, 2019 December 31, 2018
Acquisitioncost
Write-down
Carryingamount
Acquisitioncost
Write-down
Carryingamount
Merchandise ₩ 162,485 (14,557) 147,928 268,366 (8,842) 259,524Finished goods 4,264 (2,265) 1,999 1,260 (251) 1,009Work in process 2,674 (539) 2,135 3,985 (338) 3,647Raw materials 12,369 (7,967) 4,402 11,729 (2,706) 9,023Supplies 7,112 (694) 6,418 14,850 — 14,850
₩ 188,904 (26,022) 162,882 300,190 (12,137) 288,053
(2) The amount of the inventory write-downs and write-off of inventories charged to statement of income are as follows:
(In millions of won)2019 2018 2017
Charged to cost of products that have been resold ₩ 15,019 2,509 6,079Write-off upon sale (1,101) (2,396) (2,820)
There are no significant reversals of inventory write-downs for the periods presented.
(3) Inventories recognized as operating expenses during the years ended December 31, 2019, 2018 and 2017 are ₩1,498,249 million, ₩1,411,986 million and₩1,498,087 million respectively, which are included in the cost of goods sold.
Copyright © 2020 www.secdatabase.com. All Rights Reserved.Please Consider the Environment Before Printing This Document
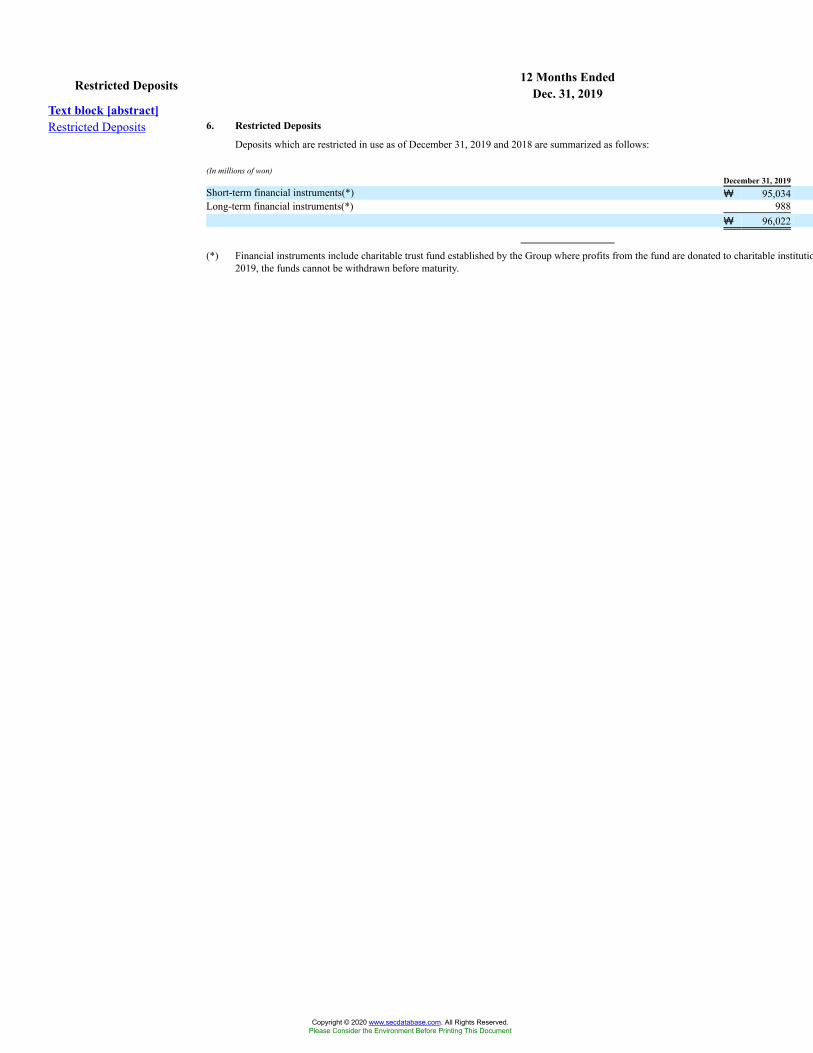
12 Months EndedRestricted Deposits Dec. 31, 2019Text block [abstract]Restricted Deposits 6. Restricted Deposits
Deposits which are restricted in use as of December 31, 2019 and 2018 are summarized as follows:
(In millions of won)December 31, 2019 December 31, 2018
Short-term financial instruments(*) ₩ 95,034 79,511Long-term financial instruments(*) 988 1,218
₩ 96,022 80,729
(*) Financial instruments include charitable trust fund established by the Group where profits from the fund are donated to charitable institutions. As of December 31,2019, the funds cannot be withdrawn before maturity.
Copyright © 2020 www.secdatabase.com. All Rights Reserved.Please Consider the Environment Before Printing This Document
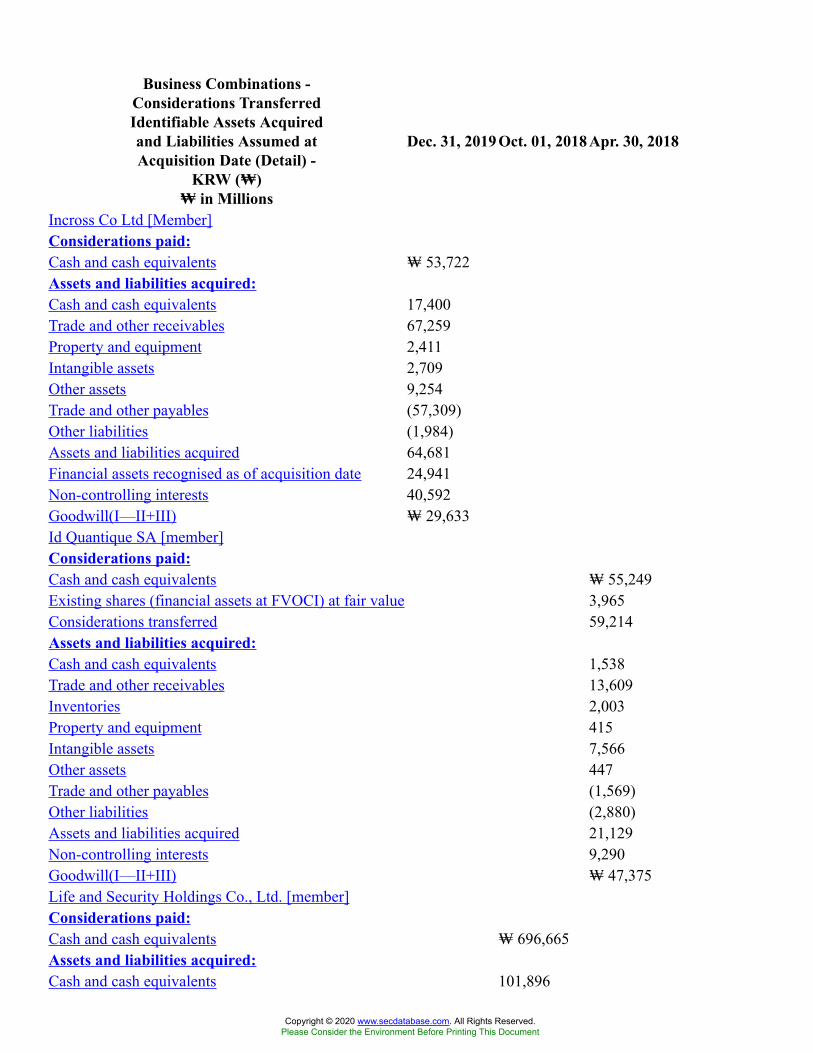
Business Combinations -Considerations TransferredIdentifiable Assets Acquiredand Liabilities Assumed atAcquisition Date (Detail) -
KRW (₩)₩ in Millions
Dec. 31, 2019 Oct. 01, 2018 Apr. 30, 2018
Incross Co Ltd [Member]Considerations paid:Cash and cash equivalents ₩ 53,722Assets and liabilities acquired:Cash and cash equivalents 17,400Trade and other receivables 67,259Property and equipment 2,411Intangible assets 2,709Other assets 9,254Trade and other payables (57,309)Other liabilities (1,984)Assets and liabilities acquired 64,681Financial assets recognised as of acquisition date 24,941Non-controlling interests 40,592Goodwill(I—II+III) ₩ 29,633Id Quantique SA [member]Considerations paid:Cash and cash equivalents ₩ 55,249Existing shares (financial assets at FVOCI) at fair value 3,965Considerations transferred 59,214Assets and liabilities acquired:Cash and cash equivalents 1,538Trade and other receivables 13,609Inventories 2,003Property and equipment 415Intangible assets 7,566Other assets 447Trade and other payables (1,569)Other liabilities (2,880)Assets and liabilities acquired 21,129Non-controlling interests 9,290Goodwill(I—II+III) ₩ 47,375Life and Security Holdings Co., Ltd. [member]Considerations paid:Cash and cash equivalents ₩ 696,665Assets and liabilities acquired:Cash and cash equivalents 101,896
Copyright © 2020 www.secdatabase.com. All Rights Reserved.Please Consider the Environment Before Printing This Document
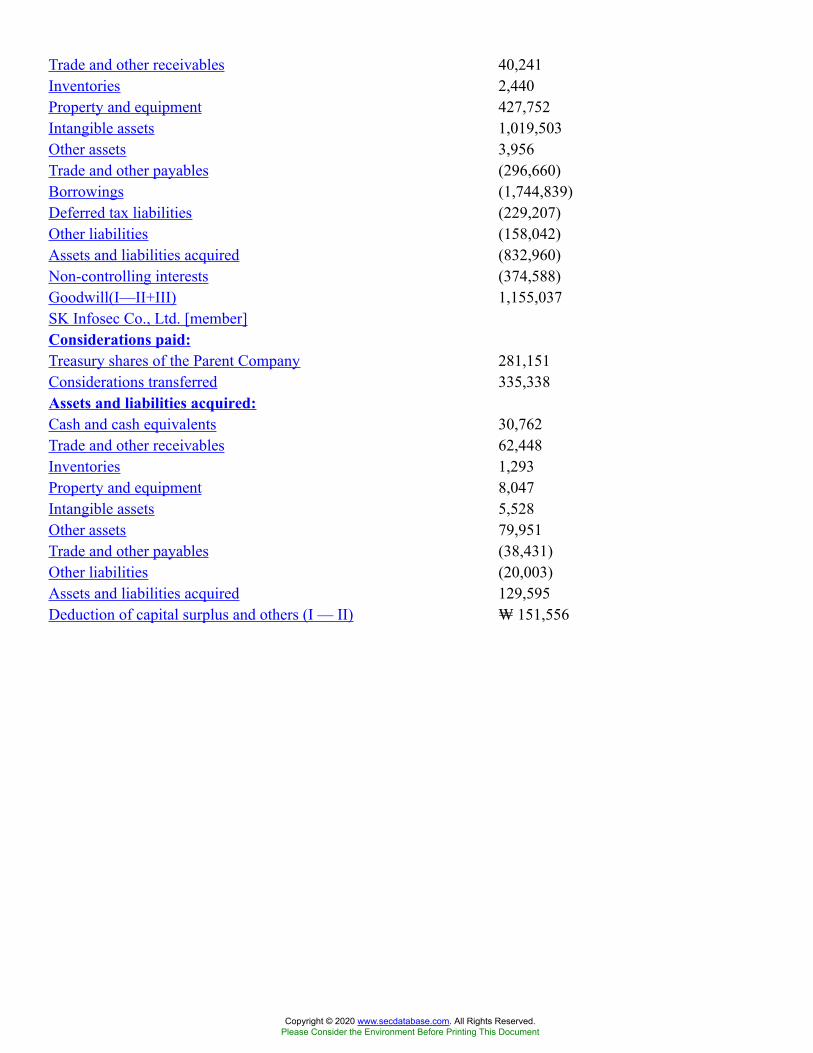
Trade and other receivables 40,241Inventories 2,440Property and equipment 427,752Intangible assets 1,019,503Other assets 3,956Trade and other payables (296,660)Borrowings (1,744,839)Deferred tax liabilities (229,207)Other liabilities (158,042)Assets and liabilities acquired (832,960)Non-controlling interests (374,588)Goodwill(I—II+III) 1,155,037SK Infosec Co., Ltd. [member]Considerations paid:Treasury shares of the Parent Company 281,151Considerations transferred 335,338Assets and liabilities acquired:Cash and cash equivalents 30,762Trade and other receivables 62,448Inventories 1,293Property and equipment 8,047Intangible assets 5,528Other assets 79,951Trade and other payables (38,431)Other liabilities (20,003)Assets and liabilities acquired 129,595Deduction of capital surplus and others (I — II) ₩ 151,556
Copyright © 2020 www.secdatabase.com. All Rights Reserved.Please Consider the Environment Before Printing This Document
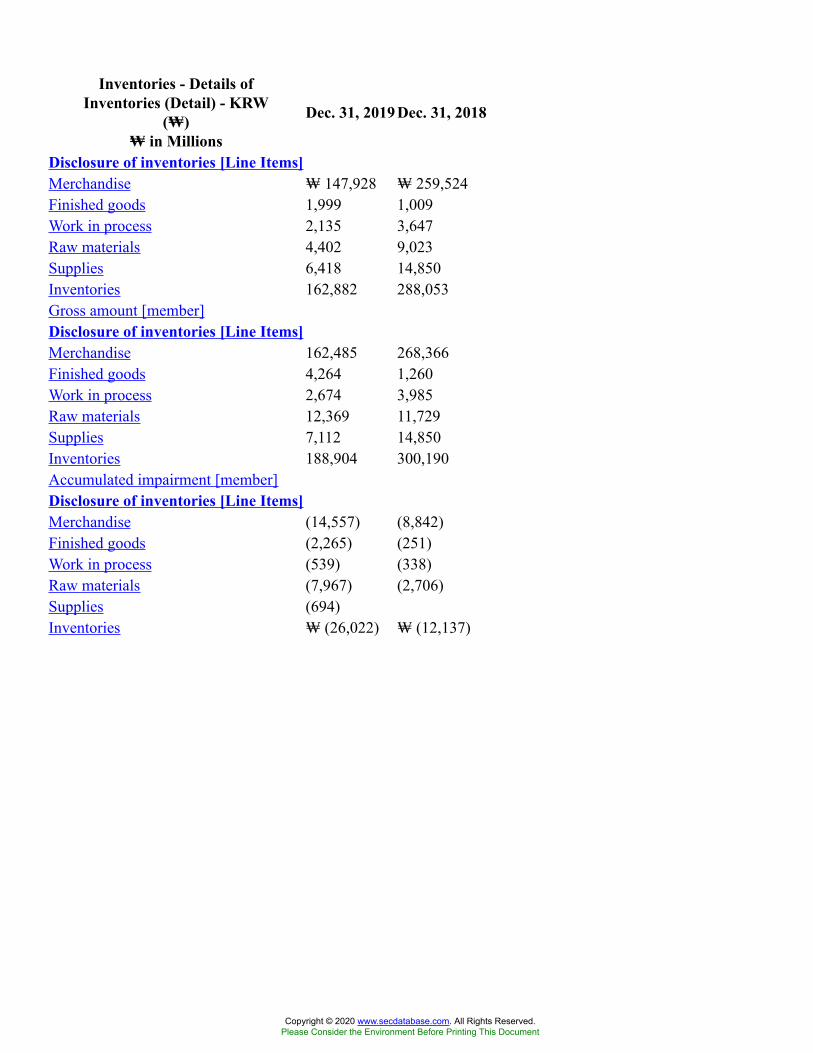
Inventories - Details ofInventories (Detail) - KRW
(₩)₩ in Millions
Dec. 31, 2019 Dec. 31, 2018
Disclosure of inventories [Line Items]Merchandise ₩ 147,928 ₩ 259,524Finished goods 1,999 1,009Work in process 2,135 3,647Raw materials 4,402 9,023Supplies 6,418 14,850Inventories 162,882 288,053Gross amount [member]Disclosure of inventories [Line Items]Merchandise 162,485 268,366Finished goods 4,264 1,260Work in process 2,674 3,985Raw materials 12,369 11,729Supplies 7,112 14,850Inventories 188,904 300,190Accumulated impairment [member]Disclosure of inventories [Line Items]Merchandise (14,557) (8,842)Finished goods (2,265) (251)Work in process (539) (338)Raw materials (7,967) (2,706)Supplies (694)Inventories ₩ (26,022) ₩ (12,137)
Copyright © 2020 www.secdatabase.com. All Rights Reserved.Please Consider the Environment Before Printing This Document

Investment Securities -Details of Long-termInvestment Securities(Detail) - KRW (₩)
₩ in Millions
Dec. 31, 2019 Dec. 31, 2018
Disclosure of financial assets [line items]Available-for-sale financial assets ₩ 857,215 ₩ 664,726Equity securities [member]Disclosure of financial assets [line items]Available-for-sale financial assets 710,272 542,496FVOCI 1,011 0Non current Assets 711,283 542,496Investment bonds [member]Disclosure of financial assets [line items]FVOCI 4,627 2,147FVTPL 141,305 120,083Non current Assets ₩ 145,932 ₩ 122,230
Copyright © 2020 www.secdatabase.com. All Rights Reserved.Please Consider the Environment Before Printing This Document
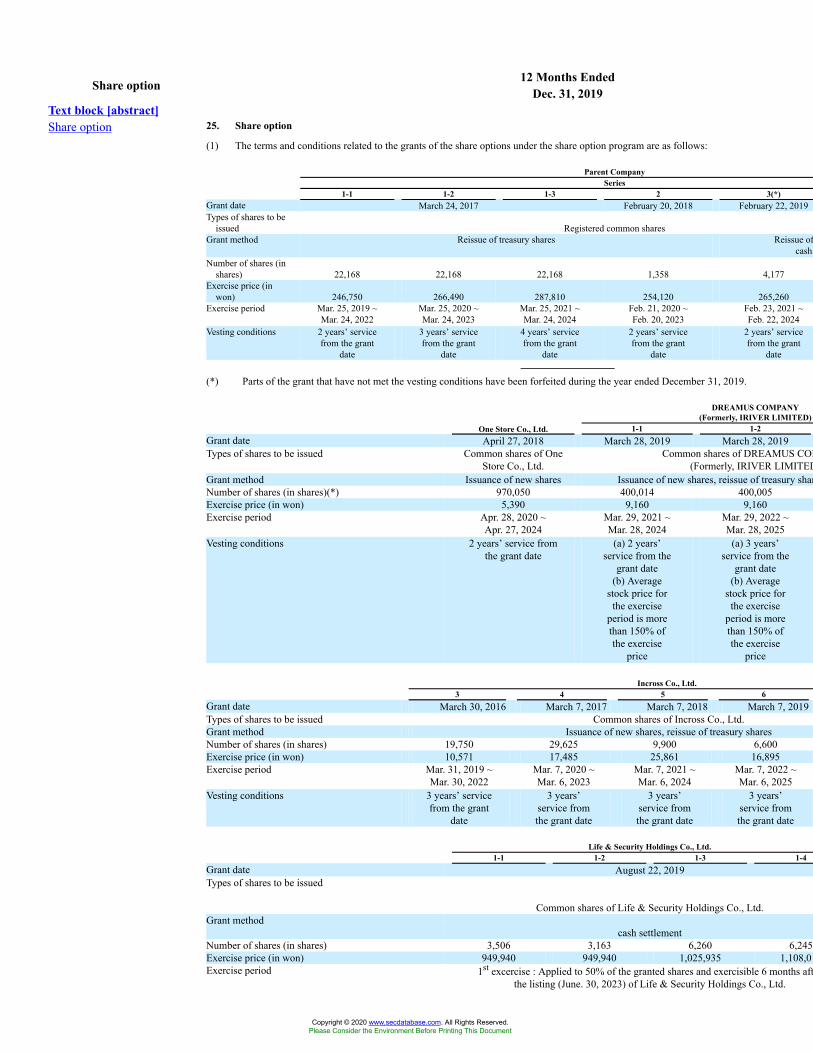
12 Months EndedShare option Dec. 31, 2019Text block [abstract]Share option 25. Share option
(1) The terms and conditions related to the grants of the share options under the share option program are as follows:
Parent CompanySeries
1-1 1-2 1-3 2 3(*) 4Grant date March 24, 2017 February 20, 2018 February 22, 2019 March 26, 2019Types of shares to be
issued Registered common sharesGrant method Reissue of treasury shares Reissue of treasury shares,
cash settlementNumber of shares (in
shares) 22,168 22,168 22,168 1,358 4,177 1,734Exercise price (in
won) 246,750 266,490 287,810 254,120 265,260 254,310Exercise period Mar. 25, 2019 ~
Mar. 24, 2022Mar. 25, 2020 ~Mar. 24, 2023
Mar. 25, 2021 ~Mar. 24, 2024
Feb. 21, 2020 ~Feb. 20, 2023
Feb. 23, 2021 ~Feb. 22, 2024
Mar. 27, 2021 ~Mar. 26, 2024
Vesting conditions 2 years’ servicefrom the grant
date
3 years’ servicefrom the grant
date
4 years’ servicefrom the grant
date
2 years’ servicefrom the grant
date
2 years’ servicefrom the grant
date
2 years’ servicefrom the grant
date
(*) Parts of the grant that have not met the vesting conditions have been forfeited during the year ended December 31, 2019.
DREAMUS COMPANY(Formerly, IRIVER LIMITED)
One Store Co., Ltd. 1-1 1-2 1-3Grant date April 27, 2018 March 28, 2019 March 28, 2019 March 28, 2019Types of shares to be issued Common shares of One
Store Co., Ltd.Common shares of DREAMUS COMPANY
(Formerly, IRIVER LIMITED)Grant method Issuance of new shares Issuance of new shares, reissue of treasury shares, cash settlementNumber of shares (in shares)(*) 970,050 400,014 400,005 399,981Exercise price (in won) 5,390 9,160 9,160 9,160Exercise period Apr. 28, 2020 ~
Apr. 27, 2024Mar. 29, 2021 ~Mar. 28, 2024
Mar. 29, 2022 ~Mar. 28, 2025
Mar. 29, 2023 ~Mar. 28, 2026
Vesting conditions 2 years’ service fromthe grant date
(a) 2 years’service from the
grant date(b) Average
stock price forthe exercise
period is morethan 150% ofthe exercise
price
(a) 3 years’service from the
grant date(b) Average
stock price forthe exercise
period is morethan 150% ofthe exercise
price
(a) 4 years’service from the
grant date(b) Average
stock price forthe exercise
period is morethan 150% ofthe exercise
price
Incross Co., Ltd.3 4 5 6 7
Grant date March 30, 2016 March 7, 2017 March 7, 2018 March 7, 2019 October 15, 2019Types of shares to be issued Common shares of Incross Co., Ltd.Grant method Issuance of new shares, reissue of treasury sharesNumber of shares (in shares) 19,750 29,625 9,900 6,600 59,225Exercise price (in won) 10,571 17,485 25,861 16,895 22,073Exercise period Mar. 31, 2019 ~
Mar. 30, 2022Mar. 7, 2020 ~Mar. 6, 2023
Mar. 7, 2021 ~Mar. 6, 2024
Mar. 7, 2022 ~Mar. 6, 2025
Oct. 15, 2022 ~Oct. 14, 2025
Vesting conditions 3 years’ servicefrom the grant
date
3 years’service fromthe grant date
3 years’service fromthe grant date
3 years’service fromthe grant date
3 years’ servicefrom the grant
date
Life & Security Holdings Co., Ltd.1-1 1-2 1-3 1-4
FSK L&S Co.,Ltd.
Grant date August 22, 2019 May 31, 2019Types of shares to be issued
Common shares of Life & Security Holdings Co., Ltd.
Commonshares of FSKL&S Co., Ltd.
Grant methodcash settlement
Issuance ofnew shares
Number of shares (in shares) 3,506 3,163 6,260 6,245 43,955Exercise price (in won) 949,940 949,940 1,025,935 1,108,010 10,000Exercise period 1st excercise : Applied to 50% of the granted shares and exercisible 6 months after
the listing (June. 30, 2023) of Life & Security Holdings Co., Ltd.June. 1, 2022 ~May. 31, 2025
Copyright © 2020 www.secdatabase.com. All Rights Reserved.Please Consider the Environment Before Printing This Document
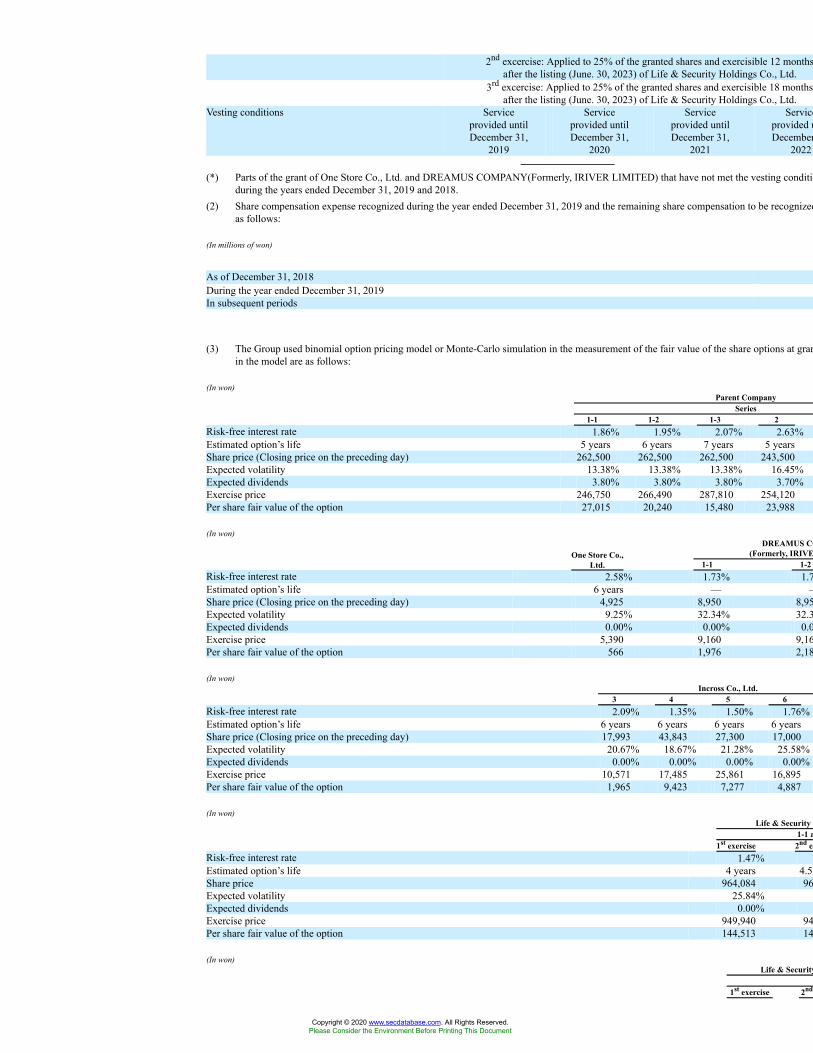
2nd excercise: Applied to 25% of the granted shares and exercisible 12 monthsafter the listing (June. 30, 2023) of Life & Security Holdings Co., Ltd.
3rd excercise: Applied to 25% of the granted shares and exercisible 18 monthsafter the listing (June. 30, 2023) of Life & Security Holdings Co., Ltd.
Vesting conditions Serviceprovided untilDecember 31,
2019
Serviceprovided untilDecember 31,
2020
Serviceprovided untilDecember 31,
2021
Serviceprovided untilDecember 31,
2022
3 years’service fromthe grant date
(*) Parts of the grant of One Store Co., Ltd. and DREAMUS COMPANY(Formerly, IRIVER LIMITED) that have not met the vesting conditions have been forfeitedduring the years ended December 31, 2019 and 2018.
(2) Share compensation expense recognized during the year ended December 31, 2019 and the remaining share compensation to be recognized in subsequent periods areas follows:
(In millions of won)Share
compensation expenseAs of December 31, 2018 ₩ 1,203During the year ended December 31, 2019 2,073In subsequent periods 4,498
₩ 7,774
(3) The Group used binomial option pricing model or Monte-Carlo simulation in the measurement of the fair value of the share options at grant date and the inputs usedin the model are as follows:
(In won)Parent Company
Series1-1 1-2 1-3 2 3 4
Risk-free interest rate 1.86% 1.95% 2.07% 2.63% 1.91% 1.78%Estimated option’s life 5 years 6 years 7 years 5 years 5 years 5 yearsShare price (Closing price on the preceding day) 262,500 262,500 262,500 243,500 259,000 253,000Expected volatility 13.38% 13.38% 13.38% 16.45% 8.30% 7.70%Expected dividends 3.80% 3.80% 3.80% 3.70% 3.80% 3.90%Exercise price 246,750 266,490 287,810 254,120 265,260 254,310Per share fair value of the option 27,015 20,240 15,480 23,988 8,600 8,111
(In won)DREAMUS COMPANY
(Formerly, IRIVER LIMITED)One Store Co.,Ltd. 1-1 1-2 1-3
Risk-free interest rate 2.58% 1.73% 1.77% 1.82%Estimated option’s life 6 years — — —Share price (Closing price on the preceding day) 4,925 8,950 8,950 8,950Expected volatility 9.25% 32.34% 32.34% 32.34%Expected dividends 0.00% 0.00% 0.00% 0.00%Exercise price 5,390 9,160 9,160 9,160Per share fair value of the option 566 1,976 2,189 2,356
(In won)Incross Co., Ltd.
3 4 5 6 7FSK L&SCo., Ltd.
Risk-free interest rate 2.09% 1.35% 1.50% 1.76% 1.41% 1.64%Estimated option’s life 6 years 6 years 6 years 6 years 6 years —Share price (Closing price on the preceding day) 17,993 43,843 27,300 17,000 22,050 10,455Expected volatility 20.67% 18.67% 21.28% 25.58% 42.37% 16.20%Expected dividends 0.00% 0.00% 0.00% 0.00% 0.00% 0.00%Exercise price 10,571 17,485 25,861 16,895 22,073 10,000Per share fair value of the option 1,965 9,423 7,277 4,887 9,209 1,420
(In won)Life & Security Holdings Co., Ltd.
1-1 and 1-21st exercise 2nd exercise 3rd exercise
Risk-free interest rate 1.47% 1.47% 1.47%Estimated option’s life 4 years 4.5 years 5 yearsShare price 964,084 964,084 964,084Expected volatility 25.84% 26.76% 26.79%Expected dividends 0.00% 0.00% 0.00%Exercise price 949,940 949,940 949,940Per share fair value of the option 144,513 145,878 162,219
(In won)Life & Security Holdings Co., Ltd.
1-31st exercise 2nd exercise 3rd exercise
Copyright © 2020 www.secdatabase.com. All Rights Reserved.Please Consider the Environment Before Printing This Document
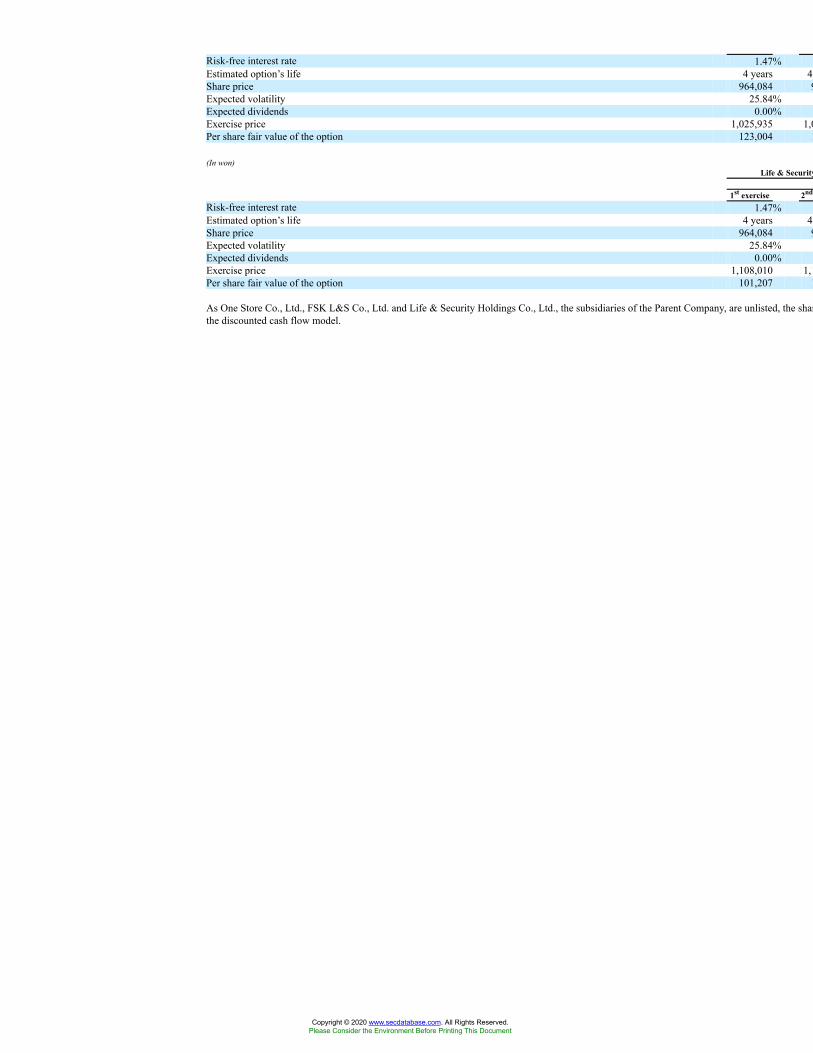
Risk-free interest rate 1.47% 1.47% 1.47%Estimated option’s life 4 years 4.5 years 5 yearsShare price 964,084 964,084 964,084Expected volatility 25.84% 26.76% 26.79%Expected dividends 0.00% 0.00% 0.00%Exercise price 1,025,935 1,025,935 1,025,935Per share fair value of the option 123,004 125,792 141,861
(In won)Life & Security Holdings Co., Ltd.
1-41st exercise 2nd exercise 3rd exercise
Risk-free interest rate 1.47% 1.47% 1.47%Estimated option’s life 4 years 4.5 years 5 yearsShare price 964,084 964,084 964,084Expected volatility 25.84% 26.76% 26.79%Expected dividends 0.00% 0.00% 0.00%Exercise price 1,108,010 1,108,010 1,108,010Per share fair value of the option 101,207 105,797 120,924
As One Store Co., Ltd., FSK L&S Co., Ltd. and Life & Security Holdings Co., Ltd., the subsidiaries of the Parent Company, are unlisted, the share price is calculated usingthe discounted cash flow model.
Copyright © 2020 www.secdatabase.com. All Rights Reserved.Please Consider the Environment Before Printing This Document
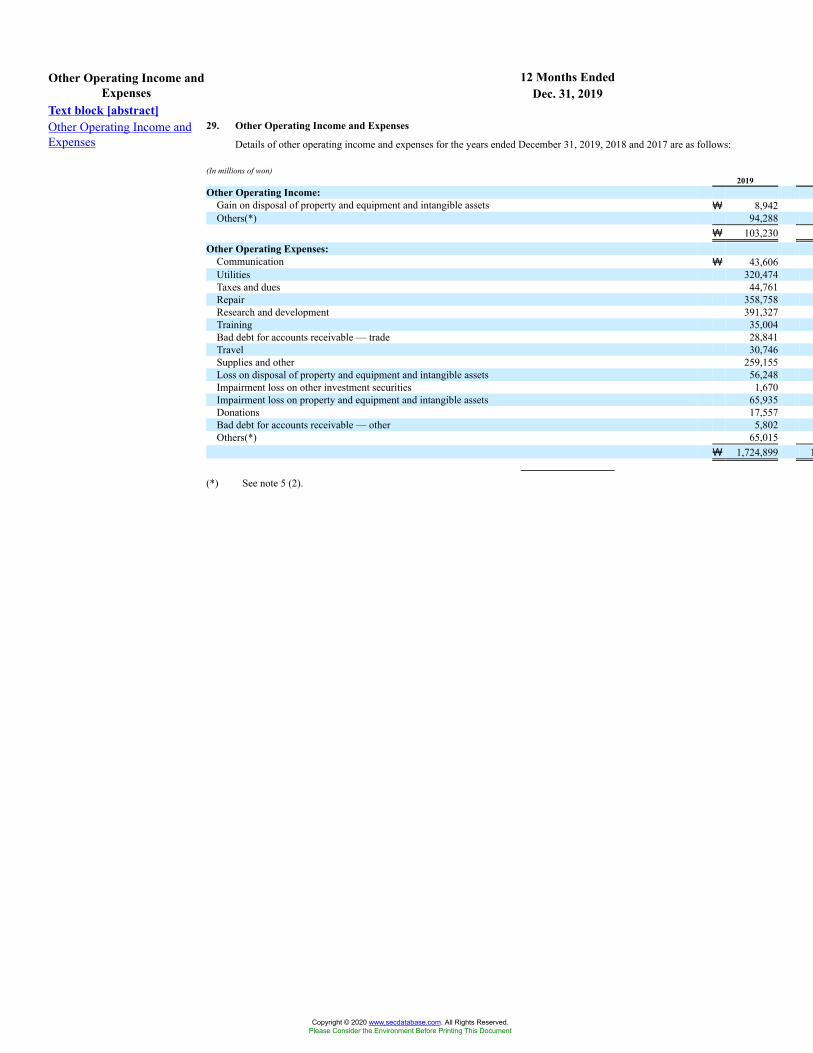
12 Months EndedOther Operating Income andExpenses Dec. 31, 2019
Text block [abstract]Other Operating Income andExpenses
29. Other Operating Income and Expenses
Details of other operating income and expenses for the years ended December 31, 2019, 2018 and 2017 are as follows:
(In millions of won)2019 2018 2017
Other Operating Income:Gain on disposal of property and equipment and intangible assets ₩ 8,942 38,933 13,991Others(*) 94,288 33,017 18,006
₩ 103,230 71,950 31,997Other Operating Expenses:
Communication ₩ 43,606 35,507 27,973Utilities 320,474 297,049 299,825Taxes and dues 44,761 37,290 27,819Repair 358,758 353,321 333,101Research and development 391,327 387,675 395,276Training 35,004 35,574 32,853Bad debt for accounts receivable — trade 28,841 38,211 34,584Travel 30,746 27,910 24,095Supplies and other 259,155 130,008 111,170Loss on disposal of property and equipment and intangible assets 56,248 87,257 60,086Impairment loss on other investment securities 1,670 3,157 9,003Impairment loss on property and equipment and intangible assets 65,935 255,839 54,946Donations 17,557 59,012 112,634Bad debt for accounts receivable — other 5,802 7,718 5,793Others(*) 65,015 26,876 101,589
₩ 1,724,899 1,782,404 1,630,747
(*) See note 5 (2).
Copyright © 2020 www.secdatabase.com. All Rights Reserved.Please Consider the Environment Before Printing This Document
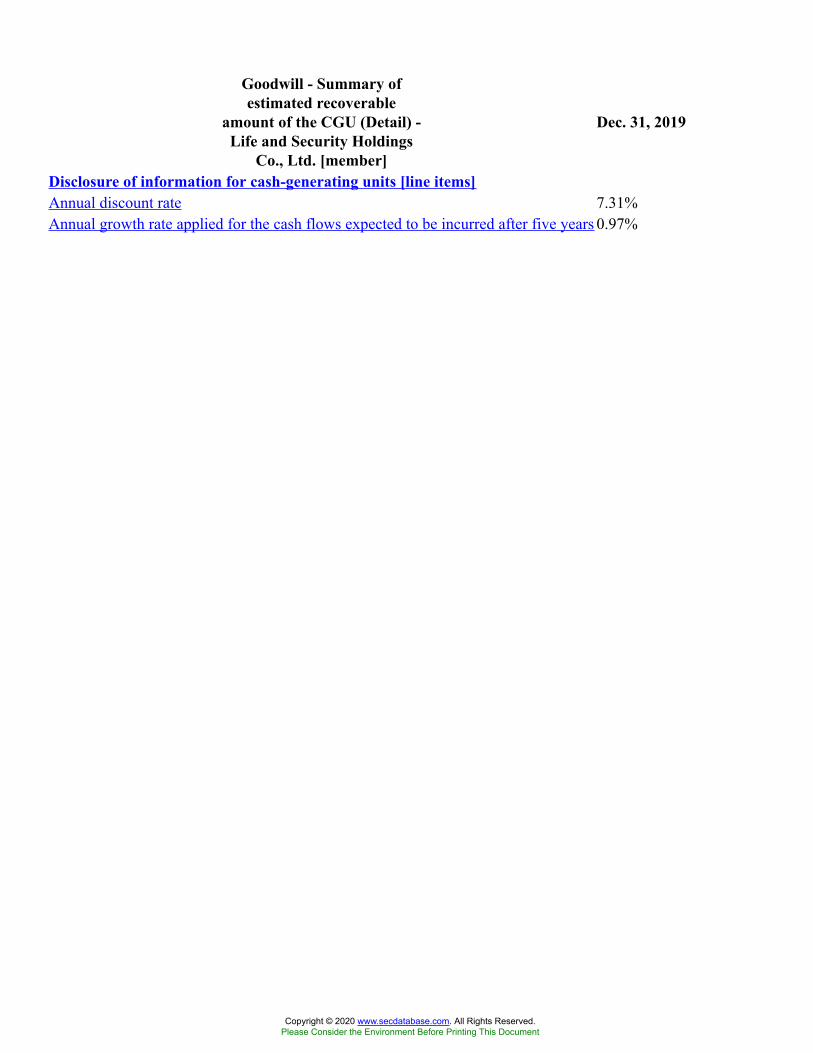
Goodwill - Summary ofestimated recoverable
amount of the CGU (Detail) -Life and Security Holdings
Co., Ltd. [member]
Dec. 31, 2019
Disclosure of information for cash-generating units [line items]Annual discount rate 7.31%Annual growth rate applied for the cash flows expected to be incurred after five years 0.97%
Copyright © 2020 www.secdatabase.com. All Rights Reserved.Please Consider the Environment Before Printing This Document
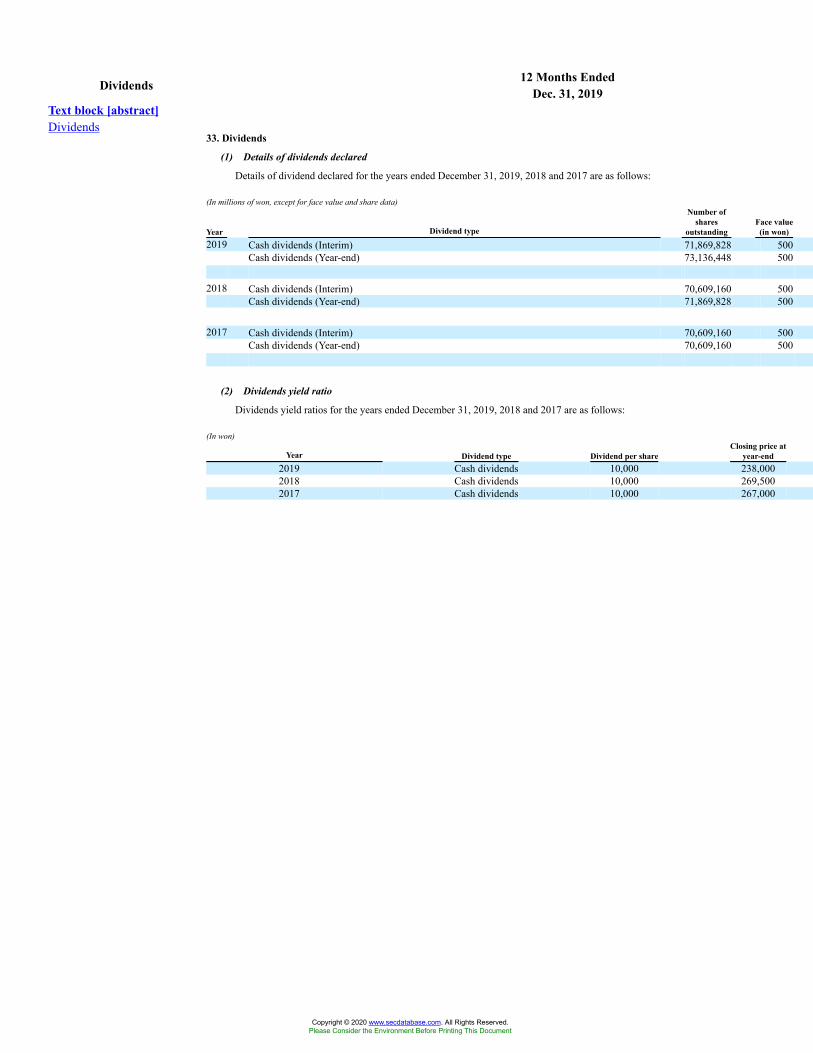
12 Months EndedDividends Dec. 31, 2019Text block [abstract]Dividends
33. Dividends
(1) Details of dividends declared
Details of dividend declared for the years ended December 31, 2019, 2018 and 2017 are as follows:
(In millions of won, except for face value and share data)
Year Dividend type
Number ofshares
outstandingFace value(in won)
Dividendratio Dividends
2019 Cash dividends (Interim) 71,869,828 500 200% ₩ 71,870Cash dividends (Year-end) 73,136,448 500 1,800% 658,228
₩730,0982018 Cash dividends (Interim) 70,609,160 500 200% ₩ 70,609
Cash dividends (Year-end) 71,869,828 500 1,800% 646,828₩717,437
2017 Cash dividends (Interim) 70,609,160 500 200% ₩ 70,609Cash dividends (Year-end) 70,609,160 500 1,800% 635,482
₩706,091
(2) Dividends yield ratio
Dividends yield ratios for the years ended December 31, 2019, 2018 and 2017 are as follows:
(In won)
Year Dividend type Dividend per shareClosing price at
year-end Dividend yield ratio2019 Cash dividends 10,000 238,000 4.20%2018 Cash dividends 10,000 269,500 3.71%2017 Cash dividends 10,000 267,000 3.75%
Copyright © 2020 www.secdatabase.com. All Rights Reserved.Please Consider the Environment Before Printing This Document
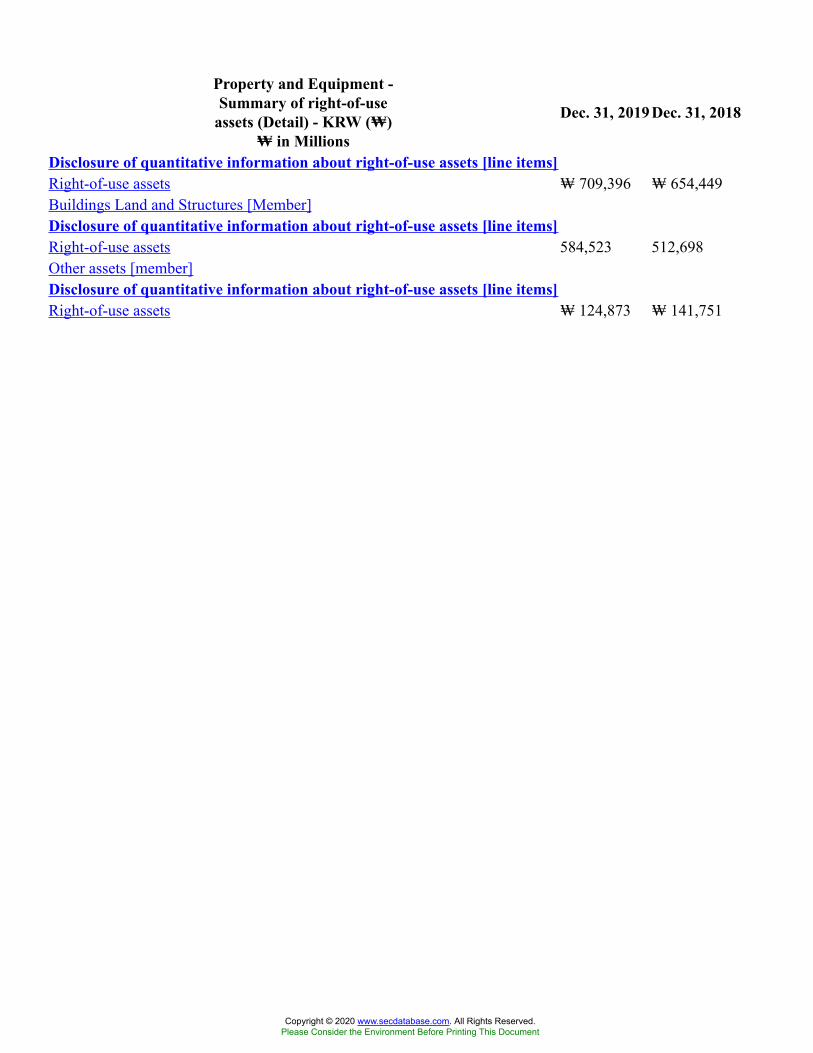
Property and Equipment -Summary of right-of-use
assets (Detail) - KRW (₩)₩ in Millions
Dec. 31, 2019 Dec. 31, 2018
Disclosure of quantitative information about right-of-use assets [line items]Right-of-use assets ₩ 709,396 ₩ 654,449Buildings Land and Structures [Member]Disclosure of quantitative information about right-of-use assets [line items]Right-of-use assets 584,523 512,698Other assets [member]Disclosure of quantitative information about right-of-use assets [line items]Right-of-use assets ₩ 124,873 ₩ 141,751
Copyright © 2020 www.secdatabase.com. All Rights Reserved.Please Consider the Environment Before Printing This Document
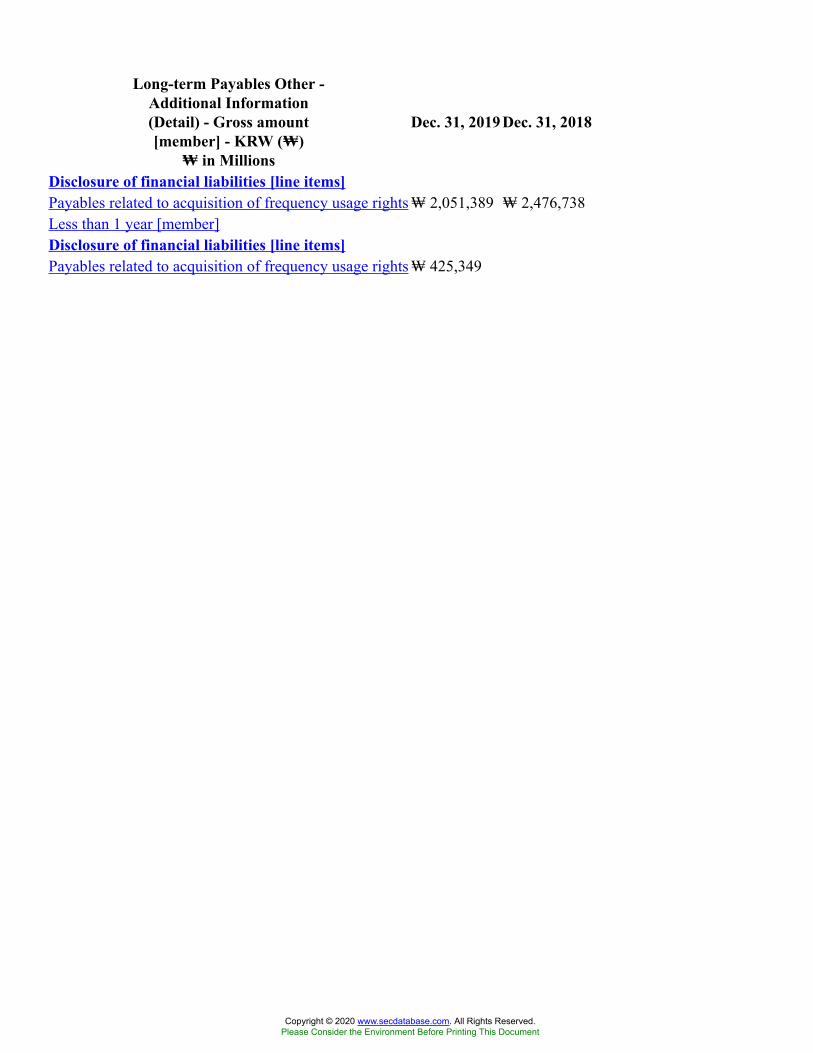
Long-term Payables Other -Additional Information(Detail) - Gross amount[member] - KRW (₩)
₩ in Millions
Dec. 31, 2019 Dec. 31, 2018
Disclosure of financial liabilities [line items]Payables related to acquisition of frequency usage rights ₩ 2,051,389 ₩ 2,476,738Less than 1 year [member]Disclosure of financial liabilities [line items]Payables related to acquisition of frequency usage rights ₩ 425,349
Copyright © 2020 www.secdatabase.com. All Rights Reserved.Please Consider the Environment Before Printing This Document
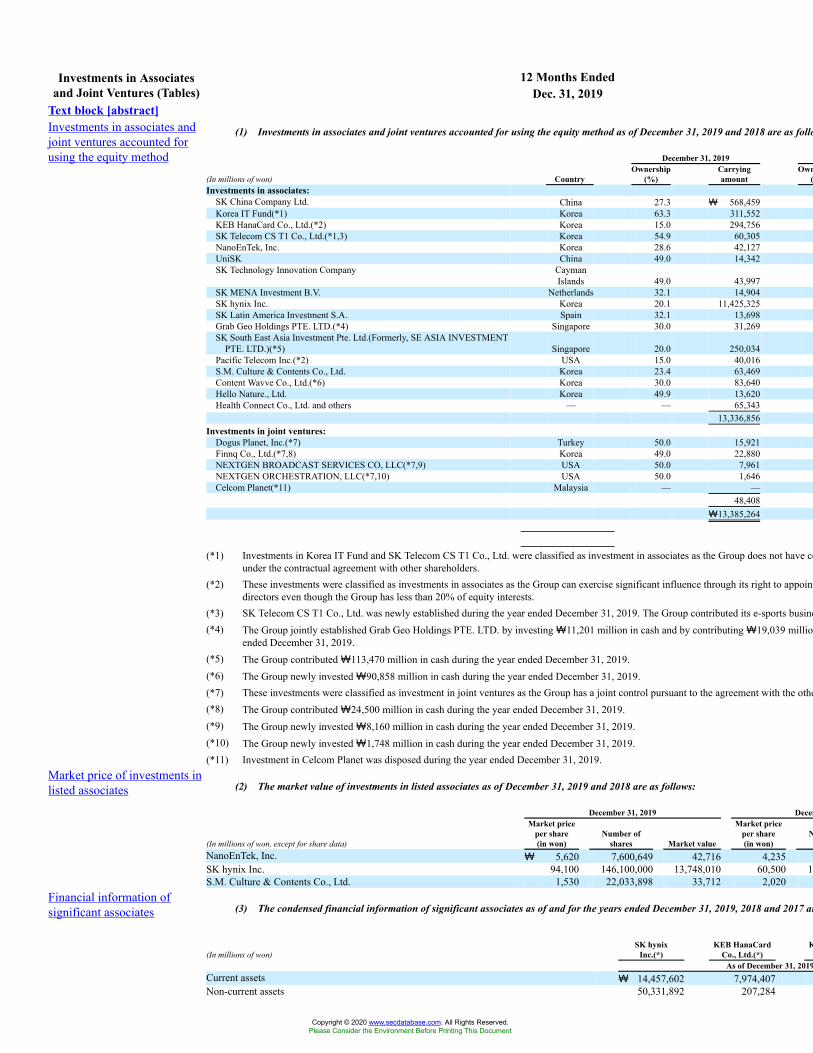
12 Months EndedInvestments in Associatesand Joint Ventures (Tables) Dec. 31, 2019
Text block [abstract]Investments in associates andjoint ventures accounted forusing the equity method
(1) Investments in associates and joint ventures accounted for using the equity method as of December 31, 2019 and 2018 are as follows:
December 31, 2019 December 31, 2018
(In millions of won) CountryOwnership
(%)Carryingamount
Ownership(%)
Carryingamount
Investments in associates:SK China Company Ltd. China 27.3 ₩ 568,459 27.3 ₩ 551,548Korea IT Fund(*1) Korea 63.3 311,552 63.3 281,684KEB HanaCard Co., Ltd.(*2) Korea 15.0 294,756 15.0 288,457SK Telecom CS T1 Co., Ltd.(*1,3) Korea 54.9 60,305 — —NanoEnTek, Inc. Korea 28.6 42,127 28.9 40,974UniSK China 49.0 14,342 49.0 13,486SK Technology Innovation Company Cayman
Islands 49.0 43,997 49.0 42,469SK MENA Investment B.V. Netherlands 32.1 14,904 32.1 14,420SK hynix Inc. Korea 20.1 11,425,325 20.1 11,208,315SK Latin America Investment S.A. Spain 32.1 13,698 32.1 13,313Grab Geo Holdings PTE. LTD.(*4) Singapore 30.0 31,269 — —SK South East Asia Investment Pte. Ltd.(Formerly, SE ASIA INVESTMENT
PTE. LTD.)(*5) Singapore 20.0 250,034 20.0 111,000Pacific Telecom Inc.(*2) USA 15.0 40,016 15.0 37,075S.M. Culture & Contents Co., Ltd. Korea 23.4 63,469 23.4 63,801Content Wavve Co., Ltd.(*6) Korea 30.0 83,640 — —Hello Nature., Ltd. Korea 49.9 13,620 49.9 28,549Health Connect Co., Ltd. and others — — 65,343 — 96,522
13,336,856 12,791,613Investments in joint ventures:
Dogus Planet, Inc.(*7) Turkey 50.0 15,921 50.0 12,487Finnq Co., Ltd.(*7,8) Korea 49.0 22,880 49.0 7,671NEXTGEN BROADCAST SERVICES CO, LLC(*7,9) USA 50.0 7,961 — —NEXTGEN ORCHESTRATION, LLC(*7,10) USA 50.0 1,646 — —Celcom Planet(*11) Malaysia — — 44.7 —
48,408 20,158₩13,385,264 ₩12,811,771
(*1) Investments in Korea IT Fund and SK Telecom CS T1 Co., Ltd. were classified as investment in associates as the Group does not have control over the investeeunder the contractual agreement with other shareholders.
(*2) These investments were classified as investments in associates as the Group can exercise significant influence through its right to appoint the members of board ofdirectors even though the Group has less than 20% of equity interests.
(*3) SK Telecom CS T1 Co., Ltd. was newly established during the year ended December 31, 2019. The Group contributed its e-sports business after the establishment.(*4) The Group jointly established Grab Geo Holdings PTE. LTD. by investing ₩11,201 million in cash and by contributing ₩19,039 million in kind during the year
ended December 31, 2019.(*5) The Group contributed ₩113,470 million in cash during the year ended December 31, 2019.(*6) The Group newly invested ₩90,858 million in cash during the year ended December 31, 2019.(*7) These investments were classified as investment in joint ventures as the Group has a joint control pursuant to the agreement with the other shareholders.(*8) The Group contributed ₩24,500 million in cash during the year ended December 31, 2019.(*9) The Group newly invested ₩8,160 million in cash during the year ended December 31, 2019.(*10) The Group newly invested ₩1,748 million in cash during the year ended December 31, 2019.(*11) Investment in Celcom Planet was disposed during the year ended December 31, 2019.
Market price of investments inlisted associates (2) The market value of investments in listed associates as of December 31, 2019 and 2018 are as follows:
December 31, 2019 December 31, 2018
(In millions of won, except for share data)
Market priceper share(in won)
Number ofshares Market value
Market priceper share(in won)
Number ofshares Market value
NanoEnTek, Inc. ₩ 5,620 7,600,649 42,716 4,235 7,600,649 32,189SK hynix Inc. 94,100 146,100,000 13,748,010 60,500 146,100,000 8,839,050S.M. Culture & Contents Co., Ltd. 1,530 22,033,898 33,712 2,020 22,033,898 44,508
Financial information ofsignificant associates (3) The condensed financial information of significant associates as of and for the years ended December 31, 2019, 2018 and 2017 are as follows:
(In millions of won)SK hynix
Inc.(*)KEB HanaCard
Co., Ltd.(*)Korea IT
Fund
SK ChinaCompany
Ltd.(*)As of December 31, 2019
Current assets ₩ 14,457,602 7,974,407 113,233 615,028Non-current assets 50,331,892 207,284 378,691 1,442,748
Copyright © 2020 www.secdatabase.com. All Rights Reserved.Please Consider the Environment Before Printing This Document

Current liabilities 7,874,033 1,015,657 — 59,395Non-current liabilities 8,972,266 5,537,850 — 215,354
2019Revenue 26,990,733 1,236,678 70,565 116,269Profit for the year 2,016,391 56,281 53,867 23,474Other comprehensive income (loss) 94,023 (4,458) 6,132 (15,093)Total comprehensive income 2,110,414 51,823 59,999 8,381
(*) The financial information of SK hynix Inc., KEB HanaCard Co., Ltd., and SK China Company Ltd. are consolidated financial information.
(In millions of won)SK hynix
Inc.(*)KEB HanaCard
Co., Ltd.(*)Korea IT
Fund
SK ChinaCompany
Ltd.(*)As of December 31, 2018
Current assets ₩ 19,894,146 7,781,888 118,024 677,686Non-current assets 43,764,189 202,251 326,740 1,221,736Current liabilities 13,031,852 1,122,538 — 71,396Non-current liabilities 3,774,152 5,286,179 — 117,094
2018Revenue 40,445,066 1,642,133 57,430 117,132Profit for the year 15,539,984 106,675 45,110 30,274Other comprehensive loss (67,219) (4,344) (13,422) (16,149)Total comprehensive income 15,472,765 102,331 31,688 14,125
(*) The financial information of SK hynix Inc., KEB HanaCard Co., Ltd., and SK China Company Ltd. are consolidated financial information.
(In millions of won)SK hynix
Inc.(*)KEB HanaCard
Co., Ltd.(*)Korea IT
Fund
SK ChinaCompany
Ltd.(*)As of December 31, 2017
Current assets ₩ 17,310,444 7,339,492 144,874 729,872Non-current assets 28,108,020 220,258 260,920 1,031,647Current liabilities 8,116,133 1,181,746 — 81,161Non-current liabilities 3,481,412 4,861,842 — 64,717
2017Revenue 30,109,434 1,519,607 11,743 69,420Profit for the year 10,642,219 106,352 1,916 11,492Other comprehensive income (loss) (422,042) (984) 4,108 27,190Total comprehensive income 10,220,177 105,368 6,024 38,682
(*) The financial information of SK hynix Inc., KEB HanaCard Co., Ltd., and SK China Company Ltd. are consolidated financial information.Condensed financialinformation of joint ventures
(4) The condensed financial information of joint ventures as of and for the years ended December 31, 2019, 2018 and 2017 are as follows:
(In millions of won) Dogus Planet, Inc. Finnq Co., Ltd.As of December 31, 2019
Current assets ₩ 59,632 42,995Cash and cash equivalents 13,422 40,619
Non-current assets 25,247 11,389Current liabilities 52,238 6,756
Accounts payable, other payables and provisions 35,459 5,062Non-current liabilities 800 1,099
2019Revenue 136,777 1,968Depreciation and amortization (5,487) (4,769)Interest income 1,455 12Interest expense (92) (198)Profit (Loss) for the year 9,294 (17,079)Total comprehensive income (loss) 9,294 (17,361)
(In millions of won) Dogus Planet, Inc. Finnq Co., Ltd.As of December 31, 2018
Current assets ₩ 43,127 11,985Cash and cash equivalents 42,416 10,434
Non-current assets 20,239 15,435Current liabilities 37,105 5,070
Accounts payable, other payables and provisions 28,432 87Non-current liabilities 1,287 7,579
2018Revenue 99,770 232Depreciation and amortization (5,427) (3,490)Interest income 1,635 5Interest expense — (301)Profit (Loss) for the year 642 (17,995)Total comprehensive income (loss) 642 (18,166)
(In millions of won) Dogus Planet, Inc. Finnq Co., Ltd.
Copyright © 2020 www.secdatabase.com. All Rights Reserved.Please Consider the Environment Before Printing This Document
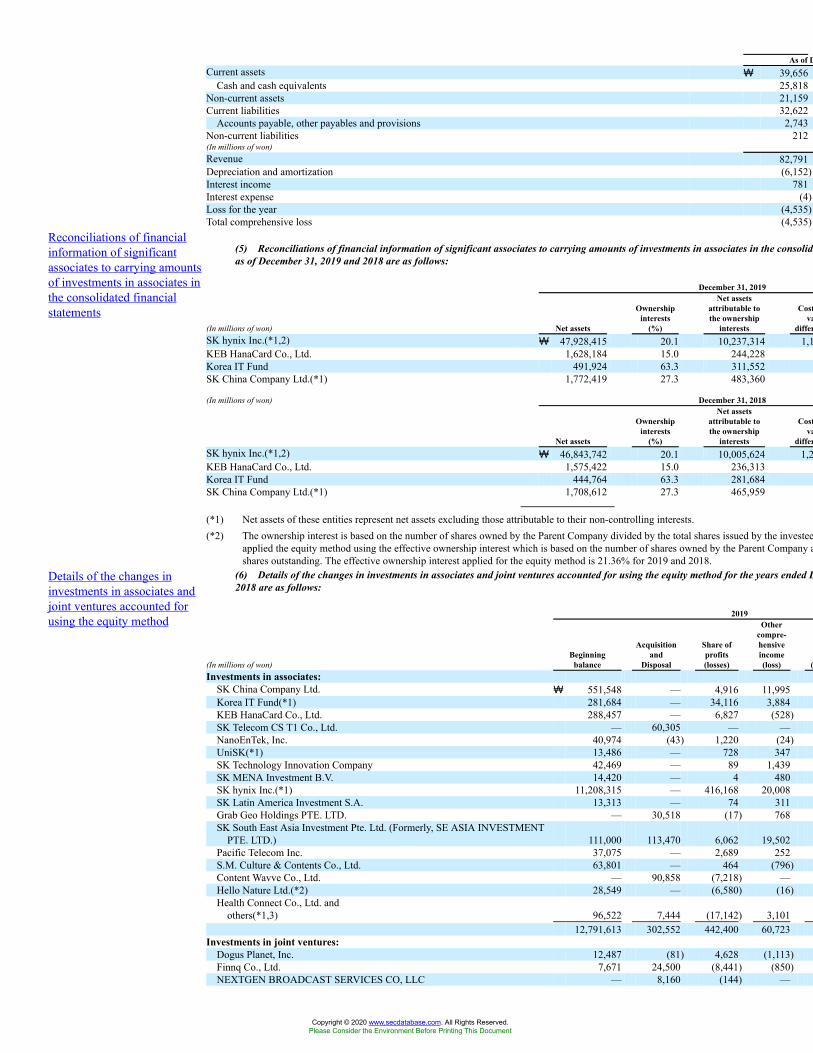
As of December 31, 2017Current assets ₩ 39,656 32,232
Cash and cash equivalents 25,818 4,590Non-current assets 21,159 15,610Current liabilities 32,622 5,685
Accounts payable, other payables and provisions 2,743 2,290Non-current liabilities 212 13,862(In millions of won) 2017Revenue 82,791 —Depreciation and amortization (6,152) (1,077)Interest income 781 532Interest expense (4) (276)Loss for the year (4,535) (15,699)Total comprehensive loss (4,535) (15,699)
Reconciliations of financialinformation of significantassociates to carrying amountsof investments in associates inthe consolidated financialstatements
(5) Reconciliations of financial information of significant associates to carrying amounts of investments in associates in the consolidated financial statementsas of December 31, 2019 and 2018 are as follows:
December 31, 2019
(In millions of won) Net assets
Ownershipinterests
(%)
Net assetsattributable tothe ownership
interests
Cost-bookvalue
differentialsCarryingamount
SK hynix Inc.(*1,2) ₩ 47,928,415 20.1 10,237,314 1,188,011 11,425,325KEB HanaCard Co., Ltd. 1,628,184 15.0 244,228 50,528 294,756Korea IT Fund 491,924 63.3 311,552 — 311,552SK China Company Ltd.(*1) 1,772,419 27.3 483,360 85,099 568,459
(In millions of won) December 31, 2018
Net assets
Ownershipinterests
(%)
Net assetsattributable tothe ownership
interests
Cost-bookvalue
differentialsCarryingamount
SK hynix Inc.(*1,2) ₩ 46,843,742 20.1 10,005,624 1,202,691 11,208,315KEB HanaCard Co., Ltd. 1,575,422 15.0 236,313 52,144 288,457Korea IT Fund 444,764 63.3 281,684 — 281,684SK China Company Ltd.(*1) 1,708,612 27.3 465,959 85,589 551,548
(*1) Net assets of these entities represent net assets excluding those attributable to their non-controlling interests.(*2) The ownership interest is based on the number of shares owned by the Parent Company divided by the total shares issued by the investee company. The Group
applied the equity method using the effective ownership interest which is based on the number of shares owned by the Parent Company and the investee’s totalshares outstanding. The effective ownership interest applied for the equity method is 21.36% for 2019 and 2018.
Details of the changes ininvestments in associates andjoint ventures accounted forusing the equity method
(6) Details of the changes in investments in associates and joint ventures accounted for using the equity method for the years ended December 31, 2019 and2018 are as follows:
2019
(In millions of won)Beginning
balance
Acquisitionand
Disposal
Share ofprofits(losses)
Othercompre-hensiveincome(loss)
Otherincrease
(decrease)Endingbalance
Investments in associates:SK China Company Ltd. ₩ 551,548 — 4,916 11,995 — 568,459Korea IT Fund(*1) 281,684 — 34,116 3,884 (8,132) 311,552KEB HanaCard Co., Ltd. 288,457 — 6,827 (528) — 294,756SK Telecom CS T1 Co., Ltd. — 60,305 — — — 60,305NanoEnTek, Inc. 40,974 (43) 1,220 (24) — 42,127UniSK(*1) 13,486 — 728 347 (219) 14,342SK Technology Innovation Company 42,469 — 89 1,439 — 43,997SK MENA Investment B.V. 14,420 — 4 480 — 14,904SK hynix Inc.(*1) 11,208,315 — 416,168 20,008 (219,166) 11,425,325SK Latin America Investment S.A. 13,313 — 74 311 — 13,698Grab Geo Holdings PTE. LTD. — 30,518 (17) 768 — 31,269SK South East Asia Investment Pte. Ltd. (Formerly, SE ASIA INVESTMENT
PTE. LTD.) 111,000 113,470 6,062 19,502 — 250,034Pacific Telecom Inc. 37,075 — 2,689 252 — 40,016S.M. Culture & Contents Co., Ltd. 63,801 — 464 (796) — 63,469Content Wavve Co., Ltd. — 90,858 (7,218) — — 83,640Hello Nature Ltd.(*2) 28,549 — (6,580) (16) (8,333) 13,620Health Connect Co., Ltd. and
others(*1,3) 96,522 7,444 (17,142) 3,101 (24,582) 65,34312,791,613 302,552 442,400 60,723 (260,432) 13,336,856
Investments in joint ventures:Dogus Planet, Inc. 12,487 (81) 4,628 (1,113) — 15,921Finnq Co., Ltd. 7,671 24,500 (8,441) (850) — 22,880NEXTGEN BROADCAST SERVICES CO, LLC — 8,160 (144) — (55) 7,961
Copyright © 2020 www.secdatabase.com. All Rights Reserved.Please Consider the Environment Before Printing This Document

NEXTGEN ORCHESTRATION, LLC — 1,748 (91) — (11) 1,646Celcom Planet(*4) — 6,141 (6,141) — — —
20,158 40,468 (10,189) (1,963) (66) 48,408₩ 12,811,771 343,020 432,211 58,760 (260,498) 13,385,264
(*1) Dividends received from the associates are deducted from the carrying amount during the year ended December 31, 2019.(*2) The Group recognized ₩8,333 million of impairment loss for the investments in Hello Nature Ltd. during the year ended December 31, 2019.
(*3) The acquisition for the year ended December 31, 2019 includes ₩6,800 million of cash investments in Carrot Co., Ltd. Other increase (decrease) includes thechanges in book value due to the reclassification of FSK L&S Co., Ltd. as investments in subsidiary from investments in associates.
(*4) Investments in Celcom Planet was disposed during the year ended December 31, 2019.
2018
(In millions of won)Beginning
balance
Acquisitionand
Disposal
Share ofprofits(losses)
Othercompre-hensiveincome(loss)
Otherincrease
(decrease)Endingbalance
Investments in associates:SK China Company Ltd. ₩ 526,099 — 7,618 17,831 — 551,548Korea IT Fund(*) 257,003 — 38,099 (9,919) (3,499) 281,684KEB HanaCard Co., Ltd. 280,988 — 14,581 (7,112) — 288,457NanoEnTek, Inc. 38,718 3,180 (116) (808) — 40,974SK Technology Innovation Company 42,511 — (1,880) 1,838 — 42,469HappyNarae Co., Ltd. 21,873 (29,325) 7,479 (27) — —SK hynix Inc.(*) 8,130,000 — 3,238,054 (13,639) (146,100) 11,208,315SK MENA Investment B.V. 13,853 — (24) 591 — 14,420S.M. Culture & Contents Co., Ltd. 64,966 — (909) (256) — 63,801Xian Tianlong Science and Technology Co., Ltd. 25,891 (25,553) (338) — — —Hello Nature Ltd. — — (959) — 29,508 28,54912CM Japan, Inc. — 7,697 (43) 80 — 7,734MAKEUS Corp. — 9,773 (574) — (6) 9,193SK South East Asia Investment Pte. Ltd. (Formerly, SE ASIA
INVESTMENT PTE. LTD.) — 111,000 — — — 111,000Pacific Telecom Inc. — 36,487 473 115 — 37,075Health Connect Co., Ltd. and others(*) 96,479 22,902 (6,474) 197 (6,710) 106,394
9,498,381 136,161 3,294,987 (11,109) (126,807) 12,791,613Investments in joint ventures:
Dogus Planet, Inc. 13,991 1,537 563 (3,604) — 12,487Finnq Co., Ltd. 16,474 — (8,728) (75) — 7,67112CM GLOBAL PTE. LTD. 9,592 (9,631) 42 (3) — —Celcom Planet — 12,932 (12,932) — — —
40,057 4,838 (21,055) (3,682) — 20,158₩ 9,538,438 140,999 3,273,932 (14,791) (126,807) 12,811,771
(*) Dividends received from the associates are deducted from the carrying amount during the year ended December 31, 2018.Details of cumulativeunrecognized equity methodlosses
(7) The Group discontinued the application of equity method to the following investees due to their carrying amounts being reduced to zero. The details ofcumulative unrecognized equity method losses as of December 31, 2019 are as follows:
Unrecognized loss Unrecognized change in equity
(In millions of won) 2019 Cumulative loss 2019Cumulative
lossWave City Development Co., Ltd. ₩(2,164) 4,370 — —Daehan Kanggun BcN Co., Ltd. and others (4,758) 10,652 (503) (138)
₩(6,922) 15,022 (503) (138)
Copyright © 2020 www.secdatabase.com. All Rights Reserved.Please Consider the Environment Before Printing This Document
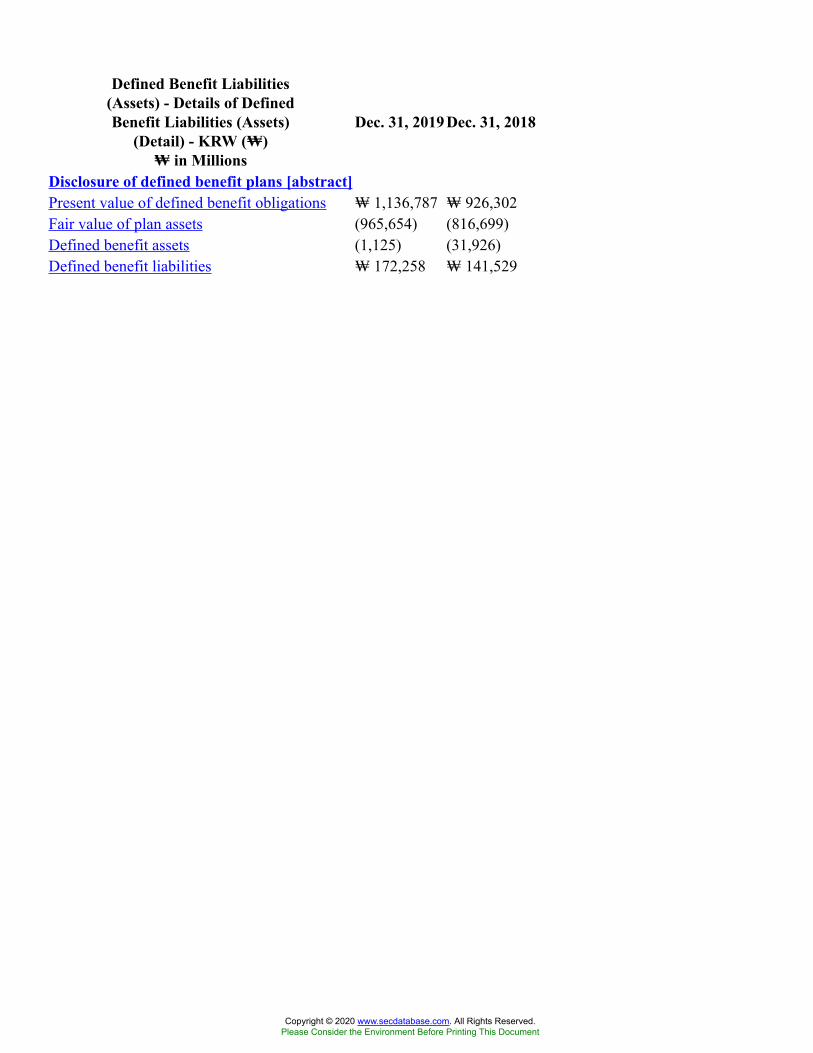
Defined Benefit Liabilities(Assets) - Details of DefinedBenefit Liabilities (Assets)
(Detail) - KRW (₩)₩ in Millions
Dec. 31, 2019 Dec. 31, 2018
Disclosure of defined benefit plans [abstract]Present value of defined benefit obligations ₩ 1,136,787 ₩ 926,302Fair value of plan assets (965,654) (816,699)Defined benefit assets (1,125) (31,926)Defined benefit liabilities ₩ 172,258 ₩ 141,529
Copyright © 2020 www.secdatabase.com. All Rights Reserved.Please Consider the Environment Before Printing This Document
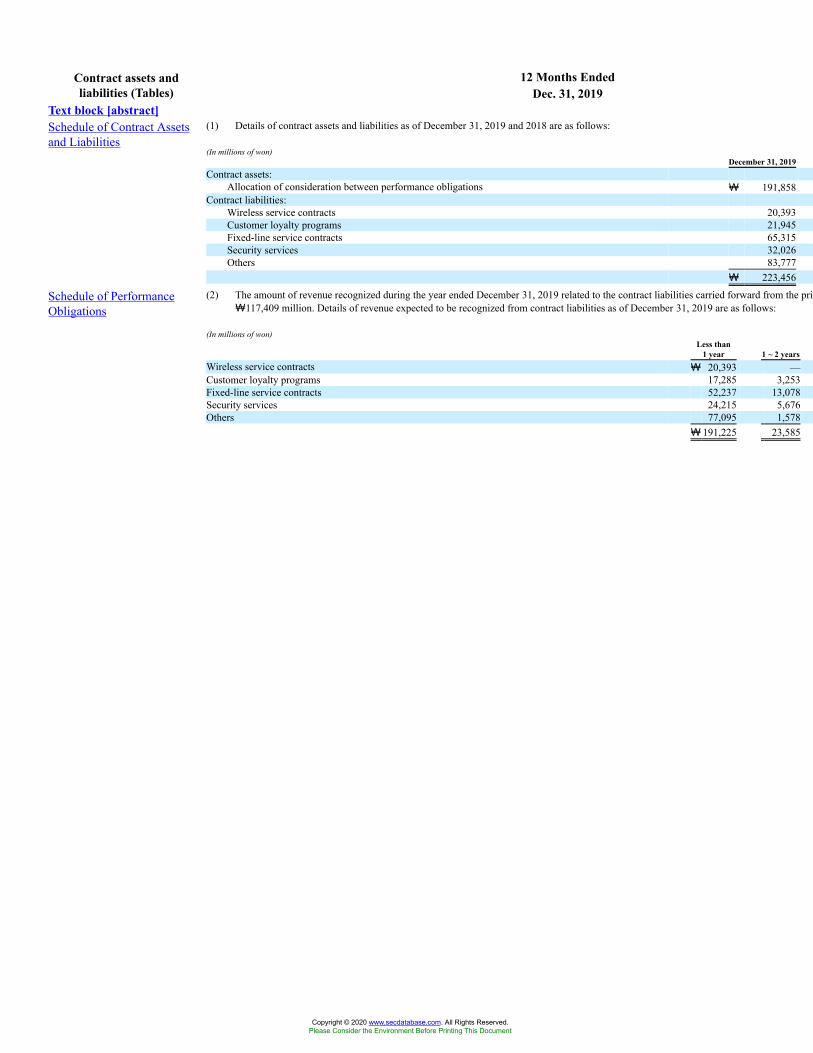
12 Months EndedContract assets andliabilities (Tables) Dec. 31, 2019
Text block [abstract]Schedule of Contract Assetsand Liabilities
(1) Details of contract assets and liabilities as of December 31, 2019 and 2018 are as follows:
(In millions of won)December 31, 2019 December 31, 2018
Contract assets:Allocation of consideration between performance obligations ₩ 191,858 133,893
Contract liabilities:Wireless service contracts 20,393 18,425Customer loyalty programs 21,945 17,113Fixed-line service contracts 65,315 57,327Security services 32,026 38,109Others 83,777 52,839
₩ 223,456 183,813
Schedule of PerformanceObligations
(2) The amount of revenue recognized during the year ended December 31, 2019 related to the contract liabilities carried forward from the prior period is₩117,409 million. Details of revenue expected to be recognized from contract liabilities as of December 31, 2019 are as follows:
(In millions of won)Less than
1 year 1 ~ 2 yearsMore than
2 years TotalWireless service contracts ₩ 20,393 — — 20,393Customer loyalty programs 17,285 3,253 1,407 21,945Fixed-line service contracts 52,237 13,078 — 65,315Security services 24,215 5,676 2,135 32,026Others 77,095 1,578 5,104 83,777
₩ 191,225 23,585 8,646 223,456
Copyright © 2020 www.secdatabase.com. All Rights Reserved.Please Consider the Environment Before Printing This Document
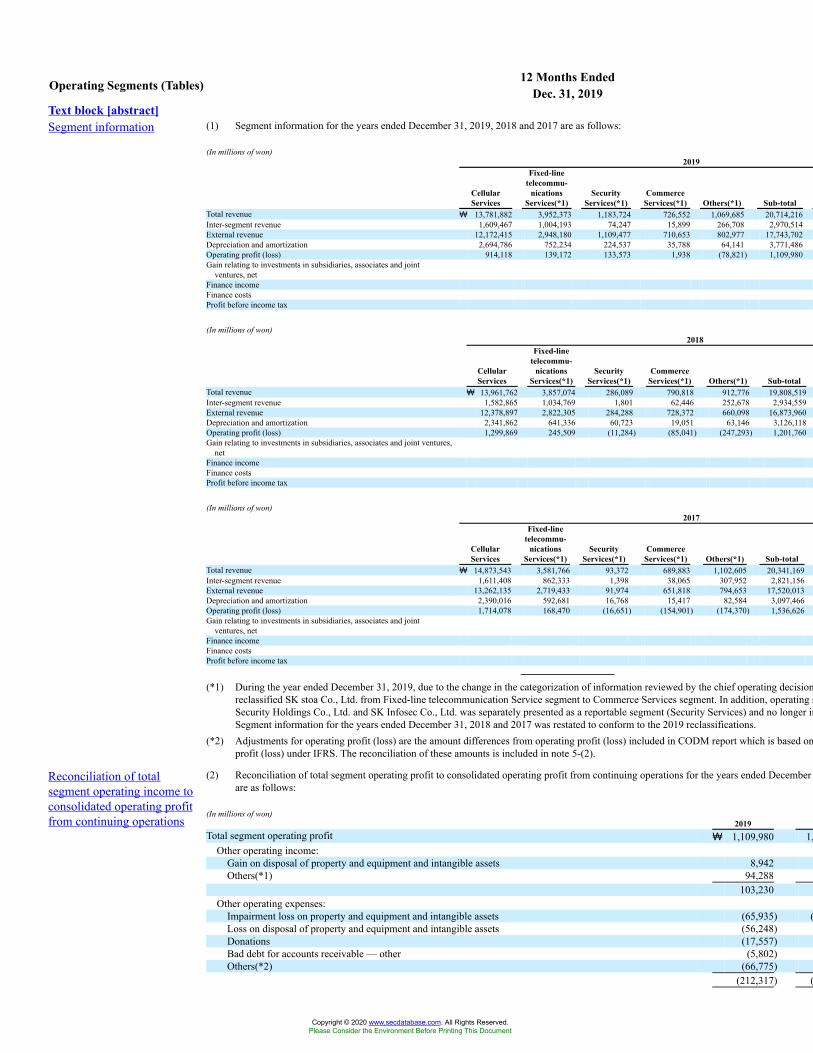
12 Months EndedOperating Segments (Tables) Dec. 31, 2019Text block [abstract]Segment information (1) Segment information for the years ended December 31, 2019, 2018 and 2017 are as follows:
(In millions of won)2019
CellularServices
Fixed-linetelecommu-
nicationsServices(*1)
SecurityServices(*1)
CommerceServices(*1) Others(*1) Sub-total
Adjustments(*2) Total
Total revenue ₩ 13,781,882 3,952,373 1,183,724 726,552 1,069,685 20,714,216 (2,970,514) 17,743,702Inter-segment revenue 1,609,467 1,004,193 74,247 15,899 266,708 2,970,514 (2,970,514) —External revenue 12,172,415 2,948,180 1,109,477 710,653 802,977 17,743,702 — 17,743,702Depreciation and amortization 2,694,786 752,234 224,537 35,788 64,141 3,771,486 — 3,771,486Operating profit (loss) 914,118 139,172 133,573 1,938 (78,821) 1,109,980 (109,087) 1,000,893Gain relating to investments in subsidiaries, associates and joint
ventures, net 449,543Finance income 141,977Finance costs (429,758)Profit before income tax 1,162,655
(In millions of won)2018
CellularServices
Fixed-linetelecommu-
nicationsServices(*1)
SecurityServices(*1)
CommerceServices(*1) Others(*1) Sub-total
Adjustments(*2) Total
Total revenue ₩ 13,961,762 3,857,074 286,089 790,818 912,776 19,808,519 (2,934,559) 16,873,960Inter-segment revenue 1,582,865 1,034,769 1,801 62,446 252,678 2,934,559 (2,934,559) —External revenue 12,378,897 2,822,305 284,288 728,372 660,098 16,873,960 — 16,873,960Depreciation and amortization 2,341,862 641,336 60,723 19,051 63,146 3,126,118 — 3,126,118Operating profit (loss) 1,299,869 245,509 (11,284) (85,041) (247,293) 1,201,760 (367,909) 833,851Gain relating to investments in subsidiaries, associates and joint ventures,
net 3,270,912Finance income 256,435Finance costs (385,232)Profit before income tax 3,975,966
(In millions of won)2017
CellularServices
Fixed-linetelecommu-
nicationsServices(*1)
SecurityServices(*1)
CommerceServices(*1) Others(*1) Sub-total
Adjustments(*2) Total
Total revenue ₩ 14,873,543 3,581,766 93,372 689,883 1,102,605 20,341,169 (2,821,156) 17,520,013Inter-segment revenue 1,611,408 862,333 1,398 38,065 307,952 2,821,156 (2,821,156) —External revenue 13,262,135 2,719,433 91,974 651,818 794,653 17,520,013 — 17,520,013Depreciation and amortization 2,390,016 592,681 16,768 15,417 82,584 3,097,466 — 3,097,466Operating profit (loss) 1,714,078 168,470 (16,651) (154,901) (174,370) 1,536,626 (312,054) 1,224,572Gain relating to investments in subsidiaries, associates and joint
ventures, net 2,245,732Finance income 366,561Finance costs (433,616)Profit before income tax 3,403,249
(*1) During the year ended December 31, 2019, due to the change in the categorization of information reviewed by the chief operating decision maker in 2019, the Groupreclassified SK stoa Co., Ltd. from Fixed-line telecommunication Service segment to Commerce Services segment. In addition, operating segment for Life &Security Holdings Co., Ltd. and SK Infosec Co., Ltd. was separately presented as a reportable segment (Security Services) and no longer included in Others segment.Segment information for the years ended December 31, 2018 and 2017 was restated to conform to the 2019 reclassifications.
(*2) Adjustments for operating profit (loss) are the amount differences from operating profit (loss) included in CODM report which is based on Korean IFRS to operatingprofit (loss) under IFRS. The reconciliation of these amounts is included in note 5-(2).
Reconciliation of totalsegment operating income toconsolidated operating profitfrom continuing operations
(2) Reconciliation of total segment operating profit to consolidated operating profit from continuing operations for the years ended December 31, 2019, 2018 and 2017are as follows:
(In millions of won)2019 2018 2017
Total segment operating profit ₩ 1,109,980 1,201,760 1,536,626Other operating income:
Gain on disposal of property and equipment and intangible assets 8,942 38,933 13,991Others(*1) 94,288 33,017 18,006
103,230 71,950 31,997Other operating expenses:
Impairment loss on property and equipment and intangible assets (65,935) (255,839) (54,946)Loss on disposal of property and equipment and intangible assets (56,248) (87,257) (60,086)Donations (17,557) (59,012) (112,634)Bad debt for accounts receivable — other (5,802) (7,718) (5,793)Others(*2) (66,775) (30,033) (110,592)
(212,317) (439,859) (344,051)
Copyright © 2020 www.secdatabase.com. All Rights Reserved.Please Consider the Environment Before Printing This Document
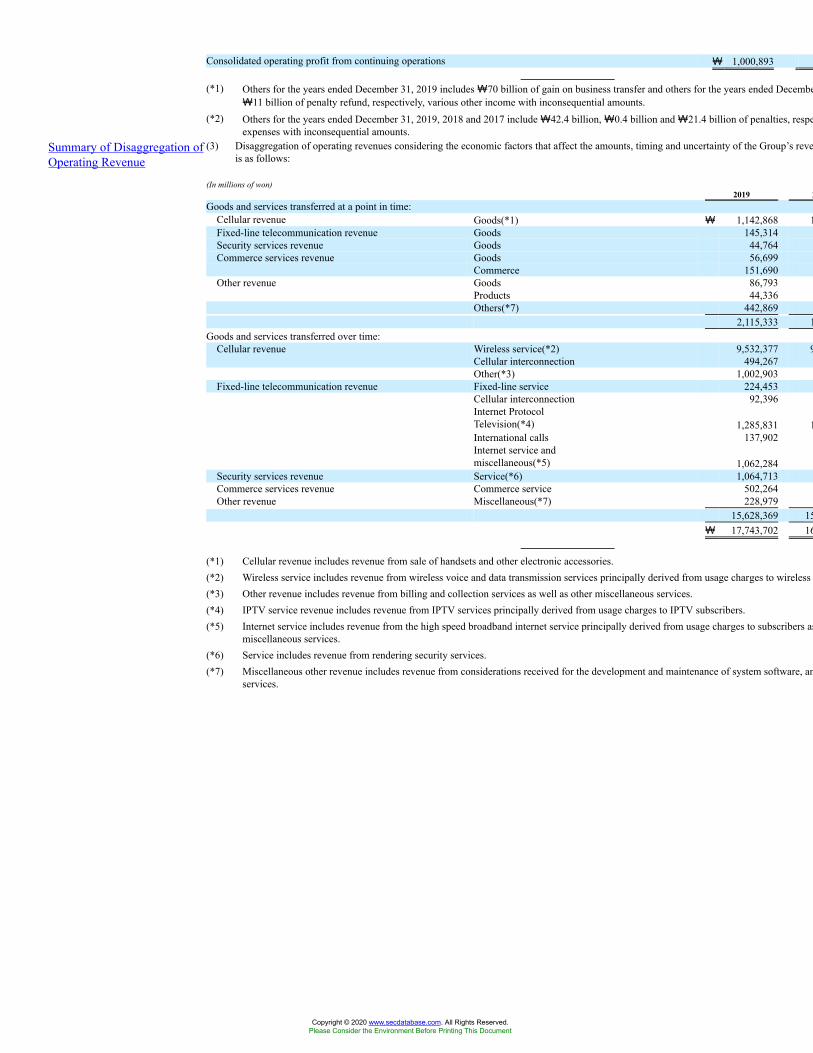
Consolidated operating profit from continuing operations ₩ 1,000,893 833,851 1,224,572
(*1) Others for the years ended December 31, 2019 includes ₩70 billion of gain on business transfer and others for the years ended December 31, 2018 includes₩11 billion of penalty refund, respectively, various other income with inconsequential amounts.
(*2) Others for the years ended December 31, 2019, 2018 and 2017 include ₩42.4 billion, ₩0.4 billion and ₩21.4 billion of penalties, respectively, and various otherexpenses with inconsequential amounts.
Summary of Disaggregation ofOperating Revenue
(3) Disaggregation of operating revenues considering the economic factors that affect the amounts, timing and uncertainty of the Group’s revenue and future cash flowsis as follows:
(In millions of won)2019 2018 2017
Goods and services transferred at a point in time:Cellular revenue Goods(*1) ₩ 1,142,868 1,124,143 1,119,662Fixed-line telecommunication revenue Goods 145,314 125,959 73,362Security services revenue Goods 44,764 12,332 404Commerce services revenue Goods 56,699 45,837 94,085
Commerce 151,690 77,539 1,512Goods 86,793 81,311 81,139Other revenueProducts 44,336 51,214 25,068Others(*7) 442,869 275,431 196,110
2,115,333 1,793,766 1,591,342Goods and services transferred over time:
Cellular revenue Wireless service(*2) 9,532,377 9,770,423 10,638,982Cellular interconnection 494,267 532,156 592,755Other(*3) 1,002,903 952,175 910,736
Fixed-line telecommunication revenue Fixed-line service 224,453 371,224 401,037Cellular interconnection 92,396 95,865 116,070Internet ProtocolTelevision(*4) 1,285,831 1,171,104 1,023,997International calls 137,902 152,918 166,901Internet service andmiscellaneous(*5) 1,062,284 905,235 938,066
Security services revenue Service(*6) 1,064,713 271,956 91,570Commerce services revenue Commerce service 502,264 604,996 556,221Other revenue Miscellaneous(*7) 228,979 252,142 492,336
15,628,369 15,080,194 15,928,671₩ 17,743,702 16,873,960 17,520,013
(*1) Cellular revenue includes revenue from sale of handsets and other electronic accessories.(*2) Wireless service includes revenue from wireless voice and data transmission services principally derived from usage charges to wireless subscribers.(*3) Other revenue includes revenue from billing and collection services as well as other miscellaneous services.(*4) IPTV service revenue includes revenue from IPTV services principally derived from usage charges to IPTV subscribers.(*5) Internet service includes revenue from the high speed broadband internet service principally derived from usage charges to subscribers as well as other
miscellaneous services.(*6) Service includes revenue from rendering security services.(*7) Miscellaneous other revenue includes revenue from considerations received for the development and maintenance of system software, and digital contents platform
services.
Copyright © 2020 www.secdatabase.com. All Rights Reserved.Please Consider the Environment Before Printing This Document
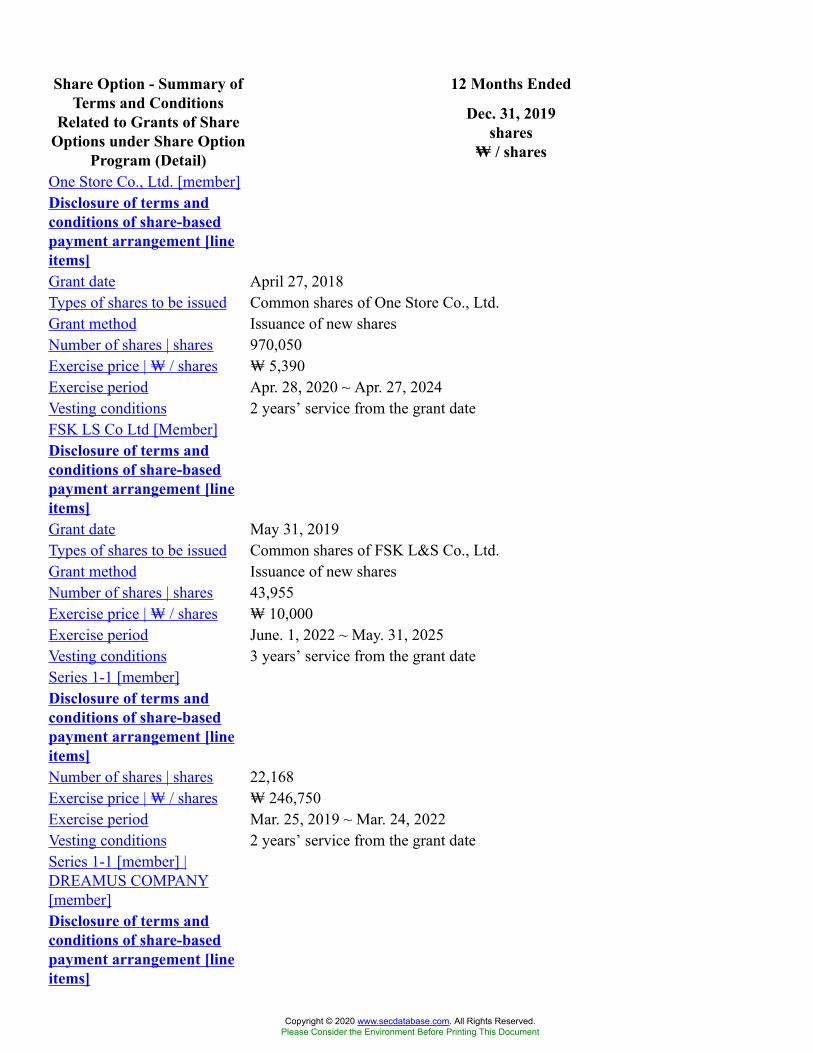
12 Months EndedShare Option - Summary ofTerms and Conditions
Related to Grants of ShareOptions under Share Option
Program (Detail)
Dec. 31, 2019shares
₩ / shares
One Store Co., Ltd. [member]Disclosure of terms andconditions of share-basedpayment arrangement [lineitems]Grant date April 27, 2018Types of shares to be issued Common shares of One Store Co., Ltd.Grant method Issuance of new sharesNumber of shares | shares 970,050Exercise price | ₩ / shares ₩ 5,390Exercise period Apr. 28, 2020 ~ Apr. 27, 2024Vesting conditions 2 years’ service from the grant dateFSK LS Co Ltd [Member]Disclosure of terms andconditions of share-basedpayment arrangement [lineitems]Grant date May 31, 2019Types of shares to be issued Common shares of FSK L&S Co., Ltd.Grant method Issuance of new sharesNumber of shares | shares 43,955Exercise price | ₩ / shares ₩ 10,000Exercise period June. 1, 2022 ~ May. 31, 2025Vesting conditions 3 years’ service from the grant dateSeries 1-1 [member]Disclosure of terms andconditions of share-basedpayment arrangement [lineitems]Number of shares | shares 22,168Exercise price | ₩ / shares ₩ 246,750Exercise period Mar. 25, 2019 ~ Mar. 24, 2022Vesting conditions 2 years’ service from the grant dateSeries 1-1 [member] |DREAMUS COMPANY[member]Disclosure of terms andconditions of share-basedpayment arrangement [lineitems]
Copyright © 2020 www.secdatabase.com. All Rights Reserved.Please Consider the Environment Before Printing This Document
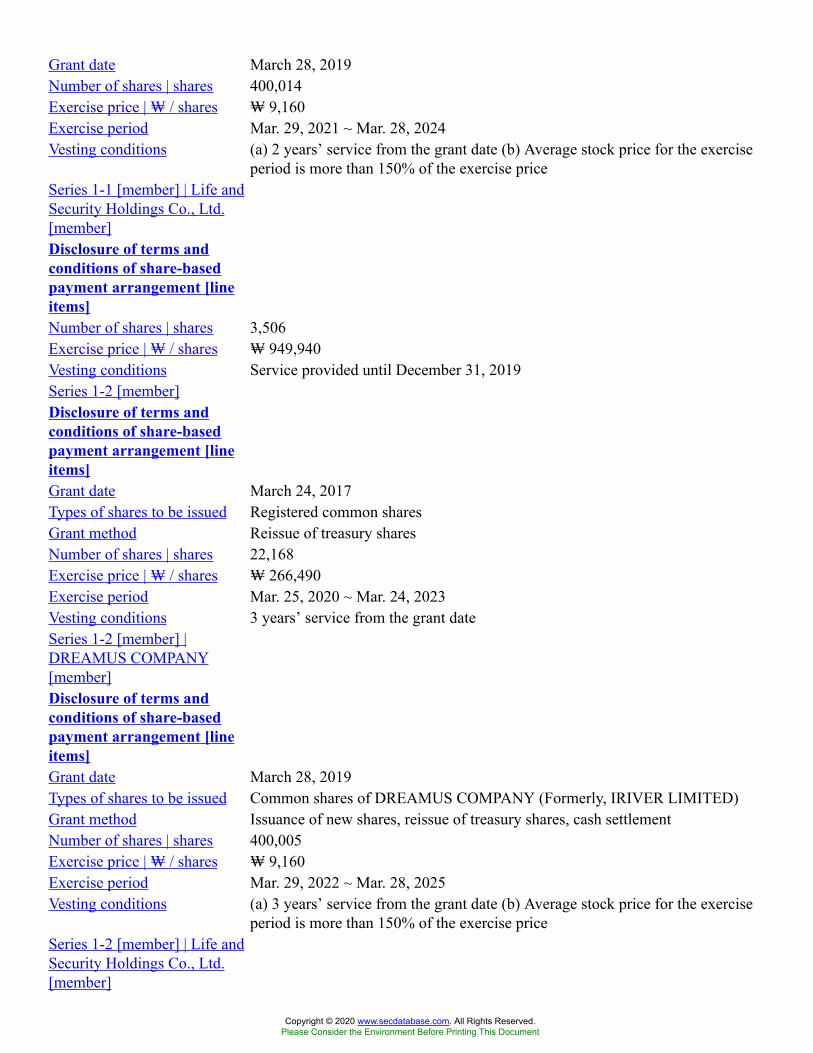
Grant date March 28, 2019Number of shares | shares 400,014Exercise price | ₩ / shares ₩ 9,160Exercise period Mar. 29, 2021 ~ Mar. 28, 2024Vesting conditions (a) 2 years’ service from the grant date (b) Average stock price for the exercise
period is more than 150% of the exercise priceSeries 1-1 [member] | Life andSecurity Holdings Co., Ltd.[member]Disclosure of terms andconditions of share-basedpayment arrangement [lineitems]Number of shares | shares 3,506Exercise price | ₩ / shares ₩ 949,940Vesting conditions Service provided until December 31, 2019Series 1-2 [member]Disclosure of terms andconditions of share-basedpayment arrangement [lineitems]Grant date March 24, 2017Types of shares to be issued Registered common sharesGrant method Reissue of treasury sharesNumber of shares | shares 22,168Exercise price | ₩ / shares ₩ 266,490Exercise period Mar. 25, 2020 ~ Mar. 24, 2023Vesting conditions 3 years’ service from the grant dateSeries 1-2 [member] |DREAMUS COMPANY[member]Disclosure of terms andconditions of share-basedpayment arrangement [lineitems]Grant date March 28, 2019Types of shares to be issued Common shares of DREAMUS COMPANY (Formerly, IRIVER LIMITED)Grant method Issuance of new shares, reissue of treasury shares, cash settlementNumber of shares | shares 400,005Exercise price | ₩ / shares ₩ 9,160Exercise period Mar. 29, 2022 ~ Mar. 28, 2025Vesting conditions (a) 3 years’ service from the grant date (b) Average stock price for the exercise
period is more than 150% of the exercise priceSeries 1-2 [member] | Life andSecurity Holdings Co., Ltd.[member]
Copyright © 2020 www.secdatabase.com. All Rights Reserved.Please Consider the Environment Before Printing This Document
Disclosure of terms andconditions of share-basedpayment arrangement [lineitems]Grant date August 22, 2019Types of shares to be issued Common shares of Life & Security Holdings Co., Ltd.Grant method cash settlementNumber of shares | shares 3,163Exercise price | ₩ / shares ₩ 949,940Exercise period 1st excercise: Applied to 50% of the granted shares and exercisible 6 months
after the listing (June. 30, 2023) of Life & Security Holdings Co., Ltd. 2ndexcercise: Applied to 25% of the granted shares and exercisible 12 months afterthe listing (June. 30, 2023) of Life & Security Holdings Co., Ltd. 3rd excercise:Applied to 25% of the granted shares and exercisible 18 months after the listing(June. 30, 2023) of Life & Security Holdings Co., Ltd.
Vesting conditions Service provideduntil December 31, 2020Series 1-3 [member]Disclosure of terms andconditions of share-basedpayment arrangement [lineitems]Number of shares | shares 22,168Exercise price | ₩ / shares ₩ 287,810Exercise period Mar. 25, 2021 ~ Mar. 24, 2024Vesting conditions 4 years’ service from the grant dateSeries 1-3 [member] |DREAMUS COMPANY[member]Disclosure of terms andconditions of share-basedpayment arrangement [lineitems]Grant date March 28, 2019Number of shares | shares 399,981Exercise price | ₩ / shares ₩ 9,160Exercise period Mar. 29, 2023 ~ Mar. 28, 2026Vesting conditions (a) 4 years’ service from the grant date (b) Average stock price for the exercise
period is more than 150% of the exercise priceSeries 1-3 [member] | Life andSecurity Holdings Co., Ltd.[member]Disclosure of terms andconditions of share-basedpayment arrangement [lineitems]Number of shares | shares 6,260
Copyright © 2020 www.secdatabase.com. All Rights Reserved.Please Consider the Environment Before Printing This Document
Exercise price | ₩ / shares ₩ 1,025,935Vesting conditions Service provided until December 31, 2021Series 1-4 [member] | Life andSecurity Holdings Co., Ltd.[member]Disclosure of terms andconditions of share-basedpayment arrangement [lineitems]Number of shares | shares 6,245Exercise price | ₩ / shares ₩ 1,108,010Vesting conditions Service provided until December 31, 2022Series 2 [member]Disclosure of terms andconditions of share-basedpayment arrangement [lineitems]Grant date February 20, 2018Number of shares | shares 1,358Exercise price | ₩ / shares ₩ 254,120Exercise period Feb. 21, 2020 ~ Feb. 20, 2023Vesting conditions 2 years’ service from the grant dateSeries 3 [member]Disclosure of terms andconditions of share-basedpayment arrangement [lineitems]Grant date February 22, 2019Grant method Reissue of treasury shares, cash settlementNumber of shares | shares 4,177Exercise price | ₩ / shares ₩ 265,260Exercise period Feb. 23, 2021 ~ Feb. 22, 2024Vesting conditions 2 years’ service from the grant dateSeries 3 [member] | Incross CoLtd [Member]Disclosure of terms andconditions of share-basedpayment arrangement [lineitems]Grant date March 30, 2016Number of shares | shares 19,750Exercise price | ₩ / shares ₩ 10,571Exercise period Mar. 31, 2019 ~ Mar. 30, 2022Vesting conditions 3 years’ service from the grant dateSeries 4 [member]
Copyright © 2020 www.secdatabase.com. All Rights Reserved.Please Consider the Environment Before Printing This Document
Disclosure of terms andconditions of share-basedpayment arrangement [lineitems]Grant date March 26, 2019Number of shares | shares 1,734Exercise price | ₩ / shares ₩ 254,310Exercise period Mar. 27, 2021 ~ Mar. 26, 2024Vesting conditions 2 years’ service from the grant dateSeries 4 [member] | Incross CoLtd [Member]Disclosure of terms andconditions of share-basedpayment arrangement [lineitems]Grant date March 7, 2017Number of shares | shares 29,625Exercise price | ₩ / shares ₩ 17,485Exercise period Mar. 7, 2020 ~ Mar. 6, 2023Vesting conditions 3 years’ service from the grant dateSeries 5 [member] | Incross CoLtd [Member]Disclosure of terms andconditions of share-basedpayment arrangement [lineitems]Grant date March 7, 2018Types of shares to be issued Common shares of Incross Co., Ltd.Grant method Issuance of new shares, reissue of treasury sharesNumber of shares | shares 9,900Exercise price | ₩ / shares ₩ 25,861Exercise period Mar. 7, 2021 ~ Mar. 6, 2024Vesting conditions 3 years’ service from the grant dateSeries 6 [member] | Incross CoLtd [Member]Disclosure of terms andconditions of share-basedpayment arrangement [lineitems]Grant date March 7, 2019Number of shares | shares 6,600Exercise price | ₩ / shares ₩ 16,895Exercise period Mar. 7, 2022 ~ Mar. 6, 2025Vesting conditions 3 years’ service from the grant dateSeries 7 [member] | Incross CoLtd [Member]
Copyright © 2020 www.secdatabase.com. All Rights Reserved.Please Consider the Environment Before Printing This Document
Disclosure of terms andconditions of share-basedpayment arrangement [lineitems]Grant date October 15, 2019Number of shares | shares 59,225Exercise price | ₩ / shares ₩ 22,073Exercise period Oct. 15, 2022 ~ Oct. 14, 2025Vesting conditions 3 years’ service from the grant date
Copyright © 2020 www.secdatabase.com. All Rights Reserved.Please Consider the Environment Before Printing This Document
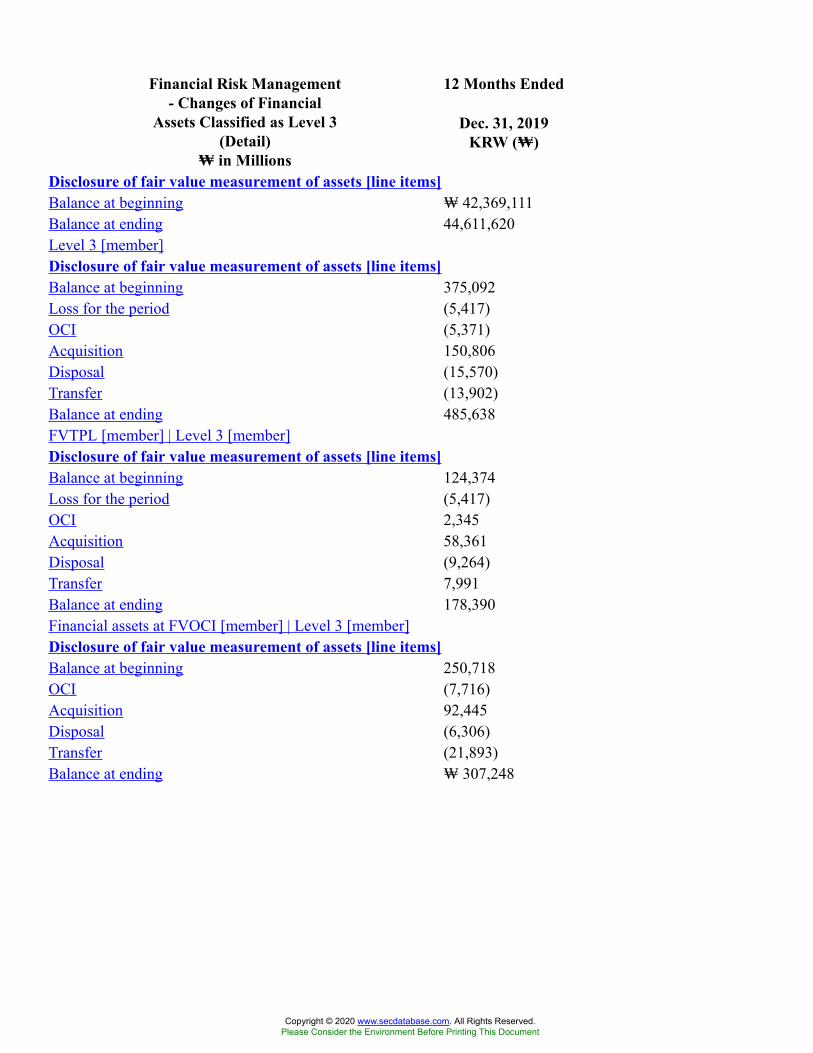
12 Months EndedFinancial Risk Management- Changes of Financial
Assets Classified as Level 3(Detail)
₩ in Millions
Dec. 31, 2019KRW (₩)
Disclosure of fair value measurement of assets [line items]Balance at beginning ₩ 42,369,111Balance at ending 44,611,620Level 3 [member]Disclosure of fair value measurement of assets [line items]Balance at beginning 375,092Loss for the period (5,417)OCI (5,371)Acquisition 150,806Disposal (15,570)Transfer (13,902)Balance at ending 485,638FVTPL [member] | Level 3 [member]Disclosure of fair value measurement of assets [line items]Balance at beginning 124,374Loss for the period (5,417)OCI 2,345Acquisition 58,361Disposal (9,264)Transfer 7,991Balance at ending 178,390Financial assets at FVOCI [member] | Level 3 [member]Disclosure of fair value measurement of assets [line items]Balance at beginning 250,718OCI (7,716)Acquisition 92,445Disposal (6,306)Transfer (21,893)Balance at ending ₩ 307,248
Copyright © 2020 www.secdatabase.com. All Rights Reserved.Please Consider the Environment Before Printing This Document
Redeemable ConvertiblePreferred Stocks - Summaryof Redeemable Convertible
Preferred Stocks(Parenthetical) (Detail)
₩ in Millions
Dec. 31, 2019KRW (₩)
Redeemable Convertible Preferred Stocks [line items]Dividend payable ₩ 18,805Non-controlling interests [member]Redeemable Convertible Preferred Stocks [line items]Dividend payable ₩ 18,805
Copyright © 2020 www.secdatabase.com. All Rights Reserved.Please Consider the Environment Before Printing This Document
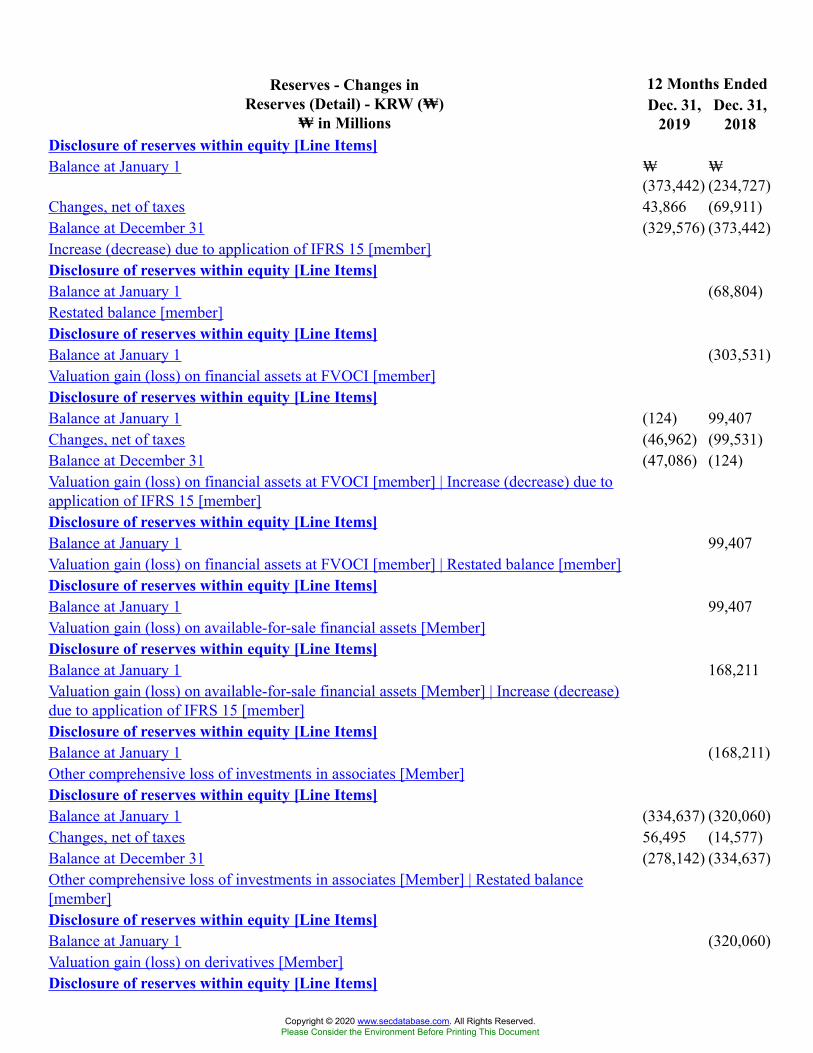
12 Months EndedReserves - Changes inReserves (Detail) - KRW (₩)
₩ in MillionsDec. 31,
2019Dec. 31,
2018Disclosure of reserves within equity [Line Items]Balance at January 1 ₩
(373,442)₩(234,727)
Changes, net of taxes 43,866 (69,911)Balance at December 31 (329,576) (373,442)Increase (decrease) due to application of IFRS 15 [member]Disclosure of reserves within equity [Line Items]Balance at January 1 (68,804)Restated balance [member]Disclosure of reserves within equity [Line Items]Balance at January 1 (303,531)Valuation gain (loss) on financial assets at FVOCI [member]Disclosure of reserves within equity [Line Items]Balance at January 1 (124) 99,407Changes, net of taxes (46,962) (99,531)Balance at December 31 (47,086) (124)Valuation gain (loss) on financial assets at FVOCI [member] | Increase (decrease) due toapplication of IFRS 15 [member]Disclosure of reserves within equity [Line Items]Balance at January 1 99,407Valuation gain (loss) on financial assets at FVOCI [member] | Restated balance [member]Disclosure of reserves within equity [Line Items]Balance at January 1 99,407Valuation gain (loss) on available-for-sale financial assets [Member]Disclosure of reserves within equity [Line Items]Balance at January 1 168,211Valuation gain (loss) on available-for-sale financial assets [Member] | Increase (decrease)due to application of IFRS 15 [member]Disclosure of reserves within equity [Line Items]Balance at January 1 (168,211)Other comprehensive loss of investments in associates [Member]Disclosure of reserves within equity [Line Items]Balance at January 1 (334,637) (320,060)Changes, net of taxes 56,495 (14,577)Balance at December 31 (278,142) (334,637)Other comprehensive loss of investments in associates [Member] | Restated balance[member]Disclosure of reserves within equity [Line Items]Balance at January 1 (320,060)Valuation gain (loss) on derivatives [Member]Disclosure of reserves within equity [Line Items]
Copyright © 2020 www.secdatabase.com. All Rights Reserved.Please Consider the Environment Before Printing This Document

Balance at January 1 (41,601) (73,828)Changes, net of taxes 40,681 32,227Balance at December 31 (920) (41,601)Valuation gain (loss) on derivatives [Member] | Restated balance [member]Disclosure of reserves within equity [Line Items]Balance at January 1 (73,828)Foreign currency translation differences for foreign operations [Member]Disclosure of reserves within equity [Line Items]Balance at January 1 2,920 (9,050)Changes, net of taxes (6,348) 11,970Balance at December 31 ₩
(3,428) 2,920
Foreign currency translation differences for foreign operations [Member] | Restated balance[member]Disclosure of reserves within equity [Line Items]Balance at January 1 ₩
(9,050)
Copyright © 2020 www.secdatabase.com. All Rights Reserved.Please Consider the Environment Before Printing This Document
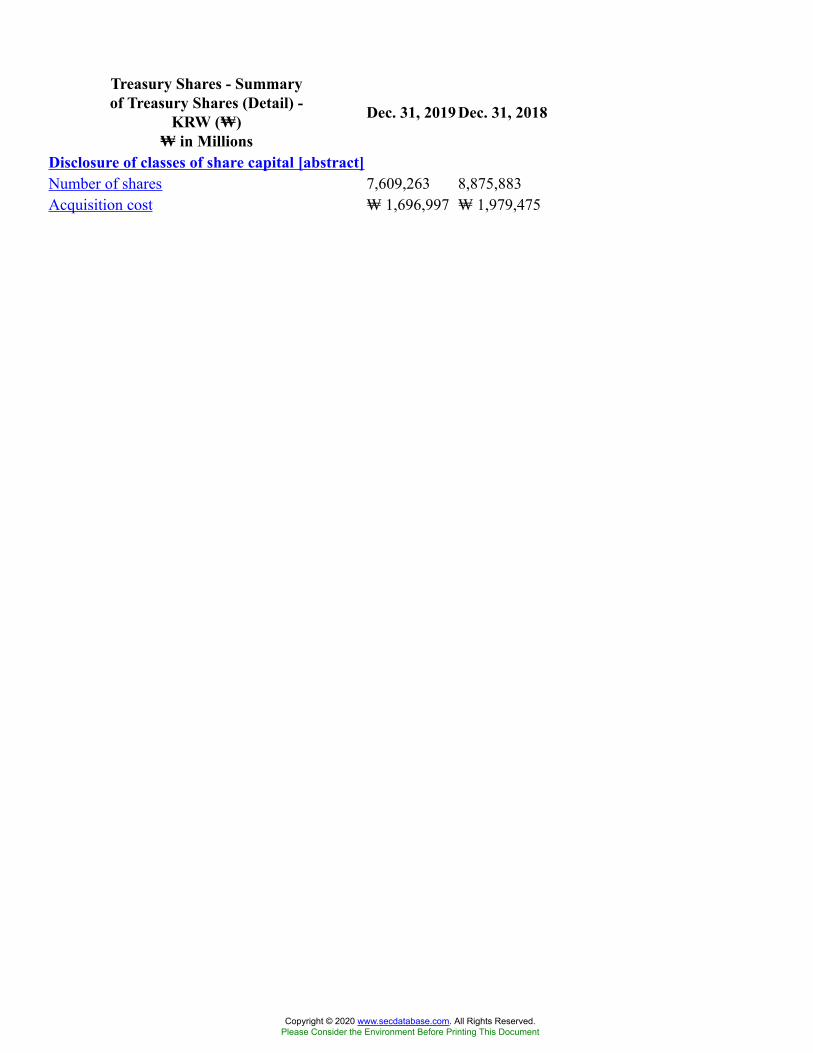
Treasury Shares - Summaryof Treasury Shares (Detail) -
KRW (₩)₩ in Millions
Dec. 31, 2019 Dec. 31, 2018
Disclosure of classes of share capital [abstract]Number of shares 7,609,263 8,875,883Acquisition cost ₩ 1,696,997 ₩ 1,979,475
Copyright © 2020 www.secdatabase.com. All Rights Reserved.Please Consider the Environment Before Printing This Document
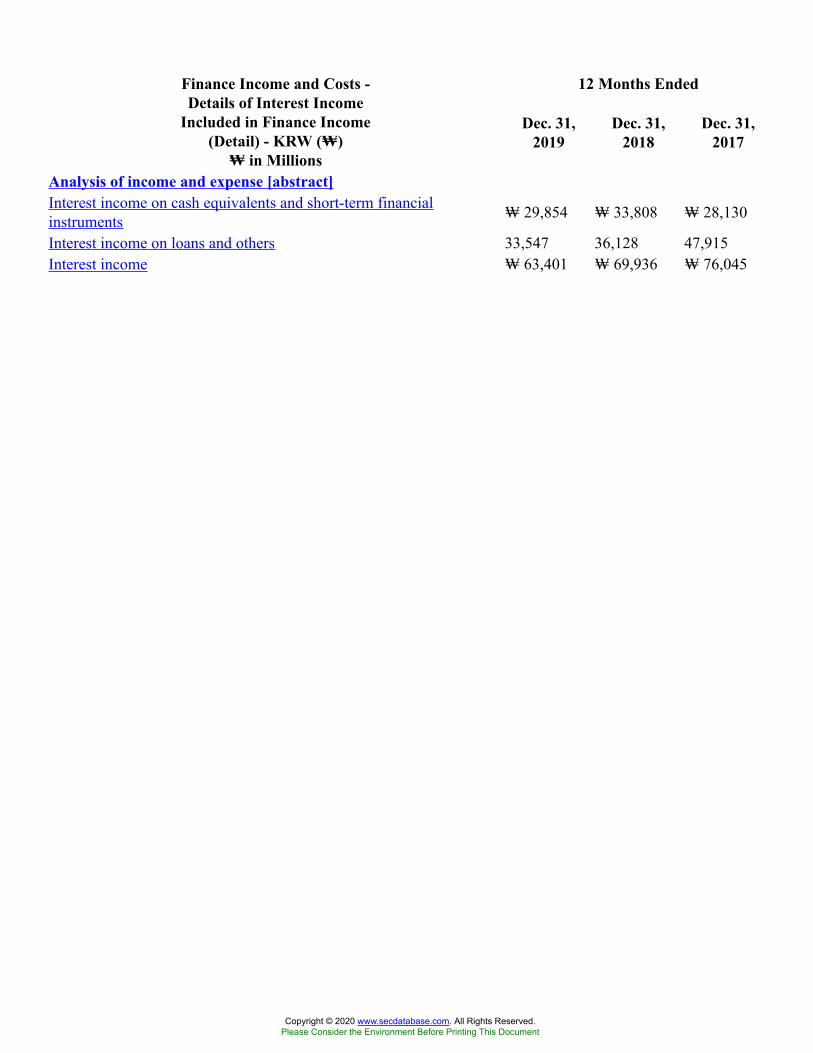
12 Months EndedFinance Income and Costs -Details of Interest Income
Included in Finance Income(Detail) - KRW (₩)
₩ in Millions
Dec. 31,2019
Dec. 31,2018
Dec. 31,2017
Analysis of income and expense [abstract]Interest income on cash equivalents and short-term financialinstruments ₩ 29,854 ₩ 33,808 ₩ 28,130
Interest income on loans and others 33,547 36,128 47,915Interest income ₩ 63,401 ₩ 69,936 ₩ 76,045
Copyright © 2020 www.secdatabase.com. All Rights Reserved.Please Consider the Environment Before Printing This Document
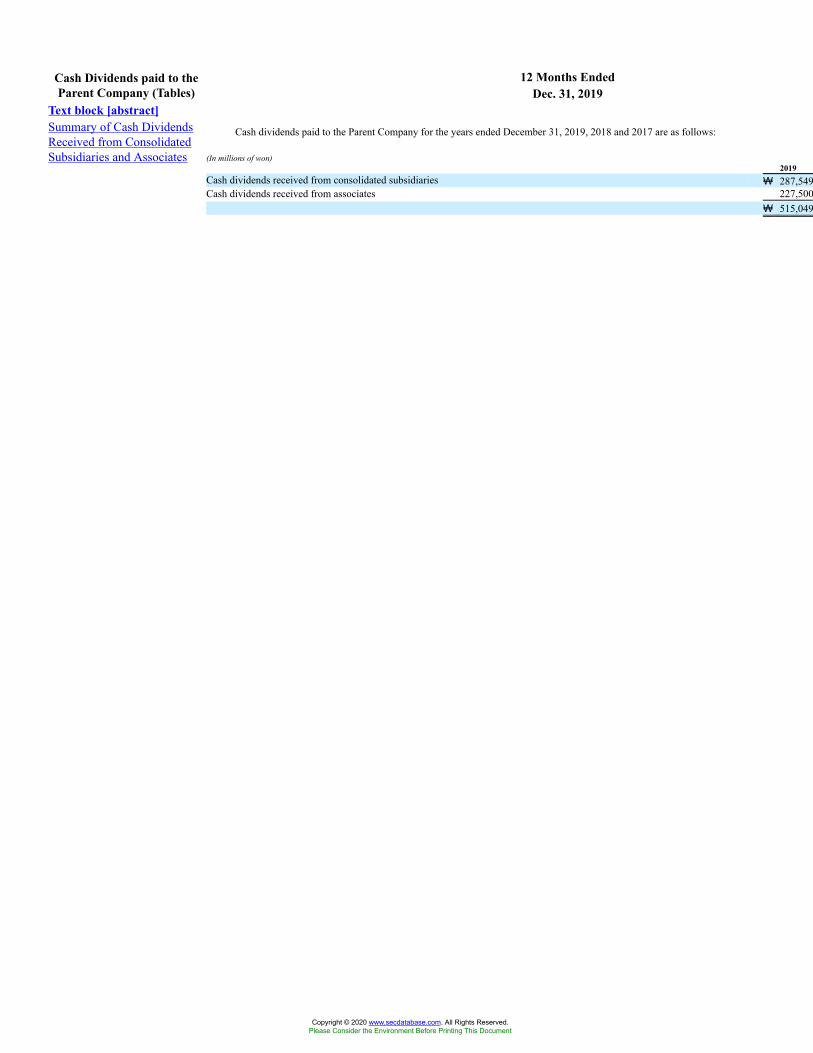
12 Months EndedCash Dividends paid to theParent Company (Tables) Dec. 31, 2019
Text block [abstract]Summary of Cash DividendsReceived from ConsolidatedSubsidiaries and Associates
Cash dividends paid to the Parent Company for the years ended December 31, 2019, 2018 and 2017 are as follows:
(In millions of won)2019 2018 2017
Cash dividends received from consolidated subsidiaries ₩ 287,549 61,985 —Cash dividends received from associates 227,500 149,815 89,063
₩ 515,049 211,800 89,063
Copyright © 2020 www.secdatabase.com. All Rights Reserved.Please Consider the Environment Before Printing This Document
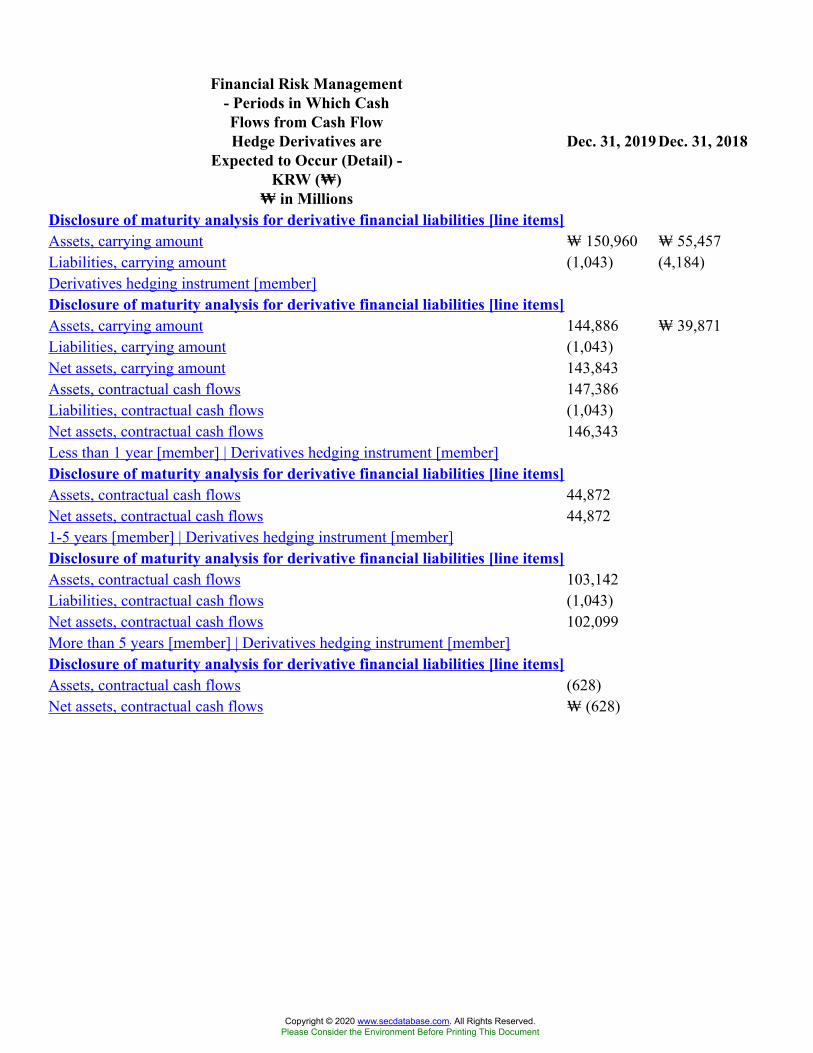
Financial Risk Management- Periods in Which CashFlows from Cash FlowHedge Derivatives are
Expected to Occur (Detail) -KRW (₩)
₩ in Millions
Dec. 31, 2019 Dec. 31, 2018
Disclosure of maturity analysis for derivative financial liabilities [line items]Assets, carrying amount ₩ 150,960 ₩ 55,457Liabilities, carrying amount (1,043) (4,184)Derivatives hedging instrument [member]Disclosure of maturity analysis for derivative financial liabilities [line items]Assets, carrying amount 144,886 ₩ 39,871Liabilities, carrying amount (1,043)Net assets, carrying amount 143,843Assets, contractual cash flows 147,386Liabilities, contractual cash flows (1,043)Net assets, contractual cash flows 146,343Less than 1 year [member] | Derivatives hedging instrument [member]Disclosure of maturity analysis for derivative financial liabilities [line items]Assets, contractual cash flows 44,872Net assets, contractual cash flows 44,8721-5 years [member] | Derivatives hedging instrument [member]Disclosure of maturity analysis for derivative financial liabilities [line items]Assets, contractual cash flows 103,142Liabilities, contractual cash flows (1,043)Net assets, contractual cash flows 102,099More than 5 years [member] | Derivatives hedging instrument [member]Disclosure of maturity analysis for derivative financial liabilities [line items]Assets, contractual cash flows (628)Net assets, contractual cash flows ₩ (628)
Copyright © 2020 www.secdatabase.com. All Rights Reserved.Please Consider the Environment Before Printing This Document
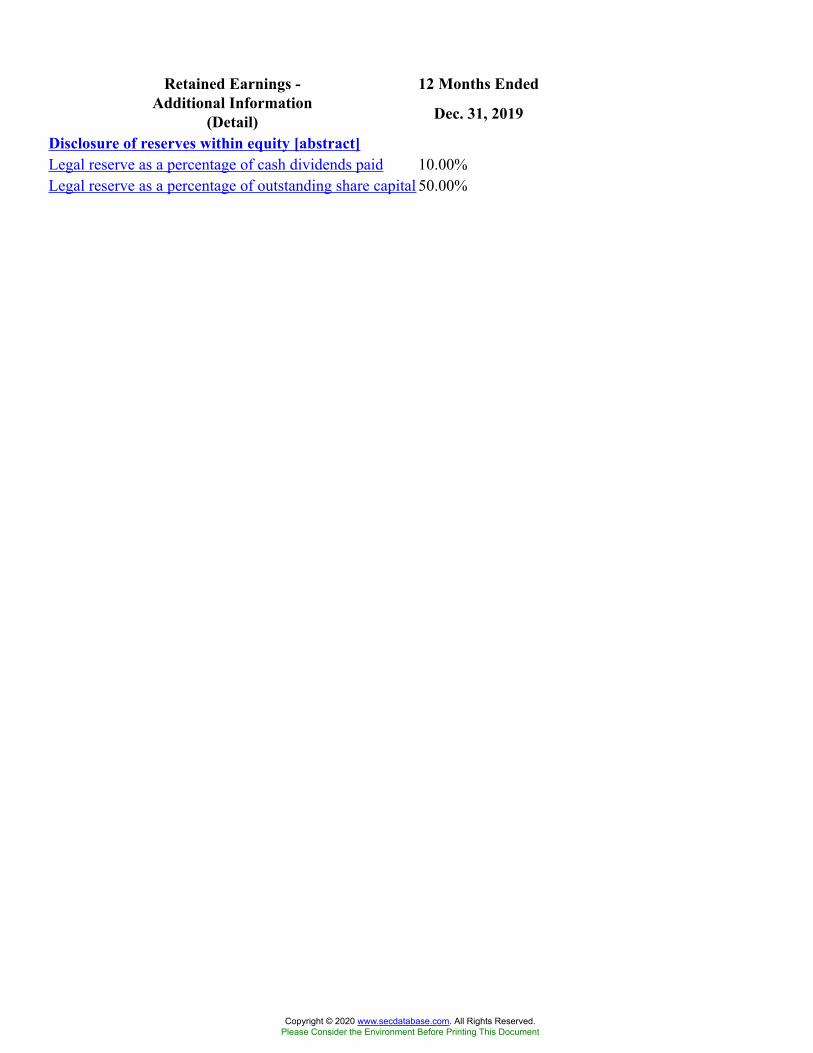
12 Months EndedRetained Earnings -Additional Information
(Detail) Dec. 31, 2019
Disclosure of reserves within equity [abstract]Legal reserve as a percentage of cash dividends paid 10.00%Legal reserve as a percentage of outstanding share capital 50.00%
Copyright © 2020 www.secdatabase.com. All Rights Reserved.Please Consider the Environment Before Printing This Document
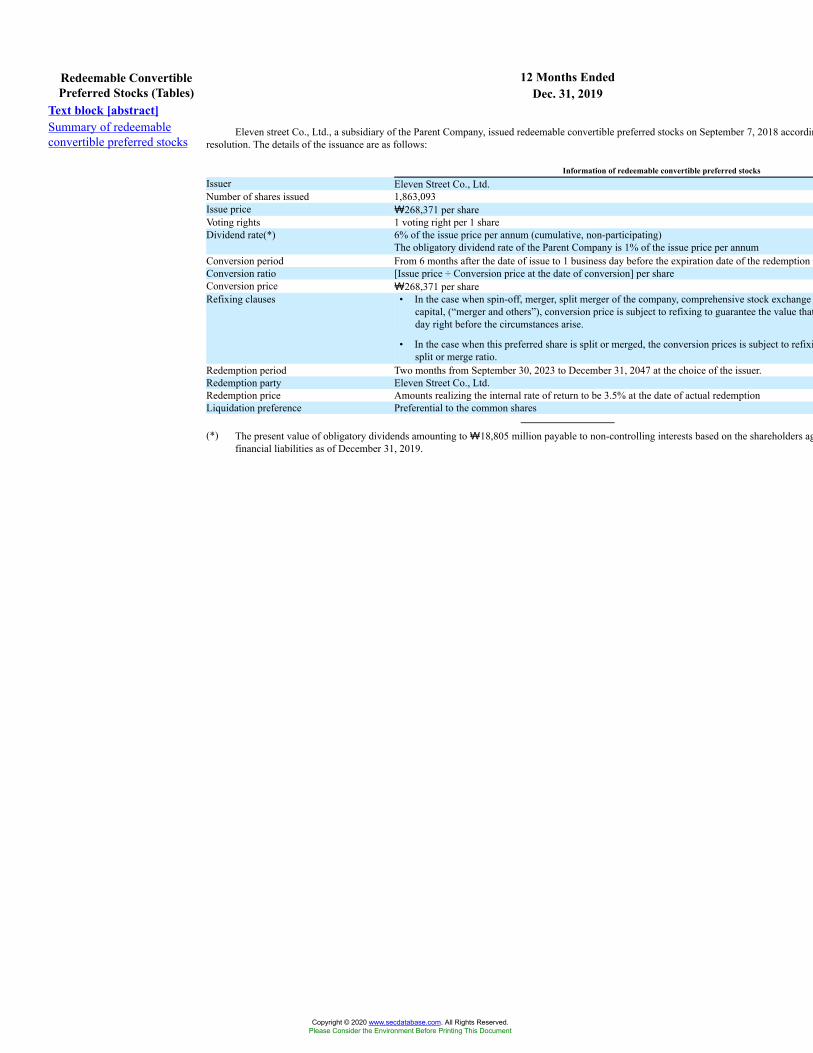
12 Months EndedRedeemable ConvertiblePreferred Stocks (Tables) Dec. 31, 2019
Text block [abstract]Summary of redeemableconvertible preferred stocks
Eleven street Co., Ltd., a subsidiary of the Parent Company, issued redeemable convertible preferred stocks on September 7, 2018 according to the board of directors’resolution. The details of the issuance are as follows:
Information of redeemable convertible preferred stocksIssuer Eleven Street Co., Ltd.Number of shares issued 1,863,093Issue price ₩268,371 per shareVoting rights 1 voting right per 1 shareDividend rate(*) 6% of the issue price per annum (cumulative, non-participating)
The obligatory dividend rate of the Parent Company is 1% of the issue price per annumConversion period From 6 months after the date of issue to 1 business day before the expiration date of the redemption periodConversion ratio [Issue price ÷ Conversion price at the date of conversion] per shareConversion price ₩268,371 per shareRefixing clauses • In the case when spin-off, merger, split merger of the company, comprehensive stock exchange or transfer and decrease in
capital, (“merger and others”), conversion price is subject to refixing to guarantee the value that the holder could earn theday right before the circumstances arise.
• In the case when this preferred share is split or merged, the conversion prices is subject to refixing to correspond with thesplit or merge ratio.
Redemption period Two months from September 30, 2023 to December 31, 2047 at the choice of the issuer.Redemption party Eleven Street Co., Ltd.Redemption price Amounts realizing the internal rate of return to be 3.5% at the date of actual redemptionLiquidation preference Preferential to the common shares
(*) The present value of obligatory dividends amounting to ₩18,805 million payable to non-controlling interests based on the shareholders agreement are recognized asfinancial liabilities as of December 31, 2019.
Copyright © 2020 www.secdatabase.com. All Rights Reserved.Please Consider the Environment Before Printing This Document
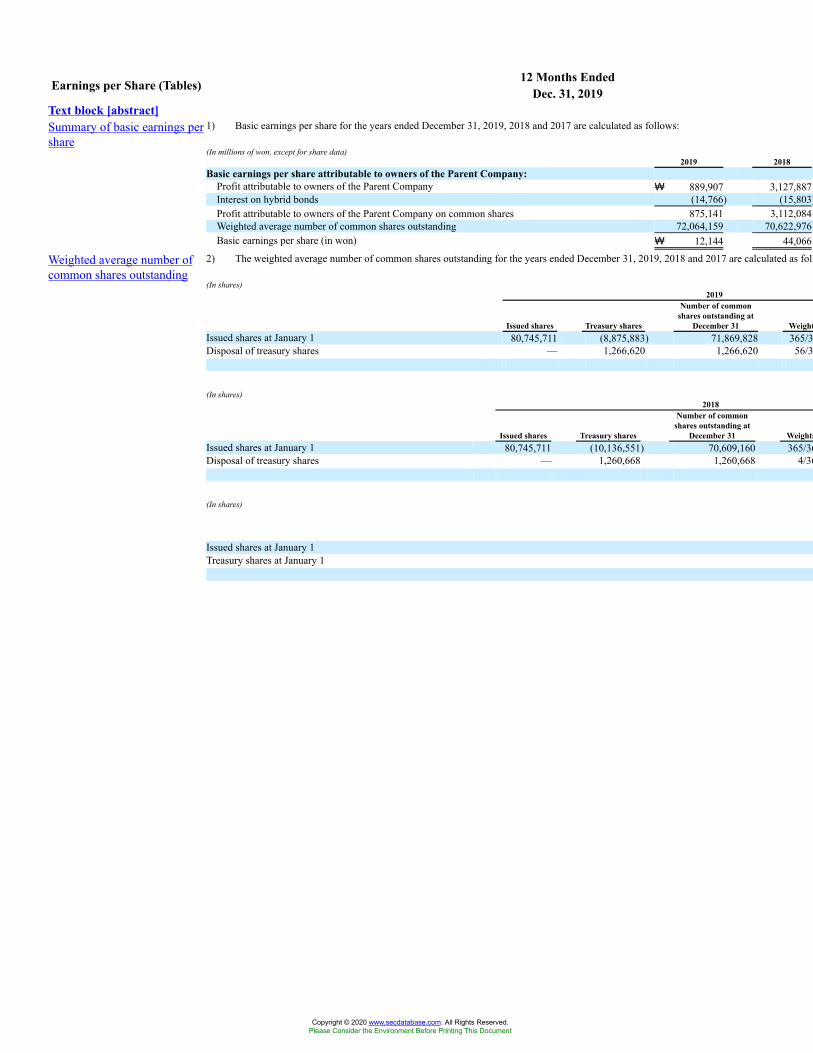
12 Months EndedEarnings per Share (Tables) Dec. 31, 2019Text block [abstract]Summary of basic earnings pershare
1) Basic earnings per share for the years ended December 31, 2019, 2018 and 2017 are calculated as follows:
(In millions of won, except for share data)2019 2018 2017
Basic earnings per share attributable to owners of the Parent Company:Profit attributable to owners of the Parent Company ₩ 889,907 3,127,887 2,599,829Interest on hybrid bonds (14,766) (15,803) (16,840)Profit attributable to owners of the Parent Company on common shares 875,141 3,112,084 2,582,989Weighted average number of common shares outstanding 72,064,159 70,622,976 70,609,160Basic earnings per share (in won) ₩ 12,144 44,066 36,582
Weighted average number ofcommon shares outstanding
2) The weighted average number of common shares outstanding for the years ended December 31, 2019, 2018 and 2017 are calculated as follows:
(In shares)2019
Issued shares Treasury shares
Number of commonshares outstanding at
December 31 Weights
Weighted averagenumber of common
sharesIssued shares at January 1 80,745,711 (8,875,883) 71,869,828 365/365 71,869,828Disposal of treasury shares — 1,266,620 1,266,620 56/365 194,331
72,064,159
(In shares)2018
Issued shares Treasury shares
Number of commonshares outstanding at
December 31 Weights
Weighted averagenumber of common
sharesIssued shares at January 1 80,745,711 (10,136,551) 70,609,160 365/365 70,609,160Disposal of treasury shares — 1,260,668 1,260,668 4/365 13,816
70,622,976
(In shares)2017
Number of commonshares
Issued shares at January 1 80,745,711Treasury shares at January 1 (10,136,551)
70,609,160
Copyright © 2020 www.secdatabase.com. All Rights Reserved.Please Consider the Environment Before Printing This Document
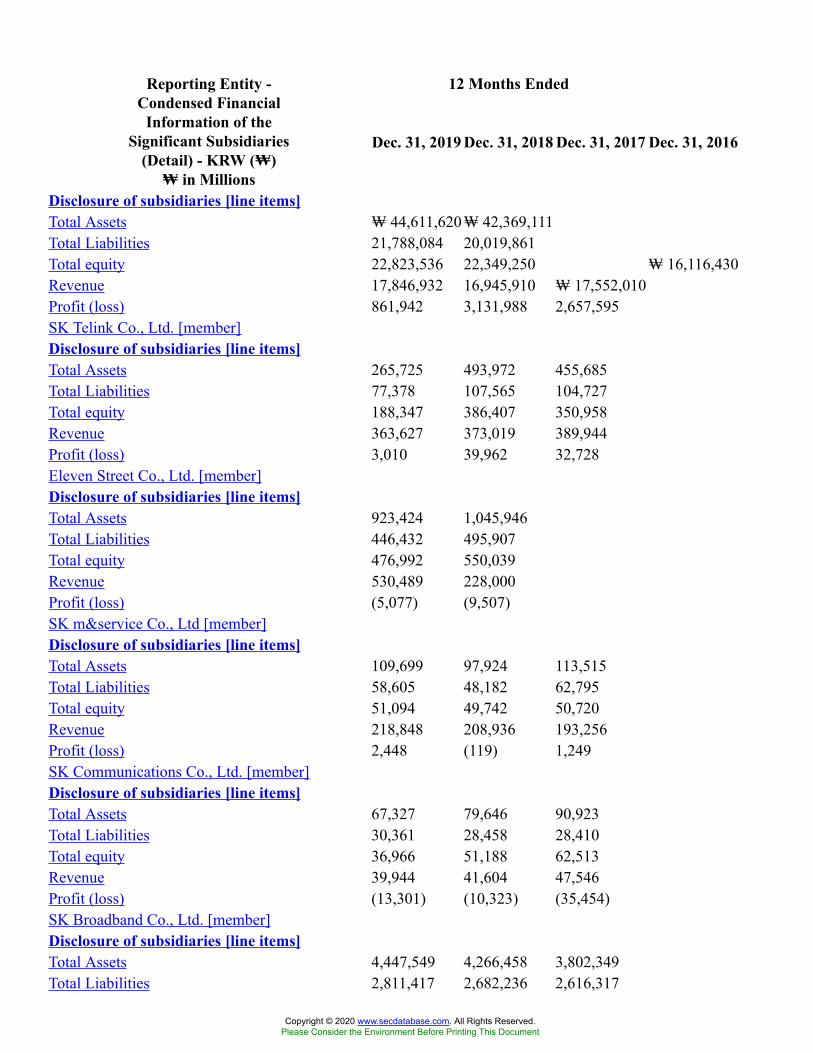
12 Months EndedReporting Entity -Condensed Financial
Information of theSignificant Subsidiaries
(Detail) - KRW (₩)₩ in Millions
Dec. 31, 2019 Dec. 31, 2018 Dec. 31, 2017 Dec. 31, 2016
Disclosure of subsidiaries [line items]Total Assets ₩ 44,611,620₩ 42,369,111Total Liabilities 21,788,084 20,019,861Total equity 22,823,536 22,349,250 ₩ 16,116,430Revenue 17,846,932 16,945,910 ₩ 17,552,010Profit (loss) 861,942 3,131,988 2,657,595SK Telink Co., Ltd. [member]Disclosure of subsidiaries [line items]Total Assets 265,725 493,972 455,685Total Liabilities 77,378 107,565 104,727Total equity 188,347 386,407 350,958Revenue 363,627 373,019 389,944Profit (loss) 3,010 39,962 32,728Eleven Street Co., Ltd. [member]Disclosure of subsidiaries [line items]Total Assets 923,424 1,045,946Total Liabilities 446,432 495,907Total equity 476,992 550,039Revenue 530,489 228,000Profit (loss) (5,077) (9,507)SK m&service Co., Ltd [member]Disclosure of subsidiaries [line items]Total Assets 109,699 97,924 113,515Total Liabilities 58,605 48,182 62,795Total equity 51,094 49,742 50,720Revenue 218,848 208,936 193,256Profit (loss) 2,448 (119) 1,249SK Communications Co., Ltd. [member]Disclosure of subsidiaries [line items]Total Assets 67,327 79,646 90,923Total Liabilities 30,361 28,458 28,410Total equity 36,966 51,188 62,513Revenue 39,944 41,604 47,546Profit (loss) (13,301) (10,323) (35,454)SK Broadband Co., Ltd. [member]Disclosure of subsidiaries [line items]Total Assets 4,447,549 4,266,458 3,802,349Total Liabilities 2,811,417 2,682,236 2,616,317
Copyright © 2020 www.secdatabase.com. All Rights Reserved.Please Consider the Environment Before Printing This Document
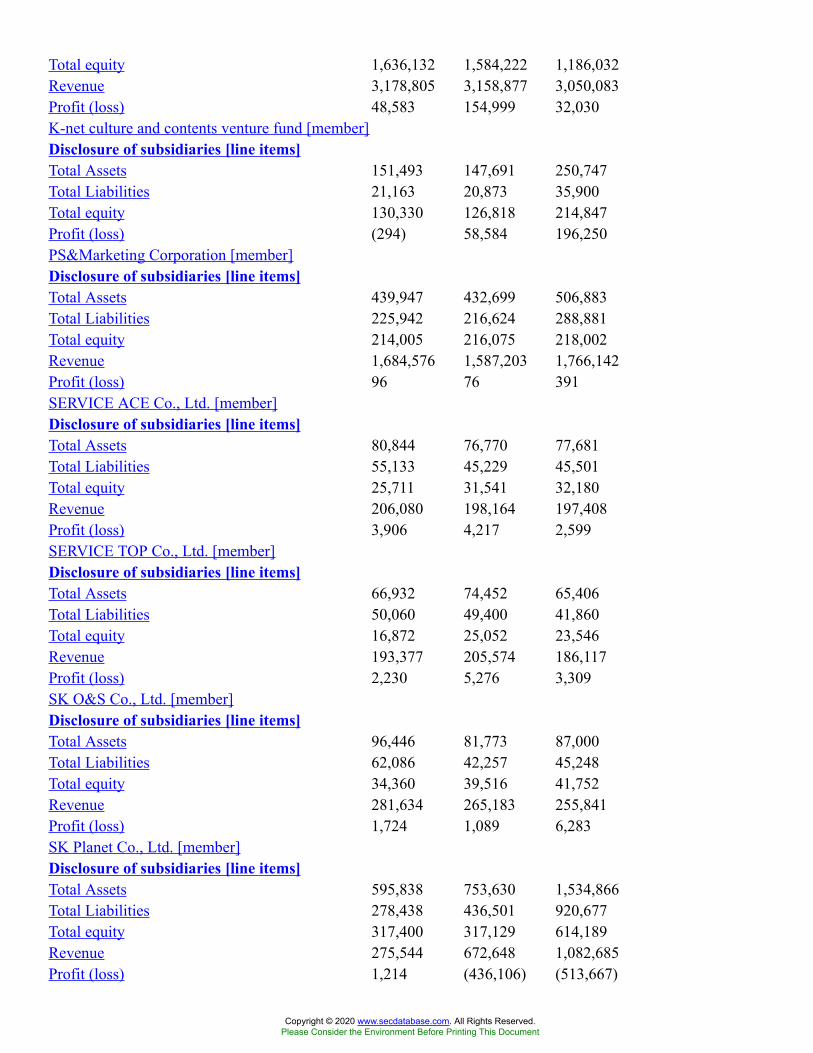
Total equity 1,636,132 1,584,222 1,186,032Revenue 3,178,805 3,158,877 3,050,083Profit (loss) 48,583 154,999 32,030K-net culture and contents venture fund [member]Disclosure of subsidiaries [line items]Total Assets 151,493 147,691 250,747Total Liabilities 21,163 20,873 35,900Total equity 130,330 126,818 214,847Profit (loss) (294) 58,584 196,250PS&Marketing Corporation [member]Disclosure of subsidiaries [line items]Total Assets 439,947 432,699 506,883Total Liabilities 225,942 216,624 288,881Total equity 214,005 216,075 218,002Revenue 1,684,576 1,587,203 1,766,142Profit (loss) 96 76 391SERVICE ACE Co., Ltd. [member]Disclosure of subsidiaries [line items]Total Assets 80,844 76,770 77,681Total Liabilities 55,133 45,229 45,501Total equity 25,711 31,541 32,180Revenue 206,080 198,164 197,408Profit (loss) 3,906 4,217 2,599SERVICE TOP Co., Ltd. [member]Disclosure of subsidiaries [line items]Total Assets 66,932 74,452 65,406Total Liabilities 50,060 49,400 41,860Total equity 16,872 25,052 23,546Revenue 193,377 205,574 186,117Profit (loss) 2,230 5,276 3,309SK O&S Co., Ltd. [member]Disclosure of subsidiaries [line items]Total Assets 96,446 81,773 87,000Total Liabilities 62,086 42,257 45,248Total equity 34,360 39,516 41,752Revenue 281,634 265,183 255,841Profit (loss) 1,724 1,089 6,283SK Planet Co., Ltd. [member]Disclosure of subsidiaries [line items]Total Assets 595,838 753,630 1,534,866Total Liabilities 278,438 436,501 920,677Total equity 317,400 317,129 614,189Revenue 275,544 672,648 1,082,685Profit (loss) 1,214 (436,106) (513,667)
Copyright © 2020 www.secdatabase.com. All Rights Reserved.Please Consider the Environment Before Printing This Document
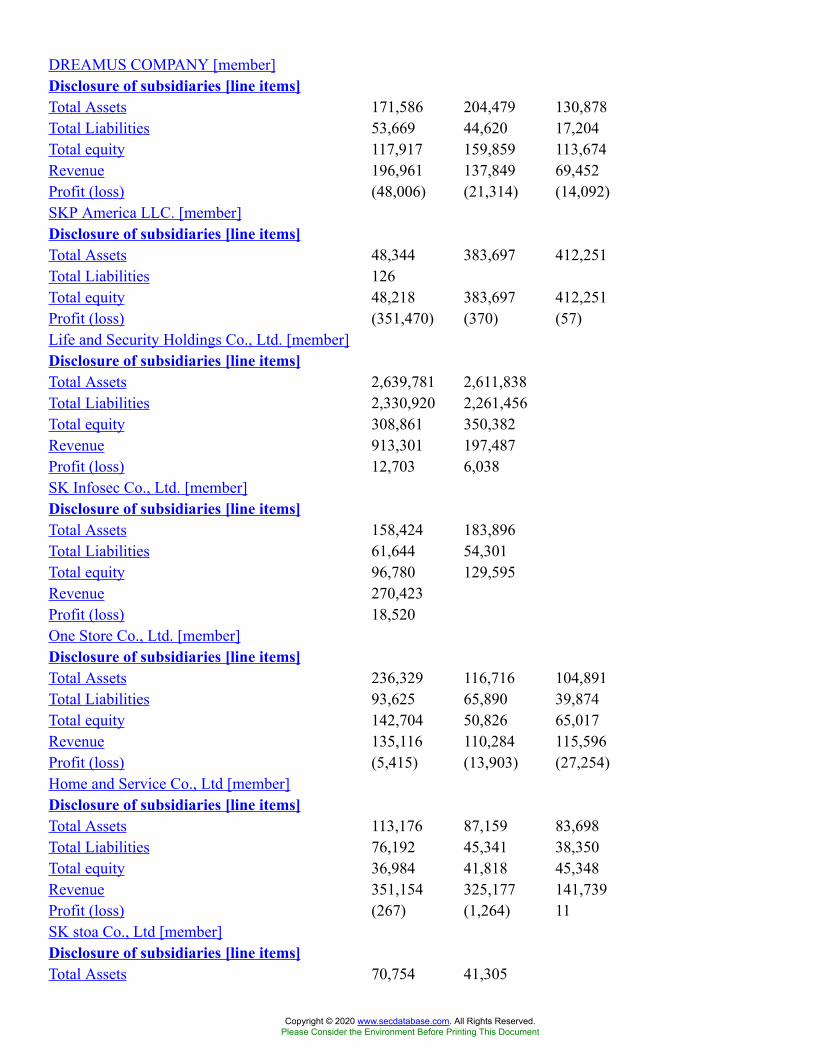
DREAMUS COMPANY [member]Disclosure of subsidiaries [line items]Total Assets 171,586 204,479 130,878Total Liabilities 53,669 44,620 17,204Total equity 117,917 159,859 113,674Revenue 196,961 137,849 69,452Profit (loss) (48,006) (21,314) (14,092)SKP America LLC. [member]Disclosure of subsidiaries [line items]Total Assets 48,344 383,697 412,251Total Liabilities 126Total equity 48,218 383,697 412,251Profit (loss) (351,470) (370) (57)Life and Security Holdings Co., Ltd. [member]Disclosure of subsidiaries [line items]Total Assets 2,639,781 2,611,838Total Liabilities 2,330,920 2,261,456Total equity 308,861 350,382Revenue 913,301 197,487Profit (loss) 12,703 6,038SK Infosec Co., Ltd. [member]Disclosure of subsidiaries [line items]Total Assets 158,424 183,896Total Liabilities 61,644 54,301Total equity 96,780 129,595Revenue 270,423Profit (loss) 18,520One Store Co., Ltd. [member]Disclosure of subsidiaries [line items]Total Assets 236,329 116,716 104,891Total Liabilities 93,625 65,890 39,874Total equity 142,704 50,826 65,017Revenue 135,116 110,284 115,596Profit (loss) (5,415) (13,903) (27,254)Home and Service Co., Ltd [member]Disclosure of subsidiaries [line items]Total Assets 113,176 87,159 83,698Total Liabilities 76,192 45,341 38,350Total equity 36,984 41,818 45,348Revenue 351,154 325,177 141,739Profit (loss) (267) (1,264) 11SK stoa Co., Ltd [member]Disclosure of subsidiaries [line items]Total Assets 70,754 41,305
Copyright © 2020 www.secdatabase.com. All Rights Reserved.Please Consider the Environment Before Printing This Document
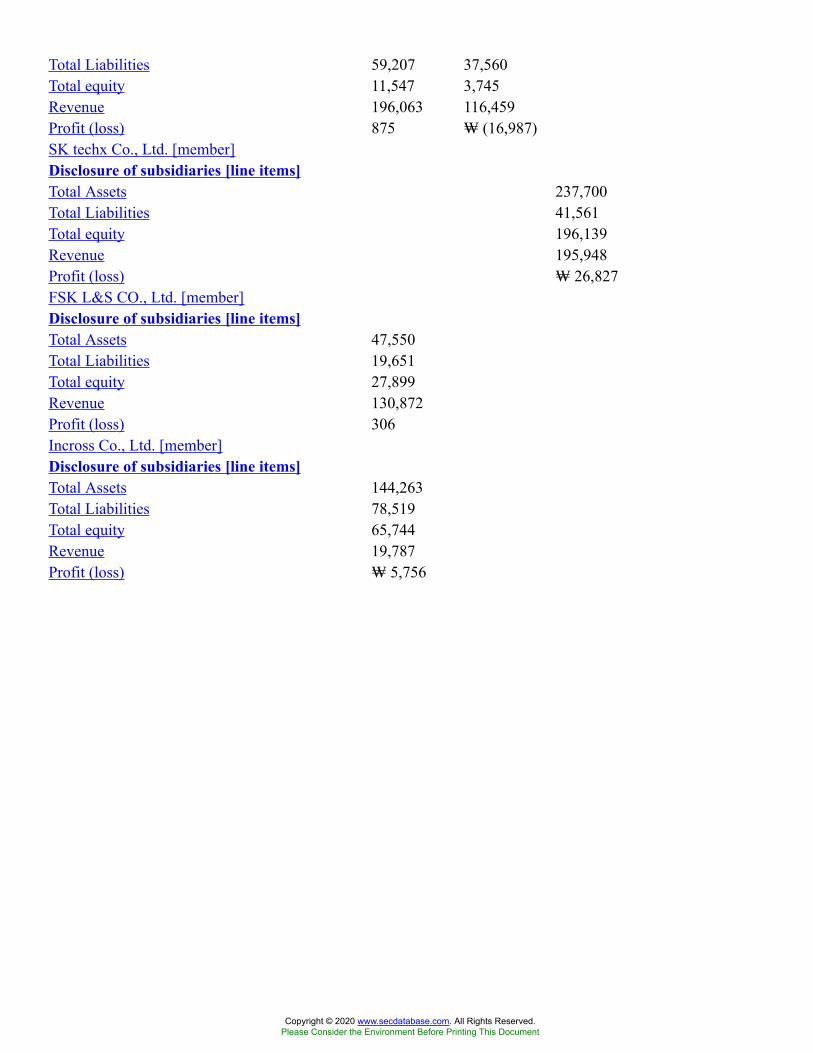
Total Liabilities 59,207 37,560Total equity 11,547 3,745Revenue 196,063 116,459Profit (loss) 875 ₩ (16,987)SK techx Co., Ltd. [member]Disclosure of subsidiaries [line items]Total Assets 237,700Total Liabilities 41,561Total equity 196,139Revenue 195,948Profit (loss) ₩ 26,827FSK L&S CO., Ltd. [member]Disclosure of subsidiaries [line items]Total Assets 47,550Total Liabilities 19,651Total equity 27,899Revenue 130,872Profit (loss) 306Incross Co., Ltd. [member]Disclosure of subsidiaries [line items]Total Assets 144,263Total Liabilities 78,519Total equity 65,744Revenue 19,787Profit (loss) ₩ 5,756
Copyright © 2020 www.secdatabase.com. All Rights Reserved.Please Consider the Environment Before Printing This Document
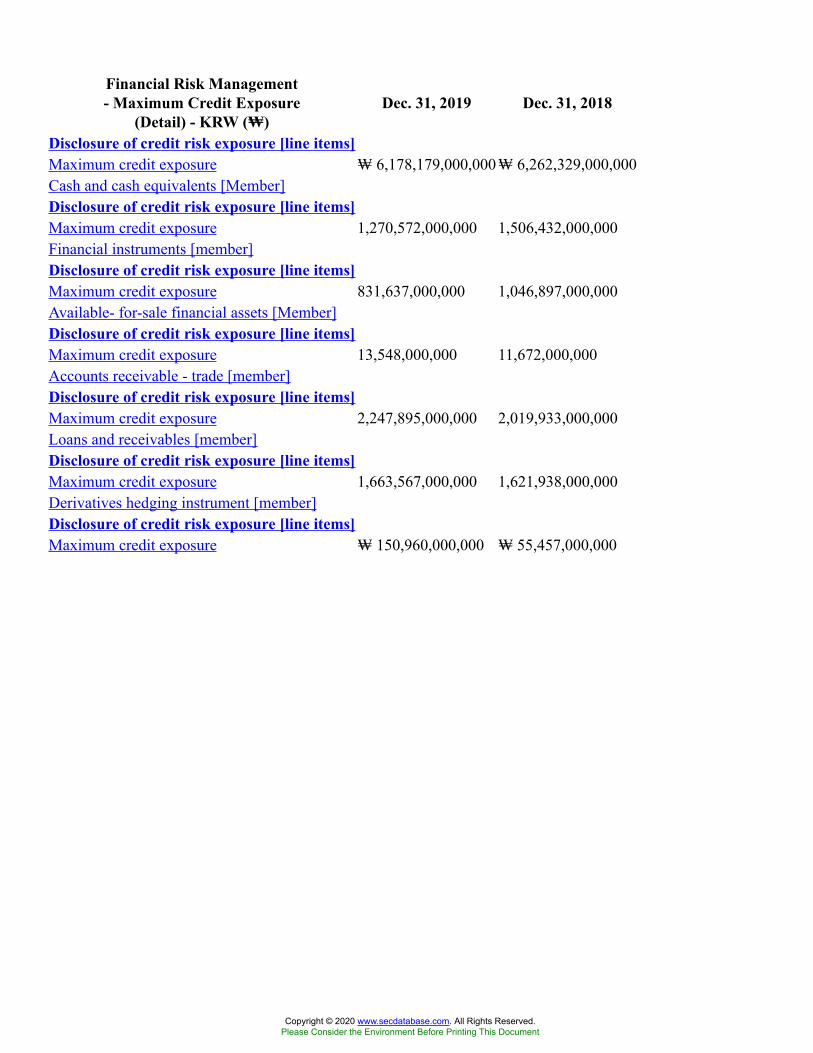
Financial Risk Management- Maximum Credit Exposure
(Detail) - KRW (₩)Dec. 31, 2019 Dec. 31, 2018
Disclosure of credit risk exposure [line items]Maximum credit exposure ₩ 6,178,179,000,000 ₩ 6,262,329,000,000Cash and cash equivalents [Member]Disclosure of credit risk exposure [line items]Maximum credit exposure 1,270,572,000,000 1,506,432,000,000Financial instruments [member]Disclosure of credit risk exposure [line items]Maximum credit exposure 831,637,000,000 1,046,897,000,000Available- for-sale financial assets [Member]Disclosure of credit risk exposure [line items]Maximum credit exposure 13,548,000,000 11,672,000,000Accounts receivable - trade [member]Disclosure of credit risk exposure [line items]Maximum credit exposure 2,247,895,000,000 2,019,933,000,000Loans and receivables [member]Disclosure of credit risk exposure [line items]Maximum credit exposure 1,663,567,000,000 1,621,938,000,000Derivatives hedging instrument [member]Disclosure of credit risk exposure [line items]Maximum credit exposure ₩ 150,960,000,000 ₩ 55,457,000,000
Copyright © 2020 www.secdatabase.com. All Rights Reserved.Please Consider the Environment Before Printing This Document