MEXICAN PETROLEUM Form 20-F Filed 2018-04-30
886
Business Address AVENIDA MARINA NACIONAL NO. 329 COLONIA VERONICA ANZURES MEXICO CITY O5 11300 5255-1944-2500 Mailing Address AVENIDA MARINA NACIONAL NO. 329 COLONIA VERONICA ANZURES MEXICO CITY O5 11300 SECURITIES AND EXCHANGE COMMISSION FORM 20-F Annual and transition report of foreign private issuers pursuant to sections 13 or 15(d) Filing Date: 2018-04-30 | Period of Report: 2017-12-31 SEC Accession No. 0001193125-18-143901 (HTML Version on secdatabase.com) FILER MEXICAN PETROLEUM CIK:932782| IRS No.: 000000000 | State of Incorp.:O5 | Fiscal Year End: 1231 Type: 20-F | Act: 34 | File No.: 000-00099 | Film No.: 18791695 SIC: 1311 Crude petroleum & natural gas Copyright © 2018 www.secdatabase.com . All Rights Reserved. Please Consider the Environment Before Printing This Document
-
Upload
khangminh22 -
Category
Documents
-
view
0 -
download
0
Transcript of MEXICAN PETROLEUM Form 20-F Filed 2018-04-30

Business AddressAVENIDA MARINANACIONAL NO. 329COLONIA VERONICAANZURESMEXICO CITY O5 113005255-1944-2500
Mailing AddressAVENIDA MARINANACIONAL NO. 329COLONIA VERONICAANZURESMEXICO CITY O5 11300
SECURITIES AND EXCHANGE COMMISSION
FORM 20-FAnnual and transition report of foreign private issuers pursuant to sections 13 or 15(d)
Filing Date: 2018-04-30 | Period of Report: 2017-12-31SEC Accession No. 0001193125-18-143901
(HTML Version on secdatabase.com)
FILERMEXICAN PETROLEUMCIK:932782| IRS No.: 000000000 | State of Incorp.:O5 | Fiscal Year End: 1231Type: 20-F | Act: 34 | File No.: 000-00099 | Film No.: 18791695SIC: 1311 Crude petroleum & natural gas
Copyright © 2018 www.secdatabase.com. All Rights Reserved.Please Consider the Environment Before Printing This Document
Table of Contents
UNITED STATESSECURITIES AND EXCHANGE COMMISSION
WASHINGTON, D.C. 20549
FORM 20-FANNUAL REPORT PURSUANT TO SECTION 13 OR 15(d) OF THE SECURITIES EXCHANGE ACT OF 1934
for the fiscal year ended December 31, 2017Commission File Number 0-99
PETRÓLEOS MEXICANOS(Exact name of registrant as specified in its charter)
Mexican Petroleum United Mexican States(Translation of registrant�s name into English) (Jurisdiction of incorporation or organization)
Avenida Marina Nacional No. 329Colonia Verónica Anzures
11300 Ciudad de México, México(Address of principal executive offices)
Jaime José del Río Castillo(5255) 1944 [email protected]
Avenida Marina Nacional No. 329Torre Ejecutiva, Piso 38 Colonia Verónica Anzures
11300 Ciudad de México, México(Name, telephone, e-mail and/or facsimile number
and address of company contact person)
Securities registered or to be registered pursuant to Section 12(b) of the Act. NoneSecurities registered or to be registered pursuant to Section 12(g) of the Act. None
Securities for which there is a reporting obligation pursuant to Section 15(d) of the Act.Title of Each Class
3.500% Notes due 2018 Floating Rate Notes due 20183.125% Notes due 2019 5.500% Notes due 2019
8.00% Guaranteed Notes due 2019 3.500% Notes due 20206.000% Notes due 2020 6.375% Notes due 20215.50% Notes due 2021 4.875% Notes due 20225.375% Notes due 2022 Floating Rate Notes due 20228.625% Bonds due 2022 3.500% Notes due 20234.625% Notes due 2023 8.625% Guaranteed Bonds due 20234.875% Notes due 2024 4.250% Notes due 20254.500% Notes due 2026 6.875% Notes due 2026
9.50% Guaranteed Bonds due 2027 9.50% Global Guaranteed Bonds due 20276.500% Notes Due 2027 6.625% Guaranteed Bonds due 2035
6.625% Guaranteed Bonds due 2038 6.500% Bonds due 20415.50% Bonds due 2044 6.375% Bonds due 20455.625% Bonds due 2046 6.750% Bonds due 2047Indicate by check mark if the registrant is a well-known seasoned issuer, as defined in Rule 405 of the Securities Act.
Yes ☐ No ☒If this report is an annual or transition report, indicate by check mark if the registrant is not required to file reports pursuant to Section 13 or 15(d) of the Securities Exchange Act of 1934.
Yes ☐ No ☒Indicate by check mark whether the registrant (1) has filed all reports required to be filed by Section 13 or 15(d) of the Securities Exchange Act of 1934 during the preceding 12 months (or
for such shorter period that the registrant was required to file such reports), and (2) has been subject to such filing requirements for the past 90 days.Yes ☒ No ☐
Indicate by check mark whether the registrant has submitted electronically and posted on its corporate Web site, if any, every Interactive Data File required to be submitted and postedpursuant to Rule 405 of Regulation S-T (§ 232.405 of this chapter) during the preceding 12 months (or for such shorter period that the registrant was required to submit and post such files).
Yes ☒ No ☐Indicate by check mark whether the registrant is a large accelerated filer, an accelerated filer, a non-accelerated filer, or an emerging growth company. See definitions of �large accelerated
filer,� �accelerated filer,� and �emerging growth company� in Rule 12b-2 of the Exchange Act. (Check one):
Large accelerated filer ☐ Accelerated filer ☐Non-accelerated filer ☒ Emerging growth company ☐
If an emerging growth company that prepares its financial statements in accordance with U.S. GAAP, indicate by check mark if the registrant has elected not to use the extended transitionperiod for complying with any new or revised financial accounting standards provided pursuant to Section 13(a) of the Exchange Act. ☐
� The term �new or revised financial accounting standard� refers to any update issued by the Financial Accounting Standards Board to its Accounting Standards Codification after April 5,2012.
Indicate by check mark which basis of accounting the registrant has used to prepare the financial statements included in this filing:U.S. GAAP ☐ IFRS as issued by the IASB ☒ Other ☐
If �Other� has been checked in response to the previous question, indicate by check mark which financial statement item the registrant has elected to follow.Item 17 ☐ Item 18 ☐
If this is an annual report, indicate by check mark whether the registrant is a shell company (as defined in Rule 12b-2 of the Exchange Act).Yes ☐ No ☒
Copyright © 2018 www.secdatabase.com. All Rights Reserved.Please Consider the Environment Before Printing This Document

Copyright © 2018 www.secdatabase.com. All Rights Reserved.Please Consider the Environment Before Printing This Document

Table of ContentsTABLE OF CONTENTS
Item 1. Identity of Directors, Senior Management and Advisers 5
Item 2. Offer Statistics and Expected Timetable 5
Item 3. Key Information 5
Item 4. Information on the Company 19
Item 4A. Unresolved Staff Comments 137
Item 5. Operating and Financial Review and Prospects 137
Item 6. Directors, Senior Management and Employees 177
Item 7. Major Shareholders and Related Party Transactions 200
Item 8. Financial Information 203
Item 9. The Offer and Listing 208
Item 10. Additional Information 208
Item 11. Quantitative and Qualitative Disclosures About Market Risk 217
Item 12. Description of Securities Other than Equity Securities 229
Item 13. Defaults, Dividend Arrearages and Delinquencies 230
Item 14. Material Modifications to the Rights of Security Holders and Use of Proceeds 230
Item 15. Controls and Procedures 230
Item 16A. Audit Committee Financial Expert 233
Item 16B. Code of Ethics 233
Item 16C. Principal Accountant Fees and Services 234
Item 16D. Exemptions from the Listing Standards for Audit Committees 235
Item 16E. Purchases of Equity Securities by the Issuer and Affiliated Purchasers 235
Item 16F. Change in Registrant�s Certifying Accountant 235
Item 16G. Corporate Governance 235
Item 16H. Mine Safety Disclosure 235
Item 17. Financial Statements 236
Item 18. Financial Statements 236
Item 19. Exhibits 236
i
Copyright © 2018 www.secdatabase.com. All Rights Reserved.Please Consider the Environment Before Printing This Document

Table of ContentsPetróleos Mexicanos and its seven subsidiary entities, which we refer to as the subsidiary entities, Pemex Exploración y Producción (Pemex
Exploration and Production), Pemex Transformación Industrial (Pemex Industrial Transformation), Pemex Perforación y Servicios (Pemex Drilling andServices), Pemex Logística (Pemex Logistics), Pemex Cogeneración y Servicios (Pemex Cogeneration and Services), Pemex Fertilizantes (PemexFertilizers) and Pemex Etileno (Pemex Ethylene), comprise the state oil and gas company of the United Mexican States, which we refer to as Mexico.Petróleos Mexicanos is a productive state-owned company of the Federal Government of Mexico, which we refer to as the Mexican Government, andeach of the subsidiary entities is a productive state-owned subsidiary of Mexico. Each of Petróleos Mexicanos and the subsidiary entities is a legal entityempowered to own property and carry on business in its own name. In addition, a number of subsidiary companies that are defined in Note 1 and listedin Note 4 to our consolidated financial statements incorporated in Item 18, which we refer to as our subsidiary companies, are incorporated into theconsolidated financial statements; these subsidiary companies are also identified with their corresponding ownership percentages in ���ConsolidatedStructure of PEMEX� on page 4. As further described under �Item 4�Information on the Company�History and Development�CorporateReorganization,� the seven new subsidiary entities assumed, on or prior to, November 1, 2015, all of the rights and obligations of the prior subsidiaryentities of Petróleos Mexicanos�Pemex-Exploración y Producción (Pemex-Exploration and Production), Pemex-Refinación (Pemex-Refining),Pemex-Gas y Petroquímica Básica (Pemex-Gas and Basic Petrochemicals) and Pemex-Petroquímica (Pemex-Petrochemicals). References to thesubsidiary entities prior to this corporate reorganization refer to Pemex-Exploration and Production, Pemex-Refining, Pemex-Gas and BasicPetrochemicals and Pemex-Petrochemicals. Petróleos Mexicanos, the subsidiary entities and the subsidiary companies are collectively referred to as�PEMEX� or �we.� See �Item 4�Information on the Company�History and Development�Energy Reform� for more details.
References herein to �U.S. $,� �$,� �U.S. dollars� or �dollars� are to United States dollars. References herein to �pesos� or �Ps.� are to the legalcurrency of Mexico. References herein to �euros� or ��� are to the legal currency of the European Economic and Monetary Union. References herein to�pounds� or �£� are to the legal currency of the United Kingdom. References herein to �Swiss francs� are to the legal currency of the SwissConfederation. References herein to �Japanese yen� or �¥� are to the legal currency of Japan. References herein to �Australian dollars� are to the legalcurrency of Australia. The term �billion� as used herein means one thousand million.
Our consolidated financial statements included in this annual report were prepared in accordance with International Financial Reporting Standardsas issued by the International Accounting Standards Board. We refer in this report to �International Financial Reporting Standards as issued by theInternational Accounting Standards Board� as IFRS. In addition, these financial statements were audited in accordance with the International Standardson Auditing, as required by the Ley del Mercado de Valores (Securities Market Law) and the Disposiciones de carácter general aplicables a lasemisoras de valores y a otros participantes del mercado de valores (General Provisions applicable to issuers of securities and other participants in thesecurities market) in each case, of Mexico, for purposes of filing with the Comisión Nacional Bancaria y de Valores (National Banking and SecuritiesCommission, or the CNBV) and the Bolsa Mexicana de Valores, S.A.B. de C.V. (Mexican Stock Exchange), and in accordance with the standards of thePublic Company Accounting Oversight Board (United States), or PCAOB, for purposes of filings with the U.S. Securities and Exchange Commission,or the SEC.
The regulations of the SEC do not require foreign private issuers that prepare their financial statements on the basis of IFRS to reconcile suchfinancial statements to United States Generally Accepted Accounting Principles, which we refer to as U.S. GAAP. Accordingly, while we have in thepast reconciled our consolidated financial statements prepared in accordance with Normas de Información Financiera Mexicanas (Mexican FinancialReporting Standards) to U.S. GAAP, those reconciliations are no longer presented in our filings with the SEC. We do, however, continue to provide thedisclosure required under the U.S. Financial Accounting Standards Board Accounting Standards Codification (ASC) Topic 932 �ExtractiveActivities�Oil and Gas� (which we refer to as ASC Topic 932), as this is required regardless of the basis of accounting on which we prepare ourfinancial statements.
Copyright © 2018 www.secdatabase.com. All Rights Reserved.Please Consider the Environment Before Printing This Document
Table of ContentsWe maintain our consolidated financial statements and accounting records in pesos. Unless otherwise indicated, we have translated all peso
amounts to U.S. dollars in this Form 20-F, including all convenience translations of our consolidated financial statements included herein, at anexchange rate of Ps. 19.7867 = U.S. $1.00, which is the exchange rate that the Secretaría de Hacienda y Crédito Público (Ministry of Finance andPublic Credit) instructed us to use on December 31, 2017. You should not construe these translations from pesos into dollars as actually representingsuch U.S. dollar amounts or meaning that you could convert such amounts into U.S. dollars at the rates indicated. Mexico has a free market for foreignexchange, and the Mexican Government allows the peso to float freely against the U.S. dollar. There can be no assurance that the Mexican Governmentwill maintain its current policies with regard to the peso or that the peso will not depreciate or appreciate significantly in the future. Due to the volatilityof the peso/U.S. dollar exchange rate, the exchange rate on any date subsequent to the date hereof could be materially different from the rate indicatedabove. See �Item 3�Key Information�Exchange Rates� for information regarding the rates of exchange between pesos and U.S. dollars.
PRESENTATION OF INFORMATION CONCERNING RESERVES
The proved hydrocarbon reserves included in this report for the year ended December 31, 2017 are those that we have the right to extract and sellbased on assignments granted by the Mexican Government to us in August 2014 through the process commonly referred to as Round Zero and theassignments we have received in subsequent bidding rounds conducted by the Mexican Government. See �Item 4�Information on the Company�Historyand Development�Energy Reform� for a description of the Round Zero process.
The estimates of our proved reserves of crude oil and natural gas for the five years ended December 31, 2017 included in this report have beencalculated according to the technical definitions required by the SEC. DeGolyer and MacNaughton, Netherland, Sewell International, S. de R.L. de C.V.(which we refer to as Netherland Sewell) and Ryder Scott Company, L.P. (which we refer to as Ryder Scott) conducted reserves audits of our estimatesof our proved hydrocarbon reserves as of December 31, 2017 or January 1, 2018, as applicable. All reserves estimates involve some degree ofuncertainty. For a description of the risks relating to reserves and reserves estimates, see �Item 3�Key Information�Risk Factors�Risk Factors Related toour Relationship with the Mexican Government� Information on Mexico�s hydrocarbon reserves is based on estimates, which are uncertain and subjectto revisions,� ��We must make significant capital expenditures to maintain our current production levels, and to maintain, as well as increase, theproved hydrocarbon reserves assigned to us by the Mexican Government. Reductions in our income, adjustments to our capital expenditures budget andour inability to obtain financing may limit our ability to make capital investments� and ��The Mexican nation, not us, owns the hydrocarbon reserveslocated in the subsoil in Mexico and our right to continue to extract these reserves is subject to the approval of the Ministry of Energy.�
FORWARD-LOOKING STATEMENTS
This Form 20-F contains words, such as �believe,� �expect,� �anticipate� and similar expressions that identify forward-looking statements, whichreflect our views about future events and financial performance. We have made forward-looking statements that address, among other things, our:
� exploration and production activities, including drilling;
� activities relating to import, export, refining, petrochemicals and transportation, storage and distribution of petroleum, natural gas and oilproducts;
� activities relating to our lines of business, including the generation of electricity;
� projected and targeted capital expenditures and other costs, commitments and revenues;
� trends in international crude oil and natural gas prices;
2
Copyright © 2018 www.secdatabase.com. All Rights Reserved.Please Consider the Environment Before Printing This Document

Table of Contents� liquidity and sources of funding, including our ability to continue operating as a going concern;
� farm-outs, joint ventures and strategic alliances with other companies; and
� the monetization of certain of our assets.
Actual results could differ materially from those projected in such forward-looking statements as a result of various factors that may be beyondour control. These factors include, but are not limited to:
� changes in international crude oil and natural gas prices;
� effects on us from competition, including on our ability to hire and retain skilled personnel;
� limitations on our access to sources of financing on competitive terms;
� our ability to find, acquire or gain access to additional reserves and to develop, either on our own or with our strategic partners, the reservesthat we obtain successfully;
� our ability to successfully identify partners and enter into farm-outs, joint ventures and strategic alliances;
� liberalization of hydrocarbon prices in Mexico;
� uncertainties inherent in making estimates of oil and gas reserves, including recently discovered oil and gas reserves;
� technical difficulties;
� significant developments in the global economy;
� significant economic or political developments in Mexico and the United States;
� developments affecting the energy sector; and
� changes in our legal regime or regulatory environment, including tax and environmental regulations.
Accordingly, you should not place undue reliance on these forward-looking statements. In any event, these statements speak only as of their dates,and we undertake no obligation to update or revise any of them, whether as a result of new information, future events or otherwise.
For a discussion of important factors that could cause actual results to differ materially from those contained in any forward-looking statement, see�Item 3�Key Information�Risk Factors.�
3
Copyright © 2018 www.secdatabase.com. All Rights Reserved.Please Consider the Environment Before Printing This Document
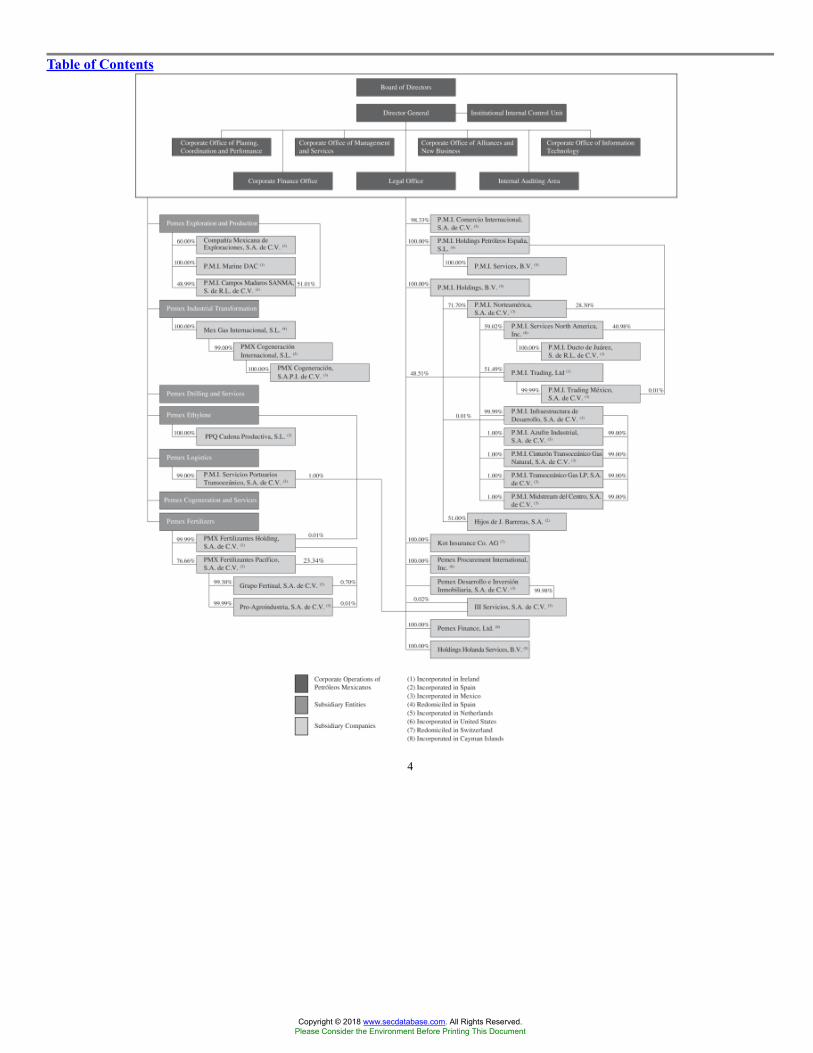
Table of Contents
4
Copyright © 2018 www.secdatabase.com. All Rights Reserved.Please Consider the Environment Before Printing This Document
Table of ContentsPART I
Item 1. Identity of Directors, Senior Management and Advisers
Not applicable.
Item 2. Offer Statistics and Expected Timetable
Not applicable.
Item 3. Key Information
SELECTED FINANCIAL DATA
The selected statement of comprehensive income (loss), statement of financial position and cash flows data set forth below as of and for the fiveyears ended December 31, 2017 have been derived from, and should be read in conjunction with, our consolidated financial statements as ofDecember 31, 2016 and 2017 and for the years ended December 31, 2015, 2016 and 2017, which are included in Item 18 of this report. Our consolidatedfinancial statements for each of the fiscal years ended December 31, 2013, 2014, 2015, 2016 and 2017 were audited by Castillo Miranda y Compañía,S.C. (which we refer to as BDO Mexico), an independent registered public accounting firm. Certain amounts in the consolidated financial statements forthe years ended December 31, 2013, 2014, 2015 and 2016 have been reclassified to conform the presentation of the amounts in the consolidatedfinancial statements for the year ended December 31, 2017. These reclassifications are not significant to the consolidated financial statements and hadno impact on our consolidated net income (loss).
As detailed below, for the years ended December 31, 2015, 2016 and 2017, we recognized a net loss of Ps. 712.6 billion, Ps. 191.1 billion and Ps.280.9 billion, respectively. In addition, we had negative equity as of December 31, 2016 and 2017 of Ps. 1,233.0 billion and Ps. 1,502.4 billion,respectively, which resulted in a negative working capital of Ps. 68.4 billion and Ps. 25.6 billion, respectively; and cash flows from operating activitiesof Ps. 63.4 billion for the year ended December 31, 2017. This has led our independent auditors to state in their most recent audit report that there ismaterial uncertainty that may cast significant doubt on our ability to continue as a going concern. Accordingly, we have prepared our consolidatedfinancial statements on a going concern basis, which assumes that we can meet our payment obligations. For more information on the actions that weare taking to face these negative trends, see �Item 5�Operating and Financial Review and Prospects�Overview� and �Item 5�Operating and FinancialReview and Prospects�Liquidity and Capital Resources.�
5
Copyright © 2018 www.secdatabase.com. All Rights Reserved.Please Consider the Environment Before Printing This Document
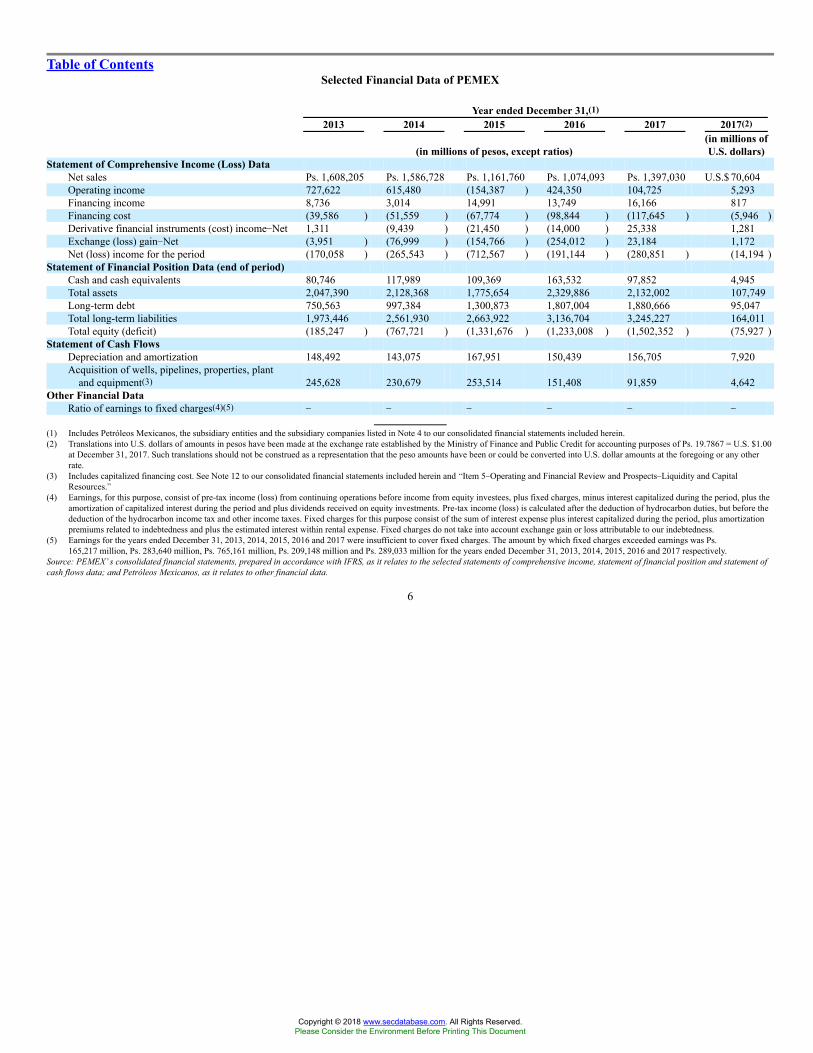
Table of ContentsSelected Financial Data of PEMEX
Year ended December 31,(1)2013 2014 2015 2016 2017 2017(2)
(in millions of pesos, except ratios)(in millions ofU.S. dollars)
Statement of Comprehensive Income (Loss) DataNet sales Ps. 1,608,205 Ps. 1,586,728 Ps. 1,161,760 Ps. 1,074,093 Ps. 1,397,030 U.S.$ 70,604Operating income 727,622 615,480 (154,387 ) 424,350 104,725 5,293Financing income 8,736 3,014 14,991 13,749 16,166 817Financing cost (39,586 ) (51,559 ) (67,774 ) (98,844 ) (117,645 ) (5,946 )Derivative financial instruments (cost) income�Net 1,311 (9,439 ) (21,450 ) (14,000 ) 25,338 1,281Exchange (loss) gain�Net (3,951 ) (76,999 ) (154,766 ) (254,012 ) 23,184 1,172Net (loss) income for the period (170,058 ) (265,543 ) (712,567 ) (191,144 ) (280,851 ) (14,194 )
Statement of Financial Position Data (end of period)Cash and cash equivalents 80,746 117,989 109,369 163,532 97,852 4,945Total assets 2,047,390 2,128,368 1,775,654 2,329,886 2,132,002 107,749Long-term debt 750,563 997,384 1,300,873 1,807,004 1,880,666 95,047Total long-term liabilities 1,973,446 2,561,930 2,663,922 3,136,704 3,245,227 164,011Total equity (deficit) (185,247 ) (767,721 ) (1,331,676 ) (1,233,008 ) (1,502,352 ) (75,927 )
Statement of Cash FlowsDepreciation and amortization 148,492 143,075 167,951 150,439 156,705 7,920Acquisition of wells, pipelines, properties, plant
and equipment(3) 245,628 230,679 253,514 151,408 91,859 4,642Other Financial Data
Ratio of earnings to fixed charges(4)(5) � � � � � �
(1) Includes Petróleos Mexicanos, the subsidiary entities and the subsidiary companies listed in Note 4 to our consolidated financial statements included herein.(2) Translations into U.S. dollars of amounts in pesos have been made at the exchange rate established by the Ministry of Finance and Public Credit for accounting purposes of Ps. 19.7867 = U.S. $1.00
at December 31, 2017. Such translations should not be construed as a representation that the peso amounts have been or could be converted into U.S. dollar amounts at the foregoing or any otherrate.
(3) Includes capitalized financing cost. See Note 12 to our consolidated financial statements included herein and �Item 5�Operating and Financial Review and Prospects�Liquidity and CapitalResources.�
(4) Earnings, for this purpose, consist of pre-tax income (loss) from continuing operations before income from equity investees, plus fixed charges, minus interest capitalized during the period, plus theamortization of capitalized interest during the period and plus dividends received on equity investments. Pre-tax income (loss) is calculated after the deduction of hydrocarbon duties, but before thededuction of the hydrocarbon income tax and other income taxes. Fixed charges for this purpose consist of the sum of interest expense plus interest capitalized during the period, plus amortizationpremiums related to indebtedness and plus the estimated interest within rental expense. Fixed charges do not take into account exchange gain or loss attributable to our indebtedness.
(5) Earnings for the years ended December 31, 2013, 2014, 2015, 2016 and 2017 were insufficient to cover fixed charges. The amount by which fixed charges exceeded earnings was Ps.165,217 million, Ps. 283,640 million, Ps. 765,161 million, Ps. 209,148 million and Ps. 289,033 million for the years ended December 31, 2013, 2014, 2015, 2016 and 2017 respectively.
Source: PEMEX�s consolidated financial statements, prepared in accordance with IFRS, as it relates to the selected statements of comprehensive income, statement of financial position and statement ofcash flows data; and Petróleos Mexicanos, as it relates to other financial data.
6
Copyright © 2018 www.secdatabase.com. All Rights Reserved.Please Consider the Environment Before Printing This Document
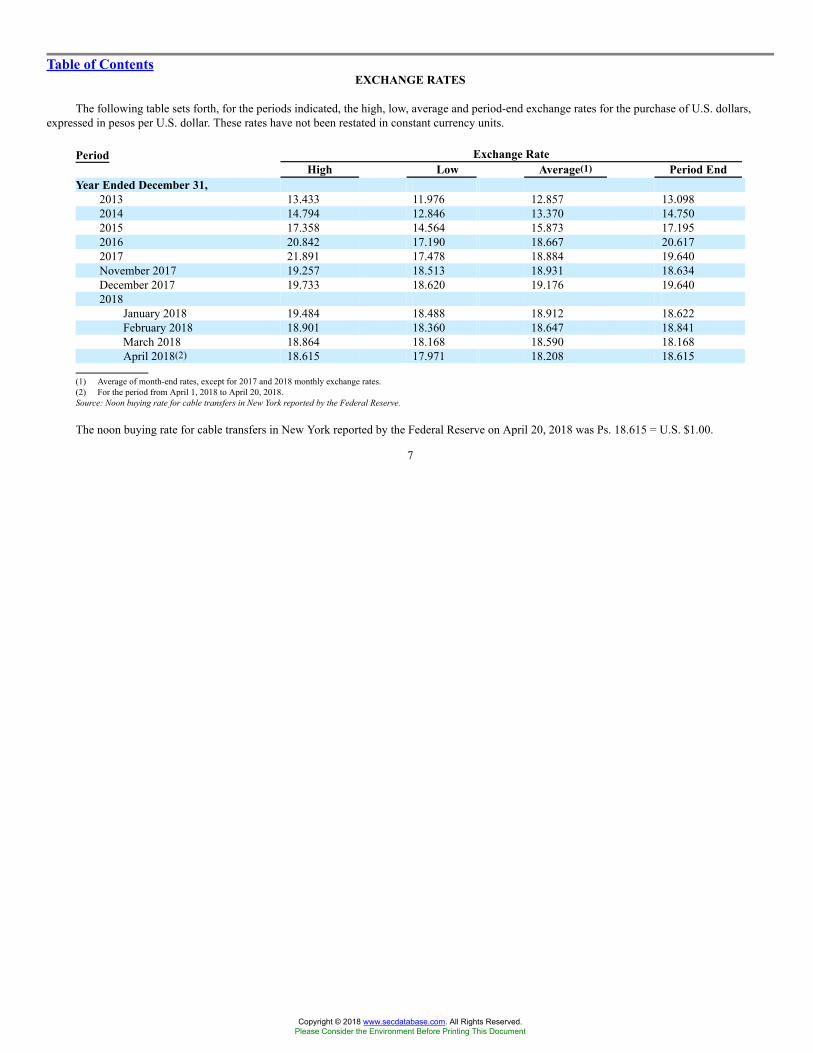
Table of ContentsEXCHANGE RATES
The following table sets forth, for the periods indicated, the high, low, average and period-end exchange rates for the purchase of U.S. dollars,expressed in pesos per U.S. dollar. These rates have not been restated in constant currency units.
Period Exchange RateHigh Low Average(1) Period End
Year Ended December 31,2013 13.433 11.976 12.857 13.0982014 14.794 12.846 13.370 14.7502015 17.358 14.564 15.873 17.1952016 20.842 17.190 18.667 20.6172017 21.891 17.478 18.884 19.640November 2017 19.257 18.513 18.931 18.634December 2017 19.733 18.620 19.176 19.6402018
January 2018 19.484 18.488 18.912 18.622February 2018 18.901 18.360 18.647 18.841March 2018 18.864 18.168 18.590 18.168April 2018(2) 18.615 17.971 18.208 18.615
(1) Average of month-end rates, except for 2017 and 2018 monthly exchange rates.(2) For the period from April 1, 2018 to April 20, 2018.Source: Noon buying rate for cable transfers in New York reported by the Federal Reserve.
The noon buying rate for cable transfers in New York reported by the Federal Reserve on April 20, 2018 was Ps. 18.615 = U.S. $1.00.
7
Copyright © 2018 www.secdatabase.com. All Rights Reserved.Please Consider the Environment Before Printing This Document

Table of ContentsRISK FACTORS
Risk Factors Related to Our Operations
Crude oil and natural gas prices are volatile and low crude oil and natural gas prices adversely affect our income and cash flows and the amount ofhydrocarbon reserves that we have the right to extract and sell.
International crude oil and natural gas prices are subject to global supply and demand and fluctuate due to many factors beyond our control. Thesefactors include competition within the oil and natural gas industry, the prices and availability of alternative sources of energy, international economictrends, exchange rate fluctuations, expectations of inflation, domestic and foreign laws and government regulations, political and other events in majoroil and natural gas producing and consuming nations and actions taken by oil exporting countries, trading activity in oil and natural gas and transactionsin derivative financial instruments (which we refer to as DFIs) related to oil and gas.
When international crude oil, petroleum product and/or natural gas prices are low, we generally earn less revenue and, therefore, generate lowercash flows and earn less income before taxes and duties because our costs remain roughly constant. Conversely, when crude oil, petroleum product andnatural gas prices are high, we earn more revenue and our income before taxes and duties increases. Crude oil export prices, which had generally tradedabove U.S. $75.00 per barrel since October 2009 and traded above U.S. $100.00 per barrel as of July 30, 2014, began to fall in August 2014. After agradual decline that resulted in per barrel prices falling to U.S. $91.16 at September 30, 2014, this decline sharply accelerated in October 2014 andprices fell to U.S. $53.27 per barrel at the end of 2014. The weighted average Mexican crude oil export price fell further in subsequent years, down toU.S. $26.54 per barrel by the end of December 2015 and to U.S. $18.90 per barrel on January 20, 2016, the lowest in twelve years, before rebounding toU.S. $46.53 per barrel on December 28, 2016. In 2017, crude oil export prices began to stabilize and during 2017 the weighted average Mexican crudeoil export price was approximately U.S. $46.73 per barrel, rising to U.S. $56.19 per barrel on December 29, 2017. During the first three months of 2018,the weighted average Mexican crude oil price was U.S. $56.82 per barrel, an increase of U.S. $10.94 per barrel as compared to the 2017 weightedaverage Mexican crude oil export price. As of April 27, 2018, the weighted average Mexican crude oil export price was U.S. $60.89 per barrel. Whileprices have begun to stabilize or even trend upwards, they still remain significantly lower than 2014 levels. Any future decline in international crude oiland natural gas prices will have a similar negative impact on our results of operations and financial condition. These fluctuations may also affectestimates of the amount of Mexico�s hydrocarbon reserves that we have the right to extract and sell, which could affect our future production levels. See��Risk Factors Related to our Relationship with the Mexican Government�Information on Mexico�s hydrocarbon reserves is based on estimates, whichare uncertain and subject to revisions� below and �Item 11�Quantitative and Qualitative Disclosures About Market Risk�Changes in Exposure to MainRisks�Market Risk�Hydrocarbon Price Risk.�
We have a substantial amount of indebtedness and other liabilities and are exposed to liquidity constraints, which could make it difficult for us toobtain financing on favorable terms and could adversely affect our financial condition, results of operations and ability to repay our debt and,ultimately, our ability to operate as a going concern.
We have a substantial amount of debt, which we have incurred primarily to finance the capital expenditures needed to carry out our capitalinvestment projects. Due to our heavy tax burden, our cash flow from operations in recent years has not been sufficient to fund our capital expendituresand other expenses and, accordingly, our debt has significantly increased and our working capital has decreased. The sharp decline in oil prices thatbegan in late 2014 has had a negative impact on our ability to generate positive cash flows, which, together with our continued heavy tax burden andincreased competition from the private sector, has further exacerbated our ability to fund our capital expenditures and other expenses from cash flowfrom operations. Therefore, in order to develop our hydrocarbon reserves and amortize scheduled debt maturities, we will need to raise financing from abroad range of funding sources, in addition to implementing the efficiency and cost-cutting initiatives described in this annual report.
8
Copyright © 2018 www.secdatabase.com. All Rights Reserved.Please Consider the Environment Before Printing This Document

Table of ContentsAs of December 31, 2017, our total indebtedness, including accrued interest, was approximately Ps. 2,037.9 billion (U.S. $103.0 billion), in
nominal terms, which represents a 2.8% increase compared to our total indebtedness, including accrued interest, of approximately Ps. 1,983.2 billion(U.S. $96.0 billion) as of December 31, 2016. 25.8% of our existing debt as of December 31, 2017, or Ps. 526.5 billion (U.S. $26.6 billion), is scheduledto mature in the next three years. As of December 31, 2017, we had a negative working capital of Ps. 25.6 billion (U.S. $1.3 billion). Our level of debtmay increase further in the short or medium term as a result of new financing activities or depreciation of the peso as compared to the U.S. dollar, andmay have an adverse effect on our financial condition, results of operations and liquidity position. To service our debt, we have relied and may continueto rely on a combination of cash flows provided by our operations, drawdowns under our available credit facilities and the incurrence of additionalindebtedness, including the refinancing of our existing indebtedness. See �Item 5�Operating and Financial Review and Prospects�Liquidity and CapitalResources�Overview�Changes to Our Business Plan.�
Certain rating agencies have expressed concerns regarding: (1) our heavy tax burden, (2) the total amount of our debt; (3) the significant increasein our indebtedness over the last several years; (4) our negative free cash flow during 2016, primarily resulting from our significant capital investmentprojects and the low price of oil; (5) the natural decline of certain of our oil fields and lower quality of crude oil; (6) our substantial unfunded reserve forretirement pensions and seniority premiums, which was equal to Ps. 1,258.4 billion (U.S. $63.6 billion) as of December 31, 2017; and (7) the resilienceof our operating expenses notwithstanding the sharp decline in oil prices that began in late 2014. On August 3, 2017, Fitch Ratings affirmed our creditrating of �BBB+� in both global local and global foreign currency and modified its outlook from negative to stable. On December 18, 2017, Standard &Poor�s affirmed the outlook for our credit ratings as stable and affirmed our global foreign currency credit rating as �BBB+�, but lowered our globallocal currency credit rating from �A� to �A-�, citing revisions to its methodology for calculating sovereign ratings. On April 12, 2018, Moody�sInvestors Service announced the revision of its outlook for our credit ratings from negative to stable.
Any lowering of our credit ratings may have adverse consequences on our ability to access the financial markets and/or our cost of financing. Ifwe were unable to obtain financing on favorable terms, this could hamper our ability to obtain further financing, invest in projects financed through debtand meet our principal and interest payment obligations with our creditors. As a result, we may be exposed to liquidity constraints and may not be ableto service our debt or make the capital expenditures required to maintain our current production levels and to maintain, and increase, the provedhydrocarbon reserves assigned to us by the Mexican Government, which may adversely affect our financial condition and results of operations. See��Risk Factors Related to our Relationship with the Mexican Government�We must make significant capital expenditures to maintain our currentproduction levels, and to maintain, as well as increase, the proved hydrocarbon reserves assigned to us by the Mexican Government. Reductions in ourincome, adjustments to our capital expenditures budget and our inability to obtain financing may limit our ability to make capital investments� below.
If such constraints occur at a time when our cash flow from operations is less than the resources necessary to meet our debt service obligations, inorder to provide additional liquidity to our operations, we could be forced to further reduce our planned capital expenditures, implement further austeritymeasures and/or sell additional non-strategic assets in order to raise funds. A reduction in our capital expenditure program could adversely affect ourfinancial condition and results of operations. Additionally, such measures may not be sufficient to permit us to meet our obligations.
Our consolidated financial statements have been prepared under the assumption that we will continue as a going concern. However, ourindependent auditors have stated in their most recent report that there is material uncertainty that may cast significant doubt on our ability to continueoperating as a going concern. Our consolidated financial statements do not include any adjustments that might result from the outcome of thatuncertainty. If the actions we are taking to improve our financial condition, which are described in detail under �Item 5�Operating and Financial Reviewand Prospects�Liquidity and Capital Resources�Overview�Changes to Our Business Plan,� are not successful, we may not be able to continue operatingas a going concern.
9
Copyright © 2018 www.secdatabase.com. All Rights Reserved.Please Consider the Environment Before Printing This Document
Table of ContentsWe are an integrated oil and gas company and are exposed to production, equipment and transportation risks, cyber-attacks, failure in ourinformation technology system, blockades to our facilities and criminal acts and deliberate acts of terror that could adversely affect our business,results of operations and financial condition.
We are subject to several risks that are common among oil and gas companies. These risks include production risks (fluctuations in production dueto operational hazards, natural disasters or weather, accidents, etc.), equipment risks (relating to the adequacy and condition of our facilities andequipment) and transportation risks (relating to the condition and vulnerability of pipelines and other modes of transportation). More specifically, ourbusiness is subject to the risks of explosions in pipelines, refineries, plants, drilling wells and other facilities, oil spills, hurricanes in the Gulf of Mexicoand other natural or geological disasters and accidents, fires and mechanical failures. Criminal attempts to divert our crude oil, natural gas or refinedproducts from our pipeline network and facilities for illegal sale have resulted in explosions, property and environmental damage, injuries and loss oflife.
Our operations depend on our information technology systems and therefore cybersecurity plays a key role in protecting our operations. Cyber-threats and cyber-attacks are becoming increasingly sophisticated, coordinated and costly, and could be targeted at our operations. Although we haveestablished an information security program that helps us to prevent, detect and correct vulnerabilities, and we have not yet suffered a significant cyber-attack, if the integrity of our information technology system were to be compromised due to a cyber-attack, or due to the negligence or misconduct ofour employees, our business operations could be disrupted or even paralyzed and our proprietary information could be lost or stolen. As a result of theserisks, we could face, among other things, regulatory action, legal liability, damage to our reputation, a significant reduction in revenues, an increase incosts, a shutdown of operations, or loss of our investments in areas affected by such cyber-attacks, which in turn could have a material adverse effect onour reputation, results of operations and financial condition.
Our facilities are also subject to the risk of sabotage, terrorism and blockades. For example, in early 2017 we experienced widespreaddemonstrations, including blockades, as a result of the Mexican Government�s increase in fuel prices during 2017, which prevented us from accessingcertain of our supply terminals and caused gasoline shortages at several retail service stations in Mexico. The occurrence of these incidents related to theproduction, processing and transportation of oil and gas products could result in personal injuries, loss of life, environmental damage from thesubsequent containment, clean-up and repair expenses, equipment damage and damage to our facilities, which in turn could adversely affect ourbusiness, results of operations and financial condition.
We purchase comprehensive insurance policies covering most of these risks; however, these policies may not cover all liabilities, and insurancemay not be available for some of the consequential risks. There can be no assurance that significant incidents will not occur in the future, that insurancewill adequately cover the entire scope or extent of our losses or that we we will not be held responsible for such incidents. The occurrence of asignificant incident or unforeseen liability for which we are not fully insured or for which insurance recovery is significantly delayed could have amaterial adverse effect on our results of operations and financial condition. See �Item 4�Information on the Company�Business Overview�PEMEXCorporate Matters�Insurance.�
Developments in the oil and gas industry and other factors may result in substantial write-downs of the carrying amount of certain of our assets,which could adversely affect our operating results and financial condition.
We evaluate on an annual basis, or more frequently where the circumstances require, the carrying amount of our assets for possible impairment.Our impairment tests are performed by a comparison of the carrying amount of an individual asset or a cash-generating unit with its recoverable amount.Whenever the recoverable amount of an individual asset or cash-generating unit is less than its carrying amount, an impairment loss is recognized toreduce the carrying amount to the recoverable amount.
10
Copyright © 2018 www.secdatabase.com. All Rights Reserved.Please Consider the Environment Before Printing This Document
Table of ContentsChanges in the economic, regulatory, business or political environment in Mexico or other markets where we operate, such as the liberalization of
fuel prices pursuant to energy reform and the significant decline in international crude oil and gas prices in recent years, among other factors, may resultin the recognition of impairment charges in certain of our assets. Due to the decline in oil prices, we have performed impairment tests of ournon-financial assets (other than inventories and deferred taxes) at the end of each quarter. As of December 31, 2015 and 2016, we recognized animpairment charge of Ps. 477,945 million and a net reversal of impairment in the amount of Ps. 331,314 million, respectively. As of December 31, 2017,we recognized an impairment charge of Ps. 151,444 million. See Note 12(e) to our consolidated financial statements for further information about theimpairment of certain of our assets. Future developments in the economic environment, in the oil and gas industry and other factors could result infurther substantial impairment charges, adversely affecting our operating results and financial condition.
Increased competition in the energy sector due to the current legal framework in Mexico could adversely affect our business and financialperformance.
The Constitución Política de los Estados Unidos Mexicanos (Political Constitution of the United Mexican States or the �Mexican Constitution�)and the Ley de Hidrocarburos (Hydrocarbons Law) allows other oil and gas companies, in addition to us, to carry out certain activities related to theenergy sector in Mexico, including exploration and production activities, and the import and sale of gasoline. As a result, we face competition for theright to explore and develop new oil and gas reserves in Mexico. We will also likely face competition in connection with certain refining, transportationand processing activities. In addition, increased competition could make it difficult for us to hire and retain skilled personnel. For more information, see�Item 4�Information on the Company�History and Development�Energy Reform.� While we have not yet experienced significant adverse effects fromincreased competition, we expect competition to increase further and there can be no assurances that we will not experience such adverse effects in thefuture. If we are unable to compete successfully with other oil and gas companies in the energy sector in Mexico, our results of operations and financialcondition may be adversely affected.
We are increasingly participating in strategic alliances, joint ventures and other joint arrangements. These arrangements may not perform asexpected, which could harm our reputation and have an adverse effect on our business, results of operations and financial condition.
In response to the energy reform, we have entered into and may in the future enter into strategic alliances, joint ventures and other jointarrangements. These arrangements are intended to reduce risks in exploration and production, refining, transportation and processing activities. Ourpartners in such arrangements may, as a result of financial or other difficulties, be unable or unwilling to fulfill their financial or other obligations underour agreements, threatening the viability of the relevant project. In addition, our partners may have inconsistent or opposing economic or businessinterests and take action contrary to our policies or objectives, which could be to our overall detriment. If our strategic alliances, joint ventures and otherjoint arrangements do not perform as expected, our reputation may be harmed and our business, financial condition and results of operations could beadversely affected.
We are subject to Mexican and international anti-corruption, anti-bribery and anti-money laundering laws. Our failure to comply with these lawscould result in penalties, which could harm our reputation and have an adverse effect on our business, results of operations and financialcondition.
We are subject to Mexican and international anti-corruption, anti-bribery and anti-money laundering laws. See �Item 4�Information on theCompany�General Regulatory Framework.� Although we maintain policies and processes intended to comply with these laws, including the review ofour internal control over financial reporting, we are subject to the risk that our employees, contractors or any person doing business with us may engagein fraudulent activity, corruption or bribery, circumvent or override our internal controls and procedures or misappropriate or manipulate our assets fortheir personal or business advantage to our detriment. We have in
11
Copyright © 2018 www.secdatabase.com. All Rights Reserved.Please Consider the Environment Before Printing This Document
Table of Contentsplace a number of systems for identifying, monitoring and mitigating these risks, but our systems may not be effective and we cannot ensure that thesecompliance policies and processes will prevent intentional, reckless or negligent acts committed by our officers or employees. Any failure � real orperceived � by our officers or employees to comply with applicable governance or regulatory obligations could harm our reputation, limit our ability toobtain financing and otherwise have a material adverse effect on our business, financial condition and results of operations.
If we fail to comply with any applicable anti-corruption, anti-bribery or anti-money laundering laws, we and our officers and employees may besubject to criminal, administrative or civil penalties and other measures, which could have material adverse effects on our reputation, business, financialcondition and results of operations. Any investigation of potential violations of anti-corruption, anti-bribery or anti-money laundering laws bygovernmental authorities in Mexico or other jurisdictions could result in an inability to prepare our consolidated financial statements in a timely mannerand could adversely impact our reputation, ability to access financial markets and ability to obtain contracts, assignments, permits and other governmentauthorizations necessary to participate in our industry, which, in turn, could have adverse effects on our business, results of operations and financialcondition.
Our compliance with environmental regulations in Mexico could result in material adverse effects on our results of operations.
A wide range of general and industry-specific Mexican federal and state environmental laws and regulations apply to our operations; these lawsand regulations are often difficult and costly to comply with and carry substantial penalties for non-compliance. This regulatory burden increases ourcosts because it requires us to make significant capital expenditures and limits our ability to extract hydrocarbons, resulting in lower revenues. For anestimate of our accrued environmental liabilities, see �Item 4�Information on the Company�Environmental Regulation�Environmental Liabilities.�Growing international concern over greenhouse gas emissions and climate change could result in new laws and regulations that could adversely affectour results of operations and financial condition. International agreements, including the Paris Agreement approved by the Mexican Government,contemplate coordinated efforts to combat climate change. We may become subject to market changes, including carbon taxes, efficiency standards,cap-and-trade and emission allowances and credits. These measures could increase our operating and maintenance costs, increase the price of ourhydrocarbon products and possibly shift consumer demand to lower-carbon sources. See �Item 4�Environmental Regulation �Climate Change� formore information on the Mexican Government�s current legal and regulatory framework for combatting climate change.
Risk Factors Related to Mexico
Economic conditions and government policies in Mexico and elsewhere may have a material impact on our operations.
A deterioration in Mexico�s economic condition, social instability, political unrest or other adverse social developments in Mexico couldadversely affect our business and financial condition. Those events could also lead to increased volatility in the foreign exchange and financial markets,thereby affecting our ability to obtain new financing and service our debt. Additionally, the Mexican Government announced budget cuts in November2015, February 2016 and September 2016 in response to declines in international crude oil prices, and it may cut spending in the future. See ��RiskFactors Related to our Relationship with the Mexican Government�The Mexican Government controls us and it could limit our ability to satisfy ourexternal debt obligations or could reorganize or transfer us or our assets� below. Any new budget cuts could adversely affect the Mexican economy and,consequently, our business, financial condition, operating results and prospects.
In the past, Mexico has experienced several periods of slow or negative economic growth, high inflation, high interest rates, currency devaluationand other economic problems. These problems may worsen or reemerge,
12
Copyright © 2018 www.secdatabase.com. All Rights Reserved.Please Consider the Environment Before Printing This Document
Table of Contentsas applicable, in the future and could adversely affect our business and ability to service our debt. A worsening of international financial or economicconditions, such as a slowdown in growth or recessionary conditions in Mexico�s trading partners, including the United States, or the emergence of anew financial crisis, could have adverse effects on the Mexican economy, our financial condition and our ability to service our debt.
Changes in Mexico��s exchange control laws may hamper our ability to service our foreign currency debt.
The Mexican Government does not currently restrict the ability of Mexican companies or individuals to convert pesos into other currencies.However, we cannot provide assurances that the Mexican Government will maintain its current policies with regard to the peso. In the future, theMexican Government could impose a restrictive exchange control policy, as it has done in the past. Mexican Government policies preventing us fromexchanging pesos into U.S. dollars could hamper our ability to service our foreign currency obligations, including our debt, the majority of which isdenominated in currencies other than pesos.
Mexico has experienced a period of increasing criminal activity, which could affect our operations.
In recent years, Mexico has experienced a period of increasing criminal activity, primarily due to the activities of drug cartels and related criminalorganizations. In addition, the development of the illicit market in fuels in Mexico has led to increases in theft and illegal trade in the fuels that weproduce. In response, the Mexican Government has implemented various security measures and has strengthened its military and police forces, and wehave also established various strategic measures aimed at decreasing incidents of theft and other criminal activity directed at our facilities and products.See �Item 8�Financial Information�Legal Proceedings�Actions Against the Illicit Market in Fuels.� Despite these efforts, criminal activity continues toexist in Mexico, some of which may target our facilities and products. These activities, their possible escalation and the violence associated with them,in an extreme case, may have a negative impact on our financial condition and results of operations.
Economic and political developments in Mexico and the United States may adversely affect Mexican economic policy and, in turn, PEMEX��soperations.
Political events in Mexico may significantly affect Mexican economic policy and, consequently, our operations. Enrique Peña Nieto, a member ofthe Partido Revolucionario Institucional (Institutional Revolutionary Party or PRI), was elected President of Mexico and took office on December 1,2012. As of the date of this annual report, no political party holds a simple majority in either house of the Mexican Congress.
Presidential and federal congressional elections in Mexico will be held in July 2018. The Mexican presidential election will result in a change inadministration, as presidential reelection is not permitted in Mexico. We cannot provide any assurances that political developments in Mexico will nothave an adverse effect on the Mexican economy or oil and gas industry and, in turn, our business, results of operations and financial condition, includingour ability to repay our debt.
Economic conditions in Mexico are highly correlated with economic conditions in the United States due to physical proximity and the high degreeof economic activity between the two countries generally, including the trade facilitated by the North American Free Trade Agreement (�NAFTA�). Asa result, political developments in the United States, including changes in the administration and governmental policies, can have an impact on theexchange rate between the U.S. dollar and the Mexican peso, economic conditions in Mexico and the global capital markets.
Since 2003, exports of petrochemical products from Mexico to the United States have enjoyed a zero-tariff rate under NAFTA and, subject tolimited exceptions, exports of crude oil and petroleum products have also been free or exempt from tariffs. During 2017, our export sales to the UnitedStates amounted to Ps. 302.9 billion, representing 21.7% of total sales and 59.6% of export sales for the year. In August 2017, Mexico, the United
13
Copyright © 2018 www.secdatabase.com. All Rights Reserved.Please Consider the Environment Before Printing This Document
Table of ContentsStates and Canada commenced renegotiation of NAFTA. As of the date of this annual report, the extent or outcome of the renegotiations, as well as theexpected timing for their completion, is uncertain. Any increase of import tariffs resulting from re-negotiated NAFTA terms could make it economicallyunsustainable for U.S. companies to import our petrochemical, crude oil and petroleum products if they are unable to transfer those additional costs ontoconsumers, which would increase our expenses and decrease our revenues, even if domestic and international prices for our products remain constant.Higher tariffs on products that we export to the United States could also require us to renegotiate our contracts or lose business, resulting in a materialadverse impact on our business and results of operations.
Because the Mexican economy is heavily influenced by the U.S. economy, the re-negotiation, or even termination, of NAFTA and/or other U.S.government policies that may be adopted by the U.S. administration may adversely affect economic conditions in Mexico. These developments could inturn have an adverse effect on our financial condition, results of operations and ability to repay our debt.
Risk Factors Related to our Relationship with the Mexican Government
The Mexican Government controls us and it could limit our ability to satisfy our external debt obligations or could reorganize or transfer us or ourassets.
We are controlled by the Mexican Government and our annual budget may be adjusted by the Mexican Government in certain respects. Pursuantto the Petróleos Mexicanos Law, Petróleos Mexicanos was transformed from a decentralized public entity to a productive state-owned company onOctober 7, 2014. The Petróleos Mexicanos Law establishes a special regime governing, among other things, our budget, debt levels, administrativeliabilities, acquisitions, leases, services and public works. This special regime provides Petróleos Mexicanos with additional technical and managerialautonomy and, subject to certain restrictions, with additional autonomy with respect to our budget. Notwithstanding this increased autonomy, theMexican Government still controls us and has the power to adjust our financial balance goal, which represents our targeted net cash flow for the fiscalyear based on our projected revenues and expenses, and our annual wage and salary expenditures, subject to the approval of the Cámara de Diputados(Chamber of Deputies).
The adjustments to our annual budget mentioned above may compromise our ability to develop the reserves assigned to us by the MexicanGovernment and to successfully compete with other oil and gas companies that enter the Mexican energy sector. See �Item 4�General RegulatoryFramework� for more information about the Mexican Government�s authority with respect to our budget. In addition, the Mexican Government�scontrol over us could adversely affect our ability to make payments under any securities issued by Petróleos Mexicanos. Although Petróleos Mexicanosis wholly owned by the Mexican Government, our financing obligations do not constitute obligations of and are not guaranteed by the MexicanGovernment.
The Mexican Government�s agreements with international creditors may affect our external debt obligations. In certain past debt restructurings ofthe Mexican Government, Petróleos Mexicanos� external indebtedness was treated on the same terms as the debt of the Mexican Government and otherpublic-sector entities, and it may be treated on similar terms in any future debt restructuring. In addition, Mexico has entered into agreements withofficial bilateral creditors to reschedule public-sector external debt. Mexico has not requested restructuring of bonds or debt owed to multilateralagencies.
The Mexican Government has the power, if the Mexican Constitution and federal law were further amended, to further reorganize our corporatestructure, including a transfer of all or a portion of our assets to an entity not controlled, directly or indirectly, by the Mexican Government. See ��RiskFactors Related to Mexico� above.
14
Copyright © 2018 www.secdatabase.com. All Rights Reserved.Please Consider the Environment Before Printing This Document

Table of ContentsWe pay significant taxes and duties to the Mexican Government, and, if certain conditions are met, we may be required to pay a state dividend,which may limit our capacity to expand our investment program or negatively impact our financial condition generally.
We are required to make significant payments to the Mexican Government, including in the form of taxes and duties, which may limit our abilityto make capital investments. In 2017, approximately 31.7% of our sales revenues was used for payments to the Mexican Government in the form oftaxes and duties, which constituted a substantial portion of the Mexican Government�s revenues.
The Secondary Legislation includes changes to the fiscal regime applicable to us, particularly with respect to the exploration and productionactivities that we carry out in Mexico. As of 2016, we have the obligation, subject to the conditions set forth in the Petróleos Mexicanos Law, to pay astate dividend to the Mexican Government. We were not required to pay a state dividend in 2016 or 2017 and are not required to do so in 2018. See�Item 8�Financial Information�Dividends� for more information. Although the changes to the fiscal regime applicable to us are designed in part toreduce the Mexican Government�s reliance on payments made by us, we cannot provide assurances that we will not be required to continue to pay alarge proportion of our sales revenue to the Mexican Government. See �Item 4�Information on the Company�Taxes, Duties and Other Payments to theMexican Government�Fiscal Regime.� In addition, the Mexican Government may change the applicable rules in the future.
The Mexican Government has historically imposed price controls in the domestic market on our products.
The Mexican Government has from time to time imposed price controls on the sales of natural gas, liquefied petroleum gas, gasoline, diesel, gasoil intended for domestic use, fuel oil and other products. As a result of these price controls, we have not been able to pass on all of the increases in theprices of our product purchases to our customers in the domestic market when the peso depreciates in relation to the U.S. dollar. A depreciation of thepeso increases our cost of imported oil and gas products, without a corresponding increase in our revenues unless we are able to increase the price atwhich we sell products in Mexico.
In accordance with the Ley de Ingresos de la Federación para el Ejercicio Fiscal de 2017 (2017 Federal Revenue Law), during 2017 the MexicanGovernment gradually removed price controls on gasoline and diesel as part of the liberalization of fuel prices in Mexico. As of the date of this annualreport, sales prices of gasoline and diesel have been fully liberalized and are determined by the free market. For more information, see �Item4�Information on the Company�Business Overview�Industrial Transformation.� However, we do not control the Mexican Government�s domesticpolicies and the Mexican Government could impose additional price controls on the domestic market in the future. The imposition of such price controlswould adversely affect our results of operations. For more information, see �Item 4�Information on the Company�BusinessOverview�Refining�Pricing� and �Item 4�Information on the Company�Business Overview�Gas and Basic Petrochemicals�Pricing.�
The Mexican nation, not us, owns the hydrocarbon reserves located in the subsoil in Mexico and our right to continue to extract these reserves issubject to the approval of the Ministry of Energy.
The Mexican Constitution provides that the Mexican nation, not us, owns all petroleum and other hydrocarbon reserves located in the subsoil inMexico.
Article 27 of the Mexican Constitution provides that the Mexican Government will carry out exploration and production activities throughagreements with third parties and through assignments to and agreements with us. The Secondary Legislation allows us and other oil and gas companiesto explore and extract the petroleum and other hydrocarbon reserves located in Mexico, subject to assignment of rights by the Ministry of Energy andentry into agreements pursuant to a competitive bidding process.
Access to crude oil and natural gas reserves is essential to an oil and gas company�s sustained production and generation of income, and ourability to generate income would be materially and adversely affected if the
15
Copyright © 2018 www.secdatabase.com. All Rights Reserved.Please Consider the Environment Before Printing This Document

Table of ContentsMexican Government were to restrict or prevent us from exploring or extracting any of the crude oil and natural gas reserves that it has assigned to us orif we are unable to compete effectively with other oil and gas companies in future bidding rounds for additional exploration and production rights inMexico. For more information, see ��We must make significant capital expenditures to maintain our current production levels, and to maintain, as wellas increase, the proved hydrocarbon reserves assigned to us by the Mexican Government. Reductions in our income, adjustments to our capitalexpenditures budget and our inability to obtain financing may limit our ability to make capital investments� below.
Information on Mexico��s hydrocarbon reserves is based on estimates, which are uncertain and subject to revisions.
The information on oil, gas and other reserves set forth in this annual report is based on estimates. Reserves valuation is a subjective process ofestimating underground accumulations of crude oil and natural gas that cannot be measured in an exact manner; the accuracy of any reserves estimatedepends on the quality and reliability of available data, engineering and geological interpretation and subjective judgment. Additionally, estimates maybe revised based on subsequent results of drilling, testing and production. These estimates are also subject to certain adjustments based on changes invariables, including crude oil prices. Therefore, proved reserves estimates may differ materially from the ultimately recoverable quantities of crude oiland natural gas. Downward revisions in our reserve estimates could lead to lower future production, which could have an adverse effect on our results ofoperations and financial condition. See ��Risk Factors Related to Our Operations�Crude oil and natural gas prices are volatile and low crude oil andnatural gas prices adversely affect our income and cash flows and the amount of hydrocarbon reserves that we have the right to extract and sell� above.We revise annually our estimates of hydrocarbon reserves that we are entitled to extract and sell, which may result in material revisions to theseestimates. Our ability to maintain our long-term growth objectives for oil production depends on our ability to successfully develop our reserves, andfailure to do so could prevent us from achieving our long-term goals for growth in production.
The Comisión Nacional de Hidrocarburos (National Hydrocarbon Commission, or CNH) has the authority to review and approve our estimatedhydrocarbon reserves estimates and may require us to make adjustments to these estimates. A request to adjust these reserves estimates could result inour inability to prepare our consolidated financial statements in a timely manner. This could adversely impact our ability to access financial markets,obtain contracts, assignments, permits and other government authorizations necessary to participate in the crude oil and natural gas industry, which, inturn, could have an adverse effect on our business, results of operations and financial condition.
We must make significant capital expenditures to maintain our current production levels, and to maintain, as well as increase, the provedhydrocarbon reserves assigned to us by the Mexican Government. Reductions in our income, adjustments to our capital expenditures budget andour inability to obtain financing may limit our ability to make capital investments.
Because our ability to maintain, as well as increase, our oil production levels is highly dependent upon our ability to successfully develop existinghydrocarbon reserves and, in the long term, upon our ability to obtain the right to develop additional reserves, we continually invest capital to enhanceour hydrocarbon recovery ratio and improve the reliability and productivity of our infrastructure. During 2017, our total proved reserves decreased by868.1 million barrels of oil equivalent, or 10.1%, after accounting for discoveries, extensions, revisions, and delimitations, from 8,562.8 million barrelsof crude oil equivalent as of December 31, 2016 to 7,694.7 million barrels of crude oil equivalent as of December 31, 2017. See �Item 4�Information onthe Company�Business Overview��Exploration and Production��Reserves� for more information about the factors leading to this decline. Our crudeoil production decreased by 1.0% from 2012 to 2013, by 3.7% from 2013 to 2014, by 6.7% from 2014 to 2015, by 5.0% from 2015 to 2016 and by 9.5%from 2016 to 2017, primarily as a result of the decline of the Cantarell, Crudo Ligero Marino, El Golpe-Puerto Ceiba, Bellota-Chinchorro, Antonio J.Bermúdez, Cactus-Sitio Grande, Ixtal-Manik, Chuc, Costero Terreste and Tsimín-Xux projects.
16
Copyright © 2018 www.secdatabase.com. All Rights Reserved.Please Consider the Environment Before Printing This Document
Table of ContentsPursuant to energy reform in Mexico, the Mexican Government outlined a process, commonly referred to as Round Zero, for the determination of
our initial allocation of rights to continue to carry out exploration and production activities in Mexico. On August 13, 2014, the Ministry of Energygranted us the right to continue to explore and develop areas that together contain 95.9% of Mexico�s estimated proved reserves of crude oil and naturalgas. The development of the reserves that were assigned to us pursuant to Round Zero and subsequent bidding rounds, particularly the reserves in thedeep waters of the Gulf of Mexico and in shale oil and gas fields in the Burgos basin, will demand significant capital investments and will posesignificant operational challenges. Our right to develop the reserves assigned to us is conditioned on our ability to develop such reserves in accordancewith our development plans, which were based on our technical, financial and operational capabilities at the time. See �Item 4�History andDevelopment�Energy Reform�Assignment of Exploration and Production Rights.� We cannot provide assurances that we will have or will be able toobtain, in the time frame that we expect, sufficient resources or the technical capacity necessary to explore and extract the reserves that the MexicanGovernment assigned to us, or that it may grant to us in the future. We have reduced our capital expenditures in prior years in response to declining oilprices, and unless we are able to increase our capital expenditures, we may not be able to develop the reserves assigned to us in accordance with ourdevelopment plans. We would lose the right to continue to extract these reserves if we fail to develop them in accordance with our development plans,which could adversely affect our operating results and financial condition. In addition, increased competition in the oil and gas sector in Mexico mayincrease the costs of obtaining additional acreage in bidding rounds for the rights to new reserves.
Our ability to make capital expenditures is limited by the substantial taxes and duties that we pay to the Mexican Government, the ability of theMexican Government to adjust certain aspects of our annual budget, cyclical decreases in our revenues primarily related to lower oil prices and anyconstraints on our liquidity. The availability of financing may limit our ability to make capital investments that are necessary to maintain currentproduction levels and decrease the proved hydrocarbon reserves that we are entitled to extract. For more information on the liquidity constraints we areexposed to, see ��We have a substantial amount of indebtedness and other liabilities and are exposed to liquidity constraints, which could make itdifficult for us to obtain financing on favorable terms and could adversely affect our financial condition, results of operations and ability to repay ourdebt and, ultimately, our ability to operate as a going concern� above.
The energy reform has provided us with opportunities to enter into strategic alliances and partnerships, which may reduce our capitalcommitments and allow us to participate in projects for which we are more competitive. We have since entered into, and continue to enter into, strategicalliances, joint ventures and other joint arrangements with third parties in order to develop our reserves. If we are unable to find partners for such jointarrangements, or if our partners were to significantly default on their obligations to us, we may be unable to maintain production levels or extract fromour reserves. Moreover, we cannot assure you that these strategic alliances, joint ventures and other joint arrangements will be successful or reduce ourcapital commitments. For more information, see ��Risk Factors Related to Pemex�s Operations�We are increasingly participating in strategic alliances,joint ventures and other joint arrangements. These arrangements may not perform as expected, which could harm our reputation and have an adverseeffect on our business, results of operations and financial condition� above and �Item 4�Information on the Company�History andDevelopment�Capital Expenditures� and ��Energy Reform.�
We may claim some immunities under the Foreign Sovereign Immunities Act and Mexican law, and your ability to sue or recover may be limited.
We are public-sector entities of the Mexican Government. Accordingly, you may not be able to obtain a judgment in a U.S. court against us unlessthe U.S. court determines that we are not entitled to sovereign immunity with respect to that action. Under certain circumstances, Mexican law may limityour ability to enforce judgments against us in the courts of Mexico. We also do not know whether Mexican courts would enforce judgments of U.S.courts based on the civil liability provisions of the U.S. federal securities laws. Therefore, even if you were able to obtain a U.S. judgment against us,you might not be able to obtain a judgment in Mexico
17
Copyright © 2018 www.secdatabase.com. All Rights Reserved.Please Consider the Environment Before Printing This Document

Table of Contentsthat is based on that U.S. judgment. Moreover, you may not be able to enforce a judgment against our property in the United States except under thelimited circumstances specified in the Foreign Sovereign Immunities Act of 1976, as amended. Finally, if you were to bring an action in Mexico seekingto enforce our obligations under any securities issued by Petróleos Mexicanos, satisfaction of those obligations may be made in pesos, pursuant to thelaws of Mexico.
Our directors and officers, as well as some of the experts named in this annual report, reside outside the United States. Substantially all of ourassets and those of most of our directors, officers and experts are located outside the United States. As a result, investors may not be able to effectservice of process on our directors or officers or those experts within the United States.
18
Copyright © 2018 www.secdatabase.com. All Rights Reserved.Please Consider the Environment Before Printing This Document

Table of ContentsItem 4. Information on the Company
HISTORY AND DEVELOPMENT
We are the largest company in Mexico according to the June 2017 edition of Expansión magazine, and according to the November 20, 2017 issueof Petroleum Intelligence Weekly, we were the eighth largest crude oil producer and the eighteenth largest oil and gas company in the world based ondata from the year 2016.
Our executive offices are located at Avenida Marina Nacional No. 329, Colonia Verónica Anzures, Ciudad de México 11300, México. Ourtelephone number is (52-55) 1944-2500.
In March 1938, President Lázaro Cárdenas del Río nationalized the foreign-owned oil companies that were then operating in Mexico, and theMexican Congress established Petróleos Mexicanos through the Decreto que crea la Institución Petróleos Mexicanos (Decree that creates the entityPetróleos Mexicanos), which was published in the Official Gazette of the Federation and took effect on July 20, 1938.
In July 1992, the Ley Orgánica de Petróleos Mexicanos y Organismos Subsidiarios (Organic Law of Petróleos Mexicanos and Subsidiary Entities)took effect and, among other things, created Pemex-Exploration and Production, Pemex-Refining, Pemex-Gas and Basic Petrochemicals and Pemex-Petrochemicals as decentralized public entities of the Mexican Government with the legal authority to own property and conduct business in their ownnames. Each of the subsidiary entities had the characteristics of a subsidiary of Petróleos Mexicanos.
Energy Reform
Energy Reform Decree
On December 20, 2013, amendments to Articles 25, 27 and 28 of the Mexican Constitution were signed into law by President Enrique Peña Nietoand published in the Official Gazette of the Federation. We refer to this as the Energy Reform Decree. The Energy Reform Decree, which includestransitional articles setting forth the general framework and timeline for the related secondary legislation, took effect on December 21, 2013.
Secondary Legislation
On August 11, 2014, the secondary legislation was published pursuant to the Energy Reform Decree in the Official Gazette of the Federation. Werefer in this annual report to this legislation as the Secondary Legislation. The Secondary Legislation includes nine new laws, of which the following aremost relevant to our operations:
� The new Petróleos Mexicanos Law, which took effect, with the exception of certain provisions, on October 7, 2014 and repealed theprevious Petróleos Mexicanos Law, which had been effective as of November 29, 2008;
� Hydrocarbons Law, which took effect on August 12, 2014 and repealed the Ley Reglamentaria del Artículo 27 Constitucional en el Ramodel Petróleo (Regulatory Law to Article 27 of the Mexican Constitution Concerning Petroleum Affairs, which we refer to as the RegulatoryLaw); and
� Ley de Ingresos sobre Hidrocarburos (Hydrocarbons Revenue Law).
Together, the Hydrocarbons Law and the Hydrocarbons Revenue Law establish the legal framework for the exploration and production of oil andgas through assignments and contracts, as well as the new fiscal regime through which the Mexican Government will collect revenues from participantsin the Mexican oil and gas industry. The Hydrocarbons Law empowers the Ministry of Energy to determine the appropriate contract model for each areathat is subject to a competitive bidding process, while the Ministry of Finance and Public Credit is responsible for determining the economic and fiscalterms of each contract. See ��Taxes, Duties and Other
19
Copyright © 2018 www.secdatabase.com. All Rights Reserved.Please Consider the Environment Before Printing This Document
Table of ContentsPayments to the Mexican Government�Fiscal Regime� below in this Item 4. The following arrangements comprise the new contractual regimeestablished by the Secondary Legislation for upstream activities:
� licenses, pursuant to which a license holder is entitled to the oil and gas that are extracted from the subsoil;
� production-sharing contracts, pursuant to which a contractor is entitled to receive a percentage of production;
� profit-sharing contracts, pursuant to which a contractor is entitled to receive a percentage of the profit from the sale of the extracted oil andgas; and
� service contracts, pursuant to which a contractor would receive cash payments for services performed (service contracts, together withlicenses, production-sharing contracts and profit-sharing contracts are known as the contracts for the exploration and production of oil andgas, collectively referred to as contracts for exploration and production).
For midstream and downstream activities, including oil refining and natural gas processing, the Hydrocarbons Law establishes a permit regimethat is granted by the Ministry of Energy and the Comisión Reguladora de Energía (Energy Regulatory Commission, or CRE), as applicable. TheHydrocarbons Law also sets forth the process by which entities may apply for these permits. The CRE began issuing permits for the retail sale ofgasoline and diesel fuel in 2016.
Legal Regime for Petróleos Mexicanos
As part of energy reform, Petróleos Mexicanos was transformed from a decentralized public entity into a productive state-owned company onOctober 7, 2014�the day on which the new Petróleos Mexicanos Law took effect, with the exception of certain provisions. As a productive state-ownedcompany, Petróleos Mexicanos remains wholly owned by the Mexican Government and has the corporate purpose of generating economic value andincreasing the income of the Mexican nation while adhering to principles of equity, as well as social and environmental responsibility.
On December 2, 2014, upon its determination that the new Board of Directors of Petróleos Mexicanos was performing its duties and themechanisms for our oversight, transparency and accountability had been implemented, the Ministry of Energy formally announced in the OfficialGazette of the Federation that the special regime provided for in the Petróleos Mexicanos Law, which governs Petróleos Mexicanos� activities relatingto productive state-owned subsidiaries, affiliates, compensation, assets, administrative liabilities, budget, debt levels and the state dividend, had takeneffect. On June 10, 2015, the Disposiciones Generales de Contratación para Petróleos Mexicanos y Sus Empresas Productivas Subsidiarias (GeneralProvisions for Contracting for Petróleos Mexicanos and its Productive State-Owned Subsidiaries) were published in the Official Gazette of theFederation, and on June 11, 2015, the special regime for acquisitions, leases, services and public works became effective.
Corporate Reorganization
In accordance with the transitional articles of the Petróleos Mexicanos Law, on November 18, 2014, the Board of Directors of PetróleosMexicanos approved the Director General�s proposal for our corporate reorganization. In our corporate reorganization, the four existing subsidiaryentities of Petróleos Mexicanos were transformed into two new productive state-owned subsidiaries�Pemex Exploration and Production and PemexIndustrial Transformation�and five new productive state-owned subsidiaries�Pemex Drilling and Services, Pemex Logistics, Pemex Cogeneration andServices, Pemex Fertilizers and Pemex Ethylene�were created. Each of these productive state-owned subsidiaries is a legal entity empowered to ownproperty and carry on business in its own name and has technical and operational autonomy, subject to the central coordination and strategic direction ofPetróleos Mexicanos.
20
Copyright © 2018 www.secdatabase.com. All Rights Reserved.Please Consider the Environment Before Printing This Document
Table of ContentsOn March 27, 2015, the Board of Directors of Petróleos Mexicanos adopted acuerdos de creación (creation resolutions) for each of the new
productive state-owned subsidiaries, all of which were subsequently published in the Official Gazette of the Federation on April 28, 2015.
The principal lines of business of the new productive state-owned subsidiaries are as follows:
� Pemex Exploration and Production, formed on June 1, 2015 as a successor to Pemex-Exploration and Production, explores for, extracts,transports, stores and markets crude oil and natural gas;
� Pemex Cogeneration and Services, formed on June 1, 2015, generates, supplies and trades electric and thermal energy;
� Pemex Drilling and Services, formed on August 1, 2015, performs drilling and well repair services;
� Pemex Fertilizers, formed on August 1, 2015, integrates the ammonia production chain up to the point of sale of fertilizers;
� Pemex Ethylene, formed on August 1, 2015, separates the ethylene business from our petrochemicals segment in order to take advantage ofthe integration of the ethylene production chain and distributes and trades other gases, including methane and propylene;
� Pemex Logistics, formed on October 1, 2015, provides land, maritime and pipeline transportation, storage and distribution to us and thirdparties; and
� Pemex Industrial Transformation, formed on November 1, 2015 as a successor of Pemex-Refining, Pemex-Gas and Basic Petrochemicalsand Pemex-Petrochemicals, refines petroleum products and derivatives; processes natural gas, natural gas liquids, artificial gas andderivatives and engages in industrial petrochemical processes.
Capital Expenditures
The following table shows our capital expenditures, excluding non-capitalizable maintenance, for each of the three years endedDecember 31, 2017, and the budget for these expenditures for 2018. Capital expenditure amounts are derived from our budgetary records, which areprepared on a cash basis. Accordingly, these capital expenditure amounts do not correspond to capital expenditure amounts included in our consolidatedfinancial statements prepared in accordance with IFRS. The following table presents our capital expenditures by subsidiary. For the year endedDecember 31, 2015, we have included capital expenditures made by the subsidiary entities prior to our recent corporate reorganization, and for the newproductive state-owned subsidiaries, capital expenditures made after their creation. For the year ended December 31, 2016 and 2017, and for the 2018budget, we have included capital expenditures made by, or expected to be made by the productive state-owned subsidiaries.
21
Copyright © 2018 www.secdatabase.com. All Rights Reserved.Please Consider the Environment Before Printing This Document
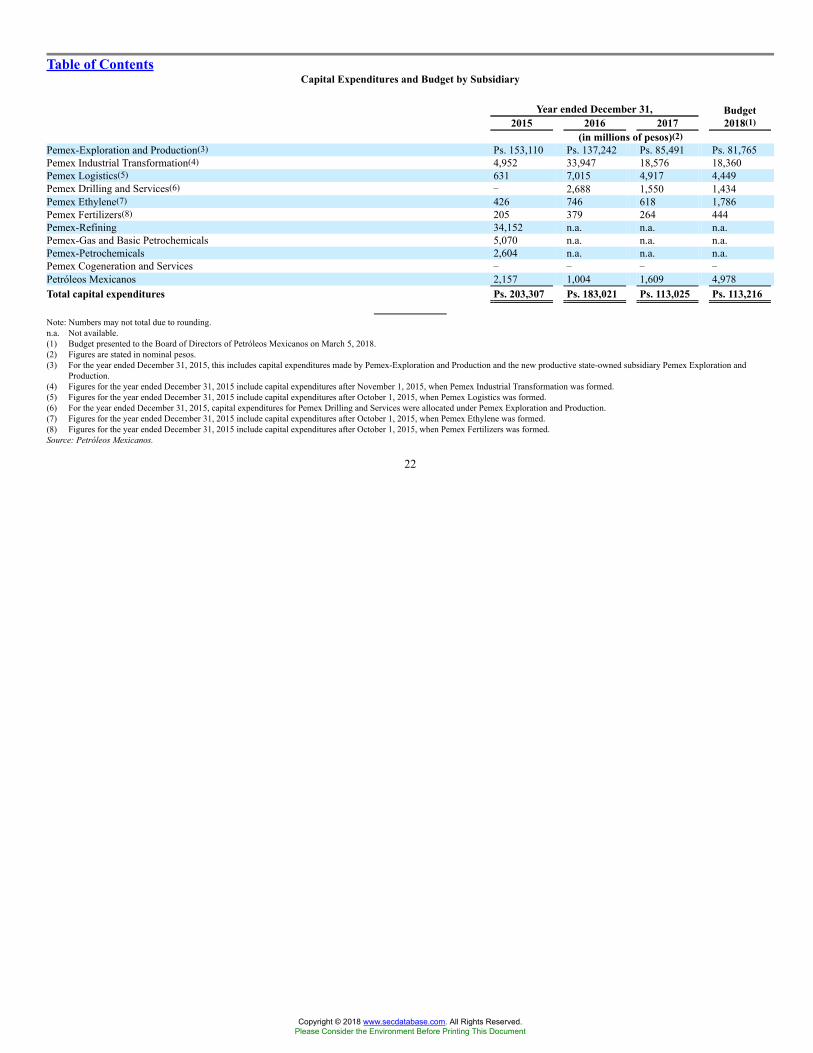
Table of ContentsCapital Expenditures and Budget by Subsidiary
Year ended December 31,2015 2016 2017
Budget2018(1)
(in millions of pesos)(2)Pemex-Exploration and Production(3) Ps. 153,110 Ps. 137,242 Ps. 85,491 Ps. 81,765Pemex Industrial Transformation(4) 4,952 33,947 18,576 18,360Pemex Logistics(5) 631 7,015 4,917 4,449Pemex Drilling and Services(6) � 2,688 1,550 1,434Pemex Ethylene(7) 426 746 618 1,786Pemex Fertilizers(8) 205 379 264 444Pemex-Refining 34,152 n.a. n.a. n.a.Pemex-Gas and Basic Petrochemicals 5,070 n.a. n.a. n.a.Pemex-Petrochemicals 2,604 n.a. n.a. n.a.Pemex Cogeneration and Services � � � �Petróleos Mexicanos 2,157 1,004 1,609 4,978Total capital expenditures Ps. 203,307 Ps. 183,021 Ps. 113,025 Ps. 113,216
Note: Numbers may not total due to rounding.n.a. Not available.(1) Budget presented to the Board of Directors of Petróleos Mexicanos on March 5, 2018.(2) Figures are stated in nominal pesos.(3) For the year ended December 31, 2015, this includes capital expenditures made by Pemex-Exploration and Production and the new productive state-owned subsidiary Pemex Exploration and
Production.(4) Figures for the year ended December 31, 2015 include capital expenditures after November 1, 2015, when Pemex Industrial Transformation was formed.(5) Figures for the year ended December 31, 2015 include capital expenditures after October 1, 2015, when Pemex Logistics was formed.(6) For the year ended December 31, 2015, capital expenditures for Pemex Drilling and Services were allocated under Pemex Exploration and Production.(7) Figures for the year ended December 31, 2015 include capital expenditures after October 1, 2015, when Pemex Ethylene was formed.(8) Figures for the year ended December 31, 2015 include capital expenditures after October 1, 2015, when Pemex Fertilizers was formed.Source: Petróleos Mexicanos.
22
Copyright © 2018 www.secdatabase.com. All Rights Reserved.Please Consider the Environment Before Printing This Document
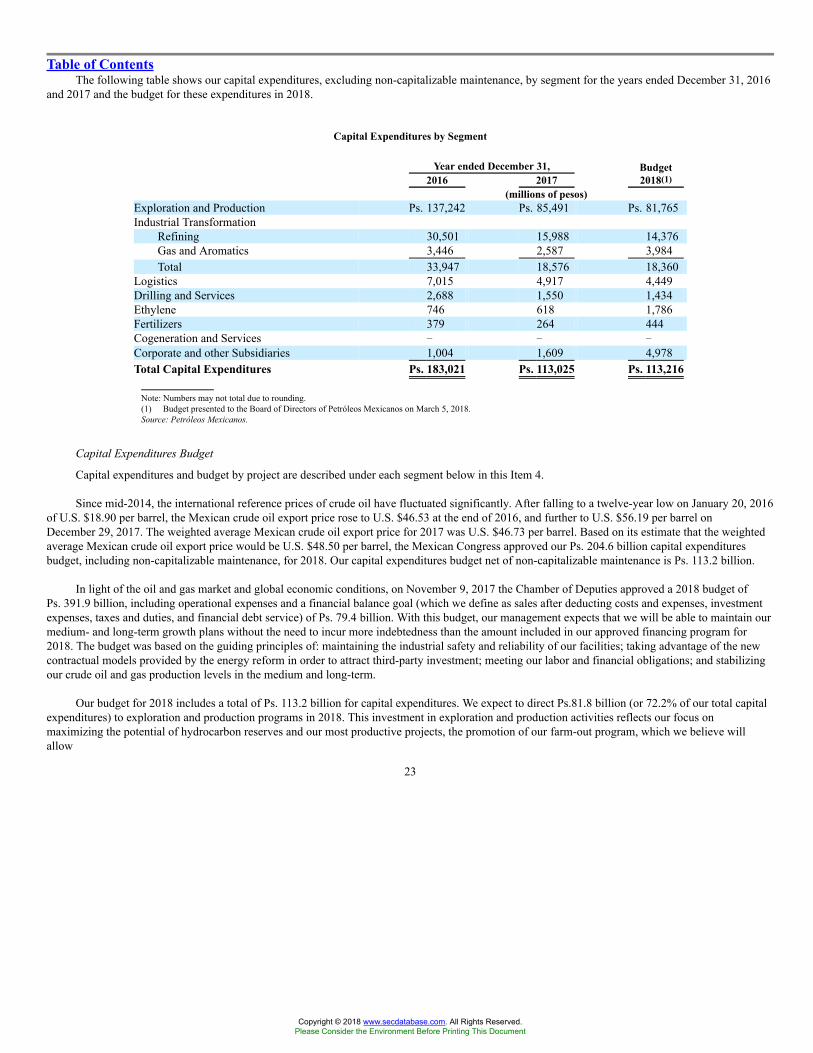
Table of ContentsThe following table shows our capital expenditures, excluding non-capitalizable maintenance, by segment for the years ended December 31, 2016
and 2017 and the budget for these expenditures in 2018.
Capital Expenditures by Segment
Year ended December 31,2016 2017
Budget2018(1)
(millions of pesos)Exploration and Production Ps. 137,242 Ps. 85,491 Ps. 81,765Industrial Transformation
Refining 30,501 15,988 14,376Gas and Aromatics 3,446 2,587 3,984Total 33,947 18,576 18,360
Logistics 7,015 4,917 4,449Drilling and Services 2,688 1,550 1,434Ethylene 746 618 1,786Fertilizers 379 264 444Cogeneration and Services � � �Corporate and other Subsidiaries 1,004 1,609 4,978Total Capital Expenditures Ps. 183,021 Ps. 113,025 Ps. 113,216
Note: Numbers may not total due to rounding.(1) Budget presented to the Board of Directors of Petróleos Mexicanos on March 5, 2018.Source: Petróleos Mexicanos.
Capital Expenditures Budget
Capital expenditures and budget by project are described under each segment below in this Item 4.
Since mid-2014, the international reference prices of crude oil have fluctuated significantly. After falling to a twelve-year low on January 20, 2016of U.S. $18.90 per barrel, the Mexican crude oil export price rose to U.S. $46.53 at the end of 2016, and further to U.S. $56.19 per barrel onDecember 29, 2017. The weighted average Mexican crude oil export price for 2017 was U.S. $46.73 per barrel. Based on its estimate that the weightedaverage Mexican crude oil export price would be U.S. $48.50 per barrel, the Mexican Congress approved our Ps. 204.6 billion capital expendituresbudget, including non-capitalizable maintenance, for 2018. Our capital expenditures budget net of non-capitalizable maintenance is Ps. 113.2 billion.
In light of the oil and gas market and global economic conditions, on November 9, 2017 the Chamber of Deputies approved a 2018 budget ofPs. 391.9 billion, including operational expenses and a financial balance goal (which we define as sales after deducting costs and expenses, investmentexpenses, taxes and duties, and financial debt service) of Ps. 79.4 billion. With this budget, our management expects that we will be able to maintain ourmedium- and long-term growth plans without the need to incur more indebtedness than the amount included in our approved financing program for2018. The budget was based on the guiding principles of: maintaining the industrial safety and reliability of our facilities; taking advantage of the newcontractual models provided by the energy reform in order to attract third-party investment; meeting our labor and financial obligations; and stabilizingour crude oil and gas production levels in the medium and long-term.
Our budget for 2018 includes a total of Ps. 113.2 billion for capital expenditures. We expect to direct Ps.81.8 billion (or 72.2% of our total capitalexpenditures) to exploration and production programs in 2018. This investment in exploration and production activities reflects our focus onmaximizing the potential of hydrocarbon reserves and our most productive projects, the promotion of our farm-out program, which we believe willallow
23
Copyright © 2018 www.secdatabase.com. All Rights Reserved.Please Consider the Environment Before Printing This Document
Table of Contentsus to sustain and increase our production levels while decreasing our corresponding capital expenditures, and our intention to take advantage of theopportunities provided by the energy reform. The energy reform provides us with opportunities to form new strategic partnerships to enhance ourfinancial, technical and operational capabilities along our entire value chain. See ��Energy Reform� above in this Item 4. We continuously review ourcapital expenditures portfolio in accordance with our current and future business plans and upcoming opportunities. In the upcoming years, we expect toreceive financial resources from third parties who may partner with us on certain projects, a collaboration made possible following the implementationof the Secondary Legislation. See ��Energy Reform� above in this Item 4 for more information about these new opportunities.
Our main objectives for upstream investment are to maximize our long-term economic value, and to increase and improve the quality of the oiland gas reserves assigned to us, enhance Pemex Exploration and Production�s reserves recovery ratio, improve the reliability of its production andtransportation infrastructure for crude oil and natural gas operations and continue to emphasize industrial safety and compliance with environmentalregulations. Our 2018 budget objectives include maintaining crude oil production at levels sufficient to satisfy domestic demand and have a surplusavailable for export and maintaining natural gas production levels.
Our downstream investment program seeks to improve the quality of our product selection and the reliability of our logistics and distributionservices, to achieve a level of efficiency similar to that of our international competitors and to continue to emphasize industrial safety and environmentalcompliance.
24
Copyright © 2018 www.secdatabase.com. All Rights Reserved.Please Consider the Environment Before Printing This Document
Table of ContentsBUSINESS OVERVIEW
Overview by Business Segment
Exploration and Production
Our exploration and production segment operates through the productive state-owned subsidiary Pemex Exploration and Production and exploresfor and produces crude oil and natural gas, primarily in the northeastern and southeastern regions of Mexico and offshore in the Gulf of Mexico. Innominal peso terms, our capital expenditures in exploration and production activities decreased by 37.7% in 2017. As a result of our investments inprevious years, our total hydrocarbon production reached a level of approximately 999.3 million barrels of oil equivalent in 2017. Despite theseinvestments, our crude oil production decreased by 9.5% from 2016 to 2017, averaging 1,948.3 thousand barrels per day in 2017, primarily as a result ofthe decline of the Cantarell, Crudo Ligero Marino, El Golpe-Puerto Ceiba, Bellota-Chinchorro, Antonio J. Bermúdez, Cactus-Sitio Grande, Ixtal-Manik,Chuc, Costero Terrestre, and Tsimín-Xux projects, which was partially offset by development of the Integral Yaxché project�s Xanab field and byrepairs, stimulations and diversification of artificial systems at our onshore fields that helped maintain production levels.
Our natural gas production (excluding natural gas liquids) decreased by 12.5% from 2016 to 2017, averaging 5,068.0 million cubic feet per day in2017. This decrease in natural gas production resulted primarily from decreased volumes in the Burgos, Crudo Ligero Marino, Ixtal-Manik, IntegralVeracruz Basin, Cactus-Sitio Grande, Integral Macuspana Basin and Ogarrio-Sánchez Magallanes projects. Exploration drilling activity increased by14.3% from 2016 to 2017, from 21 exploratory wells completed in 2016 to 24 exploratory wells completed in 2017. Development drilling activitydecreased by 57.0% from 2016 to 2017, from 128 development wells completed in 2016 to 55 development wells completed in 2017. In 2017, wecompleted the drilling of 79 wells in total. Our drilling activity in 2017 was focused on increasing the production of crude oil and associated gas in theAyatsil-Tekel, Chuc, Crudo Ligero Marino, El Golpe-Puerto Ceiba, Ku-Maloob-Zaap, Tsimín-Xux, Aceite Terciario del Golfo and Ogarrio-SánchezMagallanes projects.
Our primary objectives in 2018 include: (i) maximizing profitability to ensure the sustainability of the company; (ii) increasingly taking advantageof the opportunities and flexibility provided by the energy reform; (iii) improving our performance in industrial safety and environmental protection; and(iv) increasing productivity and efficiency. We aim to meet these objectives through the following: (1) establishment of an exploration model that allowsus to grow our proven, probable and possible reserves; (2) further development of business plans for the development of shale; (3) containment andreversal of production decline and increase of profitability of assignments migrated without third party participation; (4) entering into and developingexisting strategic alliances, partnertships and other arrangements to attract additional investment and to expand exploration activities; (5) focus onmaintenance to improve the safety of our operations; (6) improved operational efficiency and cost control; and (7) an increase in sales of ourhydrocarbons. Our production goals for 2018 include producing crude oil at a level of approximately 1,930.4 thousand barrels per day and maintainingnatural gas production above 4,656 million cubic feet per day. We aim to meet these production goals through exploration and development activities,increasing inventory reserves through new discoveries and reclassifications and managing the decline in field production by increasing our participationin future bidding rounds in order to enter into new partnerships and farm-outs.
Industrial Transformation
Our industrial transformation segment is comprised of two principal activities: (i) refining and (ii) gas and aromatics:
Refining
Pemex Industrial Transformation converts crude oil into gasoline, jet fuel, diesel, fuel oil, asphalts and lubricants. We also distribute and marketmost of these products throughout Mexico. During 2017, atmospheric
25
Copyright © 2018 www.secdatabase.com. All Rights Reserved.Please Consider the Environment Before Printing This Document
Table of Contentsdistillation refining increased to 1,627.0 thousand barrels per day, which represents an increase of 1.6% as compared to 1,602 thousand barrels per dayduring 2016. In 2017, we produced 786.2 thousand barrels per day of refined products as compared to 977.2 thousand barrels per day of refinedproducts in 2016. This decrease in refined products production was mainly due to the effects of tropical storm �Calvin� and the earthquakes thatoccurred in Mexico, which affected our crude oil processing in the Salina Cruz refinery. See ��Health, Safety and Environmental Performance� in thisItem 4. Refined products production also decreased as a result of the implementation of a general maintenance program at our Madero refinery, whichbegan on August 23, 2017. As a result of operational problems and natural disasters, processing of crude oil by the National Refining System decreased17.8 %, from 933.1 million barrels per day in 2016 to 767.0 million barrels per day in 2017.
Our primary goal for 2018 is to become profitable by focusing on maximizing the value of our distillate production. We also intend to continue totake advantage of the opportunities provided by the energy reform to enter into new strategic alliances and partnerships to improve the operationalperformance of our plants. In addition, through an increased focus on the maintenance of our facilities, we are looking to achieve higher levels of crudeoil processing and to increase the production of higher value refined products.
Gas and Aromatics
Our gas and aromatics business processes wet natural gas to produce dry natural gas, ethane, liquefied petroleum gas (LPG) and other natural gasliquids, along with aromatic derivatives chain products such as toluene, benzene and xylene. In 2017, our total sour natural gas processing capacityremained at 2016 levels of 4,523 cubic feet per day. We processed 3,237 million cubic feet of wet natural gas per day in 2017, an 11.8% decrease fromthe 3,672 million cubic feet per day of wet natural gas processed in 2016. We produced 280 thousand barrels per day of natural gas liquids in 2017, a9.1% decrease from the 308 thousand barrels per day of natural gas liquids produced in 2016. We also produced 2,667 million cubic feet of dry gas(which is natural gas with a methane content of more than 90.0%) per day in 2017, 13.2% less than the 3,074 cubic feet of dry gas per day produced in2016. We produced 622 thousand tons of aromatics and derivatives, a 33.8% decrease from 2016. The decreases in our gas and aromatics productionwas mainly due to a decrease in the supply of sour wet gas from our Marine and Southern regions, as well as the limited supply of sweet wet gas fromthe Burgos basin.
In 2018, we expect to have a lower supply of natural gas from our fields, which would require us to import higher volumes of natural gas to satisfydomestic demand. In addition, we are evaluating several alternatives for the use of our sour wet gas with high nitrogen content.
Fertilizers
Our fertilizers segment operates through the productive state-owned subsidiary Pemex Fertilizers and integrates the ammonia production chain upto the point of sale of fertilizers, including urea (produced at our Pajaritos petrochemical complex), agricultural and industrial nitrates, phosphatefertilizers and acids (produced by Fertinal).
Our strategies focus on: (1) increasing the economic value of our segment by generating diverse investment opportunities in the agricultural sectorin Mexico and (2) ensuring a reliable supply of raw materials for our plants through a long-term contract that sustains operations at our four ammoniaplants.
Ethylene
Our ethylene segment operates through the productive state-owned subsidiary Pemex Ethylene and takes advantage of the integration of theethylene production chain. In 2017, we produced a total of 1,884.0 thousand tons of petrochemical products, a 25.5% decrease from the2,528.7 thousand tons of petrochemical products produced in 2016.
26
Copyright © 2018 www.secdatabase.com. All Rights Reserved.Please Consider the Environment Before Printing This Document
Table of ContentsThe primary goals for our ethylene segment are to streamline our operations and improve our operational reliability, and to secure a steady and
reliable supply of raw materials, which will allow us to improve margins and achieve profitability.
Drilling and Services
Our drilling and services segment operates through the productive state-owned subsidiary Pemex Drilling and Services and provides drilling,completion, work-over and other services for wells in offshore and onshore fields. In 2017, this segment mainly provided completion, work-over andother drilling services to Pemex Exploration and Production, but also provided services to external clients such as Comisión Nacional del Agua(CONAGUA), Marinsa de México S.A. de C.V. (�Marinsa�), Constructora y Perforadora Latina S.A. de C.V. (�Latina�), Fieldwood Energy LLC(�Fieldwood�) and Key Energy Services (�Key Energy�).
Our well drilling activities during 2017 led to onshore discoveries. Our main discoveries were of crude oil reserves located in the Southeastern andVeracruz basins, specifically in the Northern and Southern regions. Exploration activity in the Northern region also led to the discovery of additionalnon-associated gas reserves in the Burgos basin. We are currently working on development plans for these new reserves.
Logistics
Our logistics segment operates through the productive state-owned subsidiary Pemex Logistics and provides land, maritime and pipelinetransportation, storage and distribution services to us and other companies, including the Comisión Federal de Electricidad (Federal ElectricityCommission or CFE), Aeropuertos y Servicios Auxiliares, CENAGAS, local gas stations and distributors.
During 2017, we injected approximately 1,887 thousand barrels per day of crude oil and petroleum products into our pipelines, representing a10.9% decrease as compared to 2016 when we injected approximately 2,117 thousand barrels per day, mainly due to a reduction in crude oil processedin the National Refining System and the illicit market in fuels that caused temporary closures of certain pipelines. Of the total amount of crude oil andpetroleum products that we transported in 2017, 77.1% was transported by pipeline, 7.8% by tanker and the remaining 15.1% by land transport.
During 2017, we transported 137.9 thousand barrels per day of LPG, representing a 3.5% decrease as compared to the 142.9 thousand barrels perday transported in 2016. In addition, we transported 2.3 thousand barrels per day of petrochemicals, a decrease of 30.3% as compared to the3.3 thousand barrels per day we transported in 2016. These decreases were mainly due to a decrease in the volume of LPG transported to PemexIndustrial Transformation, primarily due to the importation of LPG by private companies, as well as decreased production of natural gas by PemexExploration and Production.
As of 2016, natural gas transportation is carried out by CENAGAS, with the support of Pemex Logistics through an operation and maintenancecontract. During 2017, we transported approximately 5,196 million cubic feet per day of natural gas, a 4.5% decrease compared to the 5,440 millioncubic feet per day we transported in 2016, mainly due to a decrease in natural gas transported to CFE and Pemex Industrial Transformation.
Cogeneration and Services
Our cogeneration and services segment operates through the productive state-owned subsidiary Pemex Cogeneration and Services and usesthermal heat and steam from our industrial processes to produce the electricity required by us, as well as to generate surplus electricity to sell to thirdparties in Mexico.
Our cogeneration and services segment designs construction, financing and development structures for cogeneration through alliances with thirdparties in close geographic proximity to our productive work centers.
27
Copyright © 2018 www.secdatabase.com. All Rights Reserved.Please Consider the Environment Before Printing This Document
Table of ContentsAs of the date of this annual report, we have transferred certain assets of our cogeneration and services segment to Pemex Industrial
Transformation.
International Trading
The international trading segment, which operates through P.M.I. Comercio Internacional, S.A. de C.V. (which we refer to as PMI), P.M.I.Trading, Ltd., P.M.I. Norteamérica, S.A. de C.V., (which, together with PMI, we collectively refer to as the �PMI Subsidiaries�) and Mex GasInternational, Ltd., (which, together with the PMI Subsidiaries, we collectively refer to as the �Trading Companies�) provides us with internationaltrading, distribution, risk management, insurance and transportation services. Certain of the Trading Companies sell, buy and transport crude oil, refinedproducts and petrochemicals in world markets, and provide related risk management, insurance, transportation and storage services. The TradingCompanies have offices in Mexico City, Houston, Amsterdam, Singapore and Madrid. Export sales are made through PMI to approximately 32 majorcustomers in various foreign markets.
In 2017, our crude oil exports decreased in volume by 1.7%, from 1,194.3 thousand barrels per day in 2016 to 1,174.0 thousand barrels per day in2017. Natural gas imports decreased by 8.7% in 2017, from 1,933.9 million cubic feet per day in 2016 to 1,766.0 million cubic feet per day in 2017. In2017, exports of petrochemical products decreased 51.6%, from 124.7 thousand metric tons in 2016 to 60.4 thousand metric tons in 2017, while importsof petrochemical products increased 19.6%, from 278.2 thousand metric tons in 2016 to 332.8 thousand metric tons in 2017. In 2017, exports of otherpetroleum products decreased 14.8%, from 185.5 thousand barrels per day in 2016 to 158.0 thousand barrels per day in 2017, while imports of otherpetroleum products and liquefied petroleum gas increased 17.0%, from 800.4 thousand barrels per day in 2016 to 936.2 thousand barrels per day in2017. As a major supplier of crude oil to the United States, our international trading segment�s crude oil exports to the United States totaled U.S.$10.5 billion in 2017, an increase of U.S. $3.0 billion from 2016.
28
Copyright © 2018 www.secdatabase.com. All Rights Reserved.Please Consider the Environment Before Printing This Document
Table of ContentsInfrastructure of PEMEX
Exploration and Production
Following our 2015 corporate reorganization, certain business units and assets that were operated by our exploration and production segment weretransferred to our drilling and services segment upon the formation of Pemex Drilling and Services on August 1, 2015. For the year ended December 31,2015, we have not presented separately the operating results of our drilling and services segment in this Item 4 and, accordingly, the results of ourexploration and production segment include the results of that segment for this period. Operating results for both the exploration and production anddrilling and services segments are presented separately for periods beginning January 1, 2016. For a detailed description of the financial results of eachsegment, see our consolidated financial statements included herein.
Exploration and Drilling
We seek to identify new oil reservoirs through our exploration program in order to increase the future replacement rate of proved reserves. From1990 to 2017, we completed 13,229 exploration and development wells. During 2017, our average success rate for exploratory wells was 62.5%, an18.5% increase as compared to 2016 and our average success rate for development wells was 92.9%, an 8.1% increase as compared to 2016. From 2013to 2017, we discovered 15 new crude oil fields and 7 new natural gas fields, bringing the total number of our crude oil and natural gas producing fieldsto 397 at the end of 2017.
Our 2017 exploration program was comprised of exploration in both onshore and offshore regions, including the deep waters of the Gulf ofMexico. These exploratory activities yielded 246 million barrels of oil equivalent of proved reserves resulting from the discovery of one oil producingfield and two gas and condensate
29
Copyright © 2018 www.secdatabase.com. All Rights Reserved.Please Consider the Environment Before Printing This Document
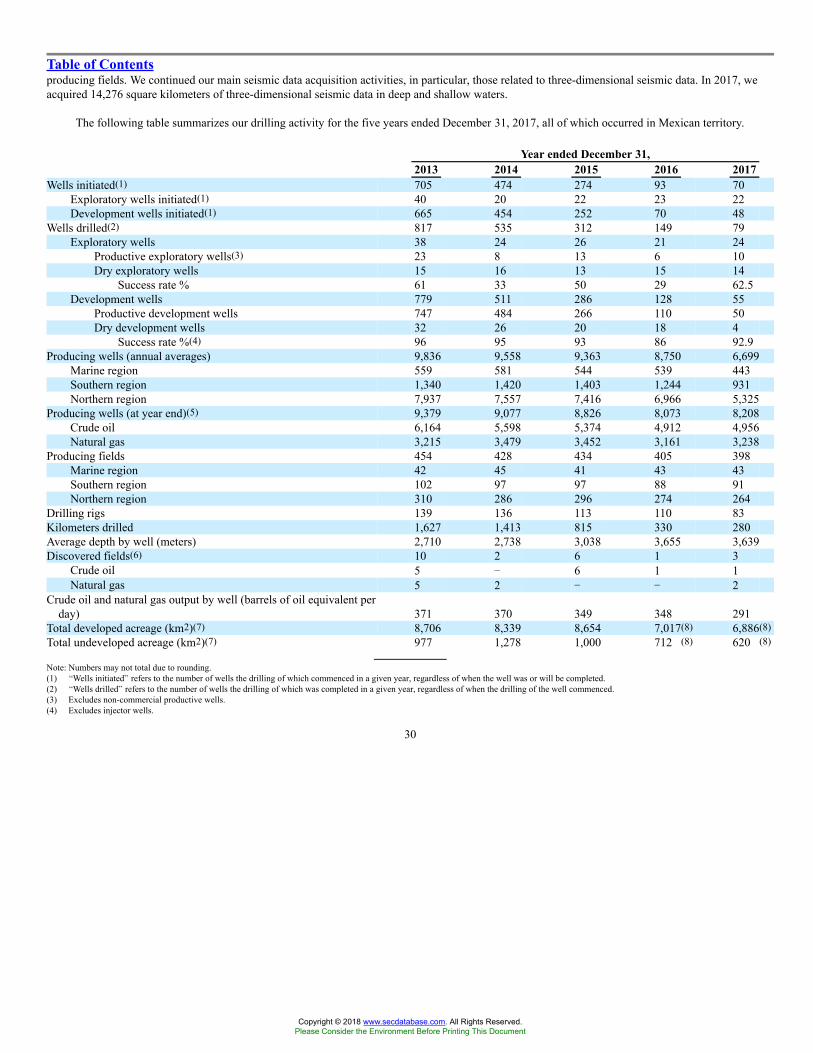
Table of Contentsproducing fields. We continued our main seismic data acquisition activities, in particular, those related to three-dimensional seismic data. In 2017, weacquired 14,276 square kilometers of three-dimensional seismic data in deep and shallow waters.
The following table summarizes our drilling activity for the five years ended December 31, 2017, all of which occurred in Mexican territory.
Year ended December 31,2013 2014 2015 2016 2017
Wells initiated(1) 705 474 274 93 70Exploratory wells initiated(1) 40 20 22 23 22Development wells initiated(1) 665 454 252 70 48
Wells drilled(2) 817 535 312 149 79Exploratory wells 38 24 26 21 24
Productive exploratory wells(3) 23 8 13 6 10Dry exploratory wells 15 16 13 15 14
Success rate % 61 33 50 29 62.5Development wells 779 511 286 128 55
Productive development wells 747 484 266 110 50Dry development wells 32 26 20 18 4
Success rate %(4) 96 95 93 86 92.9Producing wells (annual averages) 9,836 9,558 9,363 8,750 6,699
Marine region 559 581 544 539 443Southern region 1,340 1,420 1,403 1,244 931Northern region 7,937 7,557 7,416 6,966 5,325
Producing wells (at year end)(5) 9,379 9,077 8,826 8,073 8,208Crude oil 6,164 5,598 5,374 4,912 4,956Natural gas 3,215 3,479 3,452 3,161 3,238
Producing fields 454 428 434 405 398Marine region 42 45 41 43 43Southern region 102 97 97 88 91Northern region 310 286 296 274 264
Drilling rigs 139 136 113 110 83Kilometers drilled 1,627 1,413 815 330 280Average depth by well (meters) 2,710 2,738 3,038 3,655 3,639Discovered fields(6) 10 2 6 1 3
Crude oil 5 � 6 1 1Natural gas 5 2 � � 2
Crude oil and natural gas output by well (barrels of oil equivalent perday) 371 370 349 348 291
Total developed acreage (km2)(7) 8,706 8,339 8,654 7,017(8) 6,886(8)Total undeveloped acreage (km2)(7) 977 1,278 1,000 712 (8) 620 (8)
Note: Numbers may not total due to rounding.(1) �Wells initiated� refers to the number of wells the drilling of which commenced in a given year, regardless of when the well was or will be completed.(2) �Wells drilled� refers to the number of wells the drilling of which was completed in a given year, regardless of when the drilling of the well commenced.(3) Excludes non-commercial productive wells.(4) Excludes injector wells.
30
Copyright © 2018 www.secdatabase.com. All Rights Reserved.Please Consider the Environment Before Printing This Document
Table of Contents(5) For the years ended December 31, 2013, 2014 and 2015, all productive wells, and all other wells referred to in this table, are �net,� because we did not grant others any fractional working interests
in any wells that we owned no acquired any fractional working interest in wells owned by others. Figures for the years ended December 31, 2016 and 2017 include fractional interests obtainedpursuant to joint ventures and associations.
(6) Includes only fields with proved reserves.(7) For the years ended December 31, 2013, 2014 and 2015, all acreage is net because we neither granted others fractional interests nor entered into other types of production sharing arrangements.
Figures for the years ended December 31, 2016 and 2017 include fractional interests obtained pursuant to joint ventures and associations.(8) These values relate only to our current assignments.Source: Pemex Exploration and Production.
Extensions and Discoveries
During 2017, our exploratory activity in the shallow waters of the Gulf of Mexico and onshore regions resulted in new discoveries of light crudeoil in the offshore Suuk field in June 2017 and gas and condensate discoveries in the onshore Valeriana and Ixachi fields in August and November of2017, respectively. These discoveries led to the incorporation of approximately 246 million barrels of oil equivalent in three fields.
On November 3, 2017, we announced the discovery of onshore light crude oil and gas reservoirs at the Ixachi-1 well in the state of Veracruz,Mexico, which we believe may contain over 1.5 billion barrels of oil equivalent. We believe that this discovery represents our largest onshore discoveryin 15 years and that production can be accelerated due to the proximity of the reservoirs to existing infrastructure and to the Sistema Nacional deGasoductos (National Gas Pipeline System).
Reserves
Under the Mexican Constitution, all oil and other hydrocarbon reserves located in the subsoil of Mexico are owned by the Mexican nation and notby us. As of December 31, 2014, Pemex-Exploration and Production was assigned rights through Round Zero corresponding to areas that togethercontained 95.2% of Mexico�s total proved reserves. Pemex Exploration and Production, as the successor to Pemex-Exploration and Production, has theright to extract, but not own, these reserves, and to sell the resulting production. As of the date of this report, the exploration and development activitiesof Petróleos Mexicanos and the subsidiary entities are limited to reserves located in Mexico.
Proved oil and natural gas reserves are those estimated quantities of crude oil, natural gas and natural gas liquids which geological andengineering data demonstrate with reasonable certainty to be economically producible from a given date forward, from known reservoirs and underexisting economic conditions, operating methods and government regulations.
Proved reserves estimates as of December 31, 2017 were prepared by our exploration and production segment and were reviewed by theIndependent Engineering Firms (as defined below), which audit its estimates of our oil and gas reserves. In addition, pursuant to the Reglamiento de laLey de Hidrocarburos (Regulations under the Hydrocarbons Law), the CNH reviewed the proved reserves reports estimates as of December 31, 2017and approved them on March 28, 2018. See �Item 3�Key Information�Risk Factors�Risk Factors Related to our Relationship with the MexicanGovernment� Information on Mexico�s hydrocarbon reserves is based on estimates, which are uncertain and subject to revisions.�
We estimate reserves based on generally accepted petroleum engineering and evaluation methods and procedures, which are based primarily onapplicable SEC regulations and, as necessary, the Society of Petroleum Engineers� (which we refer to as the SPE) publication entitled StandardsPertaining to the Estimating and Auditing of Oil and Gas Reserves Information, dated February 19, 2007 and other SPE publications, including theSPE�s publication entitled Petroleum Resources Management System, as well as other technical sources, including Estimation and Classification ofReserves of Crude Oil, Natural Gas, and Condensate, by Chapman
31
Copyright © 2018 www.secdatabase.com. All Rights Reserved.Please Consider the Environment Before Printing This Document

Table of ContentsCronquist, and Determination of Oil and Gas Reserves, Petroleum Society Monograph Number 1, published by the Canadian Institute of Mining andMetallurgy & Petroleum. The choice of method or combination of methods employed in the analysis of each reservoir is determined by:
� experience in the area;
� stage of development;
� quality and completeness of basic data; and
� production and pressure histories.
Reserves data set forth herein represent only estimates. Reserves valuation is a subjective process of estimating underground accumulations ofcrude oil and natural gas that cannot be measured in an exact manner. The accuracy of any reserves estimate depends on the quality of available data,engineering and geological interpretation and professional judgment. As a result, estimates of different engineers may vary. In addition, the results ofdrilling, testing and producing subsequent to the date of an estimate may lead to the revision of an estimate.
During 2017, we did not record any material increase in our proved oil and gas reserves as a result of the use of new technologies.
In order to ensure the reliability of our reserves estimation efforts, we have undertaken the internal certification of our estimates of reserves since1996. We have established certain internal controls in connection with the preparation of our proved reserves estimates. Initially, teams of geoscientistsfrom our exploration and production business units (with each of these units covering several projects) prepare the reserves estimates, using distinctestimation processes for valuations relating to new discoveries and developed fields, respectively. Subsequently, the regional reserves offices collectthese reserves estimates from the units and request that the Gerencia de Recursos y Certificación de Reservas (Office of Resources and Certification ofReserves), the central hydrocarbon reserves management body of Pemex Exploration and Production, review and certify such valuations and thebooking of the related reserves. This internal certification process is undertaken in accordance with internal guidelines for estimating and classifyingproved reserves, which are based on the SEC�s rules and definitions. The Office of Resources and Certification of Reserves, which additionallyoversees and conducts an internal audit of the process described above, consists entirely of professionals with geological, geophysical, petrophysical andreservoir engineering backgrounds. Additionally, the engineers who participate in our reserves estimation process are experienced in: reservoirnumerical simulation; well drilling and completion; pressure, volume and temperature (PVT) and analytical tools used in forecasting the performance ofthe various elements comprising the production system; and design strategies in petroleum field development. Furthermore, all of our personnel havebeen certified by the Secretaría de Educación Pública (Ministry of Public Education), most have earned master�s degrees in areas of study such aspetroleum engineering, geology and geophysical engineering and they possess an average of over fifteen years of professional experience.
In addition to this internal review process, our exploration and production segment�s final reserves estimates are audited by independentengineering firms. Three independent engineering firms audited our estimates of proved reserves as of December 31, 2017: Netherland Sewell;DeGolyer and MacNaughton; and Ryder Scott (we refer to these firms together as the Independent Engineering Firms). The reserves estimates reviewedby the Independent Engineering Firms totaled 97.0% of our estimated proved reserves. The remaining 3.0% of our estimated proved reserves consistedof reserves located in certain areas in which third parties provide us with drilling services. Netherland Sewell audited the reserves in the Aceite Terciariode Golfo, Poza Rica-Altamira and the Litoral de Tabasco business units. DeGolyer and MacNaughton audited reserves in the Burgos and Veracruzbusiness units and Ryder Scott audited the reserves in the Bellota-Jujo, Cinco Presidentes, Macuspana-Muspac, Samaria-Luna, Abkatún-Pol-Chuc,Cantarell and Ku-Maloob-Zaap business units. The audits conducted by the Independent Engineering Firms consisted primarily of: (1) analysis ofhistorical static and dynamic reservoir data that we have provided; (2) construction or updating of the Independent Engineering Firms� own
32
Copyright © 2018 www.secdatabase.com. All Rights Reserved.Please Consider the Environment Before Printing This Document

Table of Contentsstatic and dynamic reservoir characterization models of some of our fields; (3) economic analysis of fields; and (4) review of our production forecastsand reserves estimates.
Since reserves estimates are, by definition, only estimates, they cannot be reviewed for the purpose of verifying exactness. Instead, theIndependent Engineering Firms conducted a detailed review of our reserves estimates so that they could express an opinion as to whether, in theaggregate, the reserves estimates we furnished were reasonable and had been estimated and presented in conformity with generally accepted petroleumengineering and evaluation methods and procedures.
All questions, including any suggested modifications to proved reserves estimates, that arose during the Independent Engineering Firms� reviewprocess were resolved by our exploration and production segment to the satisfaction of the Independent Engineering Firms. The IndependentEngineering Firms have concluded that our estimated total proved oil and natural gas reserve volumes set forth in this report are, in the aggregate,reasonable and have been prepared in accordance with Rule 4-10(a) of Regulation S-X of the SEC, as amended (which we refer to as Rule 4-10(a)), areconsistent with international reserves reporting practice and are in accordance with the revised oil and gas reserves disclosure provisions of ASC Topic932.
Our total proved developed and undeveloped reserves of crude oil, condensates and liquefiable hydrocarbons recoverable from field processingplants decreased by 11.0% in 2017, from 7,219 million barrels at December 31, 2016 to 6,427 million barrels at December 31, 2017. Our proveddeveloped reserves of crude oil, condensates and liquefiable hydrocarbons recoverable from processing plants decreased by 14.7% in 2017, from4,886 million barrels at December 31, 2016 to 4,166 million barrels at December 31, 2017. These decreases were principally due to a decrease in oilproduction in 2017, a decrease in field development and, following bidding rounds conducted by the Mexican Government, the transfer to third partiesof rights to certain fields included in our 2016 reserves. The amount of crude oil, condensate and liquefiable hydrocarbon reserves added in 2017 wasinsufficient to offset the level of production in 2017, which amounted to 805 million barrels of crude oil, condensates and liquefiable hydrocarbons.
Our total proved developed and undeveloped dry gas reserves decreased by 5.6% in 2017, from 6,984 billion cubic feet at December 31, 2016 to6,593 billion cubic feet at December 31, 2017. Our proved developed dry gas reserves decreased by 10.8% in 2017, from 4,513 billion cubic feet atDecember 31, 2016 to 4,026 billion cubic feet at December 31, 2017. These decreases were principally due to a decrease in oil production in 2017, adecrease in field development, the natural decline of fields and, following bidding rounds conducted by the Mexican Government, the transfer to thirdparties of rights to certain fields included in our 2016 reserves. The amount of dry gas reserves added in 2017 was insufficient to offset the level ofproduction in 2017, which amounted to 999 billion cubic feet of dry gas. Our proved undeveloped dry gas reserves increased by 3.9% in 2017, from2,471 billion cubic feet at December 31, 2016 to 2,567 billion cubic feet at December 31, 2017.
During 2017, our exploratory activity in the shallow waters of the Gulf of Mexico and onshore regions resulted in new discoveries of light crudeoil in the offshore Suuk field in June 2017 and gas and condensate discoveries in the onshore Valeriana and Ixachi fields in August and November of2017, respectively. These discoveries led to the incorporation of approximately 246 million barrels of oil equivalent in three fields.
In 2017, our proved reserves increased by 174.2 million barrels of oil equivalent due to reclassifications, development, revisions and discoveries.
33
Copyright © 2018 www.secdatabase.com. All Rights Reserved.Please Consider the Environment Before Printing This Document
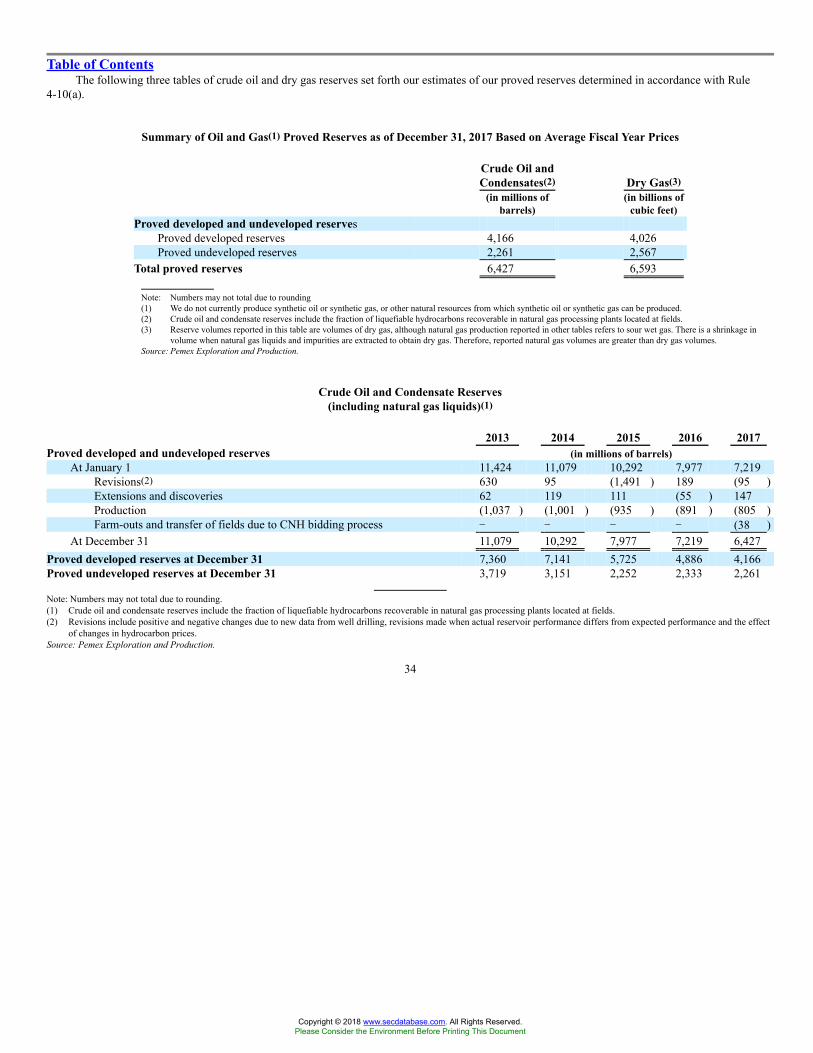
Table of ContentsThe following three tables of crude oil and dry gas reserves set forth our estimates of our proved reserves determined in accordance with Rule
4-10(a).
Summary of Oil and Gas(1) Proved Reserves as of December 31, 2017 Based on Average Fiscal Year Prices
Crude Oil andCondensates(2) Dry Gas(3)
(in millions ofbarrels)
(in billions ofcubic feet)
Proved developed and undeveloped reservesProved developed reserves 4,166 4,026Proved undeveloped reserves 2,261 2,567
Total proved reserves 6,427 6,593
Note: Numbers may not total due to rounding(1) We do not currently produce synthetic oil or synthetic gas, or other natural resources from which synthetic oil or synthetic gas can be produced.(2) Crude oil and condensate reserves include the fraction of liquefiable hydrocarbons recoverable in natural gas processing plants located at fields.(3) Reserve volumes reported in this table are volumes of dry gas, although natural gas production reported in other tables refers to sour wet gas. There is a shrinkage in
volume when natural gas liquids and impurities are extracted to obtain dry gas. Therefore, reported natural gas volumes are greater than dry gas volumes.Source: Pemex Exploration and Production.
Crude Oil and Condensate Reserves(including natural gas liquids)(1)
2013 2014 2015 2016 2017Proved developed and undeveloped reserves (in millions of barrels)
At January 1 11,424 11,079 10,292 7,977 7,219Revisions(2) 630 95 (1,491 ) 189 (95 )Extensions and discoveries 62 119 111 (55 ) 147Production (1,037 ) (1,001 ) (935 ) (891 ) (805 )Farm-outs and transfer of fields due to CNH bidding process � � � � (38 )
At December 31 11,079 10,292 7,977 7,219 6,427Proved developed reserves at December 31 7,360 7,141 5,725 4,886 4,166Proved undeveloped reserves at December 31 3,719 3,151 2,252 2,333 2,261
Note: Numbers may not total due to rounding.(1) Crude oil and condensate reserves include the fraction of liquefiable hydrocarbons recoverable in natural gas processing plants located at fields.(2) Revisions include positive and negative changes due to new data from well drilling, revisions made when actual reservoir performance differs from expected performance and the effect
of changes in hydrocarbon prices.Source: Pemex Exploration and Production.
34
Copyright © 2018 www.secdatabase.com. All Rights Reserved.Please Consider the Environment Before Printing This Document
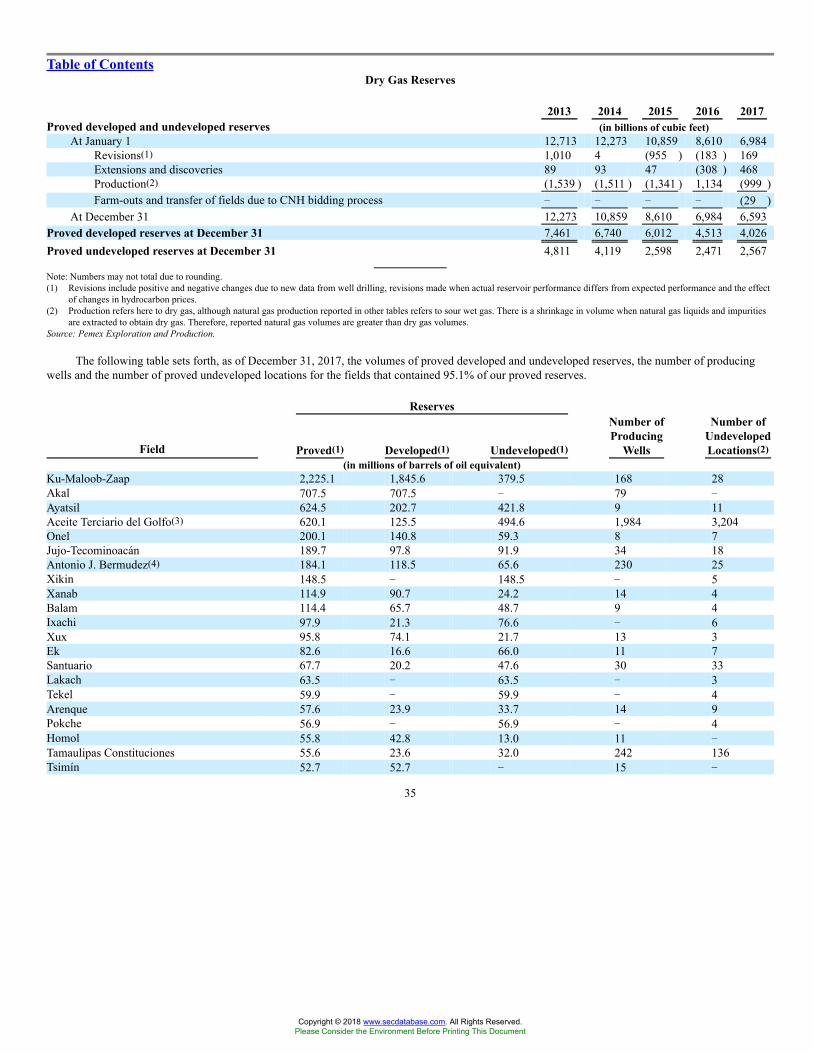
Table of ContentsDry Gas Reserves
2013 2014 2015 2016 2017Proved developed and undeveloped reserves (in billions of cubic feet)
At January 1 12,713 12,273 10,859 8,610 6,984Revisions(1) 1,010 4 (955 ) (183 ) 169Extensions and discoveries 89 93 47 (308 ) 468Production(2) (1,539 ) (1,511 ) (1,341 ) 1,134 (999 )Farm-outs and transfer of fields due to CNH bidding process � � � � (29 )
At December 31 12,273 10,859 8,610 6,984 6,593Proved developed reserves at December 31 7,461 6,740 6,012 4,513 4,026Proved undeveloped reserves at December 31 4,811 4,119 2,598 2,471 2,567
Note: Numbers may not total due to rounding.(1) Revisions include positive and negative changes due to new data from well drilling, revisions made when actual reservoir performance differs from expected performance and the effect
of changes in hydrocarbon prices.(2) Production refers here to dry gas, although natural gas production reported in other tables refers to sour wet gas. There is a shrinkage in volume when natural gas liquids and impurities
are extracted to obtain dry gas. Therefore, reported natural gas volumes are greater than dry gas volumes.Source: Pemex Exploration and Production.
The following table sets forth, as of December 31, 2017, the volumes of proved developed and undeveloped reserves, the number of producingwells and the number of proved undeveloped locations for the fields that contained 95.1% of our proved reserves.
Reserves
Field Proved(1) Developed(1) Undeveloped(1)
Number ofProducing
Wells
Number ofUndevelopedLocations(2)
(in millions of barrels of oil equivalent)Ku-Maloob-Zaap 2,225.1 1,845.6 379.5 168 28Akal 707.5 707.5 � 79 �Ayatsil 624.5 202.7 421.8 9 11Aceite Terciario del Golfo(3) 620.1 125.5 494.6 1,984 3,204Onel 200.1 140.8 59.3 8 7Jujo-Tecominoacán 189.7 97.8 91.9 34 18Antonio J. Bermudez(4) 184.1 118.5 65.6 230 25Xikin 148.5 � 148.5 � 5Xanab 114.9 90.7 24.2 14 4Balam 114.4 65.7 48.7 9 4Ixachi 97.9 21.3 76.6 � 6Xux 95.8 74.1 21.7 13 3Ek 82.6 16.6 66.0 11 7Santuario 67.7 20.2 47.6 30 33Lakach 63.5 � 63.5 � 3Tekel 59.9 � 59.9 � 4Arenque 57.6 23.9 33.7 14 9Pokche 56.9 � 56.9 � 4Homol 55.8 42.8 13.0 11 �Tamaulipas Constituciones 55.6 23.6 32.0 242 136Tsimín 52.7 52.7 � 15 �
35
Copyright © 2018 www.secdatabase.com. All Rights Reserved.Please Consider the Environment Before Printing This Document
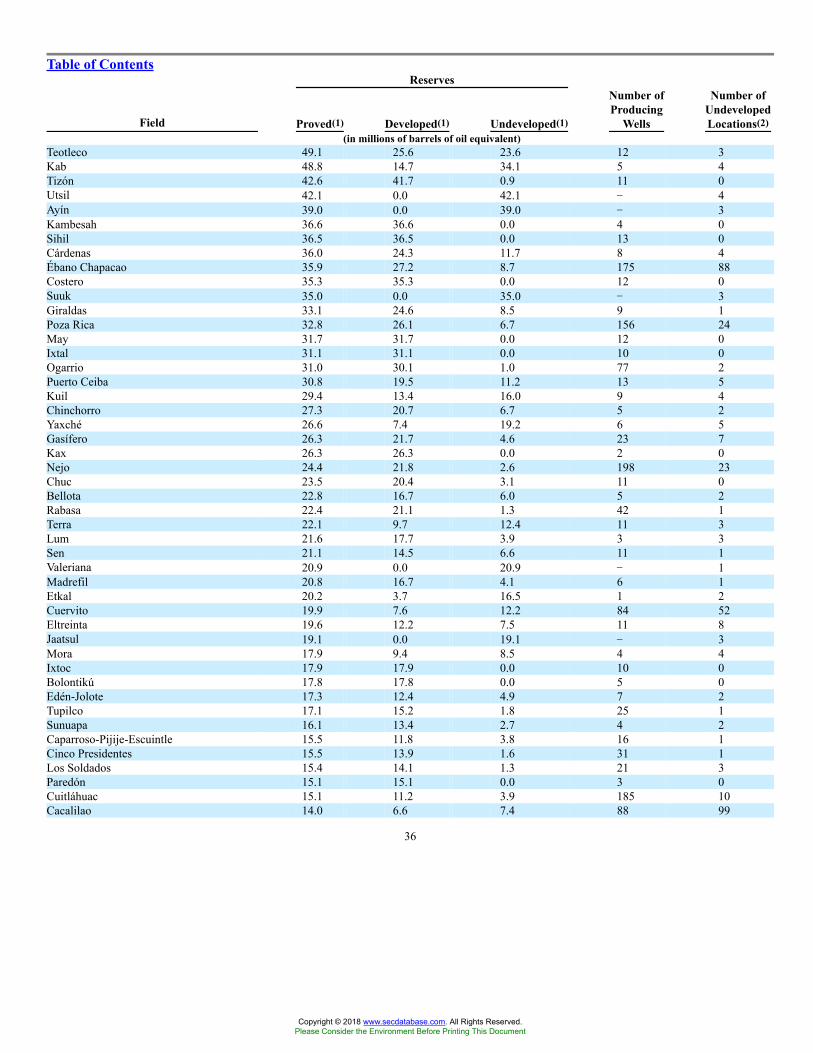
Table of ContentsReserves
Field Proved(1) Developed(1) Undeveloped(1)
Number ofProducing
Wells
Number ofUndevelopedLocations(2)
(in millions of barrels of oil equivalent)Teotleco 49.1 25.6 23.6 12 3Kab 48.8 14.7 34.1 5 4Tizón 42.6 41.7 0.9 11 0Utsil 42.1 0.0 42.1 � 4Ayín 39.0 0.0 39.0 � 3Kambesah 36.6 36.6 0.0 4 0Sihil 36.5 36.5 0.0 13 0Cárdenas 36.0 24.3 11.7 8 4Ébano Chapacao 35.9 27.2 8.7 175 88Costero 35.3 35.3 0.0 12 0Suuk 35.0 0.0 35.0 � 3Giraldas 33.1 24.6 8.5 9 1Poza Rica 32.8 26.1 6.7 156 24May 31.7 31.7 0.0 12 0Ixtal 31.1 31.1 0.0 10 0Ogarrio 31.0 30.1 1.0 77 2Puerto Ceiba 30.8 19.5 11.2 13 5Kuil 29.4 13.4 16.0 9 4Chinchorro 27.3 20.7 6.7 5 2Yaxché 26.6 7.4 19.2 6 5Gasífero 26.3 21.7 4.6 23 7Kax 26.3 26.3 0.0 2 0Nejo 24.4 21.8 2.6 198 23Chuc 23.5 20.4 3.1 11 0Bellota 22.8 16.7 6.0 5 2Rabasa 22.4 21.1 1.3 42 1Terra 22.1 9.7 12.4 11 3Lum 21.6 17.7 3.9 3 3Sen 21.1 14.5 6.6 11 1Valeriana 20.9 0.0 20.9 � 1Madrefil 20.8 16.7 4.1 6 1Etkal 20.2 3.7 16.5 1 2Cuervito 19.9 7.6 12.2 84 52Eltreinta 19.6 12.2 7.5 11 8Jaatsul 19.1 0.0 19.1 � 3Mora 17.9 9.4 8.5 4 4Ixtoc 17.9 17.9 0.0 10 0Bolontikú 17.8 17.8 0.0 5 0Edén-Jolote 17.3 12.4 4.9 7 2Tupilco 17.1 15.2 1.8 25 1Sunuapa 16.1 13.4 2.7 4 2Caparroso-Pijije-Escuintle 15.5 11.8 3.8 16 1Cinco Presidentes 15.5 13.9 1.6 31 1Los Soldados 15.4 14.1 1.3 21 3Paredón 15.1 15.1 0.0 3 0Cuitláhuac 15.1 11.2 3.9 185 10Cacalilao 14.0 6.6 7.4 88 99
36
Copyright © 2018 www.secdatabase.com. All Rights Reserved.Please Consider the Environment Before Printing This Document
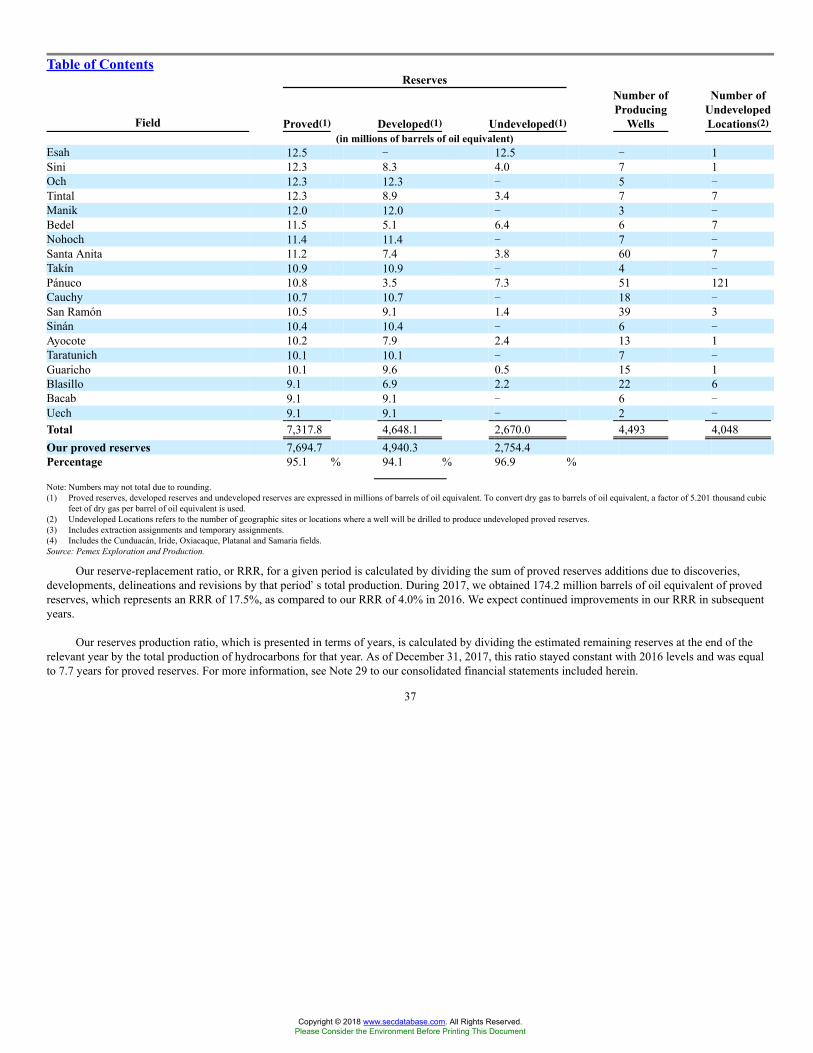
Table of ContentsReserves
Field Proved(1) Developed(1) Undeveloped(1)
Number ofProducing
Wells
Number ofUndevelopedLocations(2)
(in millions of barrels of oil equivalent)Esah 12.5 � 12.5 � 1Sini 12.3 8.3 4.0 7 1Och 12.3 12.3 � 5 �Tintal 12.3 8.9 3.4 7 7Manik 12.0 12.0 � 3 �Bedel 11.5 5.1 6.4 6 7Nohoch 11.4 11.4 � 7 �Santa Anita 11.2 7.4 3.8 60 7Takín 10.9 10.9 � 4 �Pánuco 10.8 3.5 7.3 51 121Cauchy 10.7 10.7 � 18 �San Ramón 10.5 9.1 1.4 39 3Sinán 10.4 10.4 � 6 �Ayocote 10.2 7.9 2.4 13 1Taratunich 10.1 10.1 � 7 �Guaricho 10.1 9.6 0.5 15 1Blasillo 9.1 6.9 2.2 22 6Bacab 9.1 9.1 � 6 �Uech 9.1 9.1 � 2 �
Total 7,317.8 4,648.1 2,670.0 4,493 4,048Our proved reserves 7,694.7 4,940.3 2,754.4Percentage 95.1 % 94.1 % 96.9 %
Note: Numbers may not total due to rounding.(1) Proved reserves, developed reserves and undeveloped reserves are expressed in millions of barrels of oil equivalent. To convert dry gas to barrels of oil equivalent, a factor of 5.201 thousand cubic
feet of dry gas per barrel of oil equivalent is used.(2) Undeveloped Locations refers to the number of geographic sites or locations where a well will be drilled to produce undeveloped proved reserves.(3) Includes extraction assignments and temporary assignments.(4) Includes the Cunduacán, Iride, Oxiacaque, Platanal and Samaria fields.Source: Pemex Exploration and Production.
Our reserve-replacement ratio, or RRR, for a given period is calculated by dividing the sum of proved reserves additions due to discoveries,developments, delineations and revisions by that period�s total production. During 2017, we obtained 174.2 million barrels of oil equivalent of provedreserves, which represents an RRR of 17.5%, as compared to our RRR of 4.0% in 2016. We expect continued improvements in our RRR in subsequentyears.
Our reserves production ratio, which is presented in terms of years, is calculated by dividing the estimated remaining reserves at the end of therelevant year by the total production of hydrocarbons for that year. As of December 31, 2017, this ratio stayed constant with 2016 levels and was equalto 7.7 years for proved reserves. For more information, see Note 29 to our consolidated financial statements included herein.
37
Copyright © 2018 www.secdatabase.com. All Rights Reserved.Please Consider the Environment Before Printing This Document

Table of ContentsSales Prices and Production Costs
The following table sets forth our average sales price per unit of oil and gas produced and our average production cost per unit of production, inthe aggregate and for each field containing 10% or more of our proved reserves.
Unit Sales Prices and Production Costs(1)
Ku-Maloob-Zaap Akal Other Fields All Fields
Year ended December 31, 2017 (in U.S. dollars)Average sales pricesCrude oil, per barrel U.S. $ 41.70 U.S. $48.75 U.S. $ 52.90 U.S. $48.71Natural gas, per thousand cubic feet U.S. $ 5.07 U.S. $4.25 U.S. $ 4.12 U.S. $4.32Average production costs, per barrel of oil equivalent U.S. $ 7.53 U.S. $23.25 U.S. $ 11.53 U.S. $10.90
Year ended December 31, 2016Average sales pricesCrude oil, per barrel U.S. $ 30.11 U.S. $36.67 U.S. $ 40.21 U.S. $36.55Natural gas, per thousand cubic feet U.S. $ 3.40 U.S. $2.86 U.S. $ 3.16 U.S. $3.01Average production costs, per barrel of oil equivalent U.S. $ 5.34 U.S. $16.53 U.S. $ 8.08 U.S. $7.78
Year ended December 31, 2015Average sales pricesCrude oil, per barrel U.S. $ 41.21 U.S. $47.79 U.S. $ 51.51 U.S. $48.22Natural gas, per thousand cubic feet U.S. $ 4.59 U.S. $3.59 U.S. $ 3.79 U.S. $3.78Average production costs, per barrel of oil equivalent U.S. $ 6.93 U.S. $15.97 U.S. $ 9.69 U.S. $9.40
(1) Average of sales prices as of the last day of each month of the year.Source: Pemex Exploration and Production.
In 2017, our average production cost was U.S. $10.90 per barrel of oil equivalent, and represented an increase of 40.1%, as compared to ouraverage production cost of U.S. $7.78 per barrel in 2016. This increase resulted primarily from an increase in expenses for the maintenance of wells,equipment and production facilities and payments of non-income related taxes and duties.
We calculate and disclose our production costs pursuant to international practices, which are based on U.S. GAAP under ASC Topic 932. Inaccordance with ASC Topic 932, the production cost per barrel of oil equivalent is calculated by dividing total production expenses (in U.S. dollars) bytotal production of oil and gas (in barrels of oil equivalent) for the relevant period.
Our total production cost consists of all direct and indirect costs incurred to produce crude oil and gas, including costs associated with theoperation and maintenance of wells and related equipment and facilities. In addition, it includes costs of labor to operate the wells and facilities, thecosts of materials, supplies and fuel consumed, including gas used for gas lifting, nitrogen and other chemicals, repair and non-capitalized maintenancecosts, and other costs, such as fees for general services, a labor fund for active personnel, corporate services, indirect overhead and applicable taxes andduties. However, it excludes non-cash expenses such as amortization of capitalized well expenses, the depreciation of fixed assets, expenses associatedwith the distribution and handling of oil and gas and other expenses that are related to exploration and drilling activities.
38
Copyright © 2018 www.secdatabase.com. All Rights Reserved.Please Consider the Environment Before Printing This Document

Table of ContentsCrude Oil and Natural Gas Production
In 2017, we produced an average of 1,948.3 thousand barrels per day of crude oil, 9.5% less than our average production in 2016 of2,153.5 thousand barrels per day of crude oil. The decrease in 2017 resulted primarily from the decrease of production in the Cantarell, Crudo LigeroMarino, El Golpe-Puerto Ceiba, Bellota-Chinchorro, Complejo Antonio J. Bermúdez, Cactus Sitio Grande, Ixtal-Manik, Chuc, Costero Terrestre, andTsimín-Xux projects. Accordingly, our average production of heavy crude oil decreased by 53.6 thousand barrels per day, or 4.9% less than the averagedaily production in 2016, primarily due to a decrease in our drilling activities, the natural decline in field production, an increase in fractional flow waterproduction and an increase in the gas production cap of reservoirs, particularly for reservoirs past the saturation stage. In 2017, the average productionof light crude oil decreased by 96.3 thousand barrels per day, or 12.3%, as compared to 2016. This decrease occurred mainly due to a natural decline inproduction in the Chuhuk, Caan, and Ixtal fields of the Abkatún-Pol-Chuc business unit; the Tsimín, Sinán, Bolontikú, and Yaxché fields of the Litoralde Tabasco business unit; the Costero, Sitio Grande, Teotleco fields of the Macuspana-Muspac business unit and the Samaria, Íride, Cunduacán and Sinifields of the Samaria-Luna business unit.
Crude oil can be classified by its sulfur content. �Sour� or heavy crude oil contains 3.4% or greater sulfur content by weight and �sweet� or lightcrude oil contains less than 1.0% sulfur content by weight. Most of our production is classified as sour or heavy crude oil.
Our exploration and production segment primarily produces four types of crude oil:
� Altamira, a heavy crude oil;
� Maya, a heavy crude oil;
� Isthmus, a light crude oil; and
� Olmeca, an extra-light crude oil.
Most of our production consists of Isthmus and Maya crude oil. In 2017, 53.8% of our total production of crude oil consisted of heavy crude oiland 46.2% consisted of light and extra-light crude oil. The Marine regions yield mostly heavy crude oil (61.7% of these regions� production in 2017),although significant volumes of light crude oil are also produced there (38.2% of these regions� production in 2017). The Southern region yields mainlylight and extra-light crude oil (together, 93.7% of this region�s production in 2017), and the Northern region yields both light and extra-light crude oil(44.7% of this region�s production in 2017) and heavy crude oil (55.3% of this region�s production in 2017).
The most productive crude oil and natural gas fields in the Gulf of Mexico are located in the Ku-Maloob-Zaap, Litoral de Tabasco,Abkatún-Pol-Chuc and Cantarell business units in the Marine regions and the Sarmaria Luna and Bellota-Jujo business units in the Southern region. Inparticular, the Ku-Maloob-Zaap business unit was the most important crude oil producer in 2017, producing an average of 858.0 thousand barrels ofcrude oil per day in 2017, or 44.0% of our total crude oil production for the year, and 552.3 million cubic feet per day of natural gas, or 10.9% of ourtotal natural gas production for the year. Our second most important crude oil producer was Litoral de Tabasco which produced an average of345.8 thousand barrels of crude oil per day in 2017, or 17.7% of our total crude oil production for the year, and an average of 882.3 million cubic feetper day of natural gas, or 17.4 % of our total natural gas production for the year.
39
Copyright © 2018 www.secdatabase.com. All Rights Reserved.Please Consider the Environment Before Printing This Document
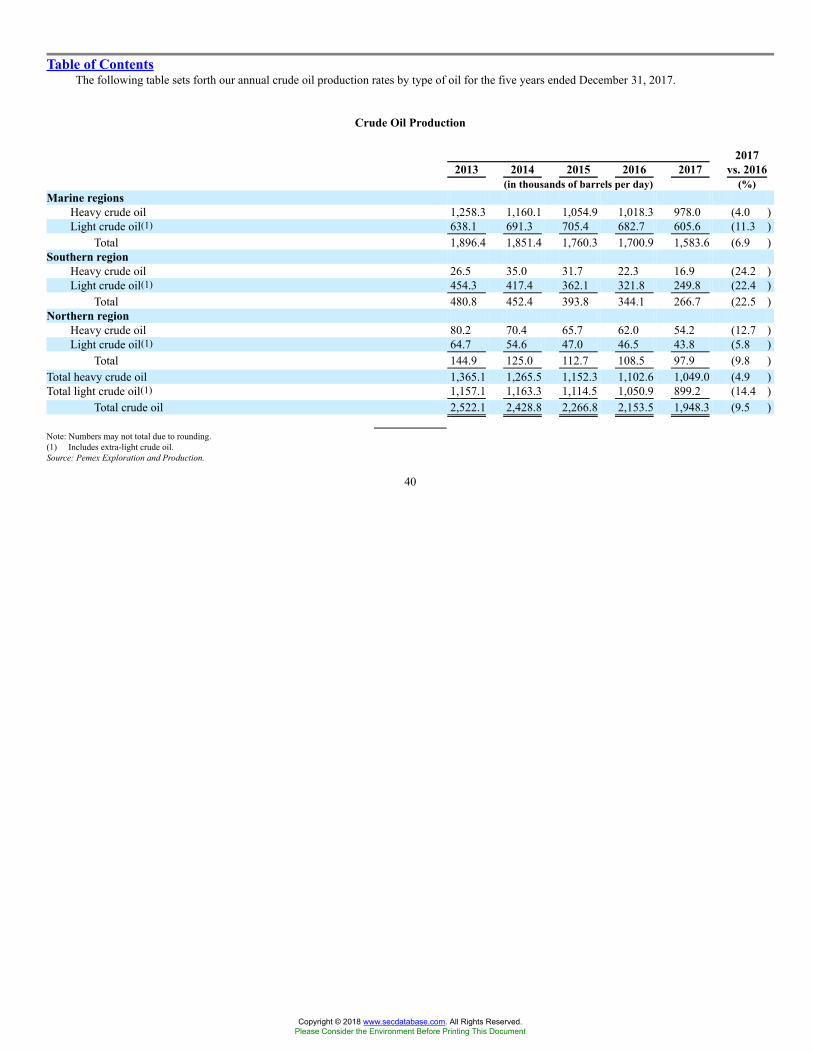
Table of ContentsThe following table sets forth our annual crude oil production rates by type of oil for the five years ended December 31, 2017.
Crude Oil Production
2013 2014 2015 2016 20172017
vs. 2016(in thousands of barrels per day) (%)
Marine regionsHeavy crude oil 1,258.3 1,160.1 1,054.9 1,018.3 978.0 (4.0 )Light crude oil(1) 638.1 691.3 705.4 682.7 605.6 (11.3 )
Total 1,896.4 1,851.4 1,760.3 1,700.9 1,583.6 (6.9 )Southern region
Heavy crude oil 26.5 35.0 31.7 22.3 16.9 (24.2 )Light crude oil(1) 454.3 417.4 362.1 321.8 249.8 (22.4 )
Total 480.8 452.4 393.8 344.1 266.7 (22.5 )Northern region
Heavy crude oil 80.2 70.4 65.7 62.0 54.2 (12.7 )Light crude oil(1) 64.7 54.6 47.0 46.5 43.8 (5.8 )
Total 144.9 125.0 112.7 108.5 97.9 (9.8 )Total heavy crude oil 1,365.1 1,265.5 1,152.3 1,102.6 1,049.0 (4.9 )Total light crude oil(1) 1,157.1 1,163.3 1,114.5 1,050.9 899.2 (14.4 )
Total crude oil 2,522.1 2,428.8 2,266.8 2,153.5 1,948.3 (9.5 )
Note: Numbers may not total due to rounding.(1) Includes extra-light crude oil.Source: Pemex Exploration and Production.
40
Copyright © 2018 www.secdatabase.com. All Rights Reserved.Please Consider the Environment Before Printing This Document
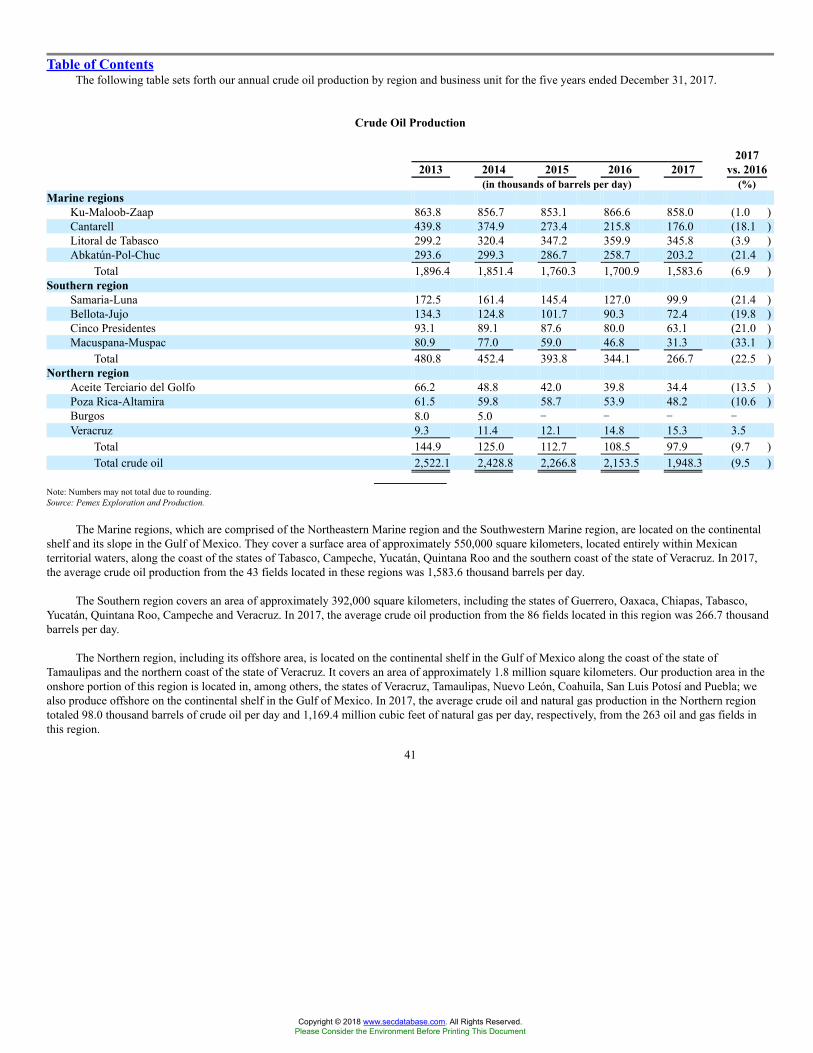
Table of ContentsThe following table sets forth our annual crude oil production by region and business unit for the five years ended December 31, 2017.
Crude Oil Production
2013 2014 2015 2016 20172017
vs. 2016(in thousands of barrels per day) (%)
Marine regionsKu-Maloob-Zaap 863.8 856.7 853.1 866.6 858.0 (1.0 )Cantarell 439.8 374.9 273.4 215.8 176.0 (18.1 )Litoral de Tabasco 299.2 320.4 347.2 359.9 345.8 (3.9 )Abkatún-Pol-Chuc 293.6 299.3 286.7 258.7 203.2 (21.4 )
Total 1,896.4 1,851.4 1,760.3 1,700.9 1,583.6 (6.9 )Southern region
Samaria-Luna 172.5 161.4 145.4 127.0 99.9 (21.4 )Bellota-Jujo 134.3 124.8 101.7 90.3 72.4 (19.8 )Cinco Presidentes 93.1 89.1 87.6 80.0 63.1 (21.0 )Macuspana-Muspac 80.9 77.0 59.0 46.8 31.3 (33.1 )
Total 480.8 452.4 393.8 344.1 266.7 (22.5 )Northern region
Aceite Terciario del Golfo 66.2 48.8 42.0 39.8 34.4 (13.5 )Poza Rica-Altamira 61.5 59.8 58.7 53.9 48.2 (10.6 )Burgos 8.0 5.0 � � � �Veracruz 9.3 11.4 12.1 14.8 15.3 3.5
Total 144.9 125.0 112.7 108.5 97.9 (9.7 )Total crude oil 2,522.1 2,428.8 2,266.8 2,153.5 1,948.3 (9.5 )
Note: Numbers may not total due to rounding.Source: Pemex Exploration and Production.
The Marine regions, which are comprised of the Northeastern Marine region and the Southwestern Marine region, are located on the continentalshelf and its slope in the Gulf of Mexico. They cover a surface area of approximately 550,000 square kilometers, located entirely within Mexicanterritorial waters, along the coast of the states of Tabasco, Campeche, Yucatán, Quintana Roo and the southern coast of the state of Veracruz. In 2017,the average crude oil production from the 43 fields located in these regions was 1,583.6 thousand barrels per day.
The Southern region covers an area of approximately 392,000 square kilometers, including the states of Guerrero, Oaxaca, Chiapas, Tabasco,Yucatán, Quintana Roo, Campeche and Veracruz. In 2017, the average crude oil production from the 86 fields located in this region was 266.7 thousandbarrels per day.
The Northern region, including its offshore area, is located on the continental shelf in the Gulf of Mexico along the coast of the state ofTamaulipas and the northern coast of the state of Veracruz. It covers an area of approximately 1.8 million square kilometers. Our production area in theonshore portion of this region is located in, among others, the states of Veracruz, Tamaulipas, Nuevo León, Coahuila, San Luis Potosí and Puebla; wealso produce offshore on the continental shelf in the Gulf of Mexico. In 2017, the average crude oil and natural gas production in the Northern regiontotaled 98.0 thousand barrels of crude oil per day and 1,169.4 million cubic feet of natural gas per day, respectively, from the 263 oil and gas fields inthis region.
41
Copyright © 2018 www.secdatabase.com. All Rights Reserved.Please Consider the Environment Before Printing This Document
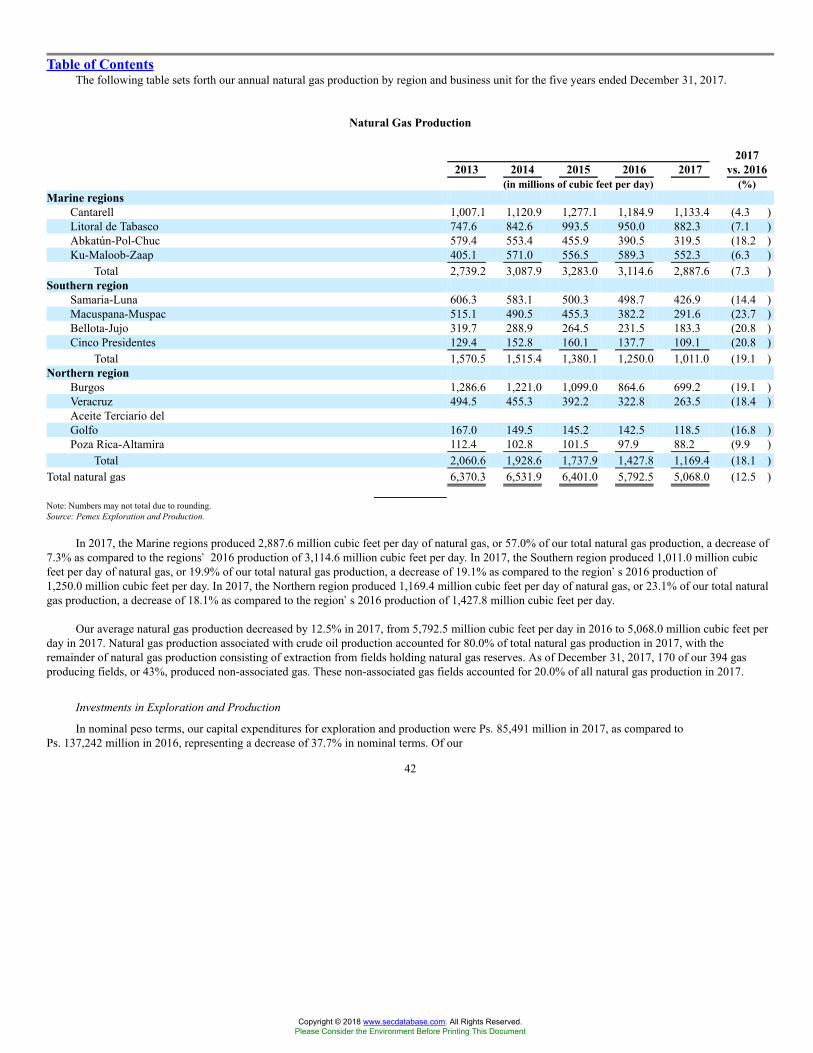
Table of ContentsThe following table sets forth our annual natural gas production by region and business unit for the five years ended December 31, 2017.
Natural Gas Production
2013 2014 2015 2016 20172017
vs. 2016(in millions of cubic feet per day) (%)
Marine regionsCantarell 1,007.1 1,120.9 1,277.1 1,184.9 1,133.4 (4.3 )Litoral de Tabasco 747.6 842.6 993.5 950.0 882.3 (7.1 )Abkatún-Pol-Chuc 579.4 553.4 455.9 390.5 319.5 (18.2 )Ku-Maloob-Zaap 405.1 571.0 556.5 589.3 552.3 (6.3 )
Total 2,739.2 3,087.9 3,283.0 3,114.6 2,887.6 (7.3 )Southern region
Samaria-Luna 606.3 583.1 500.3 498.7 426.9 (14.4 )Macuspana-Muspac 515.1 490.5 455.3 382.2 291.6 (23.7 )Bellota-Jujo 319.7 288.9 264.5 231.5 183.3 (20.8 )Cinco Presidentes 129.4 152.8 160.1 137.7 109.1 (20.8 )
Total 1,570.5 1,515.4 1,380.1 1,250.0 1,011.0 (19.1 )Northern region
Burgos 1,286.6 1,221.0 1,099.0 864.6 699.2 (19.1 )Veracruz 494.5 455.3 392.2 322.8 263.5 (18.4 )Aceite Terciario delGolfo 167.0 149.5 145.2 142.5 118.5 (16.8 )Poza Rica-Altamira 112.4 102.8 101.5 97.9 88.2 (9.9 )
Total 2,060.6 1,928.6 1,737.9 1,427.8 1,169.4 (18.1 )Total natural gas 6,370.3 6,531.9 6,401.0 5,792.5 5,068.0 (12.5 )
Note: Numbers may not total due to rounding.Source: Pemex Exploration and Production.
In 2017, the Marine regions produced 2,887.6 million cubic feet per day of natural gas, or 57.0% of our total natural gas production, a decrease of7.3% as compared to the regions� 2016 production of 3,114.6 million cubic feet per day. In 2017, the Southern region produced 1,011.0 million cubicfeet per day of natural gas, or 19.9% of our total natural gas production, a decrease of 19.1% as compared to the region�s 2016 production of1,250.0 million cubic feet per day. In 2017, the Northern region produced 1,169.4 million cubic feet per day of natural gas, or 23.1% of our total naturalgas production, a decrease of 18.1% as compared to the region�s 2016 production of 1,427.8 million cubic feet per day.
Our average natural gas production decreased by 12.5% in 2017, from 5,792.5 million cubic feet per day in 2016 to 5,068.0 million cubic feet perday in 2017. Natural gas production associated with crude oil production accounted for 80.0% of total natural gas production in 2017, with theremainder of natural gas production consisting of extraction from fields holding natural gas reserves. As of December 31, 2017, 170 of our 394 gasproducing fields, or 43%, produced non-associated gas. These non-associated gas fields accounted for 20.0% of all natural gas production in 2017.
Investments in Exploration and Production
In nominal peso terms, our capital expenditures for exploration and production were Ps. 85,491 million in 2017, as compared toPs. 137,242 million in 2016, representing a decrease of 37.7% in nominal terms. Of our
42
Copyright © 2018 www.secdatabase.com. All Rights Reserved.Please Consider the Environment Before Printing This Document
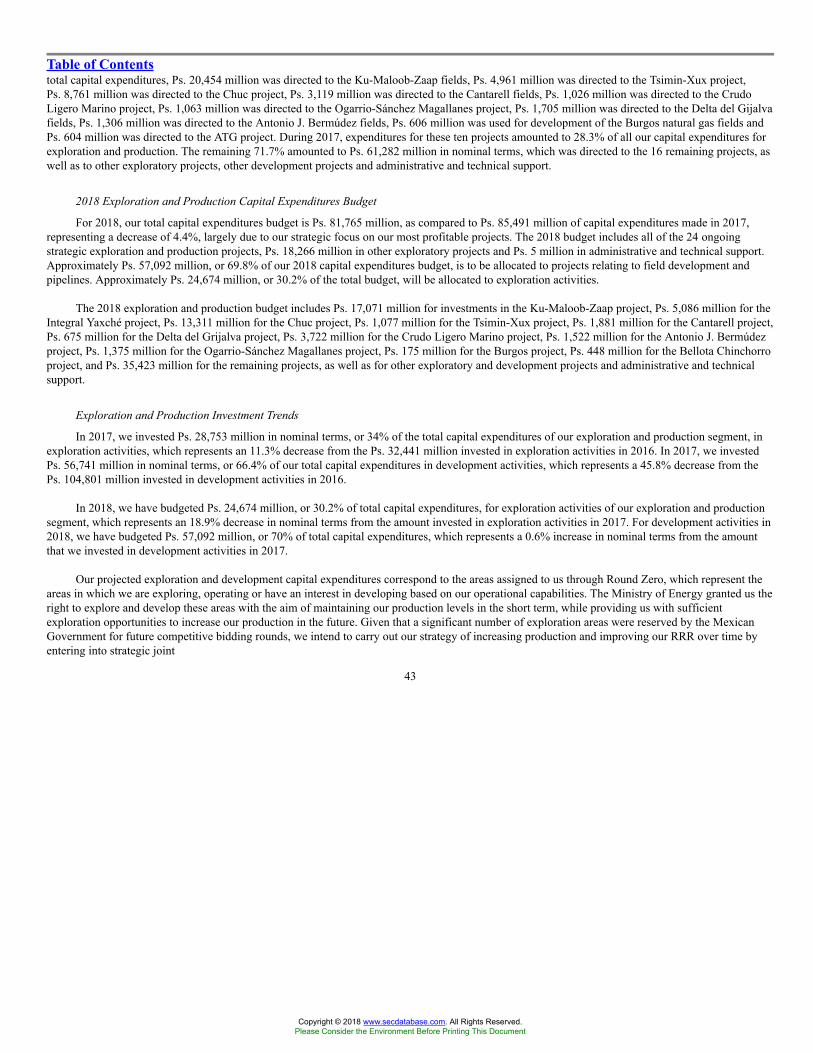
Table of Contentstotal capital expenditures, Ps. 20,454 million was directed to the Ku-Maloob-Zaap fields, Ps. 4,961 million was directed to the Tsimin-Xux project,Ps. 8,761 million was directed to the Chuc project, Ps. 3,119 million was directed to the Cantarell fields, Ps. 1,026 million was directed to the CrudoLigero Marino project, Ps. 1,063 million was directed to the Ogarrio-Sánchez Magallanes project, Ps. 1,705 million was directed to the Delta del Gijalvafields, Ps. 1,306 million was directed to the Antonio J. Bermúdez fields, Ps. 606 million was used for development of the Burgos natural gas fields andPs. 604 million was directed to the ATG project. During 2017, expenditures for these ten projects amounted to 28.3% of all our capital expenditures forexploration and production. The remaining 71.7% amounted to Ps. 61,282 million in nominal terms, which was directed to the 16 remaining projects, aswell as to other exploratory projects, other development projects and administrative and technical support.
2018 Exploration and Production Capital Expenditures Budget
For 2018, our total capital expenditures budget is Ps. 81,765 million, as compared to Ps. 85,491 million of capital expenditures made in 2017,representing a decrease of 4.4%, largely due to our strategic focus on our most profitable projects. The 2018 budget includes all of the 24 ongoingstrategic exploration and production projects, Ps. 18,266 million in other exploratory projects and Ps. 5 million in administrative and technical support.Approximately Ps. 57,092 million, or 69.8% of our 2018 capital expenditures budget, is to be allocated to projects relating to field development andpipelines. Approximately Ps. 24,674 million, or 30.2% of the total budget, will be allocated to exploration activities.
The 2018 exploration and production budget includes Ps. 17,071 million for investments in the Ku-Maloob-Zaap project, Ps. 5,086 million for theIntegral Yaxché project, Ps. 13,311 million for the Chuc project, Ps. 1,077 million for the Tsimin-Xux project, Ps. 1,881 million for the Cantarell project,Ps. 675 million for the Delta del Grijalva project, Ps. 3,722 million for the Crudo Ligero Marino project, Ps. 1,522 million for the Antonio J. Bermúdezproject, Ps. 1,375 million for the Ogarrio-Sánchez Magallanes project, Ps. 175 million for the Burgos project, Ps. 448 million for the Bellota Chinchorroproject, and Ps. 35,423 million for the remaining projects, as well as for other exploratory and development projects and administrative and technicalsupport.
Exploration and Production Investment Trends
In 2017, we invested Ps. 28,753 million in nominal terms, or 34% of the total capital expenditures of our exploration and production segment, inexploration activities, which represents an 11.3% decrease from the Ps. 32,441 million invested in exploration activities in 2016. In 2017, we investedPs. 56,741 million in nominal terms, or 66.4% of our total capital expenditures in development activities, which represents a 45.8% decrease from thePs. 104,801 million invested in development activities in 2016.
In 2018, we have budgeted Ps. 24,674 million, or 30.2% of total capital expenditures, for exploration activities of our exploration and productionsegment, which represents an 18.9% decrease in nominal terms from the amount invested in exploration activities in 2017. For development activities in2018, we have budgeted Ps. 57,092 million, or 70% of total capital expenditures, which represents a 0.6% increase in nominal terms from the amountthat we invested in development activities in 2017.
Our projected exploration and development capital expenditures correspond to the areas assigned to us through Round Zero, which represent theareas in which we are exploring, operating or have an interest in developing based on our operational capabilities. The Ministry of Energy granted us theright to explore and develop these areas with the aim of maintaining our production levels in the short term, while providing us with sufficientexploration opportunities to increase our production in the future. Given that a significant number of exploration areas were reserved by the MexicanGovernment for future competitive bidding rounds, we intend to carry out our strategy of increasing production and improving our RRR over time byentering into strategic joint
43
Copyright © 2018 www.secdatabase.com. All Rights Reserved.Please Consider the Environment Before Printing This Document
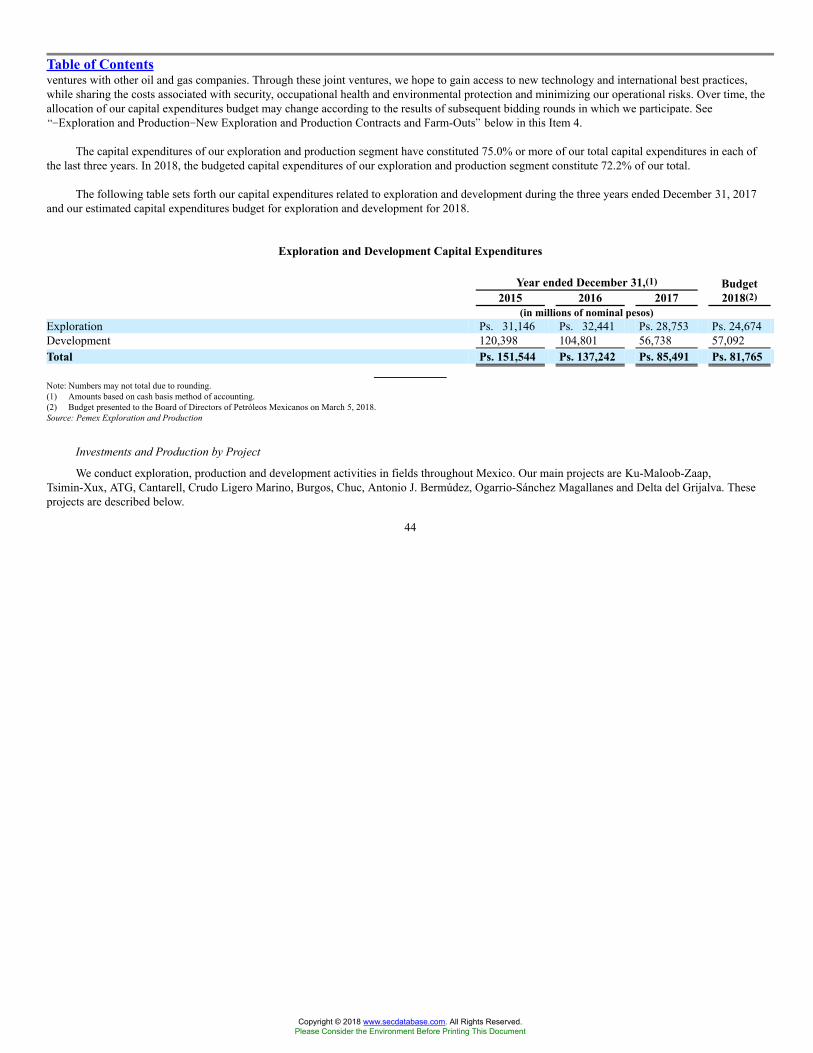
Table of Contentsventures with other oil and gas companies. Through these joint ventures, we hope to gain access to new technology and international best practices,while sharing the costs associated with security, occupational health and environmental protection and minimizing our operational risks. Over time, theallocation of our capital expenditures budget may change according to the results of subsequent bidding rounds in which we participate. See��Exploration and Production�New Exploration and Production Contracts and Farm-Outs� below in this Item 4.
The capital expenditures of our exploration and production segment have constituted 75.0% or more of our total capital expenditures in each ofthe last three years. In 2018, the budgeted capital expenditures of our exploration and production segment constitute 72.2% of our total.
The following table sets forth our capital expenditures related to exploration and development during the three years ended December 31, 2017and our estimated capital expenditures budget for exploration and development for 2018.
Exploration and Development Capital Expenditures
Year ended December 31,(1)2015 2016 2017
Budget2018(2)
(in millions of nominal pesos)Exploration Ps. 31,146 Ps. 32,441 Ps. 28,753 Ps. 24,674Development 120,398 104,801 56,738 57,092Total Ps. 151,544 Ps. 137,242 Ps. 85,491 Ps. 81,765
Note: Numbers may not total due to rounding.(1) Amounts based on cash basis method of accounting.(2) Budget presented to the Board of Directors of Petróleos Mexicanos on March 5, 2018.Source: Pemex Exploration and Production
Investments and Production by Project
We conduct exploration, production and development activities in fields throughout Mexico. Our main projects are Ku-Maloob-Zaap,Tsimin-Xux, ATG, Cantarell, Crudo Ligero Marino, Burgos, Chuc, Antonio J. Bermúdez, Ogarrio-Sánchez Magallanes and Delta del Grijalva. Theseprojects are described below.
44
Copyright © 2018 www.secdatabase.com. All Rights Reserved.Please Consider the Environment Before Printing This Document
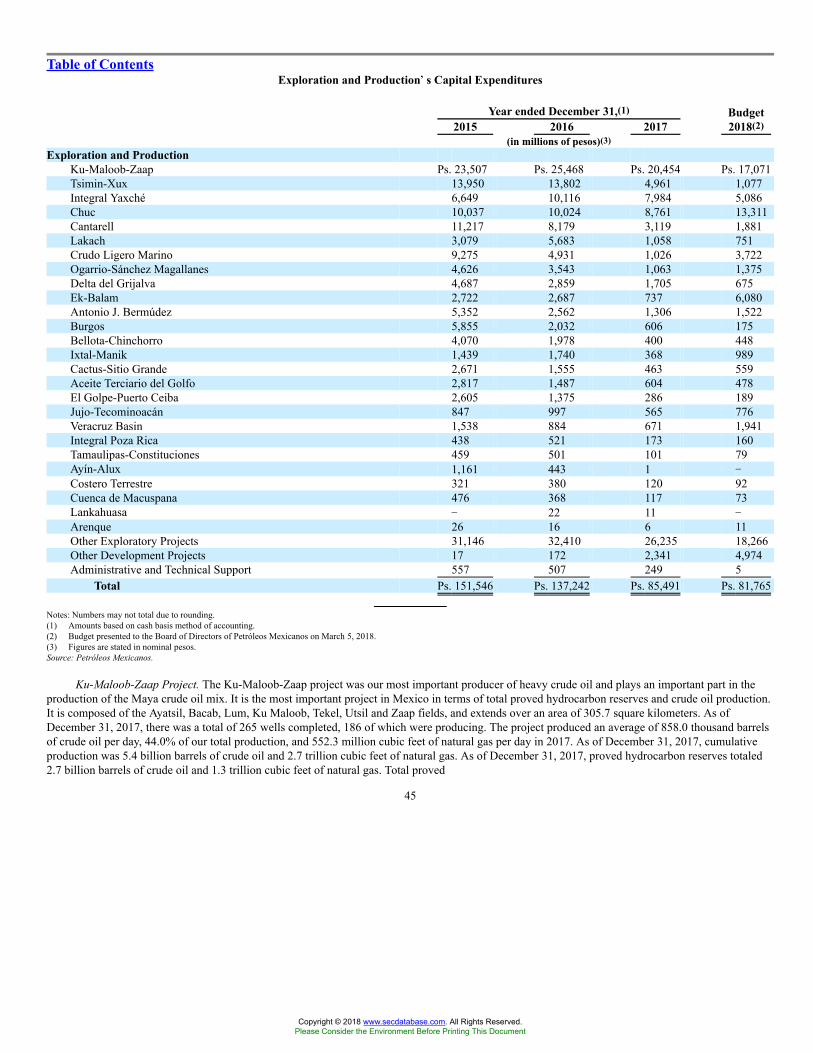
Table of ContentsExploration and Production��s Capital Expenditures
Year ended December 31,(1)2015 2016 2017
Budget2018(2)
(in millions of pesos)(3)Exploration and Production
Ku-Maloob-Zaap Ps. 23,507 Ps. 25,468 Ps. 20,454 Ps. 17,071Tsimin-Xux 13,950 13,802 4,961 1,077Integral Yaxché 6,649 10,116 7,984 5,086Chuc 10,037 10,024 8,761 13,311Cantarell 11,217 8,179 3,119 1,881Lakach 3,079 5,683 1,058 751Crudo Ligero Marino 9,275 4,931 1,026 3,722Ogarrio-Sánchez Magallanes 4,626 3,543 1,063 1,375Delta del Grijalva 4,687 2,859 1,705 675Ek-Balam 2,722 2,687 737 6,080Antonio J. Bermúdez 5,352 2,562 1,306 1,522Burgos 5,855 2,032 606 175Bellota-Chinchorro 4,070 1,978 400 448Ixtal-Manik 1,439 1,740 368 989Cactus-Sitio Grande 2,671 1,555 463 559Aceite Terciario del Golfo 2,817 1,487 604 478El Golpe-Puerto Ceiba 2,605 1,375 286 189Jujo-Tecominoacán 847 997 565 776Veracruz Basin 1,538 884 671 1,941Integral Poza Rica 438 521 173 160Tamaulipas-Constituciones 459 501 101 79Ayín-Alux 1,161 443 1 �Costero Terrestre 321 380 120 92Cuenca de Macuspana 476 368 117 73Lankahuasa � 22 11 �Arenque 26 16 6 11Other Exploratory Projects 31,146 32,410 26,235 18,266Other Development Projects 17 172 2,341 4,974Administrative and Technical Support 557 507 249 5
Total Ps. 151,546 Ps. 137,242 Ps. 85,491 Ps. 81,765
Notes: Numbers may not total due to rounding.(1) Amounts based on cash basis method of accounting.(2) Budget presented to the Board of Directors of Petróleos Mexicanos on March 5, 2018.(3) Figures are stated in nominal pesos.Source: Petróleos Mexicanos.
Ku-Maloob-Zaap Project. The Ku-Maloob-Zaap project was our most important producer of heavy crude oil and plays an important part in theproduction of the Maya crude oil mix. It is the most important project in Mexico in terms of total proved hydrocarbon reserves and crude oil production.It is composed of the Ayatsil, Bacab, Lum, Ku Maloob, Tekel, Utsil and Zaap fields, and extends over an area of 305.7 square kilometers. As ofDecember 31, 2017, there was a total of 265 wells completed, 186 of which were producing. The project produced an average of 858.0 thousand barrelsof crude oil per day, 44.0% of our total production, and 552.3 million cubic feet of natural gas per day in 2017. As of December 31, 2017, cumulativeproduction was 5.4 billion barrels of crude oil and 2.7 trillion cubic feet of natural gas. As of December 31, 2017, proved hydrocarbon reserves totaled2.7 billion barrels of crude oil and 1.3 trillion cubic feet of natural gas. Total proved
45
Copyright © 2018 www.secdatabase.com. All Rights Reserved.Please Consider the Environment Before Printing This Document

Table of Contentsreserves were 3.0 billion barrels of oil equivalent, of which 2.1 billion barrels of oil equivalent were proved developed reserves.
In nominal peso terms, our exploration and production segment�s capital expenditures for this project were Ps. 23,507 million in 2015, Ps. 25,468million in 2016 and Ps. 20,454 million in 2017. For 2018, we anticipate that our capital expenditures will be Ps. 17,071 million and that totalaccumulated capital expenditures for this project will reach approximately U.S. $360,884 million. In 2017, we paid approximately U.S. $38.3 million toacquire approximately 101.5 billion cubic feet of nitrogen for the pressure maintenance project in the fifth module of the Cantarell nitrogen cryogenicplant, which began operations in November 2006. In 2018, we expect to spend approximately U.S. $38.8 million to acquire approximately 109.5 billioncubic feet of nitrogen for injection into the Ku-Maloob-Zaap fields.
Tsimin-Xux Project. This project consists of the Tsimin and Xux fields, which include volatile oil and gas condensate reservoirs in the shallowwaters of the Gulf of Mexico. The Tsimin field is located 62 kilometers from the Dos Bocas Marine Terminal in Paraíso, Tabasco, while the Xux field islocated on the continental shelf of the Gulf of Mexico, approximately ten kilometers off the coast of Tabasco. During 2017, one new well was completedat the Xux field. During 2017, average daily production at the Tsimin-Xux project totaled 88.7 thousand barrels of crude oil and 497.3 million cubic feetof natural gas. During 2017, the sales prices of the light and extra-light crude oil produced at this field averaged approximately U.S. $59.25 per barrel,making this one of our most important projects in terms of revenue generation.
As of December 31, 2017, cumulative production totaled 0.1 billion barrels of crude oil and 0.8 trillion cubic feet of natural gas. Proved oil andgas reserves totaled 67.4 million barrels of crude oil and 368.0 billion cubic feet of natural gas. Total proved reserves were 148.6 million barrels of oilequivalent, of which 126.8 million barrels of oil equivalent were proved developed reserves.
In nominal peso terms, our exploration and production segment�s capital expenditures for the Tsimin-Xux project were Ps. 4,961 million in 2017.In 2018, we expect capital expenditures for this project to total Ps. 1,077 million and that by the end of 2018 our total accumulated capital expendituresfor this project will reach approximately U.S. $130.0 million.
Chuc Project. The Chuc project is the second largest producer of light crude oil in the Southwestern Marine region, and includes the operation andmaintenance of the Pol-A facility and water injection complexes. In 2013, the Ministry of Finance and Public Credit approved the integration of theCaan project into the Chuc project. This project covers an area of 213 square kilometers and has been exploited by our exploration and productionsegment since 1981. The fields of this project are located on the continental shelf of the Gulf of Mexico, off the coast of the states of Tabasco andCampeche, at a depth of between the 20- and 100-meter isobaths, approximately 132 kilometers from the Dos Bocas Marine Terminal in Paraíso,Tabasco, and 79 kilometers northeast of Ciudad del Carmen, Campeche. The fields in the project include Abkatún, Batab, Caan, Ché, Chuc, Chuhuk,Etkal, Homol, Kanaab, Kuil, Onel, Pol, Taratunich and Tumut. In January 2007, the Pol and Batab projects were merged into the Chuc project. As ofDecember 31, 2017, 117 wells had been completed, of which 79 were producing. During 2017, average production totaled 176.3 thousand barrels perday of crude oil and 276.6 million cubic feet per day of natural gas. As of December 31, 2017, cumulative production totaled 5.8 billion barrels of crudeoil and 6.7 trillion cubic feet of natural gas. As of December 31, 2017, proved hydrocarbon reserves totaled 297.1 million barrels of oil and 518.7 billioncubic feet of natural gas, or 377.8 million barrels of oil equivalent. As of December 31, 2017, total proved developed reserves were 240.2 million barrelsof oil equivalent.
In nominal peso terms, our exploration and production segment�s capital expenditures for the Chuc project were Ps. 10,037 million in 2015,Ps. 10,024 million in 2016 and Ps. 8,761 million in 2017. In 2018, we expect
46
Copyright © 2018 www.secdatabase.com. All Rights Reserved.Please Consider the Environment Before Printing This Document
Table of Contentsour capital expenditures to be Ps. 13,311 million and anticipate that our total accumulated capital expenditures for this project will reach approximatelyU.S. $143,581 million.
Cantarell Project. The Cantarell project is located on the continental shelf of the Gulf of Mexico. It consists of the Akal, Chac, Ixtoc, Kambesah,Kutz, Nohoch, Sihil and Takin fields, which extend over an area of 294.4 square kilometers. As of December 31, 2017, there was a total of 561 wellsdrilled in the Cantarell project, 125 of which were producing. During 2017, the Cantarell business unit, of which the Cantarell project is part, was thefourth most important producer of crude oil in Mexico, averaging 176.6 thousand barrels per day of crude oil. This was 18.1% less than 2016production, which was 215.8 thousand barrels per day, as a result of the decline of crude oil reserves remaining in these fields. Natural gas productionfrom the Cantarell business unit during 2017 averaged 1,133.4 million cubic feet per day. This was 4.3% less than the 2016 average natural gasproduction, which was 1,184.9 million cubic feet per day, due to the natural decline of field production and an increase in the fractional water flow ofwells in highly fractured deposits.
As of December 31, 2017, cumulative production of the Cantarell project was 14.3 billion barrels of crude oil and 9.5 trillion cubic feet of naturalgas. As of December 31, 2017, proved oil and gas reserves of the Cantarell project totaled 850.4 million barrels of crude oil and 941.8 billion cubic feetof natural gas. As of December 31, 2017, total proved reserves were 1,025.4 million barrels of oil equivalent, of which 910.7 million barrels wereproved developed reserves.
The Akal field, which is the most important field in the Cantarell project, averaged 55.2 thousand barrels per day of crude oil production during2017. This was 20.7% less than the average production in 2016, which was 69.5 thousand barrels per day.
In nominal peso terms, our exploration and production segment�s capital expenditures for the Cantarell project totaled Ps. 11,217 million in 2015,Ps. 8,179 million in 2016 and Ps. 3,119 million in 2017. For 2018, we budgeted Ps. 1,881 million for capital expenditures for the Cantarell project. Bythe end of 2018, we expect our total accumulated capital expenditures to be approximately U.S. $43,296 million for this project.
On October 10, 1997, we awarded a build-own-operate contract for a nitrogen cryogenic plant at the Cantarell project to a consortium formed byBOC Holdings, Linde, Marubeni, West Coast Energy and ICA Fluor Daniel. Under this contract, the consortium is responsible for the financing, design,construction and operation of the plant. The plant began operations in 2000 and cost approximately Ps. 10,131 million. Pursuant to the terms of theagreement, Pemex Exploration and Production has the right to acquire the nitrogen plant in the case of a default by the consortium. Pemex Explorationand Production has the obligation to acquire the nitrogen plant if it defaults under the contract. Under the terms of the contract, Pemex Exploration andProduction committed to purchasing 1.2 billion cubic feet per day of nitrogen from the consortium and to continue to supply service through June 2027.
During 2017, we paid approximately U.S. $190.8 million under this contract for an approximate total volume of 398.6 billion cubic feet ofnitrogen, which was injected into the Cantarell fields. In 2018, our exploration and production segment expects to pay approximatelyU.S. $205.7 million under this contract for an approximate total volume of 438.0 billion cubic feet of nitrogen to be injected into the fields.
Crudo Ligero Marino Project. In 2013, the Ministry of Finance and Public Credit approved the designation of the Crudo Ligero Marino project asa stand-alone project, thereby separating it from the Strategic Gas Program of which it formed part from 2001 through 2012. In 2013, theOch-Uech-Kax project was integrated into this project. The main objectives for the Crudo Ligero Marino project during the years 2018 to 2035 are tocontinue constructing one marine structure, in addition to the marine structure completed during 2014, drill additional wells, implement secondaryrecovery, as well as intervention, optimization and maintenance techniques to its
47
Copyright © 2018 www.secdatabase.com. All Rights Reserved.Please Consider the Environment Before Printing This Document
Table of Contentsfacilities, particularly in the Sinan, Kab and Kax fields. As of December 31, 2017, a total of 99 wells had been completed at this project, of which 38were producing. During 2017, average daily production totaled 80.9 thousand barrels of crude oil and 252.2 million cubic feet of natural gas. As ofDecember 31, 2017, cumulative production was 874.2 million barrels of crude oil and 2,477.8 billion cubic feet of natural gas. Proved oil and gasreserves totaled 98.5 million barrels of crude oil and 278.7 billion cubic feet of natural gas. Total proved reserves were 156.5 million barrels of oilequivalent, of which 122.4 million barrels were proved developed reserves.
In nominal peso terms, our exploration and production segment�s capital expenditures for the Crudo Ligero Marino project totaledPs. 1,026 million in 2017. For 2018, we anticipate our capital expenditures to total Ps. 3,722 million and that total accumulated capital expenditures forthis project will reach approximately U.S. $207.4 million.
Ogarrio-Sánchez Magallanes Project. The Ogarrio-Sánchez Magallanes project is composed of 21 crude oil and natural gas producing fields andforms part of the Cinco Presidentes business unit. This project is located between the state borders of Veracruz and Tabasco and covers an area of10,820 square kilometers. From a geological standpoint, this project pertains to the Isthmus Saline basin, specifically the southeastern basins at theTertiary level. The Ogarrio-Sánchez Magallanes project is geographically bounded by the Gulf of Mexico to the north, the geological folds of the SierraMadre of Chiapas to the south, the Tertiary basin of Veracruz to the west and the Comalcalco Tertiary basin to the east. The primary objective of thisproject is to increase production levels through the drilling of development wells and infill wells, which are drilled between producing wells to moreefficiently recover oil and gas reserves, the execution of workovers of wells and the implementation of secondary and enhanced oil recovery processes.In addition, we aim to optimize the infrastructure of this project in order to counteract the decreases in production levels that result from the naturaldepletion of its reservoirs.
As of December 31, 2017, the Ogarrio-Sánchez Magallanes project had 524 producing wells. No new wells were completed during 2017. Averagedaily production totaled 63.1 thousand barrels of crude oil and 109.1 million cubic feet of natural gas during 2017. As of December 31, 2017,cumulative production was 1.3 billion barrels of crude oil and 1.9 trillion cubic feet of natural gas. Proved hydrocarbon reserves totaled 115.6 millionbarrels of crude oil and 212.7 billion cubic feet of natural gas. Total proved reserves were 154.8 million barrels of oil equivalent, of which 137.1 millionbarrels were proved developed reserves.
In nominal peso terms, our capital expenditures for the Ogarrio-Sánchez Magallanes project were Ps. 1,063 million in 2017. For 2018, weanticipate that our capital expenditures will total Ps. 1,375 million and that by the end of 2018 total accumulated capital expenditures for this project willreach approximately U.S. $82.0 million.
Delta del Grijalva Project. The Delta del Grijalva project is the most important project in the Southern region in terms of both oil and gasproduction. The project covers an area of 1,343 square kilometers and has been exploited by our exploration and production segment since 1982. As ofDecember 31, 2017, there was a total of 199 wells drilled, of which 46 were producing. During 2017, the project produced an average of 63.0 thousandbarrels per day of crude oil and 266.0 million cubic feet per day of natural gas. The most important fields are Terra, Tizón, Sen and Caparroso-Pijije-Escuintle.
� Terra. This field covers an area of 13.7 square kilometers. As of December 31, 2017, a total of 16 wells had been completed, 11 of whichwere producing. During 2017, the field produced an average of 15.9 thousand barrels per day of crude oil and 60.9 million cubic feet perday of natural gas. As of December 31, 2017, cumulative production was 49.4 million barrels of crude oil and 159.7 billion cubic feet ofnatural gas. As of December 31, 2017, total proved reserves were 22.1 million barrels of oil equivalent, 9.7 million of which were proveddeveloped reserves.
48
Copyright © 2018 www.secdatabase.com. All Rights Reserved.Please Consider the Environment Before Printing This Document

Table of Contents� Sen. This field covers an area of 45.1 square kilometers. As of December 31, 2017, a total of 49 wells had been completed, 11 of which
were producing. During 2017, the field produced an average of 4.4 thousand barrels per day of crude oil and 13.1 million cubic feet per dayof natural gas. As of December 31, 2017, cumulative production was 314.4 million barrels of crude oil and 862.8 billion cubic feet ofnatural gas. Proved hydrocarbon reserves totaled 11.6 million barrels of crude oil and 39.8 billion cubic feet of natural gas. As ofDecember 31, 2017, total proved reserves were 21.1 million barrels of oil equivalent, 14.5 million of which were proved developedreserves.
� Caparroso-Pijije-Escuintle. This field covers an area of 28.2 square kilometers. As of December 31, 2017, a total of 53 wells had beencompleted, 16 of which were producing. During 2017, the field produced an average of 8.7 thousand barrels per day of crude oil and27.9 million cubic feet per day of natural gas. As of December 31, 2017, cumulative production was 234.5 million barrels of crude oil and659.0 billion cubic feet of natural gas. Proved hydrocarbon reserves totaled 8.8 million barrels of crude oil and 28.2 billion cubic feet ofnatural gas. As of December 31, 2017, total proved reserves were 15.5 million barrels of oil equivalent, 11.8 million of which were proveddeveloped reserves.
� Tizón. This field covers an area of 17.8 square kilometers. As of December 31, 2017, a total of 17 wells had been completed, 11 of whichwere producing. During 2017, the field produced an average of 23.5 thousand barrels per day of crude oil and 130.1 million cubic feet perday of natural gas. As of December 31, 2017, cumulative production was 85.0 million barrels of crude oil and 485.2 billion cubic feet ofnatural gas. Proved hydrocarbon reserves totaled 18.4 million barrels of crude oil and 101.7 billion cubic feet of natural gas. As ofDecember 31, 2017, total proved reserves were 42.6 million barrels of oil equivalent, 41.7 million of which were proved developedreserves.
As of December 31, 2017, cumulative production in the Delta del Grijalva project was 0.8 billion barrels of crude oil and 3.0 trillion cubic feet ofnatural gas. Proved oil and gas reserves as of December 31, 2017 totaled 66.0 million barrels of crude oil and 299.2 billion cubic feet of natural gas. Asof December 31, 2017, total proved reserves were 137.0 million barrels of oil equivalent, 88.3 million of which were proved developed reserves.
In nominal peso terms, our exploration and production segment�s capital expenditures for the Delta del Grijalva project were Ps. 4,687 million in2015, Ps. 2,859 million in 2016 and Ps. 1,705 million in 2017. In 2018, we expect our capital expenditures to be Ps. 675 million, bringing our totalcapital expenditures for the project to approximately U.S.$ 42,390 billion.
Antonio J. Bermúdez Project. In 2002, we began investing in the Antonio J. Bermúdez project, the main investment project in the Southern regionand the fifth largest in Mexico. This project is designed to accelerate reserves recovery, as well as increase the recovery factor by drilling additionalwells and implementing a system of pressure maintenance through nitrogen injection. It consists of the Samaria, Cunduacán, Oxiacaque, Iride andPlatanal fields, and covers an area of 163 square kilometers. As of December 31, 2017, a total of 845 wells had been completed, of which 230 wereproducing. During 2017, the project produced an average of 36.9 thousand barrels per day of crude oil and 160.1 million cubic feet per day of naturalgas. As of December 31, 2017, cumulative production was 3.0 billion barrels of crude oil and 4.7 trillion cubic feet of natural gas. As ofDecember 31, 2017, proved hydrocarbon reserves in this field totaled 125.8 million barrels of crude oil and 238.8 billion cubic feet of natural gas. As ofDecember 31, 2017, total proved reserves were 184.1 million barrels of oil equivalent, of which 118.5 million were proved developed reserves.
In nominal peso terms, our exploration and production segment�s capital expenditures for the Antonio J. Bermúdez project were Ps. 5,352 millionin 2015, Ps. 2,562 million in 2016 and Ps. 1,306 million in 2017. For 2018, we anticipate that our capital expenditures for this project will bePs. 1,522 million and that our total accumulated investments in the project will reach approximately U.S. $30,849 billion.
49
Copyright © 2018 www.secdatabase.com. All Rights Reserved.Please Consider the Environment Before Printing This Document
Table of ContentsIn March 2005, we entered into a contract with Praxair México, S. de R.L. de C.V. to build, own and operate a nitrogen cryogenic plant, which
was completed in June 2008. After completing testing in July 2008, we began injecting 190 million cubic feet per day of nitrogen into the project. In2017, we paid approximately Ps. 491.5 million to acquire nitrogen from this plant, which we used to inject approximately 25,097 million cubic feet perday until July 9, 2017, when the injection of nitrogen was suspended.
Burgos Project. The Burgos project is the largest producer of non-associated gas in Mexico. In 1997, our exploration and production segment,through Pemex-Exploration and Production, initiated a development program for the Burgos natural gas fields. The purpose of the Burgos project is toenable us to meet increasing domestic demand for natural gas. The fields in Burgos accounted for 13.8% of our total natural gas production in 2017. Theproject is located in northeastern Mexico.
During 2017, the Burgos project produced an average of 699.2 billion cubic feet per day of natural gas. As of December 31, 2017, the drilling of7,977 wells had been completed, 2,982 of which were producing. The most important fields are the Nejo, Arcabuz-Culebra, Cuitláhuac, Cuervito,Velero and Santa Anita fields, which together produced 50.5% of the total production of the Burgos project in 2017.
Main Fields of the Burgos Project(as of December 31, 2017)
NejoArcabuz-Culebra Cuitláhuac Velero Cuervito
SantaAnita
Wells completed 407 968 443 219 135 79Producing wells 198 516 185 137 84 602017 production of natural gas
(million cubic feet per day) 134 87 53 32 23 26Cumulative production of natural gas
(billion cubic feet) 538.3 2,074.7 807.4 349.1 206.7 263.9Proved reserves of natural gas
(billion cubic feet) 112.0 72.7 85.0 34.3 95.6 55.5Proved developed reserves 100.2 69.0 63.1 30.5 36.7 36.7Proved undeveloped reserves 11.7 3.7 21.9 3.9 58.9 18.9
Source: Pemex Exploration and Production.
During 2017, proved reserves increased by 3.8 million barrels of oil equivalent, from 178.8 million barrels of oil equivalent in 2016 to182.6 million barrels of oil equivalent in 2017, primarily due to a deceleration in the decline of the gas production rate in 2017.
In nominal peso terms, our exploration and production segment�s capital expenditures (including capital expenditures made pursuant to FPWCs)for the Burgos project were Ps. 5,855 million in 2015, Ps. 2,032 million in 2016 and Ps. 606 million in 2017. For 2018, we anticipate that our capitalexpenditures for this project will amount to Ps. 175 million and that our total accumulated capital expenditures will reach approximatelyU.S. $19,243 billion.
Aceite Terciario del Golfo Project (formerly Paleocanal de Chicontepec). The ATG project is located in the Northern region and covers an area of4,243 square kilometers. This project comprises 29 fields, which are divided among eight sectors. As of December 31, 2017, there was a total of4,569 wells completed, of which 1,984 were producing. The project produced an average of 34.4 thousand barrels of crude oil per day in 2017 ascompared to 39.8 thousand barrels of crude oil per day in 2016, which represents a 13.6% decrease, and
50
Copyright © 2018 www.secdatabase.com. All Rights Reserved.Please Consider the Environment Before Printing This Document
Table of Contents118.5 million cubic feet of natural gas per day in 2017 as compared to 142.5 million cubic feet of natural gas per day in 2016, which represents a 16.8%decrease. The decrease in crude oil and natural gas production was primarily due to the decline in pressure in certain reservoirs. As ofDecember 31, 2017, cumulative production was 314.4 million barrels of crude oil and 688.2 billion cubic feet of natural gas. As of December 31, 2017,proved reserves totaled 441.8 million barrels of crude oil and 893.1 billion cubic feet of natural gas. Total proved hydrocarbon reserves were620.1 million barrels of oil equivalent, of which 125.1 million barrels of oil equivalent were proved developed reserves.
During 2017, field development activities at the project included the drilling of 32 wells and the completion of 24 wells, all of which wereclassified as producing, reflecting a 100% success rate. As of December 31, 2017, 80% of the total producing wells were operating with artificialsystems such as mechanical, pneumatic, hydraulic and electric pumping, while the remaining 20.0% were �flowing wells� that are classifiedaccordingly because they did not require any means of artificial lift.
In nominal peso terms, our exploration and production segment�s capital expenditures for the ATG project were Ps. 2,817 million in 2015,Ps. 1,487 million in 2016 and Ps. 604 million in 2017. For 2018, we anticipate that our capital expenditures for this project will be Ps. 478 million andthat total accumulated investments in this project will be approximately U.S. $51.9 billion.
Crude Oil Sales
During 2017, domestic consumption of crude oil amounted to approximately 769.0 thousand barrels per day, which represented 39.7% of our totalcrude oil production. Through PMI�s activities, we sold the remainder of our crude oil production abroad. Maya crude oil accounted for 89.7% ofexported crude oil volume sold by PMI in 2017. See ��Business Overview�International Trading� in this Item 4.
The following table sets forth crude oil distribution for the past five years.
Crude Oil Distribution
At December 31,2013 2014 2015 2016 2017
2017vs. 2016
(in thousands of barrels per day) (%)Production 2,522.1 2,428.8 2,266.8 2,153.5 1,948.3 (9.5 )Distribution
Refineries 1,229.1 1,161.1 1,064.0 935.0 769.0 (17.8 )Export terminals 1,190.4 1,148.6 1,177.7 1,198.7 1,167.8 (2.6 )
Total 2,419.5 2,309.7 2,241.7 2,133.7 1,936.7 (9.2 )Statistical differences in stock
measurements(1) 102.6 119.1 25.2 19.8 7.8 46.6
Note: Numbers may not total due to rounding.(1) Includes measurement inconsistencies, shrinkage and leakage, naphthas and condensates added to crude oil.Source: Pemex Exploration and Production.
Differences between the volume of crude oil measured at the wellhead and the volume distributed reflect customary adjustments due to, amongother things, shifting inventories, evaporation, shrinkage and product segregation. In August 2014, we identified increases in the difference between thevolumes of crude oil production and distribution. Based on an analysis conducted in coordination with the CNH, we implemented various correctivemeasures to improve our measurement methodology and management system, including continuously monitoring our wells, calibrating ourmeasurement equipment and installing additional crude oil
51
Copyright © 2018 www.secdatabase.com. All Rights Reserved.Please Consider the Environment Before Printing This Document
Table of Contentsdehydration systems. To this end, sediment tanks have also been installed at marine terminals in order to accelerate water evaporation and crude oilstabilization in accordance with industry standards. In addition, crude oil barrels undergo a stabilization process in preparation for export, whichinvolves certification by us, the buyer and a third party to verify that the contents meet international standards and contain no more than 0.5% water.
Gas Flaring
The flaring of produced gas, which consists of the burning off of surplus combustible vapors from a well, usually occurs as a result of operationaladjustments to carry out maintenance at production facilities, and in some cases is due to limitations in the ability to handle, process or transport naturalgas. In addition, the flaring of produced gas is also used as a safety measure to relieve well pressure. Gas flaring is considered to be one of the mostsignificant sources of air emissions from offshore oil and gas installations. In 2017, gas flaring represented 4.3% of total natural gas production, ascompared to 8.8% of total natural gas production in 2016. The increased gas flaring in 2016 was primarily due to an explosion that occurred at theAbkatún-A platform in February 2016, management of oils with high gas-oil ratio and failures in gas compression equipment on offshore platforms. Formore information on the explosion at the Abkatún-A platform, see ��Health, Safety and Environmental Performance� in this Item 4. We continue toimplement programs to reduce gas flaring and improve gas extraction efficiency, including strategies to optimize the exploitation of wells with highassociated gas content at the Cantarell project. In addition, in March 2017, we agreed to certain programs with the CNH, including five projects for U.S.$3.0 billion, which may allow us to improve our gas utilization rate to up to 98.0% at our Ku-Maloob-Zaap business unit by 2020. We began to takeaction steps under this program in 2017 and are continuing to work towards increasing our gas utilization rate.
Pipelines
The crude oil and natural gas pipeline network owned by our exploration and production segment connects crude oil and natural gas producingcenters with refineries and petrochemical plants. At the end of 2017, this pipeline network consisted of approximately 38,754 kilometers of pipelines, ofwhich 2,058 kilometers were located in the Northeast Marine region, 1,173 kilometers were located in the Southeast Marine region, 9,331 kilometerswere located in the Southern region, 25,076 kilometers were located in the Northern region and 1,116 kilometers are distribution and commercialpipelines. For a description of products transported by the pipeline network, see ��Business Overview�Logistics� in this Item 4.
Integrated Exploration and Production Contracts and Financed Public Works Contracts
Our FPWC program, previously known as the Multiple Services Contracts program, was first announced in December 2001. The objective of theprogram was to provide a contractual framework that promotes efficient execution of public works in order to increase Mexico�s oil and gas production.The FPWC were public works contracts based on unit prices that aggregate a number of different services into a single contract. Under the FPWCframework, Pemex-Exploration and Production retained the rights and title to all oil and gas produced and works performed under each FPWC.
Our Integrated E&P Contracts program was established as part of reforms to the Mexican energy sector enacted in 2008. The objective of theseIntegrated E&P Contracts was to increase our execution and production capabilities. The oil and gas reserves located in and extracted from the areas towhich we have a legal right, continue to be owned exclusively by the Mexican Government. Under this program, payments to the contractors were madeon a per-barrel basis, plus recovery costs, provided that the payments did not exceed our cash flow from the particular block.
We may amend our Integrated E&P Contracts and FPWCs in order to align these contracts with the new contractual framework established underthe Hydrocarbons Law. According to the Energy Reform Decree and the new contractual framework established under the Hydrocarbons Law, anexisting Integrated E&P Contract or FPWC may be migrated into a contract for exploration and production upon agreement by the contract parties to
52
Copyright © 2018 www.secdatabase.com. All Rights Reserved.Please Consider the Environment Before Printing This Document
Table of Contentsthe technical guidelines established by the Ministry of Energy (after seeking our favorable opinion) and the financial terms determined by the Ministryof Finance and Public Credit. Upon approval by the contract parties, the existing Integrated E&P Contract or FPWC will be replaced by the newcontract for exploration and production without the need for a bidding process. If the contract parties do not agree to the proposed technical guidelinesand contractual and financial terms, the original Integrated E&P Contract or FPWC will remain in effect.
On December 19, 2014, we and the relevant counterparties requested that the Ministry of Energy migrate the Integrated E&P Contracts governingthe Santuario, Magallanes, Altamira, Arenque, Ébano, Miquetla and Pánuco blocks, and the FPWC governing the Misión and Olmos blocks, into newcontracts for exploration and production. Parties to the FPWC governing the Nejo block and parties to the Integrated E&P Contract governing the SanAndrés block made similar requests on November 24, 2015 and December 1, 2015. As part of the migration process, the Ministry of Energy, Ministry ofFinance and Public Credit and the CNH requested further information on the proposed fiscal and technical terms of the new contracts, which PemexExploration and Production provided. On December 7, 2015, January 29, 2016 and May 11, 2016, the parties to the Altamira, San Andrés and Nejoblocks, respectively, withdrew their request for migration. We continue to evaluate the business case for the Altamira and San Andrés blocks and in thefuture may re-submit our request for migration of the Integrated E&P Contracts for those blocks.
The migration of Integrated E&P Contracts and FPWCs into contracts for exploration and production has taken longer than expected. As of thedate of this annual report, the Integrated E&P contract for the Santuario block in the Southern region of Mexico was migrated on December 18, 2017and we expect the FPWC for the Misión block in the Burgos basin will be migrated into contracts for exploration and production in the first six monthsof 2018.
Among the FPWC works during 2017, maintenance activities were carried out in the Burgos project under the FPWC program. The work carriedout in 2017 represented an investment of approximately U.S. $99.0 million. In 2017, natural gas production in the existing FPWC blocks reached238.0 million cubic feet per day.
During 2017, contractors expended approximately U.S $251.4 million in connection with Integrated E&P Contracts. In 2017, production in theexisting Integrated E&P blocks reached 34.1 thousand barrels per day of crude oil and 58.1 million cubic feet per day of natural gas, for a total of45.7 thousand barrels of oil equivalent per day.
New Exploration and Production Contracts and Farm-Outs
As a result of the opportunities made available to us by the energy reform, we have pursued farm-outs and other partnerships in order to diversifyand strengthen our exploration and production portfolio and to focus on the most profitable projects. Through farm-outs, we sell a partial interest infields that have been granted to us and enter into agreements for the joint operation of such fields. This requires third parties to make financialcontributions to the partnership and to provide field services, allowing us to recoup some of our previous investments in the fields and to share some ofthe risk associated with the further development of the fields, while maintaining an interest in the future profits.
Trión Farm-Out
On July 28, 2016, the CNH published the tender offer and bidding package to select a partner for Pemex Exploration and Production to carry outexploration and production activities in the Trión block field
53
Copyright © 2018 www.secdatabase.com. All Rights Reserved.Please Consider the Environment Before Printing This Document
Table of Contentsassignments located in the Perdido Fold Belt in the Gulf of Mexico. Since the Trión block has a depth greater than 2,500 meters, it requires a high levelof technical expertise and financial investment to develop.
On December 5, 2016, the CNH announced that BHP Billiton Petróleo Operaciones de México, S. de R.L. de C.V., or BHP Billiton Mexico, anaffiliate of BHP Billiton Limited and BHP Billiton Plc, had been selected as the partner for Pemex Exploration and Production in the Trión blockfarm-out. Pursuant to the terms of its bid, BHP Billiton Mexico will make a U.S. $789.6 million contribution to the partnership in exchange for a 60%participating interest in the Trión Block. BHP Billiton Mexico will be the operator of the Trión block, and must invest U.S. $1.9 billion in the Triónfarm-out before we are required to invest in the project, which, depending on the timeline set by the consortium, will likely be in four to five years. Thecorresponding exploration and production contract, joint operating agreement and other relevant agreements were executed on March 3, 2017 and weare currently working on the development stages of this project.
Nobilis-Maximino Farm-Out
On April 27, 2017, our Board of Directors authorized the farm-out of the Nobilis-Maximino Block, which is located in ultra-deep waters in thearea of the Perdido Fold Belt in the Gulf of Mexico and, on September 18, 2017, the CNH published the announcement for the international publicbidding process corresponding to that block. On December 8, 2017, however, we announced that, due to the high geological complexity of this ultra-deep-water field, as well as prevailing market conditions affecting the oil industry, we are delaying the farm-out of the Nobilis-Maximino block. Wecontinue to seek partners and evaluate opportunities for the Nobilis-Maximino farm-out, including through potential future bidding rounds.
Ogarrio, Cárdenas-Mora and Ayin-Batsil Farm-Outs
In addition to the Trión and Nobilis-Maximino farm-outs, on October 4, 2017, the CNH held a bidding round for farm-outs of the Ogarrio,Cárdenas-Mora and Ayin-Batsil blocks. No bids were received for the Ayin-Batsil block, which is located in the shallow waters of the Gulf of Mexico.However, multiple bids were received for the Ogarrio block, which currently produces approximately 6,000 barrels of crude oil per day and 21 millioncubic feet of natural gas per day, and the Cárdenas-Mora block, which currently produces approximately 5,000 barrels of crude oil per day and 18million cubic feet of natural gas per day. The Ogarrio and Cárdenas-Mora blocks, both onshore fields located in the state of Tabasco, were ultimatelyawarded to the German company Deutsche Erdoel AG (DEA) and the Egyptian company Cheiron Holdings Limited (Cheiron), respectively. DEA�s bidconsisted of an initial cash payment of U.S. $190.0 million, a royalty rate of 13% and an additional cash payment of U.S. $213.9 million, which is thehighest sign-up bonus submitted in a CNH bidding round as of the date of this annual report. Cheiron�s bid consisted of an initial cash payment of U.S.$ 125.0 million, a royalty rate of 13% and an additional cash payment of U.S. $41.5 million. The corresponding contracts were signed on March 6, 2018and have a term of 25 years. We retain a 50% interest in both blocks.
Other Exploration and Production Contracts
In addition to the farm-outs described above, we have also pursued other types of partnerships for the exploration and production of fields thatwere not already granted to us.
On December 5, 2016, we participated in the bidding process referred to as Round 1.4, through which we, as part of a consortium consisting ofPemex Exploration and Production, Chevron Energía de Mexico, S. de R.L. de C.V., or Chevron Energía, a subsidiary of Chevron Corporation, andINPEX Corporation, were awarded an exploration contract for a field located in the Perdido Fold Belt in the Gulf of Mexico. The field covers an area ofapproximately 1,686.9 square kilometers and is located approximately 117 kilometers off the coast of Mexico in water depths ranging between 500meters and 1,700 meters. Chevron Energía will be the operator and holds a 33.3334% interest in the consortium, while Pemex Exploration andProduction and INPEX Corporation each hold a 33.3333% interest. The corresponding exploration and production contract, joint operating agreementand other relevant agreements were executed on February 28, 2017.
54
Copyright © 2018 www.secdatabase.com. All Rights Reserved.Please Consider the Environment Before Printing This Document
Table of ContentsOn May 2, 2017, Pemex Exploration and Production entered into a contract for crude oil extraction with the CNH to upgrade the assignments
under the shared shallow water production scheme for the Ek and Balam project area located in Campeche Sound. This project is in line with ourstragegy as contemplated by the 2017-2021 Business Plan to accelerate the development of fields, making it possible to reach the maximum recoveryfactor and significantly increase production. Under the contract, which has a term of twenty-two years with two possible five-year extensions, PemexExploration and Producion will pay the Mexican Government 70.5% of the operating profits and has provided a guarantee of U.S. $5.0 billion.
On May 30, 2017, we obtained approval from the CNH for the assignment of a new area that includes Chachiquin, located in the CinturónPlegado Perdido region in the deep waters of the Gulf of Mexico south of the maritime border with the U.S., and an area southwest of the Nobilis field.
On June 19, 2017, we participated in another bidding round conducted by the CNH, referred to as Round 2.1. As a result of this bidding process,we won two blocks. We were awarded Block 2, which covers an area of 549 square kilometers and is located on the continental shelf of the Tampico-Misantla basin, to the west of the Gulf of Mexico, in partnership with DEA. We are the operating partner in this block and own a 70% interest.Additionally, we were awarded Block 8, which is located in the Southeastern Basins and covers an area of 586 square kilometers, in partnership withColombia�s Ecopetrol. In Block 8, we are also the operating partner and own a 50% interest. The corresponding contracts for the exploration andextraction of hydrocarbons with DEA and Ecopetrol were signed on September 25, 2017.
On December 18, 2017, we executed contracts for an association with Petrofac México, S.A. de C.V., or Petrofac, under which we assigned toPetrofac the rights to certain fields that were part of the El Golpe-Puerto Ceiba project, including the onshore fields of Santuario, El Golpe andCaracolillo, located in the state of Tabasco. As of December 31, 2017, we still own 64% of the proved reserves in this project.
On January 31, 2018, we successfully participated in bidding Round 2.4, and were awarded the assignment of four blocks, all of which are locatedin deep waters in the Gulf of Mexico. Pemex Exploration and Production and Royal Dutch Shell PLC were awarded Block 2 of the Perdido area. Theconsortium formed by Pemex Exploration and Production, Chevron and INPEX was awarded area 22 of the Cuenca Salina province. Finally, we wereassigned Block 5 in the Perdido area and area 18 of the Mexican Range province.
On March 27, 2018, we successfully participated in the first call of bidding Round 3 of the NCH, and were awarded seven contractual areas inshallow waters, six of them as part of a consortium and one on an individual basis. Pemex Exploration and Production won four blocks in the SoutheastBasins: two in consortium with Total S.A., one with Shell Oil Company and one individually, as well as three blocks corresponding to the province ofTampico-Misantla-Veracruz: two in partnership with Compañía Española de Petróleos and one in partnership with DEA.
Collaboration and Other Agreements
Pemex Exploration and Production, or its predecessor Pemex-Exploration and Production, have entered into non-commercial scientific andtechnology agreements with the following parties, which remain in effect as of the date of this annual report:
� BP Exploration Operating Co. Ltd. during 2012;
� Statoil Mexico A.S., ExxonMobil Ventures Mexico Ltd., Japan Oil, Gas and Metals National Corporation, Chevron Deepwater Mexico Inc.,BG North America LLC during 2013; and
� Itera Group LLC, during 2013.
Pemex Exploration and Production did not enter into any collaboration agreements in 2017.
55
Copyright © 2018 www.secdatabase.com. All Rights Reserved.Please Consider the Environment Before Printing This Document
Table of ContentsThrough these agreements, we seek to increase our technical and scientific knowledge in areas including deepwater subsalt exploration and
drilling; enhanced oil recovery processes, such as air injection; and reservoir characterization of complex structures. These broad agreements oftechnological and scientific collaboration are strictly non-commercial, i.e., there is no transfer of resources and they do not establish a bindingrelationship among the parties.
Industrial Transformation
Our industrial transformation segment is comprised of two principal activities: (i) refining and (ii) gas and aromatics.
Refining
Refining Processes and Capacity
Our refining production processes include the following:
� Atmospheric distillation. This process heats crude oil in a tube furnace at atmospheric pressure to distill refined products. The primaryproducts produced are gasoline, jet fuel, diesel, atmospheric gas oil and atmospheric residual crude oil.
� Vacuum distillation. This process heats crude oil or other feedstock in a vacuum distillation column, which is operated at low pressures. Theobjective of this process is to maximize production of heavy vacuum gas oil, which is produced by boiling crude oil.
� Cracking. This process uses either heat and pressure or a catalytic agent to increase gasoline yields from crude oil.
� Visbreaking. This is a thermal cracking process, which uses a horizontal-tube heater fired to a high temperature. Visbreaking reduces flasherbottom viscosity and produces some heavy gas oil.
� Reforming processes. These processes use heat and catalysts to transform smaller or unstable hydrocarbon molecules into larger, moreuseful refining or blending products. For example, we use reforming processes to convert low octane gasoline into higher octane stocks thatare suitable for blending into finished gasoline and to convert naphthas into more volatile, higher octane products.
� Hydrotreatment or residual hydrocracking. This process uses a catalyst and hydrogen at high temperature and pressure to remove sulfur,nitrogen and some aromatic compounds. Hydrotreatment also processes some lighter liquid product off-take.
� Alkylation and isomerization. This polymerization process unites olefins and isoparaffins. Butylenes and isobutanes are combined withsulfuric acid or hydrofluoric acid to rearrange straight-chain hydrocarbon molecules into branched-chain products. Pentanes and hexanes,which are difficult to reform, are isomerized through the use of aluminum chloride and other precious-metal catalysts. Normal butane maybe isomerized to provide a portion of the isobutane feed needed for the alkylation process. The process produces a high octane, lowsensitivity blending agent for gasoline.
� Coking. This process is a severe method of thermal cracking used to upgrade heavy residuals into lighter products or distillates. Cokingproduces straight-run gasoline (coker naphtha) and various middle-distillate fractions used as catalytic feedstock, thus generating aconcentrated solid material.
56
Copyright © 2018 www.secdatabase.com. All Rights Reserved.Please Consider the Environment Before Printing This Document
Table of ContentsThese production processes together constitute our production capacity as set forth in the table below.
Refining Capacity by Production Process
At December 31,2013 2014 2015 2016 2017
(in thousands of barrels per day)Production Process
Atmospheric distillation 1,690.0 1,602.0 1,640.0 1,602.0 1,627.0Vacuum distillation 832.0 767.5 772.4 767.5 772.2Cracking 422.5 422.5 422.5 422.5 422.5Visbreaking 91.0 91.0 91.0 91.0 91.0Reforming 279.3 279.3 279.3 279.3 279.3Hydrotreatment 1,067.5 1,067.5 1,099.9 1,230.0 1,230.0Alkylation and isomerization 155.3 154.3 154.8 154.3 154.3Coking 155.8 155.8 155.8 155.8 155.8
Source: Base de Datos Institucional (Pemex Institutional Database, or Pemex BDI).
As of December 31, 2017, we owned and operated six refineries: Cadereyta, Madero, Minatitlán, Salamanca, Salina Cruz and Tula. Our refineriesconsist of atmospheric and vacuum distillation units, where the bulk of crude oil input is processed. Secondary processing facilities includedesulfurization units and facilities for catalytic cracking, reforming and hydrotreating. During 2017, our refineries processed 767.0 thousand barrels perday of crude oil (127.2 thousand barrels per day at Cadereyta, 44.6 thousand barrels per day at Madero, 86.4 thousand barrels per day at Minatitlán,156.8 thousand barrels per day at Salamanca, 137.0 thousand barrels per day at Salina Cruz and 215.1 thousand barrels per day at Tula), which in totalconsisted of 456.4 thousand barrels per day of Olmeca and Isthmus crude oil and 310.4 thousand barrels per day of Maya crude oil. In recent years, wehave been affected by operational difficulties at our auxiliary services facilities. In order to increase the processing of crude oil at our refineries and theproduction of petroleum products, we are implementing maintenance programs for critical equipment to improve the safety and reliability of ouroperating processes and to improve the performance levels of our refineries.
Since 1993, through our subsidiary company, P.M.I. Norteamérica, S.A. de C.V. (PMI-NASA), we have participated in a limited partnership withShell Oil Company in a refinery located in Deer Park, Texas, which has the capacity to process 340 thousand barrels per day of crude oil. Under theDeer Park Limited Partnership agreement, PMI-NASA and Shell Oil Company each provide 50% of the refinery�s crude oil input and own 50% of therefinery�s output. This agreement is limited to the specific purpose of operating the Deer Park refinery.
Production
We produce a wide range of products derived from crude oil and natural gas, including LPG, gasoline, jet fuel, diesel, fuel oil, asphalts, lubricantsand other refined products. In 2017, we produced 786.2 thousand barrels per day of refined products (including dry gas by-products of the refiningprocess), as compared to 977.2 thousand barrels per day in 2016, representing a decrease of 19.5%. This decrease in refined products production wasmainly due to a decrease in crude oil production as a result of the implementation of major maintenance programs at the Madero and Minatitlánrefineries in the second half of the year. In addition, our Salina Cruz refinery was affected by natural disasters: In June of 2017, the refinery was forcedinto an emergency shutdown as a result of flooding caused by tropical storm �Calvin�, and on September 7, 2017, an earthquake caused the refinery togo into an automatic safety shutdown. These natural disasters did not result in structural damage to our Salina Cruz refinery, although our electricalpower generators were affected, and operations resumed during November of 2017.
57
Copyright © 2018 www.secdatabase.com. All Rights Reserved.Please Consider the Environment Before Printing This Document
Table of ContentsThe following table sets forth, by category, our production of petroleum products from 2013 through 2017.
Refining Production
Year ended December 31,2013 2014 2015 2016 2017
2017vs. 2016
(in thousands of barrels per day) (%)Refinery Crude Oil Runs 1,224.1 1,155.1 1,064.5 933.1 767.0 (17.8 )Refined ProductsLiquefied petroleum gas 25.2 26.4 21.4 17.2 15.8 (8.1 )
GasolinePemex Magna 360.5 290.9 272.5 150.6 11.0 (92.7 )Ultra-Low Sulfur Magna 56.7 99.1 88.4 165.5 238.7 44.2Pemex Premium(1) 19.8 30.8 16.8 7.7 5.6 (27.3 )Base 0.2 0.8 3.6 1.6 1.8 12.5
Total 437.3 421.6 381.4 325.3 257.0 (21.0 )Kerosene (Jet fuel) 60.8 53.4 47.8 42.8 40.5 (5.4 )Diesel
Pemex Diesel(2) 217.7 186.9 191.5 130.1 87.4 (32.8 )Ultra-Low Sulfur Diesel 92.1 97.8 83.0 85.1 63.8 (25.0 )Others 3.7 1.9 0.2 1.0 2.4 140.0
Total 313.4 286.6 274.7 216.2 153.6 (29.0 )Fuel oil(3) 268.8 259.2 237.4 228.1 217.3 (4.7 )Other refined products
Asphalts 18.7 23.9 17.7 16.9 16.5 (2.4 )Lubricants 4.4 3.7 2.3 3.0 1.9 (36.7 )Paraffins 0.7 0.6 0.5 0.6 0.4 (33.3 )Still gas 70.7 63.9 62.2 61.9 47.9 (22.6 )Other refined products(4) 75.7 66.7 68.9 65.3 35.5 (45.6 )
Total 170.2 158.8 151.6 147.6 102.1 (30.8 )Total refined products 1,275.8 1,206.1 1,114.3 977.2 786.2 (19.5 )
Note: Numbers may not total due to rounding.(1) Pemex Premium is an ultra-low sulfur gasoline with 0.003% sulfur content.(2) Pemex Diesel is sold in the northern border market with 0.003% sulfur content.(3) Includes heavy fuel oil and intermediate 15.(4) Includes mainly coke, along with other products such as aeroflex, furfural extract, and light cyclic oil.Source: Pemex BDI.
Fuel oil, automotive gasoline and diesels represent the bulk of our production. In 2017, gasoline represented 32.7%, fuel oil represented 27.6%and diesel fuel represented 19.5% of total petroleum products production. Jet fuel represented 5.2% and LPG represented 2.0% of total production ofpetroleum products in 2017. The remainder, 13.0%, of our production consisted of a variety of other refined products.
As a result of our strategy of investing in technology to improve the quality of our fuels, we have introduced new environmentally sound productssuch as ultra-low sulfur gasoline (or ULSG) and ultra-low sulfur diesel (or ULSD).
In recent years, our production has been affected by operational problems in our auxiliary services facilities. In order to improve production, our2017-2021 Business Plan includes measures to ensure the supply of auxiliary services through partnerships with third parties. On September 1, 2017, weentered into long-term agreements
58
Copyright © 2018 www.secdatabase.com. All Rights Reserved.Please Consider the Environment Before Printing This Document
Table of Contentswith Air Liquide for the supply of hydrogen to our Tula refinery. Air Liquide will operate the existing hydrogen plant and will invest in the constructionof a second plant at our Tula refinery. Air Liquide intends to provide the total supply of hydrogen required for both the existing and new plant.
Additionally, in October 2017, we began the process of selecting partners that will supply the hydrogen for our Madero and Cadereyta refineries,and in April of 2018, we entered into a long-term agreement with the German company Linde AG for the supply of hydrogen to our Madero refinery.We expect that by carefully selecting partners we will be able to reduce the cost and improve the reliability of the supply of hydrogen, which, in turn, webelieve will improve the reliability of our crude oil refining and decrease unscheduled stoppages. We also expect that these projects will strengthen theoperational performance of our Tula, Madero and Cadereyta refineries and increase the production of gasoline and diesel.
Variable Refining Margin
During 2017, the National Refining System recorded a variable refining margin of U.S. $5.43 per barrel, an increase of U.S. $0.95 per barrel ascompared to U.S. $4.48 in 2016. This is broadly the result of the recovery in international prices for refined products in 2017.
The following table sets forth the variable refining margin for the five years ended December 31, 2017.
Variable Refining Margin
Year ended December 31,2013 2014 2015 2016 2017
2017vs. 2016
(U.S dollars per barrel) (%)Variable margin (1.84) 1.76 3.35 4.48 5.43 21.2
Domestic Sales
We market a full range of refined products, including gasoline, jet fuel, diesel, fuel oil and petrochemicals. We are one of a few major producers ofcrude oil worldwide that experiences significant domestic demand for our refined products.
59
Copyright © 2018 www.secdatabase.com. All Rights Reserved.Please Consider the Environment Before Printing This Document

Table of ContentsFor the five years ended December 31, 2017, the value of our domestic sales of refined products and petrochemicals was as follows:
Value of Refining��s Domestic Sales(1)
Year ended December 31,2013 2014 2015 2016 2017
2017vs. 2016
(in millions of pesos)(2) (%)Refined ProductsGasoline
Pemex Magna Ps.340,750.7 Ps.347,952.4 Ps.274,006.9 Ps.248,595.2 Ps.361,021.7 45.2Pemex Premium 63,723.1 80,058.9 81,813.5 87,422.8 82,028.7 (6.2 )Aviation fuels (Others) 414.1 387.5 339.8 342.4 371.1 8.4
Total 404,887.9 428,398.8 356,160.2 336,360.4 443,421.5 31.8Kerosene (Jet fuel) 35,417.9 36,449.3 27,077.2 28,945.2 39,024.5 34.8Diesel
Pemex Diesel 178,929.4 194,545.6 139,796.2 117,556.3 181,854.4 54.7Others 32,542.0 31,156.7 22,930.4 19,236.4 28,195.1 46.6
Total 211,471.4 225,702.4 162,726.7 136,792.7 210,049.5 53.6Fuel oil
Total 78,001.8 46,838.3 25,906.0 16,436.3 35,622.9 116.7Other refined products
Asphalts 7,865.4 10,788.0 7,575.5 5,468.7 $ 5,895.8 7.8Lubricants 2,991.2 2,618.9 1,297.5 1,473.0 1,061.4 (27.9 )Paraffins 339.4 319.2 257.9 267.0 230.9 (13.5 )Coke 473.4 763.3 669.5 501.9 421.1 (16.1 )Citroline 2.3 0.4 0.9 4.6 3.6 (21.7 )Gas oil for domestic use 273.1 432.2 587.4 424.2 0.0 (100.0 )
Total Ps.11,944.8 Ps.14,921.9 Ps.10,388.8 Ps.8,139.4 Ps.7,612.8 (6.5 )Total Refined Products Ps.741,723.8 Ps.752,310.8 Ps.582,258.9 Ps.526,673.9 Ps.735,731.2 39.7Petrochemicals(3) Ps.6,882.8 Ps.7,582.2 Ps.3,930.9 Ps.3,118.0 Ps.3,905.6 25.3
Note: Numbers may not total due to rounding.(1) Excludes IEPS tax and value added tax. See ��Taxes, Duties and Other Payments to the Mexican Government� in this Item 4.(2) Figures are stated in nominal pesos. See �Item 3�Key Information�Selected Financial Data.�(3) Petrochemical products produced at refineries operated by our industrial transformation segment (carbon black feedstocks and propylene).Source: Pemex BDI.
In 2017, our domestic sales of refined products increased by Ps. 209,057 million, or 39.7% in value, as compared to 2016 levels (excluding IEPStax and value added tax). This was primarily due to a 31.8% increase in the value of our gasolines sales, an increase of 53.6% in the value of diesel salesand a 116.7% increase in the value of fuel oil, in each case primarily as a result of higher average prices.
60
Copyright © 2018 www.secdatabase.com. All Rights Reserved.Please Consider the Environment Before Printing This Document

Table of ContentsThe volume of our domestic sales of refined products for the five-year period ended December 31, 2017 was distributed as follows:
Volume of Refining��s Domestic Sales
Year ended December 31,2013 2014 2015 2016 2017
2017vs. 2016
(in thousands of barrels per day, except whereotherwise indicated) (%)
Refined ProductsGasoline
Pemex Magna 667.6 639.1 638.0 637.5 660.5 3.6Pemex Premium 119.2 137.1 154.8 185.1 136.6 (26.2 )Aviation fuels (Others) 0.5 0.5 0.5 0.5 0.5 �
Total 787.3 776.7 793.3 823.1 797.5 (3.1 )Kerosenes (jet fuel) 62.2 66.5 70.8 76.2 81.7 7.2Diesel
Pemex Diesel 333.2 336.4 330.6 335.5 317.6 (5.3 )Others 58.5 53.0 54.2 51.8 47.9 (7.5 )
Total 391.7 389.4 384.7 387.2 365.5 (5.6 )Fuel oil
Total 189.3 121.7 111.7 102.6 124.7 21.5Other refined products
Asphalts 17.3 21.7 15.9 15.9 15.4 (3.1 )Lubricants 4.7 4.0 2.6 3.1 2.0 (35.5 )Paraffins 0.7 0.6 0.6 0.6 0.4 (33.3 )Coke 47.8 46.0 45.9 36.3 21.3 (41.3 )Citroline � � � 0.01 0.01 �Gas oil for domestic use 0.7 0.9 1.2 0.9 � (100.0 )
Total 71.2 73.3 66.2 56.9 39.1 (31.3 )Total refined products 1,501.8 1,427.6 1,426.7 1,446.0 1,408.4 (2.6 )
Petrochemicals(1)(2) 738.8 703.8 620.9 543.5 464.5 (14.5 )
Note: Numbers may not total due to rounding.(1) In thousands of metric tons.(2) Petrochemical products produced at refineries operated by our refining business (black feedstocks and propylene).Source: Pemex BDI.
The volume of our domestic gasoline sales decreased by 3.1% in 2017, from 823.1 thousand barrels per day in 2016 to 797.5 thousand barrels perday in 2017. The volume of our diesel sales decreased by 5.6%, from 387.2 thousand barrels per day in 2016 to 365.5 thousand barrels per day in 2017.The decrease in the volume of our domestic gasoline and diesel sales is mainly due to lower demand in the first quarter of 2017, which in turn wasprimarily the result of an increase in average gasoline and diesel prices. The volume of our domestic sales of fuel oil increased by 21.5%, from102.6 thousand barrels per day in 2016 to 124.7 thousand barrels per day in 2017, primarily due to an increase in CFE�s demand for fuel oil.
Sales of Pemex Premium gasoline decreased 26.2% in 2017, while those of Pemex Magna increased 3.6% from the previous year. This change inconsumption patterns is the result of an increase in the price differential between the two kinds of gasolines.
61
Copyright © 2018 www.secdatabase.com. All Rights Reserved.Please Consider the Environment Before Printing This Document

Table of ContentsWe have also made concerted efforts to build and enhance our brands. As a result of energy reform, beginning in April 2016, the Mexican
government has allowed private companies, including third-party franchises, to participate as retailers in the Mexican gasoline market and purchasegasoline products from us or import these same products from abroad. Pursuant to this regulatory change, on June 5, 2016, we announced that a jointbranding program had been established with various entities that own and operate retail service stations in Mexico. The joint branding program allowedour franchisees to rename their retail service stations while continuing to sell our products under our brand. In addition, we continued to providetechnical and operational assistance to such franchisees. We believe that this program strengthened our relationship with entities that own and operateretail service stations in Mexico, as we continue to adapt to the new competitive pressures in the Mexican fuel market. The joint branding programended on February 28, 2018, but a large number of franchisees opted to continue the commercial practices developed as part of the program.
On November 15, 2017, we relaunched the �Pemex Franchise� image program with a new business model that includes new products and avariety of new association schemes. The goal of this program is to provide better service to end users and to strengthen the PEMEX brand, particularlyin response to the current competitive environment in the Mexican fuel market. We have improved the quality of our fuel types by blending our PemexMagna and Pemex Premium gasoline with high-end additives. This formula was developed exclusively for us and is made with components thatmaximize the fuel�s performance, cleanliness and quality. As part of the program, we also introduced three association schemes: (i) PEMEX Franchise,(ii) sublicensing of branded products, and (iii) the sale of generic, unbranded products. We also have two options for wholesale distribution:(i) independent retailers of unbranded products, and (ii) associate distributors of PEMEX-branded gasoline and diesel. In order to strengthen and protectthe PEMEX brand, we have established various controls to ensure that all service stations comply with our demand for high quality and honest service.Furthermore, we plan to launch a new generation of performance additive for our gasoline towards the end of 2018, which will be supported bysignificant promotional and advertising efforts.
At the end of 2017, there were 11,586 retail service stations in Mexico, of which 11,540 were privately owned and operated as franchises, whilethe remaining 46 were owned by Pemex Industrial Transformation. This total number of retail service stations represents a decrease of 2.4% from the11,876 service stations as of December 31, 2016. Additionally, as of December 31, 2017, we served as the supplier for 454 retail service stations thatoperated under a brand other than the PEMEX brand.
Pricing Decrees
The energy reform provides for fuel price liberalization, which began in early 2017 and was completed by the end of that year. Even though priceshave been fully liberalized, the CRE reserves the right to intervene. Therefore, our sales prices continue to be subject to potential future regulations bythe CRE, until the Comisión Federal de Competencia Económica (Federal Economic Competition Commission) determines that there is effectivecompetition in the wholesale market.
Gasoline and Diesel
Historically, the Mexican Government has established periodic increases on the price of gasoline and diesel.
On January 1, 2014, pursuant to the Impuesto a los Combustibles Fósiles (IEPS Tax on Fossil Fuels) approved under the Ley del ImpuestoEspecial sobre Producción y Servicios (Special Tax on Production and Services Law, or the IEPS Law), unleaded gasoline and diesel became subject toone-time price increases of ten and thirteen Mexican cents per liter, respectively. See ��Information on the Company�Taxes, Duties and Other Paymentsto the Mexican Government� in this Item 4.
During 2015, the Mexican Government imposed further one-time increases of approximately 26 Mexican cents per liter on Magna gasoline anddiesel and 27 Mexican cents per liter on premium gasoline. As of
62
Copyright © 2018 www.secdatabase.com. All Rights Reserved.Please Consider the Environment Before Printing This Document
Table of ContentsJanuary 1, 2016 the Mexican Government established a new mechanism to determine the prices of gasoline and diesel, which took into accountinternational market prices. This mechanism allowed gasoline and diesel prices to float within a fixed range determined by the Mexican Government,adding a flat IEPS tax. At the end of 2016, prices of gasoline were approximately 43 Mexican cents per liter higher, as compared to 2015, and prices ofdiesel were approximately 43 Mexican cents per liter higher in 2016, as compared to 2015.
In January 2017, as part of the energy reform, the Mexican Government began to liberalize the price of gasoline and diesel. As a result, onJanuary 1, 2017, magna gasoline prices increased sharply by between Ps. 1.35 and Ps. 2.61 per liter, as compared to December 31, 2016. Similarly,diesel prices increased by between Ps. 1.78 and Ps. 3.05 per liter on January 1, 2017, as compared to December 31, 2016.
The liberalization of prices continued in 2017 and, as of December 31, 2017, sale prices of gasoline and diesel have been fully liberalized and aredetermined by the free market. For more information, see �Item 5�Operating and Financial Review and Prospects�IEPS Tax, Hydrocarbon Duties andOther Taxes.�
Discount
Since the early 1980s, the Mexican Government has also established a discount of 30% on the price at which we sell gas oil intended for domesticuse to the state of Chihuahua during the months of January, February and December of each year. On January 1, 2014, pursuant to the IEPS Tax onFossil Fuels, such gas oil became subject to a one-time price increase of 10.857 Mexican cents per liter. Gas oil became subject to a one-time priceincrease of 11.307 Mexican cents per liter in 2015, 11.558 Mexican cents per liter as of January 1, 2016, 11.94 Mexican cents per liter as of January 1,2017 and 12.73 Mexican cents per liter as of January 1, 2018. Notably, the discount on the price of gas oil in the state of Chihuahua was suspended inDecember 2016. As of the date of this annual report, this discount remains suspended.
Fuel Oil
Since December 2008, the price at which we sell fuel oil to CFE has been linked to international market prices in accordance with a pricingmethodology established by the Mexican Government. This methodology is based on the price of fuel oil in the U.S. Gulf of Mexico coastal region, andis then adjusted for quality as well as expenses related to distribution.
On January 1, 2015, the IEPS Tax on Fossil Fuels of 14.00 Mexican cents per liter of fuel oil became effective through the fiscal year endedDecember 31, 2015. As of January 1, 2016, fuel oil became subject to a premium of 14.31 Mexican cents per liter and as of January 1, 2017, the IEPSTax on Fossil Fuels is 14.78 Mexican cents per liter. As of January 1, 2018, the IEPS Tax on Fossil Fuels is 15.76 Mexican cents per liters.
As of November 3, 2017, the CRE authorized new formulas to determine the price for fuel oil. As of December 31, 2017, there are first-hand saleprices for sales at refineries and market prices for sales at storage and distribution terminals. These prices are calculated weekly and apply to allcustomers, including the CFE.
The Mexican Government could modify these price controls or impose additional price controls in the future. See �Item 3�Key Information�RiskFactors�Risk Factors Related to our Relationship with the Mexican Government�The Mexican Government has historically imposed price controls inthe domestic market on our products.�
We withhold IEPS Tax. While it is included in the price to our customers, we pay this tax to the authorities upon collection of the sale of ourproducts and it is not included in our revenues. For more information, see �Item 4�Taxes, Duties and Other Payments to the MexicanGovernment�Fiscal Regime for PEMEX.�
63
Copyright © 2018 www.secdatabase.com. All Rights Reserved.Please Consider the Environment Before Printing This Document

Table of ContentsInvestments
Over the past several years, we have focused our investment program on enhancing the quality of the gasoline and diesel we produce to meetMexico�s new environmental standards. Our aim is to improve our ability to process heavy crude oil in order to optimize the crude oil blend in ourrefineries and to increase production of unleaded gasoline and diesel to supply growing demand at a lower cost.
Our refining business invested Ps. 15,988 million in capital expenditures in 2017 and has budgeted Ps. 14,376 million in capital expenditures for2018. We hope to complement our capital expenditures in 2018 through strategic alliances.
The following table sets forth our refining business� capital expenditures, excluding non-capitalizable maintenance, for each of the three yearsended December 31, 2017, and the budget for 2018. Capital expenditure amounts are derived from our budgetary records, which are prepared on a cashbasis. Accordingly, these capital expenditure amounts do not correspond to capital expenditure amounts included in our consolidated financialstatements prepared in accordance with IFRS.
Refining��s Capital Expenditures
Year ended December 31,(1)2015 2016 2017
Budget2018(2)
(in millions of pesos)(3)RefiningFuel Quality Investments(4) Ps.9,045 Ps.10,702 Ps.5,196 Ps.2,483Reconfiguration of Miguel Hidalgo Refinery in Tula 4,674 8,610 1,912 303New Refinery in Tula(5) 561 1,849 � �Minatitlán Refinery Energy Train � 1,100 � �Cadereyta Refinery Energy Train � 872 � �Residual Conversion from Salamanca Refinery 913 749 773 68Tuxpan Pipeline and Storage and Distribution Terminals 100 15 67 71Others 14,353 6,604 8,039 11,452
Total Ps.29,646 Ps.30,501 Ps.15,988 Ps.14,376
Notes: Numbers may not total due to rounding.(1) Amounts based on cash basis method of accounting.(2) Budget presented to the Board of Directors of Petróleos Mexicanos on March 5, 2018.(3) Figures are stated in nominal pesos.(4) Includes clean fuels investments for gasoline and diesel in our six refineries.(5) Includes pre-investments studies, on-site preparation and other expenses related to this project.Source: Petróleos Mexicanos.
During 2017, we imported approximately 570.2 thousand barrels per day of gasoline, which represented approximately 71.5% of total domesticdemand for gasoline in that year.
Our projects, which will involve some private sector investments, aim to reduce greenhouse gas emissions by promoting cleaner fuels. Certain ofthese projects, including the Fuels Quality Project (formerly known as the Clean Fuels Project), the reconfiguration of the Miguel Hidalgo Refinery inTula and the residual conversion of the Salamanca Refinery, are already part of ongoing projects developed by our industrial transformation segment.Our projects are described in further detail below.
Fuel Quality Project
Our Fuel Quality Project is being developed in our six refineries, with a first phase involving the installation of eight ULSG post-treatment units,the capacities of which are set forth below by refinery. The first phase of this
64
Copyright © 2018 www.secdatabase.com. All Rights Reserved.Please Consider the Environment Before Printing This Document
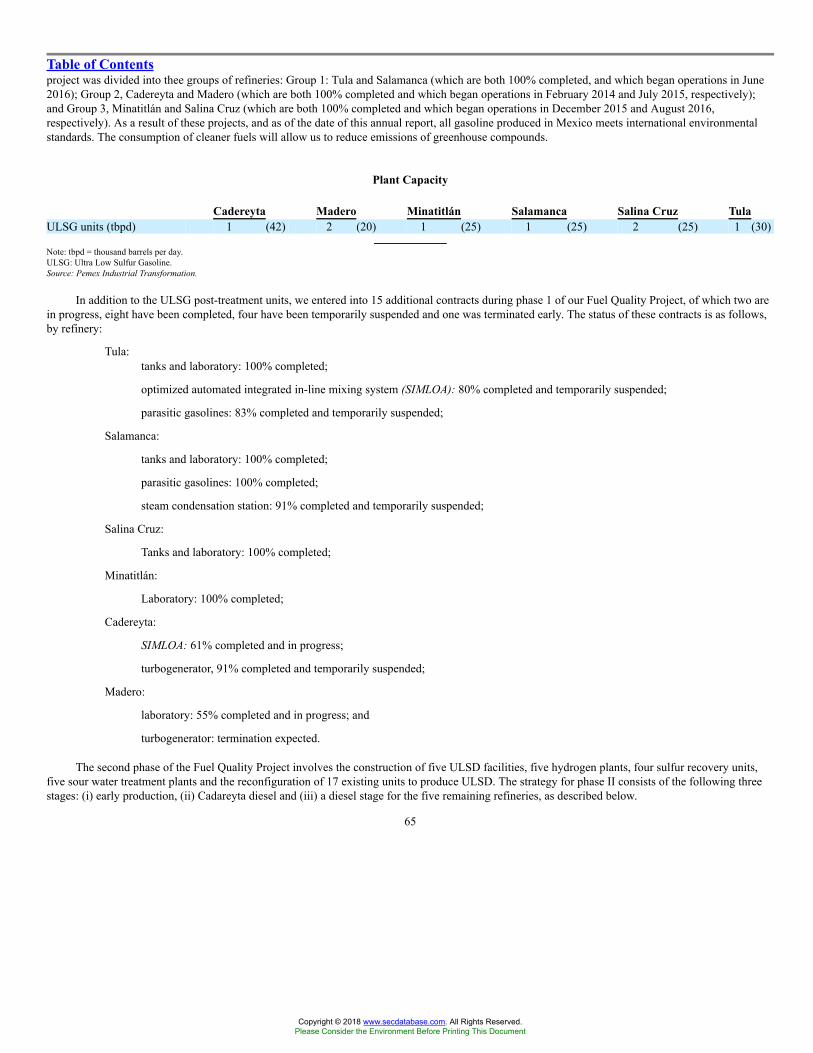
Table of Contentsproject was divided into thee groups of refineries: Group 1: Tula and Salamanca (which are both 100% completed, and which began operations in June2016); Group 2, Cadereyta and Madero (which are both 100% completed and which began operations in February 2014 and July 2015, respectively);and Group 3, Minatitlán and Salina Cruz (which are both 100% completed and which began operations in December 2015 and August 2016,respectively). As a result of these projects, and as of the date of this annual report, all gasoline produced in Mexico meets international environmentalstandards. The consumption of cleaner fuels will allow us to reduce emissions of greenhouse compounds.
Plant Capacity
Cadereyta Madero Minatitlán Salamanca Salina Cruz TulaULSG units (tbpd) 1 (42) 2 (20) 1 (25) 1 (25) 2 (25) 1 (30)
Note: tbpd = thousand barrels per day.ULSG: Ultra Low Sulfur Gasoline.Source: Pemex Industrial Transformation.
In addition to the ULSG post-treatment units, we entered into 15 additional contracts during phase 1 of our Fuel Quality Project, of which two arein progress, eight have been completed, four have been temporarily suspended and one was terminated early. The status of these contracts is as follows,by refinery:
� Tula:� tanks and laboratory: 100% completed;
� optimized automated integrated in-line mixing system (SIMLOA): 80% completed and temporarily suspended;
� parasitic gasolines: 83% completed and temporarily suspended;
� Salamanca:
� tanks and laboratory: 100% completed;
� parasitic gasolines: 100% completed;
� steam condensation station: 91% completed and temporarily suspended;
� Salina Cruz:
� Tanks and laboratory: 100% completed;
� Minatitlán:
� Laboratory: 100% completed;
� Cadereyta:
� SIMLOA: 61% completed and in progress;
� turbogenerator, 91% completed and temporarily suspended;
� Madero:
� laboratory: 55% completed and in progress; and
� turbogenerator: termination expected.
The second phase of the Fuel Quality Project involves the construction of five ULSD facilities, five hydrogen plants, four sulfur recovery units,five sour water treatment plants and the reconfiguration of 17 existing units to produce ULSD. The strategy for phase II consists of the following threestages: (i) early production, (ii) Cadareyta diesel and (iii) a diesel stage for the five remaining refineries, as described below.
65
Copyright © 2018 www.secdatabase.com. All Rights Reserved.Please Consider the Environment Before Printing This Document

Table of ContentsEarly production. We executed projects to increase efficiency at certain of our existing processing plants and to produce ULSD through eight
construction and services contracts totaling Ps. 130 billion. All of these projects have been completed and the respective plants are in operation.
Cadereyta diesel phase. Construction began in March 2013 and, as of the date of this annual report, is approximately 68% complete. Due tobudgetary constraints, however, two of the four relevant contracts have been suspended since April 2016. We are currently evaluating fundingalternatives through alliances and/or strategic partnerships in order to resume work under these two contracts and we anticipate that work may resumeduring the second quarter of 2018. The two other contracts have been completed.
Diesel phase for outstanding refineries. The Open Book Cost Estimation (OBCE) methodology is used in connection with the implementation ofthe diesel phase at the refineries other than Cadereyta and is divided into two stages:
Phase I: the development of detailed engineering plans and the placement of purchase orders for equipment requiring significant delivery time todetermine a cost estimate for Phase II. Phase I was completed with the execution of the Final Works Agreement on December 17, 2015.
Phase II: the execution of detailed engineering, procurement and construction, which commenced in January 2016. Due to budgetary constraints,however, the project was suspended in October 2016 with only a small portion completed. We are currently evaluating funding alternatives throughalliances and/or strategic partnerships in order to resume work under the contracts.
As of the date of this annual report, we also have 15 contracts for complementary facilities, which comprise the total scope of the Fuel QualityProject. Of those 15, five have been completed, eight are in development and two have been suspended as the result of budgetary constraints.
Reconfiguration of the Miguel Hidalgo Refinery in Tula
On August 12, 2009, we announced the construction of a new refinery in Tula on land that was donated by the state government of Hidalgo. Uponcompletion of our pre-investment studies relating to the new refinery in Tula, we determined that it would be more cost-effective to forgo constructionof a new refinery and instead direct our investments to the reconfiguration of the existing Miguel Hidalgo refinery. Accordingly, on December 3, 2014,we announced the commencement of renovations to upgrade the refinery as part of the Aprovechamiento de Residuales en la Refinería de Tula Hidalgo(Residue Use at the Tula Hidalgo Refinery, which we refer to as the Tula refinery reconfiguration project). The reconfigured refinery is intended to(i) generally modernize crude oil processing; (ii) increase the efficiency with which vacuum residue is converted into high value fuels; (iii) producehigher value products; (iv) increase refining margins; and (v) reduce fuel oil handling problems.
Pemex Industrial Transformation plans to implement the reconfiguration project in two phases: (i) phase one for the development of engineeringplans and (ii) phase two for detailed engineering, procurement and construction. In September 2013, ICA Fluor Daniel, S. de R.L. de C.V. (ICA Fluor)was awarded a U.S. $94.8 million contract to carry out studies and to provide engineering services for phase one. Site preparation work began inFebruary 2014 and construction of the first processing unit began in October 2014.
By the end of 2016, the project was approximately 27% completed, but due to budgetary constraints certain tasks were delayed and rescheduled,including the construction of the coking plant. Construction of the new coking plant is part of the modernization of the refinery, which is intended toincrease the production of various types of gasoline, diesel and jet fuel. We estimate that the modernization of the refinery will allow us to increaseperformance by over 40%, increasing production of refined oil products from 154 thousand barrels per day to 220 thousand barrels. The project is beingcarried out in two stages. The first stage, which is scheduled to be
66
Copyright © 2018 www.secdatabase.com. All Rights Reserved.Please Consider the Environment Before Printing This Document
Table of Contentscompleted by 2020, includes the building and commissioning of the delayed coking plant and the facilities necessary for its operation. The second stage,which is scheduled to be completed in 2022, covers the remaining new facilities, the modernization of current facilities and their integration. As ofMarch 31, 2018, construction of the coker plant was 60% completed and we are currently evaluating funding alternatives through alliances and/orstrategic partnerships in order to complete construction.
Residual Conversion of the Salamanca Refinery
The reconfiguration of the �Ingeniero Antonio M. Amor� refinery in Salamanca, Guanajuato focuses on the conversion of residuals into high-value distillates (without a need for increased crude oil processing), as well as the modernization of the lubricants train to produce group II lubricants.As part of the reconfiguration, we will construct new plants and refurnish existing plants. This project also involves the construction of a perimeter wallsurrounding the refinery with two security entrances, the relocation of CFE�s electric transmission lines and site improvements. Construction of the newplants includes a delayed coker unit, a catalytic cracking unit, a hydrogen plant, a coker naphthas hydro-desulfurization plant, a gasoil hydro-desulfurization plant, a new lubricants train, a naphtha reforming plant, a sulfur recovery unit, an amine regeneration unit and a sour water treatmentfacility. In addition, this project involves the construction of storage tanks, effluent treatment plants (at which industrial wastewater is treated for reuse)and infrastructure (including roads and street lights) in the areas surrounding the refinery, as well as services, electric power supply, high burner areas,buildings and other service and support facilities. Other units, including certain vacuum and atmospheric distillation units, will undergo renovations toenhance their ability to supply the coker plant and to increase the supply of gas oil to the new plants. Finally, the project includes the integration ofpipelines, pumping equipment and electrical substations from existing facilities.
In accordance with the OBCE methodology, Pemex Industrial Transformation plans to implement the project in two phases as part of a strategy toincrease efficiency, mitigate technical and economic risks, define the project�s scope and reduce uncertainty. Phase one includes the development ofengineering plans, while phase two includes detailed engineering plans, together with procurement and construction. At the end of 2017, the project wasapproximately 12.8% complete and phase one was approximately 98% completed but has been suspended due to budgetary constraints. However, inlight of the advanced engineering plans, site preparation and equipment design, this project is ready to commence procurement and construction and weare actively evaluating strategies and seeking partners to obtain funding to resume the project. See ��Investments� below for more informationregarding capital expenditures by project.
Pemex Industrial Transformation, together with the Department of Corporate Alliances and New Business, is currently seeking partners tocontinue the project.
Tuxpan Maritime Terminal
The Tuxpan Maritime Terminal project is intended to help meet the increasing demand for refined products in the metropolitan area of the MexicoValley. The total cost of the project is approximately Ps. 5,171.5 million, which includes the construction of a pipeline measuring 18 inches in diameterand 109 kilometers in length from Cima de Togo to Venta de Carpio, five storage tanks located at the Tuxpan Maritime Terminal with a capacity of100,000 barrels each, a research study to determine the best option for the discharge of refined products from tankers and pipelines into these storagetanks and auxiliary and integration services.
As of April 2018, two of the three phases of this project, the pre-investment studies and the transportation of the Tuxpan-Mexico pipelines, havebeen completed, and the pipeline is in operation. The third phase, the storage system, is 98.4% complete, and we have requested an extension from theSHCP for additional time within which to complete this final phase. Four of the five storage tanks have been delivered to the Tuxpan Maritime Terminaland are operational. The remaining tank is 99.7% complete and the overall Tuxpan-Mexico pipelines project is expected to be completed in 2018.
67
Copyright © 2018 www.secdatabase.com. All Rights Reserved.Please Consider the Environment Before Printing This Document

Table of ContentsMaintenance at the Francisco I. Madero Refinery
On August 23, 2017, we commenced a scheduled gradual shutdown of our Francisco I. Madero refinery, located in Ciudad Madero, Tamaulipas inorder to implement a comprehensive general maintenance program for the plants at this refinery. Operations at the plants were restarted in February2018 and we are currently in the process of stabilizing operations. We expect that this program will lead to improved safety and reliability of ouroperating processes and, in turn, improved performance of this refinery.
Hydrogen Supply for Refineries
Pursuant to the energy reform and our 2017-2021 Business Plan, we aim to partner with third parties and to enter into strategic alliances and jointventures for projects related to auxiliary services, such as the supply of hydrogen to refineries, which will permit us to specialize, maximize value, andfocus on the processing of crude oil.
On September 1, 2017, we entered into long-term agreements with Air Liquide for the supply of hydrogen to the Tula refinery. Air Liquide willoperate the existing hydrogen plant at the Tula refinery and will invest in the construction of a second plant. Air Liquide intends to provide the totalsupply of hydrogen required for both the existing plant and the refinery expansion projects. In December 2017, we executed the plant�s performanceand stabilization tests.
Additionally, in October 2017, we began the process of selecting partners that will provide the hydrogen supply for our Madero and Cadereytarefineries. In April 2018, we entered into a long-term agreement with the German company Linde AG for the supply of hydrogen to our Maderorefinery.
Gas and Aromatics
Natural Gas and Condensates
All wet natural gas production is directed to our gas processing facilities. At the end of 2017, we owned nine facilities.
The following facilities are located in the Southern region:
� Nuevo Pemex. This facility contains 13 plants that together in 2017 produced 815.5 million cubic feet per day of dry gas, 34.7 thousandbarrels per day of ethane, 39.7 thousand barrels per day of liquefied gas, 16.1 thousand barrels per day of naphtha and 55.0 thousand tons ofsulfur.
� Cactus. This facility contains 22 plants that together in 2017 produced 541.1 million cubic feet per day of dry gas, 26.9 thousand barrels perday of ethane, 33.8 thousand barrels per day of liquefied gas, 12.8 thousand barrels per day of naphtha and 216.1 thousand tons of sulfur.
� Ciudad Pemex. This facility contains eight plants that together in 2017 produced 612.7 million cubic feet per day of dry gas and140.6 thousand tons of sulfur.
� La Venta. This facility contains one plant that in 2017 produced 118.1 million cubic feet of dry gas per day.
� Matapionche. This facility contains five plants that together in 2017 produced 13.6 million cubic feet per day of dry gas, 0.6 thousandbarrels per day of liquefied gas, 0.2 thousand barrels per day of naphtha and 3.1 thousand tons of sulfur.
� The Morelos, Cangrejera and Pajaritos facilities form the Coatzacoalcos area gas processing complex (which we refer to as a GPC):
� Morelos. This facility contains one plant that in 2017 produced 16.8 thousand barrels per day of ethane, 15.4 thousand barrels perday of liquefied gas and 5.6 thousand barrels per day of naphtha.
68
Copyright © 2018 www.secdatabase.com. All Rights Reserved.Please Consider the Environment Before Printing This Document
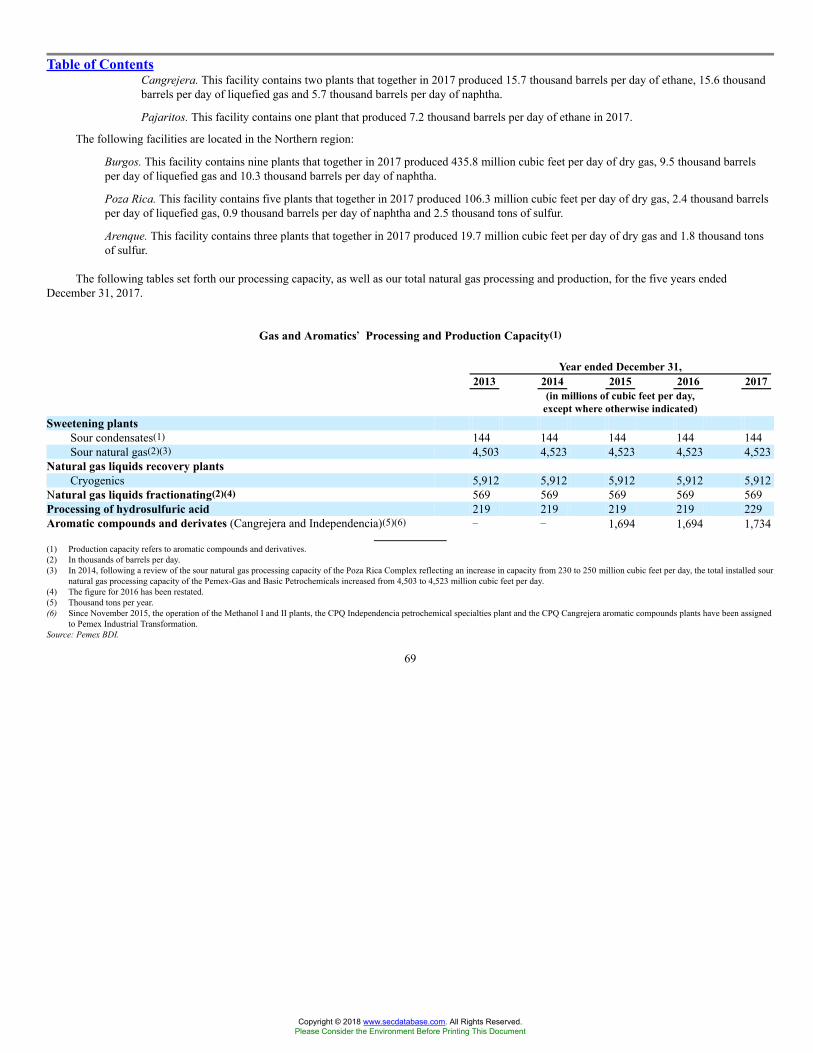
Table of Contents� Cangrejera. This facility contains two plants that together in 2017 produced 15.7 thousand barrels per day of ethane, 15.6 thousand
barrels per day of liquefied gas and 5.7 thousand barrels per day of naphtha.
� Pajaritos. This facility contains one plant that produced 7.2 thousand barrels per day of ethane in 2017.
The following facilities are located in the Northern region:
� Burgos. This facility contains nine plants that together in 2017 produced 435.8 million cubic feet per day of dry gas, 9.5 thousand barrelsper day of liquefied gas and 10.3 thousand barrels per day of naphtha.
� Poza Rica. This facility contains five plants that together in 2017 produced 106.3 million cubic feet per day of dry gas, 2.4 thousand barrelsper day of liquefied gas, 0.9 thousand barrels per day of naphtha and 2.5 thousand tons of sulfur.
� Arenque. This facility contains three plants that together in 2017 produced 19.7 million cubic feet per day of dry gas and 1.8 thousand tonsof sulfur.
The following tables set forth our processing capacity, as well as our total natural gas processing and production, for the five years endedDecember 31, 2017.
Gas and Aromatics�� Processing and Production Capacity(1)
Year ended December 31,2013 2014 2015 2016 2017
(in millions of cubic feet per day,except where otherwise indicated)
Sweetening plantsSour condensates(1) 144 144 144 144 144Sour natural gas(2)(3) 4,503 4,523 4,523 4,523 4,523
Natural gas liquids recovery plantsCryogenics 5,912 5,912 5,912 5,912 5,912
Natural gas liquids fractionating(2)(4) 569 569 569 569 569Processing of hydrosulfuric acid 219 219 219 219 229Aromatic compounds and derivates (Cangrejera and Independencia)(5)(6) � � 1,694 1,694 1,734
(1) Production capacity refers to aromatic compounds and derivatives.(2) In thousands of barrels per day.(3) In 2014, following a review of the sour natural gas processing capacity of the Poza Rica Complex reflecting an increase in capacity from 230 to 250 million cubic feet per day, the total installed sour
natural gas processing capacity of the Pemex-Gas and Basic Petrochemicals increased from 4,503 to 4,523 million cubic feet per day.(4) The figure for 2016 has been restated.(5) Thousand tons per year.(6) Since November 2015, the operation of the Methanol I and II plants, the CPQ Independencia petrochemical specialties plant and the CPQ Cangrejera aromatic compounds plants have been assigned
to Pemex Industrial Transformation.Source: Pemex BDI.
69
Copyright © 2018 www.secdatabase.com. All Rights Reserved.Please Consider the Environment Before Printing This Document
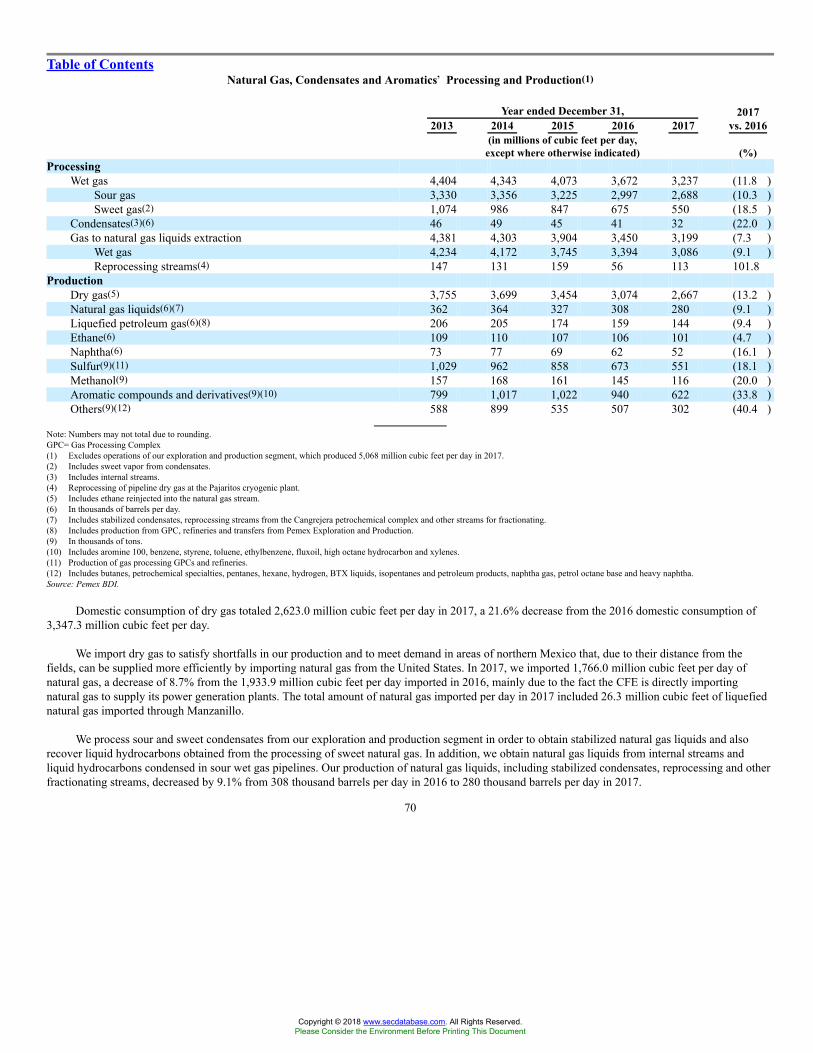
Table of ContentsNatural Gas, Condensates and Aromatics�� Processing and Production(1)
Year ended December 31,2013 2014 2015 2016 2017
2017vs. 2016
(in millions of cubic feet per day,except where otherwise indicated) (%)
ProcessingWet gas 4,404 4,343 4,073 3,672 3,237 (11.8 )
Sour gas 3,330 3,356 3,225 2,997 2,688 (10.3 )Sweet gas(2) 1,074 986 847 675 550 (18.5 )
Condensates(3)(6) 46 49 45 41 32 (22.0 )Gas to natural gas liquids extraction 4,381 4,303 3,904 3,450 3,199 (7.3 )
Wet gas 4,234 4,172 3,745 3,394 3,086 (9.1 )Reprocessing streams(4) 147 131 159 56 113 101.8
ProductionDry gas(5) 3,755 3,699 3,454 3,074 2,667 (13.2 )Natural gas liquids(6)(7) 362 364 327 308 280 (9.1 )Liquefied petroleum gas(6)(8) 206 205 174 159 144 (9.4 )Ethane(6) 109 110 107 106 101 (4.7 )Naphtha(6) 73 77 69 62 52 (16.1 )Sulfur(9)(11) 1,029 962 858 673 551 (18.1 )Methanol(9) 157 168 161 145 116 (20.0 )Aromatic compounds and derivatives(9)(10) 799 1,017 1,022 940 622 (33.8 )Others(9)(12) 588 899 535 507 302 (40.4 )
Note: Numbers may not total due to rounding.GPC= Gas Processing Complex(1) Excludes operations of our exploration and production segment, which produced 5,068 million cubic feet per day in 2017.(2) Includes sweet vapor from condensates.(3) Includes internal streams.(4) Reprocessing of pipeline dry gas at the Pajaritos cryogenic plant.(5) Includes ethane reinjected into the natural gas stream.(6) In thousands of barrels per day.(7) Includes stabilized condensates, reprocessing streams from the Cangrejera petrochemical complex and other streams for fractionating.(8) Includes production from GPC, refineries and transfers from Pemex Exploration and Production.(9) In thousands of tons.(10) Includes aromine 100, benzene, styrene, toluene, ethylbenzene, fluxoil, high octane hydrocarbon and xylenes.(11) Production of gas processing GPCs and refineries.(12) Includes butanes, petrochemical specialties, pentanes, hexane, hydrogen, BTX liquids, isopentanes and petroleum products, naphtha gas, petrol octane base and heavy naphtha.Source: Pemex BDI.
Domestic consumption of dry gas totaled 2,623.0 million cubic feet per day in 2017, a 21.6% decrease from the 2016 domestic consumption of3,347.3 million cubic feet per day.
We import dry gas to satisfy shortfalls in our production and to meet demand in areas of northern Mexico that, due to their distance from thefields, can be supplied more efficiently by importing natural gas from the United States. In 2017, we imported 1,766.0 million cubic feet per day ofnatural gas, a decrease of 8.7% from the 1,933.9 million cubic feet per day imported in 2016, mainly due to the fact the CFE is directly importingnatural gas to supply its power generation plants. The total amount of natural gas imported per day in 2017 included 26.3 million cubic feet of liquefiednatural gas imported through Manzanillo.
We process sour and sweet condensates from our exploration and production segment in order to obtain stabilized natural gas liquids and alsorecover liquid hydrocarbons obtained from the processing of sweet natural gas. In addition, we obtain natural gas liquids from internal streams andliquid hydrocarbons condensed in sour wet gas pipelines. Our production of natural gas liquids, including stabilized condensates, reprocessing and otherfractionating streams, decreased by 9.1% from 308 thousand barrels per day in 2016 to 280 thousand barrels per day in 2017.
70
Copyright © 2018 www.secdatabase.com. All Rights Reserved.Please Consider the Environment Before Printing This Document
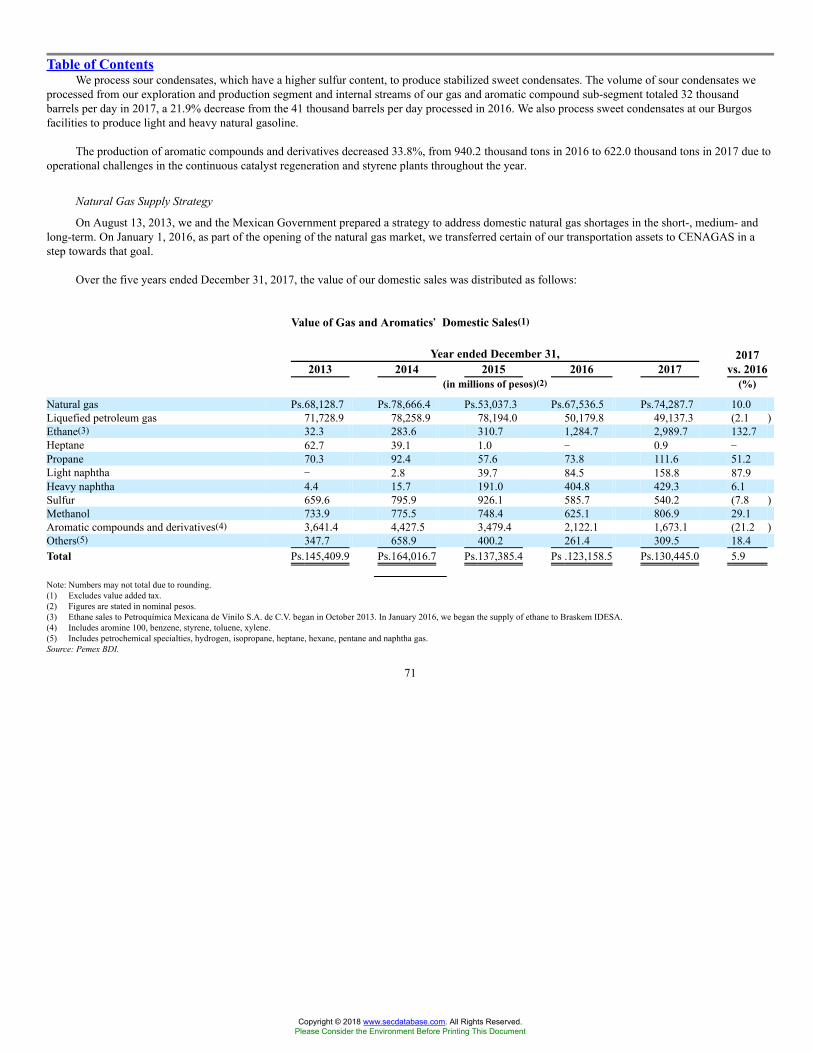
Table of ContentsWe process sour condensates, which have a higher sulfur content, to produce stabilized sweet condensates. The volume of sour condensates we
processed from our exploration and production segment and internal streams of our gas and aromatic compound sub-segment totaled 32 thousandbarrels per day in 2017, a 21.9% decrease from the 41 thousand barrels per day processed in 2016. We also process sweet condensates at our Burgosfacilities to produce light and heavy natural gasoline.
The production of aromatic compounds and derivatives decreased 33.8%, from 940.2 thousand tons in 2016 to 622.0 thousand tons in 2017 due tooperational challenges in the continuous catalyst regeneration and styrene plants throughout the year.
Natural Gas Supply Strategy
On August 13, 2013, we and the Mexican Government prepared a strategy to address domestic natural gas shortages in the short-, medium- andlong-term. On January 1, 2016, as part of the opening of the natural gas market, we transferred certain of our transportation assets to CENAGAS in astep towards that goal.
Over the five years ended December 31, 2017, the value of our domestic sales was distributed as follows:
Value of Gas and Aromatics�� Domestic Sales(1)
Year ended December 31,2013 2014 2015 2016 2017
2017vs. 2016
(in millions of pesos)(2) (%)
Natural gas Ps.68,128.7 Ps.78,666.4 Ps.53,037.3 Ps.67,536.5 Ps.74,287.7 10.0Liquefied petroleum gas 71,728.9 78,258.9 78,194.0 50,179.8 49,137.3 (2.1 )Ethane(3) 32.3 283.6 310.7 1,284.7 2,989.7 132.7Heptane 62.7 39.1 1.0 � 0.9 �Propane 70.3 92.4 57.6 73.8 111.6 51.2Light naphtha � 2.8 39.7 84.5 158.8 87.9Heavy naphtha 4.4 15.7 191.0 404.8 429.3 6.1Sulfur 659.6 795.9 926.1 585.7 540.2 (7.8 )Methanol 733.9 775.5 748.4 625.1 806.9 29.1Aromatic compounds and derivatives(4) 3,641.4 4,427.5 3,479.4 2,122.1 1,673.1 (21.2 )Others(5) 347.7 658.9 400.2 261.4 309.5 18.4Total Ps.145,409.9 Ps.164,016.7 Ps.137,385.4 Ps .123,158.5 Ps.130,445.0 5.9
Note: Numbers may not total due to rounding.(1) Excludes value added tax.(2) Figures are stated in nominal pesos.(3) Ethane sales to Petroquímica Mexicana de Vinilo S.A. de C.V. began in October 2013. In January 2016, we began the supply of ethane to Braskem IDESA.(4) Includes aromine 100, benzene, styrene, toluene, xylene.(5) Includes petrochemical specialties, hydrogen, isopropane, heptane, hexane, pentane and naphtha gas.Source: Pemex BDI.
71
Copyright © 2018 www.secdatabase.com. All Rights Reserved.Please Consider the Environment Before Printing This Document
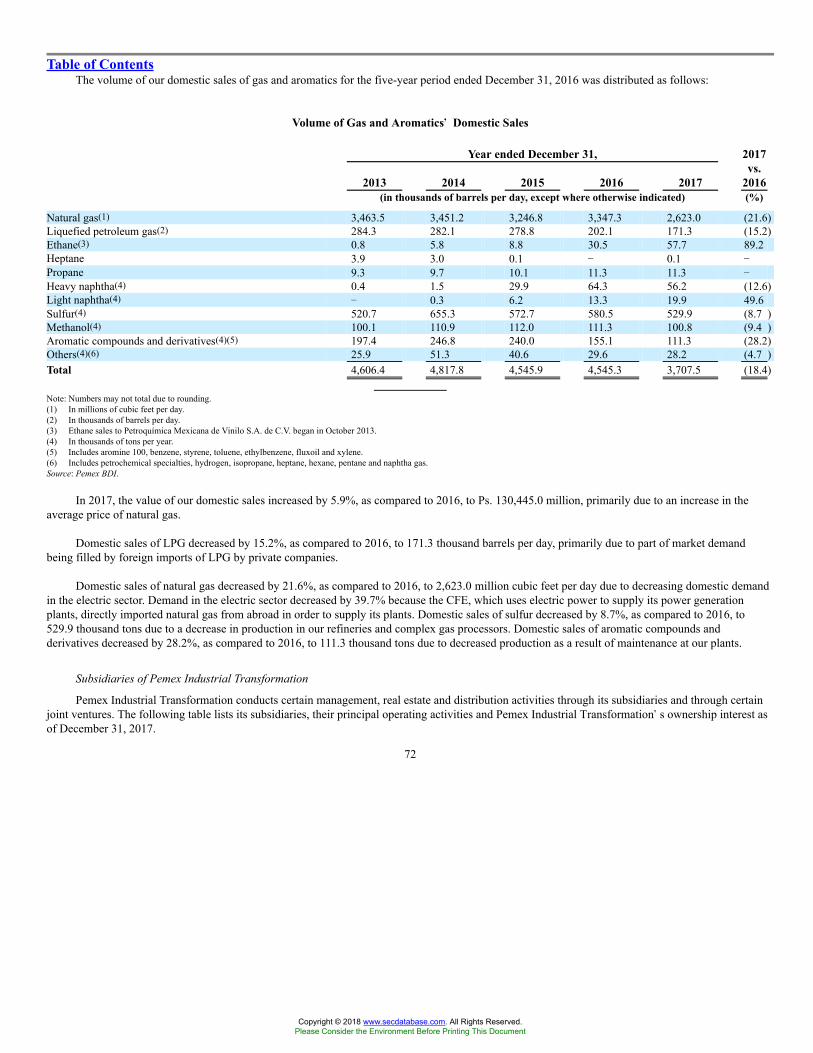
Table of ContentsThe volume of our domestic sales of gas and aromatics for the five-year period ended December 31, 2016 was distributed as follows:
Volume of Gas and Aromatics�� Domestic Sales
Year ended December 31,
2013 2014 2015 2016 2017
2017vs.
2016(in thousands of barrels per day, except where otherwise indicated) (%)
Natural gas(1) 3,463.5 3,451.2 3,246.8 3,347.3 2,623.0 (21.6)Liquefied petroleum gas(2) 284.3 282.1 278.8 202.1 171.3 (15.2)Ethane(3) 0.8 5.8 8.8 30.5 57.7 89.2Heptane 3.9 3.0 0.1 � 0.1 �Propane 9.3 9.7 10.1 11.3 11.3 �Heavy naphtha(4) 0.4 1.5 29.9 64.3 56.2 (12.6)Light naphtha(4) � 0.3 6.2 13.3 19.9 49.6Sulfur(4) 520.7 655.3 572.7 580.5 529.9 (8.7 )Methanol(4) 100.1 110.9 112.0 111.3 100.8 (9.4 )Aromatic compounds and derivatives(4)(5) 197.4 246.8 240.0 155.1 111.3 (28.2)Others(4)(6) 25.9 51.3 40.6 29.6 28.2 (4.7 )Total 4,606.4 4,817.8 4,545.9 4,545.3 3,707.5 (18.4)
Note: Numbers may not total due to rounding.(1) In millions of cubic feet per day.(2) In thousands of barrels per day.(3) Ethane sales to Petroquímica Mexicana de Vinilo S.A. de C.V. began in October 2013.(4) In thousands of tons per year.(5) Includes aromine 100, benzene, styrene, toluene, ethylbenzene, fluxoil and xylene.(6) Includes petrochemical specialties, hydrogen, isopropane, heptane, hexane, pentane and naphtha gas.Source: Pemex BDI.
In 2017, the value of our domestic sales increased by 5.9%, as compared to 2016, to Ps. 130,445.0 million, primarily due to an increase in theaverage price of natural gas.
Domestic sales of LPG decreased by 15.2%, as compared to 2016, to 171.3 thousand barrels per day, primarily due to part of market demandbeing filled by foreign imports of LPG by private companies.
Domestic sales of natural gas decreased by 21.6%, as compared to 2016, to 2,623.0 million cubic feet per day due to decreasing domestic demandin the electric sector. Demand in the electric sector decreased by 39.7% because the CFE, which uses electric power to supply its power generationplants, directly imported natural gas from abroad in order to supply its plants. Domestic sales of sulfur decreased by 8.7%, as compared to 2016, to529.9 thousand tons due to a decrease in production in our refineries and complex gas processors. Domestic sales of aromatic compounds andderivatives decreased by 28.2%, as compared to 2016, to 111.3 thousand tons due to decreased production as a result of maintenance at our plants.
Subsidiaries of Pemex Industrial Transformation
Pemex Industrial Transformation conducts certain management, real estate and distribution activities through its subsidiaries and through certainjoint ventures. The following table lists its subsidiaries, their principal operating activities and Pemex Industrial Transformation�s ownership interest asof December 31, 2017.
72
Copyright © 2018 www.secdatabase.com. All Rights Reserved.Please Consider the Environment Before Printing This Document
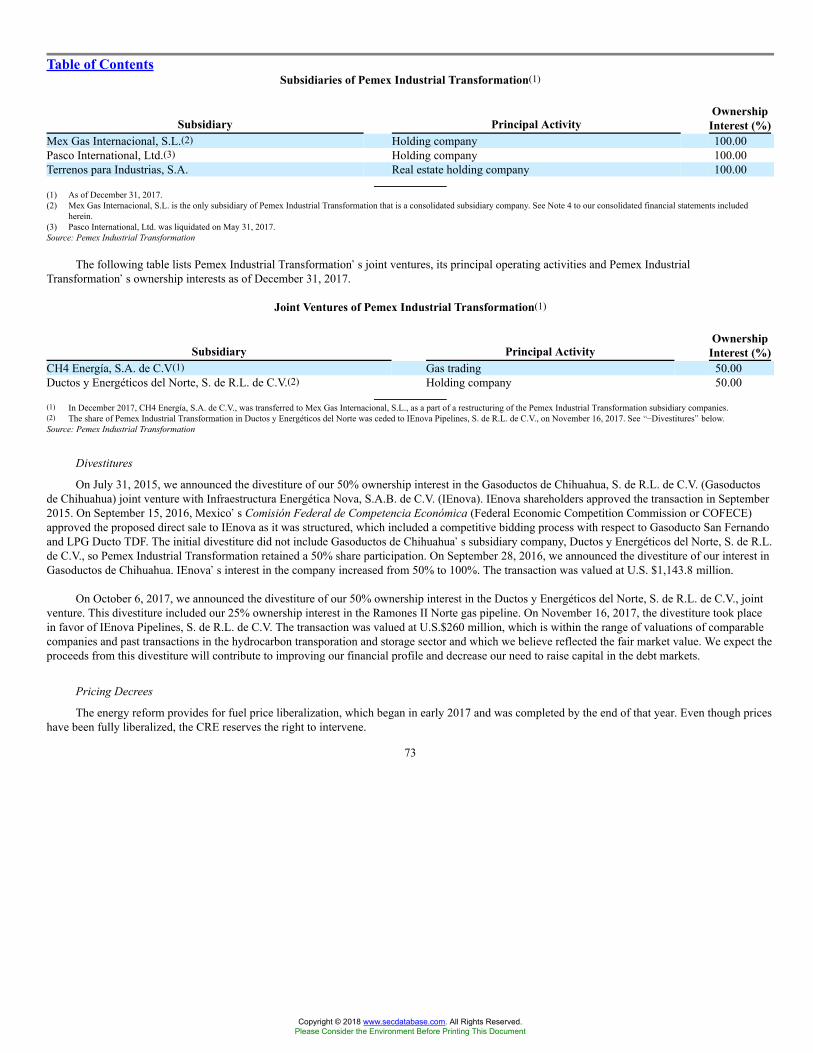
Table of ContentsSubsidiaries of Pemex Industrial Transformation(1)
Subsidiary Principal ActivityOwnership
Interest (%)Mex Gas Internacional, S.L.(2) Holding company 100.00Pasco International, Ltd.(3) Holding company 100.00Terrenos para Industrias, S.A. Real estate holding company 100.00
(1) As of December 31, 2017.(2) Mex Gas Internacional, S.L. is the only subsidiary of Pemex Industrial Transformation that is a consolidated subsidiary company. See Note 4 to our consolidated financial statements included
herein.(3) Pasco International, Ltd. was liquidated on May 31, 2017.Source: Pemex Industrial Transformation
The following table lists Pemex Industrial Transformation�s joint ventures, its principal operating activities and Pemex IndustrialTransformation�s ownership interests as of December 31, 2017.
Joint Ventures of Pemex Industrial Transformation(1)
Subsidiary Principal ActivityOwnership
Interest (%)CH4 Energía, S.A. de C.V(1) Gas trading 50.00Ductos y Energéticos del Norte, S. de R.L. de C.V.(2) Holding company 50.00
(1) In December 2017, CH4 Energía, S.A. de C.V., was transferred to Mex Gas Internacional, S.L., as a part of a restructuring of the Pemex Industrial Transformation subsidiary companies.(2) The share of Pemex Industrial Transformation in Ductos y Energéticos del Norte was ceded to IEnova Pipelines, S. de R.L. de C.V., on November 16, 2017. See ��Divestitures� below.Source: Pemex Industrial Transformation
Divestitures
On July 31, 2015, we announced the divestiture of our 50% ownership interest in the Gasoductos de Chihuahua, S. de R.L. de C.V. (Gasoductosde Chihuahua) joint venture with Infraestructura Energética Nova, S.A.B. de C.V. (IEnova). IEnova shareholders approved the transaction in September2015. On September 15, 2016, Mexico�s Comisión Federal de Competencia Económica (Federal Economic Competition Commission or COFECE)approved the proposed direct sale to IEnova as it was structured, which included a competitive bidding process with respect to Gasoducto San Fernandoand LPG Ducto TDF. The initial divestiture did not include Gasoductos de Chihuahua�s subsidiary company, Ductos y Energéticos del Norte, S. de R.L.de C.V., so Pemex Industrial Transformation retained a 50% share participation. On September 28, 2016, we announced the divestiture of our interest inGasoductos de Chihuahua. IEnova�s interest in the company increased from 50% to 100%. The transaction was valued at U.S. $1,143.8 million.
On October 6, 2017, we announced the divestiture of our 50% ownership interest in the Ductos y Energéticos del Norte, S. de R.L. de C.V., jointventure. This divestiture included our 25% ownership interest in the Ramones II Norte gas pipeline. On November 16, 2017, the divestiture took placein favor of IEnova Pipelines, S. de R.L. de C.V. The transaction was valued at U.S.$260 million, which is within the range of valuations of comparablecompanies and past transactions in the hydrocarbon transporation and storage sector and which we believe reflected the fair market value. We expect theproceeds from this divestiture will contribute to improving our financial profile and decrease our need to raise capital in the debt markets.
Pricing Decrees
The energy reform provides for fuel price liberalization, which began in early 2017 and was completed by the end of that year. Even though priceshave been fully liberalized, the CRE reserves the right to intervene.
73
Copyright © 2018 www.secdatabase.com. All Rights Reserved.Please Consider the Environment Before Printing This Document
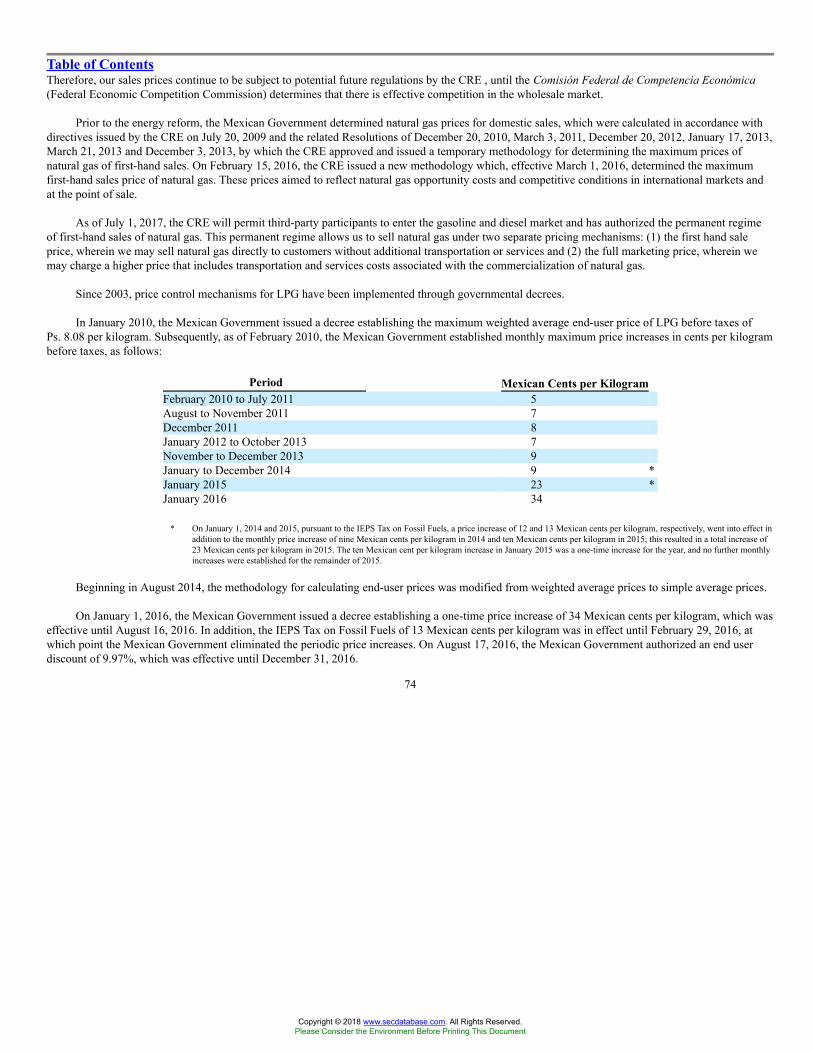
Table of ContentsTherefore, our sales prices continue to be subject to potential future regulations by the CRE , until the Comisión Federal de Competencia Económica(Federal Economic Competition Commission) determines that there is effective competition in the wholesale market.
Prior to the energy reform, the Mexican Government determined natural gas prices for domestic sales, which were calculated in accordance withdirectives issued by the CRE on July 20, 2009 and the related Resolutions of December 20, 2010, March 3, 2011, December 20, 2012, January 17, 2013,March 21, 2013 and December 3, 2013, by which the CRE approved and issued a temporary methodology for determining the maximum prices ofnatural gas of first-hand sales. On February 15, 2016, the CRE issued a new methodology which, effective March 1, 2016, determined the maximumfirst-hand sales price of natural gas. These prices aimed to reflect natural gas opportunity costs and competitive conditions in international markets andat the point of sale.
As of July 1, 2017, the CRE will permit third-party participants to enter the gasoline and diesel market and has authorized the permanent regimeof first-hand sales of natural gas. This permanent regime allows us to sell natural gas under two separate pricing mechanisms: (1) the first hand saleprice, wherein we may sell natural gas directly to customers without additional transportation or services and (2) the full marketing price, wherein wemay charge a higher price that includes transportation and services costs associated with the commercialization of natural gas.
Since 2003, price control mechanisms for LPG have been implemented through governmental decrees.
In January 2010, the Mexican Government issued a decree establishing the maximum weighted average end-user price of LPG before taxes ofPs. 8.08 per kilogram. Subsequently, as of February 2010, the Mexican Government established monthly maximum price increases in cents per kilogrambefore taxes, as follows:
Period Mexican Cents per KilogramFebruary 2010 to July 2011 5August to November 2011 7December 2011 8January 2012 to October 2013 7November to December 2013 9January to December 2014 9 *January 2015 23 *January 2016 34
* On January 1, 2014 and 2015, pursuant to the IEPS Tax on Fossil Fuels, a price increase of 12 and 13 Mexican cents per kilogram, respectively, went into effect inaddition to the monthly price increase of nine Mexican cents per kilogram in 2014 and ten Mexican cents per kilogram in 2015; this resulted in a total increase of23 Mexican cents per kilogram in 2015. The ten Mexican cent per kilogram increase in January 2015 was a one-time increase for the year, and no further monthlyincreases were established for the remainder of 2015.
Beginning in August 2014, the methodology for calculating end-user prices was modified from weighted average prices to simple average prices.
On January 1, 2016, the Mexican Government issued a decree establishing a one-time price increase of 34 Mexican cents per kilogram, which waseffective until August 16, 2016. In addition, the IEPS Tax on Fossil Fuels of 13 Mexican cents per kilogram was in effect until February 29, 2016, atwhich point the Mexican Government eliminated the periodic price increases. On August 17, 2016, the Mexican Government authorized an end userdiscount of 9.97%, which was effective until December 31, 2016.
74
Copyright © 2018 www.secdatabase.com. All Rights Reserved.Please Consider the Environment Before Printing This Document
Table of ContentsSince January 1, 2017, we have sold natural gas in accordance with the new methodology authorized by CRE for determining the first hand sales
price at the point of delivery, and all end user prices are freely determined by the market.
As of January 1, 2018, the IEPS Tax on Fossil Fuels is 14 Mexican cents per kilogram.
The Mexican Government could modify these price controls or impose additional price controls in the future. See �Item 3�Key Information�RiskFactors�Risk Factors Related to our Relationship with the Mexican Government�The Mexican Government has historically imposed price controls inthe domestic market on our products.�
Natural Gas Hedging Operations
We offer, as a value-added service, various hedging contracts to our domestic customers to protect them against fluctuations in the prices ofnatural gas. For information on hedging contracts offered to natural gas domestic customers, see �Item 11�Quantitative and Qualitative Disclosuresabout Market Risk.�
Gas and Aromatics Capital Expenditures
Our gas and aromatics business invested Ps. 2,587 million in capital expenditures in 2017 and has budgeted Ps. 3,984 million in capitalexpenditures for 2018.
75
Copyright © 2018 www.secdatabase.com. All Rights Reserved.Please Consider the Environment Before Printing This Document
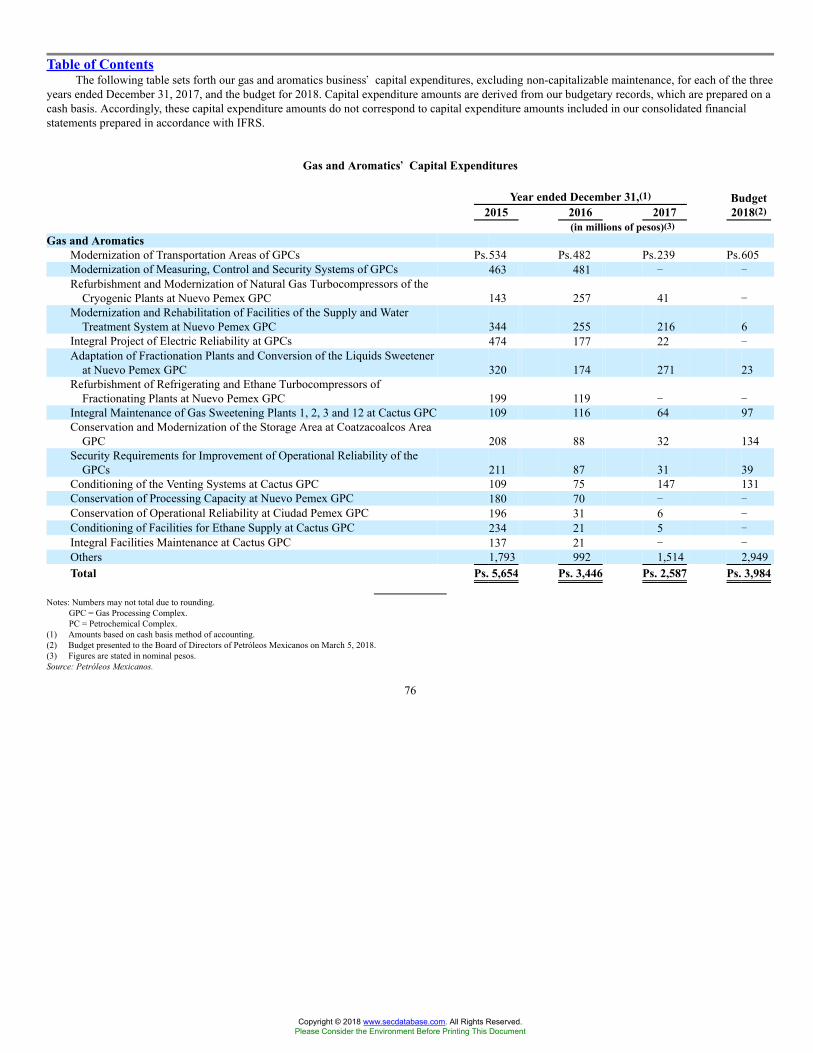
Table of ContentsThe following table sets forth our gas and aromatics business� capital expenditures, excluding non-capitalizable maintenance, for each of the three
years ended December 31, 2017, and the budget for 2018. Capital expenditure amounts are derived from our budgetary records, which are prepared on acash basis. Accordingly, these capital expenditure amounts do not correspond to capital expenditure amounts included in our consolidated financialstatements prepared in accordance with IFRS.
Gas and Aromatics�� Capital Expenditures
Year ended December 31,(1)2015 2016 2017
Budget2018(2)
(in millions of pesos)(3)Gas and Aromatics
Modernization of Transportation Areas of GPCs Ps.534 Ps.482 Ps.239 Ps.605Modernization of Measuring, Control and Security Systems of GPCs 463 481 � �Refurbishment and Modernization of Natural Gas Turbocompressors of the
Cryogenic Plants at Nuevo Pemex GPC 143 257 41 �Modernization and Rehabilitation of Facilities of the Supply and Water
Treatment System at Nuevo Pemex GPC 344 255 216 6Integral Project of Electric Reliability at GPCs 474 177 22 �Adaptation of Fractionation Plants and Conversion of the Liquids Sweetener
at Nuevo Pemex GPC 320 174 271 23Refurbishment of Refrigerating and Ethane Turbocompressors of
Fractionating Plants at Nuevo Pemex GPC 199 119 � �Integral Maintenance of Gas Sweetening Plants 1, 2, 3 and 12 at Cactus GPC 109 116 64 97Conservation and Modernization of the Storage Area at Coatzacoalcos Area
GPC 208 88 32 134Security Requirements for Improvement of Operational Reliability of the
GPCs 211 87 31 39Conditioning of the Venting Systems at Cactus GPC 109 75 147 131Conservation of Processing Capacity at Nuevo Pemex GPC 180 70 � �Conservation of Operational Reliability at Ciudad Pemex GPC 196 31 6 �Conditioning of Facilities for Ethane Supply at Cactus GPC 234 21 5 �Integral Facilities Maintenance at Cactus GPC 137 21 � �Others 1,793 992 1,514 2,949Total Ps. 5,654 Ps. 3,446 Ps. 2,587 Ps. 3,984
Notes: Numbers may not total due to rounding.GPC = Gas Processing Complex.PC = Petrochemical Complex.
(1) Amounts based on cash basis method of accounting.(2) Budget presented to the Board of Directors of Petróleos Mexicanos on March 5, 2018.(3) Figures are stated in nominal pesos.Source: Petróleos Mexicanos.
76
Copyright © 2018 www.secdatabase.com. All Rights Reserved.Please Consider the Environment Before Printing This Document
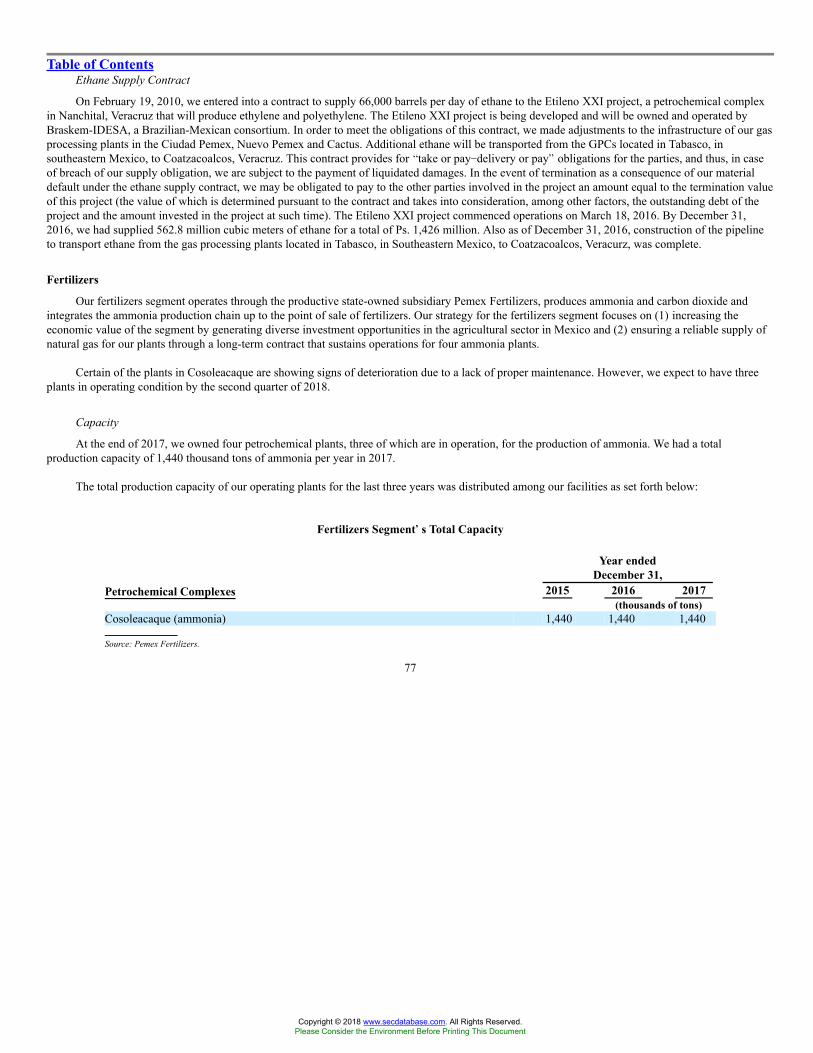
Table of ContentsEthane Supply Contract
On February 19, 2010, we entered into a contract to supply 66,000 barrels per day of ethane to the Etileno XXI project, a petrochemical complexin Nanchital, Veracruz that will produce ethylene and polyethylene. The Etileno XXI project is being developed and will be owned and operated byBraskem-IDESA, a Brazilian-Mexican consortium. In order to meet the obligations of this contract, we made adjustments to the infrastructure of our gasprocessing plants in the Ciudad Pemex, Nuevo Pemex and Cactus. Additional ethane will be transported from the GPCs located in Tabasco, insoutheastern Mexico, to Coatzacoalcos, Veracruz. This contract provides for �take or pay�delivery or pay� obligations for the parties, and thus, in caseof breach of our supply obligation, we are subject to the payment of liquidated damages. In the event of termination as a consequence of our materialdefault under the ethane supply contract, we may be obligated to pay to the other parties involved in the project an amount equal to the termination valueof this project (the value of which is determined pursuant to the contract and takes into consideration, among other factors, the outstanding debt of theproject and the amount invested in the project at such time). The Etileno XXI project commenced operations on March 18, 2016. By December 31,2016, we had supplied 562.8 million cubic meters of ethane for a total of Ps. 1,426 million. Also as of December 31, 2016, construction of the pipelineto transport ethane from the gas processing plants located in Tabasco, in Southeastern Mexico, to Coatzacoalcos, Veracurz, was complete.
Fertilizers
Our fertilizers segment operates through the productive state-owned subsidiary Pemex Fertilizers, produces ammonia and carbon dioxide andintegrates the ammonia production chain up to the point of sale of fertilizers. Our strategy for the fertilizers segment focuses on (1) increasing theeconomic value of the segment by generating diverse investment opportunities in the agricultural sector in Mexico and (2) ensuring a reliable supply ofnatural gas for our plants through a long-term contract that sustains operations for four ammonia plants.
Certain of the plants in Cosoleacaque are showing signs of deterioration due to a lack of proper maintenance. However, we expect to have threeplants in operating condition by the second quarter of 2018.
Capacity
At the end of 2017, we owned four petrochemical plants, three of which are in operation, for the production of ammonia. We had a totalproduction capacity of 1,440 thousand tons of ammonia per year in 2017.
The total production capacity of our operating plants for the last three years was distributed among our facilities as set forth below:
Fertilizers Segment��s Total Capacity
Year endedDecember 31,
Petrochemical Complexes 2015 2016 2017(thousands of tons)
Cosoleacaque (ammonia) 1,440 1,440 1,440
Source: Pemex Fertilizers.
77
Copyright © 2018 www.secdatabase.com. All Rights Reserved.Please Consider the Environment Before Printing This Document
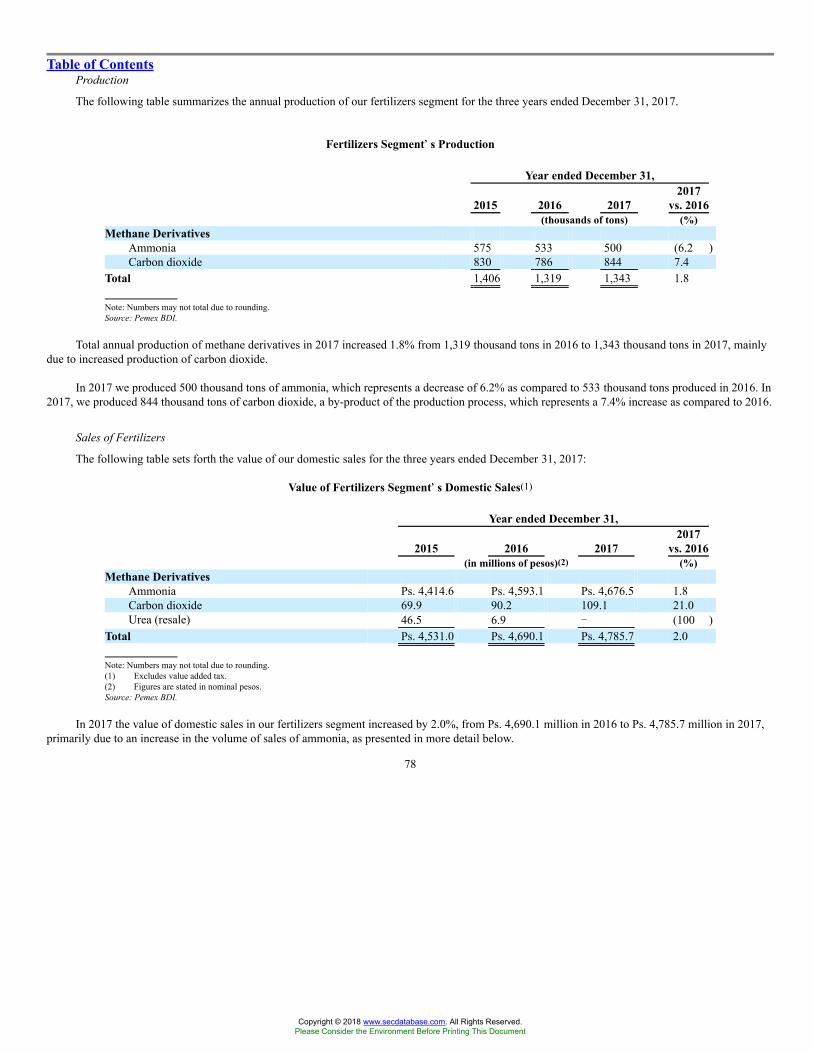
Table of ContentsProduction
The following table summarizes the annual production of our fertilizers segment for the three years ended December 31, 2017.
Fertilizers Segment��s Production
Year ended December 31,
2015 2016 20172017
vs. 2016(thousands of tons) (%)
Methane DerivativesAmmonia 575 533 500 (6.2 )Carbon dioxide 830 786 844 7.4
Total 1,406 1,319 1,343 1.8
Note: Numbers may not total due to rounding.Source: Pemex BDI.
Total annual production of methane derivatives in 2017 increased 1.8% from 1,319 thousand tons in 2016 to 1,343 thousand tons in 2017, mainlydue to increased production of carbon dioxide.
In 2017 we produced 500 thousand tons of ammonia, which represents a decrease of 6.2% as compared to 533 thousand tons produced in 2016. In2017, we produced 844 thousand tons of carbon dioxide, a by-product of the production process, which represents a 7.4% increase as compared to 2016.
Sales of Fertilizers
The following table sets forth the value of our domestic sales for the three years ended December 31, 2017:
Value of Fertilizers Segment��s Domestic Sales(1)
Year ended December 31,
2015 2016 20172017
vs. 2016(in millions of pesos)(2) (%)
Methane DerivativesAmmonia Ps. 4,414.6 Ps. 4,593.1 Ps. 4,676.5 1.8Carbon dioxide 69.9 90.2 109.1 21.0Urea (resale) 46.5 6.9 � (100 )
Total Ps. 4,531.0 Ps. 4,690.1 Ps. 4,785.7 2.0
Note: Numbers may not total due to rounding.(1) Excludes value added tax.(2) Figures are stated in nominal pesos.Source: Pemex BDI.
In 2017 the value of domestic sales in our fertilizers segment increased by 2.0%, from Ps. 4,690.1 million in 2016 to Ps. 4,785.7 million in 2017,primarily due to an increase in the volume of sales of ammonia, as presented in more detail below.
78
Copyright © 2018 www.secdatabase.com. All Rights Reserved.Please Consider the Environment Before Printing This Document
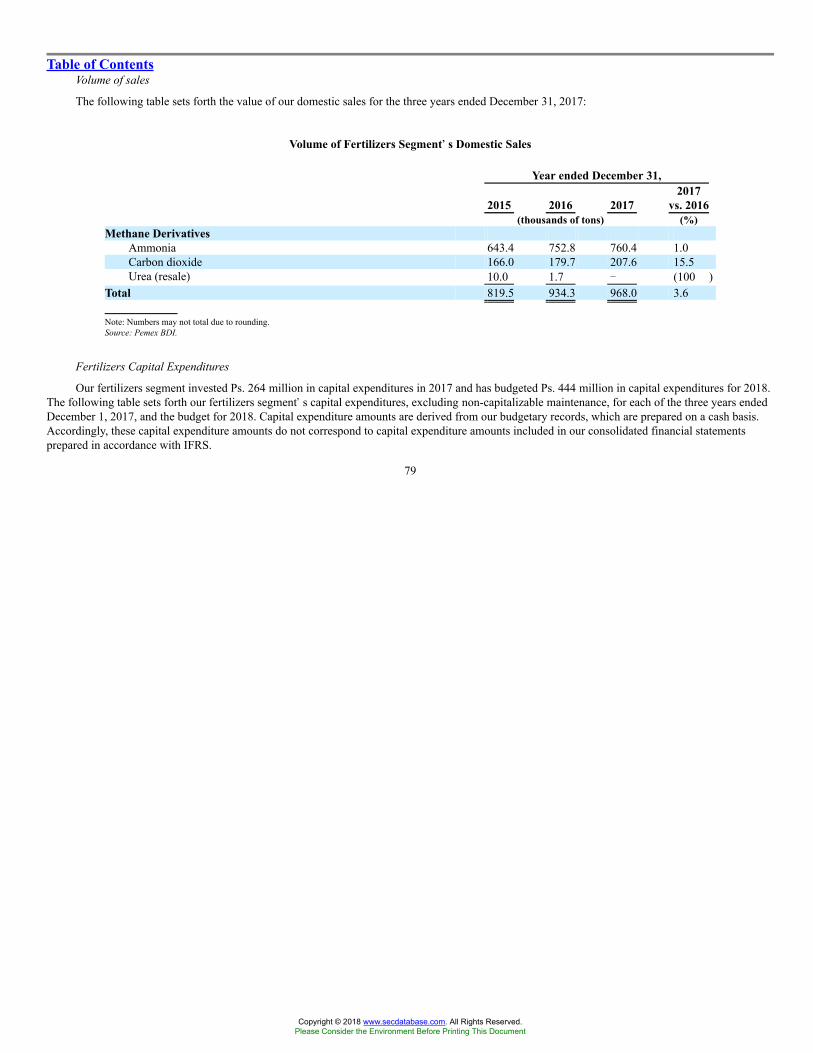
Table of ContentsVolume of sales
The following table sets forth the value of our domestic sales for the three years ended December 31, 2017:
Volume of Fertilizers Segment��s Domestic Sales
Year ended December 31,
2015 2016 20172017
vs. 2016(thousands of tons) (%)
Methane DerivativesAmmonia 643.4 752.8 760.4 1.0Carbon dioxide 166.0 179.7 207.6 15.5Urea (resale) 10.0 1.7 � (100 )
Total 819.5 934.3 968.0 3.6
Note: Numbers may not total due to rounding.Source: Pemex BDI.
Fertilizers Capital Expenditures
Our fertilizers segment invested Ps. 264 million in capital expenditures in 2017 and has budgeted Ps. 444 million in capital expenditures for 2018.The following table sets forth our fertilizers segment�s capital expenditures, excluding non-capitalizable maintenance, for each of the three years endedDecember 1, 2017, and the budget for 2018. Capital expenditure amounts are derived from our budgetary records, which are prepared on a cash basis.Accordingly, these capital expenditure amounts do not correspond to capital expenditure amounts included in our consolidated financial statementsprepared in accordance with IFRS.
79
Copyright © 2018 www.secdatabase.com. All Rights Reserved.Please Consider the Environment Before Printing This Document

Table of ContentsFertilizers�� Capital Expenditures
Year ended December 31,(1) Budget2015 2016 2017 2018(2)
(in millions of pesos)(3)Fertilizers
Rehabilitation of Ammonia Plant IV andIntegration and Auxiliary Services forCosoleacaque PC Ps.791 Ps.295 Ps.102 Ps.68
Efficiency in Storage and Distribution of Pemex-Petrochemicals � 45 38 127
Maintaining the Production Capacity of AmmoniaPlant VII and its Auxiliary Services atCosoleacaque PC 101 18 5 3
Maintaining the Production Capacity of AmmoniaPlant VI at Cosoleacaque PC 97 16 � 3
Safety and Environmental Protection, Derivedfrom Observations and Regulations II inCosoleacaque PC 43 5 � �
Rehabilitation of Primary Reformers andAuxiliary Ammonia Plant VI and VII ofCosoleacaque PC � � 75 90
Others 12 � 45 154Total Ps. 1,044 Ps. 379 Ps. 264 Ps. 444
Notes: Numbers may not total due to rounding.PC = Petrochemical Complex.
(1) Amounts based on cash basis method of accounting.(2) Budget presented to the Board of Directors of Petróleos Mexicanos on March 5, 2018.(3) Figures are stated in nominal pesos.Source: Petróleos Mexicanos..
Pajaritos Petrochemical Complex
In 2014, we acquired a closed fertilizer production facility located in Pajaritos, Veracruz, Mexico, which we are currently renovating. Therenovation of the facility involves restoring operations of our rotating, static and mechanical equipment, building a carbon dioxide compressor station,as well as other auxiliary projects and is expected to be finalized during the first quarter of 2018. By the second quarter of 2018, and assuming thesufficient supply of ammonia from Cosoleacaque, we expect to have a production capacity of 90 thousand tons of urea per month.
Acquisition of Fertinal
On January 28, 2016, PMX Fertilizantes Pacífico, S.A. de C.V., one of our subsidiaries, acquired 99.99% of the outstanding shares of Fertinal, fora total purchase price of Ps. 4,322.8 million. Before this acquisition, Fertinal experienced a prolonged period without any investment, as well asproblems with its cash flows. In July 2016, we added U.S.$120 million for working capital needs and capital expenditures in order to improve Fertinal�sproduction capacity. By the fourth quarter of 2017, Fertinal�s financial position had improved significantly and it has seen improved performance on itsproduction ratios as of the date of this annual report.
80
Copyright © 2018 www.secdatabase.com. All Rights Reserved.Please Consider the Environment Before Printing This Document
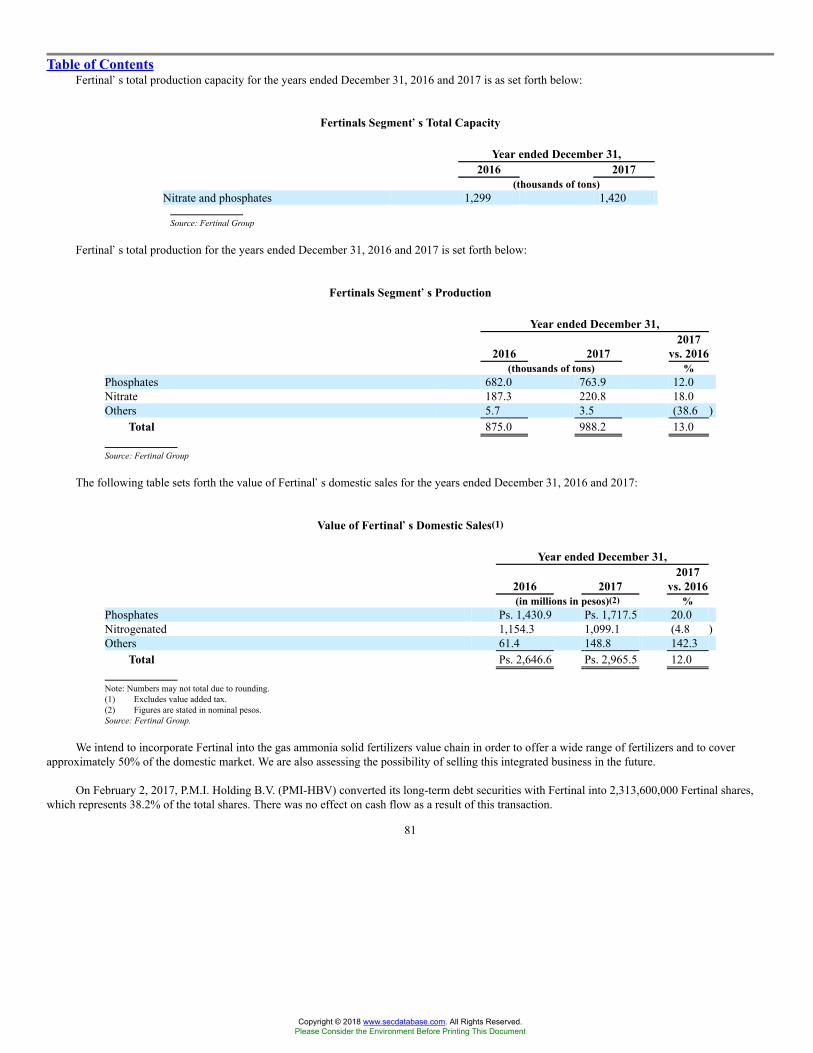
Table of ContentsFertinal�s total production capacity for the years ended December 31, 2016 and 2017 is as set forth below:
Fertinals Segment��s Total Capacity
Year ended December 31,2016 2017
(thousands of tons)Nitrate and phosphates 1,299 1,420
Source: Fertinal Group
Fertinal�s total production for the years ended December 31, 2016 and 2017 is set forth below:
Fertinals Segment��s Production
Year ended December 31,
2016 20172017
vs. 2016(thousands of tons) %
Phosphates 682.0 763.9 12.0Nitrate 187.3 220.8 18.0Others 5.7 3.5 (38.6 )
Total 875.0 988.2 13.0
Source: Fertinal Group
The following table sets forth the value of Fertinal�s domestic sales for the years ended December 31, 2016 and 2017:
Value of Fertinal��s Domestic Sales(1)
Year ended December 31,
2016 20172017
vs. 2016(in millions in pesos)(2) %
Phosphates Ps. 1,430.9 Ps. 1,717.5 20.0Nitrogenated 1,154.3 1,099.1 (4.8 )Others 61.4 148.8 142.3
Total Ps. 2,646.6 Ps. 2,965.5 12.0
Note: Numbers may not total due to rounding.(1) Excludes value added tax.(2) Figures are stated in nominal pesos.Source: Fertinal Group.
We intend to incorporate Fertinal into the gas ammonia solid fertilizers value chain in order to offer a wide range of fertilizers and to coverapproximately 50% of the domestic market. We are also assessing the possibility of selling this integrated business in the future.
On February 2, 2017, P.M.I. Holding B.V. (PMI-HBV) converted its long-term debt securities with Fertinal into 2,313,600,000 Fertinal shares,which represents 38.2% of the total shares. There was no effect on cash flow as a result of this transaction.
81
Copyright © 2018 www.secdatabase.com. All Rights Reserved.Please Consider the Environment Before Printing This Document
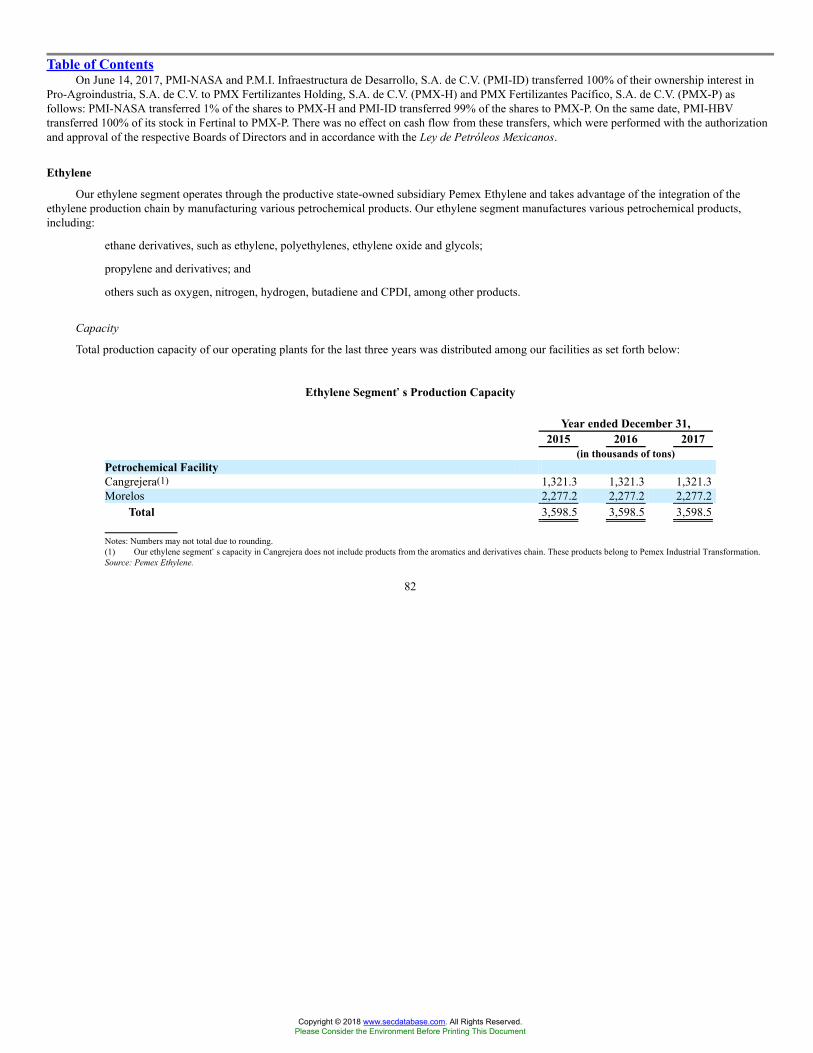
Table of ContentsOn June 14, 2017, PMI-NASA and P.M.I. Infraestructura de Desarrollo, S.A. de C.V. (PMI-ID) transferred 100% of their ownership interest in
Pro-Agroindustria, S.A. de C.V. to PMX Fertilizantes Holding, S.A. de C.V. (PMX-H) and PMX Fertilizantes Pacífico, S.A. de C.V. (PMX-P) asfollows: PMI-NASA transferred 1% of the shares to PMX-H and PMI-ID transferred 99% of the shares to PMX-P. On the same date, PMI-HBVtransferred 100% of its stock in Fertinal to PMX-P. There was no effect on cash flow from these transfers, which were performed with the authorizationand approval of the respective Boards of Directors and in accordance with the Ley de Petróleos Mexicanos.
Ethylene
Our ethylene segment operates through the productive state-owned subsidiary Pemex Ethylene and takes advantage of the integration of theethylene production chain by manufacturing various petrochemical products. Our ethylene segment manufactures various petrochemical products,including:
� ethane derivatives, such as ethylene, polyethylenes, ethylene oxide and glycols;
� propylene and derivatives; and
� others such as oxygen, nitrogen, hydrogen, butadiene and CPDI, among other products.
Capacity
Total production capacity of our operating plants for the last three years was distributed among our facilities as set forth below:
Ethylene Segment��s Production Capacity
Year ended December 31,2015 2016 2017
(in thousands of tons)Petrochemical FacilityCangrejera(1) 1,321.3 1,321.3 1,321.3Morelos 2,277.2 2,277.2 2,277.2
Total 3,598.5 3,598.5 3,598.5
Notes: Numbers may not total due to rounding.(1) Our ethylene segment�s capacity in Cangrejera does not include products from the aromatics and derivatives chain. These products belong to Pemex Industrial Transformation.Source: Pemex Ethylene.
82
Copyright © 2018 www.secdatabase.com. All Rights Reserved.Please Consider the Environment Before Printing This Document
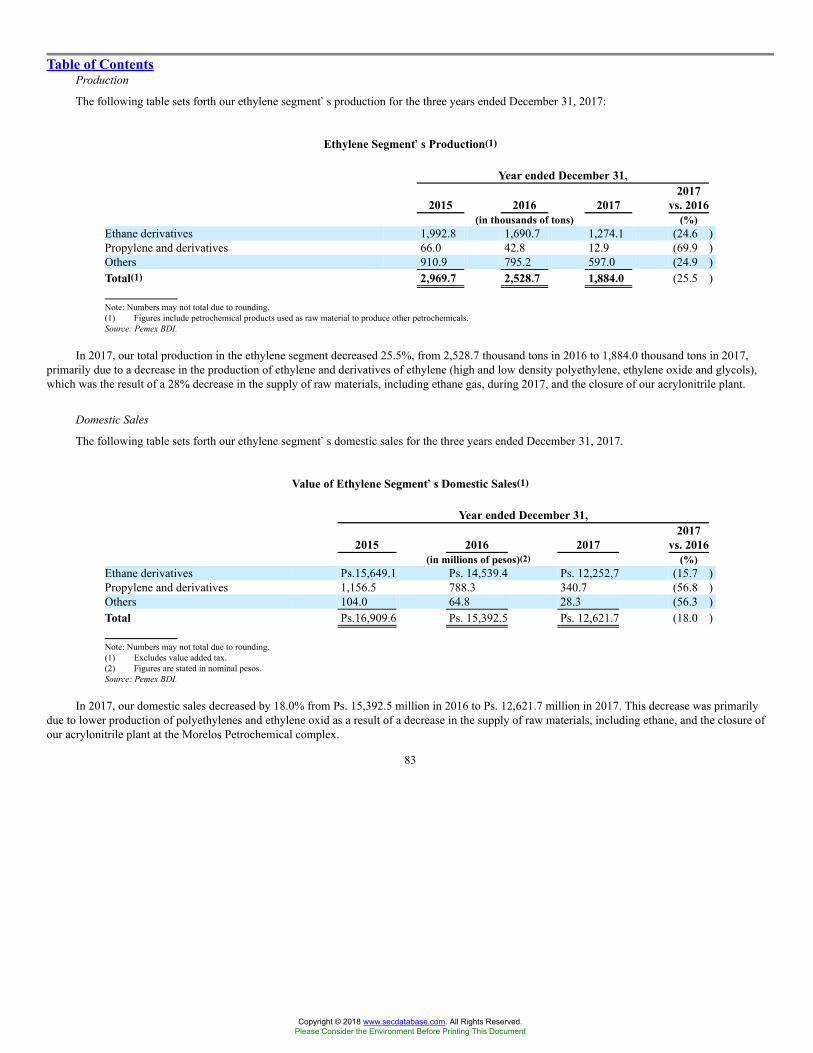
Table of ContentsProduction
The following table sets forth our ethylene segment�s production for the three years ended December 31, 2017:
Ethylene Segment��s Production(1)
Year ended December 31,
2015 2016 20172017
vs. 2016(in thousands of tons) (%)
Ethane derivatives 1,992.8 1,690.7 1,274.1 (24.6 )Propylene and derivatives 66.0 42.8 12.9 (69.9 )Others 910.9 795.2 597.0 (24.9 )Total(1) 2,969.7 2,528.7 1,884.0 (25.5 )
Note: Numbers may not total due to rounding.(1) Figures include petrochemical products used as raw material to produce other petrochemicals.Source: Pemex BDI.
In 2017, our total production in the ethylene segment decreased 25.5%, from 2,528.7 thousand tons in 2016 to 1,884.0 thousand tons in 2017,primarily due to a decrease in the production of ethylene and derivatives of ethylene (high and low density polyethylene, ethylene oxide and glycols),which was the result of a 28% decrease in the supply of raw materials, including ethane gas, during 2017, and the closure of our acrylonitrile plant.
Domestic Sales
The following table sets forth our ethylene segment�s domestic sales for the three years ended December 31, 2017.
Value of Ethylene Segment��s Domestic Sales(1)
Year ended December 31,
2015 2016 20172017
vs. 2016(in millions of pesos)(2) (%)
Ethane derivatives Ps.15,649.1 Ps. 14,539.4 Ps. 12,252,7 (15.7 )Propylene and derivatives 1,156.5 788.3 340.7 (56.8 )Others 104.0 64.8 28.3 (56.3 )Total Ps.16,909.6 Ps. 15,392.5 Ps. 12,621.7 (18.0 )
Note: Numbers may not total due to rounding.(1) Excludes value added tax.(2) Figures are stated in nominal pesos.Source: Pemex BDI.
In 2017, our domestic sales decreased by 18.0% from Ps. 15,392.5 million in 2016 to Ps. 12,621.7 million in 2017. This decrease was primarilydue to lower production of polyethylenes and ethylene oxid as a result of a decrease in the supply of raw materials, including ethane, and the closure ofour acrylonitrile plant at the Morelos Petrochemical complex.
83
Copyright © 2018 www.secdatabase.com. All Rights Reserved.Please Consider the Environment Before Printing This Document

Table of ContentsOn July 7, 2017 Pemex Ethylene successfully concluded an electronic auction to allocate the supply of ethylene oxide. Ten domestic ethylene
oxide companies participated in the auction, which resulted in all of the available volume being placed at a market price that was a higher than thehistorical price of ethylene oxide.
Sales to other Subsidiary Entities
The following table sets forth the intercompany sales of petrochemical products for the three years ended December 31, 2017.
Ethylene Segment��s Intercompany Sales(1)
Year ended December 31,
2015 2016 20172017
vs. 2016(in millions of pesos)(2) (%)
Ethane and derivatives Ps. 82.1 Ps.107.9 Ps. � (100 )Others 86.9 373.7 284.2 (23.9 )Total Ps.169.0 Ps. 481.6 Ps. 284.2 (41.0 )
Note: Numbers may not total due to rounding.(1) Excludes value added tax.(2) Figures are stated in nominal pesos.Source: Pemex Ethylene.
In 2017, our intercompany sales decreased by 41.0%, from Ps. 481.6 million in 2016 to Ps. 284.2 million in 2017. This decrease was primarilydue to a decrease in the volume of sales of nitrogen, pyrolysis gasoline and ethylene in 2017, as compared to 2016, mainly due to a decrease in thesupply of raw materials, including ethane gas.
Ethylene Capital Expenditures
Our ethylene segment invested Ps. 618 million in capital expenditures in 2017, and has budgeted Ps. 1,786 million for capital expenditures in2018.
The following table sets forth our ethylene segment�s capital expenditures, excluding non-capitalizable maintenance, for each of the three yearsended December 31, 2015, 2016 and 2017, and the budget for 2018. Capital expenditure amounts are derived from our budgetary records, which areprepared on a cash basis. Accordingly, these capital expenditure amounts do not correspond to capital expenditure amounts included in our consolidatedfinancial statements prepared in accordance with IFRS.
84
Copyright © 2018 www.secdatabase.com. All Rights Reserved.Please Consider the Environment Before Printing This Document
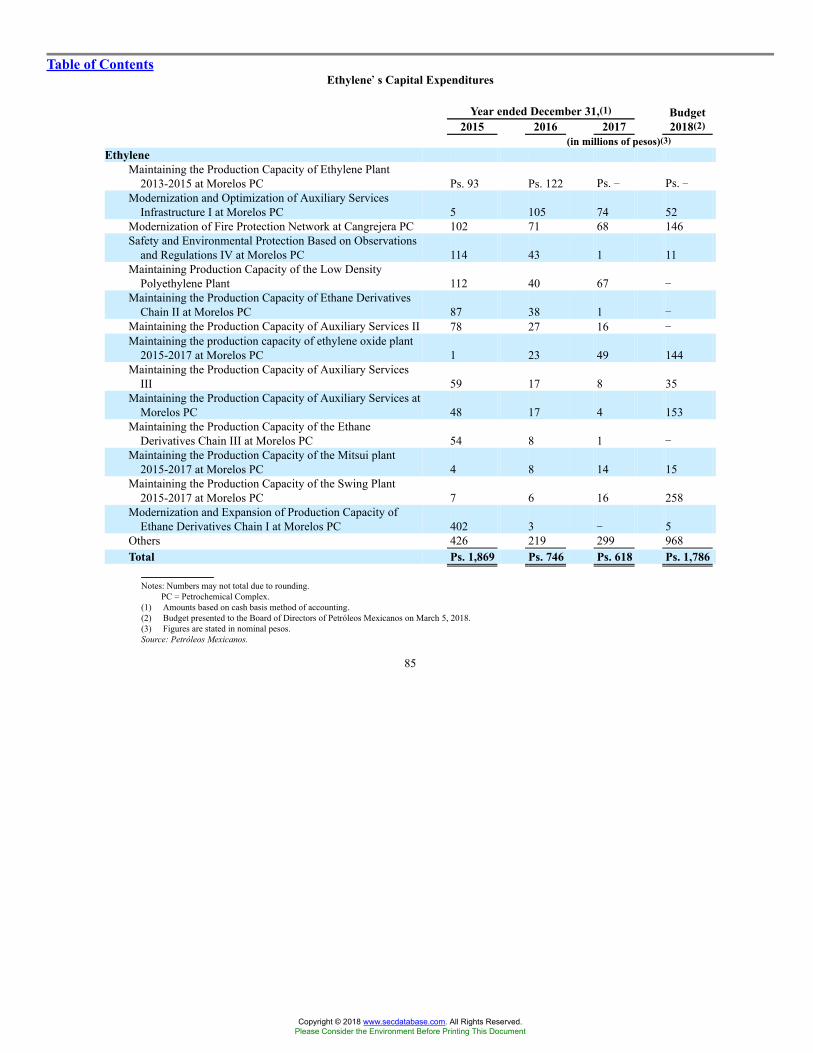
Table of ContentsEthylene��s Capital Expenditures
Year ended December 31,(1)2015 2016 2017
Budget2018(2)
(in millions of pesos)(3)Ethylene
Maintaining the Production Capacity of Ethylene Plant2013-2015 at Morelos PC Ps. 93 Ps. 122 Ps. � Ps. �
Modernization and Optimization of Auxiliary ServicesInfrastructure I at Morelos PC 5 105 74 52
Modernization of Fire Protection Network at Cangrejera PC 102 71 68 146Safety and Environmental Protection Based on Observations
and Regulations IV at Morelos PC 114 43 1 11Maintaining Production Capacity of the Low Density
Polyethylene Plant 112 40 67 �Maintaining the Production Capacity of Ethane Derivatives
Chain II at Morelos PC 87 38 1 �Maintaining the Production Capacity of Auxiliary Services II 78 27 16 �Maintaining the production capacity of ethylene oxide plant
2015-2017 at Morelos PC 1 23 49 144Maintaining the Production Capacity of Auxiliary Services
III 59 17 8 35Maintaining the Production Capacity of Auxiliary Services at
Morelos PC 48 17 4 153Maintaining the Production Capacity of the Ethane
Derivatives Chain III at Morelos PC 54 8 1 �Maintaining the Production Capacity of the Mitsui plant
2015-2017 at Morelos PC 4 8 14 15Maintaining the Production Capacity of the Swing Plant
2015-2017 at Morelos PC 7 6 16 258Modernization and Expansion of Production Capacity of
Ethane Derivatives Chain I at Morelos PC 402 3 � 5Others 426 219 299 968Total Ps. 1,869 Ps. 746 Ps. 618 Ps. 1,786
Notes: Numbers may not total due to rounding.PC = Petrochemical Complex.
(1) Amounts based on cash basis method of accounting.(2) Budget presented to the Board of Directors of Petróleos Mexicanos on March 5, 2018.(3) Figures are stated in nominal pesos.Source: Petróleos Mexicanos.
85
Copyright © 2018 www.secdatabase.com. All Rights Reserved.Please Consider the Environment Before Printing This Document
Table of ContentsJoint Venture with Mexichem
On December 20, 2017, Mexichem, S.A.B. de C.V. (Mexichem) announced that the Board of Directors of its joint venture, PetroquímicaMexicana de Vinilo S.A. of C.V. (PMV), a co-investment with PPQ Cadena Productiva S.L., a subsidiary of Pemex Ethylene, and of Mexichem�s VinylBusiness Group, has decided not to rebuild its Vinyl Monochloride (VCM) production capacity. Therefore, the joint venture�s VCM production, and theassets and liabilities associated with ethylene production and auxiliary services associated with VCM and ethylene will be classified as discontinuedoperations.
This represents the exit of PMV from the VCM and ethylene businesses in Mexico. Mexichem and Pemex Ethylene will continue to evaluate thepossibility of investing in the future, jointly or separately, through PMV or another vehicle, in businesses related to VMC and ethylene production orotherwise. Moreover, the chlorine-soda plant will continue to be operated by PMV, and therefore the alliance between Pemex Ethylene and Mexichemwill remain in place.
Drilling and Services
Our drilling and services segment operates through the productive state-owned subsidiary Pemex Drilling and Services and provides drilling,completion, work-over and other services for wells in offshore and onshore fields. During 2017, this segment mainly provided drilling services to PemexExploration and Production, but also provided services to third-party clients such as CONAGUA, Marinsa, Latina, Fieldwood and Key Energy.
As a result of our corporate reorganization, for the year ended December 31, 2015, we have presented operating results for our drilling andservices segment together with results for our exploration and production segment. We have summarized some of these results below. For additionalresults for this segment, please see ��Exploration and Production�Exploration and Drilling� above in this Item 4. Operating results for these segmentsare presented separately for periods beginning January 1, 2016. When reviewing these results, please note that our exploration and production segmentreceives drilling services not only from our drilling and services segment but also from third parties. Accordingly, the amounts presented above underdrilling activity do not relate only to services provided by our drilling and services segment. For a detailed description of the financial results of eachsegment, see our consolidated financial statements included herein.
During 2017, we drilled 52 wells, 13 onshore and 39 offshore; completed 54 wells, 11 onshore and 43 offshore; and made 496 workovers,393 onshore and 103 offshore. Of the wells completed, one was for CONAGUA. Those services were performed with an average of 47 drilling andworkover rigs, 20 terrestrial and 27 marine, including both owned and leased equipment. Moreover, we conducted 20,658 well services in 2017, ofwhich 48% were wireline operations, 30% were cementing jobs, 18% were logging operations and perforations and 4% were coiled tubing operations.In addition, we provided drilling and services to external customers such as CONAGUA, Marinsa, Latina, Fieldwood and Key Energy.
Given the current state of the oil and gas industry and relatively low global oil prices, the demand for well drilling and services decreased in 2017by approximately 35% as compared to 2016. In 2018, we expect well interventions to increase by approximately 28% compared to 2017, and we expectto operate an average of 50 rigs�23 land and 27 marine�including both owned and leased equipment, which represents a 6% increase as compared to2017. Of these, we expect that 21 land and 5 marine will be rigs we own, which is a 24% decrease as compared to 2017.
In 2017, in accordance with our �Programa de modernización de la infraestructura de perforación� (Drilling Infrastructure ModernizationProgram), we carried out the modernization of two drilling land rigs of 2000 HP for an amount of U.S. $16.6 million. In addition, we are evaluating theacquisition of two workover land rigs of 200-350 HP.
86
Copyright © 2018 www.secdatabase.com. All Rights Reserved.Please Consider the Environment Before Printing This Document
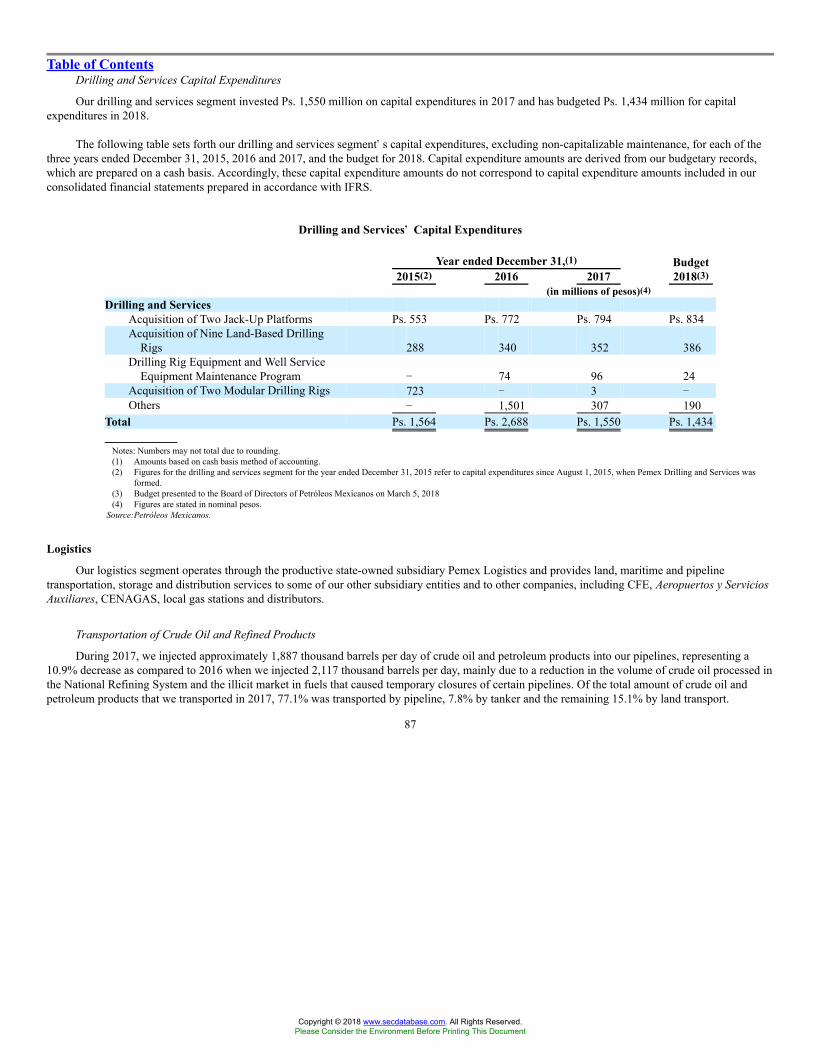
Table of ContentsDrilling and Services Capital Expenditures
Our drilling and services segment invested Ps. 1,550 million on capital expenditures in 2017 and has budgeted Ps. 1,434 million for capitalexpenditures in 2018.
The following table sets forth our drilling and services segment�s capital expenditures, excluding non-capitalizable maintenance, for each of thethree years ended December 31, 2015, 2016 and 2017, and the budget for 2018. Capital expenditure amounts are derived from our budgetary records,which are prepared on a cash basis. Accordingly, these capital expenditure amounts do not correspond to capital expenditure amounts included in ourconsolidated financial statements prepared in accordance with IFRS.
Drilling and Services�� Capital Expenditures
Year ended December 31,(1)2015(2) 2016 2017
Budget2018(3)
(in millions of pesos)(4)Drilling and Services
Acquisition of Two Jack-Up Platforms Ps. 553 Ps. 772 Ps. 794 Ps. 834Acquisition of Nine Land-Based Drilling
Rigs 288 340 352 386Drilling Rig Equipment and Well Service
Equipment Maintenance Program � 74 96 24Acquisition of Two Modular Drilling Rigs 723 � 3 �Others � 1,501 307 190
Total Ps. 1,564 Ps. 2,688 Ps. 1,550 Ps. 1,434
Notes: Numbers may not total due to rounding.(1) Amounts based on cash basis method of accounting.(2) Figures for the drilling and services segment for the year ended December 31, 2015 refer to capital expenditures since August 1, 2015, when Pemex Drilling and Services was
formed.(3) Budget presented to the Board of Directors of Petróleos Mexicanos on March 5, 2018(4) Figures are stated in nominal pesos.
Source:Petróleos Mexicanos.
Logistics
Our logistics segment operates through the productive state-owned subsidiary Pemex Logistics and provides land, maritime and pipelinetransportation, storage and distribution services to some of our other subsidiary entities and to other companies, including CFE, Aeropuertos y ServiciosAuxiliares, CENAGAS, local gas stations and distributors.
Transportation of Crude Oil and Refined Products
During 2017, we injected approximately 1,887 thousand barrels per day of crude oil and petroleum products into our pipelines, representing a10.9% decrease as compared to 2016 when we injected 2,117 thousand barrels per day, mainly due to a reduction in the volume of crude oil processed inthe National Refining System and the illicit market in fuels that caused temporary closures of certain pipelines. Of the total amount of crude oil andpetroleum products that we transported in 2017, 77.1% was transported by pipeline, 7.8% by tanker and the remaining 15.1% by land transport.
87
Copyright © 2018 www.secdatabase.com. All Rights Reserved.Please Consider the Environment Before Printing This Document

Table of ContentsDuring 2017, we transported 137.9 thousand barrels per day of LPG, representing a 3.5% decrease as compared to the 142.9 thousand barrels per
day transported in 2016. In addition, we transported 2.3 thousand barrels per day of petrochemicals, a decrease of 30.3% as compared to the3.3 thousand barrels per day we transported in 2016. These decreases were mainly due to a decrease in transportation services requested by PemexIndustrial Transformation, which is the result of importation of LPG by private companies, as well as decreased production of natural gas by PemexExploration and Production.
As of 2016, natural gas transportation is carried out by CENAGAS, with the support of Pemex Logistics through an operation and maintenancecontract. During 2017, we transported approximately 5,196 million cubic feet per day of natural gas, a 4.5% decrease compared to the 5,440 millioncubic feet per day we transported in 2016, mainly due to a decrease in the volume of natural gas requested by the CFE and Pemex IndustrialTransformation, as well as decreased production of natural gas by Pemex Exploration and Production.
Treatment and Primary Logistic
We transported an average of 1,431 thousand barrels per day of crude oil in 2017 compared to 1,551 thousand barrels per day in 2016, whichrepresents a decrease of 7.7%, mainly due to lower crude oil production. An average of 756 thousand barrels per day were delivered to the NationalRefining System and 675 thousand barrels per day were delivered to the export terminals.
During 2017, we transported an average of 3,424 million cubic feet per day of natural gas through the Altamira, Misión, Santuario and GasMarino Mesozoico transportation systems compared to the 3,765 million cubic feet per day in 2016, which represents a 9.1% decrease, partially due to adecrease in natural gas production by Pemex Exploration and Production. In addition, we transported an average of 26 thousand barrels per day ofcondensate by the Misión and Condensado Terrestre Sur transportation systems compared to 33 thousand barrels per day in 2016, which represents a21.2% decrease, partially due to a decrease in natural gas production by Pemex Exploration and Production.
During 2017, we had two leak and spill events, neither of which were significant.
Open Season
As a result of the energy reform, we may now offer pipeline transportation and storage services for refined petroleum products. During 2017,under the guidelines issued by the CRE, Pemex Logistics began participating in �Open Season� auctions, which are auctions intended to be transparentand competitive, wherein any participant can compete to offer its services. Pemex Industrial Transformation has received rights from the CRE totransport up to 59.9 thousand barrels per day and to store up to 1.27 million barrels, a volume sufficient to ensure that national supply is not affected.The remaining capacity will be offered through an Open Season auction conducted by the Aklara, the results of which will be published by the CRE.
On May 2, 2017, we announced the results of the first Open Season auction for the Baja California and Sonora systems. A totalof twenty-two companies submitted bids and seven posted bonds. Andeavor (formerly Tesoro Corporation), a U.S. company, was awarded a three-yearcontract at the assigned capacity at rates above the minimums set by us. We believe that this auction set a foundation for open and free market access toour pipeline and storage infrastructure. We believe such Open Season auctions provide importers and sellers, as well as other actors in the logisticalchain, with certainty in the petroleum market.
As a result of the successful first Open Season auction, on July 18, 2017, we executed the contracts with Andeavor, allowing it to use the ducttransport and storage system owned by us in the states of Sonora and Baja California. These contracts included access to the Rosarito-Mexicali,Rosarito-Ensenada, Guaymas-Hermosillo and Guaymas-Ciudad Obregón pipelines, as well as the Rosarito, Mexicali and Ensenada storage terminals inBaja California; Guaymas, Ciudad Obregón, Hermosillo, Magdalena, Nogales and Navojoa in Sonora. These contracts provide us with additionalresources by maximizing the use of our existing infrastructure capacity.
88
Copyright © 2018 www.secdatabase.com. All Rights Reserved.Please Consider the Environment Before Printing This Document

Table of ContentsAlso, in continuation of the Open Season auctions, on December 18, 2017, the CRE approved the auction procedures for the North Border Zone,
Pacific Topolobampo Zone and North Zone Madero.
The execution of the Open Season auctions will be carried out sequentially. In March of 2018, we held an auction for the North Border Zonesystem, which consists of three terminals and two pipeline sections in the states of Coahuila and Tamaulipas. However, since no outside bids werereceived, the capacity for this sytem will be assigned to Pemex Industrial Information.
We are working with the CRE to review the Open Season auctions procedures in order to attract outside bids in subsequent transactions. Webelieve that the Open Season auctions provide the basis for fair and competitive bidding for access to our storage and pipeline transportationinfrastructure.
Transport and distribution
Our pipelines connect crude oil and natural gas production centers with refineries and petrochemical plants, and our storage terminals withMexico�s major cities. At the end of 2017, the pipeline network measured approximately 17,397 kilometers in length, of which 17,134 kilometers arecurrently in operation and 263 kilometers are temporarily out of operation. These pipelines may be temporarily out of operation because of a decline inthe production of a field where the pipeline is located or because the transportation service is irregular, which makes its operation unprofitable. Onceproduction is restored in that field, the pipelines become operational again. As of the date of this annual report, we are analyzing the 263 kilometers ofpipelines that are temporarily out of operation to determine if and how they may be used in the future.
Approximately 5,216 kilometers of the pipelines currently in operation transport crude oil, 8,390 kilometers of pipelines transport refinedpetroleum products, 1,395 kilometers of pipelines transport LPG, 2,122 kilometers of pipelines transport basic and secondary petrochemical products,and 274 kilometers transport other products, including fuel oil, jet fuel and water.
We have implemented a pipeline integrity management plan, which requires us to keep detailed documentation on the condition of our pipelines inorder to optimize our maintenance investments. The pipeline integrity management plan is based on NOM-027, as well as API RP 1160 for liquidhydrocarbons and ASME B31.8S standards for gas, and includes the following stages:
� collection of detailed records and the development of a pipeline database;
� categorization and identification of threats that could affect pipeline integrity, safety and operation;
� identification of critical points in the pipeline;
� risk assessment, reliability and pipeline integrity;
� maintenance and risk mitigation planning and programming; and
� ongoing monitoring throughout all stages.
We have made considerable progress towards satisfying the requirements of NOM-027 on risk assessment and pipeline integrity. Specifically, asof December 31, 2017, we have analyzed 89% of our overall logistics pipeline network. In addition, we have implemented several measures related toour pipeline integrity management plan, including by collecting information in order to create pipeline databases.
Notwithstanding the implementation of our pipeline integrity management plan, we experienced 32 leaks and spills in 2017. The total number ofincidents in 2017 represented a decrease of 8.5% compared to the 35 incidents we experienced in 2016. Of the 32 incidents in our transportationpipelines, 25 were due to a failure in the mechanical integrity of the pipelines, one was due to third-party incidents and six were due to other factors.
89
Copyright © 2018 www.secdatabase.com. All Rights Reserved.Please Consider the Environment Before Printing This Document
Table of ContentsThe transportation of crude oil, natural gas and other products through the pipeline network is subject to several risks, including risk of leakage
and spills, explosions and theft. In 2017, we spent a total of Ps. 707 million in expenditures for the rehabilitation and maintenance of our pipelinenetwork and we have budgeted an additional Ps. 245 million for these expenditures in 2018. See �Item 3�Key Information�Risk Factors�Risk FactorsRelated to our Operations�We are an integrated oil and gas company and are exposed to production, equipment and transportation risks, blockades toour facilities and criminal acts and deliberate acts of terror� above.
Fleet Developments
In July of 2013, as part of a plan to modernize the fleet, we signed an agreement with the Secretaría de Marina�Armada de México (MexicanNavy), valued at approximately Ps. 3,212.1 million (U.S.$250.0 million), for the construction of 22 marine vessels for our refining segment. Thisagreement initially included construction of 16 tugboats, three multipurpose vessels and three barges, but was modified in 2016 to remove theconstruction of the three barges and to extend the final delivery date to December 31, 2018. This transaction is now valued at approximately Ps.4,346.4 million. As of December 31, 2017, the Mexican Navy has delivered seven tugboats.
As of December 31, 2017, we owned 16 refined product tankers and leased one. We also own 25 tugboats, 1,485 tank trucks and 511 train tankcars, as well as 76 storage and distribution terminals, ten liquefied gas terminals, five maritime terminals and ten dock operation and maintenancefacilities. These facilities, together with our pipeline network, constitute the hydrocarbons transportation and distribution infrastructure.
Our current fleet includes 17 vessels, of which we own 16 and lease one, and altogether we have a transportation capacity of 4,628 thousandbarrels. 68% of our vessels are located on the Pacific coast and 32% are in the Gulf of Mexico. Of the capacity of the vessels located on the Pacificcoast, 83.4% is used to transport distillates and 16.6% is used to transport fuel oil and heavy diesel. Of the capacity of the vessels located in the Gulf ofMexico, 82.5% is used for distillates and 17.5% is used for fuel oil and heavy diesel.
Our plan for the renewal and modernization of our fleet was concluded in 2014, but we may resume renewal and modernization efforts pursuant tofuture demand for petroleum products or the retirement of a vessel in accordance with current international regulations.
Logistics Capital Expenditures
Our logistics segment invested Ps. 4,917 million in capital expenditures in 2017 and has budgeted Ps. 4,449 million in capital expenditures for2018.
The following table sets forth our logistics segment�s capital expenditures, excluding non-capitalizable maintenance, for each of the three yearsended December 31, 2015, 2016 and 2017, and the budget for 2018. Capital expenditure amounts are derived from our budgetary records, which areprepared on a cash basis. Accordingly, these capital expenditure amounts do not correspond to capital expenditure amounts included in our consolidatedfinancial statements prepared in accordance with IFRS.
90
Copyright © 2018 www.secdatabase.com. All Rights Reserved.Please Consider the Environment Before Printing This Document
Table of ContentsLogistics�� Capital Expenditures
Year ended December 31,(1)2015 2016 2017
Budget2018(2)
(in millions of pesos)(3)Logistics
Larger Fleet Modernization Ps. 458 Ps. 583 Ps. 645 Ps. 429Renewal of Tugs, Chalanes and Multipurpose Vessels of the Smaller
Fleet 401 495 258 113Refurbishment, Modification and Modernization of Pumping and
Compression Stations Nationwide 221 476 95 �Maintenance of Safety, Measurement, Control and Auto-mation Systems
in Storage and Distribution Terminals 460 452 235 239Acquisition of 5 Tankers Vessel by Cash and/or by Leasing 363 427 431 311Evaluation and Rehabilitation of the Mechanical Integrity of the
Pipeline�s Poza Rica-Salamanca and Nuevo Teapa- Tula-Salamanca 461 347 6 �Replacement of Vessel Tanks Nuevo Pemex I, II, III and IV by
Acquisition and/or Leasing 278 326 332 240Implementation of the SCADA System in 47 Pipeline Transportation
Systems 520 270 78 15Evaluation and Rehabilitation of the Mechanical Integrity of the
Pipelines in Northern and Pacific Zones 271 251 316 132Evaluation and Rehabilitation of the Mechanical Integrity of the
Pipelines Nuevo Teapa-Madero-Cadereyta 574 193 88 1Integral Maintenance of Pipeline Systems for Natural Gas and LPG,
Stage II 293 172 205 1Modernization of the Instrumented Security and Basic Control Systems
of the Pumping Stations and Product Receipt Northern Zone 278 110 6 8Evaluation and Rehabilitation of the Mechanical Integrity of the
Turbosine, Diesel, Gasoline and Fuel Oil Pipelines and Gas Pipelinesin the Central Zone 464 109 80 204
Natural Gas Transportation from Jáltipan to Salina Cruz Refinery 403 31 12 �Maintenance of Marine Facilities 316 28 11 �Others 4,066 2,745 2,120 2,758
Total Ps. 9,827 Ps. 7,015 Ps. 4,917 Ps. 4,449
Notes: Numbers may not total due to rounding.(1) Amounts based on cash basis method of accounting.(2) Budget presented to the Board of Directors of Petróleos Mexicanos on March 5, 2018.(3) Figures are stated in nominal pesos.Source: Petróleos Mexicanos.
CENAGAS
Pursuant to the Hydrocarbons Law, on August 11, 2014, CENAGAS was created as a decentralized public entity of the Mexican Government toact as the independent administrator of the Integrated Natural Gas System. This system interconnects the infrastructure for the storage and transportationof natural gas across the nation, with the aim of expanding coverage, strengthening security measures and improving the continuity, quality and
91
Copyright © 2018 www.secdatabase.com. All Rights Reserved.Please Consider the Environment Before Printing This Document
Table of Contentsefficiency in transportation service. As an integrated system of transportation systems owned by CENAGAS or other participating companies, theIntegrated Natural Gas System functions as a primary transportation service supplier in Mexico with standardized fares. Within this system, the SistemaNacional de Gasoductos (National Gas Pipelines System) acts as the commercial administrator for the total available capacity of the Integrated NaturalGas System. In order for a transportation system to become part of the Integrated Natural Gas System, its transport capacity must enhance the IntegratedNatural Gas System�s flow capacity and improve the overall transportation service provided to users.
In accordance with the Energy Reform Decree, we signed a transfer agreement with CENAGAS on October 29, 2015 for the transfer toCENAGAS of assets associated with the Integrated Natural Gas System and the distribution contract for the Naco-Hermosillo pipeline system. TheNational Gas Pipeline System has 87 pipelines with a total length of almost 9,000 kilometers and a transport capacity over 5,000 million cubic feet perday, while the Naco-Hermosillo system is a 300 kilometers long pipeline with a transport capacity of 90 million cubic feet per day. The approximateaggregate book value of these assets, which were transferred to CENAGAS on January 1, 2016, was Ps. 35.3 billion as of December 31, 2016.
On December 29, 2016, we entered into two agreements with CENAGAS pursuant to which we continued to provide operation and maintenanceservices and commercial operation services to CENAGAS during 2017. Both agreements, which have a total value of approximately Ps. 249 billion andPs. 13 billion, respectively, were one-year agreements with automatic renewals unless either party gives advance notice to the contrary. As of the date ofthis annual report, CENAGAS has given us notice of termination for nine of the 21 pipeline subsystems.
During 2017 we obtained Ps. 3,268.2 million from our services provided to CENAGAS.
Cogeneration and Services
For the past three years, our cogeneration and services segment has operated through the productive state-owned subsidiary Pemex Cogenerationand Services to use thermal heat and steam from our industrial processes to produce the electricity required by us, as well as surplus electricity to sell tothird parties in Mexico. Our cogeneration and services segment has also provided technical and management services associated with supplyingelectricity.
Partly in response to prolonged periods of low hydrocarbon prices, and as part of our broader strategy to enter into strategic alliances, we havetransferred certain assets and functions of Pemex Cogeneration and Services to Pemex Industrial Transformation. The primary goal of these transfers isto focus our efforts on our core activities and to enter into alliances for the operation and maintenance of our cogeneration plants and thecommercialization of surplus energy. We believe that this focus on core activities and strategic alliances will allow us to reduce unscheduled stoppages,improving reliability throughout our supply chain and reducing costs, which we expect will improve Pemex Industrial Transformation�s financialresults. We estimate that, as a result of these transfers to Pemex Industrial Transformation, we will be able to achieve significant cost savings of U.S.$103 million. Moreover, we expect that the development of cogeneration projects in cooperation with our allies in our Tula and Cadereyta refineries willresult in additional cost savings of U.S. $466 million.
During 2017, Pemex Cogeneration and Services generated Ps. 334.8 million in services income and had a net loss of Ps. 92.1 million.
92
Copyright © 2018 www.secdatabase.com. All Rights Reserved.Please Consider the Environment Before Printing This Document
Table of ContentsInternational Trading
PMI and its subsidiaries conduct international commercial activities for our crude oil, refined and petrochemical products, with the exception ofnatural gas, which is marketed directly by our industrial transformation segment. The PMI subsidiaries� main objectives are to assist in maximizing ourprofitability and optimizing our operations through the use of international trade, facilitating our link with the international markets and pursuing newbusiness opportunities in marketing our products. PMI and its subsidiaries manage the international sales of our crude oil and petroleum products andacquire in the international markets those petroleum products that we import to satisfy domestic demand. Sales of crude oil are carried out through PMI.Sales and purchases of petroleum products in the international markets are carried out through P.M.I. Trading, Ltd., which also performs third-partytrading, transportation and risk management activities.
Exports and Imports
PMI purchases crude oil from our exploration and production segment and then sells it to PMI�s customers. PMI sold an average of1,174.0 thousand barrels of crude oil per day in 2017, which represented 60.3% of our total crude oil production.
The following tables set forth the composition and average prices of our crude oil exports for the periods indicated.
Year ended December 31,2013 2014 2015 2016 2017
(tbpd) (%) (tbpd) (%) (tbpd) (%) (tbpd) (%) (tbpd) (%)Crude Oil Exports (by Volume)Olmeca (API gravity of 38°-39°) 99 8 91 8 124 11 108 9 19 2Isthmus (API gravity of 32°-33°) 103 9 134 12 194 17 153 13 86 7Maya (API gravity of 21°-22°) 968 81 887 78 743 63 865 72 1,054 90Altamira (API gravity of 15.0°-16.5°) 20 2 27 2 28 2 24 2 15 1Talam (API gravity of -15.8º) � � 3 0.3 83 7 45 4 � �
Total 1,189 100 1,142 100 1,172 100 1,194 100 1,174 100
Notes: Numbers may not total due to rounding.tbpd = thousand barrels per day.API gravity refers to the specific gravity or density of liquid petroleum products, measured in degrees on the American Petroleum Institute (API) scale. On the API scale, oil with the lowestspecific gravity has the highest API gravity. In addition, holding all other factors constant, the higher the API gravity, the greater the value of the crude oil.
Source: PMI operating statistics as of January 9, 2018.
Year ended December 31,2013 2014 2015 2016 2017
(U.S. dollars per barrel)Crude Oil Prices
Olmeca U.S.$ 107.92 U.S.$ 93.54 U.S.$ 51.46 U.S.$ 39.71 U.S.$ 51.79Isthmus 104.69 93.39 49.28 37.72 50.75Maya 96.89 83.75 41.12 35.30 46.41Altamira 94.35 81.30 36.19 30.35 39.45Talam � 36.74 36.40 28.44 �
Weighted average realized price U.S. $98.44 U.S. $85.48 U.S. $43.12 U.S. $35.65 U.S. $46.73
Source: PMI operating statistics as of January 9, 2018.
93
Copyright © 2018 www.secdatabase.com. All Rights Reserved.Please Consider the Environment Before Printing This Document
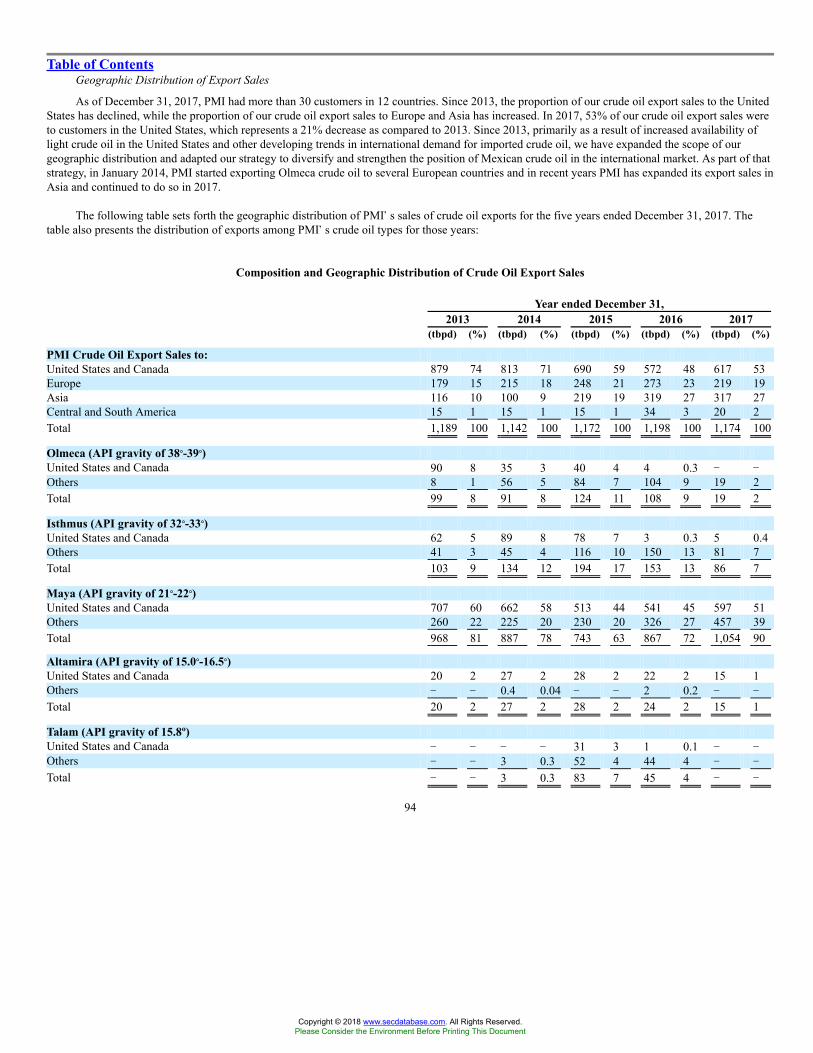
Table of ContentsGeographic Distribution of Export Sales
As of December 31, 2017, PMI had more than 30 customers in 12 countries. Since 2013, the proportion of our crude oil export sales to the UnitedStates has declined, while the proportion of our crude oil export sales to Europe and Asia has increased. In 2017, 53% of our crude oil export sales wereto customers in the United States, which represents a 21% decrease as compared to 2013. Since 2013, primarily as a result of increased availability oflight crude oil in the United States and other developing trends in international demand for imported crude oil, we have expanded the scope of ourgeographic distribution and adapted our strategy to diversify and strengthen the position of Mexican crude oil in the international market. As part of thatstrategy, in January 2014, PMI started exporting Olmeca crude oil to several European countries and in recent years PMI has expanded its export sales inAsia and continued to do so in 2017.
The following table sets forth the geographic distribution of PMI�s sales of crude oil exports for the five years ended December 31, 2017. Thetable also presents the distribution of exports among PMI�s crude oil types for those years:
Composition and Geographic Distribution of Crude Oil Export Sales
Year ended December 31,2013 2014 2015 2016 2017
(tbpd) (%) (tbpd) (%) (tbpd) (%) (tbpd) (%) (tbpd) (%)
PMI Crude Oil Export Sales to:United States and Canada 879 74 813 71 690 59 572 48 617 53Europe 179 15 215 18 248 21 273 23 219 19Asia 116 10 100 9 219 19 319 27 317 27Central and South America 15 1 15 1 15 1 34 3 20 2Total 1,189 100 1,142 100 1,172 100 1,198 100 1,174 100
Olmeca (API gravity of 38°-39°)United States and Canada 90 8 35 3 40 4 4 0.3 � �Others 8 1 56 5 84 7 104 9 19 2Total 99 8 91 8 124 11 108 9 19 2
Isthmus (API gravity of 32°-33°)United States and Canada 62 5 89 8 78 7 3 0.3 5 0.4Others 41 3 45 4 116 10 150 13 81 7Total 103 9 134 12 194 17 153 13 86 7
Maya (API gravity of 21°-22°)United States and Canada 707 60 662 58 513 44 541 45 597 51Others 260 22 225 20 230 20 326 27 457 39Total 968 81 887 78 743 63 867 72 1,054 90
Altamira (API gravity of 15.0°-16.5°)United States and Canada 20 2 27 2 28 2 22 2 15 1Others � � 0.4 0.04 � � 2 0.2 � �
Total 20 2 27 2 28 2 24 2 15 1
Talam (API gravity of 15.8º)United States and Canada � � � � 31 3 1 0.1 � �Others � � 3 0.3 52 4 44 4 � �
Total � � 3 0.3 83 7 45 4 � �
94
Copyright © 2018 www.secdatabase.com. All Rights Reserved.Please Consider the Environment Before Printing This Document
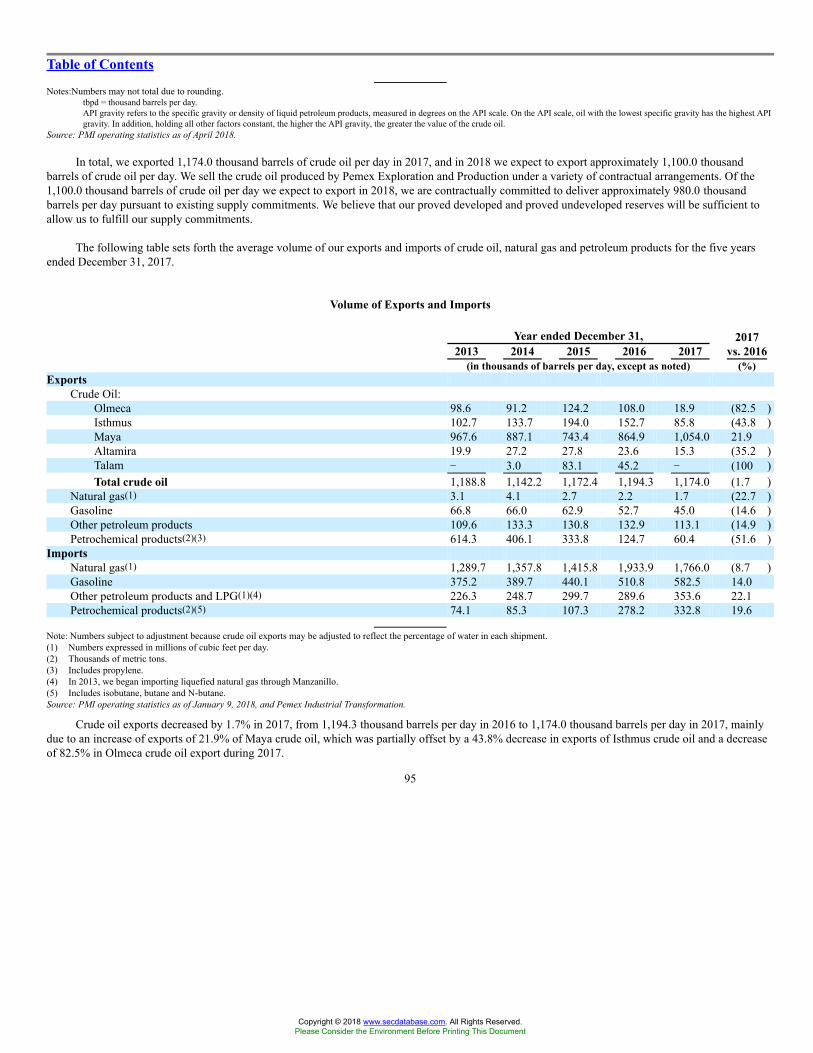
Table of Contents
Notes:Numbers may not total due to rounding.tbpd = thousand barrels per day.API gravity refers to the specific gravity or density of liquid petroleum products, measured in degrees on the API scale. On the API scale, oil with the lowest specific gravity has the highest APIgravity. In addition, holding all other factors constant, the higher the API gravity, the greater the value of the crude oil.
Source: PMI operating statistics as of April 2018.
In total, we exported 1,174.0 thousand barrels of crude oil per day in 2017, and in 2018 we expect to export approximately 1,100.0 thousandbarrels of crude oil per day. We sell the crude oil produced by Pemex Exploration and Production under a variety of contractual arrangements. Of the1,100.0 thousand barrels of crude oil per day we expect to export in 2018, we are contractually committed to deliver approximately 980.0 thousandbarrels per day pursuant to existing supply commitments. We believe that our proved developed and proved undeveloped reserves will be sufficient toallow us to fulfill our supply commitments.
The following table sets forth the average volume of our exports and imports of crude oil, natural gas and petroleum products for the five yearsended December 31, 2017.
Volume of Exports and Imports
Year ended December 31,2013 2014 2015 2016 2017
2017vs. 2016
(in thousands of barrels per day, except as noted) (%)Exports
Crude Oil:Olmeca 98.6 91.2 124.2 108.0 18.9 (82.5 )Isthmus 102.7 133.7 194.0 152.7 85.8 (43.8 )Maya 967.6 887.1 743.4 864.9 1,054.0 21.9Altamira 19.9 27.2 27.8 23.6 15.3 (35.2 )Talam � 3.0 83.1 45.2 � (100 )Total crude oil 1,188.8 1,142.2 1,172.4 1,194.3 1,174.0 (1.7 )
Natural gas(1) 3.1 4.1 2.7 2.2 1.7 (22.7 )Gasoline 66.8 66.0 62.9 52.7 45.0 (14.6 )Other petroleum products 109.6 133.3 130.8 132.9 113.1 (14.9 )Petrochemical products(2)(3) 614.3 406.1 333.8 124.7 60.4 (51.6 )
ImportsNatural gas(1) 1,289.7 1,357.8 1,415.8 1,933.9 1,766.0 (8.7 )Gasoline 375.2 389.7 440.1 510.8 582.5 14.0Other petroleum products and LPG(1)(4) 226.3 248.7 299.7 289.6 353.6 22.1Petrochemical products(2)(5) 74.1 85.3 107.3 278.2 332.8 19.6
Note: Numbers subject to adjustment because crude oil exports may be adjusted to reflect the percentage of water in each shipment.(1) Numbers expressed in millions of cubic feet per day.(2) Thousands of metric tons.(3) Includes propylene.(4) In 2013, we began importing liquefied natural gas through Manzanillo.(5) Includes isobutane, butane and N-butane.Source: PMI operating statistics as of January 9, 2018, and Pemex Industrial Transformation.
Crude oil exports decreased by 1.7% in 2017, from 1,194.3 thousand barrels per day in 2016 to 1,174.0 thousand barrels per day in 2017, mainlydue to an increase of exports of 21.9% of Maya crude oil, which was partially offset by a 43.8% decrease in exports of Isthmus crude oil and a decreaseof 82.5% in Olmeca crude oil export during 2017.
95
Copyright © 2018 www.secdatabase.com. All Rights Reserved.Please Consider the Environment Before Printing This Document
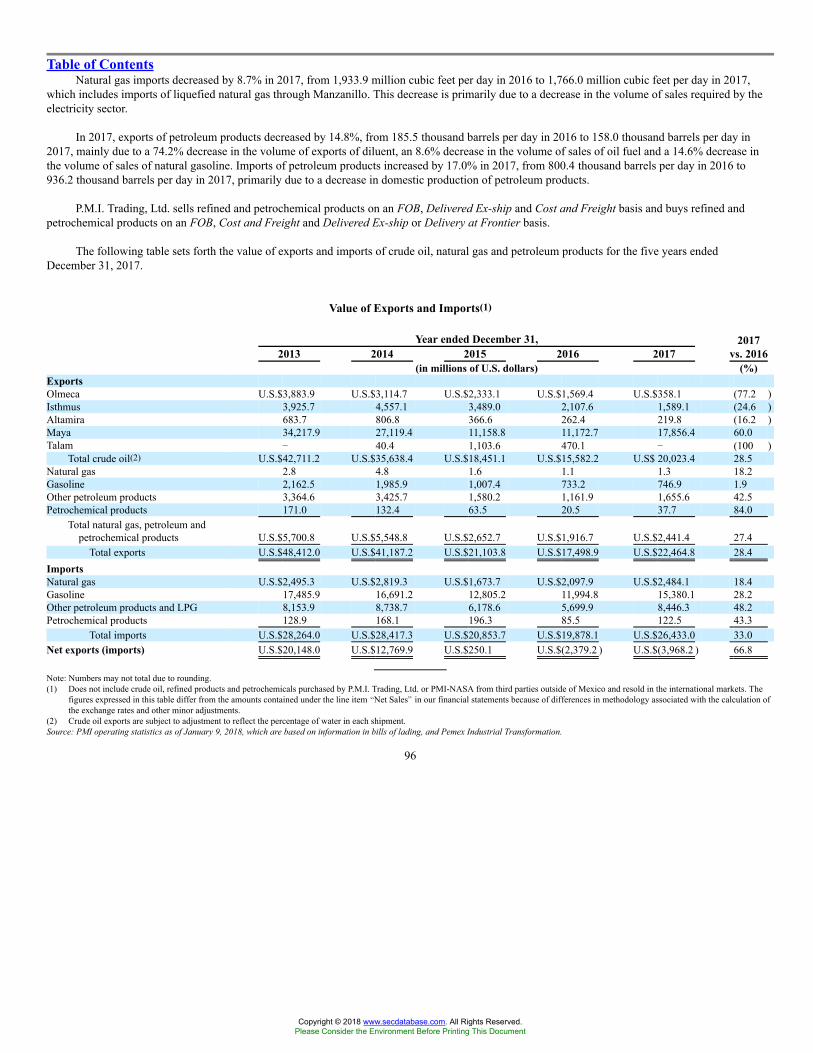
Table of ContentsNatural gas imports decreased by 8.7% in 2017, from 1,933.9 million cubic feet per day in 2016 to 1,766.0 million cubic feet per day in 2017,
which includes imports of liquefied natural gas through Manzanillo. This decrease is primarily due to a decrease in the volume of sales required by theelectricity sector.
In 2017, exports of petroleum products decreased by 14.8%, from 185.5 thousand barrels per day in 2016 to 158.0 thousand barrels per day in2017, mainly due to a 74.2% decrease in the volume of exports of diluent, an 8.6% decrease in the volume of sales of oil fuel and a 14.6% decrease inthe volume of sales of natural gasoline. Imports of petroleum products increased by 17.0% in 2017, from 800.4 thousand barrels per day in 2016 to936.2 thousand barrels per day in 2017, primarily due to a decrease in domestic production of petroleum products.
P.M.I. Trading, Ltd. sells refined and petrochemical products on an FOB, Delivered Ex-ship and Cost and Freight basis and buys refined andpetrochemical products on an FOB, Cost and Freight and Delivered Ex-ship or Delivery at Frontier basis.
The following table sets forth the value of exports and imports of crude oil, natural gas and petroleum products for the five years endedDecember 31, 2017.
Value of Exports and Imports(1)
Year ended December 31,2013 2014 2015 2016 2017
2017vs. 2016
(in millions of U.S. dollars) (%)ExportsOlmeca U.S.$3,883.9 U.S.$3,114.7 U.S.$2,333.1 U.S.$1,569.4 U.S.$358.1 (77.2 )Isthmus 3,925.7 4,557.1 3,489.0 2,107.6 1,589.1 (24.6 )Altamira 683.7 806.8 366.6 262.4 219.8 (16.2 )Maya 34,217.9 27,119.4 11,158.8 11,172.7 17,856.4 60.0Talam � 40.4 1,103.6 470.1 � (100 )
Total crude oil(2) U.S.$42,711.2 U.S.$35,638.4 U.S.$18,451.1 U.S.$15,582.2 U.S$ 20,023.4 28.5Natural gas 2.8 4.8 1.6 1.1 1.3 18.2Gasoline 2,162.5 1,985.9 1,007.4 733.2 746.9 1.9Other petroleum products 3,364.6 3,425.7 1,580.2 1,161.9 1,655.6 42.5Petrochemical products 171.0 132.4 63.5 20.5 37.7 84.0
Total natural gas, petroleum andpetrochemical products U.S.$5,700.8 U.S.$5,548.8 U.S.$2,652.7 U.S.$1,916.7 U.S.$2,441.4 27.4
Total exports U.S.$48,412.0 U.S.$41,187.2 U.S.$21,103.8 U.S.$17,498.9 U.S.$22,464.8 28.4ImportsNatural gas U.S.$2,495.3 U.S.$2,819.3 U.S.$1,673.7 U.S.$2,097.9 U.S.$2,484.1 18.4Gasoline 17,485.9 16,691.2 12,805.2 11,994.8 15,380.1 28.2Other petroleum products and LPG 8,153.9 8,738.7 6,178.6 5,699.9 8,446.3 48.2Petrochemical products 128.9 168.1 196.3 85.5 122.5 43.3
Total imports U.S.$28,264.0 U.S.$28,417.3 U.S.$20,853.7 U.S.$19,878.1 U.S.$26,433.0 33.0Net exports (imports) U.S.$20,148.0 U.S.$12,769.9 U.S.$250.1 U.S.$(2,379.2 ) U.S.$(3,968.2 ) 66.8
Note: Numbers may not total due to rounding.(1) Does not include crude oil, refined products and petrochemicals purchased by P.M.I. Trading, Ltd. or PMI-NASA from third parties outside of Mexico and resold in the international markets. The
figures expressed in this table differ from the amounts contained under the line item �Net Sales� in our financial statements because of differences in methodology associated with the calculation ofthe exchange rates and other minor adjustments.
(2) Crude oil exports are subject to adjustment to reflect the percentage of water in each shipment.Source: PMI operating statistics as of January 9, 2018, which are based on information in bills of lading, and Pemex Industrial Transformation.
96
Copyright © 2018 www.secdatabase.com. All Rights Reserved.Please Consider the Environment Before Printing This Document

Table of ContentsImports of natural gas increased in value by 18.4% during 2017, primarily as a result of an increase in the average sales price of natural gas.
Imports of gasoline increased in value by 28.2% due to an increase in volume of domestic gasoline sales and in the average sales price of gasoline.
The following table describes the composition of our exports and imports of selected refined products in 2015, 2016 and 2017.
Exports and Imports of Selected Petroleum Products
Year ended December 31,2015 2016 2017
(tbpd) (%) (tbpd) (%) (tbpd) (%)ExportsLiquefied petroleum gas(1) � � 4.5 2.4 5.7 3.6Fuel oil 123.9 64.0 113.3 61.0 103.5 65.5Gasoline 62.9 32.5 52.7 28.4 45.0 28.4Others 6.8 3.5 15.1 8.2 3.9 2.5
Total 193.7 100.0% 185.5 100.0% 158.0 100.0%ImportsGasoline(3) 440.1 59.5 510.8 63.8 582.5 62.2Fuel oil 17.0 2.3 10.7 1.3 24.4 2.6Liquefied petroleum gas(2) 105.2 14.2 50.6 6.3 42.6 4.5Diesel 145.3 19.6 187.8 23.5 237.5 25.4Others 32.2 4.3 40.4 5.1 49.1 5.2
Total 739.8 100.0% 800.4 100.0% 936.2 100.0%
Notes: Numbers may not total due to rounding.tbpd= thousand barrels per day.
(1) Includes butanes and propane.(2) Includes methyl tert-butyl ether (MTBE).(3) Includes premium gasoline, regular gasoline, premium components and naphtasSource: Pemex BDI.
Exports of petroleum products increased in value by 26.8% in 2017, primarily due to a 59.9% increase in sales of fuel oil and increases in theprices of petroleum products. In 2017, imports of petroleum products increased in value, by 34.7%, primarily due to a 17.0% increase in volume ofimports due to increased domestic demand for regular gasoline and an increase in the average price of gasoline as compared to prior year. Our netimports of petroleum products for 2017 totaled U.S. $21,423.9 million, which represents a 35.6% increase from our net imports of petroleum productsof U.S. $15,799.0 million in 2016.
The Secretary of Energy has entered into certain agreements to reduce or increase crude oil exports. See �Item 4�Information on theCompany�Trade Regulation and Export Agreements� below in this Item 4.
Hedging Operations
P.M.I. Trading, Ltd. engages in hedging operations to cover its price exposure in the trading of petroleum products. The internal policies andprocedures of P.M.I. Trading, Ltd. establish: (1) that DFIs are used exclusively to mitigate the volatility of oil and gas prices; (2) limits on the maximumamount of capital at risk and on the daily and accumulated annual losses for each business unit; and (3) the segregation of risk-taking and riskmeasurement. Capital at risk is calculated on a daily basis in order to compare the actual figures with the aforementioned limit. P.M.I. Trading, Ltd. hasa risk management subcommittee that reviews risk and hedging
97
Copyright © 2018 www.secdatabase.com. All Rights Reserved.Please Consider the Environment Before Printing This Document
Table of Contentsoperations and meets on a quarterly basis. See �Item 11�Quantitative and Qualitative Disclosures about Market Risk�Changes in Exposure to MainRisks�Hydrocarbon Price Risk.�
Gas Stations in the United States
Between late 2015 and early 2016, we opened five gas stations in Houston, Texas that are owned and operated by franchisees. This is part of ourstrategy to expand our operations to the United States in order to fulfill the energy reform mandate to generate economic value in international markets.Further, it will allow us to measure the impact of our brand against others and identify business opportunities abroad. The gas stations� fuel supply isderived from the United States wholesale market and selling prices are subject to local market conditions. As of December 31, 2017, we have seen anincrease in fuel consumption of up to 150% as compared to 2016, primarily in areas with large Hispanic populations. We are looking to build on thisstrategy and expand our presence in the United States over the next several years.
PEMEX Corporate Matters
In addition to the operating activities that we undertake through the activities of our subsidiary entities and subsidiary companies, we have certaincentralized corporate operations that coordinate general labor, safety, insurance and legal matters.
Industrial Safety and Environmental Protection
Our Corporate Office of Planning, Coordination and Performance is responsible for planning, conducting and coordinating programs to:
� foster a company culture of safety and environmental protection;
� improve the safety of our workers and facilities;
� reduce risks to residents of the areas surrounding our facilities; and
� reduce greenhouse gas emissions and identify the risks associated with climate change in Mexico in order to develop strategies to minimizethe impact of climate change on our operations.
We intend to further develop industrial safety and environmental programs for each subsidiary entity. The environmental and safety division ofeach subsidiary entity coordinates closely with the Corporate Office of Planning, Coordination and Performance.
Insurance
We maintain a comprehensive property and general liability insurance program for onshore and offshore properties and liabilities. All onshoreproperties, such as refineries, processing plants, pipelines and storage facilities are covered, as are all of our offshore assets, such as drilling platforms,rigs, gas gathering systems, maritime terminals and production facilities.
Our insurance covers risks of sudden and accidental physical damage to or destruction of our properties, as well as risk of sudden and accidentalphysical loss, including as a consequence of purposeful terrorist acts. This insurance also provides coverage for the contents of pipelines and storagefacilities, and any of our liabilities arising from such acts. Our insurance also covers extraordinary costs related to the operation of offshore wells, suchas control and re-drilling costs, evacuation expenses and liability costs associated with spills. We also maintain protection and indemnity insurance forour full marine fleet, in addition to life insurance, automobile and heavy equipment insurance, cargo and marine hull insurance, as well as insurance fordeep water drilling activities and onshore and offshore construction on operating facilities.
98
Copyright © 2018 www.secdatabase.com. All Rights Reserved.Please Consider the Environment Before Printing This Document
Table of ContentsIn accordance with Mexican law, we have entered into all of our insurance contracts with Mexican insurance carriers. These policies have limits of
U.S. $1.8 billion for onshore property, U.S. $1.9 billion for offshore property, U.S. $0.3 billion for extraordinary costs related to the operation ofoffshore wells, U.S. $1.0 billion for marine-related liabilities, U.S. $1.1 billion for onshore and offshore liabilities, U.S. $0.5 billion for offshore terroristacts and U.S. $0.5 billion for onshore terrorist acts. Limits of insurance policies purchased for each category of risk are determined using professionalrisk management assessment surveys conducted by international companies on an annual basis and the market capacity available per risk, and must be incompliance with local regulations enacted following the energy reform. In addition, in compliance with the regulations enacted in June of 2016 by theNational Agency for Industrial Safety and Environmental Protection of the Hydrocarbons Sector (ASEA), we maintain insurance coverage with respectto third party liability, liability for environmental damage and control of well, works or drilling activities and extraction of hydrocarbons, the treatmentand refining of crude oil and the processing of natural gas. We have also made the necessary endorsements to ensure that we maintain insurancecoverage in connection with our new strategic alliances and other joint arrangements.
Since June 2003, we have not maintained business interruption insurance, which in the past compensated us for loss of revenues resulting fromdamages to our facilities. Instead, we purchase ad-hoc business interruption mitigation insurance coverage, which compensates us for the additionalexpenses necessary to recover our production capabilities in the shortest time possible.
During 2017 we continued to engage in deep water exploratory and drilling activities that were covered by our existing insurance program. InAugust 2012, we purchased a policy to increase the coverage available for potential property damage, third-party liability and control of well risksrelated to these activities. Under this policy, we maintain coverage for each deep water well drilled, and the limits are determined based on the riskprofile of the corresponding well. This policy has a limit of U.S. $3.3 billion, including U.S. $1.3 billion for control of well risks, U.S. $1.1 billion forcasualty and U.S. $0.9 billion for property damage. This policy also contemplates additional coverage for environmental liabilities and remediationactivities relating to deep water exploration and drilling.
All of our insurance policies are in turn reinsured through Kot Insurance Company, AG (which we refer to as Kot AG). Kot AG is a wholly ownedsubsidiary company that was originally formed in 1993 under the laws of Bermuda as Kot Insurance Company, Ltd. and was subsequently organizedunder the laws of Switzerland in 2004. Kot AG is used as a risk management tool to structure and distribute risks across the international reinsurancemarkets. The purpose of Kot AG is to reinsure policies held through our local insurance carriers and to maintain control over the cost and quality of theinsurance covering our risks. Kot AG reinsures over 90% of its reinsurance policies with unaffiliated third-party reinsurers. Kot AG carefully monitorsthe financial performance of its reinsurers and actively manages counterparty credit risk across its reinsurance portfolio to ensure its own financialstability and maintain its creditworthiness. Kot AG maintains solid capitalization and solvency margins consistent with guidelines provided by Swissinsurance authorities and regulations. As of December 31, 2017, Kot AG�s net risk retention is capped at U.S. $327 million spread across differentreinsurance coverages to mitigate potential aggregation factors.
Investment in Repsol
On October 26, 2017, PMI HBV sold all of its shares in Repsol, S.A. (formerly known as Repsol YPF, S.A., and which we refer to asRepsol)�21,333,870 shares in total � to Credit Agricole CIB. This sale resulted in a loss of Ps. 3.5 billion. As of the date of this annual report, we do nothold any shares in Repsol. See Note 10 to our consolidated financial statements included herein.
Ethics Committee
Our Ethics Committee consists of members from our management team, with the head of the Institutional Internal Control Unit at PetróleosMexicanos serving as its chairman.
99
Copyright © 2018 www.secdatabase.com. All Rights Reserved.Please Consider the Environment Before Printing This Document
Table of ContentsOur Ethics Committee is primarily responsible for:
� promoting awareness and use of our code of ethics and code of conduct, including through online training available for our employees, inorder to improve our culture of ethics;
� establishing procedures that implement the principles found in our code of ethics in order to increase compliance and to detect behavior thatadversely affects our activities;
� analyzing and giving instructions to the appropriate areas on possible violations to our code of ethics and code of conduct that are reportedthrough the Ethics Line; and
� working with the Liabilities Unit at Petróleos Mexicanos and our Internal Auditing Area to exchange information regarding violations ofour code of ethics and our code of conduct.
See �Item 16B�Code of Ethics� for more information regarding our code of ethics.
Collaboration and Other Agreements
On September 30, 2014, Petróleos Mexicanos and the Secretaria de Desarrollo Social (SEDESOL), signed a collaboration agreement with theobjective of supporting community development in the zones of influence of oil industries by providing food and nutrition support as part of theCruzada Nacional Contra el Hambre (National Cruzade Against Hunger). This collaboration agreement expired in November 2017.
On October 27, 2014, Petróleos Mexicanos and the Secretaria de Agricultura, Ganadería, Desarrollo Rural, Pesca y Alimentación (SAGARPA)signed a collaboration agreement to provide community and environmental support to communities within the zones of influence of the oil industries.This collaboration agreement is set to expire in November 2018.
On February 5, 2015, Petróleos Mexicanos and the Instituto Politécnico Nacional (National Polytechnic Institute) of Mexico entered into acollaboration agreement for the development of human resources, technology and research, with the aim of promoting and supporting joint researchprograms and the development of knowledge related to the hydrocarbons industry.
On February 18, 2015, Petróleos Mexicanos and the Organisation for Economic Co-operation and Development (OECD) signed a memorandumof understanding with the aim of benefiting from the OECD�s knowledge of and experiences with international best practices relating to theprocurement of goods and services.
On February 19, 2015, Petróleos Mexicanos signed a memorandum of understanding with the Infraestructura Energética Nova, S.A.B. de C.V. andSempra LNG units of the U.S. energy company Sempra Energy for the potential joint development of a natural gas liquefaction project at the site of theEnergía Costa Azul facility located in Ensenada, Mexico.
On April 7, 2015, Petróleos Mexicanos and First Reserve signed a memorandum of understanding and cooperation to explore new opportunitiesfor joint energy projects, which would provide access to financing, as well as the exchange of technical and operational experience. This agreementcontemplates up to U.S. $1.0 billion of investments in potential projects relating to infrastructure, maritime transport and power cogeneration, amongothers.
On May 12, 2015, Petróleos Mexicanos and Global Water Development Partners, a company founded by private equity funds operated byBlackstone, signed a memorandum of understanding with the aim of creating a partnership to invest in water and wastewater infrastructure for PetróleosMexicanos� upstream and downstream facilities. This partnership is intended to finance and carry out environmentally sustainable projects for watertreatment in Petróleos Mexicanos� operations.
100
Copyright © 2018 www.secdatabase.com. All Rights Reserved.Please Consider the Environment Before Printing This Document

Table of ContentsOn May 12, 2015, PMX Cogeneración, S.A.P.I. de C.V., an affiliate of Petróleos Mexicanos, signed a memorandum of understanding with the
consortium formed by Enel S.p.A., an Italian renewable energy company, and Abengoa, S.A., a Spanish renewable energy company, to develop acogeneration power plant to generate and supply clean energy to the Antonio Dovali Jaime refinery in Salina Cruz, as well as the Mexican national grid.
On June 1, 2015, Petróleos Mexicanos and the U.S. based global asset manager BlackRock Inc. signed a memorandum of understanding with theaim of accelerating the development and financing of energy-related infrastructure projects that are of strategic importance to Petróleos Mexicanos.
On July 20, 2015, Petróleos Mexicanos, through its Corporate Office of Procurement and Supply, signed an agreement with the OECD with theaim of adopting and promoting best practices in procurement and fostering efficient management strategies and transparency in Petróleos Mexicanos�processes. The agreement also contemplates the training of our personnel by the OECD on issues of transparency and ethics, the design of procurementprocedures and mitigating risks of collusion.
On July 22, 2015, Petróleos Mexicanos and the Secretaría de Desarrollo Agrario, Territorial y Urbano (Ministry of Agriculture, Land and UrbanDevelopment) signed a collaboration agreement with the aim of establishing consulting and training mechanisms for the development of hydrocarbonexploration, extraction and distribution projects in strict observance of the applicable legal framework and with full respect for agricultural landowners.
On July 23, 2015, Petróleos Mexicanos and the Instituto Tecnológico y de Estudios Superiores de Monterrey, A.C. signed a collaborationagreement with the purpose of (1) fostering competitive development within the Mexican oil and gas industry; (2) carrying out specialized research andconsulting services, including lectures, seminars, conferences and other events of common interest to the institutions; and (3) providing postgraduatestudies for our employees and internships for college students at Petróleos Mexicanos.
On July 28, 2015, Petróleos Mexicanos and Banco Santander, S.A. (Santander) signed a collaboration agreement with the purpose of providingour franchisees with access to Santander banking services such as bank card sales, deposits and e-banking services, payroll management and thetransportation of money.
On September 9, 2015, Petróleos Mexicanos and General Electric signed a memorandum of understanding with the aim of creating a partnershipto invest in new technology and financing initiatives for gas compression, power generation and the production of hydrocarbons, both onshore andoffshore, including in deepwater fields.
On October 7, 2015, Petróleos Mexicanos, through its subsidiary Pemex Cogeneration and Services, and Dominion Technologies signed amemorandum of understanding to form a company aimed at the joint implementation of cogeneration projects.
On October 10, 2015, Petróleos Mexicanos and the United Nations Development Programme in Mexico reaffirmed their commitment to use bestpractices in terms of inclusion, equality and non-discrimination in the workplace.
On November 30, 2015, Petróleos Mexicanos and Global Water Development Partners agreed to create a joint venture intended to investapproximately U.S. $800 million in water and wastewater treatment infrastructure for upstream and downstream facilities in Mexico. This partnershipaims to (1) provide access to advanced technology to meet the supply and treatment requirements of wastewater at our facilities, in both onshore andoffshore production areas, as well as in refineries and petrochemical plants; and (2) in the future, to potentially implement and finance environmentallysustainable solutions for water management.
On January 19, 2016, Petróleos Mexicanos and Mubadala Petroleum signed a memorandum of understating agreeing to joint projects to explorethe Mexican energy sector, including its upstream activities, primary
101
Copyright © 2018 www.secdatabase.com. All Rights Reserved.Please Consider the Environment Before Printing This Document

Table of Contentsmidstream activities and infrastructure projects for a total investment of approximately U.S. $4.0 billion. Among these projects is a commercial logisticinfrastructure system in the Salina Cruz, Oaxaca area, for an approximate investment in excess of U.S. $3.0 billion.
On January 19, 2016, Petróleos Mexicanos and the Abu Dhabi National Oil Company signed a memorandum of understanding with the aim toshare each company�s best practices with respect to different upstream activities, including exploration, development and production in oil fields;improved recovery, handling and processing of liquefied natural gas; as well as human resources training, sustainability, internal controls, transparency,process development and cyber-security.
On January 19, 2016, Petróleos Mexicanos and Saudi Aramco signed a memorandum of understanding renewing and strengthening therelationship between both companies and establishing an exchange of ideas surrounding operational excellence, sustainability and energy efficiency, andinnovation and technological development.
These broad agreements of technological and scientific collaboration are strictly non-commercial, i.e., there is no transfer of resources among theparties.
Property, Plants and Equipment
General
Substantially all of our property, consisting of refineries, storage, production, manufacturing and transportation facilities and certain retail outlets,is located in Mexico, including Mexican waters in the Gulf of Mexico. The location, character, utilization and productive capacity of our exploration,drilling, refining, petrochemical production, transportation and storage facilities are described above. See ��Exploration and Production,� ��Drillingand Services,� �Industrial Transformation,� ��Ethylene,� ��Fertilizers,� ��Logistics� and ��Cogeneration and Services.� The insurance programcovering all of our properties is also described above. See ��Insurance.�
Reserves
Under Mexican law, all crude oil and other oil and gas reserves located in the subsoil of Mexico are owned by the Mexican nation and not by us.The Mexican Government has granted us the right to exploit the petroleum and other oil and gas reserves assigned to us in connection with Round Zero,as well as the right to explore for and exploit petroleum and other oil and gas reserves in areas that have been granted to us in Round 1.4. Productivestate-owned companies and other companies participating in the Mexican oil and gas industry may report assignments or contracts and thecorresponding expected benefits for accounting and financial purposes. See �Information on the Company�History and Development�Energy Reform�above in this Item 4. Our estimates of hydrocarbons reserves are described under ��Exploration and Production�Reserves� above.
102
Copyright © 2018 www.secdatabase.com. All Rights Reserved.Please Consider the Environment Before Printing This Document
Table of ContentsGENERAL REGULATORY FRAMEWORK
Petróleos Mexicanos is regulated by the Mexican Constitution, the Petróleos Mexicanos Law and the Hydrocarbons Law, among otherregulations. The purpose of the Petróleos Mexicanos Law is to regulate the organization, management, operation, monitoring, evaluation andaccountability of Petróleos Mexicanos as a productive-state owned company of the Mexican Government. On October 31, 2014, the Regulations to thePetróleos Mexicanos Law were published in the Official Gazette of the Federation. These regulations were modified on February 9, 2015. The purposeof these regulations is to regulate, among other things, the appointment and removal of the members of the Board of Directors of Petróleos Mexicanos,potential conflicts of interest for Board members, and the evaluation of Petróleos Mexicanos.
The Mexican Government and its ministries regulate our operations in the oil and gas sector. The Ministry of Energy monitors our operations, andthe Secretary of Energy acts as the chairperson of the Board of Directors of Petróleos Mexicanos. In addition, the Ley de los Órganos ReguladoresCoordinados en Materia Energética (Coordinated Energy Regulatory Bodies Law related to the Energy Matters Law, which was enacted as part of theSecondary Legislation and took effect on August 12, 2014) establishes mechanisms for the coordination of these entities with the Ministry of Energyand other ministries of the Mexican Government. The CNH has the authority to award and execute contracts for exploration and production inconnection with competitive bidding rounds. The CRE has the authority to grant permits for the storage, transportation and distribution of oil, gas,petroleum products and petrochemicals in Mexico, and to regulate the first-hand sale of these products. The regulatory powers of the CNH and the CREextend to all oil and gas companies operating in Mexico, including Petróleos Mexicanos and our subsidiary entities.
On December 2, 2014, the Ministry of Energy published in the Official Gazette of the Federation a statement declaring that the new Board ofDirectors of Petróleos Mexicanos was performing its duties and the mechanisms for our oversight, transparency and accountability had beenimplemented in accordance with the Petróleos Mexicanos Law. As a result, the special regime that governs Petróleos Mexicanos� activities relating toproductive state-owned subsidiaries, affiliates, compensation, assets, administrative liabilities, budget, debt levels and the state dividend took effect. OnJune 10, 2015 the General Provisions for Contracting with Petróleos Mexicanos and its Productive State-Owned Subsidiaries were published in theOfficial Gazette of the Federation, and on June 11, 2015, the special regime for acquisitions, leases, services and public became effective. In accordancewith the Petróleos Mexicanos Law, each year the Ministry of Finance and Public Credit provides us with estimated macroeconomic indicators for thefollowing fiscal year, which we are to use to prepare the consolidated annual budget for Petróleos Mexicanos and the subsidiary entities, including ourfinancing program. Upon approval by the Board of Directors of Petróleos Mexicanos, our consolidated budget and financing program is then submittedto the Ministry of Finance and Public Credit, which has the authority to adjust our financial balance goal and the ceiling on our wage and salaryexpenditures for the fiscal year. The consolidated annual budget and financing program of Petróleos Mexicanos and the subsidiary entities, includingany adjustments made by the Ministry of Finance and Public Credit, is then incorporated into the federal budget for approval by the Chamber ofDeputies. The Mexican Government is not, however, liable for the financial obligations that we incur. In approving the federal budget, the Chamber ofDeputies authorizes our financial balance goal and the ceiling on our wage and salary expenditures for the fiscal year, which it may subsequently adjustat any time by modifying the applicable law.
We are also subject to various domestic and international laws and regulations related to anti-corruption, anti-bribery and anti-money laundering.The Código Penal Federal (Federal Criminal Code) criminalizes certain corrupt practices, including bribery, embezzlement and abuse of authority. TheLey Federal Anticorrupción en Contrataciones Públicas (Federal Law of Anti-Corruption in Public Contracting) sanctions companies and individualsthat violate this law while participating in federal government contracting in Mexico, as well as Mexican companies and individuals engaged ininternational commercial transactions. This law is analogous in many respects to the FCPA. In addition, the Federal Law of AdministrativeResponsibilities of Public Officials prohibits the bribery of federal public officials in Mexico, including members of the Mexican Congress and thefederal judiciary.
103
Copyright © 2018 www.secdatabase.com. All Rights Reserved.Please Consider the Environment Before Printing This Document
Table of ContentsWe also employ internal control procedures and guidelines designed to monitor the activities of our employees, including senior management, and
to ensure compliance with applicable anti-corruption, anti-bribery and anti-money laundering laws and regulations. The Lineamientos que regulan elsistema de control interno en Petróleos Mexicanos, sus empresas productivas subsidiarias y empresas filiales (Guidelines governing the internal controlsystem of Petróleos Mexicanos, its productive subsidiary entities and affiliates) set forth the principles underlying our internal controls system and theprocedures necessary for its implementation and monitoring. In addition, the Lineamientos para la participación de testigos sociales duranteactividades de procura y abastecimiento y procedimiento de contratación de Petróleos Mexicanos y sus empresas productivas subsidiarias (Guidelinesfor the participation of public witnesses in the procurement and supply activities and contracting procedures of Petróleos Mexicanos, its productivesubsidiary entities and affiliates), delineates the ways in which public witnesses may act as third-party observers in connection with our procurementprocedures. These internal controls and guidelines are applicable to Petróleos Mexicanos and the subsidiary entities. For a description of the risksrelating to anti-corruption, anti-bribery and anti-money laundering laws and regulations, see �Item 3�Key Information�Risk Factors�Risk FactorsRelated to our Operations�We are subject to Mexican and international anti-corruption, anti-bribery and anti-money laundering laws. Our failure tocomply with these laws could result in penalties, which could harm our reputation, prevent us from obtaining governmental authorizations needed tocarry out our operations and have an adverse effect on our business, results of operations and financial condition.�
Petróleos Mexicanos and the subsidiary entities, as public entities of the Mexican Government, are subject to the Ley General del SistemaNacional Anticorrupción (General Law of the National Anti-corruption System), the Ley de Fiscalización y Rendición de Cuentas de la Federación(Federal Audit and Accountability Law), and the Ley General de Responsabilidades Administrativas (General Law of Administrative Liabilities),among others. These laws establish a national anti-corruption system to coordinate efforts among the Mexican Government, federal entities, states andmunicipalities to prevent, investigate and punish corrupt activities and oversee public resources, as well as determine administrative liabilities of publicofficials and the applicable penalties.
On July 14, 2017, the Board of Directors of Petróleos Mexicanos approved our �Compliance Program�, a series of procedures aimed to complywith legal, accounting, and financial provisions to prevent corruption and to promote ethical values. These procedures include a focus on internalcontrols, risk management, ethical principles and corporate integrity, policies promoting transparency and accountability.
On August 28, 2017, a new Código de Conducta de Petróleos Mexicanos, sus empresas productivas subsidiarias y, en su caso, empresas filiales(Code of Conduct of Petróleos Mexicanos, its productive subsidiary entities and, where applicable, affiliated companies, or the Code of Conduct) waspublished in the Official Gazette of the Federation, replacing the code of conduct issued in February 2015. This Code of Conduct delineates behaviorsexpected of and banned for our employees, in accordance with the values established in the Code of Ethics, which was also published on that same dayin the Official Gazette of the Federation, approved by the Board of the Directors of Petróleos Mexicanos in November 2016, such as: respect,non-discrimination, honesty, loyalty, responsibility, legality, impartiality and integrity, among others.
On September 11, 2017, the Políticas y Lineamientos Anticorrupción para Petróleos Mexicanos, sus empresas productivas subsidiarias y, en sucaso, Empresas Filiales (Anti-corruption Policies and Guidelines for Petróleos Mexicanos, its productive subsidiary entities and, where applicable,affiliated companies) and the Políticas y Lineamientos para el desarrollo de la Debida Diligencia en Petróleos Mexicanos, sus empresas productivassubsidiarias y, en su caso, Empresas Filiales, en Materia de Ética e Integridad Corporativa (Policies and Guidelines to carry out Due Diligence inPetróleos Mexicanos, its productive subsidiary entities and, where applicable, affiliated companies, in Ethics and Corporate Integrity matters) becameeffective. The purpose of these regulations is to set up actions against acts of corruption as well as provide means to confront and fight them andmitigate our own risks as well as third-party risks that may affect the activities of PEMEX for acts of corruption, lack of ethics or corporate integrity orour involvement in illicit acts of any kind.
104
Copyright © 2018 www.secdatabase.com. All Rights Reserved.Please Consider the Environment Before Printing This Document

Table of ContentsAs an issuer of debt securities that are registered under the Securities Act and in connection with certain representations and covenants included in
our financing agreements, we must comply with the U.S. Foreign Corrupt Practices Act, or the FCPA. The FCPA generally prohibits companies andanyone acting on their behalf from offering or making improper payments or providing benefits to government officials for the purpose of obtaining orkeeping business. In addition, we are subject to other international laws and regulations related to anti-corruption, anti-bribery and anti-moneylaundering, including the U.K. Bribery Act 2010, which prohibits the solicitation of, the agreement to receive and the acceptance of bribes.
105
Copyright © 2018 www.secdatabase.com. All Rights Reserved.Please Consider the Environment Before Printing This Document
Table of ContentsENVIRONMENTAL REGULATION
Legal Framework
We are subject to the environmental laws and regulations issued by the local and state governments where our facilities are located, includingthose associated with atmospheric emissions, water usage and wastewater discharge, as well as the management of hazardous and non-hazardous waste.In particular, we are subject to the provisions of the Ley General del Equilibrio Ecológico y la Protección al Ambiente (General Law on EcologicalEquilibrium and Environmental Protection, which we refer to as the Environmental Law) and related regulations, the Ley General de Cambio Climático(General Law on Climate Change) and other technical environmental standards issued by the Secretaría del Medio Ambiente y Recursos Naturales(Secretariat of the Environment and Natural Resources or SEMARNAT) and the Agencia de Seguridad, Energía y Ambiente (National Agency forIndustrial Safety and Environmental Protection of the Hydrocarbons Sector or ASEA). We are also subject to the Ley General para la Prevención yGestión Integral de los Residuos (General Law on Waste Prevention and Integral Management) and the Ley de Transición Energética (Law of theEnergy Transition).
In April 1997, the SEMARNAT issued regulations governing the procedures for obtaining an environmental license, under which new industrialfacilities can comply with all applicable environmental requirements through a single administrative procedure. Each environmental license integratesall of the different permits, licenses and authorizations related to environmental matters for a particular facility. Since these regulations went into effect,we have been required to obtain an environmental license for any new facility. Our facilities that existed prior to the effectiveness of these regulationsare not subject to this requirement.
Before we carry out any activity that may have an adverse impact on the environment, we are required to obtain certain authorizations fromASEA, the SEMARNAT, the Ministry of Energy, the National Water Commission and the Mexican Navy, as applicable. In particular, specificenvironmental regulations apply to petrochemical, crude oil refining and extraction activities, as well as to the construction of crude oil and natural gaspipelines. Before authorizing a new project, ASEA requires the submission of an environmental impact and risk analysis.
ASEA is an administrative body of the SEMARNAT that operates with technical and administrative autonomy and has the authority to regulateand supervise companies participating in the hydrocarbon sector through its issuance of rules establishing safety standards, limits on greenhouse gasemissions and guidelines for the dismantling and abandonment of facilities, among other things. The Ley de la Agencia Nacional de SeguridadIndustrial y de Protección al Medio Ambiente del Sector Hidrocarburos (Law of the Hydrocarbons Industrial Safety and Environmental ProtectionAgency of the Hydrocarbon Sector) provides that until the general administrative provisions and Official Mexican Standards proposed by theHydrocarbons Industrial Safety and Environmental Protection Agency are in effect, obligations will continue under the guidelines, technical andadministrative arrangements, agreements and Official Mexican Standards promulgated by the SEMARNAT, CNH and CRE.
The environmental regulations specify, among other matters, the maximum levels of emissions and waste water discharge that are permissible.These regulations also establish procedures for measuring pollution levels, the management of hazardous and non-hazardous waste and the treatment ofsites affected by hydrocarbon production.
We are also subject to the NOM-001-SEMARNAT-1996 issued by CONAGUA in conjunction with the Procuraduría Federal de Protección alAmbiente (PROFEPA), which sets forth the maximum permissible levels of pollutants in wastewater that can be discharged into national bodies ofwater. In addition, we are subject to the NOM-052-SEMARNAT-2006, which regulates hazardous waste, the NOM-161-SEMARNAT-2011, whichregulates special waste management procedures, as well as the NOM-138-SEMARNAT/SSA1-2012, which establishes the maximum permissible levelsof hydrocarbons in the soil and sets forth guidelines with respect to soil testing and the treatment of sites affected by hydrocarbon production.
106
Copyright © 2018 www.secdatabase.com. All Rights Reserved.Please Consider the Environment Before Printing This Document
Table of ContentsFederal and state authorities are authorized to inspect any facility to determine its compliance with the Environmental Law, local environmental
laws, regulations and technical environmental regulations. Violations or non-compliance with environmental standards and regulations may result insubstantial fines, temporary or permanent shutdown of a facility, required capital expenditures to minimize the effect of our operations on theenvironment, cleanup of contaminated soil and water, cancellation of a concession or revocation of an authorization to carry out certain activities and, incertain cases, criminal proceedings. See �Item 3�Key Information�Risk Factors�Risk Factors Related to Our Operations�Our compliance withenvironmental regulations in Mexico could result in material adverse effects on our results of operations.�
Mexico generally reviews and updates its environmental regulatory framework every five years , and we work with the Mexican Government todevelop new environmental regulations of activities related to the oil and gas industry.
During 2016, the CNH updated the technical provisions for the use of natural gas in exploration and extraction activities and issued regulations fordrilling, exploration and development.
Also in 2016, ASEA required that CONAGUA monitor water tables before we began drilling shale gas exploratory wells in the northern part ofVeracruz and the southern part of Tamaulipas.
During 2016, ASEA issued further regulations that establish guidelines on, among others, implementing and authorizing industrial safetymanagement systems, operational safety and environmental protection, as well as the reporting of incidents to the authorities. Moreover, in 2017 ASEAissued regulations for the external auditing of the performance of such safety systems.
Climate Change
On June 6, 2012, the General Law on Climate Change was published in the Official Gazette of the Federation, with the objectives of regulatinggreenhouse gas emissions and reducing the vulnerability of Mexico�s infrastructure, population and ecosystems to the adverse effects of climate change.The General Law on Climate Change establishes a series of financial, regulatory and technical rules and regulations, as well as tools for strategyformation, evaluation and monitoring that form the framework for a comprehensive public policy on climate change.
Our Special Climate Change Program 2014-2018 aims to reduce greenhouse gas emissions, improve energy and operational efficiency, reduce gasflaring and promote the efficient use of gas, among other things. Pursuant to this program, in 2016, we began upgrading the Ing. Antonio Dovalí JaimeRefinery in Salina Cruz, Oaxaca to operate on cleaner natural gas. We also began the test period for a cogeneration project to increase energy efficiencyat the Antonio M. Amor Refinery in Salamanca, Guanajuato, and to evaluate the reduction of greenhouse gas emissions. In addition, we continue towork on our PEMEX Environmental Strategy 2016-2020, which incorporates our former Plan de Acción Climática (Climate Action Plan), to identifyaction items, projects and best practices to mitigate the impact of our operations on climate change. These actions include the construction ofinfrastructure for transportation and gas management.
We also work with several national and international entities to develop and promote initiatives that mitigate the effects of climate change. Forinstance, we participate in the Climate and Clean Air Coalition (CCAC), with which we aim to identify emission sources in our key facilities andsubstantially reduce emissions of climate pollutants. In compliance with CCAC criteria, we carried out inspections in nine facilities, including DosBocas, Cactus and Atasta and have mitigated the emissions identified in those inspections.
In accordance with the actions carried out by the Mexican Government to mitigate global climate change, we are analyzing the implementation ofcarbon capture, use and storage (CCUS) techniques. In 2014, the �Technology Route Map of CCUS in Mexico� was developed in conjunction withSENER, SEMARNAT and
107
Copyright © 2018 www.secdatabase.com. All Rights Reserved.Please Consider the Environment Before Printing This Document
Table of ContentsCFE. This led to the execution of integrated carbon dioxide capture projects at PEMEX and CFE facilities and enhanced oil recovery (EOR) initiatives.In 2016, several tools were developed to evaluate the first CCUS-EOR project in Mexico. This project included a plan to inject carbon dioxide producedat our Cosoleacaque Petrochemical Complex into the Brillante producing field at the Cinco Presidentes business unit. By the end of 2017, we had put inplace the necessary environmental and social safeguards for the pilot projects, which in turn allows us to receive support from the World Bank.
During 2017, we recorded greenhouse gas emissions of approximately 40 million tons of carbon dioxide equivalent, which represented a 30 %decrease compared to 2016, mainly due to an increase in the use of associated gas from Kumaza, Cantarell, Abkatún Pol-Chuc and Litoral de Tabascofields. Our gas usage level was approximately 97% during 2017, as compared to 91% in 2016, which increase was mainly due to field performance andour operational flexibility.
In 2017, we continued to develop several conservation and reforestation projects designed to increase carbon dioxide and water capture topreserve the ecosystems in which we operate. Our biodiversity conservation efforts and indirect mitigation measures have been carried out through thefollowing projects:
� Proyecto de Conservación, Manejo y Restauración de los Ecosistemas Naturales de la Cuenca Media del Río Usumacinta (Conservation,Management and Restoration Project of the Natural Ecosystems of the Rio Usumacinta Basin) in Chiapas;
� Operación y manejo del corredor ecológico JATUSA (Operation and Management of the JATUSA Ecological Corridor) in the Jaguaroundiand Tuzandépetl ecologic parks, and the Santa Alejandrina swamp; and
� Educación Ambiental y Operación de la Casa del Agua, en los Pantanos de Centla (Environmental Education and Operation of the Casa delAgua in Pantanos de Centla) in Tabasco.
We also continued to develop the JATUSA Ecological Corridor. This project is one of our most important conservation initiatives and its purposeis to merge natural or modified spaces, ecosystems and habitats to facilitate the conservation of biodiversity. During the months of April through June of2017, we made improvements to the Jaguaroundi Park with the goal of attracting more visitors. Additionally, by the end of 2017 we developed abusiness plan that encourages the participation of nearby communities to maximize profits and facilitate the preservation of biodiversity. For 2018, weplan to establish a fund to guarantee the continuing operation of this project.
Clean Development Mechanism Projects
In 2000, Mexico ratified the Kyoto Protocol to the United Nations Framework Convention on Climate Change as a non-Annex B country.Accordingly, Mexico is not subject to emission parameters under the Kyoto Protocol, but Mexican companies, such as PEMEX, are allowed to developprojects known as Clean Development Mechanism (CDM) projects. These CDM projects generate carbon dioxide emission reduction certificates orcredits that can be traded in international markets. We have registered two CDM projects under the United Nations Framework Convention on ClimateChange: waste energy recovery at the Dos Bocas Maritime Terminal, which increases thermal efficiency by recovering wasted heat for the Maya oildewatering process, and the Tres Hermanos oil field gas recovery and utilization project, which involves the recovery and transportation of gas from oilwells that used to be flared from oil batteries to a new carbon dioxide separation and gas conditioning plant, where dry gas and condensates areproduced. The decrease in emissions resulting from these projects is expected to be verified by a third party recognized by the United Nations.
108
Copyright © 2018 www.secdatabase.com. All Rights Reserved.Please Consider the Environment Before Printing This Document
Table of ContentsIn addition, in November of 2017 we participated in a meeting of the Oil and Gas Climate Initiative (OGCI). This initiative is an effort by ten
international oil companies, representing 20% of the total production of oil and gas in the world, to reduce emissions of greenhouse gases. Theleadership of these companies endorse the Paris Agreement and the OGCI aims to reduce methane emissions, accelerate the deployment of carboncapture, use and sequestration, improve energy efficiency and contribute to transport efficiency. During this meeting, our CEO explained our strategy ofreducing gas burning in the shallow water assets through the rehabilitation of compression modules and optimizing energy consumption in the refiningprocesses.
109
Copyright © 2018 www.secdatabase.com. All Rights Reserved.Please Consider the Environment Before Printing This Document
Table of ContentsHEALTH, SAFETY AND ENVIRONMENTAL PERFORMANCE
We believe that we are in substantial compliance with current federal and state environmental laws and that we maintain an organizationalstructure designed to identify and solve environmental risks. In addition, our subsidiary entities have specialized departments that implement their owninternal environmental programs, audits and facilities inspections. When these internal audits reveal problems or deficiencies, the subsidiary entities takethe necessary measures to eliminate them.
In addition to our internal monitoring structure, Petróleos Mexicanos and its subsidiary entities� environmental audit program is subject to reviewby ASEA, which oversees reviewing compliance with environmental regulations for the oil and gas sector and establishes environmental remediationstandards.
Since 1993, we have participated in the National Environmental Audit Program (NEAP), a voluntary alternative to the traditional system ofinspections and penalties, with PROFEPA and now with ASEA. This program was created by PROFEPA in 1992 as a regulatory incentive forcompanies to voluntarily correct any environmental irregularities in their operations.
In general terms, voluntary environmental auditing consists of three stages: (i) an audit and compliance diagnosis; (ii) development of an actionplan to correct irregularities; and (iii) the implementation of the action plan. If a company satisfactorily completes these three stages, ASEA grants theaudited company a clean industry certificate, which means that it complies with the applicable environmental legislation of their industry.
As of December 31, 2017, we have registered 290 of our facilities with NEAP with the objective of obtaining a �clean industry� certificate foreach facility. During 2017, 123 of our facilities were re-certified and an additional 44 facilites were certified for the first time. The audits of theremaining 123 facilities are still under review. We will continue including new facilities under this program, as we expand our activities in the areas ofexploration, exploitation, refining and distribution of hydrocarbons.
On February 7, 2016, a fire and explosion occurred at the Abkatun-A-Compression processing platform in the Gulf of Mexico, which activatedthe safety systems, procedures and protocols and the platform was evacuated. As a result of this accident, three offshore workers (two PEMEXemployees and one contractor) lost their lives. The explosion was caused when the welding of an FA-4210 cap failed.
During 2017, we did not experience any major incident that had significant environmental consequences. We did, however, experience thefollowing nine material blasts or hazardous events at our facilities, none of which had significant environmental consequences:
� On January 12, 2017, during the cleaning of the hydrodesulphurizing plant exchangers of the intermediate distillates U-501 of the FranciscoI. Madero Refinery, there was a leak of sulfuric acid that killed one worker.
� On March 15, 2017, an explosion occurred at the Salamanca storage and dispatch terminal during work that was done to uncover a heavyfuel oil line. As a result of this accident three of our employees and five contractors lost their life.
� On March 23, 2017, an incident occurred at the Independencia Petrochemical Complex during railroad maneuvers. As a result of thisincident, which was caused by a miscommunication between the machinist and a rail transport worker, one employee of the railroadcompany lost his life.
� On March 29, 2017, a fire occurred inside a barge tank located at the dock of Madero shipyards while employees were removing heatingcoils, resulting in minor injuries to 17 employees.
� On March 31, 2017, while fixing an illegal tap of the Mendoza pipeline, a leak and fire occurred that resulted in three workers being injured,one of whom lost his life.
110
Copyright © 2018 www.secdatabase.com. All Rights Reserved.Please Consider the Environment Before Printing This Document
Table of Contents� On June 14, 2017, as a result of flooding caused by tropical storms �Beatriz� and �Calvin�, there was an explosion at our Salina Cruz
refinery and subsequent fire that lasted 43 hours. As a result of this incident, one employee lost his life, the pumping house at the location ofthe explosion and many pipelines were destroyed and operations at the Salina Cruz refinery were temporarily suspended.
� On July 29, 2017, the driver of a fire protection unit at our Salina Cruz Maritime Storage Terminal lost control over the unit, resulting in anaccident which caused two fatalities.
� On December 12, 2017, during railroad maneuvers inside our Salamanca Refinery, an employee of the railroad company fell down theconvoy, resulting in his death.
� On December 14, 2017, during maintenance and cleaning activities at the alkylation plant at our Madero Refinery, there was a leak ofhydrofluoric acid, causing the maintenance supervisor to suffer chemical burns and ultimately lose his life.
As part of our accident prevention strategy, we conduct root cause investigations of all incidents that occur during our operations. Theseinvestigations allow us to identify the causes and establish corrective measures to avoid the recurrence of such type of incident.
In 2017, our lost time injury rate decreased 5.6% from 0.36 in 2016 to 0.34 in 2017. The segment that contributed most to this decrease was theindustrial transformation segment. Our lost days indicator due to injuries decreased 8.7% from 23 to 21 lost days per million man hours worked withrisk exposure from 2016 to 2017. Lost days are those missed as a result of incapacitating injuries suffered at work or those on which compensation ispaid for partial, total or permanent incapacity or death. From 2016 to 2017, our contractors� lost time injury rate decreased 65.4% from 0.26 to 0.09injuries per million man-hours worked with risk exposure.
In 2017, our primary initiatives in industrial safety, health and environmental protection included the following:
� Weekly visits to subsidiary facilities to supervise the implementation of the PEMEX-SSPA System;
� Review of compliance with our 12 zero tolerance EH&S guidelines;
� Verification and advice in the application of the eight critical standards of process safety;
� Evaluation of our Binomio project for the immediate verification and mitigation of risks;
� EH&S campaigns, including the �Order and Cleaning�, �Prevention of Falls at the Same Level� and the �Up the Voice, All Safe, AllAboard� campaigns to ensure that platform workers are in optimal health;
� Several EH&S campaigns aimed at creating awareness of the importance of, and reinforcing a commitment to, equipment protection; and
� EH&S leadership evaluations at the three levels of the organization (strategic, tactical and operational).
On May 19, 2017, Pemex Exploration and Production received an award for high performance from ASEA for achieving the lowest lost timeinjury frequency rate in its history in 2016, with 0.25 injuries per million man-hours worked, 45% lower than 2015. In 2017, this index was 0.34 forPEMEX as a whole, which represents a decrease of 5.6% compared to 2016.
By the end of 2017, we finished the design of the new model of the PEMEX-SSPA System, which works to incorporate international bestpractices and includes the International Association of Oil and Gas Producers (IOGP) standards. The Pemex-SSPA System was approved by ASEA,which allows us to operate our facilities in accordance with the energy reform.
111
Copyright © 2018 www.secdatabase.com. All Rights Reserved.Please Consider the Environment Before Printing This Document
Table of ContentsEnvironmental Liabilities
As of December 31, 2017, our estimated and accrued environmental liabilities totaled Ps. 17,482.4 million. Of this total, Ps. 755.9 million belongto Pemex Exploration and Production, Ps. 2,680.8 million to Pemex Industrial Transformation and Ps. 14,045.8 million to Pemex Logistics. Thefollowing tables detail our environmental liabilities by subsidiary entity and operating region at December 31, 2017.
Pemex Exploration and Production(1)
Estimated Affected Area Estimated Liability(in hectares) (in millions of pesos)
Northern region 150.42 Ps. 359.0Southern region 159.14 250.7Total(2) 309.56 Ps. 609.6
Note: Numbers may not total due to rounding.(1) Includes all liabilities of Pemex Exploration and Production that were assumed pursuant to our corporate reorganization.(2) During 2017, environmental remediation was completed on 66.36 hectares. There were 154.65 hectares of additional affected areas in 2016, as a result of spills from
pipelines mainly.Source:PEMEX.
Holding Ponds DrainageNumber of Holding PondsReported as Liabilities(1) Estimated Liability
(in millions of pesos)Southern region 11 Ps. 19.3Northern region 69 127.0Total 80 Ps. 146.2
Total estimated environmental liabilities ofPemex Exploration and Production Ps. 755.9
Note: Numbers may not total due to rounding.(1) In 2017, no new ponds were added, and no holding ponds were restored. As a result, as of December 31, 2017, 80 ponds remain to be reported.Source:Pemex Exploration and Production.
Pemex Industrial Transformation
Estimated Affected Area Estimated Liability(in hectares) (in millions of pesos)
Refineries 285.49 Ps. 2,661.3Reynosa Gas complex processor 11.52 19.5Total estimated environmental liabilities of Pemex Industrial
Transformation 297.01 Ps 2,680.8
Note: Numbers may not total due to rounding.Source:Pemex Industrial Transformation.
112
Copyright © 2018 www.secdatabase.com. All Rights Reserved.Please Consider the Environment Before Printing This Document
Table of ContentsPemex Logistics
Estimated Affected Area Estimated Liability(in hectares) (in millions of pesos)
Storage and Distribution Terminals 69.58 Ps. 919.0Pipelines 989.59 13,126.8Total estimated environmental liabilities of Pemex Logistics 1,059.17 Ps. 14,045.8
Note: Numbers may not total due to rounding.Source:Pemex Logistics.
Our estimates of environmental liabilities include cost estimates for site-specific evaluation studies, which draw upon aspects of previousevaluations for sites with comparable characteristics and the corresponding remediation. The remediation sites consist of facilities identified in the auditprocess described above, as well as those previously identified sites in more mature petroleum operating areas that were not cleaned up in the past. Ourenvironmental liabilities also include the elimination of holding ponds created by abandoned petroleum wells. Additionally, our environmental liabilitiesinclude an accrual based on information received periodically from field managers regarding probable environmental liabilities identified in theirrespective areas of responsibility. We accrue environmental liabilities when sufficient basic knowledge is available to form a preliminary estimation asto remediation cost. Although the full potential scope of the remediation cost may not be known with certainty, these accruals are made when theliability is probable and the amount may be reasonably estimated, in accordance with IAS 37 �Provisions, Contingent Liabilities and Contingent Assets�for IFRS purposes. These estimated liabilities include assumptions resulting from an initial evaluation of damage, including land acreage to beremediated, depth and type of contamination. While the initial evaluation is extensive, there is a possibility that the actual scope of remediation couldvary depending upon information gathered during the remediation process. For a further discussion of our environmental liabilities, see Note 3(l) to ourconsolidated financial statements included herein.
Unasserted or additional claims are not reflected in our identified liabilities. We are not aware of any such claims that would be of such magnitudeas to materially affect our estimates of environmental liabilities. At the end of 2017, we were not aware of uncertainties with respect to joint and severalliabilities that could affect our assessment of environmental contingencies or otherwise result in a major environmental liability. See ��History andDevelopment�Energy Reform� above in this Item 4 for more information regarding the participation of other companies in the Mexican energy sector.As a result, we believe we are positioned to know immediately of any claims and are therefore directly accountable for any claims that may be broughtagainst us.
Pemex Exploration and Production remains responsible for handling existing environmental liabilities�these responsibilities are not part of theIntegrated E&P Contracts. Nevertheless, the Integrated E&P Contracts include environmental clauses related to contractors� and Pemex Exploration andProduction�s responsibility to ensure an adequate environmental performance, and also establish the terms for compensation and repair of any newenvironmental impacts.
The timing of remediation or cleanup of the sites to which these environmental liabilities relate is dependent upon the annual budget approved bythe Mexican Congress.
On August 1, 2017, we were granted a favorable judgment by the Supreme Court of Justice of the Nation, which determined that we are not liablefor material and environmental damages caused by hydrocarbons spills related to illegal tapping of pipelines, since the environmental damage wascaused by third party criminal behavior.
113
Copyright © 2018 www.secdatabase.com. All Rights Reserved.Please Consider the Environment Before Printing This Document
Table of ContentsEnvironmental Projects and Expenditures
In 2017, we spent approximately Ps. 5,760 million on environmental projects and related expenditures, as compared to Ps. 11,424 million in 2016.For 2018, we have budgeted Ps. 3,473 million for environmental projects and expenditures, including modernization of installations, implementation ofsystems and mechanisms to monitor and control atmospheric pollution, acquisition of equipment to address contingencies related to oil and gas spills,the expansion of water effluent systems, restoration and reforestation of affected areas, studies for environmental investigation and environmental audits.In addition, we continue to conduct research and development efforts to increase our capacity to produce gasoline, diesel and fuel oil with lower sulfurcontent at our refineries in Mexico.
We do not believe that the cost of complying with environmental laws or environmental requirements related to the NAFTA among thegovernments of Mexico, the United States and Canada, the Vienna Convention for the Protection of the Ozone Layer, the Agreement on EnvironmentalCooperation between the Governments of Mexico and Canada or Mexico�s membership in the Organization for Economic Cooperation andDevelopment, has caused or will cause a significant increase in our environmental expenditures.
Social Responsibility
We have implemented various corporate social responsibility initiatives, primarily with respect to the protection and preservation of theenvironment, relations with communities where we operate, ethical work practices, respect for labor rights and the general promotion of quality of lifefor communities and employees.
Our corporate and social responsibility goals are carried out through the following mechanisms:
� cash donations;
� product donations of fuels and asphalt;
� donations of movable and immovable property;
� environmental protection projects;
� mutually beneficial public works, which are projects we carry out in collaboration with local authorities and communities to improveinfrastructure that is beneficial both to us and to the community;
� the Programa de apoyo a la comunidad y medio ambiente (Program to support communities and the environment, which we refer to asPACMA), which supports and implements social programs, actions and public works designed to promote the economic and socialdevelopment of the communities in which we operate and to protect their environment; and
� other instruments that provide a positive impact on communities, including integrated exploration and production contracts and thesustainable development annexes and clauses to our contracts, in which we and our contractors commit to improving the quality of life incommunities where we operate.
In 2017, the total value of our donations and contributions amounted to Ps. 1,670.3 million. Our cash donations amounted to approximately Ps.59.0 million, our asphalt and fuel donations amounted to approximately Ps. 1,247.0 million and our movable and immovable property donationsamounted to approximately 17.0 million. Contributions made through provisions of our Integrated E&P Contracts, FPWCs, SD Annexes and RS KMZsustainable development clause amounted to Ps. 90.5 million, and PACMA and mutual benefit project contributions amounted to Ps. 233.8 million andPs. 23.0 million, respectively.
Approximately 92.4% of our donations and contributions were assigned to 12 states with greater activity in the oil and gas industry (Campeche,Chiapas, Coahuila, Guanajuato, Hidalgo, Nuevo León, Oaxaca, Puebla, San
114
Copyright © 2018 www.secdatabase.com. All Rights Reserved.Please Consider the Environment Before Printing This Document

Table of ContentsLuis Potosí, Tabasco, Tamaulipas and Veracruz)); and the remaining 7.6% to the remaining states. Most importantly, we took the following specificactions in 2017:
� contributed approximately Ps. 894.8 million in fuel for the operation of vehicles and machinery for various state and municipalgovernments, principally to provide assistance for emergencies, civil protection programs, services and public safety;
� contributed approximately Ps. 326.5 million to the construction, improvement or pavement of roads and highway infrastructure in 23 states;
� contributed approximately Ps. 98.9 million toward education and sports programs in oil and gas communities in 6 states, mainly forscholarships and the construction of schools and sports facilities;
� contributed approximately Ps. 41.3 million for environmental education, restoration and conservation of protected natural areas throughprograms implemented in the states of Campeche, Chiapas, Tabasco and Veracruz;
� contributed approximately Ps. 25.7 million in turbosine for the operation of state aircrafts in the states of Campeche, Chiapas, Hidalgo andVeracruz; and
� contributed approximately Ps. 15.7 million towards sustainability projects and training programs primarily aimed at fishing communities inthe states of Oaxaca and Tabasco.
In addition, we made the following donations under our PACMA program:
� contributed approximately Ps. 82.4 million for the operation of mobile medical units and other medical services in the state of Tabasco;
� contributed approximately Ps. 33.5 million for the installation of public lighting in communities in the states of Campeche, Guanajuata,Oaxaca and Veracruz;
� contributed approximately Ps. 16.3 million for the construction and restoration of public parks and sports facilities in communities in thestates of Campeche, Nuevo León, Tabasco and Veracruz; and
� contributed approximately Ps. 7.0 million for the construction of community kitchens in eight municipalities in the states of Oaxaca andVeracruz.
115
Copyright © 2018 www.secdatabase.com. All Rights Reserved.Please Consider the Environment Before Printing This Document
Table of ContentsTRADE REGULATION AND EXPORT AGREEMENTS
Though Mexico is not a member of Organization of the Petroleum Exporting Countries (which we refer to as OPEC), it has periodicallyannounced increases and decreases in our crude oil exports reflecting production revisions made by other oil producing countries, in order to contributeto crude oil prices stabilization. However, we have not changed our export goals because of announcements made by OPEC since 2004, and we believethat Mexico has no current plans to change our current level of crude oil exports.
NAFTA has not affected Mexico�s rights, through us or other companies, to explore and exploit crude oil and natural gas in Mexico, to refine andprocess crude oil and natural gas and to produce petrochemicals in Mexico. Since 2003, petrochemical products have enjoyed a zero tariff underNAFTA and, subject to limited exceptions, exports of crude oil and petroleum products from Mexico to the United States and Canada have been free orexempt from tariffs. Similarly, since 2003, Mexico�s imports of petroleum products from the United States and Canada have also been exempt fromtariffs. In addition, in 2004, NAFTA approved lower tariffs on certain materials and equipment imported by Mexico. The zero tariff on Mexico�simports of petrochemicals from the United States and Canada could have increased competition in the petrochemicals industry in Mexico. To the extentthat domestic and international prices for our products remain constant, lower tariffs on products, materials and equipment that we import from andexport to the United States and Canada, reduce our expenses and increase our revenue.
116
Copyright © 2018 www.secdatabase.com. All Rights Reserved.Please Consider the Environment Before Printing This Document
Table of ContentsTAXES, DUTIES AND OTHER PAYMENTS TO THE MEXICAN GOVERNMENT
General
Taxes and duties applicable to us are a significant source of revenues to the Mexican Government. We contributed approximately 8.6% of theMexican Government�s revenues in 2016 and 11.3% in 2017. In 2017, we paid a number of special oil and gas taxes and duties, in addition to the othertaxes and duties paid by some of the subsidiary companies, as described below under ��Other Taxes.� The fiscal regime in effect for PetróleosMexicanos and the subsidiary entities for 2017 (which we refer to as the fiscal regime) became effective in 2015 and can be subsequently modified fromtime to time. The Secondary Legislation published in August 2014 set forth a fiscal regime applicable to the new contractual arrangements that governsexploration and production activities conducted in Mexico beginning on January 1, 2015, as well as a new state dividend to be paid by PetróleosMexicanos and the subsidiary entities beginning on January 1, 2016. See ��Fiscal Regime� and ��Other Payments to the Mexican Government� below.
Fiscal Regime for PEMEX
Fiscal Regime
The Hydrocarbons Revenue Law that was adopted as part of the Secondary Legislation sets forth, among other things, the following dutiesapplicable to us in connection with our assignments granted by the Mexican Government:
� Derecho por la Utilidad Compartida (Profit-Sharing Duty): As of January 1, 2015, this duty is equivalent to 70% of the value of oil and gasproduced in the relevant area, less certain permitted deductions. Pursuant to the Hydrocarbons Revenue Law, this duty is to decrease on anannual basis until January 1, 2019, at which point it will be set at 65%. During 2017, we paid Ps. 373,728 million in connection with thisduty, a 22.8% increase from Ps. 304,299 paid in 2016, primarily resulting from an increase in oil and gas prices. On August 18, 2017, adecree was published in the Official Gazette of the Federation that increased the amount we can deduct for investments, costs and expensesmade pursuant to this duty and resulted in a benefit of Ps. 7,770 million. On November 30, 2017, the decree entitled Acuerdo por el que sereforman y adicionan diversas disposiciones de las Reglas de carácter general para definir los métodos de ajuste del valor de loshidrocarburos de los derechos sobre hidrocarburos (Agreement by which various provisions of the general rules are reformed and added todefine the methods of adjusting the value of hydrocarbons and hydrocarbon rights) was published in the Official Gazette of the Federation,defining the method for adjusting the value of hydrocarbons, which resulted in an estimated tax benefit of Ps. 8,854 million. In addition, wereceived a benefit of Ps. 2,187 million in the payment of this duty as a result of adjustments to the fair economic value of certain explorationand production areas. See �Item 5�Critical Accounting Policies�Exploration and Production Taxes and Duties� below.
� Derecho de Extracción de Hidrocarburos (Hydrocarbons Extraction Duty): This duty is to be determined based on a rate linked to the typeof hydrocarbons (e.g., crude oil, associated natural gas, non-associated natural gas or condensates), the volume of production and therelevant market price. During 2017, we paid Ps. 58,523.1 million under this duty, a 32% increase from Ps. 43,517.4 million in 2016, mainlydue to an increase in oil and gas prices.
� Derecho de Exploración de Hidrocarburos (Exploration Hydrocarbons Duty): The Mexican Government is entitled to collect a monthlypayment of Ps. 1,214 per square kilometer of non-producing areas. After 60 months, this duty increases to Ps. 2,904 per square kilometer foreach additional month that the area is not producing. These amounts will be updated on an annual basis in accordance with the nationalconsumer price index (NCPI). During 2017, we paid Ps. 981 million under this duty, a 1.8% decrease from Ps. 963 million in 2016.
� In 2016, Mexican companies paid a corporate income tax at a rate of 30% applied to revenues, less certain deductions. Beginning in 2015,Petróleos Mexicanos and the subsidiary entities became subject
117
Copyright © 2018 www.secdatabase.com. All Rights Reserved.Please Consider the Environment Before Printing This Document
Table of Contentsto the Ley del Impuesto sobre la Renta, or Mexican Income Tax Law. During 2017, we did not pay any tax under this law, as compared tothe Ps. 1,333 million we paid in 2016.
Under the 2017 fiscal regime, some of our products are subject to the following IEPS Taxes, which we withhold from our customers and pay tothe tax authorities. The IEPS tax is no longer included in our sales or expenses.
� IEPS sobre la venta de los combustibles automotrices (IEPS Tax on the Sale of Automotive Fuels): This tax is a fee on domestic sales ofautomotive fuels, gasoline and diesel, that Pemex Industrial Transformation collects on behalf of the Mexican Government. The applicablefees for this tax are Ps. 4.30 per liter of Magna gasoline; Ps. 3.64 per liter of Premium gasoline and Ps. 4.73 per liter of diesel. The amountof the fee will depend on the class of fuel, and is fixed monthly by the Ministry of Finance and Public Credit. The fees apply to sales inMexico and imports, and are not subject to VAT.
� IEPS beneficio de entidades federativas, municipios y demarcaciones territoriales (IEPS Tax in Favor of States, Municipalities andTerritories): This tax is a fee on domestic sales of automotive fuels, gasoline and diesel, that Pemex Industrial Transformation collects onbehalf of the Mexican Government. The applicable fees for this tax are 38 cents per liter of Magna gasoline, 46.37 cents per liter ofPremium gasoline and 31.54 cents per liter of diesel. This fee changes yearly in accordance with inflation. Funds gathered by this fee areallocated to Mexican states and municipalities as provided for in the Ley de Coordinación Fiscal (Tax Coordination Law). The fees onlyapply to sales in Mexico and are not subject to VAT.
� IEPS a los combustibles fósiles (IEPS Tax on Fossil Fuels): This tax is a fee on domestic sales of fossil fuels that Pemex IndustrialTransformation collects on behalf of the Mexican Government. The applicable fees for this tax are 6.50 cents per liter for propane, 8.42cents per liter for butane, 11.41 cents per liter for gasoline and aviation gasoline, 13.64 cents per liter for jet fuel and other kerosene,13.84 cents per liter for diesel, 14.78 cents per liter for fuel oil and Ps. 17.15 per ton for petroleum coke. This fee changes yearly inaccordance with inflation and applies to imports to Mexico.
The Hydrocarbons Revenue Law also establishes the fiscal terms to be applied to the contracts for exploration and production granted by theMexican Government to us or to other companies in connection with future competitive bidding rounds. Specifically, these fiscal terms contemplate thefollowing taxes, duties, royalties and other payments to the Mexican Government (in addition to any taxes owed pursuant to the Ley de Ingresos de laFederación (Federal Revenue Law) for the applicable year and other applicable tax laws):
� Cuota Contractual para la Fase Exploratoria (Exploration Phase Contractual Fee): During the exploration phase of a project governed by alicense, production-sharing contract or profit-sharing contract, the Mexican Government is entitled to collect a monthly payment ofPs. 1,214 per square kilometer of non-producing areas. After 60 months, this fee increases to Ps. 2,904 per square kilometer for eachadditional month that the area is not producing. The fee amount will be updated on an annual basis in accordance with the NCPI.
� Regalías (Royalties): Royalty payments to the Mexican Government are determined based on the �contractual value� of the relevanthydrocarbons, which is based on a variety of factors, including the type of underlying hydrocarbons (e.g., crude oil, associated natural gas,non-associated natural gas or condensates), the volume of production and the market price. Royalties are payable in connection withlicenses, production-sharing contracts and profit-sharing contracts.
� Pago del Valor Contractual (Contractual Value Payment): Licenses require a payment calculated as a percentage of the �contractual value�of the hydrocarbons produced, as determined by the Ministry of Finance and Public Credit on a contract-by-contract basis.
� Porcentaje a la Utilidad Operativa (Operating Profit Payment): Production-sharing contracts and profit-sharing contracts require a paymentequivalent to a specified percentage of operating profits. In
118
Copyright © 2018 www.secdatabase.com. All Rights Reserved.Please Consider the Environment Before Printing This Document
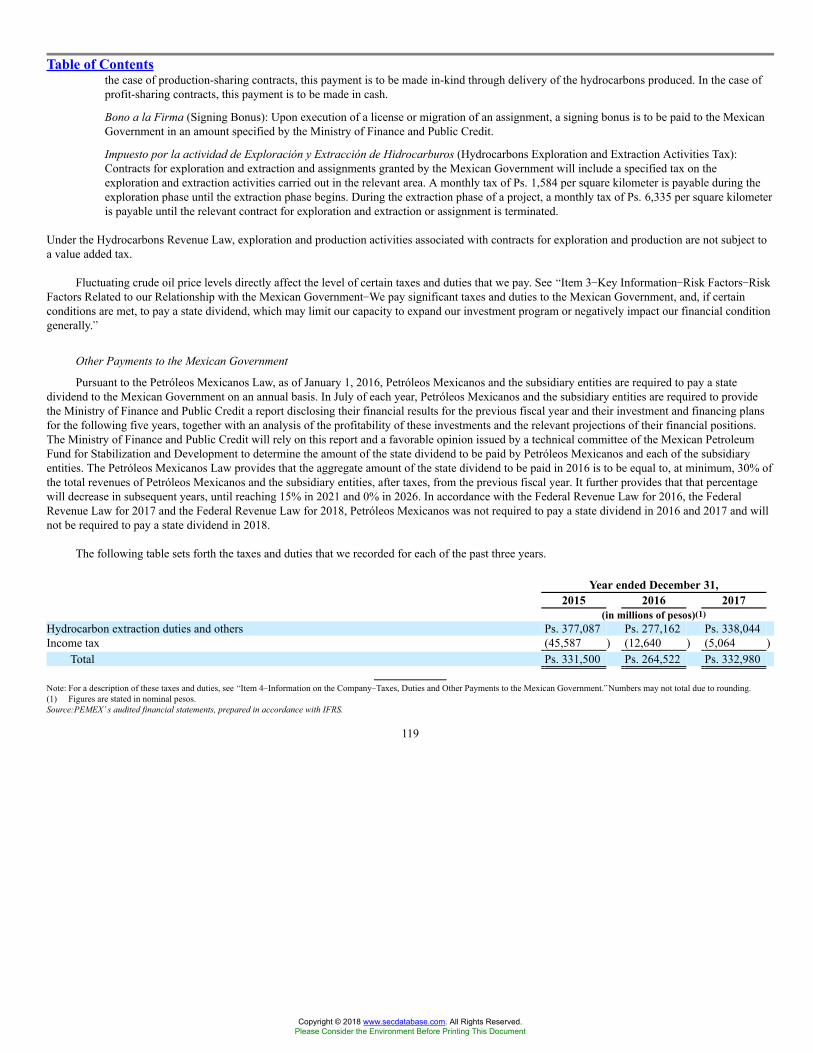
Table of Contentsthe case of production-sharing contracts, this payment is to be made in-kind through delivery of the hydrocarbons produced. In the case ofprofit-sharing contracts, this payment is to be made in cash.
� Bono a la Firma (Signing Bonus): Upon execution of a license or migration of an assignment, a signing bonus is to be paid to the MexicanGovernment in an amount specified by the Ministry of Finance and Public Credit.
� Impuesto por la actividad de Exploración y Extracción de Hidrocarburos (Hydrocarbons Exploration and Extraction Activities Tax):Contracts for exploration and extraction and assignments granted by the Mexican Government will include a specified tax on theexploration and extraction activities carried out in the relevant area. A monthly tax of Ps. 1,584 per square kilometer is payable during theexploration phase until the extraction phase begins. During the extraction phase of a project, a monthly tax of Ps. 6,335 per square kilometeris payable until the relevant contract for exploration and extraction or assignment is terminated.
Under the Hydrocarbons Revenue Law, exploration and production activities associated with contracts for exploration and production are not subject toa value added tax.
Fluctuating crude oil price levels directly affect the level of certain taxes and duties that we pay. See �Item 3�Key Information�Risk Factors�RiskFactors Related to our Relationship with the Mexican Government�We pay significant taxes and duties to the Mexican Government, and, if certainconditions are met, to pay a state dividend, which may limit our capacity to expand our investment program or negatively impact our financial conditiongenerally.�
Other Payments to the Mexican Government
Pursuant to the Petróleos Mexicanos Law, as of January 1, 2016, Petróleos Mexicanos and the subsidiary entities are required to pay a statedividend to the Mexican Government on an annual basis. In July of each year, Petróleos Mexicanos and the subsidiary entities are required to providethe Ministry of Finance and Public Credit a report disclosing their financial results for the previous fiscal year and their investment and financing plansfor the following five years, together with an analysis of the profitability of these investments and the relevant projections of their financial positions.The Ministry of Finance and Public Credit will rely on this report and a favorable opinion issued by a technical committee of the Mexican PetroleumFund for Stabilization and Development to determine the amount of the state dividend to be paid by Petróleos Mexicanos and each of the subsidiaryentities. The Petróleos Mexicanos Law provides that the aggregate amount of the state dividend to be paid in 2016 is to be equal to, at minimum, 30% ofthe total revenues of Petróleos Mexicanos and the subsidiary entities, after taxes, from the previous fiscal year. It further provides that that percentagewill decrease in subsequent years, until reaching 15% in 2021 and 0% in 2026. In accordance with the Federal Revenue Law for 2016, the FederalRevenue Law for 2017 and the Federal Revenue Law for 2018, Petróleos Mexicanos was not required to pay a state dividend in 2016 and 2017 and willnot be required to pay a state dividend in 2018.
The following table sets forth the taxes and duties that we recorded for each of the past three years.
Year ended December 31,2015 2016 2017
(in millions of pesos)(1)Hydrocarbon extraction duties and others Ps. 377,087 Ps. 277,162 Ps. 338,044Income tax (45,587 ) (12,640 ) (5,064 )
Total Ps. 331,500 Ps. 264,522 Ps. 332,980
Note: For a description of these taxes and duties, see �Item 4�Information on the Company�Taxes, Duties and Other Payments to the Mexican Government.�Numbers may not total due to rounding.(1) Figures are stated in nominal pesos.Source:PEMEX�s audited financial statements, prepared in accordance with IFRS.
119
Copyright © 2018 www.secdatabase.com. All Rights Reserved.Please Consider the Environment Before Printing This Document

Table of ContentsOther Taxes
Since 1994, our interest payments on our external debt have been subject to Mexican Government withholding taxes. Nevertheless, withholdingtaxes do not represent a substantial portion of our total tax liability.
We are subject to municipal and state taxes, such as real property and payroll taxes. However, because most of our facilities are located on federalproperty, which is not subject to municipal taxation, real property taxes are not a significant part of our overall taxes. Similarly, payroll taxes do notrepresent a substantial portion of our total tax liability.
In addition, we have a number of non-Mexican subsidiary companies that may be subject to taxation in the jurisdiction of their incorporation oroperations. The aggregate taxes paid by the subsidiary companies were Ps. 6,833.4 million in 2015, Ps. 7,200.9 million in 2016 and Ps. 2,536.3 millionin 2017.
No assurance can be given that our tax regime will not change in the future. See �Item 3�Key Information�Risk Factors�Risk Factors Related toour Relationship with the Mexican Government�We pay significant taxes and duties to the Mexican Government, and, if certain conditions are met, topay a state dividend, which may limit our capacity to expand our investment program or negatively impact our financial condition generally.�
120
Copyright © 2018 www.secdatabase.com. All Rights Reserved.Please Consider the Environment Before Printing This Document

Table of ContentsUNITED MEXICAN STATES
The information in this section with regard to Mexico has been derived from publicly available information published by, or on the websites of, theComisión Nacional Bancaria y de Valores (National Banking and Securities Commission), Banco de México (the Mexican central bank), the Ministry ofFinance and Public Credit and the Instituto Nacional de Estadística y Geografía (INEGI).
Form of Government
The President of Mexico (or the President) is the chief of the executive branch of the Mexican Government. The President is elected by thepopular vote of Mexican citizens who are eighteen years of age or older. The Mexican Constitution limits the President to one six-year term; thePresident may not run for reelection. In accordance with Mexico�s electoral law, on August 31, 2012, the Tribunal Electoral del Poder Judicial de laFederación (Federal Electoral Court) officially validated the results of the presidential election held in Mexico on July 1, 2012, and declaredMr. Enrique Peña Nieto, a member of the Partido Revolucionario Institucional (Institutional Revolutionary Party, or PRI), President-elect. Mr. EnriquePeña Nieto took office on December 1, 2012 and his term will expire on November 30, 2018.
From 1929 to 1994, the PRI won all presidential elections, and, from 1929 until July 1997, the PRI held a majority of the seats in both chambersof the Mexican Congress. From 1929 until 1989, the PRI also won all of the state gubernatorial elections. In July 2000, the candidate from the Alianzapor el Cambio (Alliance for Change), a coalition of the Partido Acción Nacional (National Action Party, or PAN), the oldest opposition party in thecountry, and the Partido Verde Ecologista de México (Ecological Green Party), won the presidential election.
Each of Mexico�s 31 states is headed by a state governor. Mexico�s Federal District, Mexico City, is headed by an elected mayor.
Legislative authority is vested in the Mexican Congress, which is composed of the Senate and the Chamber of Deputies. Members of the MexicanCongress are elected either directly or through a system of proportional representation by the popular vote of Mexican citizens who are 18 years of ageor older. The Senate is composed of 128 members, 96 of whom are elected directly, while the other 32 are elected through a system of proportionalrepresentation. The Chamber of Deputies is composed of 500 members, 300 of whom are elected directly by national electoral districts, while the other200 are elected through a system of proportional representation. Under this proportional representation system, seats are allocated to political partyrepresentatives based on the proportion of the votes cast for those parties that receive at least 3.0% of the national vote, among other requirements.
The Mexican Constitution provides that the President may veto bills and that the Mexican Congress may override such vetoes with a two-thirdsmajority vote of each chamber.
Senators serve a six-year term and deputies serve a three-year term. Federal deputies are eligible for immediate reelection for up to four termperiods and senators are eligible for immediate reelection for up to two term periods. Congressional elections for all 500 seats in the Chamber ofDeputies were last held on June 7, 2015. The following table provides the distribution as of September 1, 2017 of Congressional seats, reflecting certainpost-election changes in the party affiliations of certain senators and deputies.
121
Copyright © 2018 www.secdatabase.com. All Rights Reserved.Please Consider the Environment Before Printing This Document
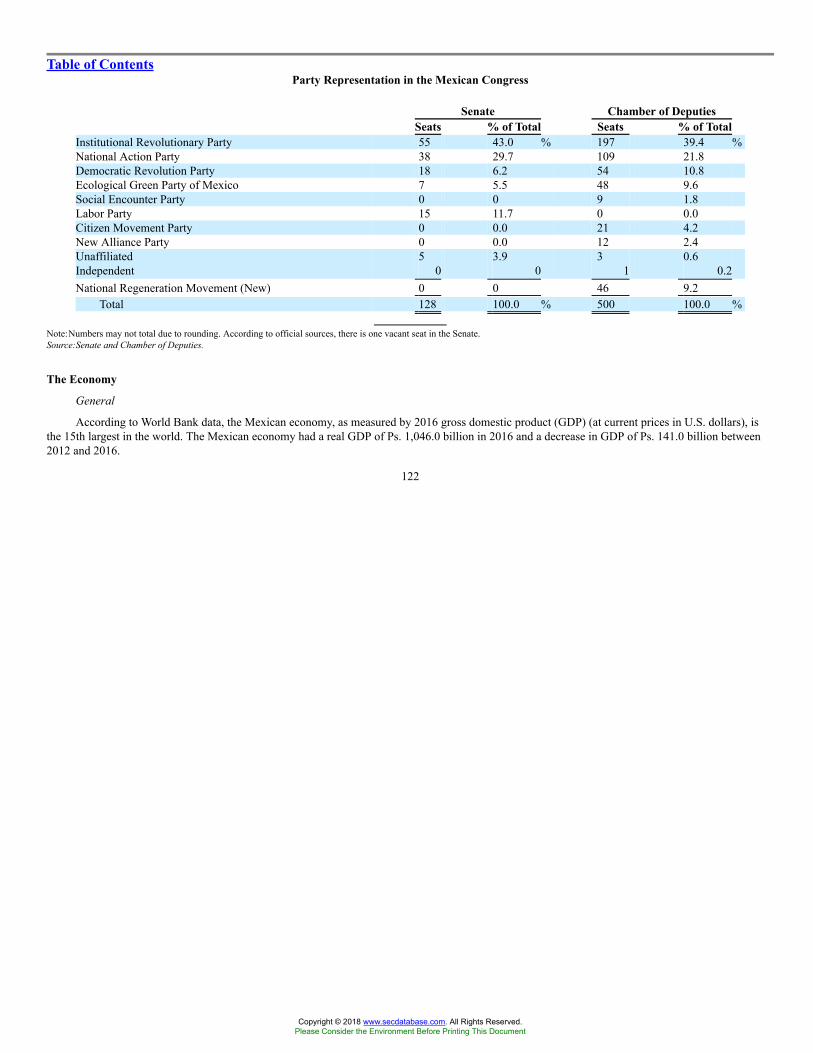
Table of ContentsParty Representation in the Mexican Congress
Senate Chamber of DeputiesSeats % of Total Seats % of Total
Institutional Revolutionary Party 55 43.0 % 197 39.4 %National Action Party 38 29.7 109 21.8Democratic Revolution Party 18 6.2 54 10.8Ecological Green Party of Mexico 7 5.5 48 9.6Social Encounter Party 0 0 9 1.8Labor Party 15 11.7 0 0.0Citizen Movement Party 0 0.0 21 4.2New Alliance Party 0 0.0 12 2.4UnaffiliatedIndependent
50
3.90
31
0.60.2
National Regeneration Movement (New) 0 0 46 9.2Total 128 100.0 % 500 100.0 %
Note:Numbers may not total due to rounding. According to official sources, there is one vacant seat in the Senate.Source:Senate and Chamber of Deputies.
The Economy
General
According to World Bank data, the Mexican economy, as measured by 2016 gross domestic product (GDP) (at current prices in U.S. dollars), isthe 15th largest in the world. The Mexican economy had a real GDP of Ps. 1,046.0 billion in 2016 and a decrease in GDP of Ps. 141.0 billion between2012 and 2016.
122
Copyright © 2018 www.secdatabase.com. All Rights Reserved.Please Consider the Environment Before Printing This Document
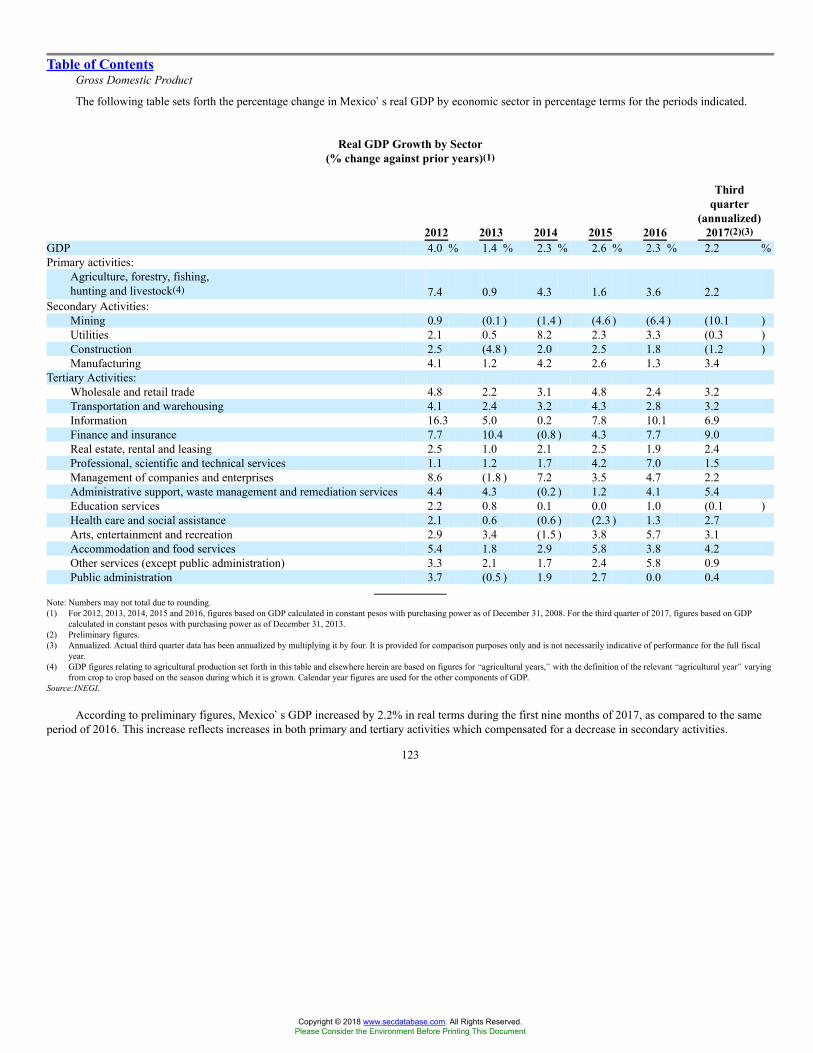
Table of ContentsGross Domestic Product
The following table sets forth the percentage change in Mexico�s real GDP by economic sector in percentage terms for the periods indicated.
Real GDP Growth by Sector(% change against prior years)(1)
2012 2013 2014 2015 2016
Thirdquarter
(annualized)2017(2)(3)
GDP 4.0 % 1.4 % 2.3 % 2.6 % 2.3 % 2.2 %Primary activities:
Agriculture, forestry, fishing,hunting and livestock(4) 7.4 0.9 4.3 1.6 3.6 2.2
Secondary Activities:Mining 0.9 (0.1 ) (1.4 ) (4.6 ) (6.4 ) (10.1 )Utilities 2.1 0.5 8.2 2.3 3.3 (0.3 )Construction 2.5 (4.8 ) 2.0 2.5 1.8 (1.2 )Manufacturing 4.1 1.2 4.2 2.6 1.3 3.4
Tertiary Activities:Wholesale and retail trade 4.8 2.2 3.1 4.8 2.4 3.2Transportation and warehousing 4.1 2.4 3.2 4.3 2.8 3.2Information 16.3 5.0 0.2 7.8 10.1 6.9Finance and insurance 7.7 10.4 (0.8 ) 4.3 7.7 9.0Real estate, rental and leasing 2.5 1.0 2.1 2.5 1.9 2.4Professional, scientific and technical services 1.1 1.2 1.7 4.2 7.0 1.5Management of companies and enterprises 8.6 (1.8 ) 7.2 3.5 4.7 2.2Administrative support, waste management and remediation services 4.4 4.3 (0.2 ) 1.2 4.1 5.4Education services 2.2 0.8 0.1 0.0 1.0 (0.1 )Health care and social assistance 2.1 0.6 (0.6 ) (2.3 ) 1.3 2.7Arts, entertainment and recreation 2.9 3.4 (1.5 ) 3.8 5.7 3.1Accommodation and food services 5.4 1.8 2.9 5.8 3.8 4.2Other services (except public administration) 3.3 2.1 1.7 2.4 5.8 0.9Public administration 3.7 (0.5 ) 1.9 2.7 0.0 0.4
Note: Numbers may not total due to rounding.(1) For 2012, 2013, 2014, 2015 and 2016, figures based on GDP calculated in constant pesos with purchasing power as of December 31, 2008. For the third quarter of 2017, figures based on GDP
calculated in constant pesos with purchasing power as of December 31, 2013.(2) Preliminary figures.(3) Annualized. Actual third quarter data has been annualized by multiplying it by four. It is provided for comparison purposes only and is not necessarily indicative of performance for the full fiscal
year.(4) GDP figures relating to agricultural production set forth in this table and elsewhere herein are based on figures for �agricultural years,� with the definition of the relevant �agricultural year� varying
from crop to crop based on the season during which it is grown. Calendar year figures are used for the other components of GDP.Source:INEGI.
According to preliminary figures, Mexico�s GDP increased by 2.2% in real terms during the first nine months of 2017, as compared to the sameperiod of 2016. This increase reflects increases in both primary and tertiary activities which compensated for a decrease in secondary activities.
123
Copyright © 2018 www.secdatabase.com. All Rights Reserved.Please Consider the Environment Before Printing This Document
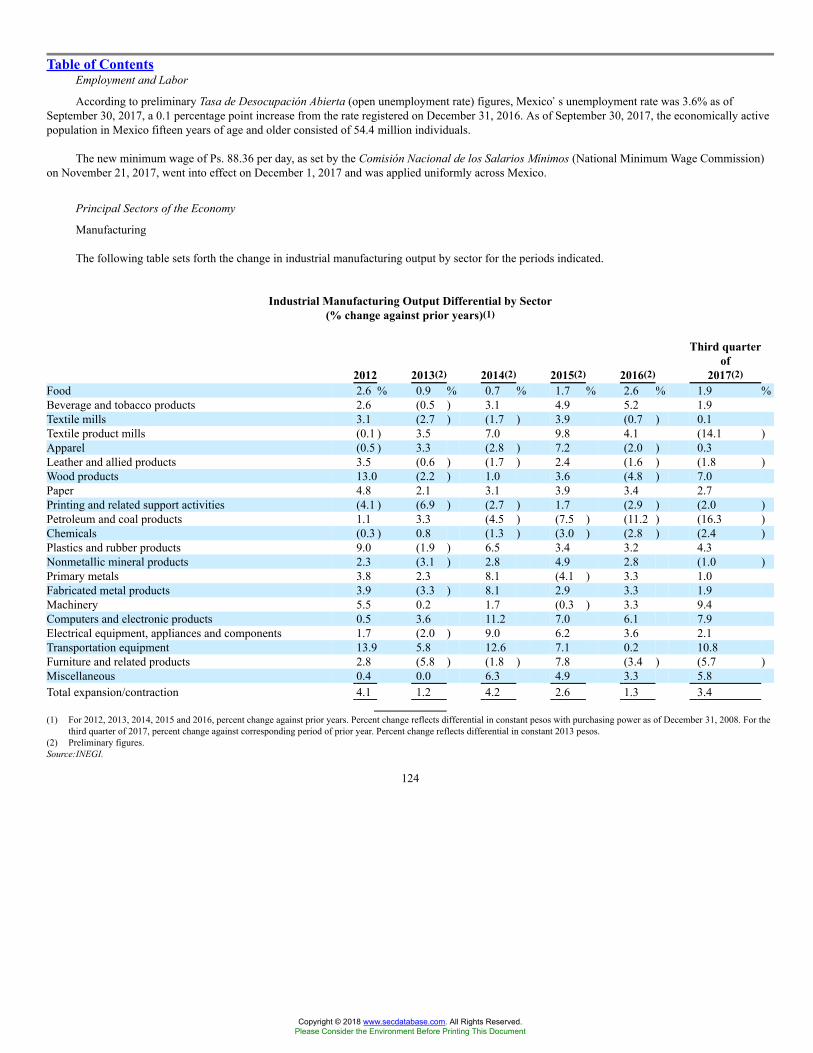
Table of ContentsEmployment and Labor
According to preliminary Tasa de Desocupación Abierta (open unemployment rate) figures, Mexico�s unemployment rate was 3.6% as ofSeptember 30, 2017, a 0.1 percentage point increase from the rate registered on December 31, 2016. As of September 30, 2017, the economically activepopulation in Mexico fifteen years of age and older consisted of 54.4 million individuals.
The new minimum wage of Ps. 88.36 per day, as set by the Comisión Nacional de los Salarios Mínimos (National Minimum Wage Commission)on November 21, 2017, went into effect on December 1, 2017 and was applied uniformly across Mexico.
Principal Sectors of the Economy
Manufacturing
The following table sets forth the change in industrial manufacturing output by sector for the periods indicated.
Industrial Manufacturing Output Differential by Sector(% change against prior years)(1)
2012 2013(2) 2014(2) 2015(2) 2016(2)
Third quarterof
2017(2)Food 2.6 % 0.9 % 0.7 % 1.7 % 2.6 % 1.9 %Beverage and tobacco products 2.6 (0.5 ) 3.1 4.9 5.2 1.9Textile mills 3.1 (2.7 ) (1.7 ) 3.9 (0.7 ) 0.1Textile product mills (0.1 ) 3.5 7.0 9.8 4.1 (14.1 )Apparel (0.5 ) 3.3 (2.8 ) 7.2 (2.0 ) 0.3Leather and allied products 3.5 (0.6 ) (1.7 ) 2.4 (1.6 ) (1.8 )Wood products 13.0 (2.2 ) 1.0 3.6 (4.8 ) 7.0Paper 4.8 2.1 3.1 3.9 3.4 2.7Printing and related support activities (4.1 ) (6.9 ) (2.7 ) 1.7 (2.9 ) (2.0 )Petroleum and coal products 1.1 3.3 (4.5 ) (7.5 ) (11.2 ) (16.3 )Chemicals (0.3 ) 0.8 (1.3 ) (3.0 ) (2.8 ) (2.4 )Plastics and rubber products 9.0 (1.9 ) 6.5 3.4 3.2 4.3Nonmetallic mineral products 2.3 (3.1 ) 2.8 4.9 2.8 (1.0 )Primary metals 3.8 2.3 8.1 (4.1 ) 3.3 1.0Fabricated metal products 3.9 (3.3 ) 8.1 2.9 3.3 1.9Machinery 5.5 0.2 1.7 (0.3 ) 3.3 9.4Computers and electronic products 0.5 3.6 11.2 7.0 6.1 7.9Electrical equipment, appliances and components 1.7 (2.0 ) 9.0 6.2 3.6 2.1Transportation equipment 13.9 5.8 12.6 7.1 0.2 10.8Furniture and related products 2.8 (5.8 ) (1.8 ) 7.8 (3.4 ) (5.7 )Miscellaneous 0.4 0.0 6.3 4.9 3.3 5.8Total expansion/contraction 4.1 1.2 4.2 2.6 1.3 3.4
(1) For 2012, 2013, 2014, 2015 and 2016, percent change against prior years. Percent change reflects differential in constant pesos with purchasing power as of December 31, 2008. For thethird quarter of 2017, percent change against corresponding period of prior year. Percent change reflects differential in constant 2013 pesos.
(2) Preliminary figures.Source:INEGI.
124
Copyright © 2018 www.secdatabase.com. All Rights Reserved.Please Consider the Environment Before Printing This Document
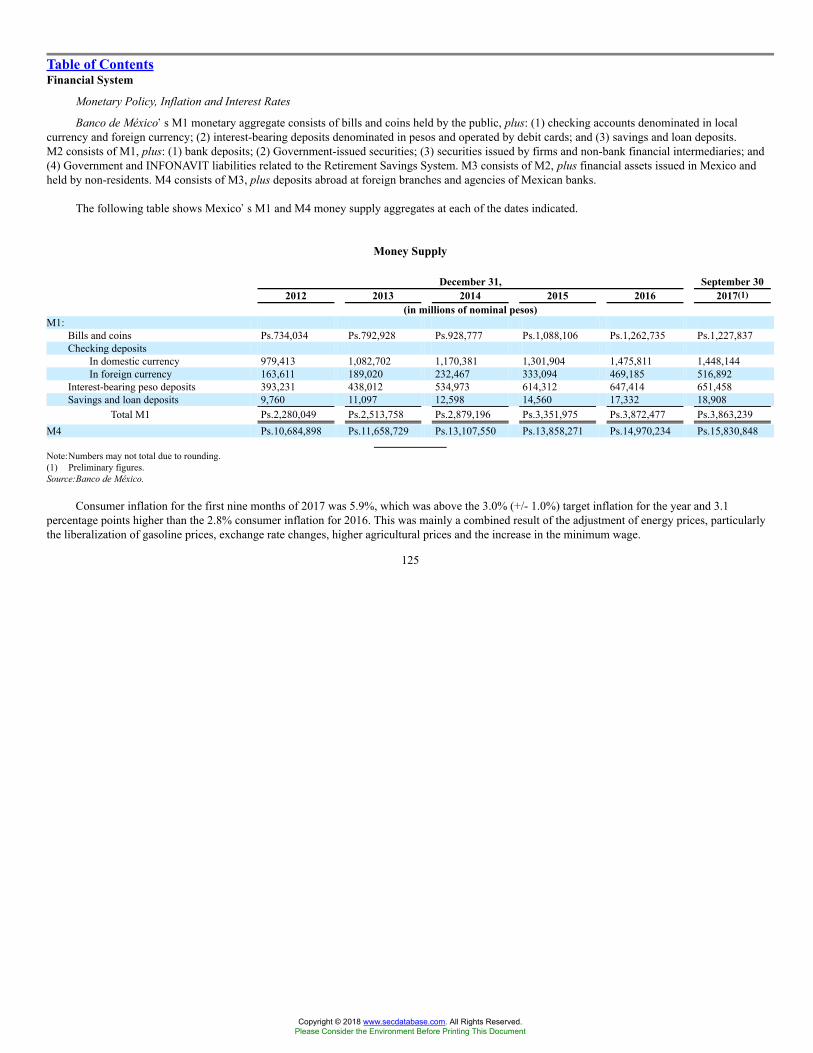
Table of ContentsFinancial System
Monetary Policy, Inflation and Interest Rates
Banco de México�s M1 monetary aggregate consists of bills and coins held by the public, plus: (1) checking accounts denominated in localcurrency and foreign currency; (2) interest-bearing deposits denominated in pesos and operated by debit cards; and (3) savings and loan deposits.M2 consists of M1, plus: (1) bank deposits; (2) Government-issued securities; (3) securities issued by firms and non-bank financial intermediaries; and(4) Government and INFONAVIT liabilities related to the Retirement Savings System. M3 consists of M2, plus financial assets issued in Mexico andheld by non-residents. M4 consists of M3, plus deposits abroad at foreign branches and agencies of Mexican banks.
The following table shows Mexico�s M1 and M4 money supply aggregates at each of the dates indicated.
Money Supply
December 31, September 302012 2013 2014 2015 2016 2017(1)
(in millions of nominal pesos)M1:
Bills and coins Ps.734,034 Ps.792,928 Ps.928,777 Ps.1,088,106 Ps.1,262,735 Ps.1,227,837Checking deposits
In domestic currency 979,413 1,082,702 1,170,381 1,301,904 1,475,811 1,448,144In foreign currency 163,611 189,020 232,467 333,094 469,185 516,892
Interest-bearing peso deposits 393,231 438,012 534,973 614,312 647,414 651,458Savings and loan deposits 9,760 11,097 12,598 14,560 17,332 18,908
Total M1 Ps.2,280,049 Ps.2,513,758 Ps.2,879,196 Ps.3,351,975 Ps.3,872,477 Ps.3,863,239M4 Ps.10,684,898 Ps.11,658,729 Ps.13,107,550 Ps.13,858,271 Ps.14,970,234 Ps.15,830,848
Note:Numbers may not total due to rounding.(1) Preliminary figures.Source:Banco de México.
Consumer inflation for the first nine months of 2017 was 5.9%, which was above the 3.0% (+/- 1.0%) target inflation for the year and 3.1percentage points higher than the 2.8% consumer inflation for 2016. This was mainly a combined result of the adjustment of energy prices, particularlythe liberalization of gasoline prices, exchange rate changes, higher agricultural prices and the increase in the minimum wage.
125
Copyright © 2018 www.secdatabase.com. All Rights Reserved.Please Consider the Environment Before Printing This Document

Table of ContentsThe following table shows, in percentage terms, the changes in price indices and annual increases in the minimum wage for the periods indicated.
Changes in Price Indices
National ProducerPrice Index(1)(2)(3)(4)
National ConsumerPrice Index(1)(5)
Increase inMinimum Wage
2012 1.8 3.6 4.62013 1.6 4.0 3.92014 3.3 4.1 3.92015 2.8 2.1 6.92016 8.5 3.4 4.22017
January 9.8 4.7 �February 9.5 4.9 �March 9.4 5.4 �April 8.7 5.8 �May 8.1 6.2 �June 6.7 6.3 �July 5.9 6.4 �August 5.6 6.7 �September 4.5 6.3 �October 5.3 6.4 �November 5.2 6.6 �December(6) � � 10.4
(1) For annual figures, changes in price indices are calculated each December.(2) National Producer Price Index figures represent the changes in the prices for basic merchandise and services (excluding oil prices). The index is based on a
methodology implemented in June 2012.(3) Preliminary figures for 2016-2017.(4) National Producer Price Index takes June 2012 as a base date.(5) National Consumer Price Index takes the second half of December 2010 as a base date.(6) December 2017 National Producer Price Index and National Consumer Price Index figures not available.
Sources:INEGI; Ministry of Labor.
During the first nine months of 2017, interest rates on 28-day Cetes averaged 6.6%, as compared to 3.8% during the same period of 2016. Interestrates on 91-day Cetes averaged 6.8%, as compared to 4.0% during the same period of 2016.
On December 28, 2017, the 28-day Cetes rate was 7.22% and the 91-day Cetes rate was 7.36%.
Exchange Controls and Foreign Exchange Rates
On December 29, 2017, the peso/dollar exchange rate closed at Ps. 19.6629 = U.S. $1.00, a 4.6% appreciation in dollar terms as compared to therate on December 31, 2016. The peso/U.S. dollar exchange rate announced by Banco de México on December 29, 2017 (which took effect on thesecond business day thereafter) was Ps. 19.6595 = U.S. $1.00.
Securities Markets
The BMV is the only authorized stock exchange involved in the listing and trading of equity and debt securities in Mexico. Upon theconsummation of the initial public offering of its shares on June 18, 2008, the BMV was transformed from a sociedad anónima de capital variable(private company) to a sociedad anónima
126
Copyright © 2018 www.secdatabase.com. All Rights Reserved.Please Consider the Environment Before Printing This Document

Table of Contentsbursátil de capital variable (public company). In connection with the initial public offering of shares, certain of the former stockholders of the BMV(banks and brokerage houses) created a control trust into which they deposited more than 50% of the issued and outstanding shares of the BMV, forpurposes of voting such shares in the future as a single block. Both debt and equity securities are listed and traded on the BMV, including stocks andbonds of private sector corporations, equity certificates or shares issued by banks, commercial paper, bankers� acceptances, certificates of deposit,Mexican Government debt and special hedging instruments linked to the dollar. Currently, institutional investors are the most active participants in theBMV, although retail investors also play a role in the market. The Mexican equity market is one of Latin America�s largest in terms of marketcapitalization, but it remains relatively small and illiquid compared to major world markets.
The BMV publishes the Índice de Precios y Cotizaciones (Stock Market Index, or IPC) based on a group of the thirty-five most actively tradedshares.
On December 28, 2017, the IPC stood at 48,862 points, representing a 7.1% increase from the level at December 30, 2016.
Foreign Trade and Balance of Payments
Foreign Trade
The following table provides information about the value of Mexico�s merchandise exports and imports (excluding tourism) for the periodsindicated.
Exports and Imports
2012 2013 2014 2015 2016(1)
First ninemonths of
2017(1)(in millions of dollars, except average price of the Mexican
crude oil mix)Merchandise exports (f.o.b.)
Oil and oil products $52,956 $49,481 $42,369 $23,100 $18,818 $16,248.5Crude oil 46,852 42,712 35,638 18,451 15,575 13,349.0Other 6,103 6,770 6,731 4,648 3,243 2,899.5
Non-oil products 317,814 330,534 354,542 357,450 355,122 283,039.7Agricultural 10,914 11,246 12,181 12,971 14,672 11,685.5Mining 4,906 4,714 5,064 4,505 4,368 3,988.9Manufactured goods(2) 301,993 314,573 337,297 339,975 336,081 267,365.3
Total merchandise exports 370,770 380,015 396,912 380,550 373,939 299,288.2Merchandise imports (f.o.b.)
Consumer goods 54,272 57,329 58,299 56,279 51,950 41,064.3Intermediate goods(2) 277,911 284,823 302,031 297,253 294,994 237,122.8Capital goods 38,568 39,057 39,647 41,700 40,120 30,152.3
Total merchandise imports 370,752 381,210 399,977 395,232 387,064 308,339.4Trade balance $18 $(1,195 ) $(3,066 ) $(14,683 ) $(13,125 ) $(9,051.2 )Average price of Mexican oil mix(3) $102.0 $98.4 $85.5 $43.1 $35.6 $44.3
Note:Numbers may not total due to rounding.(1) Preliminary figures.(2) Includes the in-bond industry.(3) In U.S. dollars per barrel.Source:Banco de México / PEMEX.
127
Copyright © 2018 www.secdatabase.com. All Rights Reserved.Please Consider the Environment Before Printing This Document
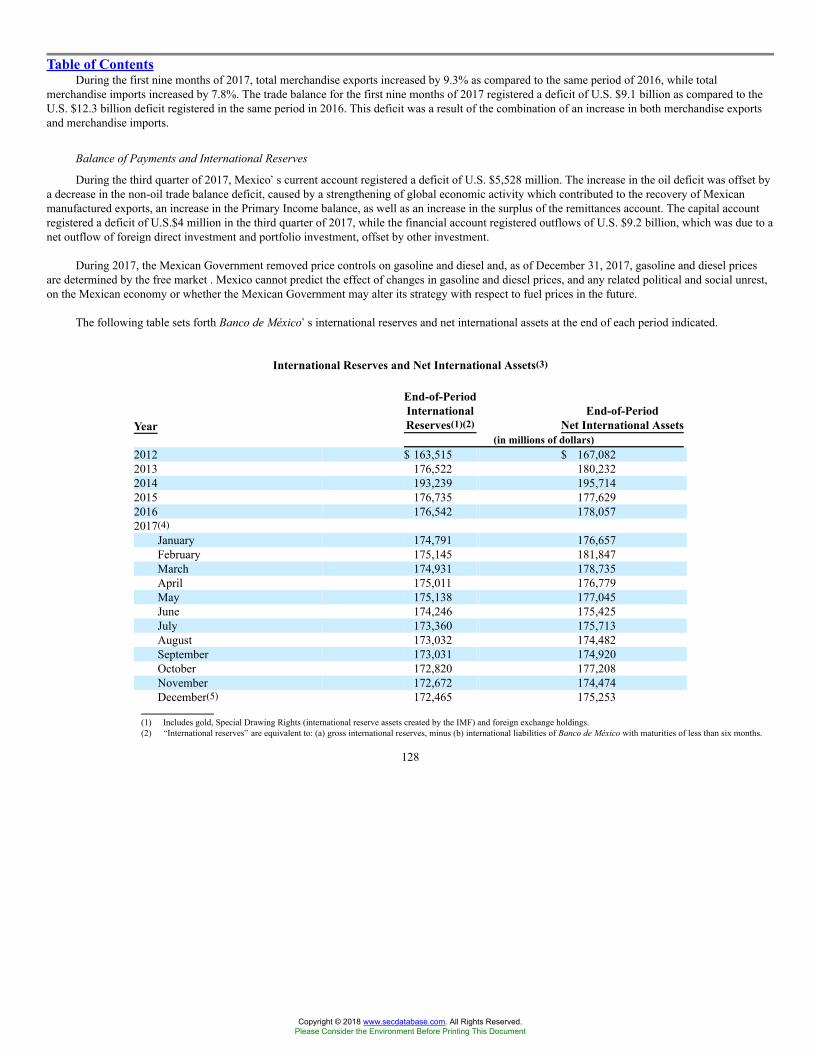
Table of ContentsDuring the first nine months of 2017, total merchandise exports increased by 9.3% as compared to the same period of 2016, while total
merchandise imports increased by 7.8%. The trade balance for the first nine months of 2017 registered a deficit of U.S. $9.1 billion as compared to theU.S. $12.3 billion deficit registered in the same period in 2016. This deficit was a result of the combination of an increase in both merchandise exportsand merchandise imports.
Balance of Payments and International Reserves
During the third quarter of 2017, Mexico�s current account registered a deficit of U.S. $5,528 million. The increase in the oil deficit was offset bya decrease in the non-oil trade balance deficit, caused by a strengthening of global economic activity which contributed to the recovery of Mexicanmanufactured exports, an increase in the Primary Income balance, as well as an increase in the surplus of the remittances account. The capital accountregistered a deficit of U.S.$4 million in the third quarter of 2017, while the financial account registered outflows of U.S. $9.2 billion, which was due to anet outflow of foreign direct investment and portfolio investment, offset by other investment.
During 2017, the Mexican Government removed price controls on gasoline and diesel and, as of December 31, 2017, gasoline and diesel pricesare determined by the free market . Mexico cannot predict the effect of changes in gasoline and diesel prices, and any related political and social unrest,on the Mexican economy or whether the Mexican Government may alter its strategy with respect to fuel prices in the future.
The following table sets forth Banco de México�s international reserves and net international assets at the end of each period indicated.
International Reserves and Net International Assets(3)
Year
End-of-PeriodInternationalReserves(1)(2)
End-of-PeriodNet International Assets
(in millions of dollars)2012 $ 163,515 $ 167,0822013 176,522 180,2322014 193,239 195,7142015 176,735 177,6292016 176,542 178,0572017(4)
January 174,791 176,657February 175,145 181,847March 174,931 178,735April 175,011 176,779May 175,138 177,045June 174,246 175,425July 173,360 175,713August 173,032 174,482September 173,031 174,920October 172,820 177,208November 172,672 174,474December(5) 172,465 175,253
(1) Includes gold, Special Drawing Rights (international reserve assets created by the IMF) and foreign exchange holdings.(2) �International reserves� are equivalent to: (a) gross international reserves, minus (b) international liabilities of Banco de México with maturities of less than six months.
128
Copyright © 2018 www.secdatabase.com. All Rights Reserved.Please Consider the Environment Before Printing This Document
Table of Contents(3) �Net international assets� are defined as: (a) gross international reserves, plus (b) assets with maturities greater than six months derived from credit agreements with
central banks, less (x) liabilities outstanding to the IMF and (y) liabilities with maturities of less than six months derived from credit agreements with central banks.(4) Preliminary figures.(5) Figures as of December 22, 2017.
Source: Banco de México.
Public Finance
Fiscal Policy
The Programa Nacional de Financiamiento del Desarrollo 2013-2018 (National Program to Finance Development 2013-2018, or PRONAFIDE),which was approved and published in the Official Gazette of the Federation on May 20, 2013 and announced on December 16, 2013, establishes theMexican Government�s fiscal policy goals. These goals include securing sufficient fiscal resources to strengthen social infrastructure and productivity.To this end, PRONAFIDE has outlined several specific objectives, including the promotion of economic development and macroeconomic stability on afederal and state level, as well as the improvement of the financial system to generate additional resources and to transform the financial system into asimpler, more progressive and more transparent system through spending efficiency and the facilitation of access to financial services.
2017 UMS Budget and Fiscal Results
On September 8, 2016, the President of Mexico submitted the proposed 2017 Federal Revenue Law and the proposed 2017 Federal ExpenditureBudget to Congress for its approval. The 2017 Revenue Law was approved by the Senate on October 26, 2016, and the 2017 Expenditure Budget wasapproved by the Chamber of Deputies on November 11, 2016. They were published in the Official Gazette of the Federation on November 15, 2016 andNovember 30, 2016, respectively. We refer to these two bills together as Mexico�s 2017 budget (the 2017 UMS Budget).
129
Copyright © 2018 www.secdatabase.com. All Rights Reserved.Please Consider the Environment Before Printing This Document
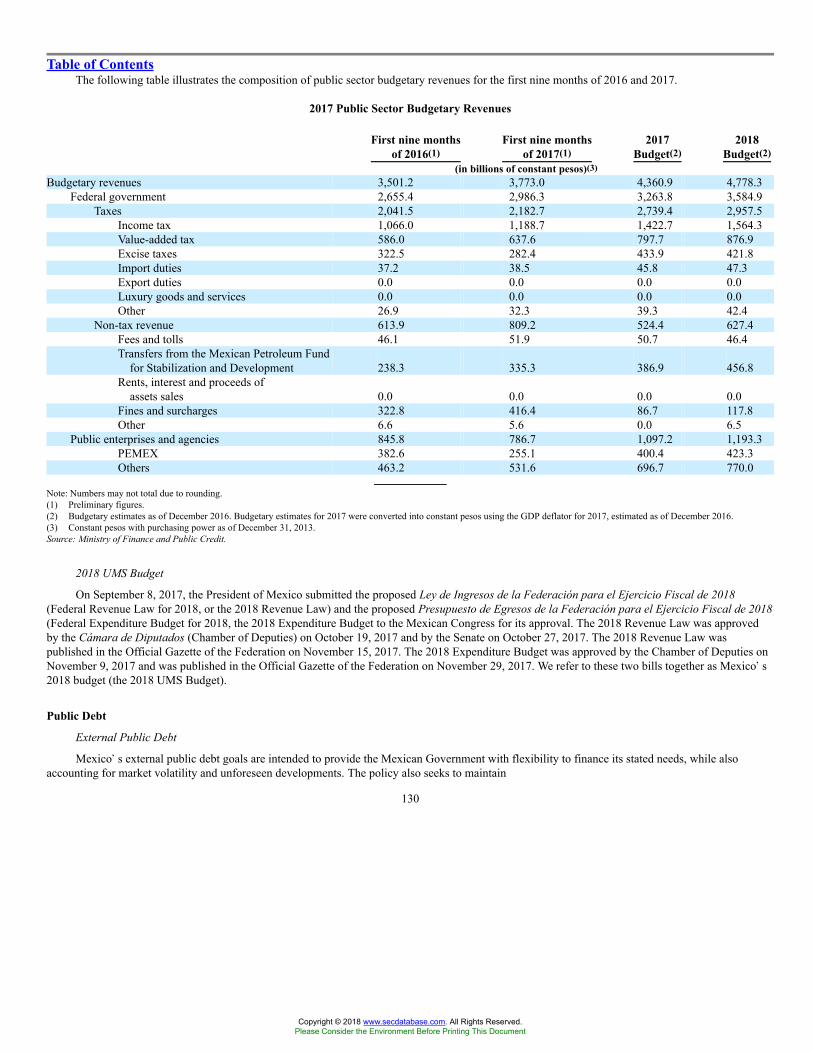
Table of ContentsThe following table illustrates the composition of public sector budgetary revenues for the first nine months of 2016 and 2017.
2017 Public Sector Budgetary Revenues
First nine monthsof 2016(1)
First nine monthsof 2017(1)
2017Budget(2)
2018Budget(2)
(in billions of constant pesos)(3)Budgetary revenues 3,501.2 3,773.0 4,360.9 4,778.3
Federal government 2,655.4 2,986.3 3,263.8 3,584.9Taxes 2,041.5 2,182.7 2,739.4 2,957.5
Income tax 1,066.0 1,188.7 1,422.7 1,564.3Value-added tax 586.0 637.6 797.7 876.9Excise taxes 322.5 282.4 433.9 421.8Import duties 37.2 38.5 45.8 47.3Export duties 0.0 0.0 0.0 0.0Luxury goods and services 0.0 0.0 0.0 0.0Other 26.9 32.3 39.3 42.4
Non-tax revenue 613.9 809.2 524.4 627.4Fees and tolls 46.1 51.9 50.7 46.4Transfers from the Mexican Petroleum Fund
for Stabilization and Development 238.3 335.3 386.9 456.8Rents, interest and proceeds of
assets sales 0.0 0.0 0.0 0.0Fines and surcharges 322.8 416.4 86.7 117.8Other 6.6 5.6 0.0 6.5
Public enterprises and agencies 845.8 786.7 1,097.2 1,193.3PEMEX 382.6 255.1 400.4 423.3Others 463.2 531.6 696.7 770.0
Note: Numbers may not total due to rounding.(1) Preliminary figures.(2) Budgetary estimates as of December 2016. Budgetary estimates for 2017 were converted into constant pesos using the GDP deflator for 2017, estimated as of December 2016.(3) Constant pesos with purchasing power as of December 31, 2013.Source: Ministry of Finance and Public Credit.
2018 UMS Budget
On September 8, 2017, the President of Mexico submitted the proposed Ley de Ingresos de la Federación para el Ejercicio Fiscal de 2018(Federal Revenue Law for 2018, or the 2018 Revenue Law) and the proposed Presupuesto de Egresos de la Federación para el Ejercicio Fiscal de 2018(Federal Expenditure Budget for 2018, the 2018 Expenditure Budget to the Mexican Congress for its approval. The 2018 Revenue Law was approvedby the Cámara de Diputados (Chamber of Deputies) on October 19, 2017 and by the Senate on October 27, 2017. The 2018 Revenue Law waspublished in the Official Gazette of the Federation on November 15, 2017. The 2018 Expenditure Budget was approved by the Chamber of Deputies onNovember 9, 2017 and was published in the Official Gazette of the Federation on November 29, 2017. We refer to these two bills together as Mexico�s2018 budget (the 2018 UMS Budget).
Public Debt
External Public Debt
Mexico�s external public debt goals are intended to provide the Mexican Government with flexibility to finance its stated needs, while alsoaccounting for market volatility and unforeseen developments. The policy also seeks to maintain
130
Copyright © 2018 www.secdatabase.com. All Rights Reserved.Please Consider the Environment Before Printing This Document
Table of Contentscosts and risks at stable levels. Mexico primarily seeks debt financing through local markets, supplemented by external financing from the U.S., Europeand Japan. Mexico�s principal objectives in connection with its external financing include improving the terms and conditions of Mexico�s externalliabilities, as well as strengthening and diversifying Mexico�s investor base, with specific consideration to Mexico�s continued presence in the mostinfluential international markets. Objectives also include strengthening Mexico�s benchmark bonds and maintaining a constant relationship withinternational investors in order to ensure transparency and to promote investment in Mexico.
Internal Public Debt
The Mexican Government�s �net internal debt� includes only the internal portion of indebtedness incurred directly by the Mexican Governmentand the assets of the Fondo del Sistema de Ahorro Para el Retiro (Retirement Savings System Fund). In addition, �net internal debt� is comprised ofCetes and other securities sold to the public in auctions for new issuances (primary auctions) but does not include any debt allocated to Banco de Méxicofor its use in Regulación Monetaria (regulating the money supply). It also does not include debt by the Instituto para la Protección al Ahorro Bancario(Bank Savings Protection Institute, or IPAB) or the debt of budget-controlled or administratively-controlled agencies. At December 31, 2016, all of theMexican Government�s internal debt was denominated in pesos or UDIs and was payable in pesos.
Over the last two decades, the Mexican Government has actively sought to increase its average debt maturity date. Accordingly, the MexicanGovernment has issued new debt instruments bearing longer maturities than those previously issued. In doing so, the Mexican Government hopes tomitigate any risk associated with the refinancing of its internal public debt. This has had the effect of establishing a long-dated benchmark yield curve(the line that plots interest rates across different contract lengths for bonds having equal credit quality). These issuances have also encouraged long-terminvestments in the following areas: (1) fixed-rate contracts; (2) peso-denominated securities by Mexican companies; (3) Mexican financial hedgingproducts; and (4) the use of long-term savings in financing long-term investment projects.
As a result of this policy, the average maturity of the Government�s internal debt increased from 7.6 years at December 31, 2011 to 8.0 years atDecember 31, 2016.
131
Copyright © 2018 www.secdatabase.com. All Rights Reserved.Please Consider the Environment Before Printing This Document
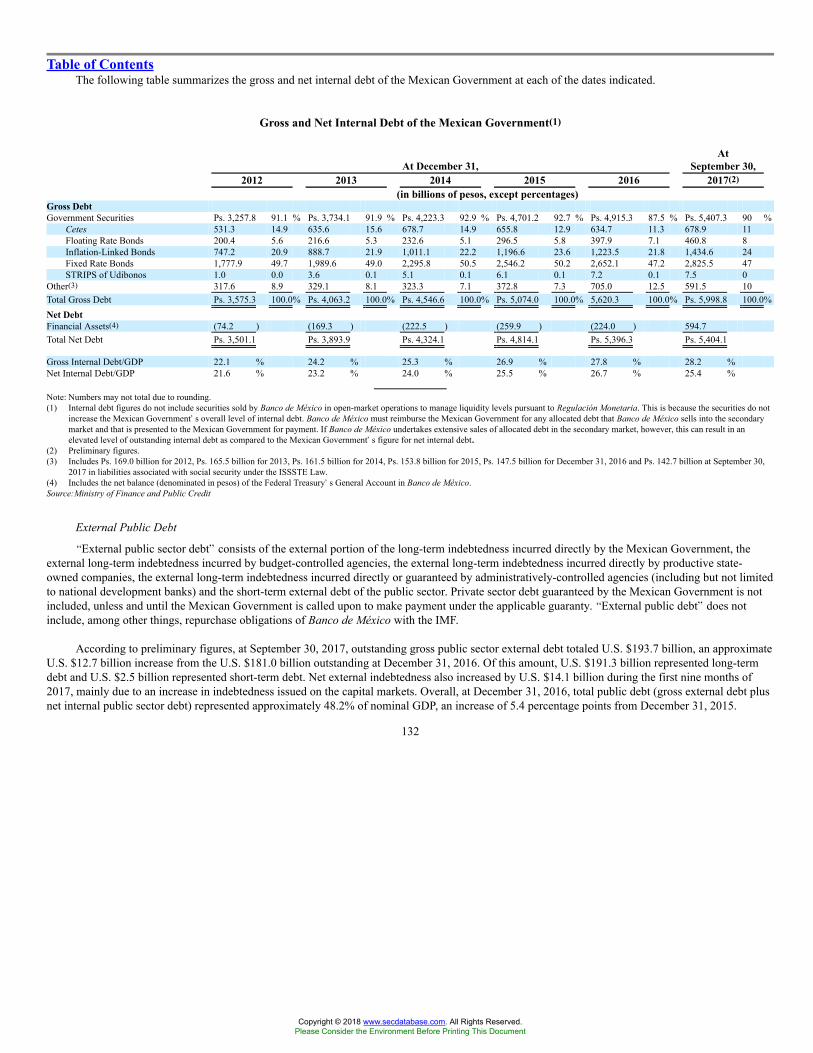
Table of ContentsThe following table summarizes the gross and net internal debt of the Mexican Government at each of the dates indicated.
Gross and Net Internal Debt of the Mexican Government(1)
At December 31,At
September 30,2012 2013 2014 2015 2016 2017(2)
(in billions of pesos, except percentages)Gross DebtGovernment Securities Ps. 3,257.8 91.1 % Ps. 3,734.1 91.9 % Ps. 4,223.3 92.9 % Ps. 4,701.2 92.7 % Ps. 4,915.3 87.5 % Ps. 5,407.3 90 %
Cetes 531.3 14.9 635.6 15.6 678.7 14.9 655.8 12.9 634.7 11.3 678.9 11Floating Rate Bonds 200.4 5.6 216.6 5.3 232.6 5.1 296.5 5.8 397.9 7.1 460.8 8Inflation-Linked Bonds 747.2 20.9 888.7 21.9 1,011.1 22.2 1,196.6 23.6 1,223.5 21.8 1,434.6 24Fixed Rate Bonds 1,777.9 49.7 1,989.6 49.0 2,295.8 50.5 2,546.2 50.2 2,652.1 47.2 2,825.5 47STRIPS of Udibonos 1.0 0.0 3.6 0.1 5.1 0.1 6.1 0.1 7.2 0.1 7.5 0
Other(3) 317.6 8.9 329.1 8.1 323.3 7.1 372.8 7.3 705.0 12.5 591.5 10Total Gross Debt Ps. 3,575.3 100.0% Ps. 4,063.2 100.0% Ps. 4,546.6 100.0% Ps. 5,074.0 100.0% 5,620.3 100.0% Ps. 5,998.8 100.0%Net DebtFinancial Assets(4) (74.2 ) (169.3 ) (222.5 ) (259.9 ) (224.0 ) 594.7Total Net Debt Ps. 3,501.1 Ps. 3,893.9 Ps. 4,324.1 Ps. 4,814.1 Ps. 5,396.3 Ps. 5,404.1
Gross Internal Debt/GDP 22.1 % 24.2 % 25.3 % 26.9 % 27.8 % 28.2 %Net Internal Debt/GDP 21.6 % 23.2 % 24.0 % 25.5 % 26.7 % 25.4 %
Note: Numbers may not total due to rounding.(1) Internal debt figures do not include securities sold by Banco de México in open-market operations to manage liquidity levels pursuant to Regulación Monetaria. This is because the securities do not
increase the Mexican Government�s overall level of internal debt. Banco de México must reimburse the Mexican Government for any allocated debt that Banco de México sells into the secondarymarket and that is presented to the Mexican Government for payment. If Banco de México undertakes extensive sales of allocated debt in the secondary market, however, this can result in anelevated level of outstanding internal debt as compared to the Mexican Government�s figure for net internal debt.
(2) Preliminary figures.(3) Includes Ps. 169.0 billion for 2012, Ps. 165.5 billion for 2013, Ps. 161.5 billion for 2014, Ps. 153.8 billion for 2015, Ps. 147.5 billion for December 31, 2016 and Ps. 142.7 billion at September 30,
2017 in liabilities associated with social security under the ISSSTE Law.(4) Includes the net balance (denominated in pesos) of the Federal Treasury�s General Account in Banco de México.Source:Ministry of Finance and Public Credit
External Public Debt
�External public sector debt� consists of the external portion of the long-term indebtedness incurred directly by the Mexican Government, theexternal long-term indebtedness incurred by budget-controlled agencies, the external long-term indebtedness incurred directly by productive state-owned companies, the external long-term indebtedness incurred directly or guaranteed by administratively-controlled agencies (including but not limitedto national development banks) and the short-term external debt of the public sector. Private sector debt guaranteed by the Mexican Government is notincluded, unless and until the Mexican Government is called upon to make payment under the applicable guaranty. �External public debt� does notinclude, among other things, repurchase obligations of Banco de México with the IMF.
According to preliminary figures, at September 30, 2017, outstanding gross public sector external debt totaled U.S. $193.7 billion, an approximateU.S. $12.7 billion increase from the U.S. $181.0 billion outstanding at December 31, 2016. Of this amount, U.S. $191.3 billion represented long-termdebt and U.S. $2.5 billion represented short-term debt. Net external indebtedness also increased by U.S. $14.1 billion during the first nine months of2017, mainly due to an increase in indebtedness issued on the capital markets. Overall, at December 31, 2016, total public debt (gross external debt plusnet internal public sector debt) represented approximately 48.2% of nominal GDP, an increase of 5.4 percentage points from December 31, 2015.
132
Copyright © 2018 www.secdatabase.com. All Rights Reserved.Please Consider the Environment Before Printing This Document
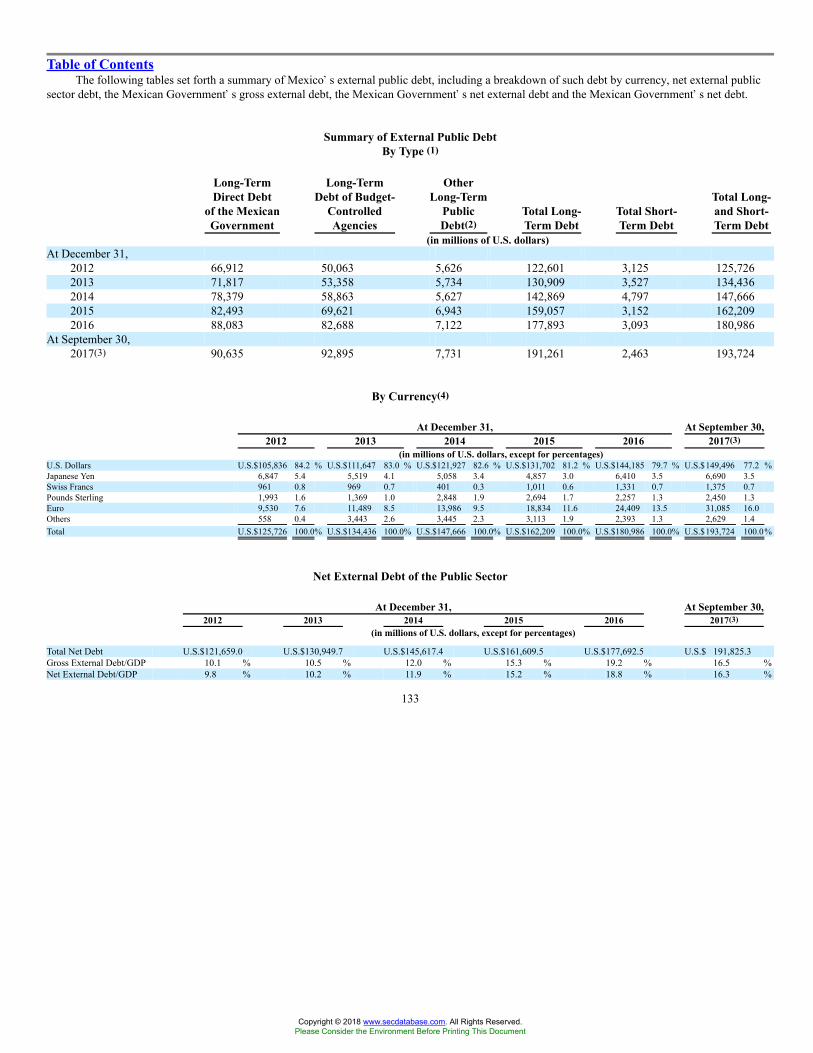
Table of ContentsThe following tables set forth a summary of Mexico�s external public debt, including a breakdown of such debt by currency, net external public
sector debt, the Mexican Government�s gross external debt, the Mexican Government�s net external debt and the Mexican Government�s net debt.
Summary of External Public DebtBy Type (1)
Long-TermDirect Debt
of the MexicanGovernment
Long-TermDebt of Budget-
ControlledAgencies
OtherLong-Term
PublicDebt(2)
Total Long-Term Debt
Total Short-Term Debt
Total Long-and Short-Term Debt
(in millions of U.S. dollars)At December 31,
2012 66,912 50,063 5,626 122,601 3,125 125,7262013 71,817 53,358 5,734 130,909 3,527 134,4362014 78,379 58,863 5,627 142,869 4,797 147,6662015 82,493 69,621 6,943 159,057 3,152 162,2092016 88,083 82,688 7,122 177,893 3,093 180,986
At September 30,2017(3) 90,635 92,895 7,731 191,261 2,463 193,724
By Currency(4)
At December 31, At September 30,2012 2013 2014 2015 2016 2017(3)
(in millions of U.S. dollars, except for percentages)U.S. Dollars U.S.$105,836 84.2 % U.S.$111,647 83.0 % U.S.$121,927 82.6 % U.S.$131,702 81.2 % U.S.$144,185 79.7 % U.S.$149,496 77.2 %Japanese Yen 6,847 5.4 5,519 4.1 5,058 3.4 4,857 3.0 6,410 3.5 6,690 3.5Swiss Francs 961 0.8 969 0.7 401 0.3 1,011 0.6 1,331 0.7 1,375 0.7Pounds Sterling 1,993 1.6 1,369 1.0 2,848 1.9 2,694 1.7 2,257 1.3 2,450 1.3Euro 9,530 7.6 11,489 8.5 13,986 9.5 18,834 11.6 24,409 13.5 31,085 16.0Others 558 0.4 3,443 2.6 3,445 2.3 3,113 1.9 2,393 1.3 2,629 1.4Total U.S.$125,726 100.0% U.S.$134,436 100.0% U.S.$147,666 100.0% U.S.$162,209 100.0% U.S.$180,986 100.0% U.S.$193,724 100.0%
Net External Debt of the Public Sector
At December 31, At September 30,2012 2013 2014 2015 2016 2017(3)
(in millions of U.S. dollars, except for percentages)
Total Net Debt U.S.$121,659.0 U.S.$130,949.7 U.S.$145,617.4 U.S.$161,609.5 U.S.$177,692.5 U.S.$ 191,825.3Gross External Debt/GDP 10.1 % 10.5 % 12.0 % 15.3 % 19.2 % 16.5 %Net External Debt/GDP 9.8 % 10.2 % 11.9 % 15.2 % 18.8 % 16.3 %
133
Copyright © 2018 www.secdatabase.com. All Rights Reserved.Please Consider the Environment Before Printing This Document
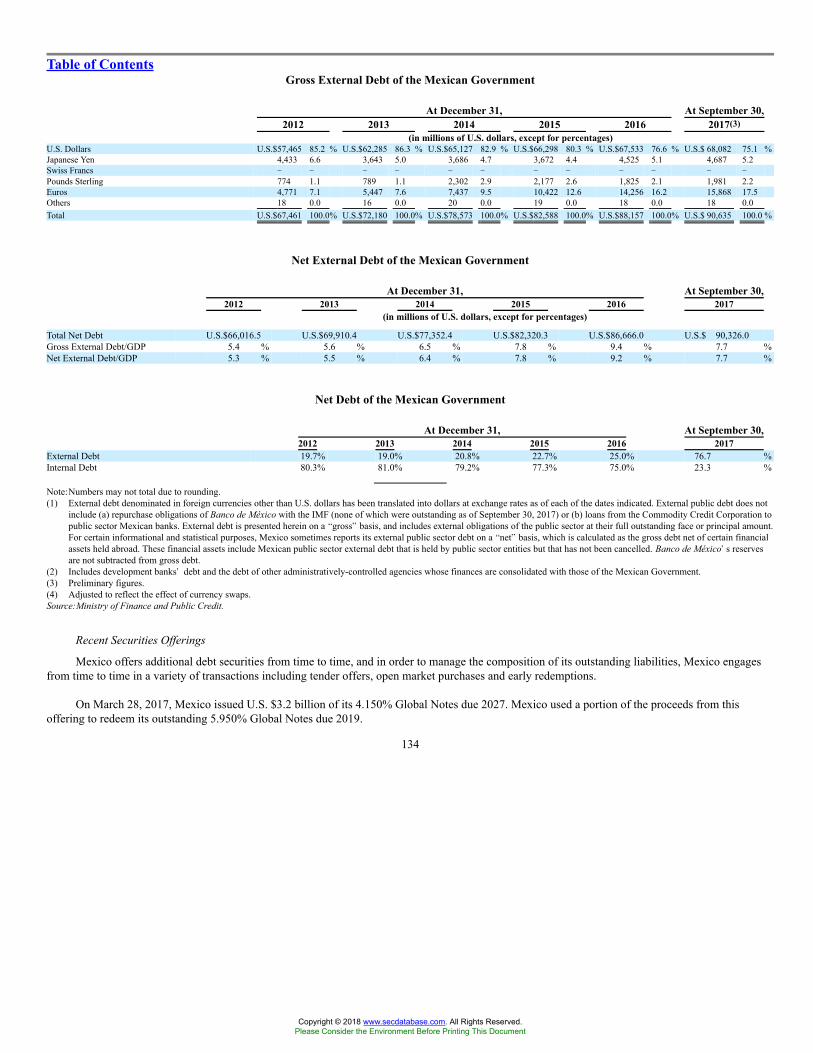
Table of ContentsGross External Debt of the Mexican Government
At December 31, At September 30,2012 2013 2014 2015 2016 2017(3)
(in millions of U.S. dollars, except for percentages)U.S. Dollars U.S.$57,465 85.2 % U.S.$62,285 86.3 % U.S.$65,127 82.9 % U.S.$66,298 80.3 % U.S.$67,533 76.6 % U.S.$ 68,082 75.1 %Japanese Yen 4,433 6.6 3,643 5.0 3,686 4.7 3,672 4.4 4,525 5.1 4,687 5.2Swiss Francs � � � � � � � � � � � �Pounds Sterling 774 1.1 789 1.1 2,302 2.9 2,177 2.6 1,825 2.1 1,981 2.2Euros 4,771 7.1 5,447 7.6 7,437 9.5 10,422 12.6 14,256 16.2 15,868 17.5Others 18 0.0 16 0.0 20 0.0 19 0.0 18 0.0 18 0.0Total U.S.$67,461 100.0% U.S.$72,180 100.0% U.S.$78,573 100.0% U.S.$82,588 100.0% U.S.$88,157 100.0% U.S.$ 90,635 100.0 %
Net External Debt of the Mexican Government
At December 31, At September 30,2012 2013 2014 2015 2016 2017
(in millions of U.S. dollars, except for percentages)
Total Net Debt U.S.$66,016.5 U.S.$69,910.4 U.S.$77,352.4 U.S.$82,320.3 U.S.$86,666.0 U.S.$ 90,326.0Gross External Debt/GDP 5.4 % 5.6 % 6.5 % 7.8 % 9.4 % 7.7 %Net External Debt/GDP 5.3 % 5.5 % 6.4 % 7.8 % 9.2 % 7.7 %
Net Debt of the Mexican Government
At December 31, At September 30,2012 2013 2014 2015 2016 2017
External Debt 19.7% 19.0% 20.8% 22.7% 25.0% 76.7 %Internal Debt 80.3% 81.0% 79.2% 77.3% 75.0% 23.3 %
Note:Numbers may not total due to rounding.(1) External debt denominated in foreign currencies other than U.S. dollars has been translated into dollars at exchange rates as of each of the dates indicated. External public debt does not
include (a) repurchase obligations of Banco de México with the IMF (none of which were outstanding as of September 30, 2017) or (b) loans from the Commodity Credit Corporation topublic sector Mexican banks. External debt is presented herein on a �gross� basis, and includes external obligations of the public sector at their full outstanding face or principal amount.For certain informational and statistical purposes, Mexico sometimes reports its external public sector debt on a �net� basis, which is calculated as the gross debt net of certain financialassets held abroad. These financial assets include Mexican public sector external debt that is held by public sector entities but that has not been cancelled. Banco de México�s reservesare not subtracted from gross debt.
(2) Includes development banks� debt and the debt of other administratively-controlled agencies whose finances are consolidated with those of the Mexican Government.(3) Preliminary figures.(4) Adjusted to reflect the effect of currency swaps.Source:Ministry of Finance and Public Credit.
Recent Securities Offerings
Mexico offers additional debt securities from time to time, and in order to manage the composition of its outstanding liabilities, Mexico engagesfrom time to time in a variety of transactions including tender offers, open market purchases and early redemptions.
On March 28, 2017, Mexico issued U.S. $3.2 billion of its 4.150% Global Notes due 2027. Mexico used a portion of the proceeds from thisoffering to redeem its outstanding 5.950% Global Notes due 2019.
134
Copyright © 2018 www.secdatabase.com. All Rights Reserved.Please Consider the Environment Before Printing This Document
Table of ContentsOn October 10, 2017, Mexico issued U.S.$1,880,000,000 4.600% Global Notes due 2048. Mexico used a portion of the proceeds from this
offering to redeem its outstanding 5.125% Global Notes due 2020.
As of September 29, of 2017, Mexico had repurchased approximately U.S. $500 million in aggregate principal amount of outstanding debtsecurities in open market transactions.
Legal and Political Reforms
Anti-Corruption
On July 18, 2016, the Sistema Nacional Anticorrupción (National Anti-Corruption System or NAS) went into force. The NAS is an institutionalframework that seeks to combat corruption and bribery in public administration and governmental accounting.
On December 21, 2016, the U.S. Department of Justice publicly disclosed that Odebrecht S.A. (or Odebrecht), a global construction conglomeratebased in Brazil, pled guilty to charges of bribery and corruption in connection with, among other things, bribes paid for more than 100 projects in twelvecountries. On December 22, 2016, authorities commenced administrative and criminal investigations into instances of bribery or corruption related tothese allegations. On January 25, 2017, the Mexican Government filed a criminal complaint with the Federal Attorney General�s Office against anyparty for acts that may have been committed against it.
Access to Information and Government Transparency
On May 9, 2016 the Ley Federal de Transparencia y Acceso a la Información Pública (Federal Law for Transparency and Access to PublicInformation) was published in the Official Gazette of the Federation, abrogating the former law of the same name. This law continues to ensure the rightto access to information held by governmental entities and, additionally, was expanded to include transparency obligations for the armed forces, theAgencia Nacional de Seguridad Industrial y de Protección al Medio Ambiente del Sector Hidrocarburos (National Agency for Industrial Safety andEnvironmental Protection on Hydrocarbons Sector), the CNH, the CRE, the Fondo Mexicano del Petróleo para la Estabilización y el Desarrollo(Mexican Petroleum Fund for Stabilization and Development) and the productive state-owned companies. The new law sets forth the authority of theInstituto Nacional de Transparencia, Acceso a la Información y Protección de Datos Personales (National Institute of Transparency, InformationAccess and Protection of Private Data or INAI) to impose sanctions.
Criminal Justice
In June 2008, the Constitución Política de los Estados Unidos Mexicanos (the Political Constitution of Mexico, or the Constitution) was amendedto reform the criminal justice system. The reforms were implemented over a period of eight years and went into force on June 18, 2016. Under thereforms, Mexico transitioned to an accusatory system of criminal justice, in which defendants are presumed innocent until proven guilty. Closed-doorproceedings, previously conducted almost exclusively through written briefs, will be replaced with oral trials open to the public. A specific judge will benamed to each criminal proceeding and will follow that proceeding through the sentencing phase and will be required to be present at every hearing. Thevictims of criminal activity are more directly involved in criminal proceedings and benefit from increased protection of their personal data, as well asaccess to legal, medical and psychological assistance.
Local Government Finance
On April 27, 2016, the Ley de Disciplina Financiera de las Entidades Federativas y los Municipios (Law for the Financial Discipline of the Statesand the Municipalities) was published in the Official Gazette of the
135
Copyright © 2018 www.secdatabase.com. All Rights Reserved.Please Consider the Environment Before Printing This Document
Table of ContentsFederation. Pursuant to the law, states and municipalities will need the authorization of the local congress to incur additional indebtedness if theiroutstanding indebtedness is higher than six percent of the revenues approved by the Legislative branch for the applicable fiscal year. The law alsoimposes a new set of requirements that must be met prior to having the Mexican Government guarantee debt issued by states and municipalities. Thislegislation follows a May 2015 decree amending various provisions of the Constitution, creating a new legal framework to control the borrowingpractices of the states and municipalities.
Economic Development
On June 1, 2016, the Ley de Zonas Económicas Especiales (Law of Special Economic Zones) was published in the Official Gazette of theFederation. This law is part of the National Development Plan and its purpose is to regulate the establishment and operation of the Special EconomicZones and promote sustainable economic growth in the undeveloped regions of the country, particularly the southern region of Mexico. The SpecialEconomic Zones are designated geographic areas subject to special incentives to promote business, attract new investment and generate employmentopportunities through infrastructure development projects.
Consistent with the National Development Plan, on January 9, 2017, the Mexican Government announced that it signed the Acuerdo para elFortalecimiento Económico y la Protección de la Economía Familiar (Agreement for Economic Strengthening and Protection of the Economy of theFamily). This agreement aims to strengthen the domestic market in Mexico with a focus on protecting the economic well-being of Mexican families,increasing investment and maintaining job creation, economic growth and competitiveness.
On May 15, 2017, the Disposiciones de Carácter General Aplicables a las Bolsas de Valores (General Provisions Applicable to Stock Exchanges)were published in the Official Gazette of the Federation. These General Provisions strengthen the regulatory framework applicable to stock exchanges,including, among other measures, enhanced internal controls of the stock market, rules covering the disclosure of market-moving information and theestablishment of contingency plans for stock exchanges experiencing operational distress.
On August 29, 2017, the concession for a new stock exchange in Mexico was published in the Official Gazette of the Federation by the Ministryof Finance and Public Credit. The new Bolsa Institutional de Valores (Institutional Stock Exchange, or BIVA) will begin operations once it fulfills therequirements set forth in the Ley del Mercado de Valores (Stock Market Exchange Law). This new concession was granted as part of the Ministry ofFinance and Public Credit�s program to develop the securities market based on four main pillars: (1) changing the configuration and regulation ofsecurities; (2) providing for the participation of development banks to promote securities markets; (3) changing the regulation of retirement funds andinsurance companies to encourage investment in new projects and creating reference portfolios to establish incentives to participate in the securitiesmarket; and (4) developing a national strategy for financial education to encourage participation in development instruments.
136
Copyright © 2018 www.secdatabase.com. All Rights Reserved.Please Consider the Environment Before Printing This Document
Table of ContentsItem 4A. Unresolved Staff Comments
Not applicable.
Item 5. Operating and Financial Review and Prospects
General
We earn income from:
� export sales, which consist of sales of crude oil and condensates, petroleum products and petrochemical products;
� domestic sales, which consist of sales of natural gas, petroleum products (such as gasoline, diesel fuel and LPG) and petrochemicalproducts; and
� other sources, including financial and investment income and insurance revenue.
Our operating expenses include:
� cost of sales, including the cost of purchases of imported petroleum and other products, depreciation and amortization, salaries, wages andbenefits, a portion of the net cost of employee benefits for the period, the variation of inventories, maintenance, and exploration andunsuccessful drilling expenses;
� transportation and distribution expenses (including a portion of the net cost of employee benefits for the period); and
� administrative expenses (including a portion of the net cost of employee benefits for the period).
Our income is affected by a number of factors, including:
� changes in international prices of crude oil, petroleum products and petrochemical products, which are denominated in U.S. dollars, anddomestic prices of petroleum products, which are denominated in pesos;
� the type and volume of crude oil produced and exported;
� the type and volume of natural gas produced, processed and sold domestically and internationally;
� the results of development and exploration activities;
� the amount of taxes, duties and other payments that we are required to make to the Mexican Government;
� fluctuations in the peso-U.S. dollar exchange rate; and
� Mexican and global economic conditions, including the levels of international interest rates.
Overview
In 2017 we focused on further recovering our financial stability, taking concrete steps towards implementing and building on the opportunitiespresented to us by the energy reform and strengthening the relationship with our stakeholders, including with our more recent partners in farm-outs andother associations. These actions took place against a macroeconomic landscape that continues to be challenging for us. While the decline in crude oilprices that commenced in late 2014 began to stabilize in 2017 and prices even began to rise slowly, we remain in a low price environment. In 2017, theweighted average price of the Mexican crude oil export price increased from U.S. $35.63 per barrel in 2016 to U.S. $46.73 per barrel.
137
Copyright © 2018 www.secdatabase.com. All Rights Reserved.Please Consider the Environment Before Printing This Document
Table of ContentsGoing Concern
Our consolidated financial statements as of December 31, 2017 and 2016 have been prepared on a going concern basis, which assumes that wecan meet our payment obligations. As we describe in Note 2 to our consolidated financial statements, we have experienced certain conditions that havegenerated material uncertainty that may cast significant doubt on our ability to continue operating as a going concern. We discuss below, and in Note 2to our consolidated financial statements, the circumstances that have caused these negative trends and the concrete actions we are taking to improve ourresults, strengthen our ability to continue operating, and achieve revenue maximization and efficiencies in an economic environment which is showingrecovery and some stability. We continue operating as a going concern, and our consolidated financial statements do not include any adjustments thatmight result from the outcome of this uncertainty.
Redefinition of Petróleos Mexicanos as a State-Owned Productive Company
We are continuing to implement a business strategy that redefines us as a state-owned productive company, enables us to operate competitivelyand efficiently and takes advantage of the opportunities made available to us by the energy reform. As a productive state-owned company, our businessmodel contemplates maximizing value for Mexico and, accordingly, we intend to focus on high-yield projects with growth potential. Every action takenunder our business plan will be directed towards the efficient allocation of resources, developing profitable businesses and considering the developmentof new businesses with third parties. These opportunities include expanding the scope of activities in which we participate, enhancing our ability toacquire technology and knowledge along the entire hydrocarbons value chain through strategic alliances and continuing the migration of certainassignments into exploration and production contracts.
Commencing in 2016, we have begun to take certain actions to increase our efficiency and competitiveness. Towards that end, we have continuedwith our implementation of the 2017-2021 Business Plan (described below), and have otherwise taken advantage of the opportunities provided by theenergy reform in the following ways:
� 2017-2021 Business Plan: On November 3, 2016, we announced our business plan for the five-year period from 2017 through 2021 (whichwe refer to as the 2017-2021 Business Plan), which is designed to improve cash flows, reduce net indebtedness, strengthen our financialbalance (which we define as sales after deducting costs and expenses, investment expenses, taxes and duties, and financial debt service),reduce financial losses in our National Refining System and plans for continued cost-cutting and administrative discipline, as well as theestablishment of additional alliances, including an intensive farm-out program. We intend to continue to execute on our business plan in2018, even while our management seeks to update it with a 2018 plan that is currently under evaluation.
� Farm-outs and Other Associations: An important part of our business plan is the leveraging of resources and expertise of third parties. In2017, we entered into our first farm-out in deep waters (Trión) and our first two onshore farm-outs (Cárdenas-Mora and Ogarrio) and weintend to continue our farm-out program in 2018. We expect that these farm-outs will allow us to recoup some of our previous investmentsin our fields, as well as share certain risks associated with further development of those fields, while maintaining an interest in future profits.In addition, we participated and won assignments in multiple bidding rounds in 2017 and we intend to participate in subsequent biddingrounds, either with partners or independently, in order to further diversify and strengthen our exploration and production portfolio.
� Improved Financial Position: In addition to taking advantage of new business opportunities and arrangements provided by the energyreform, such as farm-outs, we also continue to take certain specific measures to improve our financial position, including the following:
� Pension Reform: As of January 1, 2016, new employees receive a defined contribution plan, pursuant to which both we and ouremployees contribute to each employee�s individual account,
138
Copyright © 2018 www.secdatabase.com. All Rights Reserved.Please Consider the Environment Before Printing This Document
Table of Contentsin contrast to the defined benefit pension plan, pursuant to which only we contribute. To further reduce our pension liabilities, we areinviting employees hired prior to 2016 to transfer from their existing defined benefit pension plan to a defined contribution plan. Weexpect that this will allow us to decrease our employee benefits service cost and employee benefits liability going forward.
� Assets Sales: In November 2017, we completed the divestiture of Ductos y Energéticos del Norte, S. de R.L. de C.V. and wecontinue to evaluate the divestiture of other non-essential assets to obtain working capital, such as the divestiture of TAG NorteHolding, S. de R.L. C.V., which we expect will be concluded in the first half of 2018.
� Decreased Debt Financing: We also intend to improve our financial position by relying less on debt financing. As part of thatstrategy, in 2017 we issued Ps. 72.4 billion in debt, which is significantly less than the Ps. 231.6 billion we issued in 2016. For theyear 2018, we intend to continue this strategy and are authorized to incur additional internal net debt of Ps. 30 billion and anadditional external net debt of U.S. $6.2 billion. We continue to evaluate market conditions for opportunities to execute liabilitymanagement transactions, which we expect will allow us to improve the terms of our outstanding debt.
� 2018 Plans: Our 2018 plans set out certain objectives we expect to achieve with respect to our subsidiary entities as follows:
� Pemex Exploration and Production. Pemex Exploration and Production will focus on maintaining production levels and developingfarm-outs and associations with the aim of increasing its operations and, with time, the production of hydrocarbons in the mid-term.Pemex Exploration and Production will also accelerate the migration of Integrated E&P Contracts and FPWC to exploration andextraction contracts and will focus on the rehabilitation and reincorporation activities of wells with production possibilities. In 2018,Pemex Exploration and Production will continue to promote actions that encourage efficiency and optimize costs.
In order to continue to take advantage of the benefits of the energy reform and to ensure our economic sustainability, in 2018 and inthe up-coming years, Pemex Exploration and Production will focus on the following strategies: (1) establishment of an explorationmodel that allows us to grow our proven, probably and possible reserves; (2) further development of business plans for thedevelopment of shale; (3) containment and reversal of production decline and increase of profitability of assignments migratedwithout third party participation; (4) entering into and developing existing strategic alliances, partnertships and other arrangementsto attract additional investment and to expand exploration activities; (5) focus on maintenance to improve the safety of ouroperations; (6) improved operational efficiency and cost control; and (7) an increase in sales of our hydrocarbons.
� Pemex Industrial Transformation. With respect to Pemex Industrial Transformation, we will continue to perform reconfiguration andauxiliary services for our refineries and we will focus on the following strategies in 2018: (1) keeping our facilities safe and reliable,(2) improving the financial balance, (3) maintaining a significant market share in Mexico and (4) eliminating debts, which will helpto improve our refining margin.
� Pemex Logistics. After holding its first successful Open Season Public Auction in 2017, Pemex Logistics will continue to evaluateopportunities for executing subsequent auctions for certain of its pipelines and storage systems with the goal of diversifying itscustomer base and improving profitability.
� Pemex Fertilizers, Pemex Ethylene and Pemex Drilling and Services. With respect to Pemex Fertilizers, Pemex Ethylene and PemexDrilling and Services, we continue to focus on efficiency and profitability by, among others, entering into service contracts and byseeking partnerships for the purpose of modernizing our facilities.
139
Copyright © 2018 www.secdatabase.com. All Rights Reserved.Please Consider the Environment Before Printing This Document
Table of Contents� New Budget: On July 14, 2017, Petróleos Mexicanos� Board of Directors approved a proposal for the consolidated annual budget of
Petróleos Mexicanos and the subsidiary entities for 2018, which was subsequently approved by the Mexican Congress on November 9, 2017and published in the Official Gazette of the Federation on November 15, 2017. The consolidated annual budget of Petróleos Mexicanos andthe subsidiary entities for 2018 approved by the Mexican Chamber of Deputies is approximately Ps. 391.9 billion, as compared to the Ps.385.2 billion consolidated annual budget for 2017.
In addition, while we remain in a low price environment, if prices and markets for hydrocarbons continue to stabilize, this may allow us toaccelerate the development of our fields, through partnerships or alone, contain the decline in our production and increase our revenues through theinitiatives described above. In July 2018, presidential and federal congressional elections will be held in Mexico, which could also have an impact onthe political and economic environment of the oil and gas industry and, in turn, our strategy.
Results of operations and financial condition in 2017
For the year ended December 31, 2017, we increased our net loss by 47.0%, from a net loss of Ps. 191.1 billion (U.S. $9.3 billion) in 2016 to a netloss of Ps. 280.9 billion (U.S. $14.2 billion) in 2017. This increase in net loss was primarily due to:
� a Ps. 482.8 billion increase in impairment of wells, pipelines, properties, plant and equipment;
� a Ps. 138.4 billion increase in cost of sales, mainly due to an increase in total sales;
� a Ps. 68.5 billion increase in taxes and other duties;
� a Ps. 17.5 billion decrease in other revenues, net;
� a Ps. 3.9 billion increase in general expenses; and
� a Ps. 1.8 billion decrease in profit sharing in joint ventures, associates and other.
This increase was partially offset by:
� a Ps. 322.9 billion increase in total sales, mainly due to an increase in the average price of crude oil and natural gas;
� a Ps. 277.2 billion decrease in exchange loss, net; and
� a Ps. 23.0 billion decrease in financing cost, net.
For more information on our results of operations, see ��Results of Operations of Petróleos Mexicanos, the Subsidiary Entities and the SubsidiaryCompanies�For the Year Ended December 31, 2017 Compared to the Year Ended December 31, 2016� below.
In 2017, our (deficit) equity increased by Ps. 269.3 billion from negative Ps. 1,233.0 billion as of December 31, 2016 to negativePs. 1,502.4 billion as of December 31, 2017. For more information on our deficit increase, see ��Liquidity and Capital Resources�Equity Structure andMexican Government Contributions� below. This increase was mainly due to (1) our net loss for the year of Ps. 280.9 billion; (2) a Ps. 12.0 billionincrease in actuarial gains on employee benefits; and (3) Ps. 6.0 billion in accumulated loss from the foreign currency translation effect.
Although we continue to depend heavily on net cash flows from financing activities, in 2017 we were able to strengthen our liquidity. Ouraccounts receivable, net, increased 37.4% in 2017, from Ps. 133.2 billion as of December 31, 2016 to Ps. 170.6 billion as of December 31, 2017, mainlydue to the following:
� an increase in accounts receivables from sales to our international customers;
� customer services reimbursements;
140
Copyright © 2018 www.secdatabase.com. All Rights Reserved.Please Consider the Environment Before Printing This Document

Table of Contents� the current portion of the promissory notes issued by the Mexican Government in relation to our pension liabilities;
� higher accounts receivable from gasoline distributors; and
� an increase in tax credits associated with hydrocarbon extraction duties.
In addition to increasing our assets, during 2017 we continued to address one of the most critical problems we faced in 2015�our accounts payableto suppliers. As of December 31, 2017, we owed our suppliers approximately Ps. 140.0 billion as compared to Ps. 151.6 billion as of December 31,2016. As of December 31, 2017, we have paid the total outstanding balance due to suppliers and contractors as of December 31, 2016 and, as ofMarch 31, 2018, we have paid approximately 75.0% of the total outstanding balance due to suppliers and contractors as of December 31, 2017.
Operating Challenges
During 2017 our crude oil production totaled 1,948.3 thousand barrels per day, which, while slightly surpassing our target of 1,944 thousandbarrels per day for 2017, represented a decrease of 205.2 thousand barrels per day, or 9.5%, as compared to 2016. This decline was primarily a result ofthe natural decline of certain of our fields. We describe the reasons for this decline under �Item 4�Information on the Company�BusinessOverview�Exploration and Production�Crude Oil and Natural Gas Production.� For 2018, we have set a crude oil production target of 1,951 thousandbarrels per day.
In 2017, the total crude oil we processed decreased by 17.8% to 767.0 thousand barrels per day, primarily due to unscheduled shutdowns at ourSalina Cruz refinery as a result of natural disasters and the implementation of general maintenance programs at our Madero and Minatitlán refineries. Asa result, usage of our primary distillation capacity decreased by 11.1% to 47.1% in 2017. Although we had a decrease in crude oil processing, ourvariable refining margin increased by U.S. $0.95 per barrel to U.S. $5.43 per barrel in 2017, primarily as a result of the increase in average sales pricesfor refined products.
Critical Accounting Policies
Some of our accounting policies require the application of estimates, judgments and assumptions by management which affect the reportedamounts of assets and liabilities as of the date of our financial statements, as well as the reported amounts of revenues and expenses during the periodspresented in this report. By their nature, these estimates, judgments and assumptions are subject to a degree of uncertainty and are based on: ourhistorical experience; terms of existing contracts; management�s view of trends in the oil and gas industry, both internationally and within Mexico;economic factors in Mexico; and information from outside sources. We believe that the following critical accounting policies, among others, affectmanagement�s judgments and estimates used in the preparation of our consolidated financial statements according to IFRS, and could potentially impactour financial results and future financial performance. There can be no assurance that actual results do not differ from these estimates. These policies aremore fully described in Note 3 to our consolidated financial statements included herein.
Successful Efforts Method of Oil and Gas Accounting
We apply the successful efforts method for the exploration and production of crude oil and gas activities, considering the criteria mentioned inIFRS 6, �Exploration for and Evaluation of Mineral Resources,� in relation to the recognition of exploration and drilling assets. Costs of developmentwells and related plant, property and equipment involved in the exploitation of oil and gas are recorded as part of the cost of assets. The costs ofexploratory wells in areas that have not yet been designated as containing proved reserves are recorded as intangible assets until it is determined whethersuch reserves are commercially viable. Otherwise, the costs of drilling an exploratory well are charged to exploration expense. Other expenditures onexploration are charged to exploration expense, as incurred.
141
Copyright © 2018 www.secdatabase.com. All Rights Reserved.Please Consider the Environment Before Printing This Document
Table of ContentsDepreciation and amortization of capitalized costs associated with wells are based on the estimated commercial life of the field to which the well
corresponds, taking into account the relationship between the field�s production levels for the period and proved developed reserves, as of the beginningof the year and as updated on a quarterly basis for new development investments.
Reserves estimates are determined in accordance with earth science and petroleum engineering principles and practices pursuant to Rule 4-10(a)and, where necessary, in accordance with the Standards Pertaining to the Estimating and Auditing of Oil and Gas Reserves Information promulgated bythe SPE as of February 19, 2007. These procedures are consistent with international reserves reporting practices. The estimation of these reservesdepends on assumptions made and the interpretation of the data available, and can vary as a result of changes in such factors as forecasted oil and gasprices, reservoir performance and developments in oil field technology. The results of drilling activities, test wells and production after the date ofestimation are utilized in future revisions of reserves estimates.
Downward revision of reserves estimates can result in: higher depreciation and depletion expense per barrel in future periods; an immediate write-down of an asset�s book value in accordance with accounting rules for the impairment of properties; or changes in our accrual of the asset retirementobligation. An impairment of oil and gas producing fixed assets will result if the downward revisions are so significant that the estimated future cashflows from the remaining reserves in the field are insufficient to recover the unamortized capitalized costs. Conversely, if the oil and gas reservesquantities are revised upward, our per barrel depreciation and depletion expense will be lower.
The application of successful efforts accounting can also cause material fluctuations between periods in exploration expenses if drilling results aredifferent than expected or if we change our exploration and development plans. The determination that exploratory drilling was unsuccessful in findingeconomically producible reserves requires the immediate expensing of previously capitalized drilling costs. We make periodic assessments of theamounts included within intangible assets to determine whether capitalization is initially appropriate and should continue. Exploration wells capitalizedbeyond 12 months are subject to additional evaluation as to whether the facts and circumstances have changed, and therefore whether the conditionsdescribed below no longer apply. Exploration wells more than 12 months old are expensed unless: they are in an area requiring major capitalexpenditures before production can begin, commercially productive quantities of reserves have been found, and they are subject to further exploration orappraisal activity, in that either drilling of additional exploratory wells is underway or firmly planned for the near future; or proved reserves areidentified within 12 months following the completion of exploratory drilling.
Environmental Remediation and Asset Retirement Obligations
We are required to make judgments and estimates in recording liabilities for environmental cleanup and asset retirement obligations. Inaccordance with applicable legal requirements and accounting practices, we recognize an environmental liability when the cash outflows are probableand the amount is reasonably estimable. We account for disbursements related to the conservation of the environment that are linked to revenue fromcurrent or future operations as costs or assets, depending on the circumstances of each disbursement. Moreover, we account for disbursements related topast operations, which no longer contribute to current or future revenues, as current period costs. We accrue a liability for a future disbursement when anobligation related to environmental remediation is identified and the amount thereof can be reasonably estimated.
Estimated liabilities for environmental remediation and asset retirement obligations are subject to change as a result of: changes in laws,regulations and their interpretation; the review of additional information on the extent and nature of site contamination; the determination of additionalworks that need to be undertaken; improvements in technology; the nature and timing of expenditure; foreign currency exchange rates to the extent thatsome of these costs are incurred in U.S. dollars; and changes in discount rates.
142
Copyright © 2018 www.secdatabase.com. All Rights Reserved.Please Consider the Environment Before Printing This Document

Table of ContentsWe do not recognize the obligations related to the costs of future retirement of assets associated with the principal refining processes for gas and
petrochemicals. These assets are considered to have an indefinite useful life due to the potential for maintenance and repairs, and, accordingly, we lacksufficient information to reasonably determine the date on which they will be decommissioned.
Financial Instruments
We face market risk caused by the volatility of hydrocarbon prices, exchange rates and interest rates. In order to monitor and manage this risk,Petróleos Mexicanos and the subsidiary entities have developed policies and guidelines that promote an integrated scheme for market risk management,regulate the use of DFIs, guide the development of hedging strategies and provide strategies for the formulation of risk limits.
We enter into derivatives transactions with the sole purpose of hedging financial risks related to our operations. Nonetheless, some of thesetransactions do not qualify for hedge accounting treatment because they do not meet the strict requirements of IAS 39, �Financial InstrumentsRecognition and Measurement� for designation as hedges. They are therefore recorded in the financial statements as non-hedge instruments or asinstruments entered into for trading purposes, despite the fact that their cash flows are offset by the cash flows of the positions to which they relate. As aresult, the changes in their fair value are recognized in the financing cost. See Note 16 to our consolidated financial statements included herein.
Impairment of Non-Financial Assets
At each reporting date, we evaluate whether there is objective evidence that non-financial assets, other than inventory or deferred taxes, areimpaired. Significant judgment is required to appropriately assess the recoverable amount, represented by the higher of the value in use and the fairvalue, less costs to sell or otherwise dispose of our reporting units. Our future net cash flow projections are based on the best available estimates of thecash-generating unit income and expenses using forecasts, prior results and the outlook for the business�s performance and the market�s development.Our annual budget and business plan set macroeconomic forecasts for each of the cash-generating units, which are calculated based on differentassumptions regarding projected commodity sales prices, volume of production and overhead costs, foreign currency exchange rates and inflation,among other items, that are used to quantify income and expense estimates. Any change in the assumptions upon which the forecasts for each cash-generating unit are based can materially affect the anticipated cash flows to be generated by non-financial assets.
These estimated future net cash flows are discounted at present value using cash-generating unit specific discount rates determined as a functionof the currency in which their respective cash flows are denominated and the risks associated with these cash flows. The discount rates are intended toreflect current market assessments of the time value of money and the risks specific to the asset. Accordingly, the various discount rates used take intoconsideration country risk. To ensure that the calculations are consistent and avoid double counting, the cash flow projections do not factor in risks thathave already been built into the discount rates used. The discount rates used reflect current market conditions and specific risks related to those fixedassets. See Note 3(j) to our consolidated financial statements included herein.
As of December 31, 2017, we have carried out an impairment test to assess the carrying amount of non-financial assets, other than inventories anddeferred taxes. The impairment test has resulted in a net impairment of Ps. 151.4 billion, primarily resulting from a Ps. 129.3 billion impairment forPemex Exploration and Production due to (1) the deferral of the development investments in the first five years of the economic horizon in the provedreserves, (2) insufficient cash flows to make up for costs recovery at the Burgos and Lakach projects resulting from the 4.3% appreciation of theMexican peso against the U.S. dollar from a peso�U.S. dollar exchange rate of Ps. 20.6640 to U.S. $1.00 as of December 31, 2016 to a peso�U.S. dollarexchange rate of Ps. 19.7867 to U.S. $1.00 as of December 31, 2017, due to the fact that cash inflows are denominated in U.S. dollars and thentranslated to the reporting currency using the exchange rate at end of the
143
Copyright © 2018 www.secdatabase.com. All Rights Reserved.Please Consider the Environment Before Printing This Document

Table of Contentsperiod; (3) a 0.3% increase in the discount rate; (4) a 7.2% decrease in crude oil forward prices and (5) the natural decline in production in theMacuspana project. For more information on the impairment of our non-financial assets, see Note 12 to our consolidated financial statements includedherein.
Income Taxes
As described under �Item 4�Information on the Company�Taxes, Duties and Other Payments to the Mexican Government� above and in Note3(n) and Note 20 to our consolidated financial statements included herein, the fiscal regime applicable to Petróleos Mexicanos and the subsidiaryentities and certain subsidiary companies as of December 31, 2017 became effective on January 1, 2015. Effective as of this date, the HydrocarbonsRevenue Law and the Federal Revenue Law of the applicable year comprise the fiscal regime applicable to us.
As of December 31, 2017, Petróleos Mexicanos and the subsidiary entities are required to estimate taxable income according to IAS 12, �IncomeTaxes.� This process involves an estimation of our actual current tax and an assessment of temporary differences resulting from differing treatment ofitems for tax and accounting purposes. These differences result in deferred assets and liabilities, which are included within our consolidated balancesheet. We must then assess the likelihood that our deferred assets will be recovered from future taxable income.
Management judgment is required in determining our provision for income taxes. In the event that actual results differ from our estimates, anyadjustments recorded will affect our net income during the corresponding period.
Exploration and Production Taxes and Duties
The fiscal regime applicable to the exploration and production assignments granted to us by the Mexican Government includes the following taxesand duties:
� Profit-Sharing Duty. The Profit-Sharing Duty is calculated based on the value of hydrocarbons produced in the relevant area minus certainpermitted deductions. As of January 1, 2017, the applicable rate of this duty was 67.50%. Pursuant to the Hydrocarbons Revenue Law, theProfit-Sharing Duty decreases on an annual basis and as of January 1, 2019, it is expected to be set at 65%.
� Hydrocarbons Extraction Duty. The Hydrocarbons Extraction Duty is calculated based on a rate that varies according to (i) the type ofhydrocarbon (e.g., crude oil, associated natural gas, non-associated natural gas or condensates), (ii) the volume of production and (iii) therelevant market price.
� Exploration Hydrocarbons Duty. The Exploration Hydrocarbons Duty is calculated by applying a quote per square kilometer for eachassigned phase of production and extraction phase. Pemex Exploration and Production must make monthly payments of this duty. TheMexican Government is entitled to collect a monthly payment of Ps. 1,214 per square kilometer of non-producing areas. After 60 months,this tax increases to Ps. 2,903.54 per square kilometer for each additional month that the area is not producing. These amounts will beupdated on an annual basis in accordance with the national price index.
For more information on the taxes and duties applicable to and paid by Pemex Exploration and Production, see Note 20 to our consolidatedfinancial statements included herein.
Contingencies
In the ordinary course of business, we are named in a number of lawsuits of various types. We evaluate the merit of each claim and assess thelikely outcome. Liabilities for loss contingencies are recorded when it is probable that a liability has been incurred and the amount thereof can bereasonably estimated. We do not
144
Copyright © 2018 www.secdatabase.com. All Rights Reserved.Please Consider the Environment Before Printing This Document
Table of Contentsrecognize contingent revenues, earnings or assets until their realization is assured. We have not recorded provisions related to ongoing legal proceedingswhenever we do not expect an unfavorable resolution in such proceedings, except as disclosed in �Item 8�Financial Information�LegalProceedings�Civil Actions� and Notes 6 and 25 to our consolidated financial statements included herein.
Employee Benefits
As described under �Item 6�Directors, Senior Management and Employees�Employees� below and in Note 2(m) and Note 17 to our consolidatedfinancial statements included herein, as of January 1, 2016, we are operating both a defined contribution plan and defined benefit pension plan. UntilDecember 31, 2015, we only operated a defined benefit pension plan.
Contribution Plan
Under the defined contribution plan, both we and our employees contribute to each employee�s individual account, in contrast to the existingdefined benefit plan, pursuant to which only we contribute. We account for our contributions as costs, expenses or assets. Contributions to the definedcontribution plan that are not expected to be fully settled within 12 months after the end of the annual reporting period in which the employee renderedrelated services will be discounted using the defined benefits plan discount rate.
Benefit Pension Plan
Under the defined benefit pension plan, we are the only contributor to a trust, which is managed separately. We recognize the cost for the definedbenefit pension plan based on independent actuarial computations applying the projected unit credit method. Actuarial gains and losses are recognizedwithin other comprehensive results for the period in which they occur. The costs of prior services are recognized within profit or loss for the period inwhich they are incurred.
Our net obligation with respect to the defined benefit pension plan equals the present value of the defined benefit obligation less the fair value ofplan assets for which obligations have yet to be settled. The value of any asset is limited to the present value of the economic benefit represented by theplan reimbursements and reductions in future contributions to the plan.
In addition, other long-term employee benefits include seniority premiums payable for disability, death and survivors� benefits, medical services,gas and basic food baskets for beneficiaries. Termination benefits are recognized in profit or loss for the year in which they are incurred.
Benefits to employees were approximately 34.6% and 34.3% of our total liabilities as of December 31, 2017 and 2016, respectively, and anyadjustments recorded will affect our net income and/or comprehensive net income during the corresponding period.
Recently Issued Accounting Standards
New accounting interpretations and revisions under IFRS that apply to annual periods beginning on or after January 1, 2018, as well as additionalstandards, amendments or interpretations that, even though not yet effective, could have a material impact on our consolidated financial statements, anda breakdown of the effect of such new accounting interpretations and revisions are disclosed in Note 3(v) to our consolidated financial statementsincluded herein.
Sales Volumes and Prices
The profitability of our operations in any particular accounting period is directly related to the sales volume of, and average realized prices for, thecrude oil and natural gas that we sell. These average realized prices for crude oil and natural gas fluctuate from one period to another due to worldmarket conditions and other factors.
145
Copyright © 2018 www.secdatabase.com. All Rights Reserved.Please Consider the Environment Before Printing This Document

Table of ContentsExport Volumes and Prices
Pemex Exploration and Production sells crude oil to PMI, which then sells it to international clients. The volume of crude oil that we export is thevolume delivered to international clients as adjusted for water content according to the bill of lading and standard market practice. PMI bases crude oilexport price formulas on a basket of international reference prices and a constant set according to specific market conditions. We determine exportprices of refined products, petrochemicals and natural gas by reference to market conditions and direct negotiations with our clients.
Significant changes in international crude oil prices directly affect our financial results. The impact of changes in crude oil prices on our refiningactivities and petrochemicals business depends on:
� the magnitude of the change in crude oil prices;
� how quickly petroleum and petrochemical product prices in international markets adjust to reflect changes in crude oil prices; and
� the extent to which prices in Mexico, where we sell most of our petroleum products and petrochemicals, reflect international prices for thoseproducts.
The following table sets forth the weighted average market price per barrel of crude oil that PMI received from exports and the average price of itsbenchmark, West Texas Intermediate (or WTI) crude oil, for the years indicated. In 2013, the average prices of crude oil that we exported were higherthan the average prices of WTI crude oil. As of December 31, 2014, 2015, 2016 and 2017 however, the average price of crude oil that we exported fellbelow the average price of WTI crude oil, primarily due to the strengthening of the WTI crude oil against the prices of certain benchmark crudes, suchas West Texas Sour, Light Louisiana Sweet and Brent Dated, and against the price of high sulfur fuel oil, upon which the pricing formulas for our crudeoil are based. See �Item 4�Information on the Company�Business Overview�International Trading.�
Year ended December 31,2013 2014 2015 2016 2017
(in dollars per barrel)West Texas Intermediate crude oil
average price U.S. $ 97.99 U.S. $ 93.28 U.S. $ 48.71 U.S. $43.34 U.S. $50.79PEMEX crude oil weighted average
export price 98.44 85.48 43.12 35.65 46.73
Note: The numbers in this table are daily average prices for the full year, which differ from spot prices at year end. On April 27, 2018, the spot price for West Texas Intermediate crude oil wasU.S. $68.10 per barrel and the spot price for the PEMEX crude oil basket was an estimated U.S. $60.89 per barrel.
Sources: PMI operating statistics and Platt�s U.S. Marketscan (McGraw-Hill Company).
Domestic Prices
Until December 31, 2017, the formulas used to determine prices for petroleum products and petrochemical products sold in the Mexican marketwere determined by the Ministry of Finance and Public Credit and the CRE, in accordance with the Federal Public Administration Organic Law, asamended, the Ley de Planeación (Planning Law), the Reglamento Interior (Internal Regulations) of the Ministry of Finance and Public Credit and theLey de la Comisión Reguladora de Energía (Energy Regulatory Commission Law). The Ministry of Finance and Public Credit and the CRE receivedinput from us and other governmental ministries through committees composed of officers of Petróleos Mexicanos, the subsidiary entities, some of thesubsidiary companies, and representatives of various government ministries, including, among others, the Ministry of Finance and Public Credit, theMinistry of Energy, the Secretaría de la Función Pública (Ministry of Public Function, or the SFP) and the Secretaría de Economía (Ministry ofEconomy). The Ministry of Finance and Public Credit and the CRE determined wholesale and first-hand sale prices based on opportunity cost, whichconsiders international prices,
146
Copyright © 2018 www.secdatabase.com. All Rights Reserved.Please Consider the Environment Before Printing This Document
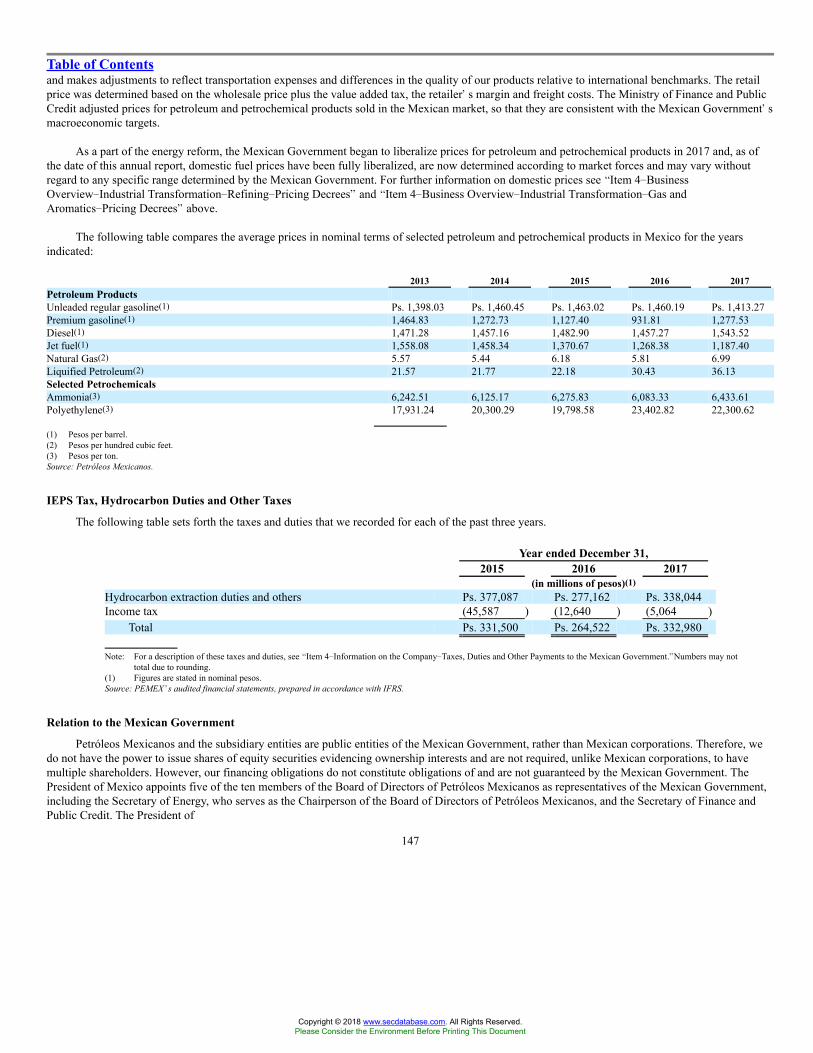
Table of Contentsand makes adjustments to reflect transportation expenses and differences in the quality of our products relative to international benchmarks. The retailprice was determined based on the wholesale price plus the value added tax, the retailer�s margin and freight costs. The Ministry of Finance and PublicCredit adjusted prices for petroleum and petrochemical products sold in the Mexican market, so that they are consistent with the Mexican Government�smacroeconomic targets.
As a part of the energy reform, the Mexican Government began to liberalize prices for petroleum and petrochemical products in 2017 and, as ofthe date of this annual report, domestic fuel prices have been fully liberalized, are now determined according to market forces and may vary withoutregard to any specific range determined by the Mexican Government. For further information on domestic prices see �Item 4�BusinessOverview�Industrial Transformation�Refining�Pricing Decrees� and �Item 4�Business Overview�Industrial Transformation�Gas andAromatics�Pricing Decrees� above.
The following table compares the average prices in nominal terms of selected petroleum and petrochemical products in Mexico for the yearsindicated:
2013 2014 2015 2016 2017Petroleum ProductsUnleaded regular gasoline(1) Ps. 1,398.03 Ps. 1,460.45 Ps. 1,463.02 Ps. 1,460.19 Ps. 1,413.27Premium gasoline(1) 1,464.83 1,272.73 1,127.40 931.81 1,277.53Diesel(1) 1,471.28 1,457.16 1,482.90 1,457.27 1,543.52Jet fuel(1) 1,558.08 1,458.34 1,370.67 1,268.38 1,187.40Natural Gas(2) 5.57 5.44 6.18 5.81 6.99Liquified Petroleum(2) 21.57 21.77 22.18 30.43 36.13Selected PetrochemicalsAmmonia(3) 6,242.51 6,125.17 6,275.83 6,083.33 6,433.61Polyethylene(3) 17,931.24 20,300.29 19,798.58 23,402.82 22,300.62
(1) Pesos per barrel.(2) Pesos per hundred cubic feet.(3) Pesos per ton.Source: Petróleos Mexicanos.
IEPS Tax, Hydrocarbon Duties and Other Taxes
The following table sets forth the taxes and duties that we recorded for each of the past three years.
Year ended December 31,2015 2016 2017
(in millions of pesos)(1)Hydrocarbon extraction duties and others Ps. 377,087 Ps. 277,162 Ps. 338,044Income tax (45,587 ) (12,640 ) (5,064 )
Total Ps. 331,500 Ps. 264,522 Ps. 332,980
Note: For a description of these taxes and duties, see �Item 4�Information on the Company�Taxes, Duties and Other Payments to the Mexican Government.�Numbers may nottotal due to rounding.
(1) Figures are stated in nominal pesos.Source: PEMEX�s audited financial statements, prepared in accordance with IFRS.
Relation to the Mexican Government
Petróleos Mexicanos and the subsidiary entities are public entities of the Mexican Government, rather than Mexican corporations. Therefore, wedo not have the power to issue shares of equity securities evidencing ownership interests and are not required, unlike Mexican corporations, to havemultiple shareholders. However, our financing obligations do not constitute obligations of and are not guaranteed by the Mexican Government. ThePresident of Mexico appoints five of the ten members of the Board of Directors of Petróleos Mexicanos as representatives of the Mexican Government,including the Secretary of Energy, who serves as the Chairperson of the Board of Directors of Petróleos Mexicanos, and the Secretary of Finance andPublic Credit. The President of
147
Copyright © 2018 www.secdatabase.com. All Rights Reserved.Please Consider the Environment Before Printing This Document
Table of ContentsMexico also appoints five independent members to the Board of Directors of Petróleos Mexicanos, whose appointments are ratified by the Senate.
Pursuant to the Petróleos Mexicanos Law, the consolidated annual budget of Petróleos Mexicanos and the subsidiary entities, including ourfinancing program, must be submitted to the Ministry of Finance and Public Credit, which has the authority to adjust our financial balance goal and theceiling on our wage and salary expenditures for the fiscal year. The Mexican Government incorporates our consolidated annual budget and financingprogram into its budget, which the Chamber of Deputies must approve each year. The Mexican Congress has the authority to adjust our annual financialbalance goal at any time by amending the applicable law. In addition, any adjustment proposed by the Board of Directors of Petróleos Mexicanos tochange our annual financial balance goal or increase the limit on our wage and salary expenditures or our financing program must be approved by theChamber of Deputies.
Inflation
Mexico experienced high inflation during the 1980s. The annual rate of inflation (as measured by the change in the NCPI) decreased from a highof 159.2% in 1987 to 11.9% in 1992, 8.0% in 1993 and 7.1% in 1994. However, the economic events that followed the devaluation of the peso againstthe U.S. dollar in late 1994 and 1995, along with turbulence in international financial markets, caused inflation to increase to 52.0% in 1995. After 1995,inflation decreased to 27.7% in 1996 and 15.7% in 1997. The annual inflation rate was, 4.0% in 2013, 4.1% in 2014, 2.1% in 2015, 3.4% in 2016 and6.8% in 2017.
We do not use inflation accounting, unless the economic environment in which we operate qualifies as �hyperinflationary,� as defined by IFRS. Inaccordance with IFRS, the threshold for considering an economy hyperinflationary, and consequently, adjusting certain line items in the financialstatements for inflation, is reached when the cumulative three-year inflation rate is 100% or more. Because the economic environment in the three-yearperiods ended December 31, 2015, 2016 and 2017 did not qualify as hyperinflationary, we did not use inflation accounting to prepare our consolidatedfinancial statements as of December 31, 2015, 2016 and 2017 included herein.
Consolidation
Our financial statements consolidate the results of Petróleos Mexicanos, the subsidiary entities and the subsidiary companies. Certain non-materialsubsidiary companies are not consolidated and are accounted for under either the cost method or the equity method. For a list of the consolidatedsubsidiary companies, see Note 3(a) and Note 4 to our consolidated financial statements included herein.
Export Agreements
Though Mexico is not a member of OPEC, it has periodically announced increases and decreases in our crude oil exports, reflecting productionrevisions made by other oil producing countries in order to contribute to crude oil prices stabilization. However, we have not changed our export goalsbecause of announcements made by OPEC since 2004, and we believe that Mexico has no plans to change our current level of crude oil exports.
Results of Operations of Petróleos Mexicanos, the Subsidiary Entities and the Subsidiary Companies��For the Year Ended December 31, 2017Compared to the Year Ended December 31, 2016
Total Sales
Total sales increased by 30.1%, or Ps. 322.9 billion, in 2017, from Ps. 1,074.1 billion in 2016 to Ps. 1,397.0 billion in 2017, primarily due to anincrease in the volume of our domestic and export sales, mainly due to an increase in the average sales prices of our petroleum products for the reasonsexplained in further detail below.
148
Copyright © 2018 www.secdatabase.com. All Rights Reserved.Please Consider the Environment Before Printing This Document
Table of ContentsDomestic Sales
Domestic sales increased by 30.9% in 2017, from Ps. 670.0 billion in 2016 to Ps. 877.4 billion in 2017, primarily due to an increase in the averageprices of fuel oil, diesel, gasoline and liquefied natural gas. Domestic sales of petroleum products increased by 39.6% in 2017, from Ps. 529.3 billion in2016 to Ps. 738.9 billion in 2017, primarily due to a 34.1% increase in the average price of gasoline, a 60.7% increase in the average price of diesel, a26.2% increase in the average price of jet fuel and a 78.9% increase in the average price of fuel oil. These price increases were partially offset by a27.1% decrease in the volume of sales of premium gasoline, primarily due to a decrease in demand from retail service stations and a 15.8% decrease inthe volume of sales of liquefied natural gas. Domestic sales of natural gas increased by 19.0% in 2017, from Ps. 59.6 billion in 2016 to Ps. 70.9 billionin 2017, primarily due to a 43.0% increase in the average sales price of natural gas, partially offset by a 16.8% decrease in the volume of sales of naturalgas. Domestic sales of liquefied natural gas decreased by 3.7% in 2017, from Ps. 50.9 billion in 2016 to Ps. 49.0 billion in 2017, primarily as a result ofa 15.8% decrease in the volume of sales of liquefied natural gas due to the market share loss that resulted from increased competition due to theliberalization of imports that began in 2016, which was partially offset by a 14.4% increase in the average sales price of liquefied natural gas. Domesticpetrochemical sales (including sales of certain by-products of the petrochemical production process) decreased by 47.0%, from Ps. 30.2 billion in 2016to Ps. 16.0 billion in 2017, primarily as a result of a decrease in the volume of sales of polyethylene.
Export Sales
Export sales increased by 28.7% in peso terms in 2017 (with U.S. dollar-denominated export revenues translated to pesos at the exchange rate onthe date of the corresponding export sale), from Ps. 395.1 billion in 2016 to Ps. 508.5 billion in 2017. This increase was primarily due to a 33.9%increase in the weighted average Mexican crude oil export price, a 63.4% increase in the export sales of fuel oil, mainly due to an increase in the averagesales price of fuel oil, a 4.5% increase in the export sales of naphthas and a Ps. 1,087.8 million increase in the export sales of petrochemical products.This increase in export sales was partially offset by a 2.7% decrease in the volume of export sales of petroleum products.
Excluding the trading activities of the Trading Companies (in order to show only the amount of export sales related to the subsidiary entities),export sales by the subsidiary entities to the Trading Companies and third parties increased by 31.4% in peso terms, from Ps. 327.8 billion in 2016 toPs. 430.6 billion in 2017. In U.S. dollar terms, excluding the trading activities of the Trading Companies, total export sales (which are U.S. dollar-denominated) increased by 29.7% in 2017, from U.S. $17.5 billion in 2016 to U.S. $22.7 billion in 2017. This was primarily due to the 33.9% increasein the weighted average Mexican crude oil export price. The trading and export activities of the Trading Companies generated additional marginalrevenues of Ps. 77.9 billion in 2017, 15.6% higher in peso terms than the Ps. 67.4 billion of additional revenues generated in 2016, mainly due to anincrease in the average prices of diesel and gasoline. Export sales of PMI-NASA, one of our principal Trading Companies, increased by 13.6% in 2017,from Ps. 57.9 billion in 2016 to Ps. 65.8 billion in 2017. The weighted average price per barrel of crude oil that PMI sold to third parties in 2017 wasU.S. $47.73, or 33.9%, higher than the weighted average price of U.S. $35.63 in 2016.
Crude oil and condensate export sales to PMI accounted for 88.4% of total export sales (excluding the trading activities of the TradingCompanies) in 2017, as compared to 88.1% in 2016. These crude oil and condensate sales increased in peso terms by 31.8% in 2017, fromPs. 288.6 billion in 2016 to Ps. 380.5 billion in 2017, and increased in U.S. dollar terms by 29.7 % in 2017, from U.S. $15.5 billion in 2016 to U.S.$20.1 billion in 2017. The weighted average price per barrel of crude oil that Pemex Exploration and Production sold to PMI for export in 2017 wasU.S. $47.26, 34.4% higher than the weighted average price of U.S. $35.17 in 2016.
Export sales of petroleum products, including natural gas and natural gas liquids, by our industrial transformation segment to the TradingCompanies and third parties decreased from 10.9% of total export sales (excluding the trading activities of the Trading Companies) in 2016 to 10.7% ofthose export sales in 2017. Export sales of petroleum products, including products derived from natural gas and natural gas liquids,
149
Copyright © 2018 www.secdatabase.com. All Rights Reserved.Please Consider the Environment Before Printing This Document
Table of Contentsincreased by 29.2%, from Ps. 35.6 billion in 2016 to Ps. 46.0 billion in 2017, primarily due to an increase in the average sales prices of fuel oil andnaphthas. In U.S. dollar terms, export sales of petroleum products, including products derived from natural gas and natural gas liquids, increased by26.3%, from U.S. $1.9 billion in 2016 to U.S. $2.4 billion in 2017. Export sales of natural gas increased by 3.3%, from Ps. 21.0 million in 2016 toPs. 21.7 million in 2017, primarily due to an increase in the average sales price of natural gas.
Petrochemical products accounted for the remainder of export sales in 2016 and 2017. Export sales of petrochemical products (including certainby-products of the petrochemical process) increased by Ps. 1,087.8 million in 2017, from Ps. 3,537.5 million in 2016 to Ps. 4,625.3 million in 2017,primarily due to an increase in export sales of Grupo Fertinal in 2017. In U.S. dollar terms, export sales of petrochemical products (including certainby-products of the petrochemical process) decreased by 2.7% in 2017, from U.S. $218.7 million in 2016 to U.S. $212.8 million in 2017.
Services Income
Services income increased by 24.0% in 2017, from Ps. 9.0 billion in 2016 to Ps. 11.1 billion in 2017, primarily as a result of an increase intransportation services provided by Pemex Logistics to CENAGAS and an increase in freight services provided by Pemex Industrial Transformation tothird parties.
Cost of Sales
Cost of sales increased by 16.0%, from Ps. 865.8 billion in 2016 to Ps. 1,004.2 billion in 2017. This increase was mainly due to: (1) an increase ofPs. 131.2 billion in purchases of imports, primarily Magna gasoline, diesel and natural gas, mainly due to an increase in the price of imports and anincrease in the volume of imports required to meet domestic demand; (2) a Ps. 15.5 billion increase in hydrocarbon exploration and extraction duties andtaxes due to higher average sales prices in 2017; (3) a Ps. 9.5 billion increase in operating expenses, mainly due to an increase in expenses for materialsand spare parts; and (4) a Ps. 6.2 billion increase in depreciation of fixed assets and amortization of wells, primarily due to the increased value of assetsto be depreciated as a result of the partial reversal of the impairment recorded in 2016. This increase was partially offset by a Ps. 26.0 billion decrease inthe cost of unsuccessful wells, primarily due to a decrease in investment.
Impairment of Wells, Pipelines, Properties, Plant and Equipment
Impairment of wells, pipelines, properties, plant and equipment increased by Ps. 482.7 billion in 2017, from a net reversal of impairment ofPs. 331.3 billion in 2016 to a net impairment of Ps. 151.4 billion in 2017, mainly due to: (1) the deferral of the development investments in the first fiveyears of the economic horizon in the proved reserves, (2) insufficient cash flows to make up for costs recovery at the Burgos and Lakach projectsresulting from the 4.3% appreciation of the Mexican peso against the U.S. dollar from a peso�U.S. dollar exchange rate of Ps. 20.6640 to U.S. $1.00 asof December 31, 2016 to a peso�U.S. dollar exchange rate of Ps. 19.7867 to U.S. $1.00 as of December 31, 2017, due to the fact that cash inflows aredenominated in U.S. dollars and then translated to the reporting currency using the exchange rate at the end of the period; (3) a 0.3% increase in thediscount rate; (4) a 7.2% decrease in crude oil forward prices, and (5) the natural decline in production in the Macuspana project.
General Expenses
General expenses increased by Ps. 3.9 billion, from Ps. 137.9 billion in 2016 to Ps. 141.8 billion in 2017, mainly due to an increase inadministrative expenses relating to the contributions to the defined contribution pension plan and incentives to encourage employees to migrate from thedefined benefit pension plan to the defined contribution plan.
150
Copyright © 2018 www.secdatabase.com. All Rights Reserved.Please Consider the Environment Before Printing This Document
Table of ContentsOther Revenues/Expenses, Net
Other revenues, net, decreased by Ps. 17.5 billion in 2017, from other revenues, net, of Ps. 22.7 billion in 2016 to other revenues, net, ofPs. 5.2 billion in 2017. This decrease was primarily due to the recognition of a Ps. 8.4 billion loss in the disposal of wells, pipelines, properties, plantand equipment and a Ps. 3.3 billion loss in the sale of our shares in Repsol. The decrease in other revenues, net, was partially offset by a Ps. 3.1 billiongain from the sale of our 50% interest in Ductos y Energéticos del Norte and the recovery of a Ps. 13.6 million insurance payment relating to an accidentthat occurred on our Abkatún-A platform in April 2015. For more information on the explosion at the Abkatún-A platform, see �Item 4�Health, Safetyand Environmental Performance�.
Financing Income
Financing income increased by Ps. 2.4 billion in 2017, from Ps. 13.8 billion in 2016 to Ps. 16.2 billion in 2017, primarily due to interest on thepromissory notes issued by the Mexican Government in relation to our pension liabilities.
Financing Cost
Financing cost increased by 18.8% in 2017, from Ps. 98.8 billion in 2016 to Ps. 117.6 billion in 2017, primarily due to an increase in interestexpense in 2017 following higher levels of indebtedness and the 4.3% appreciation of the peso relative to the U.S. dollar in 2017 as compared to 2016.
Derivative Financial Instruments Income (Cost)
Derivative financial instruments income (cost), net, increased by Ps. 39.3 billion, from a net cost of Ps. 14.0 billion in 2016 to a net income of Ps.25.3 billion in 2017, primarily due to the depreciation of the U.S. dollar relative to other foreign currencies we hedge and the restructuring of certain ofour derivative financial instruments.
Exchange Gain, Net
A substantial portion of our indebtedness, 86.6% as of December 31, 2017, is denominated in foreign currencies. Our exchange gain, net,increased by Ps. 277.2 billion in 2017, from an exchange loss of Ps. 254.0 billion in 2016 to an exchange gain of Ps. 23.2 billion in 2017, primarily as aresult of a 4.3% appreciation of the peso relative to the U.S. dollar in 2017. Due to the fact that 100.0% of our revenues from are referenced to pricesdenominated in U.S. dollars, and only 74.0% of our expenses, including financing costs, are linked to U.S. dollar prices, the appreciation of the pesorelative to the U.S. dollar had an unfavorable effect on our ability to meet peso-denominated obligations. The value of the peso in U.S. dollar termsappreciated by 4.3% in 2017, from Ps. 20.6640 = U.S. $1.00 on December 31, 2016 to Ps. 19.7867 = U.S. $1.00 on December 31, 2017, as compared toa 20.1% depreciation of the peso in U.S. dollar terms in 2016.
Taxes, Duties and Other
Hydrocarbon extraction duties and other duties and taxes paid increased by 25.9% in 2017, from Ps. 264.5 billion in 2016 to Ps. 333.0 billion in2017, primarily due to the 34.4% increase in the weighted average price of the Mexican crude oil export price, from U.S. $35.63 per barrel in 2016 toU.S. $47.26 per barrel in 2017. Income related duties and taxes represented 23.8% of total sales in 2017, as compared to 24.6 % of total sales in 2016.
151
Copyright © 2018 www.secdatabase.com. All Rights Reserved.Please Consider the Environment Before Printing This Document
Table of ContentsNet Income/Loss
In 2017, we had a net loss of Ps. 280.9 billion from Ps. 1,397.0 billion in total sales revenues, as compared to a net loss of Ps. 191.1 billion fromPs. 1,074.1 billion in total sales revenues in 2016. This increase in net loss was primarily explained by:
� a Ps. 482.7 billion increase in the impairment of fixed assets;
� a Ps. 68.5 billion increase in taxes and other duties, mainly due to the increase in the weighted average price of the Mexican crude oil exportprice; and
� a Ps. 17.5 billion decrease in other revenues, net.
This increase was partially offset by:
� a Ps. 322.9 billion increase in total sales, mainly due to the increase in average sales prices of our domestic refined petroleum products andexport crude oil;
� a Ps. 277.2 billion increase in exchange gain, net; and
� a Ps. 39.3 billion increase in derivative financial instruments income, net.
Other Comprehensive Results
In 2017, we had a net gain of Ps. 11.5 billion in other comprehensive results, as compared to a net gain of Ps. 127.9 billion in 2016, primarily dueto an increase in the reserve for employee benefits that resulted from the decrease in the discount rate and expected rate of return on plan assets used inthe actuarial computation method from 8.2% in 2016 to 7.9% in 2017, as well as the effect of employees migrating from the defined benefits pensionplan to the defined contribution plan.
Results of Operations of Petróleos Mexicanos, the Subsidiary Entities and the Subsidiary Companies��For the Year Ended December 31, 2016Compared to the Year Ended December 31, 2015
Total Sales
Total sales decreased by 7.5%, or Ps. 87.7 billion, in 2016, from Ps. 1,161.8 billion in 2015 to Ps. 1,074.1 billion in 2016, primarily due to adecrease in our domestic sales following the decrease in average sales prices of our petroleum products and the decrease in volume of sales of liquefiednatural gas in Mexico, in each case, for the reasons explained in further detail below. This decrease in total sales was partially offset by a 8.0% increasein services income.
Domestic Sales
Domestic sales decreased by 10.2% in 2016, from Ps. 746.2 billion in 2015 to Ps. 670.0 billion in 2016, primarily due to a decrease in the averageprices of fuel oil, diesel, gasoline and liquefied natural gas. Domestic sales of petroleum products decreased by 9.5% in 2016, from Ps. 585.0 billion in2015 to Ps. 529.3 billion in 2016, primarily due to a 5.5% decrease in the average price of gasoline, a 15.9% decrease in the average price of diesel, anda 36.5% decrease in the average price of fuel oil as a result of decreased demand from the CFE. These price decreases were partially offset by a 4.3%increase in the volume of sales of gasoline due to an increase in demand from retail service stations and an 8.1% increase in the volume of sales of jetfuel. Domestic sales of natural gas increased by 9.2% in 2016, from Ps. 54.5 billion in 2015 to Ps. 59.5 billion in 2016, primarily due to a 6.4% increasein the volume of sales of natural gas and a 2.9% increase in the average sales price of natural gas. Domestic sales of liquefied natural gas decreased by34.9% in 2016, from Ps. 78.2 billion in 2015 to Ps. 50.9 billion in 2016, primarily as a result of a 27.1% decrease in the volume of sales of liquefiednatural gas due to the market share loss that resulted from increased competition due to the liberalization of imports in 2016 and a 10.8% decrease in theaverage sales price of liquefied natural gas. Domestic petrochemical sales (including
152
Copyright © 2018 www.secdatabase.com. All Rights Reserved.Please Consider the Environment Before Printing This Document
Table of Contentssales of certain by-products of the petrochemical production process) increased by 6.0%, from Ps. 28.5 billion in 2015 to Ps. 30.2 billion, primarily as aresult of Ps. 2.6 billion in petrochemical sales by Grupo Fertinal.
Export Sales
Export sales decreased by 3.0% in peso terms in 2016 (with U.S. dollar-denominated export revenues translated to pesos at the exchange rate onthe date of the corresponding export sale), from Ps. 407.2 billion in 2015 to Ps. 395.1 billion in 2016. This decrease was primarily due to a 7.4%decrease in the volume of petroleum product exports, a 17.4% decrease in the weighted average Mexican crude oil export price, an 18.5% decrease inthe export sales of fuel oil, mainly due to a decrease in the average sales price and volume of sales of fuel oil, and a 13.7% decrease in the export salesof naphthas. This decrease in export sales was partially offset by a 2.1% increase in the volume of sales of crude oil and a Ps. 2,920.7 million increase inthe volume of sales of petrochemical products.
Excluding the trading activities of the Trading Companies (in order to show only the amount of export sales related to the subsidiary entities),export sales by the subsidiary entities to the Trading Companies and third parties decreased by 0.5% in peso terms, from Ps. 329.6 billion in 2015 toPs. 327.8 billion in 2016. In U.S. dollar terms, excluding the trading activities of the Trading Companies, total export sales (which are U.S. dollar-denominated) decreased by 16.2% in 2016, from U.S. $20.9 billion in 2015 to U.S. $17.5 billion in 2016. This was primarily due to the 17.4% decreasein the weighted average Mexican crude oil export price and a 2.1% increase in the volume of crude oil exports. The trading and export activities of theTrading Companies generated additional marginal revenues of Ps. 67.4 billion in 2016, 13.2% lower in peso terms than the Ps. 77.5 billion of additionalrevenues generated in 2015, mainly due to a decrease in the average prices of diesel and gasoline. Export sales of PMI-NASA, one of our principalTrading Companies, decreased by 9.4% in 2016, from Ps. 63.9 billion in 2015 to Ps. 57.9 billion in 2016. The weighted average price per barrel of crudeoil that PMI sold to third parties in 2016 was U.S. $35.63, or 17.4%, lower than the weighted average price of U.S. $43.12 in 2015.
Crude oil and condensate export sales to PMI accounted for 88.1% of total export sales (excluding the trading activities of the TradingCompanies) in 2016, as compared to 87.4% in 2015. These crude oil and condensate sales increased in peso terms by 0.2% in 2016, fromPs. 288.2 billion in 2015 to Ps. 288.6 billion in 2016, and decreased in U.S. dollar terms by 14.9% in 2016, from U.S. $18.2 billion in 2015 to U.S.$15.5 billion in 2016. The weighted average price per barrel of crude oil that Pemex Exploration and Production sold to PMI for export in 2016 wasU.S. $35.17, 17.6% lower than the weighted average price of U.S. $42.70 in 2015.
Export sales of petroleum products, including natural gas and natural gas liquids, by our industrial transformation segment to the TradingCompanies and third parties decreased from 12.4% of total export sales (excluding the trading activities of the Trading Companies) in 2015 to 10.9% ofthose export sales in 2016. Export sales of petroleum products, including products derived from natural gas and natural gas liquids, decreased by 13.0%,from Ps. 40.9 billion in 2015 to Ps. 35.6 billion in 2016, primarily due to a 5.5% decrease in the volume of exports of fuel oil and a 16.8% decrease inthe volume of exports of naphtha, as well as a decrease in the average sales price for both products. In U.S. dollar terms, export sales of petroleumproducts, including products derived from natural gas and natural gas liquids, decreased by 26.1%, from U.S. $2.6 billion in 2015 to U.S. $1.9 billion in2016. Export sales of natural gas decreased by 23.1%, from Ps. 27.3 million in 2015 to Ps. 21.0 million in 2016. This was primarily due to a decrease inthe production of natural gas.
Petrochemical products accounted for the remainder of export sales in 2015 and 2016. Export sales of petrochemical products (including certainby-products of the petrochemical process) increased by Ps. 2,920.7 million in 2016, from Ps. 616.8 million in 2015 to Ps. 3,537.5 million in 2016,primarily due to inclusion of export sales of Grupo Fertinal during 2016. In U.S. dollar terms, export sales of petrochemical products (including certainby-products of the petrochemical process) increased by Ps. 6,208.8 million in 2016, from Ps. 39.2 million in 2015 to Ps. 6,248.0 million in 2016.
153
Copyright © 2018 www.secdatabase.com. All Rights Reserved.Please Consider the Environment Before Printing This Document

Table of ContentsServices Income
Services income increased by 8.0% in 2016, from Ps. 8.3 billion in 2015 to Ps. 9.0 billion in 2016, primarily as a result of an increase intransportation services supplied by Pemex Logistics to CENAGAS and an increase in freight services provided by Pemex Industrial Transformation tothird parties.
Cost of Sales
Cost of sales decreased by 2.9%, from Ps. 892.0 billion in 2015 to Ps. 865.8 billion in 2016. This decrease was mainly due to: (1) a Ps. 23.4 billiondecrease in operating expenses, primarily due to cost saving measures; (2) a Ps. 25.0 billion decrease in cost of employee benefits, mainly due to theongoing benefits resulting from the modifications made to our pension regime in 2015; (3) a Ps. 16.9 billion decrease in the amortization of wells as aresult of the net effect of the impairment recorded in 2015 of new investments made in 2016; and (4) a Ps. 5.5 billion decrease in hydrocarbon extractionand exploration duties and taxes due to decreased production and lower average sales prices in 2016 as compared to 2015. This decrease was partiallyoffset by (1) a Ps. 46.9 billion increase in the purchases of imports, primarily gasoline and diesel, due to an increase in the price of imports owing to the20.1% appreciation of the U.S. dollar relative to the peso in 2016 and a 9.3% increase in the volume of imports; and (2) a Ps. 5.9 billion increase in thecost of unsuccessful wells.
Impairment of Wells, Pipelines, Properties, Plant and Equipment
Impairment of wells, pipelines, properties, plant and equipment decreased by Ps. 809.3 billion in 2016, from an impairment of Ps. 477.9 billion in2015 to a net reversal of Ps. 331.3 billion in 2016, mainly due to the change in the period used to estimate long-term prices of proved reserves and therecoverable amount of fixed assets from 20 to 25 years in accordance with changes to official guidelines; the appreciation of the U.S. dollar relative tothe peso; the reallocation of resources to the most highly profitable fields, particularly fields with lower production costs; and an increase in the averageprice of crude oil.
Net Periodic Cost of Employee Benefits
During 2015, we had a Ps. 196.1 billion increase in employee benefits in connection with the negotiation of our pension regime in 2015 asdescribed in �Item 6�Directors, Senior Management and Employees�Employees.� Ps. 92.2 billion of this benefit was recognized under net periodic costof employee benefits, and Ps. 103.9 billion was recognized under general expenses. We do not have a similar benefit to record under net periodic cost ofemployee benefits for 2016.
General Expenses
General expenses increased by Ps. 100.4 billion, from Ps. 37.5 billion in 2015 to Ps. 137.9 billion in 2016. This increase was primarily due to aone-time Ps. 103.9 billion benefit recognized in our cost of employee benefits in connection with the negotiation of our pension regime in 2015 asdescribed in �Item 6�Directors, Senior Management and Employees�Employees.� Excluding this one-time benefit to cost of employee benefits, generalexpenses decreased by Ps. 3.5 billion, from Ps. 141.4 billion in 2015 to Ps. 137.9 billion in 2016, primarily due to the effects of our 2016 BudgetAdjustment Plan.
Other Revenues/Expenses, Net
Other revenues, net, increased by Ps. 23.5 billion in 2016, from other expenses, net, of Ps. 0.9 billion in 2015 to other revenues, net, ofPs. 22.6 billion in 2016. This increase was primarily due to a Ps. 28.4 billion fiscal support from the Ministry of Finance and Public Credit in connectionwith the Profit-Sharing Duty, due to the decrease in average prices and production of crude oil, and a Ps. 15.2 billion profit from the sale of our 50%interest in Gasoductos de Chihuahua. This increase in other revenues, net was partially offset by an expense of
154
Copyright © 2018 www.secdatabase.com. All Rights Reserved.Please Consider the Environment Before Printing This Document
Table of ContentsPs. 27.7 billion that was recognized following our transfer of pipelines and other assets to CENAGAS, due to the difference between the book value ofthese assets and the amount paid by CENAGAS for these assets.
Financing Income
Financing income decreased by Ps. 1.2 billion in 2016, from Ps.15.0 billion in 2015 to Ps. 13.8 billion in 2016, primarily due to a decrease in theamount we were able to invest during the year, which was partially offset by yield derived from the promissory notes issued by the MexicanGovernment in connection with our pension liabilities.
Financing Cost
Financing cost increased by 45.7% in 2016, from Ps. 67.8 billion in 2015 to Ps. 98.8 billion in 2016, primarily due to an increase in interestexpense in 2016 following higher levels of indebtedness and a 20.1% depreciation of the peso against the U.S. dollar in 2016 as compared to 2015.
Derivative Financial Instruments Income (Cost)
Derivative financial instruments income (cost), net, decreased by Ps. 7.4 billion, from a net cost of Ps. 21.4 billion in 2015 to a net cost ofPs. 14.0 billion in 2016, primarily due to a decrease in the appreciation of the U.S. dollar relative to other foreign currencies we hedge, the restructuringof certain of our derivative financial instruments and favorable changes in market variables involved in our calculation of fair value of these instruments,including exchange rates, foreign currency interest rates and our counterparties� credit spread.
Exchange Loss, Net
A substantial portion of our indebtedness, 83.2% as of December 31, 2016, is denominated in foreign currencies. Our exchange loss increased byPs. 99.2 billion, from an exchange loss of Ps. 154.8 billion in 2015 to an exchange loss of Ps. 254.0 billion in 2016, primarily as a result of the 5.3%increase in our indebtedness that is denominated in other currencies and the higher rate of depreciation of the peso against the U.S. dollar, whichdepreciated by 20.1% in 2016 as compared to 16.9% in 2015. However, due to the fact that over 95.7% of our revenues from exports and domestic salesare referenced to prices denominated in U.S. dollars, and only 71.0% of our expenses, including financing costs, are linked to U.S. dollar prices, thedepreciation of the peso relative to the U.S. dollar did have a significant effect on our ability to meet U.S. dollar-denominated financial obligations andimproved our ability to meet peso-denominated financial obligations in 2016. The value of the peso in U.S. dollar terms depreciated by 20.1% in 2016,from Ps. 17.2065 = U.S. $1.00 on December 31, 2015 to Ps. 20.6640 = U.S. $1.00 on December 31, 2016, as compared to a 16.9% depreciation of thepeso in U.S. dollar terms in 2015.
Taxes, Duties and Other
Hydrocarbon extraction duties and other duties and taxes paid decreased by 20.2% in 2015, from Ps. 331.5 billion in 2015 to Ps. 264.5 billion in2016, primarily due to the 17.4% decrease in the weighted average price of the Mexican crude oil export price, from U.S. $43.12 per barrel in 2015 toU.S. $35.63 per barrel in 2016. Income related duties and taxes represented 24.9% of total sales in 2016, as compared to 24.9% of total sales in 2015.
Net Income/Loss
In 2016, we had a net loss of Ps. 191.1 billion from Ps. 1,079.5 billion in total sales revenues, as compared to a net loss of Ps. 712.6 billion fromPs. 1,166.4 billion in total sales revenues in 2015. This decrease in net loss was primarily explained by:
� a Ps. 809.2 billion decrease in the impairment of fixed assets;
155
Copyright © 2018 www.secdatabase.com. All Rights Reserved.Please Consider the Environment Before Printing This Document
Table of Contents� a Ps. 67.0 billion decrease in taxes and other duties, mainly due to the decrease in the weighted average price of the Mexican crude oil
export price; and
� a Ps. 23.5 billion increase in other revenues, net.
This decrease was partially offset by
� a Ps. 172.3 billion increase in the net periodic cost of employee benefits, mainly due to the one-time Ps. 196.1 billion decrease in pensionliabilities recorded in 2015 as a result of modifications made to our pension regime;
� a Ps. 99.2 billion increase in exchange loss, net;
� a Ps. 86.8 billion decrease in total sales, mainly due to the decrease in average sales prices of our petroleum products and the decrease involume of sales of liquefied natural gas in Mexico; and
� a Ps. 24.9 billion increase in financing costs, net.
Other Comprehensive Results
In 2016, we had a net gain of Ps. 127.9 billion in other comprehensive results, as compared to a net gain of Ps. 88.6 billion in 2015, primarily dueto a decrease in the reserve for employee benefits that resulted from the increase in the discount rate and expected rate of return on plan assets used inthe actuarial computation method from 7.4% in 2015 to 8.2% in 2016 and Ps. 21.4 in accumulated gains from the foreign currency translation effect.
Changes in Statement of Financial Position of Petróleos Mexicanos, the Subsidiary Entities and the Subsidiary Companies��from December 31,2016 to December 31, 2017
Assets
Cash and cash equivalents decreased by Ps. 65.7 billion, or 40.2%, in 2017, from Ps. 163.5 billion as of December 31, 2016 to Ps. 97.8 billion asof December 31, 2017. This decrease was mainly due to an increase in payments to suppliers and contractors, payments on our debt instruments andtaxes.
Accounts receivable, net, increased by Ps. 37.4 billion, or 28.1%, in 2016, from Ps. 133.2 billion as of December 31, 2016 to Ps. 170.6 billion asof December 31, 2017, primarily due to: (1) a Ps. 19.6 billion increase in accounts receivable, net, from sales to our international customers, mainly dueto the 34.4% increase in the weighted average market price per barrel of crude oil during 2017, from U.S. $35.17 per barrel in 2016 to U.S. $46.27 perbarrel in 2017; (2) a Ps. 20.5 billion increase in accounts receivable, net, from sales to domestic customers, mainly due to an increase in the sales priceof gasoline and fuel oil to the CFE; and (3) a Ps. 3.6 billion increase in accounts receivable from sundry debtors, mainly due to Ps. 2.5 billion as thecurrent portion of the promissory notes issued by the Mexican Government in relation to our pension liabilities. This increase was partially offset by aPs. 6.3 billion decrease in accounts receivable from tax credits.
Inventories increased by Ps. 17.8 billion, or 39.2%, in 2017, from Ps. 45.9 billion as of December 31, 2016, to Ps. 63.9 billion as of December 31,2017, mainly due to an increase in the volume of imports of petroleum products to meet domestic demand.
Derivative financial instruments increased by Ps. 25.3 billion in 2017, from Ps. 4.8 billion as of December 31, 2016 to Ps. 30.1 billion as ofDecember 31, 2017. This increase was mainly due to the increase in the fair value of cross-currency swaps as a result of the depreciation of the U.S.dollar relative to the other relevant currencies.
156
Copyright © 2018 www.secdatabase.com. All Rights Reserved.Please Consider the Environment Before Printing This Document
Table of ContentsWells, pipelines, properties, plant and equipment decreased by Ps. 231.2 billion in 2017, primarily due to a net impairment in the amount of
Ps. 151.4 billion. See ��Results of Operations of Petróleos Mexicanos, the Subsidiary Entities and the Subsidiary Companies�For the Year EndedDecember 31, 2017 Compared to the Year Ended December 31, 2016�Impairment of Wells, Pipelines, Properties, Plant and Equipment� above in thisItem 5 for more information.
Deferred taxes increased by Ps. 45.9 billion, or 45.7%, in 2017, from Ps. 100.3 billion as of December 31, 2016 to Ps. 146.2 billion as ofDecember 31, 2017, mainly due to the Ps. 37.2 billion in deferred profit-sharing duty assets and Ps. 7.1 billion of tax-loss carryforwards.
During 2017, restricted cash decreased by Ps. 10.5 due to the disbursement of previously deposited funds following a settlement agreement withCOMMISA. As a result, we no longer have any restricted cash.
Liabilities
Total debt, including accrued interest, increased by Ps. 54.7 billion, or 2.8%, in 2017, from Ps. 1,983.2 billion as of December 31, 2016 to Ps.2,037.9 billion as of December 31, 2017, mainly due to higher levels of indebtedness.
Line items related to suppliers and contractors decreased by Ps. 11.7 billion, or 7.7%, in 2017, from Ps. 151.6 billion as of December 31, 2016 toPs. 140.0 billion as of December 31, 2017, primarily due to the continued execution of payment programs established during 2016 to address the totaloutstanding balance of payments due to suppliers and contractors at year end.
Taxes and duties payable increased by Ps. 2.2 billion, or 4.5%, in 2017, from Ps. 48.8 billion as of December 31, 2016 to Ps. 51.0 billion as ofDecember 31, 2017, primarily due to (1) a Ps. 4.6 billion increase in hydrocarbon extraction duties and (2) a Ps. 2.9 billion decrease in the Profit-Sharing Duty and other taxes.
Derivative financial instruments liabilities decreased by Ps. 13.1 billion, or 42.5%, in 2017, from Ps. 30.9 billion as of December 31, 2016 to Ps.17.8 billion as of December 31, 2017. This decrease was mainly due to a decrease in the fair value of our cross-currency swaps, partially as a result ofthe depreciation of the U.S. dollar against the other relevant currencies, as well as changes in the maturity and settlement of certain cross-currencyswaps.
Employee benefits liabilities increased by Ps. 38.0 billion, or 3.1%, in 2017, from Ps. 1,220.4 billion as of December 31, 2016 to Ps.1,258.4 billion as of December 31, 2017. This increase was primarily due to (1) recognition of the net periodic cost of employee benefits and activeemployee transfers; (2) actuarial gains and contributions made to the Fondo Laboral Pemex (Pemex Labor Fund) trust; and (3) payments made formedical and hospital services and post-mortem benefits provided to retired employees and certain of their beneficiaries.
Equity (Deficit), Net
Equity (deficit), net, increased by Ps. 269.3 billion, or 21.8%, in 2017, from negative Ps. 1,233.0 billion as of December 31, 2016 to negative Ps.1,502.4 billion as of December 31, 2017. This increase was mainly due to (1) our net loss for the year of Ps. 280.9 billion; (2) a Ps. 12.0 billion increasein actuarial gains on employee benefits; and (3) Ps. 6.0 billion in accumulated loss from the foreign currency translation effect.
157
Copyright © 2018 www.secdatabase.com. All Rights Reserved.Please Consider the Environment Before Printing This Document
Table of ContentsLiquidity and Capital Resources
Overview
During 2017, we were able to strengthen our liquidity position by increasing our accounts receivable, decreasing our accounts payable to suppliersand managing our liquidity risk through derivative financial instruments.
Our principal uses of funds in 2017 were primarily the repayment of debt, strengthening our cash flow through the actions listed below, and, to alesser extent, the acquisition of wells, pipelines, properties, plant and equipment, sale of financial assets and shares, which collectively amounted toPs. 80.7 billion. We met this requirement primarily with cash provided by cash flows from borrowings, which amounted to Ps. 704.7 billion. During2017, our net cash flow from operating activities, together with our funds from financing activities, was sufficient to fund our capital expenditures andother expenses. See ��Overview� Redefinition of Petróleos Mexicanos as a State-Owned Productive Company� above for more information and adiscussion of actions being taken in response to this imbalance of resources.
For 2017, our capital expenditures decreased by approximately 38.2% from 2016, primarily due to the expected price levels of our products in2017 and our expected borrowing capacity. Additionally, one of the most critical problems we faced in 2015 and continued to address in 2017 was ouraccounts payable to suppliers. As of December 31, 2017, we owed our suppliers approximately Ps. 140.0 billion as compared to Ps. 151.6 billion as ofDecember 31, 2016. As of December 31, 2017, we have paid the total outstanding balance due to suppliers and contractors as of December 31, 2016.The average number of days outstanding of our accounts payable decreased from 82 days as of December 31, 2016 to 62 days as of December 31, 2017.Despite these obligations, we believe net cash flows from our operating and financing activities, together with available cash and cash equivalents, willbe sufficient to meet our working capital, debt service and capital expenditure requirements in 2018 because, since early 2015, we and the MexicanGovernment have adjusted investment, taxation and financing plans to address declining oil prices and maintain our financial strength and flexibility asdescribed above under �Redefinition of Petróleos Mexicanos as a State-Owned Productive Company� and as further described below:
� Changes to Our Business Plan. We have implemented certain measures intended to improve our financial situation, including the reductionof our budget in February 2016, the implementation of a plan to reduce costs and the establishment of lines of credit with Mexicandevelopment banks.
� Modifying Our Funding Strategy. We have adjusted our financing strategy to diversify our sources of funding.
� Changes to Employee Benefits Plans. We have incentivized our existing employees to migrate from the defined benefits pension plan to thedefined contribution plan. For more information, see ��Critical Accounting Policies�Employee Benefits� above.
� Asset Sales. We have sold certain of our non-essential assets to obtain working capital, including the divestiture of our participation in theRamones II Norte gas pipeline through the sale of our interest in Ductos y Energéticos del Norte, S. de R.L. de C.V., which is expected to beconcluded in the first half of 2018.
� Reduction in Outstanding Accounts Payable. As described above, as of December 31, 2017, we have paid the total outstanding balance dueto suppliers and contractors as of December 31, 2016.
� No Payment of Dividend. The Mexican Government announced that Petróleos Mexicanos was not required to pay a state dividend in 2017and will not be required to pay one in 2018. See �Item 4�Taxes, Duties and Other Payments to the Mexican Government�Fiscal Regime forPEMEX�Other Payments to the Mexican Government� above for more information.
The Federal Income Law applicable to us as of January 1, 2017, provides for the incurrence of up to U.S. $8.1 billion in net indebtedness througha combination of domestic and international capital markets offerings and borrowings from domestic and international financial institutions.
158
Copyright © 2018 www.secdatabase.com. All Rights Reserved.Please Consider the Environment Before Printing This Document
Table of ContentsWe have a substantial amount of debt, which we have incurred primarily to finance the capital expenditures needed to carry out our capital
investment projects. The sharp decline in oil prices that began in late 2014 had a negative impact on our ability to generate positive cash flows, which,together with our continued heavy tax burden, further exacerbated our ability to fund our capital expenditures and other expenses from cash flow fromoperations. Despite the continuing low price environment and our heavy tax burden, our cash flow from operations in 2017 together with our funds fromfinancing activities were sufficient to fund our capital expenditures and other expenses. We expect that net cash flows from our operations and financingactivities will also be sufficient to meet our working capital requirements, debt service and capital expenditures for 2018.
As of December 31, 2017, our total indebtedness, including accrued interest, was approximately Ps. 2,037.9 billion (U.S. $103.0 billion), innominal terms, which represents a 2.8% increase compared to our total indebtedness, including accrued interest, of approximately Ps. 1,983.2 billion(U.S. $96.0 billion) as of December 31, 2016. Approximately 25.8% of our existing debt as of December 31, 2017, or Ps. 526.5 billion(U.S. $26.6 billion), is scheduled to mature in the next three years. Our working capital increased from a negative working capital of Ps. 68.4 billion(U.S. $3.3 billion) as of December 31, 2016 to a negative working capital of Ps. 25.6 billion (U.S. $1.3 billion) as of December 31, 2017. Our level ofdebt may increase further in the short or medium term, as a result of new financing activities or future depreciation of the peso as compared to the U.S.dollar, and may have an adverse effect on our financial condition, results of operations and liquidity position. To service our debt, we have relied andmay continue to rely on a combination of cash flow from operations, drawdowns under our available credit facilities and the incurrence of additionalindebtedness (including refinancings of existing indebtedness). In addition, we are taking actions to improve our financial position, such as thosediscussed above, particularly through our 2017-2021 Business Plan.
Certain rating agencies have expressed concerns regarding: (1) the total amount of our debt; (2) the increase in our indebtedness over the lastseveral years; (3) our negative free cash flow during 2016, primarily resulting from our significant capital investment projects and the declining price ofoil; (4) our substantial unfunded reserve for retirement pensions and seniority premiums, which was equal to Ps. 1,258.4 billion (U.S. $63.6 billion) asof December 31, 2017, and (5) the resilience of our operating expenses notwithstanding the sharp decline in oil prices that began in late 2014. OnMarch 31, 2016, Moody�s Investors Service announced the revision of our global foreign currency and local currency credit ratings from �Baa1� to�Baa3� and changed the outlook for its credit ratings to negative. On August 3, 2017, Fitch Ratings affirmed our credit rating of �BBB+� in both globallocal and global foreign currency and modified its outlook from negative to stable. On December 18, 2017, Standard & Poor�s affirmed the outlook forour credit ratings as stable and affirmed our global foreign currency credit rating as �BBB+�, but lowered our global local currency credit rating from�A� to �A-�, citing revisions to its methodology for calculating sovereign ratings. On April 12, 2018, Moody�s Investors Service announced therevision of its outlook for our credit ratings from negative to stable.
Any lowering of our credit ratings may have adverse consequences on our ability to access the financial markets and/or our cost of financing. Ifwe were unable to obtain financing on favorable terms or at all, this could hamper our ability to obtain further financing on favorable terms as well asinvestment in projects financed through debt and impair our ability to meet our principal and interest payment obligations with our creditors. As a result,we may be exposed to liquidity constraints and may not be able to service our debt, which may adversely affect our financial condition and results ofoperations.
If such constraints occur at a time when our cash flow from operations is less than the resources needed to meet our debt service obligations, inorder to provide additional liquidity to our operations, we could be forced to reduce our planned capital expenditures, implement further austeritymeasures and/or sell additional non-strategic assets in order to raise funds. A reduction in our capital expenditure program could adversely affect ourfinancial condition and results of operations. Such measures may not be sufficient to permit us to meet our obligations.
159
Copyright © 2018 www.secdatabase.com. All Rights Reserved.Please Consider the Environment Before Printing This Document
Table of ContentsGoing Concern
Our consolidated financial statements have been prepared under the assumption that we will continue as a going concern. As we describe in Note2 to our consolidated financial statements, we have experienced certain conditions that have generated material uncertainty that may cast significantdoubt on our ability to continue operating as a going concern. We discuss the circumstances that have caused these negative trends, as well our plans inregard to these matters in �Operating and Financial Review and Prospects�Overview� above in this Item 5 and Note 2 to our consolidated financialstatements included herein. We continue operating as a going concern, and our consolidated financial statements do not include any adjustments thatmight result from the outcome of this uncertainty.
Equity Structure and Mexican Government Contributions
Our total equity as of December 31, 2017 was negative Ps. 1,502.4 billion, and our total capitalization (long-term debt plus equity) totaled Ps.378.3 billion. During 2017, our total equity decreased by Ps. 269.3 billion from negative Ps 1,233.0 billion as of December 31, 2016, primarily due to(1) our net loss for the year of Ps. 280.9 billion; (2) a Ps. 12.0 billion increase in actuarial gains on employee benefits; and (3) Ps. 6.0 billion inaccumulated loss from the foreign currency translation effect.. Under the Ley de Concursos Mercantiles (Commercial Bankruptcy Law of Mexico),Petróleos Mexicanos and the subsidiary entities cannot be subject to a bankruptcy proceeding. In addition, our current financing agreements do notinclude financial covenants or events of default that would be triggered as a result of our having negative equity.
In 2017, we did not receive any capital contribution from the Mexican Government.
On April 21, 2016, we received a capital contribution of Ps. 26.5 billion from the Ministry of Finance and Public Credit and, on August 3, 2016,the Ministry of Finance and Public Credit informed us that the Mexican Government would assume Ps. 184.2 billion in payment liabilities related to ourpensions and retirement plans, following the review performed by an independent expert. In accordance with the Disposiciones de carácter generalrelativas a la asunción por parte del Gobierno Federal de obligaciones de pago de pensiones y jubilaciones a cargo de Petróleos Mexicanos y susempresas productivas subsidiarias (General provisions regarding the assumption by the Federal Government of the payment obligations related topensions and retirement plans of Petróleos Mexicanos and its productive state-owned subsidiaries) published in the Official Gazette of the Federation onDecember 24, 2015, we received Ps. 184.2 billion in promissory notes issued by the Mexican Government, which replaced the Ps. 50.0 billionpromissory note issued to us on December 24, 2015 and was recognized as an increase in equity in the amount of Ps. 135.4 billion in the form ofCertificates of Contribution �A.� The Ps. 135.4 billion increase in equity was the result of the Ps. 184.2 billion value of the promissory notes as ofJune 29, 2016, minus the Ps. 50.0 billion promissory note we received on December 24, 2015, plus a Ps. 1.2 billion increase in the value of thepromissory notes from June 29, 2016 to August 15, 2016, which is the date on which we received the promissory notes. On August 15, 2016, weexchanged Ps. 47.0 billion of these promissory notes for short-term floating rate Mexican Government debt securities known as Bonos de Desarrollo delGobierno Federal (Development Bonds of the Federal Government, or BONDES D). We then sold the BONDES D to Mexican development banks forthe same price at which we received them from the Mexican Government.
As of December 31, 2016 and 2017, the balance of Mexican Government contributions to Petróleos Mexicanos was Ps. 140.6 billion. As ofDecember 31, 2016 and 2017, the total amount of contributions in the form of Certificates of Contribution �A� was Ps. 356.5 billion.
Cash Flows from Operating, Financing and Investing Activities
During 2017, net funds provided by operating activities totaled Ps. 63.4 billion, as compared to negative Ps. 41.9 billion in 2016, due to anincrease in sales and a lower corresponding increase in cost of sales resulting
160
Copyright © 2018 www.secdatabase.com. All Rights Reserved.Please Consider the Environment Before Printing This Document
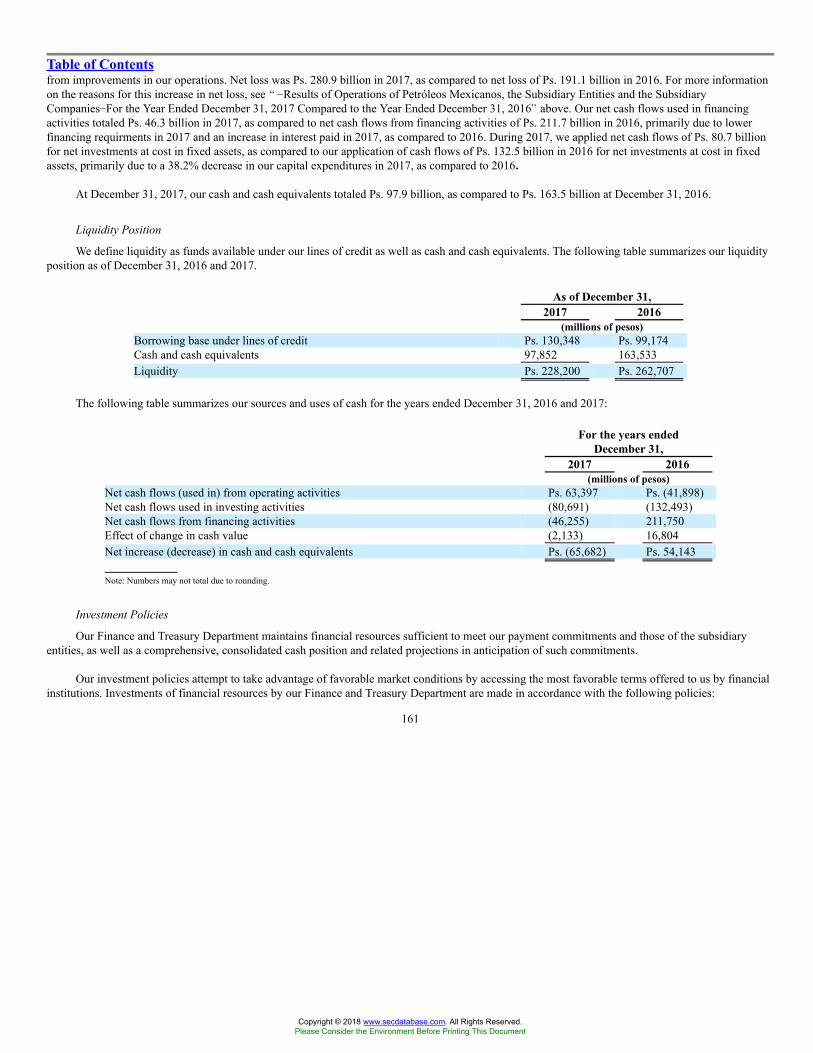
Table of Contentsfrom improvements in our operations. Net loss was Ps. 280.9 billion in 2017, as compared to net loss of Ps. 191.1 billion in 2016. For more informationon the reasons for this increase in net loss, see � �Results of Operations of Petróleos Mexicanos, the Subsidiary Entities and the SubsidiaryCompanies�For the Year Ended December 31, 2017 Compared to the Year Ended December 31, 2016� above. Our net cash flows used in financingactivities totaled Ps. 46.3 billion in 2017, as compared to net cash flows from financing activities of Ps. 211.7 billion in 2016, primarily due to lowerfinancing requirments in 2017 and an increase in interest paid in 2017, as compared to 2016. During 2017, we applied net cash flows of Ps. 80.7 billionfor net investments at cost in fixed assets, as compared to our application of cash flows of Ps. 132.5 billion in 2016 for net investments at cost in fixedassets, primarily due to a 38.2% decrease in our capital expenditures in 2017, as compared to 2016.
At December 31, 2017, our cash and cash equivalents totaled Ps. 97.9 billion, as compared to Ps. 163.5 billion at December 31, 2016.
Liquidity Position
We define liquidity as funds available under our lines of credit as well as cash and cash equivalents. The following table summarizes our liquidityposition as of December 31, 2016 and 2017.
As of December 31,2017 2016
(millions of pesos)Borrowing base under lines of credit Ps. 130,348 Ps. 99,174Cash and cash equivalents 97,852 163,533Liquidity Ps. 228,200 Ps. 262,707
The following table summarizes our sources and uses of cash for the years ended December 31, 2016 and 2017:
For the years endedDecember 31,
2017 2016(millions of pesos)
Net cash flows (used in) from operating activities Ps. 63,397 Ps. (41,898)Net cash flows used in investing activities (80,691) (132,493)Net cash flows from financing activities (46,255) 211,750Effect of change in cash value (2,133) 16,804Net increase (decrease) in cash and cash equivalents Ps. (65,682) Ps. 54,143
Note: Numbers may not total due to rounding.
Investment Policies
Our Finance and Treasury Department maintains financial resources sufficient to meet our payment commitments and those of the subsidiaryentities, as well as a comprehensive, consolidated cash position and related projections in anticipation of such commitments.
Our investment policies attempt to take advantage of favorable market conditions by accessing the most favorable terms offered to us by financialinstitutions. Investments of financial resources by our Finance and Treasury Department are made in accordance with the following policies:
161
Copyright © 2018 www.secdatabase.com. All Rights Reserved.Please Consider the Environment Before Printing This Document
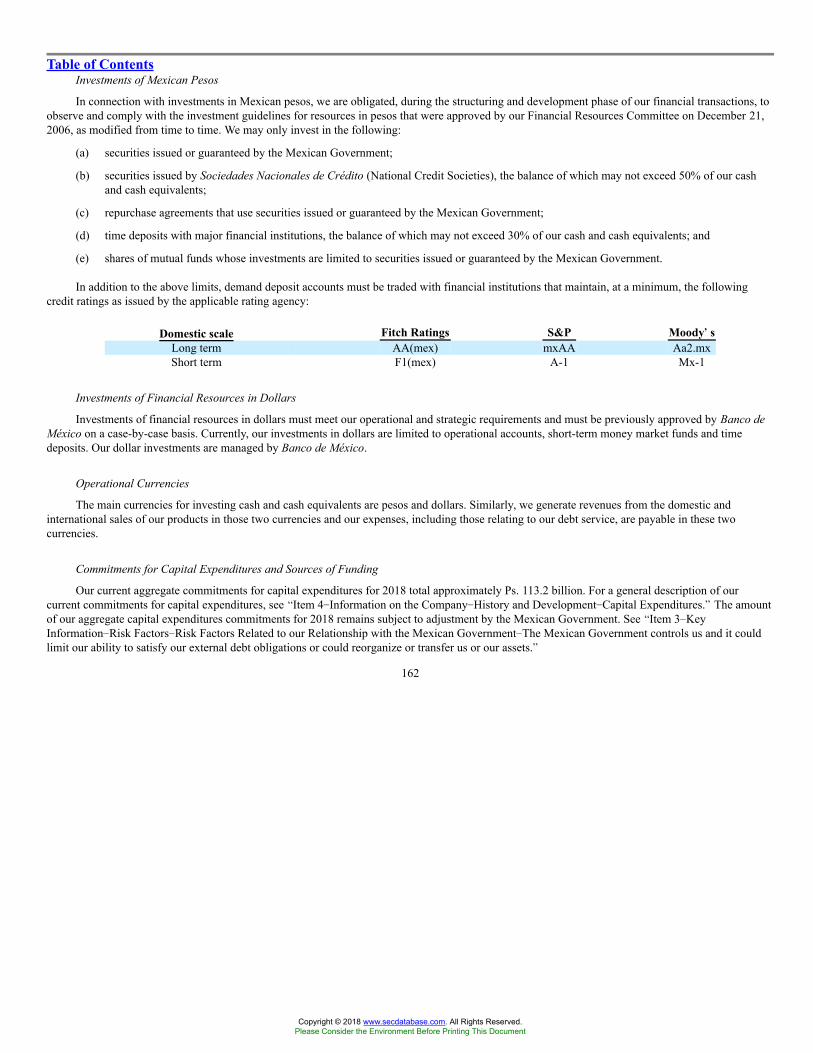
Table of ContentsInvestments of Mexican Pesos
In connection with investments in Mexican pesos, we are obligated, during the structuring and development phase of our financial transactions, toobserve and comply with the investment guidelines for resources in pesos that were approved by our Financial Resources Committee on December 21,2006, as modified from time to time. We may only invest in the following:
(a) securities issued or guaranteed by the Mexican Government;
(b) securities issued by Sociedades Nacionales de Crédito (National Credit Societies), the balance of which may not exceed 50% of our cashand cash equivalents;
(c) repurchase agreements that use securities issued or guaranteed by the Mexican Government;
(d) time deposits with major financial institutions, the balance of which may not exceed 30% of our cash and cash equivalents; and
(e) shares of mutual funds whose investments are limited to securities issued or guaranteed by the Mexican Government.
In addition to the above limits, demand deposit accounts must be traded with financial institutions that maintain, at a minimum, the followingcredit ratings as issued by the applicable rating agency:
Domestic scale Fitch Ratings S&P Moody��sLong term AA(mex) mxAA Aa2.mxShort term F1(mex) A-1 Mx-1
Investments of Financial Resources in Dollars
Investments of financial resources in dollars must meet our operational and strategic requirements and must be previously approved by Banco deMéxico on a case-by-case basis. Currently, our investments in dollars are limited to operational accounts, short-term money market funds and timedeposits. Our dollar investments are managed by Banco de México.
Operational Currencies
The main currencies for investing cash and cash equivalents are pesos and dollars. Similarly, we generate revenues from the domestic andinternational sales of our products in those two currencies and our expenses, including those relating to our debt service, are payable in these twocurrencies.
Commitments for Capital Expenditures and Sources of Funding
Our current aggregate commitments for capital expenditures for 2018 total approximately Ps. 113.2 billion. For a general description of ourcurrent commitments for capital expenditures, see �Item 4�Information on the Company�History and Development�Capital Expenditures.� The amountof our aggregate capital expenditures commitments for 2018 remains subject to adjustment by the Mexican Government. See �Item 3�KeyInformation�Risk Factors�Risk Factors Related to our Relationship with the Mexican Government�The Mexican Government controls us and it couldlimit our ability to satisfy our external debt obligations or could reorganize or transfer us or our assets.�
162
Copyright © 2018 www.secdatabase.com. All Rights Reserved.Please Consider the Environment Before Printing This Document

Table of ContentsThe following table sets forth our total capital expenditures by segment for the year ended December 31, 2017, and the budget for these
expenditures for 2018. For more information see �Item 4�History and Development�Capital Expenditures.�
Year endedDecember 31,
2017Budget2018(1)
(millions of pesos)Exploration and Production Ps. 85,491 Ps. 81,765Industrial Transformation(2) 18,576 18,360Drilling and Services 1,550 1,434Logistics 4,917 4,449Fertilizers 264 444Ethylene 618 1,786Cogeneration and Services � �Corporate and other Subsidiaries 1,609 4,978Total Ps. 113,025 Ps. 113,216
Note: Numbers may not total due to rounding.(1) Budget presented to the Board of Directors of Petróleos Mexicanos on March 5, 2018.
Our current commitments for capital expenditures have fluctuated in recent years as compared to previous years. Based on past experience, weexpect to generate sufficient funds for our working capital, capital expenditures and investments through:
� cash flow generated by operations;
� the issuance of certificados bursátiles (peso-denominated publicly traded notes) in the Mexican market;
� the issuance of debt securities in the international capital markets;
� the renewal of existing lines of credit and the entering into of new lines of credit from international and local commercial banks; and
� other financing activities.
The securities that we issue may vary in tenor, amount, currency and type of interest rate. We may issue debt securities in U.S. dollars, Japaneseyen, euros, pounds, pesos or Swiss francs, among others; these securities may be issued with fixed or floating rates and with maturities of one or moreyears, including perpetual debt securities, depending on market conditions and funding requirements. We may issue securities in the international capitalmarkets or in the Mexican domestic market, or in both markets. Commercial bank syndicated loans may be established with single or multiple trancheswith varying maturities. Bilateral loans may vary in tenor and range, which may be of one year or more. See also ��Financing Activities� below.
Financing Activities
2018 Financing Activity. During the period from January 1 to April 27, 2018, we participated in the following activity:
� On February 12, 2018, Petróleos Mexicanos issued U.S. $4,000,000,000 of debt securities under its U.S. $92,000,000,000 Medium-TermNotes Program, Series C, in two tranches: (1) U.S. $2,500,000,000 5.35% Notes due 2028 and (2) U.S. $1,500,000,000 6.35% Bonds due2048. All debt securities under this program are guaranteed by Pemex Exploration and Production, Pemex Industrial Transformation, PemexDrilling and Services, Pemex Logistics and Pemex Cogeneration and Services.
163
Copyright © 2018 www.secdatabase.com. All Rights Reserved.Please Consider the Environment Before Printing This Document
Table of Contents� On February 12, 2018, Petróleos Mexicanos consummated an exchange offer pursuant to which it exchanged (1) U.S. $952,454,000
aggregate principal amount of its outstanding 5.500% Bonds due 2044 for U.S. $881,899,000 aggregate principal amount of its new 6.350%Bonds due 2048 and (2) U.S. $1,021,065,000 aggregate principal amount of its outstanding 5.6250% Bonds due 2046 for U.S. $946,764,000aggregate principal amount of its 6.350% Bonds due 2048.
� On March 5, 2018, Petróleos Mexicanos consummated a tender offer pursuant to which it purchased U.S. $138,598,000 aggregate principalamount of its outstanding 3.125% Notes due 2019, U.S. $558,644,000 aggregate principal amount of its outstanding 5.500% Notes due2019, U.S. $91,843,000 aggregate principal amount of its outstanding 8.000% Notes due 2019, U.S. $183,017,000 aggregate principalamount of its outstanding 6.000% Notes due 2020 and U.S. $817,303,000 aggregate principal amount of its outstanding 3.500% Notes due2020.
� On March 27, 2018, Petróleos Mexicanos entered into a loan agreement with Atriadius DSB in the amount of U.S. $181,101,291, whichbears interest at a floating rate linked to LIBOR and matures in February 2025.
� On April 17, 2018, Petróleos Mexicanos increased its Medium-Term Notes Program from U.S. $92,000,000,000 to U.S. $102,000,000,000.
2017 Financing Activities. During 2017 we participated in the following activities:
� On February 14, 2017, Petróleos Mexicanos issued �4,250,000,000 of debt securities under its U.S. $72,000,000,000 Medium-Term NotesProgram, Series C, in three tranches: (1) �1,750,000,000 of its 2.5% Notes due 2021; (2) �1,250,000,000 of its 3.75% Notes due 2024; and(3) �1,250,000,000 of its 4.875% Notes due 2028. All debt securities issued under this program are guaranteed by Pemex Exploration andProduction, Pemex Industrial Transformation, Pemex Drilling and Services, Pemex Logistics and Pemex Cogeneration and Services.
� On April 6, 2017, Petróleos Mexicanos obtained a a loan from a line of credit for U.S. $132,000,000, which bears interest at a fixed rate of5.25% and matures on April 6, 2024. The line of credit is guaranteed by Pemex Exploration and Production, Pemex IndustrialTransformation, Pemex Drilling and Services, Pemex Logistics and Pemex Cogeneration and Services.
� On May 15, 2017, Petróleos Mexicanos entered into a term loan credit facility in the amount of U.S. $400,000,000, which bears interest at afloating rate linked to LIBOR (plus 165 basis points) and matures on May 15, 2020. The term loan is guaranteed by Pemex Exploration andProduction, Pemex Industrial Transformation, Pemex Drilling and Services, Pemex Logistics and Pemex Cogeneration and Services.
� On June 16, 2017, Petróleos Mexicanos increased its Medium-Term Notes Program from U.S. $72,000,000,000 to U.S. $92,000,000,000.
� On July 17, 2017, Petróleos Mexicanos entered into a revolving credit facility in the amount of U.S. $1,950,000,000, which matures in2020.
� On July 18, 2017, Petróleos Mexicanos issued U.S. $5,000,000,000 of debt securities under its U.S. $92,000,000,000 Medium-Term NotesProgram, Series C, in two tranches: (1) U.S. $2,500,000,000 of its 6.50% Notes due 2027 and (2) U.S. $2,500,000,000 of its 6.75% Bondsdue 2047. All debt securities under this program are guaranteed by Pemex Exploration and Production, Pemex Industrial Transformation,Pemex Drilling and Services, Pemex Logistics and Pemex Cogeneration and Services.
� On July 21, 2017, Petróleos Mexicanos consummated a tender offer pursuant to which it purchased U.S. $922,485,000 aggregate principalamount of its outstanding 5.750% Notes due 2018, U.S. $644,374,000 aggregate principal amount of its outstanding 3.500% Notes due2018 and U.S. $172,591,000 aggregate principal amount of its outstanding 3.125% Notes due 2019.
164
Copyright © 2018 www.secdatabase.com. All Rights Reserved.Please Consider the Environment Before Printing This Document
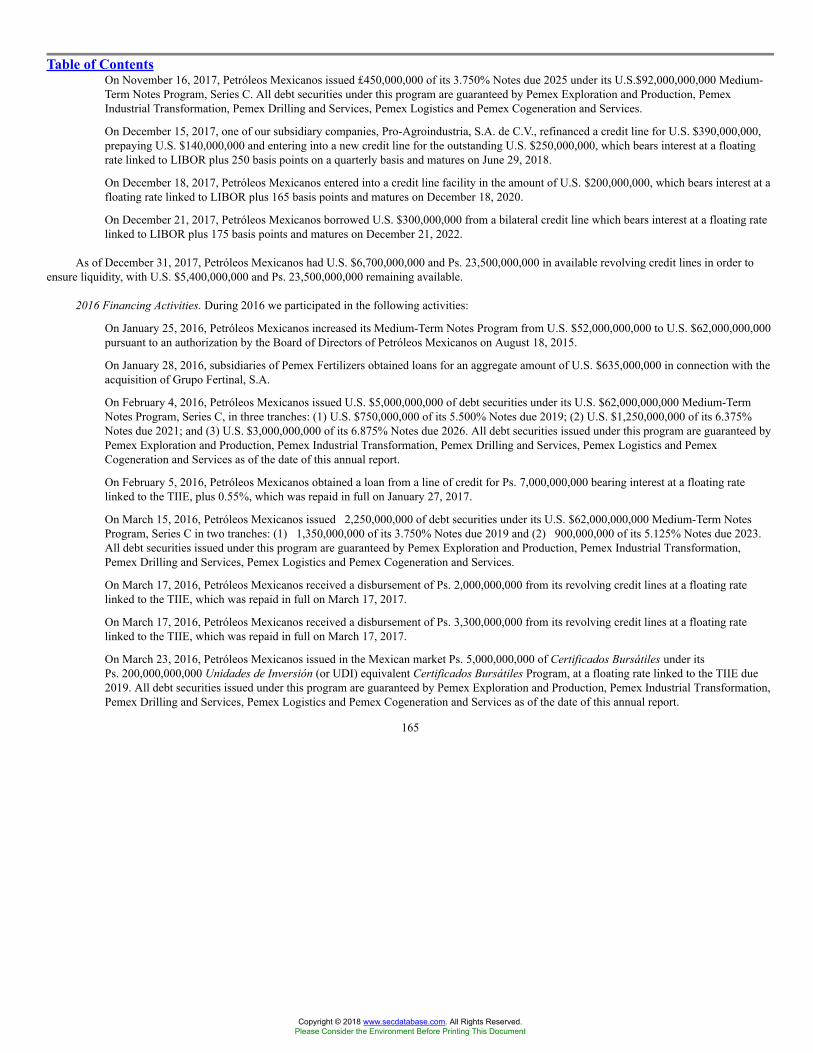
Table of Contents� On November 16, 2017, Petróleos Mexicanos issued £450,000,000 of its 3.750% Notes due 2025 under its U.S.$92,000,000,000 Medium-
Term Notes Program, Series C. All debt securities under this program are guaranteed by Pemex Exploration and Production, PemexIndustrial Transformation, Pemex Drilling and Services, Pemex Logistics and Pemex Cogeneration and Services.
� On December 15, 2017, one of our subsidiary companies, Pro-Agroindustria, S.A. de C.V., refinanced a credit line for U.S. $390,000,000,prepaying U.S. $140,000,000 and entering into a new credit line for the outstanding U.S. $250,000,000, which bears interest at a floatingrate linked to LIBOR plus 250 basis points on a quarterly basis and matures on June 29, 2018.
� On December 18, 2017, Petróleos Mexicanos entered into a credit line facility in the amount of U.S. $200,000,000, which bears interest at afloating rate linked to LIBOR plus 165 basis points and matures on December 18, 2020.
� On December 21, 2017, Petróleos Mexicanos borrowed U.S. $300,000,000 from a bilateral credit line which bears interest at a floating ratelinked to LIBOR plus 175 basis points and matures on December 21, 2022.
As of December 31, 2017, Petróleos Mexicanos had U.S. $6,700,000,000 and Ps. 23,500,000,000 in available revolving credit lines in order toensure liquidity, with U.S. $5,400,000,000 and Ps. 23,500,000,000 remaining available.
2016 Financing Activities. During 2016 we participated in the following activities:
� On January 25, 2016, Petróleos Mexicanos increased its Medium-Term Notes Program from U.S. $52,000,000,000 to U.S. $62,000,000,000pursuant to an authorization by the Board of Directors of Petróleos Mexicanos on August 18, 2015.
� On January 28, 2016, subsidiaries of Pemex Fertilizers obtained loans for an aggregate amount of U.S. $635,000,000 in connection with theacquisition of Grupo Fertinal, S.A.
� On February 4, 2016, Petróleos Mexicanos issued U.S. $5,000,000,000 of debt securities under its U.S. $62,000,000,000 Medium-TermNotes Program, Series C, in three tranches: (1) U.S. $750,000,000 of its 5.500% Notes due 2019; (2) U.S. $1,250,000,000 of its 6.375%Notes due 2021; and (3) U.S. $3,000,000,000 of its 6.875% Notes due 2026. All debt securities issued under this program are guaranteed byPemex Exploration and Production, Pemex Industrial Transformation, Pemex Drilling and Services, Pemex Logistics and PemexCogeneration and Services as of the date of this annual report.
� On February 5, 2016, Petróleos Mexicanos obtained a loan from a line of credit for Ps. 7,000,000,000 bearing interest at a floating ratelinked to the TIIE, plus 0.55%, which was repaid in full on January 27, 2017.
� On March 15, 2016, Petróleos Mexicanos issued �2,250,000,000 of debt securities under its U.S. $62,000,000,000 Medium-Term NotesProgram, Series C in two tranches: (1) �1,350,000,000 of its 3.750% Notes due 2019 and (2) �900,000,000 of its 5.125% Notes due 2023.All debt securities issued under this program are guaranteed by Pemex Exploration and Production, Pemex Industrial Transformation,Pemex Drilling and Services, Pemex Logistics and Pemex Cogeneration and Services.
� On March 17, 2016, Petróleos Mexicanos received a disbursement of Ps. 2,000,000,000 from its revolving credit lines at a floating ratelinked to the TIIE, which was repaid in full on March 17, 2017.
� On March 17, 2016, Petróleos Mexicanos received a disbursement of Ps. 3,300,000,000 from its revolving credit lines at a floating ratelinked to the TIIE, which was repaid in full on March 17, 2017.
� On March 23, 2016, Petróleos Mexicanos issued in the Mexican market Ps. 5,000,000,000 of Certificados Bursátiles under itsPs. 200,000,000,000 Unidades de Inversión (or UDI) equivalent Certificados Bursátiles Program, at a floating rate linked to the TIIE due2019. All debt securities issued under this program are guaranteed by Pemex Exploration and Production, Pemex Industrial Transformation,Pemex Drilling and Services, Pemex Logistics and Pemex Cogeneration and Services as of the date of this annual report.
165
Copyright © 2018 www.secdatabase.com. All Rights Reserved.Please Consider the Environment Before Printing This Document

Table of Contents� On March 28, 2016, Petróleos Mexicanos borrowed Ps. 9,700,000,000 from a credit line at a floating rate linked to the TIIE, which was
repaid in full on March 28, 2017.
� On April 19, 2016, Petróleos Mexicanos borrowed �500,000,000 from a credit line at a fixed rate of 5.11%, which matures on March 15,2023.
� On May 31, 2016, Petróleos Mexicanos borrowed U.S. $300,000,000 from a bilateral credit line which bears interest at a floating rate linkedto the LIBOR, which matures on May 31, 2021.
� On June 14, 2016, Petróleos Mexicanos issued CFH 375,000,000 aggregate principal amount of Notes under its U.S. $62,000,000,000Medium-Term Notes Program, Series C, in two tranches: (1) CFH 225,000,000 of its 1.500% Notes due 2018 and (2) CFH 150,000,000 ofits 2.375% Notes due 2021. All debt securities issued under this program are guaranteed by Pemex Exploration and Production, PemexIndustrial Transformation, Pemex Drilling and Services, Pemex Logistics and Pemex Cogeneration and Services as of the date of this annualreport.
� On June 17, 2016, Pemex Exploration and Production obtained approximately U.S. $1.1 billion in connection with the sale and leaseback ofcertain infrastructure assets used for oil and gas activities. As part of this transaction, Pemex Exploration and Production entered into a15-year financial lease agreement pursuant to which Pemex Exploration and Production will retain the operation of these assets and the titleand ownership of such assets will revert to Pemex Exploration and Production at the end of this period following payment of an agreedprice.
� On July 8, 2016, Pemex Industrial Transformation obtained approximately U.S. $600,000,000 in connection with the sale and leaseback of aplant located in the Madero Refinery. As part of this transaction, Pemex Industrial Transformation entered into a 20-year financial leaseagreement pursuant to which Pemex Industrial Transformation will retain the operation of this plant and the title and ownership will revertto Pemex Industrial Transformation at the end of this period following payment of an agreed price. This transaction was recognized as afinancing activity due to the fact that we retained all of the risks and benefits associated with ownership of the asset and substantially all ofthe operating rights of the asset.
� On July 26, 2016, Petróleos Mexicanos issued ¥80,000,000,000 of its 0.54% Bonds due 2026. The Bonds are guaranteed by the Japan Bankfor International Cooperation.
� On September 21, 2016, Petróleos Mexicanos issued U.S. $4,000,000,000 of its debt securities under its U.S. $62,000,000,000 Medium-Term Notes Program, Series C, in two tranches: (i) U.S. $2,000,000,000 of its 4.625% Notes due 2023 and (ii) U.S. $2,000,000,000 of its6.750% Bonds due 2047. All debt securities issued under this program are guaranteed by Pemex Exploration and Production, PemexIndustrial Transformation, Pemex Drilling and Services, Pemex Logistics and Pemex Cogeneration and Services as of the date of this annualreport.
� On October 3, 2016, Petróleos Mexicanos consummated a tender and exchange offer pursuant to which it (i) purchased U.S. $687,725,000aggregate principal amount of its outstanding 8.000% Notes due 2019 and U.S. $657,050,000 aggregate principal amount of its outstanding5.750% Notes due 2018 and (ii) exchanged (a) U.S. $73,288,000 aggregate principal amount of its outstanding 5.750% Notes due 2018 forU.S. $69,302,000 aggregate principal amount of its 4.625% Notes due 2023 and U.S. $8,059,000 aggregate principal amount of its 6.750%Bonds due 2047 and (b) U.S. $1,591,961,000 aggregate principal amount of its outstanding 5.500% Bonds due 2044 forU.S. $1,491,941,000 aggregate principal amount of its 6.750% Bonds due 2047. The 4.625% Notes due 2023 and 6.750% Bonds due 2047are guaranteed by Pemex Exploration and Production, Pemex Industrial Transformation, Pemex Drilling and Services, Pemex Logistics andPemex Cogeneration and Services and represent reopenings of the 4.625% Notes due 2023 and 6.750% Bonds due 2047, respectively,originally issued on September 21, 2016.
166
Copyright © 2018 www.secdatabase.com. All Rights Reserved.Please Consider the Environment Before Printing This Document

Table of Contents� On December 6, 2016, Petróleos Mexicanos increased its Medium-Term Notes Program, Series C, from U.S. $62,000,000,000 to U.S.
$72,000,000,000.
� On December 13, 2016, Petróleos Mexicanos issued U.S. $5,500,000,000 of its debt securities under its U.S. $72,000,000,000 Medium-Term Notes Program, Series C in three tranches: (1) U.S. $3,000,000,000 at a fixed rate of 6.50% due 2027, (2) U.S. $1,500,000,000 at afixed rate of 5.375% due 2022, and (3) U.S. $1,000,000,000 at a floating rate linked to LIBOR plus 365 basis points, due 2022. All debtsecurities issued under this program are guaranteed by Pemex Exploration and Production, Pemex Industrial Transformation, PemexDrilling and Services, Pemex Logistics and Pemex Cogeneration and Services as of the date of this annual report.
� On December 14, 2016, Petróleos Mexicanos entered into a term loan credit facility in the amount of U.S. $300,000,000 at a floating ratelinked to LIBOR plus 165 basis points, which matures on December 6, 2019.
� Between January 1 and December 31, 2016, P.M.I. Holdings B.V. obtained U.S. $11,369,800 in financing from its revolving credit lines,which was repaid in full. As of December 31, 2016, there was no outstanding amount under this revolving credit line.
As of December 31, 2016, Petróleos Mexicanos had U.S. $4,750,000,000 and Ps. 23,500,000,000 in available revolving credit lines in order toensure liquidity, with U.S. $4,630,000,000 and Ps. 3,500,000,000 remaining available.
Indebtedness
During 2017, our total debt increased by 2.8%, from Ps. 1,983.2 billion at December 31, 2016 to Ps. 2,037.9 billion at December 31, 2017,primarily due to the financing activities undertaken during this period, as described in Note 15 to our consolidated financial statements included herein.
As of December 31, 2017 and as of the date of this annual report, we were not in default on any of our financing agreements.
167
Copyright © 2018 www.secdatabase.com. All Rights Reserved.Please Consider the Environment Before Printing This Document
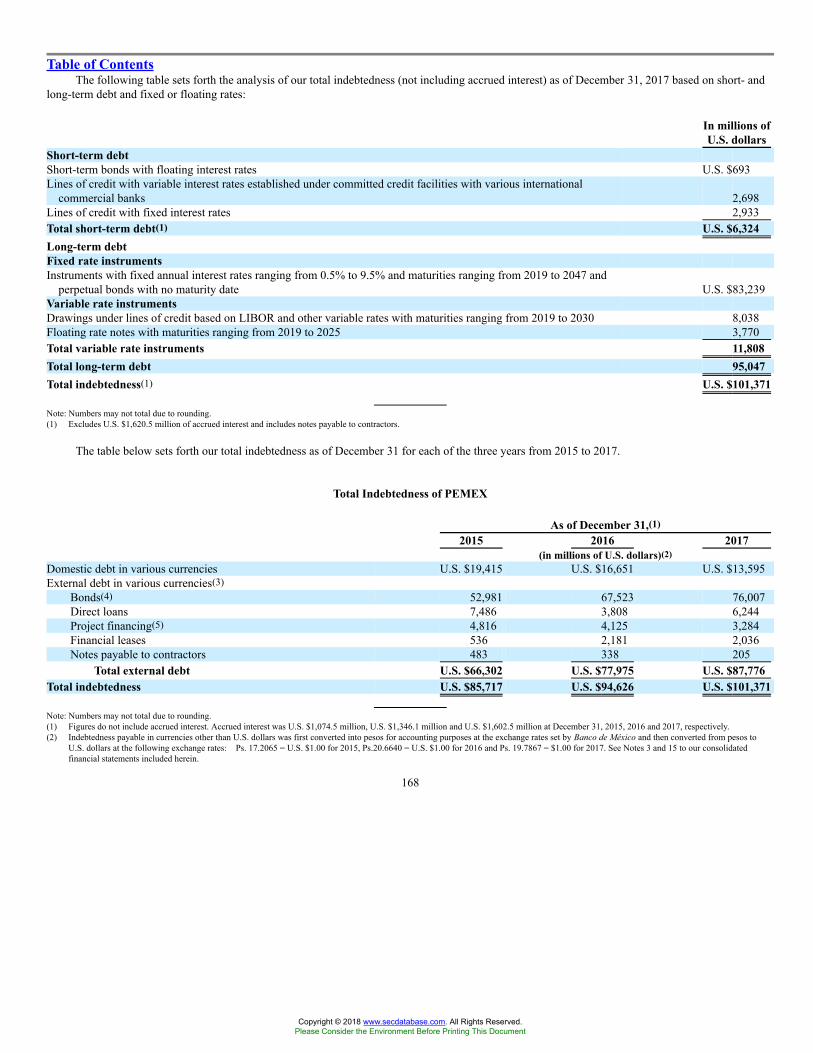
Table of ContentsThe following table sets forth the analysis of our total indebtedness (not including accrued interest) as of December 31, 2017 based on short- and
long-term debt and fixed or floating rates:
In millions ofU.S. dollars
Short-term debtShort-term bonds with floating interest rates U.S. $693Lines of credit with variable interest rates established under committed credit facilities with various international
commercial banks 2,698Lines of credit with fixed interest rates 2,933Total short-term debt(1) U.S. $6,324Long-term debtFixed rate instrumentsInstruments with fixed annual interest rates ranging from 0.5% to 9.5% and maturities ranging from 2019 to 2047 and
perpetual bonds with no maturity date U.S. $83,239Variable rate instrumentsDrawings under lines of credit based on LIBOR and other variable rates with maturities ranging from 2019 to 2030 8,038Floating rate notes with maturities ranging from 2019 to 2025 3,770Total variable rate instruments 11,808Total long-term debt 95,047Total indebtedness(1) U.S. $101,371
Note: Numbers may not total due to rounding.(1) Excludes U.S. $1,620.5 million of accrued interest and includes notes payable to contractors.
The table below sets forth our total indebtedness as of December 31 for each of the three years from 2015 to 2017.
Total Indebtedness of PEMEX
As of December 31,(1)2015 2016 2017
(in millions of U.S. dollars)(2)Domestic debt in various currencies U.S. $19,415 U.S. $16,651 U.S. $13,595External debt in various currencies(3)
Bonds(4) 52,981 67,523 76,007Direct loans 7,486 3,808 6,244Project financing(5) 4,816 4,125 3,284Financial leases 536 2,181 2,036Notes payable to contractors 483 338 205
Total external debt U.S. $66,302 U.S. $77,975 U.S. $87,776Total indebtedness U.S. $85,717 U.S. $94,626 U.S. $101,371
Note: Numbers may not total due to rounding.(1) Figures do not include accrued interest. Accrued interest was U.S. $1,074.5 million, U.S. $1,346.1 million and U.S. $1,602.5 million at December 31, 2015, 2016 and 2017, respectively.(2) Indebtedness payable in currencies other than U.S. dollars was first converted into pesos for accounting purposes at the exchange rates set by Banco de México and then converted from pesos to
U.S. dollars at the following exchange rates: Ps. 17.2065 = U.S. $1.00 for 2015, Ps.20.6640 = U.S. $1.00 for 2016 and Ps. 19.7867 = $1.00 for 2017. See Notes 3 and 15 to our consolidatedfinancial statements included herein.
168
Copyright © 2018 www.secdatabase.com. All Rights Reserved.Please Consider the Environment Before Printing This Document
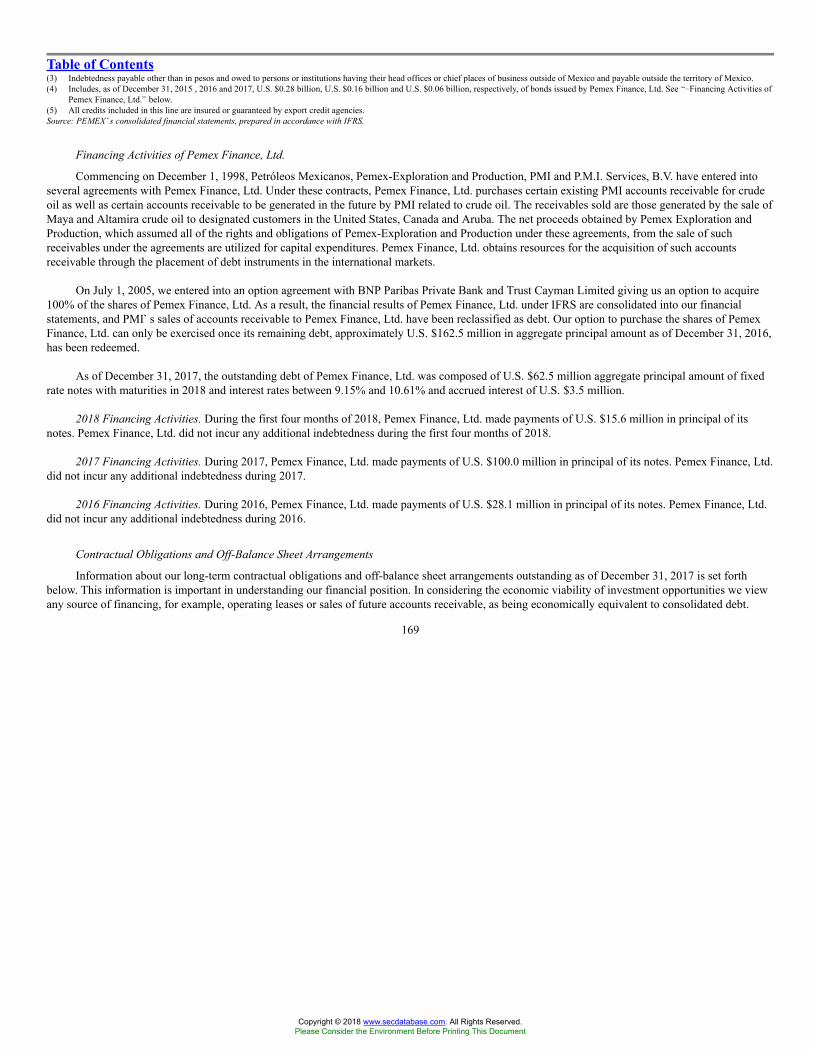
Table of Contents(3) Indebtedness payable other than in pesos and owed to persons or institutions having their head offices or chief places of business outside of Mexico and payable outside the territory of Mexico.(4) Includes, as of December 31, 2015 , 2016 and 2017, U.S. $0.28 billion, U.S. $0.16 billion and U.S. $0.06 billion, respectively, of bonds issued by Pemex Finance, Ltd. See ��Financing Activities of
Pemex Finance, Ltd.� below.(5) All credits included in this line are insured or guaranteed by export credit agencies.Source: PEMEX�s consolidated financial statements, prepared in accordance with IFRS.
Financing Activities of Pemex Finance, Ltd.
Commencing on December 1, 1998, Petróleos Mexicanos, Pemex-Exploration and Production, PMI and P.M.I. Services, B.V. have entered intoseveral agreements with Pemex Finance, Ltd. Under these contracts, Pemex Finance, Ltd. purchases certain existing PMI accounts receivable for crudeoil as well as certain accounts receivable to be generated in the future by PMI related to crude oil. The receivables sold are those generated by the sale ofMaya and Altamira crude oil to designated customers in the United States, Canada and Aruba. The net proceeds obtained by Pemex Exploration andProduction, which assumed all of the rights and obligations of Pemex-Exploration and Production under these agreements, from the sale of suchreceivables under the agreements are utilized for capital expenditures. Pemex Finance, Ltd. obtains resources for the acquisition of such accountsreceivable through the placement of debt instruments in the international markets.
On July 1, 2005, we entered into an option agreement with BNP Paribas Private Bank and Trust Cayman Limited giving us an option to acquire100% of the shares of Pemex Finance, Ltd. As a result, the financial results of Pemex Finance, Ltd. under IFRS are consolidated into our financialstatements, and PMI�s sales of accounts receivable to Pemex Finance, Ltd. have been reclassified as debt. Our option to purchase the shares of PemexFinance, Ltd. can only be exercised once its remaining debt, approximately U.S. $162.5 million in aggregate principal amount as of December 31, 2016,has been redeemed.
As of December 31, 2017, the outstanding debt of Pemex Finance, Ltd. was composed of U.S. $62.5 million aggregate principal amount of fixedrate notes with maturities in 2018 and interest rates between 9.15% and 10.61% and accrued interest of U.S. $3.5 million.
2018 Financing Activities. During the first four months of 2018, Pemex Finance, Ltd. made payments of U.S. $15.6 million in principal of itsnotes. Pemex Finance, Ltd. did not incur any additional indebtedness during the first four months of 2018.
2017 Financing Activities. During 2017, Pemex Finance, Ltd. made payments of U.S. $100.0 million in principal of its notes. Pemex Finance, Ltd.did not incur any additional indebtedness during 2017.
2016 Financing Activities. During 2016, Pemex Finance, Ltd. made payments of U.S. $28.1 million in principal of its notes. Pemex Finance, Ltd.did not incur any additional indebtedness during 2016.
Contractual Obligations and Off-Balance Sheet Arrangements
Information about our long-term contractual obligations and off-balance sheet arrangements outstanding as of December 31, 2017 is set forthbelow. This information is important in understanding our financial position. In considering the economic viability of investment opportunities we viewany source of financing, for example, operating leases or sales of future accounts receivable, as being economically equivalent to consolidated debt.
169
Copyright © 2018 www.secdatabase.com. All Rights Reserved.Please Consider the Environment Before Printing This Document
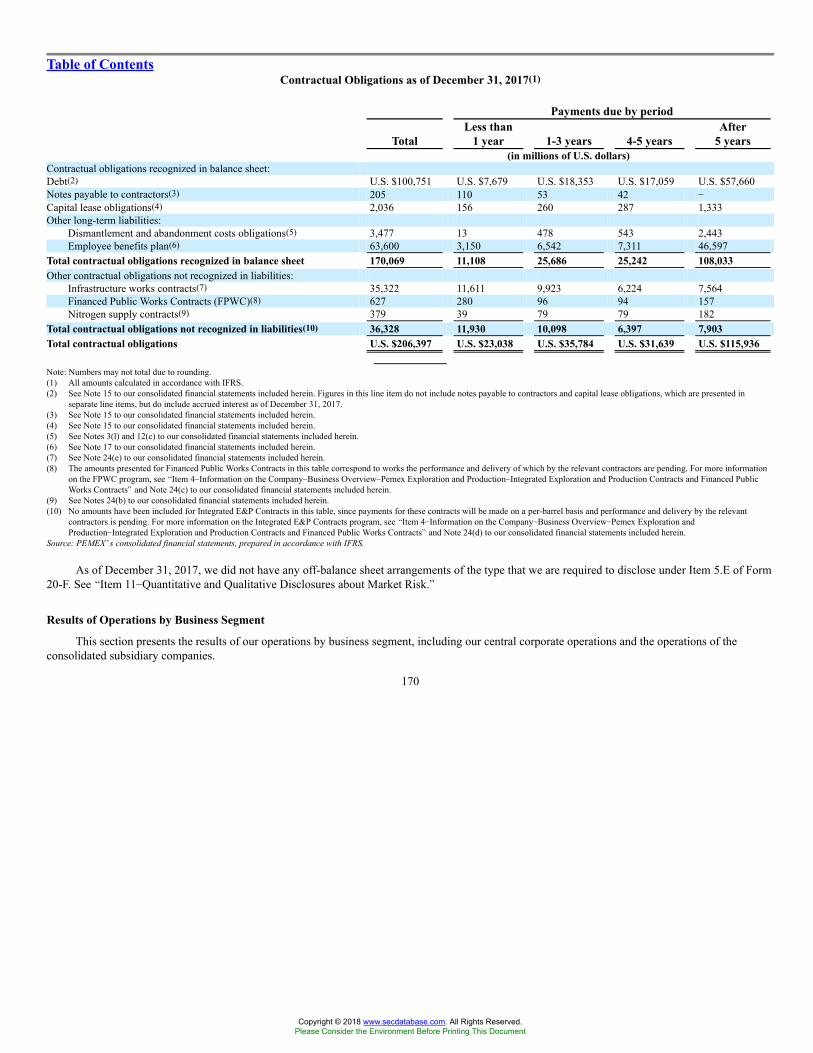
Table of ContentsContractual Obligations as of December 31, 2017(1)
Payments due by period
TotalLess than
1 year 1-3 years 4-5 yearsAfter
5 years(in millions of U.S. dollars)
Contractual obligations recognized in balance sheet:Debt(2) U.S. $100,751 U.S. $7,679 U.S. $18,353 U.S. $17,059 U.S. $57,660Notes payable to contractors(3) 205 110 53 42 �Capital lease obligations(4) 2,036 156 260 287 1,333Other long-term liabilities:
Dismantlement and abandonment costs obligations(5) 3,477 13 478 543 2,443Employee benefits plan(6) 63,600 3,150 6,542 7,311 46,597
Total contractual obligations recognized in balance sheet 170,069 11,108 25,686 25,242 108,033Other contractual obligations not recognized in liabilities:
Infrastructure works contracts(7) 35,322 11,611 9,923 6,224 7,564Financed Public Works Contracts (FPWC)(8) 627 280 96 94 157Nitrogen supply contracts(9) 379 39 79 79 182
Total contractual obligations not recognized in liabilities(10) 36,328 11,930 10,098 6,397 7,903Total contractual obligations U.S. $206,397 U.S. $23,038 U.S. $35,784 U.S. $31,639 U.S. $115,936
Note: Numbers may not total due to rounding.(1) All amounts calculated in accordance with IFRS.(2) See Note 15 to our consolidated financial statements included herein. Figures in this line item do not include notes payable to contractors and capital lease obligations, which are presented in
separate line items, but do include accrued interest as of December 31, 2017.(3) See Note 15 to our consolidated financial statements included herein.(4) See Note 15 to our consolidated financial statements included herein.(5) See Notes 3(l) and 12(c) to our consolidated financial statements included herein.(6) See Note 17 to our consolidated financial statements included herein.(7) See Note 24(e) to our consolidated financial statements included herein.(8) The amounts presented for Financed Public Works Contracts in this table correspond to works the performance and delivery of which by the relevant contractors are pending. For more information
on the FPWC program, see �Item 4�Information on the Company�Business Overview�Pemex Exploration and Production�Integrated Exploration and Production Contracts and Financed PublicWorks Contracts� and Note 24(c) to our consolidated financial statements included herein.
(9) See Notes 24(b) to our consolidated financial statements included herein.(10) No amounts have been included for Integrated E&P Contracts in this table, since payments for these contracts will be made on a per-barrel basis and performance and delivery by the relevant
contractors is pending. For more information on the Integrated E&P Contracts program, see �Item 4�Information on the Company�Business Overview�Pemex Exploration andProduction�Integrated Exploration and Production Contracts and Financed Public Works Contracts� and Note 24(d) to our consolidated financial statements included herein.
Source: PEMEX�s consolidated financial statements, prepared in accordance with IFRS.
As of December 31, 2017, we did not have any off-balance sheet arrangements of the type that we are required to disclose under Item 5.E of Form20-F. See �Item 11�Quantitative and Qualitative Disclosures about Market Risk.�
Results of Operations by Business Segment
This section presents the results of our operations by business segment, including our central corporate operations and the operations of theconsolidated subsidiary companies.
170
Copyright © 2018 www.secdatabase.com. All Rights Reserved.Please Consider the Environment Before Printing This Document
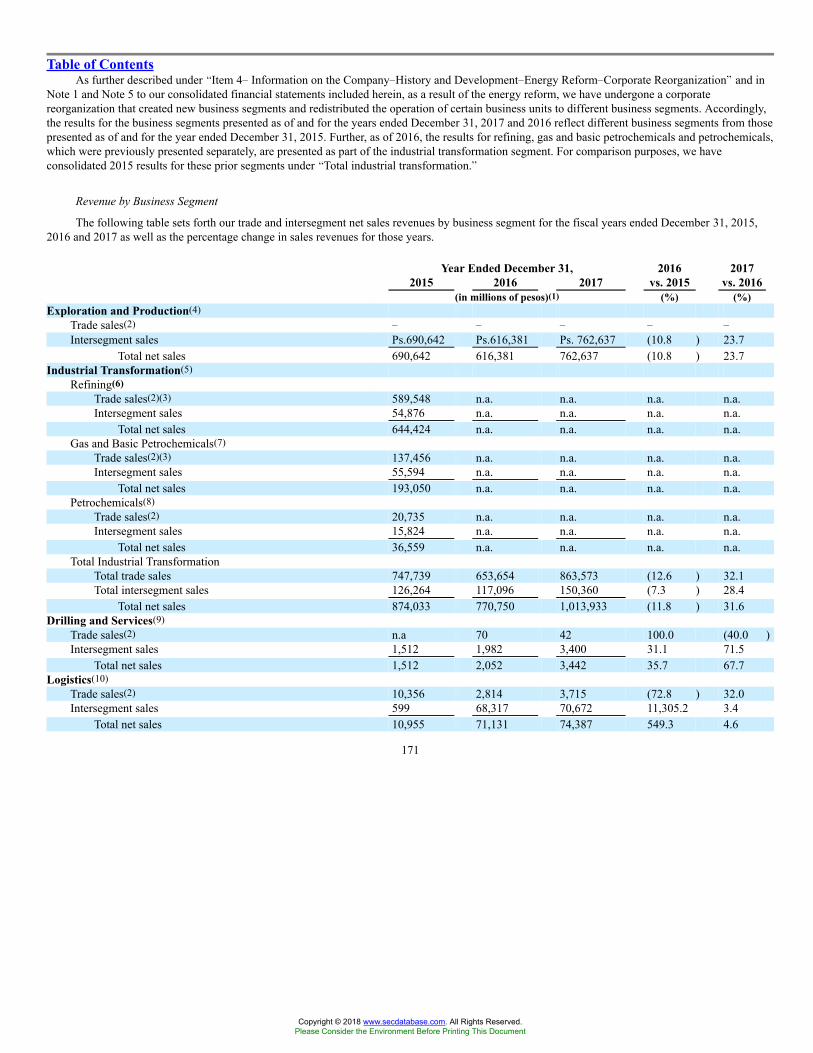
Table of ContentsAs further described under �Item 4� Information on the Company�History and Development�Energy Reform�Corporate Reorganization� and in
Note 1 and Note 5 to our consolidated financial statements included herein, as a result of the energy reform, we have undergone a corporatereorganization that created new business segments and redistributed the operation of certain business units to different business segments. Accordingly,the results for the business segments presented as of and for the years ended December 31, 2017 and 2016 reflect different business segments from thosepresented as of and for the year ended December 31, 2015. Further, as of 2016, the results for refining, gas and basic petrochemicals and petrochemicals,which were previously presented separately, are presented as part of the industrial transformation segment. For comparison purposes, we haveconsolidated 2015 results for these prior segments under �Total industrial transformation.�
Revenue by Business Segment
The following table sets forth our trade and intersegment net sales revenues by business segment for the fiscal years ended December 31, 2015,2016 and 2017 as well as the percentage change in sales revenues for those years.
Year Ended December 31, 2016 20172015 2016 2017 vs. 2015 vs. 2016
(in millions of pesos)(1) (%) (%)Exploration and Production(4)
Trade sales(2) � � � � �Intersegment sales Ps.690,642 Ps.616,381 Ps. 762,637 (10.8 ) 23.7
Total net sales 690,642 616,381 762,637 (10.8 ) 23.7Industrial Transformation(5)
Refining(6)Trade sales(2)(3) 589,548 n.a. n.a. n.a. n.a.Intersegment sales 54,876 n.a. n.a. n.a. n.a.
Total net sales 644,424 n.a. n.a. n.a. n.a.Gas and Basic Petrochemicals(7)
Trade sales(2)(3) 137,456 n.a. n.a. n.a. n.a.Intersegment sales 55,594 n.a. n.a. n.a. n.a.
Total net sales 193,050 n.a. n.a. n.a. n.a.Petrochemicals(8)
Trade sales(2) 20,735 n.a. n.a. n.a. n.a.Intersegment sales 15,824 n.a. n.a. n.a. n.a.
Total net sales 36,559 n.a. n.a. n.a. n.a.Total Industrial Transformation
Total trade sales 747,739 653,654 863,573 (12.6 ) 32.1Total intersegment sales 126,264 117,096 150,360 (7.3 ) 28.4
Total net sales 874,033 770,750 1,013,933 (11.8 ) 31.6Drilling and Services(9)
Trade sales(2) n.a 70 42 100.0 (40.0 )Intersegment sales 1,512 1,982 3,400 31.1 71.5
Total net sales 1,512 2,052 3,442 35.7 67.7Logistics(10)
Trade sales(2) 10,356 2,814 3,715 (72.8 ) 32.0Intersegment sales 599 68,317 70,672 11,305.2 3.4
Total net sales 10,955 71,131 74,387 549.3 4.6
171
Copyright © 2018 www.secdatabase.com. All Rights Reserved.Please Consider the Environment Before Printing This Document
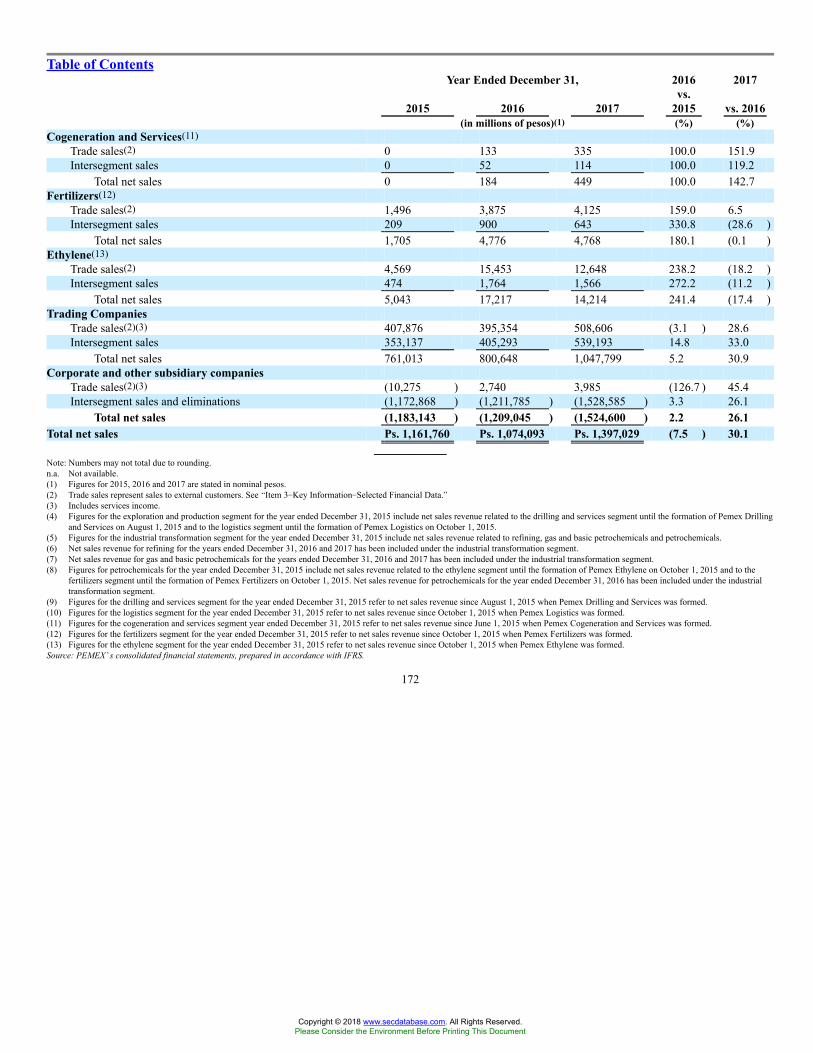
Table of ContentsYear Ended December 31, 2016 2017
2015 2016 2017vs.
2015 vs. 2016(in millions of pesos)(1) (%) (%)
Cogeneration and Services(11)Trade sales(2) 0 133 335 100.0 151.9Intersegment sales 0 52 114 100.0 119.2
Total net sales 0 184 449 100.0 142.7Fertilizers(12)
Trade sales(2) 1,496 3,875 4,125 159.0 6.5Intersegment sales 209 900 643 330.8 (28.6 )
Total net sales 1,705 4,776 4,768 180.1 (0.1 )Ethylene(13)
Trade sales(2) 4,569 15,453 12,648 238.2 (18.2 )Intersegment sales 474 1,764 1,566 272.2 (11.2 )
Total net sales 5,043 17,217 14,214 241.4 (17.4 )Trading Companies
Trade sales(2)(3) 407,876 395,354 508,606 (3.1 ) 28.6Intersegment sales 353,137 405,293 539,193 14.8 33.0
Total net sales 761,013 800,648 1,047,799 5.2 30.9Corporate and other subsidiary companies
Trade sales(2)(3) (10,275 ) 2,740 3,985 (126.7 ) 45.4Intersegment sales and eliminations (1,172,868 ) (1,211,785 ) (1,528,585 ) 3.3 26.1
Total net sales (1,183,143 ) (1,209,045 ) (1,524,600 ) 2.2 26.1Total net sales Ps. 1,161,760 Ps. 1,074,093 Ps. 1,397,029 (7.5 ) 30.1
Note: Numbers may not total due to rounding.n.a. Not available.(1) Figures for 2015, 2016 and 2017 are stated in nominal pesos.(2) Trade sales represent sales to external customers. See �Item 3�Key Information�Selected Financial Data.�(3) Includes services income.(4) Figures for the exploration and production segment for the year ended December 31, 2015 include net sales revenue related to the drilling and services segment until the formation of Pemex Drilling
and Services on August 1, 2015 and to the logistics segment until the formation of Pemex Logistics on October 1, 2015.(5) Figures for the industrial transformation segment for the year ended December 31, 2015 include net sales revenue related to refining, gas and basic petrochemicals and petrochemicals.(6) Net sales revenue for refining for the years ended December 31, 2016 and 2017 has been included under the industrial transformation segment.(7) Net sales revenue for gas and basic petrochemicals for the years ended December 31, 2016 and 2017 has been included under the industrial transformation segment.(8) Figures for petrochemicals for the year ended December 31, 2015 include net sales revenue related to the ethylene segment until the formation of Pemex Ethylene on October 1, 2015 and to the
fertilizers segment until the formation of Pemex Fertilizers on October 1, 2015. Net sales revenue for petrochemicals for the year ended December 31, 2016 has been included under the industrialtransformation segment.
(9) Figures for the drilling and services segment for the year ended December 31, 2015 refer to net sales revenue since August 1, 2015 when Pemex Drilling and Services was formed.(10) Figures for the logistics segment for the year ended December 31, 2015 refer to net sales revenue since October 1, 2015 when Pemex Logistics was formed.(11) Figures for the cogeneration and services segment year ended December 31, 2015 refer to net sales revenue since June 1, 2015 when Pemex Cogeneration and Services was formed.(12) Figures for the fertilizers segment for the year ended December 31, 2015 refer to net sales revenue since October 1, 2015 when Pemex Fertilizers was formed.(13) Figures for the ethylene segment for the year ended December 31, 2015 refer to net sales revenue since October 1, 2015 when Pemex Ethylene was formed.Source: PEMEX�s consolidated financial statements, prepared in accordance with IFRS.
172
Copyright © 2018 www.secdatabase.com. All Rights Reserved.Please Consider the Environment Before Printing This Document

Table of ContentsIncome by Business Segment
The following table sets forth our net income (loss) by business segment for each year in the three-year period ended December 31, 2017, as wellas the percentage change in income for the years 2015 to 2017.
Year Ended December 31,2016
vs. 20152017
vs. 20162015 2016 2017 (%) (%)
(in millions of pesos)(1)Business Segment
Exploration and Production(2) Ps.(667,394) Ps.(45,879) Ps. (151,037) (93.1 ) 229.2Industrial Transformation(3)
Refining(4) (113,147 ) n.a. n.a. n.a. n.a.Gas and Basic Petrochemicals(5) 18,126 n.a. n.a. n.a. n.a.Petrochemicals(6) 7,812 n.a. n.a. n.a. n.a.Total Industrial Transformation (87,209 ) (69,865 ) (55,787 ) (19.9 ) (20.2 )
Drilling and Services(7) 455 (142 ) 1,266 (131.3 ) (988.7 )Logistics(8) (3,685 ) (10,018 ) (834 ) 171.8 (91.7 )Cogeneration and Services(9) (57 ) (35 ) (92 ) (39.5 ) 165.4Fertilizers(10) (145 ) (1,659 ) (4,270 ) 1,043.7 157.3Ethylene(11) (1,755 ) 2,097 (1,442 ) (219.5 ) (168.8 )Trading Companies 8,697 11,167 12,045 28.4 7.9Corporate and other subsidiary companies(12) 38,526 (76,809 ) (80,699 ) (299.4 ) 5.1
Total net income (loss) Ps. (712,567 ) Ps. (191,144 ) Ps. 280,851 (73.2 ) 46.9
Note: Numbers may not total due to rounding.n.a. not available.(1) Figures are stated in nominal pesos. See �Item 3�Key Information�Selected Financial Data.�(2) Figures for the exploration and production segment for the year ended December 31, 2015 include net income (loss) related to the drilling and services segment until the formation of Pemex Drilling
and Services on August 1, 2015 and to the logistics segment until the formation of Pemex Logistics on October 1, 2015.(3) Figures for the industrial transformation segment for the year ended December 31, 2015 include net income (loss) related to refining, gas and basic petrochemicals and petrochemicals.(4) Net income (loss) for refining for the years ended December 31, 2016 and 2017 has been included under the industrial transformation segment.(5) Net income (loss) for gas and basic petrochemicals for the years ended December 31, 2016 and 2017 has been included under the industrial transformation segment.(6) Figures for petrochemicals for the year ended December 31, 2015 include net income (loss) related to the ethylene segment until the formation of Pemex Ethylene on October 1, 2015 and to the
fertilizers segment until the formation of Pemex Fertilizers on October 1, 2015. Net income (loss) for petrochemicals for the years ended December 31, 2016 and 2017 has been included under theindustrial transformation segment.
(7) Figures for the drilling and services segment for the year ended December 31, 2015 refer to net income (loss) since August 1, 2015 when Pemex Drilling and Services was formed.(8) Figures for the logistics segment for the year ended December 31, 2015 refer to net income (loss) since October 1, 2015 when Pemex Logistics was formed.(9) Figures for the cogeneration and services segment year ended December 31, 2015 refer to net income (loss) since June 1, 2015 when Pemex Cogeneration and Services was formed.(10) Figures for the fertilizers segment for the year ended December 31, 2015 refer to net income (loss) since October 1, 2015 when Pemex Fertilizers was formed.(11) Figures for the ethylene segment for the year ended December 31, 2015 refer to net income (loss) since October 1, 2015 when Pemex Ethylene was formed.(12) Includes intersegment eliminations.Source: PEMEX�s consolidated financial statements, prepared in accordance with IFRS.
173
Copyright © 2018 www.secdatabase.com. All Rights Reserved.Please Consider the Environment Before Printing This Document

Table of Contents2017 compared to 2016
We present below the results of our operations by business segment. For more information on our operating segments, see �Item 4� Informationon the Company�History and Development�Energy Reform�Corporate Reorganization� and Note 1 to our consolidated financial statements includedherein. For a detailed description of the financial results of each segment, see Note 1 and Note 5 to our consolidated financial statements includedherein.
Exploration and Production
In 2017, total intersegment sales, which include sales to our industrial transformation segment and the Trading Companies, increased by 23.7%,primarily due to the increase in crude oil export prices. As compared to 2016, our exploration and production segment�s sales of crude oil to the TradingCompanies in 2017 increased by 40.0% in U.S. dollar terms, primarily due to an increase in exports to the United States and an increase in crude oilexport prices. The weighted average price of crude oil sold by our exploration and production segment to the Trading Companies for export wasU.S. $47.26 in 2017, as compared to U.S. $35.17 in 2016. Net loss related to exploration and production activities increased by 229.2%, orPs. 105,158 million, from a Ps. 45,879 million loss in 2016 to a Ps. 151,037 million loss in 2017, primarily due to net impairment of our fixed assets inthis segment.
Industrial Transformation
In 2017, trade sales related to industrial transformation activities increased by 32.1%, from Ps. 653,654 million in 2016 to Ps. 863,573 million in2017, primarily due to an increase in the average sales prices of petroleum products. Intersegment sales increased by 28.4%, from Ps. 117,096 million in2016 to Ps. 150,360 million in 2017, primarily due to an increase in the prices of petroleum products sold. In 2017, our net loss related to industrialtransformation activities was Ps. 55,787 million, 20.2% lower than the loss of Ps. 69,865 million in 2016. The decrease in loss was primarily due to adecrease in cost and operating expenses.
Drilling and Services
In 2017, total sales related to the drilling and services segment increased by 67.7%, from Ps. 2,052 million in 2016 to Ps. 3,442 million in 2017.This increase was primarily due to an increase in services provided to Pemex Exploration and Production. Net income related to drilling and servicesincreased by Ps. 1,408 million, from a loss of Ps. 142 million in 2016 to a net income of Ps. 1,266 million in 2017, primarily due to an increase inforeign exchange income.
Logistics
In 2017, total sales related to the logistics segment increased by Ps. 3,256 million, from Ps. 71,131 million in 2016 to Ps. 74,387 million in 2017,primarily due to an increase in the services provided to Pemex Industrial Transformation. In 2017, our net loss related to logistics activities wasPs. 834 million, a 91.7% decrease as compared to the loss of Ps. 10,018 million in 2016. The decrease in net loss was primarily due to our foreignexchange income.
174
Copyright © 2018 www.secdatabase.com. All Rights Reserved.Please Consider the Environment Before Printing This Document
Table of ContentsCogeneration and Services
In 2017, total sales related to our cogeneration and services segment increased by Ps. 264 million from Ps. 185 million in 2016 to Ps. 449 millionin 2017, primarily due to an increase in the services provided to Pemex Industrial Transformation. In 2017, our net loss related to our cogeneration andservices activities increased by Ps. 57 million, from a net loss of Ps. 35 million in 2016 to a net loss of Ps. 92 million in 2017. This increase in loss wasprimarily due to an increase in costs and operating expenses as well as increased financing costs.
Fertilizers
In 2017, total sales related to the fertilizers segment decreased by Ps. 7 million, from Ps. 4,775 million in 2016 to Ps. 4,768 million in 2017. Thisdecrease was primarily due to a decrease in the trade sales of ammonia. In 2017, our net loss related to our fertilizers activities increased byPs. 2,611 million, from a net loss of Ps. 1,659 million in 2016 to a net loss of Ps. 4,270 million in 2017, primarily due to the net impairment of our fixedassets in this segment.
Ethylene
In 2017, total sales related to our ethylene segment decreased by Ps. 3,003 million, from Ps. 17,217 million in 2016 to Ps. 14,214 in 2017,primarily due to a decrease in sales of polyethylene, ethylene oxides, acrylonitrile and monoethylenglecol products. In 2017, our net income related toour ethylene activities decreased by Ps. 3,538 million, from a net income of Ps. 2,097 million in 2016 to a net loss of Ps. 1,442 in 2017. This decrease inincome was primarily due a decrease in total sales.
Trading Companies
In 2017, total sales relating to the Trading Companies� exports of crude oil and petroleum products to third parties (including services income)increased in peso terms, from Ps. 395,354 million in 2016 to Ps. 508,606 in 2017, primarily as a result of an increase in the prices of crude oil exports.In 2017, net income related to the Trading Companies increased by 7.9%, from Ps. 11,167 million in 2016 to Ps. 12,045 million in 2017, primarily dueto an increase in the permanent investment in associates that was recognized at fair value.
Corporate and Other Subsidiary Companies
In 2017, the total sales relating to corporate and other subsidiary companies after inter-company eliminations increased from Ps. 1,209,045 millionin 2016 to Ps. 1,524,600 million in 2017, primarily due to an increase in total intercompany sales as a result of an increase in the import of products. Netloss related to corporate and other subsidiary companies after inter-company eliminations decreased by Ps. 3,890 million, from a net loss of Ps.76,809 million in 2016 to a net loss of Ps. 80,699 million in 2017, primarily due to unfavorable results from subsidiary companies and a loss in jointventures and associates.
2016 Compared to 2015
Certain business units and assets that were operated by the refining, gas and basic petrochemicals and petrochemicals segments were transferred toour industrial transformation segment as a part of Pemex Industrial Transformation, on November 1, 2015. In order to provide investors withcomparative information, we have consolidated 2015 results for these prior segments. Accordingly, in the case of our industrial transformation segmentbelow, we present consolidated results for 2015 for the refining, gas and basic petrochemicals and petrochemicals segments under the heading�Industrial Transformation.� For more information on our corporate restructuring and our operating segments, see �Item 4� Information on theCompany�History and Development�Energy Reform�Corporate Reorganization� and Note 1 to our consolidated financial statements included herein.For a detailed description of the financial results of each segment, see Note 5 to our consolidated financial statements included herein.
175
Copyright © 2018 www.secdatabase.com. All Rights Reserved.Please Consider the Environment Before Printing This Document
Table of ContentsExploration and Production
In 2016, total intersegment sales, which include sales to our industrial transformation segment and the Trading Companies, decreased by 10.8%,primarily due to the decrease in crude oil export prices. As compared to 2015, our exploration and production segment�s sales of crude oil to theTrading Companies in 2016 decreased by 0.5% in peso terms and decreased by 16.2% in U.S. dollar terms, primarily due to a decrease in crude oilexport prices. The weighted average price of crude oil sold by our exploration and production segment to the Trading Companies for export wasU.S. $35.17 in 2016, as compared to U.S. $42.70 in 2015. Net loss related to exploration and production activities decreased by 91.3%, orPs. 621,515 million, from a Ps. 667,394 million loss in 2015 to a Ps. 45,879 million loss in 2016, primarily due to a net reversal of impairment of ourfixed assets in this segment.
Industrial Transformation
In 2016, trade sales related to industrial transformation activities decreased by 12.6%, from Ps. 747,739 million in 2015 to Ps. 653,654 million in2016, primarily due to a decrease in the average sales prices of petroleum products. Intersegment sales decreased by 7.3%, from Ps. 126,264 million in2015 to Ps. 117,096 million in 2016, primarily due to a decrease in the prices of petroleum products sold. In 2016, our net loss related to industrialtransformation activities was Ps. 69,865 million, 19.9% lower than the loss of Ps. 87,209 million in 2015. The decrease in loss was primarily due to a netreversal of impairment of our fixed assets in this segment and a decrease in cost and operating expenses, which was partially offset by an increase incrude oil purchases and an increase in material acquisitions.
Drilling and Services
In 2016, total sales related to the drilling and services segment increased by 35.7%, from Ps. 1,512 million in 2015 to Ps. 2,052 million in 2016.This increase was primarily due to an increase in services provided to Pemex Exploration and Production. Net loss related to drilling and servicesincreased by Ps. 597 million, from an income of Ps. 455 million in 2015 to a net loss of Ps. 142 million in 2016, primarily due to an increase in theexpenses related to our intersegment services, an increase in the depreciation and maintenance required for our fixed assets, and a foreign exchange loss.
Logistics
In 2016, total sales related to the logistics segment increased by Ps. 60,176 million, from Ps. 10,955 million in 2015 to Ps. 71,131 million in 2016,primarily due to an increase in the services provided to Pemex Industrial Transformation. In 2016, our net loss related to logistics activities wasPs. 10,018 million, 171.9% higher than the loss of Ps. 3,685 million in 2015. The increase in net loss was primarily due to the transfer of certain of ourassets to CENAGAS, higher operating expenses, an increase in financing cost, and a foreign exchange loss.
Fertilizers
In 2016, total sales related to the fertilizers segment increased by Ps. 3,071 million, from Ps. 1,705 million in 2015 to Ps. 4,776 million in 2016.This increase was primarily due to an increase in the trade sales of ammonia. In 2016, our net loss related to our fertilizers activities increased byPs. 1,514 million, from a net loss of Ps. 145 million in 2015 to a net loss of Ps. 1,659 million in 2016, primarily due to costs related to the acquisition ofFertinal and an increase in the cost of services received from Pemex Logistics and from maritime freights.
Ethylene
In 2016, total sales related to our ethylene segment increased by Ps. 12,174 million, from Ps. 5,043 million in 2015 to Ps. 17,217 million in 2016,primarily due to an increase in the sales of polyethylene, ethylene oxides
176
Copyright © 2018 www.secdatabase.com. All Rights Reserved.Please Consider the Environment Before Printing This Document
Table of Contentsand monoethylenglecol products. In 2016, our net income related to our ethylene activities increased by Ps. 3,852 million, from a net loss ofPs. 1,755 million in 2015 to a net income of Ps. 2,097 million in 2016. This increase in income was primarily due to a net reversal of impairment of ourplants and an increase in sales.
Trading Companies
In 2016, total sales relating to the Trading Companies� exports of crude oil and petroleum products to third parties (including services income)decreased in peso terms, from Ps. 407,876 million in 2015 to Ps. 395,354 million in 2016, primarily as a result of a decrease in the prices of crude oilexports. In 2016, net income related to the Trading Companies increased by 28.4%, from Ps. 8,697 million in 2015 to Ps. 11,167 million, primarily dueto an increase in the permanent investment in associates that was recognized at fair value.
Corporate and Other Subsidiary Companies
In 2016, the total sales relating to corporate and other subsidiary companies after inter-company eliminations increased from Ps. 1,183,143 millionin 2015 to Ps. 1,209,045 million in 2016, primarily due to an increase in total intercompany sales as a result of an increase in the import of products. Netloss related to corporate and other subsidiary companies after inter-company eliminations increased by Ps. 115,335 million, from a net income ofPs. 38,526 million in 2015 to a net loss of Ps. 76,809 million in 2016, primarily due to unfavorable results from subsidiary companies, an increase inforeign exchange loss and an increase in financing costs.
Item 6. Directors, Senior Management and Employees
Under the Petróleos Mexicanos Law, Petróleos Mexicanos is governed by a ten-member Board of Directors composed as follows:
� the Secretary of Energy, who serves as the Chairperson and has the right to cast a tie-breaking vote;
� the Secretary of Finance and Public Credit;
� three Mexican Government representatives, who are appointed by the President of Mexico; and
� five independent members, who are appointed by the President of Mexico, subject to ratification by the Senate. Independent membersperform their duties on a part-time basis, are not public officials (i.e., individuals holding federal, state or municipal government positions inMexico) and have not been employed by Petróleos Mexicanos or any of the subsidiary entities during the two years prior to theirappointment.
The Petróleos Mexicanos Law authorizes only the Secretary of Energy and the Secretary of Finance and Public Credit to designate an alternate toserve in his or her place, provided that the alternate is a public official at the undersecretary level, at minimum. This alternate may attend meetings of theBoard of Directors of Petróleos Mexicanos and otherwise assume the duties of the director, except that the Chairperson�s designated alternate may notcast a tie-breaking vote. In addition, any ministry-level secretary serving as a member of the Board of Directors of Petróleos Mexicanos may designatean alternate to attend meetings on his or her behalf, provided that such alternate is a public official at the undersecretary level, at minimum.
Under the Petróleos Mexicanos Law, all public officials serving as members of the Board of Directors of Petróleos Mexicanos are required to actimpartially and for the benefit and in the best interests of Petróleos Mexicanos, separating at all times the interests of the ministry or governmental entityfor which they work from their duties as members of the Board of Directors.
177
Copyright © 2018 www.secdatabase.com. All Rights Reserved.Please Consider the Environment Before Printing This Document
Table of ContentsExcept in the case of the independent members first appointed under the Petróleos Mexicanos Law, the five independent members will be
appointed to staggered five-year terms, and may be appointed for an additional term of the same length. The remaining members of the Board ofDirectors of Petróleos Mexicanos are not appointed for a specific term.
In 2014, the following individuals were appointed to serve as independent members of the Board of Directors of Petróleos Mexicanos for theinitial terms set forth below:
� Mr. Alberto Tiburcio Celorio, for two years;
� Mr. Octavio Francisco Pastrana Pastrana, for three years;
� Mr. Jorge José Borja Navarrete, for four years;
� Mr. Jaime Lomelín Guillén, for five years; and
� Mr. Carlos Elizondo Mayer-Serra, for six years.
On February 17, 2015, Mr. Jaime Lomelín Guillén resigned from his position as independent member of the Board of Directors of PetróleosMexicanos. On April 29, 2016, the Senate ratified the appointment of Mr. Felipe Duarte Olvera as an independent member to serve for the remainder ofMr. Lomelín Guillén�s term.
Under the Petróleos Mexicanos Law, each of the boards of directors of the subsidiary entities will consist of not less than five and no more thanseven members. The majority of the members of each of the board of directors shall be appointed by and represent the Board of Directors of PetróleosMexicanos. The Ministry of Energy and the Ministry of Finance and Public Credit may also appoint members to each board of directors of thesubsidiary entities, subject to approval by the Board of Directors of Petróleos Mexicanos.
On November 17, 2017, the Board of Directors of Petróleos Mexicanos approved the Estatuto Orgánico (Organic Statute) of PetróleosMexicanos, which was published in the Official Gazette of the Federation on December 5, 2017 and became effective the following day. This OrganicStatute establishes the structure, organizational basis and functions of the administrative units of Petróleos Mexicanos and also delineates the duties andinternal regulations of its Board of Directors.
178
Copyright © 2018 www.secdatabase.com. All Rights Reserved.Please Consider the Environment Before Printing This Document
Table of ContentsThe following tables set forth certain information with respect to directors and executive officers of Petróleos Mexicanos and each of the
subsidiary entities as of April 30, 2018.
Petróleos Mexicanos��Directors and Executive Officers
Name Position with Petróleos MexicanosYear
Appointed
Mr. Pedro Joaquín Coldwell Chairman of the Board of Directors of Petróleos Mexicanos andSecretary of EnergyBorn: 1950Business experience: Chairman of the National ExecutiveCommittee of the PRI; Senator of the LXth and LXIst Legislatures;and Chairman of the National Executive Commission of InternalProcedures of the PRI.Other board memberships: Chairman of CFE; Chairman of theCentro Nacional de Control de Energía; Chairman of CENAGAS;Banco Nacional de Comercio Exterior, S.N.C., Institución de Bancade Desarrollo; Nacional Financiera, S.N.C., Institución de Banca deDesarrollo; Comisión Nacional de Vivienda; and Instituto Nacionalde Ecología y Cambio Climático.
2012
Mr. Fernando Zendejas Reyes Alternate Board Member of Petróleos Mexicanos andUndersecretary of Electricity of the Ministry of EnergyBorn: 1986Business experience: Chief of the Legal Affairs Unit of the Ministryof Energy: Director General of Coordination of the Secretary ofEnergy´s Office; and Technical Secretary of the National ExecutiveCommittee of PRI.Other board memberships: Centro Nacional de Control de Energía;CENAGAS (Alternate); Comisión Nacional de Vivienda (Alternate);Comité de Estrategias e Inversiones of CFE (Alternate); ComitéEjecutivo de Crédito of Nacional Financiera, S.N.C., Institución deBanca de Desarrollo; Comité Ejecutivo de Crédito of BancoNacional de Comercio Exterior, S.N.C., Institución de Banca deDesarrollo; Instituto Nacional de Investigaciones Nucleares; EntidadMexicana de Acreditación; Comisión Nacional de Zonas Áridas; andCentro Nacional de Metrología.
2017
179
Copyright © 2018 www.secdatabase.com. All Rights Reserved.Please Consider the Environment Before Printing This Document
Table of ContentsPetróleos Mexicanos��Directors and Executive Officers
Name Position with Petróleos MexicanosYear
Appointed
Mr. Ildefonso Guajardo Villarreal Board Member of Petróleos Mexicanos and Secretary of EconomyBorn: 1957Business experience: Deputy Coordinator of Political Economy forthe President Elect�s Transition Team; Transition Coordinator to thePRI Candidate�s Presidential Campaign; and Federal Deputy of theLXIst Legislature.Other board memberships: Aeropuertos y Servicios Auxiliares;Banco del Ahorro Nacional y Servicios Financieros, S.N.C.,Institución de Banca de Desarrollo; Banco Nacional de ComercioExterior, S.N.C.; Caminos y Puentes Federales de Ingresos yServicios Conexos; Centro de Investigación y Docencia Económicas,A.C.; Centro Nacional de Metrología; Centro Nacional de GasNatural; Comisión Coordinadora para la Negociación de Precios deMedicamentos y otros Insumos para la Salud; CFE; Chairman of theComisión Federal de Mejora Regulatoria; Comisión Intersecretarialde Bioseguridad de los Organismos Genéticamente Modificados;Comisión Intersecretarial de Cambio Climático; Chairman of theComisión Intersecretarial de Compras y Obras de la AdministraciónPública Federal a la Micro, Pequeña y Mediana Empresa; ComisiónIntersecretarial de Desarrollo Social; Comisión Intersecretarial deGasto Público Financiamiento y Desincorporación; ComisiónIntersecretarial de Precios y Tarifas de los Bienes y Servicios de laAdministración Pública Federal; Comisión Intersecretarial deVivienda; Comisión Intersecretarial para Asuntos de la FronteraNorte; Comisión Intersecretarial para el Desarrollo de losBioenergéticos; Comisión Intersecretarial para el Desarrollo delGobierno Electrónico; Comisión Intersecretarial para el DesarrolloRural Sustentable; Comisión Intersecretarial para el ManejoSustentable de Mares y Costas; Comisión Intersecretarial para laCoordinación Operativa en los Puntos de Internación al TerritorioNacional; Comisión Intersecretarial para la Atención de Sequias eInundaciones; Comisión Intersecretarial para la Instrumentación dela Cruzada contra el Hambre; Comisión Intersecretarial para laPrevención y Combate a la Economía Ilegal; Comisión
2013
180
Copyright © 2018 www.secdatabase.com. All Rights Reserved.Please Consider the Environment Before Printing This Document
Table of ContentsPetróleos Mexicanos��Directors and Executive Officers
Name Position with Petróleos MexicanosYear
AppointedIntersecretarial para la Prevención y Erradicación del TrabajoInfantil y la Protección de Adolescentes Trabajadores en EdadPermitida en México; Comisión Intersecretarial para la TransiciónDigital; Comisión Intersecretarial para la Prevención Social de laViolencia y la Delincuencia; Comisión Intersecretarial de ZonasEconómicas Especiales; Chairman of the Comisión Nacional deInversiones Extranjeras; Comisión Nacional de Vivienda;CONAGUA; Comisión Nacional Forestal; Comisión Nacionalpara el Conocimiento y Uso de la Biodiversidad; ComisiónNacional para el Desarrollo de los Pueblos Indígenas; Chairmanof the Comité de Control y Desempeño Institucional; Chairman ofthe Comité Intersectorial para la Innovación; Comité Nacional deProductividad; Comité Nacional para el Desarrollo Sustentable dela Caña de Azúcar; Consejo Consultivo Empresarial para elCrecimiento Económico de México; Chairman of the ConsejoConsultivo para el Fomento a la Industria Eléctrica Nacional;Consejo Consultivo de Turismo; Comisión Intersecretarial para elSector Turístico; Consejo Nacional de Normalización yCertificación de Competencias Laborales; Consejo Mexicano parael Desarrollo Rural Sustentable; Consejo Nacional contra lasAdicciones; Consejo Nacional de Ciencia y Tecnología; ConsejoGeneral de Investigación Científica, Desarrollo Tecnológico eInnovación; Consejo Nacional de Fomento Educativo; ConsejoNacional de Infraestructura; Consejo Nacional de ProtecciónCivil; Consejo de Salubridad General; Consejo Nacional deVivienda; Chairman of the Consejo Nacional para laCompetitividad de la Micro, Pequeña y Mediana Empresa;Consejo Nacional para la Prevención y Control de lasEnfermedades Crónicas no Transmisibles; Coordinación Nacionalde Prospera, Programa de Inclusión Social; Consejo Nacional paralas Comunidades Mexicanas en el Exterior; El Colegio de laFrontera Norte, A.C.; Chairman of the Fideicomiso de FomentoMinero; Fideicomiso del Fondo Institucional para el Fomento dela Ciencia, el Fomento de la Tecnología y el Fomento, Desarrolloy Consolidación de
181
Copyright © 2018 www.secdatabase.com. All Rights Reserved.Please Consider the Environment Before Printing This Document
Table of ContentsPetróleos Mexicanos��Directors and Executive Officers
Name Position with Petróleos MexicanosYear
AppointedCientíficos y Tecnólogos; Fideicomiso e-México; Chairman of theFideicomiso para Promover el Acceso al Financiamiento deMIPYMES y Emprendedores (México Emprende); Chairman of theFondo de Innovación Tecnológica SE-CONACYT; GabineteEspecializado de México Próspero; Gabinete Especializado deMéxico con Responsabilidad Global; Gabinete EspecializadoIncluyente; Instituto del Fondo Nacional de la Vivienda de losTrabajadores; Instituto del Fondo Nacional para el Consumo de losTrabajadores; Instituto Mexicano de la Juventud; Chairman of theInstituto Mexicano de la Propiedad Industrial; Instituto Nacional dela Infraestructura Física Educativa; Instituto Nacional de lasMujeres; Chairman of the Instituto Nacional del Emprendedor;Nacional Financiera, S.N.C.; Chairman of the Fideicomiso PúblicoProMéxico; Chairman of the Servicio Geológico Mexicano; ServicioNacional de Capacitación y Asistencia Técnica Rural; ServicioPostal Mexicano; Sistema de Investigación Alfonso Reyes; Sistemade Investigación Benito Juárez; Sistema de Investigación FranciscoVilla; Sistema de Investigación Golfo de México; Sistema deInvestigación Ignacio Zaragoza; Sistema de Investigación José MaríaMorelos; Sistema de Investigación Justo Sierra; Sistema deInvestigación Mar de Cortés; Sistema de Investigación MiguelHidalgo; and Telecomunicaciones de México.
Mr. José Rogelio Garza Garza Alternate Board Member of Petróleos Mexicanos andUndersecretary of Industry and Trade of the Ministry of EconomyBorn: 1971Business experience: Cámara Nacional de la Industria Electrónica deTelecomunicaciones y Tecnologías de la Información; Secretary ofthe Ministry of Trade and Industrial Promotion; and QualityCoordinator of ISO-9002 Program of the Ministry of Trade andIndustrial Promotion.Other board memberships: Instituto del Fondo Nacional de laVivienda para los Trabajadores (Alternate).
2014
182
Copyright © 2018 www.secdatabase.com. All Rights Reserved.Please Consider the Environment Before Printing This Document
Table of ContentsPetróleos Mexicanos��Directors and Executive Officers
Name Position with Petróleos MexicanosYear
AppointedMr. Aldo Ricardo Flores Quiroga Board Member of Petróleos Mexicanos and Undersecretary of
Hydrocarbons of the Ministry of EnergyBorn: 1967Business experience: Secretary-General of the International EnergyForum; Director General of International Affairs of the Ministry ofEnergy; and Director General of Bilateral Economic Relations of theMinistry of Foreign Affairs.Other board memberships: CENAGAS; Consejo de Coordinacióndel Sector Energético; and Fondo Mexicano del Petróleo para laEstabilización y el Desarrollo (Alternate).
2016
Mr. José Antonio González Anaya Board Member of Petróleos Mexicanos and Secretary of Finance andPublic CreditBorn: 1967Business experience: Chief Executive Officer of PetróleosMexicanos; Chief Executive Officer of the Instituto Mexicano delSeguro Social; and Undersecretary of Income of the Ministry ofFinance and Public Credit.Other board memberships: Aeropuertos y Servicios Auxiliares;Caminos y Puentes Federales de Ingresos y Servicios Conexos;Chairman of Casa de Moneda de México; Chairman of FinancieraNacional de Desarrollo Agropecuario, Rural, Forestal y Pesquero;Fondo de Cultura Económica; Instituto del Fondo Nacional de laVivienda para los Trabajadores; Instituto del Fondo Nacional para elConsumo de los Trabajadores; Instituto Mexicano de la Radio;Chairman of the Instituto para la Protección al Ahorro Bancario;Chairman of Lotería Nacional para la Asistencia Pública; Chairmanof Pronósticos para la Asistencia Pública; Servicio Postal Mexicano;Telecomunicaciones de México; Chairman of Servicio deAdministración y Enajenación de Bienes; ; Chairman ofAgroasemex, S.A., Institución Nacional de Seguros; Chairman ofBanco del Ahorro Nacional y Servicios Financieros, S.N.C.,Institución de Banca de Desarrollo; Chairman of Banco Nacional deComercio Exterior, S.N.C., Institución de Banca de Desarrollo;Chairman of Banco Nacional de Obras y Servicios Públicos, S.N.C.,Institución de Banca de Desarrollo; Chairman of Banco Nacional delEjército, Fuerza
2017
183
Copyright © 2018 www.secdatabase.com. All Rights Reserved.Please Consider the Environment Before Printing This Document
Table of ContentsPetróleos Mexicanos��Directors and Executive Officers
Name Position with Petróleos MexicanosYear
AppointedAérea y Armada, S.N.C., Institución de Banca de Desarrollo;Chairman of Nacional Financiera, S.N.C., Institución de Banca deDesarrollo; Chairman of Seguros de Crédito a la Vivienda SHF, S.A.de C.V.; Chairman of Sociedad Hipotecaria Federal, S.N.C.,Institución de Banca de Desarrollo; CFE; Comisión de Estrategja eInversiones of CFE; Comisión de Recursos Humanos yRemuneraciones of CFE; Fondo de Operación y FinanciamientoBancario a la Vivienda; CNBV; Comisión Nacional de Seguros yFianzas; Chairman of the Comisión de Cambios; Comisión Nacionalde Inversiones Extranjeras; Banco Interamericano de Desarrollo yCorporación Interamericana de Inversiones; Banco Internacional deReconstrucción y Fomento del Banco Mundial; OrganismoMultilateral de Garantía de Inversiones del Banco Mundial; andBanco de Desarrollo del Caribe.
Mr. Alberto Torres García Alternate Board Member of Petróleos Mexicanos andUndersecretary of Income of the Ministry of Finance and PublicCreditBorn: 1971Business experience: Head of the Public Credit Unit of the Ministryof Finance and Public Credit; Director General of EconomicResearch of Banco de México; and Director of Economic Studies ofBanco de México.Other board memberships: Comisión Intersecretarial para elDesarrollo de los Bioenergéticos (Alternate); Comisión de ComercioExterior; Comité Interinstitucional para la Aplicación del EstímuloFiscal a Proyectos de Inversión en la Producción Teatral Nacional;Comité Interinstitucional para la Aplicación del Estímulo Fiscal aProyectos de Inversión en la Producción Cinematográfica Nacional.
2018
Mr. Rafael Pacchiano Alamán Board Member of Petróleos Mexicanos and Secretary of theEnvironmental and Natural ResourcesBorn: 1975Business experience: Undersecretary of Environmental ProtectionManagement of the Ministry of Environment and Natural Resources;Youth Program Coordinator of the Transition
2015
184
Copyright © 2018 www.secdatabase.com. All Rights Reserved.Please Consider the Environment Before Printing This Document
Table of ContentsPetróleos Mexicanos��Directors and Executive Officers
Name Position with Petróleos MexicanosYear
AppointedTeam for the President-Elect of Mexico; and Federal Deputy in theLXI Legislature.Other board memberships: CFE; Salubridad General; ConsejoConsultivo para las Energías Renovables; Consejo Nacional para laCompetitividad de la Micro, Pequeña y Mediana Empresa; ComitéIntersectorial para la Innovación; and Consejo Técnico de Serviciode Información Agroalimentaria y Pesquera.
Mr. Rodolfo Lacy Tamayo Alternate Board Member of Petróleos Mexicanos andUndersecretary of Planning and Environmental Policies of theMinistry of the Environmental and Natural ResourcesBorn: 1958Business experience: Programs and Projects Coordinator of CentroMario Molina para Estudios Estratégicos en Energía y MedioAmbiente; Executive Director of Special Projects of Colegio deIngenieros Ambientales de México; and Chief of Staff of theSecretary of the Environmental and Natural Resources.Other board memberships: CFE (Alternate)
2015
Mr. Carlos Elizondo Mayer-Serra Independent Board Member of Petróleos MexicanosBorn: 1962Business experience: Assistant Professor at the Instituto Tecnológicoy de Estudios Superiores de Monterrey, A.C.; Professor andResearcher at the Centro de Investigación y Docencia Económicas,A.C.; and Ambassador of Mexico to the Organización para laCooperación y Desarrollo Económicos.Other board memberships: Corporación Interamericana deEntretenimiento, S.A.B. de C.V. (Independent) and ConsejoNacional de Ciencia y Tecnología.
2014
Mr. Octavio Francisco Pastrana Pastrana Independent Board Member of Petróleos MexicanosBorn: 1952Business experience: Partner of Administradora IctineoInfraestructura, S.A.P.I. de C.V.; President and Chief ExecutiveOfficer of Isolux Mexico of Isolux Corsán, S.A.; and Director ofStrategy and Business Development of ARB Arendal.
2014
185
Copyright © 2018 www.secdatabase.com. All Rights Reserved.Please Consider the Environment Before Printing This Document
Table of ContentsPetróleos Mexicanos��Directors and Executive Officers
Name Position with Petróleos MexicanosYear
AppointedOther board memberships: COREMAR Empresa de ServiciosPortuarios, S.A. and Grupo Aeroportuario de la Ciudad de México,S.A. de C.V. (Independent).
Mr. Jorge José Borja Navarrete Independent Board Member of Petróleos MexicanosBorn: 1943Business experience: Professional Member of the Board of Directorsof Petróleos Mexicanos; Member of the Directive Board of theUniversidad Nacional Autónoma de México; and Advisor to GrupoXignux.Other board memberships: Grupo Aluminio, Vidrio y Construcción,S.A. de C.V
2014
Ms. María Teresa Fernández Labardini Independent Board Member of Petróleos MexicanosBorn: 1967Business experience: Partner of White & Case, S.C.; ExecutiveSecretary-General Director of the Instituto para la Protección alAhorro Bancario; General Technical Director of the CNBV; and VicePresident of Regulation of the CNBV.
2017
Mr. Felipe Duarte Olvera Independent Board Member of Petróleos MexicanosBorn: 1974Business experience: Assistant Director General of Infrastructureand Energy of Grupo Financiero Banorte, S.A.B. de C.V.; AssistantDirector General of Client Experience of Grupo Financiero Banorte,S.A.B. de C.V.; and Undersecretary of Transportation of the Ministryof Communications and Transportation.Other board memberships: Grupo Aeroportuario del Centro Norte,S.A.B. de C.V. (Independent)
2016
Mr. Carlos Alberto Treviño Medina Chief Executive Officer/Director GeneralBorn: 1970Business experience: Corporate Director of Management andServices of Petróleos Mexicanos; Chief Financial Officer of theInstituto Mexicano del Seguro Social; and Chief Executive Officerof Financiera Rural.
2017
Mr. David Ruelas Rodríguez Chief Financial Officer / Corporate Director of FinanceBorn: 1977Business experience: Deputy Director of Risk Management andReinsurance of Petróleos
2018
186
Copyright © 2018 www.secdatabase.com. All Rights Reserved.Please Consider the Environment Before Printing This Document

Table of ContentsPetróleos Mexicanos��Directors and Executive Officers
Name Position with Petróleos MexicanosYear
AppointedMexicanos; Associate Managing Director of Corporate FinancialManagement of Petróleos Mexicanos; and Coordinator ofGovernmental Programs of Petróleos Mexicanos.
Mr. Marco Antonio MurilloSoberanis
Corporate Director of Management and ServicesBorn: 1959Business experience: Deputy Director of Labor Relations andServices for Personnel of Petróleos Mexicanos; Acting CorporateDirector of Management of Petróleos Mexicanos; and DeputyDirector of Human Resources of Petróleos Mexicanos.
2017
Mr. Rodulfo Figueroa Alonso Corporate Director of Planning, Coordination and PerformanceBorn: 1964Business experience: Deputy Director of Planning of Pemex-Gas andBasic Petrochemicals; Associate Managing Director of Planning ofPemex-Gas and Basic Petrochemicals; and Associate ManagingDirector of Assessment and Information of Pemex-Gas and BasicPetrochemicals.
2015
Mr. Rodrigo Becerra Mizuno Chief Information Officer/Corporate Director of InformationTechnologyBorn: 1975Business experience: Director General of Public Sector (AsiaRegion) of Microsoft Corporation; Executive Director of GlobalGovernment of Microsoft Corporation; and Global Manager ofPublic Sector of Marketing Microsoft Corporation.
2016
Mr. Jorge Guillermo Lomelín Delgadillo Acting Corporate Director of Alliances and New BusinessesBorn: 1975Family Relationship: Married to Ms. Didier del Valle Toledo, ActingDirector of Management of P.M.I. Comercio Internacional, S.A. deC.V.Business experience: Deputy Director of Industrial TransformationBusiness Development of Petróleos Mexicanos; Chief of Staff of theCorporate Director of Alliances and New Business of PetróleosMexicanos; and Associate Managing Director of AdministrationControl of Petróleos Mexicanos.
2018
187
Copyright © 2018 www.secdatabase.com. All Rights Reserved.Please Consider the Environment Before Printing This Document
Table of ContentsPetróleos Mexicanos��Directors and Executive Officers
Name Position with Petróleos MexicanosYear
AppointedMr. Jorge Eduardo Kim Villatoro Legal Director
Born: 1979Business experience: Legal Director of the Instituto Mexicano delSeguro Social; Head of the Legislative Tax Unit of the Ministry ofFinance and Public Credit; and Director General of Protectionagainst Administrative Acts of the Procuraduría Fiscal de laFederación.
2016
Mr. José Salvador de la Mora Real Head of the Institutional Internal Control UnitBorn: 1959Business experience: Operative Secretary of InformationTechnologies and Communications of the Tribunal Federal deJusticia Administrativa; Head of the Internal Control Body inFinanciera Nacional para el Desarrollo Agropecuario, Rural, Forestaly Pesquero; and Associate Managing Director of Planning andProject Management of Petróleos Mexicanos.
2018
Mr. Luis Bartolini Esparza Head of Internal AuditingBorn: 1970Business experience: Head of the Internal Control Unit of NacionalFinanciera, S.N.C., Institución de Banca de Desarrollo; DirectorGeneral of Career Services of Procuraduría General de la República;and Executive Director of Movable Assets of the Servicio deAdministración y Enajenación de Bienes.Other board memberships: La Universidad La Salle Nezahualcóyotl.
2017
Pemex Exploration and Production��Directors and Executive Officers
Name Position with Pemex Exploration and ProductionYear
Appointed
Mr. Carlos Alberto Treviño Medina Chairman of the Board of Pemex Exploration and Production (referto Petróleos Mexicanos)
2017
Mr. Claudio César de la Cerda Negrete Board Member of Pemex Exploration and Production and DirectorGeneral of Exploration and Extraction of Hydrocarbons of theMinistry of EnergyBorn: 1974Business experience: Assistant General Director of InvestmentPromotion and Liaison of the Ministry of Energy; Vice-president ofOperations and Business Development of Jaguar Exploración yProducción de Hidrocarburos, S.A.P.I de C.V.; and Vice-president ofGeosciences and
2017
188
Copyright © 2018 www.secdatabase.com. All Rights Reserved.Please Consider the Environment Before Printing This Document
Table of ContentsPemex Exploration and Production��Directors and Executive Officers
Name Position with Pemex Exploration and ProductionYear
AppointedEngineering and Director of Technology of Dowell Schlumberger deMéxico, S.A. de C.V.
Mr. Alberto Torres García Board Member of Pemex Exploration and Production (refer toPetróleos Mexicanos)
2018
Mr. David Ruelas Rodríguez Board Member of Pemex Exploration and Production (refer toPetróleos Mexicanos)
2018
Mr. Carlos Rafael Murrieta Cummings Board Member of Pemex Exploration and Production and DirectorGeneral of Pemex Industrial TransformationBorn: 1965Business experience: Independent Business Consultant of Sendero;Corporate Director of Operations of Petroleos Mexicanos andDirector of McKinsey & Co.
2016
Mr. Miguel Ángel Servín Diago Board Member of Pemex Exploration and Production and OperativeDirector of Procurement and Supply of Petroleos MexicanosBorn: 1969Business experience: Head of the Administrative Unit of the InstitutoMexicano del Seguro Social; Director General of Material Resourcesof the Ministry of Communications and Transportation; and Advisorof the Secretary of Communications and Transportation.
2016
Mr. J. Javier Hinojosa Puebla Board Member of Pemex Exploration and Production and DirectorGeneral of Pemex Exploration and ProductionBorn: 1958Business experience: Executive Director of Pemex Exploration andProduction; Director of Development and Production of PemexExploration and Production; and Chief of Staff of the DirectorGeneral of Pemex-Exploration and Production.
2015
189
Copyright © 2018 www.secdatabase.com. All Rights Reserved.Please Consider the Environment Before Printing This Document
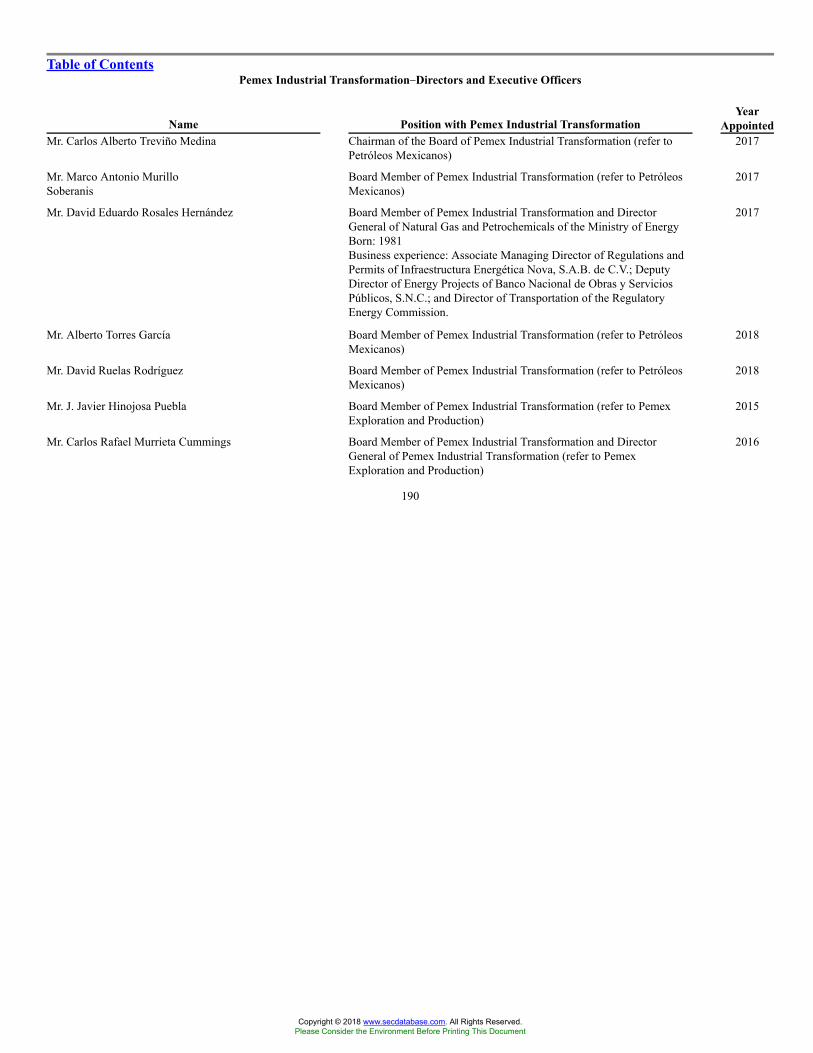
Table of ContentsPemex Industrial Transformation��Directors and Executive Officers
Name Position with Pemex Industrial TransformationYear
AppointedMr. Carlos Alberto Treviño Medina Chairman of the Board of Pemex Industrial Transformation (refer to
Petróleos Mexicanos)2017
Mr. Marco Antonio MurilloSoberanis
Board Member of Pemex Industrial Transformation (refer to PetróleosMexicanos)
2017
Mr. David Eduardo Rosales Hernández Board Member of Pemex Industrial Transformation and DirectorGeneral of Natural Gas and Petrochemicals of the Ministry of EnergyBorn: 1981Business experience: Associate Managing Director of Regulations andPermits of Infraestructura Energética Nova, S.A.B. de C.V.; DeputyDirector of Energy Projects of Banco Nacional de Obras y ServiciosPúblicos, S.N.C.; and Director of Transportation of the RegulatoryEnergy Commission.
2017
Mr. Alberto Torres García Board Member of Pemex Industrial Transformation (refer to PetróleosMexicanos)
2018
Mr. David Ruelas Rodríguez Board Member of Pemex Industrial Transformation (refer to PetróleosMexicanos)
2018
Mr. J. Javier Hinojosa Puebla Board Member of Pemex Industrial Transformation (refer to PemexExploration and Production)
2015
Mr. Carlos Rafael Murrieta Cummings Board Member of Pemex Industrial Transformation and DirectorGeneral of Pemex Industrial Transformation (refer to PemexExploration and Production)
2016
190
Copyright © 2018 www.secdatabase.com. All Rights Reserved.Please Consider the Environment Before Printing This Document
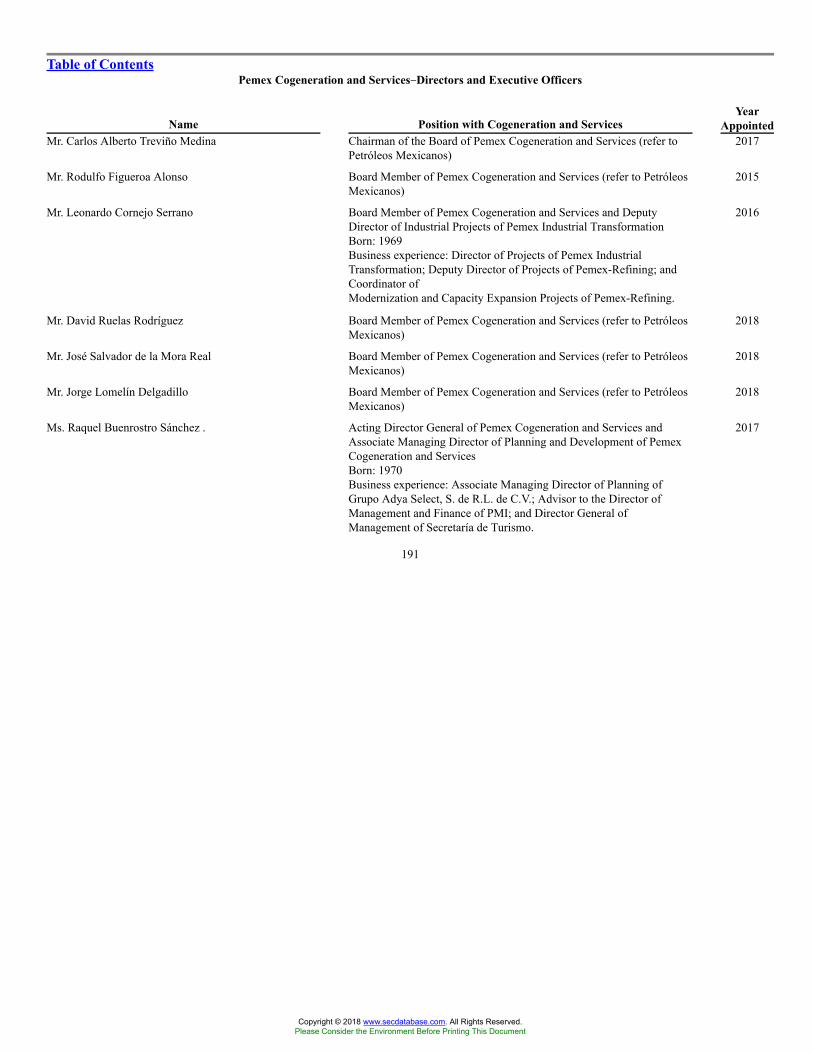
Table of ContentsPemex Cogeneration and Services��Directors and Executive Officers
Name Position with Cogeneration and ServicesYear
AppointedMr. Carlos Alberto Treviño Medina Chairman of the Board of Pemex Cogeneration and Services (refer to
Petróleos Mexicanos)2017
Mr. Rodulfo Figueroa Alonso Board Member of Pemex Cogeneration and Services (refer to PetróleosMexicanos)
2015
Mr. Leonardo Cornejo Serrano Board Member of Pemex Cogeneration and Services and DeputyDirector of Industrial Projects of Pemex Industrial TransformationBorn: 1969Business experience: Director of Projects of Pemex IndustrialTransformation; Deputy Director of Projects of Pemex-Refining; andCoordinator ofModernization and Capacity Expansion Projects of Pemex-Refining.
2016
Mr. David Ruelas Rodríguez Board Member of Pemex Cogeneration and Services (refer to PetróleosMexicanos)
2018
Mr. José Salvador de la Mora Real Board Member of Pemex Cogeneration and Services (refer to PetróleosMexicanos)
2018
Mr. Jorge Lomelín Delgadillo Board Member of Pemex Cogeneration and Services (refer to PetróleosMexicanos)
2018
Ms. Raquel Buenrostro Sánchez . Acting Director General of Pemex Cogeneration and Services andAssociate Managing Director of Planning and Development of PemexCogeneration and ServicesBorn: 1970Business experience: Associate Managing Director of Planning ofGrupo Adya Select, S. de R.L. de C.V.; Advisor to the Director ofManagement and Finance of PMI; and Director General ofManagement of Secretaría de Turismo.
2017
191
Copyright © 2018 www.secdatabase.com. All Rights Reserved.Please Consider the Environment Before Printing This Document
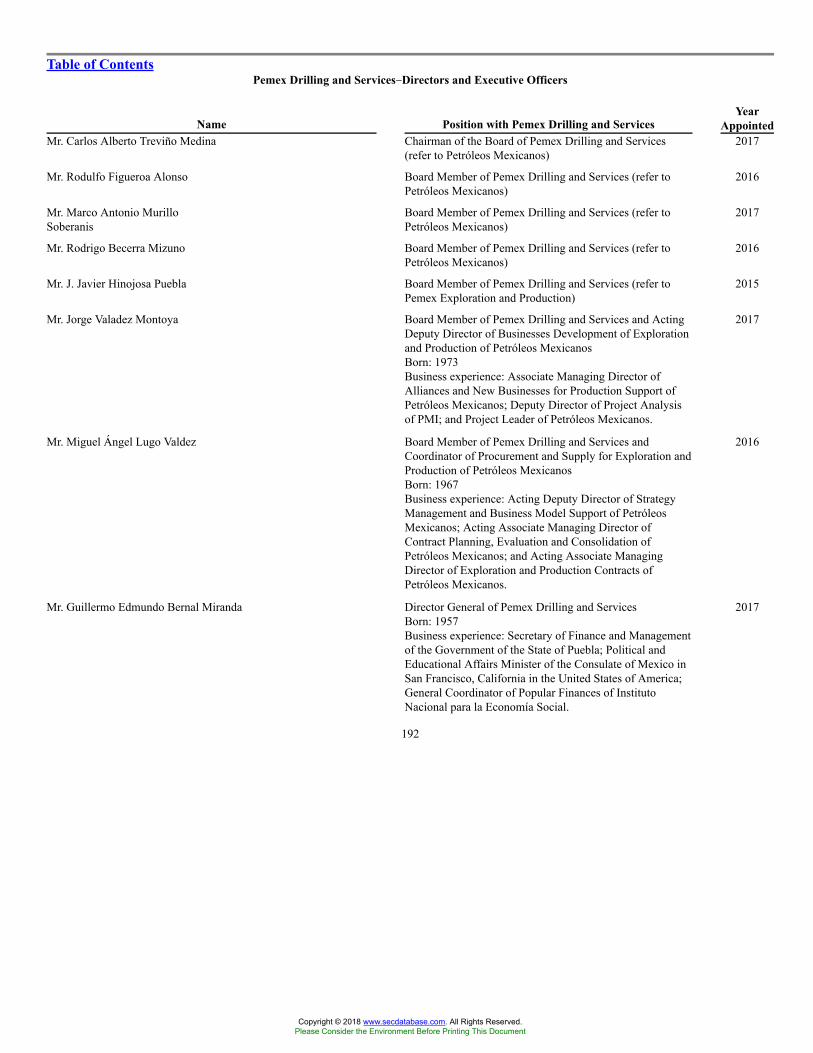
Table of ContentsPemex Drilling and Services��Directors and Executive Officers
Name Position with Pemex Drilling and ServicesYear
AppointedMr. Carlos Alberto Treviño Medina Chairman of the Board of Pemex Drilling and Services
(refer to Petróleos Mexicanos)2017
Mr. Rodulfo Figueroa Alonso Board Member of Pemex Drilling and Services (refer toPetróleos Mexicanos)
2016
Mr. Marco Antonio MurilloSoberanis
Board Member of Pemex Drilling and Services (refer toPetróleos Mexicanos)
2017
Mr. Rodrigo Becerra Mizuno Board Member of Pemex Drilling and Services (refer toPetróleos Mexicanos)
2016
Mr. J. Javier Hinojosa Puebla Board Member of Pemex Drilling and Services (refer toPemex Exploration and Production)
2015
Mr. Jorge Valadez Montoya Board Member of Pemex Drilling and Services and ActingDeputy Director of Businesses Development of Explorationand Production of Petróleos MexicanosBorn: 1973Business experience: Associate Managing Director ofAlliances and New Businesses for Production Support ofPetróleos Mexicanos; Deputy Director of Project Analysisof PMI; and Project Leader of Petróleos Mexicanos.
2017
Mr. Miguel Ángel Lugo Valdez Board Member of Pemex Drilling and Services andCoordinator of Procurement and Supply for Exploration andProduction of Petróleos MexicanosBorn: 1967Business experience: Acting Deputy Director of StrategyManagement and Business Model Support of PetróleosMexicanos; Acting Associate Managing Director ofContract Planning, Evaluation and Consolidation ofPetróleos Mexicanos; and Acting Associate ManagingDirector of Exploration and Production Contracts ofPetróleos Mexicanos.
2016
Mr. Guillermo Edmundo Bernal Miranda Director General of Pemex Drilling and ServicesBorn: 1957Business experience: Secretary of Finance and Managementof the Government of the State of Puebla; Political andEducational Affairs Minister of the Consulate of Mexico inSan Francisco, California in the United States of America;General Coordinator of Popular Finances of InstitutoNacional para la Economía Social.
2017
192
Copyright © 2018 www.secdatabase.com. All Rights Reserved.Please Consider the Environment Before Printing This Document
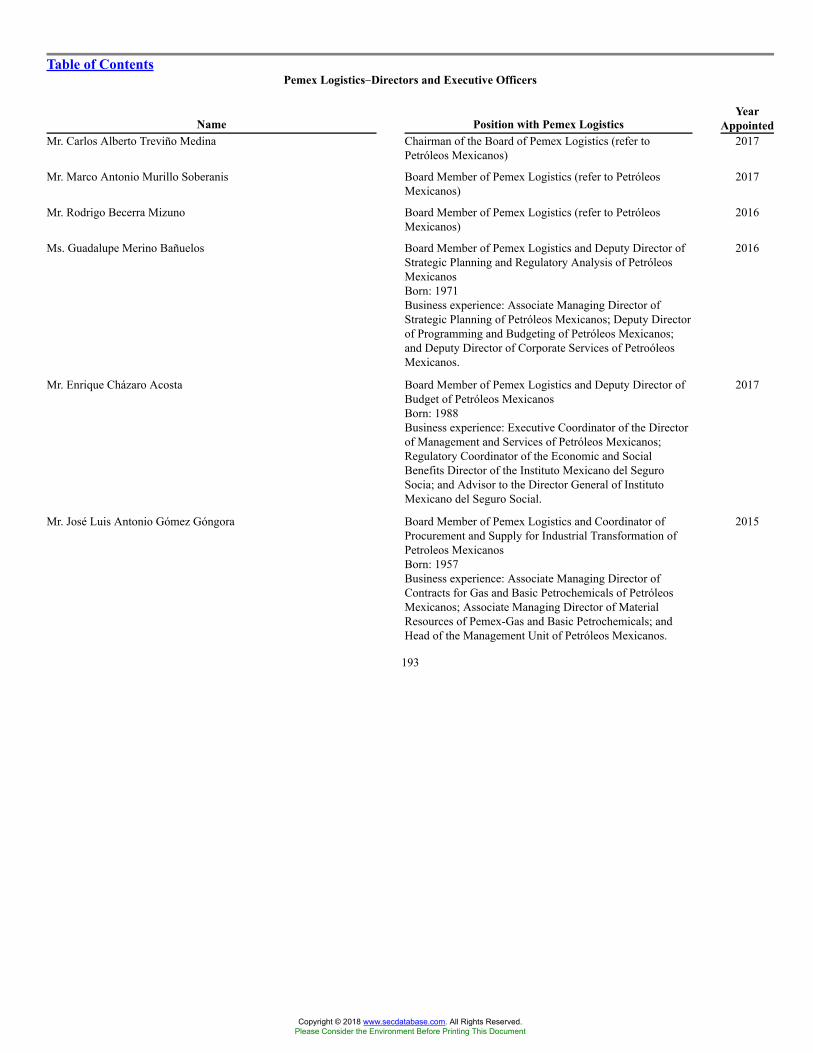
Table of ContentsPemex Logistics��Directors and Executive Officers
Name Position with Pemex LogisticsYear
AppointedMr. Carlos Alberto Treviño Medina Chairman of the Board of Pemex Logistics (refer to
Petróleos Mexicanos)2017
Mr. Marco Antonio Murillo Soberanis Board Member of Pemex Logistics (refer to PetróleosMexicanos)
2017
Mr. Rodrigo Becerra Mizuno Board Member of Pemex Logistics (refer to PetróleosMexicanos)
2016
Ms. Guadalupe Merino Bañuelos Board Member of Pemex Logistics and Deputy Director ofStrategic Planning and Regulatory Analysis of PetróleosMexicanosBorn: 1971Business experience: Associate Managing Director ofStrategic Planning of Petróleos Mexicanos; Deputy Directorof Programming and Budgeting of Petróleos Mexicanos;and Deputy Director of Corporate Services of PetroóleosMexicanos.
2016
Mr. Enrique Cházaro Acosta Board Member of Pemex Logistics and Deputy Director ofBudget of Petróleos MexicanosBorn: 1988Business experience: Executive Coordinator of the Directorof Management and Services of Petróleos Mexicanos;Regulatory Coordinator of the Economic and SocialBenefits Director of the Instituto Mexicano del SeguroSocia; and Advisor to the Director General of InstitutoMexicano del Seguro Social.
2017
Mr. José Luis Antonio Gómez Góngora Board Member of Pemex Logistics and Coordinator ofProcurement and Supply for Industrial Transformation ofPetroleos MexicanosBorn: 1957Business experience: Associate Managing Director ofContracts for Gas and Basic Petrochemicals of PetróleosMexicanos; Associate Managing Director of MaterialResources of Pemex-Gas and Basic Petrochemicals; andHead of the Management Unit of Petróleos Mexicanos.
2015
193
Copyright © 2018 www.secdatabase.com. All Rights Reserved.Please Consider the Environment Before Printing This Document
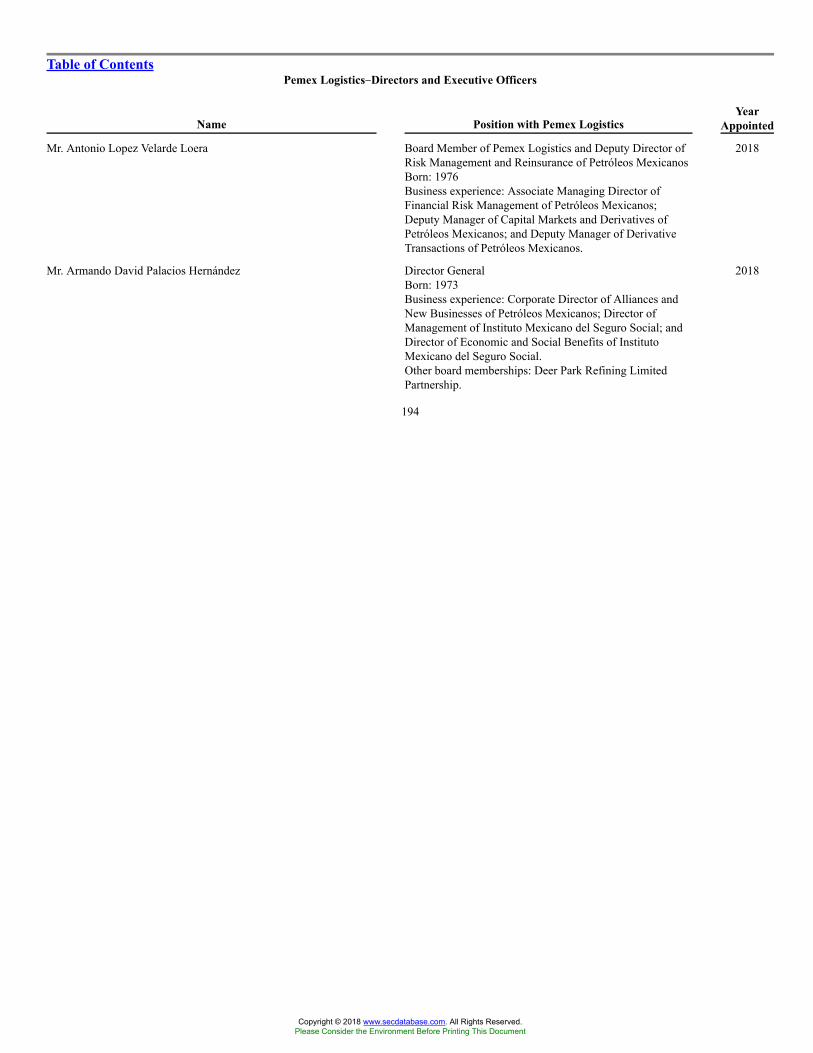
Table of ContentsPemex Logistics��Directors and Executive Officers
Name Position with Pemex LogisticsYear
Appointed
Mr. Antonio Lopez Velarde Loera Board Member of Pemex Logistics and Deputy Director ofRisk Management and Reinsurance of Petróleos MexicanosBorn: 1976Business experience: Associate Managing Director ofFinancial Risk Management of Petróleos Mexicanos;Deputy Manager of Capital Markets and Derivatives ofPetróleos Mexicanos; and Deputy Manager of DerivativeTransactions of Petróleos Mexicanos.
2018
Mr. Armando David Palacios Hernández Director GeneralBorn: 1973Business experience: Corporate Director of Alliances andNew Businesses of Petróleos Mexicanos; Director ofManagement of Instituto Mexicano del Seguro Social; andDirector of Economic and Social Benefits of InstitutoMexicano del Seguro Social.Other board memberships: Deer Park Refining LimitedPartnership.
2018
194
Copyright © 2018 www.secdatabase.com. All Rights Reserved.Please Consider the Environment Before Printing This Document
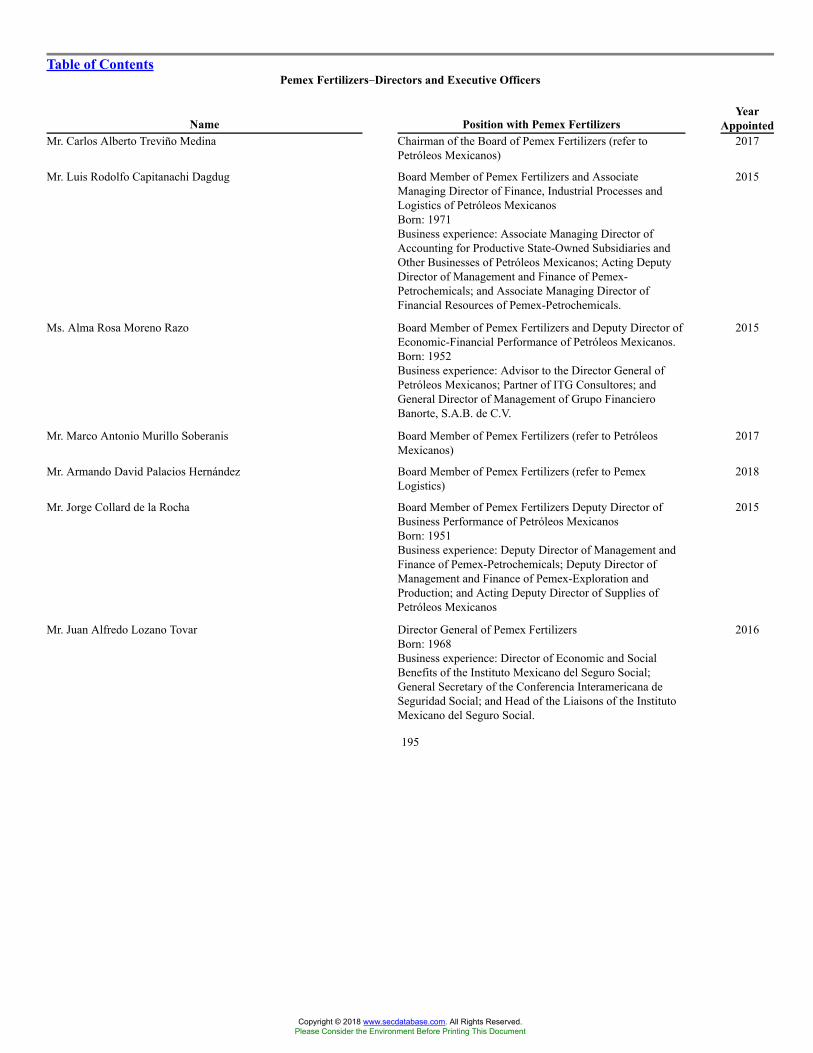
Table of ContentsPemex Fertilizers��Directors and Executive Officers
Name Position with Pemex FertilizersYear
AppointedMr. Carlos Alberto Treviño Medina Chairman of the Board of Pemex Fertilizers (refer to
Petróleos Mexicanos)2017
Mr. Luis Rodolfo Capitanachi Dagdug Board Member of Pemex Fertilizers and AssociateManaging Director of Finance, Industrial Processes andLogistics of Petróleos MexicanosBorn: 1971Business experience: Associate Managing Director ofAccounting for Productive State-Owned Subsidiaries andOther Businesses of Petróleos Mexicanos; Acting DeputyDirector of Management and Finance of Pemex-Petrochemicals; and Associate Managing Director ofFinancial Resources of Pemex-Petrochemicals.
2015
Ms. Alma Rosa Moreno Razo Board Member of Pemex Fertilizers and Deputy Director ofEconomic-Financial Performance of Petróleos Mexicanos.Born: 1952Business experience: Advisor to the Director General ofPetróleos Mexicanos; Partner of ITG Consultores; andGeneral Director of Management of Grupo FinancieroBanorte, S.A.B. de C.V.
2015
Mr. Marco Antonio Murillo Soberanis Board Member of Pemex Fertilizers (refer to PetróleosMexicanos)
2017
Mr. Armando David Palacios Hernández Board Member of Pemex Fertilizers (refer to PemexLogistics)
2018
Mr. Jorge Collard de la Rocha Board Member of Pemex Fertilizers Deputy Director ofBusiness Performance of Petróleos MexicanosBorn: 1951Business experience: Deputy Director of Management andFinance of Pemex-Petrochemicals; Deputy Director ofManagement and Finance of Pemex-Exploration andProduction; and Acting Deputy Director of Supplies ofPetróleos Mexicanos
2015
Mr. Juan Alfredo Lozano Tovar Director General of Pemex FertilizersBorn: 1968Business experience: Director of Economic and SocialBenefits of the Instituto Mexicano del Seguro Social;General Secretary of the Conferencia Interamericana deSeguridad Social; and Head of the Liaisons of the InstitutoMexicano del Seguro Social.
2016
195
Copyright © 2018 www.secdatabase.com. All Rights Reserved.Please Consider the Environment Before Printing This Document
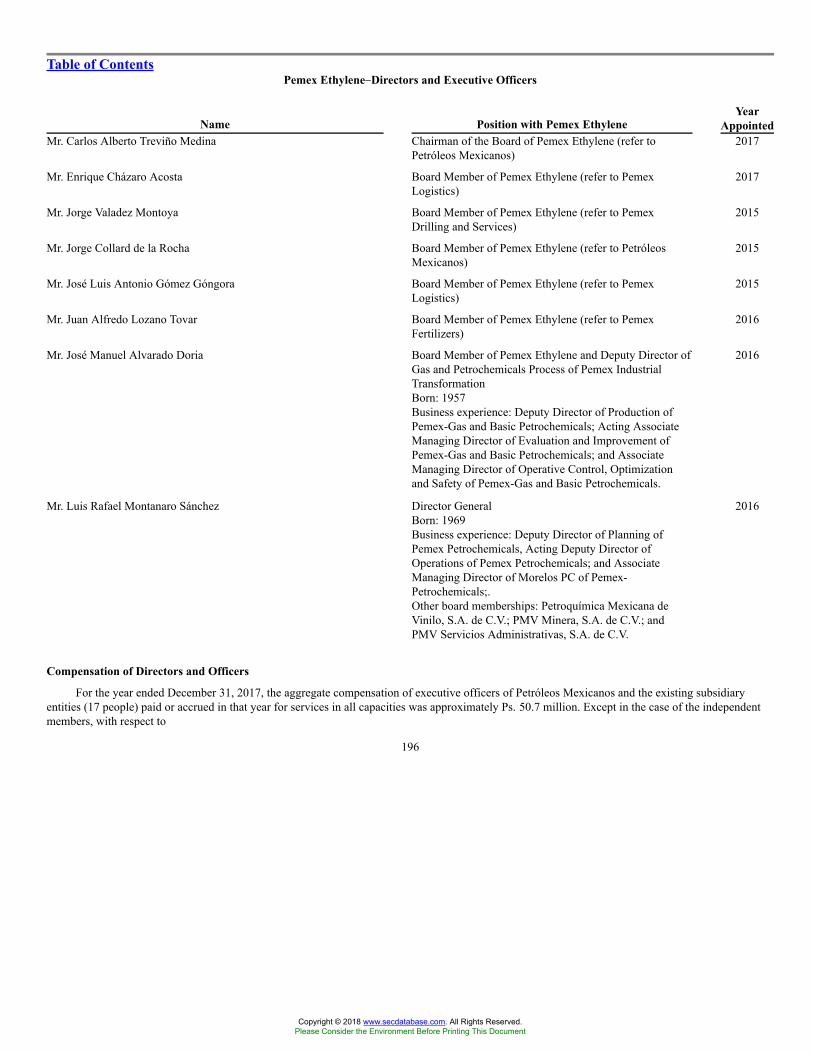
Table of ContentsPemex Ethylene��Directors and Executive Officers
Name Position with Pemex EthyleneYear
AppointedMr. Carlos Alberto Treviño Medina Chairman of the Board of Pemex Ethylene (refer to
Petróleos Mexicanos)2017
Mr. Enrique Cházaro Acosta Board Member of Pemex Ethylene (refer to PemexLogistics)
2017
Mr. Jorge Valadez Montoya Board Member of Pemex Ethylene (refer to PemexDrilling and Services)
2015
Mr. Jorge Collard de la Rocha Board Member of Pemex Ethylene (refer to PetróleosMexicanos)
2015
Mr. José Luis Antonio Gómez Góngora Board Member of Pemex Ethylene (refer to PemexLogistics)
2015
Mr. Juan Alfredo Lozano Tovar Board Member of Pemex Ethylene (refer to PemexFertilizers)
2016
Mr. José Manuel Alvarado Doria Board Member of Pemex Ethylene and Deputy Director ofGas and Petrochemicals Process of Pemex IndustrialTransformationBorn: 1957Business experience: Deputy Director of Production ofPemex-Gas and Basic Petrochemicals; Acting AssociateManaging Director of Evaluation and Improvement ofPemex-Gas and Basic Petrochemicals; and AssociateManaging Director of Operative Control, Optimizationand Safety of Pemex-Gas and Basic Petrochemicals.
2016
Mr. Luis Rafael Montanaro Sánchez Director GeneralBorn: 1969Business experience: Deputy Director of Planning ofPemex Petrochemicals, Acting Deputy Director ofOperations of Pemex Petrochemicals; and AssociateManaging Director of Morelos PC of Pemex-Petrochemicals;.Other board memberships: Petroquímica Mexicana deVinilo, S.A. de C.V.; PMV Minera, S.A. de C.V.; andPMV Servicios Administrativas, S.A. de C.V.
2016
Compensation of Directors and Officers
For the year ended December 31, 2017, the aggregate compensation of executive officers of Petróleos Mexicanos and the existing subsidiaryentities (17 people) paid or accrued in that year for services in all capacities was approximately Ps. 50.7 million. Except in the case of the independentmembers, with respect to
196
Copyright © 2018 www.secdatabase.com. All Rights Reserved.Please Consider the Environment Before Printing This Document
Table of Contentsthe previous Board of Directors of Petróleos Mexicanos and the boards of directors of the existing subsidiary entities, and the independent members,with respect to the new Board of Directors of Petróleos Mexicanos, the members of our boards of directors do not receive compensation for theirservices. The compensation paid or accrued during 2017 to the professional members of the previous Board of Directors of Petróleos Mexicanos andboards of directors of the existing subsidiary entities was approximately Ps. 7.5 million. See �Item 7�Major Shareholders and Related PartyTransactions�Related Party Transactions� for information about the salary advances that we offer to our executive officers as an employee benefit.
Board Practices
Except in the case of the independent members with respect to the Board of Directors of Petróleos Mexicanos, neither the members of the boardsof directors nor the executive officers of Petróleos Mexicanos or the productive state-owned subsidiaries are appointed for a specific term. The length ofthe terms of the Secretary of Energy and the Secretary of Finance and Public Credit is, however, limited by the length of their respective positions in theMexican Government. Except in the case of the independent members first appointed under the Petróleos Mexicanos Law, the five independentmembers of the Board of Directors of Petróleos Mexicanos will be appointed for five-year terms, and may be appointed for an additional term of thesame length.
The Mexican Government representatives that serve as members of the boards of directors of Petróleos Mexicanos and each of the existingsubsidiary entities may be removed at the discretion of the President of Mexico. The independent members of the Board of Directors of PetróleosMexicanos may be removed for cause, including failure to carry out the duties and obligations set forth in the Petróleos Mexicanos Law, by thePresident of Mexico upon Senate approval.
On October 14, 2014, the Board of Directors of Petróleos Mexicanos appointed members to and convened the four committees established by thePetróleos Mexicanos Law to support its work. Unless otherwise specified in the Petróleos Mexicanos Law, the memberships of these committees mustconsist of at least three, but no more than five, members of the Board of Directors of Petróleos Mexicanos. Each of these committees must include twoindependent members of the Board of Directors of Petróleos Mexicanos, with the exception of the Audit Committee, which must include threeindependent members. Each of the Secretary of Energy, the Secretary of Finance and Public Credit and any ministry-level secretary serving as a memberof the Board of Directors of Petróleos Mexicanos may designate one or more alternates to take his or her place at committee meetings, provided thatthese alternates are public officials whose positions are not more than two levels below such secretary�s position in the Mexican Government.
The committees may authorize a representative of the Director General to attend their meetings as a guest with the right to participate, but notvote, when deemed advisable for the performance of their duties.
Audit Committee
The Audit Committee of the Board of Directors of Petróleos Mexicanos is required to, among other duties, oversee our management, evaluate ourfinancial and operational performance, monitor the status of our internal control systems, as well as nominate our external auditors, whose appointmentsare approved by the Board of Directors of Petróleos Mexicanos. See �Item 16C�Principal Accountant Fees and Services.�
Each of the three members of the Audit Committee is �independent� of Petróleos Mexicanos within the meaning of Rule 10A-3 under theSecurities Exchange Act of 1934, as amended (the Exchange Act). In accordance with the Petróleos Mexicanos Law, the Audit Committee consists ofthree independent members of the Board of Directors of Petróleos Mexicanos, each of whom will serve as the chair of the committee on a rotating,annual basis, as determined by the Board of Directors of Petróleos Mexicanos.
197
Copyright © 2018 www.secdatabase.com. All Rights Reserved.Please Consider the Environment Before Printing This Document

Table of ContentsThe Audit Committee consists of the following members:
� Ms. María Teresa Fernández Labardini, independent member of the Board of Directors of Petróleos Mexicanos and Chairperson of theAudit Committee;
� Mr. Jorge José Borja Navarrete, independent member of the Board of Directors of Petróleos Mexicanos; and
� Mr. Felipe Duarte Olvera, independent member of the Board of Directors of Petróleos Mexicanos.
A representative of the Director General, the Head of the Internal Auditing Area, the Legal Director or any other person may attend the AuditCommittee�s meetings as a guest with the right to participate, but not vote, when deemed advisable and appropriate given the subject matter to bediscussed.
Human Resources and Compensation Committee
The Human Resources and Compensation Committee is chaired by an independent member of the Board of Directors of Petróleos Mexicanos andincludes the Secretary of Finance and Public Credit as a permanent member. The duties of the Human Resources and Compensation Committee include,among others, proposing the compensation of the Director General and other members of senior management of Petróleos Mexicanos within three levelsof the Director General, as well as proposing hiring policies, performance management guidelines and the compensation of all other employees ofPetróleos Mexicanos.
The Human Resources and Compensation Committee of Petróleos Mexicanos consists of the following members:
� Mr. Carlos Elizondo Mayer-Serra, independent member of the Board of Directors of Petróleos Mexicanos and Chairperson of the HumanResources and Compensation Committee;
� Mr. Octavio Francisco Pastrana Pastrana, independent member of the Board of Directors of Petróleos Mexicanos;
� Mr. José Antonio González Anaya, member of the Board of Directors of Petróleos Mexicanos;
� Mr. Ildefonso Guajardo Villarreal, member of the Board of Directors of Petróleos Mexicanos; and
� Mr. Rafael Pacchiano Alamán, member of the Board of Directors of Petróleos Mexicanos.
Strategy and Investment Committee
The Strategy and Investment Committee is chaired by an independent member of the Board of Directors of Petróleos Mexicanos on a rotatingannual basis and is required to, among other duties, analyze our business plan and assist the Board of Directors of Petróleos Mexicanos in the approvalof guidelines, priorities and general policies related to investments made by Petróleos Mexicanos.
The Strategy and Investment Committee of Petróleos Mexicanos consists of the following members:
� Mr. Octavio Francisco Pastrana Pastrana, independent member of the Board of Directors of Petróleos Mexicanos and Chairperson of theStrategy and Investment Committee;
� Mr. Carlos Elizondo Mayer-Serra, independent member of the Board of Directors of Petróleos Mexicanos;
� Mr. Pedro Joaquín Coldwell, member of the Board of Directors of Petróleos Mexicanos;
� Mr. José Antonio González Anaya, member of the Board of Directors of Petróleos Mexicanos; and
� Mr. Ildefonso Guajardo Villarreal, member of the Board of Directors of Petróleos Mexicanos.
198
Copyright © 2018 www.secdatabase.com. All Rights Reserved.Please Consider the Environment Before Printing This Document
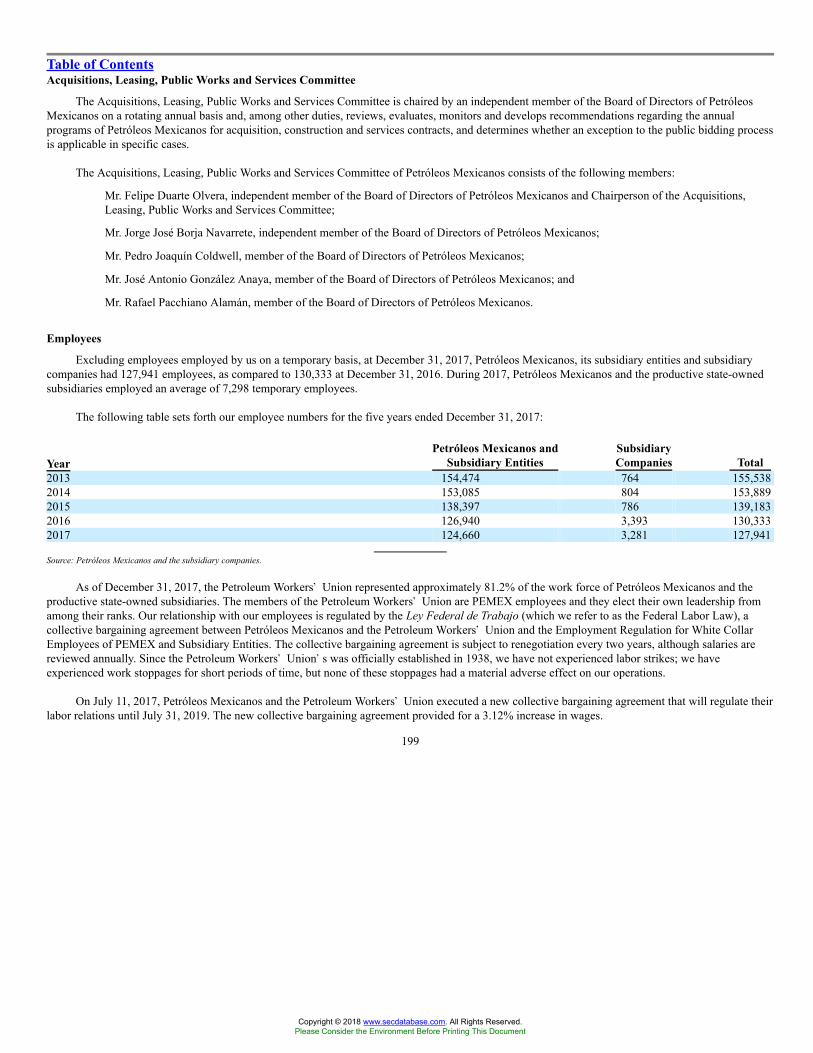
Table of ContentsAcquisitions, Leasing, Public Works and Services Committee
The Acquisitions, Leasing, Public Works and Services Committee is chaired by an independent member of the Board of Directors of PetróleosMexicanos on a rotating annual basis and, among other duties, reviews, evaluates, monitors and develops recommendations regarding the annualprograms of Petróleos Mexicanos for acquisition, construction and services contracts, and determines whether an exception to the public bidding processis applicable in specific cases.
The Acquisitions, Leasing, Public Works and Services Committee of Petróleos Mexicanos consists of the following members:
� Mr. Felipe Duarte Olvera, independent member of the Board of Directors of Petróleos Mexicanos and Chairperson of the Acquisitions,Leasing, Public Works and Services Committee;
� Mr. Jorge José Borja Navarrete, independent member of the Board of Directors of Petróleos Mexicanos;
� Mr. Pedro Joaquín Coldwell, member of the Board of Directors of Petróleos Mexicanos;
� Mr. José Antonio González Anaya, member of the Board of Directors of Petróleos Mexicanos; and
� Mr. Rafael Pacchiano Alamán, member of the Board of Directors of Petróleos Mexicanos.
Employees
Excluding employees employed by us on a temporary basis, at December 31, 2017, Petróleos Mexicanos, its subsidiary entities and subsidiarycompanies had 127,941 employees, as compared to 130,333 at December 31, 2016. During 2017, Petróleos Mexicanos and the productive state-ownedsubsidiaries employed an average of 7,298 temporary employees.
The following table sets forth our employee numbers for the five years ended December 31, 2017:
YearPetróleos Mexicanos and
Subsidiary EntitiesSubsidiaryCompanies Total
2013 154,474 764 155,5382014 153,085 804 153,8892015 138,397 786 139,1832016 126,940 3,393 130,3332017 124,660 3,281 127,941
Source: Petróleos Mexicanos and the subsidiary companies.
As of December 31, 2017, the Petroleum Workers� Union represented approximately 81.2% of the work force of Petróleos Mexicanos and theproductive state-owned subsidiaries. The members of the Petroleum Workers� Union are PEMEX employees and they elect their own leadership fromamong their ranks. Our relationship with our employees is regulated by the Ley Federal de Trabajo (which we refer to as the Federal Labor Law), acollective bargaining agreement between Petróleos Mexicanos and the Petroleum Workers� Union and the Employment Regulation for White CollarEmployees of PEMEX and Subsidiary Entities. The collective bargaining agreement is subject to renegotiation every two years, although salaries arereviewed annually. Since the Petroleum Workers� Union�s was officially established in 1938, we have not experienced labor strikes; we haveexperienced work stoppages for short periods of time, but none of these stoppages had a material adverse effect on our operations.
On July 11, 2017, Petróleos Mexicanos and the Petroleum Workers� Union executed a new collective bargaining agreement that will regulate theirlabor relations until July 31, 2019. The new collective bargaining agreement provided for a 3.12% increase in wages.
199
Copyright © 2018 www.secdatabase.com. All Rights Reserved.Please Consider the Environment Before Printing This Document
Table of ContentsOn November 11, 2015, Petróleos Mexicanos announced that it had signed an agreement with the Petroleum Workers� Union to modify the
pension regime applicable to current and new employees. Pursuant to the agreement, the retirement age for employees with less than 15 years of servicehas been increased from 55 to 60. Employees are still required to serve for at least 30 years in order to be eligible to receive full retirement benefits. Inaddition, new employees will receive individual defined contributions retirement plans, which will benefit from direct contributions from PetróleosMexicanos, portability and tax benefits applicable to retirement savings. Current employees will also be permitted to opt into the new definedcontributions retirement plans.
On December 18, 2015, the Director General of Petróleos Mexicanos informed the Ministry of Finance and Public Credit that our pensionliabilities were expected to decrease by Ps. 186.5 billion as a result of the modifications to our pension regime described above. As of December 31,2015, our pension liabilities had decreased by Ps. 196.0 billion.
On December 24, 2015, the Ministry of Finance and Public Credit published in the Official Gazette of the Federation the Disposiciones decarácter general relativas a la asunción por parte del Gobierno Federal de obligaciones de pago de pensiones y jubilaciones a cargo de PetróleosMexicanos y sus empresas productivas subsidiarias (General provisions regarding the assumption by the Mexican Government of the paymentobligations related to pensions and retirement plans of Petróleos Mexicanos and its productive state-owned subsidiaries). On August 3, 2016, theMinistry of Finance and Public Credit informed us that the Mexican Government would assume Ps. 184.2 billion in payment liabilities related to ourpensions and retirement plans, and accordingly replaced the Ps. 50 billion promissory note issued to us on December 24, 2015 with Ps. 184.2 billion inpromissory notes.
In accordance with the Federal Labor Law and collective bargaining agreement in effect as of December 31, 2015, Petróleos Mexicanos and theproductive state-owned subsidiaries are under an obligation to pay seniority premiums to retiring employees and pensions to retired employees, as wellas death benefits and pensions to certain survivors of retired employees. Retirees are entitled to receive increases in their pensions, of at least theincrease in NCPI, whenever salary increases are granted to current employees. We also provide health and medical benefits to employees, retiredemployees and their beneficiaries and, subject to our overall budgetary constraints, we provide an interest-rate subsidy on employees� mortgage loans.
On November 5, 1997, the Ministry of Finance and Public Credit and the Board of Directors of Petróleos Mexicanos authorized the formation of atrust called the Pemex Labor Fund. This fund is a vehicle to fund labor liabilities, current pension payments and seniority premiums. We have designeda contribution plan to increase the funds held in this trust and to continue to make payments on outstanding labor and pension liabilities. Ourcontributions to the plan assets for our retirement benefits totaled Ps. 55,693 million in 2016 and Ps. 51,952 million in 2017. As of December 31, 2016and 2017, the balance of the Pemex Labor Fund was Ps. 9,490 million and Ps. 8,485 million, respectively.
Item 7. Major Shareholders and Related Party Transactions
Major Shareholders
Petróleos Mexicanos and the subsidiary entities have no shareholders because they are public entities of the Mexican Government. The MexicanGovernment controls us and incorporates the consolidated annual budget and financing program of Petróleos Mexicanos and the subsidiary entities intoits budget, which must be approved by the Chamber of Deputies each year. Any adjustment proposed by the Board of Directors of Petróleos Mexicanosto change our annual financial balance goal or increase the limit on our wage and salary expenditures budget or our financing program must be approvedby the Chamber of Deputies. See �Item 4�Information on the Company�General Regulatory Framework� for more information about the MexicanGovernment�s authority with respect to our budget. Our operations in the oil and gas sector are also regulated by the Mexican Government and itsministries.
200
Copyright © 2018 www.secdatabase.com. All Rights Reserved.Please Consider the Environment Before Printing This Document
Table of ContentsMexican Government officials hold five of the ten seats on the Board of Directors of Petróleos Mexicanos, and the Secretary of Energy is the
Chairperson of the Board of Directors of Petróleos Mexicanos with the power to cast a tie-breaking vote. An additional five seats on the Board ofDirectors are held by independent members appointed by the President of Mexico and ratified by the Senate. The Director General of PetróleosMexicanos is a member of the President of Mexico�s cabinet. See also �Item 3�Key Information�Risk Factors�Risk Factors Related to our Relationshipwith the Mexican Government.�
Related Party Transactions
Directors and employees of Petróleos Mexicanos and the Subsidiary Entities are subject to regulations addressing conflicts of interest, includingthe Petróleos Mexicanos Law, Ley Federal de Responsabilidades Administrativas de los Servidores Públicos (Federal Law of AdministrativeResponsibilities of Public Officials) and the Políticas y Lineamientos Anticorrupción para Petróleos Mexicanos, sus Empresas Productivas Subsidiariasy, en su caso, Empresas Filiales (Anticorruption Policies and Guidelines for Petróleos Mexicanos, its Subsidiary Productive Companies and, whereapplicable, Subsidiary Companies). Under these provisions, directors and employees of Petróleos Mexicanos are obligated to �recuse themselves fromintervening in any way in the attention to, processing or resolution of matters in which they might have personal, family or business interest, includingthose where some benefit can result for themselves, their spouse, blood or affinity relatives up to the fourth degree, or civil relatives, or for third partieswith which they have professional, labor or business relations, or for partners or partnerships where the public officials or the persons referred above areor have been members thereof.�
The Board of Directors of Petróleos Mexicanos, including the independent members who are not public officials, are subject to the duties ofloyalty and diligence. In accordance with the Petróleos Mexicanos Law, an independent member of the Board of Directors of Petróleos Mexicanos maybe removed from his or her position for, among other causes: (1) utilizing for personal benefit or for the benefit of any third party the information madeavailable to him or her in connection with the exercise of his or her duties as a board member; (2) disclosing such information in violation of applicablelaw; or (3) not recusing him or herself from discussion of and voting on matters in respect of which he or she has a conflict of interest. A member of theBoard of Directors of Petróleos Mexicanos or of the board of directors of an existing subsidiary entity who acts in contravention of the PetróleosMexicanos Law may be held liable for any damages that he or she caused to Petróleos Mexicanos or an existing subsidiary entity.
As an employee benefit, we offer salary advances to all of our eligible Petroleum Workers� Union and non-union workers, including our executiveofficers, pursuant to the programs set forth in the collective bargaining agreement and in the Employment Regulation of White Collar Employees ofPetróleos Mexicanos and Subsidiary Entities, respectively. The salary advances, which are non-interest bearing, are offered to each eligible employee inan amount up to a maximum of four months� salary and are repaid through salary deductions in equal installments over a period of either one or twoyears, as elected by the employee. Most of our employees take advantage of this benefit. The largest amount of salary advances outstanding to executiveofficers at any one time during 2017 was Ps. 4.5 million. As of March 31, 2018, the aggregate amount of salary advances outstanding to our executiveofficers was Ps. 2.4 million.
201
Copyright © 2018 www.secdatabase.com. All Rights Reserved.Please Consider the Environment Before Printing This Document
Table of ContentsSecretary of Energy, Mr. Pedro Joaquín Coldwell, Chairman of the Board of Directors of Petróleos Mexicanos since December 2012, as well as
certain members of his family, have held ownership interests since prior to Mr. Pedro Joaquín Coldwell�s appointment to the Board of Directors andthrough October of 2017 in companies that have entered into agreements with Pemex-Refining, now held by Pemex Industrial Transformation, for thesale and purchase of gasoline and other products by certain retail service stations and a wholesale distributor, as well as the performance of other relatedactivities, as provided below:
Company NameOwnership
ShareServicio Cozumel, S.A. de C.V.(which operates a retail service station)
Mr. Pedro Joaquín Coldwell(1)Mr. Pedro Oscar Joaquín Delbouis(son of Mr. Joaquín Coldwell)Mr. Nassim Joaquín Delbouis(son of Mr. Joaquín Coldwell)
60%20%
20%
Planta de Combustible Cozumel, S.A. de C.V.(which operates as a wholesale distributor)
Testamentary Trust(2)Mr. Pedro Joaquín Coldwell(1)
57%40%
Gasolinera y Servicios Juárez, S.A. de C.V.(which operates a retail service station)
Mr. Pedro Joaquín Coldwell(1)Mr. Ignacio Nassim Ruiz Joaquín(nephew of Mr. Joaquín Coldwell) Testamentary Trust(3)
40%20%
40%
Combustibles Caleta, S.A. de C.V.(which operates a retail service station)
Mr. Pedro Joaquín Coldwell(1)Mr. Pedro Oscar Joaquín DelbouisMr. Nassim Joaquín DelbouisMr. Ignacio Nassim Ruiz JoaquínTestamentary Trust(4)
20%20%20%20%20%
Combustibles San Miguel, S.A. de C.V.(which operates a retail service station)
Mr. Pedro Joaquín Coldwell(1)Mr. Pedro Oscar Joaquín DelbouisMr. Nassim Joaquín DelbouisMr. Ignacio Nassim Ruiz Joaquín
25%25%25%25%
(1) In Novermber 2017, Mr. Pedro Joaquín Coldwell transmitted all of his shares in these companies to a management and investment trust held at the Banco Mercantil del Norte, S.A, Institución deBanca Múltiple, Grupo Financiero Banorte.
(2) 60% of these shares were owned by Fausto Nassim Joaquín Ibarra (father of Pedro Joaquín Coldwell), until his death in June of 2016, after which 57% of these shares became property of aninvestment, management and testamentary revocable trust, which we refer to as the Testamentary Trust. 50% of the voting rights of these shares are currently exercised by Mr. Pedro Oscar JoaquínDelbouis, and 50% are exercised by Mr. Nassim Joaquín Delbouis.
(3) 40% of these shares were owned by Fausto Nassim Joaquín Ibarra until his death in June of 2016, after which these shares became property of the Testamentary Trust. 100% of the voting rights ofthese shares are currently exercised by Mr. Pedro Joaquín Coldwell.
(4) 20% of these shares were owned by Fausto Nassim Joaquín Ibarra until his death in June of 2016, after which these shares became property of the Testamentary Trust. 50% of the voting rights ofthese shares are currently exercised by Mr. Pedro Oscar Joaquín Delbouis, and 50% are exercised by Mr. Nassim Joaquín Delbouis.
The rights of these companies to operate retail service stations and distribute gasoline and other products on a wholesale basis in Mexico aredependent on these agreements, the expiration or non-renewal of which may adversely affect their business. These agreements are based on our standardforms of agreements and contain the standard terms and conditions applicable to all of Pemex Industrial Transformation retail service stations andwholesale distributors.
202
Copyright © 2018 www.secdatabase.com. All Rights Reserved.Please Consider the Environment Before Printing This Document

Table of ContentsItem 8. Financial Information
Consolidated Statements and Other Financial Information
See Item 18. �Financial Statements�.
Legal Proceedings
Labor-Related Proceedings
We are a party to various legal actions involving labor claims of former and present employees. These labor disputes relate to severance payments,life insurance benefits, extensions of labor contracts, level of wages, improper termination and employee housing. We do not expect these lawsuits tohave a material adverse effect on our financial condition or future results of operations.
For information on our negotiations with the Petroleum Workers� Union and collective bargaining agreements, see �Item 6�Directors, SeniorManagement and Employees�Employees.�
Audits and Other Investigations by the Mexican Government
The Auditoría Superior de la Federación (Superior Audit Office of the Federation, or the ASF), annually reviews the Cuenta Pública (PublicAccount) of Mexican Government entities, including Petróleos Mexicanos and our subsidiary entities. This review focuses mainly on the entities�compliance with budgetary benchmarks and budget and accounting laws. The ASF prepares reports of its observations based on this review. The reportsare subject to our analysis and, if necessary, our clarification and explanation of any issues raised during the audit. Discrepancies in amounts spent maysubject our officials to legal sanctions. However, in most instances, any observed issues are clarified and disposed of.
The Liabilities Unit at Petróleos Mexicanos, which is part of the SFP, is responsible for receiving complaints and investigating violations of theFederal Law of Administrative Responsibilities of Public Officials and the General Law of Administrative Liabilities, as well as imposing administrativepenalties in accordance with the law. The SFP, through the Liabilities Unit, provided us with the information below regarding the main investigationsand administrative proceedings against our employees and former employees.
In March and April 2010, the SFP imposed administrative penalties against several officers of Pemex-Refining in connection with a pipelinerupture in Nanchital, Veracruz. As of the date of this report, the final outstanding appeal was denied, the penalties were confirmed and all legalproceedings related to these matters have concluded.
In May 2010, the SFP filed a criminal complaint and initiated two administrative proceedings against María Karen Miyazaki Hara, who served asPMI�s Deputy Director of Trading of Intermediate Distillates, for allegedly committing acts of corruption pursuant to which PMI lost revenues ofapproximately U.S. $13 million. The alleged acts involved the unauthorized sale of ULSD for the economic benefit of foreign companies, includingBlue Oil Trading Ltd. On November 25, 2015, the SFP was notified by the Federal Attorney General that there would be no criminal prosecution basedon a resolution issued on October 6, 2015. As of the date of this annual report, the criminal complaint has been concluded. In November 2010, the firstadministrative proceedings concluded, resulting in Ms. Miyazaki Hara being fined Ps. 164.2 million and banned from holding public sector positions for20 years. Ms. Miyazaki Hara filed a motion before the Séptima Sala Regional Metropolitana (Seventh Regional Metropolitan Court) of the FederalCourt of Tax and Administrative Justice seeking that this resolution be declared null and void. On December 6, 2016, the Segunda Sección de la SalaSuperior (Second Section of the Superior Court) of the Tax and Administrative Federal Court issued a judgment declaring the resolution null and void.On January 27, 2017, the SFP filed a motion to review this judgment, which was granted (file R.F.-66/2017-V) by the Octavo Tribunal Colegiado enMateria Administrativa del Primer Circuito (Eighth Administrative Joint Court of the First Circuit). The plantiff also filed a motion to review theresolution
203
Copyright © 2018 www.secdatabase.com. All Rights Reserved.Please Consider the Environment Before Printing This Document
Table of Contentsand an amparo, which was considered untimely and was denied on April 10, 2017 (D.A.-257/2017-V). The plaintiff filed a complaint against thisresolution (No. 9/2017), which was denied on May 10, 2017. As of the date of this report, this proceeding has concluded. In addition, on June 25, 2013,the second administrative proceeding concluded, and the SFP fined Ms. Miyazaki Hara for Ps. 59.3 million and banned her from holding public sectorpositions for 20 years. On September 23, 2013, Ms. Miyazaki Hara filed a motion against this resolution before the Octava Sala Regional Metropolitana(Eighth Regional Metropolitan Court) of the Federal Court of Tax and Administrative Justice seeking that this additional resolution also be declared nulland void, which was granted on February 20, 2017 (file No. 66/2017-V). On January 30, 2017, the SFP filed a motion to review this judgment, whichwas admitted (file R.F.-77/2017-II) by the Eighth Administrative Joint Court of the First Circuit. The plaintiff also filed a motion to review theresolution and an amparo, which was considered untimely and was denied on April 11, 2017 (D.A.-261/2017-II). The plaintiff filed a complaint againstthis resolution (No. 11/2017), which was denied on May 12, 2017. As of the date of this annual report, this proceeding has concluded.
In December 2010, the SFP issued a resolution imposing penalties against 15 public sector employees for being involved in irregularities relatedto the leasing procedures for four vessels. The employees were fined and barred from public sector employment for a period of ten years. Theemployees appealed the penalties. The penalties imposed by the resolution issued by the SFP were declared null and void in ten cases and valid in fourcases. In the final pending case, Mr. Zermeño Díaz filed an amparo, which was denied on July 10, 2014, by the el Cuarto Tribunal Colegiado enMateria Administrativa del Primer Circuito (Fourth Administrative Joint Court of the First Circuit). As of the date of this annual report, this proceedinghas concluded.
On October 11, 2011, the SFP announced that it had fined three former officers of PMI an aggregate amount of Ps. 267.8 million, for allegedlyimproper contracting practices in the purchase and/or sale of petroleum products, which allegedly benefited certain of PMI�s commercial counterparties.The implicated former officers of PMI were also barred from public sector employment for a period of ten years. These former officers appealed thepenalties. Two motions were granted and the resolutions declared null and void. On February 8, 2017, a judgment was issued by the Sala Superior(Higher Court) of the Tribunal Federal de Justicia Administrativa (Federal Court of Administrative Justice) declaring the third resolution null and void.On April 3, 2017, the SFP filed a motion to review this resolution and the former officer filed an amparo (file No. D.A. 198/2017) before the QuintoTribunal Colegiado en Materia Administrativa del Primer Circuito (Fifth Joint Administrative Court of the First Circuit). On February 15, 2018, ajudgment was issued declaring the judgment issued in February 2017 valid. As of the date of this annual report, this matter has concluded.
In July 2011, a criminal complaint was filed against Mario Blenda Ahumada, former Deputy Director of Trade and Refined Products of PMI, aftera Ps. 11.0 million increase in his personal assets was detected. The Federal Attorney General�s Office concluded its investigation without filing acriminal complaint. The SFP filed a motion against this resolution, which was granted. As of the date of this annual report, the investigation is ongoingto determine whether criminal charges will be brought.
On April 24, 2014, the SFP issued a resolution imposing penalties against several public sector employees in connection with operations executedwith Oceanografía, S.A. de C.V. Four employees of Pemex-Exploration and Production were barred from public sector employment for six months toone year. The employees filed motions (files No. 14/8891-19-01-02-08-OT; 10781/14-17-10-5; 16172/14-17-04-7; and 15972/14-17-11-4) before theRegional Court of Chiapas-Tabasco and the Décima Sala Regional Metropolitana (Tenth Regional Metropolitan Court), the Cuarta Sala RegionalMetropolitana (Fourth Regional Metropolitan Court) and the Décima Primera Sala Regional Metropolitana (Eleventh Regional Metropolitan Court) ofthe Federal Court of Tax and Administrative Justice, respectively, requesting that the penalties be declared null and void. The following sets forth thestatus of these proceedings:
� On April 4, 2015, a judgment was issued (file No. 14/8891-19-01-02-08-OT) declaring the resolution null and void and requesting that anew judgment be issued. On September 29, 2016, a new resolution
204
Copyright © 2018 www.secdatabase.com. All Rights Reserved.Please Consider the Environment Before Printing This Document
Table of Contentswas issued and the employee filed a new administrative claim (file No. 518/16-26-01-2) before the Sala Regional de Tabasco del Tribunalde Justicia Administrativa (Regional Court of Tabasco of the Administrative Justice Court). On June 29, 2017, a judgment was issueddeclaring the resolution null and void. The SFP filed a motion to review this resolution before the Joint Administrative and Labor Court ofthe Tenth Circuit (file No. R.F. 32/2017). As of the date of this report, a final resolution is still pending.
� On May 9, 2015, a judgment was issued (file No. 10781/14-17-10-5) declaring the resolution valid. On December 14, 2016, the employeefiled an amparo requesting that a new judgment be issued, which was granted. On June 27, 2017, a new resolution was issued declaring theresolution against the employee valid. The employee subsequently filed an amparo before the Eighth Administrative Joint Court of the FirstCircuit (file D.A. 638/2017). As of the date of this report, a new judgment is still pending.
� On February 15, 2015, a judgment was issued (file No. 16172/14-17-04-7) declaring the resolution null and void. On August 11, 2016, theTribunal Colegiado de Circuito (Circuit Court) dismissed the judgment and remanded for issuance of a new resolution. On March 1, 2017, anew judgment was issued declaring the resolution null and void, which was confirmed by the Joint Circuit Court on October 23, 2017.
� On March 19, 2015, a judgment was issued (file No. 15972/14-17-11-4) declaring the resolution null and void, which was sustained by theCircuit Court on October 16, 2015.
Key Energy Services
On August 11, 2016, the SEC announced that Key Energy Services, Inc. agreed to pay U.S. $5 million to settle SEC charges that it violated theinternal controls and books-and-records provisions of the Foreign Corrupt Practices Act. These violations arose from payments allegedly made by itssubsidiary, Key Mexico, to one of our employees to induce him to provide advice, assistance and inside information that was used by Key Energy andKey Mexico in negotiating contracts with us. The Liabilities Unit at Petróleos Mexicanos started an investigation and, as of the date of this annualreport, the investigation is ongoing.
Odebrecht
On December 21, 2016, the U.S. Department of Justice publicly disclosed that Odebrecht, a global construction conglomerate based in Brazil,pled guilty to charges of bribery and corruption in connection with, among other things, bribes paid for more than 100 projects in twelve countries. Thereport further disclosed that, between 2010 and 2014, Odebrecht had bribed officials of the Mexican government for an amount equal to U.S.$10.5 million, including the payment to a high-level official of a Mexican state-owned and state-controlled company of a bribe of U.S. $6 million.
On December 22, 2016, the Liabilities Unit commenced an investigation into instances of bribery or corruption related to these allegations. OnJanuary 25, 2017, we filed a criminal complaint with the Federal Attorney General�s Office against any party for acts that may have been committedagainst PEMEX.
As a result investigations being conducted by the Liabilities Unit, SFP and Federal Attorney General�s Office, agreements executed by Odebrechtand its affiliates with various public entities of the Mexican Government have been and are continuing to be reviewed. As of the date of this annualreport, the SFP has initiated eight administrative sanctioning procedures: four against Odebrecht and its affiliates, two against their legal representativesand two against employees of PEMEX. The results of these investigations have resulted in the following actions:
� On June 14, 2017, the Ministry of the Public Function, through the Liabilities Unit, initiated four administrative sanctioning proceduresagainst two affiliates of Odebrecht and its representatives for probable wrongful payments related to a public work contract in our MiguelHidalgo refinery.
205
Copyright © 2018 www.secdatabase.com. All Rights Reserved.Please Consider the Environment Before Printing This Document
Table of Contents� On June 16, 2017, we notified Odebrecht Ingeniería y Construcción Internacional de México, S.A. de C.V. (�ODM�) of the termination of
the engineering, procurement and construction contract between ODM and Pemex Industrial Transformation dated November 12, 2015.This contract was valued at Ps. 1.8 billion and covered works related to the construction of access ways and external works for the residualexploitation project for the Miguel Hidalgo refinery. We terminated this contract due to ODM�s failure to comply with its obligations.
� On September 11, 2017 and October 8, 2017, the SFP, through the Liabilities Unit, announced that it had identified additional irregularitiesin connection with payments of Ps. 119 million and Ps. 2.5 million, respectively, related to the execution of public work contracts in ourMiguel Hidalgo refinery involving an affiliate of Odebrecht and a public officer of Pemex Industrial Transformation.
� On December 11, 2017, the SFP announced it has banned Constructora Norberto Odebrecht, S.A. from bidding for and entering intoMexican Government contracts and contracts with PEMEX, for four years and two years, respectively, as a result of having wrongfullyreceived Ps. 119 million pesos in connection with one of the public work contracts executed for our Miguel Hidalgo refinery.
� On December 15, 2017, the SFP announced that it had fined an officer of Pemex Industrial Transformation in the amounts of Ps. 119 millionand Ps. 2.5 million and also barred such officer from public sector employment for a period of ten years.
� On April 17, 2018, the Liabilities Unit announced that it has banned each of ODM and Constructora Norberto Odebrecht, S.A for two yearsand six months from bidding for and entering into Mexican government contracts, including contracts with PEMEX, and fined each of themin an aggregate amount of Ps. 543.5 million for wrongful acts committed in connection with, and failure to comply with the requirements of,the contract executed with Pemex Industrial Transformation for the Miguel Hidalgo refinery. The SFP also announced it has banned each ofthe Director General, Mr. Luis Alberto de Meneses Weyll, and the Director of Management and Finance, Mr. Gleiber José de Faria, ofODM, for two years and three months and fined each of them in an aggregate amount of Ps. 1.26 million for wrongful acts committed inconnection with, and failure to comply with the requirements of, the contract executed with Pemex Industrial Transformation for the MiguelHidalgo refinery.
The administrative sanctions imposed by the SFP are independent of any criminal charges that may be brought as a result of the criminalinvestigation that is being carried out by the Attorney General�s Office, which, as of the date of this annual report, is still ongoing.
We are collaborating with the SFP, the Liabilities Unit, and the Federal Attorney General�s Office in order to hold those responsible for these actsaccountable and ensure that we recover any damages to which we are entitled.
Actions Against the Illicit Market in Fuels
In order to counteract the illicit fuel market, we have implemented a security strategy throughout our facilities that seeks to:
� integrate a strategic safeguard system, allowing us to respond in a timely manner to risks of illegal activity;
� strengthen coordination and collaboration between Petróleos Mexicanos and our subsidiary entities, as well as with authorities in the threeorders of government, including the Federal Attorney General�s Office, Federal Consumer�s Office, Tax Administration System, federal,state and municipal police, the Secretaría de la Defensa Nacional (Ministry of National Defense) and the Mexican navy;
� optimize our human capital and modernize our technology;
� modernize our information systems to improve our strategic decision making and our response time; and
206
Copyright © 2018 www.secdatabase.com. All Rights Reserved.Please Consider the Environment Before Printing This Document

Table of Contents� revise our security strategy to incorporate innovations from the fields of industrial safety, civil protection, and environmental preservation.
Our initiatives aim to develop a sustainable operating model to safeguard the areas in which we operate, which comprise approximately2.0 million square kilometers of onshore fields and 3.2 million square kilometers of Mexican territorial waters.
These initiatives are intended to strengthen our ability to combat the illicit market in fuels, and include our increased investments in surveillancetechnology for our facilities and pipelines, as well as the reinforcement of equipment and resources available to protect our personnel, facilities, thegeneral population and the environment. In particular, during 2017, we continued the following strategic measures in order to decrease incidents ofcriminal activity at our facilities:
� Worked with the judicial and ministerial authorities to identify 6,660 vehicles involved in the illicit market in fuels, as compared to 2,695vehicles in 2016, which represents a 147.1% increase. The number of individuals brought before judicial authorities in connection with theillicit market in fuels increased to 976, as compared to 583 individuals brought before judicial authorities in 2016, which represents a 67.4%increase, mainly due to implementation of the Sistema de Justicia Penal Acusatorio (Adversarial System in Criminal Justice), whichrequires that law enforcement, not our personnel, act as first responders to any suspected participation in hydrocarbon related crime,irrespective of whether we, or any other group initially discovered the illegal activity.
� Inspected the rights of way and facilities through a total of 19,587,523 kilometers patrolled in 2017, at an average of 52,058 kilometers perday by vehicle and 1,606 kilometers per day by foot, as compared to 305 kilometers per day by foot and 28,693 kilometers per day byvehicles during 2016, which represents an increase of 87.03% in total kilometers patrolled. These surveillance activities were carried out incoordination with the Ministry of National Defense, the Mexican Navy and other governmental authorities.
� Strengthened our collaborations with governmental entities, the Federal Attorney General�s Office, the federal police and the Ministry ofthe Interior, among others, to share information and provide support to investigative teams focused on theft and illegal trade in fuels. Wehave also provided training for authorities responsible for the prevention, detection and prosecution of criminal activities in the illicit marketin fuels, particularly in the inspection of automobile tanks and the documentation needed to be able to transport fuel, in an effort to supportintragovernmental coordination.
� Created territorial divisions to best use monitoring technologies along with our ground patrol, which has allowed us to detect a highernumber of illegal drillings and to prevent the illegal extraction of fuels.
These measures led to the recovery of 22.6 million liters of hydrocarbon product in 2017, which represents an increase of approximately 72.5% ascompared to the 13.1 million liters recovered in 2016.
These efforts also led to the identification and sealing of 10,316 illegal pipeline taps in 2017, as compared to the identification and sealing of6,873 illegal pipeline taps during 2016, which represents a 50.1% increase. This increase resulted from both increased surveillance and an increase inthe number of criminal attempts to divert our products. Our renewed focus on the detection of illegal pipeline taps in 2017 enabled us to collect moreinformation and develop more effective strategies to combat fuel theft, which in turn improved our ability to deploy ground patrol for the immediateidentification and sealing of pipeline taps and prevent additional extraction of our hydrocarbon products.
On June 1, 2017, we announced the cancellation of the franchise contracts of seven gas stations located in the state of Puebla, which allegedlycommitted irregularities in their fuel trade procedures and had tax inconsistencies. The announcement was the result of an operation involving PEMEX,the Secretaría de Hacienda
207
Copyright © 2018 www.secdatabase.com. All Rights Reserved.Please Consider the Environment Before Printing This Document

Table of Contentsy Crédito Público (Ministry of Finance and Public Credit) through the Tax Administration Service and its Financial Intelligence Unit, as well as theProcuraduría General de la República (Attorney General�s Office), the Secretaría de la Defensa Nacional (Ministry of National Defense) and theComisión Nacional de Seguridad (National Security Commission), through the federal and state police. Through measures like these, we seek to providecertainty to our customers, as well as to combat the illicit market in fuels, tax evasion, money laundering and commercial fraud.
On February 14, 2018, the Liabilities Unit at Petróleos Mexicanos imposed penalties on eight employees from the storage and distributionterminal of Pemex Logistics in the state of Chihuahua for operating technological devices to alter the measurement parameters to fill fuel tankers and fordeviating from expected routes. Three of these employees were dismissed and barred from holding public sector positions for one year and fiveemployees were suspended. On March 14, 2018, the Liabilities Unit at Petróleos Mexicanos dismissed another three employees from Sector PipelinesBajío of Pemex Logistics and barred them from holding public sector positions for ten years for the tapping of diesel in the Tula-Salamanca pipeline inCelaya, Guanajuato.
On March 27, 2018, the Liabilities Unit at Petróleos Mexicanos suspended an employee from Sector Pipelines Minatitlán of Pemex Logistics.This employee allegedly belongs to an organized network that repeatedly manipulated and altered the valves of the Minatitlán-México pipeline inAcayucan, Veracruz.
Civil Actions
In the ordinary course of our business, we are a party to a number of lawsuits of various types. We evaluate the merit of each claim and assess thelikely outcome, accruing a contingent liability when an unfavorable decision is probable and the amount is reasonably estimable. At December 31, 2016and 2017, we had accrued a reserve of Ps. 15.1 billion and Ps. 7.8 billion, respectively, for our contingent liabilities in connection with these lawsuits.Our material legal proceedings are described in Note 25 and Note 27 to our audited financial statements included in this report, and those descriptionsare incorporated by reference under this Item.
Dividends
Pursuant to the Petróleos Mexicanos Law, as of January 1, 2016, Petróleos Mexicanos and its subsidiary entities are subject to a new dividendpolicy that will require them to pay a state dividend to the Mexican Government on an annual basis. In accordance with the Federal Revenue Law of2017 and the Federal Revenue Law of 2018, Petróleos Mexicanos was not required to pay a state dividend in 2017 and will not be required to pay a statedividend in 2018. For more information, see �Item 4�Taxes, Duties and Other Payments to the Mexican Government�Fiscal Regime for PEMEX�OtherPayments to the Mexican Government.�
Item 9. The Offer and Listing
Trading in the debt securities issued by Petróleos Mexicanos takes place primarily in the over-the-counter market. All the debt securities issued byPetróleos Mexicanos that are registered pursuant to the U.S. Securities Act of 1933 (which we refer to as the Securities Act) are also listed on theLuxembourg Stock Exchange and traded on the Euro MTF market of the Luxembourg Stock Exchange.
Item 10. Additional Information
Memorandum and Articles of Association
The Mexican Congress established Petróleos Mexicanos by a decree dated June 7, 1938, effective July 20, 1938. None of Petróleos Mexicanos orthe subsidiary entities has bylaws or articles of association. Petróleos Mexicanos and the subsidiary entities, are public entities of the MexicanGovernment and each is a legal entity empowered to own property and carry on business in its own name.
208
Copyright © 2018 www.secdatabase.com. All Rights Reserved.Please Consider the Environment Before Printing This Document

Table of ContentsThe activities of Petróleos Mexicanos and the subsidiary entities are regulated by the Mexican Constitution, the Petróleos Mexicanos Law,
Regulations to the Petróleos Mexicanos Law, the Hydrocarbons Law and other federal laws and regulations. See �Item 4�Information on theCompany�History and Development.� Under the Petróleos Mexicanos Law, the Board of Directors of Petróleos Mexicanos has the followingcommittees: the Audit Committee, the Human Resources and Compensation Committee, the Strategy and Investment Committee and the Acquisitions,Leasing, Public Works and Services Committee. See �Item 6�Directors, Senior Management and Employees.�
Under the Petróleos Mexicanos Law and the Regulations to the Petróleos Mexicanos Law, our directors are obligated to abstain from voting on aproposal, arrangement or contract in which they have a personal, family or business interest. Our directors do not have the power to vote compensationto themselves or any other member of the board. Except in the case of the independent board members, our directors do not receive compensation fortheir services as members of the boards of directors of Petróleos Mexicanos and the subsidiary entities. Under the Petróleos Mexicanos Law, ourdirectors must perform their duties without obtaining or attempting to obtain any benefits greater than those granted by law. Therefore, our directors donot have borrowing powers exercisable by themselves. There is no requirement for early retirement for our directors.
Material Contracts
As of December 31, 2016 and 2017, we have entered into contracts with various contractors for approximate amounts of Ps. 817,994 million andPs. 698,905 million, respectively. These contracts are for the development of investment projects. See Note 24(e) to our consolidated financialstatements included herein.
On January 27, 2009, Petróleos Mexicanos entered into an indenture with Deutsche Bank Trust Company Americas, as Trustee. This agreementprovides for the issuance by Petróleos Mexicanos from time to time of unsecured debt securities. On the same date, Petróleos Mexicanos entered into adistribution agreement with Calyon Securities (USA) Inc. (now known as Credit Agricole Securities (USA) Inc.), Citigroup Global Markets Inc.,Citigroup Global Markets Limited, HSBC Securities (USA) Inc. and Santander Investment Securities Inc. pursuant to which Petróleos Mexicanosestablished a U.S. $7.0 billion medium-term note, Series C, program. Pursuant to the 1996 guaranty agreement referred to above, Petróleos Mexicanos�obligations under all notes issued under this program are jointly and severally guaranteed by Pemex-Exploration and Production, Pemex-Refining andPemex-Gas and Basic Petrochemicals. In December 2010, Petróleos Mexicanos appointed Credit Suisse Securities (USA) LLC as an agent under the2009 distribution agreement referred to above. In each of December 2010 and January 2010, Petróleos Mexicanos increased the size of this program toU.S. $12.0 billion and U.S. $22.0 billion, respectively. Petróleos Mexicanos issued U.S. $3.5 billion of notes and bonds under this program in 2011.In 2012, Petróleos Mexicanos issued U.S. $5.3 billion of notes and bonds under this program. In 2013, Petróleos Mexicanos increased the size of thisprogram to U.S. $32.0 billion and issued U.S. $6.9 billion of notes and bonds under it. In 2014, Petróleos Mexicanos increased the size of this programto U.S. $42.0 billion and issued U.S. $7.9 billion of notes and bonds under it. In 2017, Petróleos Mexicanos increased the size of this program toU.S. $92.0 billion and issued �4.3 billion, U.S. $5.0 billion and £450.0 million of notes and bonds under it. During the first three months of 2018,Petróleos Mexicanos increased the size of this program to U.S. $102.0 billion and issued U.S. $4.0 billion of notes and bonds under it. See �Item5�Operating and Financial Review and Prospects�Liquidity and Capital Resources�Financing Activities.�
Exchange Controls
Mexico has had a free market for foreign exchange since 1991, and the Mexican Government has allowed the peso to float freely against the U.S.dollar since December 1994. We have no control over or influence on this exchange rate policy. The Mexican Government has announced that it doesnot intend to change its floating exchange rate policy, but there is no guarantee that the Mexican Government will not change this policy. See�Item 3�Key Information�Exchange Rates.�
209
Copyright © 2018 www.secdatabase.com. All Rights Reserved.Please Consider the Environment Before Printing This Document
Table of ContentsTaxation
The 1997 Securities, the 1999 Securities, the 2003 Securities, the 2004 Securities, the 2006 Securities, the 2008 Securities, the 2009 Securities, the2010 Securities, the 2011 Securities, the 2012 Securities, the 2013 Securities, the 2014 Securities, 2016 and the 2017 Securities.
As of the date of this annual report, we have registered the following securities (the �Registered Securities�) with the Securities and ExchangeCommission.
Pursuant to a registration statement on Form F-4 (File No. 333-7796), which was declared effective by the SEC on October 17, 1997, PetróleosMexicanos, Pemex-Exploration and Production, Pemex-Refining and Pemex-Gas and Basic Petrochemicals registered pursuant to the Securities Act upto U.S. $400,000,000 of 9.50% Global Guaranteed Bonds due 2027, which we refer to as the 1997 Securities. In December 2004 and February 2006, anaggregate amount of U.S. $376,250,000 of the 1997 Securities were exchanged for bonds issued by the Pemex Project Funding Master Trust (which werefer to as the Master Trust).
Pursuant to a registration statement on Form F-4 (File No. 333-10706), which was declared effective by the SEC on October 1, 1999, PetróleosMexicanos, Pemex-Exploration and Production, Pemex-Refining and Pemex-Gas and Basic Petrochemicals registered pursuant to the Securities Act upto U.S. $500,000,000 of 9.50% Puttable or Mandatorily Exchangeable Securities (POMESSM) due 2027, which we refer to as the 1999 Securities. InDecember 2004 and February 2006, an aggregate amount of U.S. $421,522,000 of the 1999 Securities were exchanged for POMESSM issued by theMaster Trust. All outstanding 1999 Securities of Petróleos Mexicanos were, on March 16, 2006, mandatorily exchanged for 9.50% Global GuaranteedBonds due 2027 issued by Petróleos Mexicanos, thereby increasing the outstanding amount of the 1997 Securities.
Pursuant to a registration statement on Form F-4 (File No. 333-103197), which was declared effective by the SEC on February 24, 2003, theMaster Trust, Petróleos Mexicanos, Pemex-Exploration and Production, Pemex-Refining and Pemex-Gas and Basic Petrochemicals registered pursuantto the Securities Act up to U.S. $500,000,000 of 8.625% Bonds due 2022. Pursuant to a registration statement on Form F-4 (File No. 333-107905),which was declared effective by the SEC on August 21, 2003, the Master Trust, Petróleos Mexicanos, Pemex-Exploration and Production, Pemex-Refining and Pemex-Gas and Basic Petrochemicals registered pursuant to the Securities Act up to U.S. $510,154,000 of 8.625% Bonds due 2022. Werefer to the securities registered in 2003 under these registration statements as the 2003 Securities.
Pursuant to a registration statement on Form F-4 (File No. 333-118373), which was declared effective by the SEC on August 31, 2004, the MasterTrust, Petróleos Mexicanos, Pemex-Exploration and Production, Pemex-Refining and Pemex-Gas and Basic Petrochemicals registered pursuant to theSecurities Act up to U.S. $47,085,000 of 8.625% Bonds due 2022. We refer to the securities registered in 2004 as the 2004 Securities.
Pursuant to a registration statement on Form F-4 (File No. 333-126941), which was declared effective by the SEC on January 13, 2006, the MasterTrust, Petróleos Mexicanos, Pemex-Exploration and Production, Pemex-Refining and Pemex-Gas and Basic Petrochemicals registered pursuant to theSecurities Act up to U.S. $228,735,000 of 8.625% Bonds due 2023, U.S. $354,477,000 of 9.50% Bonds due 2027, U.S. $403,746,000 of POMESSM due2027 and U.S. $500,000,000 of 6.625% Guaranteed Bonds due 2035. Pursuant to a registration statement on Form F-4 (File No. 333-126948), whichwas declared effective by the SEC on January 13, 2006, the Master Trust, Petróleos Mexicanos, Pemex-Exploration and Production, Pemex-Refiningand Pemex-Gas and Basic Petrochemicals registered pursuant to the Securities Act up to U.S. $21,265,000 of 8.625% Bonds due 2023,U.S. $45,523,000 of 9.50% Bonds due 2027 and U.S. $96,254,000 of POMESSM due 2027. All outstanding POMES registered under these registrationstatements were, on March 15, 2006, mandatorily exchanged for 9.50% Bonds due 2027. Pursuant to a registration statement on Form F-4 (FileNo. 333-136674), which was declared effective by the SEC on November 3, 2006, the Master Trust, Petróleos Mexicanos, Pemex-Exploration andProduction, Pemex-Refining and Pemex-Gas and Basic Petrochemicals registered pursuant to the Securities Act up to U.S. $751,995,000 of 6.625%Guaranteed Bonds due 2035. We refer to the securities registered in 2006 under these registration statements as the 2006 Securities.
210
Copyright © 2018 www.secdatabase.com. All Rights Reserved.Please Consider the Environment Before Printing This Document
Table of ContentsPursuant to a registration statement on Form F-4 (File No. 333-152486), which was declared effective by the SEC on December 18, 2008, the
Master Trust, Petróleos Mexicanos, Pemex-Exploration and Production, Pemex-Refining and Pemex-Gas and Basic Petrochemicals registered pursuantto the Securities Act up to U.S. $501,000,000 of 6.625% Guaranteed Bonds due 2035 and up to U.S. $500,000,000 of 6.625% Guaranteed Bonds due2038. We refer to the securities registered in 2008 as the 2008 Securities.
Pursuant to a registration statement on Form F-4 (File No. 333-160799), which was declared effective by the SEC on August 25, 2009, PetróleosMexicanos, Pemex-Exploration and Production, Pemex-Refining and Pemex-Gas and Basic Petrochemicals registered pursuant to the Securities Act upto U.S. $2,000,000,000 of 8.00% Notes due 2019. We refer to the securities registered in 2009 as the 2009 Securities.
Effective as of September 30, 2009, Petróleos Mexicanos assumed, as primary obligor, all of the Master Trust�s obligations as issuer of the 2001Securities, the 2003 Securities, the 2004 Securities, the 2006 Securities and the 2008 Securities. As a result, effective as of September 30, 2009,Petróleos Mexicanos is the issuer of all Registered Securities (as defined below).
Pursuant to a registration statement on Form F-4 (File No. 333-168326), which was declared effective by the SEC on August 31, 2010, PetróleosMexicanos, Pemex-Exploration and Production, Pemex-Refining and Pemex-Gas and Basic Petrochemicals registered pursuant to the Securities Act upto U.S. $63,314,000 of 8.00% Notes due 2019, up to U.S. $1,000,000,000 of 6.000% Notes due 2020, up to U.S. $2,000,000,000 of 5.50% Notes due2021 and up to U.S. $1,000,000,000 of 6.625% Bonds due 2035. We refer to the securities registered in 2010 as the 2010 Securities.
Pursuant to a registration statement on Form F-4 (File No. 333-175821), which was declared effective by the SEC on August 31, 2011, PetróleosMexicanos, Pemex-Exploration and Production, Pemex-Refining and Pemex-Gas and Basic Petrochemicals registered pursuant to the Securities Act upto U.S. $1,000,000,000 of 5.50% Notes due 2021 and up to U.S. $1,250,000,000 of 6.500% Bonds due 2041. We refer to the securities registered in2011 as the 2011 Securities.
Pursuant to a registration statement on Form F-4 (File No. 333-182553), which was declared effective by the SEC on July 23, 2012, PetróleosMexicanos, Pemex-Exploration and Production, Pemex-Refining and Pemex-Gas and Basic Petrochemicals registered pursuant to the Securities Act upto U.S. $2,100,000,000 of 4.875% Notes due 2022 and up to U.S. $1,750,000,000 of 5.500% Bonds due 2044. We refer to the securities registered in2012 as the 2012 Securities.
Pursuant to a registration statement on Form F-4/A (File No. 333-189852), which was declared effective by the SEC on July 25, 2013, PetróleosMexicanos, Pemex-Exploration and Production, Pemex-Refining and Pemex-Gas and Basic Petrochemicals registered pursuant to the Securities Act upto U.S. $1,000,000,000 of 3.500% Notes due 2018, up to U.S. $500,000,000 of Floating Rate Notes due 2018, up to U.S. $2,100,000,000 of 3.500%Notes due 2023, up to U.S. $1,000,000,000 of 4.875% Notes due 2024, up to U.S. $500,000,000 of 6.500% Bonds due 2041 and up toU.S. $1,000,000,000 of 5.50% Bonds due 2044. We refer to the securities registered in 2013 as the 2013 Securities.
Pursuant to a registration statement on Form F-4 (File No. 333-198588), which was declared effective by the SEC on September 22, 2014,Petróleos Mexicanos, Pemex-Exploration and Production, Pemex-Refining and Pemex-Gas and Basic Petrochemicals registered pursuant to theSecurities Act up to U.S. $500,000,000 of 3.125% Notes due 2019, up to U.S. $500,000,000 of 4.875% Notes due 2024 and up to U.S. $3,000,000,000of 6.375% Bonds due 2045. We refer to the securities registered in 2014 as the 2014 Securities.
Pursuant to a registration statement on Form F-4 (File No. 333-205763), which was declared effective by the SEC on February 22, 2016, PetróleosMexicanos, Pemex-Exploration and Production, Pemex Industrial Transformation, Pemex Drilling and Services, Pemex Logistics and PemexCogeneration and Services registered
211
Copyright © 2018 www.secdatabase.com. All Rights Reserved.Please Consider the Environment Before Printing This Document
Table of Contentspursuant to the Securities Act up to U.S. $1,500,000,000 of 3.500% Notes due 2020, up to U.S. $1,000,000,000 of 4.250% Notes due 2025,$1,500,000,000 of 4.500% Notes due 2026, up to U.S. $1,500,000,000 of 5.50% Bonds due 2044 and up to U.S. $3,000,000,000 of 5.625% Bonds due2046. Pursuant to a registration statement on Form F-4 (File No. 333-213351), which was declared effective by the SEC on November 11, 2016,Petróleos Mexicanos, Pemex Exploration and Production, Pemex Industrial Transformation, Pemex Drilling and Services, Pemex Logistics and PemexCogeneration and Services registered pursuant to the Securities Act up to U.S. $750,000,000 of 5.500% Notes due 2019, up to U.S. $1,250,000,000 of6.375% Notes due 2021, up to U.S. $2,069,302,000 of 4.625% Notes due 2023, up to U.S $3,000,000,000 of 6.875% Notes due 2026, and up toU.S.$3,500,000,000 of 6.750% Notes due 2047. We refer to the securities registered in 2016 as the 2016 Securities.
Pursuant to a registration statement on Form F-4 (File No. 333-220721), which was declared effective by the SEC on February 22, 2018, PetróleosMexicanos, Pemex-Exploration and Production, Pemex Industrial Transformation, Pemex Drilling and Services, Pemex Logistics and PemexCogeneration and Services registered pursuant to the Securities Act up to U.S. $1,500,000,000 5.375% Notes due 2022, up to U.S. $1,000,000,000Floating Rate Notes due 2022, up to U.S. $5,500,000,000 6.500% Notes due 2027 and up to U.S. $2,500,000,000 6.750% Bonds due 2047. We refer tothe securities registered in 2018 as the 2018 Securities and together with the 1997 Securities, the 2003 Securities, the 2004 Securities, the 2006Securities, the 2008 Securities, the 2009 Securities, the 2010 Securities, the 2011 Securities, the 2012 Securities, the 2013 Securities, the 2014 Securitiesand the 2016 Securities as the Registered Securities.
Taxation Generally
The following summary contains a description of the principal Mexican and U.S. federal income tax consequences of the ownership anddisposition of the Registered Securities, but it does not purport to be a comprehensive description of all of the tax considerations that may be relevant toa decision to invest in, or dispose of, the Registered Securities.
This summary is based on the federal tax laws of Mexico and the United States in force on the date of this Form 20-F, including the provisions ofthe income tax treaty between the United States and Mexico together with related protocols (which are subject to change), and does not describe any taxconsequences arising under the laws of any state or municipality in Mexico, the United States or any other jurisdiction, or the laws of any taxingjurisdiction other than the federal laws of Mexico and the United States.
Mexico has also entered into, or is negotiating, tax treaties with various countries that may have effects on holders of Registered Securities. Thisreport does not discuss the consequences (if any) of such treaties.
Each holder or beneficial owner of Registered Securities should consult its tax advisor as to the Mexican, United States or other tax consequencesof the ownership and disposition of those securities, including the effect of any foreign, state or municipal tax laws, and the consequences of theapplication of any tax treaty to which Mexico is a party.
Mexican Taxation
This summary of certain Mexican federal tax considerations refers only to holders of Registered Securities that are not residents of Mexico forMexican tax purposes and that will not hold the Registered Securities or a beneficial interest therein through a permanent establishment for tax purposes(we refer to any such non-resident holder as a Foreign Holder). For purposes of Mexican taxation, an individual is a resident of Mexico if he/she hasestablished his/her domicile in Mexico. When an individual also has a place of residence in another country, that individual will be considered a residentof Mexico for tax purposes, if such individual has his/her center of vital interest in Mexico. An individual would be deemed to have his/her center ofvital interest in Mexico if, among other things: (a) more than 50% of his/her total income for the year were derived from Mexican sources, or (b) his/herprincipal center of professional activities were located in Mexico.
212
Copyright © 2018 www.secdatabase.com. All Rights Reserved.Please Consider the Environment Before Printing This Document

Table of ContentsA legal entity is a resident of Mexico if:
� it maintains the principal administration of its business in Mexico; or
� it has established its effective management in Mexico.
A Mexican national is presumed to be a resident of Mexico unless such person can demonstrate the contrary. If a legal entity or individual has apermanent establishment in Mexico, such permanent establishment shall be required to pay taxes in Mexico on income attributable to such permanentestablishment in accordance with Mexican federal tax law.
Taxation of Interest. Under the Mexican Income Tax Law and rules issued by the Ministry of Finance and Public Credit applicable to PEMEX,payments of interest (which are deemed to include any amounts paid in excess of the original issue price of the relevant securities), made by a Mexicanissuer (including Petróleos Mexicanos) in respect of notes or bonds and other debt securities to a Foreign Holder will generally be subject to a Mexicanwithholding tax assessed at a rate of 4.9%, if the following requirements are met:
� notice relating to the offering of such notes or bonds is given to the CNBV as required under the Securities Market Law and evidence ofsuch notice is timely filed with the Ministry of Finance and Public Credit;
� such notes or bonds are placed outside of Mexico through banks or brokerage houses in a country that is party to a treaty to avoid doubletaxation with Mexico; and
� the issuer duly complies with the information requirements established in the general rules issued by the Ministry of Finance and PublicCredit for such purposes.
If the effective beneficiaries, directly or indirectly, individually or jointly with related parties, receive more than 5% of the interest paid on suchnotes or bonds and are holders, directly or indirectly, individually or jointly, with related parties of more than 10% of the voting stock of the issuer orentities 20% or more of whose stock is owned directly or indirectly, individually or jointly, by parties related to the issuer, the withholding tax rateapplicable to payment of interest on such notes or bonds may be significantly higher.
Payments of interest made by Petróleos Mexicanos or the subsidiary entities, except for Pemex Fertilizers and Pemex Ethylene, in respect of theRegistered Securities to non-Mexican pension or retirement funds will be exempt from Mexican withholding taxes, provided that:
� such fund is duly organized pursuant to the laws of its country of origin and is the effective beneficiary of the interest payment;
� the income from such interest payment is exempt from income tax in its country of residence; and
� such fund delivers certain information as per rules issued by the Ministry of Finance and Public Credit.
Additional Amounts. Petróleos Mexicanos and the subsidiary entities, except for Pemex Fertilizers and Pemex Ethylene, have agreed, subject tospecified exceptions and limitations, to:
� pay Additional Amounts (as defined in the indenture dated as of September 18, 1997, as supplemented, between Petróleos Mexicanos andDeutsche Bank) to the holders of the 1997 Securities in respect of the Mexican withholding taxes mentioned above;
� pay Additional Amounts (as defined in the indenture dated as of August 7, 1998, as supplemented, between Petróleos Mexicanos andDeutsche Bank) to the holders of the 1998 Securities in respect of the Mexican withholding taxes mentioned above;
� pay Additional Amounts (as defined in the indenture dated as of July 31, 2000, as supplemented, between Petróleos Mexicanos andDeutsche Bank) to the holders of the 2003 Securities and the 2004 Securities in respect of the Mexican withholding taxes described above;
213
Copyright © 2018 www.secdatabase.com. All Rights Reserved.Please Consider the Environment Before Printing This Document
Table of Contents� pay Additional Amounts (as defined in the indenture dated as of December 30, 2004, as supplemented, between Petróleos Mexicanos and
Deutsche Bank) to the holders of the 2006 Securities and the 2008 Securities in respect of the Mexican withholding taxes described above;and
� pay Additional Amounts (as defined in the indenture dated as of January 27, 2009, as supplemented, between Petróleos Mexicanos andDeutsche Bank) to the holders of the 2009 Securities, the 2010 Securities, the 2011 Securities, the 2012 Securities, the 2013 Securities, the2014 Securities and the 2016 Securities in respect of the Mexican withholding taxes described above.
If Petróleos Mexicanos pays Additional Amounts in respect of such Mexican withholding taxes, any refunds received with respect to suchAdditional Amounts will be for the account of Petróleos Mexicanos.
Holders or beneficial owners of the Registered Securities may be required to provide certain information or documentation necessary to enablePetróleos Mexicanos and the subsidiary entities to apply the appropriate Mexican withholding tax rate applicable to holders or beneficial owners of theRegistered Securities. In the event that the specified information or documentation concerning such holder or beneficial owner, if requested, is notprovided on a timely basis, the obligation of Petróleos Mexicanos and the subsidiary entities to pay Additional Amounts may be limited.
Taxation of Dispositions. Capital gains resulting from the sale or other disposition of the Registered Securities by a Foreign Holder will not besubject to Mexican income or withholding taxes.
Other Mexican Tax Considerations. Under the Income Tax Law, any discount received by a non-resident upon purchase of the notes or bondsfrom a Mexican resident or a non-resident with a permanent establishment in Mexico is deemed interest income, and therefore, subject to taxes inMexico. Such interest income results from the difference between the face value (plus accrued interest not subject to withholding) and the purchaseprice of such notes or bonds.
Transfer and Other Taxes. There are no Mexican stamp, registration or similar taxes payable by a Foreign Holder in connection with the purchase,ownership or disposition of the Registered Securities. A Foreign Holder of the Registered Securities will not be liable for Mexican estate, succession,gift, inheritance or similar tax with respect to such securities.
United States Taxation
This summary of certain U.S. federal income tax considerations deals principally with persons that hold the Registered Securities as capital assetsand whose functional currency is the U.S. dollar. As used in this section �Taxation,� the term �United States Holder� means a beneficial owner of aRegistered Security that is an individual who is a citizen or resident of the United States, a U.S. domestic corporation or any other person that is subjectto U.S. federal income taxation on a net income basis in respect of its investment in the Registered Securities.
This summary does not purport to be a comprehensive description of all the tax considerations that may be relevant to any particular investor,including tax considerations that arise from rules of general application or that are assumed to be known to investors. This summary generally does notaddress the tax treatment of holders that may be subject to special tax rules, such as banks, insurance companies, tax-exempt organizations, dealers insecurities or currencies, certain short-term holders of Registered Securities, traders in securities electing to mark-to-market, or persons that hedge theirexposure in the Registered Securities or hold the Registered Securities as a position in a �straddle� for tax purposes or as part of a �synthetic security�or a �hedging� or �conversion� transaction or other integrated investment comprised of such Registered Securities and one or more other investments,nonresident aliens present in the United States for more than 182 days in a taxable year, U.S. expatriates, entities taxed as partnerships or the partnerstherein, persons that have a �functional currency� other
214
Copyright © 2018 www.secdatabase.com. All Rights Reserved.Please Consider the Environment Before Printing This Document
Table of Contentsthan the U.S. dollar, nor does it address the tax treatment of holders that did not acquire the Registered Securities at their issue price as part of the initialdistribution. Investors who purchased the Registered Securities at a price other than the issue price should consult their tax advisor as to the possibleapplicability to them of the amortizable bond premium or market discount rules.
In addition, this summary does not discuss the application of the Medicare contribution tax on net investment income or the alternative minimumtax. United States Holders should consult their own tax advisers concerning the U.S. federal, state, local, and other tax consequences of purchasing,owning, and disposing of a Registered Security in their particular circumstances.
United States Holders that use an accrual method of accounting for tax purposes (�accrual method holders�) generally are required to includecertain amounts in income no later than the time such amounts are reflected on certain financial statements (the �book/tax conformity rule�). Theapplication of the book/tax conformity rule thus may require the accrual of income earlier than would be the case under the general tax rules describedbelow, although it is not clear to what types of income the book/tax conformity rule applies. This rule generally is effective for tax years beginning afterDecember 31, 2017 or, for debt securities issued with original issue discount, for tax years beginning after December 31, 2018. Accrual method holdersshould consult with their tax advisors regarding the potential applicability of the book/tax conformity rule to their particular situation.
Taxation of Interest and Additional Amounts. A United States Holder will treat the gross amount of interest and Additional Amounts (i.e., withoutreduction for Mexican withholding taxes) as ordinary interest income in respect of the Registered Securities. Mexican withholding taxes paid at theappropriate rate applicable to the United States Holder will be treated as foreign income taxes eligible, subject to generally applicable limitations andconditions, for credit against such United States Holder�s U.S. federal income tax liability, at the election of such United States Holder, or for deductionin computing such United States Holder�s taxable income, provided that the United States Holder does not elect to claim a foreign tax credit for anyforeign income taxes paid or accrued for the relevant taxable year. Interest and Additional Amounts will constitute income from sources without theUnited States and generally will be treated separately along with other items of �passive� income for purposes of determining the credit for foreignincome taxes allowed under the Internal Revenue Code of 1986, as amended.
The calculation and availability of foreign tax credits or deductions involves the application of rules that depend on a United States Holder�sparticular circumstances. United States Holders should consult their own tax advisors regarding the availability of foreign tax credits and the treatmentof Additional Amounts.
Taxation of Dispositions. Upon the sale, exchange or retirement of a Registered Security, a United States Holder will generally recognize a gain orloss equal to the difference between the amount realized (less any amounts attributable to accrued and unpaid interest not previously includible in grossincome, which will be taxable as ordinary income) and the holder�s tax basis in such security, which is generally equal to the cost of the RegisteredSecurity to the United States Holder. Gain or loss recognized by a United States Holder on the sale, redemption or other disposition of the RegisteredSecurities generally will be long-term capital gain or loss if, at the time of disposition, the securities have been held for more than one year. Long-termcapital gain realized by an individual United States Holder is generally taxed at lower rates than short-term capital gains or ordinary income.
Non-United States Holders. Subject to the discussion below under �Backup Withholding and Information Reporting,� holders of the RegisteredSecurities that are not United States Holders (which we refer to as Non-United States Holders) generally will not be subject to U.S. federal income orwithholding tax on interest income in respect of the Registered Securities or on any gain realized on the disposition of the Registered Securities.
Backup Withholding and Information Reporting. Information returns may be filed with the Internal Revenue Service with respect to paymentsmade to certain United States Holders of the Registered Securities. In addition,
215
Copyright © 2018 www.secdatabase.com. All Rights Reserved.Please Consider the Environment Before Printing This Document
Table of Contentscertain United States Holders may be subject to a backup withholding tax in respect of such payments, unless they (1) provide their accurate taxpayeridentification numbers to the principal paying agent and certify that they are not subject to backup withholding or (2) otherwise establish an exemptionfrom the backup withholding tax. Backup withholding is not an additional tax. Non-United States Holders may be required to comply with applicablecertification procedures to establish that they are not United States Holders in order to avoid the application of such information reporting requirementsand backup withholding tax.
Specified Foreign Financial Assets. Certain United States Holders that own �specified foreign financial assets� with an aggregate value in excessof U.S. $50,000 are generally required to file an information statement along with their tax returns, currently on Form 8938, with respect to such assets.�Specified foreign financial assets� include any financial accounts held at a non-U.S. financial institution, as well as securities issued by a non-U.S.issuer (which would include the Registered Securities) that are not held in accounts maintained by financial institutions. Higher reporting thresholdsapply to certain individuals living abroad and to certain married individuals. Regulations extend this reporting requirement to certain entities that aretreated as formed or availed of to hold direct or indirect interests in specified foreign financial assets based on certain objective criteria. United StatesHolders who fail to report the required information could be subject to substantial penalties. In addition, the statute of limitations for assessment of taxwould be suspended, in whole or part. Prospective investors should consult their own tax advisors concerning the application of these rules to theirinvestment in the Registered Securities, including the application of the rules to their particular circumstances.
Documents on Display
We are subject to the information requirements of the Exchange Act. In accordance with these requirements, we file reports, including annualreports on Form 20-F, and other information with the SEC. These materials, including this report, and the exhibits thereto, may be inspected and copiedat the SEC�s public reference room at 100 F Street, N.E., Washington, D.C. 20549. Please call the SEC at 1-800-SEC-0330 for further information onthe public reference rooms. In addition, any filings we make electronically with the SEC will be available to the public over the Internet at the SEC�sweb site at http://www.sec.gov.
216
Copyright © 2018 www.secdatabase.com. All Rights Reserved.Please Consider the Environment Before Printing This Document
Table of ContentsItem 11. Quantitative and Qualitative Disclosures About Market Risk
QUALITATIVE DISCLOSURE
Policies for Risk Management and the Use of Derivative Financial Instruments
We face market risk caused by the volatility of hydrocarbon prices, exchange rates and interest rates, credit risk associated with investments andfinancial derivatives, as well as liquidity risk. In order to monitor and manage these risks, we have approved general provisions relating to financial riskmanagement, which are comprised of policies and guidelines that promote an integrated framework for risk management, regulate the use of derivativefinancial instruments (�DFIs�), and guide the development of risk mitigation strategies.
This regulatory framework establishes that DFIs should be used only for the purpose of mitigating financial risk. The use of DFIs for any otherpurpose must be approved in accordance with our current internal regulation. We have a Financial Risk Working Group (FRWG) which is a specializedworking group with decision-making authority on financial risk exposure, financial risk mitigation schemes, and DFIs trading of Petróleos Mexicanos,the subsidiary entities, and where applicable, subsidiary companies.
In addition, certain of the PMI subsidiaries have implemented a regulatory framework for risk management with respect to its activities, whichconsists of policies, guidelines and procedures to manage the market risk associated with its commodity trading activities in accordance with industrybest practices, such as: the use of DFIs for financial risk mitigation purposes; the segregation of duties; valuation and monitoring mechanisms, such asthe generation of a daily portfolio risk report, value at risk (VaR) computation; and VaR limits, both at a global and business unit level and theimplementation of stop loss mechanisms. In addition, PMI Trading also has its own risk management subcommittee that supervises the trading of DFIs.
Approved DFIs are mainly traded on the OTC (Over the Counter) market; however, exchange traded instruments may also be used. In the case ofPMI Trading, DFIs are traded on CME-ClearPort.
The different types of DFIs that we trade are described below in the subsections corresponding to each type of risk and applicable trading markets.See Note 16 to our consolidated financial statements included herein.
One of our policies is to contribute to minimizing the impact that unfavorable changes in financial risk factors have on our financial results bypromoting an adequate balance between expected incoming cash flows from operations and outgoing cash flows related to our liabilities.
As part of the regulatory framework for financial risk management, we have limited and specified the counterparties with which we may tradeDFIs and other financial instruments.
Given that the outstanding DFIs of Petróleos Mexicanos have been entered into for risk mitigation purposes, particularly with economic hedgingpurposes, there is no need to establish and monitor market risk limits.
For those portfolios with an open market risk exposure, our financial risk management regulatory framework establishes the implementation andmonitoring of market risk limits such as VaR and capital at risk (an aggregation of mark-to-market (�MtM�) and profit and loss, or CaR).
We have also established credit guidelines for DFIs that Pemex Industrial Transformation offers to its domestic customers, which include the useof guarantees and credit lines. For exchange traded DFIs, we trade under the margin requirements of the corresponding exchange market, and thereforedo not have internal policies for these DFIs.
217
Copyright © 2018 www.secdatabase.com. All Rights Reserved.Please Consider the Environment Before Printing This Document
Table of ContentsDFIs held with financial counterparties do not require collateral exchange clauses. Notwithstanding, our regulatory framework promotes credit
risk mitigation strategies such as collateral exchange.
We do not have an independent third party to verify the compliance with these internal standards; however, we have internal control proceduresthat certify our compliance with existing policies and guidelines.
Description about Valuation Techniques
Fair Value of DFIs
We periodically evaluate our exposure to international hydrocarbon prices, interest rates and foreign currencies, and we use derivative instrumentsas a mitigation mechanism when potential sources of market risk are identified.
We monitor the fair value of our DFI portfolio on a periodic basis. The fair value represents the price at which one party would assume the rightsand obligations of the other and is calculated for DFIs through models commonly used in the international financial markets, based on inputs obtainedfrom major market information systems and price providers.
Our DFI portfolio is composed primarily of swaps, the prices of which are estimated by discounting flows using the appropriate factors andcontains no exotic instruments that require numerical approximations for their valuation.
We value our DFIs under standard methodologies commonly applied in the financial markets, thereby we do not have an independent third partyto value our DFIs. Nonetheless, we calculate the fair value of our DFIs through the tools developed by our market information providers such asBloomberg, and through valuation models implemented in software packages used to integrate all of our business areas and accounting, such as SystemApplicable Products (SAP). We have no policies to designate a calculation or valuation agent.
Because our hedges are cash flow hedges, their effectiveness is preserved regardless of the variations in the underlying assets or referencevariables, thus asset flows are fully offset by liabilities flows. Therefore, it is not necessary to measure or monitor the hedges� effectiveness.
Fair value hierarchy
Our fair-value assumptions fall under Level 2 of the fair value hierarchy for market participant assumptions, as described below.
The fair values determined by Level 1 inputs utilize quoted prices in financial markets for identical assets or liabilities. Fair values determined byLevel 2 inputs are based on quoted prices for similar assets or liabilities in financial markets, and inputs other than quoted prices that are observed forassets or liabilities. Level 3 inputs are unobservable inputs for the assets or liabilities, and include situations where there is little, if any, market activityfor the assets or liabilities. Management uses appropriate valuation techniques based on the available inputs to measure the fair values of our applicableassets and liabilities.
When available, we measure fair value using Level 1 inputs, because they generally provide the most reliable evidence of fair value.
Liquidity Sources
Liquidity Risk
Our main internal source of liquidity comes from our operations. Additionally, through our debt planning and the purchase and sale of U.S.dollars, we currently preserve a cash balance at a level of liquidity in domestic
218
Copyright © 2018 www.secdatabase.com. All Rights Reserved.Please Consider the Environment Before Printing This Document
Table of Contentscurrency and U.S. dollars that is considered adequate to cover our investment and operating expenses, as well as other payment obligations, such asthose related to DFI�s. In order to preserve a cash balance at a suitable level, during the fourth quarter of 2017, we entered into ten FX swaps of the pesoagainst U.S. dollar for an aggregate amount of U.S. $3.0 billion.
In addition, we have acquired committed revolving credit lines in order to mitigate liquidity risk, two of which provide access to Ps. 3,500 millionand Ps. 20,000 million with expiration dates in June and November 2019, respectively, and three others that provide access to U.S. $1.5 billion, U.S.$3.3 billion and U.S. $2.0 billion with expiration dates in December 2019, February 2020 and January 2021, respectively. Finally, the investmentstrategies of our portfolios are structured by selecting time horizons that consider each currency�s cash flow requirements in order to preserve liquidity.
Certain PMI subsidiaries mitigate their liquidity risk through several mechanisms, the most important of which is the centralized treasury or�in-house bank,� which provides access to a syndicated credit line for up to U.S. $700 million and cash surplus capacity in the custody of thecentralized structure. In addition, certain PMI subsidiaries have access to bilateral credit lines from financial institutions for up to U.S. $650 million.
These companies monitor their cash flow on a daily basis and protect their creditworthiness in the financial markets. Liquidity risk is mitigated bymonitoring the maximum/minimum permissible financial ratios as set forth in the policies approved by each company�s board of directors.
Changes in Exposure to Main Risks
Market Risk
(i) Interest Rate Risk
We are exposed to fluctuations in floating interest rate liabilities. We are exposed to U.S. dollar LIBOR and to Mexican peso TIIE. As ofDecember 31, 2017, approximately 15.6 % of our total net debt outstanding consisted of floating rate debt.
Moreover, we invest in pesos and U.S. dollars in compliance with applicable internal regulations, through portfolios that have different purposesthat seek an adequate return subject to risk parameters that reduce the probability of capital losses. The objective of the investments made through theseportfolios is to meet our obligations payable in pesos and U.S. dollars.
The investments made through our portfolios are exposed to domestic and international interest rate risk and credit spread risk derived fromgovernment and corporate securities, and inflation risk arising from the relationship between UDIs and pesos. However, these risks are mitigated byestablished limits on exposure to market risk.
Interest Rate Swaps
Occasionally, for strategic reasons or in order to offset the expected inflows and outflows, we have entered into interest rate swaps. Under ourinterest rate swap agreements, we acquire the obligation to make payments based on a fixed interest rate and are entitled to receive floating interest ratepayments based on LIBOR, TIIE or a rate referenced to or calculated from TIIE.
As of December 31, 2017, we were a party to four interest rate swap agreements denominated in U.S. dollars for an aggregate notional amount ofU.S. $ 1,623.75 million at a weighted average fixed interest rate of 2.35% and a weighted average term of 7.3 years.
Similarly, in order to eliminate the volatility associated with variable interest rates of long-term financing operations, PMI NASA has executedinterest rate swap agreements denominated in U.S. dollars for an
219
Copyright © 2018 www.secdatabase.com. All Rights Reserved.Please Consider the Environment Before Printing This Document

Table of Contentsoutstanding aggregate notional amount of U.S. $ 71.94 million, at a weighted average fixed interest rate of 4.17% and a weighted average term of 4.41years.
(ii) Exchange Rate Risk
Most of our revenues are denominated in U.S. dollars, a significant amount of which is derived from exports of crude oil and petroleum products,which are priced and payable in U.S. dollars. Moreover, our revenues from domestic sales of gasoline and diesel, net of IEPS Tax, tax duties, incentives,and other related taxes, as well as domestic sales of natural gas, LPG, petrochemicals and our byproducts are referenced to international U.S. dollar-denominated prices.
Our expenses related to hydrocarbon duties are calculated based on international U.S. dollar-denominated prices and the cost of hydrocarbonimports that we acquire for resale in Mexico or use in our facilities are indexed to international U.S. dollar-denominated prices. By contrast, our capitalexpenditure and operating expenses are established in pesos.
As a result of this cash flow structure, the depreciation of the peso against the U.S. dollar increases our financial balance. The appreciation of thepeso relative to the U.S. dollar has the opposite effect. We manage this risk without the need for hedging instruments, because the impact on ourrevenues of fluctuations in the exchange rate between the U.S. dollar and the peso is offset in whole or in part by its impact on our obligations.
Cross-Currency Swaps
We prioritize debt issuances denominated in U.S. dollars; nonetheless, this is not always achievable and hence non-U.S. dollar-denominated debtissued in international currencies is hedged through DFIs, either with swaps to convert the debt into U.S. dollars or through other DFIs to mitigate ourexchange rate risk exposure. The rest of the debt is denominated in pesos or in UDIs, for which most of the debt denominated in UDIs has beenconverted into pesos through DFIs in order to eliminate the inflationary risk exposure.
As a consequence of the above, our debt issued in international currencies other than U.S. dollars has exchange rate risk mitigation strategies.Through these strategies, we have further sought to reduce our cost of funding by leaving, in some cases, part of this exchange rate exposure unhedgedwhen assessed appropriate.
The underlying currencies of our DFIs are the euro, Swiss franc, Japanese yen, Pound sterling and Australian dollar against the U.S. dollar andUDIs against the peso.
In 2017, we entered into various cross-currency swaps to hedge inflation risk arising from debt obligations denominated in UDIs for an aggregatenotional amount of Ps. 6,291.97 million. During 2016, we entered into the same kind of instruments to hedge currency risk arising from debt obligationsdenominated in euros and Swiss francs, for an aggregate notional amount of U.S. $3,459.2 million and the inflation risk arising from debt denominatedin UDIs, for an aggregate notional amount of Ps. 1,077.1 million.
Most of our cross-currency swaps are plain vanilla except for one swap entered into in 2004 to hedge our exposure to euros, which expired in2016. This swap was referred to as an �extinguishing swap� and was obtained in order to hedge long-term obligations. The main characteristic ofextinguishing swaps is that these DFIs terminate upon the occurrence of any of the credit default events specified in the DFI contract confirmation,without any payment obligation by either party. This swap had a notional amount of U.S. $1,146.4 million.
Moreover, in 2017 we entered into, without cost, three options structures called �Seagull Option� to hedge the notional risk of three debt issues ineuros for an aggregate notional amount of � 4,250 million. These structures protect the short exposure in euros against an appreciation of the euro versusthe U.S. dollar in a specific range, and recognize a benefit if the euro depreciates up to a certain exchange rate, for each debt issue. In order to mitigatethe exchange rate risk caused by the coupons of these issues we entered into only coupon swaps.
220
Copyright © 2018 www.secdatabase.com. All Rights Reserved.Please Consider the Environment Before Printing This Document
Table of ContentsAdditionally, we entered into, without cost, a structure which is composed of a cross-currency swap and the sale of a call option, in order to hedge
the notional risk of a debt issue in Pounds sterling for £450 million, guaranteeing complete protection up to a certain exchange rate and partial protectionabove that level.
In 2016, we entered into, without cost, an options structure called �Seagull Option� in order to cover the notional risk of a debt issue in Japaneseyen for ¥80,000 million, keeping the coupons in the original currency (0.5% annual coupon rate). This structure protects the short exposure in Japaneseyen against an appreciation of the Japanese yen versus the U.S. dollar in a specific range, and recognizes a benefit if the Japanese yen depreciates up to acertain exchange rate.
We recorded a total net foreign exchange gain of Ps. 23,184.1 million for the year ended December 31, 2017 and a total net foreign exchange lossof Ps. 254,012.7 million and Ps. 154,765.6 million for the years ended December 31, 2016 and 2015, respectively. These gains and losses includeunrealized foreign exchange gains associated with debt of Ps. 16,685.4 million for the year ended December 31, 2017 and unrealized foreign exchangeloss associated with debt of Ps. 243,182.8 million and Ps. 152,554.5 million for the years ended December 31, 2016 and 2015, respectively. Theappreciation of the peso caused a total net foreign exchange gain in 2017 because a significant portion of our debt, 89.4% (principal only) as ofDecember 31, 2017, is denominated in foreign currency. Unrealized foreign exchange gains and losses do not impact our cash flows. Due to the cashflow structure described above, the depreciation of the peso relative to the U.S. dollar does not affect our ability to meet U.S. dollar-denominatedfinancial obligations and it improves our ability to meet peso-denominated financial obligations. On the other hand, the appreciation of the peso relativeto the U.S. dollar may increase our peso-denominated debt service costs on a U.S. dollar basis. Our foreign exchange gain in 2017 was due to theappreciation of the peso, from Ps. 20.6640 = U.S. $1.00 on December 31, 2016 to Ps. 19.7867 = U.S. $1.00 on December 31, 2017. Our foreignexchange loss in 2016 was due to the depreciation of the peso, from Ps. 17.2065 = U.S. $1.00 on December 31, 2015 to Ps. 20.6640 = U.S. $1.00 onDecember 31, 2016. Our foreign exchange loss in 2015 was due to the depreciation of the peso, from Ps. 14.7180 = U.S. $1.00 on December 31, 2014 toPs. 17.20650 = U.S. $1.00 on December 31, 2015.
Certain of the PMI subsidiaries face market risks generated by fluctuations in foreign exchange rates. In order to mitigate these risks, the boards ofdirectors of several of these companies have authorized a policy which stipulates that no more than 5% of a company�s total financial assets may bedenominated in a currency other than its functional currency, unless the company owes a duty or expected payment in a currency other than itsfunctional one. Accordingly, certain of the PMI subsidiaries will, from time to time, enter into DFIs in order to mitigate the risk associated withfinancing operations denominated in currencies other than a company�s functional currency.
Finally, a significant amount of PMI Trading�s income and expenses, including the cost of sales and related sales costs, is derived from the tradeof refined products, petrochemicals and gas liquids to our subsidiaries and third parties, whose prices are determined and are payable in U.S. dollars.PMI Trading�s exposure to foreign currency risk results primarily from the need to fund tax payments denominated in domestic currency, as well asfrom certain related sales costs denominated in domestic currency.
PMI Trading believes it can adequately manage the risk created by the payment of taxes in domestic currency without the need to enter intohedging instruments because the exposure to this risk is marginal relative to the total flows of U.S. dollar. In addition, in the event that a potentialforeign exchange risk arises in connection with a commercial transaction, PMI Trading may implement risk mitigation measures by entering into DFIs.
(iii) Hydrocarbon Price Risk
We periodically assess our revenues and expenditures structure in order to identify the main market risk factors that our cash flows are exposed toin connection with international hydrocarbon prices. Based on this
221
Copyright © 2018 www.secdatabase.com. All Rights Reserved.Please Consider the Environment Before Printing This Document
Table of Contentsassessment, we monitor our exposure to the most significant risk factors and quantify their impact on our financial balance.
Our exports and domestic sales are directly or indirectly related to international hydrocarbon prices. Therefore, we are exposed to fluctuations inthese prices. In terms of crude oil and natural gas, part of this risk is transferred to the Mexican Government under our current fiscal regime.
We continuously evaluate the implementation of risk mitigation strategies, including those involving the use of DFIs, while taking into accountoperational and economic constraints.
Our exposure to hydrocarbon prices is partly mitigated by natural hedges between our inflows and outflows.
Since 2016, as a result of the changes in our fiscal regime, our sensitivity to crude oil prices has decreased. Nonetheless, we worked on hedgingstrategies for the following years in order to reduce our exposure to potential drops in the crude oil price.
Commodity Derivatives
In April 2017, we entered into a crude oil hedge to partially protect our cash flows from a decrease in the Mexican crude oil basket price belowthat established in the Federal Revenue Law. We hedged 409 thousand barrels per day from May to December 2017 for U.S. $133.5 million. As a resultof this strategy, we had an income of U.S. $205.7 million.
During the fourth quarter of 2017, we entered into a crude oil hedge to partially protect our cash flows for the fiscal year 2018, from a decrease inthe Mexican crude oil basket price below that established in the 2018 Federal Revenue Law. We hedged 440 thousand barrels per day from January toDecember 2018 for U.S. $449.9 million.
In addition to supplying natural gas, Pemex Industrial Transformation offers DFIs to its domestic customers in order to provide them with supportto mitigate the risk associated with the volatility of natural gas prices. Until 2016, Pemex Industrial Transformation entered into DFIs with Mex GasSupply, S.L. under the opposite position to those DFIs offered to its customers in order to mitigate the market risk it bears under such offered DFIs. MexGas Supply, S.L. then transferred the related price risk derived from the DFI position held with Pemex Industrial Transformation to internationalfinancial counterparties by entering into these opposite position DFIs with such parties. As of 2017, Pemex Industrial Transformation must enter intoDFIs with Petróleos Mexicanos under the opposite position to those DFIs offered to its customers, thereby replacing Mex Gas Supply, S.L. However, asof December 31, 2017, no DFIs had been carried out under this mechanism. Through these mechanisms, Pemex Industrial Transformation maintains anegligible or even null exposure to market risk. These portfolios have VaR and CaR limits in order to limit market risk exposure.
PMI Trading faces market risk generated by the terms of the purchase and sale of refined products and natural gas liquids, as well as the volatilityof oil prices. Accordingly, it frequently enters into DFIs in order to mitigate this risk, thereby reducing the volatility of its financial results.
In accordance with the risk management regulatory framework that PMI Trading has implemented, VaR and the change in profit and loss byportfolio are calculated daily and compared to the maximum applicable limits in order to implement risk mitigation mechanisms as necessary.
(iv) Risks Related to the Portfolio of Third-Party Shares
During 2017, PMI subsidiaries liquidated the total shareholding in Repsol, S.A. (Repsol), which was 23,416,219 shares. As a result, as ofDecember 31, 2017, we do not hold any third-party shares of companies that do not report on the financial markets and, therefore, we do not hold anyrelated DFIs.
222
Copyright © 2018 www.secdatabase.com. All Rights Reserved.Please Consider the Environment Before Printing This Document

Table of ContentsCounterparty or Credit Risk
When the fair value of a DFI is favorable to us, we face the risk that the counterparty will not be able to meet its obligations. We monitor ourcounterparties� creditworthiness and calculate the credit risk exposure for our DFIs. As a risk mitigation strategy, we only enter into DFIs with majorfinancial institutions with a minimum credit rating of BBB-. These ratings are issued and revised periodically by risk rating agencies. Furthermore, weseek to maintain a diversified portfolio of counterparties.
In order to estimate our credit risk exposure to each financial counterparty, the potential future exposure is calculated by projecting the risk factorsused in the valuation of each DFI in order to estimate the MtM value for different periods, taking into account any credit risk mitigation provisions.
Moreover, we have entered into various long-term cross-currency swaps agreements with �recouponing� provisions (pursuant to which thepayments on the swaps are adjusted when the MtM exceeds the relevant threshold specified in the swap), thereby limiting our exposure with ourcounterparties to a specific threshold amount. The specified thresholds were reached in three cross-currency swaps from the first to the fourth quarter of2017, which were used to hedge the exchange rate exposure to the euro and in five cross-currency swaps during 2016, which were used to hedge theexchange rate exposure to the Pound sterling. This resulted in the cash settlement of such swaps and the resetting of swap terms to return theirmark-to-market value to zero. During 2017, we did not enter into any cross-currency swap with these characteristics.
In addition, during 2016 we entered into long-term DFIs with mandatory early termination clauses (pursuant to which, at a given date, andirrespective of the then current MtM, the DFI will terminate and settle at the corresponding MtM, and we can either enter into a new DFI with the samecounterparty or a new counterparty) which reduces the credit risk generated by the term of the DFI by bounding it to a specific date. As of December 31,2017, we have entered into three euro swaps and two Japanese yen Seagull Option structures, with termination clauses in 2018 and 2021, respectively.
According to IFRS 13 �Fair Value Measurement,� the fair value or MtM value of DFIs must reflect the creditworthiness of the parties.Consequently, the fair value of a DFI takes into account the risk that either party may default on its obligation. In accordance with market best practices,we apply the credit value adjustment (�CVA�) method to calculate the fair value of our DFIs.
For each DFI, the CVA is calculated by determining the difference between the MtM and the estimated MtM adjusted for credit risk. Indetermining the credit risk, the CVA method takes into account the current market perception about the credit risk of both counterparties, using thefollowing inputs: (a) the MtM projection for each payment date based on forward yield curves; (b) the implied default probability obtained from both usand the counterparty�s credit default swaps, at each payment date; and (c) the default recovery rates of each counterparty.
Furthermore, by means of its credit guidelines for DFI operations, Pemex Industrial Transformation has significantly reduced its credit riskexposure related to the DFIs offered to its customers to assist them in mitigating the risk associated with the price volatility of natural gas.
In order to qualify for these DFIs, Pemex Industrial Transformation�s customers must be party to a current natural gas supply contract and sign adomestic master derivative agreement.
Additionally, beginning on October 2, 2009, DFIs with these customers must be initially secured by cash deposits, letters of credit or othercollateral provisions, as required. In accordance with these guidelines, in the event that a client does not meet its payment obligations, DFIs related tothis client are terminated, rights to collateral are exercised and, if the collateral is insufficient to cover the fair value, natural gas supply is suspendeduntil the payment is made.
223
Copyright © 2018 www.secdatabase.com. All Rights Reserved.Please Consider the Environment Before Printing This Document

Table of ContentsOn August 20, 2014, certain amendments to the credit guidelines were enacted which allowed Pemex-Gas and Petrochemicals, and now Pemex
Industrial Transformation, to offer to its clients with an adequate credit rating, based on an internal financial and credit assessment, DFIs with anexemption from collateral requirements up to certain amount through a credit line approved by the credit committee. Moreover, if the credit line isinsufficient to cover each client�s exposure, the client is obligated to deposit collateral. If a client suffers an event of default, DFIs related to this clientare terminated early and natural gas supply is suspended until the payment is made.
PMI Trading�s credit risk associated with DFI transactions is minimized through the use of futures and standardized instruments that are clearedthrough CME-ClearPort.
Accounting Standards Applied and the Impact on Results
We enter into derivatives transactions with the sole purpose of hedging financial risks related to our operations, firm commitments, plannedtransactions and assets and liabilities recorded on our statement of financial position. Nonetheless, some of these transactions do not qualify for hedgeaccounting treatment because they do not meet the requirements of the accounting standards for being designated as hedges. They are therefore recordedin the financial statements as non-hedge instruments or as instruments entered into for trading purposes, despite the fact that their cash flows are offsetby the cash flows of the positions (assets or liabilities) to which they are related. As a result, the changes in their fair value are recognized in the�Derivative financial instruments (cost) income�net� line item in the consolidated statement of comprehensive income.
As of December 31, 2017 and 2016, the net fair value of our DFIs, including both DFIs that have not reached maturity and those that have reachedmaturity but have not been settled, recognized in our consolidated statement of financial position, was Ps. 12,367.5 million and Ps. (26,010.5) million,respectively. As of December 31, 2017 and 2016, we did not have any DFIs designated as hedges. See Note 16 to our consolidated financial statementsincluded herein.
For the year ended December 31, 2017, we recognized a net gain of Ps. 25,338.3 million and for the years ended December 31, 2016 and 2015, werecognized a net loss of Ps. 14,001.0 million and Ps. 21,449.9 million, respectively, in the �Derivative financial instruments (cost) income, net� line itemwith respect to DFIs treated as instruments entered into for trading purposes.
According to established accounting policies, we have analyzed the different contracts that we have entered into and have determined thataccording to the terms thereof none of these agreements meet the criteria to be classified as embedded derivatives. Accordingly, as of December 31,2017 and 2016, we did not recognize any embedded derivatives (foreign currency or index).
QUANTITATIVE DISCLOSURE
Fair Value
The following tables show our cash flow maturities as well as the fair value of our debt and DFI portfolios as of December 31, 2017. It should benoted that:
� For debt obligations, these tables present principal cash flow and the weighted average interest rates for fixed rate debt.
� For interest rate swaps, cross-currency swaps, currency options and currency forwards, these tables present notional amounts and weightedaverage interest rates by expected (contractual) maturity dates.
� Weighted average variable rates are based on implied forward rates obtained from the interbank market yield curve at the reporting date.
224
Copyright © 2018 www.secdatabase.com. All Rights Reserved.Please Consider the Environment Before Printing This Document
Table of Contents� For natural gas DFIs, volumes are presented in millions of British thermal units (MMBtu), and fixed average and strike prices are presented
in U.S. dollars per MMBtu.
� For crude oil, volumes are presented in millions of barrels, and fixed average and strike prices are presented in U.S. dollars per barrel.
� A DFI�s fair value includes CVA and is calculated based on market quotes obtained from market sources such as Bloomberg. Forwardcurves and implied volatilities for natural gas and crude oil are supplied by the Kiodex Risk Workbench platform.
� For PMI Trading, the prices used in commercial transactions and DFIs are published by reputable sources that are widely used ininternational markets, such as CME-NYMEX, Platts and Argus, among others.
� Fair value is calculated internally, either by discounting cash flows with the corresponding zero-coupon yield curve in the original currency,or through other standard methodologies commonly used in financial markets for specific instruments.
� For all instruments, the tables are based on the contract terms in order to determine the future cash flows that are categorized by expectedmaturity dates.
This information is presented in thousands of pesos (except as noted).
225
Copyright © 2018 www.secdatabase.com. All Rights Reserved.Please Consider the Environment Before Printing This Document
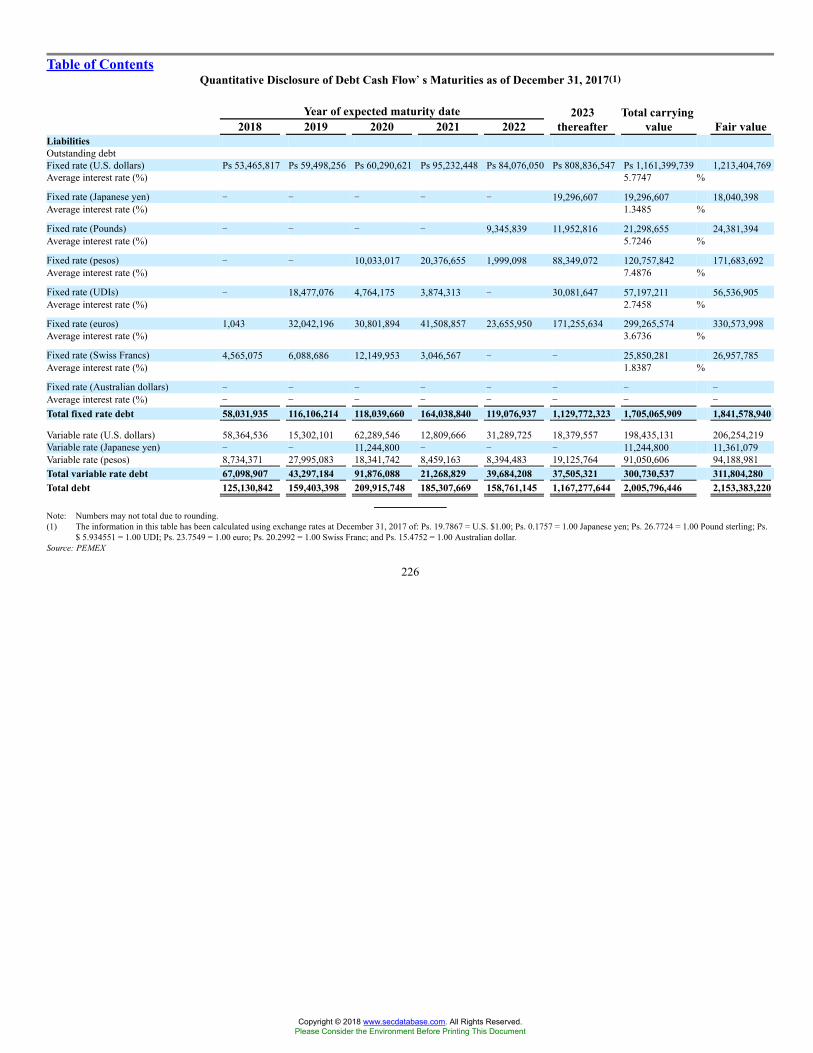
Table of ContentsQuantitative Disclosure of Debt Cash Flow��s Maturities as of December 31, 2017(1)
Year of expected maturity date2018 2019 2020 2021 2022
2023thereafter
Total carryingvalue Fair value
LiabilitiesOutstanding debtFixed rate (U.S. dollars) Ps 53,465,817 Ps 59,498,256 Ps 60,290,621 Ps 95,232,448 Ps 84,076,050 Ps 808,836,547 Ps 1,161,399,739 1,213,404,769Average interest rate (%) 5.7747 %
Fixed rate (Japanese yen) � � � � � 19,296,607 19,296,607 18,040,398Average interest rate (%) 1.3485 %
Fixed rate (Pounds) � � � � 9,345,839 11,952,816 21,298,655 24,381,394Average interest rate (%) 5.7246 %
Fixed rate (pesos) � � 10,033,017 20,376,655 1,999,098 88,349,072 120,757,842 171,683,692Average interest rate (%) 7.4876 %
Fixed rate (UDIs) � 18,477,076 4,764,175 3,874,313 � 30,081,647 57,197,211 56,536,905Average interest rate (%) 2.7458 %
Fixed rate (euros) 1,043 32,042,196 30,801,894 41,508,857 23,655,950 171,255,634 299,265,574 330,573,998Average interest rate (%) 3.6736 %
Fixed rate (Swiss Francs) 4,565,075 6,088,686 12,149,953 3,046,567 � � 25,850,281 26,957,785Average interest rate (%) 1.8387 %
Fixed rate (Australian dollars) � � � � � � � �Average interest rate (%) � � � � � � � �
Total fixed rate debt 58,031,935 116,106,214 118,039,660 164,038,840 119,076,937 1,129,772,323 1,705,065,909 1,841,578,940
Variable rate (U.S. dollars) 58,364,536 15,302,101 62,289,546 12,809,666 31,289,725 18,379,557 198,435,131 206,254,219Variable rate (Japanese yen) � � 11,244,800 � � � 11,244,800 11,361,079Variable rate (pesos) 8,734,371 27,995,083 18,341,742 8,459,163 8,394,483 19,125,764 91,050,606 94,188,981Total variable rate debt 67,098,907 43,297,184 91,876,088 21,268,829 39,684,208 37,505,321 300,730,537 311,804,280Total debt 125,130,842 159,403,398 209,915,748 185,307,669 158,761,145 1,167,277,644 2,005,796,446 2,153,383,220
Note: Numbers may not total due to rounding.(1) The information in this table has been calculated using exchange rates at December 31, 2017 of: Ps. 19.7867 = U.S. $1.00; Ps. 0.1757 = 1.00 Japanese yen; Ps. 26.7724 = 1.00 Pound sterling; Ps.
$ 5.934551 = 1.00 UDI; Ps. 23.7549 = 1.00 euro; Ps. 20.2992 = 1.00 Swiss Franc; and Ps. 15.4752 = 1.00 Australian dollar.Source: PEMEX
226
Copyright © 2018 www.secdatabase.com. All Rights Reserved.Please Consider the Environment Before Printing This Document
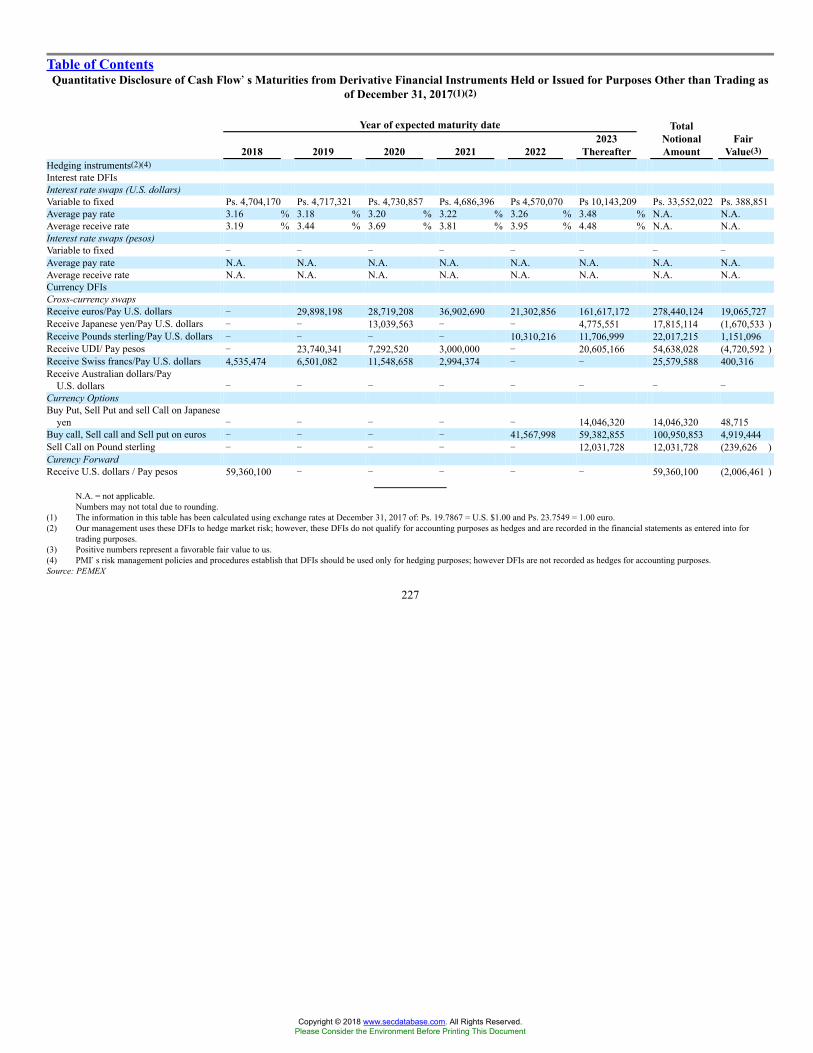
Table of ContentsQuantitative Disclosure of Cash Flow��s Maturities from Derivative Financial Instruments Held or Issued for Purposes Other than Trading as
of December 31, 2017(1)(2)
Year of expected maturity date
2018 2019 2020 2021 20222023
Thereafter
TotalNotionalAmount
FairValue(3)
Hedging instruments(2)(4)Interest rate DFIsInterest rate swaps (U.S. dollars)Variable to fixed Ps. 4,704,170 Ps. 4,717,321 Ps. 4,730,857 Ps. 4,686,396 Ps 4,570,070 Ps 10,143,209 Ps. 33,552,022 Ps. 388,851Average pay rate 3.16 % 3.18 % 3.20 % 3.22 % 3.26 % 3.48 % N.A. N.A.Average receive rate 3.19 % 3.44 % 3.69 % 3.81 % 3.95 % 4.48 % N.A. N.A.Interest rate swaps (pesos)Variable to fixed � � � � � � � �Average pay rate N.A. N.A. N.A. N.A. N.A. N.A. N.A. N.A.Average receive rate N.A. N.A. N.A. N.A. N.A. N.A. N.A. N.A.Currency DFIsCross-currency swapsReceive euros/Pay U.S. dollars � 29,898,198 28,719,208 36,902,690 21,302,856 161,617,172 278,440,124 19,065,727Receive Japanese yen/Pay U.S. dollars � � 13,039,563 � � 4,775,551 17,815,114 (1,670,533 )Receive Pounds sterling/Pay U.S. dollars � � � � 10,310,216 11,706,999 22,017,215 1,151,096Receive UDI/ Pay pesos � 23,740,341 7,292,520 3,000,000 � 20,605,166 54,638,028 (4,720,592 )Receive Swiss francs/Pay U.S. dollars 4,535,474 6,501,082 11,548,658 2,994,374 � � 25,579,588 400,316Receive Australian dollars/Pay
U.S. dollars � � � � � � � �Currency OptionsBuy Put, Sell Put and sell Call on Japanese
yen � � � � � 14,046,320 14,046,320 48,715Buy call, Sell call and Sell put on euros � � � � 41,567,998 59,382,855 100,950,853 4,919,444Sell Call on Pound sterling � � � � � 12,031,728 12,031,728 (239,626 )Curency ForwardReceive U.S. dollars / Pay pesos 59,360,100 � � � � � 59,360,100 (2,006,461 )
N.A. = not applicable.Numbers may not total due to rounding.
(1) The information in this table has been calculated using exchange rates at December 31, 2017 of: Ps. 19.7867 = U.S. $1.00 and Ps. 23.7549 = 1.00 euro.(2) Our management uses these DFIs to hedge market risk; however, these DFIs do not qualify for accounting purposes as hedges and are recorded in the financial statements as entered into for
trading purposes.(3) Positive numbers represent a favorable fair value to us.(4) PMI�s risk management policies and procedures establish that DFIs should be used only for hedging purposes; however DFIs are not recorded as hedges for accounting purposes.Source: PEMEX
227
Copyright © 2018 www.secdatabase.com. All Rights Reserved.Please Consider the Environment Before Printing This Document
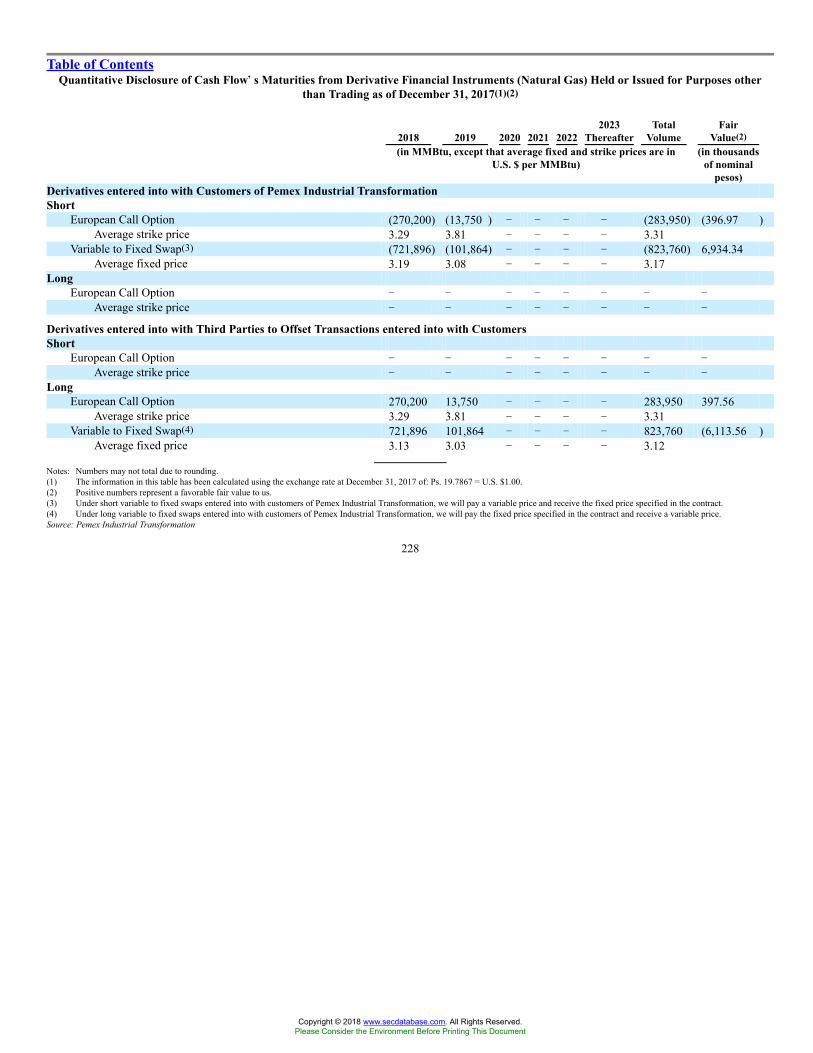
Table of ContentsQuantitative Disclosure of Cash Flow��s Maturities from Derivative Financial Instruments (Natural Gas) Held or Issued for Purposes other
than Trading as of December 31, 2017(1)(2)
2018 2019 2020 2021 20222023
ThereafterTotal
VolumeFair
Value(2)(in MMBtu, except that average fixed and strike prices are in
U.S. $ per MMBtu)(in thousands
of nominalpesos)
Derivatives entered into with Customers of Pemex Industrial TransformationShort
European Call Option (270,200) (13,750 ) � � � � (283,950) (396.97 )Average strike price 3.29 3.81 � � � � 3.31
Variable to Fixed Swap(3) (721,896) (101,864) � � � � (823,760) 6,934.34Average fixed price 3.19 3.08 � � � � 3.17
LongEuropean Call Option � � � � � � � �
Average strike price � � � � � � � �
Derivatives entered into with Third Parties to Offset Transactions entered into with CustomersShort
European Call Option � � � � � � � �Average strike price � � � � � � � �
LongEuropean Call Option 270,200 13,750 � � � � 283,950 397.56
Average strike price 3.29 3.81 � � � � 3.31Variable to Fixed Swap(4) 721,896 101,864 � � � � 823,760 (6,113.56 )
Average fixed price 3.13 3.03 � � � � 3.12
Notes: Numbers may not total due to rounding.(1) The information in this table has been calculated using the exchange rate at December 31, 2017 of: Ps. 19.7867 = U.S. $1.00.(2) Positive numbers represent a favorable fair value to us.(3) Under short variable to fixed swaps entered into with customers of Pemex Industrial Transformation, we will pay a variable price and receive the fixed price specified in the contract.(4) Under long variable to fixed swaps entered into with customers of Pemex Industrial Transformation, we will pay the fixed price specified in the contract and receive a variable price.Source: Pemex Industrial Transformation
228
Copyright © 2018 www.secdatabase.com. All Rights Reserved.Please Consider the Environment Before Printing This Document

Table of ContentsQuantitative Disclosure of Cash Flows�� Maturities from Derivative Financial Instruments (Petroleum Products) Held or Issued for Purposes
other than Trading as of December 31, 2017(1)
2018 2019 2020 2021 20222023
ThereafterTotal
VolumeFair
Value(2)(in thousands of barrels) (in thousands
of nominalpesos)
Hedging InstrumentsExchange-traded futures(3) (5) 2.1 � � � � � 2.1 (141,693 )Exchange-traded swaps(4) (5) 1.3 � � � � � 1.3 (99,680 )
Note: Numbers may not total due to rounding.(1) The information in this table has been calculated using the exchange rate at December 31, 2017 of: Ps. 19.7867 = U.S. $1.00.(2) Positive numbers represent a favorable fair value to PMI Trading.(3) Net position.(4) Swaps registered in CME ClearPort are included in these figures.(5) The balance of these financial instruments is recognized as cash and cash equivalents. PMI Trading considered these financial assets to be fully liquid.Source: P.M.I. Trading, Ltd.
Sensitivity Analysis
We have entered into DFIs with the purpose to completely mitigate the market risk for specific flows or predetermined volumes associated withour operations. Our DFIs have the same characteristics (e.g. underlying assets, payment dates, amounts, or volumes) as the hedged position, but with theopposite exposure to the market risk factors. As a result of these mitigation strategies, we have a negligible sensitivity to the hedged market risk factors.See Note 16 from our consolidated financial statements included herein.
As discussed above, because our hedges are cash flow hedges, their effectiveness is maintained regardless of variations in the underlying assets orreference variables since, through time, asset flows are fully offset by liabilities flows. Therefore, it is not necessary to measure or monitor the hedgeeffectiveness.
Natural gas DFIs that Pemex Industrial Transformation offers to its domestic customers are reported as transactions with trading purposes.However, such operations are fully compensated by the operations entered into with their financial counterparts through Petróleos Mexicanos, whichreplaced Mex Gas Supply, S.L. as of 2017. Through this mechanism (back-to-back), Pemex Industrial Transformation maintains a negligible or evennull market risk exposure, so we do not consider it necessary to conduct either a sensitivity analysis or to measure or monitor the hedge effectiveness.
Other DFIs seek to hedge the changes in the price of the commercialized products, such that the DFIs� underlying assets have correlations withthe prices of the products involved in commercialization. PMI Trading estimates the Value at Risk (VaR) of these DFIs. Notably, DFIs of PMI Trading(all of them related to petroleum derivatives), are classified under cash and cash equivalents for accounting purposes due to their liquidity.
Item 12. Description of Securities Other than Equity Securities
Not applicable.
229
Copyright © 2018 www.secdatabase.com. All Rights Reserved.Please Consider the Environment Before Printing This Document
Table of ContentsPART II
Item 13. Defaults, Dividend Arrearages and Delinquencies
None.
Item 14. Material Modifications to the Rights of Security Holders and Use of Proceeds
None.
Item 15. Controls and Procedures
(a) Disclosure Controls and Procedures
We carried out an evaluation under the supervision and with the participation of our management, including our Director General (ChiefExecutive Officer or CEO) and our Director Corporativo de Finanzas (Chief Financial Officer or CFO), of the effectiveness of the design and operationof our disclosure controls and procedures as of December 31, 2017. There are inherent limitations to the effectiveness of any system of disclosurecontrols and procedures, including the possibility of human error and the circumvention or overriding of the controls and procedures. Accordingly,effective disclosure controls and procedures can provide only reasonable assurance of achieving their control objectives.
Based upon our evaluation, and because of the material weakness in internal control over financial reporting described below, our CEO and CFOconcluded that our disclosure controls and procedures as of December 31, 2017 were not effective to provide reasonable assurance that informationrequired to be disclosed in the reports we file and submit under the Exchange Act is recorded, processed, summarized and reported within the timeperiods specified in the SEC�s rules and forms, and that such information is accumulated and communicated to our management, including to our CEOand CFO, as appropriate, to allow timely decisions regarding required disclosures.
(b) Management��s Annual Report on Internal Control over Financial Reporting
Management is responsible for establishing and maintaining adequate internal control over financial reporting. Our internal control over financialreporting is a process designed to provide reasonable assurance regarding the reliability of financial reporting and the preparation of financial statementsfor external purposes in accordance with IFRS. Our internal control over financial reporting includes those policies and procedures that:
(1) pertain to the maintenance of records that, in reasonable detail, accurately and fairly reflect the transactions and dispositions of our assets;
(2) provide reasonable assurance that transactions are recorded as necessary to permit preparation of financial statements in accordance withIFRS and with Item 18 of Form 20-F, and that our receipts and expenditures are being made only in accordance with authorizations ofmanagement and directors of the relevant entity; and
(3) provide reasonable assurance regarding prevention or timely detection of unauthorized acquisition, use or disposition of our assets thatcould have a material effect on our financial statements.
Because of its inherent limitations, internal control over financial reporting may not prevent or detect misstatements. Also, projections of anyevaluation of effectiveness for future periods are subject to the risk that the related controls may become inadequate because of changes in conditions, orthat the degree of compliance with policies or procedures may deteriorate.
We conducted an assessment of the effectiveness of our internal controls over financial reporting as of December 31, 2017. In making thisassessment, management used the criteria set for in the �Internal Control�
230
Copyright © 2018 www.secdatabase.com. All Rights Reserved.Please Consider the Environment Before Printing This Document
Table of ContentsIntegrated Framework� published by the Committee of Sponsoring Organizations of the Treadway Commission in 2013, supplemented for informationtechnologies with the guidelines suggested by IT Control Objectives for Sarbanes-Oxley (3rd Edition), published by the Information Systems Audit andControl Association, in effect as of December 31, 2015. Management relied on Auditing Standard No. 2201 of the PCAOB in order to create anappropriate framework to evaluate the effectiveness of the design and operation of our internal control over financial reporting.
Management concluded that our internal control over financial reporting was not effective as of December 31, 2017. Based on our assessment andcriteria, management concluded that a material weakness existed in connection with our internal control over financial reporting as of December 31,2017 that affected our calculation of recognized deferred taxes at the time that we filed our unaudited consolidated financial statements with theMexican Stock Exchange. Due to the lack of consistency in the reporting of, and the failure to timely determine, the amounts of the variables used in thecalculation of deferred taxes, and the ineffectiveness of controls to review and authorize such calculation, we were unable to ascertain with reasonableassurance the amount of deferred taxes for the fiscal year ended December 31, 2017. In addition, the calculation of deferred taxes included in ourunaudited consolidated financial statements did not take into account new regulations issued by the Ministry of Finance and Public Credit. OnAugust 18, 2017, the Ministry of Finance and Public Credit published a decree that increased the amount that could be deducted for investments, costsand expenses when calculating the Derecho por la Utilidad Compartida (�Profit-Sharing Duty�). On November 30, 2017, the Ministry of Finance andPublic Credit issued an additional decree that revised the methodology for calculating the value of hydrocarbons, which has an effect on thedetermination of the volumes and prices of crude oil, gas and condensates used to calculate the Profit-Sharing Duty. These new regulations, which wedid not reflect at the time that we presented our unaudited consolidated financial statements to the Mexican Stock Exchange, had an impact on thecalculation of deferred taxes.
As a result, our unaudited consolidated financial statements as of and for the year ended December 31, 2017 reflected a net loss in the amount ofPs. 333.4 billion. In connection with the preparation of our audited consolidated financial statements, we were able to determine the definitive amountsof the variables used in the calculation of deferred taxes and performed the calculation in accordance with the new regulations. As a result, we reported anet loss of Ps. 280.9 billion, or Ps. 52.5 billion less than the Ps. 333.4 billion we reported in our unaudited consolidated financial statements. Thisfavorable effect was primarily due to the Ps. 37.2 billion increase in deferred taxes resulting from the implementation of the new regulations issued bythe Ministry of Finance and Public Credit.
Although the effect is favorable, the difference between the deferred taxes disclosed in our unaudited consolidated financial statements and ouraudited consolidated financial statements as of and for the year ended December 31, 2017�an amount equal to Ps. 54.3 billion�is material and reflects afailure of our internal controls to include a mechanism to ensure that our calculation of deferred taxes is accurate and that the disclosure of our unauditedfinancial results in respect of deferred taxes is consistent with the disclosure of our audited results.
In response to the material weakness described above, we are in the process of executing a remediation plan that includes the following actions:
1. Comprehensive review of the process for consolidating, reviewing and finalizing the financial statements of Petróleos Mexicanos and itssubsidiary entities.
2. Automation of our information systems used to calculate deferred taxes, formalization of access control roles and segregation of the relevantduties, and the preparation, supervision and authorization of deferred tax calculations.
3. Implementation of periodic, rather than annual, calculations of the amount of deferred taxes to be recognized in the financial statements ofPetróleos Mexicanos and its subsidiary entities.
231
Copyright © 2018 www.secdatabase.com. All Rights Reserved.Please Consider the Environment Before Printing This Document
Table of Contents4. Update of the relevant internal procedures to ensure the responsibility and oversight of the specific operational areas involved in reporting the
underlying information necessary to calculate deferred taxes.
5. Strengthening and periodic monitoring of the existing internal controls in order to ensure the timely and accurate calculation of deferred taxesand to provide our internal control unit time to correct any failure in the internal controls.
We did report a material weakness in internal control over financial reporting in our annual report on Form 20-F for the years ended December 31,2015 and 2016, both of which related to the calculation of impairment of our wells, pipelines, properties, plant and equipment.
For the year ended December 31, 2015, we had not, at the relevant time, established an effective design of processes and procedures to effectivelyrespond to the nature and magnitude of the changes in the economic landscape at such time. In particular, the sharp decline in the price of crude oil inthe fourth quarter of 2015 triggered the need to test carrying amounts of our wells, pipelines, properties, plant and equipment for impairment. Inperforming the tests, the discount rates used were lower than those required by IFRS and those used by peers in the sector and categorized our entirerefinery system as a single cash generating unit instead of viewing each refinery as an independent cash-generating unit in order to determineimpairment charges with respect to our wells, pipelines, properties, plant and equipment, as required by IFRS. That resulted in an estimation ofrecoverable amounts of assets that did not accurately reflect operating and economic conditions as of the date of our consolidated financial statements.For the reasons set forth above, those unaudited financial statements reflected only a Ps. 229.1 billion impairment of wells, pipelines, properties, plantand equipment in 2015, Ps. 248.8 billion less than the actual impairment of Ps. 477.9 billion. In addition, at that time, our internal controls did notprovide a mechanism that enabled us to ensure that our disclosure regarding our impairment evaluation and our liquidity condition complied with IFRS.In our unaudited financial statements as of and for the fiscal year ended December 31, 2015, we did not appropriately disclose the assumptions for thecomputation of the impairment, the uncertainties about the estimates used to calculate impairment and the relevant assets impacted by the impairmentand issues related to significant doubt about our ability to continue operating as a going concern in accordance with IFRS.
For the year ended December 31, 2016, we incorrectly assumed, for purposes of the impairment analysis of our exploration and production cashgenerating units, the economic landscape related to the two-year life-of-field for those fields assigned to Petróleos Mexicanos on temporary basispursuant to Round Zero rather than 25-year life-of-field allowed by the CNH. As a result, our unaudited consolidated financial statements as of and forthe year ended December 31, 2016 only reflected a net reversal of impairment in the amount of Ps. 246.3 billion. In connection with the preparation ofour audited consolidated financial statements as of and for the year ended December 31, 2016, we applied the 25-year life-of-field assumption allowedby the CNH which, combined with the certified reserves data, resulted in a net reversal of impairment in the amount of Ps. 331.3 billion, a difference,while favorable, of Ps. 85.0 billion.
In response to the material weaknesses described above, we executed remediation plans, with oversight of our audit committee that took, amongothers, the following actions:
1. We strengthened our controls focused on generating adequate and timely policies related to updated regulatory criteria that may affect ourfinancial reporting.
2. We strengthened our procedures relating to compliance with general policies and designed procedures to ensure that regulatory criteria, legalaspects and business rules are disseminated and implemented in a timely manner.
3. We improved our internal procedures to appropriately prepare documentation that keeps track of the process for impairment calculations.
4. We improved our procedures for the definition of the criteria involved in calculating the impairment of assets in the oil and gas industry, suchas, among others, the identification of cash generating units, discount
232
Copyright © 2018 www.secdatabase.com. All Rights Reserved.Please Consider the Environment Before Printing This Document
Table of Contentsrates, hydrocarbon prices and exchange rates in order to accurately reflect the operating and economic conditions at the time of our calculations.
5. We updated our oversight and monitoring program, as part of which we submit quarterly reports to our audit committee to keep track of theprogress of the implemented actions.
We submitted the �General Policies and Procedures for the Determination of the Impairment Value of Assets in Petróleos Mexicanos and itsSubsidiary Productive Enterprises� to the Regulatory Improvement Committee (COMERI), which describes our policy proposals to comply with theInternational Accounting Standard (NIC) 36. The proposal is currently under review by COMERI.
(c) Attestation Report of the Independent Registered Public Accounting Firm
Not applicable.
(d) Changes in Internal Control over Financial Reporting
As discussed above, during 2017, we completed the design, update and strengthening of controls, procedures and assessment methodology inorder to appropriately calculate the impairment of our assets and to ensure that we respond promptly to changes in regulatory criteria and business rules.We also continued to execute on the changes made to our internal controls in 2016 in order to ensure that we effectively respond to the nature andmagnitude of the changes in the economic landscape.
Except for these changes, there has been no change in our internal control over financial reporting during 2017 that has materially affected, or isreasonably likely to materially affect, our internal control over financial reporting.
Item 16A. Audit Committee Financial Expert
Ms. Maria Teresa Fernández Labardini, member of the Audit Committee of Petróleos Mexicanos, qualifies as an �audit committee financialexpert� within the meaning of this Item 16A, and is independent, as defined in Rule 10A-3 under the Exchange Act.
Item 16B. Code of Ethics
In accordance with the Petróleos Mexicanos Law, on November 2016, we issued the Código de Ética para Petróleos Mexicanos, sus empresasproductivas subsidiarias y empresas filiales (Code of Ethics for Petróleos Mexicanos, its productive subsidiary entities and affiliates, or the Code ofEthics), a code of ethics as defined in Item 16B of Form 20-F under the Exchange Act. Our Code of Ethics applies to the members of the BoardsDirectors of Petróleos Mexicanos and the subsidiary entities and all of our employees, including our Director General, our Chief Financial Officer, ourchief accounting officer and all other employees performing similar functions, as well as other individuals and companies whose actions may affect ourreputation. The Code of Ethics defines values such as respect, non-discrimination, honesty, loyalty, responsibility, legality, impartiality and integrity,among others, that we expect will help us achieve our goals and which should be reflected in the daily behavior of employees of Petróleos Mexicanos.
Our Code of Ethics is available on our website at http://www.pemex.com. If we amend the provisions of our Code of Ethics or if we grant anywaiver of such provisions, we will disclose such amendment or waiver on our website at the same address.
On December 7, 2016, our Ethics Committee was formed to monitor the implementation and enforcement of the Code of Ethics. See�Item 4�Information on the Company�Business Overview�PEMEX Corporate Matters�Ethics Committee� for more information.
233
Copyright © 2018 www.secdatabase.com. All Rights Reserved.Please Consider the Environment Before Printing This Document

Table of ContentsOn August 28, 2017, the new Código de Conducta de Petróleos Mexicanos, sus empresas productivas subsidiarias y, en su caso, empresas filiales
(Code of Conduct of Petróleos Mexicanos, its productive subsidiary entities and, where applicable, affiliated companies, or the Code of Conduct) waspublished in the Official Gazette of the Federation. This Code of Conduct delineates behaviors expected of and banned for our employees, in accordancewith the values established in the Code of Ethics approved by the Board of the Directors of Petróleos Mexicanos in November 2016.
On September 11, 2017, the Políticas y Lineamientos Anticorrupción para Petróleos Mexicanos, sus empresas productivas subsidiarias y, en sucaso, Empresas Filiales (Anticorruption Policies and Guidelines for Petróleos Mexicanos, its productive subsidiary entities and, where applicable,affiliated companies) and the Políticas y Lineamientos para el desarrollo de la Debida Diligencia en Petróleos Mexicanos, sus empresas productivassubsidiarias y, en su caso, Empresas Filiales, en Materia de Ética e Integridad Corporativa (Policies and Guidelines to carry out Due Diligence inPetróleos Mexicanos, its productive subsidiary entities and, where applicable, affiliated companies, in Ethics and Corporate Integrity matters) becameeffective.
Additionally, we have now established an Ethics Line and made a telephone number available on our website, as a mechanism to provide adviceto address questions on ethics and integrity issues within PEMEX and to facilitate receipt of complaints about possible violations to our Code of Ethicsor our Code of Conduct. The information received will be channeled to the Ethics Committee and the appropriate areas authorized to investigate and, ifapplicable, pursue cases in accordance with the applicable laws.
We believe that the new regulations and mechanisms mentioned above, along with the legal framework applicable to PEMEX, will allow us toimprove our ability to mitigate our exposure to bribery and corruption risks in our relationships with third parties. See �Item 3�Key Information�RiskFactors�Risk Factors Related to Our Operations�We are subject to Mexican and international anti-corruption, anti-bribery and anti-money launderinglaws. Our failure to comply with these laws could result in penalties, which could harm our reputation, prevent us from obtaining governmentalauthorizations needed to carry out our operations and have an adverse effect on our business, results of operations and financial condition.�
Item 16C. Principal Accountant Fees and Services
In its meeting held on October 5, 2017, the Board of Directors of Petróleos Mexicanos appointed BDO Mexico as external auditor of PetróleosMexicanos, its productive state-owned subsidiaries and subsidiary companies for the fiscal year 2017 based on the proposal of the Audit Committee.The Board of Directors of Petróleos Mexicanos also appointed KPMG Cárdenas Dosal, S.C. as external auditor of Petróleos Mexicanos, its productivestate-owned subsidiaries and subsidiary companies for the fiscal year 2018 based on the proposal of the Audit Committee. See �Item 6�Directors,Senior Management and Employees�Audit Committee.�
Audit and Non-Audit Fees
The following table sets forth the aggregate fees billed to us for the fiscal years 2016 and 2017 by BDO Mexico, our independent registered publicaccounting firm for the years ended December 31, 2017 and 2016.
Year ended December 31,2016 2017(in thousands of nominal pesos)
Audit fees Ps. 46,587 Ps. 44,564Audit-related fees � �Tax Fees � �All other fees � �
Total fees Ps. 46,587 Ps. 44,564
234
Copyright © 2018 www.secdatabase.com. All Rights Reserved.Please Consider the Environment Before Printing This Document
Table of ContentsAudit fees in the table above are the aggregate fees billed by BDO Mexico for services provided in connection with the audits of our annual
financial statements in each year, statutory filings and statutory audits, filings with financial regulators, regulatory filings, limited review of interimfinancial information, review of public filings of financial information and reviews of documents related to offerings of securities, as well as comfortand consent letters, and services provided in accordance with the instructions of the Audit Committee.
Audit Committee Approval Policies and Procedures
In accordance with the Petróleos Mexicanos Law, the Audit Committee nominates the external auditor for approval by the Board of Directors ofPetróleos Mexicanos and issues an opinion regarding the external auditor�s report on our financial statements. See �Item 6�Directors, SeniorManagement and Employees�Audit Committee.�
On September 27, 2016, the Audit Committee issued criteria for the hiring of an external auditor for activities not related to its audit services inaccordance with the Petróleos Mexicanos Law.
Item 16D. Exemptions from the Listing Standards for Audit Committees
Not applicable.
Item 16E. Purchases of Equity Securities by the Issuer and Affiliated Purchasers
Not applicable.
Item 16F. Change in Registrant��s Certifying Accountant
Not applicable.
Item 16G. Corporate Governance
Not applicable.
Item 16H. Mine Safety Disclosure
Not applicable.
235
Copyright © 2018 www.secdatabase.com. All Rights Reserved.Please Consider the Environment Before Printing This Document

Table of ContentsPART III
Item 17. Financial Statements
Not applicable.
Item 18. Financial Statements
See pages F-1 through F-151, incorporated herein by reference.
Item 19. Exhibits. Documents filed as exhibits to this Form 20-F:
1.1 Ley de Petróleos Mexicanos (Petróleos Mexicanos Law), effective October 7, 2014 (English translation) (previously filed as Exhibit 1.1 toPetróleos Mexicanos� annual report on Form 20-F (File No. 0-99) on April 30, 2015 and incorporated by reference herein).
1.2 Reglamento de la Ley de Petróleos Mexicanos (Regulations to the Petróleos Mexicanos Law), effective November 1, 2014 and as amended asof February 9, 2015 (English translation) (previously filed as Exhibit 1.2 to Petróleos Mexicanos� annual report on Form 20-F (File No. 0-99)on April 30, 2015 and incorporated by reference herein).
1.3 Acuerdo de Creación de la Empresa Productiva del Estado Subsidiaria de Petróleos Mexicanos, denominada Pemex Exploración yProducción (Creation Resolution of the Productive State-Owned Subsidiary of Petróleos Mexicanos, denominated Pemex Exploration andProduction), effective June 1, 2015 (English translation) (previously filed as Exhibit 3.4 to the Petróleos Mexicanos Registration Statement onForm F-4 (File No. 333-205763) on July 21, 2015 and incorporated by reference herein).
1.4 Acuerdo de Creación de la Empresa Productiva del Estado Subsidiaria de Petróleos Mexicanos, denominada Pemex Cogeneración yServicios (Creation Resolution of the Productive State-Owned Subsidiary of Petróleos Mexicanos, denominated Pemex Cogeneration andServices), effective June 1, 2015 (English translation) (previously filed as Exhibit 3.5 to the Petróleos Mexicanos Registration Statement onForm F-4 (File No. 333-205763) on July 21, 2015 and incorporated by reference herein).
1.5 Acuerdo de Creación de la Empresa Productiva del Estado Subsidiaria de Petróleos Mexicanos, denominada Pemex Perforación y Servicios(Creation Resolution of the Productive State-Owned Subsidiary of Petróleos Mexicanos, denominated Pemex Drilling and Services), effectiveAugust 1, 2015 (English translation) (previously filed as Exhibit 3.5 to Amendment No. 1 to the Petróleos Mexicanos Registration Statementon Form F-4 (File No. 333-205763) on February 8, 2016 and incorporated by reference herein).
1.6 Acuerdo de Creación de la Empresa Productiva del Estado Subsidiaria de Petróleos Mexicanos, denominada Pemex Logística (CreationResolution of the Productive State-Owned Subsidiary of Petróleos Mexicanos, denominated Pemex Logistics), effective October 1, 2015(English translation) (previously filed as Exhibit 3.6 to Amendment No. 1 to the Petróleos Mexicanos Registration Statement on Form F-4(File No. 333-205763) on February 8, 2016 and incorporated by reference herein).
1.7 Acuerdo de Creación de la Empresa Productiva del Estado Subsidiaria de Petróleos Mexicanos, denominada Pemex TransformaciónIndustrial (Creation Resolution of the Productive State-Owned Subsidiary of Petróleos Mexicanos, denominated Pemex IndustrialTransformation), effective November 1, 2015 (English translation) (previously filed as Exhibit 3.7 to Amendment No. 1 to the PetróleosMexicanos Registration Statement on Form F-4 (File No. 333-205763) on February 8, 2016 and incorporated by reference herein).
236
Copyright © 2018 www.secdatabase.com. All Rights Reserved.Please Consider the Environment Before Printing This Document
Table of Contents1.8 Adecuación al Acuerdo de Creación de la Empresa Productiva del Estado Subsidiaria de Petróleos Mexicanos, denominada Pemex
Exploración y Producción (Amendment to Creation Resolution of the Productive State-Owned Subsidiary of Petróleos Mexicanos,denominated Pemex Exploration and Production), effective December 29, 2015 (English Translation) (previously filed as Exhibit 3.4 to thePetróleos Mexicanos Registration Statement on Form F-4 (File No. 333-220721) on September 29, 2017 and incorporated by referenceherein)
1.9 Adecuación al Acuerdo de Creación de la Empresa Productiva del Estado Subsidiaria de Petróleos Mexicanos, denominada PemexExploración y Producción (Amendment to Creation Resolution of the Productive State-Owned Subsidiary of Petróleos Mexicanos,denominated Pemex Exploration and Production), effective May 12, 2016 (English translation) (previously filed as Exhibit 3.4 to thePetróleos Mexicanos Registration Statement on Form F-4 (File No. 333-213351) on November 30, 2016 and incorporated by referenceherein)
2.1 Indenture, dated as of September 18, 1997, between Petróleos Mexicanos and Deutsche Bank Trust Company Americas (formerly known asBankers Trust Company) (previously filed as Exhibit 4.1 to the Petróleos Mexicanos Registration Statement on Form F-4 (File No. 333-7796)on October 17, 1997 and incorporated by reference herein).(P)
2.2 Indenture, dated as of August 7, 1998, between Petróleos Mexicanos and Deutsche Bank Trust Company Americas (formerly known asBankers Trust Company) (previously filed as Exhibit 4.1 to the Petróleos Mexicanos Registration Statement on Form F-4 (File No. 333-9310)on August 24, 1998 and incorporated by reference herein).(P)
2.3 Indenture, dated as of July 31, 2000, among the Pemex Project Funding Master Trust, Petróleos Mexicanos and Deutsche Bank TrustCompany Americas (formerly known as Bankers Trust Company) (previously filed as Exhibit 2.5 to the Petróleos Mexicanos Annual Reporton Form 20-F (File No. 0-99) on June 28, 2001 and incorporated by reference herein).(P)
2.4 First supplemental indenture dated as of September 30, 2009, between Petróleos Mexicanos and Deutsche Bank Trust Company Americas, tothe indenture dated as of July 31, 2000 (previously filed as Exhibit 2.4 to the Petróleos Mexicanos Annual Report on Form 20-F (FileNo. 0-99) on June 29, 2010 and incorporated by reference herein).
2.5 Indenture, dated as of December 30, 2004, among the Pemex Project Funding Master Trust, Petróleos Mexicanos and Deutsche Bank TrustCompany Americas (previously filed as Exhibit 2.7 to Petróleos Mexicanos� Annual Report on Form 20-F (File No. 0-99) on June 30, 2005and incorporated by reference herein).
2.6 First supplemental indenture dated as of September 30, 2009, between Petróleos Mexicanos and Deutsche Bank Trust Company Americas, tothe indenture dated as of December 30, 2004 (previously filed as Exhibit 2.6 to the Petróleos Mexicanos Annual Report on Form 20-F (FileNo. 0-99) on June 29, 2010 and incorporated by reference herein).
2.7 Indenture, dated as of January 27, 2009, between Petróleos Mexicanos and Deutsche Bank Trust Company Americas (previously filed asExhibit 2.5 to the Petróleos Mexicanos Annual Report on Form 20-F (File No. 0-99) on June 30, 2009 and incorporated by reference herein).
2.8 Fiscal Agency Agreement between Petróleos Mexicanos and Deutsche Bank Trust Company Americas (formerly known as Bankers TrustCompany), dated as of June 16, 1993, and amended and restated as of February 26, 1998 (previously filed as Exhibit 3.1 to the PetróleosMexicanos Annual Report on Form 20-F (File No. 0-99) on June 29, 2000 and incorporated by reference herein).(P)
2.9 Trust Agreement, dated as of November 10, 1998, among The Bank of New York, The Bank of New York (Delaware) and PetróleosMexicanos (previously filed as Exhibit 3.1 to the Petróleos Mexicanos Annual Report on Form 20-F (File No. 0-99) on June 30, 1999 andincorporated by reference herein).(P)
237
Copyright © 2018 www.secdatabase.com. All Rights Reserved.Please Consider the Environment Before Printing This Document
Table of Contents2.10 Amendment No. 1, dated as of November 17, 2004, to the Trust Agreement among The Bank of New York, The Bank of New York
(Delaware) and Petróleos Mexicanos dated as of November 10, 1998 (previously filed as Exhibit 2.10 to the Petróleos Mexicanos AnnualReport on Form 20-F (File No. 0-99) on June 30, 2005 and incorporated by reference herein).
2.11 Amendment No. 2, dated as of December 22, 2004, to the Trust Agreement among The Bank of New York, The Bank of New York(Delaware) and Petróleos Mexicanos dated as of November 10, 1998 (previously filed as Exhibit 2.11 to the Petróleos Mexicanos AnnualReport on Form 20-F (File No. 0-99) on June 30, 2005 and incorporated by reference herein).
2.12 Amendment No. 3, dated as of August 17, 2006, to the Trust Agreement among The Bank of New York, The Bank of New York(Delaware) and Petróleos Mexicanos dated as of November 10, 1998 (previously filed as Exhibit 3.4 to the Petróleos MexicanosRegistration Statement on Form F-4/A (File No. 333-136674) on October 27, 2006 and incorporated by reference herein).
2.13 Assignment and Indemnity Agreement, dated as of November 10, 1998, among Petróleos Mexicanos, Pemex-Exploración y Producción,Pemex-Refinación, Pemex-Gas y Petroquímica Básica and the Pemex Project Funding Master Trust (previously filed as Exhibit 3.2 to thePetróleos Mexicanos Annual Report on Form 20-F (File No. 0-99) on June 30, 1999 and incorporated by reference herein).(P)
2.14 Amendment No. 1, dated as of August 17, 2006, to the Assignment and Indemnity Agreement among Petróleos Mexicanos, Pemex-Exploración y Producción, Pemex-Refinación, Pemex-Gas y Petroquímica Básica, Pemex-Petroquímica, and the Pemex Project FundingMaster Trust dated as of November 10, 1998 (previously filed as Exhibit 4.7 to the Petróleos Mexicanos Registration Statement on FormF-4/A (File No. 333-136674-04) on October 27, 2006 and incorporated by reference herein).
2.15 Guaranty Agreement, dated July 29, 1996, among Petróleos Mexicanos, Pemex-Exploración y Producción, Pemex-Refinación andPemex-Gas y Petroquímica Básica (previously filed as Exhibit 4.4 to the Petróleos Mexicanos Registration Statement on Form F-4 (FileNo. 333-7796) on October 17, 1997 and incorporated by reference herein).(P)
2.16 Amendment Agreement dated as of June 24, 2014, between Petróleos Mexicanos and Deutsche Bank Trust Company Americas, amendingthe terms and conditions of the Petróleos Mexicanos 8.625% Bonds due 2023 issued pursuant to the Fiscal Agency Agreement betweenPetróleos Mexicanos and Deutsche Bank Trust Company (as amended and restated) (previously filed as Exhibit 4.9 to the PetróleosMexicanos Registration Statement on Form F-4 (File No. 333-198588) on September 5, 2014 and incorporated by reference herein).
2.17 First supplemental indenture dated as of June 24, 2014, between Petróleos Mexicanos and Deutsche Bank Trust Company Americas, to theindenture dated as of September 18, 1997 (previously filed as Exhibit 4.10 to the Petróleos Mexicanos Registration Statement on Form F-4(File No. 333-198588) on September 5, 2014 and incorporated by reference herein).
2.18 First supplemental indenture dated as of June 24, 2014, between Petróleos Mexicanos and Deutsche Bank Trust Company Americas, to theindenture dated as of August 7, 1998 (previously filed as Exhibit 4.11 to the Petróleos Mexicanos Registration Statement on Form F-4 (FileNo. 333-198588) on September 5, 2014 and incorporated by reference herein).
2.19 Second supplemental indenture dated as of June 24, 2014, between Petróleos Mexicanos and Deutsche Bank Trust Company Americas, tothe indenture dated as of July 31, 2000 (previously filed as Exhibit 4.12 to the Petróleos Mexicanos Registration Statement on Form F-4(File No. 333-198588) on September 5, 2014 and incorporated by reference herein).
2.20 Second supplemental indenture dated as of June 24, 2014, between Petróleos Mexicanos and Deutsche Bank Trust Company Americas, tothe indenture dated as of December 30, 2004 (previously filed as Exhibit 4.13 to the Petróleos Mexicanos Registration Statement on FormF-4 (File No. 333-198588) on September 5, 2014 and incorporated by reference herein).
238
Copyright © 2018 www.secdatabase.com. All Rights Reserved.Please Consider the Environment Before Printing This Document
Table of Contents2.21 Fourth supplemental indenture dated as of June 24, 2014, between Petróleos Mexicanos and Deutsche Bank Trust Company Americas, to
the indenture dated as of January 27, 2009 (previously filed as Exhibit 4.14 to the Petróleos Mexicanos Registration Statement on Form F-4(File No. 333-198588) on September 5, 2014 and incorporated by reference herein).
2.22 Third supplemental indenture dated as of September 10, 2014, between Petróleos Mexicanos and Deutsche Bank Trust Company Americas,to the indenture dated as of July 31, 2000 (previously filed as Exhibit 2.22 to Petróleos Mexicanos� annual report on Form 20-F (FileNo. 0-99) on April 30, 2015 and incorporated by reference herein).
2.23 Fifth supplemental indenture dated as of October 15, 2014, between Petróleos Mexicanos and Deutsche Bank Trust Company Americas, tothe indenture dated as of January 27, 2009 previously filed as Exhibit 2.23 to Petróleos Mexicanos� annual report on Form 20-F (FileNo. 0-99) on April 30, 2015 and incorporated by reference herein).
2.24 Sixth supplemental indenture dated as of December 8, 2015 between Petróleos Mexicanos and Deutsche Bank Trust Company Americas, tothe indenture dated as of January 27, 2009 (previously filed as Exhibit 4.17 to Amendment No. 1 to the Petróleos Mexicanos RegistrationStatement on Form F-4 (File No. 333-205763) on February 8, 2016 and incorporated by reference herein).
2.25 Seventh supplemental indenture dated as of June 14, 2016 between Petróleos Mexicanos and Deutsche Bank Trust Company Americas, tothe indenture dated as of January 27, 2009 (previously filed as Exhibit 4.18 to Amendment No. 1 to the Petróleos Mexicanos RegistrationStatement on Form F-4 (File No. 333-213351) on August 26, 2016 and incorporated by reference herein).
2.26 Eighth supplemental indenture dated as of February 16, 2018 between Petróleos Mexicanos and Deutsche Bank Trust Company Americas,to the indenture dated as of January 27, 2009.
The registrant agrees to furnish to the U.S. Securities and Exchange Commission, upon request, copies of any instruments that define the rights ofholders of long-term debt of the registrant that are not filed as exhibits to this report.
4.1 Receivables Purchase Agreement, dated as of December 1, 1998, by and among Pemex Finance, Ltd., P.M.I. Comercio Internacional, S.A. deC.V., P.M.I. Services, B.V. and Pemex-Exploración y Producción. (previously filed as Exhibit 3.3 to the Petróleos Mexicanos Annual Reporton Form 20-F (File No. 0-99) on June 30, 1999 and incorporated by reference herein).(P)
7.1 Computation of Ratio of Earnings to Fixed Charges.
8.1 For a list of subsidiaries, their jurisdiction of incorporation and the names under which they do business, see �Consolidated Structure ofPEMEX� on page 4.
10.1 Consent letters of Ryder Scott Company, L.P.
10.2 Reports on Reserves Data by Ryder Scott Company, L.P., Independent Qualified Reserves Evaluator or Auditor, as of December 31, 2017.
10.3 Consent letters of Netherland, Sewell International, S. de R.L. de C.V.
10.4 Reports on Reserves Data by Netherland, Sewell International, S. de R.L. de C.V., Independent Qualified Reserves Evaluator or Auditor, as ofJanuary 1, 2018.
10.5 Consent letters of DeGolyer and MacNaughton.
10.6 Reports on Reserves Data by DeGolyer and MacNaughton, Independent Qualified Reserves Evaluator or Auditor, as of January 1, 2018.
12.1 CEO Certification pursuant to Rule 13a-14(a)/15d-14(a).
12.2 CFO Certification pursuant to Rule 13a-14(a)/15d-14(a).
13.1 Certification pursuant to Rule 13a-14(b)/15d-14(b) and 18 U.S.C. §1350.
239
Copyright © 2018 www.secdatabase.com. All Rights Reserved.Please Consider the Environment Before Printing This Document
Table of Contents101.INS XBRL Instance Document.
101.SCH XBRL Taxonomy Extension Schema Document.
101.CAL XBRL Taxonomy Extension Calculation Linkbase Document.
101.DEF XBRL Taxonomy Extension Definition Linkbase Document.
101.LAB XBRL Taxonomy Extension Label Linkbase Document.
101.PRE XBRL Taxonomy Extension Presentation Linkbase Document.
(P) Filed via paper.
240
Copyright © 2018 www.secdatabase.com. All Rights Reserved.Please Consider the Environment Before Printing This Document
Table of ContentsSIGNATURE
Pursuant to the requirements of Section 12 of the Securities Exchange Act of 1934, as amended, the registrant hereby certifies that it meets all ofthe requirements for filing on Form 20-F and has duly caused and authorized the undersigned to sign this annual report on its behalf.
PETRÓLEOS MEXICANOS
By: /s/ DAVID RUELAS RODRÍGUEZName: David Ruelas RodríguezTitle: Chief Financial Officer
Date: April 30, 2018
Copyright © 2018 www.secdatabase.com. All Rights Reserved.Please Consider the Environment Before Printing This Document
Table of Contents
PETRÓLEOS MEXICANOS, PRODUCTIVE STATE-OWNED SUBSIDIARIESAND SUBSIDIARY COMPANIES
CONSOLIDATED FINANCIAL STATEMENTS
DECEMBER 31, 2017, 2016 AND 2015 AND REPORT OF INDEPENDENT REGISTERED PUBLIC ACCOUNTING FIRM
Copyright © 2018 www.secdatabase.com. All Rights Reserved.Please Consider the Environment Before Printing This Document

Table of ContentsPETRÓLEOS MEXICANOS, PRODUCTIVE STATE-OWNED SUBSIDIARIES
AND SUBSIDIARY COMPANIES
CONSOLIDATED FINANCIAL STATEMENTS
DECEMBER 31, 2017, 2016 AND 2015
Index
Contents PageReport of Independent Registered Public Accounting Firm F-2Consolidated statements:Of financial position F-4Of comprehensive income F-5Of changes in equity (deficit), net F-6Of cash flows F-7Notes to the consolidated statements through F-7 to F-151
Copyright © 2018 www.secdatabase.com. All Rights Reserved.Please Consider the Environment Before Printing This Document
Table of ContentsREPORT OF INDEPENDENT REGISTERED PUBLIC ACCOUNTING FIRM
To the Board of Directors ofPetróleos Mexicanos:
We have audited the accompanying consolidated statements of financial position of Petróleos Mexicanos, Productive State-Owned Subsidiaries andSubsidiary Companies (�PEMEX�) as of December 31, 2017 and 2016, and the related consolidated statements of comprehensive income, changes inequity (deficit), and cash flows for each of the three years in the period ended December 31, 2017. These consolidated financial statements are theresponsibility of PEMEX�s management. Our responsibility is to express an opinion on these consolidated financial statements based on our audits.
We conducted our audits in accordance with the standards of the Public Company Accounting Oversight Board (United States). Those standards requirethat we plan and perform the audit to obtain reasonable assurance about whether the financial statements are free of material misstatement. PEMEX isnot required to have, nor were we engaged to perform, an audit of its internal control over financial reporting. Our audits included consideration ofinternal control over financial reporting as a basis for designing audit procedures that are appropriate in the circumstances, but not for the purpose ofexpressing an opinion on the effectiveness of PEMEX�s internal control over financial reporting. Accordingly, we express no such opinion. An auditalso includes examining, on a test basis, evidence supporting the amounts and disclosures in the consolidated financial statements, assessing theaccounting principles used and significant estimates made by management, as well as evaluating the overall presentation of the consolidated financialstatements. We believe that our audits provide a reasonable basis for our opinion.
In our opinion, the consolidated financial statements referred to above present fairly, in all material respects, the financial position of PetróleosMexicanos, Productive State-Owned Subsidiaries and Subsidiary Companies as of December 31, 2017 and 2016, and the consolidated results of theiroperations and their cash flows for each of the three years in the period ended December 31, 2017, in conformity with International Financial ReportingStandards as issued by the International Accounting Standards Board.
The accompanying consolidated financial statements have been prepared assuming that PEMEX will continue as a going concern. As described in Note2-b to the consolidated financial statements, PEMEX has suffered recurring losses from operations, has a working capital deficiency and a net equitydeficit. As stated in Note 2-b, these events or conditions, along with other matters as set forth in such Note, indicate that a material uncertainty existsthat may cast significant doubt on the PEMEX�s ability to continue as a going concern. Management�s plans in regard to these matters are alsodescribed in Note 2-b. The consolidated financial statements do not include any adjustments that might result from the outcome of this uncertainty.
CASTILLO MIRANDA Y COMPAÑÍA, S. C.
/S/ JOSE LUIS VILLALOBOS ZUAZUAC.P.C. Jose Luis Villalobos Zuazua
Mexico City,April 30, 2018
F-2
Copyright © 2018 www.secdatabase.com. All Rights Reserved.Please Consider the Environment Before Printing This Document
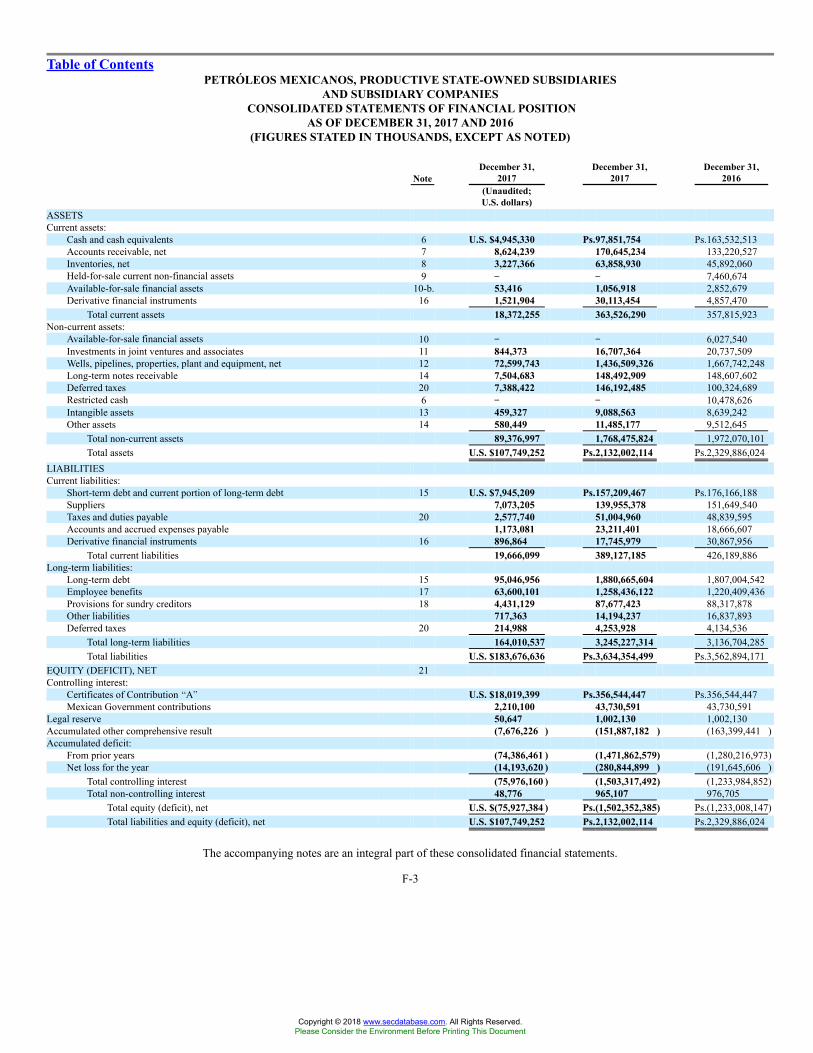
Table of ContentsPETRÓLEOS MEXICANOS, PRODUCTIVE STATE-OWNED SUBSIDIARIES
AND SUBSIDIARY COMPANIESCONSOLIDATED STATEMENTS OF FINANCIAL POSITION
AS OF DECEMBER 31, 2017 AND 2016(FIGURES STATED IN THOUSANDS, EXCEPT AS NOTED)
NoteDecember 31,
2017December 31,
2017December 31,
2016(Unaudited;U.S. dollars)
ASSETSCurrent assets:
Cash and cash equivalents 6 U.S. $4,945,330 Ps.97,851,754 Ps.163,532,513Accounts receivable, net 7 8,624,239 170,645,234 133,220,527Inventories, net 8 3,227,366 63,858,930 45,892,060Held-for-sale current non-financial assets 9 �� �� 7,460,674Available-for-sale financial assets 10-b. 53,416 1,056,918 2,852,679Derivative financial instruments 16 1,521,904 30,113,454 4,857,470
Total current assets 18,372,255 363,526,290 357,815,923Non-current assets:
Available-for-sale financial assets 10 �� �� 6,027,540Investments in joint ventures and associates 11 844,373 16,707,364 20,737,509Wells, pipelines, properties, plant and equipment, net 12 72,599,743 1,436,509,326 1,667,742,248Long-term notes receivable 14 7,504,683 148,492,909 148,607,602Deferred taxes 20 7,388,422 146,192,485 100,324,689Restricted cash 6 �� �� 10,478,626Intangible assets 13 459,327 9,088,563 8,639,242Other assets 14 580,449 11,485,177 9,512,645
Total non-current assets 89,376,997 1,768,475,824 1,972,070,101Total assets U.S. $107,749,252 Ps.2,132,002,114 Ps.2,329,886,024
LIABILITIESCurrent liabilities:
Short-term debt and current portion of long-term debt 15 U.S. $7,945,209 Ps.157,209,467 Ps.176,166,188Suppliers 7,073,205 139,955,378 151,649,540Taxes and duties payable 20 2,577,740 51,004,960 48,839,595Accounts and accrued expenses payable 1,173,081 23,211,401 18,666,607Derivative financial instruments 16 896,864 17,745,979 30,867,956
Total current liabilities 19,666,099 389,127,185 426,189,886Long-term liabilities:
Long-term debt 15 95,046,956 1,880,665,604 1,807,004,542Employee benefits 17 63,600,101 1,258,436,122 1,220,409,436Provisions for sundry creditors 18 4,431,129 87,677,423 88,317,878Other liabilities 717,363 14,194,237 16,837,893Deferred taxes 20 214,988 4,253,928 4,134,536
Total long-term liabilities 164,010,537 3,245,227,314 3,136,704,285Total liabilities U.S. $183,676,636 Ps.3,634,354,499 Ps.3,562,894,171
EQUITY (DEFICIT), NET 21Controlling interest:
Certificates of Contribution �A� U.S. $18,019,399 Ps.356,544,447 Ps.356,544,447Mexican Government contributions 2,210,100 43,730,591 43,730,591
Legal reserve 50,647 1,002,130 1,002,130Accumulated other comprehensive result (7,676,226 ) (151,887,182 ) (163,399,441 )Accumulated deficit:
From prior years (74,386,461 ) (1,471,862,579) (1,280,216,973)Net loss for the year (14,193,620 ) (280,844,899 ) (191,645,606 )
Total controlling interest (75,976,160 ) (1,503,317,492) (1,233,984,852)Total non-controlling interest 48,776 965,107 976,705
Total equity (deficit), net U.S. $(75,927,384 ) Ps.(1,502,352,385) Ps.(1,233,008,147)Total liabilities and equity (deficit), net U.S. $107,749,252 Ps.2,132,002,114 Ps.2,329,886,024
The accompanying notes are an integral part of these consolidated financial statements.
F-3
Copyright © 2018 www.secdatabase.com. All Rights Reserved.Please Consider the Environment Before Printing This Document
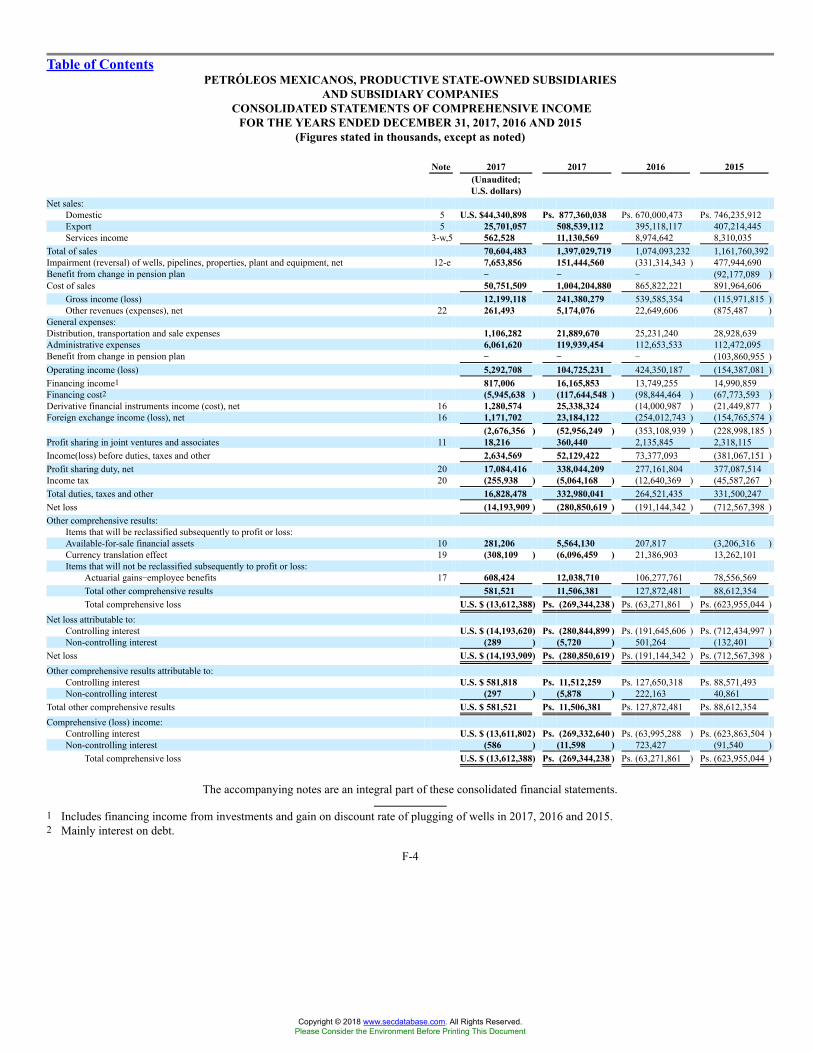
Table of ContentsPETRÓLEOS MEXICANOS, PRODUCTIVE STATE-OWNED SUBSIDIARIES
AND SUBSIDIARY COMPANIESCONSOLIDATED STATEMENTS OF COMPREHENSIVE INCOME
FOR THE YEARS ENDED DECEMBER 31, 2017, 2016 AND 2015(Figures stated in thousands, except as noted)
Note 2017 2017 2016 2015(Unaudited;U.S. dollars)
Net sales:Domestic 5 U.S. $44,340,898 Ps. 877,360,038 Ps. 670,000,473 Ps. 746,235,912Export 5 25,701,057 508,539,112 395,118,117 407,214,445Services income 3-w,5 562,528 11,130,569 8,974,642 8,310,035
Total of sales 70,604,483 1,397,029,719 1,074,093,232 1,161,760,392Impairment (reversal) of wells, pipelines, properties, plant and equipment, net 12-e 7,653,856 151,444,560 (331,314,343 ) 477,944,690Benefit from change in pension plan �� �� � (92,177,089 )Cost of sales 50,751,509 1,004,204,880 865,822,221 891,964,606
Gross income (loss) 12,199,118 241,380,279 539,585,354 (115,971,815 )Other revenues (expenses), net 22 261,493 5,174,076 22,649,606 (875,487 )
General expenses:Distribution, transportation and sale expenses 1,106,282 21,889,670 25,231,240 28,928,639Administrative expenses 6,061,620 119,939,454 112,653,533 112,472,095Benefit from change in pension plan �� �� � (103,860,955 )Operating income (loss) 5,292,708 104,725,231 424,350,187 (154,387,081 )Financing income1 817,006 16,165,853 13,749,255 14,990,859Financing cost2 (5,945,638 ) (117,644,548 ) (98,844,464 ) (67,773,593 )Derivative financial instruments income (cost), net 16 1,280,574 25,338,324 (14,000,987 ) (21,449,877 )Foreign exchange income (loss), net 16 1,171,702 23,184,122 (254,012,743 ) (154,765,574 )
(2,676,356 ) (52,956,249 ) (353,108,939 ) (228,998,185 )Profit sharing in joint ventures and associates 11 18,216 360,440 2,135,845 2,318,115Income(loss) before duties, taxes and other 2,634,569 52,129,422 73,377,093 (381,067,151 )Profit sharing duty, net 20 17,084,416 338,044,209 277,161,804 377,087,514Income tax 20 (255,938 ) (5,064,168 ) (12,640,369 ) (45,587,267 )Total duties, taxes and other 16,828,478 332,980,041 264,521,435 331,500,247Net loss (14,193,909 ) (280,850,619 ) (191,144,342 ) (712,567,398 )Other comprehensive results:
Items that will be reclassified subsequently to profit or loss:Available-for-sale financial assets 10 281,206 5,564,130 207,817 (3,206,316 )Currency translation effect 19 (308,109 ) (6,096,459 ) 21,386,903 13,262,101Items that will not be reclassified subsequently to profit or loss:
Actuarial gains�employee benefits 17 608,424 12,038,710 106,277,761 78,556,569Total other comprehensive results 581,521 11,506,381 127,872,481 88,612,354Total comprehensive loss U.S. $ (13,612,388) Ps. (269,344,238 ) Ps. (63,271,861 ) Ps. (623,955,044 )
Net loss attributable to:Controlling interest U.S. $ (14,193,620) Ps. (280,844,899 ) Ps. (191,645,606 ) Ps. (712,434,997 )Non-controlling interest (289 ) (5,720 ) 501,264 (132,401 )
Net loss U.S. $ (14,193,909) Ps. (280,850,619 ) Ps. (191,144,342 ) Ps. (712,567,398 )Other comprehensive results attributable to:
Controlling interest U.S. $ 581,818 Ps. 11,512,259 Ps. 127,650,318 Ps. 88,571,493Non-controlling interest (297 ) (5,878 ) 222,163 40,861
Total other comprehensive results U.S. $ 581,521 Ps. 11,506,381 Ps. 127,872,481 Ps. 88,612,354Comprehensive (loss) income:
Controlling interest U.S. $ (13,611,802) Ps. (269,332,640 ) Ps. (63,995,288 ) Ps. (623,863,504 )Non-controlling interest (586 ) (11,598 ) 723,427 (91,540 )
Total comprehensive loss U.S. $ (13,612,388) Ps. (269,344,238 ) Ps. (63,271,861 ) Ps. (623,955,044 )
The accompanying notes are an integral part of these consolidated financial statements.
1 Includes financing income from investments and gain on discount rate of plugging of wells in 2017, 2016 and 2015.2 Mainly interest on debt.
F-4
Copyright © 2018 www.secdatabase.com. All Rights Reserved.Please Consider the Environment Before Printing This Document
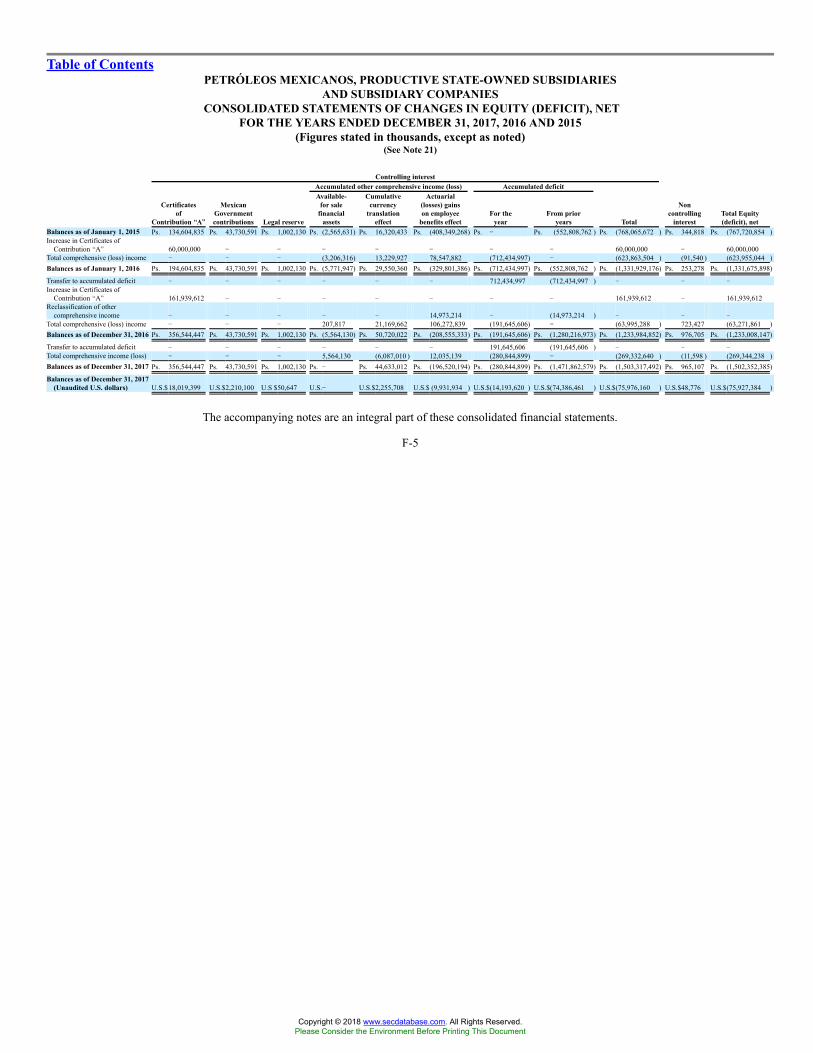
Table of ContentsPETRÓLEOS MEXICANOS, PRODUCTIVE STATE-OWNED SUBSIDIARIES
AND SUBSIDIARY COMPANIESCONSOLIDATED STATEMENTS OF CHANGES IN EQUITY (DEFICIT), NET
FOR THE YEARS ENDED DECEMBER 31, 2017, 2016 AND 2015(Figures stated in thousands, except as noted)
(See Note 21)
Controlling interestAccumulated other comprehensive income (loss) Accumulated deficit
Certificatesof
Contribution ��A��
MexicanGovernmentcontributions Legal reserve
Available-for sale
financialassets
Cumulativecurrency
translationeffect
Actuarial(losses) gainson employee
benefits effectFor the
yearFrom prior
years Total
Noncontrolling
interestTotal Equity(deficit), net
Balances as of January 1, 2015 Ps. 134,604,835 Ps. 43,730,591 Ps. 1,002,130 Ps. (2,565,631) Ps. 16,320,433 Ps. (408,349,268) Ps. � Ps. (552,808,762 ) Ps. (768,065,672 ) Ps. 344,818 Ps. (767,720,854 )Increase in Certificates of
Contribution �A� 60,000,000 � � � � � � � 60,000,000 � 60,000,000Total comprehensive (loss) income � � � (3,206,316) 13,229,927 78,547,882 (712,434,997) � (623,863,504 ) (91,540 ) (623,955,044 )Balances as of January 1, 2016 Ps. 194,604,835 Ps. 43,730,591 Ps. 1,002,130 Ps. (5,771,947) Ps. 29,550,360 Ps. (329,801,386) Ps. (712,434,997) Ps. (552,808,762 ) Ps. (1,331,929,176) Ps. 253,278 Ps. (1,331,675,898)
Transfer to accumulated deficit � � � � � � 712,434,997 (712,434,997 ) � � �Increase in Certificates of
Contribution �A� 161,939,612 � � � � � � � 161,939,612 � 161,939,612Reclassification of other
comprehensive income � � � � � 14,973,214 � (14,973,214 ) � � �
Total comprehensive (loss) income � � � 207,817 21,169,662 106,272,839 (191,645,606) �� (63,995,288 ) 723,427 (63,271,861 )Balances as of December 31, 2016 Ps. 356,544,447 Ps. 43,730,591 Ps. 1,002,130 Ps. (5,564,130) Ps. 50,720,022 Ps. (208,555,333) Ps. (191,645,606) Ps. (1,280,216,973) Ps. (1,233,984,852) Ps. 976,705 Ps. (1,233,008,147)
Transfer to accumulated deficit � � � � � � 191,645,606 (191,645,606 ) � � �Total comprehensive income (loss) � � � 5,564,130 (6,087,010 ) 12,035,139 (280,844,899) � (269,332,640 ) (11,598 ) (269,344,238 )Balances as of December 31, 2017 Ps. 356,544,447 Ps. 43,730,591 Ps. 1,002,130 Ps. � Ps. 44,633,012 Ps. (196,520,194) Ps. (280,844,899) Ps. (1,471,862,579) Ps. (1,503,317,492) Ps. 965,107 Ps. (1,502,352,385)
Balances as of December 31, 2017(Unaudited U.S. dollars) U.S.$18,019,399 U.S.$2,210,100 U.S $50,647 U.S.� U.S.$2,255,708 U.S.$ (9,931,934 ) U.S.$(14,193,620 ) U.S.$(74,386,461 ) U.S.$(75,976,160 ) U.S.$48,776 U.S.$(75,927,384 )
The accompanying notes are an integral part of these consolidated financial statements.
F-5
Copyright © 2018 www.secdatabase.com. All Rights Reserved.Please Consider the Environment Before Printing This Document

Table of ContentsPETRÓLEOS MEXICANOS, PRODUCTIVE STATE-OWNED SUBSIDIARIES
AND SUBSIDIARY COMPANIESCONSOLIDATED STATEMENTS OF CASH FLOWS
FOR THE YEARS ENDED DECEMBER 31, 2017, 2016 AND 2015(Figures stated in thousands, except as noted)
2017 2017 2016 2015(Unaudited;U.S. dollars)
Operating activitiesNet (loss) U.S. $ (14,193,909) Ps. (280,850,619) Ps. (191,144,342) Ps. (712,567,398)
Depreciation and amortization 7,919,689 156,704,513 150,439,491 167,951,250(Reversal) impairment of wells, pipelines, properties, plant and equipment 7,653,856 151,444,560 (331,314,343 ) 477,944,690Unsuccessful wells 311,554 6,164,624 29,106,084 23,213,519Exploration costs (73,168 ) (1,447,761 ) (2,022,826 ) (5,698,511 )Disposal of wells, pipelines, properties, plant and equipment 862,381 17,063,671 3,771,287 24,638,537Loss in sale of fixed assets �� �� 27,882,480 �Gain on sale of share in joint ventures and associates (158,647 ) (3,139,103 ) (15,211,039 ) (680,630 )Profit share in joint ventures and associates (18,216 ) (360,440 ) (2,135,845 ) (2,318,115 )Decrease on available�for-sale financial assets 68,743 1,360,205 � �Impairment of goodwill �� �� 4,007,018 �Disposal of held�for�sale current non�financial assets 141,932 2,808,360 � �Dividends (9,131 ) (180,675 ) (293,397 ) (359,941 )Effects of net present value of reserve for well abandonment 392,890 7,774,000 11,968,966 (608,160 )Net loss on available-for-sale financial assets 178,087 3,523,748 � �Unrealized foreign exchange (income) loss (843,265 ) (16,685,439 ) 243,182,764 152,676,256Interest expense 5,945,638 117,644,548 98,844,464 67,773,593
8,178,434 161,824,192 27,080,762 191,965,090Derivative financial instruments (1,939,584 ) (38,377,961 ) 310,905 9,802,397Accounts receivable (1,370,831 ) (27,124,228 ) (55,104,439 ) 33,003,083Inventories (908,028 ) (17,966,870 ) (1,358,879 ) 6,167,728Long-term receivables 5,796 114,693 (3,277,724 ) �Intangible assets (261,094 ) (5,166,184 ) (19,745,821 ) �Other assets (99,690 ) (1,972,532 ) (2,104,985 ) (16,602,365 )Accounts payable and accrued expenses 229,689 4,544,794 3,097,660 1,002,403Taxes and duties payable 19,144,463 378,805,745 311,015,217 384,109,597Taxes and duties paid (19,062,925 ) (377,192,377 ) (301,050,325 ) (351,370,004 )Suppliers (591,011 ) (11,694,162 ) (15,664,703 ) 51,135,948Provisions for sundry creditors (339,351 ) (6,714,632 ) (11,413,361 ) (41,239,700 )Employee benefits 2,530,255 50,065,396 47,293,069 (116,022,232 )Deferred taxes (2,312,079 ) (45,748,404 ) (43,802,181 ) (53,014,159 )
Net cash flows from (used in) operating activities 3,204,044 63,397,470 (41,898,083 ) 98,937,786Investing activitiesAcquisition of wells, pipelines, properties, plant and equipment (4,642,485 ) (91,859,465 ) (151,408,480 ) (253,514,001 )Proceeds from available-for-sale financial assets 405,668 8,026,836 � �Proceeds from the sale of associates 158,779 3,141,710 22,684,736 4,417,138Proceeds from the sale of fixed assets �� �� 560,665 �Investments in associates �� �� � (36,214 )Business acquisition �� �� (4,329,769 ) �
Net cash flows used in investing activities (4,078,038 ) (80,690,919 ) (132,492,848 ) (249,133,077 )Financing activitiesIncrease in equity due to Certificates of Contributions �A� �� �� 73,500,000 10,000,000Loans obtained from financial institutions 35,615,614 704,715,468 841,991,767 378,971,078Debt payments, principal only (32,342,434 ) (642,059,819 ) (614,987,329 ) (193,618,498 )Interest paid (5,504,223 ) (108,910,417 ) (88,754,141 ) (62,737,150 )Net cash flows from financing activities (2,231,043 ) (46,254,768 ) 211,750,297 132,615,430Net (decrease) increase in cash and cash equivalents (3,211,663 ) (63,548,217 ) 37,359,366 (17,579,861 )Effects of foreign exchange on cash balances (107,776 ) (2,132,542 ) 16,804,267 8,960,213Cash and cash equivalents at the beginning of the year 8,264,769 163,532,513 109,368,880 117,988,528Cash and cash equivalents at the end of the year (Note 6) U.S. $4,945,330 Ps. 97,851,754 Ps. 163,532,513 Ps. 109,368,880
The accompanying notes are an integral part of these consolidated financial statements.
F-6
Copyright © 2018 www.secdatabase.com. All Rights Reserved.Please Consider the Environment Before Printing This Document
Table of ContentsPETRÓLEOS MEXICANOS, PRODUCTIVE STATE-OWNED SUBSIDIARIES
AND SUBSIDIARY COMPANIESNOTES TO THE CONSOLIDATED FINANCIAL STATEMENTSFOR THE YEARS ENDED DECEMBER 31, 2017, 2016 AND 2015
(FIGURES STATED IN THOUSANDS, EXCEPT AS NOTED)
NOTE 1. STRUCTURE AND BUSINESS OPERATIONS OF PETRÓLEOS MEXICANOS, SUBSIDIARY ENTITIES AND SUBSIDIARYCOMPANIES
Petróleos Mexicanos was created by a decree issued by the Mexican Congress on June 7, 1938. The decree was published in the Diario Oficial dela Federación (�Official Gazette of the Federation�) on July 20, 1938 and came into effect on that date.
On December 20, 2013, the Decreto por el que se reforman y adicionan diversas disposiciones de la Constitución Política de los Estados UnidosMexicanos, en Materia de Energía (Decree that amends and supplements various provisions of the Mexican Constitution relating to energy matters),was published in the Official Gazette of the Federation and came into effect on December 21, 2013 (the �Energy Reform Decree�). In accordance withthe Energy Reform Decree, the Mexican Government will carry out the exploration and extraction of hydrocarbons in the United Mexican States(�Mexico�) through assignments to productive state-owned companies, as well as through agreements with productive state-owned companies and withother companies.
As part of the secondary legislation enacted in accordance with the Energy Reform Decree, on August 11, 2014, the Ley de Petróleos Mexicanos(the �Petróleos Mexicanos Law�) was published in the Official Gazette of the Federation. The Petróleos Mexicanos Law became effective on October 7,2014, except for certain provisions. On December 2, 2014, the Secretaría de Energía (�Ministry of Energy�) published in the Official Gazette of theFederation the declaration pursuant to which the special regime governing Petróleos Mexicanos� activities relating to productive state-ownedsubsidiaries, affiliates, compensation, assets, administrative liabilities, state dividend, budget and debt levels came into effect. On June 10, 2015 theDisposiciones Generales de Contratación para Petróleos Mexicanos y sus Empresas Productivas Subsidiarias (General Contracting Provisions forPetróleos Mexicanos and its productive state-owned subsidiaries) was published in the Official Gazette of the Federation and thereafter the specialregime for acquisitions, leases, services and public works matters came into effect.
Once the Petróleos Mexicanos Law came into effect, Petróleos Mexicanos was transformed from a decentralized public entity to a productivestate-owned company. Petróleos Mexicanos is a legal entity empowered to own property and carry on business in its own name with the purpose ofcarrying out exploration and extraction of crude oil and other hydrocarbons in Mexico. In addition, Petróleos Mexicanos performs activities related torefining, gas processing and engineering and research projects to create economic value and to increase the income of the Mexican Government, as itsowner, while adhering to principles of equity and social and environmental responsibility.
The Subsidiary Entities, Pemex Exploración y Producción (Pemex Exploration and Production), Pemex Transformación Industrial (PemexIndustrial Transformation), Pemex Perforación y Servicios (Pemex Drilling and Services), Pemex Logística (Pemex Logistics), Pemex Cogeneración yServicios (Pemex Cogeneration and Services), Pemex Fertilizantes (Pemex Fertilizers) and Pemex Etileno (Pemex Ethylene), are productive state-owned subsidiaries empowered to own property and carry on business in their own name, subject to the direction and coordination of PetróleosMexicanos (the �Subsidiary Entities�).
The Subsidiary Entities of Petróleos Mexicanos prior to the Corporate Reorganization (defined below) were Pemex-Exploración y Producción,Pemex-Refinación (Pemex-Refining), Pemex-Gas and Petroquímica Básica (Pemex-Gas and Basic Petrochemicals) and Pemex-Petroquímica (Pemex-Petrochemicals), which were
F-7
Copyright © 2018 www.secdatabase.com. All Rights Reserved.Please Consider the Environment Before Printing This Document

Table of ContentsPETRÓLEOS MEXICANOS, PRODUCTIVE STATE-OWNED SUBSIDIARIES
AND SUBSIDIARY COMPANIESNOTES TO THE CONSOLIDATED FINANCIAL STATEMENTSFOR THE YEARS ENDED DECEMBER 31, 2017, 2016 AND 2015
(FIGURES STATED IN THOUSANDS, EXCEPT AS NOTED)
decentralized public entities with a technical, industrial and commercial nature with their own corporate identity and equity, with the legal authority toown property and conduct business in their own names, and were 100% owned by Petróleos Mexicanos and controlled by the Mexican Government;they had been consolidated into and had the characteristics of subsidiaries of Petróleos Mexicanos.
The Board of Directors of Petróleos Mexicanos, in its meeting held on November 18, 2014, approved the Corporate Reorganization proposed bythe Chief Executive Officer of Petróleos Mexicanos.
Pursuant to the corporate reorganization, the existing four Subsidiary Entities were transformed into two new productive state-owned subsidiaries,which have assumed all of the rights and obligations of the existing Subsidiary Entities (the �Corporate Reorganization�). Pemex-Exploration andProduction was transformed into Pemex Exploration and Production, a productive state-owned subsidiary, and Pemex-Refining, Pemex-Gas and BasicPetrochemicals and Pemex-Petrochemicals were transformed into the productive state-owned subsidiary Pemex Industrial Transformation.
The Board of Directors of Petróleos Mexicanos also approved the creation of the following new Subsidiary Entities: Pemex Drilling and Services,Pemex Logistics, Pemex Cogeneration and Services, Pemex Fertilizers and Pemex Ethylene. Each of these productive state-owned subsidiaries may betransformed into an affiliate of Petróleos Mexicanos if certain conditions set forth in the Petróleos Mexicanos Law are met.
On March 27, 2015, the Board of Directors of Petróleos Mexicanos approved the Estatuto Orgánico de Petróleos Mexicanos (Organic Statute ofPetróleos Mexicanos) and the acuerdos de creación (creation resolutions) of each productive state-owned subsidiary. The Subsidiary Entities, and theirprimary purposes, are as follows:
� Pemex Exploration and Production: This entity is in charge of exploration and extraction of crude oil and solid, liquid or gaseoushydrocarbons in Mexico, in the exclusive economic zone of Mexico and abroad.
� Pemex Industrial Transformation: This entity performs activities related to refining, processing, importing, exporting, trading and the sale ofhydrocarbons.
� Pemex Drilling and Services: This entity performs drilling services and repair and services of wells.
� Pemex Logistics: This entity provides transportation, storage and related services for crude oil, petroleum products and petrochemicals toPEMEX (as defined below) and other companies, through pipelines and maritime and terrestrial means, and provides guard andmanagement services.
� Pemex Cogeneration and Services: This entity generates, supplies and trades electric and thermal energy, including but not limited to theenergy and thermal power produced in power plants and cogeneration plants, as well as performing technical and management servicesrelated to these activities to PEMEX and other companies, by itself or through companies in which it participates directly or indirectly.
� Pemex Fertilizers: This entity produces, distributes and commercializes ammonia, fertilizers and its derivatives, as well as provides relatedservices.
� Pemex Ethylene: This entity commercializes, distributes and trades methane, ethane and propylene, directly or through others.
F-8
Copyright © 2018 www.secdatabase.com. All Rights Reserved.Please Consider the Environment Before Printing This Document

Table of ContentsPETRÓLEOS MEXICANOS, PRODUCTIVE STATE-OWNED SUBSIDIARIES
AND SUBSIDIARY COMPANIESNOTES TO THE CONSOLIDATED FINANCIAL STATEMENTSFOR THE YEARS ENDED DECEMBER 31, 2017, 2016 AND 2015
(FIGURES STATED IN THOUSANDS, EXCEPT AS NOTED)
On April 28, 2015 the creation resolutions of the seven productive state-owned subsidiaries were published in the Official Gazette of theFederation. Each creation resolution included a provision establishing that the creation resolution would come into effect once the requiredadministrative procedures to start operations were in place and the Board of Directors of Petróleos Mexicanos issued and published a statement relatedto each creation resolution in the Official Gazette of the Federation.
On May 29, 2015 the statements related to the creation resolution of the productive state-owned subsidiary Pemex Exploration and Production andthe productive state-owned subsidiary Pemex Cogeneration and Services issued by the Board of Directors of Petróleos Mexicanos were published in theOfficial Gazette of the Federation and, accordingly, these creation resolutions came into effect on June 1, 2015. On December 29, 2015 and May 12,2016, modifications to the creation resolution of the productive state-owned subsidiary Pemex Exploration and Production were published in the OfficialGazette of the Federation and became effective that same date, respectively.
On July 31, 2015, the statements related to the creation resolution of the productive state-owned subsidiary Pemex Drilling and Services, theproductive state-owned subsidiary Pemex Fertilizers and the productive state-owned subsidiary Pemex Ethylene issued by the Board of Directors ofPetróleos Mexicanos were published in the Official Gazette of the Federation and, accordingly, these creation resolutions came into effect on August 1,2015.
On October 1, 2015, the statement related to the creation resolution of the productive state-owned subsidiary Pemex Logistics issued by the Boardof Directors of Petróleos Mexicanos was published in the Official Gazette of the Federation and, accordingly, these creation resolutions came into effecton October 1, 2015.
On October 6, 2015, the statement related to the creation resolution of the productive state-owned subsidiary Pemex Industrial Transformationissued by the Board of Directors of Petróleos Mexicanos was published in the Official Gazette of the Federation and, accordingly, these creationresolutions came into effect on November 1, 2015.
As of the date of this report, all of the creation resolutions of the productive state-owned subsidiaries have come into effect.
The principal distinction between the Subsidiary Entities and the Subsidiary Companies (as defined below) is that the Subsidiary Entities areproductive state-owned entities, whereas the Subsidiary Companies are affiliate companies that were formed in accordance with the applicable laws ofeach of the respective jurisdictions in which they were incorporated. The �Subsidiary Companies� are defined as those companies which are controlled,directly or indirectly, by Petróleos Mexicanos (see Note 3 a).
�Associates,� as used herein, means those companies in which Petróleos Mexicanos does not have effective control (see Note 3 a).
Petróleos Mexicanos, the Subsidiary Entities and the Subsidiary Companies are referred to collectively herein as �PEMEX.�
PEMEX�s address and its principal place of business is: Av. Marina Nacional No. 329, Col. Verónica Anzures, Delegación Miguel Hidalgo,11300 Ciudad de México, México.
F-9
Copyright © 2018 www.secdatabase.com. All Rights Reserved.Please Consider the Environment Before Printing This Document
Table of ContentsPETRÓLEOS MEXICANOS, PRODUCTIVE STATE-OWNED SUBSIDIARIES
AND SUBSIDIARY COMPANIESNOTES TO THE CONSOLIDATED FINANCIAL STATEMENTSFOR THE YEARS ENDED DECEMBER 31, 2017, 2016 AND 2015
(FIGURES STATED IN THOUSANDS, EXCEPT AS NOTED)
NOTE 2. BASIS OF PREPARATION
a. Statement of compliance
PEMEX prepared its consolidated financial statements as of December 31, 2017 and 2016, and for the years ended December 31, 2017, 2016 and2015, in accordance with International Financial Reporting Standards (�IFRS�) as issued by the International Accounting Standards Board (�IASB�).
On April 27, 2018, these consolidated financial statements under IFRS and the notes hereto were authorized for issuance by the following officers:Mr. Carlos Alberto Treviño Medina, Chief Executive Officer, Mr. David Ruelas Rodríguez, Chief Financial Officer, Mr. Manuel Salvador Cruz Flores,Deputy Director of Accounting and Tax Matters, and Mr. Oscar René Orozco Piliado, Associate Managing Director of Accounting.
These consolidated financial statements and the notes hereto as of December 31, 2017 were approved by the Board of Petróleos Mexicanos onApril 17, 2018 with prior approval from the Audit Committee of the report of the Independent Registered Public Accountant, pursuant to the terms ofArticle 13 Fraction VI of the Petróleos Mexicanos Law, Article 104 Fraction III, paragraph a, of the Ley del Mercado de Valores (Securities MarketLaw), and of Article 33 Fraction I, paragraph a, section 3 and Article 78 of the Disposiciones de carácter general aplicables a las emisoras de valores ya otros participantes del mercado de valores (General provisions applicable to securities´ issuers and other participants of the securities market).
b. Basis of measurement and going concern
These consolidated financial statements have been prepared using the historical cost basis method, except where it is indicated that certain itemshave been measured using the fair value model, amortized cost, present value or value in use. The principal items measured at fair value are derivativefinancial instruments (�DFIs�); the principal item measured at amortized cost is debt, the principal item measured at present value is the provision foremployee benefits and some components of wells, pipelines, properties, plant and equipment are measured at value in use.
Going concern
The consolidated financial statements have been prepared on a going concern basis, which assumes that PEMEX can meet its paymentobligations.
For the years ended December 31, 2017 and 2016, PEMEX recognized a net loss of Ps. 280,850,619 and Ps. 191,144,342, respectively, causedmainly by sustained low international oil prices, the high tax burden applicable to the industry, the depreciation of the peso relative to the U.S. dollar andan impairment of non-financial assets. In addition, as of December 31, 2017 and 2016, PEMEX had a negative equity of Ps. 1,502,352,385 andPs. 1,233,008,147, respectively; a negative working capital of Ps. 25,600,895 and Ps. 68,373,963, respectively; and net cash flows used in operatingactivities of Ps. 41,898,083 for the year ended December 31, 2016. However, net cash flows from operating activities were Ps. 63,397,470, for the yearended December 31, 2017.
PEMEX believes net cash flows from its operating and financing activities, including its availability of lines of credit with certain banks, will besufficient to meet its working capital needs, debt service and capital expenditure requirements and maintain its financial strength and flexibility in thetwelve months following the date of issuance of these consolidated financial statements.
F-10
Copyright © 2018 www.secdatabase.com. All Rights Reserved.Please Consider the Environment Before Printing This Document
Table of ContentsPETRÓLEOS MEXICANOS, PRODUCTIVE STATE-OWNED SUBSIDIARIES
AND SUBSIDIARY COMPANIESNOTES TO THE CONSOLIDATED FINANCIAL STATEMENTSFOR THE YEARS ENDED DECEMBER 31, 2017, 2016 AND 2015
(FIGURES STATED IN THOUSANDS, EXCEPT AS NOTED)
PEMEX continues to implement actions and business strategies that enable it to operate competitively and efficiently and take advantage ofbenefits of the Energy Reform Decree, as further described below:
� 2017-2021 Business Plan: On November 3, 2016, PEMEX announced its business plan for the five-year period from 2017 through 2021,which is designed to improve cash flows, reduce net indebtedness, strengthen its financial balance, reduce financial losses in its nationalrefining system and plan for continued cost-cutting and administrative discipline, as well as the establishment of additional strategicalliances and partnerships, including an intensive farm-out program. The business plan was prepared conservatively and does not includeadditional income from the disposal of assets.
� Plan for 2017: The 2017 actions under the business plan established certain objectives with respect to its Subsidiary Entities that wereimplemented as follows:
� Pemex Exploration and Production�s investments focused on the most profitable projects, as well as on farm-outs and otherpartnerships aimed at increasing hydrocarbon production.
� On March 3, 2017, Pemex Exploration and Production signed the first farm-out project with BHP-Billiton for the Trion projectand entered into a partnership with Chevron Energía de Mexico, S. de R.L. de C.V. (�Chevron�) and INPEX Corporation(�INPEX�) for the rights to block 3 North of the Cinturón Plegado Perdido in the Gulf of Mexico, both in deep waters.
� On May 2, 2017, Pemex Exploration and Production entered into an agreement with the Comisión Nacional deHidrocarburos, (National Hydrocarbon Commission, or �NHC�) for crude oil drilling under the shared shallow-waterproduction scheme for Ek-Balam field in the Campeche Basin.
� On May 30, 2017, Petróleos Mexicanos obtained approval from the NHC for the assignment of a new area that includesChachiquin, located in the Cinturón Plegado Perdido region in the deep waters of the Gulf of Mexico south of the maritimeborder with the U.S., and an area southwest of the Nobilis field.
� Similarly, on June 19, 2017, Pemex Exploration and Production was awarded exploration and production fields biddingprocess (�Rounds�) in Round 2.1 the rights to develop two blocks in shallow waters: Block 2, in partnership DEA DeutscheErdoel Ag (�DEA�) and Block B in partnership with Ecopetrol Global Energy, S.L.U. (�Ecopetrol�). On September 25, 2017,Pemex Exploration and Production signed the corresponding contracts for the exploration and extraction of hydrocarbons withDEA and Ecopetrol.
� On October 4, 2017, Pemex Exploration and Production finalized two farm-outs for the optimization of the development ofthe onshore fields of Cárdenas-Mora and Ogarrio, with Cheiron Holdings Limited (�Cheiron�) and DEA companies,respectively.
� On November 3, 2017, Petróleos Mexicanos announced the discovery of onshore light crude oil and gas reservoirs at theIxachi-1 well in the state of Veracruz, Mexico, which PEMEX believes may contain over 1,500 million barrels of oilequivalent in place, representing 3P reserves of around 350 million barrels of oil equivalent. PEMEX believes that thisdiscovery represents its largest onshore discovery in 15 years and that production can be accelerated due to the proximity ofthe reservoirs to existing infrastructure and to the Sistema Nacional de Gasoductos (National Gas Pipeline System.)
� On December 18, 2017, Pemex Exploration and Production and Petrofac México, S.A. de C.V., together with the NHC, signedthe exploration and extraction contract for the onshore fields Santuario and El Golpe, which are located in the state ofTabasco.
F-11
Copyright © 2018 www.secdatabase.com. All Rights Reserved.Please Consider the Environment Before Printing This Document

Table of ContentsPETRÓLEOS MEXICANOS, PRODUCTIVE STATE-OWNED SUBSIDIARIES
AND SUBSIDIARY COMPANIESNOTES TO THE CONSOLIDATED FINANCIAL STATEMENTSFOR THE YEARS ENDED DECEMBER 31, 2017, 2016 AND 2015
(FIGURES STATED IN THOUSANDS, EXCEPT AS NOTED)
� Pemex Industrial Transformation worked in partnerships for auxiliary services and the reconfiguration of certain refineries. OnSeptember 1, 2017, Pemex Industrial Transformation executed the auxiliary services contract with Air Liquide México. S.A.de R.L. de C.V. for ensuring and efficient hydrogen supply for the Miguel Hidalgo Refinery in Tula, Hidalgo.
� In September, 2017, Pemex Industrial Transformation began the selection process for partners for the hydrogen supplyprojects for the Héctor R. Lara Sosa Refinery in Cadereyta, Nuevo León and the Francisco I. Madero Refinery in CiudadMadero, Tamaulipas. In April 2018, Pemex Industrial Transformation entered into a long-term agreement with the Germancompany Linde AG for the supply of hydrogen to its Madero refinery.
� Pemex Logistics is being transformed from a company designed to ensure that Petróleos Mexicanos and its subsidiaries areproperly supplied to one that provides profitable and competitive services to multiple customers. On May 2, 2017, PEMEXannounced the results of the first Open Season Public Auction held by Pemex Logistics whereby, on July 18, 2017, PEMEXsigned the contracts with Andeavor (formerly Tesoro Corporation). Under the contracts, Andeavor may use PEMEX�spipeline transportation and storage system in the northwest of Mexico. On December 18, 2017, the Comisión Reguladora deEnergía (the Energy Regulatory Commission, or �ERC�) approved Phase 2 of the Open Season.
� PEMEX�s business plan also describes its goal to increase the profitability of Pemex Fertilizers, Pemex Ethylene and PemexDrilling and Services through service contracts and partnerships for the modernization of their facilities. On July 6, 2017,Pemex Ethylene, successfully concluded an e-auction to allocate quantities of ethylene oxide, in which 100% of the volumeavailable was placed at a market price and was higher than the historical price.
� Plan for 2018: The 2018 actions under the business plan also set out certain objectives that PEMEX expects to achieve with respect to itsSubsidiary Entities as follows:
� On January 31, 2018, PEMEX successfully participated in bidding Round 2.4, and was awarded the assignment of four blocks,all of which are located in deep waters in the Gulf of Mexico. Pemex Exploration and Production and Royal Dutch Shell PLC(�Shell�) were awarded Block 2 of the Perdido area. The consortium formed by Pemex Exploration and Production, Chevronand INPEX was awarded area 22 of the Cuenca Salina province. Finally, PEMEX was assigned on an individual basis, Block5 in the Perdido area and area 18 of the Mexican Range province.
� On March 27, 2018, Petróleos Mexicanos successfully participated in bidding Round 3.1 of the NHC tenders, and wasawarded seven contractual areas in shallow waters, six of them in a consortium and one on an individual basis. PemexExploration and Production won four blocks in the Southeast Basins: two in consortium with French Total S.A., one withShell and one on an individual basis, as well as three blocks corresponding to the province of Tampico-Misantla-Veracruz: twoin partnership with Compañía Española de Petróleos (�CEPSA�) and DEA and one more in partnership with CEPSA.
These contracts are intended to contribute to increase the reserves and hydrocarbon production with the respective economicbenefits.
� Pemex Exploration and Production will focus on maintaining production levels and developing farm-outs and associationswith the aim of increasing its operations and, with
F-12
Copyright © 2018 www.secdatabase.com. All Rights Reserved.Please Consider the Environment Before Printing This Document
Table of ContentsPETRÓLEOS MEXICANOS, PRODUCTIVE STATE-OWNED SUBSIDIARIES
AND SUBSIDIARY COMPANIESNOTES TO THE CONSOLIDATED FINANCIAL STATEMENTSFOR THE YEARS ENDED DECEMBER 31, 2017, 2016 AND 2015
(FIGURES STATED IN THOUSANDS, EXCEPT AS NOTED)
time, the production of hydrocarbons in the mid-term. Pemex Exploration and Production will also accelerate the migration ofintegrated E&P contracts and financed public works contracts to Exploration and Extraction Contracts (�EEC�) and will focuson the rehabilitation and reincorporation activities of wells with production possibilities. In 2018, Pemex Exploration andProduction will continue to promote actions that encourage efficiency and optimize costs.
� In order to continue to take advantage of the benefits of the Energy Reform and to ensure the economic sustainability ofPEMEX, in 2018 and in the up-coming years, Pemex Exploration and Production will be focusing its efforts on the followingstrategies: (1) establishing a model of exploration that allows it to achieve the objective of incorporating and increasing provedreserves; (2) developing a master plan for the development of shales; (3) containing and reversing declines in the productionof wells through reactivation and maintenance activities performed on closed wells through integrated services; (4) continuingwith farm-outs to develop complex fields and leverage third-party resources; (5) establishing schemes, including strategicpartnerships and alliances, to attract additional investment; (6) increasing revenues from hydrocarbons trading; and(7) strengthening operational efficiency and cost control.
� Pemex Industrial Transformation will continue to perform reconfiguration and auxiliary services for its refineries and to focuson the following strategies: (1) keeping its facilities safe and reliable, (2) improving the financial balance, (3) maintaining amarket share in Mexico of over 65%; and (4) eliminating debts, which will help to improve its refining margin.
In addition to taking advantage of new business opportunities and arrangements provided by the Energy Reform, such as farm-outs, PEMEX alsocontinues to take certain specific measures to improve its financial position, including the following:
� 2016 Budget Adjustment: In 2017, PEMEX developed actions from its Plan de Ajuste Presupuestal 2016 (�2016 Budget Adjustment Plan�)to reduce expenses which were included in its 2017-2021 Business Plan.
� Pension Reform. As of January 1, 2016, new employees are entitled to receive a defined contribution pension plan, pursuant to which bothPEMEX and its employees contribute to each employee�s individual account, in contrast to the existing defined benefit pension plan,pursuant to which only PEMEX contributes. Additionally, in August 2017, PEMEX began the process of inviting existing employees tomigrate from a defined benefit plan to a defined contribution plan, which will allow Pemex to decrease its employee benefits service costand its employee benefits liability.
� Asset Sales. PEMEX continues to evaluate the divestiture of non-essential assets to obtain working capital and to focus on those activitiesconsidered as the most profitable. These projects include:
� On October 5, 2017, PEMEX announced the divestiture of its participation in the Ramones II Norte gas pipeline (50% interestof Pemex Industrial Transformation in Ductos y Energéticos del Norte, S. de R.L. de C.V., and 5% indirect interest of PemexIndustrial Transformation TAG Norte Holding, S. de R.L. de C.V.). On November 10, 2017, the Comisión Federal deCompetencia Económica (the Federal Commission for Financial Competence) authorized the divestiture in Ductos yEnergéticos del Norte, S. de R.L. de C.V., closing the operation on
F-13
Copyright © 2018 www.secdatabase.com. All Rights Reserved.Please Consider the Environment Before Printing This Document
Table of ContentsPETRÓLEOS MEXICANOS, PRODUCTIVE STATE-OWNED SUBSIDIARIES
AND SUBSIDIARY COMPANIESNOTES TO THE CONSOLIDATED FINANCIAL STATEMENTSFOR THE YEARS ENDED DECEMBER 31, 2017, 2016 AND 2015
(FIGURES STATED IN THOUSANDS, EXCEPT AS NOTED)
November 16, 2017. PEMEX estimates that TAG Norte Holding, S. de R.L. de C.V. divestiture will conclude in the firstsemester of 2018.
� Decreased Debt Financing: PEMEX decreased its financing during 2017 from Ps. 231,618,067 of net indebtedness in 2016 to a netindebtedness of Ps. 72,412,672 in 2017. In addition, PEMEX developed liability management transactions in accordance with marketconditions and in order to improve its financial profile, with longer due dates and better interest rates, as described in Note 15 to theseconsolidated financial statements. As a result of this strategy, Standard & Poor�s and Fitch increased PEMEX�s ratings outlook fromnegative to stable. For the fiscal year of 2018, the Federal Income Law applicable to PEMEX authorized for Petróleos Mexicanos and itsSubsidiary Entities an internal net debt up to Ps. 30,000,000 and an external net debt up to U.S.$ 6,182,800. In addition, PEMEX willcontinue to assess opportunities for liability management in accordance with market conditions. In addition, as of December 31, 2017,PEMEX has five syndicated lines of credit to manage its liquidity for U.S.$6,700,000 and Ps.23,500,000.
� New Budget: On July 14, 2017, the Board of Directors of Petróleos Mexicanos approved a proposal for the annual consolidated budget ofPetróleos Mexicanos and its Subsidiaries Entities for 2018, which was subsequently approved by the Chamber of Deputies on November 9,2017.
The consolidated annual budget of Petróleos Mexicanos and its Subsidiary Entities for 2018 is approximately Ps. 391,946,000, a 1.7%increase as compared to the Ps. 385,211,257 consolidated annual adjusted budget for 2017.
� The structural changes arising from the Energy Reform, and the actions taken by management are aimed at ensuring the continuity ofPEMEX�s operations, reducing costs, generating more revenue and operating more efficiently.
� In 2017, PEMEX entered into a crude oil hedge program to partially protect its cash flows from decreases in the price of Mexican crude oil.
Petróleos Mexicanos and its Subsidiary Entities are not subject to the Ley de Concursos Mercantiles (the Bankruptcy Law) and none of PEMEX�sexisting financing agreements include any clause that could lead to the demand for immediate payment of the respective debt due to having negativeequity.
PEMEX prepared its consolidated financial statements as of December 31, 2017 and 2016 on a going concern basis. There are certain conditionsthat have generated important uncertainty and significant doubts concerning the entity�s ability to continue operating, including recurring net losses,negative working capital and negative equity. These financial statements do not contain any adjustments that would be required if they were notprepared on a going concern basis.
c. Functional and reporting currency and translation of foreign currency operations
These consolidated financial statements are presented in Mexican pesos, which is both PEMEX�s functional and reporting currency, due to thefollowing:
i. the economic environment in which PEMEX operates is Mexico, where the legal currency is the Mexican peso;
ii. Petróleos Mexicanos and its Subsidiary Entities have budgetary autonomy, subject only to maintaining the financial balance (the differencebetween income and total net spending, including the financial
F-14
Copyright © 2018 www.secdatabase.com. All Rights Reserved.Please Consider the Environment Before Printing This Document

Table of ContentsPETRÓLEOS MEXICANOS, PRODUCTIVE STATE-OWNED SUBSIDIARIES
AND SUBSIDIARY COMPANIESNOTES TO THE CONSOLIDATED FINANCIAL STATEMENTSFOR THE YEARS ENDED DECEMBER 31, 2017, 2016 AND 2015
(FIGURES STATED IN THOUSANDS, EXCEPT AS NOTED)
cost of the public debt of the Mexican Government and the entities directly controlled by the Mexican Government) and the spending cap ofpersonnel services proposed by SHCP and approved by the Mexican Congress, in Mexican pesos.
iii. Employee benefits provision was approximately 35% and 34% of PEMEX�s total liabilities as of December 31, 2017 and 2016,respectively. This provision is computed, denominated and payable in Mexican pesos; and
iv. cash flows for payment of general expenses, taxes and duties are realized in Mexican pesos.
Although the sales prices of several products are based on international U.S. dollar-indices, final domestic selling prices are governed by theeconomic and financial policies established by the Mexican Government. Accordingly, cash flows from domestic sales are generated and received inMexican pesos.
Mexico�s monetary policy regulator, the Banco de México, requires that Mexican Government entities other than financial entities sell theirforeign currency to the Banco de México in accordance with its terms, receiving Mexican pesos in exchange, which is the currency of legal tender inMexico.
Translation of financial statements of foreign operations
The financial statements of foreign subsidiaries and associates are translated into the reporting currency by first identifying if the functionalcurrency is different from the currency for recording the foreign operations, and, if so, the recording currency is translated into the functional currencyand then into the reporting currency using the year-end exchange rate of each period for assets and liabilities reported in the consolidated statements offinancial position; the historical exchange rate at the date of the transaction for equity items; and the weighted average exchange rate of the year forincome and expenses reported in the statement of comprehensive income.
d. Terms definition
References in these consolidated financial statements and the related notes to �pesos� or �Ps.� refers to Mexican pesos, �U.S. dollars� or �US$�refers to dollars of the United States of America, �yen� or �¥� refers to Japanese yen, �euro� or ��� refers to the legal currency of the EuropeanEconomic and Monetary Union, �Pounds sterling� or �£� refers to the legal currency of the United Kingdom, �Swiss francs� or �CHF� refers to thelegal currency of the Swiss Confederation, �Canadian dollars� or �CAD� refers to the legal currency of Canada and �Australian dollars� or �AUD�refers to the legal currency of Australia. Figures in all currencies are presented in thousands of the relevant currency unit, except exchange rates andproduct and share prices.
e. Convenience translations
These consolidated financial statements are presented in Mexican pesos (reporting currency), which is the same as the recording currency and thefunctional currency of PEMEX. The U.S. dollar amounts shown in the consolidated statements of financial position, the consolidated statements ofcomprehensive income, the consolidated statements of changes in equity (deficit) and the consolidated statements of cash flows have been includedsolely for the convenience of the reader and are unaudited. Such amounts have been translated from amounts in pesos, as a matter of arithmeticcomputation only, at the exchange rate for the settlement of obligations in foreign currencies provided by Banco de México and SHCP at December 31,2017 of Ps. 19.7867 per U.S. dollar. Translations herein should not be construed as a representation that the peso amounts have been or could beconverted into U.S. dollars at the foregoing or any other rate.
F-15
Copyright © 2018 www.secdatabase.com. All Rights Reserved.Please Consider the Environment Before Printing This Document
Table of ContentsPETRÓLEOS MEXICANOS, PRODUCTIVE STATE-OWNED SUBSIDIARIES
AND SUBSIDIARY COMPANIESNOTES TO THE CONSOLIDATED FINANCIAL STATEMENTSFOR THE YEARS ENDED DECEMBER 31, 2017, 2016 AND 2015
(FIGURES STATED IN THOUSANDS, EXCEPT AS NOTED)
NOTE 3. Significant accounting policies
The preparation of the consolidated financial statements in accordance with IFRS requires the use of estimates and assumptions made byPEMEX�s management that affect the recorded amounts of assets and liabilities and the disclosures of contingent assets and liabilities as of the date ofthese consolidated financial statements, as well as the recorded amounts of income, costs and expenses during the year.
Significant estimates and underlying assumptions are reviewed, and the effects of such revisions are recognized in the years in which anyestimates are revised and in any future periods affected by such revision.
Information about estimates, assumptions and critical accounting policies that have the most significant effects on the amounts recognized in theconsolidated financial statements are described in the following notes:
� Note 3(e) Financial instruments�determination of fair values
� Note 3(h) Wells, pipelines, properties, plant and equipment, including the successful efforts method�economic feasibility determining tocapitalize assets
� Note 3(j) Impairment of non-financial assets�cash flow estimates and discount rates determination
� Note 3(l) Provisions�environmental liabilities and retirement of assets
� Note 3(m) Employee benefits�actuarial assumptions and hypothesis
� Note 3(n) Income taxes and duties�assessment of deferred income tax asset recovery
� Note 3(p) Contingencies�assessment of likelihood of contingency
Actual results could differ from those estimates and assumptions.
Below is a summary of the principal accounting policies, which have been consistently applied to each of the years presented and followed byPEMEX in the preparation of its consolidated financial statements:
a. Basis of consolidation
The consolidated financial statements include those of Petróleos Mexicanos, the Subsidiary Entities and the Subsidiary Companies. Allintercompany balances and transactions of the consolidated companies; income and expenses, as well as unrealized profits and losses resulting fromoperations between them have been eliminated in the preparation of the consolidated financial statements pursuant to IFRS 10, �Consolidated FinancialStatements� (�IFRS 10�).
Unrealized gains arising from transactions with entities whose investment is accounted for using the equity method are eliminated against theinvestment to the extent of PEMEX�s participation in such entities. Unrealized losses are eliminated in the same way as unrealized gains but only to theextent that there is no evidence of impairment of the investment. If such evidence exists, PEMEX recognizes it in its consolidated financial statements.
Investment in subsidiaries
The Subsidiary Entities and Subsidiary Companies are consolidated from the date that control commences until the date that control ceases.
F-16
Copyright © 2018 www.secdatabase.com. All Rights Reserved.Please Consider the Environment Before Printing This Document

Table of ContentsPETRÓLEOS MEXICANOS, PRODUCTIVE STATE-OWNED SUBSIDIARIES
AND SUBSIDIARY COMPANIESNOTES TO THE CONSOLIDATED FINANCIAL STATEMENTSFOR THE YEARS ENDED DECEMBER 31, 2017, 2016 AND 2015
(FIGURES STATED IN THOUSANDS, EXCEPT AS NOTED)
Petróleos Mexicanos controls a subsidiary when it is exposed to or has rights to variable returns from the company and has the ability to affectthose returns through its power over the company.
The financial statements of the Subsidiary Entities and Subsidiary Companies have been prepared based on the same period of PetróleosMexicanos� consolidated financial statements applying the same accounting policies.
For more information about Subsidiary Companies, see Note 4.
Investments in associates and joint arrangements
Associates are those entities in which PEMEX has significant influence but not the power to control financial and operational decisions. It ispresumed that there is significant influence when PEMEX owns directly or indirectly between 20% and 50% of voting rights in another entity.
Joint arrangements are those arrangements whereby two or more parties have joint control of an arrangement. A joint arrangement is either a jointventure, where both of the parties have rights to the net assets of the arrangements, or a joint operation, where the parties have both rights to the assets,and obligations for the liabilities relating to the arrangements.
Investments in associates and joint ventures are recognized based on the equity method and recorded initially at cost, including any goodwillidentified on acquisition. With respect to joint operations, the assets, liabilities, income and expenses are recognized in relation to the share of each partyand in accordance with the applicable IFRS for each of those items. The investment cost includes transaction costs.
These consolidated financial statements include the proportion of gains, losses and other comprehensive income corresponding to PEMEX�sshare in each investee, once these items are adjusted to align with the accounting policies of PEMEX, from the date that significant influence and jointcontrol begins to the date that such influence or joint control ceases.
When the value of the share of losses exceeds the value of PEMEX�s investment in an associate or joint venture, the carrying value of theinvestment, including any long-term investment, is reduced to zero and PEMEX ceases to recognize additional losses, except in cases where PEMEX isliable for obligations incurred by those associates and joint ventures.
For more information about associates and joint arrangements, see Note 11.
Non-controlling interests
The equity interests of third parties who do not have a controlling interest in the equity or comprehensive result of subsidiaries of PEMEX arepresented in the consolidated statements of financial position, the consolidated statements of changes in equity (deficit) as �non-controlling interests�and as �net income and comprehensive income for the period, attributable to non-controlling interests,� in the consolidated statements of comprehensiveincome.
Changes in a parent�s ownership interest in a subsidiary that do not result in a loss of control are accounted for as equity transactions. In suchcircumstances, the carrying amounts of the controlling and non-controlling interests shall be adjusted to reflect the changes in their relative interests inthe subsidiary.
F-17
Copyright © 2018 www.secdatabase.com. All Rights Reserved.Please Consider the Environment Before Printing This Document
Table of ContentsPETRÓLEOS MEXICANOS, PRODUCTIVE STATE-OWNED SUBSIDIARIES
AND SUBSIDIARY COMPANIESNOTES TO THE CONSOLIDATED FINANCIAL STATEMENTSFOR THE YEARS ENDED DECEMBER 31, 2017, 2016 AND 2015
(FIGURES STATED IN THOUSANDS, EXCEPT AS NOTED)
Dividends in cash and assets other than cash
A liability for distributions of dividends in cash and non-cash assets to third parties is recognized when the distribution is authorized by the Boardof Directors. The corresponding amount is recognized directly in equity.
Distributions of dividends in non-cash assets are measured at the fair value of the assets to be distributed. Changes relating to these measurementsof the fair value, between the date on which the distribution is declared and the date when the assets are transferred, are recognized directly in equity.
When distributing non-cash assets, any difference between the carrying amount of the liability for distribution of dividends and the carryingamount of the assets distributed is recognized in the consolidated statements of comprehensive income.
b. Business combinations and goodwill
Business combinations are accounted for using the acquisition method. The cost of an acquisition is measured as the aggregate of theconsideration transferred, measured as the acquisition date fair value, and the amount of any non-controlling interest in the acquiree.
When PEMEX acquires a business, it assesses the acquired assets and liabilities in order to appropriately classify and designate each, taking intoaccount the contractual terms, economic circumstances and other pertinent conditions as of the date of the acquisition. This includes the separation ofembedded derivatives in host contractors by the acquiree. Acquired petroleum reserves and resources that can be reliably measured are recognizedseparately in the assessment of fair values on acquisition. Other potential reserves and rights, for which fair values cannot be reliably measured, are notrecognized separately, but instead are subsumed in goodwill.
For business combinations achieved in stages, any previously held equity interest is measured at its acquisition date fair value, and any resultinggain or loss is recognized in income or loss or other comprehensive income.
Any contingent consideration to be transferred by the acquirer will be recognized at fair value on the acquisition date. Contingent considerationclassified as an asset or liability that is a financial instrument and within the scope of IAS 39 �Financial instruments: Recognition and Measurement� ismeasured at fair value, with changes in fair value recognized in income or loss or other comprehensive income. If contingent consideration is not withthe scope of IAS 39, it is measured in accordance with the appropriate IFRS requirement. Contingent consideration that is classified as equity is notremeasured, and subsequent settlement is accounted for within equity.
Goodwill, which is initially measured at cost, is the excess of the aggregate of the consideration transferred and the amount recognized fornon-controlling interest over the fair value of the identifiable net assets acquired and liabilities assumed. If the fair value of the net asset acquired isgreater than the aggregate consideration transferred (bargain purchase), before recognizing a gain, PEMEX reassesses whether it has correctly identifiedall of the assets acquired and all of the liabilities assumed and reviews the procedures used to measure the amounts to be recognized at the acquisitiondate. If the assessment still results in an excess of the fair value of net assets acquired over the aggregate consideration transferred, then the gain isrecognized in the consolidated statements of comprehensive income.
F-18
Copyright © 2018 www.secdatabase.com. All Rights Reserved.Please Consider the Environment Before Printing This Document
Table of ContentsPETRÓLEOS MEXICANOS, PRODUCTIVE STATE-OWNED SUBSIDIARIES
AND SUBSIDIARY COMPANIESNOTES TO THE CONSOLIDATED FINANCIAL STATEMENTSFOR THE YEARS ENDED DECEMBER 31, 2017, 2016 AND 2015
(FIGURES STATED IN THOUSANDS, EXCEPT AS NOTED)
After initial recognition, goodwill is measured at cost less any accumulated impairment losses. For the purpose of impairment testing, goodwillacquired in a business combination is, from the acquisition date, allocated to each cash generating unit that is expected to benefit from the combination,irrespective of whether other assets or liabilities of the acquiree are assigned to those units.
When goodwill is allocated to a cash generating unit and certain of the operations in that unit are disposed of, the goodwill associated with thedisposed operation is included in the carrying amount of the operation when determining the gain or loss on disposal. Goodwill disposed in thesecircumstances is measured based on the relative values of the disposed operation and the portion of the cash generating unit retained.
c. Transactions in foreign currency
In accordance with IAS 21, �The Effects of Changes in Foreign Exchange Rates� (�IAS 21�), transactions in foreign currencies are translated andrecorded at exchange rates at the dates of the transactions and/or of the presentation of financial information.
Exchange differences arising from the settlement of monetary items or from the translation of monetary items into rates different from those atwhich they were translated on their initial recognition, are recognized in the results of operations in the reporting period in which they arise. When again or loss from a non-monetary item is recognized in other comprehensive results, any exchange difference included in that gain or loss is recognizedin other comprehensive results. Conversely, when a gain or loss from a non-monetary item is recognized in the results of operations, any exchangedifference included in that gain or loss is recognized in the results of operations for the period.
d. Fair value measurement
PEMEX measures certain financial instruments such as DFIs at fair value as of the closing date of the relevant reporting period.
Fair value is the price that would be received to sell an asset or paid to transfer a liability in an orderly transaction between market participants atthe measurement date. A measurement at fair value assumes that the sale of the asset or transfer of a liability occurs:
i. in the principal market for the asset or liability; or
ii. in the absence of a principal market, in the most advantageous market for the asset or liability.
The principal market or the most advantageous market must be accessible for PEMEX.
The fair value of an asset or liability is measured by using the same assumptions that market participants would make when pricing the asset orliability under the premise that market participants take into account highest and best use of the asset or liability.
e. Financial instruments
Financial instruments are classified as: (i) financial instruments measured at fair value through profit or loss; (ii) financial instruments held tomaturity; (iii) available-for-sale financial assets; (iv) investments in equity instruments; (v) loans and receivables; and (vi) DFIs. PEMEX determines theclassification of its financial instruments at the time of initial recognition.
F-19
Copyright © 2018 www.secdatabase.com. All Rights Reserved.Please Consider the Environment Before Printing This Document

Table of ContentsPETRÓLEOS MEXICANOS, PRODUCTIVE STATE-OWNED SUBSIDIARIES
AND SUBSIDIARY COMPANIESNOTES TO THE CONSOLIDATED FINANCIAL STATEMENTSFOR THE YEARS ENDED DECEMBER 31, 2017, 2016 AND 2015
(FIGURES STATED IN THOUSANDS, EXCEPT AS NOTED)
PEMEX�s financial instruments include cash and short-term deposits, available-for-sale financial assets, accounts receivable, other receivables,loans, accounts payable to suppliers, other accounts payable, borrowings and debts, as well as DFIs.
Below are descriptions of the financial instruments policies employed by PEMEX:
Financial instruments measured at fair value through profit or loss
A financial instrument is measured at fair value through profit or loss if it is classified as held for trading or designated as such upon initialrecognition. Financial assets are designated at fair value through profit or loss if PEMEX manages such investments and makes purchase and saledecisions based on their fair value in accordance with PEMEX�s documented risk management or investment strategy. In addition, directly attributabletransaction costs are recognized in the consolidated statements of comprehensive income for the year. These financial instruments are recognized at fairvalue and corresponding changes relating to dividend income are recognized in the consolidated statements of comprehensive income.
Available-for-sale financial assets
Available-for-sale financial assets are non-DFIs that are designated as available-for-sale or are not classified in any of the previous categories.PEMEX�s investments in certain equity securities and debt securities are classified as available-for-sale financial assets. Available-for-sale financialassets are recognized initially at fair value plus any directly attributable transaction costs.
Subsequent to initial recognition, available-for-sale financial assets are measured at fair value. In addition, any gains or losses associated withsuch instruments, as well as foreign exchange differences are recognized in other comprehensive results and presented in the fair value reserve in equity.When an investment is derecognized, any gains or losses accumulated in the equity are reclassified to profit or loss.
Sales and purchases of financial assets that require the delivery of such assets within a period of time established by market practice arerecognized as of the negotiation date (the date on which PEMEX commits to purchase or sell the asset).
Loans and receivables
Loans and receivables are initially recognized at fair value. After initial recognition, loans and debt securities that bear interest are measured atamortized cost using the effective interest rate (�EIR�) method, less impairment losses.
The amortized cost is calculated based on any discount or premium on acquisition and fees and costs that are an integral part of the EIR method.Amortization of costs is included under the heading of financing cost in the consolidated statements of comprehensive income.
Derivative financial instruments
DFIs presented in the consolidated statements of financial position are carried at fair value. In the case of DFIs held for trading, changes in fairvalue are recorded in profit or loss; in the case of DFIs formally designated
F-20
Copyright © 2018 www.secdatabase.com. All Rights Reserved.Please Consider the Environment Before Printing This Document

Table of ContentsPETRÓLEOS MEXICANOS, PRODUCTIVE STATE-OWNED SUBSIDIARIES
AND SUBSIDIARY COMPANIESNOTES TO THE CONSOLIDATED FINANCIAL STATEMENTSFOR THE YEARS ENDED DECEMBER 31, 2017, 2016 AND 2015
(FIGURES STATED IN THOUSANDS, EXCEPT AS NOTED)
as and that qualify for hedging, changes in fair value are recorded in the consolidated statements of comprehensive income using cash flow or fair valuehedge accounting, with gains or losses classified in accordance with the earnings treatment of the hedge transaction.
Embedded derivatives
PEMEX evaluates the potential existence of embedded derivatives, which may be found in the terms of its contracts, or combined with other hostcontracts, which could be structured financial instruments (debt or equity instruments with embedded derivatives). Embedded derivatives have termsthat implicitly or explicitly meet the characteristics of a DFI. In some instances, these embedded derivatives must be segregated from the underlyingcontracts and measured, recognized, presented and disclosed as DFIs, such as when the economic risks and terms of the embedded derivative are notclearly and closely related to the underlying contract.
Impairment of financial assets
At each reporting date, PEMEX evaluates whether there is objective evidence that a financial asset or group of financial assets is impaired, inwhich case the value of the recoverable amount of the asset is calculated. A financial asset is impaired if objective evidence indicates that a loss eventhas occurred after the initial recognition of the asset, and that the loss event had a negative effect on the estimated future cash flows of the financialasset.
Objective evidence that a financial asset or group of assets is impaired includes significant financial difficulty of the issuer or obligor, a breach ofcontract, such as a default or delinquency in interest or principal payments; the lender, for economic or legal reasons relating to the borrower�s financialdifficulty, granting to the borrower a concession that the lender would not otherwise consider; it becoming probable that the borrower will enterbankruptcy or other financial reorganization; the disappearance of an active market for that financial asset because of financial difficulties; or observabledata indicating that there is a measurable decrease in the estimated future cash flows. Impairments by asset are:
Impairment of financial assets carried at amortized cost
The impairment of financial assets carried at amortized cost is measured as the difference between the assets carrying amount and the presentvalue of estimated future cash flows (excluding future credit losses that have not been incurred) discounted at the financial asset�s original effectiveinterest rate. The amount of the loss shall be recognized in profit or loss.
If, in a subsequent period, the amount of the impairment loss decreases and the decrease can be related objectively to an event occurring after theimpairment was recognized, the impairment loss previously recognized shall be reversed in profit or loss.
Impairment in available�for�sale financial assets
In addition to the above-mentioned, a significant or prolonged decline in the fair value of an investment in an available�for�sale equity instrumentis also objective evidence of impairment.
When there is objective evidence of the impairment of an asset, the accumulated loss recognized in other comprehensive income shall bereclassified from equity to profit or loss even though the financial asset has not been derecognized.
F-21
Copyright © 2018 www.secdatabase.com. All Rights Reserved.Please Consider the Environment Before Printing This Document
Table of ContentsPETRÓLEOS MEXICANOS, PRODUCTIVE STATE-OWNED SUBSIDIARIES
AND SUBSIDIARY COMPANIESNOTES TO THE CONSOLIDATED FINANCIAL STATEMENTSFOR THE YEARS ENDED DECEMBER 31, 2017, 2016 AND 2015
(FIGURES STATED IN THOUSANDS, EXCEPT AS NOTED)
If, in a subsequent period, the impairment loss decreases, the reversal shall be reflected as a reversal in other comprehensive income.
f. Cash and cash equivalents
Cash and cash equivalents are comprised of cash balances on hand, net of overdrafts, deposits in bank accounts, foreign currency reserves andinstruments with maturities of three months or less from the acquisition date that are subject to an insignificant risk of changes in their fair value, whichare used in the management of PEMEX�s short-term commitments.
Cash subject to restrictions or that cannot be exchanged or used to settle a liability within 12 months is presented as non-current assets.
g. Inventories and cost of sales
Inventories are valued at the lower of cost or net realizable value. Cost is determined based on the cost of production or acquisition of inventoryand other costs incurred in transporting such inventory to its present location and in its present condition, using the average cost formula. Net realizablevalue is the estimated selling price in the ordinary course of business less the estimated costs of completion and the estimated selling costs. The estimatetakes into consideration, among other things, the decrease in the value of inventories due to obsolescence.
Cost of sales represents the cost of production or acquisition of inventories at the time of sale, increased, where appropriate, by declines in netrealizable value of inventories during the year.
Advance payment to suppliers for inventory purchases are recognized as part of inventory when the risks and benefits of the ownership of theinventory have been transferred to PEMEX.
h. Wells, pipelines, properties, plant and equipment
Wells, pipelines, properties, plant and equipment are recorded at acquisition or construction cost less accumulated depreciation and accumulatedimpairment losses.
PEMEX uses the successful efforts method for the exploration and production of crude oil and gas activities, considering the criteria mentioned inIFRS 6, �Exploration for and Evaluation of Mineral Resources� in relation to the recognition of exploration and drilling assets. Costs of developmentwells and related plant, property and equipment involved in the exploitation of oil and gas are recorded as part of the cost of assets. The costs ofexploratory wells in areas that have not yet been designated as containing proved reserves are recorded as intangible assets until it is determined whetherthey are commercially viable to capitalize as fixed assets, otherwise they are recognized as exploration expenses. Other expenditures on exploration arerecognized as exploration expenses as they are incurred.
In accordance with IAS 16, �Property, Plant and Equipment� (�IAS 16�), initial costs of wells, pipelines, properties, plant and equipment areinitially recorded at cost, which includes their original purchase price or construction cost, any costs attributable to bringing the assets to a workingcondition for their intended use and the costs of dismantling and removing the items and restoring the site on which they are located, including theestimated cost of plugging and abandoning wells.
F-22
Copyright © 2018 www.secdatabase.com. All Rights Reserved.Please Consider the Environment Before Printing This Document
Table of ContentsPETRÓLEOS MEXICANOS, PRODUCTIVE STATE-OWNED SUBSIDIARIES
AND SUBSIDIARY COMPANIESNOTES TO THE CONSOLIDATED FINANCIAL STATEMENTSFOR THE YEARS ENDED DECEMBER 31, 2017, 2016 AND 2015
(FIGURES STATED IN THOUSANDS, EXCEPT AS NOTED)
The cost of financing projects that require large investments and financing incurred for projects, net of interest revenues from the temporaryinvestment of these funds, is recognized as part of wells, pipelines, properties, plant and equipment when the cost is directly attributable to theconstruction or acquisition of a qualifying asset. The capitalization of these costs is suspended during periods in which the development of constructionis interrupted, and its capitalization ends when the activities necessary for the use of the qualifying asset are substantially completed. All other financingcosts are recognized in the consolidated statements of comprehensive income in the period in which they are incurred.
The cost of self-constructed assets includes the cost of materials and direct labor, interest on financing and any other costs directly attributable tostart up. In some cases the cost also includes the cost of plugging of wells and removal.
Expenditures related to the construction of wells, pipelines, properties, plant and equipment during the stage prior to commissioning are stated atcost as intangible assets or construction in progress, in accordance with the characteristics of the asset. Once the assets are ready for use, they aretransferred to the respective component of wells, pipelines, properties, plant and equipment and depreciation or amortization begins.
The costs of major maintenance or replacement of a significant component of an item of wells, pipelines, properties, plant and equipment arerecognized in the carrying amount of the item if it is probable that the future economic benefits embodied within the component will flow to PEMEXand its cost can be measured reliably. The costs of recurring maintenance, repairs and renovations of wells, pipelines, properties, plant and equipmentcarried out to maintain the facilities in normal operation conditions are recognized in profit or loss as incurred.
Depreciation and amortization of capitalized costs in wells are determined based on the estimated economic life of the field to which the wellsbelong, considering the relationship between the production of barrels of oil equivalent for the period and proved developed reserves of the field, as ofthe beginning of the period, with quarterly updates for new development investments.
Depreciation of other elements of pipelines, properties, plant and equipment is recognized in profit or loss on a straight-line basis over theestimated useful life of the asset, beginning as of the date that the asset is available for use, or in the case of construction, from the date that the asset iscompleted and ready for use.
When parts of an item of wells, pipelines, properties and equipment are significant relative to the total cost of the item, the part is depreciatedseparately.
Estimated useful lives of items of properties, plant and equipment are reviewed if expectations differ from previous estimates.
Pipelines, properties, and equipment received from customers are initially recognized at fair value as revenue from ordinary operating activities ifPEMEX has no future obligations to the customer who transferred the item. In contrast, if PEMEX does have future obligations to such a customer, theinitial recognition is recorded as a deferred liability based on the period in which the assets will provide services to the customers.
The capitalized value of finance leases is also included in the line item of wells, pipelines, properties, plant and equipment. Properties, plant andequipment acquired through financial leases are depreciated over the shorter of the lease term or the useful life of the asset.
F-23
Copyright © 2018 www.secdatabase.com. All Rights Reserved.Please Consider the Environment Before Printing This Document
Table of ContentsPETRÓLEOS MEXICANOS, PRODUCTIVE STATE-OWNED SUBSIDIARIES
AND SUBSIDIARY COMPANIESNOTES TO THE CONSOLIDATED FINANCIAL STATEMENTSFOR THE YEARS ENDED DECEMBER 31, 2017, 2016 AND 2015
(FIGURES STATED IN THOUSANDS, EXCEPT AS NOTED)
Advance payments for the acquisition of pipelines, properties, plant and equipment are also recognized in the line item of wells, pipelines,properties, plant and equipment when the risks and benefits of the ownership have been transferred to PEMEX.
i. Crude oil and natural gas reserves
Under Mexican law, all crude oil and other hydrocarbon reserves located in the subsoil of Mexico are owned by the Mexican nation and not byPEMEX. In accordance with the aforementioned and based on the applicable regulation as of the date of these consolidated financial statements, thereserves assigned to PEMEX by the Mexican Government are not registered for accounting purposes because they are not PEMEX�s property. PEMEXestimates total proved oil and natural gas reserve volumes in accordance with the definitions, methods and procedures established in Rule 4-10(a) ofRegulation S-X (�Rule 4-10(a)�) of the U.S. Securities and Exchange Commission (�SEC�) as amended, and where necessary, in accordance with theStandards Pertaining to the Estimating and Auditing of Oil and Gas Reserves Information promulgated by the Society of Petroleum Engineers (the�SPE�) as of February 19, 2007. These procedures are consistent with international reserves reporting practice. The estimation of these reserves dependson assumptions made and the interpretation of the data available, and may vary among analysts. The results of drilling activities, test wells andproduction after the date of estimation are utilized in future revisions of reserves estimates.
Although PEMEX does not own the oil and other hydrocarbon reserves within Mexico, these procedures allow PEMEX to record the effects thatsuch oil and other hydrocarbon reserves have on its consolidated financial statements, including, for example, in the depreciation and amortization lineitem.
j. Impairment of non-financial assets
The carrying amounts of PEMEX�s non-financial assets, other than inventories and deferred taxes, are assessed for indicators of impairment at theend of each reporting period. If the net carrying value of the asset or its cash-generating unit exceeds the recoverable amount, PEMEX records animpairment charge in its consolidated statement of comprehensive income.
A cash-generating unit is the smallest identifiable group of assets which can generate cash flows independently from other assets or groups ofassets.
The recoverable amount of an asset or a cash-generating unit is defined as the higher of its fair value minus the costs of disposal and its value inuse. The value in use is the discounted present value of the net future cash flows expected to arise from the continuing use of an asset and from itsdisposal at the end of its useful life. In measuring value in use, the discount rate applied is the pre-tax rate that reflects current market assessments of thetime value of money and the risks specific to the asset. Fair value is calculated using discounted cash flows determined by the assumptions that marketparticipants would apply in order to estimate the price of an asset or cash generating unit, assuming that such participants were acting in their besteconomic interest.
In the case of cash-generating assets or items dedicated to the exploration and evaluation of hydrocarbons reserves, the recoverable amount isdetermined using the value in use based on the proved reserves and probable reserves, in some cases, for the risk factor associated with such reserves.
Both impairment losses and reversals are recognized in the statement of comprehensive income in the costs and expenses line items in which thedepreciation and amortization are recognized. Impairment losses may not be
F-24
Copyright © 2018 www.secdatabase.com. All Rights Reserved.Please Consider the Environment Before Printing This Document

Table of ContentsPETRÓLEOS MEXICANOS, PRODUCTIVE STATE-OWNED SUBSIDIARIES
AND SUBSIDIARY COMPANIESNOTES TO THE CONSOLIDATED FINANCIAL STATEMENTSFOR THE YEARS ENDED DECEMBER 31, 2017, 2016 AND 2015
(FIGURES STATED IN THOUSANDS, EXCEPT AS NOTED)
presented as part of the costs that have been capitalized in the value of any asset. Impairment losses related to inventories are recognized as part of costof sales. Impairment losses on investments in associates, joint ventures and other investments are recognized as profit (loss) sharing in associates.
An impairment loss shall be reversed if there has been a change in the estimates used since the date when the impairment loss was recognized.These reversals will not exceed the carrying value of the asset as though no impairment had been recognized. Impairment losses and reversals arepresented in a separate line item in the statement of comprehensive income.
k. Leases
The determination of whether an agreement is or contains a lease is based on the economic substance of the agreement at the date of execution.An agreement contains a lease if performance under the agreement depends upon the use of a specific asset or assets, or if the agreement grants the rightto use the asset.
Finance leases, which transfer to PEMEX substantially all the inherent benefits and risks of the leased property, are capitalized at the date thelease commences, and the value is recorded as the lower of the fair value of the leased property and the present value of the minimum lease payments.Payments on the lease are divided between the financial costs and the amortization of the remaining debt principal in order to achieve a constanteffective interest rate for the outstanding liability. The financing costs are recognized in the statement of comprehensive income.
Operating lease payments are recognized as expenses in the statement of comprehensive income on a straight line basis over the term of the leaseand variable rent payments are recognized in the operating results on an accrued basis.
l. Provisions
PEMEX recognizes provisions when, as a result of a past event, PEMEX has incurred a legal or assumed present obligation for which a futuredisbursement is probable and the value of such disbursement is reasonably estimable. In certain cases, such amounts are recorded at their present value.
Environmental liabilities
In accordance with applicable legal requirements and accounting practices, an environmental liability is recognized when the cash outflows areprobable and the amount is reasonably estimable. Disbursements related to the conservation of the environment that are linked to revenue from currentor future operations are accounted as expenses or assets, depending on the circumstances of each disbursement. Disbursements related to pastoperations, which no longer contribute to current or future revenues, are accounted for as current period expenses.
The accrual of a liability for a future disbursement occurs when an obligation related to environmental remediation, for which PEMEX has theinformation necessary to determine a reasonable estimated cost, is identified.
F-25
Copyright © 2018 www.secdatabase.com. All Rights Reserved.Please Consider the Environment Before Printing This Document
Table of ContentsPETRÓLEOS MEXICANOS, PRODUCTIVE STATE-OWNED SUBSIDIARIES
AND SUBSIDIARY COMPANIESNOTES TO THE CONSOLIDATED FINANCIAL STATEMENTSFOR THE YEARS ENDED DECEMBER 31, 2017, 2016 AND 2015
(FIGURES STATED IN THOUSANDS, EXCEPT AS NOTED)
Retirement of assets
The obligations associated with the future retirement of assets, including those related to the retirement of wells, pipelines, properties, plant andequipment and their components are recognized at the date that the retirement obligation is incurred, based on the discounted cash flow method. Thedetermination of the fair value is based on existing technology and regulations. If a reliable estimation of fair value cannot be made at the time theobligation is incurred, the accrual will be recognized when there is sufficient information to estimate the fair value.
The obligations related to the costs of future retirement of assets associated with the principal refining processes for gas and petrochemicals arenot recognized. These assets are considered to have an indefinite useful life due to the potential for maintenance and repairs.
The abandonment costs related to wells currently in production and wells temporarily closed are recorded in the statement of comprehensiveincome based on the units of production method. Total cost of abandonment and plugging for non-producing wells is recognized in the statement ofcomprehensive income at the end of each period. All estimations are based on the useful lives of the wells, considering their discounted present value.Salvage values are not considered, as these values commonly have not traditionally existed.
m. Employee benefits
Beginning January 1, 2016, Petróleos Mexicanos and the Subsidiary Entities have operated both a defined contribution plan and a defined benefitpension plan. Until December 31, 2015, PEMEX only operated a defined benefit pension plan.
Defined contribution pension plan
In this plan, both Petróleos Mexicanos and the Subsidiary Entities and their respective employees contribute to the worker�s individual account.PEMEX�s contributions are recognized on an accrual basis as cost, expense or asset, and are credited to liability.
Contributions to the defined contribution plan that are not expected to be fully settled within 12 months after the end of the annual reportingperiod in which the employee rendered related services will be discounted using the defined benefit plan discount rate.
Defined benefit plan
Under the defined benefit plan, Petróleos Mexicanos and the Subsidiary Entities are the only parties that contribute to a trust, which is managedseparately. Petróleos Mexicanos and the Subsidiary Entities recognize the cost for defined benefit plans based on independent actuarial computationsapplying the projected unit credit method. Actuarial gains and losses are recognized within other comprehensive results for the period in which they aredetermined.
The costs of prior services are recognized within profit or loss for the period in which they are determined.
The asset or liability in the defined benefit plan comprises the present value of the defined benefit obligation less the fair value of plan assets forwhich obligations have to be settled. The value of any asset is limited to the present value of any economic benefit represented by the planreimbursements or reductions of the future contributions to the plan.
F-26
Copyright © 2018 www.secdatabase.com. All Rights Reserved.Please Consider the Environment Before Printing This Document
Table of ContentsPETRÓLEOS MEXICANOS, PRODUCTIVE STATE-OWNED SUBSIDIARIES
AND SUBSIDIARY COMPANIESNOTES TO THE CONSOLIDATED FINANCIAL STATEMENTSFOR THE YEARS ENDED DECEMBER 31, 2017, 2016 AND 2015
(FIGURES STATED IN THOUSANDS, EXCEPT AS NOTED)
In addition, other long term employee benefits include the seniority premiums payable for disability, death and survivors benefits, medicalservices, gas and basic food basket for beneficiaries.
Termination benefits are recognized in profit or loss for the year in which they are incurred.
n. Income taxes and duties
Current income tax
Current income tax assets or liabilities for the current and prior years are measured as the amount expected to be paid or to be recovered from thetax authorities, using either the tax rates in force or tax rates which are in the process of being approved and are substantially completed by the end ofthe year.
Current income taxes related with items that are recognized as equity are presented in the other comprehensive income of the year. Periodically,PEMEX evaluates the positions taken in its tax returns for those regulations that are subject to interpretation and books corresponding provisions, if it isdeemed necessary.
Deferred income taxes
Deferred taxes are recorded based on the assets and liabilities method, which consists of the recognition of deferred taxes by applying tax ratesapplicable to the income tax to the temporary differences between the carrying value and tax values of assets and liabilities at the date of theseconsolidated financial statements.
Deferred tax liabilities are recognized for all taxable temporary differences, except to the extent that the deferred tax liability arises from:
� the initial recognition of goodwill or the initial recognition of an asset or liability in a transaction which is not a business combination and atthe time of the transaction, affects neither accounting profit nor taxable profit or tax loss; and
� taxable temporary differences associated with investments in subsidiaries, branches and associates, and interest in joint arrangements, whenthe parent, investor, joint venture or joint operator is able to control the timing of reversal of the temporary difference and it is probable thatthe temporary difference will not reverse in the foreseeable future.
Deferred tax assets are recognized for all deductible temporary differences and the carry forward of both unused tax credits and unused tax lossesto the extent that it is probable that taxable profit will be available against deductible temporary differences, and that the carry forward of both unusedtax credits and unused tax losses can be utilized, unless:
� the deferred tax asset relating to deductible temporary difference arises from the initial recognition of asset or liability derived from atransaction that is not a business combination and, at the time of the transaction, affects neither accounting profit nor taxable profit or taxloss; and
� in respect of deductible temporary differences associated with investments in subsidiaries, associates and interests in joint ventures, deferredtax assets are recognized only to the extent that it is probable that the temporary differences will reverse in the foreseeable future andtaxable profit will be available, against which the temporary differences can be utilized.
F-27
Copyright © 2018 www.secdatabase.com. All Rights Reserved.Please Consider the Environment Before Printing This Document

Table of ContentsPETRÓLEOS MEXICANOS, PRODUCTIVE STATE-OWNED SUBSIDIARIES
AND SUBSIDIARY COMPANIESNOTES TO THE CONSOLIDATED FINANCIAL STATEMENTSFOR THE YEARS ENDED DECEMBER 31, 2017, 2016 AND 2015
(FIGURES STATED IN THOUSANDS, EXCEPT AS NOTED)
The carrying amount of a deferred tax asset is reviewed at the end of each reporting period. PEMEX reduces the carrying amount of a deferred taxasset to the extent that it is no longer probable that a sufficient taxable profit will be available to allow the benefit of that deferred tax asset to be utilizedin whole or in part. Unrecognized deferred tax assets are revalued at each reporting date and will be recognized to the extent that it is probable thatfuture taxable income will be sufficient to allow for the recovery of the deferred tax asset.
Deferred tax assets and liabilities are measured at the tax rates that are expected to apply to the period when the asset is realized or the liability issettled, based on tax rates (and tax laws) that have been enacted or substantively enacted by the end of the reporting period.
Deferred tax assets and deferred tax liabilities related with items that are recognized in equity shall be presented directly in other comprehensiveincome.
Deferred tax assets and deferred tax liabilities are offset if PEMEX has a legal right to set off current tax assets against current tax liabilities andare levied by the same taxation authority or the same taxable entity.
Income taxes and duties
PEMEX is subject to taxes and special duties, which are based on the value of hydrocarbons extracted, with certain deductions.
These taxes and duties are recognized in accordance with IAS 12, �Income Taxes� (IAS 12), when they have the characteristics of income tax,which occurs when such taxes are set by a government authority and are determined on a formula that considers the balance of income (or extractionvalued at a selling price) less expenses. Taxes and duties that meet this criteria should be recognized for current and deferred income tax based on theabove paragraphs. Taxes and duties that do not meet this criteria are recognized as liabilities, affecting the costs and expenses relating to the transactionsthat gave rise to them.
o. Impuesto Especial sobre Producción y Servicios
(Special Tax on Production and Services, or �IEPS Tax�)
The IEPS Tax charged to customers is a withholding tax on domestic sales of gasoline, diesel and fossil fuels. The applicable quotas depend on,among other factors, the product, producer�s price, freight costs, commissions and the region in which the respective product is sold. The withholdingtax does not affect the results of PEMEX.
p. Contingencies
Contingency losses are recorded when it is probable that a liability has been incurred and the amount thereof can be reasonably estimated. When areasonable estimation cannot be made, qualitative disclosure is provided in the notes to the consolidated financial statements. Contingent revenues,earnings or assets are not recognized until realization is assured.
F-28
Copyright © 2018 www.secdatabase.com. All Rights Reserved.Please Consider the Environment Before Printing This Document

Table of ContentsPETRÓLEOS MEXICANOS, PRODUCTIVE STATE-OWNED SUBSIDIARIES
AND SUBSIDIARY COMPANIESNOTES TO THE CONSOLIDATED FINANCIAL STATEMENTSFOR THE YEARS ENDED DECEMBER 31, 2017, 2016 AND 2015
(FIGURES STATED IN THOUSANDS, EXCEPT AS NOTED)
q. Revenue recognition
Sales revenue is recognized at the moment when the risks and benefits of ownership of crude oil, refined or gas products, and derivative andpetrochemical products are transferred to the customers who acquire them, which occurs as follows:
� in accordance with contractual terms;
� the moment at which the customer picks up product at PEMEX�s facilities; or
� the moment at which PEMEX delivers the product to the delivery point.
Services rendered are recognized as services income when the customers accept the receipt of the services.
r. Presentation of consolidated statements of comprehensive income
The costs and expenses shown in PEMEX�s consolidated statements of comprehensive income are presented based on their function, whichallows for a better understanding of the components of PEMEX�s operating income. This classification allows for a comparison to the industry to whichPEMEX belongs.
Revenues
Represents revenues from sale or products or services.
Cost of sales
Cost of sales represents the acquisition and production costs of inventories at the time of sale. Cost of sales mainly includes depreciation,amortization, salaries, wages and benefits, a portion of the cost of the reserve for employee benefits and operating expenses related to the productionprocess.
Other revenues (expenses), net
Other revenues (expenses), net consist primarily of income and expenses that are not related directly to the operation of PEMEX.
Transportation, distribution and sale expenses
Transportation, distribution and sale expenses are costs in connection with the storage, sale and delivery of products, such as the depreciation andoperating expenses associated with these activities.
Administrative expenses
Administrative expenses are costs related to PEMEX�s areas that provide administrative support.
Financing income
Financing income is comprised of interest income, financial income and other income from financial operations between PEMEX and thirdparties.
F-29
Copyright © 2018 www.secdatabase.com. All Rights Reserved.Please Consider the Environment Before Printing This Document

Table of ContentsPETRÓLEOS MEXICANOS, PRODUCTIVE STATE-OWNED SUBSIDIARIES
AND SUBSIDIARY COMPANIESNOTES TO THE CONSOLIDATED FINANCIAL STATEMENTSFOR THE YEARS ENDED DECEMBER 31, 2017, 2016 AND 2015
(FIGURES STATED IN THOUSANDS, EXCEPT AS NOTED)
Financing cost
Financing cost is comprised of interest expenses, commissions and other expenses related to PEMEX�s financing operations less any portion ofthe financing cost that is capitalized.
Derivative financial instruments (cost) income, net
Derivative financial instruments (cost) income represents the net effect of the profit or loss for the year associated with DFIs.
Foreign exchange loss, net
Exchange rate variations relating to assets or liabilities governed by contracts denominated in foreign currencies are recorded in income (loss) forthe year.
s. Operating segments
Operating segments are identifiable components of PEMEX that pursue business activities from which PEMEX earns revenues and incursexpenses, including those revenues and expenses from transactions with other segments of PEMEX, and for which information is available tomanagement on a segmented basis and is assessed by the Board of Directors in order to allocate resources and assess the profitability of the segments.
t. Non-current assets held for sale, non-current assets held for distribution to owners and discontinued operations
Non-current assets held for sale
PEMEX classifies a non-current asset, or a disposal group of assets, as held for sale if (a) its carrying amount will be recovered principallythrough a sale transaction rather than through continuing use; (b) the asset or group of assets is available in its present condition for immediate sale and(c) the sale is expected to be completed within one year from the date of classification, or more, with certain exceptions.
Non-current assets classified as held for sale are measured at the lower of its carrying amount, and fair value less cost of sales and presented in aseparate line item in the consolidated statements of financial position. Non-current assets classified as held for sale are not subject to depreciation oramortization after the classification as held for sale.
The liabilities of a disposal group classified as held for sale are presented separately from other liabilities in the statement of financial position.Those assets and liabilities are not offset and are presented as a single amount.
Non-current asset held for distribution to owners
When PEMEX agrees to distribute a non-current asset, or a disposal group of assets, to owners, this asset or disposal group of assets, is classifiedas held for distribution to owners if: a) a non-current asset or disposal group of assets is available for immediate distribution in its present condition andb) the distribution must be highly expected to be completed within one year from the date of classification, with certain exceptions.
F-30
Copyright © 2018 www.secdatabase.com. All Rights Reserved.Please Consider the Environment Before Printing This Document
Table of ContentsPETRÓLEOS MEXICANOS, PRODUCTIVE STATE-OWNED SUBSIDIARIES
AND SUBSIDIARY COMPANIESNOTES TO THE CONSOLIDATED FINANCIAL STATEMENTSFOR THE YEARS ENDED DECEMBER 31, 2017, 2016 AND 2015
(FIGURES STATED IN THOUSANDS, EXCEPT AS NOTED)
Non-current assets classified as held for distribution are measured at the lower of their carrying amount and fair value less cost of distribution andare presented in a separate line item in the consolidated financial statements. Non-current assets classified as held for distribution are not subject todepreciation or amortization after the classification as held for distribution.
The liabilities of a disposal group classified as held for distribution to owners are presented separately from other liabilities in the statement offinancial position. Those assets and liabilities shall not be offset and shall be presented as a single amount.
Discontinued operations
A discontinued operation is a component of an entity that either has been disposed of or is classified as held for sale, and either:
� represents a separate major line of business or geographical area of operations;
� is part or a single coordinated plan to dispose of a separated major line of business or geographical area of operations; or
� is a subsidiary acquired exclusively with a view to resale.
The revenues or expenses from discontinued operations, including profits or losses from previous years, are presented in a specific line item in theconsolidated statements of comprehensive income.
u. Accounting changes
The IASB issued new amendments to the IFRS mentioned below, which are applicable to PEMEX and are effective for annual periods beginningJanuary 1, 2017:
a) IAS 12 �Income Taxes: Recognition of Deferred Tax Assets for Unrealized Losses� (�IAS 12�)
The IASB issues amendments to IAS 12 to clarify the diversity of practices in the recognition of deferred tax assets for unrealized losses related todebt instruments measured at fair value.
The amendments to IAS 12 include some explanatory paragraphs and an illustrative example.
The amendments clarify the following aspects of IAS 12:
� Unrealized losses on debt instruments measured at fair value for accounting purposes and measured at cost for tax purposes give rise todeductible temporary differences regardless of whether the debt instrument�s holder expects to recover the carrying amount of the debtinstrument by sale or by use.
� The carrying amount of an asset does not limit the estimation of probable future taxable profits.
� Estimates of future taxable profits exclude tax deductions resulting from the reversal of deductible temporary differences.
� An entity assesses a deferred tax asset in combination with other deferred tax assets. Where tax law restricts the utilization of tax losses, anentity would assess a deferred tax asset in combination with other deferred tax assets of the same type.
F-31
Copyright © 2018 www.secdatabase.com. All Rights Reserved.Please Consider the Environment Before Printing This Document
Table of ContentsPETRÓLEOS MEXICANOS, PRODUCTIVE STATE-OWNED SUBSIDIARIES
AND SUBSIDIARY COMPANIESNOTES TO THE CONSOLIDATED FINANCIAL STATEMENTSFOR THE YEARS ENDED DECEMBER 31, 2017, 2016 AND 2015
(FIGURES STATED IN THOUSANDS, EXCEPT AS NOTED)
The amendments are to be applied retrospectively and are effective for annual periods beginning on or after January 1, 2017. Earlier application ispermitted.
These amendments had no impact on these consolidated financial statements.
b) Amendments to IAS 7 �Statement of Cash Flows� (�IAS 7�)
The IASB issued amendments to IAS 7. The amendments are intended to clarify disclosure provided to the user of financial statements about anentity�s financing activities.
Changes
The amendments in IAS 7 come with the objective that entities shall provide disclosures that enable users of financial statements to evaluatechanges in liabilities arising from financing activities.
To achieve this objective, the IASB requires that the following changes in liabilities arising from financing activities are disclosed: (i) changesfrom financing cash flows; (ii) changes arising from obtaining or losing control of subsidiaries or other businesses; (iii) the effects of changes in foreignexchange rate; (iv) changes in fair values; and (v) other changes.
The IASB defines liabilities arising from financing activities as liabilities �for which cash flows were, or future cash flows will be, classified inthe statements of cash flows as cash flows from financing activities.� It also stresses that the new disclosure requirements also relate to changes infinancial assets if they meet the same definition.
The amendments state that one way to fulfill the new disclosure requirements is to provide reconciliation between the opening and closingbalances in the statement of financial position for liabilities arising from financing activities.
Finally, the amendments state that changes in liabilities arising from financing activities must be disclosed separately from changes in other assetsand liabilities.
The amendments are effective for annual periods beginning on or after January 1, 2017. Earlier application is permitted. Entities need not providecomparative information when they first apply the amendments.
Impacts on this amendments are disclosed in Note 15.
c) IFRS 12 �Disclosure of Interest in Other Entities� (�IFRS 12�)�Annual Improvements to IFRS 2014�2016 Cycle.
As of December 2016, the IASB published Annual Improvements to IFRS 2014�2016 Cycle, which clarified the scope of IFRS 12, by specifyingthat the disclosure requirements apply to all subsidiaries, joint arrangements, associates and unconsolidated structured entities classified as held for sale,held for distribution or as discontinued operations in accordance with IFRS 5, with certain exceptions.
F-32
Copyright © 2018 www.secdatabase.com. All Rights Reserved.Please Consider the Environment Before Printing This Document

Table of ContentsPETRÓLEOS MEXICANOS, PRODUCTIVE STATE-OWNED SUBSIDIARIES
AND SUBSIDIARY COMPANIESNOTES TO THE CONSOLIDATED FINANCIAL STATEMENTSFOR THE YEARS ENDED DECEMBER 31, 2017, 2016 AND 2015
(FIGURES STATED IN THOUSANDS, EXCEPT AS NOTED)
The amendments are going to be applied restrospectively and are effective for annual periods beginning on or after January 1, 2017.
These improvements had no impact on these consolidated financial statements.
v. New IFRS not yet adopted
The IASB issued amendments and new IFRS that are not effective as of December 31, 2017 but that could have an impact on subsequent PEMEXfinancial statements.
Amendments effective for periods beginning in 2018:
a) IFRS 15, �Revenue from Contracts with Customers� (�IFRS 15�)
The core principle of the new IFRS 15 is that an entity should recognize revenue as the promised transfer of goods or services to the customer,valued at the amount that the entity expects to be entitled in exchanged for those goods or services.
Pursuant to IFRS 15, an entity should:
� identify customer contracts that fall within the scope of the new standard;
� identify the separate performance obligations in the contract based on the following criteria: (i) sales of goods or services, separately,(ii) sales that are dependent or interrelated with other products or services; and (iii) homogeneous and consistent sales pattern;
� determine the price of the transaction by applying the following considerations: (i) variable consideration and constraining estimates ofvariable consideration; (ii) the existence of a significant financing component in the contract; (iii) any non-cash consideration; and (iv) theconsideration payable to the customer;
� allocate the transaction price to each separate performance obligation; and
� recognize revenue when (or as) each performance obligation is satisfied either over time or at a point in time.
The new IFRS 15 enhances disclosures of revenue. This standard must be applied for periods beginning on or after January 1, 2018, and earlyapplication is permitted. During the year of application, entities may apply the rule retrospectively or use a modified approach.
PEMEX will adopt IFRS 15 retrospectively with the cumulative effect of applying the new standard recognized at the date of initial adoption(January 1, 2018) as an adjustment to the opening balance of retained earnings or other component of equity, as applicable. Under this transition method,PEMEX elected to apply this standard retrospectively only to contracts that were not completed contracts at January 1, 2018. For contracts that havebeen completed before December 31, 2017, with revenues not fully recognized as of that date, the current accounting policies under IAS 18 willcontinue to apply when recognizing revenue of those contracts during 2018. For contracts that take effect from January 1, 2018, revenue will berecognized in accordance with IFRS 15.
F-33
Copyright © 2018 www.secdatabase.com. All Rights Reserved.Please Consider the Environment Before Printing This Document
Table of ContentsPETRÓLEOS MEXICANOS, PRODUCTIVE STATE-OWNED SUBSIDIARIES
AND SUBSIDIARY COMPANIESNOTES TO THE CONSOLIDATED FINANCIAL STATEMENTSFOR THE YEARS ENDED DECEMBER 31, 2017, 2016 AND 2015
(FIGURES STATED IN THOUSANDS, EXCEPT AS NOTED)
As part of the implementation of IFRS 15, different types of revenue from contracts with customers have been identified, evaluated anddocumented, as well as the main changes in accounting policies that will be reflected as of January 1, 2018 with respect to new contracts. The mainchanges in accounting policies are as follows:
i. Sale of products with other services:
The adoption of IFRS 15 will affect the manner in which PEMEX records the sale of products including oil, refined products, gas,petrochemicals, fertilizers and other sales. Until December 31, 2017, freight and other services, for example were recognized separatelyfrom products sold. Under IFRS 15, revenue is recognized with respect to the performance obligation under the contract, and so certainservices that are currently accounted for separately, will now be presented as a single performance obligation together with the sale of theproduct.
ii. Services:
Services include transportation and storage of hydrocarbons, petroleum, petrochemicals, refined products, gas, petrochemical derivativesand others.
Rental services and some transportation services are currently presented in the revenues from services line item in the income statement. Inmany cases of services with components of leases are less than one year operating leases. Revenues corresponding to leasing have not beenpresented separately from revenues from services.
Under IFRS 15, leases cannot be presented in the same line item as revenues from service. The main change in accounting policy will be theseparation and presentation of service and lease components.
iii. Determination of the transaction price:
Refunds, discounts, quantity and quality claims (in favor or against) and penalties (to customers or PEMEX) or breaches related to the saleof certain products were previously recognized as revenues. However, under IFRS 15, revenues will only be recognized if it is highlyprobable that there will not be a significant reversal in the revenue received. As a result, PEMEX will put in place mechanisms toapproximate the refunds, discounts, quantity and quality claims and penalties at the time that the control of the product is transferred.
Revenue recognition
Revenues are currently recognized when the risks and benefits of the product are transferred, which occurs when the customer picks up or receivesthe product at PEMEX´s facilities or at a specific point of sale, accepts the products and assumes the risks and benefits related to the transfer ofownership.
Under IFRS 15, revenues from sale of products are recognized when the contractual obligation is satisfied, and control of the products istransferred to the customer. There will be changes in the revenue recognition of gas sale and certain services from �one point in time� to �over time�.However, a significant change is not expected because in some cases the practical expedient �right to invoice� will be applied to measure progresstowards completion of the transaction.
F-34
Copyright © 2018 www.secdatabase.com. All Rights Reserved.Please Consider the Environment Before Printing This Document
Table of ContentsPETRÓLEOS MEXICANOS, PRODUCTIVE STATE-OWNED SUBSIDIARIES
AND SUBSIDIARY COMPANIESNOTES TO THE CONSOLIDATED FINANCIAL STATEMENTSFOR THE YEARS ENDED DECEMBER 31, 2017, 2016 AND 2015
(FIGURES STATED IN THOUSANDS, EXCEPT AS NOTED)
As of December 31, 2017, PEMEX did not identify any significant uncompleted contracts. As a result, PEMEX has determined that the changesto amounts in prior years will not be significant. Nonetheless, there will be important changes in accounting policies for contracts issued as of January 1,2018.
b) IFRS 9, �Financial Instruments� (�IFRS 9�(2014))
In July 2014, the IASB finalized the accounting reform of financial instruments and issued IFRS 9 (revised in 2014), which contains therequirements for, a) the classification and measurement of financial assets and liabilities, b) impairment methodology, and c) general information abouthedge accounting. IFRS 9 (revised in 2014) replaces IAS 39 Financial Instruments: Recognition and Measurement as of its effective date.
These requirements should be applied retrospectively and, as permitted by IFRS 9 transitional provisions, it is not necessary for companies torestate comparative figures. Any adjustment in the carrying amounts of the financial assets and liabilities at the transition date is recognized by affectingthe cumulative effect in the initial opening period.
The classification criteria depends on a combination of two important factors:
i. the business model within the financial asses is held (the business model test); and
ii. the contractual cashflow of the financial asset (the SPPI test). Based on these two tests, the asset can be measured as follows:
� Amortized cost: Financial Instruments under a business model whose objective is only the collection of contractual cash flowswhich are composed of principal and interest payments and where there are no significant sales unjustified and fair value is not a keyfactor in the management of these financial assets and the characteristics of cash flows represent substantially a �basic loanagreement� or SPPI. Unjustified sales are different from sales related to an increase in the credit risk of an asset or unexpectedfinancing needs.
� Fair value with changes through other comprehensive income (�FVOCI�): Financial Instruments in a business model whoseobjective is to obtain cash flows and the sale of those assets, where fair value is a key factor in its management. In addition, thecharacteristics of the contractual cash flows represent substantially a �basic loan agreement�.
� Fair value with changes through profit or loss (�FVPL�): Financial instruments in a business model whose objective is not theaforementioned models, where fair value is a key factor in the management of these assets, and the financial instruments whosecontractual cash flow characteristics do not substantially represent a �basic loan agreement�.
IFRS also replaces the impairment model of IAS 39 (the �loss incurred model�) with a new impairment model called the �expected credit loss�model. This impairment model will be applicable to financial assets that are not measured at FVPL. Changes in fair value of financial assets throughFVOCI to the point of disposal are recorded in OCI.
The expected credit loss recognized for impairment purposes under IFRS 9 will be equivalent to a 12-month reserve, except when the financialinstrument presents a �significant increase in credit risk� or presents objective evidence of impairment, recognizing a reserve equivalent to theremaining life of the financial instrument, based on the definition of general approach under IFRS 9.
F-35
Copyright © 2018 www.secdatabase.com. All Rights Reserved.Please Consider the Environment Before Printing This Document
Table of ContentsPETRÓLEOS MEXICANOS, PRODUCTIVE STATE-OWNED SUBSIDIARIES
AND SUBSIDIARY COMPANIESNOTES TO THE CONSOLIDATED FINANCIAL STATEMENTSFOR THE YEARS ENDED DECEMBER 31, 2017, 2016 AND 2015
(FIGURES STATED IN THOUSANDS, EXCEPT AS NOTED)
IFRS 9 Implementation and government strategy
PEMEX has established a multidisciplinary working group with the objective to adapt its processes to the new standard in relation to theclassification and measurement of financial instruments and the impairment estimation of credit risk, ensuring that these processes have been appliedand adopted in accordance with IFRS 9.
Regarding classification and measurement, PEMEX carried out an analysis of its financial assets in order to identify those that could trigger achange in the accounting methodology, due to the definition of the business model and a failure to satisfy the SPPI test.
IFRS 9 Implementation analysis
PEMEX has defined January 1, 2018 as the initial date of adoption of IFRS 9 �Financial Instruments� and according to the transitional standard inIFRS 9, PEMEX will not restate previous periods for comparison purposes and any difference that may arise as a result of the adoption of IFRS 9between the previous carrying amount and the carrying amount at the beginning of the reporting period shall be recognized in accumulated results overthe opening initial period.
PEMEX has concluded that most of its financial assets will continue to be classified in the same way:
ClassificationAssets IAS 39 IFRS 9 ChangeCash and cash equivalents FVPL FVPL NoAvailable�for�sale financial assets FVOCI FVOCI NoDerivative financial instruments FVPL FVPL NoLong�term notes receivable Amortized Cost Amortized Cost No
Capital or debt instruments classified as available-for-sale financial assets will continue to be measured at FVOCI.
PEMEX has concluded that the financial assets most affected by the impairment estimate under the expected credit loss model will be its accountsreceivables, in relation to PEMEX�s holding of the long-term notes issued by the Mexican Government. The evaluation of the possible impairment ofthe notes will be made using the general approach for calculating impairment of the notes will be made using the general approach for calculatingimpairment contemplated under IFRS 9.
PEMEX considers it probable that impairment losses increase and present more volatility for instruments under the new methodology of expectedcredit losses. Furthermore, PEMEX considers that most of its accounts receivable are short-term without a significant financial component, so thesimplified approach will be applied.
The preliminary evaluation of PEMEX indicates that the application of the new impairment requirements of IFRS 9 as of December 31, 2017 willimpact the accounts receivable reserves as of January 1, 2018. An increase between 39.0% and 51.1% is expected in the accounts receivable reserves ascompared to impairment losses incurred in accordance with IAS 39.
F-36
Copyright © 2018 www.secdatabase.com. All Rights Reserved.Please Consider the Environment Before Printing This Document

Table of ContentsPETRÓLEOS MEXICANOS, PRODUCTIVE STATE-OWNED SUBSIDIARIES
AND SUBSIDIARY COMPANIESNOTES TO THE CONSOLIDATED FINANCIAL STATEMENTSFOR THE YEARS ENDED DECEMBER 31, 2017, 2016 AND 2015
(FIGURES STATED IN THOUSANDS, EXCEPT AS NOTED)
Hedge accounting
PEMEX, as part of the initial adoption, elected to continue applying the hedge accounting requirements of IAS 39 instead of IFRS 9. PEMEXuses DFI�s to cover the exposure of foreign currency risk, interest rate risk and fluctuations in the price of its products, but these contracts are notaccounted for as designated hedges. DFI�s are initially recognized at fair value on the date the derivative contract is entered into and after initialrecognition are measured again at fair value.
As a result, PEMEX has determined that the changes to amounts in prior years will not be significant.
c) Interpretation of IFRIC 22 �Foreign Currency Transactions and Advance Considerations� (IFRIC 22)
As of December 2016, IASB published an interpretation of IFRIC 22 developed by the International Financial Reporting Standards InterpretationsCommittee (the Interpretations Committee). The interpretation clarified when to recognize payments and collections of foreign currency transactionspaid in advance.
According to the interpretations, an entity must recognize foreign currency transactions when:
i. there is consideration that is denominated or priced in a foreign currency;
ii. the entity recognizes a prepayment asset or a deferred income liability in respect of that consideration, in advance of the recognition of therelated asset, expense or income; and
iii. the prepayment asset or deferred income liability is non-monetary.
The Interpretations Committee concluded that:
� The date of the transaction, for the purpose of determining the exchange rate, is the date of initial recognition of the non- monetaryprepayment asset or deferred income liability.
� If there are multiple payments or receipts in advance, a date of transaction is established for each payment or receipt.
IFRIC 22 is effective for annual reporting periods beginning on or after January 1, 2018. Entities may apply the rule retrospectively, orprospectively, in accordance with IAS 8 with certain exemptions.
PEMEX believes that these standards will not have an impact on its consolidated financial statements.
Standards effective for periods beginning in 2019
a) IFRS 16, �Leases� (�IFRS 16�)
In January 2016, the IASB published a new accounting standard IFRS 16, which replaces IAS 17, �Leases and Guide interpretations.�
The main changes from the previous standard are:
� IFRS 16 provides a comprehensive model for the identification of the lease arrangements and their treatment in the financial statements ofboth lessees and lessors;
� the new standard applies a control model to the identification of leases, distinguishing between leases and service contracts on the basis ofwhether there is an identified asset controlled by the customer;
F-37
Copyright © 2018 www.secdatabase.com. All Rights Reserved.Please Consider the Environment Before Printing This Document
Table of ContentsPETRÓLEOS MEXICANOS, PRODUCTIVE STATE-OWNED SUBSIDIARIES
AND SUBSIDIARY COMPANIESNOTES TO THE CONSOLIDATED FINANCIAL STATEMENTSFOR THE YEARS ENDED DECEMBER 31, 2017, 2016 AND 2015
(FIGURES STATED IN THOUSANDS, EXCEPT AS NOTED)
� the distinction between financial and operating leasing is removed, therefore, the assets and liabilities are recognized in respect of all leases,with some exceptions for short-term leases and leases of low-value assets; and
� the standard does not include significant changes to the requirements for accounting by lessors.
The standard is effective for annual periods beginning on or after January 1, 2019, with earlier application permitted for entities that have alsoadopted IFRS 15, �Revenue from Contracts with Customers.�
PEMEX has established a multidisciplinary working group with the objective to adapt its processes to the new standard in the following phases:(i) training, (ii) obtaining information, (iii) diagnostic, (iv) determination of initial adjustments and (v) integration of change. As of the date of theseconsolidated financial statements, the training phase for the accounting staff is complete and PEMEX is in the process of analyzing leasing contracts inorder to determine necessary changes to its procedures and reports. PEMEX has not determined the impact of IFRS 16 on its net income (loss) for theyear. PEMEX estimates that it will conclude the implementation of IFRS 16 in February 2019.
b) Annual improvements�2015-2017 Cycle
In December 2017, the IASB published �the Annual Improvements to the IFRS of the 2015-2017 Cycle� through which it clarifies the followingIFRS:
� IFRS 3 Business Combinations and IFRS 11 Joint Arrangements
IFRS 3 Business Combinations clarifies how an entity should recognize an increase of its interest in a joint operation:
� When a party to a joint arrangement obtains control of a business that was a part of that joint arrangement, and where that party hadassumed a portion of the rights to the assets and obligations to the liabilities of that business prior to the acquisition date, theacquisition will be considered a business combination that is achieved in stages. The acquiriting entity must therefore apply therequirements for a business combination achieved in stages, including by measuring its previously held interest in the jointarrangement.
� When a party participates in, but does not share in the control of a joint operation, and subsequently takes joint control of that jointoperation, this will constitute the acquisition of a business and previously held interest in the joint operation are not measured.
� IAS 12 Income Tax
All income tax consequence of dividends (including payments on financial instruments classified as equity) are recognized consistently with thetransactions that generated the distributable profits (i. e. in profit or loss, other comprehensive income or equity basis).
� IAS 23 Borrowing Costs
With respect to the treatment of costs for loans subject to capitalization, the amendments clarify that:
� To the extent that an entity borrows funds generally and uses them for the purpose of obtaining a qualifying asset, that entity shalldetermine the amount of borrowing costs eligible for
F-38
Copyright © 2018 www.secdatabase.com. All Rights Reserved.Please Consider the Environment Before Printing This Document
Table of ContentsPETRÓLEOS MEXICANOS, PRODUCTIVE STATE-OWNED SUBSIDIARIES
AND SUBSIDIARY COMPANIESNOTES TO THE CONSOLIDATED FINANCIAL STATEMENTSFOR THE YEARS ENDED DECEMBER 31, 2017, 2016 AND 2015
(FIGURES STATED IN THOUSANDS, EXCEPT AS NOTED)
capitalization by applying a capitalization rate to the expenditures on that asset. The capitalization rate shall be the weighted averageof the borrowing costs applicable to all borrowings of the entity that are outstanding during the period.
� However, an entity shall exclude from this calculation borrowing cost applicable to borrowing made specifically for the purpose ofobtaining a qualifying asset until substantially all the activities necessary to prepare that asset for its intended used or sale arecomplete.
The amount of borrowing costs that an entity capitalizes during a period shall not exceed the amount of borrowing costs it incurred during thatperiod.
The amendments are effective for annual periods beginning on or after January 1, 2019.
PEMEX is in the process of evaluating the impact that these amendments will have on its consolidated financial statements.
c) IFRIC 23�Uncertainty over Income Tax Treatments
In June 2017, the IASB published a new accounting interpretation to be applied to the determination of taxable profit (tax loss), tax bases, unusedtax losses, unused tax credits and tax rates, where there is uncertainty over income tax treatments under IAS 12.
In order to make these tax assessments, an entity must consider whether it is probable that the relevant taxing authority will accept each taxtreatment, or group of tax treatments, that the entity has used or plans to use in its next income tax filing:
� If the entity concludes that it is probable that a particular tax treatment will be accepted by the relevant taxing authority, that entity mustdetermine taxable profit (tax loss), tax bases, unused tax losses, unused tax credits or tax rates consistently with the tax treatment included inits income tax filings.
� If the entity concludes that it is not probable that a particular tax treatment is accepted by the relevant taxing authority, the entity must usethe most likely amount or the expected value of the tax treatment when determining taxable profit (tax loss), tax bases, unused tax losses,unused tax credits and tax rates. That calculation should be based on which method provides better predictions of the resolution of theuncertainty.
IFRIC 23 is effective for annual reporting periods beginning on or after January 1, 2019. Earlier application is permitted. PEMEX does notanticipate being impacted by IFRIC 23 because all tax positions are discussed and agreed with the SHCP prior to releasing quarterly or annual financialstatements.
F-39
Copyright © 2018 www.secdatabase.com. All Rights Reserved.Please Consider the Environment Before Printing This Document

Table of ContentsPETRÓLEOS MEXICANOS, PRODUCTIVE STATE-OWNED SUBSIDIARIES
AND SUBSIDIARY COMPANIESNOTES TO THE CONSOLIDATED FINANCIAL STATEMENTSFOR THE YEARS ENDED DECEMBER 31, 2017, 2016 AND 2015
(FIGURES STATED IN THOUSANDS, EXCEPT AS NOTED)
w. Reclassifications
Due to a significant loss of control over TAG Norte Holdings, S. de R.L. de C.V. and TAG Pipelines Sur, S. de R.L. de C.V., whose investment inthese companies was presented in investments in joint ventures and associates in the past was reclassified to available-for-sale financial assets as ofDecember 31, 2017. Accordingly the balance as of these investments as of December 31, 2016 was reclassified for purposes of improving itspresentation the consolidated statements of financial position as follows:
2016
Line itemAs previously
(reported) ReclassificationFollowing
reclassificationAvailable�for�sale financial assets Ps. 435,556 Ps. 2,417,123 Ps. 2,852,679Total current assets 355,398,800 2,417,123 357,815,923Investments in joint ventures and associates 23,154,632 (2,417,123 ) 20,737,509Total non-current assets 1,974,487,224 (2,417,123 ) 1,972,070,101
These reclassifications had no impact on PEMEX�s total assets.
Due to the fact that reinsurance premiums from KOT Insurance Company, AG., from which PEMEX derives revenue, are not part of the coreservices provided by PEMEX, they are included in other income (expenses), net. Therefore, for comparison purposes, the consolidated statements ofcomprehensive income for the years ended December 31, 2016 and 2015 were reclassified as follow:
2016
Line itemAs previously
(reported) ReclassificationFollowing
reclassificationServices income Ps. 14,427,081 Ps. (5,452,439 ) Ps. 8,974,642Total of sales 1,079,545,671 (5,452,439 ) 1,074,093,232Cost of sales 867,580,634 (1,758,413 ) 865,822,221Gross income (loss) 543,279,380 (3,694,026 ) 539,585,354Other income (expenses), net 18,955,580 3,694,026 22,649,606
2015
Line itemAs previously
(reported) ReclassificationFollowing
reclassificationServices income Ps. 12,912,112 Ps. (4,602,077 ) Ps. 8,310,035Total of sales 1,166,362,469 (4,602,077 ) 1,161,760,392Cost of sales 895,068,904 (3,104,298 ) 891,964,606Gross income (loss) (114,474,036 ) (1,497,779 ) (115,971,815 )Other income (expenses), net (2,373,266 ) 1,497,779 (875,487 )
These reclassifications had no impact on PEMEX�s net income.
F-40
Copyright © 2018 www.secdatabase.com. All Rights Reserved.Please Consider the Environment Before Printing This Document

Table of ContentsPETRÓLEOS MEXICANOS, PRODUCTIVE STATE-OWNED SUBSIDIARIES
AND SUBSIDIARY COMPANIESNOTES TO THE CONSOLIDATED FINANCIAL STATEMENTSFOR THE YEARS ENDED DECEMBER 31, 2017, 2016 AND 2015
(FIGURES STATED IN THOUSANDS, EXCEPT AS NOTED)
In order to provide a better presentation in Duties, taxes and other, certain amounts in Income Tax line item, were reclassified to Hydrocarbonextraction duties and others line item, as follows:
2016
Line itemAs previously
(reported) ReclassificationFollowing
reclassificationHydrocarbon extraction duties and others Ps. 304,813,375 Ps. (27,651,571 ) Ps. 277,161,804Income tax (40,291,940 ) 27,651,571 (12,640,369 )
These reclassifications had no impact on PEMEX�s net income.
NOTE 4. SUBSIDIARY ENTITIES AND SUBSIDIARY COMPANIES
As of December 31, 2017, the Subsidiary Entities consolidated in these financial statements include Pemex Exploration and Production, PemexIndustrial Transformation, Pemex Cogeneration and Services, Pemex Drilling and Services, Pemex Logistics, Pemex Fertilizers and Pemex Ethylene.
The consolidated Subsidiary Companies are as follows:
� P.M.I. Marine, DAC. (PMI Mar) (i)
� P.M.I. Services, B.V. (PMI SHO) (i)
� P.M.I. Holdings, B.V. (PMI HBV) (i)(x)
� P.M.I. Trading, Ltd. (PMI Trading) (i)
� PEMEX Internacional España, S. A. (PMI SES) (i)(viii)
� P.M.I. Holdings Petróleos España, S. L. (HPE) (i)
� P.M.I. Services North America, Inc. (PMI SUS) (i)
� P.M.I. Holdings North America, Inc. (PMI HNA) (i)(ix)
� P.M.I. Norteamérica, S. A. de C. V. (PMI NASA) (i)
� P.M.I. Comercio Internacional, S. A. de C. V. (PMI CIM) (i)(ii)
� PMI Field Management Resources, S. L. (FMR) (i)(xi)
� PMI Campos Maduros SANMA, S. de R. L. de C. V. (SANMA) (i)
� Pro-Agroindustria, S. A. de C. V. (AGRO)
� PMI Azufre Industrial, S. A. de C. V. (PMI AZIND) (i)
� PMI Infraestructura de Desarrollo, S. A. de C. V. (PMI ID) (i)
� PMI Cinturón Transoceánico Gas Natural, S. A. de C. V. (PMI CT) (i)
� PMI Transoceánico Gas LP, S. A. de C. V. (PMI TG) (i)
� PMI Servicios Portuarios Transoceánicos, S. A. de C. V. (PMI SP)
� PMI Midstream del Centro, S. A. de C. V. (PMI MC) (i)
F-41
Copyright © 2018 www.secdatabase.com. All Rights Reserved.Please Consider the Environment Before Printing This Document
Table of ContentsPETRÓLEOS MEXICANOS, PRODUCTIVE STATE-OWNED SUBSIDIARIES
AND SUBSIDIARY COMPANIESNOTES TO THE CONSOLIDATED FINANCIAL STATEMENTSFOR THE YEARS ENDED DECEMBER 31, 2017, 2016 AND 2015
(FIGURES STATED IN THOUSANDS, EXCEPT AS NOTED)
� PEMEX Procurement International, Inc. (PPI)
� Hijos de J. Barreras, S. A. (HJ BARRERAS) (ii)
� PEMEX Finance, Ltd. (FIN) (ii)
� Mex Gas Internacional, S. L. (MGAS)
� Pemex Desarrollo e Inversión Inmobiliaria, S. A. de C. V. (PDII)
� Kot Insurance Company, AG. (KOT)
� PPQ Cadena Productiva, S.L. (PPQCP)
� III Servicios, S. A. de C. V. (III Servicios)
� PMI Ducto de Juárez, S. de R.L. de C.V. (PMI DJ)(i)(iii)
� PMX Cogeneración Internacional, S.L. (MG COG) (iv)(vi)(xii)
� PMX Cogeneración S.A.P.I. de C.V. (PMX COG)(iv) (xii)
� PMX Fertilizantes Holding, S.A de C.V. (PMX FH) (iv)
� PMX Fertilizantes Pacífico, S.A. de C.V. (PMX FP) (iv)
� Grupo Fertinal (GP FER) (iv)
� Compañía Mexicana de Exploraciones, S.A. de C.V. (COMESA)(v)
� P.M.I Trading Mexico, S.A. de C.V. (TRDMX) (vii)
� Holdings Holanda Services, B.V. (HHS) (x)
i. Member Company of the �PMI Subsidiaries�.ii. Non-controlling Interest Company.iii. As of January 2016, this company started operations and was included in the consolidated financial statements of PEMEX.iv. As of June 2016, this company was included in the consolidated financial statements of PEMEX.v. As of July 2016, this company was included in the consolidated financial statements of PEMEX.vi. Until October 2016, formerly Mex Gas Cogeneración S.L.vii. As of January 2017, this company started operations and was included in the consolidated financial statements of PEMEXviii. As of February 2017, this company merged with HPE.ix. As of June 2017, this company merged with SUS.x. As of October 2017, PMI HBV was divided and HHS was created and included in the consolidated financial statements of PEMEX.xi. This Company was liquidated.xii. As of December 2017, PEMEX acquired shares in these companies and they were included in the consolidated financial statements of PEMEX.
NOTE 5. Segment financial information
PEMEX�s primary business is the exploration and production of crude oil and natural gas, as well as the production, processing, marketing anddistribution of petroleum and petrochemical products. After the Corporate Reorganization, PEMEX�s operations have been conducted through ninebusiness segments: exploration and production, industrial transformation, cogeneration and services, drilling and services, logistics, ethylene, fertilizers,the Trading Companies and corporate and other operating subsidiary companies. Due to PEMEX�s structure, there are significant quantities of inter-segment sales among the reporting segments, which are made at internal transfer prices established by PEMEX reflecting international market prices.
F-42
Copyright © 2018 www.secdatabase.com. All Rights Reserved.Please Consider the Environment Before Printing This Document
Table of ContentsPETRÓLEOS MEXICANOS, PRODUCTIVE STATE-OWNED SUBSIDIARIES
AND SUBSIDIARY COMPANIESNOTES TO THE CONSOLIDATED FINANCIAL STATEMENTSFOR THE YEARS ENDED DECEMBER 31, 2017, 2016 AND 2015
(FIGURES STATED IN THOUSANDS, EXCEPT AS NOTED)
The primary sources of revenue for PEMEX�s business segments are as described below:
� The exploration and production segment earns revenues from domestic sales of crude oil and natural gas, and from exporting crude oilthrough certain of the Trading Companies. Export sales are made through PMI CIM to approximately 32 major customers in various foreignmarkets. Approximately half of PEMEX�s crude oil is sold to Pemex Industrial Transformation.
� The industrial transformation segment earns revenues from sales of refined petroleum products and derivatives, mainly to third partieswithin the domestic market. This segment also sells a significant portion of the fuel oil it produces to the Comisión Federal de Electricidad(Federal Electricity Commission, or �CFE�) and a significant portion of jet fuel produced to Aeropuertos y Servicios Auxiliares (theAirports and Auxiliary Services Agency). The refining segment�s most important products are different types of gasoline and diesel.
� The industrial transformation segment also earns revenues from domestic sources generated by sales of natural gas, liquefied petroleum gas,naphtha, butane and ethane and certain other petrochemicals such as methane derivatives, ethane derivatives, aromatics and derivatives.
� The cogeneration segment receives income from the cogeneration, supply and sale of electricity and thermal energy and also providestechnical and management activities associated with these services.
� The drilling segment receives income from drilling services, and servicing and repairing wells.
� The logistics segment earns income from transportation and storage of crude oil, petroleum products and petrochemicals, as well as relatedservices, which it provides by employing pipelines and offshore and onshore resources, and from providing services related to themaintenance, handling, guarding and management of these products.
� The ethylene segment earns revenues from the distribution and trade of methane, ethane and propylene in the domestic market.
� The fertilizers segment earns revenues from trading ammonia, fertilizers and its derivatives, mostly in the domestic market.
� The trading companies segment, which consist of PMI CIM, PMI NASA, PMI Trading and MGAS (the �Trading Companies�), earnrevenues from trading crude oil, natural gas and petroleum and petrochemical products in international markets.
� The segment related to corporate and other operating Subsidiary Companies provides administrative, financing, consulting and logisticalservices, as well as economic, tax and legal advice and re-insurance services to PEMEX�s entities and companies.
F-43
Copyright © 2018 www.secdatabase.com. All Rights Reserved.Please Consider the Environment Before Printing This Document

Table of ContentsPETRÓLEOS MEXICANOS, PRODUCTIVE STATE-OWNED SUBSIDIARIES
AND SUBSIDIARY COMPANIESNOTES TO THE CONSOLIDATED FINANCIAL STATEMENTSFOR THE YEARS ENDED DECEMBER 31, 2017, 2016 AND 2015
(FIGURES STATED IN THOUSANDS, EXCEPT AS NOTED)
The following tables present the condensed financial information of these segments, after elimination of unrealized intersegment gain (loss), andinclude only select line items. As a result, the line items presented below may not total. These reporting segments are those which PEMEX�smanagement evaluates in its analysis of PEMEX and on which it bases its decision-making.
As of/for the year ended December 31, 2017
Explorationand
ProductionIndustrial
Transformation
Cogenerationand
Services(1)Drilling and
Services Logistics Fertilizers EthyleneTrading
Companies
Corporate andOther Operating
SubsidiaryCompanies
Intersegmenteliminations Total
Sales:Trade Ps.� Ps. 857,456,146 Ps. � Ps.� Ps.� Ps. 4,123,006 Ps. 12,621,648 Ps. 508,539,112 Ps. 3,159,238 Ps.� Ps. 1,385,899,150Intersegment 762,637,362 150,360,283 114,233 3,400,456 70,671,871 642,965 1,565,757 539,193,190 79,031,944 (1,607,618,061) �Services income � 6,116,937 334,755 41,741 3,714,941 2,339 26,733 66,621 826,502 � 11,130,569
(Reversal) impairment of wells pipelines,properties, plant and equipment, net 129,350,315 15,952,092 � � � 1,935,500 � � 4,206,653 � 151,444,560
Cost of sales 391,089,410 1,004,683,554 472,732 468,171 50,926,263 6,001,259 14,272,340 1,031,997,901 33,033,923 (1,528,740,673) 1,004,204,880Gross income (loss) 242,197,637 (6,702,280 ) (23,744 ) 2,974,026 23,460,549 (3,168,449 ) (58,202 ) 15,801,022 45,777,108 (78,877,388 ) 241,380,279Other revenues (expenses), net 10,204,045 1,515,538 2,646 (31,454 ) (24,134,436 ) 9,013 23,030 307,212 (5,344,872 ) 22,623,354 5,174,076Distribution, transportation and sales expenses � 26,049,566 13,581 � 73,526 528,370 334,663 375,482 59,043 (5,544,561 ) 21,889,670Administrative expenses 58,539,119 38,994,887 37,679 888,776 7,459,928 352,537 1,105,554 1,564,859 62,001,641 (51,005,526 ) 119,939,454Operating income (loss) 193,862,563 (70,231,195 ) (72,358 ) 2,053,796 (8,207,341 ) (4,040,343 ) (1,475,389 ) 14,167,893 (21,628,448 ) 296,053 104,725,231Financing income 121,293,404 11,427,907 147 57,313 1,622,827 2,248 46,113 905,405 145,907,795 (265,097,306 ) 16,165,853Financing cost (136,378,338 ) (2,398,643 ) (19,882 ) (795,947 ) (2,307,427 ) (211,004 ) (1,964 ) (1,328,827 ) (239,003,771 ) 264,801,255 (117,644,548 )Derivative financial instruments (cost) income,
net (1,613,874 ) 5,835 � � � � � (772,143 ) 27,718,506 � 25,338,324Foreign exchange (loss) income, net 10,043,316 4,924,209 � 227,365 613,099 (20,925 ) (10,486 ) (4,318 ) 7,411,862 � 23,184,122Profit (loss) sharing in joint ventures and
associates (75,195 ) 485,224 � � (74 ) � � 1,049,809 (212,666,494 ) 211,567,170 360,440Taxes, duties and other 338,169,260 � � 276,967 (7,444,967 ) � � 1,972,718 6,063 � 332,980,041Net (loss) income (151,037,384 ) (55,786,663 ) (92,093 ) 1,265,560 (833,949 ) (4,270,024 ) (1,441,726 ) 12,045,101 (292,266,613 ) 211,567,172 (280,850,619 )Total current assets 1,036,063,541 570,380,888 179,807 6,871,148 49,391,784 3,155,476 3,994,381 158,414,445 506,187,594 (1,971,112,774) 363,526,290Investments in joint ventures and associates 64,328 4 � � 18,336 � � 15,805,506 (465,026,224 ) 465,845,414 16,707,364Wells, pipelines, properties,plant and equipment, net 945,945,889 286,423,735 � 18,956,882 119,647,553 5,713,998 19,008,822 6,739,231 34,073,216 � 1,436,509,326Total assets 2,058,036,405 857,196,306 179,807 26,220,748 191,895,993 8,923,456 23,142,045 186,808,899 2,111,740,735 (3,332,142,280) 2,132,002,114Total current liabilities 284,656,058 459,130,165 531,580 2,201,936 44,521,371 6,455,246 2,183,654 112,046,527 1,439,097,882 (1,961,697,234) 389,127,185Long-term debt 1,826,843,268 25,437,147 � 11,258,734 2,814,640 � � 2,712,654 1,837,690,559 (1,826,091,398) 1,880,665,604Employee benefits 372,032,958 588,573,518 � 333,212 1,842,892 98,361 105,033 (966,238 ) 296,416,386 � 1,258,436,122Total liabilities 2,570,412,398 1,077,108,748 531,580 13,886,424 56,706,251 6,556,050 2,308,890 116,842,881 3,587,988,972 (3,797,987,695) 3,634,354,499Equity (deficit), net (512,375,993 ) (219,912,442 ) (351,773 ) 12,334,324 135,189,742 2,367,406 20,833,155 69,966,018 (1,476,248,237 ) 465,845,415 (1,502,352,385 )Depreciation and amortization 127,742,568 17,935,112 � 2,368,123 4,562,140 422,930 1,688,493 (19,798 ) 2,004,945 � 156,704,513Net periodic cost of employee benefits 32,794,386 52,538,989 � 39,697 (4,954 ) (1,999 ) (12,561 ) 16,166 22,703,351 � 108,073,075Acquisition of wells, pipelines, properties,
plant and equipment 67,845,989 14,678,182 � 418,283 5,189,409 219,152 475,196 321,145 4,832,461 � 93,979,817
(1) Certain of the assets of Pemex Cogeneration and Services have been transferred to Pemex Industrial Transformation.
F-44
Copyright © 2018 www.secdatabase.com. All Rights Reserved.Please Consider the Environment Before Printing This Document

Table of ContentsPETRÓLEOS MEXICANOS, PRODUCTIVE STATE-OWNED SUBSIDIARIES
AND SUBSIDIARY COMPANIESNOTES TO THE CONSOLIDATED FINANCIAL STATEMENTSFOR THE YEARS ENDED DECEMBER 31, 2017, 2016 AND 2015
(FIGURES STATED IN THOUSANDS, EXCEPT AS NOTED)
As of/for the year ended December 31, 2016
Explorationand
ProductionIndustrial
TransformationCogenerationand Services
Drilling andServices Logistics Fertilizers Ethylene
TradingCompanies
Corporate andOther Operating
SubsidiaryCompanies
Intersegmenteliminations Total
Sales:Trade Ps.� Ps.648,088,013 Ps. � Ps.� Ps.� Ps.3,873,403 Ps.15,392,552 Ps.395,118,117 Ps.2,646,505 Ps.� Ps.1,065,118,590Intersegment 616,380,615 117,096,378 51,913 1,981,754 68,316,958 900,464 1,764,438 405,293,283 50,683,175 (1,262,468,978) �Services income � 5,565,604 132,521 70,112 2,813,887 1,908 60,141 236,230 473,415 (379,176 ) 8,974,642
(Reversal) impairment of wells pipelines,properties, plant and equipment, net (271,709,433 ) (52,498,881 ) � � (5,829,520 ) � (1,276,509 ) � � � (331,314,343 )
Cost of sales 359,064,884 823,763,927 166,721 143,956 61,248,584 5,506,198 13,936,213 783,691,245 7,260,043 (1,188,959,550) 865,822,221Gross income (loss) 529,025,164 (515,051 ) 17,713 1,907,910 15,711,781 (730,423 ) 4,557,427 16,956,385 46,543,052 (73,888,604 ) 539,585,354Other revenues (expenses), net 27,346,794 19,964,654 � 591,704 (27,189,969 ) 32,710 63,989 3,412,711 (906,183 ) (666,804 ) 22,649,606Distribution, transportation and sales expenses � 50,792,317 8,232 6 148,215 185,168 481,727 229,432 49,162 (26,663,019 ) 25,231,240Administrative expenses 54,509,047 34,183,846 32,126 983,560 7,175,451 731,479 2,101,834 1,157,182 60,497,232 (48,718,224 ) 112,653,533Operating income (loss) 501,862,911 (65,526,560 ) (22,645 ) 1,516,048 (18,801,854 ) (1,614,360) 2,037,855 18,982,482 (14,909,525 ) 825,835 424,350,187Financing income 56,040,129 11,056,345 � 72,995 373,301 4,358 64,582 1,098,079 125,964,466 (180,925,000 ) 13,749,255Financing cost (109,946,363 ) (3,188,892 ) (12,055 ) (642,711 ) (481,741 ) (20,217 ) (2,980 ) (1,342,351 ) (163,400,779 ) 180,193,625 (98,844,464 )Derivative financial instruments (cost) income, net � 3,172 � � � � � (1,951,959 ) (12,052,200 ) � (14,000,987 )Foreign exchange (loss) income, net (217,166,718 ) (12,858,875 ) � (1,570,317 ) (1,118,537 ) (29,263 ) (2,843 ) 174,866 (21,441,056 ) � (254,012,743 )Profit (loss) sharing in joint ventures and associates (21,164 ) 649,520 � � � � � 1,586,503 (117,426,818 ) 117,347,804 2,135,845Taxes, duties and other 276,647,448 � � (481,581 ) (10,010,686 ) � � 7,380,870 (9,014,616 ) � 264,521,435Net (loss) income (45,878,653 ) (69,865,290 ) (34,700 ) (142,404 ) (10,018,145 ) (1,659,482) 2,096,614 11,166,750 (194,251,296 ) 117,442,264 (191,144,342 )Total current assets 983,260,710 795,237,287 388,422 6,032,213 22,087,801 1,724,967 5,817,262 125,081,531 613,881,578 (2,195,695,848) 357,815,923Investments in joint ventures and associates 139,523 257,159 � � � � � 17,568,893 (247,349,711 ) 250,121,645 20,737,509Wells, pipelines, properties, plant and equipment,
net 1,176,504,263 311,432,174 � 21,023,629 86,695,514 7,771,634 20,086,650 6,691,813 37,536,571 � 1,667,742,248Total assets 2,206,418,541 1,107,094,580 388,423 27,673,598 130,824,921 9,556,469 26,007,319 155,376,864 2,359,024,145 (3,692,478,836) 2,329,886,024Total current liabilities 340,011,451 666,467,674 472,236 3,894,121 19,824,792 2,995,088 3,879,828 78,894,485 1,497,612,971 (2,187,862,760) 426,189,886Long-term debt 1,737,109,328 31,495,027 � 12,489,423 4,382,109 � � 3,597,938 1,757,315,685 (1,739,384,968) 1,807,004,542Employee benefits 362,312,386 575,277,374 191,876 441,127 571,702 20,362 21,893 (749,034 ) 282,321,750 � 1,220,409,436Total liabilities 2,533,221,665 1,278,138,290 664,829 16,853,202 29,336,417 3,015,450 3,901,722 86,885,889 3,553,477,189 (3,942,600,482) 3,562,894,171Equity (deficit), net (326,803,124 ) (171,043,710 ) (276,406 ) 10,820,396 101,488,504 6,541,019 22,105,597 68,490,975 (1,194,453,044) 250,121,646 (1,233,008,147)Depreciation and amortization 124,329,921 17,425,472 � 2,559,357 2,230,557 481,241 1,395,232 86,707 1,931,004 � 150,439,491Net periodic cost of employee benefits 32,617,215 52,886,397 5,860 31,491 30,340 (1,178 ) 1,424 (552,735 ) 24,719,602 � 109,738,416Acquisition of wells, pipelines, properties, plant
and equipment 70,418,370 32,254,531 � 2,053,139 26,344,495 889,420 1,724,690 1,019,484 21,031,214 � 155,735,343
F-45
Copyright © 2018 www.secdatabase.com. All Rights Reserved.Please Consider the Environment Before Printing This Document
Table of ContentsPETRÓLEOS MEXICANOS, PRODUCTIVE STATE-OWNED SUBSIDIARIES
AND SUBSIDIARY COMPANIESNOTES TO THE CONSOLIDATED FINANCIAL STATEMENTSFOR THE YEARS ENDED DECEMBER 31, 2017, 2016 AND 2015
(FIGURES STATED IN THOUSANDS, EXCEPT AS NOTED)
As of/for the year ended December 31, 2015
Explorationand
ProductionIndustrial
TransformationCogenerationand Services
Drilling andServices Logistics Fertilizers Ethylene
TradingCompanies
Corporate andOther Operating
SubsidiaryCompanies
Intersegmenteliminations Total
Sales:Trade Ps. � Ps.740,190,020 Ps. � Ps. � Ps. � Ps. 1,494,478 Ps.4,551,413 Ps. 407,214,446 Ps. � Ps. � Ps. 1,153,450,357Intersegment 690,642,133 126,294,195 � 1,511,970 598,853 209,970 473,990 353,137,149 18,296,515 (1,191,164,775) �Services income � 7,549,061 � � 10,355,988 236 17,893 661,683 505,032 (10,779,858 ) 8,310,035
Impairment of wells, pipelines, properties, plantand equipment 394,396,580 76,442,079 � � 5,829,519 � 1,276,512 � � � 477,944,690
Benefit from change in pension plan (46,368,308 ) (45,808,781 ) � � � � � � � � (92,177,089 )Cost of sales 427,158,621 876,531,944 2,793 706,896 10,727,462 1,707,548 4,965,414 749,655,199 2,791,350 (1,182,282,621) 891,964,606
Gross income (loss) (84,544,760 ) (33,131,966 ) (2,793 ) 805,074 (5,602,140 ) (2,864 ) (1,198,630 ) 11,358,079 16,010,197 (19,662,012 ) (115,971,815 )Other revenues (expenses), net (7,957,202 ) 1,243,040 � 38 26,941 14,680 19,909 1,666,783 2,219,539 1,890,785 (875,487 )Distribution, transportation and sales expenses � 35,292,527 1,448 � 3,009 4,416 62,071 428,613 254 (6,863,699 ) 28,928,639Administrative expenses 18,454,281 40,529,587 47,670 8,553 104,794 152,404 519,351 1,967,581 61,609,813 (10,921,939 ) 112,472,095Benefit from change in pension plan (17,853,725 ) (39,975,450 ) � � � � � � (46,031,780 ) � (103,860,955 )Operating income (loss) (93,102,518 ) (67,735,590 ) (51,911 ) 796,559 (5,683,002 ) (145,004 ) (1,760,143 ) 10,628,668 2,651,449 14,411 (154,387,081 )Financing income 25,852,078 2,789,535 � 43,690 37 3,503 7,728 1,147,870 110,816,691 (125,670,273 ) 14,990,859Financing cost (90,822,360 ) (13,738,104 ) 2,110 (95,280 ) (61,153 ) � � (1,299,580 ) (87,289,616 ) 125,530,390 (67,773,593 )Derivative financial instruments (cost) income, net � 6,463 � � � � � 1,347,323 (22,803,663 ) � (21,449,877 )Foreign exchange (loss), net (132,165,427 ) (7,364,486 ) (7,509 ) (92,046 ) (11,090 ) (3,600 ) (2,802 ) (49,190 ) (15,069,424 ) � (154,765,574 )(Loss) profit sharing in joint ventures and
associates (473,082 ) 671,868 � � � � � 2,056,259 (749,900,890 ) 749,963,960 2,318,115Taxes, duties and other 376,682,705 1,839,021 � 197,491 (2,069,848 ) � � 5,134,176 (50,283,298 ) � 331,500,247Net (loss) income (667,394,014 ) (87,209,335 ) (57,310 ) 455,432 (3,685,360 ) (145,101 ) (1,755,217 ) 8,697,174 (711,312,155 ) 749,838,488 (712,567,398 )
Total current assets 709,252,019 313,801,630 655,239 2,171,717 49,162,929 1,594,643 4,988,511 73,116,155 275,582,816 (1,163,125,162) 267,200,497Investments in joint ventures and associates 919,654 6,687,977 � � � 8,500 � 11,845,489 (242,233,405 ) 246,937,384 24,165,599Wells, pipelines, properties, plant and equipment,
net 966,144,619 246,463,069 � 22,647,454 58,078,603 7,405,969 18,480,684 3,045,704 22,217,529 � 1,344,483,631Total assets 1,698,909,240 567,486,579 655,240 24,917,981 111,307,038 9,034,376 23,705,118 93,266,620 1,443,189,885 (2,196,817,877) 1,775,654,200Total current liabilities 278,507,394 104,569,842 469,524 1,981,652 14,698,159 1,486,468 4,534,980 34,749,438 1,157,183,570 (1,154,773,306) 443,407,721Long-term debt 1,252,239,594 16,707,005 � 12,031,849 4,850,905 � � 3,607,840 1,285,676,066 (1,274,240,092) 1,300,873,167Employee benefits 379,150,943 609,492,623 61,171 417,817 368,036 12,533 3,611 (59,581 ) 289,938,288 � 1,279,385,441Total liabilities 1,985,557,185 735,280,560 530,696 14,431,318 19,917,100 1,499,001 4,538,591 41,420,792 2,747,910,113 (2,443,755,258) 3,107,330,098Equity (deficit), net (286,647,945 ) (167,793,981 ) 124,544 10,486,663 91,389,938 7,535,375 19,166,527 51,845,828 (1,304,720,228) 246,937,381 (1,331,675,898)Depreciation and amortization 144,567,149 20,916,796 � 612,741 337,364 158,505 442,504 84,493 831,698 � 167,951,250Net periodic cost of employee benefits 23,608,485 21,392,600 (298 ) � (310 ) � � (119,819 ) 17,668,484 � 62,549,142Acquisition of wells, pipelines, properties, plant
and equipment 184,786,051 68,935,841 � � 1,544,224 320,762 1,882,108 677,314 6,711,511 � 264,857,811
F-46
Copyright © 2018 www.secdatabase.com. All Rights Reserved.Please Consider the Environment Before Printing This Document
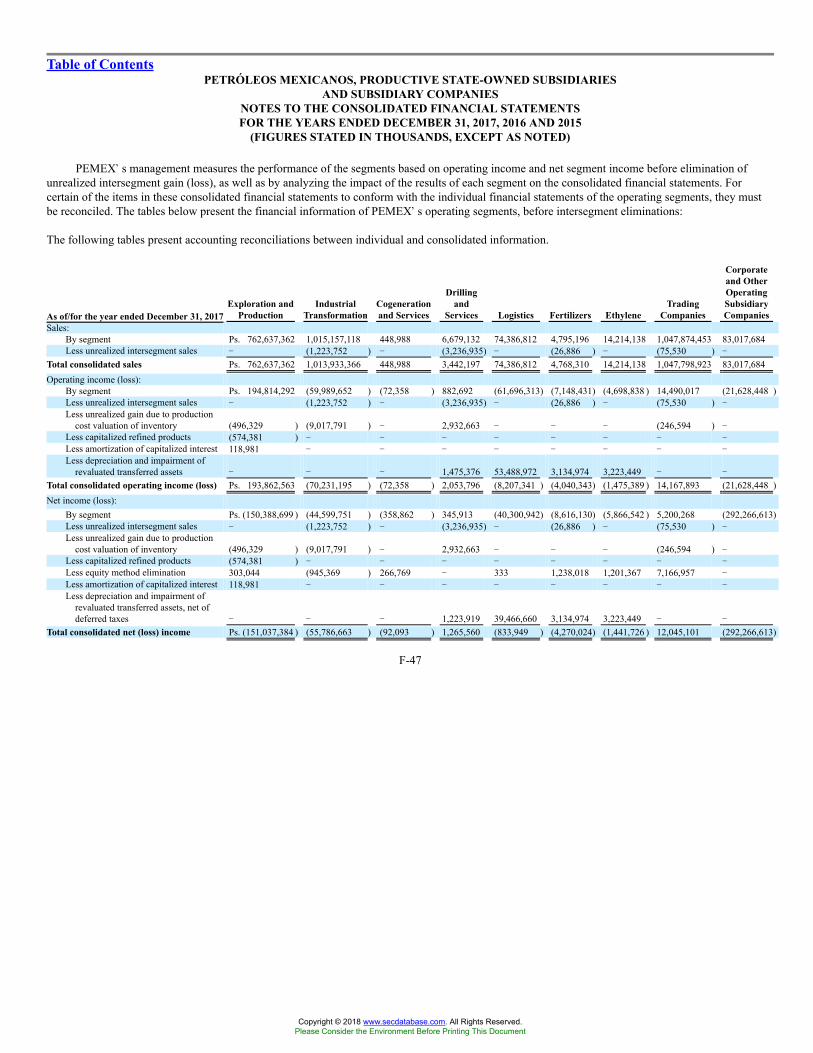
Table of ContentsPETRÓLEOS MEXICANOS, PRODUCTIVE STATE-OWNED SUBSIDIARIES
AND SUBSIDIARY COMPANIESNOTES TO THE CONSOLIDATED FINANCIAL STATEMENTSFOR THE YEARS ENDED DECEMBER 31, 2017, 2016 AND 2015
(FIGURES STATED IN THOUSANDS, EXCEPT AS NOTED)
PEMEX�s management measures the performance of the segments based on operating income and net segment income before elimination ofunrealized intersegment gain (loss), as well as by analyzing the impact of the results of each segment on the consolidated financial statements. Forcertain of the items in these consolidated financial statements to conform with the individual financial statements of the operating segments, they mustbe reconciled. The tables below present the financial information of PEMEX�s operating segments, before intersegment eliminations:
The following tables present accounting reconciliations between individual and consolidated information.
As of/for the year ended December 31, 2017Exploration and
ProductionIndustrial
TransformationCogenerationand Services
Drillingand
Services Logistics Fertilizers EthyleneTrading
Companies
Corporateand OtherOperatingSubsidiaryCompanies
Sales:By segment Ps. 762,637,362 1,015,157,118 448,988 6,679,132 74,386,812 4,795,196 14,214,138 1,047,874,453 83,017,684Less unrealized intersegment sales � (1,223,752 ) � (3,236,935) � (26,886 ) � (75,530 ) �
Total consolidated sales Ps. 762,637,362 1,013,933,366 448,988 3,442,197 74,386,812 4,768,310 14,214,138 1,047,798,923 83,017,684Operating income (loss):
By segment Ps. 194,814,292 (59,989,652 ) (72,358 ) 882,692 (61,696,313) (7,148,431) (4,698,838 ) 14,490,017 (21,628,448 )Less unrealized intersegment sales � (1,223,752 ) � (3,236,935) � (26,886 ) � (75,530 ) �Less unrealized gain due to production
cost valuation of inventory (496,329 ) (9,017,791 ) � 2,932,663 � � � (246,594 ) �Less capitalized refined products (574,381 ) � � � � � � � �Less amortization of capitalized interest 118,981 � � � � � � � �Less depreciation and impairment of
revaluated transferred assets � � � 1,475,376 53,488,972 3,134,974 3,223,449 � �
Total consolidated operating income (loss) Ps. 193,862,563 (70,231,195 ) (72,358 ) 2,053,796 (8,207,341 ) (4,040,343) (1,475,389 ) 14,167,893 (21,628,448 )Net income (loss):
By segment Ps. (150,388,699 ) (44,599,751 ) (358,862 ) 345,913 (40,300,942) (8,616,130) (5,866,542 ) 5,200,268 (292,266,613)Less unrealized intersegment sales � (1,223,752 ) � (3,236,935) � (26,886 ) � (75,530 ) �Less unrealized gain due to production
cost valuation of inventory (496,329 ) (9,017,791 ) � 2,932,663 � � � (246,594 ) �Less capitalized refined products (574,381 ) � � � � � � � �Less equity method elimination 303,044 (945,369 ) 266,769 � 333 1,238,018 1,201,367 7,166,957 �Less amortization of capitalized interest 118,981 � � � � � � � �Less depreciation and impairment of
revaluated transferred assets, net ofdeferred taxes � � � 1,223,919 39,466,660 3,134,974 3,223,449 � �
Total consolidated net (loss) income Ps. (151,037,384 ) (55,786,663 ) (92,093 ) 1,265,560 (833,949 ) (4,270,024) (1,441,726 ) 12,045,101 (292,266,613)
F-47
Copyright © 2018 www.secdatabase.com. All Rights Reserved.Please Consider the Environment Before Printing This Document
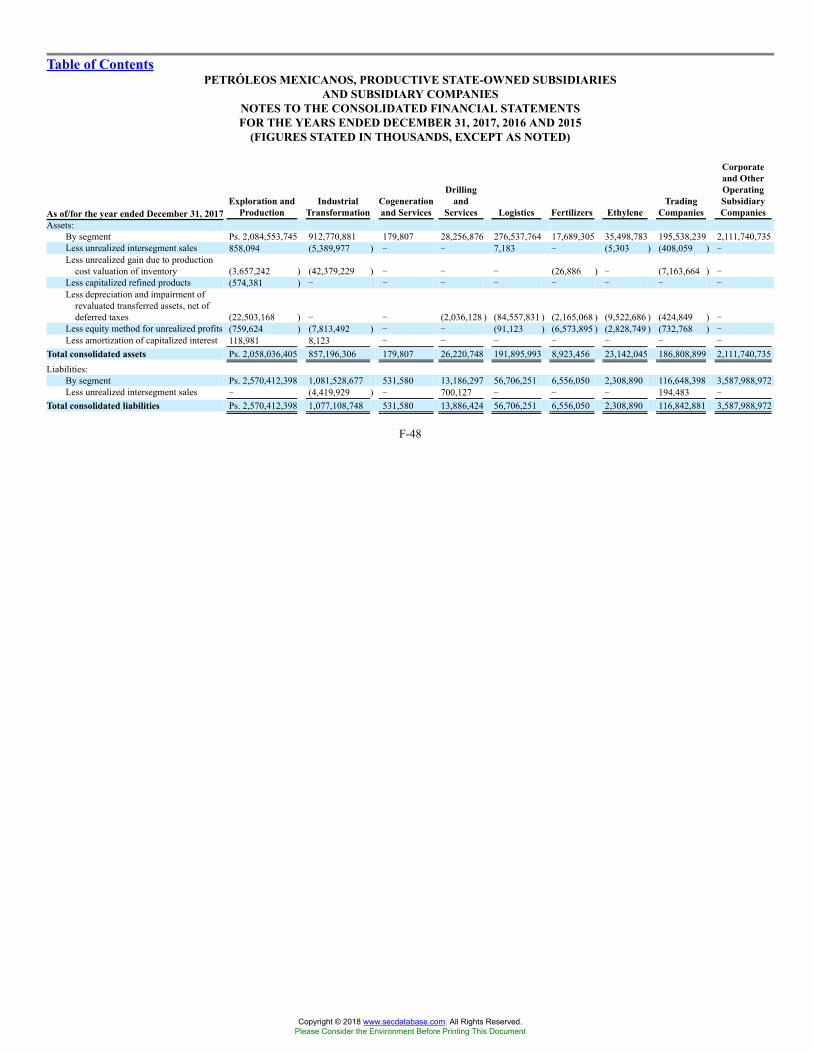
Table of ContentsPETRÓLEOS MEXICANOS, PRODUCTIVE STATE-OWNED SUBSIDIARIES
AND SUBSIDIARY COMPANIESNOTES TO THE CONSOLIDATED FINANCIAL STATEMENTSFOR THE YEARS ENDED DECEMBER 31, 2017, 2016 AND 2015
(FIGURES STATED IN THOUSANDS, EXCEPT AS NOTED)
As of/for the year ended December 31, 2017Exploration and
ProductionIndustrial
TransformationCogenerationand Services
Drillingand
Services Logistics Fertilizers EthyleneTrading
Companies
Corporateand OtherOperatingSubsidiaryCompanies
Assets:By segment Ps. 2,084,553,745 912,770,881 179,807 28,256,876 276,537,764 17,689,305 35,498,783 195,538,239 2,111,740,735Less unrealized intersegment sales 858,094 (5,389,977 ) � � 7,183 � (5,303 ) (408,059 ) �Less unrealized gain due to production
cost valuation of inventory (3,657,242 ) (42,379,229 ) � � � (26,886 ) � (7,163,664 ) �Less capitalized refined products (574,381 ) � � � � � � � �Less depreciation and impairment of
revaluated transferred assets, net ofdeferred taxes (22,503,168 ) � � (2,036,128 ) (84,557,831 ) (2,165,068 ) (9,522,686 ) (424,849 ) �
Less equity method for unrealized profits (759,624 ) (7,813,492 ) � � (91,123 ) (6,573,895 ) (2,828,749 ) (732,768 ) �Less amortization of capitalized interest 118,981 8,123 � � � � � � �
Total consolidated assets Ps. 2,058,036,405 857,196,306 179,807 26,220,748 191,895,993 8,923,456 23,142,045 186,808,899 2,111,740,735Liabilities:
By segment Ps. 2,570,412,398 1,081,528,677 531,580 13,186,297 56,706,251 6,556,050 2,308,890 116,648,398 3,587,988,972Less unrealized intersegment sales � (4,419,929 ) � 700,127 � � � 194,483 �
Total consolidated liabilities Ps. 2,570,412,398 1,077,108,748 531,580 13,886,424 56,706,251 6,556,050 2,308,890 116,842,881 3,587,988,972
F-48
Copyright © 2018 www.secdatabase.com. All Rights Reserved.Please Consider the Environment Before Printing This Document

Table of ContentsPETRÓLEOS MEXICANOS, PRODUCTIVE STATE-OWNED SUBSIDIARIES
AND SUBSIDIARY COMPANIESNOTES TO THE CONSOLIDATED FINANCIAL STATEMENTSFOR THE YEARS ENDED DECEMBER 31, 2017, 2016 AND 2015
(FIGURES STATED IN THOUSANDS, EXCEPT AS NOTED)
As of/for the year endedDecember 31, 2016
Exploration andProduction
IndustrialTransformation
Cogeneration andServices
Drilling andServices Logistics Fertilizers Ethylene
TradingCompanies
Corporate andOther Operating
SubsidiaryCompanies
Sales:By segment Ps. 616,380,615 771,597,427 184,434 6,263,093 71,130,845 4,775,775 17,217,131 800,979,076 53,803,095Less unrealized intersegment
sales � (847,432 ) � (4,211,227 ) � � � (331,446 ) �
Total consolidated sales Ps. 616,380,615 770,749,995 184,434 2,051,866 71,130,845 4,775,775 17,217,131 800,647,630 53,803,095Operating income (loss):
By segment Ps. 503,679,153 (60,347,367 ) (22,645 ) 1,271,202 (25,701,065) (2,877,725) (3,504,812 ) 19,526,997 (14,909,525 )Less unrealized intersegment
sales � (847,432 ) � (4,211,227 ) � � � (331,446 ) �Less unrealized gain due to
production cost valuation ofinventory (273,237 ) 3,572,498 � 3,815,371 � 905,910 (2,163 ) (213,069 ) �
Less capitalized refinedproducts (1,661,986 ) (7,904,259 ) � � � � � � �
Less amortization ofcapitalized interest 118,981 � � � � � � � �
Less depreciation andimpairment of revaluatedassets � � � 640,702 6,899,211 357,455 5,544,830 � �
Total consolidated operatingincome (loss) Ps. 501,862,911 (65,526,560 ) (22,645 ) 1,516,048 (18,801,854) (1,614,360) 2,037,855 18,982,482 (14,909,525 )
Net income (loss):By segment Ps. (44,069,001 ) (61,639,067 ) (381,214 ) (387,250 ) (16,917,356) (7,820,835) (3,780,706 ) 11,711,265 (194,251,296 )Less unrealized intersegment
sales � (847,432 ) � (4,211,227 ) � � � (331,446 ) �Less unrealized gain due to
production cost valuation ofinventory (273,237 ) 3,572,498 � 3,815,371 � 905,910 (2,163 ) (213,069 ) �
Less capitalized refinedproducts (1,661,986 ) (7,904,259 ) � � � � � � �
Less equity methodelimination 6,590 (3,047,030 ) 346,514 � � 4,897,988 334,653 � �
Less amortization ofcapitalized interest 118,981 � � � � � � � �
Less depreciation of revaluatedassets � � � 640,702 6,899,211 357,455 5,544,830 � �
Total consolidated net (loss)income Ps. (45,878,653) (69,865,290 ) (34,700 ) (142,404 ) (10,018,145) (1,659,482) 2,096,614 11,166,750 (194,251,296 )
F-49
Copyright © 2018 www.secdatabase.com. All Rights Reserved.Please Consider the Environment Before Printing This Document
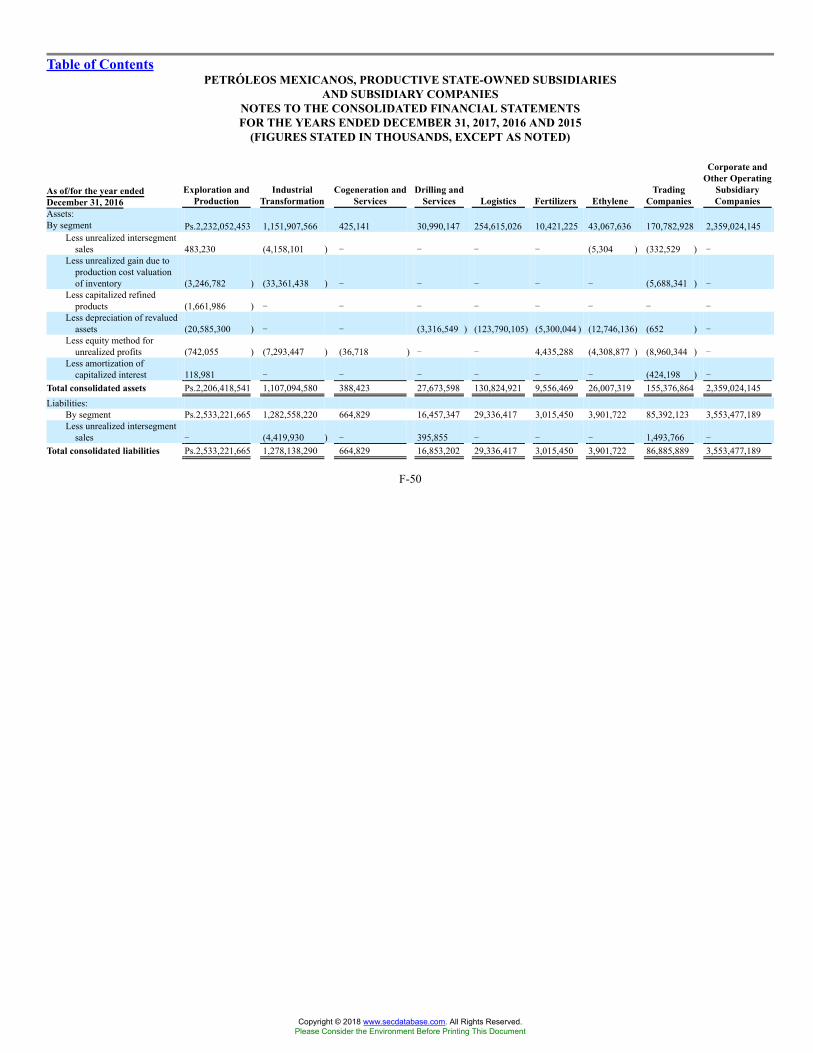
Table of ContentsPETRÓLEOS MEXICANOS, PRODUCTIVE STATE-OWNED SUBSIDIARIES
AND SUBSIDIARY COMPANIESNOTES TO THE CONSOLIDATED FINANCIAL STATEMENTSFOR THE YEARS ENDED DECEMBER 31, 2017, 2016 AND 2015
(FIGURES STATED IN THOUSANDS, EXCEPT AS NOTED)
As of/for the year endedDecember 31, 2016
Exploration andProduction
IndustrialTransformation
Cogeneration andServices
Drilling andServices Logistics Fertilizers Ethylene
TradingCompanies
Corporate andOther Operating
SubsidiaryCompanies
Assets:By segment Ps.2,232,052,453 1,151,907,566 425,141 30,990,147 254,615,026 10,421,225 43,067,636 170,782,928 2,359,024,145
Less unrealized intersegmentsales 483,230 (4,158,101 ) � � � � (5,304 ) (332,529 ) �
Less unrealized gain due toproduction cost valuationof inventory (3,246,782 ) (33,361,438 ) � � � � � (5,688,341 ) �
Less capitalized refinedproducts (1,661,986 ) � � � � � � � �
Less depreciation of revaluedassets (20,585,300 ) � � (3,316,549 ) (123,790,105) (5,300,044 ) (12,746,136) (652 ) �
Less equity method forunrealized profits (742,055 ) (7,293,447 ) (36,718 ) � � 4,435,288 (4,308,877 ) (8,960,344 ) �
Less amortization ofcapitalized interest 118,981 � � � � � � (424,198 ) �
Total consolidated assets Ps.2,206,418,541 1,107,094,580 388,423 27,673,598 130,824,921 9,556,469 26,007,319 155,376,864 2,359,024,145Liabilities:
By segment Ps.2,533,221,665 1,282,558,220 664,829 16,457,347 29,336,417 3,015,450 3,901,722 85,392,123 3,553,477,189Less unrealized intersegment
sales � (4,419,930 ) � 395,855 � � � 1,493,766 �
Total consolidated liabilities Ps.2,533,221,665 1,278,138,290 664,829 16,853,202 29,336,417 3,015,450 3,901,722 86,885,889 3,553,477,189
F-50
Copyright © 2018 www.secdatabase.com. All Rights Reserved.Please Consider the Environment Before Printing This Document

Table of ContentsPETRÓLEOS MEXICANOS, PRODUCTIVE STATE-OWNED SUBSIDIARIES
AND SUBSIDIARY COMPANIESNOTES TO THE CONSOLIDATED FINANCIAL STATEMENTSFOR THE YEARS ENDED DECEMBER 31, 2017, 2016 AND 2015
(FIGURES STATED IN THOUSANDS, EXCEPT AS NOTED)
As of/for the year ended December 31, 2015
Explorationand
ProductionIndustrial
TransformationCogeneration and
ServicesDrilling and
Services Logistics Fertilizers EthyleneTrading
Companies
Corporate andOther Operating
SubsidiaryCompanies
Sales:By segment Ps.690,642,133 874,630,488 � 1,511,970 10,954,841 1,704,684 5,048,600 761,213,475 18,801,547Less unrealized intersegment sales � (597,212 ) � � � � (5,304 ) (200,197 ) �
Total consolidated sales Ps.690,642,133 874,033,276 � 1,511,970 10,954,841 1,704,684 5,043,296 761,013,278 18,801,547Operating income (loss):
By segment Ps.(89,473,302 ) (88,819,558 ) (51,911 ) 700,748 (6,875,252 ) (262,145 ) (2,288,747) 10,334,138 2,651,449Less unrealized intersegment sales � (597,212 ) � � � � (5,304 ) (200,197 ) �Less unrealized gain due to production
cost valuation of inventory (251,995 ) 21,681,180 � � � � 2,163 494,727 �Less capitalized refined products (3,496,201 ) � � � � � � � �Less amortization of capitalized interest 118,980 � � � � � � � �Less depreciation and impairment of
revaluated assets � � � 95,811 1,192,250 117,141 531,745 � �
Total consolidated operating (loss) income Ps.(93,102,518 ) (67,735,590 ) (51,911 ) 796,559 (5,683,002 ) (145,004 ) (1,760,143) 10,628,668 2,651,449Net income (loss):
By segment Ps. (663,719,119) (107,164,261 ) (57,310 ) 359,621 (4,877,610 ) (262,242 ) (2,314,774) 8,402,644 (711,312,155 )Less unrealized intersegment sales � (597,212 ) � � � � (5,304 ) (200,197 ) �Less unrealized gain due to production
cost valuation of inventory (251,995 ) 21,681,180 � � � � 2,163 494,727 �Less capitalized refined products (3,496,201 ) � � � � � � �Less equity method elimination (45,679 ) (1,129,042 ) � � � � 30,953 � �Less amortization of capitalized interest 118,980 � � � � � � � �Less depreciation of revaluated assets � � � 95,811 1,192,250 117,141 531,745 � �
Total consolidated net (loss) income Ps. (667,394,014) (87,209,335 ) (57,310 ) 455,432 (3,685,360 ) (145,101 ) (1,755,217) 8,697,174 (711,312,155 )
F-51
Copyright © 2018 www.secdatabase.com. All Rights Reserved.Please Consider the Environment Before Printing This Document

Table of ContentsPETRÓLEOS MEXICANOS, PRODUCTIVE STATE-OWNED SUBSIDIARIES
AND SUBSIDIARY COMPANIESNOTES TO THE CONSOLIDATED FINANCIAL STATEMENTSFOR THE YEARS ENDED DECEMBER 31, 2017, 2016 AND 2015
(FIGURES STATED IN THOUSANDS, EXCEPT AS NOTED)
Supplemental geographic information:
For the years ended December 31,2017 2016 2015
Domestic sales Ps.877,360,038 Ps.670,000,473 Ps.746,235,912Export sales:
United States 302,912,999 221,954,461 266,826,499Canada, Central and South America 13,943,080 14,058,897 11,027,813Europe 71,470,613 64,348,997 58,707,787Other 120,212,420 94,755,762 70,652,346
Total export sales 508,539,112 395,118,117 407,214,445Services income 11,130,569 8,974,642 8,310,035Total sales Ps. 1,397,029,719 Ps. 1,074,093,232 Ps. 1,161,760,392
PEMEX does not have significant long-lived assets outside of Mexico.
The following table shows income by product:
For the years ended December 31,2017 2016 2015
Domestic salesRefined petroleum products and derivatives (primarily
gasolines) Ps. 784,048,048 Ps. 578,718,674 Ps. 660,573,780Gas 70,930,855 59,648,576 54,497,824Petrochemical products 22,381,135 31,633,223 31,164,308Total domestic sales Ps. 877,360,038 Ps. 670,000,473 Ps. 746,235,912Export salesCrude oil Ps. 380,461,147 Ps. 288,625,794 Ps. 288,170,451Refined petroleum products and derivatives (primarily
gasolines) 109,615,457 92,705,248 118,129,615Gas 21,675 20,995 27,283Petrochemical products 18,440,833 13,766,080 887,096Total export sales Ps. 508,539,112 Ps. 395,118,117 Ps. 407,214,445
F-52
Copyright © 2018 www.secdatabase.com. All Rights Reserved.Please Consider the Environment Before Printing This Document
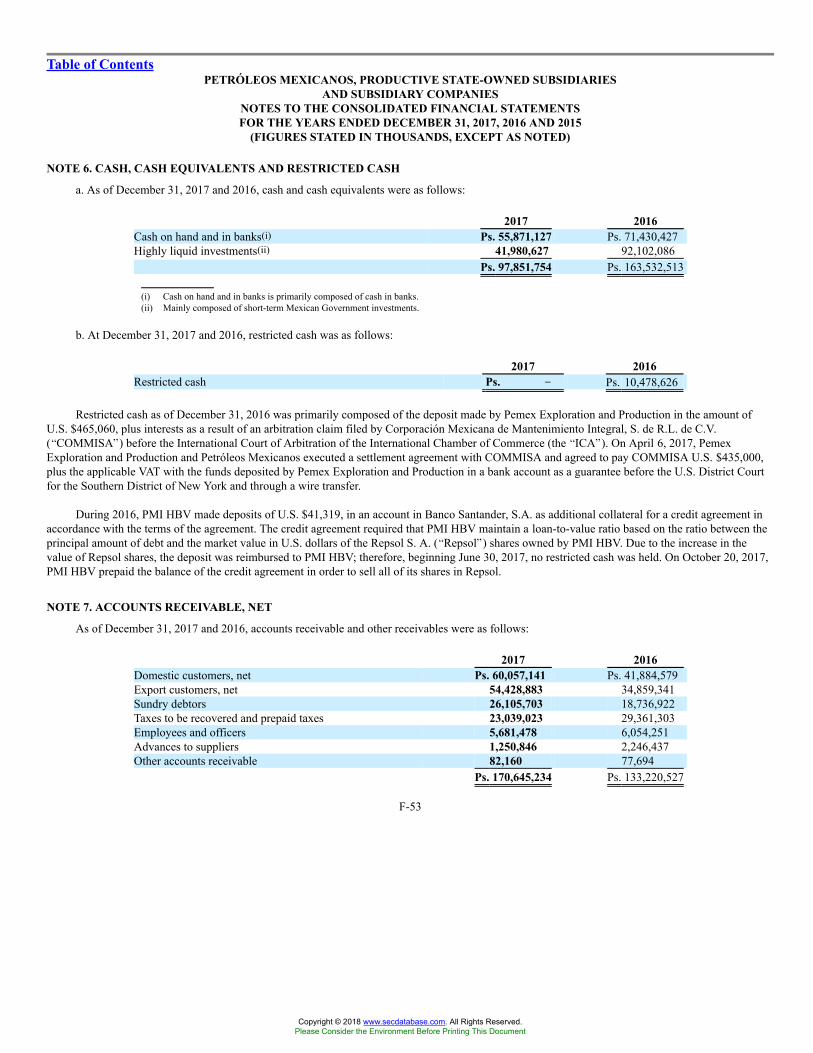
Table of ContentsPETRÓLEOS MEXICANOS, PRODUCTIVE STATE-OWNED SUBSIDIARIES
AND SUBSIDIARY COMPANIESNOTES TO THE CONSOLIDATED FINANCIAL STATEMENTSFOR THE YEARS ENDED DECEMBER 31, 2017, 2016 AND 2015
(FIGURES STATED IN THOUSANDS, EXCEPT AS NOTED)
NOTE 6. CASH, CASH EQUIVALENTS AND RESTRICTED CASH
a. As of December 31, 2017 and 2016, cash and cash equivalents were as follows:
2017 2016Cash on hand and in banks(i) Ps. 55,871,127 Ps. 71,430,427Highly liquid investments(ii) 41,980,627 92,102,086
Ps. 97,851,754 Ps. 163,532,513
(i) Cash on hand and in banks is primarily composed of cash in banks.(ii) Mainly composed of short-term Mexican Government investments.
b. At December 31, 2017 and 2016, restricted cash was as follows:
2017 2016Restricted cash Ps. �� Ps. 10,478,626
Restricted cash as of December 31, 2016 was primarily composed of the deposit made by Pemex Exploration and Production in the amount ofU.S. $465,060, plus interests as a result of an arbitration claim filed by Corporación Mexicana de Mantenimiento Integral, S. de R.L. de C.V.(�COMMISA�) before the International Court of Arbitration of the International Chamber of Commerce (the �ICA�). On April 6, 2017, PemexExploration and Production and Petróleos Mexicanos executed a settlement agreement with COMMISA and agreed to pay COMMISA U.S. $435,000,plus the applicable VAT with the funds deposited by Pemex Exploration and Production in a bank account as a guarantee before the U.S. District Courtfor the Southern District of New York and through a wire transfer.
During 2016, PMI HBV made deposits of U.S. $41,319, in an account in Banco Santander, S.A. as additional collateral for a credit agreement inaccordance with the terms of the agreement. The credit agreement required that PMI HBV maintain a loan-to-value ratio based on the ratio between theprincipal amount of debt and the market value in U.S. dollars of the Repsol S. A. (�Repsol�) shares owned by PMI HBV. Due to the increase in thevalue of Repsol shares, the deposit was reimbursed to PMI HBV; therefore, beginning June 30, 2017, no restricted cash was held. On October 20, 2017,PMI HBV prepaid the balance of the credit agreement in order to sell all of its shares in Repsol.
NOTE 7. ACCOUNTS RECEIVABLE, NET
As of December 31, 2017 and 2016, accounts receivable and other receivables were as follows:
2017 2016Domestic customers, net Ps. 60,057,141 Ps. 41,884,579Export customers, net 54,428,883 34,859,341Sundry debtors 26,105,703 18,736,922Taxes to be recovered and prepaid taxes 23,039,023 29,361,303Employees and officers 5,681,478 6,054,251Advances to suppliers 1,250,846 2,246,437Other accounts receivable 82,160 77,694
Ps. 170,645,234 Ps. 133,220,527
F-53
Copyright © 2018 www.secdatabase.com. All Rights Reserved.Please Consider the Environment Before Printing This Document
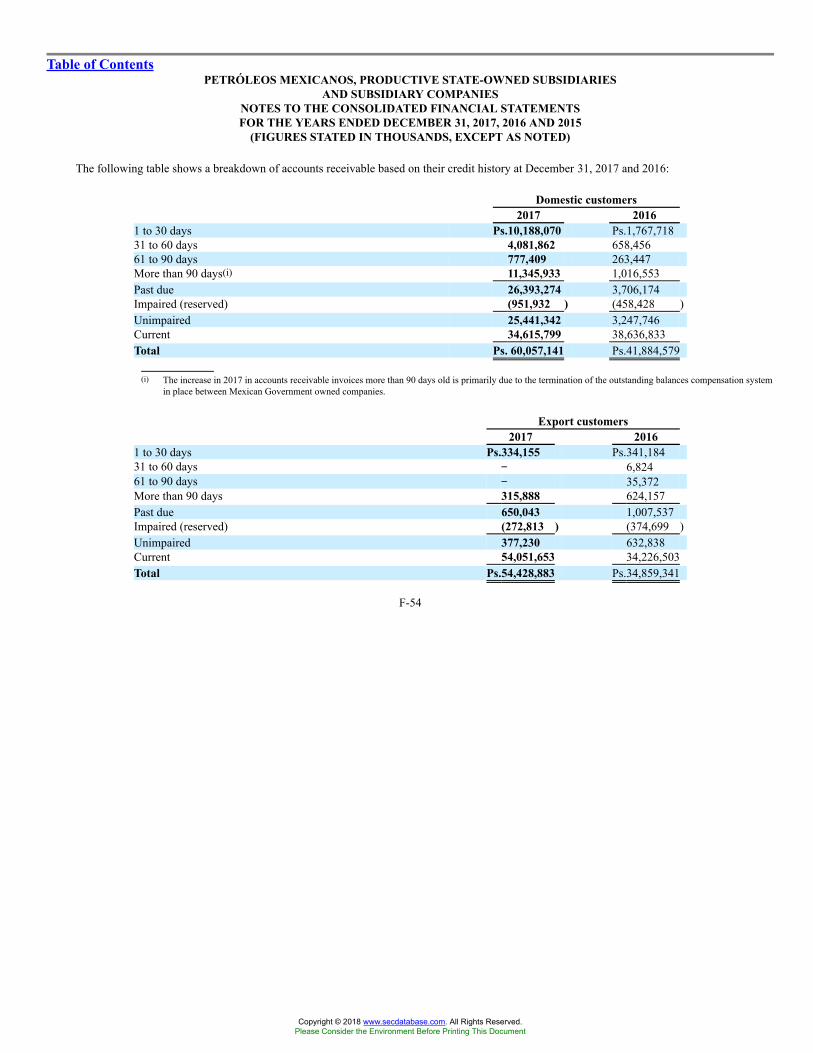
Table of ContentsPETRÓLEOS MEXICANOS, PRODUCTIVE STATE-OWNED SUBSIDIARIES
AND SUBSIDIARY COMPANIESNOTES TO THE CONSOLIDATED FINANCIAL STATEMENTSFOR THE YEARS ENDED DECEMBER 31, 2017, 2016 AND 2015
(FIGURES STATED IN THOUSANDS, EXCEPT AS NOTED)
The following table shows a breakdown of accounts receivable based on their credit history at December 31, 2017 and 2016:
Domestic customers2017 2016
1 to 30 days Ps.10,188,070 Ps.1,767,71831 to 60 days 4,081,862 658,45661 to 90 days 777,409 263,447More than 90 days(i) 11,345,933 1,016,553Past due 26,393,274 3,706,174Impaired (reserved) (951,932 ) (458,428 )Unimpaired 25,441,342 3,247,746Current 34,615,799 38,636,833Total Ps. 60,057,141 Ps.41,884,579
(i) The increase in 2017 in accounts receivable invoices more than 90 days old is primarily due to the termination of the outstanding balances compensation systemin place between Mexican Government owned companies.
Export customers2017 2016
1 to 30 days Ps.334,155 Ps.341,18431 to 60 days �� 6,82461 to 90 days �� 35,372More than 90 days 315,888 624,157Past due 650,043 1,007,537Impaired (reserved) (272,813 ) (374,699 )Unimpaired 377,230 632,838Current 54,051,653 34,226,503Total Ps.54,428,883 Ps.34,859,341
F-54
Copyright © 2018 www.secdatabase.com. All Rights Reserved.Please Consider the Environment Before Printing This Document
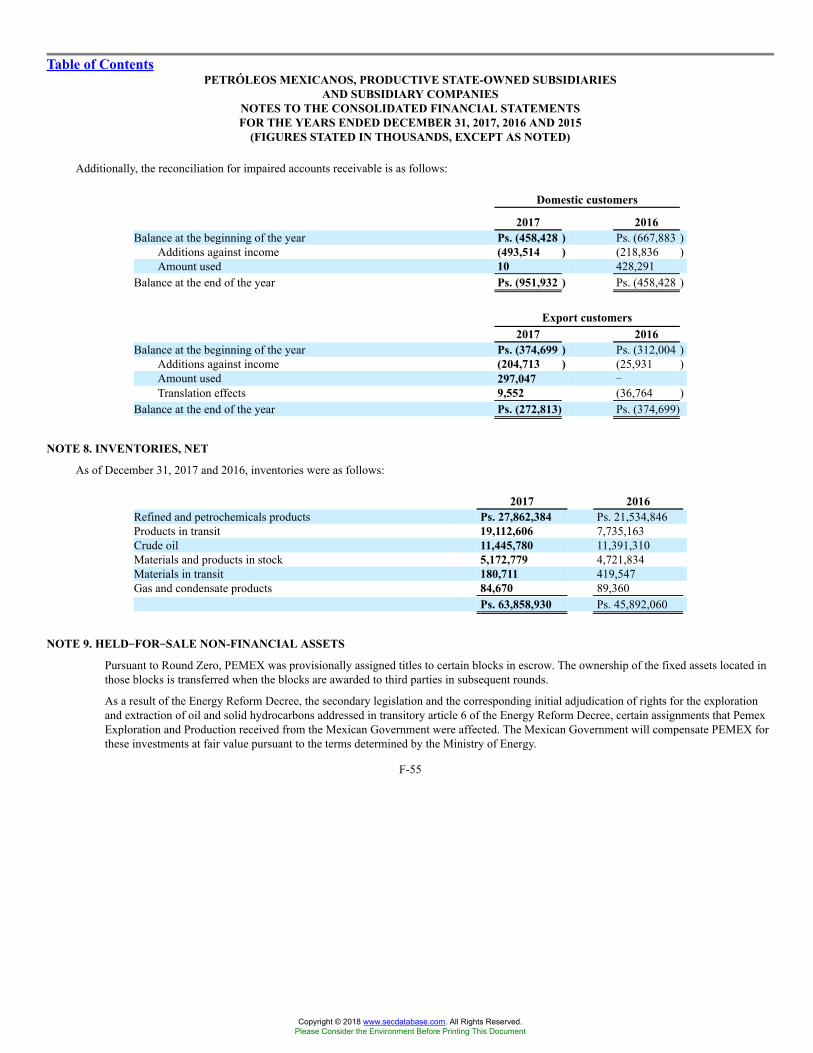
Table of ContentsPETRÓLEOS MEXICANOS, PRODUCTIVE STATE-OWNED SUBSIDIARIES
AND SUBSIDIARY COMPANIESNOTES TO THE CONSOLIDATED FINANCIAL STATEMENTSFOR THE YEARS ENDED DECEMBER 31, 2017, 2016 AND 2015
(FIGURES STATED IN THOUSANDS, EXCEPT AS NOTED)
Additionally, the reconciliation for impaired accounts receivable is as follows:
Domestic customers
2017 2016Balance at the beginning of the year Ps. (458,428 ) Ps. (667,883 )
Additions against income (493,514 ) (218,836 )Amount used 10 428,291
Balance at the end of the year Ps. (951,932 ) Ps. (458,428 )
Export customers2017 2016
Balance at the beginning of the year Ps. (374,699 ) Ps. (312,004 )Additions against income (204,713 ) (25,931 )Amount used 297,047 �Translation effects 9,552 (36,764 )
Balance at the end of the year Ps. (272,813) Ps. (374,699)
NOTE 8. INVENTORIES, NET
As of December 31, 2017 and 2016, inventories were as follows:
2017 2016Refined and petrochemicals products Ps. 27,862,384 Ps. 21,534,846Products in transit 19,112,606 7,735,163Crude oil 11,445,780 11,391,310Materials and products in stock 5,172,779 4,721,834Materials in transit 180,711 419,547Gas and condensate products 84,670 89,360
Ps. 63,858,930 Ps. 45,892,060
NOTE 9. HELD��FOR��SALE NON-FINANCIAL ASSETS
Pursuant to Round Zero, PEMEX was provisionally assigned titles to certain blocks in escrow. The ownership of the fixed assets located inthose blocks is transferred when the blocks are awarded to third parties in subsequent rounds.
As a result of the Energy Reform Decree, the secondary legislation and the corresponding initial adjudication of rights for the explorationand extraction of oil and solid hydrocarbons addressed in transitory article 6 of the Energy Reform Decree, certain assignments that PemexExploration and Production received from the Mexican Government were affected. The Mexican Government will compensate PEMEX forthese investments at fair value pursuant to the terms determined by the Ministry of Energy.
F-55
Copyright © 2018 www.secdatabase.com. All Rights Reserved.Please Consider the Environment Before Printing This Document

Table of ContentsPETRÓLEOS MEXICANOS, PRODUCTIVE STATE-OWNED SUBSIDIARIES
AND SUBSIDIARY COMPANIESNOTES TO THE CONSOLIDATED FINANCIAL STATEMENTSFOR THE YEARS ENDED DECEMBER 31, 2017, 2016 AND 2015
(FIGURES STATED IN THOUSANDS, EXCEPT AS NOTED)
In 2016, pursuant to Round 1.3, the Ministry of Energy awarded certain contractual areas for the exploration and extraction of oil and solidhydrocarbons to third parties and their respective fixed assets have been transferred from PEMEX to such third parties. During 2016,PEMEX submitted the application for compensation from the Ministry of Energy for the fixed assets located in those areas, receivingresolution in 2017.
All the assets that are part of unassigned areas to PEMEX as part of Round Zero continue to be classified as long-lived assets, subject to allregulations applicable to such assets, provided PEMEX (1) obtains the economic benefits derived from the use thereof and (2) at the sametime exercises control over them and assumes the benefits and risks associated with such assets.
Assets that are part of the areas that were not assigned to PEMEX as part of Round Zero, and from which PEMEX does not obtaineconomic benefits derived from use of such assets, are written down, affecting the results for that year.
As a result, of the Ps. 7,460,674 held-for-sale, the non-financial assets at December 31, 2016, Ps.4,652,314 were reclassified to fixed assetsand the remaining Ps. 2,808,360, were transferred to the results of the year.
NOTE 10. AVAILABLE��FOR��SALE��FINANCIAL ASSETS
a. On January 1, 2016, PEMEX had a total of 20,724,331 shares of Repsol valued at Ps. 3,944,696, which represented approximately 1.48% ofRepsol�s share capital.
On January 15, 2016, PMI HBV received 942,015 new Repsol shares valued at Ps. 188,490 as an in-kind dividend that was declared onDecember 31, 2015.
On June 13, 2016, Repsol declared flexible dividends to its shareholders, of which PMI HBV received 555,547 new Repsol shares as anin-kind dividend on July 18, 2016, valued at Ps. 128,051.
Since the 1,497,562 new Repsol shares were received as an in-kind dividend during 2016, they were not included in the loan agreementobtained by PMI HBV in August 2015 and these shares are presented as short-term available-for-sale financial assets amounting to Ps.435,556. These shares were sold in January 2017.
On December 14, 2016, Repsol declared flexible dividends to its shareholders, of which PMI HBV received 584,786 new Repsol shares asan in-kind dividend in January 23, 2017. This amount was recognized as an account receivable of Ps.165,346 as of December 31, 2016.
As of December 31, 2016, the investment in 20,724,331 shares of Repsol held by PMI HBV was valued at Ps. 6,027,540. These shares arepresented under non-current assets. The effect of the valuation on the investment at fair value was recorded in other comprehensive result inthe consolidated statement of changes in equity (deficit) as a profit of Ps. 207,817 at December 31, 2016.
On January 24, 2017 and January 25, 2017, PMI HBV sold a total of 2,082,348 Repsol shares at an average price of � 14.17 per share, for atotal amount of Ps. 684,029. These shares were not included as collateral on the loan agreement.
On June 7, 2017, Repsol declared flexible dividends to its shareholders, of which PMI HBV received 609,539 new Repsol shares as anin-kind dividend on July 13, 2017. This amount was recognized as an account receivable of Ps. 180,729.
F-56
Copyright © 2018 www.secdatabase.com. All Rights Reserved.Please Consider the Environment Before Printing This Document
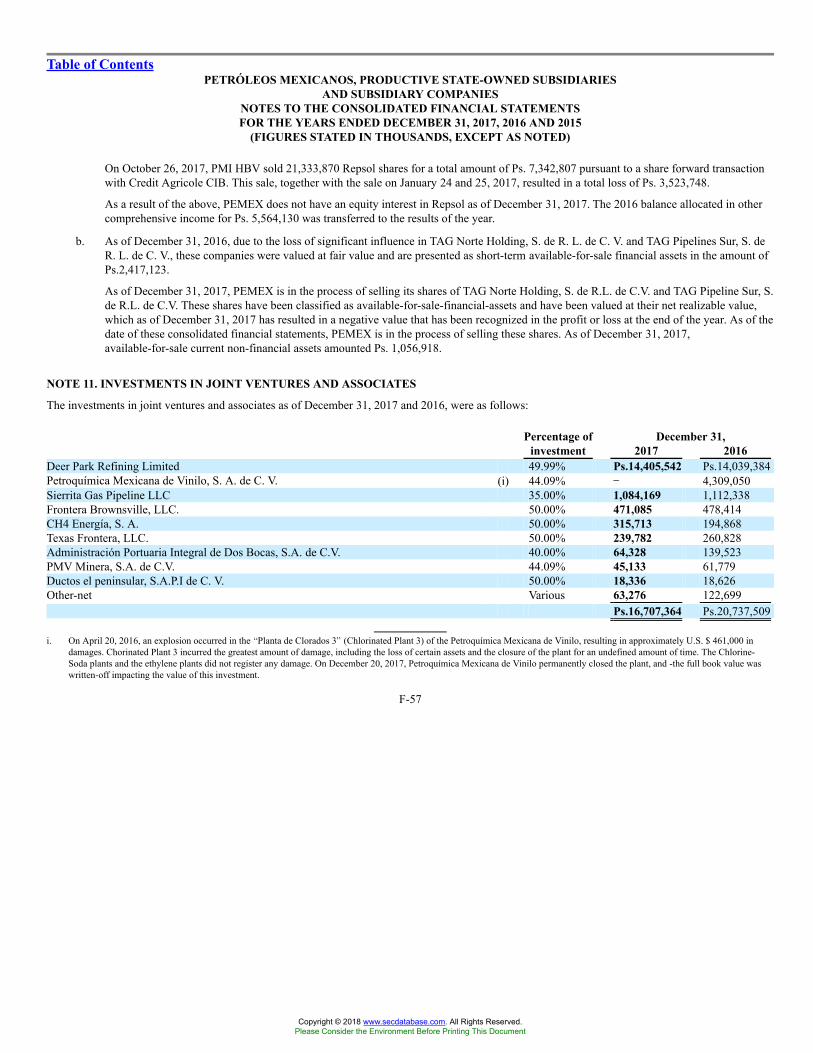
Table of ContentsPETRÓLEOS MEXICANOS, PRODUCTIVE STATE-OWNED SUBSIDIARIES
AND SUBSIDIARY COMPANIESNOTES TO THE CONSOLIDATED FINANCIAL STATEMENTSFOR THE YEARS ENDED DECEMBER 31, 2017, 2016 AND 2015
(FIGURES STATED IN THOUSANDS, EXCEPT AS NOTED)
On October 26, 2017, PMI HBV sold 21,333,870 Repsol shares for a total amount of Ps. 7,342,807 pursuant to a share forward transactionwith Credit Agricole CIB. This sale, together with the sale on January 24 and 25, 2017, resulted in a total loss of Ps. 3,523,748.
As a result of the above, PEMEX does not have an equity interest in Repsol as of December 31, 2017. The 2016 balance allocated in othercomprehensive income for Ps. 5,564,130 was transferred to the results of the year.
b. As of December 31, 2016, due to the loss of significant influence in TAG Norte Holding, S. de R. L. de C. V. and TAG Pipelines Sur, S. deR. L. de C. V., these companies were valued at fair value and are presented as short-term available-for-sale financial assets in the amount ofPs.2,417,123.
As of December 31, 2017, PEMEX is in the process of selling its shares of TAG Norte Holding, S. de R.L. de C.V. and TAG Pipeline Sur, S.de R.L. de C.V. These shares have been classified as available-for-sale-financial-assets and have been valued at their net realizable value,which as of December 31, 2017 has resulted in a negative value that has been recognized in the profit or loss at the end of the year. As of thedate of these consolidated financial statements, PEMEX is in the process of selling these shares. As of December 31, 2017,available-for-sale current non-financial assets amounted Ps. 1,056,918.
NOTE 11. INVESTMENTS IN JOINT VENTURES AND ASSOCIATES
The investments in joint ventures and associates as of December 31, 2017 and 2016, were as follows:
December 31,Percentage ofinvestment 2017 2016
Deer Park Refining Limited 49.99% Ps.14,405,542 Ps.14,039,384Petroquímica Mexicana de Vinilo, S. A. de C. V. (i) 44.09% �� 4,309,050Sierrita Gas Pipeline LLC 35.00% 1,084,169 1,112,338Frontera Brownsville, LLC. 50.00% 471,085 478,414CH4 Energía, S. A. 50.00% 315,713 194,868Texas Frontera, LLC. 50.00% 239,782 260,828Administración Portuaria Integral de Dos Bocas, S.A. de C.V. 40.00% 64,328 139,523PMV Minera, S.A. de C.V. 44.09% 45,133 61,779Ductos el peninsular, S.A.P.I de C. V. 50.00% 18,336 18,626Other-net Various 63,276 122,699
Ps.16,707,364 Ps.20,737,509
i. On April 20, 2016, an explosion occurred in the �Planta de Clorados 3� (Chlorinated Plant 3) of the Petroquímica Mexicana de Vinilo, resulting in approximately U.S. $ 461,000 indamages. Chorinated Plant 3 incurred the greatest amount of damage, including the loss of certain assets and the closure of the plant for an undefined amount of time. The Chlorine-Soda plants and the ethylene plants did not register any damage. On December 20, 2017, Petroquímica Mexicana de Vinilo permanently closed the plant, and -the full book value waswritten-off impacting the value of this investment.
F-57
Copyright © 2018 www.secdatabase.com. All Rights Reserved.Please Consider the Environment Before Printing This Document
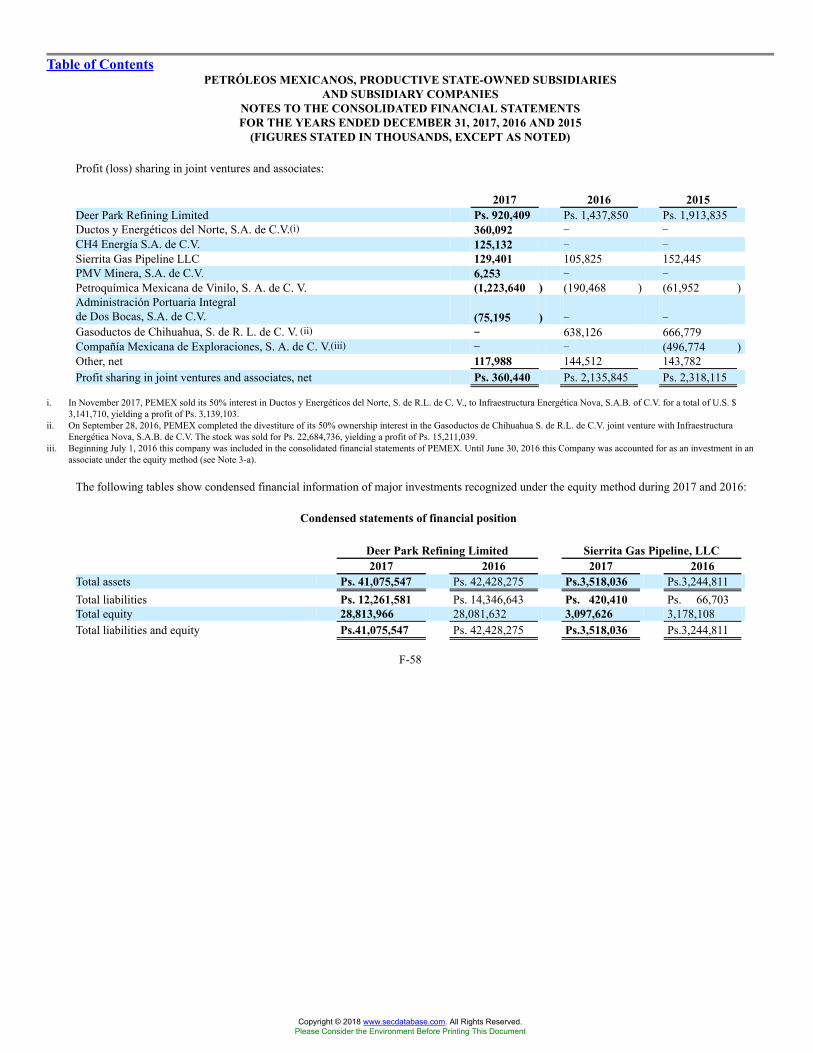
Table of ContentsPETRÓLEOS MEXICANOS, PRODUCTIVE STATE-OWNED SUBSIDIARIES
AND SUBSIDIARY COMPANIESNOTES TO THE CONSOLIDATED FINANCIAL STATEMENTSFOR THE YEARS ENDED DECEMBER 31, 2017, 2016 AND 2015
(FIGURES STATED IN THOUSANDS, EXCEPT AS NOTED)
Profit (loss) sharing in joint ventures and associates:
2017 2016 2015Deer Park Refining Limited Ps. 920,409 Ps. 1,437,850 Ps. 1,913,835Ductos y Energéticos del Norte, S.A. de C.V.(i) 360,092 � �CH4 Energía S.A. de C.V. 125,132 � �Sierrita Gas Pipeline LLC 129,401 105,825 152,445PMV Minera, S.A. de C.V. 6,253 � �Petroquímica Mexicana de Vinilo, S. A. de C. V. (1,223,640 ) (190,468 ) (61,952 )Administración Portuaria Integralde Dos Bocas, S.A. de C.V. (75,195 ) � �Gasoductos de Chihuahua, S. de R. L. de C. V. (ii) �� 638,126 666,779Compañía Mexicana de Exploraciones, S. A. de C. V.(iii) �� � (496,774 )Other, net 117,988 144,512 143,782Profit sharing in joint ventures and associates, net Ps. 360,440 Ps. 2,135,845 Ps. 2,318,115
i. In November 2017, PEMEX sold its 50% interest in Ductos y Energéticos del Norte, S. de R.L. de C. V., to Infraestructura Energética Nova, S.A.B. of C.V. for a total of U.S. $3,141,710, yielding a profit of Ps. 3,139,103.
ii. On September 28, 2016, PEMEX completed the divestiture of its 50% ownership interest in the Gasoductos de Chihuahua S. de R.L. de C.V. joint venture with InfraestructuraEnergética Nova, S.A.B. de C.V. The stock was sold for Ps. 22,684,736, yielding a profit of Ps. 15,211,039.
iii. Beginning July 1, 2016 this company was included in the consolidated financial statements of PEMEX. Until June 30, 2016 this Company was accounted for as an investment in anassociate under the equity method (see Note 3-a).
The following tables show condensed financial information of major investments recognized under the equity method during 2017 and 2016:
Condensed statements of financial position
Deer Park Refining Limited Sierrita Gas Pipeline, LLC2017 2016 2017 2016
Total assets Ps. 41,075,547 Ps. 42,428,275 Ps.3,518,036 Ps.3,244,811Total liabilities Ps. 12,261,581 Ps. 14,346,643 Ps. 420,410 Ps. 66,703Total equity 28,813,966 28,081,632 3,097,626 3,178,108Total liabilities and equity Ps.41,075,547 Ps. 42,428,275 Ps.3,518,036 Ps.3,244,811
F-58
Copyright © 2018 www.secdatabase.com. All Rights Reserved.Please Consider the Environment Before Printing This Document
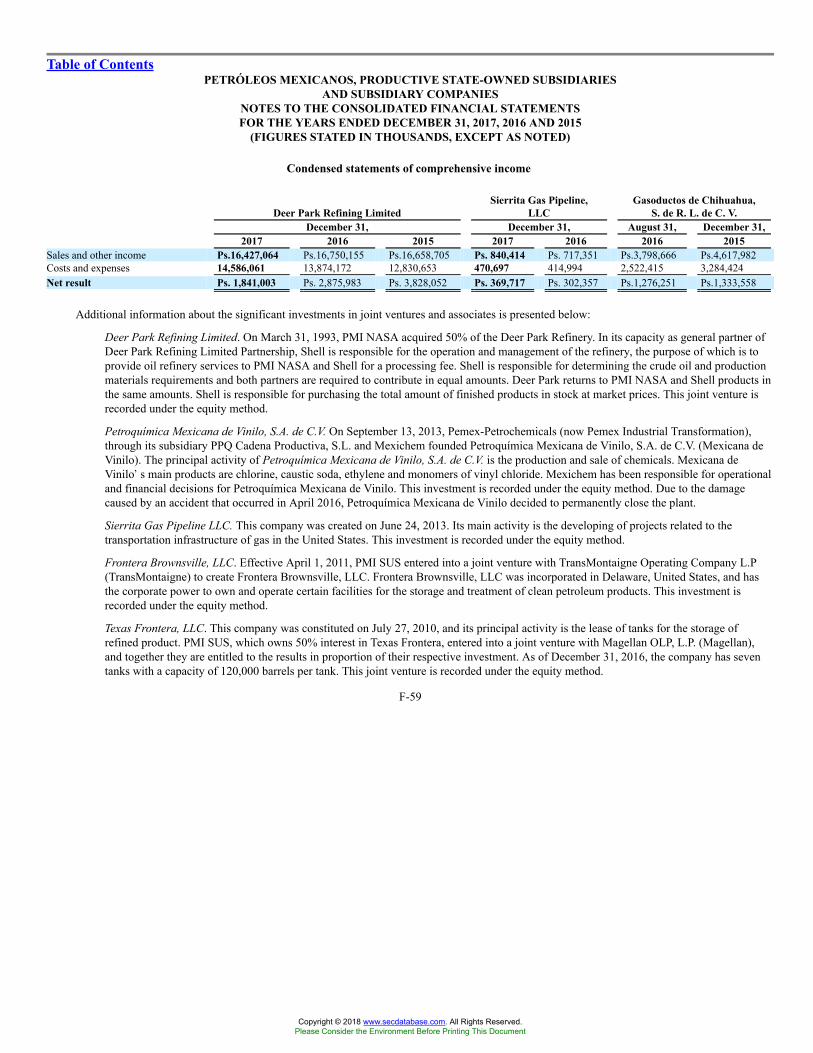
Table of ContentsPETRÓLEOS MEXICANOS, PRODUCTIVE STATE-OWNED SUBSIDIARIES
AND SUBSIDIARY COMPANIESNOTES TO THE CONSOLIDATED FINANCIAL STATEMENTSFOR THE YEARS ENDED DECEMBER 31, 2017, 2016 AND 2015
(FIGURES STATED IN THOUSANDS, EXCEPT AS NOTED)
Condensed statements of comprehensive income
Deer Park Refining LimitedSierrita Gas Pipeline,
LLCGasoductos de Chihuahua,
S. de R. L. de C. V.December 31, December 31, August 31, December 31,
2017 2016 2015 2017 2016 2016 2015Sales and other income Ps.16,427,064 Ps.16,750,155 Ps.16,658,705 Ps. 840,414 Ps. 717,351 Ps.3,798,666 Ps.4,617,982Costs and expenses 14,586,061 13,874,172 12,830,653 470,697 414,994 2,522,415 3,284,424Net result Ps. 1,841,003 Ps. 2,875,983 Ps. 3,828,052 Ps. 369,717 Ps. 302,357 Ps.1,276,251 Ps.1,333,558
Additional information about the significant investments in joint ventures and associates is presented below:
� Deer Park Refining Limited. On March 31, 1993, PMI NASA acquired 50% of the Deer Park Refinery. In its capacity as general partner ofDeer Park Refining Limited Partnership, Shell is responsible for the operation and management of the refinery, the purpose of which is toprovide oil refinery services to PMI NASA and Shell for a processing fee. Shell is responsible for determining the crude oil and productionmaterials requirements and both partners are required to contribute in equal amounts. Deer Park returns to PMI NASA and Shell products inthe same amounts. Shell is responsible for purchasing the total amount of finished products in stock at market prices. This joint venture isrecorded under the equity method.
� Petroquímica Mexicana de Vinilo, S.A. de C.V. On September 13, 2013, Pemex-Petrochemicals (now Pemex Industrial Transformation),through its subsidiary PPQ Cadena Productiva, S.L. and Mexichem founded Petroquímica Mexicana de Vinilo, S.A. de C.V. (Mexicana deVinilo). The principal activity of Petroquímica Mexicana de Vinilo, S.A. de C.V. is the production and sale of chemicals. Mexicana deVinilo�s main products are chlorine, caustic soda, ethylene and monomers of vinyl chloride. Mexichem has been responsible for operationaland financial decisions for Petroquímica Mexicana de Vinilo. This investment is recorded under the equity method. Due to the damagecaused by an accident that occurred in April 2016, Petroquímica Mexicana de Vinilo decided to permanently close the plant.
� Sierrita Gas Pipeline LLC. This company was created on June 24, 2013. Its main activity is the developing of projects related to thetransportation infrastructure of gas in the United States. This investment is recorded under the equity method.
� Frontera Brownsville, LLC. Effective April 1, 2011, PMI SUS entered into a joint venture with TransMontaigne Operating Company L.P(TransMontaigne) to create Frontera Brownsville, LLC. Frontera Brownsville, LLC was incorporated in Delaware, United States, and hasthe corporate power to own and operate certain facilities for the storage and treatment of clean petroleum products. This investment isrecorded under the equity method.
� Texas Frontera, LLC. This company was constituted on July 27, 2010, and its principal activity is the lease of tanks for the storage ofrefined product. PMI SUS, which owns 50% interest in Texas Frontera, entered into a joint venture with Magellan OLP, L.P. (Magellan),and together they are entitled to the results in proportion of their respective investment. As of December 31, 2016, the company has seventanks with a capacity of 120,000 barrels per tank. This joint venture is recorded under the equity method.
F-59
Copyright © 2018 www.secdatabase.com. All Rights Reserved.Please Consider the Environment Before Printing This Document

Table of ContentsPETRÓLEOS MEXICANOS, PRODUCTIVE STATE-OWNED SUBSIDIARIES
AND SUBSIDIARY COMPANIESNOTES TO THE CONSOLIDATED FINANCIAL STATEMENTSFOR THE YEARS ENDED DECEMBER 31, 2017, 2016 AND 2015
(FIGURES STATED IN THOUSANDS, EXCEPT AS NOTED)
� CH4 Energía, S.A. This company was constituted on December 21, 2000. CH4 Energía engages in the purchase and sale of natural gas andin activities related to the trading of natural gas, such as transport and distribution in Valle de Toluca, México. This joint venture is recordedunder the equity method.
� Administración Portuaria Integral de Dos Bocas, S.A. de C.V. This company was constituted on August 12, 1999. Its primary activity isadminitrating the Dos Bocas port, which is in Mexico�s public domain, promoting the port�s infrastructure and providing related portservices. This investment is recorded under the equity method.
� PMV Minera, S.A. de C.V. This company was constituted on October 1, 2014 and the principal activity is the extraction and sale of salmuera(mixture of salt and water). This investment is recorded under the equity method.
� Gasoductos de Chihuahua, S. de R.L. de C.V. On February 6, 1997, Pemex Industrial Transformation (formerly Pemex-Refining) enteredinto a joint venture with IEnova Gasoductos Holding, S. de R.L de C.V. to own and operate companies related to gas transportation anddistribution, called Gasoductos de Chihuahua, S. de R.L. de C.V. Decision-making requires the consent of both partners. The participationof each of the partners was 50% of the share capital. This investment was recorded under the equity method until August 2016, whenPEMEX completed the divestiture of this company as described in footnote (ii) to the table above.
� Compañía Mexicana de Exploraciones S.A. de C.V., (�COMESA�). COMESA was founded on November 12, 1968 to support PEMEX�sexploration programs. The operations of COMESA are focused on designing integral solutions for the energy sector, along the value chainfor exploration and production, refining, petrochemicals, geothermal energy and other energy areas all over the energy sector in Mexico,South America and the United States. COMESA�s principal activities are: gravimetric, magnetometric and microseismic studies, landseismic data acquisition (2D,3D, 3C), marine Seismic data acquisition, seismic data processing, seismic data interpretation and integration,vertical Seismic Profile (VSP) 2D and 3D, reservoir characterization and visualization, conceptualization and definition for the explorationprocess. Until June 30, 2016 this company was accounted under the equity method. As of July 1, 2016 this company is included in theconsolidated results.
F-60
Copyright © 2018 www.secdatabase.com. All Rights Reserved.Please Consider the Environment Before Printing This Document
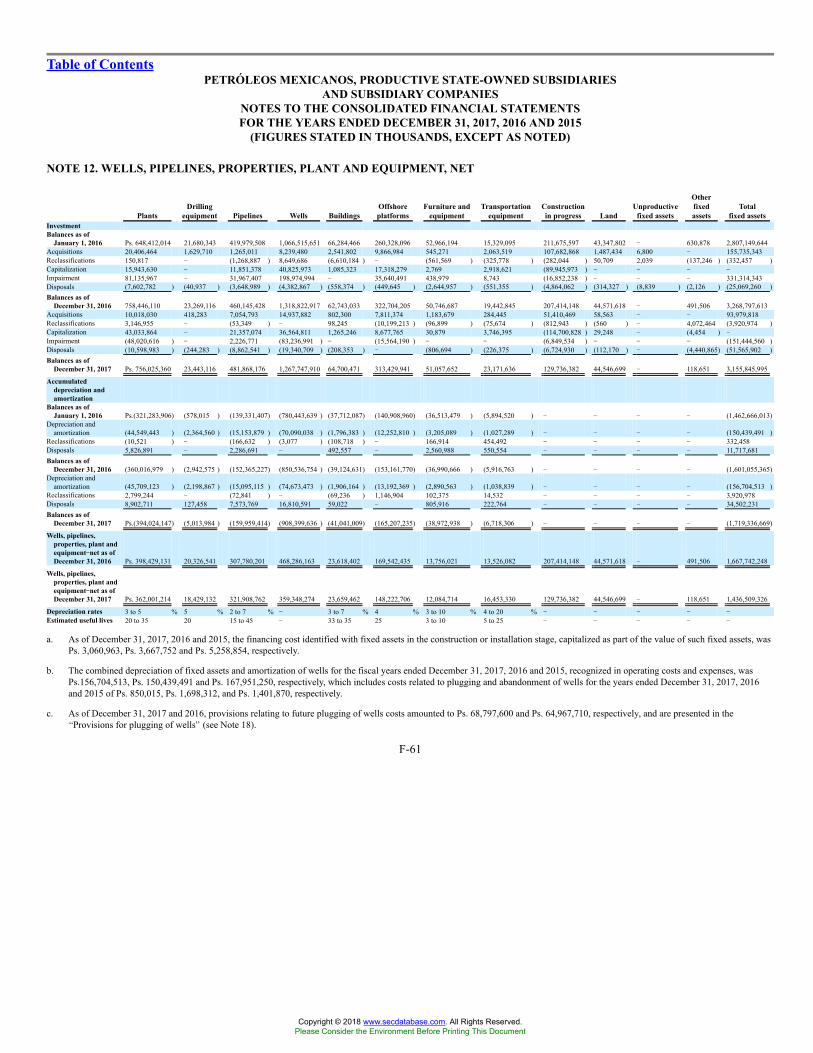
Table of ContentsPETRÓLEOS MEXICANOS, PRODUCTIVE STATE-OWNED SUBSIDIARIES
AND SUBSIDIARY COMPANIESNOTES TO THE CONSOLIDATED FINANCIAL STATEMENTSFOR THE YEARS ENDED DECEMBER 31, 2017, 2016 AND 2015
(FIGURES STATED IN THOUSANDS, EXCEPT AS NOTED)
NOTE 12. WELLS, PIPELINES, PROPERTIES, PLANT AND EQUIPMENT, NET
PlantsDrilling
equipment Pipelines Wells BuildingsOffshoreplatforms
Furniture andequipment
Transportationequipment
Constructionin progress Land
Unproductivefixed assets
Otherfixedassets
Totalfixed assets
InvestmentBalances as of
January 1, 2016 Ps. 648,412,014 21,680,343 419,979,508 1,066,515,651 66,284,466 260,328,096 52,966,194 15,329,095 211,675,597 43,347,802 � 630,878 2,807,149,644Acquisitions 20,406,464 1,629,710 1,265,011 8,239,480 2,541,802 9,866,984 545,271 2,063,519 107,682,868 1,487,434 6,800 � 155,735,343Reclassifications 150,817 � (1,268,887 ) 8,649,686 (6,610,184 ) � (561,569 ) (325,778 ) (282,044 ) 50,709 2,039 (137,246 ) (332,457 )Capitalization 15,943,630 � 11,851,378 40,825,973 1,085,323 17,318,279 2,769 2,918,621 (89,945,973 ) � � � �Impairment 81,135,967 � 31,967,407 198,974,994 � 35,640,491 438,979 8,743 (16,852,238 ) � � � 331,314,343Disposals (7,602,782 ) (40,937 ) (3,648,989 ) (4,382,867 ) (558,374 ) (449,645 ) (2,644,957 ) (551,355 ) (4,864,062 ) (314,327 ) (8,839 ) (2,126 ) (25,069,260 )Balances as of
December 31, 2016 758,446,110 23,269,116 460,145,428 1,318,822,917 62,743,033 322,704,205 50,746,687 19,442,845 207,414,148 44,571,618 � 491,506 3,268,797,613Acquisitions 10,018,030 418,283 7,054,793 14,937,882 802,300 7,811,374 1,183,679 284,445 51,410,469 58,563 � � 93,979,818Reclassifications 3,146,955 � (53,349 ) � 98,245 (10,199,213 ) (96,899 ) (75,674 ) (812,943 ) (560 ) � 4,072,464 (3,920,974 )Capitalization 43,033,864 � 21,357,074 36,564,811 1,265,246 8,677,765 30,879 3,746,395 (114,700,828 ) 29,248 � (4,454 ) �Impairment (48,020,616 ) � 2,226,771 (83,236,991 ) � (15,564,190 ) � � (6,849,534 ) � � � (151,444,560 )Disposals (10,598,983 ) (244,283 ) (8,862,541 ) (19,340,709 ) (208,353 ) � (806,694 ) (226,375 ) (6,724,930 ) (112,170 ) � (4,440,865) (51,565,902 )Balances as of
December 31, 2017 Ps. 756,025,360 23,443,116 481,868,176 1,267,747,910 64,700,471 313,429,941 51,057,652 23,171,636 129,736,382 44,546,699 � 118,651 3,155,845,995
Accumulateddepreciation andamortization
Balances as ofJanuary 1, 2016 Ps.(321,283,906) (578,015 ) (139,331,407) (780,443,639 ) (37,712,087) (140,908,960) (36,513,479 ) (5,894,520 ) � � � � (1,462,666,013)
Depreciation andamortization (44,549,443 ) (2,364,560 ) (15,153,879 ) (70,090,038 ) (1,796,383 ) (12,252,810 ) (3,205,089 ) (1,027,289 ) � � � � (150,439,491 )
Reclassifications (10,521 ) � (166,632 ) (3,077 ) (108,718 ) � 166,914 454,492 � � � � 332,458Disposals 5,826,891 � 2,286,691 � 492,557 � 2,560,988 550,554 � � � � 11,717,681Balances as of
December 31, 2016 (360,016,979 ) (2,942,575 ) (152,365,227) (850,536,754 ) (39,124,631) (153,161,770) (36,990,666 ) (5,916,763 ) � � � � (1,601,055,365)Depreciation and
amortization (45,709,123 ) (2,198,867 ) (15,095,115 ) (74,673,473 ) (1,906,164 ) (13,192,369 ) (2,890,563 ) (1,038,839 ) � � � � (156,704,513 )Reclassifications 2,799,244 � (72,841 ) � (69,236 ) 1,146,904 102,375 14,532 � � � � 3,920,978Disposals 8,902,711 127,458 7,573,769 16,810,591 59,022 � 805,916 222,764 � � � � 34,502,231Balances as of
December 31, 2017 Ps.(394,024,147) (5,013,984 ) (159,959,414) (908,399,636 ) (41,041,009) (165,207,235) (38,972,938 ) (6,718,306 ) � � � � (1,719,336,669)
Wells, pipelines,properties, plant andequipment��net as ofDecember 31, 2016 Ps. 398,429,131 20,326,541 307,780,201 468,286,163 23,618,402 169,542,435 13,756,021 13,526,082 207,414,148 44,571,618 � 491,506 1,667,742,248
Wells, pipelines,properties, plant andequipment��net as ofDecember 31, 2017 Ps. 362,001,214 18,429,132 321,908,762 359,348,274 23,659,462 148,222,706 12,084,714 16,453,330 129,736,382 44,546,699 � 118,651 1,436,509,326
Depreciation rates 3 to 5 % 5 % 2 to 7 % � 3 to 7 % 4 % 3 to 10 % 4 to 20 % � � � � �Estimated useful lives 20 to 35 20 15 to 45 � 33 to 35 25 3 to 10 5 to 25 � � � � �
a. As of December 31, 2017, 2016 and 2015, the financing cost identified with fixed assets in the construction or installation stage, capitalized as part of the value of such fixed assets, wasPs. 3,060,963, Ps. 3,667,752 and Ps. 5,258,854, respectively.
b. The combined depreciation of fixed assets and amortization of wells for the fiscal years ended December 31, 2017, 2016 and 2015, recognized in operating costs and expenses, wasPs.156,704,513, Ps. 150,439,491 and Ps. 167,951,250, respectively, which includes costs related to plugging and abandonment of wells for the years ended December 31, 2017, 2016and 2015 of Ps. 850,015, Ps. 1,698,312, and Ps. 1,401,870, respectively.
c. As of December 31, 2017 and 2016, provisions relating to future plugging of wells costs amounted to Ps. 68,797,600 and Ps. 64,967,710, respectively, and are presented in the�Provisions for plugging of wells� (see Note 18).
F-61
Copyright © 2018 www.secdatabase.com. All Rights Reserved.Please Consider the Environment Before Printing This Document
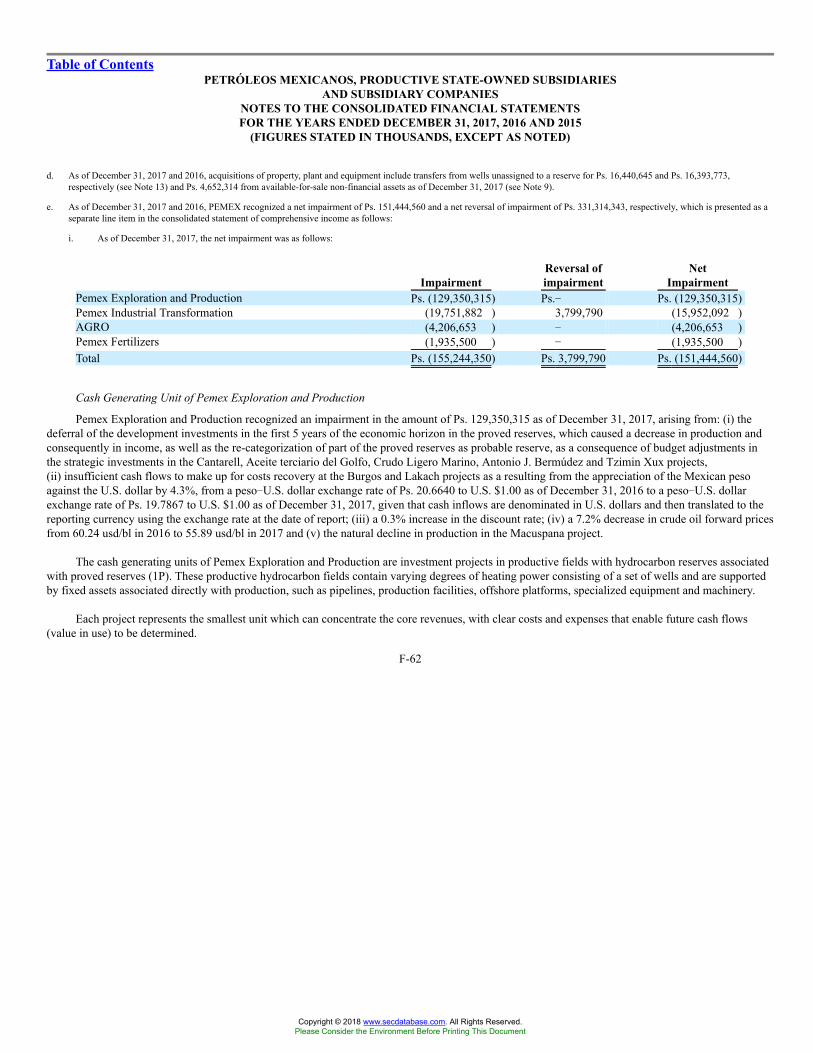
Table of ContentsPETRÓLEOS MEXICANOS, PRODUCTIVE STATE-OWNED SUBSIDIARIES
AND SUBSIDIARY COMPANIESNOTES TO THE CONSOLIDATED FINANCIAL STATEMENTSFOR THE YEARS ENDED DECEMBER 31, 2017, 2016 AND 2015
(FIGURES STATED IN THOUSANDS, EXCEPT AS NOTED)
d. As of December 31, 2017 and 2016, acquisitions of property, plant and equipment include transfers from wells unassigned to a reserve for Ps. 16,440,645 and Ps. 16,393,773,respectively (see Note 13) and Ps. 4,652,314 from available-for-sale non-financial assets as of December 31, 2017 (see Note 9).
e. As of December 31, 2017 and 2016, PEMEX recognized a net impairment of Ps. 151,444,560 and a net reversal of impairment of Ps. 331,314,343, respectively, which is presented as aseparate line item in the consolidated statement of comprehensive income as follows:
i. As of December 31, 2017, the net impairment was as follows:
ImpairmentReversal ofimpairment
NetImpairment
Pemex Exploration and Production Ps. (129,350,315) Ps.� Ps. (129,350,315)Pemex Industrial Transformation (19,751,882 ) 3,799,790 (15,952,092 )AGRO (4,206,653 ) � (4,206,653 )Pemex Fertilizers (1,935,500 ) � (1,935,500 )Total Ps. (155,244,350) Ps. 3,799,790 Ps. (151,444,560)
Cash Generating Unit of Pemex Exploration and Production
Pemex Exploration and Production recognized an impairment in the amount of Ps. 129,350,315 as of December 31, 2017, arising from: (i) thedeferral of the development investments in the first 5 years of the economic horizon in the proved reserves, which caused a decrease in production andconsequently in income, as well as the re-categorization of part of the proved reserves as probable reserve, as a consequence of budget adjustments inthe strategic investments in the Cantarell, Aceite terciario del Golfo, Crudo Ligero Marino, Antonio J. Bermúdez and Tzimin Xux projects,(ii) insufficient cash flows to make up for costs recovery at the Burgos and Lakach projects as a resulting from the appreciation of the Mexican pesoagainst the U.S. dollar by 4.3%, from a peso�U.S. dollar exchange rate of Ps. 20.6640 to U.S. $1.00 as of December 31, 2016 to a peso�U.S. dollarexchange rate of Ps. 19.7867 to U.S. $1.00 as of December 31, 2017, given that cash inflows are denominated in U.S. dollars and then translated to thereporting currency using the exchange rate at the date of report; (iii) a 0.3% increase in the discount rate; (iv) a 7.2% decrease in crude oil forward pricesfrom 60.24 usd/bl in 2016 to 55.89 usd/bl in 2017 and (v) the natural decline in production in the Macuspana project.
The cash generating units of Pemex Exploration and Production are investment projects in productive fields with hydrocarbon reserves associatedwith proved reserves (1P). These productive hydrocarbon fields contain varying degrees of heating power consisting of a set of wells and are supportedby fixed assets associated directly with production, such as pipelines, production facilities, offshore platforms, specialized equipment and machinery.
Each project represents the smallest unit which can concentrate the core revenues, with clear costs and expenses that enable future cash flows(value in use) to be determined.
F-62
Copyright © 2018 www.secdatabase.com. All Rights Reserved.Please Consider the Environment Before Printing This Document
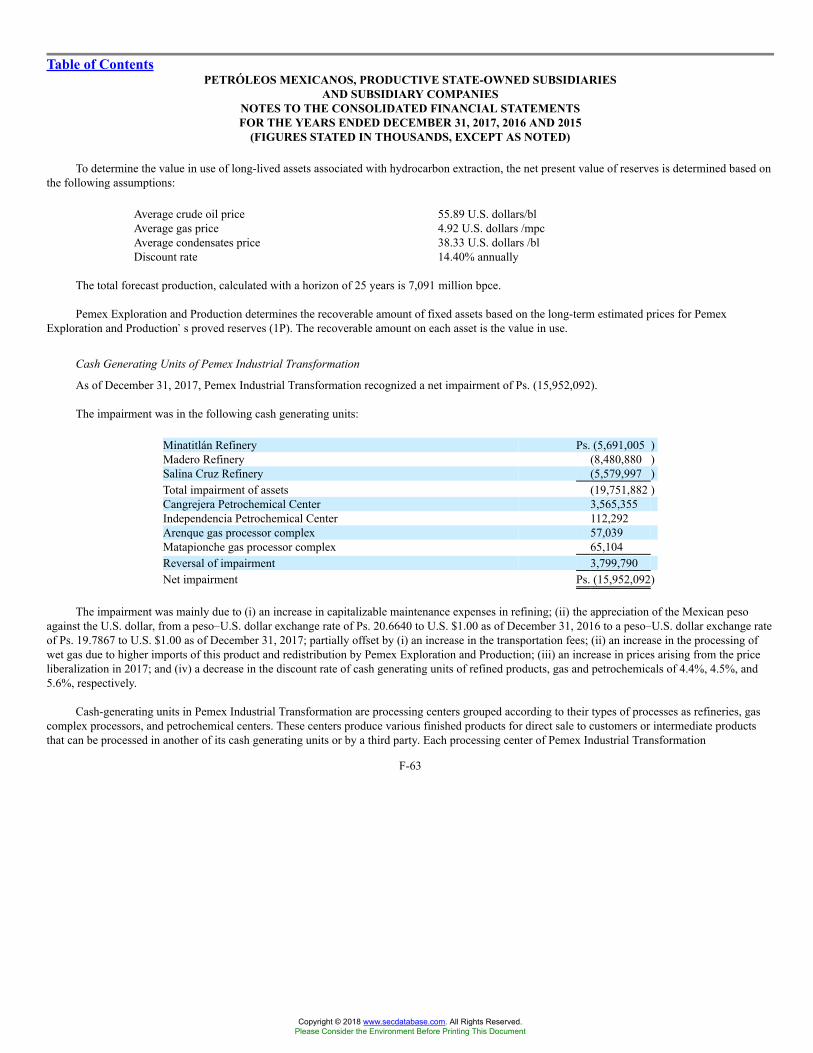
Table of ContentsPETRÓLEOS MEXICANOS, PRODUCTIVE STATE-OWNED SUBSIDIARIES
AND SUBSIDIARY COMPANIESNOTES TO THE CONSOLIDATED FINANCIAL STATEMENTSFOR THE YEARS ENDED DECEMBER 31, 2017, 2016 AND 2015
(FIGURES STATED IN THOUSANDS, EXCEPT AS NOTED)
To determine the value in use of long-lived assets associated with hydrocarbon extraction, the net present value of reserves is determined based onthe following assumptions:
Average crude oil price 55.89 U.S. dollars/blAverage gas price 4.92 U.S. dollars /mpcAverage condensates price 38.33 U.S. dollars /blDiscount rate 14.40% annually
The total forecast production, calculated with a horizon of 25 years is 7,091 million bpce.
Pemex Exploration and Production determines the recoverable amount of fixed assets based on the long-term estimated prices for PemexExploration and Production�s proved reserves (1P). The recoverable amount on each asset is the value in use.
Cash Generating Units of Pemex Industrial Transformation
As of December 31, 2017, Pemex Industrial Transformation recognized a net impairment of Ps. (15,952,092).
The impairment was in the following cash generating units:
Minatitlán Refinery Ps. (5,691,005 )Madero Refinery (8,480,880 )Salina Cruz Refinery (5,579,997 )Total impairment of assets (19,751,882 )Cangrejera Petrochemical Center 3,565,355Independencia Petrochemical Center 112,292Arenque gas processor complex 57,039Matapionche gas processor complex 65,104Reversal of impairment 3,799,790Net impairment Ps. (15,952,092)
The impairment was mainly due to (i) an increase in capitalizable maintenance expenses in refining; (ii) the appreciation of the Mexican pesoagainst the U.S. dollar, from a peso�U.S. dollar exchange rate of Ps. 20.6640 to U.S. $1.00 as of December 31, 2016 to a peso�U.S. dollar exchange rateof Ps. 19.7867 to U.S. $1.00 as of December 31, 2017; partially offset by (i) an increase in the transportation fees; (ii) an increase in the processing ofwet gas due to higher imports of this product and redistribution by Pemex Exploration and Production; (iii) an increase in prices arising from the priceliberalization in 2017; and (iv) a decrease in the discount rate of cash generating units of refined products, gas and petrochemicals of 4.4%, 4.5%, and5.6%, respectively.
Cash-generating units in Pemex Industrial Transformation are processing centers grouped according to their types of processes as refineries, gascomplex processors, and petrochemical centers. These centers produce various finished products for direct sale to customers or intermediate productsthat can be processed in another of its cash generating units or by a third party. Each processing center of Pemex Industrial Transformation
F-63
Copyright © 2018 www.secdatabase.com. All Rights Reserved.Please Consider the Environment Before Printing This Document

Table of ContentsPETRÓLEOS MEXICANOS, PRODUCTIVE STATE-OWNED SUBSIDIARIES
AND SUBSIDIARY COMPANIESNOTES TO THE CONSOLIDATED FINANCIAL STATEMENTSFOR THE YEARS ENDED DECEMBER 31, 2017, 2016 AND 2015
(FIGURES STATED IN THOUSANDS, EXCEPT AS NOTED)
represents the smallest unit which can concentrate the core revenues, with clear costs and expenses that enable future cash flows (value in use) to bedetermined.
Cash flow determinations are made based on PEMEX�s business plans, operating financial programs, forecasts of future prices of products relatedto the processes of the cash generating units, budget programs and various statistical models that consider historical information of processes and thecapacity of the various processing centers.
To determine the value in use of long-lived assets associated with the cash-generating units of Pemex Industrial Transformation, the net presentvalue of cash flows was determined based on the following assumptions:
Refining Gas PetrochemicalsAverage crude oil Price 51.30 U.S. dollars N.A. N.A.Processed volume 767 mbd 3,085 mmpcd or sour gas Variable because the
load inputs arediverse
Rate of U.S. dollar Ps.19.7867 mxp/usd Ps.19.7867 mxp/usd Ps.19.7867 mxp/usdUseful lives of the cash generating units Average of 16 years Average of 9 years Average of 6 yearsDiscount rate 11.53% annually 10.24% annually 9.71% annuallyPeriod 2018-2034 2018-2029 2016-2024
The recoverable amount of assets is based on each asset�s value in use. The value in use for each asset is calculated based on cash flows, takinginto consideration the volumes to be produced and sales to be carried out. As of December 31, 2017, the value in use for the impairment or reversal ofimpairment of fixed assets was as follows:
Minatitlán Refinery Ps. 32,531,925Madero Refinery 11,420,952Salina Cruz Refinery 12,051,597Cangrejera Petrochemical Center 17,544,825Independencia Petrochemical Center 3,146,413Arenque gas processor complex 1,283,201Matapionche gas processor complex 1,074,729Total value in use Ps. 79,053,642
Pro-Agroindustria, S.A. de C.V.
Pro-Agroindustria, S.A. de C.V. recognized an impairment for Ps. (4,206,653) related to its nitric acid, amonium nitrate and UAN 32 acquiredplants, the rehabilitation of which has not yet commenced. The company will not be able to develop an alternate plan for the rehabilitation of theseplants in the following five years due to its financing commitments.
Cash Generating Units of Pemex Fertilizers
Cash generating units are plants used in the ammonia process.
F-64
Copyright © 2018 www.secdatabase.com. All Rights Reserved.Please Consider the Environment Before Printing This Document
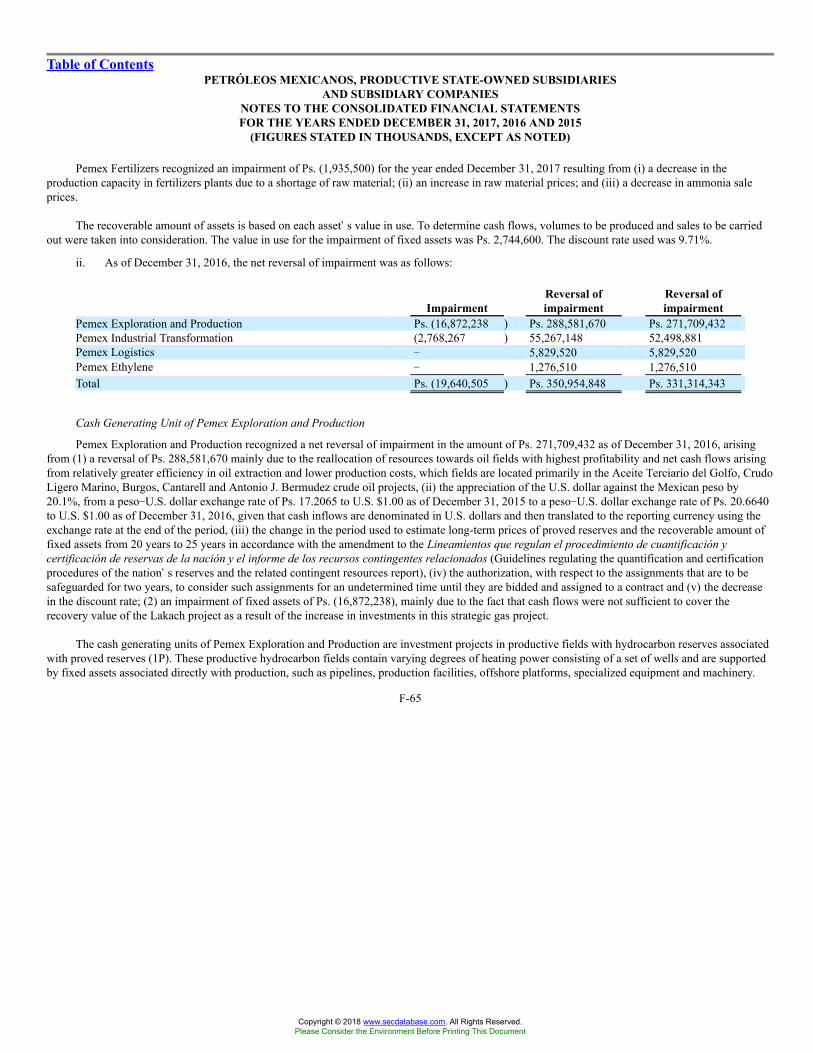
Table of ContentsPETRÓLEOS MEXICANOS, PRODUCTIVE STATE-OWNED SUBSIDIARIES
AND SUBSIDIARY COMPANIESNOTES TO THE CONSOLIDATED FINANCIAL STATEMENTSFOR THE YEARS ENDED DECEMBER 31, 2017, 2016 AND 2015
(FIGURES STATED IN THOUSANDS, EXCEPT AS NOTED)
Pemex Fertilizers recognized an impairment of Ps. (1,935,500) for the year ended December 31, 2017 resulting from (i) a decrease in theproduction capacity in fertilizers plants due to a shortage of raw material; (ii) an increase in raw material prices; and (iii) a decrease in ammonia saleprices.
The recoverable amount of assets is based on each asset�s value in use. To determine cash flows, volumes to be produced and sales to be carriedout were taken into consideration. The value in use for the impairment of fixed assets was Ps. 2,744,600. The discount rate used was 9.71%.
ii. As of December 31, 2016, the net reversal of impairment was as follows:
ImpairmentReversal ofimpairment
Reversal ofimpairment
Pemex Exploration and Production Ps. (16,872,238 ) Ps. 288,581,670 Ps. 271,709,432Pemex Industrial Transformation (2,768,267 ) 55,267,148 52,498,881Pemex Logistics � 5,829,520 5,829,520Pemex Ethylene � 1,276,510 1,276,510Total Ps. (19,640,505 ) Ps. 350,954,848 Ps. 331,314,343
Cash Generating Unit of Pemex Exploration and Production
Pemex Exploration and Production recognized a net reversal of impairment in the amount of Ps. 271,709,432 as of December 31, 2016, arisingfrom (1) a reversal of Ps. 288,581,670 mainly due to the reallocation of resources towards oil fields with highest profitability and net cash flows arisingfrom relatively greater efficiency in oil extraction and lower production costs, which fields are located primarily in the Aceite Terciario del Golfo, CrudoLigero Marino, Burgos, Cantarell and Antonio J. Bermudez crude oil projects, (ii) the appreciation of the U.S. dollar against the Mexican peso by20.1%, from a peso�U.S. dollar exchange rate of Ps. 17.2065 to U.S. $1.00 as of December 31, 2015 to a peso�U.S. dollar exchange rate of Ps. 20.6640to U.S. $1.00 as of December 31, 2016, given that cash inflows are denominated in U.S. dollars and then translated to the reporting currency using theexchange rate at the end of the period, (iii) the change in the period used to estimate long-term prices of proved reserves and the recoverable amount offixed assets from 20 years to 25 years in accordance with the amendment to the Lineamientos que regulan el procedimiento de cuantificación ycertificación de reservas de la nación y el informe de los recursos contingentes relacionados (Guidelines regulating the quantification and certificationprocedures of the nation�s reserves and the related contingent resources report), (iv) the authorization, with respect to the assignments that are to besafeguarded for two years, to consider such assignments for an undetermined time until they are bidded and assigned to a contract and (v) the decreasein the discount rate; (2) an impairment of fixed assets of Ps. (16,872,238), mainly due to the fact that cash flows were not sufficient to cover therecovery value of the Lakach project as a result of the increase in investments in this strategic gas project.
The cash generating units of Pemex Exploration and Production are investment projects in productive fields with hydrocarbon reserves associatedwith proved reserves (1P). These productive hydrocarbon fields contain varying degrees of heating power consisting of a set of wells and are supportedby fixed assets associated directly with production, such as pipelines, production facilities, offshore platforms, specialized equipment and machinery.
F-65
Copyright © 2018 www.secdatabase.com. All Rights Reserved.Please Consider the Environment Before Printing This Document

Table of ContentsPETRÓLEOS MEXICANOS, PRODUCTIVE STATE-OWNED SUBSIDIARIES
AND SUBSIDIARY COMPANIESNOTES TO THE CONSOLIDATED FINANCIAL STATEMENTSFOR THE YEARS ENDED DECEMBER 31, 2017, 2016 AND 2015
(FIGURES STATED IN THOUSANDS, EXCEPT AS NOTED)
Each project represents the smallest unit which can concentrate the core revenues, with clear costs and expenses that enable future cash flows(value in use) to be determined.
To determine the value in use of long-lived assets associated to hydrocarbon extraction, the net present value of reserves is determined based onthe following assumptions:
Average crude oil price 60.24 U.S. dollars/blAverage gas price 4.69 U.S. dollars/mpcAverage condensates price 40.22 U.S. dollars/blDiscount rate 14.36% annually
The total forecast production, calculated with a horizon of 25 years is 7,092 million bpce.
Pemex Exploration and Production determines the recoverable amount of fixed assets based on the long-term estimated prices for PemexExploration and Production�s proved reserves (1P). The recoverable amount on each asset is the value in use.
Cash Generating Unit of Pemex Industrial Transformation
As of December 31, 2016, Pemex Industrial Transformation recognized a net reversal of impairment of Ps. 52,498,881.
The net reversal of impairment was in the following cash generating units:
Minatitlán Refinery Ps. 33,165,095Madero Refinery 21,833,892Arenque gas processor complex 268,161Reversal of impairment 55,267,148Cangrejera Petrochemical Center (2,590,870 )Independencia Petrochemical Center (112,292 )Matapionche gas processor complex (65,105 )Total impairment of assets (2,768,267 )Net reversal of impairment Ps. 52,498,881
As of December 31, 2016, Pemex Industrial Transformation recognized a net reversal of impairment of Ps. 52,498,881 mainly due to (1) areversal of impairment of Ps. 55,267,148 corresponding to the Madero and Minatitlán refineries due to higher prices than were forecasted in 2015 duringthe market decline, a decrease in the discount rate in the National Refinery System from 13.72% to 12.06%, and the appreciation of the U.S. dollaragainst the Mexican peso by 20.1%, from a peso�U.S. dollar exchange rate of Ps. 17.2065 to U.S. $1.00 as of December 31, 2015 to a peso�U.S. dollarexchange rate of Ps. 20.6640 to U.S. $1.00 as of December 31, 2016; (2) a reversal of impairment of the cash generating units of the Arenque gasprocessor complex of Ps. 268,161 due to an increase in the prices, the appreciation of the U.S. dollar against the Mexican peso and, improved efficiencyin operating expenses and (3) impairment of three additional cash generating units, including Ps. (65,105) in the Matapionche gas processor complex,Ps. (2,590,870) in the Cangrejera Petrochemical Center and Ps. (112,292) for the Independencia Petrochemical Center, due to a decrease in the methanolprice produced in these petrochemical centers.
F-66
Copyright © 2018 www.secdatabase.com. All Rights Reserved.Please Consider the Environment Before Printing This Document
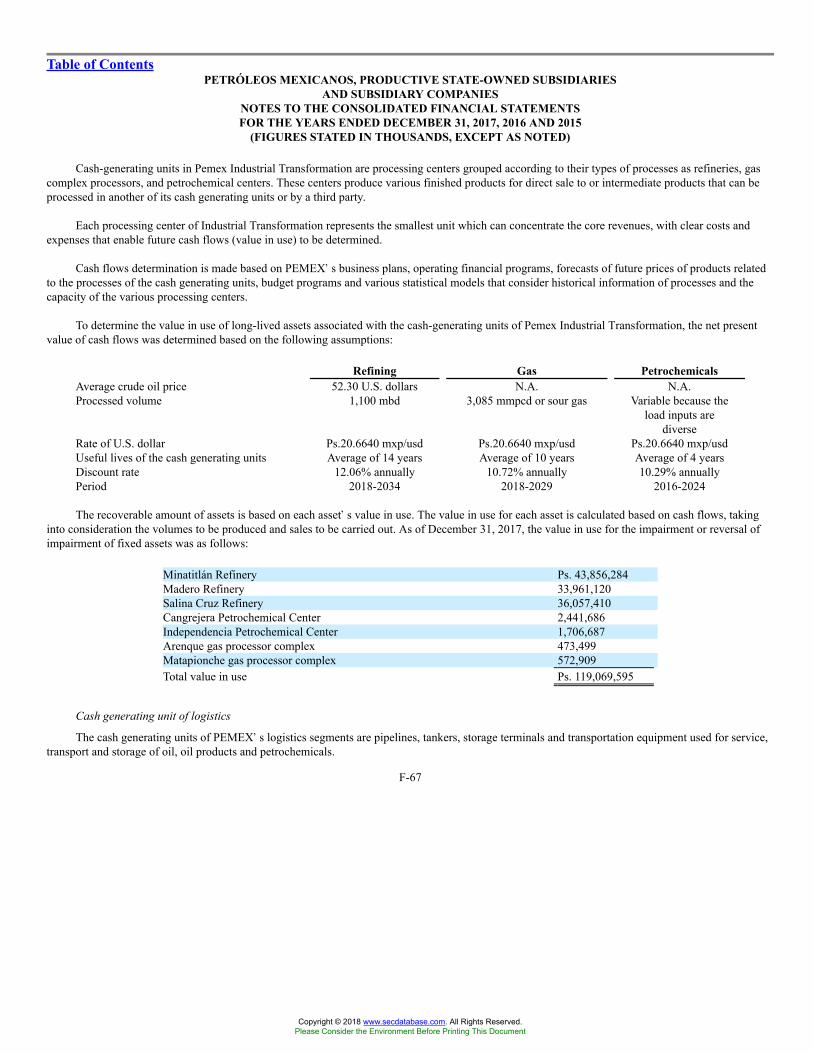
Table of ContentsPETRÓLEOS MEXICANOS, PRODUCTIVE STATE-OWNED SUBSIDIARIES
AND SUBSIDIARY COMPANIESNOTES TO THE CONSOLIDATED FINANCIAL STATEMENTSFOR THE YEARS ENDED DECEMBER 31, 2017, 2016 AND 2015
(FIGURES STATED IN THOUSANDS, EXCEPT AS NOTED)
Cash-generating units in Pemex Industrial Transformation are processing centers grouped according to their types of processes as refineries, gascomplex processors, and petrochemical centers. These centers produce various finished products for direct sale to or intermediate products that can beprocessed in another of its cash generating units or by a third party.
Each processing center of Industrial Transformation represents the smallest unit which can concentrate the core revenues, with clear costs andexpenses that enable future cash flows (value in use) to be determined.
Cash flows determination is made based on PEMEX�s business plans, operating financial programs, forecasts of future prices of products relatedto the processes of the cash generating units, budget programs and various statistical models that consider historical information of processes and thecapacity of the various processing centers.
To determine the value in use of long-lived assets associated with the cash-generating units of Pemex Industrial Transformation, the net presentvalue of cash flows was determined based on the following assumptions:
Refining Gas PetrochemicalsAverage crude oil price 52.30 U.S. dollars N.A. N.A.Processed volume 1,100 mbd 3,085 mmpcd or sour gas Variable because the
load inputs arediverse
Rate of U.S. dollar Ps.20.6640 mxp/usd Ps.20.6640 mxp/usd Ps.20.6640 mxp/usdUseful lives of the cash generating units Average of 14 years Average of 10 years Average of 4 yearsDiscount rate 12.06% annually 10.72% annually 10.29% annuallyPeriod 2018-2034 2018-2029 2016-2024
The recoverable amount of assets is based on each asset�s value in use. The value in use for each asset is calculated based on cash flows, takinginto consideration the volumes to be produced and sales to be carried out. As of December 31, 2017, the value in use for the impairment or reversal ofimpairment of fixed assets was as follows:
Minatitlán Refinery Ps. 43,856,284Madero Refinery 33,961,120Salina Cruz Refinery 36,057,410Cangrejera Petrochemical Center 2,441,686Independencia Petrochemical Center 1,706,687Arenque gas processor complex 473,499Matapionche gas processor complex 572,909Total value in use Ps. 119,069,595
Cash generating unit of logistics
The cash generating units of PEMEX�s logistics segments are pipelines, tankers, storage terminals and transportation equipment used for service,transport and storage of oil, oil products and petrochemicals.
F-67
Copyright © 2018 www.secdatabase.com. All Rights Reserved.Please Consider the Environment Before Printing This Document
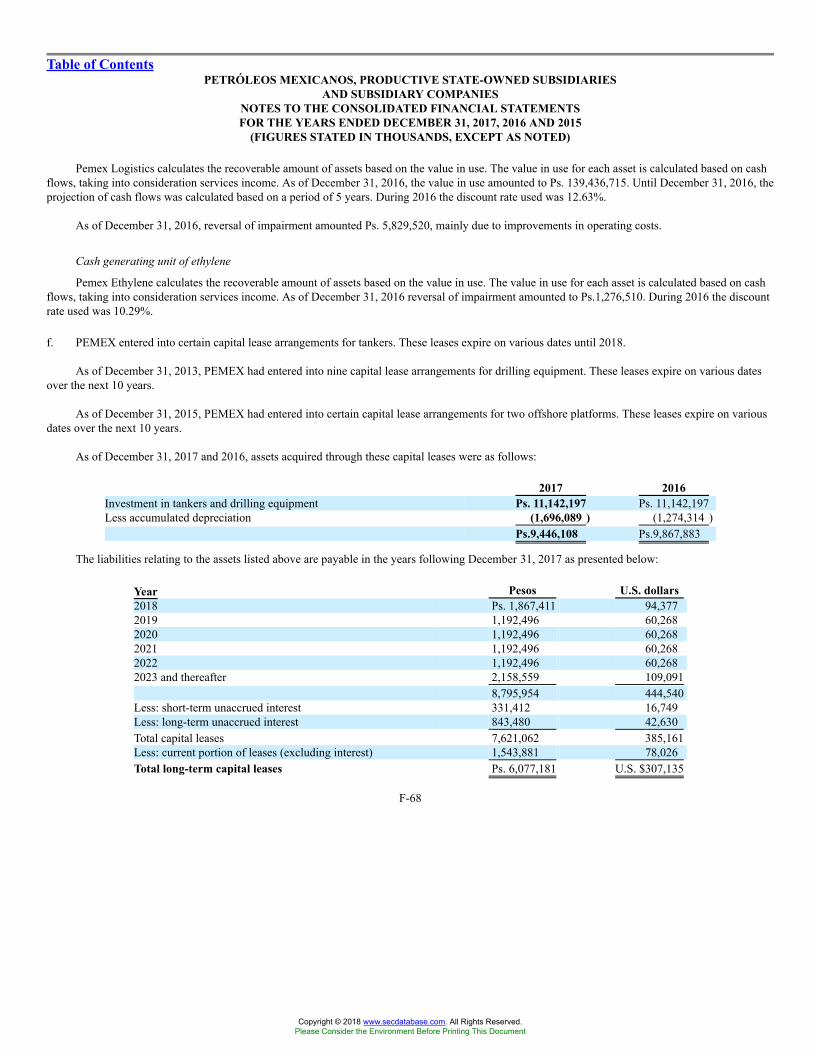
Table of ContentsPETRÓLEOS MEXICANOS, PRODUCTIVE STATE-OWNED SUBSIDIARIES
AND SUBSIDIARY COMPANIESNOTES TO THE CONSOLIDATED FINANCIAL STATEMENTSFOR THE YEARS ENDED DECEMBER 31, 2017, 2016 AND 2015
(FIGURES STATED IN THOUSANDS, EXCEPT AS NOTED)
Pemex Logistics calculates the recoverable amount of assets based on the value in use. The value in use for each asset is calculated based on cashflows, taking into consideration services income. As of December 31, 2016, the value in use amounted to Ps. 139,436,715. Until December 31, 2016, theprojection of cash flows was calculated based on a period of 5 years. During 2016 the discount rate used was 12.63%.
As of December 31, 2016, reversal of impairment amounted Ps. 5,829,520, mainly due to improvements in operating costs.
Cash generating unit of ethylene
Pemex Ethylene calculates the recoverable amount of assets based on the value in use. The value in use for each asset is calculated based on cashflows, taking into consideration services income. As of December 31, 2016 reversal of impairment amounted to Ps.1,276,510. During 2016 the discountrate used was 10.29%.
f. PEMEX entered into certain capital lease arrangements for tankers. These leases expire on various dates until 2018.
As of December 31, 2013, PEMEX had entered into nine capital lease arrangements for drilling equipment. These leases expire on various datesover the next 10 years.
As of December 31, 2015, PEMEX had entered into certain capital lease arrangements for two offshore platforms. These leases expire on variousdates over the next 10 years.
As of December 31, 2017 and 2016, assets acquired through these capital leases were as follows:
2017 2016Investment in tankers and drilling equipment Ps. 11,142,197 Ps. 11,142,197Less accumulated depreciation (1,696,089 ) (1,274,314 )
Ps.9,446,108 Ps.9,867,883
The liabilities relating to the assets listed above are payable in the years following December 31, 2017 as presented below:
Year Pesos U.S. dollars2018 Ps. 1,867,411 94,3772019 1,192,496 60,2682020 1,192,496 60,2682021 1,192,496 60,2682022 1,192,496 60,2682023 and thereafter 2,158,559 109,091
8,795,954 444,540Less: short-term unaccrued interest 331,412 16,749Less: long-term unaccrued interest 843,480 42,630Total capital leases 7,621,062 385,161Less: current portion of leases (excluding interest) 1,543,881 78,026Total long-term capital leases Ps. 6,077,181 U.S. $307,135
F-68
Copyright © 2018 www.secdatabase.com. All Rights Reserved.Please Consider the Environment Before Printing This Document
Table of ContentsPETRÓLEOS MEXICANOS, PRODUCTIVE STATE-OWNED SUBSIDIARIES
AND SUBSIDIARY COMPANIESNOTES TO THE CONSOLIDATED FINANCIAL STATEMENTSFOR THE YEARS ENDED DECEMBER 31, 2017, 2016 AND 2015
(FIGURES STATED IN THOUSANDS, EXCEPT AS NOTED)
The interest expense from capital leases for the years ended December 31, 2017, 2016 and 2015 was Ps. 418,883, Ps. 500,654 and Ps. 450,760,respectively.
The discount rates applied to the calculation of capital leases were as follows:
i. 7.96 % rate in nominal terms (1.11% in real terms) as of December 31, 2017.
ii. 7.96 % rate in nominal terms (4.45% in real terms) as of December 31, 2016.
iii. 7.96 % rate in nominal terms (5.71% in real terms) as of December 31, 2015.
g. Certain infrastructure assets used for oil and gas activities are guarantees for the U.S. $1,100,000 and U.S. $600,000 sale and lease backagreements dated as of June 17, 2016 and July 8, 2016 (see Note 15).
h. PEMEX can conduct exploration and extraction activities through Exploration and Extraction Contracts (EEC). The EECs are awardedindividually, through associations or joint ventures based on guidelines approved by the NHC and are classified into:
a. Production-sharing contracts;
b. Profit-sharing contracts;
c. License agreements; and
d. Service contracts.
Certain of the EECs are operated though joint arrangements, for which PEMEX recognizes in its financial statements, both the rights to the assetsand the obligations for the liabilities, as well as profits and losses relating to the arrangements.
EECs as of December 31, 2017 are:
a. Production-sharing contracts
i. Hydrocarbon Extraction Contract (Shallow Water), Ek-Balam contractual area.
The object of the contract is the execution of oil activities, under shared production contracts, between, Mexico through the MexicanGovernment via the NHC and Pemex Exploration and Production, as a contractor, for the contractual area and all the costs, risks, terms andconditions involved in the contract and in accordance with the applicable regulations and best practices of the Industry receiving, inexchange, benefits in favor of the contractor.
Pemex Exploration and Production got the 100% of this contractual area.
ii. Exploration and Extraction Contract related to Area 2 Tampico Misantla, with the association formed by Pemex Exploration and Productionand DEA.
The object of the contract is the realization of oil activities, under shared production contracts, by the contractor for the contractual area andall the costs, risks, terms and conditions involved in the contract and in accordance with the applicable regulations and best practices of theIndustry receiving, in exchange, benefits in favor of the contractor.
Pemex Exploration and Production owns 70% of this contractual area, while DEA has the 30% of this contractual area, respectively. Thecondition of operator will be in charge of Pemex Exploration and Production.
F-69
Copyright © 2018 www.secdatabase.com. All Rights Reserved.Please Consider the Environment Before Printing This Document

Table of ContentsPETRÓLEOS MEXICANOS, PRODUCTIVE STATE-OWNED SUBSIDIARIES
AND SUBSIDIARY COMPANIESNOTES TO THE CONSOLIDATED FINANCIAL STATEMENTSFOR THE YEARS ENDED DECEMBER 31, 2017, 2016 AND 2015
(FIGURES STATED IN THOUSANDS, EXCEPT AS NOTED)
This contract requires a total investment of U.S. $ 45,230 million, of which U.S. $ 36,520 million correspond to exploratory activities to becarried out in the period of 2017-2021.
iii. Exploration and Extraction Contract, related to Area 8 Cuencas del Sureste, pursuant to consortium formed by Pemex Exploration andProduction and EPC Hidrocarburos México, S. A. de C. V. company (EPC).
Pemex Exploration and Production was designated by all the participating companies and with the approval of the NHC as the operator ofthis contract and all operational aspects of the petroleum activities will be carried out only by the operator on behalf of all participatingcompanies.
Pemex Exploration and Production and EPC each have a 50% interest in this contractual area.
b. License contracts
i. A licensing contract with BHP Billiton Petróleo Operaciones de México, S. de R.L. (BHP Billiton) for the Trión block, under which BHPBilliton has the right to explore and extract hydrocarbons owned by Mexico in the contractual area and bears the costs and risks associatedwith such exploration and extraction activities.
BHP Billiton owns 60% of the contractual area, while Pemex Exploration and Production owns 40%.
ii. Hydrocarbons Exploration and Extraction Contract for the contractual area 3 �Plegado Perdido�, in deep waters, formed by Inpex, Chevronand Pemex Exploration and Production.
A licensing contract that permits the exploration and extraction of hydrocarbons owned by Mexico in the contractual area. Chevron wasappointed by the participating companies, with the approval of the NHC, as the operator of this contract on behalf of each of theparticipating companies.
Chevron, Pemex Exploration and Production and Inpex have a 33.3334%, 33.3333% and 33.3333% interest in this project, respectively.
F-70
Copyright © 2018 www.secdatabase.com. All Rights Reserved.Please Consider the Environment Before Printing This Document
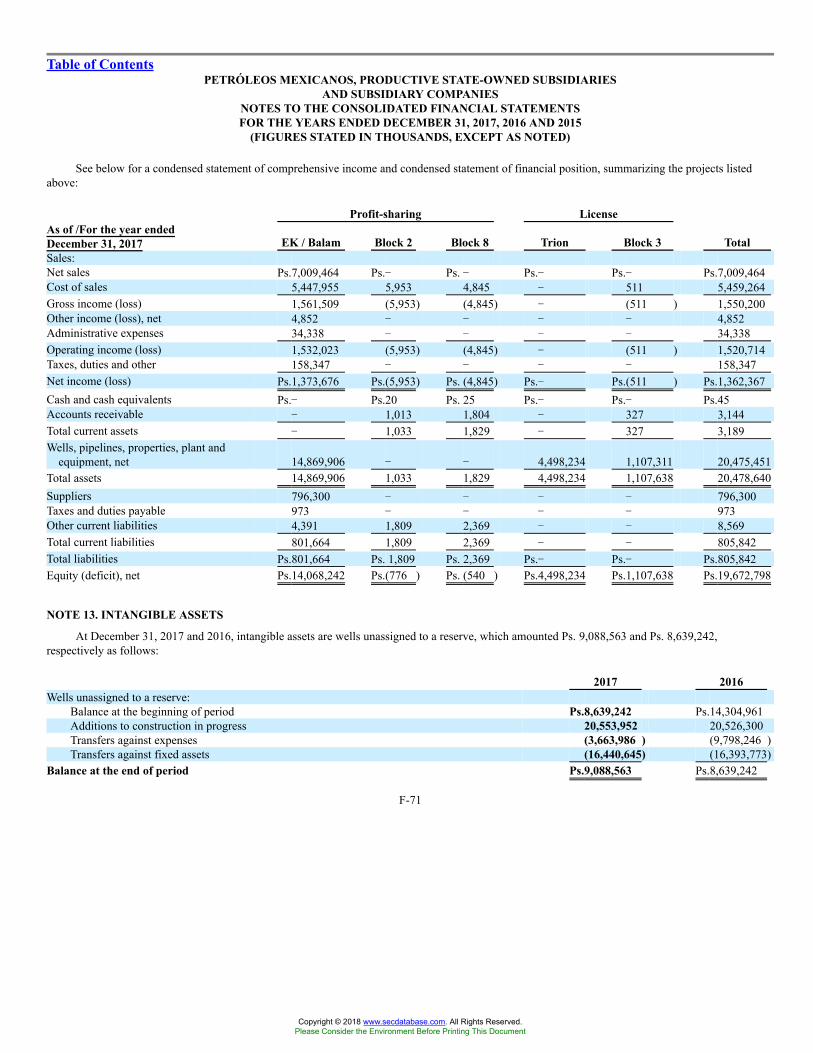
Table of ContentsPETRÓLEOS MEXICANOS, PRODUCTIVE STATE-OWNED SUBSIDIARIES
AND SUBSIDIARY COMPANIESNOTES TO THE CONSOLIDATED FINANCIAL STATEMENTSFOR THE YEARS ENDED DECEMBER 31, 2017, 2016 AND 2015
(FIGURES STATED IN THOUSANDS, EXCEPT AS NOTED)
See below for a condensed statement of comprehensive income and condensed statement of financial position, summarizing the projects listedabove:
Profit-sharing LicenseAs of /For the year endedDecember 31, 2017 EK / Balam Block 2 Block 8 Trion Block 3 TotalSales:Net sales Ps.7,009,464 Ps.� Ps. � Ps.� Ps.� Ps.7,009,464Cost of sales 5,447,955 5,953 4,845 � 511 5,459,264Gross income (loss) 1,561,509 (5,953) (4,845) � (511 ) 1,550,200Other income (loss), net 4,852 � � � � 4,852Administrative expenses 34,338 � � � � 34,338Operating income (loss) 1,532,023 (5,953) (4,845) � (511 ) 1,520,714Taxes, duties and other 158,347 � � � � 158,347Net income (loss) Ps.1,373,676 Ps.(5,953) Ps. (4,845) Ps.� Ps.(511 ) Ps.1,362,367Cash and cash equivalents Ps.� Ps.20 Ps. 25 Ps.� Ps.� Ps.45Accounts receivable � 1,013 1,804 � 327 3,144Total current assets � 1,033 1,829 � 327 3,189Wells, pipelines, properties, plant and
equipment, net 14,869,906 � � 4,498,234 1,107,311 20,475,451Total assets 14,869,906 1,033 1,829 4,498,234 1,107,638 20,478,640Suppliers 796,300 � � � � 796,300Taxes and duties payable 973 � � � � 973Other current liabilities 4,391 1,809 2,369 � � 8,569Total current liabilities 801,664 1,809 2,369 � � 805,842Total liabilities Ps.801,664 Ps. 1,809 Ps. 2,369 Ps.� Ps.� Ps.805,842Equity (deficit), net Ps.14,068,242 Ps.(776 ) Ps. (540 ) Ps.4,498,234 Ps.1,107,638 Ps.19,672,798
NOTE 13. INTANGIBLE ASSETS
At December 31, 2017 and 2016, intangible assets are wells unassigned to a reserve, which amounted Ps. 9,088,563 and Ps. 8,639,242,respectively as follows:
2017 2016Wells unassigned to a reserve:
Balance at the beginning of period Ps.8,639,242 Ps.14,304,961Additions to construction in progress 20,553,952 20,526,300Transfers against expenses (3,663,986 ) (9,798,246 )Transfers against fixed assets (16,440,645) (16,393,773)
Balance at the end of period Ps.9,088,563 Ps.8,639,242
F-71
Copyright © 2018 www.secdatabase.com. All Rights Reserved.Please Consider the Environment Before Printing This Document
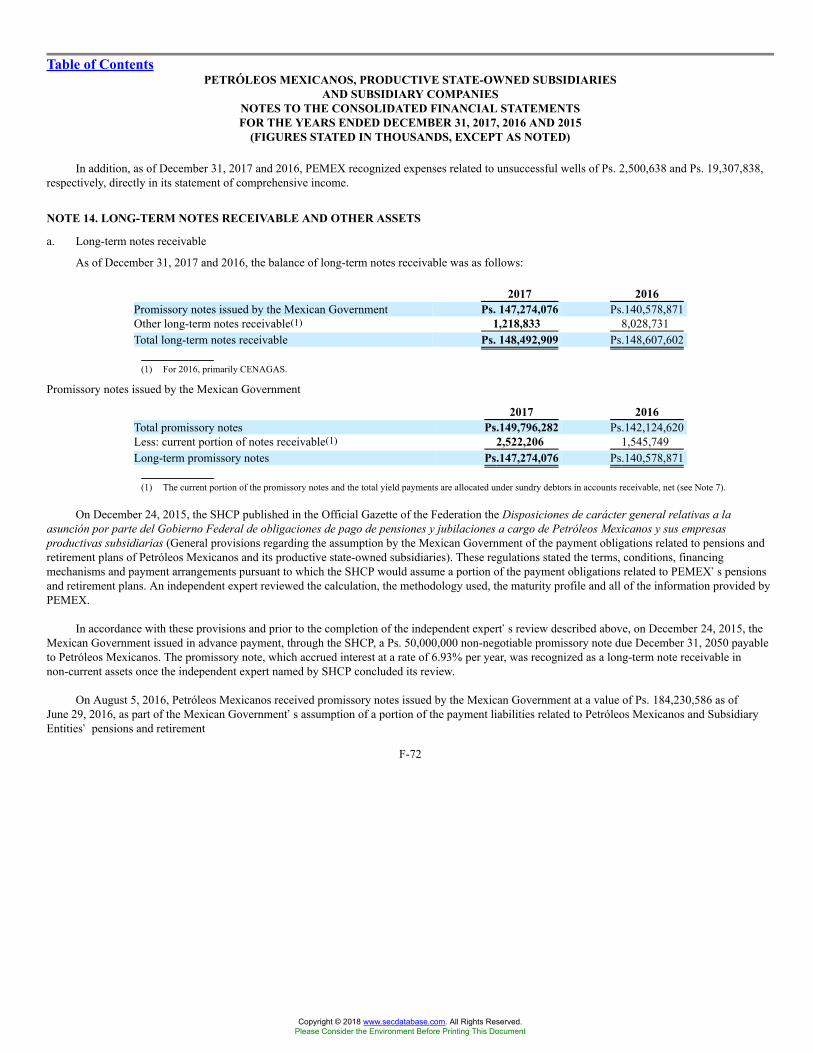
Table of ContentsPETRÓLEOS MEXICANOS, PRODUCTIVE STATE-OWNED SUBSIDIARIES
AND SUBSIDIARY COMPANIESNOTES TO THE CONSOLIDATED FINANCIAL STATEMENTSFOR THE YEARS ENDED DECEMBER 31, 2017, 2016 AND 2015
(FIGURES STATED IN THOUSANDS, EXCEPT AS NOTED)
In addition, as of December 31, 2017 and 2016, PEMEX recognized expenses related to unsuccessful wells of Ps. 2,500,638 and Ps. 19,307,838,respectively, directly in its statement of comprehensive income.
NOTE 14. LONG-TERM NOTES RECEIVABLE AND OTHER ASSETS
a. Long-term notes receivable
As of December 31, 2017 and 2016, the balance of long-term notes receivable was as follows:
2017 2016Promissory notes issued by the Mexican Government Ps. 147,274,076 Ps.140,578,871Other long-term notes receivable(1) 1,218,833 8,028,731Total long-term notes receivable Ps. 148,492,909 Ps.148,607,602
(1) For 2016, primarily CENAGAS.
Promissory notes issued by the Mexican Government
2017 2016Total promissory notes Ps.149,796,282 Ps.142,124,620Less: current portion of notes receivable(1) 2,522,206 1,545,749Long-term promissory notes Ps.147,274,076 Ps.140,578,871
(1) The current portion of the promissory notes and the total yield payments are allocated under sundry debtors in accounts receivable, net (see Note 7).
On December 24, 2015, the SHCP published in the Official Gazette of the Federation the Disposiciones de carácter general relativas a laasunción por parte del Gobierno Federal de obligaciones de pago de pensiones y jubilaciones a cargo de Petróleos Mexicanos y sus empresasproductivas subsidiarias (General provisions regarding the assumption by the Mexican Government of the payment obligations related to pensions andretirement plans of Petróleos Mexicanos and its productive state-owned subsidiaries). These regulations stated the terms, conditions, financingmechanisms and payment arrangements pursuant to which the SHCP would assume a portion of the payment obligations related to PEMEX�s pensionsand retirement plans. An independent expert reviewed the calculation, the methodology used, the maturity profile and all of the information provided byPEMEX.
In accordance with these provisions and prior to the completion of the independent expert�s review described above, on December 24, 2015, theMexican Government issued in advance payment, through the SHCP, a Ps. 50,000,000 non-negotiable promissory note due December 31, 2050 payableto Petróleos Mexicanos. The promissory note, which accrued interest at a rate of 6.93% per year, was recognized as a long-term note receivable innon-current assets once the independent expert named by SHCP concluded its review.
On August 5, 2016, Petróleos Mexicanos received promissory notes issued by the Mexican Government at a value of Ps. 184,230,586 as ofJune 29, 2016, as part of the Mexican Government�s assumption of a portion of the payment liabilities related to Petróleos Mexicanos and SubsidiaryEntities� pensions and retirement
F-72
Copyright © 2018 www.secdatabase.com. All Rights Reserved.Please Consider the Environment Before Printing This Document
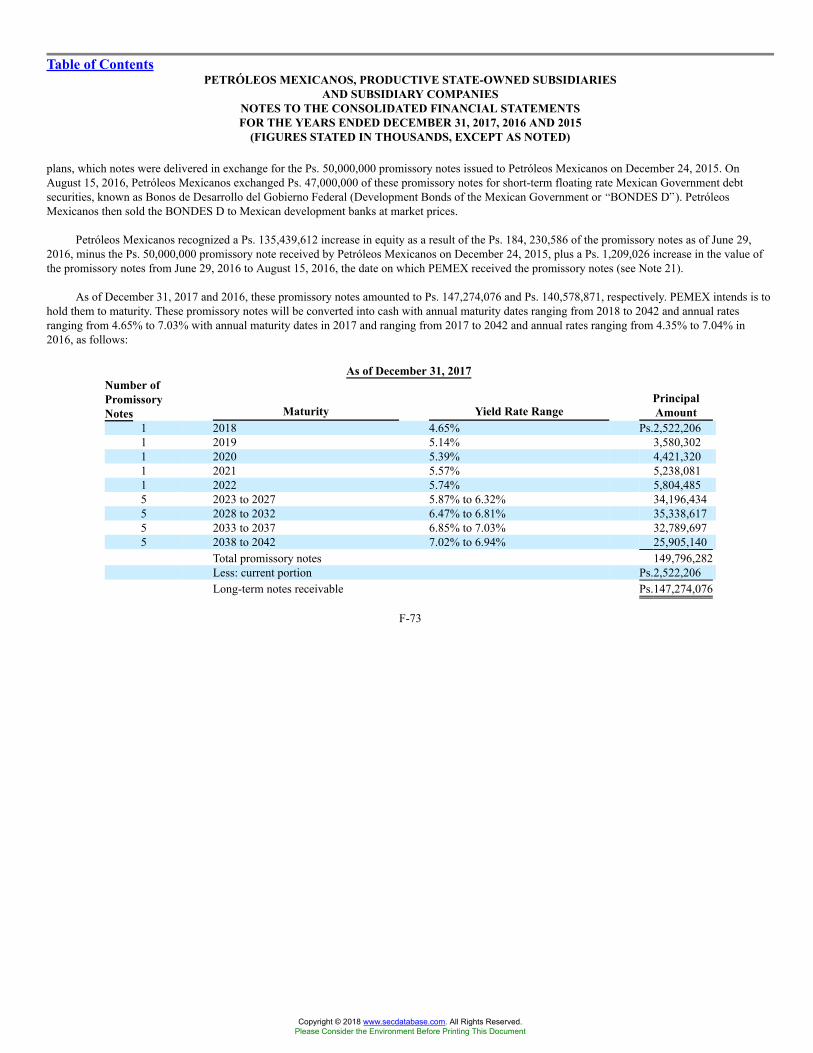
Table of ContentsPETRÓLEOS MEXICANOS, PRODUCTIVE STATE-OWNED SUBSIDIARIES
AND SUBSIDIARY COMPANIESNOTES TO THE CONSOLIDATED FINANCIAL STATEMENTSFOR THE YEARS ENDED DECEMBER 31, 2017, 2016 AND 2015
(FIGURES STATED IN THOUSANDS, EXCEPT AS NOTED)
plans, which notes were delivered in exchange for the Ps. 50,000,000 promissory notes issued to Petróleos Mexicanos on December 24, 2015. OnAugust 15, 2016, Petróleos Mexicanos exchanged Ps. 47,000,000 of these promissory notes for short-term floating rate Mexican Government debtsecurities, known as Bonos de Desarrollo del Gobierno Federal (Development Bonds of the Mexican Government or �BONDES D�). PetróleosMexicanos then sold the BONDES D to Mexican development banks at market prices.
Petróleos Mexicanos recognized a Ps. 135,439,612 increase in equity as a result of the Ps. 184, 230,586 of the promissory notes as of June 29,2016, minus the Ps. 50,000,000 promissory note received by Petróleos Mexicanos on December 24, 2015, plus a Ps. 1,209,026 increase in the value ofthe promissory notes from June 29, 2016 to August 15, 2016, the date on which PEMEX received the promissory notes (see Note 21).
As of December 31, 2017 and 2016, these promissory notes amounted to Ps. 147,274,076 and Ps. 140,578,871, respectively. PEMEX intends is tohold them to maturity. These promissory notes will be converted into cash with annual maturity dates ranging from 2018 to 2042 and annual ratesranging from 4.65% to 7.03% with annual maturity dates in 2017 and ranging from 2017 to 2042 and annual rates ranging from 4.35% to 7.04% in2016, as follows:
As of December 31, 2017Number ofPromissoryNotes Maturity Yield Rate Range
PrincipalAmount
1 2018 4.65% Ps.2,522,2061 2019 5.14% 3,580,3021 2020 5.39% 4,421,3201 2021 5.57% 5,238,0811 2022 5.74% 5,804,4855 2023 to 2027 5.87% to 6.32% 34,196,4345 2028 to 2032 6.47% to 6.81% 35,338,6175 2033 to 2037 6.85% to 7.03% 32,789,6975 2038 to 2042 7.02% to 6.94% 25,905,140
Total promissory notes 149,796,282Less: current portion Ps.2,522,206Long-term notes receivable Ps.147,274,076
F-73
Copyright © 2018 www.secdatabase.com. All Rights Reserved.Please Consider the Environment Before Printing This Document
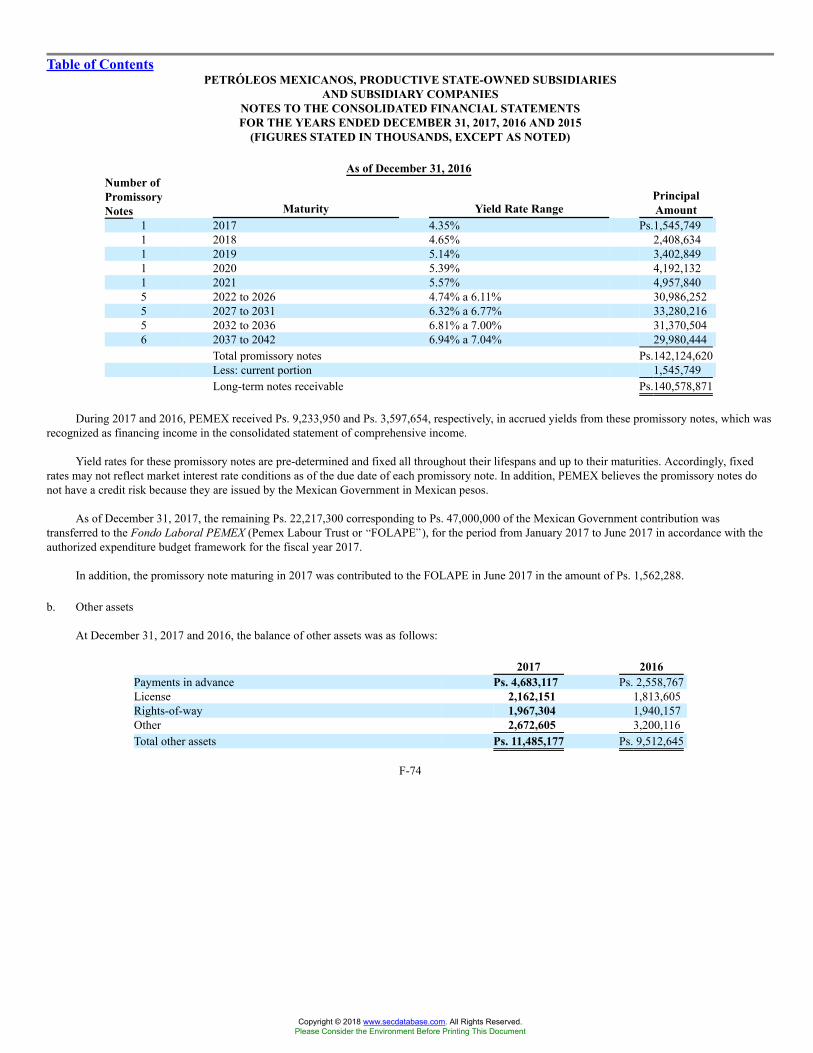
Table of ContentsPETRÓLEOS MEXICANOS, PRODUCTIVE STATE-OWNED SUBSIDIARIES
AND SUBSIDIARY COMPANIESNOTES TO THE CONSOLIDATED FINANCIAL STATEMENTSFOR THE YEARS ENDED DECEMBER 31, 2017, 2016 AND 2015
(FIGURES STATED IN THOUSANDS, EXCEPT AS NOTED)
As of December 31, 2016Number ofPromissoryNotes Maturity Yield Rate Range
PrincipalAmount
1 2017 4.35% Ps.1,545,7491 2018 4.65% 2,408,6341 2019 5.14% 3,402,8491 2020 5.39% 4,192,1321 2021 5.57% 4,957,8405 2022 to 2026 4.74% a 6.11% 30,986,2525 2027 to 2031 6.32% a 6.77% 33,280,2165 2032 to 2036 6.81% a 7.00% 31,370,5046 2037 to 2042 6.94% a 7.04% 29,980,444
Total promissory notes Ps.142,124,620Less: current portion 1,545,749Long-term notes receivable Ps.140,578,871
During 2017 and 2016, PEMEX received Ps. 9,233,950 and Ps. 3,597,654, respectively, in accrued yields from these promissory notes, which wasrecognized as financing income in the consolidated statement of comprehensive income.
Yield rates for these promissory notes are pre-determined and fixed all throughout their lifespans and up to their maturities. Accordingly, fixedrates may not reflect market interest rate conditions as of the due date of each promissory note. In addition, PEMEX believes the promissory notes donot have a credit risk because they are issued by the Mexican Government in Mexican pesos.
As of December 31, 2017, the remaining Ps. 22,217,300 corresponding to Ps. 47,000,000 of the Mexican Government contribution wastransferred to the Fondo Laboral PEMEX (Pemex Labour Trust or �FOLAPE�), for the period from January 2017 to June 2017 in accordance with theauthorized expenditure budget framework for the fiscal year 2017.
In addition, the promissory note maturing in 2017 was contributed to the FOLAPE in June 2017 in the amount of Ps. 1,562,288.
b. Other assets
At December 31, 2017 and 2016, the balance of other assets was as follows:
2017 2016Payments in advance Ps. 4,683,117 Ps. 2,558,767License 2,162,151 1,813,605Rights-of-way 1,967,304 1,940,157Other 2,672,605 3,200,116Total other assets Ps. 11,485,177 Ps. 9,512,645
F-74
Copyright © 2018 www.secdatabase.com. All Rights Reserved.Please Consider the Environment Before Printing This Document
Table of ContentsPETRÓLEOS MEXICANOS, PRODUCTIVE STATE-OWNED SUBSIDIARIES
AND SUBSIDIARY COMPANIESNOTES TO THE CONSOLIDATED FINANCIAL STATEMENTSFOR THE YEARS ENDED DECEMBER 31, 2017, 2016 AND 2015
(FIGURES STATED IN THOUSANDS, EXCEPT AS NOTED)
NOTE 15. DEBT
The Federal Income Law applicable to PEMEX as of January 1, 2017, published in the Official Gazette of the Federation on November 17, 2016,authorized Petróleos Mexicanos and its Subsidiary Entities to incur an internal net debt up to Ps. 28,000,000 and an external net debt up to U.S.$7,100,000. PEMEX can incur additional internal or external debt, as long as the total amount of net debt (Ps. 150,000,000 equivalent to U.S.$8,055,900) does not exceed the ceiling established by the Federal Income Law.
On July 8, 2016, the Board of Directors of Petróleos Mexicanos approved policies and general requirements for obligations that constitute publicdebt of Petróleos Mexicanos and Subsidiary Entities, in accordance with Article 106 section I of the Petroleos Mexicanos Law.
Subsequently, the Board of Directors of PEMEX, approved the debt program for fiscal year 2017 in accordance with Article 13 section XXVI ofthe Petróleos Mexicanos Law.
During the period from January 1 to December 31, 2017, PEMEX participated in the following financing activities:
a. On February 14, 2017, Petróleos Mexicanos issued � 4,250,000 of debt securities under its Medium-Term Notes Program, Series C in threetranches: (i) � 1,750,000 of its 2.50% Notes due August 2021;(ii) � 1,250,000 of its 3.75% Notes due February 2024; and (iii) � 1,250,000of its 4.875% Notes due February 2028.
b. On April 6, 2017, Petróleos Mexicanos executed a U.S. $132,000, non-revolving bilateral credit line from Banco Mercantil del Norte, S.A.,Institución de Banca Múltiple, Grupo Financiero Banorte, due on April 6, 2024, which bears a fixed interest rate of 5.25%.
c. On May 15, 2017, Petróleos Mexicanos entered into a simple credit line in the amount of U.S. $400,000 at a floating interest rate linked toLIBOR plus 165 basis points, due May 2020 and was used in two tranches of U.S. $200,000 (on May 24, 2017 and July 14, 2017,respectively).
d. On June 16, 2017, Petróleos Mexicanos increased its Medium-Term Notes Program, Series C, from U.S. $72,000,000 to U.S. $92,000,000.
e. On July 17, 2017, Petróleos Mexicanos entered into a revolving credit facility in the amount of U.S. $1,950,000 and matures in 2020.
f. On July 18, 2017, Petróleos Mexicanos issued under its U.S.$92,000,000 Medium-Term Notes Program, Series C: (i) U.S. $2,500,000 of its6.500% Notes due 2027; and (ii) U.S. $2,500,000 of its 6.75% Bonds due 2047.
g. On July 21, 2017, Petróleos Mexicanos consummated a tender offer pursuant to which it purchased U.S. $922,485 aggregate principalamount of its outstanding 5.750% Notes due 2018, U.S. $644,374 aggregate principal amount of its outstanding 3.500% Notes due 2018 andU.S. $172,591 aggregate principal amount of its outstanding 3.125% Notes due 2019.
h. On November 16, 2017, Petróleos Mexicanos issued £ 450,000 at a rate interest of its 3.750% Notes due 2025 under its U.S.$92,000,000Medium-Term Notes Program, Series C.
i. On December 15, 2017, AGRO refinanced a credit line for U.S. $390,000, prepaying U.S. $140,000 and entering into a new credit line forthe outstanding U.S. $250,000, which bears interest at a floating rate linked to LIBOR plus 250 basis points on a quarterly basis and matureson June 29, 2018.
j. On December 18, 2017, Petróleos Mexicanos entered into a bilateral credit line facility in the amount of U.S. $200,000, which bears interestat a floating rate linked to LIBOR plus 165 basis points and matures on December 18, 2020.
F-75
Copyright © 2018 www.secdatabase.com. All Rights Reserved.Please Consider the Environment Before Printing This Document
Table of ContentsPETRÓLEOS MEXICANOS, PRODUCTIVE STATE-OWNED SUBSIDIARIES
AND SUBSIDIARY COMPANIESNOTES TO THE CONSOLIDATED FINANCIAL STATEMENTSFOR THE YEARS ENDED DECEMBER 31, 2017, 2016 AND 2015
(FIGURES STATED IN THOUSANDS, EXCEPT AS NOTED)
k. On December 21, 2017, Petróleos Mexicanos borrowed U.S. $300,000 from a bilateral credit line which bears interest at a floating ratelinked to LIBOR plus 175 basis points, which matures on December 21, 2022.
All the financing activities were guaranteed by Pemex Exploration and Production, Pemex Industrial Transformation, Pemex Drilling andServices, Pemex Logistics and Pemex Cogeneration and Services.
From January 1 to December 31, 2017, PMI HBV obtained U.S. $15,141,500 in financing from its revolving credit line and repaid U.S.$14,914,000. As of December 31, 2017, the outstanding amount under this revolving credit line was U.S. $227,500.
As of December 31, 2017, Petróleos Mexicanos had U.S. $6,700,000 and Ps. 23,500,000 in available credit lines in order to ensure liquidity. Theavailable amounts are U.S. $5,400,000 and Ps. 23,500,000, respectively.
The Federal Income Law that was applicable to PEMEX as of January 1, 2016, published in the Official Gazette of the Federation onNovember 18, 2015, authorized Petróleos Mexicanos and its Subsidiary Entities to incur an internal net debt up to Ps. 110,500,000 and an external netdebt up to U.S. $8,500,000. PEMEX was entitled to incur additional internal or external debt, as long as the total amount of net debt (Ps.240,550,000equivalent to U.S. $15,722,000) did not exceed the ceiling established by the Federal Income Law.
On November 18, 2014, the Board of Directors of Petróleos Mexicanos approved policies and general requirements for obligations that constitutepublic debt of Petróleos Mexicanos and Subsidiary Entities, in accordance with the Article 107 of the Petroleos Mexicanos Law.
Subsequently, the Board of Directors of PEMEX, approved the debt program for fiscal year 2016 in accordance with Article 13 section XXVI ofthe Petróleos Mexicanos Law.
During 2016, PEMEX participated in the following financing activities:
a. On January 25, 2016, Petróleos Mexicanos increased its Medium-Term Notes Program from U.S. $52,000,000 to U.S. $62,000,000.
b. On February 4, 2016, Petróleos Mexicanos issued U.S. $5,000,000 of debt securities under its Medium-Term Notes Program, Series C, inthree tranches: (i) U.S. $750,000 of its 5.500% Notes due February 2019; (ii) U.S. $1,250,000 of its 6.375% Notes due February 2021; and(iii) U.S. $3,000,000 of its 6.875% Notes due August 2026. All debt securities issued under this program are guaranteed by PemexExploration and Production, Pemex Industrial Transformation, Pemex Drilling and Services, Pemex Logistics and Pemex Cogeneration andServices.
c. On February 5, 2016, Petróleos Mexicanos obtained a loan from a line of credit for Ps. 7,000,000,000 bearing interest at a floating ratelinked to the TIIE, plus 0.55%, and matured on January 2017.
d. On March 15, 2016, Petróleos Mexicanos issued �2,250,000 of debt securities U.S. $62,000,000 Medium-Term Notes Program, Series C intwo tranches: (i) �1,350,000 of its 3.750% Notes due to March 2019 and (ii) �900,000 of its 5.125% Notes due to March 2023. All debtsecurities issued under this program are guaranteed by Pemex Exploration and Production, Pemex Industrial Transformation, PemexDrilling and Services, Pemex Logistics and Pemex Cogeneration and Services.
e. On March 17, 2016, Petróleos Mexicanos borrowed Ps. 2,000,000 from a credit line at a floating rate linked to TIIE and matured on March2017.
F-76
Copyright © 2018 www.secdatabase.com. All Rights Reserved.Please Consider the Environment Before Printing This Document
Table of ContentsPETRÓLEOS MEXICANOS, PRODUCTIVE STATE-OWNED SUBSIDIARIES
AND SUBSIDIARY COMPANIESNOTES TO THE CONSOLIDATED FINANCIAL STATEMENTSFOR THE YEARS ENDED DECEMBER 31, 2017, 2016 AND 2015
(FIGURES STATED IN THOUSANDS, EXCEPT AS NOTED)
f. On March 17, 2016, Petróleos Mexicanos borrowed Ps. 3,300,000 from a credit line at a floating rate linked to TIIE and matured on March2017.
g. On March 23, 2016, Petróleos Mexicanos issued Ps. 5,000,000 of Certificados Bursátiles due to October 2019 at a floating rate linked toTIIE. As of December 31, 2016, all debt securities issued under this program are guaranteed by Pemex Exploration and Production, PemexIndustrial Transformation, Pemex Drilling and Services, Pemex Logistics and Pemex Cogeneration and Services.
h. On March 28, 2016, Petróleos Mexicanos borrowed Ps. 9,700,000 from a credit line at a floating rate linked to TIIE, and matured on March2017.
i. On April 19, 2016, Petróleos Mexicanos borrowed �500,000 from a credit line at fixed rate of 5.11%, which matures on March 2023.
j. On May 31, 2016, Petróleos Mexicanos obtained a U.S. $300,000 bilateral credit line from Export Development Canada (EDC), due onMay 2021, which bears interest at a floating rate linked to LIBOR.
k. On June 14, 2016, Petróleos Mexicanos issued CHF 375,000 of debt securities under its Medium-Term Notes Program, Series C, in twotranches: (1) CHF 225,000 of its 1.50% Notes due to June 2018 and (2) CHF 150,000 of its 2.35% Notes due to December 2021. The Notesare guaranteed by Pemex Exploration and Production, Pemex Industrial Transformation, Pemex Drilling and Services, Pemex Logistics andPemex Cogeneration and Services.
l. On June 17, 2016, Pemex Exploration and Production obtained approximately U.S. $1,100,000 in connection with the sale and leaseback ofcertain infrastructure assets used for oil and gas activities (see Note 12-g). As part of this transaction, Pemex Exploration and Productionentered into a 15-year financial lease agreement, which will last for the greater part of the economic life of the asset, at a fixed rate of8.38%, pursuant to which Pemex Exploration and Production will retain the operation of these assets and the title and ownership of suchassets will revert to Pemex Exploration and Production at the end of this period following payment of an agreed price. This transaction wasrecognized as a financing activity due to the fact that PEMEX retained all of the risks and benefits associated with ownership of the assetand substantially all of the operating rights of the asset.
m. On July 8, 2016, Pemex Industrial Transformation obtained approximately U.S. $600,000 in connection with the sale and leaseback of aplant located in the Madero Refinery. As part of this transaction, Pemex Industrial Transformation entered into a 20-year financial leaseagreement pursuant to which Pemex Industrial Transformation will retain the operation of the plant and title and ownership will revert toPemex Industrial Transformation at the end of this period following payment of an agreed price. This transaction was recognized as afinancing activity due to the fact that Pemex Industrial Transformation retained all of the risks and benefits associated with ownership of theasset and substantially all of the operating rights of the asset.
n. On July 26, 2016, Petróleos Mexicanos issued ¥80,000,000 Bonds at 0.54% due July 2026. The Bonds are guaranteed by the Japan Bank forInternational Cooperation.
o. On September 21, 2016, Petróleos Mexicanos issued U.S. $4,000,000 aggregate principal amount of debt securities under its U.S.$62,000,000 Medium-Term Notes Program, Series C, in two tranches: (i) U.S. $2,000,000 of its 4.625% Notes due to September 2023 and(ii) U.S. $2,000,000 of its 6.750% Bonds due to September 2047. The debt securities are guaranteed by Pemex Exploration and
F-77
Copyright © 2018 www.secdatabase.com. All Rights Reserved.Please Consider the Environment Before Printing This Document
Table of ContentsPETRÓLEOS MEXICANOS, PRODUCTIVE STATE-OWNED SUBSIDIARIES
AND SUBSIDIARY COMPANIESNOTES TO THE CONSOLIDATED FINANCIAL STATEMENTSFOR THE YEARS ENDED DECEMBER 31, 2017, 2016 AND 2015
(FIGURES STATED IN THOUSANDS, EXCEPT AS NOTED)
Production, Pemex Industrial Transformation, Pemex Drilling and Services, Pemex Logistics and Pemex Cogeneration and Services.
p. On October 3, 2016, Petróleos Mexicanos consummated a tender and exchange offer pursuant to which it (i) purchased U.S. $687,725aggregate principal amount of its outstanding 8.000% Notes due 2019 and U.S. $657,050 aggregate principal amount of its outstanding5.750% Notes due 2018 and (ii) exchanged (a) U.S. $73,288 aggregate principal amount of its outstanding 5.750% Notes due 2018 for U.S.$69,302 aggregate principal amount of its 4.625% Notes due 2023 and U.S. $8,059 aggregate principal amount of its 6.750% Bonds due2047 and (b) U.S. $1,591,961 aggregate principal amount of its outstanding 5.500% Bonds due 2044 for U.S. $1,491,941 aggregateprincipal amount of its 6.750% Bonds due 2047. The 4.625% Notes due 2023 and 6.750% Bonds due 2047 are guaranteed by PemexExploration and Production, Pemex Industrial Transformation, Pemex Drilling and Services, Pemex Logistics and Pemex Cogeneration andServices and represent reopenings of the 4.625% Notes due 2023 and 6.750% Bonds due 2047, respectively, originally issued onSeptember 21, 2016
q. On December 6, 2016, Petróleos Mexicanos increased its Medium-Term Notes Program, Series C, from U.S. $ 62,000,000 to U.S.$72,000,000.
r. On December 13, 2016, Petróleos Mexicanos issued U.S. $5,500,000 of its debt securities under its Medium-Term Notes Program, Series Cin three tranches: (1) U.S. $3,000,000 at fixed rate of 6.50% due March 2027, (2) U.S. $1,500,000 a fixed rate of 5.375% due March 2022,and (3) U.S. $1,000,000 at a floating rate linked to LIBOR, due March 2022. As of December 31, 2016, all debt securities issued under thisprogram are guaranteed by Pemex Exploration and Production, Pemex Industrial Transformation, Pemex Drilling and Services, PemexLogistics and Pemex Cogeneration and Services.
s. On December 14, 2016, Petróleos Mexicanos entered into a term loan credit facility in the amount of U.S. $300,000 at floating rate linked toLIBOR, matures on December 2019.
Between January 1 and December 31, 2016, PMI HBV obtained and paid U.S. $11,369,800 in revolving credit lines. As of December 31,2016 there was no outstanding amount.
As of December 31, 2016, Petróleos Mexicanos had U.S. $4,750,000 and Ps. 23,500,000 in available credit lines in order to ensure liquidity. Theavailable amounts are U.S. $4,630,000 and Ps. 3,500,000, respectively.
Various financial transactions (including credit facilities and bond issuances) require compliance with various covenants that, among other things,place restrictions on the following types of transactions by PEMEX, subject to certain exceptions:
� The sale of substantial assets essential for the continued operations of its business.
� The incurrence of liens against its assets.
� Transfers, sales or assignments of rights to payment not yet earned under contracts for the sale of crude oil or natural gas, accountsreceivable or other negotiable instruments.
As of December 31, 2017 and as of the date of the issuance of these consolidated financial statements, PEMEX was in compliance with thecovenants described above.
F-78
Copyright © 2018 www.secdatabase.com. All Rights Reserved.Please Consider the Environment Before Printing This Document
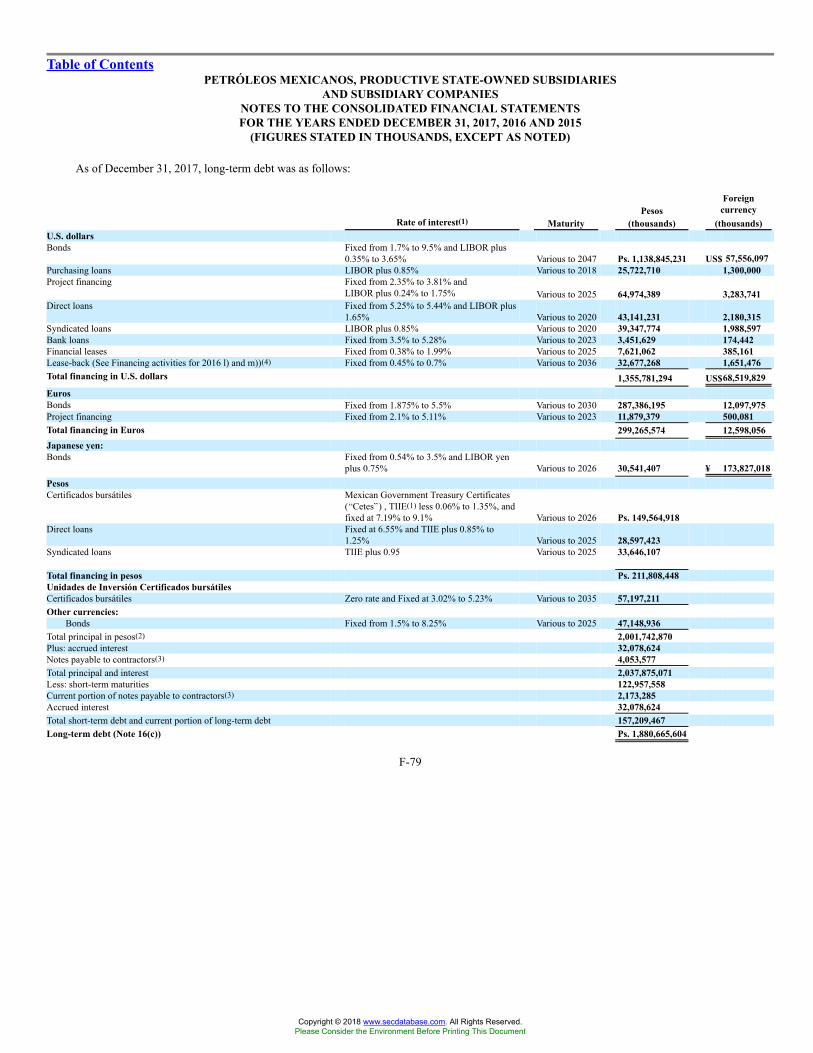
Table of ContentsPETRÓLEOS MEXICANOS, PRODUCTIVE STATE-OWNED SUBSIDIARIES
AND SUBSIDIARY COMPANIESNOTES TO THE CONSOLIDATED FINANCIAL STATEMENTSFOR THE YEARS ENDED DECEMBER 31, 2017, 2016 AND 2015
(FIGURES STATED IN THOUSANDS, EXCEPT AS NOTED)
As of December 31, 2017, long-term debt was as follows:
PesosForeigncurrency
Rate of interest(1) Maturity (thousands) (thousands)U.S. dollarsBonds Fixed from 1.7% to 9.5% and LIBOR plus
0.35% to 3.65% Various to 2047 Ps. 1,138,845,231 US$ 57,556,097Purchasing loans LIBOR plus 0.85% Various to 2018 25,722,710 1,300,000Project financing Fixed from 2.35% to 3.81% and
LIBOR plus 0.24% to 1.75% Various to 2025 64,974,389 3,283,741Direct loans Fixed from 5.25% to 5.44% and LIBOR plus
1.65% Various to 2020 43,141,231 2,180,315Syndicated loans LIBOR plus 0.85% Various to 2020 39,347,774 1,988,597Bank loans Fixed from 3.5% to 5.28% Various to 2023 3,451,629 174,442Financial leases Fixed from 0.38% to 1.99% Various to 2025 7,621,062 385,161Lease-back (See Financing activities for 2016 l) and m))(4) Fixed from 0.45% to 0.7% Various to 2036 32,677,268 1,651,476Total financing in U.S. dollars 1,355,781,294 US$68,519,829EurosBonds Fixed from 1.875% to 5.5% Various to 2030 287,386,195 �� 12,097,975Project financing Fixed from 2.1% to 5.11% Various to 2023 11,879,379 500,081Total financing in Euros 299,265,574 �� 12,598,056Japanese yen:Bonds Fixed from 0.54% to 3.5% and LIBOR yen
plus 0.75% Various to 2026 30,541,407 ¥ 173,827,018PesosCertificados bursátiles Mexican Government Treasury Certificates
(�Cetes�) , TIIE(1) less 0.06% to 1.35%, andfixed at 7.19% to 9.1% Various to 2026 Ps. 149,564,918
Direct loans Fixed at 6.55% and TIIE plus 0.85% to1.25% Various to 2025 28,597,423
Syndicated loans TIIE plus 0.95 Various to 2025 33,646,107
Total financing in pesos Ps. 211,808,448Unidades de Inversión Certificados bursátilesCertificados bursátiles Zero rate and Fixed at 3.02% to 5.23% Various to 2035 57,197,211Other currencies:
Bonds Fixed from 1.5% to 8.25% Various to 2025 47,148,936Total principal in pesos(2) 2,001,742,870Plus: accrued interest 32,078,624Notes payable to contractors(3) 4,053,577Total principal and interest 2,037,875,071Less: short-term maturities 122,957,558Current portion of notes payable to contractors(3) 2,173,285Accrued interest 32,078,624Total short-term debt and current portion of long-term debt 157,209,467Long-term debt (Note 16(c)) Ps. 1,880,665,604
F-79
Copyright © 2018 www.secdatabase.com. All Rights Reserved.Please Consider the Environment Before Printing This Document
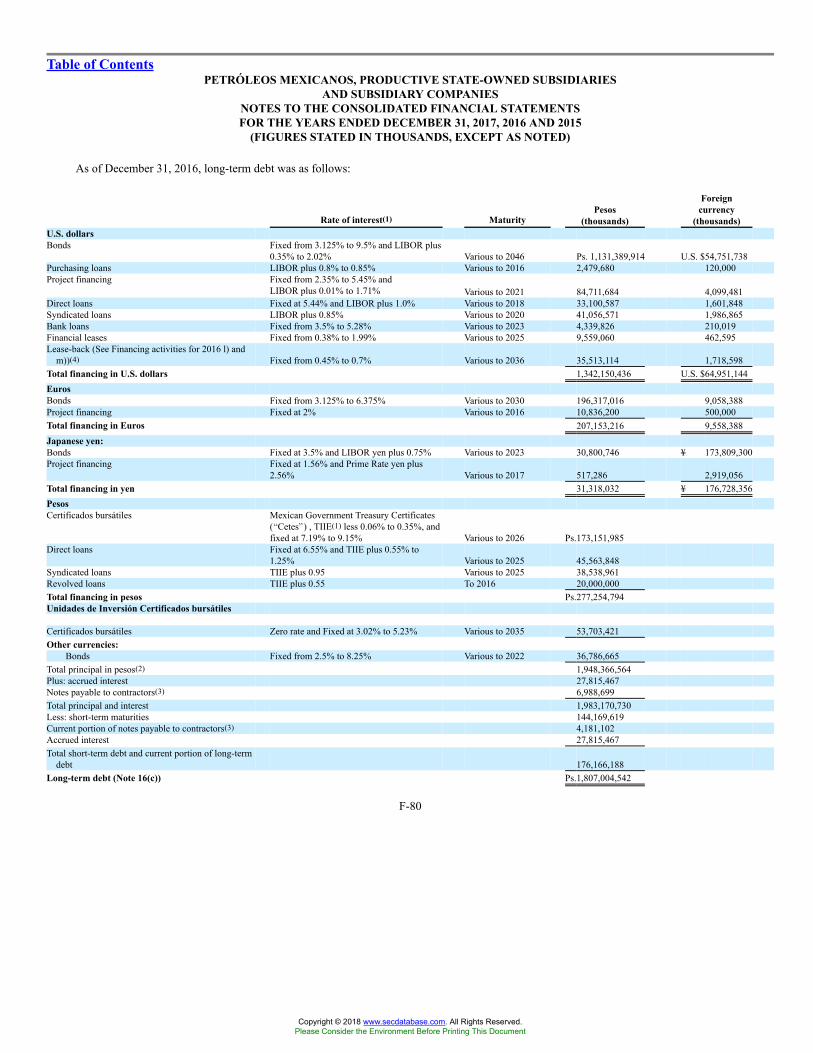
Table of ContentsPETRÓLEOS MEXICANOS, PRODUCTIVE STATE-OWNED SUBSIDIARIES
AND SUBSIDIARY COMPANIESNOTES TO THE CONSOLIDATED FINANCIAL STATEMENTSFOR THE YEARS ENDED DECEMBER 31, 2017, 2016 AND 2015
(FIGURES STATED IN THOUSANDS, EXCEPT AS NOTED)
As of December 31, 2016, long-term debt was as follows:
Rate of interest(1) MaturityPesos
(thousands)
Foreigncurrency
(thousands)U.S. dollarsBonds Fixed from 3.125% to 9.5% and LIBOR plus
0.35% to 2.02% Various to 2046 Ps. 1,131,389,914 U.S. $54,751,738Purchasing loans LIBOR plus 0.8% to 0.85% Various to 2016 2,479,680 120,000Project financing Fixed from 2.35% to 5.45% and
LIBOR plus 0.01% to 1.71% Various to 2021 84,711,684 4,099,481Direct loans Fixed at 5.44% and LIBOR plus 1.0% Various to 2018 33,100,587 1,601,848Syndicated loans LIBOR plus 0.85% Various to 2020 41,056,571 1,986,865Bank loans Fixed from 3.5% to 5.28% Various to 2023 4,339,826 210,019Financial leases Fixed from 0.38% to 1.99% Various to 2025 9,559,060 462,595Lease-back (See Financing activities for 2016 l) and
m))(4) Fixed from 0.45% to 0.7% Various to 2036 35,513,114 1,718,598Total financing in U.S. dollars 1,342,150,436 U.S. $64,951,144EurosBonds Fixed from 3.125% to 6.375% Various to 2030 196,317,016 � 9,058,388Project financing Fixed at 2% Various to 2016 10,836,200 500,000Total financing in Euros 207,153,216 � 9,558,388Japanese yen:Bonds Fixed at 3.5% and LIBOR yen plus 0.75% Various to 2023 30,800,746 ¥ 173,809,300Project financing Fixed at 1.56% and Prime Rate yen plus
2.56% Various to 2017 517,286 2,919,056Total financing in yen 31,318,032 ¥ 176,728,356PesosCertificados bursátiles Mexican Government Treasury Certificates
(�Cetes�) , TIIE(1) less 0.06% to 0.35%, andfixed at 7.19% to 9.15% Various to 2026 Ps.173,151,985
Direct loans Fixed at 6.55% and TIIE plus 0.55% to1.25% Various to 2025 45,563,848
Syndicated loans TIIE plus 0.95 Various to 2025 38,538,961Revolved loans TIIE plus 0.55 To 2016 20,000,000Total financing in pesos Ps.277,254,794Unidades de Inversión Certificados bursátiles
Certificados bursátiles Zero rate and Fixed at 3.02% to 5.23% Various to 2035 53,703,421Other currencies:
Bonds Fixed from 2.5% to 8.25% Various to 2022 36,786,665Total principal in pesos(2) 1,948,366,564Plus: accrued interest 27,815,467Notes payable to contractors(3) 6,988,699Total principal and interest 1,983,170,730Less: short-term maturities 144,169,619Current portion of notes payable to contractors(3) 4,181,102Accrued interest 27,815,467Total short-term debt and current portion of long-term
debt 176,166,188Long-term debt (Note 16(c)) Ps.1,807,004,542
F-80
Copyright © 2018 www.secdatabase.com. All Rights Reserved.Please Consider the Environment Before Printing This Document
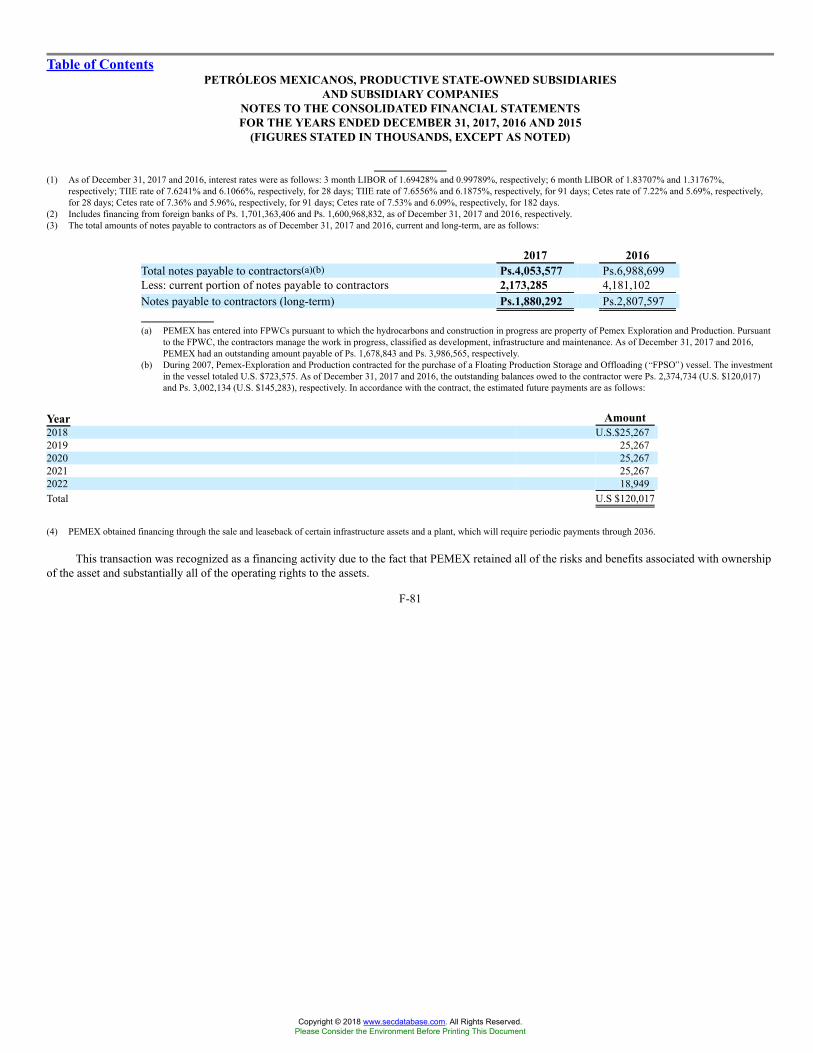
Table of ContentsPETRÓLEOS MEXICANOS, PRODUCTIVE STATE-OWNED SUBSIDIARIES
AND SUBSIDIARY COMPANIESNOTES TO THE CONSOLIDATED FINANCIAL STATEMENTSFOR THE YEARS ENDED DECEMBER 31, 2017, 2016 AND 2015
(FIGURES STATED IN THOUSANDS, EXCEPT AS NOTED)
(1) As of December 31, 2017 and 2016, interest rates were as follows: 3 month LIBOR of 1.69428% and 0.99789%, respectively; 6 month LIBOR of 1.83707% and 1.31767%,respectively; TIIE rate of 7.6241% and 6.1066%, respectively, for 28 days; TIIE rate of 7.6556% and 6.1875%, respectively, for 91 days; Cetes rate of 7.22% and 5.69%, respectively,for 28 days; Cetes rate of 7.36% and 5.96%, respectively, for 91 days; Cetes rate of 7.53% and 6.09%, respectively, for 182 days.
(2) Includes financing from foreign banks of Ps. 1,701,363,406 and Ps. 1,600,968,832, as of December 31, 2017 and 2016, respectively.(3) The total amounts of notes payable to contractors as of December 31, 2017 and 2016, current and long-term, are as follows:
2017 2016Total notes payable to contractors(a)(b) Ps.4,053,577 Ps.6,988,699Less: current portion of notes payable to contractors 2,173,285 4,181,102Notes payable to contractors (long-term) Ps.1,880,292 Ps.2,807,597
(a) PEMEX has entered into FPWCs pursuant to which the hydrocarbons and construction in progress are property of Pemex Exploration and Production. Pursuantto the FPWC, the contractors manage the work in progress, classified as development, infrastructure and maintenance. As of December 31, 2017 and 2016,PEMEX had an outstanding amount payable of Ps. 1,678,843 and Ps. 3,986,565, respectively.
(b) During 2007, Pemex-Exploration and Production contracted for the purchase of a Floating Production Storage and Offloading (�FPSO�) vessel. The investmentin the vessel totaled U.S. $723,575. As of December 31, 2017 and 2016, the outstanding balances owed to the contractor were Ps. 2,374,734 (U.S. $120,017)and Ps. 3,002,134 (U.S. $145,283), respectively. In accordance with the contract, the estimated future payments are as follows:
Year Amount2018 U.S.$25,2672019 25,2672020 25,2672021 25,2672022 18,949Total U.S $120,017
(4) PEMEX obtained financing through the sale and leaseback of certain infrastructure assets and a plant, which will require periodic payments through 2036.
This transaction was recognized as a financing activity due to the fact that PEMEX retained all of the risks and benefits associated with ownershipof the asset and substantially all of the operating rights to the assets.
F-81
Copyright © 2018 www.secdatabase.com. All Rights Reserved.Please Consider the Environment Before Printing This Document
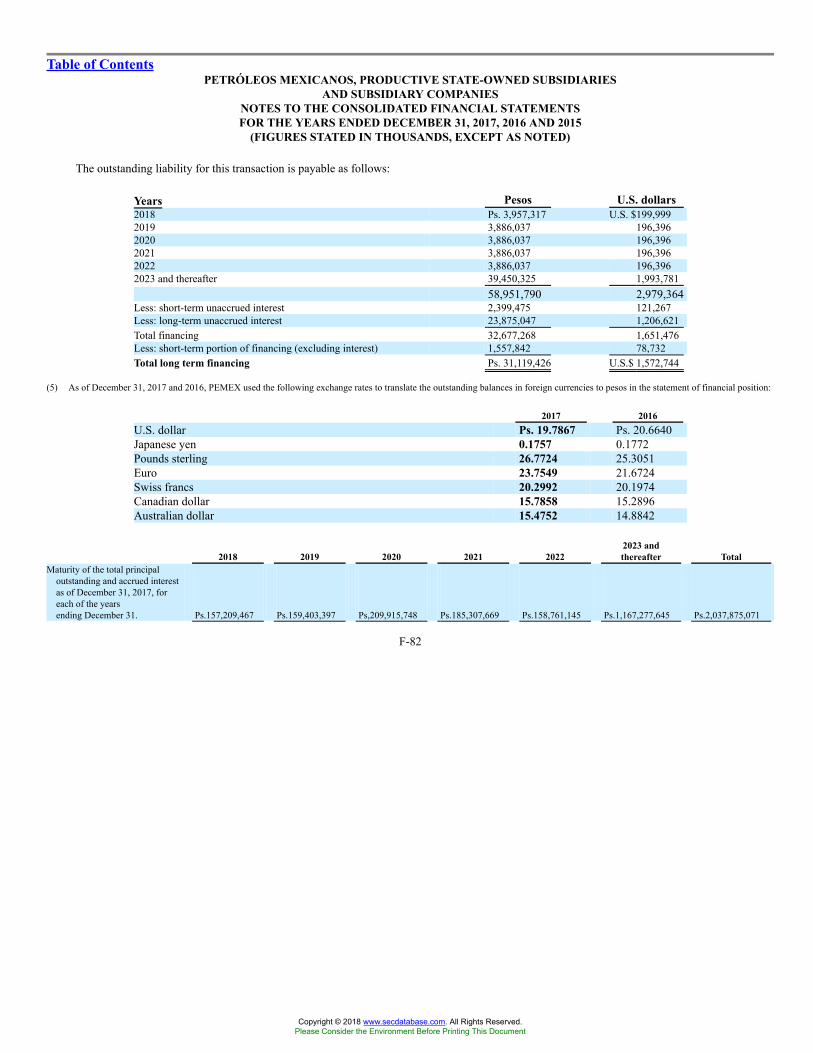
Table of ContentsPETRÓLEOS MEXICANOS, PRODUCTIVE STATE-OWNED SUBSIDIARIES
AND SUBSIDIARY COMPANIESNOTES TO THE CONSOLIDATED FINANCIAL STATEMENTSFOR THE YEARS ENDED DECEMBER 31, 2017, 2016 AND 2015
(FIGURES STATED IN THOUSANDS, EXCEPT AS NOTED)
The outstanding liability for this transaction is payable as follows:
Years Pesos U.S. dollars2018 Ps. 3,957,317 U.S. $199,9992019 3,886,037 196,3962020 3,886,037 196,3962021 3,886,037 196,3962022 3,886,037 196,3962023 and thereafter 39,450,325 1,993,781
58,951,790 2,979,364Less: short-term unaccrued interest 2,399,475 121,267Less: long-term unaccrued interest 23,875,047 1,206,621Total financing 32,677,268 1,651,476Less: short-term portion of financing (excluding interest) 1,557,842 78,732Total long term financing Ps. 31,119,426 U.S.$ 1,572,744
(5) As of December 31, 2017 and 2016, PEMEX used the following exchange rates to translate the outstanding balances in foreign currencies to pesos in the statement of financial position:
2017 2016U.S. dollar Ps. 19.7867 Ps. 20.6640Japanese yen 0.1757 0.1772Pounds sterling 26.7724 25.3051Euro 23.7549 21.6724Swiss francs 20.2992 20.1974Canadian dollar 15.7858 15.2896Australian dollar 15.4752 14.8842
2018 2019 2020 2021 20222023 andthereafter Total
Maturity of the total principaloutstanding and accrued interestas of December 31, 2017, foreach of the yearsending December 31. Ps.157,209,467 Ps.159,403,397 Ps,209,915,748 Ps.185,307,669 Ps.158,761,145 Ps.1,167,277,645 Ps.2,037,875,071
F-82
Copyright © 2018 www.secdatabase.com. All Rights Reserved.Please Consider the Environment Before Printing This Document
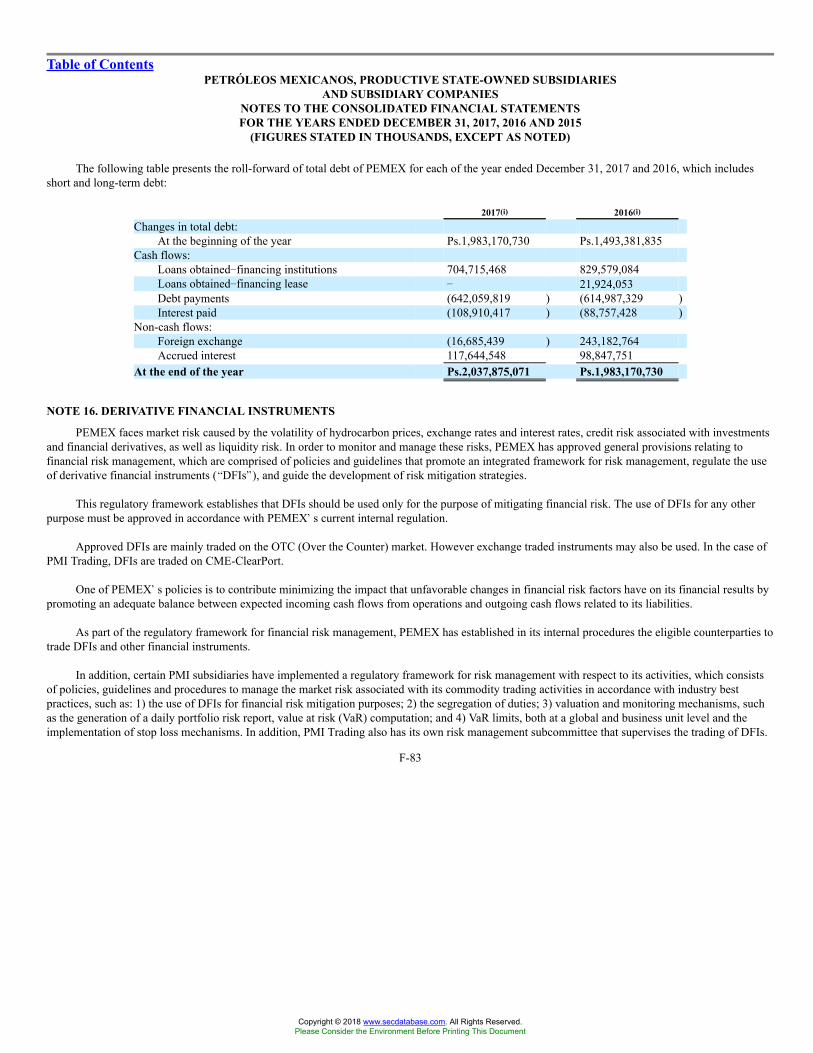
Table of ContentsPETRÓLEOS MEXICANOS, PRODUCTIVE STATE-OWNED SUBSIDIARIES
AND SUBSIDIARY COMPANIESNOTES TO THE CONSOLIDATED FINANCIAL STATEMENTSFOR THE YEARS ENDED DECEMBER 31, 2017, 2016 AND 2015
(FIGURES STATED IN THOUSANDS, EXCEPT AS NOTED)
The following table presents the roll-forward of total debt of PEMEX for each of the year ended December 31, 2017 and 2016, which includesshort and long-term debt:
2017(i) 2016(i)
Changes in total debt:At the beginning of the year Ps.1,983,170,730 Ps.1,493,381,835
Cash flows:Loans obtained�financing institutions 704,715,468 829,579,084Loans obtained�financing lease � 21,924,053Debt payments (642,059,819 ) (614,987,329 )Interest paid (108,910,417 ) (88,757,428 )
Non-cash flows:Foreign exchange (16,685,439 ) 243,182,764Accrued interest 117,644,548 98,847,751
At the end of the year Ps.2,037,875,071 Ps.1,983,170,730
NOTE 16. DERIVATIVE FINANCIAL INSTRUMENTS
PEMEX faces market risk caused by the volatility of hydrocarbon prices, exchange rates and interest rates, credit risk associated with investmentsand financial derivatives, as well as liquidity risk. In order to monitor and manage these risks, PEMEX has approved general provisions relating tofinancial risk management, which are comprised of policies and guidelines that promote an integrated framework for risk management, regulate the useof derivative financial instruments (�DFIs�), and guide the development of risk mitigation strategies.
This regulatory framework establishes that DFIs should be used only for the purpose of mitigating financial risk. The use of DFIs for any otherpurpose must be approved in accordance with PEMEX�s current internal regulation.
Approved DFIs are mainly traded on the OTC (Over the Counter) market. However exchange traded instruments may also be used. In the case ofPMI Trading, DFIs are traded on CME-ClearPort.
One of PEMEX�s policies is to contribute minimizing the impact that unfavorable changes in financial risk factors have on its financial results bypromoting an adequate balance between expected incoming cash flows from operations and outgoing cash flows related to its liabilities.
As part of the regulatory framework for financial risk management, PEMEX has established in its internal procedures the eligible counterparties totrade DFIs and other financial instruments.
In addition, certain PMI subsidiaries have implemented a regulatory framework for risk management with respect to its activities, which consistsof policies, guidelines and procedures to manage the market risk associated with its commodity trading activities in accordance with industry bestpractices, such as: 1) the use of DFIs for financial risk mitigation purposes; 2) the segregation of duties; 3) valuation and monitoring mechanisms, suchas the generation of a daily portfolio risk report, value at risk (VaR) computation; and 4) VaR limits, both at a global and business unit level and theimplementation of stop loss mechanisms. In addition, PMI Trading also has its own risk management subcommittee that supervises the trading of DFIs.
F-83
Copyright © 2018 www.secdatabase.com. All Rights Reserved.Please Consider the Environment Before Printing This Document

Table of ContentsPETRÓLEOS MEXICANOS, PRODUCTIVE STATE-OWNED SUBSIDIARIES
AND SUBSIDIARY COMPANIESNOTES TO THE CONSOLIDATED FINANCIAL STATEMENTSFOR THE YEARS ENDED DECEMBER 31, 2017, 2016 AND 2015
(FIGURES STATED IN THOUSANDS, EXCEPT AS NOTED)
Given that PEMEX�s outstanding DFIs have been entered into for risk mitigation purposes, particularly with economic hedging purposes, it isunnecessary to establish and monitor market risk limits.
For those portfolios with an open market risk exposure, PEMEX�s financial risk management regulatory framework establishes theimplementation and monitoring of market risk limits such as VaR and capital at risk (an aggregation of fair value or mark-to-market (�MtM�) and profitand loss, or CaR).
PEMEX has also established credit guidelines for DFIs that Pemex Industrial Transformation offers to its domestic customers, which include theuse of guarantees and credit lines. For exchange traded DFIs, PEMEX trades under the margin requirements of the corresponding exchange market, andtherefore does not have internal policies for these DFIs.
DFIs held with financial counterparties do not include collateral exchange clauses. Notwithstanding, PEMEX�s regulatory framework promotescredit risk mitigation strategies such as collateral exchange
A. Risk Management
I. Market Risk
i. Interest rate risk
PEMEX is exposed to fluctuations in floating interest rate liabilities. PEMEX is exposed to U.S. dollar LIBOR and to Mexican peso TIIE. As ofDecember 31, 2017, approximately 15.6% of PEMEX�s total net debt outstanding consisted of floating rate debt.
Occasionally, for strategic reasons or in order to offset the expected inflows and outflows, PEMEX has entered into interest rate swaps. Under itsinterest rate swap agreements, PEMEX acquires the obligation to make payments based on a fixed interest rate and is entitled to receive floating interestrate payments based on LIBOR, TIIE or a rate referenced to or calculated from TIIE.
As of December 31, 2017, PEMEX was a party to four interest rate swap agreements denominated in U.S. dollars for an aggregate notionalamount of U.S. $1,623,750 at a weighted average fixed interest rate of 2.35% and a weighted average term of 7.3 years.
Similarly, in order to eliminate the volatility associated with variable interest rates of long-term financing operations, PMI NASA has executedinterest rate swap agreements denominated in U.S. dollars for an aggregate notional amount of U.S. $71,936, at a weighted average fixed interest rate of4.17% and a weighted average term of 4.41 years.
Moreover, PEMEX invests in pesos and U.S. dollars in compliance with applicable internal regulations, through portfolios that have differentpurposes that seek an adequate return subject to risk parameters that reduce the probability of capital losses. The objective of the investments madethrough these portfolios is to meet PEMEX�s obligations payable in pesos and U.S. dollars.
The investments made through PEMEX�s portfolios are exposed to domestic and international interest rate risk and credit spread risk derivedfrom government and corporate securities, and inflation risk arising from the relationship between UDIs and pesos. However, these risks are mitigatedby established limits on exposure to market risk.
F-84
Copyright © 2018 www.secdatabase.com. All Rights Reserved.Please Consider the Environment Before Printing This Document
Table of ContentsPETRÓLEOS MEXICANOS, PRODUCTIVE STATE-OWNED SUBSIDIARIES
AND SUBSIDIARY COMPANIESNOTES TO THE CONSOLIDATED FINANCIAL STATEMENTSFOR THE YEARS ENDED DECEMBER 31, 2017, 2016 AND 2015
(FIGURES STATED IN THOUSANDS, EXCEPT AS NOTED)
ii. Exchange rate risk
Most of PEMEX�s revenues are denominated in U.S. dollars, a significant amount of which is derived from exports of crude oil and petroleumproducts, which are priced and payable in U.S. dollars. Additionally, PEMEX�s revenues from domestic sales of gasoline and diesel net of IEPS Tax,tax duties, incentives, and other related taxes, as well as domestic sales of natural gas and its byproducts, LPG and petrochemicals, are referenced tointernational U.S. dollar-denominated prices.
PEMEX�s expenses related to hydrocarbon duties are calculated based on international U.S. dollar-denominated prices and the cost ofhydrocarbon imports that PEMEX acquires for resale in Mexico or use in its facilities are indexed to international U.S. dollar-denominated prices. Bycontrast, PEMEX�s capital expenditure and operating expenses are established in pesos.
As a result of this cash flow structure, the depreciation of the peso against the U.S. dollar increases PEMEX�s financial balance. The appreciationof the peso relative to the U.S. dollar has the opposite effect. PEMEX manages this risk without the need for hedging instruments, because the impact onPEMEX�s revenues of fluctuations in the exchange rate between the U.S. dollar and the peso is offset in whole or in part by its impact on its obligations.
Therefore, PEMEX prioritizes debt issuances denominated in U.S. dollars; nonetheless, this is not always achievable, hence non-U.S. dollar debtissued in international currencies are hedged through DFIs to mitigate their exchange rate exposure, either by swapping them into U.S. dollars orthrough other derivative structures. The rest of the debt is denominated in pesos or in UDIs, for which most of the debt denominated in UDIs has beenconverted into pesos through DFIs in order to eliminate the inflationary risk exposure.
As a consequence of the above, PEMEX�s debt issued in international currencies other than U.S. dollars has exchange rate risk mitigationstrategies. PEMEX has selected strategies that further seek to reduce its cost of funding by leaving, in some cases, part of this exchange rate exposureunhedged when assessed appropriate.
The underlying currencies of PEMEX�s DFIs are the euro, Swiss franc, Japanese yen, Pound sterling and Australian dollar versus the U.S. dollarand UDIs versus the peso.
In 2017, PEMEX entered into various cross-currency swaps to hedge inflation risk arising from debt denominated in UDIs, for an aggregatenotional amount of Ps. 6,291,969. During 2016, PEMEX entered into the same kind of instruments to hedge currency risk arising from debt obligationsdenominated in euros and Swiss francs for an aggregate notional amount of U.S. $3,459,236 and the inflation risk arising from debt denominated inUDIs, for an aggregate notional amount of Ps. 1,077,101.
Most of PEMEX�s cross-currency swaps are plain vanilla except for one swap entered into in 2004 to hedge its exposure to the euro, whichexpired in 2016. This swap was referred to as an �extinguishing swap� and was obtained in order to hedge long-term obligations. The maincharacteristic of extinguishing swaps was that these DFIs terminate upon the occurrence of any of the credit default events specified in the DFI contractconfirmation, without any payment obligation for either party. This swap had a notional amount of U.S. $1,146,410.
In 2016, PEMEX entered into, without cost, an options structure called �Seagull Option� in order to cover the notional risk of a debt issue inJapanese yen for ¥80,000,000, keeping the coupons in the original currency
F-85
Copyright © 2018 www.secdatabase.com. All Rights Reserved.Please Consider the Environment Before Printing This Document
Table of ContentsPETRÓLEOS MEXICANOS, PRODUCTIVE STATE-OWNED SUBSIDIARIES
AND SUBSIDIARY COMPANIESNOTES TO THE CONSOLIDATED FINANCIAL STATEMENTSFOR THE YEARS ENDED DECEMBER 31, 2017, 2016 AND 2015
(FIGURES STATED IN THOUSANDS, EXCEPT AS NOTED)
(0.5% annual coupon rate). This structure protects the short exposure in Japanese yen against an appreciation of the Japanese yen versus the U.S. dollarfrom JPY 83.70 and up to JPY 75.00 and recognizes a benefit if the Japanese yen depreciates to an average of 117.39 JPY/USD.
Moreover, in 2017 PEMEX entered into, without cost, three more Seagull Options to hedge the notional risk of three debt issues in euros for anaggregate notional amount of � 4,250,000. These structures protect the short exposure in euros against an appreciation of the euro versus the U.S. dollarin a specific range, and PEMEX recognizes a benefit if the euro depreciates up to a certain exchange rate, for each debt issue. Whereas, in order tomitigate the exchange rate risk caused by the coupons of these issues PEMEX entered into coupon-only swaps.
Additionally, PEMEX entered into, without cost, a structure which is composed of a cross-currency swap and the sale of a call option, in order tohedge the notional risk of a debt issue in Pound sterling for £450,000, guaranteeing complete protection up to a certain exchange rate and partialprotection above that level.
PEMEX recorded a total net foreign exchange gain (loss) of Ps. 23,184,122, Ps. (254,012,743) and Ps. (154,765,574), for the years endedDecember 31, 2017, 2016 and 2015, respectively; these amounts include the unrealized foreign exchange gain (loss) associated with debt of Ps.16,685,439, Ps. (243,182,764) and Ps. (152,554,454) for the years ended December 31, 2017, 2016 and 2015, respectively. The appreciation of the pesocaused a total net foreign exchange gain because a significant part of PEMEX�s debt, 89.4% (principal only), as of December 31, 2017 is denominatedin foreign currency. Unrealized foreign exchange gains and losses do not impact PEMEX�s cash flows. Due to the cash flow structure described above,the depreciation of the peso relative to the U.S. dollar does not affect PEMEX�s ability to meet U.S. dollar-denominated financial obligations andimproves PEMEX�s ability to meet peso-denominated financial obligations. On the other hand, the appreciation of the peso relative to the U.S. dollarmay increase PEMEX�s peso debt service costs on a U.S. dollar basis. PEMEX�s foreign exchange gain in 2017 was due to the appreciation of thepeso, from Ps. 20.6640 = U.S. $1.00 on December 31, 2016 to Ps. 19.7867 = U.S. $1.00 on December 31, 2017. PEMEX�s foreign exchange loss in2016 was due to the depreciation of the peso, from Ps. 17.2065 = U.S. $1.00 on December 31, 2015 to Ps. 20.6640 = U.S. $1.00 on December 31, 2016.PEMEX�s foreign exchange loss in 2015 was due to the depreciation of the peso, from Ps. 14.7180 = U.S. $1.00 on December 31, 2014 to Ps.17.2065 =U.S. $1.00 on December 31, 2015.
Certain of the PMI subsidiaries face market risks generated by fluctuations in foreign exchange rates. In order to mitigate these risks, the boards ofdirectors of several of these companies have authorized a policy which stipulates that no more than 5% of a company�s total financial assets may bedenominated in a currency other than its functional currency, unless the company owes a duty or expected payment in a currency other than itsfunctional one. Accordingly, certain PMI subsidiaries will, from time to time, enter into DFIs in order to mitigate the risk associated with financingoperations denominated in currencies other than their respective functional currency.
Finally, a significant amount of PMI Trading�s income and expenses, including the cost of sales and related sales costs, is derived from the tradeof refined products, petrochemicals and gas liquids to PEMEX subsidiaries and third parties, whose prices are determined and are payable in U.S.dollars. PMI Trading�s exposure to foreign currency risk results primarily from the need to fund tax payments denominated in domestic currency, aswell as certain related sales costs denominated in domestic currency.
PMI Trading believes it can adequately manage the risk created by the payment of taxes in domestic currency without the need to enter intohedging instruments because the exposure to this risk is marginal relative
F-86
Copyright © 2018 www.secdatabase.com. All Rights Reserved.Please Consider the Environment Before Printing This Document

Table of ContentsPETRÓLEOS MEXICANOS, PRODUCTIVE STATE-OWNED SUBSIDIARIES
AND SUBSIDIARY COMPANIESNOTES TO THE CONSOLIDATED FINANCIAL STATEMENTSFOR THE YEARS ENDED DECEMBER 31, 2017, 2016 AND 2015
(FIGURES STATED IN THOUSANDS, EXCEPT AS NOTED)
to the total flows of U.S. dollar. In addition, in the event that a potential foreign exchange risk arises in connection with a commercial transaction, PMITrading may implement risk mitigation measures by entering into DFIs.
iii. Hydrocarbon Price Risk
PEMEX periodically assesses its revenues and expenditures structure in order to identify the main market risk factors that PEMEX�s cash flowsare exposed to in connection with international hydrocarbon prices. Based on this assessment, PEMEX monitors its exposure to the most significant riskfactors and quantifies their impact on PEMEX�s financial balance.
PEMEX�s exports and domestic sales are directly or indirectly related to international hydrocarbon prices. Therefore, PEMEX is exposed tofluctuations in these prices. In terms of crude oil and natural gas, part of this risk is transferred to the Mexican Government under PEMEX�s currentfiscal regime.
PEMEX continuously evaluates the implementation of risk mitigation strategies, including those involving the use of DFIs, while taking intoaccount operational and economic constraints.
PEMEX�s exposure to hydrocarbon prices is partly mitigated by natural hedges between its inflows and outflows.
Since 2016, as a result of the changes in the PEMEX�s fiscal regime, its sensitivity to crude oil prices decreased. Nonetheless, PEMEX worked ona hedging strategy for the following years in order to reduce its exposure to drops in crude oil price.
In April 2017, PEMEX entered into a crude oil hedge to partially protect its cash flows from decreases in the Mexican crude oil basket pricebelow that established in the Ley de Ingresos de la Federación (�Federal Revenue Law�). PEMEX hedged 409 thousand barrels per day from May toDecember 2017 for U.S. $133,503. As a result of this strategy PEMEX had an income of U.S. $205,705.
During the fourth quarter of 2017, PEMEX entered into a crude oil hedge to partially protect cash flows for the fiscal year 2018 from decreases inthe Mexican crude oil basket price below the one established in the 2018 Federal Revenue Law. PEMEX hedged 440 thousand barrels per day fromJanuary to December 2018 for U.S. $449,898.
In 2015, PEMEX entered into various swaps in order to hedge the risk arising from the variations of the propane price of its imports. These DFIswere held over a percentage of the total imports volume with maturity dates in 2015. During 2017 and 2016, PEMEX did not enter into any propaneimport price swaps.
In addition to supplying natural gas, Pemex Industrial Transformation offers DFIs to its domestic customers in order to provide them with supportto mitigate the risk associated with the volatility of natural gas prices. Until 2016, Pemex Industrial Transformation entered into DFIs with Mex GasSupply, S.L. under the opposite position to those DFIs offered to its customers in order to mitigate the market risk it bears under such offered DFIs. MexGas Supply, S.L. then transferred the related price risk derived from the DFI position held with Pemex Industrial Transformation to internationalfinancial counterparties by entering into these opposite position DFIs with such parties. As of 2017, Pemex Industrial Transformation must enter intoDFIs with Petróleos Mexicanos under the
F-87
Copyright © 2018 www.secdatabase.com. All Rights Reserved.Please Consider the Environment Before Printing This Document

Table of ContentsPETRÓLEOS MEXICANOS, PRODUCTIVE STATE-OWNED SUBSIDIARIES
AND SUBSIDIARY COMPANIESNOTES TO THE CONSOLIDATED FINANCIAL STATEMENTSFOR THE YEARS ENDED DECEMBER 31, 2017, 2016 AND 2015
(FIGURES STATED IN THOUSANDS, EXCEPT AS NOTED)
opposite position to those DFIs offered to its customers, thereby replacing Mex Gas Supply, S.L. However, as of December 31, 2017, no DFIs have beenentered into under this mechanism. Due to the above, Pemex Industrial Transformation maintains a negligible or even null exposure to market risk.These portfolios have VaR and Capital at Risk limits in order to limit market risk exposure.
PMI Trading faces market risk generated by the terms of the purchase and sale of refined products and natural gas liquids, as well as the volatilityof oil prices. Accordingly, it frequently enters into DFIs in order to mitigate this risk, thereby reducing the volatility of its financial results.
iv. Risks relating to the portfolio of third-party shares
As of December 31, 2017, Petróleos Mexicanos does not hold any third-party shares of companies that do not participate in financial markets and,therefore, does not hold any related DFIs.
During 2017, PMI HBV liquidated the total shareholding in Repsol, S.A. (Repsol), which was 23,416,219 shares. Therefore, as of December 31,2017, PEMEX does not hold any third-party shares and does not hold any related DFIs.
v. Market risk quantification
The quantification of market risk exposure in PEMEX�s financial instruments is presented below, in accordance with the applicable internationalrisk management practices.
Interest rate risk quantification
The quantification of interest rate risk of investment portfolios is carried out by using the one-day horizon historical VaR, with a confidence levelof 95%, over a period of one year. The VaR incorporates interest rate and spread risks. In addition, for portfolios in domestic currency, the VaR includesthe inflation risk embedded in securities denominated in UDI. For portfolio management purposes, interest rate risk is mitigated by VaR limits.
As of December 31, 2017, the VaR of PEMEX�s investment portfolios was Ps. (10.82) for the Peso Treasury Portfolio, Ps. (44.95) for the FondoLaboral Pemex Portfolio (�FOLAPE�), Ps. (7.17) for the Fideicomiso de Cobertura Laboral y de Vivienda Portfolio (�FICOLAVI�), Ps. (544.32) for theMexican Peso Treasury Portfolio managed by Operadora de Fondos Nafinsa, S.A. de C.V. (�OFINSA�), and U.S. $0 for the U.S. Dollar TreasuryPortfolio.
In addition to the exposure to interest rate fluctuations of the DFIs in which PEMEX is obligated to pay floating rates, PEMEX�s DFIs areexposed to MtM volatility as a result of changes in the interest rate curves used in their valuation.
Interest rate risk quantification was calculated for DFIs in conjunction with the interest rate risk quantification for the debt portfolio. Thefollowing table shows the sensitivity of PEMEX�s DFIs and debt portfolio to a parallel shift of 10 basis points (bp) over the zero coupon rate curves.The 10bp parallel shift may be used to estimate in a simple manner the impact for proportional values to this shift and was selected in accordance withmarket practices for financial risk management.
F-88
Copyright © 2018 www.secdatabase.com. All Rights Reserved.Please Consider the Environment Before Printing This Document
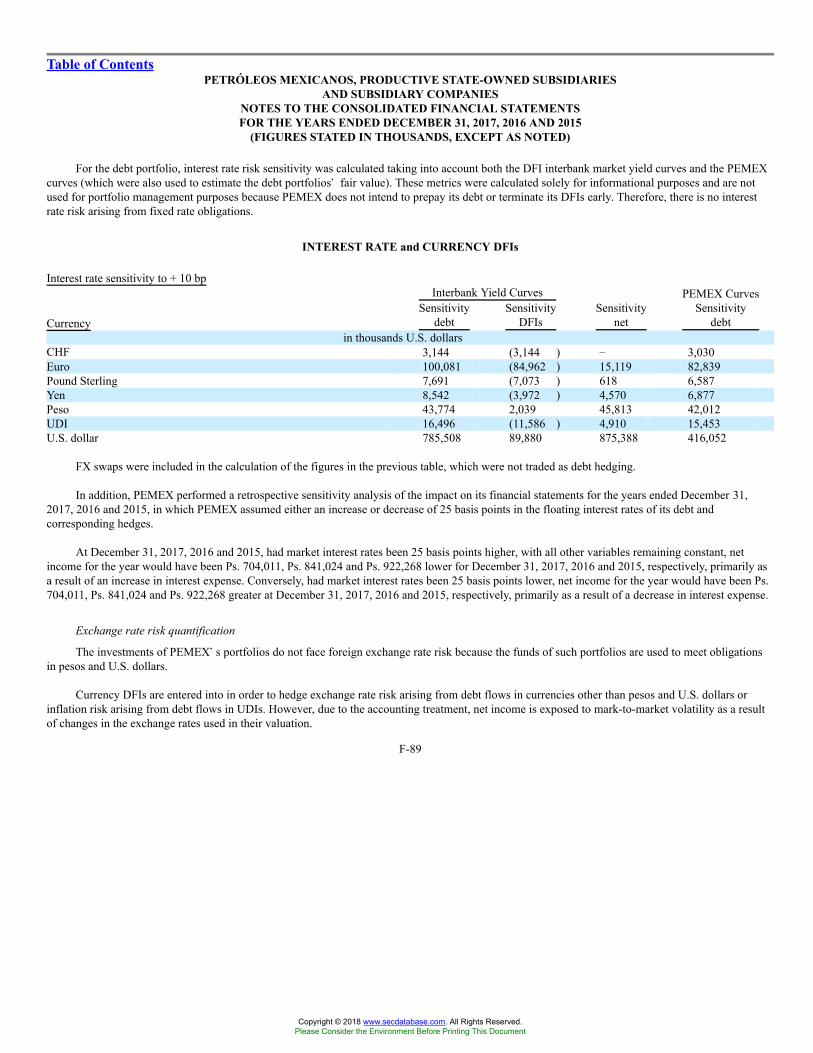
Table of ContentsPETRÓLEOS MEXICANOS, PRODUCTIVE STATE-OWNED SUBSIDIARIES
AND SUBSIDIARY COMPANIESNOTES TO THE CONSOLIDATED FINANCIAL STATEMENTSFOR THE YEARS ENDED DECEMBER 31, 2017, 2016 AND 2015
(FIGURES STATED IN THOUSANDS, EXCEPT AS NOTED)
For the debt portfolio, interest rate risk sensitivity was calculated taking into account both the DFI interbank market yield curves and the PEMEXcurves (which were also used to estimate the debt portfolios� fair value). These metrics were calculated solely for informational purposes and are notused for portfolio management purposes because PEMEX does not intend to prepay its debt or terminate its DFIs early. Therefore, there is no interestrate risk arising from fixed rate obligations.
INTEREST RATE and CURRENCY DFIs
Interest rate sensitivity to + 10 bpInterbank Yield Curves
CurrencySensitivity
debtSensitivity
DFIsSensitivity
net
PEMEX CurvesSensitivity
debtin thousands U.S. dollars
CHF 3,144 (3,144 ) � 3,030Euro 100,081 (84,962 ) 15,119 82,839Pound Sterling 7,691 (7,073 ) 618 6,587Yen 8,542 (3,972 ) 4,570 6,877Peso 43,774 2,039 45,813 42,012UDI 16,496 (11,586 ) 4,910 15,453U.S. dollar 785,508 89,880 875,388 416,052
FX swaps were included in the calculation of the figures in the previous table, which were not traded as debt hedging.
In addition, PEMEX performed a retrospective sensitivity analysis of the impact on its financial statements for the years ended December 31,2017, 2016 and 2015, in which PEMEX assumed either an increase or decrease of 25 basis points in the floating interest rates of its debt andcorresponding hedges.
At December 31, 2017, 2016 and 2015, had market interest rates been 25 basis points higher, with all other variables remaining constant, netincome for the year would have been Ps. 704,011, Ps. 841,024 and Ps. 922,268 lower for December 31, 2017, 2016 and 2015, respectively, primarily asa result of an increase in interest expense. Conversely, had market interest rates been 25 basis points lower, net income for the year would have been Ps.704,011, Ps. 841,024 and Ps. 922,268 greater at December 31, 2017, 2016 and 2015, respectively, primarily as a result of a decrease in interest expense.
Exchange rate risk quantification
The investments of PEMEX�s portfolios do not face foreign exchange rate risk because the funds of such portfolios are used to meet obligationsin pesos and U.S. dollars.
Currency DFIs are entered into in order to hedge exchange rate risk arising from debt flows in currencies other than pesos and U.S. dollars orinflation risk arising from debt flows in UDIs. However, due to the accounting treatment, net income is exposed to mark-to-market volatility as a resultof changes in the exchange rates used in their valuation.
F-89
Copyright © 2018 www.secdatabase.com. All Rights Reserved.Please Consider the Environment Before Printing This Document

Table of ContentsPETRÓLEOS MEXICANOS, PRODUCTIVE STATE-OWNED SUBSIDIARIES
AND SUBSIDIARY COMPANIESNOTES TO THE CONSOLIDATED FINANCIAL STATEMENTSFOR THE YEARS ENDED DECEMBER 31, 2017, 2016 AND 2015
(FIGURES STATED IN THOUSANDS, EXCEPT AS NOTED)
Exchange rate risk quantification was calculated for DFIs in conjunction with the exchange rate risk quantification for the debt portfolio. Thefollowing table shows the sensitivity of PEMEX�s DFIs and debt portfolio to an increase of 1% to the exchange rates of currencies against the U.S.dollar. The 1% may be used to estimate in a simple manner the impact for proportional values to this increase and was selected in accordance withmarket practices for financial risk management.
For the debt portfolio, exchange rate risk sensitivity was calculated taking into account both, interbank market yield curves and the PEMEXcurves. In addition, the table shows the one-day horizon historical VaR of the remaining open position, with a confidence level of 95%, over a period ofone year. These metrics were calculated solely for informational purposes. Nevertheless, in order to carry out management activities related to its debtportfolio, PEMEX periodically conducts quantitative analyses in order to estimate the exchange rate risk exposure generated by its debt issuances.Based on these analyses, PEMEX has elected to enter into DFIs as an exchange rate risk mitigation strategy.
INTEREST RATE and CURRENCY DFIs
Interbank Yield Curves
Currency1%
Debt1%
DFIs1%Net
VaR 95%Net
PEMEX Curves1%
Debtin thousands U.S. dollars
CHF (13,943 ) 13,943 � � (13,624 )Euro (187,988) 165,894 (22,094 ) (19,744 ) (167,068 )Pound Sterling (13,822 ) 13,042 (780 ) (666 ) (12,322 )Yen (16,914 ) 11,470 (5,444 ) (4,398 ) (14,859 )Peso (135,974) 1,409 (134,565) (162,336) (133,525 )UDI (29,485 ) 25,358 (4,127 ) (5,038 ) (28,573 )
As shown in the table above, exchange rate risk derived from debt denominated in currencies other than pesos and U.S. dollars is almost fullyhedged by DFIs.
The exchange rate risk exposure to the euro, Pound sterling and Japanese yen is result of the delta of the structures described above (SeagullOptions and Calls).
FX swaps which were not traded as part of debt hedging were included in the calculation of the figures in the table above.
In addition, PEMEX performed a retrospective sensitivity analysis of the impact on its financial statements of the years ended December 31, 2017,2016 and 2015, in which PEMEX assumed either an increase or decrease of 10% in the exchange rate between the U.S. dollar and peso in order todetermine the impact on net income and equity as a result of applying these new rates to the monthly balances of assets and liabilities denominated inU.S. dollars.
At December 31, 2017, 2016 and 2015, had the peso depreciated against the U.S. dollar by 10% with other variables remaining constant, netincome would have been Ps.149,669, Ps.124,512 and Ps.105,915 lower, respectively, primarily as a result of an increase in the exchange rate losses.However, had the peso appreciated against the U.S. dollar by 10%, net income for the period would have increased by Ps.149,669, Ps.124,512 andPs.105,915, respectively, primarily as a result of the decrease in exchange rate losses.
F-90
Copyright © 2018 www.secdatabase.com. All Rights Reserved.Please Consider the Environment Before Printing This Document
Table of ContentsPETRÓLEOS MEXICANOS, PRODUCTIVE STATE-OWNED SUBSIDIARIES
AND SUBSIDIARY COMPANIESNOTES TO THE CONSOLIDATED FINANCIAL STATEMENTSFOR THE YEARS ENDED DECEMBER 31, 2017, 2016 AND 2015
(FIGURES STATED IN THOUSANDS, EXCEPT AS NOTED)
Hydrocarbon price risk quantification
Pemex Industrial Transformation occasionally faces market risk due to open positions arising from the mismatch between the DFI portfoliooffered to domestic customers and hedges with international counterparties. As of December 31, 2017, Pemex Industrial Transformation�s natural gasDFI portfolio had no market risk exposure.
Market risk exposure is measured using the 20-day Delta-Gamma VaR methodology, with a confidence level of 95%, based on 500 dailyobservations; VaR and CaR are monitored and mitigated by pre-established limits.
It should be noted that sensitivity analyses were not carried out for other financial instruments, such as accounts receivable and payable (asdefined in the financial reporting standards). Such accounts are cleared in short-term, and therefore market risk is considered to be nonexistent. Most ofthese accounts are related to hydrocarbon prices.
In accordance with the risk management regulatory framework that PMI Trading has implemented, VaR and the change in profit and loss byportfolio are calculated daily and compared to the maximum applicable limits in order to implement risk mitigation mechanisms as necessary.
PMI Trading�s global VaR associated with commodities market risk was U.S. $(8,789) as of December 31, 2017. This VaR was calculated usingthe historical method with a 99% confidence level, two-year history and a one-day horizon. The minimum VaR recorded on the year was U.S. $(4,720)(registered on October 17, 2017) and the maximum VaR recorded on the year was U.S. $(19,695) (registered on January 4, 2017). As of December 31,2016, the global VaR was U.S. $(23,198).
The quantification of crude oil price risk is carried out by using the one-day horizon historical VaR, with a confidence level of 95%, over a periodof one year. As of December 31, 2017, this was U.S. $0 as a result of the rise in the price of crude oil.
II. Credit Risk
When the fair value of a DFI is favorable to PEMEX, PEMEX faces the risk that the counterparty will not be able to meet its obligations. PEMEXmonitors its counterparties� creditworthiness and calculates the credit risk exposure for its DFIs. As a risk mitigation strategy, PEMEX only enters intoDFIs with major financial institutions with a minimum credit rating of BBB-. These ratings are issued and revised periodically by risk rating agencies.Furthermore, PEMEX seeks to maintain a diversified portfolio of counterparties.
In order to estimate PEMEX�s credit risk exposure to each financial counterparty, the potential future exposure is calculated by projecting the riskfactors used in the valuation of each DFI in order to estimate the MtM value for different periods, taking into account any credit risk mitigationprovisions.
Moreover, PEMEX has entered into various long-term cross-currency swaps agreements with �recouponing� provisions (pursuant to which thepayments on the swaps are adjusted when the MtM exceeds the relevant threshold specified in the swap), thereby limiting the exposure with itscounterparties to a specific threshold amount. The specified thresholds were reached in three cross-currency swaps from the first to the fourth quarter of2017, which were used to hedge the exchange rate exposure to the euro and in five cross-currency swaps during 2016, which were used to hedge theexchange rate exposure to the Pound sterling. This resulted in the cash settlement of such swaps and the resetting of swap terms to return theirmark-to-market value to zero. During 2017, PEMEX did not enter into any cross-currency swap with these characteristics.
F-91
Copyright © 2018 www.secdatabase.com. All Rights Reserved.Please Consider the Environment Before Printing This Document
Table of ContentsPETRÓLEOS MEXICANOS, PRODUCTIVE STATE-OWNED SUBSIDIARIES
AND SUBSIDIARY COMPANIESNOTES TO THE CONSOLIDATED FINANCIAL STATEMENTSFOR THE YEARS ENDED DECEMBER 31, 2017, 2016 AND 2015
(FIGURES STATED IN THOUSANDS, EXCEPT AS NOTED)
In addition, during 2016 PEMEX entered into long-term DFIs with mandatory early termination clauses (pursuant to which, at a given date andirrespective of the current MtM, the DFI will terminate and settle at the corresponding MtM, and PEMEX can either enter into a new DFI with the samecounterparty or a new counterparty), which reduces the credit risk generated by the term of the DFI by bounding it to a specific date. As ofDecember 31, 2017, PEMEX has entered into three euro swaps and two Japanese yen Seagull Option structures, with termination clauses in 2018 and2021, respectively.
According to IFRS 13 �Fair Value Measurement,� the fair value or MtM value of DFIs must reflect the creditworthiness of the parties.Consequently, the fair value of a DFI takes into account the risk that either party may default on its obligation. In accordance with market best practices,PEMEX applies the credit value adjustment (�CVA�) method to calculate the fair value of its DFIs.
For each DFI, the CVA is calculated by determining the difference between the MtM and the estimated MtM adjusted for credit risk. Indetermining the credit risk, the CVA method takes into account the current market perception about the credit risk of both counterparties, using thefollowing inputs: a) the MtM projection for each payment date based on forward yield curves; b) the implied default probability obtained from both,PEMEX and the counterparty credit default swaps�, at each payment date; and c) the default recovery rates of each counterparty.
The current and potential exposures, aggregated by credit rating, are as follows:
Maximum Credit Exposure by term in Petróleos Mexicanos
Rating Current Less than 1 year 1-3 years 3-5 years 5-7 years 7-10 years More than 10 yearsin thousands U.S. dollars
A 257,424 976,230 1,298,110 1,314,296 578,548 482,959 �A- 138,850 235,594 191,681 228,801 223,751 257,465 �BBB+ 310,705 1,010,356 1,540,015 1,349,311 1,243,898 1,115,559 78,831BBB 2,183 18,626 20,064 18,092 � � �
PEMEX also faces credit risk derived from its investments. As of December 31, 2017, the notional amounts of investments in domestic currency,organized by the credit ratings of the issuances, were as follows:
Credit rating ofissuances*
Notionalamount
mxAAA Ps. 811,548mxAA 200,876mxA 271,275* Minimum S&P, Moody�s and Fitch credit rating.National Credit Rating Scale.Does not include investments in Mexican Government bonds.
The table above does not include domestic currency Mexican Government bonds because these issuances are considered not to carry default riskin this currency.
PEMEX held an investment in a note linked to United Mexican States� credit risk that was issued by a U.S. financial institution with a BBB+credit rating. This note matured in June 2016 and had a face value of U.S. $108,000. As of December 31, 2017, PEMEX does not hold an investment instructured notes.
F-92
Copyright © 2018 www.secdatabase.com. All Rights Reserved.Please Consider the Environment Before Printing This Document
Table of ContentsPETRÓLEOS MEXICANOS, PRODUCTIVE STATE-OWNED SUBSIDIARIES
AND SUBSIDIARY COMPANIESNOTES TO THE CONSOLIDATED FINANCIAL STATEMENTSFOR THE YEARS ENDED DECEMBER 31, 2017, 2016 AND 2015
(FIGURES STATED IN THOUSANDS, EXCEPT AS NOTED)
Furthermore, by means of its credit guidelines for DFI operations, Pemex Industrial Transformation has significantly reduced its credit riskexposure related to the DFIs offered to its customers to assist them in mitigating the risk associated with the volatility of natural gas.
In order to qualify for these DFIs, Pemex Industrial Transformation�s customers must be party to a current natural gas supply contract and sign adomestic master derivative agreement.
Additionally, beginning on October 2, 2009, DFIs with these customers must be initially secured by cash deposits, letters of credit or othercollateral provisions, as required. In accordance with these guidelines, in the event that a client does not meet its payment obligations, DFIs related tothis client are terminated, rights to collateral are exercised and, if the collateral is insufficient to cover the fair value, natural gas supply is suspendeduntil the payment is made.
On August 20, 2014, certain amendments to the credit guidelines were enacted, which allowed Pemex-Gas and Petrochemicals, and now PemexIndustrial Transformation, to offer to its clients with an adequate credit rating, based on an internal financial and credit assessment, DFIs with anexemption from collateral requirements up to certain amount through a credit line approved by the credit committee. Moreover, if the credit line isinsufficient to cover each client�s exposure, the client is obligated to deposit collateral. If a client suffers an event of default, DFIs related to this clientare terminated early and natural gas supply is suspended until the payment is made.
As of December 31, 2017, Pemex Industrial Transformation�s DFIs had a fair value of U.S. $1,464 (deferred premiums included) for clients withexempted credit lines and U.S. $8,183 for clients with guaranteed credit lines. The total amount of exempt credit lines rose to U.S. $117,956,representing 1% usage of available exempt credit lines, while the total amount of guaranteed credit lines rose to U.S. $930,199, representing a 1% usageof available guaranteed credit lines.
As of December 31, 2017, the overdue accounts of natural gas customers in the industrial and distribution sectors accounted for less than 1.00% ofthe total sales of Pemex Industrial Transformation.
As of December 31, 2017, Pemex Industrial Transformation had open DFIs with 8 customers. Of the total volume (in millions of British thermalunits or MMBtu) of DFIs, industrial customers represented 100%.
As of December 31, 2017 and 2016, Pemex Industrial Transformation had not provided any collateral for DFIs entered into to hedge its DFIs withcustomers. This was due to the following: (i) natural gas prices maintained levels below the strike price, which has kept the credit limits within the setlimits; and (ii) when certain DFIs matured, Pemex-Gas and Basic Petrochemicals, and now Pemex Industrial Transformation, had used domesticcustomers� payments to meet its international obligations.
The potential future exposure of Mex Gas Supply, S.L.�s DFI portfolio was calculated in an analogous manner to the analysis of PetróleosMexicanos� DFI positions. The current and potential exposure, aggregated by credit rating, is as follows:
Maximum Credit Exposure by term in Pemex Industrial Transformation
Rating Current Less than 1 year 1-3 years 3-5 years 5-7 years 7-10 years More than 10 yearsin thousands U.S. dollars
A 27 27 � � � � �A- 541 541 306 � � � �BBB+ 25 25 1 � � � �
F-93
Copyright © 2018 www.secdatabase.com. All Rights Reserved.Please Consider the Environment Before Printing This Document
Table of ContentsPETRÓLEOS MEXICANOS, PRODUCTIVE STATE-OWNED SUBSIDIARIES
AND SUBSIDIARY COMPANIESNOTES TO THE CONSOLIDATED FINANCIAL STATEMENTSFOR THE YEARS ENDED DECEMBER 31, 2017, 2016 AND 2015
(FIGURES STATED IN THOUSANDS, EXCEPT AS NOTED)
PMI Trading�s credit risk associated with DFI transactions is mitigated through the use of futures and standardized instruments that are clearedthrough CME-ClearPort.
III. Liquidity Risk
Through its debt planning and the purchase and sale of U.S. dollars, PEMEX currently preserves a cash balance at a level of liquidity in domesticcurrency and U.S. dollars that is considered adequate to cover its investment and operating expenses, as well as other payment obligations. In order topreserve a cash balance at a suitable level, in December of 2017, PEMEX entered into ten FX swaps of the peso against U.S. dollar for an aggregateamount of U.S. $3,000,000.
In addition, PEMEX has acquired committed revolving credit lines in order to mitigate liquidity risk, two of which provide access to Ps. 3,500,000and Ps. 20,000,000 with expiration dates in June and November 2019, respectively; and three others that each provide access to U.S. $1,500,000, U.S.$3,250,000 and U.S. $1,950,000 with expiration dates in December 2019, February 2020 and January 2021, respectively.
Finally, the investment strategies of PEMEX�s portfolios are structured by selecting time horizons that consider each currency�s cash flowrequirements in order to preserve liquidity.
Certain PMI subsidiaries mitigate their liquidity risk through several mechanisms, the most important of which is the centralized treasury or�in-house bank,� which provides access to a syndicated credit line for up to U.S. $700,000 and cash surplus capacity in the custody of the centralizedstructure. In addition, certain PMI subsidiaries have access to bilateral credit lines from financial institutions for up to U.S. $650,000.
These companies monitor their cash flow on a daily basis and protect their creditworthiness in the financial markets. Liquidity risk is mitigated bymonitoring the maximum/minimum permissible financial ratios as set forth in the policies approved by each company�s board of directors.
The following tables show the cash flow maturities as well as the fair value of PEMEX�s debt and DFI portfolios as of December 31, 2017 and2016. It should be noted that:
� For debt obligations, these tables present principal cash flow and the weighted average interest rates for fixed rate debt.
� For interest rate swaps, cross currency swaps, currency options and currency forwards, these tables present notional amounts and weightedaverage interest rates by expected (contractual) maturity dates.
� Weighted average variable rates are based on implied forward rates obtained from the interbank market yield curve at the reporting date.
� For natural gas DFIs, volumes are presented in millions of British thermal unit (MMBtu), and fixed average and strike prices are presentedin U.S. dollars per MMBtu.
� For crude oil, volumes are presented in millions of barrels, and fixed average and strike prices are presented in U.S. dollars per barrel.
� A DFI�s fair value includes CVA and is calculated based on market quotes obtained from market sources such as Bloomberg. Forwardcurves and implied volatilities for natural gas and crude oil are supplied by the Kiodex Risk Workbench platform.
F-94
Copyright © 2018 www.secdatabase.com. All Rights Reserved.Please Consider the Environment Before Printing This Document

Table of ContentsPETRÓLEOS MEXICANOS, PRODUCTIVE STATE-OWNED SUBSIDIARIES
AND SUBSIDIARY COMPANIESNOTES TO THE CONSOLIDATED FINANCIAL STATEMENTSFOR THE YEARS ENDED DECEMBER 31, 2017, 2016 AND 2015
(FIGURES STATED IN THOUSANDS, EXCEPT AS NOTED)
� For PMI Trading, the prices used in commercial transactions and DFIs are published by reputable sources that are widely used ininternational markets, such as CME-NYMEX, Platts and Argus, among others.
� Fair value is calculated internally, either by discounting cash flows with the corresponding zero-coupon yield curve in the original currency,or through other standard methodologies commonly applied in financial markets for specific instruments.
� For all instruments, tables are based on the contract terms in order to determine the future cash flows that are categorized by expectedmaturity dates.
This information is presented in thousands of pesos, except as noted.
F-95
Copyright © 2018 www.secdatabase.com. All Rights Reserved.Please Consider the Environment Before Printing This Document
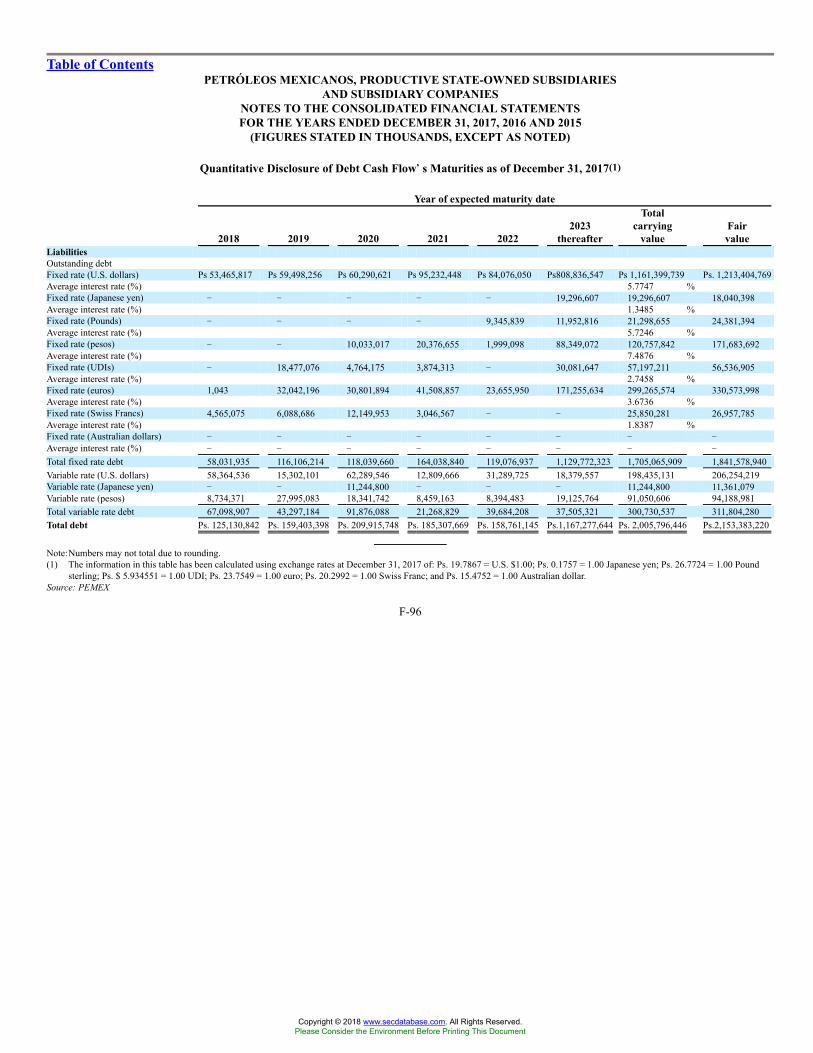
Table of ContentsPETRÓLEOS MEXICANOS, PRODUCTIVE STATE-OWNED SUBSIDIARIES
AND SUBSIDIARY COMPANIESNOTES TO THE CONSOLIDATED FINANCIAL STATEMENTSFOR THE YEARS ENDED DECEMBER 31, 2017, 2016 AND 2015
(FIGURES STATED IN THOUSANDS, EXCEPT AS NOTED)
Quantitative Disclosure of Debt Cash Flow��s Maturities as of December 31, 2017(1)
Year of expected maturity date
2018 2019 2020 2021 20222023
thereafter
Totalcarrying
valueFairvalue
LiabilitiesOutstanding debtFixed rate (U.S. dollars) Ps 53,465,817 Ps 59,498,256 Ps 60,290,621 Ps 95,232,448 Ps 84,076,050 Ps808,836,547 Ps 1,161,399,739 Ps. 1,213,404,769Average interest rate (%) 5.7747 %Fixed rate (Japanese yen) � � � � � 19,296,607 19,296,607 18,040,398Average interest rate (%) 1.3485 %Fixed rate (Pounds) � � � � 9,345,839 11,952,816 21,298,655 24,381,394Average interest rate (%) 5.7246 %Fixed rate (pesos) � � 10,033,017 20,376,655 1,999,098 88,349,072 120,757,842 171,683,692Average interest rate (%) 7.4876 %Fixed rate (UDIs) � 18,477,076 4,764,175 3,874,313 � 30,081,647 57,197,211 56,536,905Average interest rate (%) 2.7458 %Fixed rate (euros) 1,043 32,042,196 30,801,894 41,508,857 23,655,950 171,255,634 299,265,574 330,573,998Average interest rate (%) 3.6736 %Fixed rate (Swiss Francs) 4,565,075 6,088,686 12,149,953 3,046,567 � � 25,850,281 26,957,785Average interest rate (%) 1.8387 %Fixed rate (Australian dollars) � � � � � � � �Average interest rate (%) � � � � � � � �
Total fixed rate debt 58,031,935 116,106,214 118,039,660 164,038,840 119,076,937 1,129,772,323 1,705,065,909 1,841,578,940Variable rate (U.S. dollars) 58,364,536 15,302,101 62,289,546 12,809,666 31,289,725 18,379,557 198,435,131 206,254,219Variable rate (Japanese yen) � � 11,244,800 � � � 11,244,800 11,361,079Variable rate (pesos) 8,734,371 27,995,083 18,341,742 8,459,163 8,394,483 19,125,764 91,050,606 94,188,981Total variable rate debt 67,098,907 43,297,184 91,876,088 21,268,829 39,684,208 37,505,321 300,730,537 311,804,280Total debt Ps. 125,130,842 Ps. 159,403,398 Ps. 209,915,748 Ps. 185,307,669 Ps. 158,761,145 Ps.1,167,277,644 Ps. 2,005,796,446 Ps.2,153,383,220
Note:Numbers may not total due to rounding.(1) The information in this table has been calculated using exchange rates at December 31, 2017 of: Ps. 19.7867 = U.S. $1.00; Ps. 0.1757 = 1.00 Japanese yen; Ps. 26.7724 = 1.00 Pound
sterling; Ps. $ 5.934551 = 1.00 UDI; Ps. 23.7549 = 1.00 euro; Ps. 20.2992 = 1.00 Swiss Franc; and Ps. 15.4752 = 1.00 Australian dollar.Source: PEMEX
F-96
Copyright © 2018 www.secdatabase.com. All Rights Reserved.Please Consider the Environment Before Printing This Document
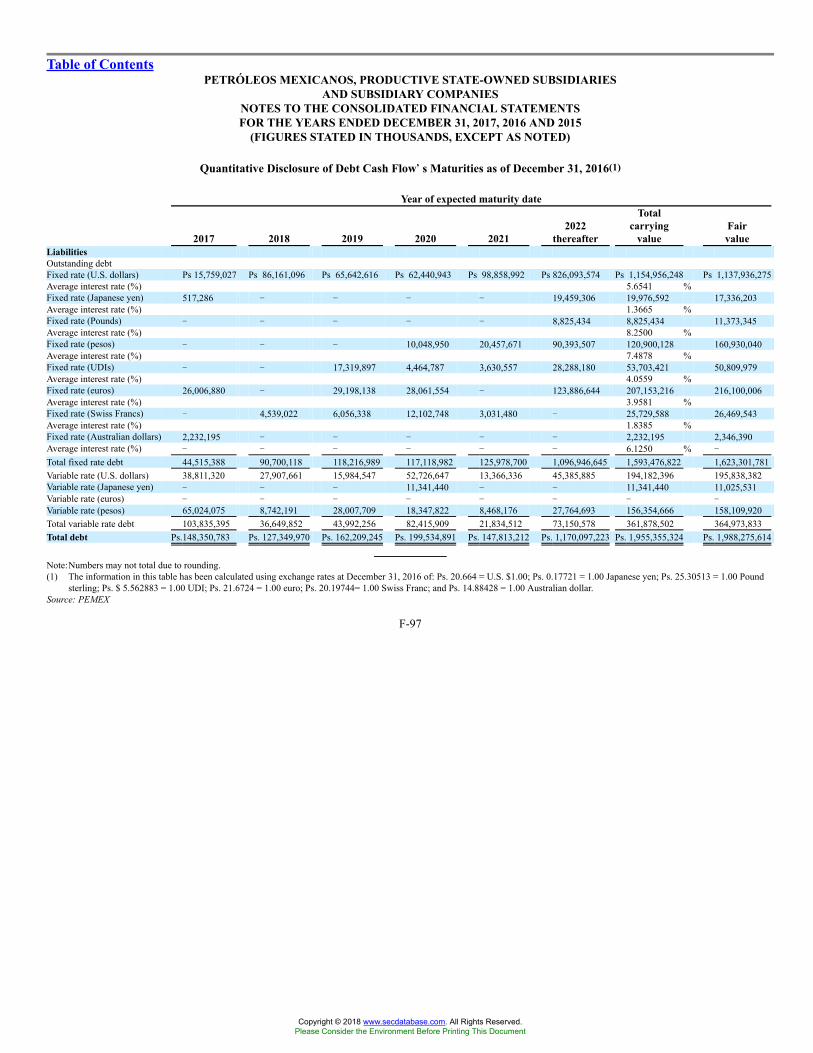
Table of ContentsPETRÓLEOS MEXICANOS, PRODUCTIVE STATE-OWNED SUBSIDIARIES
AND SUBSIDIARY COMPANIESNOTES TO THE CONSOLIDATED FINANCIAL STATEMENTSFOR THE YEARS ENDED DECEMBER 31, 2017, 2016 AND 2015
(FIGURES STATED IN THOUSANDS, EXCEPT AS NOTED)
Quantitative Disclosure of Debt Cash Flow��s Maturities as of December 31, 2016(1)
Year of expected maturity date
2017 2018 2019 2020 20212022
thereafter
Totalcarrying
valueFairvalue
LiabilitiesOutstanding debtFixed rate (U.S. dollars) Ps 15,759,027 Ps 86,161,096 Ps 65,642,616 Ps 62,440,943 Ps 98,858,992 Ps 826,093,574 Ps 1,154,956,248 Ps 1,137,936,275Average interest rate (%) 5.6541 %Fixed rate (Japanese yen) 517,286 � � � � 19,459,306 19,976,592 17,336,203Average interest rate (%) 1.3665 %Fixed rate (Pounds) � � � � � 8,825,434 8,825,434 11,373,345Average interest rate (%) 8.2500 %Fixed rate (pesos) � � � 10,048,950 20,457,671 90,393,507 120,900,128 160,930,040Average interest rate (%) 7.4878 %Fixed rate (UDIs) � � 17,319,897 4,464,787 3,630,557 28,288,180 53,703,421 50,809,979Average interest rate (%) 4.0559 %Fixed rate (euros) 26,006,880 � 29,198,138 28,061,554 � 123,886,644 207,153,216 216,100,006Average interest rate (%) 3.9581 %Fixed rate (Swiss Francs) � 4,539,022 6,056,338 12,102,748 3,031,480 � 25,729,588 26,469,543Average interest rate (%) 1.8385 %Fixed rate (Australian dollars) 2,232,195 � � � � � 2,232,195 2,346,390Average interest rate (%) � � � � � � 6.1250 % �
Total fixed rate debt 44,515,388 90,700,118 118,216,989 117,118,982 125,978,700 1,096,946,645 1,593,476,822 1,623,301,781Variable rate (U.S. dollars) 38,811,320 27,907,661 15,984,547 52,726,647 13,366,336 45,385,885 194,182,396 195,838,382Variable rate (Japanese yen) � � � 11,341,440 � � 11,341,440 11,025,531Variable rate (euros) � � � � � � � �Variable rate (pesos) 65,024,075 8,742,191 28,007,709 18,347,822 8,468,176 27,764,693 156,354,666 158,109,920Total variable rate debt 103,835,395 36,649,852 43,992,256 82,415,909 21,834,512 73,150,578 361,878,502 364,973,833Total debt Ps.148,350,783 Ps. 127,349,970 Ps. 162,209,245 Ps. 199,534,891 Ps. 147,813,212 Ps. 1,170,097,223 Ps. 1,955,355,324 Ps. 1,988,275,614
Note:Numbers may not total due to rounding.(1) The information in this table has been calculated using exchange rates at December 31, 2016 of: Ps. 20.664 = U.S. $1.00; Ps. 0.17721 = 1.00 Japanese yen; Ps. 25.30513 = 1.00 Pound
sterling; Ps. $ 5.562883 = 1.00 UDI; Ps. 21.6724 = 1.00 euro; Ps. 20.19744= 1.00 Swiss Franc; and Ps. 14.88428 = 1.00 Australian dollar.Source: PEMEX
F-97
Copyright © 2018 www.secdatabase.com. All Rights Reserved.Please Consider the Environment Before Printing This Document

Table of ContentsPETRÓLEOS MEXICANOS, PRODUCTIVE STATE-OWNED SUBSIDIARIES
AND SUBSIDIARY COMPANIESNOTES TO THE CONSOLIDATED FINANCIAL STATEMENTSFOR THE YEARS ENDED DECEMBER 31, 2017, 2016 AND 2015
(FIGURES STATED IN THOUSANDS, EXCEPT AS NOTED)
Quantitative Disclosure of Cash Flow��s Maturities from Derivative Financial Instruments Held or Issued for Purposes Other than Trading asof December 31, 2017(1)(2)
Year of expected maturity date
2018 2019 2020 2021 20222023
Thereafter
TotalNotionalAmount
FairValue(3)
Hedging instruments(2)(4)Interest rate DFIsInterest rate swaps (U.S. dollars)Variable to fixed Ps. 4,704,170 Ps. 4,717,321 Ps. 4,730,857 Ps. 4,686,396 Ps 4,570,070 Ps 10,143,209 Ps. 33,552,022 Ps. 388,851Average pay rate 3.16 % 3.18 % 3.20 % 3.22 % 3.26 % 3.48 % N.A. N.A.Average receive rate 3.19 % 3.44 % 3.69 % 3.81 % 3.95 % 4.48 % N.A. N.A.Interest rate swaps (pesos)Variable to fixed � � � � � � � �Average pay rate N.A. N.A. N.A. N.A. N.A. N.A. N.A. N.A.Average receive rate N.A. N.A. N.A. N.A. N.A. N.A. N.A. N.A.Currency DFIsCross-currency swapsReceive euros/Pay U.S. dollars � 29,898,198 28,719,208 36,902,690 21,302,856 161,617,172 278,440,124 19,065,727Receive Japanese yen/ Pay U.S. dollars � � 13,039,563 � � 4,775,551 17,815,114 (1,670,533 )Receive Pounds sterling/ Pay U.S. dollars � � � � 10,310,216 11,706,999 22,017,215 1,151,096Receive UDI/ Pay pesos � 23,740,341 7,292,520 3,000,000 � 20,605,166 54,638,028 (4,720,592 )Receive Swiss francs/ Pay U.S. dollars 4,535,474 6,501,082 11,548,658 2,994,374 � � 25,579,588 400,316Receive Australian dollars/ Pay U.S. dollars � � � � � � � �Currency OptionsBuy Put, Sell Put and Sell Call on Japanese
yen � � � � � 14,046,320 14,046,320 48,715Buy call, Sell call and Sell Put on euros � � � 41,567,998 � 59,382,855 100,950,853 4,919,444Sell Call on Pound sterling � � � � � 12,031,728 12,031,728 (239,626 )Currency ForwardsReceive U.S. dollars / Pay pesos 59,360,100 � � � � � 59,360,100 (2,006,461 )
N.A. = not applicable.Numbers may not total due to rounding.(1) The information in this table has been calculated using exchange rates at December 31, 2017 of: Ps. 19.7867 = U.S. $1.00 and Ps. 23.7549 = 1.00 euro.(2) PEMEX�s management uses these DFIs to hedge market risk; however, these DFIs do not qualify for accounting purposes as hedges and are recorded in the financial statements as
entered into for trading purposes.(3) Positive numbers represent a favorable fair value to PEMEX.(4) PMI�s risk management policies and procedures establish that DFIs should be used only for hedging purposes; however DFIs are not recorded as hedges for accounting purposes.Source: PEMEX
F-98
Copyright © 2018 www.secdatabase.com. All Rights Reserved.Please Consider the Environment Before Printing This Document
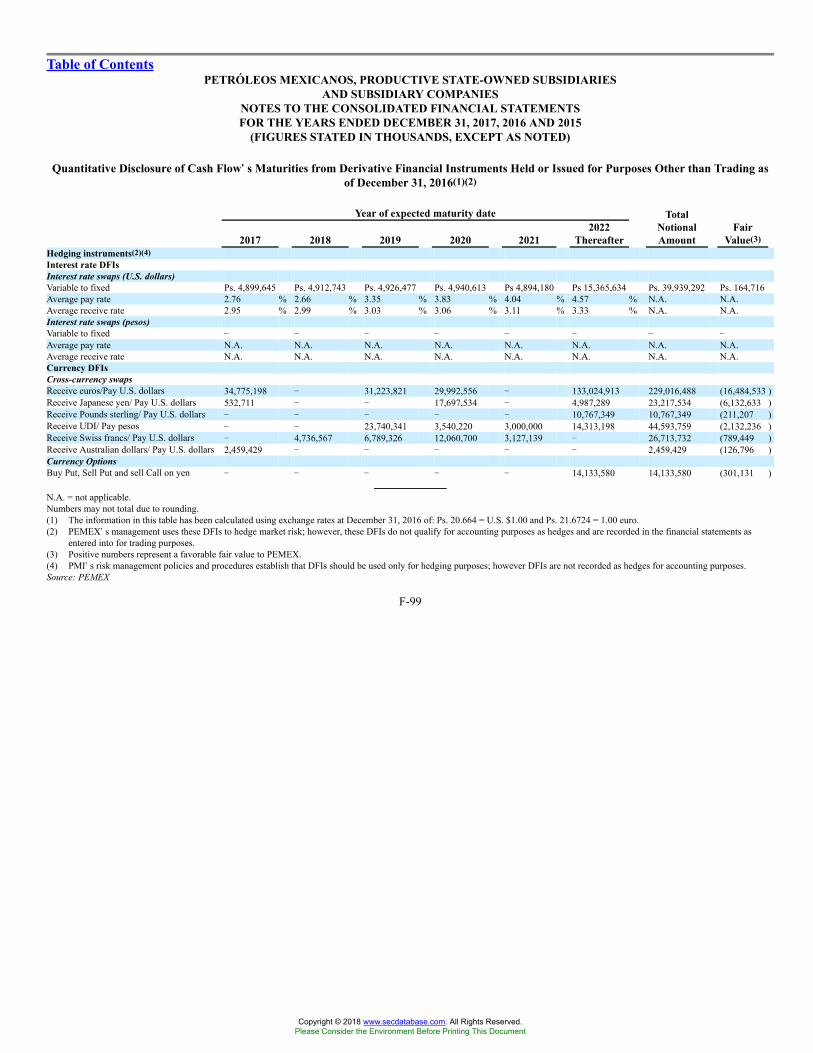
Table of ContentsPETRÓLEOS MEXICANOS, PRODUCTIVE STATE-OWNED SUBSIDIARIES
AND SUBSIDIARY COMPANIESNOTES TO THE CONSOLIDATED FINANCIAL STATEMENTSFOR THE YEARS ENDED DECEMBER 31, 2017, 2016 AND 2015
(FIGURES STATED IN THOUSANDS, EXCEPT AS NOTED)
Quantitative Disclosure of Cash Flow��s Maturities from Derivative Financial Instruments Held or Issued for Purposes Other than Trading asof December 31, 2016(1)(2)
Year of expected maturity date
2017 2018 2019 2020 20212022
Thereafter
TotalNotionalAmount
FairValue(3)
Hedging instruments(2)(4)Interest rate DFIsInterest rate swaps (U.S. dollars)Variable to fixed Ps. 4,899,645 Ps. 4,912,743 Ps. 4,926,477 Ps. 4,940,613 Ps 4,894,180 Ps 15,365,634 Ps. 39,939,292 Ps. 164,716Average pay rate 2.76 % 2.66 % 3.35 % 3.83 % 4.04 % 4.57 % N.A. N.A.Average receive rate 2.95 % 2.99 % 3.03 % 3.06 % 3.11 % 3.33 % N.A. N.A.Interest rate swaps (pesos)Variable to fixed � � � � � � � �Average pay rate N.A. N.A. N.A. N.A. N.A. N.A. N.A. N.A.Average receive rate N.A. N.A. N.A. N.A. N.A. N.A. N.A. N.A.Currency DFIsCross-currency swapsReceive euros/Pay U.S. dollars 34,775,198 � 31,223,821 29,992,556 � 133,024,913 229,016,488 (16,484,533 )Receive Japanese yen/ Pay U.S. dollars 532,711 � � 17,697,534 � 4,987,289 23,217,534 (6,132,633 )Receive Pounds sterling/ Pay U.S. dollars � � � � � 10,767,349 10,767,349 (211,207 )Receive UDI/ Pay pesos � � 23,740,341 3,540,220 3,000,000 14,313,198 44,593,759 (2,132,236 )Receive Swiss francs/ Pay U.S. dollars � 4,736,567 6,789,326 12,060,700 3,127,139 � 26,713,732 (789,449 )Receive Australian dollars/ Pay U.S. dollars 2,459,429 � � � � � 2,459,429 (126,796 )Currency OptionsBuy Put, Sell Put and sell Call on yen � � � � � 14,133,580 14,133,580 (301,131 )
N.A. = not applicable.Numbers may not total due to rounding.(1) The information in this table has been calculated using exchange rates at December 31, 2016 of: Ps. 20.664 = U.S. $1.00 and Ps. 21.6724 = 1.00 euro.(2) PEMEX�s management uses these DFIs to hedge market risk; however, these DFIs do not qualify for accounting purposes as hedges and are recorded in the financial statements as
entered into for trading purposes.(3) Positive numbers represent a favorable fair value to PEMEX.(4) PMI�s risk management policies and procedures establish that DFIs should be used only for hedging purposes; however DFIs are not recorded as hedges for accounting purposes.Source: PEMEX
F-99
Copyright © 2018 www.secdatabase.com. All Rights Reserved.Please Consider the Environment Before Printing This Document
Table of ContentsPETRÓLEOS MEXICANOS, PRODUCTIVE STATE-OWNED SUBSIDIARIES
AND SUBSIDIARY COMPANIESNOTES TO THE CONSOLIDATED FINANCIAL STATEMENTSFOR THE YEARS ENDED DECEMBER 31, 2017, 2016 AND 2015
(FIGURES STATED IN THOUSANDS, EXCEPT AS NOTED)
B. Fair value of derivative financial instruments
PEMEX periodically evaluates its exposure to international hydrocarbon prices, interest rates and foreign currencies and uses derivativeinstruments as a mitigation mechanism when potential sources of market risk are identified.
PEMEX monitors the fair value of its DFI portfolio on a periodic basis. The fair value represents the price at which one party would assume therights and obligations of the other and is calculated for DFIs through models commonly used in the international financial markets, based on inputsobtained from major market information systems and price providers. As a result of this monitoring, PEMEX does not employ an independent thirdparty to perform the valuation.
PEMEX�s DFIs portfolio is composed primarily of swaps, the prices of which are estimated by discounting flows using the appropriate factorsand contains no exotic instruments that require numerical approximations for their valuation.
Embedded derivatives
In accordance with established policies, PEMEX has analyzed the different contracts it has entered into and has determined that according to theterms thereof, none meet the criteria necessary to be classified as embedded derivatives. Accordingly, as of December 31, 2017 and 2016, PEMEX didnot recognize any embedded derivatives (foreign currency or index).
Accounting treatment
PEMEX enters into derivatives transactions with the sole purpose of hedging financial risks related to its operations, firm commitments, plannedtransactions and assets and liabilities recorded on its statement of financial position. Nonetheless, some of these transactions do not qualify for hedgeaccounting treatment because they do not meet the requirements of the accounting standards for designation as hedges. They are therefore recorded inthe financial statements as non-hedge instruments or as instruments entered into for trading purposes, despite the fact that their cash flows are offset bythe cash flows of the positions (assets or liabilities) to which they relate. As a result, the changes in their fair value are recognized in the �Derivativefinancial instruments (cost) income, net� line item in the consolidated statement of comprehensive income.
As of December 31, 2017 and 2016, the net fair value of PEMEX�s DFIs (including both DFIs that have not reached maturity and those that havereached maturity but have not been settled), recognized in the consolidated statement of financial position, was Ps. 12,367,475 and Ps. (26,010,486),respectively. As of December 31, 2017 and 2016, PEMEX did not have any DFIs designated as hedges.
The following table shows the fair values and notional amounts of PEMEX�s OTC DFIs that were designated as non-hedges for accountingpurposes and entered into for trading purposes as of December 31, 2017 and 2016. It should be noted that:
� A DFI�s fair value includes CVA and is calculated based on market quotes obtained from market sources such as Bloomberg. Forwardcurves and implied volatilities for natural gas and crude oil are supplied by the Kiodex Risk Workbench platform.
� Fair value is calculated internally, either by discounting cash flows with the corresponding zero-coupon yield curve, in the original currency,or through other standard methodologies commonly applied in the financial markets for certain specific instruments.
� The information is presented in thousands of pesos (except as noted).
F-100
Copyright © 2018 www.secdatabase.com. All Rights Reserved.Please Consider the Environment Before Printing This Document
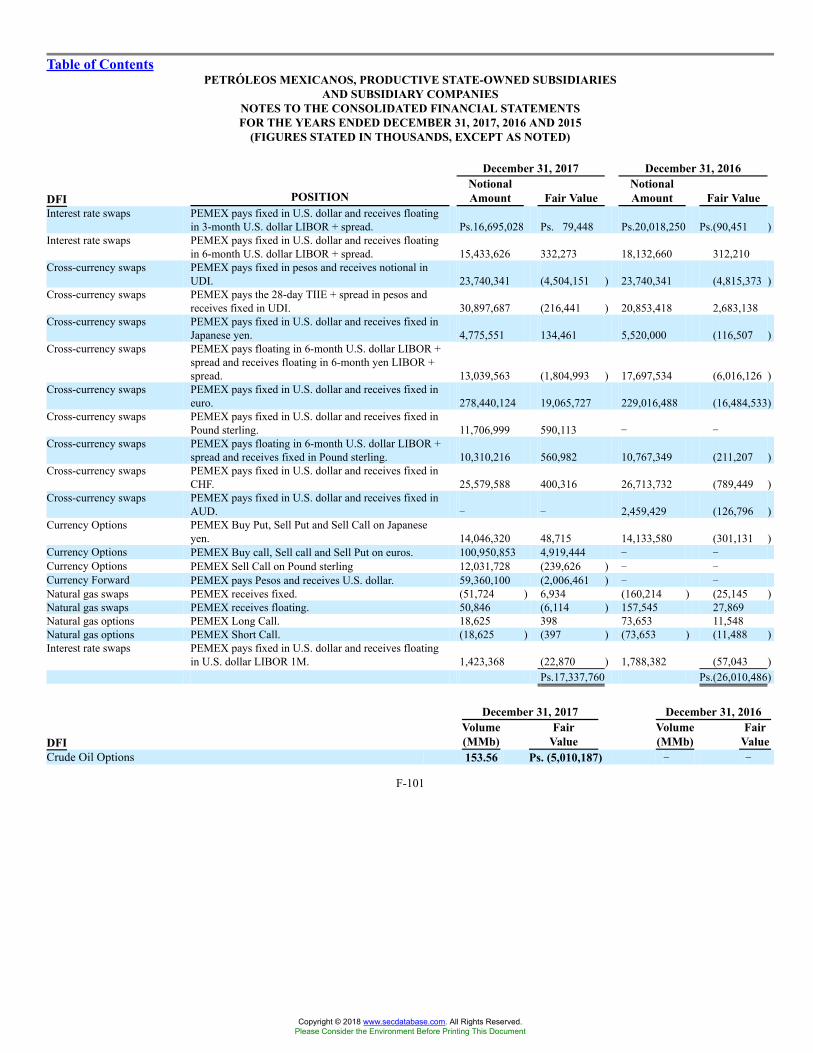
Table of ContentsPETRÓLEOS MEXICANOS, PRODUCTIVE STATE-OWNED SUBSIDIARIES
AND SUBSIDIARY COMPANIESNOTES TO THE CONSOLIDATED FINANCIAL STATEMENTSFOR THE YEARS ENDED DECEMBER 31, 2017, 2016 AND 2015
(FIGURES STATED IN THOUSANDS, EXCEPT AS NOTED)
December 31, 2017 December 31, 2016
DFI POSITIONNotionalAmount Fair Value
NotionalAmount Fair Value
Interest rate swaps PEMEX pays fixed in U.S. dollar and receives floatingin 3-month U.S. dollar LIBOR + spread. Ps.16,695,028 Ps. 79,448 Ps.20,018,250 Ps.(90,451 )
Interest rate swaps PEMEX pays fixed in U.S. dollar and receives floatingin 6-month U.S. dollar LIBOR + spread. 15,433,626 332,273 18,132,660 312,210
Cross-currency swaps PEMEX pays fixed in pesos and receives notional inUDI. 23,740,341 (4,504,151 ) 23,740,341 (4,815,373 )
Cross-currency swaps PEMEX pays the 28-day TIIE + spread in pesos andreceives fixed in UDI. 30,897,687 (216,441 ) 20,853,418 2,683,138
Cross-currency swaps PEMEX pays fixed in U.S. dollar and receives fixed inJapanese yen. 4,775,551 134,461 5,520,000 (116,507 )
Cross-currency swaps PEMEX pays floating in 6-month U.S. dollar LIBOR +spread and receives floating in 6-month yen LIBOR +spread. 13,039,563 (1,804,993 ) 17,697,534 (6,016,126 )
Cross-currency swaps PEMEX pays fixed in U.S. dollar and receives fixed ineuro. 278,440,124 19,065,727 229,016,488 (16,484,533)
Cross-currency swaps PEMEX pays fixed in U.S. dollar and receives fixed inPound sterling. 11,706,999 590,113 � �
Cross-currency swaps PEMEX pays floating in 6-month U.S. dollar LIBOR +spread and receives fixed in Pound sterling. 10,310,216 560,982 10,767,349 (211,207 )
Cross-currency swaps PEMEX pays fixed in U.S. dollar and receives fixed inCHF. 25,579,588 400,316 26,713,732 (789,449 )
Cross-currency swaps PEMEX pays fixed in U.S. dollar and receives fixed inAUD. � � 2,459,429 (126,796 )
Currency Options PEMEX Buy Put, Sell Put and Sell Call on Japaneseyen. 14,046,320 48,715 14,133,580 (301,131 )
Currency Options PEMEX Buy call, Sell call and Sell Put on euros. 100,950,853 4,919,444 � �Currency Options PEMEX Sell Call on Pound sterling 12,031,728 (239,626 ) � �Currency Forward PEMEX pays Pesos and receives U.S. dollar. 59,360,100 (2,006,461 ) � �Natural gas swaps PEMEX receives fixed. (51,724 ) 6,934 (160,214 ) (25,145 )Natural gas swaps PEMEX receives floating. 50,846 (6,114 ) 157,545 27,869Natural gas options PEMEX Long Call. 18,625 398 73,653 11,548Natural gas options PEMEX Short Call. (18,625 ) (397 ) (73,653 ) (11,488 )Interest rate swaps PEMEX pays fixed in U.S. dollar and receives floating
in U.S. dollar LIBOR 1M. 1,423,368 (22,870 ) 1,788,382 (57,043 )Ps.17,337,760 Ps.(26,010,486)
December 31, 2017 December 31, 2016
DFIVolume(MMb)
FairValue
Volume(MMb)
FairValue
Crude Oil Options 153.56 Ps. (5,010,187) � �
F-101
Copyright © 2018 www.secdatabase.com. All Rights Reserved.Please Consider the Environment Before Printing This Document

Table of ContentsPETRÓLEOS MEXICANOS, PRODUCTIVE STATE-OWNED SUBSIDIARIES
AND SUBSIDIARY COMPANIESNOTES TO THE CONSOLIDATED FINANCIAL STATEMENTSFOR THE YEARS ENDED DECEMBER 31, 2017, 2016 AND 2015
(FIGURES STATED IN THOUSANDS, EXCEPT AS NOTED)
December 31, 2017 December 31, 2016
DFI MarketVolume(MMb)
Fairvalue
Volume(MMb)
Fairvalue
Futures Exchange traded 2.1 Ps. (141,693) � Ps. �Petroleum Products Swaps Exchange traded 1.3 Ps. (99,680) 4.1 Ps. (688,016)
Notes: Numbers may not total due to rounding.(1) The fair value of the Futures and the Petroleum Products Swaps, was recognized as �Cash and cash equivalents� in the statement of financial position because PEMEX considered these
financial assets to be fully liquid.
The exchange rate for U.S. dollars as of December 31, 2017 and 2016 was Ps. 19.7867 and Ps. 20.6640 per U.S. dollar, respectively. Theexchange rate for euros as of December 31, 2017 and 2016 was Ps. 23.7549 and Ps. 21.6724 per euro, respectively.
For the years ended December 31, 2017, 2016 and 2015, PEMEX recognized a net gain (loss) of Ps. 25,338,324, Ps. (14,000,987) and Ps.(21,449,877), respectively, in the �Derivative financial instruments (cost) income, net� line item with respect to DFIs treated as instruments entered intofor trading purposes.
The following table presents the fair value of PEMEX�s DFIs that are showed on the consolidated statement of financial position in derivativefinancial instruments (including both DFIs that have not reached maturity and those that have reached maturity but have not been settled), as ofDecember 31, 2017 and 2016:
Derivatives assetsFair value
2017 2016Derivatives not designated as hedging instrumentsCrude oil options Ps.397,630 Ps.�Currency options 4,968,159 �Natural gas options 398 11,548Cross-currency swaps 24,126,452 4,503,550Natural gas swaps 7,003 30,162Propane swaps �� �Interest rate swaps 411,721 312,210Others 202,091 �
Total derivatives not designated as hedging instruments 30,113,454 4,857,470Total assets Ps. 30,113,454 Ps. 4,857,470
F-102
Copyright © 2018 www.secdatabase.com. All Rights Reserved.Please Consider the Environment Before Printing This Document
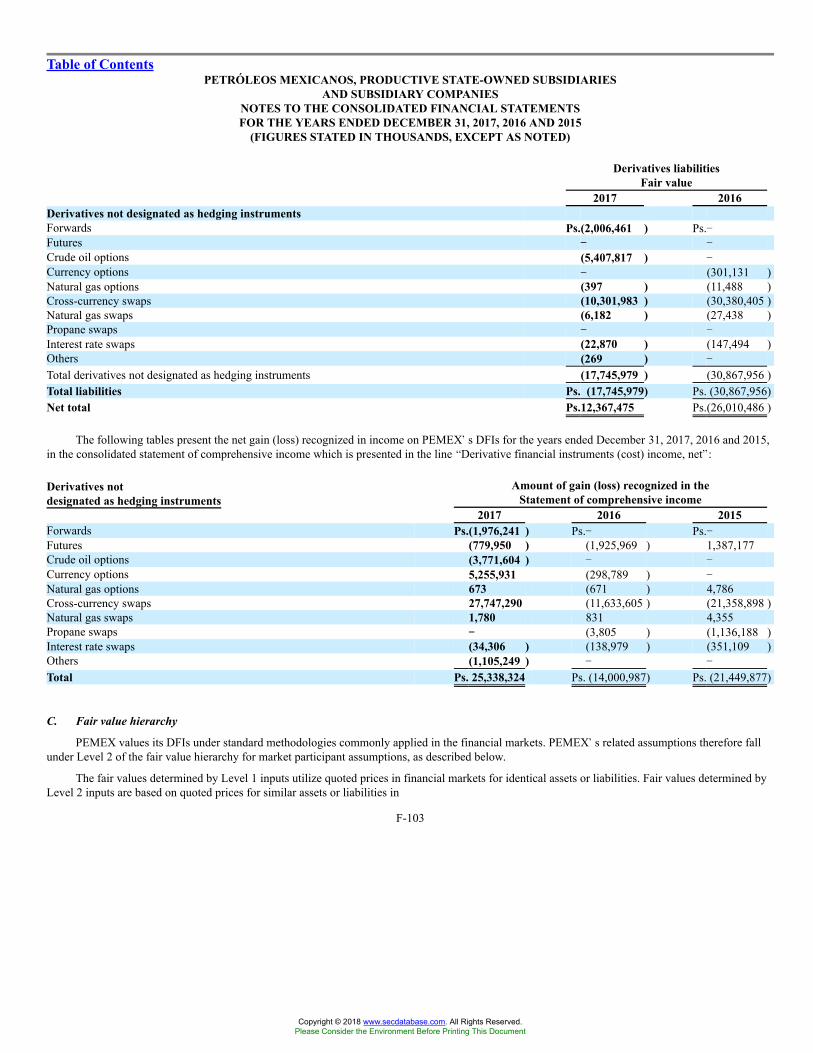
Table of ContentsPETRÓLEOS MEXICANOS, PRODUCTIVE STATE-OWNED SUBSIDIARIES
AND SUBSIDIARY COMPANIESNOTES TO THE CONSOLIDATED FINANCIAL STATEMENTSFOR THE YEARS ENDED DECEMBER 31, 2017, 2016 AND 2015
(FIGURES STATED IN THOUSANDS, EXCEPT AS NOTED)
Derivatives liabilitiesFair value
2017 2016Derivatives not designated as hedging instrumentsForwards Ps.(2,006,461 ) Ps.�Futures �� �Crude oil options (5,407,817 ) �Currency options �� (301,131 )Natural gas options (397 ) (11,488 )Cross-currency swaps (10,301,983 ) (30,380,405 )Natural gas swaps (6,182 ) (27,438 )Propane swaps �� �Interest rate swaps (22,870 ) (147,494 )Others (269 ) �
Total derivatives not designated as hedging instruments (17,745,979 ) (30,867,956 )Total liabilities Ps. (17,745,979) Ps. (30,867,956)Net total Ps.12,367,475 Ps.(26,010,486 )
The following tables present the net gain (loss) recognized in income on PEMEX�s DFIs for the years ended December 31, 2017, 2016 and 2015,in the consolidated statement of comprehensive income which is presented in the line �Derivative financial instruments (cost) income, net�:
Derivatives notdesignated as hedging instruments
Amount of gain (loss) recognized in theStatement of comprehensive income
2017 2016 2015Forwards Ps.(1,976,241 ) Ps.� Ps.�Futures (779,950 ) (1,925,969 ) 1,387,177Crude oil options (3,771,604 ) � �Currency options 5,255,931 (298,789 ) �Natural gas options 673 (671 ) 4,786Cross-currency swaps 27,747,290 (11,633,605 ) (21,358,898 )Natural gas swaps 1,780 831 4,355Propane swaps �� (3,805 ) (1,136,188 )Interest rate swaps (34,306 ) (138,979 ) (351,109 )Others (1,105,249 ) � �
Total Ps. 25,338,324 Ps. (14,000,987) Ps. (21,449,877)
C. Fair value hierarchy
PEMEX values its DFIs under standard methodologies commonly applied in the financial markets. PEMEX�s related assumptions therefore fallunder Level 2 of the fair value hierarchy for market participant assumptions, as described below.
The fair values determined by Level 1 inputs utilize quoted prices in financial markets for identical assets or liabilities. Fair values determined byLevel 2 inputs are based on quoted prices for similar assets or liabilities in
F-103
Copyright © 2018 www.secdatabase.com. All Rights Reserved.Please Consider the Environment Before Printing This Document
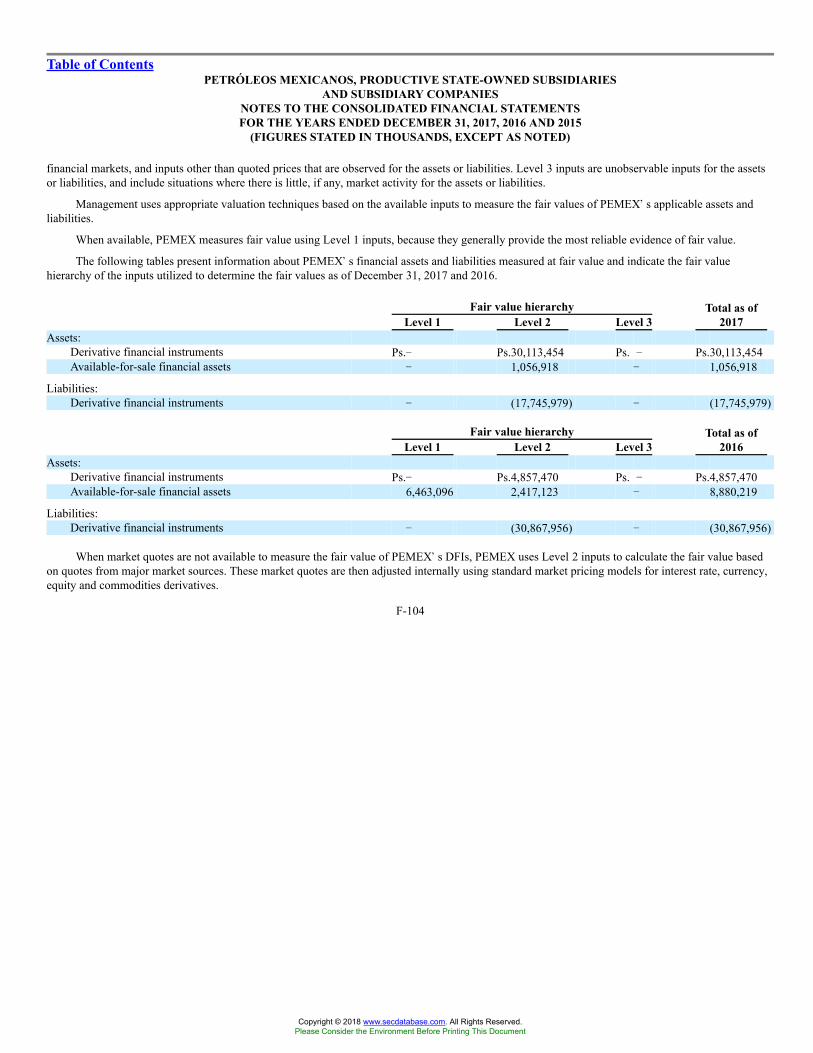
Table of ContentsPETRÓLEOS MEXICANOS, PRODUCTIVE STATE-OWNED SUBSIDIARIES
AND SUBSIDIARY COMPANIESNOTES TO THE CONSOLIDATED FINANCIAL STATEMENTSFOR THE YEARS ENDED DECEMBER 31, 2017, 2016 AND 2015
(FIGURES STATED IN THOUSANDS, EXCEPT AS NOTED)
financial markets, and inputs other than quoted prices that are observed for the assets or liabilities. Level 3 inputs are unobservable inputs for the assetsor liabilities, and include situations where there is little, if any, market activity for the assets or liabilities.
Management uses appropriate valuation techniques based on the available inputs to measure the fair values of PEMEX�s applicable assets andliabilities.
When available, PEMEX measures fair value using Level 1 inputs, because they generally provide the most reliable evidence of fair value.
The following tables present information about PEMEX�s financial assets and liabilities measured at fair value and indicate the fair valuehierarchy of the inputs utilized to determine the fair values as of December 31, 2017 and 2016.
Fair value hierarchyLevel 1 Level 2 Level 3
Total as of2017
Assets:Derivative financial instruments Ps.� Ps.30,113,454 Ps. � Ps.30,113,454Available-for-sale financial assets � 1,056,918 � 1,056,918
Liabilities:Derivative financial instruments � (17,745,979) � (17,745,979)
Fair value hierarchyLevel 1 Level 2 Level 3
Total as of2016
Assets:Derivative financial instruments Ps.� Ps.4,857,470 Ps. � Ps.4,857,470Available-for-sale financial assets 6,463,096 2,417,123 � 8,880,219
Liabilities:Derivative financial instruments � (30,867,956) � (30,867,956)
When market quotes are not available to measure the fair value of PEMEX�s DFIs, PEMEX uses Level 2 inputs to calculate the fair value basedon quotes from major market sources. These market quotes are then adjusted internally using standard market pricing models for interest rate, currency,equity and commodities derivatives.
F-104
Copyright © 2018 www.secdatabase.com. All Rights Reserved.Please Consider the Environment Before Printing This Document

Table of ContentsPETRÓLEOS MEXICANOS, PRODUCTIVE STATE-OWNED SUBSIDIARIES
AND SUBSIDIARY COMPANIESNOTES TO THE CONSOLIDATED FINANCIAL STATEMENTSFOR THE YEARS ENDED DECEMBER 31, 2017, 2016 AND 2015
(FIGURES STATED IN THOUSANDS, EXCEPT AS NOTED)
The following table shows the carrying value and the estimated fair value of the remaining financial assets and liabilities, which are not valued atfair value, as of December 31, 2017 and 2016:
2017 2016Carrying value Fair value Carrying value Fair value
Assets:Cash and cash equivalents Ps.97,851,754 Ps.97,851,754 Ps.163,532,513 Ps.163,532,513Accounts receivable, net 170,645,234 170,645,234 133,220,527 133,220,527Long-term notes receivable 148,492,909 148,492,909 148,607,602 148,607,602
Liabilities:Suppliers 139,955,378 139,955,378 151,649,540 151,649,540Accounts and accrued expenses payable 23,211,401 23,211,401 18,666,607 18,666,607Short-term debt and current portion of
long-term debt 157,209,467 157,209,467 176,166,188 176,166,188Long-term debt 1,880,665,604 1,996,173,753 1,807,004,542 1,812,109,426
The fair values of the financial current assets and current liabilities presented in the table above are included for informational purposes.
The fair values of current financial assets and short-term liabilities are equal to their nominal values because, due to their short-term maturities,their nominal values are very close to their corresponding fair values.
The fair value of long-term debt is estimated using quotes from major market sources which are then adjusted internally using standard marketpricing models. As a result of relevant assumptions, estimated fair values do not necessarily represent the actual terms at which existing transactionscould be liquidated or unwound.
The information related to �Cash and cash equivalents�, �Accounts receivable, net�, �Available-for-sale financial assets�, �Long-term notesreceivable� and �Debt� is described in the following notes, respectively:
� Note 6, Cash, cash equivalents and restricted cash;
� Note 7, Accounts receivable, net;
� Note 10, Available-for-sale financial assets;
� Note 14, Long-term notes receivable and other; and
� Note 15, Debt.
NOTE 17. EMPLOYEE BENEFITS
Until December 31, 2015, Petróleos Mexicanos and Subsidiary Entities only had defined benefit pension plans for the retirement of its employees,to which only Petróleos Mexicanos and the Subsidiary Entities contribute. Benefits under these plans are based on an employee�s salary and years ofservice completed at retirement. As of January 1, 2016, Petróleos Mexicanos and Subsidiary Entities also has a defined contribution pension plan, inwhich both Petróleos Mexicanos and Subsidiary Entities and the employee contribute to an employee�s individual account.
F-105
Copyright © 2018 www.secdatabase.com. All Rights Reserved.Please Consider the Environment Before Printing This Document
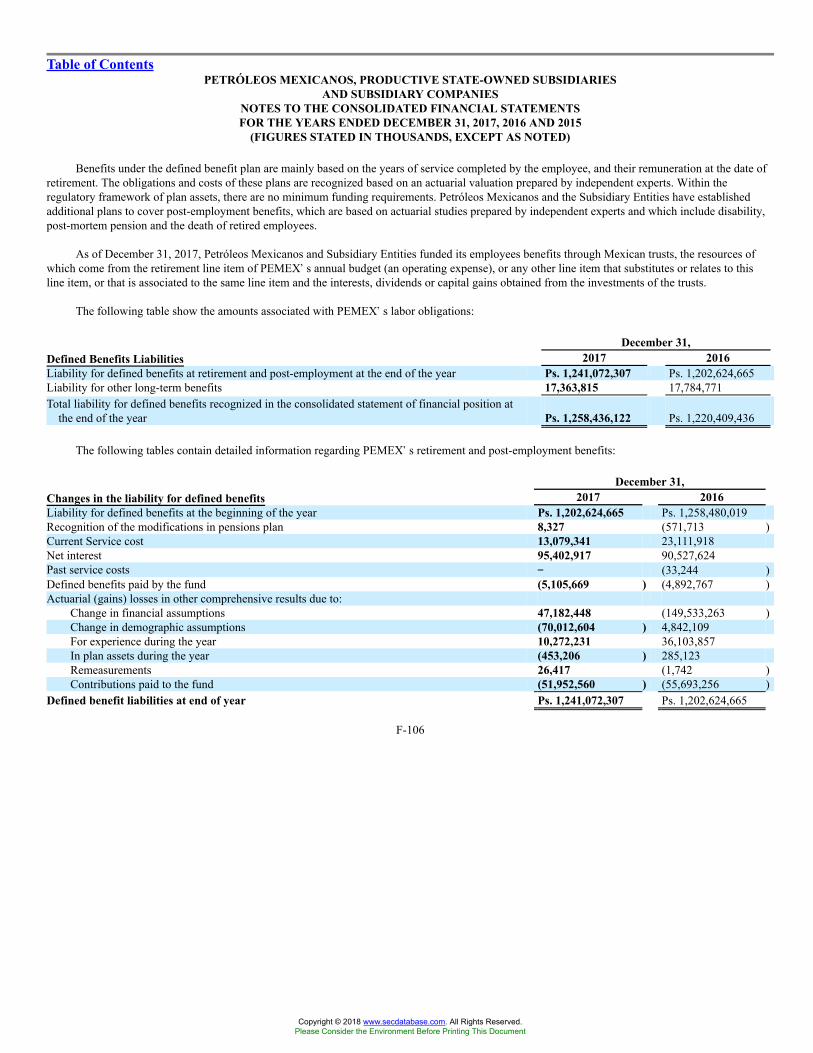
Table of ContentsPETRÓLEOS MEXICANOS, PRODUCTIVE STATE-OWNED SUBSIDIARIES
AND SUBSIDIARY COMPANIESNOTES TO THE CONSOLIDATED FINANCIAL STATEMENTSFOR THE YEARS ENDED DECEMBER 31, 2017, 2016 AND 2015
(FIGURES STATED IN THOUSANDS, EXCEPT AS NOTED)
Benefits under the defined benefit plan are mainly based on the years of service completed by the employee, and their remuneration at the date ofretirement. The obligations and costs of these plans are recognized based on an actuarial valuation prepared by independent experts. Within theregulatory framework of plan assets, there are no minimum funding requirements. Petróleos Mexicanos and the Subsidiary Entities have establishedadditional plans to cover post-employment benefits, which are based on actuarial studies prepared by independent experts and which include disability,post-mortem pension and the death of retired employees.
As of December 31, 2017, Petróleos Mexicanos and Subsidiary Entities funded its employees benefits through Mexican trusts, the resources ofwhich come from the retirement line item of PEMEX�s annual budget (an operating expense), or any other line item that substitutes or relates to thisline item, or that is associated to the same line item and the interests, dividends or capital gains obtained from the investments of the trusts.
The following table show the amounts associated with PEMEX�s labor obligations:
December 31,Defined Benefits Liabilities 2017 2016Liability for defined benefits at retirement and post-employment at the end of the year Ps. 1,241,072,307 Ps. 1,202,624,665Liability for other long-term benefits 17,363,815 17,784,771Total liability for defined benefits recognized in the consolidated statement of financial position at
the end of the year Ps. 1,258,436,122 Ps. 1,220,409,436
The following tables contain detailed information regarding PEMEX�s retirement and post-employment benefits:
December 31,Changes in the liability for defined benefits 2017 2016Liability for defined benefits at the beginning of the year Ps. 1,202,624,665 Ps. 1,258,480,019Recognition of the modifications in pensions plan 8,327 (571,713 )Current Service cost 13,079,341 23,111,918Net interest 95,402,917 90,527,624Past service costs �� (33,244 )Defined benefits paid by the fund (5,105,669 ) (4,892,767 )Actuarial (gains) losses in other comprehensive results due to:
Change in financial assumptions 47,182,448 (149,533,263 )Change in demographic assumptions (70,012,604 ) 4,842,109For experience during the year 10,272,231 36,103,857In plan assets during the year (453,206 ) 285,123Remeasurements 26,417 (1,742 )Contributions paid to the fund (51,952,560 ) (55,693,256 )
Defined benefit liabilities at end of year Ps. 1,241,072,307 Ps. 1,202,624,665
F-106
Copyright © 2018 www.secdatabase.com. All Rights Reserved.Please Consider the Environment Before Printing This Document
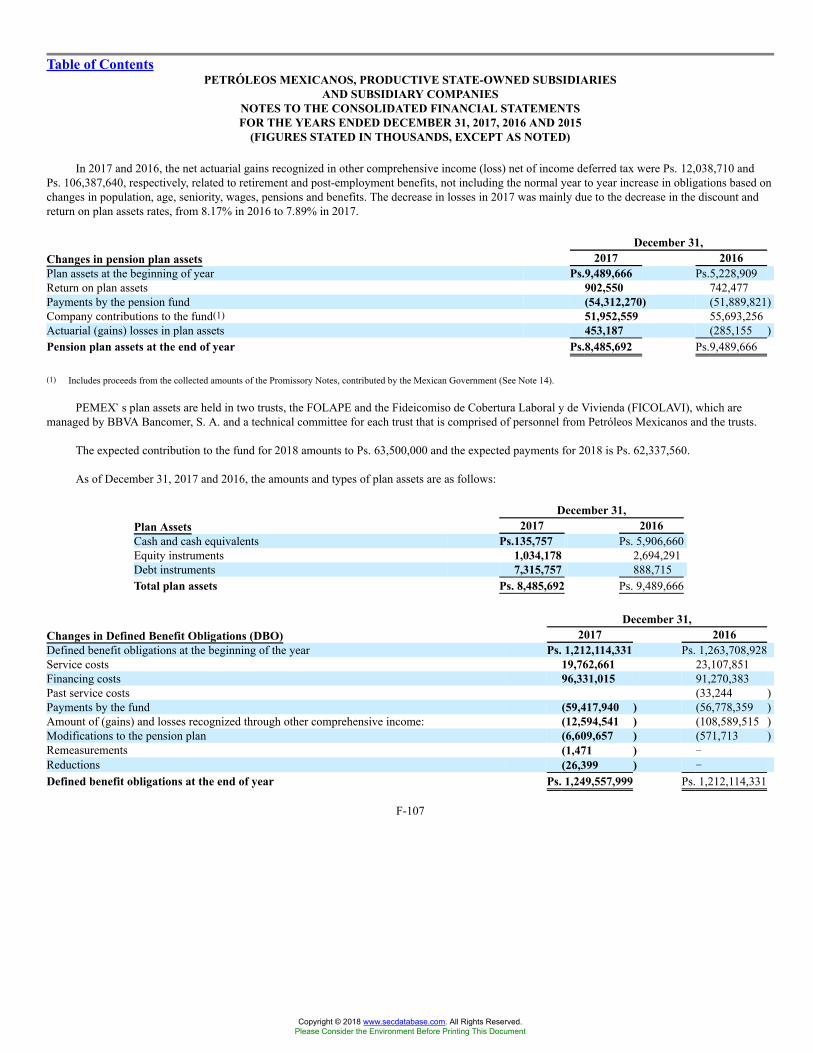
Table of ContentsPETRÓLEOS MEXICANOS, PRODUCTIVE STATE-OWNED SUBSIDIARIES
AND SUBSIDIARY COMPANIESNOTES TO THE CONSOLIDATED FINANCIAL STATEMENTSFOR THE YEARS ENDED DECEMBER 31, 2017, 2016 AND 2015
(FIGURES STATED IN THOUSANDS, EXCEPT AS NOTED)
In 2017 and 2016, the net actuarial gains recognized in other comprehensive income (loss) net of income deferred tax were Ps. 12,038,710 andPs. 106,387,640, respectively, related to retirement and post-employment benefits, not including the normal year to year increase in obligations based onchanges in population, age, seniority, wages, pensions and benefits. The decrease in losses in 2017 was mainly due to the decrease in the discount andreturn on plan assets rates, from 8.17% in 2016 to 7.89% in 2017.
December 31,Changes in pension plan assets 2017 2016Plan assets at the beginning of year Ps.9,489,666 Ps.5,228,909Return on plan assets 902,550 742,477Payments by the pension fund (54,312,270) (51,889,821)Company contributions to the fund(1) 51,952,559 55,693,256Actuarial (gains) losses in plan assets 453,187 (285,155 )Pension plan assets at the end of year Ps.8,485,692 Ps.9,489,666
(1) Includes proceeds from the collected amounts of the Promissory Notes, contributed by the Mexican Government (See Note 14).
PEMEX�s plan assets are held in two trusts, the FOLAPE and the Fideicomiso de Cobertura Laboral y de Vivienda (FICOLAVI), which aremanaged by BBVA Bancomer, S. A. and a technical committee for each trust that is comprised of personnel from Petróleos Mexicanos and the trusts.
The expected contribution to the fund for 2018 amounts to Ps. 63,500,000 and the expected payments for 2018 is Ps. 62,337,560.
As of December 31, 2017 and 2016, the amounts and types of plan assets are as follows:
December 31,Plan Assets 2017 2016Cash and cash equivalents Ps.135,757 Ps. 5,906,660Equity instruments 1,034,178 2,694,291Debt instruments 7,315,757 888,715Total plan assets Ps. 8,485,692 Ps. 9,489,666
December 31,Changes in Defined Benefit Obligations (DBO) 2017 2016Defined benefit obligations at the beginning of the year Ps. 1,212,114,331 Ps. 1,263,708,928Service costs 19,762,661 23,107,851Financing costs 96,331,015 91,270,383Past service costs (33,244 )Payments by the fund (59,417,940 ) (56,778,359 )Amount of (gains) and losses recognized through other comprehensive income: (12,594,541 ) (108,589,515 )Modifications to the pension plan (6,609,657 ) (571,713 )Remeasurements (1,471 ) �Reductions (26,399 ) �
Defined benefit obligations at the end of year Ps. 1,249,557,999 Ps. 1,212,114,331
F-107
Copyright © 2018 www.secdatabase.com. All Rights Reserved.Please Consider the Environment Before Printing This Document
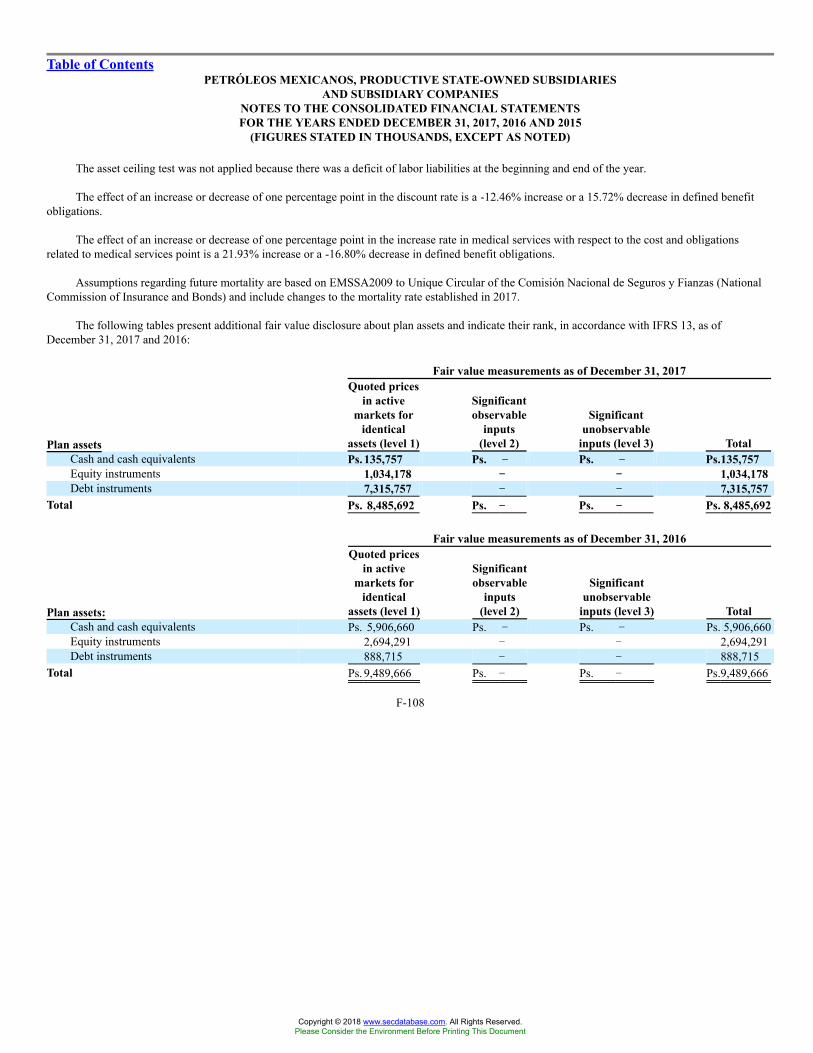
Table of ContentsPETRÓLEOS MEXICANOS, PRODUCTIVE STATE-OWNED SUBSIDIARIES
AND SUBSIDIARY COMPANIESNOTES TO THE CONSOLIDATED FINANCIAL STATEMENTSFOR THE YEARS ENDED DECEMBER 31, 2017, 2016 AND 2015
(FIGURES STATED IN THOUSANDS, EXCEPT AS NOTED)
The asset ceiling test was not applied because there was a deficit of labor liabilities at the beginning and end of the year.
The effect of an increase or decrease of one percentage point in the discount rate is a -12.46% increase or a 15.72% decrease in defined benefitobligations.
The effect of an increase or decrease of one percentage point in the increase rate in medical services with respect to the cost and obligationsrelated to medical services point is a 21.93% increase or a -16.80% decrease in defined benefit obligations.
Assumptions regarding future mortality are based on EMSSA2009 to Unique Circular of the Comisión Nacional de Seguros y Fianzas (NationalCommission of Insurance and Bonds) and include changes to the mortality rate established in 2017.
The following tables present additional fair value disclosure about plan assets and indicate their rank, in accordance with IFRS 13, as ofDecember 31, 2017 and 2016:
Fair value measurements as of December 31, 2017
Plan assets
Quoted pricesin active
markets foridentical
assets (level 1)
Significantobservable
inputs(level 2)
Significantunobservable
inputs (level 3) TotalCash and cash equivalents Ps. 135,757 Ps. �� Ps. �� Ps.135,757Equity instruments 1,034,178 �� �� 1,034,178Debt instruments 7,315,757 �� �� 7,315,757
Total Ps. 8,485,692 Ps. �� Ps. �� Ps. 8,485,692
Fair value measurements as of December 31, 2016
Plan assets:
Quoted pricesin active
markets foridentical
assets (level 1)
Significantobservable
inputs(level 2)
Significantunobservable
inputs (level 3) TotalCash and cash equivalents Ps. 5,906,660 Ps. � Ps. � Ps. 5,906,660Equity instruments 2,694,291 � � 2,694,291Debt instruments 888,715 � � 888,715
Total Ps. 9,489,666 Ps. � Ps. � Ps.9,489,666
F-108
Copyright © 2018 www.secdatabase.com. All Rights Reserved.Please Consider the Environment Before Printing This Document
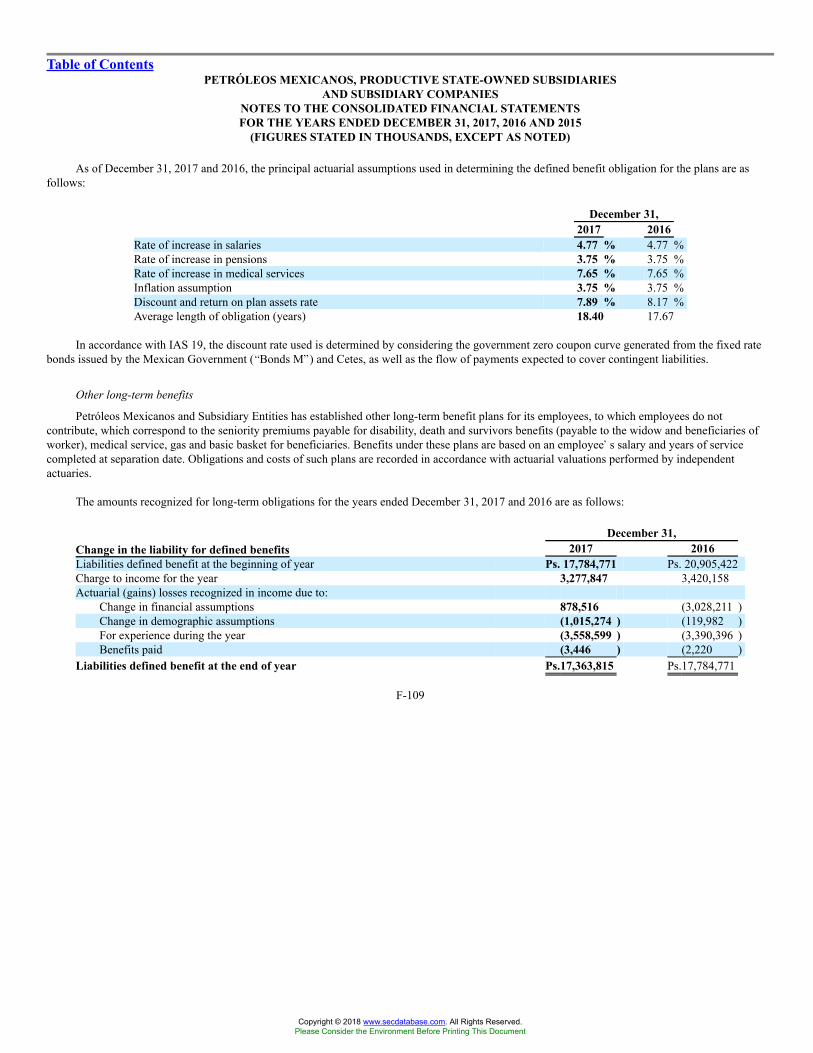
Table of ContentsPETRÓLEOS MEXICANOS, PRODUCTIVE STATE-OWNED SUBSIDIARIES
AND SUBSIDIARY COMPANIESNOTES TO THE CONSOLIDATED FINANCIAL STATEMENTSFOR THE YEARS ENDED DECEMBER 31, 2017, 2016 AND 2015
(FIGURES STATED IN THOUSANDS, EXCEPT AS NOTED)
As of December 31, 2017 and 2016, the principal actuarial assumptions used in determining the defined benefit obligation for the plans are asfollows:
December 31,2017 2016
Rate of increase in salaries 4.77 % 4.77 %Rate of increase in pensions 3.75 % 3.75 %Rate of increase in medical services 7.65 % 7.65 %Inflation assumption 3.75 % 3.75 %Discount and return on plan assets rate 7.89 % 8.17 %Average length of obligation (years) 18.40 17.67
In accordance with IAS 19, the discount rate used is determined by considering the government zero coupon curve generated from the fixed ratebonds issued by the Mexican Government (�Bonds M�) and Cetes, as well as the flow of payments expected to cover contingent liabilities.
Other long-term benefits
Petróleos Mexicanos and Subsidiary Entities has established other long-term benefit plans for its employees, to which employees do notcontribute, which correspond to the seniority premiums payable for disability, death and survivors benefits (payable to the widow and beneficiaries ofworker), medical service, gas and basic basket for beneficiaries. Benefits under these plans are based on an employee�s salary and years of servicecompleted at separation date. Obligations and costs of such plans are recorded in accordance with actuarial valuations performed by independentactuaries.
The amounts recognized for long-term obligations for the years ended December 31, 2017 and 2016 are as follows:
December 31,Change in the liability for defined benefits 2017 2016Liabilities defined benefit at the beginning of year Ps. 17,784,771 Ps. 20,905,422Charge to income for the year 3,277,847 3,420,158Actuarial (gains) losses recognized in income due to:
Change in financial assumptions 878,516 (3,028,211 )Change in demographic assumptions (1,015,274 ) (119,982 )For experience during the year (3,558,599 ) (3,390,396 )Benefits paid (3,446 ) (2,220 )
Liabilities defined benefit at the end of year Ps.17,363,815 Ps.17,784,771
F-109
Copyright © 2018 www.secdatabase.com. All Rights Reserved.Please Consider the Environment Before Printing This Document

Table of ContentsPETRÓLEOS MEXICANOS, PRODUCTIVE STATE-OWNED SUBSIDIARIES
AND SUBSIDIARY COMPANIESNOTES TO THE CONSOLIDATED FINANCIAL STATEMENTSFOR THE YEARS ENDED DECEMBER 31, 2017, 2016 AND 2015
(FIGURES STATED IN THOUSANDS, EXCEPT AS NOTED)
The principal actuarial assumptions used in determining the defined benefit obligation for the plans are as follows:
December 31,2017 2016
Rate of increase in salaries 4.77 % 4.77 %Inflation assumption 3.75 % 3.75 %Discount and return on plan assets rate 7.89 % 8.17 %Average length of obligation (years) 18.40 17.67
In accordance with IAS 19, the discount rate used is determined by considering the government zero coupon curve generated from Bonds M andCetes, as well as the flow of payments expected to cover contingent liabilities.
NOTE 18. PROVISIONS FOR SUNDRY CREDITORS
At December 31, 2017 and 2016, the provisions for sundry creditors and others is as follows:
2017 2016Provision for plugging of wells (Note 12) Ps. 68,797,600 Ps. 64,967,710Provision for trails in process (Note 25) 7,812,689 15,119,692Provision for environmental costs 11,067,134 8,230,476
Ps.87,677,423 Ps.88,317,878
The following tables show the allowance account for plugging of wells, trials in progress and environmental costs:
Plugging of wells2017 2016
Balance at the beginning of the year Ps. 64,967,710 Ps. 56,894,695Decrease capitalized in fixed assets (3,791,482 ) (3,878,503 )Unwinding of discount against income 7,774,000 11,968,966Amount used (152,628 ) (17,448 )Balance at the end of the year Ps.68,797,600 Ps.64,967,710
Trials in progress2017 2016
Balance at the beginning of the year Ps. 15,119,692 Ps. 12,775,263Additions against income 2,835,357 3,049,202Provision cancellation (1,973,153 ) (632,806 )Amount used (8,169,207 ) (71,967 )Balance at the end of the year Ps.7,812,689 Ps.15,119,692
F-110
Copyright © 2018 www.secdatabase.com. All Rights Reserved.Please Consider the Environment Before Printing This Document

Table of ContentsPETRÓLEOS MEXICANOS, PRODUCTIVE STATE-OWNED SUBSIDIARIES
AND SUBSIDIARY COMPANIESNOTES TO THE CONSOLIDATED FINANCIAL STATEMENTSFOR THE YEARS ENDED DECEMBER 31, 2017, 2016 AND 2015
(FIGURES STATED IN THOUSANDS, EXCEPT AS NOTED)
Environmental costs2017 2016
Balance at the beginning of the year Ps.8,230,476 Ps.3,521,838Additions against income 3,203,982 6,118,454Provision cancellation (312,937 ) (1,347,285)Amount used (54,387 ) (62,531 )Balance at the end of the year(1) Ps. 11,067,134 Ps.8,230,476
(1) PEMEX is subject to the provisions of the Ley General del Equilibrio Ecológico y la Protección al Ambiente (General Law on Ecological Equilibrium andEnvironmental Protection). To comply with this law, environmental audits of PEMEX�s larger operating, storage and transportation facilities have been or arebeing conducted. Following the completion of such audits, PEMEX has signed various agreements with the Procuraduría Federal de Protección al Ambiente(Federal Attorney of Environmental Protection) to implement environmental remediation and improve environmental plans. Such plans contemplateremediation for environmental damages, as well as related investments for the improvement of equipment, maintenance, labor and materials.
Provision for plugging of wells
PEMEX records a provision at present value for the future plugging cost of an oil production facility or pipeline at the time that it is built. Presentvalue is determined based on discount rates ranging from 4.0% to 10.5% in 2017.
The plugging provision represents the present value of plugging costs related to oil and gas properties. These provisions have been created basedon internal estimates of PEMEX. PEMEX has made certain assumptions based on the current economic environment that PEMEX believes provide areasonable basis on which to estimate the future liability. These estimates are reviewed regularly to take into account any material changes in theassumptions. However, actual plugging costs in the long run will depend on future market prices for the necessary plugging work, which reflect marketconditions at the time the work is being performed.
Moreover, the time of plugging depends on when the fields cease to have economically viable production rates, which, in turn, depends on theinherently uncertain future prices of oil and gas.
NOTE 19. DISCLOSURES OF CASH FLOW
The following items represent non-cash transactions and are presented for disclosure purposes:
For the years ended December 31,2017 2016 2015
Operating activitiesEmployee benefits equity effect(i) Ps. 12,038,710 Ps. 106,277,761 Ps. 78,556,569Net (benefits) cost of the year for employee benefits(i) 108,073,074 109,738,416 (62,549,142 )Investing activities(ii)Available-for-sale financial assets 5,564,130 207,817 (3,206,316 )Financing activitiesFinanced Public Works Contracts �� 146,217,292 2,001,093Currency translation effect (7,597,283 ) 21,386,902 13,262,101Accrued interest 8,734,131 9,326,945 4,816,784
F-111
Copyright © 2018 www.secdatabase.com. All Rights Reserved.Please Consider the Environment Before Printing This Document
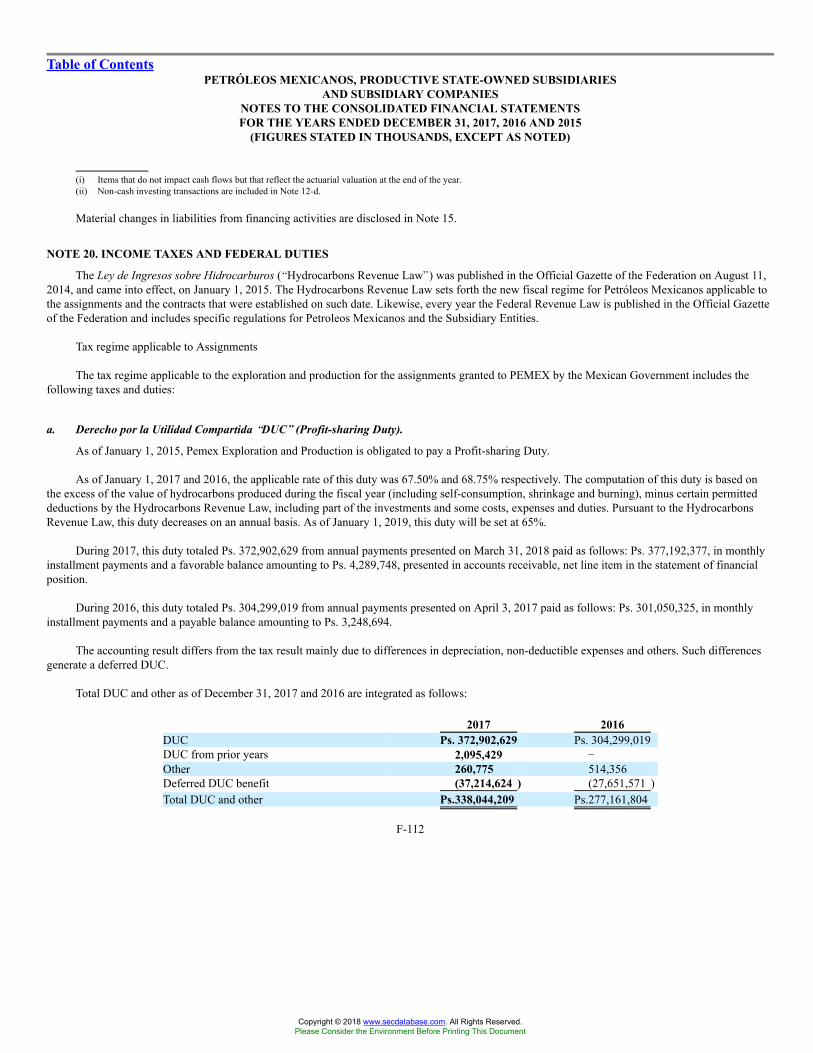
Table of ContentsPETRÓLEOS MEXICANOS, PRODUCTIVE STATE-OWNED SUBSIDIARIES
AND SUBSIDIARY COMPANIESNOTES TO THE CONSOLIDATED FINANCIAL STATEMENTSFOR THE YEARS ENDED DECEMBER 31, 2017, 2016 AND 2015
(FIGURES STATED IN THOUSANDS, EXCEPT AS NOTED)
(i) Items that do not impact cash flows but that reflect the actuarial valuation at the end of the year.(ii) Non-cash investing transactions are included in Note 12-d.
Material changes in liabilities from financing activities are disclosed in Note 15.
NOTE 20. INCOME TAXES AND FEDERAL DUTIES
The Ley de Ingresos sobre Hidrocarburos (�Hydrocarbons Revenue Law�) was published in the Official Gazette of the Federation on August 11,2014, and came into effect, on January 1, 2015. The Hydrocarbons Revenue Law sets forth the new fiscal regime for Petróleos Mexicanos applicable tothe assignments and the contracts that were established on such date. Likewise, every year the Federal Revenue Law is published in the Official Gazetteof the Federation and includes specific regulations for Petroleos Mexicanos and the Subsidiary Entities.
Tax regime applicable to Assignments
The tax regime applicable to the exploration and production for the assignments granted to PEMEX by the Mexican Government includes thefollowing taxes and duties:
a. Derecho por la Utilidad Compartida ��DUC�� (Profit-sharing Duty).
As of January 1, 2015, Pemex Exploration and Production is obligated to pay a Profit-sharing Duty.
As of January 1, 2017 and 2016, the applicable rate of this duty was 67.50% and 68.75% respectively. The computation of this duty is based onthe excess of the value of hydrocarbons produced during the fiscal year (including self-consumption, shrinkage and burning), minus certain permitteddeductions by the Hydrocarbons Revenue Law, including part of the investments and some costs, expenses and duties. Pursuant to the HydrocarbonsRevenue Law, this duty decreases on an annual basis. As of January 1, 2019, this duty will be set at 65%.
During 2017, this duty totaled Ps. 372,902,629 from annual payments presented on March 31, 2018 paid as follows: Ps. 377,192,377, in monthlyinstallment payments and a favorable balance amounting to Ps. 4,289,748, presented in accounts receivable, net line item in the statement of financialposition.
During 2016, this duty totaled Ps. 304,299,019 from annual payments presented on April 3, 2017 paid as follows: Ps. 301,050,325, in monthlyinstallment payments and a payable balance amounting to Ps. 3,248,694.
The accounting result differs from the tax result mainly due to differences in depreciation, non-deductible expenses and others. Such differencesgenerate a deferred DUC.
Total DUC and other as of December 31, 2017 and 2016 are integrated as follows:
2017 2016DUC Ps. 372,902,629 Ps. 304,299,019DUC from prior years 2,095,429 �Other 260,775 514,356Deferred DUC benefit (37,214,624 ) (27,651,571 )Total DUC and other Ps.338,044,209 Ps.277,161,804
F-112
Copyright © 2018 www.secdatabase.com. All Rights Reserved.Please Consider the Environment Before Printing This Document
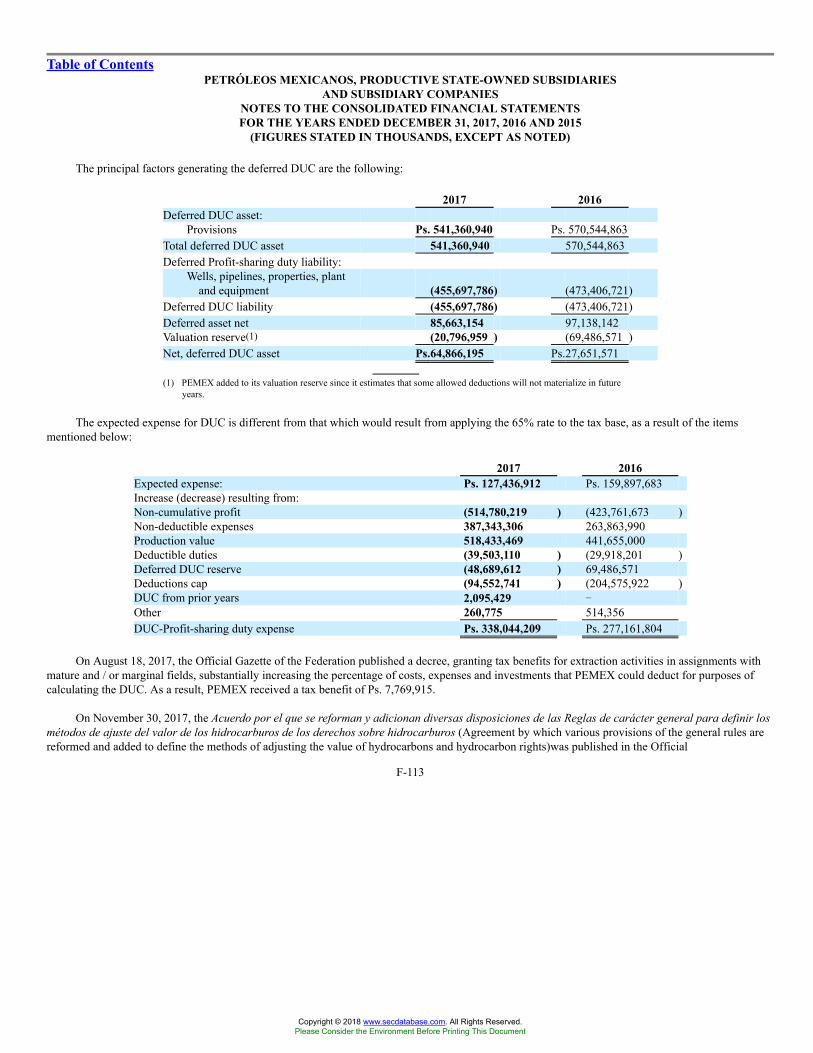
Table of ContentsPETRÓLEOS MEXICANOS, PRODUCTIVE STATE-OWNED SUBSIDIARIES
AND SUBSIDIARY COMPANIESNOTES TO THE CONSOLIDATED FINANCIAL STATEMENTSFOR THE YEARS ENDED DECEMBER 31, 2017, 2016 AND 2015
(FIGURES STATED IN THOUSANDS, EXCEPT AS NOTED)
The principal factors generating the deferred DUC are the following:
2017 2016Deferred DUC asset:
Provisions Ps. 541,360,940 Ps. 570,544,863Total deferred DUC asset 541,360,940 570,544,863Deferred Profit-sharing duty liability:
Wells, pipelines, properties, plantand equipment (455,697,786) (473,406,721)
Deferred DUC liability (455,697,786) (473,406,721)Deferred asset net 85,663,154 97,138,142Valuation reserve(1) (20,796,959 ) (69,486,571 )Net, deferred DUC asset Ps.64,866,195 Ps.27,651,571
(1) PEMEX added to its valuation reserve since it estimates that some allowed deductions will not materialize in futureyears.
The expected expense for DUC is different from that which would result from applying the 65% rate to the tax base, as a result of the itemsmentioned below:
2017 2016Expected expense: Ps. 127,436,912 Ps. 159,897,683Increase (decrease) resulting from:Non-cumulative profit (514,780,219 ) (423,761,673 )Non-deductible expenses 387,343,306 263,863,990Production value 518,433,469 441,655,000Deductible duties (39,503,110 ) (29,918,201 )Deferred DUC reserve (48,689,612 ) 69,486,571Deductions cap (94,552,741 ) (204,575,922 )DUC from prior years 2,095,429 �Other 260,775 514,356DUC-Profit-sharing duty expense Ps. 338,044,209 Ps. 277,161,804
On August 18, 2017, the Official Gazette of the Federation published a decree, granting tax benefits for extraction activities in assignments withmature and / or marginal fields, substantially increasing the percentage of costs, expenses and investments that PEMEX could deduct for purposes ofcalculating the DUC. As a result, PEMEX received a tax benefit of Ps. 7,769,915.
On November 30, 2017, the Acuerdo por el que se reforman y adicionan diversas disposiciones de las Reglas de carácter general para definir losmétodos de ajuste del valor de los hidrocarburos de los derechos sobre hidrocarburos (Agreement by which various provisions of the general rules arereformed and added to define the methods of adjusting the value of hydrocarbons and hydrocarbon rights)was published in the Official
F-113
Copyright © 2018 www.secdatabase.com. All Rights Reserved.Please Consider the Environment Before Printing This Document

Table of ContentsPETRÓLEOS MEXICANOS, PRODUCTIVE STATE-OWNED SUBSIDIARIES
AND SUBSIDIARY COMPANIESNOTES TO THE CONSOLIDATED FINANCIAL STATEMENTSFOR THE YEARS ENDED DECEMBER 31, 2017, 2016 AND 2015
(FIGURES STATED IN THOUSANDS, EXCEPT AS NOTED)
Gazette of the Federation, resulting in new calibrations and adjustments of existing formulas of calculating the value of hydrocarbons and hydrocarbonrights. As a result, PEMEX received an estimated tax benefit of Ps. 8,854,391.
The compensation of Ps. 2,186,963 was also authorized for the recognition of the fair economic value of the investments affected as a result of theallocation process for assignments to carry out hydrocarbon exploration and extraction activities, in accordance with the provisions of Transitory Article21 of the Federation Income Law of 2017.
On April 18, 2016, a decree granting a fiscal benefit to Pemex Exploration and Production (assignee) was published in the Official Gazette of theFederation and increases the limit on the amount Pemex Exploration and Production can deduct for costs, expenses and investments in the calculation ofits DUC, for onshore areas or in offshore areas with water depths lower than 500 meters. The benefit was granted to further the Mexican Government�sstrategic hydrocarbon exploration and extraction activities through assignments, in light of historically low international hydrocarbons prices in late2015 and early 2016 combined with historically low oil production in Mexico, thereby, together with other actions avoiding that the worldwideeconomic conditions had affected the national economy. The benefit obtained was Ps. 40,213,913. Additionally, the Mexican Government grantedPEMEX a fiscal support on November 16, 2016 of Ps. 28,439,379. This benefit consisted of a tax credit against the DUC as a measure to mitigate theimpact generated by the financial environment of the Mexican hydrocarbons exploration and extraction companies (assignees), as international energyprices continued to be depressed, which impacted the economies of several countries, including Mexico.
b. Derecho de Extracción de Hidrocarburos (Hydrocarbons Extraction Duty).
This duty is to be calculated using a rate based on a formula applicable to each type of hydrocarbon, the volume of production and utilizing therelevant market price for hydrocarbons in U.S. Dollars.
During 2017 Pemex Exploration and Production made payments of Ps. 58,523,125, which are included in the cost of sales line item.
c. Derecho de Exploración de Hidrocarburos (Exploration Hydrocarbons Duty).
The Mexican Government is entitled to collect a monthly payment of Ps. 1,214.21 per square kilometer of non-producing areas. After 60 months,this tax increases to Ps. 2,903.54 per square kilometer for each additional month that the area is not producing. These amounts will be updated on anannual basis in accordance with the national consumer price index.
During 2017, Pemex Exploration and Production made payments under this duty, totaling Ps. 980,843, which are included in the cost of sales lineitem.
d. Impuesto por la actividad de Exploración y Extracción de Hidrocarburos (Exploration and Extraction Hydrocarbons Duty).
The assignments granted by the Mexican Government create a tax on the exploration and extraction activities carried out in the correspondingarea. The monthly tax paid during the exploration phase and until the extraction phase begins is Ps. 1,583.74 per square kilometer. During the extractionphase, the monthly tax from the start of the extraction phase and until the assignment ends is Ps. 6,334.98 per square kilometer. During 2017 paymentsfor this tax amounted Ps. 3,986,112, which are included in the cost of sales line item.
F-114
Copyright © 2018 www.secdatabase.com. All Rights Reserved.Please Consider the Environment Before Printing This Document
Table of ContentsPETRÓLEOS MEXICANOS, PRODUCTIVE STATE-OWNED SUBSIDIARIES
AND SUBSIDIARY COMPANIESNOTES TO THE CONSOLIDATED FINANCIAL STATEMENTSFOR THE YEARS ENDED DECEMBER 31, 2017, 2016 AND 2015
(FIGURES STATED IN THOUSANDS, EXCEPT AS NOTED)
Tax Regime applicable to contracts:
As of January 1, 2015, the tax regime applicable to Pemex Exploration and Production for contracts is set forth in the Hydrocarbons Revenue lawwhich regulates, among other things, the fiscal terms applicable to the exploration and extraction contracts (license, profit sharing contracts, productionsharing and services) and sets duties and other taxes paid to the Mexican Government.
The Hydrocarbons Revenue Law also establishes the following duties applicable to PEMEX in connection with assignments granted to it by theMexican Government:
� Cuota Contractual para la Fase Exploratoria (Exploration Phase Contractual Fee)
During the exploration phase of an exploration and extraction contract, the Mexican Government is entitled to collect a monthly payment ofPs. 1,175.42 per square kilometer of non-producing areas. After 60 months, this fee increases to Ps. 2,810.78 per square kilometer for eachadditional month that the area is not producing. The fee amount will be updated on an annual basis in accordance with the nationalconsumer price index.
� Regalías (Royalties)
Royalty payments to the Mexican Government are determined based on the �contractual value� of the relevant hydrocarbons, which isbased on a variety of factors, including the type of underlying hydrocarbons (e.g., crude oil, associated natural gas, non-associated naturalgas or condensates), the volume of production and the market price. Royalties are payable in connection with licensing contracts,production-sharing contracts and profit-sharing contracts.
� Pago del Valor Contractual (Contractual Value Payment)
Licensing contracts require a payment to the Mexican Government calculated as a percentage of the �contractual value� of thehydrocarbons produced, as determined by the SHCP on a contract-by-contract basis.
� Porcentaje a la Utilidad Operativa (Operating Profit Payment)
Production-sharing contracts and profit-sharing contracts require a payment equivalent to a specified percentage of operating profits. In thecase of production-sharing contracts, this payment shall be made in-kind through delivery of the hydrocarbons produced. In the case ofprofit-sharing contracts, this payment shall be made in cash.
� Bono a la Firma (Signing Bonus)
Upon execution of a licensing contract, a signing bonus is to be paid to the Mexican Government in an amount specified by the SHCP in therelevant bidding terms and conditions or in the contracts resulting from a migration.
� Impuesto por la actividad de Exploración y Extracción de Hidrocarburos (Hydrocarbons Exploration and Extraction Activities Tax)
Contracts for exploration and extraction granted by the Mexican Government will include a specified tax on the exploration and extractionactivities carried out in the relevant area. A monthly tax of Ps. 1,583.74 per square kilometer is payable during the exploration phase untilthe extraction phase begins. During the extraction phase of a project, a monthly tax of Ps. 6,334.98 per square kilometer is payable from thestarting date until the relevant contract for exploration and extraction is terminated.
F-115
Copyright © 2018 www.secdatabase.com. All Rights Reserved.Please Consider the Environment Before Printing This Document

Table of ContentsPETRÓLEOS MEXICANOS, PRODUCTIVE STATE-OWNED SUBSIDIARIES
AND SUBSIDIARY COMPANIESNOTES TO THE CONSOLIDATED FINANCIAL STATEMENTSFOR THE YEARS ENDED DECEMBER 31, 2017, 2016 AND 2015
(FIGURES STATED IN THOUSANDS, EXCEPT AS NOTED)
Other applicable taxes
Beginning with the creation of the Subsidiary Entities during 2015, they became subject to the Income Tax Law and the Value Added Tax Law.Pemex Industrial Transformation is also subject to the Special Tax on Production and Services (IEPS Tax).
2017 indirect taxes are as listed below:
a. IEPS Tax
IEPS Tax on the sale of automotive fuels: This is a tax imposed on domestic sales of automotive fuels, including gasoline and diesel, which PemexIndustrial Transformation collects on behalf of the Mexican Government. The applicable quotas for 2017 were: 4.30 pesos per liter of Magna gasoline;3.64 pesos per liter of Premium gasoline and 4.73 pesos per liter of diesel. This fee is updated annually according to inflation and adjusted monthly bythe tax authorities.
IEPS Tax to benefit Mexican states and municipalities: This tax is a quota on domestic sales of automotive fuels, including gasoline and diesel,which Pemex Industrial Transformation collects on behalf of the Mexican Government. The applicable quotas for 2017 were 38.00 cents per liter ofMagna gasoline, 46.37 cents per liter of premium gasoline and 31.54 cents per liter of diesel. This rate is updated annually with inflation. The fundsraised by this quota are allocated to the states and municipalities as provided in the Tax Coordination Law.
IEPS Tax on Fossil Fuels: This tax is a quota on the internal sales of fossil fuels, which Pemex Industrial Transformation collects on behalf of theMexican Government. The applicable quotas for 2017 were 6.50 cents per liter for propane, 8.42 cents per liter for butane, 11.41 cents per liter for jetand other fuel, 13.64 cents per liter for turbosine and other kerosene, 13.84 cents per liter for diesel, 14.78 cents per liter for fuel oil and Ps. 17.15 perton for petroleum coke. This rate is updated annually according to inflation.
b. Value Added Tax (��VAT��)
For VAT purposes, final monthly payments are determined based on PEMEX�s cash flow, in accordance with the provisions of the Value AddedTax Law, applicable to payers of this tax.
The VAT is caused by the sales of goods, rendering of services, granting of the temporary use of goods in the national territory and by theimportation of goods and services to the national territory. VAT taxpayers transfer VAT to their customers and are entitled to credit the VAT paid to theirsuppliers and on their imports. The net balance between VAT transferred to customers and paid to suppliers and on imports results each month in theVAT to be paid to the tax authorities or in an amount in favor of the taxpayer. The taxpayer has the right to credit VAT in favor against VAT payable infuture months, to request a refund or to offset it against other payable federal taxes.
Taxes on Income are described below:
c. Income Tax
As of January 1, 2015, Petróleos Mexicanos, Subsidiary Entities and the subsidiary companies residing in Mexico for tax purposes are subject tothe Income Tax Law.
F-116
Copyright © 2018 www.secdatabase.com. All Rights Reserved.Please Consider the Environment Before Printing This Document
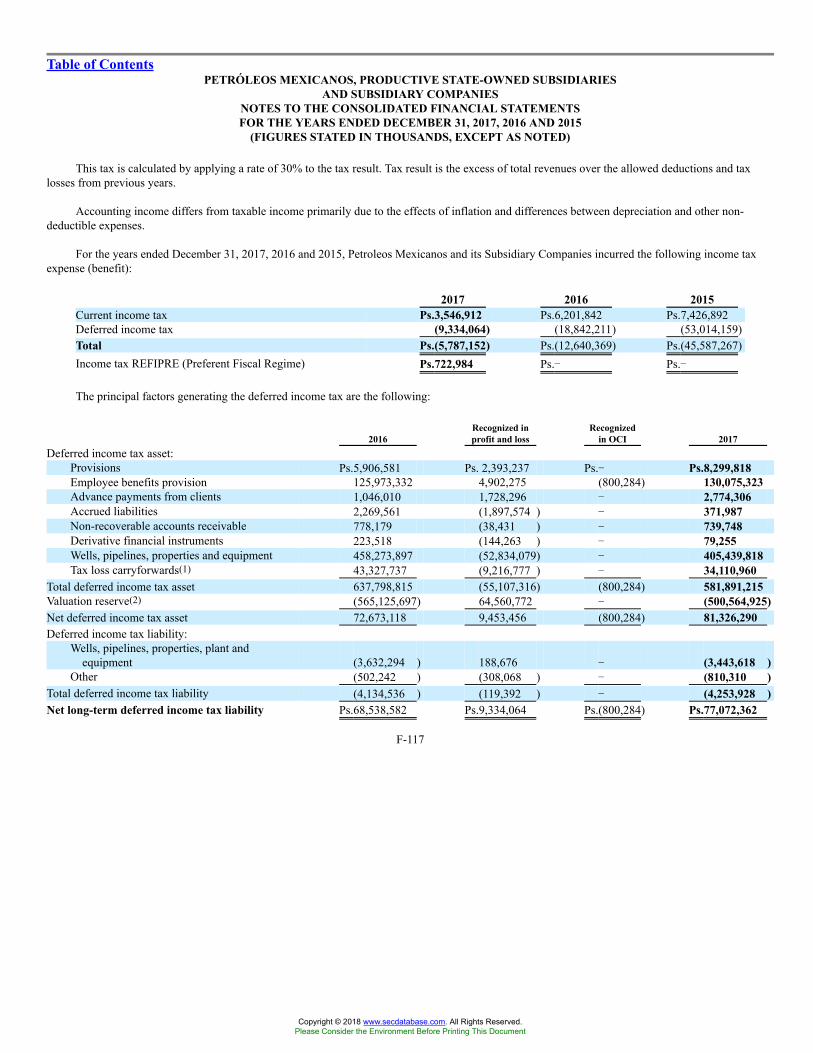
Table of ContentsPETRÓLEOS MEXICANOS, PRODUCTIVE STATE-OWNED SUBSIDIARIES
AND SUBSIDIARY COMPANIESNOTES TO THE CONSOLIDATED FINANCIAL STATEMENTSFOR THE YEARS ENDED DECEMBER 31, 2017, 2016 AND 2015
(FIGURES STATED IN THOUSANDS, EXCEPT AS NOTED)
This tax is calculated by applying a rate of 30% to the tax result. Tax result is the excess of total revenues over the allowed deductions and taxlosses from previous years.
Accounting income differs from taxable income primarily due to the effects of inflation and differences between depreciation and other non-deductible expenses.
For the years ended December 31, 2017, 2016 and 2015, Petroleos Mexicanos and its Subsidiary Companies incurred the following income taxexpense (benefit):
2017 2016 2015Current income tax Ps.3,546,912 Ps.6,201,842 Ps.7,426,892Deferred income tax (9,334,064) (18,842,211) (53,014,159)Total Ps.(5,787,152) Ps.(12,640,369) Ps.(45,587,267)Income tax REFIPRE (Preferent Fiscal Regime) Ps.722,984 Ps.� Ps.�
The principal factors generating the deferred income tax are the following:
2016Recognized inprofit and loss
Recognizedin OCI 2017
Deferred income tax asset:Provisions Ps.5,906,581 Ps. 2,393,237 Ps.� Ps.8,299,818Employee benefits provision 125,973,332 4,902,275 (800,284) 130,075,323Advance payments from clients 1,046,010 1,728,296 � 2,774,306Accrued liabilities 2,269,561 (1,897,574 ) � 371,987Non-recoverable accounts receivable 778,179 (38,431 ) � 739,748Derivative financial instruments 223,518 (144,263 ) � 79,255Wells, pipelines, properties and equipment 458,273,897 (52,834,079) � 405,439,818Tax loss carryforwards(1) 43,327,737 (9,216,777 ) � 34,110,960
Total deferred income tax asset 637,798,815 (55,107,316) (800,284) 581,891,215Valuation reserve(2) (565,125,697) 64,560,772 � (500,564,925)Net deferred income tax asset 72,673,118 9,453,456 (800,284) 81,326,290Deferred income tax liability:
Wells, pipelines, properties, plant andequipment (3,632,294 ) 188,676 � (3,443,618 )
Other (502,242 ) (308,068 ) � (810,310 )Total deferred income tax liability (4,134,536 ) (119,392 ) � (4,253,928 )Net long-term deferred income tax liability Ps.68,538,582 Ps.9,334,064 Ps.(800,284) Ps.77,072,362
F-117
Copyright © 2018 www.secdatabase.com. All Rights Reserved.Please Consider the Environment Before Printing This Document
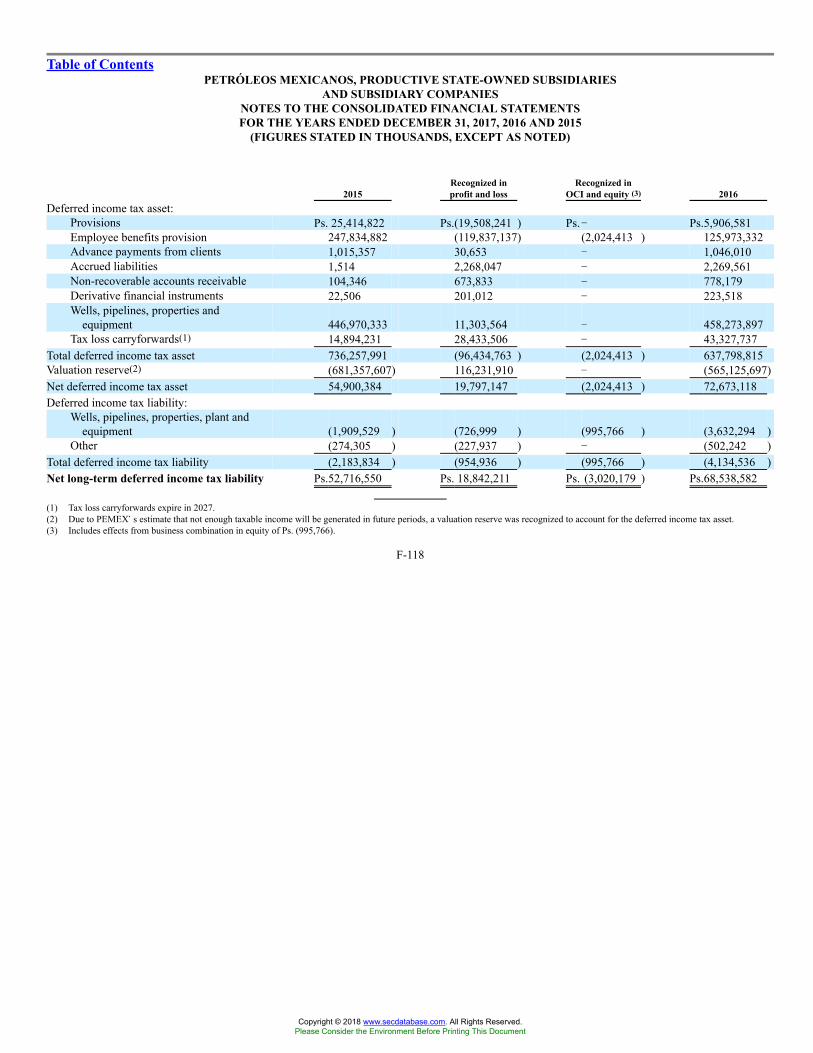
Table of ContentsPETRÓLEOS MEXICANOS, PRODUCTIVE STATE-OWNED SUBSIDIARIES
AND SUBSIDIARY COMPANIESNOTES TO THE CONSOLIDATED FINANCIAL STATEMENTSFOR THE YEARS ENDED DECEMBER 31, 2017, 2016 AND 2015
(FIGURES STATED IN THOUSANDS, EXCEPT AS NOTED)
2015Recognized inprofit and loss
Recognized inOCI and equity (3) 2016
Deferred income tax asset:Provisions Ps. 25,414,822 Ps.(19,508,241 ) Ps.� Ps.5,906,581Employee benefits provision 247,834,882 (119,837,137) (2,024,413 ) 125,973,332Advance payments from clients 1,015,357 30,653 � 1,046,010Accrued liabilities 1,514 2,268,047 � 2,269,561Non-recoverable accounts receivable 104,346 673,833 � 778,179Derivative financial instruments 22,506 201,012 � 223,518Wells, pipelines, properties and
equipment 446,970,333 11,303,564 � 458,273,897Tax loss carryforwards(1) 14,894,231 28,433,506 � 43,327,737
Total deferred income tax asset 736,257,991 (96,434,763 ) (2,024,413 ) 637,798,815Valuation reserve(2) (681,357,607) 116,231,910 � (565,125,697)Net deferred income tax asset 54,900,384 19,797,147 (2,024,413 ) 72,673,118Deferred income tax liability:
Wells, pipelines, properties, plant andequipment (1,909,529 ) (726,999 ) (995,766 ) (3,632,294 )
Other (274,305 ) (227,937 ) � (502,242 )Total deferred income tax liability (2,183,834 ) (954,936 ) (995,766 ) (4,134,536 )Net long-term deferred income tax liability Ps.52,716,550 Ps. 18,842,211 Ps. (3,020,179 ) Ps.68,538,582
(1) Tax loss carryforwards expire in 2027.(2) Due to PEMEX�s estimate that not enough taxable income will be generated in future periods, a valuation reserve was recognized to account for the deferred income tax asset.(3) Includes effects from business combination in equity of Ps. (995,766).
F-118
Copyright © 2018 www.secdatabase.com. All Rights Reserved.Please Consider the Environment Before Printing This Document
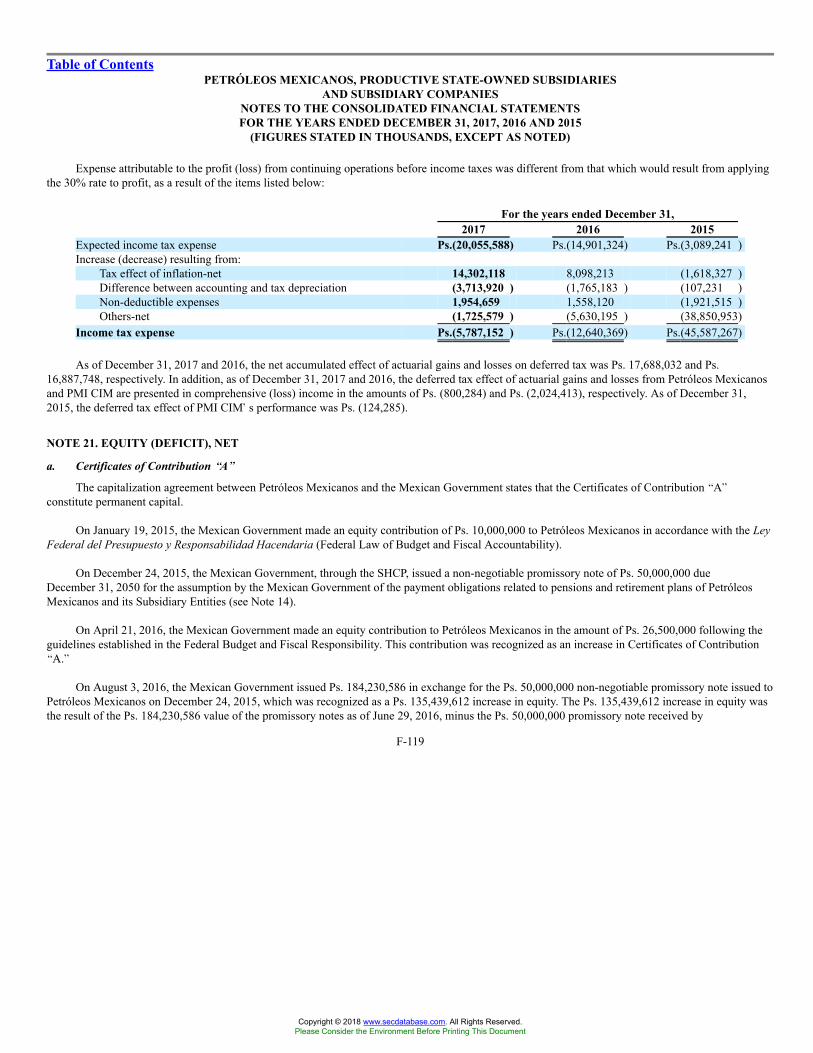
Table of ContentsPETRÓLEOS MEXICANOS, PRODUCTIVE STATE-OWNED SUBSIDIARIES
AND SUBSIDIARY COMPANIESNOTES TO THE CONSOLIDATED FINANCIAL STATEMENTSFOR THE YEARS ENDED DECEMBER 31, 2017, 2016 AND 2015
(FIGURES STATED IN THOUSANDS, EXCEPT AS NOTED)
Expense attributable to the profit (loss) from continuing operations before income taxes was different from that which would result from applyingthe 30% rate to profit, as a result of the items listed below:
For the years ended December 31,2017 2016 2015
Expected income tax expense Ps.(20,055,588) Ps.(14,901,324) Ps.(3,089,241 )Increase (decrease) resulting from:
Tax effect of inflation-net 14,302,118 8,098,213 (1,618,327 )Difference between accounting and tax depreciation (3,713,920 ) (1,765,183 ) (107,231 )Non-deductible expenses 1,954,659 1,558,120 (1,921,515 )Others-net (1,725,579 ) (5,630,195 ) (38,850,953)
Income tax expense Ps.(5,787,152 ) Ps.(12,640,369) Ps.(45,587,267)
As of December 31, 2017 and 2016, the net accumulated effect of actuarial gains and losses on deferred tax was Ps. 17,688,032 and Ps.16,887,748, respectively. In addition, as of December 31, 2017 and 2016, the deferred tax effect of actuarial gains and losses from Petróleos Mexicanosand PMI CIM are presented in comprehensive (loss) income in the amounts of Ps. (800,284) and Ps. (2,024,413), respectively. As of December 31,2015, the deferred tax effect of PMI CIM�s performance was Ps. (124,285).
NOTE 21. EQUITY (DEFICIT), NET
a. Certificates of Contribution ��A��
The capitalization agreement between Petróleos Mexicanos and the Mexican Government states that the Certificates of Contribution �A�constitute permanent capital.
On January 19, 2015, the Mexican Government made an equity contribution of Ps. 10,000,000 to Petróleos Mexicanos in accordance with the LeyFederal del Presupuesto y Responsabilidad Hacendaria (Federal Law of Budget and Fiscal Accountability).
On December 24, 2015, the Mexican Government, through the SHCP, issued a non-negotiable promissory note of Ps. 50,000,000 dueDecember 31, 2050 for the assumption by the Mexican Government of the payment obligations related to pensions and retirement plans of PetróleosMexicanos and its Subsidiary Entities (see Note 14).
On April 21, 2016, the Mexican Government made an equity contribution to Petróleos Mexicanos in the amount of Ps. 26,500,000 following theguidelines established in the Federal Budget and Fiscal Responsibility. This contribution was recognized as an increase in Certificates of Contribution�A.�
On August 3, 2016, the Mexican Government issued Ps. 184,230,586 in exchange for the Ps. 50,000,000 non-negotiable promissory note issued toPetróleos Mexicanos on December 24, 2015, which was recognized as a Ps. 135,439,612 increase in equity. The Ps. 135,439,612 increase in equity wasthe result of the Ps. 184,230,586 value of the promissory notes as of June 29, 2016, minus the Ps. 50,000,000 promissory note received by
F-119
Copyright © 2018 www.secdatabase.com. All Rights Reserved.Please Consider the Environment Before Printing This Document
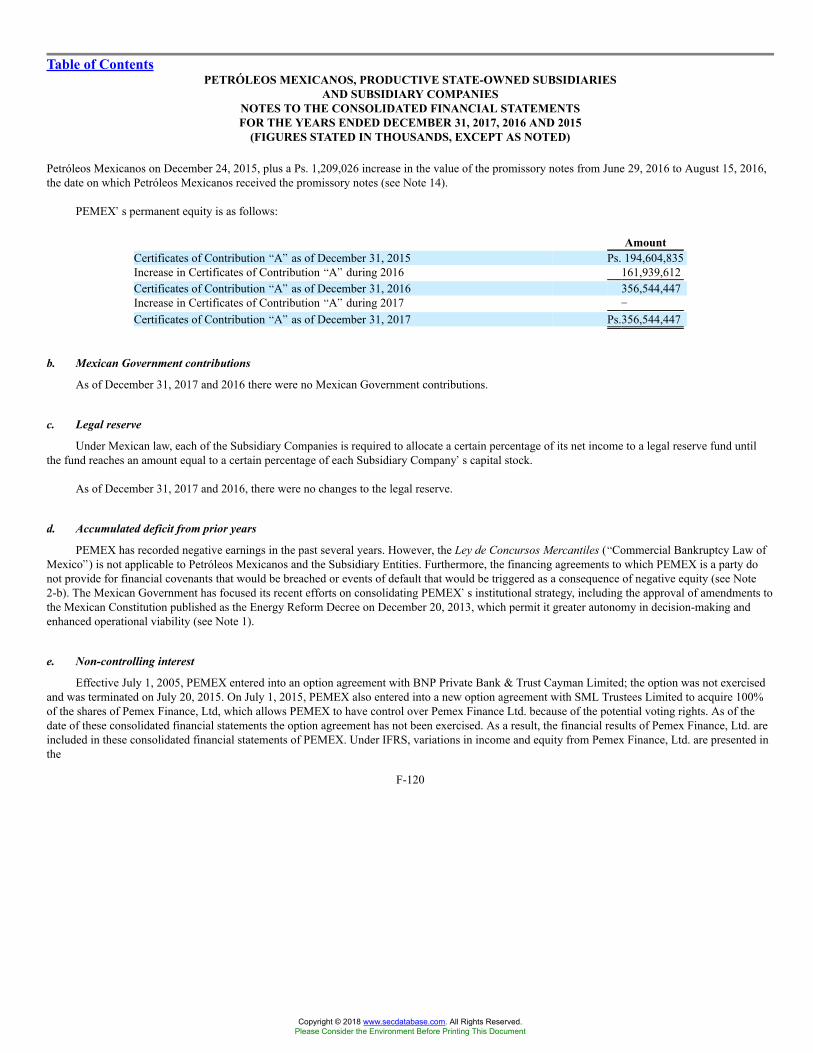
Table of ContentsPETRÓLEOS MEXICANOS, PRODUCTIVE STATE-OWNED SUBSIDIARIES
AND SUBSIDIARY COMPANIESNOTES TO THE CONSOLIDATED FINANCIAL STATEMENTSFOR THE YEARS ENDED DECEMBER 31, 2017, 2016 AND 2015
(FIGURES STATED IN THOUSANDS, EXCEPT AS NOTED)
Petróleos Mexicanos on December 24, 2015, plus a Ps. 1,209,026 increase in the value of the promissory notes from June 29, 2016 to August 15, 2016,the date on which Petróleos Mexicanos received the promissory notes (see Note 14).
PEMEX�s permanent equity is as follows:
AmountCertificates of Contribution �A� as of December 31, 2015 Ps. 194,604,835Increase in Certificates of Contribution �A� during 2016 161,939,612Certificates of Contribution �A� as of December 31, 2016 356,544,447Increase in Certificates of Contribution �A� during 2017 �
Certificates of Contribution �A� as of December 31, 2017 Ps.356,544,447
b. Mexican Government contributions
As of December 31, 2017 and 2016 there were no Mexican Government contributions.
c. Legal reserve
Under Mexican law, each of the Subsidiary Companies is required to allocate a certain percentage of its net income to a legal reserve fund untilthe fund reaches an amount equal to a certain percentage of each Subsidiary Company�s capital stock.
As of December 31, 2017 and 2016, there were no changes to the legal reserve.
d. Accumulated deficit from prior years
PEMEX has recorded negative earnings in the past several years. However, the Ley de Concursos Mercantiles (�Commercial Bankruptcy Law ofMexico�) is not applicable to Petróleos Mexicanos and the Subsidiary Entities. Furthermore, the financing agreements to which PEMEX is a party donot provide for financial covenants that would be breached or events of default that would be triggered as a consequence of negative equity (see Note2-b). The Mexican Government has focused its recent efforts on consolidating PEMEX�s institutional strategy, including the approval of amendments tothe Mexican Constitution published as the Energy Reform Decree on December 20, 2013, which permit it greater autonomy in decision-making andenhanced operational viability (see Note 1).
e. Non-controlling interest
Effective July 1, 2005, PEMEX entered into an option agreement with BNP Private Bank & Trust Cayman Limited; the option was not exercisedand was terminated on July 20, 2015. On July 1, 2015, PEMEX also entered into a new option agreement with SML Trustees Limited to acquire 100%of the shares of Pemex Finance, Ltd, which allows PEMEX to have control over Pemex Finance Ltd. because of the potential voting rights. As of thedate of these consolidated financial statements the option agreement has not been exercised. As a result, the financial results of Pemex Finance, Ltd. areincluded in these consolidated financial statements of PEMEX. Under IFRS, variations in income and equity from Pemex Finance, Ltd. are presented inthe
F-120
Copyright © 2018 www.secdatabase.com. All Rights Reserved.Please Consider the Environment Before Printing This Document

Table of ContentsPETRÓLEOS MEXICANOS, PRODUCTIVE STATE-OWNED SUBSIDIARIES
AND SUBSIDIARY COMPANIESNOTES TO THE CONSOLIDATED FINANCIAL STATEMENTSFOR THE YEARS ENDED DECEMBER 31, 2017, 2016 AND 2015
(FIGURES STATED IN THOUSANDS, EXCEPT AS NOTED)
consolidated statements of changes in equity (deficit), net as �non-controlling interest,� and as net income and comprehensive income for the year,attributable to non-controlling interest, in the consolidated statements of comprehensive income, due to the fact that PEMEX does not currently own anyof the shares of Pemex Finance, Ltd.
Similarly, because PEMEX does not currently own all of the shares of PMI CIM, HJ BARRERAS and COMESA, variations in income and equityfrom these entities are also presented in the consolidated statements of changes in equity (deficit) as �non-controlling interest.�
As of December 31, 2017 and 2016, non-controlling interest represented gains of Ps. 965,107 and Ps. 976,705, respectively, in PEMEX�s equity(deficit).
NOTE 22. OTHER REVENUES AND EXPENSES-NET
Other revenues and expenses-net for each of the years ended December 31, 2017, 2016 and 2015, was as follows:
2017 2016 2015Revenues:
Claims recovery Ps. 16,386,250 Ps.3,695,217 Ps. 1,975,281Fiscal support (Profit-sharing duty) (see Note 20a.) �� 28,439,379 �Other income for services 4,720,546 4,266,854 3,953,888Price of sale share (see Note 11-iii) 3,139,103 22,684,736 �Other 4,277,207 14,228,801 6,992,954Revenues from reinsurance premiums 1,986,568 3,694,026 1,497,779Franchise fees 917,934 1,059,333 1,148,528Bidding terms, sanctions, penalties and other 825,956 3,223,437 1,262,458Gain on sale of fixed assets �� 2,687,652 �Assets value transferred to CENAGAS �� 7,450,931 �Negative IEPS �� � 2,519,126Total other revenues 32,253,564 91,430,366 19,350,014Expenses:Loss in the Assets value transferred to CENAGAS �� (35,333,411 ) �Disposal of assets (8,447,031 ) (2,140,943 ) (3,364,063 )Transportation and distribution of natural gas (6,652,878 ) (8,830,967 ) (369,317 )Other (7,927,150 ) (3,581,036 ) (726,589 )Claims (3,640,036 ) (4,757,116 ) (12,527,548 )Loss in the sale of associates (412,393 ) (7,473,698 ) �Impairment of goodwill �� (4,007,018 ) �Services provided �� (2,656,571 ) (3,237,984 )Total other expenses (27,079,488) (68,780,760 ) (20,225,501 )Other revenues and expenses-net Ps.5,174,076 Ps.22,649,606 Ps.(875,487 )
F-121
Copyright © 2018 www.secdatabase.com. All Rights Reserved.Please Consider the Environment Before Printing This Document
Table of ContentsPETRÓLEOS MEXICANOS, PRODUCTIVE STATE-OWNED SUBSIDIARIES
AND SUBSIDIARY COMPANIESNOTES TO THE CONSOLIDATED FINANCIAL STATEMENTSFOR THE YEARS ENDED DECEMBER 31, 2017, 2016 AND 2015
(FIGURES STATED IN THOUSANDS, EXCEPT AS NOTED)
NOTE 23. RELATED PARTIES
Directors and employees of Petróleos Mexicanos and the Subsidiary Entities are subject to regulations related conflict of interest such as thePetróleos Mexicanos Law, Ley Federal de Responsabilidades Administrativas de los Servidores Públicos (Federal Law of AdministrativeResponsibilities of Public Officials) and the Políticas y Lineamientos Anticorrupción para Petróleos Mexicanos, sus Empresas Productivas Subsidiariasy, en su caso, Empresas Filiales (Anticorruption Policies and Guidelines for Petróleos Mexicanos, its Subsidiary Productive Companies and, whereapplicable, Subsidiary Companies). Under these provisions, PEMEX�s directors and employees are obligated to �recuse themselves from intervening inany way in the attention to, processing or resolution of matters in which they might have personal, family or business interest, including those wheresome benefit can result for themselves, their spouse, blood or affinity relatives up to the fourth degree, or civil relatives, or for third parties with whichthey have professional, labor or business relations, or for partners or partnerships where the public officials or the persons referred above are or havebeen members thereof.�
Related parties include individuals and companies that do not form part of PEMEX, but that could take advantage of being in a privileged positionas a result of their relation with PEMEX. Also included are situations in which PEMEX could take advantage of a special relationship in order to benefitits financial position or results of operations.
F-122
Copyright © 2018 www.secdatabase.com. All Rights Reserved.Please Consider the Environment Before Printing This Document
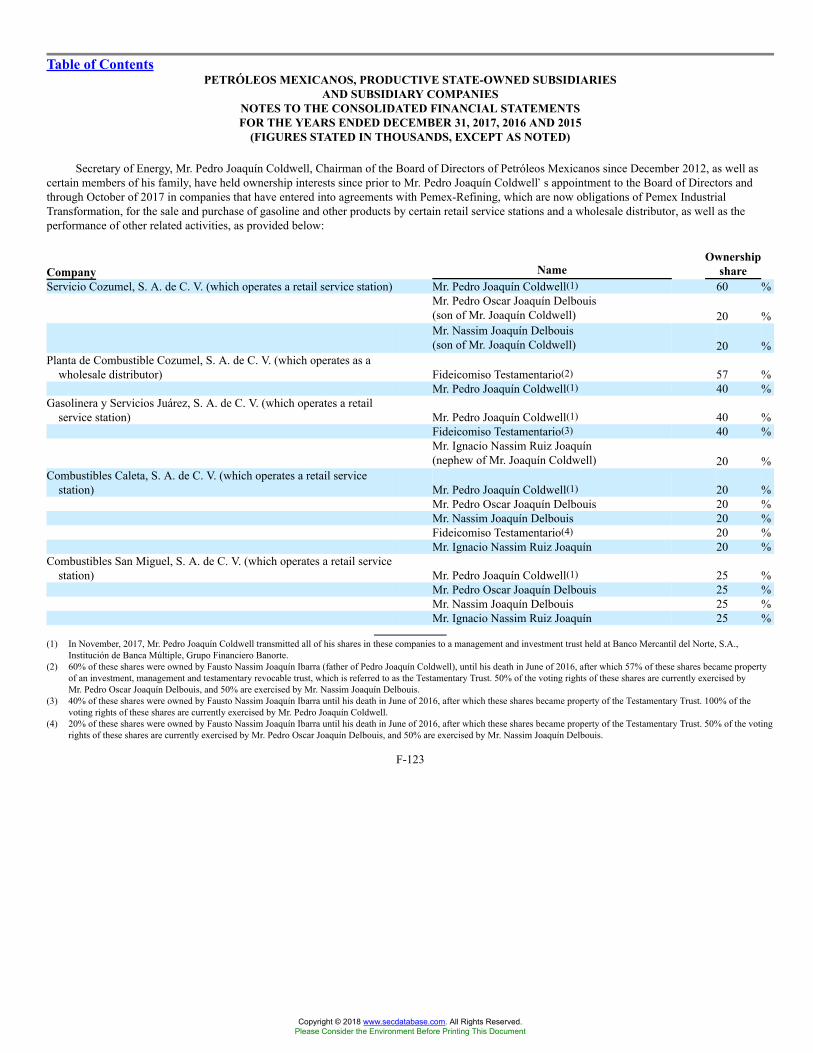
Table of ContentsPETRÓLEOS MEXICANOS, PRODUCTIVE STATE-OWNED SUBSIDIARIES
AND SUBSIDIARY COMPANIESNOTES TO THE CONSOLIDATED FINANCIAL STATEMENTSFOR THE YEARS ENDED DECEMBER 31, 2017, 2016 AND 2015
(FIGURES STATED IN THOUSANDS, EXCEPT AS NOTED)
Secretary of Energy, Mr. Pedro Joaquín Coldwell, Chairman of the Board of Directors of Petróleos Mexicanos since December 2012, as well ascertain members of his family, have held ownership interests since prior to Mr. Pedro Joaquín Coldwell�s appointment to the Board of Directors andthrough October of 2017 in companies that have entered into agreements with Pemex-Refining, which are now obligations of Pemex IndustrialTransformation, for the sale and purchase of gasoline and other products by certain retail service stations and a wholesale distributor, as well as theperformance of other related activities, as provided below:
Company NameOwnership
shareServicio Cozumel, S. A. de C. V. (which operates a retail service station) Mr. Pedro Joaquín Coldwell(1) 60 %
Mr. Pedro Oscar Joaquín Delbouis(son of Mr. Joaquín Coldwell) 20 %Mr. Nassim Joaquín Delbouis(son of Mr. Joaquín Coldwell) 20 %
Planta de Combustible Cozumel, S. A. de C. V. (which operates as awholesale distributor) Fideicomiso Testamentario(2) 57 %
Mr. Pedro Joaquín Coldwell(1) 40 %Gasolinera y Servicios Juárez, S. A. de C. V. (which operates a retail
service station) Mr. Pedro Joaquín Coldwell(1) 40 %Fideicomiso Testamentario(3) 40 %Mr. Ignacio Nassim Ruiz Joaquín(nephew of Mr. Joaquín Coldwell) 20 %
Combustibles Caleta, S. A. de C. V. (which operates a retail servicestation) Mr. Pedro Joaquín Coldwell(1) 20 %
Mr. Pedro Oscar Joaquín Delbouis 20 %Mr. Nassim Joaquín Delbouis 20 %Fideicomiso Testamentario(4) 20 %Mr. Ignacio Nassim Ruiz Joaquín 20 %
Combustibles San Miguel, S. A. de C. V. (which operates a retail servicestation) Mr. Pedro Joaquín Coldwell(1) 25 %
Mr. Pedro Oscar Joaquín Delbouis 25 %Mr. Nassim Joaquín Delbouis 25 %Mr. Ignacio Nassim Ruiz Joaquín 25 %
(1) In November, 2017, Mr. Pedro Joaquín Coldwell transmitted all of his shares in these companies to a management and investment trust held at Banco Mercantil del Norte, S.A.,Institución de Banca Múltiple, Grupo Financiero Banorte.
(2) 60% of these shares were owned by Fausto Nassim Joaquín Ibarra (father of Pedro Joaquín Coldwell), until his death in June of 2016, after which 57% of these shares became propertyof an investment, management and testamentary revocable trust, which is referred to as the Testamentary Trust. 50% of the voting rights of these shares are currently exercised byMr. Pedro Oscar Joaquín Delbouis, and 50% are exercised by Mr. Nassim Joaquín Delbouis.
(3) 40% of these shares were owned by Fausto Nassim Joaquín Ibarra until his death in June of 2016, after which these shares became property of the Testamentary Trust. 100% of thevoting rights of these shares are currently exercised by Mr. Pedro Joaquín Coldwell.
(4) 20% of these shares were owned by Fausto Nassim Joaquín Ibarra until his death in June of 2016, after which these shares became property of the Testamentary Trust. 50% of the votingrights of these shares are currently exercised by Mr. Pedro Oscar Joaquín Delbouis, and 50% are exercised by Mr. Nassim Joaquín Delbouis.
F-123
Copyright © 2018 www.secdatabase.com. All Rights Reserved.Please Consider the Environment Before Printing This Document
Table of ContentsPETRÓLEOS MEXICANOS, PRODUCTIVE STATE-OWNED SUBSIDIARIES
AND SUBSIDIARY COMPANIESNOTES TO THE CONSOLIDATED FINANCIAL STATEMENTSFOR THE YEARS ENDED DECEMBER 31, 2017, 2016 AND 2015
(FIGURES STATED IN THOUSANDS, EXCEPT AS NOTED)
The rights of these companies to operate retail service stations and distribute gasoline and other products on a wholesale basis in Mexico aredependent on these agreements, the expiration or non-renewal of which may adversely affect their business. These agreements are based on PEMEX�sstandard forms of agreements and contain the standard terms and conditions applicable to all of Pemex Industrial Transformation�s retail servicestations and wholesale distributors.
a. Compensation of Directors and Officers
For the years ended December 31, 2017, 2016 and 2015, the aggregate compensation of executive officers of Petróleos Mexicanos and theSubsidiary Entities paid or accrued in that year for services in all capacities was approximately Ps. 50,749, Ps. 49,165 and Ps. 116,930, respectively.Retirement and former employee benefits are granted as described in Note 17. Except in the case of the professional members, with respect to theprevious Board of Directors of Petróleos Mexicanos and the boards of directors of the existing Subsidiary Entities, and the independent members, withrespect to the new Board of Directors of Petróleos Mexicanos, members of the Boards of Directors of Petróleos Mexicanos and the Subsidiary Entitiesdo not receive compensation for their services.
The compensation paid or accrued during 2017, 2016 and 2015 to the professional members of the previous Board of Directors of PetróleosMexicanos and boards of directors of the existing Subsidiary Entities was approximately Ps. 7,525, Ps. 8,339, and Ps. 17,899, respectively.
b. Salary Advances
As an employee benefit, PEMEX offers salary advances to all of its eligible Petroleum Workers� Union and non-union workers, includingexecutive officers, pursuant to the programs set forth in the collective bargaining agreement and in the Reglamento de Trabajo del Personal deConfianza de Petróleos Mexicanos y Empresas Productivas Subsidiarias (Employment Regulation of White Collar Employees of Petróleos Mexicanosand Subsidiary Entities), respectively. The salary advances, which are non-interest bearing, are offered to each eligible employee in an amount up to amaximum of four months� salary and are repaid through salary deductions in equal installments over a period of either one or two years, as elected bythe employee. Most employees take advantage of this benefit. The amount of salary advances outstanding to executive officers at December 31, 2017was Ps. 3,466 and at December 31, 2016 was Ps. 2,415. The amount of salary advances outstanding to executive officers at March 31, 2018 wasPs. 2,363.
NOTE 24. COMMITMENTS
a. PMI CIM has entered into several contracts for the sale of crude oil on the international market to foreign companies. The terms and conditions ofthese contracts are specific to each client, and their durations may be indefinite (evergreen contracts) or they may contain a minimum obligatoryperiod (long-term contracts).
b. PEMEX has entered into a nitrogen supply contract for the pressure maintenance program at the Cantarell complex. During 2007, an additionalcontract was entered into with the purpose of supplying nitrogen to the
F-124
Copyright © 2018 www.secdatabase.com. All Rights Reserved.Please Consider the Environment Before Printing This Document
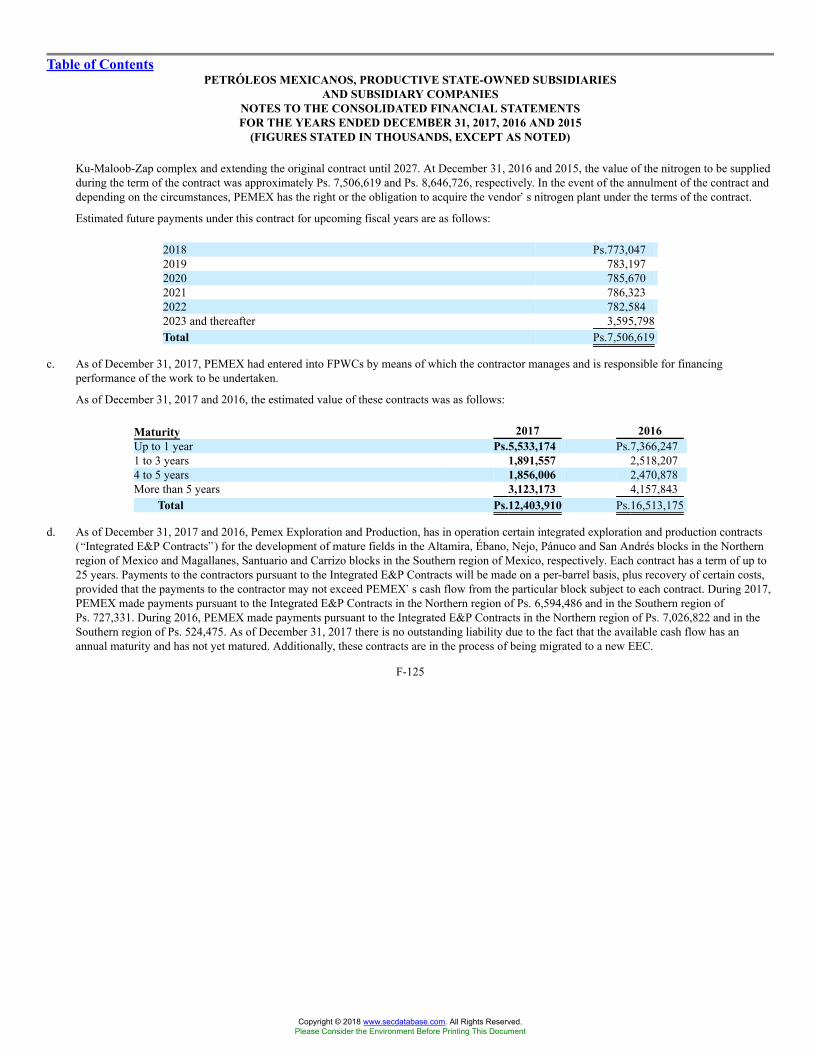
Table of ContentsPETRÓLEOS MEXICANOS, PRODUCTIVE STATE-OWNED SUBSIDIARIES
AND SUBSIDIARY COMPANIESNOTES TO THE CONSOLIDATED FINANCIAL STATEMENTSFOR THE YEARS ENDED DECEMBER 31, 2017, 2016 AND 2015
(FIGURES STATED IN THOUSANDS, EXCEPT AS NOTED)
Ku-Maloob-Zap complex and extending the original contract until 2027. At December 31, 2016 and 2015, the value of the nitrogen to be suppliedduring the term of the contract was approximately Ps. 7,506,619 and Ps. 8,646,726, respectively. In the event of the annulment of the contract anddepending on the circumstances, PEMEX has the right or the obligation to acquire the vendor�s nitrogen plant under the terms of the contract.
Estimated future payments under this contract for upcoming fiscal years are as follows:
2018 Ps.773,0472019 783,1972020 785,6702021 786,3232022 782,5842023 and thereafter 3,595,798Total Ps.7,506,619
c. As of December 31, 2017, PEMEX had entered into FPWCs by means of which the contractor manages and is responsible for financingperformance of the work to be undertaken.
As of December 31, 2017 and 2016, the estimated value of these contracts was as follows:
Maturity 2017 2016Up to 1 year Ps.5,533,174 Ps.7,366,2471 to 3 years 1,891,557 2,518,2074 to 5 years 1,856,006 2,470,878More than 5 years 3,123,173 4,157,843
Total Ps.12,403,910 Ps.16,513,175
d. As of December 31, 2017 and 2016, Pemex Exploration and Production, has in operation certain integrated exploration and production contracts(�Integrated E&P Contracts�) for the development of mature fields in the Altamira, Ébano, Nejo, Pánuco and San Andrés blocks in the Northernregion of Mexico and Magallanes, Santuario and Carrizo blocks in the Southern region of Mexico, respectively. Each contract has a term of up to25 years. Payments to the contractors pursuant to the Integrated E&P Contracts will be made on a per-barrel basis, plus recovery of certain costs,provided that the payments to the contractor may not exceed PEMEX�s cash flow from the particular block subject to each contract. During 2017,PEMEX made payments pursuant to the Integrated E&P Contracts in the Northern region of Ps. 6,594,486 and in the Southern region ofPs. 727,331. During 2016, PEMEX made payments pursuant to the Integrated E&P Contracts in the Northern region of Ps. 7,026,822 and in theSouthern region of Ps. 524,475. As of December 31, 2017 there is no outstanding liability due to the fact that the available cash flow has anannual maturity and has not yet matured. Additionally, these contracts are in the process of being migrated to a new EEC.
F-125
Copyright © 2018 www.secdatabase.com. All Rights Reserved.Please Consider the Environment Before Printing This Document

Table of ContentsPETRÓLEOS MEXICANOS, PRODUCTIVE STATE-OWNED SUBSIDIARIES
AND SUBSIDIARY COMPANIESNOTES TO THE CONSOLIDATED FINANCIAL STATEMENTSFOR THE YEARS ENDED DECEMBER 31, 2017, 2016 AND 2015
(FIGURES STATED IN THOUSANDS, EXCEPT AS NOTED)
e. As of December 31, 2017 and 2016, the estimated value of the contracts that PEMEX has entered into with several contractors for thedevelopment of various infrastructure and services works was as follows:
Maturity 2017 2016Up to 1 year Ps.229,738,368 Ps.347,606,8481 to 3 years 196,335,411 281,563,6074 to 5 years 123,159,215 69,541,826More than 5 years 149,672,236 119,281,849Total Ps.698,905,230 Ps.817,994,130
NOTE 25. CONTINGENCIES
In the ordinary course of business, PEMEX is named in a number of lawsuits of various types. PEMEX evaluates the merit of each claim andassesses the likely outcome. PEMEX has not recorded provisions related to ongoing legal proceedings due to the fact that an unfavorable resolution isnot expected in such proceedings, with the exception of the proceeding described in further detail in this Note.
PEMEX is involved in various civil, tax, criminal, administrative, labor and commercial lawsuits and arbitration proceedings. The results of theseproceedings are uncertain as of the date of these consolidated financial statements. As of December 31, 2017 and 2016, PEMEX had accrued a reserveof Ps. 7,812,689 and Ps. 15,119,692, respectively, for these contingent liabilities. As of December 31, 2017, the current status of the principal lawsuits inwhich PEMEX is involved is as follows:
� On April 4, 2011, Pemex-Exploration and Production was summoned before the Séptima Sala Regional Metropolitana (�Seventh RegionalMetropolitan Court�) of the Tribunal Federal de Justicia Fiscal y Administrativa (�Tax and Administrative Federal Court�) in connectionwith an administrative claim (No. 4957/1117071) filed by EMS Energy Services de México, S. de R.L. de C.V. and Energy MaintenanceServices Group I. LLC requesting that Pemex-Exploration and Production�s termination of the public works contract be declared null andvoid. In a concurrent proceeding, the plaintiffs also filed an administrative claim (No. 13620/15-17-06) against Pemex Exploration andProduction before the Sexta Sala Regional Metropolitana (�Sixth Regional Metropolitan Court�) of the Tax and Administrative FederalCourt in Mexico City seeking damages totaling U.S. $193,713 related to the above-mentioned contract. Pemex-Exploration and Productionfiled a response requesting the two administrative claims be joined in a single proceeding, which was granted on May 10, 2016 by theSeventh Regional Metropolitan Court. On May 3, 2017, the proceeding was closed for a judgment to be issued. As of the date of thesefinancial statements, a resolution from the Second Section of the Superior Court of the Tax and Administrative Federal Court is stillpending.
� In June 2016, Pemex Exploration and Production was summoned before the Juzgado Octavo de Distrito en Materia Civil (�Eighth CivilDistrict Court�) in Mexico City, in connection with a claim filed by Drake Mesa, S. de R.L. (file No. 200/2016-II), seeking approximatelyU.S.$120,856 related to expenses and damages, in connection with a public work agreement executed between them. On November 9, 2017,a judgment was issued finding the Eighth Civil District Court lacked jurisdiction over this case. Both parties filed appeals against thisresolution. As of the date of these financial statements, a final resolution is still pending.
� On June 11, 2015, the Segunda Sala Regional del Noreste (�Second Regional Northeast Court�) notified Pemex-Refining of anadministrative claim (file no. 2383/15-06-02-4) filed by Severo
F-126
Copyright © 2018 www.secdatabase.com. All Rights Reserved.Please Consider the Environment Before Printing This Document
Table of ContentsPETRÓLEOS MEXICANOS, PRODUCTIVE STATE-OWNED SUBSIDIARIES
AND SUBSIDIARY COMPANIESNOTES TO THE CONSOLIDATED FINANCIAL STATEMENTSFOR THE YEARS ENDED DECEMBER 31, 2017, 2016 AND 2015
(FIGURES STATED IN THOUSANDS, EXCEPT AS NOTED)
Granados Mendoza, Luciano Machorro Olvera and Hilario Martínez Cerda, as President, Secretary and Treasurer of the Ejido Tepehuaje,seeking Ps. 2,094,232 in damages due to a hydrocarbon spill on their land. Pemex-Refining filed a response to this claim and the plaintiffswere given time to amend their claim. The defendant filed a motion against this resolution and responded to the amended claim onFebruary 17, 2017. The trial is in the evidentiary stage. The appointment of an independent expert related to environmental issues is stillpending. A final judgment is still pending.
� On July 8, 2011, Pemex Exploration and Production was summoned in connection with an administrative claim (no. 4334/1111026) filed byCompañía Petrolera La Norma, S.A., against the Chief Executive Officer of Petróleos Mexicanos and the Chief Executive Officer ofPemex-Exploration and Production before the Segunda Sala Regional Hidalgo-México (�Hidalgo-Mexico Second Regional Court�) of theTax Administrative Federal Court in Tlalnepantla, Estado de México. The plaintiff is seeking compensation for the cancellation of itsalleged petroleum rights concessions and damages for up to Ps.1,552,730. On August 20, 2014, the proceeding was sent to the SegundaSección de la Sala Superior (�Second Section of The Superior Court�) of the Tax and Administrative Federal Court(4334/11-11-02-6/1337/14-s2-07-04). On October 29, 2014, the proceeding was returned to the Second Regional Court to correct aprocedural error. A new term to file pleas was approved. On September 7, 2017, a motion was filed questioning a signature�s authenticity.In December 2017, a documentary expert�s opinion was filed by the plaintiff and a new expert was designated by Pemex Exploration andProduction. The acceptance of this designation is still pending. As of the date of these financial statements, a final resolution is still pending.
� On December 12, 2017, Pemex Exploration and Production was summoned in connection with an arbitration claim (no. 23217/JPA) filed bySUBSEA 7 de México, S. de R. L. de C.V. (�SUBSEA 7�) seeking U.S.$153,000 related to additional expenses in connection with apipelines construction contract. A response by the defendant is still pending as of the date of these financial statements.
� On August 1, 2017, Pemex Exploration and Production was summoned in connection with an administrative claim (no. 11590/17-17-06-2)filed by Proyectos y Cimentaciones Industriales, S.A. de C.V. before the Sixth Regional Metropolitan Court seeking Ps. 800,000 and U.S.$12.82 and to have the settlement certificate dated March 22, 2017 related to services agreement declared null and void. On September 25,2017 Pemex Exploration and Production filed a response to this claim. As of the date of these financial statements, a final resolution is stillpending.
The results of these proceedings are uncertain until their final resolutions are issued by the appropriate authorities. PEMEX has recorded liabilitiesfor loss contingencies when it is probable that a liability has been incurred and the amount thereof can be reasonably estimated. When a reasonableestimation could not be made, qualitative disclosure was provided in the notes to these consolidated financial statements.
PEMEX does not disclose amounts accrued for each individual claim because such disclosure could adversely affect PEMEX�s legal strategy, aswell as the outcome of the related litigation.
Pursuant to an ordinary session held by the Board of Directors on August 23, 2013, Petróleos Mexicanos established policies for the granting ofmutual guarantees, loans or any type of credit in favor of the Subsidiary Entities and Subsidiary Companies; in accordance with these policies, theCorporate Finance Department issues an opinion with its risk analysis, financial valuation, budget sufficiency, accounting treatment and conclusions.
F-127
Copyright © 2018 www.secdatabase.com. All Rights Reserved.Please Consider the Environment Before Printing This Document
Table of ContentsPETRÓLEOS MEXICANOS, PRODUCTIVE STATE-OWNED SUBSIDIARIES
AND SUBSIDIARY COMPANIESNOTES TO THE CONSOLIDATED FINANCIAL STATEMENTSFOR THE YEARS ENDED DECEMBER 31, 2017, 2016 AND 2015
(FIGURES STATED IN THOUSANDS, EXCEPT AS NOTED)
Additionally, Pemex Logistics has granted the following corporate guarantees in connection with the exploration and extraction contracts enteredinto Pemex Exploration and Production, as required by the NHC:
� Exploration and extraction of hydrocarbons under the deep-water license modality, Trión field (Tender CNH-A1-TRION / 2016), of US$4,000,000.
� Exploration and extraction of the contract area 3 Cinturón plegado perdido (Tender CNHR01- L04 / 2015), of US $3,333,000.
� Extraction of hydrocarbons under shared production contract of the Ek-Balam fields, of U.S. $5,000,000.
� Extraction of hydrocarbons in contractual area Santuario and El Golpe 3 field, of U.S. $320,000.
� Exploration and extraction of hydrocarbons under shared production contract, contractual area 2 Tampico-Misantla, of U.S. $1,750,000.
� Exploration and extraction of hydrocarbons under shared production contract, contractual area 8 Cuencas del Sureste, of U.S. $1,250,000.
� Exploration and extraction of hydrocarbons shared production contract, assignment AE-0398-Mission of U.S. $255,000.
� Extraction of hydrocarbons under license agreement, Ogarrio field of U.S. $250,000.
� Extraction of hydrocarbons under license agreement, Cárdenas and Mora fields, of U.S. $250,000.
Certain other Subsidiary Entities have also granted guarantees and other contingencies.
PEMEX considers the probability it needs to make a disbursement of cash, for the guarantees granted and in effect as of December 31, 2017remote.
NOTE 26. BUSINESS COMBINATION
On January 28, 2016, PMX Fertilizantes Pacífico, S.A. de C.V., a PEMEX subsidiary company, acquired 99.99% of the outstanding shares ofFertinal, for a total purchase price of Ps. 4,322,826. This amount was paid through credit lines under a simple credit agreement. Additionally, within thesame credit line, PMX Fertilizantes obtained U.S. $425,800 for the liquidation of Fertinal�s debt. These loans will mature in 16 years.
F-128
Copyright © 2018 www.secdatabase.com. All Rights Reserved.Please Consider the Environment Before Printing This Document
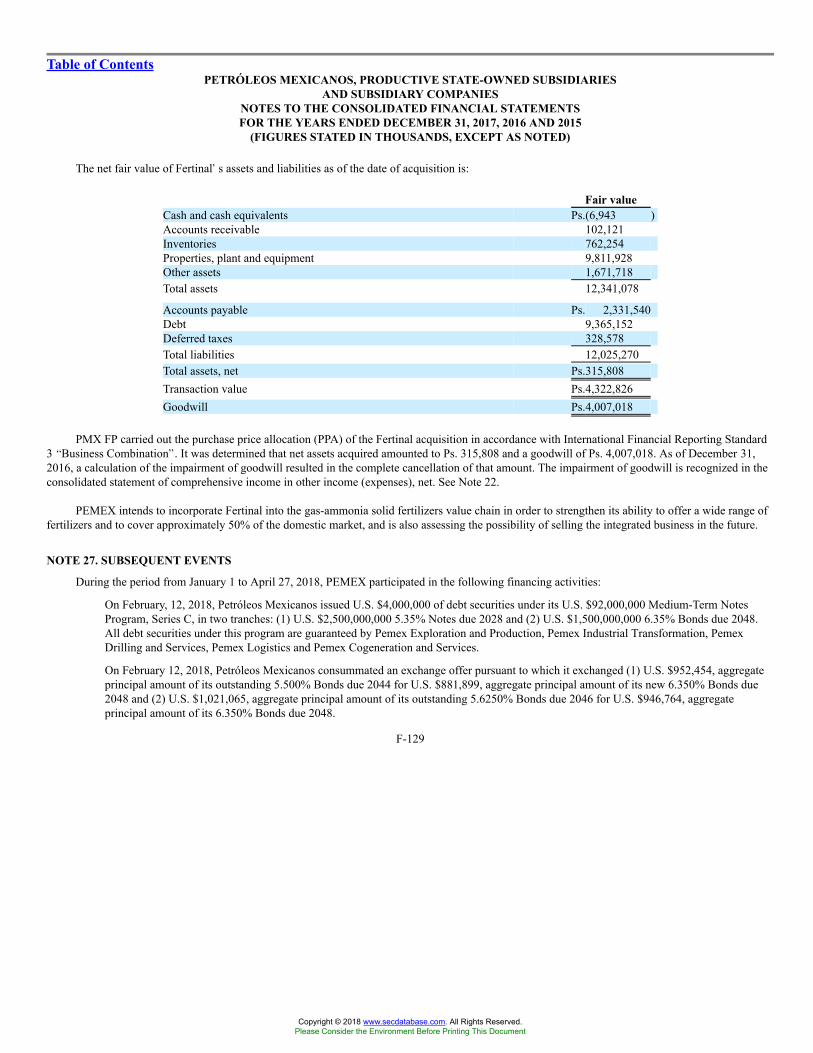
Table of ContentsPETRÓLEOS MEXICANOS, PRODUCTIVE STATE-OWNED SUBSIDIARIES
AND SUBSIDIARY COMPANIESNOTES TO THE CONSOLIDATED FINANCIAL STATEMENTSFOR THE YEARS ENDED DECEMBER 31, 2017, 2016 AND 2015
(FIGURES STATED IN THOUSANDS, EXCEPT AS NOTED)
The net fair value of Fertinal�s assets and liabilities as of the date of acquisition is:
Fair valueCash and cash equivalents Ps.(6,943 )Accounts receivable 102,121Inventories 762,254Properties, plant and equipment 9,811,928Other assets 1,671,718Total assets 12,341,078
Accounts payable Ps. 2,331,540Debt 9,365,152Deferred taxes 328,578Total liabilities 12,025,270Total assets, net Ps.315,808Transaction value Ps.4,322,826Goodwill Ps.4,007,018
PMX FP carried out the purchase price allocation (PPA) of the Fertinal acquisition in accordance with International Financial Reporting Standard3 �Business Combination�. It was determined that net assets acquired amounted to Ps. 315,808 and a goodwill of Ps. 4,007,018. As of December 31,2016, a calculation of the impairment of goodwill resulted in the complete cancellation of that amount. The impairment of goodwill is recognized in theconsolidated statement of comprehensive income in other income (expenses), net. See Note 22.
PEMEX intends to incorporate Fertinal into the gas-ammonia solid fertilizers value chain in order to strengthen its ability to offer a wide range offertilizers and to cover approximately 50% of the domestic market, and is also assessing the possibility of selling the integrated business in the future.
NOTE 27. SUBSEQUENT EVENTS
During the period from January 1 to April 27, 2018, PEMEX participated in the following financing activities:
� On February, 12, 2018, Petróleos Mexicanos issued U.S. $4,000,000 of debt securities under its U.S. $92,000,000 Medium-Term NotesProgram, Series C, in two tranches: (1) U.S. $2,500,000,000 5.35% Notes due 2028 and (2) U.S. $1,500,000,000 6.35% Bonds due 2048.All debt securities under this program are guaranteed by Pemex Exploration and Production, Pemex Industrial Transformation, PemexDrilling and Services, Pemex Logistics and Pemex Cogeneration and Services.
� On February 12, 2018, Petróleos Mexicanos consummated an exchange offer pursuant to which it exchanged (1) U.S. $952,454, aggregateprincipal amount of its outstanding 5.500% Bonds due 2044 for U.S. $881,899, aggregate principal amount of its new 6.350% Bonds due2048 and (2) U.S. $1,021,065, aggregate principal amount of its outstanding 5.6250% Bonds due 2046 for U.S. $946,764, aggregateprincipal amount of its 6.350% Bonds due 2048.
F-129
Copyright © 2018 www.secdatabase.com. All Rights Reserved.Please Consider the Environment Before Printing This Document
Table of ContentsPETRÓLEOS MEXICANOS, PRODUCTIVE STATE-OWNED SUBSIDIARIES
AND SUBSIDIARY COMPANIESNOTES TO THE CONSOLIDATED FINANCIAL STATEMENTSFOR THE YEARS ENDED DECEMBER 31, 2017, 2016 AND 2015
(FIGURES STATED IN THOUSANDS, EXCEPT AS NOTED)
� On March 5, 2018, Petróleos Mexicanos consummated a tender offer pursuant to which it purchased U.S. $138,598, aggregate principalamount of its outstanding 3.125% Notes due 2019, U.S. $558,644 aggregate principal amount of its outstanding 5.500% Notes due 2019,U.S. $91,843 aggregate principal amount of its outstanding 8.000% Notes due 2019, U.S. $183,017 aggregate principal amount of itsoutstanding 6.000% Notes due 2020 and U.S. $817,303 aggregate principal amount of its outstanding 3.500% Notes due 2020.
Between January 1 to April 27, 2018, PMI HBV obtained U.S. $7,126,000 and repaid U.S. $6,126,000 in financing from its revolving credit lines.As of April 27, 2018, the outstanding amount under these revolving credit lines was U.S. $1,227,500.
As of April 27, 2018, the Mexican peso-U.S. dollar exchange rate was Ps. 19.0530 per U.S. dollar, which represents a 3.7% appreciation of thevalue of the peso in U.S. dollar terms as compared to the exchange rate as of December 31, 2017, which was Ps. 19.7867 per U.S. dollar.
As of April 27, 2018, the weighted average price of the crude oil exported by PEMEX was U.S. $60.89 per barrel. This represents a price increaseof approximately 8.3% as compared to the average price as of December 31, 2017, which was U.S. $56.19 per barrel.
In March 2018, Pemex Exploration and Production was summoned before the International Centre for Dispute Resolution of the AmericanArbitration Association in connection with an arbitration claim (No. 01-18-0001-1499) filed by Loadmaster Universal Rigs, Inc., Loadmaster DrillingTechnologies, LLC, Ulterra Drilling Technologies Mexico, S.A. de C.V. and Kennedy Fabricating, LLC seeking U.S. $139,870 in connection with theconstruction and acquisition of modular drilling equipment. Pemex Exploration and Production is currently analyzing the legal actions available to it inresponse to this claim.
NOTE 28. SUBSIDIARY GUARANTOR INFORMATION
The following consolidating information presents: (i) condensed consolidated statements of financial position at December 31, 2017 and 2016 andcondensed consolidated statements of comprehensive income and cash flows for the years ended December 31, 2017, 2016 and 2015 of PetróleosMexicanos, the Subsidiary Guarantors and the Non-Guarantor Subsidiaries (as defined below).
These condensed consolidated statements were prepared in conformity with IFRS, with one exception: for the purposes of the presentation of thesubsidiary guarantor information, the Subsidiary Entities and Subsidiary Companies have been accounted for as investments under the equity method byPetróleos Mexicanos. Earnings of subsidiaries are therefore reflected in Petróleos Mexicanos� investment account and earnings. The principalelimination entries eliminate Petróleos Mexicanos� investment in subsidiaries and inter-company balances and transactions. Pemex Exploration andProduction, Pemex Industrial Transformation, Pemex Drilling and Services, Pemex Logistics and Pemex Cogeneration and Services (collectively, the�Subsidiary Guarantors�) and Pemex Ethylene and Pemex Fertilizers are 100%-owned subsidiaries of the Mexican Government. The guaranties by theSubsidiary Guarantors of Petróleos Mexicanos� payment obligations under this indebtedness are full, unconditional, joint and several. Pemex Ethylene,Pemex Fertilizers, Pemex Finance, Ltd. and the Subsidiary Companies collectively comprise the non-guarantor subsidiaries (the �Non-GuarantorSubsidiaries�).
The Pemex Project Funding Master Trust (the �Master Trust�), which was a trust formed for the purpose of financing PEMEX�s projects, wasdissolved effective December 20, 2011 and is no longer consolidated in the financial statements of PEMEX as of December 31, 2011 and thereafter.
F-130
Copyright © 2018 www.secdatabase.com. All Rights Reserved.Please Consider the Environment Before Printing This Document
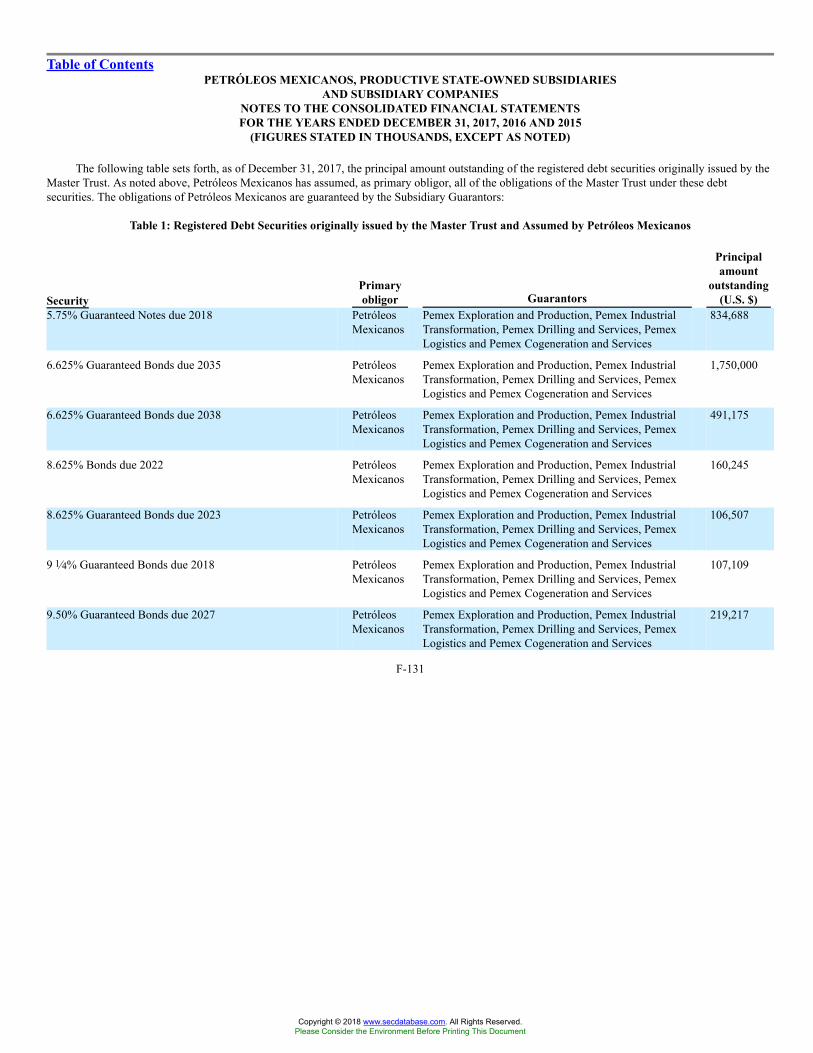
Table of ContentsPETRÓLEOS MEXICANOS, PRODUCTIVE STATE-OWNED SUBSIDIARIES
AND SUBSIDIARY COMPANIESNOTES TO THE CONSOLIDATED FINANCIAL STATEMENTSFOR THE YEARS ENDED DECEMBER 31, 2017, 2016 AND 2015
(FIGURES STATED IN THOUSANDS, EXCEPT AS NOTED)
The following table sets forth, as of December 31, 2017, the principal amount outstanding of the registered debt securities originally issued by theMaster Trust. As noted above, Petróleos Mexicanos has assumed, as primary obligor, all of the obligations of the Master Trust under these debtsecurities. The obligations of Petróleos Mexicanos are guaranteed by the Subsidiary Guarantors:
Table 1: Registered Debt Securities originally issued by the Master Trust and Assumed by Petróleos Mexicanos
SecurityPrimaryobligor Guarantors
Principalamount
outstanding(U.S. $)
5.75% Guaranteed Notes due 2018 PetróleosMexicanos
Pemex Exploration and Production, Pemex IndustrialTransformation, Pemex Drilling and Services, PemexLogistics and Pemex Cogeneration and Services
834,688
6.625% Guaranteed Bonds due 2035 PetróleosMexicanos
Pemex Exploration and Production, Pemex IndustrialTransformation, Pemex Drilling and Services, PemexLogistics and Pemex Cogeneration and Services
1,750,000
6.625% Guaranteed Bonds due 2038 PetróleosMexicanos
Pemex Exploration and Production, Pemex IndustrialTransformation, Pemex Drilling and Services, PemexLogistics and Pemex Cogeneration and Services
491,175
8.625% Bonds due 2022 PetróleosMexicanos
Pemex Exploration and Production, Pemex IndustrialTransformation, Pemex Drilling and Services, PemexLogistics and Pemex Cogeneration and Services
160,245
8.625% Guaranteed Bonds due 2023 PetróleosMexicanos
Pemex Exploration and Production, Pemex IndustrialTransformation, Pemex Drilling and Services, PemexLogistics and Pemex Cogeneration and Services
106,507
9 1⁄4% Guaranteed Bonds due 2018 PetróleosMexicanos
Pemex Exploration and Production, Pemex IndustrialTransformation, Pemex Drilling and Services, PemexLogistics and Pemex Cogeneration and Services
107,109
9.50% Guaranteed Bonds due 2027 PetróleosMexicanos
Pemex Exploration and Production, Pemex IndustrialTransformation, Pemex Drilling and Services, PemexLogistics and Pemex Cogeneration and Services
219,217
F-131
Copyright © 2018 www.secdatabase.com. All Rights Reserved.Please Consider the Environment Before Printing This Document
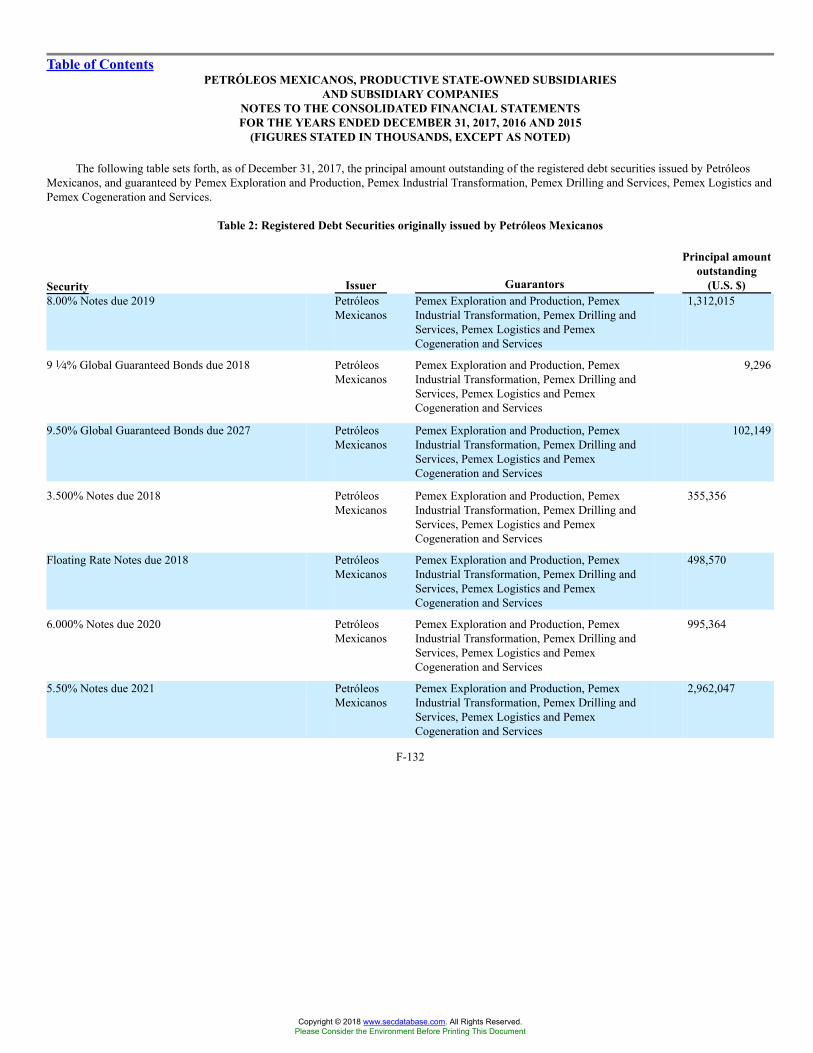
Table of ContentsPETRÓLEOS MEXICANOS, PRODUCTIVE STATE-OWNED SUBSIDIARIES
AND SUBSIDIARY COMPANIESNOTES TO THE CONSOLIDATED FINANCIAL STATEMENTSFOR THE YEARS ENDED DECEMBER 31, 2017, 2016 AND 2015
(FIGURES STATED IN THOUSANDS, EXCEPT AS NOTED)
The following table sets forth, as of December 31, 2017, the principal amount outstanding of the registered debt securities issued by PetróleosMexicanos, and guaranteed by Pemex Exploration and Production, Pemex Industrial Transformation, Pemex Drilling and Services, Pemex Logistics andPemex Cogeneration and Services.
Table 2: Registered Debt Securities originally issued by Petróleos Mexicanos
Security Issuer Guarantors
Principal amountoutstanding
(U.S. $)8.00% Notes due 2019 Petróleos
MexicanosPemex Exploration and Production, PemexIndustrial Transformation, Pemex Drilling andServices, Pemex Logistics and PemexCogeneration and Services
1,312,015
9 1⁄4% Global Guaranteed Bonds due 2018 PetróleosMexicanos
Pemex Exploration and Production, PemexIndustrial Transformation, Pemex Drilling andServices, Pemex Logistics and PemexCogeneration and Services
9,296
9.50% Global Guaranteed Bonds due 2027 PetróleosMexicanos
Pemex Exploration and Production, PemexIndustrial Transformation, Pemex Drilling andServices, Pemex Logistics and PemexCogeneration and Services
102,149
3.500% Notes due 2018 PetróleosMexicanos
Pemex Exploration and Production, PemexIndustrial Transformation, Pemex Drilling andServices, Pemex Logistics and PemexCogeneration and Services
355,356
Floating Rate Notes due 2018 PetróleosMexicanos
Pemex Exploration and Production, PemexIndustrial Transformation, Pemex Drilling andServices, Pemex Logistics and PemexCogeneration and Services
498,570
6.000% Notes due 2020 PetróleosMexicanos
Pemex Exploration and Production, PemexIndustrial Transformation, Pemex Drilling andServices, Pemex Logistics and PemexCogeneration and Services
995,364
5.50% Notes due 2021 PetróleosMexicanos
Pemex Exploration and Production, PemexIndustrial Transformation, Pemex Drilling andServices, Pemex Logistics and PemexCogeneration and Services
2,962,047
F-132
Copyright © 2018 www.secdatabase.com. All Rights Reserved.Please Consider the Environment Before Printing This Document
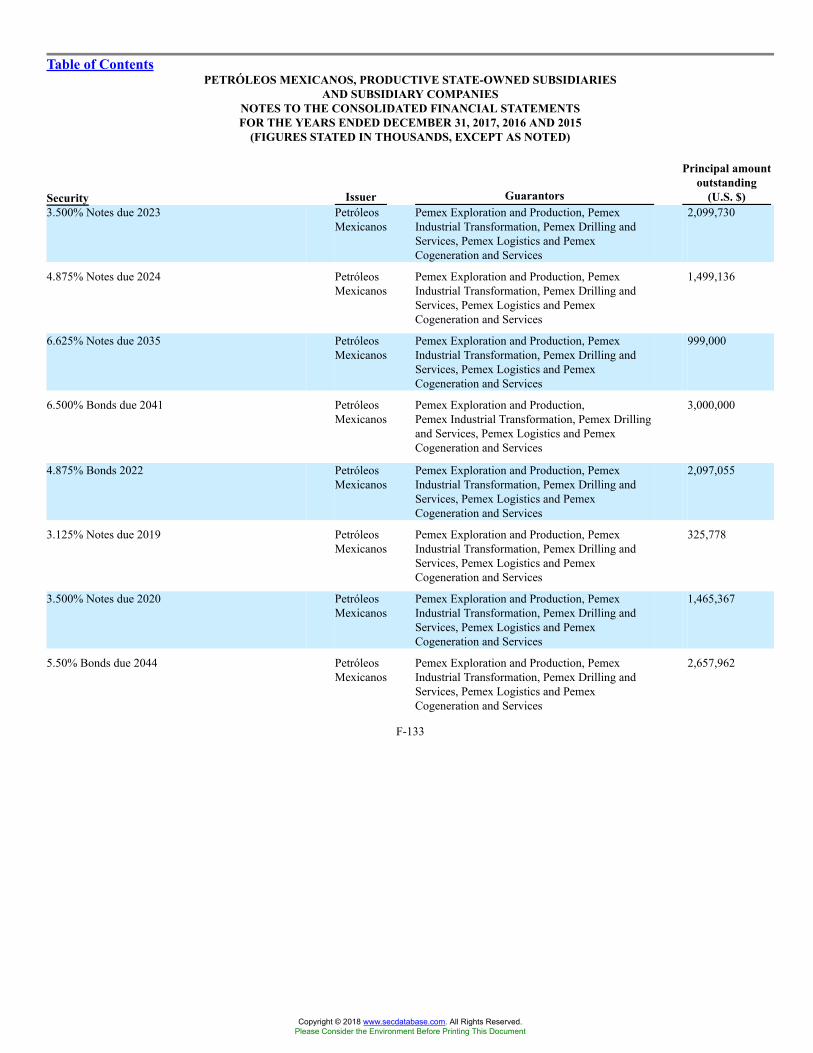
Table of ContentsPETRÓLEOS MEXICANOS, PRODUCTIVE STATE-OWNED SUBSIDIARIES
AND SUBSIDIARY COMPANIESNOTES TO THE CONSOLIDATED FINANCIAL STATEMENTSFOR THE YEARS ENDED DECEMBER 31, 2017, 2016 AND 2015
(FIGURES STATED IN THOUSANDS, EXCEPT AS NOTED)
Security Issuer Guarantors
Principal amountoutstanding
(U.S. $)3.500% Notes due 2023 Petróleos
MexicanosPemex Exploration and Production, PemexIndustrial Transformation, Pemex Drilling andServices, Pemex Logistics and PemexCogeneration and Services
2,099,730
4.875% Notes due 2024 PetróleosMexicanos
Pemex Exploration and Production, PemexIndustrial Transformation, Pemex Drilling andServices, Pemex Logistics and PemexCogeneration and Services
1,499,136
6.625% Notes due 2035 PetróleosMexicanos
Pemex Exploration and Production, PemexIndustrial Transformation, Pemex Drilling andServices, Pemex Logistics and PemexCogeneration and Services
999,000
6.500% Bonds due 2041 PetróleosMexicanos
Pemex Exploration and Production,Pemex Industrial Transformation, Pemex Drillingand Services, Pemex Logistics and PemexCogeneration and Services
3,000,000
4.875% Bonds 2022 PetróleosMexicanos
Pemex Exploration and Production, PemexIndustrial Transformation, Pemex Drilling andServices, Pemex Logistics and PemexCogeneration and Services
2,097,055
3.125% Notes due 2019 PetróleosMexicanos
Pemex Exploration and Production, PemexIndustrial Transformation, Pemex Drilling andServices, Pemex Logistics and PemexCogeneration and Services
325,778
3.500% Notes due 2020 PetróleosMexicanos
Pemex Exploration and Production, PemexIndustrial Transformation, Pemex Drilling andServices, Pemex Logistics and PemexCogeneration and Services
1,465,367
5.50% Bonds due 2044 PetróleosMexicanos
Pemex Exploration and Production, PemexIndustrial Transformation, Pemex Drilling andServices, Pemex Logistics and PemexCogeneration and Services
2,657,962
F-133
Copyright © 2018 www.secdatabase.com. All Rights Reserved.Please Consider the Environment Before Printing This Document
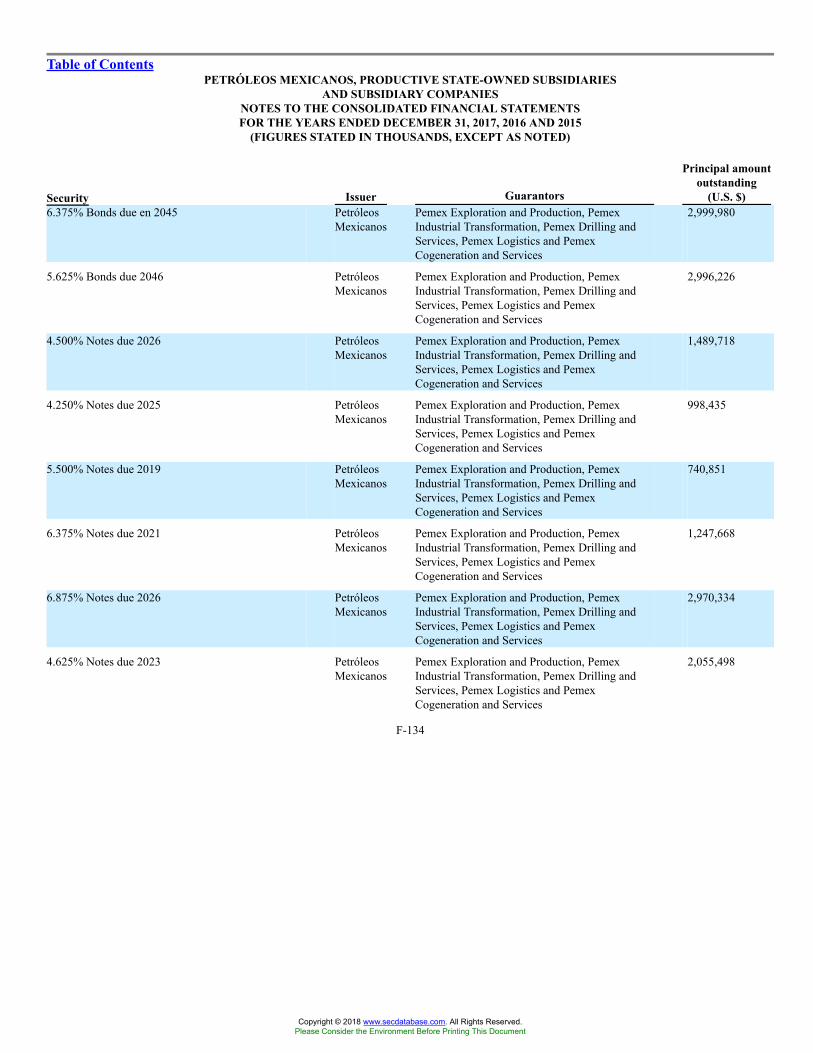
Table of ContentsPETRÓLEOS MEXICANOS, PRODUCTIVE STATE-OWNED SUBSIDIARIES
AND SUBSIDIARY COMPANIESNOTES TO THE CONSOLIDATED FINANCIAL STATEMENTSFOR THE YEARS ENDED DECEMBER 31, 2017, 2016 AND 2015
(FIGURES STATED IN THOUSANDS, EXCEPT AS NOTED)
Security Issuer Guarantors
Principal amountoutstanding
(U.S. $)6.375% Bonds due en 2045 Petróleos
MexicanosPemex Exploration and Production, PemexIndustrial Transformation, Pemex Drilling andServices, Pemex Logistics and PemexCogeneration and Services
2,999,980
5.625% Bonds due 2046 PetróleosMexicanos
Pemex Exploration and Production, PemexIndustrial Transformation, Pemex Drilling andServices, Pemex Logistics and PemexCogeneration and Services
2,996,226
4.500% Notes due 2026 PetróleosMexicanos
Pemex Exploration and Production, PemexIndustrial Transformation, Pemex Drilling andServices, Pemex Logistics and PemexCogeneration and Services
1,489,718
4.250% Notes due 2025 PetróleosMexicanos
Pemex Exploration and Production, PemexIndustrial Transformation, Pemex Drilling andServices, Pemex Logistics and PemexCogeneration and Services
998,435
5.500% Notes due 2019 PetróleosMexicanos
Pemex Exploration and Production, PemexIndustrial Transformation, Pemex Drilling andServices, Pemex Logistics and PemexCogeneration and Services
740,851
6.375% Notes due 2021 PetróleosMexicanos
Pemex Exploration and Production, PemexIndustrial Transformation, Pemex Drilling andServices, Pemex Logistics and PemexCogeneration and Services
1,247,668
6.875% Notes due 2026 PetróleosMexicanos
Pemex Exploration and Production, PemexIndustrial Transformation, Pemex Drilling andServices, Pemex Logistics and PemexCogeneration and Services
2,970,334
4.625% Notes due 2023 PetróleosMexicanos
Pemex Exploration and Production, PemexIndustrial Transformation, Pemex Drilling andServices, Pemex Logistics and PemexCogeneration and Services
2,055,498
F-134
Copyright © 2018 www.secdatabase.com. All Rights Reserved.Please Consider the Environment Before Printing This Document
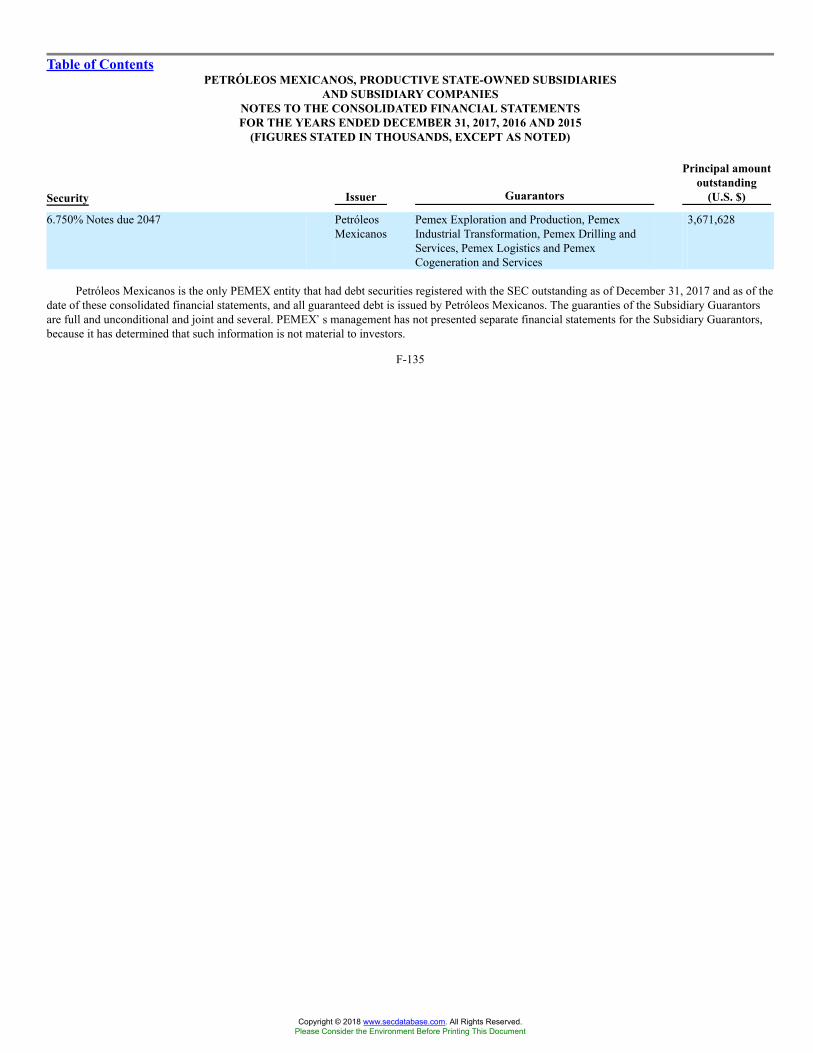
Table of ContentsPETRÓLEOS MEXICANOS, PRODUCTIVE STATE-OWNED SUBSIDIARIES
AND SUBSIDIARY COMPANIESNOTES TO THE CONSOLIDATED FINANCIAL STATEMENTSFOR THE YEARS ENDED DECEMBER 31, 2017, 2016 AND 2015
(FIGURES STATED IN THOUSANDS, EXCEPT AS NOTED)
Security Issuer Guarantors
Principal amountoutstanding
(U.S. $)
6.750% Notes due 2047 PetróleosMexicanos
Pemex Exploration and Production, PemexIndustrial Transformation, Pemex Drilling andServices, Pemex Logistics and PemexCogeneration and Services
3,671,628
Petróleos Mexicanos is the only PEMEX entity that had debt securities registered with the SEC outstanding as of December 31, 2017 and as of thedate of these consolidated financial statements, and all guaranteed debt is issued by Petróleos Mexicanos. The guaranties of the Subsidiary Guarantorsare full and unconditional and joint and several. PEMEX�s management has not presented separate financial statements for the Subsidiary Guarantors,because it has determined that such information is not material to investors.
F-135
Copyright © 2018 www.secdatabase.com. All Rights Reserved.Please Consider the Environment Before Printing This Document
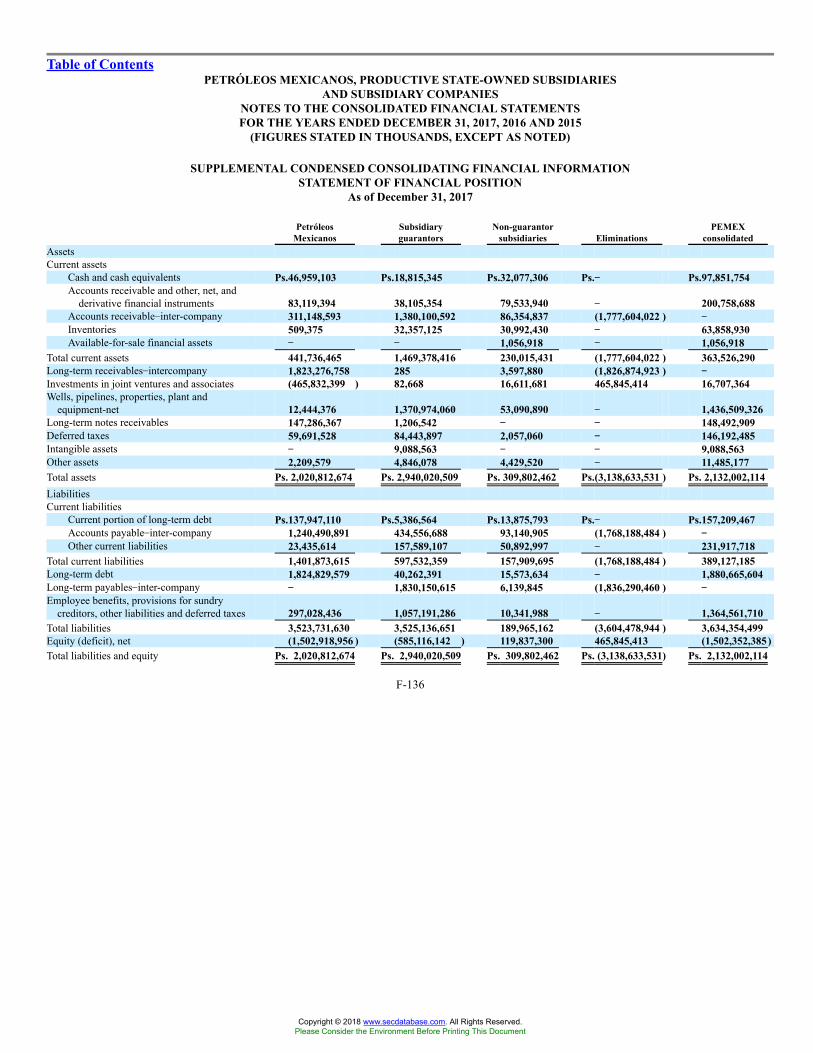
Table of ContentsPETRÓLEOS MEXICANOS, PRODUCTIVE STATE-OWNED SUBSIDIARIES
AND SUBSIDIARY COMPANIESNOTES TO THE CONSOLIDATED FINANCIAL STATEMENTSFOR THE YEARS ENDED DECEMBER 31, 2017, 2016 AND 2015
(FIGURES STATED IN THOUSANDS, EXCEPT AS NOTED)
SUPPLEMENTAL CONDENSED CONSOLIDATING FINANCIAL INFORMATIONSTATEMENT OF FINANCIAL POSITION
As of December 31, 2017
PetróleosMexicanos
Subsidiaryguarantors
Non-guarantorsubsidiaries Eliminations
PEMEXconsolidated
AssetsCurrent assets
Cash and cash equivalents Ps.46,959,103 Ps.18,815,345 Ps.32,077,306 Ps.�� Ps.97,851,754Accounts receivable and other, net, and
derivative financial instruments 83,119,394 38,105,354 79,533,940 �� 200,758,688Accounts receivable�inter-company 311,148,593 1,380,100,592 86,354,837 (1,777,604,022 ) ��Inventories 509,375 32,357,125 30,992,430 �� 63,858,930Available-for-sale financial assets �� �� 1,056,918 �� 1,056,918
Total current assets 441,736,465 1,469,378,416 230,015,431 (1,777,604,022 ) 363,526,290Long-term receivables�intercompany 1,823,276,758 285 3,597,880 (1,826,874,923 ) ��Investments in joint ventures and associates (465,832,399 ) 82,668 16,611,681 465,845,414 16,707,364Wells, pipelines, properties, plant and
equipment-net 12,444,376 1,370,974,060 53,090,890 �� 1,436,509,326Long-term notes receivables 147,286,367 1,206,542 �� �� 148,492,909Deferred taxes 59,691,528 84,443,897 2,057,060 �� 146,192,485Intangible assets �� 9,088,563 �� �� 9,088,563Other assets 2,209,579 4,846,078 4,429,520 �� 11,485,177Total assets Ps. 2,020,812,674 Ps. 2,940,020,509 Ps. 309,802,462 Ps.(3,138,633,531 ) Ps. 2,132,002,114LiabilitiesCurrent liabilities
Current portion of long-term debt Ps.137,947,110 Ps.5,386,564 Ps.13,875,793 Ps.�� Ps.157,209,467Accounts payable�inter-company 1,240,490,891 434,556,688 93,140,905 (1,768,188,484 ) ��Other current liabilities 23,435,614 157,589,107 50,892,997 �� 231,917,718
Total current liabilities 1,401,873,615 597,532,359 157,909,695 (1,768,188,484 ) 389,127,185Long-term debt 1,824,829,579 40,262,391 15,573,634 �� 1,880,665,604Long-term payables�inter-company �� 1,830,150,615 6,139,845 (1,836,290,460 ) ��Employee benefits, provisions for sundry
creditors, other liabilities and deferred taxes 297,028,436 1,057,191,286 10,341,988 �� 1,364,561,710Total liabilities 3,523,731,630 3,525,136,651 189,965,162 (3,604,478,944 ) 3,634,354,499Equity (deficit), net (1,502,918,956 ) (585,116,142 ) 119,837,300 465,845,413 (1,502,352,385)Total liabilities and equity Ps. 2,020,812,674 Ps. 2,940,020,509 Ps. 309,802,462 Ps. (3,138,633,531) Ps. 2,132,002,114
F-136
Copyright © 2018 www.secdatabase.com. All Rights Reserved.Please Consider the Environment Before Printing This Document
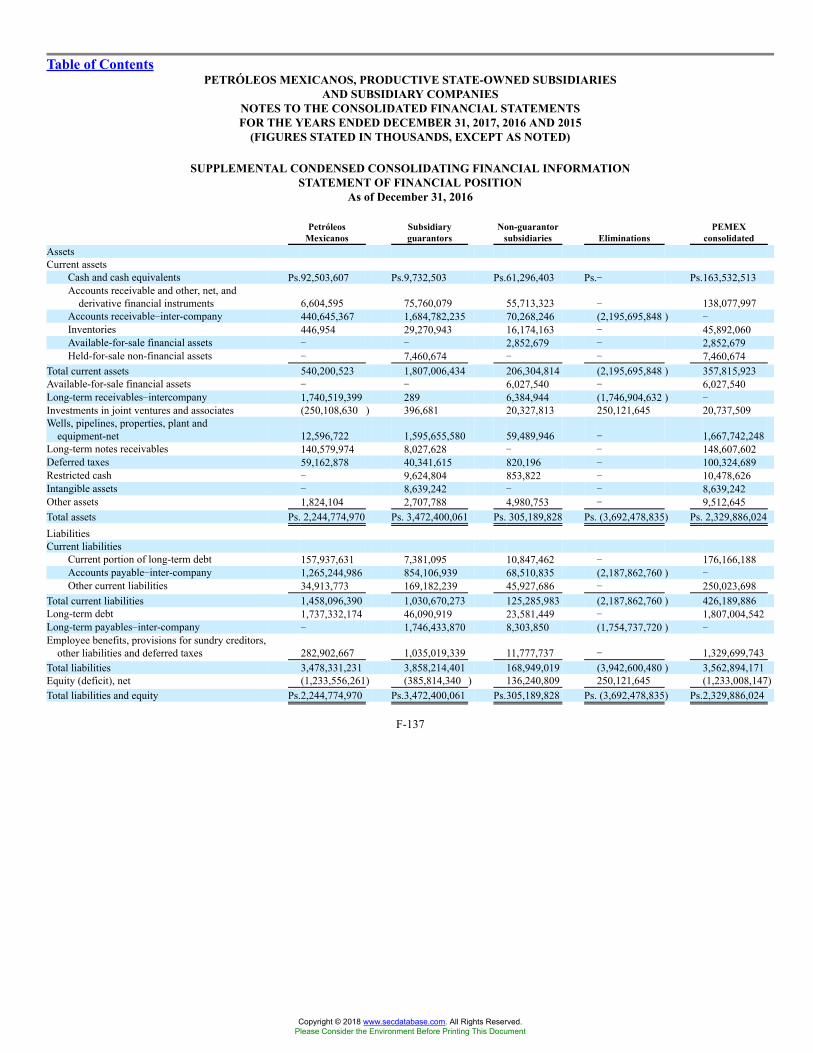
Table of ContentsPETRÓLEOS MEXICANOS, PRODUCTIVE STATE-OWNED SUBSIDIARIES
AND SUBSIDIARY COMPANIESNOTES TO THE CONSOLIDATED FINANCIAL STATEMENTSFOR THE YEARS ENDED DECEMBER 31, 2017, 2016 AND 2015
(FIGURES STATED IN THOUSANDS, EXCEPT AS NOTED)
SUPPLEMENTAL CONDENSED CONSOLIDATING FINANCIAL INFORMATIONSTATEMENT OF FINANCIAL POSITION
As of December 31, 2016
PetróleosMexicanos
Subsidiaryguarantors
Non-guarantorsubsidiaries Eliminations
PEMEXconsolidated
AssetsCurrent assets
Cash and cash equivalents Ps.92,503,607 Ps.9,732,503 Ps.61,296,403 Ps.� Ps.163,532,513Accounts receivable and other, net, and
derivative financial instruments 6,604,595 75,760,079 55,713,323 � 138,077,997Accounts receivable�inter-company 440,645,367 1,684,782,235 70,268,246 (2,195,695,848 ) �Inventories 446,954 29,270,943 16,174,163 � 45,892,060Available-for-sale financial assets � � 2,852,679 � 2,852,679Held-for-sale non-financial assets � 7,460,674 � � 7,460,674
Total current assets 540,200,523 1,807,006,434 206,304,814 (2,195,695,848 ) 357,815,923Available-for-sale financial assets � � 6,027,540 � 6,027,540Long-term receivables�intercompany 1,740,519,399 289 6,384,944 (1,746,904,632 ) �Investments in joint ventures and associates (250,108,630 ) 396,681 20,327,813 250,121,645 20,737,509Wells, pipelines, properties, plant and
equipment-net 12,596,722 1,595,655,580 59,489,946 � 1,667,742,248Long-term notes receivables 140,579,974 8,027,628 � � 148,607,602Deferred taxes 59,162,878 40,341,615 820,196 � 100,324,689Restricted cash � 9,624,804 853,822 � 10,478,626Intangible assets � 8,639,242 � � 8,639,242Other assets 1,824,104 2,707,788 4,980,753 � 9,512,645Total assets Ps. 2,244,774,970 Ps. 3,472,400,061 Ps. 305,189,828 Ps. (3,692,478,835) Ps. 2,329,886,024LiabilitiesCurrent liabilities
Current portion of long-term debt 157,937,631 7,381,095 10,847,462 � 176,166,188Accounts payable�inter-company 1,265,244,986 854,106,939 68,510,835 (2,187,862,760 ) �Other current liabilities 34,913,773 169,182,239 45,927,686 � 250,023,698
Total current liabilities 1,458,096,390 1,030,670,273 125,285,983 (2,187,862,760 ) 426,189,886Long-term debt 1,737,332,174 46,090,919 23,581,449 � 1,807,004,542Long-term payables�inter-company � 1,746,433,870 8,303,850 (1,754,737,720 ) �Employee benefits, provisions for sundry creditors,
other liabilities and deferred taxes 282,902,667 1,035,019,339 11,777,737 � 1,329,699,743Total liabilities 3,478,331,231 3,858,214,401 168,949,019 (3,942,600,480 ) 3,562,894,171Equity (deficit), net (1,233,556,261) (385,814,340 ) 136,240,809 250,121,645 (1,233,008,147)Total liabilities and equity Ps.2,244,774,970 Ps.3,472,400,061 Ps.305,189,828 Ps. (3,692,478,835) Ps.2,329,886,024
F-137
Copyright © 2018 www.secdatabase.com. All Rights Reserved.Please Consider the Environment Before Printing This Document
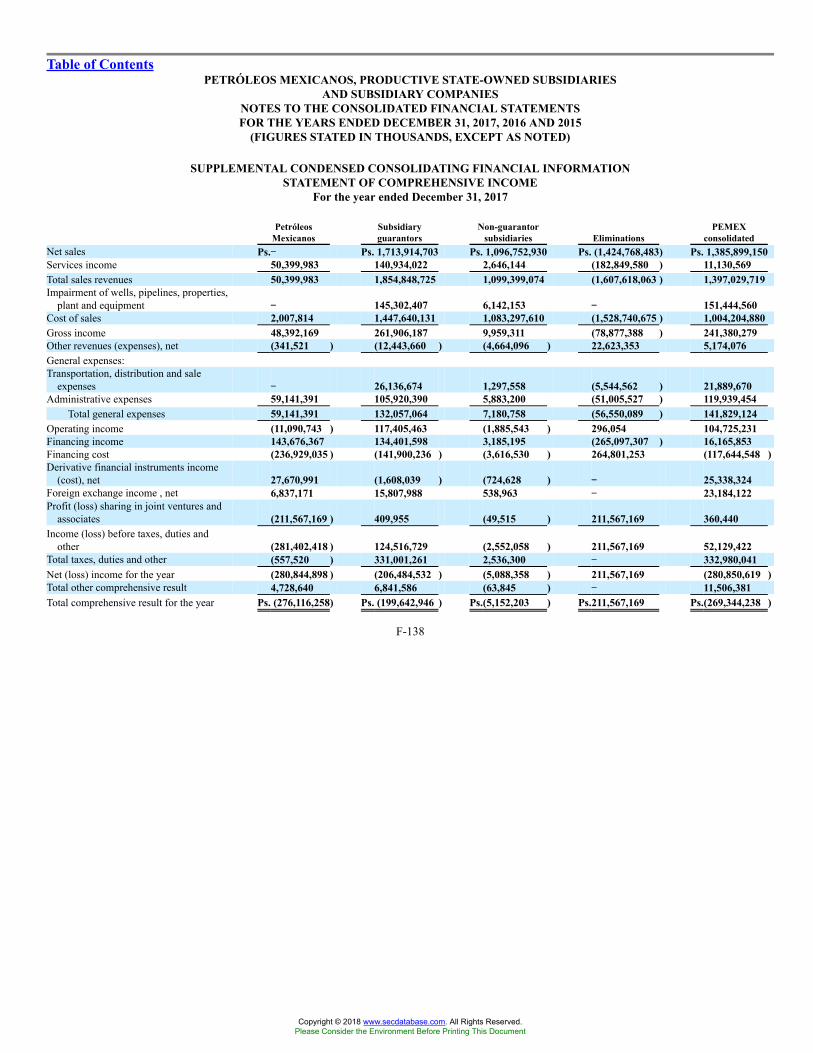
Table of ContentsPETRÓLEOS MEXICANOS, PRODUCTIVE STATE-OWNED SUBSIDIARIES
AND SUBSIDIARY COMPANIESNOTES TO THE CONSOLIDATED FINANCIAL STATEMENTSFOR THE YEARS ENDED DECEMBER 31, 2017, 2016 AND 2015
(FIGURES STATED IN THOUSANDS, EXCEPT AS NOTED)
SUPPLEMENTAL CONDENSED CONSOLIDATING FINANCIAL INFORMATIONSTATEMENT OF COMPREHENSIVE INCOME
For the year ended December 31, 2017
PetróleosMexicanos
Subsidiaryguarantors
Non-guarantorsubsidiaries Eliminations
PEMEXconsolidated
Net sales Ps.�� Ps. 1,713,914,703 Ps. 1,096,752,930 Ps. (1,424,768,483) Ps. 1,385,899,150Services income 50,399,983 140,934,022 2,646,144 (182,849,580 ) 11,130,569Total sales revenues 50,399,983 1,854,848,725 1,099,399,074 (1,607,618,063 ) 1,397,029,719Impairment of wells, pipelines, properties,
plant and equipment �� 145,302,407 6,142,153 �� 151,444,560Cost of sales 2,007,814 1,447,640,131 1,083,297,610 (1,528,740,675 ) 1,004,204,880Gross income 48,392,169 261,906,187 9,959,311 (78,877,388 ) 241,380,279Other revenues (expenses), net (341,521 ) (12,443,660 ) (4,664,096 ) 22,623,353 5,174,076General expenses:Transportation, distribution and sale
expenses �� 26,136,674 1,297,558 (5,544,562 ) 21,889,670Administrative expenses 59,141,391 105,920,390 5,883,200 (51,005,527 ) 119,939,454
Total general expenses 59,141,391 132,057,064 7,180,758 (56,550,089 ) 141,829,124Operating income (11,090,743 ) 117,405,463 (1,885,543 ) 296,054 104,725,231Financing income 143,676,367 134,401,598 3,185,195 (265,097,307 ) 16,165,853Financing cost (236,929,035 ) (141,900,236 ) (3,616,530 ) 264,801,253 (117,644,548 )Derivative financial instruments income
(cost), net 27,670,991 (1,608,039 ) (724,628 ) �� 25,338,324Foreign exchange income , net 6,837,171 15,807,988 538,963 �� 23,184,122Profit (loss) sharing in joint ventures and
associates (211,567,169 ) 409,955 (49,515 ) 211,567,169 360,440Income (loss) before taxes, duties and
other (281,402,418 ) 124,516,729 (2,552,058 ) 211,567,169 52,129,422Total taxes, duties and other (557,520 ) 331,001,261 2,536,300 �� 332,980,041Net (loss) income for the year (280,844,898 ) (206,484,532 ) (5,088,358 ) 211,567,169 (280,850,619 )Total other comprehensive result 4,728,640 6,841,586 (63,845 ) �� 11,506,381Total comprehensive result for the year Ps. (276,116,258) Ps. (199,642,946 ) Ps.(5,152,203 ) Ps.211,567,169 Ps.(269,344,238 )
F-138
Copyright © 2018 www.secdatabase.com. All Rights Reserved.Please Consider the Environment Before Printing This Document

Table of ContentsPETRÓLEOS MEXICANOS, PRODUCTIVE STATE-OWNED SUBSIDIARIES
AND SUBSIDIARY COMPANIESNOTES TO THE CONSOLIDATED FINANCIAL STATEMENTSFOR THE YEARS ENDED DECEMBER 31, 2017, 2016 AND 2015
(FIGURES STATED IN THOUSANDS, EXCEPT AS NOTED)
SUPPLEMENTAL CONDENSED CONSOLIDATING FINANCIAL INFORMATIONSTATEMENT OF COMPREHENSIVE INCOME
For the year ended December 31, 2016
PetróleosMexicanos
Subsidiaryguarantors
Non-guarantorsubsidiaries Eliminations
PEMEXconsolidated
Net sales Ps.� Ps. 1,361,538,624 Ps. 828,143,332 Ps. (1,124,563,366) Ps. 1,065,118,590Services income 46,330,245 98,959,131 1,970,055 (138,284,789 ) 8,974,642Total sales revenues 46,330,245 1,460,497,755 830,113,387 (1,262,848,155 ) 1,074,093,232(Reversal) impairment of wells, pipelines,
properties, plant and equipment � (330,037,834 ) (1,276,509 ) � (331,314,343 )Cost of sales 1,236,921 1,244,388,072 809,156,778 (1,188,959,550 ) 865,822,221Gross income 45,093,324 546,147,517 22,233,118 (73,888,605 ) 539,585,354Other revenues (expenses), net (312,611 ) 20,713,184 2,915,837 (666,804 ) 22,649,606General expenses:Transportation, distribution and sale expenses � 50,948,771 945,489 (26,663,020 ) 25,231,240Administrative expenses 57,437,455 96,884,031 7,050,271 (48,718,224 ) 112,653,533
Total general expenses 57,437,455 147,832,802 7,995,760 (75,381,244 ) 137,884,773Operating income (12,656,742 ) 419,027,899 17,153,195 825,835 424,350,187Financing income 123,266,281 67,542,768 3,526,378 (180,586,172 ) 13,749,255Financing cost (160,824,632 ) (114,271,762 ) (3,602,868 ) 179,854,798 (98,844,464 )Derivative financial instruments (cost) income, net (12,052,200 ) 3,172 (1,951,959 ) � (14,000,987 )Foreign exchange loss, net (20,531,005 ) (232,714,446 ) (767,292 ) � (254,012,743 )Profit (loss) sharing in joint ventures and associates (117,347,803 ) 628,357 1,507,488 117,347,803 2,135,845Income (loss) before taxes, duties and other (200,146,101 ) 140,215,988 15,864,942 117,442,264 73,377,093Total taxes, duties and other (8,834,626 ) 266,155,181 7,200,880 � 264,521,435Net (loss) income for the year (191,311,475 ) (125,939,193 ) 8,664,062 117,442,264 (191,144,342 )Total other comprehensive result 10,126,560 96,032,433 21,713,488 � 127,872,481Total comprehensive result for the year Ps. (181,184,915) Ps. (29,906,760 ) Ps. 30,377,550 Ps.117,442,264 Ps. (63,271,861 )
F-139
Copyright © 2018 www.secdatabase.com. All Rights Reserved.Please Consider the Environment Before Printing This Document

Table of ContentsPETRÓLEOS MEXICANOS, PRODUCTIVE STATE-OWNED SUBSIDIARIES
AND SUBSIDIARY COMPANIESNOTES TO THE CONSOLIDATED FINANCIAL STATEMENTSFOR THE YEARS ENDED DECEMBER 31, 2017, 2016 AND 2015
(FIGURES STATED IN THOUSANDS, EXCEPT AS NOTED)
SUPPLEMENTAL CONDENSED CONSOLIDATING FINANCIAL INFORMATIONSTATEMENT OF COMPREHENSIVE INCOME
For the year ended December 31, 2015
PetróleosMexicanos
Subsidiaryguarantors
Non-guarantorsubsidiaries Eliminations
PEMEXconsolidated
Net sales Ps.15,556 Ps. 1,523,767,800 Ps. 803,623,324 Ps. (1,173,956,323) Ps. 1,153,450,357Services income 16,897,139 16,815,589 2,585,617 (27,988,310 ) 8,310,035Total sales revenues 16,912,695 1,540,583,389 806,208,941 (1,201,944,633 ) 1,161,760,392
Impairment of wells, pipelines, properties,plant and equipment � 476,276,159 1,668,531 � 477,944,690
Benefit from change in pension plan (83,657,496 ) (8,519,593 ) � (92,177,089 )Cost of sales 2,695,423 1,280,404,059 791,147,745 (1,182,282,621 ) 891,964,606Gross income 14,217,272 (132,439,333 ) 21,912,258 (19,662,012 ) (115,971,815 )Other (expenses) revenues, net (19,805 ) (6,073,003 ) 3,326,421 1,890,900 (875,487 )General expenses:Transportation, distribution and sale expenses � 32,870,908 2,921,430 (6,863,699 ) 28,928,639Administrative expenses 59,923,878 52,832,029 10,638,127 (10,921,939 ) 112,472,095Benefit from change in pension plan (46,031,780 ) (50,394,477 ) (7,434,698 ) � (103,860,955 )
Total general expenses 13,892,098 35,308,460 6,124,859 (17,785,638 ) 37,539,779Operating income 305,369 (173,820,796 ) 19,113,820 14,526 (154,387,081 )Financing income 108,543,665 28,639,034 3,478,434 (125,670,274 ) 14,990,859Financing cost (85,544,060 ) (104,453,148 ) (3,306,776 ) 125,530,391 (67,773,593 )Derivative financial instruments (cost) income, net (22,803,663 ) 6,463 1,347,323 � (21,449,877 )Foreign exchange loss, net (14,829,436 ) (139,623,910 ) (312,228 ) � (154,765,574 )(Loss) profit sharing in joint ventures and associates (749,963,960 ) 198,786 2,119,329 749,963,960 2,318,115(Loss) income before taxes, duties and other (764,292,085 ) (389,053,571 ) 22,439,902 749,838,603 (381,067,151 )Total taxes, duties and other (51,982,560 ) 376,649,369 6,833,438 � 331,500,247Net (loss) income for the year (712,309,525 ) (765,702,940 ) 15,606,464 749,838,603 (712,567,398 )Total other comprehensive result 10,980,787 56,585,790 21,045,777 � 88,612,354Total comprehensive result for the year Ps. (701,328,738) Ps.(709,117,150 ) Ps.36,652,241 Ps.749,838,603 Ps.(623,955,044)
F-140
Copyright © 2018 www.secdatabase.com. All Rights Reserved.Please Consider the Environment Before Printing This Document
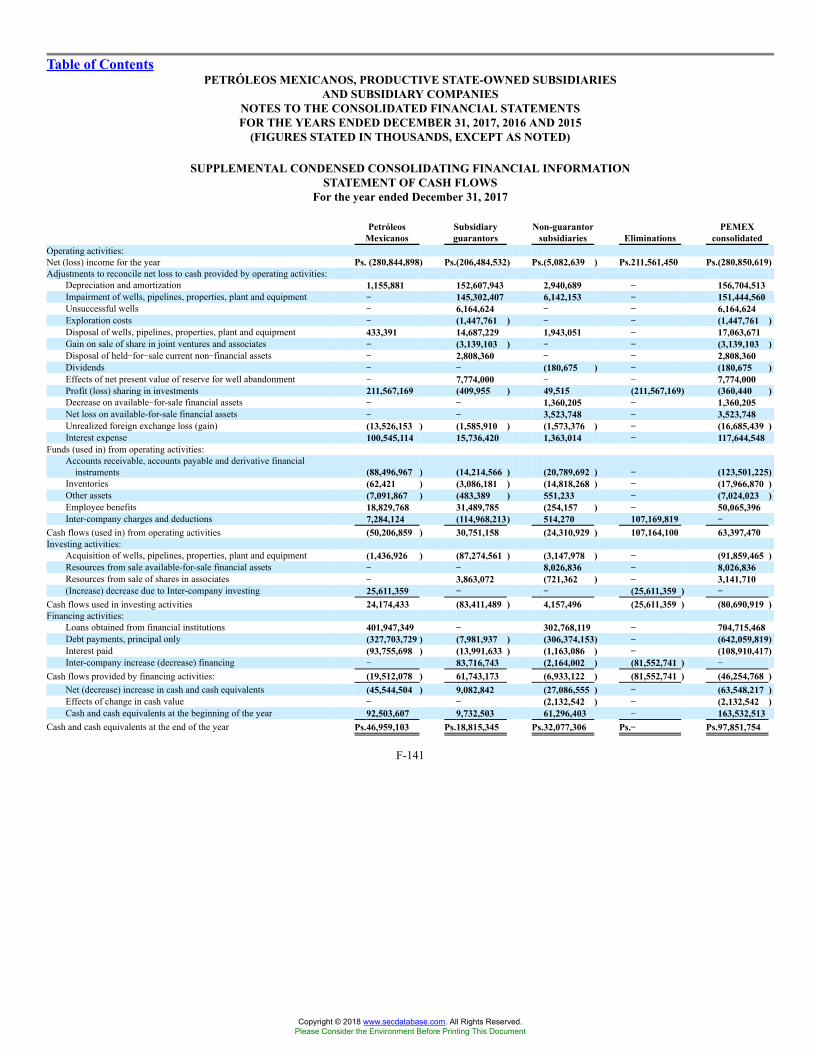
Table of ContentsPETRÓLEOS MEXICANOS, PRODUCTIVE STATE-OWNED SUBSIDIARIES
AND SUBSIDIARY COMPANIESNOTES TO THE CONSOLIDATED FINANCIAL STATEMENTSFOR THE YEARS ENDED DECEMBER 31, 2017, 2016 AND 2015
(FIGURES STATED IN THOUSANDS, EXCEPT AS NOTED)
SUPPLEMENTAL CONDENSED CONSOLIDATING FINANCIAL INFORMATIONSTATEMENT OF CASH FLOWS
For the year ended December 31, 2017
PetróleosMexicanos
Subsidiaryguarantors
Non-guarantorsubsidiaries Eliminations
PEMEXconsolidated
Operating activities:Net (loss) income for the year Ps. (280,844,898) Ps.(206,484,532) Ps.(5,082,639 ) Ps.211,561,450 Ps.(280,850,619)Adjustments to reconcile net loss to cash provided by operating activities:
Depreciation and amortization 1,155,881 152,607,943 2,940,689 �� 156,704,513Impairment of wells, pipelines, properties, plant and equipment �� 145,302,407 6,142,153 �� 151,444,560Unsuccessful wells �� 6,164,624 �� �� 6,164,624Exploration costs �� (1,447,761 ) �� �� (1,447,761 )Disposal of wells, pipelines, properties, plant and equipment 433,391 14,687,229 1,943,051 �� 17,063,671Gain on sale of share in joint ventures and associates �� (3,139,103 ) �� �� (3,139,103 )Disposal of held�for�sale current non�financial assets �� 2,808,360 �� �� 2,808,360Dividends �� �� (180,675 ) �� (180,675 )Effects of net present value of reserve for well abandonment �� 7,774,000 �� �� 7,774,000Profit (loss) sharing in investments 211,567,169 (409,955 ) 49,515 (211,567,169) (360,440 )Decrease on available�for-sale financial assets �� �� 1,360,205 �� 1,360,205Net loss on available-for-sale financial assets �� �� 3,523,748 �� 3,523,748Unrealized foreign exchange loss (gain) (13,526,153 ) (1,585,910 ) (1,573,376 ) �� (16,685,439 )Interest expense 100,545,114 15,736,420 1,363,014 �� 117,644,548
Funds (used in) from operating activities:Accounts receivable, accounts payable and derivative financial
instruments (88,496,967 ) (14,214,566 ) (20,789,692 ) �� (123,501,225)Inventories (62,421 ) (3,086,181 ) (14,818,268 ) �� (17,966,870 )Other assets (7,091,867 ) (483,389 ) 551,233 �� (7,024,023 )Employee benefits 18,829,768 31,489,785 (254,157 ) �� 50,065,396Inter-company charges and deductions 7,284,124 (114,968,213) 514,270 107,169,819 ��
Cash flows (used in) from operating activities (50,206,859 ) 30,751,158 (24,310,929 ) 107,164,100 63,397,470Investing activities:
Acquisition of wells, pipelines, properties, plant and equipment (1,436,926 ) (87,274,561 ) (3,147,978 ) �� (91,859,465 )Resources from sale available-for-sale financial assets �� �� 8,026,836 �� 8,026,836Resources from sale of shares in associates �� 3,863,072 (721,362 ) �� 3,141,710(Increase) decrease due to Inter-company investing 25,611,359 �� �� (25,611,359 ) ��
Cash flows used in investing activities 24,174,433 (83,411,489 ) 4,157,496 (25,611,359 ) (80,690,919 )Financing activities:
Loans obtained from financial institutions 401,947,349 �� 302,768,119 �� 704,715,468Debt payments, principal only (327,703,729 ) (7,981,937 ) (306,374,153) �� (642,059,819)Interest paid (93,755,698 ) (13,991,633 ) (1,163,086 ) �� (108,910,417)Inter-company increase (decrease) financing �� 83,716,743 (2,164,002 ) (81,552,741 ) ��
Cash flows provided by financing activities: (19,512,078 ) 61,743,173 (6,933,122 ) (81,552,741 ) (46,254,768 )Net (decrease) increase in cash and cash equivalents (45,544,504 ) 9,082,842 (27,086,555 ) �� (63,548,217 )Effects of change in cash value �� �� (2,132,542 ) �� (2,132,542 )Cash and cash equivalents at the beginning of the year 92,503,607 9,732,503 61,296,403 �� 163,532,513
Cash and cash equivalents at the end of the year Ps.46,959,103 Ps.18,815,345 Ps.32,077,306 Ps.�� Ps.97,851,754
F-141
Copyright © 2018 www.secdatabase.com. All Rights Reserved.Please Consider the Environment Before Printing This Document
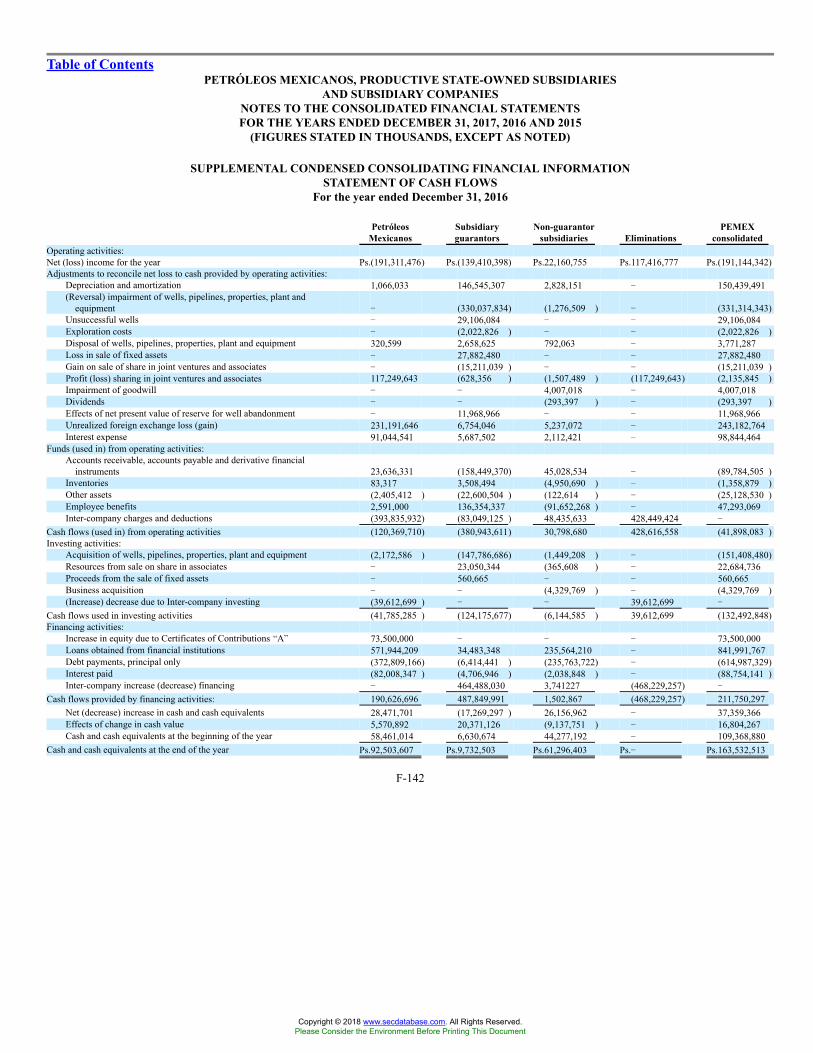
Table of ContentsPETRÓLEOS MEXICANOS, PRODUCTIVE STATE-OWNED SUBSIDIARIES
AND SUBSIDIARY COMPANIESNOTES TO THE CONSOLIDATED FINANCIAL STATEMENTSFOR THE YEARS ENDED DECEMBER 31, 2017, 2016 AND 2015
(FIGURES STATED IN THOUSANDS, EXCEPT AS NOTED)
SUPPLEMENTAL CONDENSED CONSOLIDATING FINANCIAL INFORMATIONSTATEMENT OF CASH FLOWS
For the year ended December 31, 2016
PetróleosMexicanos
Subsidiaryguarantors
Non-guarantorsubsidiaries Eliminations
PEMEXconsolidated
Operating activities:Net (loss) income for the year Ps.(191,311,476) Ps.(139,410,398) Ps.22,160,755 Ps.117,416,777 Ps.(191,144,342)Adjustments to reconcile net loss to cash provided by operating activities:
Depreciation and amortization 1,066,033 146,545,307 2,828,151 � 150,439,491(Reversal) impairment of wells, pipelines, properties, plant and
equipment � (330,037,834) (1,276,509 ) � (331,314,343)Unsuccessful wells � 29,106,084 � � 29,106,084Exploration costs � (2,022,826 ) � � (2,022,826 )Disposal of wells, pipelines, properties, plant and equipment 320,599 2,658,625 792,063 � 3,771,287Loss in sale of fixed assets � 27,882,480 � � 27,882,480Gain on sale of share in joint ventures and associates � (15,211,039 ) � � (15,211,039 )Profit (loss) sharing in joint ventures and associates 117,249,643 (628,356 ) (1,507,489 ) (117,249,643) (2,135,845 )Impairment of goodwill � � 4,007,018 � 4,007,018Dividends � � (293,397 ) � (293,397 )Effects of net present value of reserve for well abandonment � 11,968,966 � � 11,968,966Unrealized foreign exchange loss (gain) 231,191,646 6,754,046 5,237,072 � 243,182,764Interest expense 91,044,541 5,687,502 2,112,421 � 98,844,464
Funds (used in) from operating activities:Accounts receivable, accounts payable and derivative financial
instruments 23,636,331 (158,449,370) 45,028,534 � (89,784,505 )Inventories 83,317 3,508,494 (4,950,690 ) � (1,358,879 )Other assets (2,405,412 ) (22,600,504 ) (122,614 ) � (25,128,530 )Employee benefits 2,591,000 136,354,337 (91,652,268 ) � 47,293,069Inter-company charges and deductions (393,835,932) (83,049,125 ) 48,435,633 428,449,424 �
Cash flows (used in) from operating activities (120,369,710) (380,943,611) 30,798,680 428,616,558 (41,898,083 )Investing activities:
Acquisition of wells, pipelines, properties, plant and equipment (2,172,586 ) (147,786,686) (1,449,208 ) � (151,408,480)Resources from sale on share in associates � 23,050,344 (365,608 ) � 22,684,736Proceeds from the sale of fixed assets � 560,665 � � 560,665Business acquisition � � (4,329,769 ) � (4,329,769 )(Increase) decrease due to Inter-company investing (39,612,699 ) � � 39,612,699 �
Cash flows used in investing activities (41,785,285 ) (124,175,677) (6,144,585 ) 39,612,699 (132,492,848)Financing activities:
Increase in equity due to Certificates of Contributions �A� 73,500,000 � � � 73,500,000Loans obtained from financial institutions 571,944,209 34,483,348 235,564,210 � 841,991,767Debt payments, principal only (372,809,166) (6,414,441 ) (235,763,722) � (614,987,329)Interest paid (82,008,347 ) (4,706,946 ) (2,038,848 ) � (88,754,141 )Inter-company increase (decrease) financing � 464,488,030 3,741227 (468,229,257) �
Cash flows provided by financing activities: 190,626,696 487,849,991 1,502,867 (468,229,257) 211,750,297Net (decrease) increase in cash and cash equivalents 28,471,701 (17,269,297 ) 26,156,962 � 37,359,366Effects of change in cash value 5,570,892 20,371,126 (9,137,751 ) � 16,804,267Cash and cash equivalents at the beginning of the year 58,461,014 6,630,674 44,277,192 � 109,368,880
Cash and cash equivalents at the end of the year Ps.92,503,607 Ps.9,732,503 Ps.61,296,403 Ps.� Ps.163,532,513
F-142
Copyright © 2018 www.secdatabase.com. All Rights Reserved.Please Consider the Environment Before Printing This Document

Table of ContentsPETRÓLEOS MEXICANOS, PRODUCTIVE STATE-OWNED SUBSIDIARIES
AND SUBSIDIARY COMPANIESNOTES TO THE CONSOLIDATED FINANCIAL STATEMENTSFOR THE YEARS ENDED DECEMBER 31, 2017, 2016 AND 2015
(FIGURES STATED IN THOUSANDS, EXCEPT AS NOTED)
SUPPLEMENTAL CONDENSED CONSOLIDATING FINANCIAL INFORMATIONSTATEMENT OF CASH FLOWS
For the year ended December 31, 2015
PetróleosMexicanos
Subsidiaryguarantors
Non-guarantorsubsidiaries Eliminations
PEMEXconsolidated
Operating activities:Net (loss) income for the year Ps. (712,177,124) Ps.(765,702,826) Ps.15,738,868 Ps.749,573,684 Ps.(712,567,398)Adjustments to reconcile net loss to cash provided by operating activities:
Depreciation and amortization 789,657 164,221,429 2,940,164 � 167,951,250Impairment of wells, pipelines, properties, plant and equipment � 476,276,159 1,668,531 � 477,944,690Unsuccessful wells � 23,213,519 � � 23,213,519Exploration costs � (5,698,511 ) � � (5,698,511 )Disposal of wells, pipelines, properties, plant and equipment 180,992 21,945,266 2,512,279 � 24,638,537Profit (loss) sharing in joint ventures and associates 749,963,958 (198,786 ) (2,119,329 ) (749,963,958) (2,318,115 )Gain on sale of share in joint ventures and associates � (337,675 ) (342,955 ) � (680,630 )Dividends � � (359,941 ) � (359,941 )Effects of net present value of reserve for well abandonment � (608,160 ) � � (608,160 )Unrealized foreign exchange loss (gain) 145,971,158 2,996,219 3,708,879 � 152,676,256Interest expense 63,460,443 3,414,430 898,720 � 67,773,593
Funds provided by (used in) operating activities:Accounts receivable, accounts payable and derivative financial
instruments (58,554,144 ) 119,761,648 (27,777,939 ) � 33,429,565Inventories 108,568 4,547,843 1,511,317 � 6,167,728Other assets (149,819 ) (16,578,827 ) 126,281 � (16,602,365 )Employee benefits (10,037,444 ) (94,183,192 ) (11,801,596 ) � (116,022,232)Inter-company charges and deductions (310,384,820 ) 30,044,041 31,975,215 248,365,564 �
Cash flows provided by operating activities (130,828,575 ) (36,887,423 ) 18,678,494 247,975,290 98,937,786Investing activities:
Acquisition of wells, pipelines, properties, plant and equipment (1,496,277 ) (239,315,507) (12,702,217 ) � (253,514,001)Investments in associates � � (36,214 ) � (36,214 )Resources from the sales on share in associates � (130,323 ) 4,547,461 � 4,417,138(Increase) decrease due to Inter-company investing (39,108,879 ) � � 39,108,879 �
Cash flows used in investing activities (40,605,156 ) (239,445,830) (8,190,970 ) 39,108,879 (249,133,077)Financing activities:
Increase in equity due to Certificates of Contributions �A� 10,000,000 (1,915,922 ) 1,844,394 71,528 10,000,000Loans obtained from financial institutions 345,383,990 � 33,587,088 � 378,971,078Debt payments, principal only (147,927,857 ) (8,081,177 ) (37,609,464 ) � (193,618,498)Interest paid (58,123,368 ) (3,443,923 ) (1,169,859 ) � (62,737,150 )Inter-company increase (decrease) financing (3,626,448 ) 289,859,173 922,972 (287,155,697) �
Cash flows provided by financing activities: 145,706,317 276,418,151 (2,424,869 ) (287,084,169) 132,615,430Net (decrease) increase in cash and cash equivalents (25,727,414 ) 84,898 8,062,655 � (17,579,861 )Effects of change in cash value 11,185,788 1,138,356 (3,363,931 ) � 8,960,213Cash and cash equivalents at the beginning of the year 73,002,640 5,407,420 39,578,468 � 117,988,528
Cash and cash equivalents at the end of the year Ps.58,461,014 Ps.6,630,674 Ps.44,277,192 Ps.� Ps.109,368,880
F-143
Copyright © 2018 www.secdatabase.com. All Rights Reserved.Please Consider the Environment Before Printing This Document
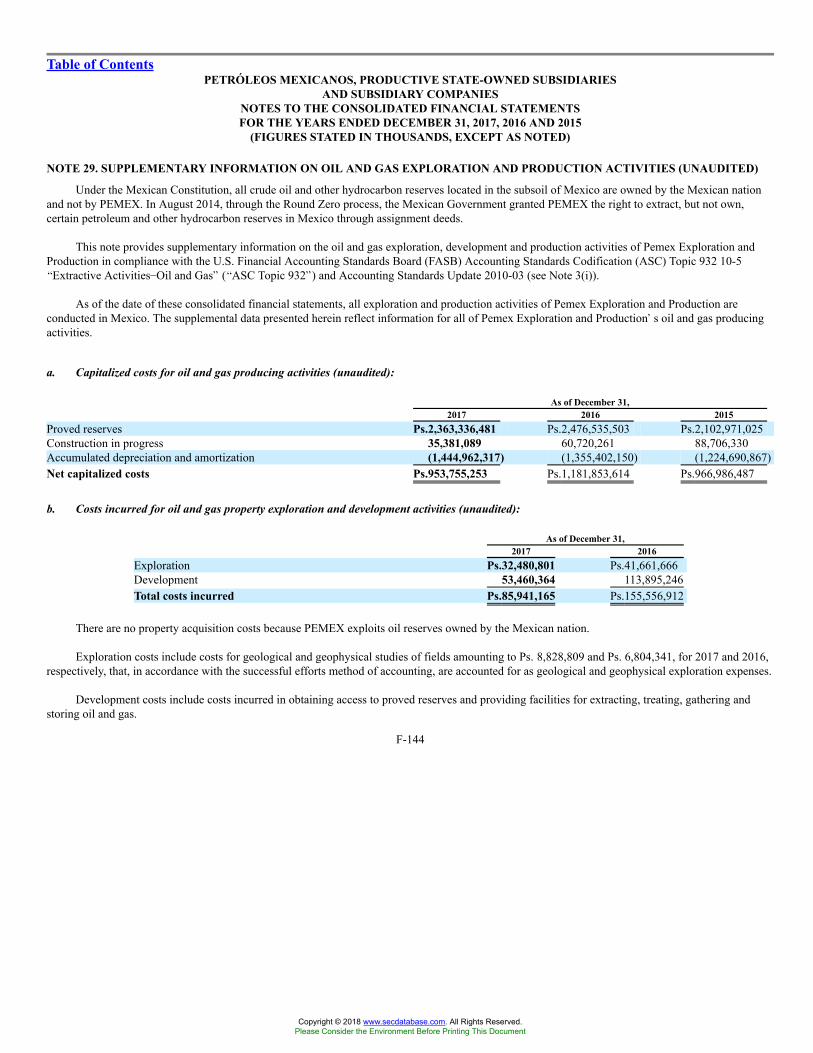
Table of ContentsPETRÓLEOS MEXICANOS, PRODUCTIVE STATE-OWNED SUBSIDIARIES
AND SUBSIDIARY COMPANIESNOTES TO THE CONSOLIDATED FINANCIAL STATEMENTSFOR THE YEARS ENDED DECEMBER 31, 2017, 2016 AND 2015
(FIGURES STATED IN THOUSANDS, EXCEPT AS NOTED)
NOTE 29. SUPPLEMENTARY INFORMATION ON OIL AND GAS EXPLORATION AND PRODUCTION ACTIVITIES (UNAUDITED)
Under the Mexican Constitution, all crude oil and other hydrocarbon reserves located in the subsoil of Mexico are owned by the Mexican nationand not by PEMEX. In August 2014, through the Round Zero process, the Mexican Government granted PEMEX the right to extract, but not own,certain petroleum and other hydrocarbon reserves in Mexico through assignment deeds.
This note provides supplementary information on the oil and gas exploration, development and production activities of Pemex Exploration andProduction in compliance with the U.S. Financial Accounting Standards Board (FASB) Accounting Standards Codification (ASC) Topic 932 10-5�Extractive Activities�Oil and Gas� (�ASC Topic 932�) and Accounting Standards Update 2010-03 (see Note 3(i)).
As of the date of these consolidated financial statements, all exploration and production activities of Pemex Exploration and Production areconducted in Mexico. The supplemental data presented herein reflect information for all of Pemex Exploration and Production�s oil and gas producingactivities.
a. Capitalized costs for oil and gas producing activities (unaudited):
As of December 31,2017 2016 2015
Proved reserves Ps.2,363,336,481 Ps.2,476,535,503 Ps.2,102,971,025Construction in progress 35,381,089 60,720,261 88,706,330Accumulated depreciation and amortization (1,444,962,317) (1,355,402,150) (1,224,690,867)Net capitalized costs Ps.953,755,253 Ps.1,181,853,614 Ps.966,986,487
b. Costs incurred for oil and gas property exploration and development activities (unaudited):
As of December 31,2017 2016
Exploration Ps.32,480,801 Ps.41,661,666Development 53,460,364 113,895,246Total costs incurred Ps.85,941,165 Ps.155,556,912
There are no property acquisition costs because PEMEX exploits oil reserves owned by the Mexican nation.
Exploration costs include costs for geological and geophysical studies of fields amounting to Ps. 8,828,809 and Ps. 6,804,341, for 2017 and 2016,respectively, that, in accordance with the successful efforts method of accounting, are accounted for as geological and geophysical exploration expenses.
Development costs include costs incurred in obtaining access to proved reserves and providing facilities for extracting, treating, gathering andstoring oil and gas.
F-144
Copyright © 2018 www.secdatabase.com. All Rights Reserved.Please Consider the Environment Before Printing This Document

Table of ContentsPETRÓLEOS MEXICANOS, PRODUCTIVE STATE-OWNED SUBSIDIARIES
AND SUBSIDIARY COMPANIESNOTES TO THE CONSOLIDATED FINANCIAL STATEMENTSFOR THE YEARS ENDED DECEMBER 31, 2017, 2016 AND 2015
(FIGURES STATED IN THOUSANDS, EXCEPT AS NOTED)
c. Results of operations for oil and gas producing activities (unaudited):
2017 2016 2015Revenues from sale of oil and gas Ps.762,637,362 Ps.616,380,608 Ps.690,591,455Hydrocarbon duties 375,156,405 304,299,019 376,682,705Production costs (excluding taxes) 248,957,950 171,194,337 177,774,082Other costs and expenses (3,954,222 ) 61,359,271 20,360,540Exploration expenses 14,993,433 39,693,273 31,244,564Depreciation, depletion, amortization and accretion 240,672,906 (150,891,739) 527,014,056
875,826,472 425,654,161 1,133,075,947Results of operations for oil and gas producing activities Ps. (113,189,111) Ps.190,726,447 Ps. (442,484,491 )
Note: Numbers may not total due to rounding.
d. Sales prices (unaudited)
The following table summarizes average sales prices in U.S. dollars for each of the years ended December 31 (excluding production taxes):
2017 2016 2015Weighted average sales price per barrel of oil equivalent (boe)(1) US$ 38.63 US$ 29.18 US$ 37.17Crude oil, per barrel 48.71 36.55 48.22Natural gas, per thousand cubic feet 4.32 3.01 3.78
(1) To convert dry gas to barrels of oil equivalent, a factor of 5.201 thousand cubic feet of dry gas per barrel of oil equivalent is used.
e. Crude oil and natural gas reserves (unaudited)
Under the Mexican Constitution, all oil and other hydrocarbon reserves located in the subsoil of Mexico are owned by the Mexican nation and notby PEMEX. Under the Petróleos Mexicanos Law, Pemex Exploration and Production has the right to extract, but not own, these reserves, and to sell theresulting production. The exploration and development activities of Petróleos Mexicanos and the Subsidiary Entities are limited to reserves located inMexico.
Proved oil and natural gas reserves are those estimated quantities of crude oil, natural gas and natural gas liquids which geological andengineering data demonstrate with reasonable certainty to be economically producible from a given date forward, from known reservoirs and underexisting economic conditions, operating methods and government regulations.
Proved reserves estimates as of December 31, 2017 were prepared by the exploration and production segment and were reviewed by theIndependent Engineering Firms (as defined below), which audit its estimates of its hydrocarbon reserves. In addition, pursuant to the Reglamento de laLey de Hidrocarburos (Regulations to the Hydrocarbons Law), on March 23, 2018 the NHC reviewed and approved the proved reserves estimates as ofDecember 31, 2017.
F-145
Copyright © 2018 www.secdatabase.com. All Rights Reserved.Please Consider the Environment Before Printing This Document
Table of ContentsPETRÓLEOS MEXICANOS, PRODUCTIVE STATE-OWNED SUBSIDIARIES
AND SUBSIDIARY COMPANIESNOTES TO THE CONSOLIDATED FINANCIAL STATEMENTSFOR THE YEARS ENDED DECEMBER 31, 2017, 2016 AND 2015
(FIGURES STATED IN THOUSANDS, EXCEPT AS NOTED)
Pemex Exploration and Production estimates reserves based on generally accepted petroleum engineering and evaluation methods and procedures,which are based primarily on applicable SEC regulations and, as necessary, the SPE�s publication entitled Standards Pertaining to the Estimating andAuditing of Oil and Gas Reserves Information, dated February 19, 2007 and other SPE publications, including the SPE�s publication entitled PetroleumResources Management System, as well as other technical sources, including Estimation and Classification of Reserves of Crude Oil, Natural Gas, andCondensate, by Chapman Cronquist, and Determination of Oil and Gas Reserves, Petroleum Society Monograph Number 1, published by the CanadianInstitute of Mining and Metallurgy & Petroleum. The choice of method or combination of methods employed in the analysis of each reservoir isdetermined by:
� Experience in the area
� Stage of development
� Quality and completeness of basic data
� Production and pressure histories
Reserves data set forth herein represents only estimates. Reserves valuation is a subjective process of estimating underground accumulations ofcrude oil and natural gas that cannot be measured in an exact manner. The accuracy of any reserves estimate depends on the quality of available data,engineering and geological interpretation and professional judgment. As a result, estimates of different engineers may vary. In addition, the results ofdrilling, testing and producing subsequent to the date of an estimate may lead to the revision of an estimate.
During 2017, PEMEX did not record any material increase in PEMEX�s hydrocarbons reserves as a result of the use of new technologies.
In order to ensure the reliability of PEMEX�s reserves estimation efforts, it has undertaken the internal certification of its estimates of reservessince 1996. PEMEX has established certain internal controls in connection with the preparation of its proved reserves estimates. Initially, teams ofgeoscientists from Pemex Exploration and Production�s exploration and exploitation business units (with each of these units covering several projects)prepare the reserves estimates, using distinct estimation processes for valuations relating to new discoveries and developed fields, respectively.Subsequently, the regional reserves offices collect these reserves estimates from the units and request that the Gerencia de Recursos y Certificación deReservas (Office of Resources and Reserves Certification), the central hydrocarbon reserves management body of Pemex Exploration and Production,review and certify such valuations and the booking of the related reserves. This internal certification process is undertaken in accordance with internalguidelines for estimating and classifying hydrocarbon reserves, which are based on the SEC�s rules and definitions. The Office of Resources andReserves Certification, which additionally oversees and conducts an internal audit of the above process, consists entirely of professionals withgeological, geophysical, petrophysical and reservoir engineering backgrounds. The engineers who participate in PEMEX�s reserves estimation processare experienced in: reservoir numerical simulation; well drilling and completion; pressure, volume and temperature (PVT) analysis; analytical tools usedin forecasting the performance of the various elements comprising the production system; and design strategies in petroleum field development.Furthermore, all of PEMEX�s personnel have been certified by the Secretaría de Educación Pública (Ministry of Public Education), most have earnedmaster�s degrees in areas of study such as petroleum engineering, geology and geophysical engineering and they possess an average of over fifteenyears of professional experience.
F-146
Copyright © 2018 www.secdatabase.com. All Rights Reserved.Please Consider the Environment Before Printing This Document
Table of ContentsPETRÓLEOS MEXICANOS, PRODUCTIVE STATE-OWNED SUBSIDIARIES
AND SUBSIDIARY COMPANIESNOTES TO THE CONSOLIDATED FINANCIAL STATEMENTSFOR THE YEARS ENDED DECEMBER 31, 2017, 2016 AND 2015
(FIGURES STATED IN THOUSANDS, EXCEPT AS NOTED)
In addition to this internal review process, Pemex Exploration and Production�s final reserves estimates are audited by independent engineeringfirms. Three independent engineering firms audited Pemex Exploration and Production�s estimates of proved reserves as of December 31, 2017:Netherland Sewell International, S. de R. L. de C. V. (�Netherland Sewell�); DeGolyer and MacNaughton (�DeGolyer�); and Ryder Scott Company,L.P. (�Ryder Scott,�) and, together with Netherland Sewell and DeGolyer and MacNaughton, the �Independent Engineering Firms�. The reservesestimates reviewed by the Independent Engineering Firms totaled 97.0% of PEMEX�s estimated proved reserves. The remaining 3.0% of PEMEX�sestimated proved reserves consisted of reserves located in certain areas in which third parties provide drilling services to Pemex Exploration andProduction. Under such agreements, the corresponding third party is responsible of assessing the volume of reserves.
Netherland Sewell audited the reserves in the Poza Rica-Altamira, Aceite Terciario del Golfo and Litoral de Tabasco assets. DeGolyer in Burgosand Veracruz Assets and Ryder Scott audited the reserves in the Bellota-Jujo, Cinco Presidentes, Macuspana-Muspac, Samaria-Luna,Abkatún-Pol-Chuc, Cantarell and Ku-Maloob-Zaap Assets. The audits conducted by the Independent Engineering Firms consisted primarily of:(1) analysis of historical static and dynamic reservoir data provided by Pemex-Exploration and Production; (2) construction or updating of theIndependent Engineering Firms� own static and dynamic reservoir characterization models of some of the fields; (3) economic analysis of the fields;and (4) review of Pemex Exploration and Production�s production forecasts and reserves estimates.
Since reserves estimates are, by definition, only estimates, they cannot be reviewed for the purpose of verifying exactness. Instead, theIndependent Engineering Firms conducted a detailed review of Pemex Exploration and Production�s reserves estimates so that they could express anopinion as to whether, in the aggregate, the reserves estimates that Pemex Exploration and Production furnished were reasonable and had been estimatedand presented in conformity with generally accepted petroleum engineering and evaluation methods and procedures.
All questions, including any suggested modifications to proved reserves estimates, that arose during the Independent Engineering Firms� reviewprocess were resolved by Pemex Exploration and Production to the satisfaction of the Independent Engineering Firms. The Independent EngineeringFirms have concluded that PEMEX�s estimated total proved oil and natural gas reserve volumes set forth in this report are, in the aggregate, reasonableand have been prepared in accordance with Rule 4-10(a) are consistent with international reserves reporting practice and are in accordance with therevised oil and gas reserves disclosure provisions of ASC Topic 932.
PEMEX�s total proved developed and undeveloped reserves of crude oil, condensates and liquefiable hydrocarbons recoverable from fieldprocessing plants decreased by 11.0% in 2017, from 7,219 million barrels at December 31, 2016 to 6,427 million barrels at December 31, 2017.PEMEX�s proved developed reserves of crude oil, condensates and liquefiable hydrocarbons recoverable from processing plants decreased by 14.7% in2017, from 4,866 million barrels at December 31, 2016 to 4,166 million barrels at December 31, 2017. These decreases were principally due to oilproduction in 2017, a decrease in field development activities and field behavior and the transfer to third parties, who were awarded with contracts in thebidding rounds, of certain
F-147
Copyright © 2018 www.secdatabase.com. All Rights Reserved.Please Consider the Environment Before Printing This Document

Table of ContentsPETRÓLEOS MEXICANOS, PRODUCTIVE STATE-OWNED SUBSIDIARIES
AND SUBSIDIARY COMPANIESNOTES TO THE CONSOLIDATED FINANCIAL STATEMENTSFOR THE YEARS ENDED DECEMBER 31, 2017, 2016 AND 2015
(FIGURES STATED IN THOUSANDS, EXCEPT AS NOTED)
fields that had been temporarily assigned to PEMEX and associations and alliances such as Santuario and El Golpe fields, of which PEMEX is assigneda 64% of their proved reserves . The amount of crude oil, condensate and liquefiable hydrocarbon reserves added in 2017 was insufficient to offset thelevel of production in 2017, which amounted to 805.5 million barrels of crude oil, condensates and liquefiable hydrocarbons.
PEMEX�s proved developed and undeveloped dry gas reserves decreased by 5.6% in 2017, from 6,984 billion cubic feet at December 31, 2016 to6,593 billion cubic feet at December 31, 2017. PEMEX�s proved developed dry gas reserves decreased by 10.8% in 2017, from 4,513 billion cubic feetat December 31, 2016 to 4,026 billion cubic feet at December 31, 2017. These decreases were principally due to oil production in 2017, a decrease infield development activities and field behavior and the transfer to third parties, who were awarded with contracts in the bidding rounds, of certain fieldsthat had been temporarily assigned to PEMEX and associations and alliances such as Santuario and El Golpe fields, of which PEMEX is assigned a 64%of their proved reserves. The amount of dry gas reserves added in 2017 was insufficient to offset the level of production in 2017, which amounted to999 billion cubic feet of dry gas. PEMEX�s proved undeveloped dry gas reserves increased by 3.9% in 2017, from 2,471 billion cubic feet atDecember 31, 2016 to 2,567 billion cubic feet at December 31, 2017.
During 2017, our exploratory activity in the shallow waters of the Gulf of Mexico and onshore regions resulted in new discoveries of light crudeoil in the offshore Suuk field in June 2017 and gas and condensate discoveries in the onshore Valeriana and lxachi fields in August and November of2017, respectively. These discoveries led to the incorporation of approximately 246 million barrels of oil equivalent in three fields.
The following three tables of crude oil and dry gas reserves set forth PEMEX�s estimates of its proved reserves determined in accordance withRule 4-10(a).
Summary of oil and gas(1) proved reserves as of December 31, 2017based on average fiscal year prices
Crude oil and Condensates(2) Dry Gas(3)(in millions of barrels) (in billions of cubic feet)
Proved developed and un-developedreserves:
Proved developed reserves 4,166 4,026Proved undeveloped reserves 2,261 2,567
Total proved reserves 6,427 6,593
Note: Numbers may not total due to rounding.(1) PEMEX does not currently produce synthetic oil or synthetic gas, or other natural resources from which synthetic oil or synthetic gas can be produced.(2) Crude oil and condensate reserves include the fraction of liquefiable hydrocarbons recoverable in natural gas processing plants located at fields.(3) Reserve volumes reported in this table are volumes of dry gas, although natural gas production reported in other tables refers to sour wet gas. There is a shrinkage in volume
when natural gas liquids and impurities are extracted to obtain dry gas. Therefore, reported natural gas volumes are greater than dry gas volumes.Source: Pemex Exploration and Production.
F-148
Copyright © 2018 www.secdatabase.com. All Rights Reserved.Please Consider the Environment Before Printing This Document
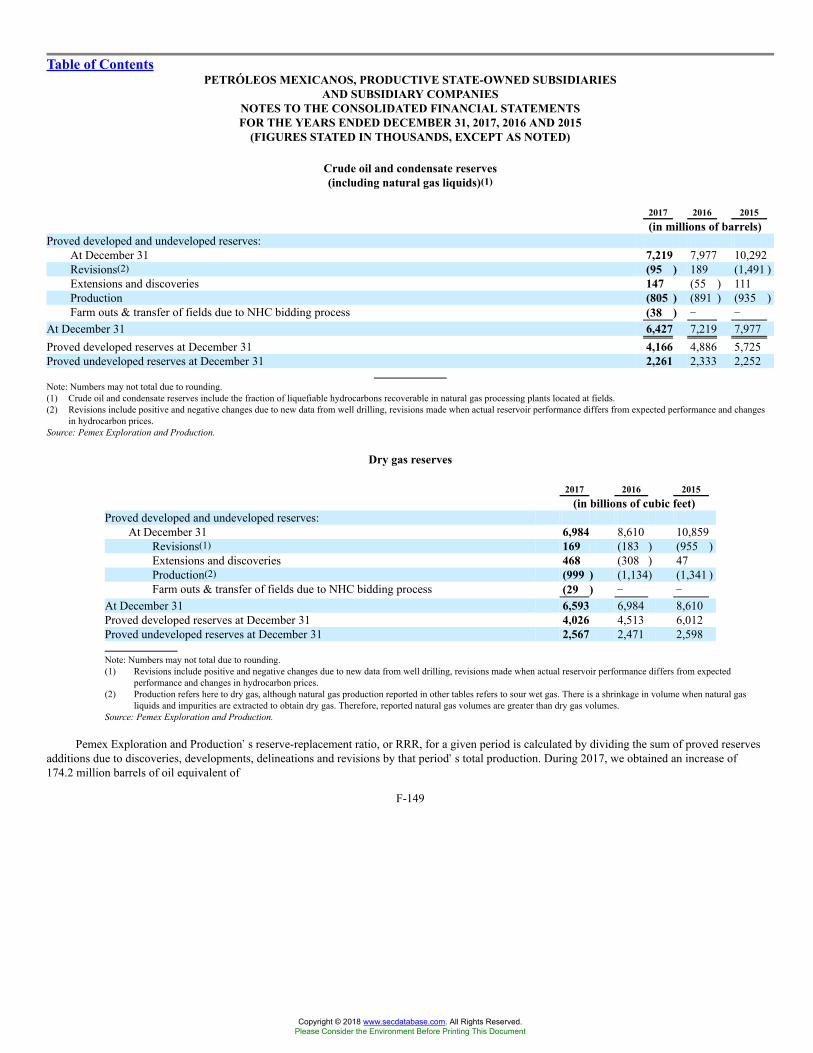
Table of ContentsPETRÓLEOS MEXICANOS, PRODUCTIVE STATE-OWNED SUBSIDIARIES
AND SUBSIDIARY COMPANIESNOTES TO THE CONSOLIDATED FINANCIAL STATEMENTSFOR THE YEARS ENDED DECEMBER 31, 2017, 2016 AND 2015
(FIGURES STATED IN THOUSANDS, EXCEPT AS NOTED)
Crude oil and condensate reserves(including natural gas liquids)(1)
2017 2016 2015(in millions of barrels)
Proved developed and undeveloped reserves:At December 31 7,219 7,977 10,292Revisions(2) (95 ) 189 (1,491 )Extensions and discoveries 147 (55 ) 111Production (805 ) (891 ) (935 )Farm outs & transfer of fields due to NHC bidding process (38 ) � �
At December 31 6,427 7,219 7,977Proved developed reserves at December 31 4,166 4,886 5,725Proved undeveloped reserves at December 31 2,261 2,333 2,252
Note: Numbers may not total due to rounding.(1) Crude oil and condensate reserves include the fraction of liquefiable hydrocarbons recoverable in natural gas processing plants located at fields.(2) Revisions include positive and negative changes due to new data from well drilling, revisions made when actual reservoir performance differs from expected performance and changes
in hydrocarbon prices.Source: Pemex Exploration and Production.
Dry gas reserves
2017 2016 2015(in billions of cubic feet)
Proved developed and undeveloped reserves:At December 31 6,984 8,610 10,859
Revisions(1) 169 (183 ) (955 )Extensions and discoveries 468 (308 ) 47Production(2) (999 ) (1,134) (1,341 )Farm outs & transfer of fields due to NHC bidding process (29 ) � �
At December 31 6,593 6,984 8,610Proved developed reserves at December 31 4,026 4,513 6,012Proved undeveloped reserves at December 31 2,567 2,471 2,598
Note: Numbers may not total due to rounding.(1) Revisions include positive and negative changes due to new data from well drilling, revisions made when actual reservoir performance differs from expected
performance and changes in hydrocarbon prices.(2) Production refers here to dry gas, although natural gas production reported in other tables refers to sour wet gas. There is a shrinkage in volume when natural gas
liquids and impurities are extracted to obtain dry gas. Therefore, reported natural gas volumes are greater than dry gas volumes.Source: Pemex Exploration and Production.
Pemex Exploration and Production�s reserve-replacement ratio, or RRR, for a given period is calculated by dividing the sum of proved reservesadditions due to discoveries, developments, delineations and revisions by that period�s total production. During 2017, we obtained an increase of174.2 million barrels of oil equivalent of
F-149
Copyright © 2018 www.secdatabase.com. All Rights Reserved.Please Consider the Environment Before Printing This Document
Table of ContentsPETRÓLEOS MEXICANOS, PRODUCTIVE STATE-OWNED SUBSIDIARIES
AND SUBSIDIARY COMPANIESNOTES TO THE CONSOLIDATED FINANCIAL STATEMENTSFOR THE YEARS ENDED DECEMBER 31, 2017, 2016 AND 2015
(FIGURES STATED IN THOUSANDS, EXCEPT AS NOTED)
proved reserves as aggregated from discoveries, revisions, delimitations and development and production, which represents a RRR of 17.5 %.PEMEX�s 2017 RRR is an improvement as compared to 2016, when the RRR was 4.0%. PEMEX expects continued improvements in its RRR insubsequent years.
PEMEX�s reserves production ratio, which is presented in terms of years, is calculated by dividing the estimated remaining reserves at the end ofthe relevant year by the total production of hydrocarbons for that year. As of December 31, 2017, this ratio stayed constant with 2016 levels and wasequal to 7.7 years for proved reserves.
f. Standardized measure of discounted future net cash flows related to proved oil and gas reserves (unaudited)
The standardized measure tables presented below relate to proved oil and gas reserves excluding proved reserves scheduled to be produced afterthe year 2042. This measure is presented in accordance with ASC Topic 932.
Estimated future cash inflows from production are computed by applying average prices of oil and gas on the first day of each month of 2017.Future development and production costs are those estimated future expenditures needed to develop and produce the year-end estimated proved reservesafter a net cash flows discount factor of 10%, assuming constant year-end economic conditions.
Future tax expenses are computed by applying the appropriate year-end statutory tax rates with consideration of the tax rates of the new fiscalregime for Pemex Exploration and Production already legislated for 2017 to the future pre-tax net cash flows related to PEMEX�s proved oil and gasreserves.
The estimated future payment of taxes was calculated based on fiscal regime applicable by decree to Pemex-Exploration and Production effectiveJanuary 1, 2015 and by the tax benefits published in the Official Gazette of the Federation on April 18, 2016.
The standardized measure provided below represents a comparative benchmark value rather than an estimate of expected future cash flows or fairmarket value of PEMEX�s production rights. There are numerous uncertainties inherent in estimating quantities of proved reserves and in projectingfuture rates of production and timing of development expenditures, including many factors beyond the control of the producer. Accordingly, reserveestimates may be materially different from the quantities of crude oil and natural gas that are ultimately recovered.
F-150
Copyright © 2018 www.secdatabase.com. All Rights Reserved.Please Consider the Environment Before Printing This Document
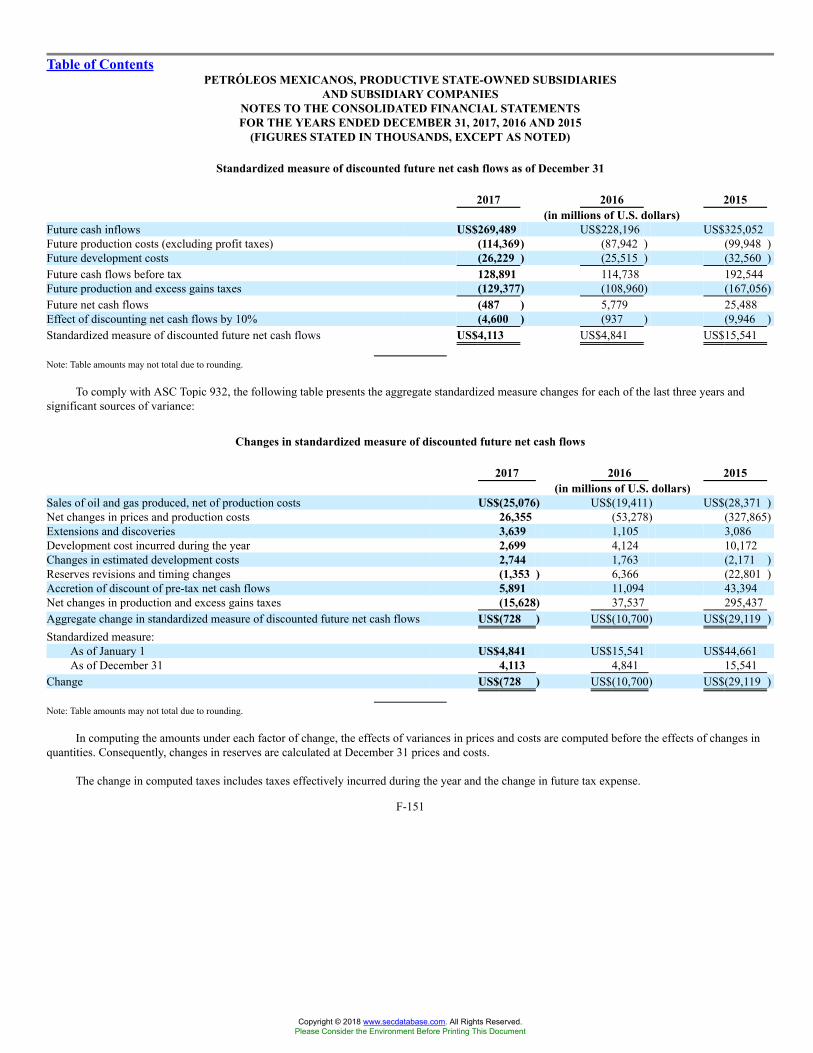
Table of ContentsPETRÓLEOS MEXICANOS, PRODUCTIVE STATE-OWNED SUBSIDIARIES
AND SUBSIDIARY COMPANIESNOTES TO THE CONSOLIDATED FINANCIAL STATEMENTSFOR THE YEARS ENDED DECEMBER 31, 2017, 2016 AND 2015
(FIGURES STATED IN THOUSANDS, EXCEPT AS NOTED)
Standardized measure of discounted future net cash flows as of December 31
2017 2016 2015(in millions of U.S. dollars)
Future cash inflows US$269,489 US$228,196 US$325,052Future production costs (excluding profit taxes) (114,369) (87,942 ) (99,948 )Future development costs (26,229 ) (25,515 ) (32,560 )Future cash flows before tax 128,891 114,738 192,544Future production and excess gains taxes (129,377) (108,960) (167,056)Future net cash flows (487 ) 5,779 25,488Effect of discounting net cash flows by 10% (4,600 ) (937 ) (9,946 )Standardized measure of discounted future net cash flows US$4,113 US$4,841 US$15,541
Note: Table amounts may not total due to rounding.
To comply with ASC Topic 932, the following table presents the aggregate standardized measure changes for each of the last three years andsignificant sources of variance:
Changes in standardized measure of discounted future net cash flows
2017 2016 2015(in millions of U.S. dollars)
Sales of oil and gas produced, net of production costs US$(25,076) US$(19,411) US$(28,371 )Net changes in prices and production costs 26,355 (53,278) (327,865)Extensions and discoveries 3,639 1,105 3,086Development cost incurred during the year 2,699 4,124 10,172Changes in estimated development costs 2,744 1,763 (2,171 )Reserves revisions and timing changes (1,353 ) 6,366 (22,801 )Accretion of discount of pre-tax net cash flows 5,891 11,094 43,394Net changes in production and excess gains taxes (15,628) 37,537 295,437Aggregate change in standardized measure of discounted future net cash flows US$(728 ) US$(10,700) US$(29,119 )Standardized measure:
As of January 1 US$4,841 US$15,541 US$44,661As of December 31 4,113 4,841 15,541
Change US$(728 ) US$(10,700) US$(29,119 )
Note: Table amounts may not total due to rounding.
In computing the amounts under each factor of change, the effects of variances in prices and costs are computed before the effects of changes inquantities. Consequently, changes in reserves are calculated at December 31 prices and costs.
The change in computed taxes includes taxes effectively incurred during the year and the change in future tax expense.
F-151
Copyright © 2018 www.secdatabase.com. All Rights Reserved.Please Consider the Environment Before Printing This Document
Exhibit 2.26
EIGHTH SUPPLEMENTAL INDENTURE
EIGHTH SUPPLEMENTAL INDENTURE (the �Eighth Supplemental Indenture�), dated as of February 16, 2018, between Petróleos Mexicanos(the �Issuer�), having its principal office at Avenida Marina Nacional No. 329, Colonia Petróleos Mexicanos, Mexico City, 11300, Mexico, andDeutsche Bank Trust Company Americas, as trustee (the �Trustee�).
W I T N E S S E T H:
WHEREAS, the Issuer and the Trustee previously have entered into an Indenture, dated as of January 27, 2009 (the �Original Indenture� and, assupplemented by the first supplemental indenture (the �First Supplemental Indenture�), dated as of June 2, 2009, among the Issuer, the Trustee andDeutsche Bank AG, London Branch, by the second supplemental indenture (the �Second Supplemental Indenture�), dated as of October 13, 2009,among the Issuer, Credit Suisse AG and BNP Paribas (Suisse) S.A., by the third supplemental indenture (the �Third Supplemental Indenture�), dated asof April 10, 2012, among the Issuer, the Trustee and Credit Suisse AG, by the fourth supplemental indenture (the �Fourth Supplemental Indenture�),dated as of June 24, 2014, between the Issuer and the Trustee, by the fifth supplemental indenture (the �Fifth Supplemental Indenture�), dated as ofOctober 15, 2014, between the Issuer and the Trustee, by the sixth supplemental indenture (the �Sixth Supplemental Indenture�), dated as ofDecember 8, 2015, among the Issuer, the Trustee, BNP Paribas (Suisse) SA, as principal Swiss paying and authenticating agent, and Credit Suisse AG,as an additional Swiss paying agent, by the seventh supplemental indenture (the �Seventh Supplemental Indenture�), dated as of June 14, 2016 amongthe Issuer, the Trustee, Credit Suisse AG, as principal Swiss paying and authenticating agent, and UBS AG, as an additional Swiss paying agent, and bythis Eighth Supplemental Indenture and by any further supplements thereto, the �Indenture�), providing for the issuance from time to time of unsecuredbonds, debentures, notes and other evidences of indebtedness (the �Securities�) of the Issuer to be issued in one or more series as provided in theIndenture;
WHEREAS, pursuant to Section 9.02 of the Original Indenture, the Issuer and the Trustee may amend or supplement certain provisions of theIndenture and the Securities with the consent of Holders of not less than a majority in aggregate principal amount of the then Outstanding Securities;
WHEREAS, the Issuer desires to amend a certain provision of the Indenture;
WHEREAS, pursuant to an Offer to Purchase and Consent Solicitation Statement dated February 1, 2018 (as amended and supplement from timeto time, the �Statement�), and a related Consent and Letter of Transmittal dated February 1, 2018 (the �Consent and Letter of Transmittal�) the Issuersolicited the consents of the Holders of the 5.500% Notes due 2019 (the �Solicited Series�) to a proposed amendment to the Indenture as it relates to theSolicited Series (the �Amendment�) and the Holders of at least a majority in aggregate principal amount of the Solicited Series (with respect to anySolicited Series, the �Required Consents�) duly consented to the Amendment pursuant to Section 9.02 of the Original Indenture at or prior to 5:00 p.m.(New York City time) on February 14, 2018 (the �Early Tender Date�);
WHEREAS, the Issuer has heretofore delivered, or is delivering contemporaneously herewith, to the Trustee (i) a Board Resolution authorizingthe execution of this Eighth Supplemental Indenture, (ii) evidence of the written consent of the Holders of not less than a majority in aggregate principalamount Outstanding of the Solicited Series and (iii) the Opinion of Counsel described in Section 9.03 of the Original Indenture;
WHEREAS, the Issuer has duly authorized the execution and delivery of this Eighth Supplemental Indenture for the foregoing purposes;
WHEREAS, all conditions necessary to authorize the execution and delivery of this Eighth Supplemental Indenture and to make this EighthSupplemental Indenture valid and binding have been complied with or have been done or performed; and
WHEREAS, the Issuer has requested that the Trustee execute and deliver this Eighth Supplemental Indenture.
Copyright © 2018 www.secdatabase.com. All Rights Reserved.Please Consider the Environment Before Printing This Document

NOW, THEREFORE, for and in consideration of the premises and the mutual covenants contained herein and in the Indenture and for othergood and valuable consideration, the receipt and sufficiency of which are herein acknowledged, the Issuer and the Trustee hereby agree, for the equaland ratable benefit of all Holders, as follows:
ARTICLE ONE
DEFINITIONS
Section 1.01. Defined Terms. All capitalized terms used but not defined herein shall have the meanings ascribed to such terms in the Indenture,as supplemented and amended hereby. As used in this Eighth Supplemental Indenture, �Consent Solicitation Completion Date�shall mean such time as each of the following events shall have occurred with respect to the Solicited Series in accordance with theterms and conditions of the Statement and the Consent and Letter of Transmittal: (i) the Issuer shall have completed (and notterminated) the offers to purchase the Solicited Series; and (ii) the Issuer shall have purchased all validly tendered and acceptednotes of the Solicited Series. All definitions in the Original Indenture shall be read in a manner consistent with the terms of thisEighth Supplemental Indenture.
ARTICLE TWO
AMENDMENT TO INDENTURE
Section 2.01. With respect to the Solicited Series, upon the occurrence of a Consent Solicitation Completion Date, the first paragraph ofSection 11.05 of the Indenture solely as it relates and applies to the Solicited Series shall be amended and restated in its entirety asfollows:
�Notice of redemption shall be given not less than three (3) Business Days nor more than ten (10) days prior to the RedemptionDate to each Holder of the Securities of any series to be redeemed in accordance with Section 1.06.�
Section 2.02. With respect to the Solicited Series, upon the occurrence of a Consent Solicitation Completion Date and without any further actionby any party hereto, any provision contained in each Global Security representing the notes of the Solicited Series that relates tothe section in the Indenture that is amended pursuant to Section 2.01 hereof shall likewise be amended so that any such provisioncontained in such Global Security will conform to and be consistent with the Indenture, as amended by this Eighth SupplementalIndenture.
ARTICLE THREE
MISCELLANEOUS
Section 3.01. Effect of Supplemental Indenture. This Eighth Supplemental Indenture supplements the Original Indenture, as supplemented by theFirst Supplemental Indenture, the Second Supplemental Indenture, the Third Supplemental Indenture, the Fourth SupplementalIndenture, the Fifth Supplemental Indenture, the Sixth Supplemental Indenture and the Seventh Supplemental Indenture, and shallbe a part, and subject to all the terms, thereof solely with respect to the Solicited Series. The Original Indenture, as supplementedand amended by the First Supplemental Indenture, the Second Supplemental Indenture, the Third Supplemental Indenture, theFourth Supplemental Indenture, the Fifth Supplemental Indenture, the Sixth Supplemental Indenture, the Seventh SupplementalIndenture and this Eighth Supplemental Indenture, is in all respects ratified and confirmed, and the Original Indenture, assupplemented by the First Supplemental Indenture, the Second Supplemental Indenture, the Third Supplemental Indenture, theFourth Supplemental Indenture, the Fifth Supplemental Indenture, the Sixth Supplemental Indenture, the Seventh SupplementalIndenture and this Eighth Supplemental Indenture, solely as it relates and applies to the Solicited Series shall be read, taken andconstrued as one and the same instrument. All provisions included in this Eighth Supplemental Indenture supersede any conflictingprovisions
Copyright © 2018 www.secdatabase.com. All Rights Reserved.Please Consider the Environment Before Printing This Document
included in the Original Indenture solely as it relates and applies to the Solicited Series, unless not permitted by law. The Trusteeaccepts the trusts created by the Original Indenture, as supplemented by this Eighth Supplemental Indenture, and agrees to performthe same upon the terms and conditions of the Original Indenture, as supplemented by this Eighth Supplemental Indenture.
Section 3.02. Governing Law. This Eighth Supplemental Indenture shall be governed by and construed in accordance with the laws of the Stateof New York, except that all matters relating to the authorization and execution of this Eighth Supplemental Indenture and theSecurities by the Issuer will be governed by the laws of Mexico.
Section 3.03. Notices. All notices and communications hereunder shall be given in the manner set forth in Section 1.05 of the Indenture.
Section 3.04. Effect of Headings. The section headings herein are for convenience only and shall not affect the construction of this EighthSupplemental Indenture.
Section 3.05. Counterparts. The parties may sign any number of copies of this Eighth Supplemental Indenture. Each signed copy shall be anoriginal, but all of them shall represent the same agreement.
Section 3.06. Liability of Trustee. The Trustee shall not be responsible in any manner whatsoever for or in respect of the validity or sufficiency ofthis Eighth Supplemental Indenture or for or in respect of the recitals contained herein, all of which recitals are made solely by theIssuer.
[SIGNATURE PAGE TO FOLLOW IMMEDIATELY]
Copyright © 2018 www.secdatabase.com. All Rights Reserved.Please Consider the Environment Before Printing This Document
IN WITNESS WHEREOF, the parties have caused this Eighth Supplemental Indenture to be duly executed by their respective officersthereunto duly authorized as of the day and year first above written.
PETRÓLEOS MEXICANOS
By: /s/ CARLOS CARAVEO SÁNCHEZName: Carlos Caraveo SánchezTitle: Associate Managing Director of Finance
of Petróleoes Mexicanos
Copyright © 2018 www.secdatabase.com. All Rights Reserved.Please Consider the Environment Before Printing This Document

DEUTSCHE BANK TRUST COMPANY AMERICAS, asTrusteeBy: Deutsche Bank National Trust Company
By: /s/ IRINA GOLOVASHCHUKName: Irina GolovashchukTitle: Vice President
By: /s/ JEFFREY SCHOENFELDName: Jeffrey SchoenfeldTitle: Vice President
Copyright © 2018 www.secdatabase.com. All Rights Reserved.Please Consider the Environment Before Printing This Document
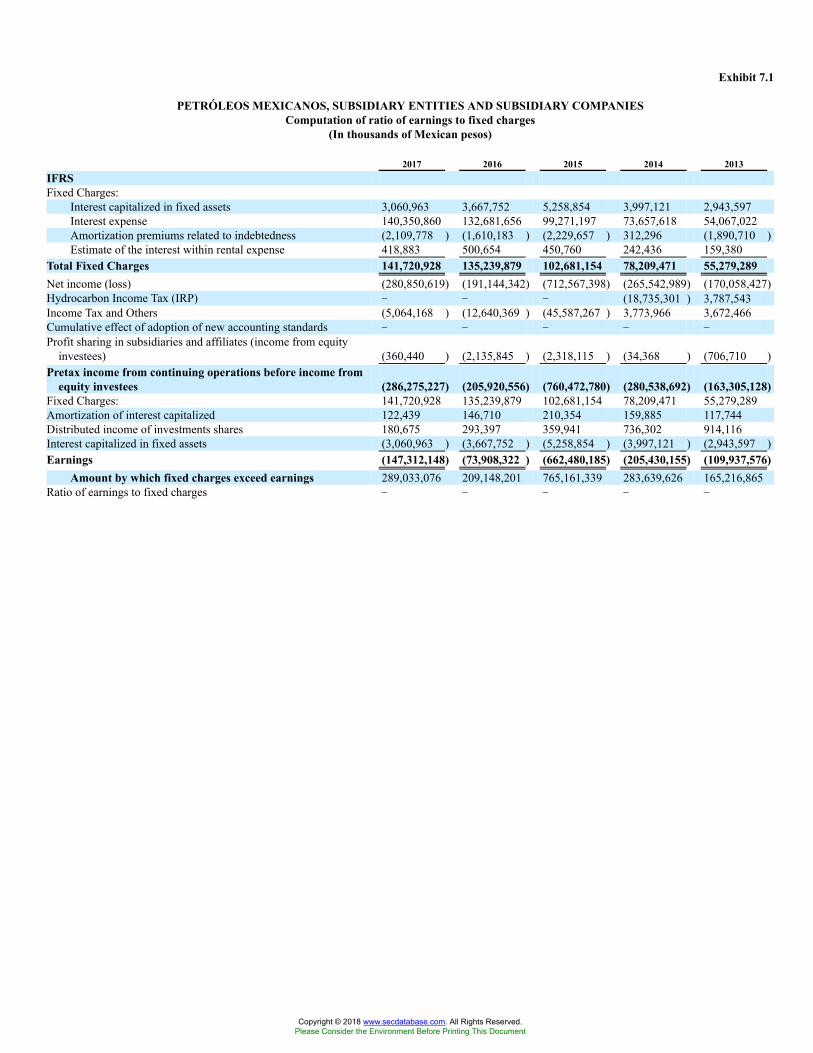
Exhibit 7.1
PETRÓLEOS MEXICANOS, SUBSIDIARY ENTITIES AND SUBSIDIARY COMPANIESComputation of ratio of earnings to fixed charges
(In thousands of Mexican pesos)
2017 2016 2015 2014 2013IFRSFixed Charges:
Interest capitalized in fixed assets 3,060,963 3,667,752 5,258,854 3,997,121 2,943,597Interest expense 140,350,860 132,681,656 99,271,197 73,657,618 54,067,022Amortization premiums related to indebtedness (2,109,778 ) (1,610,183 ) (2,229,657 ) 312,296 (1,890,710 )Estimate of the interest within rental expense 418,883 500,654 450,760 242,436 159,380
Total Fixed Charges 141,720,928 135,239,879 102,681,154 78,209,471 55,279,289Net income (loss) (280,850,619) (191,144,342) (712,567,398) (265,542,989) (170,058,427)Hydrocarbon Income Tax (IRP) � � � (18,735,301 ) 3,787,543Income Tax and Others (5,064,168 ) (12,640,369 ) (45,587,267 ) 3,773,966 3,672,466Cumulative effect of adoption of new accounting standards � � � � �Profit sharing in subsidiaries and affiliates (income from equity
investees) (360,440 ) (2,135,845 ) (2,318,115 ) (34,368 ) (706,710 )Pretax income from continuing operations before income from
equity investees (286,275,227) (205,920,556) (760,472,780) (280,538,692) (163,305,128)Fixed Charges: 141,720,928 135,239,879 102,681,154 78,209,471 55,279,289Amortization of interest capitalized 122,439 146,710 210,354 159,885 117,744Distributed income of investments shares 180,675 293,397 359,941 736,302 914,116Interest capitalized in fixed assets (3,060,963 ) (3,667,752 ) (5,258,854 ) (3,997,121 ) (2,943,597 )Earnings (147,312,148) (73,908,322 ) (662,480,185) (205,430,155) (109,937,576)
Amount by which fixed charges exceed earnings 289,033,076 209,148,201 765,161,339 283,639,626 165,216,865Ratio of earnings to fixed charges � � � � �
Copyright © 2018 www.secdatabase.com. All Rights Reserved.Please Consider the Environment Before Printing This Document
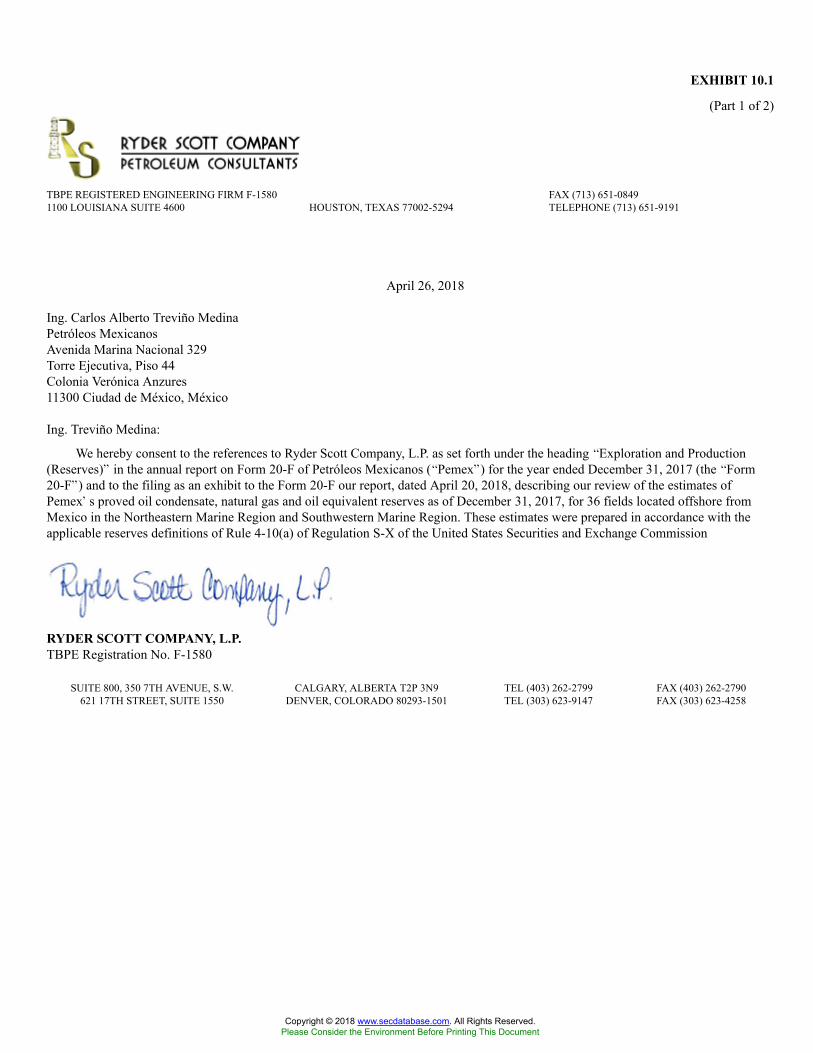
EXHIBIT 10.1
(Part 1 of 2)
TBPE REGISTERED ENGINEERING FIRM F-1580 FAX (713) 651-08491100 LOUISIANA SUITE 4600 HOUSTON, TEXAS 77002-5294 TELEPHONE (713) 651-9191
April 26, 2018
Ing. Carlos Alberto Treviño MedinaPetróleos MexicanosAvenida Marina Nacional 329Torre Ejecutiva, Piso 44Colonia Verónica Anzures11300 Ciudad de México, México
Ing. Treviño Medina:
We hereby consent to the references to Ryder Scott Company, L.P. as set forth under the heading �Exploration and Production(Reserves)� in the annual report on Form 20-F of Petróleos Mexicanos (�Pemex�) for the year ended December 31, 2017 (the �Form20-F�) and to the filing as an exhibit to the Form 20-F our report, dated April 20, 2018, describing our review of the estimates ofPemex�s proved oil condensate, natural gas and oil equivalent reserves as of December 31, 2017, for 36 fields located offshore fromMexico in the Northeastern Marine Region and Southwestern Marine Region. These estimates were prepared in accordance with theapplicable reserves definitions of Rule 4-10(a) of Regulation S-X of the United States Securities and Exchange Commission
RYDER SCOTT COMPANY, L.P.TBPE Registration No. F-1580
SUITE 800, 350 7TH AVENUE, S.W. CALGARY, ALBERTA T2P 3N9 TEL (403) 262-2799 FAX (403) 262-2790621 17TH STREET, SUITE 1550 DENVER, COLORADO 80293-1501 TEL (303) 623-9147 FAX (303) 623-4258
Copyright © 2018 www.secdatabase.com. All Rights Reserved.Please Consider the Environment Before Printing This Document

EXHIBIT 10.1
(Part 2 of 2)
TBPE REGISTERED ENGINEERING FIRM F-1580 FAX (713) 651-08491100 LOUISIANA SUITE 4600 HOUSTON, TEXAS 77002-5294 TELEPHONE (713) 651-9191
April 26, 2018
Ing. Carlos Alberto Treviño MedinaPetróleos MexicanosAvenida Marina Nacional 329Torre Ejecutiva, Piso 44Colonia Verónica Anzures11300 Ciudad de México, México
Dear Ing. Treviño Medina:
We hereby consent to the references to Ryder Scott Company, L.P. as set forth under the heading �Exploration and Production(Reserves)� in the annual report on Form 20-F of Petróleos Mexicanos (�Pemex�) for the year ended December 31, 2017 (the �Form20-F�) and to the filing as an exhibit to the Form 20-F our report, dated April 20, 2018, describing our review of the estimates ofPemex�s proved oil condensate, natural gas and oil equivalent reserves as of December 31, 2017, for 88 fields located onshore inMexico in the Southern Region. These estimates were prepared in accordance with the applicable reserves definitions of Rule 4-10(a) ofRegulation S-X of the United States Securities and Exchange Commission
RYDER SCOTT COMPANY, L.P.TBPE Registration No. F-1580
SUITE 800, 350 7TH AVENUE, S.W. CALGARY, ALBERTA T2P 3N9 TEL (403) 262-2799 FAX (403) 262-2790621 17TH STREET, SUITE 1550 DENVER, COLORADO 80293-1501 TEL (303) 623-9147 FAX (303) 623-4258
Copyright © 2018 www.secdatabase.com. All Rights Reserved.Please Consider the Environment Before Printing This Document
Exhibit 10.2(Part 1 of 2)
Pemex Exploración y Producción
Estimated
Future Reserves
Attributable to Certain Offshore
Oil and Gas Properties in Mexico
Activo Abkatun-Pol-Chuc
Activo Cantarell
Activo Ku-Maloob-Zaap
SEC Parameters
As of
December 31, 2017
Guale Ramirez, P.E.TBPE License No.48318Executive Vice President
RYDER SCOTT COMPANY, L.P.TBPE Firm Registration No. F-1580
RYDER SCOTT COMPANY PETROLEUM CONSULTANTS
Copyright © 2018 www.secdatabase.com. All Rights Reserved.Please Consider the Environment Before Printing This Document

TBPE REGISTERED ENGINEERING FIRM F-1580 FAX (713) 651-08491100 LOUISIANA SUITE 4600 HOUSTON, TEXAS 77002-5294 TELEPHONE (713) 651-9191
April 20, 2018
Ing. J. Javier Hinojosa PueblaDirector General de Pemex Exploración y ProducciónAvenida Marina Nacional 329Torre Ejecutiva, Piso 41Col. Verónica Anzúres, C.P. 11300Del. Miguel Hidalgo, Ciudad de México
Dear Ing. Hinojosa Puebla,
At the request of Pemex Exploración y Producción (PEP), a wholly owned subsidiary of Petróleos Mexicanos (Pemex), RyderScott Company, L.P. (Ryder Scott) has conducted a reserves audit of the estimates of the proved reserves owned by the United MexicanStates as of December 31, 2017. The properties reviewed by us are operated by Pemex. The estimates we audited were prepared byPEP�s engineering and geological staff based on the definitions and disclosure guidelines of the United States Securities and ExchangeCommission contained in Title 17, Code of Federal Regulations, Modernization of Oil and Gas Reporting, Final Rule releasedJanuary 14, 2009, in the Federal Register (SEC regulations). Our third party reserves audit, completed on February 28, 2018, andpresented herein, was prepared for public disclosure by Pemex in filings made with the SEC in accordance with the disclosurerequirements set forth in the SEC regulations. The properties reviewed by Ryder Scott in this report are comprised of those propertiescontractually awarded to PEP and located in three areas of operations known as Activos. The names of these Activos as well as theirgeographical locations are shown below:
Activo Abkatun-Pol-Chuc Offshore Mexican territorial waters, Gulf of MexicoActivo Cantarell Offshore Mexican territorial waters, Gulf of MexicoActivo Ku-Maloob-Zaap Offshore Mexican territorial waters, Gulf of Mexico
The proved net reserves attributable to the properties that we reviewed account for 100 percent of the total proved net oilequivalent barrels (BOE) of PEP for the Activos listed above.
As prescribed by the Society of Petroleum Engineers in Paragraph 2.2(f) of the Standards Pertaining to the Estimating andAuditing of Oil and Gas Reserves Information (SPE auditing standards), a reserves audit is defined as �the process of reviewing certainof the pertinent facts interpreted and assumptions made that have resulted in an estimate of reserves and/or Reserves Informationprepared by others and the rendering of an opinion about (1) the appropriateness of the methodologies employed; (2) the adequacy andquality of the data relied upon; (3) the depth and thoroughness of the reserves estimation process; (4) the classification of reservesappropriate to the relevant definitions used; and (5) the reasonableness of the estimated reserve quantities and/or Reserves Information.�Reserves Information may consist of various estimates pertaining to the extent and value of petroleum properties.
Based on our review, including the data, technical processes and interpretations presented by PEP, it is our opinion that the overallprocedures and methodologies utilized by PEP in preparing their estimates of the proved reserves as of December 31, 2017 comply withthe current SEC regulations, and that the overall proved reserves for the reviewed properties as estimated by PEP are, in the aggregate,reasonable within the established audit tolerance guidelines of 10 percent set forth in the SPE auditing standards.
SUITE 800, 350 7TH AVENUE, S.W. CALGARY, ALBERTA T2P 3N9 TEL (403) 262-2799 FAX (403) 262-2790621 17TH STREET, SUITE 1550 DENVER, COLORADO 80293-1501 TEL (303) 623-9147 FAX (303) 623-4258
Copyright © 2018 www.secdatabase.com. All Rights Reserved.Please Consider the Environment Before Printing This Document
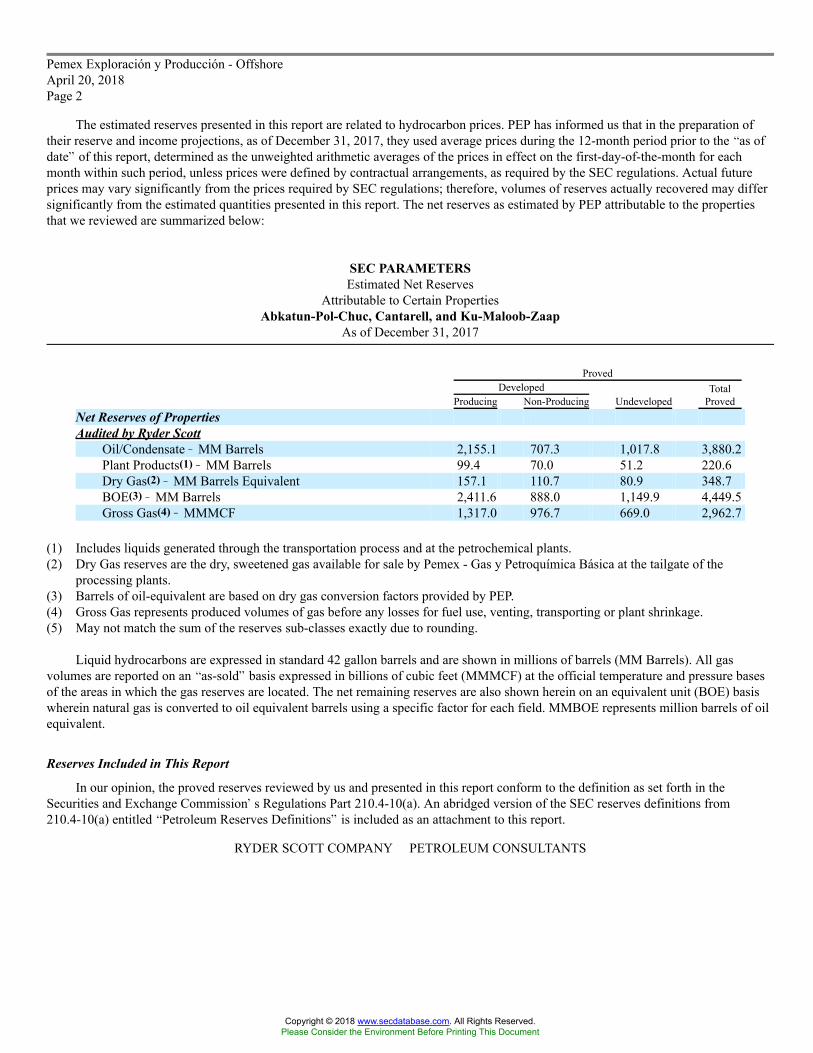
Pemex Exploración y Producción - OffshoreApril 20, 2018Page 2
The estimated reserves presented in this report are related to hydrocarbon prices. PEP has informed us that in the preparation oftheir reserve and income projections, as of December 31, 2017, they used average prices during the 12-month period prior to the �as ofdate� of this report, determined as the unweighted arithmetic averages of the prices in effect on the first-day-of-the-month for eachmonth within such period, unless prices were defined by contractual arrangements, as required by the SEC regulations. Actual futureprices may vary significantly from the prices required by SEC regulations; therefore, volumes of reserves actually recovered may differsignificantly from the estimated quantities presented in this report. The net reserves as estimated by PEP attributable to the propertiesthat we reviewed are summarized below:
SEC PARAMETERSEstimated Net Reserves
Attributable to Certain PropertiesAbkatun-Pol-Chuc, Cantarell, and Ku-Maloob-Zaap
As of December 31, 2017
ProvedDeveloped Total
Producing Non-Producing Undeveloped ProvedNet Reserves of PropertiesAudited by Ryder Scott
Oil/Condensate � MM Barrels 2,155.1 707.3 1,017.8 3,880.2Plant Products(1) � MM Barrels 99.4 70.0 51.2 220.6Dry Gas(2) � MM Barrels Equivalent 157.1 110.7 80.9 348.7BOE(3) � MM Barrels 2,411.6 888.0 1,149.9 4,449.5Gross Gas(4) � MMMCF 1,317.0 976.7 669.0 2,962.7
(1) Includes liquids generated through the transportation process and at the petrochemical plants.(2) Dry Gas reserves are the dry, sweetened gas available for sale by Pemex - Gas y Petroquímica Básica at the tailgate of the
processing plants.(3) Barrels of oil-equivalent are based on dry gas conversion factors provided by PEP.(4) Gross Gas represents produced volumes of gas before any losses for fuel use, venting, transporting or plant shrinkage.(5) May not match the sum of the reserves sub-classes exactly due to rounding.
Liquid hydrocarbons are expressed in standard 42 gallon barrels and are shown in millions of barrels (MM Barrels). All gasvolumes are reported on an �as-sold� basis expressed in billions of cubic feet (MMMCF) at the official temperature and pressure basesof the areas in which the gas reserves are located. The net remaining reserves are also shown herein on an equivalent unit (BOE) basiswherein natural gas is converted to oil equivalent barrels using a specific factor for each field. MMBOE represents million barrels of oilequivalent.
Reserves Included in This Report
In our opinion, the proved reserves reviewed by us and presented in this report conform to the definition as set forth in theSecurities and Exchange Commission�s Regulations Part 210.4-10(a). An abridged version of the SEC reserves definitions from210.4-10(a) entitled �Petroleum Reserves Definitions� is included as an attachment to this report.
RYDER SCOTT COMPANY PETROLEUM CONSULTANTS
Copyright © 2018 www.secdatabase.com. All Rights Reserved.Please Consider the Environment Before Printing This Document
Pemex Exploración y Producción - OffshoreApril 20, 2018Page 3
The various proved reserve status categories are defined under the attachment entitled �Petroleum Reserves Status Definitions andGuidelines� in this report. The proved developed non-producing reserves included herein consist of the shut-in and behind pipecategories.
Reserves are �estimated remaining quantities of oil and gas and related substances anticipated to be economically producible, as ofa given date, by application of development projects to known accumulations.� All reserve estimates involve an assessment of theuncertainty relating the likelihood that the actual remaining quantities recovered will be greater or less than the estimated quantitiesdetermined as of the date the estimate is made. The uncertainty depends chiefly on the amount of reliable geologic and engineering dataavailable at the time of the estimate and the interpretation of these data. The relative degree of uncertainty may be conveyed by placingreserves into one of two principal categories, either proved or unproved. Unproved reserves are less certain to be recovered than provedreserves and may be further sub-categorized as probable and possible reserves to denote progressively increasing uncertainty in theirrecoverability. At PEP�s request, this report addresses only the proved reserves attributable to the properties reviewed herein.
Proved oil and gas reserves are those quantities of oil and gas which, by analysis of geoscience and engineering data, can beestimated with reasonable certainty to be economically producible from a given date forward.� The proved reserves included hereinwere estimated using deterministic methods. If deterministic methods are used, the SEC has defined reasonable certainty for provedreserves as a �high degree of confidence that the quantities will be recovered.�
Proved reserve estimates will generally be revised only as additional geologic or engineering data become available or aseconomic conditions change. For proved reserves, the SEC states that �as changes due to increased availability of geoscience(geological, geophysical, and geochemical), engineering, and economic data are made to the estimated ultimate recovery (EUR) withtime, reasonably certain EUR is much more likely to increase or remain constant than to decrease.� Moreover, estimates of provedreserves may be revised as a result of future operations, effects of regulation by governmental agencies or geopolitical or economicrisks. Therefore, the proved reserves included in this report are estimates only and should not be construed as being exact quantities, andif recovered, could be more or less than the estimated amounts.
Audit Data, Methodology, Procedure and Assumptions
The estimation of reserves involves two distinct determinations. The first determination results in the estimation of the quantitiesof recoverable oil and gas and the second determination results in the estimation of the uncertainty associated with those estimatedquantities in accordance with the definitions set forth by the Securities and Exchange Commission�s Regulations Part 210.4-10(a). Theprocess of estimating the quantities of recoverable oil and gas reserves relies on the use of certain generally accepted analyticalprocedures. These analytical procedures fall into three broad categories or methods: (1) performance-based methods; (2) volumetric-based methods; and (3) analogy. These methods may be used individually or in combination by the reserve evaluator in the process ofestimating the quantities of reserves. Reserve evaluators must select the method or combination of methods that in their professionaljudgment is most appropriate given the nature and amount of reliable geoscience and engineering data available at the time of theestimate, the established or anticipated performance characteristics of the reservoir being evaluated and the stage of development orproducing maturity of the property.
RYDER SCOTT COMPANY PETROLEUM CONSULTANTS
Copyright © 2018 www.secdatabase.com. All Rights Reserved.Please Consider the Environment Before Printing This Document
Pemex Exploración y Producción - OffshoreApril 20, 2018Page 4
In many cases, the analysis of the available geoscience and engineering data and the subsequent interpretation of this data mayindicate a range of possible outcomes in an estimate, irrespective of the method selected by the evaluator. When a range in the quantityof reserves is identified, the evaluator must determine the uncertainty associated with the incremental quantities of the reserves. If thereserve quantities are estimated using the deterministic incremental approach, the uncertainty for each discrete incremental quantity ofthe reserves is addressed by the reserve category assigned by the evaluator. Therefore, it is the categorization of reserve quantities asproved, probable and/or possible that addresses the inherent uncertainty in the estimated quantities reported. For proved reserves,uncertainty is defined by the SEC as reasonable certainty wherein the �quantities actually recovered are much more likely than not to beachieved.� The SEC states that �probable reserves are those additional reserves that are less certain to be recovered than proved reservesbut which, together with proved reserves, are as likely as not to be recovered.� The SEC states that �possible reserves are thoseadditional reserves that are less certain to be recovered than probable reserves and the total quantities ultimately recovered from aproject have a low probability of exceeding proved plus probable plus possible reserves.� All quantities of reserves within the samereserve category must meet the SEC definitions as noted above.
Estimates of reserves quantities and their associated reserve categories may be revised in the future as additional geoscience orengineering data become available. Furthermore, estimates of reserves quantities and their associated reserve categories may also berevised due to other factors such as changes in economic conditions, results of future operations, effects of regulation by governmentalagencies or geopolitical or economic risks as previously noted herein.
The proved reserves prepared by PEP for the properties that we reviewed were estimated by performance methods, the volumetricmethod, analogy, or a combination of methods. Approximately 60 percent of the proved producing reserves attributable to producingwells and/or reservoirs that we reviewed were estimated by performance methods. These performance methods include, but may not belimited to, decline curve analysis, numerical simulation and material balance, which utilized extrapolations of historical production andpressure data available through December 2017, in those cases where such data were considered to be definitive. The data utilized inthese analyses were furnished to Ryder Scott by PEP and were considered sufficient for the purpose thereof. The remaining 40 percentof the proved producing reserves that we reviewed were estimated by the volumetric method, analogy, or a combination of methods.These methods were used where there were inadequate historical performance data to establish a definitive trend and where the use ofproduction performance data as a basis for the reserve estimates was considered to be inappropriate.
All of the proved developed non-producing and undeveloped reserves that we reviewed were estimated by the volumetric method,analogy, or a combination of methods. Volume versus depth analytical volumetric models that considered historical production volumesas well as movements of oil-water and gas-oil contacts with time were also utilized for certain major properties located offshore. Thevolumetric analysis utilized pertinent well and seismic data furnished to Ryder Scott by PEP for our review that were available throughDecember 2017. The data utilized from the analogues in conjunction with well and seismic data incorporated into the volumetricanalysis were considered sufficient for the purpose thereof.
To estimate economically recoverable proved oil and gas reserves many factors and assumptions are considered including, but notlimited to, the use of reservoir parameters derived from geological, geophysical and engineering data which cannot be measureddirectly, economic criteria based on current costs and SEC pricing requirements, and forecasts of future production rates. Under the SECregulations 210.4-10(a)(22)(v) and (26), proved reserves must be anticipated to be economically producible from a given date forwardbased on existing economic conditions including the
RYDER SCOTT COMPANY PETROLEUM CONSULTANTS
Copyright © 2018 www.secdatabase.com. All Rights Reserved.Please Consider the Environment Before Printing This Document
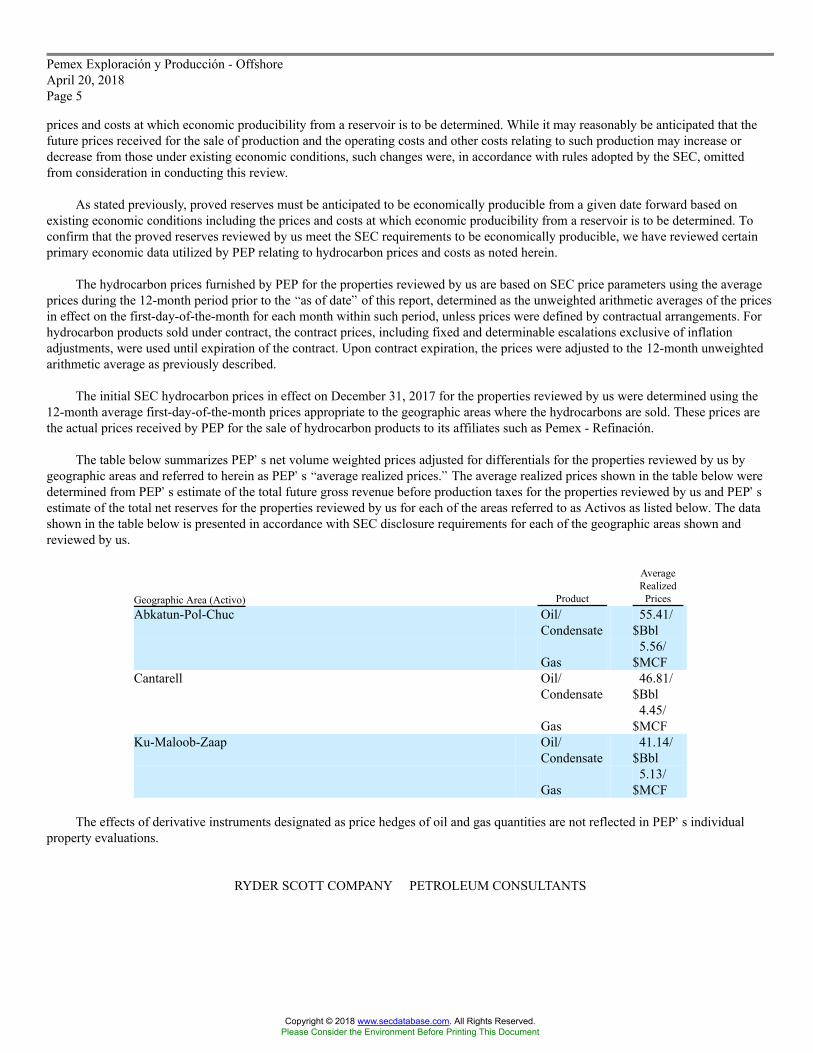
Pemex Exploración y Producción - OffshoreApril 20, 2018Page 5
prices and costs at which economic producibility from a reservoir is to be determined. While it may reasonably be anticipated that thefuture prices received for the sale of production and the operating costs and other costs relating to such production may increase ordecrease from those under existing economic conditions, such changes were, in accordance with rules adopted by the SEC, omittedfrom consideration in conducting this review.
As stated previously, proved reserves must be anticipated to be economically producible from a given date forward based onexisting economic conditions including the prices and costs at which economic producibility from a reservoir is to be determined. Toconfirm that the proved reserves reviewed by us meet the SEC requirements to be economically producible, we have reviewed certainprimary economic data utilized by PEP relating to hydrocarbon prices and costs as noted herein.
The hydrocarbon prices furnished by PEP for the properties reviewed by us are based on SEC price parameters using the averageprices during the 12-month period prior to the �as of date� of this report, determined as the unweighted arithmetic averages of the pricesin effect on the first-day-of-the-month for each month within such period, unless prices were defined by contractual arrangements. Forhydrocarbon products sold under contract, the contract prices, including fixed and determinable escalations exclusive of inflationadjustments, were used until expiration of the contract. Upon contract expiration, the prices were adjusted to the 12-month unweightedarithmetic average as previously described.
The initial SEC hydrocarbon prices in effect on December 31, 2017 for the properties reviewed by us were determined using the12-month average first-day-of-the-month prices appropriate to the geographic areas where the hydrocarbons are sold. These prices arethe actual prices received by PEP for the sale of hydrocarbon products to its affiliates such as Pemex - Refinación.
The table below summarizes PEP�s net volume weighted prices adjusted for differentials for the properties reviewed by us bygeographic areas and referred to herein as PEP�s �average realized prices.� The average realized prices shown in the table below weredetermined from PEP�s estimate of the total future gross revenue before production taxes for the properties reviewed by us and PEP�sestimate of the total net reserves for the properties reviewed by us for each of the areas referred to as Activos as listed below. The datashown in the table below is presented in accordance with SEC disclosure requirements for each of the geographic areas shown andreviewed by us.
Geographic Area (Activo) Product
AverageRealized
PricesAbkatun-Pol-Chuc Oil/
Condensate $55.41/Bbl
Gas $5.56/MCF
Cantarell Oil/Condensate $
46.81/Bbl
Gas $4.45/MCF
Ku-Maloob-Zaap Oil/Condensate $
41.14/Bbl
Gas $5.13/MCF
The effects of derivative instruments designated as price hedges of oil and gas quantities are not reflected in PEP�s individualproperty evaluations.
RYDER SCOTT COMPANY PETROLEUM CONSULTANTS
Copyright © 2018 www.secdatabase.com. All Rights Reserved.Please Consider the Environment Before Printing This Document
Pemex Exploración y Producción - OffshoreApril 20, 2018Page 6
Accumulated gas production imbalances, if any, were not taken into account in the proved gas reserve estimates reviewed. Theproved gas volumes included herein do not attribute gas consumed in operations as reserves.
Operating costs furnished by PEP are based on the operating expense reports of PEP and include only those costs directlyapplicable to the fields or wells for the properties reviewed by us. The operating costs include a portion of general and administrativecosts allocated directly to the fields and wells. The operating costs furnished by PEP were accepted as factual data and reviewed by usfor their reasonableness; however, we have not conducted an independent verification of the data used by PEP. No deduction was madefor loan repayments, interest expenses, or exploration and development prepayments that were not charged directly to the fields, wellsor contract areas.
Development costs furnished by PEP are based on authorizations for expenditure for the proposed work or actual costs for similarprojects. The development costs furnished by PEP were accepted as factual data and reviewed by us for their reasonableness; however,we have not conducted an independent verification of the data used by PEP. The estimated net cost of abandonment after salvage wasincluded by Pemex for properties where abandonment costs net of salvage were significant. Pemex�s estimates of the net abandonmentcosts were accepted without independent verification.
The proved developed non-producing and undeveloped reserves for the properties reviewed by us have been incorporated herein inaccordance with PEP�s plans to develop these reserves as of December 31, 2017. The implementation of these development plans aspresented to us is subject to the approval process adopted by PEP�s management. As the result of our inquiries during the course of ourreview, PEP has informed us that the development activities for the properties reviewed by us have been subjected to and received theinternal approvals required by PEP�s management at the appropriate local, regional and/or corporate level. Additionally, PEP hasinformed us that they are not aware of any legal, regulatory or political obstacles that would significantly alter their plans. While theseplans could change from those under existing economic conditions as of December 31, 2017, such changes were, in accordance withrules adopted by the SEC, omitted from consideration in making this evaluation.
Current costs used by PEP were held constant throughout the life of the properties.
PEP�s forecasts of future production rates are based on historical performance from wells currently on production. If noproduction decline trend has been established, future production rates were held constant until a decline in ability to produce wasanticipated. An estimated rate of decline was then applied to depletion of the reserves. If a decline trend has been established, this trendwas used as the basis for estimating future production rates.
Test data and other related information were used by PEP to estimate the anticipated initial production rates for those wells orlocations that are not currently producing. For reserves not yet on production, sales were estimated to commence at an anticipated datefurnished by PEP. Wells or locations that are not currently producing may start producing earlier or later than anticipated in PEP�sestimates due to unforeseen factors causing a change in the timing to initiate production. Such factors may include delays due toweather, the availability of rigs, the sequence of drilling, completing and/or recompleting wells and/or constraints set by regulatorybodies.
The future production rates from wells currently on production or wells or locations that are not currently producing may be moreor less than estimated because of changes including, but not limited to, reservoir performance, operating conditions related to surfacefacilities, compression and artificial lift, pipeline capacity and/or operating conditions, producing market demand and/or allowables orother constraints set by regulatory bodies.
RYDER SCOTT COMPANY PETROLEUM CONSULTANTS
Copyright © 2018 www.secdatabase.com. All Rights Reserved.Please Consider the Environment Before Printing This Document

Pemex Exploración y Producción - OffshoreApril 20, 2018Page 7
Ryder Scott did not evaluate the country and geopolitical risks in the country of Mexico where all of the subject properties arelocated. PEP�s operations may be subject to various levels of governmental controls and regulations. These controls and regulationsmay include, but may not be limited to, matters relating to land tenure and use, drilling and production practices, environmentalprotection, marketing and pricing policies, various taxes and levies and are subject to change from time to time. Such changes ingovernmental regulations and policies may cause volumes of proved reserves actually recovered and amounts of proved income actuallyreceived to differ significantly from the estimated quantities.
The estimates of proved reserves presented herein were based upon a review of the subject properties; however, we have not madeany field examination of the properties. No consideration was given in this report to potential environmental liabilities that may existnor were any costs included by PEP for potential liabilities to restore and clean up damages, if any, caused by past operating practices.
Certain technical personnel of PEP are responsible for the preparation of reserve estimates on new properties and for thepreparation of revised estimates, when necessary, on old properties. These personnel assembled the necessary data and maintained thedata and workpapers in an orderly manner. We consulted with these technical personnel and had access to their workpapers andsupporting data in the course of our audit.
PEP has informed us that they have furnished us all of the material accounts, records, geological and engineering data, and reportsand other data required for this investigation. In performing our audit of PEP�s forecast of future proved production, we have reliedupon data furnished by PEP with respect to property interests, production and well tests from examined wells, normal direct costs ofoperating the properties, other costs such as transportation and/or processing fees, recompletion and development costs, developmentplans, abandonment costs after salvage, product prices based on the SEC regulations, adjustments or differentials to product prices,geological structural and isochore maps, well logs, core analyses, and pressure measurements. Ryder Scott reviewed such factual datafor its reasonableness; however, we have not conducted an independent verification of the data furnished by PEP. The data describedherein were accepted as authentic and sufficient for determining the reserves unless, during the course of our examination, a matter ofquestion came to our attention in which case the data were not accepted until all questions were satisfactorily resolved. We consider thefactual data furnished to us by PEP to be appropriate and sufficient for the purpose of our review of PEP�s estimates of reserves. Insummary, we consider the assumptions, data, methods and analytical procedures used by PEP and as reviewed by us appropriate for thepurpose hereof, and we have used all such methods and procedures that we consider necessary and appropriate under the circumstancesto render the conclusions set forth herein.
Audit Opinion
Based on our review, including the data, technical processes and interpretations presented by PEP, it is our opinion that the overallprocedures and methodologies utilized by PEP in preparing their estimates of the proved reserves as of December 31, 2017 comply withthe current SEC regulations and that the overall proved reserves in terms of barrels of oil equivalent (BOE) for the reviewed propertiesas estimated by PEP are, in the aggregate, reasonable within the established audit tolerance guidelines of 10 percent as set forth in theSPE auditing standards. Ryder Scott found the processes and controls used by PEP in their estimation of proved reserves to be effectiveand, in the aggregate, we found no bias in the utilization and analysis of data in estimates for these properties.
RYDER SCOTT COMPANY PETROLEUM CONSULTANTS
Copyright © 2018 www.secdatabase.com. All Rights Reserved.Please Consider the Environment Before Printing This Document

Pemex Exploración y Producción - OffshoreApril 20, 2018Page 8
We were in reasonable agreement with PEP�s estimates of proved reserves for the properties which we reviewed; however, incertain cases there was more than an acceptable variance between PEP�s estimates and our estimates due to a difference ininterpretation of data or due to our having access to data which were not available to PEP when its reserve estimates were prepared. Inthese cases, PEP revised its estimates to better conform to our estimates. As a consequence, it is our opinion that on an aggregate basisthe data presented herein for the properties that we reviewed fairly reflects the estimated net reserves for those properties owned by theUnited Mexican States.
Standards of Independence and Professional Qualification
Ryder Scott is an independent petroleum engineering consulting firm that has been providing petroleum consulting servicesthroughout the world since 1937. Ryder Scott is employee-owned and maintains offices in Houston, Texas; Denver, Colorado; andCalgary, Alberta, Canada. We have over eighty engineers and geoscientists on our permanent staff. By virtue of the size of our firm andthe large number of clients for which we provide services, no single client or job represents a material portion of our annual revenue. Wedo not serve as officers or directors of any privately-owned or publicly-traded oil and gas company and are separate and independentfrom the operating and investment decision-making process of our clients. This allows us to bring the highest level of independence andobjectivity to each engagement for our services.
Ryder Scott actively participates in industry-related professional societies and organizes an annual public forum focused on thesubject of reserves evaluations and SEC regulations. Many of our staff have authored or co-authored technical papers on the subject ofreserves related topics. We encourage our staff to maintain and enhance their professional skills by actively participating in ongoingcontinuing education.
Prior to becoming an officer of the Company, Ryder Scott requires that staff engineers and geoscientists have received professionalaccreditation in the form of a registered or certified professional engineer�s license or a registered or certified professionalgeoscientist�s license, or the equivalent thereof, from an appropriate governmental authority or a recognized self-regulating professionalorganization.
We are independent petroleum engineers with respect to PEP. Neither we nor any of our employees have any financial interest inthe subject properties, and neither the employment to do this work nor the compensation is contingent on our estimates of reserves forthe properties which were reviewed.
The results of this audit, presented herein, are based on technical analysis conducted by teams of geoscientists and engineers fromRyder Scott. The professional qualifications of the undersigned, the technical person primarily responsible for the review of the reservesinformation discussed in this report, are included as an attachment to this letter.
Terms of Usage
The results of our third party audit, presented in report form herein, were prepared in accordance with the disclosure requirementsset forth in the SEC regulations and intended for public disclosure as an exhibit in filings made with the SEC by Pemex.
Pemex makes periodic filings on Form 20-F with the SEC under the 1934 Exchange Act. Furthermore, Pemex files registrationstatements with the SEC under the 1933 Securities Act into which filings on Form 20-F are incorporated by reference. We haveconsented to the references to our name
RYDER SCOTT COMPANY PETROLEUM CONSULTANTS
Copyright © 2018 www.secdatabase.com. All Rights Reserved.Please Consider the Environment Before Printing This Document

Pemex Exploración y Producción - OffshoreApril 20, 2018Page 9
in and the filing of this report as an exhibit to the annual report on Form 20-F of Pemex for the year ended December 31, 2017. Ourwritten consent for such use will be included as a separate exhibit to such Form 20-F. In the event the references to our name as well asreferences to our report are incorporated by reference into any registration statement on Form F-4, then our written consent for such usewill be included as a separate exhibit to such registration statement.
We have provided PEP with a digital version of the original signed copy of this report letter. In the event there are any differencesbetween the digital version included in filings made by Pemex and the original signed report letter, the original signed report letter shallcontrol and supersede the digital version.
The data and workpapers used in the preparation of this report are available for examination by authorized parties in our offices.Please contact us if we can be of further service.
Very truly yours,
RYDER SCOTT COMPANY, L.P.TBPE Firm Registration No. F-1580
Guale Ramirez, P.E.TBPE License No. 48318Executive Vice President
GR (DPR)/pl
RYDER SCOTT COMPANY PETROLEUM CONSULTANTS
Copyright © 2018 www.secdatabase.com. All Rights Reserved.Please Consider the Environment Before Printing This Document
Professional Qualifications of Primary Technical Person
The conclusions presented in this report are the result of technical analysis conducted by teams of geoscientists and engineers fromRyder Scott Company, L.P. Guadalupe Ramirez was the primary technical person responsible for overseeing the estimate of thereserves, future production and income.
Mr. Ramirez, an employee of Ryder Scott Company, L.P. (Ryder Scott) since 1981, is the Executive Vice President and also serves as amember of the Board of Directors. He is responsible for coordinating and supervising staff and consulting engineers of the company inongoing reservoir evaluation studies worldwide. Before joining Ryder Scott, Mr. Ramirez served in a number of engineering positionswith Sun Oil Company and Natomas North America. For more information regarding Mr. Ramirez�s geographic and job specificexperience, please refer to the Ryder Scott Company website at www.ryderscott.com/Company/Employees.
Mr. Ramirez earned a Bachelor of Science Degree in Mechanical Engineering with honors from Texas A&M University in 1976 and is alicensed Professional Engineer in the State of Texas. He is also a member of the Society of Petroleum Engineers and Society ofPetroleum Evaluation Engineers.
In addition to gaining experience and competency through prior work experience, the Texas Board of Professional Engineers requires aminimum of fifteen hours of continuing education annually, including at least one hour in the area of professional ethics, whichMr. Ramirez fulfills. As part of his 2017 continuing education hours, Mr. Ramirez attended and internally received 12 hours offormalized training as well as a day-long public forum, the 2017 RSC Reserves Conference relating to the definitions and disclosureguidelines contained in the United States Securities and Exchange Commission Title 17, Code of Federal Regulations, Modernization ofOil and Gas Reporting, Final Rule released January 14, 2009 in the Federal Register. Mr. Ramirez has also presented courses on the newSEC and SPE-PRMS reserves definitions on various occasions during 2011, 2012, 2013, 2015 and 2017 and received 7.0 hours offormalized external training during 2017, covering such topics as the Guidelines for Application of the SPE/WPC/AAPG/SPEEPetroleum Resources Management System, reservoir engineering, geoscience and petroleum economics evaluation methods, proceduresand software, unconventional resources and ethics for consultants.
Based on his educational background, professional training and more than 35 years of practical experience in the estimation andevaluation of petroleum reserves, Mr. Ramirez has attained the professional qualifications as a Reserves Estimator and Reserves Auditorset forth in Article III of the �Standards Pertaining to the Estimating and Auditing of Oil and Gas Reserves Information� promulgatedby the Society of Petroleum Engineers as of February 19, 2007.
RYDER SCOTT COMPANY PETROLEUM CONSULTANTS
Copyright © 2018 www.secdatabase.com. All Rights Reserved.Please Consider the Environment Before Printing This Document

PETROLEUM RESERVES DEFINITIONS
As Adapted From:RULE 4-10(a) of REGULATION S-X PART 210
UNITED STATES SECURITIES AND EXCHANGE COMMISSION (SEC)
PREAMBLE
On January 14, 2009, the United States Securities and Exchange Commission (SEC) published the �Modernization of Oil and GasReporting; Final Rule� in the Federal Register of National Archives and Records Administration (NARA). The �Modernization of Oiland Gas Reporting; Final Rule� includes revisions and additions to the definition section in Rule 4-10 of Regulation S-X, revisions andadditions to the oil and gas reporting requirements in Regulation S-K, and amends and codifies Industry Guide 2 in Regulation S-K. The�Modernization of Oil and Gas Reporting; Final Rule�, including all references to Regulation S-X and Regulation S-K, shall be referredto herein collectively as the �SEC regulations�. The SEC regulations take effect for all filings made with the United States Securitiesand Exchange Commission as of December 31, 2009, or after January 1, 2010. Reference should be made to the full text under Title 17,Code of Federal Regulations, Regulation S-X Part 210, Rule 4-10(a) for the complete definitions (direct passages excerpted in part orwholly from the aforementioned SEC document are denoted in italics herein).
Reserves are estimated remaining quantities of oil and gas and related substances anticipated to be economically producible, as ofa given date, by application of development projects to known accumulations. All reserve estimates involve an assessment of theuncertainty relating the likelihood that the actual remaining quantities recovered will be greater or less than the estimated quantitiesdetermined as of the date the estimate is made. The uncertainty depends chiefly on the amount of reliable geologic and engineering dataavailable at the time of the estimate and the interpretation of these data. The relative degree of uncertainty may be conveyed by placingreserves into one of two principal classifications, either proved or unproved. Unproved reserves are less certain to be recovered thanproved reserves and may be further sub-classified as probable and possible reserves to denote progressively increasing uncertainty intheir recoverability. Under the SEC regulations as of December 31, 2009, or after January 1, 2010, a company may optionally discloseestimated quantities of probable or possible oil and gas reserves in documents publicly filed with the SEC. The SEC regulationscontinue to prohibit disclosure of estimates of oil and gas resources other than reserves and any estimated values of such resources inany document publicly filed with the SEC unless such information is required to be disclosed in the document by foreign or state law asnoted in §229.1202 Instruction to Item 1202.
Reserves estimates will generally be revised only as additional geologic or engineering data become available or as economicconditions change.
Reserves may be attributed to either natural energy or improved recovery methods. Improved recovery methods include allmethods for supplementing natural energy or altering natural forces in the reservoir to increase ultimate recovery. Examples of suchmethods are pressure maintenance, natural gas cycling, waterflooding, thermal methods, chemical flooding, and the use of miscible andimmiscible displacement fluids. Other improved recovery methods may be developed in the future as petroleum technology continues toevolve.
Reserves may be attributed to either conventional or unconventional petroleum accumulations. Petroleum accumulations areconsidered as either conventional or unconventional based on the nature of their in-place characteristics, extraction method applied, ordegree of processing prior to sale.
RYDER SCOTT COMPANY PETROLEUM CONSULTANTS
Copyright © 2018 www.secdatabase.com. All Rights Reserved.Please Consider the Environment Before Printing This Document
PETROLEUM RESERVES DEFINITIONSPage 2
Examples of unconventional petroleum accumulations include coalbed or coalseam methane (CBM/CSM), basin-centered gas, shalegas, gas hydrates, natural bitumen and oil shale deposits. These unconventional accumulations may require specialized extractiontechnology and/or significant processing prior to sale.
Reserves do not include quantities of petroleum being held in inventory.
Because of the differences in uncertainty, caution should be exercised when aggregating quantities of petroleum from differentreserves categories.
RESERVES (SEC DEFINITIONS)
Securities and Exchange Commission Regulation S-X §210.4-10(a)(26) defines reserves as follows:
Reserves. Reserves are estimated remaining quantities of oil and gas and related substances anticipated to be economically producible,as of a given date, by application of development projects to known accumulations. In addition, there must exist, or there must be areasonable expectation that there will exist, the legal right to produce or a revenue interest in the production, installed means ofdelivering oil and gas or related substances to market, and all permits and financing required to implement the project.
Note to paragraph (a)(26): Reserves should not be assigned to adjacent reservoirs isolated by major, potentially sealing, faults untilthose reservoirs are penetrated and evaluated as economically producible. Reserves should not be assigned to areas that are clearlyseparated from a known accumulation by a non-productive reservoir (i.e., absence of reservoir, structurally low reservoir, or negativetest results). Such areas may contain prospective resources (i.e., potentially recoverable resources from undiscovered accumulations).
PROVED RESERVES (SEC DEFINITIONS)
Securities and Exchange Commission Regulation S-X §210.4-10(a)(22) defines proved oil and gas reserves as follows:
Proved oil and gas reserves. Proved oil and gas reserves are those quantities of oil and gas, which, by analysis of geoscience andengineering data, can be estimated with reasonable certainty to be economically producible�from a given date forward, from knownreservoirs, and under existing economic conditions, operating methods, and government regulations�prior to the time at whichcontracts providing the right to operate expire, unless evidence indicates that renewal is reasonably certain, regardless of whetherdeterministic or probabilistic methods are used for the estimation. The project to extract the hydrocarbons must have commenced or theoperator must be reasonably certain that it will commence the project within a reasonable time.
(i) The area of the reservoir considered as proved includes:
(A) The area identified by drilling and limited by fluid contacts, if any, and
(B) Adjacent undrilled portions of the reservoir that can, with reasonable certainty, be judged to be continuous with itand to contain economically producible oil or gas on the basis of available geoscience and engineering data.
RYDER SCOTT COMPANY PETROLEUM CONSULTANTS
Copyright © 2018 www.secdatabase.com. All Rights Reserved.Please Consider the Environment Before Printing This Document
PETROLEUM RESERVES DEFINITIONSPage 3
PROVED RESERVES (SEC DEFINITIONS) CONTINUED
(ii) In the absence of data on fluid contacts, proved quantities in a reservoir are limited by the lowest known hydrocarbons (LKH)as seen in a well penetration unless geoscience, engineering, or performance data and reliable technology establishes a lowercontact with reasonable certainty.
(iii) Where direct observation from well penetrations has defined a highest known oil (HKO) elevation and the potential exists foran associated gas cap, proved oil reserves may be assigned in the structurally higher portions of the reservoir only if geoscience,engineering, or performance data and reliable technology establish the higher contact with reasonable certainty.
(iv) Reserves which can be produced economically through application of improved recovery techniques (including, but not limitedto, fluid injection) are included in the proved classification when:
(A) Successful testing by a pilot project in an area of the reservoir with properties no more favorable than in thereservoir as a whole, the operation of an installed program in the reservoir or an analogous reservoir, or otherevidence using reliable technology establishes the reasonable certainty of the engineering analysis on which theproject or program was based; and
(B) The project has been approved for development by all necessary parties and entities, including governmentalentities.
(v) Existing economic conditions include prices and costs at which economic producibility from a reservoir is to be determined.The price shall be the average price during the 12-month period prior to the ending date of the period covered by the report,determined as an unweighted arithmetic average of the first-day-of-the-month price for each month within such period, unlessprices are defined by contractual arrangements, excluding escalations based upon future conditions.
RYDER SCOTT COMPANY PETROLEUM CONSULTANTS
Copyright © 2018 www.secdatabase.com. All Rights Reserved.Please Consider the Environment Before Printing This Document
PETROLEUM RESERVES STATUS DEFINITIONS AND GUIDELINES
As Adapted From:RULE 4-10(a) of REGULATION S-X PART 210
UNITED STATES SECURITIES AND EXCHANGE COMMISSION (SEC)
and
PETROLEUM RESOURCES MANAGEMENT SYSTEM (SPE-PRMS)Sponsored and Approved by:
SOCIETY OF PETROLEUM ENGINEERS (SPE)WORLD PETROLEUM COUNCIL (WPC)
AMERICAN ASSOCIATION OF PETROLEUM GEOLOGISTS (AAPG)SOCIETY OF PETROLEUM EVALUATION ENGINEERS (SPEE)
Reserves status categories define the development and producing status of wells and reservoirs. Reference should be made to Title17, Code of Federal Regulations, Regulation S-X Part 210, Rule 4-10(a) and the SPE-PRMS as the following reserves status definitionsare based on excerpts from the original documents (direct passages excerpted from the aforementioned SEC and SPE-PRMS documentsare denoted in italics herein).
DEVELOPED RESERVES (SEC DEFINITIONS)
Securities and Exchange Commission Regulation S-X §210.4-10(a)(6) defines developed oil and gas reserves as follows:
Developed oil and gas reserves are reserves of any category that can be expected to be recovered:
(i) Through existing wells with existing equipment and operating methods or in which the cost of the requiredequipment is relatively minor compared to the cost of a new well; and
(ii) Through installed extraction equipment and infrastructure operational at the time of the reserves estimate if theextraction is by means not involving a well.
Developed Producing (SPE-PRMS Definitions)
While not a requirement for disclosure under the SEC regulations, developed oil and gas reserves may be further sub-classifiedaccording to the guidance contained in the SPE-PRMS as Producing or Non-Producing.
Developed Producing Reserves
Developed Producing Reserves are expected to be recovered from completion intervals that are open and producing at the time ofthe estimate.
Improved recovery reserves are considered producing only after the improved recovery project is in operation.
RYDER SCOTT COMPANY PETROLEUM CONSULTANTS
Copyright © 2018 www.secdatabase.com. All Rights Reserved.Please Consider the Environment Before Printing This Document
PETROLEUM RESERVES STATUS DEFINITIONS AND GUIDELINESPage 2
Developed Non-Producing
Developed Non-Producing Reserves include shut-in and behind-pipe reserves.
Shut-In
Shut-in Reserves are expected to be recovered from:
(1) completion intervals which are open at the time of the estimate, but which have not started producing;
(2) wells which were shut-in for market conditions or pipeline connections; or
(3) wells not capable of production for mechanical reasons.
Behind-Pipe
Behind-pipe Reserves are expected to be recovered from zones in existing wells, which will require additional completion work orfuture re-completion prior to start of production.
In all cases, production can be initiated or restored with relatively low expenditure compared to the cost of drilling a new well.
UNDEVELOPED RESERVES (SEC DEFINITIONS)
Securities and Exchange Commission Regulation S-X §210.4-10(a)(31) defines undeveloped oil and gas reserves as follows:
Undeveloped oil and gas reserves are reserves of any category that are expected to be recovered from new wells on undrilledacreage, or from existing wells where a relatively major expenditure is required for recompletion.
(i) Reserves on undrilled acreage shall be limited to those directly offsetting development spacing areas that arereasonably certain of production when drilled, unless evidence using reliable technology exists that establishesreasonable certainty of economic producibility at greater distances.
(ii) Undrilled locations can be classified as having undeveloped reserves only if a development plan has been adoptedindicating that they are scheduled to be drilled within five years, unless the specific circumstances, justify a longertime.
(iii) Under no circumstances shall estimates for undeveloped reserves be attributable to any acreage for which anapplication of fluid injection or other improved recovery technique is contemplated, unless such techniques have beenproved effective by actual projects in the same reservoir or an analogous reservoir, as defined in paragraph (a)(2) ofthis section, or by other evidence using reliable technology establishing reasonable certainty.
RYDER SCOTT COMPANY PETROLEUM CONSULTANTS
Copyright © 2018 www.secdatabase.com. All Rights Reserved.Please Consider the Environment Before Printing This Document

Exhibit 10.2(Part 2 of 2)
Pemex Exploración y Producción
Estimated
Future Reserves
Attributable to Certain
Oil and Gas Properties in Mexico
Activo Bellota-Jujo
Activo Cinco Presidentes
Activo Macuspana-Muspac
Activo Samaria-Luna
SEC Parameters
As of
December 31, 2017
Guale Ramirez, P.E.TBPE License No.48318Executive Vice President
RYDER SCOTT COMPANY, L.P.TBPE Firm Registration No. F-1580
RYDER SCOTT COMPANY PETROLEUM CONSULTANTS
Copyright © 2018 www.secdatabase.com. All Rights Reserved.Please Consider the Environment Before Printing This Document

TBPE REGISTERED ENGINEERING FIRM F-1580 FAX (713) 651-08491100 LOUISIANA SUITE 4600 HOUSTON, TEXAS 77002-5294 TELEPHONE (713) 651-9191
April 20, 2018
Ing. J. Javier Hinojosa PueblaDirector General de Pemex Exploración y ProducciónAvenida Marina Nacional 329Torre Ejecutiva, Piso 41Col Verónica Anzures, C.P. 11300Del. Miguel Hidalgo, Ciudad de MéxicoMéxico
Dear Ing. Hinojosa Puebla:
At the request of Pemex Exploración y Producción (PEP), a wholly owned subsidiary of Petróleos Mexicanos (Pemex), RyderScott Company, L.P. (Ryder Scott) has conducted a reserves audit of the estimates of the proved reserves owned by the United MexicanStates as of December 31, 2017. In most cases the properties reviewed by us are operated by Pemex; however, certain contract areas areoperated by other companies. The estimates we audited were prepared by PEP�s engineering and geological staff based on thedefinitions and disclosure guidelines of the United States Securities and Exchange Commission contained in Title 17, Code of FederalRegulations, Modernization of Oil and Gas Reporting, Final Rule released January 14, 2009, in the Federal Register (SEC regulations).Our third party reserves audit, completed on February 28, 2018, and presented herein, was prepared for public disclosure by Pemex infilings made with the SEC in accordance with the disclosure requirements set forth in the SEC regulations. The properties reviewed byRyder Scott in this report are comprised of those properties contractually awarded to PEP and located in four areas of operations knownas Activos. The names of these Activos as well as their geographical locations are shown below:
Activo Bellota-Jujo Onshore Mexican state of TabascoActivo Cinco Presidentes Onshore Mexican states of Tabasco and VeracruzActivo Macuspana-Muspac Onshore Mexican states of Chiapas and TabascoActivo Samaria-Luna Onshore Mexican state of Tabasco
The proved net reserves attributable to the properties that we reviewed account for 100 percent of the total proved net oilequivalent barrels (BOE) of PEP for the Activos listed above.
As prescribed by the Society of Petroleum Engineers in Paragraph 2.2(f) of the Standards Pertaining to the Estimating andAuditing of Oil and Gas Reserves Information (SPE auditing standards), a reserves audit is defined as �the process of reviewing certainof the pertinent facts interpreted and assumptions made that have resulted in an estimate of reserves and/or Reserves Informationprepared by others and the rendering of an opinion about (1) the appropriateness of the methodologies employed; (2) the adequacy andquality of the data relied upon; (3) the depth and thoroughness of the reserves estimation process; (4) the classification of reservesappropriate to the relevant definitions used; and (5) the reasonableness of the estimated reserve quantities and/or Reserves Information.�Reserves Information may consist of various estimates pertaining to the extent and value of petroleum properties.
SUITE 800, 350 7TH AVENUE, S.W. CALGARY, ALBERTA T2P 3N9 TEL (403) 262-2799 FAX (403) 262-2790621 17TH STREET, SUITE 1550 DENVER, COLORADO 80293-1501 TEL (303) 623-9147 FAX (303) 623-4258
Copyright © 2018 www.secdatabase.com. All Rights Reserved.Please Consider the Environment Before Printing This Document
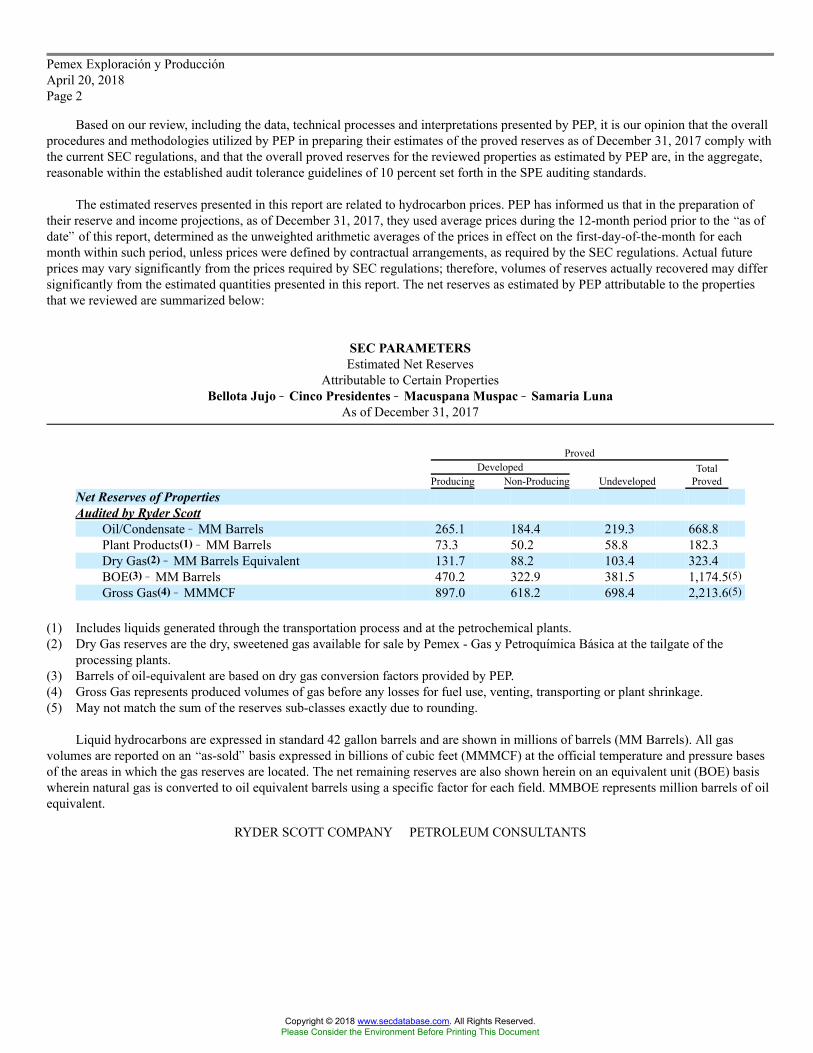
Pemex Exploración y ProducciónApril 20, 2018Page 2
Based on our review, including the data, technical processes and interpretations presented by PEP, it is our opinion that the overallprocedures and methodologies utilized by PEP in preparing their estimates of the proved reserves as of December 31, 2017 comply withthe current SEC regulations, and that the overall proved reserves for the reviewed properties as estimated by PEP are, in the aggregate,reasonable within the established audit tolerance guidelines of 10 percent set forth in the SPE auditing standards.
The estimated reserves presented in this report are related to hydrocarbon prices. PEP has informed us that in the preparation oftheir reserve and income projections, as of December 31, 2017, they used average prices during the 12-month period prior to the �as ofdate� of this report, determined as the unweighted arithmetic averages of the prices in effect on the first-day-of-the-month for eachmonth within such period, unless prices were defined by contractual arrangements, as required by the SEC regulations. Actual futureprices may vary significantly from the prices required by SEC regulations; therefore, volumes of reserves actually recovered may differsignificantly from the estimated quantities presented in this report. The net reserves as estimated by PEP attributable to the propertiesthat we reviewed are summarized below:
SEC PARAMETERSEstimated Net Reserves
Attributable to Certain PropertiesBellota Jujo �� Cinco Presidentes �� Macuspana Muspac �� Samaria Luna
As of December 31, 2017
ProvedDeveloped Total
Producing Non-Producing Undeveloped ProvedNet Reserves of PropertiesAudited by Ryder Scott
Oil/Condensate � MM Barrels 265.1 184.4 219.3 668.8Plant Products(1) � MM Barrels 73.3 50.2 58.8 182.3Dry Gas(2) � MM Barrels Equivalent 131.7 88.2 103.4 323.4BOE(3) � MM Barrels 470.2 322.9 381.5 1,174.5(5)Gross Gas(4) � MMMCF 897.0 618.2 698.4 2,213.6(5)
(1) Includes liquids generated through the transportation process and at the petrochemical plants.(2) Dry Gas reserves are the dry, sweetened gas available for sale by Pemex - Gas y Petroquímica Básica at the tailgate of the
processing plants.(3) Barrels of oil-equivalent are based on dry gas conversion factors provided by PEP.(4) Gross Gas represents produced volumes of gas before any losses for fuel use, venting, transporting or plant shrinkage.(5) May not match the sum of the reserves sub-classes exactly due to rounding.
Liquid hydrocarbons are expressed in standard 42 gallon barrels and are shown in millions of barrels (MM Barrels). All gasvolumes are reported on an �as-sold� basis expressed in billions of cubic feet (MMMCF) at the official temperature and pressure basesof the areas in which the gas reserves are located. The net remaining reserves are also shown herein on an equivalent unit (BOE) basiswherein natural gas is converted to oil equivalent barrels using a specific factor for each field. MMBOE represents million barrels of oilequivalent.
RYDER SCOTT COMPANY PETROLEUM CONSULTANTS
Copyright © 2018 www.secdatabase.com. All Rights Reserved.Please Consider the Environment Before Printing This Document

Pemex Exploración y ProducciónApril 20, 2018Page 3
Reserves Included in This Report
In our opinion, the proved reserves reviewed by us and presented in this report conform to the definition as set forth in theSecurities and Exchange Commission�s Regulations Part 210.4-10(a). An abridged version of the SEC reserves definitions from210.4-10(a) entitled �Petroleum Reserves Definitions� is included as an attachment to this report.
The various proved reserve status categories are defined under the attachment entitled �Petroleum Reserves Status Definitions andGuidelines� in this report. The proved developed non-producing reserves included herein consist of the shut-in and behind pipecategories.
Reserves are �estimated remaining quantities of oil and gas and related substances anticipated to be economically producible, as ofa given date, by application of development projects to known accumulations.� All reserve estimates involve an assessment of theuncertainty relating the likelihood that the actual remaining quantities recovered will be greater or less than the estimated quantitiesdetermined as of the date the estimate is made. The uncertainty depends chiefly on the amount of reliable geologic and engineering dataavailable at the time of the estimate and the interpretation of these data. The relative degree of uncertainty may be conveyed by placingreserves into one of two principal categories, either proved or unproved. Unproved reserves are less certain to be recovered than provedreserves and may be further sub-categorized as probable and possible reserves to denote progressively increasing uncertainty in theirrecoverability. At PEP�s request, this report addresses only the proved reserves attributable to the properties reviewed herein.
Proved oil and gas reserves are those quantities of oil and gas which, by analysis of geoscience and engineering data, can beestimated with reasonable certainty to be economically producible from a given date forward.� The proved reserves included hereinwere estimated using deterministic methods. If deterministic methods are used, the SEC has defined reasonable certainty for provedreserves as a �high degree of confidence that the quantities will be recovered.�
Proved reserve estimates will generally be revised only as additional geologic or engineering data become available or aseconomic conditions change. For proved reserves, the SEC states that �as changes due to increased availability of geoscience(geological, geophysical, and geochemical), engineering, and economic data are made to the estimated ultimate recovery (EUR) withtime, reasonably certain EUR is much more likely to increase or remain constant than to decrease.� Moreover, estimates of provedreserves may be revised as a result of future operations, effects of regulation by governmental agencies or geopolitical or economicrisks. Therefore, the proved reserves included in this report are estimates only and should not be construed as being exact quantities, andif recovered, could be more or less than the estimated amounts.
Audit Data, Methodology, Procedure and Assumptions
The estimation of reserves involves two distinct determinations. The first determination results in the estimation of the quantitiesof recoverable oil and gas and the second determination results in the estimation of the uncertainty associated with those estimatedquantities in accordance with the definitions set forth by the Securities and Exchange Commission�s Regulations Part 210.4-10(a). Theprocess of estimating the quantities of recoverable oil and gas reserves relies on the use of certain generally accepted analyticalprocedures. These analytical procedures fall into three broad categories or methods: (1) performance-based methods; (2) volumetric-based methods; and (3) analogy. These methods may be used individually or in combination by the reserve evaluator in the process ofestimating the quantities of reserves. Reserve evaluators must select the method or combination of
RYDER SCOTT COMPANY PETROLEUM CONSULTANTS
Copyright © 2018 www.secdatabase.com. All Rights Reserved.Please Consider the Environment Before Printing This Document
Pemex Exploración y ProducciónApril 20, 2018Page 4
methods that in their professional judgment is most appropriate given the nature and amount of reliable geoscience and engineering dataavailable at the time of the estimate, the established or anticipated performance characteristics of the reservoir being evaluated and thestage of development or producing maturity of the property.
In many cases, the analysis of the available geoscience and engineering data and the subsequent interpretation of this data mayindicate a range of possible outcomes in an estimate, irrespective of the method selected by the evaluator. When a range in the quantityof reserves is identified, the evaluator must determine the uncertainty associated with the incremental quantities of the reserves. If thereserve quantities are estimated using the deterministic incremental approach, the uncertainty for each discrete incremental quantity ofthe reserves is addressed by the reserve category assigned by the evaluator. Therefore, it is the categorization of reserve quantities asproved, probable and/or possible that addresses the inherent uncertainty in the estimated quantities reported. For proved reserves,uncertainty is defined by the SEC as reasonable certainty wherein the �quantities actually recovered are much more likely than not to beachieved.� The SEC states that �probable reserves are those additional reserves that are less certain to be recovered than proved reservesbut which, together with proved reserves, are as likely as not to be recovered.� The SEC states that �possible reserves are thoseadditional reserves that are less certain to be recovered than probable reserves and the total quantities ultimately recovered from aproject have a low probability of exceeding proved plus probable plus possible reserves.� All quantities of reserves within the samereserve category must meet the SEC definitions as noted above.
Estimates of reserves quantities and their associated reserve categories may be revised in the future as additional geoscience orengineering data become available. Furthermore, estimates of reserves quantities and their associated reserve categories may also berevised due to other factors such as changes in economic conditions, results of future operations, effects of regulation by governmentalagencies or geopolitical or economic risks as previously noted herein.
The proved reserves prepared by PEP for the properties that we reviewed were estimated by performance methods, the volumetricmethod, analogy, or a combination of methods. Approximately 90 percent of the proved producing reserves attributable to producingwells and/or reservoirs that we reviewed were estimated by performance methods. These performance methods include, but may not belimited to, decline curve analysis, numerical simulation and material balance calculations, which utilized extrapolations of historicalproduction and pressure data available through December 2017, in those cases where such data were considered to be definitive. Thedata utilized in these analyses were furnished to Ryder Scott by PEP and were considered sufficient for the purpose thereof. Theremaining 10 percent of the proved producing reserves that we reviewed were estimated by the volumetric method, analogy, or acombination of methods. These methods were used where there were inadequate historical performance data to establish a definitivetrend and where the use of production performance data as a basis for the reserve estimates was considered to be inappropriate.
All of the proved developed non-producing and undeveloped reserves that we reviewed were estimated by the volumetric method,analogy, or a combination of methods. The volumetric analyses utilized pertinent well and seismic data furnished to Ryder Scott by PEPfor our review that were available through December 2017. The data utilized from the analogues in conjunction with well and seismicdata incorporated into the volumetric analysis were considered sufficient for the purpose thereof.
To estimate economically recoverable proved oil and gas reserves many factors and assumptions are considered including, but notlimited to, the use of reservoir parameters derived from geological, geophysical and engineering data which cannot be measureddirectly, economic criteria
RYDER SCOTT COMPANY PETROLEUM CONSULTANTS
Copyright © 2018 www.secdatabase.com. All Rights Reserved.Please Consider the Environment Before Printing This Document
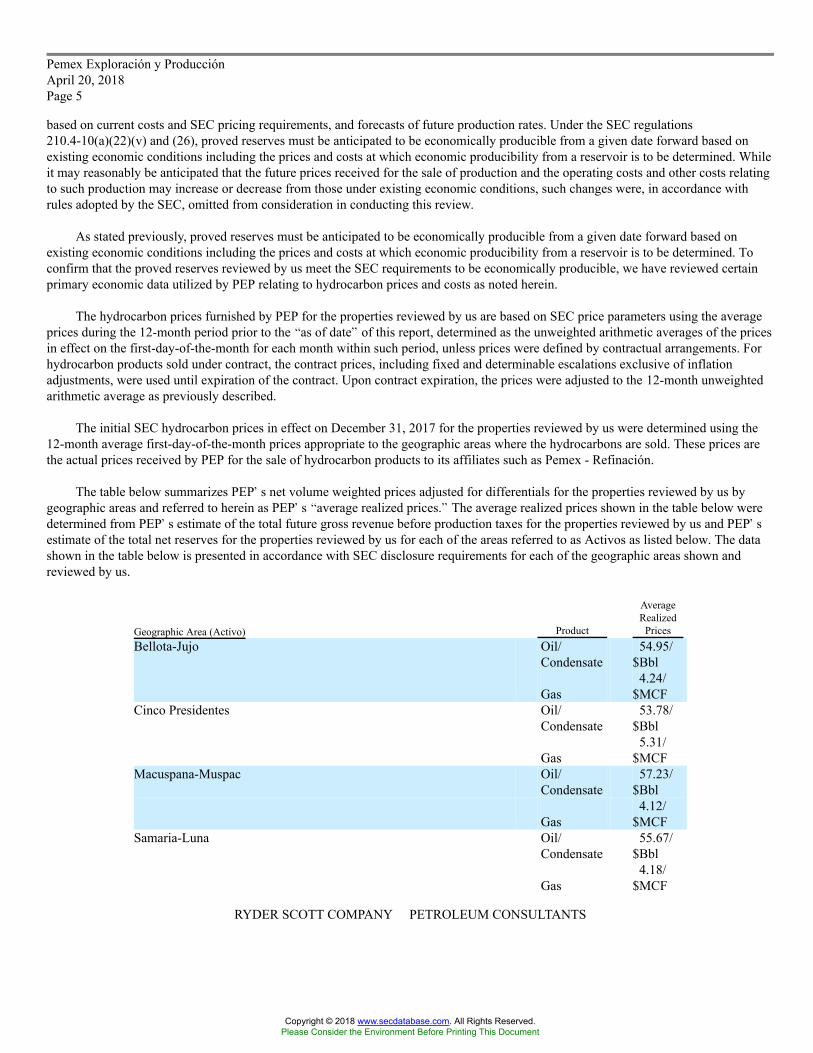
Pemex Exploración y ProducciónApril 20, 2018Page 5
based on current costs and SEC pricing requirements, and forecasts of future production rates. Under the SEC regulations210.4-10(a)(22)(v) and (26), proved reserves must be anticipated to be economically producible from a given date forward based onexisting economic conditions including the prices and costs at which economic producibility from a reservoir is to be determined. Whileit may reasonably be anticipated that the future prices received for the sale of production and the operating costs and other costs relatingto such production may increase or decrease from those under existing economic conditions, such changes were, in accordance withrules adopted by the SEC, omitted from consideration in conducting this review.
As stated previously, proved reserves must be anticipated to be economically producible from a given date forward based onexisting economic conditions including the prices and costs at which economic producibility from a reservoir is to be determined. Toconfirm that the proved reserves reviewed by us meet the SEC requirements to be economically producible, we have reviewed certainprimary economic data utilized by PEP relating to hydrocarbon prices and costs as noted herein.
The hydrocarbon prices furnished by PEP for the properties reviewed by us are based on SEC price parameters using the averageprices during the 12-month period prior to the �as of date� of this report, determined as the unweighted arithmetic averages of the pricesin effect on the first-day-of-the-month for each month within such period, unless prices were defined by contractual arrangements. Forhydrocarbon products sold under contract, the contract prices, including fixed and determinable escalations exclusive of inflationadjustments, were used until expiration of the contract. Upon contract expiration, the prices were adjusted to the 12-month unweightedarithmetic average as previously described.
The initial SEC hydrocarbon prices in effect on December 31, 2017 for the properties reviewed by us were determined using the12-month average first-day-of-the-month prices appropriate to the geographic areas where the hydrocarbons are sold. These prices arethe actual prices received by PEP for the sale of hydrocarbon products to its affiliates such as Pemex - Refinación.
The table below summarizes PEP�s net volume weighted prices adjusted for differentials for the properties reviewed by us bygeographic areas and referred to herein as PEP�s �average realized prices.� The average realized prices shown in the table below weredetermined from PEP�s estimate of the total future gross revenue before production taxes for the properties reviewed by us and PEP�sestimate of the total net reserves for the properties reviewed by us for each of the areas referred to as Activos as listed below. The datashown in the table below is presented in accordance with SEC disclosure requirements for each of the geographic areas shown andreviewed by us.
Geographic Area (Activo) Product
AverageRealized
PricesBellota-Jujo Oil/
Condensate $54.95/Bbl
Gas $4.24/MCF
Cinco Presidentes Oil/Condensate $
53.78/Bbl
Gas $5.31/MCF
Macuspana-Muspac Oil/Condensate $
57.23/Bbl
Gas $4.12/MCF
Samaria-Luna Oil/Condensate $
55.67/Bbl
Gas $4.18/MCF
RYDER SCOTT COMPANY PETROLEUM CONSULTANTS
Copyright © 2018 www.secdatabase.com. All Rights Reserved.Please Consider the Environment Before Printing This Document
Pemex Exploración y ProducciónApril 20, 2018Page 6
The effects of derivative instruments designated as price hedges of oil and gas quantities are not reflected in PEP�s individualproperty evaluations.
Accumulated gas production imbalances, if any, were not taken into account in the proved gas reserve estimates reviewed. Theproved gas volumes included herein do not attribute gas consumed in operations as reserves.
Operating costs furnished by PEP are based on the operating expense reports of PEP and include only those costs directlyapplicable to the fields or wells for the properties reviewed by us. The operating costs include a portion of general and administrativecosts allocated directly to the fields and wells. The operating costs furnished by PEP were accepted as factual data and reviewed by usfor their reasonableness; however, we have not conducted an independent verification of the data used by PEP. No deduction was madefor loan repayments, interest expenses, or exploration and development prepayments that were not charged directly to the fields, wellsor contract areas.
Development costs furnished by PEP are based on authorizations for expenditure for the proposed work or actual costs for similarprojects. The development costs furnished by PEP were accepted as factual data and reviewed by us for their reasonableness; however,we have not conducted an independent verification of the data used by PEP. The estimated net cost of abandonment after salvage wasincluded by Pemex for properties where abandonment costs net of salvage were significant. Pemex�s estimates of the net abandonmentcosts were accepted without independent verification.
The proved developed non-producing and undeveloped reserves for the operated and non-operated properties reviewed by us havebeen incorporated herein in accordance with PEP�s and the other operator�s plans to develop these reserves as of December 31, 2017.The implementation of these development plans as presented to us is subject to the approval process adopted by PEP�s management. Asthe result of our inquiries during the course of our review, PEP has informed us that the development activities for the propertiesreviewed by us have been subjected to and received the internal approvals required by PEP�s management at the appropriate local,regional and/or corporate level. PEP has also informed us that the same type of approval process has been conducted by the otheroperators for those properties that such companies operate. Additionally, PEP has informed us that they are not aware of any legal,regulatory or political obstacles that would significantly alter their plans. While these plans could change from those under existingeconomic conditions as of December 31, 2017, such changes were, in accordance with rules adopted by the SEC, omitted fromconsideration in making this evaluation.
Current costs used by PEP were held constant throughout the life of the properties.
As previously stated, certain properties that we reviewed are situated in contract areas that are not operated by PEP. According tothe new Mexican hydrocarbon law, these companies have the option to convert the contractual terms currently in place to other types ofcontractual arrangements such as Concession Licenses, Production Sharing Contracts or Profit Sharing Contracts. Currently Pemex hasentered into such a contractual agreement with one company on three specific fields and the net reserves pertaining to PEP for thesefields have been included in the reserves stated above. Other negotiations currently or soon to be in progress are not in effect as of theeffective date of this report. Therefore, the reserves reported herein for these areas are based on the contractual terms that were effectiveas of December 31, 2017.
RYDER SCOTT COMPANY PETROLEUM CONSULTANTS
Copyright © 2018 www.secdatabase.com. All Rights Reserved.Please Consider the Environment Before Printing This Document
Pemex Exploración y ProducciónApril 20, 2018Page 7
PEP�s forecasts of future production rates are based on historical performance from wells currently on production. If noproduction decline trend has been established, future production rates were held constant until a decline in ability to produce wasanticipated. An estimated rate of decline was then applied to depletion of the reserves. If a decline trend has been established, this trendwas used as the basis for estimating future production rates.
Test data and other related information were used by PEP to estimate the anticipated initial production rates for those wells orlocations that are not currently producing. For reserves not yet on production, sales were estimated to commence at an anticipated datefurnished by PEP. Wells or locations that are not currently producing may start producing earlier or later than anticipated in PEP�sestimates due to unforeseen factors causing a change in the timing to initiate production. Such factors may include delays due toweather, the availability of rigs, the sequence of drilling, completing and/or recompleting wells and/or constraints set by regulatorybodies.
The future production rates from wells currently on production or wells or locations that are not currently producing may be moreor less than estimated because of changes including, but not limited to, reservoir performance, operating conditions related to surfacefacilities, compression and artificial lift, pipeline capacity and/or operating conditions, producing market demand and/or allowables orother constraints set by regulatory bodies.
Ryder Scott did not evaluate the country and geopolitical risks in the country of Mexico where all of the subject properties arelocated. PEP�s operations and the operations of the other companies may be subject to various levels of governmental controls andregulations. These controls and regulations may include, but may not be limited to, matters relating to land tenure and use, drilling andproduction practices, environmental protection, marketing and pricing policies, various taxes and levies and are subject to change fromtime to time. Such changes in governmental regulations and policies may cause volumes of proved reserves actually recovered andamounts of proved income actually received to differ significantly from the estimated quantities.
Certain properties included herein are operated by other operators under specified operating contracts. Under the terms of thesecontracts, the other operators have the right to operate and produce hydrocarbons; however, the produced volumes are ultimatelydelivered to PEP for marketing. Such contracts signed between PEP and the other operators also dictate that the reserves associated withthe contract areas are the property of the United Mexican States.
The estimates of proved reserves presented herein were based upon a review of the subject properties; however, we have not madeany field examination of the properties. No consideration was given in this report to potential environmental liabilities that may existnor were any costs included by PEP for potential liabilities to restore and clean up damages, if any, caused by past operating practices.
Certain technical personnel of PEP are responsible for the preparation of reserve estimates on new properties and for thepreparation of revised estimates, when necessary, on old properties. These personnel assembled the necessary data and maintained thedata and workpapers in an orderly manner. We consulted with these technical personnel and had access to their workpapers andsupporting data in the course of our audit.
PEP has informed us that for both the operated and non-operated properties they have furnished us all of the material accounts,records, geological and engineering data, and reports and other data required for this investigation. In performing our audit of PEP�sforecast of future proved production, we have relied upon data furnished by PEP with respect to property interests, production and welltests from examined wells, normal direct costs of operating the properties, other costs such as transportation and/or processing fees,recompletion and development costs, development plans, abandonment costs after salvage, product prices based on the SEC regulations,adjustments or
RYDER SCOTT COMPANY PETROLEUM CONSULTANTS
Copyright © 2018 www.secdatabase.com. All Rights Reserved.Please Consider the Environment Before Printing This Document
Pemex Exploración y ProducciónApril 20, 2018Page 8
differentials to product prices, geological structural and isochore maps, well logs, core analyses, and pressure measurements. Fornon-operated properties, the costs provided by Pemex include all charges related to the expense of such contractual obligations. RyderScott reviewed such factual data for its reasonableness; however, we have not conducted an independent verification of the datafurnished by PEP. The data described herein were accepted as authentic and sufficient for determining the reserves unless, during thecourse of our examination, a matter of question came to our attention in which case the data were not accepted until all questions weresatisfactorily resolved. We consider the factual data furnished to us by PEP to be appropriate and sufficient for the purpose of our reviewof PEP�s estimates of reserves. In summary, we consider the assumptions, data, methods and analytical procedures used by PEP and asreviewed by us appropriate for the purpose hereof, and we have used all such methods and procedures that we consider necessary andappropriate under the circumstances to render the conclusions set forth herein.
Audit Opinion
Based on our review, including the data, technical processes and interpretations presented by PEP, it is our opinion that the overallprocedures and methodologies utilized by PEP in preparing their estimates of the proved reserves as of December 31, 2017 comply withthe current SEC regulations and that the overall proved reserves in terms of barrels of oil equivalent (BOE) for the reviewed propertiesas estimated by PEP are, in the aggregate, reasonable within the established audit tolerance guidelines of 10 percent as set forth in theSPE auditing standards. Ryder Scott found the processes and controls used by PEP in their estimation of proved reserves to be effectiveand, in the aggregate, we found no bias in the utilization and analysis of data in estimates for these properties.
We were in reasonable agreement with PEP�s estimates of proved reserves for the properties which we reviewed; however, incertain cases there was more than an acceptable variance between PEP�s estimates and our estimates due to a difference ininterpretation of data or due to our having access to data which were not available to PEP when its reserve estimates were prepared. Inthese cases, PEP revised its estimates to better conform to our estimates. As a consequence, it is our opinion that on an aggregate basisthe data presented herein for the properties that we reviewed fairly reflects the estimated net reserves for those properties, both operatedand non-operated, and owned by the United Mexican States.
Standards of Independence and Professional Qualification
Ryder Scott is an independent petroleum engineering consulting firm that has been providing petroleum consulting servicesthroughout the world since 1937. Ryder Scott is employee-owned and maintains offices in Houston, Texas; Denver, Colorado; andCalgary, Alberta, Canada. We have over eighty engineers and geoscientists on our permanent staff. By virtue of the size of our firm andthe large number of clients for which we provide services, no single client or job represents a material portion of our annual revenue. Wedo not serve as officers or directors of any privately-owned or publicly-traded oil and gas company and are separate and independentfrom the operating and investment decision-making process of our clients. This allows us to bring the highest level of independence andobjectivity to each engagement for our services.
Ryder Scott actively participates in industry-related professional societies and organizes an annual public forum focused on thesubject of reserves evaluations and SEC regulations. Many of our staff have authored or co-authored technical papers on the subject ofreserves related topics. We encourage our staff to maintain and enhance their professional skills by actively participating in ongoingcontinuing education.
RYDER SCOTT COMPANY PETROLEUM CONSULTANTS
Copyright © 2018 www.secdatabase.com. All Rights Reserved.Please Consider the Environment Before Printing This Document

Pemex Exploración y ProducciónApril 20, 2018Page 9
Prior to becoming an officer of the Company, Ryder Scott requires that staff engineers and geoscientists have received professionalaccreditation in the form of a registered or certified professional engineer�s license or a registered or certified professionalgeoscientist�s license, or the equivalent thereof, from an appropriate governmental authority or a recognized self-regulating professionalorganization.
We are independent petroleum engineers with respect to PEP. Neither we nor any of our employees have any financial interest inthe subject properties, and neither the employment to do this work nor the compensation is contingent on our estimates of reserves forthe properties which were reviewed.
The results of this audit, presented herein, are based on technical analysis conducted by teams of geoscientists and engineers fromRyder Scott. The professional qualifications of the undersigned, the technical person primarily responsible for the review of the reservesinformation discussed in this report, are included as an attachment to this letter.
Terms of Usage
The results of our third party audit, presented in report form herein, were prepared in accordance with the disclosure requirementsset forth in the SEC regulations and intended for public disclosure as an exhibit in filings made with the SEC by Pemex.
Pemex makes periodic filings on Form 20-F with the SEC under the 1934 Exchange Act. Furthermore, Pemex files registrationstatements with the SEC under the 1933 Securities Act into which filings on Form 20-F are incorporated by reference. We haveconsented to the references to our name in and the filing of this report as an exhibit to the annual report on Form 20-F of Pemex for theyear ended December 31, 2017 Our written consent for such use will be included as a separate exhibit to such Form 20-F. In the eventthe references to our name as well as references to our report are incorporated by reference into any registration statement on Form F-4,then our written consent for such use will be included as a separate exhibit to such registration statement.
We have provided PEP with a digital version of the original signed copy of this report letter. In the event there are any differencesbetween the digital version included in filings made by Pemex and the original signed report letter, the original signed report letter shallcontrol and supersede the digital version.
RYDER SCOTT COMPANY PETROLEUM CONSULTANTS
Copyright © 2018 www.secdatabase.com. All Rights Reserved.Please Consider the Environment Before Printing This Document
Pemex Exploración y ProducciónApril 20, 2018Page 10
The data and workpapers used in the preparation of this report are available for examination by authorized parties in our offices.Please contact us if we can be of further service.
Very truly yours,
RYDER SCOTT COMPANY, L.P.TBPE Firm Registration No. F-1580
Guale Ramirez, P.E.TBPE License No. 48318Executive Vice President
GR (DPR)/pl
RYDER SCOTT COMPANY PETROLEUM CONSULTANTS
Copyright © 2018 www.secdatabase.com. All Rights Reserved.Please Consider the Environment Before Printing This Document

Professional Qualifications of Primary Technical Person
The conclusions presented in this report are the result of technical analysis conducted by teams of geoscientists and engineers fromRyder Scott Company, L.P. Guadalupe Ramirez was the primary technical person responsible for overseeing the estimate of thereserves, future production and income.
Mr. Ramirez, an employee of Ryder Scott Company, L.P. (Ryder Scott) since 1981, is the Executive Vice President and also serves as amember of the Board of Directors. He is responsible for coordinating and supervising staff and consulting engineers of the company inongoing reservoir evaluation studies worldwide. Before joining Ryder Scott, Mr. Ramirez served in a number of engineering positionswith Sun Oil Company and Natomas North America. For more information regarding Mr. Ramirez�s geographic and job specificexperience, please refer to the Ryder Scott Company website at www.ryderscott.com/Company/Employees.
Mr. Ramirez earned a Bachelor of Science Degree in Mechanical Engineering with honors from Texas A&M University in 1976 and is alicensed Professional Engineer in the State of Texas. He is also a member of the Society of Petroleum Engineers and Society ofPetroleum Evaluation Engineers.
In addition to gaining experience and competency through prior work experience, the Texas Board of Professional Engineers requires aminimum of fifteen hours of continuing education annually, including at least one hour in the area of professional ethics, whichMr. Ramirez fulfills. As part of his 2017 continuing education hours, Mr. Ramirez attended and internally received 12 hours offormalized training as well as a day-long public forum, the 2017 RSC Reserves Conference relating to the definitions and disclosureguidelines contained in the United States Securities and Exchange Commission Title 17, Code of Federal Regulations, Modernization ofOil and Gas Reporting, Final Rule released January 14, 2009 in the Federal Register. Mr. Ramirez has also presented courses on the newSEC and SPE-PRMS reserves definitions on various occasions during 2011, 2012, 2013, 2015 and 2017 and received 7.0 hours offormalized external training during 2017, covering such topics as the Guidelines for Application of the SPE/WPC/AAPG/SPEEPetroleum Resources Management System, reservoir engineering, geoscience and petroleum economics evaluation methods, proceduresand software, unconventional resources and ethics for consultants.
Based on his educational background, professional training and more than 35 years of practical experience in the estimation andevaluation of petroleum reserves, Mr. Ramirez has attained the professional qualifications as a Reserves Estimator and Reserves Auditorset forth in Article III of the �Standards Pertaining to the Estimating and Auditing of Oil and Gas Reserves Information� promulgatedby the Society of Petroleum Engineers as of February 19, 2007.
RYDER SCOTT COMPANY PETROLEUM CONSULTANTS
Copyright © 2018 www.secdatabase.com. All Rights Reserved.Please Consider the Environment Before Printing This Document

PETROLEUM RESERVES DEFINITIONS
As Adapted From:RULE 4-10(a) of REGULATION S-X PART 210
UNITED STATES SECURITIES AND EXCHANGE COMMISSION (SEC)
PREAMBLE
On January 14, 2009, the United States Securities and Exchange Commission (SEC) published the �Modernization of Oil and GasReporting; Final Rule� in the Federal Register of National Archives and Records Administration (NARA). The �Modernization of Oiland Gas Reporting; Final Rule� includes revisions and additions to the definition section in Rule 4-10 of Regulation S-X, revisions andadditions to the oil and gas reporting requirements in Regulation S-K, and amends and codifies Industry Guide 2 in Regulation S-K. The�Modernization of Oil and Gas Reporting; Final Rule�, including all references to Regulation S-X and Regulation S-K, shall be referredto herein collectively as the �SEC regulations�. The SEC regulations take effect for all filings made with the United States Securitiesand Exchange Commission as of December 31, 2009, or after January 1, 2010. Reference should be made to the full text under Title 17,Code of Federal Regulations, Regulation S-X Part 210, Rule 4-10(a) for the complete definitions (direct passages excerpted in part orwholly from the aforementioned SEC document are denoted in italics herein).
Reserves are estimated remaining quantities of oil and gas and related substances anticipated to be economically producible, as ofa given date, by application of development projects to known accumulations. All reserve estimates involve an assessment of theuncertainty relating the likelihood that the actual remaining quantities recovered will be greater or less than the estimated quantitiesdetermined as of the date the estimate is made. The uncertainty depends chiefly on the amount of reliable geologic and engineering dataavailable at the time of the estimate and the interpretation of these data. The relative degree of uncertainty may be conveyed by placingreserves into one of two principal classifications, either proved or unproved. Unproved reserves are less certain to be recovered thanproved reserves and may be further sub-classified as probable and possible reserves to denote progressively increasing uncertainty intheir recoverability. Under the SEC regulations as of December 31, 2009, or after January 1, 2010, a company may optionally discloseestimated quantities of probable or possible oil and gas reserves in documents publicly filed with the SEC. The SEC regulationscontinue to prohibit disclosure of estimates of oil and gas resources other than reserves and any estimated values of such resources inany document publicly filed with the SEC unless such information is required to be disclosed in the document by foreign or state law asnoted in §229.1202 Instruction to Item 1202.
Reserves estimates will generally be revised only as additional geologic or engineering data become available or as economicconditions change.
Reserves may be attributed to either natural energy or improved recovery methods. Improved recovery methods include allmethods for supplementing natural energy or altering natural forces in the reservoir to increase ultimate recovery. Examples of suchmethods are pressure maintenance, natural gas cycling, waterflooding, thermal methods, chemical flooding, and the use of miscible andimmiscible displacement fluids. Other improved recovery methods may be developed in the future as petroleum technology continues toevolve.
Reserves may be attributed to either conventional or unconventional petroleum accumulations. Petroleum accumulations areconsidered as either conventional or unconventional based on the nature of their in-place characteristics, extraction method applied, ordegree of processing prior to sale.
RYDER SCOTT COMPANY PETROLEUM CONSULTANTS
Copyright © 2018 www.secdatabase.com. All Rights Reserved.Please Consider the Environment Before Printing This Document
PETROLEUM RESERVES DEFINITIONSPage 2
Examples of unconventional petroleum accumulations include coalbed or coalseam methane (CBM/CSM), basin-centered gas, shalegas, gas hydrates, natural bitumen and oil shale deposits. These unconventional accumulations may require specialized extractiontechnology and/or significant processing prior to sale.
Reserves do not include quantities of petroleum being held in inventory.
Because of the differences in uncertainty, caution should be exercised when aggregating quantities of petroleum from differentreserves categories.
RESERVES (SEC DEFINITIONS)
Securities and Exchange Commission Regulation S-X §210.4-10(a)(26) defines reserves as follows:
Reserves. Reserves are estimated remaining quantities of oil and gas and related substances anticipated to be economically producible,as of a given date, by application of development projects to known accumulations. In addition, there must exist, or there must be areasonable expectation that there will exist, the legal right to produce or a revenue interest in the production, installed means ofdelivering oil and gas or related substances to market, and all permits and financing required to implement the project.
Note to paragraph (a)(26): Reserves should not be assigned to adjacent reservoirs isolated by major, potentially sealing, faults untilthose reservoirs are penetrated and evaluated as economically producible. Reserves should not be assigned to areas that are clearlyseparated from a known accumulation by a non-productive reservoir (i.e., absence of reservoir, structurally low reservoir, or negativetest results). Such areas may contain prospective resources (i.e., potentially recoverable resources from undiscovered accumulations).
PROVED RESERVES (SEC DEFINITIONS)
Securities and Exchange Commission Regulation S-X §210.4-10(a)(22) defines proved oil and gas reserves as follows:
Proved oil and gas reserves. Proved oil and gas reserves are those quantities of oil and gas, which, by analysis of geoscience andengineering data, can be estimated with reasonable certainty to be economically producible�from a given date forward, from knownreservoirs, and under existing economic conditions, operating methods, and government regulations�prior to the time at whichcontracts providing the right to operate expire, unless evidence indicates that renewal is reasonably certain, regardless of whetherdeterministic or probabilistic methods are used for the estimation. The project to extract the hydrocarbons must have commenced or theoperator must be reasonably certain that it will commence the project within a reasonable time.
(i) The area of the reservoir considered as proved includes:
(A) The area identified by drilling and limited by fluid contacts, if any, and
(B) Adjacent undrilled portions of the reservoir that can, with reasonable certainty, be judged to be continuous with itand to contain economically producible oil or gas on the basis of available geoscience and engineering data.
RYDER SCOTT COMPANY PETROLEUM CONSULTANTS
Copyright © 2018 www.secdatabase.com. All Rights Reserved.Please Consider the Environment Before Printing This Document

PETROLEUM RESERVES DEFINITIONSPage 3
PROVED RESERVES (SEC DEFINITIONS) CONTINUED
(ii) In the absence of data on fluid contacts, proved quantities in a reservoir are limited by the lowest known hydrocarbons (LKH)as seen in a well penetration unless geoscience, engineering, or performance data and reliable technology establishes a lowercontact with reasonable certainty.
(iii) Where direct observation from well penetrations has defined a highest known oil (HKO) elevation and the potential exists foran associated gas cap, proved oil reserves may be assigned in the structurally higher portions of the reservoir only if geoscience,engineering, or performance data and reliable technology establish the higher contact with reasonable certainty.
(iv) Reserves which can be produced economically through application of improved recovery techniques (including, but not limitedto, fluid injection) are included in the proved classification when:
(A) Successful testing by a pilot project in an area of the reservoir with properties no more favorable than in thereservoir as a whole, the operation of an installed program in the reservoir or an analogous reservoir, or otherevidence using reliable technology establishes the reasonable certainty of the engineering analysis on which theproject or program was based; and
(B) The project has been approved for development by all necessary parties and entities, including governmentalentities.
(v) Existing economic conditions include prices and costs at which economic producibility from a reservoir is to be determined.The price shall be the average price during the 12-month period prior to the ending date of the period covered by the report,determined as an unweighted arithmetic average of the first-day-of-the-month price for each month within such period, unlessprices are defined by contractual arrangements, excluding escalations based upon future conditions.
RYDER SCOTT COMPANY PETROLEUM CONSULTANTS
Copyright © 2018 www.secdatabase.com. All Rights Reserved.Please Consider the Environment Before Printing This Document

PETROLEUM RESERVES STATUS DEFINITIONS AND GUIDELINES
As Adapted From:RULE 4-10(a) of REGULATION S-X PART 210
UNITED STATES SECURITIES AND EXCHANGE COMMISSION (SEC)
and
PETROLEUM RESOURCES MANAGEMENT SYSTEM (SPE-PRMS)Sponsored and Approved by:
SOCIETY OF PETROLEUM ENGINEERS (SPE)WORLD PETROLEUM COUNCIL (WPC)
AMERICAN ASSOCIATION OF PETROLEUM GEOLOGISTS (AAPG)SOCIETY OF PETROLEUM EVALUATION ENGINEERS (SPEE)
Reserves status categories define the development and producing status of wells and reservoirs. Reference should be made to Title17, Code of Federal Regulations, Regulation S-X Part 210, Rule 4-10(a) and the SPE-PRMS as the following reserves status definitionsare based on excerpts from the original documents (direct passages excerpted from the aforementioned SEC and SPE-PRMS documentsare denoted in italics herein).
DEVELOPED RESERVES (SEC DEFINITIONS)
Securities and Exchange Commission Regulation S-X §210.4-10(a)(6) defines developed oil and gas reserves as follows:
Developed oil and gas reserves are reserves of any category that can be expected to be recovered:
(i) Through existing wells with existing equipment and operating methods or in which the cost of the requiredequipment is relatively minor compared to the cost of a new well; and
(ii) Through installed extraction equipment and infrastructure operational at the time of the reserves estimate if theextraction is by means not involving a well.
Developed Producing (SPE-PRMS Definitions)
While not a requirement for disclosure under the SEC regulations, developed oil and gas reserves may be further sub-classifiedaccording to the guidance contained in the SPE-PRMS as Producing or Non-Producing.
Developed Producing Reserves
Developed Producing Reserves are expected to be recovered from completion intervals that are open and producing at the time ofthe estimate.
Improved recovery reserves are considered producing only after the improved recovery project is in operation.
RYDER SCOTT COMPANY PETROLEUM CONSULTANTS
Copyright © 2018 www.secdatabase.com. All Rights Reserved.Please Consider the Environment Before Printing This Document

PETROLEUM RESERVES STATUS DEFINITIONS AND GUIDELINESPage 2
Developed Non-Producing
Developed Non-Producing Reserves include shut-in and behind-pipe reserves.
Shut-In
Shut-in Reserves are expected to be recovered from:
(1) completion intervals which are open at the time of the estimate, but which have not started producing;
(2) wells which were shut-in for market conditions or pipeline connections; or
(3) wells not capable of production for mechanical reasons.
Behind-Pipe
Behind-pipe Reserves are expected to be recovered from zones in existing wells, which will require additional completion work orfuture re-completion prior to start of production.
In all cases, production can be initiated or restored with relatively low expenditure compared to the cost of drilling a new well.
UNDEVELOPED RESERVES (SEC DEFINITIONS)
Securities and Exchange Commission Regulation S-X §210.4-10(a)(31) defines undeveloped oil and gas reserves as follows:
Undeveloped oil and gas reserves are reserves of any category that are expected to be recovered from new wells on undrilledacreage, or from existing wells where a relatively major expenditure is required for recompletion.
(i) Reserves on undrilled acreage shall be limited to those directly offsetting development spacing areas that arereasonably certain of production when drilled, unless evidence using reliable technology exists that establishesreasonable certainty of economic producibility at greater distances.
(ii) Undrilled locations can be classified as having undeveloped reserves only if a development plan has been adoptedindicating that they are scheduled to be drilled within five years, unless the specific circumstances, justify a longertime.
(iii) Under no circumstances shall estimates for undeveloped reserves be attributable to any acreage for which anapplication of fluid injection or other improved recovery technique is contemplated, unless such techniques have beenproved effective by actual projects in the same reservoir or an analogous reservoir, as defined in paragraph (a)(2) ofthis section, or by other evidence using reliable technology establishing reasonable certainty.
RYDER SCOTT COMPANY PETROLEUM CONSULTANTS
Copyright © 2018 www.secdatabase.com. All Rights Reserved.Please Consider the Environment Before Printing This Document

Exhibit 10.3(Part 1 of 3)
PRESIDENT - ROBERT C. BARG
VICE PRESIDENTSALLEN E. EVANS, JR.RANDOLPH K.GREEN
JOHN G. HATTNERC. H. (SCOTT) REES III
DANNY D. SIMMONSDAN PAUL SMITHERIC J. STEVENS
April 26, 2018
Ing. Carlos Alberto Treviño MedinaPetróleos MexicanosAvenida Marina Nacional 329Torre Ejecutiva, Piso 44Colonia Verónica Anzures11300 Ciudad de México, México
Dear Ing. Treviño Medina:
We hereby consent to all references to our firm as set forth in the Annual Report on Form 20-F of Petróleos Mexicanos (�Pemex�) forthe year ending December 31, 2017 (the �Form 20-F�), under the heading �Exploration and Production (Reserves),� and to the filing ofour audit letter dated April 24, 2018, as an exhibit to the Form 20-F. We have audited the estimates of Pemex�s proved oil, condensate,natural gas, and oil equivalent reserves, as of January 1, 2018, for 71 fields located in the Poza Rica-Altamira District in the NorthRegion of Mexico. These estimates were prepared by Pemex Exploración y Producción in accordance with the reserves definitions ofRegulation S-X Rule 4-10(a) of the U.S. Securities and Exchange Commission.
Sincerely,
NETHERLAND, SEWELL INTERNATIONAL, S. DE R.L. DE C.V.
By:Robert C. Barg, P.E.President
RCB:LMS
2100 ROSS AVENUE, SUITE 2200 �� DALLAS, TEXAS 75201-2737 �� PH: 214-969-5401 �� FAX: 214-969-5411
Copyright © 2018 www.secdatabase.com. All Rights Reserved.Please Consider the Environment Before Printing This Document
Exhibit 10.3(Part 2 of 3)
PRESIDENT - ROBERT C. BARG
VICE PRESIDENTSALLEN E. EVANS, JR.RANDOLPH K.GREEN
JOHN G. HATTNERC. H. (SCOTT) REES III
DANNY D. SIMMONSDAN PAUL SMITHERIC J. STEVENS
April 26, 2018
Ing. Carlos Alberto Treviño MedinaPetróleos MexicanosAvenida Marina Nacional 329Torre Ejecutiva, Piso 44Colonia Verónica Anzures11300 Ciudad de México, México
Dear Ing. Treviño Medina:
We hereby consent to all references to our firm as set forth in the Annual Report on Form 20-F of Petróleos Mexicanos (�Pemex�) forthe year ending December 31, 2017 (the �Form 20-F�), under the heading �Exploration and Production (Reserves),� and to the filing ofour audit letter dated April 24, 2018, as an exhibit to the Form 20-F. We have audited the estimates of Pemex�s proved oil, condensate,natural gas, and oil equivalent reserves, as of January 1, 2018, for 30 fields located in the Litoral de Tabasco Asset in the SouthwestMarine Region. These estimates were prepared by Pemex Exploración y Producción in accordance with the reserves definitions ofRegulation S-X Rule 4-10(a) of the U.S. Securities and Exchange Commission.
Sincerely,
NETHERLAND, SEWELL INTERNATIONAL, S. DE R.L. DE C.V.
By:Robert C. Barg, P.E.President
RCB:LMS
2100 ROSS AVENUE, SUITE 2200 �� DALLAS, TEXAS 75201-2737 �� PH: 214-969-5401 �� FAX: 214-969-5411
Copyright © 2018 www.secdatabase.com. All Rights Reserved.Please Consider the Environment Before Printing This Document

Exhibit 10.3(Part 3 of 3)
PRESIDENT - ROBERT C. BARG
VICE PRESIDENTSALLEN E. EVANS, JR.RANDOLPH K.GREEN
JOHN G. HATTNERC. H. (SCOTT) REES III
DANNY D. SIMMONSDAN PAUL SMITHERIC J. STEVENS
April 26, 2018
lng. Carlos Alberto Treviño MedinaPetróleos MexicanosAvenida Marina Nacional 329Torre Ejecutiva, Piso 44Colonia Verónica Anzures11300 Ciudad de México, México
Dear lng. Treviño Medina:
We hereby consent to all references to our firm as set forth in the Annual Report on Form 20-F of Petróleos Mexicanos (�Pemex�) forthe year ending December 31, 2017 (the �Form 20-F�), under the heading �Exploration and Production (Reserves),� and to the filing ofour audit letter dated April 24, 2018, as an exhibit to the Form 20-F. We have audited the estimates of Pemex�s proved oil, condensate,natural gas, and oil equivalent reserves, as of January 1, 2018, for 27 fields located in the Aceite Terciario del Golfo District in Veracruz,Mexico. These estimates were prepared by Pemex Exploración y Producción in accordance with the reserves definitions of RegulationS-X Rule 4-10(a) of the U.S. Securities and Exchange Commission.
Sincerely,
NETHERLAND, SEWELL INTERNATIONAL, S. DE R.L. DE C.V.
By:Robert C. Barg, P.E.President
RCB:LMS
2100 ROSS AVENUE, SUITE 2200 �� DALLAS, TEXAS 75201-2737 �� PH: 214-969-5401 �� FAX: 214-969-5411
Copyright © 2018 www.secdatabase.com. All Rights Reserved.Please Consider the Environment Before Printing This Document
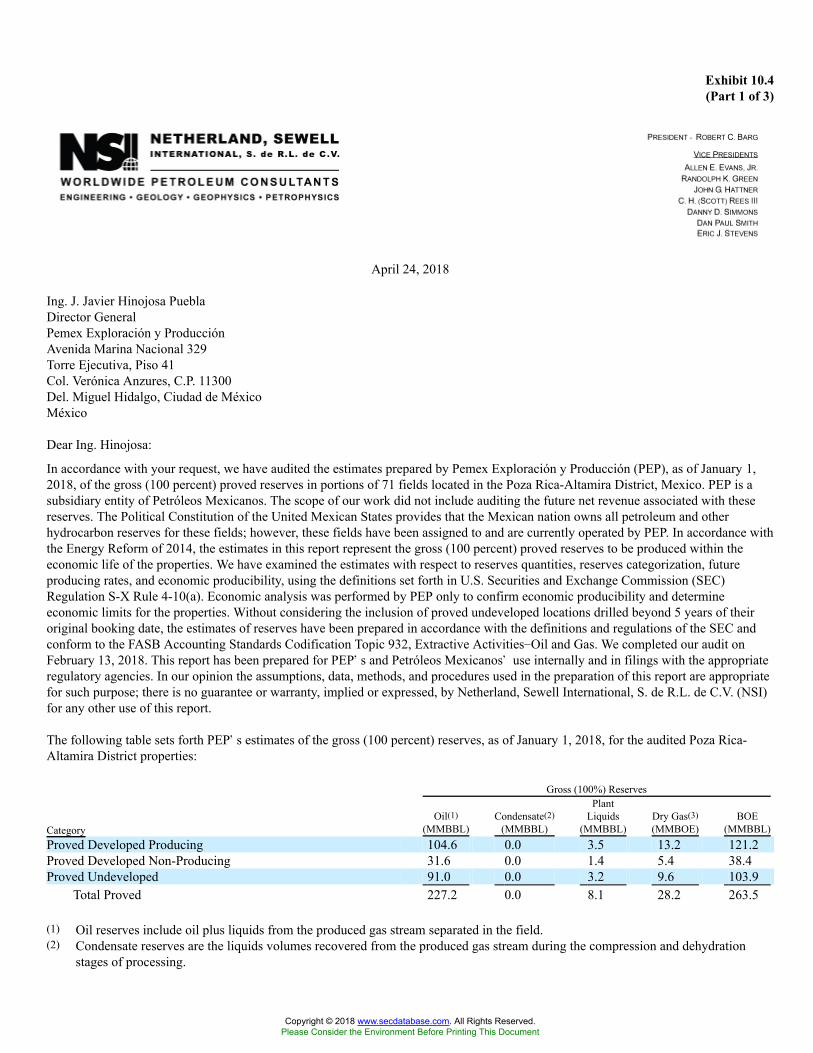
Exhibit 10.4(Part 1 of 3)
April 24, 2018
Ing. J. Javier Hinojosa PueblaDirector GeneralPemex Exploración y ProducciónAvenida Marina Nacional 329Torre Ejecutiva, Piso 41Col. Verónica Anzures, C.P. 11300Del. Miguel Hidalgo, Ciudad de MéxicoMéxico
Dear Ing. Hinojosa:
In accordance with your request, we have audited the estimates prepared by Pemex Exploración y Producción (PEP), as of January 1,2018, of the gross (100 percent) proved reserves in portions of 71 fields located in the Poza Rica-Altamira District, Mexico. PEP is asubsidiary entity of Petróleos Mexicanos. The scope of our work did not include auditing the future net revenue associated with thesereserves. The Political Constitution of the United Mexican States provides that the Mexican nation owns all petroleum and otherhydrocarbon reserves for these fields; however, these fields have been assigned to and are currently operated by PEP. In accordance withthe Energy Reform of 2014, the estimates in this report represent the gross (100 percent) proved reserves to be produced within theeconomic life of the properties. We have examined the estimates with respect to reserves quantities, reserves categorization, futureproducing rates, and economic producibility, using the definitions set forth in U.S. Securities and Exchange Commission (SEC)Regulation S-X Rule 4-10(a). Economic analysis was performed by PEP only to confirm economic producibility and determineeconomic limits for the properties. Without considering the inclusion of proved undeveloped locations drilled beyond 5 years of theiroriginal booking date, the estimates of reserves have been prepared in accordance with the definitions and regulations of the SEC andconform to the FASB Accounting Standards Codification Topic 932, Extractive Activities�Oil and Gas. We completed our audit onFebruary 13, 2018. This report has been prepared for PEP�s and Petróleos Mexicanos� use internally and in filings with the appropriateregulatory agencies. In our opinion the assumptions, data, methods, and procedures used in the preparation of this report are appropriatefor such purpose; there is no guarantee or warranty, implied or expressed, by Netherland, Sewell International, S. de R.L. de C.V. (NSI)for any other use of this report.
The following table sets forth PEP�s estimates of the gross (100 percent) reserves, as of January 1, 2018, for the audited Poza Rica-Altamira District properties:
Gross (100%) Reserves
CategoryOil(1)
(MMBBL)Condensate(2)
(MMBBL)
PlantLiquids
(MMBBL)Dry Gas(3)(MMBOE)
BOE(MMBBL)
Proved Developed Producing 104.6 0.0 3.5 13.2 121.2Proved Developed Non-Producing 31.6 0.0 1.4 5.4 38.4Proved Undeveloped 91.0 0.0 3.2 9.6 103.9
Total Proved 227.2 0.0 8.1 28.2 263.5
(1) Oil reserves include oil plus liquids from the produced gas stream separated in the field.(2) Condensate reserves are the liquids volumes recovered from the produced gas stream during the compression and dehydration
stages of processing.
Copyright © 2018 www.secdatabase.com. All Rights Reserved.Please Consider the Environment Before Printing This Document
(3) Dry gas reserves are the dry, sweetened gas available for sale by Pemex Transformación Industrial at the tailgate of the processingplants.
2100 ROSS AVENUE, SUITE 2200 � DALLAS, TEXAS 75201-2737 � PH: 214-969-5401 � FAX: 214-969-5411
Copyright © 2018 www.secdatabase.com. All Rights Reserved.Please Consider the Environment Before Printing This Document
Oil, condensate, plant liquids, and barrels of oil equivalent (BOE) volumes are expressed in millions of barrels (MMBBL); a barrel isequivalent to 42 United States gallons. Dry gas volumes are expressed in millions of barrels of oil equivalent (MMBOE), determinedusing dry gas conversion factors provided by PEP.
When compared on a field-by-field basis, some of the estimates of PEP are greater and some are less than the estimates of NSI.However, in our opinion the estimates of reserves prepared by PEP shown herein are reasonable when aggregated at the total provedlevel and have been prepared in accordance with the Standards Pertaining to the Estimating and Auditing of Oil and Gas ReservesInformation promulgated by the Society of Petroleum Engineers (SPE Standards). Additionally, these estimates are within therecommended 10 percent tolerance threshold set forth in the SPE Standards and adhere to the SEC definitions, except that it is ourunderstanding that a significant portion of the proved undeveloped reserves are associated with locations that have been categorized asproved undeveloped for longer than 5 years. We are satisfied with the methods and procedures used by PEP in preparing the January 1,2018, estimates of reserves, and we saw nothing of an unusual nature that would cause us to take exception with the estimates, in theaggregate, as prepared by PEP.
Reserves categorization conveys the relative degree of certainty; reserves subcategorization is based on development and productionstatus. The estimates of reserves included herein have not been adjusted for risk. PEP�s estimates do not include probable or possiblereserves that exist for these properties.
Oil and gas prices were used only to confirm economic producibility and determine economic limits for the properties. It is ourunderstanding that prices used by PEP are representative of the 12-month average for the period January through December 2017. NSIaccepted the prices provided without independent review or verification. All prices are held constant throughout the lives of theproperties.
Costs were used only to confirm economic producibility and determine economic limits for the properties. It is our understanding thatoperating costs used by PEP are representative of the 12-month average for the period January through December 2017. These costsinclude district and regional overhead expenses along with costs to be incurred at the field level. Operating costs for certainundeveloped fields are based on PEP�s analogy to a similar type of producing field. Operating costs have been divided into field-levelcosts, per-well costs, and per-unit-of-production costs. No headquarters general and administrative overhead expenses are included.Capital costs used by PEP are based on authorizations for expenditure and actual costs from recent activity. Capital costs are included asrequired for workovers, new development wells, and production equipment. Abandonment costs used are PEP�s estimates of the coststo abandon the wells, platforms, and production facilities, net of any salvage value. NSI accepted the operating cost parameters and thecapital and abandonment costs provided without independent review or verification. Operating, capital, and abandonment costs are notescalated for inflation.
The reserves shown in this report are estimates only and should not be construed as exact quantities. Proved reserves are those quantitiesof oil and gas which, by analysis of engineering and geoscience data, can be estimated with reasonable certainty to be economicallyproducible; probable and possible reserves are those additional reserves which are sequentially less certain to be recovered than provedreserves. Estimates of reserves may increase or decrease as a result of market conditions, future operations, changes in regulations, oractual reservoir performance. In addition to the primary economic assumptions discussed herein, estimates of PEP and NSI are based oncertain assumptions including, but not limited to, that the properties will be developed consistent with current development plans asprovided to us by PEP, that the properties will be operated in a prudent manner, that no governmental regulations or controls will be putin place that would impact the ability of PEP to produce and recover the reserves, and that projections of future production will proveconsistent with actual performance. If the reserves are recovered, the revenues therefrom and the costs related thereto could be more orless than the estimated amounts used to confirm economic producibility and determine economic limits for the properties. Because ofgovernmental policies and uncertainties of supply and demand, the sales rates, prices received for the reserves, and costs incurred inrecovering such reserves may vary from assumptions made while preparing these estimates.
Copyright © 2018 www.secdatabase.com. All Rights Reserved.Please Consider the Environment Before Printing This Document
It should be understood that our audit does not constitute a complete reserves study of the audited oil and gas properties. Our auditconsisted primarily of substantive testing, wherein we conducted a detailed review of all properties making up the total proved reserves.In the conduct of our audit, we have not independently verified the accuracy and completeness of information and data furnished byPEP with respect to oil and gas production, well test data, historical costs of operation and development, product prices, or anyagreements relating to current and future operations of the properties and sales of production. Our audit did not include a review ofPEP�s overall reserves management processes and practices.
We used standard engineering and geoscience methods, or a combination of methods, including performance analysis, volumetricanalysis, and analogy, that we considered to be appropriate and necessary to establish the conclusions set forth herein. As in all aspectsof oil and gas evaluation, there are uncertainties inherent in the interpretation of engineering and geoscience data; therefore, ourconclusions necessarily represent only informed professional judgment.
Supporting data documenting this audit, along with data provided by PEP, are on file in our office. The technical persons primarilyresponsible for conducting this audit meet the requirements regarding qualifications, independence, objectivity, and confidentiality setforth in the SPE Standards. Eric J. Stevens, a Licensed Professional Engineer in the State of Texas, has been practicing consultingpetroleum engineering at Netherland, Sewell & Associates, Inc. (NSAI), of which NSI is a subsidiary, since 2007 and has 5 years ofprior industry experience. Michelle F. Herrera, a Licensed Professional Geoscientist in the State of Texas, has been practicing consultingpetroleum geoscience at NSAI since 2013 and has 10 years of prior industry experience. We are independent petroleum engineers,geologists, geophysicists, and petrophysicists; we do not own an interest in these properties nor are we employed on a contingent basis.
Sincerely,
NETHERLAND, SEWELL INTERNATIONAL, S. DE R.L.DE C.V.
By:
Robert C. Barg, P.E.President
By:By:
Eric J. Stevens, P.E. 102415Vice President
Michelle F. Herrera, P.G. 11912Geoscientist
Date Signed: April 24, 2018 Date Signed: April 24, 2018
EJS:DSS
Copyright © 2018 www.secdatabase.com. All Rights Reserved.Please Consider the Environment Before Printing This Document
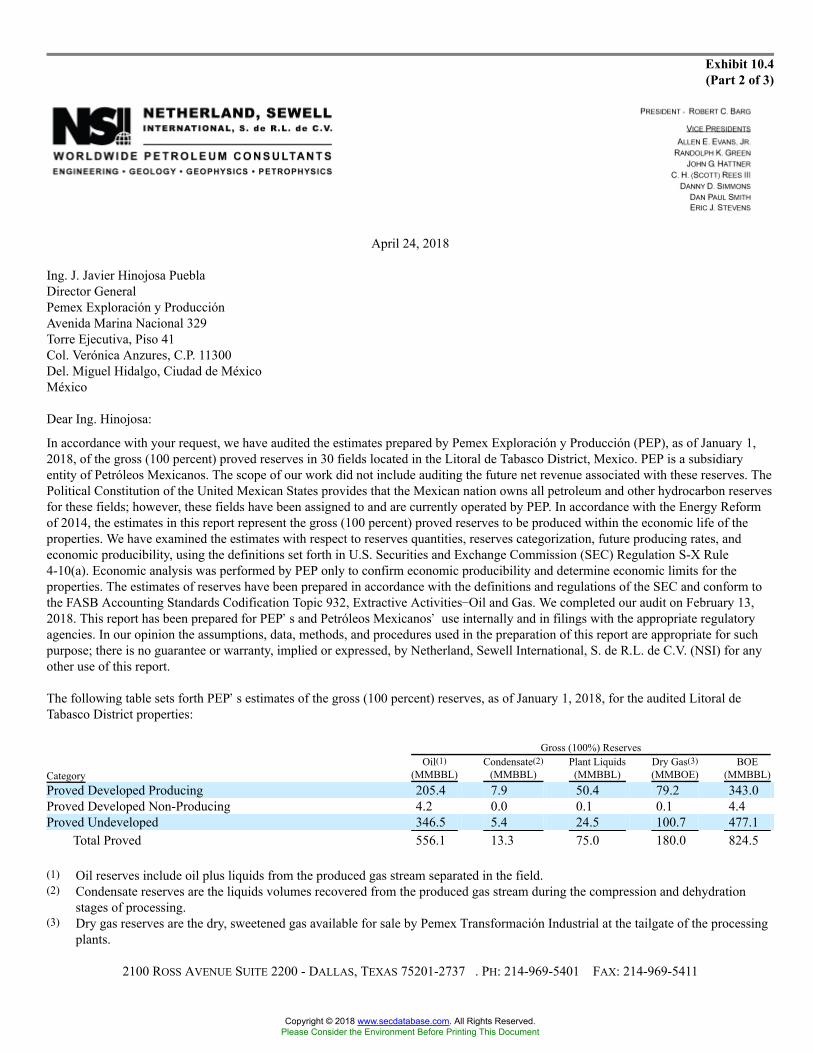
Exhibit 10.4(Part 2 of 3)
April 24, 2018
Ing. J. Javier Hinojosa PueblaDirector GeneralPemex Exploración y ProducciónAvenida Marina Nacional 329Torre Ejecutiva, Piso 41Col. Verónica Anzures, C.P. 11300Del. Miguel Hidalgo, Ciudad de MéxicoMéxico
Dear Ing. Hinojosa:
In accordance with your request, we have audited the estimates prepared by Pemex Exploración y Producción (PEP), as of January 1,2018, of the gross (100 percent) proved reserves in 30 fields located in the Litoral de Tabasco District, Mexico. PEP is a subsidiaryentity of Petróleos Mexicanos. The scope of our work did not include auditing the future net revenue associated with these reserves. ThePolitical Constitution of the United Mexican States provides that the Mexican nation owns all petroleum and other hydrocarbon reservesfor these fields; however, these fields have been assigned to and are currently operated by PEP. In accordance with the Energy Reformof 2014, the estimates in this report represent the gross (100 percent) proved reserves to be produced within the economic life of theproperties. We have examined the estimates with respect to reserves quantities, reserves categorization, future producing rates, andeconomic producibility, using the definitions set forth in U.S. Securities and Exchange Commission (SEC) Regulation S-X Rule4-10(a). Economic analysis was performed by PEP only to confirm economic producibility and determine economic limits for theproperties. The estimates of reserves have been prepared in accordance with the definitions and regulations of the SEC and conform tothe FASB Accounting Standards Codification Topic 932, Extractive Activities�Oil and Gas. We completed our audit on February 13,2018. This report has been prepared for PEP�s and Petróleos Mexicanos� use internally and in filings with the appropriate regulatoryagencies. In our opinion the assumptions, data, methods, and procedures used in the preparation of this report are appropriate for suchpurpose; there is no guarantee or warranty, implied or expressed, by Netherland, Sewell International, S. de R.L. de C.V. (NSI) for anyother use of this report.
The following table sets forth PEP�s estimates of the gross (100 percent) reserves, as of January 1, 2018, for the audited Litoral deTabasco District properties:
Gross (100%) ReservesOil(1) Condensate(2) Plant Liquids Dry Gas(3) BOE
Category (MMBBL) (MMBBL) (MMBBL) (MMBOE) (MMBBL)Proved Developed Producing 205.4 7.9 50.4 79.2 343.0Proved Developed Non-Producing 4.2 0.0 0.1 0.1 4.4Proved Undeveloped 346.5 5.4 24.5 100.7 477.1
Total Proved 556.1 13.3 75.0 180.0 824.5
(1) Oil reserves include oil plus liquids from the produced gas stream separated in the field.(2) Condensate reserves are the liquids volumes recovered from the produced gas stream during the compression and dehydration
stages of processing.(3) Dry gas reserves are the dry, sweetened gas available for sale by Pemex Transformación Industrial at the tailgate of the processing
plants.
2100 ROSS AVENUE SUITE 2200 - DALLAS, TEXAS 75201-2737 �. PH: 214-969-5401 � FAX: 214-969-5411
Copyright © 2018 www.secdatabase.com. All Rights Reserved.Please Consider the Environment Before Printing This Document
Oil, condensate, plant liquids, and barrels of oil equivalent (BOE) volumes are expressed in millions of barrels (MMBBL); a barrel isequivalent to 42 United States gallons. Dry gas volumes are expressed in millions of barrels of oil equivalent (MMBOE), determinedusing dry gas conversion factors provided by PEP.
When compared on a field-by-field basis, some of the estimates of PEP are greater and some are less than the estimates of NSI.However, in our opinion the estimates of reserves prepared by PEP shown herein are reasonable when aggregated at the total provedlevel and have been prepared in accordance with the Standards Pertaining to the Estimating and Auditing of Oil and Gas ReservesInformation promulgated by the Society of Petroleum Engineers (SPE Standards). Additionally, these estimates are within therecommended 10 percent tolerance threshold set forth in the SPE Standards. We are satisfied with the methods and procedures used byPEP in preparing the January 1, 2018, estimates of reserves, and we saw nothing of an unusual nature that would cause us to takeexception with the estimates, in the aggregate, as prepared by PEP.
Reserves categorization conveys the relative degree of certainty; reserves subcategorization is based on development and productionstatus. The estimates of reserves included herein have not been adjusted for risk. PEP�s estimates do not include probable or possiblereserves that exist for these properties.
Oil and gas prices were used only to confirm economic producibility and determine economic limits for the properties. It is ourunderstanding that prices used by PEP are representative of the 12-month average for the period January through December 2017. NSIaccepted the prices provided without independent review or verification. All prices are held constant throughout the lives of theproperties.
Costs were used only to confirm economic producibility and determine economic limits for the properties. It is our understanding thatoperating costs used by PEP are representative of the 12-month average for the period January through December 2017. These costsinclude district and regional overhead expenses along with costs to be incurred at the field level. Operating costs for certainundeveloped fields are based on PEP�s analogy to a similar type of producing field. Operating costs have been divided into field-levelcosts, per-well costs, and per-unit-of-production costs. No headquarters general and administrative overhead expenses are included.Capital costs used by PEP are based on authorizations for expenditure and actual costs from recent activity. Capital costs are included asrequired for workovers, new development wells, and production equipment. Abandonment costs used are PEP�s estimates of the coststo abandon the wells, platforms, and production facilities, net of any salvage value. NSI accepted the operating cost parameters and thecapital and abandonment costs provided without independent review or verification. Operating, capital, and abandonment costs are notescalated for inflation.
The reserves shown in this report are estimates only and should not be construed as exact quantities. Proved reserves are those quantitiesof oil and gas which, by analysis of engineering and geoscience data, can be estimated with reasonable certainty to be economicallyproducible; probable and possible reserves are those additional reserves which are sequentially less certain to be recovered than provedreserves. Estimates of reserves may increase or decrease as a result of market conditions, future operations, changes in regulations, oractual reservoir performance. In addition to the primary economic assumptions discussed herein, estimates of PEP and NSI are based oncertain assumptions including, but not limited to, that the properties will be developed consistent with current development plans asprovided to us by PEP, that the properties will be operated in a prudent manner, that no governmental regulations or controls will be putin place that would impact the ability of PEP to produce and recover the reserves, and that projections of future production will proveconsistent with actual performance. If the reserves are recovered, the revenues therefrom and the costs related thereto could be more orless than the estimated amounts used to confirm economic producibility and determine economic limits for the properties. Because ofgovernmental policies and uncertainties of supply and demand, the sales rates, prices received for the reserves, and costs incurred inrecovering such reserves may vary from assumptions made while preparing these estimates.
It should be understood that our audit does not constitute a complete reserves study of the audited oil and gas properties. Our auditconsisted primarily of substantive testing, wherein we conducted a detailed review of all properties making up the total proved reserves.In the conduct of our audit, we have not independently verified the
Copyright © 2018 www.secdatabase.com. All Rights Reserved.Please Consider the Environment Before Printing This Document
accuracy and completeness of information and data furnished by PEP with respect to oil and gas production, well test data, historicalcosts of operation and development, product prices, or any agreements relating to current and future operations of the properties andsales of production. Our audit did not include a review of PEP�s overall reserves management processes and practices.
We used standard engineering and geoscience methods, or a combination of methods, including performance analysis, volumetricanalysis, analogy, and reservoir modeling, that we considered to be appropriate and necessary to establish the conclusions set forthherein. As in all aspects of oil and gas evaluation, there are uncertainties inherent in the interpretation of engineering and geosciencedata; therefore, our conclusions necessarily represent only informed professional judgment.
Supporting data documenting this audit, along with data provided by PEP, are on file in our office. The technical persons primarilyresponsible for conducting this audit meet the requirements regarding qualifications, independence, objectivity, and confidentiality setforth in the SPE Standards. Andres F. Castaño, a Licensed Professional Engineer in the State of Texas, has been practicing consultingpetroleum engineering at Netherland, Sewell & Associates, Inc. (NSAI), of which NSI is a subsidiary, since 2013 and has 8 years ofprior industry experience. Allen E. Evans, Jr., a Licensed Professional Geoscientist in the State of Texas, has been practicing consultingpetroleum geoscience at NSAI since 1996 and has 13 years of prior industry experience. We are independent petroleum engineers,geologists, geophysicists, and petrophysicists; we do not own an interest in these properties nor are we employed on a contingent basis.
Sincerely,
NETHERLAND, SEWELL INTERNATIONAL, S. DER.L. DE C.V.
By:Robert C. Barg, P.E.President
By:
By:
Andres F. Castaño, P.E. 121698Petroleum Engineer
Allen E. Evans, Jr., P.G. 1286Vice President
Date Signed: April 24, 2018 Date Signed: April 24, 2018AFC:LMS
Copyright © 2018 www.secdatabase.com. All Rights Reserved.Please Consider the Environment Before Printing This Document
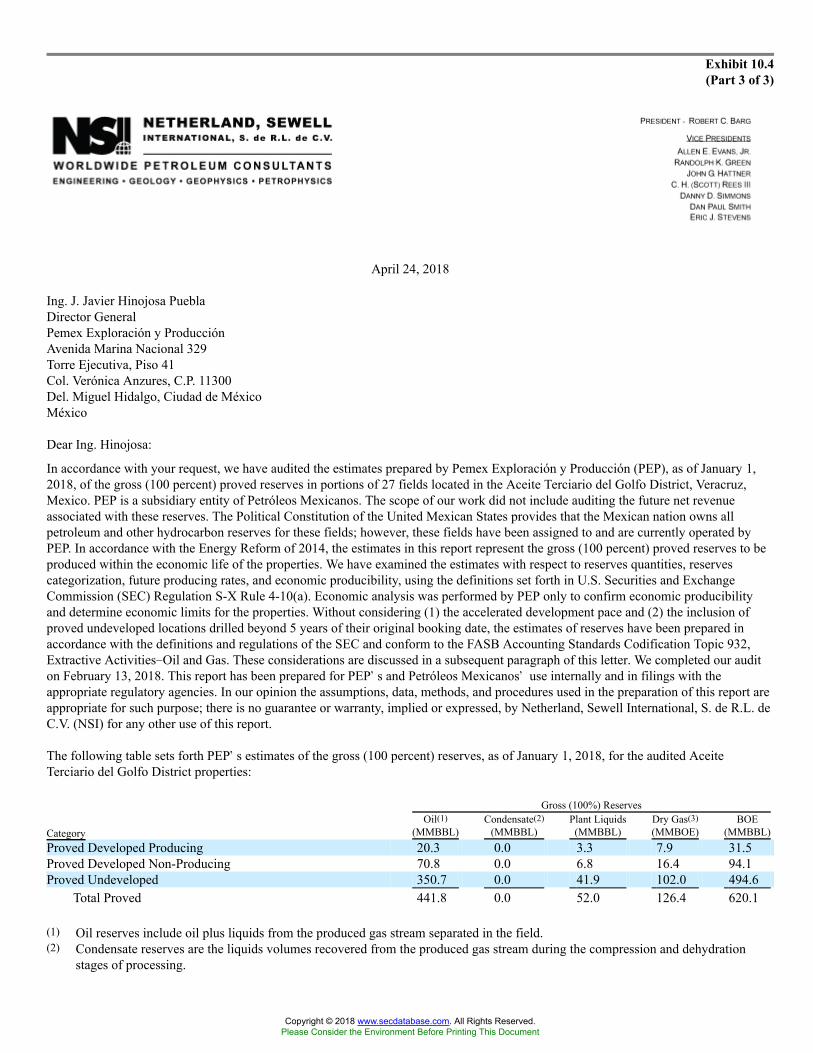
Exhibit 10.4(Part 3 of 3)
April 24, 2018
Ing. J. Javier Hinojosa PueblaDirector GeneralPemex Exploración y ProducciónAvenida Marina Nacional 329Torre Ejecutiva, Piso 41Col. Verónica Anzures, C.P. 11300Del. Miguel Hidalgo, Ciudad de MéxicoMéxico
Dear Ing. Hinojosa:
In accordance with your request, we have audited the estimates prepared by Pemex Exploración y Producción (PEP), as of January 1,2018, of the gross (100 percent) proved reserves in portions of 27 fields located in the Aceite Terciario del Golfo District, Veracruz,Mexico. PEP is a subsidiary entity of Petróleos Mexicanos. The scope of our work did not include auditing the future net revenueassociated with these reserves. The Political Constitution of the United Mexican States provides that the Mexican nation owns allpetroleum and other hydrocarbon reserves for these fields; however, these fields have been assigned to and are currently operated byPEP. In accordance with the Energy Reform of 2014, the estimates in this report represent the gross (100 percent) proved reserves to beproduced within the economic life of the properties. We have examined the estimates with respect to reserves quantities, reservescategorization, future producing rates, and economic producibility, using the definitions set forth in U.S. Securities and ExchangeCommission (SEC) Regulation S-X Rule 4-10(a). Economic analysis was performed by PEP only to confirm economic producibilityand determine economic limits for the properties. Without considering (1) the accelerated development pace and (2) the inclusion ofproved undeveloped locations drilled beyond 5 years of their original booking date, the estimates of reserves have been prepared inaccordance with the definitions and regulations of the SEC and conform to the FASB Accounting Standards Codification Topic 932,Extractive Activities�Oil and Gas. These considerations are discussed in a subsequent paragraph of this letter. We completed our auditon February 13, 2018. This report has been prepared for PEP�s and Petróleos Mexicanos� use internally and in filings with theappropriate regulatory agencies. In our opinion the assumptions, data, methods, and procedures used in the preparation of this report areappropriate for such purpose; there is no guarantee or warranty, implied or expressed, by Netherland, Sewell International, S. de R.L. deC.V. (NSI) for any other use of this report.
The following table sets forth PEP�s estimates of the gross (100 percent) reserves, as of January 1, 2018, for the audited AceiteTerciario del Golfo District properties:
Gross (100%) ReservesOil(1) Condensate(2) Plant Liquids Dry Gas(3) BOE
Category (MMBBL) (MMBBL) (MMBBL) (MMBOE) (MMBBL)Proved Developed Producing 20.3 0.0 3.3 7.9 31.5Proved Developed Non-Producing 70.8 0.0 6.8 16.4 94.1Proved Undeveloped 350.7 0.0 41.9 102.0 494.6
Total Proved 441.8 0.0 52.0 126.4 620.1
(1) Oil reserves include oil plus liquids from the produced gas stream separated in the field.(2) Condensate reserves are the liquids volumes recovered from the produced gas stream during the compression and dehydration
stages of processing.
Copyright © 2018 www.secdatabase.com. All Rights Reserved.Please Consider the Environment Before Printing This Document

(3) Dry gas reserves are the dry, sweetened gas available for sale by Pemex Transformación Industrial at the tailgate of the processingplants.
2100 ROSS AVENUE, SUITE 2200 � DALLAS, TEXAS 75201-2737 � PH: 214-969-5401 � FAX: 214-963-5411
Copyright © 2018 www.secdatabase.com. All Rights Reserved.Please Consider the Environment Before Printing This Document
Oil, condensate, plant liquids, and barrels of oil equivalent (BOE) volumes are expressed in millions of barrels (MMBBL); a barrel isequivalent to 42 United States gallons. Dry gas volumes are expressed in millions of barrels of oil equivalent (MMBOE), determinedusing dry gas conversion factors provided by PEP.
In our opinion, the estimates of proved reserves shown herein have been prepared in accordance with generally accepted petroleumengineering and evaluation principles set forth in the Standards Pertaining to the Estimating and Auditing of Oil and Gas ReservesInformation promulgated by the Society of Petroleum Engineers (SPE Standards) and, aside from the following considerations, adhereto the SEC definitions. First, the development plan incorporated in these estimates represents a more accelerated drilling pace than therecent development drilling. Focused development of the Chicontepec formation began in 2007, and to date, over 4,500 wells have beendrilled. Development drilling peaked in 2009 with the drilling of 794 wells; however, in recent years development has slowed, withapproximately 100 wells drilled from 2015 through 2017. Based on discussions with PEP, its development plan consists of drilling morethan 33,000 wells over the next 35 years to develop the Chicontepec formation. PEP has indicated a commitment to develop the AceiteTerciario del Golfo District and plans to drill 33 proved undeveloped locations in 2018, ramping up to a maximum of 999 provedundeveloped locations in 2021. The time period for development of proved reserves locations is restricted to 5 years. Second, it is ourunderstanding that a significant portion of the proved undeveloped reserves are associated with locations that have been categorized asproved undeveloped for longer than 5 years.
When compared on a field-by-field basis, some of the estimates of PEP are greater and some are less than the estimates of NSI.However, in our opinion the estimates of reserves prepared by PEP shown herein are reasonable when aggregated at the total provedlevel and have been prepared in accordance with the SPE Standards. Additionally, these estimates are within the recommended10 percent tolerance threshold set forth in the SPE Standards. We are satisfied with the methods and procedures used by PEP inpreparing the January 1, 2018, estimates of reserves, and we saw nothing of an unusual nature that would cause us to take exceptionwith the estimates, in the aggregate, as prepared by PEP.
Reserves categorization conveys the relative degree of certainty; reserves subcategorization is based on development and productionstatus. The estimates of reserves included herein have not been adjusted for risk. PEP�s estimates do not include probable or possiblereserves that exist for these properties.
Oil and gas prices were used only to confirm economic producibility and determine economic limits for the properties. It is ourunderstanding that prices used by PEP are representative of the 12-month average for the period January through December 2017. NSIaccepted the prices provided without independent review or verification. All prices are held constant throughout the lives of theproperties.
Costs were used only to confirm economic producibility and determine economic limits for the properties. It is our understanding thatoperating costs used by PEP are representative of the 12-month average for the period January through December 2017. These costsinclude district and regional overhead expenses along with costs to be incurred at the field level. Operating costs for certainundeveloped fields are based on PEP�s analogy to a similar type of producing field. Operating costs have been divided into field-levelcosts, per-well costs, and per-unit-of-production costs. No headquarters general and administrative overhead expenses are included.Capital costs used by PEP are based on authorizations for expenditure and actual costs from recent activity. Capital costs are included asrequired for workovers, new development wells, and production equipment. Abandonment costs used are PEP�s estimates of the coststo abandon the wells and production facilities, net of any salvage value. NSI accepted the operating cost parameters and the capital andabandonment costs provided without independent review or verification. Operating, capital, and abandonment costs are not escalated forinflation.
The reserves shown in this report are estimates only and should not be construed as exact quantities. Proved reserves are those quantitiesof oil and gas which, by analysis of engineering and geoscience data, can be estimated with reasonable certainty to be economicallyproducible; probable and possible reserves are those additional reserves which are sequentially less certain to be recovered than provedreserves. Estimates of reserves may increase or decrease as a result of market conditions, future operations, changes in regulations, oractual reservoir performance. In addition to the primary economic assumptions discussed herein, estimates of PEP and NSI are based oncertain assumptions including, but not limited to, that the properties will be developed consistent with current development plans asprovided to us by PEP, that the properties will be operated in a prudent manner, that no governmental regulations or controls will be putin place that would impact the ability of PEP to produce and recover the reserves, and that projections of future production will proveconsistent with actual performance. A
Copyright © 2018 www.secdatabase.com. All Rights Reserved.Please Consider the Environment Before Printing This Document
portion of these reserves are for properties operated by service contractors that are involved with the investment, planning, anddevelopment in accordance with their agreements with PEP. The development plan incorporated in this report was provided by PEP; thisdevelopment plan may differ from development plans of individual service contract operators. If the reserves are recovered, therevenues therefrom and the costs related thereto could be more or less than the estimated amounts used to confirm economicproducibility and determine economic limits for the properties. Because of governmental policies and uncertainties of supply anddemand, the sales rates, prices received for the reserves, and costs incurred in recovering such reserves may vary from assumptionsmade while preparing these estimates.
It should be understood that our audit does not constitute a complete reserves study of the audited oil and gas properties. Our auditconsisted primarily of substantive testing, wherein we conducted a detailed review of all properties making up the total proved reserves.In the conduct of our audit, we have not independently verified the accuracy and completeness of information and data furnished byPEP with respect to oil and gas production, well test data, historical costs of operation and development, product prices, or anyagreements relating to current and future operations of the properties and sales of production. Our audit did not include a review ofPEP�s overall reserves management processes and practices.
We used standard engineering and geoscience methods, or a combination of methods, including performance analysis and analogy, thatwe considered to be appropriate and necessary to establish the conclusions set forth herein. As in all aspects of oil and gas evaluation,there are uncertainties inherent in the interpretation of engineering and geoscience data; therefore, our conclusions necessarily representonly informed professional judgment.
Supporting data documenting this audit, along with data provided by PEP, are on file in our office. The technical persons primarilyresponsible for conducting this audit meet the requirements regarding qualifications, independence, objectivity, and confidentiality setforth in the SPE Standards. Eric J. Stevens, a Licensed Professional Engineer in the State of Texas, has been practicing consultingpetroleum engineering at Netherland, Sewell & Associates, Inc. (NSAI), of which NSI is a subsidiary, since 2007 and has 5 years ofprior industry experience. Dana D. Coryell, a Licensed Professional Geoscientist in the State of Texas, has been practicing consultingpetroleum geoscience at NSAI since 1999 and has 15 years of prior industry experience. We are independent petroleum engineers,geologists, geophysicists, and petrophysicists; we do not own an interest in these properties nor are we employed on a contingent basis.
Sincerely,
NETHERLAND, SEWELL INTERNATIONAL, S. DE R.L.DE C.V.
By:Robert C. Barg, P.E.President
By: By:Eric J. Stevens, P.E. 102415Petroleum Engineer
Dana D. Coryell, P.G. 10566Geoscientist
Date Signed: April 24, 2018 Date Signed: April 24, 2018JMW:ARC
Copyright © 2018 www.secdatabase.com. All Rights Reserved.Please Consider the Environment Before Printing This Document

Exhibit 10.5(Part 1 of 2)
DEGOLYER AND MACNAUGHTON5001 SPRING VALLEY ROAD
SUITE 800 EASTDALLAS, TEXAS 75244
April 26, 2018
Ing. Carlos Alberto Treviño MedinaDirector GeneralPetróleos MexicanosAvenida Marina Nacional No. 329Torre Ejecutiva, Piso 44Colonia Verónica Anzures11300 Ciudad de México, México
Dear Ing. Treviño Medina:
We hereby consent to the references to DeGolyer and MacNaughton as set forth under the headings �Presentation of InformationConcerning Reserves,� �Item 4. Information on the Company � Business Overview � Exploration and Production � Reserves,� and�Item 19. Exhibits. Documents filed as exhibits to this Form 20-F� in the Annual Report on Form 20-F of Petróleos Mexicanos(PEMEX) for the year ended December 31, 2017 (the Form 20-F), and to the filing as Exhibit 10.6 to the Form 20-F of our report ofthird party dated April 20, 2018, describing our independent reserves evaluation of the estimated proved oil, marketable gas, sales gas,condensate, natural gas liquids (NGL), and oil equivalent reserves that PEMEX has represented are owned by the United MexicanStates (México) as of January 1, 2018, for certain fields located in the Burgos area of México, which include reserves that PEMEX hasrepresented that it has the right to extract and sell. These estimates were prepared �in accordance with the reseres definitions of Rules4-10(a) (1)-(32) of Regulation s-x of the United States Securities and Exchange Commission.
Very truly yours,
DeGOLYER and MacNAUGHTONTexas Registered Engineering Firm F-716
Copyright © 2018 www.secdatabase.com. All Rights Reserved.Please Consider the Environment Before Printing This Document
Exhibit 10.5(Part 2 of 2)
DEGOLYER AND MACNAUGHTON5001 SPRING VALLEY ROAD
SUITE 800 EASTDALLAS, TEXAS 75244
April 26, 2018
Ing. Carlos Alberto Treviño MedinaDirector GeneralPetróleos MexicanosAvenida Marina Nacional No. 329Torre Ejecutiva, Piso 44Colonia Verónica Anzures11300 Ciudad de México, México
Dear Ing. Treviño Medina:
We hereby consent to the references to DeGolyer and MacNaughton as set forth under the headings �Presentation of InformationConcerning Reserves,� �Item 4. Information on the Company � Business Overview � Exploration and Production � Reserves,� and�Item 19. Exhibits. Documents filed as exhibits to this Form 20-F� in the Annual Report on Form 20-F of Petróleos Mexicanos(PEMEX) for the year ended December 31, 2017 (the Form 20-F), and to the filing as Exhibit 10.6 to the Form 20-F of our report ofthird party dated April 20, 2018, describing our independent reserves evaluation of the estimated proved oil, marketable gas, sales gas,condensate, natural gas liquids (NGL), and oil equivalent reserves that PEMEX has represented are owned by the United MexicanStates (México) as of January 1, 2018, for certain fields located in the Veracruz area of México, which include reserves that PEMEX hasrepresented that it has the right to extract and sell. These estimates were prepared in accordance with the reserves definitions of Rules4-10(a) (l)-(32) of Regulation S-X of the United States Securities and Exchange Commission.
Very truly yours,
DeGOLYER and MacNAUGHTONTexas Registered Engineering Firm F-716
Copyright © 2018 www.secdatabase.com. All Rights Reserved.Please Consider the Environment Before Printing This Document
Exhibit 10.6(Part 1 of 2)
DEGOLYER AND MACNAUGHTON5001 SPRING VALLEY ROAD
SUITE 800 EASTDALLAS, TEXAS 75244
This is a digital representation of a DeGolyer and MacNaughton report.
This file is intended to be a manifestation of certain data in the subject report and as such are subject to the same conditions thereof. Theinformation and data contained in this file may be subject to misinterpretation; therefore, the signed and bound copy of this reportshould be considered the only authoritative source of such information.
Copyright © 2018 www.secdatabase.com. All Rights Reserved.Please Consider the Environment Before Printing This Document

DEGOLYER AND MACNAUGHTON5001 SPRING VALLEY ROAD
SUITE 800 EASTDALLAS, TEXAS 75244
April 20, 2018
Ing. J. Javier Hinojosa PueblaDirector General de Pemex Exploración y ProducciónAvenida Marina Nacional 329Torre Ejecutiva, Piso 41Col. Verónica Anzures, C.P. 11300Del. Miguel Hidalgo, Ciudad de México
Dear Ing. Hinojosa,
Pursuant to your request, DeGolyer and MacNaughton has conducted an independent reserves evaluation of the net proved oil,gas, condensate, and oil equivalent reserves, as of January 1, 2018, of certain properties that PEMEX Exploración y Producción (PEP)has represented are owned by the United Mexican States in the Burgos area of Mexico. This evaluation was completed on February 15,2018. PEP has represented that these properties account for 2.4 percent on a net oil equivalent barrel basis of the net proved reservesassigned to PEP, as of January 1, 2018, and that the net proved reserves estimates have been prepared in accordance with the reservesdefinitions of Rules 4�10(a) (1)�(32) of Regulation S�X of the Securities and Exchange Commission (SEC) of the United States. At therequest of PEP, this report also includes estimates prepared by PEP of its natural gas liquids (NGL) reserves; however, PEP hasrepresented that PEP�s management of the properties stops at the inlet of the gas processing plants. PEP has represented that allsubsurface hydrocarbons belong to the United Mexican States, and has further represented that PEP has received a 100-percentassignment in these properties by the United Mexican States; therefore, gross reserves are equal to net reserves and are defined as thetotal estimated petroleum to be produced from these properties after December 31, 2017. We have reviewed information provided to usby PEP that it represents to be PEP�s estimates of the net proved reserves, as of January 1, 2018, for the same properties as those whichwe evaluated. This report was prepared in accordance with guidelines specified in Item 1202 (a)(8) of Regulation S-K and is to be usedfor inclusion in certain SEC filings by PEP.
Copyright © 2018 www.secdatabase.com. All Rights Reserved.Please Consider the Environment Before Printing This Document
2
DEGOLYER AND MACNAUGHTON
Based on Mexico�s Energy Reform of 2014, PEP has represented that its estimates of the net proved reserves assigned to PEPpresented in this report correspond to 99.8 percent of the total net proved reserves of the Burgos area assigned to PEP, on an oilequivalent basis.
Reserves estimates included herein are expressed as net reserves as represented by PEP. Gross reserves are defined as the totalestimated petroleum to be produced from these properties after December 31, 2017. Net reserves are defined as that portion of the grossreserves attributable to the interests owned by the United Mexican States after deducting all interests owned by others.
Estimates of oil, gas, condensate, NGL, and oil equivalent reserves should be regarded only as estimates that may change asfurther production history and additional information become available. Not only are such reserves estimates based on that informationwhich is currently available, but such estimates are also subject to the uncertainties inherent in the application of judgmental factors ininterpreting such information.
Data used in this evaluation were obtained from reviews with PEP personnel, from PEP files, from records on file with theappropriate regulatory agencies, and from public sources. In the preparation of this report we have relied, without independentverification, upon such information furnished by PEP with respect to property interests, production from such properties, current costsof operation and development, current prices for production, agreements relating to current and future operations and sale of production,and various other information and data that were accepted as represented. A field examination of the properties was not considerednecessary for the purposes of this report.
Methodology and Procedures
Estimates of reserves were prepared by the use of appropriate geologic, petroleum engineering, and evaluation principles andtechniques that are in accordance with practices generally recognized by the petroleum industry as presented in the publication of theSociety of Petroleum Engineers entitled �Standards Pertaining to the Estimating and Auditing of Oil and Gas Reserves Information(Revision as of February 19, 2007).� The method or combination of methods used in the analysis of each reservoir was tempered byexperience with similar reservoirs, stage of development, quality and completeness of basic data, and production history.
Copyright © 2018 www.secdatabase.com. All Rights Reserved.Please Consider the Environment Before Printing This Document

3
DEGOLYER AND MACNAUGHTON
Based on the current stage of field development, production performance, the development plans provided by PEP, and analyses ofareas offsetting existing wells with test or production data, reserves were classified as proved.
When applicable, the volumetric method was used to estimate the original oil in place (OOIP) and the original gas in place(OGIP). Structure and isopach maps were constructed to estimate reservoir volume. Electrical logs, radioactivity logs, core analyses,and other available data were used to prepare these maps as well as to estimate representative values for porosity and water saturation.When adequate data were available and when circumstances justified, material balance and other engineering methods were used toestimate OOIP or OGIP.
Estimates of ultimate recovery were obtained after applying recovery factors to OOIP or OGIP. These recovery factors were basedon consideration of the type of energy inherent in the reservoirs, analyses of the petroleum, the structural positions of the properties, andthe production histories. When applicable, material balance and other engineering methods were used to estimate recovery factors. Insuch cases, an analysis of reservoir performance, including production rate, reservoir pressure, and gas-oil ratio behavior, was used inthe estimation of reserves.
For depletion-type reservoirs or those whose performance disclosed a reliable decline in producing-rate trends or other diagnosticcharacteristics, reserves were estimated by the application of appropriate decline curves or other performance relationships. In theanalyses of production-decline curves, reserves were estimated only to the limits of economic production based on existing economicconditions.
Gas quantities estimated herein are expressed as marketable gas and sales gas at a temperature base of 20 degrees Celsius and at apressure base of 1 atmosphere. Marketable gas is defined as the total gas in the reservoirs to be produced after shrinkage resulting fromfield separation and flare. Marketable gas includes fuel. Sales gas is defined as the total gas to be produced from the reservoirs,measured at the point of delivery, after reduction for injection, fuel usage, flare, and shrinkage resulting from field separation and plantprocessing. Oil, condensate, and NGL reserves estimated herein are expressed in terms of 42 United States gallons per barrel. Oil andcondensate reserves estimated herein are to be recovered by normal field separation. PEP has represented that its NGL reserves havebeen estimated on the basis of the quantities of liquids recovered from gas delivered to a gas plant for processing, and can includepropane, butane, and C5+ fractions.
Copyright © 2018 www.secdatabase.com. All Rights Reserved.Please Consider the Environment Before Printing This Document

4
DEGOLYER AND MACNAUGHTON
Definition of Reserves
Petroleum reserves estimated by PEP included in this report are classified as proved. Only proved reserves have been evaluated forthis report. Reserves classifications used by PEP in this report are in accordance with the reserves definitions of Rules 4�10(a) (1)�(32)of Regulation S�X of the SEC. Reserves are judged to be economically producible in future years from known reservoirs under existingeconomic and operating conditions and assuming continuation of current regulatory practices using conventional production methodsand equipment. In the analyses of production-decline curves, reserves were estimated only to the limit of economic rates of productionunder existing economic and operating conditions using prices and costs consistent with the effective date of this report, includingconsideration of changes in existing prices provided only by contractual arrangements but not including escalations based upon futureconditions. The petroleum reserves are classified as follows:
Proved oil and gas reserves � Proved oil and gas reserves are those quantities of oil and gas, which, by analysis of geoscience andengineering data, can be estimated with reasonable certainty to be economically producible�from a given date forward, fromknown reservoirs, and under existing economic conditions, operating methods, and government regulations�prior to the time atwhich contracts providing the right to operate expire, unless evidence indicates that renewal is reasonably certain, regardless ofwhether deterministic or probabilistic methods are used for the estimation. The project to extract the hydrocarbons must havecommenced or the operator must be reasonably certain that it will commence the project within a reasonable time.
(i) The area of the reservoir considered as proved includes:
(A) The area identified by drilling and limited by fluid contacts, if any, and (B) Adjacent undrilled portions of the reservoirthat can, with reasonable certainty, be judged to be continuous with it and to contain economically producible oil or gas onthe basis of available geoscience and engineering data.
Copyright © 2018 www.secdatabase.com. All Rights Reserved.Please Consider the Environment Before Printing This Document

5
DEGOLYER AND MACNAUGHTON
(ii) In the absence of data on fluid contacts, proved quantities in a reservoir are limited by the lowest known hydrocarbons(LKH) as seen in a well penetration unless geoscience, engineering, or performance data and reliable technology establishesa lower contact with reasonable certainty.
(iii) Where direct observation from well penetrations has defined a highest known oil (HKO) elevation and the potentialexists for an associated gas cap, proved oil reserves may be assigned in the structurally higher portions of the reservoir only ifgeoscience, engineering, or performance data and reliable technology establish the higher contact with reasonable certainty.
(iv) Reserves which can be produced economically through application of improved recovery techniques (including, but notlimited to, fluid injection) are included in the proved classification when:
(A) Successful testing by a pilot project in an area of the reservoir with properties no more favorable than in the reservoir as awhole, the operation of an installed program in the reservoir or an analogous reservoir, or other evidence using reliabletechnology establishes the reasonable certainty of the engineering analysis on which the project or program was based; and(B) The project has been approved for development by all necessary parties and entities, including governmental entities.
(v) Existing economic conditions include prices and costs at which economic producibility from a reservoir is to bedetermined. The price shall be the average price during the 12-month period prior to the ending date of the period covered bythe report, determined as an unweighted arithmetic average of the first-day-of-the-month price for each month within suchperiod, unless prices are defined by contractual arrangements, excluding escalations based upon future conditions.
Developed oil and gas reserves � Developed oil and gas reserves are reserves of any category that can be expected to be recovered:
(i) Through existing wells with existing equipment and operating methods or in which the cost of the required equipment isrelatively minor compared to the cost of a new well; and
Copyright © 2018 www.secdatabase.com. All Rights Reserved.Please Consider the Environment Before Printing This Document

6
DEGOLYER AND MACNAUGHTON
(ii) Through installed extraction equipment and infrastructure operational at the time of the reserves estimate if the extractionis by means not involving a well.
Undeveloped oil and gas reserves � Undeveloped oil and gas reserves are reserves of any category that are expected to berecovered from new wells on undrilled acreage, or from existing wells where a relatively major expenditure is required forrecompletion.
(i) Reserves on undrilled acreage shall be limited to those directly offsetting development spacing areas that are reasonablycertain of production when drilled, unless evidence using reliable technology exists that establishes reasonable certainty ofeconomic producibility at greater distances.
(ii) Undrilled locations can be classified as having undeveloped reserves only if a development plan has been adoptedindicating that they are scheduled to be drilled within five years, unless the specific circumstances justify a longer time.
(iii) Under no circumstances shall estimates for undeveloped reserves be attributable to any acreage for which an applicationof fluid injection or other improved recovery technique is contemplated, unless such techniques have been proved effectiveby actual projects in the same reservoir or an analogous reservoir, as defined in [section 210.4�10 (a) Definitions], or byother evidence using reliable technology establishing reasonable certainty.
Copyright © 2018 www.secdatabase.com. All Rights Reserved.Please Consider the Environment Before Printing This Document
7
DEGOLYER AND MACNAUGHTON
Primary Economic Assumptions
The following economic assumptions were used for estimating existing and future prices and costs, expressed in United Statesdollars (U.S.$):
Condensate Prices
PEP has represented that the condensate prices were based on a reference price, calculated as the unweighted arithmeticaverage of the first-day-of-the-month price for each month within the 12-month period prior to the end of the reportingperiod. As represented by PEP, the reference price utilized is the Mexican Mix reference price, which is composed of theIstmo, Maya, and Olmeca reference prices and is calculated based on a formula that includes the West Texas Sour, LightLouisiana Sweet, Brent, Oman, and Dubai reference prices. PEP supplied differentials by field to an average Mexican Mixreference price of U.S.$52.32 per barrel and the prices were held constant thereafter. The volume-weighted average adjustedprice attributable to estimated proved reserves for the fields that were evaluated was U.S.$48.34 per barrel for condensate.These prices were not escalated for inflation.
Gas Prices
PEP has represented that the gas prices were based on a 12-month average price, calculated as the unweighted arithmeticaverage of the first-day-of-the-month price for each month within the 12-month period prior to the end of the reportingperiod, unless prices are defined by contractual arrangements. Each field�s calorific value, which includes NGL, was used todetermine each field�s gas price. The volume-weighted average adjusted price for the fields that were evaluated wasU.S.$3.79 per thousand cubic feet. These prices were not escalated for inflation.
Operating Expenses, Capital Costs, and Abandonment Costs
Operating expenses and capital costs, based on information provided by PEP, were used in estimating future costs required tooperate the properties. In certain cases, future costs, either higher or lower than existing costs, may have been used becauseof anticipated changes in operating conditions. These costs were not escalated for inflation. Abandonment costs wereprovided by PEP.
Copyright © 2018 www.secdatabase.com. All Rights Reserved.Please Consider the Environment Before Printing This Document

8
DEGOLYER AND MACNAUGHTON
While the oil and gas industry may be subject to regulatory changes from time to time that could affect an industry participant�sability to recover its reserves, we are not aware of any such governmental actions which would restrict the recovery of the January 1,2018, estimated reserves.
PEP has represented that its estimated net proved reserves attributable to the reviewed properties were based on the definition ofproved reserves of the SEC. PEP has represented that its estimates of the net proved reserves attributable to these properties, whichrepresent 2.4 percent of PEP�s reserves on a net oil equivalent basis, are summarized as follows, expressed in millions of barrels(MMbbl), billions of cubic feet (Bcf), and millions of barrels of oil equivalent (MMboe):
Estimated by PEPNet Proved Reserves
as ofJanuary 1, 2018
Properties Reviewed by DeGolyer and MacNaughtonOil
(MMbbl)
MarketableGas(Bcf)
SalesGas(Bcf)
Condensate(MMbbl)
NGL(MMbbl)
OilEquivalent(MMboe)
Burgos AreaTotal Proved 0.00 971.81 818.52 14.18 15.10 182.22
Notes:
1. Oil equivalent is calculated based on oil, marketable gas, and condensate quantities.2. Marketable gas is converted to oil equivalent on a field-by-field basis using an energy equivalent factor reflecting the reservoir gas composition of each field.
In our opinion, the information relating to estimated proved reserves of oil, condensate, natural gas liquids, and gas contained inthis report has been prepared in accordance with Paragraphs 932-235-50-4, 932-235-50-6, 932-235-50-7, and 932-235-50-9 of theAccounting Standards Update 932-235-50, Extractive Industries � Oil and Gas (Topic 932): Oil and Gas Reserve Estimation andDisclosures (January 2010) of the Financial Accounting Standards Board and Rules 4�10(a) (1)�(32) of Regulation S�X and Rules302(b), 1201, and 1202(a) (1), (2), (3), (4), (8) of Regulation S�K of the Securities and Exchange Commission; provided, however, thatestimates of proved developed and proved undeveloped reserves are not presented at the beginning of the year.
Copyright © 2018 www.secdatabase.com. All Rights Reserved.Please Consider the Environment Before Printing This Document
9
DEGOLYER AND MACNAUGHTON
To the extent the above-enumerated rules, regulations, and statements require determinations of an accounting or legal nature, we,as engineers, are necessarily unable to express an opinion as to whether the above-described information is in accordance therewith orsufficient therefor.
In comparing the detailed net proved reserves estimates prepared by DeGolyer and MacNaughton and by PEP, differences havebeen found, both positive and negative, resulting in an aggregate difference of 5.7 percent when compared on the basis of net oilequivalent barrels. It is DeGolyer and MacNaughton�s opinion that the net proved reserves estimates prepared by PEP on the propertiesreviewed and referred to above, when compared on the basis of net oil equivalent barrels, in aggregate, are considered reasonable.
DeGolyer and MacNaughton 1s an independent petroleum engineering consulting firm that has been providing petroleumconsulting services throughout the world since 1936. DeGolyer and MacNaughton does not have any financial interest, including stockownership, in PEP. Our fees were not contingent on the results of our evaluation. This letter report has been prepared at the request ofPEP. DeGolyer and MacNaughton has used all assumptions, data, procedures, and methods that it considers necessary and appropriateto prepare this report.
Submitted,
DeGOLYER and MacNAUGHTONTexas Registered Engineering Firm F-716
Thomas C. Pence, P.E.Senior Vice PresidentDeGolyer and MacNaughton
Copyright © 2018 www.secdatabase.com. All Rights Reserved.Please Consider the Environment Before Printing This Document

DEGOLYER AND MACNAUGHTON
CERTIFICATE of QUALIFICATION
I, Thomas C. Pence, Petroleum Engineer with DeGolyer and MacNaughton, 5001 Spring Valley Road, Suite 800 East, Dallas,Texas, 75244 U.S.A., hereby certify:
1. That I am a Senior Vice President of DeGolyer and MacNaughton, which company did prepare the letter report addressed toPEP dated April 20, 2018, and that I, as Senior Vice President, was responsible for the preparation of this letter report.
2. That I attended Texas A&M University, and that I graduated with a degree in Petroleum Engineering in the year 1982; that I ama Registered Professional Engineer in the State of Texas; that I am a member of the International Society of Petroleum Engineers; andthat I have in excess of 35 years of experience in oil and gas reservoir studies and reserves evaluations.
Thomas C. Pence, P.E.Senior Vice PresidentDeGolyer and MacNaughton
Copyright © 2018 www.secdatabase.com. All Rights Reserved.Please Consider the Environment Before Printing This Document
Exhibit 10.6(Part 2 of 2)
DEGOLYER AND MACNAUGHTON5001 SPRING VALLEY ROAD
SUITE 800 EASTDALLAS, TEXAS 75244
This is a digital representation of a DeGolyer and MacNaughton report.
This file is intended to be a manifestation of certain data in the subject report and as such are subject to the same conditions thereof. Theinformation and data contained in this file may be subject to misinterpretation; therefore, the signed and bound copy of this reportshould be considered the only authoritative source of such information.
Copyright © 2018 www.secdatabase.com. All Rights Reserved.Please Consider the Environment Before Printing This Document

DEGOLYER AND MACNAUGHTON5001 SPRING VALLEY ROAD
SUITE 800 EASTDALLAS, TEXAS 75244
April 20, 2018
Ing. J. Javier Hinojosa PueblaDirector General de Pemex Exploración y ProducciónAvenida Marina Nacional 329Torre Ejecutiva, Piso 41Col. Verónica Anzures, C.P. 11300Del. Miguel Hidalgo, Ciudad de México
Dear Ing. Hinojosa,
Pursuant to your request, DeGolyer and MacNaughton has conducted an independent reserves evaluation of the net proved oil,gas, condensate, and oil equivalent reserves, as of January 1, 2018, of certain properties that PEMEX Exploración y Producción (PEP)has represented are owned by the United Mexican States in the Veracruz area of Mexico. This evaluation was completed on February15, 2018. PEP has represented that these properties account for 2.3 percent on a net oil equivalent barrel basis of the net proved reservesassigned to PEP, as of January 1, 2018, and that the net proved reserves estimates have been prepared in accordance with the reservesdefinitions of Rules 4�10(a) (1)�(32) of Regulation S�X of the Securities and Exchange Commission (SEC) of the United States. At therequest of PEP, this report also includes estimates prepared by PEP of its natural gas liquids (NGL) reserves; however, PEP hasrepresented that PEP�s management of the properties stops at the inlet of the gas processing plants. PEP has represented that allsubsurface hydrocarbons belong to the United Mexican States, and has further represented that PEP has received a 100-percentassignment in these properties by the United Mexican States; therefore, gross reserves are equal to net reserves and are defined as thetotal estimated petroleum to be produced from these properties after December 31, 2017. We have reviewed information provided to usby PEP that it represents to be PEP�s estimates of the net proved reserves, as of January 1, 2018, for the same properties as those whichwe evaluated. This report was prepared in accordance with guidelines specified in Item 1202 (a)(8) of Regulation S-K and is to be usedfor inclusion in certain SEC filings by PEP.
Copyright © 2018 www.secdatabase.com. All Rights Reserved.Please Consider the Environment Before Printing This Document

2
DEGOLYER AND MACNAUGHTON
Based on Mexico�s Energy Reform of 2014, PEP has represented that its estimates of the net proved reserves assigned to PEPpresented in this report correspond to 100 percent of the total net proved reserves of the Veracruz area assigned to PEP, on an oilequivalent basis.
Reserves estimates included herein are expressed as net reserves as represented by PEP. Gross reserves are defined as the totalestimated petroleum to be produced from these properties after December 31, 2017. Net reserves are defined as that portion of the grossreserves attributable to the interests owned by the United Mexican States after deducting all interests owned by others.
Estimates of oil, gas, condensate, NGL, and oil equivalent reserves should be regarded only as estimates that may change asfurther production history and additional information become available. Not only are such reserves estimates based on that informationwhich is currently available, but such estimates are also subject to the uncertainties inherent in the application of judgmental factors ininterpreting such information.
Data used in this evaluation were obtained from reviews with PEP personnel, from PEP files, from records on file with theappropriate regulatory agencies, and from public sources. In the preparation of this report we have relied, without independentverification, upon such information furnished by PEP with respect to property interests, production from such properties, current costsof operation and development, current prices for production, agreements relating to current and future operations and sale of production,and various other information and data that were accepted as represented. A field examination of the properties was not considerednecessary for the purposes of this report.
Methodology and Procedures
Estimates of reserves were prepared by the use of appropriate geologic, petroleum engineering, and evaluation principles andtechniques that are in accordance with practices generally recognized by the petroleum industry as presented in the publication of theSociety of Petroleum Engineers entitled �Standards Pertaining to the Estimating and Auditing of Oil and Gas Reserves Information(Revision as of February 19, 2007).� The method or combination of methods used in the analysis of each reservoir was tempered byexperience with similar reservoirs, stage of development, quality and completeness of basic data, and production history.
Copyright © 2018 www.secdatabase.com. All Rights Reserved.Please Consider the Environment Before Printing This Document
3
DEGOLYER AND MACNAUGHTON
Based on the current stage of field development, production performance, the development plans provided by PEP, and analyses ofareas offsetting existing wells with test or production data, reserves were classified as proved.
When applicable, the volumetric method was used to estimate the original oil in place (OOIP) and the original gas in place(OGIP). Structure and isopach maps were constructed to estimate reservoir volume. Electrical logs, radioactivity logs, core analyses,and other available data were used to prepare these maps as well as to estimate representative values for porosity and water saturation.When adequate data were available and when circumstances justified, material balance and other engineering methods were used toestimate OOIP or OGIP.
Estimates of ultimate recovery were obtained after applying recovery factors to OOIP or OGIP. These recovery factors were basedon consideration of the type of energy inherent in the reservoirs, analyses of the petroleum, the structural positions of the properties, andthe production histories. When applicable, material balance and other engineering methods were used to estimate recovery factors. Insuch cases, an analysis of reservoir performance, including production rate, reservoir pressure, and gas-oil ratio behavior, was used inthe estimation of reserves.
For depletion-type reservoirs or those whose performance disclosed a reliable decline in producing-rate trends or other diagnosticcharacteristics, reserves were estimated by the application of appropriate decline curves or other performance relationships. In theanalyses of production-decline curves, reserves were estimated only to the limits of economic production based on existing economicconditions.
Gas quantities estimated herein are expressed as marketable gas and sales gas at a temperature base of 20 degrees Celsius and at apressure base of 1 atmosphere. Marketable gas is defined as the total gas in the reservoirs to be produced after shrinkage resulting fromfield separation and flare. Marketable gas includes fuel. Sales gas is defined as the total gas to be produced from the reservoirs,measured at the point of delivery, after reduction for injection, fuel usage, flare, and shrinkage resulting from field separation and plantprocessing. Oil, condensate, and NGL reserves estimated herein are expressed in terms of 42 United States gallons per barrel. Oil andcondensate reserves estimated herein are to be recovered by normal field separation. PEP has represented that its NGL reserves havebeen estimated on the basis of the quantities of liquids recovered from gas delivered to a gas plant for processing, and can includepropane, butane, and C5+ fractions.
Copyright © 2018 www.secdatabase.com. All Rights Reserved.Please Consider the Environment Before Printing This Document
4
DEGOLYER AND MACNAUGHTON
Definition of Reserves
Petroleum reserves estimated by PEP included in this report are classified as proved. Only proved reserves have been evaluated forthis report. Reserves classifications used by PEP in this report are in accordance with the reserves definitions of Rules 4�10(a) (1)�(32)of Regulation S�X of the SEC. Reserves are judged to be economically producible in future years from known reservoirs under existingeconomic and operating conditions and assuming continuation of current regulatory practices using conventional production methodsand equipment. In the analyses of production-decline curves, reserves were estimated only to the limit of economic rates of productionunder existing economic and operating conditions using prices and costs consistent with the effective date of this report, includingconsideration of changes in existing prices provided only by contractual arrangements but not including escalations based upon futureconditions. The petroleum reserves are classified as follows:
Proved oil and gas reserves � Proved oil and gas reserves are those quantities of oil and gas, which, by analysis of geoscience andengineering data, can be estimated with reasonable certainty to be economically producible�from a given date forward, fromknown reservoirs, and under existing economic conditions, operating methods, and government regulations�prior to the time atwhich contracts providing the right to operate expire, unless evidence indicates that renewal is reasonably certain, regardless ofwhether deterministic or probabilistic methods are used for the estimation. The project to extract the hydrocarbons must havecommenced or the operator must be reasonably certain that it will commence the project within a reasonable time.
(i) The area of the reservoir considered as proved includes:
(A) The area identified by drilling and limited by fluid contacts, if any, and (B) Adjacent undrilled portions of the reservoirthat can, with reasonable certainty, be judged to be continuous with it and to contain economically producible oil or gas onthe basis of available geoscience and engineering data.
Copyright © 2018 www.secdatabase.com. All Rights Reserved.Please Consider the Environment Before Printing This Document

5
DEGOLYER AND MACNAUGHTON
(ii) In the absence of data on fluid contacts, proved quantities in a reservoir are limited by the lowest known hydrocarbons(LKH) as seen in a well penetration unless geoscience, engineering, or performance data and reliable technology establishesa lower contact with reasonable certainty.
(iii) Where direct observation from well penetrations has defined a highest known oil (HKO) elevation and the potentialexists for an associated gas cap, proved oil reserves may be assigned in the structurally higher portions of the reservoir only ifgeoscience, engineering, or performance data and reliable technology establish the higher contact with reasonable certainty.
(iv) Reserves which can be produced economically through application of improved recovery techniques (including, but notlimited to, fluid injection) are included in the proved classification when:
(A) Successful testing by a pilot project in an area of the reservoir with properties no more favorable than in the reservoir as awhole, the operation of an installed program in the reservoir or an analogous reservoir, or other evidence using reliabletechnology establishes the reasonable certainty of the engineering analysis on which the project or program was based; and(B) The project has been approved for development by all necessary parties and entities, including governmental entities.
(v) Existing economic conditions include prices and costs at which economic producibility from a reservoir is to bedetermined. The price shall be the average price during the 12-month period prior to the ending date of the period covered bythe report, determined as an unweighted arithmetic average of the first-day-of-the-month price for each month within suchperiod, unless prices are defined by contractual arrangements, excluding escalations based upon future conditions.
Developed oil and gas reserves � Developed oil and gas reserves are reserves of any category that can be expected to be recovered:
(i) Through existing wells with existing equipment and operating methods or in which the cost of the required equipment isrelatively minor compared to the cost of a new well; and
Copyright © 2018 www.secdatabase.com. All Rights Reserved.Please Consider the Environment Before Printing This Document

6
DEGOLYER AND MACNAUGHTON
(ii) Through installed extraction equipment and infrastructure operational at the time of the reserves estimate if the extractionis by means not involving a well.
Undeveloped oil and gas reserves � Undeveloped oil and gas reserves are reserves of any category that are expected to berecovered from new wells on undrilled acreage, or from existing wells where a relatively major expenditure is required forrecompletion.
(i) Reserves on undrilled acreage shall be limited to those directly offsetting development spacing areas that arereasonably certain of production when drilled, unless evidence using reliable technology exists that establishes reasonablecertainty of economic producibility at greater distances.
(ii) Undrilled locations can be classified as having undeveloped reserves only if a development plan has been adoptedindicating that they are scheduled to be drilled within five years, unless the specific circumstances justify a longer time.
(iii) Under no circumstances shall estimates for undeveloped reserves be attributable to any acreage for which anapplication of fluid injection or other improved recovery technique is contemplated, unless such techniques have been provedeffective by actual projects in the same reservoir or an analogous reservoir, as defined in [section 210.4�10 (a) Definitions],or by other evidence using reliable technology establishing reasonable certainty.
Copyright © 2018 www.secdatabase.com. All Rights Reserved.Please Consider the Environment Before Printing This Document
7
DEGOLYER AND MACNAUGHTON
Primary Economic Assumptions
The following economic assumptions were used for estimating existing and future prices and costs, expressed in United Statesdollars (U.S.$):
Oil and Condensate Prices
PEP has represented that the oil and condensate prices were based on a reference price, calculated as the unweightedarithmetic average of the first-day-of-the-month price for each month within the 12-month period prior to the end of thereporting period. As represented by PEP, the reference price utilized is the Mexican Mix reference price, which is composedof the Istmo, Maya, and Olmeca reference prices and is calculated based on a formula that includes the West Texas Sour,Light Louisiana Sweet, Brent, Oman, and Dubai reference prices. PEP supplied differentials by field to an average MexicanMix reference price of U.S.$52.32 per barrel and the prices were held constant thereafter. The volume-weighted averageadjusted prices attributable to estimated proved reserves for the fields that were evaluated were U.S.$49.64 per barrel for oiland U.S.$50.06 per barrel for condensate. These prices were not escalated for inflation.
Gas Prices
PEP has represented that the gas prices were based on a 12-month average price, calculated as the unweighted arithmeticaverage of the first-day-of-the-month price for each month within the 12-month period prior to the end of the reportingperiod, unless prices are defined by contractual arrangements. Each field�s calorific value, which includes NGL, was used todetermine each field�s gas price. The volume-weighted average adjusted price for the fields that were evaluated wasU.S.$3.81 per thousand cubic feet. These prices were not escalated for inflation.
Operating Expenses, Capital Costs, and Abandonment Costs
Operating expenses and capital costs, based on information provided by PEP, were used in estimating future costs required tooperate the properties. In certain cases, future costs, either higher or lower than existing costs, may have been used becauseof anticipated changes in operating conditions. These costs were not escalated for inflation. Abandonment costs wereprovided by PEP.
Copyright © 2018 www.secdatabase.com. All Rights Reserved.Please Consider the Environment Before Printing This Document
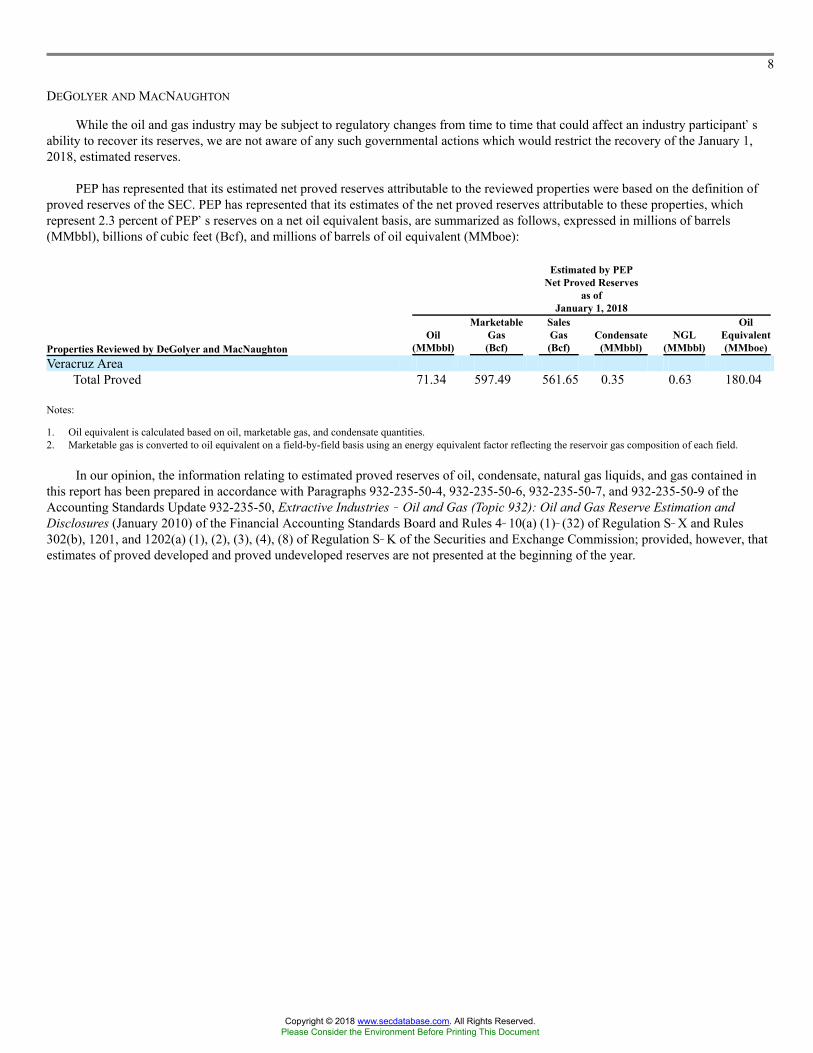
8
DEGOLYER AND MACNAUGHTON
While the oil and gas industry may be subject to regulatory changes from time to time that could affect an industry participant�sability to recover its reserves, we are not aware of any such governmental actions which would restrict the recovery of the January 1,2018, estimated reserves.
PEP has represented that its estimated net proved reserves attributable to the reviewed properties were based on the definition ofproved reserves of the SEC. PEP has represented that its estimates of the net proved reserves attributable to these properties, whichrepresent 2.3 percent of PEP�s reserves on a net oil equivalent basis, are summarized as follows, expressed in millions of barrels(MMbbl), billions of cubic feet (Bcf), and millions of barrels of oil equivalent (MMboe):
Estimated by PEPNet Proved Reserves
as ofJanuary 1, 2018
Properties Reviewed by DeGolyer and MacNaughtonOil
(MMbbl)
MarketableGas(Bcf)
SalesGas(Bcf)
Condensate(MMbbl)
NGL(MMbbl)
OilEquivalent(MMboe)
Veracruz AreaTotal Proved 71.34 597.49 561.65 0.35 0.63 180.04
Notes:
1. Oil equivalent is calculated based on oil, marketable gas, and condensate quantities.2. Marketable gas is converted to oil equivalent on a field-by-field basis using an energy equivalent factor reflecting the reservoir gas composition of each field.
In our opinion, the information relating to estimated proved reserves of oil, condensate, natural gas liquids, and gas contained inthis report has been prepared in accordance with Paragraphs 932-235-50-4, 932-235-50-6, 932-235-50-7, and 932-235-50-9 of theAccounting Standards Update 932-235-50, Extractive Industries � Oil and Gas (Topic 932): Oil and Gas Reserve Estimation andDisclosures (January 2010) of the Financial Accounting Standards Board and Rules 4�10(a) (1)�(32) of Regulation S�X and Rules302(b), 1201, and 1202(a) (1), (2), (3), (4), (8) of Regulation S�K of the Securities and Exchange Commission; provided, however, thatestimates of proved developed and proved undeveloped reserves are not presented at the beginning of the year.
Copyright © 2018 www.secdatabase.com. All Rights Reserved.Please Consider the Environment Before Printing This Document
9
DEGOLYER AND MACNAUGHTON
To the extent the above-enumerated rules, regulations, and statements require determinations of an accounting or legal nature, we,as engineers, are necessarily unable to express an opinion as to whether the above-described information is in accordance therewith orsufficient therefor.
In comparing the detailed net proved reserves estimates prepared by DeGolyer and MacNaughton and by PEP, differences havebeen found, both positive and negative, resulting in an aggregate difference of 3.8 percent when compared on the basis of net oilequivalent barrels. It is DeGolyer and MacNaughton�s opinion that the net proved reserves estimates prepared by PEP on the propertiesreviewed and referred to above, when compared on the basis of net oil equivalent barrels, in aggregate, do not differ materially fromthose prepared us.
DeGolyer and MacNaughton is an independent petroleum engineering consulting firm that has been providing petroleumconsulting services throughout the world since 1936. DeGolyer and MacNaughton does not have any financial interest, including stockownership, in PEP. Our fees were not contingent on the results of our evaluation. This letter report has been prepared at the request ofPEP. DeGolyer and MacNaughton has used all assumptions, data, procedures, and methods that it considers necessary and appropriateto prepare this report.
Submitted,
DeGOLYER and MacNAUGHTONTexas Registered Engineering Firm F-716
Thomas C. Pence, P.E.Senior Vice PresidentDeGolyer and MacNaughton
Copyright © 2018 www.secdatabase.com. All Rights Reserved.Please Consider the Environment Before Printing This Document

DEGOLYER AND MACNAUGHTON
CERTIFICATE of QUALIFICATION
I, Thomas C. Pence, Petroleum Engineer with DeGolyer and MacNaughton, 5001 Spring Valley Road, Suite 800 East, Dallas,Texas, 75244 U.S.A., hereby certify:
1. That I am a Senior Vice President of DeGolyer and MacNaughton, which company did prepare the letter report addressed toPEP dated April 20, 2018, and that I, as Senior Vice President, was responsible for the preparation of this letter report.
2. That I attended Texas A&M University, and that I graduated with a degree in Petroleum Engineering in the year 1982; that I ama Registered Professional Engineer in the State of Texas; that I am a member of the International Society of Petroleum Engineers; andthat I have in excess of 35 years of experience in oil and gas reservoir studies and reserves evaluations.
Thomas C. Pence, P.E.Senior Vice PresidentDeGolyer and MacNaughton
Copyright © 2018 www.secdatabase.com. All Rights Reserved.Please Consider the Environment Before Printing This Document
Exhibit 12.1
CERTIFICATION
I, Carlos Alberto Treviño Medina, certify that:
1. I have reviewed this annual report on Form 20-F of Petróleos Mexicanos;
2. Based on my knowledge, this report does not contain any untrue statement of a material fact or omit to state a material fact necessary to makethe statements made, in light of the circumstances under which such statements were made, not misleading with respect to the period covered by thisreport;
3. Based on my knowledge, the financial statements, and other financial information included in this report, fairly present in all material respectsthe financial condition, results of operations and cash flows of the company as of, and for, the periods presented in this report;
4. The company�s other certifying officer and I are responsible for establishing and maintaining disclosure controls and procedures (as definedin Exchange Act Rules 13a-15(e) and 15d-15(e)) and internal control over financial reporting (as defined in Exchange Act Rules 13a-15(f) and15d-15(f)) for the company and have:
(a) Designed such disclosure controls and procedures, or caused such disclosure controls and procedures to be designed under our supervision,to ensure that material information relating to the company, including its consolidated subsidiaries, is made known to us by others within thoseentities, particularly during the period in which this report is being prepared;
(b) Designed such internal control over financial reporting, or caused such internal control over financial reporting to be designed under oursupervision, to provide reasonable assurance regarding the reliability of financial reporting and the preparation of financial statements for externalpurposes in accordance with generally accepted accounting principles;
(c) Evaluated the effectiveness of the company�s disclosure controls and procedures and presented in this report our conclusions about theeffectiveness of the disclosure controls and procedures, as of the end of the period covered by this report based on such evaluation; and
(d) Disclosed in this report any change in the company�s internal control over financial reporting that occurred during the period covered by theannual report that has materially affected, or is reasonably likely to materially affect, the company�s internal control over financial reporting; and
5. The company�s other certifying officer and I have disclosed, based on our most recent evaluation of internal control over financial reporting,to the company�s auditors and the audit committee of the company�s board of directors (or persons performing the equivalent functions):
(a) All significant deficiencies and material weaknesses in the design or operation of internal control over financial reporting which arereasonably likely to adversely affect the company�s ability to record, process, summarize and report financial information; and
(b) Any fraud, whether or not material, that involves management or other employees who have a significant role in the company�s internalcontrol over financial reporting.
Date: April 30, 2018
By: /s/ CARLOS ALBERTO TREVIÑO MEDINAName: Carlos Alberto Treviño MedinaTitle: Chief Executive Officer/Director General
Copyright © 2018 www.secdatabase.com. All Rights Reserved.Please Consider the Environment Before Printing This Document

Exhibit 12.2
CERTIFICATION
I, David Ruelas Rodríguez, certify that:
1. I have reviewed this annual report on Form 20-F of Petróleos Mexicanos;
2. Based on my knowledge, this report does not contain any untrue statement of a material fact or omit to state a material fact necessary to makethe statements made, in light of the circumstances under which such statements were made, not misleading with respect to the period covered by thisreport;
3. Based on my knowledge, the financial statements, and other financial information included in this report, fairly present in all material respectsthe financial condition, results of operations and cash flows of the company as of, and for, the periods presented in this report;
4. The company�s other certifying officer and I are responsible for establishing and maintaining disclosure controls and procedures (as definedin Exchange Act Rules 13a-15(e) and 15d-15(e)) and internal control over financial reporting (as defined in Exchange Act Rules 13a-15(f) and15d-15(f)) for the company and have:
(a) Designed such disclosure controls and procedures, or caused such disclosure controls and procedures to be designed under our supervision,to ensure that material information relating to the company, including its consolidated subsidiaries, is made known to us by others within thoseentities, particularly during the period in which this report is being prepared;
(b) Designed such internal control over financial reporting, or caused such internal control over financial reporting to be designed under oursupervision, to provide reasonable assurance regarding the reliability of financial reporting and the preparation of financial statements for externalpurposes in accordance with generally accepted accounting principles;
(c) Evaluated the effectiveness of the company�s disclosure controls and procedures and presented in this report our conclusions about theeffectiveness of the disclosure controls and procedures, as of the end of the period covered by this report based on such evaluation; and
(d) Disclosed in this report any change in the company�s internal control over financial reporting that occurred during the period covered by theannual report that has materially affected, or is reasonably likely to materially affect, the company�s internal control over financial reporting; and
5. The company�s other certifying officer and I have disclosed, based on our most recent evaluation of internal control over financial reporting,to the company�s auditors and the audit committee of the company�s board of directors (or persons performing the equivalent functions):
(a) All significant deficiencies and material weaknesses in the design or operation of internal control over financial reporting which arereasonably likely to adversely affect the company�s ability to record, process, summarize and report financial information; and
(b) Any fraud, whether or not material, that involves management or other employees who have a significant role in the company�s internalcontrol over financial reporting.
Date: April 30, 2018
By: /s/ DAVID RUELAS RODRÍGUEZName: David Ruelas RodríguezTitle: Chief Financial Officer/Corporate
Director of Finance
Copyright © 2018 www.secdatabase.com. All Rights Reserved.Please Consider the Environment Before Printing This Document

Exhibit 13.1
CertificationPursuant to Section 906 of the Sarbanes-Oxley Act of 2002
(Subsections (a) and (b) of Section 1350, Chapter 63 of Title 18, United States Code)
Pursuant to section 906 of the Sarbanes-Oxley Act of 2002 (subsections (a) and (b) of section 1350, chapter 63 of title 18, United States Code),each of the undersigned officers of Petróleos Mexicanos, a productive state-owned company of the Federal Government of the United Mexican States(the �Company�), does hereby certify, to such officer�s knowledge, that:
The Annual Report on Form 20-F for the year ended December 31, 2016 (the �Form 20-F�) of the Company fully complies with the requirementsof section 13(a) or 15(d) of the Securities Exchange Act of 1934 and information contained in the Form 20-F fairly presents, in all material respects, thefinancial condition and results of operations of the Company.
Date: April 30, 2018
By: /S/ CARLOS ALBERTO TREVIÑO MEDINAName: Carlos Alberto Treviño MedinaTitle: Chief Executive Officer/Director General
Date: April 30, 2018
By: /S/ DAVID RUELAS RODRÍGUEZName: David Ruelas RodríguezTitle: Chief Financial Officer/Corporate
Director of Finance
Copyright © 2018 www.secdatabase.com. All Rights Reserved.Please Consider the Environment Before Printing This Document
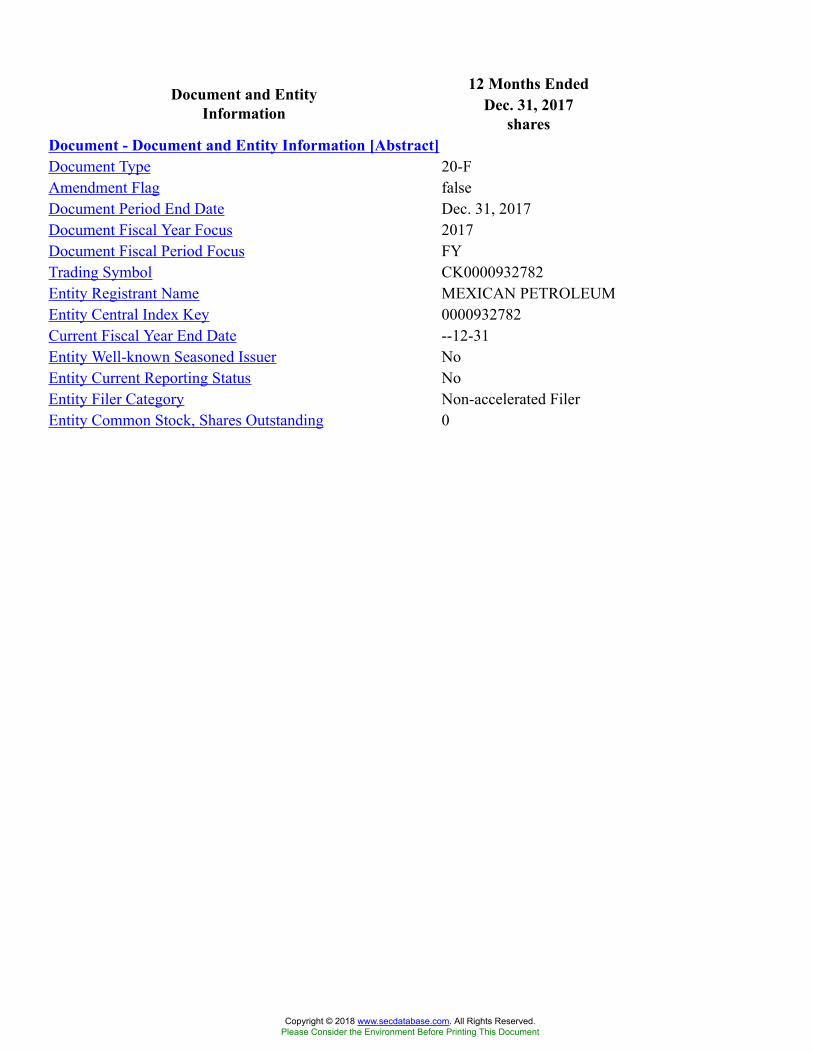
12 Months EndedDocument and EntityInformation Dec. 31, 2017
sharesDocument - Document and Entity Information [Abstract]Document Type 20-FAmendment Flag falseDocument Period End Date Dec. 31, 2017Document Fiscal Year Focus 2017Document Fiscal Period Focus FYTrading Symbol CK0000932782Entity Registrant Name MEXICAN PETROLEUMEntity Central Index Key 0000932782Current Fiscal Year End Date --12-31Entity Well-known Seasoned Issuer NoEntity Current Reporting Status NoEntity Filer Category Non-accelerated FilerEntity Common Stock, Shares Outstanding 0
Copyright © 2018 www.secdatabase.com. All Rights Reserved.Please Consider the Environment Before Printing This Document
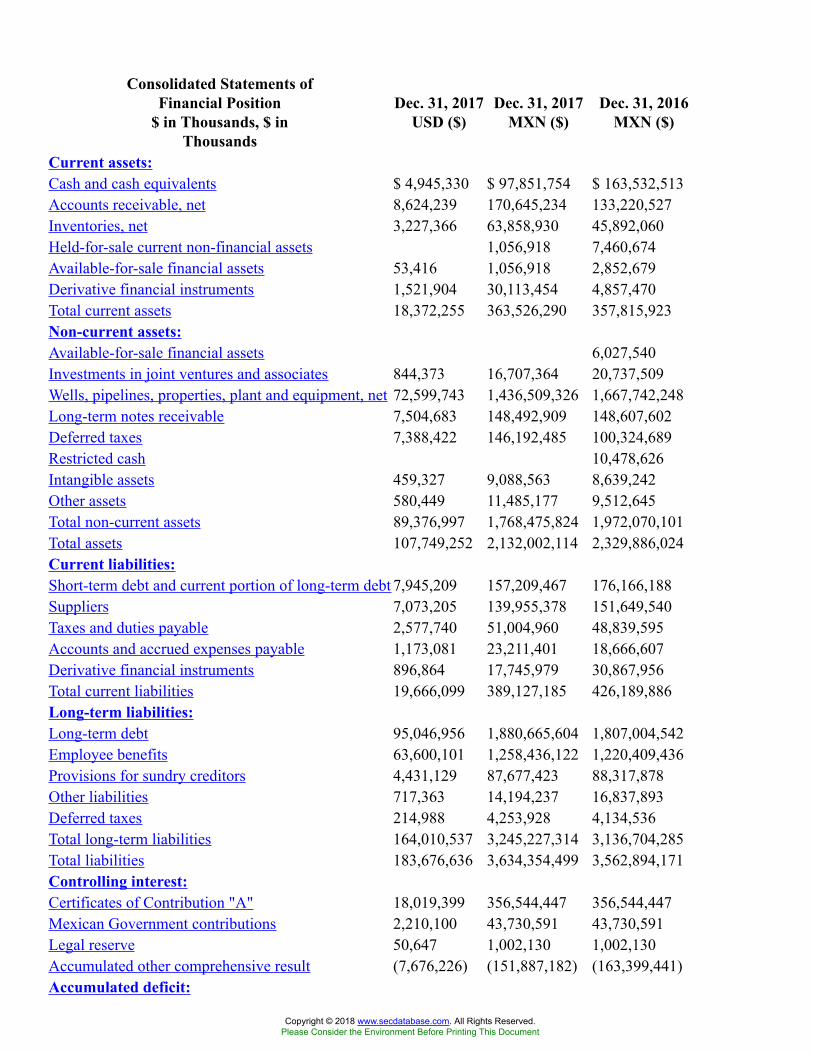
Consolidated Statements ofFinancial Position
$ in Thousands, $ inThousands
Dec. 31, 2017USD ($)
Dec. 31, 2017MXN ($)
Dec. 31, 2016MXN ($)
Current assets:Cash and cash equivalents $ 4,945,330 $ 97,851,754 $ 163,532,513Accounts receivable, net 8,624,239 170,645,234 133,220,527Inventories, net 3,227,366 63,858,930 45,892,060Held-for-sale current non-financial assets 1,056,918 7,460,674Available-for-sale financial assets 53,416 1,056,918 2,852,679Derivative financial instruments 1,521,904 30,113,454 4,857,470Total current assets 18,372,255 363,526,290 357,815,923Non-current assets:Available-for-sale financial assets 6,027,540Investments in joint ventures and associates 844,373 16,707,364 20,737,509Wells, pipelines, properties, plant and equipment, net 72,599,743 1,436,509,326 1,667,742,248Long-term notes receivable 7,504,683 148,492,909 148,607,602Deferred taxes 7,388,422 146,192,485 100,324,689Restricted cash 10,478,626Intangible assets 459,327 9,088,563 8,639,242Other assets 580,449 11,485,177 9,512,645Total non-current assets 89,376,997 1,768,475,824 1,972,070,101Total assets 107,749,252 2,132,002,114 2,329,886,024Current liabilities:Short-term debt and current portion of long-term debt 7,945,209 157,209,467 176,166,188Suppliers 7,073,205 139,955,378 151,649,540Taxes and duties payable 2,577,740 51,004,960 48,839,595Accounts and accrued expenses payable 1,173,081 23,211,401 18,666,607Derivative financial instruments 896,864 17,745,979 30,867,956Total current liabilities 19,666,099 389,127,185 426,189,886Long-term liabilities:Long-term debt 95,046,956 1,880,665,604 1,807,004,542Employee benefits 63,600,101 1,258,436,122 1,220,409,436Provisions for sundry creditors 4,431,129 87,677,423 88,317,878Other liabilities 717,363 14,194,237 16,837,893Deferred taxes 214,988 4,253,928 4,134,536Total long-term liabilities 164,010,537 3,245,227,314 3,136,704,285Total liabilities 183,676,636 3,634,354,499 3,562,894,171Controlling interest:Certificates of Contribution "A" 18,019,399 356,544,447 356,544,447Mexican Government contributions 2,210,100 43,730,591 43,730,591Legal reserve 50,647 1,002,130 1,002,130Accumulated other comprehensive result (7,676,226) (151,887,182) (163,399,441)Accumulated deficit:
Copyright © 2018 www.secdatabase.com. All Rights Reserved.Please Consider the Environment Before Printing This Document

From prior years (74,386,461) (1,471,862,579) (1,280,216,973)Net loss for the year (14,193,620) (280,844,899) (191,645,606)Total controlling interest (75,976,160) (1,503,317,492) (1,233,984,852)Total non-controlling interest 48,776 965,107 976,705Total equity (deficit), net (75,927,384) (1,502,352,385) (1,233,008,147)Total liabilities and equity (deficit), net $ 107,749,252$ 2,132,002,114$ 2,329,886,024
Copyright © 2018 www.secdatabase.com. All Rights Reserved.Please Consider the Environment Before Printing This Document
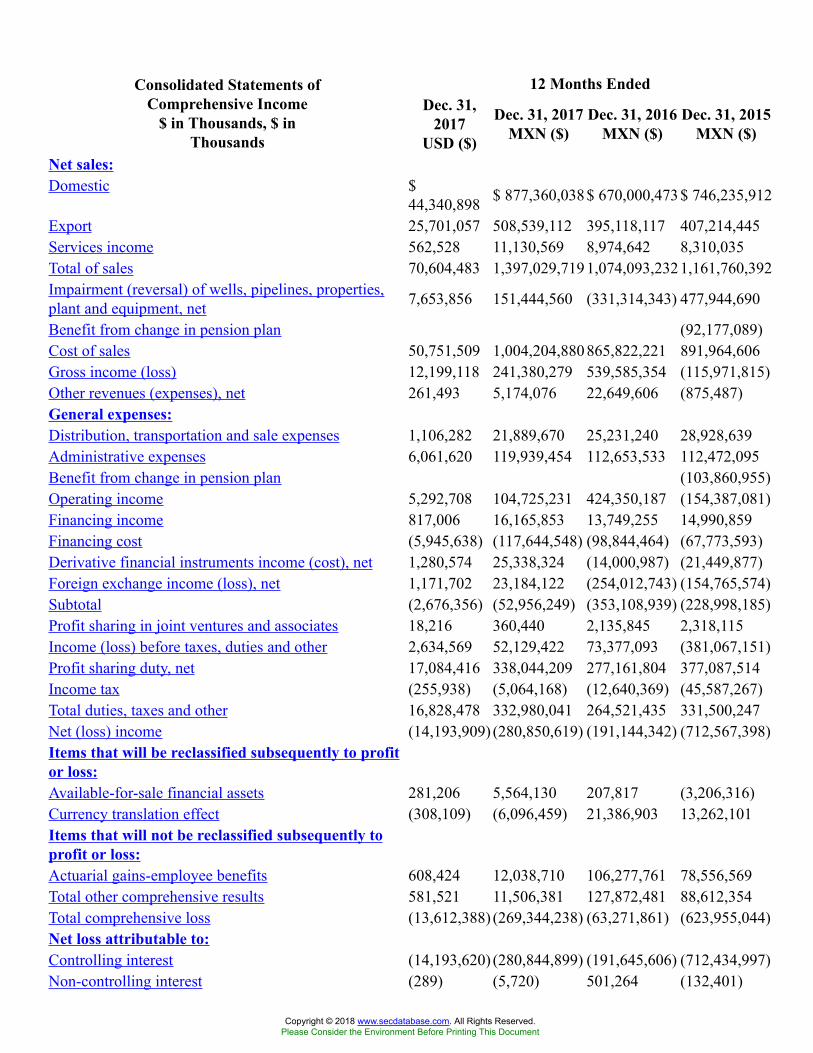
12 Months EndedConsolidated Statements ofComprehensive Income
$ in Thousands, $ inThousands
Dec. 31,2017
USD ($)
Dec. 31, 2017MXN ($)
Dec. 31, 2016MXN ($)
Dec. 31, 2015MXN ($)
Net sales:Domestic $
44,340,898 $ 877,360,038$ 670,000,473$ 746,235,912
Export 25,701,057 508,539,112 395,118,117 407,214,445Services income 562,528 11,130,569 8,974,642 8,310,035Total of sales 70,604,483 1,397,029,7191,074,093,2321,161,760,392Impairment (reversal) of wells, pipelines, properties,plant and equipment, net 7,653,856 151,444,560 (331,314,343) 477,944,690
Benefit from change in pension plan (92,177,089)Cost of sales 50,751,509 1,004,204,880865,822,221 891,964,606Gross income (loss) 12,199,118 241,380,279 539,585,354 (115,971,815)Other revenues (expenses), net 261,493 5,174,076 22,649,606 (875,487)General expenses:Distribution, transportation and sale expenses 1,106,282 21,889,670 25,231,240 28,928,639Administrative expenses 6,061,620 119,939,454 112,653,533 112,472,095Benefit from change in pension plan (103,860,955)Operating income 5,292,708 104,725,231 424,350,187 (154,387,081)Financing income 817,006 16,165,853 13,749,255 14,990,859Financing cost (5,945,638) (117,644,548) (98,844,464) (67,773,593)Derivative financial instruments income (cost), net 1,280,574 25,338,324 (14,000,987) (21,449,877)Foreign exchange income (loss), net 1,171,702 23,184,122 (254,012,743) (154,765,574)Subtotal (2,676,356) (52,956,249) (353,108,939) (228,998,185)Profit sharing in joint ventures and associates 18,216 360,440 2,135,845 2,318,115Income (loss) before taxes, duties and other 2,634,569 52,129,422 73,377,093 (381,067,151)Profit sharing duty, net 17,084,416 338,044,209 277,161,804 377,087,514Income tax (255,938) (5,064,168) (12,640,369) (45,587,267)Total duties, taxes and other 16,828,478 332,980,041 264,521,435 331,500,247Net (loss) income (14,193,909) (280,850,619) (191,144,342) (712,567,398)Items that will be reclassified subsequently to profitor loss:Available-for-sale financial assets 281,206 5,564,130 207,817 (3,206,316)Currency translation effect (308,109) (6,096,459) 21,386,903 13,262,101Items that will not be reclassified subsequently toprofit or loss:Actuarial gains-employee benefits 608,424 12,038,710 106,277,761 78,556,569Total other comprehensive results 581,521 11,506,381 127,872,481 88,612,354Total comprehensive loss (13,612,388) (269,344,238) (63,271,861) (623,955,044)Net loss attributable to:Controlling interest (14,193,620) (280,844,899) (191,645,606) (712,434,997)Non-controlling interest (289) (5,720) 501,264 (132,401)
Copyright © 2018 www.secdatabase.com. All Rights Reserved.Please Consider the Environment Before Printing This Document
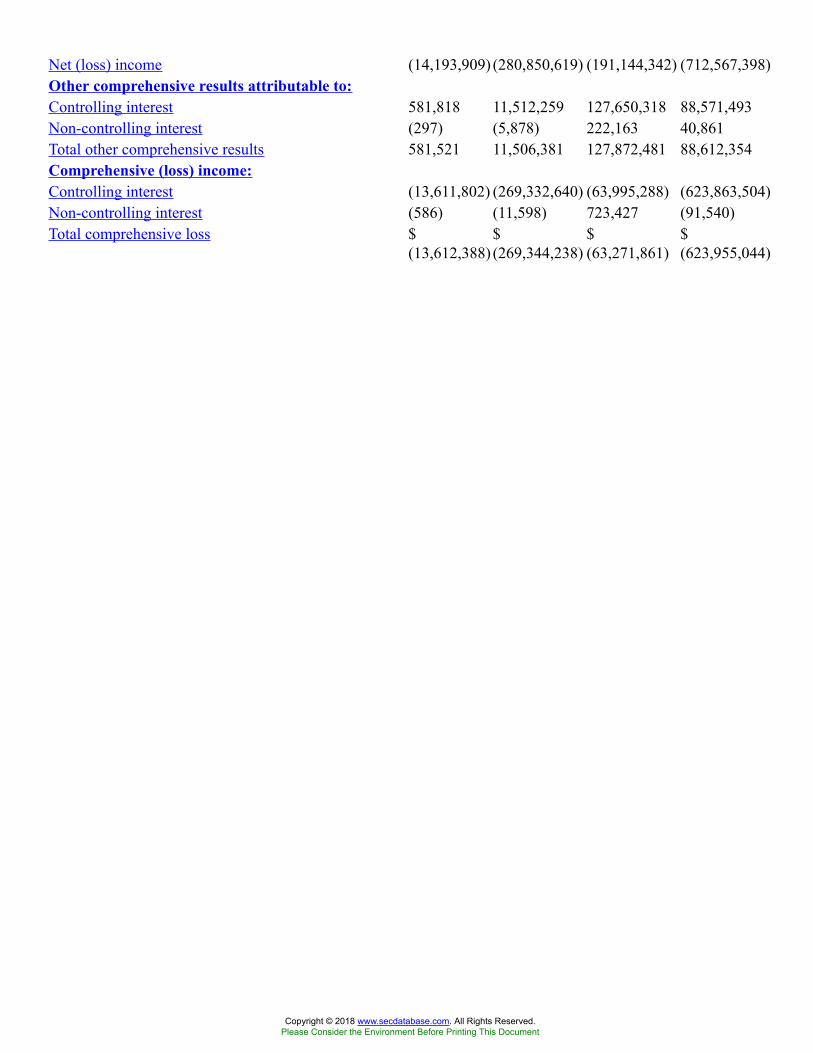
Net (loss) income (14,193,909) (280,850,619) (191,144,342) (712,567,398)Other comprehensive results attributable to:Controlling interest 581,818 11,512,259 127,650,318 88,571,493Non-controlling interest (297) (5,878) 222,163 40,861Total other comprehensive results 581,521 11,506,381 127,872,481 88,612,354Comprehensive (loss) income:Controlling interest (13,611,802) (269,332,640) (63,995,288) (623,863,504)Non-controlling interest (586) (11,598) 723,427 (91,540)Total comprehensive loss $
(13,612,388)$(269,344,238)
$(63,271,861)
$(623,955,044)
Copyright © 2018 www.secdatabase.com. All Rights Reserved.Please Consider the Environment Before Printing This Document
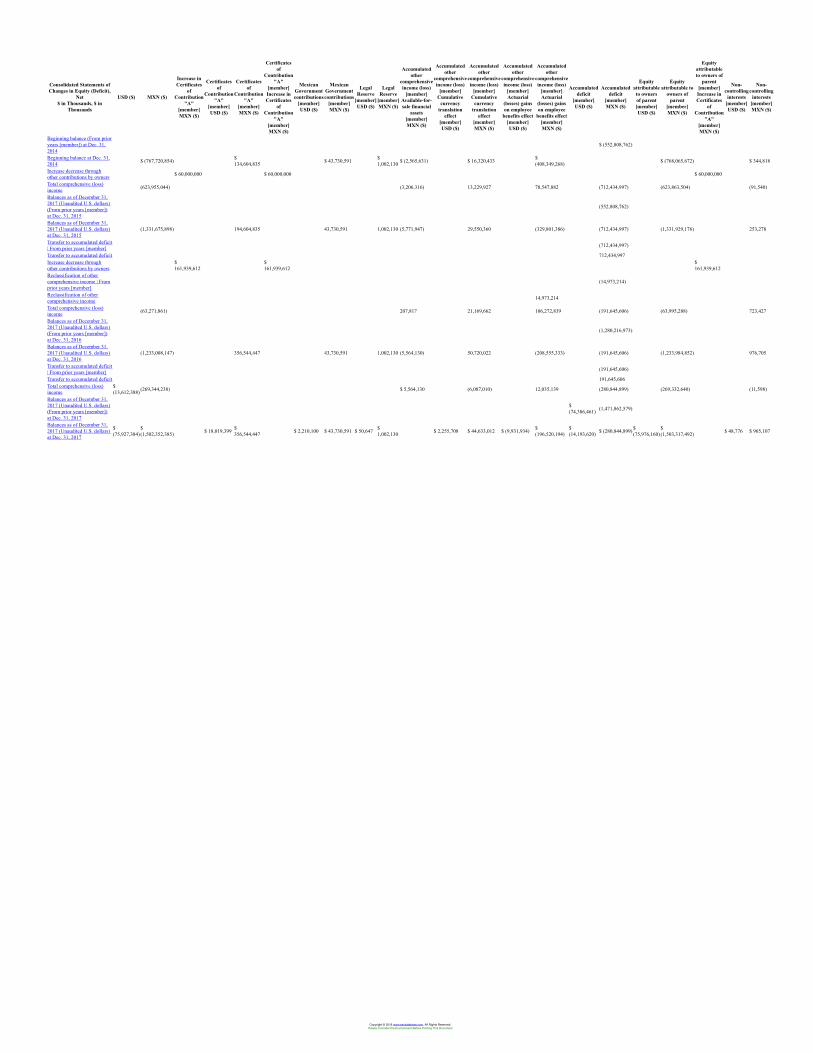
Consolidated Statements ofChanges in Equity (Deficit),
Net$ in Thousands, $ in
Thousands
USD ($) MXN ($)
Increase inCertificates
ofContribution
"A"[member]MXN ($)
Certificatesof
Contribution"A"
[member]USD ($)
Certificatesof
Contribution"A"
[member]MXN ($)
Certificatesof
Contribution"A"
[member]Increase inCertificates
ofContribution
"A"[member]MXN ($)
MexicanGovernmentcontributions
[member]USD ($)
MexicanGovernmentcontributions
[member]MXN ($)
LegalReserve
[member]USD ($)
LegalReserve
[member]MXN ($)
Accumulatedother
comprehensiveincome (loss)
[member]Available-for-sale financial
assets[member]MXN ($)
Accumulatedother
comprehensiveincome (loss)
[member]Cumulative
currencytranslation
effect[member]USD ($)
Accumulatedother
comprehensiveincome (loss)
[member]Cumulative
currencytranslation
effect[member]MXN ($)
Accumulatedother
comprehensiveincome (loss)
[member]Actuarial
(losses) gainson employee
benefits effect[member]USD ($)
Accumulatedother
comprehensiveincome (loss)
[member]Actuarial
(losses) gainson employee
benefits effect[member]MXN ($)
Accumulateddeficit
[member]USD ($)
Accumulateddeficit
[member]MXN ($)
Equityattributableto ownersof parent[member]USD ($)
Equityattributable to
owners ofparent
[member]MXN ($)
Equityattributableto owners of
parent[member]Increase inCertificates
ofContribution
"A"[member]MXN ($)
Non-controlling
interests[member]USD ($)
Non-controlling
interests[member]MXN ($)
Beginning balance (From prioryears [member]) at Dec. 31,2014
$ (552,808,762)
Beginning balance at Dec. 31,2014 $ (767,720,854) $
134,604,835 $ 43,730,591 $1,002,130 $ (2,565,631) $ 16,320,433 $
(408,349,268) $ (768,065,672) $ 344,818
Increase decrease throughother contributions by owners $ 60,000,000 $ 60,000,000 $ 60,000,000
Total comprehensive (loss)income (623,955,044) (3,206,316) 13,229,927 78,547,882 (712,434,997) (623,863,504) (91,540)
Balances as of December 31,2017 (Unaudited U.S. dollars)(From prior years [member])at Dec. 31, 2015
(552,808,762)
Balances as of December 31,2017 (Unaudited U.S. dollars)at Dec. 31, 2015
(1,331,675,898) 194,604,835 43,730,591 1,002,130 (5,771,947) 29,550,360 (329,801,386) (712,434,997) (1,331,929,176) 253,278
Transfer to accumulated deficit| From prior years [member] (712,434,997)
Transfer to accumulated deficit 712,434,997Increase decrease throughother contributions by owners
$161,939,612
$161,939,612
$161,939,612
Reclassification of othercomprehensive income | Fromprior years [member]
(14,973,214)
Reclassification of othercomprehensive income 14,973,214
Total comprehensive (loss)income (63,271,861) 207,817 21,169,662 106,272,839 (191,645,606) (63,995,288) 723,427
Balances as of December 31,2017 (Unaudited U.S. dollars)(From prior years [member])at Dec. 31, 2016
(1,280,216,973)
Balances as of December 31,2017 (Unaudited U.S. dollars)at Dec. 31, 2016
(1,233,008,147) 356,544,447 43,730,591 1,002,130 (5,564,130) 50,720,022 (208,555,333) (191,645,606) (1,233,984,852) 976,705
Transfer to accumulated deficit| From prior years [member] (191,645,606)
Transfer to accumulated deficit 191,645,606Total comprehensive (loss)income
$(13,612,388) (269,344,238) $ 5,564,130 (6,087,010) 12,035,139 (280,844,899) (269,332,640) (11,598)
Balances as of December 31,2017 (Unaudited U.S. dollars)(From prior years [member])at Dec. 31, 2017
$(74,386,461) (1,471,862,579)
Balances as of December 31,2017 (Unaudited U.S. dollars)at Dec. 31, 2017
$(75,927,384)
$(1,502,352,385) $ 18,019,399 $
356,544,447 $ 2,210,100 $ 43,730,591 $ 50,647 $1,002,130 $ 2,255,708 $ 44,633,012 $ (9,931,934) $
(196,520,194)$(14,193,620) $ (280,844,899) $
(75,976,160)$(1,503,317,492) $ 48,776 $ 965,107
Copyright © 2018 www.secdatabase.com. All Rights Reserved.Please Consider the Environment Before Printing This Document
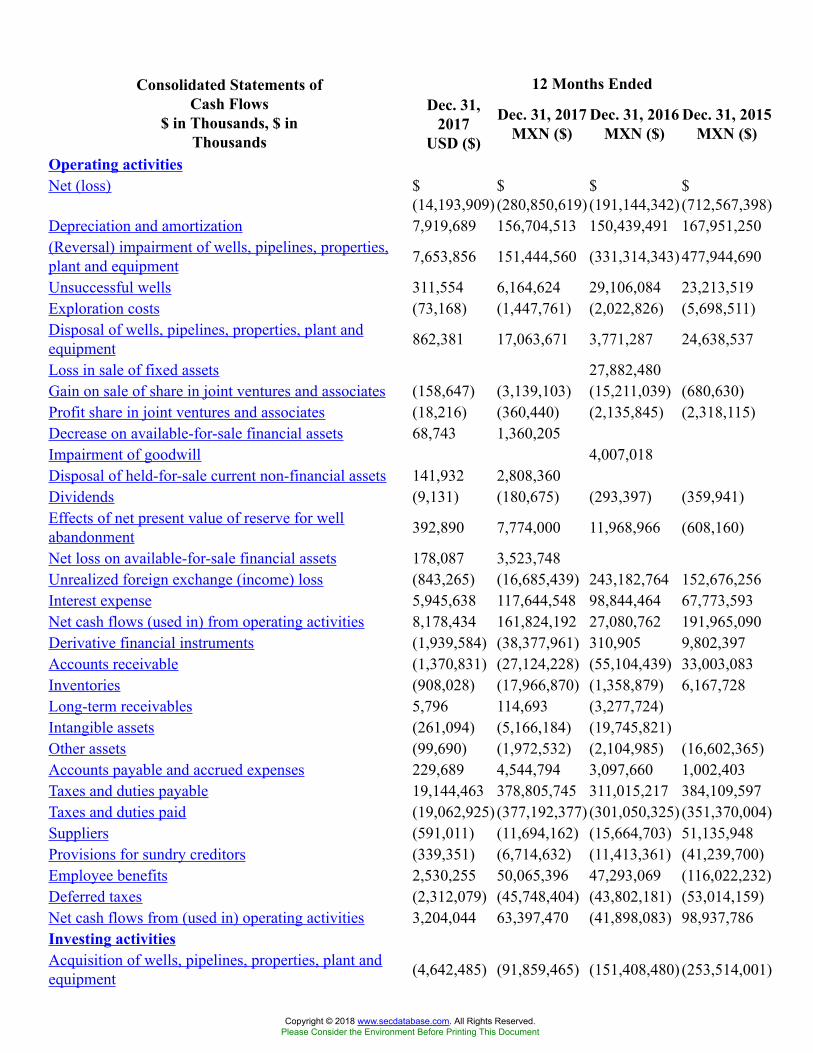
12 Months EndedConsolidated Statements ofCash Flows
$ in Thousands, $ inThousands
Dec. 31,2017
USD ($)
Dec. 31, 2017MXN ($)
Dec. 31, 2016MXN ($)
Dec. 31, 2015MXN ($)
Operating activitiesNet (loss) $
(14,193,909)$(280,850,619)
$(191,144,342)
$(712,567,398)
Depreciation and amortization 7,919,689 156,704,513 150,439,491 167,951,250(Reversal) impairment of wells, pipelines, properties,plant and equipment 7,653,856 151,444,560 (331,314,343) 477,944,690
Unsuccessful wells 311,554 6,164,624 29,106,084 23,213,519Exploration costs (73,168) (1,447,761) (2,022,826) (5,698,511)Disposal of wells, pipelines, properties, plant andequipment 862,381 17,063,671 3,771,287 24,638,537
Loss in sale of fixed assets 27,882,480Gain on sale of share in joint ventures and associates (158,647) (3,139,103) (15,211,039) (680,630)Profit share in joint ventures and associates (18,216) (360,440) (2,135,845) (2,318,115)Decrease on available-for-sale financial assets 68,743 1,360,205Impairment of goodwill 4,007,018Disposal of held-for-sale current non-financial assets 141,932 2,808,360Dividends (9,131) (180,675) (293,397) (359,941)Effects of net present value of reserve for wellabandonment 392,890 7,774,000 11,968,966 (608,160)
Net loss on available-for-sale financial assets 178,087 3,523,748Unrealized foreign exchange (income) loss (843,265) (16,685,439) 243,182,764 152,676,256Interest expense 5,945,638 117,644,548 98,844,464 67,773,593Net cash flows (used in) from operating activities 8,178,434 161,824,192 27,080,762 191,965,090Derivative financial instruments (1,939,584) (38,377,961) 310,905 9,802,397Accounts receivable (1,370,831) (27,124,228) (55,104,439) 33,003,083Inventories (908,028) (17,966,870) (1,358,879) 6,167,728Long-term receivables 5,796 114,693 (3,277,724)Intangible assets (261,094) (5,166,184) (19,745,821)Other assets (99,690) (1,972,532) (2,104,985) (16,602,365)Accounts payable and accrued expenses 229,689 4,544,794 3,097,660 1,002,403Taxes and duties payable 19,144,463 378,805,745 311,015,217 384,109,597Taxes and duties paid (19,062,925) (377,192,377) (301,050,325) (351,370,004)Suppliers (591,011) (11,694,162) (15,664,703) 51,135,948Provisions for sundry creditors (339,351) (6,714,632) (11,413,361) (41,239,700)Employee benefits 2,530,255 50,065,396 47,293,069 (116,022,232)Deferred taxes (2,312,079) (45,748,404) (43,802,181) (53,014,159)Net cash flows from (used in) operating activities 3,204,044 63,397,470 (41,898,083) 98,937,786Investing activitiesAcquisition of wells, pipelines, properties, plant andequipment (4,642,485) (91,859,465) (151,408,480) (253,514,001)
Copyright © 2018 www.secdatabase.com. All Rights Reserved.Please Consider the Environment Before Printing This Document
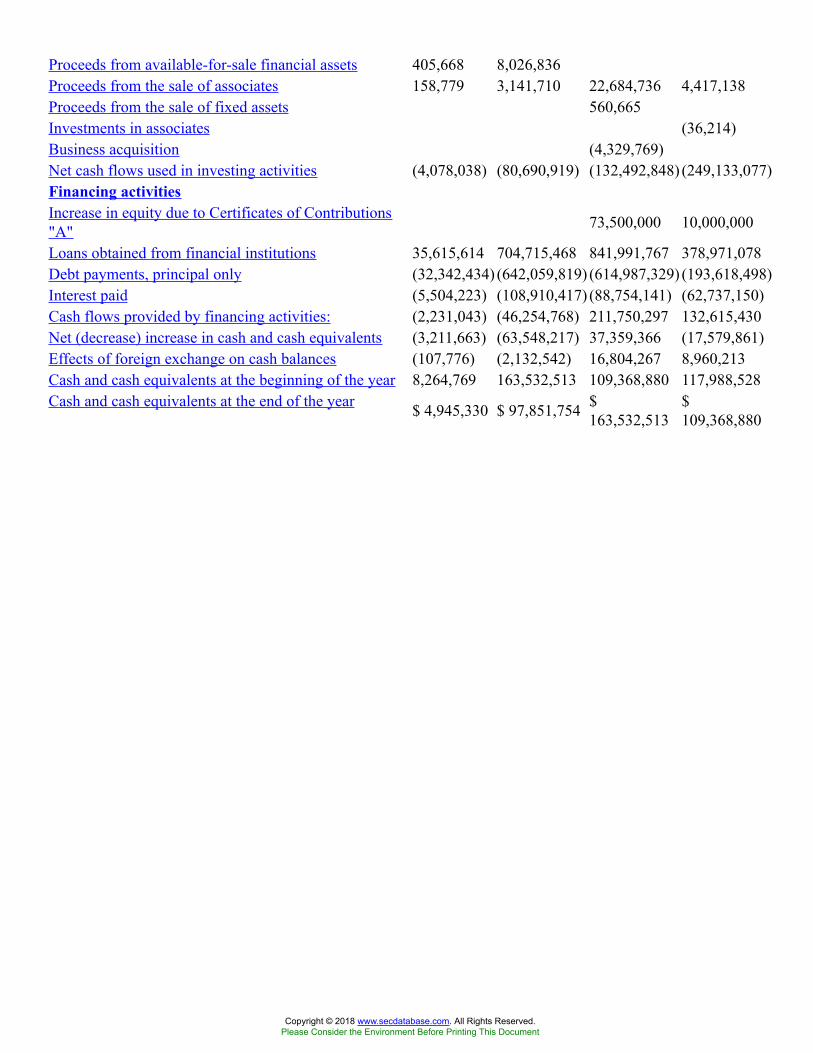
Proceeds from available-for-sale financial assets 405,668 8,026,836Proceeds from the sale of associates 158,779 3,141,710 22,684,736 4,417,138Proceeds from the sale of fixed assets 560,665Investments in associates (36,214)Business acquisition (4,329,769)Net cash flows used in investing activities (4,078,038) (80,690,919) (132,492,848) (249,133,077)Financing activitiesIncrease in equity due to Certificates of Contributions"A" 73,500,000 10,000,000
Loans obtained from financial institutions 35,615,614 704,715,468 841,991,767 378,971,078Debt payments, principal only (32,342,434) (642,059,819) (614,987,329) (193,618,498)Interest paid (5,504,223) (108,910,417) (88,754,141) (62,737,150)Cash flows provided by financing activities: (2,231,043) (46,254,768) 211,750,297 132,615,430Net (decrease) increase in cash and cash equivalents (3,211,663) (63,548,217) 37,359,366 (17,579,861)Effects of foreign exchange on cash balances (107,776) (2,132,542) 16,804,267 8,960,213Cash and cash equivalents at the beginning of the year 8,264,769 163,532,513 109,368,880 117,988,528Cash and cash equivalents at the end of the year $ 4,945,330 $ 97,851,754 $
163,532,513$109,368,880
Copyright © 2018 www.secdatabase.com. All Rights Reserved.Please Consider the Environment Before Printing This Document
12 Months EndedStructure and BusinessOperations of PetroleosMexicanos, SubsidiaryEntities and Subsidiary
Companies
Dec. 31, 2017
Text block1 [abstract]Structure and BusinessOperations of PetroleosMexicanos, Subsidiary Entitiesand Subsidiary Companies
NOTE 1. STRUCTURE AND BUSINESS OPERATIONS OF PETRÓLEOSMEXICANOS, SUBSIDIARY ENTITIES AND SUBSIDIARY COMPANIES
Petróleos Mexicanos was created by a decree issued by the Mexican Congress on June 7,1938. The decree was published in the Diario Oficial de la Federación (“Official Gazette of theFederation”) on July 20, 1938 and came into effect on that date.
On December 20, 2013, the Decreto por el que se reforman y adicionan diversasdisposiciones de la Constitución Política de los Estados Unidos Mexicanos, en Materia deEnergía (Decree that amends and supplements various provisions of the Mexican Constitutionrelating to energy matters), was published in the Official Gazette of the Federation and came intoeffect on December 21, 2013 (the “Energy Reform Decree”). In accordance with the EnergyReform Decree, the Mexican Government will carry out the exploration and extraction ofhydrocarbons in the United Mexican States (“Mexico”) through assignments to productive state-owned companies, as well as through agreements with productive state-owned companies andwith other companies.
As part of the secondary legislation enacted in accordance with the Energy Reform Decree,on August 11, 2014, the Ley de Petróleos Mexicanos (the “Petróleos Mexicanos Law”) waspublished in the Official Gazette of the Federation. The Petróleos Mexicanos Law becameeffective on October 7, 2014, except for certain provisions. On December 2, 2014, the Secretaríade Energía (“Ministry of Energy”) published in the Official Gazette of the Federation thedeclaration pursuant to which the special regime governing Petróleos Mexicanos’ activitiesrelating to productive state-owned subsidiaries, affiliates, compensation, assets, administrativeliabilities, state dividend, budget and debt levels came into effect. On June 10, 2015 theDisposiciones Generales de Contratación para Petróleos Mexicanos y sus Empresas ProductivasSubsidiarias (General Contracting Provisions for Petróleos Mexicanos and its productive state-owned subsidiaries) was published in the Official Gazette of the Federation and thereafter thespecial regime for acquisitions, leases, services and public works matters came into effect.
Once the Petróleos Mexicanos Law came into effect, Petróleos Mexicanos was transformedfrom a decentralized public entity to a productive state-owned company. Petróleos Mexicanos is alegal entity empowered to own property and carry on business in its own name with the purposeof carrying out exploration and extraction of crude oil and other hydrocarbons in Mexico. Inaddition, Petróleos Mexicanos performs activities related to refining, gas processing andengineering and research projects to create economic value and to increase the income of theMexican Government, as its owner, while adhering to principles of equity and social andenvironmental responsibility.
The Subsidiary Entities, Pemex Exploración y Producción (Pemex Exploration andProduction), Pemex Transformación Industrial (Pemex Industrial Transformation), PemexPerforación y Servicios (Pemex Drilling and Services), Pemex Logística (Pemex Logistics),Pemex Cogeneración y Servicios (Pemex Cogeneration and Services), PemexFertilizantes (Pemex Fertilizers) and Pemex Etileno (Pemex Ethylene), are productive state-owned subsidiaries empowered to own property and carry on business in their own name, subjectto the direction and coordination of Petróleos Mexicanos (the “Subsidiary Entities”).
The Subsidiary Entities of Petróleos Mexicanos prior to the Corporate Reorganization(defined below) were Pemex-Exploración y Producción, Pemex-Refinación (Pemex-Refining),
Copyright © 2018 www.secdatabase.com. All Rights Reserved.Please Consider the Environment Before Printing This Document
Pemex-Gas and Petroquímica Básica (Pemex-Gas and Basic Petrochemicals) and Pemex-Petroquímica (Pemex-Petrochemicals), which were decentralized public entities with a technical,industrial and commercial nature with their own corporate identity and equity, with the legalauthority to own property and conduct business in their own names, and were 100% owned byPetróleos Mexicanos and controlled by the Mexican Government; they had been consolidatedinto and had the characteristics of subsidiaries of Petróleos Mexicanos.
The Board of Directors of Petróleos Mexicanos, in its meeting held on November 18, 2014,approved the Corporate Reorganization proposed by the Chief Executive Officer of PetróleosMexicanos.
Pursuant to the corporate reorganization, the existing four Subsidiary Entities weretransformed into two new productive state-owned subsidiaries, which have assumed all of therights and obligations of the existing Subsidiary Entities (the “Corporate Reorganization”).Pemex-Exploration and Production was transformed into Pemex Exploration and Production, aproductive state-owned subsidiary, and Pemex-Refining, Pemex-Gas and Basic Petrochemicalsand Pemex-Petrochemicals were transformed into the productive state-owned subsidiary PemexIndustrial Transformation.
The Board of Directors of Petróleos Mexicanos also approved the creation of the followingnew Subsidiary Entities: Pemex Drilling and Services, Pemex Logistics, Pemex Cogeneration andServices, Pemex Fertilizers and Pemex Ethylene. Each of these productive state-ownedsubsidiaries may be transformed into an affiliate of Petróleos Mexicanos if certain conditions setforth in the Petróleos Mexicanos Law are met.
On March 27, 2015, the Board of Directors of Petróleos Mexicanos approved the EstatutoOrgánico de Petróleos Mexicanos (Organic Statute of Petróleos Mexicanos) and the acuerdos decreación (creation resolutions) of each productive state-owned subsidiary. The SubsidiaryEntities, and their primary purposes, are as follows:
• Pemex Exploration and Production: This entity is in charge of exploration and extractionof crude oil and solid, liquid or gaseous hydrocarbons in Mexico, in the exclusiveeconomic zone of Mexico and abroad.
• Pemex Industrial Transformation: This entity performs activities related to refining,processing, importing, exporting, trading and the sale of hydrocarbons.
• Pemex Drilling and Services: This entity performs drilling services and repair andservices of wells.
• Pemex Logistics: This entity provides transportation, storage and related services forcrude oil, petroleum products and petrochemicals to PEMEX (as defined below) andother companies, through pipelines and maritime and terrestrial means, and providesguard and management services.
• Pemex Cogeneration and Services: This entity generates, supplies and trades electric andthermal energy, including but not limited to the energy and thermal power produced inpower plants and cogeneration plants, as well as performing technical and managementservices related to these activities to PEMEX and other companies, by itself or throughcompanies in which it participates directly or indirectly.
• Pemex Fertilizers: This entity produces, distributes and commercializes ammonia,fertilizers and its derivatives, as well as provides related services.
• Pemex Ethylene: This entity commercializes, distributes and trades methane, ethane andpropylene, directly or through others.
On April 28, 2015 the creation resolutions of the seven productive state-owned subsidiarieswere published in the Official Gazette of the Federation. Each creation resolution included aprovision establishing that the creation resolution would come into effect once the required
Copyright © 2018 www.secdatabase.com. All Rights Reserved.Please Consider the Environment Before Printing This Document
administrative procedures to start operations were in place and the Board of Directors ofPetróleos Mexicanos issued and published a statement related to each creation resolution in theOfficial Gazette of the Federation.
On May 29, 2015 the statements related to the creation resolution of the productive state-owned subsidiary Pemex Exploration and Production and the productive state-owned subsidiaryPemex Cogeneration and Services issued by the Board of Directors of Petróleos Mexicanos werepublished in the Official Gazette of the Federation and, accordingly, these creation resolutionscame into effect on June 1, 2015. On December 29, 2015 and May 12, 2016, modifications to thecreation resolution of the productive state-owned subsidiary Pemex Exploration and Productionwere published in the Official Gazette of the Federation and became effective that same date,respectively.
On July 31, 2015, the statements related to the creation resolution of the productive state-owned subsidiary Pemex Drilling and Services, the productive state-owned subsidiary PemexFertilizers and the productive state-owned subsidiary Pemex Ethylene issued by the Board ofDirectors of Petróleos Mexicanos were published in the Official Gazette of the Federation and,accordingly, these creation resolutions came into effect on August 1, 2015.
On October 1, 2015, the statement related to the creation resolution of the productive state-owned subsidiary Pemex Logistics issued by the Board of Directors of Petróleos Mexicanos waspublished in the Official Gazette of the Federation and, accordingly, these creation resolutionscame into effect on October 1, 2015.
On October 6, 2015, the statement related to the creation resolution of the productive state-owned subsidiary Pemex Industrial Transformation issued by the Board of Directors of PetróleosMexicanos was published in the Official Gazette of the Federation and, accordingly, thesecreation resolutions came into effect on November 1, 2015.
As of the date of this report, all of the creation resolutions of the productive state-ownedsubsidiaries have come into effect.
The principal distinction between the Subsidiary Entities and the Subsidiary Companies (asdefined below) is that the Subsidiary Entities are productive state-owned entities, whereas theSubsidiary Companies are affiliate companies that were formed in accordance with the applicablelaws of each of the respective jurisdictions in which they were incorporated. The “SubsidiaryCompanies” are defined as those companies which are controlled, directly or indirectly, byPetróleos Mexicanos (see Note 3 a).
“Associates,” as used herein, means those companies in which Petróleos Mexicanos does nothave effective control (see Note 3 a).
Petróleos Mexicanos, the Subsidiary Entities and the Subsidiary Companies are referred tocollectively herein as “PEMEX.”
PEMEX’s address and its principal place of business is: Av. Marina Nacional No. 329, Col.Verónica Anzures, Delegación Miguel Hidalgo, 11300 Ciudad de México, México.
Copyright © 2018 www.secdatabase.com. All Rights Reserved.Please Consider the Environment Before Printing This Document
12 Months EndedBasis of Preparation Dec. 31, 2017Text block1 [abstract]Basis of Preparation NOTE 2. BASIS OF PREPARATION
a. Statement of compliance
PEMEX prepared its consolidated financial statements as of December 31, 2017 and 2016,and for the years ended December 31, 2017, 2016 and 2015, in accordance with InternationalFinancial Reporting Standards (“IFRS”) as issued by the International Accounting StandardsBoard (“IASB”).
On April 27, 2018, these consolidated financial statements under IFRS and the notes heretowere authorized for issuance by the following officers: Mr. Carlos Alberto Treviño Medina, ChiefExecutive Officer, Mr. David Ruelas Rodríguez, Chief Financial Officer, Mr. Manuel SalvadorCruz Flores, Deputy Director of Accounting and Tax Matters, and Mr. Oscar René OrozcoPiliado, Associate Managing Director of Accounting.
These consolidated financial statements and the notes hereto as of December 31, 2017 wereapproved by the Board of Petróleos Mexicanos on April 17, 2018 with prior approval from theAudit Committee of the report of the Independent Registered Public Accountant, pursuant to theterms of Article 13 Fraction VI of the Petróleos Mexicanos Law, Article 104 Fraction III,paragraph a, of the Ley del Mercado de Valores (Securities Market Law), and of Article 33Fraction I, paragraph a, section 3 and Article 78 of the Disposiciones de carácter generalaplicables a las emisoras de valores y a otros participantes del mercado de valores (Generalprovisions applicable to securities´ issuers and other participants of the securities market).
b. Basis of measurement and going concern
These consolidated financial statements have been prepared using the historical cost basismethod, except where it is indicated that certain items have been measured using the fair valuemodel, amortized cost, present value or value in use. The principal items measured at fair valueare derivative financial instruments (“DFIs”); the principal item measured at amortized cost isdebt, the principal item measured at present value is the provision for employee benefits andsome components of wells, pipelines, properties, plant and equipment are measured at value inuse.
Going concern
The consolidated financial statements have been prepared on a going concern basis, whichassumes that PEMEX can meet its payment obligations.
For the years ended December 31, 2017 and 2016, PEMEX recognized a net loss of Ps.280,850,619 and Ps. 191,144,342, respectively, caused mainly by sustained low international oilprices, the high tax burden applicable to the industry, the depreciation of the peso relative to theU.S. dollar and an impairment of non-financial assets. In addition, as of December 31, 2017 and2016, PEMEX had a negative equity of Ps. 1,502,352,385 and Ps. 1,233,008,147, respectively; anegative working capital of Ps. 25,600,895 and Ps. 68,373,963, respectively; and net cash flowsused in operating activities of Ps. 41,898,083 for the year ended December 31, 2016. However,net cash flows from operating activities were Ps. 63,397,470, for the year ended December 31,2017.
PEMEX believes net cash flows from its operating and financing activities, including itsavailability of lines of credit with certain banks, will be sufficient to meet its working capitalneeds, debt service and capital expenditure requirements and maintain its financial strength andflexibility in the twelve months following the date of issuance of these consolidated financialstatements.
Copyright © 2018 www.secdatabase.com. All Rights Reserved.Please Consider the Environment Before Printing This Document
PEMEX continues to implement actions and business strategies that enable it to operatecompetitively and efficiently and take advantage of benefits of the Energy Reform Decree, asfurther described below:
• 2017-2021 Business Plan: On November 3, 2016, PEMEX announced its business planfor the five-year period from 2017 through 2021, which is designed to improve cashflows, reduce net indebtedness, strengthen its financial balance, reduce financial losses inits national refining system and plan for continued cost-cutting and administrativediscipline, as well as the establishment of additional strategic alliances and partnerships,including an intensive farm-out program. The business plan was prepared conservativelyand does not include additional income from the disposal of assets.
• Plan for 2017: The 2017 actions under the business plan established certain objectiveswith respect to its Subsidiary Entities that were implemented as follows:
• Pemex Exploration and Production’s investments focused on the most profitableprojects, as well as on farm-outs and other partnerships aimed at increasinghydrocarbon production.
• On March 3, 2017, Pemex Exploration and Production signed the first farm-outproject with BHP-Billiton for the Trion project and entered into a partnershipwith Chevron Energía de Mexico, S. de R.L. de C.V. (“Chevron”) and INPEXCorporation (“INPEX”) for the rights to block 3 North of the Cinturón PlegadoPerdido in the Gulf of Mexico, both in deep waters.
• On May 2, 2017, Pemex Exploration and Production entered into an agreementwith the Comisión Nacional de Hidrocarburos, (National HydrocarbonCommission, or “NHC”) for crude oil drilling under the shared shallow-waterproduction scheme for Ek-Balam field in the Campeche Basin.
• On May 30, 2017, Petróleos Mexicanos obtained approval from the NHC for theassignment of a new area that includes Chachiquin, located in the CinturónPlegado Perdido region in the deep waters of the Gulf of Mexico south of themaritime border with the U.S., and an area southwest of the Nobilis field.
• Similarly, on June 19, 2017, Pemex Exploration and Production was awardedexploration and production fields bidding process (“Rounds”) in Round 2.1 therights to develop two blocks in shallow waters: Block 2, in partnership DEADeutsche Erdoel Ag (“DEA”) and Block B in partnership with Ecopetrol GlobalEnergy, S.L.U. (“Ecopetrol”). On September 25, 2017, Pemex Exploration andProduction signed the corresponding contracts for the exploration and extractionof hydrocarbons with DEA and Ecopetrol.
• On October 4, 2017, Pemex Exploration and Production finalized two farm-outsfor the optimization of the development of the onshore fields of Cárdenas-Moraand Ogarrio, with Cheiron Holdings Limited (“Cheiron”) and DEA companies,respectively.
• On November 3, 2017, Petróleos Mexicanos announced the discovery of onshorelight crude oil and gas reservoirs at the Ixachi-1 well in the state of Veracruz,Mexico, which PEMEX believes may contain over 1,500 million barrels of oilequivalent in place, representing 3P reserves of around 350 million barrels of oilequivalent. PEMEX believes that this discovery represents its largest onshorediscovery in 15 years and that production can be accelerated due to the proximityof the reservoirs to existing infrastructure and to the Sistema Nacional deGasoductos (National Gas Pipeline System.)
• On December 18, 2017, Pemex Exploration and Production and PetrofacMéxico, S.A. de C.V., together with the NHC, signed the exploration andextraction contract for the onshore fields Santuario and El Golpe, which arelocated in the state of Tabasco.
Copyright © 2018 www.secdatabase.com. All Rights Reserved.Please Consider the Environment Before Printing This Document
• Pemex Industrial Transformation worked in partnerships for auxiliary servicesand the reconfiguration of certain refineries. On September 1, 2017, PemexIndustrial Transformation executed the auxiliary services contract with AirLiquide México. S.A. de R.L. de C.V. for ensuring and efficient hydrogen supplyfor the Miguel Hidalgo Refinery in Tula, Hidalgo.
• In September, 2017, Pemex Industrial Transformation began the selectionprocess for partners for the hydrogen supply projects for the Héctor R. Lara SosaRefinery in Cadereyta, Nuevo León and the Francisco I. Madero Refinery inCiudad Madero, Tamaulipas. In April 2018, Pemex Industrial Transformationentered into a long-term agreement with the German company Linde AG for thesupply of hydrogen to its Madero refinery.
• Pemex Logistics is being transformed from a company designed to ensure thatPetróleos Mexicanos and its subsidiaries are properly supplied to one thatprovides profitable and competitive services to multiple customers. On May 2,2017, PEMEX announced the results of the first Open Season Public Auctionheld by Pemex Logistics whereby, on July 18, 2017, PEMEX signed thecontracts with Andeavor (formerly Tesoro Corporation). Under the contracts,Andeavor may use PEMEX’s pipeline transportation and storage system in thenorthwest of Mexico. On December 18, 2017, the Comisión Reguladora deEnergía (the Energy Regulatory Commission, or “ERC”) approved Phase 2 ofthe Open Season.
• PEMEX’s business plan also describes its goal to increase the profitability ofPemex Fertilizers, Pemex Ethylene and Pemex Drilling and Services throughservice contracts and partnerships for the modernization of their facilities. OnJuly 6, 2017, Pemex Ethylene, successfully concluded an e-auction to allocatequantities of ethylene oxide, in which 100% of the volume available was placedat a market price and was higher than the historical price.
• Plan for 2018: The 2018 actions under the business plan also set out certain objectivesthat PEMEX expects to achieve with respect to its Subsidiary Entities as follows:
• On January 31, 2018, PEMEX successfully participated in bidding Round 2.4,and was awarded the assignment of four blocks, all of which are located in deepwaters in the Gulf of Mexico. Pemex Exploration and Production and RoyalDutch Shell PLC (“Shell”) were awarded Block 2 of the Perdido area. Theconsortium formed by Pemex Exploration and Production, Chevron and INPEXwas awarded area 22 of the Cuenca Salina province. Finally, PEMEX wasassigned on an individual basis, Block 5 in the Perdido area and area 18 of theMexican Range province.
• On March 27, 2018, Petróleos Mexicanos successfully participated in biddingRound 3.1 of the NHC tenders, and was awarded seven contractual areas inshallow waters, six of them in a consortium and one on an individual basis.Pemex Exploration and Production won four blocks in the Southeast Basins: twoin consortium with French Total S.A., one with Shell and one on an individualbasis, as well as three blocks corresponding to the province of Tampico-Misantla-Veracruz: two in partnership with Compañía Española de Petróleos(“CEPSA”) and DEA and one more in partnership with CEPSA.
These contracts are intended to contribute to increase the reserves andhydrocarbon production with the respective economic benefits.
Copyright © 2018 www.secdatabase.com. All Rights Reserved.Please Consider the Environment Before Printing This Document
• Pemex Exploration and Production will focus on maintaining production levelsand developing farm-outs and associations with the aim of increasing itsoperations and, with time, the production of hydrocarbons in the mid-term.Pemex Exploration and Production will also accelerate the migration ofintegrated E&P contracts and financed public works contracts to Exploration andExtraction Contracts (“EEC”) and will focus on the rehabilitation andreincorporation activities of wells with production possibilities. In 2018, PemexExploration and Production will continue to promote actions that encourageefficiency and optimize costs.
• In order to continue to take advantage of the benefits of the Energy Reform andto ensure the economic sustainability of PEMEX, in 2018 and in the up-comingyears, Pemex Exploration and Production will be focusing its efforts on thefollowing strategies: (1) establishing a model of exploration that allows it toachieve the objective of incorporating and increasing proved reserves;(2) developing a master plan for the development of shales; (3) containing andreversing declines in the production of wells through reactivation andmaintenance activities performed on closed wells through integrated services;(4) continuing with farm-outs to develop complex fields and leverage third-partyresources; (5) establishing schemes, including strategic partnerships andalliances, to attract additional investment; (6) increasing revenues fromhydrocarbons trading; and (7) strengthening operational efficiency and costcontrol.
• Pemex Industrial Transformation will continue to perform reconfiguration andauxiliary services for its refineries and to focus on the following strategies:(1) keeping its facilities safe and reliable, (2) improving the financial balance,(3) maintaining a market share in Mexico of over 65%; and (4) eliminatingdebts, which will help to improve its refining margin.
In addition to taking advantage of new business opportunities and arrangements provided bythe Energy Reform, such as farm-outs, PEMEX also continues to take certain specific measuresto improve its financial position, including the following:
• 2016 Budget Adjustment: In 2017, PEMEX developed actions from its Plan de AjustePresupuestal 2016 (“2016 Budget Adjustment Plan”) to reduce expenses which wereincluded in its 2017-2021 Business Plan.
• Pension Reform. As of January 1, 2016, new employees are entitled to receive a definedcontribution pension plan, pursuant to which both PEMEX and its employees contributeto each employee’s individual account, in contrast to the existing defined benefit pensionplan, pursuant to which only PEMEX contributes. Additionally, in August 2017, PEMEXbegan the process of inviting existing employees to migrate from a defined benefit plan toa defined contribution plan, which will allow Pemex to decrease its employee benefitsservice cost and its employee benefits liability.
• Asset Sales. PEMEX continues to evaluate the divestiture of non-essential assets to obtainworking capital and to focus on those activities considered as the most profitable. Theseprojects include:
• On October 5, 2017, PEMEX announced the divestiture of its participation in theRamones II Norte gas pipeline (50% interest of Pemex Industrial Transformationin Ductos y Energéticos del Norte, S. de R.L. de C.V., and 5% indirect interest ofPemex Industrial Transformation TAG Norte Holding, S. de R.L. de C.V.). OnNovember 10, 2017, the Comisión Federal de Competencia Económica (theFederal Commission for Financial Competence) authorized the divestiture inDuctos y Energéticos del Norte, S. de R.L. de C.V., closing the operation onNovember 16, 2017. PEMEX estimates that TAG Norte Holding, S. de R.L. deC.V. divestiture will conclude in the first semester of 2018.
Copyright © 2018 www.secdatabase.com. All Rights Reserved.Please Consider the Environment Before Printing This Document
• Decreased Debt Financing: PEMEX decreased its financing during 2017 from Ps.231,618,067 of net indebtedness in 2016 to a net indebtedness of Ps. 72,412,672 in 2017.In addition, PEMEX developed liability management transactions in accordance withmarket conditions and in order to improve its financial profile, with longer due dates andbetter interest rates, as described in Note 15 to these consolidated financial statements. Asa result of this strategy, Standard & Poor’s and Fitch increased PEMEX’s ratings outlookfrom negative to stable. For the fiscal year of 2018, the Federal Income Law applicable toPEMEX authorized for Petróleos Mexicanos and its Subsidiary Entities an internal netdebt up to Ps. 30,000,000 and an external net debt up to U.S.$ 6,182,800. In addition,PEMEX will continue to assess opportunities for liability management in accordance withmarket conditions. In addition, as of December 31, 2017, PEMEX has five syndicatedlines of credit to manage its liquidity for U.S.$6,700,000 and Ps.23,500,000.
• New Budget: On July 14, 2017, the Board of Directors of Petróleos Mexicanos approveda proposal for the annual consolidated budget of Petróleos Mexicanos and its SubsidiariesEntities for 2018, which was subsequently approved by the Chamber of Deputies onNovember 9, 2017.
The consolidated annual budget of Petróleos Mexicanos and its Subsidiary Entities for2018 is approximately Ps. 391,946,000, a 1.7% increase as compared to the Ps.385,211,257 consolidated annual adjusted budget for 2017.
• The structural changes arising from the Energy Reform, and the actions taken bymanagement are aimed at ensuring the continuity of PEMEX’s operations, reducing costs,generating more revenue and operating more efficiently.
• In 2017, PEMEX entered into a crude oil hedge program to partially protect its cash flowsfrom decreases in the price of Mexican crude oil.
Petróleos Mexicanos and its Subsidiary Entities are not subject to the Ley de ConcursosMercantiles (the Bankruptcy Law) and none of PEMEX’s existing financing agreements includeany clause that could lead to the demand for immediate payment of the respective debt due tohaving negative equity.
PEMEX prepared its consolidated financial statements as of December 31, 2017 and 2016 ona going concern basis. There are certain conditions that have generated important uncertainty andsignificant doubts concerning the entity’s ability to continue operating, including recurring netlosses, negative working capital and negative equity. These financial statements do not containany adjustments that would be required if they were not prepared on a going concern basis.
c. Functional and reporting currency and translation of foreign currency operations
These consolidated financial statements are presented in Mexican pesos, which is bothPEMEX’s functional and reporting currency, due to the following:
i. the economic environment in which PEMEX operates is Mexico, where the legalcurrency is the Mexican peso;
ii. Petróleos Mexicanos and its Subsidiary Entities have budgetary autonomy, subject only tomaintaining the financial balance (the difference between income and total net spending,including the financial cost of the public debt of the Mexican Government and the entitiesdirectly controlled by the Mexican Government) and the spending cap of personnelservices proposed by SHCP and approved by the Mexican Congress, in Mexican pesos.
iii. Employee benefits provision was approximately 35% and 34% of PEMEX’s totalliabilities as of December 31, 2017 and 2016, respectively. This provision is computed,denominated and payable in Mexican pesos; and
iv. cash flows for payment of general expenses, taxes and duties are realized in Mexicanpesos.
Copyright © 2018 www.secdatabase.com. All Rights Reserved.Please Consider the Environment Before Printing This Document

Although the sales prices of several products are based on international U.S. dollar-indices,final domestic selling prices are governed by the economic and financial policies established bythe Mexican Government. Accordingly, cash flows from domestic sales are generated andreceived in Mexican pesos.
Mexico’s monetary policy regulator, the Banco de México, requires that MexicanGovernment entities other than financial entities sell their foreign currency to the Banco deMéxico in accordance with its terms, receiving Mexican pesos in exchange, which is the currencyof legal tender in Mexico.
Translation of financial statements of foreign operations
The financial statements of foreign subsidiaries and associates are translated into thereporting currency by first identifying if the functional currency is different from the currency forrecording the foreign operations, and, if so, the recording currency is translated into the functionalcurrency and then into the reporting currency using the year-end exchange rate of each period forassets and liabilities reported in the consolidated statements of financial position; the historicalexchange rate at the date of the transaction for equity items; and the weighted average exchangerate of the year for income and expenses reported in the statement of comprehensive income.
d. Terms definition
References in these consolidated financial statements and the related notes to “pesos” or “Ps.”refers to Mexican pesos, “U.S. dollars” or “US$” refers to dollars of the United States ofAmerica, “yen” or “¥” refers to Japanese yen, “euro” or “€” refers to the legal currency of theEuropean Economic and Monetary Union, “Pounds sterling” or “£” refers to the legal currency ofthe United Kingdom, “Swiss francs” or “CHF” refers to the legal currency of the SwissConfederation, “Canadian dollars” or “CAD” refers to the legal currency of Canada and“Australian dollars” or “AUD” refers to the legal currency of Australia. Figures in all currenciesare presented in thousands of the relevant currency unit, except exchange rates and product andshare prices.
e. Convenience translations
These consolidated financial statements are presented in Mexican pesos (reporting currency),which is the same as the recording currency and the functional currency of PEMEX. The U.S.dollar amounts shown in the consolidated statements of financial position, the consolidatedstatements of comprehensive income, the consolidated statements of changes in equity (deficit)and the consolidated statements of cash flows have been included solely for the convenience ofthe reader and are unaudited. Such amounts have been translated from amounts in pesos, as amatter of arithmetic computation only, at the exchange rate for the settlement of obligations inforeign currencies provided by Banco de México and SHCP at December 31, 2017 ofPs. 19.7867 per U.S. dollar. Translations herein should not be construed as a representation thatthe peso amounts have been or could be converted into U.S. dollars at the foregoing or any otherrate.
Copyright © 2018 www.secdatabase.com. All Rights Reserved.Please Consider the Environment Before Printing This Document
12 Months EndedSignificant AccountingPolicies Dec. 31, 2017
Text block1 [abstract]Significant AccountingPolicies
NOTE 3. Significant accounting policies
The preparation of the consolidated financial statements in accordance with IFRS requires theuse of estimates and assumptions made by PEMEX’s management that affect the recordedamounts of assets and liabilities and the disclosures of contingent assets and liabilities as of thedate of these consolidated financial statements, as well as the recorded amounts of income, costsand expenses during the year.
Significant estimates and underlying assumptions are reviewed, and the effects of suchrevisions are recognized in the years in which any estimates are revised and in any future periodsaffected by such revision.
Information about estimates, assumptions and critical accounting policies that have the mostsignificant effects on the amounts recognized in the consolidated financial statements aredescribed in the following notes:
• Note 3(e) Financial instruments—determination of fair values
• Note 3(h) Wells, pipelines, properties, plant and equipment, including the successfulefforts method—economic feasibility determining to capitalize assets
• Note 3(j) Impairment of non-financial assets—cash flow estimates and discount ratesdetermination
• Note 3(l) Provisions—environmental liabilities and retirement of assets
• Note 3(m) Employee benefits—actuarial assumptions and hypothesis
• Note 3(n) Income taxes and duties—assessment of deferred income tax asset recovery
• Note 3(p) Contingencies—assessment of likelihood of contingency
Actual results could differ from those estimates and assumptions.
Below is a summary of the principal accounting policies, which have been consistentlyapplied to each of the years presented and followed by PEMEX in the preparation of itsconsolidated financial statements:
a. Basis of consolidation
The consolidated financial statements include those of Petróleos Mexicanos, the SubsidiaryEntities and the Subsidiary Companies. All intercompany balances and transactions of theconsolidated companies; income and expenses, as well as unrealized profits and losses resultingfrom operations between them have been eliminated in the preparation of the consolidatedfinancial statements pursuant to IFRS 10, “Consolidated Financial Statements” (“IFRS 10”).
Unrealized gains arising from transactions with entities whose investment is accounted forusing the equity method are eliminated against the investment to the extent of PEMEX’sparticipation in such entities. Unrealized losses are eliminated in the same way as unrealizedgains but only to the extent that there is no evidence of impairment of the investment. If suchevidence exists, PEMEX recognizes it in its consolidated financial statements.
Investment in subsidiaries
The Subsidiary Entities and Subsidiary Companies are consolidated from the date that controlcommences until the date that control ceases.
Copyright © 2018 www.secdatabase.com. All Rights Reserved.Please Consider the Environment Before Printing This Document
Petróleos Mexicanos controls a subsidiary when it is exposed to or has rights to variablereturns from the company and has the ability to affect those returns through its power over thecompany.
The financial statements of the Subsidiary Entities and Subsidiary Companies have beenprepared based on the same period of Petróleos Mexicanos’ consolidated financial statementsapplying the same accounting policies.
For more information about Subsidiary Companies, see Note 4.
Investments in associates and joint arrangements
Associates are those entities in which PEMEX has significant influence but not the power tocontrol financial and operational decisions. It is presumed that there is significant influence whenPEMEX owns directly or indirectly between 20% and 50% of voting rights in another entity.
Joint arrangements are those arrangements whereby two or more parties have joint control ofan arrangement. A joint arrangement is either a joint venture, where both of the parties haverights to the net assets of the arrangements, or a joint operation, where the parties have both rightsto the assets, and obligations for the liabilities relating to the arrangements.
Investments in associates and joint ventures are recognized based on the equity method andrecorded initially at cost, including any goodwill identified on acquisition. With respect to jointoperations, the assets, liabilities, income and expenses are recognized in relation to the share ofeach party and in accordance with the applicable IFRS for each of those items. The investmentcost includes transaction costs.
These consolidated financial statements include the proportion of gains, losses and othercomprehensive income corresponding to PEMEX’s share in each investee, once these items areadjusted to align with the accounting policies of PEMEX, from the date that significant influenceand joint control begins to the date that such influence or joint control ceases.
When the value of the share of losses exceeds the value of PEMEX’s investment in anassociate or joint venture, the carrying value of the investment, including any long-terminvestment, is reduced to zero and PEMEX ceases to recognize additional losses, except in caseswhere PEMEX is liable for obligations incurred by those associates and joint ventures.
For more information about associates and joint arrangements, see Note 11.
Non-controlling interests
The equity interests of third parties who do not have a controlling interest in the equity orcomprehensive result of subsidiaries of PEMEX are presented in the consolidated statements offinancial position, the consolidated statements of changes in equity (deficit) as “non-controllinginterests” and as “net income and comprehensive income for the period, attributable tonon-controlling interests,” in the consolidated statements of comprehensive income.
Changes in a parent’s ownership interest in a subsidiary that do not result in a loss of controlare accounted for as equity transactions. In such circumstances, the carrying amounts of thecontrolling and non-controlling interests shall be adjusted to reflect the changes in their relativeinterests in the subsidiary.
Dividends in cash and assets other than cash
A liability for distributions of dividends in cash and non-cash assets to third parties isrecognized when the distribution is authorized by the Board of Directors. The correspondingamount is recognized directly in equity.
Copyright © 2018 www.secdatabase.com. All Rights Reserved.Please Consider the Environment Before Printing This Document

Distributions of dividends in non-cash assets are measured at the fair value of the assets to bedistributed. Changes relating to these measurements of the fair value, between the date on whichthe distribution is declared and the date when the assets are transferred, are recognized directly inequity.
When distributing non-cash assets, any difference between the carrying amount of theliability for distribution of dividends and the carrying amount of the assets distributed isrecognized in the consolidated statements of comprehensive income.
b. Business combinations and goodwill
Business combinations are accounted for using the acquisition method. The cost of anacquisition is measured as the aggregate of the consideration transferred, measured as theacquisition date fair value, and the amount of any non-controlling interest in the acquiree.
When PEMEX acquires a business, it assesses the acquired assets and liabilities in order toappropriately classify and designate each, taking into account the contractual terms, economiccircumstances and other pertinent conditions as of the date of the acquisition. This includes theseparation of embedded derivatives in host contractors by the acquiree. Acquired petroleumreserves and resources that can be reliably measured are recognized separately in the assessmentof fair values on acquisition. Other potential reserves and rights, for which fair values cannot bereliably measured, are not recognized separately, but instead are subsumed in goodwill.
For business combinations achieved in stages, any previously held equity interest is measuredat its acquisition date fair value, and any resulting gain or loss is recognized in income or loss orother comprehensive income.
Any contingent consideration to be transferred by the acquirer will be recognized at fair valueon the acquisition date. Contingent consideration classified as an asset or liability that is afinancial instrument and within the scope of IAS 39 “Financial instruments: Recognition andMeasurement” is measured at fair value, with changes in fair value recognized in income or lossor other comprehensive income. If contingent consideration is not with the scope of IAS 39, it ismeasured in accordance with the appropriate IFRS requirement. Contingent consideration that isclassified as equity is not remeasured, and subsequent settlement is accounted for within equity.
Goodwill, which is initially measured at cost, is the excess of the aggregate of theconsideration transferred and the amount recognized for non-controlling interest over the fairvalue of the identifiable net assets acquired and liabilities assumed. If the fair value of the netasset acquired is greater than the aggregate consideration transferred (bargain purchase), beforerecognizing a gain, PEMEX reassesses whether it has correctly identified all of the assetsacquired and all of the liabilities assumed and reviews the procedures used to measure theamounts to be recognized at the acquisition date. If the assessment still results in an excess of thefair value of net assets acquired over the aggregate consideration transferred, then the gain isrecognized in the consolidated statements of comprehensive income.
After initial recognition, goodwill is measured at cost less any accumulated impairmentlosses. For the purpose of impairment testing, goodwill acquired in a business combination is,from the acquisition date, allocated to each cash generating unit that is expected to benefit fromthe combination, irrespective of whether other assets or liabilities of the acquiree are assigned tothose units.
When goodwill is allocated to a cash generating unit and certain of the operations in that unitare disposed of, the goodwill associated with the disposed operation is included in the carryingamount of the operation when determining the gain or loss on disposal. Goodwill disposed inthese circumstances is measured based on the relative values of the disposed operation and theportion of the cash generating unit retained.
Copyright © 2018 www.secdatabase.com. All Rights Reserved.Please Consider the Environment Before Printing This Document
c. Transactions in foreign currency
In accordance with IAS 21, “The Effects of Changes in Foreign Exchange Rates” (“IAS 21”),transactions in foreign currencies are translated and recorded at exchange rates at the dates of thetransactions and/or of the presentation of financial information.
Exchange differences arising from the settlement of monetary items or from the translation ofmonetary items into rates different from those at which they were translated on their initialrecognition, are recognized in the results of operations in the reporting period in which they arise.When a gain or loss from a non-monetary item is recognized in other comprehensive results, anyexchange difference included in that gain or loss is recognized in other comprehensive results.Conversely, when a gain or loss from a non-monetary item is recognized in the results ofoperations, any exchange difference included in that gain or loss is recognized in the results ofoperations for the period.
d. Fair value measurement
PEMEX measures certain financial instruments such as DFIs at fair value as of the closingdate of the relevant reporting period.
Fair value is the price that would be received to sell an asset or paid to transfer a liability inan orderly transaction between market participants at the measurement date. A measurement atfair value assumes that the sale of the asset or transfer of a liability occurs:
i. in the principal market for the asset or liability; or
ii. in the absence of a principal market, in the most advantageous market for the asset orliability.
The principal market or the most advantageous market must be accessible for PEMEX.
The fair value of an asset or liability is measured by using the same assumptions that marketparticipants would make when pricing the asset or liability under the premise that marketparticipants take into account highest and best use of the asset or liability.
e. Financial instruments
Financial instruments are classified as: (i) financial instruments measured at fair valuethrough profit or loss; (ii) financial instruments held to maturity; (iii) available-for-sale financialassets; (iv) investments in equity instruments; (v) loans and receivables; and (vi) DFIs. PEMEXdetermines the classification of its financial instruments at the time of initial recognition.
PEMEX’s financial instruments include cash and short-term deposits, available-for-salefinancial assets, accounts receivable, other receivables, loans, accounts payable to suppliers, otheraccounts payable, borrowings and debts, as well as DFIs.
Below are descriptions of the financial instruments policies employed by PEMEX:
Financial instruments measured at fair value through profit or loss
A financial instrument is measured at fair value through profit or loss if it is classified as heldfor trading or designated as such upon initial recognition. Financial assets are designated at fairvalue through profit or loss if PEMEX manages such investments and makes purchase and saledecisions based on their fair value in accordance with PEMEX’s documented risk management orinvestment strategy. In addition, directly attributable transaction costs are recognized in theconsolidated statements of comprehensive income for the year. These financial instruments are
Copyright © 2018 www.secdatabase.com. All Rights Reserved.Please Consider the Environment Before Printing This Document
recognized at fair value and corresponding changes relating to dividend income are recognized inthe consolidated statements of comprehensive income.
Available-for-sale financial assets
Available-for-sale financial assets are non-DFIs that are designated as available-for-sale or arenot classified in any of the previous categories. PEMEX’s investments in certain equity securitiesand debt securities are classified as available-for-sale financial assets. Available-for-sale financialassets are recognized initially at fair value plus any directly attributable transaction costs.
Subsequent to initial recognition, available-for-sale financial assets are measured at fair value.In addition, any gains or losses associated with such instruments, as well as foreign exchangedifferences are recognized in other comprehensive results and presented in the fair value reservein equity. When an investment is derecognized, any gains or losses accumulated in the equity arereclassified to profit or loss.
Sales and purchases of financial assets that require the delivery of such assets within a periodof time established by market practice are recognized as of the negotiation date (the date onwhich PEMEX commits to purchase or sell the asset).
Loans and receivables
Loans and receivables are initially recognized at fair value. After initial recognition, loans anddebt securities that bear interest are measured at amortized cost using the effective interest rate(“EIR”) method, less impairment losses.
The amortized cost is calculated based on any discount or premium on acquisition and feesand costs that are an integral part of the EIR method. Amortization of costs is included under theheading of financing cost in the consolidated statements of comprehensive income.
Derivative financial instruments
DFIs presented in the consolidated statements of financial position are carried at fair value. Inthe case of DFIs held for trading, changes in fair value are recorded in profit or loss; in the case ofDFIs formally designated as and that qualify for hedging, changes in fair value are recorded in theconsolidated statements of comprehensive income using cash flow or fair value hedgeaccounting, with gains or losses classified in accordance with the earnings treatment of the hedgetransaction.
Embedded derivatives
PEMEX evaluates the potential existence of embedded derivatives, which may be found inthe terms of its contracts, or combined with other host contracts, which could be structuredfinancial instruments (debt or equity instruments with embedded derivatives). Embeddedderivatives have terms that implicitly or explicitly meet the characteristics of a DFI. In someinstances, these embedded derivatives must be segregated from the underlying contracts andmeasured, recognized, presented and disclosed as DFIs, such as when the economic risks andterms of the embedded derivative are not clearly and closely related to the underlying contract.
Impairment of financial assets
At each reporting date, PEMEX evaluates whether there is objective evidence that a financialasset or group of financial assets is impaired, in which case the value of the recoverable amountof the asset is calculated. A financial asset is impaired if objective evidence indicates that a lossevent has occurred after the initial recognition of the asset, and that the loss event had a negativeeffect on the estimated future cash flows of the financial asset.
Copyright © 2018 www.secdatabase.com. All Rights Reserved.Please Consider the Environment Before Printing This Document
Objective evidence that a financial asset or group of assets is impaired includes significantfinancial difficulty of the issuer or obligor, a breach of contract, such as a default or delinquencyin interest or principal payments; the lender, for economic or legal reasons relating to theborrower’s financial difficulty, granting to the borrower a concession that the lender would nototherwise consider; it becoming probable that the borrower will enter bankruptcy or otherfinancial reorganization; the disappearance of an active market for that financial asset because offinancial difficulties; or observable data indicating that there is a measurable decrease in theestimated future cash flows. Impairments by asset are:
Impairment of financial assets carried at amortized cost
The impairment of financial assets carried at amortized cost is measured as the differencebetween the assets carrying amount and the present value of estimated future cash flows(excluding future credit losses that have not been incurred) discounted at the financial asset’soriginal effective interest rate. The amount of the loss shall be recognized in profit or loss.
If, in a subsequent period, the amount of the impairment loss decreases and the decrease canbe related objectively to an event occurring after the impairment was recognized, the impairmentloss previously recognized shall be reversed in profit or loss.
Impairment in available—for—sale financial assets
In addition to the above-mentioned, a significant or prolonged decline in the fair value of aninvestment in an available—for—sale equity instrument is also objective evidence of impairment.
When there is objective evidence of the impairment of an asset, the accumulated lossrecognized in other comprehensive income shall be reclassified from equity to profit or loss eventhough the financial asset has not been derecognized.
If, in a subsequent period, the impairment loss decreases, the reversal shall be reflected as areversal in other comprehensive income.
f. Cash and cash equivalents
Cash and cash equivalents are comprised of cash balances on hand, net of overdrafts, depositsin bank accounts, foreign currency reserves and instruments with maturities of three months orless from the acquisition date that are subject to an insignificant risk of changes in their fair value,which are used in the management of PEMEX’s short-term commitments.
Cash subject to restrictions or that cannot be exchanged or used to settle a liability within 12months is presented as non-current assets.
g. Inventories and cost of sales
Inventories are valued at the lower of cost or net realizable value. Cost is determined basedon the cost of production or acquisition of inventory and other costs incurred in transporting suchinventory to its present location and in its present condition, using the average cost formula. Netrealizable value is the estimated selling price in the ordinary course of business less the estimatedcosts of completion and the estimated selling costs. The estimate takes into consideration, amongother things, the decrease in the value of inventories due to obsolescence.
Cost of sales represents the cost of production or acquisition of inventories at the time of sale,increased, where appropriate, by declines in net realizable value of inventories during the year.
Advance payment to suppliers for inventory purchases are recognized as part of inventorywhen the risks and benefits of the ownership of the inventory have been transferred to PEMEX.
Copyright © 2018 www.secdatabase.com. All Rights Reserved.Please Consider the Environment Before Printing This Document
h. Wells, pipelines, properties, plant and equipment
Wells, pipelines, properties, plant and equipment are recorded at acquisition or constructioncost less accumulated depreciation and accumulated impairment losses.
PEMEX uses the successful efforts method for the exploration and production of crude oiland gas activities, considering the criteria mentioned in IFRS 6, “Exploration for and Evaluationof Mineral Resources” in relation to the recognition of exploration and drilling assets. Costs ofdevelopment wells and related plant, property and equipment involved in the exploitation of oiland gas are recorded as part of the cost of assets. The costs of exploratory wells in areas that havenot yet been designated as containing proved reserves are recorded as intangible assets until it isdetermined whether they are commercially viable to capitalize as fixed assets, otherwise they arerecognized as exploration expenses. Other expenditures on exploration are recognized asexploration expenses as they are incurred.
In accordance with IAS 16, “Property, Plant and Equipment” (“IAS 16”), initial costs ofwells, pipelines, properties, plant and equipment are initially recorded at cost, which includestheir original purchase price or construction cost, any costs attributable to bringing the assets to aworking condition for their intended use and the costs of dismantling and removing the items andrestoring the site on which they are located, including the estimated cost of plugging andabandoning wells.
The cost of financing projects that require large investments and financing incurred forprojects, net of interest revenues from the temporary investment of these funds, is recognized aspart of wells, pipelines, properties, plant and equipment when the cost is directly attributable tothe construction or acquisition of a qualifying asset. The capitalization of these costs is suspendedduring periods in which the development of construction is interrupted, and its capitalization endswhen the activities necessary for the use of the qualifying asset are substantially completed. Allother financing costs are recognized in the consolidated statements of comprehensive income inthe period in which they are incurred.
The cost of self-constructed assets includes the cost of materials and direct labor, interest onfinancing and any other costs directly attributable to start up. In some cases the cost also includesthe cost of plugging of wells and removal.
Expenditures related to the construction of wells, pipelines, properties, plant and equipmentduring the stage prior to commissioning are stated at cost as intangible assets or construction inprogress, in accordance with the characteristics of the asset. Once the assets are ready for use,they are transferred to the respective component of wells, pipelines, properties, plant andequipment and depreciation or amortization begins.
The costs of major maintenance or replacement of a significant component of an item ofwells, pipelines, properties, plant and equipment are recognized in the carrying amount of theitem if it is probable that the future economic benefits embodied within the component will flowto PEMEX and its cost can be measured reliably. The costs of recurring maintenance, repairs andrenovations of wells, pipelines, properties, plant and equipment carried out to maintain thefacilities in normal operation conditions are recognized in profit or loss as incurred.
Depreciation and amortization of capitalized costs in wells are determined based on theestimated economic life of the field to which the wells belong, considering the relationshipbetween the production of barrels of oil equivalent for the period and proved developed reservesof the field, as of the beginning of the period, with quarterly updates for new developmentinvestments.
Depreciation of other elements of pipelines, properties, plant and equipment is recognized inprofit or loss on a straight-line basis over the estimated useful life of the asset, beginning as of thedate that the asset is available for use, or in the case of construction, from the date that the asset iscompleted and ready for use.
Copyright © 2018 www.secdatabase.com. All Rights Reserved.Please Consider the Environment Before Printing This Document

When parts of an item of wells, pipelines, properties and equipment are significant relative tothe total cost of the item, the part is depreciated separately.
Estimated useful lives of items of properties, plant and equipment are reviewed ifexpectations differ from previous estimates.
Pipelines, properties, and equipment received from customers are initially recognized at fairvalue as revenue from ordinary operating activities if PEMEX has no future obligations to thecustomer who transferred the item. In contrast, if PEMEX does have future obligations to such acustomer, the initial recognition is recorded as a deferred liability based on the period in whichthe assets will provide services to the customers.
The capitalized value of finance leases is also included in the line item of wells, pipelines,properties, plant and equipment. Properties, plant and equipment acquired through financialleases are depreciated over the shorter of the lease term or the useful life of the asset.
Advance payments for the acquisition of pipelines, properties, plant and equipment are alsorecognized in the line item of wells, pipelines, properties, plant and equipment when the risks andbenefits of the ownership have been transferred to PEMEX.
i. Crude oil and natural gas reserves
Under Mexican law, all crude oil and other hydrocarbon reserves located in the subsoil ofMexico are owned by the Mexican nation and not by PEMEX. In accordance with theaforementioned and based on the applicable regulation as of the date of these consolidatedfinancial statements, the reserves assigned to PEMEX by the Mexican Government are notregistered for accounting purposes because they are not PEMEX’s property. PEMEX estimatestotal proved oil and natural gas reserve volumes in accordance with the definitions, methods andprocedures established in Rule 4-10(a) of Regulation S-X (“Rule 4-10(a)”) of the U.S. Securitiesand Exchange Commission (“SEC”) as amended, and where necessary, in accordance with theStandards Pertaining to the Estimating and Auditing of Oil and Gas Reserves Informationpromulgated by the Society of Petroleum Engineers (the “SPE”) as of February 19, 2007. Theseprocedures are consistent with international reserves reporting practice. The estimation of thesereserves depends on assumptions made and the interpretation of the data available, and may varyamong analysts. The results of drilling activities, test wells and production after the date ofestimation are utilized in future revisions of reserves estimates.
Although PEMEX does not own the oil and other hydrocarbon reserves within Mexico, theseprocedures allow PEMEX to record the effects that such oil and other hydrocarbon reserves haveon its consolidated financial statements, including, for example, in the depreciation andamortization line item.
j. Impairment of non-financial assets
The carrying amounts of PEMEX’s non-financial assets, other than inventories and deferredtaxes, are assessed for indicators of impairment at the end of each reporting period. If the netcarrying value of the asset or its cash-generating unit exceeds the recoverable amount, PEMEXrecords an impairment charge in its consolidated statement of comprehensive income.
A cash-generating unit is the smallest identifiable group of assets which can generate cashflows independently from other assets or groups of assets.
The recoverable amount of an asset or a cash-generating unit is defined as the higher of itsfair value minus the costs of disposal and its value in use. The value in use is the discountedpresent value of the net future cash flows expected to arise from the continuing use of an assetand from its disposal at the end of its useful life. In measuring value in use, the discount rateapplied is the pre-tax rate that reflects current market assessments of the time value of money and
Copyright © 2018 www.secdatabase.com. All Rights Reserved.Please Consider the Environment Before Printing This Document
the risks specific to the asset. Fair value is calculated using discounted cash flows determined bythe assumptions that market participants would apply in order to estimate the price of an asset orcash generating unit, assuming that such participants were acting in their best economic interest.
In the case of cash-generating assets or items dedicated to the exploration and evaluation ofhydrocarbons reserves, the recoverable amount is determined using the value in use based on theproved reserves and probable reserves, in some cases, for the risk factor associated with suchreserves.
Both impairment losses and reversals are recognized in the statement of comprehensiveincome in the costs and expenses line items in which the depreciation and amortization arerecognized. Impairment losses may not be presented as part of the costs that have beencapitalized in the value of any asset. Impairment losses related to inventories are recognized aspart of cost of sales. Impairment losses on investments in associates, joint ventures and otherinvestments are recognized as profit (loss) sharing in associates.
An impairment loss shall be reversed if there has been a change in the estimates used sincethe date when the impairment loss was recognized. These reversals will not exceed the carryingvalue of the asset as though no impairment had been recognized. Impairment losses and reversalsare presented in a separate line item in the statement of comprehensive income.
k. Leases
The determination of whether an agreement is or contains a lease is based on the economicsubstance of the agreement at the date of execution. An agreement contains a lease ifperformance under the agreement depends upon the use of a specific asset or assets, or if theagreement grants the right to use the asset.
Finance leases, which transfer to PEMEX substantially all the inherent benefits and risks ofthe leased property, are capitalized at the date the lease commences, and the value is recorded asthe lower of the fair value of the leased property and the present value of the minimum leasepayments. Payments on the lease are divided between the financial costs and the amortization ofthe remaining debt principal in order to achieve a constant effective interest rate for theoutstanding liability. The financing costs are recognized in the statement of comprehensiveincome.
Operating lease payments are recognized as expenses in the statement of comprehensiveincome on a straight line basis over the term of the lease and variable rent payments arerecognized in the operating results on an accrued basis.
l. Provisions
PEMEX recognizes provisions when, as a result of a past event, PEMEX has incurred a legalor assumed present obligation for which a future disbursement is probable and the value of suchdisbursement is reasonably estimable. In certain cases, such amounts are recorded at their presentvalue.
Environmental liabilities
In accordance with applicable legal requirements and accounting practices, an environmentalliability is recognized when the cash outflows are probable and the amount is reasonablyestimable. Disbursements related to the conservation of the environment that are linked torevenue from current or future operations are accounted as expenses or assets, depending on thecircumstances of each disbursement. Disbursements related to past operations, which no longercontribute to current or future revenues, are accounted for as current period expenses.
Copyright © 2018 www.secdatabase.com. All Rights Reserved.Please Consider the Environment Before Printing This Document
The accrual of a liability for a future disbursement occurs when an obligation related toenvironmental remediation, for which PEMEX has the information necessary to determine areasonable estimated cost, is identified.
Retirement of assets
The obligations associated with the future retirement of assets, including those related to theretirement of wells, pipelines, properties, plant and equipment and their components arerecognized at the date that the retirement obligation is incurred, based on the discounted cashflow method. The determination of the fair value is based on existing technology and regulations.If a reliable estimation of fair value cannot be made at the time the obligation is incurred, theaccrual will be recognized when there is sufficient information to estimate the fair value.
The obligations related to the costs of future retirement of assets associated with the principalrefining processes for gas and petrochemicals are not recognized. These assets are considered tohave an indefinite useful life due to the potential for maintenance and repairs.
The abandonment costs related to wells currently in production and wells temporarily closedare recorded in the statement of comprehensive income based on the units of production method.Total cost of abandonment and plugging for non-producing wells is recognized in the statementof comprehensive income at the end of each period. All estimations are based on the useful livesof the wells, considering their discounted present value. Salvage values are not considered, asthese values commonly have not traditionally existed.
m. Employee benefits
Beginning January 1, 2016, Petróleos Mexicanos and the Subsidiary Entities have operatedboth a defined contribution plan and a defined benefit pension plan. Until December 31, 2015,PEMEX only operated a defined benefit pension plan.
Defined contribution pension plan
In this plan, both Petróleos Mexicanos and the Subsidiary Entities and their respectiveemployees contribute to the worker’s individual account. PEMEX’s contributions are recognizedon an accrual basis as cost, expense or asset, and are credited to liability.
Contributions to the defined contribution plan that are not expected to be fully settled within12 months after the end of the annual reporting period in which the employee rendered relatedservices will be discounted using the defined benefit plan discount rate.
Defined benefit plan
Under the defined benefit plan, Petróleos Mexicanos and the Subsidiary Entities are the onlyparties that contribute to a trust, which is managed separately. Petróleos Mexicanos and theSubsidiary Entities recognize the cost for defined benefit plans based on independent actuarialcomputations applying the projected unit credit method. Actuarial gains and losses are recognizedwithin other comprehensive results for the period in which they are determined.
The costs of prior services are recognized within profit or loss for the period in which theyare determined.
The asset or liability in the defined benefit plan comprises the present value of the definedbenefit obligation less the fair value of plan assets for which obligations have to be settled. Thevalue of any asset is limited to the present value of any economic benefit represented by the planreimbursements or reductions of the future contributions to the plan.
Copyright © 2018 www.secdatabase.com. All Rights Reserved.Please Consider the Environment Before Printing This Document
In addition, other long term employee benefits include the seniority premiums payable fordisability, death and survivors benefits, medical services, gas and basic food basket forbeneficiaries.
Termination benefits are recognized in profit or loss for the year in which they are incurred.
n. Income taxes and duties
Current income tax
Current income tax assets or liabilities for the current and prior years are measured as theamount expected to be paid or to be recovered from the tax authorities, using either the tax ratesin force or tax rates which are in the process of being approved and are substantially completedby the end of the year.
Current income taxes related with items that are recognized as equity are presented in theother comprehensive income of the year. Periodically, PEMEX evaluates the positions taken in itstax returns for those regulations that are subject to interpretation and books correspondingprovisions, if it is deemed necessary.
Deferred income taxes
Deferred taxes are recorded based on the assets and liabilities method, which consists of therecognition of deferred taxes by applying tax rates applicable to the income tax to the temporarydifferences between the carrying value and tax values of assets and liabilities at the date of theseconsolidated financial statements.
Deferred tax liabilities are recognized for all taxable temporary differences, except to theextent that the deferred tax liability arises from:
• the initial recognition of goodwill or the initial recognition of an asset or liability in atransaction which is not a business combination and at the time of the transaction, affectsneither accounting profit nor taxable profit or tax loss; and
• taxable temporary differences associated with investments in subsidiaries, branches andassociates, and interest in joint arrangements, when the parent, investor, joint venture orjoint operator is able to control the timing of reversal of the temporary difference and it isprobable that the temporary difference will not reverse in the foreseeable future.
Deferred tax assets are recognized for all deductible temporary differences and the carryforward of both unused tax credits and unused tax losses to the extent that it is probable thattaxable profit will be available against deductible temporary differences, and that the carryforward of both unused tax credits and unused tax losses can be utilized, unless:
• the deferred tax asset relating to deductible temporary difference arises from the initialrecognition of asset or liability derived from a transaction that is not a businesscombination and, at the time of the transaction, affects neither accounting profit nortaxable profit or tax loss; and
• in respect of deductible temporary differences associated with investments in subsidiaries,associates and interests in joint ventures, deferred tax assets are recognized only to theextent that it is probable that the temporary differences will reverse in the foreseeablefuture and taxable profit will be available, against which the temporary differences can beutilized.
The carrying amount of a deferred tax asset is reviewed at the end of each reporting period.PEMEX reduces the carrying amount of a deferred tax asset to the extent that it is no longerprobable that a sufficient taxable profit will be available to allow the benefit of that deferred taxasset to be utilized in whole or in part. Unrecognized deferred tax assets are revalued at each
Copyright © 2018 www.secdatabase.com. All Rights Reserved.Please Consider the Environment Before Printing This Document
reporting date and will be recognized to the extent that it is probable that future taxable incomewill be sufficient to allow for the recovery of the deferred tax asset.
Deferred tax assets and liabilities are measured at the tax rates that are expected to apply tothe period when the asset is realized or the liability is settled, based on tax rates (and tax laws)that have been enacted or substantively enacted by the end of the reporting period.
Deferred tax assets and deferred tax liabilities related with items that are recognized in equityshall be presented directly in other comprehensive income.
Deferred tax assets and deferred tax liabilities are offset if PEMEX has a legal right to set offcurrent tax assets against current tax liabilities and are levied by the same taxation authority orthe same taxable entity.
Income taxes and duties
PEMEX is subject to taxes and special duties, which are based on the value of hydrocarbonsextracted, with certain deductions.
These taxes and duties are recognized in accordance with IAS 12, “Income Taxes” (IAS 12),when they have the characteristics of income tax, which occurs when such taxes are set by agovernment authority and are determined on a formula that considers the balance of income (orextraction valued at a selling price) less expenses. Taxes and duties that meet this criteria shouldbe recognized for current and deferred income tax based on the above paragraphs. Taxes andduties that do not meet this criteria are recognized as liabilities, affecting the costs and expensesrelating to the transactions that gave rise to them.
o. Impuesto Especial sobre Producción y Servicios
(Special Tax on Production and Services, or “IEPS Tax”)
The IEPS Tax charged to customers is a withholding tax on domestic sales of gasoline, dieseland fossil fuels. The applicable quotas depend on, among other factors, the product, producer’sprice, freight costs, commissions and the region in which the respective product is sold. Thewithholding tax does not affect the results of PEMEX.
p. Contingencies
Contingency losses are recorded when it is probable that a liability has been incurred and theamount thereof can be reasonably estimated. When a reasonable estimation cannot be made,qualitative disclosure is provided in the notes to the consolidated financial statements. Contingentrevenues, earnings or assets are not recognized until realization is assured.
q. Revenue recognition
Sales revenue is recognized at the moment when the risks and benefits of ownership of crudeoil, refined or gas products, and derivative and petrochemical products are transferred to thecustomers who acquire them, which occurs as follows:
• in accordance with contractual terms;
• the moment at which the customer picks up product at PEMEX’s facilities; or
• the moment at which PEMEX delivers the product to the delivery point.
Services rendered are recognized as services income when the customers accept the receipt ofthe services.
r. Presentation of consolidated statements of comprehensive income
Copyright © 2018 www.secdatabase.com. All Rights Reserved.Please Consider the Environment Before Printing This Document
The costs and expenses shown in PEMEX’s consolidated statements of comprehensiveincome are presented based on their function, which allows for a better understanding of thecomponents of PEMEX’s operating income. This classification allows for a comparison to theindustry to which PEMEX belongs.
Revenues
Represents revenues from sale or products or services.
Cost of sales
Cost of sales represents the acquisition and production costs of inventories at the time of sale.Cost of sales mainly includes depreciation, amortization, salaries, wages and benefits, a portion ofthe cost of the reserve for employee benefits and operating expenses related to the productionprocess.
Other revenues (expenses), net
Other revenues (expenses), net consist primarily of income and expenses that are not relateddirectly to the operation of PEMEX.
Transportation, distribution and sale expenses
Transportation, distribution and sale expenses are costs in connection with the storage, saleand delivery of products, such as the depreciation and operating expenses associated with theseactivities.
Administrative expenses
Administrative expenses are costs related to PEMEX’s areas that provide administrativesupport.
Financing income
Financing income is comprised of interest income, financial income and other income fromfinancial operations between PEMEX and third parties.
Financing cost
Financing cost is comprised of interest expenses, commissions and other expenses related toPEMEX’s financing operations less any portion of the financing cost that is capitalized.
Derivative financial instruments (cost) income, net
Derivative financial instruments (cost) income represents the net effect of the profit or lossfor the year associated with DFIs.
Foreign exchange loss, net
Exchange rate variations relating to assets or liabilities governed by contracts denominated inforeign currencies are recorded in income (loss) for the year.
s. Operating segments
Operating segments are identifiable components of PEMEX that pursue business activitiesfrom which PEMEX earns revenues and incurs expenses, including those revenues and expensesfrom transactions with other segments of PEMEX, and for which information is available to
Copyright © 2018 www.secdatabase.com. All Rights Reserved.Please Consider the Environment Before Printing This Document
management on a segmented basis and is assessed by the Board of Directors in order to allocateresources and assess the profitability of the segments.
t. Non-current assets held for sale, non-current assets held for distribution to owners anddiscontinued operations
Non-current assets held for sale
PEMEX classifies a non-current asset, or a disposal group of assets, as held for sale if (a) itscarrying amount will be recovered principally through a sale transaction rather than throughcontinuing use; (b) the asset or group of assets is available in its present condition for immediatesale and (c) the sale is expected to be completed within one year from the date of classification, ormore, with certain exceptions.
Non-current assets classified as held for sale are measured at the lower of its carrying amount,and fair value less cost of sales and presented in a separate line item in the consolidatedstatements of financial position. Non-current assets classified as held for sale are not subject todepreciation or amortization after the classification as held for sale.
The liabilities of a disposal group classified as held for sale are presented separately fromother liabilities in the statement of financial position. Those assets and liabilities are not offsetand are presented as a single amount.
Non-current asset held for distribution to owners
When PEMEX agrees to distribute a non-current asset, or a disposal group of assets, toowners, this asset or disposal group of assets, is classified as held for distribution to owners if: a)a non-current asset or disposal group of assets is available for immediate distribution in itspresent condition and b) the distribution must be highly expected to be completed within one yearfrom the date of classification, with certain exceptions.
Non-current assets classified as held for distribution are measured at the lower of theircarrying amount and fair value less cost of distribution and are presented in a separate line item inthe consolidated financial statements. Non-current assets classified as held for distribution are notsubject to depreciation or amortization after the classification as held for distribution.
The liabilities of a disposal group classified as held for distribution to owners are presentedseparately from other liabilities in the statement of financial position. Those assets and liabilitiesshall not be offset and shall be presented as a single amount.
Discontinued operations
A discontinued operation is a component of an entity that either has been disposed of or isclassified as held for sale, and either:
• represents a separate major line of business or geographical area of operations;
• is part or a single coordinated plan to dispose of a separated major line of business orgeographical area of operations; or
• is a subsidiary acquired exclusively with a view to resale.
The revenues or expenses from discontinued operations, including profits or losses fromprevious years, are presented in a specific line item in the consolidated statements ofcomprehensive income.
u. Accounting changes
Copyright © 2018 www.secdatabase.com. All Rights Reserved.Please Consider the Environment Before Printing This Document
The IASB issued new amendments to the IFRS mentioned below, which are applicable toPEMEX and are effective for annual periods beginning January 1, 2017:
a) IAS 12 “Income Taxes: Recognition of Deferred Tax Assets for Unrealized Losses” (“IAS12”)
The IASB issues amendments to IAS 12 to clarify the diversity of practices in the recognitionof deferred tax assets for unrealized losses related to debt instruments measured at fair value.
The amendments to IAS 12 include some explanatory paragraphs and an illustrative example.
The amendments clarify the following aspects of IAS 12:
• Unrealized losses on debt instruments measured at fair value for accounting purposes andmeasured at cost for tax purposes give rise to deductible temporary differences regardlessof whether the debt instrument’s holder expects to recover the carrying amount of the debtinstrument by sale or by use.
• The carrying amount of an asset does not limit the estimation of probable future taxableprofits.
• Estimates of future taxable profits exclude tax deductions resulting from the reversal ofdeductible temporary differences.
• An entity assesses a deferred tax asset in combination with other deferred tax assets.Where tax law restricts the utilization of tax losses, an entity would assess a deferred taxasset in combination with other deferred tax assets of the same type.
The amendments are to be applied retrospectively and are effective for annual periodsbeginning on or after January 1, 2017. Earlier application is permitted.
These amendments had no impact on these consolidated financial statements.
b) Amendments to IAS 7 “Statement of Cash Flows” (“IAS 7”)
The IASB issued amendments to IAS 7. The amendments are intended to clarify disclosureprovided to the user of financial statements about an entity’s financing activities.
Changes
The amendments in IAS 7 come with the objective that entities shall provide disclosures thatenable users of financial statements to evaluate changes in liabilities arising from financingactivities.
To achieve this objective, the IASB requires that the following changes in liabilities arisingfrom financing activities are disclosed: (i) changes from financing cash flows; (ii) changes arisingfrom obtaining or losing control of subsidiaries or other businesses; (iii) the effects of changes inforeign exchange rate; (iv) changes in fair values; and (v) other changes.
The IASB defines liabilities arising from financing activities as liabilities “for which cashflows were, or future cash flows will be, classified in the statements of cash flows as cash flowsfrom financing activities.” It also stresses that the new disclosure requirements also relate tochanges in financial assets if they meet the same definition.
The amendments state that one way to fulfill the new disclosure requirements is to providereconciliation between the opening and closing balances in the statement of financial position forliabilities arising from financing activities.
Copyright © 2018 www.secdatabase.com. All Rights Reserved.Please Consider the Environment Before Printing This Document
Finally, the amendments state that changes in liabilities arising from financing activities mustbe disclosed separately from changes in other assets and liabilities.
The amendments are effective for annual periods beginning on or after January 1, 2017.Earlier application is permitted. Entities need not provide comparative information when theyfirst apply the amendments.
Impacts on this amendments are disclosed in Note 15.
c) IFRS 12 “Disclosure of Interest in Other Entities” (“IFRS 12”)—Annual Improvements toIFRS 2014—2016 Cycle.
As of December 2016, the IASB published Annual Improvements to IFRS 2014—2016Cycle, which clarified the scope of IFRS 12, by specifying that the disclosure requirements applyto all subsidiaries, joint arrangements, associates and unconsolidated structured entities classifiedas held for sale, held for distribution or as discontinued operations in accordance with IFRS 5,with certain exceptions.
The amendments are going to be applied restrospectively and are effective for annual periodsbeginning on or after January 1, 2017.
These improvements had no impact on these consolidated financial statements.
v. New IFRS not yet adopted
The IASB issued amendments and new IFRS that are not effective as of December 31, 2017but that could have an impact on subsequent PEMEX financial statements.
Amendments effective for periods beginning in 2018:
a) IFRS 15, “Revenue from Contracts with Customers” (“IFRS 15”)
The core principle of the new IFRS 15 is that an entity should recognize revenue as thepromised transfer of goods or services to the customer, valued at the amount that the entityexpects to be entitled in exchanged for those goods or services.
Pursuant to IFRS 15, an entity should:
• identify customer contracts that fall within the scope of the new standard;
• identify the separate performance obligations in the contract based on the followingcriteria: (i) sales of goods or services, separately, (ii) sales that are dependent orinterrelated with other products or services; and (iii) homogeneous and consistent salespattern;
• determine the price of the transaction by applying the following considerations:(i) variable consideration and constraining estimates of variable consideration; (ii) theexistence of a significant financing component in the contract; (iii) any non-cashconsideration; and (iv) the consideration payable to the customer;
• allocate the transaction price to each separate performance obligation; and
• recognize revenue when (or as) each performance obligation is satisfied either over timeor at a point in time.
The new IFRS 15 enhances disclosures of revenue. This standard must be applied for periodsbeginning on or after January 1, 2018, and early application is permitted. During the year ofapplication, entities may apply the rule retrospectively or use a modified approach.
Copyright © 2018 www.secdatabase.com. All Rights Reserved.Please Consider the Environment Before Printing This Document
PEMEX will adopt IFRS 15 retrospectively with the cumulative effect of applying the newstandard recognized at the date of initial adoption (January 1, 2018) as an adjustment to theopening balance of retained earnings or other component of equity, as applicable. Under thistransition method, PEMEX elected to apply this standard retrospectively only to contracts thatwere not completed contracts at January 1, 2018. For contracts that have been completed beforeDecember 31, 2017, with revenues not fully recognized as of that date, the current accountingpolicies under IAS 18 will continue to apply when recognizing revenue of those contracts during2018. For contracts that take effect from January 1, 2018, revenue will be recognized inaccordance with IFRS 15.
As part of the implementation of IFRS 15, different types of revenue from contracts withcustomers have been identified, evaluated and documented, as well as the main changes inaccounting policies that will be reflected as of January 1, 2018 with respect to new contracts. Themain changes in accounting policies are as follows:
i. Sale of products with other services:
The adoption of IFRS 15 will affect the manner in which PEMEX records the sale ofproducts including oil, refined products, gas, petrochemicals, fertilizers and other sales.Until December 31, 2017, freight and other services, for example were recognizedseparately from products sold. Under IFRS 15, revenue is recognized with respect to theperformance obligation under the contract, and so certain services that are currentlyaccounted for separately, will now be presented as a single performance obligationtogether with the sale of the product.
ii. Services:
Services include transportation and storage of hydrocarbons, petroleum, petrochemicals,refined products, gas, petrochemical derivatives and others.
Rental services and some transportation services are currently presented in the revenuesfrom services line item in the income statement. In many cases of services withcomponents of leases are less than one year operating leases. Revenues corresponding toleasing have not been presented separately from revenues from services.
Under IFRS 15, leases cannot be presented in the same line item as revenues fromservice. The main change in accounting policy will be the separation and presentation ofservice and lease components.
iii. Determination of the transaction price:
Refunds, discounts, quantity and quality claims (in favor or against) and penalties (tocustomers or PEMEX) or breaches related to the sale of certain products were previouslyrecognized as revenues. However, under IFRS 15, revenues will only be recognized if it ishighly probable that there will not be a significant reversal in the revenue received. As aresult, PEMEX will put in place mechanisms to approximate the refunds, discounts,quantity and quality claims and penalties at the time that the control of the product istransferred.
Revenue recognition
Revenues are currently recognized when the risks and benefits of the product are transferred,which occurs when the customer picks up or receives the product at PEMEX´s facilities or at aspecific point of sale, accepts the products and assumes the risks and benefits related to thetransfer of ownership.
Under IFRS 15, revenues from sale of products are recognized when the contractualobligation is satisfied, and control of the products is transferred to the customer. There will bechanges in the revenue recognition of gas sale and certain services from “one point in time” to
Copyright © 2018 www.secdatabase.com. All Rights Reserved.Please Consider the Environment Before Printing This Document

“over time”. However, a significant change is not expected because in some cases the practicalexpedient “right to invoice” will be applied to measure progress towards completion of thetransaction.
As of December 31, 2017, PEMEX did not identify any significant uncompleted contracts. Asa result, PEMEX has determined that the changes to amounts in prior years will not besignificant. Nonetheless, there will be important changes in accounting policies for contractsissued as of January 1, 2018.
b) IFRS 9, “Financial Instruments” (“IFRS 9”(2014))
In July 2014, the IASB finalized the accounting reform of financial instruments and issuedIFRS 9 (revised in 2014), which contains the requirements for, a) the classification andmeasurement of financial assets and liabilities, b) impairment methodology, and c) generalinformation about hedge accounting. IFRS 9 (revised in 2014) replaces IAS 39 FinancialInstruments: Recognition and Measurement as of its effective date.
These requirements should be applied retrospectively and, as permitted by IFRS 9 transitionalprovisions, it is not necessary for companies to restate comparative figures. Any adjustment in thecarrying amounts of the financial assets and liabilities at the transition date is recognized byaffecting the cumulative effect in the initial opening period.
The classification criteria depends on a combination of two important factors:
i. the business model within the financial asses is held (the business model test); and
ii. the contractual cashflow of the financial asset (the SPPI test). Based on these two tests,the asset can be measured as follows:
• Amortized cost: Financial Instruments under a business model whose objective isonly the collection of contractual cash flows which are composed of principal andinterest payments and where there are no significant sales unjustified and fair valueis not a key factor in the management of these financial assets and the characteristicsof cash flows represent substantially a “basic loan agreement” or SPPI. Unjustifiedsales are different from sales related to an increase in the credit risk of an asset orunexpected financing needs.
• Fair value with changes through other comprehensive income (“FVOCI”): FinancialInstruments in a business model whose objective is to obtain cash flows and the saleof those assets, where fair value is a key factor in its management. In addition, thecharacteristics of the contractual cash flows represent substantially a “basic loanagreement”.
• Fair value with changes through profit or loss (“FVPL”): Financial instruments in abusiness model whose objective is not the aforementioned models, where fair valueis a key factor in the management of these assets, and the financial instrumentswhose contractual cash flow characteristics do not substantially represent a “basicloan agreement”.
IFRS also replaces the impairment model of IAS 39 (the “loss incurred model”) with a newimpairment model called the “expected credit loss” model. This impairment model will beapplicable to financial assets that are not measured at FVPL. Changes in fair value of financialassets through FVOCI to the point of disposal are recorded in OCI.
The expected credit loss recognized for impairment purposes under IFRS 9 will be equivalentto a 12-month reserve, except when the financial instrument presents a “significant increase incredit risk” or presents objective evidence of impairment, recognizing a reserve equivalent to theremaining life of the financial instrument, based on the definition of general approach under IFRS9.
Copyright © 2018 www.secdatabase.com. All Rights Reserved.Please Consider the Environment Before Printing This Document
IFRS 9 Implementation and government strategy
PEMEX has established a multidisciplinary working group with the objective to adapt itsprocesses to the new standard in relation to the classification and measurement of financialinstruments and the impairment estimation of credit risk, ensuring that these processes have beenapplied and adopted in accordance with IFRS 9.
Regarding classification and measurement, PEMEX carried out an analysis of its financialassets in order to identify those that could trigger a change in the accounting methodology, due tothe definition of the business model and a failure to satisfy the SPPI test.
IFRS 9 Implementation analysis
PEMEX has defined January 1, 2018 as the initial date of adoption of IFRS 9 “FinancialInstruments” and according to the transitional standard in IFRS 9, PEMEX will not restateprevious periods for comparison purposes and any difference that may arise as a result of theadoption of IFRS 9 between the previous carrying amount and the carrying amount at thebeginning of the reporting period shall be recognized in accumulated results over the openinginitial period.
PEMEX has concluded that most of its financial assets will continue to be classified in thesame way:
ClassificationAssets IAS 39 IFRS 9 ChangeCash and cash equivalents FVPL FVPL NoAvailable—for—sale financial
assets FVOCI FVOCI NoDerivative financial
instruments FVPL FVPL NoLong—term notes receivable Amortized Cost Amortized Cost No
Capital or debt instruments classified as available-for-sale financial assets will continue to bemeasured at FVOCI.
PEMEX has concluded that the financial assets most affected by the impairment estimateunder the expected credit loss model will be its accounts receivables, in relation to PEMEX’sholding of the long-term notes issued by the Mexican Government. The evaluation of the possibleimpairment of the notes will be made using the general approach for calculating impairment ofthe notes will be made using the general approach for calculating impairment contemplated underIFRS 9.
PEMEX considers it probable that impairment losses increase and present more volatility forinstruments under the new methodology of expected credit losses. Furthermore, PEMEXconsiders that most of its accounts receivable are short-term without a significant financialcomponent, so the simplified approach will be applied.
The preliminary evaluation of PEMEX indicates that the application of the new impairmentrequirements of IFRS 9 as of December 31, 2017 will impact the accounts receivable reserves asof January 1, 2018. An increase between 39.0% and 51.1% is expected in the accounts receivablereserves as compared to impairment losses incurred in accordance with IAS 39.
Hedge accounting
PEMEX, as part of the initial adoption, elected to continue applying the hedge accountingrequirements of IAS 39 instead of IFRS 9. PEMEX uses DFI’s to cover the exposure of foreign
Copyright © 2018 www.secdatabase.com. All Rights Reserved.Please Consider the Environment Before Printing This Document
currency risk, interest rate risk and fluctuations in the price of its products, but these contracts arenot accounted for as designated hedges. DFI’s are initially recognized at fair value on the date thederivative contract is entered into and after initial recognition are measured again at fair value.
As a result, PEMEX has determined that the changes to amounts in prior years will not besignificant.
c) Interpretation of IFRIC 22 “Foreign Currency Transactions and Advance Considerations”(IFRIC 22)
As of December 2016, IASB published an interpretation of IFRIC 22 developed by theInternational Financial Reporting Standards Interpretations Committee (the InterpretationsCommittee). The interpretation clarified when to recognize payments and collections of foreigncurrency transactions paid in advance.
According to the interpretations, an entity must recognize foreign currency transactions when:
i. there is consideration that is denominated or priced in a foreign currency;
ii. the entity recognizes a prepayment asset or a deferred income liability in respect of thatconsideration, in advance of the recognition of the related asset, expense or income; and
iii. the prepayment asset or deferred income liability is non-monetary.
The Interpretations Committee concluded that:
• The date of the transaction, for the purpose of determining the exchange rate, is the dateof initial recognition of the non- monetary prepayment asset or deferred income liability.
• If there are multiple payments or receipts in advance, a date of transaction is establishedfor each payment or receipt.
IFRIC 22 is effective for annual reporting periods beginning on or after January 1, 2018.Entities may apply the rule retrospectively, or prospectively, in accordance with IAS 8 withcertain exemptions.
PEMEX believes that these standards will not have an impact on its consolidated financialstatements.
Standards effective for periods beginning in 2019
a) IFRS 16, “Leases” (“IFRS 16”)
In January 2016, the IASB published a new accounting standard IFRS 16, which replaces IAS17, “Leases and Guide interpretations.”
The main changes from the previous standard are:
• IFRS 16 provides a comprehensive model for the identification of the lease arrangementsand their treatment in the financial statements of both lessees and lessors;
• the new standard applies a control model to the identification of leases, distinguishingbetween leases and service contracts on the basis of whether there is an identified assetcontrolled by the customer;
• the distinction between financial and operating leasing is removed, therefore, the assetsand liabilities are recognized in respect of all leases, with some exceptions for short-termleases and leases of low-value assets; and
• the standard does not include significant changes to the requirements for accounting bylessors.
Copyright © 2018 www.secdatabase.com. All Rights Reserved.Please Consider the Environment Before Printing This Document
The standard is effective for annual periods beginning on or after January 1, 2019, withearlier application permitted for entities that have also adopted IFRS 15, “Revenue fromContracts with Customers.”
PEMEX has established a multidisciplinary working group with the objective to adapt itsprocesses to the new standard in the following phases: (i) training, (ii) obtaining information,(iii) diagnostic, (iv) determination of initial adjustments and (v) integration of change. As of thedate of these consolidated financial statements, the training phase for the accounting staff iscomplete and PEMEX is in the process of analyzing leasing contracts in order to determinenecessary changes to its procedures and reports. PEMEX has not determined the impact of IFRS16 on its net income (loss) for the year. PEMEX estimates that it will conclude theimplementation of IFRS 16 in February 2019.
b) Annual improvements—2015-2017 Cycle
In December 2017, the IASB published “the Annual Improvements to the IFRS of the2015-2017 Cycle” through which it clarifies the following IFRS:
• IFRS 3 Business Combinations and IFRS 11 Joint Arrangements
IFRS 3 Business Combinations clarifies how an entity should recognize an increase of itsinterest in a joint operation:
• When a party to a joint arrangement obtains control of a business that was a part ofthat joint arrangement, and where that party had assumed a portion of the rights tothe assets and obligations to the liabilities of that business prior to the acquisitiondate, the acquisition will be considered a business combination that is achieved instages. The acquiriting entity must therefore apply the requirements for a businesscombination achieved in stages, including by measuring its previously held interestin the joint arrangement.
• When a party participates in, but does not share in the control of a joint operation,and subsequently takes joint control of that joint operation, this will constitute theacquisition of a business and previously held interest in the joint operation are notmeasured.
• IAS 12 Income Tax
All income tax consequence of dividends (including payments on financial instrumentsclassified as equity) are recognized consistently with the transactions that generated thedistributable profits (i. e. in profit or loss, other comprehensive income or equity basis).
• IAS 23 Borrowing Costs
With respect to the treatment of costs for loans subject to capitalization, the amendmentsclarify that:
• To the extent that an entity borrows funds generally and uses them for the purpose ofobtaining a qualifying asset, that entity shall determine the amount of borrowingcosts eligible for capitalization by applying a capitalization rate to the expenditureson that asset. The capitalization rate shall be the weighted average of the borrowingcosts applicable to all borrowings of the entity that are outstanding during the period.
• However, an entity shall exclude from this calculation borrowing cost applicable toborrowing made specifically for the purpose of obtaining a qualifying asset untilsubstantially all the activities necessary to prepare that asset for its intended used orsale are complete.
The amount of borrowing costs that an entity capitalizes during a period shall not exceed theamount of borrowing costs it incurred during that period.
Copyright © 2018 www.secdatabase.com. All Rights Reserved.Please Consider the Environment Before Printing This Document
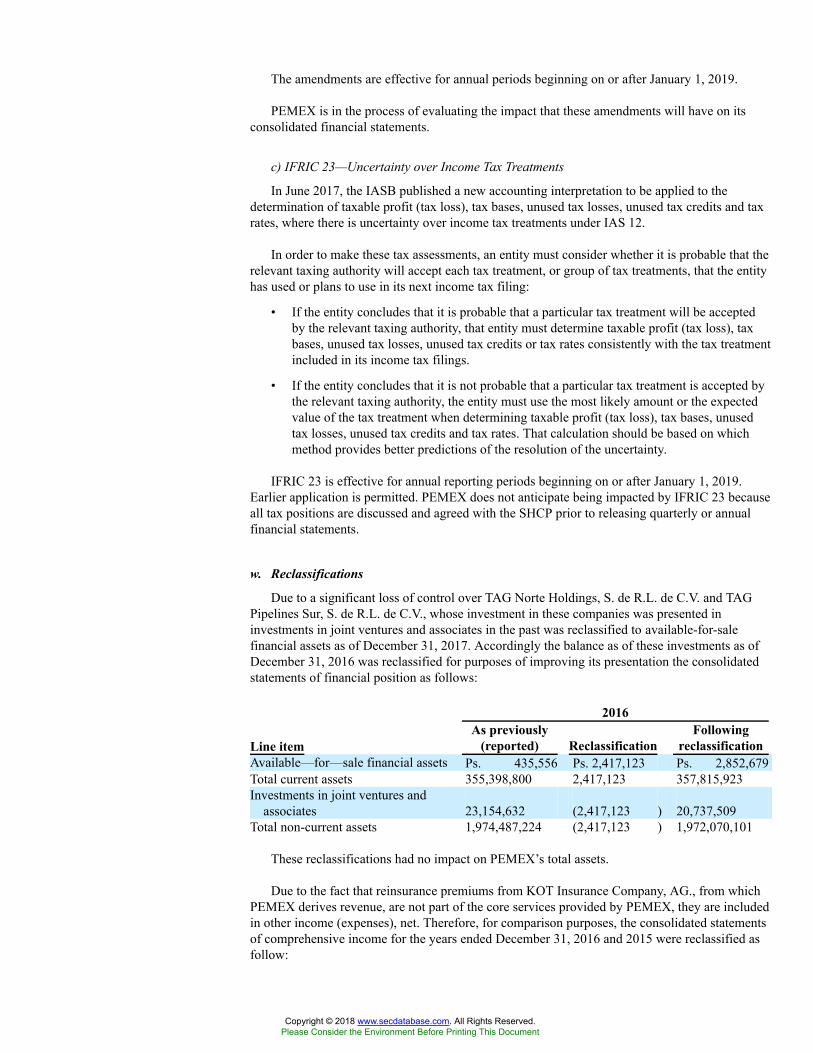
The amendments are effective for annual periods beginning on or after January 1, 2019.
PEMEX is in the process of evaluating the impact that these amendments will have on itsconsolidated financial statements.
c) IFRIC 23—Uncertainty over Income Tax Treatments
In June 2017, the IASB published a new accounting interpretation to be applied to thedetermination of taxable profit (tax loss), tax bases, unused tax losses, unused tax credits and taxrates, where there is uncertainty over income tax treatments under IAS 12.
In order to make these tax assessments, an entity must consider whether it is probable that therelevant taxing authority will accept each tax treatment, or group of tax treatments, that the entityhas used or plans to use in its next income tax filing:
• If the entity concludes that it is probable that a particular tax treatment will be acceptedby the relevant taxing authority, that entity must determine taxable profit (tax loss), taxbases, unused tax losses, unused tax credits or tax rates consistently with the tax treatmentincluded in its income tax filings.
• If the entity concludes that it is not probable that a particular tax treatment is accepted bythe relevant taxing authority, the entity must use the most likely amount or the expectedvalue of the tax treatment when determining taxable profit (tax loss), tax bases, unusedtax losses, unused tax credits and tax rates. That calculation should be based on whichmethod provides better predictions of the resolution of the uncertainty.
IFRIC 23 is effective for annual reporting periods beginning on or after January 1, 2019.Earlier application is permitted. PEMEX does not anticipate being impacted by IFRIC 23 becauseall tax positions are discussed and agreed with the SHCP prior to releasing quarterly or annualfinancial statements.
w. Reclassifications
Due to a significant loss of control over TAG Norte Holdings, S. de R.L. de C.V. and TAGPipelines Sur, S. de R.L. de C.V., whose investment in these companies was presented ininvestments in joint ventures and associates in the past was reclassified to available-for-salefinancial assets as of December 31, 2017. Accordingly the balance as of these investments as ofDecember 31, 2016 was reclassified for purposes of improving its presentation the consolidatedstatements of financial position as follows:
2016
Line itemAs previously
(reported) ReclassificationFollowing
reclassificationAvailable—for—sale financial assets Ps. 435,556 Ps. 2,417,123 Ps. 2,852,679Total current assets 355,398,800 2,417,123 357,815,923Investments in joint ventures and
associates 23,154,632 (2,417,123 ) 20,737,509Total non-current assets 1,974,487,224 (2,417,123 ) 1,972,070,101
These reclassifications had no impact on PEMEX’s total assets.
Due to the fact that reinsurance premiums from KOT Insurance Company, AG., from whichPEMEX derives revenue, are not part of the core services provided by PEMEX, they are includedin other income (expenses), net. Therefore, for comparison purposes, the consolidated statementsof comprehensive income for the years ended December 31, 2016 and 2015 were reclassified asfollow:
Copyright © 2018 www.secdatabase.com. All Rights Reserved.Please Consider the Environment Before Printing This Document
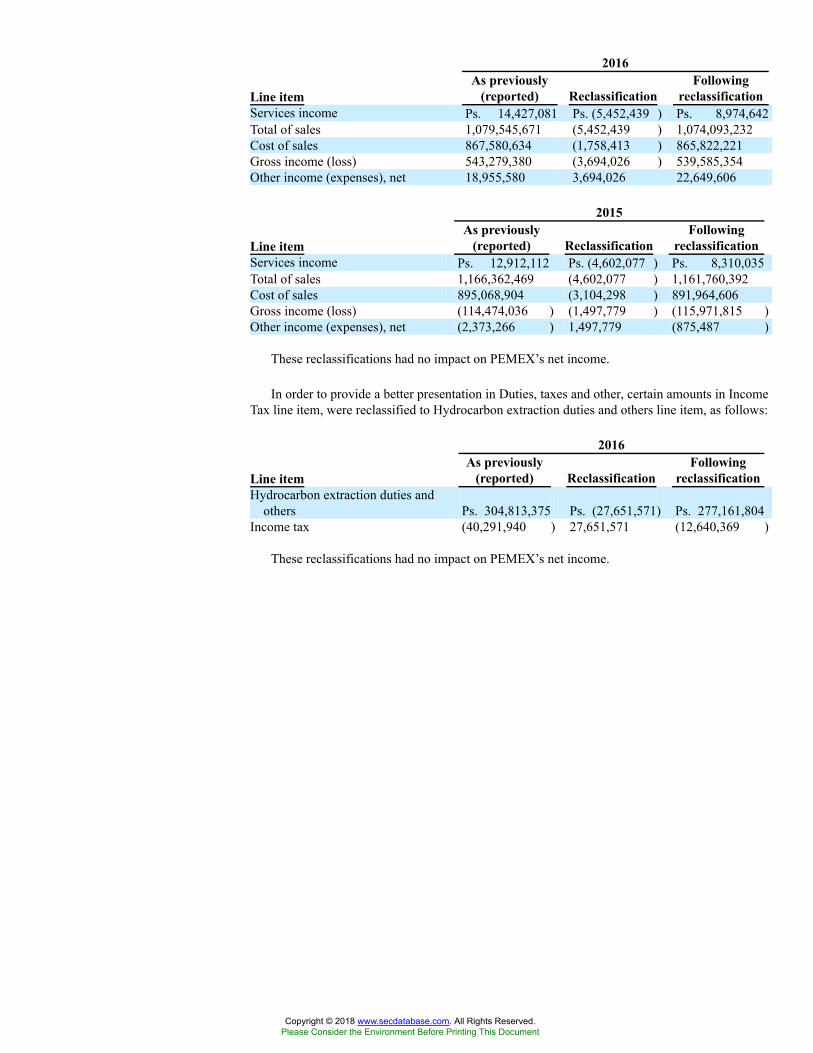
2016
Line itemAs previously
(reported) ReclassificationFollowing
reclassificationServices income Ps. 14,427,081 Ps. (5,452,439 ) Ps. 8,974,642Total of sales 1,079,545,671 (5,452,439 ) 1,074,093,232Cost of sales 867,580,634 (1,758,413 ) 865,822,221Gross income (loss) 543,279,380 (3,694,026 ) 539,585,354Other income (expenses), net 18,955,580 3,694,026 22,649,606
2015
Line itemAs previously
(reported) ReclassificationFollowing
reclassificationServices income Ps. 12,912,112 Ps. (4,602,077 ) Ps. 8,310,035Total of sales 1,166,362,469 (4,602,077 ) 1,161,760,392Cost of sales 895,068,904 (3,104,298 ) 891,964,606Gross income (loss) (114,474,036 ) (1,497,779 ) (115,971,815 )Other income (expenses), net (2,373,266 ) 1,497,779 (875,487 )
These reclassifications had no impact on PEMEX’s net income.
In order to provide a better presentation in Duties, taxes and other, certain amounts in IncomeTax line item, were reclassified to Hydrocarbon extraction duties and others line item, as follows:
2016
Line itemAs previously
(reported) ReclassificationFollowing
reclassificationHydrocarbon extraction duties and
others Ps. 304,813,375 Ps. (27,651,571) Ps. 277,161,804Income tax (40,291,940 ) 27,651,571 (12,640,369 )
These reclassifications had no impact on PEMEX’s net income.
Copyright © 2018 www.secdatabase.com. All Rights Reserved.Please Consider the Environment Before Printing This Document
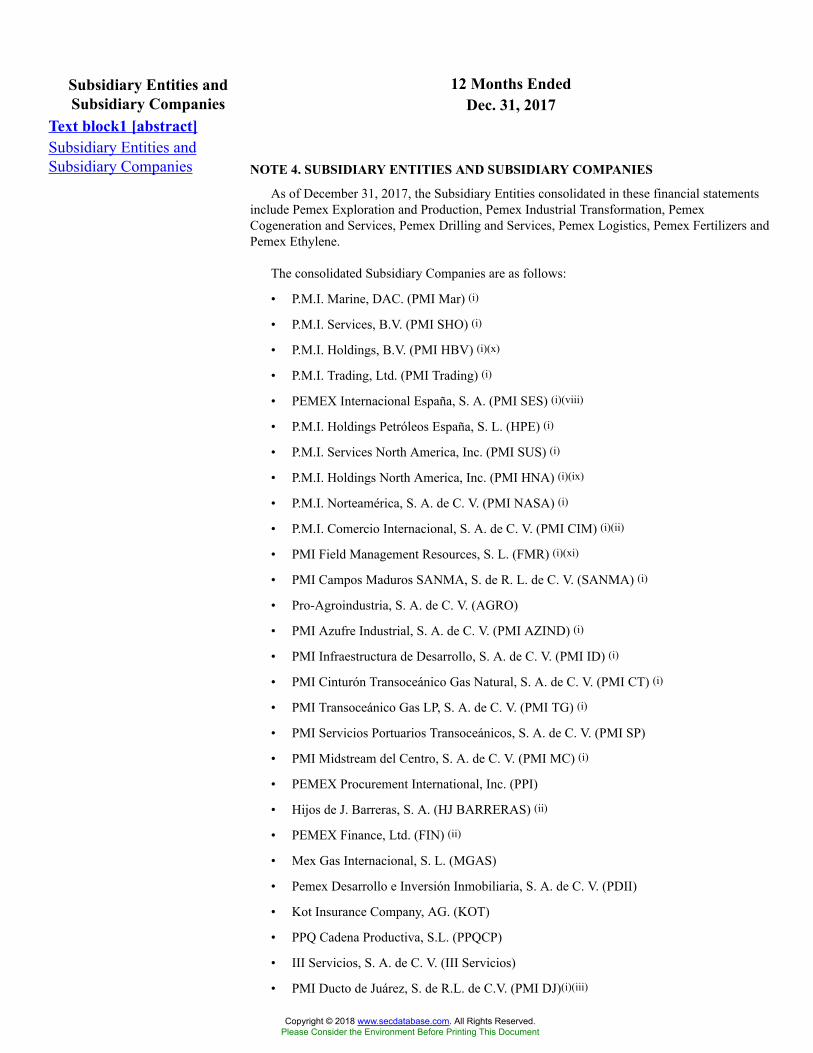
12 Months EndedSubsidiary Entities andSubsidiary Companies Dec. 31, 2017
Text block1 [abstract]Subsidiary Entities andSubsidiary Companies NOTE 4. SUBSIDIARY ENTITIES AND SUBSIDIARY COMPANIES
As of December 31, 2017, the Subsidiary Entities consolidated in these financial statementsinclude Pemex Exploration and Production, Pemex Industrial Transformation, PemexCogeneration and Services, Pemex Drilling and Services, Pemex Logistics, Pemex Fertilizers andPemex Ethylene.
The consolidated Subsidiary Companies are as follows:
• P.M.I. Marine, DAC. (PMI Mar) (i)
• P.M.I. Services, B.V. (PMI SHO) (i)
• P.M.I. Holdings, B.V. (PMI HBV) (i)(x)
• P.M.I. Trading, Ltd. (PMI Trading) (i)
• PEMEX Internacional España, S. A. (PMI SES) (i)(viii)
• P.M.I. Holdings Petróleos España, S. L. (HPE) (i)
• P.M.I. Services North America, Inc. (PMI SUS) (i)
• P.M.I. Holdings North America, Inc. (PMI HNA) (i)(ix)
• P.M.I. Norteamérica, S. A. de C. V. (PMI NASA) (i)
• P.M.I. Comercio Internacional, S. A. de C. V. (PMI CIM) (i)(ii)
• PMI Field Management Resources, S. L. (FMR) (i)(xi)
• PMI Campos Maduros SANMA, S. de R. L. de C. V. (SANMA) (i)
• Pro-Agroindustria, S. A. de C. V. (AGRO)
• PMI Azufre Industrial, S. A. de C. V. (PMI AZIND) (i)
• PMI Infraestructura de Desarrollo, S. A. de C. V. (PMI ID) (i)
• PMI Cinturón Transoceánico Gas Natural, S. A. de C. V. (PMI CT) (i)
• PMI Transoceánico Gas LP, S. A. de C. V. (PMI TG) (i)
• PMI Servicios Portuarios Transoceánicos, S. A. de C. V. (PMI SP)
• PMI Midstream del Centro, S. A. de C. V. (PMI MC) (i)
• PEMEX Procurement International, Inc. (PPI)
• Hijos de J. Barreras, S. A. (HJ BARRERAS) (ii)
• PEMEX Finance, Ltd. (FIN) (ii)
• Mex Gas Internacional, S. L. (MGAS)
• Pemex Desarrollo e Inversión Inmobiliaria, S. A. de C. V. (PDII)
• Kot Insurance Company, AG. (KOT)
• PPQ Cadena Productiva, S.L. (PPQCP)
• III Servicios, S. A. de C. V. (III Servicios)
• PMI Ducto de Juárez, S. de R.L. de C.V. (PMI DJ)(i)(iii)
Copyright © 2018 www.secdatabase.com. All Rights Reserved.Please Consider the Environment Before Printing This Document
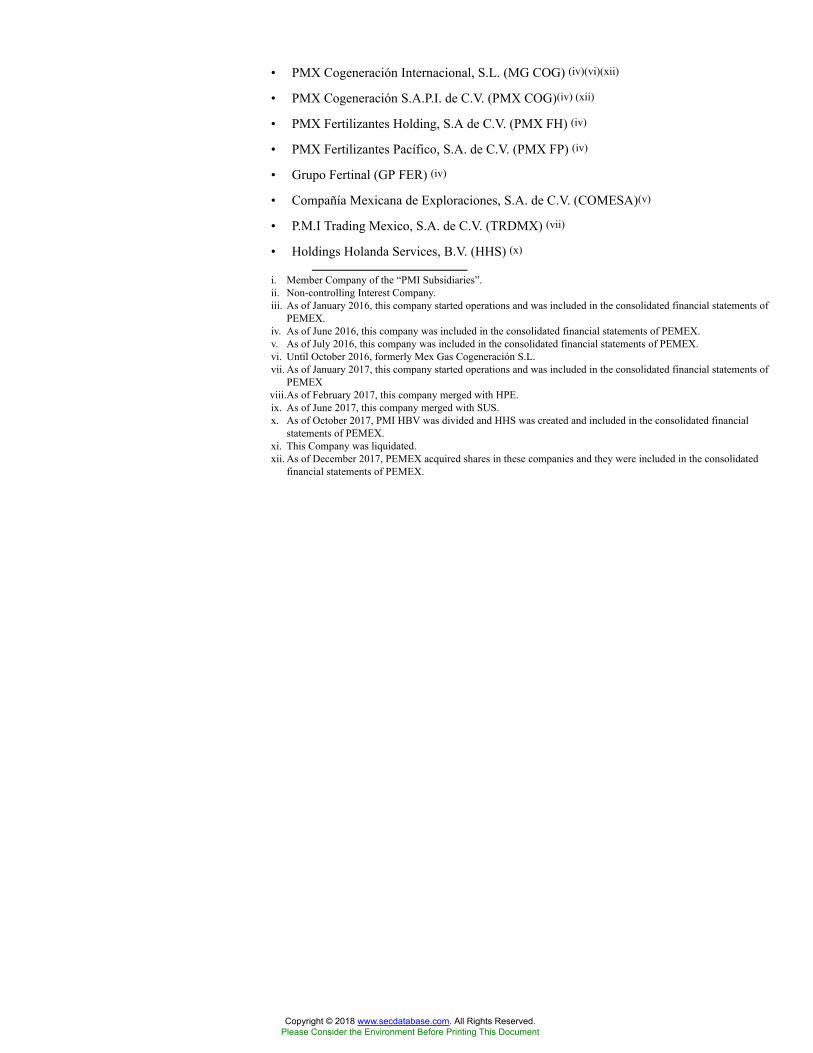
• PMX Cogeneración Internacional, S.L. (MG COG) (iv)(vi)(xii)
• PMX Cogeneración S.A.P.I. de C.V. (PMX COG)(iv) (xii)
• PMX Fertilizantes Holding, S.A de C.V. (PMX FH) (iv)
• PMX Fertilizantes Pacífico, S.A. de C.V. (PMX FP) (iv)
• Grupo Fertinal (GP FER) (iv)
• Compañía Mexicana de Exploraciones, S.A. de C.V. (COMESA)(v)
• P.M.I Trading Mexico, S.A. de C.V. (TRDMX) (vii)
• Holdings Holanda Services, B.V. (HHS) (x)
i. Member Company of the “PMI Subsidiaries”.ii. Non-controlling Interest Company.iii. As of January 2016, this company started operations and was included in the consolidated financial statements of
PEMEX.iv. As of June 2016, this company was included in the consolidated financial statements of PEMEX.v. As of July 2016, this company was included in the consolidated financial statements of PEMEX.vi. Until October 2016, formerly Mex Gas Cogeneración S.L.vii. As of January 2017, this company started operations and was included in the consolidated financial statements of
PEMEXviii.As of February 2017, this company merged with HPE.ix. As of June 2017, this company merged with SUS.x. As of October 2017, PMI HBV was divided and HHS was created and included in the consolidated financial
statements of PEMEX.xi. This Company was liquidated.xii. As of December 2017, PEMEX acquired shares in these companies and they were included in the consolidated
financial statements of PEMEX.
Copyright © 2018 www.secdatabase.com. All Rights Reserved.Please Consider the Environment Before Printing This Document
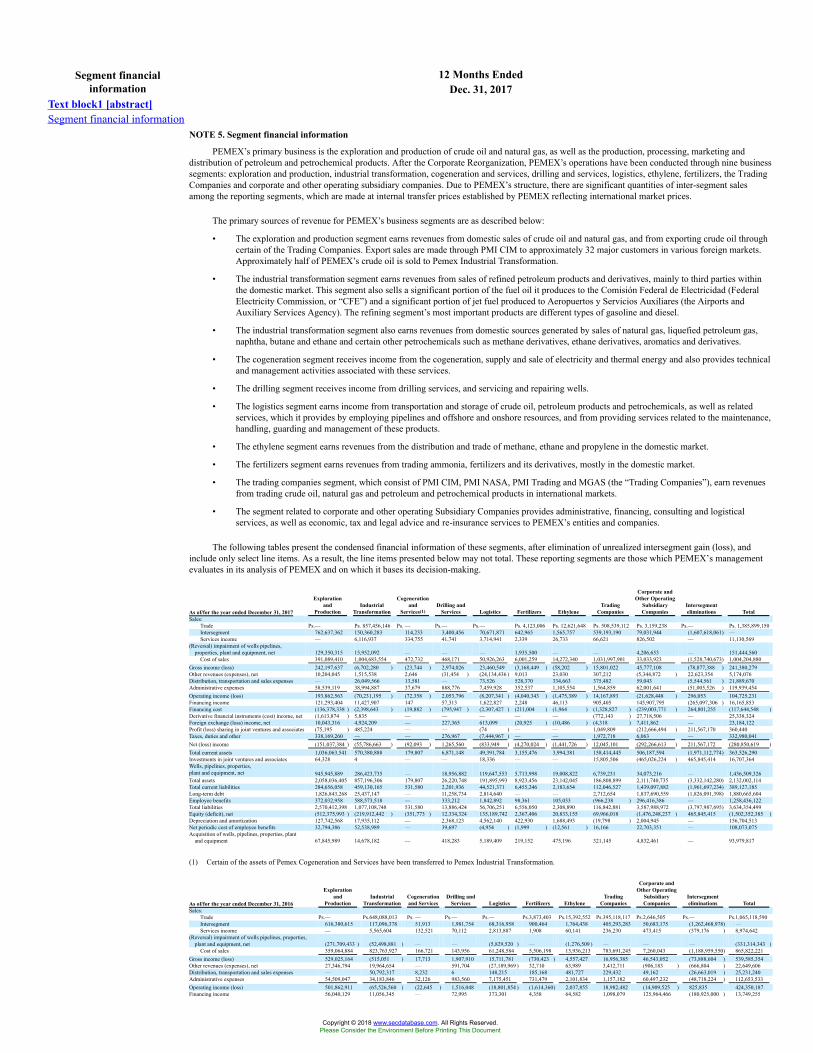
12 Months EndedSegment financialinformation Dec. 31, 2017
Text block1 [abstract]Segment financial information
NOTE 5. Segment financial information
PEMEX’s primary business is the exploration and production of crude oil and natural gas, as well as the production, processing, marketing anddistribution of petroleum and petrochemical products. After the Corporate Reorganization, PEMEX’s operations have been conducted through nine businesssegments: exploration and production, industrial transformation, cogeneration and services, drilling and services, logistics, ethylene, fertilizers, the TradingCompanies and corporate and other operating subsidiary companies. Due to PEMEX’s structure, there are significant quantities of inter-segment salesamong the reporting segments, which are made at internal transfer prices established by PEMEX reflecting international market prices.
The primary sources of revenue for PEMEX’s business segments are as described below:
• The exploration and production segment earns revenues from domestic sales of crude oil and natural gas, and from exporting crude oil throughcertain of the Trading Companies. Export sales are made through PMI CIM to approximately 32 major customers in various foreign markets.Approximately half of PEMEX’s crude oil is sold to Pemex Industrial Transformation.
• The industrial transformation segment earns revenues from sales of refined petroleum products and derivatives, mainly to third parties withinthe domestic market. This segment also sells a significant portion of the fuel oil it produces to the Comisión Federal de Electricidad (FederalElectricity Commission, or “CFE”) and a significant portion of jet fuel produced to Aeropuertos y Servicios Auxiliares (the Airports andAuxiliary Services Agency). The refining segment’s most important products are different types of gasoline and diesel.
• The industrial transformation segment also earns revenues from domestic sources generated by sales of natural gas, liquefied petroleum gas,naphtha, butane and ethane and certain other petrochemicals such as methane derivatives, ethane derivatives, aromatics and derivatives.
• The cogeneration segment receives income from the cogeneration, supply and sale of electricity and thermal energy and also provides technicaland management activities associated with these services.
• The drilling segment receives income from drilling services, and servicing and repairing wells.
• The logistics segment earns income from transportation and storage of crude oil, petroleum products and petrochemicals, as well as relatedservices, which it provides by employing pipelines and offshore and onshore resources, and from providing services related to the maintenance,handling, guarding and management of these products.
• The ethylene segment earns revenues from the distribution and trade of methane, ethane and propylene in the domestic market.
• The fertilizers segment earns revenues from trading ammonia, fertilizers and its derivatives, mostly in the domestic market.
• The trading companies segment, which consist of PMI CIM, PMI NASA, PMI Trading and MGAS (the “Trading Companies”), earn revenuesfrom trading crude oil, natural gas and petroleum and petrochemical products in international markets.
• The segment related to corporate and other operating Subsidiary Companies provides administrative, financing, consulting and logisticalservices, as well as economic, tax and legal advice and re-insurance services to PEMEX’s entities and companies.
The following tables present the condensed financial information of these segments, after elimination of unrealized intersegment gain (loss), andinclude only select line items. As a result, the line items presented below may not total. These reporting segments are those which PEMEX’s managementevaluates in its analysis of PEMEX and on which it bases its decision-making.
As of/for the year ended December 31, 2017
Explorationand
ProductionIndustrial
Transformation
Cogenerationand
Services(1)Drilling and
Services Logistics Fertilizers EthyleneTrading
Companies
Corporate andOther Operating
SubsidiaryCompanies
Intersegmenteliminations Total
Sales:Trade Ps.— Ps. 857,456,146 Ps. — Ps.— Ps.— Ps. 4,123,006 Ps. 12,621,648 Ps. 508,539,112 Ps. 3,159,238 Ps.— Ps. 1,385,899,150Intersegment 762,637,362 150,360,283 114,233 3,400,456 70,671,871 642,965 1,565,757 539,193,190 79,031,944 (1,607,618,061) —Services income — 6,116,937 334,755 41,741 3,714,941 2,339 26,733 66,621 826,502 — 11,130,569
(Reversal) impairment of wells pipelines,properties, plant and equipment, net 129,350,315 15,952,092 — — — 1,935,500 — — 4,206,653 — 151,444,560
Cost of sales 391,089,410 1,004,683,554 472,732 468,171 50,926,263 6,001,259 14,272,340 1,031,997,901 33,033,923 (1,528,740,673) 1,004,204,880Gross income (loss) 242,197,637 (6,702,280 ) (23,744 ) 2,974,026 23,460,549 (3,168,449 ) (58,202 ) 15,801,022 45,777,108 (78,877,388 ) 241,380,279Other revenues (expenses), net 10,204,045 1,515,538 2,646 (31,454 ) (24,134,436 ) 9,013 23,030 307,212 (5,344,872 ) 22,623,354 5,174,076Distribution, transportation and sales expenses — 26,049,566 13,581 — 73,526 528,370 334,663 375,482 59,043 (5,544,561 ) 21,889,670Administrative expenses 58,539,119 38,994,887 37,679 888,776 7,459,928 352,537 1,105,554 1,564,859 62,001,641 (51,005,526 ) 119,939,454Operating income (loss) 193,862,563 (70,231,195 ) (72,358 ) 2,053,796 (8,207,341 ) (4,040,343 ) (1,475,389 ) 14,167,893 (21,628,448 ) 296,053 104,725,231Financing income 121,293,404 11,427,907 147 57,313 1,622,827 2,248 46,113 905,405 145,907,795 (265,097,306 ) 16,165,853Financing cost (136,378,338 ) (2,398,643 ) (19,882 ) (795,947 ) (2,307,427 ) (211,004 ) (1,964 ) (1,328,827 ) (239,003,771 ) 264,801,255 (117,644,548 )Derivative financial instruments (cost) income, net (1,613,874 ) 5,835 — — — — — (772,143 ) 27,718,506 — 25,338,324Foreign exchange (loss) income, net 10,043,316 4,924,209 — 227,365 613,099 (20,925 ) (10,486 ) (4,318 ) 7,411,862 — 23,184,122Profit (loss) sharing in joint ventures and associates (75,195 ) 485,224 — — (74 ) — — 1,049,809 (212,666,494 ) 211,567,170 360,440Taxes, duties and other 338,169,260 — — 276,967 (7,444,967 ) — — 1,972,718 6,063 — 332,980,041Net (loss) income (151,037,384 ) (55,786,663 ) (92,093 ) 1,265,560 (833,949 ) (4,270,024 ) (1,441,726 ) 12,045,101 (292,266,613 ) 211,567,172 (280,850,619 )Total current assets 1,036,063,541 570,380,888 179,807 6,871,148 49,391,784 3,155,476 3,994,381 158,414,445 506,187,594 (1,971,112,774) 363,526,290Investments in joint ventures and associates 64,328 4 — — 18,336 — — 15,805,506 (465,026,224 ) 465,845,414 16,707,364Wells, pipelines, properties,plant and equipment, net 945,945,889 286,423,735 — 18,956,882 119,647,553 5,713,998 19,008,822 6,739,231 34,073,216 — 1,436,509,326Total assets 2,058,036,405 857,196,306 179,807 26,220,748 191,895,993 8,923,456 23,142,045 186,808,899 2,111,740,735 (3,332,142,280) 2,132,002,114Total current liabilities 284,656,058 459,130,165 531,580 2,201,936 44,521,371 6,455,246 2,183,654 112,046,527 1,439,097,882 (1,961,697,234) 389,127,185Long-term debt 1,826,843,268 25,437,147 — 11,258,734 2,814,640 — — 2,712,654 1,837,690,559 (1,826,091,398) 1,880,665,604Employee benefits 372,032,958 588,573,518 — 333,212 1,842,892 98,361 105,033 (966,238 ) 296,416,386 — 1,258,436,122Total liabilities 2,570,412,398 1,077,108,748 531,580 13,886,424 56,706,251 6,556,050 2,308,890 116,842,881 3,587,988,972 (3,797,987,695) 3,634,354,499Equity (deficit), net (512,375,993 ) (219,912,442 ) (351,773 ) 12,334,324 135,189,742 2,367,406 20,833,155 69,966,018 (1,476,248,237 ) 465,845,415 (1,502,352,385 )Depreciation and amortization 127,742,568 17,935,112 — 2,368,123 4,562,140 422,930 1,688,493 (19,798 ) 2,004,945 — 156,704,513Net periodic cost of employee benefits 32,794,386 52,538,989 — 39,697 (4,954 ) (1,999 ) (12,561 ) 16,166 22,703,351 — 108,073,075Acquisition of wells, pipelines, properties, plant
and equipment 67,845,989 14,678,182 — 418,283 5,189,409 219,152 475,196 321,145 4,832,461 — 93,979,817
(1) Certain of the assets of Pemex Cogeneration and Services have been transferred to Pemex Industrial Transformation.
As of/for the year ended December 31, 2016
Explorationand
ProductionIndustrial
TransformationCogenerationand Services
Drilling andServices Logistics Fertilizers Ethylene
TradingCompanies
Corporate andOther Operating
SubsidiaryCompanies
Intersegmenteliminations Total
Sales:Trade Ps.— Ps.648,088,013 Ps. — Ps.— Ps.— Ps.3,873,403 Ps.15,392,552 Ps.395,118,117 Ps.2,646,505 Ps.— Ps.1,065,118,590Intersegment 616,380,615 117,096,378 51,913 1,981,754 68,316,958 900,464 1,764,438 405,293,283 50,683,175 (1,262,468,978) —Services income — 5,565,604 132,521 70,112 2,813,887 1,908 60,141 236,230 473,415 (379,176 ) 8,974,642
(Reversal) impairment of wells pipelines, properties,plant and equipment, net (271,709,433 ) (52,498,881 ) — — (5,829,520 ) — (1,276,509 ) — — — (331,314,343 )
Cost of sales 359,064,884 823,763,927 166,721 143,956 61,248,584 5,506,198 13,936,213 783,691,245 7,260,043 (1,188,959,550) 865,822,221Gross income (loss) 529,025,164 (515,051 ) 17,713 1,907,910 15,711,781 (730,423 ) 4,557,427 16,956,385 46,543,052 (73,888,604 ) 539,585,354Other revenues (expenses), net 27,346,794 19,964,654 — 591,704 (27,189,969 ) 32,710 63,989 3,412,711 (906,183 ) (666,804 ) 22,649,606Distribution, transportation and sales expenses — 50,792,317 8,232 6 148,215 185,168 481,727 229,432 49,162 (26,663,019 ) 25,231,240Administrative expenses 54,509,047 34,183,846 32,126 983,560 7,175,451 731,479 2,101,834 1,157,182 60,497,232 (48,718,224 ) 112,653,533Operating income (loss) 501,862,911 (65,526,560 ) (22,645 ) 1,516,048 (18,801,854 ) (1,614,360) 2,037,855 18,982,482 (14,909,525 ) 825,835 424,350,187Financing income 56,040,129 11,056,345 — 72,995 373,301 4,358 64,582 1,098,079 125,964,466 (180,925,000 ) 13,749,255
Copyright © 2018 www.secdatabase.com. All Rights Reserved.Please Consider the Environment Before Printing This Document
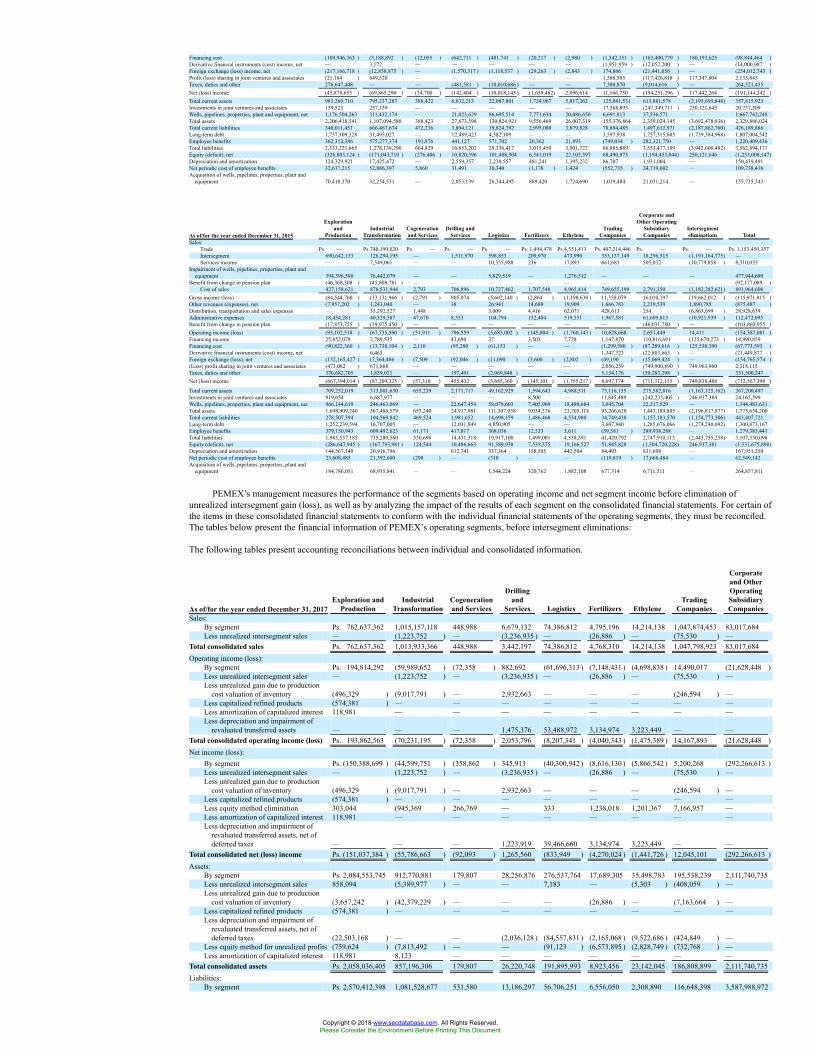
Financing cost (109,946,363 ) (3,188,892 ) (12,055 ) (642,711 ) (481,741 ) (20,217 ) (2,980 ) (1,342,351 ) (163,400,779 ) 180,193,625 (98,844,464 )Derivative financial instruments (cost) income, net — 3,172 — — — — — (1,951,959 ) (12,052,200 ) — (14,000,987 )Foreign exchange (loss) income, net (217,166,718 ) (12,858,875 ) — (1,570,317 ) (1,118,537 ) (29,263 ) (2,843 ) 174,866 (21,441,056 ) — (254,012,743 )Profit (loss) sharing in joint ventures and associates (21,164 ) 649,520 — — — — — 1,586,503 (117,426,818 ) 117,347,804 2,135,845Taxes, duties and other 276,647,448 — — (481,581 ) (10,010,686 ) — — 7,380,870 (9,014,616 ) — 264,521,435Net (loss) income (45,878,653 ) (69,865,290 ) (34,700 ) (142,404 ) (10,018,145 ) (1,659,482) 2,096,614 11,166,750 (194,251,296 ) 117,442,264 (191,144,342 )Total current assets 983,260,710 795,237,287 388,422 6,032,213 22,087,801 1,724,967 5,817,262 125,081,531 613,881,578 (2,195,695,848) 357,815,923Investments in joint ventures and associates 139,523 257,159 — — — — — 17,568,893 (247,349,711 ) 250,121,645 20,737,509Wells, pipelines, properties, plant and equipment, net 1,176,504,263 311,432,174 — 21,023,629 86,695,514 7,771,634 20,086,650 6,691,813 37,536,571 — 1,667,742,248Total assets 2,206,418,541 1,107,094,580 388,423 27,673,598 130,824,921 9,556,469 26,007,319 155,376,864 2,359,024,145 (3,692,478,836) 2,329,886,024Total current liabilities 340,011,451 666,467,674 472,236 3,894,121 19,824,792 2,995,088 3,879,828 78,894,485 1,497,612,971 (2,187,862,760) 426,189,886Long-term debt 1,737,109,328 31,495,027 — 12,489,423 4,382,109 — — 3,597,938 1,757,315,685 (1,739,384,968) 1,807,004,542Employee benefits 362,312,386 575,277,374 191,876 441,127 571,702 20,362 21,893 (749,034 ) 282,321,750 — 1,220,409,436Total liabilities 2,533,221,665 1,278,138,290 664,829 16,853,202 29,336,417 3,015,450 3,901,722 86,885,889 3,553,477,189 (3,942,600,482) 3,562,894,171Equity (deficit), net (326,803,124 ) (171,043,710 ) (276,406 ) 10,820,396 101,488,504 6,541,019 22,105,597 68,490,975 (1,194,453,044) 250,121,646 (1,233,008,147)Depreciation and amortization 124,329,921 17,425,472 — 2,559,357 2,230,557 481,241 1,395,232 86,707 1,931,004 — 150,439,491Net periodic cost of employee benefits 32,617,215 52,886,397 5,860 31,491 30,340 (1,178 ) 1,424 (552,735 ) 24,719,602 — 109,738,416Acquisition of wells, pipelines, properties, plant and
equipment 70,418,370 32,254,531 — 2,053,139 26,344,495 889,420 1,724,690 1,019,484 21,031,214 — 155,735,343
As of/for the year ended December 31, 2015
Explorationand
ProductionIndustrial
TransformationCogenerationand Services
Drilling andServices Logistics Fertilizers Ethylene
TradingCompanies
Corporate andOther Operating
SubsidiaryCompanies
Intersegmenteliminations Total
Sales:Trade Ps. — Ps.740,190,020 Ps. — Ps. — Ps. — Ps. 1,494,478 Ps.4,551,413 Ps. 407,214,446 Ps. — Ps. — Ps. 1,153,450,357Intersegment 690,642,133 126,294,195 — 1,511,970 598,853 209,970 473,990 353,137,149 18,296,515 (1,191,164,775) —Services income — 7,549,061 — — 10,355,988 236 17,893 661,683 505,032 (10,779,858 ) 8,310,035
Impairment of wells, pipelines, properties, plant andequipment 394,396,580 76,442,079 — — 5,829,519 — 1,276,512 — — — 477,944,690
Benefit from change in pension plan (46,368,308 ) (45,808,781 ) — — — — — — — — (92,177,089 )Cost of sales 427,158,621 876,531,944 2,793 706,896 10,727,462 1,707,548 4,965,414 749,655,199 2,791,350 (1,182,282,621) 891,964,606
Gross income (loss) (84,544,760 ) (33,131,966 ) (2,793 ) 805,074 (5,602,140 ) (2,864 ) (1,198,630 ) 11,358,079 16,010,197 (19,662,012 ) (115,971,815 )Other revenues (expenses), net (7,957,202 ) 1,243,040 — 38 26,941 14,680 19,909 1,666,783 2,219,539 1,890,785 (875,487 )Distribution, transportation and sales expenses — 35,292,527 1,448 — 3,009 4,416 62,071 428,613 254 (6,863,699 ) 28,928,639Administrative expenses 18,454,281 40,529,587 47,670 8,553 104,794 152,404 519,351 1,967,581 61,609,813 (10,921,939 ) 112,472,095Benefit from change in pension plan (17,853,725 ) (39,975,450 ) — — — — — — (46,031,780 ) — (103,860,955 )Operating income (loss) (93,102,518 ) (67,735,590 ) (51,911 ) 796,559 (5,683,002 ) (145,004 ) (1,760,143 ) 10,628,668 2,651,449 14,411 (154,387,081 )Financing income 25,852,078 2,789,535 — 43,690 37 3,503 7,728 1,147,870 110,816,691 (125,670,273 ) 14,990,859Financing cost (90,822,360 ) (13,738,104 ) 2,110 (95,280 ) (61,153 ) — — (1,299,580 ) (87,289,616 ) 125,530,390 (67,773,593 )Derivative financial instruments (cost) income, net — 6,463 — — — — — 1,347,323 (22,803,663 ) — (21,449,877 )Foreign exchange (loss), net (132,165,427 ) (7,364,486 ) (7,509 ) (92,046 ) (11,090 ) (3,600 ) (2,802 ) (49,190 ) (15,069,424 ) — (154,765,574 )(Loss) profit sharing in joint ventures and associates (473,082 ) 671,868 — — — — — 2,056,259 (749,900,890 ) 749,963,960 2,318,115Taxes, duties and other 376,682,705 1,839,021 — 197,491 (2,069,848 ) — — 5,134,176 (50,283,298 ) — 331,500,247Net (loss) income (667,394,014 ) (87,209,335 ) (57,310 ) 455,432 (3,685,360 ) (145,101 ) (1,755,217 ) 8,697,174 (711,312,155 ) 749,838,488 (712,567,398 )
Total current assets 709,252,019 313,801,630 655,239 2,171,717 49,162,929 1,594,643 4,988,511 73,116,155 275,582,816 (1,163,125,162) 267,200,497Investments in joint ventures and associates 919,654 6,687,977 — — — 8,500 — 11,845,489 (242,233,405 ) 246,937,384 24,165,599Wells, pipelines, properties, plant and equipment, net 966,144,619 246,463,069 — 22,647,454 58,078,603 7,405,969 18,480,684 3,045,704 22,217,529 — 1,344,483,631Total assets 1,698,909,240 567,486,579 655,240 24,917,981 111,307,038 9,034,376 23,705,118 93,266,620 1,443,189,885 (2,196,817,877) 1,775,654,200Total current liabilities 278,507,394 104,569,842 469,524 1,981,652 14,698,159 1,486,468 4,534,980 34,749,438 1,157,183,570 (1,154,773,306) 443,407,721Long-term debt 1,252,239,594 16,707,005 — 12,031,849 4,850,905 — — 3,607,840 1,285,676,066 (1,274,240,092) 1,300,873,167Employee benefits 379,150,943 609,492,623 61,171 417,817 368,036 12,533 3,611 (59,581 ) 289,938,288 — 1,279,385,441Total liabilities 1,985,557,185 735,280,560 530,696 14,431,318 19,917,100 1,499,001 4,538,591 41,420,792 2,747,910,113 (2,443,755,258) 3,107,330,098Equity (deficit), net (286,647,945 ) (167,793,981 ) 124,544 10,486,663 91,389,938 7,535,375 19,166,527 51,845,828 (1,304,720,228) 246,937,381 (1,331,675,898)Depreciation and amortization 144,567,149 20,916,796 — 612,741 337,364 158,505 442,504 84,493 831,698 — 167,951,250Net periodic cost of employee benefits 23,608,485 21,392,600 (298 ) — (310 ) — — (119,819 ) 17,668,484 — 62,549,142Acquisition of wells, pipelines, properties, plant and
equipment 184,786,051 68,935,841 — — 1,544,224 320,762 1,882,108 677,314 6,711,511 — 264,857,811
PEMEX’s management measures the performance of the segments based on operating income and net segment income before elimination ofunrealized intersegment gain (loss), as well as by analyzing the impact of the results of each segment on the consolidated financial statements. For certain ofthe items in these consolidated financial statements to conform with the individual financial statements of the operating segments, they must be reconciled.The tables below present the financial information of PEMEX’s operating segments, before intersegment eliminations:
The following tables present accounting reconciliations between individual and consolidated information.
As of/for the year ended December 31, 2017Exploration and
ProductionIndustrial
TransformationCogenerationand Services
Drillingand
Services Logistics Fertilizers EthyleneTrading
Companies
Corporateand OtherOperatingSubsidiaryCompanies
Sales:By segment Ps. 762,637,362 1,015,157,118 448,988 6,679,132 74,386,812 4,795,196 14,214,138 1,047,874,453 83,017,684Less unrealized intersegment sales — (1,223,752 ) — (3,236,935 ) — (26,886 ) — (75,530 ) —
Total consolidated sales Ps. 762,637,362 1,013,933,366 448,988 3,442,197 74,386,812 4,768,310 14,214,138 1,047,798,923 83,017,684Operating income (loss):
By segment Ps. 194,814,292 (59,989,652 ) (72,358 ) 882,692 (61,696,313 ) (7,148,431 ) (4,698,838 ) 14,490,017 (21,628,448 )Less unrealized intersegment sales — (1,223,752 ) — (3,236,935 ) — (26,886 ) — (75,530 ) —Less unrealized gain due to production
cost valuation of inventory (496,329 ) (9,017,791 ) — 2,932,663 — — — (246,594 ) —Less capitalized refined products (574,381 ) — — — — — — — —Less amortization of capitalized interest 118,981 — — — — — — — —Less depreciation and impairment of
revaluated transferred assets — — — 1,475,376 53,488,972 3,134,974 3,223,449 — —Total consolidated operating income (loss) Ps. 193,862,563 (70,231,195 ) (72,358 ) 2,053,796 (8,207,341 ) (4,040,343 ) (1,475,389 ) 14,167,893 (21,628,448 )Net income (loss):
By segment Ps. (150,388,699 ) (44,599,751 ) (358,862 ) 345,913 (40,300,942 ) (8,616,130 ) (5,866,542 ) 5,200,268 (292,266,613 )Less unrealized intersegment sales — (1,223,752 ) — (3,236,935 ) — (26,886 ) — (75,530 ) —Less unrealized gain due to production
cost valuation of inventory (496,329 ) (9,017,791 ) — 2,932,663 — — — (246,594 ) —Less capitalized refined products (574,381 ) — — — — — — — —Less equity method elimination 303,044 (945,369 ) 266,769 — 333 1,238,018 1,201,367 7,166,957 —Less amortization of capitalized interest 118,981 — — — — — — — —Less depreciation and impairment of
revaluated transferred assets, net ofdeferred taxes — — — 1,223,919 39,466,660 3,134,974 3,223,449 — —
Total consolidated net (loss) income Ps. (151,037,384 ) (55,786,663 ) (92,093 ) 1,265,560 (833,949 ) (4,270,024 ) (1,441,726 ) 12,045,101 (292,266,613 )Assets:
By segment Ps. 2,084,553,745 912,770,881 179,807 28,256,876 276,537,764 17,689,305 35,498,783 195,538,239 2,111,740,735Less unrealized intersegment sales 858,094 (5,389,977 ) — — 7,183 — (5,303 ) (408,059 ) —Less unrealized gain due to production
cost valuation of inventory (3,657,242 ) (42,379,229 ) — — — (26,886 ) — (7,163,664 ) —Less capitalized refined products (574,381 ) — — — — — — — —Less depreciation and impairment of
revaluated transferred assets, net ofdeferred taxes (22,503,168 ) — — (2,036,128 ) (84,557,831 ) (2,165,068 ) (9,522,686 ) (424,849 ) —
Less equity method for unrealized profits (759,624 ) (7,813,492 ) — — (91,123 ) (6,573,895 ) (2,828,749 ) (732,768 ) —Less amortization of capitalized interest 118,981 8,123 — — — — — — —
Total consolidated assets Ps. 2,058,036,405 857,196,306 179,807 26,220,748 191,895,993 8,923,456 23,142,045 186,808,899 2,111,740,735Liabilities:
By segment Ps. 2,570,412,398 1,081,528,677 531,580 13,186,297 56,706,251 6,556,050 2,308,890 116,648,398 3,587,988,972
Copyright © 2018 www.secdatabase.com. All Rights Reserved.Please Consider the Environment Before Printing This Document
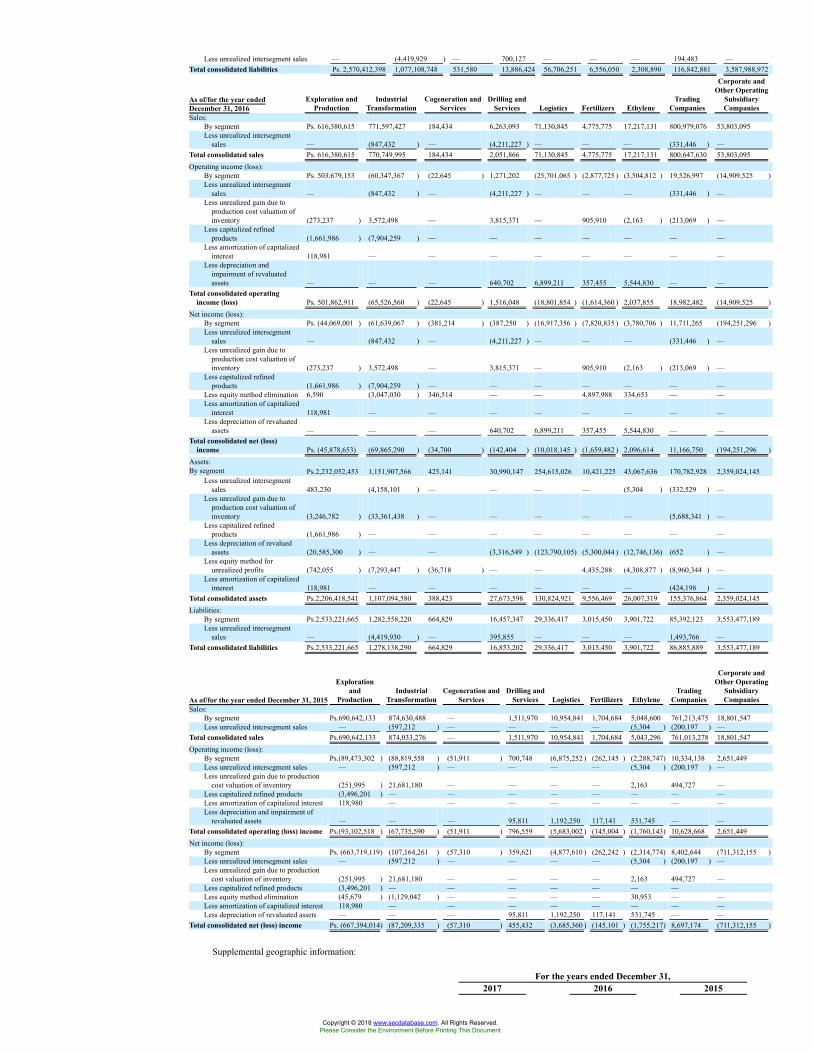
Less unrealized intersegment sales — (4,419,929 ) — 700,127 — — — 194,483 —Total consolidated liabilities Ps. 2,570,412,398 1,077,108,748 531,580 13,886,424 56,706,251 6,556,050 2,308,890 116,842,881 3,587,988,972
As of/for the year endedDecember 31, 2016
Exploration andProduction
IndustrialTransformation
Cogeneration andServices
Drilling andServices Logistics Fertilizers Ethylene
TradingCompanies
Corporate andOther Operating
SubsidiaryCompanies
Sales:By segment Ps. 616,380,615 771,597,427 184,434 6,263,093 71,130,845 4,775,775 17,217,131 800,979,076 53,803,095Less unrealized intersegment
sales — (847,432 ) — (4,211,227 ) — — — (331,446 ) —Total consolidated sales Ps. 616,380,615 770,749,995 184,434 2,051,866 71,130,845 4,775,775 17,217,131 800,647,630 53,803,095Operating income (loss):
By segment Ps. 503,679,153 (60,347,367 ) (22,645 ) 1,271,202 (25,701,065 ) (2,877,725 ) (3,504,812 ) 19,526,997 (14,909,525 )Less unrealized intersegment
sales — (847,432 ) — (4,211,227 ) — — — (331,446 ) —Less unrealized gain due to
production cost valuation ofinventory (273,237 ) 3,572,498 — 3,815,371 — 905,910 (2,163 ) (213,069 ) —
Less capitalized refinedproducts (1,661,986 ) (7,904,259 ) — — — — — — —
Less amortization of capitalizedinterest 118,981 — — — — — — — —
Less depreciation andimpairment of revaluatedassets — — — 640,702 6,899,211 357,455 5,544,830 — —
Total consolidated operatingincome (loss) Ps. 501,862,911 (65,526,560 ) (22,645 ) 1,516,048 (18,801,854 ) (1,614,360 ) 2,037,855 18,982,482 (14,909,525 )
Net income (loss):By segment Ps. (44,069,001 ) (61,639,067 ) (381,214 ) (387,250 ) (16,917,356 ) (7,820,835 ) (3,780,706 ) 11,711,265 (194,251,296 )Less unrealized intersegment
sales — (847,432 ) — (4,211,227 ) — — — (331,446 ) —Less unrealized gain due to
production cost valuation ofinventory (273,237 ) 3,572,498 — 3,815,371 — 905,910 (2,163 ) (213,069 ) —
Less capitalized refinedproducts (1,661,986 ) (7,904,259 ) — — — — — — —
Less equity method elimination 6,590 (3,047,030 ) 346,514 — — 4,897,988 334,653 — —Less amortization of capitalized
interest 118,981 — — — — — — — —Less depreciation of revaluated
assets — — — 640,702 6,899,211 357,455 5,544,830 — —Total consolidated net (loss)
income Ps. (45,878,653) (69,865,290 ) (34,700 ) (142,404 ) (10,018,145 ) (1,659,482 ) 2,096,614 11,166,750 (194,251,296 )Assets:By segment Ps.2,232,052,453 1,151,907,566 425,141 30,990,147 254,615,026 10,421,225 43,067,636 170,782,928 2,359,024,145
Less unrealized intersegmentsales 483,230 (4,158,101 ) — — — — (5,304 ) (332,529 ) —
Less unrealized gain due toproduction cost valuation ofinventory (3,246,782 ) (33,361,438 ) — — — — — (5,688,341 ) —
Less capitalized refinedproducts (1,661,986 ) — — — — — — — —
Less depreciation of revaluedassets (20,585,300 ) — — (3,316,549 ) (123,790,105) (5,300,044 ) (12,746,136) (652 ) —
Less equity method forunrealized profits (742,055 ) (7,293,447 ) (36,718 ) — — 4,435,288 (4,308,877 ) (8,960,344 ) —
Less amortization of capitalizedinterest 118,981 — — — — — — (424,198 ) —
Total consolidated assets Ps.2,206,418,541 1,107,094,580 388,423 27,673,598 130,824,921 9,556,469 26,007,319 155,376,864 2,359,024,145Liabilities:
By segment Ps.2,533,221,665 1,282,558,220 664,829 16,457,347 29,336,417 3,015,450 3,901,722 85,392,123 3,553,477,189Less unrealized intersegment
sales — (4,419,930 ) — 395,855 — — — 1,493,766 —Total consolidated liabilities Ps.2,533,221,665 1,278,138,290 664,829 16,853,202 29,336,417 3,015,450 3,901,722 86,885,889 3,553,477,189
As of/for the year ended December 31, 2015
Explorationand
ProductionIndustrial
TransformationCogeneration and
ServicesDrilling and
Services Logistics Fertilizers EthyleneTrading
Companies
Corporate andOther Operating
SubsidiaryCompanies
Sales:By segment Ps.690,642,133 874,630,488 — 1,511,970 10,954,841 1,704,684 5,048,600 761,213,475 18,801,547Less unrealized intersegment sales — (597,212 ) — — — — (5,304 ) (200,197 ) —
Total consolidated sales Ps.690,642,133 874,033,276 — 1,511,970 10,954,841 1,704,684 5,043,296 761,013,278 18,801,547Operating income (loss):
By segment Ps.(89,473,302 ) (88,819,558 ) (51,911 ) 700,748 (6,875,252 ) (262,145 ) (2,288,747) 10,334,138 2,651,449Less unrealized intersegment sales — (597,212 ) — — — — (5,304 ) (200,197 ) —Less unrealized gain due to production
cost valuation of inventory (251,995 ) 21,681,180 — — — — 2,163 494,727 —Less capitalized refined products (3,496,201 ) — — — — — — — —Less amortization of capitalized interest 118,980 — — — — — — — —Less depreciation and impairment of
revaluated assets — — — 95,811 1,192,250 117,141 531,745 — —Total consolidated operating (loss) income Ps.(93,102,518 ) (67,735,590 ) (51,911 ) 796,559 (5,683,002 ) (145,004 ) (1,760,143) 10,628,668 2,651,449Net income (loss):
By segment Ps. (663,719,119) (107,164,261 ) (57,310 ) 359,621 (4,877,610 ) (262,242 ) (2,314,774) 8,402,644 (711,312,155 )Less unrealized intersegment sales — (597,212 ) — — — — (5,304 ) (200,197 ) —Less unrealized gain due to production
cost valuation of inventory (251,995 ) 21,681,180 — — — — 2,163 494,727 —Less capitalized refined products (3,496,201 ) — — — — — — —Less equity method elimination (45,679 ) (1,129,042 ) — — — — 30,953 — —Less amortization of capitalized interest 118,980 — — — — — — — —Less depreciation of revaluated assets — — — 95,811 1,192,250 117,141 531,745 — —
Total consolidated net (loss) income Ps. (667,394,014) (87,209,335 ) (57,310 ) 455,432 (3,685,360 ) (145,101 ) (1,755,217) 8,697,174 (711,312,155 )
Supplemental geographic information:
For the years ended December 31,2017 2016 2015
Copyright © 2018 www.secdatabase.com. All Rights Reserved.Please Consider the Environment Before Printing This Document
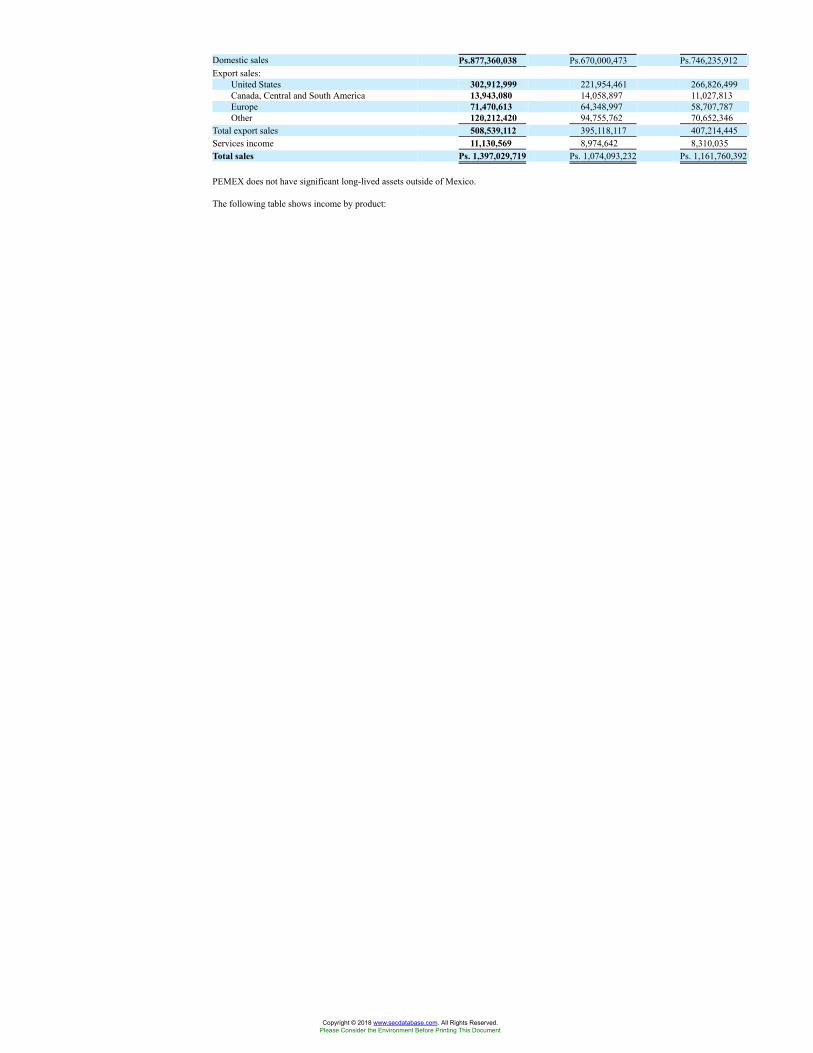
Domestic sales Ps.877,360,038 Ps.670,000,473 Ps.746,235,912Export sales:
United States 302,912,999 221,954,461 266,826,499Canada, Central and South America 13,943,080 14,058,897 11,027,813Europe 71,470,613 64,348,997 58,707,787Other 120,212,420 94,755,762 70,652,346
Total export sales 508,539,112 395,118,117 407,214,445Services income 11,130,569 8,974,642 8,310,035Total sales Ps. 1,397,029,719 Ps. 1,074,093,232 Ps. 1,161,760,392
PEMEX does not have significant long-lived assets outside of Mexico.
The following table shows income by product:
Copyright © 2018 www.secdatabase.com. All Rights Reserved.Please Consider the Environment Before Printing This Document
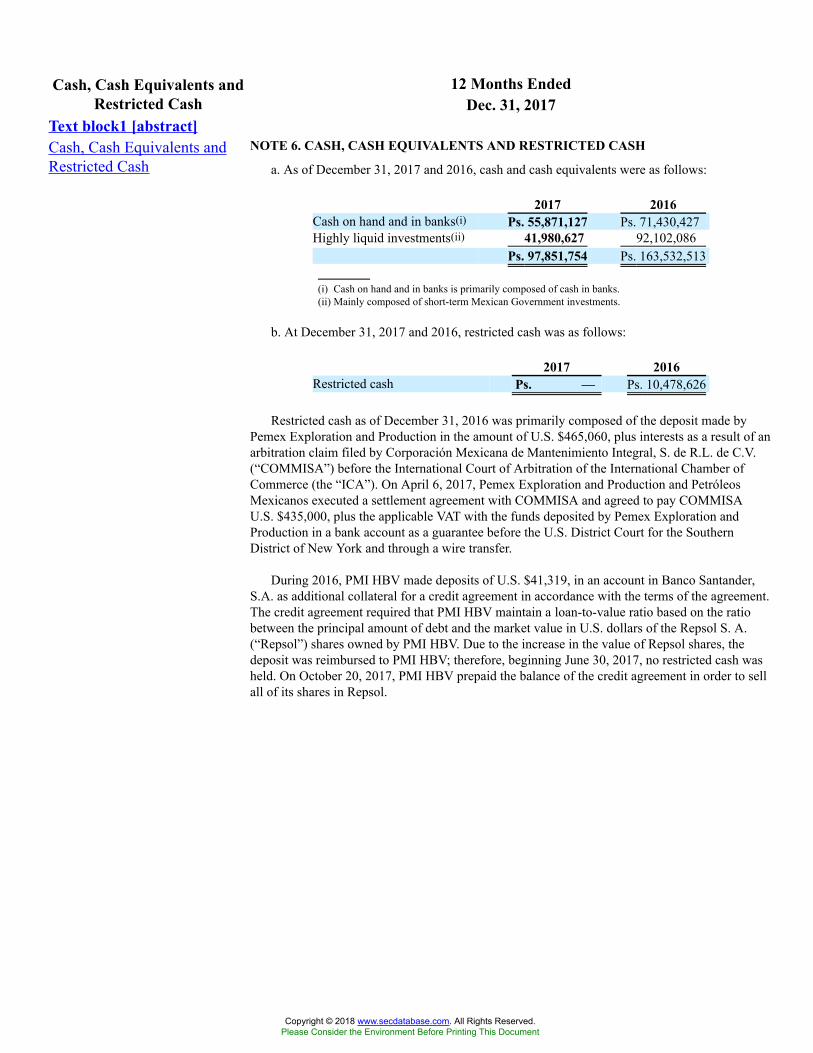
12 Months EndedCash, Cash Equivalents andRestricted Cash Dec. 31, 2017
Text block1 [abstract]Cash, Cash Equivalents andRestricted Cash
NOTE 6. CASH, CASH EQUIVALENTS AND RESTRICTED CASH
a. As of December 31, 2017 and 2016, cash and cash equivalents were as follows:
2017 2016Cash on hand and in banks(i) Ps. 55,871,127 Ps. 71,430,427Highly liquid investments(ii) 41,980,627 92,102,086
Ps. 97,851,754 Ps. 163,532,513
(i) Cash on hand and in banks is primarily composed of cash in banks.(ii) Mainly composed of short-term Mexican Government investments.
b. At December 31, 2017 and 2016, restricted cash was as follows:
2017 2016Restricted cash Ps. — Ps. 10,478,626
Restricted cash as of December 31, 2016 was primarily composed of the deposit made byPemex Exploration and Production in the amount of U.S. $465,060, plus interests as a result of anarbitration claim filed by Corporación Mexicana de Mantenimiento Integral, S. de R.L. de C.V.(“COMMISA”) before the International Court of Arbitration of the International Chamber ofCommerce (the “ICA”). On April 6, 2017, Pemex Exploration and Production and PetróleosMexicanos executed a settlement agreement with COMMISA and agreed to pay COMMISAU.S. $435,000, plus the applicable VAT with the funds deposited by Pemex Exploration andProduction in a bank account as a guarantee before the U.S. District Court for the SouthernDistrict of New York and through a wire transfer.
During 2016, PMI HBV made deposits of U.S. $41,319, in an account in Banco Santander,S.A. as additional collateral for a credit agreement in accordance with the terms of the agreement.The credit agreement required that PMI HBV maintain a loan-to-value ratio based on the ratiobetween the principal amount of debt and the market value in U.S. dollars of the Repsol S. A.(“Repsol”) shares owned by PMI HBV. Due to the increase in the value of Repsol shares, thedeposit was reimbursed to PMI HBV; therefore, beginning June 30, 2017, no restricted cash washeld. On October 20, 2017, PMI HBV prepaid the balance of the credit agreement in order to sellall of its shares in Repsol.
Copyright © 2018 www.secdatabase.com. All Rights Reserved.Please Consider the Environment Before Printing This Document
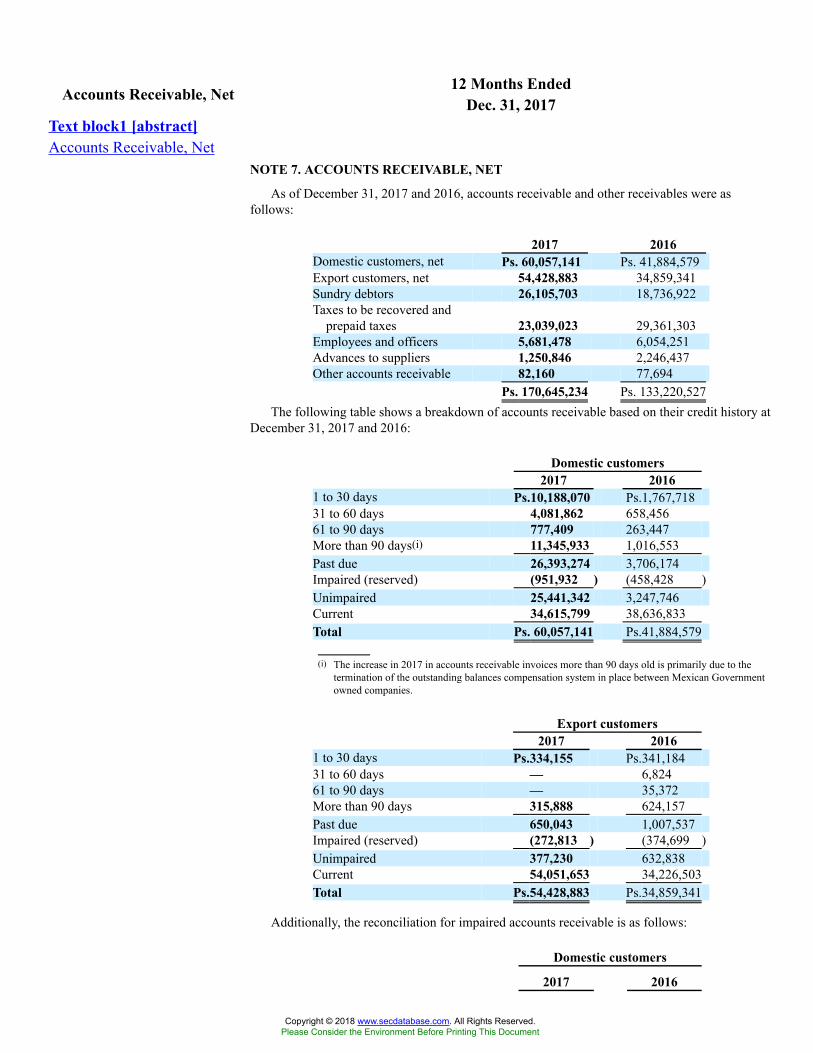
12 Months EndedAccounts Receivable, Net Dec. 31, 2017Text block1 [abstract]Accounts Receivable, Net
NOTE 7. ACCOUNTS RECEIVABLE, NET
As of December 31, 2017 and 2016, accounts receivable and other receivables were asfollows:
2017 2016Domestic customers, net Ps. 60,057,141 Ps. 41,884,579Export customers, net 54,428,883 34,859,341Sundry debtors 26,105,703 18,736,922Taxes to be recovered and
prepaid taxes 23,039,023 29,361,303Employees and officers 5,681,478 6,054,251Advances to suppliers 1,250,846 2,246,437Other accounts receivable 82,160 77,694
Ps. 170,645,234 Ps. 133,220,527The following table shows a breakdown of accounts receivable based on their credit history at
December 31, 2017 and 2016:
Domestic customers2017 2016
1 to 30 days Ps.10,188,070 Ps.1,767,71831 to 60 days 4,081,862 658,45661 to 90 days 777,409 263,447More than 90 days(i) 11,345,933 1,016,553Past due 26,393,274 3,706,174Impaired (reserved) (951,932 ) (458,428 )Unimpaired 25,441,342 3,247,746Current 34,615,799 38,636,833Total Ps. 60,057,141 Ps.41,884,579
(i) The increase in 2017 in accounts receivable invoices more than 90 days old is primarily due to thetermination of the outstanding balances compensation system in place between Mexican Governmentowned companies.
Export customers2017 2016
1 to 30 days Ps.334,155 Ps.341,18431 to 60 days — 6,82461 to 90 days — 35,372More than 90 days 315,888 624,157Past due 650,043 1,007,537Impaired (reserved) (272,813 ) (374,699 )Unimpaired 377,230 632,838Current 54,051,653 34,226,503Total Ps.54,428,883 Ps.34,859,341
Additionally, the reconciliation for impaired accounts receivable is as follows:
Domestic customers
2017 2016
Copyright © 2018 www.secdatabase.com. All Rights Reserved.Please Consider the Environment Before Printing This Document
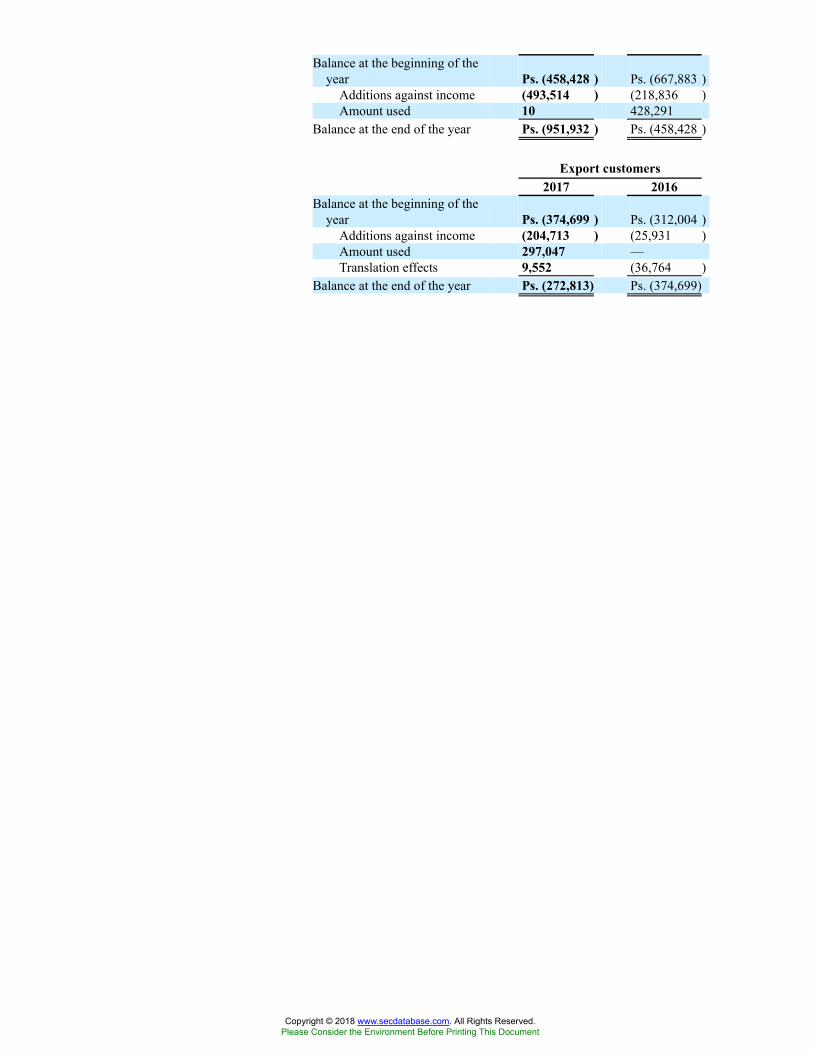
Balance at the beginning of theyear Ps. (458,428 ) Ps. (667,883 )
Additions against income (493,514 ) (218,836 )Amount used 10 428,291
Balance at the end of the year Ps. (951,932 ) Ps. (458,428 )
Export customers2017 2016
Balance at the beginning of theyear Ps. (374,699 ) Ps. (312,004 )
Additions against income (204,713 ) (25,931 )Amount used 297,047 —Translation effects 9,552 (36,764 )
Balance at the end of the year Ps. (272,813) Ps. (374,699)
Copyright © 2018 www.secdatabase.com. All Rights Reserved.Please Consider the Environment Before Printing This Document

12 Months EndedInventories, Net Dec. 31, 2017Text block1 [abstract]Inventories, Net
NOTE 8. INVENTORIES, NET
As of December 31, 2017 and 2016, inventories were as follows:
2017 2016Refined and
petrochemicalsproducts Ps. 27,862,384 Ps. 21,534,846
Products in transit 19,112,606 7,735,163Crude oil 11,445,780 11,391,310Materials and
products in stock 5,172,779 4,721,834Materials in transit 180,711 419,547Gas and
condensateproducts 84,670 89,360
Ps. 63,858,930 Ps. 45,892,060
Copyright © 2018 www.secdatabase.com. All Rights Reserved.Please Consider the Environment Before Printing This Document
12 Months EndedHeld-for-Sale Non-FinancialAssets Dec. 31, 2017
Text block1 [abstract]Held-for-Sale Non-FinancialAssets NOTE 9. HELD—FOR—SALE NON-FINANCIAL ASSETS
Pursuant to Round Zero, PEMEX was provisionally assigned titles tocertain blocks in escrow. The ownership of the fixed assets located inthose blocks is transferred when the blocks are awarded to third parties insubsequent rounds.
As a result of the Energy Reform Decree, the secondary legislation andthe corresponding initial adjudication of rights for the exploration andextraction of oil and solid hydrocarbons addressed in transitory article 6 ofthe Energy Reform Decree, certain assignments that Pemex Explorationand Production received from the Mexican Government were affected.The Mexican Government will compensate PEMEX for these investmentsat fair value pursuant to the terms determined by the Ministry of Energy.
In 2016, pursuant to Round 1.3, the Ministry of Energy awarded certaincontractual areas for the exploration and extraction of oil and solidhydrocarbons to third parties and their respective fixed assets have beentransferred from PEMEX to such third parties. During 2016, PEMEXsubmitted the application for compensation from the Ministry of Energyfor the fixed assets located in those areas, receiving resolution in 2017.
All the assets that are part of unassigned areas to PEMEX as part ofRound Zero continue to be classified as long-lived assets, subject to allregulations applicable to such assets, provided PEMEX (1) obtains theeconomic benefits derived from the use thereof and (2) at the same timeexercises control over them and assumes the benefits and risks associatedwith such assets.
Assets that are part of the areas that were not assigned to PEMEX as partof Round Zero, and from which PEMEX does not obtain economicbenefits derived from use of such assets, are written down, affecting theresults for that year.
As a result, of the Ps. 7,460,674 held-for-sale, the non-financial assets atDecember 31, 2016, Ps.4,652,314 were reclassified to fixed assets and theremaining Ps. 2,808,360, were transferred to the results of the year.
Copyright © 2018 www.secdatabase.com. All Rights Reserved.Please Consider the Environment Before Printing This Document
12 Months EndedAvailable-for-Sale-FinancialAssets Dec. 31, 2017
Text block1 [abstract]Available-for-Sale-FinancialAssets NOTE 10. AVAILABLE—FOR—SALE—FINANCIAL ASSETS
a. On January 1, 2016, PEMEX had a total of 20,724,331 shares of Repsol valued atPs. 3,944,696, which represented approximately 1.48% of Repsol’s share capital.
On January 15, 2016, PMI HBV received 942,015 new Repsol shares valued at Ps.188,490 as an in-kind dividend that was declared on December 31, 2015.
On June 13, 2016, Repsol declared flexible dividends to its shareholders, of which PMIHBV received 555,547 new Repsol shares as an in-kind dividend on July 18, 2016,valued at Ps. 128,051.
Since the 1,497,562 new Repsol shares were received as an in-kind dividend during 2016,they were not included in the loan agreement obtained by PMI HBV in August 2015 andthese shares are presented as short-term available-for-sale financial assets amounting toPs. 435,556. These shares were sold in January 2017.
On December 14, 2016, Repsol declared flexible dividends to its shareholders, of whichPMI HBV received 584,786 new Repsol shares as an in-kind dividend in January 23,2017. This amount was recognized as an account receivable of Ps.165,346 as ofDecember 31, 2016.
As of December 31, 2016, the investment in 20,724,331 shares of Repsol held by PMIHBV was valued at Ps. 6,027,540. These shares are presented under non-current assets.The effect of the valuation on the investment at fair value was recorded in othercomprehensive result in the consolidated statement of changes in equity (deficit) as aprofit of Ps. 207,817 at December 31, 2016.
On January 24, 2017 and January 25, 2017, PMI HBV sold a total of 2,082,348 Repsolshares at an average price of € 14.17 per share, for a total amount of Ps. 684,029. Theseshares were not included as collateral on the loan agreement.
On June 7, 2017, Repsol declared flexible dividends to its shareholders, of which PMIHBV received 609,539 new Repsol shares as an in-kind dividend on July 13, 2017. Thisamount was recognized as an account receivable of Ps. 180,729.
On October 26, 2017, PMI HBV sold 21,333,870 Repsol shares for a total amount of Ps.7,342,807 pursuant to a share forward transaction with Credit Agricole CIB. This sale,together with the sale on January 24 and 25, 2017, resulted in a total loss of Ps.3,523,748.
As a result of the above, PEMEX does not have an equity interest in Repsol as ofDecember 31, 2017. The 2016 balance allocated in other comprehensive income for Ps.5,564,130 was transferred to the results of the year.
b. As of December 31, 2016, due to the loss of significant influence in TAG Norte Holding,S. de R. L. de C. V. and TAG Pipelines Sur, S. de R. L. de C. V., these companies werevalued at fair value and are presented as short-term available-for-sale financial assets inthe amount of Ps.2,417,123.
As of December 31, 2017, PEMEX is in the process of selling its shares of TAG NorteHolding, S. de R.L. de C.V. and TAG Pipeline Sur, S. de R.L. de C.V. These shares havebeen classified as available-for-sale-financial-assets and have been valued at their netrealizable value, which as of December 31, 2017 has resulted in a negative value that hasbeen recognized in the profit or loss at the end of the year. As of the date of theseconsolidated financial statements, PEMEX is in the process of selling these shares. As ofDecember 31, 2017, available-for-sale current non-financial assets amounted Ps.1,056,918.
Copyright © 2018 www.secdatabase.com. All Rights Reserved.Please Consider the Environment Before Printing This Document

12 Months EndedInvestments in JointVentures and Associates Dec. 31, 2017
Investments Schedule[Abstract]Investments in Joint Venturesand Associates NOTE 11. INVESTMENTS IN JOINT VENTURES AND ASSOCIATES
The investments in joint ventures and associates as of December 31, 2017 and 2016, were as follows:
December 31,Percentage ofinvestment 2017 2016
Deer Park Refining Limited 49.99% Ps.14,405,542 Ps.14,039,384Petroquímica Mexicana de Vinilo, S. A. de C. V. (i) 44.09% — 4,309,050Sierrita Gas Pipeline LLC 35.00% 1,084,169 1,112,338Frontera Brownsville, LLC. 50.00% 471,085 478,414CH4 Energía, S. A. 50.00% 315,713 194,868Texas Frontera, LLC. 50.00% 239,782 260,828Administración Portuaria Integral de Dos Bocas,
S.A. de C.V. 40.00% 64,328 139,523PMV Minera, S.A. de C.V. 44.09% 45,133 61,779Ductos el peninsular, S.A.P.I de C. V. 50.00% 18,336 18,626Other-net Various 63,276 122,699
Ps.16,707,364 Ps.20,737,509
i. On April 20, 2016, an explosion occurred in the “Planta de Clorados 3” (Chlorinated Plant 3) of the Petroquímica Mexicana deVinilo, resulting in approximately U.S. $ 461,000 in damages. Chorinated Plant 3 incurred the greatest amount of damage,including the loss of certain assets and the closure of the plant for an undefined amount of time. The Chlorine-Soda plants andthe ethylene plants did not register any damage. On December 20, 2017, Petroquímica Mexicana de Vinilo permanently closedthe plant, and -the full book value was written-off impacting the value of this investment.
Profit (loss) sharing in joint ventures and associates:
2017 2016 2015Deer Park Refining Limited Ps. 920,409 Ps. 1,437,850 Ps. 1,913,835Ductos y Energéticos del Norte, S.A. de
C.V.(i) 360,092 — —CH4 Energía S.A. de C.V. 125,132 — —Sierrita Gas Pipeline LLC 129,401 105,825 152,445PMV Minera, S.A. de C.V. 6,253 — —Petroquímica Mexicana de Vinilo, S. A. de C.
V. (1,223,640 ) (190,468 ) (61,952 )Administración Portuaria Integralde Dos Bocas, S.A. de C.V. (75,195 ) — —Gasoductos de Chihuahua, S. de R. L. de C.
V. (ii) — 638,126 666,779Compañía Mexicana de Exploraciones, S. A.
de C. V.(iii) — — (496,774 )Other, net 117,988 144,512 143,782Profit sharing in joint ventures and associates,
net Ps. 360,440 Ps. 2,135,845 Ps. 2,318,115
i. In November 2017, PEMEX sold its 50% interest in Ductos y Energéticos del Norte, S. de R.L. de C. V., to InfraestructuraEnergética Nova, S.A.B. of C.V. for a total of U.S. $ 3,141,710, yielding a profit of Ps. 3,139,103.
ii. On September 28, 2016, PEMEX completed the divestiture of its 50% ownership interest in the Gasoductos de Chihuahua S. deR.L. de C.V. joint venture with Infraestructura Energética Nova, S.A.B. de C.V. The stock was sold for Ps. 22,684,736, yieldinga profit of Ps. 15,211,039.
iii. Beginning July 1, 2016 this company was included in the consolidated financial statements of PEMEX. Until June 30, 2016 thisCompany was accounted for as an investment in an associate under the equity method (see Note 3-a).
The following tables show condensed financial information of major investments recognized underthe equity method during 2017 and 2016:
Copyright © 2018 www.secdatabase.com. All Rights Reserved.Please Consider the Environment Before Printing This Document
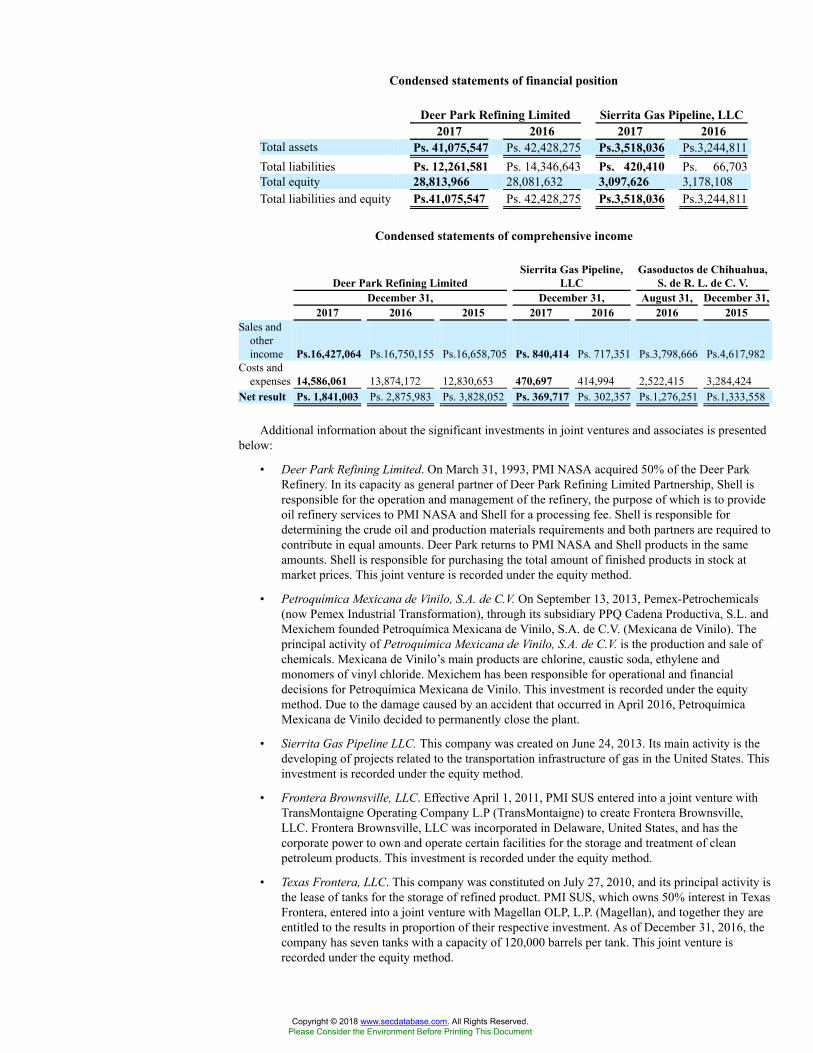
Condensed statements of financial position
Deer Park Refining Limited Sierrita Gas Pipeline, LLC2017 2016 2017 2016
Total assets Ps. 41,075,547 Ps. 42,428,275 Ps.3,518,036 Ps.3,244,811Total liabilities Ps. 12,261,581 Ps. 14,346,643 Ps. 420,410 Ps. 66,703Total equity 28,813,966 28,081,632 3,097,626 3,178,108Total liabilities and equity Ps.41,075,547 Ps. 42,428,275 Ps.3,518,036 Ps.3,244,811
Condensed statements of comprehensive income
Deer Park Refining LimitedSierrita Gas Pipeline,
LLCGasoductos de Chihuahua,
S. de R. L. de C. V.December 31, December 31, August 31, December 31,
2017 2016 2015 2017 2016 2016 2015Sales and
otherincome Ps.16,427,064 Ps.16,750,155 Ps.16,658,705 Ps. 840,414 Ps. 717,351 Ps.3,798,666 Ps.4,617,982
Costs andexpenses 14,586,061 13,874,172 12,830,653 470,697 414,994 2,522,415 3,284,424
Net result Ps. 1,841,003 Ps. 2,875,983 Ps. 3,828,052 Ps. 369,717 Ps. 302,357 Ps.1,276,251 Ps.1,333,558
Additional information about the significant investments in joint ventures and associates is presentedbelow:
• Deer Park Refining Limited. On March 31, 1993, PMI NASA acquired 50% of the Deer ParkRefinery. In its capacity as general partner of Deer Park Refining Limited Partnership, Shell isresponsible for the operation and management of the refinery, the purpose of which is to provideoil refinery services to PMI NASA and Shell for a processing fee. Shell is responsible fordetermining the crude oil and production materials requirements and both partners are required tocontribute in equal amounts. Deer Park returns to PMI NASA and Shell products in the sameamounts. Shell is responsible for purchasing the total amount of finished products in stock atmarket prices. This joint venture is recorded under the equity method.
• Petroquímica Mexicana de Vinilo, S.A. de C.V. On September 13, 2013, Pemex-Petrochemicals(now Pemex Industrial Transformation), through its subsidiary PPQ Cadena Productiva, S.L. andMexichem founded Petroquímica Mexicana de Vinilo, S.A. de C.V. (Mexicana de Vinilo). Theprincipal activity of Petroquímica Mexicana de Vinilo, S.A. de C.V. is the production and sale ofchemicals. Mexicana de Vinilo’s main products are chlorine, caustic soda, ethylene andmonomers of vinyl chloride. Mexichem has been responsible for operational and financialdecisions for Petroquímica Mexicana de Vinilo. This investment is recorded under the equitymethod. Due to the damage caused by an accident that occurred in April 2016, PetroquímicaMexicana de Vinilo decided to permanently close the plant.
• Sierrita Gas Pipeline LLC. This company was created on June 24, 2013. Its main activity is thedeveloping of projects related to the transportation infrastructure of gas in the United States. Thisinvestment is recorded under the equity method.
• Frontera Brownsville, LLC. Effective April 1, 2011, PMI SUS entered into a joint venture withTransMontaigne Operating Company L.P (TransMontaigne) to create Frontera Brownsville,LLC. Frontera Brownsville, LLC was incorporated in Delaware, United States, and has thecorporate power to own and operate certain facilities for the storage and treatment of cleanpetroleum products. This investment is recorded under the equity method.
• Texas Frontera, LLC. This company was constituted on July 27, 2010, and its principal activity isthe lease of tanks for the storage of refined product. PMI SUS, which owns 50% interest in TexasFrontera, entered into a joint venture with Magellan OLP, L.P. (Magellan), and together they areentitled to the results in proportion of their respective investment. As of December 31, 2016, thecompany has seven tanks with a capacity of 120,000 barrels per tank. This joint venture isrecorded under the equity method.
Copyright © 2018 www.secdatabase.com. All Rights Reserved.Please Consider the Environment Before Printing This Document
• CH4 Energía, S.A. This company was constituted on December 21, 2000. CH4 Energía engagesin the purchase and sale of natural gas and in activities related to the trading of natural gas, suchas transport and distribution in Valle de Toluca, México. This joint venture is recorded under theequity method.
• Administración Portuaria Integral de Dos Bocas, S.A. de C.V. This company was constituted onAugust 12, 1999. Its primary activity is adminitrating the Dos Bocas port, which is in Mexico’spublic domain, promoting the port’s infrastructure and providing related port services. Thisinvestment is recorded under the equity method.
• PMV Minera, S.A. de C.V. This company was constituted on October 1, 2014 and the principalactivity is the extraction and sale of salmuera (mixture of salt and water). This investment isrecorded under the equity method.
• Gasoductos de Chihuahua, S. de R.L. de C.V. On February 6, 1997, Pemex IndustrialTransformation (formerly Pemex-Refining) entered into a joint venture with IEnova GasoductosHolding, S. de R.L de C.V. to own and operate companies related to gas transportation anddistribution, called Gasoductos de Chihuahua, S. de R.L. de C.V. Decision-making requires theconsent of both partners. The participation of each of the partners was 50% of the share capital.This investment was recorded under the equity method until August 2016, when PEMEXcompleted the divestiture of this company as described in footnote (ii) to the table above.
• Compañía Mexicana de Exploraciones S.A. de C.V., (“COMESA”). COMESA was founded onNovember 12, 1968 to support PEMEX’s exploration programs. The operations of COMESA arefocused on designing integral solutions for the energy sector, along the value chain forexploration and production, refining, petrochemicals, geothermal energy and other energy areasall over the energy sector in Mexico, South America and the United States. COMESA’s principalactivities are: gravimetric, magnetometric and microseismic studies, land seismic data acquisition(2D,3D, 3C), marine Seismic data acquisition, seismic data processing, seismic datainterpretation and integration, vertical Seismic Profile (VSP) 2D and 3D, reservoircharacterization and visualization, conceptualization and definition for the exploration process.Until June 30, 2016 this company was accounted under the equity method. As of July 1, 2016this company is included in the consolidated results.
Copyright © 2018 www.secdatabase.com. All Rights Reserved.Please Consider the Environment Before Printing This Document
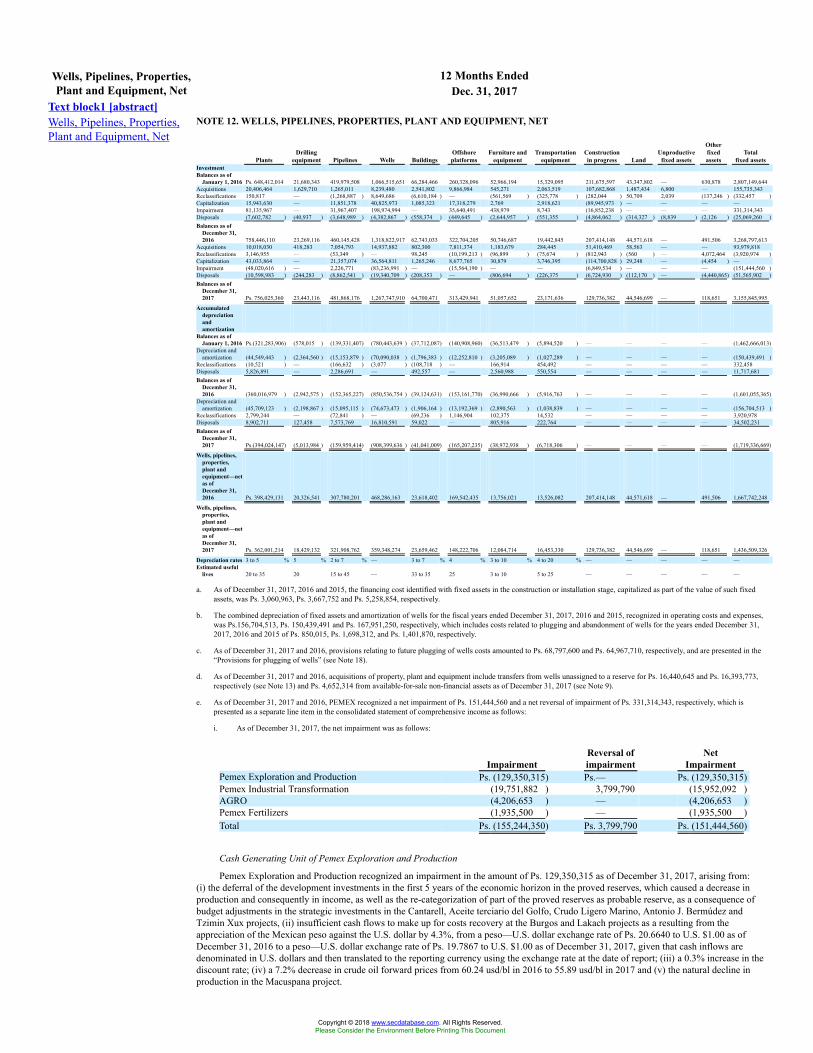
12 Months EndedWells, Pipelines, Properties,Plant and Equipment, Net Dec. 31, 2017
Text block1 [abstract]Wells, Pipelines, Properties,Plant and Equipment, Net
NOTE 12. WELLS, PIPELINES, PROPERTIES, PLANT AND EQUIPMENT, NET
PlantsDrilling
equipment Pipelines Wells BuildingsOffshoreplatforms
Furniture andequipment
Transportationequipment
Constructionin progress Land
Unproductivefixed assets
Otherfixedassets
Totalfixed assets
InvestmentBalances as of
January 1, 2016 Ps. 648,412,014 21,680,343 419,979,508 1,066,515,651 66,284,466 260,328,096 52,966,194 15,329,095 211,675,597 43,347,802 — 630,878 2,807,149,644Acquisitions 20,406,464 1,629,710 1,265,011 8,239,480 2,541,802 9,866,984 545,271 2,063,519 107,682,868 1,487,434 6,800 — 155,735,343Reclassifications 150,817 — (1,268,887 ) 8,649,686 (6,610,184 ) — (561,569 ) (325,778 ) (282,044 ) 50,709 2,039 (137,246 ) (332,457 )Capitalization 15,943,630 — 11,851,378 40,825,973 1,085,323 17,318,279 2,769 2,918,621 (89,945,973 ) — — — —Impairment 81,135,967 — 31,967,407 198,974,994 — 35,640,491 438,979 8,743 (16,852,238 ) — — — 331,314,343Disposals (7,602,782 ) (40,937 ) (3,648,989 ) (4,382,867 ) (558,374 ) (449,645 ) (2,644,957 ) (551,355 ) (4,864,062 ) (314,327 ) (8,839 ) (2,126 ) (25,069,260 )Balances as of
December 31,2016 758,446,110 23,269,116 460,145,428 1,318,822,917 62,743,033 322,704,205 50,746,687 19,442,845 207,414,148 44,571,618 — 491,506 3,268,797,613
Acquisitions 10,018,030 418,283 7,054,793 14,937,882 802,300 7,811,374 1,183,679 284,445 51,410,469 58,563 — — 93,979,818Reclassifications 3,146,955 — (53,349 ) — 98,245 (10,199,213 ) (96,899 ) (75,674 ) (812,943 ) (560 ) — 4,072,464 (3,920,974 )Capitalization 43,033,864 — 21,357,074 36,564,811 1,265,246 8,677,765 30,879 3,746,395 (114,700,828 ) 29,248 — (4,454 ) —Impairment (48,020,616 ) — 2,226,771 (83,236,991 ) — (15,564,190 ) — — (6,849,534 ) — — — (151,444,560 )Disposals (10,598,983 ) (244,283 ) (8,862,541 ) (19,340,709 ) (208,353 ) — (806,694 ) (226,375 ) (6,724,930 ) (112,170 ) — (4,440,865) (51,565,902 )Balances as of
December 31,2017 Ps. 756,025,360 23,443,116 481,868,176 1,267,747,910 64,700,471 313,429,941 51,057,652 23,171,636 129,736,382 44,546,699 — 118,651 3,155,845,995
Accumulateddepreciationandamortization
Balances as ofJanuary 1, 2016 Ps.(321,283,906) (578,015 ) (139,331,407) (780,443,639 ) (37,712,087) (140,908,960) (36,513,479 ) (5,894,520 ) — — — — (1,462,666,013)
Depreciation andamortization (44,549,443 ) (2,364,560 ) (15,153,879 ) (70,090,038 ) (1,796,383 ) (12,252,810 ) (3,205,089 ) (1,027,289 ) — — — — (150,439,491 )
Reclassifications (10,521 ) — (166,632 ) (3,077 ) (108,718 ) — 166,914 454,492 — — — — 332,458Disposals 5,826,891 — 2,286,691 — 492,557 — 2,560,988 550,554 — — — — 11,717,681Balances as of
December 31,2016 (360,016,979 ) (2,942,575 ) (152,365,227) (850,536,754 ) (39,124,631) (153,161,770) (36,990,666 ) (5,916,763 ) — — — — (1,601,055,365)
Depreciation andamortization (45,709,123 ) (2,198,867 ) (15,095,115 ) (74,673,473 ) (1,906,164 ) (13,192,369 ) (2,890,563 ) (1,038,839 ) — — — — (156,704,513 )
Reclassifications 2,799,244 — (72,841 ) — (69,236 ) 1,146,904 102,375 14,532 — — — — 3,920,978Disposals 8,902,711 127,458 7,573,769 16,810,591 59,022 — 805,916 222,764 — — — — 34,502,231Balances as of
December 31,2017 Ps.(394,024,147) (5,013,984 ) (159,959,414) (908,399,636 ) (41,041,009) (165,207,235) (38,972,938 ) (6,718,306 ) — — — — (1,719,336,669)
Wells, pipelines,properties,plant andequipment—netas ofDecember 31,2016 Ps. 398,429,131 20,326,541 307,780,201 468,286,163 23,618,402 169,542,435 13,756,021 13,526,082 207,414,148 44,571,618 — 491,506 1,667,742,248
Wells, pipelines,properties,plant andequipment—netas ofDecember 31,2017 Ps. 362,001,214 18,429,132 321,908,762 359,348,274 23,659,462 148,222,706 12,084,714 16,453,330 129,736,382 44,546,699 — 118,651 1,436,509,326
Depreciation rates 3 to 5 % 5 % 2 to 7 % — 3 to 7 % 4 % 3 to 10 % 4 to 20 % — — — — —Estimated useful
lives 20 to 35 20 15 to 45 — 33 to 35 25 3 to 10 5 to 25 — — — — —
a. As of December 31, 2017, 2016 and 2015, the financing cost identified with fixed assets in the construction or installation stage, capitalized as part of the value of such fixedassets, was Ps. 3,060,963, Ps. 3,667,752 and Ps. 5,258,854, respectively.
b. The combined depreciation of fixed assets and amortization of wells for the fiscal years ended December 31, 2017, 2016 and 2015, recognized in operating costs and expenses,was Ps.156,704,513, Ps. 150,439,491 and Ps. 167,951,250, respectively, which includes costs related to plugging and abandonment of wells for the years ended December 31,2017, 2016 and 2015 of Ps. 850,015, Ps. 1,698,312, and Ps. 1,401,870, respectively.
c. As of December 31, 2017 and 2016, provisions relating to future plugging of wells costs amounted to Ps. 68,797,600 and Ps. 64,967,710, respectively, and are presented in the“Provisions for plugging of wells” (see Note 18).
d. As of December 31, 2017 and 2016, acquisitions of property, plant and equipment include transfers from wells unassigned to a reserve for Ps. 16,440,645 and Ps. 16,393,773,respectively (see Note 13) and Ps. 4,652,314 from available-for-sale non-financial assets as of December 31, 2017 (see Note 9).
e. As of December 31, 2017 and 2016, PEMEX recognized a net impairment of Ps. 151,444,560 and a net reversal of impairment of Ps. 331,314,343, respectively, which ispresented as a separate line item in the consolidated statement of comprehensive income as follows:
i. As of December 31, 2017, the net impairment was as follows:
ImpairmentReversal ofimpairment
NetImpairment
Pemex Exploration and Production Ps. (129,350,315) Ps.— Ps. (129,350,315)Pemex Industrial Transformation (19,751,882 ) 3,799,790 (15,952,092 )AGRO (4,206,653 ) — (4,206,653 )Pemex Fertilizers (1,935,500 ) — (1,935,500 )Total Ps. (155,244,350) Ps. 3,799,790 Ps. (151,444,560)
Cash Generating Unit of Pemex Exploration and Production
Pemex Exploration and Production recognized an impairment in the amount of Ps. 129,350,315 as of December 31, 2017, arising from:(i) the deferral of the development investments in the first 5 years of the economic horizon in the proved reserves, which caused a decrease inproduction and consequently in income, as well as the re-categorization of part of the proved reserves as probable reserve, as a consequence ofbudget adjustments in the strategic investments in the Cantarell, Aceite terciario del Golfo, Crudo Ligero Marino, Antonio J. Bermúdez andTzimin Xux projects, (ii) insufficient cash flows to make up for costs recovery at the Burgos and Lakach projects as a resulting from theappreciation of the Mexican peso against the U.S. dollar by 4.3%, from a peso—U.S. dollar exchange rate of Ps. 20.6640 to U.S. $1.00 as ofDecember 31, 2016 to a peso—U.S. dollar exchange rate of Ps. 19.7867 to U.S. $1.00 as of December 31, 2017, given that cash inflows aredenominated in U.S. dollars and then translated to the reporting currency using the exchange rate at the date of report; (iii) a 0.3% increase in thediscount rate; (iv) a 7.2% decrease in crude oil forward prices from 60.24 usd/bl in 2016 to 55.89 usd/bl in 2017 and (v) the natural decline inproduction in the Macuspana project.
Copyright © 2018 www.secdatabase.com. All Rights Reserved.Please Consider the Environment Before Printing This Document
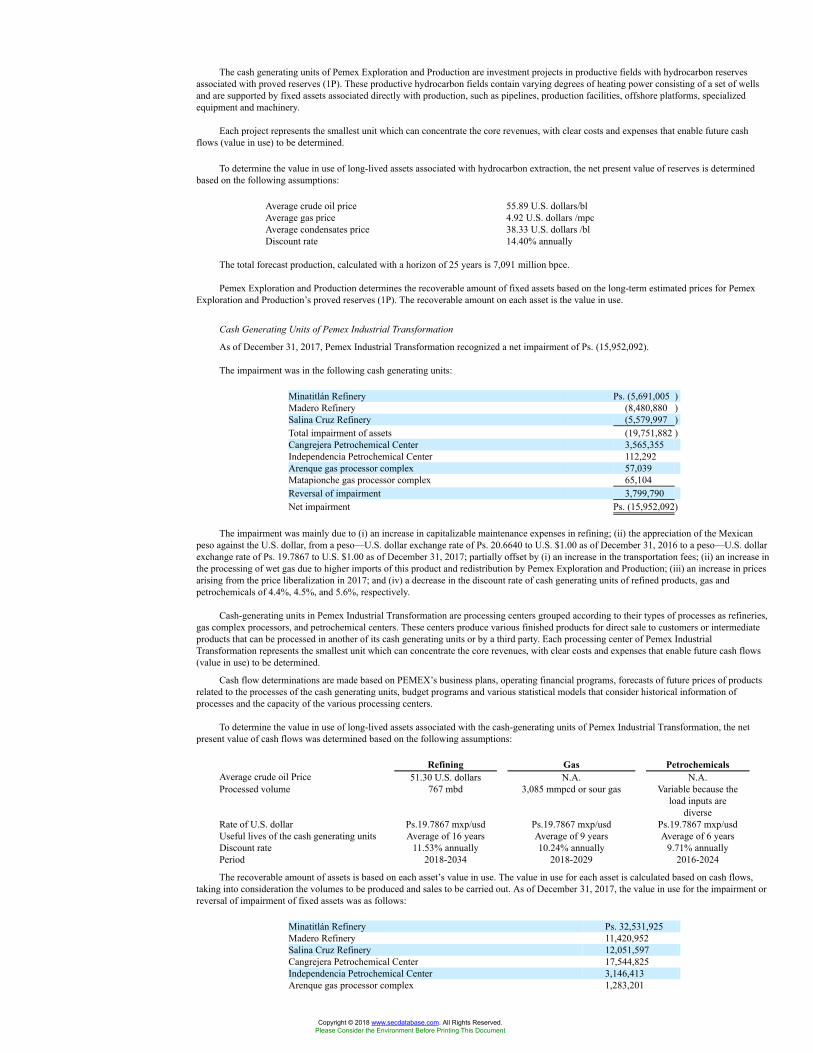
The cash generating units of Pemex Exploration and Production are investment projects in productive fields with hydrocarbon reservesassociated with proved reserves (1P). These productive hydrocarbon fields contain varying degrees of heating power consisting of a set of wellsand are supported by fixed assets associated directly with production, such as pipelines, production facilities, offshore platforms, specializedequipment and machinery.
Each project represents the smallest unit which can concentrate the core revenues, with clear costs and expenses that enable future cashflows (value in use) to be determined.
To determine the value in use of long-lived assets associated with hydrocarbon extraction, the net present value of reserves is determinedbased on the following assumptions:
Average crude oil price 55.89 U.S. dollars/blAverage gas price 4.92 U.S. dollars /mpcAverage condensates price 38.33 U.S. dollars /blDiscount rate 14.40% annually
The total forecast production, calculated with a horizon of 25 years is 7,091 million bpce.
Pemex Exploration and Production determines the recoverable amount of fixed assets based on the long-term estimated prices for PemexExploration and Production’s proved reserves (1P). The recoverable amount on each asset is the value in use.
Cash Generating Units of Pemex Industrial Transformation
As of December 31, 2017, Pemex Industrial Transformation recognized a net impairment of Ps. (15,952,092).
The impairment was in the following cash generating units:
Minatitlán Refinery Ps. (5,691,005 )Madero Refinery (8,480,880 )Salina Cruz Refinery (5,579,997 )Total impairment of assets (19,751,882 )Cangrejera Petrochemical Center 3,565,355Independencia Petrochemical Center 112,292Arenque gas processor complex 57,039Matapionche gas processor complex 65,104Reversal of impairment 3,799,790Net impairment Ps. (15,952,092)
The impairment was mainly due to (i) an increase in capitalizable maintenance expenses in refining; (ii) the appreciation of the Mexicanpeso against the U.S. dollar, from a peso—U.S. dollar exchange rate of Ps. 20.6640 to U.S. $1.00 as of December 31, 2016 to a peso—U.S. dollarexchange rate of Ps. 19.7867 to U.S. $1.00 as of December 31, 2017; partially offset by (i) an increase in the transportation fees; (ii) an increase inthe processing of wet gas due to higher imports of this product and redistribution by Pemex Exploration and Production; (iii) an increase in pricesarising from the price liberalization in 2017; and (iv) a decrease in the discount rate of cash generating units of refined products, gas andpetrochemicals of 4.4%, 4.5%, and 5.6%, respectively.
Cash-generating units in Pemex Industrial Transformation are processing centers grouped according to their types of processes as refineries,gas complex processors, and petrochemical centers. These centers produce various finished products for direct sale to customers or intermediateproducts that can be processed in another of its cash generating units or by a third party. Each processing center of Pemex IndustrialTransformation represents the smallest unit which can concentrate the core revenues, with clear costs and expenses that enable future cash flows(value in use) to be determined.
Cash flow determinations are made based on PEMEX’s business plans, operating financial programs, forecasts of future prices of productsrelated to the processes of the cash generating units, budget programs and various statistical models that consider historical information ofprocesses and the capacity of the various processing centers.
To determine the value in use of long-lived assets associated with the cash-generating units of Pemex Industrial Transformation, the netpresent value of cash flows was determined based on the following assumptions:
Refining Gas PetrochemicalsAverage crude oil Price 51.30 U.S. dollars N.A. N.A.Processed volume 767 mbd 3,085 mmpcd or sour gas Variable because the
load inputs arediverse
Rate of U.S. dollar Ps.19.7867 mxp/usd Ps.19.7867 mxp/usd Ps.19.7867 mxp/usdUseful lives of the cash generating units Average of 16 years Average of 9 years Average of 6 yearsDiscount rate 11.53% annually 10.24% annually 9.71% annuallyPeriod 2018-2034 2018-2029 2016-2024
The recoverable amount of assets is based on each asset’s value in use. The value in use for each asset is calculated based on cash flows,taking into consideration the volumes to be produced and sales to be carried out. As of December 31, 2017, the value in use for the impairment orreversal of impairment of fixed assets was as follows:
Minatitlán Refinery Ps. 32,531,925Madero Refinery 11,420,952Salina Cruz Refinery 12,051,597Cangrejera Petrochemical Center 17,544,825Independencia Petrochemical Center 3,146,413Arenque gas processor complex 1,283,201
Copyright © 2018 www.secdatabase.com. All Rights Reserved.Please Consider the Environment Before Printing This Document
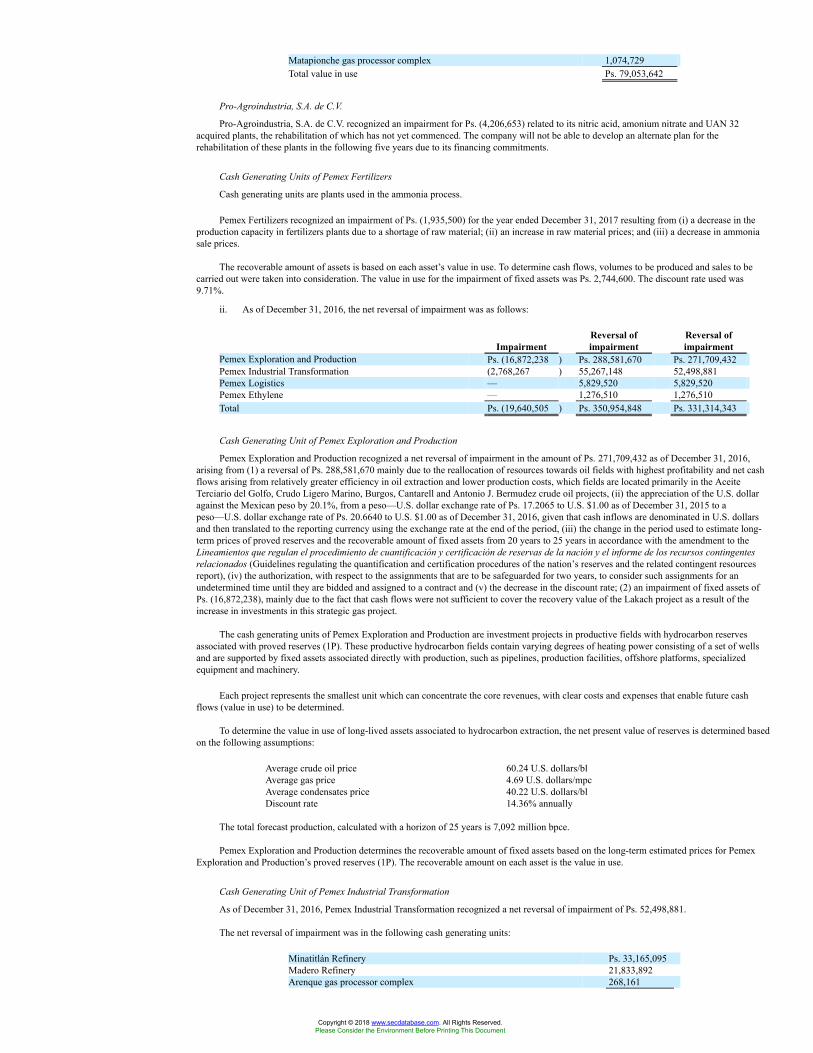
Matapionche gas processor complex 1,074,729Total value in use Ps. 79,053,642
Pro-Agroindustria, S.A. de C.V.
Pro-Agroindustria, S.A. de C.V. recognized an impairment for Ps. (4,206,653) related to its nitric acid, amonium nitrate and UAN 32acquired plants, the rehabilitation of which has not yet commenced. The company will not be able to develop an alternate plan for therehabilitation of these plants in the following five years due to its financing commitments.
Cash Generating Units of Pemex Fertilizers
Cash generating units are plants used in the ammonia process.
Pemex Fertilizers recognized an impairment of Ps. (1,935,500) for the year ended December 31, 2017 resulting from (i) a decrease in theproduction capacity in fertilizers plants due to a shortage of raw material; (ii) an increase in raw material prices; and (iii) a decrease in ammoniasale prices.
The recoverable amount of assets is based on each asset’s value in use. To determine cash flows, volumes to be produced and sales to becarried out were taken into consideration. The value in use for the impairment of fixed assets was Ps. 2,744,600. The discount rate used was9.71%.
ii. As of December 31, 2016, the net reversal of impairment was as follows:
ImpairmentReversal ofimpairment
Reversal ofimpairment
Pemex Exploration and Production Ps. (16,872,238 ) Ps. 288,581,670 Ps. 271,709,432Pemex Industrial Transformation (2,768,267 ) 55,267,148 52,498,881Pemex Logistics — 5,829,520 5,829,520Pemex Ethylene — 1,276,510 1,276,510Total Ps. (19,640,505 ) Ps. 350,954,848 Ps. 331,314,343
Cash Generating Unit of Pemex Exploration and Production
Pemex Exploration and Production recognized a net reversal of impairment in the amount of Ps. 271,709,432 as of December 31, 2016,arising from (1) a reversal of Ps. 288,581,670 mainly due to the reallocation of resources towards oil fields with highest profitability and net cashflows arising from relatively greater efficiency in oil extraction and lower production costs, which fields are located primarily in the AceiteTerciario del Golfo, Crudo Ligero Marino, Burgos, Cantarell and Antonio J. Bermudez crude oil projects, (ii) the appreciation of the U.S. dollaragainst the Mexican peso by 20.1%, from a peso—U.S. dollar exchange rate of Ps. 17.2065 to U.S. $1.00 as of December 31, 2015 to apeso—U.S. dollar exchange rate of Ps. 20.6640 to U.S. $1.00 as of December 31, 2016, given that cash inflows are denominated in U.S. dollarsand then translated to the reporting currency using the exchange rate at the end of the period, (iii) the change in the period used to estimate long-term prices of proved reserves and the recoverable amount of fixed assets from 20 years to 25 years in accordance with the amendment to theLineamientos que regulan el procedimiento de cuantificación y certificación de reservas de la nación y el informe de los recursos contingentesrelacionados (Guidelines regulating the quantification and certification procedures of the nation’s reserves and the related contingent resourcesreport), (iv) the authorization, with respect to the assignments that are to be safeguarded for two years, to consider such assignments for anundetermined time until they are bidded and assigned to a contract and (v) the decrease in the discount rate; (2) an impairment of fixed assets ofPs. (16,872,238), mainly due to the fact that cash flows were not sufficient to cover the recovery value of the Lakach project as a result of theincrease in investments in this strategic gas project.
The cash generating units of Pemex Exploration and Production are investment projects in productive fields with hydrocarbon reservesassociated with proved reserves (1P). These productive hydrocarbon fields contain varying degrees of heating power consisting of a set of wellsand are supported by fixed assets associated directly with production, such as pipelines, production facilities, offshore platforms, specializedequipment and machinery.
Each project represents the smallest unit which can concentrate the core revenues, with clear costs and expenses that enable future cashflows (value in use) to be determined.
To determine the value in use of long-lived assets associated to hydrocarbon extraction, the net present value of reserves is determined basedon the following assumptions:
Average crude oil price 60.24 U.S. dollars/blAverage gas price 4.69 U.S. dollars/mpcAverage condensates price 40.22 U.S. dollars/blDiscount rate 14.36% annually
The total forecast production, calculated with a horizon of 25 years is 7,092 million bpce.
Pemex Exploration and Production determines the recoverable amount of fixed assets based on the long-term estimated prices for PemexExploration and Production’s proved reserves (1P). The recoverable amount on each asset is the value in use.
Cash Generating Unit of Pemex Industrial Transformation
As of December 31, 2016, Pemex Industrial Transformation recognized a net reversal of impairment of Ps. 52,498,881.
The net reversal of impairment was in the following cash generating units:
Minatitlán Refinery Ps. 33,165,095Madero Refinery 21,833,892Arenque gas processor complex 268,161
Copyright © 2018 www.secdatabase.com. All Rights Reserved.Please Consider the Environment Before Printing This Document
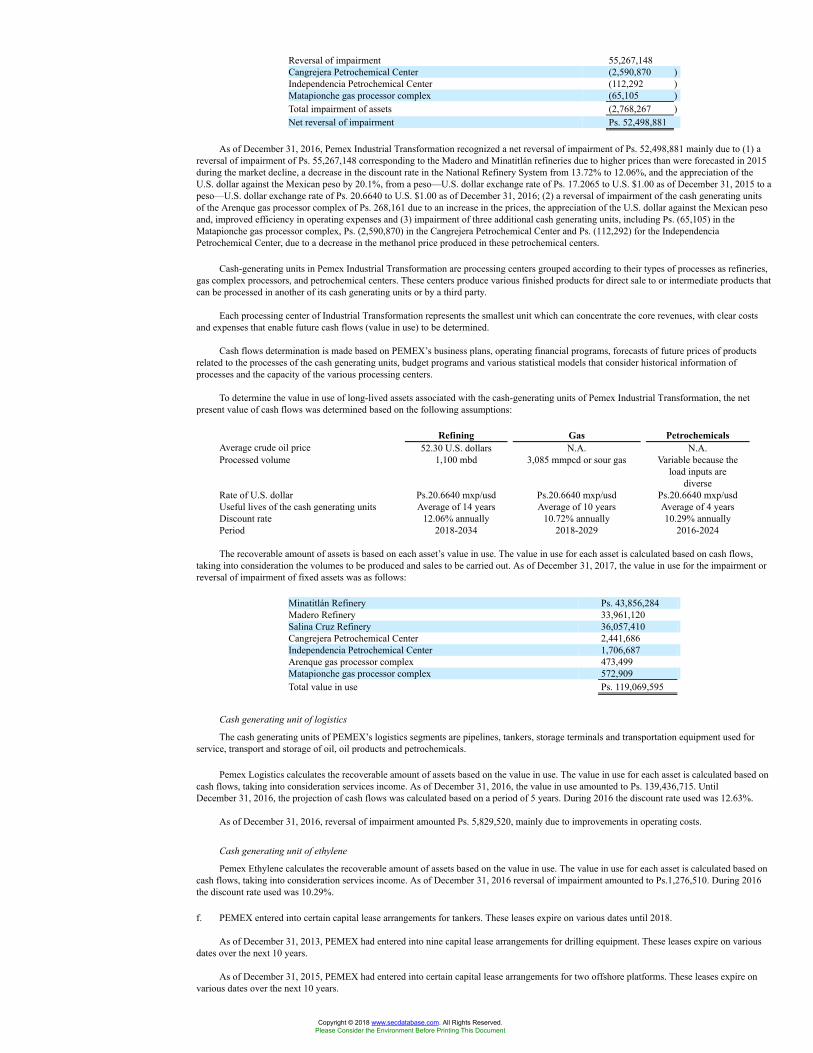
Reversal of impairment 55,267,148Cangrejera Petrochemical Center (2,590,870 )Independencia Petrochemical Center (112,292 )Matapionche gas processor complex (65,105 )Total impairment of assets (2,768,267 )Net reversal of impairment Ps. 52,498,881
As of December 31, 2016, Pemex Industrial Transformation recognized a net reversal of impairment of Ps. 52,498,881 mainly due to (1) areversal of impairment of Ps. 55,267,148 corresponding to the Madero and Minatitlán refineries due to higher prices than were forecasted in 2015during the market decline, a decrease in the discount rate in the National Refinery System from 13.72% to 12.06%, and the appreciation of theU.S. dollar against the Mexican peso by 20.1%, from a peso—U.S. dollar exchange rate of Ps. 17.2065 to U.S. $1.00 as of December 31, 2015 to apeso—U.S. dollar exchange rate of Ps. 20.6640 to U.S. $1.00 as of December 31, 2016; (2) a reversal of impairment of the cash generating unitsof the Arenque gas processor complex of Ps. 268,161 due to an increase in the prices, the appreciation of the U.S. dollar against the Mexican pesoand, improved efficiency in operating expenses and (3) impairment of three additional cash generating units, including Ps. (65,105) in theMatapionche gas processor complex, Ps. (2,590,870) in the Cangrejera Petrochemical Center and Ps. (112,292) for the IndependenciaPetrochemical Center, due to a decrease in the methanol price produced in these petrochemical centers.
Cash-generating units in Pemex Industrial Transformation are processing centers grouped according to their types of processes as refineries,gas complex processors, and petrochemical centers. These centers produce various finished products for direct sale to or intermediate products thatcan be processed in another of its cash generating units or by a third party.
Each processing center of Industrial Transformation represents the smallest unit which can concentrate the core revenues, with clear costsand expenses that enable future cash flows (value in use) to be determined.
Cash flows determination is made based on PEMEX’s business plans, operating financial programs, forecasts of future prices of productsrelated to the processes of the cash generating units, budget programs and various statistical models that consider historical information ofprocesses and the capacity of the various processing centers.
To determine the value in use of long-lived assets associated with the cash-generating units of Pemex Industrial Transformation, the netpresent value of cash flows was determined based on the following assumptions:
Refining Gas PetrochemicalsAverage crude oil price 52.30 U.S. dollars N.A. N.A.Processed volume 1,100 mbd 3,085 mmpcd or sour gas Variable because the
load inputs arediverse
Rate of U.S. dollar Ps.20.6640 mxp/usd Ps.20.6640 mxp/usd Ps.20.6640 mxp/usdUseful lives of the cash generating units Average of 14 years Average of 10 years Average of 4 yearsDiscount rate 12.06% annually 10.72% annually 10.29% annuallyPeriod 2018-2034 2018-2029 2016-2024
The recoverable amount of assets is based on each asset’s value in use. The value in use for each asset is calculated based on cash flows,taking into consideration the volumes to be produced and sales to be carried out. As of December 31, 2017, the value in use for the impairment orreversal of impairment of fixed assets was as follows:
Minatitlán Refinery Ps. 43,856,284Madero Refinery 33,961,120Salina Cruz Refinery 36,057,410Cangrejera Petrochemical Center 2,441,686Independencia Petrochemical Center 1,706,687Arenque gas processor complex 473,499Matapionche gas processor complex 572,909Total value in use Ps. 119,069,595
Cash generating unit of logistics
The cash generating units of PEMEX’s logistics segments are pipelines, tankers, storage terminals and transportation equipment used forservice, transport and storage of oil, oil products and petrochemicals.
Pemex Logistics calculates the recoverable amount of assets based on the value in use. The value in use for each asset is calculated based oncash flows, taking into consideration services income. As of December 31, 2016, the value in use amounted to Ps. 139,436,715. UntilDecember 31, 2016, the projection of cash flows was calculated based on a period of 5 years. During 2016 the discount rate used was 12.63%.
As of December 31, 2016, reversal of impairment amounted Ps. 5,829,520, mainly due to improvements in operating costs.
Cash generating unit of ethylene
Pemex Ethylene calculates the recoverable amount of assets based on the value in use. The value in use for each asset is calculated based oncash flows, taking into consideration services income. As of December 31, 2016 reversal of impairment amounted to Ps.1,276,510. During 2016the discount rate used was 10.29%.
f. PEMEX entered into certain capital lease arrangements for tankers. These leases expire on various dates until 2018.
As of December 31, 2013, PEMEX had entered into nine capital lease arrangements for drilling equipment. These leases expire on variousdates over the next 10 years.
As of December 31, 2015, PEMEX had entered into certain capital lease arrangements for two offshore platforms. These leases expire onvarious dates over the next 10 years.
Copyright © 2018 www.secdatabase.com. All Rights Reserved.Please Consider the Environment Before Printing This Document
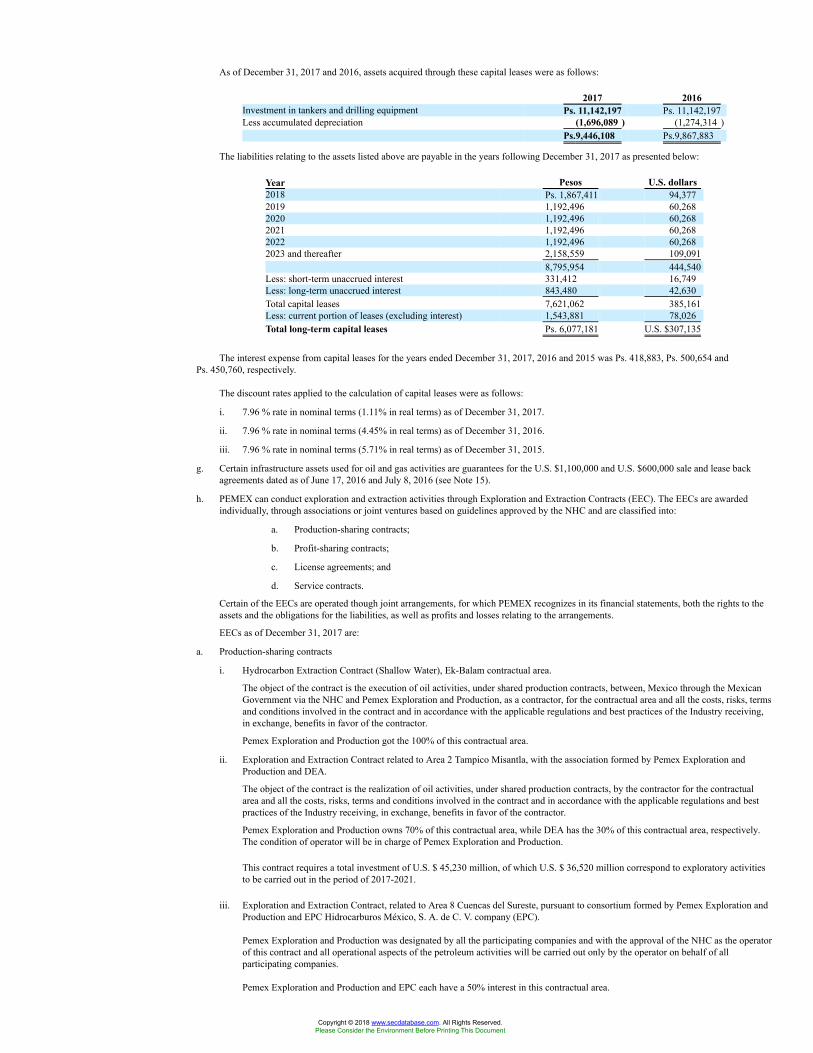
As of December 31, 2017 and 2016, assets acquired through these capital leases were as follows:
2017 2016Investment in tankers and drilling equipment Ps. 11,142,197 Ps. 11,142,197Less accumulated depreciation (1,696,089 ) (1,274,314 )
Ps.9,446,108 Ps.9,867,883
The liabilities relating to the assets listed above are payable in the years following December 31, 2017 as presented below:
Year Pesos U.S. dollars2018 Ps. 1,867,411 94,3772019 1,192,496 60,2682020 1,192,496 60,2682021 1,192,496 60,2682022 1,192,496 60,2682023 and thereafter 2,158,559 109,091
8,795,954 444,540Less: short-term unaccrued interest 331,412 16,749Less: long-term unaccrued interest 843,480 42,630Total capital leases 7,621,062 385,161Less: current portion of leases (excluding interest) 1,543,881 78,026Total long-term capital leases Ps. 6,077,181 U.S. $307,135
The interest expense from capital leases for the years ended December 31, 2017, 2016 and 2015 was Ps. 418,883, Ps. 500,654 andPs. 450,760, respectively.
The discount rates applied to the calculation of capital leases were as follows:
i. 7.96 % rate in nominal terms (1.11% in real terms) as of December 31, 2017.
ii. 7.96 % rate in nominal terms (4.45% in real terms) as of December 31, 2016.
iii. 7.96 % rate in nominal terms (5.71% in real terms) as of December 31, 2015.
g. Certain infrastructure assets used for oil and gas activities are guarantees for the U.S. $1,100,000 and U.S. $600,000 sale and lease backagreements dated as of June 17, 2016 and July 8, 2016 (see Note 15).
h. PEMEX can conduct exploration and extraction activities through Exploration and Extraction Contracts (EEC). The EECs are awardedindividually, through associations or joint ventures based on guidelines approved by the NHC and are classified into:
a. Production-sharing contracts;
b. Profit-sharing contracts;
c. License agreements; and
d. Service contracts.
Certain of the EECs are operated though joint arrangements, for which PEMEX recognizes in its financial statements, both the rights to theassets and the obligations for the liabilities, as well as profits and losses relating to the arrangements.
EECs as of December 31, 2017 are:
a. Production-sharing contracts
i. Hydrocarbon Extraction Contract (Shallow Water), Ek-Balam contractual area.
The object of the contract is the execution of oil activities, under shared production contracts, between, Mexico through the MexicanGovernment via the NHC and Pemex Exploration and Production, as a contractor, for the contractual area and all the costs, risks, termsand conditions involved in the contract and in accordance with the applicable regulations and best practices of the Industry receiving,in exchange, benefits in favor of the contractor.
Pemex Exploration and Production got the 100% of this contractual area.
ii. Exploration and Extraction Contract related to Area 2 Tampico Misantla, with the association formed by Pemex Exploration andProduction and DEA.
The object of the contract is the realization of oil activities, under shared production contracts, by the contractor for the contractualarea and all the costs, risks, terms and conditions involved in the contract and in accordance with the applicable regulations and bestpractices of the Industry receiving, in exchange, benefits in favor of the contractor.
Pemex Exploration and Production owns 70% of this contractual area, while DEA has the 30% of this contractual area, respectively.The condition of operator will be in charge of Pemex Exploration and Production.
This contract requires a total investment of U.S. $ 45,230 million, of which U.S. $ 36,520 million correspond to exploratory activitiesto be carried out in the period of 2017-2021.
iii. Exploration and Extraction Contract, related to Area 8 Cuencas del Sureste, pursuant to consortium formed by Pemex Exploration andProduction and EPC Hidrocarburos México, S. A. de C. V. company (EPC).
Pemex Exploration and Production was designated by all the participating companies and with the approval of the NHC as the operatorof this contract and all operational aspects of the petroleum activities will be carried out only by the operator on behalf of allparticipating companies.
Pemex Exploration and Production and EPC each have a 50% interest in this contractual area.
Copyright © 2018 www.secdatabase.com. All Rights Reserved.Please Consider the Environment Before Printing This Document
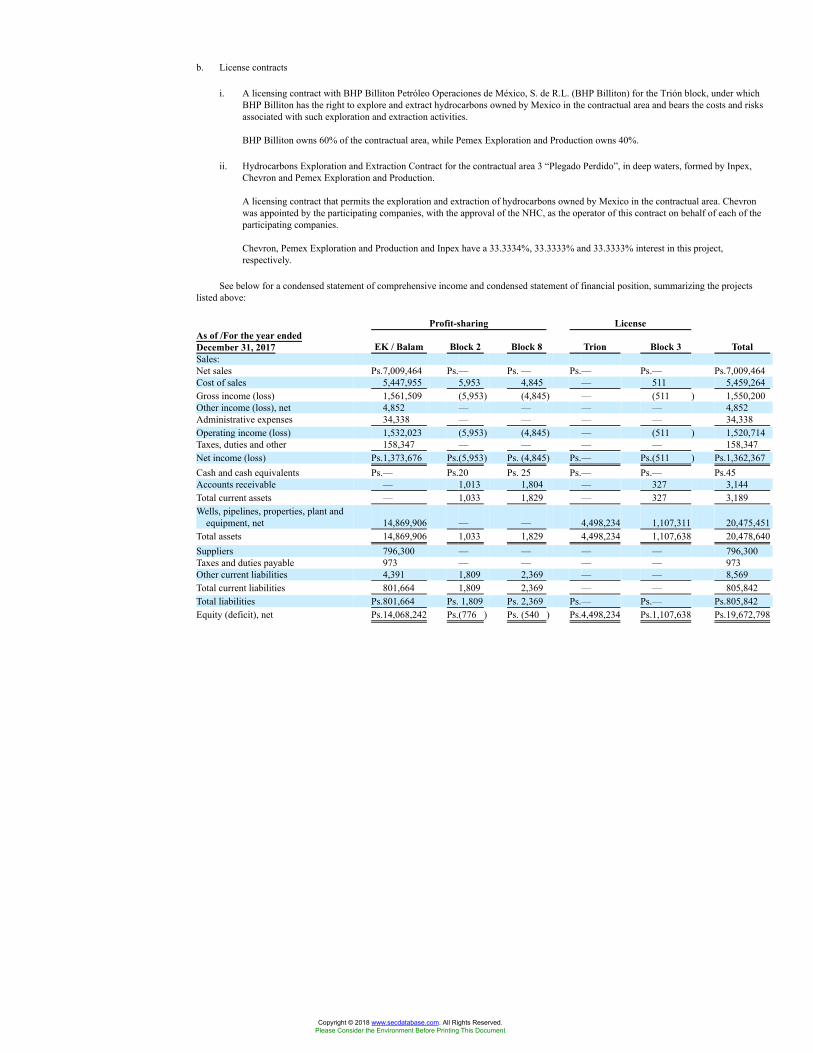
b. License contracts
i. A licensing contract with BHP Billiton Petróleo Operaciones de México, S. de R.L. (BHP Billiton) for the Trión block, under whichBHP Billiton has the right to explore and extract hydrocarbons owned by Mexico in the contractual area and bears the costs and risksassociated with such exploration and extraction activities.
BHP Billiton owns 60% of the contractual area, while Pemex Exploration and Production owns 40%.
ii. Hydrocarbons Exploration and Extraction Contract for the contractual area 3 “Plegado Perdido”, in deep waters, formed by Inpex,Chevron and Pemex Exploration and Production.
A licensing contract that permits the exploration and extraction of hydrocarbons owned by Mexico in the contractual area. Chevronwas appointed by the participating companies, with the approval of the NHC, as the operator of this contract on behalf of each of theparticipating companies.
Chevron, Pemex Exploration and Production and Inpex have a 33.3334%, 33.3333% and 33.3333% interest in this project,respectively.
See below for a condensed statement of comprehensive income and condensed statement of financial position, summarizing the projectslisted above:
Profit-sharing LicenseAs of /For the year endedDecember 31, 2017 EK / Balam Block 2 Block 8 Trion Block 3 TotalSales:Net sales Ps.7,009,464 Ps.— Ps. — Ps.— Ps.— Ps.7,009,464Cost of sales 5,447,955 5,953 4,845 — 511 5,459,264Gross income (loss) 1,561,509 (5,953) (4,845) — (511 ) 1,550,200Other income (loss), net 4,852 — — — — 4,852Administrative expenses 34,338 — — — — 34,338Operating income (loss) 1,532,023 (5,953) (4,845) — (511 ) 1,520,714Taxes, duties and other 158,347 — — — — 158,347Net income (loss) Ps.1,373,676 Ps.(5,953) Ps. (4,845) Ps.— Ps.(511 ) Ps.1,362,367Cash and cash equivalents Ps.— Ps.20 Ps. 25 Ps.— Ps.— Ps.45Accounts receivable — 1,013 1,804 — 327 3,144Total current assets — 1,033 1,829 — 327 3,189Wells, pipelines, properties, plant and
equipment, net 14,869,906 — — 4,498,234 1,107,311 20,475,451Total assets 14,869,906 1,033 1,829 4,498,234 1,107,638 20,478,640Suppliers 796,300 — — — — 796,300Taxes and duties payable 973 — — — — 973Other current liabilities 4,391 1,809 2,369 — — 8,569Total current liabilities 801,664 1,809 2,369 — — 805,842Total liabilities Ps.801,664 Ps. 1,809 Ps. 2,369 Ps.— Ps.— Ps.805,842Equity (deficit), net Ps.14,068,242 Ps.(776 ) Ps. (540 ) Ps.4,498,234 Ps.1,107,638 Ps.19,672,798
Copyright © 2018 www.secdatabase.com. All Rights Reserved.Please Consider the Environment Before Printing This Document
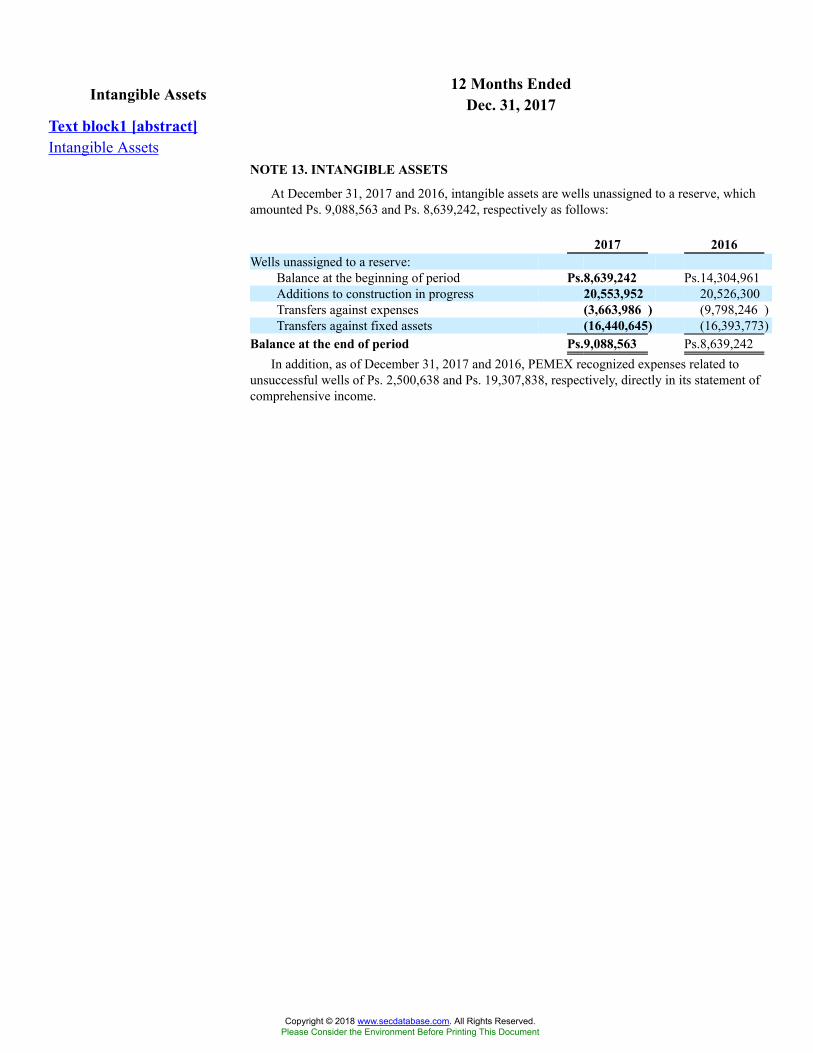
12 Months EndedIntangible Assets Dec. 31, 2017Text block1 [abstract]Intangible Assets
NOTE 13. INTANGIBLE ASSETS
At December 31, 2017 and 2016, intangible assets are wells unassigned to a reserve, whichamounted Ps. 9,088,563 and Ps. 8,639,242, respectively as follows:
2017 2016Wells unassigned to a reserve:
Balance at the beginning of period Ps.8,639,242 Ps.14,304,961Additions to construction in progress 20,553,952 20,526,300Transfers against expenses (3,663,986 ) (9,798,246 )Transfers against fixed assets (16,440,645) (16,393,773)
Balance at the end of period Ps.9,088,563 Ps.8,639,242In addition, as of December 31, 2017 and 2016, PEMEX recognized expenses related to
unsuccessful wells of Ps. 2,500,638 and Ps. 19,307,838, respectively, directly in its statement ofcomprehensive income.
Copyright © 2018 www.secdatabase.com. All Rights Reserved.Please Consider the Environment Before Printing This Document
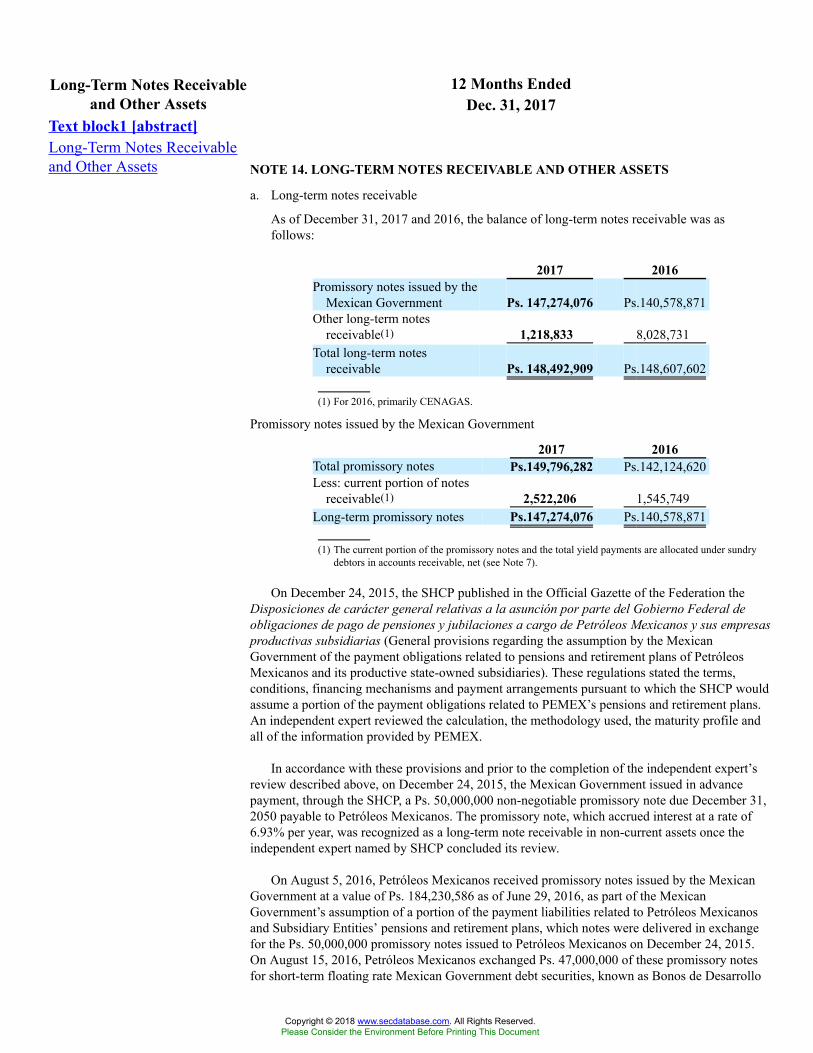
12 Months EndedLong-Term Notes Receivableand Other Assets Dec. 31, 2017
Text block1 [abstract]Long-Term Notes Receivableand Other Assets NOTE 14. LONG-TERM NOTES RECEIVABLE AND OTHER ASSETS
a. Long-term notes receivable
As of December 31, 2017 and 2016, the balance of long-term notes receivable was asfollows:
2017 2016Promissory notes issued by the
Mexican Government Ps. 147,274,076 Ps.140,578,871Other long-term notes
receivable(1) 1,218,833 8,028,731Total long-term notes
receivable Ps. 148,492,909 Ps.148,607,602
(1) For 2016, primarily CENAGAS.
Promissory notes issued by the Mexican Government
2017 2016Total promissory notes Ps.149,796,282 Ps.142,124,620Less: current portion of notes
receivable(1) 2,522,206 1,545,749Long-term promissory notes Ps.147,274,076 Ps.140,578,871
(1) The current portion of the promissory notes and the total yield payments are allocated under sundrydebtors in accounts receivable, net (see Note 7).
On December 24, 2015, the SHCP published in the Official Gazette of the Federation theDisposiciones de carácter general relativas a la asunción por parte del Gobierno Federal deobligaciones de pago de pensiones y jubilaciones a cargo de Petróleos Mexicanos y sus empresasproductivas subsidiarias (General provisions regarding the assumption by the MexicanGovernment of the payment obligations related to pensions and retirement plans of PetróleosMexicanos and its productive state-owned subsidiaries). These regulations stated the terms,conditions, financing mechanisms and payment arrangements pursuant to which the SHCP wouldassume a portion of the payment obligations related to PEMEX’s pensions and retirement plans.An independent expert reviewed the calculation, the methodology used, the maturity profile andall of the information provided by PEMEX.
In accordance with these provisions and prior to the completion of the independent expert’sreview described above, on December 24, 2015, the Mexican Government issued in advancepayment, through the SHCP, a Ps. 50,000,000 non-negotiable promissory note due December 31,2050 payable to Petróleos Mexicanos. The promissory note, which accrued interest at a rate of6.93% per year, was recognized as a long-term note receivable in non-current assets once theindependent expert named by SHCP concluded its review.
On August 5, 2016, Petróleos Mexicanos received promissory notes issued by the MexicanGovernment at a value of Ps. 184,230,586 as of June 29, 2016, as part of the MexicanGovernment’s assumption of a portion of the payment liabilities related to Petróleos Mexicanosand Subsidiary Entities’ pensions and retirement plans, which notes were delivered in exchangefor the Ps. 50,000,000 promissory notes issued to Petróleos Mexicanos on December 24, 2015.On August 15, 2016, Petróleos Mexicanos exchanged Ps. 47,000,000 of these promissory notesfor short-term floating rate Mexican Government debt securities, known as Bonos de Desarrollo
Copyright © 2018 www.secdatabase.com. All Rights Reserved.Please Consider the Environment Before Printing This Document
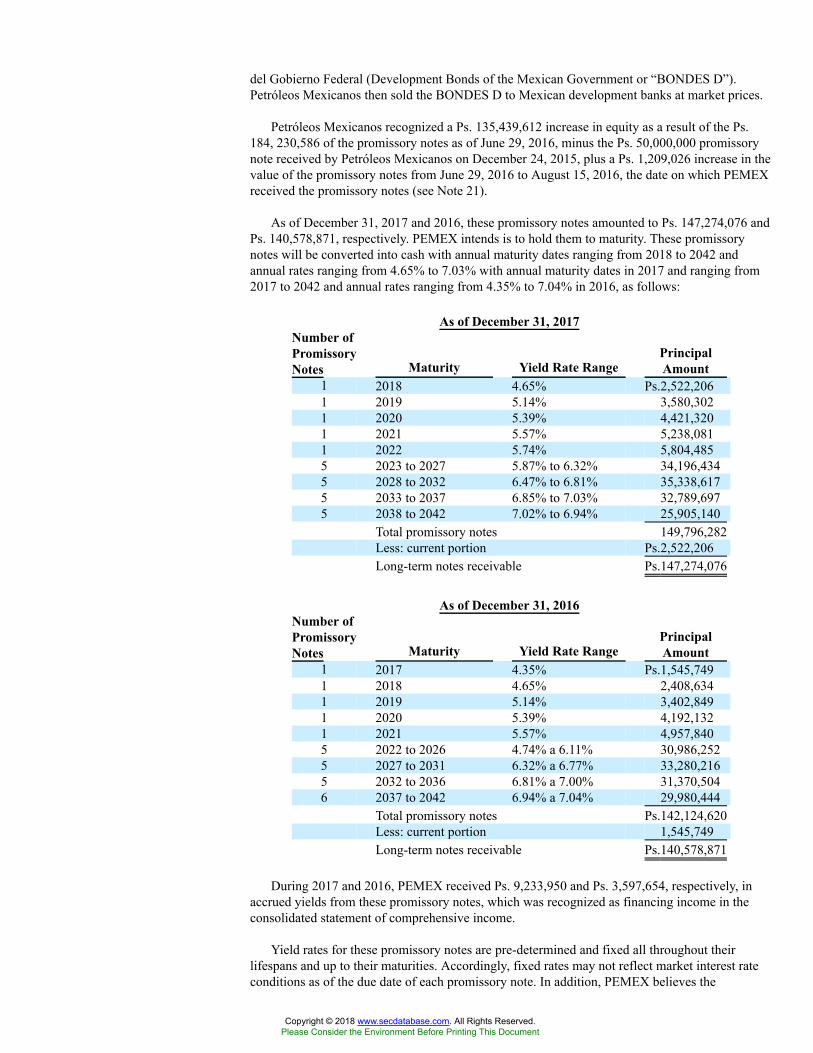
del Gobierno Federal (Development Bonds of the Mexican Government or “BONDES D”).Petróleos Mexicanos then sold the BONDES D to Mexican development banks at market prices.
Petróleos Mexicanos recognized a Ps. 135,439,612 increase in equity as a result of the Ps.184, 230,586 of the promissory notes as of June 29, 2016, minus the Ps. 50,000,000 promissorynote received by Petróleos Mexicanos on December 24, 2015, plus a Ps. 1,209,026 increase in thevalue of the promissory notes from June 29, 2016 to August 15, 2016, the date on which PEMEXreceived the promissory notes (see Note 21).
As of December 31, 2017 and 2016, these promissory notes amounted to Ps. 147,274,076 andPs. 140,578,871, respectively. PEMEX intends is to hold them to maturity. These promissorynotes will be converted into cash with annual maturity dates ranging from 2018 to 2042 andannual rates ranging from 4.65% to 7.03% with annual maturity dates in 2017 and ranging from2017 to 2042 and annual rates ranging from 4.35% to 7.04% in 2016, as follows:
As of December 31, 2017Number ofPromissoryNotes Maturity Yield Rate Range
PrincipalAmount
1 2018 4.65% Ps.2,522,2061 2019 5.14% 3,580,3021 2020 5.39% 4,421,3201 2021 5.57% 5,238,0811 2022 5.74% 5,804,4855 2023 to 2027 5.87% to 6.32% 34,196,4345 2028 to 2032 6.47% to 6.81% 35,338,6175 2033 to 2037 6.85% to 7.03% 32,789,6975 2038 to 2042 7.02% to 6.94% 25,905,140
Total promissory notes 149,796,282Less: current portion Ps.2,522,206Long-term notes receivable Ps.147,274,076
As of December 31, 2016Number ofPromissoryNotes Maturity Yield Rate Range
PrincipalAmount
1 2017 4.35% Ps.1,545,7491 2018 4.65% 2,408,6341 2019 5.14% 3,402,8491 2020 5.39% 4,192,1321 2021 5.57% 4,957,8405 2022 to 2026 4.74% a 6.11% 30,986,2525 2027 to 2031 6.32% a 6.77% 33,280,2165 2032 to 2036 6.81% a 7.00% 31,370,5046 2037 to 2042 6.94% a 7.04% 29,980,444
Total promissory notes Ps.142,124,620Less: current portion 1,545,749Long-term notes receivable Ps.140,578,871
During 2017 and 2016, PEMEX received Ps. 9,233,950 and Ps. 3,597,654, respectively, inaccrued yields from these promissory notes, which was recognized as financing income in theconsolidated statement of comprehensive income.
Yield rates for these promissory notes are pre-determined and fixed all throughout theirlifespans and up to their maturities. Accordingly, fixed rates may not reflect market interest rateconditions as of the due date of each promissory note. In addition, PEMEX believes the
Copyright © 2018 www.secdatabase.com. All Rights Reserved.Please Consider the Environment Before Printing This Document
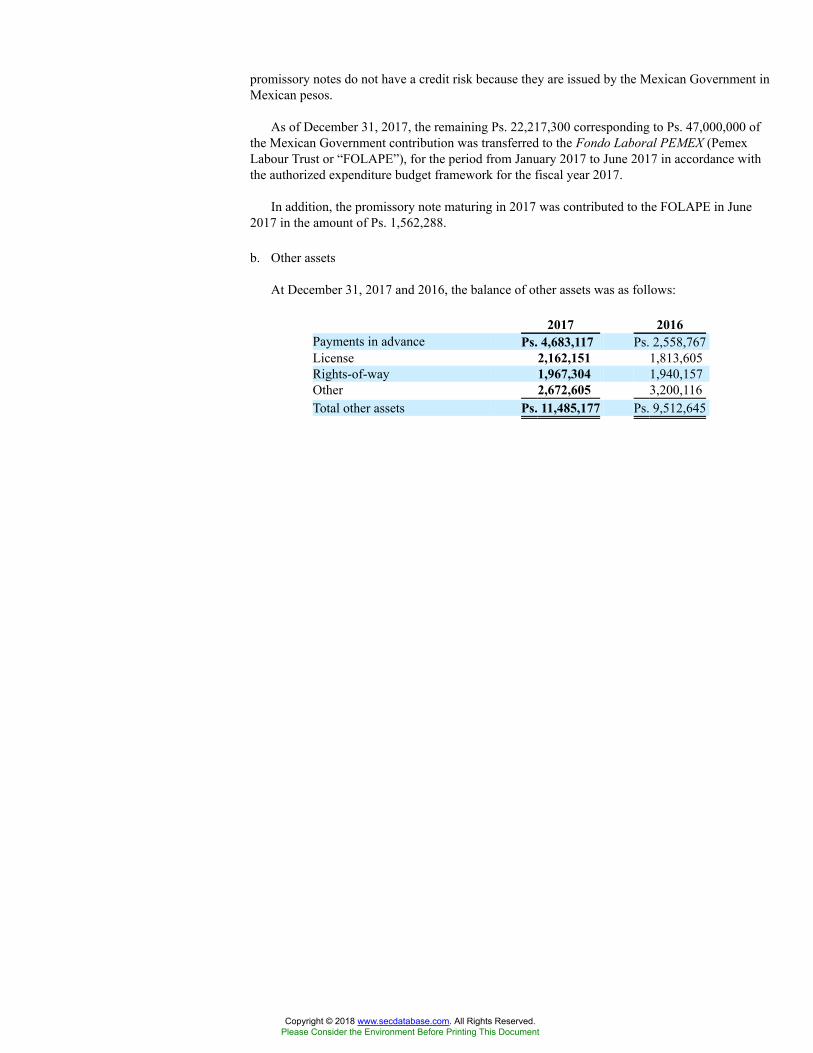
promissory notes do not have a credit risk because they are issued by the Mexican Government inMexican pesos.
As of December 31, 2017, the remaining Ps. 22,217,300 corresponding to Ps. 47,000,000 ofthe Mexican Government contribution was transferred to the Fondo Laboral PEMEX (PemexLabour Trust or “FOLAPE”), for the period from January 2017 to June 2017 in accordance withthe authorized expenditure budget framework for the fiscal year 2017.
In addition, the promissory note maturing in 2017 was contributed to the FOLAPE in June2017 in the amount of Ps. 1,562,288.
b. Other assets
At December 31, 2017 and 2016, the balance of other assets was as follows:
2017 2016Payments in advance Ps. 4,683,117 Ps. 2,558,767License 2,162,151 1,813,605Rights-of-way 1,967,304 1,940,157Other 2,672,605 3,200,116Total other assets Ps. 11,485,177 Ps. 9,512,645
Copyright © 2018 www.secdatabase.com. All Rights Reserved.Please Consider the Environment Before Printing This Document
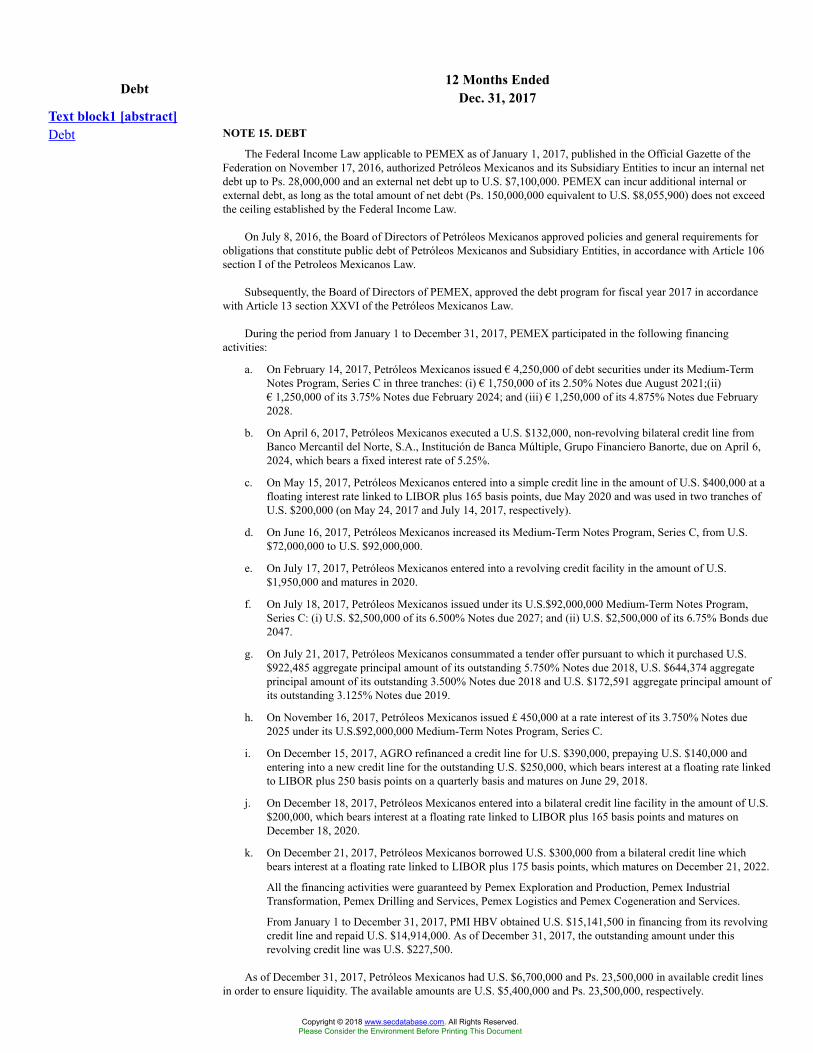
12 Months EndedDebt Dec. 31, 2017Text block1 [abstract]Debt NOTE 15. DEBT
The Federal Income Law applicable to PEMEX as of January 1, 2017, published in the Official Gazette of theFederation on November 17, 2016, authorized Petróleos Mexicanos and its Subsidiary Entities to incur an internal netdebt up to Ps. 28,000,000 and an external net debt up to U.S. $7,100,000. PEMEX can incur additional internal orexternal debt, as long as the total amount of net debt (Ps. 150,000,000 equivalent to U.S. $8,055,900) does not exceedthe ceiling established by the Federal Income Law.
On July 8, 2016, the Board of Directors of Petróleos Mexicanos approved policies and general requirements forobligations that constitute public debt of Petróleos Mexicanos and Subsidiary Entities, in accordance with Article 106section I of the Petroleos Mexicanos Law.
Subsequently, the Board of Directors of PEMEX, approved the debt program for fiscal year 2017 in accordancewith Article 13 section XXVI of the Petróleos Mexicanos Law.
During the period from January 1 to December 31, 2017, PEMEX participated in the following financingactivities:
a. On February 14, 2017, Petróleos Mexicanos issued € 4,250,000 of debt securities under its Medium-TermNotes Program, Series C in three tranches: (i) € 1,750,000 of its 2.50% Notes due August 2021;(ii)€ 1,250,000 of its 3.75% Notes due February 2024; and (iii) € 1,250,000 of its 4.875% Notes due February2028.
b. On April 6, 2017, Petróleos Mexicanos executed a U.S. $132,000, non-revolving bilateral credit line fromBanco Mercantil del Norte, S.A., Institución de Banca Múltiple, Grupo Financiero Banorte, due on April 6,2024, which bears a fixed interest rate of 5.25%.
c. On May 15, 2017, Petróleos Mexicanos entered into a simple credit line in the amount of U.S. $400,000 at afloating interest rate linked to LIBOR plus 165 basis points, due May 2020 and was used in two tranches ofU.S. $200,000 (on May 24, 2017 and July 14, 2017, respectively).
d. On June 16, 2017, Petróleos Mexicanos increased its Medium-Term Notes Program, Series C, from U.S.$72,000,000 to U.S. $92,000,000.
e. On July 17, 2017, Petróleos Mexicanos entered into a revolving credit facility in the amount of U.S.$1,950,000 and matures in 2020.
f. On July 18, 2017, Petróleos Mexicanos issued under its U.S.$92,000,000 Medium-Term Notes Program,Series C: (i) U.S. $2,500,000 of its 6.500% Notes due 2027; and (ii) U.S. $2,500,000 of its 6.75% Bonds due2047.
g. On July 21, 2017, Petróleos Mexicanos consummated a tender offer pursuant to which it purchased U.S.$922,485 aggregate principal amount of its outstanding 5.750% Notes due 2018, U.S. $644,374 aggregateprincipal amount of its outstanding 3.500% Notes due 2018 and U.S. $172,591 aggregate principal amount ofits outstanding 3.125% Notes due 2019.
h. On November 16, 2017, Petróleos Mexicanos issued £ 450,000 at a rate interest of its 3.750% Notes due2025 under its U.S.$92,000,000 Medium-Term Notes Program, Series C.
i. On December 15, 2017, AGRO refinanced a credit line for U.S. $390,000, prepaying U.S. $140,000 andentering into a new credit line for the outstanding U.S. $250,000, which bears interest at a floating rate linkedto LIBOR plus 250 basis points on a quarterly basis and matures on June 29, 2018.
j. On December 18, 2017, Petróleos Mexicanos entered into a bilateral credit line facility in the amount of U.S.$200,000, which bears interest at a floating rate linked to LIBOR plus 165 basis points and matures onDecember 18, 2020.
k. On December 21, 2017, Petróleos Mexicanos borrowed U.S. $300,000 from a bilateral credit line whichbears interest at a floating rate linked to LIBOR plus 175 basis points, which matures on December 21, 2022.
All the financing activities were guaranteed by Pemex Exploration and Production, Pemex IndustrialTransformation, Pemex Drilling and Services, Pemex Logistics and Pemex Cogeneration and Services.
From January 1 to December 31, 2017, PMI HBV obtained U.S. $15,141,500 in financing from its revolvingcredit line and repaid U.S. $14,914,000. As of December 31, 2017, the outstanding amount under thisrevolving credit line was U.S. $227,500.
As of December 31, 2017, Petróleos Mexicanos had U.S. $6,700,000 and Ps. 23,500,000 in available credit linesin order to ensure liquidity. The available amounts are U.S. $5,400,000 and Ps. 23,500,000, respectively.
Copyright © 2018 www.secdatabase.com. All Rights Reserved.Please Consider the Environment Before Printing This Document
The Federal Income Law that was applicable to PEMEX as of January 1, 2016, published in the Official Gazetteof the Federation on November 18, 2015, authorized Petróleos Mexicanos and its Subsidiary Entities to incur aninternal net debt up to Ps. 110,500,000 and an external net debt up to U.S. $8,500,000. PEMEX was entitled to incuradditional internal or external debt, as long as the total amount of net debt (Ps.240,550,000 equivalent to U.S.$15,722,000) did not exceed the ceiling established by the Federal Income Law.
On November 18, 2014, the Board of Directors of Petróleos Mexicanos approved policies and generalrequirements for obligations that constitute public debt of Petróleos Mexicanos and Subsidiary Entities, in accordancewith the Article 107 of the Petroleos Mexicanos Law.
Subsequently, the Board of Directors of PEMEX, approved the debt program for fiscal year 2016 in accordancewith Article 13 section XXVI of the Petróleos Mexicanos Law.
During 2016, PEMEX participated in the following financing activities:
a. On January 25, 2016, Petróleos Mexicanos increased its Medium-Term Notes Program from U.S.$52,000,000 to U.S. $62,000,000.
b. On February 4, 2016, Petróleos Mexicanos issued U.S. $5,000,000 of debt securities under its Medium-TermNotes Program, Series C, in three tranches: (i) U.S. $750,000 of its 5.500% Notes due February 2019; (ii)U.S. $1,250,000 of its 6.375% Notes due February 2021; and (iii) U.S. $3,000,000 of its 6.875% Notes dueAugust 2026. All debt securities issued under this program are guaranteed by Pemex Exploration andProduction, Pemex Industrial Transformation, Pemex Drilling and Services, Pemex Logistics and PemexCogeneration and Services.
c. On February 5, 2016, Petróleos Mexicanos obtained a loan from a line of credit for Ps. 7,000,000,000 bearinginterest at a floating rate linked to the TIIE, plus 0.55%, and matured on January 2017.
d. On March 15, 2016, Petróleos Mexicanos issued €2,250,000 of debt securities U.S. $62,000,000 Medium-Term Notes Program, Series C in two tranches: (i) €1,350,000 of its 3.750% Notes due to March 2019 and(ii) €900,000 of its 5.125% Notes due to March 2023. All debt securities issued under this program areguaranteed by Pemex Exploration and Production, Pemex Industrial Transformation, Pemex Drilling andServices, Pemex Logistics and Pemex Cogeneration and Services.
e. On March 17, 2016, Petróleos Mexicanos borrowed Ps. 2,000,000 from a credit line at a floating rate linkedto TIIE and matured on March 2017.
f. On March 17, 2016, Petróleos Mexicanos borrowed Ps. 3,300,000 from a credit line at a floating rate linkedto TIIE and matured on March 2017.
g. On March 23, 2016, Petróleos Mexicanos issued Ps. 5,000,000 of Certificados Bursátiles due to October2019 at a floating rate linked to TIIE. As of December 31, 2016, all debt securities issued under this programare guaranteed by Pemex Exploration and Production, Pemex Industrial Transformation, Pemex Drilling andServices, Pemex Logistics and Pemex Cogeneration and Services.
h. On March 28, 2016, Petróleos Mexicanos borrowed Ps. 9,700,000 from a credit line at a floating rate linkedto TIIE, and matured on March 2017.
i. On April 19, 2016, Petróleos Mexicanos borrowed €500,000 from a credit line at fixed rate of 5.11%, whichmatures on March 2023.
j. On May 31, 2016, Petróleos Mexicanos obtained a U.S. $300,000 bilateral credit line from ExportDevelopment Canada (EDC), due on May 2021, which bears interest at a floating rate linked to LIBOR.
k. On June 14, 2016, Petróleos Mexicanos issued CHF 375,000 of debt securities under its Medium-Term NotesProgram, Series C, in two tranches: (1) CHF 225,000 of its 1.50% Notes due to June 2018 and (2) CHF150,000 of its 2.35% Notes due to December 2021. The Notes are guaranteed by Pemex Exploration andProduction, Pemex Industrial Transformation, Pemex Drilling and Services, Pemex Logistics and PemexCogeneration and Services.
l. On June 17, 2016, Pemex Exploration and Production obtained approximately U.S. $1,100,000 in connectionwith the sale and leaseback of certain infrastructure assets used for oil and gas activities (see Note 12-g). Aspart of this transaction, Pemex Exploration and Production entered into a 15-year financial lease agreement,which will last for the greater part of the economic life of the asset, at a fixed rate of 8.38%, pursuant towhich Pemex Exploration and Production will retain the operation of these assets and the title and ownershipof such assets will revert to Pemex Exploration and Production at the end of this period following payment ofan agreed price. This transaction was recognized as a financing activity due to the fact that PEMEX retainedall of the risks and benefits associated with ownership of the asset and substantially all of the operating rightsof the asset.
Copyright © 2018 www.secdatabase.com. All Rights Reserved.Please Consider the Environment Before Printing This Document
m. On July 8, 2016, Pemex Industrial Transformation obtained approximately U.S. $600,000 in connection withthe sale and leaseback of a plant located in the Madero Refinery. As part of this transaction, Pemex IndustrialTransformation entered into a 20-year financial lease agreement pursuant to which Pemex IndustrialTransformation will retain the operation of the plant and title and ownership will revert to Pemex IndustrialTransformation at the end of this period following payment of an agreed price. This transaction wasrecognized as a financing activity due to the fact that Pemex Industrial Transformation retained all of therisks and benefits associated with ownership of the asset and substantially all of the operating rights of theasset.
n. On July 26, 2016, Petróleos Mexicanos issued ¥80,000,000 Bonds at 0.54% due July 2026. The Bonds areguaranteed by the Japan Bank for International Cooperation.
o. On September 21, 2016, Petróleos Mexicanos issued U.S. $4,000,000 aggregate principal amount of debtsecurities under its U.S. $62,000,000 Medium-Term Notes Program, Series C, in two tranches: (i) U.S.$2,000,000 of its 4.625% Notes due to September 2023 and (ii) U.S. $2,000,000 of its 6.750% Bonds due toSeptember 2047. The debt securities are guaranteed by Pemex Exploration and Production, Pemex IndustrialTransformation, Pemex Drilling and Services, Pemex Logistics and Pemex Cogeneration and Services.
p. On October 3, 2016, Petróleos Mexicanos consummated a tender and exchange offer pursuant to which it(i) purchased U.S. $687,725 aggregate principal amount of its outstanding 8.000% Notes due 2019 and U.S.$657,050 aggregate principal amount of its outstanding 5.750% Notes due 2018 and (ii) exchanged (a) U.S.$73,288 aggregate principal amount of its outstanding 5.750% Notes due 2018 for U.S. $69,302 aggregateprincipal amount of its 4.625% Notes due 2023 and U.S. $8,059 aggregate principal amount of its 6.750%Bonds due 2047 and (b) U.S. $1,591,961 aggregate principal amount of its outstanding 5.500% Bonds due2044 for U.S. $1,491,941 aggregate principal amount of its 6.750% Bonds due 2047. The 4.625% Notes due2023 and 6.750% Bonds due 2047 are guaranteed by Pemex Exploration and Production, Pemex IndustrialTransformation, Pemex Drilling and Services, Pemex Logistics and Pemex Cogeneration and Services andrepresent reopenings of the 4.625% Notes due 2023 and 6.750% Bonds due 2047, respectively, originallyissued on September 21, 2016
q. On December 6, 2016, Petróleos Mexicanos increased its Medium-Term Notes Program, Series C, from U.S.$ 62,000,000 to U.S. $72,000,000.
r. On December 13, 2016, Petróleos Mexicanos issued U.S. $5,500,000 of its debt securities under its Medium-Term Notes Program, Series C in three tranches: (1) U.S. $3,000,000 at fixed rate of 6.50% due March 2027,(2) U.S. $1,500,000 a fixed rate of 5.375% due March 2022, and (3) U.S. $1,000,000 at a floating rate linkedto LIBOR, due March 2022. As of December 31, 2016, all debt securities issued under this program areguaranteed by Pemex Exploration and Production, Pemex Industrial Transformation, Pemex Drilling andServices, Pemex Logistics and Pemex Cogeneration and Services.
s. On December 14, 2016, Petróleos Mexicanos entered into a term loan credit facility in the amount of U.S.$300,000 at floating rate linked to LIBOR, matures on December 2019.
Between January 1 and December 31, 2016, PMI HBV obtained and paid U.S. $11,369,800 in revolvingcredit lines. As of December 31, 2016 there was no outstanding amount.
As of December 31, 2016, Petróleos Mexicanos had U.S. $4,750,000 and Ps. 23,500,000 in available credit linesin order to ensure liquidity. The available amounts are U.S. $4,630,000 and Ps. 3,500,000, respectively.
Various financial transactions (including credit facilities and bond issuances) require compliance with variouscovenants that, among other things, place restrictions on the following types of transactions by PEMEX, subject tocertain exceptions:
• The sale of substantial assets essential for the continued operations of its business.
• The incurrence of liens against its assets.
• Transfers, sales or assignments of rights to payment not yet earned under contracts for the sale of crude oil ornatural gas, accounts receivable or other negotiable instruments.
As of December 31, 2017 and as of the date of the issuance of these consolidated financial statements, PEMEXwas in compliance with the covenants described above.
As of December 31, 2017, long-term debt was as follows:
PesosForeigncurrency
Rate of interest(1) Maturity (thousands) (thousands)U.S. dollarsBonds Fixed from 1.7% to 9.5% and
LIBOR plus 0.35% to 3.65% Various to 2047 Ps. 1,138,845,231 US$ 57,556,097Purchasing loans LIBOR plus 0.85% Various to 2018 25,722,710 1,300,000Project financing Fixed from 2.35% to 3.81% and
LIBOR plus 0.24% to 1.75% Various to 2025 64,974,389 3,283,741
Copyright © 2018 www.secdatabase.com. All Rights Reserved.Please Consider the Environment Before Printing This Document
Direct loans Fixed from 5.25% to 5.44% andLIBOR plus 1.65% Various to 2020 43,141,231 2,180,315
Syndicated loans LIBOR plus 0.85% Various to 2020 39,347,774 1,988,597Bank loans Fixed from 3.5% to 5.28% Various to 2023 3,451,629 174,442Financial leases Fixed from 0.38% to 1.99% Various to 2025 7,621,062 385,161Lease-back (See Financing activities for 2016 l) and
m))(4) Fixed from 0.45% to 0.7% Various to 2036 32,677,268 1,651,476Total financing in U.S. dollars 1,355,781,294 US$68,519,829EurosBonds Fixed from 1.875% to 5.5% Various to 2030 287,386,195 € 12,097,975Project financing Fixed from 2.1% to 5.11% Various to 2023 11,879,379 500,081Total financing in Euros 299,265,574 € 12,598,056Japanese yen:Bonds Fixed from 0.54% to 3.5% and
LIBOR yen plus 0.75% Various to 2026 30,541,407 ¥ 173,827,018PesosCertificados bursátiles Mexican Government Treasury
Certificates (“Cetes”) , TIIE(1)less 0.06% to 1.35%, and fixedat 7.19% to 9.1% Various to 2026 Ps. 149,564,918
Direct loans Fixed at 6.55% and TIIE plus0.85% to 1.25% Various to 2025 28,597,423
Syndicated loans TIIE plus 0.95 Various to 2025 33,646,107
Total financing in pesos Ps. 211,808,448Unidades de Inversión Certificados bursátilesCertificados bursátiles Zero rate and Fixed at 3.02% to
5.23% Various to 2035 57,197,211Other currencies:
Bonds Fixed from 1.5% to 8.25% Various to 2025 47,148,936Total principal in pesos(2) 2,001,742,870Plus: accrued interest 32,078,624Notes payable to contractors(3) 4,053,577Total principal and interest 2,037,875,071Less: short-term maturities 122,957,558Current portion of notes payable to contractors(3) 2,173,285Accrued interest 32,078,624Total short-term debt and current portion of long-
term debt 157,209,467Long-term debt (Note 16(c)) Ps. 1,880,665,604
As of December 31, 2016, long-term debt was as follows:
Rate of interest(1) MaturityPesos
(thousands)
Foreigncurrency
(thousands)U.S. dollarsBonds Fixed from 3.125% to 9.5% and
LIBOR plus 0.35% to 2.02% Various to 2046 Ps. 1,131,389,914 U.S. $54,751,738Purchasing loans LIBOR plus 0.8% to 0.85% Various to 2016 2,479,680 120,000Project financing Fixed from 2.35% to 5.45% and
LIBOR plus 0.01% to 1.71% Various to 2021 84,711,684 4,099,481Direct loans Fixed at 5.44% and LIBOR plus
1.0% Various to 2018 33,100,587 1,601,848Syndicated loans LIBOR plus 0.85% Various to 2020 41,056,571 1,986,865Bank loans Fixed from 3.5% to 5.28% Various to 2023 4,339,826 210,019Financial leases Fixed from 0.38% to 1.99% Various to 2025 9,559,060 462,595Lease-back (See Financing activities
for 2016 l) and m))(4) Fixed from 0.45% to 0.7% Various to 2036 35,513,114 1,718,598Total financing in U.S. dollars 1,342,150,436 U.S. $64,951,144EurosBonds Fixed from 3.125% to 6.375% Various to 2030 196,317,016 € 9,058,388Project financing Fixed at 2% Various to 2016 10,836,200 500,000Total financing in Euros 207,153,216 € 9,558,388Japanese yen:Bonds Fixed at 3.5% and LIBOR yen
plus 0.75% Various to 2023 30,800,746 ¥ 173,809,300Project financing Fixed at 1.56% and Prime Rate
yen plus 2.56% Various to 2017 517,286 2,919,056Total financing in yen 31,318,032 ¥ 176,728,356PesosCertificados bursátiles Mexican Government Treasury
Certificates (“Cetes”) , TIIE(1)less 0.06% to 0.35%, and fixedat 7.19% to 9.15% Various to 2026 Ps.173,151,985
Direct loans Fixed at 6.55% and TIIE plus0.55% to 1.25% Various to 2025 45,563,848
Syndicated loans TIIE plus 0.95 Various to 2025 38,538,961Revolved loans TIIE plus 0.55 To 2016 20,000,000Total financing in pesos Ps.277,254,794
Copyright © 2018 www.secdatabase.com. All Rights Reserved.Please Consider the Environment Before Printing This Document
Unidades de Inversión Certificadosbursátiles
Certificados bursátiles Zero rate and Fixed at 3.02% to5.23%
Various to 203553,703,421
Other currencies:Bonds Fixed from 2.5% to 8.25% Various to 2022 36,786,665
Total principal in pesos(2) 1,948,366,564Plus: accrued interest 27,815,467Notes payable to contractors(3) 6,988,699Total principal and interest 1,983,170,730Less: short-term maturities 144,169,619Current portion of notes payable to
contractors(3) 4,181,102Accrued interest 27,815,467Total short-term debt and current
portion of long-term debt 176,166,188Long-term debt (Note 16(c)) Ps.1,807,004,542
(1) As of December 31, 2017 and 2016, interest rates were as follows: 3 month LIBOR of 1.69428% and 0.99789%, respectively; 6 month LIBORof 1.83707% and 1.31767%, respectively; TIIE rate of 7.6241% and 6.1066%, respectively, for 28 days; TIIE rate of 7.6556% and 6.1875%,respectively, for 91 days; Cetes rate of 7.22% and 5.69%, respectively, for 28 days; Cetes rate of 7.36% and 5.96%, respectively, for 91 days;Cetes rate of 7.53% and 6.09%, respectively, for 182 days.
(2) Includes financing from foreign banks of Ps. 1,701,363,406 and Ps. 1,600,968,832, as of December 31, 2017 and 2016, respectively.(3) The total amounts of notes payable to contractors as of December 31, 2017 and 2016, current and long-term, are as follows:
2017 2016Total notes payable to contractors(a)(b) Ps.4,053,577 Ps.6,988,699Less: current portion of notes payable to contractors 2,173,285 4,181,102Notes payable to contractors (long-term) Ps.1,880,292 Ps.2,807,597
(a) PEMEX has entered into FPWCs pursuant to which the hydrocarbons and construction in progress are property of PemexExploration and Production. Pursuant to the FPWC, the contractors manage the work in progress, classified as development,infrastructure and maintenance. As of December 31, 2017 and 2016, PEMEX had an outstanding amount payable ofPs. 1,678,843 and Ps. 3,986,565, respectively.
(b) During 2007, Pemex-Exploration and Production contracted for the purchase of a Floating Production Storage andOffloading (“FPSO”) vessel. The investment in the vessel totaled U.S. $723,575. As of December 31, 2017 and 2016, theoutstanding balances owed to the contractor were Ps. 2,374,734 (U.S. $120,017) and Ps. 3,002,134 (U.S. $145,283),respectively. In accordance with the contract, the estimated future payments are as follows:
Year Amount2018 U.S.$25,2672019 25,2672020 25,2672021 25,2672022 18,949Total U.S $120,017
(4) PEMEX obtained financing through the sale and leaseback of certain infrastructure assets and a plant, which will require periodic paymentsthrough 2036.
This transaction was recognized as a financing activity due to the fact that PEMEX retained all of the risks andbenefits associated with ownership of the asset and substantially all of the operating rights to the assets.
The outstanding liability for this transaction is payable as follows:
Years Pesos U.S. dollars2018 Ps. 3,957,317 U.S. $199,9992019 3,886,037 196,3962020 3,886,037 196,3962021 3,886,037 196,3962022 3,886,037 196,3962023 and thereafter 39,450,325 1,993,781
58,951,790 2,979,364Less: short-term unaccrued interest 2,399,475 121,267Less: long-term unaccrued interest 23,875,047 1,206,621Total financing 32,677,268 1,651,476Less: short-term portion of financing (excluding
interest) 1,557,842 78,732Total long term financing Ps. 31,119,426 U.S.$ 1,572,744
(5) As of December 31, 2017 and 2016, PEMEX used the following exchange rates to translate the outstanding balances in foreign currencies topesos in the statement of financial position:
Copyright © 2018 www.secdatabase.com. All Rights Reserved.Please Consider the Environment Before Printing This Document
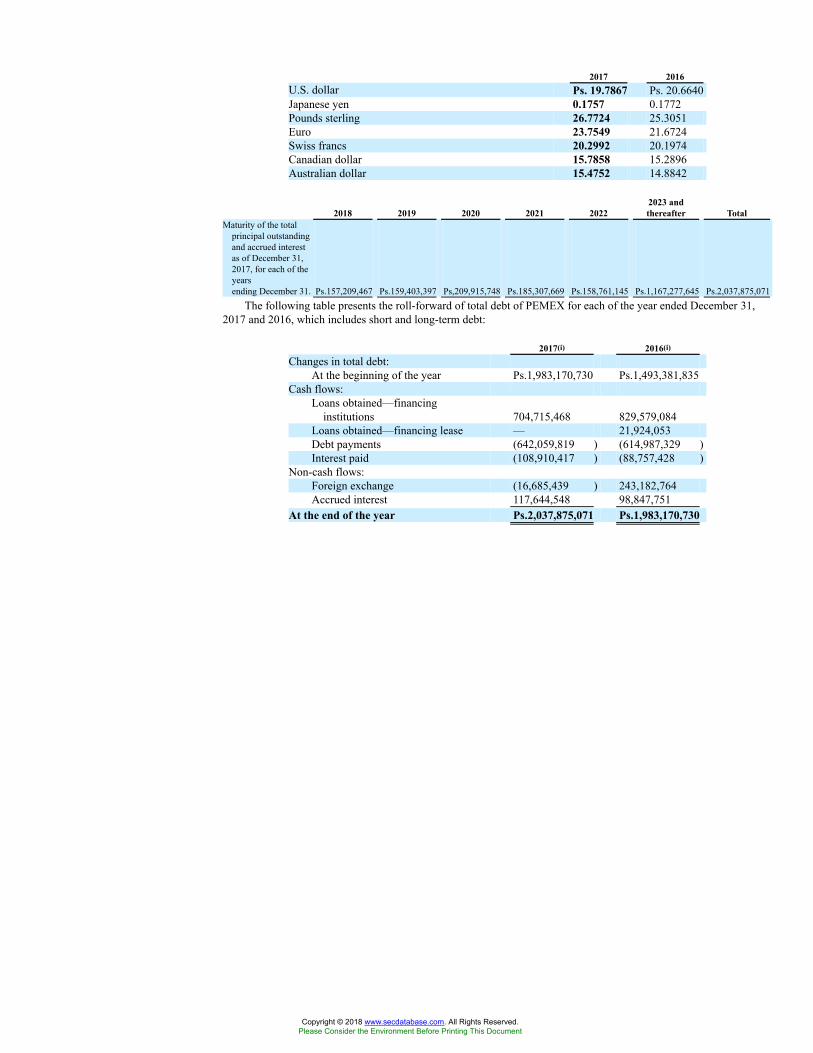
2017 2016U.S. dollar Ps. 19.7867 Ps. 20.6640Japanese yen 0.1757 0.1772Pounds sterling 26.7724 25.3051Euro 23.7549 21.6724Swiss francs 20.2992 20.1974Canadian dollar 15.7858 15.2896Australian dollar 15.4752 14.8842
2018 2019 2020 2021 20222023 andthereafter Total
Maturity of the totalprincipal outstandingand accrued interestas of December 31,2017, for each of theyearsending December 31. Ps.157,209,467 Ps.159,403,397 Ps,209,915,748 Ps.185,307,669 Ps.158,761,145 Ps.1,167,277,645 Ps.2,037,875,071
The following table presents the roll-forward of total debt of PEMEX for each of the year ended December 31,2017 and 2016, which includes short and long-term debt:
2017(i) 2016(i)
Changes in total debt:At the beginning of the year Ps.1,983,170,730 Ps.1,493,381,835
Cash flows:Loans obtained—financing
institutions 704,715,468 829,579,084Loans obtained—financing lease — 21,924,053Debt payments (642,059,819 ) (614,987,329 )Interest paid (108,910,417 ) (88,757,428 )
Non-cash flows:Foreign exchange (16,685,439 ) 243,182,764Accrued interest 117,644,548 98,847,751
At the end of the year Ps.2,037,875,071 Ps.1,983,170,730
Copyright © 2018 www.secdatabase.com. All Rights Reserved.Please Consider the Environment Before Printing This Document
12 Months EndedDerivative FinancialInstruments Dec. 31, 2017
Text block1 [abstract]Derivative FinancialInstruments NOTE 16. DERIVATIVE FINANCIAL INSTRUMENTS
PEMEX faces market risk caused by the volatility of hydrocarbon prices, exchange rates and interest rates, credit riskassociated with investments and financial derivatives, as well as liquidity risk. In order to monitor and manage these risks,PEMEX has approved general provisions relating to financial risk management, which are comprised of policies and guidelinesthat promote an integrated framework for risk management, regulate the use of derivative financial instruments (“DFIs”), andguide the development of risk mitigation strategies.
This regulatory framework establishes that DFIs should be used only for the purpose of mitigating financial risk. The use ofDFIs for any other purpose must be approved in accordance with PEMEX’s current internal regulation.
Approved DFIs are mainly traded on the OTC (Over the Counter) market. However exchange traded instruments may also beused. In the case of PMI Trading, DFIs are traded on CME-ClearPort.
One of PEMEX’s policies is to contribute minimizing the impact that unfavorable changes in financial risk factors have onits financial results by promoting an adequate balance between expected incoming cash flows from operations and outgoing cashflows related to its liabilities.
As part of the regulatory framework for financial risk management, PEMEX has established in its internal procedures theeligible counterparties to trade DFIs and other financial instruments.
In addition, certain PMI subsidiaries have implemented a regulatory framework for risk management with respect to itsactivities, which consists of policies, guidelines and procedures to manage the market risk associated with its commodity tradingactivities in accordance with industry best practices, such as: 1) the use of DFIs for financial risk mitigation purposes; 2) thesegregation of duties; 3) valuation and monitoring mechanisms, such as the generation of a daily portfolio risk report, value at risk(VaR) computation; and 4) VaR limits, both at a global and business unit level and the implementation of stop loss mechanisms. Inaddition, PMI Trading also has its own risk management subcommittee that supervises the trading of DFIs.
Given that PEMEX’s outstanding DFIs have been entered into for risk mitigation purposes, particularly with economichedging purposes, it is unnecessary to establish and monitor market risk limits.
For those portfolios with an open market risk exposure, PEMEX’s financial risk management regulatory frameworkestablishes the implementation and monitoring of market risk limits such as VaR and capital at risk (an aggregation of fair value ormark-to-market (“MtM”) and profit and loss, or CaR).
PEMEX has also established credit guidelines for DFIs that Pemex Industrial Transformation offers to its domesticcustomers, which include the use of guarantees and credit lines. For exchange traded DFIs, PEMEX trades under the marginrequirements of the corresponding exchange market, and therefore does not have internal policies for these DFIs.
DFIs held with financial counterparties do not include collateral exchange clauses. Notwithstanding, PEMEX’s regulatoryframework promotes credit risk mitigation strategies such as collateral exchange
A. Risk Management
I. Market Risk
i. Interest rate risk
PEMEX is exposed to fluctuations in floating interest rate liabilities. PEMEX is exposed to U.S. dollar LIBOR and toMexican peso TIIE. As of December 31, 2017, approximately 15.6% of PEMEX’s total net debt outstanding consisted of floatingrate debt.
Occasionally, for strategic reasons or in order to offset the expected inflows and outflows, PEMEX has entered into interestrate swaps. Under its interest rate swap agreements, PEMEX acquires the obligation to make payments based on a fixed interestrate and is entitled to receive floating interest rate payments based on LIBOR, TIIE or a rate referenced to or calculated from TIIE.
As of December 31, 2017, PEMEX was a party to four interest rate swap agreements denominated in U.S. dollars for anaggregate notional amount of U.S. $1,623,750 at a weighted average fixed interest rate of 2.35% and a weighted average term of7.3 years.
Similarly, in order to eliminate the volatility associated with variable interest rates of long-term financing operations, PMINASA has executed interest rate swap agreements denominated in U.S. dollars for an aggregate notional amount of U.S. $71,936,at a weighted average fixed interest rate of 4.17% and a weighted average term of 4.41 years.
Moreover, PEMEX invests in pesos and U.S. dollars in compliance with applicable internal regulations, through portfoliosthat have different purposes that seek an adequate return subject to risk parameters that reduce the probability of capital losses.The objective of the investments made through these portfolios is to meet PEMEX’s obligations payable in pesos and U.S. dollars.
Copyright © 2018 www.secdatabase.com. All Rights Reserved.Please Consider the Environment Before Printing This Document
The investments made through PEMEX’s portfolios are exposed to domestic and international interest rate risk and creditspread risk derived from government and corporate securities, and inflation risk arising from the relationship between UDIs andpesos. However, these risks are mitigated by established limits on exposure to market risk.
ii. Exchange rate risk
Most of PEMEX’s revenues are denominated in U.S. dollars, a significant amount of which is derived from exports of crudeoil and petroleum products, which are priced and payable in U.S. dollars. Additionally, PEMEX’s revenues from domestic sales ofgasoline and diesel net of IEPS Tax, tax duties, incentives, and other related taxes, as well as domestic sales of natural gas and itsbyproducts, LPG and petrochemicals, are referenced to international U.S. dollar-denominated prices.
PEMEX’s expenses related to hydrocarbon duties are calculated based on international U.S. dollar-denominated prices andthe cost of hydrocarbon imports that PEMEX acquires for resale in Mexico or use in its facilities are indexed to international U.S.dollar-denominated prices. By contrast, PEMEX’s capital expenditure and operating expenses are established in pesos.
As a result of this cash flow structure, the depreciation of the peso against the U.S. dollar increases PEMEX’s financialbalance. The appreciation of the peso relative to the U.S. dollar has the opposite effect. PEMEX manages this risk without theneed for hedging instruments, because the impact on PEMEX’s revenues of fluctuations in the exchange rate between the U.S.dollar and the peso is offset in whole or in part by its impact on its obligations.
Therefore, PEMEX prioritizes debt issuances denominated in U.S. dollars; nonetheless, this is not always achievable, hencenon-U.S. dollar debt issued in international currencies are hedged through DFIs to mitigate their exchange rate exposure, either byswapping them into U.S. dollars or through other derivative structures. The rest of the debt is denominated in pesos or in UDIs, forwhich most of the debt denominated in UDIs has been converted into pesos through DFIs in order to eliminate the inflationary riskexposure.
As a consequence of the above, PEMEX’s debt issued in international currencies other than U.S. dollars has exchange raterisk mitigation strategies. PEMEX has selected strategies that further seek to reduce its cost of funding by leaving, in some cases,part of this exchange rate exposure unhedged when assessed appropriate.
The underlying currencies of PEMEX’s DFIs are the euro, Swiss franc, Japanese yen, Pound sterling and Australian dollarversus the U.S. dollar and UDIs versus the peso.
In 2017, PEMEX entered into various cross-currency swaps to hedge inflation risk arising from debt denominated in UDIs,for an aggregate notional amount of Ps. 6,291,969. During 2016, PEMEX entered into the same kind of instruments to hedgecurrency risk arising from debt obligations denominated in euros and Swiss francs for an aggregate notional amount of U.S.$3,459,236 and the inflation risk arising from debt denominated in UDIs, for an aggregate notional amount of Ps. 1,077,101.
Most of PEMEX’s cross-currency swaps are plain vanilla except for one swap entered into in 2004 to hedge its exposure tothe euro, which expired in 2016. This swap was referred to as an “extinguishing swap” and was obtained in order to hedge long-term obligations. The main characteristic of extinguishing swaps was that these DFIs terminate upon the occurrence of any of thecredit default events specified in the DFI contract confirmation, without any payment obligation for either party. This swap had anotional amount of U.S. $1,146,410.
In 2016, PEMEX entered into, without cost, an options structure called “Seagull Option” in order to cover the notional riskof a debt issue in Japanese yen for ¥80,000,000, keeping the coupons in the original currency (0.5% annual coupon rate). Thisstructure protects the short exposure in Japanese yen against an appreciation of the Japanese yen versus the U.S. dollar from JPY83.70 and up to JPY 75.00 and recognizes a benefit if the Japanese yen depreciates to an average of 117.39 JPY/USD.
Moreover, in 2017 PEMEX entered into, without cost, three more Seagull Options to hedge the notional risk of three debtissues in euros for an aggregate notional amount of € 4,250,000. These structures protect the short exposure in euros against anappreciation of the euro versus the U.S. dollar in a specific range, and PEMEX recognizes a benefit if the euro depreciates up to acertain exchange rate, for each debt issue. Whereas, in order to mitigate the exchange rate risk caused by the coupons of theseissues PEMEX entered into coupon-only swaps.
Additionally, PEMEX entered into, without cost, a structure which is composed of a cross-currency swap and the sale of acall option, in order to hedge the notional risk of a debt issue in Pound sterling for £450,000, guaranteeing complete protection upto a certain exchange rate and partial protection above that level.
PEMEX recorded a total net foreign exchange gain (loss) of Ps. 23,184,122, Ps. (254,012,743) and Ps. (154,765,574), for theyears ended December 31, 2017, 2016 and 2015, respectively; these amounts include the unrealized foreign exchange gain (loss)associated with debt of Ps. 16,685,439, Ps. (243,182,764) and Ps. (152,554,454) for the years ended December 31, 2017, 2016 and2015, respectively. The appreciation of the peso caused a total net foreign exchange gain because a significant part of PEMEX’sdebt, 89.4% (principal only), as of December 31, 2017 is denominated in foreign currency. Unrealized foreign exchange gains andlosses do not impact PEMEX’s cash flows. Due to the cash flow structure described above, the depreciation of the peso relative tothe U.S. dollar does not affect PEMEX’s ability to meet U.S. dollar-denominated financial obligations and improves PEMEX’sability to meet peso-denominated financial obligations. On the other hand, the appreciation of the peso relative to the U.S. dollarmay increase PEMEX’s peso debt service costs on a U.S. dollar basis. PEMEX’s foreign exchange gain in 2017 was due to theappreciation of the peso, from Ps. 20.6640 = U.S. $1.00 on December 31, 2016 to Ps. 19.7867 = U.S. $1.00 on December 31,2017. PEMEX’s foreign exchange loss in 2016 was due to the depreciation of the peso, from Ps. 17.2065 = U.S. $1.00 onDecember 31, 2015 to Ps. 20.6640 = U.S. $1.00 on December 31, 2016. PEMEX’s foreign exchange loss in 2015 was due to thedepreciation of the peso, from Ps. 14.7180 = U.S. $1.00 on December 31, 2014 to Ps.17.2065 = U.S. $1.00 on December 31, 2015.
Copyright © 2018 www.secdatabase.com. All Rights Reserved.Please Consider the Environment Before Printing This Document
Certain of the PMI subsidiaries face market risks generated by fluctuations in foreign exchange rates. In order to mitigatethese risks, the boards of directors of several of these companies have authorized a policy which stipulates that no more than 5%of a company’s total financial assets may be denominated in a currency other than its functional currency, unless the companyowes a duty or expected payment in a currency other than its functional one. Accordingly, certain PMI subsidiaries will, from timeto time, enter into DFIs in order to mitigate the risk associated with financing operations denominated in currencies other thantheir respective functional currency.
Finally, a significant amount of PMI Trading’s income and expenses, including the cost of sales and related sales costs, isderived from the trade of refined products, petrochemicals and gas liquids to PEMEX subsidiaries and third parties, whose pricesare determined and are payable in U.S. dollars. PMI Trading’s exposure to foreign currency risk results primarily from the need tofund tax payments denominated in domestic currency, as well as certain related sales costs denominated in domestic currency.
PMI Trading believes it can adequately manage the risk created by the payment of taxes in domestic currency without theneed to enter into hedging instruments because the exposure to this risk is marginal relative to the total flows of U.S. dollar. Inaddition, in the event that a potential foreign exchange risk arises in connection with a commercial transaction, PMI Trading mayimplement risk mitigation measures by entering into DFIs.
iii. Hydrocarbon Price Risk
PEMEX periodically assesses its revenues and expenditures structure in order to identify the main market risk factors thatPEMEX’s cash flows are exposed to in connection with international hydrocarbon prices. Based on this assessment, PEMEXmonitors its exposure to the most significant risk factors and quantifies their impact on PEMEX’s financial balance.
PEMEX’s exports and domestic sales are directly or indirectly related to international hydrocarbon prices. Therefore,PEMEX is exposed to fluctuations in these prices. In terms of crude oil and natural gas, part of this risk is transferred to theMexican Government under PEMEX’s current fiscal regime.
PEMEX continuously evaluates the implementation of risk mitigation strategies, including those involving the use of DFIs,while taking into account operational and economic constraints.
PEMEX’s exposure to hydrocarbon prices is partly mitigated by natural hedges between its inflows and outflows.
Since 2016, as a result of the changes in the PEMEX’s fiscal regime, its sensitivity to crude oil prices decreased.Nonetheless, PEMEX worked on a hedging strategy for the following years in order to reduce its exposure to drops in crude oilprice.
In April 2017, PEMEX entered into a crude oil hedge to partially protect its cash flows from decreases in the Mexican crudeoil basket price below that established in the Ley de Ingresos de la Federación (“Federal Revenue Law”). PEMEX hedged409 thousand barrels per day from May to December 2017 for U.S. $133,503. As a result of this strategy PEMEX had an incomeof U.S. $205,705.
During the fourth quarter of 2017, PEMEX entered into a crude oil hedge to partially protect cash flows for the fiscal year2018 from decreases in the Mexican crude oil basket price below the one established in the 2018 Federal Revenue Law. PEMEXhedged 440 thousand barrels per day from January to December 2018 for U.S. $449,898.
In 2015, PEMEX entered into various swaps in order to hedge the risk arising from the variations of the propane price of itsimports. These DFIs were held over a percentage of the total imports volume with maturity dates in 2015. During 2017 and 2016,PEMEX did not enter into any propane import price swaps.
In addition to supplying natural gas, Pemex Industrial Transformation offers DFIs to its domestic customers in order toprovide them with support to mitigate the risk associated with the volatility of natural gas prices. Until 2016, Pemex IndustrialTransformation entered into DFIs with Mex Gas Supply, S.L. under the opposite position to those DFIs offered to its customers inorder to mitigate the market risk it bears under such offered DFIs. Mex Gas Supply, S.L. then transferred the related price riskderived from the DFI position held with Pemex Industrial Transformation to international financial counterparties by entering intothese opposite position DFIs with such parties. As of 2017, Pemex Industrial Transformation must enter into DFIs with PetróleosMexicanos under the opposite position to those DFIs offered to its customers, thereby replacing Mex Gas Supply, S.L. However,as of December 31, 2017, no DFIs have been entered into under this mechanism. Due to the above, Pemex IndustrialTransformation maintains a negligible or even null exposure to market risk. These portfolios have VaR and Capital at Risk limitsin order to limit market risk exposure.
PMI Trading faces market risk generated by the terms of the purchase and sale of refined products and natural gas liquids, aswell as the volatility of oil prices. Accordingly, it frequently enters into DFIs in order to mitigate this risk, thereby reducing thevolatility of its financial results.
iv. Risks relating to the portfolio of third-party shares
As of December 31, 2017, Petróleos Mexicanos does not hold any third-party shares of companies that do not participate infinancial markets and, therefore, does not hold any related DFIs.
During 2017, PMI HBV liquidated the total shareholding in Repsol, S.A. (Repsol), which was 23,416,219 shares. Therefore,as of December 31, 2017, PEMEX does not hold any third-party shares and does not hold any related DFIs.
Copyright © 2018 www.secdatabase.com. All Rights Reserved.Please Consider the Environment Before Printing This Document
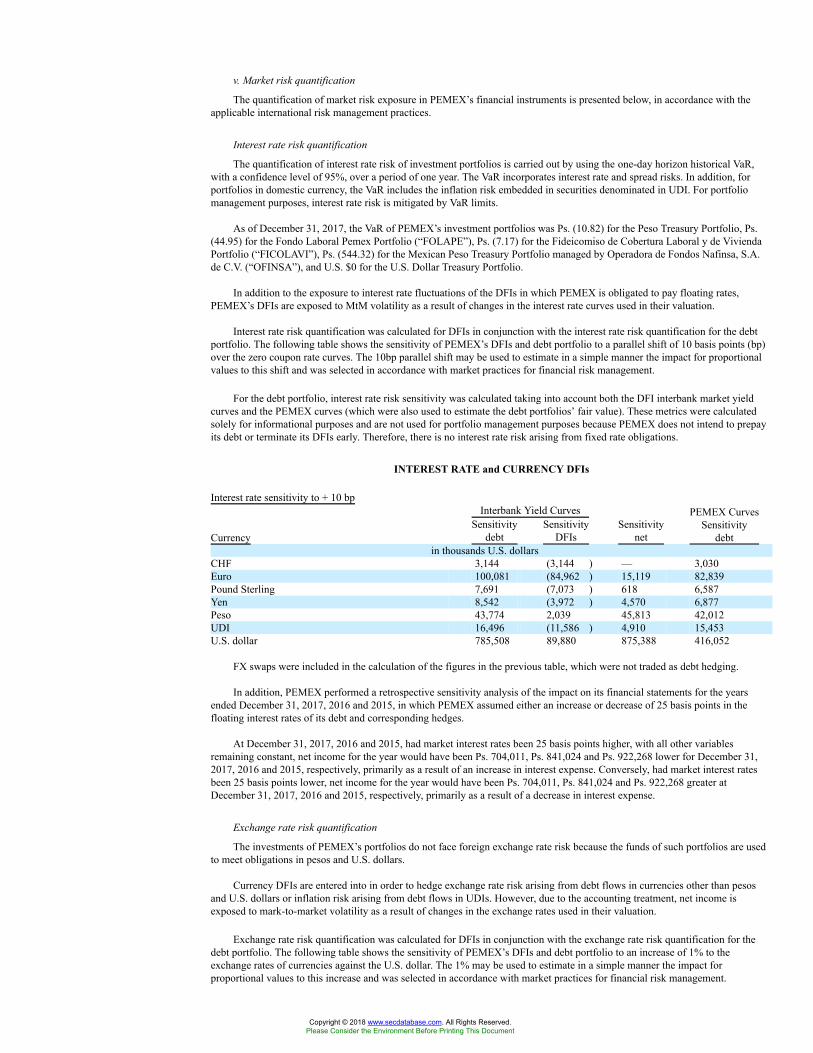
v. Market risk quantification
The quantification of market risk exposure in PEMEX’s financial instruments is presented below, in accordance with theapplicable international risk management practices.
Interest rate risk quantification
The quantification of interest rate risk of investment portfolios is carried out by using the one-day horizon historical VaR,with a confidence level of 95%, over a period of one year. The VaR incorporates interest rate and spread risks. In addition, forportfolios in domestic currency, the VaR includes the inflation risk embedded in securities denominated in UDI. For portfoliomanagement purposes, interest rate risk is mitigated by VaR limits.
As of December 31, 2017, the VaR of PEMEX’s investment portfolios was Ps. (10.82) for the Peso Treasury Portfolio, Ps.(44.95) for the Fondo Laboral Pemex Portfolio (“FOLAPE”), Ps. (7.17) for the Fideicomiso de Cobertura Laboral y de ViviendaPortfolio (“FICOLAVI”), Ps. (544.32) for the Mexican Peso Treasury Portfolio managed by Operadora de Fondos Nafinsa, S.A.de C.V. (“OFINSA”), and U.S. $0 for the U.S. Dollar Treasury Portfolio.
In addition to the exposure to interest rate fluctuations of the DFIs in which PEMEX is obligated to pay floating rates,PEMEX’s DFIs are exposed to MtM volatility as a result of changes in the interest rate curves used in their valuation.
Interest rate risk quantification was calculated for DFIs in conjunction with the interest rate risk quantification for the debtportfolio. The following table shows the sensitivity of PEMEX’s DFIs and debt portfolio to a parallel shift of 10 basis points (bp)over the zero coupon rate curves. The 10bp parallel shift may be used to estimate in a simple manner the impact for proportionalvalues to this shift and was selected in accordance with market practices for financial risk management.
For the debt portfolio, interest rate risk sensitivity was calculated taking into account both the DFI interbank market yieldcurves and the PEMEX curves (which were also used to estimate the debt portfolios’ fair value). These metrics were calculatedsolely for informational purposes and are not used for portfolio management purposes because PEMEX does not intend to prepayits debt or terminate its DFIs early. Therefore, there is no interest rate risk arising from fixed rate obligations.
INTEREST RATE and CURRENCY DFIs
Interest rate sensitivity to + 10 bpInterbank Yield Curves
CurrencySensitivity
debtSensitivity
DFIsSensitivity
net
PEMEX CurvesSensitivity
debtin thousands U.S. dollars
CHF 3,144 (3,144 ) — 3,030Euro 100,081 (84,962 ) 15,119 82,839Pound Sterling 7,691 (7,073 ) 618 6,587Yen 8,542 (3,972 ) 4,570 6,877Peso 43,774 2,039 45,813 42,012UDI 16,496 (11,586 ) 4,910 15,453U.S. dollar 785,508 89,880 875,388 416,052
FX swaps were included in the calculation of the figures in the previous table, which were not traded as debt hedging.
In addition, PEMEX performed a retrospective sensitivity analysis of the impact on its financial statements for the yearsended December 31, 2017, 2016 and 2015, in which PEMEX assumed either an increase or decrease of 25 basis points in thefloating interest rates of its debt and corresponding hedges.
At December 31, 2017, 2016 and 2015, had market interest rates been 25 basis points higher, with all other variablesremaining constant, net income for the year would have been Ps. 704,011, Ps. 841,024 and Ps. 922,268 lower for December 31,2017, 2016 and 2015, respectively, primarily as a result of an increase in interest expense. Conversely, had market interest ratesbeen 25 basis points lower, net income for the year would have been Ps. 704,011, Ps. 841,024 and Ps. 922,268 greater atDecember 31, 2017, 2016 and 2015, respectively, primarily as a result of a decrease in interest expense.
Exchange rate risk quantification
The investments of PEMEX’s portfolios do not face foreign exchange rate risk because the funds of such portfolios are usedto meet obligations in pesos and U.S. dollars.
Currency DFIs are entered into in order to hedge exchange rate risk arising from debt flows in currencies other than pesosand U.S. dollars or inflation risk arising from debt flows in UDIs. However, due to the accounting treatment, net income isexposed to mark-to-market volatility as a result of changes in the exchange rates used in their valuation.
Exchange rate risk quantification was calculated for DFIs in conjunction with the exchange rate risk quantification for thedebt portfolio. The following table shows the sensitivity of PEMEX’s DFIs and debt portfolio to an increase of 1% to theexchange rates of currencies against the U.S. dollar. The 1% may be used to estimate in a simple manner the impact forproportional values to this increase and was selected in accordance with market practices for financial risk management.
Copyright © 2018 www.secdatabase.com. All Rights Reserved.Please Consider the Environment Before Printing This Document

For the debt portfolio, exchange rate risk sensitivity was calculated taking into account both, interbank market yield curvesand the PEMEX curves. In addition, the table shows the one-day horizon historical VaR of the remaining open position, with aconfidence level of 95%, over a period of one year. These metrics were calculated solely for informational purposes. Nevertheless,in order to carry out management activities related to its debt portfolio, PEMEX periodically conducts quantitative analyses inorder to estimate the exchange rate risk exposure generated by its debt issuances. Based on these analyses, PEMEX has elected toenter into DFIs as an exchange rate risk mitigation strategy.
INTEREST RATE and CURRENCY DFIs
Interbank Yield Curves
Currency1%
Debt1%
DFIs1%Net
VaR 95%Net
PEMEX Curves1%
Debtin thousands U.S. dollars
CHF (13,943 ) 13,943 — — (13,624 )Euro (187,988) 165,894 (22,094 ) (19,744 ) (167,068 )Pound Sterling (13,822 ) 13,042 (780 ) (666 ) (12,322 )Yen (16,914 ) 11,470 (5,444 ) (4,398 ) (14,859 )Peso (135,974) 1,409 (134,565) (162,336) (133,525 )UDI (29,485 ) 25,358 (4,127 ) (5,038 ) (28,573 )
As shown in the table above, exchange rate risk derived from debt denominated in currencies other than pesos and U.S.dollars is almost fully hedged by DFIs.
The exchange rate risk exposure to the euro, Pound sterling and Japanese yen is result of the delta of the structures describedabove (Seagull Options and Calls).
FX swaps which were not traded as part of debt hedging were included in the calculation of the figures in the table above.
In addition, PEMEX performed a retrospective sensitivity analysis of the impact on its financial statements of the yearsended December 31, 2017, 2016 and 2015, in which PEMEX assumed either an increase or decrease of 10% in the exchange ratebetween the U.S. dollar and peso in order to determine the impact on net income and equity as a result of applying these new ratesto the monthly balances of assets and liabilities denominated in U.S. dollars.
At December 31, 2017, 2016 and 2015, had the peso depreciated against the U.S. dollar by 10% with other variablesremaining constant, net income would have been Ps.149,669, Ps.124,512 and Ps.105,915 lower, respectively, primarily as a resultof an increase in the exchange rate losses. However, had the peso appreciated against the U.S. dollar by 10%, net income for theperiod would have increased by Ps.149,669, Ps.124,512 and Ps.105,915, respectively, primarily as a result of the decrease inexchange rate losses.
Hydrocarbon price risk quantification
Pemex Industrial Transformation occasionally faces market risk due to open positions arising from the mismatch between theDFI portfolio offered to domestic customers and hedges with international counterparties. As of December 31, 2017, PemexIndustrial Transformation’s natural gas DFI portfolio had no market risk exposure.
Market risk exposure is measured using the 20-day Delta-Gamma VaR methodology, with a confidence level of 95%, basedon 500 daily observations; VaR and CaR are monitored and mitigated by pre-established limits.
It should be noted that sensitivity analyses were not carried out for other financial instruments, such as accounts receivableand payable (as defined in the financial reporting standards). Such accounts are cleared in short-term, and therefore market risk isconsidered to be nonexistent. Most of these accounts are related to hydrocarbon prices.
In accordance with the risk management regulatory framework that PMI Trading has implemented, VaR and the change inprofit and loss by portfolio are calculated daily and compared to the maximum applicable limits in order to implement riskmitigation mechanisms as necessary.
PMI Trading’s global VaR associated with commodities market risk was U.S. $(8,789) as of December 31, 2017. This VaRwas calculated using the historical method with a 99% confidence level, two-year history and a one-day horizon. The minimumVaR recorded on the year was U.S. $(4,720) (registered on October 17, 2017) and the maximum VaR recorded on the year wasU.S. $(19,695) (registered on January 4, 2017). As of December 31, 2016, the global VaR was U.S. $(23,198).
The quantification of crude oil price risk is carried out by using the one-day horizon historical VaR, with a confidence levelof 95%, over a period of one year. As of December 31, 2017, this was U.S. $0 as a result of the rise in the price of crude oil.
II. Credit Risk
When the fair value of a DFI is favorable to PEMEX, PEMEX faces the risk that the counterparty will not be able to meet itsobligations. PEMEX monitors its counterparties’ creditworthiness and calculates the credit risk exposure for its DFIs. As a riskmitigation strategy, PEMEX only enters into DFIs with major financial institutions with a minimum credit rating of BBB-. These
Copyright © 2018 www.secdatabase.com. All Rights Reserved.Please Consider the Environment Before Printing This Document
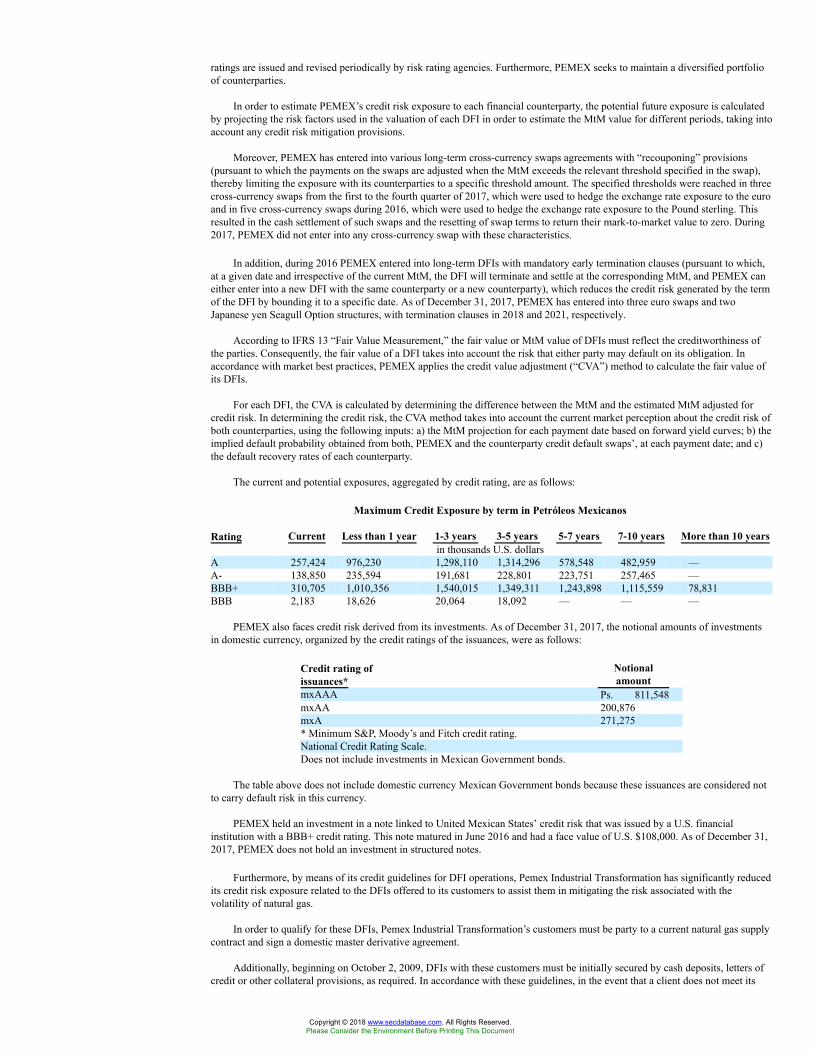
ratings are issued and revised periodically by risk rating agencies. Furthermore, PEMEX seeks to maintain a diversified portfolioof counterparties.
In order to estimate PEMEX’s credit risk exposure to each financial counterparty, the potential future exposure is calculatedby projecting the risk factors used in the valuation of each DFI in order to estimate the MtM value for different periods, taking intoaccount any credit risk mitigation provisions.
Moreover, PEMEX has entered into various long-term cross-currency swaps agreements with “recouponing” provisions(pursuant to which the payments on the swaps are adjusted when the MtM exceeds the relevant threshold specified in the swap),thereby limiting the exposure with its counterparties to a specific threshold amount. The specified thresholds were reached in threecross-currency swaps from the first to the fourth quarter of 2017, which were used to hedge the exchange rate exposure to the euroand in five cross-currency swaps during 2016, which were used to hedge the exchange rate exposure to the Pound sterling. Thisresulted in the cash settlement of such swaps and the resetting of swap terms to return their mark-to-market value to zero. During2017, PEMEX did not enter into any cross-currency swap with these characteristics.
In addition, during 2016 PEMEX entered into long-term DFIs with mandatory early termination clauses (pursuant to which,at a given date and irrespective of the current MtM, the DFI will terminate and settle at the corresponding MtM, and PEMEX caneither enter into a new DFI with the same counterparty or a new counterparty), which reduces the credit risk generated by the termof the DFI by bounding it to a specific date. As of December 31, 2017, PEMEX has entered into three euro swaps and twoJapanese yen Seagull Option structures, with termination clauses in 2018 and 2021, respectively.
According to IFRS 13 “Fair Value Measurement,” the fair value or MtM value of DFIs must reflect the creditworthiness ofthe parties. Consequently, the fair value of a DFI takes into account the risk that either party may default on its obligation. Inaccordance with market best practices, PEMEX applies the credit value adjustment (“CVA”) method to calculate the fair value ofits DFIs.
For each DFI, the CVA is calculated by determining the difference between the MtM and the estimated MtM adjusted forcredit risk. In determining the credit risk, the CVA method takes into account the current market perception about the credit risk ofboth counterparties, using the following inputs: a) the MtM projection for each payment date based on forward yield curves; b) theimplied default probability obtained from both, PEMEX and the counterparty credit default swaps’, at each payment date; and c)the default recovery rates of each counterparty.
The current and potential exposures, aggregated by credit rating, are as follows:
Maximum Credit Exposure by term in Petróleos Mexicanos
Rating Current Less than 1 year 1-3 years 3-5 years 5-7 years 7-10 years More than 10 yearsin thousands U.S. dollars
A 257,424 976,230 1,298,110 1,314,296 578,548 482,959 —A- 138,850 235,594 191,681 228,801 223,751 257,465 —BBB+ 310,705 1,010,356 1,540,015 1,349,311 1,243,898 1,115,559 78,831BBB 2,183 18,626 20,064 18,092 — — —
PEMEX also faces credit risk derived from its investments. As of December 31, 2017, the notional amounts of investmentsin domestic currency, organized by the credit ratings of the issuances, were as follows:
Credit rating ofissuances*
Notionalamount
mxAAA Ps. 811,548mxAA 200,876mxA 271,275* Minimum S&P, Moody’s and Fitch credit rating.National Credit Rating Scale.Does not include investments in Mexican Government bonds.
The table above does not include domestic currency Mexican Government bonds because these issuances are considered notto carry default risk in this currency.
PEMEX held an investment in a note linked to United Mexican States’ credit risk that was issued by a U.S. financialinstitution with a BBB+ credit rating. This note matured in June 2016 and had a face value of U.S. $108,000. As of December 31,2017, PEMEX does not hold an investment in structured notes.
Furthermore, by means of its credit guidelines for DFI operations, Pemex Industrial Transformation has significantly reducedits credit risk exposure related to the DFIs offered to its customers to assist them in mitigating the risk associated with thevolatility of natural gas.
In order to qualify for these DFIs, Pemex Industrial Transformation’s customers must be party to a current natural gas supplycontract and sign a domestic master derivative agreement.
Additionally, beginning on October 2, 2009, DFIs with these customers must be initially secured by cash deposits, letters ofcredit or other collateral provisions, as required. In accordance with these guidelines, in the event that a client does not meet its
Copyright © 2018 www.secdatabase.com. All Rights Reserved.Please Consider the Environment Before Printing This Document
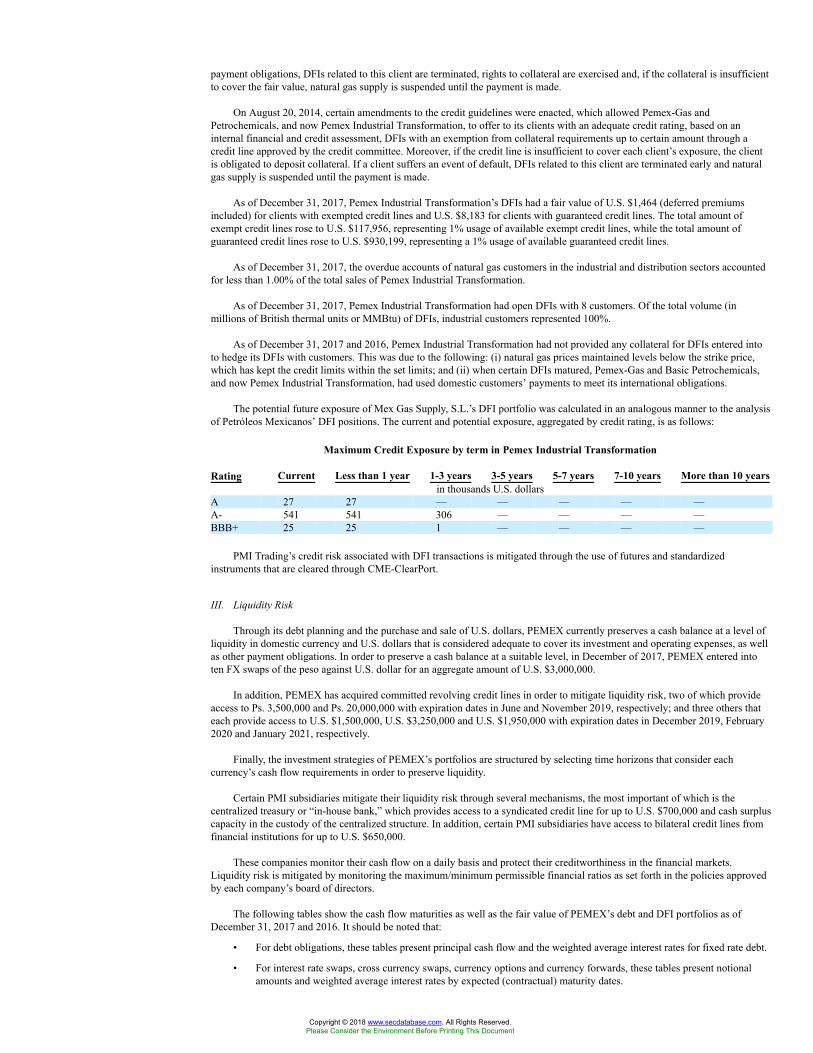
payment obligations, DFIs related to this client are terminated, rights to collateral are exercised and, if the collateral is insufficientto cover the fair value, natural gas supply is suspended until the payment is made.
On August 20, 2014, certain amendments to the credit guidelines were enacted, which allowed Pemex-Gas andPetrochemicals, and now Pemex Industrial Transformation, to offer to its clients with an adequate credit rating, based on aninternal financial and credit assessment, DFIs with an exemption from collateral requirements up to certain amount through acredit line approved by the credit committee. Moreover, if the credit line is insufficient to cover each client’s exposure, the clientis obligated to deposit collateral. If a client suffers an event of default, DFIs related to this client are terminated early and naturalgas supply is suspended until the payment is made.
As of December 31, 2017, Pemex Industrial Transformation’s DFIs had a fair value of U.S. $1,464 (deferred premiumsincluded) for clients with exempted credit lines and U.S. $8,183 for clients with guaranteed credit lines. The total amount ofexempt credit lines rose to U.S. $117,956, representing 1% usage of available exempt credit lines, while the total amount ofguaranteed credit lines rose to U.S. $930,199, representing a 1% usage of available guaranteed credit lines.
As of December 31, 2017, the overdue accounts of natural gas customers in the industrial and distribution sectors accountedfor less than 1.00% of the total sales of Pemex Industrial Transformation.
As of December 31, 2017, Pemex Industrial Transformation had open DFIs with 8 customers. Of the total volume (inmillions of British thermal units or MMBtu) of DFIs, industrial customers represented 100%.
As of December 31, 2017 and 2016, Pemex Industrial Transformation had not provided any collateral for DFIs entered intoto hedge its DFIs with customers. This was due to the following: (i) natural gas prices maintained levels below the strike price,which has kept the credit limits within the set limits; and (ii) when certain DFIs matured, Pemex-Gas and Basic Petrochemicals,and now Pemex Industrial Transformation, had used domestic customers’ payments to meet its international obligations.
The potential future exposure of Mex Gas Supply, S.L.’s DFI portfolio was calculated in an analogous manner to the analysisof Petróleos Mexicanos’ DFI positions. The current and potential exposure, aggregated by credit rating, is as follows:
Maximum Credit Exposure by term in Pemex Industrial Transformation
Rating Current Less than 1 year 1-3 years 3-5 years 5-7 years 7-10 years More than 10 yearsin thousands U.S. dollars
A 27 27 — — — — —A- 541 541 306 — — — —BBB+ 25 25 1 — — — —
PMI Trading’s credit risk associated with DFI transactions is mitigated through the use of futures and standardizedinstruments that are cleared through CME-ClearPort.
III. Liquidity Risk
Through its debt planning and the purchase and sale of U.S. dollars, PEMEX currently preserves a cash balance at a level ofliquidity in domestic currency and U.S. dollars that is considered adequate to cover its investment and operating expenses, as wellas other payment obligations. In order to preserve a cash balance at a suitable level, in December of 2017, PEMEX entered intoten FX swaps of the peso against U.S. dollar for an aggregate amount of U.S. $3,000,000.
In addition, PEMEX has acquired committed revolving credit lines in order to mitigate liquidity risk, two of which provideaccess to Ps. 3,500,000 and Ps. 20,000,000 with expiration dates in June and November 2019, respectively; and three others thateach provide access to U.S. $1,500,000, U.S. $3,250,000 and U.S. $1,950,000 with expiration dates in December 2019, February2020 and January 2021, respectively.
Finally, the investment strategies of PEMEX’s portfolios are structured by selecting time horizons that consider eachcurrency’s cash flow requirements in order to preserve liquidity.
Certain PMI subsidiaries mitigate their liquidity risk through several mechanisms, the most important of which is thecentralized treasury or “in-house bank,” which provides access to a syndicated credit line for up to U.S. $700,000 and cash surpluscapacity in the custody of the centralized structure. In addition, certain PMI subsidiaries have access to bilateral credit lines fromfinancial institutions for up to U.S. $650,000.
These companies monitor their cash flow on a daily basis and protect their creditworthiness in the financial markets.Liquidity risk is mitigated by monitoring the maximum/minimum permissible financial ratios as set forth in the policies approvedby each company’s board of directors.
The following tables show the cash flow maturities as well as the fair value of PEMEX’s debt and DFI portfolios as ofDecember 31, 2017 and 2016. It should be noted that:
• For debt obligations, these tables present principal cash flow and the weighted average interest rates for fixed rate debt.
• For interest rate swaps, cross currency swaps, currency options and currency forwards, these tables present notionalamounts and weighted average interest rates by expected (contractual) maturity dates.
Copyright © 2018 www.secdatabase.com. All Rights Reserved.Please Consider the Environment Before Printing This Document
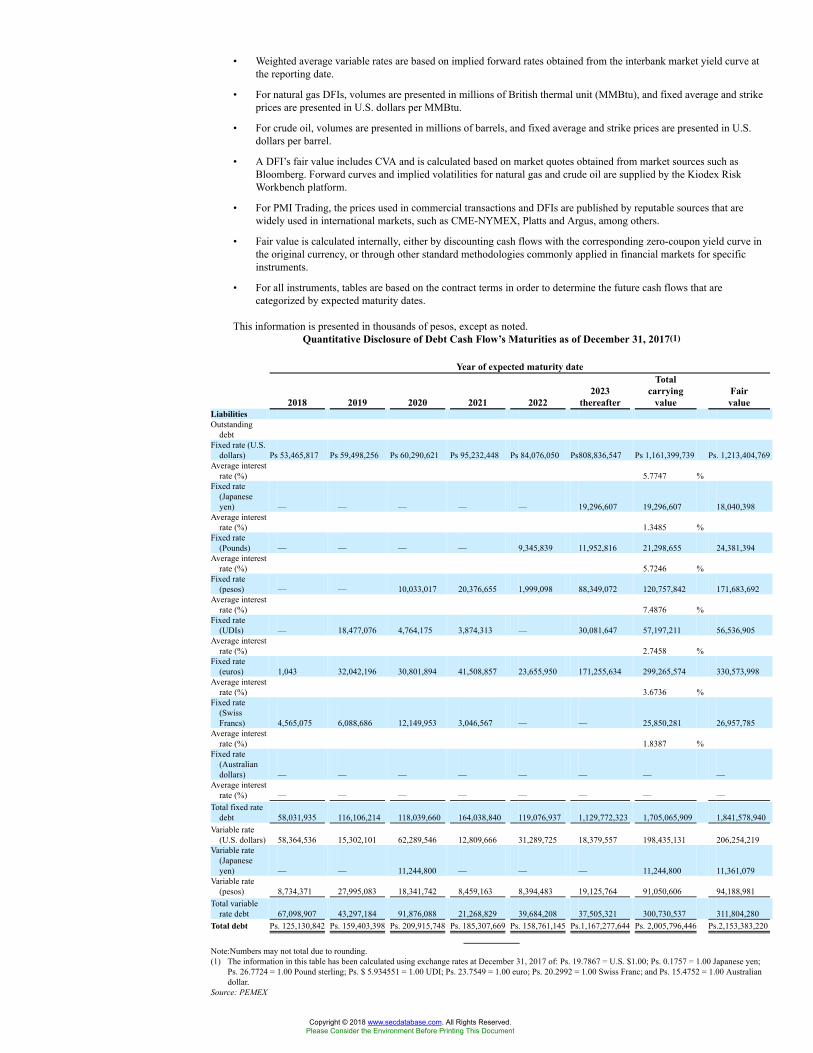
• Weighted average variable rates are based on implied forward rates obtained from the interbank market yield curve atthe reporting date.
• For natural gas DFIs, volumes are presented in millions of British thermal unit (MMBtu), and fixed average and strikeprices are presented in U.S. dollars per MMBtu.
• For crude oil, volumes are presented in millions of barrels, and fixed average and strike prices are presented in U.S.dollars per barrel.
• A DFI’s fair value includes CVA and is calculated based on market quotes obtained from market sources such asBloomberg. Forward curves and implied volatilities for natural gas and crude oil are supplied by the Kiodex RiskWorkbench platform.
• For PMI Trading, the prices used in commercial transactions and DFIs are published by reputable sources that arewidely used in international markets, such as CME-NYMEX, Platts and Argus, among others.
• Fair value is calculated internally, either by discounting cash flows with the corresponding zero-coupon yield curve inthe original currency, or through other standard methodologies commonly applied in financial markets for specificinstruments.
• For all instruments, tables are based on the contract terms in order to determine the future cash flows that arecategorized by expected maturity dates.
This information is presented in thousands of pesos, except as noted.Quantitative Disclosure of Debt Cash Flow’s Maturities as of December 31, 2017(1)
Year of expected maturity date
2018 2019 2020 2021 20222023
thereafter
Totalcarrying
valueFairvalue
LiabilitiesOutstanding
debtFixed rate (U.S.
dollars) Ps 53,465,817 Ps 59,498,256 Ps 60,290,621 Ps 95,232,448 Ps 84,076,050 Ps808,836,547 Ps 1,161,399,739 Ps. 1,213,404,769Average interest
rate (%) 5.7747 %Fixed rate
(Japaneseyen) — — — — — 19,296,607 19,296,607 18,040,398
Average interestrate (%) 1.3485 %
Fixed rate(Pounds) — — — — 9,345,839 11,952,816 21,298,655 24,381,394
Average interestrate (%) 5.7246 %
Fixed rate(pesos) — — 10,033,017 20,376,655 1,999,098 88,349,072 120,757,842 171,683,692
Average interestrate (%) 7.4876 %
Fixed rate(UDIs) — 18,477,076 4,764,175 3,874,313 — 30,081,647 57,197,211 56,536,905
Average interestrate (%) 2.7458 %
Fixed rate(euros) 1,043 32,042,196 30,801,894 41,508,857 23,655,950 171,255,634 299,265,574 330,573,998
Average interestrate (%) 3.6736 %
Fixed rate(SwissFrancs) 4,565,075 6,088,686 12,149,953 3,046,567 — — 25,850,281 26,957,785
Average interestrate (%) 1.8387 %
Fixed rate(Australiandollars) — — — — — — — —
Average interestrate (%) — — — — — — — —
Total fixed ratedebt 58,031,935 116,106,214 118,039,660 164,038,840 119,076,937 1,129,772,323 1,705,065,909 1,841,578,940
Variable rate(U.S. dollars) 58,364,536 15,302,101 62,289,546 12,809,666 31,289,725 18,379,557 198,435,131 206,254,219
Variable rate(Japaneseyen) — — 11,244,800 — — — 11,244,800 11,361,079
Variable rate(pesos) 8,734,371 27,995,083 18,341,742 8,459,163 8,394,483 19,125,764 91,050,606 94,188,981
Total variablerate debt 67,098,907 43,297,184 91,876,088 21,268,829 39,684,208 37,505,321 300,730,537 311,804,280
Total debt Ps. 125,130,842 Ps. 159,403,398 Ps. 209,915,748 Ps. 185,307,669 Ps. 158,761,145 Ps.1,167,277,644 Ps. 2,005,796,446 Ps.2,153,383,220
Note:Numbers may not total due to rounding.(1) The information in this table has been calculated using exchange rates at December 31, 2017 of: Ps. 19.7867 = U.S. $1.00; Ps. 0.1757 = 1.00 Japanese yen;
Ps. 26.7724 = 1.00 Pound sterling; Ps. $ 5.934551 = 1.00 UDI; Ps. 23.7549 = 1.00 euro; Ps. 20.2992 = 1.00 Swiss Franc; and Ps. 15.4752 = 1.00 Australiandollar.
Source: PEMEX
Copyright © 2018 www.secdatabase.com. All Rights Reserved.Please Consider the Environment Before Printing This Document
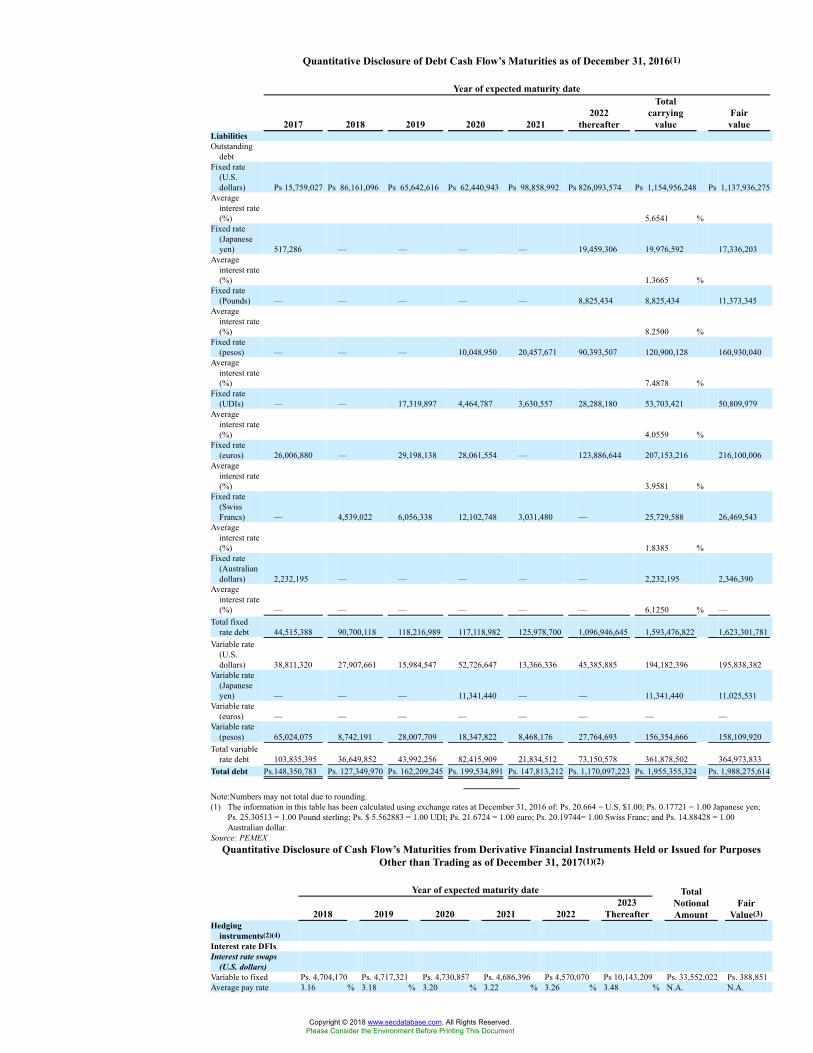
Quantitative Disclosure of Debt Cash Flow’s Maturities as of December 31, 2016(1)
Year of expected maturity date
2017 2018 2019 2020 20212022
thereafter
Totalcarrying
valueFairvalue
LiabilitiesOutstanding
debtFixed rate
(U.S.dollars) Ps 15,759,027 Ps 86,161,096 Ps 65,642,616 Ps 62,440,943 Ps 98,858,992 Ps 826,093,574 Ps 1,154,956,248 Ps 1,137,936,275
Averageinterest rate(%) 5.6541 %
Fixed rate(Japaneseyen) 517,286 — — — — 19,459,306 19,976,592 17,336,203
Averageinterest rate(%) 1.3665 %
Fixed rate(Pounds) — — — — — 8,825,434 8,825,434 11,373,345
Averageinterest rate(%) 8.2500 %
Fixed rate(pesos) — — — 10,048,950 20,457,671 90,393,507 120,900,128 160,930,040
Averageinterest rate(%) 7.4878 %
Fixed rate(UDIs) — — 17,319,897 4,464,787 3,630,557 28,288,180 53,703,421 50,809,979
Averageinterest rate(%) 4.0559 %
Fixed rate(euros) 26,006,880 — 29,198,138 28,061,554 — 123,886,644 207,153,216 216,100,006
Averageinterest rate(%) 3.9581 %
Fixed rate(SwissFrancs) — 4,539,022 6,056,338 12,102,748 3,031,480 — 25,729,588 26,469,543
Averageinterest rate(%) 1.8385 %
Fixed rate(Australiandollars) 2,232,195 — — — — — 2,232,195 2,346,390
Averageinterest rate(%) — — — — — — 6.1250 % —
Total fixedrate debt 44,515,388 90,700,118 118,216,989 117,118,982 125,978,700 1,096,946,645 1,593,476,822 1,623,301,781
Variable rate(U.S.dollars) 38,811,320 27,907,661 15,984,547 52,726,647 13,366,336 45,385,885 194,182,396 195,838,382
Variable rate(Japaneseyen) — — — 11,341,440 — — 11,341,440 11,025,531
Variable rate(euros) — — — — — — — —
Variable rate(pesos) 65,024,075 8,742,191 28,007,709 18,347,822 8,468,176 27,764,693 156,354,666 158,109,920
Total variablerate debt 103,835,395 36,649,852 43,992,256 82,415,909 21,834,512 73,150,578 361,878,502 364,973,833
Total debt Ps.148,350,783 Ps. 127,349,970 Ps. 162,209,245 Ps. 199,534,891 Ps. 147,813,212 Ps. 1,170,097,223 Ps. 1,955,355,324 Ps. 1,988,275,614
Note:Numbers may not total due to rounding.(1) The information in this table has been calculated using exchange rates at December 31, 2016 of: Ps. 20.664 = U.S. $1.00; Ps. 0.17721 = 1.00 Japanese yen;
Ps. 25.30513 = 1.00 Pound sterling; Ps. $ 5.562883 = 1.00 UDI; Ps. 21.6724 = 1.00 euro; Ps. 20.19744= 1.00 Swiss Franc; and Ps. 14.88428 = 1.00Australian dollar.
Source: PEMEXQuantitative Disclosure of Cash Flow’s Maturities from Derivative Financial Instruments Held or Issued for Purposes
Other than Trading as of December 31, 2017(1)(2)
Year of expected maturity date
2018 2019 2020 2021 20222023
Thereafter
TotalNotionalAmount
FairValue(3)
Hedginginstruments(2)(4)
Interest rate DFIsInterest rate swaps
(U.S. dollars)Variable to fixed Ps. 4,704,170 Ps. 4,717,321 Ps. 4,730,857 Ps. 4,686,396 Ps 4,570,070 Ps 10,143,209 Ps. 33,552,022 Ps. 388,851Average pay rate 3.16 % 3.18 % 3.20 % 3.22 % 3.26 % 3.48 % N.A. N.A.
Copyright © 2018 www.secdatabase.com. All Rights Reserved.Please Consider the Environment Before Printing This Document

Average receive rate 3.19 % 3.44 % 3.69 % 3.81 % 3.95 % 4.48 % N.A. N.A.Interest rate swaps
(pesos)Variable to fixed — — — — — — — —Average pay rate N.A. N.A. N.A. N.A. N.A. N.A. N.A. N.A.Average receive rate N.A. N.A. N.A. N.A. N.A. N.A. N.A. N.A.Currency DFIsCross-currency swapsReceive euros/Pay
U.S. dollars — 29,898,198 28,719,208 36,902,690 21,302,856 161,617,172 278,440,124 19,065,727Receive Japanese yen/
Pay U.S. dollars — — 13,039,563 — — 4,775,551 17,815,114 (1,670,533 )Receive Pounds
sterling/ PayU.S. dollars — — — — 10,310,216 11,706,999 22,017,215 1,151,096
Receive UDI/ Paypesos — 23,740,341 7,292,520 3,000,000 — 20,605,166 54,638,028 (4,720,592 )
Receive Swiss francs/Pay U.S. dollars 4,535,474 6,501,082 11,548,658 2,994,374 — — 25,579,588 400,316
Receive Australiandollars/ PayU.S. dollars — — — — — — — —
Currency OptionsBuy Put, Sell Put and
Sell Call on Japaneseyen — — — — — 14,046,320 14,046,320 48,715
Buy call, Sell call andSell Put on euros — — — 41,567,998 — 59,382,855 100,950,853 4,919,444
Sell Call on Poundsterling — — — — — 12,031,728 12,031,728 (239,626 )
Currency ForwardsReceive U.S. dollars /
Pay pesos 59,360,100 — — — — — 59,360,100 (2,006,461 )
N.A. = not applicable.Numbers may not total due to rounding.(1) The information in this table has been calculated using exchange rates at December 31, 2017 of: Ps. 19.7867 = U.S. $1.00 and Ps. 23.7549 = 1.00 euro.(2) PEMEX’s management uses these DFIs to hedge market risk; however, these DFIs do not qualify for accounting purposes as hedges and are recorded in the
financial statements as entered into for trading purposes.(3) Positive numbers represent a favorable fair value to PEMEX.(4) PMI’s risk management policies and procedures establish that DFIs should be used only for hedging purposes; however DFIs are not recorded as hedges for
accounting purposes.Source: PEMEX
Quantitative Disclosure of Cash Flow’s Maturities from Derivative Financial Instruments Held or Issued for PurposesOther than Trading as of December 31, 2016(1)(2)
Year of expected maturity date
2017 2018 2019 2020 20212022
Thereafter
TotalNotionalAmount
FairValue(3)
Hedginginstruments(2)(4)
Interest rate DFIsInterest rate swaps
(U.S. dollars)Variable to fixed Ps. 4,899,645 Ps. 4,912,743 Ps. 4,926,477 Ps. 4,940,613 Ps 4,894,180 Ps 15,365,634 Ps. 39,939,292 Ps. 164,716Average pay rate 2.76 % 2.66 % 3.35 % 3.83 % 4.04 % 4.57 % N.A. N.A.Average receive rate 2.95 % 2.99 % 3.03 % 3.06 % 3.11 % 3.33 % N.A. N.A.Interest rate swaps
(pesos)Variable to fixed — — — — — — — —Average pay rate N.A. N.A. N.A. N.A. N.A. N.A. N.A. N.A.Average receive rate N.A. N.A. N.A. N.A. N.A. N.A. N.A. N.A.Currency DFIsCross-currency swapsReceive euros/Pay
U.S. dollars 34,775,198 — 31,223,821 29,992,556 — 133,024,913 229,016,488 (16,484,533)Receive Japanese yen/
Pay U.S. dollars 532,711 — — 17,697,534 — 4,987,289 23,217,534 (6,132,633 )Receive Pounds sterling/
Pay U.S. dollars — — — — — 10,767,349 10,767,349 (211,207 )Receive UDI/ Pay pesos — — 23,740,341 3,540,220 3,000,000 14,313,198 44,593,759 (2,132,236 )Receive Swiss francs/
Pay U.S. dollars — 4,736,567 6,789,326 12,060,700 3,127,139 — 26,713,732 (789,449 )Receive Australian
dollars/ PayU.S. dollars 2,459,429 — — — — — 2,459,429 (126,796 )
Currency OptionsBuy Put, Sell Put and
sell Call on yen — — — — — 14,133,580 14,133,580 (301,131 )
N.A. = not applicable.Numbers may not total due to rounding.(1) The information in this table has been calculated using exchange rates at December 31, 2016 of: Ps. 20.664 = U.S. $1.00 and Ps. 21.6724 = 1.00 euro.(2) PEMEX’s management uses these DFIs to hedge market risk; however, these DFIs do not qualify for accounting purposes as hedges and are recorded in the
financial statements as entered into for trading purposes.(3) Positive numbers represent a favorable fair value to PEMEX.(4) PMI’s risk management policies and procedures establish that DFIs should be used only for hedging purposes; however DFIs are not recorded as hedges for
accounting purposes.
Copyright © 2018 www.secdatabase.com. All Rights Reserved.Please Consider the Environment Before Printing This Document

Source: PEMEX
B. Fair value of derivative financial instruments
PEMEX periodically evaluates its exposure to international hydrocarbon prices, interest rates and foreign currencies and usesderivative instruments as a mitigation mechanism when potential sources of market risk are identified.
PEMEX monitors the fair value of its DFI portfolio on a periodic basis. The fair value represents the price at which one partywould assume the rights and obligations of the other and is calculated for DFIs through models commonly used in theinternational financial markets, based on inputs obtained from major market information systems and price providers. As a resultof this monitoring, PEMEX does not employ an independent third party to perform the valuation.
PEMEX’s DFIs portfolio is composed primarily of swaps, the prices of which are estimated by discounting flows using theappropriate factors and contains no exotic instruments that require numerical approximations for their valuation.
Embedded derivatives
In accordance with established policies, PEMEX has analyzed the different contracts it has entered into and has determinedthat according to the terms thereof, none meet the criteria necessary to be classified as embedded derivatives. Accordingly, as ofDecember 31, 2017 and 2016, PEMEX did not recognize any embedded derivatives (foreign currency or index).
Accounting treatment
PEMEX enters into derivatives transactions with the sole purpose of hedging financial risks related to its operations, firmcommitments, planned transactions and assets and liabilities recorded on its statement of financial position. Nonetheless, some ofthese transactions do not qualify for hedge accounting treatment because they do not meet the requirements of the accountingstandards for designation as hedges. They are therefore recorded in the financial statements as non-hedge instruments or asinstruments entered into for trading purposes, despite the fact that their cash flows are offset by the cash flows of the positions(assets or liabilities) to which they relate. As a result, the changes in their fair value are recognized in the “Derivative financialinstruments (cost) income, net” line item in the consolidated statement of comprehensive income.
As of December 31, 2017 and 2016, the net fair value of PEMEX’s DFIs (including both DFIs that have not reached maturityand those that have reached maturity but have not been settled), recognized in the consolidated statement of financial position, wasPs. 12,367,475 and Ps. (26,010,486), respectively. As of December 31, 2017 and 2016, PEMEX did not have any DFIs designatedas hedges.
The following table shows the fair values and notional amounts of PEMEX’s OTC DFIs that were designated as non-hedgesfor accounting purposes and entered into for trading purposes as of December 31, 2017 and 2016. It should be noted that:
• A DFI’s fair value includes CVA and is calculated based on market quotes obtained from market sources such asBloomberg. Forward curves and implied volatilities for natural gas and crude oil are supplied by the Kiodex RiskWorkbench platform.
• Fair value is calculated internally, either by discounting cash flows with the corresponding zero-coupon yield curve, inthe original currency, or through other standard methodologies commonly applied in the financial markets for certainspecific instruments.
• The information is presented in thousands of pesos (except as noted).December 31, 2017 December 31, 2016
DFI POSITIONNotionalAmount Fair Value
NotionalAmount Fair Value
Interest rate swaps PEMEX pays fixed in U.S. dollar andreceives floating in 3-month U.S. dollarLIBOR + spread. Ps.16,695,028 Ps. 79,448 Ps.20,018,250 Ps.(90,451 )
Interest rate swaps PEMEX pays fixed in U.S. dollar andreceives floating in 6-month U.S. dollarLIBOR + spread. 15,433,626 332,273 18,132,660 312,210
Cross-currency swaps PEMEX pays fixed in pesos and receivesnotional in UDI. 23,740,341 (4,504,151 ) 23,740,341 (4,815,373 )
Cross-currency swaps PEMEX pays the 28-day TIIE + spread inpesos and receives fixed in UDI. 30,897,687 (216,441 ) 20,853,418 2,683,138
Cross-currency swaps PEMEX pays fixed in U.S. dollar andreceives fixed in Japanese yen. 4,775,551 134,461 5,520,000 (116,507 )
Cross-currency swaps PEMEX pays floating in 6-month U.S.dollar LIBOR + spread and receivesfloating in 6-month yen LIBOR + spread. 13,039,563 (1,804,993 ) 17,697,534 (6,016,126 )
Cross-currency swaps PEMEX pays fixed in U.S. dollar andreceives fixed in euro. 278,440,124 19,065,727 229,016,488 (16,484,533)
Cross-currency swaps PEMEX pays fixed in U.S. dollar andreceives fixed in Pound sterling. 11,706,999 590,113 — —
Cross-currency swaps PEMEX pays floating in 6-month U.S.dollar LIBOR + spread and receives fixedin Pound sterling. 10,310,216 560,982 10,767,349 (211,207 )
Cross-currency swaps PEMEX pays fixed in U.S. dollar andreceives fixed in CHF. 25,579,588 400,316 26,713,732 (789,449 )
Copyright © 2018 www.secdatabase.com. All Rights Reserved.Please Consider the Environment Before Printing This Document
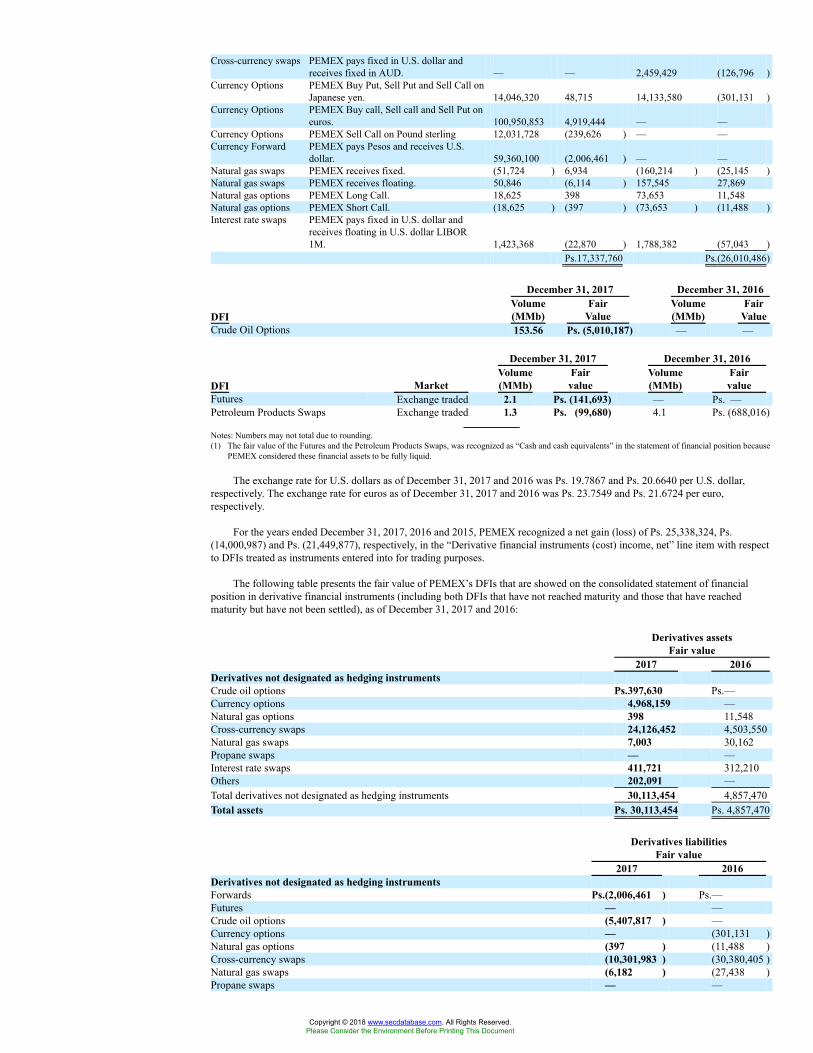
Cross-currency swaps PEMEX pays fixed in U.S. dollar andreceives fixed in AUD. — — 2,459,429 (126,796 )
Currency Options PEMEX Buy Put, Sell Put and Sell Call onJapanese yen. 14,046,320 48,715 14,133,580 (301,131 )
Currency Options PEMEX Buy call, Sell call and Sell Put oneuros. 100,950,853 4,919,444 — —
Currency Options PEMEX Sell Call on Pound sterling 12,031,728 (239,626 ) — —Currency Forward PEMEX pays Pesos and receives U.S.
dollar. 59,360,100 (2,006,461 ) — —Natural gas swaps PEMEX receives fixed. (51,724 ) 6,934 (160,214 ) (25,145 )Natural gas swaps PEMEX receives floating. 50,846 (6,114 ) 157,545 27,869Natural gas options PEMEX Long Call. 18,625 398 73,653 11,548Natural gas options PEMEX Short Call. (18,625 ) (397 ) (73,653 ) (11,488 )Interest rate swaps PEMEX pays fixed in U.S. dollar and
receives floating in U.S. dollar LIBOR1M. 1,423,368 (22,870 ) 1,788,382 (57,043 )
Ps.17,337,760 Ps.(26,010,486)
December 31, 2017 December 31, 2016
DFIVolume(MMb)
FairValue
Volume(MMb)
FairValue
Crude Oil Options 153.56 Ps. (5,010,187) — —
December 31, 2017 December 31, 2016
DFI MarketVolume(MMb)
Fairvalue
Volume(MMb)
Fairvalue
Futures Exchange traded 2.1 Ps. (141,693) — Ps. —Petroleum Products Swaps Exchange traded 1.3 Ps. (99,680) 4.1 Ps. (688,016)
Notes: Numbers may not total due to rounding.(1) The fair value of the Futures and the Petroleum Products Swaps, was recognized as “Cash and cash equivalents” in the statement of financial position because
PEMEX considered these financial assets to be fully liquid.
The exchange rate for U.S. dollars as of December 31, 2017 and 2016 was Ps. 19.7867 and Ps. 20.6640 per U.S. dollar,respectively. The exchange rate for euros as of December 31, 2017 and 2016 was Ps. 23.7549 and Ps. 21.6724 per euro,respectively.
For the years ended December 31, 2017, 2016 and 2015, PEMEX recognized a net gain (loss) of Ps. 25,338,324, Ps.(14,000,987) and Ps. (21,449,877), respectively, in the “Derivative financial instruments (cost) income, net” line item with respectto DFIs treated as instruments entered into for trading purposes.
The following table presents the fair value of PEMEX’s DFIs that are showed on the consolidated statement of financialposition in derivative financial instruments (including both DFIs that have not reached maturity and those that have reachedmaturity but have not been settled), as of December 31, 2017 and 2016:
Derivatives assetsFair value
2017 2016Derivatives not designated as hedging instrumentsCrude oil options Ps.397,630 Ps.—Currency options 4,968,159 —Natural gas options 398 11,548Cross-currency swaps 24,126,452 4,503,550Natural gas swaps 7,003 30,162Propane swaps — —Interest rate swaps 411,721 312,210Others 202,091 —Total derivatives not designated as hedging instruments 30,113,454 4,857,470Total assets Ps. 30,113,454 Ps. 4,857,470
Derivatives liabilitiesFair value
2017 2016Derivatives not designated as hedging instrumentsForwards Ps.(2,006,461 ) Ps.—Futures — —Crude oil options (5,407,817 ) —Currency options — (301,131 )Natural gas options (397 ) (11,488 )Cross-currency swaps (10,301,983 ) (30,380,405 )Natural gas swaps (6,182 ) (27,438 )Propane swaps — —
Copyright © 2018 www.secdatabase.com. All Rights Reserved.Please Consider the Environment Before Printing This Document
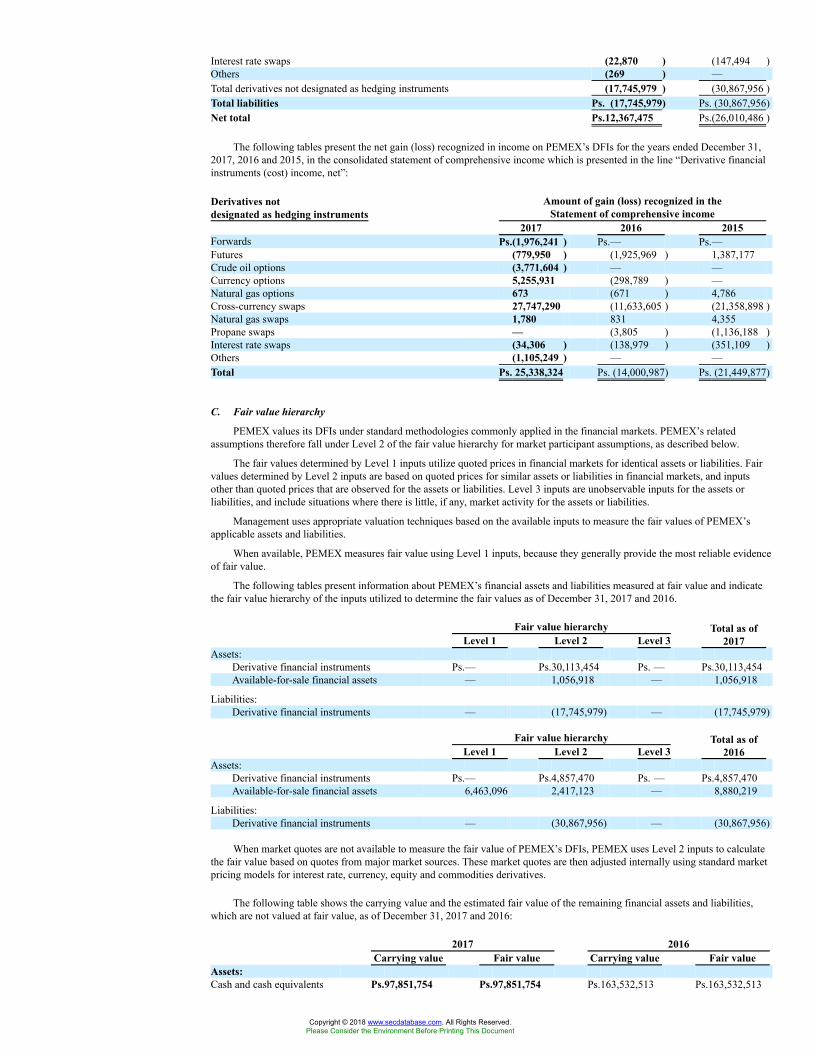
Interest rate swaps (22,870 ) (147,494 )Others (269 ) —Total derivatives not designated as hedging instruments (17,745,979 ) (30,867,956 )Total liabilities Ps. (17,745,979) Ps. (30,867,956)Net total Ps.12,367,475 Ps.(26,010,486 )
The following tables present the net gain (loss) recognized in income on PEMEX’s DFIs for the years ended December 31,2017, 2016 and 2015, in the consolidated statement of comprehensive income which is presented in the line “Derivative financialinstruments (cost) income, net”:
Derivatives notdesignated as hedging instruments
Amount of gain (loss) recognized in theStatement of comprehensive income
2017 2016 2015Forwards Ps.(1,976,241 ) Ps.— Ps.—Futures (779,950 ) (1,925,969 ) 1,387,177Crude oil options (3,771,604 ) — —Currency options 5,255,931 (298,789 ) —Natural gas options 673 (671 ) 4,786Cross-currency swaps 27,747,290 (11,633,605 ) (21,358,898 )Natural gas swaps 1,780 831 4,355Propane swaps — (3,805 ) (1,136,188 )Interest rate swaps (34,306 ) (138,979 ) (351,109 )Others (1,105,249 ) — —Total Ps. 25,338,324 Ps. (14,000,987) Ps. (21,449,877)
C. Fair value hierarchy
PEMEX values its DFIs under standard methodologies commonly applied in the financial markets. PEMEX’s relatedassumptions therefore fall under Level 2 of the fair value hierarchy for market participant assumptions, as described below.
The fair values determined by Level 1 inputs utilize quoted prices in financial markets for identical assets or liabilities. Fairvalues determined by Level 2 inputs are based on quoted prices for similar assets or liabilities in financial markets, and inputsother than quoted prices that are observed for the assets or liabilities. Level 3 inputs are unobservable inputs for the assets orliabilities, and include situations where there is little, if any, market activity for the assets or liabilities.
Management uses appropriate valuation techniques based on the available inputs to measure the fair values of PEMEX’sapplicable assets and liabilities.
When available, PEMEX measures fair value using Level 1 inputs, because they generally provide the most reliable evidenceof fair value.
The following tables present information about PEMEX’s financial assets and liabilities measured at fair value and indicatethe fair value hierarchy of the inputs utilized to determine the fair values as of December 31, 2017 and 2016.
Fair value hierarchyLevel 1 Level 2 Level 3
Total as of2017
Assets:Derivative financial instruments Ps.— Ps.30,113,454 Ps. — Ps.30,113,454Available-for-sale financial assets — 1,056,918 — 1,056,918
Liabilities:Derivative financial instruments — (17,745,979) — (17,745,979)
Fair value hierarchyLevel 1 Level 2 Level 3
Total as of2016
Assets:Derivative financial instruments Ps.— Ps.4,857,470 Ps. — Ps.4,857,470Available-for-sale financial assets 6,463,096 2,417,123 — 8,880,219
Liabilities:Derivative financial instruments — (30,867,956) — (30,867,956)
When market quotes are not available to measure the fair value of PEMEX’s DFIs, PEMEX uses Level 2 inputs to calculatethe fair value based on quotes from major market sources. These market quotes are then adjusted internally using standard marketpricing models for interest rate, currency, equity and commodities derivatives.
The following table shows the carrying value and the estimated fair value of the remaining financial assets and liabilities,which are not valued at fair value, as of December 31, 2017 and 2016:
2017 2016Carrying value Fair value Carrying value Fair value
Assets:Cash and cash equivalents Ps.97,851,754 Ps.97,851,754 Ps.163,532,513 Ps.163,532,513
Copyright © 2018 www.secdatabase.com. All Rights Reserved.Please Consider the Environment Before Printing This Document
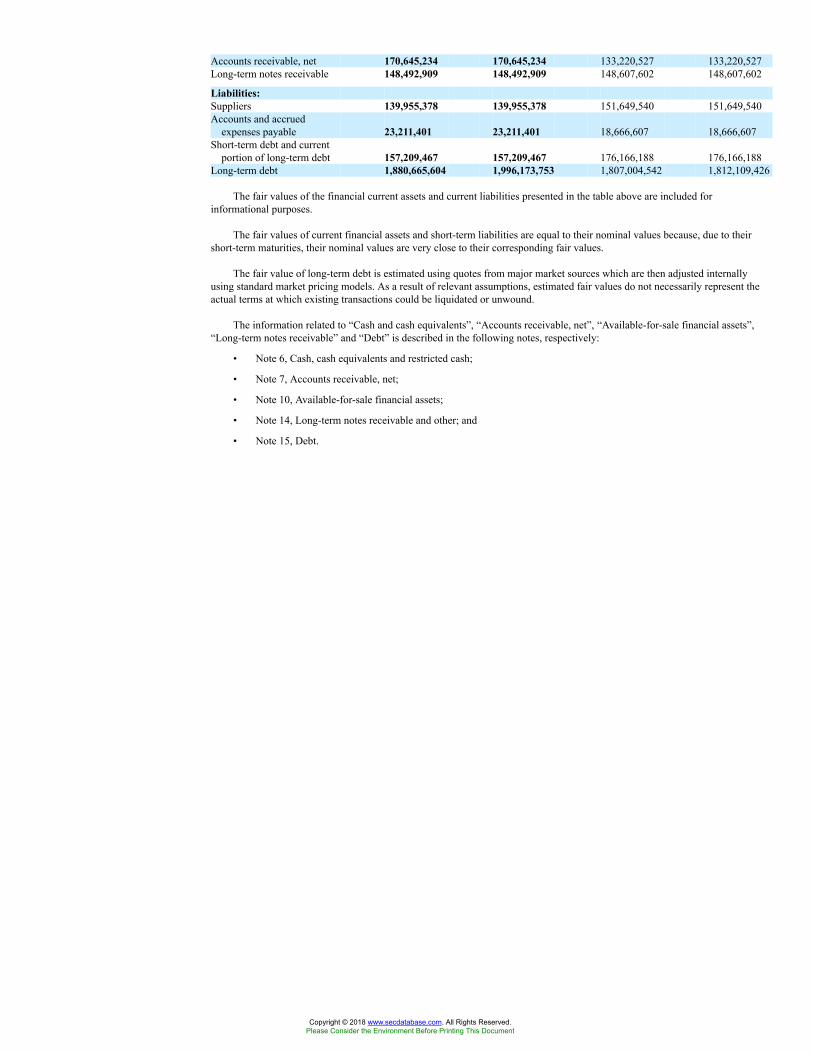
Accounts receivable, net 170,645,234 170,645,234 133,220,527 133,220,527Long-term notes receivable 148,492,909 148,492,909 148,607,602 148,607,602
Liabilities:Suppliers 139,955,378 139,955,378 151,649,540 151,649,540Accounts and accrued
expenses payable 23,211,401 23,211,401 18,666,607 18,666,607Short-term debt and current
portion of long-term debt 157,209,467 157,209,467 176,166,188 176,166,188Long-term debt 1,880,665,604 1,996,173,753 1,807,004,542 1,812,109,426
The fair values of the financial current assets and current liabilities presented in the table above are included forinformational purposes.
The fair values of current financial assets and short-term liabilities are equal to their nominal values because, due to theirshort-term maturities, their nominal values are very close to their corresponding fair values.
The fair value of long-term debt is estimated using quotes from major market sources which are then adjusted internallyusing standard market pricing models. As a result of relevant assumptions, estimated fair values do not necessarily represent theactual terms at which existing transactions could be liquidated or unwound.
The information related to “Cash and cash equivalents”, “Accounts receivable, net”, “Available-for-sale financial assets”,“Long-term notes receivable” and “Debt” is described in the following notes, respectively:
• Note 6, Cash, cash equivalents and restricted cash;
• Note 7, Accounts receivable, net;
• Note 10, Available-for-sale financial assets;
• Note 14, Long-term notes receivable and other; and
• Note 15, Debt.
Copyright © 2018 www.secdatabase.com. All Rights Reserved.Please Consider the Environment Before Printing This Document
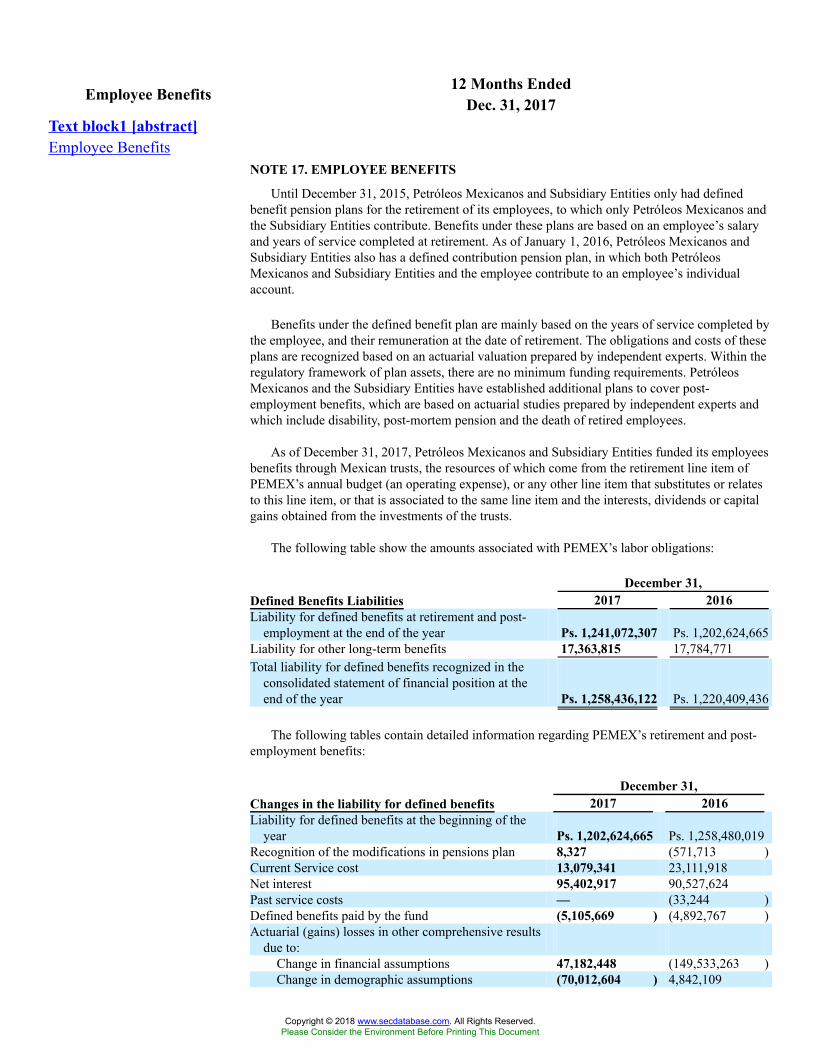
12 Months EndedEmployee Benefits Dec. 31, 2017Text block1 [abstract]Employee Benefits
NOTE 17. EMPLOYEE BENEFITS
Until December 31, 2015, Petróleos Mexicanos and Subsidiary Entities only had definedbenefit pension plans for the retirement of its employees, to which only Petróleos Mexicanos andthe Subsidiary Entities contribute. Benefits under these plans are based on an employee’s salaryand years of service completed at retirement. As of January 1, 2016, Petróleos Mexicanos andSubsidiary Entities also has a defined contribution pension plan, in which both PetróleosMexicanos and Subsidiary Entities and the employee contribute to an employee’s individualaccount.
Benefits under the defined benefit plan are mainly based on the years of service completed bythe employee, and their remuneration at the date of retirement. The obligations and costs of theseplans are recognized based on an actuarial valuation prepared by independent experts. Within theregulatory framework of plan assets, there are no minimum funding requirements. PetróleosMexicanos and the Subsidiary Entities have established additional plans to cover post-employment benefits, which are based on actuarial studies prepared by independent experts andwhich include disability, post-mortem pension and the death of retired employees.
As of December 31, 2017, Petróleos Mexicanos and Subsidiary Entities funded its employeesbenefits through Mexican trusts, the resources of which come from the retirement line item ofPEMEX’s annual budget (an operating expense), or any other line item that substitutes or relatesto this line item, or that is associated to the same line item and the interests, dividends or capitalgains obtained from the investments of the trusts.
The following table show the amounts associated with PEMEX’s labor obligations:
December 31,Defined Benefits Liabilities 2017 2016Liability for defined benefits at retirement and post-
employment at the end of the year Ps. 1,241,072,307 Ps. 1,202,624,665Liability for other long-term benefits 17,363,815 17,784,771Total liability for defined benefits recognized in the
consolidated statement of financial position at theend of the year Ps. 1,258,436,122 Ps. 1,220,409,436
The following tables contain detailed information regarding PEMEX’s retirement and post-employment benefits:
December 31,Changes in the liability for defined benefits 2017 2016Liability for defined benefits at the beginning of the
year Ps. 1,202,624,665 Ps. 1,258,480,019Recognition of the modifications in pensions plan 8,327 (571,713 )Current Service cost 13,079,341 23,111,918Net interest 95,402,917 90,527,624Past service costs — (33,244 )Defined benefits paid by the fund (5,105,669 ) (4,892,767 )Actuarial (gains) losses in other comprehensive results
due to:Change in financial assumptions 47,182,448 (149,533,263 )Change in demographic assumptions (70,012,604 ) 4,842,109
Copyright © 2018 www.secdatabase.com. All Rights Reserved.Please Consider the Environment Before Printing This Document
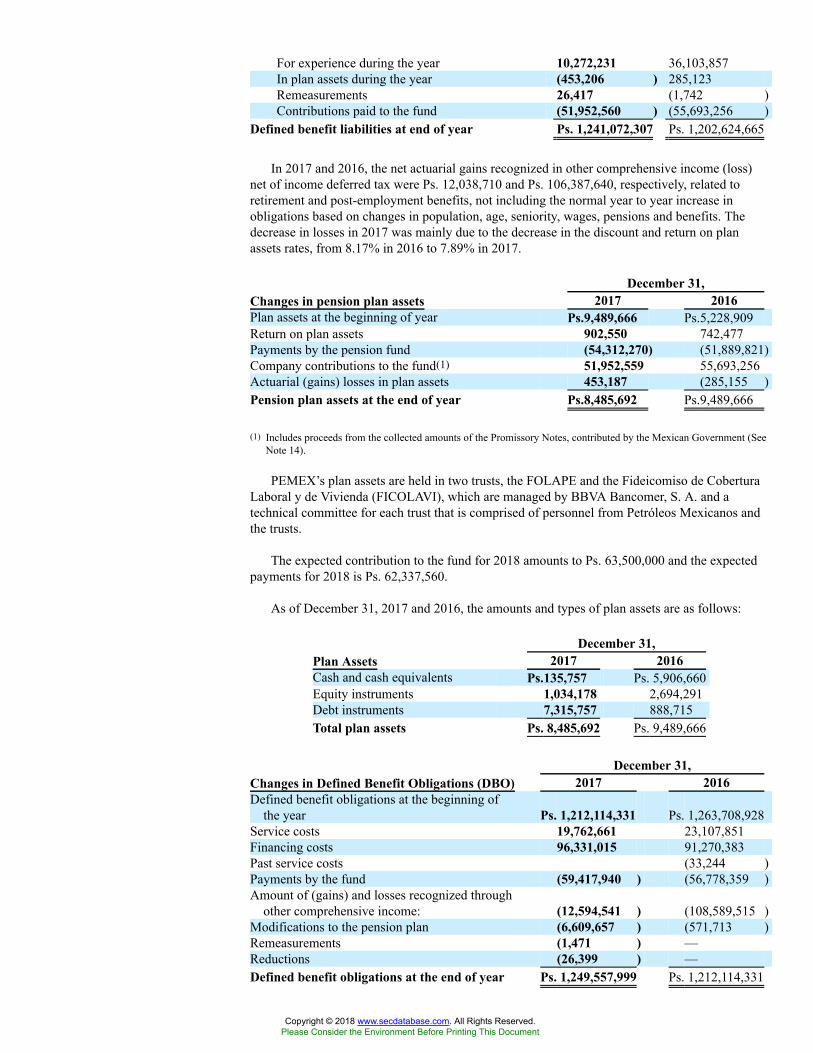
For experience during the year 10,272,231 36,103,857In plan assets during the year (453,206 ) 285,123Remeasurements 26,417 (1,742 )Contributions paid to the fund (51,952,560 ) (55,693,256 )
Defined benefit liabilities at end of year Ps. 1,241,072,307 Ps. 1,202,624,665
In 2017 and 2016, the net actuarial gains recognized in other comprehensive income (loss)net of income deferred tax were Ps. 12,038,710 and Ps. 106,387,640, respectively, related toretirement and post-employment benefits, not including the normal year to year increase inobligations based on changes in population, age, seniority, wages, pensions and benefits. Thedecrease in losses in 2017 was mainly due to the decrease in the discount and return on planassets rates, from 8.17% in 2016 to 7.89% in 2017.
December 31,Changes in pension plan assets 2017 2016Plan assets at the beginning of year Ps.9,489,666 Ps.5,228,909Return on plan assets 902,550 742,477Payments by the pension fund (54,312,270) (51,889,821)Company contributions to the fund(1) 51,952,559 55,693,256Actuarial (gains) losses in plan assets 453,187 (285,155 )Pension plan assets at the end of year Ps.8,485,692 Ps.9,489,666
(1) Includes proceeds from the collected amounts of the Promissory Notes, contributed by the Mexican Government (SeeNote 14).
PEMEX’s plan assets are held in two trusts, the FOLAPE and the Fideicomiso de CoberturaLaboral y de Vivienda (FICOLAVI), which are managed by BBVA Bancomer, S. A. and atechnical committee for each trust that is comprised of personnel from Petróleos Mexicanos andthe trusts.
The expected contribution to the fund for 2018 amounts to Ps. 63,500,000 and the expectedpayments for 2018 is Ps. 62,337,560.
As of December 31, 2017 and 2016, the amounts and types of plan assets are as follows:
December 31,Plan Assets 2017 2016Cash and cash equivalents Ps.135,757 Ps. 5,906,660Equity instruments 1,034,178 2,694,291Debt instruments 7,315,757 888,715Total plan assets Ps. 8,485,692 Ps. 9,489,666
December 31,Changes in Defined Benefit Obligations (DBO) 2017 2016Defined benefit obligations at the beginning of
the year Ps. 1,212,114,331 Ps. 1,263,708,928Service costs 19,762,661 23,107,851Financing costs 96,331,015 91,270,383Past service costs (33,244 )Payments by the fund (59,417,940 ) (56,778,359 )Amount of (gains) and losses recognized through
other comprehensive income: (12,594,541 ) (108,589,515 )Modifications to the pension plan (6,609,657 ) (571,713 )Remeasurements (1,471 ) —Reductions (26,399 ) —Defined benefit obligations at the end of year Ps. 1,249,557,999 Ps. 1,212,114,331
Copyright © 2018 www.secdatabase.com. All Rights Reserved.Please Consider the Environment Before Printing This Document
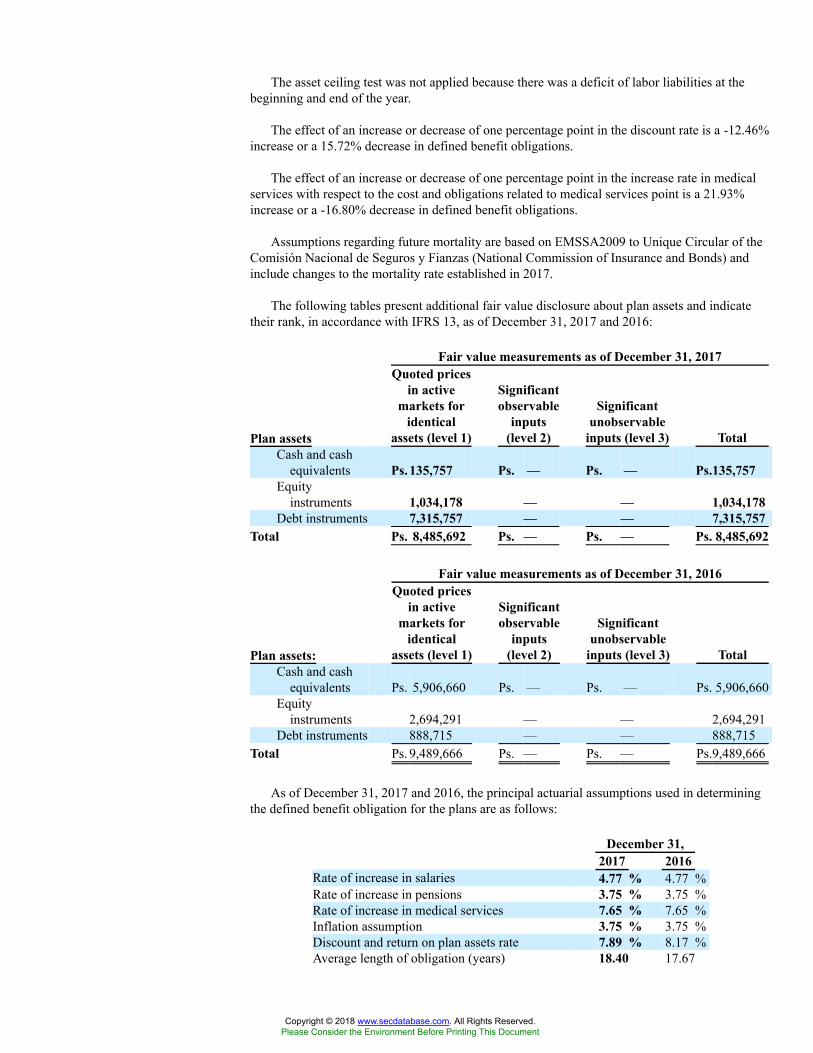
The asset ceiling test was not applied because there was a deficit of labor liabilities at thebeginning and end of the year.
The effect of an increase or decrease of one percentage point in the discount rate is a -12.46%increase or a 15.72% decrease in defined benefit obligations.
The effect of an increase or decrease of one percentage point in the increase rate in medicalservices with respect to the cost and obligations related to medical services point is a 21.93%increase or a -16.80% decrease in defined benefit obligations.
Assumptions regarding future mortality are based on EMSSA2009 to Unique Circular of theComisión Nacional de Seguros y Fianzas (National Commission of Insurance and Bonds) andinclude changes to the mortality rate established in 2017.
The following tables present additional fair value disclosure about plan assets and indicatetheir rank, in accordance with IFRS 13, as of December 31, 2017 and 2016:
Fair value measurements as of December 31, 2017
Plan assets
Quoted pricesin active
markets foridentical
assets (level 1)
Significantobservable
inputs(level 2)
Significantunobservable
inputs (level 3) TotalCash and cash
equivalents Ps. 135,757 Ps. — Ps. — Ps.135,757Equity
instruments 1,034,178 — — 1,034,178Debt instruments 7,315,757 — — 7,315,757
Total Ps. 8,485,692 Ps. — Ps. — Ps. 8,485,692
Fair value measurements as of December 31, 2016
Plan assets:
Quoted pricesin active
markets foridentical
assets (level 1)
Significantobservable
inputs(level 2)
Significantunobservable
inputs (level 3) TotalCash and cash
equivalents Ps. 5,906,660 Ps. — Ps. — Ps. 5,906,660Equity
instruments 2,694,291 — — 2,694,291Debt instruments 888,715 — — 888,715
Total Ps. 9,489,666 Ps. — Ps. — Ps.9,489,666
As of December 31, 2017 and 2016, the principal actuarial assumptions used in determiningthe defined benefit obligation for the plans are as follows:
December 31,2017 2016
Rate of increase in salaries 4.77 % 4.77 %Rate of increase in pensions 3.75 % 3.75 %Rate of increase in medical services 7.65 % 7.65 %Inflation assumption 3.75 % 3.75 %Discount and return on plan assets rate 7.89 % 8.17 %Average length of obligation (years) 18.40 17.67
Copyright © 2018 www.secdatabase.com. All Rights Reserved.Please Consider the Environment Before Printing This Document
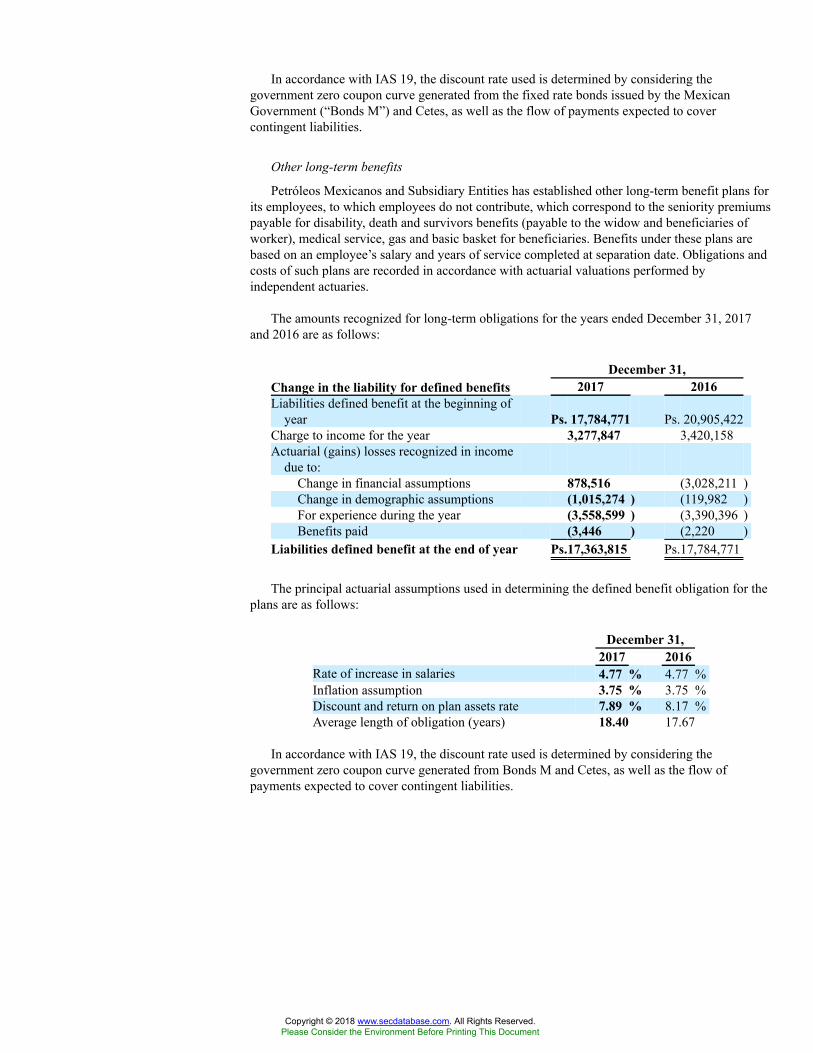
In accordance with IAS 19, the discount rate used is determined by considering thegovernment zero coupon curve generated from the fixed rate bonds issued by the MexicanGovernment (“Bonds M”) and Cetes, as well as the flow of payments expected to covercontingent liabilities.
Other long-term benefits
Petróleos Mexicanos and Subsidiary Entities has established other long-term benefit plans forits employees, to which employees do not contribute, which correspond to the seniority premiumspayable for disability, death and survivors benefits (payable to the widow and beneficiaries ofworker), medical service, gas and basic basket for beneficiaries. Benefits under these plans arebased on an employee’s salary and years of service completed at separation date. Obligations andcosts of such plans are recorded in accordance with actuarial valuations performed byindependent actuaries.
The amounts recognized for long-term obligations for the years ended December 31, 2017and 2016 are as follows:
December 31,Change in the liability for defined benefits 2017 2016Liabilities defined benefit at the beginning of
year Ps. 17,784,771 Ps. 20,905,422Charge to income for the year 3,277,847 3,420,158Actuarial (gains) losses recognized in income
due to:Change in financial assumptions 878,516 (3,028,211 )Change in demographic assumptions (1,015,274 ) (119,982 )For experience during the year (3,558,599 ) (3,390,396 )Benefits paid (3,446 ) (2,220 )
Liabilities defined benefit at the end of year Ps.17,363,815 Ps.17,784,771
The principal actuarial assumptions used in determining the defined benefit obligation for theplans are as follows:
December 31,2017 2016
Rate of increase in salaries 4.77 % 4.77 %Inflation assumption 3.75 % 3.75 %Discount and return on plan assets rate 7.89 % 8.17 %Average length of obligation (years) 18.40 17.67
In accordance with IAS 19, the discount rate used is determined by considering thegovernment zero coupon curve generated from Bonds M and Cetes, as well as the flow ofpayments expected to cover contingent liabilities.
Copyright © 2018 www.secdatabase.com. All Rights Reserved.Please Consider the Environment Before Printing This Document
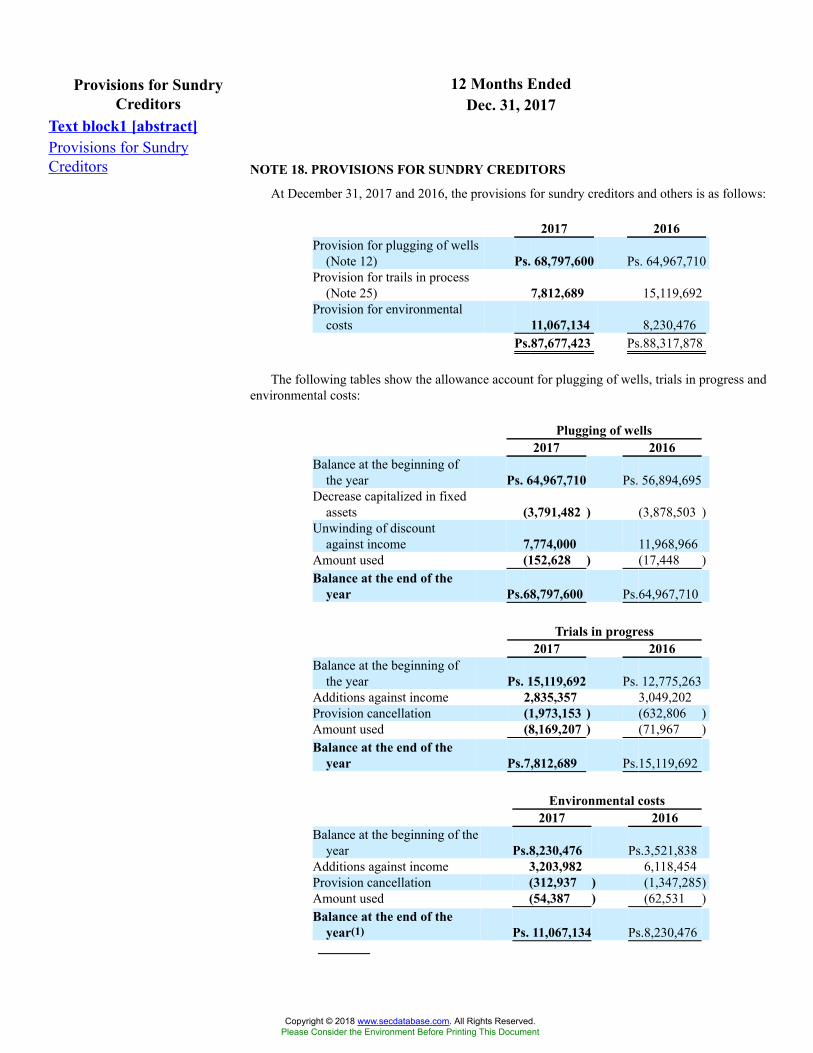
12 Months EndedProvisions for SundryCreditors Dec. 31, 2017
Text block1 [abstract]Provisions for SundryCreditors NOTE 18. PROVISIONS FOR SUNDRY CREDITORS
At December 31, 2017 and 2016, the provisions for sundry creditors and others is as follows:
2017 2016Provision for plugging of wells
(Note 12) Ps. 68,797,600 Ps. 64,967,710Provision for trails in process
(Note 25) 7,812,689 15,119,692Provision for environmental
costs 11,067,134 8,230,476Ps.87,677,423 Ps.88,317,878
The following tables show the allowance account for plugging of wells, trials in progress andenvironmental costs:
Plugging of wells2017 2016
Balance at the beginning ofthe year Ps. 64,967,710 Ps. 56,894,695
Decrease capitalized in fixedassets (3,791,482 ) (3,878,503 )
Unwinding of discountagainst income 7,774,000 11,968,966
Amount used (152,628 ) (17,448 )Balance at the end of the
year Ps.68,797,600 Ps.64,967,710
Trials in progress2017 2016
Balance at the beginning ofthe year Ps. 15,119,692 Ps. 12,775,263
Additions against income 2,835,357 3,049,202Provision cancellation (1,973,153 ) (632,806 )Amount used (8,169,207 ) (71,967 )Balance at the end of the
year Ps.7,812,689 Ps.15,119,692
Environmental costs2017 2016
Balance at the beginning of theyear Ps.8,230,476 Ps.3,521,838
Additions against income 3,203,982 6,118,454Provision cancellation (312,937 ) (1,347,285)Amount used (54,387 ) (62,531 )Balance at the end of the
year(1) Ps. 11,067,134 Ps.8,230,476
Copyright © 2018 www.secdatabase.com. All Rights Reserved.Please Consider the Environment Before Printing This Document
(1) PEMEX is subject to the provisions of the Ley General del Equilibrio Ecológico y la Protección alAmbiente (General Law on Ecological Equilibrium and Environmental Protection). To comply withthis law, environmental audits of PEMEX’s larger operating, storage and transportation facilities havebeen or are being conducted. Following the completion of such audits, PEMEX has signed variousagreements with the Procuraduría Federal de Protección al Ambiente (Federal Attorney ofEnvironmental Protection) to implement environmental remediation and improve environmental plans.Such plans contemplate remediation for environmental damages, as well as related investments for theimprovement of equipment, maintenance, labor and materials.
Provision for plugging of wells
PEMEX records a provision at present value for the future plugging cost of an oil productionfacility or pipeline at the time that it is built. Present value is determined based on discount ratesranging from 4.0% to 10.5% in 2017.
The plugging provision represents the present value of plugging costs related to oil and gasproperties. These provisions have been created based on internal estimates of PEMEX. PEMEXhas made certain assumptions based on the current economic environment that PEMEX believesprovide a reasonable basis on which to estimate the future liability. These estimates are reviewedregularly to take into account any material changes in the assumptions. However, actual pluggingcosts in the long run will depend on future market prices for the necessary plugging work, whichreflect market conditions at the time the work is being performed.
Moreover, the time of plugging depends on when the fields cease to have economically viableproduction rates, which, in turn, depends on the inherently uncertain future prices of oil and gas.
Copyright © 2018 www.secdatabase.com. All Rights Reserved.Please Consider the Environment Before Printing This Document
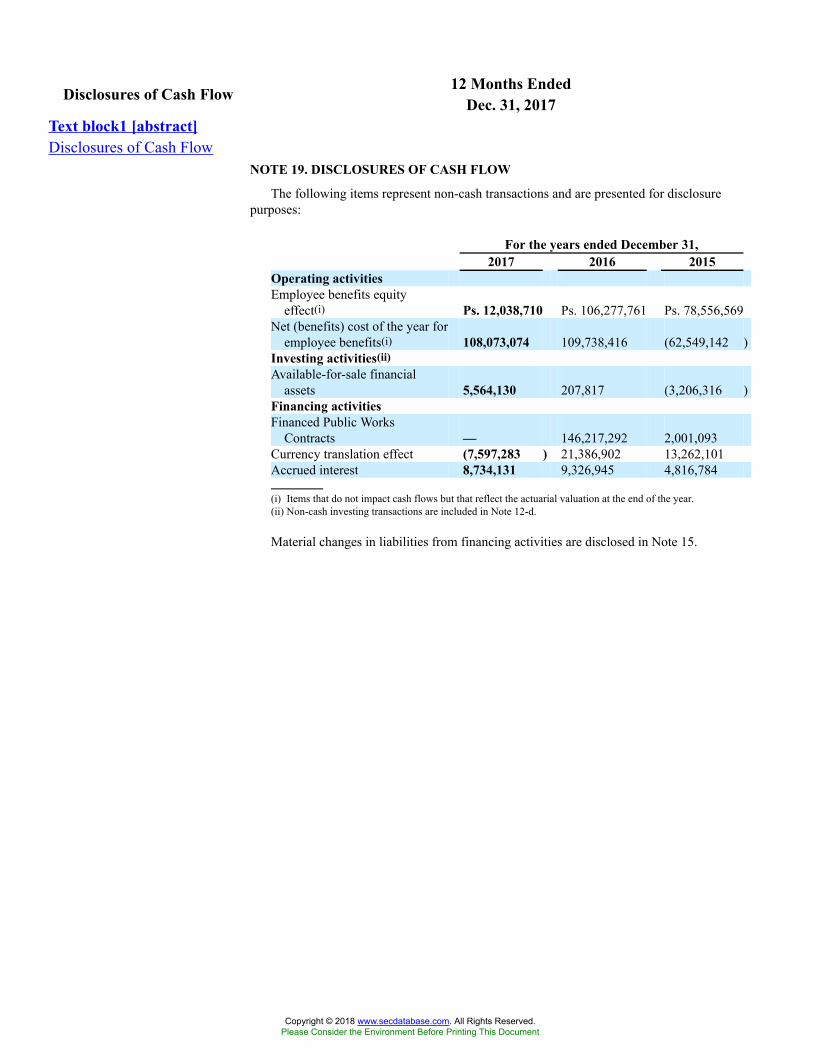
12 Months EndedDisclosures of Cash Flow Dec. 31, 2017Text block1 [abstract]Disclosures of Cash Flow
NOTE 19. DISCLOSURES OF CASH FLOW
The following items represent non-cash transactions and are presented for disclosurepurposes:
For the years ended December 31,2017 2016 2015
Operating activitiesEmployee benefits equity
effect(i) Ps. 12,038,710 Ps. 106,277,761 Ps. 78,556,569Net (benefits) cost of the year for
employee benefits(i) 108,073,074 109,738,416 (62,549,142 )Investing activities(ii)Available-for-sale financial
assets 5,564,130 207,817 (3,206,316 )Financing activitiesFinanced Public Works
Contracts — 146,217,292 2,001,093Currency translation effect (7,597,283 ) 21,386,902 13,262,101Accrued interest 8,734,131 9,326,945 4,816,784
(i) Items that do not impact cash flows but that reflect the actuarial valuation at the end of the year.(ii) Non-cash investing transactions are included in Note 12-d.
Material changes in liabilities from financing activities are disclosed in Note 15.
Copyright © 2018 www.secdatabase.com. All Rights Reserved.Please Consider the Environment Before Printing This Document
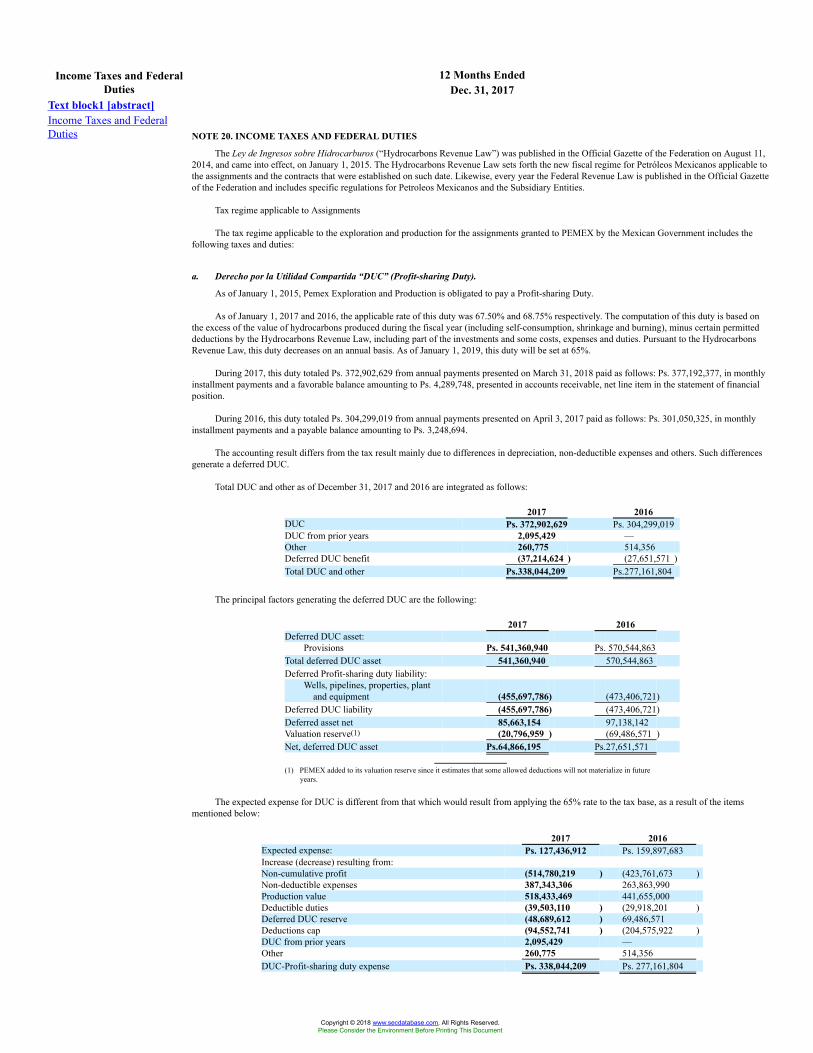
12 Months EndedIncome Taxes and FederalDuties Dec. 31, 2017
Text block1 [abstract]Income Taxes and FederalDuties NOTE 20. INCOME TAXES AND FEDERAL DUTIES
The Ley de Ingresos sobre Hidrocarburos (“Hydrocarbons Revenue Law”) was published in the Official Gazette of the Federation on August 11,2014, and came into effect, on January 1, 2015. The Hydrocarbons Revenue Law sets forth the new fiscal regime for Petróleos Mexicanos applicable tothe assignments and the contracts that were established on such date. Likewise, every year the Federal Revenue Law is published in the Official Gazetteof the Federation and includes specific regulations for Petroleos Mexicanos and the Subsidiary Entities.
Tax regime applicable to Assignments
The tax regime applicable to the exploration and production for the assignments granted to PEMEX by the Mexican Government includes thefollowing taxes and duties:
a. Derecho por la Utilidad Compartida “DUC” (Profit-sharing Duty).
As of January 1, 2015, Pemex Exploration and Production is obligated to pay a Profit-sharing Duty.
As of January 1, 2017 and 2016, the applicable rate of this duty was 67.50% and 68.75% respectively. The computation of this duty is based onthe excess of the value of hydrocarbons produced during the fiscal year (including self-consumption, shrinkage and burning), minus certain permitteddeductions by the Hydrocarbons Revenue Law, including part of the investments and some costs, expenses and duties. Pursuant to the HydrocarbonsRevenue Law, this duty decreases on an annual basis. As of January 1, 2019, this duty will be set at 65%.
During 2017, this duty totaled Ps. 372,902,629 from annual payments presented on March 31, 2018 paid as follows: Ps. 377,192,377, in monthlyinstallment payments and a favorable balance amounting to Ps. 4,289,748, presented in accounts receivable, net line item in the statement of financialposition.
During 2016, this duty totaled Ps. 304,299,019 from annual payments presented on April 3, 2017 paid as follows: Ps. 301,050,325, in monthlyinstallment payments and a payable balance amounting to Ps. 3,248,694.
The accounting result differs from the tax result mainly due to differences in depreciation, non-deductible expenses and others. Such differencesgenerate a deferred DUC.
Total DUC and other as of December 31, 2017 and 2016 are integrated as follows:
2017 2016DUC Ps. 372,902,629 Ps. 304,299,019DUC from prior years 2,095,429 —Other 260,775 514,356Deferred DUC benefit (37,214,624 ) (27,651,571 )Total DUC and other Ps.338,044,209 Ps.277,161,804
The principal factors generating the deferred DUC are the following:
2017 2016Deferred DUC asset:
Provisions Ps. 541,360,940 Ps. 570,544,863Total deferred DUC asset 541,360,940 570,544,863Deferred Profit-sharing duty liability:
Wells, pipelines, properties, plantand equipment (455,697,786) (473,406,721)
Deferred DUC liability (455,697,786) (473,406,721)Deferred asset net 85,663,154 97,138,142Valuation reserve(1) (20,796,959 ) (69,486,571 )Net, deferred DUC asset Ps.64,866,195 Ps.27,651,571
(1) PEMEX added to its valuation reserve since it estimates that some allowed deductions will not materialize in futureyears.
The expected expense for DUC is different from that which would result from applying the 65% rate to the tax base, as a result of the itemsmentioned below:
2017 2016Expected expense: Ps. 127,436,912 Ps. 159,897,683Increase (decrease) resulting from:Non-cumulative profit (514,780,219 ) (423,761,673 )Non-deductible expenses 387,343,306 263,863,990Production value 518,433,469 441,655,000Deductible duties (39,503,110 ) (29,918,201 )Deferred DUC reserve (48,689,612 ) 69,486,571Deductions cap (94,552,741 ) (204,575,922 )DUC from prior years 2,095,429 —Other 260,775 514,356DUC-Profit-sharing duty expense Ps. 338,044,209 Ps. 277,161,804
Copyright © 2018 www.secdatabase.com. All Rights Reserved.Please Consider the Environment Before Printing This Document
On August 18, 2017, the Official Gazette of the Federation published a decree, granting tax benefits for extraction activities in assignments withmature and / or marginal fields, substantially increasing the percentage of costs, expenses and investments that PEMEX could deduct for purposes ofcalculating the DUC. As a result, PEMEX received a tax benefit of Ps. 7,769,915.
On November 30, 2017, the Acuerdo por el que se reforman y adicionan diversas disposiciones de las Reglas de carácter general para definir losmétodos de ajuste del valor de los hidrocarburos de los derechos sobre hidrocarburos (Agreement by which various provisions of the general rules arereformed and added to define the methods of adjusting the value of hydrocarbons and hydrocarbon rights)was published in the Official Gazette of theFederation, resulting in new calibrations and adjustments of existing formulas of calculating the value of hydrocarbons and hydrocarbon rights. As aresult, PEMEX received an estimated tax benefit of Ps. 8,854,391.
The compensation of Ps. 2,186,963 was also authorized for the recognition of the fair economic value of the investments affected as a result of theallocation process for assignments to carry out hydrocarbon exploration and extraction activities, in accordance with the provisions of Transitory Article21 of the Federation Income Law of 2017.
On April 18, 2016, a decree granting a fiscal benefit to Pemex Exploration and Production (assignee) was published in the Official Gazette of theFederation and increases the limit on the amount Pemex Exploration and Production can deduct for costs, expenses and investments in the calculation ofits DUC, for onshore areas or in offshore areas with water depths lower than 500 meters. The benefit was granted to further the Mexican Government’sstrategic hydrocarbon exploration and extraction activities through assignments, in light of historically low international hydrocarbons prices in late2015 and early 2016 combined with historically low oil production in Mexico, thereby, together with other actions avoiding that the worldwideeconomic conditions had affected the national economy. The benefit obtained was Ps. 40,213,913. Additionally, the Mexican Government grantedPEMEX a fiscal support on November 16, 2016 of Ps. 28,439,379. This benefit consisted of a tax credit against the DUC as a measure to mitigate theimpact generated by the financial environment of the Mexican hydrocarbons exploration and extraction companies (assignees), as international energyprices continued to be depressed, which impacted the economies of several countries, including Mexico.
b. Derecho de Extracción de Hidrocarburos (Hydrocarbons Extraction Duty).
This duty is to be calculated using a rate based on a formula applicable to each type of hydrocarbon, the volume of production and utilizing therelevant market price for hydrocarbons in U.S. Dollars.
During 2017 Pemex Exploration and Production made payments of Ps. 58,523,125, which are included in the cost of sales line item.
c. Derecho de Exploración de Hidrocarburos (Exploration Hydrocarbons Duty).
The Mexican Government is entitled to collect a monthly payment of Ps. 1,214.21 per square kilometer of non-producing areas. After 60 months,this tax increases to Ps. 2,903.54 per square kilometer for each additional month that the area is not producing. These amounts will be updated on anannual basis in accordance with the national consumer price index.
During 2017, Pemex Exploration and Production made payments under this duty, totaling Ps. 980,843, which are included in the cost of sales lineitem.
d. Impuesto por la actividad de Exploración y Extracción de Hidrocarburos (Exploration and Extraction Hydrocarbons Duty).
The assignments granted by the Mexican Government create a tax on the exploration and extraction activities carried out in the correspondingarea. The monthly tax paid during the exploration phase and until the extraction phase begins is Ps. 1,583.74 per square kilometer. During the extractionphase, the monthly tax from the start of the extraction phase and until the assignment ends is Ps. 6,334.98 per square kilometer. During 2017 paymentsfor this tax amounted Ps. 3,986,112, which are included in the cost of sales line item.
Tax Regime applicable to contracts:
As of January 1, 2015, the tax regime applicable to Pemex Exploration and Production for contracts is set forth in the Hydrocarbons Revenue lawwhich regulates, among other things, the fiscal terms applicable to the exploration and extraction contracts (license, profit sharing contracts, productionsharing and services) and sets duties and other taxes paid to the Mexican Government.
The Hydrocarbons Revenue Law also establishes the following duties applicable to PEMEX in connection with assignments granted to it by theMexican Government:
• Cuota Contractual para la Fase Exploratoria (Exploration Phase Contractual Fee)
During the exploration phase of an exploration and extraction contract, the Mexican Government is entitled to collect a monthlypayment of Ps. 1,175.42 per square kilometer of non-producing areas. After 60 months, this fee increases to Ps. 2,810.78 persquare kilometer for each additional month that the area is not producing. The fee amount will be updated on an annual basis inaccordance with the national consumer price index.
• Regalías (Royalties)
Royalty payments to the Mexican Government are determined based on the “contractual value” of the relevant hydrocarbons,which is based on a variety of factors, including the type of underlying hydrocarbons (e.g., crude oil, associated naturalgas, non-associatednatural gas or condensates), the volume of production and the market price. Royalties are payable inconnection with licensing contracts, production-sharing contracts and profit-sharing contracts.
• Pago del Valor Contractual (Contractual Value Payment)
Licensing contracts require a payment to the Mexican Government calculated as a percentage of the “contractual value” of thehydrocarbons produced, as determined by the SHCP on a contract-by-contract basis.
• Porcentaje a la Utilidad Operativa (Operating Profit Payment)
Production-sharing contracts and profit-sharing contracts require a payment equivalent to a specified percentage of operatingprofits. In the case of production-sharing contracts, this payment shall be made in-kind through delivery of the hydrocarbonsproduced. In the case of profit-sharing contracts, this payment shall be made in cash.
• Bono a la Firma (Signing Bonus)
Upon execution of a licensing contract, a signing bonus is to be paid to the Mexican Government in an amount specified by theSHCP in the relevant bidding terms and conditions or in the contracts resulting from a migration.
Copyright © 2018 www.secdatabase.com. All Rights Reserved.Please Consider the Environment Before Printing This Document
• Impuesto por la actividad de Exploración y Extracción de Hidrocarburos (Hydrocarbons Exploration and Extraction Activities Tax)
Contracts for exploration and extraction granted by the Mexican Government will include a specified tax on the exploration andextraction activities carried out in the relevant area. A monthly tax of Ps. 1,583.74 per square kilometer is payable during theexploration phase until the extraction phase begins. During the extraction phase of a project, a monthly tax of Ps. 6,334.98 persquare kilometer is payable from the starting date until the relevant contract for exploration and extraction is terminated.
Other applicable taxes
Beginning with the creation of the Subsidiary Entities during 2015, they became subject to the Income Tax Law and the Value Added Tax Law.Pemex Industrial Transformation is also subject to the Special Tax on Production and Services (IEPS Tax).
2017 indirect taxes are as listed below:
a. IEPS Tax
IEPS Tax on the sale of automotive fuels: This is a tax imposed on domestic sales of automotive fuels, including gasoline and diesel, which PemexIndustrial Transformation collects on behalf of the Mexican Government. The applicable quotas for 2017 were: 4.30 pesos per liter of Magna gasoline;3.64 pesos per liter of Premium gasoline and 4.73 pesos per liter of diesel. This fee is updated annually according to inflation and adjusted monthly bythe tax authorities.
IEPS Tax to benefit Mexican states and municipalities: This tax is a quota on domestic sales of automotive fuels, including gasoline and diesel,which Pemex Industrial Transformation collects on behalf of the Mexican Government. The applicable quotas for 2017 were 38.00 cents per liter ofMagna gasoline, 46.37 cents per liter of premium gasoline and 31.54 cents per liter of diesel. This rate is updated annually with inflation. The fundsraised by this quota are allocated to the states and municipalities as provided in the Tax Coordination Law.
IEPS Tax on Fossil Fuels: This tax is a quota on the internal sales of fossil fuels, which Pemex Industrial Transformation collects on behalf of theMexican Government. The applicable quotas for 2017 were 6.50 cents per liter for propane, 8.42 cents per liter for butane, 11.41 cents per liter for jetand other fuel, 13.64 cents per liter for turbosine and other kerosene, 13.84 cents per liter for diesel, 14.78 cents per liter for fuel oil and Ps. 17.15 perton for petroleum coke. This rate is updated annually according to inflation.
b. Value Added Tax (“VAT”)
For VAT purposes, final monthly payments are determined based on PEMEX’s cash flow, in accordance with the provisions of the Value AddedTax Law, applicable to payers of this tax.
The VAT is caused by the sales of goods, rendering of services, granting of the temporary use of goods in the national territory and by theimportation of goods and services to the national territory. VAT taxpayers transfer VAT to their customers and are entitled to credit the VAT paid to theirsuppliers and on their imports. The net balance between VAT transferred to customers and paid to suppliers and on imports results each month in theVAT to be paid to the tax authorities or in an amount in favor of the taxpayer. The taxpayer has the right to credit VAT in favor against VAT payable infuture months, to request a refund or to offset it against other payable federal taxes.
Taxes on Income are described below:
c. Income Tax
As of January 1, 2015, Petróleos Mexicanos, Subsidiary Entities and the subsidiary companies residing in Mexico for tax purposes are subject tothe Income Tax Law.
This tax is calculated by applying a rate of 30% to the tax result. Tax result is the excess of total revenues over the allowed deductions and taxlosses from previous years.
Accounting income differs from taxable income primarily due to the effects of inflation and differences between depreciation and other non-deductible expenses.
For the years ended December 31, 2017, 2016 and 2015, Petroleos Mexicanos and its Subsidiary Companies incurred the following income taxexpense (benefit):
2017 2016 2015Current income tax Ps.3,546,912 Ps.6,201,842 Ps.7,426,892Deferred income tax (9,334,064) (18,842,211) (53,014,159)Total Ps.(5,787,152) Ps.(12,640,369) Ps.(45,587,267)Income tax REFIPRE (Preferent Fiscal Regime) Ps.722,984 Ps.— Ps.—
The principal factors generating the deferred income tax are the following:
2016Recognized inprofit and loss
Recognizedin OCI 2017
Deferred income tax asset:Provisions Ps.5,906,581 Ps. 2,393,237 Ps.— Ps.8,299,818Employee benefits provision 125,973,332 4,902,275 (800,284) 130,075,323Advance payments from clients 1,046,010 1,728,296 — 2,774,306Accrued liabilities 2,269,561 (1,897,574 ) — 371,987Non-recoverable accounts receivable 778,179 (38,431 ) — 739,748Derivative financial instruments 223,518 (144,263 ) — 79,255Wells, pipelines, properties and equipment 458,273,897 (52,834,079) — 405,439,818Tax loss carryforwards(1) 43,327,737 (9,216,777 ) — 34,110,960
Total deferred income tax asset 637,798,815 (55,107,316) (800,284) 581,891,215Valuation reserve(2) (565,125,697) 64,560,772 — (500,564,925)Net deferred income tax asset 72,673,118 9,453,456 (800,284) 81,326,290Deferred income tax liability:
Copyright © 2018 www.secdatabase.com. All Rights Reserved.Please Consider the Environment Before Printing This Document
Wells, pipelines, properties, plant andequipment (3,632,294 ) 188,676 — (3,443,618 )
Other (502,242 ) (308,068 ) — (810,310 )Total deferred income tax liability (4,134,536 ) (119,392 ) — (4,253,928 )Net long-term deferred income tax liability Ps.68,538,582 Ps.9,334,064 Ps.(800,284) Ps.77,072,362
2015Recognized inprofit and loss
Recognized inOCI and equity (3) 2016
Deferred income tax asset:Provisions Ps. 25,414,822 Ps.(19,508,241 ) Ps.— Ps.5,906,581Employee benefits provision 247,834,882 (119,837,137) (2,024,413 ) 125,973,332Advance payments from clients 1,015,357 30,653 — 1,046,010Accrued liabilities 1,514 2,268,047 — 2,269,561Non-recoverable accounts receivable 104,346 673,833 — 778,179Derivative financial instruments 22,506 201,012 — 223,518Wells, pipelines, properties and
equipment 446,970,333 11,303,564 — 458,273,897Tax loss carryforwards(1) 14,894,231 28,433,506 — 43,327,737
Total deferred income tax asset 736,257,991 (96,434,763 ) (2,024,413 ) 637,798,815Valuation reserve(2) (681,357,607) 116,231,910 — (565,125,697)Net deferred income tax asset 54,900,384 19,797,147 (2,024,413 ) 72,673,118Deferred income tax liability:
Wells, pipelines, properties, plant andequipment (1,909,529 ) (726,999 ) (995,766 ) (3,632,294 )
Other (274,305 ) (227,937 ) — (502,242 )Total deferred income tax liability (2,183,834 ) (954,936 ) (995,766 ) (4,134,536 )Net long-term deferred income tax liability Ps.52,716,550 Ps. 18,842,211 Ps. (3,020,179 ) Ps.68,538,582
(1) Tax loss carryforwards expire in 2027.(2) Due to PEMEX’s estimate that not enough taxable income will be generated in future periods, a valuation reserve was recognized to account for the deferred income tax asset.(3) Includes effects from business combination in equity of Ps. (995,766).
Expense attributable to the profit (loss) from continuing operations before income taxes was different from that which would result from applyingthe 30% rate to profit, as a result of the items listed below:
For the years ended December 31,2017 2016 2015
Expected income tax expense Ps.(20,055,588) Ps.(14,901,324) Ps.(3,089,241 )Increase (decrease) resulting from:
Tax effect of inflation-net 14,302,118 8,098,213 (1,618,327 )Difference between accounting and tax depreciation (3,713,920 ) (1,765,183 ) (107,231 )Non-deductible expenses 1,954,659 1,558,120 (1,921,515 )Others-net (1,725,579 ) (5,630,195 ) (38,850,953)
Income tax expense Ps.(5,787,152 ) Ps.(12,640,369) Ps.(45,587,267)
As of December 31, 2017 and 2016, the net accumulated effect of actuarial gains and losses on deferred tax was Ps. 17,688,032 and Ps.16,887,748, respectively. In addition, as of December 31, 2017 and 2016, the deferred tax effect of actuarial gains and losses from Petróleos Mexicanosand PMI CIM are presented in comprehensive (loss) income in the amounts of Ps. (800,284) and Ps. (2,024,413), respectively. As of December 31,2015, the deferred tax effect of PMI CIM’s performance was Ps. (124,285).
Copyright © 2018 www.secdatabase.com. All Rights Reserved.Please Consider the Environment Before Printing This Document
12 Months EndedEquity (Deficit), Net Dec. 31, 2017Text block1 [abstract]Equity (Deficit), Net
NOTE 21. EQUITY (DEFICIT), NET
a. Certificates of Contribution “A”
The capitalization agreement between Petróleos Mexicanos and the Mexican Governmentstates that the Certificates of Contribution “A” constitute permanent capital.
On January 19, 2015, the Mexican Government made an equity contribution ofPs. 10,000,000 to Petróleos Mexicanos in accordance with the Ley Federal del Presupuesto yResponsabilidad Hacendaria (Federal Law of Budget and Fiscal Accountability).
On December 24, 2015, the Mexican Government, through the SHCP, issued anon-negotiable promissory note of Ps. 50,000,000 due December 31, 2050 for the assumption bythe Mexican Government of the payment obligations related to pensions and retirement plans ofPetróleos Mexicanos and its Subsidiary Entities (see Note 14).
On April 21, 2016, the Mexican Government made an equity contribution to PetróleosMexicanos in the amount of Ps. 26,500,000 following the guidelines established in the FederalBudget and Fiscal Responsibility. This contribution was recognized as an increase in Certificatesof Contribution “A.”
On August 3, 2016, the Mexican Government issued Ps. 184,230,586 in exchange for thePs. 50,000,000 non-negotiable promissory note issued to Petróleos Mexicanos on December 24,2015, which was recognized as a Ps. 135,439,612 increase in equity. The Ps. 135,439,612increase in equity was the result of the Ps. 184,230,586 value of the promissory notes as ofJune 29, 2016, minus the Ps. 50,000,000 promissory note received by Petróleos Mexicanos onDecember 24, 2015, plus a Ps. 1,209,026 increase in the value of the promissory notes fromJune 29, 2016 to August 15, 2016, the date on which Petróleos Mexicanos received thepromissory notes (see Note 14).
PEMEX’s permanent equity is as follows:
AmountCertificates of Contribution “A” as of
December 31, 2015 Ps. 194,604,835Increase in Certificates of Contribution “A” during
2016 161,939,612Certificates of Contribution “A” as of
December 31, 2016 356,544,447Increase in Certificates of Contribution “A” during
2017 —Certificates of Contribution “A” as of
December 31, 2017 Ps.356,544,447
b. Mexican Government contributions
As of December 31, 2017 and 2016 there were no Mexican Government contributions.
c. Legal reserve
Copyright © 2018 www.secdatabase.com. All Rights Reserved.Please Consider the Environment Before Printing This Document
Under Mexican law, each of the Subsidiary Companies is required to allocate a certainpercentage of its net income to a legal reserve fund until the fund reaches an amount equal to acertain percentage of each Subsidiary Company’s capital stock.
As of December 31, 2017 and 2016, there were no changes to the legal reserve.
d. Accumulated deficit from prior years
PEMEX has recorded negative earnings in the past several years. However, the Ley deConcursos Mercantiles (“Commercial Bankruptcy Law of Mexico”) is not applicable to PetróleosMexicanos and the Subsidiary Entities. Furthermore, the financing agreements to which PEMEXis a party do not provide for financial covenants that would be breached or events of default thatwould be triggered as a consequence of negative equity (see Note 2-b). The Mexican Governmenthas focused its recent efforts on consolidating PEMEX’s institutional strategy, including theapproval of amendments to the Mexican Constitution published as the Energy Reform Decree onDecember 20, 2013, which permit it greater autonomy in decision-making and enhancedoperational viability (see Note 1).
e. Non-controlling interest
Effective July 1, 2005, PEMEX entered into an option agreement with BNP Private Bank &Trust Cayman Limited; the option was not exercised and was terminated on July 20, 2015. OnJuly 1, 2015, PEMEX also entered into a new option agreement with SML Trustees Limited toacquire 100% of the shares of Pemex Finance, Ltd, which allows PEMEX to have control overPemex Finance Ltd. because of the potential voting rights. As of the date of these consolidatedfinancial statements the option agreement has not been exercised. As a result, the financial resultsof Pemex Finance, Ltd. are included in these consolidated financial statements of PEMEX. UnderIFRS, variations in income and equity from Pemex Finance, Ltd. are presented in theconsolidated statements of changes in equity (deficit), net as “non-controlling interest,” and as netincome and comprehensive income for the year, attributable to non-controlling interest, in theconsolidated statements of comprehensive income, due to the fact that PEMEX does not currentlyown any of the shares of Pemex Finance, Ltd.
Similarly, because PEMEX does not currently own all of the shares of PMI CIM, HJBARRERAS and COMESA, variations in income and equity from these entities are alsopresented in the consolidated statements of changes in equity (deficit) as “non-controllinginterest.”
As of December 31, 2017 and 2016, non-controlling interest represented gains of Ps. 965,107and Ps. 976,705, respectively, in PEMEX’s equity (deficit).
Copyright © 2018 www.secdatabase.com. All Rights Reserved.Please Consider the Environment Before Printing This Document
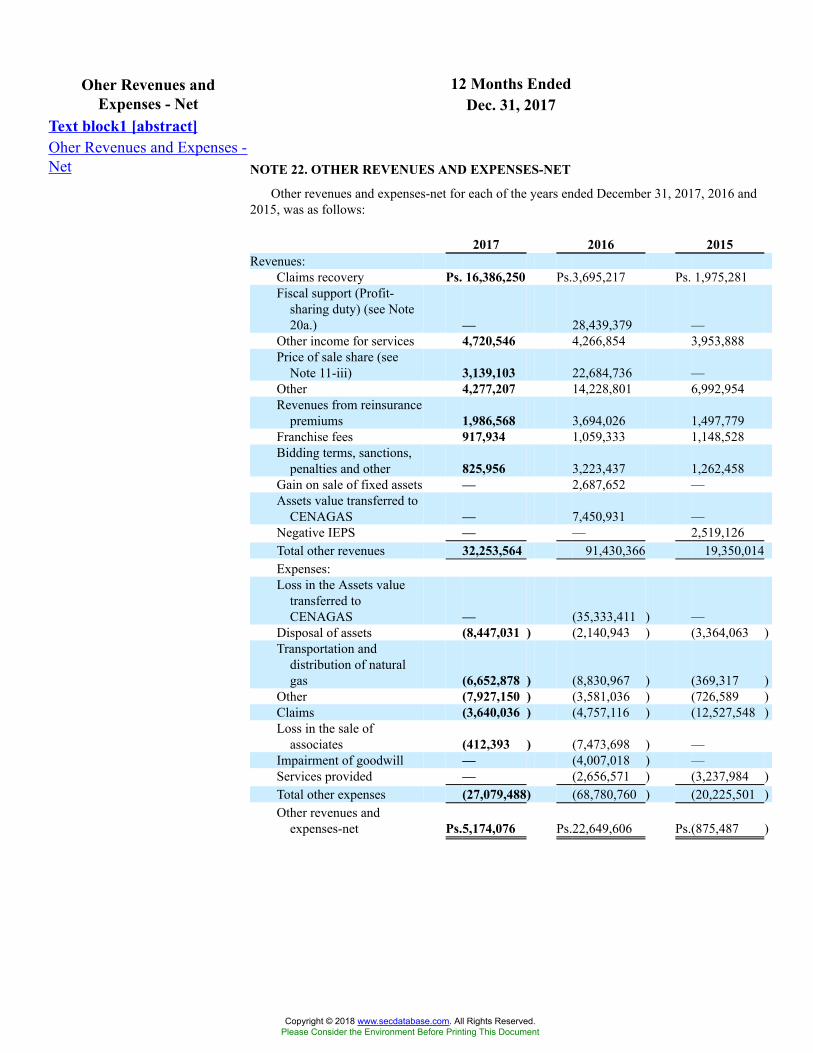
12 Months EndedOher Revenues andExpenses - Net Dec. 31, 2017
Text block1 [abstract]Oher Revenues and Expenses -Net NOTE 22. OTHER REVENUES AND EXPENSES-NET
Other revenues and expenses-net for each of the years ended December 31, 2017, 2016 and2015, was as follows:
2017 2016 2015Revenues:
Claims recovery Ps. 16,386,250 Ps.3,695,217 Ps. 1,975,281Fiscal support (Profit-
sharing duty) (see Note20a.) — 28,439,379 —
Other income for services 4,720,546 4,266,854 3,953,888Price of sale share (see
Note 11-iii) 3,139,103 22,684,736 —Other 4,277,207 14,228,801 6,992,954Revenues from reinsurance
premiums 1,986,568 3,694,026 1,497,779Franchise fees 917,934 1,059,333 1,148,528Bidding terms, sanctions,
penalties and other 825,956 3,223,437 1,262,458Gain on sale of fixed assets — 2,687,652 —Assets value transferred to
CENAGAS — 7,450,931 —Negative IEPS — — 2,519,126Total other revenues 32,253,564 91,430,366 19,350,014Expenses:Loss in the Assets value
transferred toCENAGAS — (35,333,411 ) —
Disposal of assets (8,447,031 ) (2,140,943 ) (3,364,063 )Transportation and
distribution of naturalgas (6,652,878 ) (8,830,967 ) (369,317 )
Other (7,927,150 ) (3,581,036 ) (726,589 )Claims (3,640,036 ) (4,757,116 ) (12,527,548 )Loss in the sale of
associates (412,393 ) (7,473,698 ) —Impairment of goodwill — (4,007,018 ) —Services provided — (2,656,571 ) (3,237,984 )Total other expenses (27,079,488) (68,780,760 ) (20,225,501 )Other revenues and
expenses-net Ps.5,174,076 Ps.22,649,606 Ps.(875,487 )
Copyright © 2018 www.secdatabase.com. All Rights Reserved.Please Consider the Environment Before Printing This Document
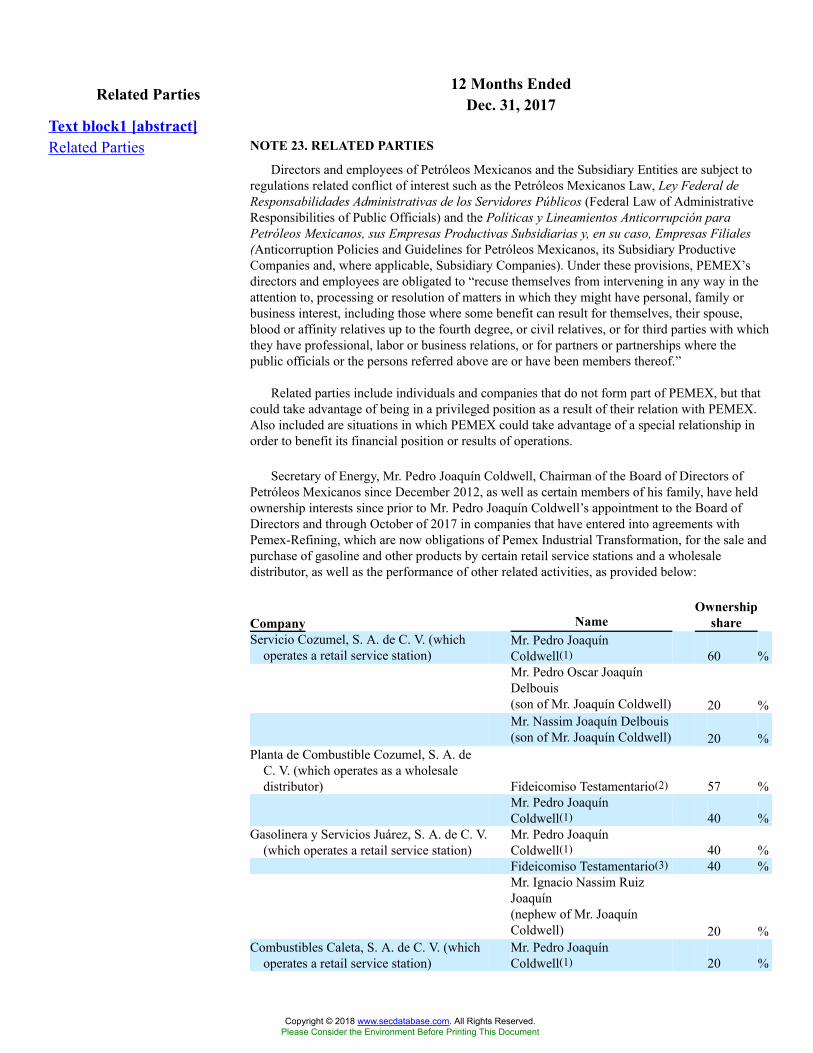
12 Months EndedRelated Parties Dec. 31, 2017Text block1 [abstract]Related Parties NOTE 23. RELATED PARTIES
Directors and employees of Petróleos Mexicanos and the Subsidiary Entities are subject toregulations related conflict of interest such as the Petróleos Mexicanos Law, Ley Federal deResponsabilidades Administrativas de los Servidores Públicos (Federal Law of AdministrativeResponsibilities of Public Officials) and the Políticas y Lineamientos Anticorrupción paraPetróleos Mexicanos, sus Empresas Productivas Subsidiarias y, en su caso, Empresas Filiales(Anticorruption Policies and Guidelines for Petróleos Mexicanos, its Subsidiary ProductiveCompanies and, where applicable, Subsidiary Companies). Under these provisions, PEMEX’sdirectors and employees are obligated to “recuse themselves from intervening in any way in theattention to, processing or resolution of matters in which they might have personal, family orbusiness interest, including those where some benefit can result for themselves, their spouse,blood or affinity relatives up to the fourth degree, or civil relatives, or for third parties with whichthey have professional, labor or business relations, or for partners or partnerships where thepublic officials or the persons referred above are or have been members thereof.”
Related parties include individuals and companies that do not form part of PEMEX, but thatcould take advantage of being in a privileged position as a result of their relation with PEMEX.Also included are situations in which PEMEX could take advantage of a special relationship inorder to benefit its financial position or results of operations.
Secretary of Energy, Mr. Pedro Joaquín Coldwell, Chairman of the Board of Directors ofPetróleos Mexicanos since December 2012, as well as certain members of his family, have heldownership interests since prior to Mr. Pedro Joaquín Coldwell’s appointment to the Board ofDirectors and through October of 2017 in companies that have entered into agreements withPemex-Refining, which are now obligations of Pemex Industrial Transformation, for the sale andpurchase of gasoline and other products by certain retail service stations and a wholesaledistributor, as well as the performance of other related activities, as provided below:
Company NameOwnership
shareServicio Cozumel, S. A. de C. V. (which
operates a retail service station)Mr. Pedro JoaquínColdwell(1) 60 %Mr. Pedro Oscar JoaquínDelbouis(son of Mr. Joaquín Coldwell) 20 %Mr. Nassim Joaquín Delbouis(son of Mr. Joaquín Coldwell) 20 %
Planta de Combustible Cozumel, S. A. deC. V. (which operates as a wholesaledistributor) Fideicomiso Testamentario(2) 57 %
Mr. Pedro JoaquínColdwell(1) 40 %
Gasolinera y Servicios Juárez, S. A. de C. V.(which operates a retail service station)
Mr. Pedro JoaquínColdwell(1) 40 %Fideicomiso Testamentario(3) 40 %Mr. Ignacio Nassim RuizJoaquín(nephew of Mr. JoaquínColdwell) 20 %
Combustibles Caleta, S. A. de C. V. (whichoperates a retail service station)
Mr. Pedro JoaquínColdwell(1) 20 %
Copyright © 2018 www.secdatabase.com. All Rights Reserved.Please Consider the Environment Before Printing This Document

Mr. Pedro Oscar JoaquínDelbouis 20 %Mr. Nassim Joaquín Delbouis 20 %Fideicomiso Testamentario(4) 20 %Mr. Ignacio Nassim RuizJoaquín 20 %
Combustibles San Miguel, S. A. de C. V.(which operates a retail service station)
Mr. Pedro JoaquínColdwell(1) 25 %Mr. Pedro Oscar JoaquínDelbouis 25 %Mr. Nassim Joaquín Delbouis 25 %Mr. Ignacio Nassim RuizJoaquín 25 %
(1) In November, 2017, Mr. Pedro Joaquín Coldwell transmitted all of his shares in these companies to a management andinvestment trust held at Banco Mercantil del Norte, S.A., Institución de Banca Múltiple, Grupo Financiero Banorte.
(2) 60% of these shares were owned by Fausto Nassim Joaquín Ibarra (father of Pedro Joaquín Coldwell), until his deathin June of 2016, after which 57% of these shares became property of an investment, management and testamentaryrevocable trust, which is referred to as the Testamentary Trust. 50% of the voting rights of these shares are currentlyexercised by Mr. Pedro Oscar Joaquín Delbouis, and 50% are exercised by Mr. Nassim Joaquín Delbouis.
(3) 40% of these shares were owned by Fausto Nassim Joaquín Ibarra until his death in June of 2016, after which theseshares became property of the Testamentary Trust. 100% of the voting rights of these shares are currently exercised byMr. Pedro Joaquín Coldwell.
(4) 20% of these shares were owned by Fausto Nassim Joaquín Ibarra until his death in June of 2016, after which theseshares became property of the Testamentary Trust. 50% of the voting rights of these shares are currently exercised byMr. Pedro Oscar Joaquín Delbouis, and 50% are exercised by Mr. Nassim Joaquín Delbouis.
The rights of these companies to operate retail service stations and distribute gasoline andother products on a wholesale basis in Mexico are dependent on these agreements, the expirationor non-renewal of which may adversely affect their business. These agreements are based onPEMEX’s standard forms of agreements and contain the standard terms and conditions applicableto all of Pemex Industrial Transformation’s retail service stations and wholesale distributors.
a. Compensation of Directors and Officers
For the years ended December 31, 2017, 2016 and 2015, the aggregate compensation ofexecutive officers of Petróleos Mexicanos and the Subsidiary Entities paid or accrued in that yearfor services in all capacities was approximately Ps. 50,749, Ps. 49,165 and Ps. 116,930,respectively. Retirement and former employee benefits are granted as described in Note 17.Except in the case of the professional members, with respect to the previous Board of Directors ofPetróleos Mexicanos and the boards of directors of the existing Subsidiary Entities, and theindependent members, with respect to the new Board of Directors of Petróleos Mexicanos,members of the Boards of Directors of Petróleos Mexicanos and the Subsidiary Entities do notreceive compensation for their services.
The compensation paid or accrued during 2017, 2016 and 2015 to the professional membersof the previous Board of Directors of Petróleos Mexicanos and boards of directors of the existingSubsidiary Entities was approximately Ps. 7,525, Ps. 8,339, and Ps. 17,899, respectively.
b. Salary Advances
As an employee benefit, PEMEX offers salary advances to all of its eligible PetroleumWorkers’ Union and non-union workers, including executive officers, pursuant to the programsset forth in the collective bargaining agreement and in the Reglamento de Trabajo del Personal deConfianza de Petróleos Mexicanos y Empresas Productivas Subsidiarias (EmploymentRegulation of White Collar Employees of Petróleos Mexicanos and Subsidiary Entities),respectively. The salary advances, which are non-interest bearing, are offered to each eligibleemployee in an amount up to a maximum of four months’ salary and are repaid through salarydeductions in equal installments over a period of either one or two years, as elected by theemployee. Most employees take advantage of this benefit. The amount of salary advances
Copyright © 2018 www.secdatabase.com. All Rights Reserved.Please Consider the Environment Before Printing This Document
outstanding to executive officers at December 31, 2017 was Ps. 3,466 and at December 31, 2016was Ps. 2,415. The amount of salary advances outstanding to executive officers at March 31,2018 was Ps. 2,363.
Copyright © 2018 www.secdatabase.com. All Rights Reserved.Please Consider the Environment Before Printing This Document

12 Months EndedCommitments Dec. 31, 2017Text block1 [abstract]Commitments
NOTE 24. COMMITMENTS
a. PMI CIM has entered into several contracts for the sale of crude oil on the internationalmarket to foreign companies. The terms and conditions of these contracts are specific to eachclient, and their durations may be indefinite (evergreen contracts) or they may contain aminimum obligatory period (long-term contracts).
b. PEMEX has entered into a nitrogen supply contract for the pressure maintenance program atthe Cantarell complex. During 2007, an additional contract was entered into with the purposeof supplying nitrogen to the Ku-Maloob-Zap complex and extending the original contractuntil 2027. At December 31, 2016 and 2015, the value of the nitrogen to be supplied duringthe term of the contract was approximately Ps. 7,506,619 and Ps. 8,646,726, respectively. Inthe event of the annulment of the contract and depending on the circumstances, PEMEX hasthe right or the obligation to acquire the vendor’s nitrogen plant under the terms of thecontract.
Estimated future payments under this contract for upcoming fiscal years are as follows:
2018 Ps.773,0472019 783,1972020 785,6702021 786,3232022 782,5842023 and thereafter 3,595,798Total Ps.7,506,619
c. As of December 31, 2017, PEMEX had entered into FPWCs by means of which thecontractor manages and is responsible for financing performance of the work to beundertaken.
As of December 31, 2017 and 2016, the estimated value of these contracts was as follows:
Maturity 2017 2016Up to 1 year Ps.5,533,174 Ps.7,366,2471 to 3 years 1,891,557 2,518,2074 to 5 years 1,856,006 2,470,878More than 5 years 3,123,173 4,157,843
Total Ps.12,403,910 Ps.16,513,175
d. As of December 31, 2017 and 2016, Pemex Exploration and Production, has in operationcertain integrated exploration and production contracts (“Integrated E&P Contracts”) for thedevelopment of mature fields in the Altamira, Ébano, Nejo, Pánuco and San Andrés blocks inthe Northern region of Mexico and Magallanes, Santuario and Carrizo blocks in the Southernregion of Mexico, respectively. Each contract has a term of up to 25 years. Payments to thecontractors pursuant to the Integrated E&P Contracts will be made on a per-barrel basis, plusrecovery of certain costs, provided that the payments to the contractor may not exceedPEMEX’s cash flow from the particular block subject to each contract. During 2017, PEMEXmade payments pursuant to the Integrated E&P Contracts in the Northern region ofPs. 6,594,486 and in the Southern region of Ps. 727,331. During 2016, PEMEX madepayments pursuant to the Integrated E&P Contracts in the Northern region of Ps. 7,026,822and in the Southern region of Ps. 524,475. As of December 31, 2017 there is no outstandingliability due to the fact that the available cash flow has an annual maturity and has not yetmatured. Additionally, these contracts are in the process of being migrated to a new EEC.
Copyright © 2018 www.secdatabase.com. All Rights Reserved.Please Consider the Environment Before Printing This Document

e. As of December 31, 2017 and 2016, the estimated value of the contracts that PEMEX hasentered into with several contractors for the development of various infrastructure andservices works was as follows:
Maturity 2017 2016Up to 1 year Ps.229,738,368 Ps.347,606,8481 to 3 years 196,335,411 281,563,6074 to 5 years 123,159,215 69,541,826More than 5 years 149,672,236 119,281,849Total Ps.698,905,230 Ps.817,994,130
Copyright © 2018 www.secdatabase.com. All Rights Reserved.Please Consider the Environment Before Printing This Document

12 Months EndedContingencies Dec. 31, 2017Text block1 [abstract]Contingencies
NOTE 25. CONTINGENCIES
In the ordinary course of business, PEMEX is named in a number of lawsuits of varioustypes. PEMEX evaluates the merit of each claim and assesses the likely outcome. PEMEX hasnot recorded provisions related to ongoing legal proceedings due to the fact that an unfavorableresolution is not expected in such proceedings, with the exception of the proceeding described infurther detail in this Note.
PEMEX is involved in various civil, tax, criminal, administrative, labor and commerciallawsuits and arbitration proceedings. The results of these proceedings are uncertain as of the dateof these consolidated financial statements. As of December 31, 2017 and 2016, PEMEX hadaccrued a reserve of Ps. 7,812,689 and Ps. 15,119,692, respectively, for these contingentliabilities. As of December 31, 2017, the current status of the principal lawsuits in which PEMEXis involved is as follows:
• On April 4, 2011, Pemex-Exploration and Production was summoned before the SéptimaSala Regional Metropolitana (“Seventh Regional Metropolitan Court”) of the TribunalFederal de Justicia Fiscal y Administrativa (“Tax and Administrative Federal Court”) inconnection with an administrative claim (No. 4957/1117071) filed by EMS EnergyServices de México, S. de R.L. de C.V. and Energy Maintenance Services Group I. LLCrequesting that Pemex-Exploration and Production’s termination of the public workscontract be declared null and void. In a concurrent proceeding, the plaintiffs also filed anadministrative claim (No. 13620/15-17-06) against Pemex Exploration and Productionbefore the Sexta Sala Regional Metropolitana (“Sixth Regional Metropolitan Court”) ofthe Tax and Administrative Federal Court in Mexico City seeking damages totaling U.S.$193,713 related to the above-mentioned contract. Pemex-Exploration and Productionfiled a response requesting the two administrative claims be joined in a single proceeding,which was granted on May 10, 2016 by the Seventh Regional Metropolitan Court. OnMay 3, 2017, the proceeding was closed for a judgment to be issued. As of the date ofthese financial statements, a resolution from the Second Section of the Superior Court ofthe Tax and Administrative Federal Court is still pending.
• In June 2016, Pemex Exploration and Production was summoned before the JuzgadoOctavo de Distrito en Materia Civil (“Eighth Civil District Court”) in Mexico City, inconnection with a claim filed by Drake Mesa, S. de R.L. (file No. 200/2016-II), seekingapproximately U.S.$120,856 related to expenses and damages, in connection with apublic work agreement executed between them. On November 9, 2017, a judgment wasissued finding the Eighth Civil District Court lacked jurisdiction over this case. Bothparties filed appeals against this resolution. As of the date of these financial statements, afinal resolution is still pending.
• On June 11, 2015, the Segunda Sala Regional del Noreste (“Second Regional NortheastCourt”) notified Pemex-Refining of an administrative claim (file no. 2383/15-06-02-4)filed by Severo Granados Mendoza, Luciano Machorro Olvera and Hilario MartínezCerda, as President, Secretary and Treasurer of the Ejido Tepehuaje, seeking Ps.2,094,232 in damages due to a hydrocarbon spill on their land. Pemex-Refining filed aresponse to this claim and the plaintiffs were given time to amend their claim. Thedefendant filed a motion against this resolution and responded to the amended claim onFebruary 17, 2017. The trial is in the evidentiary stage. The appointment of anindependent expert related to environmental issues is still pending. A final judgment isstill pending.
Copyright © 2018 www.secdatabase.com. All Rights Reserved.Please Consider the Environment Before Printing This Document

• On July 8, 2011, Pemex Exploration and Production was summoned in connection withan administrative claim (no. 4334/1111026) filed by Compañía Petrolera La Norma, S.A.,against the Chief Executive Officer of Petróleos Mexicanos and the Chief ExecutiveOfficer of Pemex-Exploration and Production before the Segunda Sala RegionalHidalgo-México (“Hidalgo-Mexico Second Regional Court”) of the Tax AdministrativeFederal Court in Tlalnepantla, Estado de México. The plaintiff is seeking compensationfor the cancellation of its alleged petroleum rights concessions and damages for up toPs.1,552,730. On August 20, 2014, the proceeding was sent to the Segunda Sección de laSala Superior (“Second Section of The Superior Court”) of the Tax and AdministrativeFederal Court (4334/11-11-02-6/1337/14-s2-07-04). On October 29, 2014, the proceedingwas returned to the Second Regional Court to correct a procedural error. A new term tofile pleas was approved. On September 7, 2017, a motion was filed questioning asignature’s authenticity. In December 2017, a documentary expert’s opinion was filed bythe plaintiff and a new expert was designated by Pemex Exploration and Production. Theacceptance of this designation is still pending. As of the date of these financial statements,a final resolution is still pending.
• On December 12, 2017, Pemex Exploration and Production was summoned in connectionwith an arbitration claim (no. 23217/JPA) filed by SUBSEA 7 de México, S. de R. L. deC.V. (“SUBSEA 7”) seeking U.S.$153,000 related to additional expenses in connectionwith a pipelines construction contract. A response by the defendant is still pending as ofthe date of these financial statements.
• On August 1, 2017, Pemex Exploration and Production was summoned in connectionwith an administrative claim (no. 11590/17-17-06-2) filed by Proyectos y CimentacionesIndustriales, S.A. de C.V. before the Sixth Regional Metropolitan Court seeking Ps.800,000 and U.S.$ 12.82 and to have the settlement certificate dated March 22, 2017related to services agreement declared null and void. On September 25, 2017 PemexExploration and Production filed a response to this claim. As of the date of these financialstatements, a final resolution is still pending.
The results of these proceedings are uncertain until their final resolutions are issued by theappropriate authorities. PEMEX has recorded liabilities for loss contingencies when it is probablethat a liability has been incurred and the amount thereof can be reasonably estimated. When areasonable estimation could not be made, qualitative disclosure was provided in the notes to theseconsolidated financial statements.
PEMEX does not disclose amounts accrued for each individual claim because such disclosurecould adversely affect PEMEX’s legal strategy, as well as the outcome of the related litigation.
Pursuant to an ordinary session held by the Board of Directors on August 23, 2013, PetróleosMexicanos established policies for the granting of mutual guarantees, loans or any type of creditin favor of the Subsidiary Entities and Subsidiary Companies; in accordance with these policies,the Corporate Finance Department issues an opinion with its risk analysis, financial valuation,budget sufficiency, accounting treatment and conclusions.
Additionally, Pemex Logistics has granted the following corporate guarantees in connectionwith the exploration and extraction contracts entered into Pemex Exploration and Production, asrequired by the NHC:
• Exploration and extraction of hydrocarbons under the deep-water license modality, Triónfield (Tender CNH-A1-TRION / 2016), of US $4,000,000.
• Exploration and extraction of the contract area 3 Cinturón plegado perdido (TenderCNHR01- L04 / 2015), of US $3,333,000.
• Extraction of hydrocarbons under shared production contract of the Ek-Balam fields, ofU.S. $5,000,000.
• Extraction of hydrocarbons in contractual area Santuario and El Golpe 3 field, of U.S.$320,000.
Copyright © 2018 www.secdatabase.com. All Rights Reserved.Please Consider the Environment Before Printing This Document
• Exploration and extraction of hydrocarbons under shared production contract, contractualarea 2 Tampico-Misantla, of U.S. $1,750,000.
• Exploration and extraction of hydrocarbons under shared production contract, contractualarea 8 Cuencas del Sureste, of U.S. $1,250,000.
• Exploration and extraction of hydrocarbons shared production contract, assignmentAE-0398-Mission of U.S. $255,000.
• Extraction of hydrocarbons under license agreement, Ogarrio field of U.S. $250,000.
• Extraction of hydrocarbons under license agreement, Cárdenas and Mora fields, of U.S.$250,000.
Certain other Subsidiary Entities have also granted guarantees and other contingencies.
PEMEX considers the probability it needs to make a disbursement of cash, for the guaranteesgranted and in effect as of December 31, 2017 remote.
Copyright © 2018 www.secdatabase.com. All Rights Reserved.Please Consider the Environment Before Printing This Document
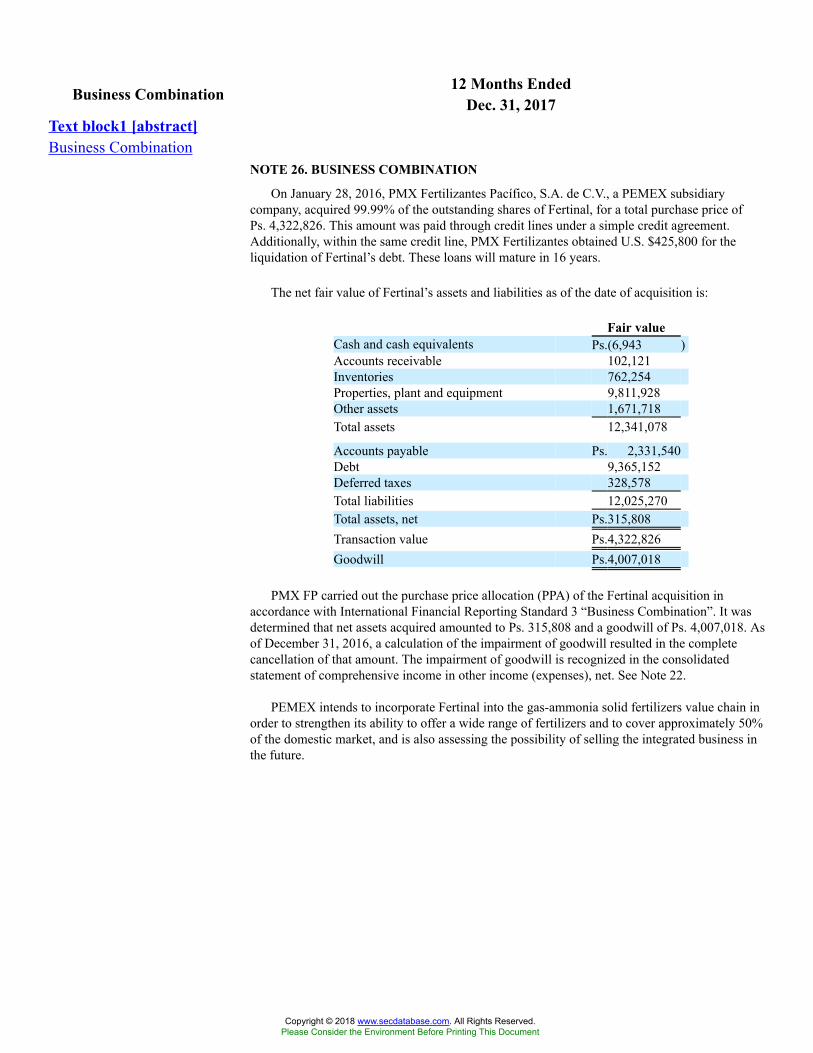
12 Months EndedBusiness Combination Dec. 31, 2017Text block1 [abstract]Business Combination
NOTE 26. BUSINESS COMBINATION
On January 28, 2016, PMX Fertilizantes Pacífico, S.A. de C.V., a PEMEX subsidiarycompany, acquired 99.99% of the outstanding shares of Fertinal, for a total purchase price ofPs. 4,322,826. This amount was paid through credit lines under a simple credit agreement.Additionally, within the same credit line, PMX Fertilizantes obtained U.S. $425,800 for theliquidation of Fertinal’s debt. These loans will mature in 16 years.
The net fair value of Fertinal’s assets and liabilities as of the date of acquisition is:
Fair valueCash and cash equivalents Ps.(6,943 )Accounts receivable 102,121Inventories 762,254Properties, plant and equipment 9,811,928Other assets 1,671,718Total assets 12,341,078
Accounts payable Ps. 2,331,540Debt 9,365,152Deferred taxes 328,578Total liabilities 12,025,270Total assets, net Ps.315,808Transaction value Ps.4,322,826Goodwill Ps.4,007,018
PMX FP carried out the purchase price allocation (PPA) of the Fertinal acquisition inaccordance with International Financial Reporting Standard 3 “Business Combination”. It wasdetermined that net assets acquired amounted to Ps. 315,808 and a goodwill of Ps. 4,007,018. Asof December 31, 2016, a calculation of the impairment of goodwill resulted in the completecancellation of that amount. The impairment of goodwill is recognized in the consolidatedstatement of comprehensive income in other income (expenses), net. See Note 22.
PEMEX intends to incorporate Fertinal into the gas-ammonia solid fertilizers value chain inorder to strengthen its ability to offer a wide range of fertilizers and to cover approximately 50%of the domestic market, and is also assessing the possibility of selling the integrated business inthe future.
Copyright © 2018 www.secdatabase.com. All Rights Reserved.Please Consider the Environment Before Printing This Document
12 Months EndedSubsequent Events Dec. 31, 2017Text block1 [abstract]Subsequent Events
NOTE 27. SUBSEQUENT EVENTS
During the period from January 1 to April 27, 2018, PEMEX participated in the followingfinancing activities:
• On February, 12, 2018, Petróleos Mexicanos issued U.S. $4,000,000 of debt securitiesunder its U.S. $92,000,000 Medium-Term Notes Program, Series C, in two tranches:(1) U.S. $2,500,000,000 5.35% Notes due 2028 and (2) U.S. $1,500,000,000 6.35%Bonds due 2048. All debt securities under this program are guaranteed by PemexExploration and Production, Pemex Industrial Transformation, Pemex Drilling andServices, Pemex Logistics and Pemex Cogeneration and Services.
• On February 12, 2018, Petróleos Mexicanos consummated an exchange offer pursuant towhich it exchanged (1) U.S. $952,454, aggregate principal amount of its outstanding5.500% Bonds due 2044 for U.S. $881,899, aggregate principal amount of its new6.350% Bonds due 2048 and (2) U.S. $1,021,065, aggregate principal amount of itsoutstanding 5.6250% Bonds due 2046 for U.S. $946,764, aggregate principal amount ofits 6.350% Bonds due 2048.
• On March 5, 2018, Petróleos Mexicanos consummated a tender offer pursuant to which itpurchased U.S. $138,598, aggregate principal amount of its outstanding 3.125% Notesdue 2019, U.S. $558,644 aggregate principal amount of its outstanding 5.500% Notes due2019, U.S. $91,843 aggregate principal amount of its outstanding 8.000% Notes due2019, U.S. $183,017 aggregate principal amount of its outstanding 6.000% Notes due2020 and U.S. $817,303 aggregate principal amount of its outstanding 3.500% Notes due2020.
Between January 1 to April 27, 2018, PMI HBV obtained U.S. $7,126,000 and repaid U.S.$6,126,000 in financing from its revolving credit lines. As of April 27, 2018, the outstandingamount under these revolving credit lines was U.S. $1,227,500.
As of April 27, 2018, the Mexican peso-U.S. dollar exchange rate was Ps. 19.0530 perU.S. dollar, which represents a 3.7% appreciation of the value of the peso in U.S. dollar terms ascompared to the exchange rate as of December 31, 2017, which was Ps. 19.7867 per U.S. dollar.
As of April 27, 2018, the weighted average price of the crude oil exported by PEMEX wasU.S. $60.89 per barrel. This represents a price increase of approximately 8.3% as compared to theaverage price as of December 31, 2017, which was U.S. $56.19 per barrel.
In March 2018, Pemex Exploration and Production was summoned before the InternationalCentre for Dispute Resolution of the American Arbitration Association in connection with anarbitration claim (No. 01-18-0001-1499) filed by Loadmaster Universal Rigs, Inc., LoadmasterDrilling Technologies, LLC, Ulterra Drilling Technologies Mexico, S.A. de C.V. and KennedyFabricating, LLC seeking U.S. $139,870 in connection with the construction and acquisition ofmodular drilling equipment. Pemex Exploration and Production is currently analyzing the legalactions available to it in response to this claim.
Copyright © 2018 www.secdatabase.com. All Rights Reserved.Please Consider the Environment Before Printing This Document
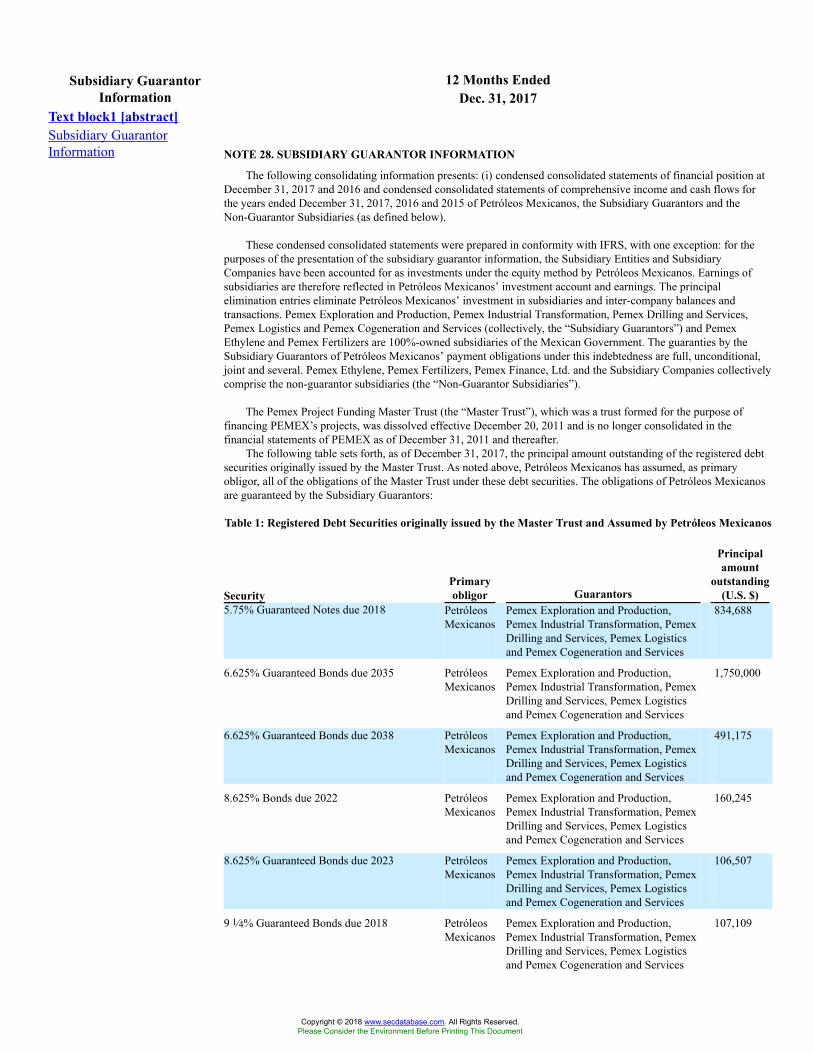
12 Months EndedSubsidiary GuarantorInformation Dec. 31, 2017
Text block1 [abstract]Subsidiary GuarantorInformation NOTE 28. SUBSIDIARY GUARANTOR INFORMATION
The following consolidating information presents: (i) condensed consolidated statements of financial position atDecember 31, 2017 and 2016 and condensed consolidated statements of comprehensive income and cash flows forthe years ended December 31, 2017, 2016 and 2015 of Petróleos Mexicanos, the Subsidiary Guarantors and theNon-Guarantor Subsidiaries (as defined below).
These condensed consolidated statements were prepared in conformity with IFRS, with one exception: for thepurposes of the presentation of the subsidiary guarantor information, the Subsidiary Entities and SubsidiaryCompanies have been accounted for as investments under the equity method by Petróleos Mexicanos. Earnings ofsubsidiaries are therefore reflected in Petróleos Mexicanos’ investment account and earnings. The principalelimination entries eliminate Petróleos Mexicanos’ investment in subsidiaries and inter-company balances andtransactions. Pemex Exploration and Production, Pemex Industrial Transformation, Pemex Drilling and Services,Pemex Logistics and Pemex Cogeneration and Services (collectively, the “Subsidiary Guarantors”) and PemexEthylene and Pemex Fertilizers are 100%-owned subsidiaries of the Mexican Government. The guaranties by theSubsidiary Guarantors of Petróleos Mexicanos’ payment obligations under this indebtedness are full, unconditional,joint and several. Pemex Ethylene, Pemex Fertilizers, Pemex Finance, Ltd. and the Subsidiary Companies collectivelycomprise the non-guarantor subsidiaries (the “Non-Guarantor Subsidiaries”).
The Pemex Project Funding Master Trust (the “Master Trust”), which was a trust formed for the purpose offinancing PEMEX’s projects, was dissolved effective December 20, 2011 and is no longer consolidated in thefinancial statements of PEMEX as of December 31, 2011 and thereafter.
The following table sets forth, as of December 31, 2017, the principal amount outstanding of the registered debtsecurities originally issued by the Master Trust. As noted above, Petróleos Mexicanos has assumed, as primaryobligor, all of the obligations of the Master Trust under these debt securities. The obligations of Petróleos Mexicanosare guaranteed by the Subsidiary Guarantors:
Table 1: Registered Debt Securities originally issued by the Master Trust and Assumed by Petróleos Mexicanos
SecurityPrimaryobligor Guarantors
Principalamount
outstanding(U.S. $)
5.75% Guaranteed Notes due 2018 PetróleosMexicanos
Pemex Exploration and Production,Pemex Industrial Transformation, PemexDrilling and Services, Pemex Logisticsand Pemex Cogeneration and Services
834,688
6.625% Guaranteed Bonds due 2035 PetróleosMexicanos
Pemex Exploration and Production,Pemex Industrial Transformation, PemexDrilling and Services, Pemex Logisticsand Pemex Cogeneration and Services
1,750,000
6.625% Guaranteed Bonds due 2038 PetróleosMexicanos
Pemex Exploration and Production,Pemex Industrial Transformation, PemexDrilling and Services, Pemex Logisticsand Pemex Cogeneration and Services
491,175
8.625% Bonds due 2022 PetróleosMexicanos
Pemex Exploration and Production,Pemex Industrial Transformation, PemexDrilling and Services, Pemex Logisticsand Pemex Cogeneration and Services
160,245
8.625% Guaranteed Bonds due 2023 PetróleosMexicanos
Pemex Exploration and Production,Pemex Industrial Transformation, PemexDrilling and Services, Pemex Logisticsand Pemex Cogeneration and Services
106,507
9 1⁄4% Guaranteed Bonds due 2018 PetróleosMexicanos
Pemex Exploration and Production,Pemex Industrial Transformation, PemexDrilling and Services, Pemex Logisticsand Pemex Cogeneration and Services
107,109
Copyright © 2018 www.secdatabase.com. All Rights Reserved.Please Consider the Environment Before Printing This Document
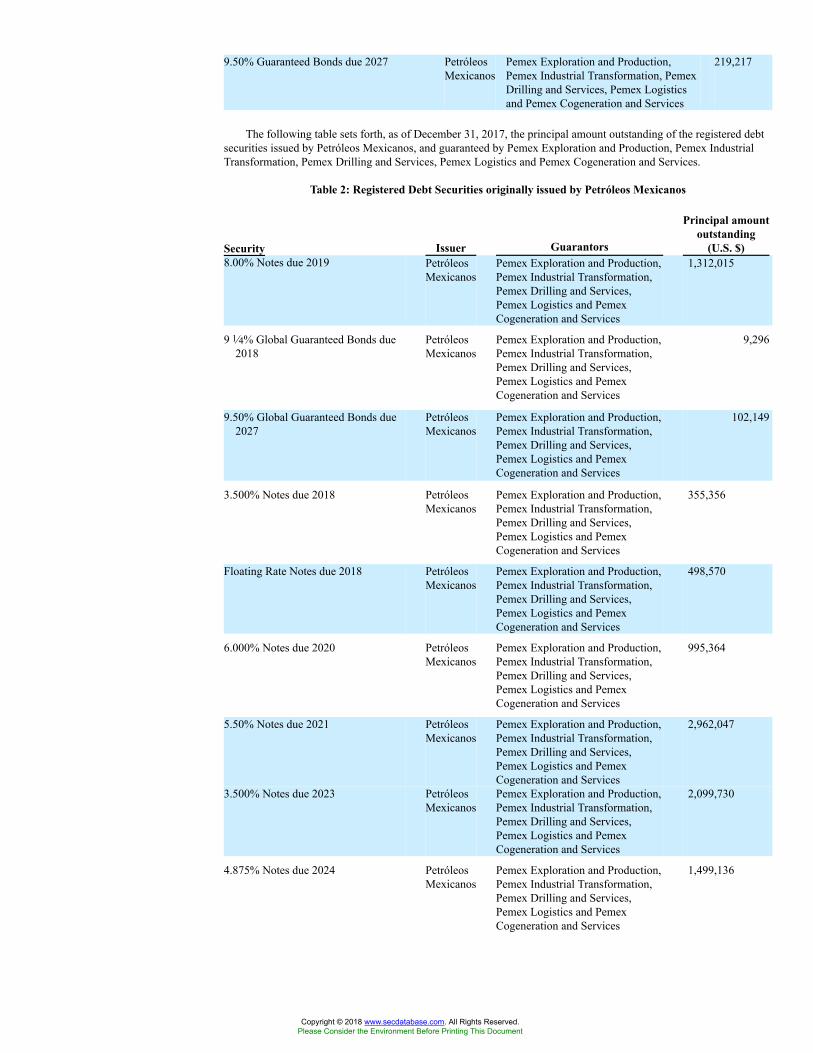
9.50% Guaranteed Bonds due 2027 PetróleosMexicanos
Pemex Exploration and Production,Pemex Industrial Transformation, PemexDrilling and Services, Pemex Logisticsand Pemex Cogeneration and Services
219,217
The following table sets forth, as of December 31, 2017, the principal amount outstanding of the registered debtsecurities issued by Petróleos Mexicanos, and guaranteed by Pemex Exploration and Production, Pemex IndustrialTransformation, Pemex Drilling and Services, Pemex Logistics and Pemex Cogeneration and Services.
Table 2: Registered Debt Securities originally issued by Petróleos Mexicanos
Security Issuer Guarantors
Principal amountoutstanding
(U.S. $)8.00% Notes due 2019 Petróleos
MexicanosPemex Exploration and Production,Pemex Industrial Transformation,Pemex Drilling and Services,Pemex Logistics and PemexCogeneration and Services
1,312,015
9 1⁄4% Global Guaranteed Bonds due2018
PetróleosMexicanos
Pemex Exploration and Production,Pemex Industrial Transformation,Pemex Drilling and Services,Pemex Logistics and PemexCogeneration and Services
9,296
9.50% Global Guaranteed Bonds due2027
PetróleosMexicanos
Pemex Exploration and Production,Pemex Industrial Transformation,Pemex Drilling and Services,Pemex Logistics and PemexCogeneration and Services
102,149
3.500% Notes due 2018 PetróleosMexicanos
Pemex Exploration and Production,Pemex Industrial Transformation,Pemex Drilling and Services,Pemex Logistics and PemexCogeneration and Services
355,356
Floating Rate Notes due 2018 PetróleosMexicanos
Pemex Exploration and Production,Pemex Industrial Transformation,Pemex Drilling and Services,Pemex Logistics and PemexCogeneration and Services
498,570
6.000% Notes due 2020 PetróleosMexicanos
Pemex Exploration and Production,Pemex Industrial Transformation,Pemex Drilling and Services,Pemex Logistics and PemexCogeneration and Services
995,364
5.50% Notes due 2021 PetróleosMexicanos
Pemex Exploration and Production,Pemex Industrial Transformation,Pemex Drilling and Services,Pemex Logistics and PemexCogeneration and Services
2,962,047
3.500% Notes due 2023 PetróleosMexicanos
Pemex Exploration and Production,Pemex Industrial Transformation,Pemex Drilling and Services,Pemex Logistics and PemexCogeneration and Services
2,099,730
4.875% Notes due 2024 PetróleosMexicanos
Pemex Exploration and Production,Pemex Industrial Transformation,Pemex Drilling and Services,Pemex Logistics and PemexCogeneration and Services
1,499,136
Copyright © 2018 www.secdatabase.com. All Rights Reserved.Please Consider the Environment Before Printing This Document
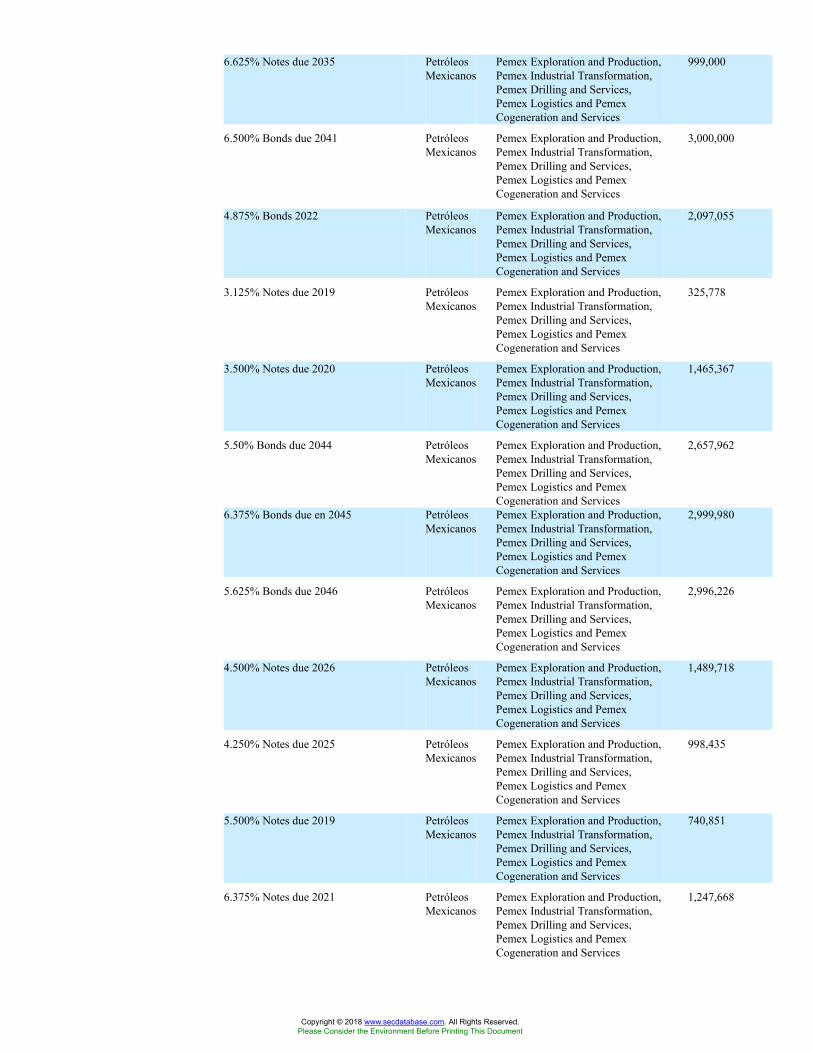
6.625% Notes due 2035 PetróleosMexicanos
Pemex Exploration and Production,Pemex Industrial Transformation,Pemex Drilling and Services,Pemex Logistics and PemexCogeneration and Services
999,000
6.500% Bonds due 2041 PetróleosMexicanos
Pemex Exploration and Production,Pemex Industrial Transformation,Pemex Drilling and Services,Pemex Logistics and PemexCogeneration and Services
3,000,000
4.875% Bonds 2022 PetróleosMexicanos
Pemex Exploration and Production,Pemex Industrial Transformation,Pemex Drilling and Services,Pemex Logistics and PemexCogeneration and Services
2,097,055
3.125% Notes due 2019 PetróleosMexicanos
Pemex Exploration and Production,Pemex Industrial Transformation,Pemex Drilling and Services,Pemex Logistics and PemexCogeneration and Services
325,778
3.500% Notes due 2020 PetróleosMexicanos
Pemex Exploration and Production,Pemex Industrial Transformation,Pemex Drilling and Services,Pemex Logistics and PemexCogeneration and Services
1,465,367
5.50% Bonds due 2044 PetróleosMexicanos
Pemex Exploration and Production,Pemex Industrial Transformation,Pemex Drilling and Services,Pemex Logistics and PemexCogeneration and Services
2,657,962
6.375% Bonds due en 2045 PetróleosMexicanos
Pemex Exploration and Production,Pemex Industrial Transformation,Pemex Drilling and Services,Pemex Logistics and PemexCogeneration and Services
2,999,980
5.625% Bonds due 2046 PetróleosMexicanos
Pemex Exploration and Production,Pemex Industrial Transformation,Pemex Drilling and Services,Pemex Logistics and PemexCogeneration and Services
2,996,226
4.500% Notes due 2026 PetróleosMexicanos
Pemex Exploration and Production,Pemex Industrial Transformation,Pemex Drilling and Services,Pemex Logistics and PemexCogeneration and Services
1,489,718
4.250% Notes due 2025 PetróleosMexicanos
Pemex Exploration and Production,Pemex Industrial Transformation,Pemex Drilling and Services,Pemex Logistics and PemexCogeneration and Services
998,435
5.500% Notes due 2019 PetróleosMexicanos
Pemex Exploration and Production,Pemex Industrial Transformation,Pemex Drilling and Services,Pemex Logistics and PemexCogeneration and Services
740,851
6.375% Notes due 2021 PetróleosMexicanos
Pemex Exploration and Production,Pemex Industrial Transformation,Pemex Drilling and Services,Pemex Logistics and PemexCogeneration and Services
1,247,668
Copyright © 2018 www.secdatabase.com. All Rights Reserved.Please Consider the Environment Before Printing This Document
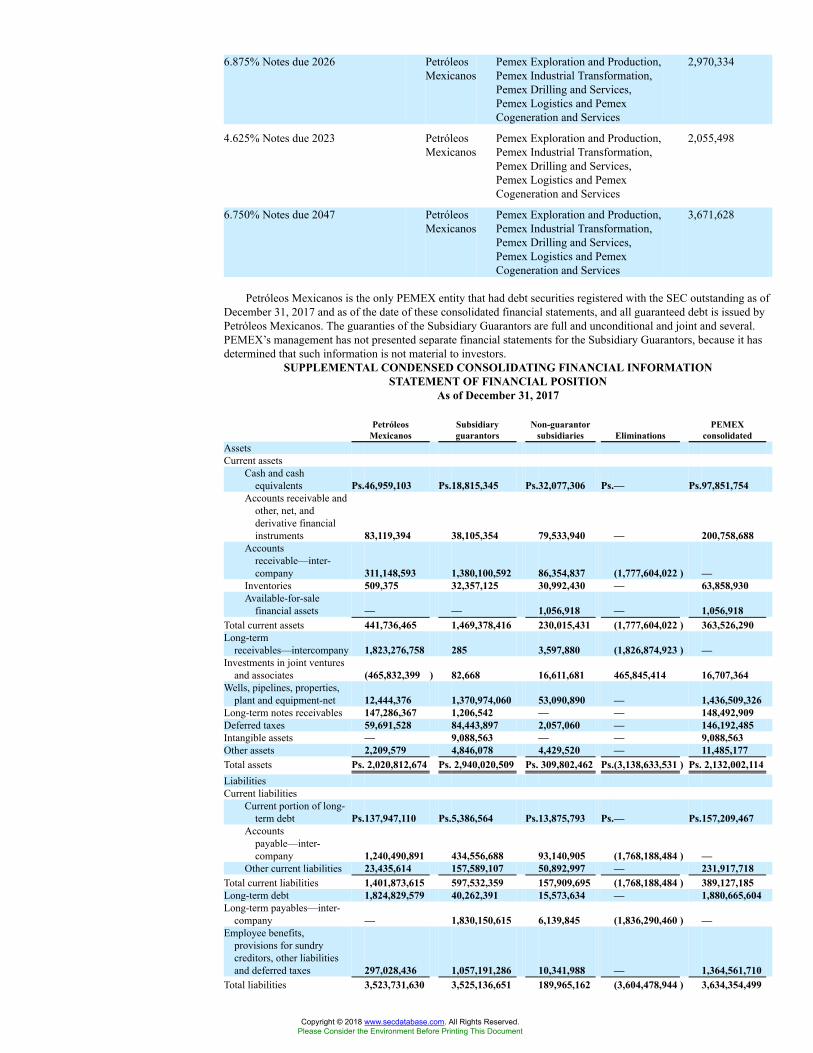
6.875% Notes due 2026 PetróleosMexicanos
Pemex Exploration and Production,Pemex Industrial Transformation,Pemex Drilling and Services,Pemex Logistics and PemexCogeneration and Services
2,970,334
4.625% Notes due 2023 PetróleosMexicanos
Pemex Exploration and Production,Pemex Industrial Transformation,Pemex Drilling and Services,Pemex Logistics and PemexCogeneration and Services
2,055,498
6.750% Notes due 2047 PetróleosMexicanos
Pemex Exploration and Production,Pemex Industrial Transformation,Pemex Drilling and Services,Pemex Logistics and PemexCogeneration and Services
3,671,628
Petróleos Mexicanos is the only PEMEX entity that had debt securities registered with the SEC outstanding as ofDecember 31, 2017 and as of the date of these consolidated financial statements, and all guaranteed debt is issued byPetróleos Mexicanos. The guaranties of the Subsidiary Guarantors are full and unconditional and joint and several.PEMEX’s management has not presented separate financial statements for the Subsidiary Guarantors, because it hasdetermined that such information is not material to investors.
SUPPLEMENTAL CONDENSED CONSOLIDATING FINANCIAL INFORMATIONSTATEMENT OF FINANCIAL POSITION
As of December 31, 2017
PetróleosMexicanos
Subsidiaryguarantors
Non-guarantorsubsidiaries Eliminations
PEMEXconsolidated
AssetsCurrent assets
Cash and cashequivalents Ps.46,959,103 Ps.18,815,345 Ps.32,077,306 Ps.— Ps.97,851,754
Accounts receivable andother, net, andderivative financialinstruments 83,119,394 38,105,354 79,533,940 — 200,758,688
Accountsreceivable—inter-company 311,148,593 1,380,100,592 86,354,837 (1,777,604,022 ) —
Inventories 509,375 32,357,125 30,992,430 — 63,858,930Available-for-sale
financial assets — — 1,056,918 — 1,056,918Total current assets 441,736,465 1,469,378,416 230,015,431 (1,777,604,022 ) 363,526,290Long-term
receivables—intercompany 1,823,276,758 285 3,597,880 (1,826,874,923 ) —Investments in joint ventures
and associates (465,832,399 ) 82,668 16,611,681 465,845,414 16,707,364Wells, pipelines, properties,
plant and equipment-net 12,444,376 1,370,974,060 53,090,890 — 1,436,509,326Long-term notes receivables 147,286,367 1,206,542 — — 148,492,909Deferred taxes 59,691,528 84,443,897 2,057,060 — 146,192,485Intangible assets — 9,088,563 — — 9,088,563Other assets 2,209,579 4,846,078 4,429,520 — 11,485,177Total assets Ps. 2,020,812,674 Ps. 2,940,020,509 Ps. 309,802,462 Ps.(3,138,633,531 ) Ps. 2,132,002,114LiabilitiesCurrent liabilities
Current portion of long-term debt Ps.137,947,110 Ps.5,386,564 Ps.13,875,793 Ps.— Ps.157,209,467
Accountspayable—inter-company 1,240,490,891 434,556,688 93,140,905 (1,768,188,484 ) —
Other current liabilities 23,435,614 157,589,107 50,892,997 — 231,917,718Total current liabilities 1,401,873,615 597,532,359 157,909,695 (1,768,188,484 ) 389,127,185Long-term debt 1,824,829,579 40,262,391 15,573,634 — 1,880,665,604Long-term payables—inter-
company — 1,830,150,615 6,139,845 (1,836,290,460 ) —Employee benefits,
provisions for sundrycreditors, other liabilitiesand deferred taxes 297,028,436 1,057,191,286 10,341,988 — 1,364,561,710
Total liabilities 3,523,731,630 3,525,136,651 189,965,162 (3,604,478,944 ) 3,634,354,499
Copyright © 2018 www.secdatabase.com. All Rights Reserved.Please Consider the Environment Before Printing This Document
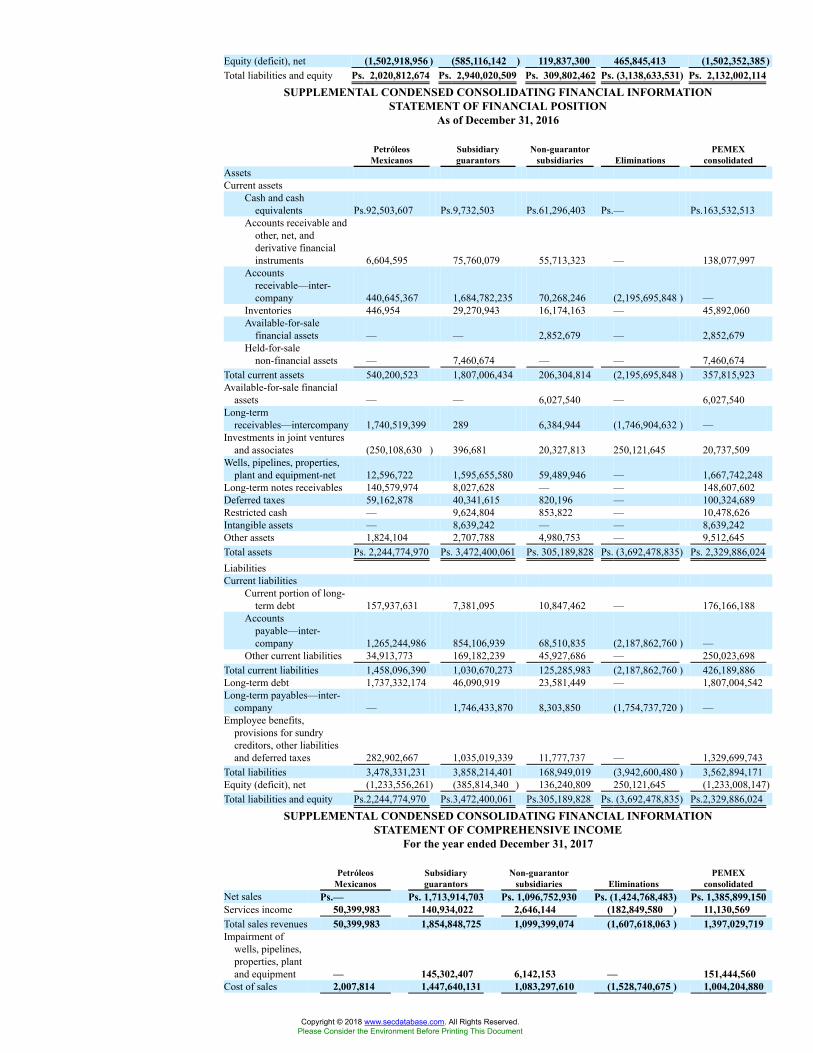
Equity (deficit), net (1,502,918,956 ) (585,116,142 ) 119,837,300 465,845,413 (1,502,352,385)Total liabilities and equity Ps. 2,020,812,674 Ps. 2,940,020,509 Ps. 309,802,462 Ps. (3,138,633,531) Ps. 2,132,002,114
SUPPLEMENTAL CONDENSED CONSOLIDATING FINANCIAL INFORMATIONSTATEMENT OF FINANCIAL POSITION
As of December 31, 2016
PetróleosMexicanos
Subsidiaryguarantors
Non-guarantorsubsidiaries Eliminations
PEMEXconsolidated
AssetsCurrent assets
Cash and cashequivalents Ps.92,503,607 Ps.9,732,503 Ps.61,296,403 Ps.— Ps.163,532,513
Accounts receivable andother, net, andderivative financialinstruments 6,604,595 75,760,079 55,713,323 — 138,077,997
Accountsreceivable—inter-company 440,645,367 1,684,782,235 70,268,246 (2,195,695,848 ) —
Inventories 446,954 29,270,943 16,174,163 — 45,892,060Available-for-sale
financial assets — — 2,852,679 — 2,852,679Held-for-sale
non-financial assets — 7,460,674 — — 7,460,674Total current assets 540,200,523 1,807,006,434 206,304,814 (2,195,695,848 ) 357,815,923Available-for-sale financial
assets — — 6,027,540 — 6,027,540Long-term
receivables—intercompany 1,740,519,399 289 6,384,944 (1,746,904,632 ) —Investments in joint ventures
and associates (250,108,630 ) 396,681 20,327,813 250,121,645 20,737,509Wells, pipelines, properties,
plant and equipment-net 12,596,722 1,595,655,580 59,489,946 — 1,667,742,248Long-term notes receivables 140,579,974 8,027,628 — — 148,607,602Deferred taxes 59,162,878 40,341,615 820,196 — 100,324,689Restricted cash — 9,624,804 853,822 — 10,478,626Intangible assets — 8,639,242 — — 8,639,242Other assets 1,824,104 2,707,788 4,980,753 — 9,512,645Total assets Ps. 2,244,774,970 Ps. 3,472,400,061 Ps. 305,189,828 Ps. (3,692,478,835) Ps. 2,329,886,024LiabilitiesCurrent liabilities
Current portion of long-term debt 157,937,631 7,381,095 10,847,462 — 176,166,188
Accountspayable—inter-company 1,265,244,986 854,106,939 68,510,835 (2,187,862,760 ) —
Other current liabilities 34,913,773 169,182,239 45,927,686 — 250,023,698Total current liabilities 1,458,096,390 1,030,670,273 125,285,983 (2,187,862,760 ) 426,189,886Long-term debt 1,737,332,174 46,090,919 23,581,449 — 1,807,004,542Long-term payables—inter-
company — 1,746,433,870 8,303,850 (1,754,737,720 ) —Employee benefits,
provisions for sundrycreditors, other liabilitiesand deferred taxes 282,902,667 1,035,019,339 11,777,737 — 1,329,699,743
Total liabilities 3,478,331,231 3,858,214,401 168,949,019 (3,942,600,480 ) 3,562,894,171Equity (deficit), net (1,233,556,261) (385,814,340 ) 136,240,809 250,121,645 (1,233,008,147)Total liabilities and equity Ps.2,244,774,970 Ps.3,472,400,061 Ps.305,189,828 Ps. (3,692,478,835) Ps.2,329,886,024
SUPPLEMENTAL CONDENSED CONSOLIDATING FINANCIAL INFORMATIONSTATEMENT OF COMPREHENSIVE INCOME
For the year ended December 31, 2017
PetróleosMexicanos
Subsidiaryguarantors
Non-guarantorsubsidiaries Eliminations
PEMEXconsolidated
Net sales Ps.— Ps. 1,713,914,703 Ps. 1,096,752,930 Ps. (1,424,768,483) Ps. 1,385,899,150Services income 50,399,983 140,934,022 2,646,144 (182,849,580 ) 11,130,569Total sales revenues 50,399,983 1,854,848,725 1,099,399,074 (1,607,618,063 ) 1,397,029,719Impairment of
wells, pipelines,properties, plantand equipment — 145,302,407 6,142,153 — 151,444,560
Cost of sales 2,007,814 1,447,640,131 1,083,297,610 (1,528,740,675 ) 1,004,204,880
Copyright © 2018 www.secdatabase.com. All Rights Reserved.Please Consider the Environment Before Printing This Document
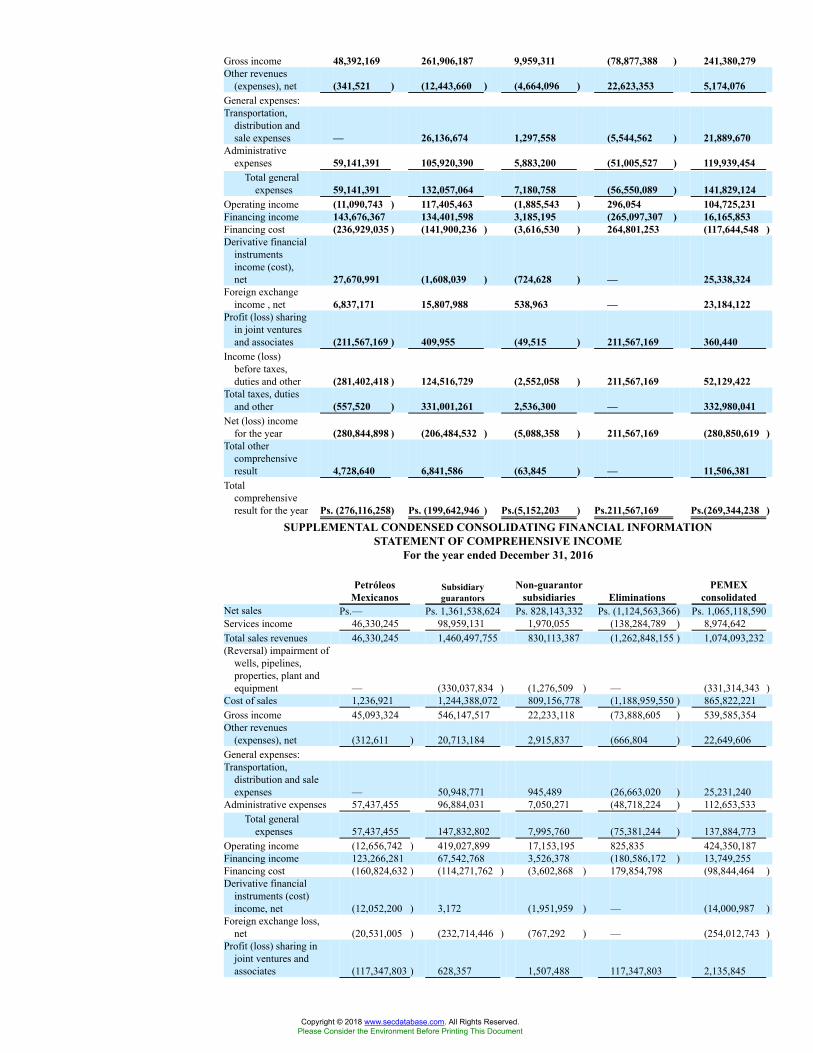
Gross income 48,392,169 261,906,187 9,959,311 (78,877,388 ) 241,380,279Other revenues
(expenses), net (341,521 ) (12,443,660 ) (4,664,096 ) 22,623,353 5,174,076General expenses:Transportation,
distribution andsale expenses — 26,136,674 1,297,558 (5,544,562 ) 21,889,670
Administrativeexpenses 59,141,391 105,920,390 5,883,200 (51,005,527 ) 119,939,454
Total generalexpenses 59,141,391 132,057,064 7,180,758 (56,550,089 ) 141,829,124
Operating income (11,090,743 ) 117,405,463 (1,885,543 ) 296,054 104,725,231Financing income 143,676,367 134,401,598 3,185,195 (265,097,307 ) 16,165,853Financing cost (236,929,035 ) (141,900,236 ) (3,616,530 ) 264,801,253 (117,644,548 )Derivative financial
instrumentsincome (cost),net 27,670,991 (1,608,039 ) (724,628 ) — 25,338,324
Foreign exchangeincome , net 6,837,171 15,807,988 538,963 — 23,184,122
Profit (loss) sharingin joint venturesand associates (211,567,169 ) 409,955 (49,515 ) 211,567,169 360,440
Income (loss)before taxes,duties and other (281,402,418 ) 124,516,729 (2,552,058 ) 211,567,169 52,129,422
Total taxes, dutiesand other (557,520 ) 331,001,261 2,536,300 — 332,980,041
Net (loss) incomefor the year (280,844,898 ) (206,484,532 ) (5,088,358 ) 211,567,169 (280,850,619 )
Total othercomprehensiveresult 4,728,640 6,841,586 (63,845 ) — 11,506,381
Totalcomprehensiveresult for the year Ps. (276,116,258) Ps. (199,642,946 ) Ps.(5,152,203 ) Ps.211,567,169 Ps.(269,344,238 )
SUPPLEMENTAL CONDENSED CONSOLIDATING FINANCIAL INFORMATIONSTATEMENT OF COMPREHENSIVE INCOME
For the year ended December 31, 2016
PetróleosMexicanos
Subsidiaryguarantors
Non-guarantorsubsidiaries Eliminations
PEMEXconsolidated
Net sales Ps.— Ps. 1,361,538,624 Ps. 828,143,332 Ps. (1,124,563,366) Ps. 1,065,118,590Services income 46,330,245 98,959,131 1,970,055 (138,284,789 ) 8,974,642Total sales revenues 46,330,245 1,460,497,755 830,113,387 (1,262,848,155 ) 1,074,093,232(Reversal) impairment of
wells, pipelines,properties, plant andequipment — (330,037,834 ) (1,276,509 ) — (331,314,343 )
Cost of sales 1,236,921 1,244,388,072 809,156,778 (1,188,959,550 ) 865,822,221Gross income 45,093,324 546,147,517 22,233,118 (73,888,605 ) 539,585,354Other revenues
(expenses), net (312,611 ) 20,713,184 2,915,837 (666,804 ) 22,649,606General expenses:Transportation,
distribution and saleexpenses — 50,948,771 945,489 (26,663,020 ) 25,231,240
Administrative expenses 57,437,455 96,884,031 7,050,271 (48,718,224 ) 112,653,533Total general
expenses 57,437,455 147,832,802 7,995,760 (75,381,244 ) 137,884,773Operating income (12,656,742 ) 419,027,899 17,153,195 825,835 424,350,187Financing income 123,266,281 67,542,768 3,526,378 (180,586,172 ) 13,749,255Financing cost (160,824,632 ) (114,271,762 ) (3,602,868 ) 179,854,798 (98,844,464 )Derivative financial
instruments (cost)income, net (12,052,200 ) 3,172 (1,951,959 ) — (14,000,987 )
Foreign exchange loss,net (20,531,005 ) (232,714,446 ) (767,292 ) — (254,012,743 )
Profit (loss) sharing injoint ventures andassociates (117,347,803 ) 628,357 1,507,488 117,347,803 2,135,845
Copyright © 2018 www.secdatabase.com. All Rights Reserved.Please Consider the Environment Before Printing This Document

Income (loss) beforetaxes, duties and other (200,146,101 ) 140,215,988 15,864,942 117,442,264 73,377,093
Total taxes, duties andother (8,834,626 ) 266,155,181 7,200,880 — 264,521,435
Net (loss) income for theyear (191,311,475 ) (125,939,193 ) 8,664,062 117,442,264 (191,144,342 )
Total othercomprehensive result 10,126,560 96,032,433 21,713,488 — 127,872,481
Total comprehensiveresult for the year Ps. (181,184,915) Ps. (29,906,760 ) Ps. 30,377,550 Ps.117,442,264 Ps. (63,271,861 )
SUPPLEMENTAL CONDENSED CONSOLIDATING FINANCIAL INFORMATIONSTATEMENT OF COMPREHENSIVE INCOME
For the year ended December 31, 2015
PetróleosMexicanos
Subsidiaryguarantors
Non-guarantorsubsidiaries Eliminations
PEMEXconsolidated
Net sales Ps.15,556 Ps. 1,523,767,800 Ps. 803,623,324 Ps. (1,173,956,323) Ps. 1,153,450,357Services income 16,897,139 16,815,589 2,585,617 (27,988,310 ) 8,310,035Total sales revenues 16,912,695 1,540,583,389 806,208,941 (1,201,944,633 ) 1,161,760,392
Impairment ofwells, pipelines,properties, plantand equipment — 476,276,159 1,668,531 — 477,944,690
Benefit from change inpension plan (83,657,496 ) (8,519,593 ) — (92,177,089 )
Cost of sales 2,695,423 1,280,404,059 791,147,745 (1,182,282,621 ) 891,964,606Gross income 14,217,272 (132,439,333 ) 21,912,258 (19,662,012 ) (115,971,815 )Other (expenses)
revenues, net (19,805 ) (6,073,003 ) 3,326,421 1,890,900 (875,487 )General expenses:Transportation,
distribution and saleexpenses — 32,870,908 2,921,430 (6,863,699 ) 28,928,639
Administrative expenses 59,923,878 52,832,029 10,638,127 (10,921,939 ) 112,472,095Benefit from change in
pension plan (46,031,780 ) (50,394,477 ) (7,434,698 ) — (103,860,955 )Total general
expenses 13,892,098 35,308,460 6,124,859 (17,785,638 ) 37,539,779Operating income 305,369 (173,820,796 ) 19,113,820 14,526 (154,387,081 )Financing income 108,543,665 28,639,034 3,478,434 (125,670,274 ) 14,990,859Financing cost (85,544,060 ) (104,453,148 ) (3,306,776 ) 125,530,391 (67,773,593 )Derivative financial
instruments (cost)income, net (22,803,663 ) 6,463 1,347,323 — (21,449,877 )
Foreign exchange loss,net (14,829,436 ) (139,623,910 ) (312,228 ) — (154,765,574 )
(Loss) profit sharing injoint ventures andassociates (749,963,960 ) 198,786 2,119,329 749,963,960 2,318,115
(Loss) income beforetaxes, duties and other (764,292,085 ) (389,053,571 ) 22,439,902 749,838,603 (381,067,151 )
Total taxes, duties andother (51,982,560 ) 376,649,369 6,833,438 — 331,500,247
Net (loss) income for theyear (712,309,525 ) (765,702,940 ) 15,606,464 749,838,603 (712,567,398 )
Total othercomprehensive result 10,980,787 56,585,790 21,045,777 — 88,612,354
Total comprehensiveresult for the year Ps. (701,328,738) Ps.(709,117,150 ) Ps.36,652,241 Ps.749,838,603 Ps.(623,955,044)
SUPPLEMENTAL CONDENSED CONSOLIDATING FINANCIAL INFORMATIONSTATEMENT OF CASH FLOWS
For the year ended December 31, 2017
PetróleosMexicanos
Subsidiaryguarantors
Non-guarantorsubsidiaries Eliminations
PEMEXconsolidated
Operating activities:Net (loss) income for the year Ps. (280,844,898) Ps.(206,484,532) Ps.(5,082,639 ) Ps.211,561,450 Ps.(280,850,619)Adjustments to reconcile net loss to cash
provided by operating activities:Depreciation and amortization 1,155,881 152,607,943 2,940,689 — 156,704,513Impairment of wells, pipelines,
properties, plant and equipment — 145,302,407 6,142,153 — 151,444,560Unsuccessful wells — 6,164,624 — — 6,164,624
Copyright © 2018 www.secdatabase.com. All Rights Reserved.Please Consider the Environment Before Printing This Document
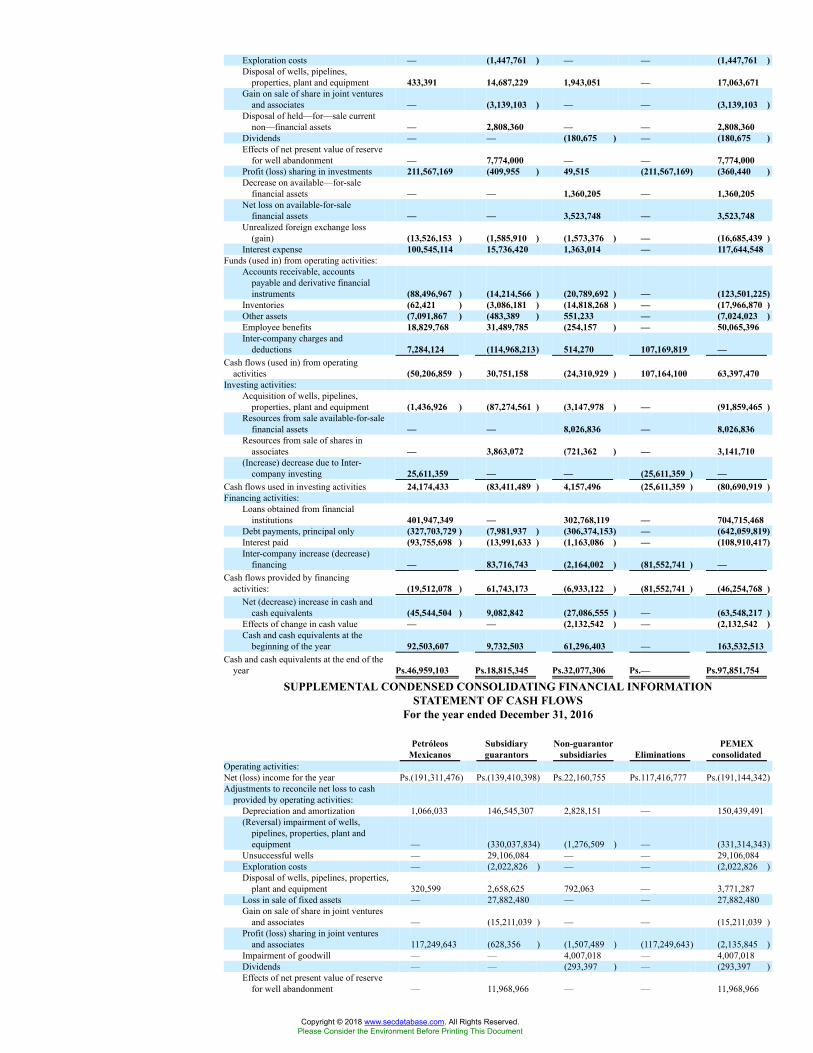
Exploration costs — (1,447,761 ) — — (1,447,761 )Disposal of wells, pipelines,
properties, plant and equipment 433,391 14,687,229 1,943,051 — 17,063,671Gain on sale of share in joint ventures
and associates — (3,139,103 ) — — (3,139,103 )Disposal of held—for—sale current
non—financial assets — 2,808,360 — — 2,808,360Dividends — — (180,675 ) — (180,675 )Effects of net present value of reserve
for well abandonment — 7,774,000 — — 7,774,000Profit (loss) sharing in investments 211,567,169 (409,955 ) 49,515 (211,567,169) (360,440 )Decrease on available—for-sale
financial assets — — 1,360,205 — 1,360,205Net loss on available-for-sale
financial assets — — 3,523,748 — 3,523,748Unrealized foreign exchange loss
(gain) (13,526,153 ) (1,585,910 ) (1,573,376 ) — (16,685,439 )Interest expense 100,545,114 15,736,420 1,363,014 — 117,644,548
Funds (used in) from operating activities:Accounts receivable, accounts
payable and derivative financialinstruments (88,496,967 ) (14,214,566 ) (20,789,692 ) — (123,501,225)
Inventories (62,421 ) (3,086,181 ) (14,818,268 ) — (17,966,870 )Other assets (7,091,867 ) (483,389 ) 551,233 — (7,024,023 )Employee benefits 18,829,768 31,489,785 (254,157 ) — 50,065,396Inter-company charges and
deductions 7,284,124 (114,968,213) 514,270 107,169,819 —Cash flows (used in) from operating
activities (50,206,859 ) 30,751,158 (24,310,929 ) 107,164,100 63,397,470Investing activities:
Acquisition of wells, pipelines,properties, plant and equipment (1,436,926 ) (87,274,561 ) (3,147,978 ) — (91,859,465 )
Resources from sale available-for-salefinancial assets — — 8,026,836 — 8,026,836
Resources from sale of shares inassociates — 3,863,072 (721,362 ) — 3,141,710
(Increase) decrease due to Inter-company investing 25,611,359 — — (25,611,359 ) —
Cash flows used in investing activities 24,174,433 (83,411,489 ) 4,157,496 (25,611,359 ) (80,690,919 )Financing activities:
Loans obtained from financialinstitutions 401,947,349 — 302,768,119 — 704,715,468
Debt payments, principal only (327,703,729 ) (7,981,937 ) (306,374,153) — (642,059,819)Interest paid (93,755,698 ) (13,991,633 ) (1,163,086 ) — (108,910,417)Inter-company increase (decrease)
financing — 83,716,743 (2,164,002 ) (81,552,741 ) —Cash flows provided by financing
activities: (19,512,078 ) 61,743,173 (6,933,122 ) (81,552,741 ) (46,254,768 )Net (decrease) increase in cash and
cash equivalents (45,544,504 ) 9,082,842 (27,086,555 ) — (63,548,217 )Effects of change in cash value — — (2,132,542 ) — (2,132,542 )Cash and cash equivalents at the
beginning of the year 92,503,607 9,732,503 61,296,403 — 163,532,513Cash and cash equivalents at the end of the
year Ps.46,959,103 Ps.18,815,345 Ps.32,077,306 Ps.— Ps.97,851,754
SUPPLEMENTAL CONDENSED CONSOLIDATING FINANCIAL INFORMATIONSTATEMENT OF CASH FLOWS
For the year ended December 31, 2016
PetróleosMexicanos
Subsidiaryguarantors
Non-guarantorsubsidiaries Eliminations
PEMEXconsolidated
Operating activities:Net (loss) income for the year Ps.(191,311,476) Ps.(139,410,398) Ps.22,160,755 Ps.117,416,777 Ps.(191,144,342)Adjustments to reconcile net loss to cash
provided by operating activities:Depreciation and amortization 1,066,033 146,545,307 2,828,151 — 150,439,491(Reversal) impairment of wells,
pipelines, properties, plant andequipment — (330,037,834) (1,276,509 ) — (331,314,343)
Unsuccessful wells — 29,106,084 — — 29,106,084Exploration costs — (2,022,826 ) — — (2,022,826 )Disposal of wells, pipelines, properties,
plant and equipment 320,599 2,658,625 792,063 — 3,771,287Loss in sale of fixed assets — 27,882,480 — — 27,882,480Gain on sale of share in joint ventures
and associates — (15,211,039 ) — — (15,211,039 )Profit (loss) sharing in joint ventures
and associates 117,249,643 (628,356 ) (1,507,489 ) (117,249,643) (2,135,845 )Impairment of goodwill — — 4,007,018 — 4,007,018Dividends — — (293,397 ) — (293,397 )Effects of net present value of reserve
for well abandonment — 11,968,966 — — 11,968,966
Copyright © 2018 www.secdatabase.com. All Rights Reserved.Please Consider the Environment Before Printing This Document

Unrealized foreign exchange loss(gain) 231,191,646 6,754,046 5,237,072 — 243,182,764
Interest expense 91,044,541 5,687,502 2,112,421 — 98,844,464Funds (used in) from operating activities:
Accounts receivable, accounts payableand derivative financial instruments 23,636,331 (158,449,370) 45,028,534 — (89,784,505 )
Inventories 83,317 3,508,494 (4,950,690 ) — (1,358,879 )Other assets (2,405,412 ) (22,600,504 ) (122,614 ) — (25,128,530 )Employee benefits 2,591,000 136,354,337 (91,652,268 ) — 47,293,069Inter-company charges and deductions (393,835,932) (83,049,125 ) 48,435,633 428,449,424 —
Cash flows (used in) from operatingactivities (120,369,710) (380,943,611) 30,798,680 428,616,558 (41,898,083 )
Investing activities:Acquisition of wells, pipelines,
properties, plant and equipment (2,172,586 ) (147,786,686) (1,449,208 ) — (151,408,480)Resources from sale on share in
associates — 23,050,344 (365,608 ) — 22,684,736Proceeds from the sale of fixed assets — 560,665 — — 560,665Business acquisition — — (4,329,769 ) — (4,329,769 )(Increase) decrease due to Inter-
company investing (39,612,699 ) — — 39,612,699 —Cash flows used in investing activities (41,785,285 ) (124,175,677) (6,144,585 ) 39,612,699 (132,492,848)Financing activities:
Increase in equity due to Certificates ofContributions “A” 73,500,000 — — — 73,500,000
Loans obtained from financialinstitutions 571,944,209 34,483,348 235,564,210 — 841,991,767
Debt payments, principal only (372,809,166) (6,414,441 ) (235,763,722) — (614,987,329)Interest paid (82,008,347 ) (4,706,946 ) (2,038,848 ) — (88,754,141 )Inter-company increase (decrease)
financing — 464,488,030 3,741227 (468,229,257) —Cash flows provided by financing activities: 190,626,696 487,849,991 1,502,867 (468,229,257) 211,750,297
Net (decrease) increase in cash andcash equivalents 28,471,701 (17,269,297 ) 26,156,962 — 37,359,366
Effects of change in cash value 5,570,892 20,371,126 (9,137,751 ) — 16,804,267Cash and cash equivalents at the
beginning of the year 58,461,014 6,630,674 44,277,192 — 109,368,880Cash and cash equivalents at the end of the
year Ps.92,503,607 Ps.9,732,503 Ps.61,296,403 Ps.— Ps.163,532,513
SUPPLEMENTAL CONDENSED CONSOLIDATING FINANCIAL INFORMATIONSTATEMENT OF CASH FLOWS
For the year ended December 31, 2015
PetróleosMexicanos
Subsidiaryguarantors
Non-guarantorsubsidiaries Eliminations
PEMEXconsolidated
Operating activities:Net (loss) income for the year Ps. (712,177,124) Ps.(765,702,826) Ps.15,738,868 Ps.749,573,684 Ps.(712,567,398)Adjustments to reconcile net loss to cash
provided by operating activities:Depreciation and amortization 789,657 164,221,429 2,940,164 — 167,951,250Impairment of wells, pipelines,
properties, plant and equipment — 476,276,159 1,668,531 — 477,944,690Unsuccessful wells — 23,213,519 — — 23,213,519Exploration costs — (5,698,511 ) — — (5,698,511 )Disposal of wells, pipelines,
properties, plant and equipment 180,992 21,945,266 2,512,279 — 24,638,537Profit (loss) sharing in joint ventures
and associates 749,963,958 (198,786 ) (2,119,329 ) (749,963,958) (2,318,115 )Gain on sale of share in joint ventures
and associates — (337,675 ) (342,955 ) — (680,630 )Dividends — — (359,941 ) — (359,941 )Effects of net present value of reserve
for well abandonment — (608,160 ) — — (608,160 )Unrealized foreign exchange loss
(gain) 145,971,158 2,996,219 3,708,879 — 152,676,256Interest expense 63,460,443 3,414,430 898,720 — 67,773,593
Funds provided by (used in) operatingactivities:
Accounts receivable, accounts payableand derivative financial instruments (58,554,144 ) 119,761,648 (27,777,939 ) — 33,429,565
Inventories 108,568 4,547,843 1,511,317 — 6,167,728Other assets (149,819 ) (16,578,827 ) 126,281 — (16,602,365 )Employee benefits (10,037,444 ) (94,183,192 ) (11,801,596 ) — (116,022,232)Inter-company charges and deductions (310,384,820 ) 30,044,041 31,975,215 248,365,564 —
Cash flows provided by operating activities (130,828,575 ) (36,887,423 ) 18,678,494 247,975,290 98,937,786Investing activities:
Acquisition of wells, pipelines,properties, plant and equipment (1,496,277 ) (239,315,507) (12,702,217 ) — (253,514,001)
Investments in associates — — (36,214 ) — (36,214 )Resources from the sales on share in
associates — (130,323 ) 4,547,461 — 4,417,138
Copyright © 2018 www.secdatabase.com. All Rights Reserved.Please Consider the Environment Before Printing This Document
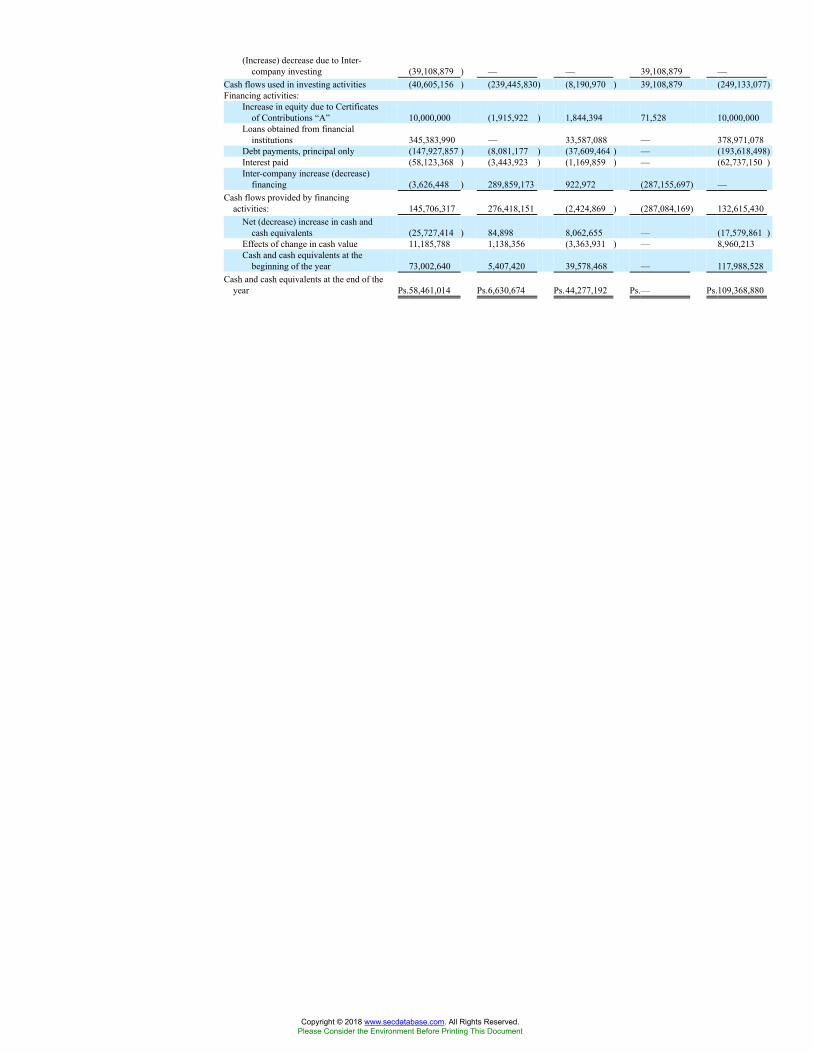
(Increase) decrease due to Inter-company investing (39,108,879 ) — — 39,108,879 —
Cash flows used in investing activities (40,605,156 ) (239,445,830) (8,190,970 ) 39,108,879 (249,133,077)Financing activities:
Increase in equity due to Certificatesof Contributions “A” 10,000,000 (1,915,922 ) 1,844,394 71,528 10,000,000
Loans obtained from financialinstitutions 345,383,990 — 33,587,088 — 378,971,078
Debt payments, principal only (147,927,857 ) (8,081,177 ) (37,609,464 ) — (193,618,498)Interest paid (58,123,368 ) (3,443,923 ) (1,169,859 ) — (62,737,150 )Inter-company increase (decrease)
financing (3,626,448 ) 289,859,173 922,972 (287,155,697) —Cash flows provided by financing
activities: 145,706,317 276,418,151 (2,424,869 ) (287,084,169) 132,615,430Net (decrease) increase in cash and
cash equivalents (25,727,414 ) 84,898 8,062,655 — (17,579,861 )Effects of change in cash value 11,185,788 1,138,356 (3,363,931 ) — 8,960,213Cash and cash equivalents at the
beginning of the year 73,002,640 5,407,420 39,578,468 — 117,988,528Cash and cash equivalents at the end of the
year Ps.58,461,014 Ps.6,630,674 Ps.44,277,192 Ps.— Ps.109,368,880
Copyright © 2018 www.secdatabase.com. All Rights Reserved.Please Consider the Environment Before Printing This Document
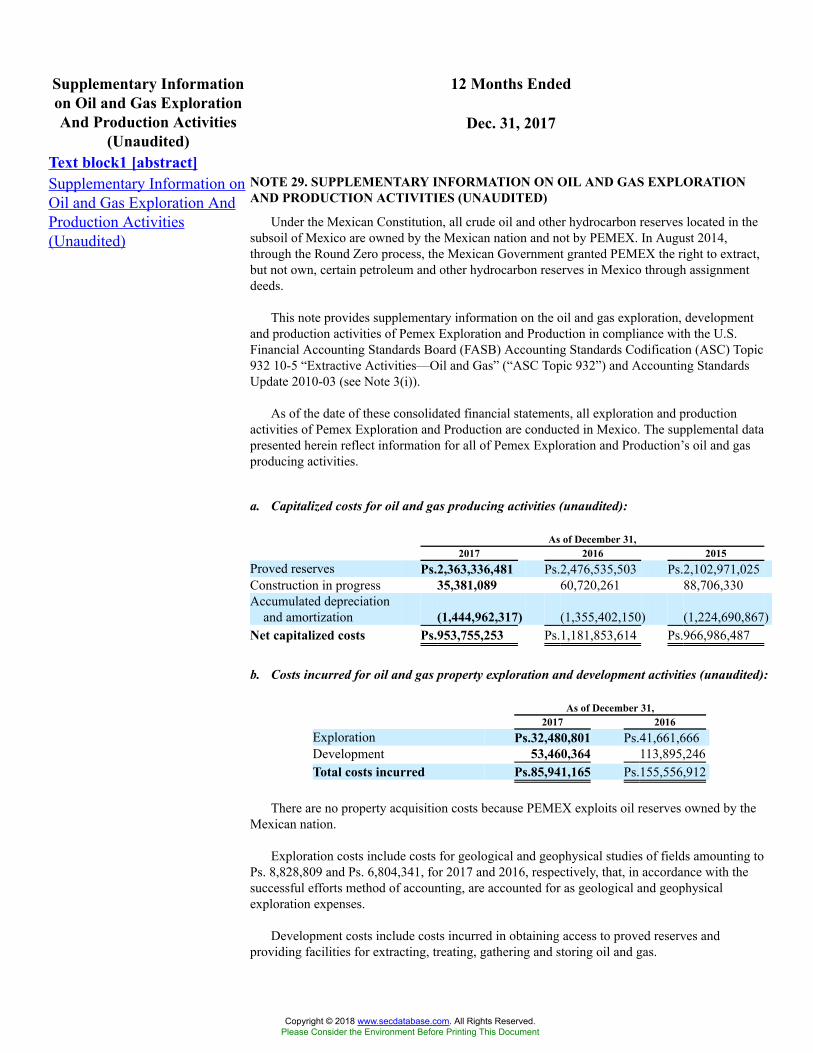
12 Months EndedSupplementary Informationon Oil and Gas ExplorationAnd Production Activities
(Unaudited)Dec. 31, 2017
Text block1 [abstract]Supplementary Information onOil and Gas Exploration AndProduction Activities(Unaudited)
NOTE 29. SUPPLEMENTARY INFORMATION ON OIL AND GAS EXPLORATIONAND PRODUCTION ACTIVITIES (UNAUDITED)
Under the Mexican Constitution, all crude oil and other hydrocarbon reserves located in thesubsoil of Mexico are owned by the Mexican nation and not by PEMEX. In August 2014,through the Round Zero process, the Mexican Government granted PEMEX the right to extract,but not own, certain petroleum and other hydrocarbon reserves in Mexico through assignmentdeeds.
This note provides supplementary information on the oil and gas exploration, developmentand production activities of Pemex Exploration and Production in compliance with the U.S.Financial Accounting Standards Board (FASB) Accounting Standards Codification (ASC) Topic932 10-5 “Extractive Activities—Oil and Gas” (“ASC Topic 932”) and Accounting StandardsUpdate 2010-03 (see Note 3(i)).
As of the date of these consolidated financial statements, all exploration and productionactivities of Pemex Exploration and Production are conducted in Mexico. The supplemental datapresented herein reflect information for all of Pemex Exploration and Production’s oil and gasproducing activities.
a. Capitalized costs for oil and gas producing activities (unaudited):
As of December 31,2017 2016 2015
Proved reserves Ps.2,363,336,481 Ps.2,476,535,503 Ps.2,102,971,025Construction in progress 35,381,089 60,720,261 88,706,330Accumulated depreciation
and amortization (1,444,962,317) (1,355,402,150) (1,224,690,867)Net capitalized costs Ps.953,755,253 Ps.1,181,853,614 Ps.966,986,487
b. Costs incurred for oil and gas property exploration and development activities (unaudited):
As of December 31,2017 2016
Exploration Ps.32,480,801 Ps.41,661,666Development 53,460,364 113,895,246Total costs incurred Ps.85,941,165 Ps.155,556,912
There are no property acquisition costs because PEMEX exploits oil reserves owned by theMexican nation.
Exploration costs include costs for geological and geophysical studies of fields amounting toPs. 8,828,809 and Ps. 6,804,341, for 2017 and 2016, respectively, that, in accordance with thesuccessful efforts method of accounting, are accounted for as geological and geophysicalexploration expenses.
Development costs include costs incurred in obtaining access to proved reserves andproviding facilities for extracting, treating, gathering and storing oil and gas.
Copyright © 2018 www.secdatabase.com. All Rights Reserved.Please Consider the Environment Before Printing This Document
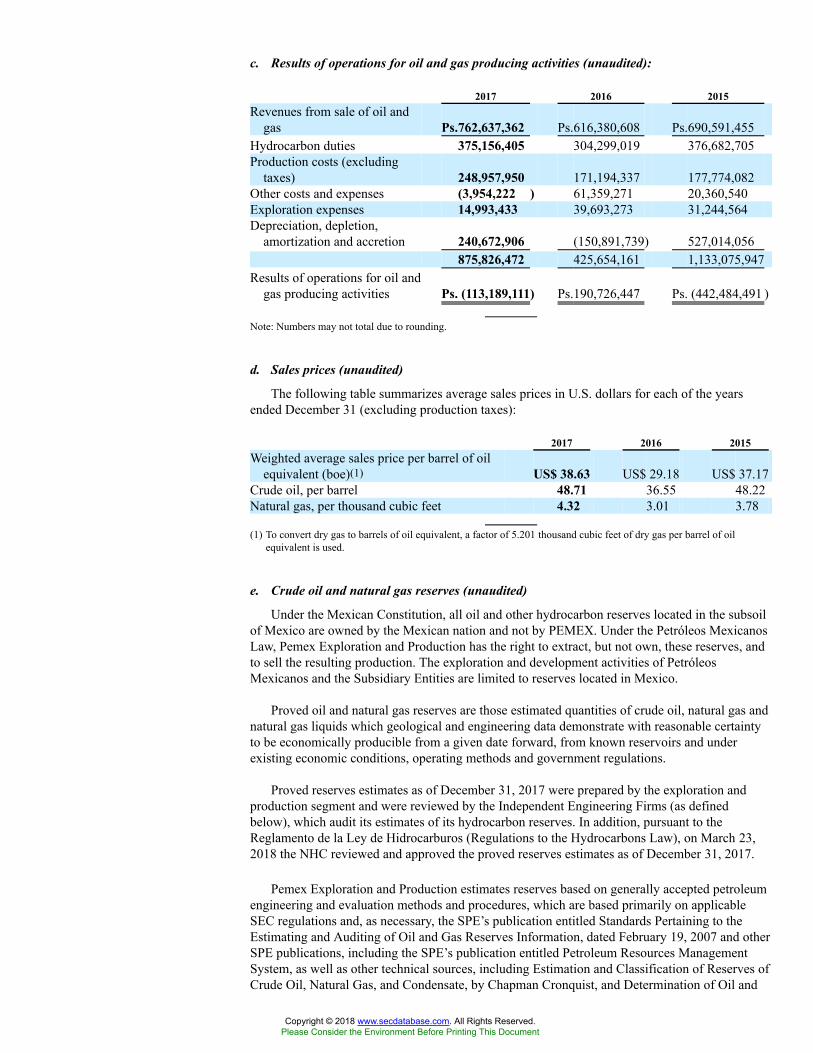
c. Results of operations for oil and gas producing activities (unaudited):
2017 2016 2015Revenues from sale of oil and
gas Ps.762,637,362 Ps.616,380,608 Ps.690,591,455Hydrocarbon duties 375,156,405 304,299,019 376,682,705Production costs (excluding
taxes) 248,957,950 171,194,337 177,774,082Other costs and expenses (3,954,222 ) 61,359,271 20,360,540Exploration expenses 14,993,433 39,693,273 31,244,564Depreciation, depletion,
amortization and accretion 240,672,906 (150,891,739) 527,014,056875,826,472 425,654,161 1,133,075,947
Results of operations for oil andgas producing activities Ps. (113,189,111) Ps.190,726,447 Ps. (442,484,491 )
Note: Numbers may not total due to rounding.
d. Sales prices (unaudited)
The following table summarizes average sales prices in U.S. dollars for each of the yearsended December 31 (excluding production taxes):
2017 2016 2015Weighted average sales price per barrel of oil
equivalent (boe)(1) US$ 38.63 US$ 29.18 US$ 37.17Crude oil, per barrel 48.71 36.55 48.22Natural gas, per thousand cubic feet 4.32 3.01 3.78
(1) To convert dry gas to barrels of oil equivalent, a factor of 5.201 thousand cubic feet of dry gas per barrel of oilequivalent is used.
e. Crude oil and natural gas reserves (unaudited)
Under the Mexican Constitution, all oil and other hydrocarbon reserves located in the subsoilof Mexico are owned by the Mexican nation and not by PEMEX. Under the Petróleos MexicanosLaw, Pemex Exploration and Production has the right to extract, but not own, these reserves, andto sell the resulting production. The exploration and development activities of PetróleosMexicanos and the Subsidiary Entities are limited to reserves located in Mexico.
Proved oil and natural gas reserves are those estimated quantities of crude oil, natural gas andnatural gas liquids which geological and engineering data demonstrate with reasonable certaintyto be economically producible from a given date forward, from known reservoirs and underexisting economic conditions, operating methods and government regulations.
Proved reserves estimates as of December 31, 2017 were prepared by the exploration andproduction segment and were reviewed by the Independent Engineering Firms (as definedbelow), which audit its estimates of its hydrocarbon reserves. In addition, pursuant to theReglamento de la Ley de Hidrocarburos (Regulations to the Hydrocarbons Law), on March 23,2018 the NHC reviewed and approved the proved reserves estimates as of December 31, 2017.
Pemex Exploration and Production estimates reserves based on generally accepted petroleumengineering and evaluation methods and procedures, which are based primarily on applicableSEC regulations and, as necessary, the SPE’s publication entitled Standards Pertaining to theEstimating and Auditing of Oil and Gas Reserves Information, dated February 19, 2007 and otherSPE publications, including the SPE’s publication entitled Petroleum Resources ManagementSystem, as well as other technical sources, including Estimation and Classification of Reserves ofCrude Oil, Natural Gas, and Condensate, by Chapman Cronquist, and Determination of Oil and
Copyright © 2018 www.secdatabase.com. All Rights Reserved.Please Consider the Environment Before Printing This Document
Gas Reserves, Petroleum Society Monograph Number 1, published by the Canadian Institute ofMining and Metallurgy & Petroleum. The choice of method or combination of methods employedin the analysis of each reservoir is determined by:
• Experience in the area
• Stage of development
• Quality and completeness of basic data
• Production and pressure histories
Reserves data set forth herein represents only estimates. Reserves valuation is a subjectiveprocess of estimating underground accumulations of crude oil and natural gas that cannot bemeasured in an exact manner. The accuracy of any reserves estimate depends on the quality ofavailable data, engineering and geological interpretation and professional judgment. As a result,estimates of different engineers may vary. In addition, the results of drilling, testing andproducing subsequent to the date of an estimate may lead to the revision of an estimate.
During 2017, PEMEX did not record any material increase in PEMEX’s hydrocarbonsreserves as a result of the use of new technologies.
In order to ensure the reliability of PEMEX’s reserves estimation efforts, it has undertaken theinternal certification of its estimates of reserves since 1996. PEMEX has established certaininternal controls in connection with the preparation of its proved reserves estimates. Initially,teams of geoscientists from Pemex Exploration and Production’s exploration and exploitationbusiness units (with each of these units covering several projects) prepare the reserves estimates,using distinct estimation processes for valuations relating to new discoveries and developedfields, respectively. Subsequently, the regional reserves offices collect these reserves estimatesfrom the units and request that the Gerencia de Recursos y Certificación de Reservas (Office ofResources and Reserves Certification), the central hydrocarbon reserves management body ofPemex Exploration and Production, review and certify such valuations and the booking of therelated reserves. This internal certification process is undertaken in accordance with internalguidelines for estimating and classifying hydrocarbon reserves, which are based on the SEC’srules and definitions. The Office of Resources and Reserves Certification, which additionallyoversees and conducts an internal audit of the above process, consists entirely of professionalswith geological, geophysical, petrophysical and reservoir engineering backgrounds. Theengineers who participate in PEMEX’s reserves estimation process are experienced in: reservoirnumerical simulation; well drilling and completion; pressure, volume and temperature (PVT)analysis; analytical tools used in forecasting the performance of the various elements comprisingthe production system; and design strategies in petroleum field development. Furthermore, all ofPEMEX’s personnel have been certified by the Secretaría de Educación Pública (Ministry ofPublic Education), most have earned master’s degrees in areas of study such as petroleumengineering, geology and geophysical engineering and they possess an average of over fifteenyears of professional experience.
In addition to this internal review process, Pemex Exploration and Production’s final reservesestimates are audited by independent engineering firms. Three independent engineering firmsaudited Pemex Exploration and Production’s estimates of proved reserves as of December 31,2017: Netherland Sewell International, S. de R. L. de C. V. (“Netherland Sewell”); DeGolyer andMacNaughton (“DeGolyer”); and Ryder Scott Company, L.P. (“Ryder Scott,”) and, together withNetherland Sewell and DeGolyer and MacNaughton, the “Independent Engineering Firms”. Thereserves estimates reviewed by the Independent Engineering Firms totaled 97.0% of PEMEX’sestimated proved reserves. The remaining 3.0% of PEMEX’s estimated proved reserves consistedof reserves located in certain areas in which third parties provide drilling services to PemexExploration and Production. Under such agreements, the corresponding third party is responsibleof assessing the volume of reserves.
Netherland Sewell audited the reserves in the Poza Rica-Altamira, Aceite Terciario del Golfoand Litoral de Tabasco assets. DeGolyer in Burgos and Veracruz Assets and Ryder Scott audited
Copyright © 2018 www.secdatabase.com. All Rights Reserved.Please Consider the Environment Before Printing This Document
the reserves in the Bellota-Jujo, Cinco Presidentes, Macuspana-Muspac, Samaria-Luna,Abkatún-Pol-Chuc, Cantarell and Ku-Maloob-Zaap Assets. The audits conducted by theIndependent Engineering Firms consisted primarily of: (1) analysis of historical static anddynamic reservoir data provided by Pemex-Exploration and Production; (2) construction orupdating of the Independent Engineering Firms’ own static and dynamic reservoircharacterization models of some of the fields; (3) economic analysis of the fields; and (4) reviewof Pemex Exploration and Production’s production forecasts and reserves estimates.
Since reserves estimates are, by definition, only estimates, they cannot be reviewed for thepurpose of verifying exactness. Instead, the Independent Engineering Firms conducted a detailedreview of Pemex Exploration and Production’s reserves estimates so that they could express anopinion as to whether, in the aggregate, the reserves estimates that Pemex Exploration andProduction furnished were reasonable and had been estimated and presented in conformity withgenerally accepted petroleum engineering and evaluation methods and procedures.
All questions, including any suggested modifications to proved reserves estimates, that aroseduring the Independent Engineering Firms’ review process were resolved by Pemex Explorationand Production to the satisfaction of the Independent Engineering Firms. The IndependentEngineering Firms have concluded that PEMEX’s estimated total proved oil and natural gasreserve volumes set forth in this report are, in the aggregate, reasonable and have been preparedin accordance with Rule 4-10(a) are consistent with international reserves reporting practice andare in accordance with the revised oil and gas reserves disclosure provisions of ASC Topic 932.
PEMEX’s total proved developed and undeveloped reserves of crude oil, condensates andliquefiable hydrocarbons recoverable from field processing plants decreased by 11.0% in 2017,from 7,219 million barrels at December 31, 2016 to 6,427 million barrels at December 31, 2017.PEMEX’s proved developed reserves of crude oil, condensates and liquefiable hydrocarbonsrecoverable from processing plants decreased by 14.7% in 2017, from 4,866 million barrels atDecember 31, 2016 to 4,166 million barrels at December 31, 2017. These decreases wereprincipally due to oil production in 2017, a decrease in field development activities and fieldbehavior and the transfer to third parties, who were awarded with contracts in the bidding rounds,of certain fields that had been temporarily assigned to PEMEX and associations and alliancessuch as Santuario and El Golpe fields, of which PEMEX is assigned a 64% of their provedreserves . The amount of crude oil, condensate and liquefiable hydrocarbon reserves added in2017 was insufficient to offset the level of production in 2017, which amounted to 805.5 millionbarrels of crude oil, condensates and liquefiable hydrocarbons.
PEMEX’s proved developed and undeveloped dry gas reserves decreased by 5.6% in 2017,from 6,984 billion cubic feet at December 31, 2016 to 6,593 billion cubic feet atDecember 31, 2017. PEMEX’s proved developed dry gas reserves decreased by 10.8% in 2017,from 4,513 billion cubic feet at December 31, 2016 to 4,026 billion cubic feet atDecember 31, 2017. These decreases were principally due to oil production in 2017, a decrease infield development activities and field behavior and the transfer to third parties, who were awardedwith contracts in the bidding rounds, of certain fields that had been temporarily assigned toPEMEX and associations and alliances such as Santuario and El Golpe fields, of which PEMEXis assigned a 64% of their proved reserves. The amount of dry gas reserves added in 2017 wasinsufficient to offset the level of production in 2017, which amounted to 999 billion cubic feet ofdry gas. PEMEX’s proved undeveloped dry gas reserves increased by 3.9% in 2017, from2,471 billion cubic feet at December 31, 2016 to 2,567 billion cubic feet at December 31, 2017.
During 2017, our exploratory activity in the shallow waters of the Gulf of Mexico andonshore regions resulted in new discoveries of light crude oil in the offshore Suuk field in June2017 and gas and condensate discoveries in the onshore Valeriana and lxachi fields in August andNovember of 2017, respectively. These discoveries led to the incorporation of approximately 246million barrels of oil equivalent in three fields.
The following three tables of crude oil and dry gas reserves set forth PEMEX’s estimates ofits proved reserves determined in accordance with Rule 4-10(a).
Copyright © 2018 www.secdatabase.com. All Rights Reserved.Please Consider the Environment Before Printing This Document
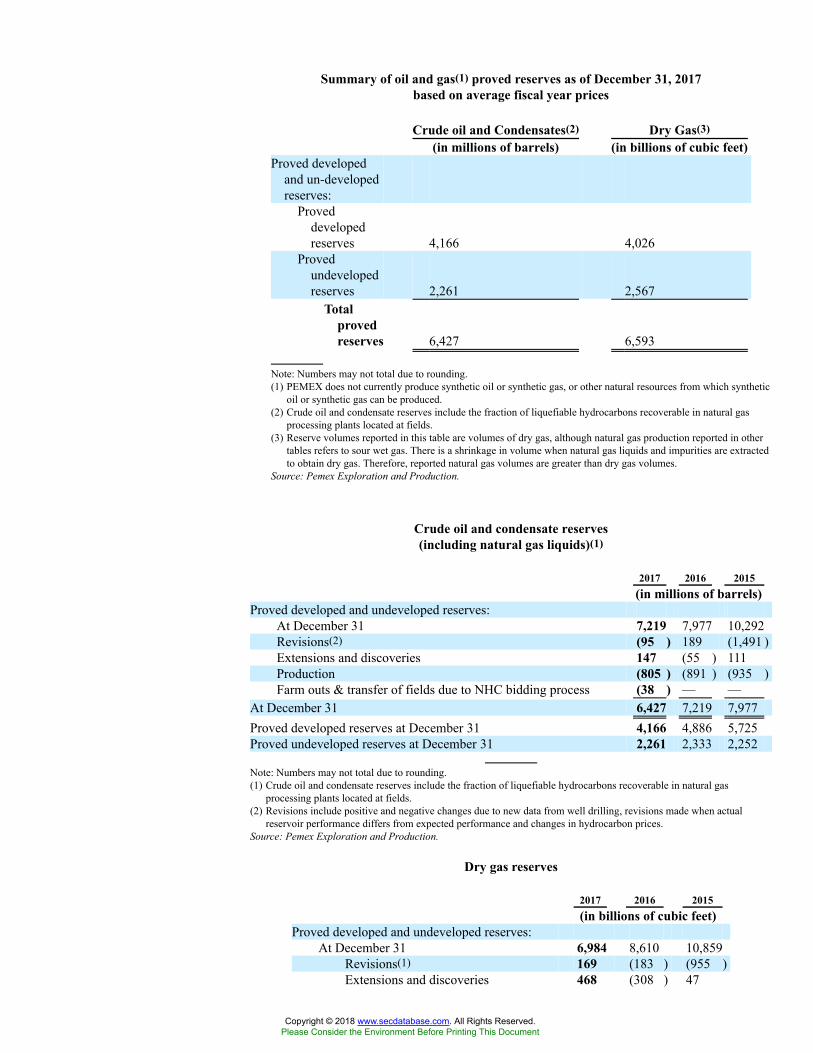
Summary of oil and gas(1) proved reserves as of December 31, 2017based on average fiscal year prices
Crude oil and Condensates(2) Dry Gas(3)(in millions of barrels) (in billions of cubic feet)
Proved developedand un-developedreserves:
Proveddevelopedreserves 4,166 4,026
Provedundevelopedreserves 2,261 2,567
Totalprovedreserves 6,427 6,593
Note: Numbers may not total due to rounding.(1) PEMEX does not currently produce synthetic oil or synthetic gas, or other natural resources from which synthetic
oil or synthetic gas can be produced.(2) Crude oil and condensate reserves include the fraction of liquefiable hydrocarbons recoverable in natural gas
processing plants located at fields.(3) Reserve volumes reported in this table are volumes of dry gas, although natural gas production reported in other
tables refers to sour wet gas. There is a shrinkage in volume when natural gas liquids and impurities are extractedto obtain dry gas. Therefore, reported natural gas volumes are greater than dry gas volumes.
Source: Pemex Exploration and Production.
Crude oil and condensate reserves(including natural gas liquids)(1)
2017 2016 2015(in millions of barrels)
Proved developed and undeveloped reserves:At December 31 7,219 7,977 10,292Revisions(2) (95 ) 189 (1,491 )Extensions and discoveries 147 (55 ) 111Production (805 ) (891 ) (935 )Farm outs & transfer of fields due to NHC bidding process (38 ) — —
At December 31 6,427 7,219 7,977Proved developed reserves at December 31 4,166 4,886 5,725Proved undeveloped reserves at December 31 2,261 2,333 2,252
Note: Numbers may not total due to rounding.(1) Crude oil and condensate reserves include the fraction of liquefiable hydrocarbons recoverable in natural gas
processing plants located at fields.(2) Revisions include positive and negative changes due to new data from well drilling, revisions made when actual
reservoir performance differs from expected performance and changes in hydrocarbon prices.Source: Pemex Exploration and Production.
Dry gas reserves
2017 2016 2015(in billions of cubic feet)
Proved developed and undeveloped reserves:At December 31 6,984 8,610 10,859
Revisions(1) 169 (183 ) (955 )Extensions and discoveries 468 (308 ) 47
Copyright © 2018 www.secdatabase.com. All Rights Reserved.Please Consider the Environment Before Printing This Document
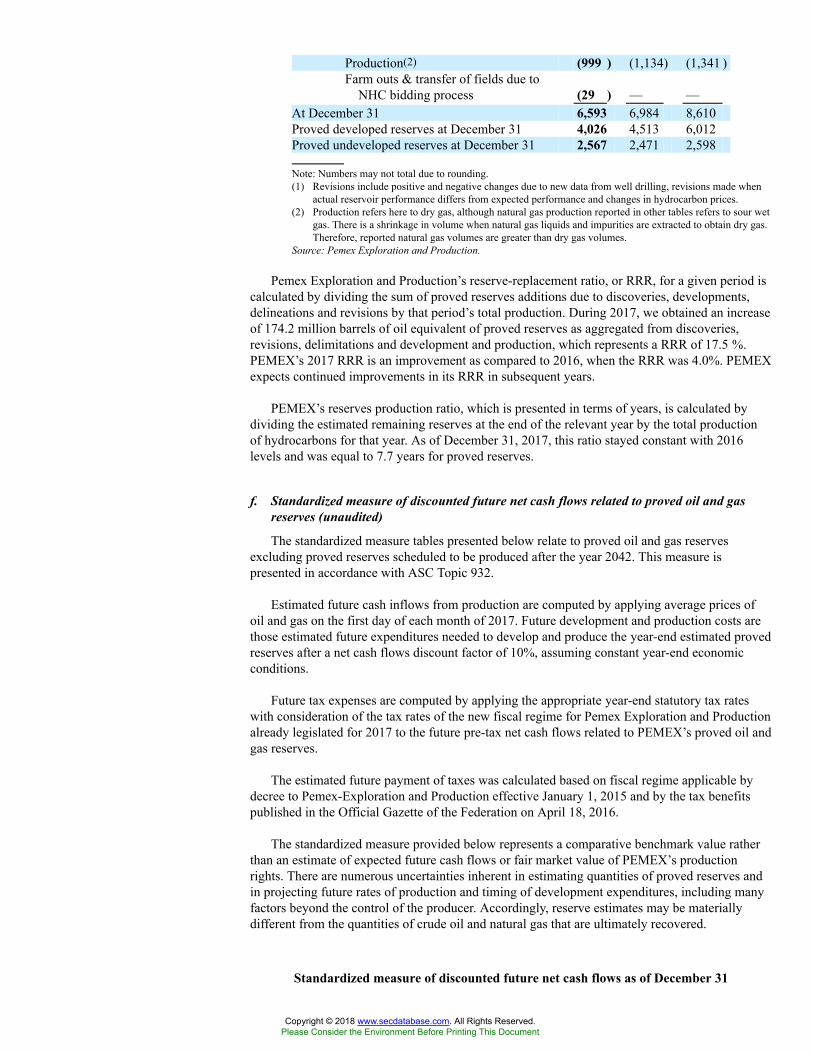
Production(2) (999 ) (1,134) (1,341 )Farm outs & transfer of fields due to
NHC bidding process (29 ) — —At December 31 6,593 6,984 8,610Proved developed reserves at December 31 4,026 4,513 6,012Proved undeveloped reserves at December 31 2,567 2,471 2,598
Note: Numbers may not total due to rounding.(1) Revisions include positive and negative changes due to new data from well drilling, revisions made when
actual reservoir performance differs from expected performance and changes in hydrocarbon prices.(2) Production refers here to dry gas, although natural gas production reported in other tables refers to sour wet
gas. There is a shrinkage in volume when natural gas liquids and impurities are extracted to obtain dry gas.Therefore, reported natural gas volumes are greater than dry gas volumes.
Source: Pemex Exploration and Production.
Pemex Exploration and Production’s reserve-replacement ratio, or RRR, for a given period iscalculated by dividing the sum of proved reserves additions due to discoveries, developments,delineations and revisions by that period’s total production. During 2017, we obtained an increaseof 174.2 million barrels of oil equivalent of proved reserves as aggregated from discoveries,revisions, delimitations and development and production, which represents a RRR of 17.5 %.PEMEX’s 2017 RRR is an improvement as compared to 2016, when the RRR was 4.0%. PEMEXexpects continued improvements in its RRR in subsequent years.
PEMEX’s reserves production ratio, which is presented in terms of years, is calculated bydividing the estimated remaining reserves at the end of the relevant year by the total productionof hydrocarbons for that year. As of December 31, 2017, this ratio stayed constant with 2016levels and was equal to 7.7 years for proved reserves.
f. Standardized measure of discounted future net cash flows related to proved oil and gasreserves (unaudited)
The standardized measure tables presented below relate to proved oil and gas reservesexcluding proved reserves scheduled to be produced after the year 2042. This measure ispresented in accordance with ASC Topic 932.
Estimated future cash inflows from production are computed by applying average prices ofoil and gas on the first day of each month of 2017. Future development and production costs arethose estimated future expenditures needed to develop and produce the year-end estimated provedreserves after a net cash flows discount factor of 10%, assuming constant year-end economicconditions.
Future tax expenses are computed by applying the appropriate year-end statutory tax rateswith consideration of the tax rates of the new fiscal regime for Pemex Exploration and Productionalready legislated for 2017 to the future pre-tax net cash flows related to PEMEX’s proved oil andgas reserves.
The estimated future payment of taxes was calculated based on fiscal regime applicable bydecree to Pemex-Exploration and Production effective January 1, 2015 and by the tax benefitspublished in the Official Gazette of the Federation on April 18, 2016.
The standardized measure provided below represents a comparative benchmark value ratherthan an estimate of expected future cash flows or fair market value of PEMEX’s productionrights. There are numerous uncertainties inherent in estimating quantities of proved reserves andin projecting future rates of production and timing of development expenditures, including manyfactors beyond the control of the producer. Accordingly, reserve estimates may be materiallydifferent from the quantities of crude oil and natural gas that are ultimately recovered.
Standardized measure of discounted future net cash flows as of December 31
Copyright © 2018 www.secdatabase.com. All Rights Reserved.Please Consider the Environment Before Printing This Document

2017 2016 2015(in millions of U.S. dollars)
Future cash inflows US$269,489 US$228,196 US$325,052Future production costs (excluding
profit taxes) (114,369) (87,942 ) (99,948 )Future development costs (26,229 ) (25,515 ) (32,560 )Future cash flows before tax 128,891 114,738 192,544Future production and excess gains
taxes (129,377) (108,960) (167,056)Future net cash flows (487 ) 5,779 25,488Effect of discounting net cash flows
by 10% (4,600 ) (937 ) (9,946 )Standardized measure of discounted
future net cash flows US$4,113 US$4,841 US$15,541
Note: Table amounts may not total due to rounding.
To comply with ASC Topic 932, the following table presents the aggregate standardizedmeasure changes for each of the last three years and significant sources of variance:
Changes in standardized measure of discounted future net cash flows
2017 2016 2015(in millions of U.S. dollars)
Sales of oil and gas produced, net ofproduction costs US$(25,076) US$(19,411) US$(28,371 )
Net changes in prices and productioncosts 26,355 (53,278) (327,865)
Extensions and discoveries 3,639 1,105 3,086Development cost incurred during the
year 2,699 4,124 10,172Changes in estimated development costs 2,744 1,763 (2,171 )Reserves revisions and timing changes (1,353 ) 6,366 (22,801 )Accretion of discount of pre-tax net
cash flows 5,891 11,094 43,394Net changes in production and excess
gains taxes (15,628) 37,537 295,437Aggregate change in standardized
measure of discounted future net cashflows US$(728 ) US$(10,700) US$(29,119 )
Standardized measure:As of January 1 US$4,841 US$15,541 US$44,661As of December 31 4,113 4,841 15,541
Change US$(728 ) US$(10,700) US$(29,119 )
Note: Table amounts may not total due to rounding.
In computing the amounts under each factor of change, the effects of variances in prices andcosts are computed before the effects of changes in quantities. Consequently, changes in reservesare calculated at December 31 prices and costs.
The change in computed taxes includes taxes effectively incurred during the year and thechange in future tax expense.
Copyright © 2018 www.secdatabase.com. All Rights Reserved.Please Consider the Environment Before Printing This Document

12 Months EndedSignificant AccountingPolicies (Policies) Dec. 31, 2017
Text block1 [abstract]Basis of consolidation a. Basis of consolidation
The consolidated financial statements include those of Petróleos Mexicanos, the SubsidiaryEntities and the Subsidiary Companies. All intercompany balances and transactions of theconsolidated companies; income and expenses, as well as unrealized profits and losses resultingfrom operations between them have been eliminated in the preparation of the consolidatedfinancial statements pursuant to IFRS 10, “Consolidated Financial Statements” (“IFRS 10”).
Unrealized gains arising from transactions with entities whose investment is accounted forusing the equity method are eliminated against the investment to the extent of PEMEX’sparticipation in such entities. Unrealized losses are eliminated in the same way as unrealizedgains but only to the extent that there is no evidence of impairment of the investment. If suchevidence exists, PEMEX recognizes it in its consolidated financial statements.
Investment in subsidiaries
The Subsidiary Entities and Subsidiary Companies are consolidated from the date that controlcommences until the date that control ceases.
Petróleos Mexicanos controls a subsidiary when it is exposed to or has rights to variablereturns from the company and has the ability to affect those returns through its power over thecompany.
The financial statements of the Subsidiary Entities and Subsidiary Companies have beenprepared based on the same period of Petróleos Mexicanos’ consolidated financial statementsapplying the same accounting policies.
For more information about Subsidiary Companies, see Note 4.
Investments in associates and joint arrangements
Associates are those entities in which PEMEX has significant influence but not the power tocontrol financial and operational decisions. It is presumed that there is significant influence whenPEMEX owns directly or indirectly between 20% and 50% of voting rights in another entity.
Joint arrangements are those arrangements whereby two or more parties have joint control ofan arrangement. A joint arrangement is either a joint venture, where both of the parties haverights to the net assets of the arrangements, or a joint operation, where the parties have both rightsto the assets, and obligations for the liabilities relating to the arrangements.
Investments in associates and joint ventures are recognized based on the equity method andrecorded initially at cost, including any goodwill identified on acquisition. With respect to jointoperations, the assets, liabilities, income and expenses are recognized in relation to the share ofeach party and in accordance with the applicable IFRS for each of those items. The investmentcost includes transaction costs.
These consolidated financial statements include the proportion of gains, losses and othercomprehensive income corresponding to PEMEX’s share in each investee, once these items areadjusted to align with the accounting policies of PEMEX, from the date that significant influenceand joint control begins to the date that such influence or joint control ceases.
When the value of the share of losses exceeds the value of PEMEX’s investment in anassociate or joint venture, the carrying value of the investment, including any long-term
Copyright © 2018 www.secdatabase.com. All Rights Reserved.Please Consider the Environment Before Printing This Document

investment, is reduced to zero and PEMEX ceases to recognize additional losses, except in caseswhere PEMEX is liable for obligations incurred by those associates and joint ventures.
For more information about associates and joint arrangements, see Note 11.
Non-controlling interests
The equity interests of third parties who do not have a controlling interest in the equity orcomprehensive result of subsidiaries of PEMEX are presented in the consolidated statements offinancial position, the consolidated statements of changes in equity (deficit)as “non-controllinginterests” and as “net income and comprehensive income for the period,attributable to non-controlling interests,” in the consolidated statements of comprehensiveincome.
Changes in a parent’s ownership interest in a subsidiary that do not result in a loss of controlare accounted for as equity transactions. In such circumstances, the carrying amounts of thecontrolling and non-controlling interests shall be adjusted to reflect the changes in their relativeinterests in the subsidiary.
Dividends in cash and assets other than cash
A liability for distributions of dividends in cash and non-cash assets to third parties isrecognized when the distribution is authorized by the Board of Directors. The correspondingamount is recognized directly in equity.
Distributions of dividends in non-cash assets are measured at the fair value of the assets to bedistributed. Changes relating to these measurements of the fair value, between the date on whichthe distribution is declared and the date when the assets are transferred, are recognized directly inequity.
When distributing non-cash assets, any difference between the carrying amount of theliability for distribution of dividends and the carrying amount of the assets distributed isrecognized in the consolidated statements of comprehensive income.
Business combinations andgoodwill
b. Business combinations and goodwill
Business combinations are accounted for using the acquisition method. The cost of anacquisition is measured as the aggregate of the consideration transferred, measured as theacquisition date fair value, and the amount of any non-controlling interest in the acquiree.
When PEMEX acquires a business, it assesses the acquired assets and liabilities in order toappropriately classify and designate each, taking into account the contractual terms, economiccircumstances and other pertinent conditions as of the date of the acquisition. This includes theseparation of embedded derivatives in host contractors by the acquiree. Acquired petroleumreserves and resources that can be reliably measured are recognized separately in the assessmentof fair values on acquisition. Other potential reserves and rights, for which fair values cannot bereliably measured, are not recognized separately, but instead are subsumed in goodwill.
For business combinations achieved in stages, any previously held equity interest is measuredat its acquisition date fair value, and any resulting gain or loss is recognized in income or loss orother comprehensive income.
Any contingent consideration to be transferred by the acquirer will be recognized at fair valueon the acquisition date. Contingent consideration classified as an asset or liability that is afinancial instrument and within the scope of IAS 39 “Financial instruments: Recognition andMeasurement” is measured at fair value, with changes in fair value recognized in income or lossor other comprehensive income. If contingent consideration is not with the scope of IAS 39, it ismeasured in accordance with the appropriate IFRS requirement. Contingent consideration that isclassified as equity is not remeasured, and subsequent settlement is accounted for within equity.
Copyright © 2018 www.secdatabase.com. All Rights Reserved.Please Consider the Environment Before Printing This Document
Goodwill, which is initially measured at cost, is the excess of the aggregate of theconsideration transferred and the amount recognized for non-controlling interest over the fairvalue of the identifiable net assets acquired and liabilities assumed. If the fair value of the netasset acquired is greater than the aggregate consideration transferred (bargain purchase), beforerecognizing a gain, PEMEX reassesses whether it has correctly identified all of the assetsacquired and all of the liabilities assumed and reviews the procedures used to measure theamounts to be recognized at the acquisition date. If the assessment still results in an excess of thefair value of net assets acquired over the aggregate consideration transferred, then the gain isrecognized in the consolidated statements of comprehensive income.
After initial recognition, goodwill is measured at cost less any accumulated impairmentlosses. For the purpose of impairment testing, goodwill acquired in a business combination is,from the acquisition date, allocated to each cash generating unit that is expected to benefit fromthe combination, irrespective of whether other assets or liabilities of the acquiree are assigned tothose units.
When goodwill is allocated to a cash generating unit and certain of the operations in that unitare disposed of, the goodwill associated with the disposed operation is included in the carryingamount of the operation when determining the gain or loss on disposal. Goodwill disposed inthese circumstances is measured based on the relative values of the disposed operation and theportion of the cash generating unit retained.
Transactions in foreigncurrency
c. Transactions in foreign currency
In accordance with IAS 21, “The Effects of Changes in Foreign Exchange Rates” (“IAS 21”),transactions in foreign currencies are translated and recorded at exchange rates at the dates of thetransactions and/or of the presentation of financial information.
Exchange differences arising from the settlement of monetary items or from the translation ofmonetary items into rates different from those at which they were translated on their initialrecognition, are recognized in the results of operations in the reporting period in which they arise.When a gain or loss from a non-monetary item is recognized in other comprehensive results, anyexchange difference included in that gain or loss is recognized in other comprehensive results.Conversely, when a gain or loss from a non-monetary item is recognized in the results ofoperations, any exchange difference included in that gain or loss is recognized in the results ofoperations for the period.
Fair value measurement d. Fair value measurement
PEMEX measures certain financial instruments such as DFIs at fair value as of the closingdate of the relevant reporting period.
Fair value is the price that would be received to sell an asset or paid to transfer a liability inan orderly transaction between market participants at the measurement date. A measurement atfair value assumes that the sale of the asset or transfer of a liability occurs:
i. in the principal market for the asset or liability; or
ii. in the absence of a principal market, in the most advantageous market for the asset orliability.
The principal market or the most advantageous market must be accessible for PEMEX.
The fair value of an asset or liability is measured by using the same assumptions that marketparticipants would make when pricing the asset or liability under the premise that marketparticipants take into account highest and best use of the asset or liability.
Financial instruments e. Financial instruments
Financial instruments are classified as: (i) financial instruments measured at fair valuethrough profit or loss; (ii) financial instruments held to maturity; (iii) available-for-sale financial
Copyright © 2018 www.secdatabase.com. All Rights Reserved.Please Consider the Environment Before Printing This Document
assets; (iv) investments in equity instruments; (v) loans and receivables; and (vi) DFIs. PEMEXdetermines the classification of its financial instruments at the time of initial recognition.
PEMEX’s financial instruments include cash and short-term deposits, available-for-salefinancial assets, accounts receivable, other receivables, loans, accounts payable to suppliers, otheraccounts payable, borrowings and debts, as well as DFIs.
Below are descriptions of the financial instruments policies employed by PEMEX:
Financial instruments measured at fair value through profit or loss
A financial instrument is measured at fair value through profit or loss if it is classified as heldfor trading or designated as such upon initial recognition. Financial assets are designated at fairvalue through profit or loss if PEMEX manages such investments and makes purchase and saledecisions based on their fair value in accordance with PEMEX’s documented risk management orinvestment strategy. In addition, directly attributable transaction costs are recognized in theconsolidated statements of comprehensive income for the year. These financial instruments arerecognized at fair value and corresponding changes relating to dividend income are recognized inthe consolidated statements of comprehensive income.
Available-for-sale financial assets
Available-for-sale financial assets are non-DFIs that are designated as available-for-sale or arenot classified in any of the previous categories. PEMEX’s investments in certain equity securitiesand debt securities are classified as available-for-sale financial assets. Available-for-sale financialassets are recognized initially at fair value plus any directly attributable transaction costs.
Subsequent to initial recognition, available-for-sale financial assets are measured at fair value.In addition, any gains or losses associated with such instruments, as well as foreign exchangedifferences are recognized in other comprehensive results and presented in the fair value reservein equity. When an investment is derecognized, any gains or losses accumulated in the equity arereclassified to profit or loss.
Sales and purchases of financial assets that require the delivery of such assets within a periodof time established by market practice are recognized as of the negotiation date (the date onwhich PEMEX commits to purchase or sell the asset).
Loans and receivables
Loans and receivables are initially recognized at fair value. After initial recognition, loans anddebt securities that bear interest are measured at amortized cost using the effective interest rate(“EIR”) method, less impairment losses.
The amortized cost is calculated based on any discount or premium on acquisition and feesand costs that are an integral part of the EIR method. Amortization of costs is included under theheading of financing cost in the consolidated statements of comprehensive income.
Derivative financial instruments
DFIs presented in the consolidated statements of financial position are carried at fair value. Inthe case of DFIs held for trading, changes in fair value are recorded in profit or loss; in the case ofDFIs formally designated as and that qualify for hedging, changes in fair value are recorded in theconsolidated statements of comprehensive income using cash flow or fair value hedgeaccounting, with gains or losses classified in accordance with the earnings treatment of the hedgetransaction.
Embedded derivatives
Copyright © 2018 www.secdatabase.com. All Rights Reserved.Please Consider the Environment Before Printing This Document
PEMEX evaluates the potential existence of embedded derivatives, which may be found inthe terms of its contracts, or combined with other host contracts, which could be structuredfinancial instruments (debt or equity instruments with embedded derivatives). Embeddedderivatives have terms that implicitly or explicitly meet the characteristics of a DFI. In someinstances, these embedded derivatives must be segregated from the underlying contracts andmeasured, recognized, presented and disclosed as DFIs, such as when the economic risks andterms of the embedded derivative are not clearly and closely related to the underlying contract.
Impairment of financial assets
At each reporting date, PEMEX evaluates whether there is objective evidence that a financialasset or group of financial assets is impaired, in which case the value of the recoverable amountof the asset is calculated. A financial asset is impaired if objective evidence indicates that a lossevent has occurred after the initial recognition of the asset, and that the loss event had a negativeeffect on the estimated future cash flows of the financial asset.
Objective evidence that a financial asset or group of assets is impaired includes significantfinancial difficulty of the issuer or obligor, a breach of contract, such as a default or delinquencyin interest or principal payments; the lender, for economic or legal reasons relating to theborrower’s financial difficulty, granting to the borrower a concession that the lender would nototherwise consider; it becoming probable that the borrower will enter bankruptcy or otherfinancial reorganization; the disappearance of an active market for that financial asset because offinancial difficulties; or observable data indicating that there is a measurable decrease in theestimated future cash flows. Impairments by asset are:
Impairment of financial assets carried at amortized cost
The impairment of financial assets carried at amortized cost is measured as the differencebetween the assets carrying amount and the present value of estimated future cash flows(excluding future credit losses that have not been incurred) discounted at the financial asset’soriginal effective interest rate. The amount of the loss shall be recognized in profit or loss.
If, in a subsequent period, the amount of the impairment loss decreases and the decrease canbe related objectively to an event occurring after the impairment was recognized, the impairmentloss previously recognized shall be reversed in profit or loss.
Impairment in available—for—sale financial assets
In addition to the above-mentioned, a significant or prolonged decline in the fair value of aninvestment in an available—for—sale equity instrument is also objective evidence of impairment.
When there is objective evidence of the impairment of an asset, the accumulated lossrecognized in other comprehensive income shall be reclassified from equity to profit or loss eventhough the financial asset has not been derecognized.
If, in a subsequent period, the impairment loss decreases, the reversal shall be reflected as areversal in other comprehensive income.
Cash and cash equivalents f. Cash and cash equivalents
Cash and cash equivalents are comprised of cash balances on hand, net of overdrafts, depositsin bank accounts, foreign currency reserves and instruments with maturities of three months orless from the acquisition date that are subject to an insignificant risk of changes in their fair value,which are used in the management of PEMEX’s short-term commitments.
Cash subject to restrictions or that cannot be exchanged or used to settle a liability within 12months is presented as non-current assets.
Inventories and cost of sales g. Inventories and cost of sales
Copyright © 2018 www.secdatabase.com. All Rights Reserved.Please Consider the Environment Before Printing This Document
Inventories are valued at the lower of cost or net realizable value. Cost is determined basedon the cost of production or acquisition of inventory and other costs incurred in transporting suchinventory to its present location and in its present condition, using the average cost formula. Netrealizable value is the estimated selling price in the ordinary course of business less the estimatedcosts of completion and the estimated selling costs. The estimate takes into consideration, amongother things, the decrease in the value of inventories due to obsolescence.
Cost of sales represents the cost of production or acquisition of inventories at the time of sale,increased, where appropriate, by declines in net realizable value of inventories during the year.
Advance payment to suppliers for inventory purchases are recognized as part of inventorywhen the risks and benefits of the ownership of the inventory have been transferred to PEMEX.
Wells, pipelines, properties,plant and equipment
h. Wells, pipelines, properties, plant and equipment
Wells, pipelines, properties, plant and equipment are recorded at acquisition or constructioncost less accumulated depreciation and accumulated impairment losses.
PEMEX uses the successful efforts method for the exploration and production of crude oiland gas activities, considering the criteria mentioned in IFRS 6, “Exploration for and Evaluationof Mineral Resources” in relation to the recognition of exploration and drilling assets. Costs ofdevelopment wells and related plant, property and equipment involved in the exploitation of oiland gas are recorded as part of the cost of assets. The costs of exploratory wells in areas that havenot yet been designated as containing proved reserves are recorded as intangible assets until it isdetermined whether they are commercially viable to capitalize as fixed assets, otherwise they arerecognized as exploration expenses. Other expenditures on exploration are recognized asexploration expenses as they are incurred.
In accordance with IAS 16, “Property, Plant and Equipment” (“IAS 16”), initial costs ofwells, pipelines, properties, plant and equipment are initially recorded at cost, which includestheir original purchase price or construction cost, any costs attributable to bringing the assets to aworking condition for their intended use and the costs of dismantling and removing the items andrestoring the site on which they are located, including the estimated cost of plugging andabandoning wells.
The cost of financing projects that require large investments and financing incurred forprojects, net of interest revenues from the temporary investment of these funds, is recognized aspart of wells, pipelines, properties, plant and equipment when the cost is directly attributable tothe construction or acquisition of a qualifying asset. The capitalization of these costs is suspendedduring periods in which the development of construction is interrupted, and its capitalization endswhen the activities necessary for the use of the qualifying asset are substantially completed. Allother financing costs are recognized in the consolidated statements of comprehensive income inthe period in which they are incurred.
The cost of self-constructed assets includes the cost of materials and direct labor, interest onfinancing and any other costs directly attributable to start up. In some cases the cost also includesthe cost of plugging of wells and removal.
Expenditures related to the construction of wells, pipelines, properties, plant and equipmentduring the stage prior to commissioning are stated at cost as intangible assets or construction inprogress, in accordance with the characteristics of the asset. Once the assets are ready for use,they are transferred to the respective component of wells, pipelines, properties, plant andequipment and depreciation or amortization begins.
The costs of major maintenance or replacement of a significant component of an item ofwells, pipelines, properties, plant and equipment are recognized in the carrying amount of theitem if it is probable that the future economic benefits embodied within the component will flowto PEMEX and its cost can be measured reliably. The costs of recurring maintenance, repairs and
Copyright © 2018 www.secdatabase.com. All Rights Reserved.Please Consider the Environment Before Printing This Document
renovations of wells, pipelines, properties, plant and equipment carried out to maintain thefacilities in normal operation conditions are recognized in profit or loss as incurred.
Depreciation and amortization of capitalized costs in wells are determined based on theestimated economic life of the field to which the wells belong, considering the relationshipbetween the production of barrels of oil equivalent for the period and proved developed reservesof the field, as of the beginning of the period, with quarterly updates for new developmentinvestments.
Depreciation of other elements of pipelines, properties, plant and equipment is recognized inprofit or loss on a straight-line basis over the estimated useful life of the asset, beginning as of thedate that the asset is available for use, or in the case of construction, from the date that the asset iscompleted and ready for use.
When parts of an item of wells, pipelines, properties and equipment are significant relative tothe total cost of the item, the part is depreciated separately.
Estimated useful lives of items of properties, plant and equipment are reviewed ifexpectations differ from previous estimates.
Pipelines, properties, and equipment received from customers are initially recognized at fairvalue as revenue from ordinary operating activities if PEMEX has no future obligations to thecustomer who transferred the item. In contrast, if PEMEX does have future obligations to such acustomer, the initial recognition is recorded as a deferred liability based on the period in whichthe assets will provide services to the customers.
The capitalized value of finance leases is also included in the line item of wells, pipelines,properties, plant and equipment. Properties, plant and equipment acquired through financialleases are depreciated over the shorter of the lease term or the useful life of the asset.
Advance payments for the acquisition of pipelines, properties, plant and equipment are alsorecognized in the line item of wells, pipelines, properties, plant and equipment when the risks andbenefits of the ownership have been transferred to PEMEX.
Crude oil and natural gasreserves
i. Crude oil and natural gas reserves
Under Mexican law, all crude oil and other hydrocarbon reserves located in the subsoil ofMexico are owned by the Mexican nation and not by PEMEX. In accordance with theaforementioned and based on the applicable regulation as of the date of these consolidatedfinancial statements, the reserves assigned to PEMEX by the Mexican Government are notregistered for accounting purposes because they are not PEMEX’s property. PEMEX estimatestotal proved oil and natural gas reserve volumes in accordance with the definitions, methods andprocedures established in Rule 4-10(a) of Regulation S-X (“Rule 4-10(a)”) of the U.S. Securitiesand Exchange Commission (“SEC”) as amended, and where necessary, in accordance with theStandards Pertaining to the Estimating and Auditing of Oil and Gas Reserves Informationpromulgated by the Society of Petroleum Engineers (the “SPE”) as of February 19, 2007. Theseprocedures are consistent with international reserves reporting practice. The estimation of thesereserves depends on assumptions made and the interpretation of the data available, and may varyamong analysts. The results of drilling activities, test wells and production after the date ofestimation are utilized in future revisions of reserves estimates.
Although PEMEX does not own the oil and other hydrocarbon reserves within Mexico, theseprocedures allow PEMEX to record the effects that such oil and other hydrocarbon reserves haveon its consolidated financial statements, including, for example, in the depreciation andamortization line item.
Impairment of non-financialassets
j. Impairment of non-financial assets
The carrying amounts of PEMEX’s non-financial assets, other than inventories and deferredtaxes, are assessed for indicators of impairment at the end of each reporting period. If the net
Copyright © 2018 www.secdatabase.com. All Rights Reserved.Please Consider the Environment Before Printing This Document
carrying value of the asset or its cash-generating unit exceeds the recoverable amount, PEMEXrecords an impairment charge in its consolidated statement of comprehensive income.
A cash-generating unit is the smallest identifiable group of assets which can generate cashflows independently from other assets or groups of assets.
The recoverable amount of an asset or a cash-generating unit is defined as the higher of itsfair value minus the costs of disposal and its value in use. The value in use is the discountedpresent value of the net future cash flows expected to arise from the continuing use of an assetand from its disposal at the end of its useful life. In measuring value in use, the discount rateapplied is the pre-tax rate that reflects current market assessments of the time value of money andthe risks specific to the asset. Fair value is calculated using discounted cash flows determined bythe assumptions that market participants would apply in order to estimate the price of an asset orcash generating unit, assuming that such participants were acting in their best economic interest.
In the case of cash-generating assets or items dedicated to the exploration and evaluation ofhydrocarbons reserves, the recoverable amount is determined using the value in use based on theproved reserves and probable reserves, in some cases, for the risk factor associated with suchreserves.
Both impairment losses and reversals are recognized in the statement of comprehensiveincome in the costs and expenses line items in which the depreciation and amortization arerecognized. Impairment losses may not be presented as part of the costs that have beencapitalized in the value of any asset. Impairment losses related to inventories are recognized aspart of cost of sales. Impairment losses on investments in associates, joint ventures and otherinvestments are recognized as profit (loss) sharing in associates.
An impairment loss shall be reversed if there has been a change in the estimates used sincethe date when the impairment loss was recognized. These reversals will not exceed the carryingvalue of the asset as though no impairment had been recognized. Impairment losses and reversalsare presented in a separate line item in the statement of comprehensive income.
Leases k. Leases
The determination of whether an agreement is or contains a lease is based on the economicsubstance of the agreement at the date of execution. An agreement contains a lease ifperformance under the agreement depends upon the use of a specific asset or assets, or if theagreement grants the right to use the asset.
Finance leases, which transfer to PEMEX substantially all the inherent benefits and risks ofthe leased property, are capitalized at the date the lease commences, and the value is recorded asthe lower of the fair value of the leased property and the present value of the minimum leasepayments. Payments on the lease are divided between the financial costs and the amortization ofthe remaining debt principal in order to achieve a constant effective interest rate for theoutstanding liability. The financing costs are recognized in the statement of comprehensiveincome.
Operating lease payments are recognized as expenses in the statement of comprehensiveincome on a straight line basis over the term of the lease and variable rent payments arerecognized in the operating results on an accrued basis.
Provisions l. Provisions
PEMEX recognizes provisions when, as a result of a past event, PEMEX has incurred a legalor assumed present obligation for which a future disbursement is probable and the value of suchdisbursement is reasonably estimable. In certain cases, such amounts are recorded at their presentvalue.
Environmental liabilities
Copyright © 2018 www.secdatabase.com. All Rights Reserved.Please Consider the Environment Before Printing This Document
In accordance with applicable legal requirements and accounting practices, an environmentalliability is recognized when the cash outflows are probable and the amount is reasonablyestimable. Disbursements related to the conservation of the environment that are linked torevenue from current or future operations are accounted as expenses or assets, depending on thecircumstances of each disbursement. Disbursements related to past operations, which no longercontribute to current or future revenues, are accounted for as current period expenses.
The accrual of a liability for a future disbursement occurs when an obligation related toenvironmental remediation, for which PEMEX has the information necessary to determine areasonable estimated cost, is identified.
Retirement of assets
The obligations associated with the future retirement of assets, including those related to theretirement of wells, pipelines, properties, plant and equipment and their components arerecognized at the date that the retirement obligation is incurred, based on the discounted cashflow method. The determination of the fair value is based on existing technology and regulations.If a reliable estimation of fair value cannot be made at the time the obligation is incurred, theaccrual will be recognized when there is sufficient information to estimate the fair value.
The obligations related to the costs of future retirement of assets associated with the principalrefining processes for gas and petrochemicals are not recognized. These assets are considered tohave an indefinite useful life due to the potential for maintenance and repairs.
The abandonment costs related to wells currently in production and wells temporarily closedare recorded in the statement of comprehensive income based on the units of production method.Total cost of abandonment and plugging for non-producing wells is recognized in the statementof comprehensive income at the end of each period. All estimations are based on the useful livesof the wells, considering their discounted present value. Salvage values are not considered, asthese values commonly have not traditionally existed.
Employee benefits m. Employee benefits
Beginning January 1, 2016, Petróleos Mexicanos and the Subsidiary Entities have operatedboth a defined contribution plan and a defined benefit pension plan. Until December 31, 2015,PEMEX only operated a defined benefit pension plan.
Defined contribution pension plan
In this plan, both Petróleos Mexicanos and the Subsidiary Entities and their respectiveemployees contribute to the worker’s individual account. PEMEX’s contributions are recognizedon an accrual basis as cost, expense or asset, and are credited to liability.
Contributions to the defined contribution plan that are not expected to be fully settled within12 months after the end of the annual reporting period in which the employee rendered relatedservices will be discounted using the defined benefit plan discount rate.
Defined benefit plan
Under the defined benefit plan, Petróleos Mexicanos and the Subsidiary Entities are the onlyparties that contribute to a trust, which is managed separately. Petróleos Mexicanos and theSubsidiary Entities recognize the cost for defined benefit plans based on independent actuarialcomputations applying the projected unit credit method. Actuarial gains and losses are recognizedwithin other comprehensive results for the period in which they are determined.
The costs of prior services are recognized within profit or loss for the period in which theyare determined.
Copyright © 2018 www.secdatabase.com. All Rights Reserved.Please Consider the Environment Before Printing This Document
The asset or liability in the defined benefit plan comprises the present value of the definedbenefit obligation less the fair value of plan assets for which obligations have to be settled. Thevalue of any asset is limited to the present value of any economic benefit represented by the planreimbursements or reductions of the future contributions to the plan.
In addition, other long term employee benefits include the seniority premiums payable fordisability, death and survivors benefits, medical services, gas and basic food basket forbeneficiaries.
Termination benefits are recognized in profit or loss for the year in which they are incurred.Income taxes and duties n. Income taxes and duties
Current income tax
Current income tax assets or liabilities for the current and prior years are measured as theamount expected to be paid or to be recovered from the tax authorities, using either the tax ratesin force or tax rates which are in the process of being approved and are substantially completedby the end of the year.
Current income taxes related with items that are recognized as equity are presented in theother comprehensive income of the year. Periodically, PEMEX evaluates the positions taken in itstax returns for those regulations that are subject to interpretation and books correspondingprovisions, if it is deemed necessary.
Deferred income taxes
Deferred taxes are recorded based on the assets and liabilities method, which consists of therecognition of deferred taxes by applying tax rates applicable to the income tax to the temporarydifferences between the carrying value and tax values of assets and liabilities at the date of theseconsolidated financial statements.
Deferred tax liabilities are recognized for all taxable temporary differences, except to theextent that the deferred tax liability arises from:
• the initial recognition of goodwill or the initial recognition of an asset or liability in atransaction which is not a business combination and at the time of the transaction, affectsneither accounting profit nor taxable profit or tax loss; and
• taxable temporary differences associated with investments in subsidiaries, branches andassociates, and interest in joint arrangements, when the parent, investor, joint venture orjoint operator is able to control the timing of reversal of the temporary difference and it isprobable that the temporary difference will not reverse in the foreseeable future.
Deferred tax assets are recognized for all deductible temporary differences and the carryforward of both unused tax credits and unused tax losses to the extent that it is probable thattaxable profit will be available against deductible temporary differences, and that the carryforward of both unused tax credits and unused tax losses can be utilized, unless:
• the deferred tax asset relating to deductible temporary difference arises from the initialrecognition of asset or liability derived from a transaction that is not a businesscombination and, at the time of the transaction, affects neither accounting profit nortaxable profit or tax loss; and
• in respect of deductible temporary differences associated with investments in subsidiaries,associates and interests in joint ventures, deferred tax assets are recognized only to theextent that it is probable that the temporary differences will reverse in the foreseeablefuture and taxable profit will be available, against which the temporary differences can beutilized.
Copyright © 2018 www.secdatabase.com. All Rights Reserved.Please Consider the Environment Before Printing This Document
The carrying amount of a deferred tax asset is reviewed at the end of each reporting period.PEMEX reduces the carrying amount of a deferred tax asset to the extent that it is no longerprobable that a sufficient taxable profit will be available to allow the benefit of that deferred taxasset to be utilized in whole or in part. Unrecognized deferred tax assets are revalued at eachreporting date and will be recognized to the extent that it is probable that future taxable incomewill be sufficient to allow for the recovery of the deferred tax asset.
Deferred tax assets and liabilities are measured at the tax rates that are expected to apply tothe period when the asset is realized or the liability is settled, based on tax rates (and tax laws)that have been enacted or substantively enacted by the end of the reporting period.
Deferred tax assets and deferred tax liabilities related with items that are recognized in equityshall be presented directly in other comprehensive income.
Deferred tax assets and deferred tax liabilities are offset if PEMEX has a legal right to set offcurrent tax assets against current tax liabilities and are levied by the same taxation authority orthe same taxable entity.
Income taxes and duties
PEMEX is subject to taxes and special duties, which are based on the value of hydrocarbonsextracted, with certain deductions.
These taxes and duties are recognized in accordance with IAS 12, “Income Taxes” (IAS 12),when they have the characteristics of income tax, which occurs when such taxes are set by agovernment authority and are determined on a formula that considers the balance of income (orextraction valued at a selling price) less expenses. Taxes and duties that meet this criteria shouldbe recognized for current and deferred income tax based on the above paragraphs. Taxes andduties that do not meet this criteria are recognized as liabilities, affecting the costs and expensesrelating to the transactions that gave rise to them.
Impuesto Especial sobreProduccion y Servicios
o. Impuesto Especial sobre Producción y Servicios
(Special Tax on Production and Services, or “IEPS Tax”)
The IEPS Tax charged to customers is a withholding tax on domestic sales of gasoline, dieseland fossil fuels. The applicable quotas depend on, among other factors, the product, producer’sprice, freight costs, commissions and the region in which the respective product is sold. Thewithholding tax does not affect the results of PEMEX.
Contingencies p. Contingencies
Contingency losses are recorded when it is probable that a liability has been incurred and theamount thereof can be reasonably estimated. When a reasonable estimation cannot be made,qualitative disclosure is provided in the notes to the consolidated financial statements. Contingentrevenues, earnings or assets are not recognized until realization is assured.
Revenue recognition q. Revenue recognition
Sales revenue is recognized at the moment when the risks and benefits of ownership of crudeoil, refined or gas products, and derivative and petrochemical products are transferred to thecustomers who acquire them, which occurs as follows:
• in accordance with contractual terms;
• the moment at which the customer picks up product at PEMEX’s facilities; or
• the moment at which PEMEX delivers the product to the delivery point.
Services rendered are recognized as services income when the customers accept the receipt ofthe services.
Presentation of consolidatedstatements of comprehensiveincome
r. Presentation of consolidated statements of comprehensive income
The costs and expenses shown in PEMEX’s consolidated statements of comprehensiveincome are presented based on their function, which allows for a better understanding of the
Copyright © 2018 www.secdatabase.com. All Rights Reserved.Please Consider the Environment Before Printing This Document
components of PEMEX’s operating income. This classification allows for a comparison to theindustry to which PEMEX belongs.
Revenues
Represents revenues from sale or products or services.
Cost of sales
Cost of sales represents the acquisition and production costs of inventories at the time of sale.Cost of sales mainly includes depreciation, amortization, salaries, wages and benefits, a portion ofthe cost of the reserve for employee benefits and operating expenses related to the productionprocess.
Other revenues (expenses), net
Other revenues (expenses), net consist primarily of income and expenses that are not relateddirectly to the operation of PEMEX.
Transportation, distribution and sale expenses
Transportation, distribution and sale expenses are costs in connection with the storage, saleand delivery of products, such as the depreciation and operating expenses associated with theseactivities.
Administrative expenses
Administrative expenses are costs related to PEMEX’s areas that provide administrativesupport.
Financing income
Financing income is comprised of interest income, financial income and other income fromfinancial operations between PEMEX and third parties.
Financing cost
Financing cost is comprised of interest expenses, commissions and other expenses related toPEMEX’s financing operations less any portion of the financing cost that is capitalized.
Derivative financial instruments (cost) income, net
Derivative financial instruments (cost) income represents the net effect of the profit or lossfor the year associated with DFIs.
Foreign exchange loss, net
Exchange rate variations relating to assets or liabilities governed by contracts denominated inforeign currencies are recorded in income (loss) for the year.
Operating segments s. Operating segments
Operating segments are identifiable components of PEMEX that pursue business activitiesfrom which PEMEX earns revenues and incurs expenses, including those revenues and expensesfrom transactions with other segments of PEMEX, and for which information is available tomanagement on a segmented basis and is assessed by the Board of Directors in order to allocateresources and assess the profitability of the segments.
Non-current assets held forsale, non-current assets held
t. Non-current assets held for sale, non-current assets held for distribution to owners anddiscontinued operations
Copyright © 2018 www.secdatabase.com. All Rights Reserved.Please Consider the Environment Before Printing This Document
for distribution to owners anddiscontinued operations
Non-current assets held for sale
PEMEX classifies a non-current asset, or a disposal group of assets, as held for sale if (a) itscarrying amount will be recovered principally through a sale transaction rather than throughcontinuing use; (b) the asset or group of assets is available in its present condition for immediatesale and (c) the sale is expected to be completed within one year from the date of classification, ormore, with certain exceptions.
Non-current assets classified as held for sale are measured at the lower of its carrying amount,and fair value less cost of sales and presented in a separate line item in the consolidatedstatements of financial position. Non-current assets classified as held for sale are not subject todepreciation or amortization after the classification as held for sale.
The liabilities of a disposal group classified as held for sale are presented separately fromother liabilities in the statement of financial position. Those assets and liabilities are not offsetand are presented as a single amount.
Non-current asset held for distribution to owners
When PEMEX agrees to distribute a non-current asset, or a disposal group of assets, toowners, this asset or disposal group of assets, is classified as held for distribution to owners if: a)a non-current asset or disposal group of assets is available for immediate distribution in itspresent condition and b) the distribution must be highly expected to be completed within one yearfrom the date of classification, with certain exceptions.
Non-current assets classified as held for distribution are measured at the lower of theircarrying amount and fair value less cost of distribution and are presented in a separate line item inthe consolidated financial statements. Non-current assets classified as held for distribution are notsubject to depreciation or amortization after the classification as held for distribution.
The liabilities of a disposal group classified as held for distribution to owners are presentedseparately from other liabilities in the statement of financial position. Those assets and liabilitiesshall not be offset and shall be presented as a single amount.
Discontinued operations
A discontinued operation is a component of an entity that either has been disposed of or isclassified as held for sale, and either:
• represents a separate major line of business or geographical area of operations;
• is part or a single coordinated plan to dispose of a separated major line of business orgeographical area of operations; or
• is a subsidiary acquired exclusively with a view to resale.
The revenues or expenses from discontinued operations, including profits or losses fromprevious years, are presented in a specific line item in the consolidated statements ofcomprehensive income.
Accounting changes u. Accounting changes
The IASB issued new amendments to the IFRS mentioned below, which are applicable toPEMEX and are effective for annual periods beginning January 1, 2017:
a) IAS 12 “Income Taxes: Recognition of Deferred Tax Assets for Unrealized Losses”(“IAS 12”)
The IASB issues amendments to IAS 12 to clarify the diversity of practices in the recognitionof deferred tax assets for unrealized losses related to debt instruments measured at fair value.
Copyright © 2018 www.secdatabase.com. All Rights Reserved.Please Consider the Environment Before Printing This Document
The amendments to IAS 12 include some explanatory paragraphs and an illustrative example.
The amendments clarify the following aspects of IAS 12:
• Unrealized losses on debt instruments measured at fair value for accounting purposes andmeasured at cost for tax purposes give rise to deductible temporary differences regardlessof whether the debt instrument’s holder expects to recover the carrying amount of the debtinstrument by sale or by use.
• The carrying amount of an asset does not limit the estimation of probable future taxableprofits.
• Estimates of future taxable profits exclude tax deductions resulting from the reversal ofdeductible temporary differences.
• An entity assesses a deferred tax asset in combination with other deferred tax assets.Where tax law restricts the utilization of tax losses, an entity would assess a deferred taxasset in combination with other deferred tax assets of the same type.
The amendments are to be applied retrospectively and are effective for annual periodsbeginning on or after January 1, 2017. Earlier application is permitted.
These amendments had no impact on these consolidated financial statements.
b) Amendments to IAS 7 “Statement of Cash Flows” (“IAS 7”)
The IASB issued amendments to IAS 7. The amendments are intended to clarify disclosureprovided to the user of financial statements about an entity’s financing activities.
Changes
The amendments in IAS 7 come with the objective that entities shall provide disclosures thatenable users of financial statements to evaluate changes in liabilities arising from financingactivities.
To achieve this objective, the IASB requires that the following changes in liabilities arisingfrom financing activities are disclosed: (i) changes from financing cash flows; (ii) changes arisingfrom obtaining or losing control of subsidiaries or other businesses; (iii) the effects of changes inforeign exchange rate; (iv) changes in fair values; and (v) other changes.
The IASB defines liabilities arising from financing activities as liabilities “for which cashflows were, or future cash flows will be, classified in the statements of cash flows as cash flowsfrom financing activities.” It also stresses that the new disclosure requirements also relate tochanges in financial assets if they meet the same definition.
The amendments state that one way to fulfill the new disclosure requirements is to providereconciliation between the opening and closing balances in the statement of financial position forliabilities arising from financing activities.
Finally, the amendments state that changes in liabilities arising from financing activities mustbe disclosed separately from changes in other assets and liabilities.
The amendments are effective for annual periods beginning on or after January 1, 2017.Earlier application is permitted. Entities need not provide comparative information when theyfirst apply the amendments.
Impacts on this amendments are disclosed in Note 15.
Copyright © 2018 www.secdatabase.com. All Rights Reserved.Please Consider the Environment Before Printing This Document
c) IFRS 12 “Disclosure of Interest in Other Entities” (“IFRS 12”)—AnnualImprovements to IFRS 2014—2016 Cycle.
As of December 2016, the IASB published Annual Improvements to IFRS 2014—2016Cycle, which clarified the scope of IFRS 12, by specifying that the disclosure requirements applyto all subsidiaries, joint arrangements, associates and unconsolidated structured entities classifiedas held for sale, held for distribution or as discontinued operations in accordance with IFRS 5,with certain exceptions.
The amendments are going to be applied restrospectively and are effective for annual periodsbeginning on or after January 1, 2017.
These improvements had no impact on these consolidated financial statements.New accounting policies notyet adopted
v. New IFRS not yet adopted
The IASB issued amendments and new IFRS that are not effective as of December 31, 2017but that could have an impact on subsequent PEMEX financial statements.
Amendments effective for periods beginning in 2018:
a) IFRS 15, “Revenue from Contracts with Customers” (“IFRS 15”)
The core principle of the new IFRS 15 is that an entity should recognize revenue as thepromised transfer of goods or services to the customer, valued at the amount that the entityexpects to be entitled in exchanged for those goods or services.
Pursuant to IFRS 15, an entity should:
• identify customer contracts that fall within the scope of the new standard;
• identify the separate performance obligations in the contract based on the followingcriteria: (i) sales of goods or services, separately, (ii) sales that are dependent orinterrelated with other products or services; and (iii) homogeneous and consistent salespattern;
• determine the price of the transaction by applying the following considerations:(i) variable consideration and constraining estimates of variable consideration; (ii) theexistence of a significant financing component in the contract; (iii) any non-cashconsideration; and (iv) the consideration payable to the customer;
• allocate the transaction price to each separate performance obligation; and
• recognize revenue when (or as) each performance obligation is satisfied either over timeor at a point in time.
The new IFRS 15 enhances disclosures of revenue. This standard must be applied for periodsbeginning on or after January 1, 2018, and early application is permitted. During the year ofapplication, entities may apply the rule retrospectively or use a modified approach.
PEMEX will adopt IFRS 15 retrospectively with the cumulative effect of applying the newstandard recognized at the date of initial adoption (January 1, 2018) as an adjustment to theopening balance of retained earnings or other component of equity, as applicable. Under thistransition method, PEMEX elected to apply this standard retrospectively only to contracts thatwere not completed contracts at January 1, 2018. For contracts that have been completed beforeDecember 31, 2017, with revenues not fully recognized as of that date, the current accountingpolicies under IAS 18 will continue to apply when recognizing revenue of those contracts during2018. For contracts that take effect from January 1, 2018, revenue will be recognized inaccordance with IFRS 15.
Copyright © 2018 www.secdatabase.com. All Rights Reserved.Please Consider the Environment Before Printing This Document
As part of the implementation of IFRS 15, different types of revenue from contracts withcustomers have been identified, evaluated and documented, as well as the main changes inaccounting policies that will be reflected as of January 1, 2018 with respect to new contracts. Themain changes in accounting policies are as follows:
i. Sale of products with other services:
The adoption of IFRS 15 will affect the manner in which PEMEX records the sale ofproducts including oil, refined products, gas, petrochemicals, fertilizers and other sales.Until December 31, 2017, freight and other services, for example were recognizedseparately from products sold. Under IFRS 15, revenue is recognized with respect to theperformance obligation under the contract, and so certain services that are currentlyaccounted for separately, will now be presented as a single performance obligationtogether with the sale of the product.
ii. Services:
Services include transportation and storage of hydrocarbons, petroleum, petrochemicals,refined products, gas, petrochemical derivatives and others.
Rental services and some transportation services are currently presented in the revenuesfrom services line item in the income statement. In many cases of services withcomponents of leases are less than one year operating leases. Revenues corresponding toleasing have not been presented separately from revenues from services.
Under IFRS 15, leases cannot be presented in the same line item as revenues fromservice. The main change in accounting policy will be the separation and presentation ofservice and lease components.
iii. Determination of the transaction price:
Refunds, discounts, quantity and quality claims (in favor or against) and penalties (tocustomers or PEMEX) or breaches related to the sale of certain products were previouslyrecognized as revenues. However, under IFRS 15, revenues will only be recognized if it ishighly probable that there will not be a significant reversal in the revenue received. As aresult, PEMEX will put in place mechanisms to approximate the refunds, discounts,quantity and quality claims and penalties at the time that the control of the product istransferred.
Revenue recognition
Revenues are currently recognized when the risks and benefits of the product are transferred,which occurs when the customer picks up or receives the product at PEMEX´s facilities or at aspecific point of sale, accepts the products and assumes the risks and benefits related to thetransfer of ownership.
Under IFRS 15, revenues from sale of products are recognized when the contractualobligation is satisfied, and control of the products is transferred to the customer. There will bechanges in the revenue recognition of gas sale and certain services from “one point in time” to“over time”. However, a significant change is not expected because in some cases the practicalexpedient “right to invoice” will be applied to measure progress towards completion of thetransaction.
As of December 31, 2017, PEMEX did not identify any significant uncompleted contracts. Asa result, PEMEX has determined that the changes to amounts in prior years will not besignificant. Nonetheless, there will be important changes in accounting policies for contractsissued as of January 1, 2018.
b) IFRS 9, “Financial Instruments” (“IFRS 9”(2014))
Copyright © 2018 www.secdatabase.com. All Rights Reserved.Please Consider the Environment Before Printing This Document
In July 2014, the IASB finalized the accounting reform of financial instruments and issuedIFRS 9 (revised in 2014), which contains the requirements for, a) the classification andmeasurement of financial assets and liabilities, b) impairment methodology, and c) generalinformation about hedge accounting. IFRS 9 (revised in 2014) replaces IAS 39 FinancialInstruments: Recognition and Measurement as of its effective date.
These requirements should be applied retrospectively and, as permitted by IFRS 9 transitionalprovisions, it is not necessary for companies to restate comparative figures. Any adjustment in thecarrying amounts of the financial assets and liabilities at the transition date is recognized byaffecting the cumulative effect in the initial opening period.
The classification criteria depends on a combination of two important factors:
i. the business model within the financial asses is held (the business model test); and
ii. the contractual cashflow of the financial asset (the SPPI test). Based on these two tests,the asset can be measured as follows:
• Amortized cost: Financial Instruments under a business model whose objective isonly the collection of contractual cash flows which are composed of principal andinterest payments and where there are no significant sales unjustified and fair valueis not a key factor in the management of these financial assets and the characteristicsof cash flows represent substantially a “basic loan agreement” or SPPI. Unjustifiedsales are different from sales related to an increase in the credit risk of an asset orunexpected financing needs.
• Fair value with changes through other comprehensive income (“FVOCI”): FinancialInstruments in a business model whose objective is to obtain cash flows and the saleof those assets, where fair value is a key factor in its management. In addition, thecharacteristics of the contractual cash flows represent substantially a “basic loanagreement”.
• Fair value with changes through profit or loss (“FVPL”): Financial instruments in abusiness model whose objective is not the aforementioned models, where fair valueis a key factor in the management of these assets, and the financial instrumentswhose contractual cash flow characteristics do not substantially represent a “basicloan agreement”.
IFRS also replaces the impairment model of IAS 39 (the “loss incurred model”) with a newimpairment model called the “expected credit loss” model. This impairment model will beapplicable to financial assets that are not measured at FVPL. Changes in fair value of financialassets through FVOCI to the point of disposal are recorded in OCI.
The expected credit loss recognized for impairment purposes under IFRS 9 will be equivalentto a 12-month reserve, except when the financial instrument presents a “significant increase incredit risk” or presents objective evidence of impairment, recognizing a reserve equivalent to theremaining life of the financial instrument, based on the definition of general approach under IFRS9.
IFRS 9 Implementation and government strategy
PEMEX has established a multidisciplinary working group with the objective to adapt itsprocesses to the new standard in relation to the classification and measurement of financialinstruments and the impairment estimation of credit risk, ensuring that these processes have beenapplied and adopted in accordance with IFRS 9.
Regarding classification and measurement, PEMEX carried out an analysis of its financialassets in order to identify those that could trigger a change in the accounting methodology, due tothe definition of the business model and a failure to satisfy the SPPI test.
Copyright © 2018 www.secdatabase.com. All Rights Reserved.Please Consider the Environment Before Printing This Document
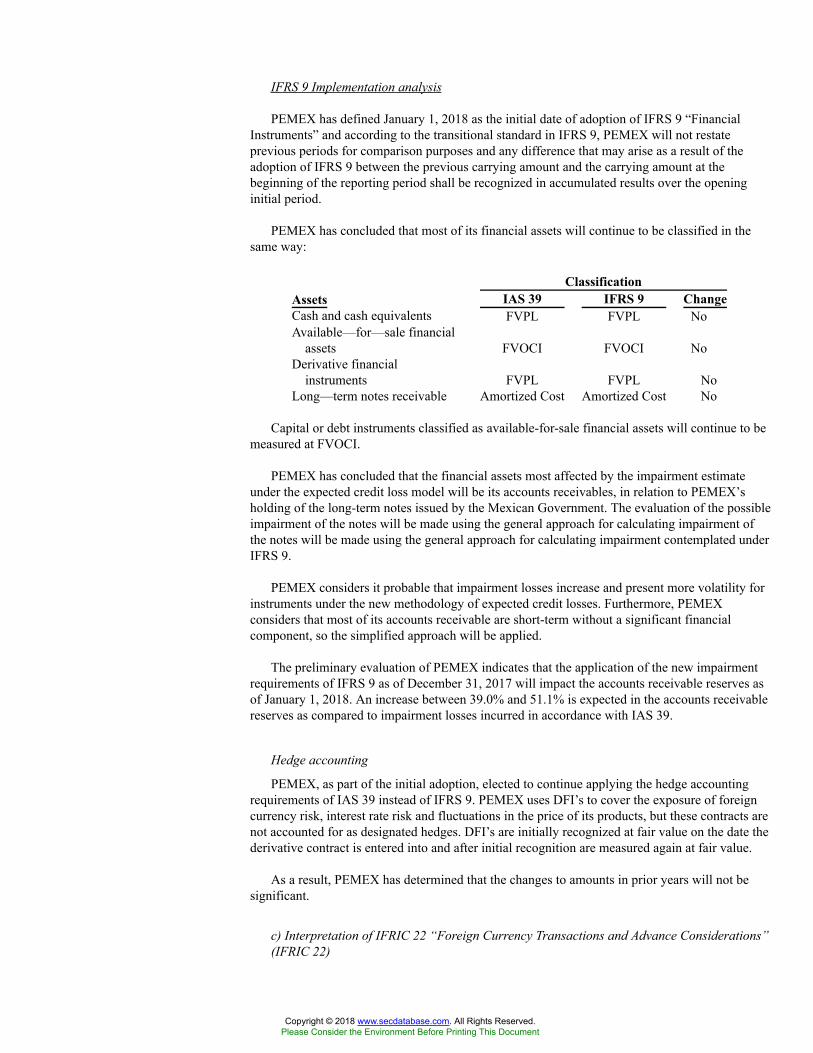
IFRS 9 Implementation analysis
PEMEX has defined January 1, 2018 as the initial date of adoption of IFRS 9 “FinancialInstruments” and according to the transitional standard in IFRS 9, PEMEX will not restateprevious periods for comparison purposes and any difference that may arise as a result of theadoption of IFRS 9 between the previous carrying amount and the carrying amount at thebeginning of the reporting period shall be recognized in accumulated results over the openinginitial period.
PEMEX has concluded that most of its financial assets will continue to be classified in thesame way:
ClassificationAssets IAS 39 IFRS 9 ChangeCash and cash equivalents FVPL FVPL NoAvailable—for—sale financial
assets FVOCI FVOCI NoDerivative financial
instruments FVPL FVPL NoLong—term notes receivable Amortized Cost Amortized Cost No
Capital or debt instruments classified as available-for-sale financial assets will continue to bemeasured at FVOCI.
PEMEX has concluded that the financial assets most affected by the impairment estimateunder the expected credit loss model will be its accounts receivables, in relation to PEMEX’sholding of the long-term notes issued by the Mexican Government. The evaluation of the possibleimpairment of the notes will be made using the general approach for calculating impairment ofthe notes will be made using the general approach for calculating impairment contemplated underIFRS 9.
PEMEX considers it probable that impairment losses increase and present more volatility forinstruments under the new methodology of expected credit losses. Furthermore, PEMEXconsiders that most of its accounts receivable are short-term without a significant financialcomponent, so the simplified approach will be applied.
The preliminary evaluation of PEMEX indicates that the application of the new impairmentrequirements of IFRS 9 as of December 31, 2017 will impact the accounts receivable reserves asof January 1, 2018. An increase between 39.0% and 51.1% is expected in the accounts receivablereserves as compared to impairment losses incurred in accordance with IAS 39.
Hedge accounting
PEMEX, as part of the initial adoption, elected to continue applying the hedge accountingrequirements of IAS 39 instead of IFRS 9. PEMEX uses DFI’s to cover the exposure of foreigncurrency risk, interest rate risk and fluctuations in the price of its products, but these contracts arenot accounted for as designated hedges. DFI’s are initially recognized at fair value on the date thederivative contract is entered into and after initial recognition are measured again at fair value.
As a result, PEMEX has determined that the changes to amounts in prior years will not besignificant.
c) Interpretation of IFRIC 22 “Foreign Currency Transactions and Advance Considerations”(IFRIC 22)
Copyright © 2018 www.secdatabase.com. All Rights Reserved.Please Consider the Environment Before Printing This Document
As of December 2016, IASB published an interpretation of IFRIC 22 developed by theInternational Financial Reporting Standards Interpretations Committee (the InterpretationsCommittee). The interpretation clarified when to recognize payments and collections of foreigncurrency transactions paid in advance.
According to the interpretations, an entity must recognize foreign currency transactions when:
i. there is consideration that is denominated or priced in a foreign currency;
ii. the entity recognizes a prepayment asset or a deferred income liability in respect of thatconsideration, in advance of the recognition of the related asset, expense or income; and
iii. the prepayment asset or deferred income liability is non-monetary.
The Interpretations Committee concluded that:
• The date of the transaction, for the purpose of determining the exchange rate, is the dateof initial recognition of the non- monetary prepayment asset or deferred income liability.
• If there are multiple payments or receipts in advance, a date of transaction is establishedfor each payment or receipt.
IFRIC 22 is effective for annual reporting periods beginning on or after January 1, 2018.Entities may apply the rule retrospectively, or prospectively, in accordance with IAS 8 withcertain exemptions.
PEMEX believes that these standards will not have an impact on its consolidated financialstatements.
Standards effective for periods beginning in 2019
a) IFRS 16, “Leases” (“IFRS 16”)
In January 2016, the IASB published a new accounting standard IFRS 16, which replaces IAS17, “Leases and Guide interpretations.”
The main changes from the previous standard are:
• IFRS 16 provides a comprehensive model for the identification of the lease arrangementsand their treatment in the financial statements of both lessees and lessors;
• the new standard applies a control model to the identification of leases, distinguishingbetween leases and service contracts on the basis of whether there is an identified assetcontrolled by the customer;
• the distinction between financial and operating leasing is removed, therefore, the assetsand liabilities are recognized in respect of all leases, with some exceptions for short-termleases and leases of low-value assets; and
• the standard does not include significant changes to the requirements for accounting bylessors.
The standard is effective for annual periods beginning on or after January 1, 2019, withearlier application permitted for entities that have also adopted IFRS 15, “Revenue fromContracts with Customers.”
PEMEX has established a multidisciplinary working group with the objective to adapt itsprocesses to the new standard in the following phases: (i) training, (ii) obtaining information,(iii) diagnostic, (iv) determination of initial adjustments and (v) integration of change. As of thedate of these consolidated financial statements, the training phase for the accounting staff iscomplete and PEMEX is in the process of analyzing leasing contracts in order to determinenecessary changes to its procedures and reports. PEMEX has not determined the impact of IFRS
Copyright © 2018 www.secdatabase.com. All Rights Reserved.Please Consider the Environment Before Printing This Document

16 on its net income (loss) for the year. PEMEX estimates that it will conclude theimplementation of IFRS 16 in February 2019.
b) Annual improvements—2015-2017 Cycle
In December 2017, the IASB published “the Annual Improvements to the IFRS of the2015-2017 Cycle” through which it clarifies the following IFRS:
• IFRS 3 Business Combinations and IFRS 11 Joint Arrangements
IFRS 3 Business Combinations clarifies how an entity should recognize an increase of itsinterest in a joint operation:
• When a party to a joint arrangement obtains control of a business that was a part ofthat joint arrangement, and where that party had assumed a portion of the rights tothe assets and obligations to the liabilities of that business prior to the acquisitiondate, the acquisition will be considered a business combination that is achieved instages. The acquiriting entity must therefore apply the requirements for a businesscombination achieved in stages, including by measuring its previously held interestin the joint arrangement.
• When a party participates in, but does not share in the control of a joint operation,and subsequently takes joint control of that joint operation, this will constitute theacquisition of a business and previously held interest in the joint operation are notmeasured.
• IAS 12 Income Tax
All income tax consequence of dividends (including payments on financial instrumentsclassified as equity) are recognized consistently with the transactions that generated thedistributable profits (i. e. in profit or loss, other comprehensive income or equity basis).
• IAS 23 Borrowing Costs
With respect to the treatment of costs for loans subject to capitalization, the amendmentsclarify that:
• To the extent that an entity borrows funds generally and uses them for the purpose ofobtaining a qualifying asset, that entity shall determine the amount of borrowingcosts eligible for capitalization by applying a capitalization rate to the expenditureson that asset. The capitalization rate shall be the weighted average of the borrowingcosts applicable to all borrowings of the entity that are outstanding during the period.
• However, an entity shall exclude from this calculation borrowing cost applicable toborrowing made specifically for the purpose of obtaining a qualifying asset untilsubstantially all the activities necessary to prepare that asset for its intended used orsale are complete.
The amount of borrowing costs that an entity capitalizes during a period shall not exceed theamount of borrowing costs it incurred during that period.
The amendments are effective for annual periods beginning on or after January 1, 2019.
PEMEX is in the process of evaluating the impact that these amendments will have on itsconsolidated financial statements.
c) IFRIC 23—Uncertainty over Income Tax Treatments
In June 2017, the IASB published a new accounting interpretation to be applied to thedetermination of taxable profit (tax loss), tax bases, unused tax losses, unused tax credits and taxrates, where there is uncertainty over income tax treatments under IAS 12.
Copyright © 2018 www.secdatabase.com. All Rights Reserved.Please Consider the Environment Before Printing This Document
In order to make these tax assessments, an entity must consider whether it is probable that therelevant taxing authority will accept each tax treatment, or group of tax treatments, that the entityhas used or plans to use in its next income tax filing:
• If the entity concludes that it is probable that a particular tax treatment will be acceptedby the relevant taxing authority, that entity must determine taxable profit (tax loss), taxbases, unused tax losses, unused tax credits or tax rates consistently with the tax treatmentincluded in its income tax filings.
• If the entity concludes that it is not probable that a particular tax treatment is accepted bythe relevant taxing authority, the entity must use the most likely amount or the expectedvalue of the tax treatment when determining taxable profit (tax loss), tax bases, unusedtax losses, unused tax credits and tax rates. That calculation should be based on whichmethod provides better predictions of the resolution of the uncertainty.
IFRIC 23 is effective for annual reporting periods beginning on or after January 1, 2019.Earlier application is permitted. PEMEX does not anticipate being impacted by IFRIC 23 becauseall tax positions are discussed and agreed with the SHCP prior to releasing quarterly or annualfinancial statements.
Copyright © 2018 www.secdatabase.com. All Rights Reserved.Please Consider the Environment Before Printing This Document
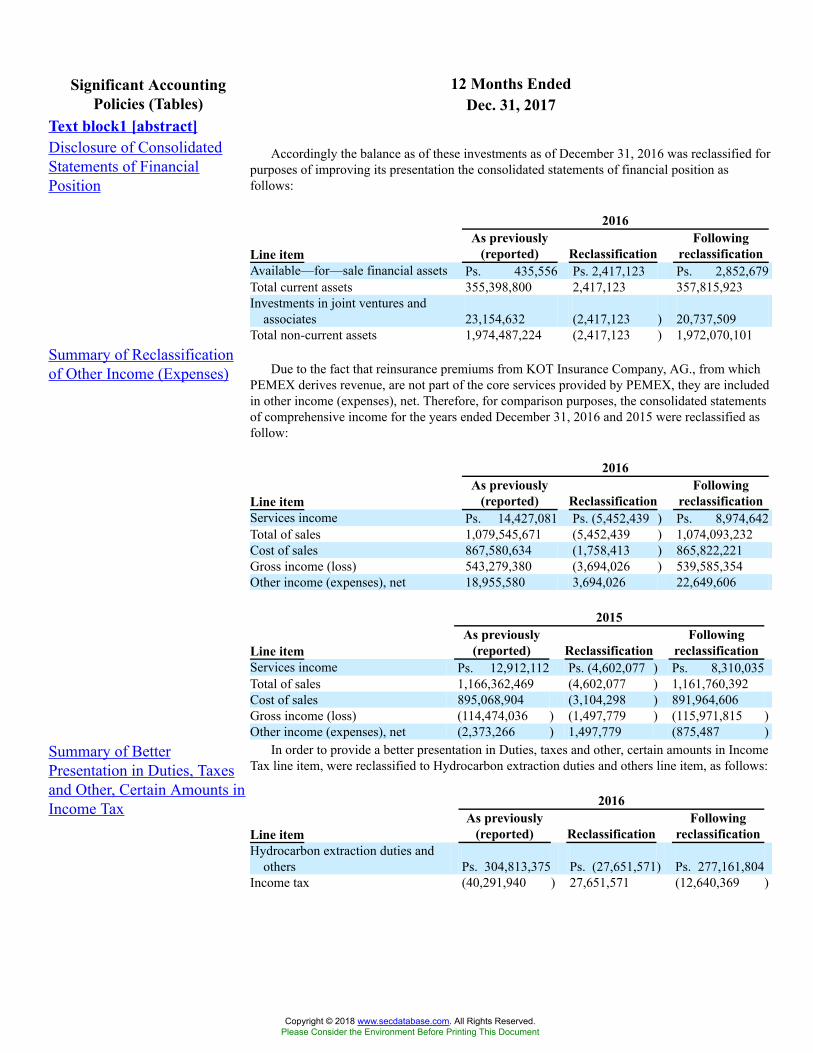
12 Months EndedSignificant AccountingPolicies (Tables) Dec. 31, 2017
Text block1 [abstract]Disclosure of ConsolidatedStatements of FinancialPosition
Accordingly the balance as of these investments as of December 31, 2016 was reclassified forpurposes of improving its presentation the consolidated statements of financial position asfollows:
2016
Line itemAs previously
(reported) ReclassificationFollowing
reclassificationAvailable—for—sale financial assets Ps. 435,556 Ps. 2,417,123 Ps. 2,852,679Total current assets 355,398,800 2,417,123 357,815,923Investments in joint ventures and
associates 23,154,632 (2,417,123 ) 20,737,509Total non-current assets 1,974,487,224 (2,417,123 ) 1,972,070,101
Summary of Reclassificationof Other Income (Expenses) Due to the fact that reinsurance premiums from KOT Insurance Company, AG., from which
PEMEX derives revenue, are not part of the core services provided by PEMEX, they are includedin other income (expenses), net. Therefore, for comparison purposes, the consolidated statementsof comprehensive income for the years ended December 31, 2016 and 2015 were reclassified asfollow:
2016
Line itemAs previously
(reported) ReclassificationFollowing
reclassificationServices income Ps. 14,427,081 Ps. (5,452,439 ) Ps. 8,974,642Total of sales 1,079,545,671 (5,452,439 ) 1,074,093,232Cost of sales 867,580,634 (1,758,413 ) 865,822,221Gross income (loss) 543,279,380 (3,694,026 ) 539,585,354Other income (expenses), net 18,955,580 3,694,026 22,649,606
2015
Line itemAs previously
(reported) ReclassificationFollowing
reclassificationServices income Ps. 12,912,112 Ps. (4,602,077 ) Ps. 8,310,035Total of sales 1,166,362,469 (4,602,077 ) 1,161,760,392Cost of sales 895,068,904 (3,104,298 ) 891,964,606Gross income (loss) (114,474,036 ) (1,497,779 ) (115,971,815 )Other income (expenses), net (2,373,266 ) 1,497,779 (875,487 )
Summary of BetterPresentation in Duties, Taxesand Other, Certain Amounts inIncome Tax
In order to provide a better presentation in Duties, taxes and other, certain amounts in IncomeTax line item, were reclassified to Hydrocarbon extraction duties and others line item, as follows:
2016
Line itemAs previously
(reported) ReclassificationFollowing
reclassificationHydrocarbon extraction duties and
others Ps. 304,813,375 Ps. (27,651,571) Ps. 277,161,804Income tax (40,291,940 ) 27,651,571 (12,640,369 )
Copyright © 2018 www.secdatabase.com. All Rights Reserved.Please Consider the Environment Before Printing This Document
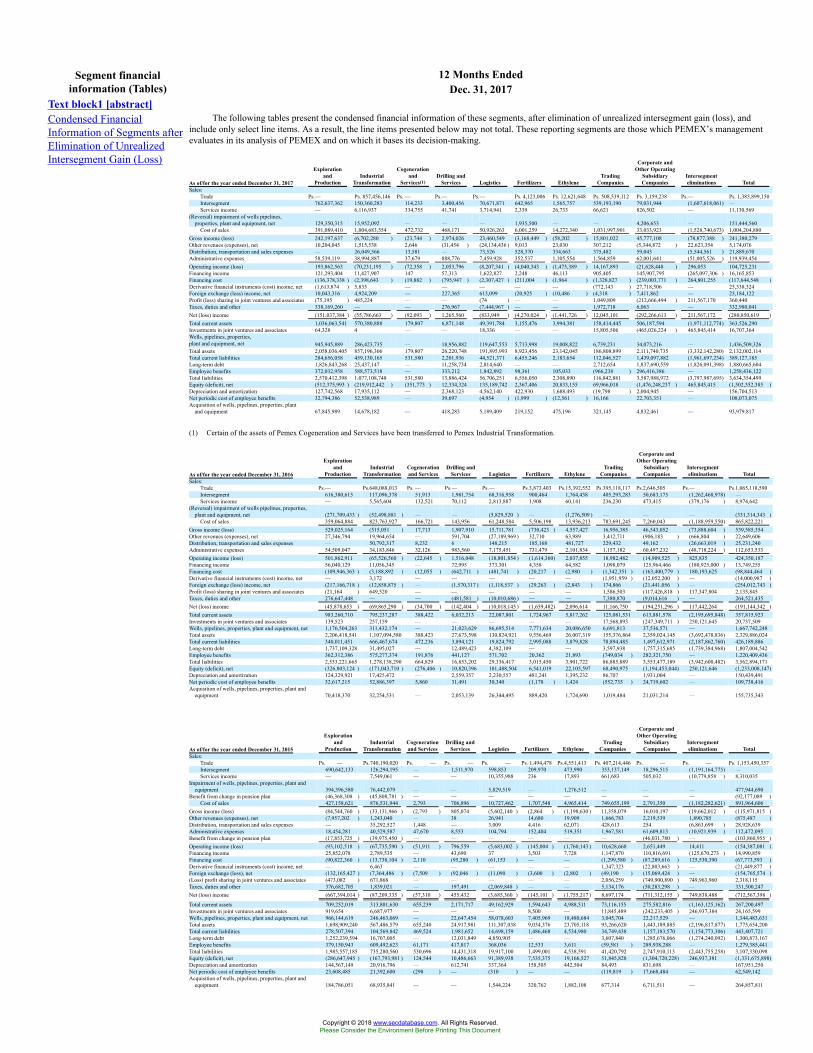
12 Months EndedSegment financialinformation (Tables) Dec. 31, 2017
Text block1 [abstract]Condensed FinancialInformation of Segments afterElimination of UnrealizedIntersegment Gain (Loss)
The following tables present the condensed financial information of these segments, after elimination of unrealized intersegment gain (loss), andinclude only select line items. As a result, the line items presented below may not total. These reporting segments are those which PEMEX’s managementevaluates in its analysis of PEMEX and on which it bases its decision-making.
As of/for the year ended December 31, 2017
Explorationand
ProductionIndustrial
Transformation
Cogenerationand
Services(1)Drilling and
Services Logistics Fertilizers EthyleneTrading
Companies
Corporate andOther Operating
SubsidiaryCompanies
Intersegmenteliminations Total
Sales:Trade Ps.— Ps. 857,456,146 Ps. — Ps.— Ps.— Ps. 4,123,006 Ps. 12,621,648 Ps. 508,539,112 Ps. 3,159,238 Ps.— Ps. 1,385,899,150Intersegment 762,637,362 150,360,283 114,233 3,400,456 70,671,871 642,965 1,565,757 539,193,190 79,031,944 (1,607,618,061) —Services income — 6,116,937 334,755 41,741 3,714,941 2,339 26,733 66,621 826,502 — 11,130,569
(Reversal) impairment of wells pipelines,properties, plant and equipment, net 129,350,315 15,952,092 — — — 1,935,500 — — 4,206,653 — 151,444,560
Cost of sales 391,089,410 1,004,683,554 472,732 468,171 50,926,263 6,001,259 14,272,340 1,031,997,901 33,033,923 (1,528,740,673) 1,004,204,880Gross income (loss) 242,197,637 (6,702,280 ) (23,744 ) 2,974,026 23,460,549 (3,168,449 ) (58,202 ) 15,801,022 45,777,108 (78,877,388 ) 241,380,279Other revenues (expenses), net 10,204,045 1,515,538 2,646 (31,454 ) (24,134,436 ) 9,013 23,030 307,212 (5,344,872 ) 22,623,354 5,174,076Distribution, transportation and sales expenses — 26,049,566 13,581 — 73,526 528,370 334,663 375,482 59,043 (5,544,561 ) 21,889,670Administrative expenses 58,539,119 38,994,887 37,679 888,776 7,459,928 352,537 1,105,554 1,564,859 62,001,641 (51,005,526 ) 119,939,454Operating income (loss) 193,862,563 (70,231,195 ) (72,358 ) 2,053,796 (8,207,341 ) (4,040,343 ) (1,475,389 ) 14,167,893 (21,628,448 ) 296,053 104,725,231Financing income 121,293,404 11,427,907 147 57,313 1,622,827 2,248 46,113 905,405 145,907,795 (265,097,306 ) 16,165,853Financing cost (136,378,338 ) (2,398,643 ) (19,882 ) (795,947 ) (2,307,427 ) (211,004 ) (1,964 ) (1,328,827 ) (239,003,771 ) 264,801,255 (117,644,548 )Derivative financial instruments (cost) income, net (1,613,874 ) 5,835 — — — — — (772,143 ) 27,718,506 — 25,338,324Foreign exchange (loss) income, net 10,043,316 4,924,209 — 227,365 613,099 (20,925 ) (10,486 ) (4,318 ) 7,411,862 — 23,184,122Profit (loss) sharing in joint ventures and associates (75,195 ) 485,224 — — (74 ) — — 1,049,809 (212,666,494 ) 211,567,170 360,440Taxes, duties and other 338,169,260 — — 276,967 (7,444,967 ) — — 1,972,718 6,063 — 332,980,041Net (loss) income (151,037,384 ) (55,786,663 ) (92,093 ) 1,265,560 (833,949 ) (4,270,024 ) (1,441,726 ) 12,045,101 (292,266,613 ) 211,567,172 (280,850,619 )Total current assets 1,036,063,541 570,380,888 179,807 6,871,148 49,391,784 3,155,476 3,994,381 158,414,445 506,187,594 (1,971,112,774) 363,526,290Investments in joint ventures and associates 64,328 4 — — 18,336 — — 15,805,506 (465,026,224 ) 465,845,414 16,707,364Wells, pipelines, properties,plant and equipment, net 945,945,889 286,423,735 — 18,956,882 119,647,553 5,713,998 19,008,822 6,739,231 34,073,216 — 1,436,509,326Total assets 2,058,036,405 857,196,306 179,807 26,220,748 191,895,993 8,923,456 23,142,045 186,808,899 2,111,740,735 (3,332,142,280) 2,132,002,114Total current liabilities 284,656,058 459,130,165 531,580 2,201,936 44,521,371 6,455,246 2,183,654 112,046,527 1,439,097,882 (1,961,697,234) 389,127,185Long-term debt 1,826,843,268 25,437,147 — 11,258,734 2,814,640 — — 2,712,654 1,837,690,559 (1,826,091,398) 1,880,665,604Employee benefits 372,032,958 588,573,518 — 333,212 1,842,892 98,361 105,033 (966,238 ) 296,416,386 — 1,258,436,122Total liabilities 2,570,412,398 1,077,108,748 531,580 13,886,424 56,706,251 6,556,050 2,308,890 116,842,881 3,587,988,972 (3,797,987,695) 3,634,354,499Equity (deficit), net (512,375,993 ) (219,912,442 ) (351,773 ) 12,334,324 135,189,742 2,367,406 20,833,155 69,966,018 (1,476,248,237 ) 465,845,415 (1,502,352,385 )Depreciation and amortization 127,742,568 17,935,112 — 2,368,123 4,562,140 422,930 1,688,493 (19,798 ) 2,004,945 — 156,704,513Net periodic cost of employee benefits 32,794,386 52,538,989 — 39,697 (4,954 ) (1,999 ) (12,561 ) 16,166 22,703,351 — 108,073,075Acquisition of wells, pipelines, properties, plant
and equipment 67,845,989 14,678,182 — 418,283 5,189,409 219,152 475,196 321,145 4,832,461 — 93,979,817
(1) Certain of the assets of Pemex Cogeneration and Services have been transferred to Pemex Industrial Transformation.
As of/for the year ended December 31, 2016
Explorationand
ProductionIndustrial
TransformationCogenerationand Services
Drilling andServices Logistics Fertilizers Ethylene
TradingCompanies
Corporate andOther Operating
SubsidiaryCompanies
Intersegmenteliminations Total
Sales:Trade Ps.— Ps.648,088,013 Ps. — Ps.— Ps.— Ps.3,873,403 Ps.15,392,552 Ps.395,118,117 Ps.2,646,505 Ps.— Ps.1,065,118,590Intersegment 616,380,615 117,096,378 51,913 1,981,754 68,316,958 900,464 1,764,438 405,293,283 50,683,175 (1,262,468,978) —Services income — 5,565,604 132,521 70,112 2,813,887 1,908 60,141 236,230 473,415 (379,176 ) 8,974,642
(Reversal) impairment of wells pipelines, properties,plant and equipment, net (271,709,433 ) (52,498,881 ) — — (5,829,520 ) — (1,276,509 ) — — — (331,314,343 )
Cost of sales 359,064,884 823,763,927 166,721 143,956 61,248,584 5,506,198 13,936,213 783,691,245 7,260,043 (1,188,959,550) 865,822,221Gross income (loss) 529,025,164 (515,051 ) 17,713 1,907,910 15,711,781 (730,423 ) 4,557,427 16,956,385 46,543,052 (73,888,604 ) 539,585,354Other revenues (expenses), net 27,346,794 19,964,654 — 591,704 (27,189,969 ) 32,710 63,989 3,412,711 (906,183 ) (666,804 ) 22,649,606Distribution, transportation and sales expenses — 50,792,317 8,232 6 148,215 185,168 481,727 229,432 49,162 (26,663,019 ) 25,231,240Administrative expenses 54,509,047 34,183,846 32,126 983,560 7,175,451 731,479 2,101,834 1,157,182 60,497,232 (48,718,224 ) 112,653,533Operating income (loss) 501,862,911 (65,526,560 ) (22,645 ) 1,516,048 (18,801,854 ) (1,614,360) 2,037,855 18,982,482 (14,909,525 ) 825,835 424,350,187Financing income 56,040,129 11,056,345 — 72,995 373,301 4,358 64,582 1,098,079 125,964,466 (180,925,000 ) 13,749,255Financing cost (109,946,363 ) (3,188,892 ) (12,055 ) (642,711 ) (481,741 ) (20,217 ) (2,980 ) (1,342,351 ) (163,400,779 ) 180,193,625 (98,844,464 )Derivative financial instruments (cost) income, net — 3,172 — — — — — (1,951,959 ) (12,052,200 ) — (14,000,987 )Foreign exchange (loss) income, net (217,166,718 ) (12,858,875 ) — (1,570,317 ) (1,118,537 ) (29,263 ) (2,843 ) 174,866 (21,441,056 ) — (254,012,743 )Profit (loss) sharing in joint ventures and associates (21,164 ) 649,520 — — — — — 1,586,503 (117,426,818 ) 117,347,804 2,135,845Taxes, duties and other 276,647,448 — — (481,581 ) (10,010,686 ) — — 7,380,870 (9,014,616 ) — 264,521,435Net (loss) income (45,878,653 ) (69,865,290 ) (34,700 ) (142,404 ) (10,018,145 ) (1,659,482) 2,096,614 11,166,750 (194,251,296 ) 117,442,264 (191,144,342 )Total current assets 983,260,710 795,237,287 388,422 6,032,213 22,087,801 1,724,967 5,817,262 125,081,531 613,881,578 (2,195,695,848) 357,815,923Investments in joint ventures and associates 139,523 257,159 — — — — — 17,568,893 (247,349,711 ) 250,121,645 20,737,509Wells, pipelines, properties, plant and equipment, net 1,176,504,263 311,432,174 — 21,023,629 86,695,514 7,771,634 20,086,650 6,691,813 37,536,571 — 1,667,742,248Total assets 2,206,418,541 1,107,094,580 388,423 27,673,598 130,824,921 9,556,469 26,007,319 155,376,864 2,359,024,145 (3,692,478,836) 2,329,886,024Total current liabilities 340,011,451 666,467,674 472,236 3,894,121 19,824,792 2,995,088 3,879,828 78,894,485 1,497,612,971 (2,187,862,760) 426,189,886Long-term debt 1,737,109,328 31,495,027 — 12,489,423 4,382,109 — — 3,597,938 1,757,315,685 (1,739,384,968) 1,807,004,542Employee benefits 362,312,386 575,277,374 191,876 441,127 571,702 20,362 21,893 (749,034 ) 282,321,750 — 1,220,409,436Total liabilities 2,533,221,665 1,278,138,290 664,829 16,853,202 29,336,417 3,015,450 3,901,722 86,885,889 3,553,477,189 (3,942,600,482) 3,562,894,171Equity (deficit), net (326,803,124 ) (171,043,710 ) (276,406 ) 10,820,396 101,488,504 6,541,019 22,105,597 68,490,975 (1,194,453,044) 250,121,646 (1,233,008,147)Depreciation and amortization 124,329,921 17,425,472 — 2,559,357 2,230,557 481,241 1,395,232 86,707 1,931,004 — 150,439,491Net periodic cost of employee benefits 32,617,215 52,886,397 5,860 31,491 30,340 (1,178 ) 1,424 (552,735 ) 24,719,602 — 109,738,416Acquisition of wells, pipelines, properties, plant and
equipment 70,418,370 32,254,531 — 2,053,139 26,344,495 889,420 1,724,690 1,019,484 21,031,214 — 155,735,343
As of/for the year ended December 31, 2015
Explorationand
ProductionIndustrial
TransformationCogenerationand Services
Drilling andServices Logistics Fertilizers Ethylene
TradingCompanies
Corporate andOther Operating
SubsidiaryCompanies
Intersegmenteliminations Total
Sales:Trade Ps. — Ps.740,190,020 Ps. — Ps. — Ps. — Ps. 1,494,478 Ps.4,551,413 Ps. 407,214,446 Ps. — Ps. — Ps. 1,153,450,357Intersegment 690,642,133 126,294,195 — 1,511,970 598,853 209,970 473,990 353,137,149 18,296,515 (1,191,164,775) —Services income — 7,549,061 — — 10,355,988 236 17,893 661,683 505,032 (10,779,858 ) 8,310,035
Impairment of wells, pipelines, properties, plant andequipment 394,396,580 76,442,079 — — 5,829,519 — 1,276,512 — — — 477,944,690
Benefit from change in pension plan (46,368,308 ) (45,808,781 ) — — — — — — — — (92,177,089 )Cost of sales 427,158,621 876,531,944 2,793 706,896 10,727,462 1,707,548 4,965,414 749,655,199 2,791,350 (1,182,282,621) 891,964,606
Gross income (loss) (84,544,760 ) (33,131,966 ) (2,793 ) 805,074 (5,602,140 ) (2,864 ) (1,198,630 ) 11,358,079 16,010,197 (19,662,012 ) (115,971,815 )Other revenues (expenses), net (7,957,202 ) 1,243,040 — 38 26,941 14,680 19,909 1,666,783 2,219,539 1,890,785 (875,487 )Distribution, transportation and sales expenses — 35,292,527 1,448 — 3,009 4,416 62,071 428,613 254 (6,863,699 ) 28,928,639Administrative expenses 18,454,281 40,529,587 47,670 8,553 104,794 152,404 519,351 1,967,581 61,609,813 (10,921,939 ) 112,472,095Benefit from change in pension plan (17,853,725 ) (39,975,450 ) — — — — — — (46,031,780 ) — (103,860,955 )Operating income (loss) (93,102,518 ) (67,735,590 ) (51,911 ) 796,559 (5,683,002 ) (145,004 ) (1,760,143 ) 10,628,668 2,651,449 14,411 (154,387,081 )Financing income 25,852,078 2,789,535 — 43,690 37 3,503 7,728 1,147,870 110,816,691 (125,670,273 ) 14,990,859Financing cost (90,822,360 ) (13,738,104 ) 2,110 (95,280 ) (61,153 ) — — (1,299,580 ) (87,289,616 ) 125,530,390 (67,773,593 )Derivative financial instruments (cost) income, net — 6,463 — — — — — 1,347,323 (22,803,663 ) — (21,449,877 )Foreign exchange (loss), net (132,165,427 ) (7,364,486 ) (7,509 ) (92,046 ) (11,090 ) (3,600 ) (2,802 ) (49,190 ) (15,069,424 ) — (154,765,574 )(Loss) profit sharing in joint ventures and associates (473,082 ) 671,868 — — — — — 2,056,259 (749,900,890 ) 749,963,960 2,318,115Taxes, duties and other 376,682,705 1,839,021 — 197,491 (2,069,848 ) — — 5,134,176 (50,283,298 ) — 331,500,247Net (loss) income (667,394,014 ) (87,209,335 ) (57,310 ) 455,432 (3,685,360 ) (145,101 ) (1,755,217 ) 8,697,174 (711,312,155 ) 749,838,488 (712,567,398 )
Total current assets 709,252,019 313,801,630 655,239 2,171,717 49,162,929 1,594,643 4,988,511 73,116,155 275,582,816 (1,163,125,162) 267,200,497Investments in joint ventures and associates 919,654 6,687,977 — — — 8,500 — 11,845,489 (242,233,405 ) 246,937,384 24,165,599Wells, pipelines, properties, plant and equipment, net 966,144,619 246,463,069 — 22,647,454 58,078,603 7,405,969 18,480,684 3,045,704 22,217,529 — 1,344,483,631Total assets 1,698,909,240 567,486,579 655,240 24,917,981 111,307,038 9,034,376 23,705,118 93,266,620 1,443,189,885 (2,196,817,877) 1,775,654,200Total current liabilities 278,507,394 104,569,842 469,524 1,981,652 14,698,159 1,486,468 4,534,980 34,749,438 1,157,183,570 (1,154,773,306) 443,407,721Long-term debt 1,252,239,594 16,707,005 — 12,031,849 4,850,905 — — 3,607,840 1,285,676,066 (1,274,240,092) 1,300,873,167Employee benefits 379,150,943 609,492,623 61,171 417,817 368,036 12,533 3,611 (59,581 ) 289,938,288 — 1,279,385,441Total liabilities 1,985,557,185 735,280,560 530,696 14,431,318 19,917,100 1,499,001 4,538,591 41,420,792 2,747,910,113 (2,443,755,258) 3,107,330,098Equity (deficit), net (286,647,945 ) (167,793,981 ) 124,544 10,486,663 91,389,938 7,535,375 19,166,527 51,845,828 (1,304,720,228) 246,937,381 (1,331,675,898)Depreciation and amortization 144,567,149 20,916,796 — 612,741 337,364 158,505 442,504 84,493 831,698 — 167,951,250Net periodic cost of employee benefits 23,608,485 21,392,600 (298 ) — (310 ) — — (119,819 ) 17,668,484 — 62,549,142Acquisition of wells, pipelines, properties, plant and
equipment 184,786,051 68,935,841 — — 1,544,224 320,762 1,882,108 677,314 6,711,511 — 264,857,811
Copyright © 2018 www.secdatabase.com. All Rights Reserved.Please Consider the Environment Before Printing This Document
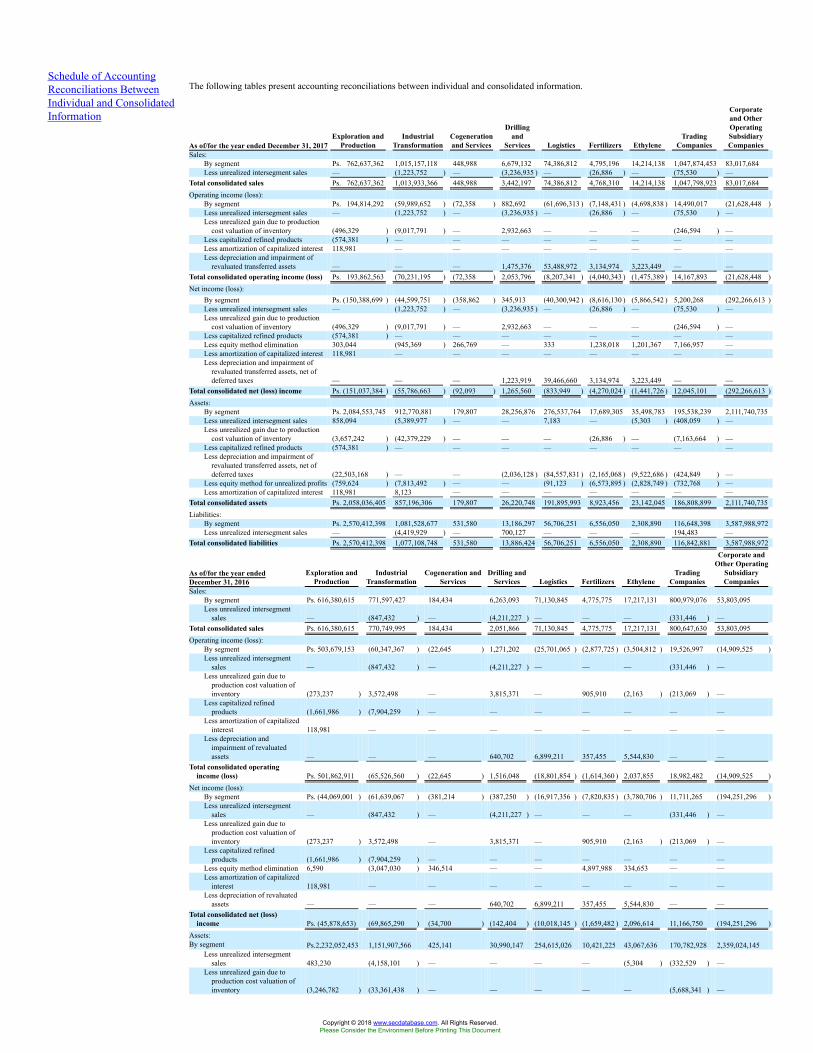
Schedule of AccountingReconciliations BetweenIndividual and ConsolidatedInformation
The following tables present accounting reconciliations between individual and consolidated information.
As of/for the year ended December 31, 2017Exploration and
ProductionIndustrial
TransformationCogenerationand Services
Drillingand
Services Logistics Fertilizers EthyleneTrading
Companies
Corporateand OtherOperatingSubsidiaryCompanies
Sales:By segment Ps. 762,637,362 1,015,157,118 448,988 6,679,132 74,386,812 4,795,196 14,214,138 1,047,874,453 83,017,684Less unrealized intersegment sales — (1,223,752 ) — (3,236,935 ) — (26,886 ) — (75,530 ) —
Total consolidated sales Ps. 762,637,362 1,013,933,366 448,988 3,442,197 74,386,812 4,768,310 14,214,138 1,047,798,923 83,017,684Operating income (loss):
By segment Ps. 194,814,292 (59,989,652 ) (72,358 ) 882,692 (61,696,313 ) (7,148,431 ) (4,698,838 ) 14,490,017 (21,628,448 )Less unrealized intersegment sales — (1,223,752 ) — (3,236,935 ) — (26,886 ) — (75,530 ) —Less unrealized gain due to production
cost valuation of inventory (496,329 ) (9,017,791 ) — 2,932,663 — — — (246,594 ) —Less capitalized refined products (574,381 ) — — — — — — — —Less amortization of capitalized interest 118,981 — — — — — — — —Less depreciation and impairment of
revaluated transferred assets — — — 1,475,376 53,488,972 3,134,974 3,223,449 — —Total consolidated operating income (loss) Ps. 193,862,563 (70,231,195 ) (72,358 ) 2,053,796 (8,207,341 ) (4,040,343 ) (1,475,389 ) 14,167,893 (21,628,448 )Net income (loss):
By segment Ps. (150,388,699 ) (44,599,751 ) (358,862 ) 345,913 (40,300,942 ) (8,616,130 ) (5,866,542 ) 5,200,268 (292,266,613 )Less unrealized intersegment sales — (1,223,752 ) — (3,236,935 ) — (26,886 ) — (75,530 ) —Less unrealized gain due to production
cost valuation of inventory (496,329 ) (9,017,791 ) — 2,932,663 — — — (246,594 ) —Less capitalized refined products (574,381 ) — — — — — — — —Less equity method elimination 303,044 (945,369 ) 266,769 — 333 1,238,018 1,201,367 7,166,957 —Less amortization of capitalized interest 118,981 — — — — — — — —Less depreciation and impairment of
revaluated transferred assets, net ofdeferred taxes — — — 1,223,919 39,466,660 3,134,974 3,223,449 — —
Total consolidated net (loss) income Ps. (151,037,384 ) (55,786,663 ) (92,093 ) 1,265,560 (833,949 ) (4,270,024 ) (1,441,726 ) 12,045,101 (292,266,613 )Assets:
By segment Ps. 2,084,553,745 912,770,881 179,807 28,256,876 276,537,764 17,689,305 35,498,783 195,538,239 2,111,740,735Less unrealized intersegment sales 858,094 (5,389,977 ) — — 7,183 — (5,303 ) (408,059 ) —Less unrealized gain due to production
cost valuation of inventory (3,657,242 ) (42,379,229 ) — — — (26,886 ) — (7,163,664 ) —Less capitalized refined products (574,381 ) — — — — — — — —Less depreciation and impairment of
revaluated transferred assets, net ofdeferred taxes (22,503,168 ) — — (2,036,128 ) (84,557,831 ) (2,165,068 ) (9,522,686 ) (424,849 ) —
Less equity method for unrealized profits (759,624 ) (7,813,492 ) — — (91,123 ) (6,573,895 ) (2,828,749 ) (732,768 ) —Less amortization of capitalized interest 118,981 8,123 — — — — — — —
Total consolidated assets Ps. 2,058,036,405 857,196,306 179,807 26,220,748 191,895,993 8,923,456 23,142,045 186,808,899 2,111,740,735Liabilities:
By segment Ps. 2,570,412,398 1,081,528,677 531,580 13,186,297 56,706,251 6,556,050 2,308,890 116,648,398 3,587,988,972Less unrealized intersegment sales — (4,419,929 ) — 700,127 — — — 194,483 —
Total consolidated liabilities Ps. 2,570,412,398 1,077,108,748 531,580 13,886,424 56,706,251 6,556,050 2,308,890 116,842,881 3,587,988,972
As of/for the year endedDecember 31, 2016
Exploration andProduction
IndustrialTransformation
Cogeneration andServices
Drilling andServices Logistics Fertilizers Ethylene
TradingCompanies
Corporate andOther Operating
SubsidiaryCompanies
Sales:By segment Ps. 616,380,615 771,597,427 184,434 6,263,093 71,130,845 4,775,775 17,217,131 800,979,076 53,803,095Less unrealized intersegment
sales — (847,432 ) — (4,211,227 ) — — — (331,446 ) —Total consolidated sales Ps. 616,380,615 770,749,995 184,434 2,051,866 71,130,845 4,775,775 17,217,131 800,647,630 53,803,095Operating income (loss):
By segment Ps. 503,679,153 (60,347,367 ) (22,645 ) 1,271,202 (25,701,065 ) (2,877,725 ) (3,504,812 ) 19,526,997 (14,909,525 )Less unrealized intersegment
sales — (847,432 ) — (4,211,227 ) — — — (331,446 ) —Less unrealized gain due to
production cost valuation ofinventory (273,237 ) 3,572,498 — 3,815,371 — 905,910 (2,163 ) (213,069 ) —
Less capitalized refinedproducts (1,661,986 ) (7,904,259 ) — — — — — — —
Less amortization of capitalizedinterest 118,981 — — — — — — — —
Less depreciation andimpairment of revaluatedassets — — — 640,702 6,899,211 357,455 5,544,830 — —
Total consolidated operatingincome (loss) Ps. 501,862,911 (65,526,560 ) (22,645 ) 1,516,048 (18,801,854 ) (1,614,360 ) 2,037,855 18,982,482 (14,909,525 )
Net income (loss):By segment Ps. (44,069,001 ) (61,639,067 ) (381,214 ) (387,250 ) (16,917,356 ) (7,820,835 ) (3,780,706 ) 11,711,265 (194,251,296 )Less unrealized intersegment
sales — (847,432 ) — (4,211,227 ) — — — (331,446 ) —Less unrealized gain due to
production cost valuation ofinventory (273,237 ) 3,572,498 — 3,815,371 — 905,910 (2,163 ) (213,069 ) —
Less capitalized refinedproducts (1,661,986 ) (7,904,259 ) — — — — — — —
Less equity method elimination 6,590 (3,047,030 ) 346,514 — — 4,897,988 334,653 — —Less amortization of capitalized
interest 118,981 — — — — — — — —Less depreciation of revaluated
assets — — — 640,702 6,899,211 357,455 5,544,830 — —Total consolidated net (loss)
income Ps. (45,878,653) (69,865,290 ) (34,700 ) (142,404 ) (10,018,145 ) (1,659,482 ) 2,096,614 11,166,750 (194,251,296 )Assets:By segment Ps.2,232,052,453 1,151,907,566 425,141 30,990,147 254,615,026 10,421,225 43,067,636 170,782,928 2,359,024,145
Less unrealized intersegmentsales 483,230 (4,158,101 ) — — — — (5,304 ) (332,529 ) —
Less unrealized gain due toproduction cost valuation ofinventory (3,246,782 ) (33,361,438 ) — — — — — (5,688,341 ) —
Copyright © 2018 www.secdatabase.com. All Rights Reserved.Please Consider the Environment Before Printing This Document
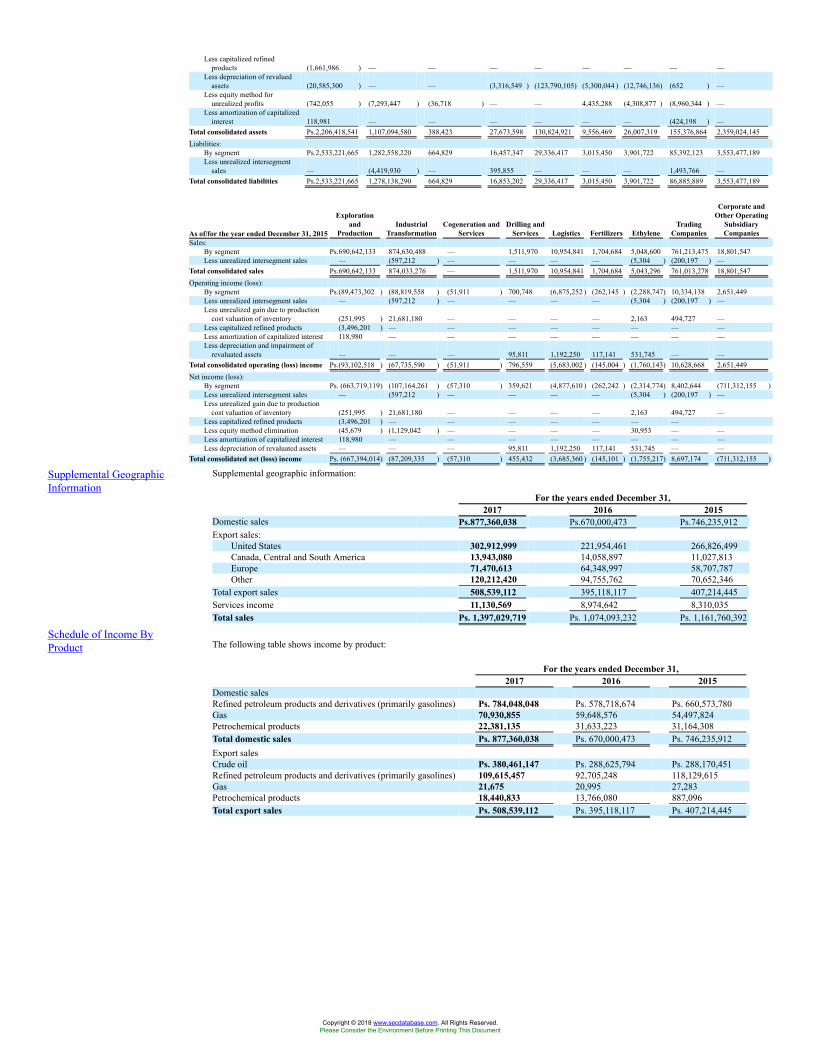
Less capitalized refinedproducts (1,661,986 ) — — — — — — — —
Less depreciation of revaluedassets (20,585,300 ) — — (3,316,549 ) (123,790,105) (5,300,044 ) (12,746,136) (652 ) —
Less equity method forunrealized profits (742,055 ) (7,293,447 ) (36,718 ) — — 4,435,288 (4,308,877 ) (8,960,344 ) —
Less amortization of capitalizedinterest 118,981 — — — — — — (424,198 ) —
Total consolidated assets Ps.2,206,418,541 1,107,094,580 388,423 27,673,598 130,824,921 9,556,469 26,007,319 155,376,864 2,359,024,145Liabilities:
By segment Ps.2,533,221,665 1,282,558,220 664,829 16,457,347 29,336,417 3,015,450 3,901,722 85,392,123 3,553,477,189Less unrealized intersegment
sales — (4,419,930 ) — 395,855 — — — 1,493,766 —Total consolidated liabilities Ps.2,533,221,665 1,278,138,290 664,829 16,853,202 29,336,417 3,015,450 3,901,722 86,885,889 3,553,477,189
As of/for the year ended December 31, 2015
Explorationand
ProductionIndustrial
TransformationCogeneration and
ServicesDrilling and
Services Logistics Fertilizers EthyleneTrading
Companies
Corporate andOther Operating
SubsidiaryCompanies
Sales:By segment Ps.690,642,133 874,630,488 — 1,511,970 10,954,841 1,704,684 5,048,600 761,213,475 18,801,547Less unrealized intersegment sales — (597,212 ) — — — — (5,304 ) (200,197 ) —
Total consolidated sales Ps.690,642,133 874,033,276 — 1,511,970 10,954,841 1,704,684 5,043,296 761,013,278 18,801,547Operating income (loss):
By segment Ps.(89,473,302 ) (88,819,558 ) (51,911 ) 700,748 (6,875,252 ) (262,145 ) (2,288,747) 10,334,138 2,651,449Less unrealized intersegment sales — (597,212 ) — — — — (5,304 ) (200,197 ) —Less unrealized gain due to production
cost valuation of inventory (251,995 ) 21,681,180 — — — — 2,163 494,727 —Less capitalized refined products (3,496,201 ) — — — — — — — —Less amortization of capitalized interest 118,980 — — — — — — — —Less depreciation and impairment of
revaluated assets — — — 95,811 1,192,250 117,141 531,745 — —Total consolidated operating (loss) income Ps.(93,102,518 ) (67,735,590 ) (51,911 ) 796,559 (5,683,002 ) (145,004 ) (1,760,143) 10,628,668 2,651,449Net income (loss):
By segment Ps. (663,719,119) (107,164,261 ) (57,310 ) 359,621 (4,877,610 ) (262,242 ) (2,314,774) 8,402,644 (711,312,155 )Less unrealized intersegment sales — (597,212 ) — — — — (5,304 ) (200,197 ) —Less unrealized gain due to production
cost valuation of inventory (251,995 ) 21,681,180 — — — — 2,163 494,727 —Less capitalized refined products (3,496,201 ) — — — — — — —Less equity method elimination (45,679 ) (1,129,042 ) — — — — 30,953 — —Less amortization of capitalized interest 118,980 — — — — — — — —Less depreciation of revaluated assets — — — 95,811 1,192,250 117,141 531,745 — —
Total consolidated net (loss) income Ps. (667,394,014) (87,209,335 ) (57,310 ) 455,432 (3,685,360 ) (145,101 ) (1,755,217) 8,697,174 (711,312,155 )
Supplemental GeographicInformation
Supplemental geographic information:
For the years ended December 31,2017 2016 2015
Domestic sales Ps.877,360,038 Ps.670,000,473 Ps.746,235,912Export sales:
United States 302,912,999 221,954,461 266,826,499Canada, Central and South America 13,943,080 14,058,897 11,027,813Europe 71,470,613 64,348,997 58,707,787Other 120,212,420 94,755,762 70,652,346
Total export sales 508,539,112 395,118,117 407,214,445Services income 11,130,569 8,974,642 8,310,035Total sales Ps. 1,397,029,719 Ps. 1,074,093,232 Ps. 1,161,760,392
Schedule of Income ByProduct The following table shows income by product:
For the years ended December 31,2017 2016 2015
Domestic salesRefined petroleum products and derivatives (primarily gasolines) Ps. 784,048,048 Ps. 578,718,674 Ps. 660,573,780Gas 70,930,855 59,648,576 54,497,824Petrochemical products 22,381,135 31,633,223 31,164,308Total domestic sales Ps. 877,360,038 Ps. 670,000,473 Ps. 746,235,912Export salesCrude oil Ps. 380,461,147 Ps. 288,625,794 Ps. 288,170,451Refined petroleum products and derivatives (primarily gasolines) 109,615,457 92,705,248 118,129,615Gas 21,675 20,995 27,283Petrochemical products 18,440,833 13,766,080 887,096Total export sales Ps. 508,539,112 Ps. 395,118,117 Ps. 407,214,445
Copyright © 2018 www.secdatabase.com. All Rights Reserved.Please Consider the Environment Before Printing This Document
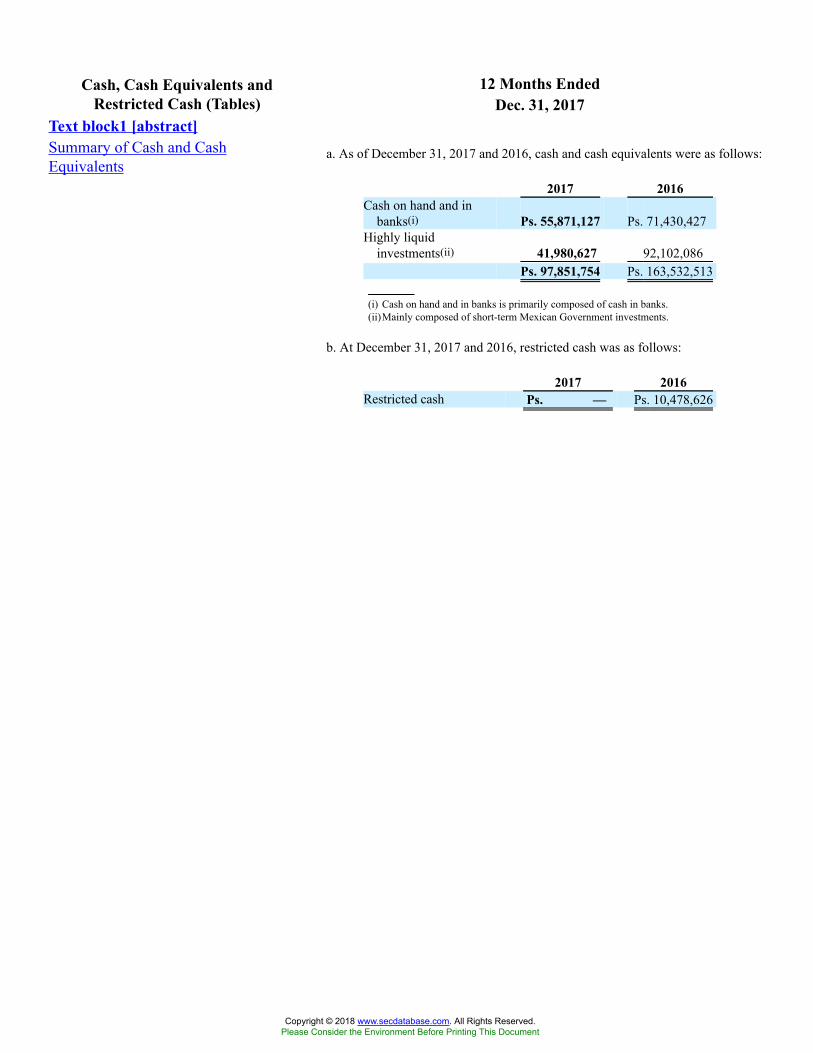
12 Months EndedCash, Cash Equivalents andRestricted Cash (Tables) Dec. 31, 2017
Text block1 [abstract]Summary of Cash and CashEquivalents
a. As of December 31, 2017 and 2016, cash and cash equivalents were as follows:
2017 2016Cash on hand and in
banks(i) Ps. 55,871,127 Ps. 71,430,427Highly liquid
investments(ii) 41,980,627 92,102,086Ps. 97,851,754 Ps. 163,532,513
(i) Cash on hand and in banks is primarily composed of cash in banks.(ii)Mainly composed of short-term Mexican Government investments.
b. At December 31, 2017 and 2016, restricted cash was as follows:
2017 2016Restricted cash Ps. — Ps. 10,478,626
Copyright © 2018 www.secdatabase.com. All Rights Reserved.Please Consider the Environment Before Printing This Document
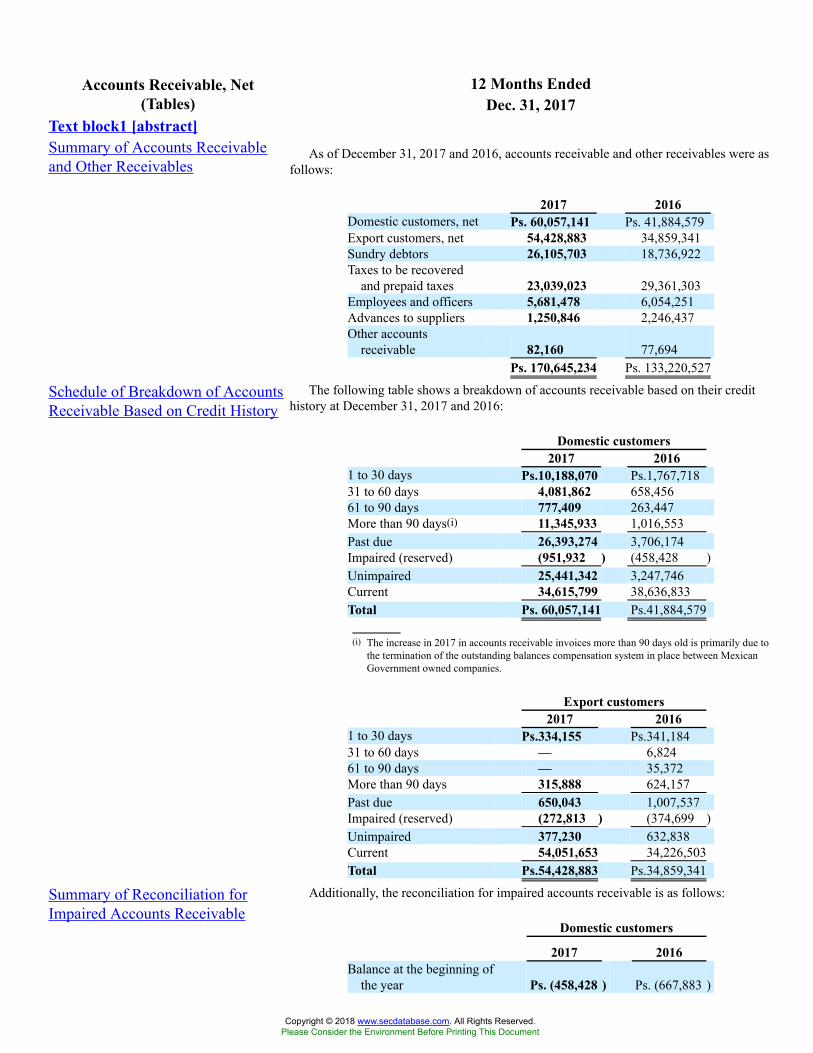
12 Months EndedAccounts Receivable, Net(Tables) Dec. 31, 2017
Text block1 [abstract]Summary of Accounts Receivableand Other Receivables
As of December 31, 2017 and 2016, accounts receivable and other receivables were asfollows:
2017 2016Domestic customers, net Ps. 60,057,141 Ps. 41,884,579Export customers, net 54,428,883 34,859,341Sundry debtors 26,105,703 18,736,922Taxes to be recovered
and prepaid taxes 23,039,023 29,361,303Employees and officers 5,681,478 6,054,251Advances to suppliers 1,250,846 2,246,437Other accounts
receivable 82,160 77,694Ps. 170,645,234 Ps. 133,220,527
Schedule of Breakdown of AccountsReceivable Based on Credit History
The following table shows a breakdown of accounts receivable based on their credithistory at December 31, 2017 and 2016:
Domestic customers2017 2016
1 to 30 days Ps.10,188,070 Ps.1,767,71831 to 60 days 4,081,862 658,45661 to 90 days 777,409 263,447More than 90 days(i) 11,345,933 1,016,553Past due 26,393,274 3,706,174Impaired (reserved) (951,932 ) (458,428 )Unimpaired 25,441,342 3,247,746Current 34,615,799 38,636,833Total Ps. 60,057,141 Ps.41,884,579
(i) The increase in 2017 in accounts receivable invoices more than 90 days old is primarily due tothe termination of the outstanding balances compensation system in place between MexicanGovernment owned companies.
Export customers2017 2016
1 to 30 days Ps.334,155 Ps.341,18431 to 60 days — 6,82461 to 90 days — 35,372More than 90 days 315,888 624,157Past due 650,043 1,007,537Impaired (reserved) (272,813 ) (374,699 )Unimpaired 377,230 632,838Current 54,051,653 34,226,503Total Ps.54,428,883 Ps.34,859,341
Summary of Reconciliation forImpaired Accounts Receivable
Additionally, the reconciliation for impaired accounts receivable is as follows:
Domestic customers
2017 2016Balance at the beginning of
the year Ps. (458,428 ) Ps. (667,883 )
Copyright © 2018 www.secdatabase.com. All Rights Reserved.Please Consider the Environment Before Printing This Document
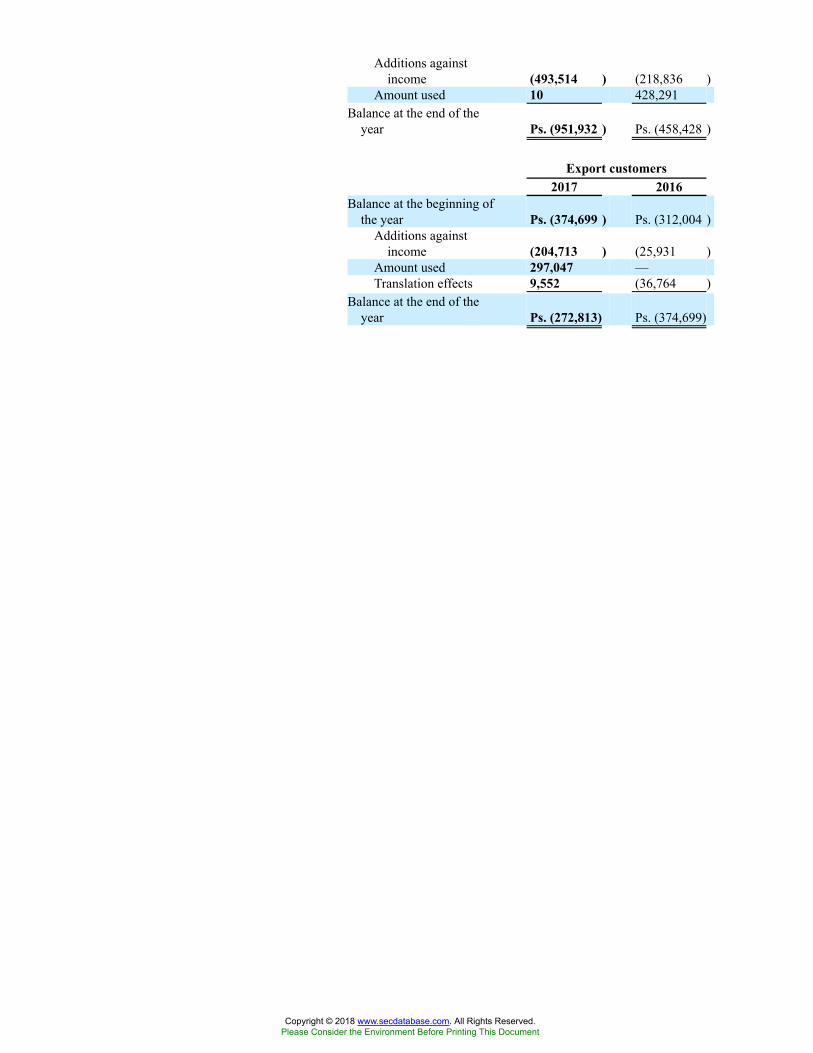
Additions againstincome (493,514 ) (218,836 )
Amount used 10 428,291Balance at the end of the
year Ps. (951,932 ) Ps. (458,428 )
Export customers2017 2016
Balance at the beginning ofthe year Ps. (374,699 ) Ps. (312,004 )
Additions againstincome (204,713 ) (25,931 )
Amount used 297,047 —Translation effects 9,552 (36,764 )
Balance at the end of theyear Ps. (272,813) Ps. (374,699)
Copyright © 2018 www.secdatabase.com. All Rights Reserved.Please Consider the Environment Before Printing This Document
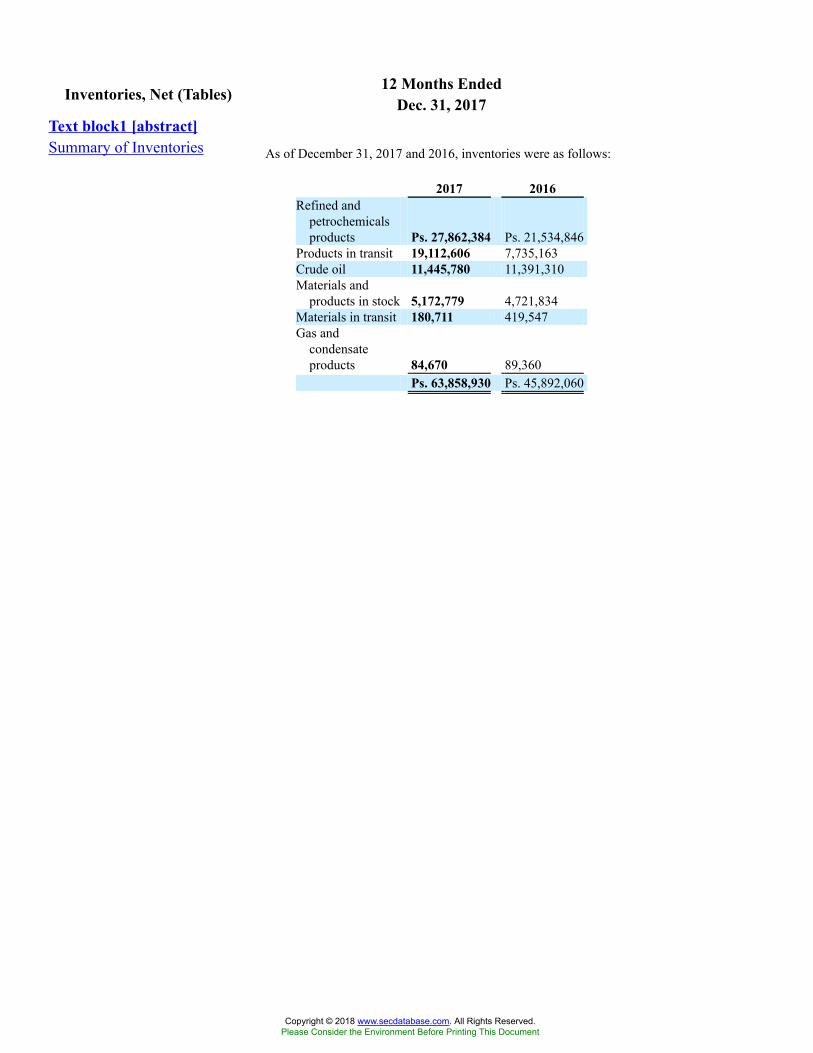
12 Months EndedInventories, Net (Tables) Dec. 31, 2017Text block1 [abstract]Summary of Inventories As of December 31, 2017 and 2016, inventories were as follows:
2017 2016Refined and
petrochemicalsproducts Ps. 27,862,384 Ps. 21,534,846
Products in transit 19,112,606 7,735,163Crude oil 11,445,780 11,391,310Materials and
products in stock 5,172,779 4,721,834Materials in transit 180,711 419,547Gas and
condensateproducts 84,670 89,360
Ps. 63,858,930 Ps. 45,892,060
Copyright © 2018 www.secdatabase.com. All Rights Reserved.Please Consider the Environment Before Printing This Document
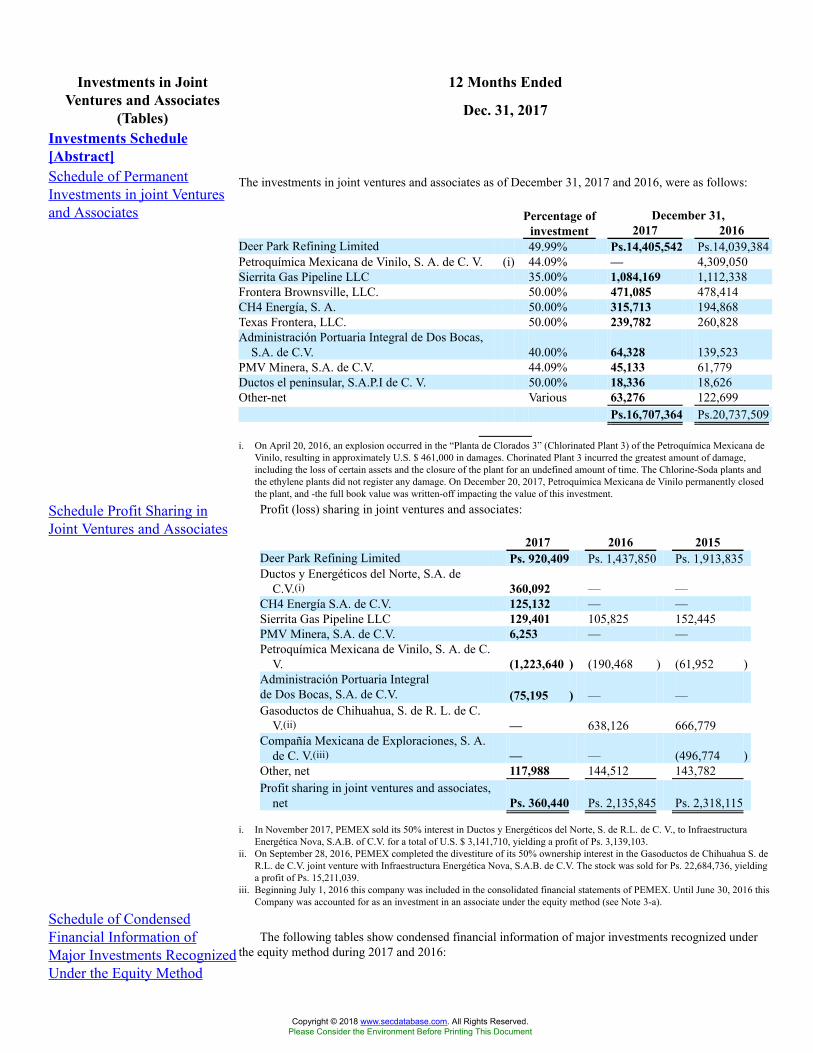
12 Months EndedInvestments in JointVentures and Associates
(Tables) Dec. 31, 2017
Investments Schedule[Abstract]Schedule of PermanentInvestments in joint Venturesand Associates
The investments in joint ventures and associates as of December 31, 2017 and 2016, were as follows:
December 31,Percentage ofinvestment 2017 2016
Deer Park Refining Limited 49.99% Ps.14,405,542 Ps.14,039,384Petroquímica Mexicana de Vinilo, S. A. de C. V. (i) 44.09% — 4,309,050Sierrita Gas Pipeline LLC 35.00% 1,084,169 1,112,338Frontera Brownsville, LLC. 50.00% 471,085 478,414CH4 Energía, S. A. 50.00% 315,713 194,868Texas Frontera, LLC. 50.00% 239,782 260,828Administración Portuaria Integral de Dos Bocas,
S.A. de C.V. 40.00% 64,328 139,523PMV Minera, S.A. de C.V. 44.09% 45,133 61,779Ductos el peninsular, S.A.P.I de C. V. 50.00% 18,336 18,626Other-net Various 63,276 122,699
Ps.16,707,364 Ps.20,737,509
i. On April 20, 2016, an explosion occurred in the “Planta de Clorados 3” (Chlorinated Plant 3) of the Petroquímica Mexicana deVinilo, resulting in approximately U.S. $ 461,000 in damages. Chorinated Plant 3 incurred the greatest amount of damage,including the loss of certain assets and the closure of the plant for an undefined amount of time. The Chlorine-Soda plants andthe ethylene plants did not register any damage. On December 20, 2017, Petroquímica Mexicana de Vinilo permanently closedthe plant, and -the full book value was written-off impacting the value of this investment.
Schedule Profit Sharing inJoint Ventures and Associates
Profit (loss) sharing in joint ventures and associates:
2017 2016 2015Deer Park Refining Limited Ps. 920,409 Ps. 1,437,850 Ps. 1,913,835Ductos y Energéticos del Norte, S.A. de
C.V.(i) 360,092 — —CH4 Energía S.A. de C.V. 125,132 — —Sierrita Gas Pipeline LLC 129,401 105,825 152,445PMV Minera, S.A. de C.V. 6,253 — —Petroquímica Mexicana de Vinilo, S. A. de C.
V. (1,223,640 ) (190,468 ) (61,952 )Administración Portuaria Integralde Dos Bocas, S.A. de C.V. (75,195 ) — —Gasoductos de Chihuahua, S. de R. L. de C.
V.(ii) — 638,126 666,779Compañía Mexicana de Exploraciones, S. A.
de C. V.(iii) — — (496,774 )Other, net 117,988 144,512 143,782Profit sharing in joint ventures and associates,
net Ps. 360,440 Ps. 2,135,845 Ps. 2,318,115
i. In November 2017, PEMEX sold its 50% interest in Ductos y Energéticos del Norte, S. de R.L. de C. V., to InfraestructuraEnergética Nova, S.A.B. of C.V. for a total of U.S. $ 3,141,710, yielding a profit of Ps. 3,139,103.
ii. On September 28, 2016, PEMEX completed the divestiture of its 50% ownership interest in the Gasoductos de Chihuahua S. deR.L. de C.V. joint venture with Infraestructura Energética Nova, S.A.B. de C.V. The stock was sold for Ps. 22,684,736, yieldinga profit of Ps. 15,211,039.
iii. Beginning July 1, 2016 this company was included in the consolidated financial statements of PEMEX. Until June 30, 2016 thisCompany was accounted for as an investment in an associate under the equity method (see Note 3-a).
Schedule of CondensedFinancial Information ofMajor Investments RecognizedUnder the Equity Method
The following tables show condensed financial information of major investments recognized underthe equity method during 2017 and 2016:
Copyright © 2018 www.secdatabase.com. All Rights Reserved.Please Consider the Environment Before Printing This Document
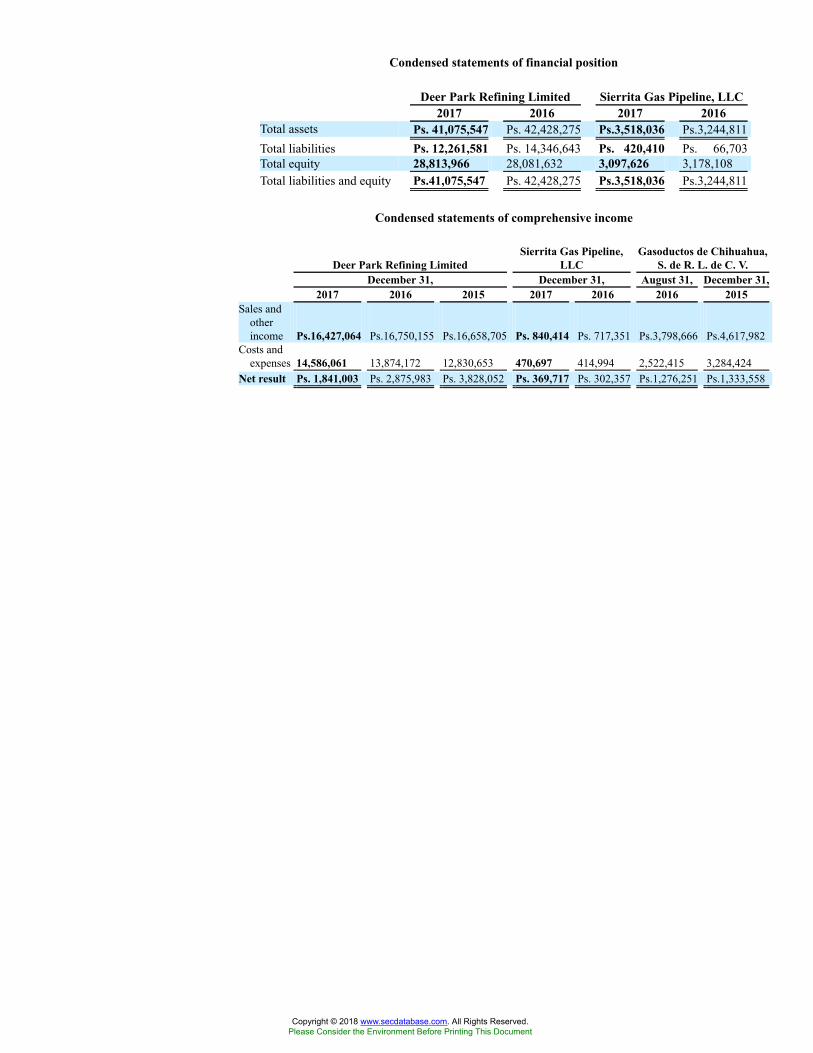
Condensed statements of financial position
Deer Park Refining Limited Sierrita Gas Pipeline, LLC2017 2016 2017 2016
Total assets Ps. 41,075,547 Ps. 42,428,275 Ps.3,518,036 Ps.3,244,811Total liabilities Ps. 12,261,581 Ps. 14,346,643 Ps. 420,410 Ps. 66,703Total equity 28,813,966 28,081,632 3,097,626 3,178,108Total liabilities and equity Ps.41,075,547 Ps. 42,428,275 Ps.3,518,036 Ps.3,244,811
Condensed statements of comprehensive income
Deer Park Refining LimitedSierrita Gas Pipeline,
LLCGasoductos de Chihuahua,
S. de R. L. de C. V.December 31, December 31, August 31, December 31,
2017 2016 2015 2017 2016 2016 2015Sales and
otherincome Ps.16,427,064 Ps.16,750,155 Ps.16,658,705 Ps. 840,414 Ps. 717,351 Ps.3,798,666 Ps.4,617,982
Costs andexpenses 14,586,061 13,874,172 12,830,653 470,697 414,994 2,522,415 3,284,424
Net result Ps. 1,841,003 Ps. 2,875,983 Ps. 3,828,052 Ps. 369,717 Ps. 302,357 Ps.1,276,251 Ps.1,333,558
Copyright © 2018 www.secdatabase.com. All Rights Reserved.Please Consider the Environment Before Printing This Document
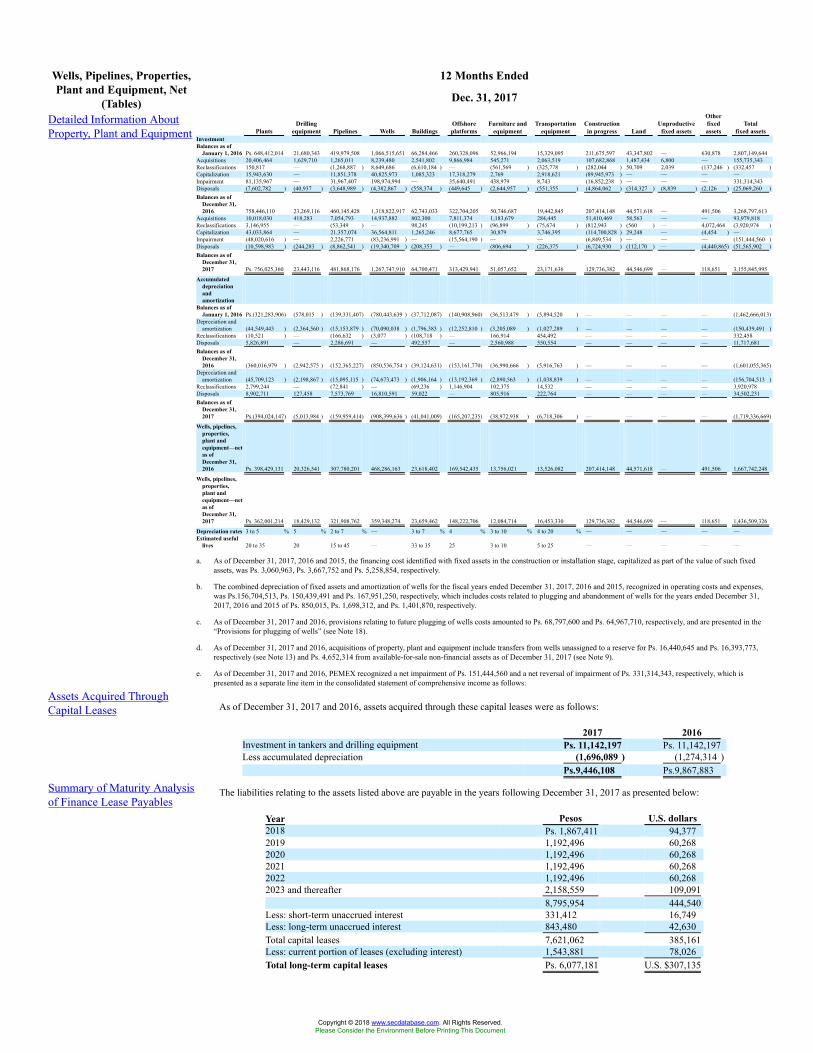
12 Months EndedWells, Pipelines, Properties,Plant and Equipment, Net
(Tables) Dec. 31, 2017
Detailed Information AboutProperty, Plant and Equipment Plants
Drillingequipment Pipelines Wells Buildings
Offshoreplatforms
Furniture andequipment
Transportationequipment
Constructionin progress Land
Unproductivefixed assets
Otherfixedassets
Totalfixed assets
InvestmentBalances as of
January 1, 2016 Ps. 648,412,014 21,680,343 419,979,508 1,066,515,651 66,284,466 260,328,096 52,966,194 15,329,095 211,675,597 43,347,802 — 630,878 2,807,149,644Acquisitions 20,406,464 1,629,710 1,265,011 8,239,480 2,541,802 9,866,984 545,271 2,063,519 107,682,868 1,487,434 6,800 — 155,735,343Reclassifications 150,817 — (1,268,887 ) 8,649,686 (6,610,184 ) — (561,569 ) (325,778 ) (282,044 ) 50,709 2,039 (137,246 ) (332,457 )Capitalization 15,943,630 — 11,851,378 40,825,973 1,085,323 17,318,279 2,769 2,918,621 (89,945,973 ) — — — —Impairment 81,135,967 — 31,967,407 198,974,994 — 35,640,491 438,979 8,743 (16,852,238 ) — — — 331,314,343Disposals (7,602,782 ) (40,937 ) (3,648,989 ) (4,382,867 ) (558,374 ) (449,645 ) (2,644,957 ) (551,355 ) (4,864,062 ) (314,327 ) (8,839 ) (2,126 ) (25,069,260 )Balances as of
December 31,2016 758,446,110 23,269,116 460,145,428 1,318,822,917 62,743,033 322,704,205 50,746,687 19,442,845 207,414,148 44,571,618 — 491,506 3,268,797,613
Acquisitions 10,018,030 418,283 7,054,793 14,937,882 802,300 7,811,374 1,183,679 284,445 51,410,469 58,563 — — 93,979,818Reclassifications 3,146,955 — (53,349 ) — 98,245 (10,199,213 ) (96,899 ) (75,674 ) (812,943 ) (560 ) — 4,072,464 (3,920,974 )Capitalization 43,033,864 — 21,357,074 36,564,811 1,265,246 8,677,765 30,879 3,746,395 (114,700,828 ) 29,248 — (4,454 ) —Impairment (48,020,616 ) — 2,226,771 (83,236,991 ) — (15,564,190 ) — — (6,849,534 ) — — — (151,444,560 )Disposals (10,598,983 ) (244,283 ) (8,862,541 ) (19,340,709 ) (208,353 ) — (806,694 ) (226,375 ) (6,724,930 ) (112,170 ) — (4,440,865) (51,565,902 )Balances as of
December 31,2017 Ps. 756,025,360 23,443,116 481,868,176 1,267,747,910 64,700,471 313,429,941 51,057,652 23,171,636 129,736,382 44,546,699 — 118,651 3,155,845,995
Accumulateddepreciationandamortization
Balances as ofJanuary 1, 2016 Ps.(321,283,906) (578,015 ) (139,331,407) (780,443,639 ) (37,712,087) (140,908,960) (36,513,479 ) (5,894,520 ) — — — — (1,462,666,013)
Depreciation andamortization (44,549,443 ) (2,364,560 ) (15,153,879 ) (70,090,038 ) (1,796,383 ) (12,252,810 ) (3,205,089 ) (1,027,289 ) — — — — (150,439,491 )
Reclassifications (10,521 ) — (166,632 ) (3,077 ) (108,718 ) — 166,914 454,492 — — — — 332,458Disposals 5,826,891 — 2,286,691 — 492,557 — 2,560,988 550,554 — — — — 11,717,681Balances as of
December 31,2016 (360,016,979 ) (2,942,575 ) (152,365,227) (850,536,754 ) (39,124,631) (153,161,770) (36,990,666 ) (5,916,763 ) — — — — (1,601,055,365)
Depreciation andamortization (45,709,123 ) (2,198,867 ) (15,095,115 ) (74,673,473 ) (1,906,164 ) (13,192,369 ) (2,890,563 ) (1,038,839 ) — — — — (156,704,513 )
Reclassifications 2,799,244 — (72,841 ) — (69,236 ) 1,146,904 102,375 14,532 — — — — 3,920,978Disposals 8,902,711 127,458 7,573,769 16,810,591 59,022 — 805,916 222,764 — — — — 34,502,231Balances as of
December 31,2017 Ps.(394,024,147) (5,013,984 ) (159,959,414) (908,399,636 ) (41,041,009) (165,207,235) (38,972,938 ) (6,718,306 ) — — — — (1,719,336,669)
Wells, pipelines,properties,plant andequipment—netas ofDecember 31,2016 Ps. 398,429,131 20,326,541 307,780,201 468,286,163 23,618,402 169,542,435 13,756,021 13,526,082 207,414,148 44,571,618 — 491,506 1,667,742,248
Wells, pipelines,properties,plant andequipment—netas ofDecember 31,2017 Ps. 362,001,214 18,429,132 321,908,762 359,348,274 23,659,462 148,222,706 12,084,714 16,453,330 129,736,382 44,546,699 — 118,651 1,436,509,326
Depreciation rates 3 to 5 % 5 % 2 to 7 % — 3 to 7 % 4 % 3 to 10 % 4 to 20 % — — — — —Estimated useful
lives 20 to 35 20 15 to 45 — 33 to 35 25 3 to 10 5 to 25 — — — — —
a. As of December 31, 2017, 2016 and 2015, the financing cost identified with fixed assets in the construction or installation stage, capitalized as part of the value of such fixedassets, was Ps. 3,060,963, Ps. 3,667,752 and Ps. 5,258,854, respectively.
b. The combined depreciation of fixed assets and amortization of wells for the fiscal years ended December 31, 2017, 2016 and 2015, recognized in operating costs and expenses,was Ps.156,704,513, Ps. 150,439,491 and Ps. 167,951,250, respectively, which includes costs related to plugging and abandonment of wells for the years ended December 31,2017, 2016 and 2015 of Ps. 850,015, Ps. 1,698,312, and Ps. 1,401,870, respectively.
c. As of December 31, 2017 and 2016, provisions relating to future plugging of wells costs amounted to Ps. 68,797,600 and Ps. 64,967,710, respectively, and are presented in the“Provisions for plugging of wells” (see Note 18).
d. As of December 31, 2017 and 2016, acquisitions of property, plant and equipment include transfers from wells unassigned to a reserve for Ps. 16,440,645 and Ps. 16,393,773,respectively (see Note 13) and Ps. 4,652,314 from available-for-sale non-financial assets as of December 31, 2017 (see Note 9).
e. As of December 31, 2017 and 2016, PEMEX recognized a net impairment of Ps. 151,444,560 and a net reversal of impairment of Ps. 331,314,343, respectively, which ispresented as a separate line item in the consolidated statement of comprehensive income as follows:
Assets Acquired ThroughCapital Leases As of December 31, 2017 and 2016, assets acquired through these capital leases were as follows:
2017 2016Investment in tankers and drilling equipment Ps. 11,142,197 Ps. 11,142,197Less accumulated depreciation (1,696,089 ) (1,274,314 )
Ps.9,446,108 Ps.9,867,883
Summary of Maturity Analysisof Finance Lease Payables
The liabilities relating to the assets listed above are payable in the years following December 31, 2017 as presented below:
Year Pesos U.S. dollars2018 Ps. 1,867,411 94,3772019 1,192,496 60,2682020 1,192,496 60,2682021 1,192,496 60,2682022 1,192,496 60,2682023 and thereafter 2,158,559 109,091
8,795,954 444,540Less: short-term unaccrued interest 331,412 16,749Less: long-term unaccrued interest 843,480 42,630Total capital leases 7,621,062 385,161Less: current portion of leases (excluding interest) 1,543,881 78,026Total long-term capital leases Ps. 6,077,181 U.S. $307,135
Copyright © 2018 www.secdatabase.com. All Rights Reserved.Please Consider the Environment Before Printing This Document

Consolidated and SeparateFinancial Statements
Profit-sharing LicenseAs of /For the year endedDecember 31, 2017 EK / Balam Block 2 Block 8 Trion Block 3 TotalSales:Net sales Ps.7,009,464 Ps.— Ps. — Ps.— Ps.— Ps.7,009,464Cost of sales 5,447,955 5,953 4,845 — 511 5,459,264Gross income (loss) 1,561,509 (5,953) (4,845) — (511 ) 1,550,200Other income (loss), net 4,852 — — — — 4,852Administrative expenses 34,338 — — — — 34,338Operating income (loss) 1,532,023 (5,953) (4,845) — (511 ) 1,520,714Taxes, duties and other 158,347 — — — — 158,347Net income (loss) Ps.1,373,676 Ps.(5,953) Ps. (4,845) Ps.— Ps.(511 ) Ps.1,362,367Cash and cash equivalents Ps.— Ps.20 Ps. 25 Ps.— Ps.— Ps.45Accounts receivable — 1,013 1,804 — 327 3,144Total current assets — 1,033 1,829 — 327 3,189Wells, pipelines, properties, plant and
equipment, net 14,869,906 — — 4,498,234 1,107,311 20,475,451Total assets 14,869,906 1,033 1,829 4,498,234 1,107,638 20,478,640Suppliers 796,300 — — — — 796,300Taxes and duties payable 973 — — — — 973Other current liabilities 4,391 1,809 2,369 — — 8,569Total current liabilities 801,664 1,809 2,369 — — 805,842Total liabilities Ps.801,664 Ps. 1,809 Ps. 2,369 Ps.— Ps.— Ps.805,842Equity (deficit), net Ps.14,068,242 Ps.(776 ) Ps. (540 ) Ps.4,498,234 Ps.1,107,638 Ps.19,672,798
Pemex industrialtransformation [member]Assumptions to Determine NetPresent Value of ReservesLong Lived Assets
To determine the value in use of long-lived assets associated with the cash-generating units of Pemex Industrial Transformation, the netpresent value of cash flows was determined based on the following assumptions:
Refining Gas PetrochemicalsAverage crude oil Price 51.30 U.S. dollars N.A. N.A.Processed volume 767 mbd 3,085 mmpcd or sour gas Variable because the
load inputs arediverse
Rate of U.S. dollar Ps.19.7867 mxp/usd Ps.19.7867 mxp/usd Ps.19.7867 mxp/usdUseful lives of the cash generating units Average of 16 years Average of 9 years Average of 6 yearsDiscount rate 11.53% annually 10.24% annually 9.71% annuallyPeriod 2018-2034 2018-2029 2016-2024
To determine the value in use of long-lived assets associated with the cash-generating units of Pemex Industrial Transformation, the netpresent value of cash flows was determined based on the following assumptions:
Refining Gas PetrochemicalsAverage crude oil price 52.30 U.S. dollars N.A. N.A.Processed volume 1,100 mbd 3,085 mmpcd or sour gas Variable because the
load inputs arediverse
Rate of U.S. dollar Ps.20.6640 mxp/usd Ps.20.6640 mxp/usd Ps.20.6640 mxp/usdUseful lives of the cash generating units Average of 14 years Average of 10 years Average of 4 yearsDiscount rate 12.06% annually 10.72% annually 10.29% annuallyPeriod 2018-2034 2018-2029 2016-2024
Pemex exploration andproduction [member]Assumptions to Determine NetPresent Value of ReservesLong Lived Assets
To determine the value in use of long-lived assets associated with hydrocarbon extraction, the net present value of reserves is determinedbased on the following assumptions:
Average crude oil price 55.89 U.S. dollars/blAverage gas price 4.92 U.S. dollars /mpcAverage condensates price 38.33 U.S. dollars /blDiscount rate 14.40% annually
To determine the value in use of long-lived assets associated to hydrocarbon extraction, the net present value of reserves is determined basedon the following assumptions:
Average crude oil price 60.24 U.S. dollars/blAverage gas price 4.69 U.S. dollars/mpcAverage condensates price 40.22 U.S. dollars/blDiscount rate 14.36% annually
Fixed assets [member] | Pemexindustrial transformation[member]
Copyright © 2018 www.secdatabase.com. All Rights Reserved.Please Consider the Environment Before Printing This Document
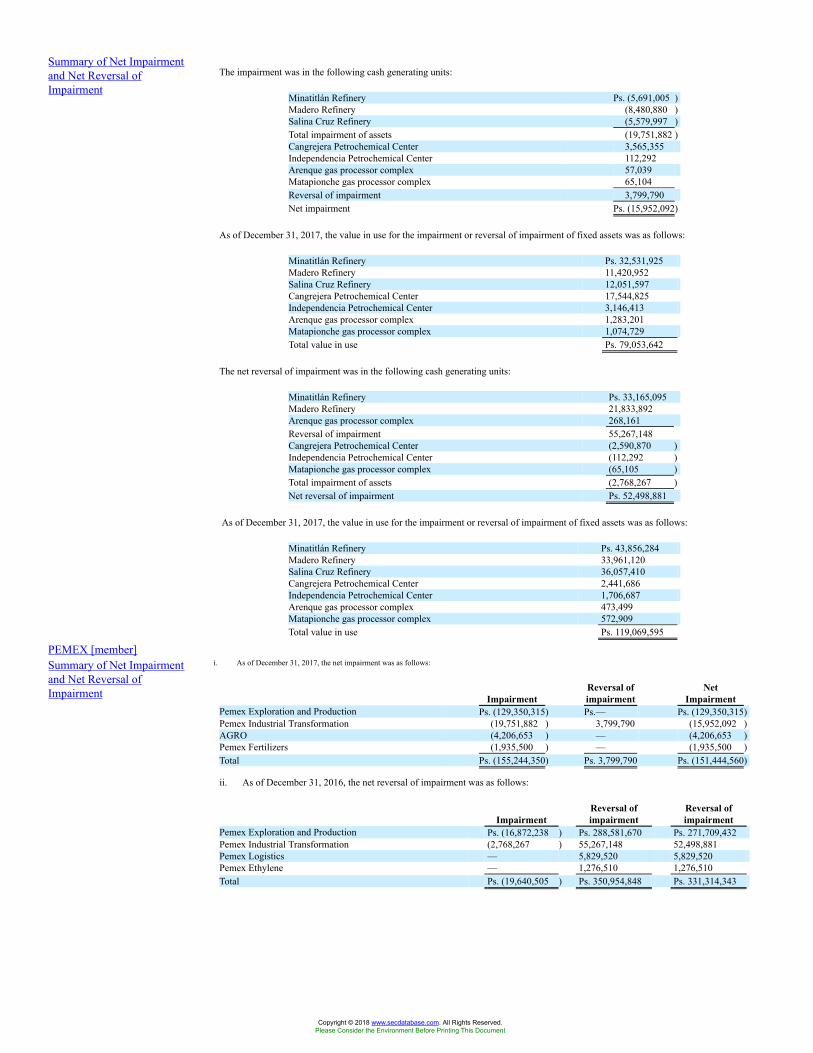
Summary of Net Impairmentand Net Reversal ofImpairment
The impairment was in the following cash generating units:
Minatitlán Refinery Ps. (5,691,005 )Madero Refinery (8,480,880 )Salina Cruz Refinery (5,579,997 )Total impairment of assets (19,751,882 )Cangrejera Petrochemical Center 3,565,355Independencia Petrochemical Center 112,292Arenque gas processor complex 57,039Matapionche gas processor complex 65,104Reversal of impairment 3,799,790Net impairment Ps. (15,952,092)
As of December 31, 2017, the value in use for the impairment or reversal of impairment of fixed assets was as follows:
Minatitlán Refinery Ps. 32,531,925Madero Refinery 11,420,952Salina Cruz Refinery 12,051,597Cangrejera Petrochemical Center 17,544,825Independencia Petrochemical Center 3,146,413Arenque gas processor complex 1,283,201Matapionche gas processor complex 1,074,729Total value in use Ps. 79,053,642
The net reversal of impairment was in the following cash generating units:
Minatitlán Refinery Ps. 33,165,095Madero Refinery 21,833,892Arenque gas processor complex 268,161Reversal of impairment 55,267,148Cangrejera Petrochemical Center (2,590,870 )Independencia Petrochemical Center (112,292 )Matapionche gas processor complex (65,105 )Total impairment of assets (2,768,267 )Net reversal of impairment Ps. 52,498,881
As of December 31, 2017, the value in use for the impairment or reversal of impairment of fixed assets was as follows:
Minatitlán Refinery Ps. 43,856,284Madero Refinery 33,961,120Salina Cruz Refinery 36,057,410Cangrejera Petrochemical Center 2,441,686Independencia Petrochemical Center 1,706,687Arenque gas processor complex 473,499Matapionche gas processor complex 572,909Total value in use Ps. 119,069,595
PEMEX [member]Summary of Net Impairmentand Net Reversal ofImpairment
i. As of December 31, 2017, the net impairment was as follows:
ImpairmentReversal ofimpairment
NetImpairment
Pemex Exploration and Production Ps. (129,350,315) Ps.— Ps. (129,350,315)Pemex Industrial Transformation (19,751,882 ) 3,799,790 (15,952,092 )AGRO (4,206,653 ) — (4,206,653 )Pemex Fertilizers (1,935,500 ) — (1,935,500 )Total Ps. (155,244,350) Ps. 3,799,790 Ps. (151,444,560)
ii. As of December 31, 2016, the net reversal of impairment was as follows:
ImpairmentReversal ofimpairment
Reversal ofimpairment
Pemex Exploration and Production Ps. (16,872,238 ) Ps. 288,581,670 Ps. 271,709,432Pemex Industrial Transformation (2,768,267 ) 55,267,148 52,498,881Pemex Logistics — 5,829,520 5,829,520Pemex Ethylene — 1,276,510 1,276,510Total Ps. (19,640,505 ) Ps. 350,954,848 Ps. 331,314,343
Copyright © 2018 www.secdatabase.com. All Rights Reserved.Please Consider the Environment Before Printing This Document
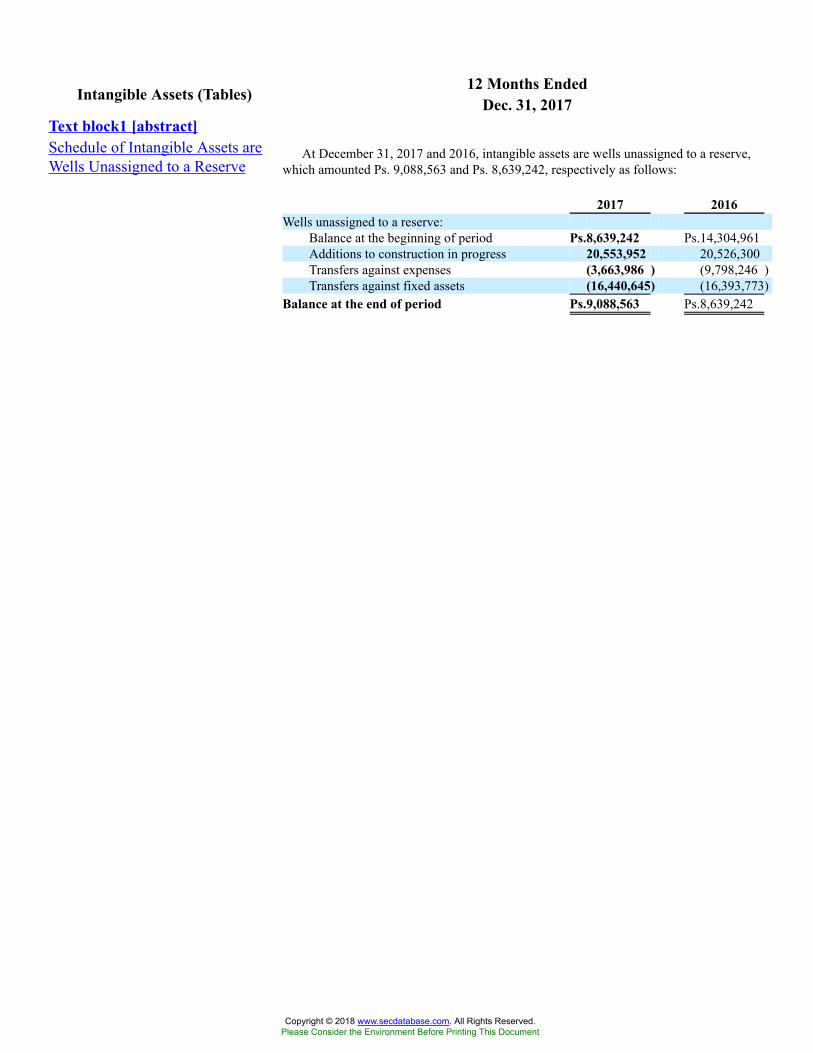
12 Months EndedIntangible Assets (Tables) Dec. 31, 2017Text block1 [abstract]Schedule of Intangible Assets areWells Unassigned to a Reserve
At December 31, 2017 and 2016, intangible assets are wells unassigned to a reserve,which amounted Ps. 9,088,563 and Ps. 8,639,242, respectively as follows:
2017 2016Wells unassigned to a reserve:
Balance at the beginning of period Ps.8,639,242 Ps.14,304,961Additions to construction in progress 20,553,952 20,526,300Transfers against expenses (3,663,986 ) (9,798,246 )Transfers against fixed assets (16,440,645) (16,393,773)
Balance at the end of period Ps.9,088,563 Ps.8,639,242
Copyright © 2018 www.secdatabase.com. All Rights Reserved.Please Consider the Environment Before Printing This Document
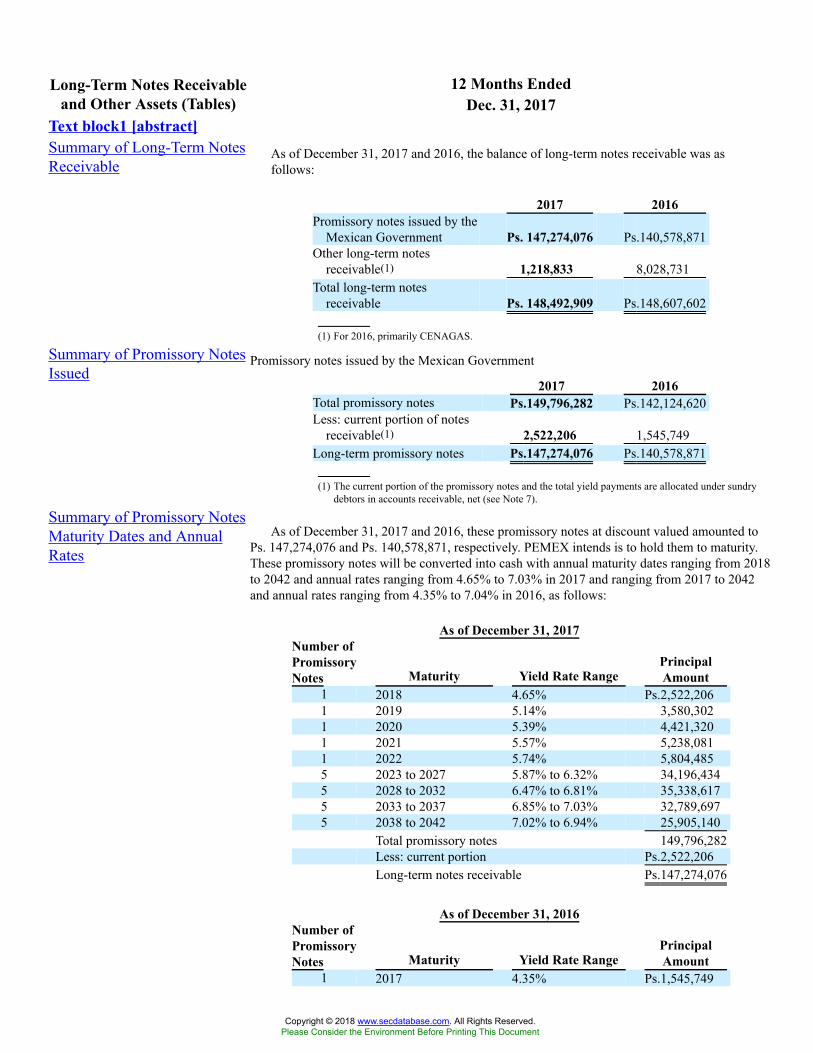
12 Months EndedLong-Term Notes Receivableand Other Assets (Tables) Dec. 31, 2017
Text block1 [abstract]Summary of Long-Term NotesReceivable
As of December 31, 2017 and 2016, the balance of long-term notes receivable was asfollows:
2017 2016Promissory notes issued by the
Mexican Government Ps. 147,274,076 Ps.140,578,871Other long-term notes
receivable(1) 1,218,833 8,028,731Total long-term notes
receivable Ps. 148,492,909 Ps.148,607,602
(1) For 2016, primarily CENAGAS.
Summary of Promissory NotesIssued
Promissory notes issued by the Mexican Government
2017 2016Total promissory notes Ps.149,796,282 Ps.142,124,620Less: current portion of notes
receivable(1) 2,522,206 1,545,749Long-term promissory notes Ps.147,274,076 Ps.140,578,871
(1) The current portion of the promissory notes and the total yield payments are allocated under sundrydebtors in accounts receivable, net (see Note 7).
Summary of Promissory NotesMaturity Dates and AnnualRates
As of December 31, 2017 and 2016, these promissory notes at discount valued amounted toPs. 147,274,076 and Ps. 140,578,871, respectively. PEMEX intends is to hold them to maturity.These promissory notes will be converted into cash with annual maturity dates ranging from 2018to 2042 and annual rates ranging from 4.65% to 7.03% in 2017 and ranging from 2017 to 2042and annual rates ranging from 4.35% to 7.04% in 2016, as follows:
As of December 31, 2017Number ofPromissoryNotes Maturity Yield Rate Range
PrincipalAmount
1 2018 4.65% Ps.2,522,2061 2019 5.14% 3,580,3021 2020 5.39% 4,421,3201 2021 5.57% 5,238,0811 2022 5.74% 5,804,4855 2023 to 2027 5.87% to 6.32% 34,196,4345 2028 to 2032 6.47% to 6.81% 35,338,6175 2033 to 2037 6.85% to 7.03% 32,789,6975 2038 to 2042 7.02% to 6.94% 25,905,140
Total promissory notes 149,796,282Less: current portion Ps.2,522,206Long-term notes receivable Ps.147,274,076
As of December 31, 2016Number ofPromissoryNotes Maturity Yield Rate Range
PrincipalAmount
1 2017 4.35% Ps.1,545,749
Copyright © 2018 www.secdatabase.com. All Rights Reserved.Please Consider the Environment Before Printing This Document

1 2018 4.65% 2,408,6341 2019 5.14% 3,402,8491 2020 5.39% 4,192,1321 2021 5.57% 4,957,8405 2022 to 2026 4.74% a 6.11% 30,986,2525 2027 to 2031 6.32% a 6.77% 33,280,2165 2032 to 2036 6.81% a 7.00% 31,370,5046 2037 to 2042 6.94% a 7.04% 29,980,444
Total promissory notes Ps.142,124,620Less: current portion 1,545,749Long-term notes receivable Ps.140,578,871
Summary of Other AssetsAt December 31, 2017 and 2016, the balance of other assets was as follows:
2017 2016Payments in advance Ps. 4,683,117 Ps. 2,558,767License 2,162,151 1,813,605Rights-of-way 1,967,304 1,940,157Other 2,672,605 3,200,116Total other assets Ps. 11,485,177 Ps. 9,512,645
Copyright © 2018 www.secdatabase.com. All Rights Reserved.Please Consider the Environment Before Printing This Document
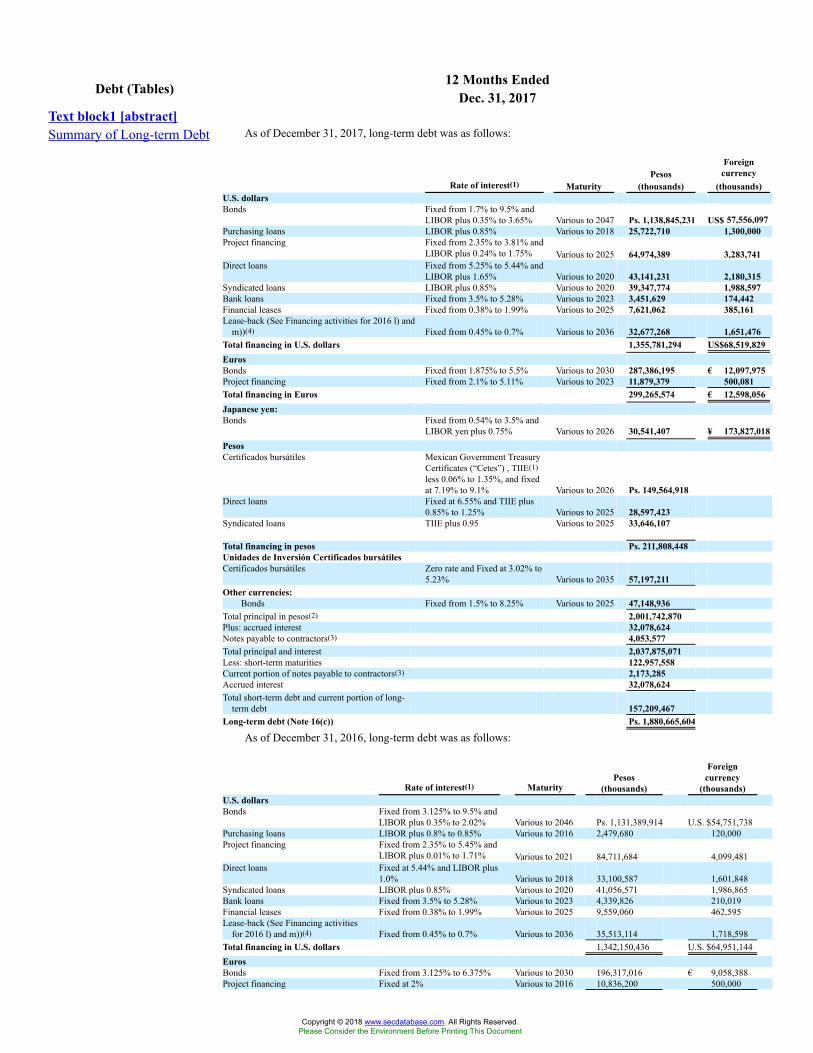
12 Months EndedDebt (Tables) Dec. 31, 2017Text block1 [abstract]Summary of Long-term Debt As of December 31, 2017, long-term debt was as follows:
PesosForeigncurrency
Rate of interest(1) Maturity (thousands) (thousands)U.S. dollarsBonds Fixed from 1.7% to 9.5% and
LIBOR plus 0.35% to 3.65% Various to 2047 Ps. 1,138,845,231 US$ 57,556,097Purchasing loans LIBOR plus 0.85% Various to 2018 25,722,710 1,300,000Project financing Fixed from 2.35% to 3.81% and
LIBOR plus 0.24% to 1.75% Various to 2025 64,974,389 3,283,741Direct loans Fixed from 5.25% to 5.44% and
LIBOR plus 1.65% Various to 2020 43,141,231 2,180,315Syndicated loans LIBOR plus 0.85% Various to 2020 39,347,774 1,988,597Bank loans Fixed from 3.5% to 5.28% Various to 2023 3,451,629 174,442Financial leases Fixed from 0.38% to 1.99% Various to 2025 7,621,062 385,161Lease-back (See Financing activities for 2016 l) and
m))(4) Fixed from 0.45% to 0.7% Various to 2036 32,677,268 1,651,476Total financing in U.S. dollars 1,355,781,294 US$68,519,829EurosBonds Fixed from 1.875% to 5.5% Various to 2030 287,386,195 € 12,097,975Project financing Fixed from 2.1% to 5.11% Various to 2023 11,879,379 500,081Total financing in Euros 299,265,574 € 12,598,056Japanese yen:Bonds Fixed from 0.54% to 3.5% and
LIBOR yen plus 0.75% Various to 2026 30,541,407 ¥ 173,827,018PesosCertificados bursátiles Mexican Government Treasury
Certificates (“Cetes”) , TIIE(1)less 0.06% to 1.35%, and fixedat 7.19% to 9.1% Various to 2026 Ps. 149,564,918
Direct loans Fixed at 6.55% and TIIE plus0.85% to 1.25% Various to 2025 28,597,423
Syndicated loans TIIE plus 0.95 Various to 2025 33,646,107
Total financing in pesos Ps. 211,808,448Unidades de Inversión Certificados bursátilesCertificados bursátiles Zero rate and Fixed at 3.02% to
5.23% Various to 2035 57,197,211Other currencies:
Bonds Fixed from 1.5% to 8.25% Various to 2025 47,148,936Total principal in pesos(2) 2,001,742,870Plus: accrued interest 32,078,624Notes payable to contractors(3) 4,053,577Total principal and interest 2,037,875,071Less: short-term maturities 122,957,558Current portion of notes payable to contractors(3) 2,173,285Accrued interest 32,078,624Total short-term debt and current portion of long-
term debt 157,209,467Long-term debt (Note 16(c)) Ps. 1,880,665,604
As of December 31, 2016, long-term debt was as follows:
Rate of interest(1) MaturityPesos
(thousands)
Foreigncurrency
(thousands)U.S. dollarsBonds Fixed from 3.125% to 9.5% and
LIBOR plus 0.35% to 2.02% Various to 2046 Ps. 1,131,389,914 U.S. $54,751,738Purchasing loans LIBOR plus 0.8% to 0.85% Various to 2016 2,479,680 120,000Project financing Fixed from 2.35% to 5.45% and
LIBOR plus 0.01% to 1.71% Various to 2021 84,711,684 4,099,481Direct loans Fixed at 5.44% and LIBOR plus
1.0% Various to 2018 33,100,587 1,601,848Syndicated loans LIBOR plus 0.85% Various to 2020 41,056,571 1,986,865Bank loans Fixed from 3.5% to 5.28% Various to 2023 4,339,826 210,019Financial leases Fixed from 0.38% to 1.99% Various to 2025 9,559,060 462,595Lease-back (See Financing activities
for 2016 l) and m))(4) Fixed from 0.45% to 0.7% Various to 2036 35,513,114 1,718,598Total financing in U.S. dollars 1,342,150,436 U.S. $64,951,144EurosBonds Fixed from 3.125% to 6.375% Various to 2030 196,317,016 € 9,058,388Project financing Fixed at 2% Various to 2016 10,836,200 500,000
Copyright © 2018 www.secdatabase.com. All Rights Reserved.Please Consider the Environment Before Printing This Document
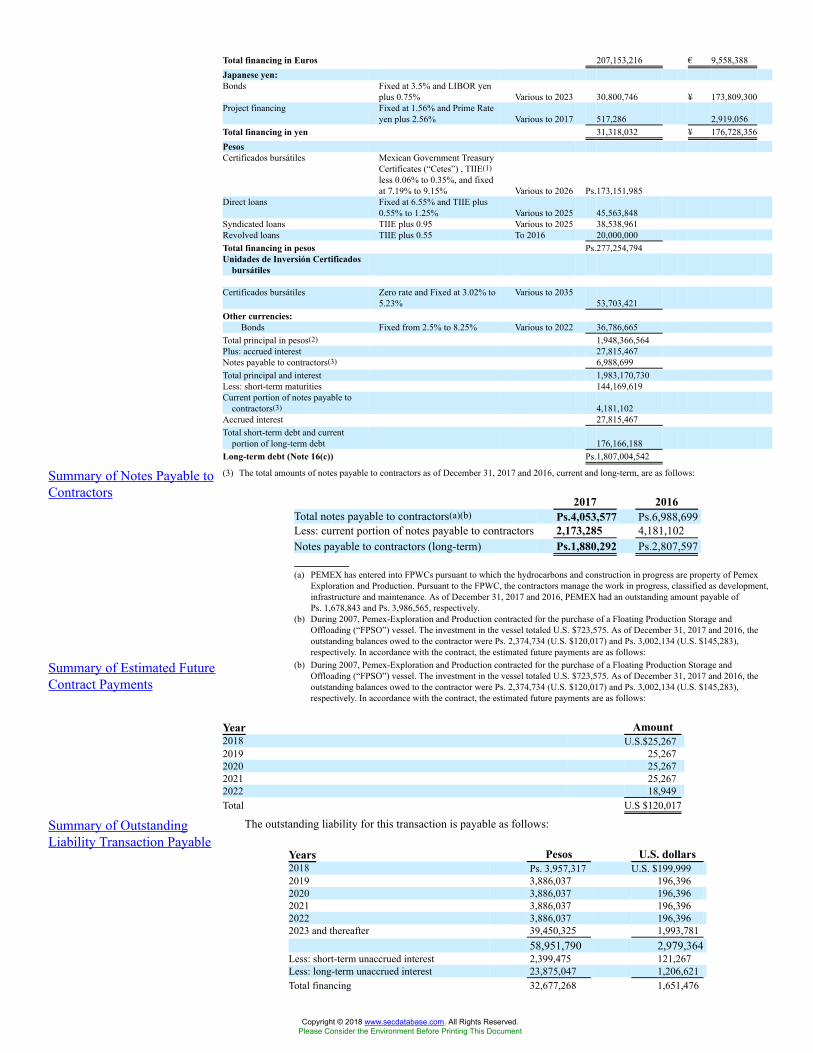
Total financing in Euros 207,153,216 € 9,558,388Japanese yen:Bonds Fixed at 3.5% and LIBOR yen
plus 0.75% Various to 2023 30,800,746 ¥ 173,809,300Project financing Fixed at 1.56% and Prime Rate
yen plus 2.56% Various to 2017 517,286 2,919,056Total financing in yen 31,318,032 ¥ 176,728,356PesosCertificados bursátiles Mexican Government Treasury
Certificates (“Cetes”) , TIIE(1)less 0.06% to 0.35%, and fixedat 7.19% to 9.15% Various to 2026 Ps.173,151,985
Direct loans Fixed at 6.55% and TIIE plus0.55% to 1.25% Various to 2025 45,563,848
Syndicated loans TIIE plus 0.95 Various to 2025 38,538,961Revolved loans TIIE plus 0.55 To 2016 20,000,000Total financing in pesos Ps.277,254,794Unidades de Inversión Certificados
bursátiles
Certificados bursátiles Zero rate and Fixed at 3.02% to5.23%
Various to 203553,703,421
Other currencies:Bonds Fixed from 2.5% to 8.25% Various to 2022 36,786,665
Total principal in pesos(2) 1,948,366,564Plus: accrued interest 27,815,467Notes payable to contractors(3) 6,988,699Total principal and interest 1,983,170,730Less: short-term maturities 144,169,619Current portion of notes payable to
contractors(3) 4,181,102Accrued interest 27,815,467Total short-term debt and current
portion of long-term debt 176,166,188Long-term debt (Note 16(c)) Ps.1,807,004,542
Summary of Notes Payable toContractors
(3) The total amounts of notes payable to contractors as of December 31, 2017 and 2016, current and long-term, are as follows:
2017 2016Total notes payable to contractors(a)(b) Ps.4,053,577 Ps.6,988,699Less: current portion of notes payable to contractors 2,173,285 4,181,102Notes payable to contractors (long-term) Ps.1,880,292 Ps.2,807,597
(a) PEMEX has entered into FPWCs pursuant to which the hydrocarbons and construction in progress are property of PemexExploration and Production. Pursuant to the FPWC, the contractors manage the work in progress, classified as development,infrastructure and maintenance. As of December 31, 2017 and 2016, PEMEX had an outstanding amount payable ofPs. 1,678,843 and Ps. 3,986,565, respectively.
(b) During 2007, Pemex-Exploration and Production contracted for the purchase of a Floating Production Storage andOffloading (“FPSO”) vessel. The investment in the vessel totaled U.S. $723,575. As of December 31, 2017 and 2016, theoutstanding balances owed to the contractor were Ps. 2,374,734 (U.S. $120,017) and Ps. 3,002,134 (U.S. $145,283),respectively. In accordance with the contract, the estimated future payments are as follows:
Summary of Estimated FutureContract Payments
(b) During 2007, Pemex-Exploration and Production contracted for the purchase of a Floating Production Storage andOffloading (“FPSO”) vessel. The investment in the vessel totaled U.S. $723,575. As of December 31, 2017 and 2016, theoutstanding balances owed to the contractor were Ps. 2,374,734 (U.S. $120,017) and Ps. 3,002,134 (U.S. $145,283),respectively. In accordance with the contract, the estimated future payments are as follows:
Year Amount2018 U.S.$25,2672019 25,2672020 25,2672021 25,2672022 18,949Total U.S $120,017
Summary of OutstandingLiability Transaction Payable
The outstanding liability for this transaction is payable as follows:
Years Pesos U.S. dollars2018 Ps. 3,957,317 U.S. $199,9992019 3,886,037 196,3962020 3,886,037 196,3962021 3,886,037 196,3962022 3,886,037 196,3962023 and thereafter 39,450,325 1,993,781
58,951,790 2,979,364Less: short-term unaccrued interest 2,399,475 121,267Less: long-term unaccrued interest 23,875,047 1,206,621Total financing 32,677,268 1,651,476
Copyright © 2018 www.secdatabase.com. All Rights Reserved.Please Consider the Environment Before Printing This Document
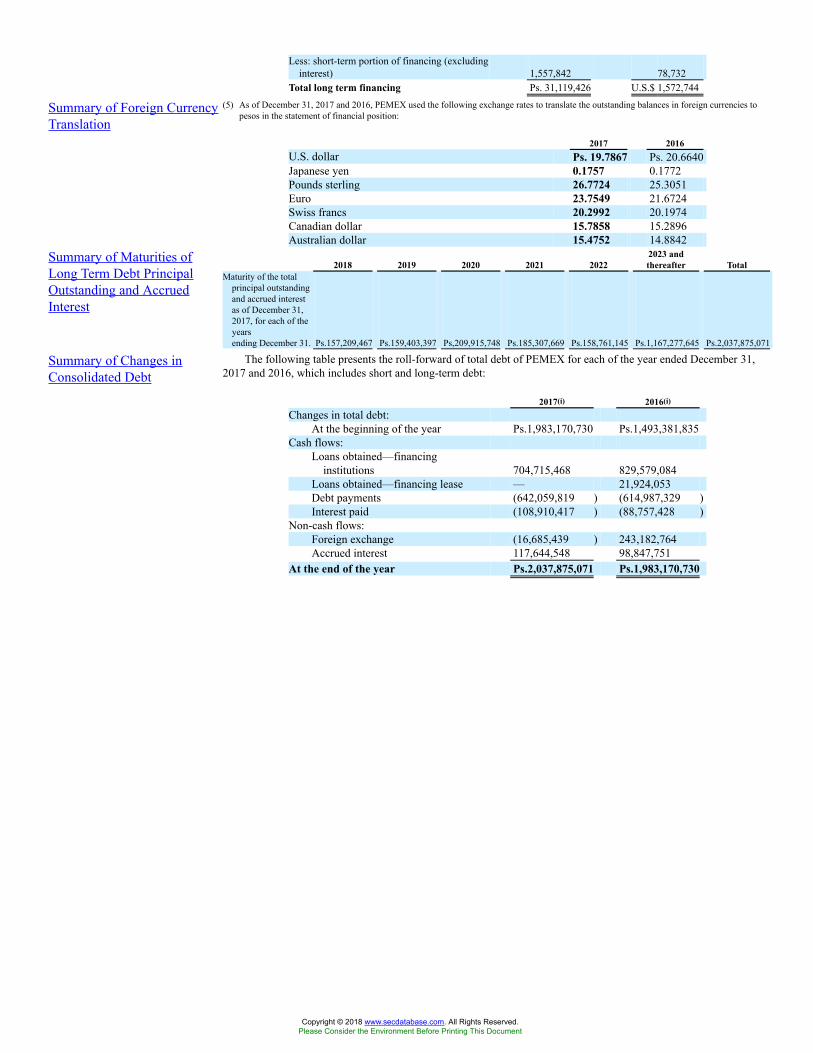
Less: short-term portion of financing (excludinginterest) 1,557,842 78,732
Total long term financing Ps. 31,119,426 U.S.$ 1,572,744
Summary of Foreign CurrencyTranslation
(5) As of December 31, 2017 and 2016, PEMEX used the following exchange rates to translate the outstanding balances in foreign currencies topesos in the statement of financial position:
2017 2016U.S. dollar Ps. 19.7867 Ps. 20.6640Japanese yen 0.1757 0.1772Pounds sterling 26.7724 25.3051Euro 23.7549 21.6724Swiss francs 20.2992 20.1974Canadian dollar 15.7858 15.2896Australian dollar 15.4752 14.8842
Summary of Maturities ofLong Term Debt PrincipalOutstanding and AccruedInterest
2018 2019 2020 2021 20222023 andthereafter Total
Maturity of the totalprincipal outstandingand accrued interestas of December 31,2017, for each of theyearsending December 31. Ps.157,209,467 Ps.159,403,397 Ps,209,915,748 Ps.185,307,669 Ps.158,761,145 Ps.1,167,277,645 Ps.2,037,875,071
Summary of Changes inConsolidated Debt
The following table presents the roll-forward of total debt of PEMEX for each of the year ended December 31,2017 and 2016, which includes short and long-term debt:
2017(i) 2016(i)
Changes in total debt:At the beginning of the year Ps.1,983,170,730 Ps.1,493,381,835
Cash flows:Loans obtained—financing
institutions 704,715,468 829,579,084Loans obtained—financing lease — 21,924,053Debt payments (642,059,819 ) (614,987,329 )Interest paid (108,910,417 ) (88,757,428 )
Non-cash flows:Foreign exchange (16,685,439 ) 243,182,764Accrued interest 117,644,548 98,847,751
At the end of the year Ps.2,037,875,071 Ps.1,983,170,730
Copyright © 2018 www.secdatabase.com. All Rights Reserved.Please Consider the Environment Before Printing This Document
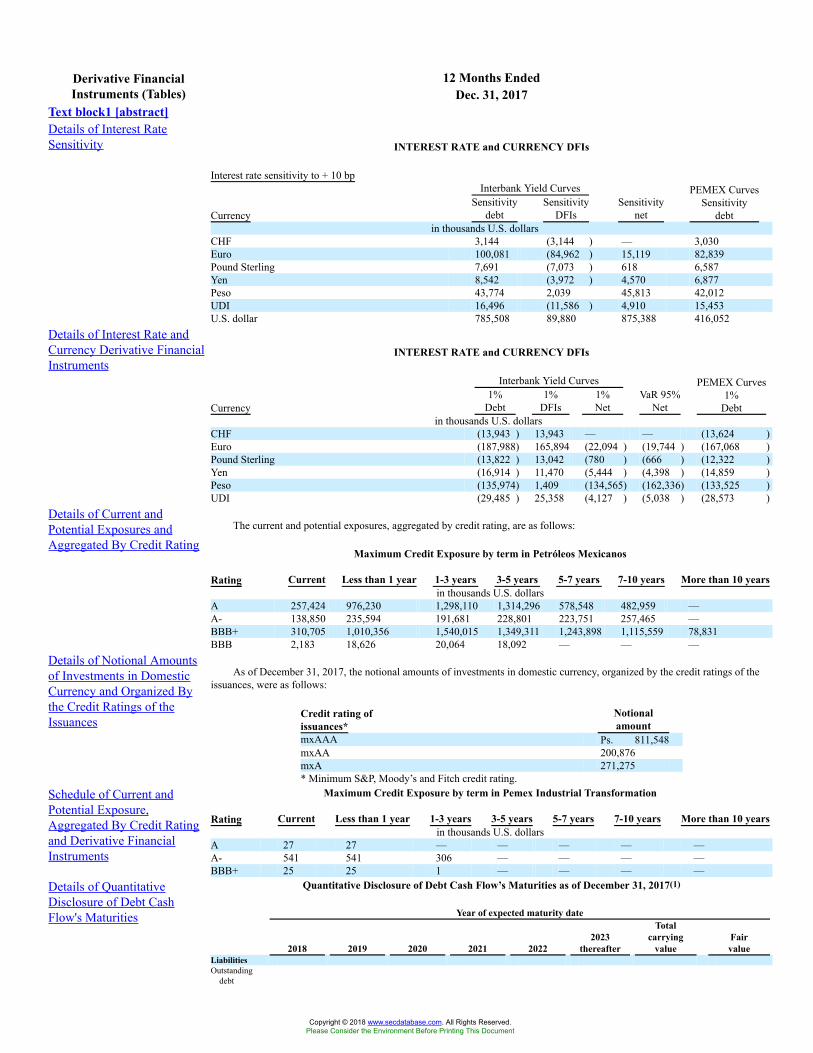
12 Months EndedDerivative FinancialInstruments (Tables) Dec. 31, 2017
Text block1 [abstract]Details of Interest RateSensitivity INTEREST RATE and CURRENCY DFIs
Interest rate sensitivity to + 10 bpInterbank Yield Curves
CurrencySensitivity
debtSensitivity
DFIsSensitivity
net
PEMEX CurvesSensitivity
debtin thousands U.S. dollars
CHF 3,144 (3,144 ) — 3,030Euro 100,081 (84,962 ) 15,119 82,839Pound Sterling 7,691 (7,073 ) 618 6,587Yen 8,542 (3,972 ) 4,570 6,877Peso 43,774 2,039 45,813 42,012UDI 16,496 (11,586 ) 4,910 15,453U.S. dollar 785,508 89,880 875,388 416,052
Details of Interest Rate andCurrency Derivative FinancialInstruments
INTEREST RATE and CURRENCY DFIs
Interbank Yield Curves
Currency1%
Debt1%
DFIs1%Net
VaR 95%Net
PEMEX Curves1%
Debtin thousands U.S. dollars
CHF (13,943 ) 13,943 — — (13,624 )Euro (187,988) 165,894 (22,094 ) (19,744 ) (167,068 )Pound Sterling (13,822 ) 13,042 (780 ) (666 ) (12,322 )Yen (16,914 ) 11,470 (5,444 ) (4,398 ) (14,859 )Peso (135,974) 1,409 (134,565) (162,336) (133,525 )UDI (29,485 ) 25,358 (4,127 ) (5,038 ) (28,573 )
Details of Current andPotential Exposures andAggregated By Credit Rating
The current and potential exposures, aggregated by credit rating, are as follows:
Maximum Credit Exposure by term in Petróleos Mexicanos
Rating Current Less than 1 year 1-3 years 3-5 years 5-7 years 7-10 years More than 10 yearsin thousands U.S. dollars
A 257,424 976,230 1,298,110 1,314,296 578,548 482,959 —A- 138,850 235,594 191,681 228,801 223,751 257,465 —BBB+ 310,705 1,010,356 1,540,015 1,349,311 1,243,898 1,115,559 78,831BBB 2,183 18,626 20,064 18,092 — — —
Details of Notional Amountsof Investments in DomesticCurrency and Organized Bythe Credit Ratings of theIssuances
As of December 31, 2017, the notional amounts of investments in domestic currency, organized by the credit ratings of theissuances, were as follows:
Credit rating ofissuances*
Notionalamount
mxAAA Ps. 811,548mxAA 200,876mxA 271,275* Minimum S&P, Moody’s and Fitch credit rating.
Schedule of Current andPotential Exposure,Aggregated By Credit Ratingand Derivative FinancialInstruments
Maximum Credit Exposure by term in Pemex Industrial Transformation
Rating Current Less than 1 year 1-3 years 3-5 years 5-7 years 7-10 years More than 10 yearsin thousands U.S. dollars
A 27 27 — — — — —A- 541 541 306 — — — —BBB+ 25 25 1 — — — —
Details of QuantitativeDisclosure of Debt CashFlow's Maturities
Quantitative Disclosure of Debt Cash Flow’s Maturities as of December 31, 2017(1)
Year of expected maturity date
2018 2019 2020 2021 20222023
thereafter
Totalcarrying
valueFairvalue
LiabilitiesOutstanding
debt
Copyright © 2018 www.secdatabase.com. All Rights Reserved.Please Consider the Environment Before Printing This Document

Fixed rate (U.S.dollars) Ps 53,465,817 Ps 59,498,256 Ps 60,290,621 Ps 95,232,448 Ps 84,076,050 Ps808,836,547 Ps 1,161,399,739 Ps. 1,213,404,769
Average interestrate (%) 5.7747 %
Fixed rate(Japaneseyen) — — — — — 19,296,607 19,296,607 18,040,398
Average interestrate (%) 1.3485 %
Fixed rate(Pounds) — — — — 9,345,839 11,952,816 21,298,655 24,381,394
Average interestrate (%) 5.7246 %
Fixed rate(pesos) — — 10,033,017 20,376,655 1,999,098 88,349,072 120,757,842 171,683,692
Average interestrate (%) 7.4876 %
Fixed rate(UDIs) — 18,477,076 4,764,175 3,874,313 — 30,081,647 57,197,211 56,536,905
Average interestrate (%) 2.7458 %
Fixed rate(euros) 1,043 32,042,196 30,801,894 41,508,857 23,655,950 171,255,634 299,265,574 330,573,998
Average interestrate (%) 3.6736 %
Fixed rate(SwissFrancs) 4,565,075 6,088,686 12,149,953 3,046,567 — — 25,850,281 26,957,785
Average interestrate (%) 1.8387 %
Fixed rate(Australiandollars) — — — — — — — —
Average interestrate (%) — — — — — — — —
Total fixed ratedebt 58,031,935 116,106,214 118,039,660 164,038,840 119,076,937 1,129,772,323 1,705,065,909 1,841,578,940
Variable rate(U.S. dollars) 58,364,536 15,302,101 62,289,546 12,809,666 31,289,725 18,379,557 198,435,131 206,254,219
Variable rate(Japaneseyen) — — 11,244,800 — — — 11,244,800 11,361,079
Variable rate(pesos) 8,734,371 27,995,083 18,341,742 8,459,163 8,394,483 19,125,764 91,050,606 94,188,981
Total variablerate debt 67,098,907 43,297,184 91,876,088 21,268,829 39,684,208 37,505,321 300,730,537 311,804,280
Total debt Ps. 125,130,842 Ps. 159,403,398 Ps. 209,915,748 Ps. 185,307,669 Ps. 158,761,145 Ps.1,167,277,644 Ps. 2,005,796,446 Ps.2,153,383,220
Note:Numbers may not total due to rounding.(1) The information in this table has been calculated using exchange rates at December 31, 2017 of: Ps. 19.7867 = U.S. $1.00; Ps. 0.1757 = 1.00 Japanese yen;
Ps. 26.7724 = 1.00 Pound sterling; Ps. $ 5.934551 = 1.00 UDI; Ps. 23.7549 = 1.00 euro; Ps. 20.2992 = 1.00 Swiss Franc; and Ps. 15.4752 = 1.00 Australiandollar.
Source: PEMEXQuantitative Disclosure of Debt Cash Flow’s Maturities as of December 31, 2016(1)
Year of expected maturity date
2017 2018 2019 2020 20212022
thereafter
Totalcarrying
valueFairvalue
LiabilitiesOutstanding
debtFixed rate
(U.S.dollars) Ps 15,759,027 Ps 86,161,096 Ps 65,642,616 Ps 62,440,943 Ps 98,858,992 Ps 826,093,574 Ps 1,154,956,248 Ps 1,137,936,275
Averageinterest rate(%) 5.6541 %
Fixed rate(Japaneseyen) 517,286 — — — — 19,459,306 19,976,592 17,336,203
Averageinterest rate(%) 1.3665 %
Fixed rate(Pounds) — — — — — 8,825,434 8,825,434 11,373,345
Averageinterest rate(%) 8.2500 %
Fixed rate(pesos) — — — 10,048,950 20,457,671 90,393,507 120,900,128 160,930,040
Averageinterest rate(%) 7.4878 %
Fixed rate(UDIs) — — 17,319,897 4,464,787 3,630,557 28,288,180 53,703,421 50,809,979
Averageinterest rate(%) 4.0559 %
Copyright © 2018 www.secdatabase.com. All Rights Reserved.Please Consider the Environment Before Printing This Document

Fixed rate(euros) 26,006,880 — 29,198,138 28,061,554 — 123,886,644 207,153,216 216,100,006
Averageinterest rate(%) 3.9581 %
Fixed rate(SwissFrancs) — 4,539,022 6,056,338 12,102,748 3,031,480 — 25,729,588 26,469,543
Averageinterest rate(%) 1.8385 %
Fixed rate(Australiandollars) 2,232,195 — — — — — 2,232,195 2,346,390
Averageinterest rate(%) — — — — — — 6.1250 % —
Total fixedrate debt 44,515,388 90,700,118 118,216,989 117,118,982 125,978,700 1,096,946,645 1,593,476,822 1,623,301,781
Variable rate(U.S.dollars) 38,811,320 27,907,661 15,984,547 52,726,647 13,366,336 45,385,885 194,182,396 195,838,382
Variable rate(Japaneseyen) — — — 11,341,440 — — 11,341,440 11,025,531
Variable rate(euros) — — — — — — — —
Variable rate(pesos) 65,024,075 8,742,191 28,007,709 18,347,822 8,468,176 27,764,693 156,354,666 158,109,920
Total variablerate debt 103,835,395 36,649,852 43,992,256 82,415,909 21,834,512 73,150,578 361,878,502 364,973,833
Total debt Ps.148,350,783 Ps. 127,349,970 Ps. 162,209,245 Ps. 199,534,891 Ps. 147,813,212 Ps. 1,170,097,223 Ps. 1,955,355,324 Ps. 1,988,275,614
Note:Numbers may not total due to rounding.(1) The information in this table has been calculated using exchange rates at December 31, 2016 of: Ps. 20.664 = U.S. $1.00; Ps. 0.17721 = 1.00 Japanese yen;
Ps. 25.30513 = 1.00 Pound sterling; Ps. $ 5.562883 = 1.00 UDI; Ps. 21.6724 = 1.00 euro; Ps. 20.19744= 1.00 Swiss Franc; and Ps. 14.88428 = 1.00Australian dollar.
Summary of QuantitativeDisclosure of Cash Flow'sMaturities
Quantitative Disclosure of Cash Flow’s Maturities from Derivative Financial Instruments Held or Issued for PurposesOther than Trading as of December 31, 2017(1)(2)
Year of expected maturity date
2018 2019 2020 2021 20222023
Thereafter
TotalNotionalAmount
FairValue(3)
Hedginginstruments(2)(4)
Interest rate DFIsInterest rate swaps
(U.S. dollars)Variable to fixed Ps. 4,704,170 Ps. 4,717,321 Ps. 4,730,857 Ps. 4,686,396 Ps 4,570,070 Ps 10,143,209 Ps. 33,552,022 Ps. 388,851Average pay rate 3.16 % 3.18 % 3.20 % 3.22 % 3.26 % 3.48 % N.A. N.A.Average receive rate 3.19 % 3.44 % 3.69 % 3.81 % 3.95 % 4.48 % N.A. N.A.Interest rate swaps
(pesos)Variable to fixed — — — — — — — —Average pay rate N.A. N.A. N.A. N.A. N.A. N.A. N.A. N.A.Average receive rate N.A. N.A. N.A. N.A. N.A. N.A. N.A. N.A.Currency DFIsCross-currency swapsReceive euros/Pay
U.S. dollars — 29,898,198 28,719,208 36,902,690 21,302,856 161,617,172 278,440,124 19,065,727Receive Japanese yen/
Pay U.S. dollars — — 13,039,563 — — 4,775,551 17,815,114 (1,670,533 )Receive Pounds
sterling/ PayU.S. dollars — — — — 10,310,216 11,706,999 22,017,215 1,151,096
Receive UDI/ Paypesos — 23,740,341 7,292,520 3,000,000 — 20,605,166 54,638,028 (4,720,592 )
Receive Swiss francs/Pay U.S. dollars 4,535,474 6,501,082 11,548,658 2,994,374 — — 25,579,588 400,316
Receive Australiandollars/ PayU.S. dollars — — — — — — — —
Currency OptionsBuy Put, Sell Put and
Sell Call on Japaneseyen — — — — — 14,046,320 14,046,320 48,715
Buy call, Sell call andSell Put on euros — — — 41,567,998 — 59,382,855 100,950,853 4,919,444
Sell Call on Poundsterling — — — — — 12,031,728 12,031,728 (239,626 )
Currency ForwardsReceive U.S. dollars /
Pay pesos 59,360,100 — — — — — 59,360,100 (2,006,461 )
N.A. = not applicable.Numbers may not total due to rounding.(1) The information in this table has been calculated using exchange rates at December 31, 2017 of: Ps. 19.7867 = U.S. $1.00 and Ps. 23.7549 = 1.00 euro.
Copyright © 2018 www.secdatabase.com. All Rights Reserved.Please Consider the Environment Before Printing This Document
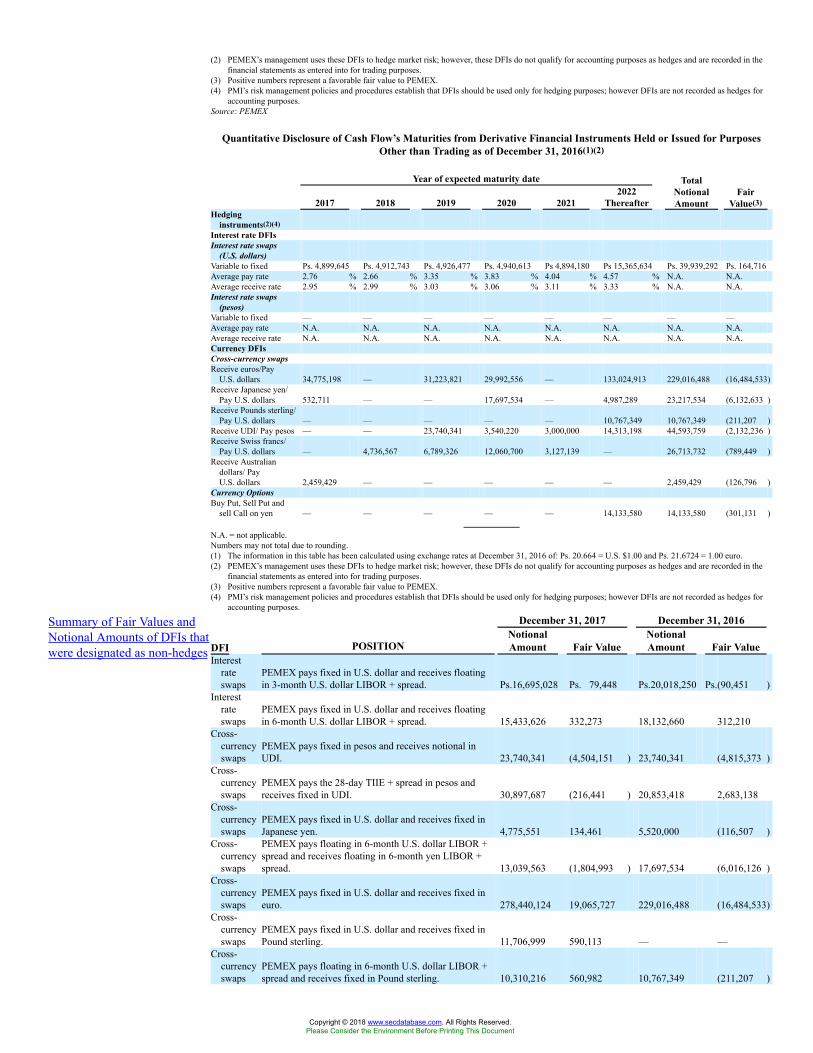
(2) PEMEX’s management uses these DFIs to hedge market risk; however, these DFIs do not qualify for accounting purposes as hedges and are recorded in thefinancial statements as entered into for trading purposes.
(3) Positive numbers represent a favorable fair value to PEMEX.(4) PMI’s risk management policies and procedures establish that DFIs should be used only for hedging purposes; however DFIs are not recorded as hedges for
accounting purposes.Source: PEMEX
Quantitative Disclosure of Cash Flow’s Maturities from Derivative Financial Instruments Held or Issued for PurposesOther than Trading as of December 31, 2016(1)(2)
Year of expected maturity date
2017 2018 2019 2020 20212022
Thereafter
TotalNotionalAmount
FairValue(3)
Hedginginstruments(2)(4)
Interest rate DFIsInterest rate swaps
(U.S. dollars)Variable to fixed Ps. 4,899,645 Ps. 4,912,743 Ps. 4,926,477 Ps. 4,940,613 Ps 4,894,180 Ps 15,365,634 Ps. 39,939,292 Ps. 164,716Average pay rate 2.76 % 2.66 % 3.35 % 3.83 % 4.04 % 4.57 % N.A. N.A.Average receive rate 2.95 % 2.99 % 3.03 % 3.06 % 3.11 % 3.33 % N.A. N.A.Interest rate swaps
(pesos)Variable to fixed — — — — — — — —Average pay rate N.A. N.A. N.A. N.A. N.A. N.A. N.A. N.A.Average receive rate N.A. N.A. N.A. N.A. N.A. N.A. N.A. N.A.Currency DFIsCross-currency swapsReceive euros/Pay
U.S. dollars 34,775,198 — 31,223,821 29,992,556 — 133,024,913 229,016,488 (16,484,533)Receive Japanese yen/
Pay U.S. dollars 532,711 — — 17,697,534 — 4,987,289 23,217,534 (6,132,633 )Receive Pounds sterling/
Pay U.S. dollars — — — — — 10,767,349 10,767,349 (211,207 )Receive UDI/ Pay pesos — — 23,740,341 3,540,220 3,000,000 14,313,198 44,593,759 (2,132,236 )Receive Swiss francs/
Pay U.S. dollars — 4,736,567 6,789,326 12,060,700 3,127,139 — 26,713,732 (789,449 )Receive Australian
dollars/ PayU.S. dollars 2,459,429 — — — — — 2,459,429 (126,796 )
Currency OptionsBuy Put, Sell Put and
sell Call on yen — — — — — 14,133,580 14,133,580 (301,131 )
N.A. = not applicable.Numbers may not total due to rounding.(1) The information in this table has been calculated using exchange rates at December 31, 2016 of: Ps. 20.664 = U.S. $1.00 and Ps. 21.6724 = 1.00 euro.(2) PEMEX’s management uses these DFIs to hedge market risk; however, these DFIs do not qualify for accounting purposes as hedges and are recorded in the
financial statements as entered into for trading purposes.(3) Positive numbers represent a favorable fair value to PEMEX.(4) PMI’s risk management policies and procedures establish that DFIs should be used only for hedging purposes; however DFIs are not recorded as hedges for
accounting purposes.
Summary of Fair Values andNotional Amounts of DFIs thatwere designated as non-hedges
December 31, 2017 December 31, 2016
DFI POSITIONNotionalAmount Fair Value
NotionalAmount Fair Value
Interestrateswaps
PEMEX pays fixed in U.S. dollar and receives floatingin 3-month U.S. dollar LIBOR + spread. Ps.16,695,028 Ps. 79,448 Ps.20,018,250 Ps.(90,451 )
Interestrateswaps
PEMEX pays fixed in U.S. dollar and receives floatingin 6-month U.S. dollar LIBOR + spread. 15,433,626 332,273 18,132,660 312,210
Cross-currencyswaps
PEMEX pays fixed in pesos and receives notional inUDI. 23,740,341 (4,504,151 ) 23,740,341 (4,815,373 )
Cross-currencyswaps
PEMEX pays the 28-day TIIE + spread in pesos andreceives fixed in UDI. 30,897,687 (216,441 ) 20,853,418 2,683,138
Cross-currencyswaps
PEMEX pays fixed in U.S. dollar and receives fixed inJapanese yen. 4,775,551 134,461 5,520,000 (116,507 )
Cross-currencyswaps
PEMEX pays floating in 6-month U.S. dollar LIBOR +spread and receives floating in 6-month yen LIBOR +spread. 13,039,563 (1,804,993 ) 17,697,534 (6,016,126 )
Cross-currencyswaps
PEMEX pays fixed in U.S. dollar and receives fixed ineuro. 278,440,124 19,065,727 229,016,488 (16,484,533)
Cross-currencyswaps
PEMEX pays fixed in U.S. dollar and receives fixed inPound sterling. 11,706,999 590,113 — —
Cross-currencyswaps
PEMEX pays floating in 6-month U.S. dollar LIBOR +spread and receives fixed in Pound sterling. 10,310,216 560,982 10,767,349 (211,207 )
Copyright © 2018 www.secdatabase.com. All Rights Reserved.Please Consider the Environment Before Printing This Document
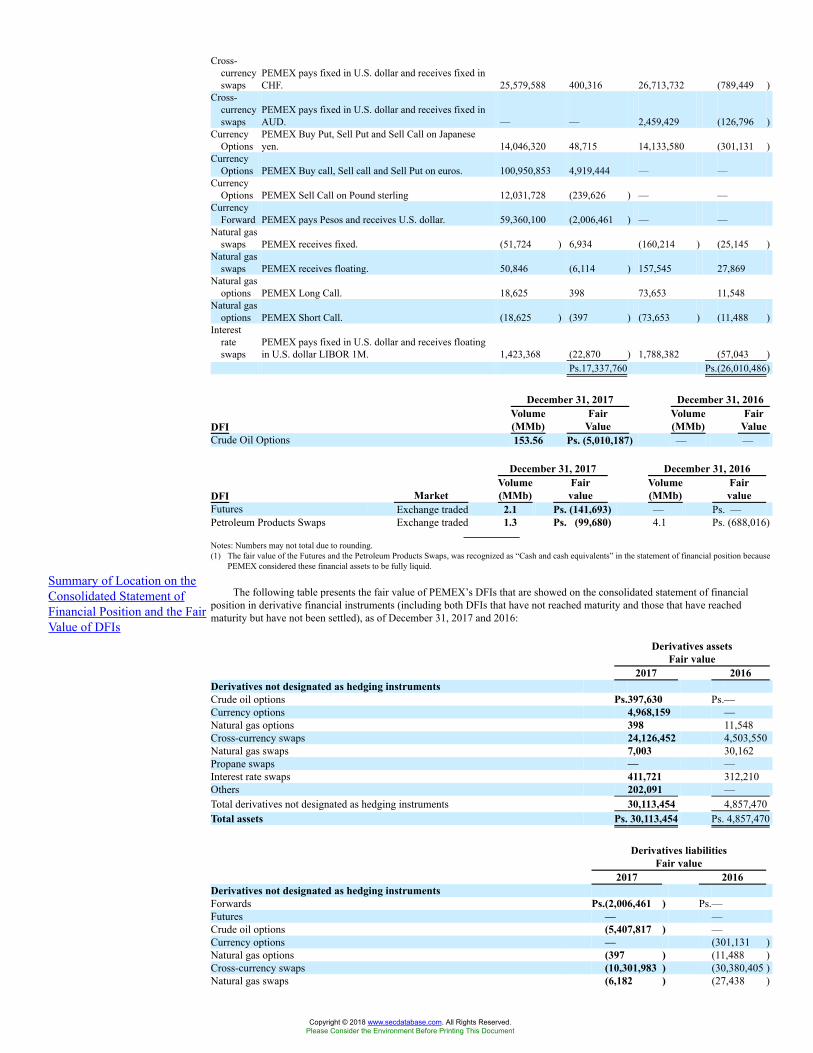
Cross-currencyswaps
PEMEX pays fixed in U.S. dollar and receives fixed inCHF. 25,579,588 400,316 26,713,732 (789,449 )
Cross-currencyswaps
PEMEX pays fixed in U.S. dollar and receives fixed inAUD. — — 2,459,429 (126,796 )
CurrencyOptions
PEMEX Buy Put, Sell Put and Sell Call on Japaneseyen. 14,046,320 48,715 14,133,580 (301,131 )
CurrencyOptions PEMEX Buy call, Sell call and Sell Put on euros. 100,950,853 4,919,444 — —
CurrencyOptions PEMEX Sell Call on Pound sterling 12,031,728 (239,626 ) — —
CurrencyForward PEMEX pays Pesos and receives U.S. dollar. 59,360,100 (2,006,461 ) — —
Natural gasswaps PEMEX receives fixed. (51,724 ) 6,934 (160,214 ) (25,145 )
Natural gasswaps PEMEX receives floating. 50,846 (6,114 ) 157,545 27,869
Natural gasoptions PEMEX Long Call. 18,625 398 73,653 11,548
Natural gasoptions PEMEX Short Call. (18,625 ) (397 ) (73,653 ) (11,488 )
Interestrateswaps
PEMEX pays fixed in U.S. dollar and receives floatingin U.S. dollar LIBOR 1M. 1,423,368 (22,870 ) 1,788,382 (57,043 )
Ps.17,337,760 Ps.(26,010,486)
December 31, 2017 December 31, 2016
DFIVolume(MMb)
FairValue
Volume(MMb)
FairValue
Crude Oil Options 153.56 Ps. (5,010,187) — —
December 31, 2017 December 31, 2016
DFI MarketVolume(MMb)
Fairvalue
Volume(MMb)
Fairvalue
Futures Exchange traded 2.1 Ps. (141,693) — Ps. —Petroleum Products Swaps Exchange traded 1.3 Ps. (99,680) 4.1 Ps. (688,016)
Notes: Numbers may not total due to rounding.(1) The fair value of the Futures and the Petroleum Products Swaps, was recognized as “Cash and cash equivalents” in the statement of financial position because
PEMEX considered these financial assets to be fully liquid.
Summary of Location on theConsolidated Statement ofFinancial Position and the FairValue of DFIs
The following table presents the fair value of PEMEX’s DFIs that are showed on the consolidated statement of financialposition in derivative financial instruments (including both DFIs that have not reached maturity and those that have reachedmaturity but have not been settled), as of December 31, 2017 and 2016:
Derivatives assetsFair value
2017 2016Derivatives not designated as hedging instrumentsCrude oil options Ps.397,630 Ps.—Currency options 4,968,159 —Natural gas options 398 11,548Cross-currency swaps 24,126,452 4,503,550Natural gas swaps 7,003 30,162Propane swaps — —Interest rate swaps 411,721 312,210Others 202,091 —Total derivatives not designated as hedging instruments 30,113,454 4,857,470Total assets Ps. 30,113,454 Ps. 4,857,470
Derivatives liabilitiesFair value
2017 2016Derivatives not designated as hedging instrumentsForwards Ps.(2,006,461 ) Ps.—Futures — —Crude oil options (5,407,817 ) —Currency options — (301,131 )Natural gas options (397 ) (11,488 )Cross-currency swaps (10,301,983 ) (30,380,405 )Natural gas swaps (6,182 ) (27,438 )
Copyright © 2018 www.secdatabase.com. All Rights Reserved.Please Consider the Environment Before Printing This Document
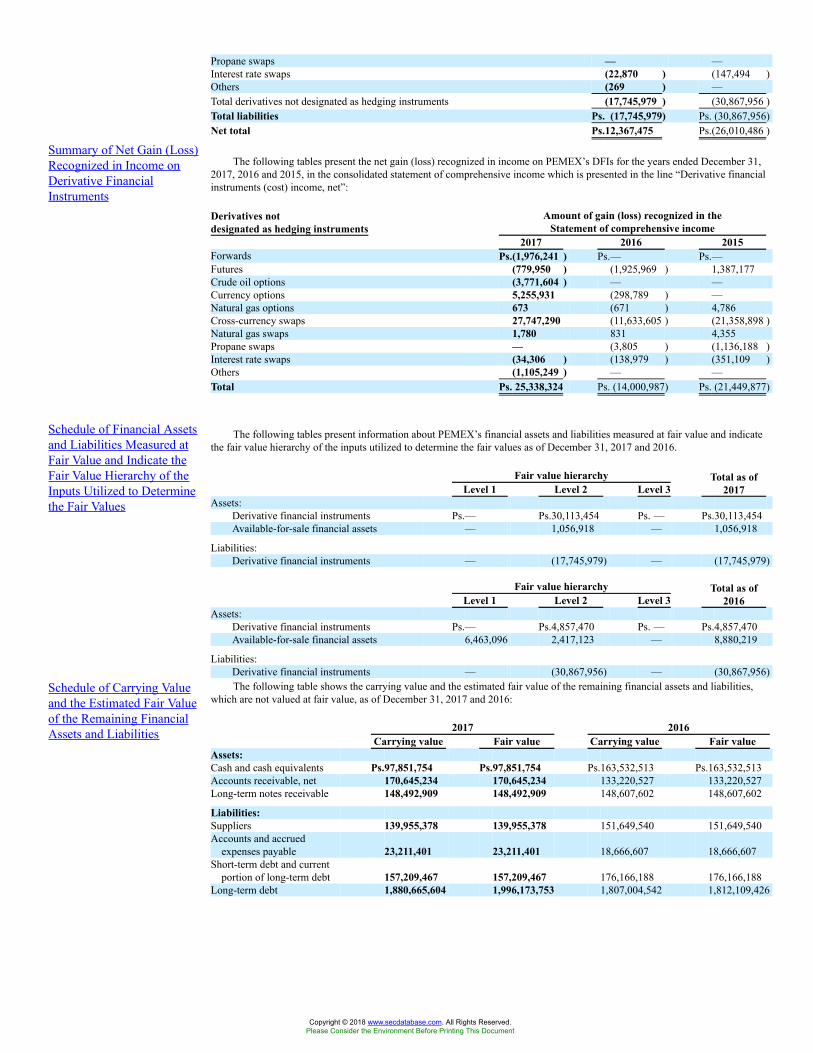
Propane swaps — —Interest rate swaps (22,870 ) (147,494 )Others (269 ) —Total derivatives not designated as hedging instruments (17,745,979 ) (30,867,956 )Total liabilities Ps. (17,745,979) Ps. (30,867,956)Net total Ps.12,367,475 Ps.(26,010,486 )
Summary of Net Gain (Loss)Recognized in Income onDerivative FinancialInstruments
The following tables present the net gain (loss) recognized in income on PEMEX’s DFIs for the years ended December 31,2017, 2016 and 2015, in the consolidated statement of comprehensive income which is presented in the line “Derivative financialinstruments (cost) income, net”:
Derivatives notdesignated as hedging instruments
Amount of gain (loss) recognized in theStatement of comprehensive income
2017 2016 2015Forwards Ps.(1,976,241 ) Ps.— Ps.—Futures (779,950 ) (1,925,969 ) 1,387,177Crude oil options (3,771,604 ) — —Currency options 5,255,931 (298,789 ) —Natural gas options 673 (671 ) 4,786Cross-currency swaps 27,747,290 (11,633,605 ) (21,358,898 )Natural gas swaps 1,780 831 4,355Propane swaps — (3,805 ) (1,136,188 )Interest rate swaps (34,306 ) (138,979 ) (351,109 )Others (1,105,249 ) — —Total Ps. 25,338,324 Ps. (14,000,987) Ps. (21,449,877)
Schedule of Financial Assetsand Liabilities Measured atFair Value and Indicate theFair Value Hierarchy of theInputs Utilized to Determinethe Fair Values
The following tables present information about PEMEX’s financial assets and liabilities measured at fair value and indicatethe fair value hierarchy of the inputs utilized to determine the fair values as of December 31, 2017 and 2016.
Fair value hierarchyLevel 1 Level 2 Level 3
Total as of2017
Assets:Derivative financial instruments Ps.— Ps.30,113,454 Ps. — Ps.30,113,454Available-for-sale financial assets — 1,056,918 — 1,056,918
Liabilities:Derivative financial instruments — (17,745,979) — (17,745,979)
Fair value hierarchyLevel 1 Level 2 Level 3
Total as of2016
Assets:Derivative financial instruments Ps.— Ps.4,857,470 Ps. — Ps.4,857,470Available-for-sale financial assets 6,463,096 2,417,123 — 8,880,219
Liabilities:Derivative financial instruments — (30,867,956) — (30,867,956)
Schedule of Carrying Valueand the Estimated Fair Valueof the Remaining FinancialAssets and Liabilities
The following table shows the carrying value and the estimated fair value of the remaining financial assets and liabilities,which are not valued at fair value, as of December 31, 2017 and 2016:
2017 2016Carrying value Fair value Carrying value Fair value
Assets:Cash and cash equivalents Ps.97,851,754 Ps.97,851,754 Ps.163,532,513 Ps.163,532,513Accounts receivable, net 170,645,234 170,645,234 133,220,527 133,220,527Long-term notes receivable 148,492,909 148,492,909 148,607,602 148,607,602
Liabilities:Suppliers 139,955,378 139,955,378 151,649,540 151,649,540Accounts and accrued
expenses payable 23,211,401 23,211,401 18,666,607 18,666,607Short-term debt and current
portion of long-term debt 157,209,467 157,209,467 176,166,188 176,166,188Long-term debt 1,880,665,604 1,996,173,753 1,807,004,542 1,812,109,426
Copyright © 2018 www.secdatabase.com. All Rights Reserved.Please Consider the Environment Before Printing This Document
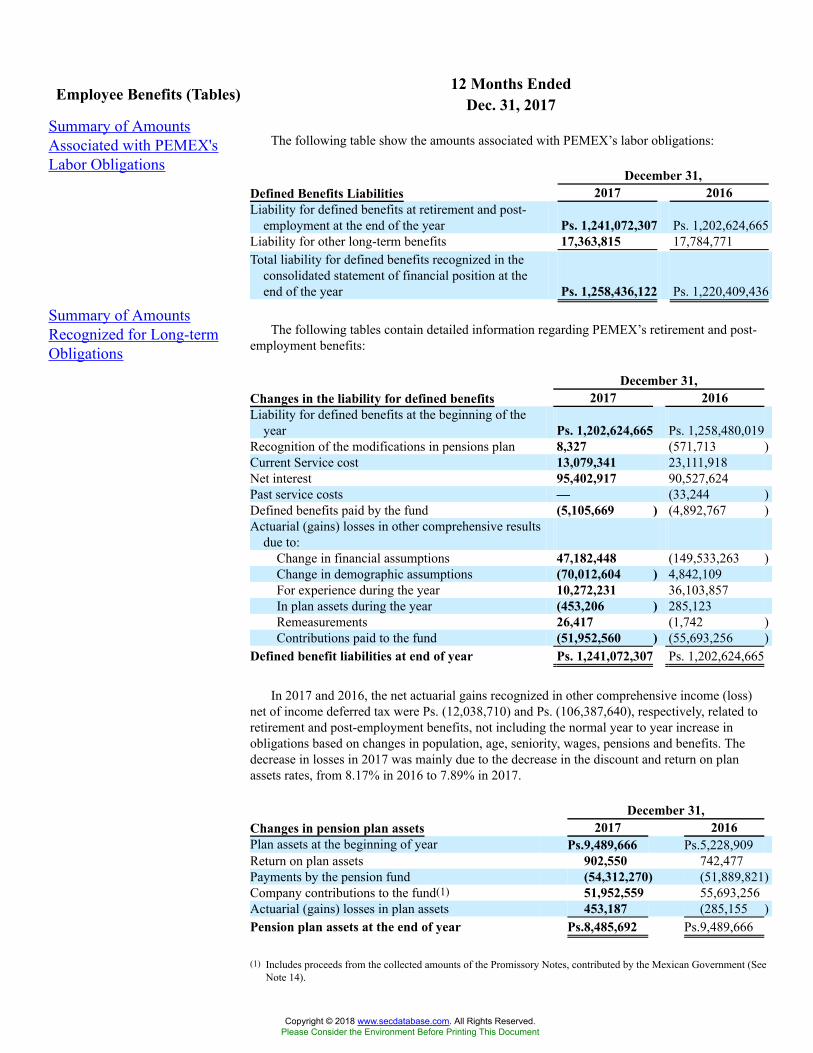
12 Months EndedEmployee Benefits (Tables) Dec. 31, 2017Summary of AmountsAssociated with PEMEX'sLabor Obligations
The following table show the amounts associated with PEMEX’s labor obligations:
December 31,Defined Benefits Liabilities 2017 2016Liability for defined benefits at retirement and post-
employment at the end of the year Ps. 1,241,072,307 Ps. 1,202,624,665Liability for other long-term benefits 17,363,815 17,784,771Total liability for defined benefits recognized in the
consolidated statement of financial position at theend of the year Ps. 1,258,436,122 Ps. 1,220,409,436
Summary of AmountsRecognized for Long-termObligations
The following tables contain detailed information regarding PEMEX’s retirement and post-employment benefits:
December 31,Changes in the liability for defined benefits 2017 2016Liability for defined benefits at the beginning of the
year Ps. 1,202,624,665 Ps. 1,258,480,019Recognition of the modifications in pensions plan 8,327 (571,713 )Current Service cost 13,079,341 23,111,918Net interest 95,402,917 90,527,624Past service costs — (33,244 )Defined benefits paid by the fund (5,105,669 ) (4,892,767 )Actuarial (gains) losses in other comprehensive results
due to:Change in financial assumptions 47,182,448 (149,533,263 )Change in demographic assumptions (70,012,604 ) 4,842,109For experience during the year 10,272,231 36,103,857In plan assets during the year (453,206 ) 285,123Remeasurements 26,417 (1,742 )Contributions paid to the fund (51,952,560 ) (55,693,256 )
Defined benefit liabilities at end of year Ps. 1,241,072,307 Ps. 1,202,624,665
In 2017 and 2016, the net actuarial gains recognized in other comprehensive income (loss)net of income deferred tax were Ps. (12,038,710) and Ps. (106,387,640), respectively, related toretirement and post-employment benefits, not including the normal year to year increase inobligations based on changes in population, age, seniority, wages, pensions and benefits. Thedecrease in losses in 2017 was mainly due to the decrease in the discount and return on planassets rates, from 8.17% in 2016 to 7.89% in 2017.
December 31,Changes in pension plan assets 2017 2016Plan assets at the beginning of year Ps.9,489,666 Ps.5,228,909Return on plan assets 902,550 742,477Payments by the pension fund (54,312,270) (51,889,821)Company contributions to the fund(1) 51,952,559 55,693,256Actuarial (gains) losses in plan assets 453,187 (285,155 )Pension plan assets at the end of year Ps.8,485,692 Ps.9,489,666
(1) Includes proceeds from the collected amounts of the Promissory Notes, contributed by the Mexican Government (SeeNote 14).
Copyright © 2018 www.secdatabase.com. All Rights Reserved.Please Consider the Environment Before Printing This Document
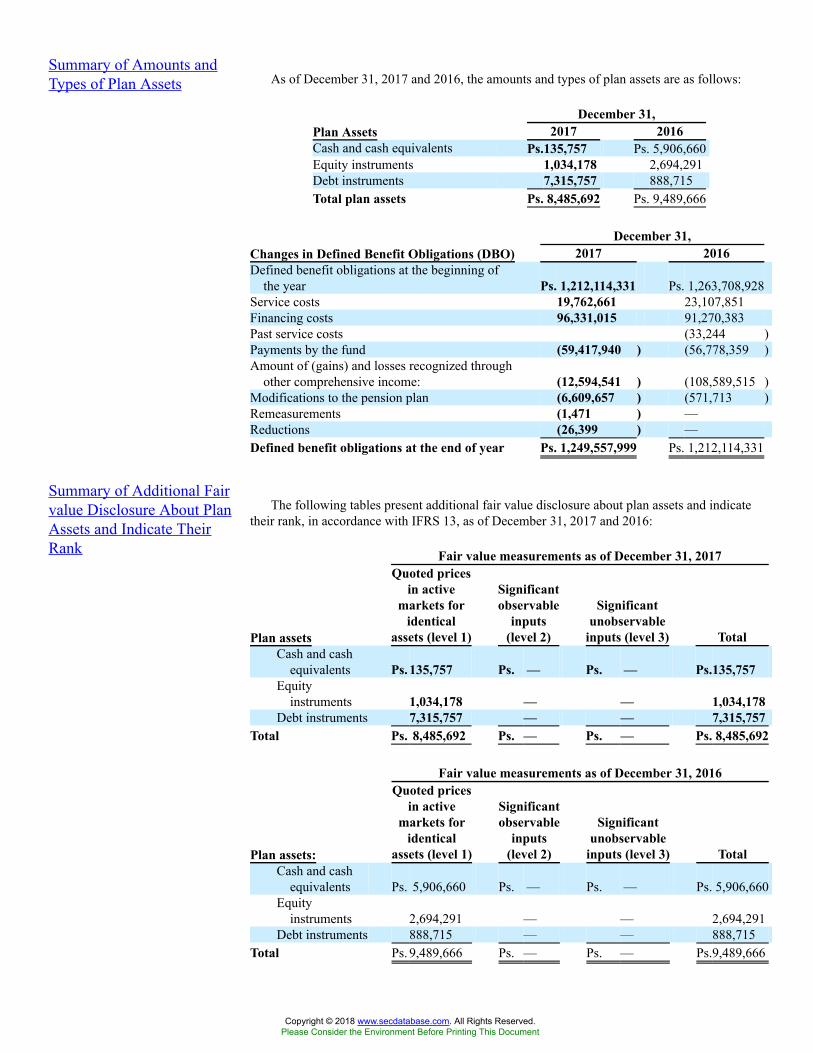
Summary of Amounts andTypes of Plan Assets As of December 31, 2017 and 2016, the amounts and types of plan assets are as follows:
December 31,Plan Assets 2017 2016Cash and cash equivalents Ps.135,757 Ps. 5,906,660Equity instruments 1,034,178 2,694,291Debt instruments 7,315,757 888,715Total plan assets Ps. 8,485,692 Ps. 9,489,666
December 31,Changes in Defined Benefit Obligations (DBO) 2017 2016Defined benefit obligations at the beginning of
the year Ps. 1,212,114,331 Ps. 1,263,708,928Service costs 19,762,661 23,107,851Financing costs 96,331,015 91,270,383Past service costs (33,244 )Payments by the fund (59,417,940 ) (56,778,359 )Amount of (gains) and losses recognized through
other comprehensive income: (12,594,541 ) (108,589,515 )Modifications to the pension plan (6,609,657 ) (571,713 )Remeasurements (1,471 ) —Reductions (26,399 ) —Defined benefit obligations at the end of year Ps. 1,249,557,999 Ps. 1,212,114,331
Summary of Additional Fairvalue Disclosure About PlanAssets and Indicate TheirRank
The following tables present additional fair value disclosure about plan assets and indicatetheir rank, in accordance with IFRS 13, as of December 31, 2017 and 2016:
Fair value measurements as of December 31, 2017
Plan assets
Quoted pricesin active
markets foridentical
assets (level 1)
Significantobservable
inputs(level 2)
Significantunobservable
inputs (level 3) TotalCash and cash
equivalents Ps. 135,757 Ps. — Ps. — Ps.135,757Equity
instruments 1,034,178 — — 1,034,178Debt instruments 7,315,757 — — 7,315,757
Total Ps. 8,485,692 Ps. — Ps. — Ps. 8,485,692
Fair value measurements as of December 31, 2016
Plan assets:
Quoted pricesin active
markets foridentical
assets (level 1)
Significantobservable
inputs(level 2)
Significantunobservable
inputs (level 3) TotalCash and cash
equivalents Ps. 5,906,660 Ps. — Ps. — Ps. 5,906,660Equity
instruments 2,694,291 — — 2,694,291Debt instruments 888,715 — — 888,715
Total Ps. 9,489,666 Ps. — Ps. — Ps.9,489,666
Copyright © 2018 www.secdatabase.com. All Rights Reserved.Please Consider the Environment Before Printing This Document
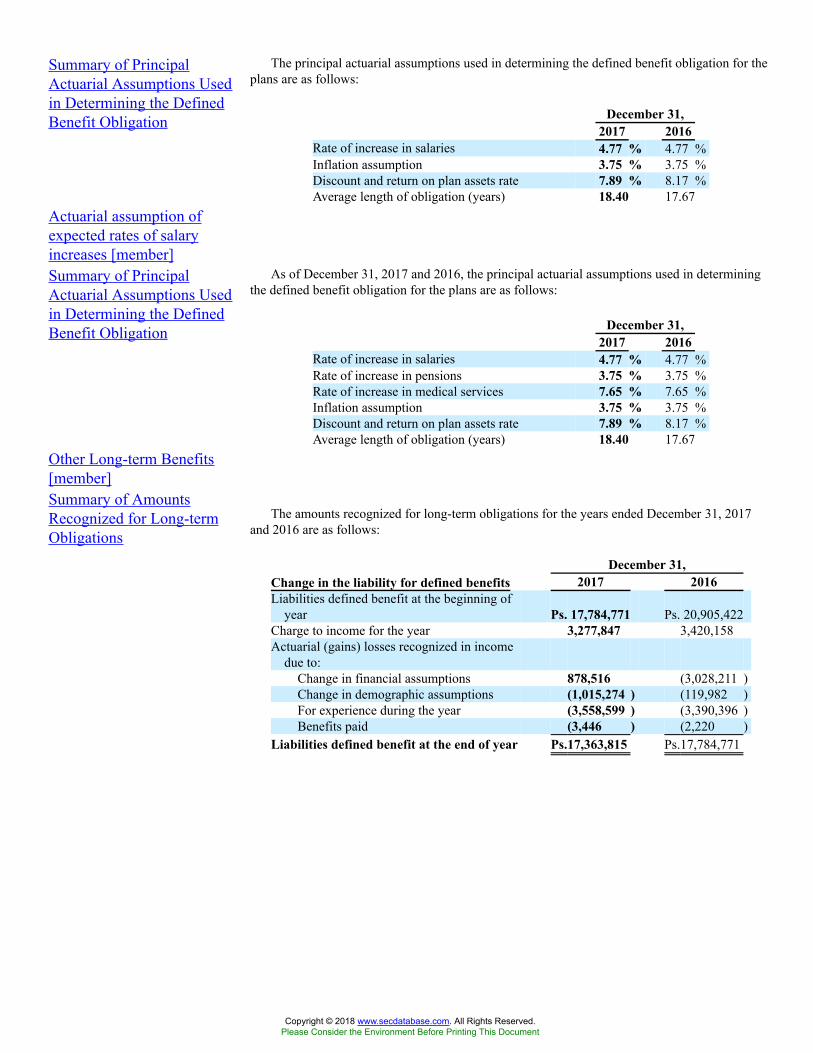
Summary of PrincipalActuarial Assumptions Usedin Determining the DefinedBenefit Obligation
The principal actuarial assumptions used in determining the defined benefit obligation for theplans are as follows:
December 31,2017 2016
Rate of increase in salaries 4.77 % 4.77 %Inflation assumption 3.75 % 3.75 %Discount and return on plan assets rate 7.89 % 8.17 %Average length of obligation (years) 18.40 17.67
Actuarial assumption ofexpected rates of salaryincreases [member]Summary of PrincipalActuarial Assumptions Usedin Determining the DefinedBenefit Obligation
As of December 31, 2017 and 2016, the principal actuarial assumptions used in determiningthe defined benefit obligation for the plans are as follows:
December 31,2017 2016
Rate of increase in salaries 4.77 % 4.77 %Rate of increase in pensions 3.75 % 3.75 %Rate of increase in medical services 7.65 % 7.65 %Inflation assumption 3.75 % 3.75 %Discount and return on plan assets rate 7.89 % 8.17 %Average length of obligation (years) 18.40 17.67
Other Long-term Benefits[member]Summary of AmountsRecognized for Long-termObligations
The amounts recognized for long-term obligations for the years ended December 31, 2017and 2016 are as follows:
December 31,Change in the liability for defined benefits 2017 2016Liabilities defined benefit at the beginning of
year Ps. 17,784,771 Ps. 20,905,422Charge to income for the year 3,277,847 3,420,158Actuarial (gains) losses recognized in income
due to:Change in financial assumptions 878,516 (3,028,211 )Change in demographic assumptions (1,015,274 ) (119,982 )For experience during the year (3,558,599 ) (3,390,396 )Benefits paid (3,446 ) (2,220 )
Liabilities defined benefit at the end of year Ps.17,363,815 Ps.17,784,771
Copyright © 2018 www.secdatabase.com. All Rights Reserved.Please Consider the Environment Before Printing This Document
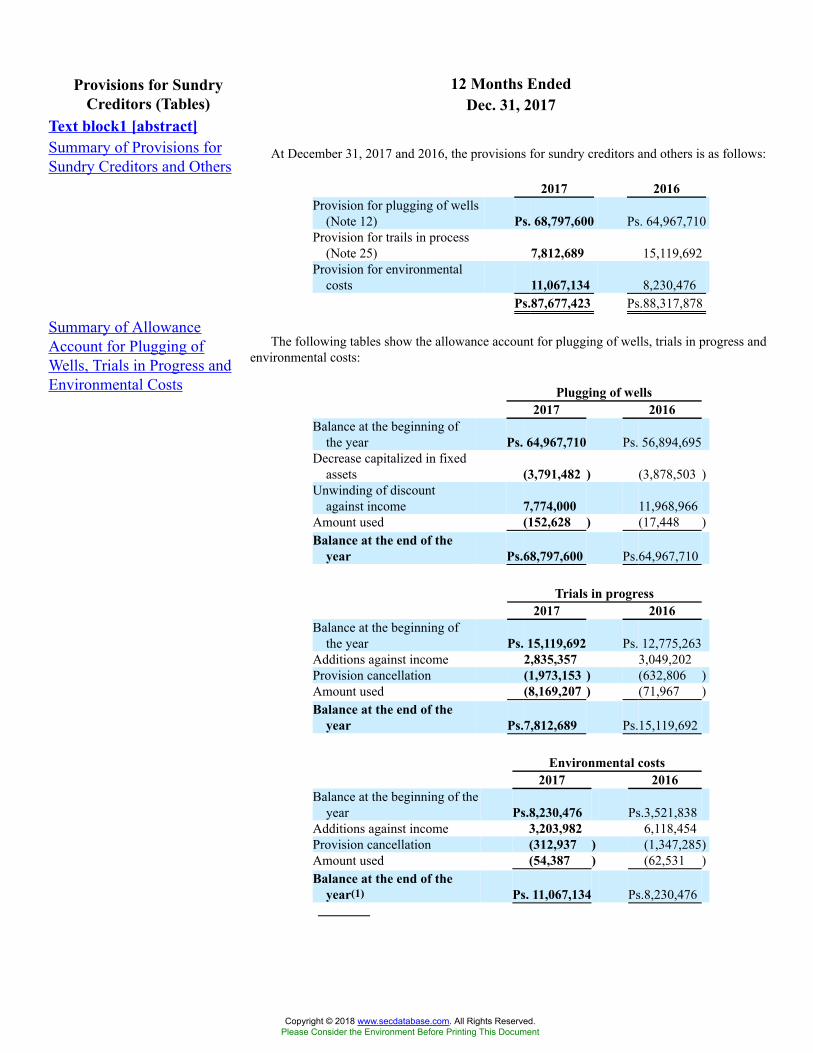
12 Months EndedProvisions for SundryCreditors (Tables) Dec. 31, 2017
Text block1 [abstract]Summary of Provisions forSundry Creditors and Others
At December 31, 2017 and 2016, the provisions for sundry creditors and others is as follows:
2017 2016Provision for plugging of wells
(Note 12) Ps. 68,797,600 Ps. 64,967,710Provision for trails in process
(Note 25) 7,812,689 15,119,692Provision for environmental
costs 11,067,134 8,230,476Ps.87,677,423 Ps.88,317,878
Summary of AllowanceAccount for Plugging ofWells, Trials in Progress andEnvironmental Costs
The following tables show the allowance account for plugging of wells, trials in progress andenvironmental costs:
Plugging of wells2017 2016
Balance at the beginning ofthe year Ps. 64,967,710 Ps. 56,894,695
Decrease capitalized in fixedassets (3,791,482 ) (3,878,503 )
Unwinding of discountagainst income 7,774,000 11,968,966
Amount used (152,628 ) (17,448 )Balance at the end of the
year Ps.68,797,600 Ps.64,967,710
Trials in progress2017 2016
Balance at the beginning ofthe year Ps. 15,119,692 Ps. 12,775,263
Additions against income 2,835,357 3,049,202Provision cancellation (1,973,153 ) (632,806 )Amount used (8,169,207 ) (71,967 )Balance at the end of the
year Ps.7,812,689 Ps.15,119,692
Environmental costs2017 2016
Balance at the beginning of theyear Ps.8,230,476 Ps.3,521,838
Additions against income 3,203,982 6,118,454Provision cancellation (312,937 ) (1,347,285)Amount used (54,387 ) (62,531 )Balance at the end of the
year(1) Ps. 11,067,134 Ps.8,230,476
Copyright © 2018 www.secdatabase.com. All Rights Reserved.Please Consider the Environment Before Printing This Document
(1) PEMEX is subject to the provisions of the Ley General del Equilibrio Ecológico y la Protección alAmbiente (General Law on Ecological Equilibrium and Environmental Protection). To comply withthis law, environmental audits of PEMEX’s larger operating, storage and transportation facilities havebeen or are being conducted. Following the completion of such audits, PEMEX has signed variousagreements with the Procuraduría Federal de Protección al Ambiente (Federal Attorney ofEnvironmental Protection) to implement environmental remediation and improve environmental plans.Such plans contemplate remediation for environmental damages, as well as related investments for theimprovement of equipment, maintenance, labor and materials.
Copyright © 2018 www.secdatabase.com. All Rights Reserved.Please Consider the Environment Before Printing This Document
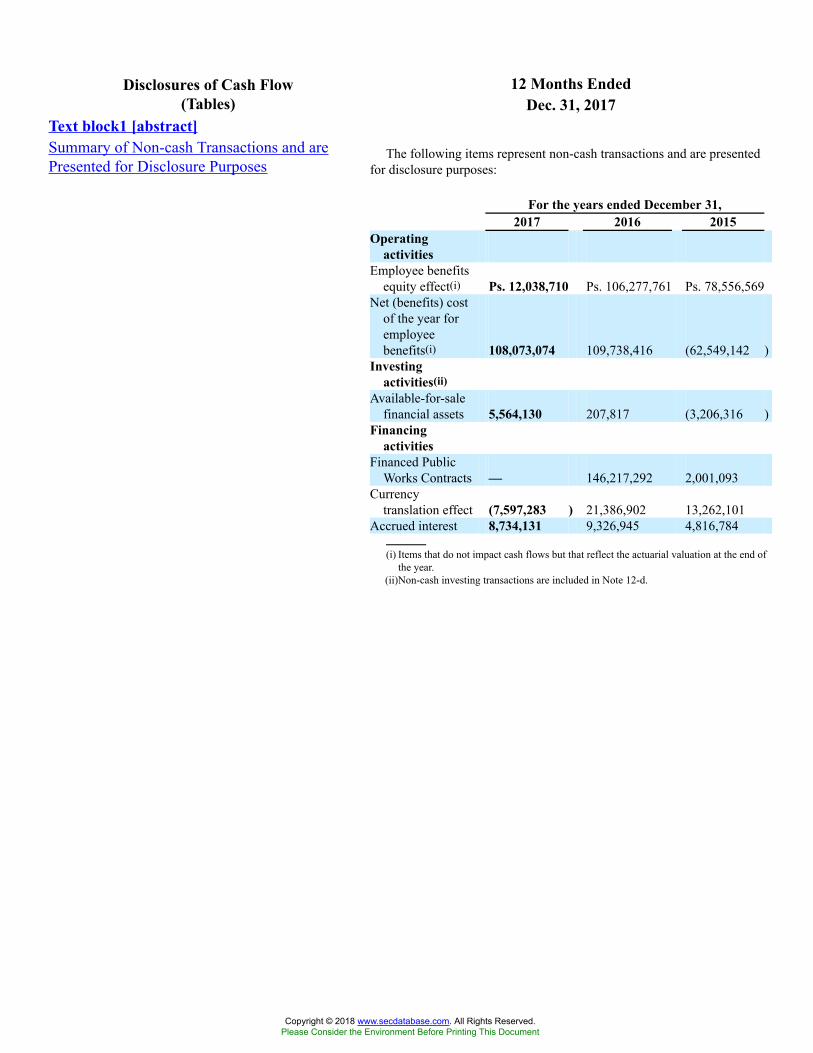
12 Months EndedDisclosures of Cash Flow(Tables) Dec. 31, 2017
Text block1 [abstract]Summary of Non-cash Transactions and arePresented for Disclosure Purposes
The following items represent non-cash transactions and are presentedfor disclosure purposes:
For the years ended December 31,2017 2016 2015
Operatingactivities
Employee benefitsequity effect(i) Ps. 12,038,710 Ps. 106,277,761 Ps. 78,556,569
Net (benefits) costof the year foremployeebenefits(i) 108,073,074 109,738,416 (62,549,142 )
Investingactivities(ii)
Available-for-salefinancial assets 5,564,130 207,817 (3,206,316 )
Financingactivities
Financed PublicWorks Contracts — 146,217,292 2,001,093
Currencytranslation effect (7,597,283 ) 21,386,902 13,262,101
Accrued interest 8,734,131 9,326,945 4,816,784
(i) Items that do not impact cash flows but that reflect the actuarial valuation at the end ofthe year.
(ii)Non-cash investing transactions are included in Note 12-d.
Copyright © 2018 www.secdatabase.com. All Rights Reserved.Please Consider the Environment Before Printing This Document
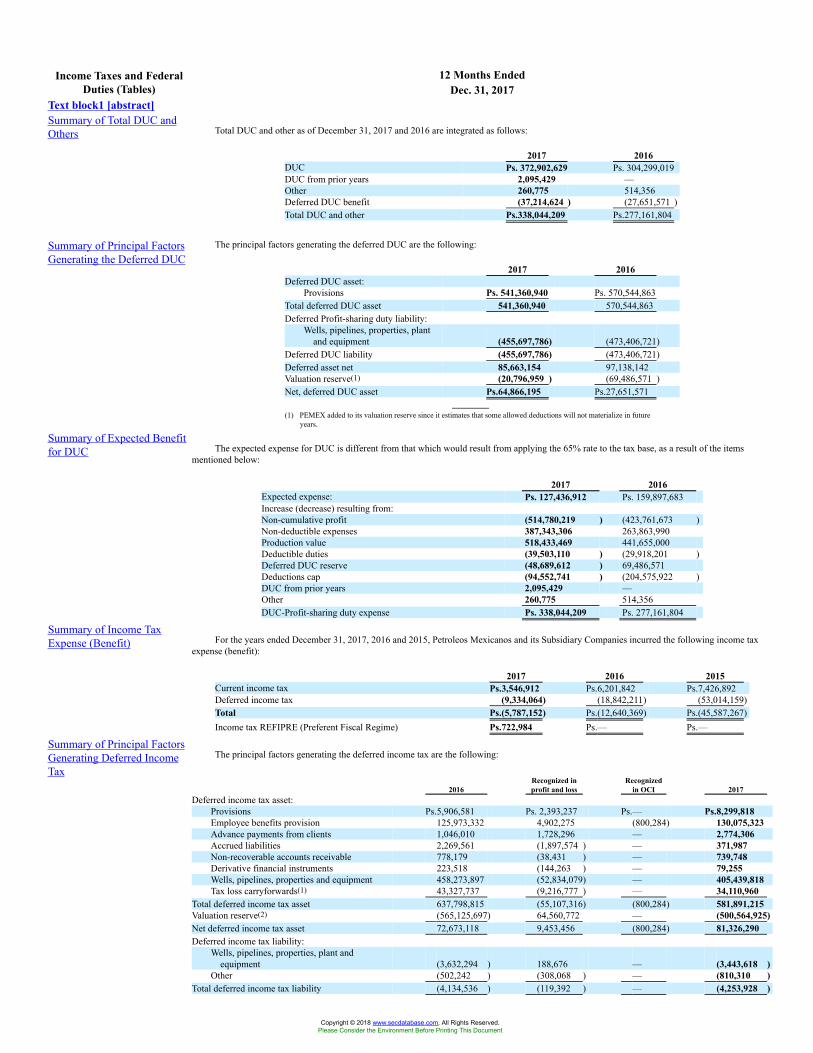
12 Months EndedIncome Taxes and FederalDuties (Tables) Dec. 31, 2017
Text block1 [abstract]Summary of Total DUC andOthers Total DUC and other as of December 31, 2017 and 2016 are integrated as follows:
2017 2016DUC Ps. 372,902,629 Ps. 304,299,019DUC from prior years 2,095,429 —Other 260,775 514,356Deferred DUC benefit (37,214,624 ) (27,651,571 )Total DUC and other Ps.338,044,209 Ps.277,161,804
Summary of Principal FactorsGenerating the Deferred DUC
The principal factors generating the deferred DUC are the following:
2017 2016Deferred DUC asset:
Provisions Ps. 541,360,940 Ps. 570,544,863Total deferred DUC asset 541,360,940 570,544,863Deferred Profit-sharing duty liability:
Wells, pipelines, properties, plantand equipment (455,697,786) (473,406,721)
Deferred DUC liability (455,697,786) (473,406,721)Deferred asset net 85,663,154 97,138,142Valuation reserve(1) (20,796,959 ) (69,486,571 )Net, deferred DUC asset Ps.64,866,195 Ps.27,651,571
(1) PEMEX added to its valuation reserve since it estimates that some allowed deductions will not materialize in futureyears.
Summary of Expected Benefitfor DUC The expected expense for DUC is different from that which would result from applying the 65% rate to the tax base, as a result of the items
mentioned below:
2017 2016Expected expense: Ps. 127,436,912 Ps. 159,897,683Increase (decrease) resulting from:Non-cumulative profit (514,780,219 ) (423,761,673 )Non-deductible expenses 387,343,306 263,863,990Production value 518,433,469 441,655,000Deductible duties (39,503,110 ) (29,918,201 )Deferred DUC reserve (48,689,612 ) 69,486,571Deductions cap (94,552,741 ) (204,575,922 )DUC from prior years 2,095,429 —Other 260,775 514,356DUC-Profit-sharing duty expense Ps. 338,044,209 Ps. 277,161,804
Summary of Income TaxExpense (Benefit) For the years ended December 31, 2017, 2016 and 2015, Petroleos Mexicanos and its Subsidiary Companies incurred the following income tax
expense (benefit):
2017 2016 2015Current income tax Ps.3,546,912 Ps.6,201,842 Ps.7,426,892Deferred income tax (9,334,064) (18,842,211) (53,014,159)Total Ps.(5,787,152) Ps.(12,640,369) Ps.(45,587,267)Income tax REFIPRE (Preferent Fiscal Regime) Ps.722,984 Ps.— Ps.—
Summary of Principal FactorsGenerating Deferred IncomeTax
The principal factors generating the deferred income tax are the following:
2016Recognized inprofit and loss
Recognizedin OCI 2017
Deferred income tax asset:Provisions Ps.5,906,581 Ps. 2,393,237 Ps.— Ps.8,299,818Employee benefits provision 125,973,332 4,902,275 (800,284) 130,075,323Advance payments from clients 1,046,010 1,728,296 — 2,774,306Accrued liabilities 2,269,561 (1,897,574 ) — 371,987Non-recoverable accounts receivable 778,179 (38,431 ) — 739,748Derivative financial instruments 223,518 (144,263 ) — 79,255Wells, pipelines, properties and equipment 458,273,897 (52,834,079) — 405,439,818Tax loss carryforwards(1) 43,327,737 (9,216,777 ) — 34,110,960
Total deferred income tax asset 637,798,815 (55,107,316) (800,284) 581,891,215Valuation reserve(2) (565,125,697) 64,560,772 — (500,564,925)Net deferred income tax asset 72,673,118 9,453,456 (800,284) 81,326,290Deferred income tax liability:
Wells, pipelines, properties, plant andequipment (3,632,294 ) 188,676 — (3,443,618 )
Other (502,242 ) (308,068 ) — (810,310 )Total deferred income tax liability (4,134,536 ) (119,392 ) — (4,253,928 )
Copyright © 2018 www.secdatabase.com. All Rights Reserved.Please Consider the Environment Before Printing This Document

Net long-term deferred income tax liability Ps.68,538,582 Ps.9,334,064 Ps.(800,284) Ps.77,072,362
2015Recognized inprofit and loss
Recognized inOCI and equity (3) 2016
Deferred income tax asset:Provisions Ps. 25,414,822 Ps.(19,508,241 ) Ps.— Ps.5,906,581Employee benefits provision 247,834,882 (119,837,137) (2,024,413 ) 125,973,332Advance payments from clients 1,015,357 30,653 — 1,046,010Accrued liabilities 1,514 2,268,047 — 2,269,561Non-recoverable accounts receivable 104,346 673,833 — 778,179Derivative financial instruments 22,506 201,012 — 223,518Wells, pipelines, properties and
equipment 446,970,333 11,303,564 — 458,273,897Tax loss carryforwards(1) 14,894,231 28,433,506 — 43,327,737
Total deferred income tax asset 736,257,991 (96,434,763 ) (2,024,413 ) 637,798,815Valuation reserve(2) (681,357,607) 116,231,910 — (565,125,697)Net deferred income tax asset 54,900,384 19,797,147 (2,024,413 ) 72,673,118Deferred income tax liability:
Wells, pipelines, properties, plant andequipment (1,909,529 ) (726,999 ) (995,766 ) (3,632,294 )
Other (274,305 ) (227,937 ) — (502,242 )Total deferred income tax liability (2,183,834 ) (954,936 ) (995,766 ) (4,134,536 )Net long-term deferred income tax liability Ps.52,716,550 Ps. 18,842,211 Ps. (3,020,179 ) Ps.68,538,582
(1) Tax loss carryforwards expire in 2027.(2) Due to PEMEX’s estimate that not enough taxable income will be generated in future periods, a valuation reserve was recognized to account for the deferred income tax asset.(3) Includes effects from business combination in equity of Ps. (995,766).
Summary of Expense (Benefit)Attributable to Profit (Loss)from Continuing Operationsbefore Income Taxes
Expense attributable to the profit (loss) from continuing operations before income taxes was different from that which would result from applyingthe 30% rate to profit, as a result of the items listed below:
For the years ended December 31,2017 2016 2015
Expected income tax expense Ps.(20,055,588) Ps.(14,901,324) Ps.(3,089,241 )Increase (decrease) resulting from:
Tax effect of inflation-net 14,302,118 8,098,213 (1,618,327 )Difference between accounting and tax depreciation (3,713,920 ) (1,765,183 ) (107,231 )Non-deductible expenses 1,954,659 1,558,120 (1,921,515 )Others-net (1,725,579 ) (5,630,195 ) (38,850,953)
Income tax expense Ps.(5,787,152 ) Ps.(12,640,369) Ps.(45,587,267)
Copyright © 2018 www.secdatabase.com. All Rights Reserved.Please Consider the Environment Before Printing This Document
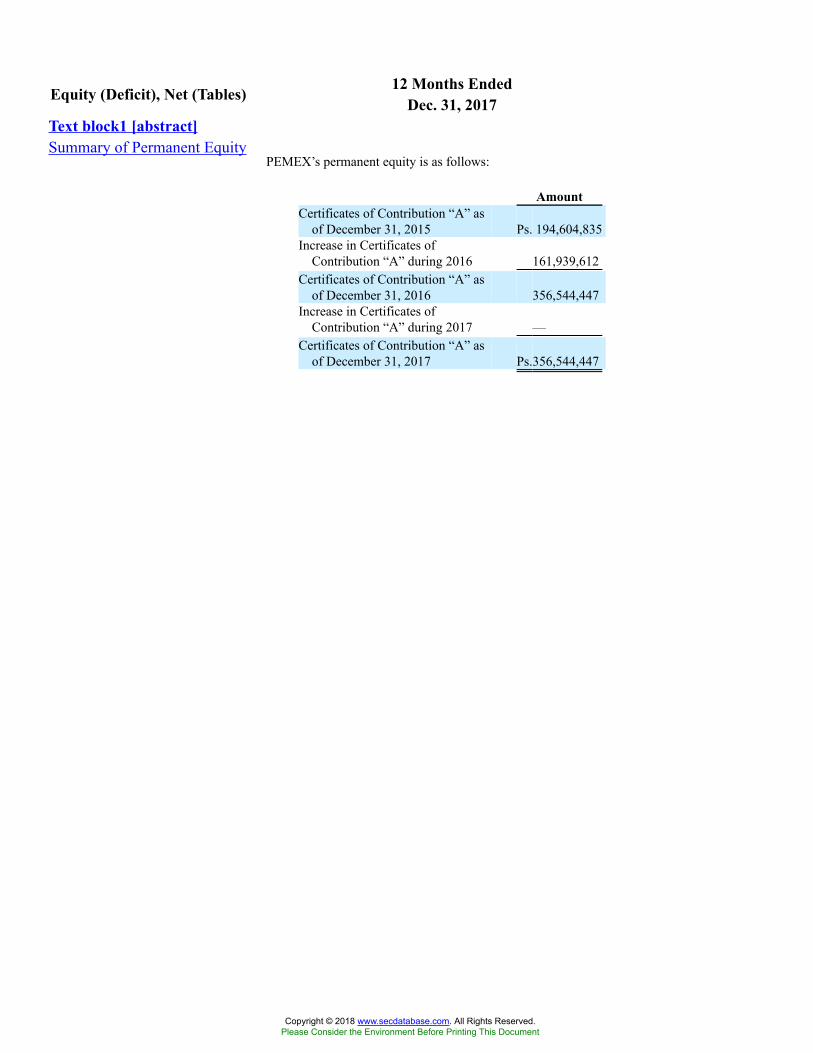
12 Months EndedEquity (Deficit), Net (Tables) Dec. 31, 2017Text block1 [abstract]Summary of Permanent Equity
PEMEX’s permanent equity is as follows:
AmountCertificates of Contribution “A” as
of December 31, 2015 Ps. 194,604,835Increase in Certificates of
Contribution “A” during 2016 161,939,612Certificates of Contribution “A” as
of December 31, 2016 356,544,447Increase in Certificates of
Contribution “A” during 2017 —Certificates of Contribution “A” as
of December 31, 2017 Ps.356,544,447
Copyright © 2018 www.secdatabase.com. All Rights Reserved.Please Consider the Environment Before Printing This Document
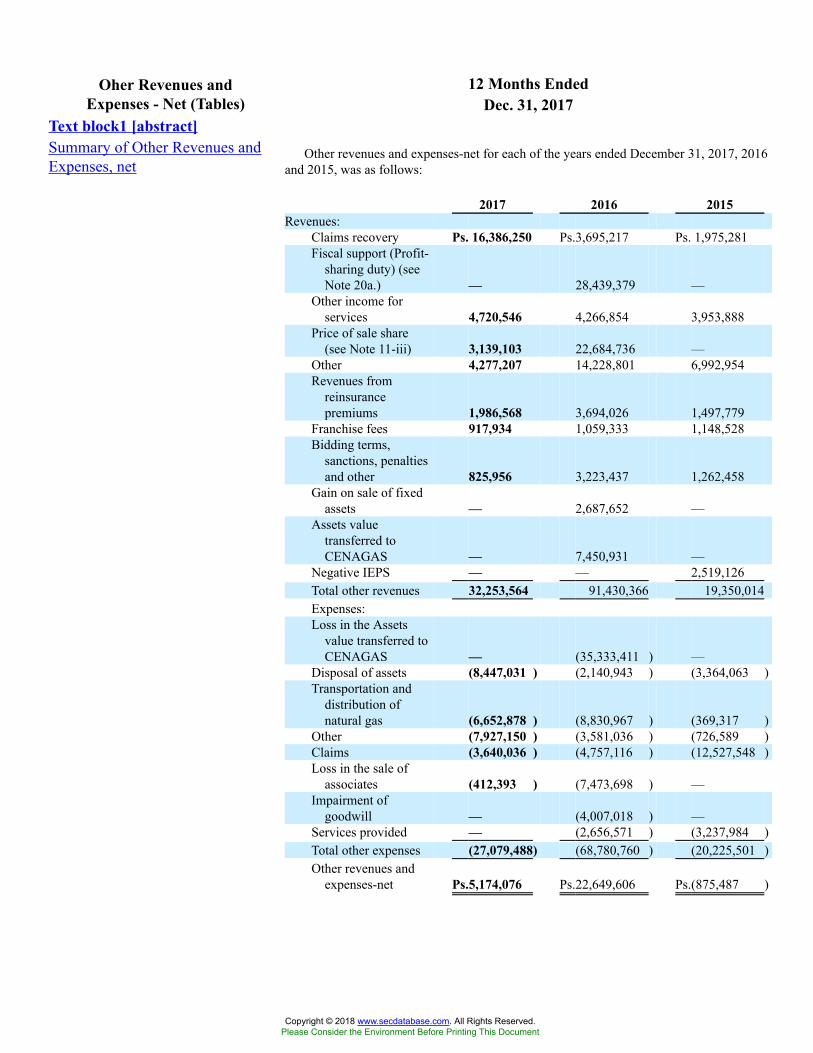
12 Months EndedOher Revenues andExpenses - Net (Tables) Dec. 31, 2017
Text block1 [abstract]Summary of Other Revenues andExpenses, net
Other revenues and expenses-net for each of the years ended December 31, 2017, 2016and 2015, was as follows:
2017 2016 2015Revenues:
Claims recovery Ps. 16,386,250 Ps.3,695,217 Ps. 1,975,281Fiscal support (Profit-
sharing duty) (seeNote 20a.) — 28,439,379 —
Other income forservices 4,720,546 4,266,854 3,953,888
Price of sale share(see Note 11-iii) 3,139,103 22,684,736 —
Other 4,277,207 14,228,801 6,992,954Revenues from
reinsurancepremiums 1,986,568 3,694,026 1,497,779
Franchise fees 917,934 1,059,333 1,148,528Bidding terms,
sanctions, penaltiesand other 825,956 3,223,437 1,262,458
Gain on sale of fixedassets — 2,687,652 —
Assets valuetransferred toCENAGAS — 7,450,931 —
Negative IEPS — — 2,519,126Total other revenues 32,253,564 91,430,366 19,350,014Expenses:Loss in the Assets
value transferred toCENAGAS — (35,333,411 ) —
Disposal of assets (8,447,031 ) (2,140,943 ) (3,364,063 )Transportation and
distribution ofnatural gas (6,652,878 ) (8,830,967 ) (369,317 )
Other (7,927,150 ) (3,581,036 ) (726,589 )Claims (3,640,036 ) (4,757,116 ) (12,527,548 )Loss in the sale of
associates (412,393 ) (7,473,698 ) —Impairment of
goodwill — (4,007,018 ) —Services provided — (2,656,571 ) (3,237,984 )Total other expenses (27,079,488) (68,780,760 ) (20,225,501 )Other revenues and
expenses-net Ps.5,174,076 Ps.22,649,606 Ps.(875,487 )
Copyright © 2018 www.secdatabase.com. All Rights Reserved.Please Consider the Environment Before Printing This Document
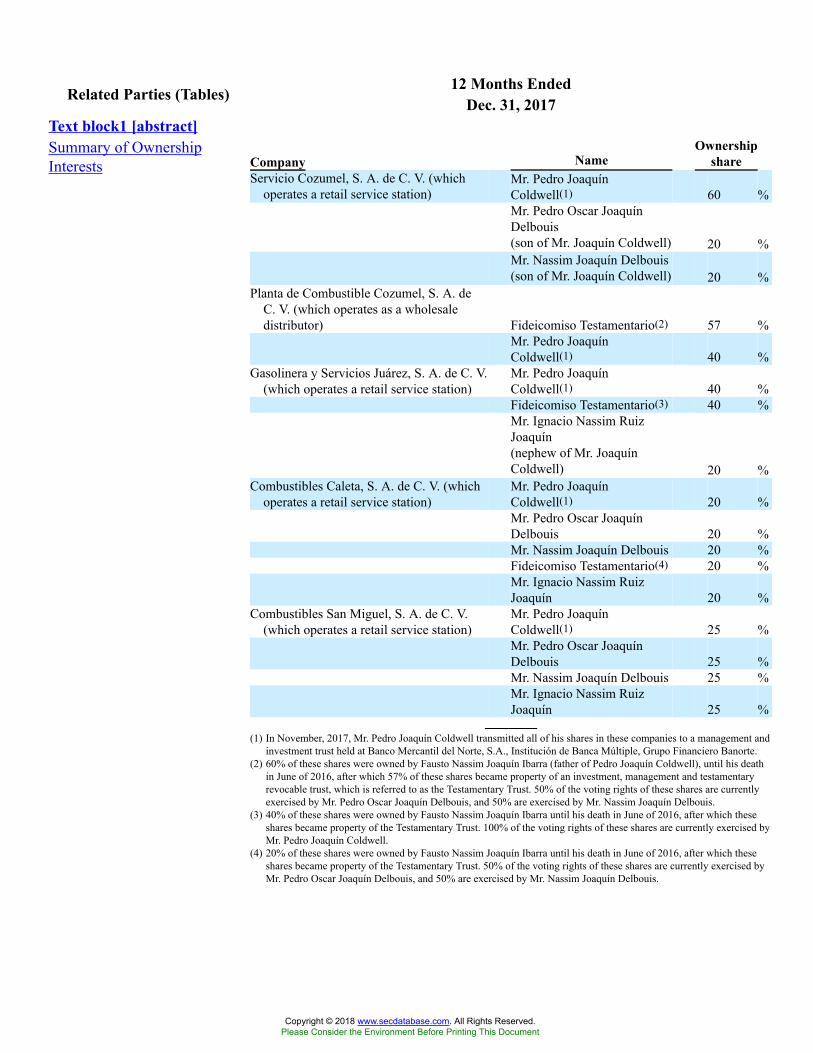
12 Months EndedRelated Parties (Tables) Dec. 31, 2017Text block1 [abstract]Summary of OwnershipInterests Company Name
Ownershipshare
Servicio Cozumel, S. A. de C. V. (whichoperates a retail service station)
Mr. Pedro JoaquínColdwell(1) 60 %Mr. Pedro Oscar JoaquínDelbouis(son of Mr. Joaquín Coldwell) 20 %Mr. Nassim Joaquín Delbouis(son of Mr. Joaquín Coldwell) 20 %
Planta de Combustible Cozumel, S. A. deC. V. (which operates as a wholesaledistributor) Fideicomiso Testamentario(2) 57 %
Mr. Pedro JoaquínColdwell(1) 40 %
Gasolinera y Servicios Juárez, S. A. de C. V.(which operates a retail service station)
Mr. Pedro JoaquínColdwell(1) 40 %Fideicomiso Testamentario(3) 40 %Mr. Ignacio Nassim RuizJoaquín(nephew of Mr. JoaquínColdwell) 20 %
Combustibles Caleta, S. A. de C. V. (whichoperates a retail service station)
Mr. Pedro JoaquínColdwell(1) 20 %Mr. Pedro Oscar JoaquínDelbouis 20 %Mr. Nassim Joaquín Delbouis 20 %Fideicomiso Testamentario(4) 20 %Mr. Ignacio Nassim RuizJoaquín 20 %
Combustibles San Miguel, S. A. de C. V.(which operates a retail service station)
Mr. Pedro JoaquínColdwell(1) 25 %Mr. Pedro Oscar JoaquínDelbouis 25 %Mr. Nassim Joaquín Delbouis 25 %Mr. Ignacio Nassim RuizJoaquín 25 %
(1) In November, 2017, Mr. Pedro Joaquín Coldwell transmitted all of his shares in these companies to a management andinvestment trust held at Banco Mercantil del Norte, S.A., Institución de Banca Múltiple, Grupo Financiero Banorte.
(2) 60% of these shares were owned by Fausto Nassim Joaquín Ibarra (father of Pedro Joaquín Coldwell), until his deathin June of 2016, after which 57% of these shares became property of an investment, management and testamentaryrevocable trust, which is referred to as the Testamentary Trust. 50% of the voting rights of these shares are currentlyexercised by Mr. Pedro Oscar Joaquín Delbouis, and 50% are exercised by Mr. Nassim Joaquín Delbouis.
(3) 40% of these shares were owned by Fausto Nassim Joaquín Ibarra until his death in June of 2016, after which theseshares became property of the Testamentary Trust. 100% of the voting rights of these shares are currently exercised byMr. Pedro Joaquín Coldwell.
(4) 20% of these shares were owned by Fausto Nassim Joaquín Ibarra until his death in June of 2016, after which theseshares became property of the Testamentary Trust. 50% of the voting rights of these shares are currently exercised byMr. Pedro Oscar Joaquín Delbouis, and 50% are exercised by Mr. Nassim Joaquín Delbouis.
Copyright © 2018 www.secdatabase.com. All Rights Reserved.Please Consider the Environment Before Printing This Document

12 Months EndedCommitments (Tables) Dec. 31, 2017Estimated Future PaymentsUnder Contract
Estimated future payments under this contract for upcoming fiscal years are as follows:
2018 Ps.773,0472019 783,1972020 785,6702021 786,3232022 782,5842023 and thereafter 3,595,798Total Ps.7,506,619
Estimated Value of Contracts As of December 31, 2017 and 2016, the estimated value of these contracts was as follows:
Maturity 2017 2016Up to 1 year Ps.5,533,174 Ps.7,366,2471 to 3 years 1,891,557 2,518,2074 to 5 years 1,856,006 2,470,878More than 5 years 3,123,173 4,157,843
Total Ps.12,403,910 Ps.16,513,175
Development Expenditure[member]Estimated Value of Contracts e. As of December 31, 2017 and 2016, the estimated value of the contracts that PEMEX has
entered into with several contractors for the development of various infrastructure andservices works was as follows:
Maturity 2017 2016Up to 1 year Ps.229,738,368 Ps.347,606,8481 to 3 years 196,335,411 281,563,6074 to 5 years 123,159,215 69,541,826More than 5 years 149,672,236 119,281,849Total Ps.698,905,230 Ps.817,994,130
Copyright © 2018 www.secdatabase.com. All Rights Reserved.Please Consider the Environment Before Printing This Document

12 Months EndedBusiness Combination(Tables) Dec. 31, 2017
Text block1 [abstract]Net Fair Value of Assets and Liabilities atAcquisition Date
The net fair value of Fertinal’s assets and liabilities as of the date ofacquisition is:
Fair valueCash and cash equivalents Ps.(6,943 )Accounts receivable 102,121Inventories 762,254Properties, plant and
equipment 9,811,928Other assets 1,671,718Total assets 12,341,078
Accounts payable Ps. 2,331,540Debt 9,365,152Deferred taxes 328,578Total liabilities 12,025,270Total assets, net Ps.315,808Transaction value Ps.4,322,826Goodwill Ps.4,007,018
Copyright © 2018 www.secdatabase.com. All Rights Reserved.Please Consider the Environment Before Printing This Document
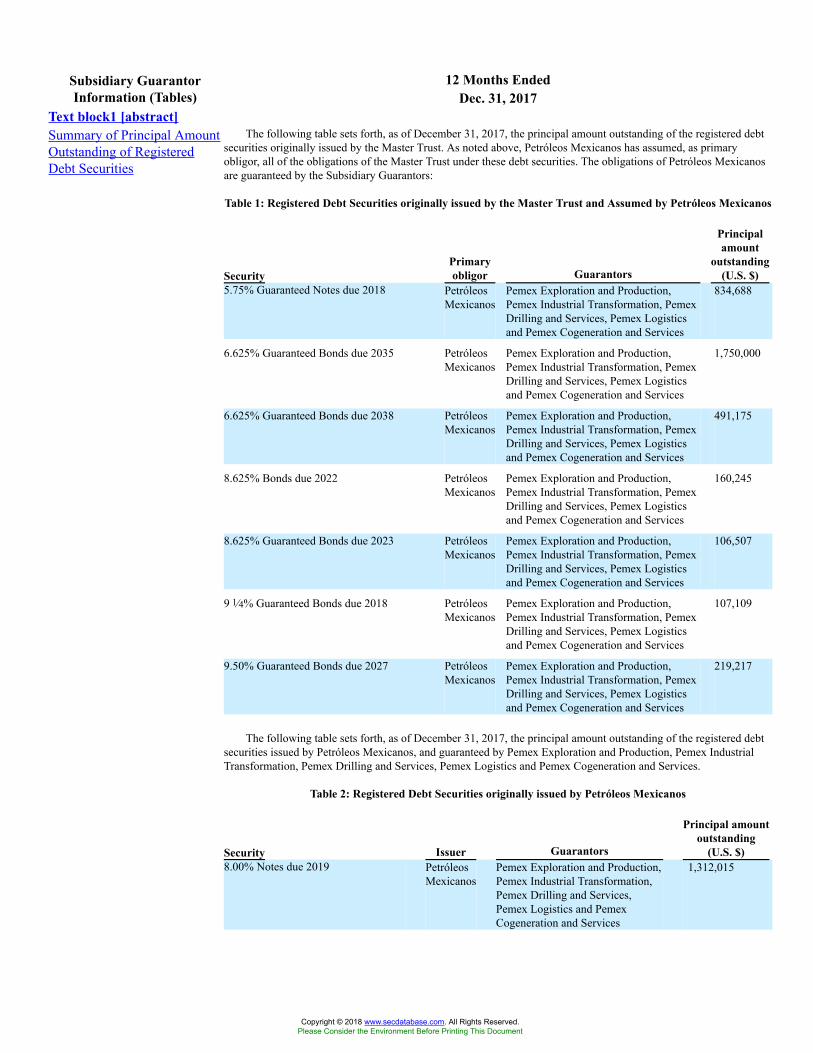
12 Months EndedSubsidiary GuarantorInformation (Tables) Dec. 31, 2017
Text block1 [abstract]Summary of Principal AmountOutstanding of RegisteredDebt Securities
The following table sets forth, as of December 31, 2017, the principal amount outstanding of the registered debtsecurities originally issued by the Master Trust. As noted above, Petróleos Mexicanos has assumed, as primaryobligor, all of the obligations of the Master Trust under these debt securities. The obligations of Petróleos Mexicanosare guaranteed by the Subsidiary Guarantors:
Table 1: Registered Debt Securities originally issued by the Master Trust and Assumed by Petróleos Mexicanos
SecurityPrimaryobligor Guarantors
Principalamount
outstanding(U.S. $)
5.75% Guaranteed Notes due 2018 PetróleosMexicanos
Pemex Exploration and Production,Pemex Industrial Transformation, PemexDrilling and Services, Pemex Logisticsand Pemex Cogeneration and Services
834,688
6.625% Guaranteed Bonds due 2035 PetróleosMexicanos
Pemex Exploration and Production,Pemex Industrial Transformation, PemexDrilling and Services, Pemex Logisticsand Pemex Cogeneration and Services
1,750,000
6.625% Guaranteed Bonds due 2038 PetróleosMexicanos
Pemex Exploration and Production,Pemex Industrial Transformation, PemexDrilling and Services, Pemex Logisticsand Pemex Cogeneration and Services
491,175
8.625% Bonds due 2022 PetróleosMexicanos
Pemex Exploration and Production,Pemex Industrial Transformation, PemexDrilling and Services, Pemex Logisticsand Pemex Cogeneration and Services
160,245
8.625% Guaranteed Bonds due 2023 PetróleosMexicanos
Pemex Exploration and Production,Pemex Industrial Transformation, PemexDrilling and Services, Pemex Logisticsand Pemex Cogeneration and Services
106,507
9 1⁄4% Guaranteed Bonds due 2018 PetróleosMexicanos
Pemex Exploration and Production,Pemex Industrial Transformation, PemexDrilling and Services, Pemex Logisticsand Pemex Cogeneration and Services
107,109
9.50% Guaranteed Bonds due 2027 PetróleosMexicanos
Pemex Exploration and Production,Pemex Industrial Transformation, PemexDrilling and Services, Pemex Logisticsand Pemex Cogeneration and Services
219,217
The following table sets forth, as of December 31, 2017, the principal amount outstanding of the registered debtsecurities issued by Petróleos Mexicanos, and guaranteed by Pemex Exploration and Production, Pemex IndustrialTransformation, Pemex Drilling and Services, Pemex Logistics and Pemex Cogeneration and Services.
Table 2: Registered Debt Securities originally issued by Petróleos Mexicanos
Security Issuer Guarantors
Principal amountoutstanding
(U.S. $)8.00% Notes due 2019 Petróleos
MexicanosPemex Exploration and Production,Pemex Industrial Transformation,Pemex Drilling and Services,Pemex Logistics and PemexCogeneration and Services
1,312,015
Copyright © 2018 www.secdatabase.com. All Rights Reserved.Please Consider the Environment Before Printing This Document
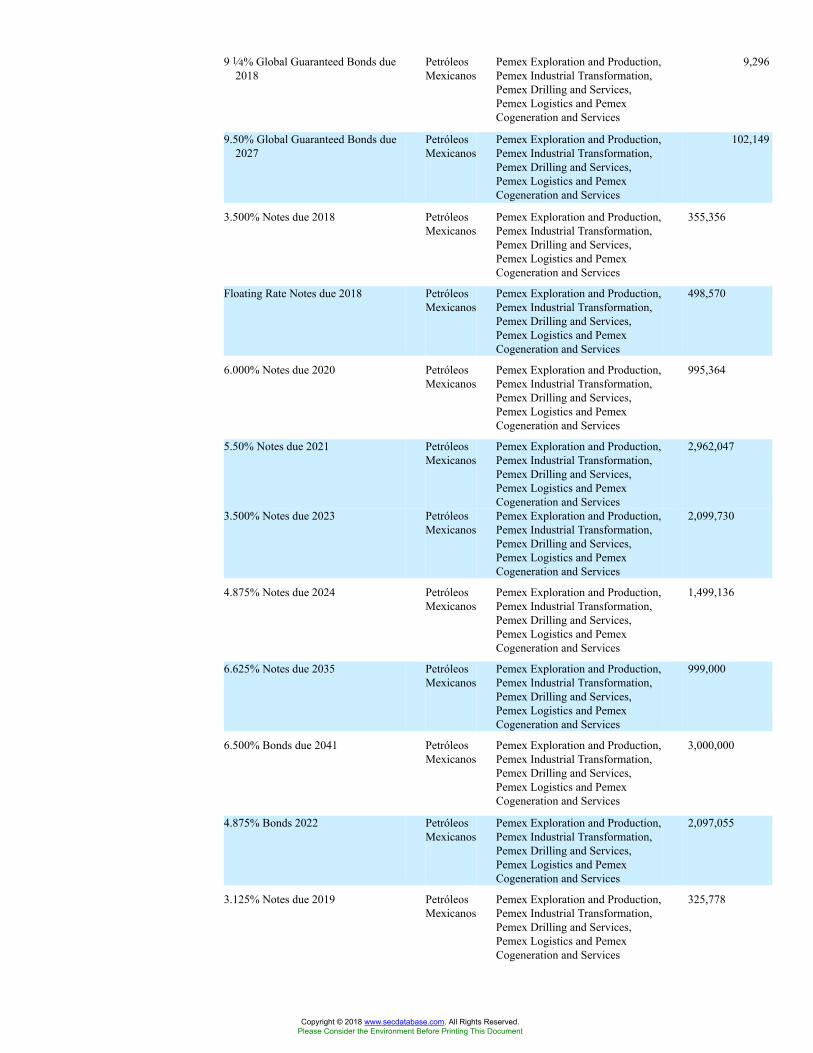
9 1⁄4% Global Guaranteed Bonds due2018
PetróleosMexicanos
Pemex Exploration and Production,Pemex Industrial Transformation,Pemex Drilling and Services,Pemex Logistics and PemexCogeneration and Services
9,296
9.50% Global Guaranteed Bonds due2027
PetróleosMexicanos
Pemex Exploration and Production,Pemex Industrial Transformation,Pemex Drilling and Services,Pemex Logistics and PemexCogeneration and Services
102,149
3.500% Notes due 2018 PetróleosMexicanos
Pemex Exploration and Production,Pemex Industrial Transformation,Pemex Drilling and Services,Pemex Logistics and PemexCogeneration and Services
355,356
Floating Rate Notes due 2018 PetróleosMexicanos
Pemex Exploration and Production,Pemex Industrial Transformation,Pemex Drilling and Services,Pemex Logistics and PemexCogeneration and Services
498,570
6.000% Notes due 2020 PetróleosMexicanos
Pemex Exploration and Production,Pemex Industrial Transformation,Pemex Drilling and Services,Pemex Logistics and PemexCogeneration and Services
995,364
5.50% Notes due 2021 PetróleosMexicanos
Pemex Exploration and Production,Pemex Industrial Transformation,Pemex Drilling and Services,Pemex Logistics and PemexCogeneration and Services
2,962,047
3.500% Notes due 2023 PetróleosMexicanos
Pemex Exploration and Production,Pemex Industrial Transformation,Pemex Drilling and Services,Pemex Logistics and PemexCogeneration and Services
2,099,730
4.875% Notes due 2024 PetróleosMexicanos
Pemex Exploration and Production,Pemex Industrial Transformation,Pemex Drilling and Services,Pemex Logistics and PemexCogeneration and Services
1,499,136
6.625% Notes due 2035 PetróleosMexicanos
Pemex Exploration and Production,Pemex Industrial Transformation,Pemex Drilling and Services,Pemex Logistics and PemexCogeneration and Services
999,000
6.500% Bonds due 2041 PetróleosMexicanos
Pemex Exploration and Production,Pemex Industrial Transformation,Pemex Drilling and Services,Pemex Logistics and PemexCogeneration and Services
3,000,000
4.875% Bonds 2022 PetróleosMexicanos
Pemex Exploration and Production,Pemex Industrial Transformation,Pemex Drilling and Services,Pemex Logistics and PemexCogeneration and Services
2,097,055
3.125% Notes due 2019 PetróleosMexicanos
Pemex Exploration and Production,Pemex Industrial Transformation,Pemex Drilling and Services,Pemex Logistics and PemexCogeneration and Services
325,778
Copyright © 2018 www.secdatabase.com. All Rights Reserved.Please Consider the Environment Before Printing This Document
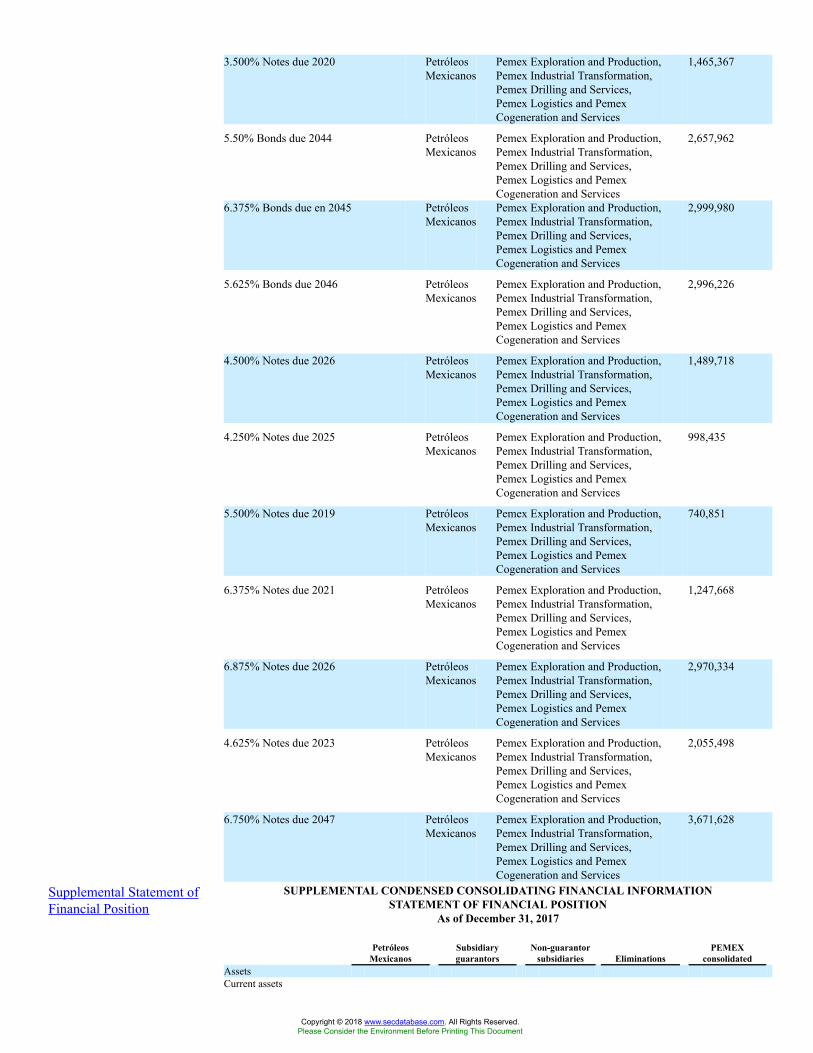
3.500% Notes due 2020 PetróleosMexicanos
Pemex Exploration and Production,Pemex Industrial Transformation,Pemex Drilling and Services,Pemex Logistics and PemexCogeneration and Services
1,465,367
5.50% Bonds due 2044 PetróleosMexicanos
Pemex Exploration and Production,Pemex Industrial Transformation,Pemex Drilling and Services,Pemex Logistics and PemexCogeneration and Services
2,657,962
6.375% Bonds due en 2045 PetróleosMexicanos
Pemex Exploration and Production,Pemex Industrial Transformation,Pemex Drilling and Services,Pemex Logistics and PemexCogeneration and Services
2,999,980
5.625% Bonds due 2046 PetróleosMexicanos
Pemex Exploration and Production,Pemex Industrial Transformation,Pemex Drilling and Services,Pemex Logistics and PemexCogeneration and Services
2,996,226
4.500% Notes due 2026 PetróleosMexicanos
Pemex Exploration and Production,Pemex Industrial Transformation,Pemex Drilling and Services,Pemex Logistics and PemexCogeneration and Services
1,489,718
4.250% Notes due 2025 PetróleosMexicanos
Pemex Exploration and Production,Pemex Industrial Transformation,Pemex Drilling and Services,Pemex Logistics and PemexCogeneration and Services
998,435
5.500% Notes due 2019 PetróleosMexicanos
Pemex Exploration and Production,Pemex Industrial Transformation,Pemex Drilling and Services,Pemex Logistics and PemexCogeneration and Services
740,851
6.375% Notes due 2021 PetróleosMexicanos
Pemex Exploration and Production,Pemex Industrial Transformation,Pemex Drilling and Services,Pemex Logistics and PemexCogeneration and Services
1,247,668
6.875% Notes due 2026 PetróleosMexicanos
Pemex Exploration and Production,Pemex Industrial Transformation,Pemex Drilling and Services,Pemex Logistics and PemexCogeneration and Services
2,970,334
4.625% Notes due 2023 PetróleosMexicanos
Pemex Exploration and Production,Pemex Industrial Transformation,Pemex Drilling and Services,Pemex Logistics and PemexCogeneration and Services
2,055,498
6.750% Notes due 2047 PetróleosMexicanos
Pemex Exploration and Production,Pemex Industrial Transformation,Pemex Drilling and Services,Pemex Logistics and PemexCogeneration and Services
3,671,628
Supplemental Statement ofFinancial Position
SUPPLEMENTAL CONDENSED CONSOLIDATING FINANCIAL INFORMATIONSTATEMENT OF FINANCIAL POSITION
As of December 31, 2017
PetróleosMexicanos
Subsidiaryguarantors
Non-guarantorsubsidiaries Eliminations
PEMEXconsolidated
AssetsCurrent assets
Copyright © 2018 www.secdatabase.com. All Rights Reserved.Please Consider the Environment Before Printing This Document

Cash and cashequivalents Ps.46,959,103 Ps.18,815,345 Ps.32,077,306 Ps.— Ps.97,851,754
Accounts receivable andother, net, andderivative financialinstruments 83,119,394 38,105,354 79,533,940 — 200,758,688
Accountsreceivable—inter-company 311,148,593 1,380,100,592 86,354,837 (1,777,604,022 ) —
Inventories 509,375 32,357,125 30,992,430 — 63,858,930Available-for-sale
financial assets — — 1,056,918 — 1,056,918Total current assets 441,736,465 1,469,378,416 230,015,431 (1,777,604,022 ) 363,526,290Long-term
receivables—intercompany 1,823,276,758 285 3,597,880 (1,826,874,923 ) —Investments in joint ventures
and associates (465,832,399 ) 82,668 16,611,681 465,845,414 16,707,364Wells, pipelines, properties,
plant and equipment-net 12,444,376 1,370,974,060 53,090,890 — 1,436,509,326Long-term notes receivables 147,286,367 1,206,542 — — 148,492,909Deferred taxes 59,691,528 84,443,897 2,057,060 — 146,192,485Intangible assets — 9,088,563 — — 9,088,563Other assets 2,209,579 4,846,078 4,429,520 — 11,485,177Total assets Ps. 2,020,812,674 Ps. 2,940,020,509 Ps. 309,802,462 Ps.(3,138,633,531 ) Ps. 2,132,002,114LiabilitiesCurrent liabilities
Current portion of long-term debt Ps.137,947,110 Ps.5,386,564 Ps.13,875,793 Ps.— Ps.157,209,467
Accountspayable—inter-company 1,240,490,891 434,556,688 93,140,905 (1,768,188,484 ) —
Other current liabilities 23,435,614 157,589,107 50,892,997 — 231,917,718Total current liabilities 1,401,873,615 597,532,359 157,909,695 (1,768,188,484 ) 389,127,185Long-term debt 1,824,829,579 40,262,391 15,573,634 — 1,880,665,604Long-term payables—inter-
company — 1,830,150,615 6,139,845 (1,836,290,460 ) —Employee benefits,
provisions for sundrycreditors, other liabilitiesand deferred taxes 297,028,436 1,057,191,286 10,341,988 — 1,364,561,710
Total liabilities 3,523,731,630 3,525,136,651 189,965,162 (3,604,478,944 ) 3,634,354,499Equity (deficit), net (1,502,918,956 ) (585,116,142 ) 119,837,300 465,845,413 (1,502,352,385)Total liabilities and equity Ps. 2,020,812,674 Ps. 2,940,020,509 Ps. 309,802,462 Ps. (3,138,633,531) Ps. 2,132,002,114
SUPPLEMENTAL CONDENSED CONSOLIDATING FINANCIAL INFORMATIONSTATEMENT OF FINANCIAL POSITION
As of December 31, 2016
PetróleosMexicanos
Subsidiaryguarantors
Non-guarantorsubsidiaries Eliminations
PEMEXconsolidated
AssetsCurrent assets
Cash and cashequivalents Ps.92,503,607 Ps.9,732,503 Ps.61,296,403 Ps.— Ps.163,532,513
Accounts receivable andother, net, andderivative financialinstruments 6,604,595 75,760,079 55,713,323 — 138,077,997
Accountsreceivable—inter-company 440,645,367 1,684,782,235 70,268,246 (2,195,695,848 ) —
Inventories 446,954 29,270,943 16,174,163 — 45,892,060Available-for-sale
financial assets — — 2,852,679 — 2,852,679Held-for-sale
non-financial assets — 7,460,674 — — 7,460,674Total current assets 540,200,523 1,807,006,434 206,304,814 (2,195,695,848 ) 357,815,923Available-for-sale financial
assets — — 6,027,540 — 6,027,540Long-term
receivables—intercompany 1,740,519,399 289 6,384,944 (1,746,904,632 ) —Investments in joint ventures
and associates (250,108,630 ) 396,681 20,327,813 250,121,645 20,737,509
Copyright © 2018 www.secdatabase.com. All Rights Reserved.Please Consider the Environment Before Printing This Document

Wells, pipelines, properties,plant and equipment-net 12,596,722 1,595,655,580 59,489,946 — 1,667,742,248
Long-term notes receivables 140,579,974 8,027,628 — — 148,607,602Deferred taxes 59,162,878 40,341,615 820,196 — 100,324,689Restricted cash — 9,624,804 853,822 — 10,478,626Intangible assets — 8,639,242 — — 8,639,242Other assets 1,824,104 2,707,788 4,980,753 — 9,512,645Total assets Ps. 2,244,774,970 Ps. 3,472,400,061 Ps. 305,189,828 Ps. (3,692,478,835) Ps. 2,329,886,024LiabilitiesCurrent liabilities
Current portion of long-term debt 157,937,631 7,381,095 10,847,462 — 176,166,188
Accountspayable—inter-company 1,265,244,986 854,106,939 68,510,835 (2,187,862,760 ) —
Other current liabilities 34,913,773 169,182,239 45,927,686 — 250,023,698Total current liabilities 1,458,096,390 1,030,670,273 125,285,983 (2,187,862,760 ) 426,189,886Long-term debt 1,737,332,174 46,090,919 23,581,449 — 1,807,004,542Long-term payables—inter-
company — 1,746,433,870 8,303,850 (1,754,737,720 ) —Employee benefits,
provisions for sundrycreditors, other liabilitiesand deferred taxes 282,902,667 1,035,019,339 11,777,737 — 1,329,699,743
Total liabilities 3,478,331,231 3,858,214,401 168,949,019 (3,942,600,480 ) 3,562,894,171Equity (deficit), net (1,233,556,261) (385,814,340 ) 136,240,809 250,121,645 (1,233,008,147)Total liabilities and equity Ps.2,244,774,970 Ps.3,472,400,061 Ps.305,189,828 Ps. (3,692,478,835) Ps.2,329,886,024
Supplemental Statement ofComprehensive Income
SUPPLEMENTAL CONDENSED CONSOLIDATING FINANCIAL INFORMATIONSTATEMENT OF COMPREHENSIVE INCOME
For the year ended December 31, 2017
PetróleosMexicanos
Subsidiaryguarantors
Non-guarantorsubsidiaries Eliminations
PEMEXconsolidated
Net sales Ps.— Ps. 1,713,914,703 Ps. 1,096,752,930 Ps. (1,424,768,483) Ps. 1,385,899,150Services income 50,399,983 140,934,022 2,646,144 (182,849,580 ) 11,130,569Total sales revenues 50,399,983 1,854,848,725 1,099,399,074 (1,607,618,063 ) 1,397,029,719Impairment of
wells, pipelines,properties, plantand equipment — 145,302,407 6,142,153 — 151,444,560
Cost of sales 2,007,814 1,447,640,131 1,083,297,610 (1,528,740,675 ) 1,004,204,880Gross income 48,392,169 261,906,187 9,959,311 (78,877,388 ) 241,380,279Other revenues
(expenses), net (341,521 ) (12,443,660 ) (4,664,096 ) 22,623,353 5,174,076General expenses:Transportation,
distribution andsale expenses — 26,136,674 1,297,558 (5,544,562 ) 21,889,670
Administrativeexpenses 59,141,391 105,920,390 5,883,200 (51,005,527 ) 119,939,454
Total generalexpenses 59,141,391 132,057,064 7,180,758 (56,550,089 ) 141,829,124
Operating income (11,090,743 ) 117,405,463 (1,885,543 ) 296,054 104,725,231Financing income 143,676,367 134,401,598 3,185,195 (265,097,307 ) 16,165,853Financing cost (236,929,035 ) (141,900,236 ) (3,616,530 ) 264,801,253 (117,644,548 )Derivative financial
instrumentsincome (cost),net 27,670,991 (1,608,039 ) (724,628 ) — 25,338,324
Foreign exchangeincome , net 6,837,171 15,807,988 538,963 — 23,184,122
Profit (loss) sharingin joint venturesand associates (211,567,169 ) 409,955 (49,515 ) 211,567,169 360,440
Income (loss)before taxes,duties and other (281,402,418 ) 124,516,729 (2,552,058 ) 211,567,169 52,129,422
Total taxes, dutiesand other (557,520 ) 331,001,261 2,536,300 — 332,980,041
Net (loss) incomefor the year (280,844,898 ) (206,484,532 ) (5,088,358 ) 211,567,169 (280,850,619 )
Copyright © 2018 www.secdatabase.com. All Rights Reserved.Please Consider the Environment Before Printing This Document
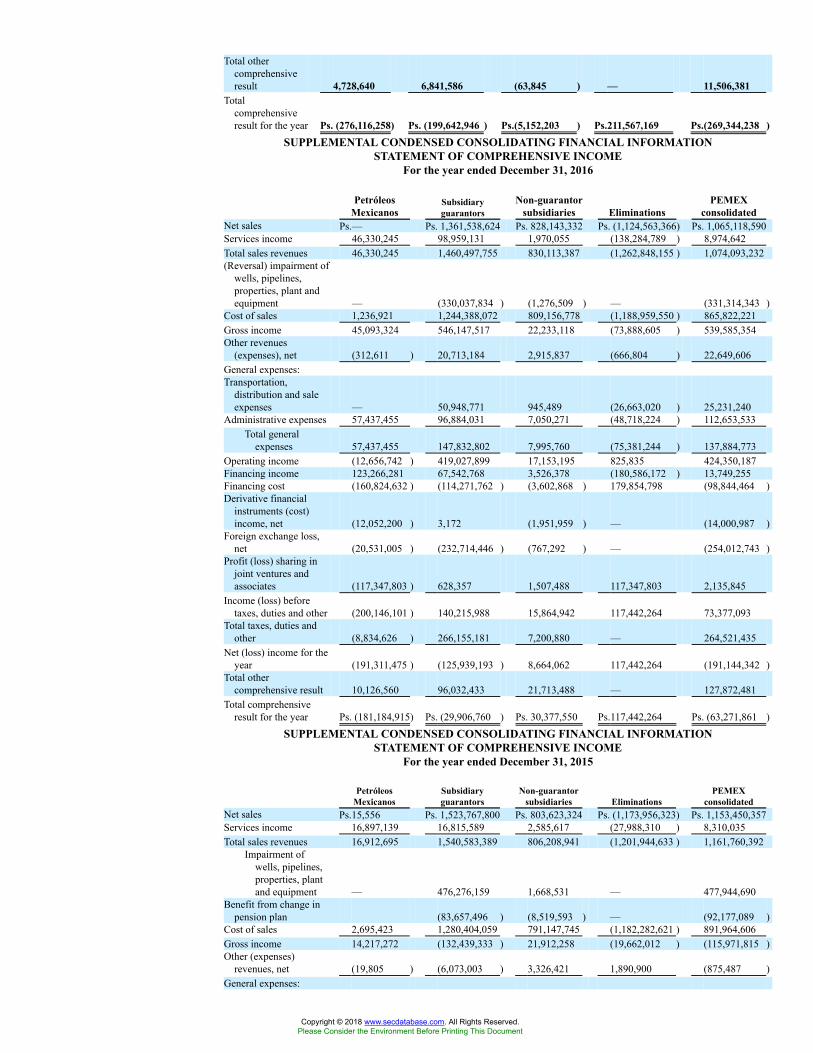
Total othercomprehensiveresult 4,728,640 6,841,586 (63,845 ) — 11,506,381
Totalcomprehensiveresult for the year Ps. (276,116,258) Ps. (199,642,946 ) Ps.(5,152,203 ) Ps.211,567,169 Ps.(269,344,238 )
SUPPLEMENTAL CONDENSED CONSOLIDATING FINANCIAL INFORMATIONSTATEMENT OF COMPREHENSIVE INCOME
For the year ended December 31, 2016
PetróleosMexicanos
Subsidiaryguarantors
Non-guarantorsubsidiaries Eliminations
PEMEXconsolidated
Net sales Ps.— Ps. 1,361,538,624 Ps. 828,143,332 Ps. (1,124,563,366) Ps. 1,065,118,590Services income 46,330,245 98,959,131 1,970,055 (138,284,789 ) 8,974,642Total sales revenues 46,330,245 1,460,497,755 830,113,387 (1,262,848,155 ) 1,074,093,232(Reversal) impairment of
wells, pipelines,properties, plant andequipment — (330,037,834 ) (1,276,509 ) — (331,314,343 )
Cost of sales 1,236,921 1,244,388,072 809,156,778 (1,188,959,550 ) 865,822,221Gross income 45,093,324 546,147,517 22,233,118 (73,888,605 ) 539,585,354Other revenues
(expenses), net (312,611 ) 20,713,184 2,915,837 (666,804 ) 22,649,606General expenses:Transportation,
distribution and saleexpenses — 50,948,771 945,489 (26,663,020 ) 25,231,240
Administrative expenses 57,437,455 96,884,031 7,050,271 (48,718,224 ) 112,653,533Total general
expenses 57,437,455 147,832,802 7,995,760 (75,381,244 ) 137,884,773Operating income (12,656,742 ) 419,027,899 17,153,195 825,835 424,350,187Financing income 123,266,281 67,542,768 3,526,378 (180,586,172 ) 13,749,255Financing cost (160,824,632 ) (114,271,762 ) (3,602,868 ) 179,854,798 (98,844,464 )Derivative financial
instruments (cost)income, net (12,052,200 ) 3,172 (1,951,959 ) — (14,000,987 )
Foreign exchange loss,net (20,531,005 ) (232,714,446 ) (767,292 ) — (254,012,743 )
Profit (loss) sharing injoint ventures andassociates (117,347,803 ) 628,357 1,507,488 117,347,803 2,135,845
Income (loss) beforetaxes, duties and other (200,146,101 ) 140,215,988 15,864,942 117,442,264 73,377,093
Total taxes, duties andother (8,834,626 ) 266,155,181 7,200,880 — 264,521,435
Net (loss) income for theyear (191,311,475 ) (125,939,193 ) 8,664,062 117,442,264 (191,144,342 )
Total othercomprehensive result 10,126,560 96,032,433 21,713,488 — 127,872,481
Total comprehensiveresult for the year Ps. (181,184,915) Ps. (29,906,760 ) Ps. 30,377,550 Ps.117,442,264 Ps. (63,271,861 )
SUPPLEMENTAL CONDENSED CONSOLIDATING FINANCIAL INFORMATIONSTATEMENT OF COMPREHENSIVE INCOME
For the year ended December 31, 2015
PetróleosMexicanos
Subsidiaryguarantors
Non-guarantorsubsidiaries Eliminations
PEMEXconsolidated
Net sales Ps.15,556 Ps. 1,523,767,800 Ps. 803,623,324 Ps. (1,173,956,323) Ps. 1,153,450,357Services income 16,897,139 16,815,589 2,585,617 (27,988,310 ) 8,310,035Total sales revenues 16,912,695 1,540,583,389 806,208,941 (1,201,944,633 ) 1,161,760,392
Impairment ofwells, pipelines,properties, plantand equipment — 476,276,159 1,668,531 — 477,944,690
Benefit from change inpension plan (83,657,496 ) (8,519,593 ) — (92,177,089 )
Cost of sales 2,695,423 1,280,404,059 791,147,745 (1,182,282,621 ) 891,964,606Gross income 14,217,272 (132,439,333 ) 21,912,258 (19,662,012 ) (115,971,815 )Other (expenses)
revenues, net (19,805 ) (6,073,003 ) 3,326,421 1,890,900 (875,487 )General expenses:
Copyright © 2018 www.secdatabase.com. All Rights Reserved.Please Consider the Environment Before Printing This Document
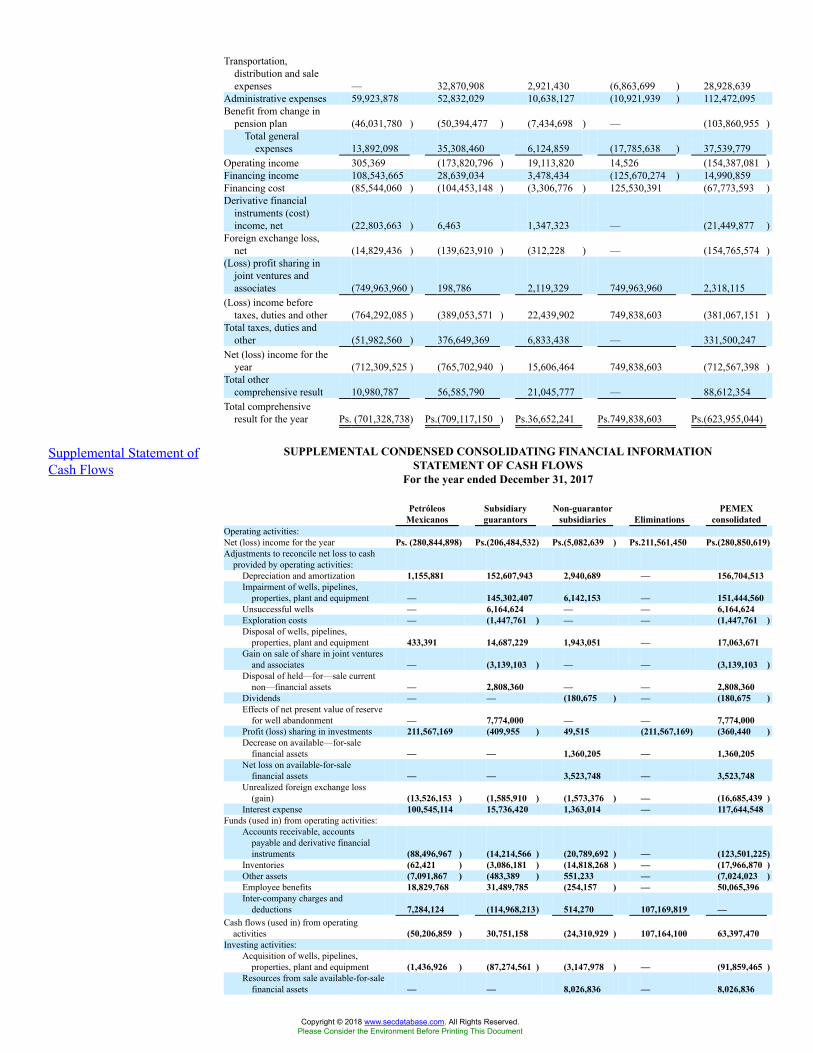
Transportation,distribution and saleexpenses — 32,870,908 2,921,430 (6,863,699 ) 28,928,639
Administrative expenses 59,923,878 52,832,029 10,638,127 (10,921,939 ) 112,472,095Benefit from change in
pension plan (46,031,780 ) (50,394,477 ) (7,434,698 ) — (103,860,955 )Total general
expenses 13,892,098 35,308,460 6,124,859 (17,785,638 ) 37,539,779Operating income 305,369 (173,820,796 ) 19,113,820 14,526 (154,387,081 )Financing income 108,543,665 28,639,034 3,478,434 (125,670,274 ) 14,990,859Financing cost (85,544,060 ) (104,453,148 ) (3,306,776 ) 125,530,391 (67,773,593 )Derivative financial
instruments (cost)income, net (22,803,663 ) 6,463 1,347,323 — (21,449,877 )
Foreign exchange loss,net (14,829,436 ) (139,623,910 ) (312,228 ) — (154,765,574 )
(Loss) profit sharing injoint ventures andassociates (749,963,960 ) 198,786 2,119,329 749,963,960 2,318,115
(Loss) income beforetaxes, duties and other (764,292,085 ) (389,053,571 ) 22,439,902 749,838,603 (381,067,151 )
Total taxes, duties andother (51,982,560 ) 376,649,369 6,833,438 — 331,500,247
Net (loss) income for theyear (712,309,525 ) (765,702,940 ) 15,606,464 749,838,603 (712,567,398 )
Total othercomprehensive result 10,980,787 56,585,790 21,045,777 — 88,612,354
Total comprehensiveresult for the year Ps. (701,328,738) Ps.(709,117,150 ) Ps.36,652,241 Ps.749,838,603 Ps.(623,955,044)
Supplemental Statement ofCash Flows
SUPPLEMENTAL CONDENSED CONSOLIDATING FINANCIAL INFORMATIONSTATEMENT OF CASH FLOWS
For the year ended December 31, 2017
PetróleosMexicanos
Subsidiaryguarantors
Non-guarantorsubsidiaries Eliminations
PEMEXconsolidated
Operating activities:Net (loss) income for the year Ps. (280,844,898) Ps.(206,484,532) Ps.(5,082,639 ) Ps.211,561,450 Ps.(280,850,619)Adjustments to reconcile net loss to cash
provided by operating activities:Depreciation and amortization 1,155,881 152,607,943 2,940,689 — 156,704,513Impairment of wells, pipelines,
properties, plant and equipment — 145,302,407 6,142,153 — 151,444,560Unsuccessful wells — 6,164,624 — — 6,164,624Exploration costs — (1,447,761 ) — — (1,447,761 )Disposal of wells, pipelines,
properties, plant and equipment 433,391 14,687,229 1,943,051 — 17,063,671Gain on sale of share in joint ventures
and associates — (3,139,103 ) — — (3,139,103 )Disposal of held—for—sale current
non—financial assets — 2,808,360 — — 2,808,360Dividends — — (180,675 ) — (180,675 )Effects of net present value of reserve
for well abandonment — 7,774,000 — — 7,774,000Profit (loss) sharing in investments 211,567,169 (409,955 ) 49,515 (211,567,169) (360,440 )Decrease on available—for-sale
financial assets — — 1,360,205 — 1,360,205Net loss on available-for-sale
financial assets — — 3,523,748 — 3,523,748Unrealized foreign exchange loss
(gain) (13,526,153 ) (1,585,910 ) (1,573,376 ) — (16,685,439 )Interest expense 100,545,114 15,736,420 1,363,014 — 117,644,548
Funds (used in) from operating activities:Accounts receivable, accounts
payable and derivative financialinstruments (88,496,967 ) (14,214,566 ) (20,789,692 ) — (123,501,225)
Inventories (62,421 ) (3,086,181 ) (14,818,268 ) — (17,966,870 )Other assets (7,091,867 ) (483,389 ) 551,233 — (7,024,023 )Employee benefits 18,829,768 31,489,785 (254,157 ) — 50,065,396Inter-company charges and
deductions 7,284,124 (114,968,213) 514,270 107,169,819 —Cash flows (used in) from operating
activities (50,206,859 ) 30,751,158 (24,310,929 ) 107,164,100 63,397,470Investing activities:
Acquisition of wells, pipelines,properties, plant and equipment (1,436,926 ) (87,274,561 ) (3,147,978 ) — (91,859,465 )
Resources from sale available-for-salefinancial assets — — 8,026,836 — 8,026,836
Copyright © 2018 www.secdatabase.com. All Rights Reserved.Please Consider the Environment Before Printing This Document
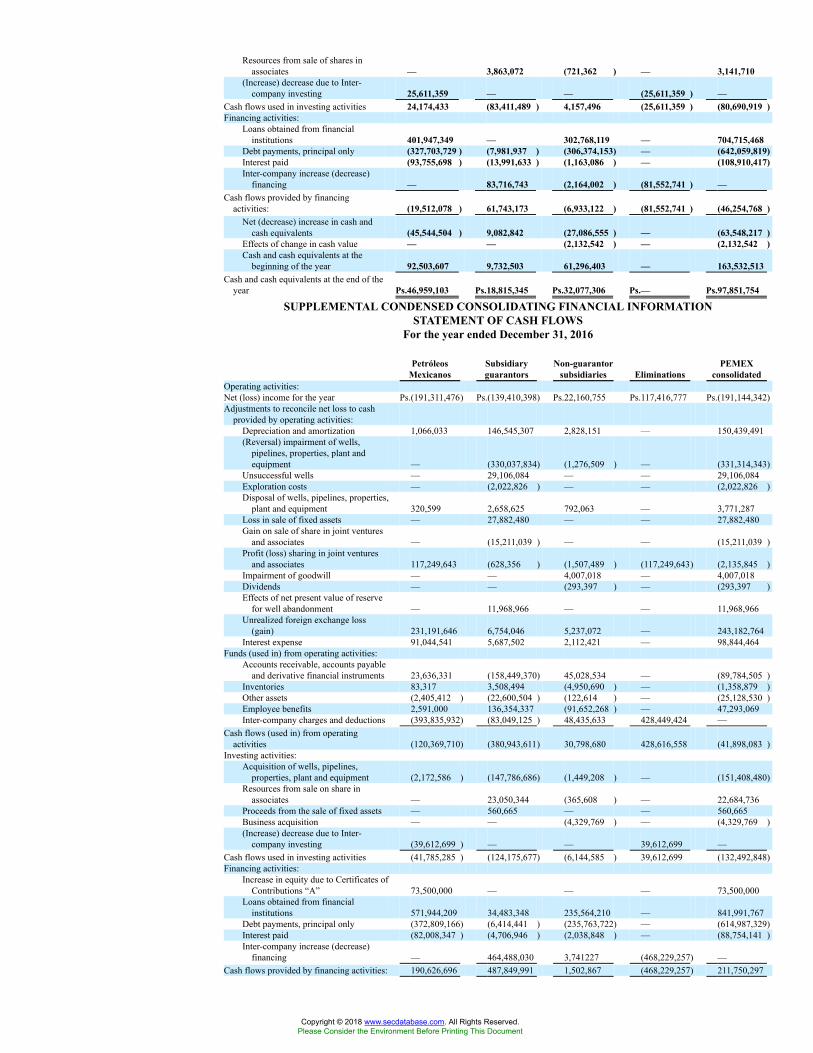
Resources from sale of shares inassociates — 3,863,072 (721,362 ) — 3,141,710
(Increase) decrease due to Inter-company investing 25,611,359 — — (25,611,359 ) —
Cash flows used in investing activities 24,174,433 (83,411,489 ) 4,157,496 (25,611,359 ) (80,690,919 )Financing activities:
Loans obtained from financialinstitutions 401,947,349 — 302,768,119 — 704,715,468
Debt payments, principal only (327,703,729 ) (7,981,937 ) (306,374,153) — (642,059,819)Interest paid (93,755,698 ) (13,991,633 ) (1,163,086 ) — (108,910,417)Inter-company increase (decrease)
financing — 83,716,743 (2,164,002 ) (81,552,741 ) —Cash flows provided by financing
activities: (19,512,078 ) 61,743,173 (6,933,122 ) (81,552,741 ) (46,254,768 )Net (decrease) increase in cash and
cash equivalents (45,544,504 ) 9,082,842 (27,086,555 ) — (63,548,217 )Effects of change in cash value — — (2,132,542 ) — (2,132,542 )Cash and cash equivalents at the
beginning of the year 92,503,607 9,732,503 61,296,403 — 163,532,513Cash and cash equivalents at the end of the
year Ps.46,959,103 Ps.18,815,345 Ps.32,077,306 Ps.— Ps.97,851,754
SUPPLEMENTAL CONDENSED CONSOLIDATING FINANCIAL INFORMATIONSTATEMENT OF CASH FLOWS
For the year ended December 31, 2016
PetróleosMexicanos
Subsidiaryguarantors
Non-guarantorsubsidiaries Eliminations
PEMEXconsolidated
Operating activities:Net (loss) income for the year Ps.(191,311,476) Ps.(139,410,398) Ps.22,160,755 Ps.117,416,777 Ps.(191,144,342)Adjustments to reconcile net loss to cash
provided by operating activities:Depreciation and amortization 1,066,033 146,545,307 2,828,151 — 150,439,491(Reversal) impairment of wells,
pipelines, properties, plant andequipment — (330,037,834) (1,276,509 ) — (331,314,343)
Unsuccessful wells — 29,106,084 — — 29,106,084Exploration costs — (2,022,826 ) — — (2,022,826 )Disposal of wells, pipelines, properties,
plant and equipment 320,599 2,658,625 792,063 — 3,771,287Loss in sale of fixed assets — 27,882,480 — — 27,882,480Gain on sale of share in joint ventures
and associates — (15,211,039 ) — — (15,211,039 )Profit (loss) sharing in joint ventures
and associates 117,249,643 (628,356 ) (1,507,489 ) (117,249,643) (2,135,845 )Impairment of goodwill — — 4,007,018 — 4,007,018Dividends — — (293,397 ) — (293,397 )Effects of net present value of reserve
for well abandonment — 11,968,966 — — 11,968,966Unrealized foreign exchange loss
(gain) 231,191,646 6,754,046 5,237,072 — 243,182,764Interest expense 91,044,541 5,687,502 2,112,421 — 98,844,464
Funds (used in) from operating activities:Accounts receivable, accounts payable
and derivative financial instruments 23,636,331 (158,449,370) 45,028,534 — (89,784,505 )Inventories 83,317 3,508,494 (4,950,690 ) — (1,358,879 )Other assets (2,405,412 ) (22,600,504 ) (122,614 ) — (25,128,530 )Employee benefits 2,591,000 136,354,337 (91,652,268 ) — 47,293,069Inter-company charges and deductions (393,835,932) (83,049,125 ) 48,435,633 428,449,424 —
Cash flows (used in) from operatingactivities (120,369,710) (380,943,611) 30,798,680 428,616,558 (41,898,083 )
Investing activities:Acquisition of wells, pipelines,
properties, plant and equipment (2,172,586 ) (147,786,686) (1,449,208 ) — (151,408,480)Resources from sale on share in
associates — 23,050,344 (365,608 ) — 22,684,736Proceeds from the sale of fixed assets — 560,665 — — 560,665Business acquisition — — (4,329,769 ) — (4,329,769 )(Increase) decrease due to Inter-
company investing (39,612,699 ) — — 39,612,699 —Cash flows used in investing activities (41,785,285 ) (124,175,677) (6,144,585 ) 39,612,699 (132,492,848)Financing activities:
Increase in equity due to Certificates ofContributions “A” 73,500,000 — — — 73,500,000
Loans obtained from financialinstitutions 571,944,209 34,483,348 235,564,210 — 841,991,767
Debt payments, principal only (372,809,166) (6,414,441 ) (235,763,722) — (614,987,329)Interest paid (82,008,347 ) (4,706,946 ) (2,038,848 ) — (88,754,141 )Inter-company increase (decrease)
financing — 464,488,030 3,741227 (468,229,257) —Cash flows provided by financing activities: 190,626,696 487,849,991 1,502,867 (468,229,257) 211,750,297
Copyright © 2018 www.secdatabase.com. All Rights Reserved.Please Consider the Environment Before Printing This Document

Net (decrease) increase in cash andcash equivalents 28,471,701 (17,269,297 ) 26,156,962 — 37,359,366
Effects of change in cash value 5,570,892 20,371,126 (9,137,751 ) — 16,804,267Cash and cash equivalents at the
beginning of the year 58,461,014 6,630,674 44,277,192 — 109,368,880Cash and cash equivalents at the end of the
year Ps.92,503,607 Ps.9,732,503 Ps.61,296,403 Ps.— Ps.163,532,513
SUPPLEMENTAL CONDENSED CONSOLIDATING FINANCIAL INFORMATIONSTATEMENT OF CASH FLOWS
For the year ended December 31, 2015
PetróleosMexicanos
Subsidiaryguarantors
Non-guarantorsubsidiaries Eliminations
PEMEXconsolidated
Operating activities:Net (loss) income for the year Ps. (712,177,124) Ps.(765,702,826) Ps.15,738,868 Ps.749,573,684 Ps.(712,567,398)Adjustments to reconcile net loss to cash
provided by operating activities:Depreciation and amortization 789,657 164,221,429 2,940,164 — 167,951,250Impairment of wells, pipelines,
properties, plant and equipment — 476,276,159 1,668,531 — 477,944,690Unsuccessful wells — 23,213,519 — — 23,213,519Exploration costs — (5,698,511 ) — — (5,698,511 )Disposal of wells, pipelines,
properties, plant and equipment 180,992 21,945,266 2,512,279 — 24,638,537Profit (loss) sharing in joint ventures
and associates 749,963,958 (198,786 ) (2,119,329 ) (749,963,958) (2,318,115 )Gain on sale of share in joint ventures
and associates — (337,675 ) (342,955 ) — (680,630 )Dividends — — (359,941 ) — (359,941 )Effects of net present value of reserve
for well abandonment — (608,160 ) — — (608,160 )Unrealized foreign exchange loss
(gain) 145,971,158 2,996,219 3,708,879 — 152,676,256Interest expense 63,460,443 3,414,430 898,720 — 67,773,593
Funds provided by (used in) operatingactivities:
Accounts receivable, accounts payableand derivative financial instruments (58,554,144 ) 119,761,648 (27,777,939 ) — 33,429,565
Inventories 108,568 4,547,843 1,511,317 — 6,167,728Other assets (149,819 ) (16,578,827 ) 126,281 — (16,602,365 )Employee benefits (10,037,444 ) (94,183,192 ) (11,801,596 ) — (116,022,232)Inter-company charges and deductions (310,384,820 ) 30,044,041 31,975,215 248,365,564 —
Cash flows provided by operating activities (130,828,575 ) (36,887,423 ) 18,678,494 247,975,290 98,937,786Investing activities:
Acquisition of wells, pipelines,properties, plant and equipment (1,496,277 ) (239,315,507) (12,702,217 ) — (253,514,001)
Investments in associates — — (36,214 ) — (36,214 )Resources from the sales on share in
associates — (130,323 ) 4,547,461 — 4,417,138(Increase) decrease due to Inter-
company investing (39,108,879 ) — — 39,108,879 —Cash flows used in investing activities (40,605,156 ) (239,445,830) (8,190,970 ) 39,108,879 (249,133,077)Financing activities:
Increase in equity due to Certificatesof Contributions “A” 10,000,000 (1,915,922 ) 1,844,394 71,528 10,000,000
Loans obtained from financialinstitutions 345,383,990 — 33,587,088 — 378,971,078
Debt payments, principal only (147,927,857 ) (8,081,177 ) (37,609,464 ) — (193,618,498)Interest paid (58,123,368 ) (3,443,923 ) (1,169,859 ) — (62,737,150 )Inter-company increase (decrease)
financing (3,626,448 ) 289,859,173 922,972 (287,155,697) —Cash flows provided by financing
activities: 145,706,317 276,418,151 (2,424,869 ) (287,084,169) 132,615,430Net (decrease) increase in cash and
cash equivalents (25,727,414 ) 84,898 8,062,655 — (17,579,861 )Effects of change in cash value 11,185,788 1,138,356 (3,363,931 ) — 8,960,213Cash and cash equivalents at the
beginning of the year 73,002,640 5,407,420 39,578,468 — 117,988,528Cash and cash equivalents at the end of the
year Ps.58,461,014 Ps.6,630,674 Ps.44,277,192 Ps.— Ps.109,368,880
Copyright © 2018 www.secdatabase.com. All Rights Reserved.Please Consider the Environment Before Printing This Document

12 Months EndedSupplementary Informationon Oil and Gas ExplorationAnd Production Activities
(Unaudited) (Tables)Dec. 31, 2017
Text block1 [abstract]Summary of Capitalized Costs forOil and Gas Producing Activities
a. Capitalized costs for oil and gas producing activities (unaudited):
As of December 31,2017 2016 2015
Proved reserves Ps.2,363,336,481 Ps.2,476,535,503 Ps.2,102,971,025Construction in progress 35,381,089 60,720,261 88,706,330Accumulated
depreciation andamortization (1,444,962,317) (1,355,402,150) (1,224,690,867)
Net capitalized costs Ps.953,755,253 Ps.1,181,853,614 Ps.966,986,487
Summary of Costs Incurred forOil and Gas Property Explorationand Development Activities
b. Costs incurred for oil and gas property exploration and development activities(unaudited):
As of December 31,2017 2016
Exploration Ps.32,480,801 Ps.41,661,666Development 53,460,364 113,895,246Total costs incurred Ps.85,941,165 Ps.155,556,912
Summary of Results ofOperations for Oil and GasProducing Activities
c. Results of operations for oil and gas producing activities (unaudited):
2017 2016 2015Revenues from sale of oil
and gas Ps.762,637,362 Ps.616,380,608 Ps.690,591,455Hydrocarbon duties 375,156,405 304,299,019 376,682,705Production costs (excluding
taxes) 248,957,950 171,194,337 177,774,082Other costs and expenses (3,954,222 ) 61,359,271 20,360,540Exploration expenses 14,993,433 39,693,273 31,244,564Depreciation, depletion,
amortization and accretion 240,672,906 (150,891,739) 527,014,056875,826,472 425,654,161 1,133,075,947
Results of operations for oiland gas producingactivities Ps. (113,189,111) Ps.190,726,447 Ps. (442,484,491 )
Summary of Results ofOperations for Oil and GasProducing Activities
d. Sales prices (unaudited)
The following table summarizes average sales prices in U.S. dollars for each of the yearsended December 31 (excluding production taxes):
2017 2016 2015Weighted average sales price per barrel of
oil equivalent (boe)(1) US$ 38.63 US$ 29.18 US$ 37.17Crude oil, per barrel 48.71 36.55 48.22Natural gas, per thousand cubic feet 4.32 3.01 3.78
(1) To convert dry gas to barrels of oil equivalent, a factor of 5.201 thousand cubic feet of dry gas per barrel of oilequivalent is used.
Summary of Oil and Gas ProvedReserves Summary of oil and gas(1) proved reserves as of December 31, 2017
Copyright © 2018 www.secdatabase.com. All Rights Reserved.Please Consider the Environment Before Printing This Document

based on average fiscal year prices
Crude oil and Condensates(2) Dry Gas(3)(in millions of barrels) (in billions of cubic feet)
Proved developedand un-developedreserves:
Proveddevelopedreserves 4,166 4,026
Provedundevelopedreserves 2,261 2,567
Totalprovedreserves 6,427 6,593
Note: Numbers may not total due to rounding.(1) PEMEX does not currently produce synthetic oil or synthetic gas, or other natural resources from which
synthetic oil or synthetic gas can be produced.(2) Crude oil and condensate reserves include the fraction of liquefiable hydrocarbons recoverable in natural gas
processing plants located at fields.(3) Reserve volumes reported in this table are volumes of dry gas, although natural gas production reported in
other tables refers to sour wet gas. There is a shrinkage in volume when natural gas liquids and impurities areextracted to obtain dry gas. Therefore, reported natural gas volumes are greater than dry gas volumes.
Disclosure of Proved Developedand Undeveloped Reserve
Crude oil and condensate reserves(including natural gas liquids)(1)
2017 2016 2015(in millions of barrels)
Proved developed and undeveloped reserves:At December 31 7,219 7,977 10,292Revisions(2) (95 ) 189 (1,491 )Extensions and discoveries 147 (55 ) 111Production (805 ) (891 ) (935 )Farm outs & transfer of fields due to NHC bidding process (38 ) — —
At December 31 6,427 7,219 7,977Proved developed reserves at December 31 4,166 4,886 5,725Proved undeveloped reserves at December 31 2,261 2,333 2,252
Note: Numbers may not total due to rounding.(1) Crude oil and condensate reserves include the fraction of liquefiable hydrocarbons recoverable in natural gas
processing plants located at fields.(2) Revisions include positive and negative changes due to new data from well drilling, revisions made when actual
reservoir performance differs from expected performance and changes in hydrocarbon prices.Source: Pemex Exploration and Production.
Dry gas reserves
2017 2016 2015(in billions of cubic feet)
Proved developed and undeveloped reserves:At December 31 6,984 8,610 10,859
Revisions(1) 169 (183 ) (955 )Extensions and discoveries 468 (308 ) 47Production(2) (999 ) (1,134) (1,341 )Farm outs & transfer of fields due to
NHC bidding process (29 ) — —At December 31 6,593 6,984 8,610Proved developed reserves at December 31 4,026 4,513 6,012
Copyright © 2018 www.secdatabase.com. All Rights Reserved.Please Consider the Environment Before Printing This Document
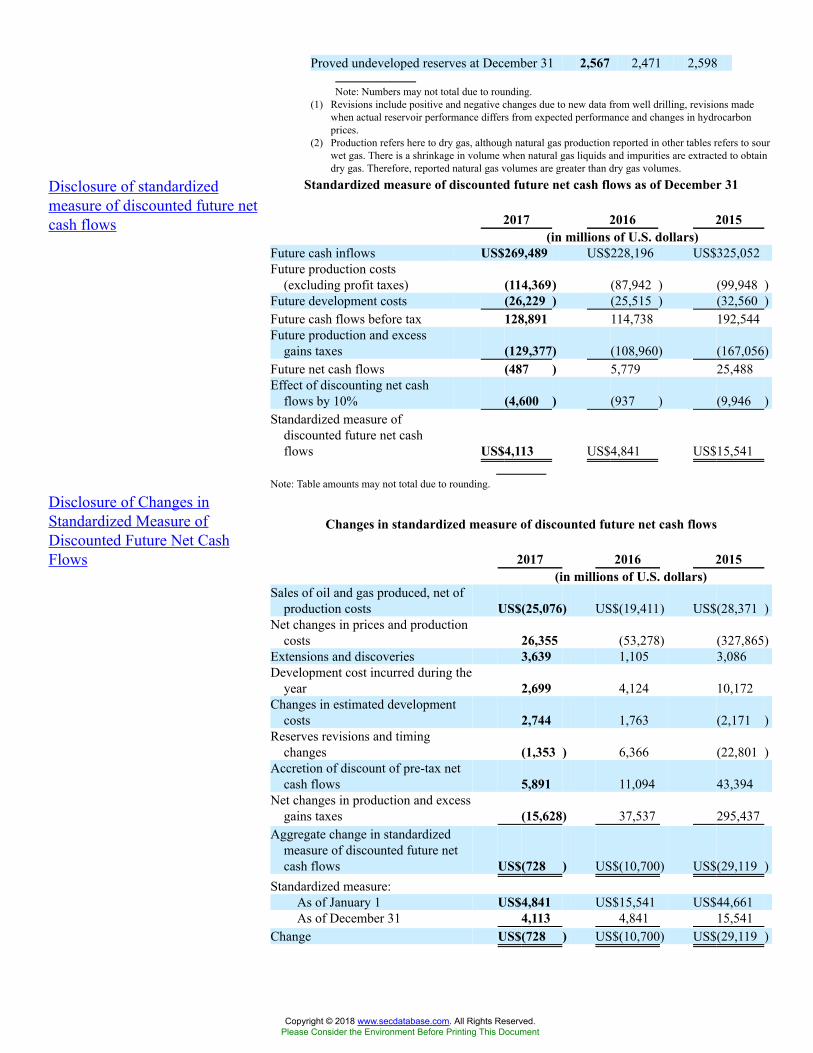
Proved undeveloped reserves at December 31 2,567 2,471 2,598
Note: Numbers may not total due to rounding.(1) Revisions include positive and negative changes due to new data from well drilling, revisions made
when actual reservoir performance differs from expected performance and changes in hydrocarbonprices.
(2) Production refers here to dry gas, although natural gas production reported in other tables refers to sourwet gas. There is a shrinkage in volume when natural gas liquids and impurities are extracted to obtaindry gas. Therefore, reported natural gas volumes are greater than dry gas volumes.
Disclosure of standardizedmeasure of discounted future netcash flows
Standardized measure of discounted future net cash flows as of December 31
2017 2016 2015(in millions of U.S. dollars)
Future cash inflows US$269,489 US$228,196 US$325,052Future production costs
(excluding profit taxes) (114,369) (87,942 ) (99,948 )Future development costs (26,229 ) (25,515 ) (32,560 )Future cash flows before tax 128,891 114,738 192,544Future production and excess
gains taxes (129,377) (108,960) (167,056)Future net cash flows (487 ) 5,779 25,488Effect of discounting net cash
flows by 10% (4,600 ) (937 ) (9,946 )Standardized measure of
discounted future net cashflows US$4,113 US$4,841 US$15,541
Note: Table amounts may not total due to rounding.
Disclosure of Changes inStandardized Measure ofDiscounted Future Net CashFlows
Changes in standardized measure of discounted future net cash flows
2017 2016 2015(in millions of U.S. dollars)
Sales of oil and gas produced, net ofproduction costs US$(25,076) US$(19,411) US$(28,371 )
Net changes in prices and productioncosts 26,355 (53,278) (327,865)
Extensions and discoveries 3,639 1,105 3,086Development cost incurred during the
year 2,699 4,124 10,172Changes in estimated development
costs 2,744 1,763 (2,171 )Reserves revisions and timing
changes (1,353 ) 6,366 (22,801 )Accretion of discount of pre-tax net
cash flows 5,891 11,094 43,394Net changes in production and excess
gains taxes (15,628) 37,537 295,437Aggregate change in standardized
measure of discounted future netcash flows US$(728 ) US$(10,700) US$(29,119 )
Standardized measure:As of January 1 US$4,841 US$15,541 US$44,661As of December 31 4,113 4,841 15,541
Change US$(728 ) US$(10,700) US$(29,119 )
Copyright © 2018 www.secdatabase.com. All Rights Reserved.Please Consider the Environment Before Printing This Document

Structure and BusinessOperations of PetroleosMexicanos, SubsidiaryEntities and SubsidiaryCompanies - Additional
Information (Detail)
Dec. 31, 2017
Description of business and nature of operations [abstract]Ownership percentage 100.00%
Copyright © 2018 www.secdatabase.com. All Rights Reserved.Please Consider the Environment Before Printing This Document
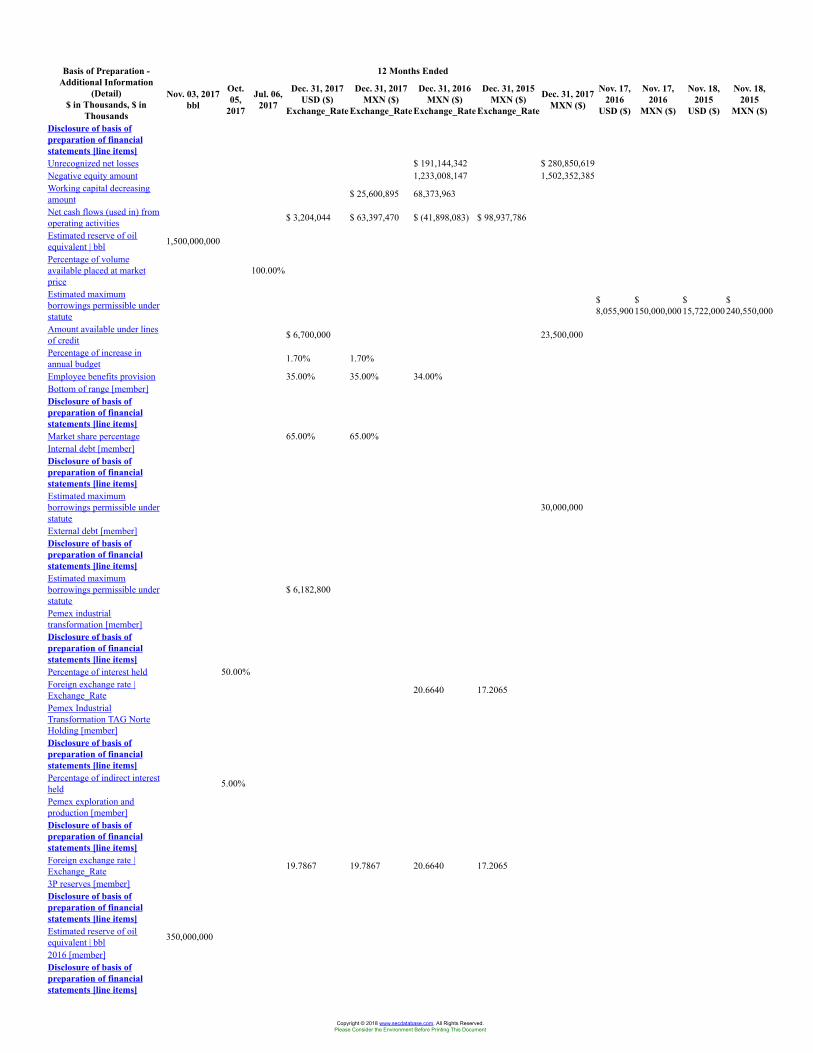
12 Months EndedBasis of Preparation -Additional Information
(Detail)$ in Thousands, $ in
Thousands
Nov. 03, 2017bbl
Oct.05,
2017
Jul. 06,2017
Dec. 31, 2017USD ($)
Exchange_Rate
Dec. 31, 2017MXN ($)
Exchange_Rate
Dec. 31, 2016MXN ($)
Exchange_Rate
Dec. 31, 2015MXN ($)
Exchange_Rate
Dec. 31, 2017MXN ($)
Nov. 17,2016
USD ($)
Nov. 17,2016
MXN ($)
Nov. 18,2015
USD ($)
Nov. 18,2015
MXN ($)
Disclosure of basis ofpreparation of financialstatements [line items]Unrecognized net losses $ 191,144,342 $ 280,850,619Negative equity amount 1,233,008,147 1,502,352,385Working capital decreasingamount $ 25,600,895 68,373,963
Net cash flows (used in) fromoperating activities $ 3,204,044 $ 63,397,470 $ (41,898,083) $ 98,937,786
Estimated reserve of oilequivalent | bbl 1,500,000,000
Percentage of volumeavailable placed at marketprice
100.00%
Estimated maximumborrowings permissible understatute
$8,055,900
$150,000,000
$15,722,000
$240,550,000
Amount available under linesof credit $ 6,700,000 23,500,000
Percentage of increase inannual budget 1.70% 1.70%
Employee benefits provision 35.00% 35.00% 34.00%Bottom of range [member]Disclosure of basis ofpreparation of financialstatements [line items]Market share percentage 65.00% 65.00%Internal debt [member]Disclosure of basis ofpreparation of financialstatements [line items]Estimated maximumborrowings permissible understatute
30,000,000
External debt [member]Disclosure of basis ofpreparation of financialstatements [line items]Estimated maximumborrowings permissible understatute
$ 6,182,800
Pemex industrialtransformation [member]Disclosure of basis ofpreparation of financialstatements [line items]Percentage of interest held 50.00%Foreign exchange rate |Exchange_Rate 20.6640 17.2065
Pemex IndustrialTransformation TAG NorteHolding [member]Disclosure of basis ofpreparation of financialstatements [line items]Percentage of indirect interestheld 5.00%
Pemex exploration andproduction [member]Disclosure of basis ofpreparation of financialstatements [line items]Foreign exchange rate |Exchange_Rate 19.7867 19.7867 20.6640 17.2065
3P reserves [member]Disclosure of basis ofpreparation of financialstatements [line items]Estimated reserve of oilequivalent | bbl 350,000,000
2016 [member]Disclosure of basis ofpreparation of financialstatements [line items]
Copyright © 2018 www.secdatabase.com. All Rights Reserved.Please Consider the Environment Before Printing This Document
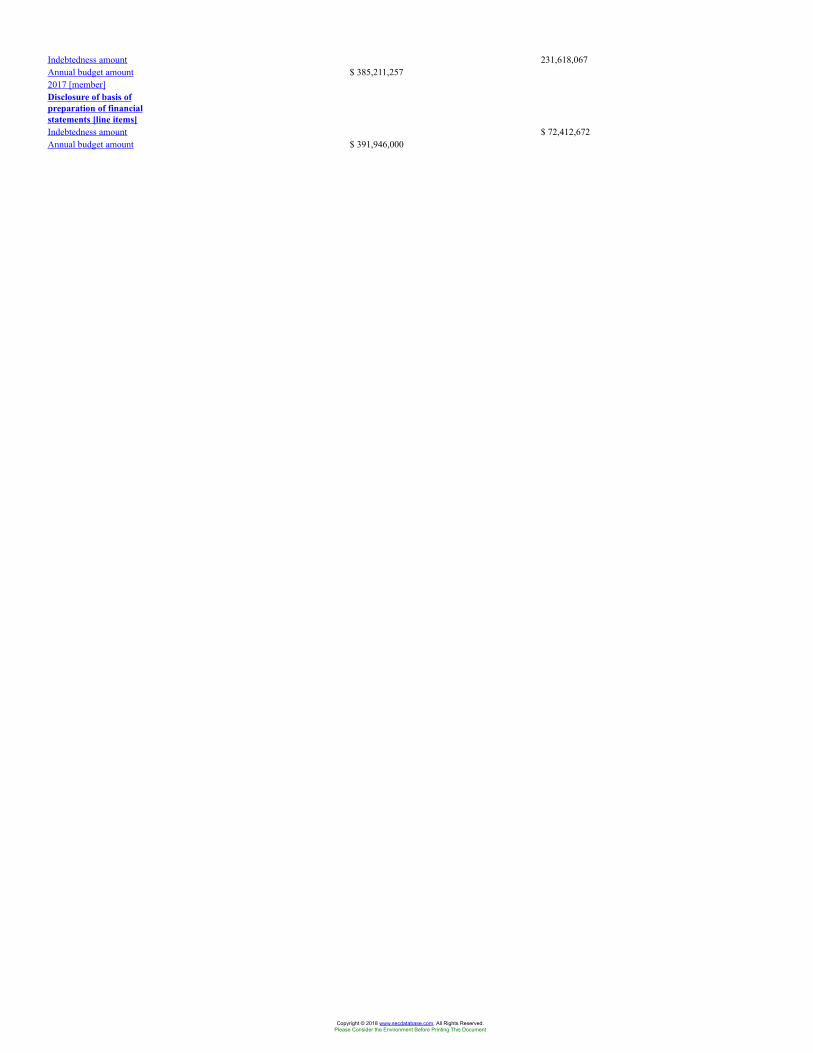
Indebtedness amount 231,618,067Annual budget amount $ 385,211,2572017 [member]Disclosure of basis ofpreparation of financialstatements [line items]Indebtedness amount $ 72,412,672Annual budget amount $ 391,946,000
Copyright © 2018 www.secdatabase.com. All Rights Reserved.Please Consider the Environment Before Printing This Document
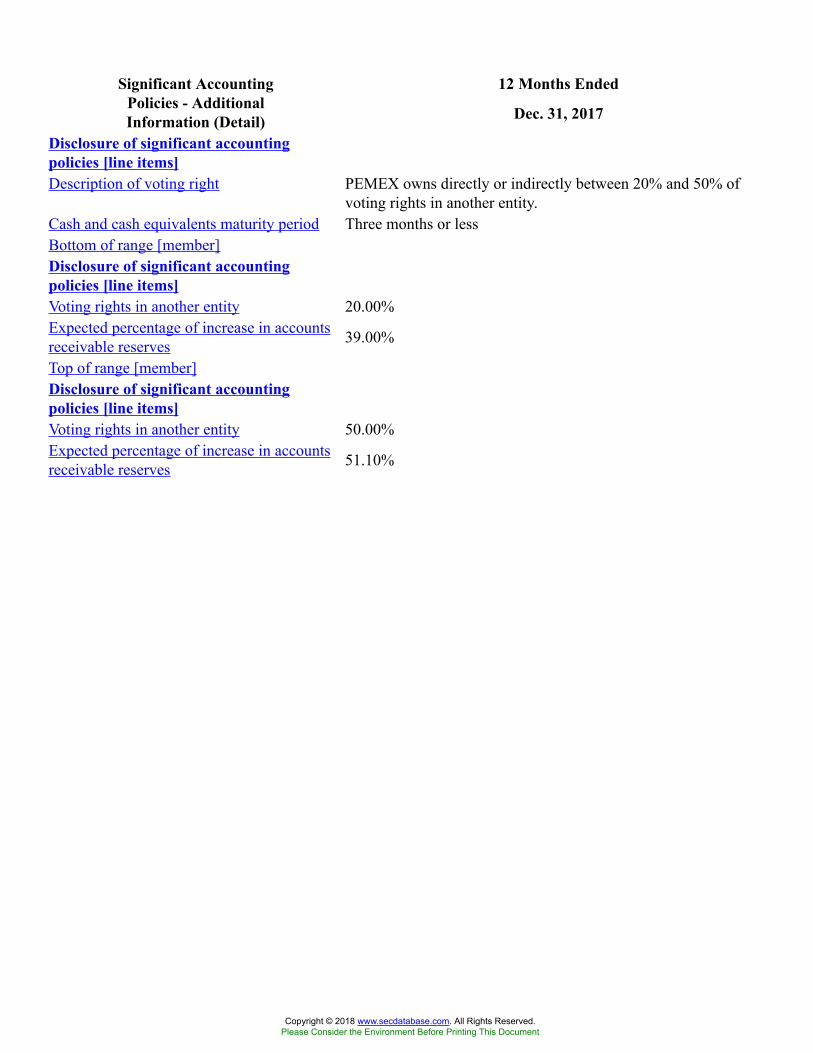
12 Months EndedSignificant AccountingPolicies - AdditionalInformation (Detail) Dec. 31, 2017
Disclosure of significant accountingpolicies [line items]Description of voting right PEMEX owns directly or indirectly between 20% and 50% of
voting rights in another entity.Cash and cash equivalents maturity period Three months or lessBottom of range [member]Disclosure of significant accountingpolicies [line items]Voting rights in another entity 20.00%Expected percentage of increase in accountsreceivable reserves 39.00%
Top of range [member]Disclosure of significant accountingpolicies [line items]Voting rights in another entity 50.00%Expected percentage of increase in accountsreceivable reserves 51.10%
Copyright © 2018 www.secdatabase.com. All Rights Reserved.Please Consider the Environment Before Printing This Document
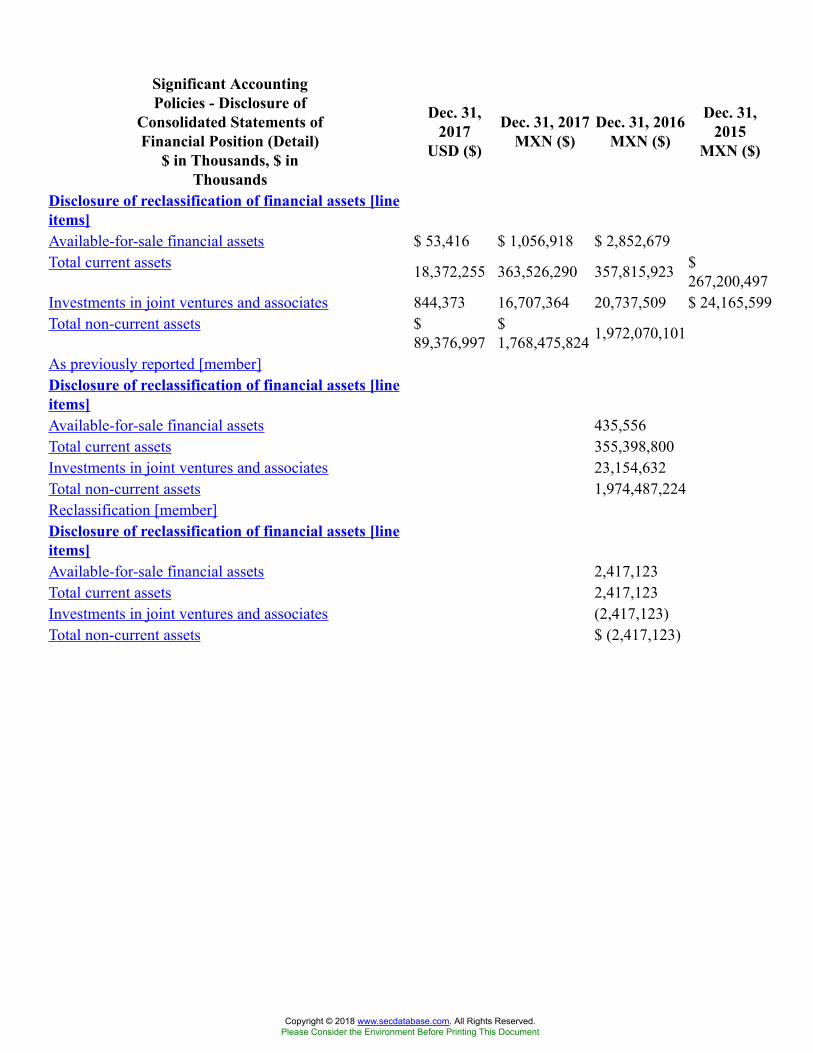
Significant AccountingPolicies - Disclosure of
Consolidated Statements ofFinancial Position (Detail)
$ in Thousands, $ inThousands
Dec. 31,2017
USD ($)
Dec. 31, 2017MXN ($)
Dec. 31, 2016MXN ($)
Dec. 31,2015
MXN ($)
Disclosure of reclassification of financial assets [lineitems]Available-for-sale financial assets $ 53,416 $ 1,056,918 $ 2,852,679Total current assets 18,372,255 363,526,290 357,815,923 $
267,200,497Investments in joint ventures and associates 844,373 16,707,364 20,737,509 $ 24,165,599Total non-current assets $
89,376,997$1,768,475,824 1,972,070,101
As previously reported [member]Disclosure of reclassification of financial assets [lineitems]Available-for-sale financial assets 435,556Total current assets 355,398,800Investments in joint ventures and associates 23,154,632Total non-current assets 1,974,487,224Reclassification [member]Disclosure of reclassification of financial assets [lineitems]Available-for-sale financial assets 2,417,123Total current assets 2,417,123Investments in joint ventures and associates (2,417,123)Total non-current assets $ (2,417,123)
Copyright © 2018 www.secdatabase.com. All Rights Reserved.Please Consider the Environment Before Printing This Document

12 Months EndedSignificant AccountingPolicies - Summary of
Reclassification of OtherIncome (Expenses) (Detail)
$ in Thousands, $ inThousands
Dec. 31,2017
USD ($)
Dec. 31, 2017MXN ($)
Dec. 31, 2016MXN ($)
Dec. 31, 2015MXN ($)
Disclosure of significant accounting policies [lineitems]Services income $ 562,528 $ 11,130,569 $ 8,974,642 $ 8,310,035Total of sales 70,604,483 1,397,029,7191,074,093,2321,161,760,392Cost of sales 50,751,509 1,004,204,880865,822,221 891,964,606Gross income (loss) 12,199,118 241,380,279 539,585,354 (115,971,815)Other income (expenses), net $ 261,493 $ 5,174,076 22,649,606 (875,487)As previously reported [member]Disclosure of significant accounting policies [lineitems]Services income 14,427,081 12,912,112Total of sales 1,079,545,6711,166,362,469Cost of sales 867,580,634 895,068,904Gross income (loss) 543,279,380 (114,474,036)Other income (expenses), net 18,955,580 (2,373,266)Reclassification [member]Disclosure of significant accounting policies [lineitems]Services income (5,452,439) (4,602,077)Total of sales (5,452,439) (4,602,077)Cost of sales (1,758,413) (3,104,298)Gross income (loss) (3,694,026) (1,497,779)Other income (expenses), net $ 3,694,026 $ 1,497,779
Copyright © 2018 www.secdatabase.com. All Rights Reserved.Please Consider the Environment Before Printing This Document
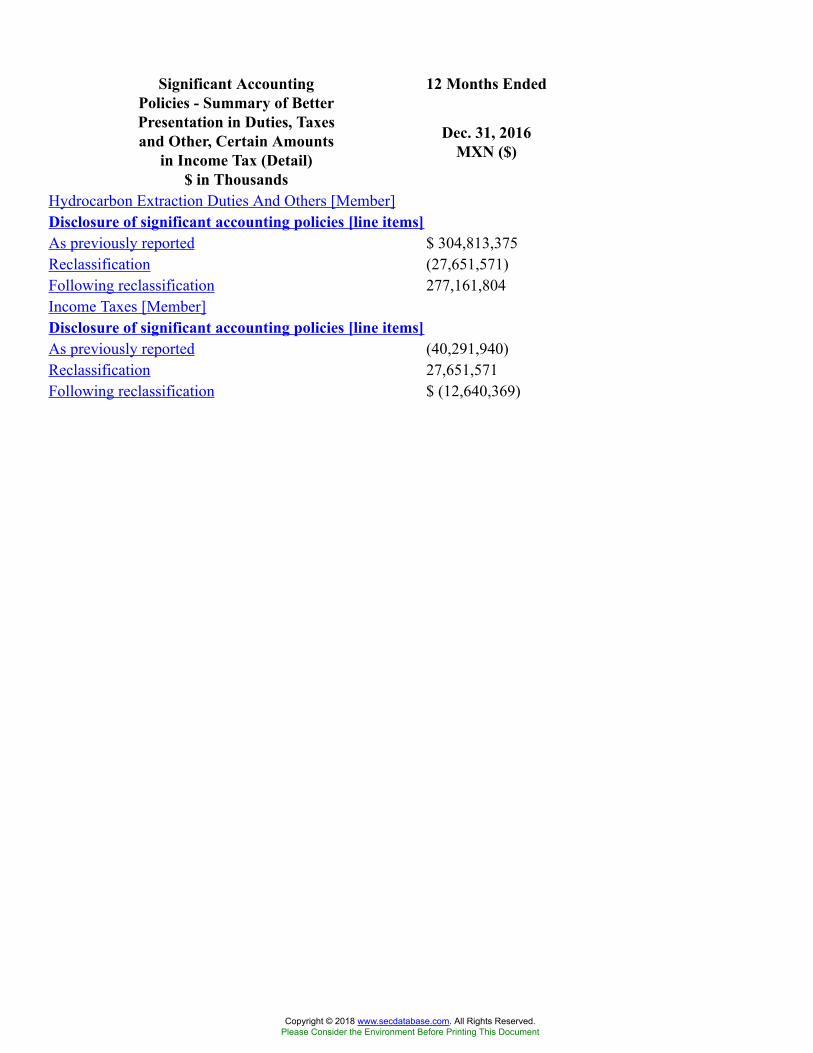
12 Months EndedSignificant AccountingPolicies - Summary of BetterPresentation in Duties, Taxesand Other, Certain Amounts
in Income Tax (Detail)$ in Thousands
Dec. 31, 2016MXN ($)
Hydrocarbon Extraction Duties And Others [Member]Disclosure of significant accounting policies [line items]As previously reported $ 304,813,375Reclassification (27,651,571)Following reclassification 277,161,804Income Taxes [Member]Disclosure of significant accounting policies [line items]As previously reported (40,291,940)Reclassification 27,651,571Following reclassification $ (12,640,369)
Copyright © 2018 www.secdatabase.com. All Rights Reserved.Please Consider the Environment Before Printing This Document

12 Months EndedSegment FinancialInformation - Additional
Information (Detail)
Dec. 31, 2017Segment
Major_CustomerDisclosure of operating segments [abstract]Number of business segments | Segment 9Number of major customers | Major_Customer 32
Copyright © 2018 www.secdatabase.com. All Rights Reserved.Please Consider the Environment Before Printing This Document
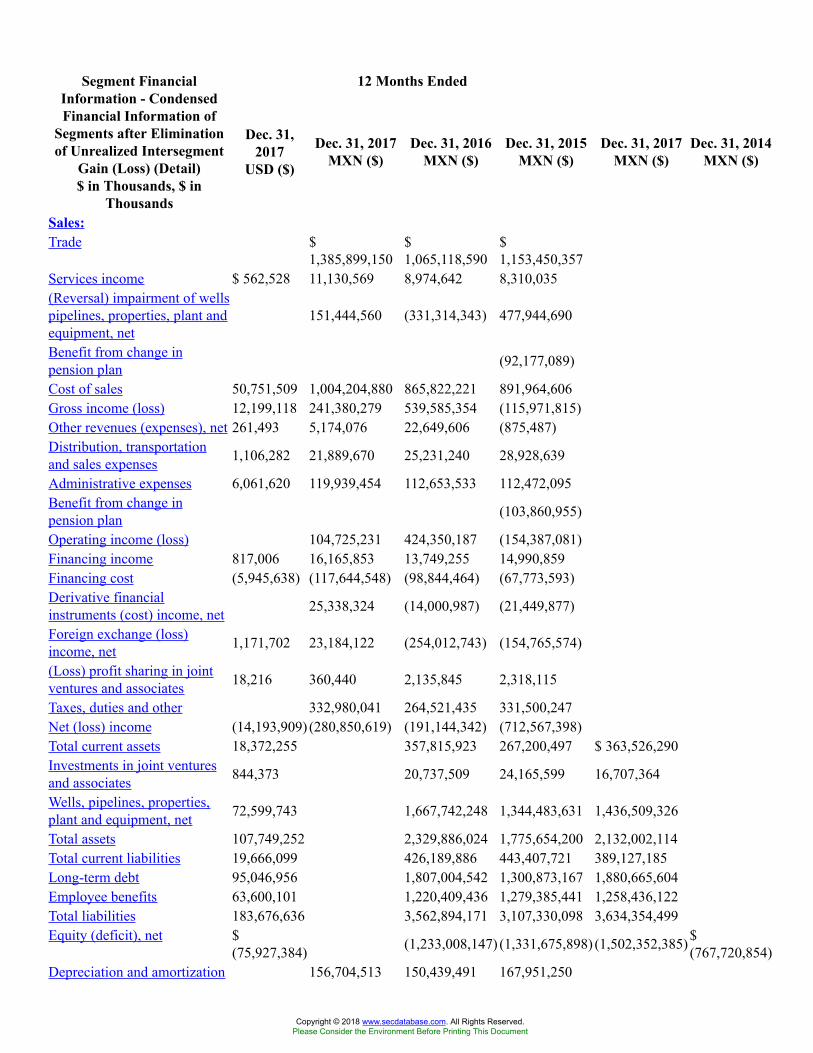
12 Months EndedSegment FinancialInformation - CondensedFinancial Information of
Segments after Eliminationof Unrealized Intersegment
Gain (Loss) (Detail)$ in Thousands, $ in
Thousands
Dec. 31,2017
USD ($)
Dec. 31, 2017MXN ($)
Dec. 31, 2016MXN ($)
Dec. 31, 2015MXN ($)
Dec. 31, 2017MXN ($)
Dec. 31, 2014MXN ($)
Sales:Trade $
1,385,899,150$1,065,118,590
$1,153,450,357
Services income $ 562,528 11,130,569 8,974,642 8,310,035(Reversal) impairment of wellspipelines, properties, plant andequipment, net
151,444,560 (331,314,343) 477,944,690
Benefit from change inpension plan (92,177,089)
Cost of sales 50,751,509 1,004,204,880 865,822,221 891,964,606Gross income (loss) 12,199,118 241,380,279 539,585,354 (115,971,815)Other revenues (expenses), net 261,493 5,174,076 22,649,606 (875,487)Distribution, transportationand sales expenses 1,106,282 21,889,670 25,231,240 28,928,639
Administrative expenses 6,061,620 119,939,454 112,653,533 112,472,095Benefit from change inpension plan (103,860,955)
Operating income (loss) 104,725,231 424,350,187 (154,387,081)Financing income 817,006 16,165,853 13,749,255 14,990,859Financing cost (5,945,638) (117,644,548) (98,844,464) (67,773,593)Derivative financialinstruments (cost) income, net 25,338,324 (14,000,987) (21,449,877)
Foreign exchange (loss)income, net 1,171,702 23,184,122 (254,012,743) (154,765,574)
(Loss) profit sharing in jointventures and associates 18,216 360,440 2,135,845 2,318,115
Taxes, duties and other 332,980,041 264,521,435 331,500,247Net (loss) income (14,193,909) (280,850,619) (191,144,342) (712,567,398)Total current assets 18,372,255 357,815,923 267,200,497 $ 363,526,290Investments in joint venturesand associates 844,373 20,737,509 24,165,599 16,707,364
Wells, pipelines, properties,plant and equipment, net 72,599,743 1,667,742,248 1,344,483,631 1,436,509,326
Total assets 107,749,252 2,329,886,024 1,775,654,200 2,132,002,114Total current liabilities 19,666,099 426,189,886 443,407,721 389,127,185Long-term debt 95,046,956 1,807,004,542 1,300,873,167 1,880,665,604Employee benefits 63,600,101 1,220,409,436 1,279,385,441 1,258,436,122Total liabilities 183,676,636 3,562,894,171 3,107,330,098 3,634,354,499Equity (deficit), net $
(75,927,384) (1,233,008,147) (1,331,675,898) (1,502,352,385) $(767,720,854)
Depreciation and amortization 156,704,513 150,439,491 167,951,250
Copyright © 2018 www.secdatabase.com. All Rights Reserved.Please Consider the Environment Before Printing This Document
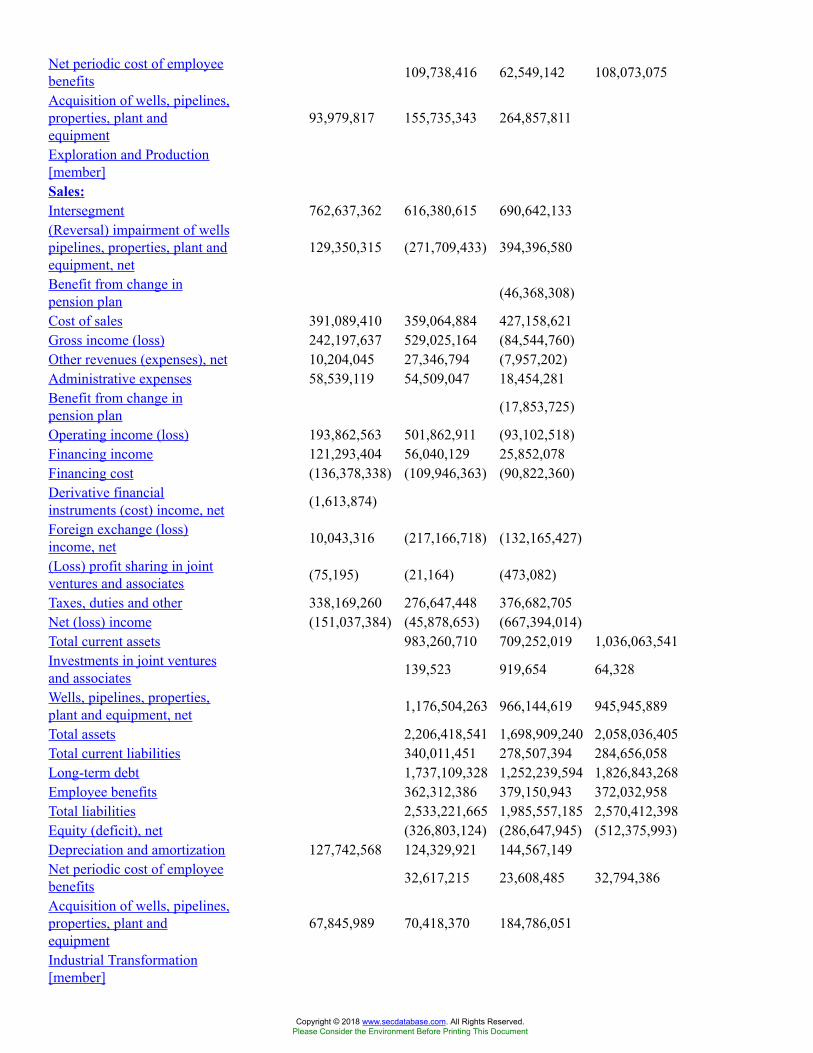
Net periodic cost of employeebenefits 109,738,416 62,549,142 108,073,075
Acquisition of wells, pipelines,properties, plant andequipment
93,979,817 155,735,343 264,857,811
Exploration and Production[member]Sales:Intersegment 762,637,362 616,380,615 690,642,133(Reversal) impairment of wellspipelines, properties, plant andequipment, net
129,350,315 (271,709,433) 394,396,580
Benefit from change inpension plan (46,368,308)
Cost of sales 391,089,410 359,064,884 427,158,621Gross income (loss) 242,197,637 529,025,164 (84,544,760)Other revenues (expenses), net 10,204,045 27,346,794 (7,957,202)Administrative expenses 58,539,119 54,509,047 18,454,281Benefit from change inpension plan (17,853,725)
Operating income (loss) 193,862,563 501,862,911 (93,102,518)Financing income 121,293,404 56,040,129 25,852,078Financing cost (136,378,338) (109,946,363) (90,822,360)Derivative financialinstruments (cost) income, net (1,613,874)
Foreign exchange (loss)income, net 10,043,316 (217,166,718) (132,165,427)
(Loss) profit sharing in jointventures and associates (75,195) (21,164) (473,082)
Taxes, duties and other 338,169,260 276,647,448 376,682,705Net (loss) income (151,037,384) (45,878,653) (667,394,014)Total current assets 983,260,710 709,252,019 1,036,063,541Investments in joint venturesand associates 139,523 919,654 64,328
Wells, pipelines, properties,plant and equipment, net 1,176,504,263 966,144,619 945,945,889
Total assets 2,206,418,541 1,698,909,240 2,058,036,405Total current liabilities 340,011,451 278,507,394 284,656,058Long-term debt 1,737,109,328 1,252,239,594 1,826,843,268Employee benefits 362,312,386 379,150,943 372,032,958Total liabilities 2,533,221,665 1,985,557,185 2,570,412,398Equity (deficit), net (326,803,124) (286,647,945) (512,375,993)Depreciation and amortization 127,742,568 124,329,921 144,567,149Net periodic cost of employeebenefits 32,617,215 23,608,485 32,794,386
Acquisition of wells, pipelines,properties, plant andequipment
67,845,989 70,418,370 184,786,051
Industrial Transformation[member]
Copyright © 2018 www.secdatabase.com. All Rights Reserved.Please Consider the Environment Before Printing This Document

Sales:Trade 857,456,146 648,088,013 740,190,020Intersegment 150,360,283 117,096,378 126,294,195Services income 6,116,937 5,565,604 7,549,061(Reversal) impairment of wellspipelines, properties, plant andequipment, net
15,952,092 (52,498,881) 76,442,079
Benefit from change inpension plan (45,808,781)
Cost of sales 1,004,683,554 823,763,927 876,531,944Gross income (loss) (6,702,280) (515,051) (33,131,966)Other revenues (expenses), net 1,515,538 19,964,654 1,243,040Distribution, transportationand sales expenses 26,049,566 50,792,317 35,292,527
Administrative expenses 38,994,887 34,183,846 40,529,587Benefit from change inpension plan (39,975,450)
Operating income (loss) (70,231,195) (65,526,560) (67,735,590)Financing income 11,427,907 11,056,345 2,789,535Financing cost (2,398,643) (3,188,892) (13,738,104)Derivative financialinstruments (cost) income, net 5,835 3,172 6,463
Foreign exchange (loss)income, net 4,924,209 (12,858,875) (7,364,486)
(Loss) profit sharing in jointventures and associates 485,224 649,520 671,868
Taxes, duties and other 1,839,021Net (loss) income (55,786,663) (69,865,290) (87,209,335)Total current assets 795,237,287 313,801,630 570,380,888Investments in joint venturesand associates 257,159 6,687,977 4
Wells, pipelines, properties,plant and equipment, net 311,432,174 246,463,069 286,423,735
Total assets 1,107,094,580 567,486,579 857,196,306Total current liabilities 666,467,674 104,569,842 459,130,165Long-term debt 31,495,027 16,707,005 25,437,147Employee benefits 575,277,374 609,492,623 588,573,518Total liabilities 1,278,138,290 735,280,560 1,077,108,748Equity (deficit), net (171,043,710) (167,793,981) (219,912,442)Depreciation and amortization 17,935,112 17,425,472 20,916,796Net periodic cost of employeebenefits 52,886,397 21,392,600 52,538,989
Acquisition of wells, pipelines,properties, plant andequipment
14,678,182 32,254,531 68,935,841
Cogeneration and Services[member]Sales:Intersegment 114,233 51,913Services income 334,755 132,521
Copyright © 2018 www.secdatabase.com. All Rights Reserved.Please Consider the Environment Before Printing This Document
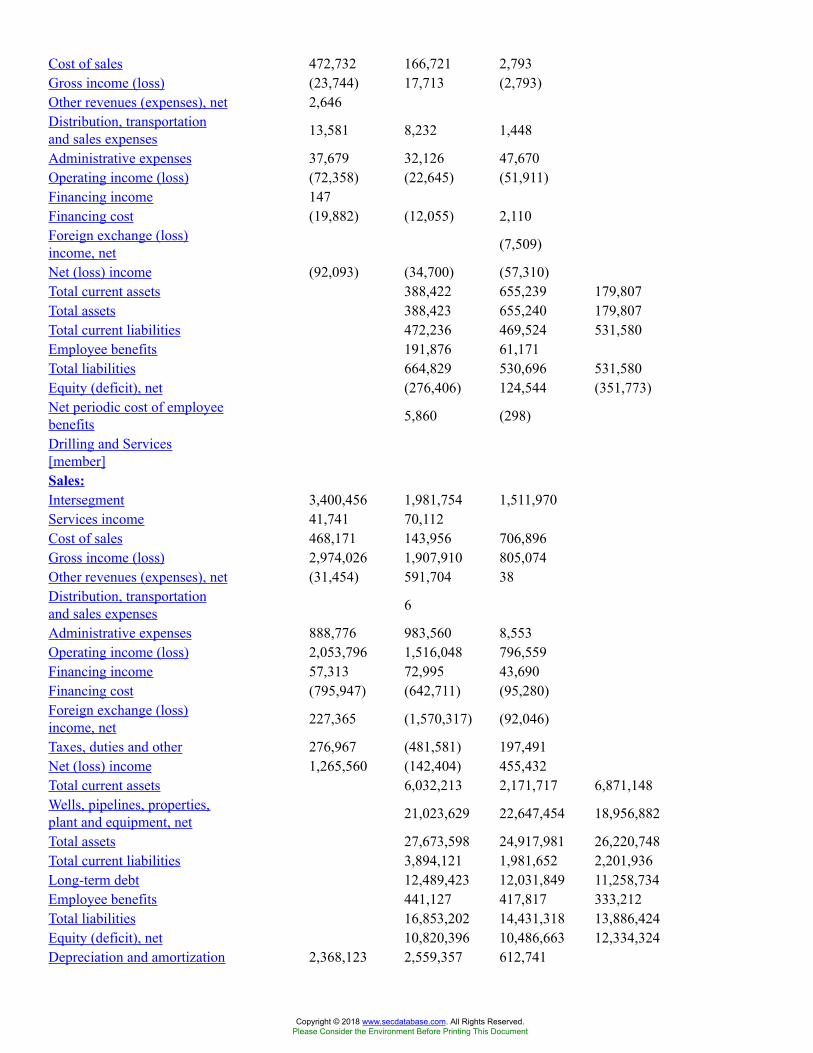
Cost of sales 472,732 166,721 2,793Gross income (loss) (23,744) 17,713 (2,793)Other revenues (expenses), net 2,646Distribution, transportationand sales expenses 13,581 8,232 1,448
Administrative expenses 37,679 32,126 47,670Operating income (loss) (72,358) (22,645) (51,911)Financing income 147Financing cost (19,882) (12,055) 2,110Foreign exchange (loss)income, net (7,509)
Net (loss) income (92,093) (34,700) (57,310)Total current assets 388,422 655,239 179,807Total assets 388,423 655,240 179,807Total current liabilities 472,236 469,524 531,580Employee benefits 191,876 61,171Total liabilities 664,829 530,696 531,580Equity (deficit), net (276,406) 124,544 (351,773)Net periodic cost of employeebenefits 5,860 (298)
Drilling and Services[member]Sales:Intersegment 3,400,456 1,981,754 1,511,970Services income 41,741 70,112Cost of sales 468,171 143,956 706,896Gross income (loss) 2,974,026 1,907,910 805,074Other revenues (expenses), net (31,454) 591,704 38Distribution, transportationand sales expenses 6
Administrative expenses 888,776 983,560 8,553Operating income (loss) 2,053,796 1,516,048 796,559Financing income 57,313 72,995 43,690Financing cost (795,947) (642,711) (95,280)Foreign exchange (loss)income, net 227,365 (1,570,317) (92,046)
Taxes, duties and other 276,967 (481,581) 197,491Net (loss) income 1,265,560 (142,404) 455,432Total current assets 6,032,213 2,171,717 6,871,148Wells, pipelines, properties,plant and equipment, net 21,023,629 22,647,454 18,956,882
Total assets 27,673,598 24,917,981 26,220,748Total current liabilities 3,894,121 1,981,652 2,201,936Long-term debt 12,489,423 12,031,849 11,258,734Employee benefits 441,127 417,817 333,212Total liabilities 16,853,202 14,431,318 13,886,424Equity (deficit), net 10,820,396 10,486,663 12,334,324Depreciation and amortization 2,368,123 2,559,357 612,741
Copyright © 2018 www.secdatabase.com. All Rights Reserved.Please Consider the Environment Before Printing This Document
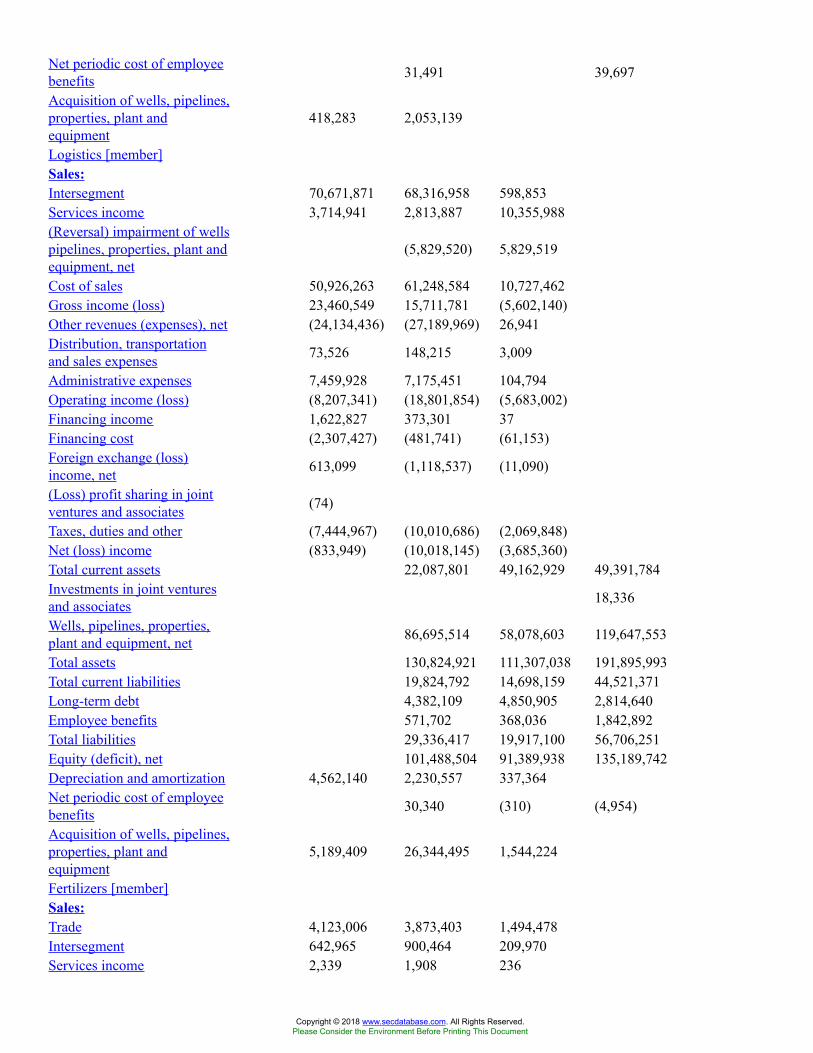
Net periodic cost of employeebenefits 31,491 39,697
Acquisition of wells, pipelines,properties, plant andequipment
418,283 2,053,139
Logistics [member]Sales:Intersegment 70,671,871 68,316,958 598,853Services income 3,714,941 2,813,887 10,355,988(Reversal) impairment of wellspipelines, properties, plant andequipment, net
(5,829,520) 5,829,519
Cost of sales 50,926,263 61,248,584 10,727,462Gross income (loss) 23,460,549 15,711,781 (5,602,140)Other revenues (expenses), net (24,134,436) (27,189,969) 26,941Distribution, transportationand sales expenses 73,526 148,215 3,009
Administrative expenses 7,459,928 7,175,451 104,794Operating income (loss) (8,207,341) (18,801,854) (5,683,002)Financing income 1,622,827 373,301 37Financing cost (2,307,427) (481,741) (61,153)Foreign exchange (loss)income, net 613,099 (1,118,537) (11,090)
(Loss) profit sharing in jointventures and associates (74)
Taxes, duties and other (7,444,967) (10,010,686) (2,069,848)Net (loss) income (833,949) (10,018,145) (3,685,360)Total current assets 22,087,801 49,162,929 49,391,784Investments in joint venturesand associates 18,336
Wells, pipelines, properties,plant and equipment, net 86,695,514 58,078,603 119,647,553
Total assets 130,824,921 111,307,038 191,895,993Total current liabilities 19,824,792 14,698,159 44,521,371Long-term debt 4,382,109 4,850,905 2,814,640Employee benefits 571,702 368,036 1,842,892Total liabilities 29,336,417 19,917,100 56,706,251Equity (deficit), net 101,488,504 91,389,938 135,189,742Depreciation and amortization 4,562,140 2,230,557 337,364Net periodic cost of employeebenefits 30,340 (310) (4,954)
Acquisition of wells, pipelines,properties, plant andequipment
5,189,409 26,344,495 1,544,224
Fertilizers [member]Sales:Trade 4,123,006 3,873,403 1,494,478Intersegment 642,965 900,464 209,970Services income 2,339 1,908 236
Copyright © 2018 www.secdatabase.com. All Rights Reserved.Please Consider the Environment Before Printing This Document
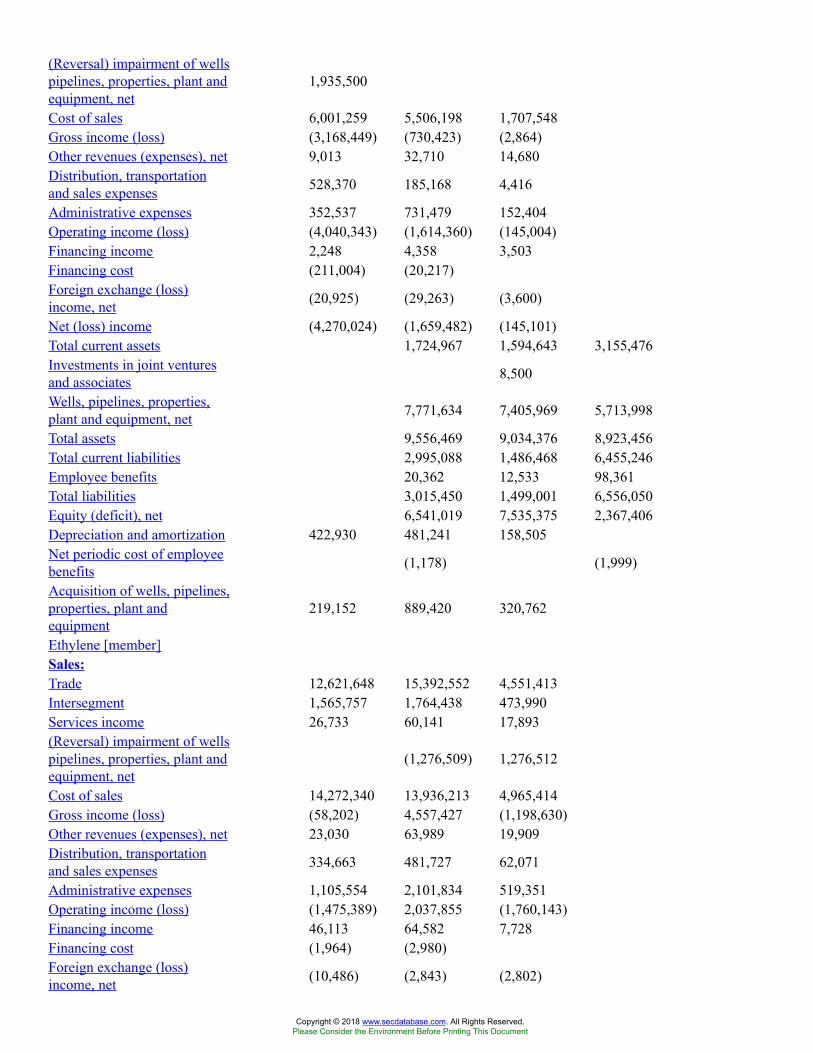
(Reversal) impairment of wellspipelines, properties, plant andequipment, net
1,935,500
Cost of sales 6,001,259 5,506,198 1,707,548Gross income (loss) (3,168,449) (730,423) (2,864)Other revenues (expenses), net 9,013 32,710 14,680Distribution, transportationand sales expenses 528,370 185,168 4,416
Administrative expenses 352,537 731,479 152,404Operating income (loss) (4,040,343) (1,614,360) (145,004)Financing income 2,248 4,358 3,503Financing cost (211,004) (20,217)Foreign exchange (loss)income, net (20,925) (29,263) (3,600)
Net (loss) income (4,270,024) (1,659,482) (145,101)Total current assets 1,724,967 1,594,643 3,155,476Investments in joint venturesand associates 8,500
Wells, pipelines, properties,plant and equipment, net 7,771,634 7,405,969 5,713,998
Total assets 9,556,469 9,034,376 8,923,456Total current liabilities 2,995,088 1,486,468 6,455,246Employee benefits 20,362 12,533 98,361Total liabilities 3,015,450 1,499,001 6,556,050Equity (deficit), net 6,541,019 7,535,375 2,367,406Depreciation and amortization 422,930 481,241 158,505Net periodic cost of employeebenefits (1,178) (1,999)
Acquisition of wells, pipelines,properties, plant andequipment
219,152 889,420 320,762
Ethylene [member]Sales:Trade 12,621,648 15,392,552 4,551,413Intersegment 1,565,757 1,764,438 473,990Services income 26,733 60,141 17,893(Reversal) impairment of wellspipelines, properties, plant andequipment, net
(1,276,509) 1,276,512
Cost of sales 14,272,340 13,936,213 4,965,414Gross income (loss) (58,202) 4,557,427 (1,198,630)Other revenues (expenses), net 23,030 63,989 19,909Distribution, transportationand sales expenses 334,663 481,727 62,071
Administrative expenses 1,105,554 2,101,834 519,351Operating income (loss) (1,475,389) 2,037,855 (1,760,143)Financing income 46,113 64,582 7,728Financing cost (1,964) (2,980)Foreign exchange (loss)income, net (10,486) (2,843) (2,802)
Copyright © 2018 www.secdatabase.com. All Rights Reserved.Please Consider the Environment Before Printing This Document
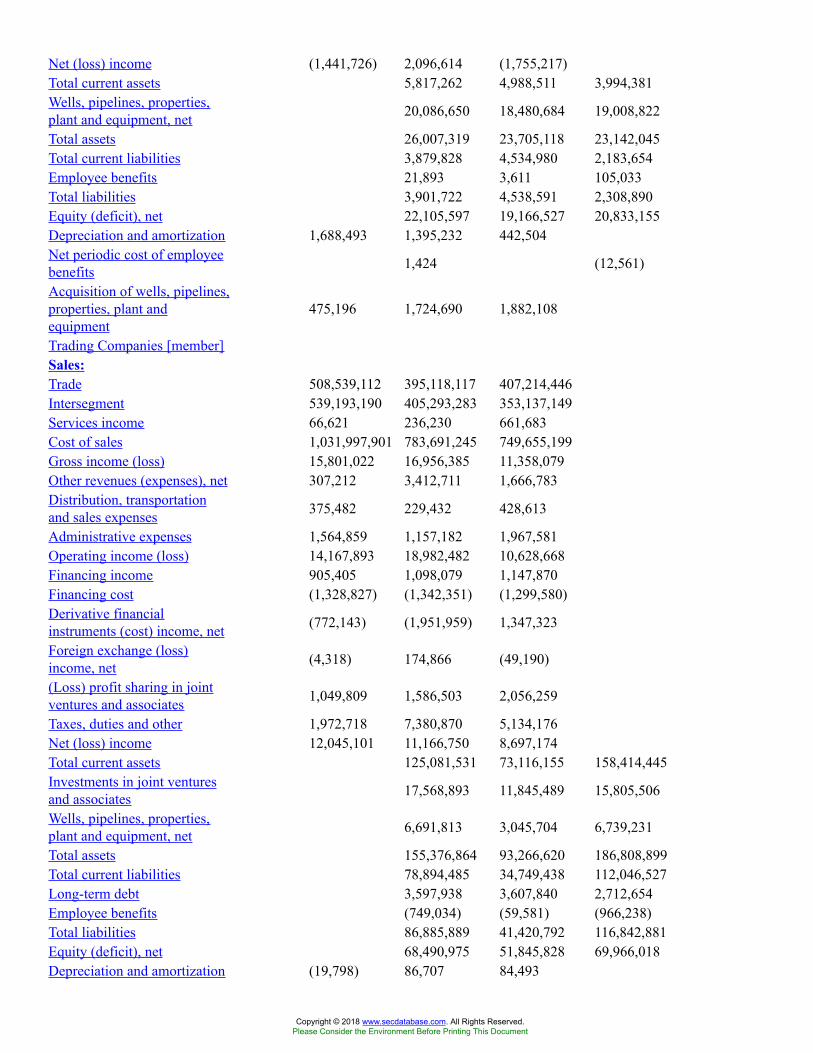
Net (loss) income (1,441,726) 2,096,614 (1,755,217)Total current assets 5,817,262 4,988,511 3,994,381Wells, pipelines, properties,plant and equipment, net 20,086,650 18,480,684 19,008,822
Total assets 26,007,319 23,705,118 23,142,045Total current liabilities 3,879,828 4,534,980 2,183,654Employee benefits 21,893 3,611 105,033Total liabilities 3,901,722 4,538,591 2,308,890Equity (deficit), net 22,105,597 19,166,527 20,833,155Depreciation and amortization 1,688,493 1,395,232 442,504Net periodic cost of employeebenefits 1,424 (12,561)
Acquisition of wells, pipelines,properties, plant andequipment
475,196 1,724,690 1,882,108
Trading Companies [member]Sales:Trade 508,539,112 395,118,117 407,214,446Intersegment 539,193,190 405,293,283 353,137,149Services income 66,621 236,230 661,683Cost of sales 1,031,997,901 783,691,245 749,655,199Gross income (loss) 15,801,022 16,956,385 11,358,079Other revenues (expenses), net 307,212 3,412,711 1,666,783Distribution, transportationand sales expenses 375,482 229,432 428,613
Administrative expenses 1,564,859 1,157,182 1,967,581Operating income (loss) 14,167,893 18,982,482 10,628,668Financing income 905,405 1,098,079 1,147,870Financing cost (1,328,827) (1,342,351) (1,299,580)Derivative financialinstruments (cost) income, net (772,143) (1,951,959) 1,347,323
Foreign exchange (loss)income, net (4,318) 174,866 (49,190)
(Loss) profit sharing in jointventures and associates 1,049,809 1,586,503 2,056,259
Taxes, duties and other 1,972,718 7,380,870 5,134,176Net (loss) income 12,045,101 11,166,750 8,697,174Total current assets 125,081,531 73,116,155 158,414,445Investments in joint venturesand associates 17,568,893 11,845,489 15,805,506
Wells, pipelines, properties,plant and equipment, net 6,691,813 3,045,704 6,739,231
Total assets 155,376,864 93,266,620 186,808,899Total current liabilities 78,894,485 34,749,438 112,046,527Long-term debt 3,597,938 3,607,840 2,712,654Employee benefits (749,034) (59,581) (966,238)Total liabilities 86,885,889 41,420,792 116,842,881Equity (deficit), net 68,490,975 51,845,828 69,966,018Depreciation and amortization (19,798) 86,707 84,493
Copyright © 2018 www.secdatabase.com. All Rights Reserved.Please Consider the Environment Before Printing This Document

Net periodic cost of employeebenefits (552,735) (119,819) 16,166
Acquisition of wells, pipelines,properties, plant andequipment
321,145 1,019,484 677,314
Corporate and Other OperatingSubsidiary Companies[member]Sales:Trade 3,159,238 2,646,505Intersegment 79,031,944 50,683,175 18,296,515Services income 826,502 473,415 505,032(Reversal) impairment of wellspipelines, properties, plant andequipment, net
4,206,653
Cost of sales 33,033,923 7,260,043 2,791,350Gross income (loss) 45,777,108 46,543,052 16,010,197Other revenues (expenses), net (5,344,872) (906,183) 2,219,539Distribution, transportationand sales expenses 59,043 49,162 254
Administrative expenses 62,001,641 60,497,232 61,609,813Benefit from change inpension plan (46,031,780)
Operating income (loss) (21,628,448) (14,909,525) 2,651,449Financing income 145,907,795 125,964,466 110,816,691Financing cost (239,003,771) (163,400,779) (87,289,616)Derivative financialinstruments (cost) income, net 27,718,506 (12,052,200) (22,803,663)
Foreign exchange (loss)income, net 7,411,862 (21,441,056) (15,069,424)
(Loss) profit sharing in jointventures and associates (212,666,494) (117,426,818) (749,900,890)
Taxes, duties and other 6,063 (9,014,616) (50,283,298)Net (loss) income (292,266,613) (194,251,296) (711,312,155)Total current assets 613,881,578 275,582,816 506,187,594Investments in joint venturesand associates (247,349,711) (242,233,405) (465,026,224)
Wells, pipelines, properties,plant and equipment, net 37,536,571 22,217,529 34,073,216
Total assets 2,359,024,145 1,443,189,885 2,111,740,735Total current liabilities 1,497,612,971 1,157,183,570 1,439,097,882Long-term debt 1,757,315,685 1,285,676,066 1,837,690,559Employee benefits 282,321,750 289,938,288 296,416,386Total liabilities 3,553,477,189 2,747,910,113 3,587,988,972Equity (deficit), net (1,194,453,044) (1,304,720,228) (1,476,248,237)Depreciation and amortization 2,004,945 1,931,004 831,698Net periodic cost of employeebenefits 24,719,602 17,668,484 22,703,351
Copyright © 2018 www.secdatabase.com. All Rights Reserved.Please Consider the Environment Before Printing This Document
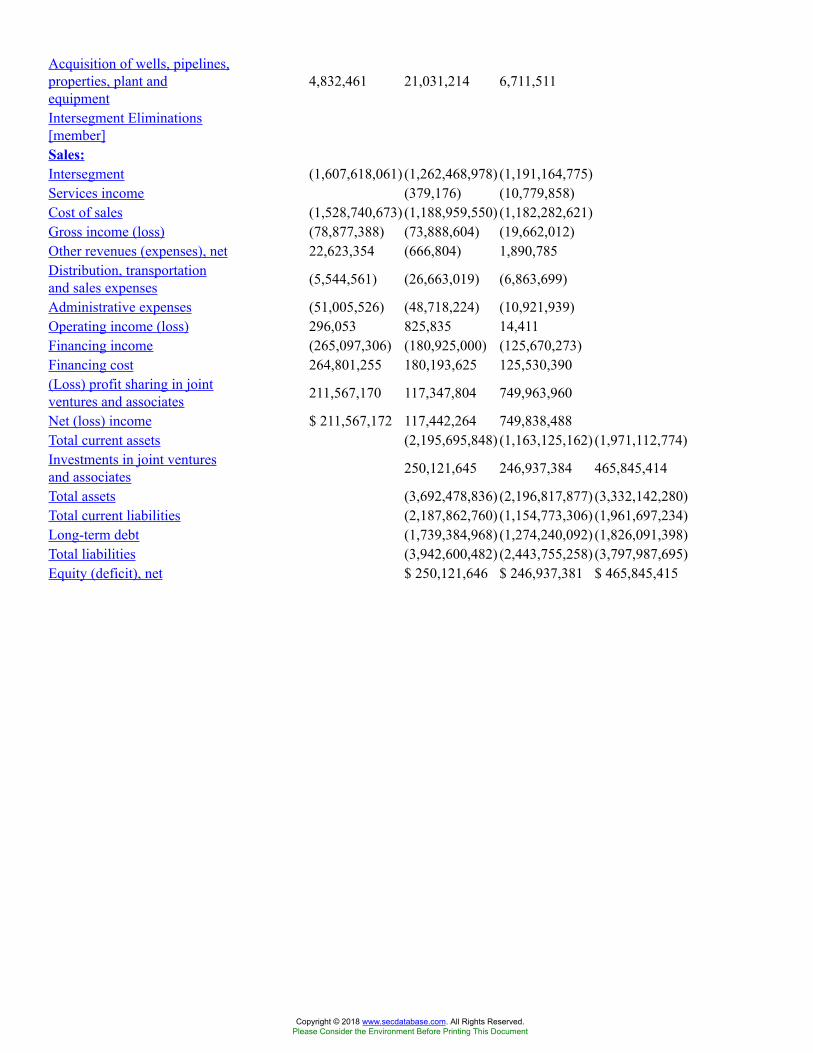
Acquisition of wells, pipelines,properties, plant andequipment
4,832,461 21,031,214 6,711,511
Intersegment Eliminations[member]Sales:Intersegment (1,607,618,061) (1,262,468,978) (1,191,164,775)Services income (379,176) (10,779,858)Cost of sales (1,528,740,673) (1,188,959,550) (1,182,282,621)Gross income (loss) (78,877,388) (73,888,604) (19,662,012)Other revenues (expenses), net 22,623,354 (666,804) 1,890,785Distribution, transportationand sales expenses (5,544,561) (26,663,019) (6,863,699)
Administrative expenses (51,005,526) (48,718,224) (10,921,939)Operating income (loss) 296,053 825,835 14,411Financing income (265,097,306) (180,925,000) (125,670,273)Financing cost 264,801,255 180,193,625 125,530,390(Loss) profit sharing in jointventures and associates 211,567,170 117,347,804 749,963,960
Net (loss) income $ 211,567,172 117,442,264 749,838,488Total current assets (2,195,695,848) (1,163,125,162) (1,971,112,774)Investments in joint venturesand associates 250,121,645 246,937,384 465,845,414
Total assets (3,692,478,836) (2,196,817,877) (3,332,142,280)Total current liabilities (2,187,862,760) (1,154,773,306) (1,961,697,234)Long-term debt (1,739,384,968) (1,274,240,092) (1,826,091,398)Total liabilities (3,942,600,482) (2,443,755,258) (3,797,987,695)Equity (deficit), net $ 250,121,646 $ 246,937,381 $ 465,845,415
Copyright © 2018 www.secdatabase.com. All Rights Reserved.Please Consider the Environment Before Printing This Document
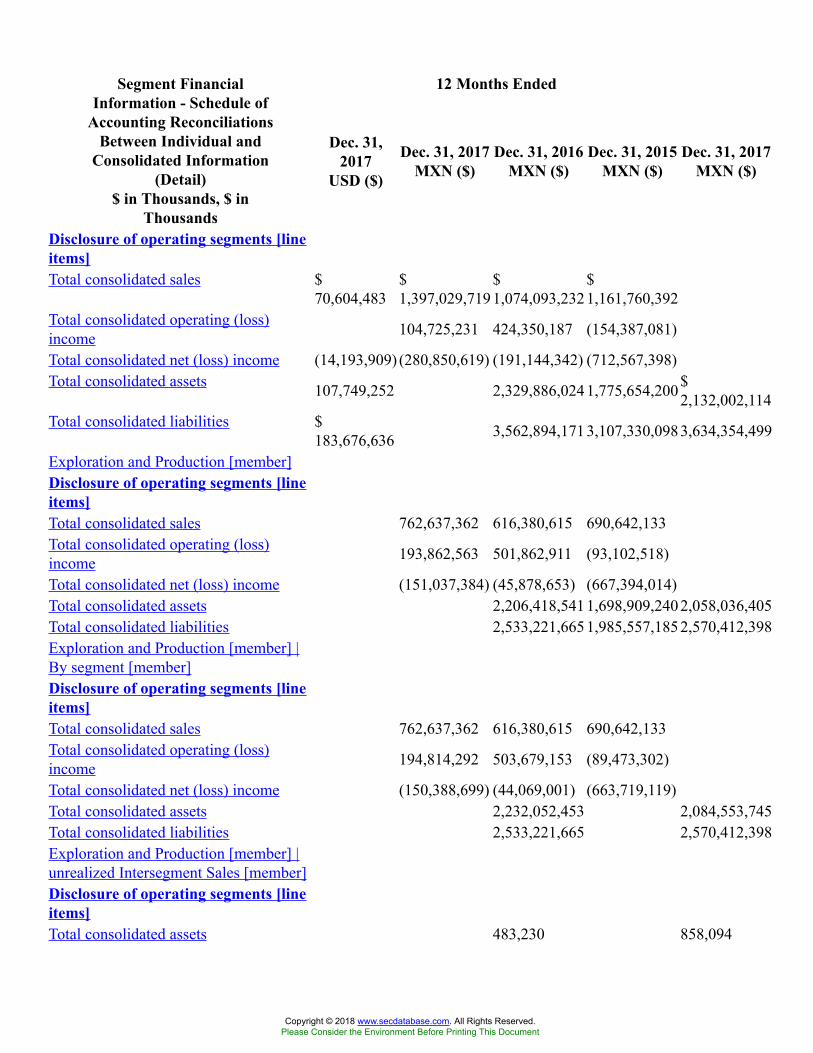
12 Months EndedSegment FinancialInformation - Schedule of
Accounting ReconciliationsBetween Individual and
Consolidated Information(Detail)
$ in Thousands, $ inThousands
Dec. 31,2017
USD ($)
Dec. 31, 2017MXN ($)
Dec. 31, 2016MXN ($)
Dec. 31, 2015MXN ($)
Dec. 31, 2017MXN ($)
Disclosure of operating segments [lineitems]Total consolidated sales $
70,604,483$1,397,029,719
$1,074,093,232
$1,161,760,392
Total consolidated operating (loss)income 104,725,231 424,350,187 (154,387,081)
Total consolidated net (loss) income (14,193,909) (280,850,619) (191,144,342) (712,567,398)Total consolidated assets 107,749,252 2,329,886,0241,775,654,200$
2,132,002,114Total consolidated liabilities $
183,676,636 3,562,894,1713,107,330,0983,634,354,499
Exploration and Production [member]Disclosure of operating segments [lineitems]Total consolidated sales 762,637,362 616,380,615 690,642,133Total consolidated operating (loss)income 193,862,563 501,862,911 (93,102,518)
Total consolidated net (loss) income (151,037,384) (45,878,653) (667,394,014)Total consolidated assets 2,206,418,5411,698,909,2402,058,036,405Total consolidated liabilities 2,533,221,6651,985,557,1852,570,412,398Exploration and Production [member] |By segment [member]Disclosure of operating segments [lineitems]Total consolidated sales 762,637,362 616,380,615 690,642,133Total consolidated operating (loss)income 194,814,292 503,679,153 (89,473,302)
Total consolidated net (loss) income (150,388,699) (44,069,001) (663,719,119)Total consolidated assets 2,232,052,453 2,084,553,745Total consolidated liabilities 2,533,221,665 2,570,412,398Exploration and Production [member] |unrealized Intersegment Sales [member]Disclosure of operating segments [lineitems]Total consolidated assets 483,230 858,094
Copyright © 2018 www.secdatabase.com. All Rights Reserved.Please Consider the Environment Before Printing This Document
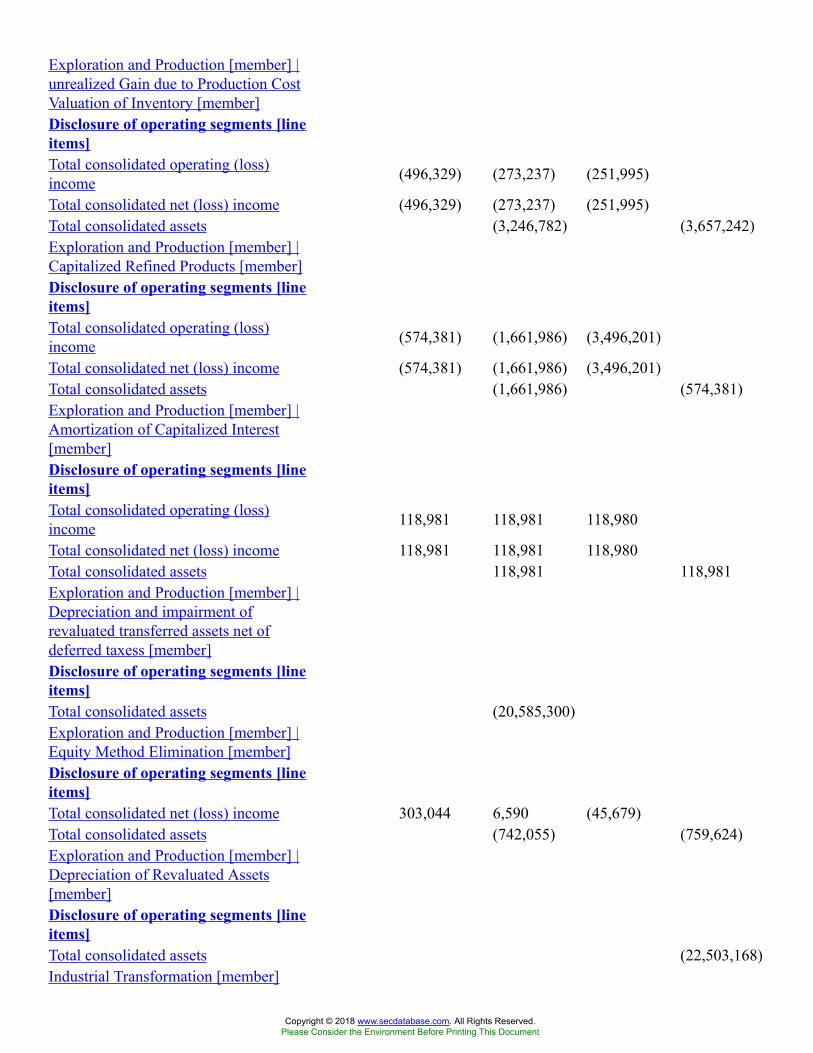
Exploration and Production [member] |unrealized Gain due to Production CostValuation of Inventory [member]Disclosure of operating segments [lineitems]Total consolidated operating (loss)income (496,329) (273,237) (251,995)
Total consolidated net (loss) income (496,329) (273,237) (251,995)Total consolidated assets (3,246,782) (3,657,242)Exploration and Production [member] |Capitalized Refined Products [member]Disclosure of operating segments [lineitems]Total consolidated operating (loss)income (574,381) (1,661,986) (3,496,201)
Total consolidated net (loss) income (574,381) (1,661,986) (3,496,201)Total consolidated assets (1,661,986) (574,381)Exploration and Production [member] |Amortization of Capitalized Interest[member]Disclosure of operating segments [lineitems]Total consolidated operating (loss)income 118,981 118,981 118,980
Total consolidated net (loss) income 118,981 118,981 118,980Total consolidated assets 118,981 118,981Exploration and Production [member] |Depreciation and impairment ofrevaluated transferred assets net ofdeferred taxess [member]Disclosure of operating segments [lineitems]Total consolidated assets (20,585,300)Exploration and Production [member] |Equity Method Elimination [member]Disclosure of operating segments [lineitems]Total consolidated net (loss) income 303,044 6,590 (45,679)Total consolidated assets (742,055) (759,624)Exploration and Production [member] |Depreciation of Revaluated Assets[member]Disclosure of operating segments [lineitems]Total consolidated assets (22,503,168)Industrial Transformation [member]
Copyright © 2018 www.secdatabase.com. All Rights Reserved.Please Consider the Environment Before Printing This Document
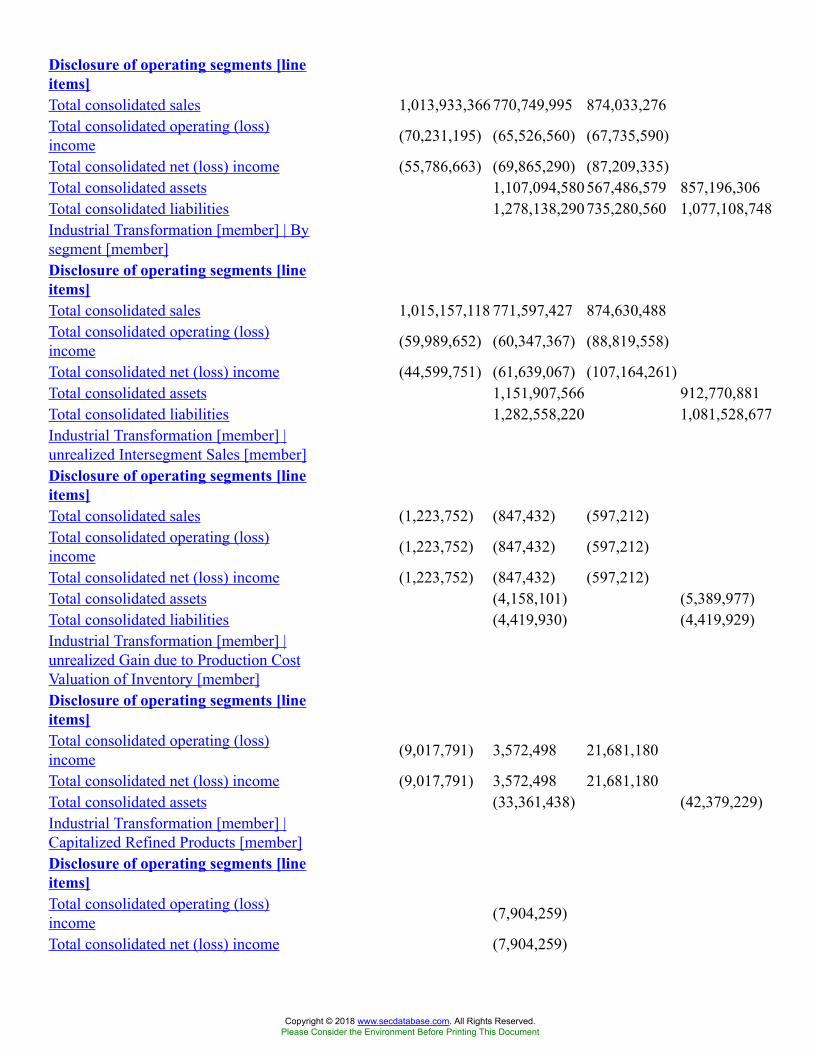
Disclosure of operating segments [lineitems]Total consolidated sales 1,013,933,366770,749,995 874,033,276Total consolidated operating (loss)income (70,231,195) (65,526,560) (67,735,590)
Total consolidated net (loss) income (55,786,663) (69,865,290) (87,209,335)Total consolidated assets 1,107,094,580567,486,579 857,196,306Total consolidated liabilities 1,278,138,290735,280,560 1,077,108,748Industrial Transformation [member] | Bysegment [member]Disclosure of operating segments [lineitems]Total consolidated sales 1,015,157,118 771,597,427 874,630,488Total consolidated operating (loss)income (59,989,652) (60,347,367) (88,819,558)
Total consolidated net (loss) income (44,599,751) (61,639,067) (107,164,261)Total consolidated assets 1,151,907,566 912,770,881Total consolidated liabilities 1,282,558,220 1,081,528,677Industrial Transformation [member] |unrealized Intersegment Sales [member]Disclosure of operating segments [lineitems]Total consolidated sales (1,223,752) (847,432) (597,212)Total consolidated operating (loss)income (1,223,752) (847,432) (597,212)
Total consolidated net (loss) income (1,223,752) (847,432) (597,212)Total consolidated assets (4,158,101) (5,389,977)Total consolidated liabilities (4,419,930) (4,419,929)Industrial Transformation [member] |unrealized Gain due to Production CostValuation of Inventory [member]Disclosure of operating segments [lineitems]Total consolidated operating (loss)income (9,017,791) 3,572,498 21,681,180
Total consolidated net (loss) income (9,017,791) 3,572,498 21,681,180Total consolidated assets (33,361,438) (42,379,229)Industrial Transformation [member] |Capitalized Refined Products [member]Disclosure of operating segments [lineitems]Total consolidated operating (loss)income (7,904,259)
Total consolidated net (loss) income (7,904,259)
Copyright © 2018 www.secdatabase.com. All Rights Reserved.Please Consider the Environment Before Printing This Document
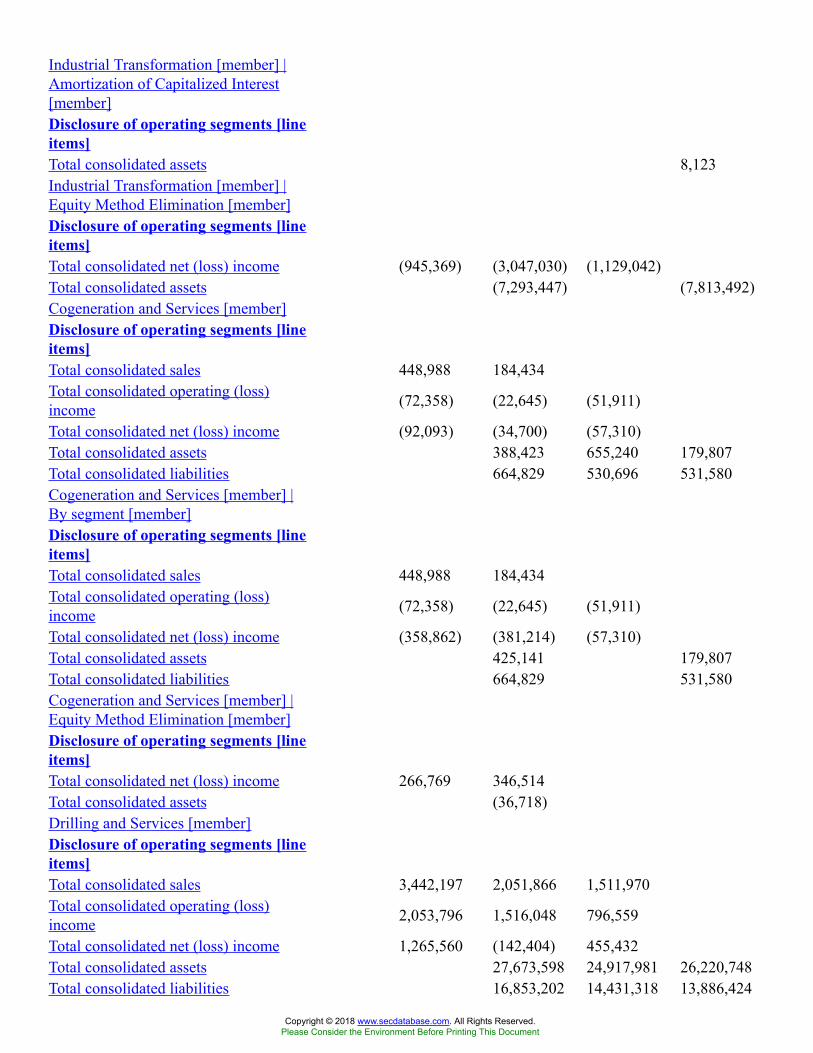
Industrial Transformation [member] |Amortization of Capitalized Interest[member]Disclosure of operating segments [lineitems]Total consolidated assets 8,123Industrial Transformation [member] |Equity Method Elimination [member]Disclosure of operating segments [lineitems]Total consolidated net (loss) income (945,369) (3,047,030) (1,129,042)Total consolidated assets (7,293,447) (7,813,492)Cogeneration and Services [member]Disclosure of operating segments [lineitems]Total consolidated sales 448,988 184,434Total consolidated operating (loss)income (72,358) (22,645) (51,911)
Total consolidated net (loss) income (92,093) (34,700) (57,310)Total consolidated assets 388,423 655,240 179,807Total consolidated liabilities 664,829 530,696 531,580Cogeneration and Services [member] |By segment [member]Disclosure of operating segments [lineitems]Total consolidated sales 448,988 184,434Total consolidated operating (loss)income (72,358) (22,645) (51,911)
Total consolidated net (loss) income (358,862) (381,214) (57,310)Total consolidated assets 425,141 179,807Total consolidated liabilities 664,829 531,580Cogeneration and Services [member] |Equity Method Elimination [member]Disclosure of operating segments [lineitems]Total consolidated net (loss) income 266,769 346,514Total consolidated assets (36,718)Drilling and Services [member]Disclosure of operating segments [lineitems]Total consolidated sales 3,442,197 2,051,866 1,511,970Total consolidated operating (loss)income 2,053,796 1,516,048 796,559
Total consolidated net (loss) income 1,265,560 (142,404) 455,432Total consolidated assets 27,673,598 24,917,981 26,220,748Total consolidated liabilities 16,853,202 14,431,318 13,886,424
Copyright © 2018 www.secdatabase.com. All Rights Reserved.Please Consider the Environment Before Printing This Document
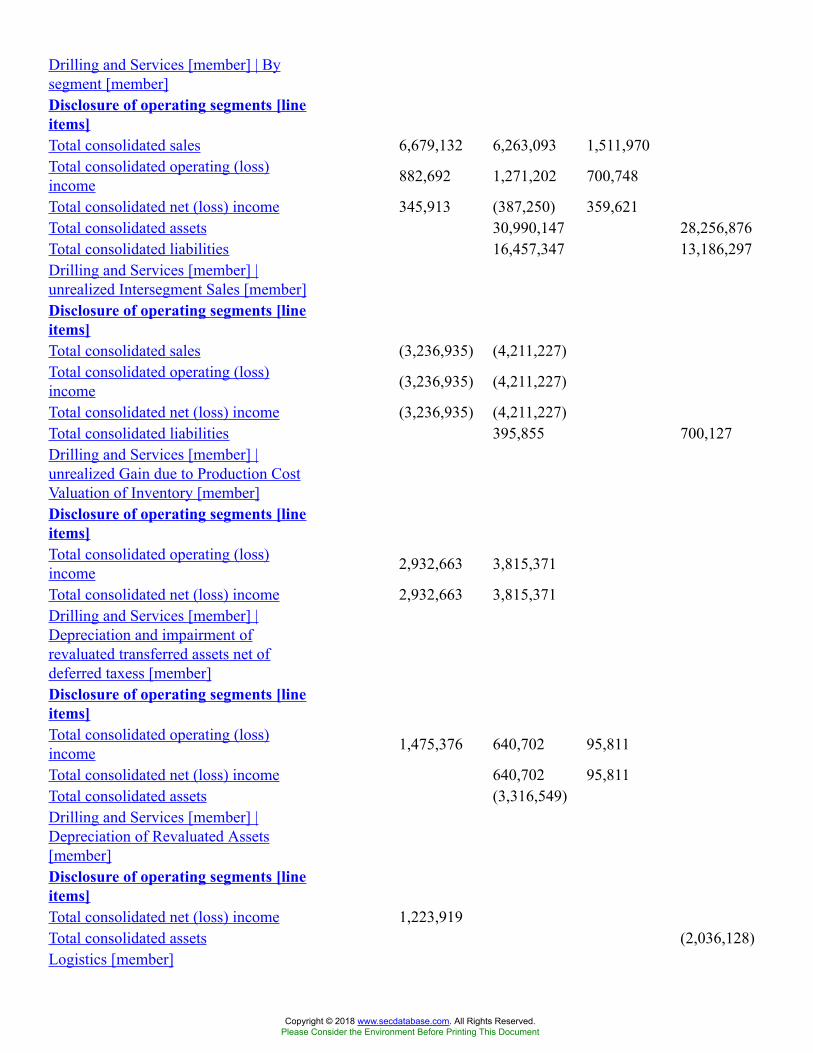
Drilling and Services [member] | Bysegment [member]Disclosure of operating segments [lineitems]Total consolidated sales 6,679,132 6,263,093 1,511,970Total consolidated operating (loss)income 882,692 1,271,202 700,748
Total consolidated net (loss) income 345,913 (387,250) 359,621Total consolidated assets 30,990,147 28,256,876Total consolidated liabilities 16,457,347 13,186,297Drilling and Services [member] |unrealized Intersegment Sales [member]Disclosure of operating segments [lineitems]Total consolidated sales (3,236,935) (4,211,227)Total consolidated operating (loss)income (3,236,935) (4,211,227)
Total consolidated net (loss) income (3,236,935) (4,211,227)Total consolidated liabilities 395,855 700,127Drilling and Services [member] |unrealized Gain due to Production CostValuation of Inventory [member]Disclosure of operating segments [lineitems]Total consolidated operating (loss)income 2,932,663 3,815,371
Total consolidated net (loss) income 2,932,663 3,815,371Drilling and Services [member] |Depreciation and impairment ofrevaluated transferred assets net ofdeferred taxess [member]Disclosure of operating segments [lineitems]Total consolidated operating (loss)income 1,475,376 640,702 95,811
Total consolidated net (loss) income 640,702 95,811Total consolidated assets (3,316,549)Drilling and Services [member] |Depreciation of Revaluated Assets[member]Disclosure of operating segments [lineitems]Total consolidated net (loss) income 1,223,919Total consolidated assets (2,036,128)Logistics [member]
Copyright © 2018 www.secdatabase.com. All Rights Reserved.Please Consider the Environment Before Printing This Document
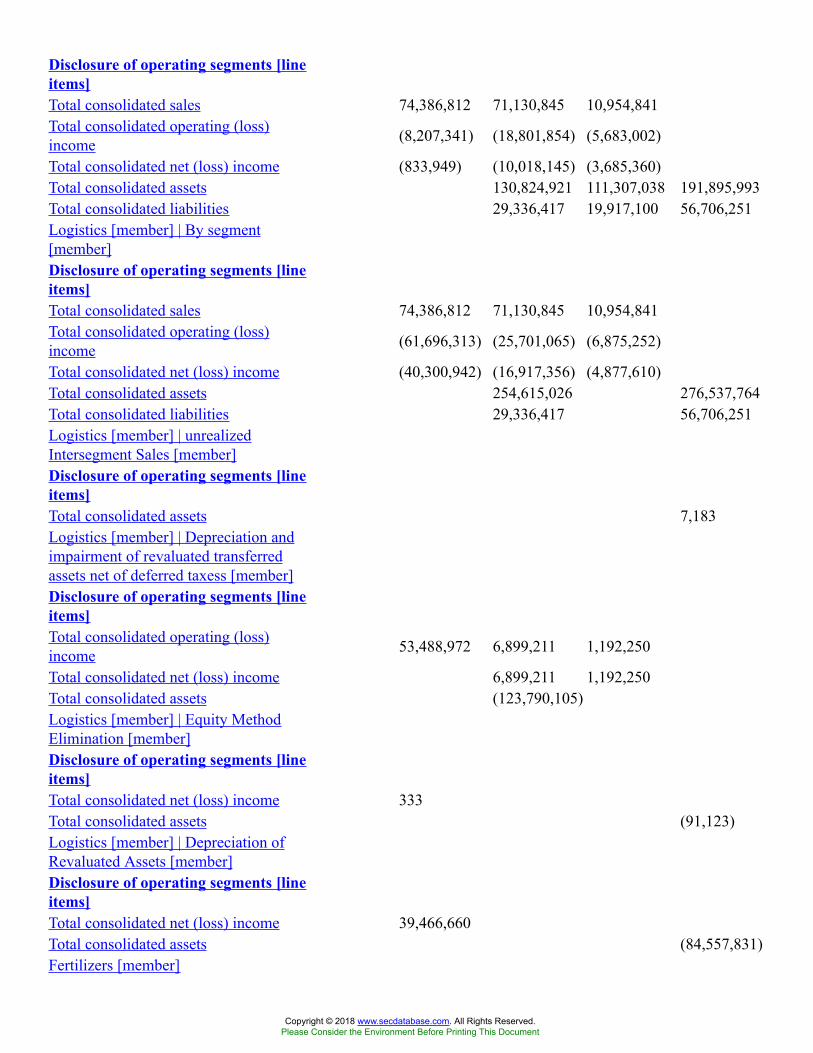
Disclosure of operating segments [lineitems]Total consolidated sales 74,386,812 71,130,845 10,954,841Total consolidated operating (loss)income (8,207,341) (18,801,854) (5,683,002)
Total consolidated net (loss) income (833,949) (10,018,145) (3,685,360)Total consolidated assets 130,824,921 111,307,038 191,895,993Total consolidated liabilities 29,336,417 19,917,100 56,706,251Logistics [member] | By segment[member]Disclosure of operating segments [lineitems]Total consolidated sales 74,386,812 71,130,845 10,954,841Total consolidated operating (loss)income (61,696,313) (25,701,065) (6,875,252)
Total consolidated net (loss) income (40,300,942) (16,917,356) (4,877,610)Total consolidated assets 254,615,026 276,537,764Total consolidated liabilities 29,336,417 56,706,251Logistics [member] | unrealizedIntersegment Sales [member]Disclosure of operating segments [lineitems]Total consolidated assets 7,183Logistics [member] | Depreciation andimpairment of revaluated transferredassets net of deferred taxess [member]Disclosure of operating segments [lineitems]Total consolidated operating (loss)income 53,488,972 6,899,211 1,192,250
Total consolidated net (loss) income 6,899,211 1,192,250Total consolidated assets (123,790,105)Logistics [member] | Equity MethodElimination [member]Disclosure of operating segments [lineitems]Total consolidated net (loss) income 333Total consolidated assets (91,123)Logistics [member] | Depreciation ofRevaluated Assets [member]Disclosure of operating segments [lineitems]Total consolidated net (loss) income 39,466,660Total consolidated assets (84,557,831)Fertilizers [member]
Copyright © 2018 www.secdatabase.com. All Rights Reserved.Please Consider the Environment Before Printing This Document
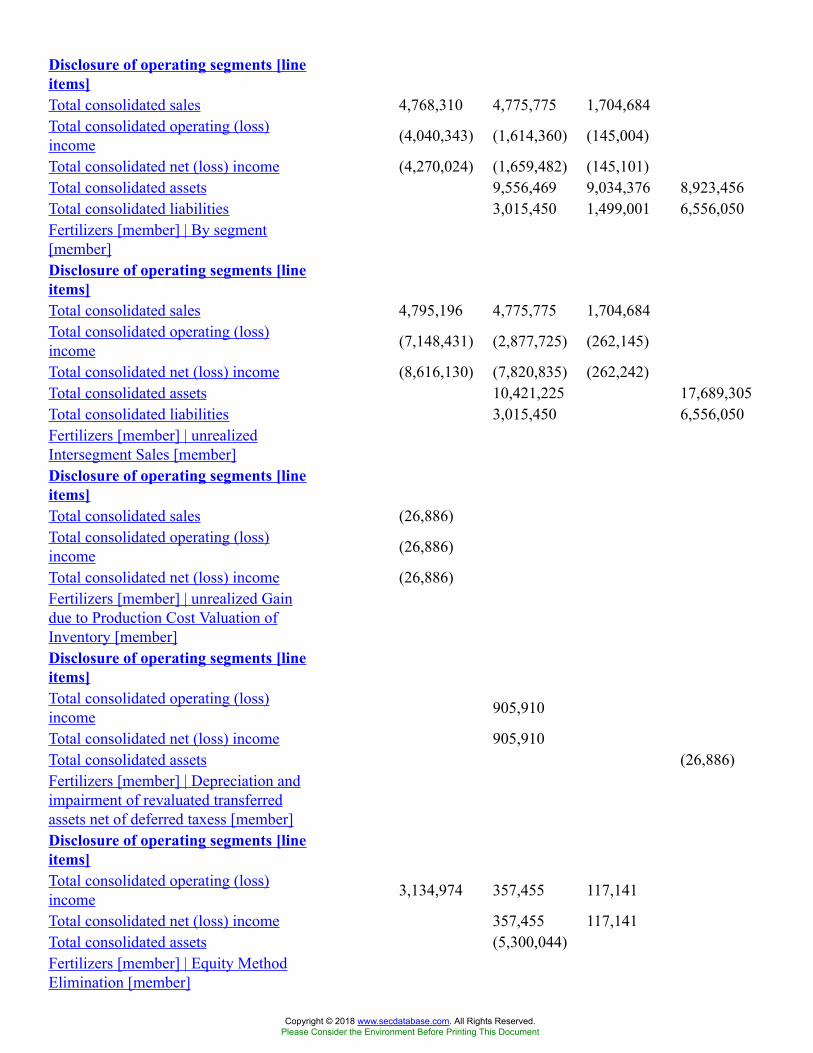
Disclosure of operating segments [lineitems]Total consolidated sales 4,768,310 4,775,775 1,704,684Total consolidated operating (loss)income (4,040,343) (1,614,360) (145,004)
Total consolidated net (loss) income (4,270,024) (1,659,482) (145,101)Total consolidated assets 9,556,469 9,034,376 8,923,456Total consolidated liabilities 3,015,450 1,499,001 6,556,050Fertilizers [member] | By segment[member]Disclosure of operating segments [lineitems]Total consolidated sales 4,795,196 4,775,775 1,704,684Total consolidated operating (loss)income (7,148,431) (2,877,725) (262,145)
Total consolidated net (loss) income (8,616,130) (7,820,835) (262,242)Total consolidated assets 10,421,225 17,689,305Total consolidated liabilities 3,015,450 6,556,050Fertilizers [member] | unrealizedIntersegment Sales [member]Disclosure of operating segments [lineitems]Total consolidated sales (26,886)Total consolidated operating (loss)income (26,886)
Total consolidated net (loss) income (26,886)Fertilizers [member] | unrealized Gaindue to Production Cost Valuation ofInventory [member]Disclosure of operating segments [lineitems]Total consolidated operating (loss)income 905,910
Total consolidated net (loss) income 905,910Total consolidated assets (26,886)Fertilizers [member] | Depreciation andimpairment of revaluated transferredassets net of deferred taxess [member]Disclosure of operating segments [lineitems]Total consolidated operating (loss)income 3,134,974 357,455 117,141
Total consolidated net (loss) income 357,455 117,141Total consolidated assets (5,300,044)Fertilizers [member] | Equity MethodElimination [member]
Copyright © 2018 www.secdatabase.com. All Rights Reserved.Please Consider the Environment Before Printing This Document
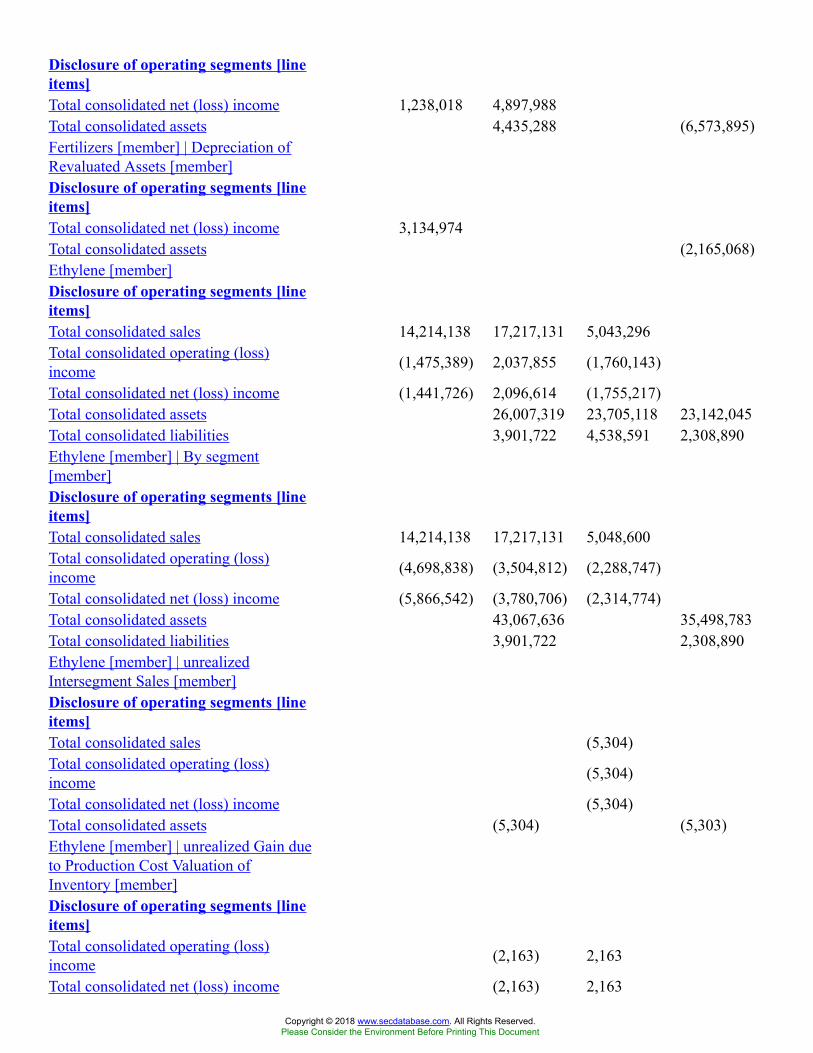
Disclosure of operating segments [lineitems]Total consolidated net (loss) income 1,238,018 4,897,988Total consolidated assets 4,435,288 (6,573,895)Fertilizers [member] | Depreciation ofRevaluated Assets [member]Disclosure of operating segments [lineitems]Total consolidated net (loss) income 3,134,974Total consolidated assets (2,165,068)Ethylene [member]Disclosure of operating segments [lineitems]Total consolidated sales 14,214,138 17,217,131 5,043,296Total consolidated operating (loss)income (1,475,389) 2,037,855 (1,760,143)
Total consolidated net (loss) income (1,441,726) 2,096,614 (1,755,217)Total consolidated assets 26,007,319 23,705,118 23,142,045Total consolidated liabilities 3,901,722 4,538,591 2,308,890Ethylene [member] | By segment[member]Disclosure of operating segments [lineitems]Total consolidated sales 14,214,138 17,217,131 5,048,600Total consolidated operating (loss)income (4,698,838) (3,504,812) (2,288,747)
Total consolidated net (loss) income (5,866,542) (3,780,706) (2,314,774)Total consolidated assets 43,067,636 35,498,783Total consolidated liabilities 3,901,722 2,308,890Ethylene [member] | unrealizedIntersegment Sales [member]Disclosure of operating segments [lineitems]Total consolidated sales (5,304)Total consolidated operating (loss)income (5,304)
Total consolidated net (loss) income (5,304)Total consolidated assets (5,304) (5,303)Ethylene [member] | unrealized Gain dueto Production Cost Valuation ofInventory [member]Disclosure of operating segments [lineitems]Total consolidated operating (loss)income (2,163) 2,163
Total consolidated net (loss) income (2,163) 2,163
Copyright © 2018 www.secdatabase.com. All Rights Reserved.Please Consider the Environment Before Printing This Document
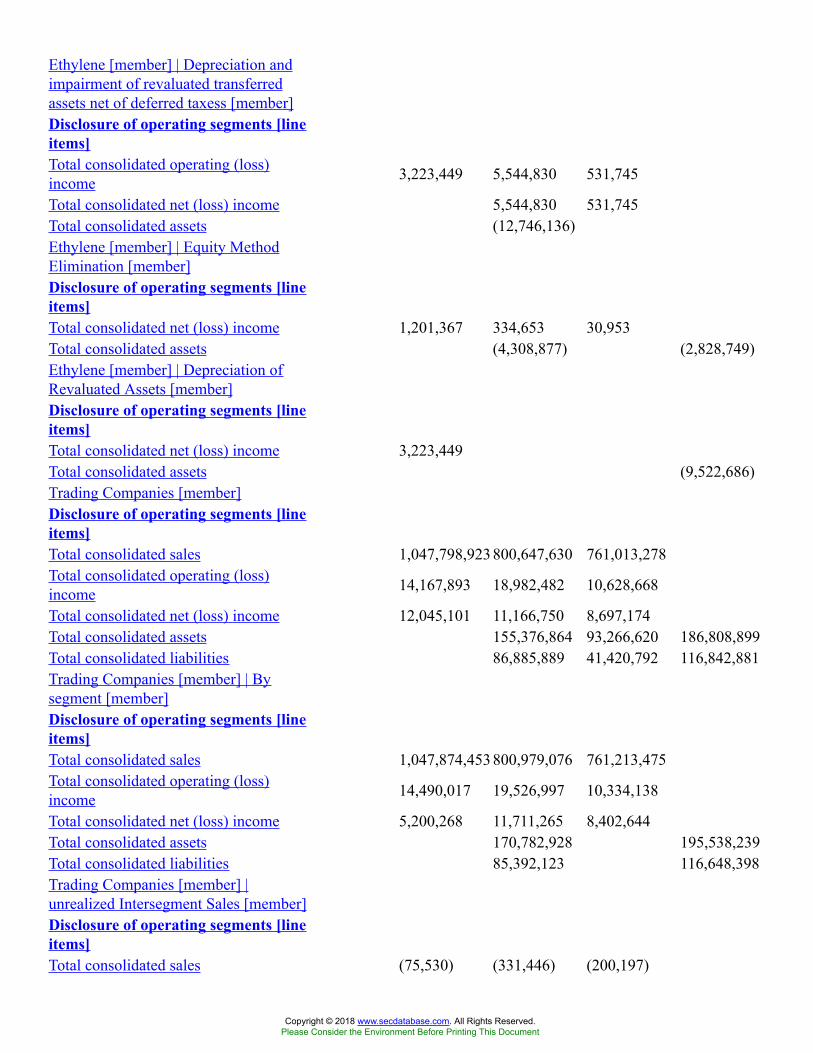
Ethylene [member] | Depreciation andimpairment of revaluated transferredassets net of deferred taxess [member]Disclosure of operating segments [lineitems]Total consolidated operating (loss)income 3,223,449 5,544,830 531,745
Total consolidated net (loss) income 5,544,830 531,745Total consolidated assets (12,746,136)Ethylene [member] | Equity MethodElimination [member]Disclosure of operating segments [lineitems]Total consolidated net (loss) income 1,201,367 334,653 30,953Total consolidated assets (4,308,877) (2,828,749)Ethylene [member] | Depreciation ofRevaluated Assets [member]Disclosure of operating segments [lineitems]Total consolidated net (loss) income 3,223,449Total consolidated assets (9,522,686)Trading Companies [member]Disclosure of operating segments [lineitems]Total consolidated sales 1,047,798,923800,647,630 761,013,278Total consolidated operating (loss)income 14,167,893 18,982,482 10,628,668
Total consolidated net (loss) income 12,045,101 11,166,750 8,697,174Total consolidated assets 155,376,864 93,266,620 186,808,899Total consolidated liabilities 86,885,889 41,420,792 116,842,881Trading Companies [member] | Bysegment [member]Disclosure of operating segments [lineitems]Total consolidated sales 1,047,874,453800,979,076 761,213,475Total consolidated operating (loss)income 14,490,017 19,526,997 10,334,138
Total consolidated net (loss) income 5,200,268 11,711,265 8,402,644Total consolidated assets 170,782,928 195,538,239Total consolidated liabilities 85,392,123 116,648,398Trading Companies [member] |unrealized Intersegment Sales [member]Disclosure of operating segments [lineitems]Total consolidated sales (75,530) (331,446) (200,197)
Copyright © 2018 www.secdatabase.com. All Rights Reserved.Please Consider the Environment Before Printing This Document
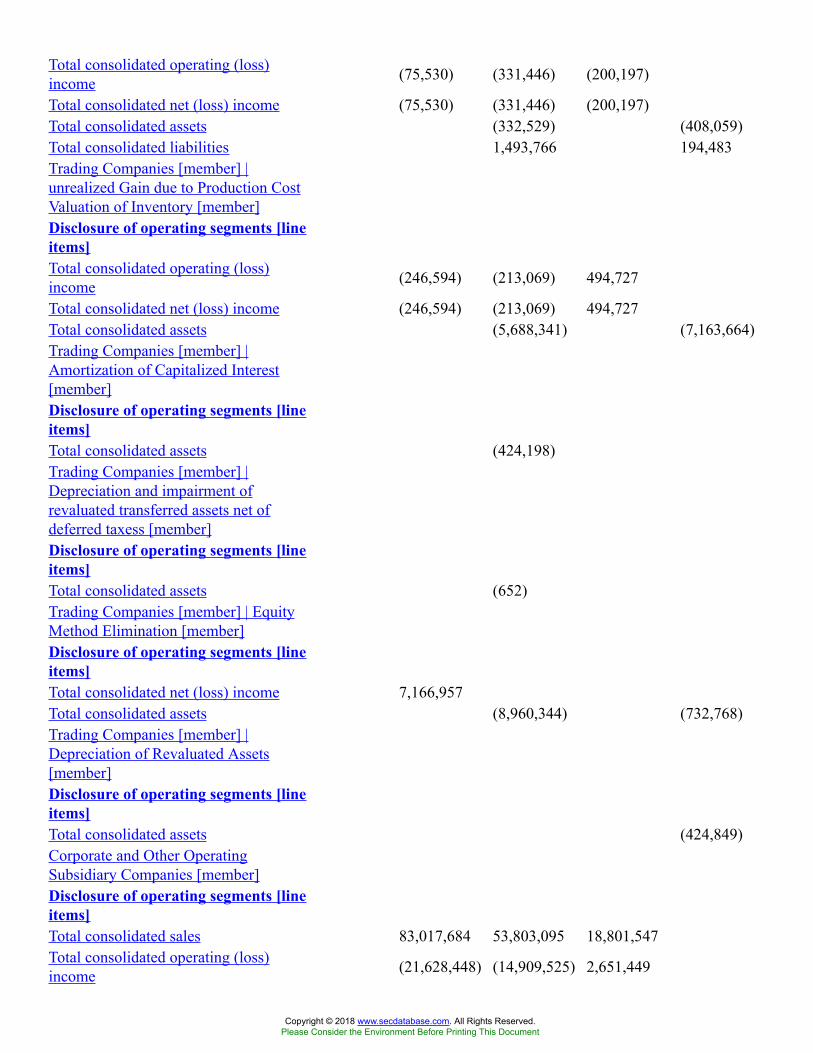
Total consolidated operating (loss)income (75,530) (331,446) (200,197)
Total consolidated net (loss) income (75,530) (331,446) (200,197)Total consolidated assets (332,529) (408,059)Total consolidated liabilities 1,493,766 194,483Trading Companies [member] |unrealized Gain due to Production CostValuation of Inventory [member]Disclosure of operating segments [lineitems]Total consolidated operating (loss)income (246,594) (213,069) 494,727
Total consolidated net (loss) income (246,594) (213,069) 494,727Total consolidated assets (5,688,341) (7,163,664)Trading Companies [member] |Amortization of Capitalized Interest[member]Disclosure of operating segments [lineitems]Total consolidated assets (424,198)Trading Companies [member] |Depreciation and impairment ofrevaluated transferred assets net ofdeferred taxess [member]Disclosure of operating segments [lineitems]Total consolidated assets (652)Trading Companies [member] | EquityMethod Elimination [member]Disclosure of operating segments [lineitems]Total consolidated net (loss) income 7,166,957Total consolidated assets (8,960,344) (732,768)Trading Companies [member] |Depreciation of Revaluated Assets[member]Disclosure of operating segments [lineitems]Total consolidated assets (424,849)Corporate and Other OperatingSubsidiary Companies [member]Disclosure of operating segments [lineitems]Total consolidated sales 83,017,684 53,803,095 18,801,547Total consolidated operating (loss)income (21,628,448) (14,909,525) 2,651,449
Copyright © 2018 www.secdatabase.com. All Rights Reserved.Please Consider the Environment Before Printing This Document
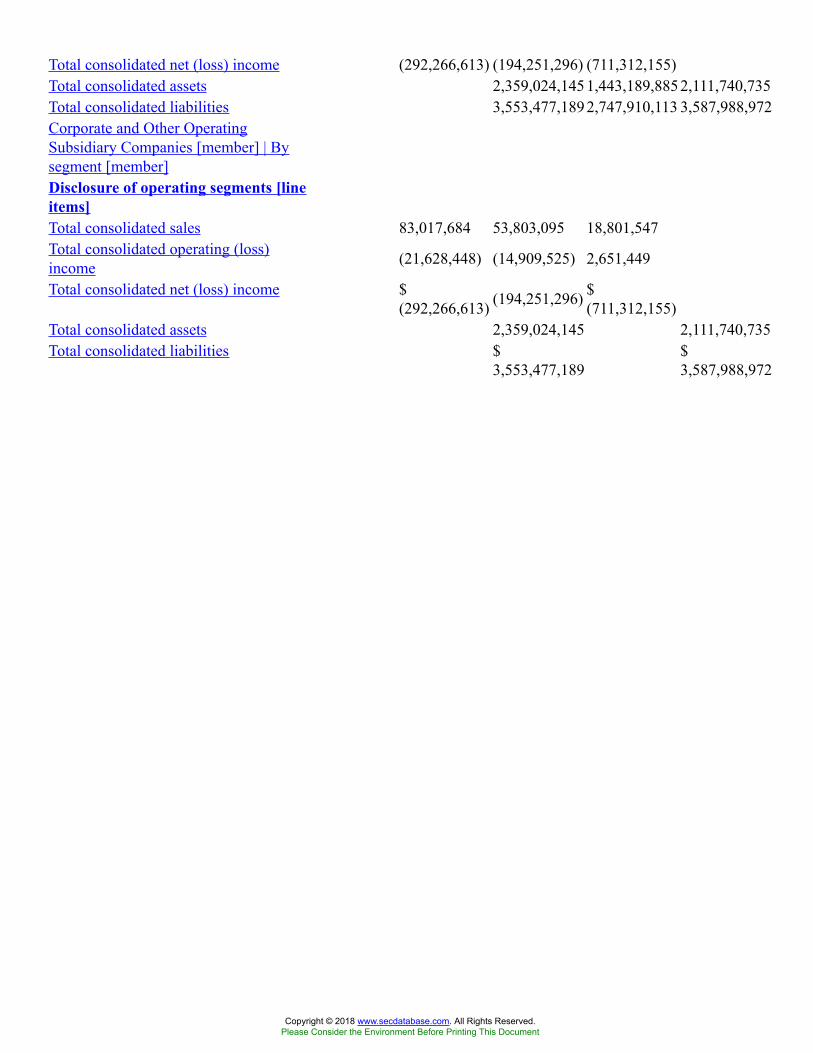
Total consolidated net (loss) income (292,266,613) (194,251,296) (711,312,155)Total consolidated assets 2,359,024,1451,443,189,8852,111,740,735Total consolidated liabilities 3,553,477,1892,747,910,113 3,587,988,972Corporate and Other OperatingSubsidiary Companies [member] | Bysegment [member]Disclosure of operating segments [lineitems]Total consolidated sales 83,017,684 53,803,095 18,801,547Total consolidated operating (loss)income (21,628,448) (14,909,525) 2,651,449
Total consolidated net (loss) income $(292,266,613) (194,251,296) $
(711,312,155)Total consolidated assets 2,359,024,145 2,111,740,735Total consolidated liabilities $
3,553,477,189$3,587,988,972
Copyright © 2018 www.secdatabase.com. All Rights Reserved.Please Consider the Environment Before Printing This Document
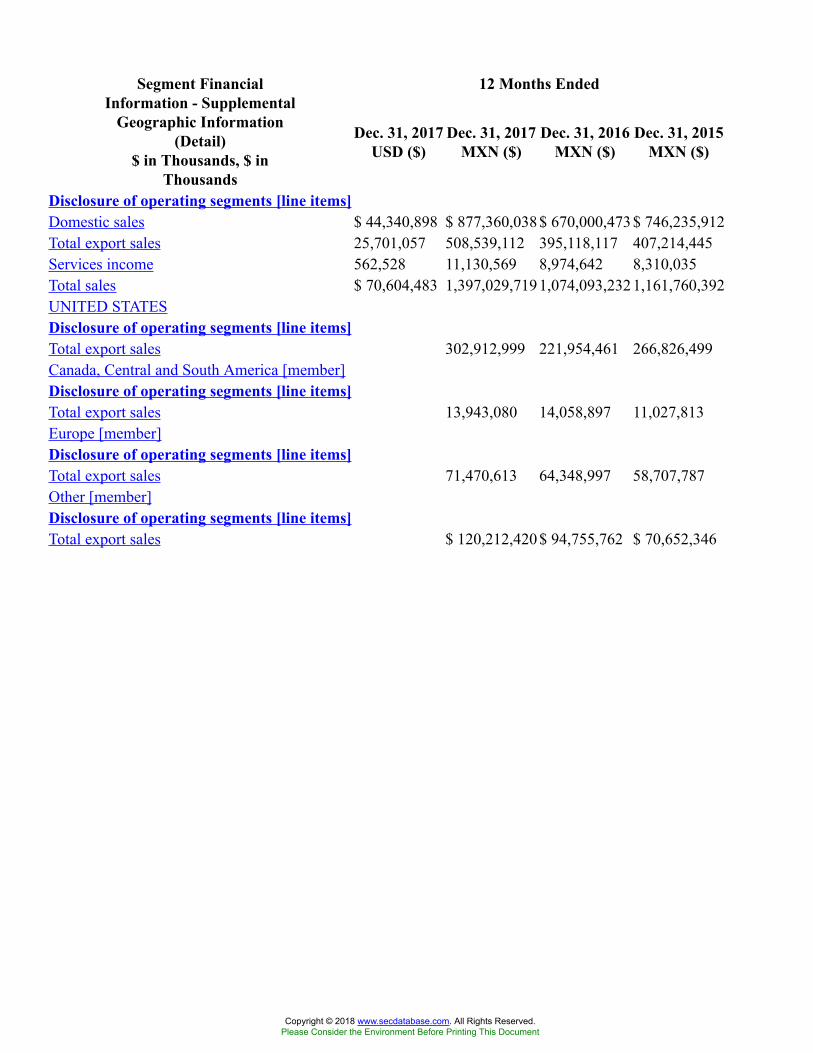
12 Months EndedSegment FinancialInformation - Supplemental
Geographic Information(Detail)
$ in Thousands, $ inThousands
Dec. 31, 2017USD ($)
Dec. 31, 2017MXN ($)
Dec. 31, 2016MXN ($)
Dec. 31, 2015MXN ($)
Disclosure of operating segments [line items]Domestic sales $ 44,340,898 $ 877,360,038$ 670,000,473$ 746,235,912Total export sales 25,701,057 508,539,112 395,118,117 407,214,445Services income 562,528 11,130,569 8,974,642 8,310,035Total sales $ 70,604,483 1,397,029,7191,074,093,2321,161,760,392UNITED STATESDisclosure of operating segments [line items]Total export sales 302,912,999 221,954,461 266,826,499Canada, Central and South America [member]Disclosure of operating segments [line items]Total export sales 13,943,080 14,058,897 11,027,813Europe [member]Disclosure of operating segments [line items]Total export sales 71,470,613 64,348,997 58,707,787Other [member]Disclosure of operating segments [line items]Total export sales $ 120,212,420$ 94,755,762 $ 70,652,346
Copyright © 2018 www.secdatabase.com. All Rights Reserved.Please Consider the Environment Before Printing This Document

12 Months EndedSegment FinancialInformation - Schedule of
Income by Product (Detail)$ in Thousands, $ in
Thousands
Dec. 31,2017
USD ($)
Dec. 31, 2017MXN ($)
Dec. 31, 2016MXN ($)
Dec. 31, 2015MXN ($)
Disclosure of operating segments [line items]Total domestic sales $ 44,340,898 $
877,360,038$670,000,473
$746,235,912
Total export sales $ 25,701,057 508,539,112 395,118,117 407,214,445Refined Petroleum Products and Derivatives[member]Disclosure of operating segments [line items]Total domestic sales 784,048,048 578,718,674 660,573,780Total export sales 109,615,457 92,705,248 118,129,615Gas [member]Disclosure of operating segments [line items]Total domestic sales 70,930,855 59,648,576 54,497,824Total export sales 21,675 20,995 27,283Petrochemical Products [member]Disclosure of operating segments [line items]Total domestic sales 22,381,135 31,633,223 31,164,308Total export sales 18,440,833 13,766,080 887,096Crude oil [member]Disclosure of operating segments [line items]Total export sales $
380,461,147$288,625,794
$288,170,451
Copyright © 2018 www.secdatabase.com. All Rights Reserved.Please Consider the Environment Before Printing This Document
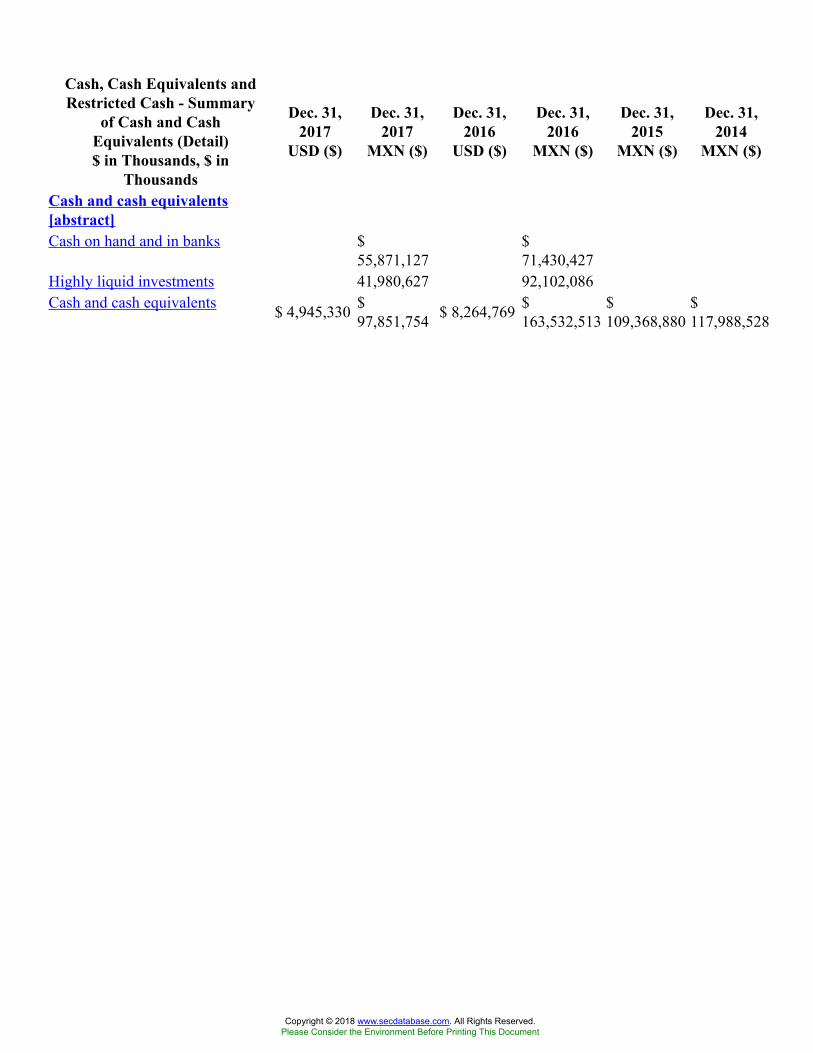
Cash, Cash Equivalents andRestricted Cash - Summary
of Cash and CashEquivalents (Detail)$ in Thousands, $ in
Thousands
Dec. 31,2017
USD ($)
Dec. 31,2017
MXN ($)
Dec. 31,2016
USD ($)
Dec. 31,2016
MXN ($)
Dec. 31,2015
MXN ($)
Dec. 31,2014
MXN ($)
Cash and cash equivalents[abstract]Cash on hand and in banks $
55,871,127$71,430,427
Highly liquid investments 41,980,627 92,102,086Cash and cash equivalents $ 4,945,330 $
97,851,754 $ 8,264,769 $163,532,513
$109,368,880
$117,988,528
Copyright © 2018 www.secdatabase.com. All Rights Reserved.Please Consider the Environment Before Printing This Document

Cash, Cash Equivalents andRestricted Cash - Summaryof Restricted Cash (Detail)
$ in Thousands
Dec. 31, 2016MXN ($)
Disclosure Of Restricted Cash And Cash Equivalents [Abstract]Restricted cash $ 10,478,626
Copyright © 2018 www.secdatabase.com. All Rights Reserved.Please Consider the Environment Before Printing This Document

Cash, Cash Equivalents andRestricted Cash - AdditionalInformation (Detail) - USD
($)$ in Thousands
Apr. 06, 2017Dec. 31, 2016
Collateral [member]Disclosure of Restricted Cash and Cash Equivalents [Line Items]Deposit amount $ 41,319Pemex exploration and production [member]Disclosure of Restricted Cash and Cash Equivalents [Line Items]Deposit amount $ 465,060Settlement amount paid $ 435,000
Copyright © 2018 www.secdatabase.com. All Rights Reserved.Please Consider the Environment Before Printing This Document
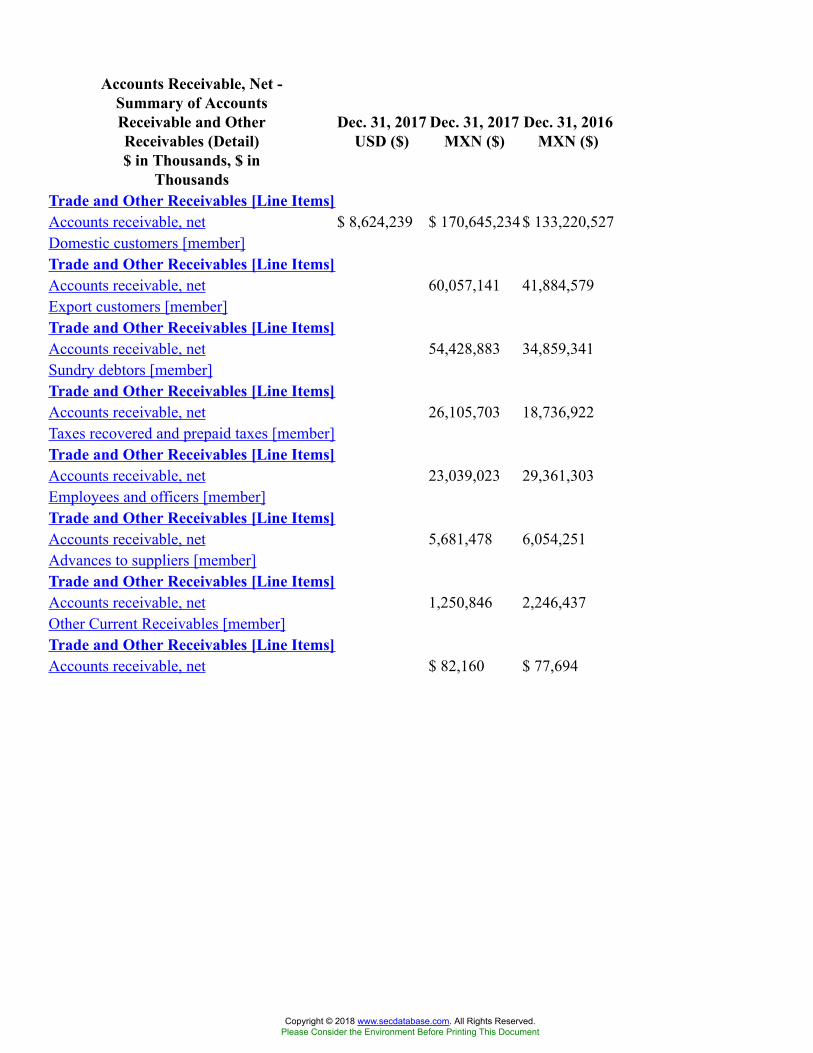
Accounts Receivable, Net -Summary of AccountsReceivable and OtherReceivables (Detail)$ in Thousands, $ in
Thousands
Dec. 31, 2017USD ($)
Dec. 31, 2017MXN ($)
Dec. 31, 2016MXN ($)
Trade and Other Receivables [Line Items]Accounts receivable, net $ 8,624,239 $ 170,645,234$ 133,220,527Domestic customers [member]Trade and Other Receivables [Line Items]Accounts receivable, net 60,057,141 41,884,579Export customers [member]Trade and Other Receivables [Line Items]Accounts receivable, net 54,428,883 34,859,341Sundry debtors [member]Trade and Other Receivables [Line Items]Accounts receivable, net 26,105,703 18,736,922Taxes recovered and prepaid taxes [member]Trade and Other Receivables [Line Items]Accounts receivable, net 23,039,023 29,361,303Employees and officers [member]Trade and Other Receivables [Line Items]Accounts receivable, net 5,681,478 6,054,251Advances to suppliers [member]Trade and Other Receivables [Line Items]Accounts receivable, net 1,250,846 2,246,437Other Current Receivables [member]Trade and Other Receivables [Line Items]Accounts receivable, net $ 82,160 $ 77,694
Copyright © 2018 www.secdatabase.com. All Rights Reserved.Please Consider the Environment Before Printing This Document
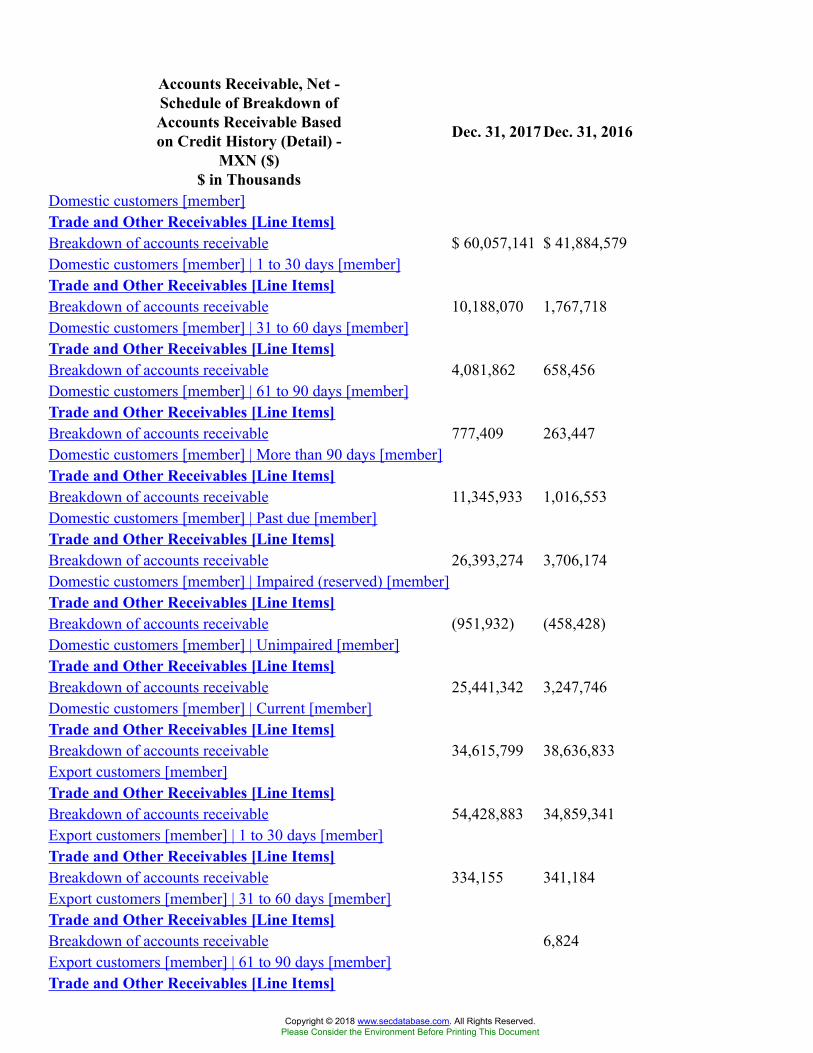
Accounts Receivable, Net -Schedule of Breakdown ofAccounts Receivable Basedon Credit History (Detail) -
MXN ($)$ in Thousands
Dec. 31, 2017 Dec. 31, 2016
Domestic customers [member]Trade and Other Receivables [Line Items]Breakdown of accounts receivable $ 60,057,141 $ 41,884,579Domestic customers [member] | 1 to 30 days [member]Trade and Other Receivables [Line Items]Breakdown of accounts receivable 10,188,070 1,767,718Domestic customers [member] | 31 to 60 days [member]Trade and Other Receivables [Line Items]Breakdown of accounts receivable 4,081,862 658,456Domestic customers [member] | 61 to 90 days [member]Trade and Other Receivables [Line Items]Breakdown of accounts receivable 777,409 263,447Domestic customers [member] | More than 90 days [member]Trade and Other Receivables [Line Items]Breakdown of accounts receivable 11,345,933 1,016,553Domestic customers [member] | Past due [member]Trade and Other Receivables [Line Items]Breakdown of accounts receivable 26,393,274 3,706,174Domestic customers [member] | Impaired (reserved) [member]Trade and Other Receivables [Line Items]Breakdown of accounts receivable (951,932) (458,428)Domestic customers [member] | Unimpaired [member]Trade and Other Receivables [Line Items]Breakdown of accounts receivable 25,441,342 3,247,746Domestic customers [member] | Current [member]Trade and Other Receivables [Line Items]Breakdown of accounts receivable 34,615,799 38,636,833Export customers [member]Trade and Other Receivables [Line Items]Breakdown of accounts receivable 54,428,883 34,859,341Export customers [member] | 1 to 30 days [member]Trade and Other Receivables [Line Items]Breakdown of accounts receivable 334,155 341,184Export customers [member] | 31 to 60 days [member]Trade and Other Receivables [Line Items]Breakdown of accounts receivable 6,824Export customers [member] | 61 to 90 days [member]Trade and Other Receivables [Line Items]
Copyright © 2018 www.secdatabase.com. All Rights Reserved.Please Consider the Environment Before Printing This Document
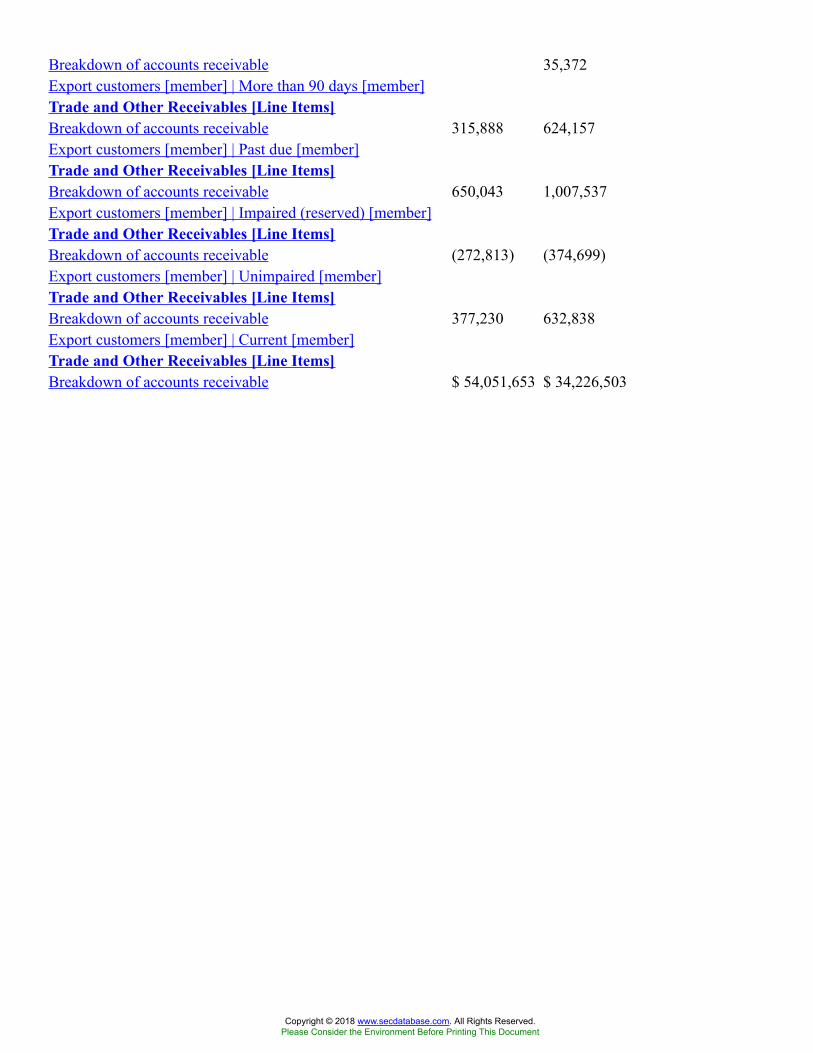
Breakdown of accounts receivable 35,372Export customers [member] | More than 90 days [member]Trade and Other Receivables [Line Items]Breakdown of accounts receivable 315,888 624,157Export customers [member] | Past due [member]Trade and Other Receivables [Line Items]Breakdown of accounts receivable 650,043 1,007,537Export customers [member] | Impaired (reserved) [member]Trade and Other Receivables [Line Items]Breakdown of accounts receivable (272,813) (374,699)Export customers [member] | Unimpaired [member]Trade and Other Receivables [Line Items]Breakdown of accounts receivable 377,230 632,838Export customers [member] | Current [member]Trade and Other Receivables [Line Items]Breakdown of accounts receivable $ 54,051,653 $ 34,226,503
Copyright © 2018 www.secdatabase.com. All Rights Reserved.Please Consider the Environment Before Printing This Document
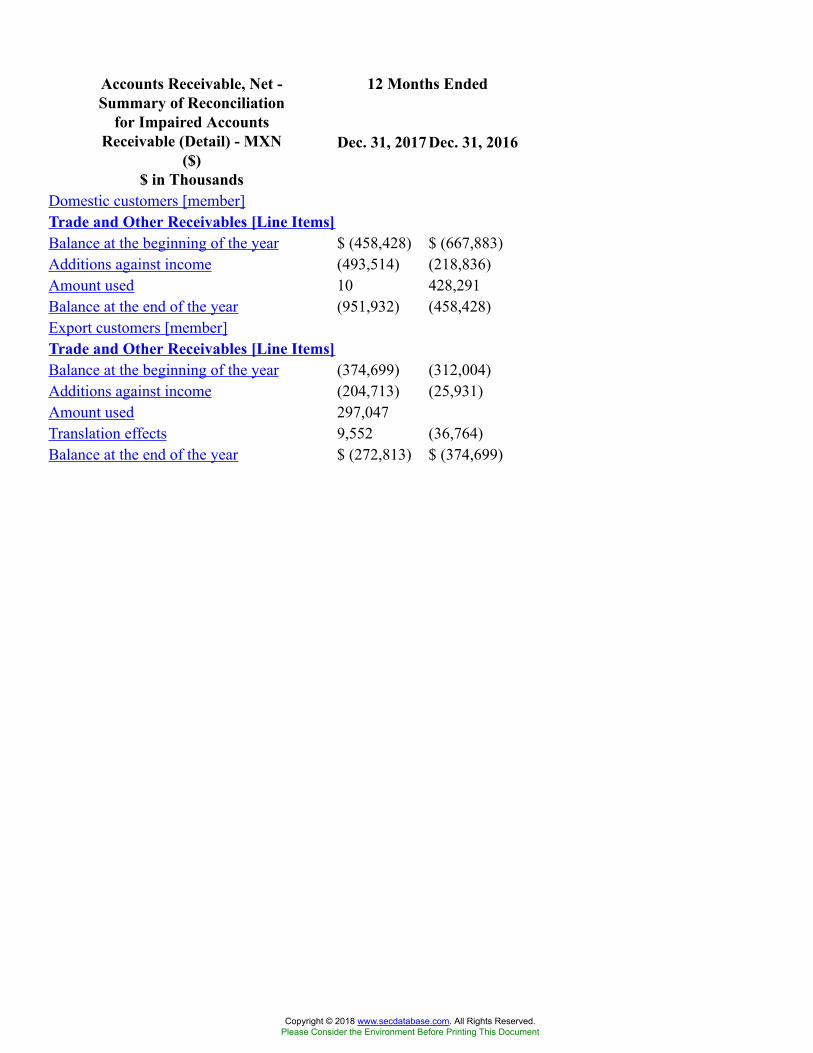
12 Months EndedAccounts Receivable, Net -Summary of Reconciliation
for Impaired AccountsReceivable (Detail) - MXN
($)$ in Thousands
Dec. 31, 2017 Dec. 31, 2016
Domestic customers [member]Trade and Other Receivables [Line Items]Balance at the beginning of the year $ (458,428) $ (667,883)Additions against income (493,514) (218,836)Amount used 10 428,291Balance at the end of the year (951,932) (458,428)Export customers [member]Trade and Other Receivables [Line Items]Balance at the beginning of the year (374,699) (312,004)Additions against income (204,713) (25,931)Amount used 297,047Translation effects 9,552 (36,764)Balance at the end of the year $ (272,813) $ (374,699)
Copyright © 2018 www.secdatabase.com. All Rights Reserved.Please Consider the Environment Before Printing This Document
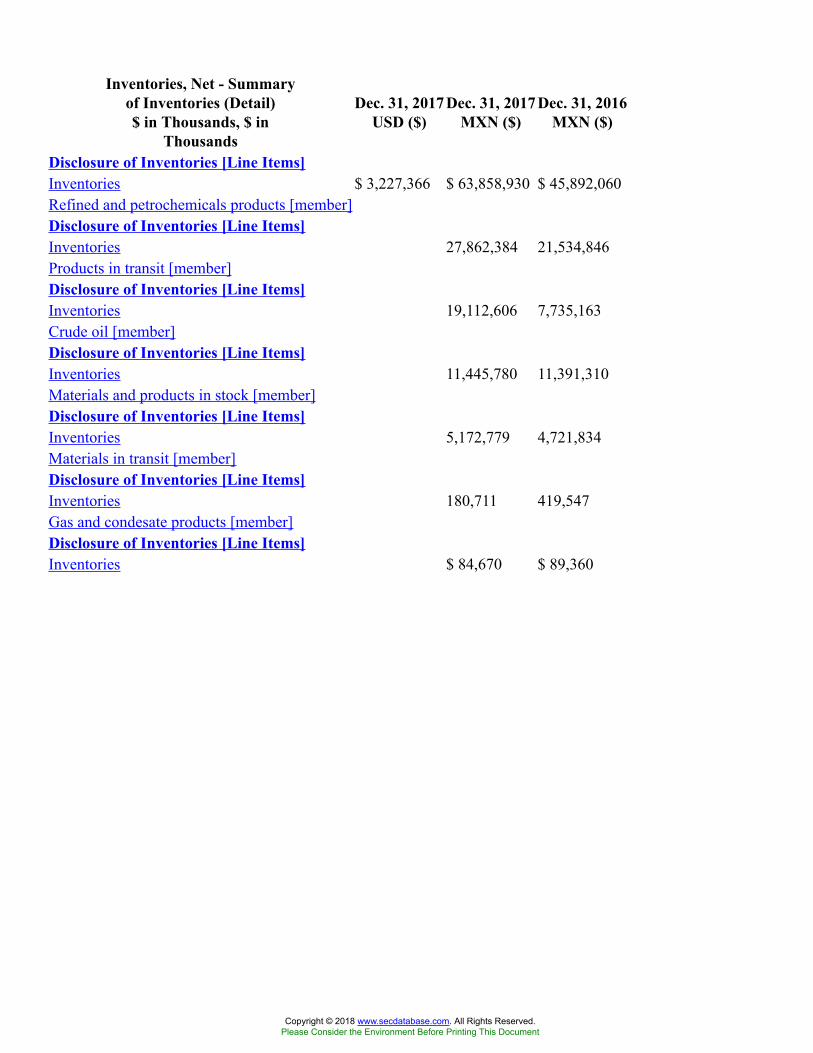
Inventories, Net - Summaryof Inventories (Detail)$ in Thousands, $ in
Thousands
Dec. 31, 2017USD ($)
Dec. 31, 2017MXN ($)
Dec. 31, 2016MXN ($)
Disclosure of Inventories [Line Items]Inventories $ 3,227,366 $ 63,858,930 $ 45,892,060Refined and petrochemicals products [member]Disclosure of Inventories [Line Items]Inventories 27,862,384 21,534,846Products in transit [member]Disclosure of Inventories [Line Items]Inventories 19,112,606 7,735,163Crude oil [member]Disclosure of Inventories [Line Items]Inventories 11,445,780 11,391,310Materials and products in stock [member]Disclosure of Inventories [Line Items]Inventories 5,172,779 4,721,834Materials in transit [member]Disclosure of Inventories [Line Items]Inventories 180,711 419,547Gas and condesate products [member]Disclosure of Inventories [Line Items]Inventories $ 84,670 $ 89,360
Copyright © 2018 www.secdatabase.com. All Rights Reserved.Please Consider the Environment Before Printing This Document
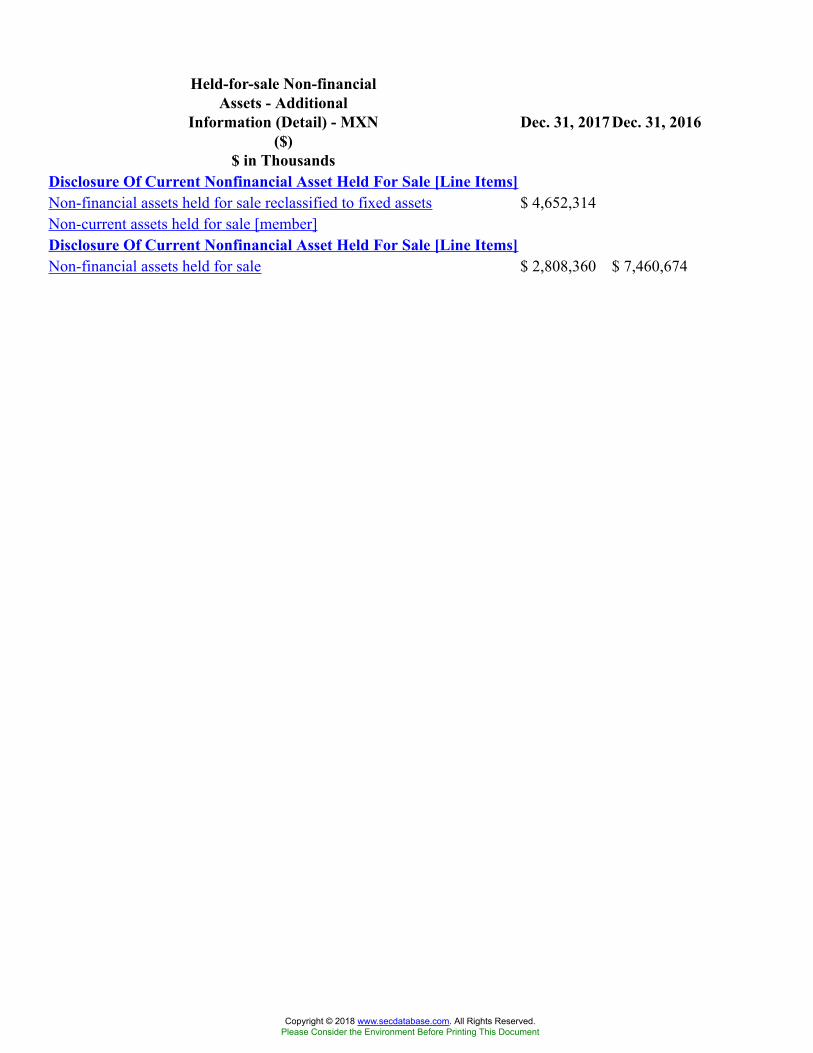
Held-for-sale Non-financialAssets - Additional
Information (Detail) - MXN($)
$ in Thousands
Dec. 31, 2017 Dec. 31, 2016
Disclosure Of Current Nonfinancial Asset Held For Sale [Line Items]Non-financial assets held for sale reclassified to fixed assets $ 4,652,314Non-current assets held for sale [member]Disclosure Of Current Nonfinancial Asset Held For Sale [Line Items]Non-financial assets held for sale $ 2,808,360 $ 7,460,674
Copyright © 2018 www.secdatabase.com. All Rights Reserved.Please Consider the Environment Before Printing This Document
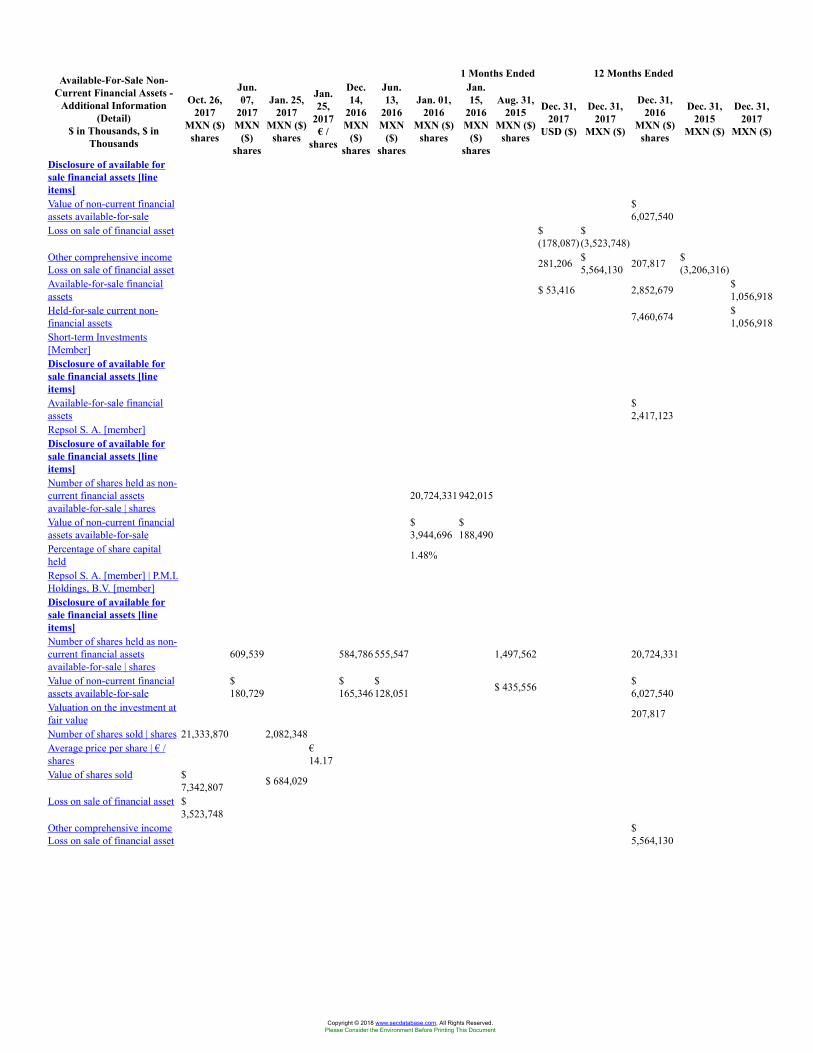
1 Months Ended 12 Months EndedAvailable-For-Sale Non-Current Financial Assets -
Additional Information(Detail)
$ in Thousands, $ inThousands
Oct. 26,2017
MXN ($)shares
Jun.07,
2017MXN
($)shares
Jan. 25,2017
MXN ($)shares
Jan.25,
2017€ /
shares
Dec.14,
2016MXN
($)shares
Jun.13,
2016MXN
($)shares
Jan. 01,2016
MXN ($)shares
Jan.15,
2016MXN
($)shares
Aug. 31,2015
MXN ($)shares
Dec. 31,2017
USD ($)
Dec. 31,2017
MXN ($)
Dec. 31,2016
MXN ($)shares
Dec. 31,2015
MXN ($)
Dec. 31,2017
MXN ($)
Disclosure of available forsale financial assets [lineitems]Value of non-current financialassets available-for-sale
$6,027,540
Loss on sale of financial asset $(178,087)
$(3,523,748)
Other comprehensive incomeLoss on sale of financial asset 281,206 $
5,564,130 207,817 $(3,206,316)
Available-for-sale financialassets $ 53,416 2,852,679 $
1,056,918Held-for-sale current non-financial assets 7,460,674 $
1,056,918Short-term Investments[Member]Disclosure of available forsale financial assets [lineitems]Available-for-sale financialassets
$2,417,123
Repsol S. A. [member]Disclosure of available forsale financial assets [lineitems]Number of shares held as non-current financial assetsavailable-for-sale | shares
20,724,331942,015
Value of non-current financialassets available-for-sale
$3,944,696
$188,490
Percentage of share capitalheld 1.48%
Repsol S. A. [member] | P.M.I.Holdings, B.V. [member]Disclosure of available forsale financial assets [lineitems]Number of shares held as non-current financial assetsavailable-for-sale | shares
609,539 584,786 555,547 1,497,562 20,724,331
Value of non-current financialassets available-for-sale
$180,729
$165,346
$128,051 $ 435,556 $
6,027,540Valuation on the investment atfair value 207,817
Number of shares sold | shares 21,333,870 2,082,348Average price per share | € /shares
€14.17
Value of shares sold $7,342,807 $ 684,029
Loss on sale of financial asset $3,523,748
Other comprehensive incomeLoss on sale of financial asset
$5,564,130
Copyright © 2018 www.secdatabase.com. All Rights Reserved.Please Consider the Environment Before Printing This Document
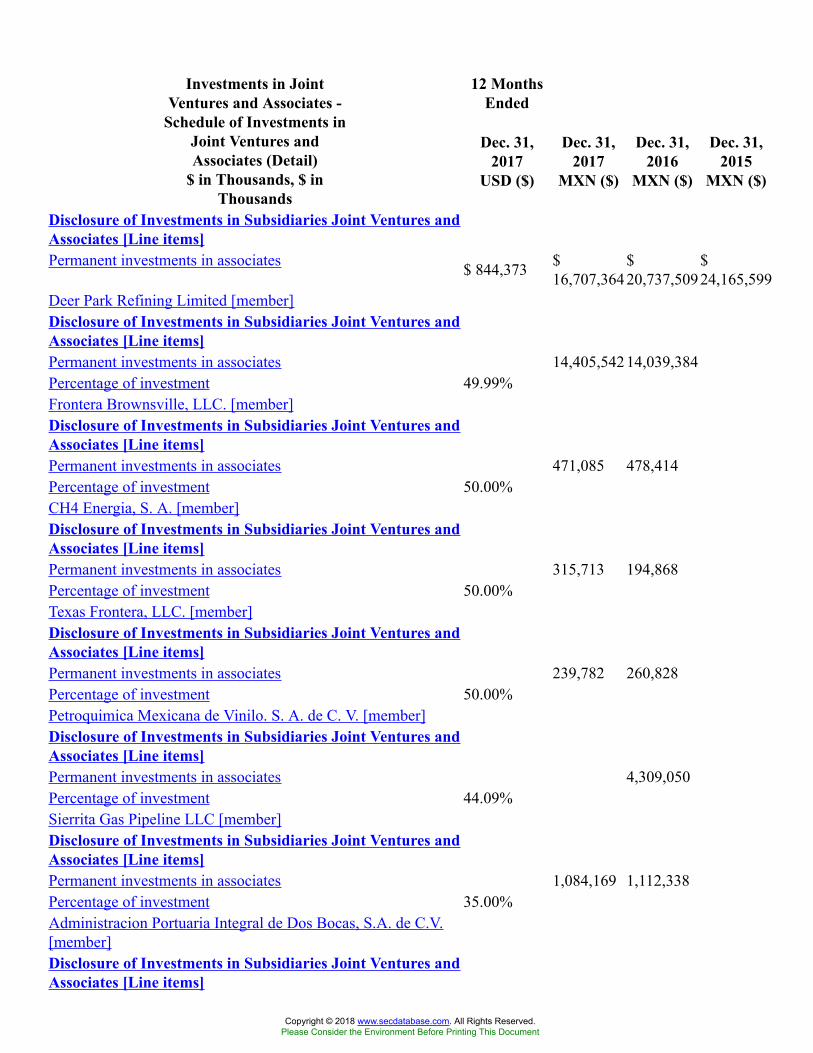
12 MonthsEnded
Investments in JointVentures and Associates -
Schedule of Investments inJoint Ventures andAssociates (Detail)
$ in Thousands, $ inThousands
Dec. 31,2017
USD ($)
Dec. 31,2017
MXN ($)
Dec. 31,2016
MXN ($)
Dec. 31,2015
MXN ($)
Disclosure of Investments in Subsidiaries Joint Ventures andAssociates [Line items]Permanent investments in associates $ 844,373 $
16,707,364$20,737,509
$24,165,599
Deer Park Refining Limited [member]Disclosure of Investments in Subsidiaries Joint Ventures andAssociates [Line items]Permanent investments in associates 14,405,54214,039,384Percentage of investment 49.99%Frontera Brownsville, LLC. [member]Disclosure of Investments in Subsidiaries Joint Ventures andAssociates [Line items]Permanent investments in associates 471,085 478,414Percentage of investment 50.00%CH4 Energia, S. A. [member]Disclosure of Investments in Subsidiaries Joint Ventures andAssociates [Line items]Permanent investments in associates 315,713 194,868Percentage of investment 50.00%Texas Frontera, LLC. [member]Disclosure of Investments in Subsidiaries Joint Ventures andAssociates [Line items]Permanent investments in associates 239,782 260,828Percentage of investment 50.00%Petroquimica Mexicana de Vinilo. S. A. de C. V. [member]Disclosure of Investments in Subsidiaries Joint Ventures andAssociates [Line items]Permanent investments in associates 4,309,050Percentage of investment 44.09%Sierrita Gas Pipeline LLC [member]Disclosure of Investments in Subsidiaries Joint Ventures andAssociates [Line items]Permanent investments in associates 1,084,169 1,112,338Percentage of investment 35.00%Administracion Portuaria Integral de Dos Bocas, S.A. de C.V.[member]Disclosure of Investments in Subsidiaries Joint Ventures andAssociates [Line items]
Copyright © 2018 www.secdatabase.com. All Rights Reserved.Please Consider the Environment Before Printing This Document
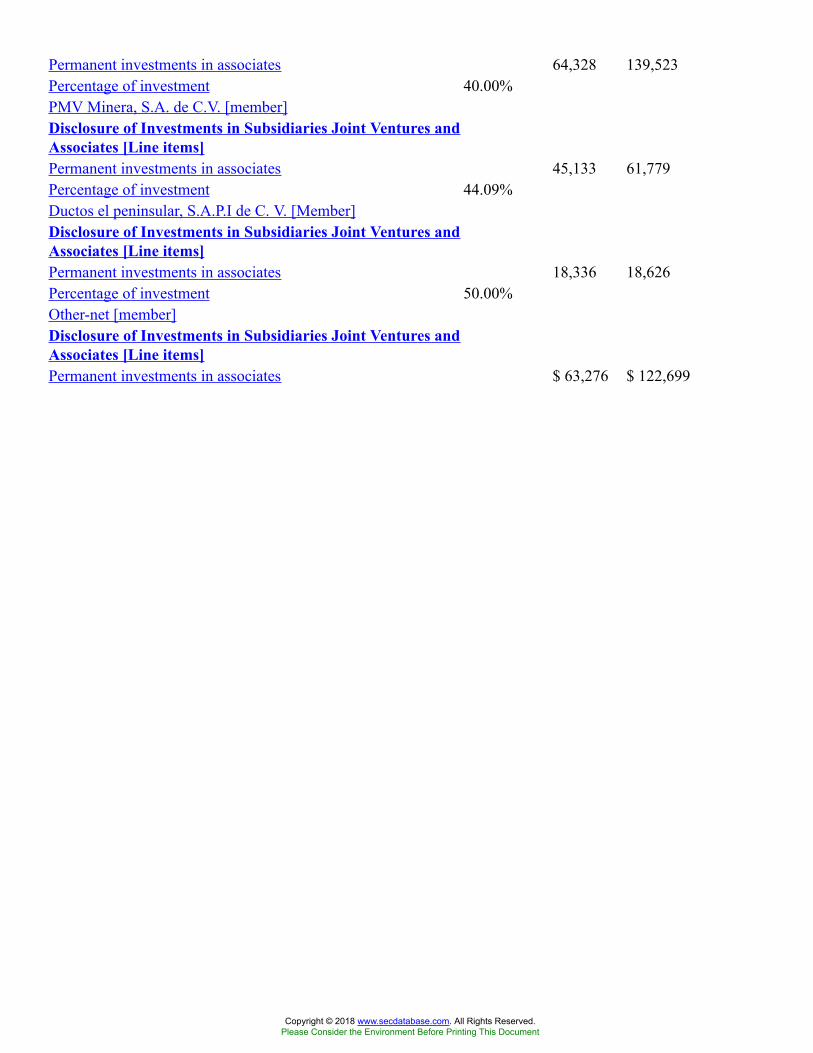
Permanent investments in associates 64,328 139,523Percentage of investment 40.00%PMV Minera, S.A. de C.V. [member]Disclosure of Investments in Subsidiaries Joint Ventures andAssociates [Line items]Permanent investments in associates 45,133 61,779Percentage of investment 44.09%Ductos el peninsular, S.A.P.I de C. V. [Member]Disclosure of Investments in Subsidiaries Joint Ventures andAssociates [Line items]Permanent investments in associates 18,336 18,626Percentage of investment 50.00%Other-net [member]Disclosure of Investments in Subsidiaries Joint Ventures andAssociates [Line items]Permanent investments in associates $ 63,276 $ 122,699
Copyright © 2018 www.secdatabase.com. All Rights Reserved.Please Consider the Environment Before Printing This Document

Investments in JointVentures and Associates -
Schedule of Investments inJoint Ventures and
Associates (Parenthetical)(Detail)
$ in Thousands
Apr. 20, 2016MXN ($)
Petroquimica Mexicana de Vinilo. S. A. de C. V. [member]Disclosure of Investments in Subsidiaries Joint Ventures and Associates [Line items]Damages value $ 461,000
Copyright © 2018 www.secdatabase.com. All Rights Reserved.Please Consider the Environment Before Printing This Document
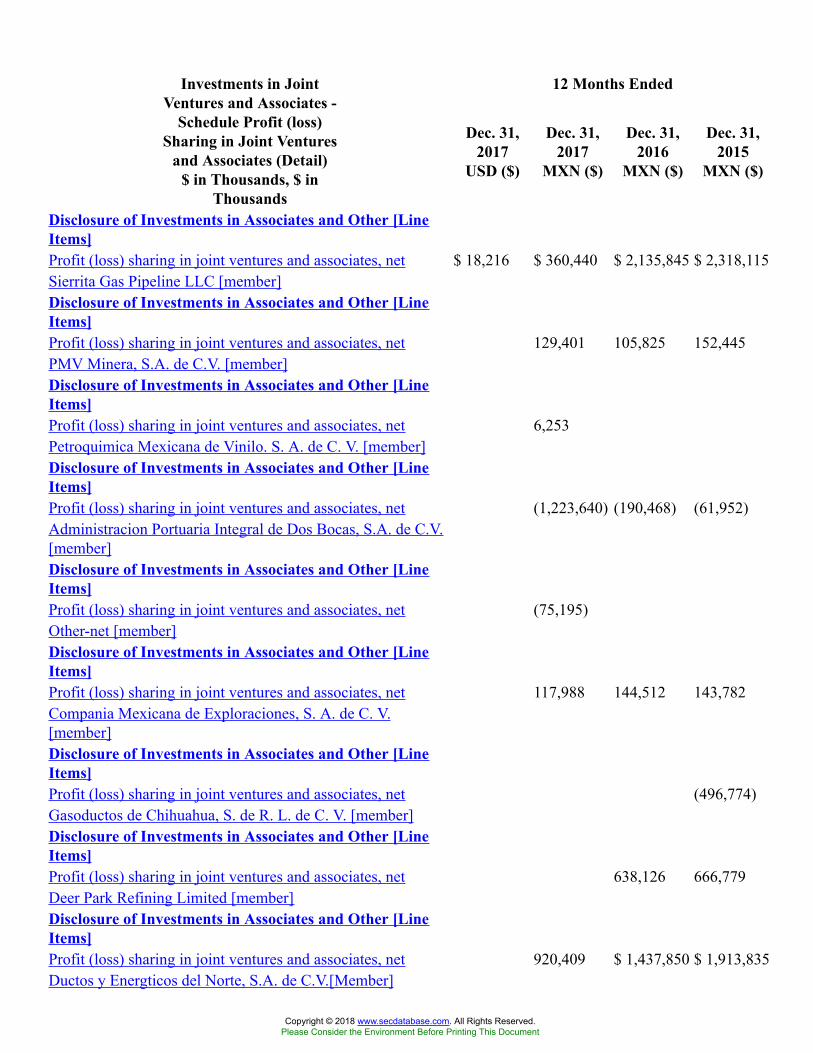
12 Months EndedInvestments in JointVentures and Associates -
Schedule Profit (loss)Sharing in Joint Ventures
and Associates (Detail)$ in Thousands, $ in
Thousands
Dec. 31,2017
USD ($)
Dec. 31,2017
MXN ($)
Dec. 31,2016
MXN ($)
Dec. 31,2015
MXN ($)
Disclosure of Investments in Associates and Other [LineItems]Profit (loss) sharing in joint ventures and associates, net $ 18,216 $ 360,440 $ 2,135,845 $ 2,318,115Sierrita Gas Pipeline LLC [member]Disclosure of Investments in Associates and Other [LineItems]Profit (loss) sharing in joint ventures and associates, net 129,401 105,825 152,445PMV Minera, S.A. de C.V. [member]Disclosure of Investments in Associates and Other [LineItems]Profit (loss) sharing in joint ventures and associates, net 6,253Petroquimica Mexicana de Vinilo. S. A. de C. V. [member]Disclosure of Investments in Associates and Other [LineItems]Profit (loss) sharing in joint ventures and associates, net (1,223,640) (190,468) (61,952)Administracion Portuaria Integral de Dos Bocas, S.A. de C.V.[member]Disclosure of Investments in Associates and Other [LineItems]Profit (loss) sharing in joint ventures and associates, net (75,195)Other-net [member]Disclosure of Investments in Associates and Other [LineItems]Profit (loss) sharing in joint ventures and associates, net 117,988 144,512 143,782Compania Mexicana de Exploraciones, S. A. de C. V.[member]Disclosure of Investments in Associates and Other [LineItems]Profit (loss) sharing in joint ventures and associates, net (496,774)Gasoductos de Chihuahua, S. de R. L. de C. V. [member]Disclosure of Investments in Associates and Other [LineItems]Profit (loss) sharing in joint ventures and associates, net 638,126 666,779Deer Park Refining Limited [member]Disclosure of Investments in Associates and Other [LineItems]Profit (loss) sharing in joint ventures and associates, net 920,409 $ 1,437,850 $ 1,913,835Ductos y Energticos del Norte, S.A. de C.V.[Member]
Copyright © 2018 www.secdatabase.com. All Rights Reserved.Please Consider the Environment Before Printing This Document
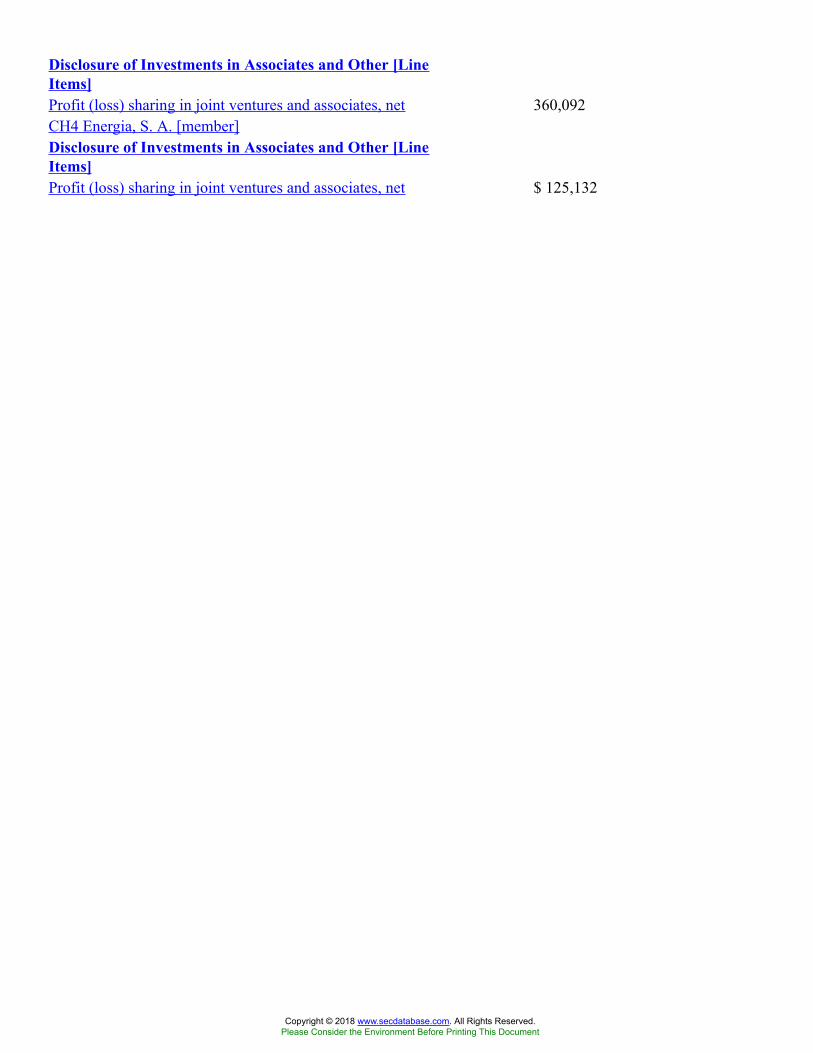
Disclosure of Investments in Associates and Other [LineItems]Profit (loss) sharing in joint ventures and associates, net 360,092CH4 Energia, S. A. [member]Disclosure of Investments in Associates and Other [LineItems]Profit (loss) sharing in joint ventures and associates, net $ 125,132
Copyright © 2018 www.secdatabase.com. All Rights Reserved.Please Consider the Environment Before Printing This Document
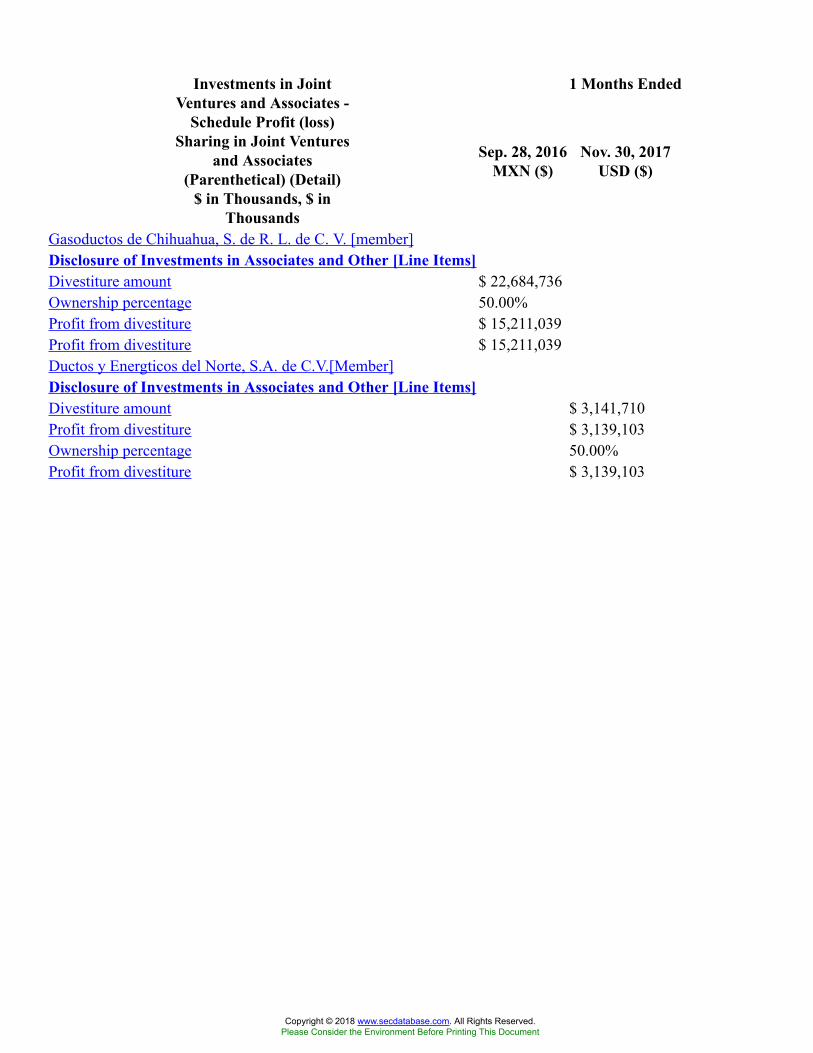
1 Months EndedInvestments in JointVentures and Associates -
Schedule Profit (loss)Sharing in Joint Ventures
and Associates(Parenthetical) (Detail)
$ in Thousands, $ inThousands
Sep. 28, 2016MXN ($)
Nov. 30, 2017USD ($)
Gasoductos de Chihuahua, S. de R. L. de C. V. [member]Disclosure of Investments in Associates and Other [Line Items]Divestiture amount $ 22,684,736Ownership percentage 50.00%Profit from divestiture $ 15,211,039Profit from divestiture $ 15,211,039Ductos y Energticos del Norte, S.A. de C.V.[Member]Disclosure of Investments in Associates and Other [Line Items]Divestiture amount $ 3,141,710Profit from divestiture $ 3,139,103Ownership percentage 50.00%Profit from divestiture $ 3,139,103
Copyright © 2018 www.secdatabase.com. All Rights Reserved.Please Consider the Environment Before Printing This Document
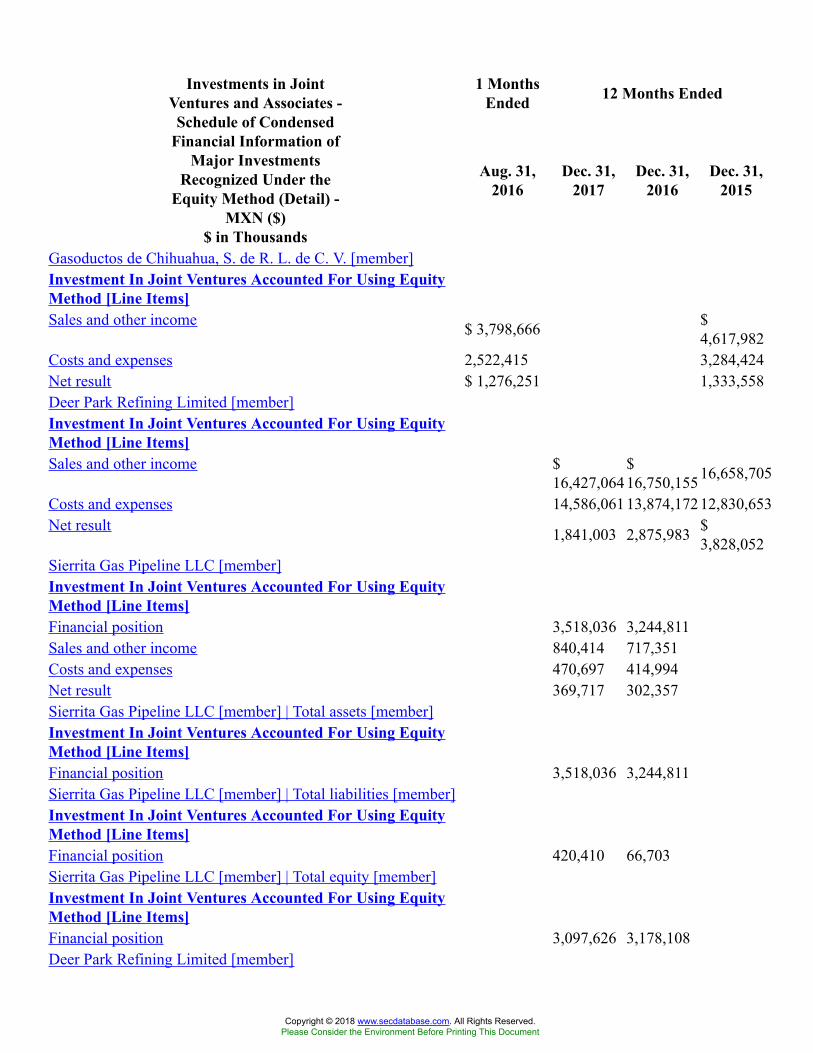
1 MonthsEnded 12 Months EndedInvestments in Joint
Ventures and Associates -Schedule of Condensed
Financial Information ofMajor Investments
Recognized Under theEquity Method (Detail) -
MXN ($)$ in Thousands
Aug. 31,2016
Dec. 31,2017
Dec. 31,2016
Dec. 31,2015
Gasoductos de Chihuahua, S. de R. L. de C. V. [member]Investment In Joint Ventures Accounted For Using EquityMethod [Line Items]Sales and other income $ 3,798,666 $
4,617,982Costs and expenses 2,522,415 3,284,424Net result $ 1,276,251 1,333,558Deer Park Refining Limited [member]Investment In Joint Ventures Accounted For Using EquityMethod [Line Items]Sales and other income $
16,427,064$16,750,15516,658,705
Costs and expenses 14,586,06113,874,17212,830,653Net result 1,841,003 2,875,983 $
3,828,052Sierrita Gas Pipeline LLC [member]Investment In Joint Ventures Accounted For Using EquityMethod [Line Items]Financial position 3,518,036 3,244,811Sales and other income 840,414 717,351Costs and expenses 470,697 414,994Net result 369,717 302,357Sierrita Gas Pipeline LLC [member] | Total assets [member]Investment In Joint Ventures Accounted For Using EquityMethod [Line Items]Financial position 3,518,036 3,244,811Sierrita Gas Pipeline LLC [member] | Total liabilities [member]Investment In Joint Ventures Accounted For Using EquityMethod [Line Items]Financial position 420,410 66,703Sierrita Gas Pipeline LLC [member] | Total equity [member]Investment In Joint Ventures Accounted For Using EquityMethod [Line Items]Financial position 3,097,626 3,178,108Deer Park Refining Limited [member]
Copyright © 2018 www.secdatabase.com. All Rights Reserved.Please Consider the Environment Before Printing This Document
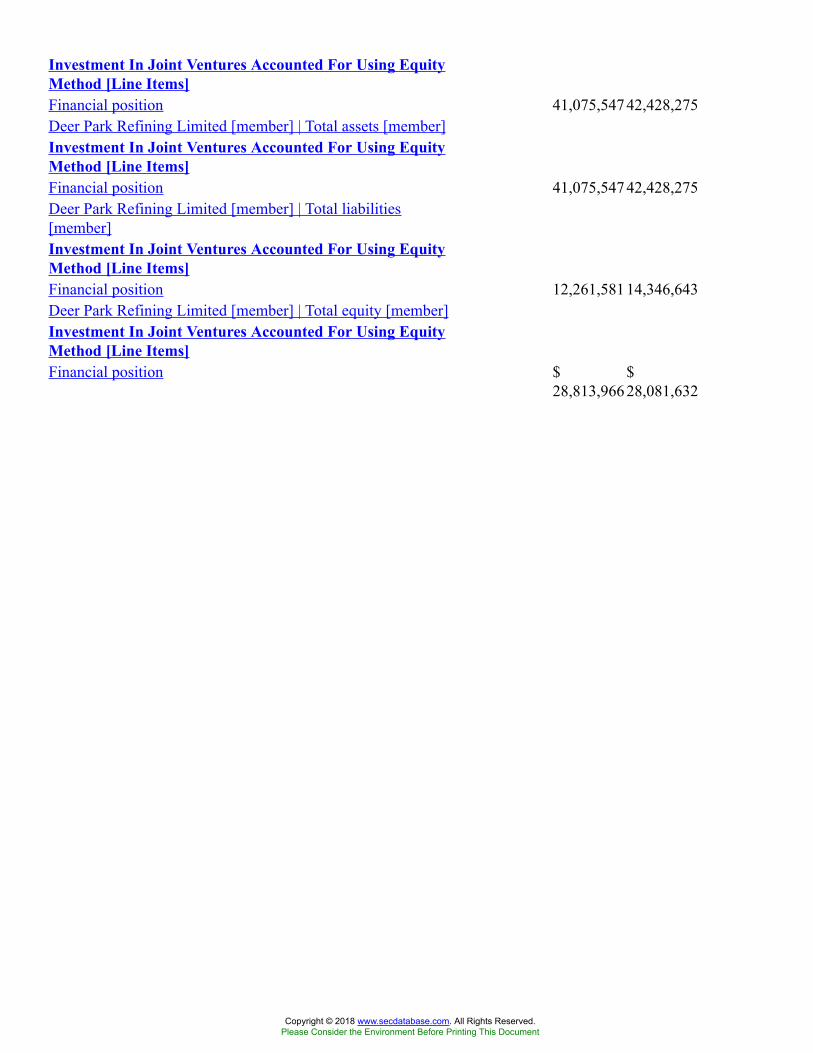
Investment In Joint Ventures Accounted For Using EquityMethod [Line Items]Financial position 41,075,54742,428,275Deer Park Refining Limited [member] | Total assets [member]Investment In Joint Ventures Accounted For Using EquityMethod [Line Items]Financial position 41,075,54742,428,275Deer Park Refining Limited [member] | Total liabilities[member]Investment In Joint Ventures Accounted For Using EquityMethod [Line Items]Financial position 12,261,58114,346,643Deer Park Refining Limited [member] | Total equity [member]Investment In Joint Ventures Accounted For Using EquityMethod [Line Items]Financial position $
28,813,966$28,081,632
Copyright © 2018 www.secdatabase.com. All Rights Reserved.Please Consider the Environment Before Printing This Document
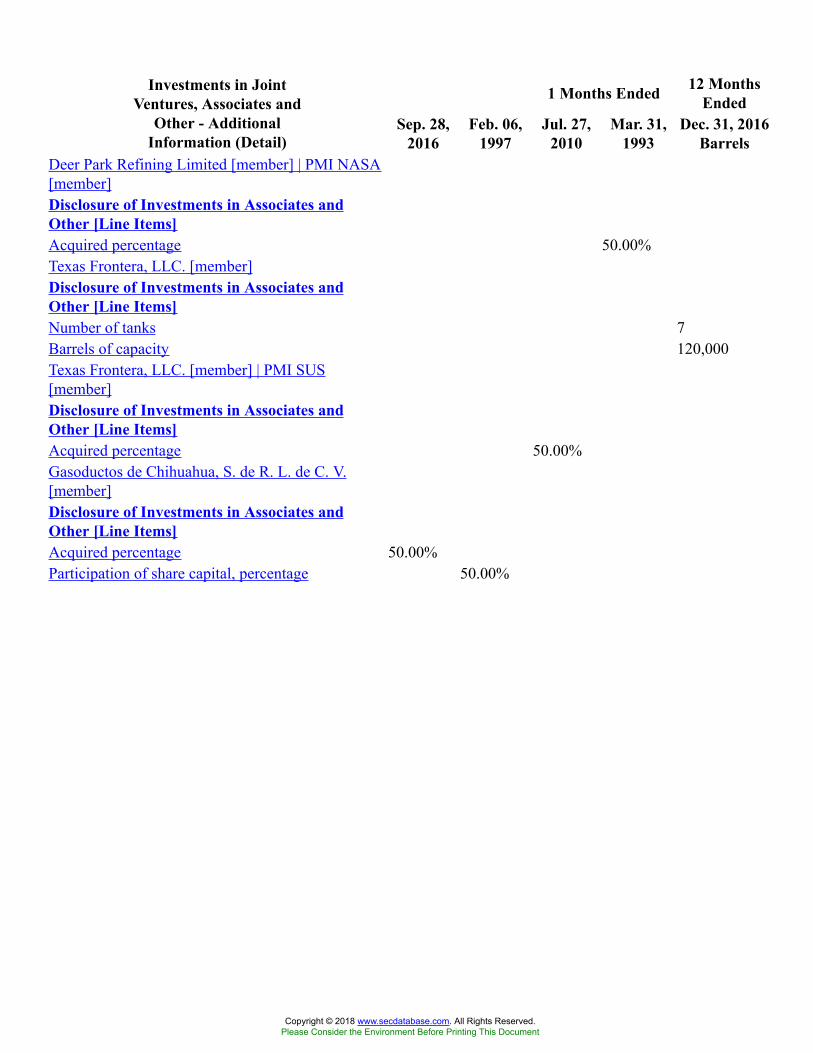
1 Months Ended 12 MonthsEnded
Investments in JointVentures, Associates and
Other - AdditionalInformation (Detail)
Sep. 28,2016
Feb. 06,1997
Jul. 27,2010
Mar. 31,1993
Dec. 31, 2016Barrels
Deer Park Refining Limited [member] | PMI NASA[member]Disclosure of Investments in Associates andOther [Line Items]Acquired percentage 50.00%Texas Frontera, LLC. [member]Disclosure of Investments in Associates andOther [Line Items]Number of tanks 7Barrels of capacity 120,000Texas Frontera, LLC. [member] | PMI SUS[member]Disclosure of Investments in Associates andOther [Line Items]Acquired percentage 50.00%Gasoductos de Chihuahua, S. de R. L. de C. V.[member]Disclosure of Investments in Associates andOther [Line Items]Acquired percentage 50.00%Participation of share capital, percentage 50.00%
Copyright © 2018 www.secdatabase.com. All Rights Reserved.Please Consider the Environment Before Printing This Document
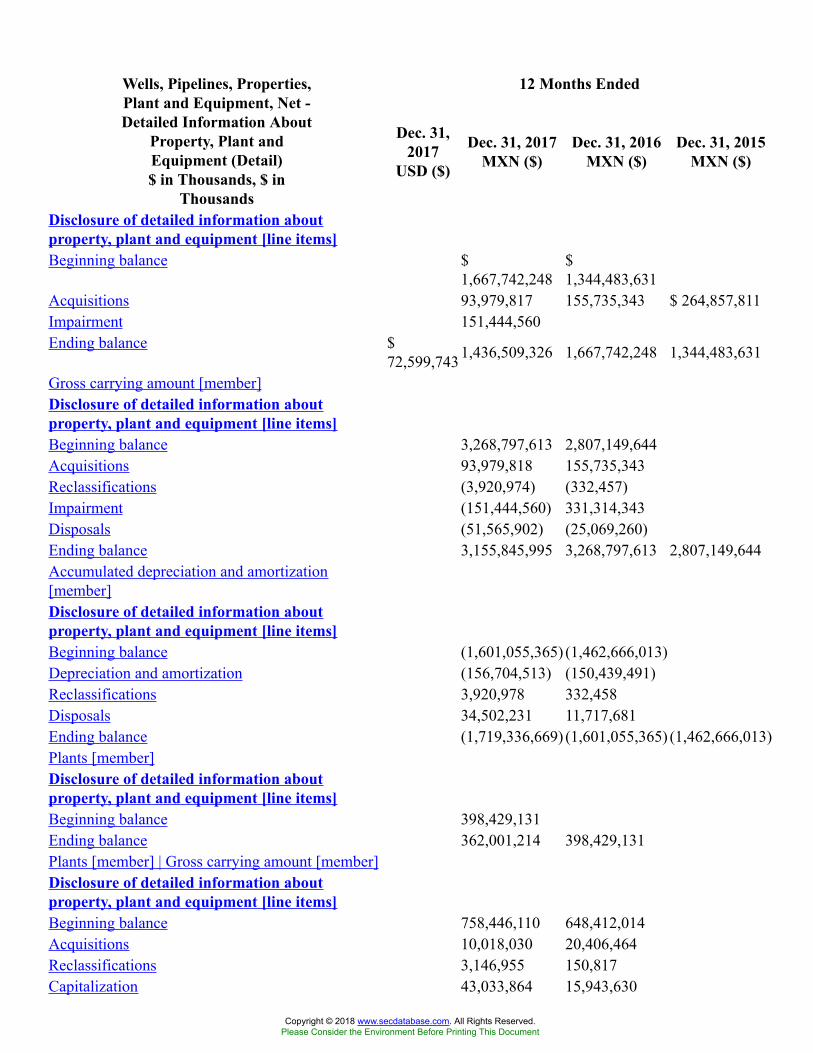
12 Months EndedWells, Pipelines, Properties,Plant and Equipment, Net -Detailed Information About
Property, Plant andEquipment (Detail)$ in Thousands, $ in
Thousands
Dec. 31,2017
USD ($)
Dec. 31, 2017MXN ($)
Dec. 31, 2016MXN ($)
Dec. 31, 2015MXN ($)
Disclosure of detailed information aboutproperty, plant and equipment [line items]Beginning balance $
1,667,742,248$1,344,483,631
Acquisitions 93,979,817 155,735,343 $ 264,857,811Impairment 151,444,560Ending balance $
72,599,7431,436,509,326 1,667,742,248 1,344,483,631
Gross carrying amount [member]Disclosure of detailed information aboutproperty, plant and equipment [line items]Beginning balance 3,268,797,613 2,807,149,644Acquisitions 93,979,818 155,735,343Reclassifications (3,920,974) (332,457)Impairment (151,444,560) 331,314,343Disposals (51,565,902) (25,069,260)Ending balance 3,155,845,995 3,268,797,613 2,807,149,644Accumulated depreciation and amortization[member]Disclosure of detailed information aboutproperty, plant and equipment [line items]Beginning balance (1,601,055,365) (1,462,666,013)Depreciation and amortization (156,704,513) (150,439,491)Reclassifications 3,920,978 332,458Disposals 34,502,231 11,717,681Ending balance (1,719,336,669) (1,601,055,365) (1,462,666,013)Plants [member]Disclosure of detailed information aboutproperty, plant and equipment [line items]Beginning balance 398,429,131Ending balance 362,001,214 398,429,131Plants [member] | Gross carrying amount [member]Disclosure of detailed information aboutproperty, plant and equipment [line items]Beginning balance 758,446,110 648,412,014Acquisitions 10,018,030 20,406,464Reclassifications 3,146,955 150,817Capitalization 43,033,864 15,943,630
Copyright © 2018 www.secdatabase.com. All Rights Reserved.Please Consider the Environment Before Printing This Document

Impairment (48,020,616) 81,135,967Disposals (10,598,983) (7,602,782)Ending balance 756,025,360 758,446,110 648,412,014Plants [member] | Accumulated depreciation andamortization [member]Disclosure of detailed information aboutproperty, plant and equipment [line items]Beginning balance (360,016,979) (321,283,906)Depreciation and amortization (45,709,123) (44,549,443)Reclassifications 2,799,244 (10,521)Disposals 8,902,711 5,826,891Ending balance $ (394,024,147) (360,016,979) (321,283,906)Plants [member] | Bottom of range [member]Disclosure of detailed information aboutproperty, plant and equipment [line items]Depreciation rates 3.00% 3.00%Estimated useful lives 20 Years 20 YearsPlants [member] | Top of range [member]Disclosure of detailed information aboutproperty, plant and equipment [line items]Depreciation rates 5.00% 5.00%Estimated useful lives 35 Years 35 YearsDrilling equipment [member]Disclosure of detailed information aboutproperty, plant and equipment [line items]Beginning balance $ 20,326,541Ending balance $ 18,429,132 20,326,541Depreciation rates 5.00% 5.00%Estimated useful lives 20 Years 20 YearsDrilling equipment [member] | Gross carryingamount [member]Disclosure of detailed information aboutproperty, plant and equipment [line items]Beginning balance $ 23,269,116 21,680,343Acquisitions 418,283 1,629,710Disposals (244,283) (40,937)Ending balance 23,443,116 23,269,116 21,680,343Drilling equipment [member] | Accumulateddepreciation and amortization [member]Disclosure of detailed information aboutproperty, plant and equipment [line items]Beginning balance (2,942,575) (578,015)Depreciation and amortization (2,198,867) (2,364,560)Disposals 127,458Ending balance (5,013,984) (2,942,575) (578,015)
Copyright © 2018 www.secdatabase.com. All Rights Reserved.Please Consider the Environment Before Printing This Document
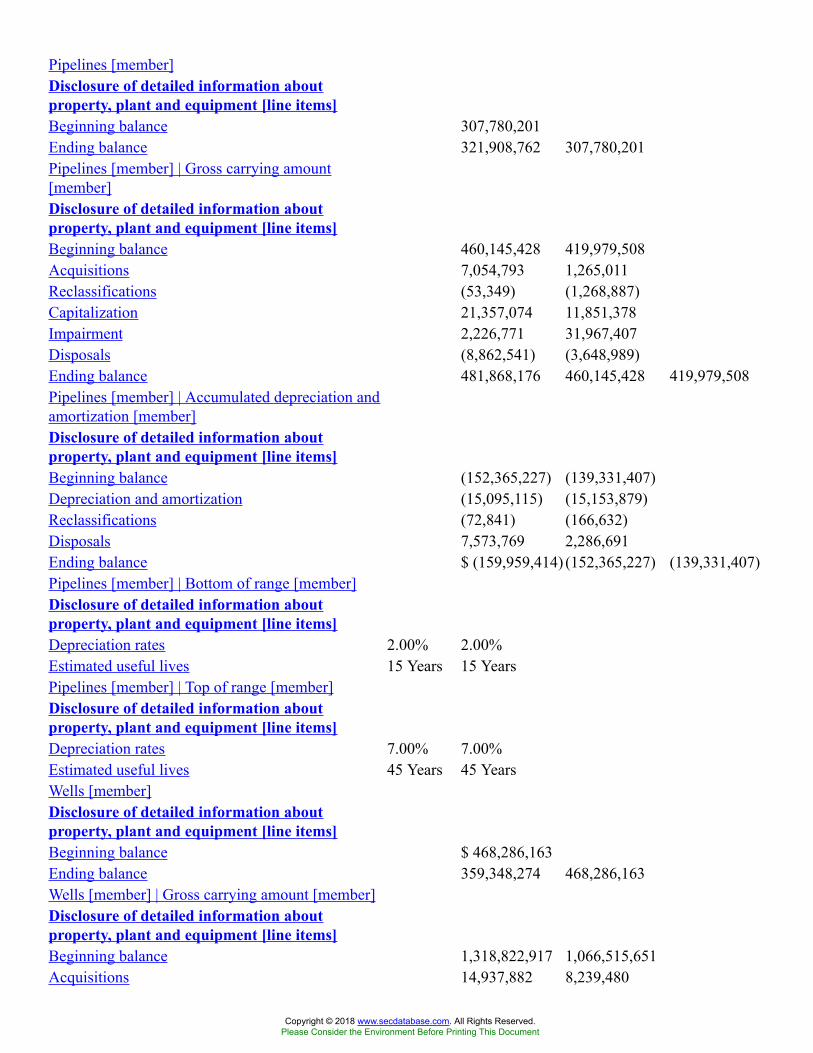
Pipelines [member]Disclosure of detailed information aboutproperty, plant and equipment [line items]Beginning balance 307,780,201Ending balance 321,908,762 307,780,201Pipelines [member] | Gross carrying amount[member]Disclosure of detailed information aboutproperty, plant and equipment [line items]Beginning balance 460,145,428 419,979,508Acquisitions 7,054,793 1,265,011Reclassifications (53,349) (1,268,887)Capitalization 21,357,074 11,851,378Impairment 2,226,771 31,967,407Disposals (8,862,541) (3,648,989)Ending balance 481,868,176 460,145,428 419,979,508Pipelines [member] | Accumulated depreciation andamortization [member]Disclosure of detailed information aboutproperty, plant and equipment [line items]Beginning balance (152,365,227) (139,331,407)Depreciation and amortization (15,095,115) (15,153,879)Reclassifications (72,841) (166,632)Disposals 7,573,769 2,286,691Ending balance $ (159,959,414) (152,365,227) (139,331,407)Pipelines [member] | Bottom of range [member]Disclosure of detailed information aboutproperty, plant and equipment [line items]Depreciation rates 2.00% 2.00%Estimated useful lives 15 Years 15 YearsPipelines [member] | Top of range [member]Disclosure of detailed information aboutproperty, plant and equipment [line items]Depreciation rates 7.00% 7.00%Estimated useful lives 45 Years 45 YearsWells [member]Disclosure of detailed information aboutproperty, plant and equipment [line items]Beginning balance $ 468,286,163Ending balance 359,348,274 468,286,163Wells [member] | Gross carrying amount [member]Disclosure of detailed information aboutproperty, plant and equipment [line items]Beginning balance 1,318,822,917 1,066,515,651Acquisitions 14,937,882 8,239,480
Copyright © 2018 www.secdatabase.com. All Rights Reserved.Please Consider the Environment Before Printing This Document
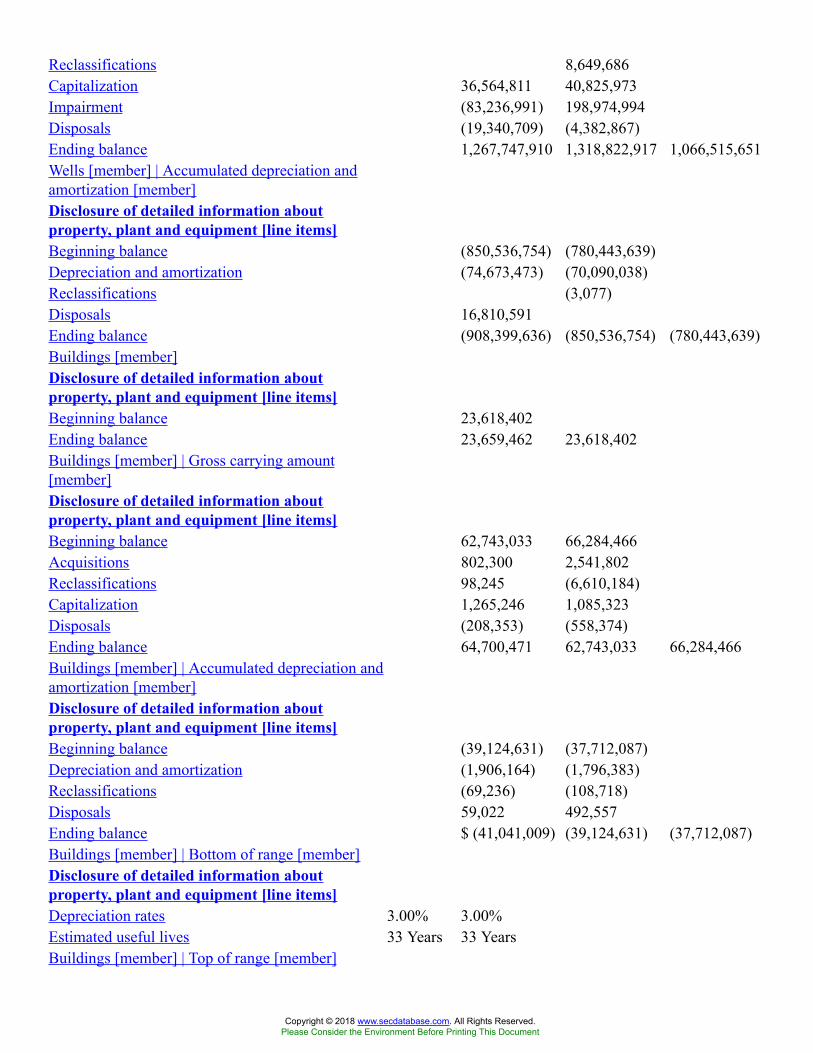
Reclassifications 8,649,686Capitalization 36,564,811 40,825,973Impairment (83,236,991) 198,974,994Disposals (19,340,709) (4,382,867)Ending balance 1,267,747,910 1,318,822,917 1,066,515,651Wells [member] | Accumulated depreciation andamortization [member]Disclosure of detailed information aboutproperty, plant and equipment [line items]Beginning balance (850,536,754) (780,443,639)Depreciation and amortization (74,673,473) (70,090,038)Reclassifications (3,077)Disposals 16,810,591Ending balance (908,399,636) (850,536,754) (780,443,639)Buildings [member]Disclosure of detailed information aboutproperty, plant and equipment [line items]Beginning balance 23,618,402Ending balance 23,659,462 23,618,402Buildings [member] | Gross carrying amount[member]Disclosure of detailed information aboutproperty, plant and equipment [line items]Beginning balance 62,743,033 66,284,466Acquisitions 802,300 2,541,802Reclassifications 98,245 (6,610,184)Capitalization 1,265,246 1,085,323Disposals (208,353) (558,374)Ending balance 64,700,471 62,743,033 66,284,466Buildings [member] | Accumulated depreciation andamortization [member]Disclosure of detailed information aboutproperty, plant and equipment [line items]Beginning balance (39,124,631) (37,712,087)Depreciation and amortization (1,906,164) (1,796,383)Reclassifications (69,236) (108,718)Disposals 59,022 492,557Ending balance $ (41,041,009) (39,124,631) (37,712,087)Buildings [member] | Bottom of range [member]Disclosure of detailed information aboutproperty, plant and equipment [line items]Depreciation rates 3.00% 3.00%Estimated useful lives 33 Years 33 YearsBuildings [member] | Top of range [member]
Copyright © 2018 www.secdatabase.com. All Rights Reserved.Please Consider the Environment Before Printing This Document
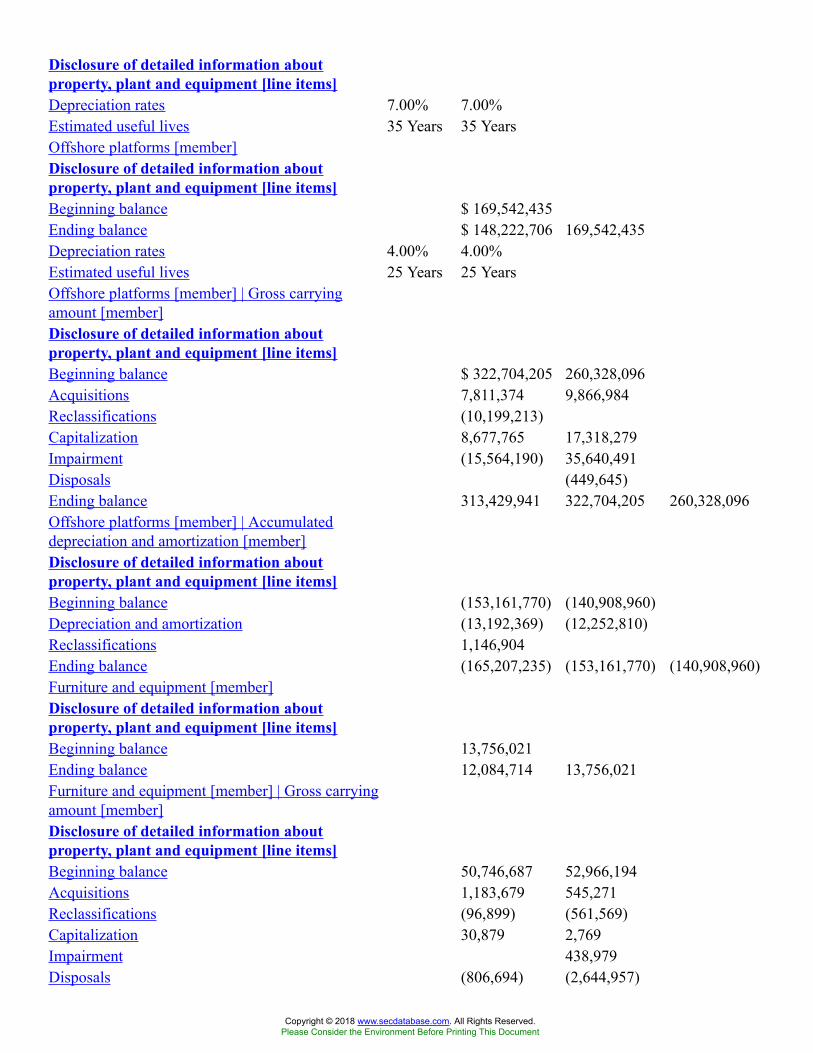
Disclosure of detailed information aboutproperty, plant and equipment [line items]Depreciation rates 7.00% 7.00%Estimated useful lives 35 Years 35 YearsOffshore platforms [member]Disclosure of detailed information aboutproperty, plant and equipment [line items]Beginning balance $ 169,542,435Ending balance $ 148,222,706 169,542,435Depreciation rates 4.00% 4.00%Estimated useful lives 25 Years 25 YearsOffshore platforms [member] | Gross carryingamount [member]Disclosure of detailed information aboutproperty, plant and equipment [line items]Beginning balance $ 322,704,205 260,328,096Acquisitions 7,811,374 9,866,984Reclassifications (10,199,213)Capitalization 8,677,765 17,318,279Impairment (15,564,190) 35,640,491Disposals (449,645)Ending balance 313,429,941 322,704,205 260,328,096Offshore platforms [member] | Accumulateddepreciation and amortization [member]Disclosure of detailed information aboutproperty, plant and equipment [line items]Beginning balance (153,161,770) (140,908,960)Depreciation and amortization (13,192,369) (12,252,810)Reclassifications 1,146,904Ending balance (165,207,235) (153,161,770) (140,908,960)Furniture and equipment [member]Disclosure of detailed information aboutproperty, plant and equipment [line items]Beginning balance 13,756,021Ending balance 12,084,714 13,756,021Furniture and equipment [member] | Gross carryingamount [member]Disclosure of detailed information aboutproperty, plant and equipment [line items]Beginning balance 50,746,687 52,966,194Acquisitions 1,183,679 545,271Reclassifications (96,899) (561,569)Capitalization 30,879 2,769Impairment 438,979Disposals (806,694) (2,644,957)
Copyright © 2018 www.secdatabase.com. All Rights Reserved.Please Consider the Environment Before Printing This Document

Ending balance 51,057,652 50,746,687 52,966,194Furniture and equipment [member] | Accumulateddepreciation and amortization [member]Disclosure of detailed information aboutproperty, plant and equipment [line items]Beginning balance (36,990,666) (36,513,479)Depreciation and amortization (2,890,563) (3,205,089)Reclassifications 102,375 166,914Disposals 805,916 2,560,988Ending balance $ (38,972,938) (36,990,666) (36,513,479)Furniture and equipment [member] | Bottom ofrange [member]Disclosure of detailed information aboutproperty, plant and equipment [line items]Depreciation rates 3.00% 3.00%Estimated useful lives 3 Years 3 YearsFurniture and equipment [member] | Top of range[member]Disclosure of detailed information aboutproperty, plant and equipment [line items]Depreciation rates 10.00% 10.00%Estimated useful lives 10 Years 10 YearsTransportation equipment [member]Disclosure of detailed information aboutproperty, plant and equipment [line items]Beginning balance $ 13,526,082Ending balance 16,453,330 13,526,082Transportation equipment [member] | Grosscarrying amount [member]Disclosure of detailed information aboutproperty, plant and equipment [line items]Beginning balance 19,442,845 15,329,095Acquisitions 284,445 2,063,519Reclassifications (75,674) (325,778)Capitalization 3,746,395 2,918,621Impairment 8,743Disposals (226,375) (551,355)Ending balance 23,171,636 19,442,845 15,329,095Transportation equipment [member] | Accumulateddepreciation and amortization [member]Disclosure of detailed information aboutproperty, plant and equipment [line items]Beginning balance (5,916,763) (5,894,520)Depreciation and amortization (1,038,839) (1,027,289)Reclassifications 14,532 454,492
Copyright © 2018 www.secdatabase.com. All Rights Reserved.Please Consider the Environment Before Printing This Document

Disposals 222,764 550,554Ending balance $ (6,718,306) (5,916,763) (5,894,520)Transportation equipment [member] | Bottom ofrange [member]Disclosure of detailed information aboutproperty, plant and equipment [line items]Depreciation rates 4.00% 4.00%Estimated useful lives 5 Years 5 YearsTransportation equipment [member] | Top of range[member]Disclosure of detailed information aboutproperty, plant and equipment [line items]Depreciation rates 20.00% 20.00%Estimated useful lives 25 Years 25 YearsConstruction in progress [member]Disclosure of detailed information aboutproperty, plant and equipment [line items]Beginning balance $ 207,414,148Ending balance 129,736,382 207,414,148Construction in progress [member] | Gross carryingamount [member]Disclosure of detailed information aboutproperty, plant and equipment [line items]Beginning balance 207,414,148 211,675,597Acquisitions 51,410,469 107,682,868Reclassifications (812,943) (282,044)Capitalization (114,700,828) (89,945,973)Impairment (6,849,534) (16,852,238)Disposals (6,724,930) (4,864,062)Ending balance 129,736,382 207,414,148 211,675,597Land [member]Disclosure of detailed information aboutproperty, plant and equipment [line items]Beginning balance 44,571,618Ending balance 44,546,699 44,571,618Land [member] | Gross carrying amount [member]Disclosure of detailed information aboutproperty, plant and equipment [line items]Beginning balance 44,571,618 43,347,802Acquisitions 58,563 1,487,434Reclassifications (560) 50,709Capitalization 29,248Disposals (112,170) (314,327)Ending balance $ 44,546,699 44,571,618 43,347,802Land [member] | Bottom of range [member]
Copyright © 2018 www.secdatabase.com. All Rights Reserved.Please Consider the Environment Before Printing This Document
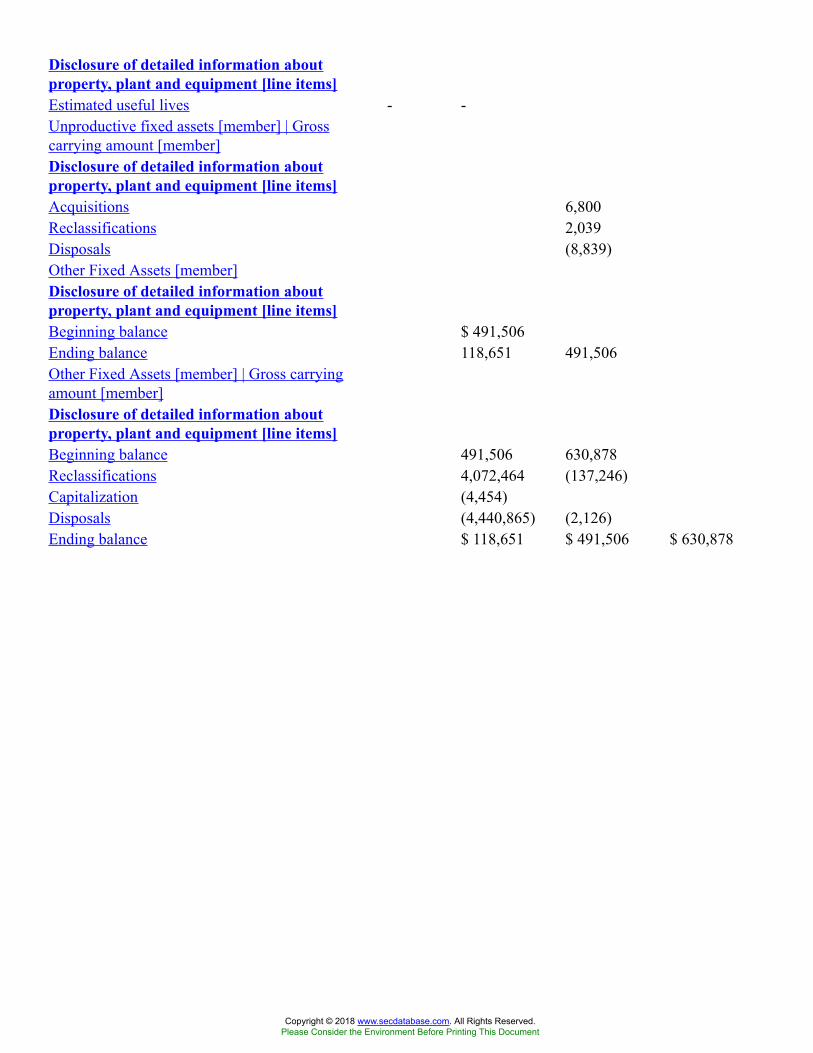
Disclosure of detailed information aboutproperty, plant and equipment [line items]Estimated useful lives - -Unproductive fixed assets [member] | Grosscarrying amount [member]Disclosure of detailed information aboutproperty, plant and equipment [line items]Acquisitions 6,800Reclassifications 2,039Disposals (8,839)Other Fixed Assets [member]Disclosure of detailed information aboutproperty, plant and equipment [line items]Beginning balance $ 491,506Ending balance 118,651 491,506Other Fixed Assets [member] | Gross carryingamount [member]Disclosure of detailed information aboutproperty, plant and equipment [line items]Beginning balance 491,506 630,878Reclassifications 4,072,464 (137,246)Capitalization (4,454)Disposals (4,440,865) (2,126)Ending balance $ 118,651 $ 491,506 $ 630,878
Copyright © 2018 www.secdatabase.com. All Rights Reserved.Please Consider the Environment Before Printing This Document
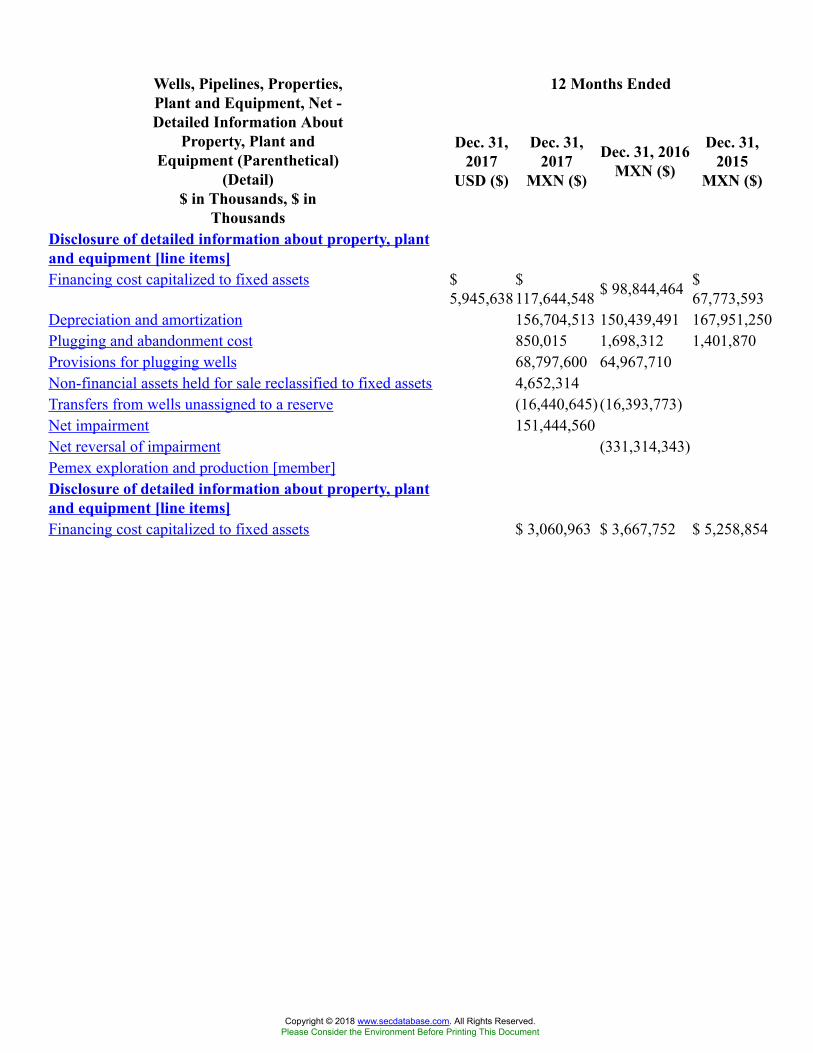
12 Months EndedWells, Pipelines, Properties,Plant and Equipment, Net -Detailed Information About
Property, Plant andEquipment (Parenthetical)
(Detail)$ in Thousands, $ in
Thousands
Dec. 31,2017
USD ($)
Dec. 31,2017
MXN ($)
Dec. 31, 2016MXN ($)
Dec. 31,2015
MXN ($)
Disclosure of detailed information about property, plantand equipment [line items]Financing cost capitalized to fixed assets $
5,945,638$117,644,548 $ 98,844,464 $
67,773,593Depreciation and amortization 156,704,513 150,439,491 167,951,250Plugging and abandonment cost 850,015 1,698,312 1,401,870Provisions for plugging wells 68,797,600 64,967,710Non-financial assets held for sale reclassified to fixed assets 4,652,314Transfers from wells unassigned to a reserve (16,440,645) (16,393,773)Net impairment 151,444,560Net reversal of impairment (331,314,343)Pemex exploration and production [member]Disclosure of detailed information about property, plantand equipment [line items]Financing cost capitalized to fixed assets $ 3,060,963 $ 3,667,752 $ 5,258,854
Copyright © 2018 www.secdatabase.com. All Rights Reserved.Please Consider the Environment Before Printing This Document

12 Months EndedWells, Pipelines, Properties,Plant and Equipment, Net -
Summary of Net Impairment(Detail)
$ in Thousands, $ inThousands
Dec. 31,2017
USD ($)
Dec. 31, 2017MXN ($)
Dec. 31,2016
MXN ($)
Dec. 31, 2015MXN ($)
Disclosure of detailed information about property,plant and equipment [line items]Impairment $
(155,244,350)$(19,640,505)
Reversal of impairment 3,799,790 350,954,848Impairment / (Reversal of impairment) $
(7,653,856) (151,444,560) 331,314,343 $(477,944,690)
Pemex exploration and production [member]Disclosure of detailed information about property,plant and equipment [line items]Impairment (129,350,315) (16,872,238)Reversal of impairment 288,581,670Impairment / (Reversal of impairment) (129,350,315) 271,709,432Pemex industrial transformation [member]Disclosure of detailed information about property,plant and equipment [line items]Impairment (19,751,882) (2,768,267)Reversal of impairment 3,799,790 55,267,148Impairment / (Reversal of impairment) (15,952,092) 52,498,881AGRO [member]Disclosure of detailed information about property,plant and equipment [line items]Impairment (4,206,653)Impairment / (Reversal of impairment) (4,206,653)Pemex Fertilizers [member]Disclosure of detailed information about property,plant and equipment [line items]Impairment (1,935,500)Impairment / (Reversal of impairment) $ (1,935,500)Pemex Logistics [member]Disclosure of detailed information about property,plant and equipment [line items]Reversal of impairment 5,829,520Impairment / (Reversal of impairment) 5,829,520Pemex Ethylene [member]Disclosure of detailed information about property,plant and equipment [line items]Reversal of impairment 1,276,510Impairment / (Reversal of impairment) $ 1,276,510
Copyright © 2018 www.secdatabase.com. All Rights Reserved.Please Consider the Environment Before Printing This Document
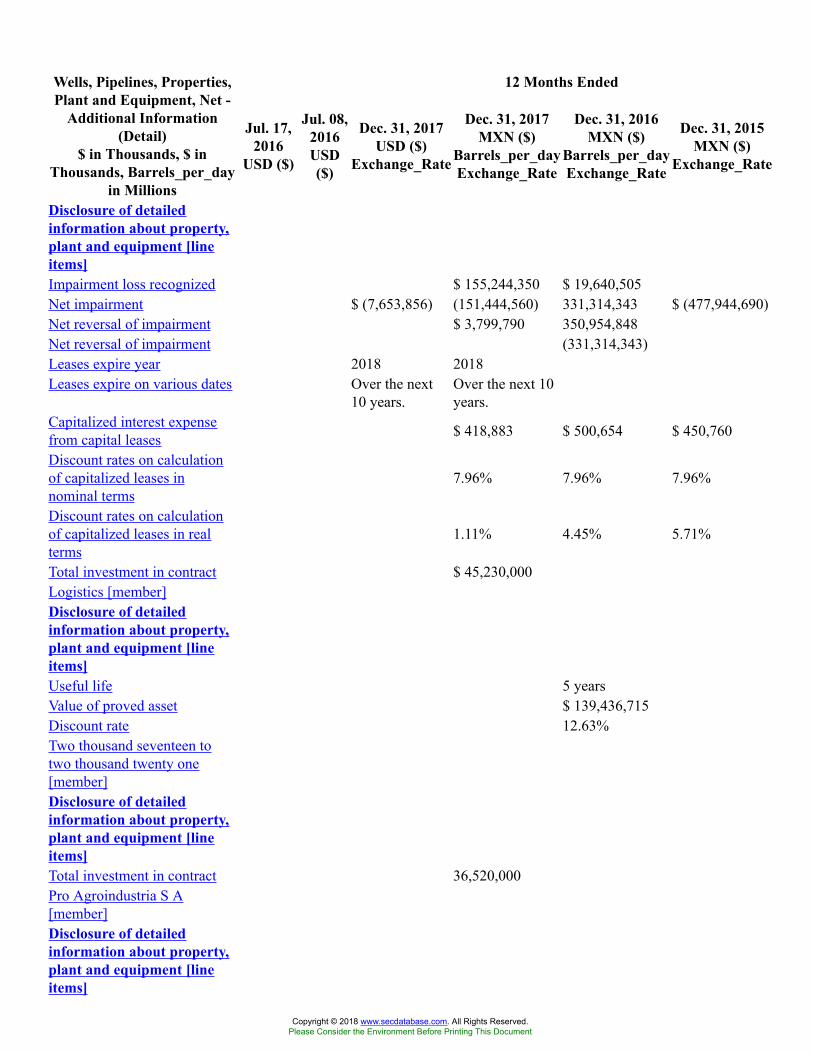
12 Months EndedWells, Pipelines, Properties,Plant and Equipment, Net -
Additional Information(Detail)
$ in Thousands, $ inThousands, Barrels_per_day
in Millions
Jul. 17,2016
USD ($)
Jul. 08,2016USD($)
Dec. 31, 2017USD ($)
Exchange_Rate
Dec. 31, 2017MXN ($)
Barrels_per_dayExchange_Rate
Dec. 31, 2016MXN ($)
Barrels_per_dayExchange_Rate
Dec. 31, 2015MXN ($)
Exchange_Rate
Disclosure of detailedinformation about property,plant and equipment [lineitems]Impairment loss recognized $ 155,244,350 $ 19,640,505Net impairment $ (7,653,856) (151,444,560) 331,314,343 $ (477,944,690)Net reversal of impairment $ 3,799,790 350,954,848Net reversal of impairment (331,314,343)Leases expire year 2018 2018Leases expire on various dates Over the next
10 years.Over the next 10years.
Capitalized interest expensefrom capital leases $ 418,883 $ 500,654 $ 450,760
Discount rates on calculationof capitalized leases innominal terms
7.96% 7.96% 7.96%
Discount rates on calculationof capitalized leases in realterms
1.11% 4.45% 5.71%
Total investment in contract $ 45,230,000Logistics [member]Disclosure of detailedinformation about property,plant and equipment [lineitems]Useful life 5 yearsValue of proved asset $ 139,436,715Discount rate 12.63%Two thousand seventeen totwo thousand twenty one[member]Disclosure of detailedinformation about property,plant and equipment [lineitems]Total investment in contract 36,520,000Pro Agroindustria S A[member]Disclosure of detailedinformation about property,plant and equipment [lineitems]
Copyright © 2018 www.secdatabase.com. All Rights Reserved.Please Consider the Environment Before Printing This Document
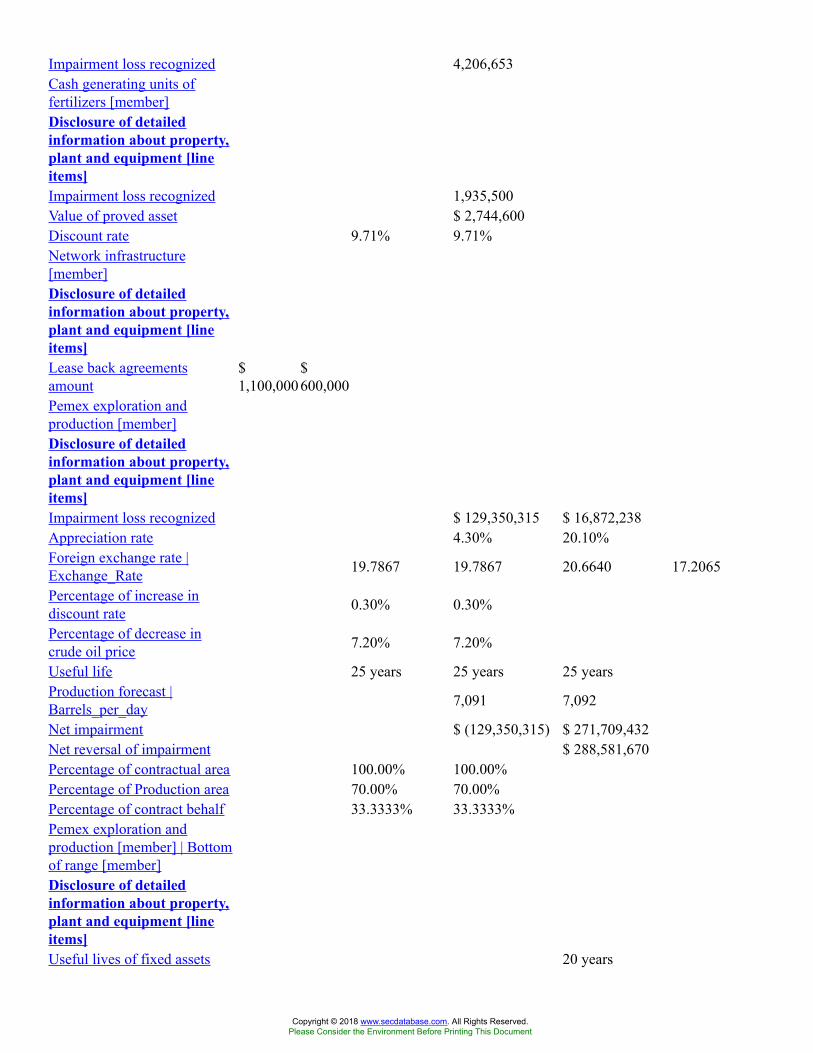
Impairment loss recognized 4,206,653Cash generating units offertilizers [member]Disclosure of detailedinformation about property,plant and equipment [lineitems]Impairment loss recognized 1,935,500Value of proved asset $ 2,744,600Discount rate 9.71% 9.71%Network infrastructure[member]Disclosure of detailedinformation about property,plant and equipment [lineitems]Lease back agreementsamount
$1,100,000
$600,000
Pemex exploration andproduction [member]Disclosure of detailedinformation about property,plant and equipment [lineitems]Impairment loss recognized $ 129,350,315 $ 16,872,238Appreciation rate 4.30% 20.10%Foreign exchange rate |Exchange_Rate 19.7867 19.7867 20.6640 17.2065
Percentage of increase indiscount rate 0.30% 0.30%
Percentage of decrease incrude oil price 7.20% 7.20%
Useful life 25 years 25 years 25 yearsProduction forecast |Barrels_per_day 7,091 7,092
Net impairment $ (129,350,315) $ 271,709,432Net reversal of impairment $ 288,581,670Percentage of contractual area 100.00% 100.00%Percentage of Production area 70.00% 70.00%Percentage of contract behalf 33.3333% 33.3333%Pemex exploration andproduction [member] | Bottomof range [member]Disclosure of detailedinformation about property,plant and equipment [lineitems]Useful lives of fixed assets 20 years
Copyright © 2018 www.secdatabase.com. All Rights Reserved.Please Consider the Environment Before Printing This Document

Pemex exploration andproduction [member] | Top ofrange [member]Disclosure of detailedinformation about property,plant and equipment [lineitems]Useful lives of fixed assets 25 yearsPemex exploration andproduction [member] |Licenses [member]Disclosure of detailedinformation about property,plant and equipment [lineitems]Percentage of contractual area 40.00% 40.00%Pemex exploration andproduction [member] | Areatwo [member]Disclosure of detailedinformation about property,plant and equipment [lineitems]Percentage of Production area 30.00% 30.00%Pemex exploration andproduction [member] | Areaeight [member]Disclosure of detailedinformation about property,plant and equipment [lineitems]Percentage of contractual area 50.00% 50.00%Pemex exploration andproduction [member] | Oilfields [member]Disclosure of detailedinformation about property,plant and equipment [lineitems]Net reversal of impairment $ 288,581,670Pemex industrialtransformation [member]Disclosure of detailedinformation about property,plant and equipment [lineitems]Impairment loss recognized $ 19,751,882 $ 2,768,267Appreciation rate 20.10%Foreign exchange rate |Exchange_Rate 20.6640 17.2065
Copyright © 2018 www.secdatabase.com. All Rights Reserved.Please Consider the Environment Before Printing This Document
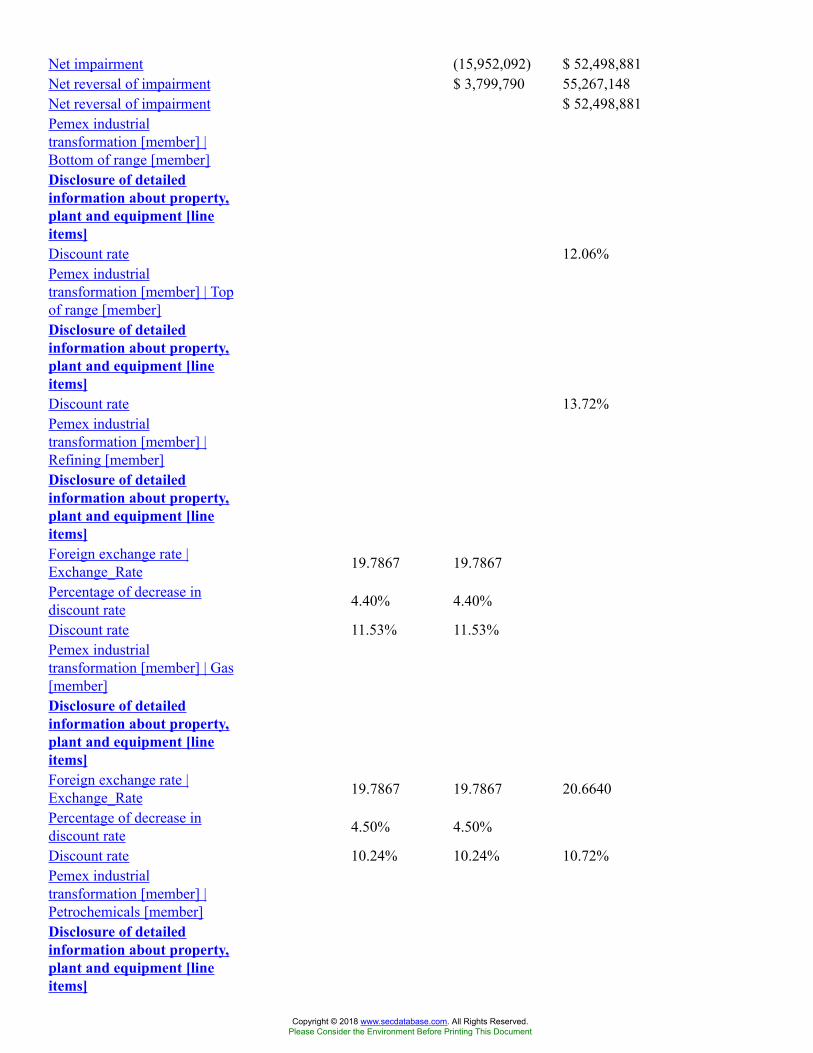
Net impairment (15,952,092) $ 52,498,881Net reversal of impairment $ 3,799,790 55,267,148Net reversal of impairment $ 52,498,881Pemex industrialtransformation [member] |Bottom of range [member]Disclosure of detailedinformation about property,plant and equipment [lineitems]Discount rate 12.06%Pemex industrialtransformation [member] | Topof range [member]Disclosure of detailedinformation about property,plant and equipment [lineitems]Discount rate 13.72%Pemex industrialtransformation [member] |Refining [member]Disclosure of detailedinformation about property,plant and equipment [lineitems]Foreign exchange rate |Exchange_Rate 19.7867 19.7867
Percentage of decrease indiscount rate 4.40% 4.40%
Discount rate 11.53% 11.53%Pemex industrialtransformation [member] | Gas[member]Disclosure of detailedinformation about property,plant and equipment [lineitems]Foreign exchange rate |Exchange_Rate 19.7867 19.7867 20.6640
Percentage of decrease indiscount rate 4.50% 4.50%
Discount rate 10.24% 10.24% 10.72%Pemex industrialtransformation [member] |Petrochemicals [member]Disclosure of detailedinformation about property,plant and equipment [lineitems]
Copyright © 2018 www.secdatabase.com. All Rights Reserved.Please Consider the Environment Before Printing This Document
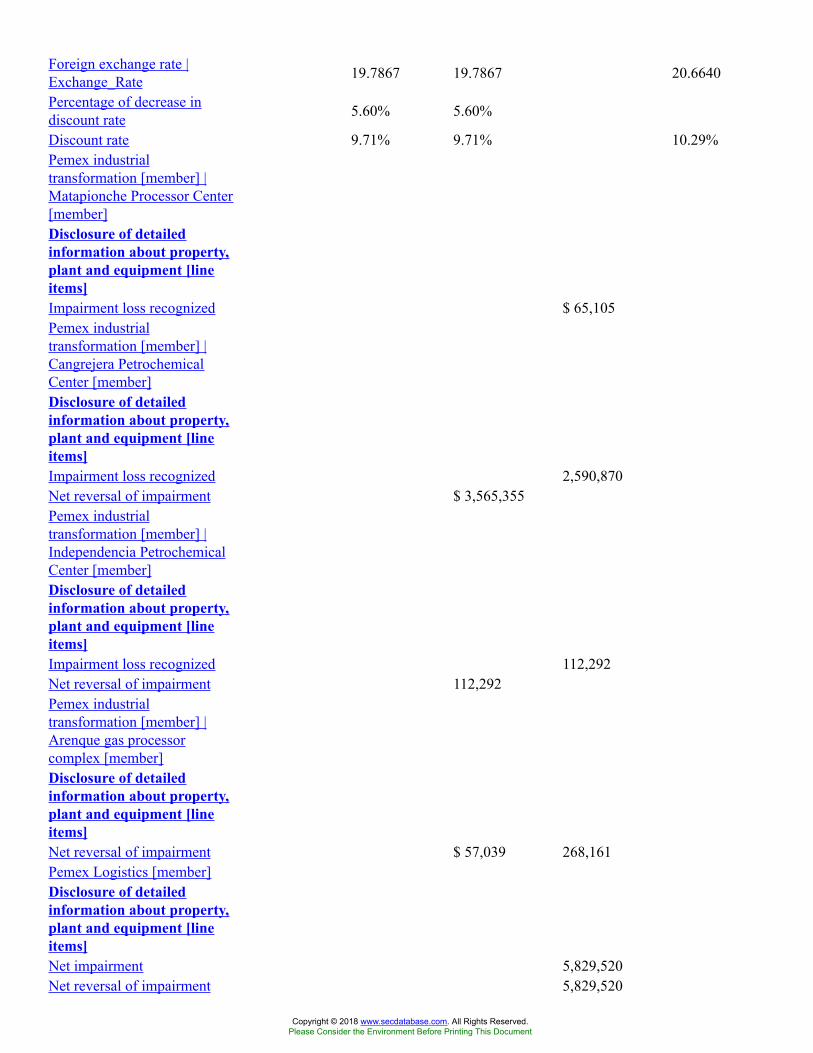
Foreign exchange rate |Exchange_Rate 19.7867 19.7867 20.6640
Percentage of decrease indiscount rate 5.60% 5.60%
Discount rate 9.71% 9.71% 10.29%Pemex industrialtransformation [member] |Matapionche Processor Center[member]Disclosure of detailedinformation about property,plant and equipment [lineitems]Impairment loss recognized $ 65,105Pemex industrialtransformation [member] |Cangrejera PetrochemicalCenter [member]Disclosure of detailedinformation about property,plant and equipment [lineitems]Impairment loss recognized 2,590,870Net reversal of impairment $ 3,565,355Pemex industrialtransformation [member] |Independencia PetrochemicalCenter [member]Disclosure of detailedinformation about property,plant and equipment [lineitems]Impairment loss recognized 112,292Net reversal of impairment 112,292Pemex industrialtransformation [member] |Arenque gas processorcomplex [member]Disclosure of detailedinformation about property,plant and equipment [lineitems]Net reversal of impairment $ 57,039 268,161Pemex Logistics [member]Disclosure of detailedinformation about property,plant and equipment [lineitems]Net impairment 5,829,520Net reversal of impairment 5,829,520
Copyright © 2018 www.secdatabase.com. All Rights Reserved.Please Consider the Environment Before Printing This Document
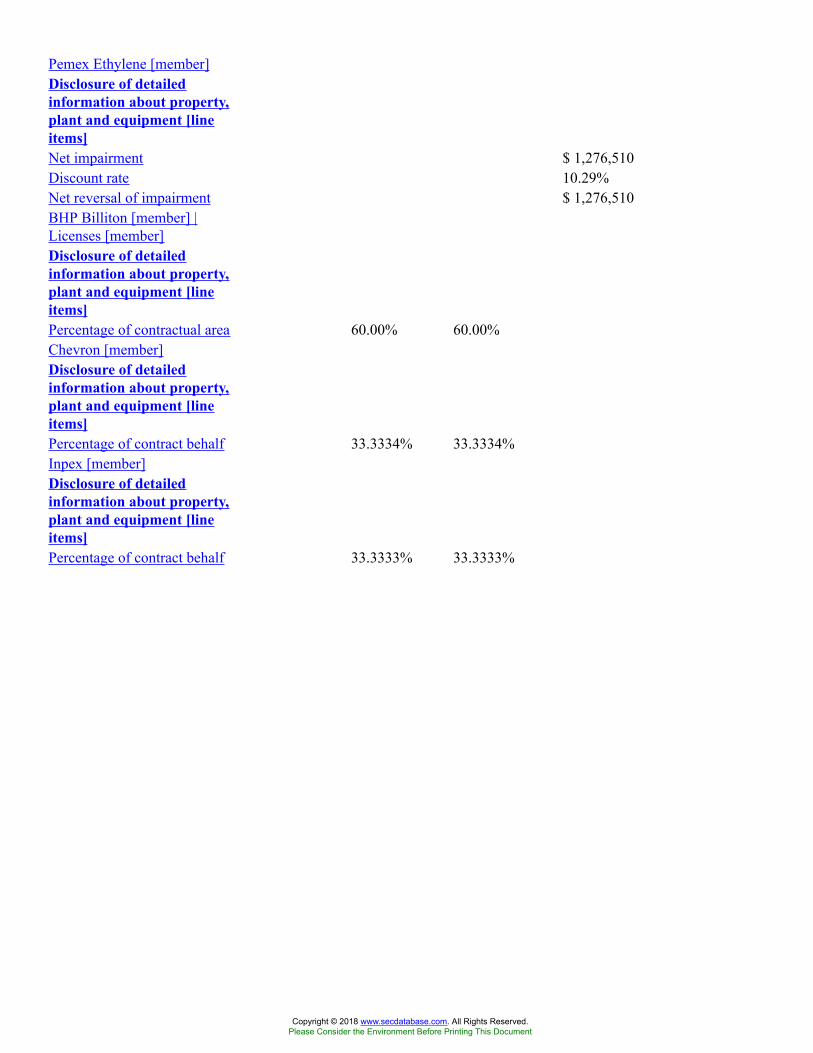
Pemex Ethylene [member]Disclosure of detailedinformation about property,plant and equipment [lineitems]Net impairment $ 1,276,510Discount rate 10.29%Net reversal of impairment $ 1,276,510BHP Billiton [member] |Licenses [member]Disclosure of detailedinformation about property,plant and equipment [lineitems]Percentage of contractual area 60.00% 60.00%Chevron [member]Disclosure of detailedinformation about property,plant and equipment [lineitems]Percentage of contract behalf 33.3334% 33.3334%Inpex [member]Disclosure of detailedinformation about property,plant and equipment [lineitems]Percentage of contract behalf 33.3333% 33.3333%
Copyright © 2018 www.secdatabase.com. All Rights Reserved.Please Consider the Environment Before Printing This Document

12 Months EndedWells, Pipelines, Properties,Plant and Equipment, Net -Assumptions to Determine
Net Present Value ofReserves Long Lived Assets
(Detail)
Dec. 31, 2017USD ($)
Exchange_Rate
Dec. 31, 2016USD ($)
Exchange_Rate
Dec. 31, 2015Exchange_Rate
Dec.31,
2017MXN
($)
Dec.31,
2016MXN
($)Pemex industrial transformation [member]Disclosure of significant unobservable inputsused in fair value measurement of assets [lineitems]Rate of U.S. dollar | Exchange_Rate 20.6640 17.2065Pemex exploration and production [member]Disclosure of significant unobservable inputsused in fair value measurement of assets [lineitems]Average crude oil price $ 55.89 $ 60.24Average gas price 4.92 4.69Average condensates price $ 38.33 $ 40.22Discount rate 14.40% 14.36%Refined Products [member] | Pemex industrialtransformation [member]Disclosure of significant unobservable inputsused in fair value measurement of assets [lineitems]Average crude oil price $ 52.30Processed volume $
1,100Useful lives of the cash generating units Average of 14
yearsRate of U.S. dollar | Exchange_Rate 20.6640Discount rate 12.06%Period 2018-2034Gas [member] | Pemex industrial transformation[member]Disclosure of significant unobservable inputsused in fair value measurement of assets [lineitems]Processed volume $
3,085$3,085
Useful lives of the cash generating units Average of 9years
Average of 10years
Rate of U.S. dollar | Exchange_Rate 19.7867 20.6640Discount rate 10.24% 10.72%Period 2018-2029 2018-2029
Copyright © 2018 www.secdatabase.com. All Rights Reserved.Please Consider the Environment Before Printing This Document
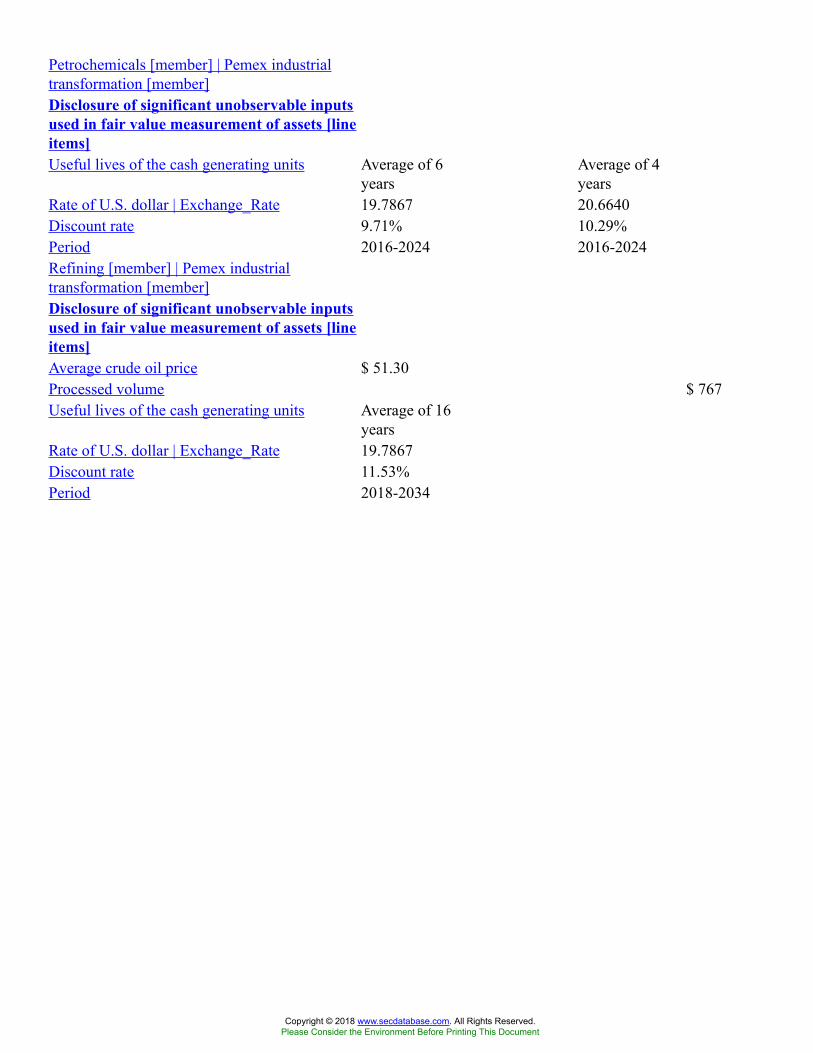
Petrochemicals [member] | Pemex industrialtransformation [member]Disclosure of significant unobservable inputsused in fair value measurement of assets [lineitems]Useful lives of the cash generating units Average of 6
yearsAverage of 4years
Rate of U.S. dollar | Exchange_Rate 19.7867 20.6640Discount rate 9.71% 10.29%Period 2016-2024 2016-2024Refining [member] | Pemex industrialtransformation [member]Disclosure of significant unobservable inputsused in fair value measurement of assets [lineitems]Average crude oil price $ 51.30Processed volume $ 767Useful lives of the cash generating units Average of 16
yearsRate of U.S. dollar | Exchange_Rate 19.7867Discount rate 11.53%Period 2018-2034
Copyright © 2018 www.secdatabase.com. All Rights Reserved.Please Consider the Environment Before Printing This Document
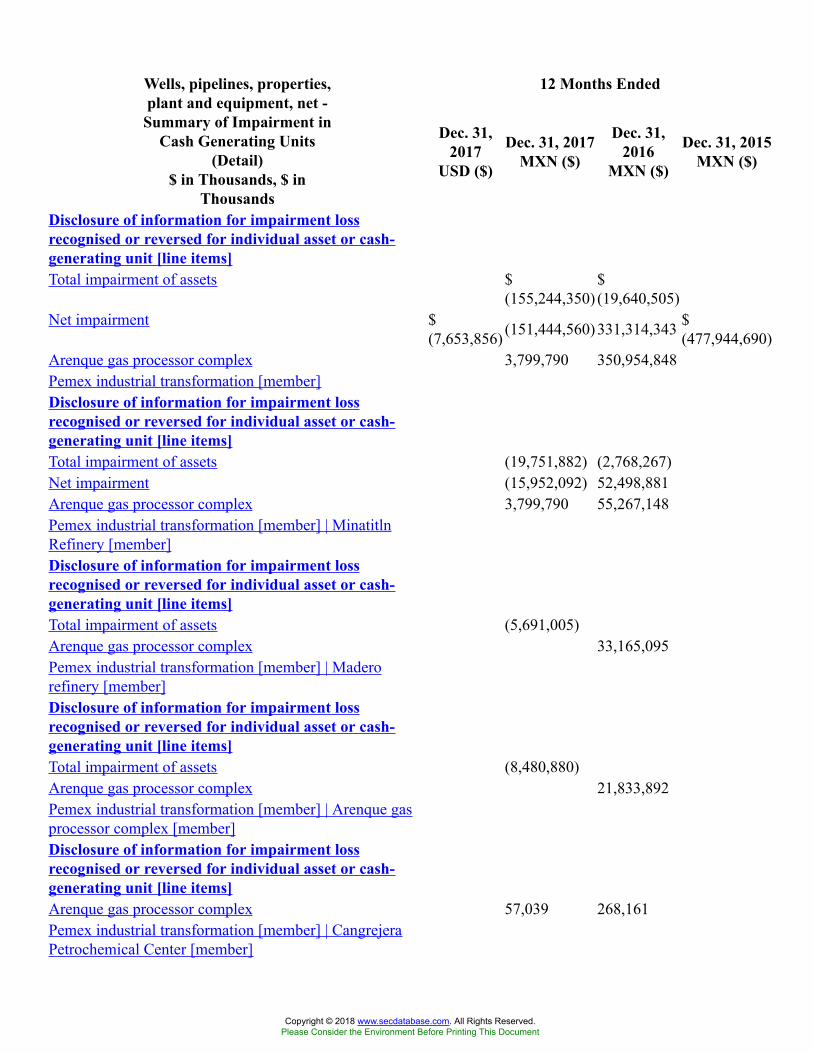
12 Months EndedWells, pipelines, properties,plant and equipment, net -Summary of Impairment in
Cash Generating Units(Detail)
$ in Thousands, $ inThousands
Dec. 31,2017
USD ($)
Dec. 31, 2017MXN ($)
Dec. 31,2016
MXN ($)
Dec. 31, 2015MXN ($)
Disclosure of information for impairment lossrecognised or reversed for individual asset or cash-generating unit [line items]Total impairment of assets $
(155,244,350)$(19,640,505)
Net impairment $(7,653,856) (151,444,560) 331,314,343 $
(477,944,690)Arenque gas processor complex 3,799,790 350,954,848Pemex industrial transformation [member]Disclosure of information for impairment lossrecognised or reversed for individual asset or cash-generating unit [line items]Total impairment of assets (19,751,882) (2,768,267)Net impairment (15,952,092) 52,498,881Arenque gas processor complex 3,799,790 55,267,148Pemex industrial transformation [member] | MinatitlnRefinery [member]Disclosure of information for impairment lossrecognised or reversed for individual asset or cash-generating unit [line items]Total impairment of assets (5,691,005)Arenque gas processor complex 33,165,095Pemex industrial transformation [member] | Maderorefinery [member]Disclosure of information for impairment lossrecognised or reversed for individual asset or cash-generating unit [line items]Total impairment of assets (8,480,880)Arenque gas processor complex 21,833,892Pemex industrial transformation [member] | Arenque gasprocessor complex [member]Disclosure of information for impairment lossrecognised or reversed for individual asset or cash-generating unit [line items]Arenque gas processor complex 57,039 268,161Pemex industrial transformation [member] | CangrejeraPetrochemical Center [member]
Copyright © 2018 www.secdatabase.com. All Rights Reserved.Please Consider the Environment Before Printing This Document
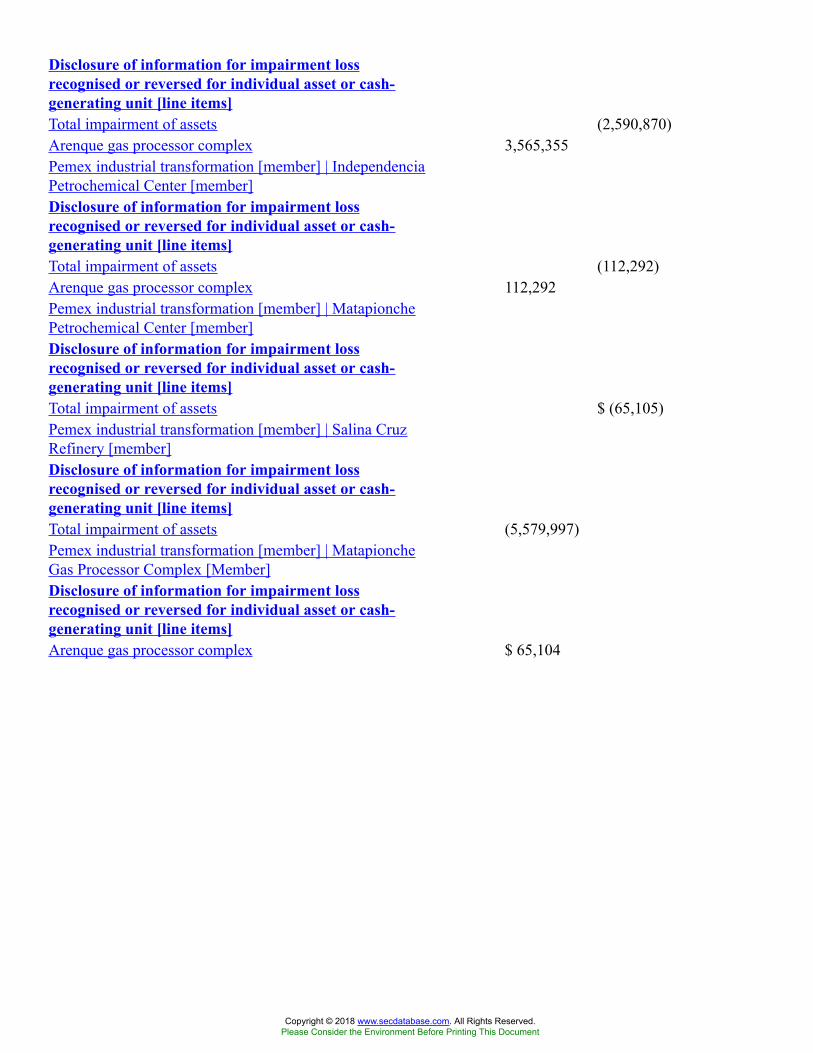
Disclosure of information for impairment lossrecognised or reversed for individual asset or cash-generating unit [line items]Total impairment of assets (2,590,870)Arenque gas processor complex 3,565,355Pemex industrial transformation [member] | IndependenciaPetrochemical Center [member]Disclosure of information for impairment lossrecognised or reversed for individual asset or cash-generating unit [line items]Total impairment of assets (112,292)Arenque gas processor complex 112,292Pemex industrial transformation [member] | MatapionchePetrochemical Center [member]Disclosure of information for impairment lossrecognised or reversed for individual asset or cash-generating unit [line items]Total impairment of assets $ (65,105)Pemex industrial transformation [member] | Salina CruzRefinery [member]Disclosure of information for impairment lossrecognised or reversed for individual asset or cash-generating unit [line items]Total impairment of assets (5,579,997)Pemex industrial transformation [member] | MatapioncheGas Processor Complex [Member]Disclosure of information for impairment lossrecognised or reversed for individual asset or cash-generating unit [line items]Arenque gas processor complex $ 65,104
Copyright © 2018 www.secdatabase.com. All Rights Reserved.Please Consider the Environment Before Printing This Document
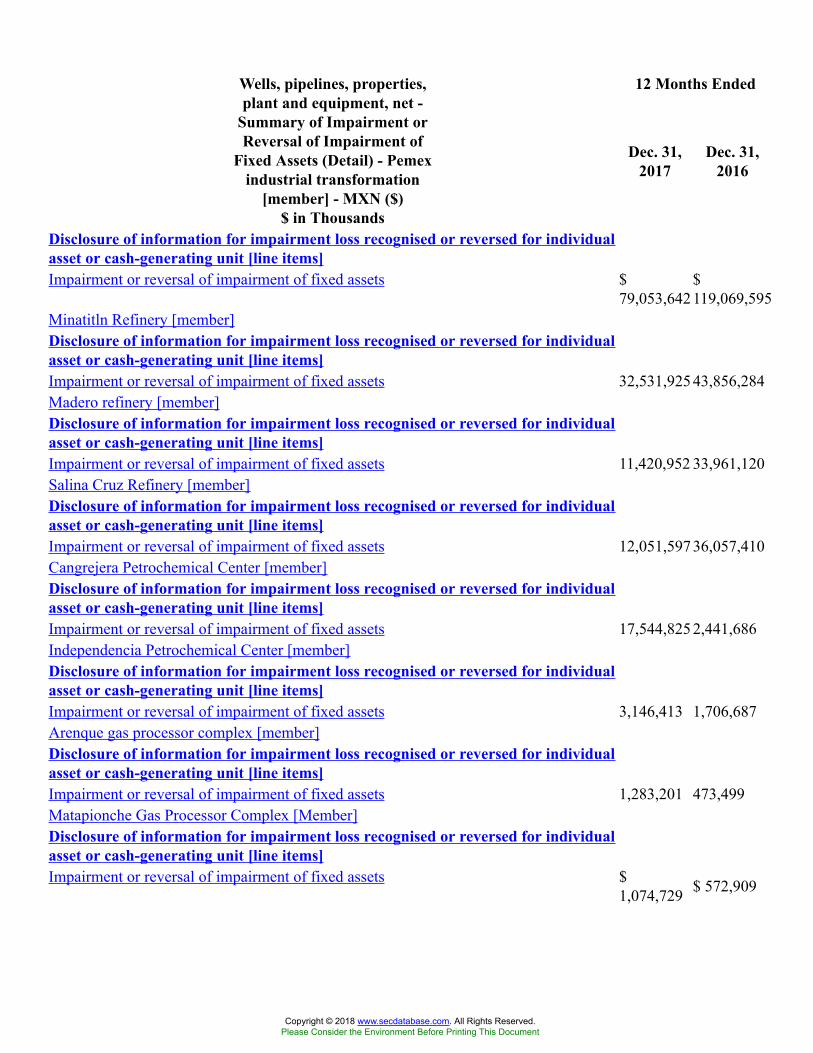
12 Months EndedWells, pipelines, properties,plant and equipment, net -
Summary of Impairment orReversal of Impairment of
Fixed Assets (Detail) - Pemexindustrial transformation
[member] - MXN ($)$ in Thousands
Dec. 31,2017
Dec. 31,2016
Disclosure of information for impairment loss recognised or reversed for individualasset or cash-generating unit [line items]Impairment or reversal of impairment of fixed assets $
79,053,642$119,069,595
Minatitln Refinery [member]Disclosure of information for impairment loss recognised or reversed for individualasset or cash-generating unit [line items]Impairment or reversal of impairment of fixed assets 32,531,92543,856,284Madero refinery [member]Disclosure of information for impairment loss recognised or reversed for individualasset or cash-generating unit [line items]Impairment or reversal of impairment of fixed assets 11,420,952 33,961,120Salina Cruz Refinery [member]Disclosure of information for impairment loss recognised or reversed for individualasset or cash-generating unit [line items]Impairment or reversal of impairment of fixed assets 12,051,59736,057,410Cangrejera Petrochemical Center [member]Disclosure of information for impairment loss recognised or reversed for individualasset or cash-generating unit [line items]Impairment or reversal of impairment of fixed assets 17,544,8252,441,686Independencia Petrochemical Center [member]Disclosure of information for impairment loss recognised or reversed for individualasset or cash-generating unit [line items]Impairment or reversal of impairment of fixed assets 3,146,413 1,706,687Arenque gas processor complex [member]Disclosure of information for impairment loss recognised or reversed for individualasset or cash-generating unit [line items]Impairment or reversal of impairment of fixed assets 1,283,201 473,499Matapionche Gas Processor Complex [Member]Disclosure of information for impairment loss recognised or reversed for individualasset or cash-generating unit [line items]Impairment or reversal of impairment of fixed assets $
1,074,729 $ 572,909
Copyright © 2018 www.secdatabase.com. All Rights Reserved.Please Consider the Environment Before Printing This Document

Wells, Pipelines, Properties,Plant and Equipment, Net -Assets Acquired ThroughCapital Leases (Detail) -
MXN ($)$ in Thousands
Dec. 31, 2017 Dec. 31, 2016
Disclosure of acquisitions and disposals [Line Items]Assets acquired through capital leases $ 9,446,108 $ 9,867,883Gross carrying amount [member]Disclosure of acquisitions and disposals [Line Items]Assets acquired through capital leases 11,142,197 11,142,197Accumulated depreciation and amortization [member]Disclosure of acquisitions and disposals [Line Items]Assets acquired through capital leases $ (1,696,089) $ (1,274,314)
Copyright © 2018 www.secdatabase.com. All Rights Reserved.Please Consider the Environment Before Printing This Document

Wells, Pipelines, Properties,Plant and Equipment, Net -
Summary of MaturityAnalysis of Finance LeasePayables (Detail) - Dec. 31,
2017$ in Thousands, $ in
Thousands
USD ($) MXN ($)
Disclosure Of Maturity Analysis Of Finance Lease Payables [Line Items]Finance lease payables $ 444,540$ 8,795,954Less: short-term unaccrued interest 16,749 331,412Less: long-term unaccrued interest 42,630 843,480Total capital leases 385,161 7,621,062Less: current portion of leases (excluding interest) 78,026 1,543,881Total long-term capital leases 307,135 6,077,1812017 [member]Disclosure Of Maturity Analysis Of Finance Lease Payables [Line Items]Finance lease payables 94,377 1,867,4112018 [member]Disclosure Of Maturity Analysis Of Finance Lease Payables [Line Items]Finance lease payables 60,268 1,192,4962019 [member]Disclosure Of Maturity Analysis Of Finance Lease Payables [Line Items]Finance lease payables 60,268 1,192,4962020 [member]Disclosure Of Maturity Analysis Of Finance Lease Payables [Line Items]Finance lease payables 60,268 1,192,4962021 [member]Disclosure Of Maturity Analysis Of Finance Lease Payables [Line Items]Finance lease payables 60,268 1,192,4962022 and thereafter [member]Disclosure Of Maturity Analysis Of Finance Lease Payables [Line Items]Finance lease payables $ 109,091$ 2,158,559
Copyright © 2018 www.secdatabase.com. All Rights Reserved.Please Consider the Environment Before Printing This Document
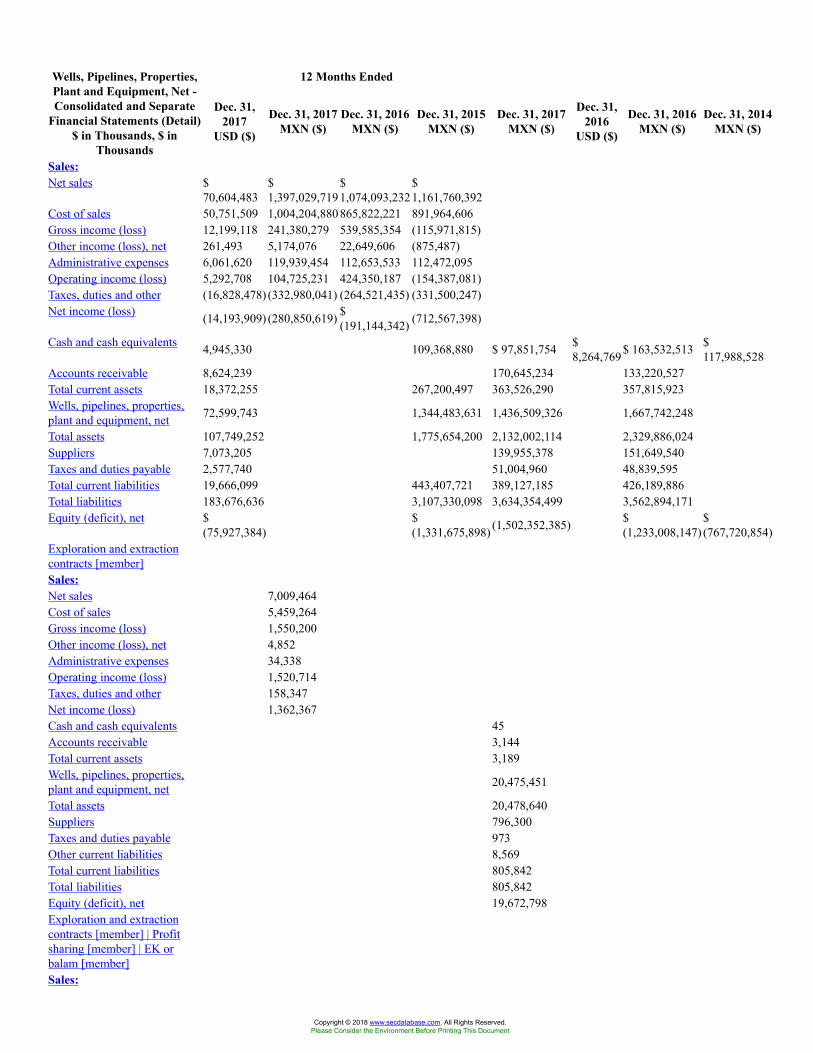
12 Months EndedWells, Pipelines, Properties,Plant and Equipment, Net -Consolidated and Separate
Financial Statements (Detail)$ in Thousands, $ in
Thousands
Dec. 31,2017
USD ($)
Dec. 31, 2017MXN ($)
Dec. 31, 2016MXN ($)
Dec. 31, 2015MXN ($)
Dec. 31, 2017MXN ($)
Dec. 31,2016
USD ($)
Dec. 31, 2016MXN ($)
Dec. 31, 2014MXN ($)
Sales:Net sales $
70,604,483$1,397,029,719
$1,074,093,232
$1,161,760,392
Cost of sales 50,751,509 1,004,204,880865,822,221 891,964,606Gross income (loss) 12,199,118 241,380,279 539,585,354 (115,971,815)Other income (loss), net 261,493 5,174,076 22,649,606 (875,487)Administrative expenses 6,061,620 119,939,454 112,653,533 112,472,095Operating income (loss) 5,292,708 104,725,231 424,350,187 (154,387,081)Taxes, duties and other (16,828,478) (332,980,041) (264,521,435) (331,500,247)Net income (loss) (14,193,909) (280,850,619) $
(191,144,342) (712,567,398)
Cash and cash equivalents 4,945,330 109,368,880 $ 97,851,754 $8,264,769$ 163,532,513 $
117,988,528Accounts receivable 8,624,239 170,645,234 133,220,527Total current assets 18,372,255 267,200,497 363,526,290 357,815,923Wells, pipelines, properties,plant and equipment, net 72,599,743 1,344,483,631 1,436,509,326 1,667,742,248
Total assets 107,749,252 1,775,654,200 2,132,002,114 2,329,886,024Suppliers 7,073,205 139,955,378 151,649,540Taxes and duties payable 2,577,740 51,004,960 48,839,595Total current liabilities 19,666,099 443,407,721 389,127,185 426,189,886Total liabilities 183,676,636 3,107,330,098 3,634,354,499 3,562,894,171Equity (deficit), net $
(75,927,384)$(1,331,675,898) (1,502,352,385) $
(1,233,008,147)$(767,720,854)
Exploration and extractioncontracts [member]Sales:Net sales 7,009,464Cost of sales 5,459,264Gross income (loss) 1,550,200Other income (loss), net 4,852Administrative expenses 34,338Operating income (loss) 1,520,714Taxes, duties and other 158,347Net income (loss) 1,362,367Cash and cash equivalents 45Accounts receivable 3,144Total current assets 3,189Wells, pipelines, properties,plant and equipment, net 20,475,451
Total assets 20,478,640Suppliers 796,300Taxes and duties payable 973Other current liabilities 8,569Total current liabilities 805,842Total liabilities 805,842Equity (deficit), net 19,672,798Exploration and extractioncontracts [member] | Profitsharing [member] | EK orbalam [member]Sales:
Copyright © 2018 www.secdatabase.com. All Rights Reserved.Please Consider the Environment Before Printing This Document
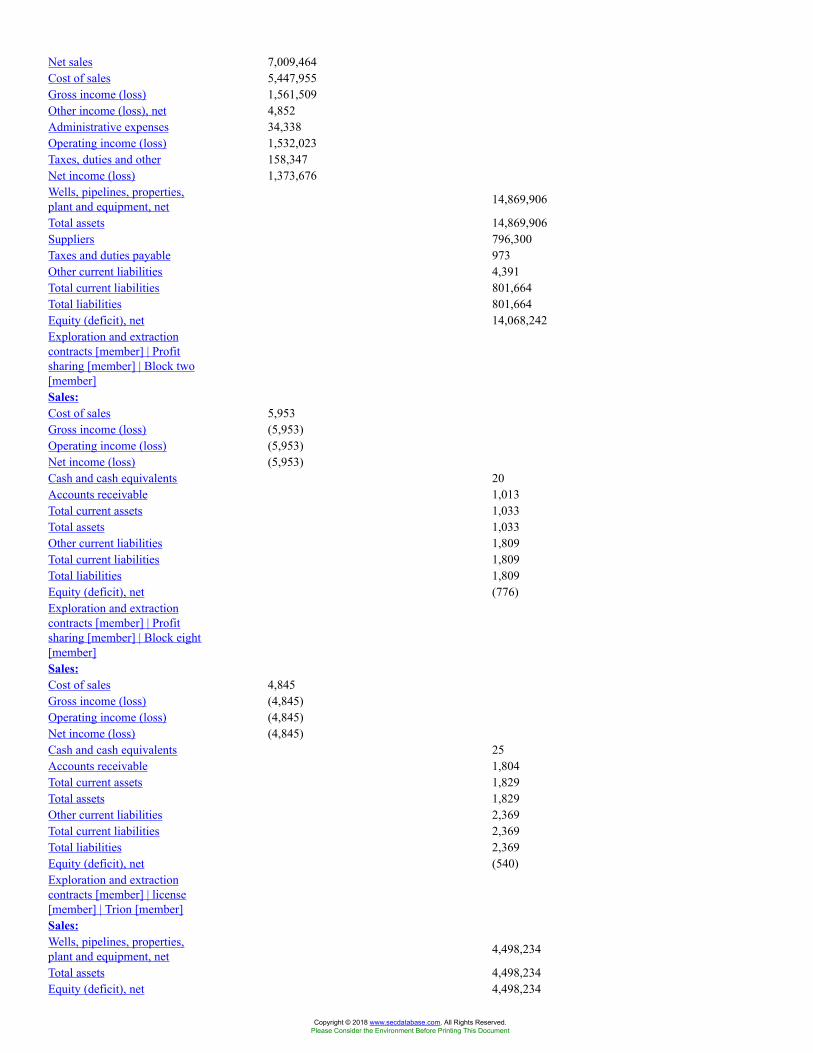
Net sales 7,009,464Cost of sales 5,447,955Gross income (loss) 1,561,509Other income (loss), net 4,852Administrative expenses 34,338Operating income (loss) 1,532,023Taxes, duties and other 158,347Net income (loss) 1,373,676Wells, pipelines, properties,plant and equipment, net 14,869,906
Total assets 14,869,906Suppliers 796,300Taxes and duties payable 973Other current liabilities 4,391Total current liabilities 801,664Total liabilities 801,664Equity (deficit), net 14,068,242Exploration and extractioncontracts [member] | Profitsharing [member] | Block two[member]Sales:Cost of sales 5,953Gross income (loss) (5,953)Operating income (loss) (5,953)Net income (loss) (5,953)Cash and cash equivalents 20Accounts receivable 1,013Total current assets 1,033Total assets 1,033Other current liabilities 1,809Total current liabilities 1,809Total liabilities 1,809Equity (deficit), net (776)Exploration and extractioncontracts [member] | Profitsharing [member] | Block eight[member]Sales:Cost of sales 4,845Gross income (loss) (4,845)Operating income (loss) (4,845)Net income (loss) (4,845)Cash and cash equivalents 25Accounts receivable 1,804Total current assets 1,829Total assets 1,829Other current liabilities 2,369Total current liabilities 2,369Total liabilities 2,369Equity (deficit), net (540)Exploration and extractioncontracts [member] | license[member] | Trion [member]Sales:Wells, pipelines, properties,plant and equipment, net 4,498,234
Total assets 4,498,234Equity (deficit), net 4,498,234
Copyright © 2018 www.secdatabase.com. All Rights Reserved.Please Consider the Environment Before Printing This Document
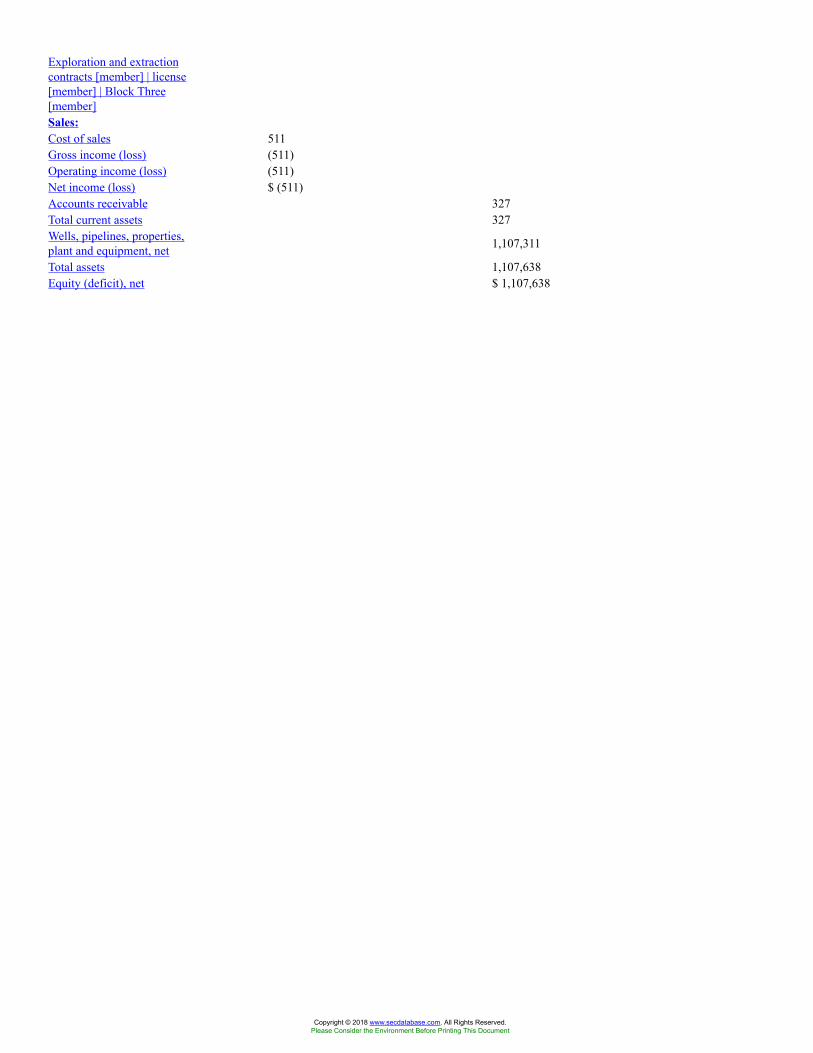
Exploration and extractioncontracts [member] | license[member] | Block Three[member]Sales:Cost of sales 511Gross income (loss) (511)Operating income (loss) (511)Net income (loss) $ (511)Accounts receivable 327Total current assets 327Wells, pipelines, properties,plant and equipment, net 1,107,311
Total assets 1,107,638Equity (deficit), net $ 1,107,638
Copyright © 2018 www.secdatabase.com. All Rights Reserved.Please Consider the Environment Before Printing This Document
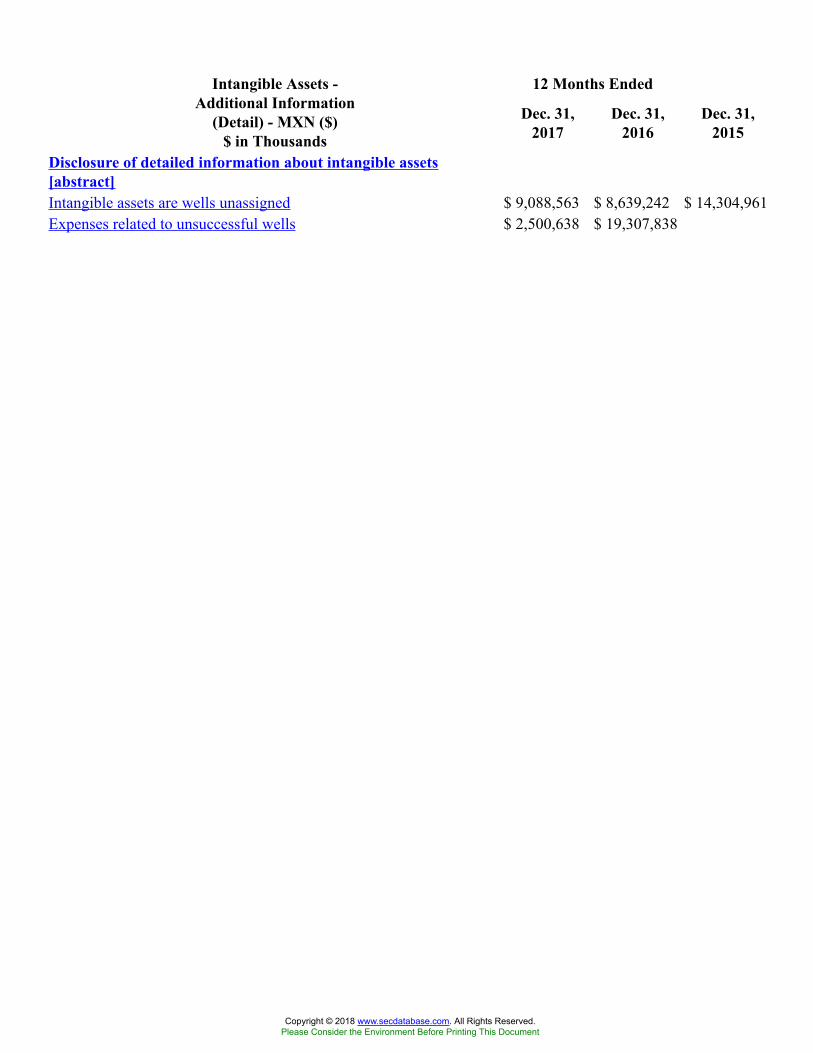
12 Months EndedIntangible Assets -Additional Information
(Detail) - MXN ($)$ in Thousands
Dec. 31,2017
Dec. 31,2016
Dec. 31,2015
Disclosure of detailed information about intangible assets[abstract]Intangible assets are wells unassigned $ 9,088,563 $ 8,639,242 $ 14,304,961Expenses related to unsuccessful wells $ 2,500,638 $ 19,307,838
Copyright © 2018 www.secdatabase.com. All Rights Reserved.Please Consider the Environment Before Printing This Document
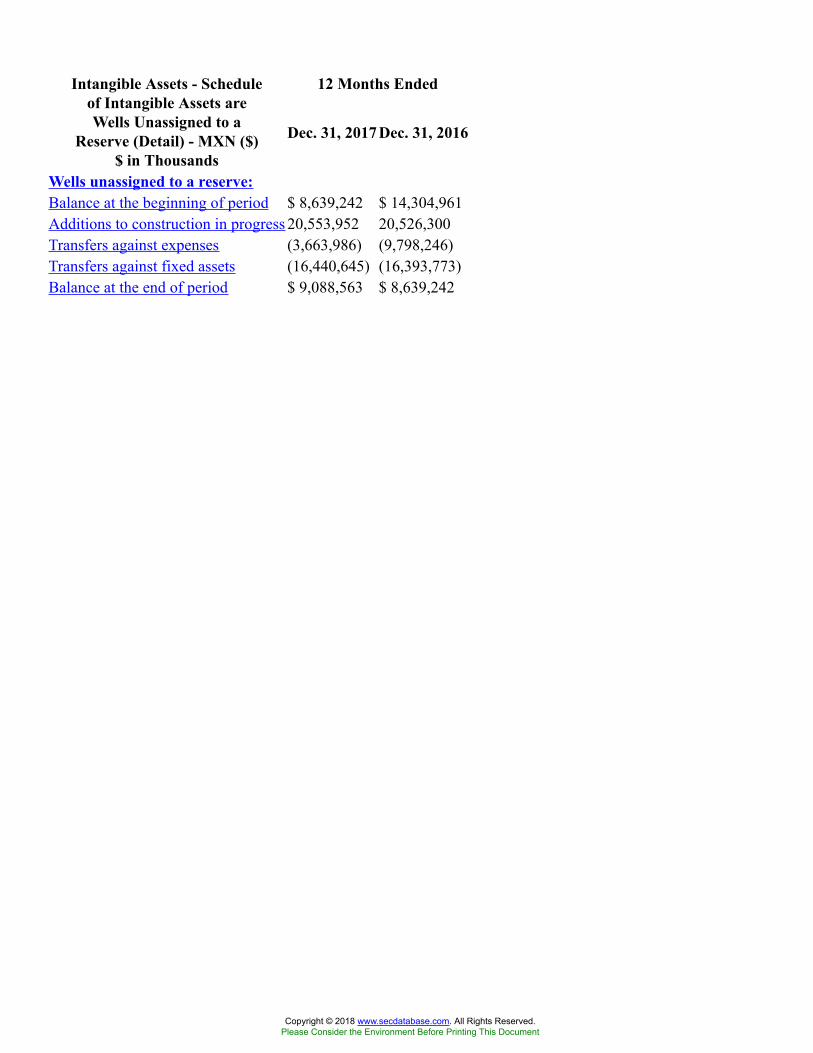
12 Months EndedIntangible Assets - Scheduleof Intangible Assets areWells Unassigned to a
Reserve (Detail) - MXN ($)$ in Thousands
Dec. 31, 2017 Dec. 31, 2016
Wells unassigned to a reserve:Balance at the beginning of period $ 8,639,242 $ 14,304,961Additions to construction in progress 20,553,952 20,526,300Transfers against expenses (3,663,986) (9,798,246)Transfers against fixed assets (16,440,645) (16,393,773)Balance at the end of period $ 9,088,563 $ 8,639,242
Copyright © 2018 www.secdatabase.com. All Rights Reserved.Please Consider the Environment Before Printing This Document
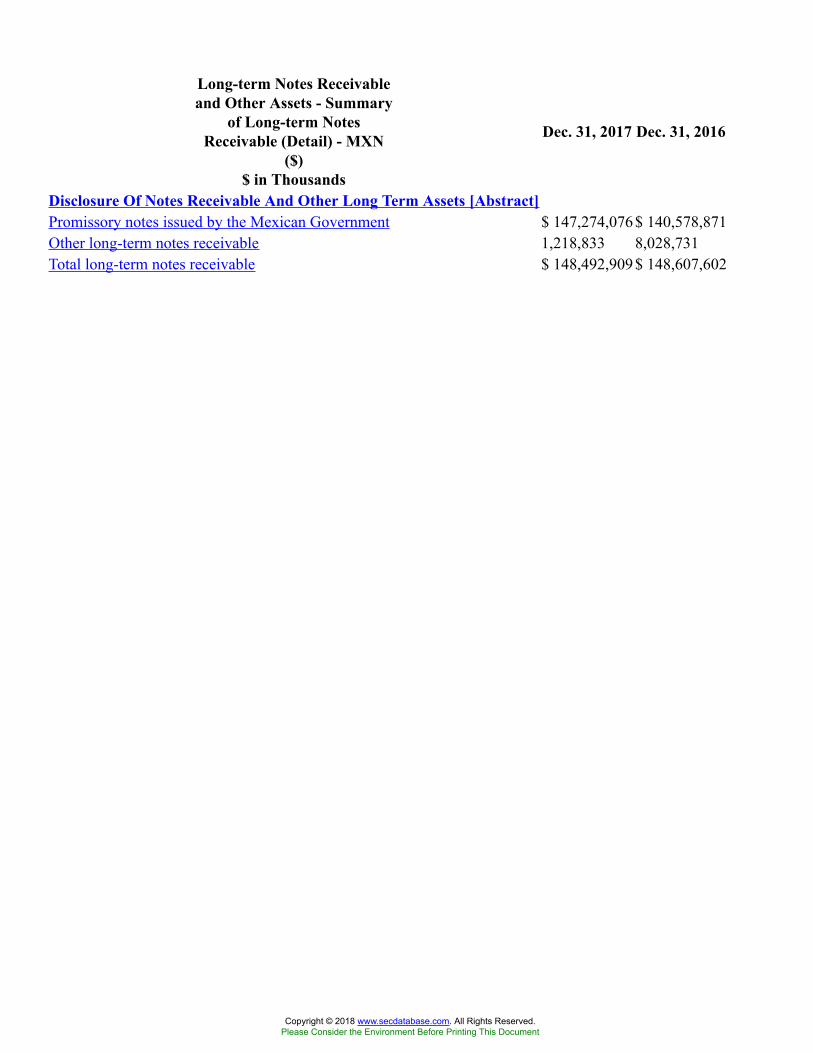
Long-term Notes Receivableand Other Assets - Summary
of Long-term NotesReceivable (Detail) - MXN
($)$ in Thousands
Dec. 31, 2017 Dec. 31, 2016
Disclosure Of Notes Receivable And Other Long Term Assets [Abstract]Promissory notes issued by the Mexican Government $ 147,274,076$ 140,578,871Other long-term notes receivable 1,218,833 8,028,731Total long-term notes receivable $ 148,492,909$ 148,607,602
Copyright © 2018 www.secdatabase.com. All Rights Reserved.Please Consider the Environment Before Printing This Document
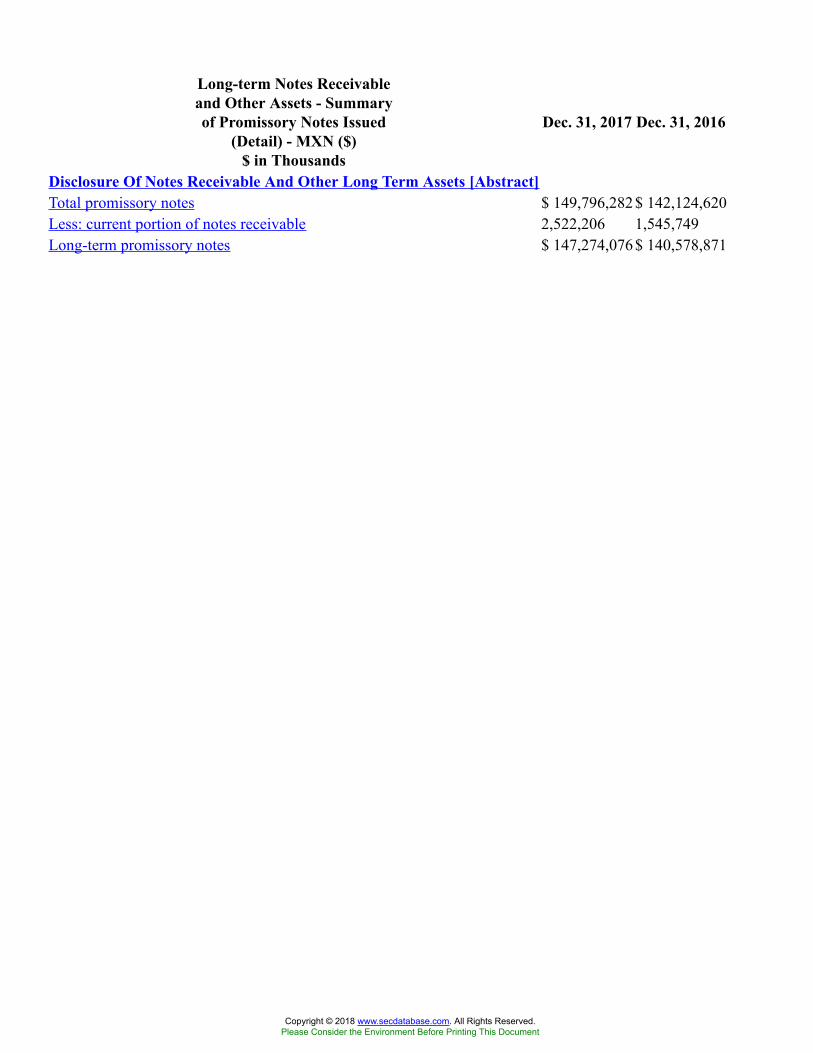
Long-term Notes Receivableand Other Assets - Summaryof Promissory Notes Issued
(Detail) - MXN ($)$ in Thousands
Dec. 31, 2017 Dec. 31, 2016
Disclosure Of Notes Receivable And Other Long Term Assets [Abstract]Total promissory notes $ 149,796,282$ 142,124,620Less: current portion of notes receivable 2,522,206 1,545,749Long-term promissory notes $ 147,274,076$ 140,578,871
Copyright © 2018 www.secdatabase.com. All Rights Reserved.Please Consider the Environment Before Printing This Document
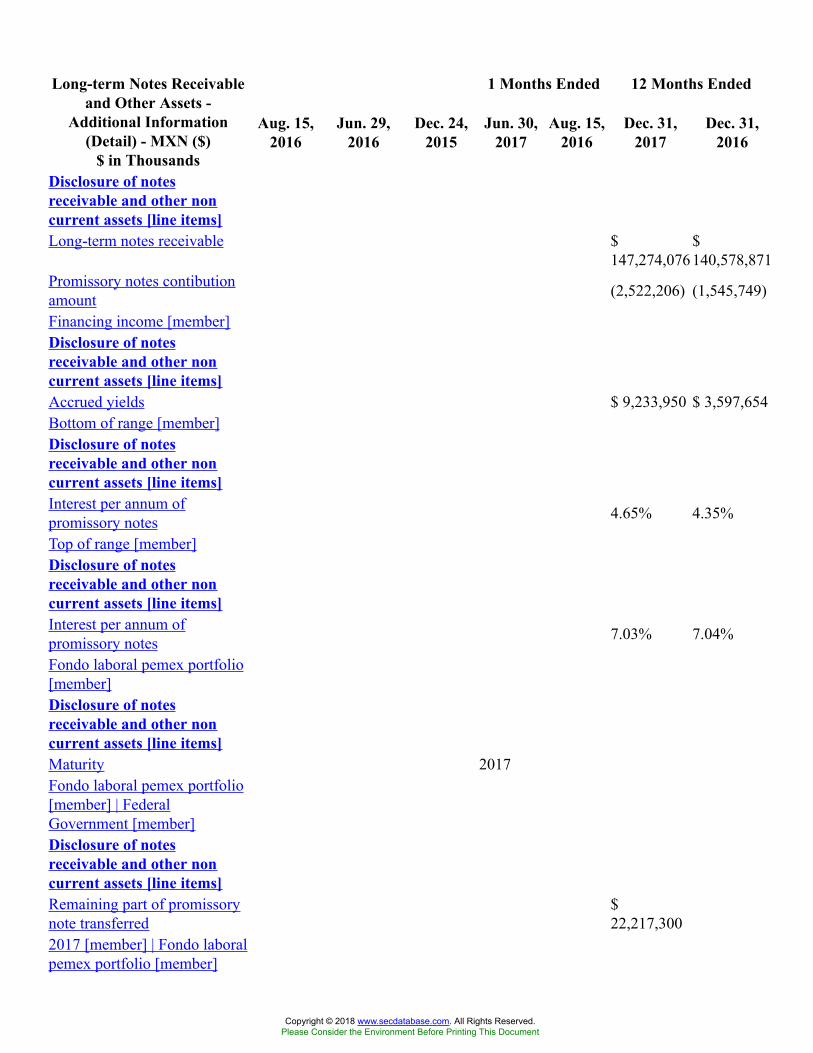
1 Months Ended 12 Months EndedLong-term Notes Receivableand Other Assets -
Additional Information(Detail) - MXN ($)
$ in Thousands
Aug. 15,2016
Jun. 29,2016
Dec. 24,2015
Jun. 30,2017
Aug. 15,2016
Dec. 31,2017
Dec. 31,2016
Disclosure of notesreceivable and other noncurrent assets [line items]Long-term notes receivable $
147,274,076$140,578,871
Promissory notes contibutionamount (2,522,206) (1,545,749)
Financing income [member]Disclosure of notesreceivable and other noncurrent assets [line items]Accrued yields $ 9,233,950 $ 3,597,654Bottom of range [member]Disclosure of notesreceivable and other noncurrent assets [line items]Interest per annum ofpromissory notes 4.65% 4.35%
Top of range [member]Disclosure of notesreceivable and other noncurrent assets [line items]Interest per annum ofpromissory notes 7.03% 7.04%
Fondo laboral pemex portfolio[member]Disclosure of notesreceivable and other noncurrent assets [line items]Maturity 2017Fondo laboral pemex portfolio[member] | FederalGovernment [member]Disclosure of notesreceivable and other noncurrent assets [line items]Remaining part of promissorynote transferred
$22,217,300
2017 [member] | Fondo laboralpemex portfolio [member]
Copyright © 2018 www.secdatabase.com. All Rights Reserved.Please Consider the Environment Before Printing This Document
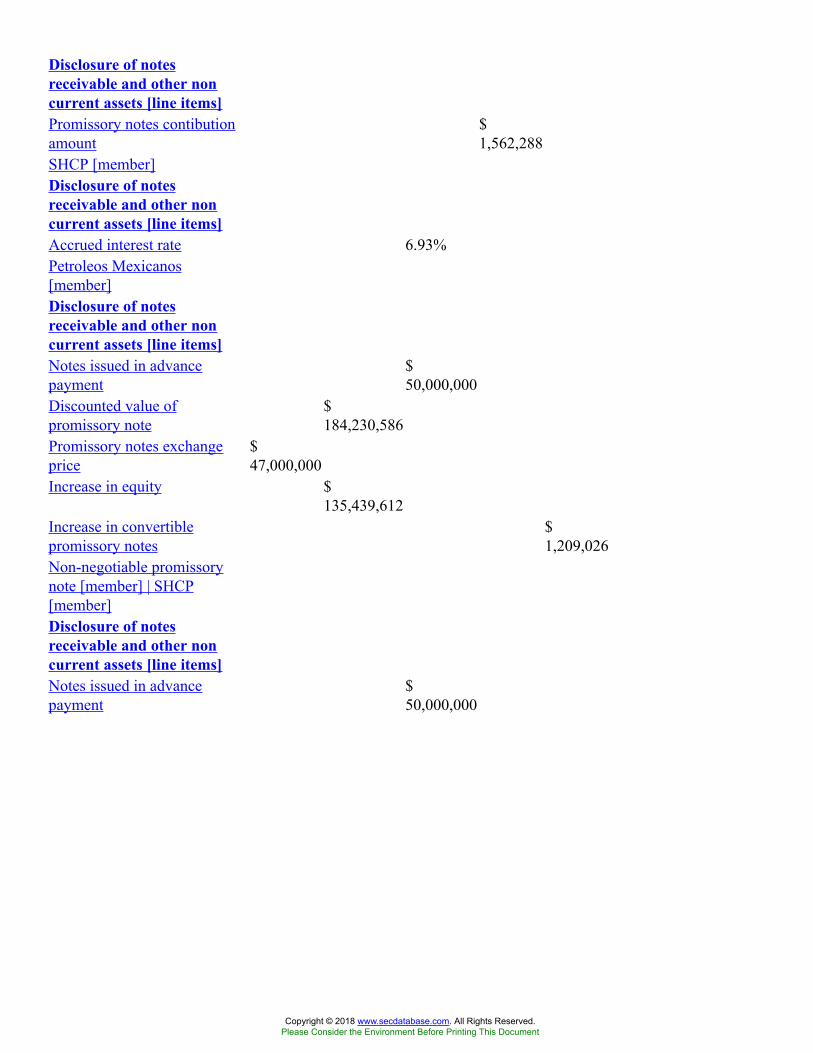
Disclosure of notesreceivable and other noncurrent assets [line items]Promissory notes contibutionamount
$1,562,288
SHCP [member]Disclosure of notesreceivable and other noncurrent assets [line items]Accrued interest rate 6.93%Petroleos Mexicanos[member]Disclosure of notesreceivable and other noncurrent assets [line items]Notes issued in advancepayment
$50,000,000
Discounted value ofpromissory note
$184,230,586
Promissory notes exchangeprice
$47,000,000
Increase in equity $135,439,612
Increase in convertiblepromissory notes
$1,209,026
Non-negotiable promissorynote [member] | SHCP[member]Disclosure of notesreceivable and other noncurrent assets [line items]Notes issued in advancepayment
$50,000,000
Copyright © 2018 www.secdatabase.com. All Rights Reserved.Please Consider the Environment Before Printing This Document
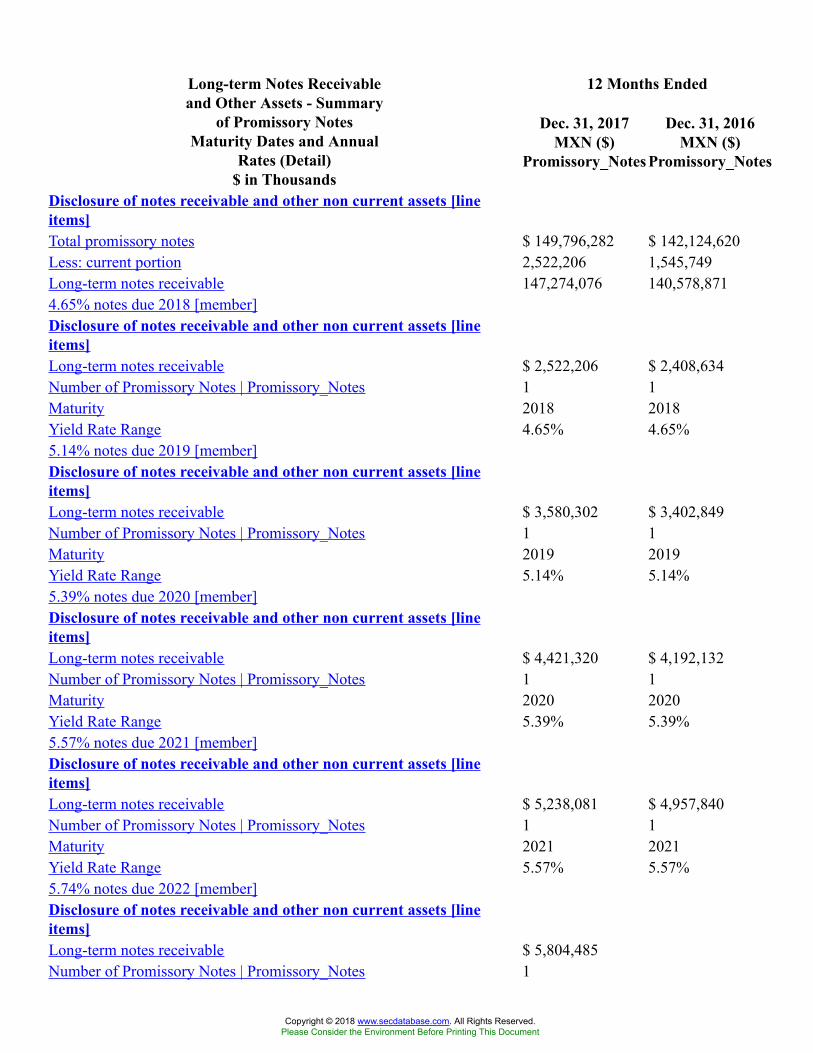
12 Months EndedLong-term Notes Receivableand Other Assets - Summary
of Promissory NotesMaturity Dates and Annual
Rates (Detail)$ in Thousands
Dec. 31, 2017MXN ($)
Promissory_Notes
Dec. 31, 2016MXN ($)
Promissory_Notes
Disclosure of notes receivable and other non current assets [lineitems]Total promissory notes $ 149,796,282 $ 142,124,620Less: current portion 2,522,206 1,545,749Long-term notes receivable 147,274,076 140,578,8714.65% notes due 2018 [member]Disclosure of notes receivable and other non current assets [lineitems]Long-term notes receivable $ 2,522,206 $ 2,408,634Number of Promissory Notes | Promissory_Notes 1 1Maturity 2018 2018Yield Rate Range 4.65% 4.65%5.14% notes due 2019 [member]Disclosure of notes receivable and other non current assets [lineitems]Long-term notes receivable $ 3,580,302 $ 3,402,849Number of Promissory Notes | Promissory_Notes 1 1Maturity 2019 2019Yield Rate Range 5.14% 5.14%5.39% notes due 2020 [member]Disclosure of notes receivable and other non current assets [lineitems]Long-term notes receivable $ 4,421,320 $ 4,192,132Number of Promissory Notes | Promissory_Notes 1 1Maturity 2020 2020Yield Rate Range 5.39% 5.39%5.57% notes due 2021 [member]Disclosure of notes receivable and other non current assets [lineitems]Long-term notes receivable $ 5,238,081 $ 4,957,840Number of Promissory Notes | Promissory_Notes 1 1Maturity 2021 2021Yield Rate Range 5.57% 5.57%5.74% notes due 2022 [member]Disclosure of notes receivable and other non current assets [lineitems]Long-term notes receivable $ 5,804,485Number of Promissory Notes | Promissory_Notes 1
Copyright © 2018 www.secdatabase.com. All Rights Reserved.Please Consider the Environment Before Printing This Document
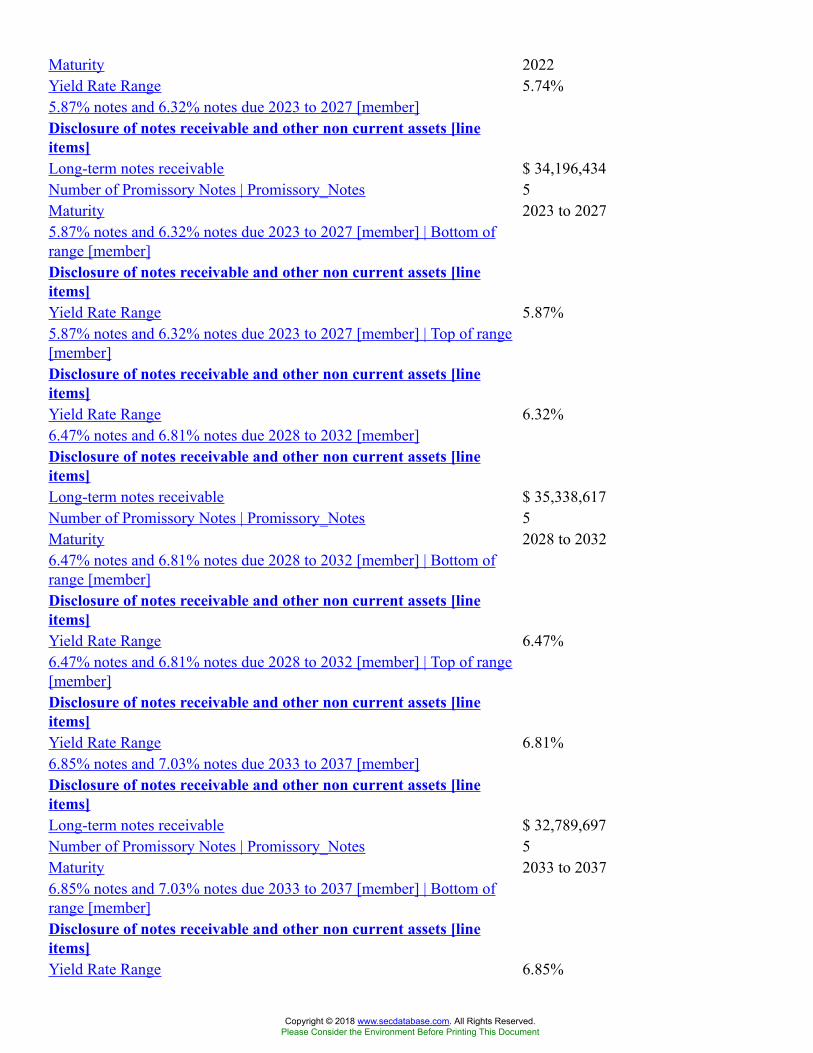
Maturity 2022Yield Rate Range 5.74%5.87% notes and 6.32% notes due 2023 to 2027 [member]Disclosure of notes receivable and other non current assets [lineitems]Long-term notes receivable $ 34,196,434Number of Promissory Notes | Promissory_Notes 5Maturity 2023 to 20275.87% notes and 6.32% notes due 2023 to 2027 [member] | Bottom ofrange [member]Disclosure of notes receivable and other non current assets [lineitems]Yield Rate Range 5.87%5.87% notes and 6.32% notes due 2023 to 2027 [member] | Top of range[member]Disclosure of notes receivable and other non current assets [lineitems]Yield Rate Range 6.32%6.47% notes and 6.81% notes due 2028 to 2032 [member]Disclosure of notes receivable and other non current assets [lineitems]Long-term notes receivable $ 35,338,617Number of Promissory Notes | Promissory_Notes 5Maturity 2028 to 20326.47% notes and 6.81% notes due 2028 to 2032 [member] | Bottom ofrange [member]Disclosure of notes receivable and other non current assets [lineitems]Yield Rate Range 6.47%6.47% notes and 6.81% notes due 2028 to 2032 [member] | Top of range[member]Disclosure of notes receivable and other non current assets [lineitems]Yield Rate Range 6.81%6.85% notes and 7.03% notes due 2033 to 2037 [member]Disclosure of notes receivable and other non current assets [lineitems]Long-term notes receivable $ 32,789,697Number of Promissory Notes | Promissory_Notes 5Maturity 2033 to 20376.85% notes and 7.03% notes due 2033 to 2037 [member] | Bottom ofrange [member]Disclosure of notes receivable and other non current assets [lineitems]Yield Rate Range 6.85%
Copyright © 2018 www.secdatabase.com. All Rights Reserved.Please Consider the Environment Before Printing This Document
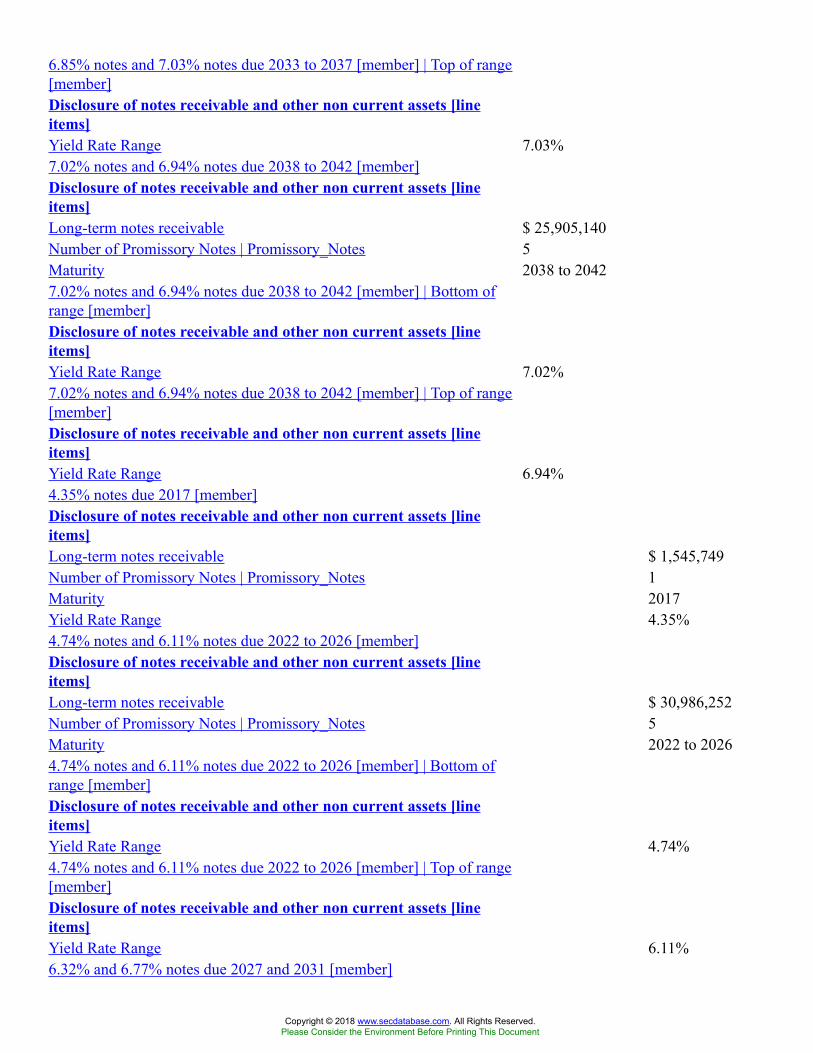
6.85% notes and 7.03% notes due 2033 to 2037 [member] | Top of range[member]Disclosure of notes receivable and other non current assets [lineitems]Yield Rate Range 7.03%7.02% notes and 6.94% notes due 2038 to 2042 [member]Disclosure of notes receivable and other non current assets [lineitems]Long-term notes receivable $ 25,905,140Number of Promissory Notes | Promissory_Notes 5Maturity 2038 to 20427.02% notes and 6.94% notes due 2038 to 2042 [member] | Bottom ofrange [member]Disclosure of notes receivable and other non current assets [lineitems]Yield Rate Range 7.02%7.02% notes and 6.94% notes due 2038 to 2042 [member] | Top of range[member]Disclosure of notes receivable and other non current assets [lineitems]Yield Rate Range 6.94%4.35% notes due 2017 [member]Disclosure of notes receivable and other non current assets [lineitems]Long-term notes receivable $ 1,545,749Number of Promissory Notes | Promissory_Notes 1Maturity 2017Yield Rate Range 4.35%4.74% notes and 6.11% notes due 2022 to 2026 [member]Disclosure of notes receivable and other non current assets [lineitems]Long-term notes receivable $ 30,986,252Number of Promissory Notes | Promissory_Notes 5Maturity 2022 to 20264.74% notes and 6.11% notes due 2022 to 2026 [member] | Bottom ofrange [member]Disclosure of notes receivable and other non current assets [lineitems]Yield Rate Range 4.74%4.74% notes and 6.11% notes due 2022 to 2026 [member] | Top of range[member]Disclosure of notes receivable and other non current assets [lineitems]Yield Rate Range 6.11%6.32% and 6.77% notes due 2027 and 2031 [member]
Copyright © 2018 www.secdatabase.com. All Rights Reserved.Please Consider the Environment Before Printing This Document

Disclosure of notes receivable and other non current assets [lineitems]Long-term notes receivable $ 33,280,216Number of Promissory Notes | Promissory_Notes 5Maturity 2027 to 20316.32% and 6.77% notes due 2027 and 2031 [member] | Bottom of range[member]Disclosure of notes receivable and other non current assets [lineitems]Yield Rate Range 6.32%6.32% and 6.77% notes due 2027 and 2031 [member] | Top of range[member]Disclosure of notes receivable and other non current assets [lineitems]Yield Rate Range 6.77%6.81% notes to 7% notes due 2032 to 2036 [member]Disclosure of notes receivable and other non current assets [lineitems]Long-term notes receivable $ 31,370,504Number of Promissory Notes | Promissory_Notes 5Maturity 2032 to 20366.81% notes to 7% notes due 2032 to 2036 [member] | Bottom of range[member]Disclosure of notes receivable and other non current assets [lineitems]Yield Rate Range 6.81%6.81% notes to 7% notes due 2032 to 2036 [member] | Top of range[member]Disclosure of notes receivable and other non current assets [lineitems]Yield Rate Range 7.00%6.94% and 7.04% notes due 2037 and 2042 [member]Disclosure of notes receivable and other non current assets [lineitems]Long-term notes receivable $ 29,980,444Number of Promissory Notes | Promissory_Notes 6Maturity 2037 to 20426.94% and 7.04% notes due 2037 and 2042 [member] | Bottom of range[member]Disclosure of notes receivable and other non current assets [lineitems]Yield Rate Range 6.94%6.94% and 7.04% notes due 2037 and 2042 [member] | Top of range[member]Disclosure of notes receivable and other non current assets [lineitems]
Copyright © 2018 www.secdatabase.com. All Rights Reserved.Please Consider the Environment Before Printing This Document

Yield Rate Range 7.04%
Copyright © 2018 www.secdatabase.com. All Rights Reserved.Please Consider the Environment Before Printing This Document
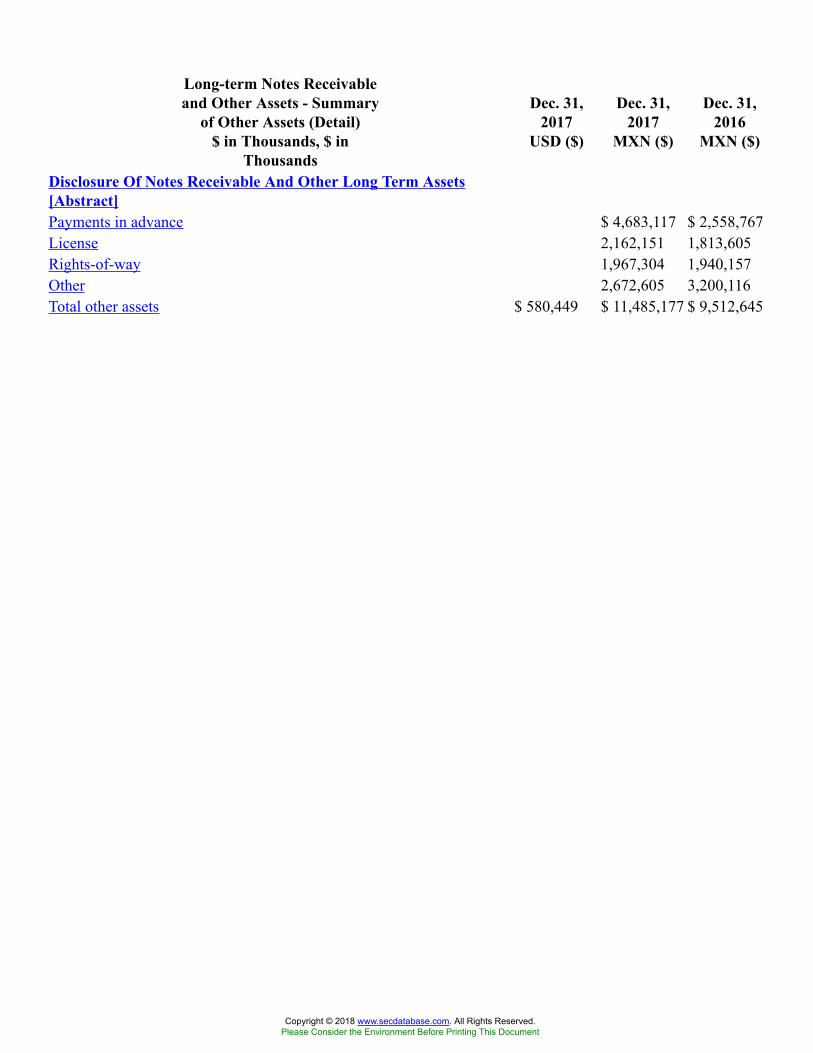
Long-term Notes Receivableand Other Assets - Summary
of Other Assets (Detail)$ in Thousands, $ in
Thousands
Dec. 31,2017
USD ($)
Dec. 31,2017
MXN ($)
Dec. 31,2016
MXN ($)
Disclosure Of Notes Receivable And Other Long Term Assets[Abstract]Payments in advance $ 4,683,117 $ 2,558,767License 2,162,151 1,813,605Rights-of-way 1,967,304 1,940,157Other 2,672,605 3,200,116Total other assets $ 580,449 $ 11,485,177 $ 9,512,645
Copyright © 2018 www.secdatabase.com. All Rights Reserved.Please Consider the Environment Before Printing This Document
1 Months Ended 12 Months EndedDebt - AdditionalInformation (Detail)€ in Thousands, ¥ inThousands, SFr in
Thousands
Dec. 21,2017
USD ($)
Dec. 18,2017
USD ($)
Dec. 15,2017
USD ($)
Nov. 16, 2017MXN ($)
Jul. 08,2016
USD ($)
Jun. 17, 2016USD ($)
Feb. 05, 2016MXN ($)
Dec. 31, 2017USD ($)
Jul. 17, 2017USD ($)
May 15,2017
USD ($)
Dec. 31, 2017USD ($)
Dec. 31, 2017MXN ($)
Dec. 31, 2016MXN ($)
Dec. 31, 2015MXN ($)
Feb. 18, 2018USD ($)
Dec. 31, 2017MXN ($)
Jul. 21,2017
USD ($)
Jul. 18, 2017USD ($)
Jul. 14,2017
USD ($)
Jun. 16, 2017USD ($)
Jun. 15, 2017USD ($)
May 24,2017
USD ($)
Feb. 14,2017
EUR (€)
Dec. 31, 2016USD ($)
Dec. 31, 2016MXN ($)
Dec. 14,2016
USD ($)
Dec. 13, 2016USD ($)
Dec. 06, 2016USD ($)
Nov. 17, 2016USD ($)
Nov. 17, 2016MXN ($)
Oct. 03, 2016USD ($)
Sep. 21, 2016USD ($)
Jul. 26,2016
CNY (¥)
Jun.14,
2016CHF(SFr)
Apr.19,
2016EUR(€)
Mar. 28,2016
MXN ($)
Mar. 23,2016
MXN ($)
Mar. 17,2016
MXN ($)
Mar. 15, 2016USD ($)
Mar. 15,2016
EUR (€)
Feb. 04, 2016USD ($)
Jan. 25, 2016USD ($)
Nov. 18, 2015USD ($)
Nov. 18, 2015MXN ($)
Disclosure of debt [LineItems]Internal net debt $
28,000,000,000$110,500,000,000
External net debt 7,100,000,000 $8,500,000,000
Total amount of net debt $8,055,900,000
$150,000,000,000
$15,722,000,000
$240,550,000,000
Debt securities issued $4,000,000,000
Line of credit $5,400,000,000
$5,400,000,000 $ 23,500,000,000 $
4,630,000,000 $ 3,500,000,000
Principal amount of debt 2,001,742,870,000 1,948,366,564,000Repayment of revolving creditlines 32,342,434,000 $
642,059,819,000$614,987,329,000
$193,618,498,000
Line of credit to ensureliquidity
$6,700,000,000
$6,700,000,000 $ 23,500,000,000 4,750,000,000 $ 23,500,000,000
Sale and leaseback of oil andgas products
$1,100,000,000
Lease agreement period 15 yearsSale and leaseback of oil andgas products
$762,637,362,000
$616,380,608,000
$690,591,455,000
Madero refinery [member]Disclosure of debt [LineItems]Lease agreement period 20 yearsSale and leaseback of oil andgas products
$600,000,000
Subsidiaries [member]Disclosure of debt [LineItems]Revolving credit facilityamount 11,369,800,000
Revolving credit amountoutstanding $ 0
Revolving credit line[member]Disclosure of debt [LineItems]Disbursement amount received $
1,950,000,000Series C medium term notesprogram [member]Disclosure of debt [LineItems]Debt securities issued $
92,000,000,000Fixed rate [member]Disclosure of debt [LineItems]Interest rate 8.38% 5.11%Line of credit | € €
500,000Maturity date March 2023 March 2023Floating rate [member]Disclosure of debt [LineItems]Line of credit $
300,000,000Maturity date December
2019 December 2019
Floating rate [member] | TIIE[member]Disclosure of debt [LineItems]Interest rate 0.55%Maturity March 2017 March 2017Line of credit $
7,000,000,000,000$9,700,000,000
Maturity date January 2017Floating rate [member] | TIIE[member] | CertificadosBursatiles [member]Disclosure of debt [LineItems]Debt securities issued $
5,000,000,000Maturity October 2019 October 2019Three point seven fivepercentage notes due twothousand twenty five[member]Disclosure of debt [LineItems]Debt securities issued $ 450,000,000Interest rate 3.75%Maturity 20255.25% notes due April 6, 2024[member] | Fixed rate[member] | Non-revolvingcredit facility [member]Disclosure of debt [LineItems]Interest rate 5.25% 5.25% 5.25%Maturity April 6, 2024Line of credit $ 132,000,000 $ 132,000,0001.65 basis point due May 2020[member] | Simple credit line[member]Disclosure of debt [LineItems]Maturity May 2020Line of credit $
400,000,000$200,000,000
$200,000,000
Interest rate basis description Floatinginterest ratelinked toLIBOR plus165 basispoints
Interest rate 1.65%6.50% notes due 2027[member] | Series C mediumterm notes program [member]Disclosure of debt [LineItems]Debt securities issued $
2,500,000,000Interest rate 6.50%6.750% bonds due 2047[member]Disclosure of debt [LineItems]Interest rate 6.75%Principal amount of debt $
1,491,941,000Principal amount of debtexchanged $ 8,059,000
6.750% bonds due 2047[member] | Series C mediumterm notes program [member]Disclosure of debt [LineItems]Debt securities issued $
2,500,000,000Interest rate 6.75%5.750% note due to 2018[member]Disclosure of debt [LineItems]Interest rate 5.75%Principal amount of debtpurchased
$922,485,000
3.500% notes due to 2018[member]Disclosure of debt [LineItems]Interest rate 3.50%Principal amount of debt $
644,374,0003.125% notes due to 2019[member]Disclosure of debt [LineItems]Interest rate 3.125%Principal amount of debt $
172,591,000One seven five basis point duetwo thousand twenty two[member] | Bilateral CreditLine [member]Disclosure of debt [LineItems]Maturity 2022Line of credit $
300,000,000Interest rate basis description LIBOR plus
175 basispoints
Interest rate 1.75%8.000% notes due 2019[member]Disclosure of debt [LineItems]Interest rate 8.00%Principal amount of debtpurchased $ 687,725,000
5.750% notes due 2018[member]Disclosure of debt [LineItems]Interest rate 5.75%Principal amount of debtpurchased $ 657,050,000
Principal amount of debtexchanged $ 73,288,000
4.625% notes due 2023[member]Disclosure of debt [LineItems]Interest rate 4.625%Principal amount of debtexchanged $ 69,302,000
5.500% bonds due 2044[member]Disclosure of debt [LineItems]Interest rate 5.50%Principal amount of debt $
1,591,961,000Two five zero basis point duetwo thousand eighteen[member]Disclosure of debt [LineItems]Maturity 2018Line of credit $
390,000,000Interest rate basis description LIBOR plus
250 basispoints on aquarterlybasis
Interest rate 2.50%Line of credit prepayingamount
$140,000,000
Two five zero basis point duetwo thousand eighteen[member] | New Credit Line[member]Disclosure of debt [LineItems]Line of credit $
250,000,000One six five basis point duetwo thousand twenty[member] | Bilateral CreditLine [member]Disclosure of debt [LineItems]Maturity 2020Line of credit $
200,000,000Interest rate basis description LIBOR plus
165 basispoints
Interest rate 1.65%P.M.I. Holdings, B.V.[member]Disclosure of debt [LineItems]Revolving credit facilityamount 15,141,500,000 15,141,500,000
Repayment of revolving creditlines 14,914,000,000
Revolving credit amountoutstanding $ 227,500,000 $ 227,500,000
Bottom of range [member]Disclosure of debt [LineItems]Debt securities issued $
62,000,000,000Bottom of range [member] |Floating rate [member] | TIIE[member]Disclosure of debt [LineItems]Line of credit $
2,000,000,000Top of range [member]Disclosure of debt [LineItems]Debt securities issued $
72,000,000,000Top of range [member] |Floating rate [member] | TIIE[member]Disclosure of debt [LineItems]Line of credit $
3,300,000,000
Copyright © 2018 www.secdatabase.com. All Rights Reserved.Please Consider the Environment Before Printing This Document

Series C medium term notesprogram [member]Disclosure of debt [LineItems]Debt securities issued $
92,000,000,000$92,000,000,000
$72,000,000,000
€4,250,000
$5,500,000,000
$62,000,000,000
SFr375,000
$62,000,000,000
€2,250,000
$5,000,000,000
Principal amount of debt 4,000,000,000Series C medium term notesprogram [member] | Threepoint seven five percentagenotes due two thousand twentyfive [member]Disclosure of debt [LineItems]Debt securities issued $
92,000,000,000Series C medium term notesprogram [member] | 1.50%notes due to June 2018[member]Disclosure of debt [LineItems]Debt securities issued | SFr SFr
225,000Interest rate 1.50%Maturity June 2018 June 2018Series C medium term notesprogram [member] | 2.35%notes due to December 2021[member]Disclosure of debt [LineItems]Debt securities issued | SFr SFr
150,000Interest rate 2.35%Maturity December
2021 December 2021
Series C medium term notesprogram [member] | 4.625%notes due to September 2023[member]Disclosure of debt [LineItems]Debt securities issued $
2,000,000,000Interest rate 4.625%Maturity September
2023 September 2023
Series C medium term notesprogram [member] | 6.750%bonds due to September 2047[member]Disclosure of debt [LineItems]Debt securities issued $
2,000,000,000Interest rate 6.75%Maturity September
2047 September 2047
Series C medium term notesprogram [member] | 2.50%notes due August 2021[member]Disclosure of debt [LineItems]Debt securities issued | € €
1,750,000Interest rate 2.50%Maturity August 2021 August 2021Series C medium term notesprogram [member] | 3.75%notes due February 2024[member]Disclosure of debt [LineItems]Debt securities issued | € €
1,250,000Interest rate 3.75%Maturity February 2024 February 2024Series C medium term notesprogram [member] | 4.875%notes due February 2028[member]Disclosure of debt [LineItems]Debt securities issued | € €
1,250,000Interest rate 4.875%Maturity February 2028 February 2028Series C medium term notesprogram [member] | 5.500%notes due February 2019[member]Disclosure of debt [LineItems]Debt securities issued $ 750,000,000Interest rate 5.50%Maturity February 2019 February 2019Series C medium term notesprogram [member] | 6.375%notes due February 2021[member]Disclosure of debt [LineItems]Debt securities issued $
1,250,000,000Interest rate 6.375%Maturity February 2021 February 2021Series C medium term notesprogram [member] | 6.875%notes due August 2026[member]Disclosure of debt [LineItems]Debt securities issued $
3,000,000,000Interest rate 6.875%Maturity August 2026 August 2026Series C medium term notesprogram [member] | 3.750%Notes due to March 2019[member]Disclosure of debt [LineItems]Debt securities issued | € €
1,350,000Interest rate 3.75% 3.75%Maturity March 2019 March 2019Series C medium term notesprogram [member] | 5.125%Notes due to March 2023[member]Disclosure of debt [LineItems]Debt securities issued | € € 900,000Interest rate 5.125% 5.125%Maturity March 2023 March 2023Series C medium term notesprogram [member] | 6.50%due March 2027 [member] |Fixed rate [member]Disclosure of debt [LineItems]Debt securities issued $
3,000,000,000Interest rate 6.50%Maturity March 2027 March 2027Series C medium term notesprogram [member] | 5.375%due March 2022 [member] |Fixed rate [member]Disclosure of debt [LineItems]Debt securities issued $
1,500,000,000Interest rate 5.375%Series C medium term notesprogram [member] | Notes dueMarch 2022 [member] |Floating rate [member]Disclosure of debt [LineItems]Debt securities issued $
1,000,000,000Maturity March 2022 March 2022Series C medium term notesprogram [member] | Bottom ofrange [member]Disclosure of debt [LineItems]Debt securities issued $
52,000,000,000Series C medium term notesprogram [member] | Top ofrange [member]Disclosure of debt [LineItems]Debt securities issued $
62,000,000,000Bond securities [member]Disclosure of debt [LineItems]Debt securities issued | ¥ ¥
80,000,000Interest rate 0.54%Maturity July 2026 July 2026
Copyright © 2018 www.secdatabase.com. All Rights Reserved.Please Consider the Environment Before Printing This Document
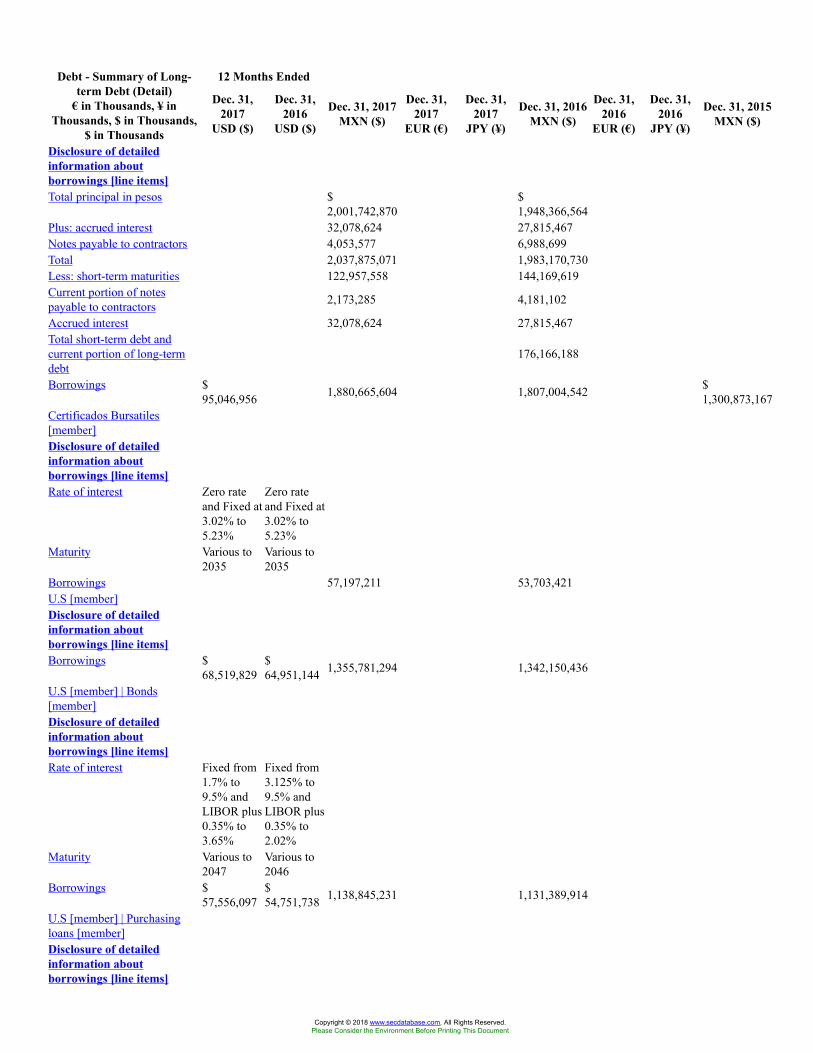
12 Months EndedDebt - Summary of Long-term Debt (Detail)
€ in Thousands, ¥ inThousands, $ in Thousands,
$ in Thousands
Dec. 31,2017
USD ($)
Dec. 31,2016
USD ($)
Dec. 31, 2017MXN ($)
Dec. 31,2017
EUR (€)
Dec. 31,2017
JPY (¥)
Dec. 31, 2016MXN ($)
Dec. 31,2016
EUR (€)
Dec. 31,2016
JPY (¥)
Dec. 31, 2015MXN ($)
Disclosure of detailedinformation aboutborrowings [line items]Total principal in pesos $
2,001,742,870$1,948,366,564
Plus: accrued interest 32,078,624 27,815,467Notes payable to contractors 4,053,577 6,988,699Total 2,037,875,071 1,983,170,730Less: short-term maturities 122,957,558 144,169,619Current portion of notespayable to contractors 2,173,285 4,181,102
Accrued interest 32,078,624 27,815,467Total short-term debt andcurrent portion of long-termdebt
176,166,188
Borrowings $95,046,956 1,880,665,604 1,807,004,542 $
1,300,873,167Certificados Bursatiles[member]Disclosure of detailedinformation aboutborrowings [line items]Rate of interest Zero rate
and Fixed at3.02% to5.23%
Zero rateand Fixed at3.02% to5.23%
Maturity Various to2035
Various to2035
Borrowings 57,197,211 53,703,421U.S [member]Disclosure of detailedinformation aboutborrowings [line items]Borrowings $
68,519,829$64,951,144 1,355,781,294 1,342,150,436
U.S [member] | Bonds[member]Disclosure of detailedinformation aboutborrowings [line items]Rate of interest Fixed from
1.7% to9.5% andLIBOR plus0.35% to3.65%
Fixed from3.125% to9.5% andLIBOR plus0.35% to2.02%
Maturity Various to2047
Various to2046
Borrowings $57,556,097
$54,751,738 1,138,845,231 1,131,389,914
U.S [member] | Purchasingloans [member]Disclosure of detailedinformation aboutborrowings [line items]
Copyright © 2018 www.secdatabase.com. All Rights Reserved.Please Consider the Environment Before Printing This Document

Rate of interest LIBOR plus0.85%
LIBOR plus0.8% to0.85%
Maturity Various to2018
Various to2016
Borrowings $ 1,300,000 $ 120,000 25,722,710 2,479,680U.S [member] | ProjectFinance [member]Disclosure of detailedinformation aboutborrowings [line items]Rate of interest Fixed from
2.35% to3.81% andLIBOR plus0.24% to1.75%
Fixed from2.35% to5.45% andLIBOR plus0.01% to1.71%
Maturity Various to2025
Various to2021
Borrowings $ 3,283,741 $ 4,099,481 64,974,389 84,711,684U.S [member] | Direct loans[member]Disclosure of detailedinformation aboutborrowings [line items]Rate of interest Fixed from
5.25% to5.44% andLIBOR plus1.65%
Fixed at5.44% andLIBOR plus1.0%
Maturity Various to2020
Various to2018
Borrowings $ 2,180,315 $ 1,601,848 43,141,231 33,100,587U.S [member] | Syndicatedloan [member]Disclosure of detailedinformation aboutborrowings [line items]Rate of interest LIBOR plus
0.85%LIBOR plus0.85%
Maturity Various to2020
Various to2020
Borrowings $ 1,988,597 $ 1,986,865 39,347,774 41,056,571U.S [member] | Bank loans[member]Disclosure of detailedinformation aboutborrowings [line items]Rate of interest Fixed from
3.5% to5.28%
Fixed from3.5% to5.28%
Maturity Various to2023
Various to2023
Borrowings $ 174,442 $ 210,019 3,451,629 4,339,826U.S [member] | Finance Lease[member]Disclosure of detailedinformation aboutborrowings [line items]
Copyright © 2018 www.secdatabase.com. All Rights Reserved.Please Consider the Environment Before Printing This Document
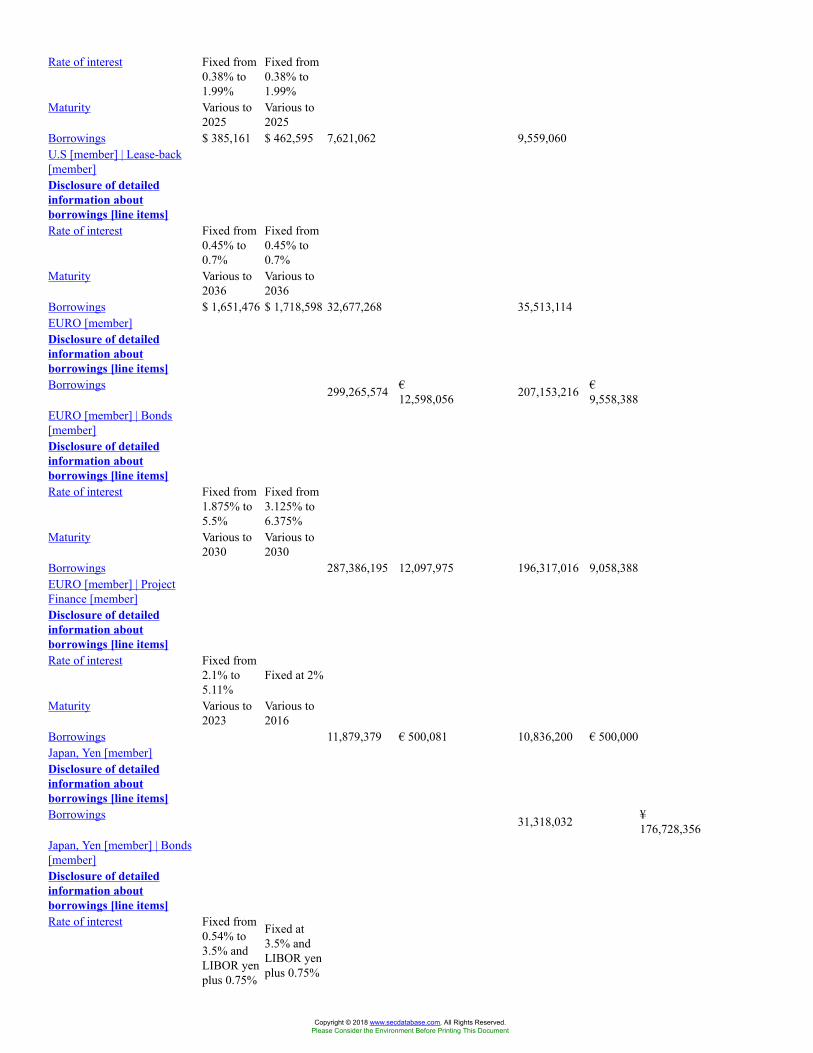
Rate of interest Fixed from0.38% to1.99%
Fixed from0.38% to1.99%
Maturity Various to2025
Various to2025
Borrowings $ 385,161 $ 462,595 7,621,062 9,559,060U.S [member] | Lease-back[member]Disclosure of detailedinformation aboutborrowings [line items]Rate of interest Fixed from
0.45% to0.7%
Fixed from0.45% to0.7%
Maturity Various to2036
Various to2036
Borrowings $ 1,651,476 $ 1,718,598 32,677,268 35,513,114EURO [member]Disclosure of detailedinformation aboutborrowings [line items]Borrowings 299,265,574 €
12,598,056 207,153,216 €9,558,388
EURO [member] | Bonds[member]Disclosure of detailedinformation aboutborrowings [line items]Rate of interest Fixed from
1.875% to5.5%
Fixed from3.125% to6.375%
Maturity Various to2030
Various to2030
Borrowings 287,386,195 12,097,975 196,317,016 9,058,388EURO [member] | ProjectFinance [member]Disclosure of detailedinformation aboutborrowings [line items]Rate of interest Fixed from
2.1% to5.11%
Fixed at 2%
Maturity Various to2023
Various to2016
Borrowings 11,879,379 € 500,081 10,836,200 € 500,000Japan, Yen [member]Disclosure of detailedinformation aboutborrowings [line items]Borrowings 31,318,032 ¥
176,728,356Japan, Yen [member] | Bonds[member]Disclosure of detailedinformation aboutborrowings [line items]Rate of interest Fixed from
0.54% to3.5% andLIBOR yenplus 0.75%
Fixed at3.5% andLIBOR yenplus 0.75%
Copyright © 2018 www.secdatabase.com. All Rights Reserved.Please Consider the Environment Before Printing This Document
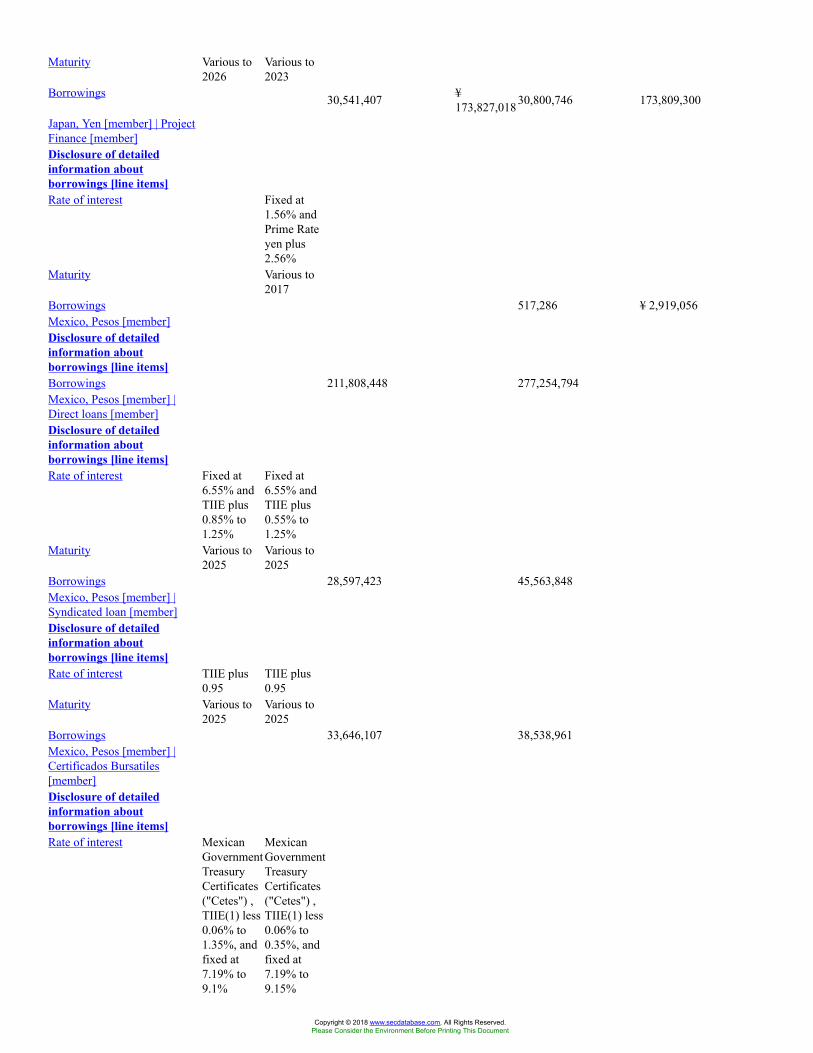
Maturity Various to2026
Various to2023
Borrowings 30,541,407 ¥173,827,01830,800,746 173,809,300
Japan, Yen [member] | ProjectFinance [member]Disclosure of detailedinformation aboutborrowings [line items]Rate of interest Fixed at
1.56% andPrime Rateyen plus2.56%
Maturity Various to2017
Borrowings 517,286 ¥ 2,919,056Mexico, Pesos [member]Disclosure of detailedinformation aboutborrowings [line items]Borrowings 211,808,448 277,254,794Mexico, Pesos [member] |Direct loans [member]Disclosure of detailedinformation aboutborrowings [line items]Rate of interest Fixed at
6.55% andTIIE plus0.85% to1.25%
Fixed at6.55% andTIIE plus0.55% to1.25%
Maturity Various to2025
Various to2025
Borrowings 28,597,423 45,563,848Mexico, Pesos [member] |Syndicated loan [member]Disclosure of detailedinformation aboutborrowings [line items]Rate of interest TIIE plus
0.95TIIE plus0.95
Maturity Various to2025
Various to2025
Borrowings 33,646,107 38,538,961Mexico, Pesos [member] |Certificados Bursatiles[member]Disclosure of detailedinformation aboutborrowings [line items]Rate of interest Mexican
GovernmentTreasuryCertificates("Cetes") ,TIIE(1) less0.06% to1.35%, andfixed at7.19% to9.1%
MexicanGovernmentTreasuryCertificates("Cetes") ,TIIE(1) less0.06% to0.35%, andfixed at7.19% to9.15%
Copyright © 2018 www.secdatabase.com. All Rights Reserved.Please Consider the Environment Before Printing This Document

Maturity Various to2026
Various to2026
Borrowings 149,564,918 173,151,985Mexico, Pesos [member] |Revolved loans [member]Disclosure of detailedinformation aboutborrowings [line items]Rate of interest TIIE plus
0.55Maturity To 2016Borrowings 20,000,000Other Currencies [member] |Bonds [member]Disclosure of detailedinformation aboutborrowings [line items]Rate of interest Fixed from
1.5% to8.25%
Fixed from2.5% to8.25%
Maturity Various to2025
Various to2022
Borrowings $ 47,148,936 $ 36,786,665
Copyright © 2018 www.secdatabase.com. All Rights Reserved.Please Consider the Environment Before Printing This Document
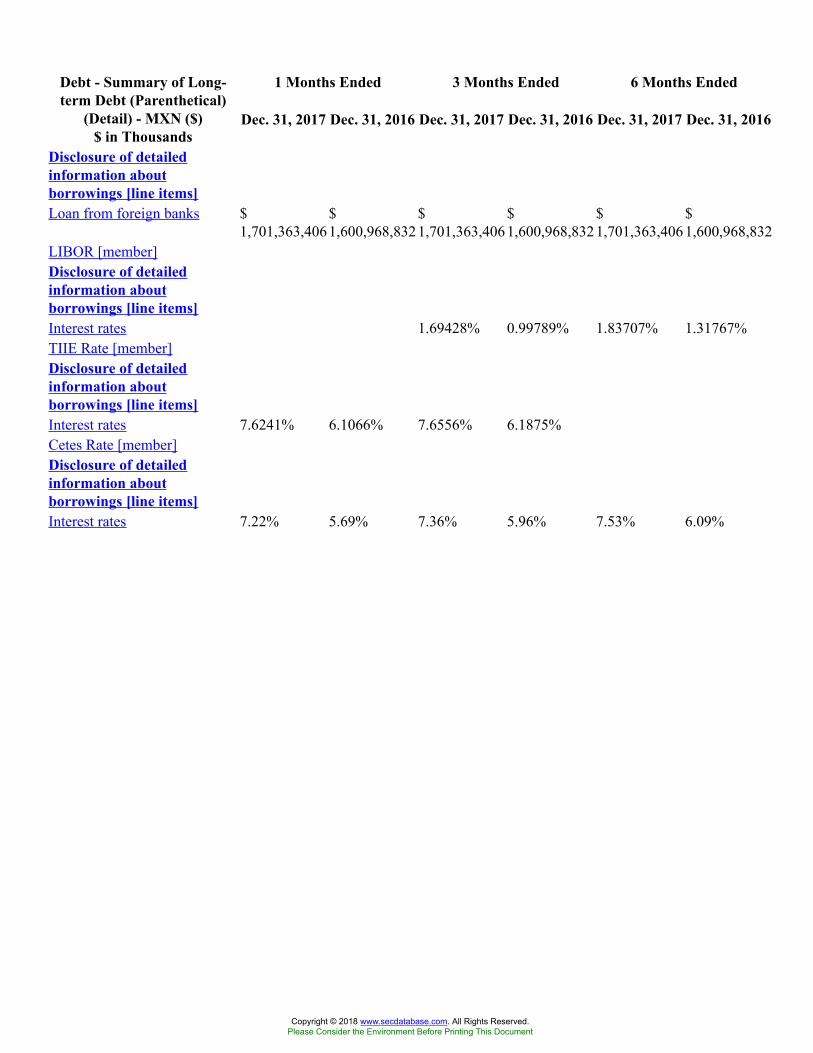
1 Months Ended 3 Months Ended 6 Months EndedDebt - Summary of Long-term Debt (Parenthetical)
(Detail) - MXN ($)$ in Thousands
Dec. 31, 2017 Dec. 31, 2016 Dec. 31, 2017 Dec. 31, 2016 Dec. 31, 2017 Dec. 31, 2016
Disclosure of detailedinformation aboutborrowings [line items]Loan from foreign banks $
1,701,363,406$1,600,968,832
$1,701,363,406
$1,600,968,832
$1,701,363,406
$1,600,968,832
LIBOR [member]Disclosure of detailedinformation aboutborrowings [line items]Interest rates 1.69428% 0.99789% 1.83707% 1.31767%TIIE Rate [member]Disclosure of detailedinformation aboutborrowings [line items]Interest rates 7.6241% 6.1066% 7.6556% 6.1875%Cetes Rate [member]Disclosure of detailedinformation aboutborrowings [line items]Interest rates 7.22% 5.69% 7.36% 5.96% 7.53% 6.09%
Copyright © 2018 www.secdatabase.com. All Rights Reserved.Please Consider the Environment Before Printing This Document
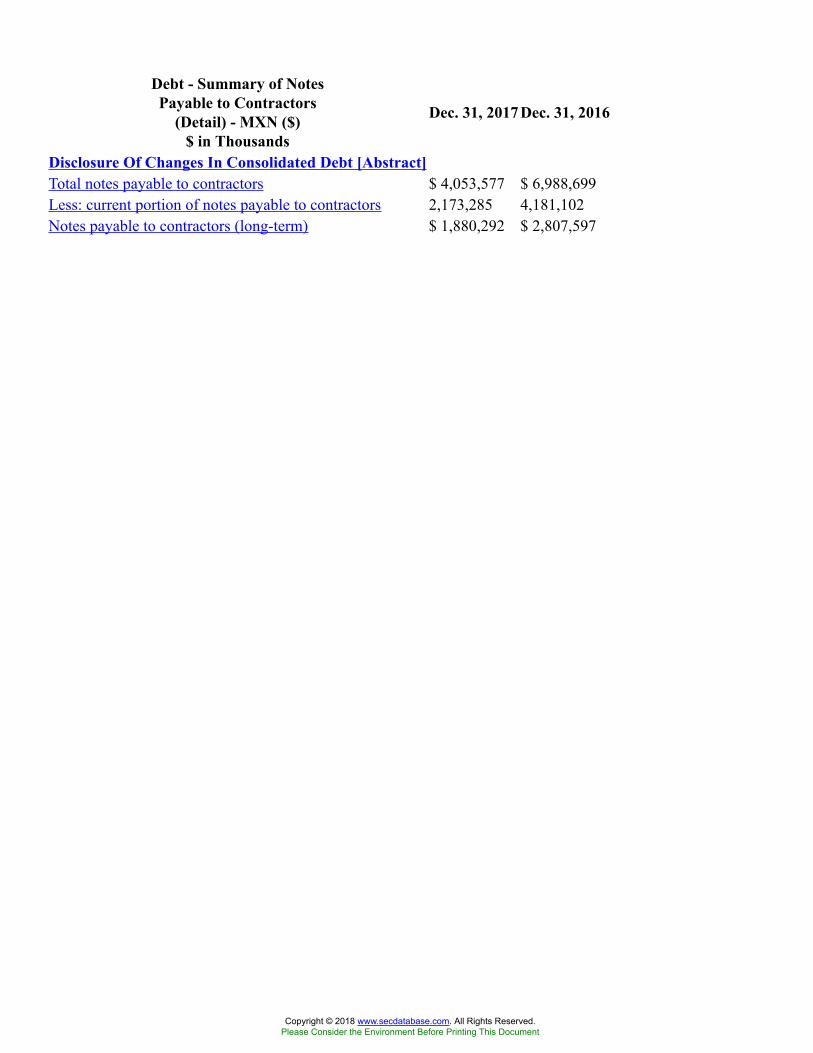
Debt - Summary of NotesPayable to Contractors
(Detail) - MXN ($)$ in Thousands
Dec. 31, 2017 Dec. 31, 2016
Disclosure Of Changes In Consolidated Debt [Abstract]Total notes payable to contractors $ 4,053,577 $ 6,988,699Less: current portion of notes payable to contractors 2,173,285 4,181,102Notes payable to contractors (long-term) $ 1,880,292 $ 2,807,597
Copyright © 2018 www.secdatabase.com. All Rights Reserved.Please Consider the Environment Before Printing This Document
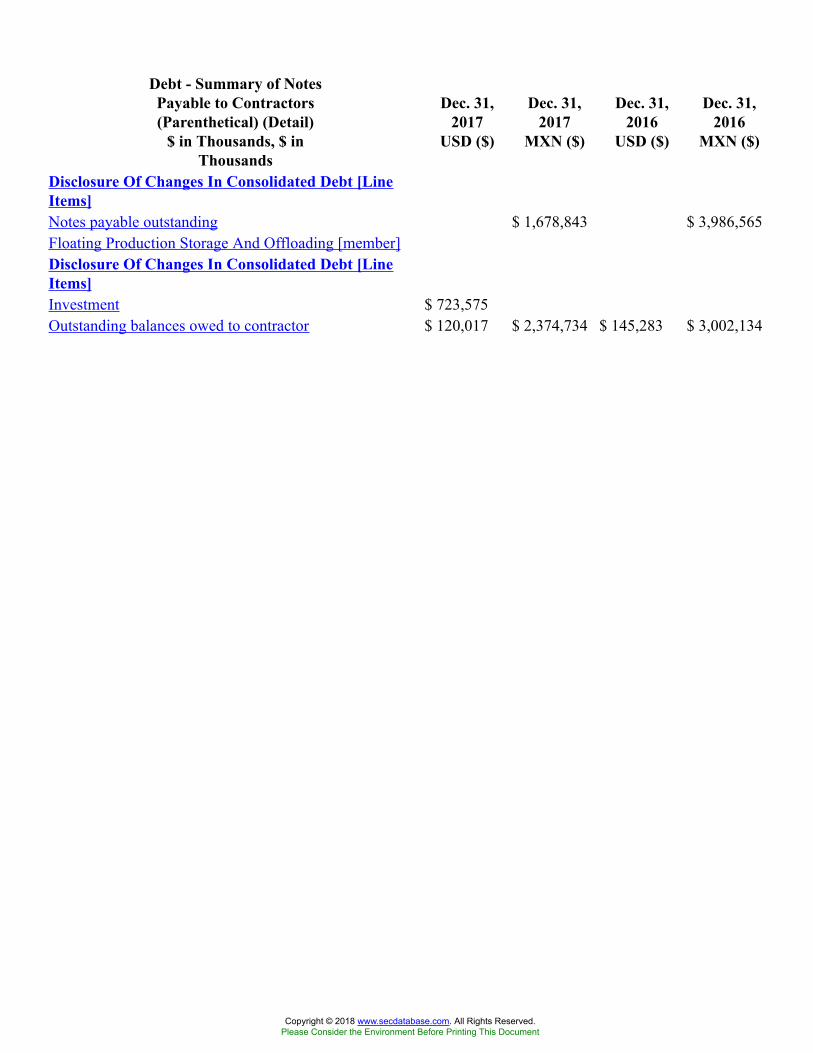
Debt - Summary of NotesPayable to Contractors(Parenthetical) (Detail)
$ in Thousands, $ inThousands
Dec. 31,2017
USD ($)
Dec. 31,2017
MXN ($)
Dec. 31,2016
USD ($)
Dec. 31,2016
MXN ($)
Disclosure Of Changes In Consolidated Debt [LineItems]Notes payable outstanding $ 1,678,843 $ 3,986,565Floating Production Storage And Offloading [member]Disclosure Of Changes In Consolidated Debt [LineItems]Investment $ 723,575Outstanding balances owed to contractor $ 120,017 $ 2,374,734 $ 145,283 $ 3,002,134
Copyright © 2018 www.secdatabase.com. All Rights Reserved.Please Consider the Environment Before Printing This Document
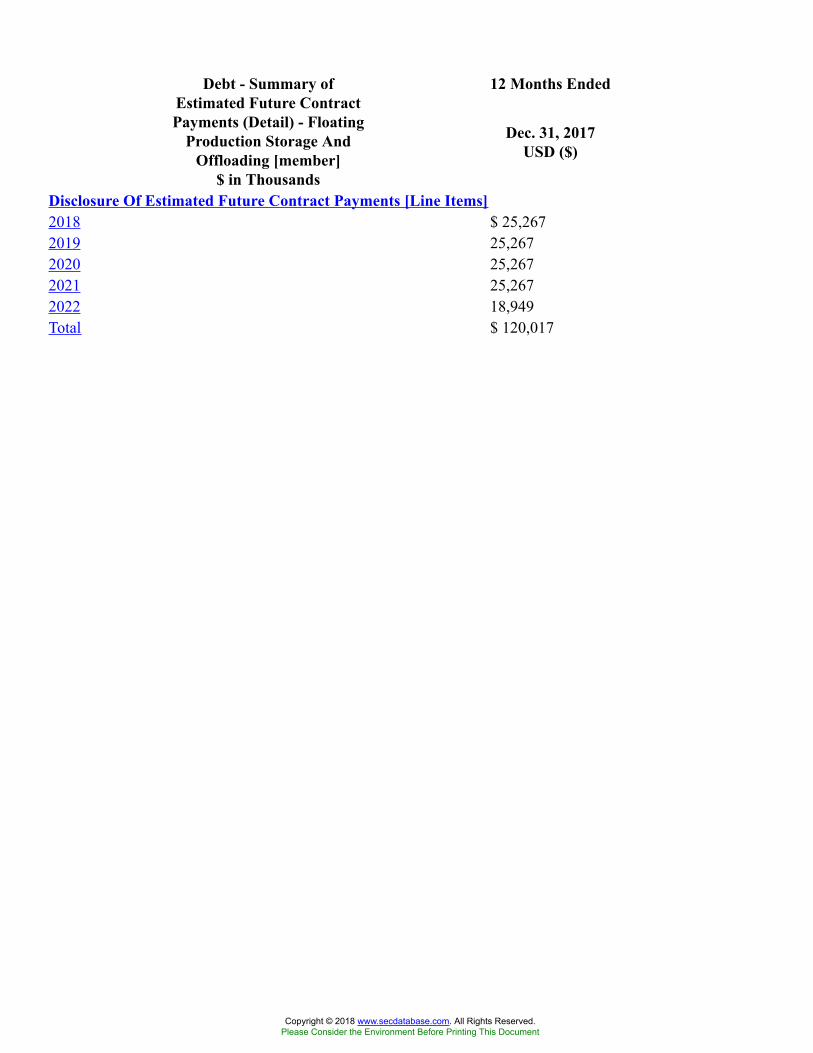
12 Months EndedDebt - Summary ofEstimated Future ContractPayments (Detail) - Floating
Production Storage AndOffloading [member]
$ in Thousands
Dec. 31, 2017USD ($)
Disclosure Of Estimated Future Contract Payments [Line Items]2018 $ 25,2672019 25,2672020 25,2672021 25,2672022 18,949Total $ 120,017
Copyright © 2018 www.secdatabase.com. All Rights Reserved.Please Consider the Environment Before Printing This Document
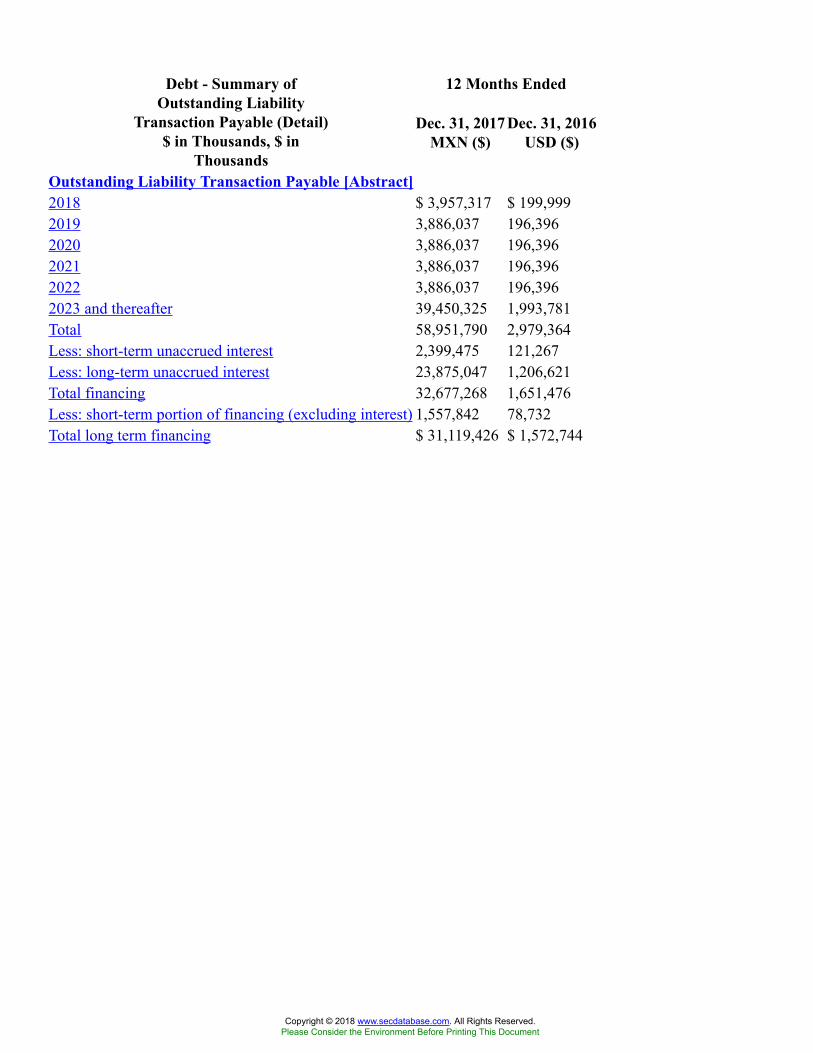
12 Months EndedDebt - Summary ofOutstanding Liability
Transaction Payable (Detail)$ in Thousands, $ in
Thousands
Dec. 31, 2017MXN ($)
Dec. 31, 2016USD ($)
Outstanding Liability Transaction Payable [Abstract]2018 $ 3,957,317 $ 199,9992019 3,886,037 196,3962020 3,886,037 196,3962021 3,886,037 196,3962022 3,886,037 196,3962023 and thereafter 39,450,325 1,993,781Total 58,951,790 2,979,364Less: short-term unaccrued interest 2,399,475 121,267Less: long-term unaccrued interest 23,875,047 1,206,621Total financing 32,677,268 1,651,476Less: short-term portion of financing (excluding interest) 1,557,842 78,732Total long term financing $ 31,119,426 $ 1,572,744
Copyright © 2018 www.secdatabase.com. All Rights Reserved.Please Consider the Environment Before Printing This Document
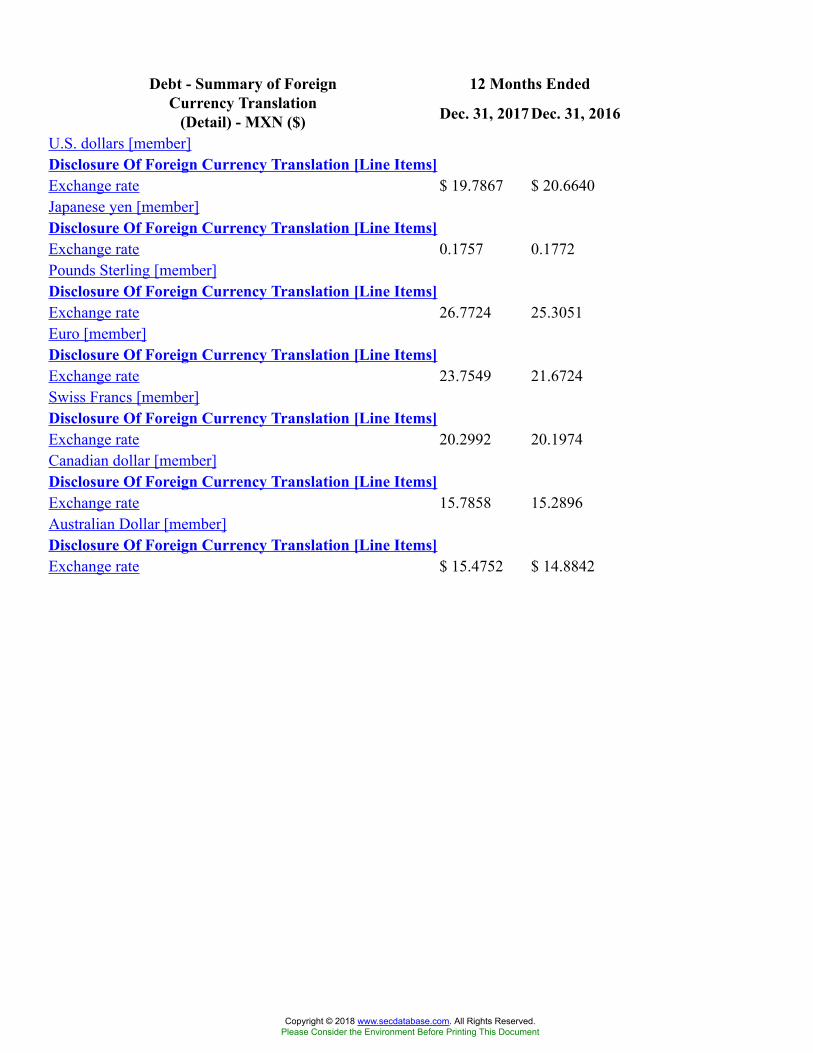
12 Months EndedDebt - Summary of ForeignCurrency Translation
(Detail) - MXN ($) Dec. 31, 2017 Dec. 31, 2016
U.S. dollars [member]Disclosure Of Foreign Currency Translation [Line Items]Exchange rate $ 19.7867 $ 20.6640Japanese yen [member]Disclosure Of Foreign Currency Translation [Line Items]Exchange rate 0.1757 0.1772Pounds Sterling [member]Disclosure Of Foreign Currency Translation [Line Items]Exchange rate 26.7724 25.3051Euro [member]Disclosure Of Foreign Currency Translation [Line Items]Exchange rate 23.7549 21.6724Swiss Francs [member]Disclosure Of Foreign Currency Translation [Line Items]Exchange rate 20.2992 20.1974Canadian dollar [member]Disclosure Of Foreign Currency Translation [Line Items]Exchange rate 15.7858 15.2896Australian Dollar [member]Disclosure Of Foreign Currency Translation [Line Items]Exchange rate $ 15.4752 $ 14.8842
Copyright © 2018 www.secdatabase.com. All Rights Reserved.Please Consider the Environment Before Printing This Document
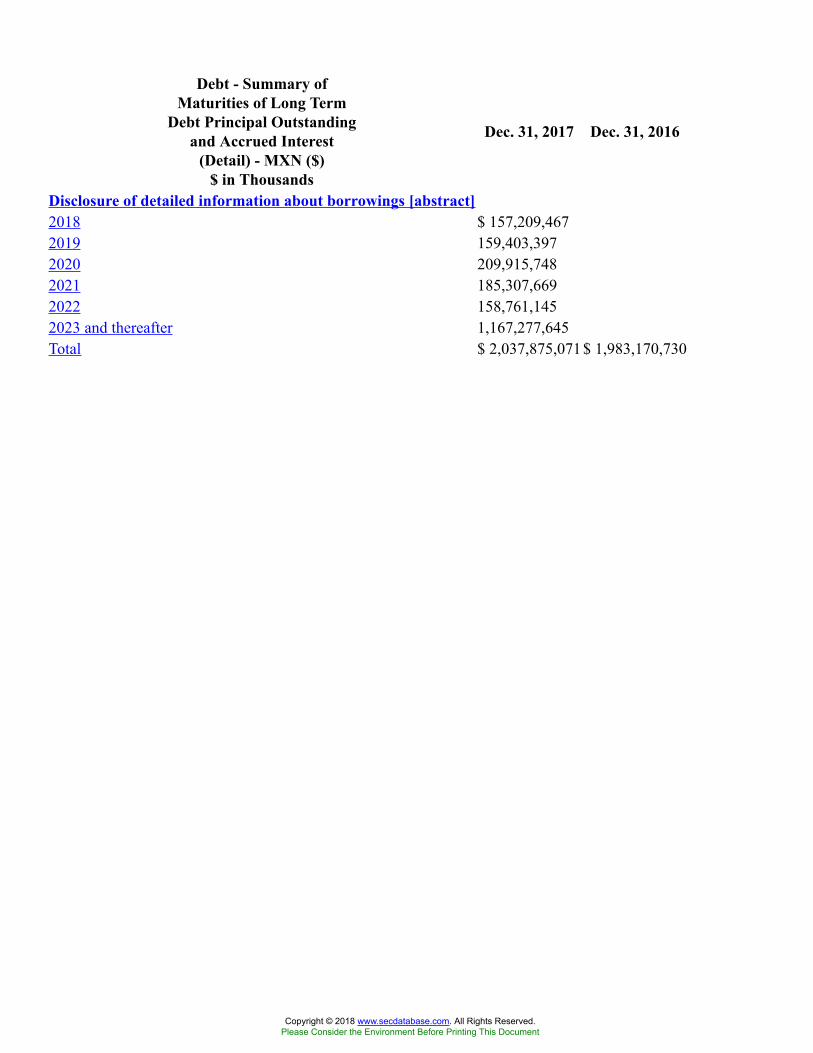
Debt - Summary ofMaturities of Long Term
Debt Principal Outstandingand Accrued Interest
(Detail) - MXN ($)$ in Thousands
Dec. 31, 2017 Dec. 31, 2016
Disclosure of detailed information about borrowings [abstract]2018 $ 157,209,4672019 159,403,3972020 209,915,7482021 185,307,6692022 158,761,1452023 and thereafter 1,167,277,645Total $ 2,037,875,071$ 1,983,170,730
Copyright © 2018 www.secdatabase.com. All Rights Reserved.Please Consider the Environment Before Printing This Document
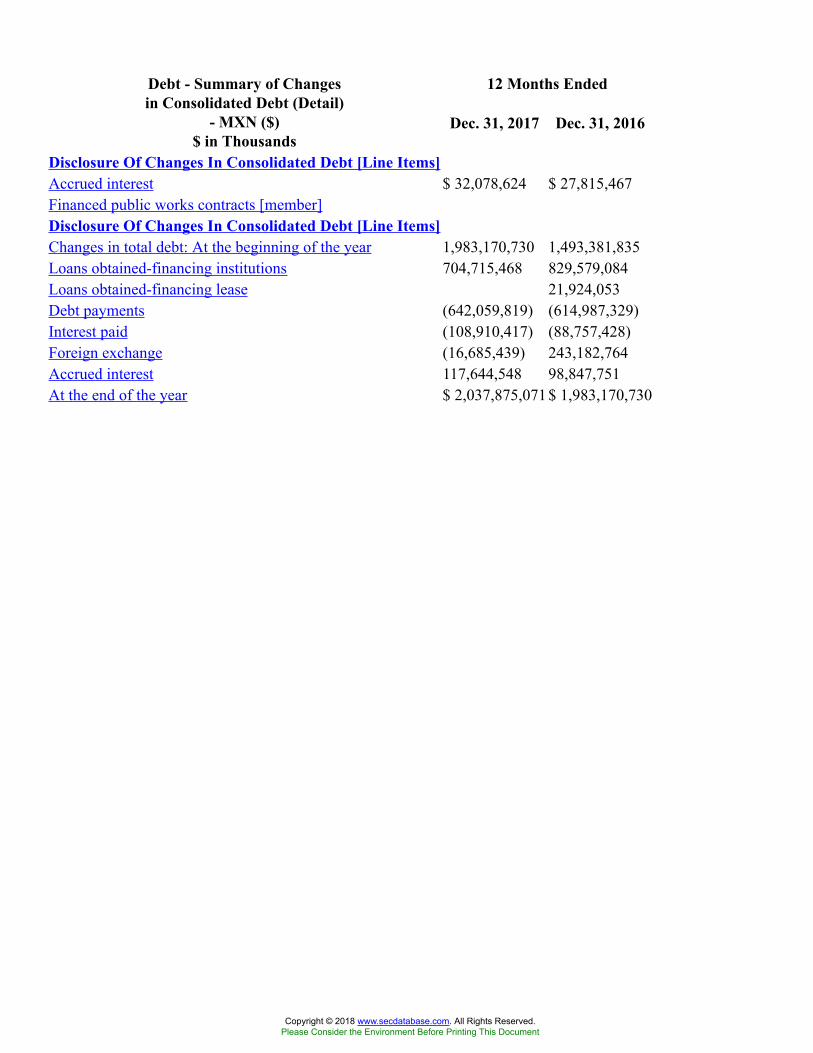
12 Months EndedDebt - Summary of Changesin Consolidated Debt (Detail)
- MXN ($)$ in Thousands
Dec. 31, 2017 Dec. 31, 2016
Disclosure Of Changes In Consolidated Debt [Line Items]Accrued interest $ 32,078,624 $ 27,815,467Financed public works contracts [member]Disclosure Of Changes In Consolidated Debt [Line Items]Changes in total debt: At the beginning of the year 1,983,170,730 1,493,381,835Loans obtained-financing institutions 704,715,468 829,579,084Loans obtained-financing lease 21,924,053Debt payments (642,059,819) (614,987,329)Interest paid (108,910,417) (88,757,428)Foreign exchange (16,685,439) 243,182,764Accrued interest 117,644,548 98,847,751At the end of the year $ 2,037,875,071$ 1,983,170,730
Copyright © 2018 www.secdatabase.com. All Rights Reserved.Please Consider the Environment Before Printing This Document
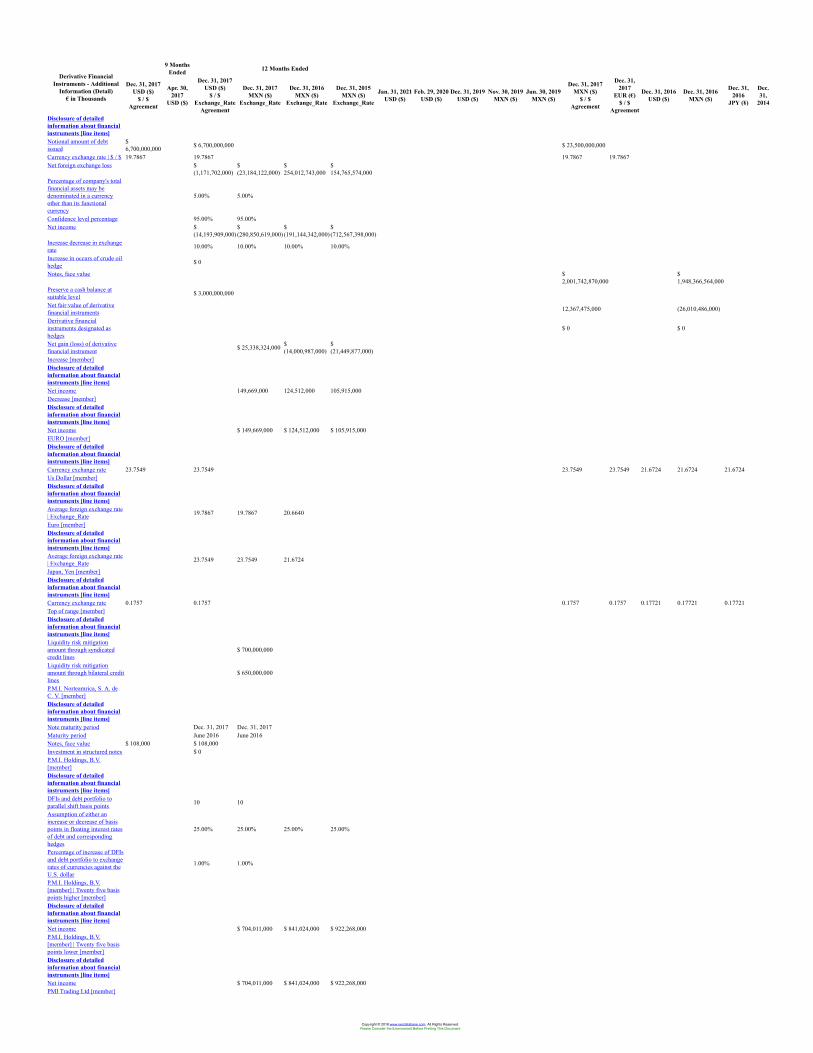
9 MonthsEnded 12 Months Ended
Derivative FinancialInstruments - Additional
Information (Detail)€ in Thousands
Dec. 31, 2017USD ($)
$ / $Agreement
Apr. 30,2017
USD ($)
Dec. 31, 2017USD ($)
$ / $Exchange_Rate
Agreement
Dec. 31, 2017MXN ($)
Exchange_Rate
Dec. 31, 2016MXN ($)
Exchange_Rate
Dec. 31, 2015MXN ($)
Exchange_Rate
Jan. 31, 2021USD ($)
Feb. 29, 2020USD ($)
Dec. 31, 2019USD ($)
Nov. 30, 2019MXN ($)
Jun. 30, 2019MXN ($)
Dec. 31, 2017MXN ($)
$ / $Agreement
Dec. 31,2017
EUR (€)$ / $
Agreement
Dec. 31, 2016USD ($)
Dec. 31, 2016MXN ($)
Dec. 31,2016
JPY (¥)
Dec.31,
2014
Disclosure of detailedinformation about financialinstruments [line items]Notional amount of debtissued
$6,700,000,000 $ 6,700,000,000 $ 23,500,000,000
Currency exchange rate | $ / $ 19.7867 19.7867 19.7867 19.7867Net foreign exchange loss $
(1,171,702,000)$(23,184,122,000)
$254,012,743,000
$154,765,574,000
Percentage of company's totalfinancial assets may bedenominated in a currencyother than its functionalcurrency
5.00% 5.00%
Confidence level percentage 95.00% 95.00%Net income $
(14,193,909,000)$(280,850,619,000)
$(191,144,342,000)
$(712,567,398,000)
Increase decrease in exchangerate 10.00% 10.00% 10.00% 10.00%
Increase in occurs of crude oilhedge $ 0
Notes, face value $2,001,742,870,000
$1,948,366,564,000
Preserve a cash balance atsuitable level $ 3,000,000,000
Net fair value of derivativefinancial instruments 12,367,475,000 (26,010,486,000)
Derivative financialinstruments designated ashedges
$ 0 $ 0
Net gain (loss) of derivativefinancial instrument $ 25,338,324,000 $
(14,000,987,000)$(21,449,877,000)
Increase [member]Disclosure of detailedinformation about financialinstruments [line items]Net income 149,669,000 124,512,000 105,915,000Decrease [member]Disclosure of detailedinformation about financialinstruments [line items]Net income $ 149,669,000 $ 124,512,000 $ 105,915,000EURO [member]Disclosure of detailedinformation about financialinstruments [line items]Currency exchange rate 23.7549 23.7549 23.7549 23.7549 21.6724 21.6724 21.6724Us Dollar [member]Disclosure of detailedinformation about financialinstruments [line items]Average foreign exchange rate| Exchange_Rate 19.7867 19.7867 20.6640
Euro [member]Disclosure of detailedinformation about financialinstruments [line items]Average foreign exchange rate| Exchange_Rate 23.7549 23.7549 21.6724
Japan, Yen [member]Disclosure of detailedinformation about financialinstruments [line items]Currency exchange rate 0.1757 0.1757 0.1757 0.1757 0.17721 0.17721 0.17721Top of range [member]Disclosure of detailedinformation about financialinstruments [line items]Liquidity risk mitigationamount through syndicatedcredit lines
$ 700,000,000
Liquidity risk mitigationamount through bilateral creditlines
$ 650,000,000
P.M.I. Norteamrica, S. A. deC. V. [member]Disclosure of detailedinformation about financialinstruments [line items]Note maturity period Dec. 31, 2017 Dec. 31, 2017Maturity period June 2016 June 2016Notes, face value $ 108,000 $ 108,000Investment in structured notes $ 0P.M.I. Holdings, B.V.[member]Disclosure of detailedinformation about financialinstruments [line items]DFIs and debt portfolio toparallel shift basis points 10 10
Assumption of either anincrease or decrease of basispoints in floating interest ratesof debt and correspondinghedges
25.00% 25.00% 25.00% 25.00%
Percentage of increase of DFIsand debt portfolio to exchangerates of currencies against theU.S. dollar
1.00% 1.00%
P.M.I. Holdings, B.V.[member] | Twenty five basispoints higher [member]Disclosure of detailedinformation about financialinstruments [line items]Net income $ 704,011,000 $ 841,024,000 $ 922,268,000P.M.I. Holdings, B.V.[member] | Twenty five basispoints lower [member]Disclosure of detailedinformation about financialinstruments [line items]Net income $ 704,011,000 $ 841,024,000 $ 922,268,000PMI Trading Ltd [member]
Copyright © 2018 www.secdatabase.com. All Rights Reserved.Please Consider the Environment Before Printing This Document
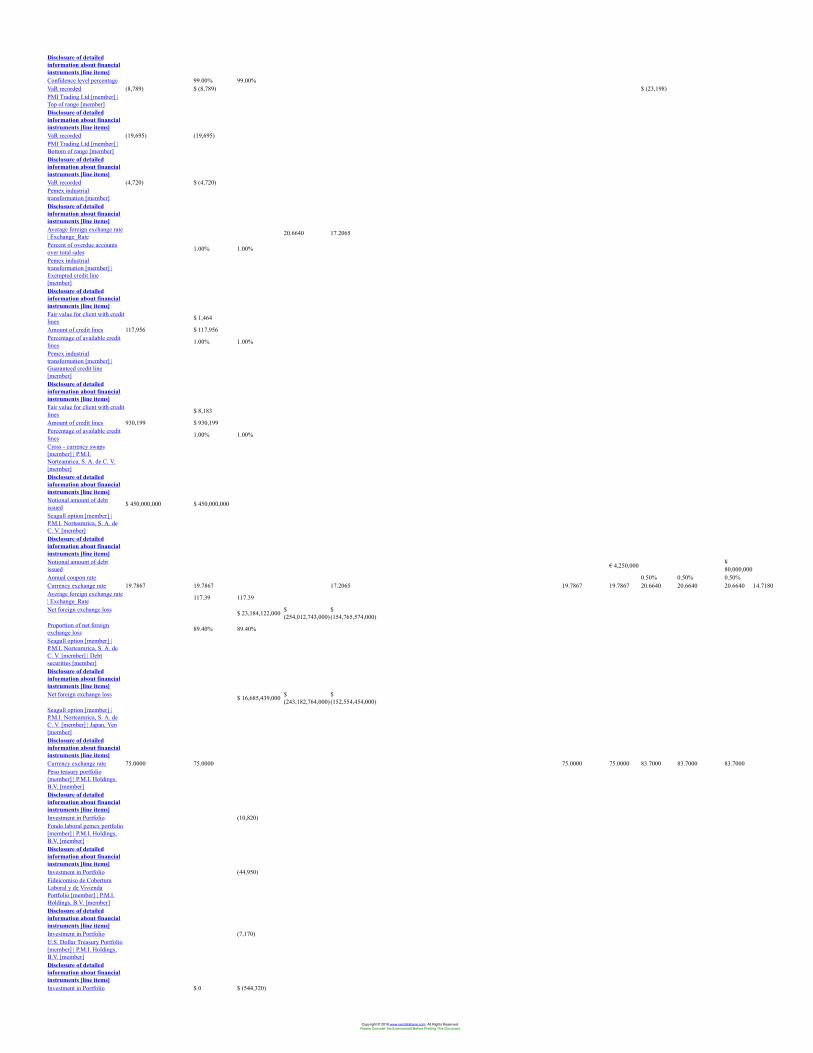
Disclosure of detailedinformation about financialinstruments [line items]Confidence level percentage 99.00% 99.00%VaR recorded (8,789) $ (8,789) $ (23,198)PMI Trading Ltd [member] |Top of range [member]Disclosure of detailedinformation about financialinstruments [line items]VaR recorded (19,695) (19,695)PMI Trading Ltd [member] |Bottom of range [member]Disclosure of detailedinformation about financialinstruments [line items]VaR recorded (4,720) $ (4,720)Pemex industrialtransformation [member]Disclosure of detailedinformation about financialinstruments [line items]Average foreign exchange rate| Exchange_Rate 20.6640 17.2065
Percent of overdue accountsover total sales 1.00% 1.00%
Pemex industrialtransformation [member] |Exempted credit line[member]Disclosure of detailedinformation about financialinstruments [line items]Fair value for client with creditlines $ 1,464
Amount of credit lines 117,956 $ 117,956Percentage of available creditlines 1.00% 1.00%
Pemex industrialtransformation [member] |Guaranteed credit line[member]Disclosure of detailedinformation about financialinstruments [line items]Fair value for client with creditlines $ 8,183
Amount of credit lines 930,199 $ 930,199Percentage of available creditlines 1.00% 1.00%
Cross - currency swaps[member] | P.M.I.Norteamrica, S. A. de C. V.[member]Disclosure of detailedinformation about financialinstruments [line items]Notional amount of debtissued $ 450,000,000 $ 450,000,000
Seagull option [member] |P.M.I. Norteamrica, S. A. deC. V. [member]Disclosure of detailedinformation about financialinstruments [line items]Notional amount of debtissued € 4,250,000 ¥
80,000,000Annual coupon rate 0.50% 0.50% 0.50%Currency exchange rate 19.7867 19.7867 17.2065 19.7867 19.7867 20.6640 20.6640 20.6640 14.7180Average foreign exchange rate| Exchange_Rate 117.39 117.39
Net foreign exchange loss $ 23,184,122,000 $(254,012,743,000)
$(154,765,574,000)
Proportion of net foreignexchange loss 89.40% 89.40%
Seagull option [member] |P.M.I. Norteamrica, S. A. deC. V. [member] | Debtsecurities [member]Disclosure of detailedinformation about financialinstruments [line items]Net foreign exchange loss $ 16,685,439,000 $
(243,182,764,000)$(152,554,454,000)
Seagull option [member] |P.M.I. Norteamrica, S. A. deC. V. [member] | Japan, Yen[member]Disclosure of detailedinformation about financialinstruments [line items]Currency exchange rate 75.0000 75.0000 75.0000 75.0000 83.7000 83.7000 83.7000Peso teasury portfolio[member] | P.M.I. Holdings,B.V. [member]Disclosure of detailedinformation about financialinstruments [line items]Investment in Portfolio (10,820)Fondo laboral pemex portfolio[member] | P.M.I. Holdings,B.V. [member]Disclosure of detailedinformation about financialinstruments [line items]Investment in Portfolio (44,950)Fideicomiso de CoberturaLaboral y de ViviendaPortfolio [member] | P.M.I.Holdings, B.V. [member]Disclosure of detailedinformation about financialinstruments [line items]Investment in Portfolio (7,170)U.S. Dollar Treasury Portfolio[member] | P.M.I. Holdings,B.V. [member]Disclosure of detailedinformation about financialinstruments [line items]Investment in Portfolio $ 0 $ (544,320)
Copyright © 2018 www.secdatabase.com. All Rights Reserved.Please Consider the Environment Before Printing This Document
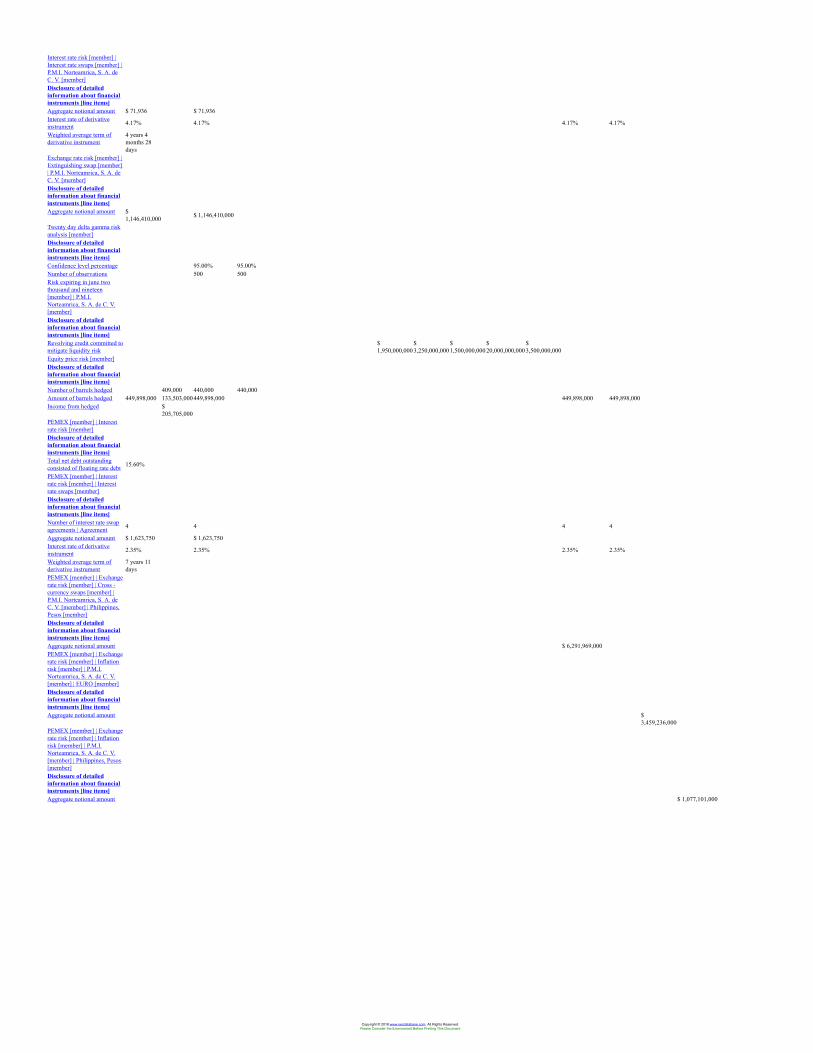
Interest rate risk [member] |Interest rate swaps [member] |P.M.I. Norteamrica, S. A. deC. V. [member]Disclosure of detailedinformation about financialinstruments [line items]Aggregate notional amount $ 71,936 $ 71,936Interest rate of derivativeinstrument 4.17% 4.17% 4.17% 4.17%
Weighted average term ofderivative instrument
4 years 4months 28days
Exchange rate risk [member] |Extinguishing swap [member]| P.M.I. Norteamrica, S. A. deC. V. [member]Disclosure of detailedinformation about financialinstruments [line items]Aggregate notional amount $
1,146,410,000 $ 1,146,410,000
Twenty day delta gamma riskanalysis [member]Disclosure of detailedinformation about financialinstruments [line items]Confidence level percentage 95.00% 95.00%Number of observations 500 500Risk expiring in june twothousand and nineteen[member] | P.M.I.Norteamrica, S. A. de C. V.[member]Disclosure of detailedinformation about financialinstruments [line items]Revolving credit committed tomitigate liquidity risk
$1,950,000,000
$3,250,000,000
$1,500,000,000
$20,000,000,000
$3,500,000,000
Equity price risk [member]Disclosure of detailedinformation about financialinstruments [line items]Number of barrels hedged 409,000 440,000 440,000Amount of barrels hedged 449,898,000 133,503,000449,898,000 449,898,000 449,898,000Income from hedged $
205,705,000PEMEX [member] | Interestrate risk [member]Disclosure of detailedinformation about financialinstruments [line items]Total net debt outstandingconsisted of floating rate debt 15.60%
PEMEX [member] | Interestrate risk [member] | Interestrate swaps [member]Disclosure of detailedinformation about financialinstruments [line items]Number of interest rate swapagreements | Agreement 4 4 4 4
Aggregate notional amount $ 1,623,750 $ 1,623,750Interest rate of derivativeinstrument 2.35% 2.35% 2.35% 2.35%
Weighted average term ofderivative instrument
7 years 11days
PEMEX [member] | Exchangerate risk [member] | Cross -currency swaps [member] |P.M.I. Norteamrica, S. A. deC. V. [member] | Philippines,Pesos [member]Disclosure of detailedinformation about financialinstruments [line items]Aggregate notional amount $ 6,291,969,000PEMEX [member] | Exchangerate risk [member] | Inflationrisk [member] | P.M.I.Norteamrica, S. A. de C. V.[member] | EURO [member]Disclosure of detailedinformation about financialinstruments [line items]Aggregate notional amount $
3,459,236,000PEMEX [member] | Exchangerate risk [member] | Inflationrisk [member] | P.M.I.Norteamrica, S. A. de C. V.[member] | Philippines, Pesos[member]Disclosure of detailedinformation about financialinstruments [line items]Aggregate notional amount $ 1,077,101,000
Copyright © 2018 www.secdatabase.com. All Rights Reserved.Please Consider the Environment Before Printing This Document
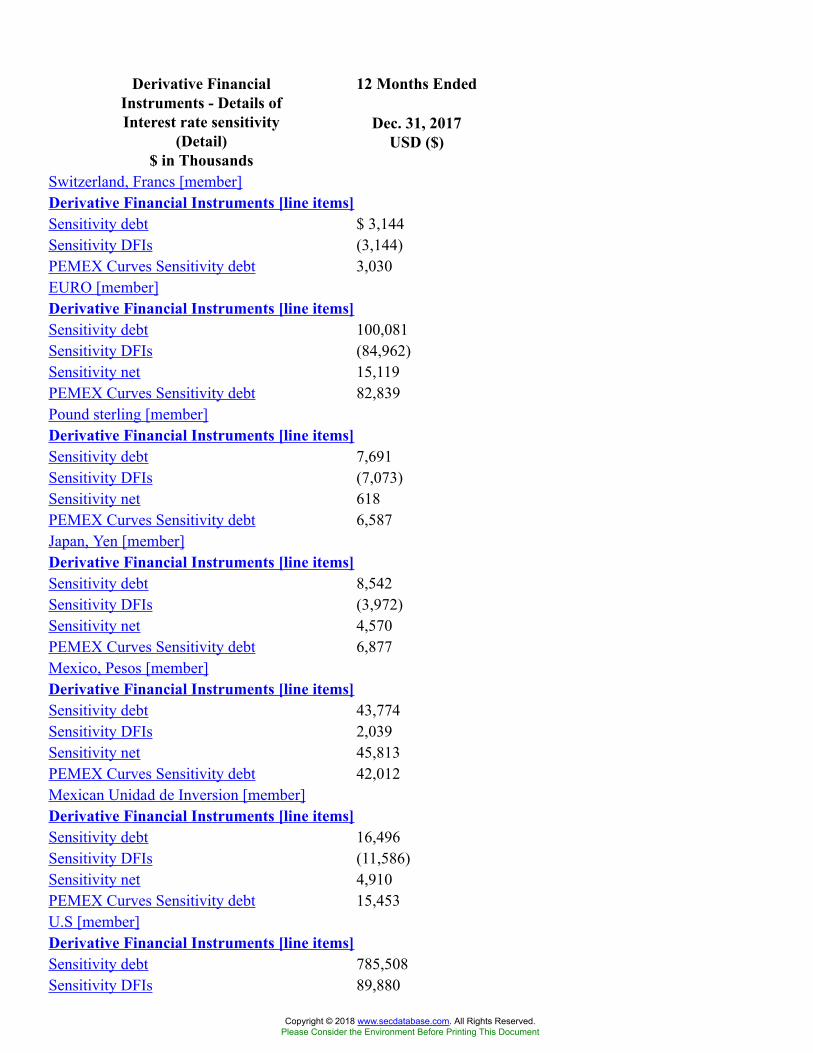
12 Months EndedDerivative FinancialInstruments - Details ofInterest rate sensitivity
(Detail)$ in Thousands
Dec. 31, 2017USD ($)
Switzerland, Francs [member]Derivative Financial Instruments [line items]Sensitivity debt $ 3,144Sensitivity DFIs (3,144)PEMEX Curves Sensitivity debt 3,030EURO [member]Derivative Financial Instruments [line items]Sensitivity debt 100,081Sensitivity DFIs (84,962)Sensitivity net 15,119PEMEX Curves Sensitivity debt 82,839Pound sterling [member]Derivative Financial Instruments [line items]Sensitivity debt 7,691Sensitivity DFIs (7,073)Sensitivity net 618PEMEX Curves Sensitivity debt 6,587Japan, Yen [member]Derivative Financial Instruments [line items]Sensitivity debt 8,542Sensitivity DFIs (3,972)Sensitivity net 4,570PEMEX Curves Sensitivity debt 6,877Mexico, Pesos [member]Derivative Financial Instruments [line items]Sensitivity debt 43,774Sensitivity DFIs 2,039Sensitivity net 45,813PEMEX Curves Sensitivity debt 42,012Mexican Unidad de Inversion [member]Derivative Financial Instruments [line items]Sensitivity debt 16,496Sensitivity DFIs (11,586)Sensitivity net 4,910PEMEX Curves Sensitivity debt 15,453U.S [member]Derivative Financial Instruments [line items]Sensitivity debt 785,508Sensitivity DFIs 89,880
Copyright © 2018 www.secdatabase.com. All Rights Reserved.Please Consider the Environment Before Printing This Document

Sensitivity net 875,388PEMEX Curves Sensitivity debt $ 416,052
Copyright © 2018 www.secdatabase.com. All Rights Reserved.Please Consider the Environment Before Printing This Document
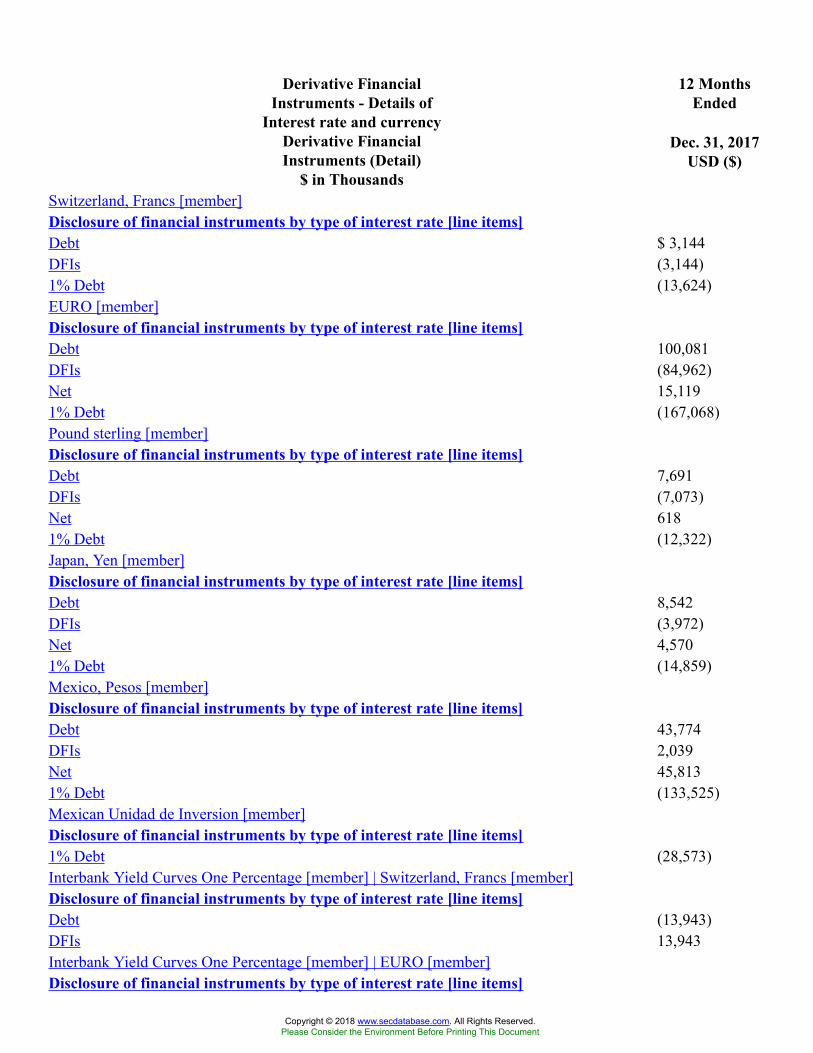
12 MonthsEnded
Derivative FinancialInstruments - Details of
Interest rate and currencyDerivative FinancialInstruments (Detail)
$ in Thousands
Dec. 31, 2017USD ($)
Switzerland, Francs [member]Disclosure of financial instruments by type of interest rate [line items]Debt $ 3,144DFIs (3,144)1% Debt (13,624)EURO [member]Disclosure of financial instruments by type of interest rate [line items]Debt 100,081DFIs (84,962)Net 15,1191% Debt (167,068)Pound sterling [member]Disclosure of financial instruments by type of interest rate [line items]Debt 7,691DFIs (7,073)Net 6181% Debt (12,322)Japan, Yen [member]Disclosure of financial instruments by type of interest rate [line items]Debt 8,542DFIs (3,972)Net 4,5701% Debt (14,859)Mexico, Pesos [member]Disclosure of financial instruments by type of interest rate [line items]Debt 43,774DFIs 2,039Net 45,8131% Debt (133,525)Mexican Unidad de Inversion [member]Disclosure of financial instruments by type of interest rate [line items]1% Debt (28,573)Interbank Yield Curves One Percentage [member] | Switzerland, Francs [member]Disclosure of financial instruments by type of interest rate [line items]Debt (13,943)DFIs 13,943Interbank Yield Curves One Percentage [member] | EURO [member]Disclosure of financial instruments by type of interest rate [line items]
Copyright © 2018 www.secdatabase.com. All Rights Reserved.Please Consider the Environment Before Printing This Document

Debt (187,988)DFIs 165,894Net (22,094)Interbank Yield Curves One Percentage [member] | Pound sterling [member]Disclosure of financial instruments by type of interest rate [line items]Debt (13,822)DFIs 13,042Net (780)Interbank Yield Curves One Percentage [member] | Japan, Yen [member]Disclosure of financial instruments by type of interest rate [line items]Debt (16,914)DFIs 11,470Net (5,444)Interbank Yield Curves One Percentage [member] | Mexico, Pesos [member]Disclosure of financial instruments by type of interest rate [line items]Debt (135,974)DFIs 1,409Net (134,565)Interbank Yield Curves One Percentage [member] | Mexican Unidad de Inversion [member]Disclosure of financial instruments by type of interest rate [line items]Debt (29,485)DFIs 25,358Net (4,127)Interbank Yield Curves VaR Ninety Percentage [member] | EURO [member]Disclosure of financial instruments by type of interest rate [line items]Net (19,744)Interbank Yield Curves VaR Ninety Percentage [member] | Pound sterling [member]Disclosure of financial instruments by type of interest rate [line items]Net (666)Interbank Yield Curves VaR Ninety Percentage [member] | Japan, Yen [member]Disclosure of financial instruments by type of interest rate [line items]Net (4,398)Interbank Yield Curves VaR Ninety Percentage [member] | Mexico, Pesos [member]Disclosure of financial instruments by type of interest rate [line items]Net (162,336)Interbank Yield Curves VaR Ninety Percentage [member] | Mexican Unidad de Inversion[member]Disclosure of financial instruments by type of interest rate [line items]Net $ (5,038)
Copyright © 2018 www.secdatabase.com. All Rights Reserved.Please Consider the Environment Before Printing This Document
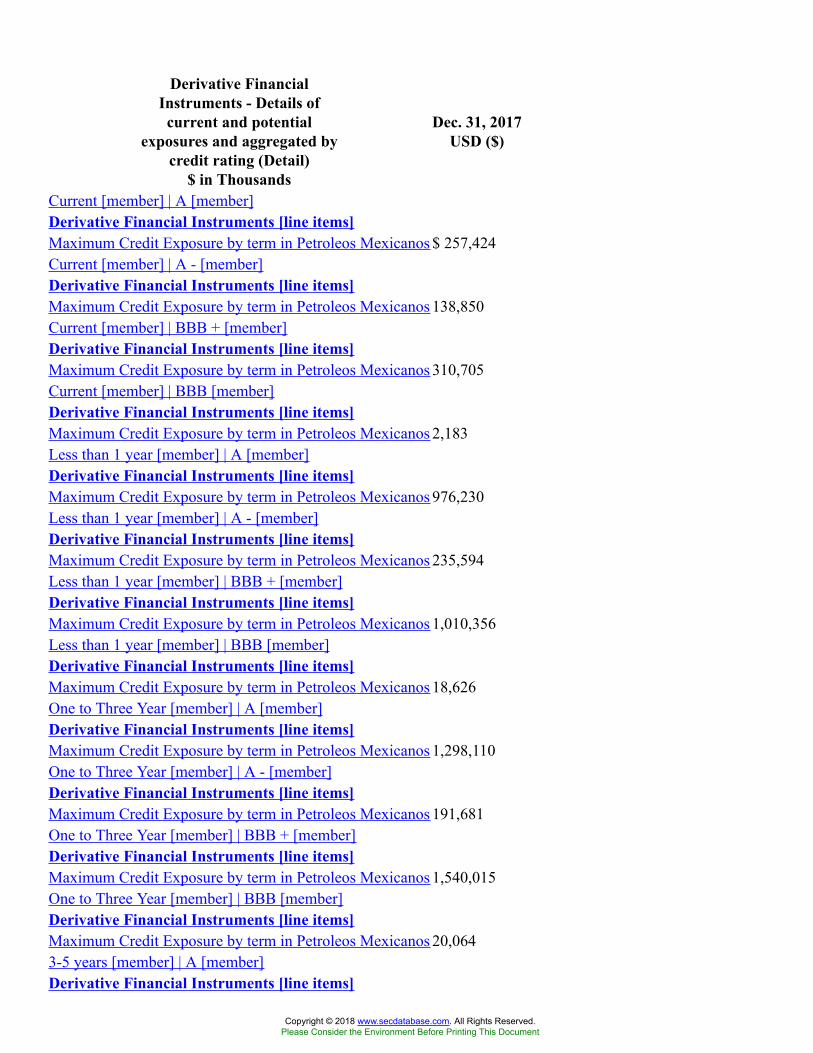
Derivative FinancialInstruments - Details ofcurrent and potential
exposures and aggregated bycredit rating (Detail)
$ in Thousands
Dec. 31, 2017USD ($)
Current [member] | A [member]Derivative Financial Instruments [line items]Maximum Credit Exposure by term in Petroleos Mexicanos $ 257,424Current [member] | A - [member]Derivative Financial Instruments [line items]Maximum Credit Exposure by term in Petroleos Mexicanos 138,850Current [member] | BBB + [member]Derivative Financial Instruments [line items]Maximum Credit Exposure by term in Petroleos Mexicanos 310,705Current [member] | BBB [member]Derivative Financial Instruments [line items]Maximum Credit Exposure by term in Petroleos Mexicanos 2,183Less than 1 year [member] | A [member]Derivative Financial Instruments [line items]Maximum Credit Exposure by term in Petroleos Mexicanos 976,230Less than 1 year [member] | A - [member]Derivative Financial Instruments [line items]Maximum Credit Exposure by term in Petroleos Mexicanos 235,594Less than 1 year [member] | BBB + [member]Derivative Financial Instruments [line items]Maximum Credit Exposure by term in Petroleos Mexicanos 1,010,356Less than 1 year [member] | BBB [member]Derivative Financial Instruments [line items]Maximum Credit Exposure by term in Petroleos Mexicanos 18,626One to Three Year [member] | A [member]Derivative Financial Instruments [line items]Maximum Credit Exposure by term in Petroleos Mexicanos 1,298,110One to Three Year [member] | A - [member]Derivative Financial Instruments [line items]Maximum Credit Exposure by term in Petroleos Mexicanos 191,681One to Three Year [member] | BBB + [member]Derivative Financial Instruments [line items]Maximum Credit Exposure by term in Petroleos Mexicanos 1,540,015One to Three Year [member] | BBB [member]Derivative Financial Instruments [line items]Maximum Credit Exposure by term in Petroleos Mexicanos 20,0643-5 years [member] | A [member]Derivative Financial Instruments [line items]
Copyright © 2018 www.secdatabase.com. All Rights Reserved.Please Consider the Environment Before Printing This Document

Maximum Credit Exposure by term in Petroleos Mexicanos 1,314,2963-5 years [member] | A - [member]Derivative Financial Instruments [line items]Maximum Credit Exposure by term in Petroleos Mexicanos 228,8013-5 years [member] | BBB + [member]Derivative Financial Instruments [line items]Maximum Credit Exposure by term in Petroleos Mexicanos 1,349,3113-5 years [member] | BBB [member]Derivative Financial Instruments [line items]Maximum Credit Exposure by term in Petroleos Mexicanos 18,0925-7 years [member] | A [member]Derivative Financial Instruments [line items]Maximum Credit Exposure by term in Petroleos Mexicanos 578,5485-7 years [member] | A - [member]Derivative Financial Instruments [line items]Maximum Credit Exposure by term in Petroleos Mexicanos 223,7515-7 years [member] | BBB + [member]Derivative Financial Instruments [line items]Maximum Credit Exposure by term in Petroleos Mexicanos 1,243,8987-10 years [member] | A [member]Derivative Financial Instruments [line items]Maximum Credit Exposure by term in Petroleos Mexicanos 482,9597-10 years [member] | A - [member]Derivative Financial Instruments [line items]Maximum Credit Exposure by term in Petroleos Mexicanos 257,4657-10 years [member] | BBB + [member]Derivative Financial Instruments [line items]Maximum Credit Exposure by term in Petroleos Mexicanos 1,115,559More than 10 years [member] | BBB + [member]Derivative Financial Instruments [line items]Maximum Credit Exposure by term in Petroleos Mexicanos $ 78,831
Copyright © 2018 www.secdatabase.com. All Rights Reserved.Please Consider the Environment Before Printing This Document
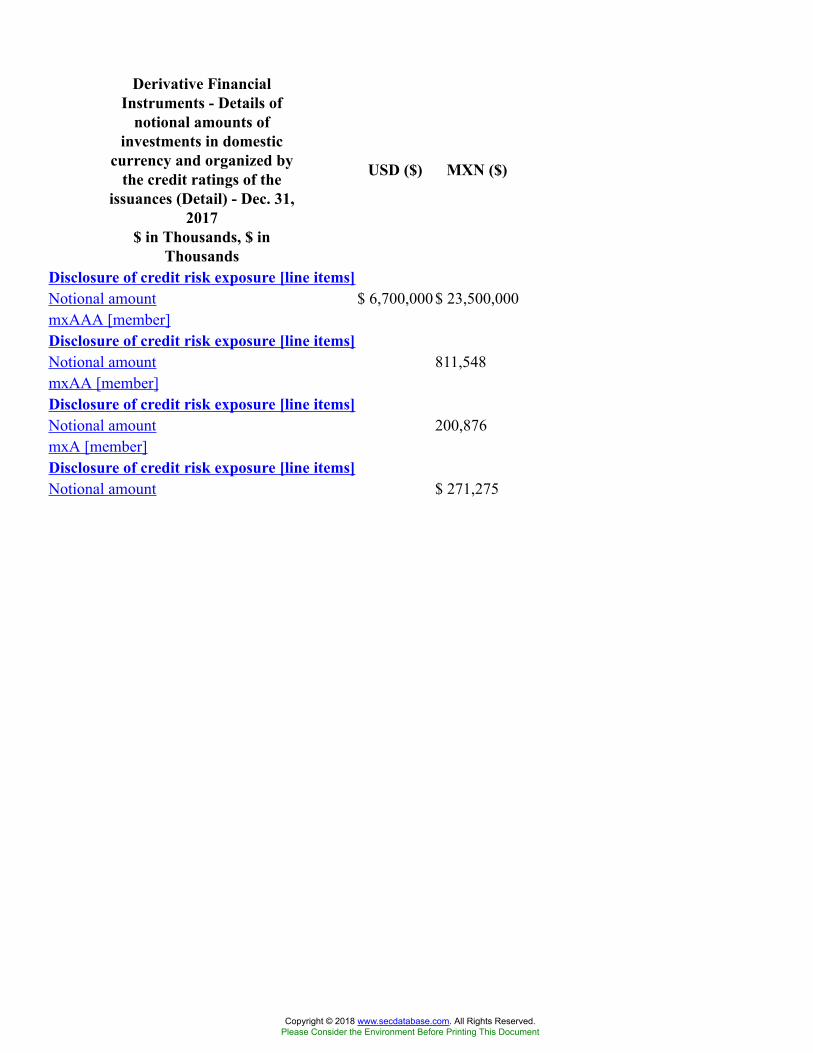
Derivative FinancialInstruments - Details of
notional amounts ofinvestments in domestic
currency and organized bythe credit ratings of the
issuances (Detail) - Dec. 31,2017
$ in Thousands, $ inThousands
USD ($) MXN ($)
Disclosure of credit risk exposure [line items]Notional amount $ 6,700,000$ 23,500,000mxAAA [member]Disclosure of credit risk exposure [line items]Notional amount 811,548mxAA [member]Disclosure of credit risk exposure [line items]Notional amount 200,876mxA [member]Disclosure of credit risk exposure [line items]Notional amount $ 271,275
Copyright © 2018 www.secdatabase.com. All Rights Reserved.Please Consider the Environment Before Printing This Document
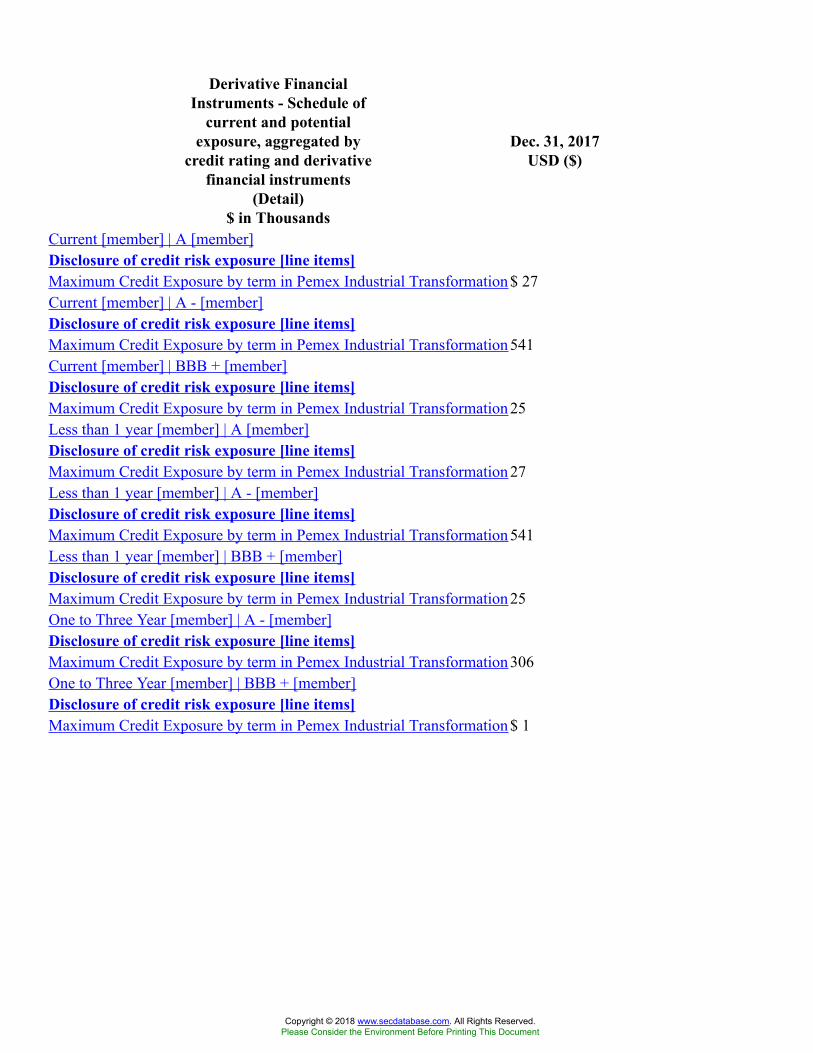
Derivative FinancialInstruments - Schedule of
current and potentialexposure, aggregated by
credit rating and derivativefinancial instruments
(Detail)$ in Thousands
Dec. 31, 2017USD ($)
Current [member] | A [member]Disclosure of credit risk exposure [line items]Maximum Credit Exposure by term in Pemex Industrial Transformation $ 27Current [member] | A - [member]Disclosure of credit risk exposure [line items]Maximum Credit Exposure by term in Pemex Industrial Transformation 541Current [member] | BBB + [member]Disclosure of credit risk exposure [line items]Maximum Credit Exposure by term in Pemex Industrial Transformation 25Less than 1 year [member] | A [member]Disclosure of credit risk exposure [line items]Maximum Credit Exposure by term in Pemex Industrial Transformation 27Less than 1 year [member] | A - [member]Disclosure of credit risk exposure [line items]Maximum Credit Exposure by term in Pemex Industrial Transformation 541Less than 1 year [member] | BBB + [member]Disclosure of credit risk exposure [line items]Maximum Credit Exposure by term in Pemex Industrial Transformation 25One to Three Year [member] | A - [member]Disclosure of credit risk exposure [line items]Maximum Credit Exposure by term in Pemex Industrial Transformation 306One to Three Year [member] | BBB + [member]Disclosure of credit risk exposure [line items]Maximum Credit Exposure by term in Pemex Industrial Transformation $ 1
Copyright © 2018 www.secdatabase.com. All Rights Reserved.Please Consider the Environment Before Printing This Document

12 Months EndedDerivative FinancialInstruments - Details of
quantitative disclosure ofdebt cash flow's maturities
(Detail) - MXN ($)$ in Thousands
Dec. 31, 2017 Dec. 31, 2016
2018 [member]Disclosure of maturity analysis for derivative financial liabilities [lineitems]Outstanding debt $ 125,130,842 $ 148,350,7832018 [member] | Fixed rate (U.S. dollars) [member]Disclosure of maturity analysis for derivative financial liabilities [lineitems]Outstanding debt 53,465,817 15,759,0272018 [member] | Fixed rate (Japanese yen) [member]Disclosure of maturity analysis for derivative financial liabilities [lineitems]Outstanding debt 517,2862018 [member] | Fixed rate (euros) [member]Disclosure of maturity analysis for derivative financial liabilities [lineitems]Outstanding debt 1,043 26,006,8802018 [member] | Fixed rate (Swiss Francs)) [member]Disclosure of maturity analysis for derivative financial liabilities [lineitems]Outstanding debt 4,565,0752018 [member] | Fixed rate (Australian dollars) [member]Disclosure of maturity analysis for derivative financial liabilities [lineitems]Outstanding debt 2,232,1952018 [member] | Fixed rate [member]Disclosure of maturity analysis for derivative financial liabilities [lineitems]Outstanding debt 58,031,935 44,515,3882018 [member] | Variable rate (U.S. dollars) [member]Disclosure of maturity analysis for derivative financial liabilities [lineitems]Outstanding debt 58,364,536 38,811,3202018 [member] | Variable rate (pesos) [member]Disclosure of maturity analysis for derivative financial liabilities [lineitems]Outstanding debt 8,734,371 65,024,0752018 [member] | Variable rate [member]Disclosure of maturity analysis for derivative financial liabilities [lineitems]
Copyright © 2018 www.secdatabase.com. All Rights Reserved.Please Consider the Environment Before Printing This Document

Outstanding debt 67,098,907 103,835,3952019 [member]Disclosure of maturity analysis for derivative financial liabilities [lineitems]Outstanding debt 159,403,398 127,349,9702019 [member] | Fixed rate (U.S. dollars) [member]Disclosure of maturity analysis for derivative financial liabilities [lineitems]Outstanding debt 59,498,256 86,161,0962019 [member] | Fixed rate (UDIs) [member]Disclosure of maturity analysis for derivative financial liabilities [lineitems]Outstanding debt 18,477,0762019 [member] | Fixed rate (euros) [member]Disclosure of maturity analysis for derivative financial liabilities [lineitems]Outstanding debt 32,042,1962019 [member] | Fixed rate (Swiss Francs)) [member]Disclosure of maturity analysis for derivative financial liabilities [lineitems]Outstanding debt 6,088,686 4,539,0222019 [member] | Fixed rate [member]Disclosure of maturity analysis for derivative financial liabilities [lineitems]Outstanding debt 116,106,214 90,700,1182019 [member] | Variable rate (U.S. dollars) [member]Disclosure of maturity analysis for derivative financial liabilities [lineitems]Outstanding debt 15,302,101 27,907,6612019 [member] | Variable rate (pesos) [member]Disclosure of maturity analysis for derivative financial liabilities [lineitems]Outstanding debt 27,995,083 8,742,1912019 [member] | Variable rate [member]Disclosure of maturity analysis for derivative financial liabilities [lineitems]Outstanding debt 43,297,184 36,649,8522020 [member]Disclosure of maturity analysis for derivative financial liabilities [lineitems]Outstanding debt 209,915,748 162,209,2452020 [member] | Fixed rate (U.S. dollars) [member]Disclosure of maturity analysis for derivative financial liabilities [lineitems]Outstanding debt 60,290,621 65,642,616
Copyright © 2018 www.secdatabase.com. All Rights Reserved.Please Consider the Environment Before Printing This Document
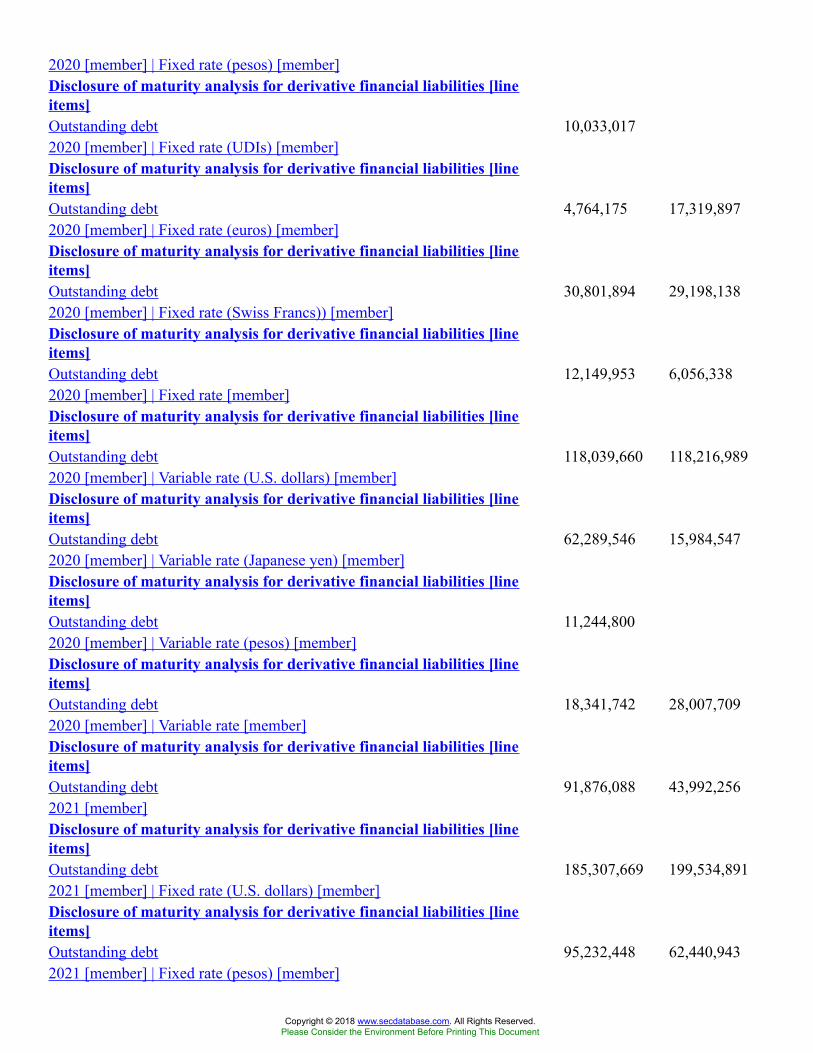
2020 [member] | Fixed rate (pesos) [member]Disclosure of maturity analysis for derivative financial liabilities [lineitems]Outstanding debt 10,033,0172020 [member] | Fixed rate (UDIs) [member]Disclosure of maturity analysis for derivative financial liabilities [lineitems]Outstanding debt 4,764,175 17,319,8972020 [member] | Fixed rate (euros) [member]Disclosure of maturity analysis for derivative financial liabilities [lineitems]Outstanding debt 30,801,894 29,198,1382020 [member] | Fixed rate (Swiss Francs)) [member]Disclosure of maturity analysis for derivative financial liabilities [lineitems]Outstanding debt 12,149,953 6,056,3382020 [member] | Fixed rate [member]Disclosure of maturity analysis for derivative financial liabilities [lineitems]Outstanding debt 118,039,660 118,216,9892020 [member] | Variable rate (U.S. dollars) [member]Disclosure of maturity analysis for derivative financial liabilities [lineitems]Outstanding debt 62,289,546 15,984,5472020 [member] | Variable rate (Japanese yen) [member]Disclosure of maturity analysis for derivative financial liabilities [lineitems]Outstanding debt 11,244,8002020 [member] | Variable rate (pesos) [member]Disclosure of maturity analysis for derivative financial liabilities [lineitems]Outstanding debt 18,341,742 28,007,7092020 [member] | Variable rate [member]Disclosure of maturity analysis for derivative financial liabilities [lineitems]Outstanding debt 91,876,088 43,992,2562021 [member]Disclosure of maturity analysis for derivative financial liabilities [lineitems]Outstanding debt 185,307,669 199,534,8912021 [member] | Fixed rate (U.S. dollars) [member]Disclosure of maturity analysis for derivative financial liabilities [lineitems]Outstanding debt 95,232,448 62,440,9432021 [member] | Fixed rate (pesos) [member]
Copyright © 2018 www.secdatabase.com. All Rights Reserved.Please Consider the Environment Before Printing This Document

Disclosure of maturity analysis for derivative financial liabilities [lineitems]Outstanding debt 20,376,655 10,048,9502021 [member] | Fixed rate (UDIs) [member]Disclosure of maturity analysis for derivative financial liabilities [lineitems]Outstanding debt 3,874,313 4,464,7872021 [member] | Fixed rate (euros) [member]Disclosure of maturity analysis for derivative financial liabilities [lineitems]Outstanding debt 41,508,857 28,061,5542021 [member] | Fixed rate (Swiss Francs)) [member]Disclosure of maturity analysis for derivative financial liabilities [lineitems]Outstanding debt 3,046,567 12,102,7482021 [member] | Fixed rate [member]Disclosure of maturity analysis for derivative financial liabilities [lineitems]Outstanding debt 164,038,840 117,118,9822021 [member] | Variable rate (U.S. dollars) [member]Disclosure of maturity analysis for derivative financial liabilities [lineitems]Outstanding debt 12,809,666 52,726,6472021 [member] | Variable rate (Japanese yen) [member]Disclosure of maturity analysis for derivative financial liabilities [lineitems]Outstanding debt 11,341,4402021 [member] | Variable rate (pesos) [member]Disclosure of maturity analysis for derivative financial liabilities [lineitems]Outstanding debt 8,459,163 18,347,8222021 [member] | Variable rate [member]Disclosure of maturity analysis for derivative financial liabilities [lineitems]Outstanding debt 21,268,829 82,415,9092022 thereafter [member]Disclosure of maturity analysis for derivative financial liabilities [lineitems]Outstanding debt 158,761,145 147,813,2122022 thereafter [member] | Fixed rate (U.S. dollars) [member]Disclosure of maturity analysis for derivative financial liabilities [lineitems]Outstanding debt 84,076,050 98,858,9922022 thereafter [member] | Fixed rate (Pounds) [member]
Copyright © 2018 www.secdatabase.com. All Rights Reserved.Please Consider the Environment Before Printing This Document
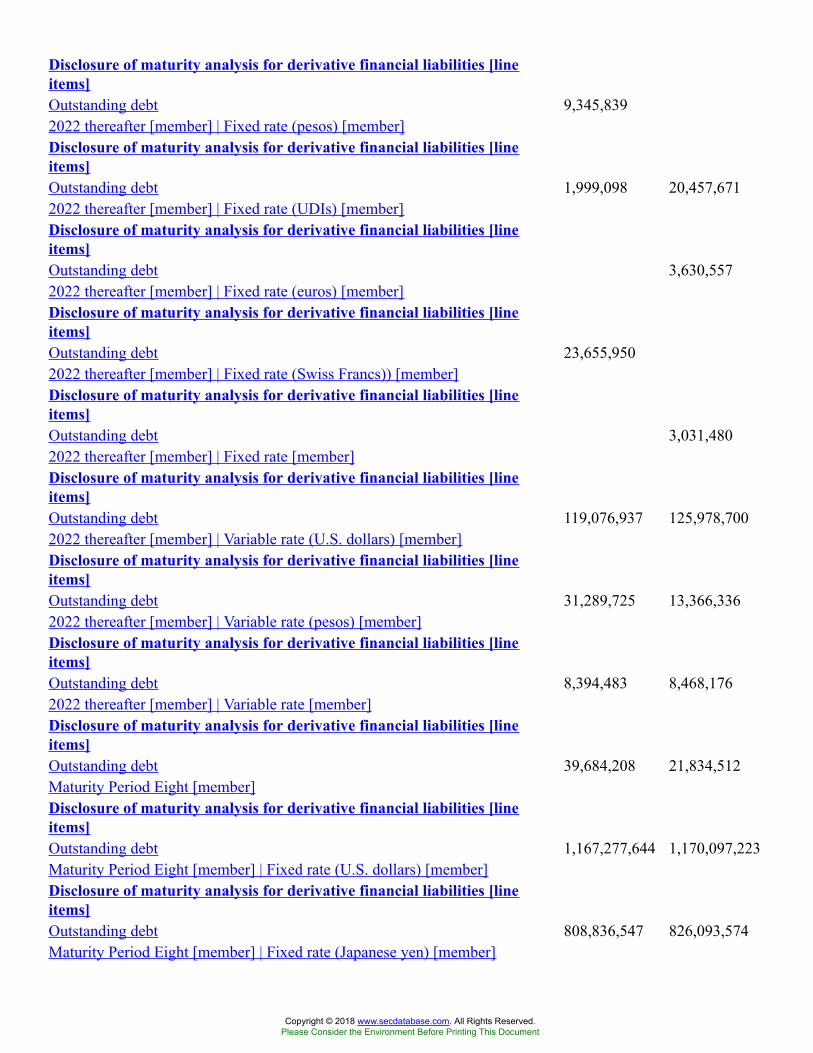
Disclosure of maturity analysis for derivative financial liabilities [lineitems]Outstanding debt 9,345,8392022 thereafter [member] | Fixed rate (pesos) [member]Disclosure of maturity analysis for derivative financial liabilities [lineitems]Outstanding debt 1,999,098 20,457,6712022 thereafter [member] | Fixed rate (UDIs) [member]Disclosure of maturity analysis for derivative financial liabilities [lineitems]Outstanding debt 3,630,5572022 thereafter [member] | Fixed rate (euros) [member]Disclosure of maturity analysis for derivative financial liabilities [lineitems]Outstanding debt 23,655,9502022 thereafter [member] | Fixed rate (Swiss Francs)) [member]Disclosure of maturity analysis for derivative financial liabilities [lineitems]Outstanding debt 3,031,4802022 thereafter [member] | Fixed rate [member]Disclosure of maturity analysis for derivative financial liabilities [lineitems]Outstanding debt 119,076,937 125,978,7002022 thereafter [member] | Variable rate (U.S. dollars) [member]Disclosure of maturity analysis for derivative financial liabilities [lineitems]Outstanding debt 31,289,725 13,366,3362022 thereafter [member] | Variable rate (pesos) [member]Disclosure of maturity analysis for derivative financial liabilities [lineitems]Outstanding debt 8,394,483 8,468,1762022 thereafter [member] | Variable rate [member]Disclosure of maturity analysis for derivative financial liabilities [lineitems]Outstanding debt 39,684,208 21,834,512Maturity Period Eight [member]Disclosure of maturity analysis for derivative financial liabilities [lineitems]Outstanding debt 1,167,277,644 1,170,097,223Maturity Period Eight [member] | Fixed rate (U.S. dollars) [member]Disclosure of maturity analysis for derivative financial liabilities [lineitems]Outstanding debt 808,836,547 826,093,574Maturity Period Eight [member] | Fixed rate (Japanese yen) [member]
Copyright © 2018 www.secdatabase.com. All Rights Reserved.Please Consider the Environment Before Printing This Document
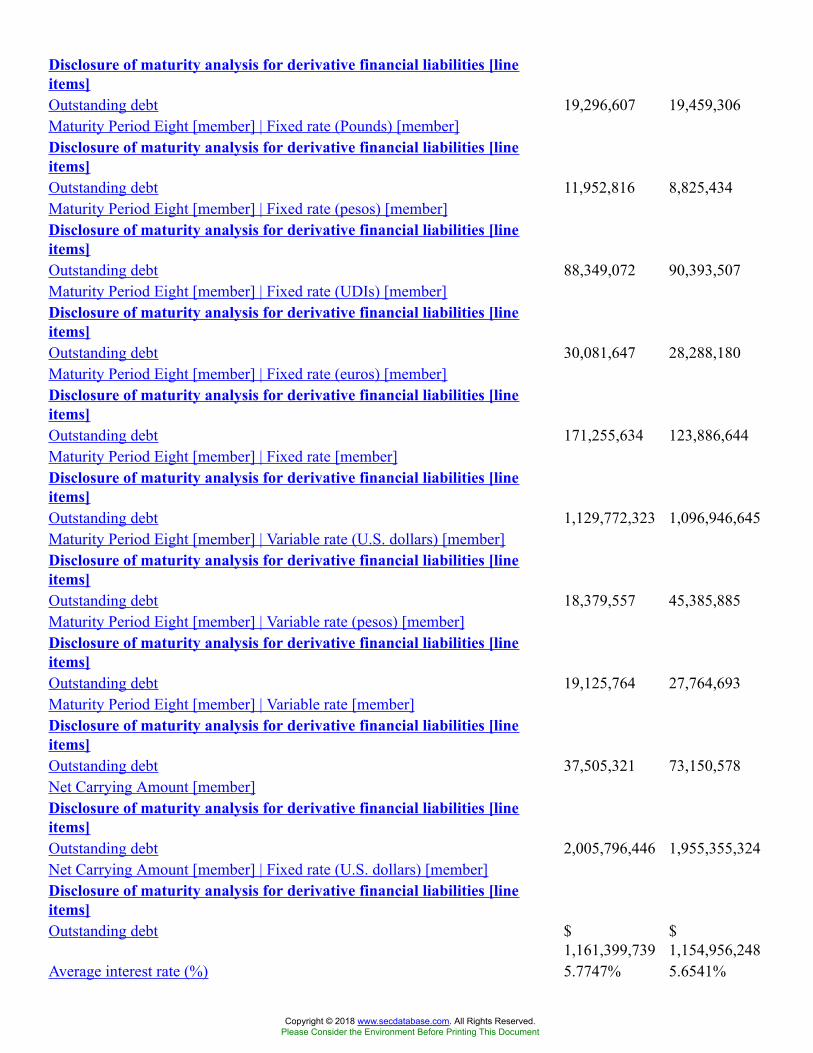
Disclosure of maturity analysis for derivative financial liabilities [lineitems]Outstanding debt 19,296,607 19,459,306Maturity Period Eight [member] | Fixed rate (Pounds) [member]Disclosure of maturity analysis for derivative financial liabilities [lineitems]Outstanding debt 11,952,816 8,825,434Maturity Period Eight [member] | Fixed rate (pesos) [member]Disclosure of maturity analysis for derivative financial liabilities [lineitems]Outstanding debt 88,349,072 90,393,507Maturity Period Eight [member] | Fixed rate (UDIs) [member]Disclosure of maturity analysis for derivative financial liabilities [lineitems]Outstanding debt 30,081,647 28,288,180Maturity Period Eight [member] | Fixed rate (euros) [member]Disclosure of maturity analysis for derivative financial liabilities [lineitems]Outstanding debt 171,255,634 123,886,644Maturity Period Eight [member] | Fixed rate [member]Disclosure of maturity analysis for derivative financial liabilities [lineitems]Outstanding debt 1,129,772,323 1,096,946,645Maturity Period Eight [member] | Variable rate (U.S. dollars) [member]Disclosure of maturity analysis for derivative financial liabilities [lineitems]Outstanding debt 18,379,557 45,385,885Maturity Period Eight [member] | Variable rate (pesos) [member]Disclosure of maturity analysis for derivative financial liabilities [lineitems]Outstanding debt 19,125,764 27,764,693Maturity Period Eight [member] | Variable rate [member]Disclosure of maturity analysis for derivative financial liabilities [lineitems]Outstanding debt 37,505,321 73,150,578Net Carrying Amount [member]Disclosure of maturity analysis for derivative financial liabilities [lineitems]Outstanding debt 2,005,796,446 1,955,355,324Net Carrying Amount [member] | Fixed rate (U.S. dollars) [member]Disclosure of maturity analysis for derivative financial liabilities [lineitems]Outstanding debt $
1,161,399,739$1,154,956,248
Average interest rate (%) 5.7747% 5.6541%
Copyright © 2018 www.secdatabase.com. All Rights Reserved.Please Consider the Environment Before Printing This Document
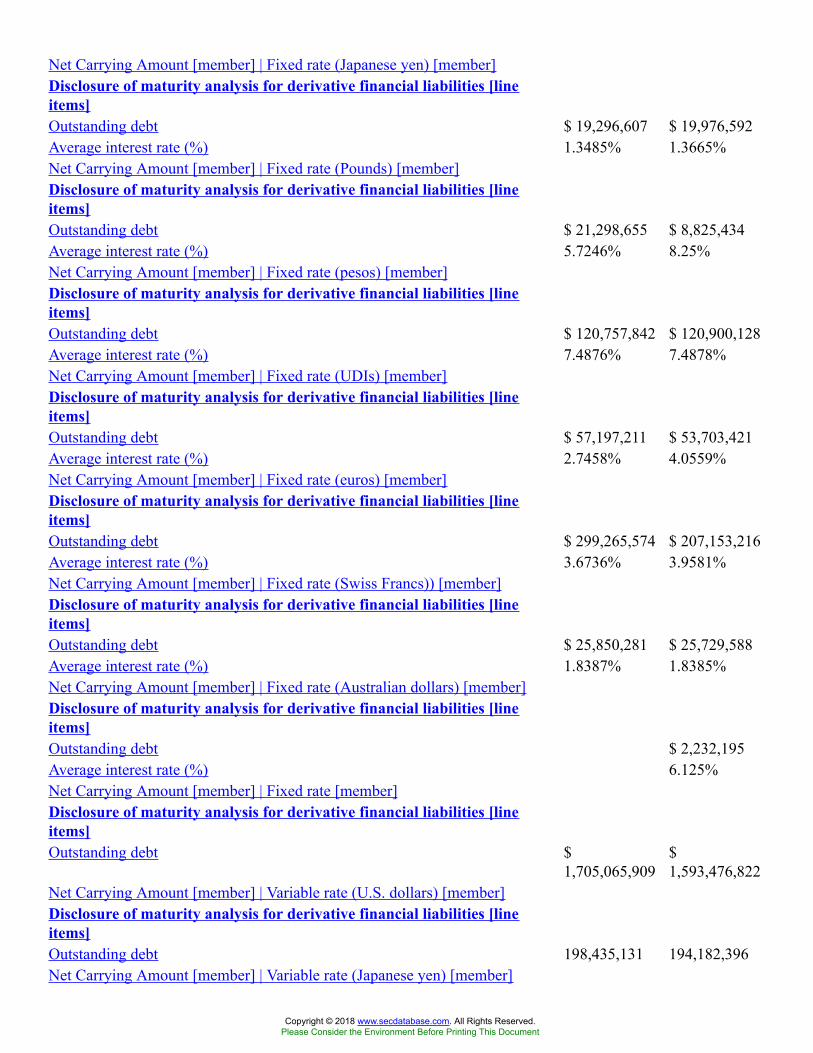
Net Carrying Amount [member] | Fixed rate (Japanese yen) [member]Disclosure of maturity analysis for derivative financial liabilities [lineitems]Outstanding debt $ 19,296,607 $ 19,976,592Average interest rate (%) 1.3485% 1.3665%Net Carrying Amount [member] | Fixed rate (Pounds) [member]Disclosure of maturity analysis for derivative financial liabilities [lineitems]Outstanding debt $ 21,298,655 $ 8,825,434Average interest rate (%) 5.7246% 8.25%Net Carrying Amount [member] | Fixed rate (pesos) [member]Disclosure of maturity analysis for derivative financial liabilities [lineitems]Outstanding debt $ 120,757,842 $ 120,900,128Average interest rate (%) 7.4876% 7.4878%Net Carrying Amount [member] | Fixed rate (UDIs) [member]Disclosure of maturity analysis for derivative financial liabilities [lineitems]Outstanding debt $ 57,197,211 $ 53,703,421Average interest rate (%) 2.7458% 4.0559%Net Carrying Amount [member] | Fixed rate (euros) [member]Disclosure of maturity analysis for derivative financial liabilities [lineitems]Outstanding debt $ 299,265,574 $ 207,153,216Average interest rate (%) 3.6736% 3.9581%Net Carrying Amount [member] | Fixed rate (Swiss Francs)) [member]Disclosure of maturity analysis for derivative financial liabilities [lineitems]Outstanding debt $ 25,850,281 $ 25,729,588Average interest rate (%) 1.8387% 1.8385%Net Carrying Amount [member] | Fixed rate (Australian dollars) [member]Disclosure of maturity analysis for derivative financial liabilities [lineitems]Outstanding debt $ 2,232,195Average interest rate (%) 6.125%Net Carrying Amount [member] | Fixed rate [member]Disclosure of maturity analysis for derivative financial liabilities [lineitems]Outstanding debt $
1,705,065,909$1,593,476,822
Net Carrying Amount [member] | Variable rate (U.S. dollars) [member]Disclosure of maturity analysis for derivative financial liabilities [lineitems]Outstanding debt 198,435,131 194,182,396Net Carrying Amount [member] | Variable rate (Japanese yen) [member]
Copyright © 2018 www.secdatabase.com. All Rights Reserved.Please Consider the Environment Before Printing This Document
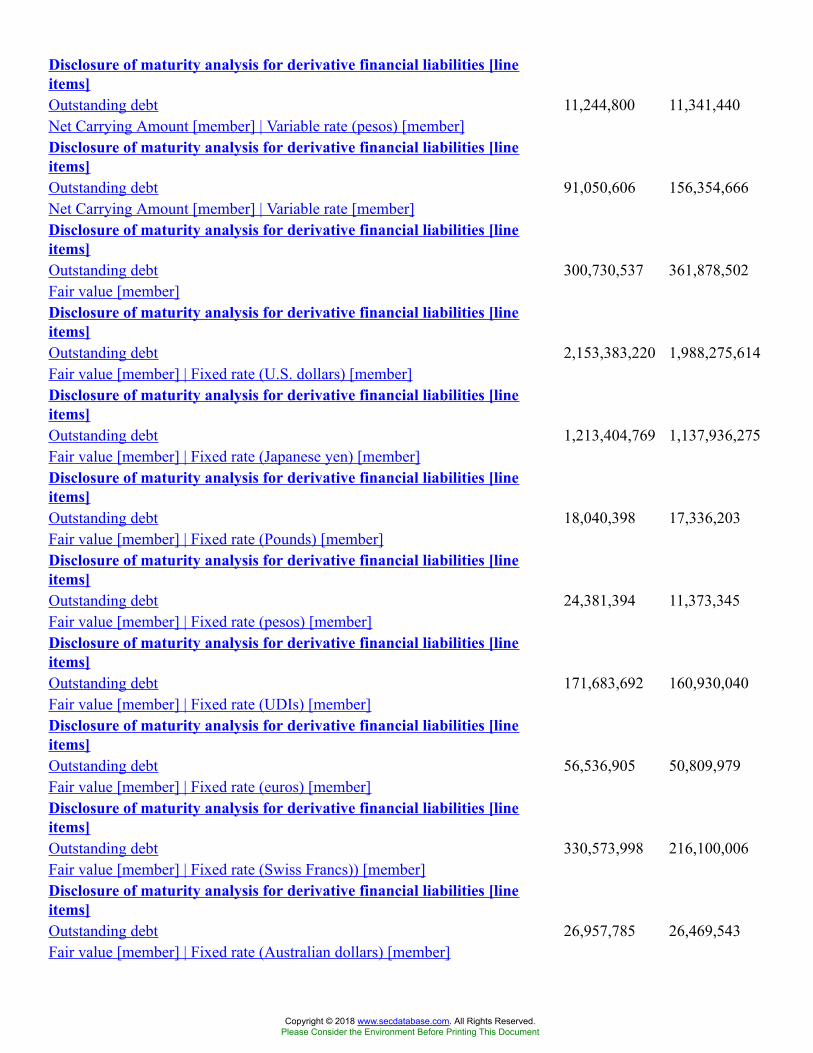
Disclosure of maturity analysis for derivative financial liabilities [lineitems]Outstanding debt 11,244,800 11,341,440Net Carrying Amount [member] | Variable rate (pesos) [member]Disclosure of maturity analysis for derivative financial liabilities [lineitems]Outstanding debt 91,050,606 156,354,666Net Carrying Amount [member] | Variable rate [member]Disclosure of maturity analysis for derivative financial liabilities [lineitems]Outstanding debt 300,730,537 361,878,502Fair value [member]Disclosure of maturity analysis for derivative financial liabilities [lineitems]Outstanding debt 2,153,383,220 1,988,275,614Fair value [member] | Fixed rate (U.S. dollars) [member]Disclosure of maturity analysis for derivative financial liabilities [lineitems]Outstanding debt 1,213,404,769 1,137,936,275Fair value [member] | Fixed rate (Japanese yen) [member]Disclosure of maturity analysis for derivative financial liabilities [lineitems]Outstanding debt 18,040,398 17,336,203Fair value [member] | Fixed rate (Pounds) [member]Disclosure of maturity analysis for derivative financial liabilities [lineitems]Outstanding debt 24,381,394 11,373,345Fair value [member] | Fixed rate (pesos) [member]Disclosure of maturity analysis for derivative financial liabilities [lineitems]Outstanding debt 171,683,692 160,930,040Fair value [member] | Fixed rate (UDIs) [member]Disclosure of maturity analysis for derivative financial liabilities [lineitems]Outstanding debt 56,536,905 50,809,979Fair value [member] | Fixed rate (euros) [member]Disclosure of maturity analysis for derivative financial liabilities [lineitems]Outstanding debt 330,573,998 216,100,006Fair value [member] | Fixed rate (Swiss Francs)) [member]Disclosure of maturity analysis for derivative financial liabilities [lineitems]Outstanding debt 26,957,785 26,469,543Fair value [member] | Fixed rate (Australian dollars) [member]
Copyright © 2018 www.secdatabase.com. All Rights Reserved.Please Consider the Environment Before Printing This Document
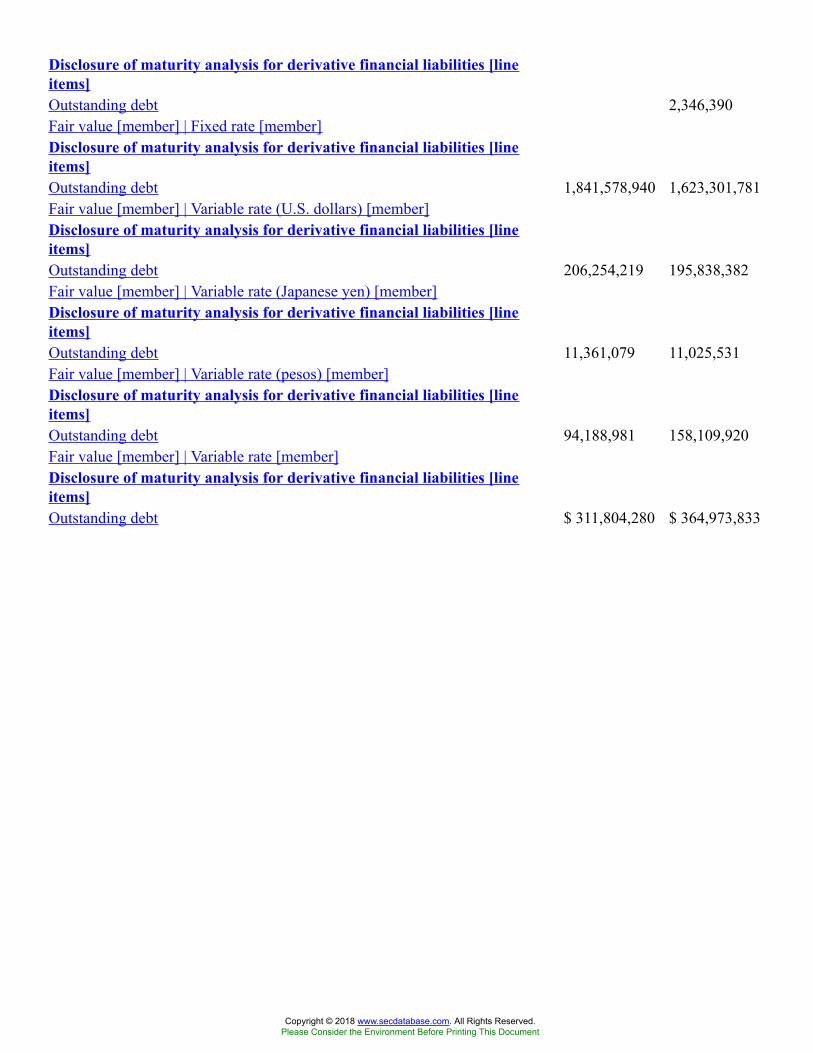
Disclosure of maturity analysis for derivative financial liabilities [lineitems]Outstanding debt 2,346,390Fair value [member] | Fixed rate [member]Disclosure of maturity analysis for derivative financial liabilities [lineitems]Outstanding debt 1,841,578,940 1,623,301,781Fair value [member] | Variable rate (U.S. dollars) [member]Disclosure of maturity analysis for derivative financial liabilities [lineitems]Outstanding debt 206,254,219 195,838,382Fair value [member] | Variable rate (Japanese yen) [member]Disclosure of maturity analysis for derivative financial liabilities [lineitems]Outstanding debt 11,361,079 11,025,531Fair value [member] | Variable rate (pesos) [member]Disclosure of maturity analysis for derivative financial liabilities [lineitems]Outstanding debt 94,188,981 158,109,920Fair value [member] | Variable rate [member]Disclosure of maturity analysis for derivative financial liabilities [lineitems]Outstanding debt $ 311,804,280 $ 364,973,833
Copyright © 2018 www.secdatabase.com. All Rights Reserved.Please Consider the Environment Before Printing This Document
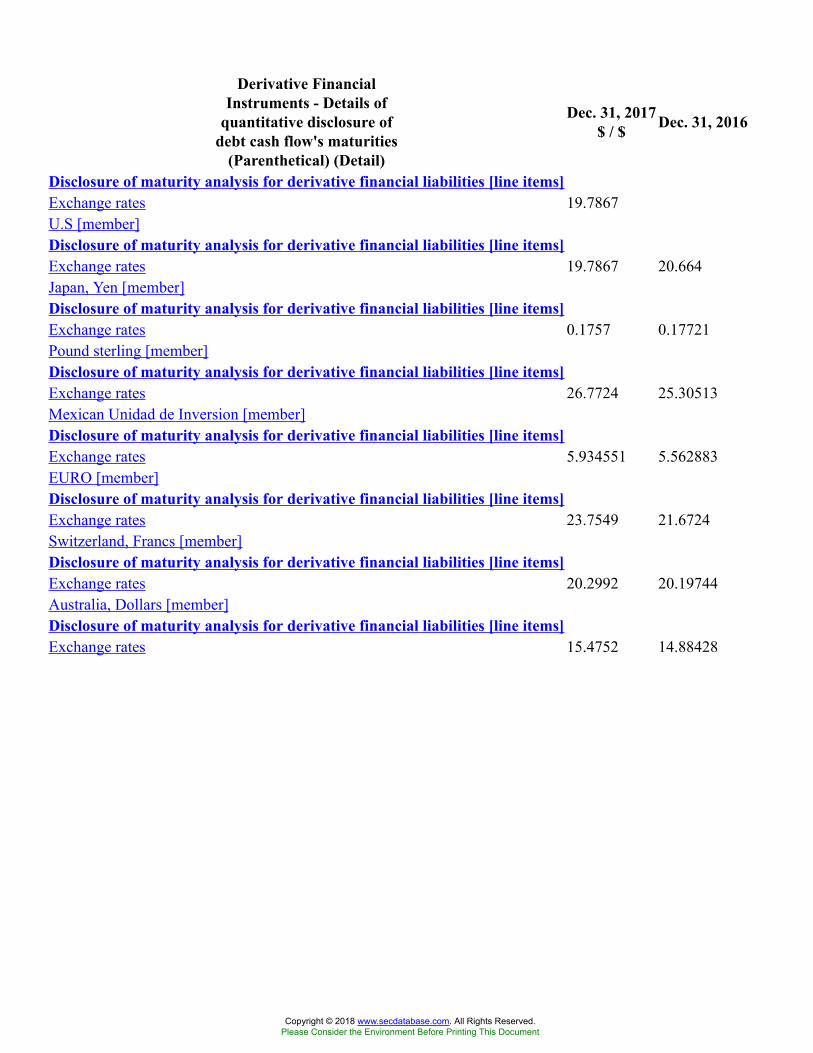
Derivative FinancialInstruments - Details of
quantitative disclosure ofdebt cash flow's maturities
(Parenthetical) (Detail)
Dec. 31, 2017$ / $ Dec. 31, 2016
Disclosure of maturity analysis for derivative financial liabilities [line items]Exchange rates 19.7867U.S [member]Disclosure of maturity analysis for derivative financial liabilities [line items]Exchange rates 19.7867 20.664Japan, Yen [member]Disclosure of maturity analysis for derivative financial liabilities [line items]Exchange rates 0.1757 0.17721Pound sterling [member]Disclosure of maturity analysis for derivative financial liabilities [line items]Exchange rates 26.7724 25.30513Mexican Unidad de Inversion [member]Disclosure of maturity analysis for derivative financial liabilities [line items]Exchange rates 5.934551 5.562883EURO [member]Disclosure of maturity analysis for derivative financial liabilities [line items]Exchange rates 23.7549 21.6724Switzerland, Francs [member]Disclosure of maturity analysis for derivative financial liabilities [line items]Exchange rates 20.2992 20.19744Australia, Dollars [member]Disclosure of maturity analysis for derivative financial liabilities [line items]Exchange rates 15.4752 14.88428
Copyright © 2018 www.secdatabase.com. All Rights Reserved.Please Consider the Environment Before Printing This Document
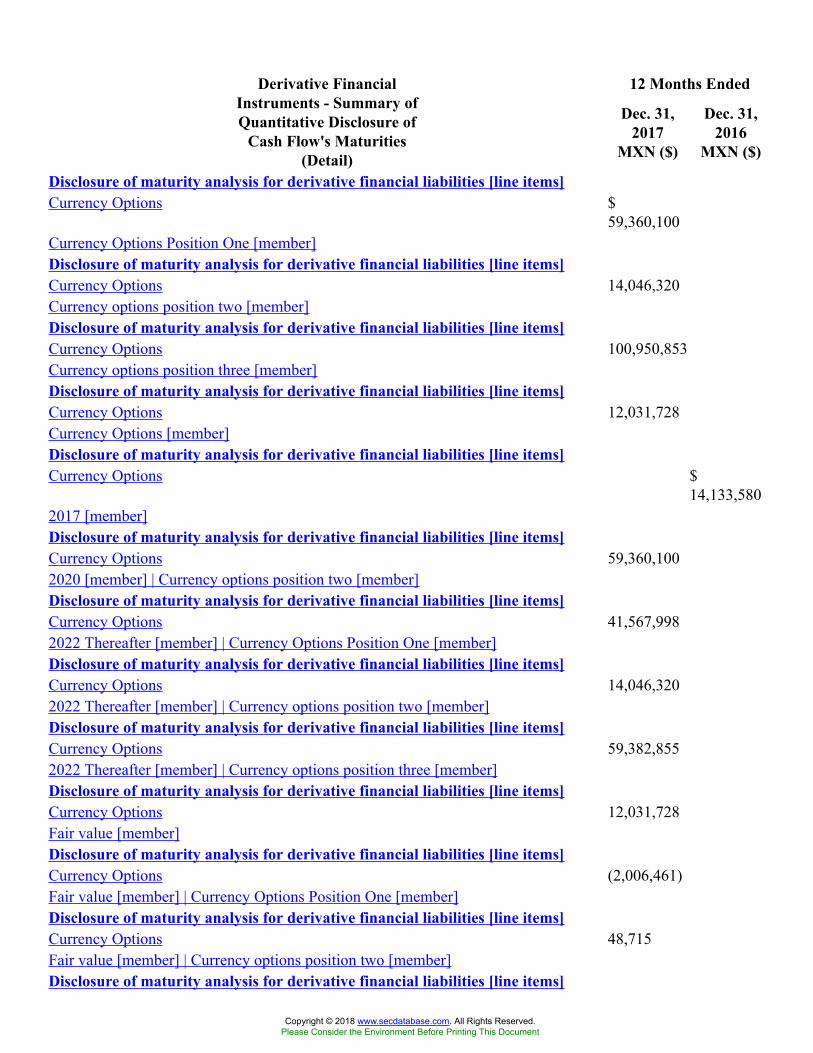
12 Months EndedDerivative FinancialInstruments - Summary ofQuantitative Disclosure of
Cash Flow's Maturities(Detail)
Dec. 31,2017
MXN ($)
Dec. 31,2016
MXN ($)
Disclosure of maturity analysis for derivative financial liabilities [line items]Currency Options $
59,360,100Currency Options Position One [member]Disclosure of maturity analysis for derivative financial liabilities [line items]Currency Options 14,046,320Currency options position two [member]Disclosure of maturity analysis for derivative financial liabilities [line items]Currency Options 100,950,853Currency options position three [member]Disclosure of maturity analysis for derivative financial liabilities [line items]Currency Options 12,031,728Currency Options [member]Disclosure of maturity analysis for derivative financial liabilities [line items]Currency Options $
14,133,5802017 [member]Disclosure of maturity analysis for derivative financial liabilities [line items]Currency Options 59,360,1002020 [member] | Currency options position two [member]Disclosure of maturity analysis for derivative financial liabilities [line items]Currency Options 41,567,9982022 Thereafter [member] | Currency Options Position One [member]Disclosure of maturity analysis for derivative financial liabilities [line items]Currency Options 14,046,3202022 Thereafter [member] | Currency options position two [member]Disclosure of maturity analysis for derivative financial liabilities [line items]Currency Options 59,382,8552022 Thereafter [member] | Currency options position three [member]Disclosure of maturity analysis for derivative financial liabilities [line items]Currency Options 12,031,728Fair value [member]Disclosure of maturity analysis for derivative financial liabilities [line items]Currency Options (2,006,461)Fair value [member] | Currency Options Position One [member]Disclosure of maturity analysis for derivative financial liabilities [line items]Currency Options 48,715Fair value [member] | Currency options position two [member]Disclosure of maturity analysis for derivative financial liabilities [line items]
Copyright © 2018 www.secdatabase.com. All Rights Reserved.Please Consider the Environment Before Printing This Document
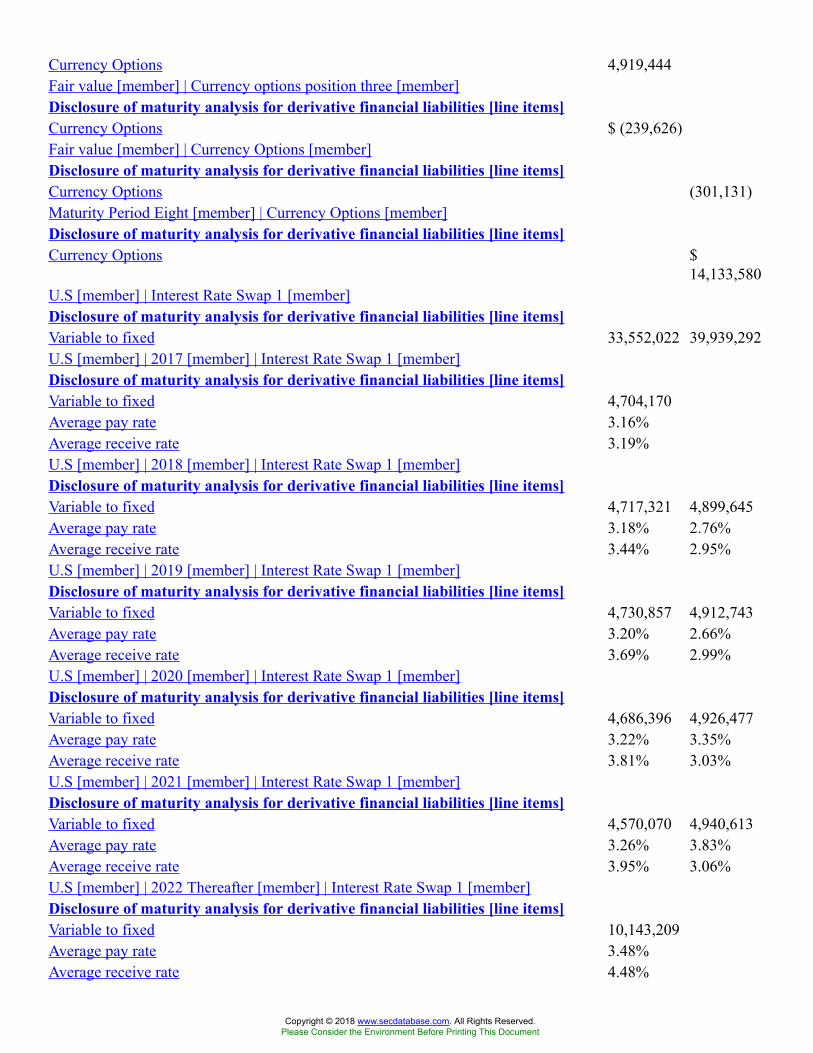
Currency Options 4,919,444Fair value [member] | Currency options position three [member]Disclosure of maturity analysis for derivative financial liabilities [line items]Currency Options $ (239,626)Fair value [member] | Currency Options [member]Disclosure of maturity analysis for derivative financial liabilities [line items]Currency Options (301,131)Maturity Period Eight [member] | Currency Options [member]Disclosure of maturity analysis for derivative financial liabilities [line items]Currency Options $
14,133,580U.S [member] | Interest Rate Swap 1 [member]Disclosure of maturity analysis for derivative financial liabilities [line items]Variable to fixed 33,552,022 39,939,292U.S [member] | 2017 [member] | Interest Rate Swap 1 [member]Disclosure of maturity analysis for derivative financial liabilities [line items]Variable to fixed 4,704,170Average pay rate 3.16%Average receive rate 3.19%U.S [member] | 2018 [member] | Interest Rate Swap 1 [member]Disclosure of maturity analysis for derivative financial liabilities [line items]Variable to fixed 4,717,321 4,899,645Average pay rate 3.18% 2.76%Average receive rate 3.44% 2.95%U.S [member] | 2019 [member] | Interest Rate Swap 1 [member]Disclosure of maturity analysis for derivative financial liabilities [line items]Variable to fixed 4,730,857 4,912,743Average pay rate 3.20% 2.66%Average receive rate 3.69% 2.99%U.S [member] | 2020 [member] | Interest Rate Swap 1 [member]Disclosure of maturity analysis for derivative financial liabilities [line items]Variable to fixed 4,686,396 4,926,477Average pay rate 3.22% 3.35%Average receive rate 3.81% 3.03%U.S [member] | 2021 [member] | Interest Rate Swap 1 [member]Disclosure of maturity analysis for derivative financial liabilities [line items]Variable to fixed 4,570,070 4,940,613Average pay rate 3.26% 3.83%Average receive rate 3.95% 3.06%U.S [member] | 2022 Thereafter [member] | Interest Rate Swap 1 [member]Disclosure of maturity analysis for derivative financial liabilities [line items]Variable to fixed 10,143,209Average pay rate 3.48%Average receive rate 4.48%
Copyright © 2018 www.secdatabase.com. All Rights Reserved.Please Consider the Environment Before Printing This Document

U.S [member] | Fair value [member] | Interest Rate Swap 1 [member]Disclosure of maturity analysis for derivative financial liabilities [line items]Variable to fixed 388,851 164,716U.S [member] | 2022 thereafter [member] | Interest Rate Swap 1 [member]Disclosure of maturity analysis for derivative financial liabilities [line items]Variable to fixed 4,894,180Average pay rate 4.04%Average receive rate 3.11%U.S [member] | Maturity Period Eight [member] | Interest Rate Swap 1 [member]Disclosure of maturity analysis for derivative financial liabilities [line items]Variable to fixed 15,365,634Average pay rate 4.57%Average receive rate 3.33%Receive euros pay us dollars [member] | Cross - currency swaps [member]Disclosure of maturity analysis for derivative financial liabilities [line items]Received cross currency swaps $
278,440,124$229,016,488
Receive euros pay us dollars [member] | 2018 [member] | Cross - currency swaps[member]Disclosure of maturity analysis for derivative financial liabilities [line items]Received cross currency swaps 29,898,198 34,775,198Receive euros pay us dollars [member] | 2019 [member] | Cross - currency swaps[member]Disclosure of maturity analysis for derivative financial liabilities [line items]Received cross currency swaps 28,719,208Receive euros pay us dollars [member] | 2020 [member] | Cross - currency swaps[member]Disclosure of maturity analysis for derivative financial liabilities [line items]Received cross currency swaps 36,902,690 31,223,821Receive euros pay us dollars [member] | 2021 [member] | Cross - currency swaps[member]Disclosure of maturity analysis for derivative financial liabilities [line items]Received cross currency swaps 21,302,856 29,992,556Receive euros pay us dollars [member] | 2022 Thereafter [member] | Cross - currencyswaps [member]Disclosure of maturity analysis for derivative financial liabilities [line items]Received cross currency swaps 161,617,172Receive euros pay us dollars [member] | Fair value [member] | Cross - currency swaps[member]Disclosure of maturity analysis for derivative financial liabilities [line items]Received cross currency swaps 19,065,727 (16,484,533)Receive euros pay us dollars [member] | Maturity Period Eight [member] | Cross -currency swaps [member]Disclosure of maturity analysis for derivative financial liabilities [line items]Received cross currency swaps 133,024,913
Copyright © 2018 www.secdatabase.com. All Rights Reserved.Please Consider the Environment Before Printing This Document
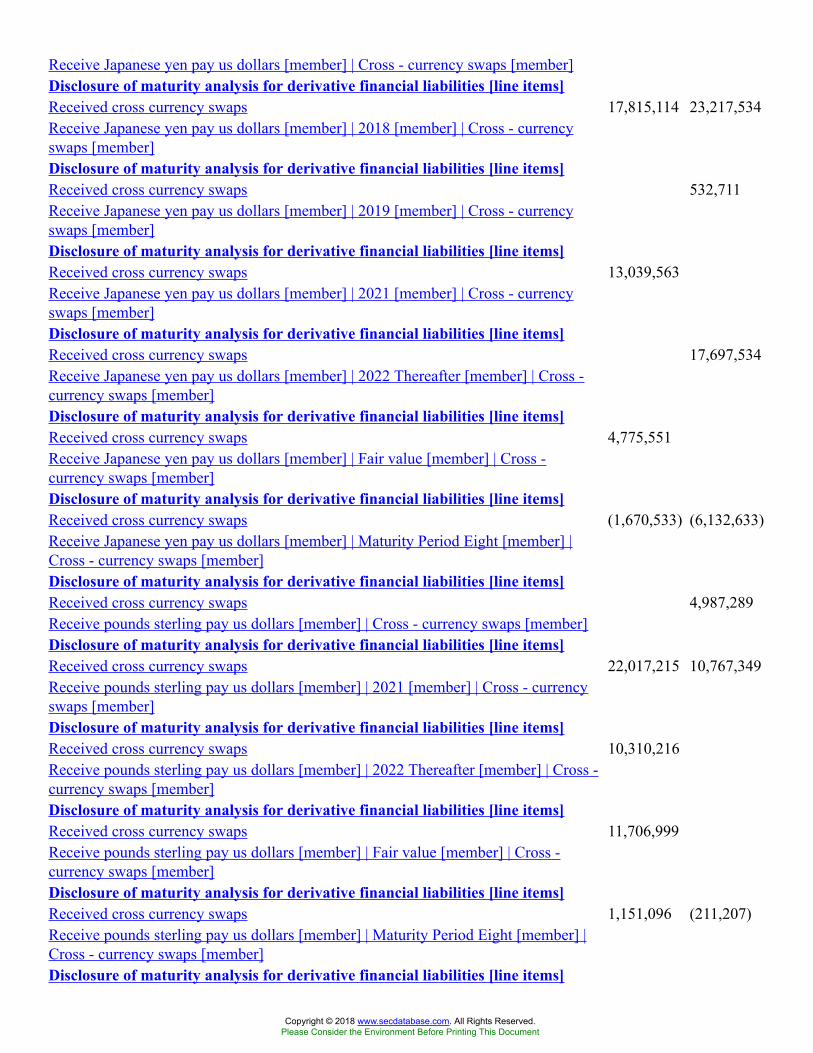
Receive Japanese yen pay us dollars [member] | Cross - currency swaps [member]Disclosure of maturity analysis for derivative financial liabilities [line items]Received cross currency swaps 17,815,114 23,217,534Receive Japanese yen pay us dollars [member] | 2018 [member] | Cross - currencyswaps [member]Disclosure of maturity analysis for derivative financial liabilities [line items]Received cross currency swaps 532,711Receive Japanese yen pay us dollars [member] | 2019 [member] | Cross - currencyswaps [member]Disclosure of maturity analysis for derivative financial liabilities [line items]Received cross currency swaps 13,039,563Receive Japanese yen pay us dollars [member] | 2021 [member] | Cross - currencyswaps [member]Disclosure of maturity analysis for derivative financial liabilities [line items]Received cross currency swaps 17,697,534Receive Japanese yen pay us dollars [member] | 2022 Thereafter [member] | Cross -currency swaps [member]Disclosure of maturity analysis for derivative financial liabilities [line items]Received cross currency swaps 4,775,551Receive Japanese yen pay us dollars [member] | Fair value [member] | Cross -currency swaps [member]Disclosure of maturity analysis for derivative financial liabilities [line items]Received cross currency swaps (1,670,533) (6,132,633)Receive Japanese yen pay us dollars [member] | Maturity Period Eight [member] |Cross - currency swaps [member]Disclosure of maturity analysis for derivative financial liabilities [line items]Received cross currency swaps 4,987,289Receive pounds sterling pay us dollars [member] | Cross - currency swaps [member]Disclosure of maturity analysis for derivative financial liabilities [line items]Received cross currency swaps 22,017,215 10,767,349Receive pounds sterling pay us dollars [member] | 2021 [member] | Cross - currencyswaps [member]Disclosure of maturity analysis for derivative financial liabilities [line items]Received cross currency swaps 10,310,216Receive pounds sterling pay us dollars [member] | 2022 Thereafter [member] | Cross -currency swaps [member]Disclosure of maturity analysis for derivative financial liabilities [line items]Received cross currency swaps 11,706,999Receive pounds sterling pay us dollars [member] | Fair value [member] | Cross -currency swaps [member]Disclosure of maturity analysis for derivative financial liabilities [line items]Received cross currency swaps 1,151,096 (211,207)Receive pounds sterling pay us dollars [member] | Maturity Period Eight [member] |Cross - currency swaps [member]Disclosure of maturity analysis for derivative financial liabilities [line items]
Copyright © 2018 www.secdatabase.com. All Rights Reserved.Please Consider the Environment Before Printing This Document
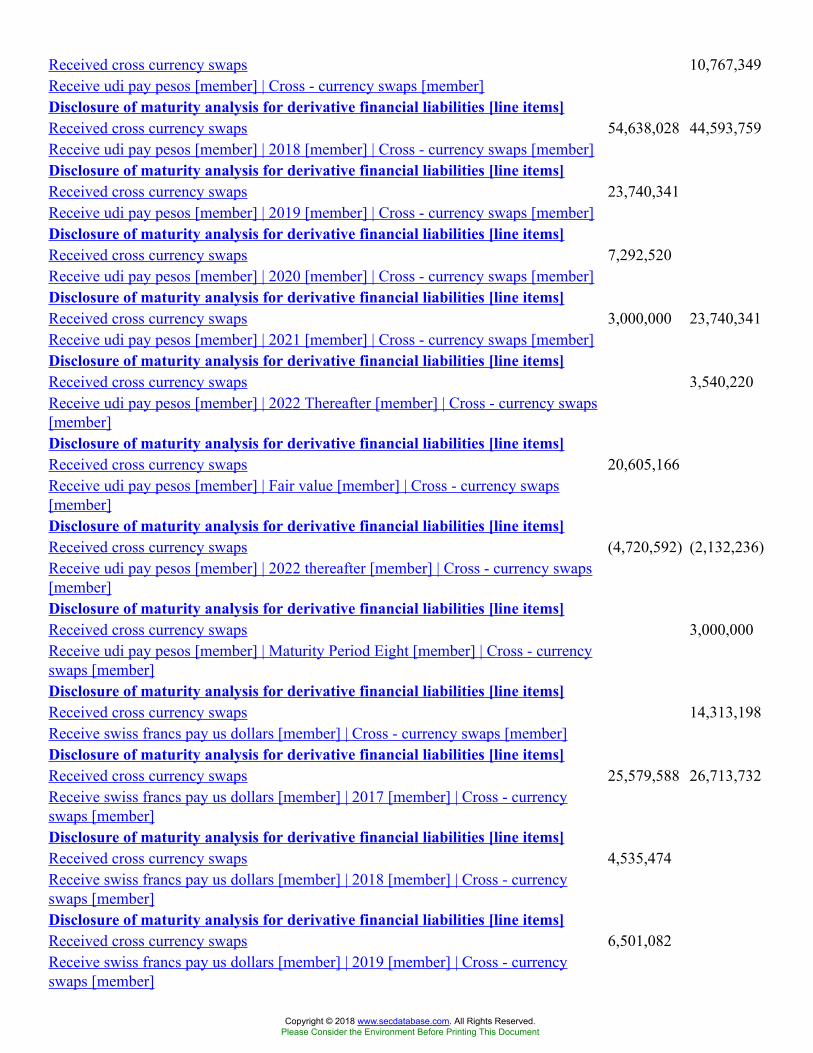
Received cross currency swaps 10,767,349Receive udi pay pesos [member] | Cross - currency swaps [member]Disclosure of maturity analysis for derivative financial liabilities [line items]Received cross currency swaps 54,638,028 44,593,759Receive udi pay pesos [member] | 2018 [member] | Cross - currency swaps [member]Disclosure of maturity analysis for derivative financial liabilities [line items]Received cross currency swaps 23,740,341Receive udi pay pesos [member] | 2019 [member] | Cross - currency swaps [member]Disclosure of maturity analysis for derivative financial liabilities [line items]Received cross currency swaps 7,292,520Receive udi pay pesos [member] | 2020 [member] | Cross - currency swaps [member]Disclosure of maturity analysis for derivative financial liabilities [line items]Received cross currency swaps 3,000,000 23,740,341Receive udi pay pesos [member] | 2021 [member] | Cross - currency swaps [member]Disclosure of maturity analysis for derivative financial liabilities [line items]Received cross currency swaps 3,540,220Receive udi pay pesos [member] | 2022 Thereafter [member] | Cross - currency swaps[member]Disclosure of maturity analysis for derivative financial liabilities [line items]Received cross currency swaps 20,605,166Receive udi pay pesos [member] | Fair value [member] | Cross - currency swaps[member]Disclosure of maturity analysis for derivative financial liabilities [line items]Received cross currency swaps (4,720,592) (2,132,236)Receive udi pay pesos [member] | 2022 thereafter [member] | Cross - currency swaps[member]Disclosure of maturity analysis for derivative financial liabilities [line items]Received cross currency swaps 3,000,000Receive udi pay pesos [member] | Maturity Period Eight [member] | Cross - currencyswaps [member]Disclosure of maturity analysis for derivative financial liabilities [line items]Received cross currency swaps 14,313,198Receive swiss francs pay us dollars [member] | Cross - currency swaps [member]Disclosure of maturity analysis for derivative financial liabilities [line items]Received cross currency swaps 25,579,588 26,713,732Receive swiss francs pay us dollars [member] | 2017 [member] | Cross - currencyswaps [member]Disclosure of maturity analysis for derivative financial liabilities [line items]Received cross currency swaps 4,535,474Receive swiss francs pay us dollars [member] | 2018 [member] | Cross - currencyswaps [member]Disclosure of maturity analysis for derivative financial liabilities [line items]Received cross currency swaps 6,501,082Receive swiss francs pay us dollars [member] | 2019 [member] | Cross - currencyswaps [member]
Copyright © 2018 www.secdatabase.com. All Rights Reserved.Please Consider the Environment Before Printing This Document
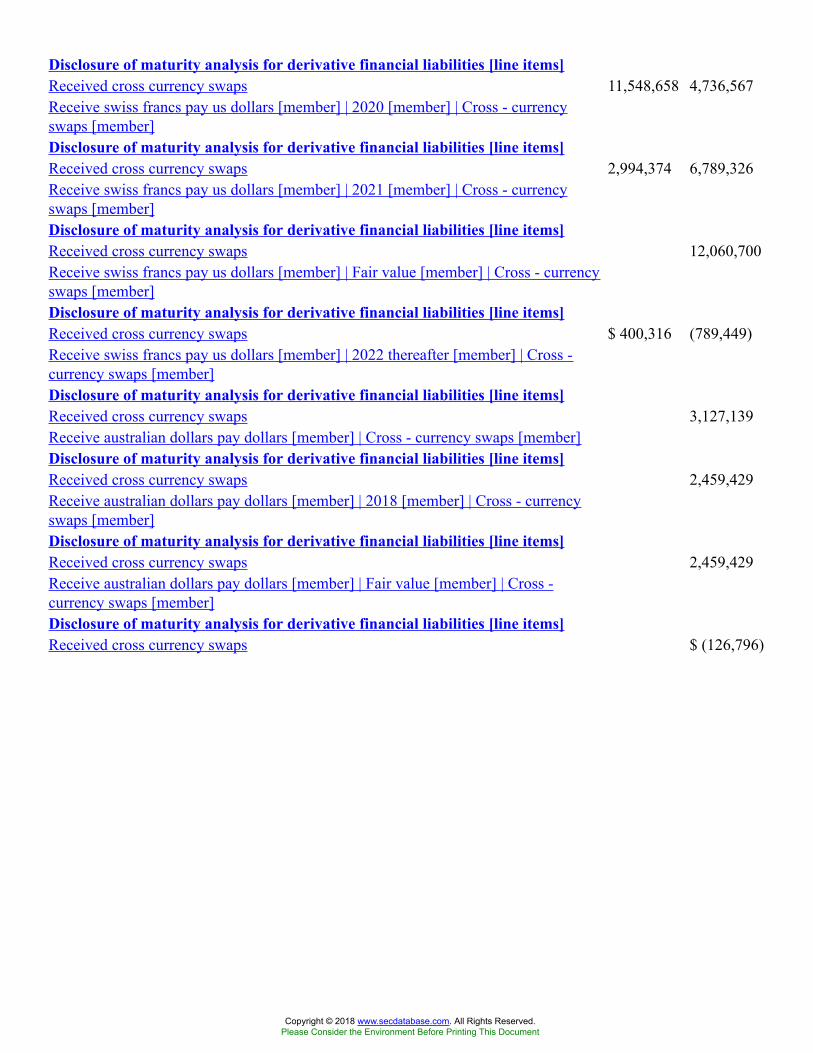
Disclosure of maturity analysis for derivative financial liabilities [line items]Received cross currency swaps 11,548,658 4,736,567Receive swiss francs pay us dollars [member] | 2020 [member] | Cross - currencyswaps [member]Disclosure of maturity analysis for derivative financial liabilities [line items]Received cross currency swaps 2,994,374 6,789,326Receive swiss francs pay us dollars [member] | 2021 [member] | Cross - currencyswaps [member]Disclosure of maturity analysis for derivative financial liabilities [line items]Received cross currency swaps 12,060,700Receive swiss francs pay us dollars [member] | Fair value [member] | Cross - currencyswaps [member]Disclosure of maturity analysis for derivative financial liabilities [line items]Received cross currency swaps $ 400,316 (789,449)Receive swiss francs pay us dollars [member] | 2022 thereafter [member] | Cross -currency swaps [member]Disclosure of maturity analysis for derivative financial liabilities [line items]Received cross currency swaps 3,127,139Receive australian dollars pay dollars [member] | Cross - currency swaps [member]Disclosure of maturity analysis for derivative financial liabilities [line items]Received cross currency swaps 2,459,429Receive australian dollars pay dollars [member] | 2018 [member] | Cross - currencyswaps [member]Disclosure of maturity analysis for derivative financial liabilities [line items]Received cross currency swaps 2,459,429Receive australian dollars pay dollars [member] | Fair value [member] | Cross -currency swaps [member]Disclosure of maturity analysis for derivative financial liabilities [line items]Received cross currency swaps $ (126,796)
Copyright © 2018 www.secdatabase.com. All Rights Reserved.Please Consider the Environment Before Printing This Document
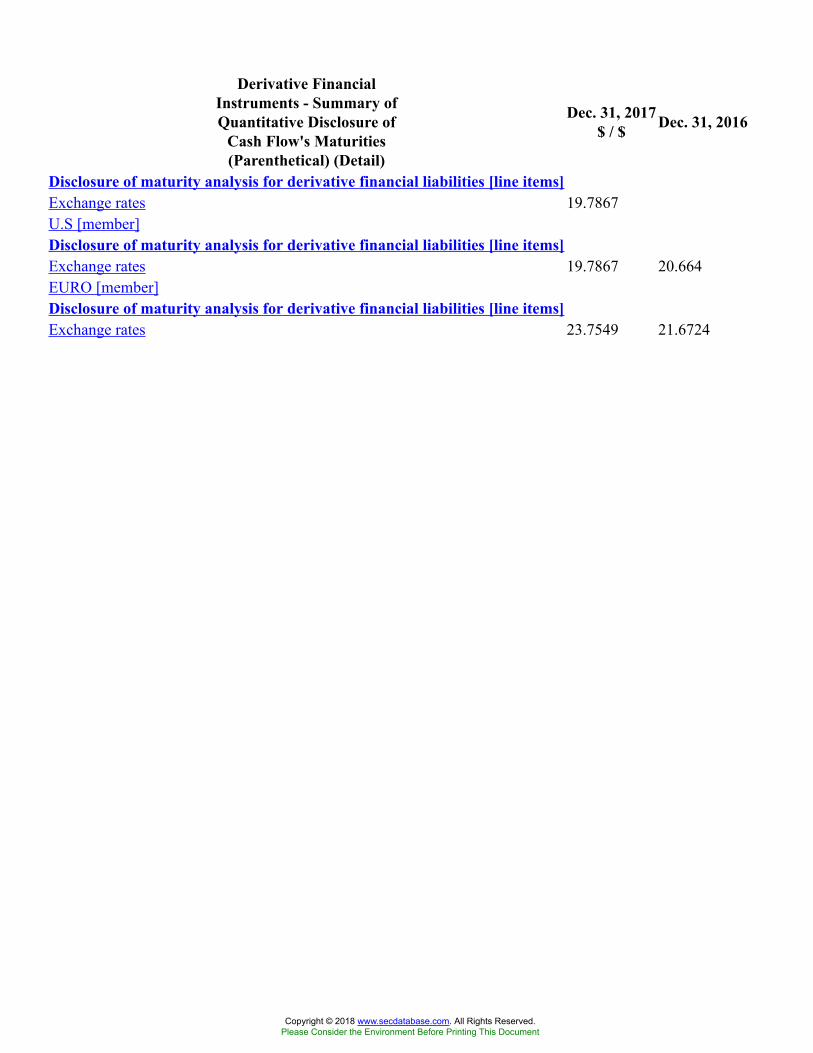
Derivative FinancialInstruments - Summary ofQuantitative Disclosure of
Cash Flow's Maturities(Parenthetical) (Detail)
Dec. 31, 2017$ / $ Dec. 31, 2016
Disclosure of maturity analysis for derivative financial liabilities [line items]Exchange rates 19.7867U.S [member]Disclosure of maturity analysis for derivative financial liabilities [line items]Exchange rates 19.7867 20.664EURO [member]Disclosure of maturity analysis for derivative financial liabilities [line items]Exchange rates 23.7549 21.6724
Copyright © 2018 www.secdatabase.com. All Rights Reserved.Please Consider the Environment Before Printing This Document
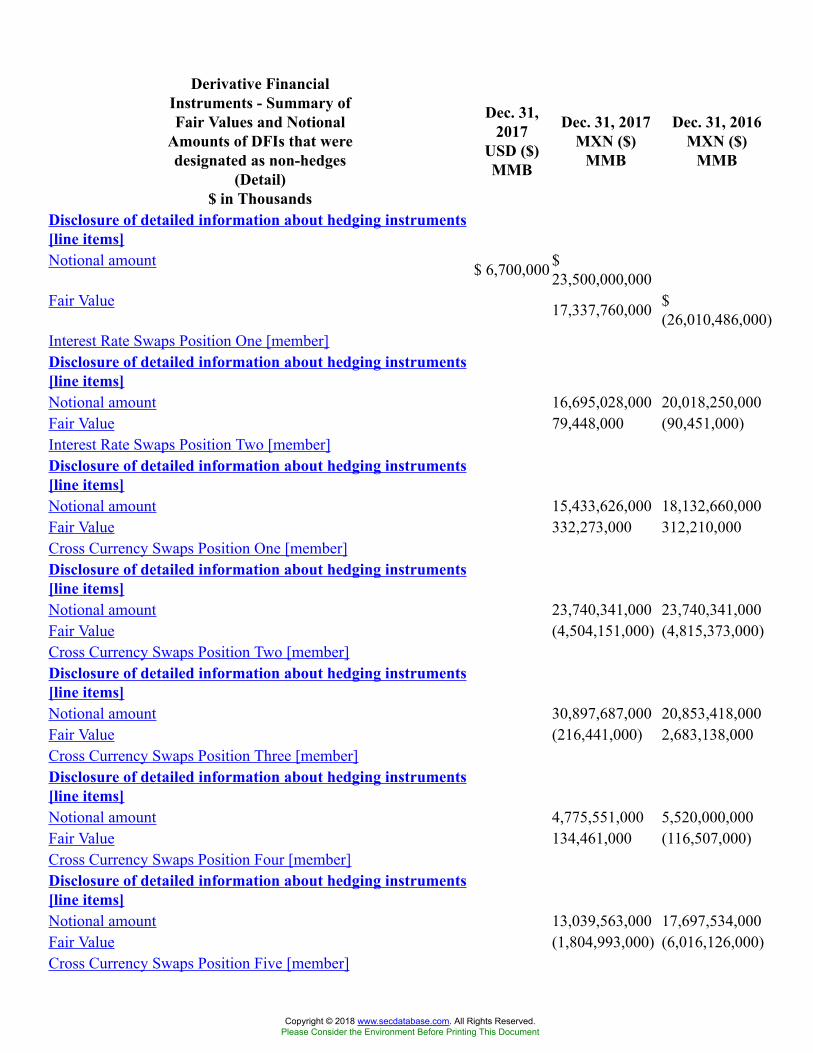
Derivative FinancialInstruments - Summary ofFair Values and Notional
Amounts of DFIs that weredesignated as non-hedges
(Detail)$ in Thousands
Dec. 31,2017
USD ($)MMB
Dec. 31, 2017MXN ($)
MMB
Dec. 31, 2016MXN ($)
MMB
Disclosure of detailed information about hedging instruments[line items]Notional amount $ 6,700,000 $
23,500,000,000Fair Value 17,337,760,000 $
(26,010,486,000)Interest Rate Swaps Position One [member]Disclosure of detailed information about hedging instruments[line items]Notional amount 16,695,028,000 20,018,250,000Fair Value 79,448,000 (90,451,000)Interest Rate Swaps Position Two [member]Disclosure of detailed information about hedging instruments[line items]Notional amount 15,433,626,000 18,132,660,000Fair Value 332,273,000 312,210,000Cross Currency Swaps Position One [member]Disclosure of detailed information about hedging instruments[line items]Notional amount 23,740,341,000 23,740,341,000Fair Value (4,504,151,000) (4,815,373,000)Cross Currency Swaps Position Two [member]Disclosure of detailed information about hedging instruments[line items]Notional amount 30,897,687,000 20,853,418,000Fair Value (216,441,000) 2,683,138,000Cross Currency Swaps Position Three [member]Disclosure of detailed information about hedging instruments[line items]Notional amount 4,775,551,000 5,520,000,000Fair Value 134,461,000 (116,507,000)Cross Currency Swaps Position Four [member]Disclosure of detailed information about hedging instruments[line items]Notional amount 13,039,563,000 17,697,534,000Fair Value (1,804,993,000) (6,016,126,000)Cross Currency Swaps Position Five [member]
Copyright © 2018 www.secdatabase.com. All Rights Reserved.Please Consider the Environment Before Printing This Document

Disclosure of detailed information about hedging instruments[line items]Notional amount 278,440,124,000229,016,488,000Fair Value 19,065,727,000 (16,484,533,000)Cross currency swaps position nine [member]Disclosure of detailed information about hedging instruments[line items]Notional amount 11,706,999,000Fair Value 590,113,000Cross Currency Swaps Position Six [member]Disclosure of detailed information about hedging instruments[line items]Notional amount 10,310,216,000 10,767,349,000Fair Value 560,982,000 (211,207,000)Cross Currency Swaps Position Seven [member]Disclosure of detailed information about hedging instruments[line items]Notional amount 25,579,588,000 26,713,732,000Fair Value 400,316,000 (789,449,000)Cross Currency Swaps Position Eight [member]Disclosure of detailed information about hedging instruments[line items]Notional amount 2,459,429,000Fair Value (126,796,000)Currency Options Position One [member]Disclosure of detailed information about hedging instruments[line items]Notional amount 14,046,320,000 14,133,580,000Fair Value 48,715,000 (301,131,000)Currency options position three [member]Disclosure of detailed information about hedging instruments[line items]Notional amount 100,950,853,000Fair Value 4,919,444,000Currency options position two [member]Disclosure of detailed information about hedging instruments[line items]Notional amount 12,031,728,000Fair Value (239,626,000)Currency forward Position one [member]Disclosure of detailed information about hedging instruments[line items]Notional amount 59,360,100,000Fair Value (2,006,461,000)Natural Gas Swaps Position One [member]
Copyright © 2018 www.secdatabase.com. All Rights Reserved.Please Consider the Environment Before Printing This Document
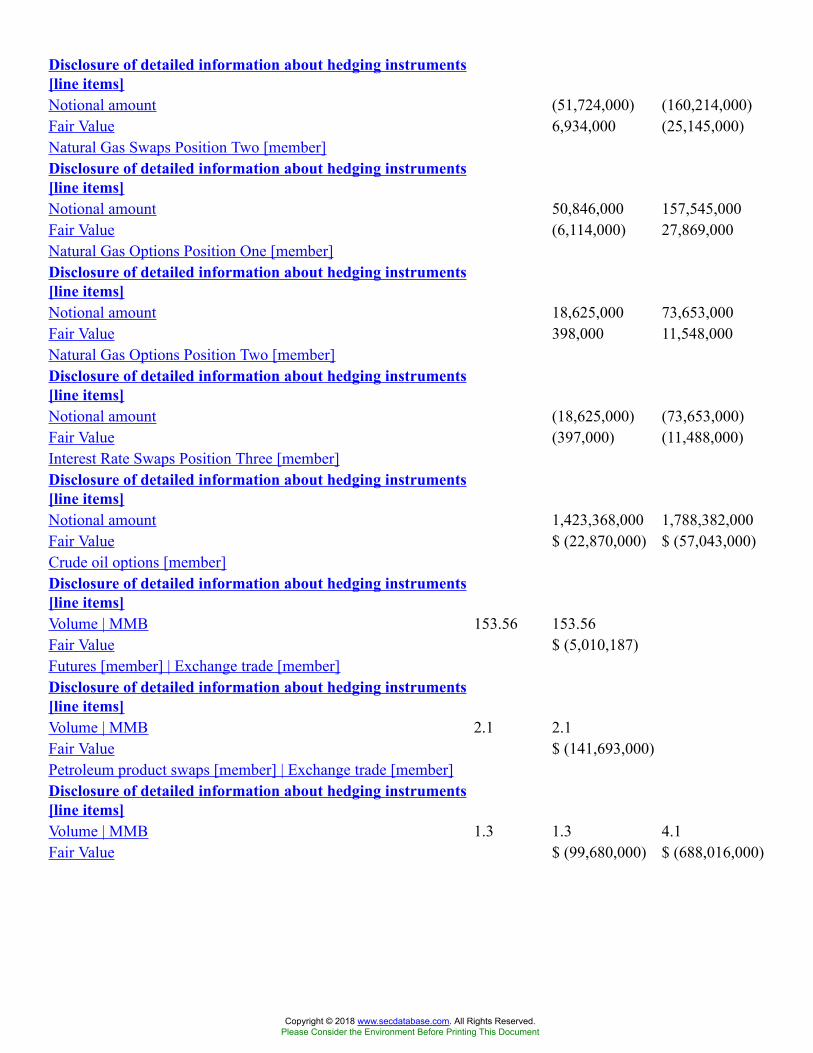
Disclosure of detailed information about hedging instruments[line items]Notional amount (51,724,000) (160,214,000)Fair Value 6,934,000 (25,145,000)Natural Gas Swaps Position Two [member]Disclosure of detailed information about hedging instruments[line items]Notional amount 50,846,000 157,545,000Fair Value (6,114,000) 27,869,000Natural Gas Options Position One [member]Disclosure of detailed information about hedging instruments[line items]Notional amount 18,625,000 73,653,000Fair Value 398,000 11,548,000Natural Gas Options Position Two [member]Disclosure of detailed information about hedging instruments[line items]Notional amount (18,625,000) (73,653,000)Fair Value (397,000) (11,488,000)Interest Rate Swaps Position Three [member]Disclosure of detailed information about hedging instruments[line items]Notional amount 1,423,368,000 1,788,382,000Fair Value $ (22,870,000) $ (57,043,000)Crude oil options [member]Disclosure of detailed information about hedging instruments[line items]Volume | MMB 153.56 153.56Fair Value $ (5,010,187)Futures [member] | Exchange trade [member]Disclosure of detailed information about hedging instruments[line items]Volume | MMB 2.1 2.1Fair Value $ (141,693,000)Petroleum product swaps [member] | Exchange trade [member]Disclosure of detailed information about hedging instruments[line items]Volume | MMB 1.3 1.3 4.1Fair Value $ (99,680,000) $ (688,016,000)
Copyright © 2018 www.secdatabase.com. All Rights Reserved.Please Consider the Environment Before Printing This Document
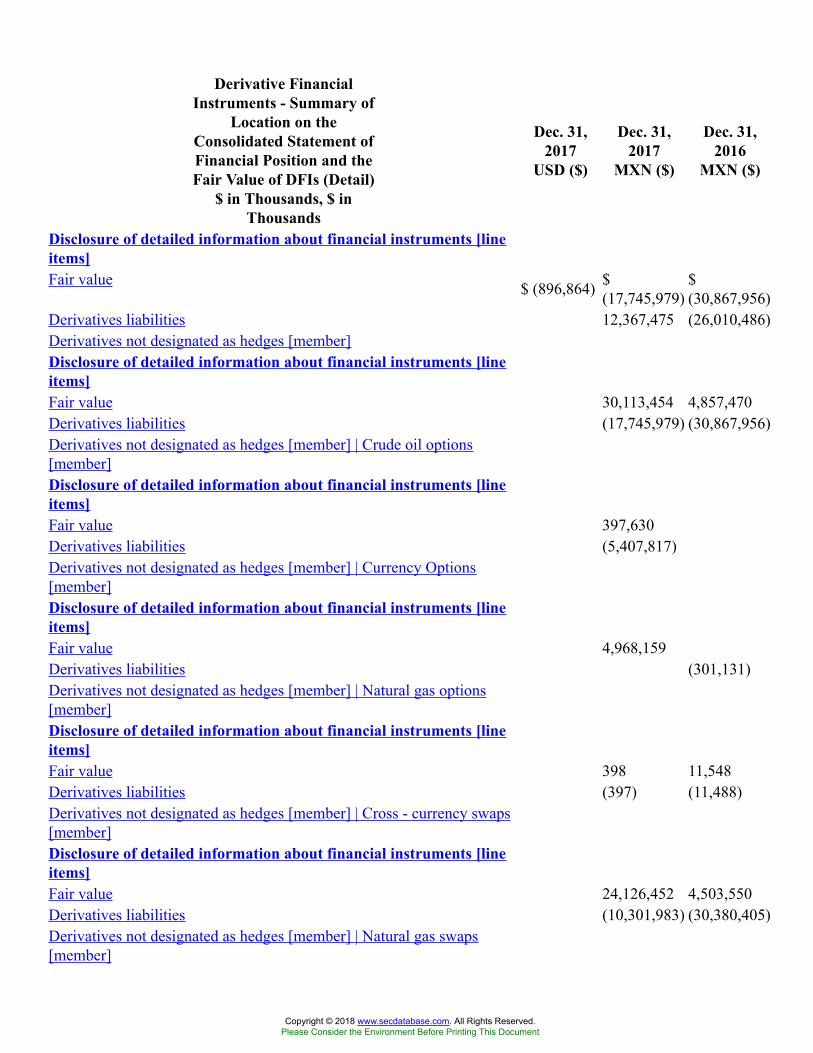
Derivative FinancialInstruments - Summary of
Location on theConsolidated Statement ofFinancial Position and theFair Value of DFIs (Detail)
$ in Thousands, $ inThousands
Dec. 31,2017
USD ($)
Dec. 31,2017
MXN ($)
Dec. 31,2016
MXN ($)
Disclosure of detailed information about financial instruments [lineitems]Fair value $ (896,864) $
(17,745,979)$(30,867,956)
Derivatives liabilities 12,367,475 (26,010,486)Derivatives not designated as hedges [member]Disclosure of detailed information about financial instruments [lineitems]Fair value 30,113,454 4,857,470Derivatives liabilities (17,745,979) (30,867,956)Derivatives not designated as hedges [member] | Crude oil options[member]Disclosure of detailed information about financial instruments [lineitems]Fair value 397,630Derivatives liabilities (5,407,817)Derivatives not designated as hedges [member] | Currency Options[member]Disclosure of detailed information about financial instruments [lineitems]Fair value 4,968,159Derivatives liabilities (301,131)Derivatives not designated as hedges [member] | Natural gas options[member]Disclosure of detailed information about financial instruments [lineitems]Fair value 398 11,548Derivatives liabilities (397) (11,488)Derivatives not designated as hedges [member] | Cross - currency swaps[member]Disclosure of detailed information about financial instruments [lineitems]Fair value 24,126,452 4,503,550Derivatives liabilities (10,301,983) (30,380,405)Derivatives not designated as hedges [member] | Natural gas swaps[member]
Copyright © 2018 www.secdatabase.com. All Rights Reserved.Please Consider the Environment Before Printing This Document
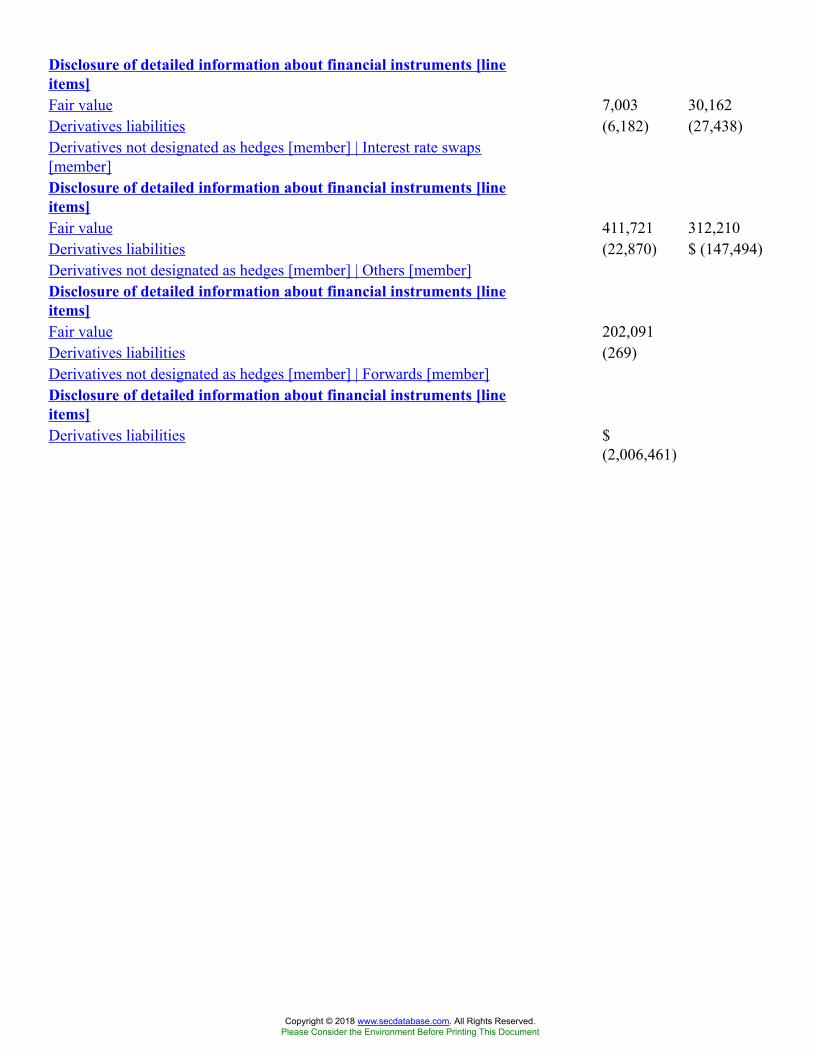
Disclosure of detailed information about financial instruments [lineitems]Fair value 7,003 30,162Derivatives liabilities (6,182) (27,438)Derivatives not designated as hedges [member] | Interest rate swaps[member]Disclosure of detailed information about financial instruments [lineitems]Fair value 411,721 312,210Derivatives liabilities (22,870) $ (147,494)Derivatives not designated as hedges [member] | Others [member]Disclosure of detailed information about financial instruments [lineitems]Fair value 202,091Derivatives liabilities (269)Derivatives not designated as hedges [member] | Forwards [member]Disclosure of detailed information about financial instruments [lineitems]Derivatives liabilities $
(2,006,461)
Copyright © 2018 www.secdatabase.com. All Rights Reserved.Please Consider the Environment Before Printing This Document

12 Months EndedDerivative FinancialInstruments - Summary ofNet Gain (Loss) Recognized
in Income on DerivativeFinancial Instruments
(Detail) - MXN ($)$ in Thousands
Dec. 31,2017
Dec. 31,2016
Dec. 31,2015
Disclosure of detailed information about financial instruments [lineitems]Net gain loss on derivatives $
25,338,324$(14,000,987)
$(21,449,877)
Derivatives not designated as hedges [member] | Forwards [member]Disclosure of detailed information about financial instruments [lineitems]Net gain loss on derivatives (1,976,241)Derivatives not designated as hedges [member] | Futures [member]Disclosure of detailed information about financial instruments [lineitems]Net gain loss on derivatives (779,950) (1,925,969) 1,387,177Derivatives not designated as hedges [member] | Crude oil options[member]Disclosure of detailed information about financial instruments [lineitems]Net gain loss on derivatives (3,771,604)Derivatives not designated as hedges [member] | Currency Options[member]Disclosure of detailed information about financial instruments [lineitems]Net gain loss on derivatives 5,255,931 (298,789)Derivatives not designated as hedges [member] | Natural gas options[member]Disclosure of detailed information about financial instruments [lineitems]Net gain loss on derivatives 673 (671) 4,786Derivatives not designated as hedges [member] | Cross - currency swaps[member]Disclosure of detailed information about financial instruments [lineitems]Net gain loss on derivatives 27,747,290 (11,633,605) (21,358,898)Derivatives not designated as hedges [member] | Natural gas swaps[member]Disclosure of detailed information about financial instruments [lineitems]Net gain loss on derivatives 1,780 831 4,355
Copyright © 2018 www.secdatabase.com. All Rights Reserved.Please Consider the Environment Before Printing This Document

Derivatives not designated as hedges [member] | Propane swaps[member]Disclosure of detailed information about financial instruments [lineitems]Net gain loss on derivatives (3,805) (1,136,188)Derivatives not designated as hedges [member] | Interest rate swaps[member]Disclosure of detailed information about financial instruments [lineitems]Net gain loss on derivatives (34,306) $ (138,979) $ (351,109)Derivatives not designated as hedges [member] | Others [member]Disclosure of detailed information about financial instruments [lineitems]Net gain loss on derivatives $
(1,105,249)
Copyright © 2018 www.secdatabase.com. All Rights Reserved.Please Consider the Environment Before Printing This Document
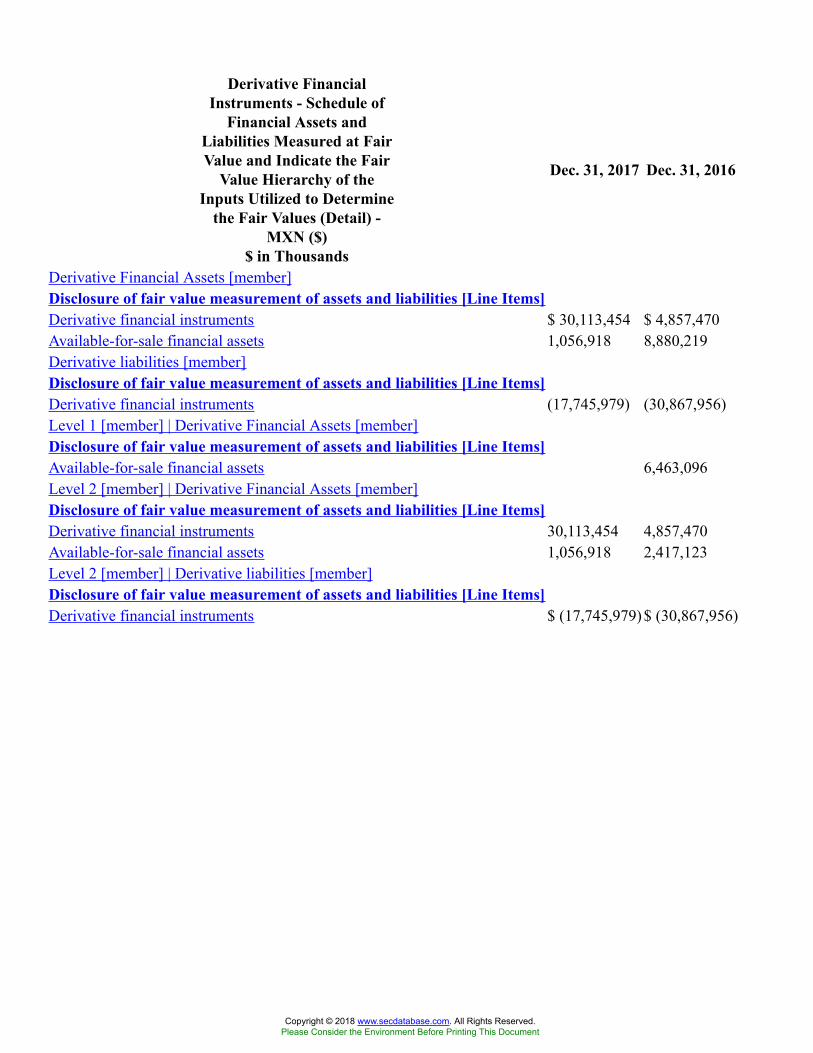
Derivative FinancialInstruments - Schedule of
Financial Assets andLiabilities Measured at FairValue and Indicate the Fair
Value Hierarchy of theInputs Utilized to Determine
the Fair Values (Detail) -MXN ($)
$ in Thousands
Dec. 31, 2017 Dec. 31, 2016
Derivative Financial Assets [member]Disclosure of fair value measurement of assets and liabilities [Line Items]Derivative financial instruments $ 30,113,454 $ 4,857,470Available-for-sale financial assets 1,056,918 8,880,219Derivative liabilities [member]Disclosure of fair value measurement of assets and liabilities [Line Items]Derivative financial instruments (17,745,979) (30,867,956)Level 1 [member] | Derivative Financial Assets [member]Disclosure of fair value measurement of assets and liabilities [Line Items]Available-for-sale financial assets 6,463,096Level 2 [member] | Derivative Financial Assets [member]Disclosure of fair value measurement of assets and liabilities [Line Items]Derivative financial instruments 30,113,454 4,857,470Available-for-sale financial assets 1,056,918 2,417,123Level 2 [member] | Derivative liabilities [member]Disclosure of fair value measurement of assets and liabilities [Line Items]Derivative financial instruments $ (17,745,979) $ (30,867,956)
Copyright © 2018 www.secdatabase.com. All Rights Reserved.Please Consider the Environment Before Printing This Document
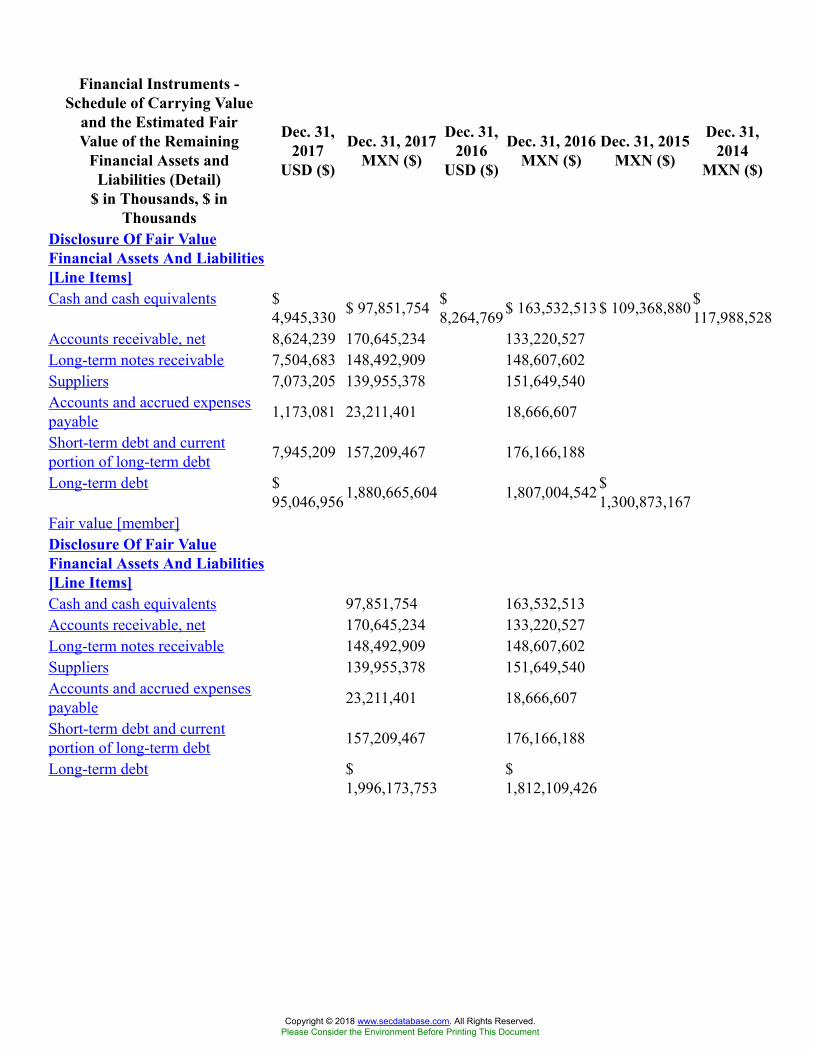
Financial Instruments -Schedule of Carrying Value
and the Estimated FairValue of the Remaining
Financial Assets andLiabilities (Detail)
$ in Thousands, $ inThousands
Dec. 31,2017
USD ($)
Dec. 31, 2017MXN ($)
Dec. 31,2016
USD ($)
Dec. 31, 2016MXN ($)
Dec. 31, 2015MXN ($)
Dec. 31,2014
MXN ($)
Disclosure Of Fair ValueFinancial Assets And Liabilities[Line Items]Cash and cash equivalents $
4,945,330 $ 97,851,754 $8,264,769$ 163,532,513$ 109,368,880$
117,988,528Accounts receivable, net 8,624,239 170,645,234 133,220,527Long-term notes receivable 7,504,683 148,492,909 148,607,602Suppliers 7,073,205 139,955,378 151,649,540Accounts and accrued expensespayable 1,173,081 23,211,401 18,666,607
Short-term debt and currentportion of long-term debt 7,945,209 157,209,467 176,166,188
Long-term debt $95,046,9561,880,665,604 1,807,004,542$
1,300,873,167Fair value [member]Disclosure Of Fair ValueFinancial Assets And Liabilities[Line Items]Cash and cash equivalents 97,851,754 163,532,513Accounts receivable, net 170,645,234 133,220,527Long-term notes receivable 148,492,909 148,607,602Suppliers 139,955,378 151,649,540Accounts and accrued expensespayable 23,211,401 18,666,607
Short-term debt and currentportion of long-term debt 157,209,467 176,166,188
Long-term debt $1,996,173,753
$1,812,109,426
Copyright © 2018 www.secdatabase.com. All Rights Reserved.Please Consider the Environment Before Printing This Document
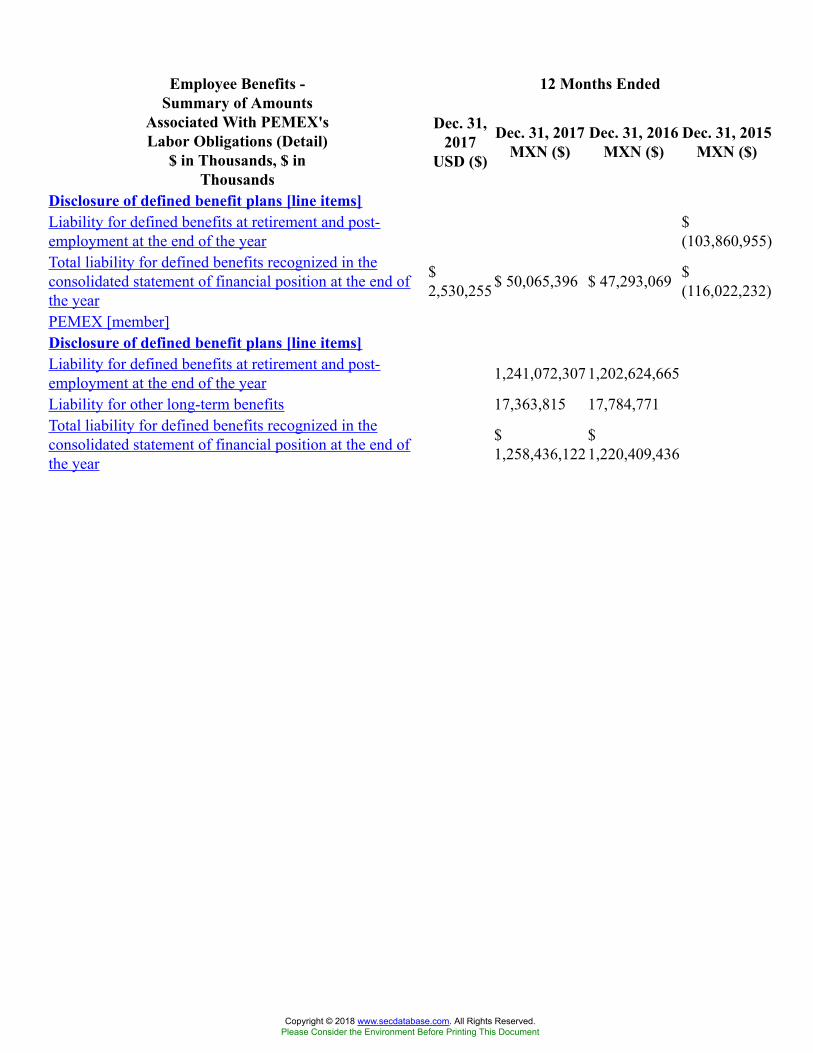
12 Months EndedEmployee Benefits -Summary of Amounts
Associated With PEMEX'sLabor Obligations (Detail)
$ in Thousands, $ inThousands
Dec. 31,2017
USD ($)
Dec. 31, 2017MXN ($)
Dec. 31, 2016MXN ($)
Dec. 31, 2015MXN ($)
Disclosure of defined benefit plans [line items]Liability for defined benefits at retirement and post-employment at the end of the year
$(103,860,955)
Total liability for defined benefits recognized in theconsolidated statement of financial position at the end ofthe year
$2,530,255$ 50,065,396 $ 47,293,069 $
(116,022,232)
PEMEX [member]Disclosure of defined benefit plans [line items]Liability for defined benefits at retirement and post-employment at the end of the year 1,241,072,3071,202,624,665
Liability for other long-term benefits 17,363,815 17,784,771Total liability for defined benefits recognized in theconsolidated statement of financial position at the end ofthe year
$1,258,436,122
$1,220,409,436
Copyright © 2018 www.secdatabase.com. All Rights Reserved.Please Consider the Environment Before Printing This Document
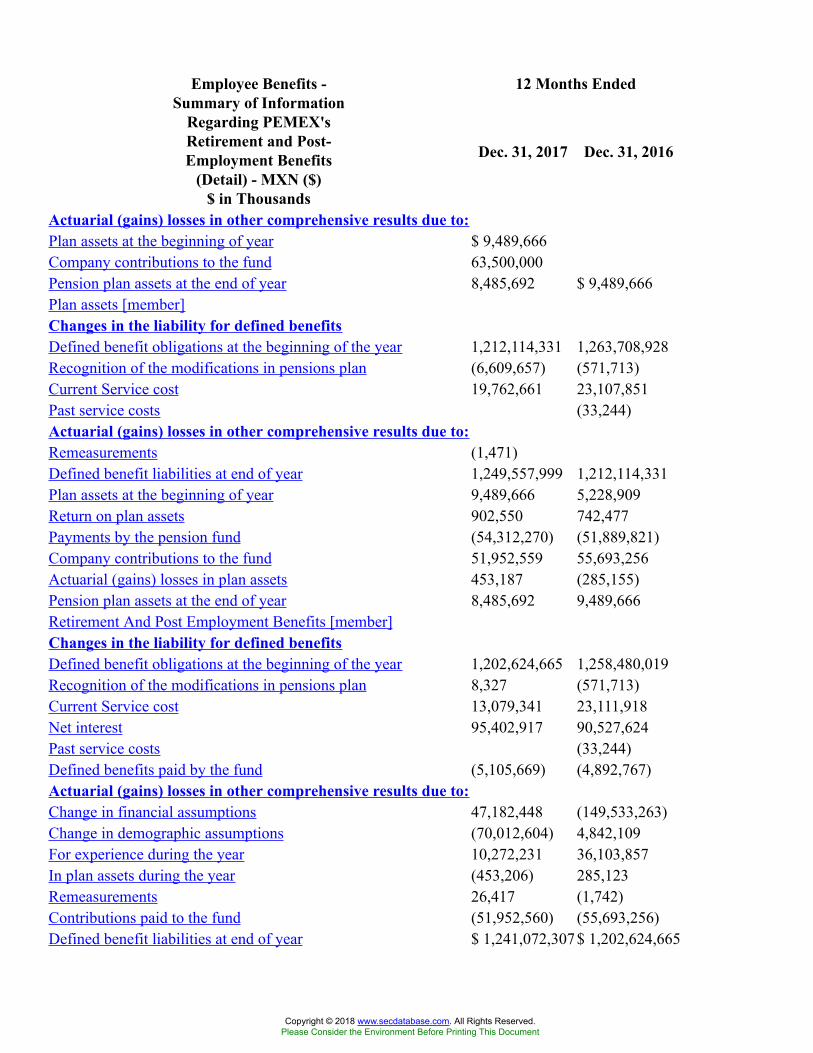
12 Months EndedEmployee Benefits -Summary of Information
Regarding PEMEX'sRetirement and Post-Employment Benefits
(Detail) - MXN ($)$ in Thousands
Dec. 31, 2017 Dec. 31, 2016
Actuarial (gains) losses in other comprehensive results due to:Plan assets at the beginning of year $ 9,489,666Company contributions to the fund 63,500,000Pension plan assets at the end of year 8,485,692 $ 9,489,666Plan assets [member]Changes in the liability for defined benefitsDefined benefit obligations at the beginning of the year 1,212,114,331 1,263,708,928Recognition of the modifications in pensions plan (6,609,657) (571,713)Current Service cost 19,762,661 23,107,851Past service costs (33,244)Actuarial (gains) losses in other comprehensive results due to:Remeasurements (1,471)Defined benefit liabilities at end of year 1,249,557,999 1,212,114,331Plan assets at the beginning of year 9,489,666 5,228,909Return on plan assets 902,550 742,477Payments by the pension fund (54,312,270) (51,889,821)Company contributions to the fund 51,952,559 55,693,256Actuarial (gains) losses in plan assets 453,187 (285,155)Pension plan assets at the end of year 8,485,692 9,489,666Retirement And Post Employment Benefits [member]Changes in the liability for defined benefitsDefined benefit obligations at the beginning of the year 1,202,624,665 1,258,480,019Recognition of the modifications in pensions plan 8,327 (571,713)Current Service cost 13,079,341 23,111,918Net interest 95,402,917 90,527,624Past service costs (33,244)Defined benefits paid by the fund (5,105,669) (4,892,767)Actuarial (gains) losses in other comprehensive results due to:Change in financial assumptions 47,182,448 (149,533,263)Change in demographic assumptions (70,012,604) 4,842,109For experience during the year 10,272,231 36,103,857In plan assets during the year (453,206) 285,123Remeasurements 26,417 (1,742)Contributions paid to the fund (51,952,560) (55,693,256)Defined benefit liabilities at end of year $ 1,241,072,307$ 1,202,624,665
Copyright © 2018 www.secdatabase.com. All Rights Reserved.Please Consider the Environment Before Printing This Document
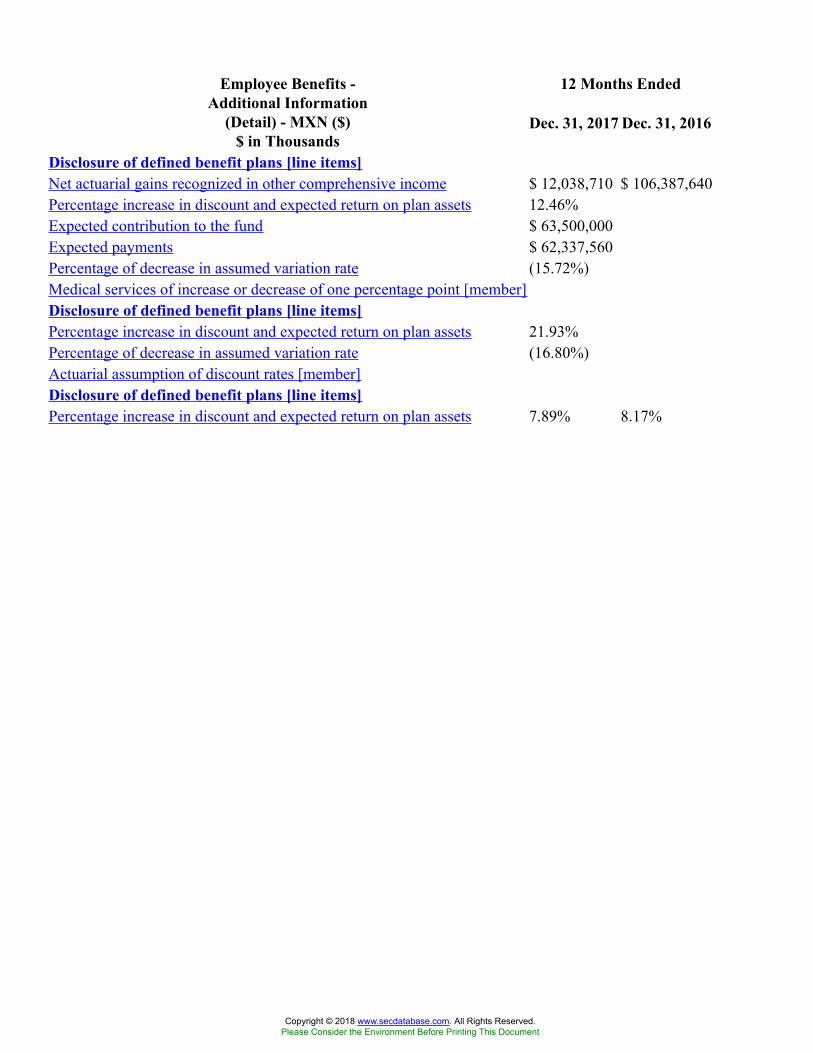
12 Months EndedEmployee Benefits -Additional Information
(Detail) - MXN ($)$ in Thousands
Dec. 31, 2017 Dec. 31, 2016
Disclosure of defined benefit plans [line items]Net actuarial gains recognized in other comprehensive income $ 12,038,710 $ 106,387,640Percentage increase in discount and expected return on plan assets 12.46%Expected contribution to the fund $ 63,500,000Expected payments $ 62,337,560Percentage of decrease in assumed variation rate (15.72%)Medical services of increase or decrease of one percentage point [member]Disclosure of defined benefit plans [line items]Percentage increase in discount and expected return on plan assets 21.93%Percentage of decrease in assumed variation rate (16.80%)Actuarial assumption of discount rates [member]Disclosure of defined benefit plans [line items]Percentage increase in discount and expected return on plan assets 7.89% 8.17%
Copyright © 2018 www.secdatabase.com. All Rights Reserved.Please Consider the Environment Before Printing This Document
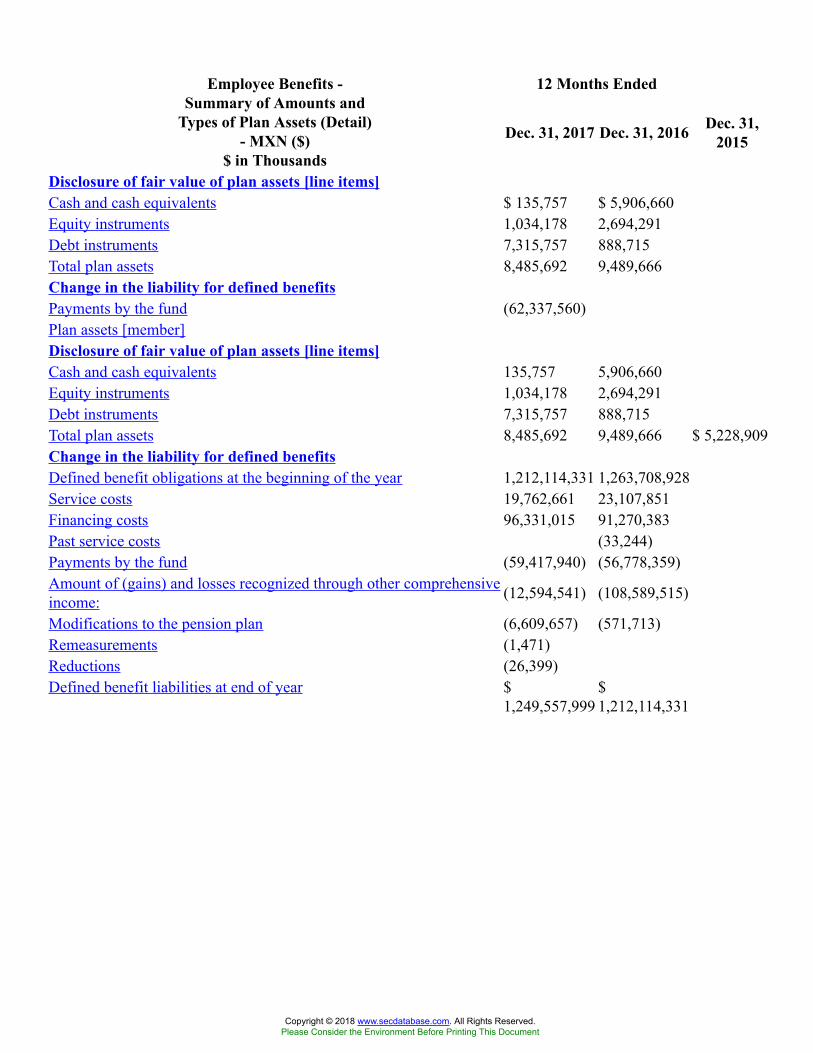
12 Months EndedEmployee Benefits -Summary of Amounts and
Types of Plan Assets (Detail)- MXN ($)
$ in Thousands
Dec. 31, 2017 Dec. 31, 2016 Dec. 31,2015
Disclosure of fair value of plan assets [line items]Cash and cash equivalents $ 135,757 $ 5,906,660Equity instruments 1,034,178 2,694,291Debt instruments 7,315,757 888,715Total plan assets 8,485,692 9,489,666Change in the liability for defined benefitsPayments by the fund (62,337,560)Plan assets [member]Disclosure of fair value of plan assets [line items]Cash and cash equivalents 135,757 5,906,660Equity instruments 1,034,178 2,694,291Debt instruments 7,315,757 888,715Total plan assets 8,485,692 9,489,666 $ 5,228,909Change in the liability for defined benefitsDefined benefit obligations at the beginning of the year 1,212,114,331 1,263,708,928Service costs 19,762,661 23,107,851Financing costs 96,331,015 91,270,383Past service costs (33,244)Payments by the fund (59,417,940) (56,778,359)Amount of (gains) and losses recognized through other comprehensiveincome: (12,594,541) (108,589,515)
Modifications to the pension plan (6,609,657) (571,713)Remeasurements (1,471)Reductions (26,399)Defined benefit liabilities at end of year $
1,249,557,999$1,212,114,331
Copyright © 2018 www.secdatabase.com. All Rights Reserved.Please Consider the Environment Before Printing This Document

Employee Benefits -Summary of Additional Fairvalue Disclosure About Plan
Assets and Indicate TheirRank (Detail) - MXN ($)
$ in Thousands
Dec. 31, 2017 Dec. 31, 2016
Disclosure of fair value of plan assets [line items]Cash and cash equivalents $ 135,757 $ 5,906,660Equity instruments 1,034,178 2,694,291Debt instruments 7,315,757 888,715Total 8,485,692 9,489,666Level 1 [member]Disclosure of fair value of plan assets [line items]Cash and cash equivalents 135,757 5,906,660Equity instruments 1,034,178 2,694,291Debt instruments 7,315,757 888,715Total $ 8,485,692 $ 9,489,666
Copyright © 2018 www.secdatabase.com. All Rights Reserved.Please Consider the Environment Before Printing This Document

12 Months EndedEmployee Benefits -DisclosureOfSensitivityAnalysisForActuarialAssumptionsExplanatory
(Detail) Dec. 31, 2017 Dec. 31, 2016
Disclosure of sensitivity analysis for actuarial assumptions[line items]Discount and return on plan assets rate 12.46%Average length of obligation (years) 18 years 4 months 24
days17 years 8 months 1day
Actuarial assumption of expected rates of salary increases[member]Disclosure of sensitivity analysis for actuarial assumptions[line items]Discount and return on plan assets rate 4.77% 4.77%Actuarial assumption of expected rates of pension increases[member]Disclosure of sensitivity analysis for actuarial assumptions[line items]Discount and return on plan assets rate 3.75% 3.75%Medical services [member]Disclosure of sensitivity analysis for actuarial assumptions[line items]Discount and return on plan assets rate 7.65% 7.65%Actuarial assumption of expected rates of inflation [member]Disclosure of sensitivity analysis for actuarial assumptions[line items]Discount and return on plan assets rate 3.75% 3.75%Actuarial assumption of discount rates [member]Disclosure of sensitivity analysis for actuarial assumptions[line items]Discount and return on plan assets rate 7.89% 8.17%
Copyright © 2018 www.secdatabase.com. All Rights Reserved.Please Consider the Environment Before Printing This Document
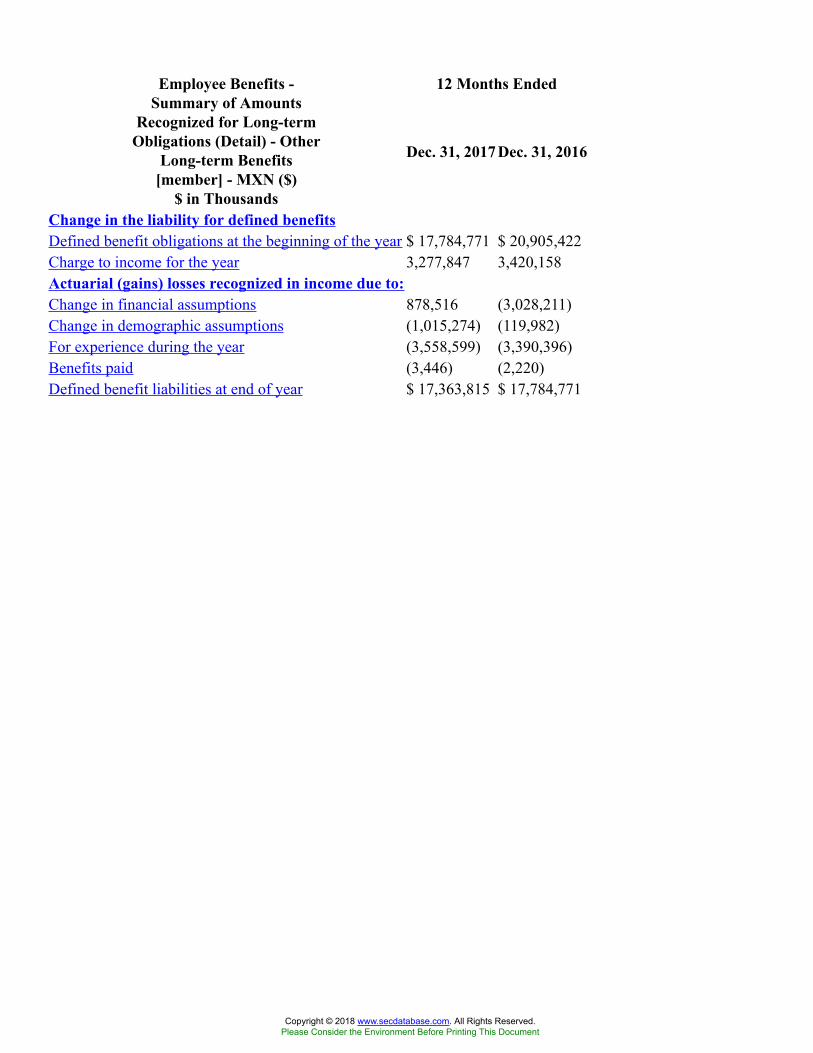
12 Months EndedEmployee Benefits -Summary of Amounts
Recognized for Long-termObligations (Detail) - Other
Long-term Benefits[member] - MXN ($)
$ in Thousands
Dec. 31, 2017 Dec. 31, 2016
Change in the liability for defined benefitsDefined benefit obligations at the beginning of the year $ 17,784,771 $ 20,905,422Charge to income for the year 3,277,847 3,420,158Actuarial (gains) losses recognized in income due to:Change in financial assumptions 878,516 (3,028,211)Change in demographic assumptions (1,015,274) (119,982)For experience during the year (3,558,599) (3,390,396)Benefits paid (3,446) (2,220)Defined benefit liabilities at end of year $ 17,363,815 $ 17,784,771
Copyright © 2018 www.secdatabase.com. All Rights Reserved.Please Consider the Environment Before Printing This Document
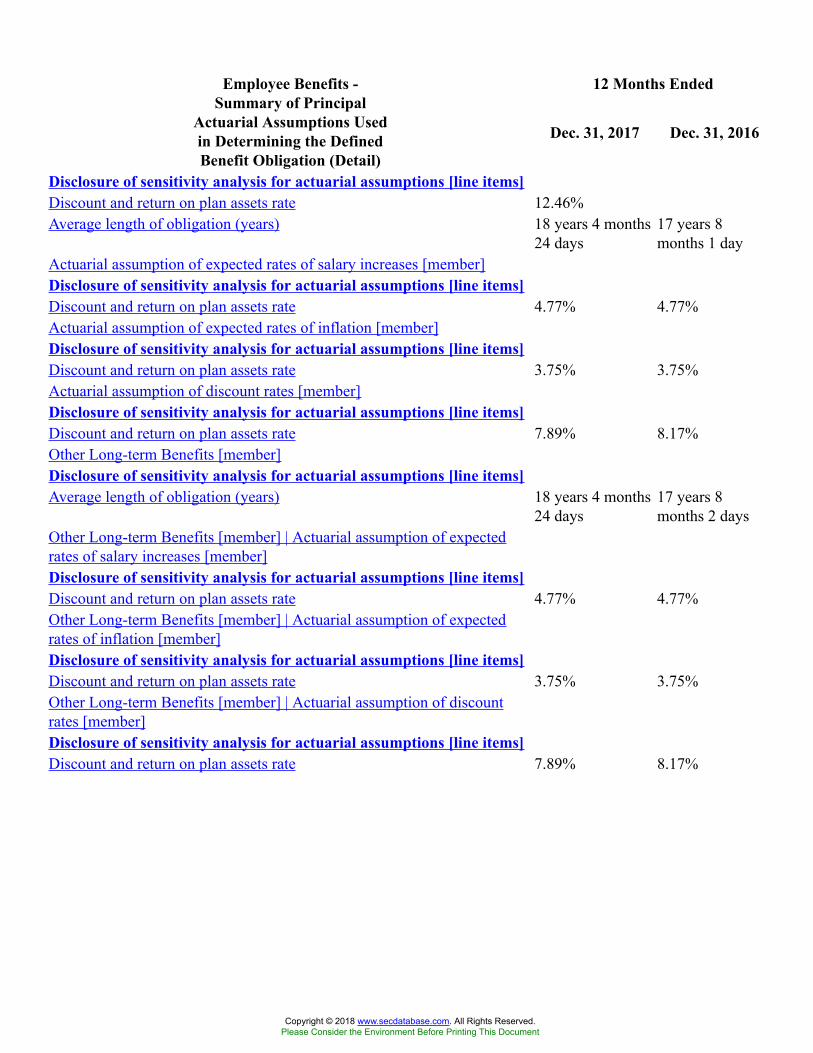
12 Months EndedEmployee Benefits -Summary of Principal
Actuarial Assumptions Usedin Determining the DefinedBenefit Obligation (Detail)
Dec. 31, 2017 Dec. 31, 2016
Disclosure of sensitivity analysis for actuarial assumptions [line items]Discount and return on plan assets rate 12.46%Average length of obligation (years) 18 years 4 months
24 days17 years 8months 1 day
Actuarial assumption of expected rates of salary increases [member]Disclosure of sensitivity analysis for actuarial assumptions [line items]Discount and return on plan assets rate 4.77% 4.77%Actuarial assumption of expected rates of inflation [member]Disclosure of sensitivity analysis for actuarial assumptions [line items]Discount and return on plan assets rate 3.75% 3.75%Actuarial assumption of discount rates [member]Disclosure of sensitivity analysis for actuarial assumptions [line items]Discount and return on plan assets rate 7.89% 8.17%Other Long-term Benefits [member]Disclosure of sensitivity analysis for actuarial assumptions [line items]Average length of obligation (years) 18 years 4 months
24 days17 years 8months 2 days
Other Long-term Benefits [member] | Actuarial assumption of expectedrates of salary increases [member]Disclosure of sensitivity analysis for actuarial assumptions [line items]Discount and return on plan assets rate 4.77% 4.77%Other Long-term Benefits [member] | Actuarial assumption of expectedrates of inflation [member]Disclosure of sensitivity analysis for actuarial assumptions [line items]Discount and return on plan assets rate 3.75% 3.75%Other Long-term Benefits [member] | Actuarial assumption of discountrates [member]Disclosure of sensitivity analysis for actuarial assumptions [line items]Discount and return on plan assets rate 7.89% 8.17%
Copyright © 2018 www.secdatabase.com. All Rights Reserved.Please Consider the Environment Before Printing This Document
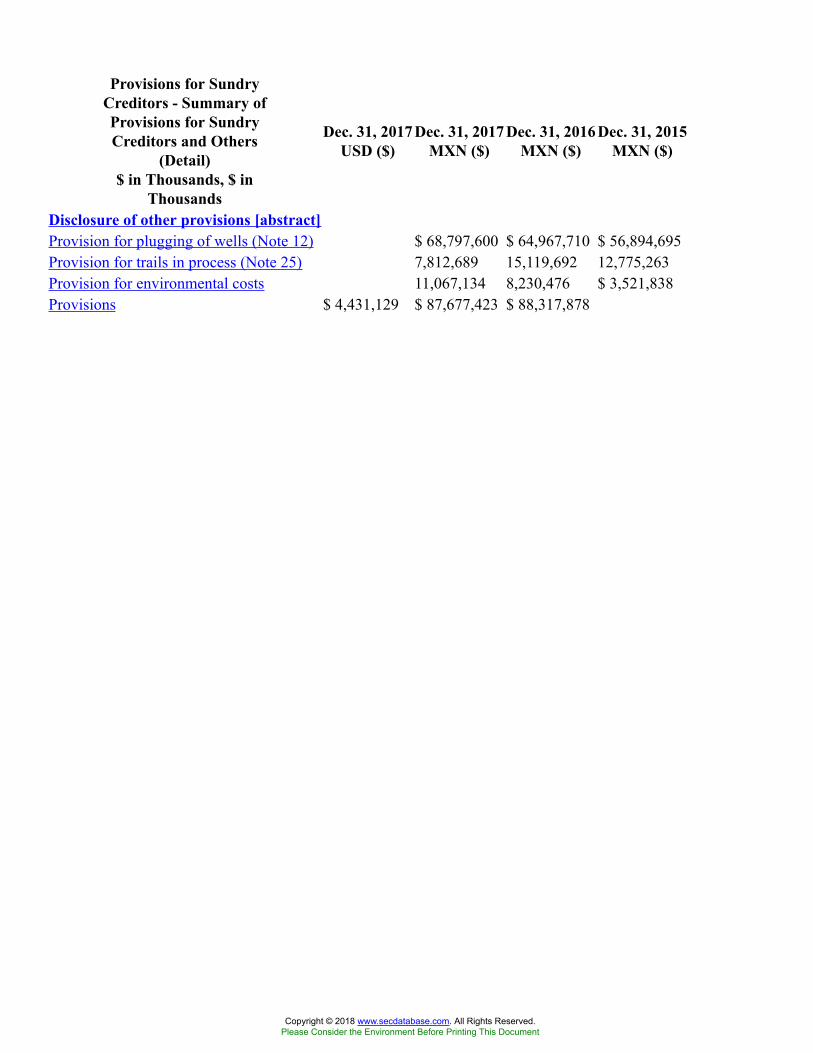
Provisions for SundryCreditors - Summary ofProvisions for SundryCreditors and Others
(Detail)$ in Thousands, $ in
Thousands
Dec. 31, 2017USD ($)
Dec. 31, 2017MXN ($)
Dec. 31, 2016MXN ($)
Dec. 31, 2015MXN ($)
Disclosure of other provisions [abstract]Provision for plugging of wells (Note 12) $ 68,797,600 $ 64,967,710 $ 56,894,695Provision for trails in process (Note 25) 7,812,689 15,119,692 12,775,263Provision for environmental costs 11,067,134 8,230,476 $ 3,521,838Provisions $ 4,431,129 $ 87,677,423 $ 88,317,878
Copyright © 2018 www.secdatabase.com. All Rights Reserved.Please Consider the Environment Before Printing This Document
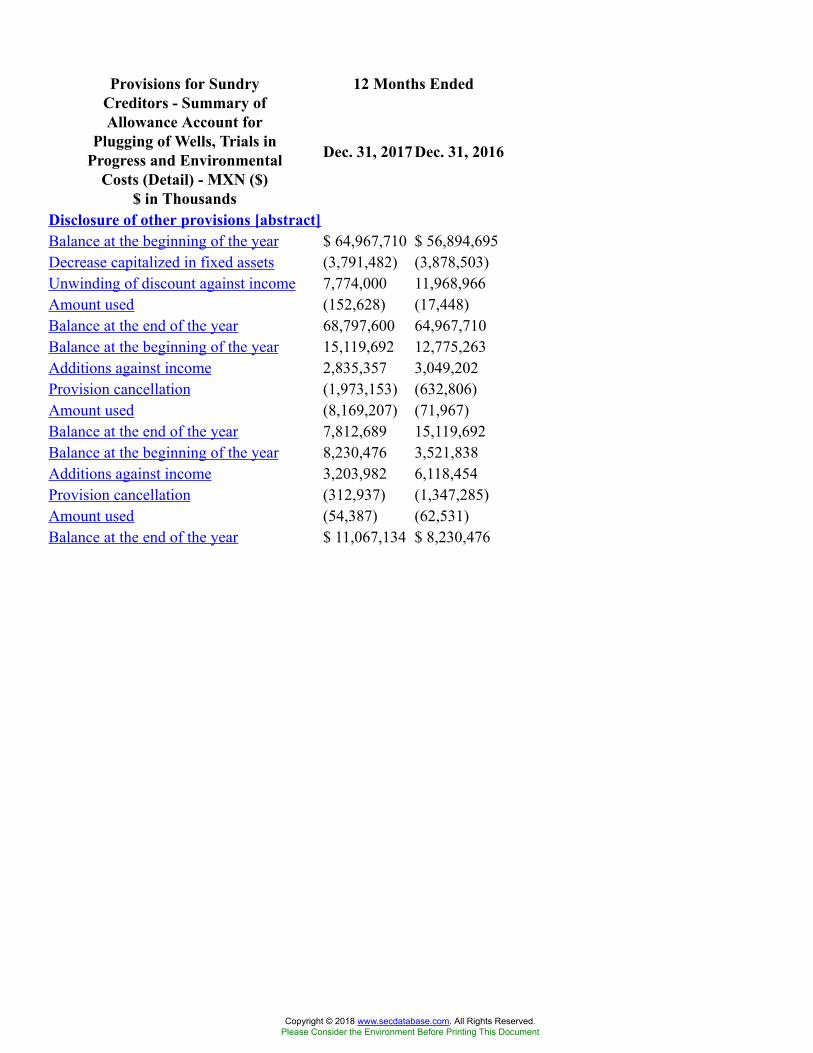
12 Months EndedProvisions for SundryCreditors - Summary ofAllowance Account for
Plugging of Wells, Trials inProgress and Environmental
Costs (Detail) - MXN ($)$ in Thousands
Dec. 31, 2017 Dec. 31, 2016
Disclosure of other provisions [abstract]Balance at the beginning of the year $ 64,967,710 $ 56,894,695Decrease capitalized in fixed assets (3,791,482) (3,878,503)Unwinding of discount against income 7,774,000 11,968,966Amount used (152,628) (17,448)Balance at the end of the year 68,797,600 64,967,710Balance at the beginning of the year 15,119,692 12,775,263Additions against income 2,835,357 3,049,202Provision cancellation (1,973,153) (632,806)Amount used (8,169,207) (71,967)Balance at the end of the year 7,812,689 15,119,692Balance at the beginning of the year 8,230,476 3,521,838Additions against income 3,203,982 6,118,454Provision cancellation (312,937) (1,347,285)Amount used (54,387) (62,531)Balance at the end of the year $ 11,067,134 $ 8,230,476
Copyright © 2018 www.secdatabase.com. All Rights Reserved.Please Consider the Environment Before Printing This Document
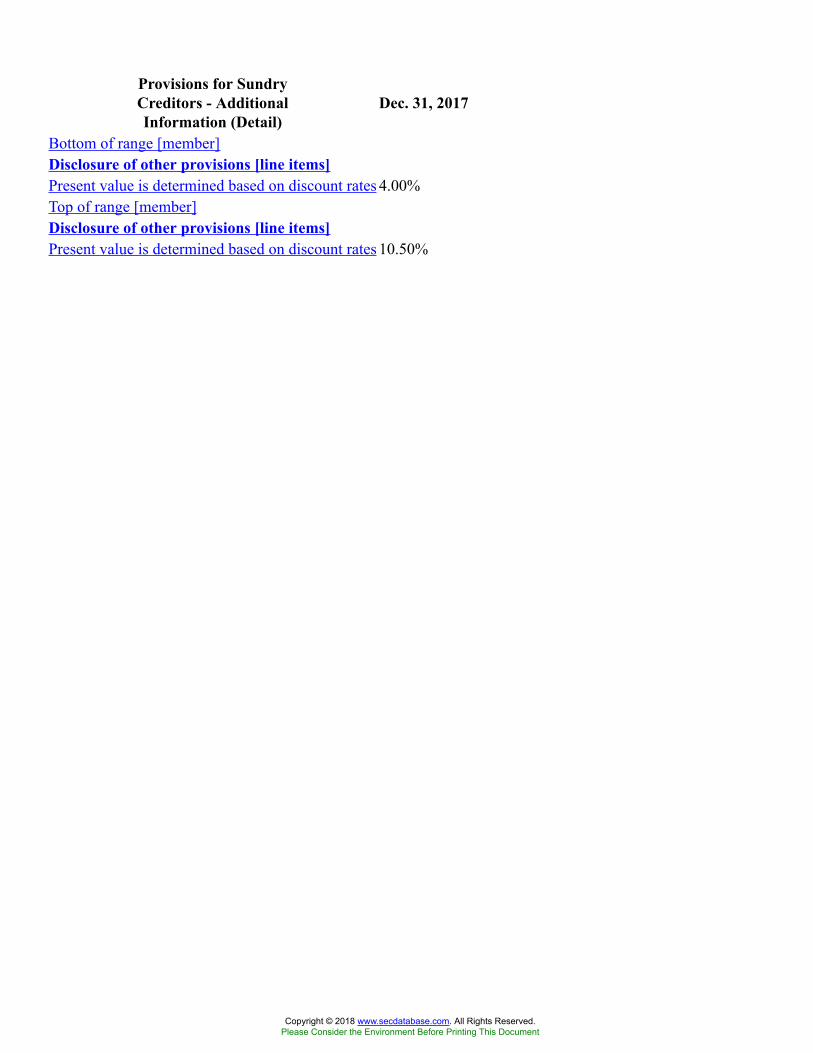
Provisions for SundryCreditors - AdditionalInformation (Detail)
Dec. 31, 2017
Bottom of range [member]Disclosure of other provisions [line items]Present value is determined based on discount rates 4.00%Top of range [member]Disclosure of other provisions [line items]Present value is determined based on discount rates 10.50%
Copyright © 2018 www.secdatabase.com. All Rights Reserved.Please Consider the Environment Before Printing This Document

12 Months EndedDisclosures of Cash Flow -Summary of Non-cashTransactions and are
Presented for DisclosurePurposes (Detail) - MXN ($)
$ in Thousands
Dec. 31, 2017 Dec. 31, 2016 Dec. 31, 2015
Operating activitiesEmployee benefits equity effect $ 12,038,710 $ 106,277,761$ 78,556,569Net (benefits) cost of the year for employee benefits 108,073,074 109,738,416 (62,549,142)Investing activitiesAvailable-for-sale financial assets 5,564,130 207,817 (3,206,316)Financing activitiesFinanced Public Works Contracts 146,217,292 2,001,093Currency translation effect (7,597,283) 21,386,902 13,262,101Accrued interest $ 8,734,131 $ 9,326,945 $ 4,816,784
Copyright © 2018 www.secdatabase.com. All Rights Reserved.Please Consider the Environment Before Printing This Document
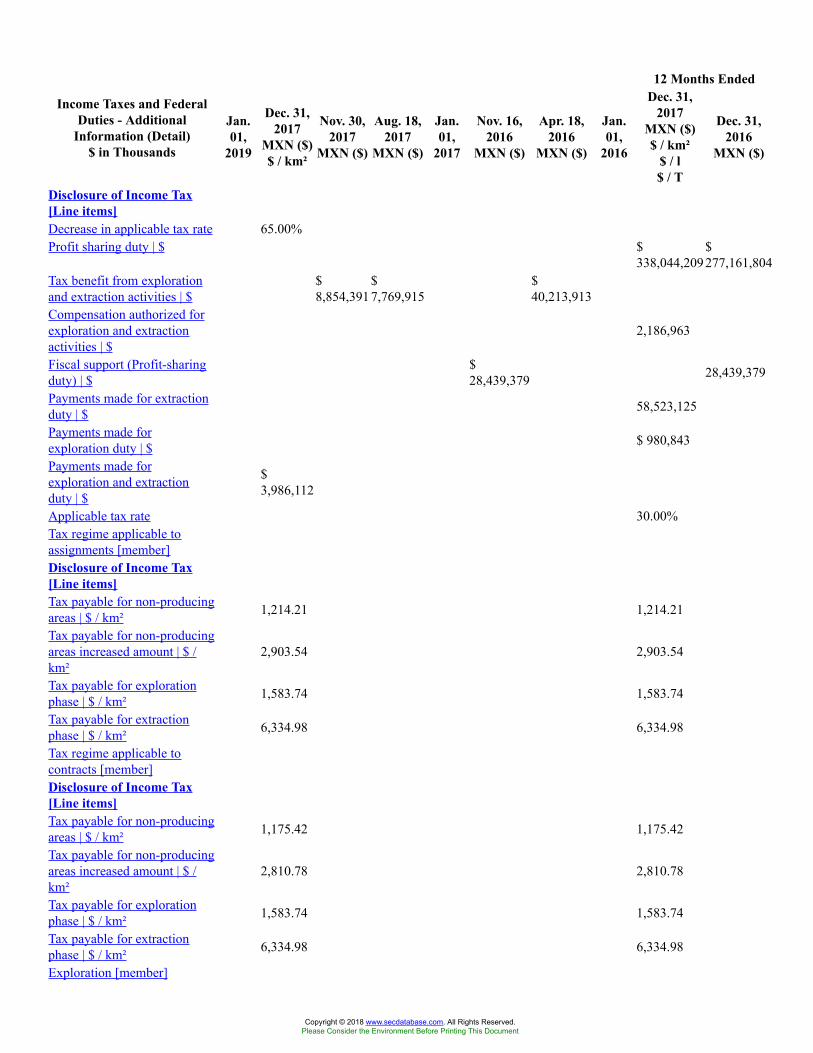
12 Months Ended
Income Taxes and FederalDuties - Additional
Information (Detail)$ in Thousands
Jan.01,
2019
Dec. 31,2017
MXN ($)$ / km²
Nov. 30,2017
MXN ($)
Aug. 18,2017
MXN ($)
Jan.01,
2017
Nov. 16,2016
MXN ($)
Apr. 18,2016
MXN ($)
Jan.01,
2016
Dec. 31,2017
MXN ($)$ / km²
$ / l$ / T
Dec. 31,2016
MXN ($)
Disclosure of Income Tax[Line items]Decrease in applicable tax rate 65.00%Profit sharing duty | $ $
338,044,209$277,161,804
Tax benefit from explorationand extraction activities | $
$8,854,391
$7,769,915
$40,213,913
Compensation authorized forexploration and extractionactivities | $
2,186,963
Fiscal support (Profit-sharingduty) | $
$28,439,379 28,439,379
Payments made for extractionduty | $ 58,523,125
Payments made forexploration duty | $ $ 980,843
Payments made forexploration and extractionduty | $
$3,986,112
Applicable tax rate 30.00%Tax regime applicable toassignments [member]Disclosure of Income Tax[Line items]Tax payable for non-producingareas | $ / km² 1,214.21 1,214.21
Tax payable for non-producingareas increased amount | $ /km²
2,903.54 2,903.54
Tax payable for explorationphase | $ / km² 1,583.74 1,583.74
Tax payable for extractionphase | $ / km² 6,334.98 6,334.98
Tax regime applicable tocontracts [member]Disclosure of Income Tax[Line items]Tax payable for non-producingareas | $ / km² 1,175.42 1,175.42
Tax payable for non-producingareas increased amount | $ /km²
2,810.78 2,810.78
Tax payable for explorationphase | $ / km² 1,583.74 1,583.74
Tax payable for extractionphase | $ / km² 6,334.98 6,334.98
Exploration [member]
Copyright © 2018 www.secdatabase.com. All Rights Reserved.Please Consider the Environment Before Printing This Document
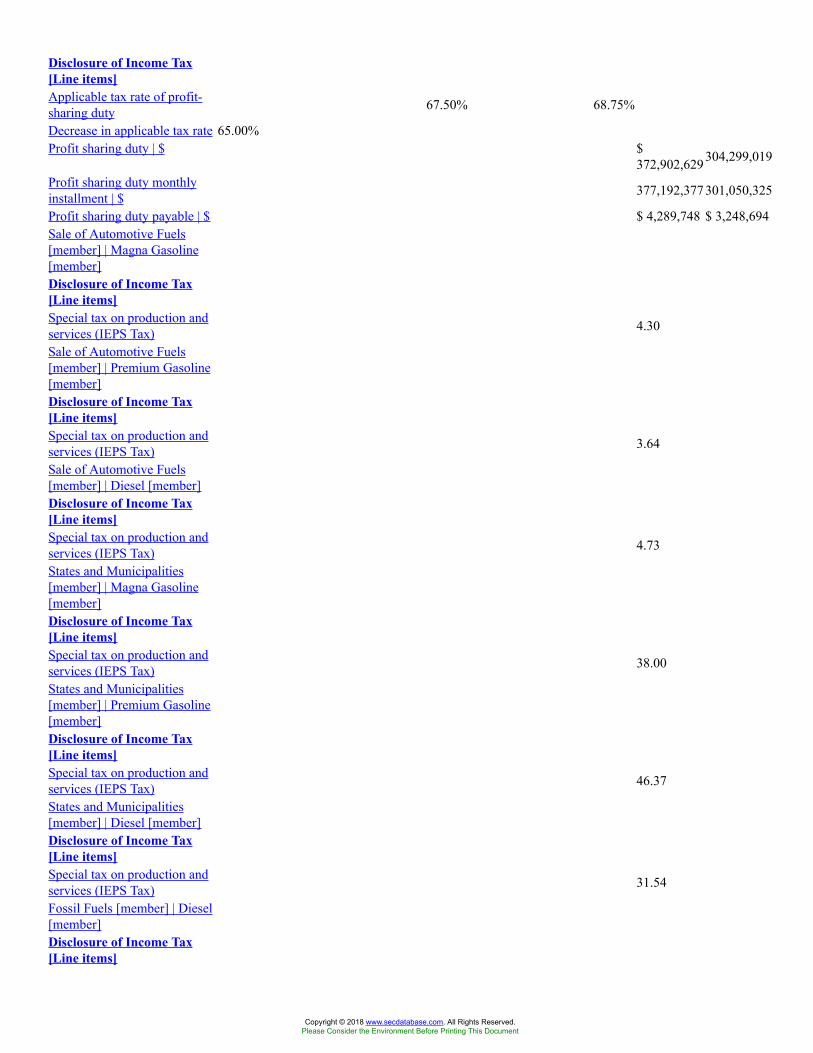
Disclosure of Income Tax[Line items]Applicable tax rate of profit-sharing duty 67.50% 68.75%
Decrease in applicable tax rate 65.00%Profit sharing duty | $ $
372,902,629304,299,019
Profit sharing duty monthlyinstallment | $ 377,192,377301,050,325
Profit sharing duty payable | $ $ 4,289,748 $ 3,248,694Sale of Automotive Fuels[member] | Magna Gasoline[member]Disclosure of Income Tax[Line items]Special tax on production andservices (IEPS Tax) 4.30
Sale of Automotive Fuels[member] | Premium Gasoline[member]Disclosure of Income Tax[Line items]Special tax on production andservices (IEPS Tax) 3.64
Sale of Automotive Fuels[member] | Diesel [member]Disclosure of Income Tax[Line items]Special tax on production andservices (IEPS Tax) 4.73
States and Municipalities[member] | Magna Gasoline[member]Disclosure of Income Tax[Line items]Special tax on production andservices (IEPS Tax) 38.00
States and Municipalities[member] | Premium Gasoline[member]Disclosure of Income Tax[Line items]Special tax on production andservices (IEPS Tax) 46.37
States and Municipalities[member] | Diesel [member]Disclosure of Income Tax[Line items]Special tax on production andservices (IEPS Tax) 31.54
Fossil Fuels [member] | Diesel[member]Disclosure of Income Tax[Line items]
Copyright © 2018 www.secdatabase.com. All Rights Reserved.Please Consider the Environment Before Printing This Document
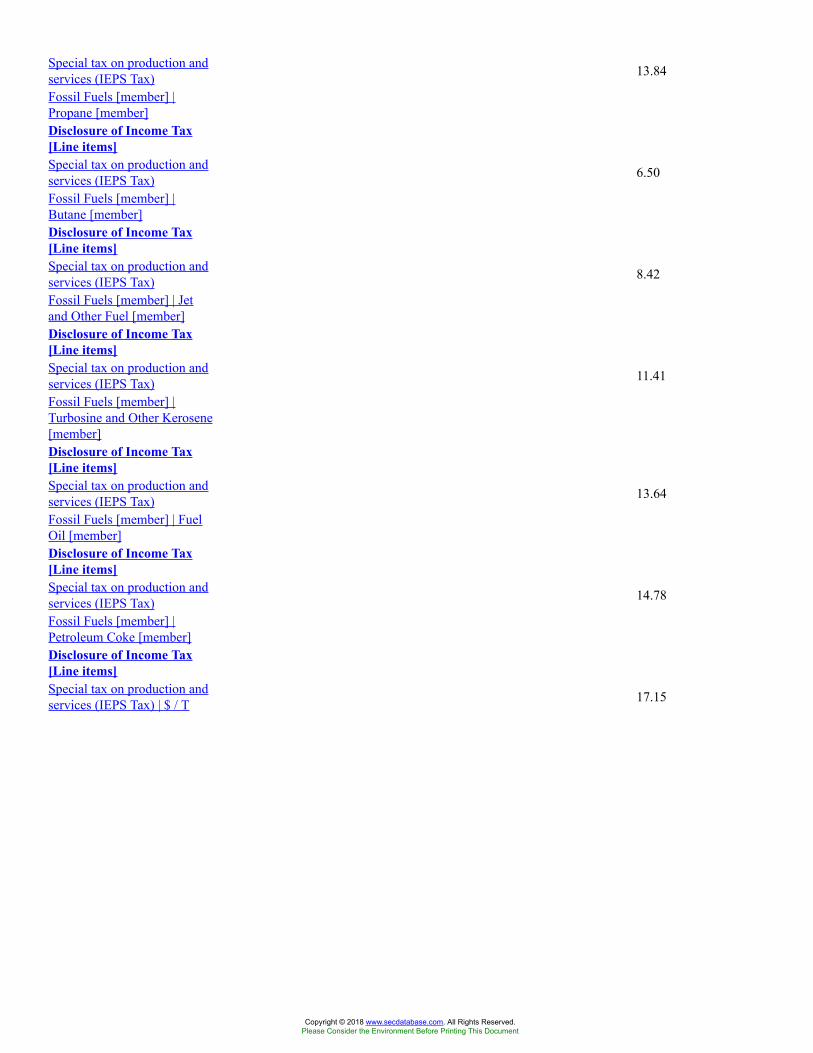
Special tax on production andservices (IEPS Tax) 13.84
Fossil Fuels [member] |Propane [member]Disclosure of Income Tax[Line items]Special tax on production andservices (IEPS Tax) 6.50
Fossil Fuels [member] |Butane [member]Disclosure of Income Tax[Line items]Special tax on production andservices (IEPS Tax) 8.42
Fossil Fuels [member] | Jetand Other Fuel [member]Disclosure of Income Tax[Line items]Special tax on production andservices (IEPS Tax) 11.41
Fossil Fuels [member] |Turbosine and Other Kerosene[member]Disclosure of Income Tax[Line items]Special tax on production andservices (IEPS Tax) 13.64
Fossil Fuels [member] | FuelOil [member]Disclosure of Income Tax[Line items]Special tax on production andservices (IEPS Tax) 14.78
Fossil Fuels [member] |Petroleum Coke [member]Disclosure of Income Tax[Line items]Special tax on production andservices (IEPS Tax) | $ / T 17.15
Copyright © 2018 www.secdatabase.com. All Rights Reserved.Please Consider the Environment Before Printing This Document
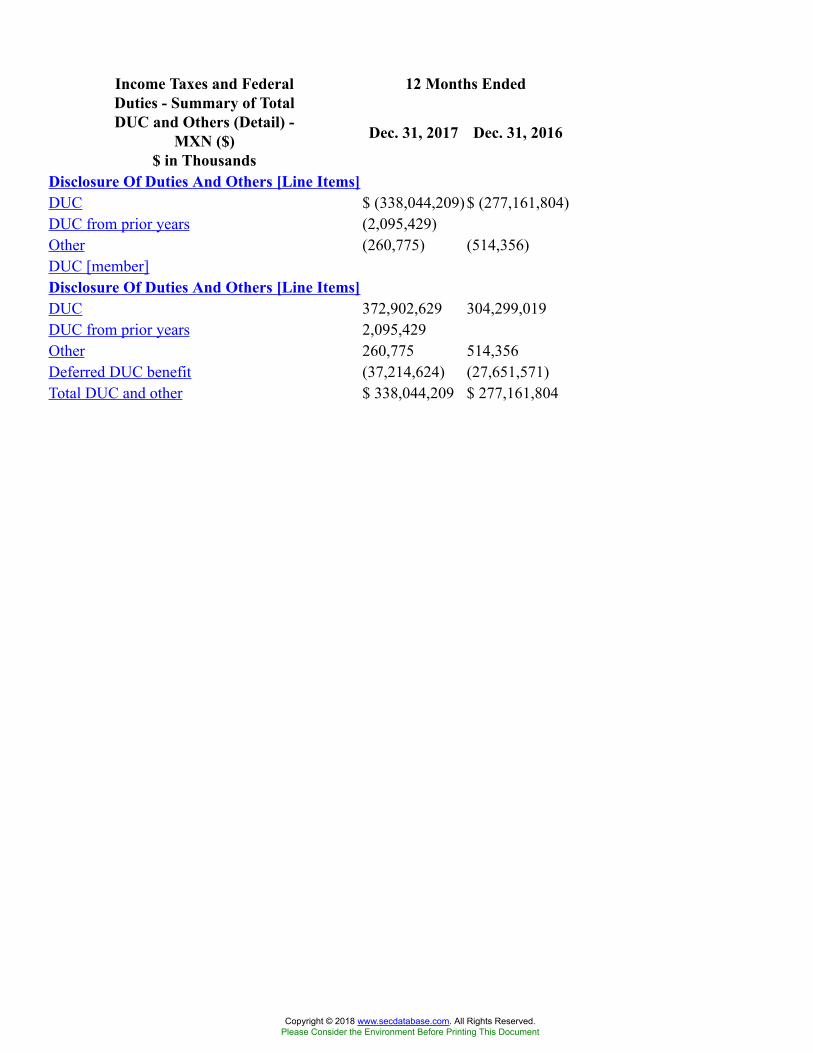
12 Months EndedIncome Taxes and FederalDuties - Summary of TotalDUC and Others (Detail) -
MXN ($)$ in Thousands
Dec. 31, 2017 Dec. 31, 2016
Disclosure Of Duties And Others [Line Items]DUC $ (338,044,209) $ (277,161,804)DUC from prior years (2,095,429)Other (260,775) (514,356)DUC [member]Disclosure Of Duties And Others [Line Items]DUC 372,902,629 304,299,019DUC from prior years 2,095,429Other 260,775 514,356Deferred DUC benefit (37,214,624) (27,651,571)Total DUC and other $ 338,044,209 $ 277,161,804
Copyright © 2018 www.secdatabase.com. All Rights Reserved.Please Consider the Environment Before Printing This Document

12 Months EndedIncome Taxes And FederalDuties - Summary of
Principal Factors Generatingthe Deferred DUC (Detail)
$ in Thousands, $ inThousands
Dec. 31,2017
MXN ($)
Dec. 31, 2016MXN ($)
Dec. 31,2017
USD ($)
Dec. 31, 2017MXN ($)
Dec. 31, 2015MXN ($)
Deferred DUC assetProvisions $ 88,317,878 $ 4,431,129 $ 87,677,423Total deferred DUC asset (100,324,689) (7,388,422) (146,192,485)Deferred Profit-sharing dutyliabilityWells, pipelines, properties, plant andequipment (1,667,742,248) (72,599,743) (1,436,509,326) $
(1,344,483,631)Deferred DUC liability 4,134,536 $ 214,988 4,253,928DUC [member]Deferred DUC assetProvisions 570,544,863 541,360,940Total deferred DUC asset 570,544,863 541,360,940Deferred Profit-sharing dutyliabilityWells, pipelines, properties, plant andequipment (473,406,721) (455,697,786)
Deferred DUC liability (473,406,721) (455,697,786)Deferred asset net 97,138,142 85,663,154Valuation reserve $
(20,796,959) (69,486,571)
Net, deferred DUC asset $ 27,651,571 $ 64,866,195
Copyright © 2018 www.secdatabase.com. All Rights Reserved.Please Consider the Environment Before Printing This Document
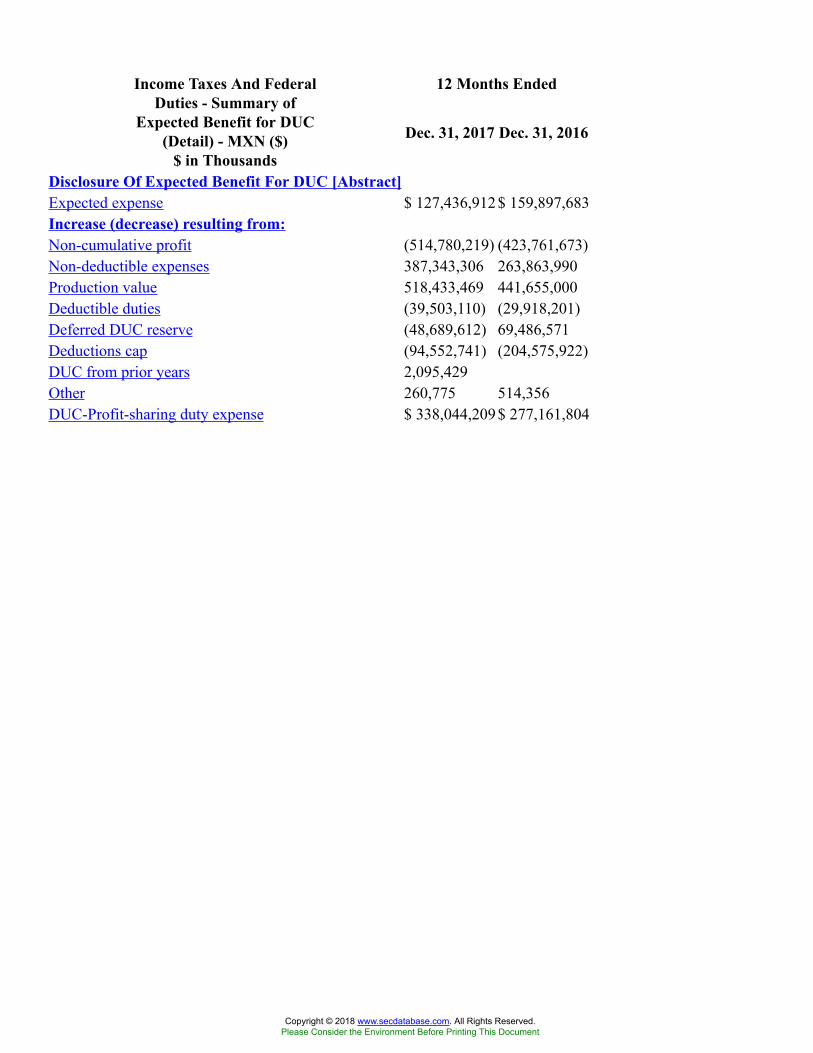
12 Months EndedIncome Taxes And FederalDuties - Summary of
Expected Benefit for DUC(Detail) - MXN ($)
$ in Thousands
Dec. 31, 2017 Dec. 31, 2016
Disclosure Of Expected Benefit For DUC [Abstract]Expected expense $ 127,436,912$ 159,897,683Increase (decrease) resulting from:Non-cumulative profit (514,780,219) (423,761,673)Non-deductible expenses 387,343,306 263,863,990Production value 518,433,469 441,655,000Deductible duties (39,503,110) (29,918,201)Deferred DUC reserve (48,689,612) 69,486,571Deductions cap (94,552,741) (204,575,922)DUC from prior years 2,095,429Other 260,775 514,356DUC-Profit-sharing duty expense $ 338,044,209$ 277,161,804
Copyright © 2018 www.secdatabase.com. All Rights Reserved.Please Consider the Environment Before Printing This Document

12 Months EndedIncome Taxes And FederalDuties - Summary of Income
Tax Expense (Benefit)(Detail)
$ in Thousands, $ inThousands
Dec. 31, 2017USD ($)
Dec. 31, 2017MXN ($)
Dec. 31, 2016MXN ($)
Dec. 31, 2015MXN ($)
Disclosure Of Income Taxes [Line Items]Income tax expense $ (255,938) $ (5,064,168) $ (12,640,369) $ (45,587,267)PEMEX [member]Disclosure Of Income Taxes [Line Items]Current income tax 3,546,912 6,201,842 7,426,892Deferred income tax (9,334,064) (18,842,211) (53,014,159)Income tax expense (5,787,152) $ (12,640,369) $ (45,587,267)Income tax REFIPRE (Preferent Fiscal Regime) $ 722,984
Copyright © 2018 www.secdatabase.com. All Rights Reserved.Please Consider the Environment Before Printing This Document
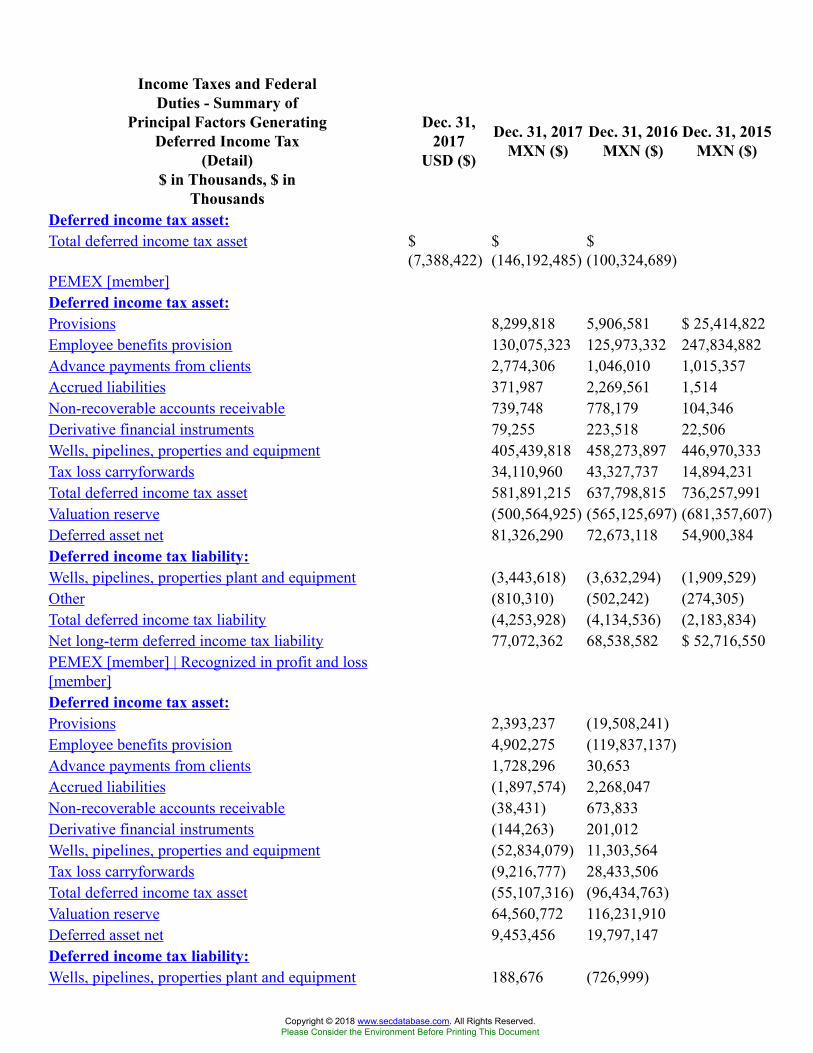
Income Taxes and FederalDuties - Summary of
Principal Factors GeneratingDeferred Income Tax
(Detail)$ in Thousands, $ in
Thousands
Dec. 31,2017
USD ($)
Dec. 31, 2017MXN ($)
Dec. 31, 2016MXN ($)
Dec. 31, 2015MXN ($)
Deferred income tax asset:Total deferred income tax asset $
(7,388,422)$(146,192,485)
$(100,324,689)
PEMEX [member]Deferred income tax asset:Provisions 8,299,818 5,906,581 $ 25,414,822Employee benefits provision 130,075,323 125,973,332 247,834,882Advance payments from clients 2,774,306 1,046,010 1,015,357Accrued liabilities 371,987 2,269,561 1,514Non-recoverable accounts receivable 739,748 778,179 104,346Derivative financial instruments 79,255 223,518 22,506Wells, pipelines, properties and equipment 405,439,818 458,273,897 446,970,333Tax loss carryforwards 34,110,960 43,327,737 14,894,231Total deferred income tax asset 581,891,215 637,798,815 736,257,991Valuation reserve (500,564,925) (565,125,697) (681,357,607)Deferred asset net 81,326,290 72,673,118 54,900,384Deferred income tax liability:Wells, pipelines, properties plant and equipment (3,443,618) (3,632,294) (1,909,529)Other (810,310) (502,242) (274,305)Total deferred income tax liability (4,253,928) (4,134,536) (2,183,834)Net long-term deferred income tax liability 77,072,362 68,538,582 $ 52,716,550PEMEX [member] | Recognized in profit and loss[member]Deferred income tax asset:Provisions 2,393,237 (19,508,241)Employee benefits provision 4,902,275 (119,837,137)Advance payments from clients 1,728,296 30,653Accrued liabilities (1,897,574) 2,268,047Non-recoverable accounts receivable (38,431) 673,833Derivative financial instruments (144,263) 201,012Wells, pipelines, properties and equipment (52,834,079) 11,303,564Tax loss carryforwards (9,216,777) 28,433,506Total deferred income tax asset (55,107,316) (96,434,763)Valuation reserve 64,560,772 116,231,910Deferred asset net 9,453,456 19,797,147Deferred income tax liability:Wells, pipelines, properties plant and equipment 188,676 (726,999)
Copyright © 2018 www.secdatabase.com. All Rights Reserved.Please Consider the Environment Before Printing This Document
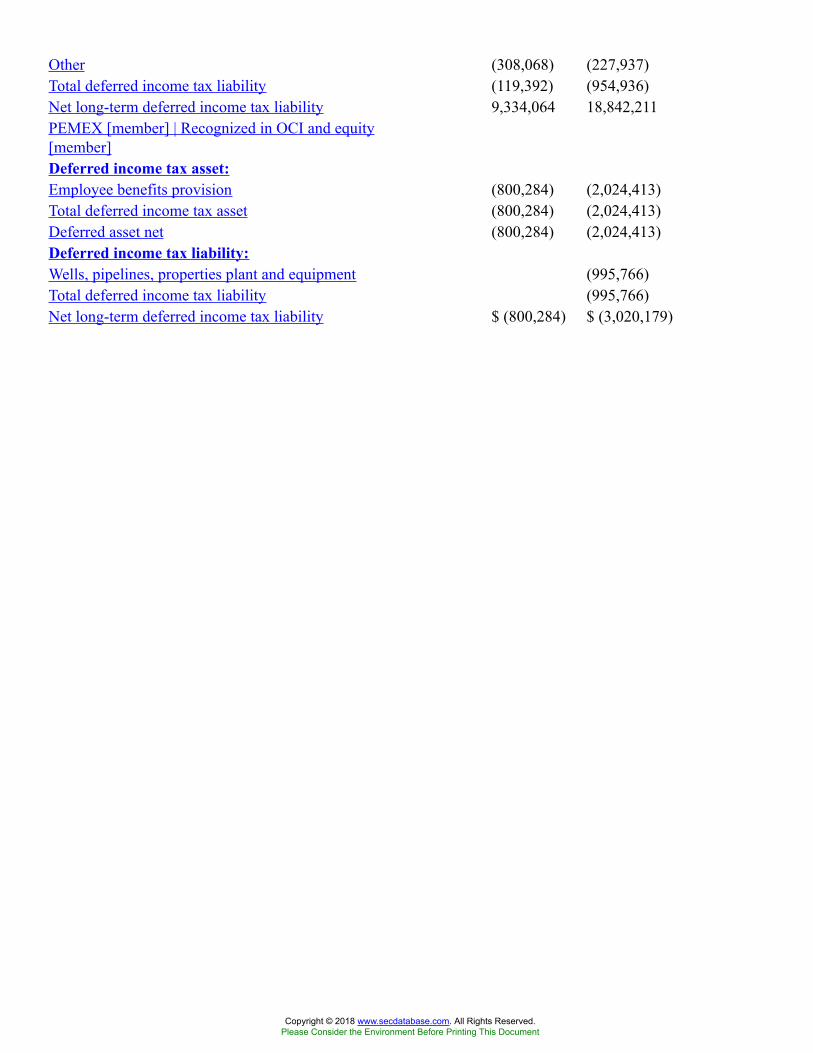
Other (308,068) (227,937)Total deferred income tax liability (119,392) (954,936)Net long-term deferred income tax liability 9,334,064 18,842,211PEMEX [member] | Recognized in OCI and equity[member]Deferred income tax asset:Employee benefits provision (800,284) (2,024,413)Total deferred income tax asset (800,284) (2,024,413)Deferred asset net (800,284) (2,024,413)Deferred income tax liability:Wells, pipelines, properties plant and equipment (995,766)Total deferred income tax liability (995,766)Net long-term deferred income tax liability $ (800,284) $ (3,020,179)
Copyright © 2018 www.secdatabase.com. All Rights Reserved.Please Consider the Environment Before Printing This Document
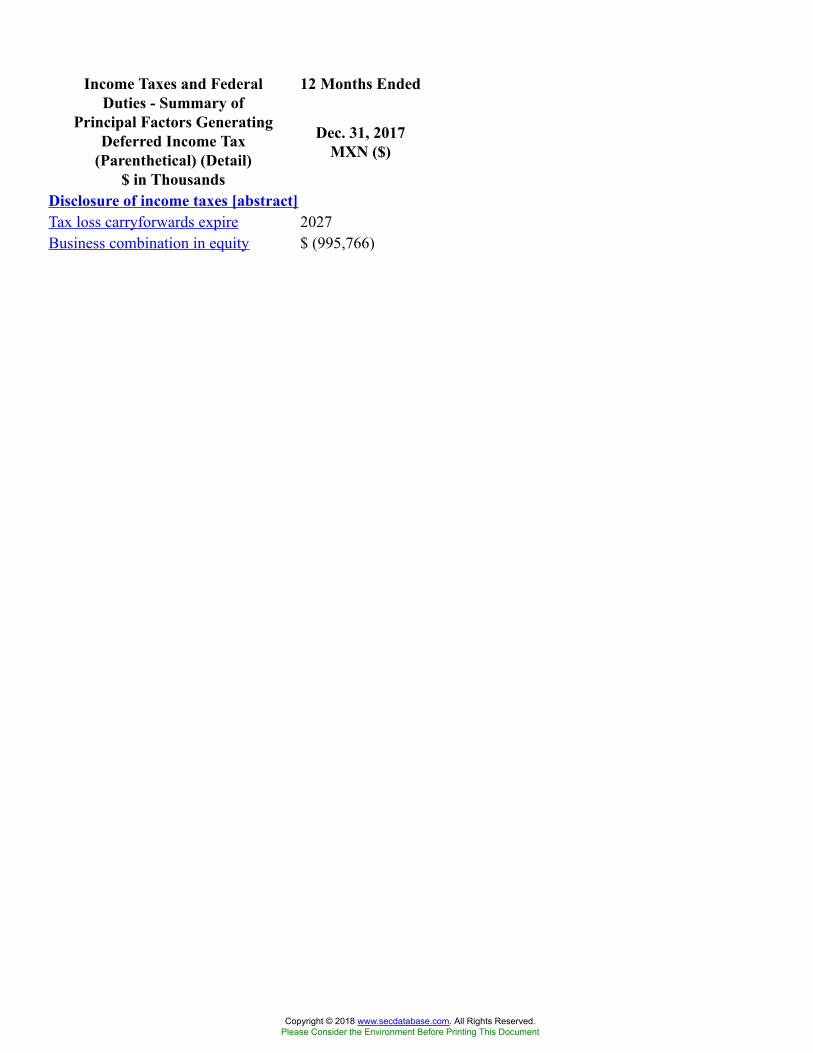
12 Months EndedIncome Taxes and FederalDuties - Summary of
Principal Factors GeneratingDeferred Income Tax
(Parenthetical) (Detail)$ in Thousands
Dec. 31, 2017MXN ($)
Disclosure of income taxes [abstract]Tax loss carryforwards expire 2027Business combination in equity $ (995,766)
Copyright © 2018 www.secdatabase.com. All Rights Reserved.Please Consider the Environment Before Printing This Document
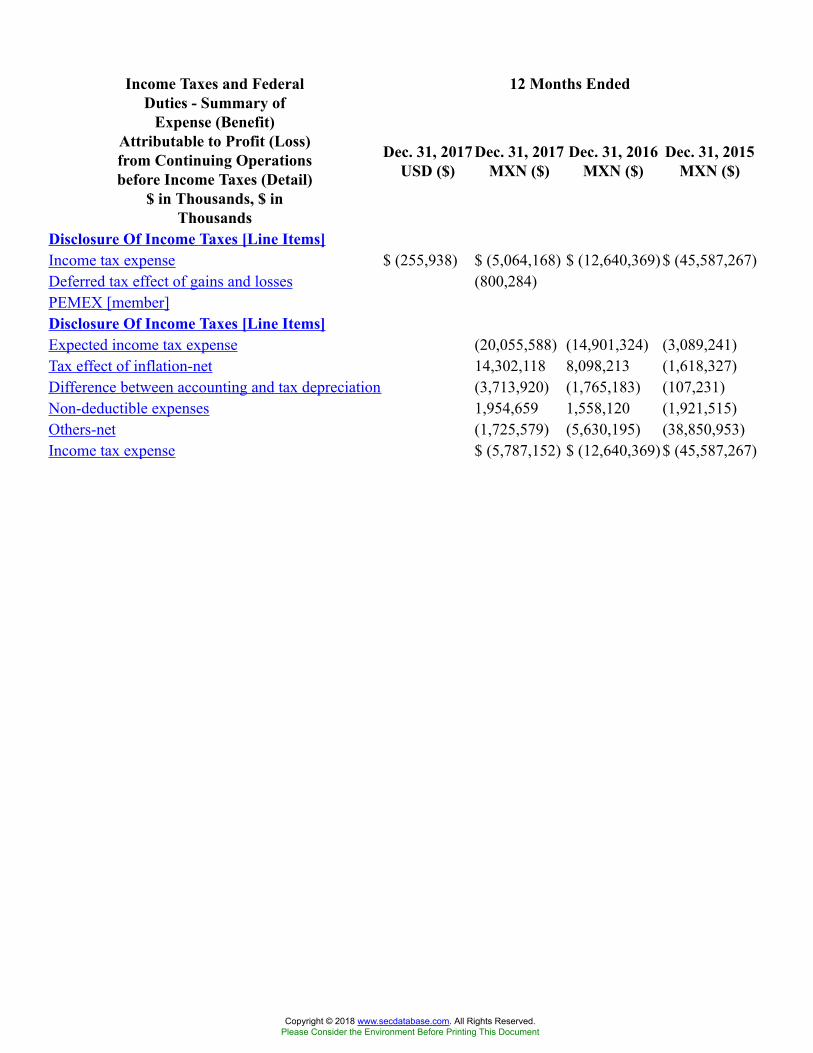
12 Months EndedIncome Taxes and FederalDuties - Summary of
Expense (Benefit)Attributable to Profit (Loss)from Continuing Operationsbefore Income Taxes (Detail)
$ in Thousands, $ inThousands
Dec. 31, 2017USD ($)
Dec. 31, 2017MXN ($)
Dec. 31, 2016MXN ($)
Dec. 31, 2015MXN ($)
Disclosure Of Income Taxes [Line Items]Income tax expense $ (255,938) $ (5,064,168) $ (12,640,369) $ (45,587,267)Deferred tax effect of gains and losses (800,284)PEMEX [member]Disclosure Of Income Taxes [Line Items]Expected income tax expense (20,055,588) (14,901,324) (3,089,241)Tax effect of inflation-net 14,302,118 8,098,213 (1,618,327)Difference between accounting and tax depreciation (3,713,920) (1,765,183) (107,231)Non-deductible expenses 1,954,659 1,558,120 (1,921,515)Others-net (1,725,579) (5,630,195) (38,850,953)Income tax expense $ (5,787,152) $ (12,640,369) $ (45,587,267)
Copyright © 2018 www.secdatabase.com. All Rights Reserved.Please Consider the Environment Before Printing This Document
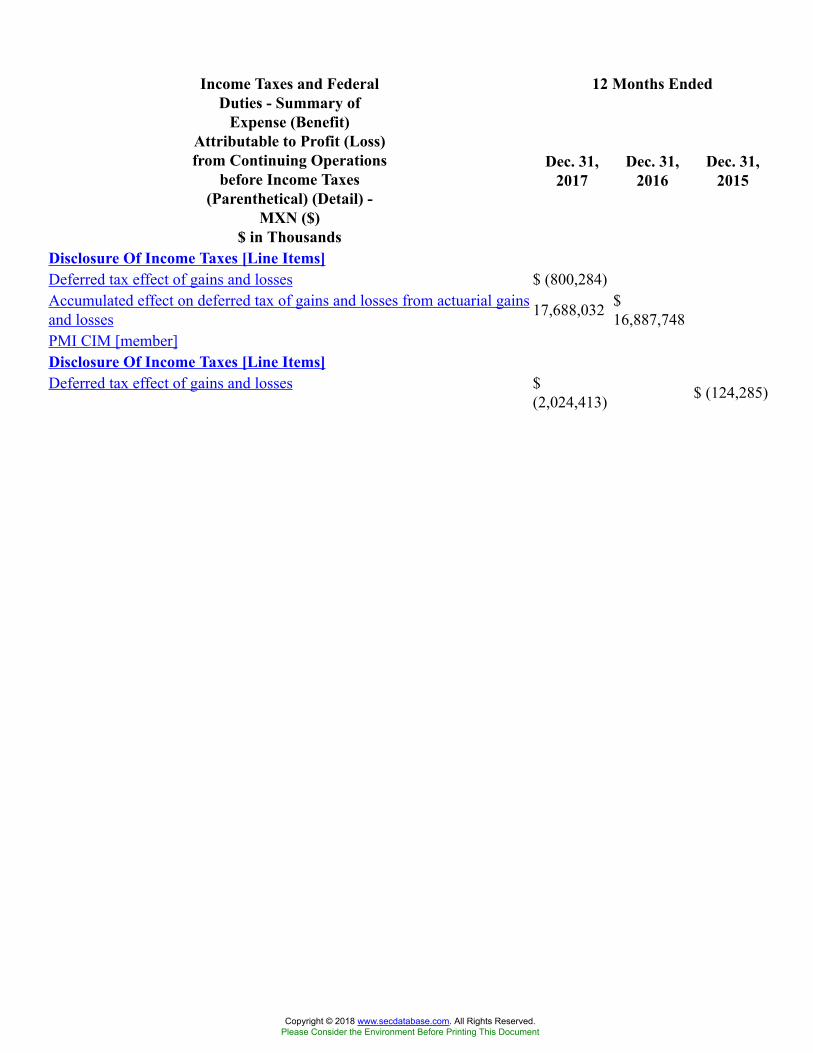
12 Months EndedIncome Taxes and FederalDuties - Summary of
Expense (Benefit)Attributable to Profit (Loss)from Continuing Operations
before Income Taxes(Parenthetical) (Detail) -
MXN ($)$ in Thousands
Dec. 31,2017
Dec. 31,2016
Dec. 31,2015
Disclosure Of Income Taxes [Line Items]Deferred tax effect of gains and losses $ (800,284)Accumulated effect on deferred tax of gains and losses from actuarial gainsand losses 17,688,032 $
16,887,748PMI CIM [member]Disclosure Of Income Taxes [Line Items]Deferred tax effect of gains and losses $
(2,024,413) $ (124,285)
Copyright © 2018 www.secdatabase.com. All Rights Reserved.Please Consider the Environment Before Printing This Document
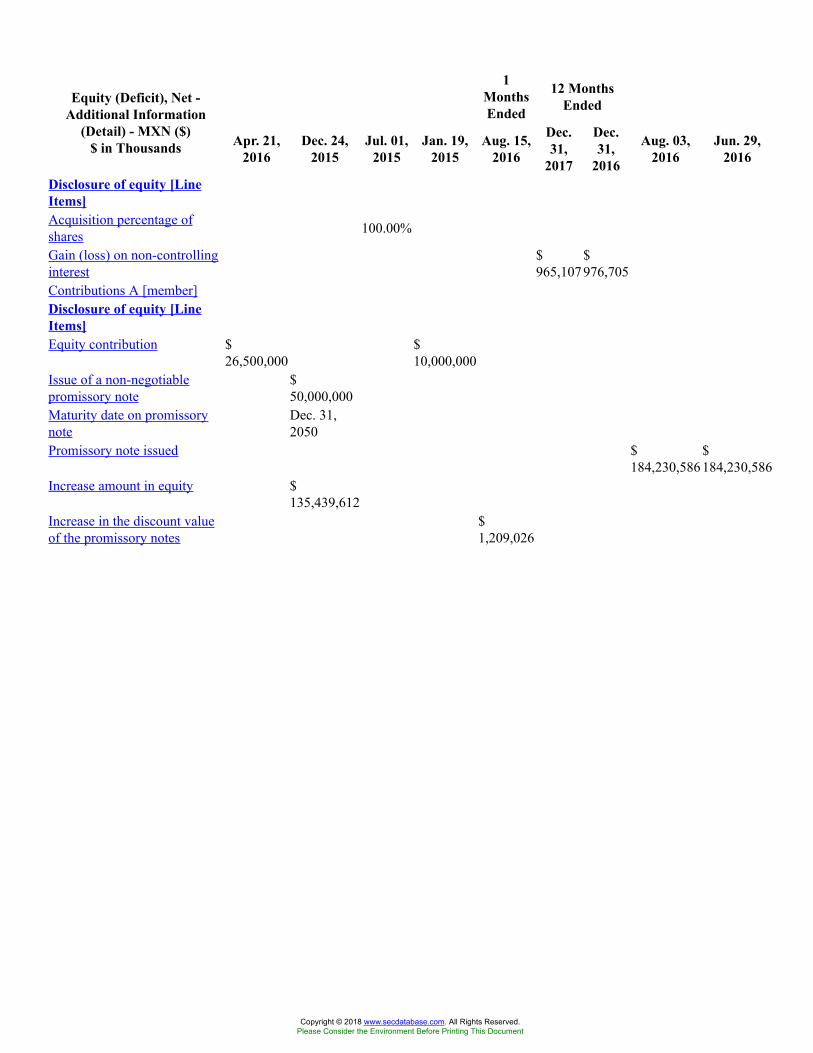
1MonthsEnded
12 MonthsEndedEquity (Deficit), Net -
Additional Information(Detail) - MXN ($)
$ in Thousands Apr. 21,2016
Dec. 24,2015
Jul. 01,2015
Jan. 19,2015
Aug. 15,2016
Dec.31,
2017
Dec.31,
2016
Aug. 03,2016
Jun. 29,2016
Disclosure of equity [LineItems]Acquisition percentage ofshares 100.00%
Gain (loss) on non-controllinginterest
$965,107
$976,705
Contributions A [member]Disclosure of equity [LineItems]Equity contribution $
26,500,000$10,000,000
Issue of a non-negotiablepromissory note
$50,000,000
Maturity date on promissorynote
Dec. 31,2050
Promissory note issued $184,230,586
$184,230,586
Increase amount in equity $135,439,612
Increase in the discount valueof the promissory notes
$1,209,026
Copyright © 2018 www.secdatabase.com. All Rights Reserved.Please Consider the Environment Before Printing This Document
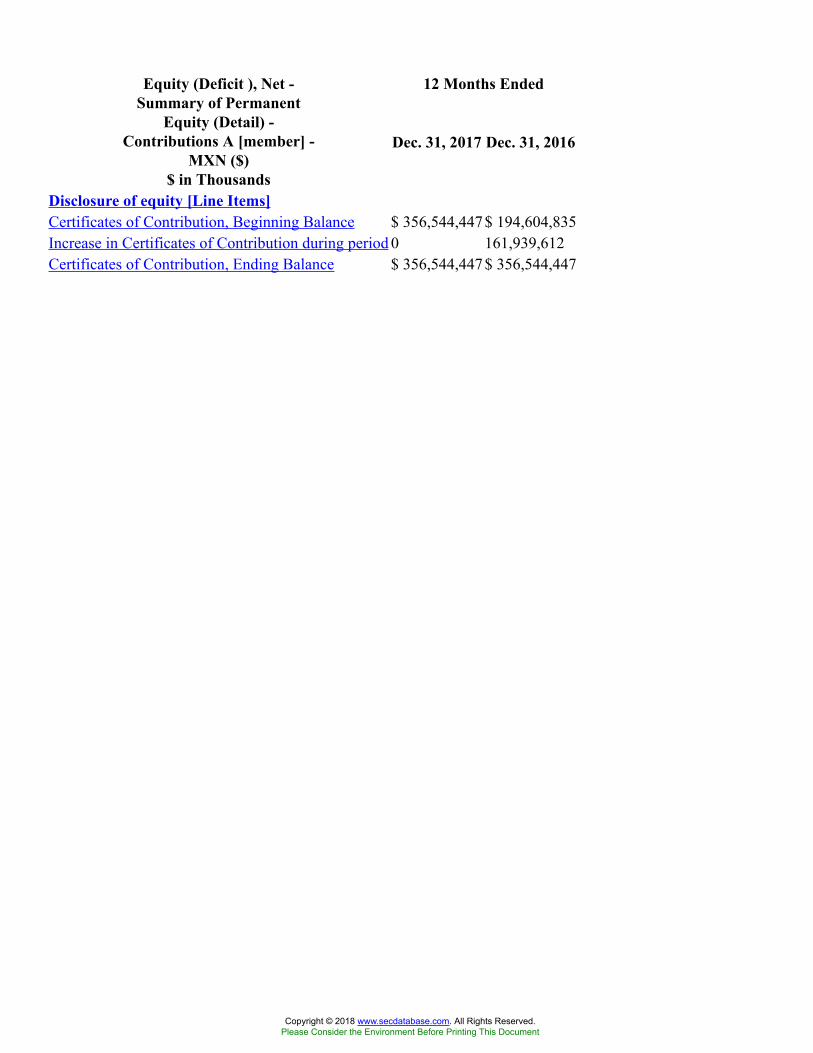
12 Months EndedEquity (Deficit ), Net -Summary of Permanent
Equity (Detail) -Contributions A [member] -
MXN ($)$ in Thousands
Dec. 31, 2017 Dec. 31, 2016
Disclosure of equity [Line Items]Certificates of Contribution, Beginning Balance $ 356,544,447$ 194,604,835Increase in Certificates of Contribution during period 0 161,939,612Certificates of Contribution, Ending Balance $ 356,544,447$ 356,544,447
Copyright © 2018 www.secdatabase.com. All Rights Reserved.Please Consider the Environment Before Printing This Document

12 Months EndedOther Revenues andExpenses - Net - Summary of
Other Revenues andExpenses, net (Detail) - MXN
($)$ in Thousands
Nov. 16, 2016Dec. 31, 2017 Dec. 31, 2016 Dec. 31, 2015
Revenues:Claims recovery $ 16,386,250 $ 3,695,217 $ 1,975,281Fiscal support (Profit-sharing duty) $ 28,439,379 28,439,379Other income for services 4,720,546 4,266,854 3,953,888Price of sale share 3,139,103 22,684,736Other 4,277,207 14,228,801 6,992,954Revenues from reinsurance premiums 1,986,568 3,694,026 1,497,779Franchise fees 917,934 1,059,333 1,148,528Bidding terms, sanctions, penalties and other 825,956 3,223,437 1,262,458Gain on sale of fixed assets 2,687,652Assets value transferred to CENAGAS 7,450,931Negative IEPS 2,519,126Total other revenues 32,253,564 91,430,366 19,350,014Expenses:Loss in the Assets value transferred to CENAGAS (35,333,411)Disposal of assets (8,447,031) (2,140,943) (3,364,063)Transportation and distribution of natural gas (6,652,878) (8,830,967) (369,317)Other (7,927,150) (3,581,036) (726,589)Claims (3,640,036) (4,757,116) (12,527,548)Loss in the sale of associates (412,393) (7,473,698)Impairment of goodwill (4,007,018)Services provided (2,656,571) (3,237,984)Total other expenses (27,079,488) (68,780,760) (20,225,501)Other revenues and expenses-net $ 5,174,076 $ 22,649,606 $ (875,487)
Copyright © 2018 www.secdatabase.com. All Rights Reserved.Please Consider the Environment Before Printing This Document
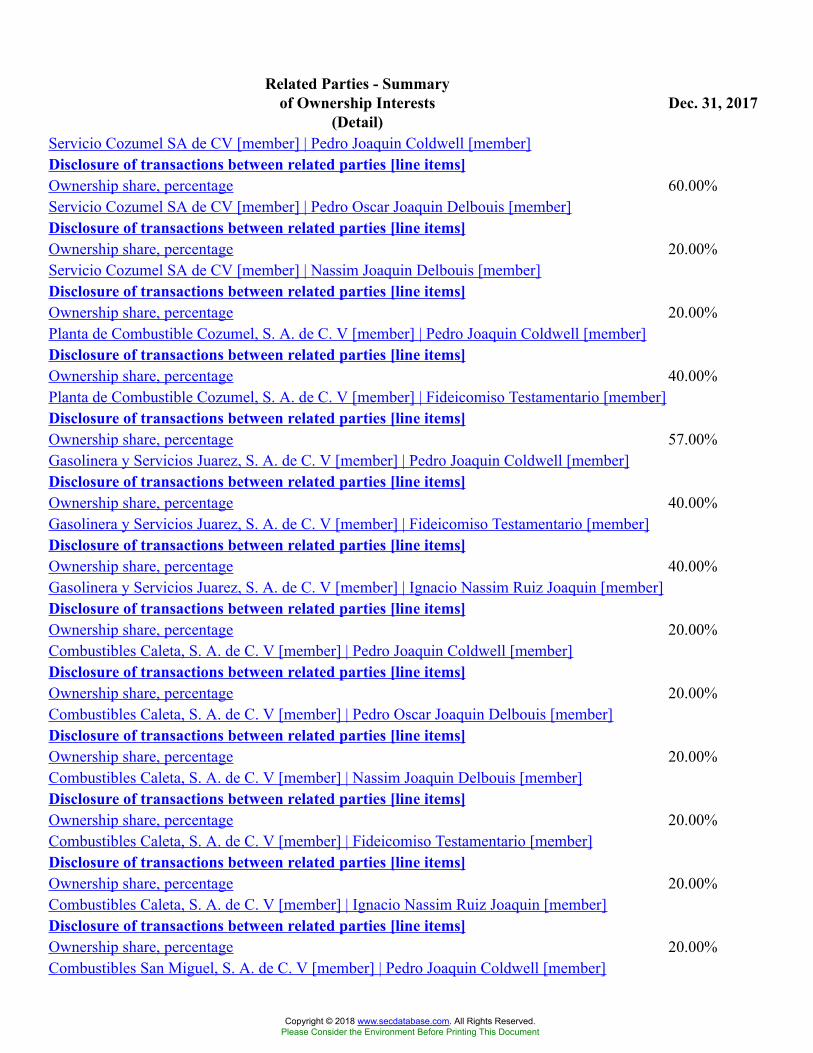
Related Parties - Summaryof Ownership Interests
(Detail)Dec. 31, 2017
Servicio Cozumel SA de CV [member] | Pedro Joaquin Coldwell [member]Disclosure of transactions between related parties [line items]Ownership share, percentage 60.00%Servicio Cozumel SA de CV [member] | Pedro Oscar Joaquin Delbouis [member]Disclosure of transactions between related parties [line items]Ownership share, percentage 20.00%Servicio Cozumel SA de CV [member] | Nassim Joaquin Delbouis [member]Disclosure of transactions between related parties [line items]Ownership share, percentage 20.00%Planta de Combustible Cozumel, S. A. de C. V [member] | Pedro Joaquin Coldwell [member]Disclosure of transactions between related parties [line items]Ownership share, percentage 40.00%Planta de Combustible Cozumel, S. A. de C. V [member] | Fideicomiso Testamentario [member]Disclosure of transactions between related parties [line items]Ownership share, percentage 57.00%Gasolinera y Servicios Juarez, S. A. de C. V [member] | Pedro Joaquin Coldwell [member]Disclosure of transactions between related parties [line items]Ownership share, percentage 40.00%Gasolinera y Servicios Juarez, S. A. de C. V [member] | Fideicomiso Testamentario [member]Disclosure of transactions between related parties [line items]Ownership share, percentage 40.00%Gasolinera y Servicios Juarez, S. A. de C. V [member] | Ignacio Nassim Ruiz Joaquin [member]Disclosure of transactions between related parties [line items]Ownership share, percentage 20.00%Combustibles Caleta, S. A. de C. V [member] | Pedro Joaquin Coldwell [member]Disclosure of transactions between related parties [line items]Ownership share, percentage 20.00%Combustibles Caleta, S. A. de C. V [member] | Pedro Oscar Joaquin Delbouis [member]Disclosure of transactions between related parties [line items]Ownership share, percentage 20.00%Combustibles Caleta, S. A. de C. V [member] | Nassim Joaquin Delbouis [member]Disclosure of transactions between related parties [line items]Ownership share, percentage 20.00%Combustibles Caleta, S. A. de C. V [member] | Fideicomiso Testamentario [member]Disclosure of transactions between related parties [line items]Ownership share, percentage 20.00%Combustibles Caleta, S. A. de C. V [member] | Ignacio Nassim Ruiz Joaquin [member]Disclosure of transactions between related parties [line items]Ownership share, percentage 20.00%Combustibles San Miguel, S. A. de C. V [member] | Pedro Joaquin Coldwell [member]
Copyright © 2018 www.secdatabase.com. All Rights Reserved.Please Consider the Environment Before Printing This Document
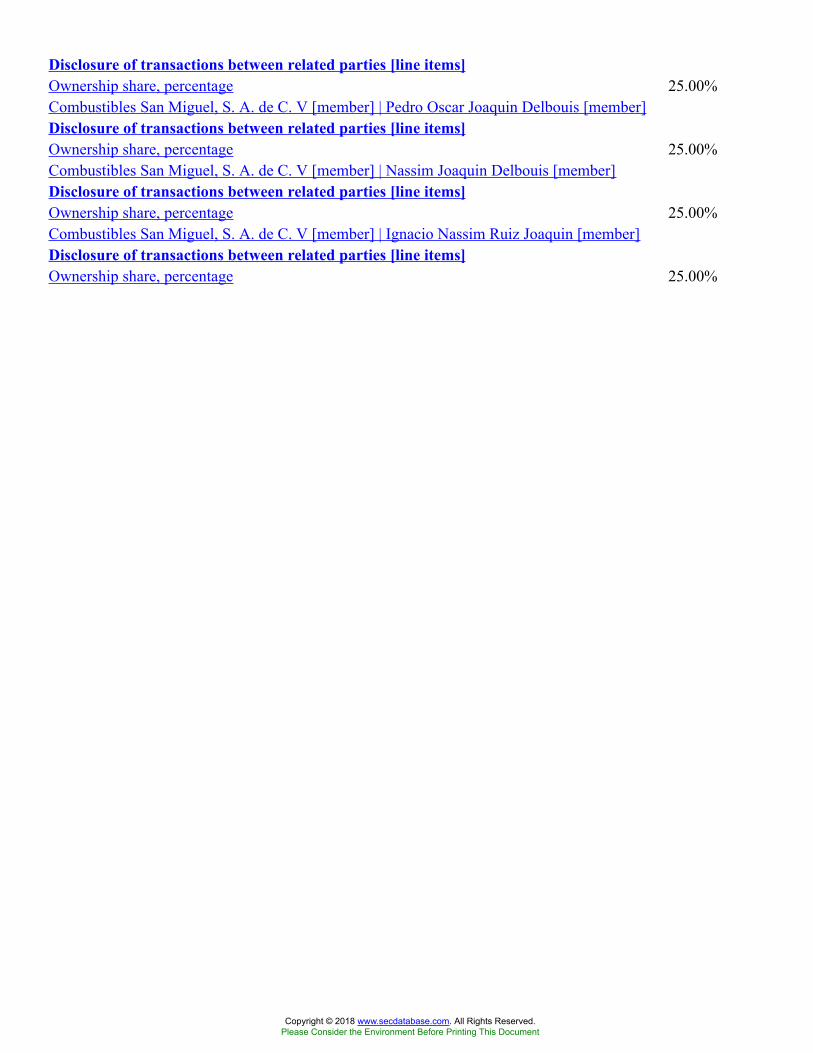
Disclosure of transactions between related parties [line items]Ownership share, percentage 25.00%Combustibles San Miguel, S. A. de C. V [member] | Pedro Oscar Joaquin Delbouis [member]Disclosure of transactions between related parties [line items]Ownership share, percentage 25.00%Combustibles San Miguel, S. A. de C. V [member] | Nassim Joaquin Delbouis [member]Disclosure of transactions between related parties [line items]Ownership share, percentage 25.00%Combustibles San Miguel, S. A. de C. V [member] | Ignacio Nassim Ruiz Joaquin [member]Disclosure of transactions between related parties [line items]Ownership share, percentage 25.00%
Copyright © 2018 www.secdatabase.com. All Rights Reserved.Please Consider the Environment Before Printing This Document

1 MonthsEndedRelated Parties - Summary
of Ownership Interests(Parenthetical) (Detail) Jun. 30,
2016Jun. 30,
2016Dec. 31,
2017Planta de Combustible Cozumel, S. A. de C. V [member] | Pedro JoaquinColdwell [member]Disclosure of transactions between related parties [line items]Ownership share, percentage 40.00%Planta de Combustible Cozumel, S. A. de C. V [member] | Pedro OscarJoaquin Delbouis [member]Disclosure of transactions between related parties [line items]Percentage of voting rights exercised 50.00%Planta de Combustible Cozumel, S. A. de C. V [member] | Nassim JoaquinDelbouis [member]Disclosure of transactions between related parties [line items]Percentage of voting rights exercised 50.00%Planta de Combustible Cozumel, S. A. de C. V [member] | Fausto NassimJoaquinIbarra [member]Disclosure of transactions between related parties [line items]Ownership share, percentage 60.00% 60.00%Percentage of shares become property of an investment 57.00%Gasolinera y Servicios Juarez, S. A. de C. V [member] | Pedro JoaquinColdwell [member]Disclosure of transactions between related parties [line items]Ownership share, percentage 40.00%Percentage of voting rights exercised 100.00%Gasolinera y Servicios Juarez, S. A. de C. V [member] | Fausto NassimJoaquinIbarra [member]Disclosure of transactions between related parties [line items]Ownership share, percentage 40.00% 40.00%Combustibles Caleta, S. A. de C. V [member] | Pedro Joaquin Coldwell[member]Disclosure of transactions between related parties [line items]Ownership share, percentage 20.00%Combustibles Caleta, S. A. de C. V [member] | Pedro Oscar JoaquinDelbouis [member]Disclosure of transactions between related parties [line items]Ownership share, percentage 20.00%Percentage of voting rights exercised 50.00%Combustibles Caleta, S. A. de C. V [member] | Nassim Joaquin Delbouis[member]Disclosure of transactions between related parties [line items]Ownership share, percentage 20.00%Percentage of voting rights exercised 50.00%
Copyright © 2018 www.secdatabase.com. All Rights Reserved.Please Consider the Environment Before Printing This Document
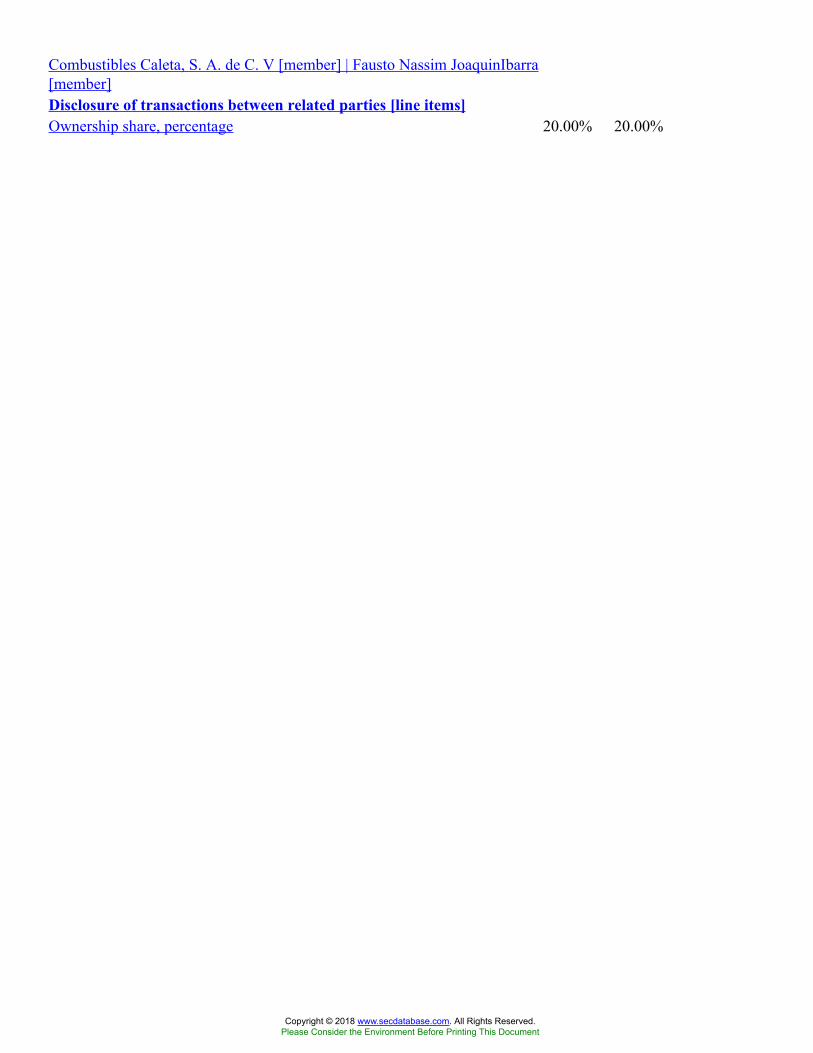
Combustibles Caleta, S. A. de C. V [member] | Fausto Nassim JoaquinIbarra[member]Disclosure of transactions between related parties [line items]Ownership share, percentage 20.00% 20.00%
Copyright © 2018 www.secdatabase.com. All Rights Reserved.Please Consider the Environment Before Printing This Document
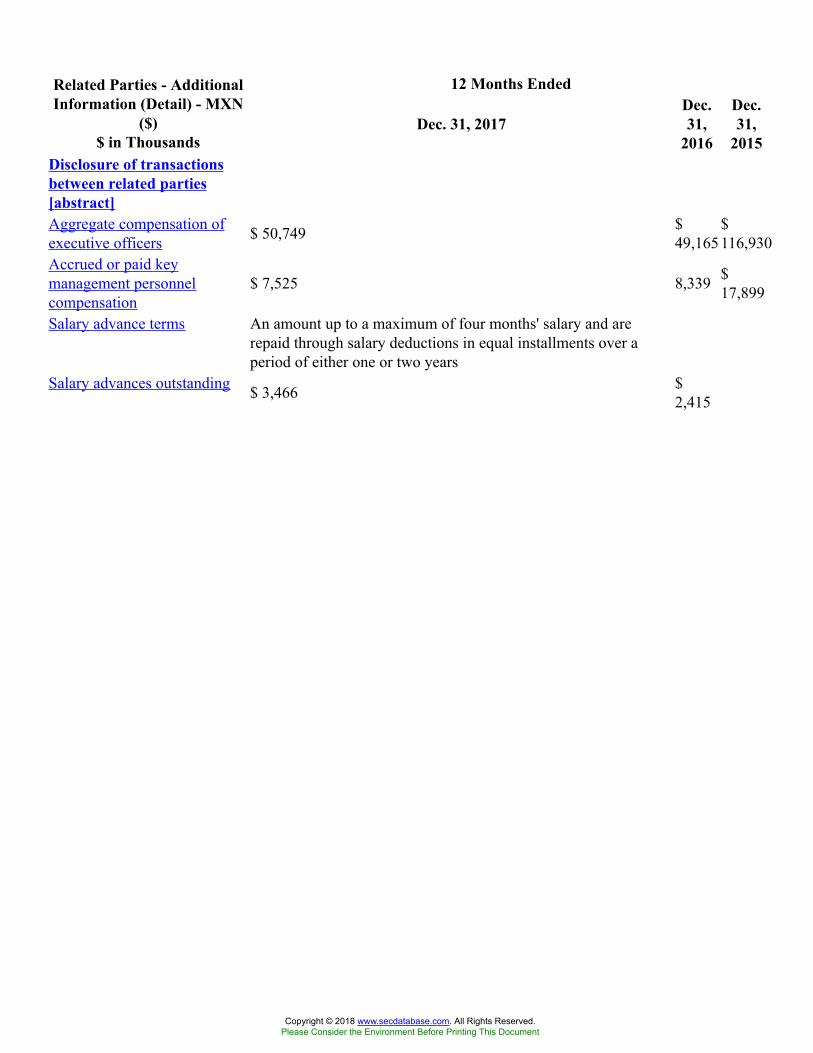
12 Months EndedRelated Parties - AdditionalInformation (Detail) - MXN
($)$ in Thousands
Dec. 31, 2017Dec.31,
2016
Dec.31,
2015Disclosure of transactionsbetween related parties[abstract]Aggregate compensation ofexecutive officers $ 50,749 $
49,165$116,930
Accrued or paid keymanagement personnelcompensation
$ 7,525 8,339 $17,899
Salary advance terms An amount up to a maximum of four months' salary and arerepaid through salary deductions in equal installments over aperiod of either one or two years
Salary advances outstanding $ 3,466 $2,415
Copyright © 2018 www.secdatabase.com. All Rights Reserved.Please Consider the Environment Before Printing This Document

12 Months EndedCommitments - Additionalinformation (Detail)$ in Thousands, $ in
Thousands
Dec. 31, 2017USD ($)
Dec. 31, 2017MXN ($)
Dec. 31, 2016MXN ($)
Dec. 31, 2015MXN ($)
Disclosure of commitments [Line Items]Nitrogen to be supplied $ 7,506,619 $ 8,646,726Contract term 25 years 25 yearsContract payments $ 591,011 $ 11,694,162 15,664,703 $ (51,135,948)Outstanding contracts payments 0Northern Region [member]Disclosure of commitments [Line Items]Contract payments 6,594,486 7,026,822Southern Region [member]Disclosure of commitments [Line Items]Contract payments $ 727,331 $ 524,475
Copyright © 2018 www.secdatabase.com. All Rights Reserved.Please Consider the Environment Before Printing This Document
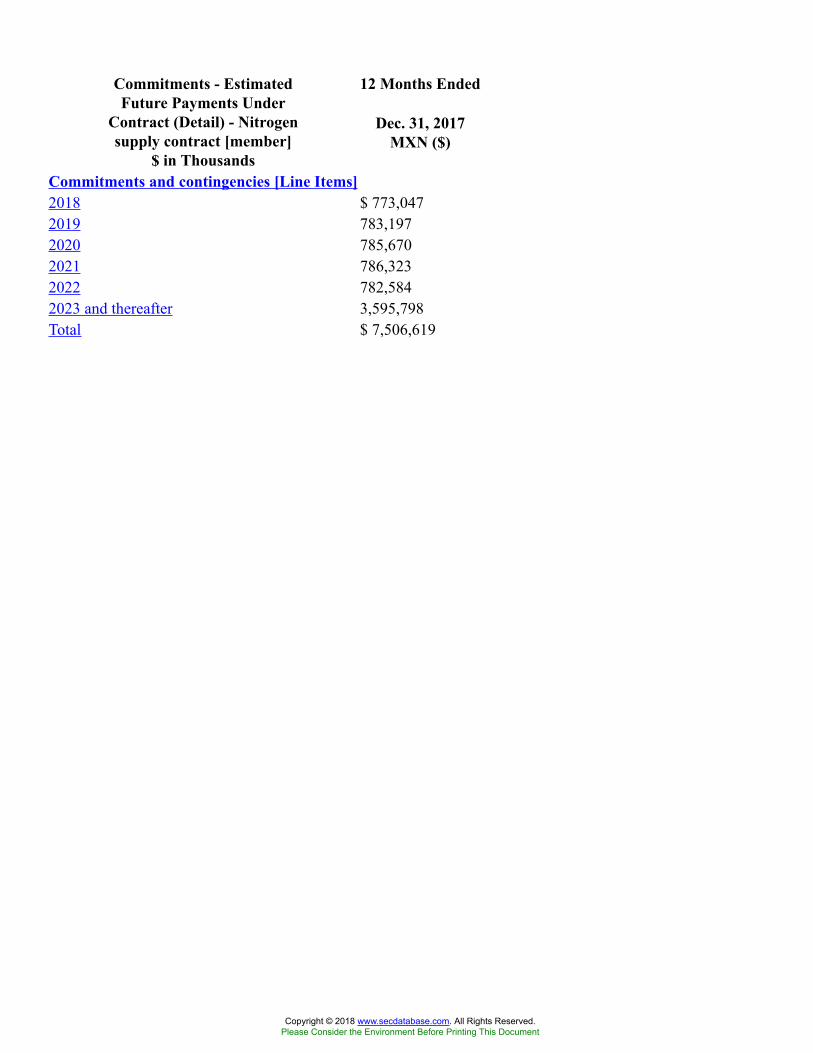
12 Months EndedCommitments - EstimatedFuture Payments Under
Contract (Detail) - Nitrogensupply contract [member]
$ in Thousands
Dec. 31, 2017MXN ($)
Commitments and contingencies [Line Items]2018 $ 773,0472019 783,1972020 785,6702021 786,3232022 782,5842023 and thereafter 3,595,798Total $ 7,506,619
Copyright © 2018 www.secdatabase.com. All Rights Reserved.Please Consider the Environment Before Printing This Document
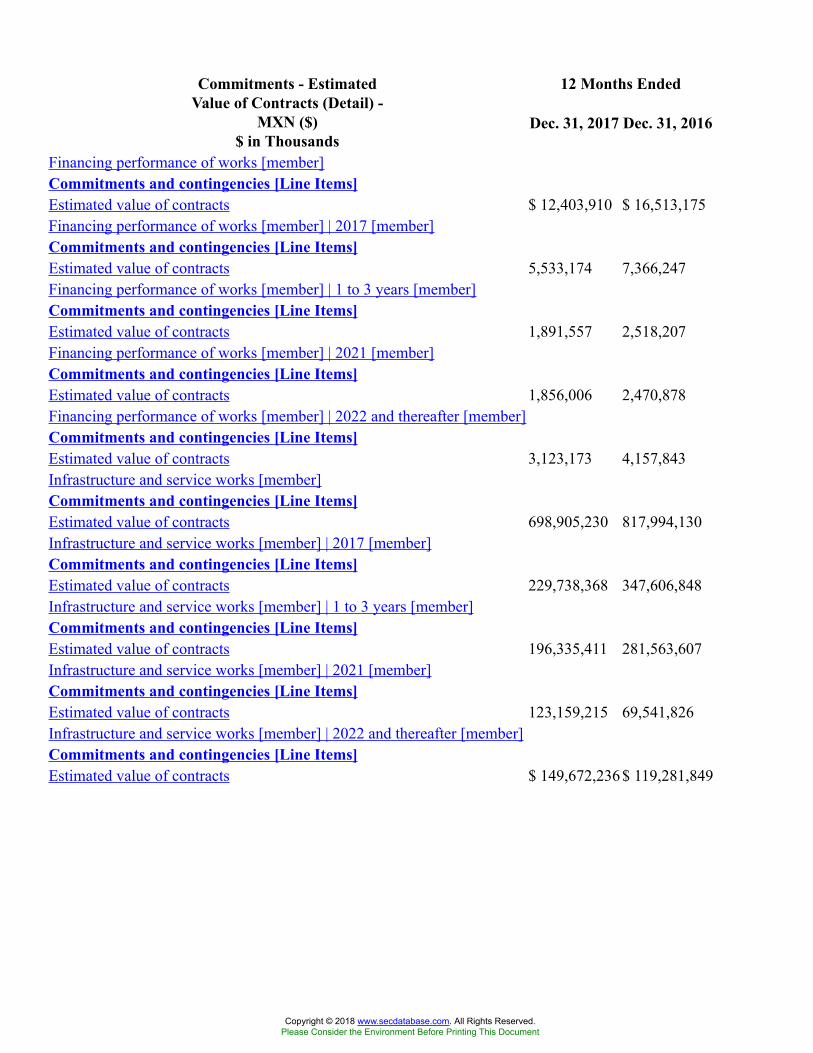
12 Months EndedCommitments - EstimatedValue of Contracts (Detail) -
MXN ($)$ in Thousands
Dec. 31, 2017 Dec. 31, 2016
Financing performance of works [member]Commitments and contingencies [Line Items]Estimated value of contracts $ 12,403,910 $ 16,513,175Financing performance of works [member] | 2017 [member]Commitments and contingencies [Line Items]Estimated value of contracts 5,533,174 7,366,247Financing performance of works [member] | 1 to 3 years [member]Commitments and contingencies [Line Items]Estimated value of contracts 1,891,557 2,518,207Financing performance of works [member] | 2021 [member]Commitments and contingencies [Line Items]Estimated value of contracts 1,856,006 2,470,878Financing performance of works [member] | 2022 and thereafter [member]Commitments and contingencies [Line Items]Estimated value of contracts 3,123,173 4,157,843Infrastructure and service works [member]Commitments and contingencies [Line Items]Estimated value of contracts 698,905,230 817,994,130Infrastructure and service works [member] | 2017 [member]Commitments and contingencies [Line Items]Estimated value of contracts 229,738,368 347,606,848Infrastructure and service works [member] | 1 to 3 years [member]Commitments and contingencies [Line Items]Estimated value of contracts 196,335,411 281,563,607Infrastructure and service works [member] | 2021 [member]Commitments and contingencies [Line Items]Estimated value of contracts 123,159,215 69,541,826Infrastructure and service works [member] | 2022 and thereafter [member]Commitments and contingencies [Line Items]Estimated value of contracts $ 149,672,236$ 119,281,849
Copyright © 2018 www.secdatabase.com. All Rights Reserved.Please Consider the Environment Before Printing This Document
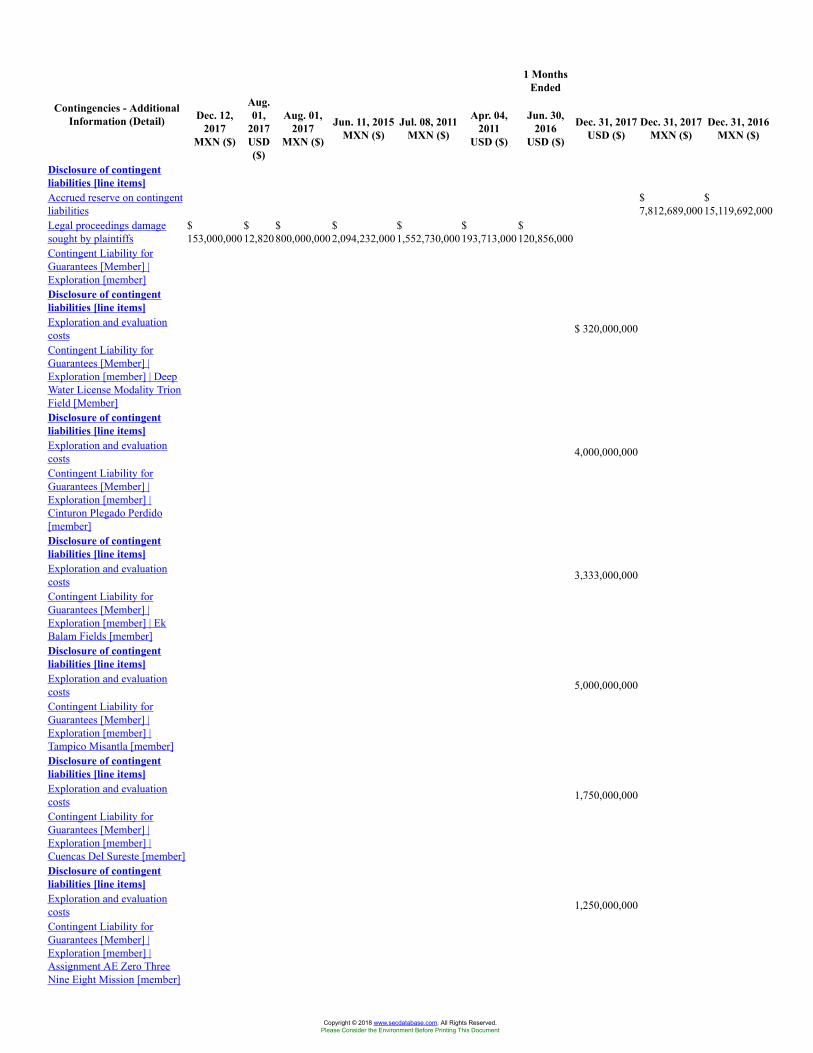
1 MonthsEnded
Contingencies - AdditionalInformation (Detail) Dec. 12,
2017MXN ($)
Aug.01,
2017USD($)
Aug. 01,2017
MXN ($)
Jun. 11, 2015MXN ($)
Jul. 08, 2011MXN ($)
Apr. 04,2011
USD ($)
Jun. 30,2016
USD ($)
Dec. 31, 2017USD ($)
Dec. 31, 2017MXN ($)
Dec. 31, 2016MXN ($)
Disclosure of contingentliabilities [line items]Accrued reserve on contingentliabilities
$7,812,689,000
$15,119,692,000
Legal proceedings damagesought by plaintiffs
$153,000,000
$12,820
$800,000,000
$2,094,232,000
$1,552,730,000
$193,713,000
$120,856,000
Contingent Liability forGuarantees [Member] |Exploration [member]Disclosure of contingentliabilities [line items]Exploration and evaluationcosts $ 320,000,000
Contingent Liability forGuarantees [Member] |Exploration [member] | DeepWater License Modality TrionField [Member]Disclosure of contingentliabilities [line items]Exploration and evaluationcosts 4,000,000,000
Contingent Liability forGuarantees [Member] |Exploration [member] |Cinturon Plegado Perdido[member]Disclosure of contingentliabilities [line items]Exploration and evaluationcosts 3,333,000,000
Contingent Liability forGuarantees [Member] |Exploration [member] | EkBalam Fields [member]Disclosure of contingentliabilities [line items]Exploration and evaluationcosts 5,000,000,000
Contingent Liability forGuarantees [Member] |Exploration [member] |Tampico Misantla [member]Disclosure of contingentliabilities [line items]Exploration and evaluationcosts 1,750,000,000
Contingent Liability forGuarantees [Member] |Exploration [member] |Cuencas Del Sureste [member]Disclosure of contingentliabilities [line items]Exploration and evaluationcosts 1,250,000,000
Contingent Liability forGuarantees [Member] |Exploration [member] |Assignment AE Zero ThreeNine Eight Mission [member]
Copyright © 2018 www.secdatabase.com. All Rights Reserved.Please Consider the Environment Before Printing This Document
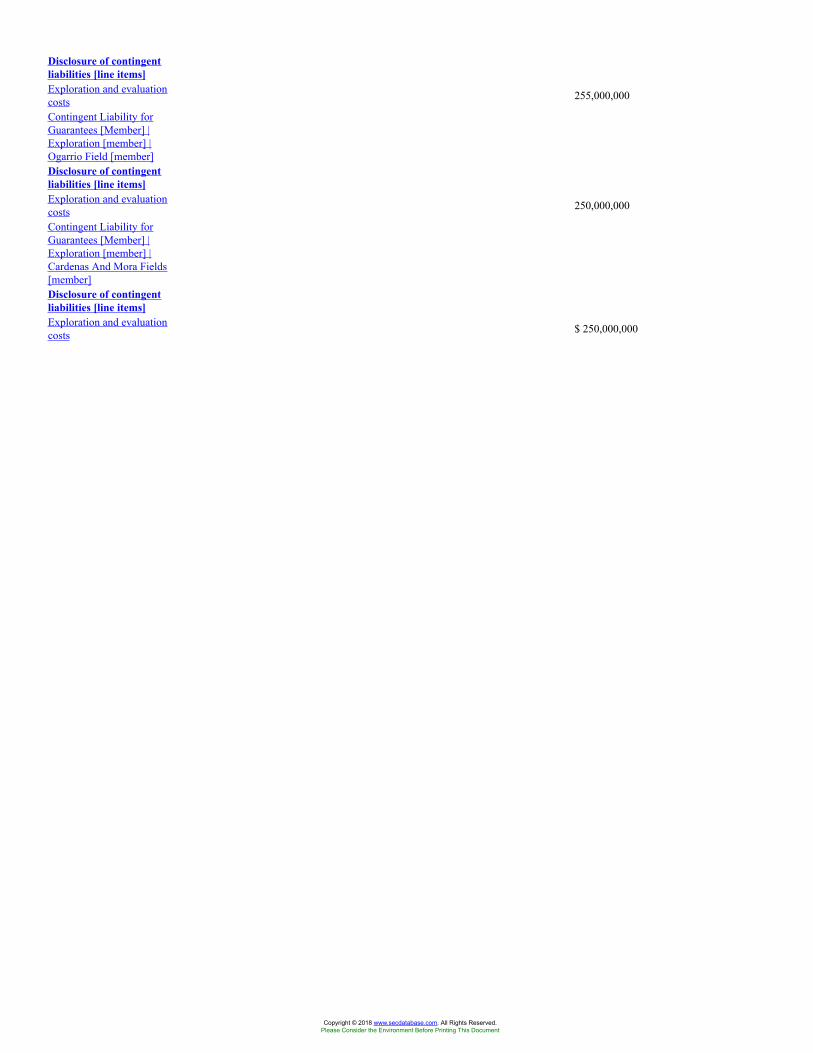
Disclosure of contingentliabilities [line items]Exploration and evaluationcosts 255,000,000
Contingent Liability forGuarantees [Member] |Exploration [member] |Ogarrio Field [member]Disclosure of contingentliabilities [line items]Exploration and evaluationcosts 250,000,000
Contingent Liability forGuarantees [Member] |Exploration [member] |Cardenas And Mora Fields[member]Disclosure of contingentliabilities [line items]Exploration and evaluationcosts $ 250,000,000
Copyright © 2018 www.secdatabase.com. All Rights Reserved.Please Consider the Environment Before Printing This Document
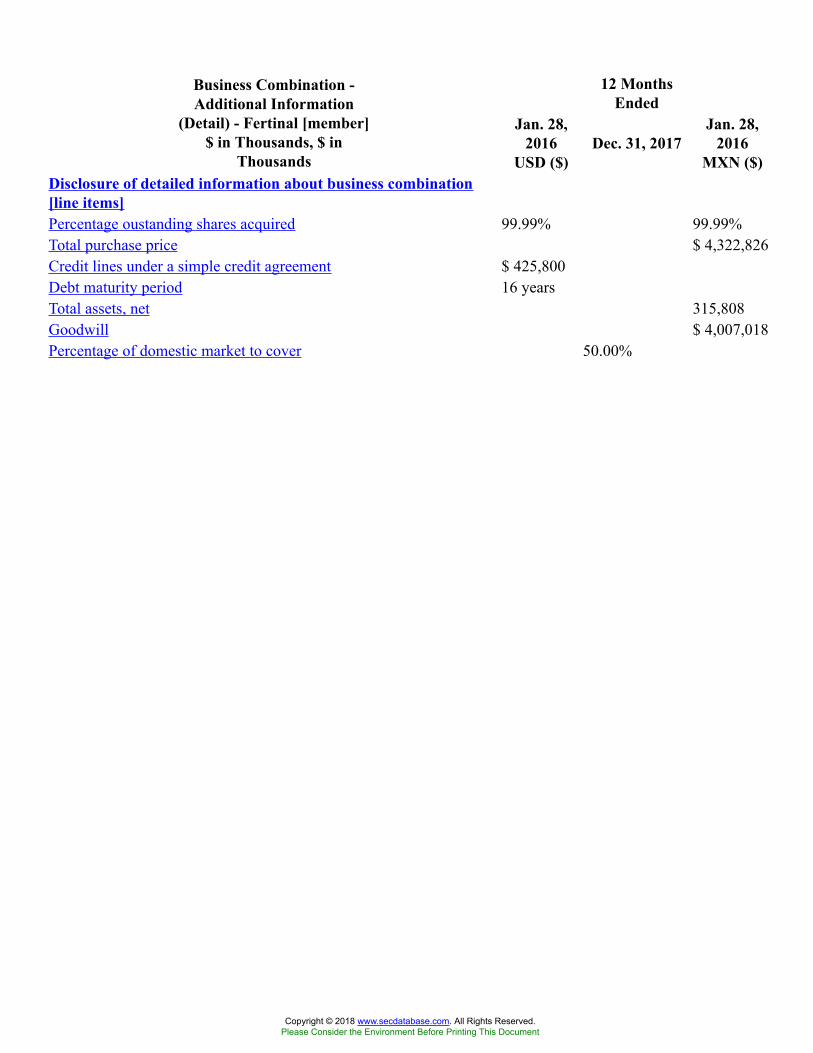
12 MonthsEnded
Business Combination -Additional Information
(Detail) - Fertinal [member]$ in Thousands, $ in
Thousands
Jan. 28,2016
USD ($)Dec. 31, 2017
Jan. 28,2016
MXN ($)Disclosure of detailed information about business combination[line items]Percentage oustanding shares acquired 99.99% 99.99%Total purchase price $ 4,322,826Credit lines under a simple credit agreement $ 425,800Debt maturity period 16 yearsTotal assets, net 315,808Goodwill $ 4,007,018Percentage of domestic market to cover 50.00%
Copyright © 2018 www.secdatabase.com. All Rights Reserved.Please Consider the Environment Before Printing This Document
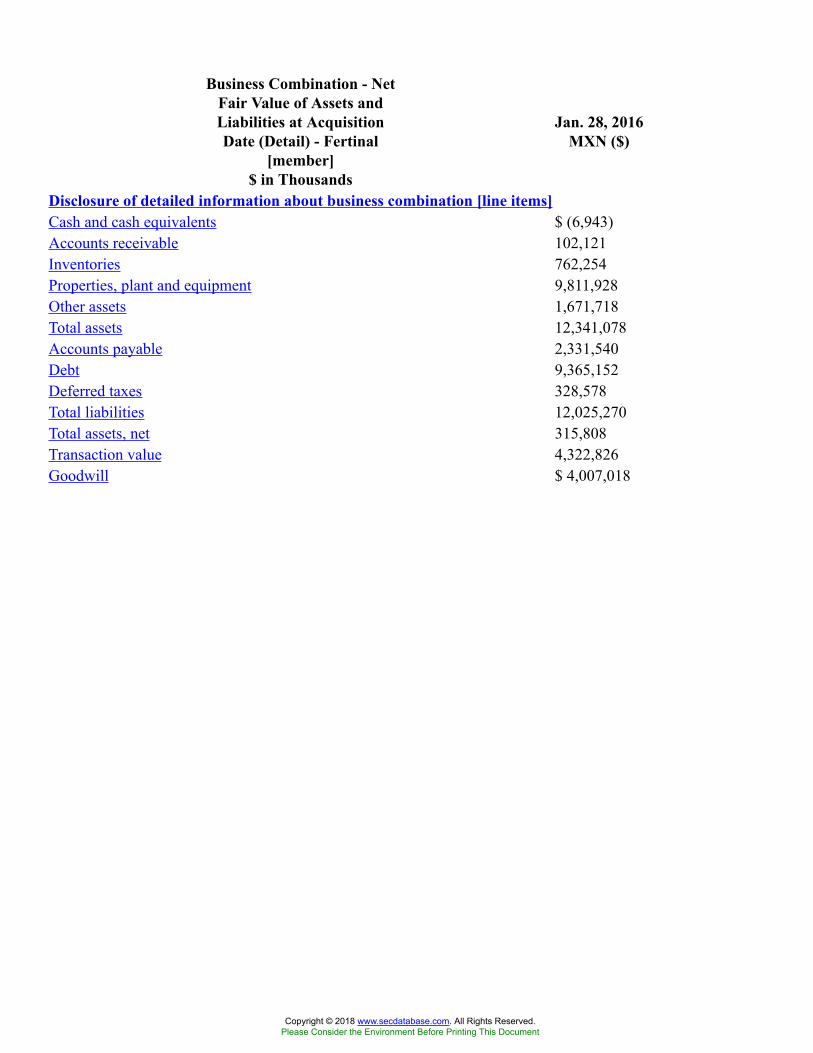
Business Combination - NetFair Value of Assets andLiabilities at AcquisitionDate (Detail) - Fertinal
[member]$ in Thousands
Jan. 28, 2016MXN ($)
Disclosure of detailed information about business combination [line items]Cash and cash equivalents $ (6,943)Accounts receivable 102,121Inventories 762,254Properties, plant and equipment 9,811,928Other assets 1,671,718Total assets 12,341,078Accounts payable 2,331,540Debt 9,365,152Deferred taxes 328,578Total liabilities 12,025,270Total assets, net 315,808Transaction value 4,322,826Goodwill $ 4,007,018
Copyright © 2018 www.secdatabase.com. All Rights Reserved.Please Consider the Environment Before Printing This Document

1MonthsEnded
12 Months EndedSubsequent Events -Additional Information
(Detail)€ in Thousands, SFr in
Thousands, $ in Thousands,$ in Thousands
Apr. 27,2018
USD ($)$ / $$ /
Barrel
Mar.05,
2018USD($)
Feb. 18, 2018USD ($)
Feb. 12,2018
USD ($)
Mar.31,
2017USD($)
Dec. 31,2017
USD ($)$ / $
$ / Barrel
Dec. 31,2017
MXN ($)$ / Barrel
Dec. 31,2016
MXN ($)
Dec. 31,2015
MXN ($)
Jun. 16,2017
USD ($)
Jun. 15,2017
USD ($)
Feb. 14,2017
EUR (€)
Dec. 13,2016
USD ($)
Sep. 21,2016
USD ($)
Jun.14,
2016CHF(SFr)
Mar. 15,2016
USD ($)
Mar. 15,2016
EUR (€)
Feb. 04,2016
USD ($)
Disclosure of non-adjustingevents after reporting period[line items]Debt securities issued $ 4,000,000Repayment of revolving creditlines
$32,342,434
$642,059,819
$614,987,329
$193,618,498
Exchange rates | $ / $ 19.7867Weighted average price ofcrude oil | $ / Barrel 56.19 56.19
Damage claimed $139,870
P.M.I. Holdings, B.V.[member]Disclosure of non-adjustingevents after reporting period[line items]Repayment of revolving creditlines
$14,914,000
Outstanding of revolvingcredit lines $ 227,500
Series C medium term notesprogram [member]Disclosure of non-adjustingevents after reporting period[line items]Debt securities issued 92,000,000 $
92,000,000$72,000,000
€4,250,000
$5,500,000
$62,000,000
SFr375,000
$62,000,000
€2,250,000
$5,000,000
Subsequent Event [member]Disclosure of non-adjustingevents after reporting period[line items]Exchange rates | $ / $ 19.0530Appreciation of foreigncurrency exchange rate 3.70%
Weighted average price ofcrude oil | $ / Barrel 60.89
Percentage of average price 8.30%Subsequent Event [member] |P.M.I. Holdings, B.V.[member]Disclosure of non-adjustingevents after reporting period[line items]Obtain of revolving creditlines
$7,126,000
Repayment of revolving creditlines 6,126,000
Outstanding of revolvingcredit lines
$1,227,500
Five Point Three FivePercentage Notes Due TwentyTwenty Eight [member] |Series C medium term notesprogram [member]Disclosure of non-adjustingevents after reporting period[line items]Debt securities issued $
2,500,000,000Interest rate 5.35%Maturity 2028Six Point Three FivePercentage Notes Due TwentyFourty Eight [Member] |Series C medium term notesprogram [member]Disclosure of non-adjustingevents after reporting period[line items]Interest rate 6.35%Maturity 2048Bonds issued $
1,500,000,000Five Point Five Zero ZeroPercentage Bonds Due TwentyFourty Four [Member] | SeriesC medium term notes program[member]Disclosure of non-adjustingevents after reporting period[line items]Interest rate 5.50%Maturity 2044Bonds exchanged amount $ 952,454
Copyright © 2018 www.secdatabase.com. All Rights Reserved.Please Consider the Environment Before Printing This Document
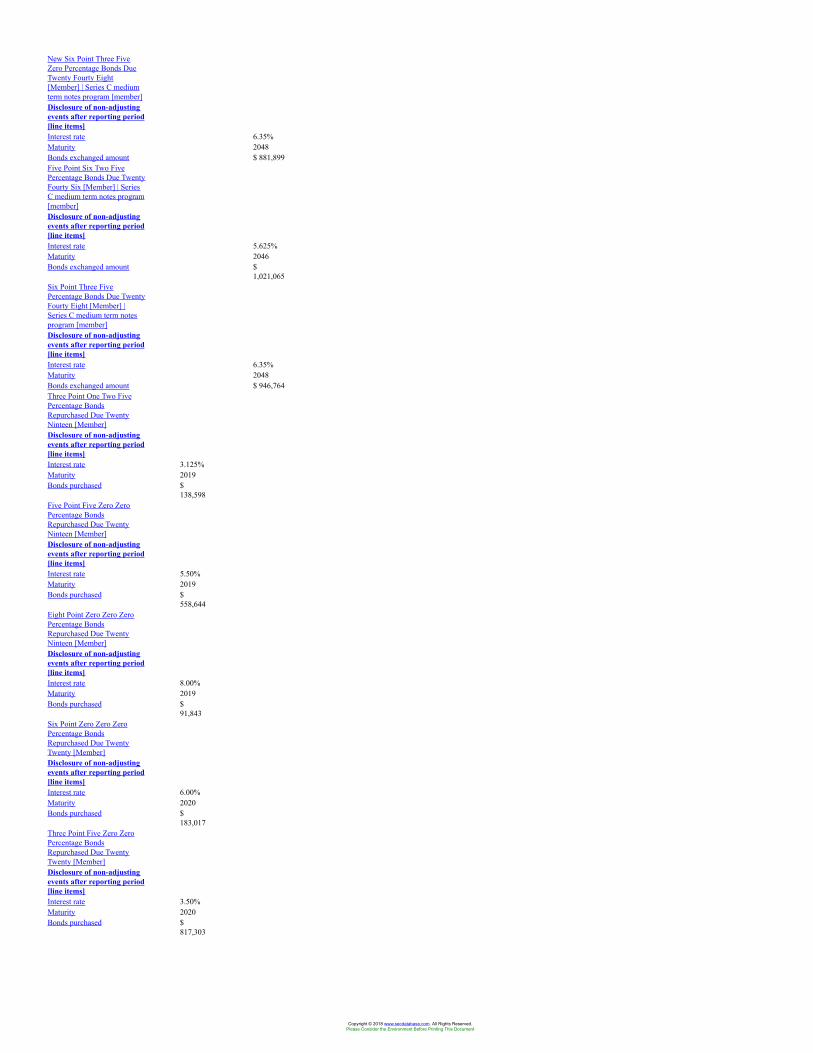
New Six Point Three FiveZero Percentage Bonds DueTwenty Fourty Eight[Member] | Series C mediumterm notes program [member]Disclosure of non-adjustingevents after reporting period[line items]Interest rate 6.35%Maturity 2048Bonds exchanged amount $ 881,899Five Point Six Two FivePercentage Bonds Due TwentyFourty Six [Member] | SeriesC medium term notes program[member]Disclosure of non-adjustingevents after reporting period[line items]Interest rate 5.625%Maturity 2046Bonds exchanged amount $
1,021,065Six Point Three FivePercentage Bonds Due TwentyFourty Eight [Member] |Series C medium term notesprogram [member]Disclosure of non-adjustingevents after reporting period[line items]Interest rate 6.35%Maturity 2048Bonds exchanged amount $ 946,764Three Point One Two FivePercentage BondsRepurchased Due TwentyNinteen [Member]Disclosure of non-adjustingevents after reporting period[line items]Interest rate 3.125%Maturity 2019Bonds purchased $
138,598Five Point Five Zero ZeroPercentage BondsRepurchased Due TwentyNinteen [Member]Disclosure of non-adjustingevents after reporting period[line items]Interest rate 5.50%Maturity 2019Bonds purchased $
558,644Eight Point Zero Zero ZeroPercentage BondsRepurchased Due TwentyNinteen [Member]Disclosure of non-adjustingevents after reporting period[line items]Interest rate 8.00%Maturity 2019Bonds purchased $
91,843Six Point Zero Zero ZeroPercentage BondsRepurchased Due TwentyTwenty [Member]Disclosure of non-adjustingevents after reporting period[line items]Interest rate 6.00%Maturity 2020Bonds purchased $
183,017Three Point Five Zero ZeroPercentage BondsRepurchased Due TwentyTwenty [Member]Disclosure of non-adjustingevents after reporting period[line items]Interest rate 3.50%Maturity 2020Bonds purchased $
817,303
Copyright © 2018 www.secdatabase.com. All Rights Reserved.Please Consider the Environment Before Printing This Document

12 Months EndedSubsidiary GuarantorInformation - Additional
Information (Detail) Dec. 31, 2017
Disclosure of subsidiaries [abstract]Percentage of owned guarantors subsidiaries 100.00%
Copyright © 2018 www.secdatabase.com. All Rights Reserved.Please Consider the Environment Before Printing This Document
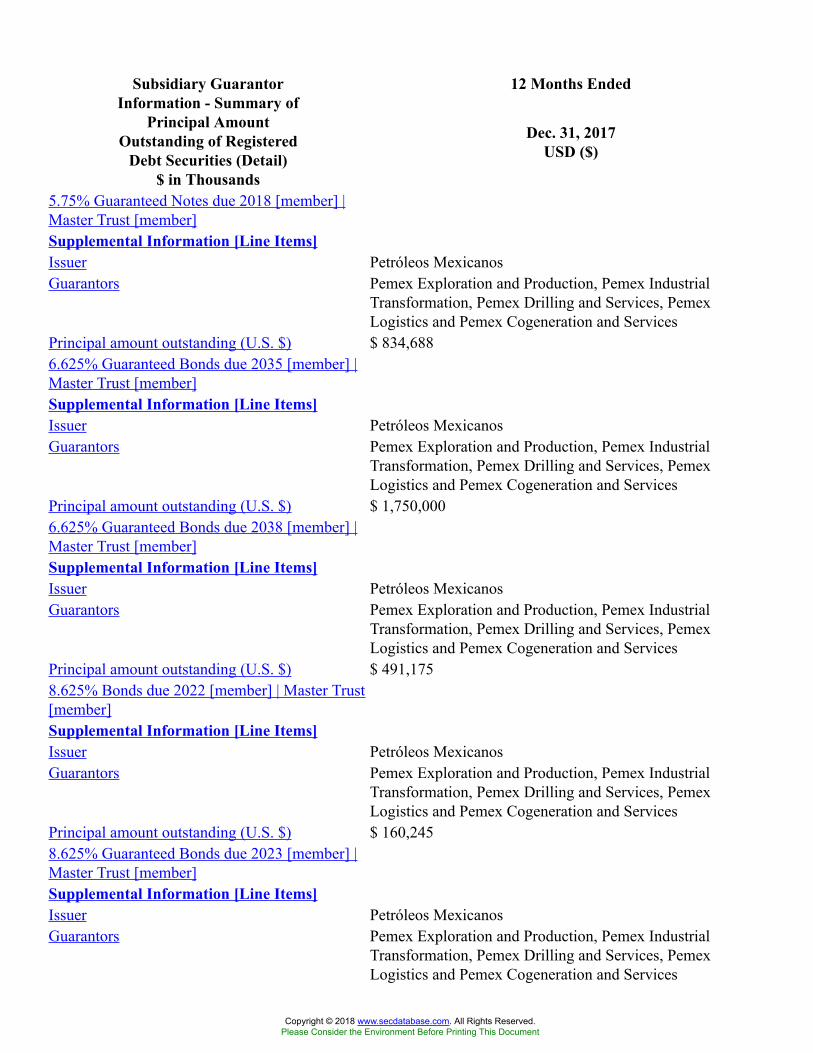
12 Months EndedSubsidiary GuarantorInformation - Summary of
Principal AmountOutstanding of Registered
Debt Securities (Detail)$ in Thousands
Dec. 31, 2017USD ($)
5.75% Guaranteed Notes due 2018 [member] |Master Trust [member]Supplemental Information [Line Items]Issuer Petróleos MexicanosGuarantors Pemex Exploration and Production, Pemex Industrial
Transformation, Pemex Drilling and Services, PemexLogistics and Pemex Cogeneration and Services
Principal amount outstanding (U.S. $) $ 834,6886.625% Guaranteed Bonds due 2035 [member] |Master Trust [member]Supplemental Information [Line Items]Issuer Petróleos MexicanosGuarantors Pemex Exploration and Production, Pemex Industrial
Transformation, Pemex Drilling and Services, PemexLogistics and Pemex Cogeneration and Services
Principal amount outstanding (U.S. $) $ 1,750,0006.625% Guaranteed Bonds due 2038 [member] |Master Trust [member]Supplemental Information [Line Items]Issuer Petróleos MexicanosGuarantors Pemex Exploration and Production, Pemex Industrial
Transformation, Pemex Drilling and Services, PemexLogistics and Pemex Cogeneration and Services
Principal amount outstanding (U.S. $) $ 491,1758.625% Bonds due 2022 [member] | Master Trust[member]Supplemental Information [Line Items]Issuer Petróleos MexicanosGuarantors Pemex Exploration and Production, Pemex Industrial
Transformation, Pemex Drilling and Services, PemexLogistics and Pemex Cogeneration and Services
Principal amount outstanding (U.S. $) $ 160,2458.625% Guaranteed Bonds due 2023 [member] |Master Trust [member]Supplemental Information [Line Items]Issuer Petróleos MexicanosGuarantors Pemex Exploration and Production, Pemex Industrial
Transformation, Pemex Drilling and Services, PemexLogistics and Pemex Cogeneration and Services
Copyright © 2018 www.secdatabase.com. All Rights Reserved.Please Consider the Environment Before Printing This Document
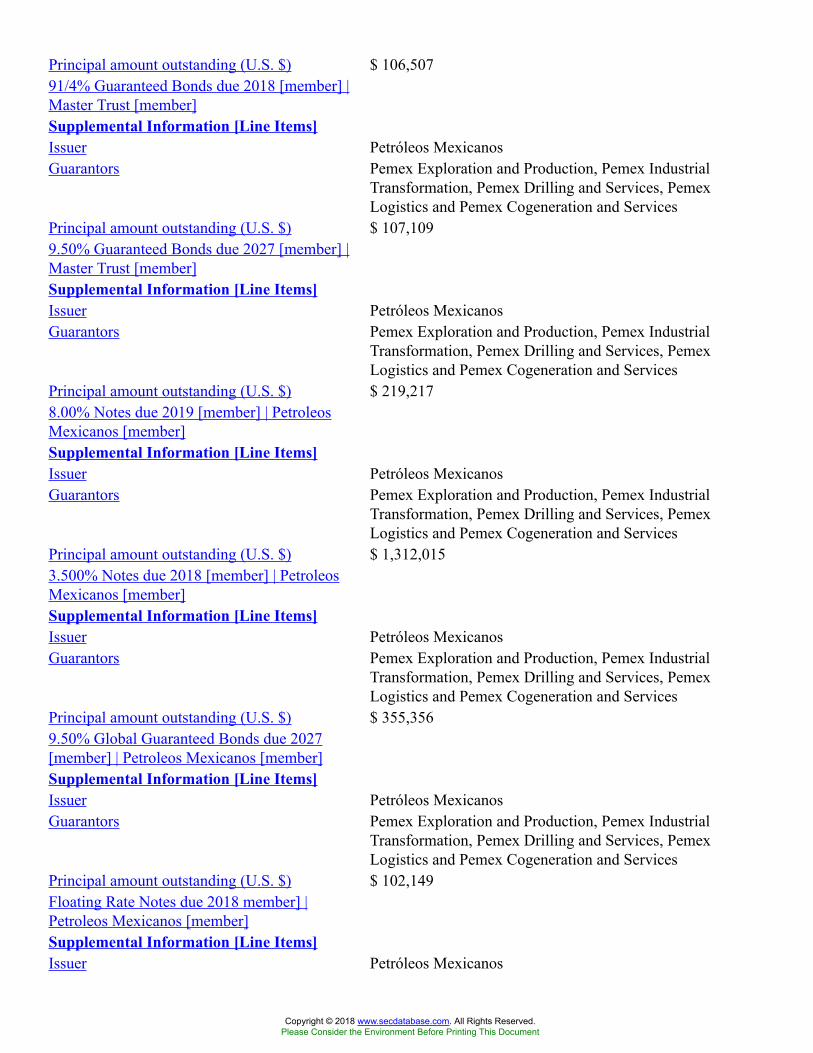
Principal amount outstanding (U.S. $) $ 106,50791/4% Guaranteed Bonds due 2018 [member] |Master Trust [member]Supplemental Information [Line Items]Issuer Petróleos MexicanosGuarantors Pemex Exploration and Production, Pemex Industrial
Transformation, Pemex Drilling and Services, PemexLogistics and Pemex Cogeneration and Services
Principal amount outstanding (U.S. $) $ 107,1099.50% Guaranteed Bonds due 2027 [member] |Master Trust [member]Supplemental Information [Line Items]Issuer Petróleos MexicanosGuarantors Pemex Exploration and Production, Pemex Industrial
Transformation, Pemex Drilling and Services, PemexLogistics and Pemex Cogeneration and Services
Principal amount outstanding (U.S. $) $ 219,2178.00% Notes due 2019 [member] | PetroleosMexicanos [member]Supplemental Information [Line Items]Issuer Petróleos MexicanosGuarantors Pemex Exploration and Production, Pemex Industrial
Transformation, Pemex Drilling and Services, PemexLogistics and Pemex Cogeneration and Services
Principal amount outstanding (U.S. $) $ 1,312,0153.500% Notes due 2018 [member] | PetroleosMexicanos [member]Supplemental Information [Line Items]Issuer Petróleos MexicanosGuarantors Pemex Exploration and Production, Pemex Industrial
Transformation, Pemex Drilling and Services, PemexLogistics and Pemex Cogeneration and Services
Principal amount outstanding (U.S. $) $ 355,3569.50% Global Guaranteed Bonds due 2027[member] | Petroleos Mexicanos [member]Supplemental Information [Line Items]Issuer Petróleos MexicanosGuarantors Pemex Exploration and Production, Pemex Industrial
Transformation, Pemex Drilling and Services, PemexLogistics and Pemex Cogeneration and Services
Principal amount outstanding (U.S. $) $ 102,149Floating Rate Notes due 2018 member] |Petroleos Mexicanos [member]Supplemental Information [Line Items]Issuer Petróleos Mexicanos
Copyright © 2018 www.secdatabase.com. All Rights Reserved.Please Consider the Environment Before Printing This Document

Guarantors Pemex Exploration and Production, Pemex IndustrialTransformation, Pemex Drilling and Services, PemexLogistics and Pemex Cogeneration and Services
Principal amount outstanding (U.S. $) $ 498,5706.000% Notes due 2020 [member] | PetroleosMexicanos [member]Supplemental Information [Line Items]Issuer Petróleos MexicanosGuarantors Pemex Exploration and Production, Pemex Industrial
Transformation, Pemex Drilling and Services, PemexLogistics and Pemex Cogeneration and Services
Principal amount outstanding (U.S. $) $ 995,3645.50% Notes due 2021 [member] | PetroleosMexicanos [member]Supplemental Information [Line Items]Issuer Petróleos MexicanosGuarantors Pemex Exploration and Production, Pemex Industrial
Transformation, Pemex Drilling and Services, PemexLogistics and Pemex Cogeneration and Services
Principal amount outstanding (U.S. $) $ 2,962,0473.500% Notes due 2023 [member] | PetroleosMexicanos [member]Supplemental Information [Line Items]Issuer Petróleos MexicanosGuarantors Pemex Exploration and Production, Pemex Industrial
Transformation, Pemex Drilling and Services, PemexLogistics and Pemex Cogeneration and Services
Principal amount outstanding (U.S. $) $ 2,099,7304.875% Notes due 2024 [member] | PetroleosMexicanos [member]Supplemental Information [Line Items]Issuer Petróleos MexicanosGuarantors Pemex Exploration and Production, Pemex Industrial
Transformation, Pemex Drilling and Services, PemexLogistics and Pemex Cogeneration and Services
Principal amount outstanding (U.S. $) $ 1,499,1366.625% Notes due 2035 [member] | PetroleosMexicanos [member]Supplemental Information [Line Items]Issuer Petróleos MexicanosGuarantors Pemex Exploration and Production, Pemex Industrial
Transformation, Pemex Drilling and Services, PemexLogistics and Pemex Cogeneration and Services
Principal amount outstanding (U.S. $) $ 999,0006.500% Bonds due 2041 [member] | PetroleosMexicanos [member]
Copyright © 2018 www.secdatabase.com. All Rights Reserved.Please Consider the Environment Before Printing This Document
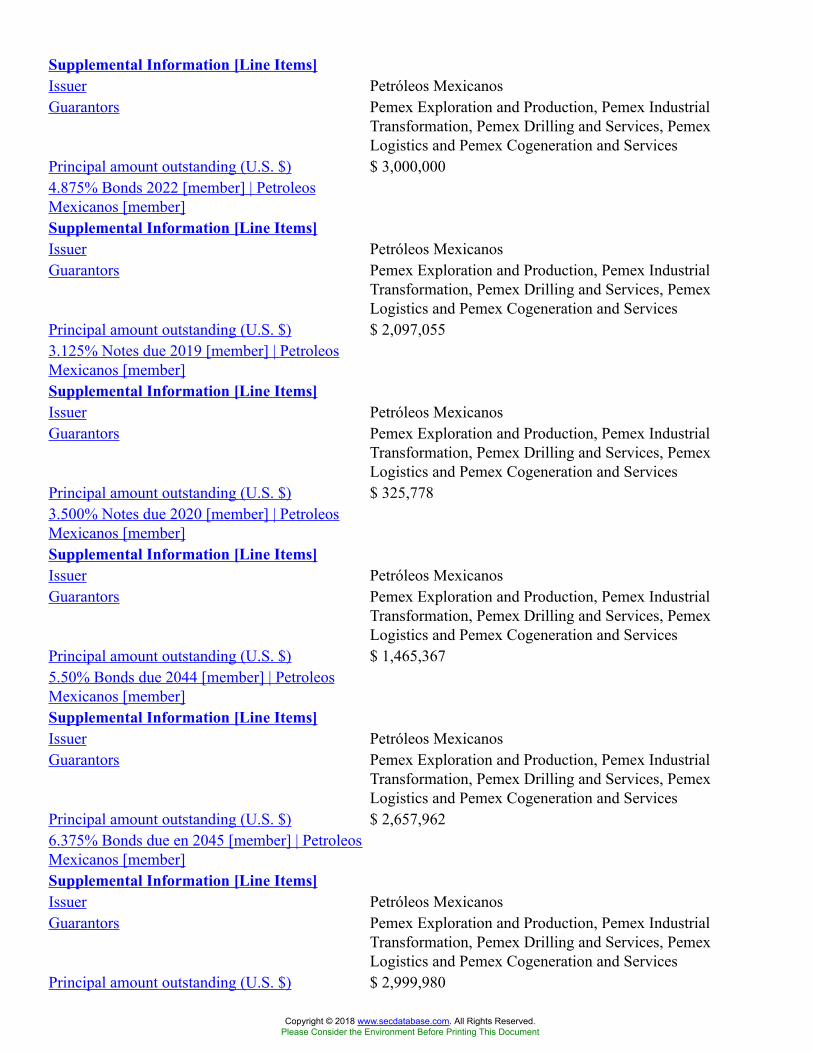
Supplemental Information [Line Items]Issuer Petróleos MexicanosGuarantors Pemex Exploration and Production, Pemex Industrial
Transformation, Pemex Drilling and Services, PemexLogistics and Pemex Cogeneration and Services
Principal amount outstanding (U.S. $) $ 3,000,0004.875% Bonds 2022 [member] | PetroleosMexicanos [member]Supplemental Information [Line Items]Issuer Petróleos MexicanosGuarantors Pemex Exploration and Production, Pemex Industrial
Transformation, Pemex Drilling and Services, PemexLogistics and Pemex Cogeneration and Services
Principal amount outstanding (U.S. $) $ 2,097,0553.125% Notes due 2019 [member] | PetroleosMexicanos [member]Supplemental Information [Line Items]Issuer Petróleos MexicanosGuarantors Pemex Exploration and Production, Pemex Industrial
Transformation, Pemex Drilling and Services, PemexLogistics and Pemex Cogeneration and Services
Principal amount outstanding (U.S. $) $ 325,7783.500% Notes due 2020 [member] | PetroleosMexicanos [member]Supplemental Information [Line Items]Issuer Petróleos MexicanosGuarantors Pemex Exploration and Production, Pemex Industrial
Transformation, Pemex Drilling and Services, PemexLogistics and Pemex Cogeneration and Services
Principal amount outstanding (U.S. $) $ 1,465,3675.50% Bonds due 2044 [member] | PetroleosMexicanos [member]Supplemental Information [Line Items]Issuer Petróleos MexicanosGuarantors Pemex Exploration and Production, Pemex Industrial
Transformation, Pemex Drilling and Services, PemexLogistics and Pemex Cogeneration and Services
Principal amount outstanding (U.S. $) $ 2,657,9626.375% Bonds due en 2045 [member] | PetroleosMexicanos [member]Supplemental Information [Line Items]Issuer Petróleos MexicanosGuarantors Pemex Exploration and Production, Pemex Industrial
Transformation, Pemex Drilling and Services, PemexLogistics and Pemex Cogeneration and Services
Principal amount outstanding (U.S. $) $ 2,999,980
Copyright © 2018 www.secdatabase.com. All Rights Reserved.Please Consider the Environment Before Printing This Document
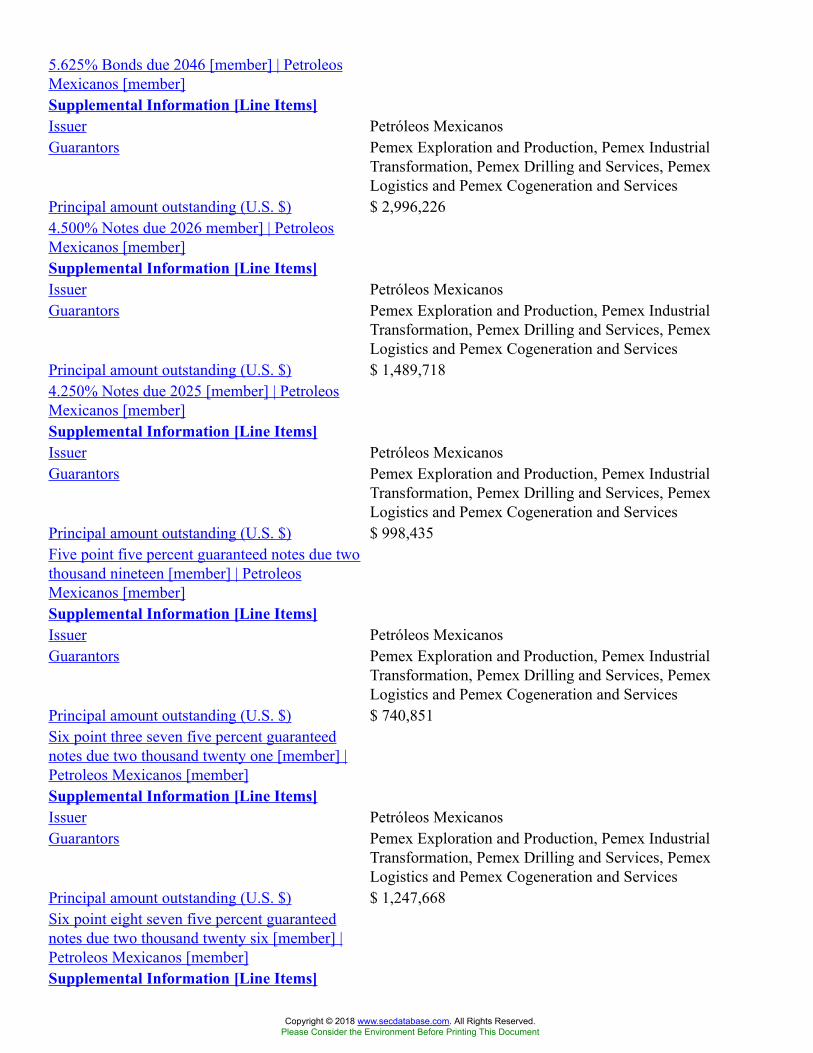
5.625% Bonds due 2046 [member] | PetroleosMexicanos [member]Supplemental Information [Line Items]Issuer Petróleos MexicanosGuarantors Pemex Exploration and Production, Pemex Industrial
Transformation, Pemex Drilling and Services, PemexLogistics and Pemex Cogeneration and Services
Principal amount outstanding (U.S. $) $ 2,996,2264.500% Notes due 2026 member] | PetroleosMexicanos [member]Supplemental Information [Line Items]Issuer Petróleos MexicanosGuarantors Pemex Exploration and Production, Pemex Industrial
Transformation, Pemex Drilling and Services, PemexLogistics and Pemex Cogeneration and Services
Principal amount outstanding (U.S. $) $ 1,489,7184.250% Notes due 2025 [member] | PetroleosMexicanos [member]Supplemental Information [Line Items]Issuer Petróleos MexicanosGuarantors Pemex Exploration and Production, Pemex Industrial
Transformation, Pemex Drilling and Services, PemexLogistics and Pemex Cogeneration and Services
Principal amount outstanding (U.S. $) $ 998,435Five point five percent guaranteed notes due twothousand nineteen [member] | PetroleosMexicanos [member]Supplemental Information [Line Items]Issuer Petróleos MexicanosGuarantors Pemex Exploration and Production, Pemex Industrial
Transformation, Pemex Drilling and Services, PemexLogistics and Pemex Cogeneration and Services
Principal amount outstanding (U.S. $) $ 740,851Six point three seven five percent guaranteednotes due two thousand twenty one [member] |Petroleos Mexicanos [member]Supplemental Information [Line Items]Issuer Petróleos MexicanosGuarantors Pemex Exploration and Production, Pemex Industrial
Transformation, Pemex Drilling and Services, PemexLogistics and Pemex Cogeneration and Services
Principal amount outstanding (U.S. $) $ 1,247,668Six point eight seven five percent guaranteednotes due two thousand twenty six [member] |Petroleos Mexicanos [member]Supplemental Information [Line Items]
Copyright © 2018 www.secdatabase.com. All Rights Reserved.Please Consider the Environment Before Printing This Document
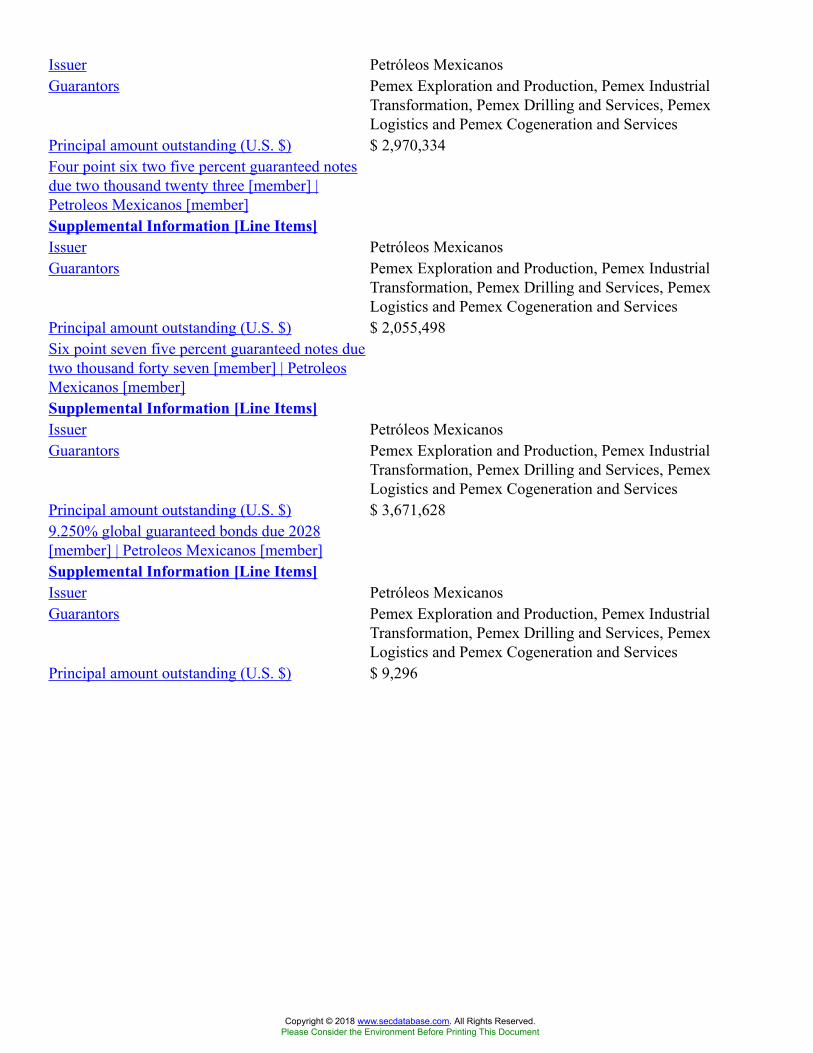
Issuer Petróleos MexicanosGuarantors Pemex Exploration and Production, Pemex Industrial
Transformation, Pemex Drilling and Services, PemexLogistics and Pemex Cogeneration and Services
Principal amount outstanding (U.S. $) $ 2,970,334Four point six two five percent guaranteed notesdue two thousand twenty three [member] |Petroleos Mexicanos [member]Supplemental Information [Line Items]Issuer Petróleos MexicanosGuarantors Pemex Exploration and Production, Pemex Industrial
Transformation, Pemex Drilling and Services, PemexLogistics and Pemex Cogeneration and Services
Principal amount outstanding (U.S. $) $ 2,055,498Six point seven five percent guaranteed notes duetwo thousand forty seven [member] | PetroleosMexicanos [member]Supplemental Information [Line Items]Issuer Petróleos MexicanosGuarantors Pemex Exploration and Production, Pemex Industrial
Transformation, Pemex Drilling and Services, PemexLogistics and Pemex Cogeneration and Services
Principal amount outstanding (U.S. $) $ 3,671,6289.250% global guaranteed bonds due 2028[member] | Petroleos Mexicanos [member]Supplemental Information [Line Items]Issuer Petróleos MexicanosGuarantors Pemex Exploration and Production, Pemex Industrial
Transformation, Pemex Drilling and Services, PemexLogistics and Pemex Cogeneration and Services
Principal amount outstanding (U.S. $) $ 9,296
Copyright © 2018 www.secdatabase.com. All Rights Reserved.Please Consider the Environment Before Printing This Document
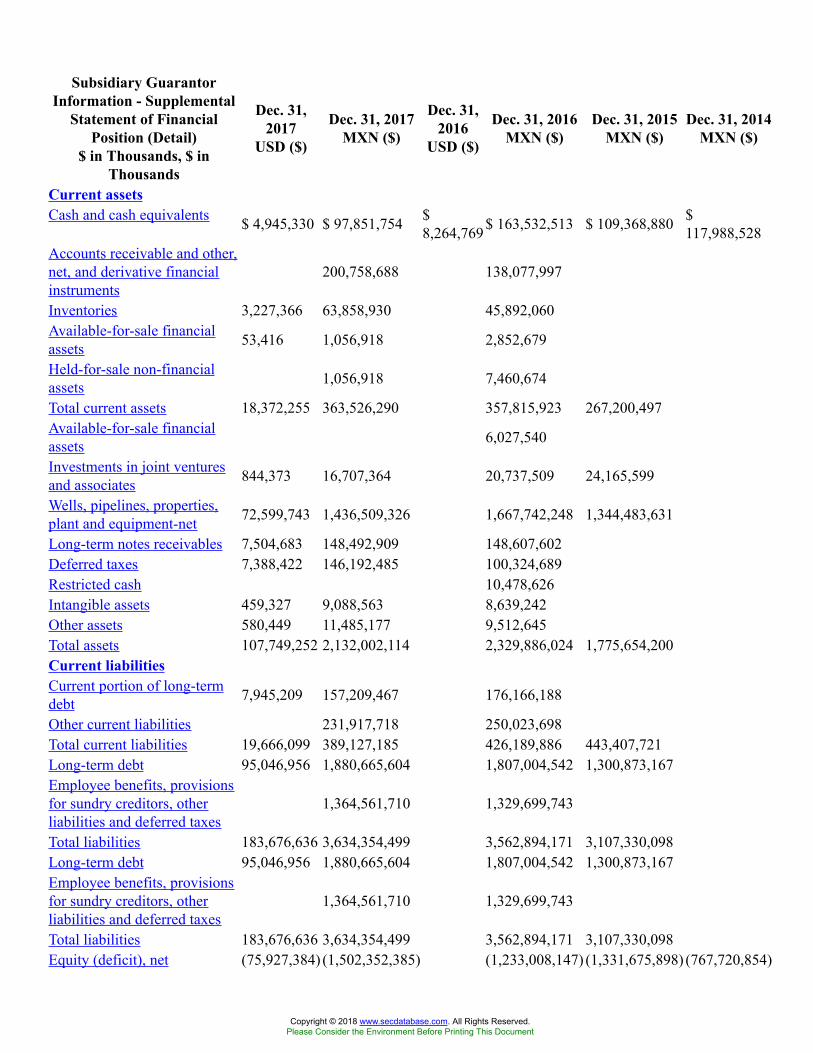
Subsidiary GuarantorInformation - Supplemental
Statement of FinancialPosition (Detail)
$ in Thousands, $ inThousands
Dec. 31,2017
USD ($)
Dec. 31, 2017MXN ($)
Dec. 31,2016
USD ($)
Dec. 31, 2016MXN ($)
Dec. 31, 2015MXN ($)
Dec. 31, 2014MXN ($)
Current assetsCash and cash equivalents $ 4,945,330 $ 97,851,754 $
8,264,769$ 163,532,513 $ 109,368,880 $117,988,528
Accounts receivable and other,net, and derivative financialinstruments
200,758,688 138,077,997
Inventories 3,227,366 63,858,930 45,892,060Available-for-sale financialassets 53,416 1,056,918 2,852,679
Held-for-sale non-financialassets 1,056,918 7,460,674
Total current assets 18,372,255 363,526,290 357,815,923 267,200,497Available-for-sale financialassets 6,027,540
Investments in joint venturesand associates 844,373 16,707,364 20,737,509 24,165,599
Wells, pipelines, properties,plant and equipment-net 72,599,743 1,436,509,326 1,667,742,248 1,344,483,631
Long-term notes receivables 7,504,683 148,492,909 148,607,602Deferred taxes 7,388,422 146,192,485 100,324,689Restricted cash 10,478,626Intangible assets 459,327 9,088,563 8,639,242Other assets 580,449 11,485,177 9,512,645Total assets 107,749,252 2,132,002,114 2,329,886,024 1,775,654,200Current liabilitiesCurrent portion of long-termdebt 7,945,209 157,209,467 176,166,188
Other current liabilities 231,917,718 250,023,698Total current liabilities 19,666,099 389,127,185 426,189,886 443,407,721Long-term debt 95,046,956 1,880,665,604 1,807,004,542 1,300,873,167Employee benefits, provisionsfor sundry creditors, otherliabilities and deferred taxes
1,364,561,710 1,329,699,743
Total liabilities 183,676,636 3,634,354,499 3,562,894,171 3,107,330,098Long-term debt 95,046,956 1,880,665,604 1,807,004,542 1,300,873,167Employee benefits, provisionsfor sundry creditors, otherliabilities and deferred taxes
1,364,561,710 1,329,699,743
Total liabilities 183,676,636 3,634,354,499 3,562,894,171 3,107,330,098Equity (deficit), net (75,927,384) (1,502,352,385) (1,233,008,147) (1,331,675,898) (767,720,854)
Copyright © 2018 www.secdatabase.com. All Rights Reserved.Please Consider the Environment Before Printing This Document
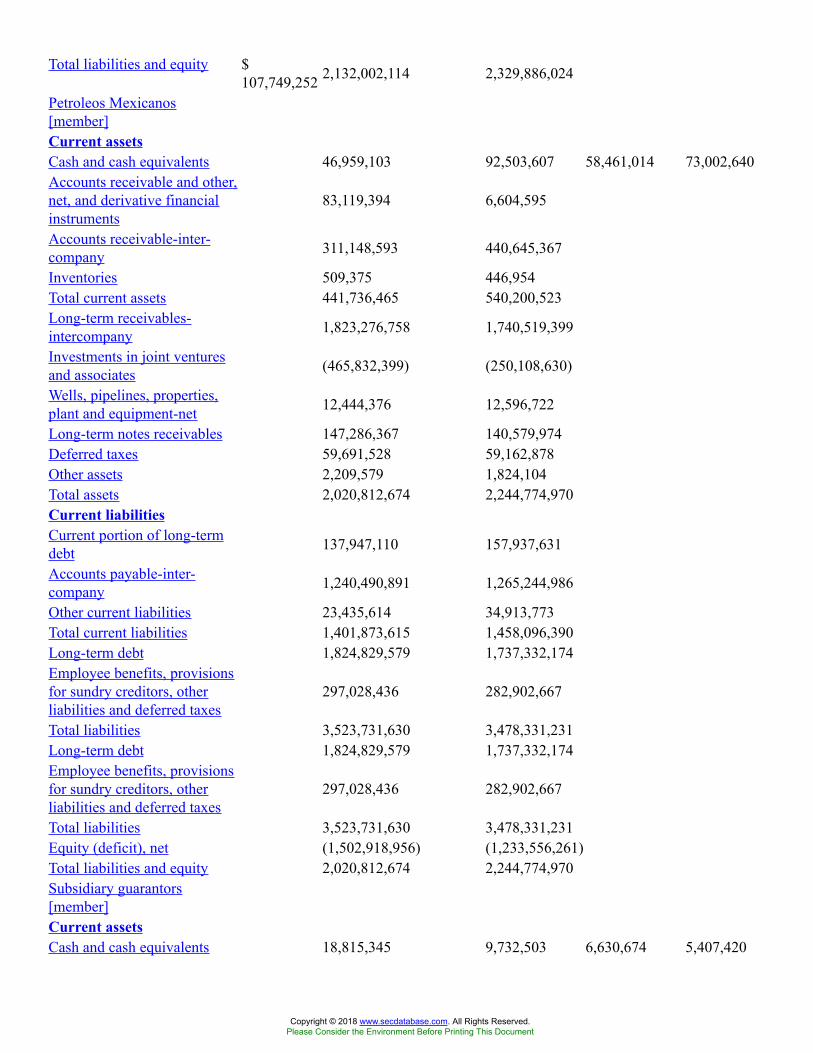
Total liabilities and equity $107,749,252 2,132,002,114 2,329,886,024
Petroleos Mexicanos[member]Current assetsCash and cash equivalents 46,959,103 92,503,607 58,461,014 73,002,640Accounts receivable and other,net, and derivative financialinstruments
83,119,394 6,604,595
Accounts receivable-inter-company 311,148,593 440,645,367
Inventories 509,375 446,954Total current assets 441,736,465 540,200,523Long-term receivables-intercompany 1,823,276,758 1,740,519,399
Investments in joint venturesand associates (465,832,399) (250,108,630)
Wells, pipelines, properties,plant and equipment-net 12,444,376 12,596,722
Long-term notes receivables 147,286,367 140,579,974Deferred taxes 59,691,528 59,162,878Other assets 2,209,579 1,824,104Total assets 2,020,812,674 2,244,774,970Current liabilitiesCurrent portion of long-termdebt 137,947,110 157,937,631
Accounts payable-inter-company 1,240,490,891 1,265,244,986
Other current liabilities 23,435,614 34,913,773Total current liabilities 1,401,873,615 1,458,096,390Long-term debt 1,824,829,579 1,737,332,174Employee benefits, provisionsfor sundry creditors, otherliabilities and deferred taxes
297,028,436 282,902,667
Total liabilities 3,523,731,630 3,478,331,231Long-term debt 1,824,829,579 1,737,332,174Employee benefits, provisionsfor sundry creditors, otherliabilities and deferred taxes
297,028,436 282,902,667
Total liabilities 3,523,731,630 3,478,331,231Equity (deficit), net (1,502,918,956) (1,233,556,261)Total liabilities and equity 2,020,812,674 2,244,774,970Subsidiary guarantors[member]Current assetsCash and cash equivalents 18,815,345 9,732,503 6,630,674 5,407,420
Copyright © 2018 www.secdatabase.com. All Rights Reserved.Please Consider the Environment Before Printing This Document
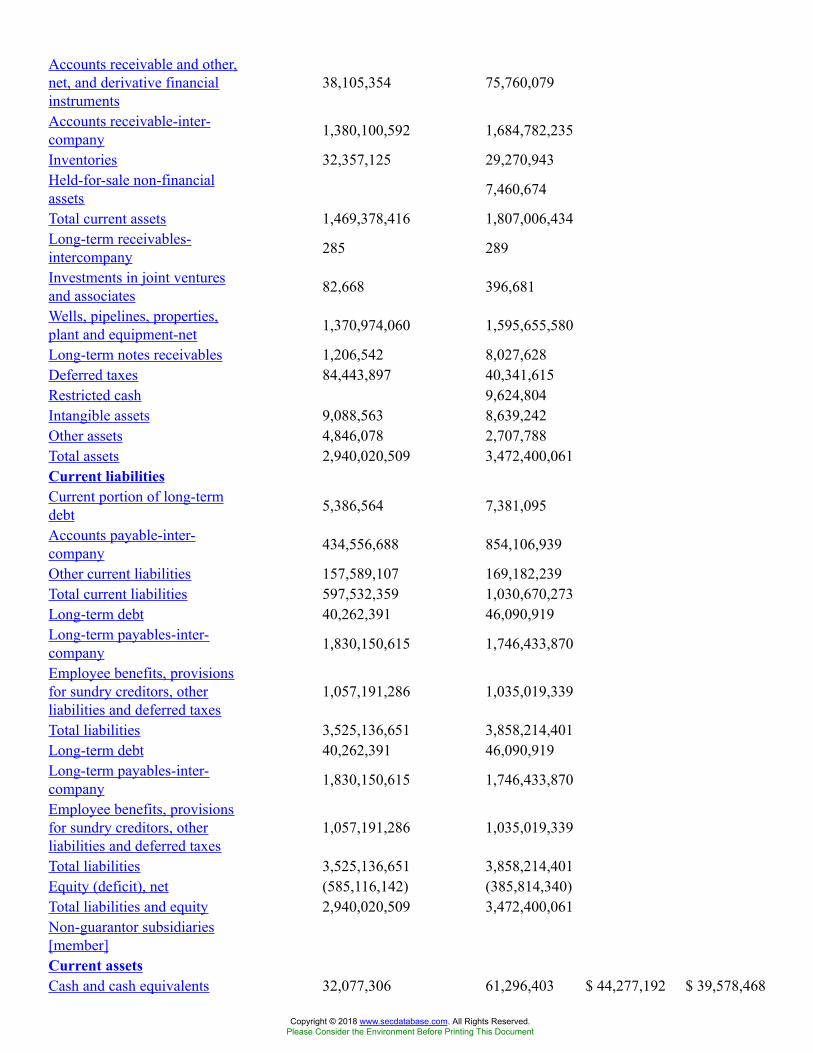
Accounts receivable and other,net, and derivative financialinstruments
38,105,354 75,760,079
Accounts receivable-inter-company 1,380,100,592 1,684,782,235
Inventories 32,357,125 29,270,943Held-for-sale non-financialassets 7,460,674
Total current assets 1,469,378,416 1,807,006,434Long-term receivables-intercompany 285 289
Investments in joint venturesand associates 82,668 396,681
Wells, pipelines, properties,plant and equipment-net 1,370,974,060 1,595,655,580
Long-term notes receivables 1,206,542 8,027,628Deferred taxes 84,443,897 40,341,615Restricted cash 9,624,804Intangible assets 9,088,563 8,639,242Other assets 4,846,078 2,707,788Total assets 2,940,020,509 3,472,400,061Current liabilitiesCurrent portion of long-termdebt 5,386,564 7,381,095
Accounts payable-inter-company 434,556,688 854,106,939
Other current liabilities 157,589,107 169,182,239Total current liabilities 597,532,359 1,030,670,273Long-term debt 40,262,391 46,090,919Long-term payables-inter-company 1,830,150,615 1,746,433,870
Employee benefits, provisionsfor sundry creditors, otherliabilities and deferred taxes
1,057,191,286 1,035,019,339
Total liabilities 3,525,136,651 3,858,214,401Long-term debt 40,262,391 46,090,919Long-term payables-inter-company 1,830,150,615 1,746,433,870
Employee benefits, provisionsfor sundry creditors, otherliabilities and deferred taxes
1,057,191,286 1,035,019,339
Total liabilities 3,525,136,651 3,858,214,401Equity (deficit), net (585,116,142) (385,814,340)Total liabilities and equity 2,940,020,509 3,472,400,061Non-guarantor subsidiaries[member]Current assetsCash and cash equivalents 32,077,306 61,296,403 $ 44,277,192 $ 39,578,468
Copyright © 2018 www.secdatabase.com. All Rights Reserved.Please Consider the Environment Before Printing This Document
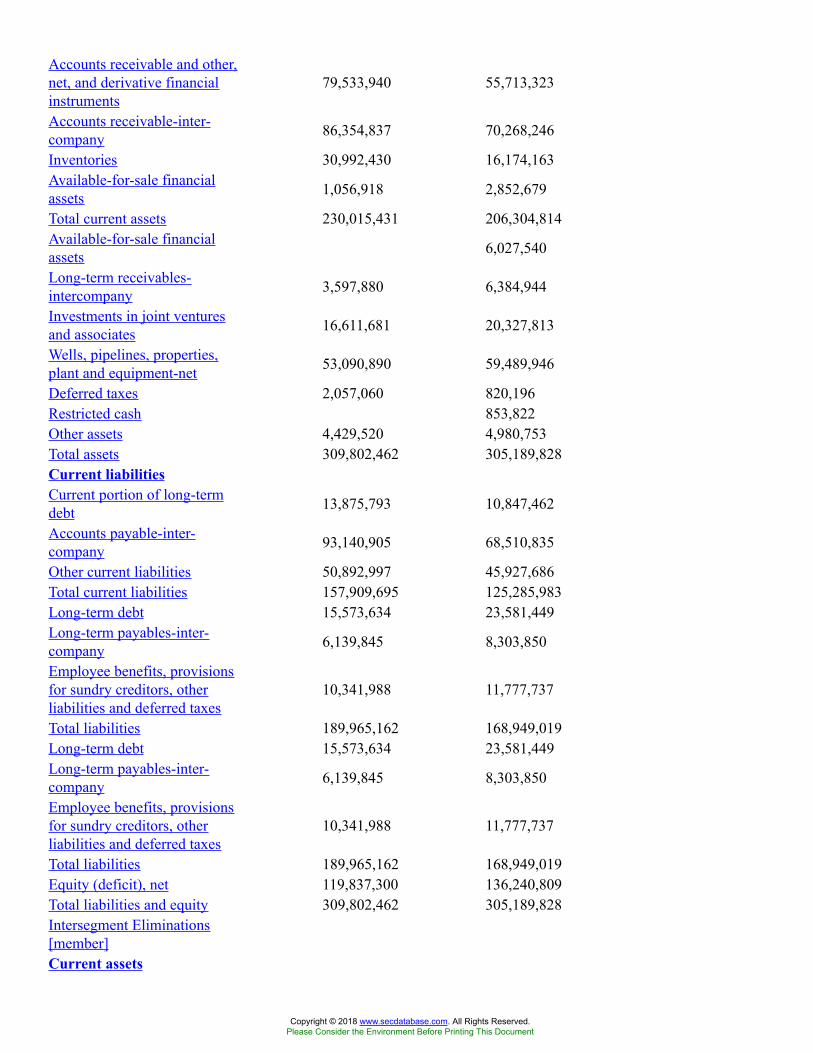
Accounts receivable and other,net, and derivative financialinstruments
79,533,940 55,713,323
Accounts receivable-inter-company 86,354,837 70,268,246
Inventories 30,992,430 16,174,163Available-for-sale financialassets 1,056,918 2,852,679
Total current assets 230,015,431 206,304,814Available-for-sale financialassets 6,027,540
Long-term receivables-intercompany 3,597,880 6,384,944
Investments in joint venturesand associates 16,611,681 20,327,813
Wells, pipelines, properties,plant and equipment-net 53,090,890 59,489,946
Deferred taxes 2,057,060 820,196Restricted cash 853,822Other assets 4,429,520 4,980,753Total assets 309,802,462 305,189,828Current liabilitiesCurrent portion of long-termdebt 13,875,793 10,847,462
Accounts payable-inter-company 93,140,905 68,510,835
Other current liabilities 50,892,997 45,927,686Total current liabilities 157,909,695 125,285,983Long-term debt 15,573,634 23,581,449Long-term payables-inter-company 6,139,845 8,303,850
Employee benefits, provisionsfor sundry creditors, otherliabilities and deferred taxes
10,341,988 11,777,737
Total liabilities 189,965,162 168,949,019Long-term debt 15,573,634 23,581,449Long-term payables-inter-company 6,139,845 8,303,850
Employee benefits, provisionsfor sundry creditors, otherliabilities and deferred taxes
10,341,988 11,777,737
Total liabilities 189,965,162 168,949,019Equity (deficit), net 119,837,300 136,240,809Total liabilities and equity 309,802,462 305,189,828Intersegment Eliminations[member]Current assets
Copyright © 2018 www.secdatabase.com. All Rights Reserved.Please Consider the Environment Before Printing This Document
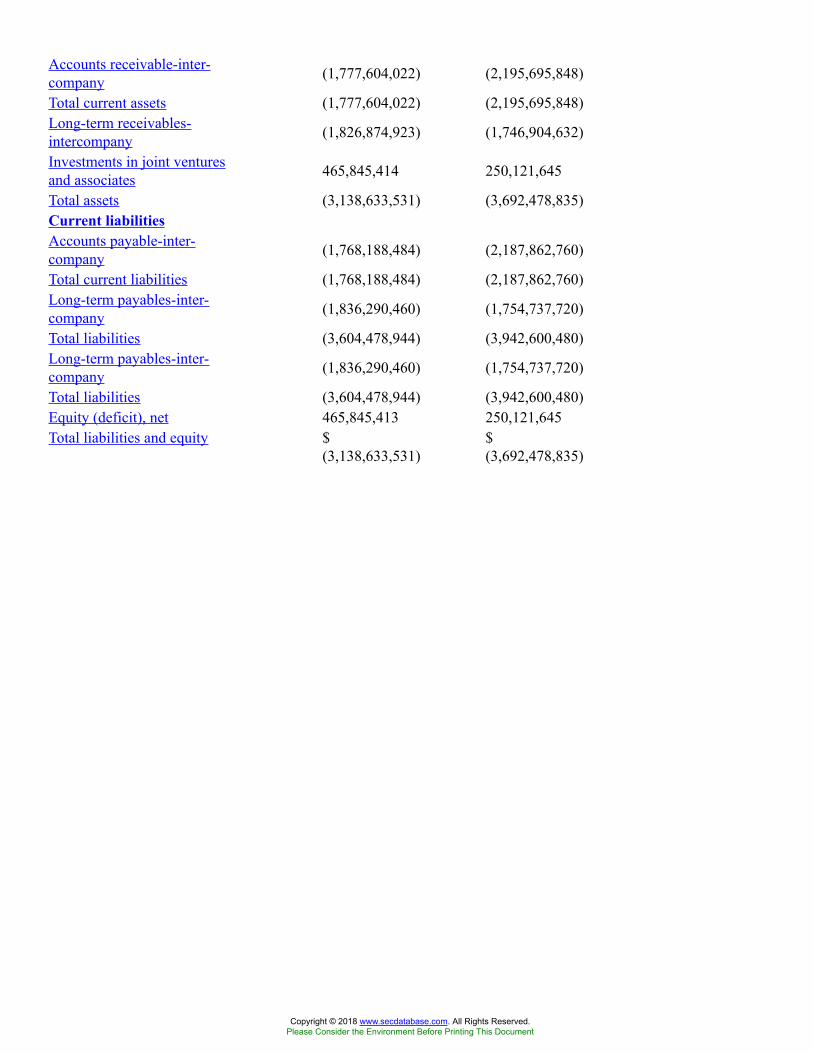
Accounts receivable-inter-company (1,777,604,022) (2,195,695,848)
Total current assets (1,777,604,022) (2,195,695,848)Long-term receivables-intercompany (1,826,874,923) (1,746,904,632)
Investments in joint venturesand associates 465,845,414 250,121,645
Total assets (3,138,633,531) (3,692,478,835)Current liabilitiesAccounts payable-inter-company (1,768,188,484) (2,187,862,760)
Total current liabilities (1,768,188,484) (2,187,862,760)Long-term payables-inter-company (1,836,290,460) (1,754,737,720)
Total liabilities (3,604,478,944) (3,942,600,480)Long-term payables-inter-company (1,836,290,460) (1,754,737,720)
Total liabilities (3,604,478,944) (3,942,600,480)Equity (deficit), net 465,845,413 250,121,645Total liabilities and equity $
(3,138,633,531)$(3,692,478,835)
Copyright © 2018 www.secdatabase.com. All Rights Reserved.Please Consider the Environment Before Printing This Document
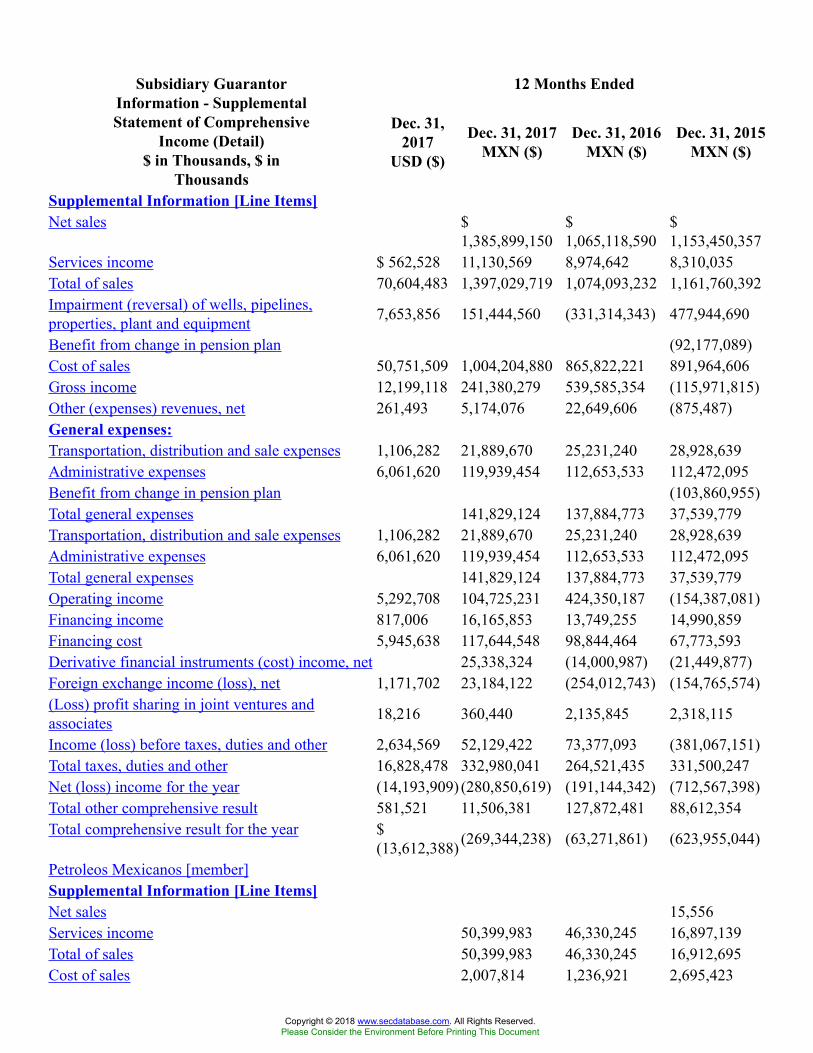
12 Months EndedSubsidiary GuarantorInformation - SupplementalStatement of Comprehensive
Income (Detail)$ in Thousands, $ in
Thousands
Dec. 31,2017
USD ($)
Dec. 31, 2017MXN ($)
Dec. 31, 2016MXN ($)
Dec. 31, 2015MXN ($)
Supplemental Information [Line Items]Net sales $
1,385,899,150$1,065,118,590
$1,153,450,357
Services income $ 562,528 11,130,569 8,974,642 8,310,035Total of sales 70,604,483 1,397,029,719 1,074,093,232 1,161,760,392Impairment (reversal) of wells, pipelines,properties, plant and equipment 7,653,856 151,444,560 (331,314,343) 477,944,690
Benefit from change in pension plan (92,177,089)Cost of sales 50,751,509 1,004,204,880 865,822,221 891,964,606Gross income 12,199,118 241,380,279 539,585,354 (115,971,815)Other (expenses) revenues, net 261,493 5,174,076 22,649,606 (875,487)General expenses:Transportation, distribution and sale expenses 1,106,282 21,889,670 25,231,240 28,928,639Administrative expenses 6,061,620 119,939,454 112,653,533 112,472,095Benefit from change in pension plan (103,860,955)Total general expenses 141,829,124 137,884,773 37,539,779Transportation, distribution and sale expenses 1,106,282 21,889,670 25,231,240 28,928,639Administrative expenses 6,061,620 119,939,454 112,653,533 112,472,095Total general expenses 141,829,124 137,884,773 37,539,779Operating income 5,292,708 104,725,231 424,350,187 (154,387,081)Financing income 817,006 16,165,853 13,749,255 14,990,859Financing cost 5,945,638 117,644,548 98,844,464 67,773,593Derivative financial instruments (cost) income, net 25,338,324 (14,000,987) (21,449,877)Foreign exchange income (loss), net 1,171,702 23,184,122 (254,012,743) (154,765,574)(Loss) profit sharing in joint ventures andassociates 18,216 360,440 2,135,845 2,318,115
Income (loss) before taxes, duties and other 2,634,569 52,129,422 73,377,093 (381,067,151)Total taxes, duties and other 16,828,478 332,980,041 264,521,435 331,500,247Net (loss) income for the year (14,193,909) (280,850,619) (191,144,342) (712,567,398)Total other comprehensive result 581,521 11,506,381 127,872,481 88,612,354Total comprehensive result for the year $
(13,612,388) (269,344,238) (63,271,861) (623,955,044)
Petroleos Mexicanos [member]Supplemental Information [Line Items]Net sales 15,556Services income 50,399,983 46,330,245 16,897,139Total of sales 50,399,983 46,330,245 16,912,695Cost of sales 2,007,814 1,236,921 2,695,423
Copyright © 2018 www.secdatabase.com. All Rights Reserved.Please Consider the Environment Before Printing This Document
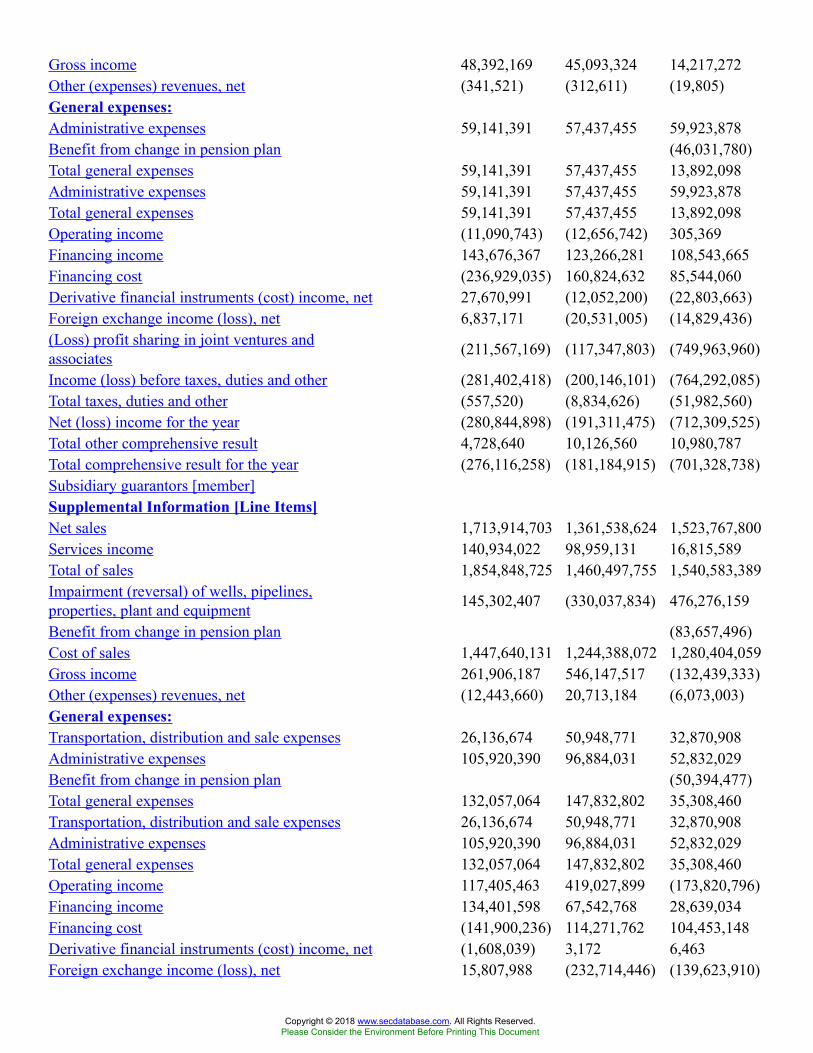
Gross income 48,392,169 45,093,324 14,217,272Other (expenses) revenues, net (341,521) (312,611) (19,805)General expenses:Administrative expenses 59,141,391 57,437,455 59,923,878Benefit from change in pension plan (46,031,780)Total general expenses 59,141,391 57,437,455 13,892,098Administrative expenses 59,141,391 57,437,455 59,923,878Total general expenses 59,141,391 57,437,455 13,892,098Operating income (11,090,743) (12,656,742) 305,369Financing income 143,676,367 123,266,281 108,543,665Financing cost (236,929,035) 160,824,632 85,544,060Derivative financial instruments (cost) income, net 27,670,991 (12,052,200) (22,803,663)Foreign exchange income (loss), net 6,837,171 (20,531,005) (14,829,436)(Loss) profit sharing in joint ventures andassociates (211,567,169) (117,347,803) (749,963,960)
Income (loss) before taxes, duties and other (281,402,418) (200,146,101) (764,292,085)Total taxes, duties and other (557,520) (8,834,626) (51,982,560)Net (loss) income for the year (280,844,898) (191,311,475) (712,309,525)Total other comprehensive result 4,728,640 10,126,560 10,980,787Total comprehensive result for the year (276,116,258) (181,184,915) (701,328,738)Subsidiary guarantors [member]Supplemental Information [Line Items]Net sales 1,713,914,703 1,361,538,624 1,523,767,800Services income 140,934,022 98,959,131 16,815,589Total of sales 1,854,848,725 1,460,497,755 1,540,583,389Impairment (reversal) of wells, pipelines,properties, plant and equipment 145,302,407 (330,037,834) 476,276,159
Benefit from change in pension plan (83,657,496)Cost of sales 1,447,640,131 1,244,388,072 1,280,404,059Gross income 261,906,187 546,147,517 (132,439,333)Other (expenses) revenues, net (12,443,660) 20,713,184 (6,073,003)General expenses:Transportation, distribution and sale expenses 26,136,674 50,948,771 32,870,908Administrative expenses 105,920,390 96,884,031 52,832,029Benefit from change in pension plan (50,394,477)Total general expenses 132,057,064 147,832,802 35,308,460Transportation, distribution and sale expenses 26,136,674 50,948,771 32,870,908Administrative expenses 105,920,390 96,884,031 52,832,029Total general expenses 132,057,064 147,832,802 35,308,460Operating income 117,405,463 419,027,899 (173,820,796)Financing income 134,401,598 67,542,768 28,639,034Financing cost (141,900,236) 114,271,762 104,453,148Derivative financial instruments (cost) income, net (1,608,039) 3,172 6,463Foreign exchange income (loss), net 15,807,988 (232,714,446) (139,623,910)
Copyright © 2018 www.secdatabase.com. All Rights Reserved.Please Consider the Environment Before Printing This Document
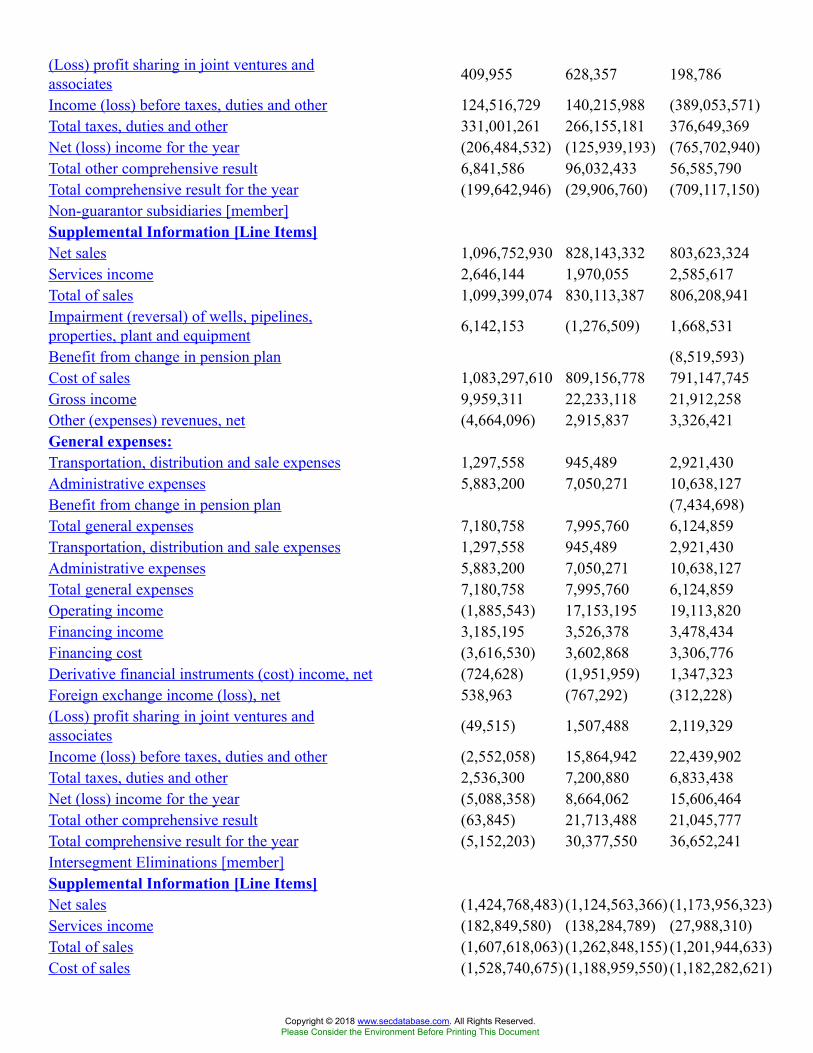
(Loss) profit sharing in joint ventures andassociates 409,955 628,357 198,786
Income (loss) before taxes, duties and other 124,516,729 140,215,988 (389,053,571)Total taxes, duties and other 331,001,261 266,155,181 376,649,369Net (loss) income for the year (206,484,532) (125,939,193) (765,702,940)Total other comprehensive result 6,841,586 96,032,433 56,585,790Total comprehensive result for the year (199,642,946) (29,906,760) (709,117,150)Non-guarantor subsidiaries [member]Supplemental Information [Line Items]Net sales 1,096,752,930 828,143,332 803,623,324Services income 2,646,144 1,970,055 2,585,617Total of sales 1,099,399,074 830,113,387 806,208,941Impairment (reversal) of wells, pipelines,properties, plant and equipment 6,142,153 (1,276,509) 1,668,531
Benefit from change in pension plan (8,519,593)Cost of sales 1,083,297,610 809,156,778 791,147,745Gross income 9,959,311 22,233,118 21,912,258Other (expenses) revenues, net (4,664,096) 2,915,837 3,326,421General expenses:Transportation, distribution and sale expenses 1,297,558 945,489 2,921,430Administrative expenses 5,883,200 7,050,271 10,638,127Benefit from change in pension plan (7,434,698)Total general expenses 7,180,758 7,995,760 6,124,859Transportation, distribution and sale expenses 1,297,558 945,489 2,921,430Administrative expenses 5,883,200 7,050,271 10,638,127Total general expenses 7,180,758 7,995,760 6,124,859Operating income (1,885,543) 17,153,195 19,113,820Financing income 3,185,195 3,526,378 3,478,434Financing cost (3,616,530) 3,602,868 3,306,776Derivative financial instruments (cost) income, net (724,628) (1,951,959) 1,347,323Foreign exchange income (loss), net 538,963 (767,292) (312,228)(Loss) profit sharing in joint ventures andassociates (49,515) 1,507,488 2,119,329
Income (loss) before taxes, duties and other (2,552,058) 15,864,942 22,439,902Total taxes, duties and other 2,536,300 7,200,880 6,833,438Net (loss) income for the year (5,088,358) 8,664,062 15,606,464Total other comprehensive result (63,845) 21,713,488 21,045,777Total comprehensive result for the year (5,152,203) 30,377,550 36,652,241Intersegment Eliminations [member]Supplemental Information [Line Items]Net sales (1,424,768,483) (1,124,563,366) (1,173,956,323)Services income (182,849,580) (138,284,789) (27,988,310)Total of sales (1,607,618,063) (1,262,848,155) (1,201,944,633)Cost of sales (1,528,740,675) (1,188,959,550) (1,182,282,621)
Copyright © 2018 www.secdatabase.com. All Rights Reserved.Please Consider the Environment Before Printing This Document

Gross income (78,877,388) (73,888,605) (19,662,012)Other (expenses) revenues, net 22,623,353 (666,804) 1,890,900General expenses:Transportation, distribution and sale expenses (5,544,562) (26,663,020) (6,863,699)Administrative expenses (51,005,527) (48,718,224) (10,921,939)Total general expenses (56,550,089) (75,381,244) (17,785,638)Transportation, distribution and sale expenses (5,544,562) (26,663,020) (6,863,699)Administrative expenses (51,005,527) (48,718,224) (10,921,939)Total general expenses (56,550,089) (75,381,244) (17,785,638)Operating income 296,054 825,835 14,526Financing income (265,097,307) (180,586,172) (125,670,274)Financing cost 264,801,253 (179,854,798) (125,530,391)(Loss) profit sharing in joint ventures andassociates 211,567,169 117,347,803 749,963,960
Income (loss) before taxes, duties and other 211,567,169 117,442,264 749,838,603Net (loss) income for the year 211,567,169 117,442,264 749,838,603Total comprehensive result for the year $ 211,567,169 $ 117,442,264 $ 749,838,603
Copyright © 2018 www.secdatabase.com. All Rights Reserved.Please Consider the Environment Before Printing This Document

12 Months EndedSubsidiary GuarantorInformation - Supplemental
Statement of Cash Flows(Detail)
$ in Thousands, $ inThousands
Dec. 31,2017
USD ($)
Dec. 31, 2017MXN ($)
Dec. 31, 2016MXN ($)
Dec. 31, 2015MXN ($)
Operating activities:Net (loss) income for the year $
(280,850,619)$(191,144,342)
$(712,567,398)
Adjustments to reconcile net loss to cash provided byoperating activities:Depreciation and amortization $ 7,919,689 156,704,513 150,439,491 167,951,250(Reversal) impairment of wells, pipelines, properties,plant and equipment 7,653,856 151,444,560 (331,314,343) 477,944,690
Unsuccessful wells 311,554 6,164,624 29,106,084 23,213,519Exploration costs (1,447,761) (2,022,826) (5,698,511)Disposal of wells, pipelines, properties, plant andequipment 862,381 17,063,671 3,771,287 24,638,537
Loss in sale of fixed assets 27,882,480Gain on sale of share in joint ventures and associates (158,647) (3,139,103) (15,211,039) (680,630)Profit (loss) sharing in joint ventures and associates (2,135,845) (2,318,115)Disposal of held-for-sale current non-financial assets 2,808,360Impairment of goodwill 4,007,018Dividends (9,131) (180,675) (293,397) (359,941)Effects of net present value of reserve for wellabandonment 392,890 7,774,000 11,968,966 (608,160)
Profit (loss) sharing in investments (360,440)Decrease on available-for-sale financial assets 68,743 1,360,205Net loss on available-for-sale financial assets 178,087 3,523,748Unrealized foreign exchange loss (gain) (843,265) (16,685,439) 243,182,764 152,676,256Interest expense 5,945,638 117,644,548 98,844,464 67,773,593Accounts receivable, accounts payable and derivativefinancial instruments (123,501,225) (89,784,505) 33,429,565
Inventories (908,028) (17,966,870) (1,358,879) 6,167,728Other assets (7,024,023) (25,128,530) (16,602,365)Employee benefits 2,530,255 50,065,396 47,293,069 (116,022,232)Net cash flows from (used in) operating activities 3,204,044 63,397,470 (41,898,083) 98,937,786Acquisition of wells, pipelines, properties, plant andequipment (4,642,485) (91,859,465) (151,408,480) (253,514,001)
Investments in associates (36,214)Resources from sale of shares in associates 158,779 3,141,710 22,684,736 4,417,138Cash flows used in investing activities (4,078,038) (80,690,919) (132,492,848) (249,133,077)Resources from sale available-for-sale financial assets 405,668 8,026,836Proceeds from the sale of fixed assets 560,665
Copyright © 2018 www.secdatabase.com. All Rights Reserved.Please Consider the Environment Before Printing This Document
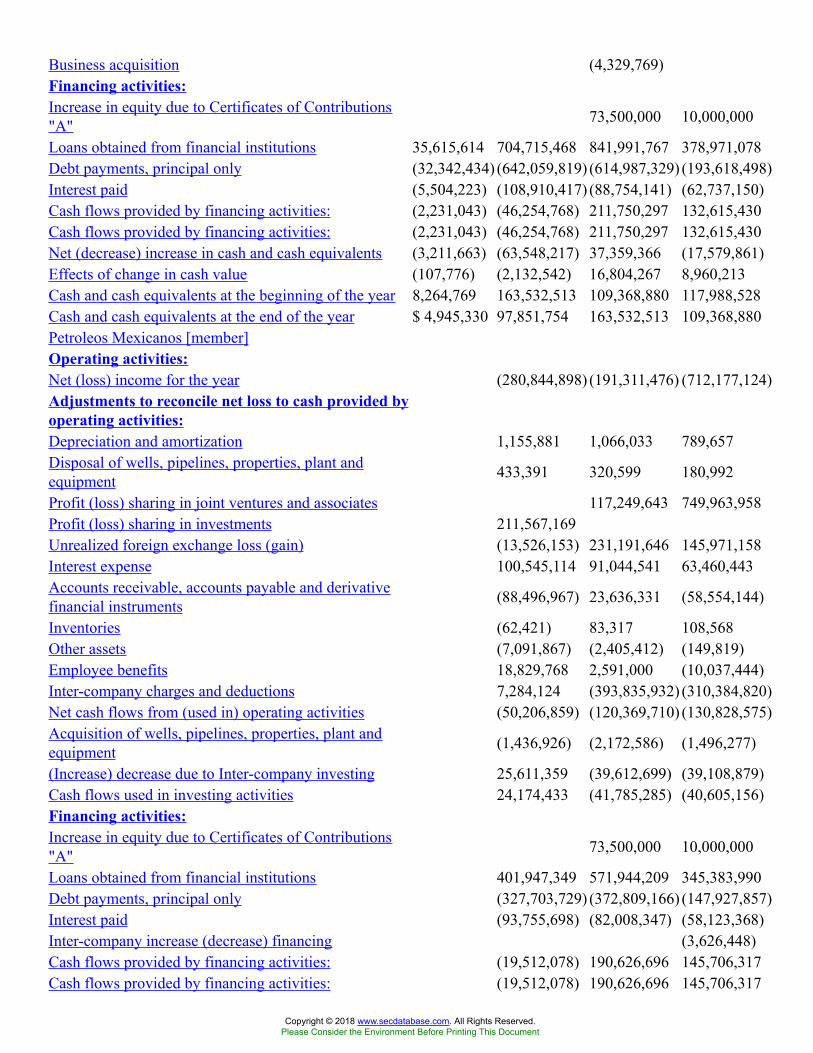
Business acquisition (4,329,769)Financing activities:Increase in equity due to Certificates of Contributions"A" 73,500,000 10,000,000
Loans obtained from financial institutions 35,615,614 704,715,468 841,991,767 378,971,078Debt payments, principal only (32,342,434) (642,059,819) (614,987,329) (193,618,498)Interest paid (5,504,223) (108,910,417) (88,754,141) (62,737,150)Cash flows provided by financing activities: (2,231,043) (46,254,768) 211,750,297 132,615,430Cash flows provided by financing activities: (2,231,043) (46,254,768) 211,750,297 132,615,430Net (decrease) increase in cash and cash equivalents (3,211,663) (63,548,217) 37,359,366 (17,579,861)Effects of change in cash value (107,776) (2,132,542) 16,804,267 8,960,213Cash and cash equivalents at the beginning of the year 8,264,769 163,532,513 109,368,880 117,988,528Cash and cash equivalents at the end of the year $ 4,945,330 97,851,754 163,532,513 109,368,880Petroleos Mexicanos [member]Operating activities:Net (loss) income for the year (280,844,898) (191,311,476) (712,177,124)Adjustments to reconcile net loss to cash provided byoperating activities:Depreciation and amortization 1,155,881 1,066,033 789,657Disposal of wells, pipelines, properties, plant andequipment 433,391 320,599 180,992
Profit (loss) sharing in joint ventures and associates 117,249,643 749,963,958Profit (loss) sharing in investments 211,567,169Unrealized foreign exchange loss (gain) (13,526,153) 231,191,646 145,971,158Interest expense 100,545,114 91,044,541 63,460,443Accounts receivable, accounts payable and derivativefinancial instruments (88,496,967) 23,636,331 (58,554,144)
Inventories (62,421) 83,317 108,568Other assets (7,091,867) (2,405,412) (149,819)Employee benefits 18,829,768 2,591,000 (10,037,444)Inter-company charges and deductions 7,284,124 (393,835,932) (310,384,820)Net cash flows from (used in) operating activities (50,206,859) (120,369,710) (130,828,575)Acquisition of wells, pipelines, properties, plant andequipment (1,436,926) (2,172,586) (1,496,277)
(Increase) decrease due to Inter-company investing 25,611,359 (39,612,699) (39,108,879)Cash flows used in investing activities 24,174,433 (41,785,285) (40,605,156)Financing activities:Increase in equity due to Certificates of Contributions"A" 73,500,000 10,000,000
Loans obtained from financial institutions 401,947,349 571,944,209 345,383,990Debt payments, principal only (327,703,729) (372,809,166) (147,927,857)Interest paid (93,755,698) (82,008,347) (58,123,368)Inter-company increase (decrease) financing (3,626,448)Cash flows provided by financing activities: (19,512,078) 190,626,696 145,706,317Cash flows provided by financing activities: (19,512,078) 190,626,696 145,706,317
Copyright © 2018 www.secdatabase.com. All Rights Reserved.Please Consider the Environment Before Printing This Document

Net (decrease) increase in cash and cash equivalents (45,544,504) 28,471,701 (25,727,414)Effects of change in cash value 5,570,892 11,185,788Cash and cash equivalents at the beginning of the year 92,503,607 58,461,014 73,002,640Cash and cash equivalents at the end of the year 46,959,103 92,503,607 58,461,014Subsidiary guarantors [member]Operating activities:Net (loss) income for the year (206,484,532) (139,410,398) (765,702,826)Adjustments to reconcile net loss to cash provided byoperating activities:Depreciation and amortization 152,607,943 146,545,307 164,221,429(Reversal) impairment of wells, pipelines, properties,plant and equipment 145,302,407 (330,037,834) 476,276,159
Unsuccessful wells 6,164,624 29,106,084 23,213,519Exploration costs (1,447,761) (2,022,826) (5,698,511)Disposal of wells, pipelines, properties, plant andequipment 14,687,229 2,658,625 21,945,266
Loss in sale of fixed assets 27,882,480Gain on sale of share in joint ventures and associates (3,139,103) (15,211,039) (337,675)Profit (loss) sharing in joint ventures and associates (628,356) (198,786)Disposal of held-for-sale current non-financial assets 2,808,360Effects of net present value of reserve for wellabandonment 7,774,000 11,968,966 (608,160)
Profit (loss) sharing in investments (409,955)Unrealized foreign exchange loss (gain) (1,585,910) 6,754,046 2,996,219Interest expense 15,736,420 5,687,502 3,414,430Accounts receivable, accounts payable and derivativefinancial instruments (14,214,566) (158,449,370) 119,761,648
Inventories (3,086,181) 3,508,494 4,547,843Other assets (483,389) (22,600,504) (16,578,827)Employee benefits 31,489,785 136,354,337 (94,183,192)Inter-company charges and deductions (114,968,213) (83,049,125) 30,044,041Net cash flows from (used in) operating activities 30,751,158 (380,943,611) (36,887,423)Acquisition of wells, pipelines, properties, plant andequipment (87,274,561) (147,786,686) (239,315,507)
Resources from sale of shares in associates 3,863,072 23,050,344 (130,323)Cash flows used in investing activities (83,411,489) (124,175,677) (239,445,830)Proceeds from the sale of fixed assets 560,665Financing activities:Increase in equity due to Certificates of Contributions"A" (1,915,922)
Loans obtained from financial institutions 34,483,348Debt payments, principal only (7,981,937) (6,414,441) (8,081,177)Interest paid (13,991,633) (4,706,946) (3,443,923)Inter-company increase (decrease) financing 83,716,743 464,488,030 289,859,173Cash flows provided by financing activities: 61,743,173 487,849,991 276,418,151
Copyright © 2018 www.secdatabase.com. All Rights Reserved.Please Consider the Environment Before Printing This Document

Cash flows provided by financing activities: 61,743,173 487,849,991 276,418,151Net (decrease) increase in cash and cash equivalents 9,082,842 (17,269,297) 84,898Effects of change in cash value 20,371,126 1,138,356Cash and cash equivalents at the beginning of the year 9,732,503 6,630,674 5,407,420Cash and cash equivalents at the end of the year 18,815,345 9,732,503 6,630,674Non-guarantor subsidiaries [member]Operating activities:Net (loss) income for the year (5,082,639) 22,160,755 15,738,868Adjustments to reconcile net loss to cash provided byoperating activities:Depreciation and amortization 2,940,689 2,828,151 2,940,164(Reversal) impairment of wells, pipelines, properties,plant and equipment 6,142,153 (1,276,509) 1,668,531
Disposal of wells, pipelines, properties, plant andequipment 1,943,051 792,063 2,512,279
Gain on sale of share in joint ventures and associates (342,955)Profit (loss) sharing in joint ventures and associates (1,507,489) (2,119,329)Impairment of goodwill 4,007,018Dividends (180,675) (293,397) (359,941)Profit (loss) sharing in investments 49,515Decrease on available-for-sale financial assets 1,360,205Net loss on available-for-sale financial assets 3,523,748Unrealized foreign exchange loss (gain) (1,573,376) 5,237,072 3,708,879Interest expense 1,363,014 2,112,421 898,720Accounts receivable, accounts payable and derivativefinancial instruments (20,789,692) 45,028,534 (27,777,939)
Inventories (14,818,268) (4,950,690) 1,511,317Other assets 551,233 (122,614) 126,281Employee benefits (254,157) (91,652,268) (11,801,596)Inter-company charges and deductions 514,270 48,435,633 31,975,215Net cash flows from (used in) operating activities (24,310,929) 30,798,680 18,678,494Acquisition of wells, pipelines, properties, plant andequipment (3,147,978) (1,449,208) (12,702,217)
Investments in associates (36,214)Resources from sale of shares in associates (721,362) (365,608) 4,547,461Cash flows used in investing activities 4,157,496 (6,144,585) (8,190,970)Resources from sale available-for-sale financial assets 8,026,836Business acquisition (4,329,769)Financing activities:Increase in equity due to Certificates of Contributions"A" 1,844,394
Loans obtained from financial institutions 302,768,119 235,564,210 33,587,088Debt payments, principal only (306,374,153) (235,763,722) (37,609,464)Interest paid (1,163,086) (2,038,848) (1,169,859)Inter-company increase (decrease) financing (2,164,002) 3,741,227 922,972
Copyright © 2018 www.secdatabase.com. All Rights Reserved.Please Consider the Environment Before Printing This Document
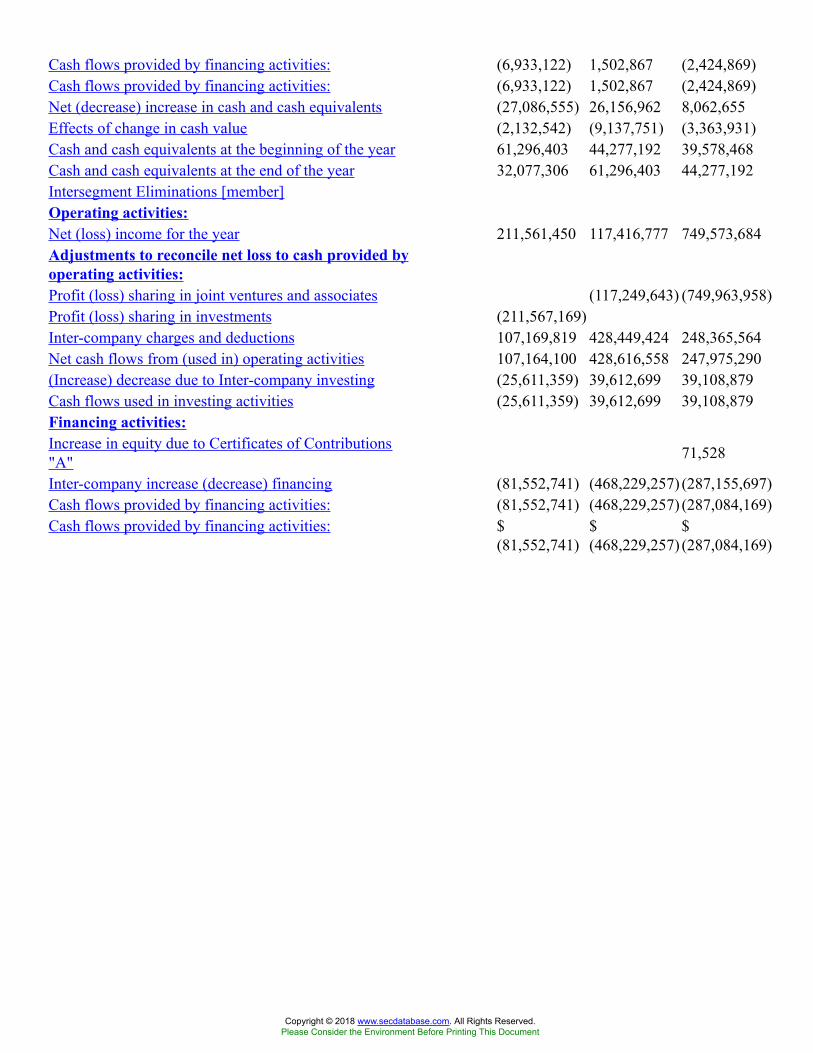
Cash flows provided by financing activities: (6,933,122) 1,502,867 (2,424,869)Cash flows provided by financing activities: (6,933,122) 1,502,867 (2,424,869)Net (decrease) increase in cash and cash equivalents (27,086,555) 26,156,962 8,062,655Effects of change in cash value (2,132,542) (9,137,751) (3,363,931)Cash and cash equivalents at the beginning of the year 61,296,403 44,277,192 39,578,468Cash and cash equivalents at the end of the year 32,077,306 61,296,403 44,277,192Intersegment Eliminations [member]Operating activities:Net (loss) income for the year 211,561,450 117,416,777 749,573,684Adjustments to reconcile net loss to cash provided byoperating activities:Profit (loss) sharing in joint ventures and associates (117,249,643) (749,963,958)Profit (loss) sharing in investments (211,567,169)Inter-company charges and deductions 107,169,819 428,449,424 248,365,564Net cash flows from (used in) operating activities 107,164,100 428,616,558 247,975,290(Increase) decrease due to Inter-company investing (25,611,359) 39,612,699 39,108,879Cash flows used in investing activities (25,611,359) 39,612,699 39,108,879Financing activities:Increase in equity due to Certificates of Contributions"A" 71,528
Inter-company increase (decrease) financing (81,552,741) (468,229,257) (287,155,697)Cash flows provided by financing activities: (81,552,741) (468,229,257) (287,084,169)Cash flows provided by financing activities: $
(81,552,741)$(468,229,257)
$(287,084,169)
Copyright © 2018 www.secdatabase.com. All Rights Reserved.Please Consider the Environment Before Printing This Document

12 Months EndedSupplementary Informationon Oil and Gas Explorationand Production Activities(Unaudited) - Summary of
Capitalized Costs for Oil andGas Producing Activities
(Detail) - MXN ($)$ in Thousands
Dec. 31, 2017 Dec. 31, 2016 Dec. 31, 2015
Disclosure Of Oil And Gas Producing Activities [LineItems]Net capitalized costs $ 953,755,253 $ 1,181,853,614 $ 966,986,487Proved reserves [member]Disclosure Of Oil And Gas Producing Activities [LineItems]Net capitalized costs 2,363,336,481 2,476,535,503 2,102,971,025Construction in progress [member]Disclosure Of Oil And Gas Producing Activities [LineItems]Net capitalized costs 35,381,089 60,720,261 88,706,330Accumulated depreciation and amortization [member]Disclosure Of Oil And Gas Producing Activities [LineItems]Net capitalized costs $
(1,444,962,317)$(1,355,402,150)
$(1,224,690,867)
Copyright © 2018 www.secdatabase.com. All Rights Reserved.Please Consider the Environment Before Printing This Document
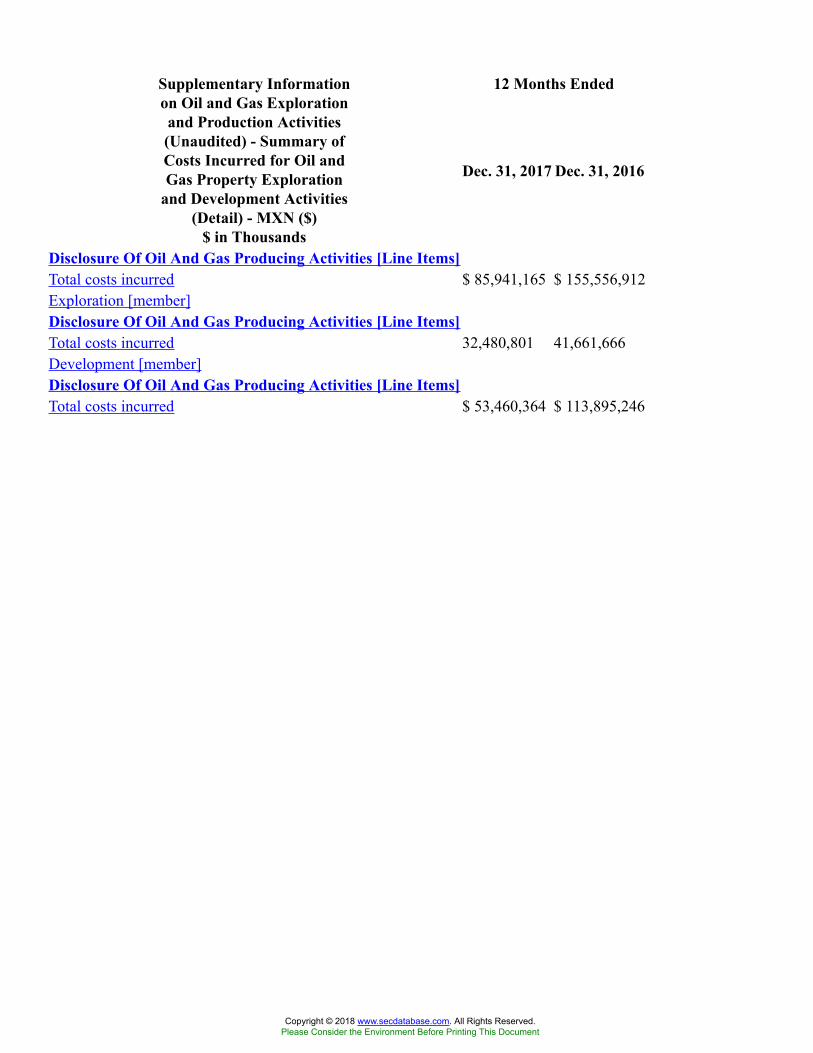
12 Months EndedSupplementary Informationon Oil and Gas Explorationand Production Activities(Unaudited) - Summary ofCosts Incurred for Oil andGas Property Exploration
and Development Activities(Detail) - MXN ($)
$ in Thousands
Dec. 31, 2017 Dec. 31, 2016
Disclosure Of Oil And Gas Producing Activities [Line Items]Total costs incurred $ 85,941,165 $ 155,556,912Exploration [member]Disclosure Of Oil And Gas Producing Activities [Line Items]Total costs incurred 32,480,801 41,661,666Development [member]Disclosure Of Oil And Gas Producing Activities [Line Items]Total costs incurred $ 53,460,364 $ 113,895,246
Copyright © 2018 www.secdatabase.com. All Rights Reserved.Please Consider the Environment Before Printing This Document
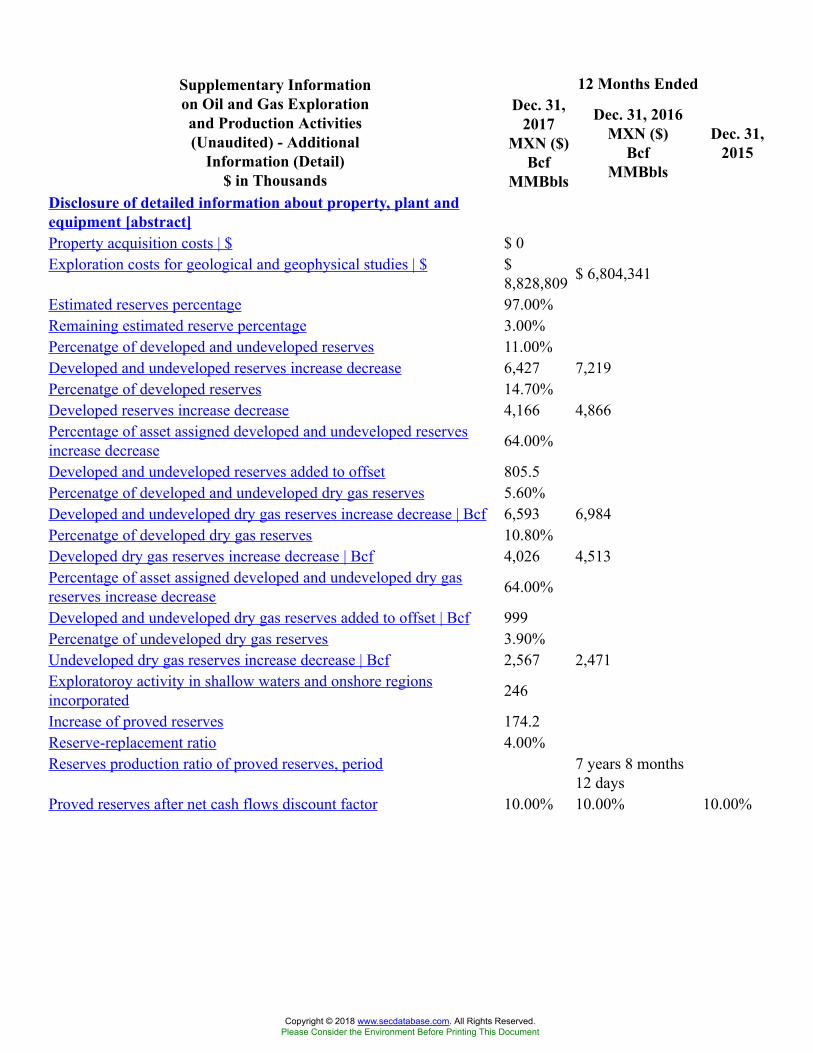
12 Months EndedSupplementary Informationon Oil and Gas Explorationand Production Activities(Unaudited) - Additional
Information (Detail)$ in Thousands
Dec. 31,2017
MXN ($)Bcf
MMBbls
Dec. 31, 2016MXN ($)
BcfMMBbls
Dec. 31,2015
Disclosure of detailed information about property, plant andequipment [abstract]Property acquisition costs | $ $ 0Exploration costs for geological and geophysical studies | $ $
8,828,809 $ 6,804,341
Estimated reserves percentage 97.00%Remaining estimated reserve percentage 3.00%Percenatge of developed and undeveloped reserves 11.00%Developed and undeveloped reserves increase decrease 6,427 7,219Percenatge of developed reserves 14.70%Developed reserves increase decrease 4,166 4,866Percentage of asset assigned developed and undeveloped reservesincrease decrease 64.00%
Developed and undeveloped reserves added to offset 805.5Percenatge of developed and undeveloped dry gas reserves 5.60%Developed and undeveloped dry gas reserves increase decrease | Bcf 6,593 6,984Percenatge of developed dry gas reserves 10.80%Developed dry gas reserves increase decrease | Bcf 4,026 4,513Percentage of asset assigned developed and undeveloped dry gasreserves increase decrease 64.00%
Developed and undeveloped dry gas reserves added to offset | Bcf 999Percenatge of undeveloped dry gas reserves 3.90%Undeveloped dry gas reserves increase decrease | Bcf 2,567 2,471Exploratoroy activity in shallow waters and onshore regionsincorporated 246
Increase of proved reserves 174.2Reserve-replacement ratio 4.00%Reserves production ratio of proved reserves, period 7 years 8 months
12 daysProved reserves after net cash flows discount factor 10.00% 10.00% 10.00%
Copyright © 2018 www.secdatabase.com. All Rights Reserved.Please Consider the Environment Before Printing This Document
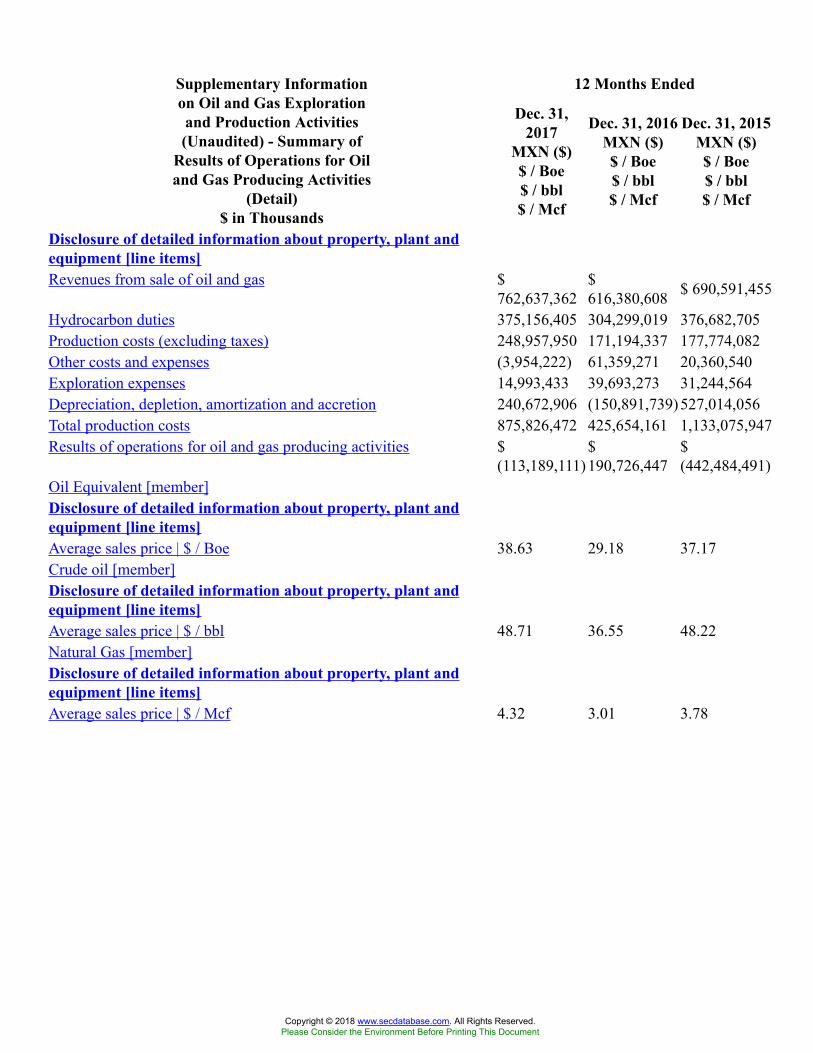
12 Months EndedSupplementary Informationon Oil and Gas Explorationand Production Activities(Unaudited) - Summary of
Results of Operations for Oiland Gas Producing Activities
(Detail)$ in Thousands
Dec. 31,2017
MXN ($)$ / Boe$ / bbl$ / Mcf
Dec. 31, 2016MXN ($)$ / Boe$ / bbl$ / Mcf
Dec. 31, 2015MXN ($)$ / Boe$ / bbl$ / Mcf
Disclosure of detailed information about property, plant andequipment [line items]Revenues from sale of oil and gas $
762,637,362$616,380,608 $ 690,591,455
Hydrocarbon duties 375,156,405 304,299,019 376,682,705Production costs (excluding taxes) 248,957,950 171,194,337 177,774,082Other costs and expenses (3,954,222) 61,359,271 20,360,540Exploration expenses 14,993,433 39,693,273 31,244,564Depreciation, depletion, amortization and accretion 240,672,906 (150,891,739) 527,014,056Total production costs 875,826,472 425,654,161 1,133,075,947Results of operations for oil and gas producing activities $
(113,189,111)$190,726,447
$(442,484,491)
Oil Equivalent [member]Disclosure of detailed information about property, plant andequipment [line items]Average sales price | $ / Boe 38.63 29.18 37.17Crude oil [member]Disclosure of detailed information about property, plant andequipment [line items]Average sales price | $ / bbl 48.71 36.55 48.22Natural Gas [member]Disclosure of detailed information about property, plant andequipment [line items]Average sales price | $ / Mcf 4.32 3.01 3.78
Copyright © 2018 www.secdatabase.com. All Rights Reserved.Please Consider the Environment Before Printing This Document

12 Months EndedSupplementary Informationon Oil and Gas Explorationand Production Activities(Unaudited) - Summary of
Oil and Gas Proved Reserves(Detail)
Dec. 31, 2017Bcf
MMBbls
Dec. 31, 2016Bcf
MMBbls
Dec. 31, 2015Bcf
MBbls
Crude oil reserve [member]Proved developed and un-developed reserves:Proved developed reserves 4,166 4,886 5,725Proved undeveloped reserves 2,261 2,333 2,252Total proved reserves | MMBbls 6,427Dry gas reserve [member]Proved developed and un-developed reserves:Proved developed reserves 4,026 4,513 6,012Proved undeveloped reserves 2,567 2,471 2,598Total proved reserves 6,593
Copyright © 2018 www.secdatabase.com. All Rights Reserved.Please Consider the Environment Before Printing This Document

12 Months EndedSupplementary Informationon Oil and Gas Explorationand Production Activities
(Unaudited) - Disclosure ofProved Developed andUndeveloped Reserve
(Detail)
Dec. 31, 2017Bcf
MMBbls
Dec. 31, 2016Bcf
MMBbls
Dec. 31, 2015Bcf
MBbls
Crude oil reserve [member]Proved developed and undeveloped reserves:Beginning balance 7,219 7,977 10,292Revisions (95) 189 (1,491)Extensions and discoveries 147 (55) 111Production (805) (891) (935)Farm outs & transfer of fields due to NHC bidding process | MMBbls (38)Ending Balance 6,427 7,219 7,977Proved developed reserves at December 31 4,166 4,886 5,725Proved undeveloped reserves at December 31 2,261 2,333 2,252Dry gas reserve [member]Proved developed and undeveloped reserves:Beginning balance 6,984 8,610 10,859Revisions 169 (183) (955)Extensions and discoveries 468 (308) 47Production (999) (1,134) (1,341)Farm outs & transfer of fields due to NHC bidding process (29)Ending Balance 6,593 6,984 8,610Proved developed reserves at December 31 4,026 4,513 6,012Proved undeveloped reserves at December 31 2,567 2,471 2,598
Copyright © 2018 www.secdatabase.com. All Rights Reserved.Please Consider the Environment Before Printing This Document
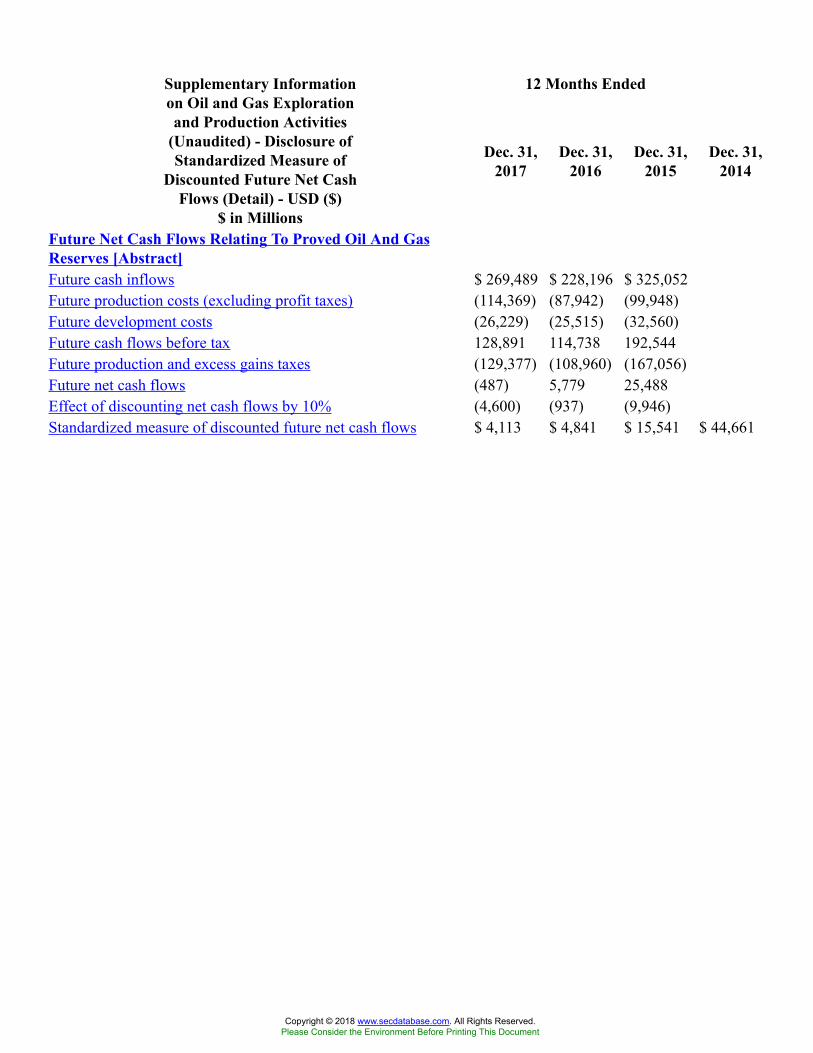
12 Months EndedSupplementary Informationon Oil and Gas Explorationand Production Activities
(Unaudited) - Disclosure ofStandardized Measure of
Discounted Future Net CashFlows (Detail) - USD ($)
$ in Millions
Dec. 31,2017
Dec. 31,2016
Dec. 31,2015
Dec. 31,2014
Future Net Cash Flows Relating To Proved Oil And GasReserves [Abstract]Future cash inflows $ 269,489 $ 228,196 $ 325,052Future production costs (excluding profit taxes) (114,369) (87,942) (99,948)Future development costs (26,229) (25,515) (32,560)Future cash flows before tax 128,891 114,738 192,544Future production and excess gains taxes (129,377) (108,960) (167,056)Future net cash flows (487) 5,779 25,488Effect of discounting net cash flows by 10% (4,600) (937) (9,946)Standardized measure of discounted future net cash flows $ 4,113 $ 4,841 $ 15,541 $ 44,661
Copyright © 2018 www.secdatabase.com. All Rights Reserved.Please Consider the Environment Before Printing This Document
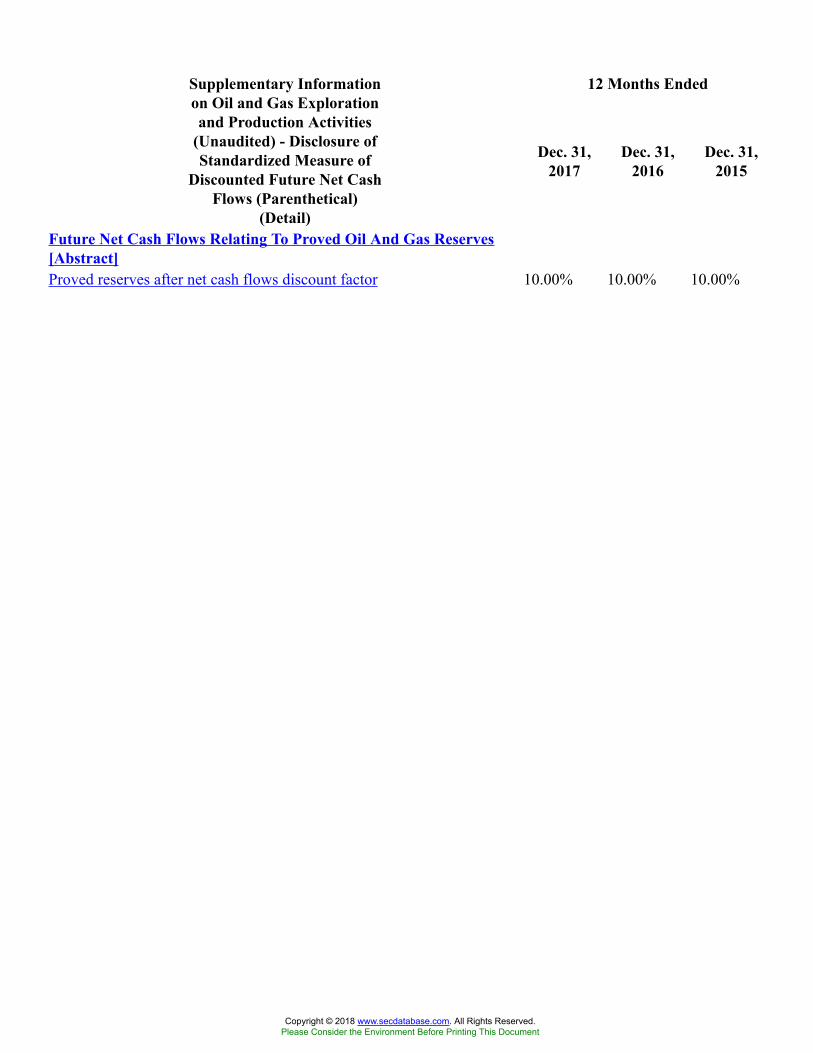
12 Months EndedSupplementary Informationon Oil and Gas Explorationand Production Activities
(Unaudited) - Disclosure ofStandardized Measure of
Discounted Future Net CashFlows (Parenthetical)
(Detail)
Dec. 31,2017
Dec. 31,2016
Dec. 31,2015
Future Net Cash Flows Relating To Proved Oil And Gas Reserves[Abstract]Proved reserves after net cash flows discount factor 10.00% 10.00% 10.00%
Copyright © 2018 www.secdatabase.com. All Rights Reserved.Please Consider the Environment Before Printing This Document
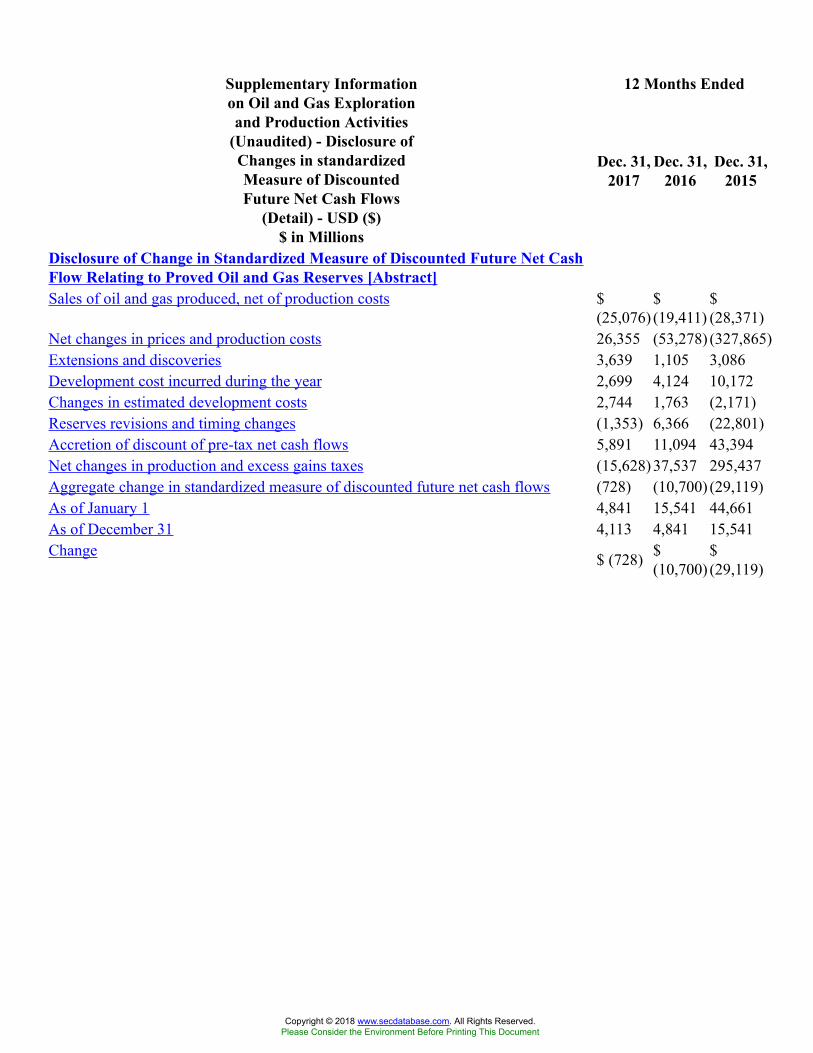
12 Months EndedSupplementary Informationon Oil and Gas Explorationand Production Activities
(Unaudited) - Disclosure ofChanges in standardizedMeasure of DiscountedFuture Net Cash Flows
(Detail) - USD ($)$ in Millions
Dec. 31,2017
Dec. 31,2016
Dec. 31,2015
Disclosure of Change in Standardized Measure of Discounted Future Net CashFlow Relating to Proved Oil and Gas Reserves [Abstract]Sales of oil and gas produced, net of production costs $
(25,076)$(19,411)
$(28,371)
Net changes in prices and production costs 26,355 (53,278) (327,865)Extensions and discoveries 3,639 1,105 3,086Development cost incurred during the year 2,699 4,124 10,172Changes in estimated development costs 2,744 1,763 (2,171)Reserves revisions and timing changes (1,353) 6,366 (22,801)Accretion of discount of pre-tax net cash flows 5,891 11,094 43,394Net changes in production and excess gains taxes (15,628) 37,537 295,437Aggregate change in standardized measure of discounted future net cash flows (728) (10,700) (29,119)As of January 1 4,841 15,541 44,661As of December 31 4,113 4,841 15,541Change $ (728) $
(10,700)$(29,119)
Copyright © 2018 www.secdatabase.com. All Rights Reserved.Please Consider the Environment Before Printing This Document