Boundary-Layer Stabilization with Dielectric Barrier Discharge ...
187
Boundary-Layer Stabilization with Dielectric Barrier Discharge Plasmas for Free-Flight Application Vom Fachbereich Maschinenbau an der Technischen Universität Darmstadt zur Erlangung des Grades eines Doktor-Ingenieurs (Dr.-Ing.) genehmigte Dissertation vorgelegt von Dipl.-Ing. Alexander Duchmann aus Frankfurt am Main Berichterstatter: Prof. Dr.-Ing. C. Tropea Mitberichterstatter: Prof. D. Henningson Tag der Einreichung: 01.11.2012 Tag der mündlichen Prüfung: 17.12.2012 Darmstadt 2013 D17
-
Upload
khangminh22 -
Category
Documents
-
view
1 -
download
0
Transcript of Boundary-Layer Stabilization with Dielectric Barrier Discharge ...

Boundary-Layer Stabilization
with Dielectric Barrier Discharge Plasmas
for Free-Flight Application
Vom Fachbereich Maschinenbauan der Technischen Universität Darmstadt
zurErlangung des Grades eines Doktor-Ingenieurs (Dr.-Ing.)
genehmigte
D i s s e r t a t i o n
vorgelegt von
Dipl.-Ing. Alexander Duchmann
aus Frankfurt am Main
Berichterstatter: Prof. Dr.-Ing. C. TropeaMitberichterstatter: Prof. D. HenningsonTag der Einreichung: 01.11.2012Tag der mündlichen Prüfung: 17.12.2012
Darmstadt 2013D17

Boundary-Layer Stabilization with Dielectric Barrier Discharge Plasmasfor Free-Flight Application
Bitte zitieren Sie dieses Dokument als:URN: urn:nbn:de:tuda-tuprints-33513URL: http://tuprints.ulb.tu-darmstadt.de/id/eprint/3351
Dieses Dokument wird bereitgestellt von TU Prints,E-Publishing-Service der Technischen Universität Darmstadthttp://[email protected]
Die Veröffentlichung steht unter folgender Creative Commons Lizenz:Namensnennung - Keine kommerzielle Nutzung - Keine Bearbeitung3.0 Deutschlandhttp://creativecommons.org/licenses/by-nc-nd/3.0/de/

Hiermit versichere ich, die vorliegende Doktorarbeit unter derBetreuung von Prof. Dr.-Ing. C. Tropea und Dr.-Ing. S. Grundmannnur mit den angegebenen Hilfsmitteln selbständig angefertigt zuhaben.
Darmstadt, den 01.11.2012.


Abstract
The present work combines experimental and numerical efforts to enhancethe maturity of dielectric barrier discharge (DBD) plasma actuators as flow-control devices. In an attempt to increase the effectiveness of controllinglaminar-turbulent transition, the understanding of a stabilizing effect ofthe actuator force field on laminar boundary-layer flow is fostered. Para-metrical studies extend the Reynolds number range for effective transitioncontrol beyond the limits of earlier investigations. A numerical tool kit,consisting of a boundary-layer solver with implemented DBD force modeland coupled stability analysis, is developed to predict the flow-control ef-fectiveness. Validation experiments show considerable transition delay ina wind-tunnel setting. The excellent agreement of the experimental datawith the numerical predictions renders the latter valuable for the design offlow-control applications. In order to realize an application of plasma ac-tuators under non-laboratory conditions, a transition control experiment isdesigned for in-flight application on a full-sized motorized glider. The per-formed proof-of-concept experiment at a Reynolds number of 3×10⁶ is thefirst to show a successful use of DBD transition control under atmosphericflight conditions. The discussion of the significantly delayed transition andresulting drag reduction concludes with an estimate for the flow-controlefficiency.
i

ii

Kurzfassung
Die vorliegende Arbeit kombiniert experimentelle und numerische Unter-suchungen zur Strömungskontrolle mit dielektrischen Barriereentladungs-Plasma Aktuatoren. Um die Effektivität der Kontrolle des laminar- tur-bulenten Umschlags zu steigern wird das Verständnis für den stabilisieren-den Effekt des Aktuator-Kraftfeldes auf laminare Grenzschichtströmungenverbessert. Parameterstudien erweitern den Reynoldszahlbereich, inner-halb dessen eine effektive Kontrolle der Transition möglich ist, jenseits derGrenzen vorheriger Untersuchungen. Ein numerisches Werkzeug, beste-hend aus einem Grenzschicht-Löser mit integriertem Modell eines Plasma-Aktuators und gekoppelter Stabilitätsanalyse, dient zur Vorhersage derKontrolleffektivität. Validierungsexperimente im Windkanal zeigen eineerhebliche Verzögerung der Transition. Die hervorragende Übereinstim-mung der experimentellen Daten mit numerischen Vorhersagen ermöglichtdie Verwendung der letztgenannten zur Auslegung von Strömungskontrol-lanwendungen. Um eine Anwendung von Plasma-Aktuatoren außerhalblaboratorieller Bedingungen zu realisieren wird ein Freiflug-Experiment zurTransitionskontrolle auf einem Motorsegler gestaltet. Die Machbarkeits-studie bei einer Reynoldszahl von 3 × 10⁶ zeigt erstmals eine erfolgreicheAnwendung von Plasma-Aktuatoren zur Transitionskontrolle unter atmo-sphärischen Flugbedingungen. Eine abschließende Diskussion der Trans-itionsverzögerung und der ermöglichten Reibungsreduktion resultiert ineiner Abschätzung der Strömungskontrolleffizienz.
iii

iv

Acknowledgements
I would like to thank Prof. Dr. Cameron Tropea for ensuring the freedomto pursue the research summarized in this thesis while working at the De-partment of Fluid Mechanics and Aerodynamics as well as the Center ofSmart Interfaces at TU Darmstadt. Furthermore, I appreciate the supportby Dr. Sven Grundmann, who always had an open office door and engagedin fruitful discussions. The financial support by the Air Force Office ofScientific Research (Grant FA8655-08-1-3032) is thankfully acknowledged.
The successful cooperation with KTH Stockholm culminated in Prof.Dan Henningson’s commitment to co-referee this thesis, for which I amtruly thankful. Additionally, I thank Ardeshir Hanifi for his patience andhelp with the numerical implementations as well as the support during myshort-term stay in Stockholm.
Without our exceptional flight-experiment crew, Andreas Reeh, Bern-hard Simon, Martin Stenger, and Michael Weismüller, the airborne exper-iments could not have been successfully performed. I would like to thankthem for their technical assistance, but even more for their help and friendlysupport in pursuing my aviation ambitions. Multiple experimental setupshave only been completed in time due to the arduous work of the electricaland mechanical workshops, and I would like to thank the whole workforcefor their persistent support.
The excellent working atmosphere at the wind-tunnel facilities in Gries-heim has always been motivating, foremost due to the presence of my col-laborators. I am grateful to Katrin Barckmann, Andreas Güttler, DanielaKlaubert, Jochen Kriegseis, Armin Kurz, Lars Opfer, Debora Vieira, andAlexander Widmann for their help and suggestions related to experimentsand numerical studies, but also for becoming friends beyond the profes-sional sphere. I am delighted to have supervised many excellent studentswho fundamentally contributed to the results of this research: IbrahimBudde, Christoph Vetter, Daniel Stehlik, Michael Köhler, Tamino Wetz,Nikolas Kienzle, Philip Magin, Tim Denk, and Kilian Lackhove.
Finally, I would like to express my deepest gratitude to my family as wellas my friends and Katharina, who unconditionally supported me during thegood and hard times of my doctoral studies.
v

vi

Contents
Abstract i
Kurzfassung iii
Acknowledgements v
1 Introduction 1
1.1 Transition Control . . . . . . . . . . . . . . . . . . . . . . . 21.2 DBD Flow Control . . . . . . . . . . . . . . . . . . . . . . . 51.3 Key Questions and Outline . . . . . . . . . . . . . . . . . . 7
2 Hydrodynamic Stability 11
2.1 Boundary-Layer Theory . . . . . . . . . . . . . . . . . . . . 112.2 Linear Stability Theory . . . . . . . . . . . . . . . . . . . . 16
3 Methodology 21
3.1 Dielectric Barrier Discharges . . . . . . . . . . . . . . . . . 213.2 Transition Detection . . . . . . . . . . . . . . . . . . . . . . 263.3 Flat Plate Experiments . . . . . . . . . . . . . . . . . . . . 30
3.3.1 Hot-Wire Measurements . . . . . . . . . . . . . . . . 323.3.2 Particle Image Velocimetry . . . . . . . . . . . . . . 333.3.3 Laser Doppler Anemometry . . . . . . . . . . . . . . 35
3.4 Flight Setup . . . . . . . . . . . . . . . . . . . . . . . . . . . 363.4.1 Glider . . . . . . . . . . . . . . . . . . . . . . . . . . 363.4.2 Wing Glove . . . . . . . . . . . . . . . . . . . . . . . 383.4.3 Exchangeable Insert . . . . . . . . . . . . . . . . . . 393.4.4 Sensors . . . . . . . . . . . . . . . . . . . . . . . . . 403.4.5 Ambient Air Data Acquisition . . . . . . . . . . . . 433.4.6 Boundary-Layer Traverse . . . . . . . . . . . . . . . 44
3.5 Numerical Tools . . . . . . . . . . . . . . . . . . . . . . . . 453.5.1 Boundary-Layer Solver . . . . . . . . . . . . . . . . . 463.5.2 Force Model . . . . . . . . . . . . . . . . . . . . . . . 513.5.3 Linear Stability Solver . . . . . . . . . . . . . . . . . 52
vii

Contents
4 Flat Plate Experiments 57
4.1 Hot-Wire Anemometry . . . . . . . . . . . . . . . . . . . . . 604.2 Phase-Locked Particle Image Velocimetry . . . . . . . . . . 664.3 Laser Doppler Anemometry . . . . . . . . . . . . . . . . . . 704.4 Flow-Control Optimization . . . . . . . . . . . . . . . . . . 71
4.4.1 Thrust Variation . . . . . . . . . . . . . . . . . . . . 724.4.2 Actuator Arrays . . . . . . . . . . . . . . . . . . . . 74
4.5 Conclusions . . . . . . . . . . . . . . . . . . . . . . . . . . . 75
5 Stability Impact 77
5.1 Code Validation by Comparison to Numerical Data . . . . . 785.2 Code Validation with Generic Flat Plate Experiments . . . 795.3 Numerical Optimization of Generic Flow Control Experiments 855.4 Stability Analysis of Experimental Data . . . . . . . . . . . 885.5 Design Tool Kit for Flight Experiments . . . . . . . . . . . 905.6 Conclusions . . . . . . . . . . . . . . . . . . . . . . . . . . . 94
6 Airfoil Experiments 97
6.1 Initial Windtunnel Experiments . . . . . . . . . . . . . . . . 986.1.1 Identification of Adequate Transition Locations . . . 1006.1.2 Quantification of Transition Delay . . . . . . . . . . 103
6.2 Constraints of Flight Operation . . . . . . . . . . . . . . . . 1076.2.1 Quantification of Ambient Condition Influences . . . 1126.2.2 Closed-Loop Performance Control . . . . . . . . . . 114
6.3 Transition Delay in Flight . . . . . . . . . . . . . . . . . . . 1176.3.1 Microphone Measurements . . . . . . . . . . . . . . 1196.3.2 Hot-Wire Measurements . . . . . . . . . . . . . . . . 1256.3.3 Forced Transition and Stability Analysis . . . . . . . 129
6.4 Efficiency Estimate . . . . . . . . . . . . . . . . . . . . . . . 1326.5 Conclusions . . . . . . . . . . . . . . . . . . . . . . . . . . . 134
7 Discussion 137
7.1 DBD Effect on Stability . . . . . . . . . . . . . . . . . . . . 1377.2 Optimization and Flow Control Design . . . . . . . . . . . . 1397.3 In-Flight Application . . . . . . . . . . . . . . . . . . . . . . 140
8 Outlook 143
Bibliography 147
viii

Contents
Nomenclature 159
List of Figures 167
List of Tables 171
ix

Contents
x

1 Introduction
Advancements within the field of aerodynamics, especially driven by in-creasing potential of sophisticated computational tools, have led to highlevels of predictability and optimization of airflow situations. Besides op-timized design of airfoil and fuselage shapes, passive flow-control methodslike riblets provide additional benefits if designed correctly and appliedwisely. Nevertheless, such passive methods usually enhance the efficiencyonly in a small range around the design point and provoke derogatory ef-fects if this condition is left. This can be caused by flow unsteadiness orchanges of ambient conditions, leading to deteriorated performance. Eco-nomically and ecologically motivated holistic efficiency considerations overthe whole mission of an aerodynamic object require a customized removalof such undesired effects. Active control strategies can beneficially influ-ence the flow at the design state as well as under non-optimal conditionsat the expense of energy consumption. The overall relevance of such flowcontrol is comprehensively reviewed by Gad-el-Hak [39] and Arnal and Ar-chambaud [6], providing theoretical and practical approaches. Variationof the expended energy allows for adaptation of the control effectiveness,and variable positioning of flow-control devices enables improvements underoff-design conditions. The necessity to spend energy on active flow manip-ulation requires accurate development of the flow-control application. Onlyefficient design capacitates dramatic changes of the global flow behavior forminute localized efforts. Surface implementation empowers on-demand useand unobstructed flow without interfering naturally ideal conditions. Dur-ing the last decade, dielectric barrier discharge (DBD) plasma actuatorshave demonstrated effective means of active flow control in a wide range ofapplications.
It is the aim of the present thesis to explore the working mechanisms,the predictability and the efficiency of such devices for transition control.A combination of experimental and numerical investigations is presentedto show efficient transition delay and drag reduction in wind tunnels andflight. The investigations focus on an explanation of the hydrodynamicallystabilizing effect and the development of a design tool for DBD transitioncontrol applications under elevated Reynolds numbers in flight.
1

1 Introduction
1.1 Transition Control
Approximately 47% of modern transport aircraft drag is caused by viscousfriction along the wetted surfaces [31], to which the fuselage and the wingscontribute about 70% [87]. If the viscous resistance can be reduced even bya small percentage, large energy savings are gained. Estimated worldwidesavings of 9 million tons of carbon dioxide per year are imaginable if thefriction on commercial airliners can be reduced by 1%. For drag reductionon airfoil shaped objects, delaying the detrimental transition to turbulencecan energetically be up to an order of magnitude more efficient than re-laminarization of a turbulent flow [53]. It is therefore desirable to maintainlaminar flow as long as possible.
Some general aviation aircraft like the HondaJet [38] and especiallysailplanes combine very smooth surfaces on the wings and fuselage withespecially designed airfoils for maximized laminar flow downstream of theleading edge. This natural laminar flow (NLF) concept leads to a pro-nounced “laminar bucket” within the flight envelope, where the drag canbe reduced by up to 50% in comparison to turbulent conditions. The rangeof flight states for this laminar bucket is determined by the flow speedsand chord length constituting the Reynolds number. The NLF concept isa designated design-point technique since at large Reynolds numbers or incase of a swept wing, the laminar bucket persists only over a small angle-of-attack range. Hence, active laminar flow-control (LFC) techniques areinvestigated to maintain the laminar flow state and delay the transition toturbulence downstream. Such active flow control combines the advantageto adapt to different flight states during a typical flight mission with a re-duction of the net drag at cruise conditions. Successful proofs of conceptinclude small slots in the surface for boundary-layer suction to increase thelaminar portion of the flow over a wing glove in flight, demonstrated byPfenninger and Groth [78]. Alternatively, a porous surface can be gener-ated by high-precision drilling to enable continuous suction through thesurface, theoretically maintaining the laminar state up to the trailing edge.Despite the flow-control success of both techniques, large suction mass-flowrates and additional mechanical installations consume the benefit. A hy-brid approach called hybrid laminar flow control (HLFC), combining activeflow control in the leading edge region with adequate profile shaping, canreduce the viscous drag and appears most appropriate for further research.A comprehensive list of experimental approaches to these techniques isprovided by Drake and Kennelly [22]. Feasibility studies relevant for com-mercial aircraft industry have been conducted on a Boeing 757 wing [89]
2

1.1 Transition Control
and the tail fin of an Airbus A320 [92]. A more detailed review of methodsto maintain flow laminarity in flight is provided by Arnal and Archambaud[6] whereas applicable measurement techniques for impact quantificationare reviewed by Fisher et al. [32] and Anderson et al. [3].
Smart flow-control approaches are required to reduce the drawbacks ofmass increase and space limitations associated with large mechanical struc-tures. Such installations are usually necessary for flow control by means ofboundary-layer suction or blowing [36]. Recent research trends in transitioncontrol tend to actively approach only the relevant transition mechanisms.Increasing knowledge about flow receptivity and different roadmaps to tur-bulence are combined with optimization routines to attenuate unstable flowstructures. Högberg and Henningson [48] show that linear optimal controlstrategies can be applied to attenuate the development of different insta-bility mechanisms in spatially evolving boundary layers. Dependent onthe flow situation, either the development of Tollmien-Schlichting instabili-ties, cross-flow modes or global instabilities needs to be tackled to preservethe laminar state. Such reactive strategies, like active Tollmien-Schlichtingwave control [45, 104], depend on sensor readings for accurate adaptationof the control action to the relevant flow structure. Following the definitionof Gad-el-Hak [39], such techniques need to be differentiated from prede-termined ones, e.g. changing the mean-flow stability properties of laminarmean flow [2]. Predetermined active flow-control strategies are also onlyeffective at the cost of energy consumption but do not require real-timeinformation about the flow. Passive mechanisms do not require the expen-diture of energy to provoke a flow-control effect, e.g. the described NLFshape optimization. Another passive approach is to employ distributedroughness elements and generate streaky structures for beneficial interac-tion of modal instabilities [37]. Nevertheless, these passive structures arepresent under all flow conditions and may deteriorate performance in off-design situations, whereas active flow control may be en- and disabled asrequired.
Transition investigations and flow-control experiments for aeronauticalapplications at elevated Reynolds numbers are necessarily performed inflight. The turbulence intensities and frequency spectra encountered inthe atmosphere are not reproducible in large wind-tunnel setups, as exem-plarily investigated by Weismüller [114]. The experimental work shows adependence of the turbulence conditions during flight measurements on thetime of day as well as on the altitude, and compares these to wind-tunnelmeasurements. Figure 1.1 illustrates the energy spectra of hot-wire data
3

1 Introduction
100
101
102
103
104
10−8
10−7
10−6
10−5
10−4
10−3
E(f)[m
2/s]
f [Hz ]
FlightWind tunnel−5/3 Slope
Figure 1.1: Spectra of wind-tunnel and flight turbulence, adapted fromWeismüller [114].
in flight and wind-tunnel experiments. Besides a significant difference inthe absolute turbulence energy level varying from Tu = 0.09 − 0.22% inflight in comparison to 0.34% in a wind tunnel, the dominant frequencyrange does not coincide for both data sets. The receptivity mechanismsby which disturbances enter the viscous boundary layer and initiate theturbulent breakdown depend on the amplitude and type of ambient tur-bulence. The transition process can differ significantly based on specificmechanisms [13] if a certain threshold (typically Tu ≈ 0.5%) is exceeded.Even during atmospheric flight, increased turbulence levels (e.g. caused bythermals) can lead to a deterioration of flight performance on NLF airfoilsdue to premature transition.
To investigate the exact reasons for this performance drop, transitionexperiments by Weismüller [114] are performed on a NLF wing glove ona motorized glider at TU Darmstadt. Wing gloves are commonly applied[3, 30, 75, 78, 89, 94, 95] to enable unobstructed integration of sensor equip-ment and flow-control devices into the surface of an airfoil. Additionally,they enable application-oriented research at elevated Reynolds numbers andrealistic pressure gradients under ambient atmospheric conditions. Hence,the laminar wing glove presented in Weismüller [114] is perfectly suited tohost an in-flight transition control experiment. The impact on the tran-sition process at the design point as well as under increased turbulenceintensities can be investigated under non-laboratory conditions.
4

1.2 DBD Flow Control
1.2 DBD Flow Control
Directed body-force fields provide an intelligent and smart way for flow con-trol and have become increasingly important throughout the last decade.Designated body-force distributions in water can be created by magneto-hydrodynamic (MHD) actuators using Lorentz forces [2] whereas electro-hydrodynamic (EHD) actuators are employed in gaseous media. Withinthe latter class, dielectric barrier discharge (DBD) actuators are commonlyadopted. DBD actuators enjoy a broad usage in industrial applications asozone generation, panel displays, lasers and surface treatments [55]. Whilesuch gas-discharge devices still lack the level of maturity necessary for in-dustrial use in aerodynamic applications, the forces of the ionized gas inan electric field have been applied for manipulation of various flows inlaboratory environments. At atmospheric pressures in the order of 1 barfound in many aerodynamic situations, gas discharges can be produced atreasonable energy costs and maintained for steady force production. Com-prehensive reviews of flow control employing gas discharges is provided byCorke et al. [21] and Moreau [72]. Cattafesta and Sheplak [17] provide abroad overview of different flow-control actuators and identify advantagesand disadvantages of each type. The main advantages of gas-discharge ac-tuators are their short response time and force generation without movingparts.
DBD actuators with AC power supply producing a surface glow dischargehave first been applied for flow control by Roth et al. [88]. The definitionand working principle of such actuators is reviewed in Chapter 3.1. In thecase of quiescent air above a solid surface, the force field induces a flowtangential to the wall. As the actuator represents a zero-net mass-flux de-vice, the tangential acceleration is accompanied by a smaller wall-normalvelocity component, i.e. a slow downward movement towards the exposedactuator electrode. Since the discovery of the working principle for aerody-namic applications, DBD actuators have mainly been used for separationcontrol on airfoils at high angles of attack [12] and bluff bodies [54] aswell as to control laminar-turbulent transition in fluid boundary layers.If the actuator is applied in a boundary-layer flow, it increases the wall-tangential momentum enabling a change of the boundary-layer properties.Grundmann and Tropea [44] first demonstrated that flush-mounted DBDactuators can delay artificially triggered transition on a flat plate inside awind tunnel. It was shown that the transition delay can either be achievedby actively canceling single frequency disturbances with a pulsed actuationin a reactive manner, or by continuous forcing in a predetermined way [45].
5

1 Introduction
Whereas the active cancelation of Tollmien-Schlichting waves had been per-formed with different flow-control devices before, the unique properties ofDBD actuation to influence the flow momentum distribution paved theway for a new transition control approach. Although the exact mechanismof the continuous operation remained unknown, it was presumed that theactuator force locally changes the stability properties of the flow and/orleads to anisotropic redistribution of the velocity fluctuations. Velkoff andKetcham [109] had utilized corona discharges earlier to obtain a delay oftransition at freestream speeds around 50 m/s along a flat plate, but nei-ther this experimental approach nor a theory for the transition impact werefurther developed. The main reason may be the necessary installation ofcorona wires above the surface, impeding an unobstructed integration intothe structure. Moreau et al. [73] employed wall-mounted corona wires toalter turbulent boundary-layer profiles on a flat plate obtaining a signif-icant drag reduction at flow velocities up to 25 m/s. Surface integratedand flush-mounted DBD actuators were applied by Magnier et al. [70] whonoticed premature triggering of transition due to the DBD operation. Adestabilizing effect of an orthogonal electrode configuration was observedby Gibson et al. [40] on a slotted flat plate subjected to external suction.Jacob and Ramakumar [52] investigated the impact of a single DBD ac-tuator on a laminar boundary-layer profile at low speeds and measured adecrease of the displacement thickness δ1 and the momentum loss thick-ness δ2. Increased velocity perturbations downstream of the actuator weremeasured, which led the authors to apply the actuator as a tripping de-vice for separation control. More recently, the stability impact of DBDoperation has been studied by Séraudie et al. [97] who observed either adelay or acceleration of natural transition on an airfoil depending on theactuator configuration. They derived a dependency of the effect on actu-ator placement and voltage, a complementary numerical study enabled astability analysis to explore the stabilizing actuator effect. The importanceof thoroughly analyzing the actuator’s impact on hydrodynamic stabilityis also underlined by recent numerical studies of Riherd and Roy [86].
Until now, all such stability investigations are based on numerical compu-tations and lack a thorough comparison to experimental data. Additionally,all successful DBD flow-control applications so far have been limited to lowReynolds number experiments in wind tunnels. The force magnitude islimited by the discharge physics and the ambient conditions, which reducesthe relative effectiveness with increasing ambient flow velocity. The presentwork presents a predetermined active flow-control strategy by means of
6

1.3 Key Questions and Outline
continuously operated DBD actuators to stabilize laminar boundary-layerflow and to delay Tollmien-Schlichting wave dominated transition. It is theaim of this work to foster the understanding of the stabilizing DBD effect,thereby enabling an optimization of the transition control effectiveness atincreasing Reynolds numbers. The delineated application of DBD tran-sition control under non-laboratory conditions in free-flight significantlyenhances the maturity of DBD flow control.
1.3 Key Questions and Outline
The relatively new approach to use DBD actuators for transition controlleaves a variety of questions to be answered.
First experiments showed the capability to delay transition on laboratorysetups without exploring the physical background in detail. For flow-controlpurposes, it may be acceptable to neglect a thorough investigation of alldischarge physics involved in the generation of the actuator force field.Nevertheless, it must be investigated how these body forces, confined to asmall region around the actuator position, alter the flow field and lead tothe macroscopically measurable transition delay much further downstream.The effect on the stability properties of the flow needs to be discussedand experimentally verified. Stability analysis can be applied to obtain adetailed view of the flow properties and to anticipate the transition process,but it remains questionable how the results relate to experimental dataunder the influence of DBD actuation.
Secondly, the maturity of DBD actuators as flow-control devices needs tobe enhanced. Until now, successful transition delay was achieved only ongeneric configurations at low Reynolds numbers. At higher flow speeds andunder strong adverse pressure gradients relevant for aviation applications,the actuators have not been successful in any flow-control application. Thephysically limited body force restricts the effectiveness of actuation in ahigh-momentum flow. Under such conditions, an optimization regardingthe positioning and configuration of DBD actuators is necessary to designa pertinent flow-control application. An experimental optimization is timeconsuming and cost intensive, because of the number of variables and nec-essary hardware adaptations. Functional computational tools are requiredto circumvent measurement uncertainties and to conduct large paramet-rical studies. The aim is to provide a design tool for optimization offlow-control applications.
Finally, flow control under non-laboratory conditions is of impor-tance for real-world applications. The ambient pressure, temperature and
7

1 Introduction
humidity of the surrounding fluid influence the effectiveness of DBD actu-ation. To demonstrate that such devices can be successfully applied undervarying conditions is of major importance for the credibility of all DBDflow-control research.
The structure of the present thesis is oriented as to answer the key ques-tions and to provide further insights on DBD transition control.
Chapter 2 reviews the concepts of boundary-layer theory and hydrody-namic stability necessary for the understanding of the transition processand the numerical procedures introduced in the following chapter.
Chapter 3 elucidates details on the methodology for answering the keyquestions. The experimental setups and numerical tools are introduced,enabling a direct understanding of the results presented in the subsequentchapters.
Chapter 4 presents the results of generic wind-tunnel experiments basedon the experimental findings by Grundmann [43]. Experiments at higherflow velocities and under natural disturbance conditions are performedshowing effective transition delay at elevated Reynolds numbers. The in-vestigations aim at the impact of the force field on the flow properties indirect vicinity of the actuator. Additionally, a parametric study on actua-tor positioning and force amplitudes related to the macroscopic transitionlocation is conducted, providing rules of thumb for further design of flow-control experiments.
Chapter 5 provides numerical data on the stability properties and allowsa comparison to the experimental data from the preceding chapter. Thevalidation with experimental data demonstrates that a stability analysis ofcomputational boundary-layer data can provide design guidelines for op-timized flow-control applications. An in-flight experiment is designed andthe numerical investigation allows for an estimate of the expected flow-control effect.
Chapter 6 demonstrates the application of DBD transition delay in flightand lifts the level of DBD flow control to a higher level of maturity. The im-pact of ambient condition variations on the flow-control performance duringatmospheric flights is quantified. The identification of influencing parame-
8

1.3 Key Questions and Outline
ters allows the design of a closed-loop controller to maintain constant flowcontrol authority at elevated Reynolds numbers and all conditions encoun-tered during a full flight mission.
Chapter 7 summarizes the experimental and numerical results. It pro-vides a conclusive report on the findings from a wide-ranging perspectivebefore Chapter 8 essays an outlook for future investigations.
9

1 Introduction
10

2 Hydrodynamic Stability
One of the main objectives of this work is to increase the understandingof boundary-layer transition under the influence of dielectric barrier dis-charges. In order to estimate the flow-control authority and gain insightinto the physical mechanisms of transition delay, the fundamental conceptsof boundary-layer theory and hydrodynamic stability need to be under-stood. This thesis cannot review all relevant information found in excellenttextbooks specialized on these topics, e.g. [90, 91]. Nevertheless, the fol-lowing paragraphs provide a concise overview of important aspects andmathematical formulations to facilitate the understanding of the computa-tional methodology delineated in Chapter 3.5.
The basic equations to describe the dynamics of Newtonian fluids are thecontinuity equation and the Navier-Stokes equations. In their general form,these equations are elliptical and do not provide closed analytical solutions.Therefore, simplifications are necessary in order to obtain solutions forspecific problems. For sufficiently low fluid velocities, the assumption ofincompressibility (ρ = const.) is valid and reduces the complexity of theequations. In vectorial notation those equations read
∇ · ~u = 0 (2.1)
ρ
(∂~u
∂t+ ~u · ∇~u
)
= −∇p+ µ∇2~u+ ~f (2.2)
comprising the velocity vector ~u, the scalar pressure p, the dynamic viscos-ity µ = νρ, and the force vector ~f . The full three-dimensional formulationis required to derive the stability equations in Chapter 2.2, whereas theboundary-layer flow will subsequently be treated two-dimensionally.
2.1 Boundary-Layer Theory
Prandtl [82] introduced the concept of boundary layers, suggesting thatviscosity only dominates the flow close to the surface of an immersed body.In this region, special assumptions apply to the incompressible continuity
11

2 Hydrodynamic Stability
equation (2.1) and the Navier-Stokes equations (2.2). For simple geome-tries like flat plates with straight leading edges or infinitely spanned wings,the flow over the body can be approximated to be two-dimensional. Therelevant dimensions are then the streamwise coordinate x and the wall-normal coordinate y, and the velocity vector is composed of the corre-sponding components ~u = [u, v]T . For each incompressible flow situation,the Navier-Stokes equations and the continuity equation can be normalizedwith appropriate reference scales. For boundary-layer flows, these are thefreestream velocity Uref = U∞ and the chord length lref = c of the immersedbody.
Several other simplifications are accessible via estimates of the orders ofmagnitudes of the single terms of (2.1) and (2.2) which can be reviewed instandard fluid mechanics text books, e.g. [90, 102], finally simplifying theset of equations for steady flow to
∂u
∂x+∂v
∂y= 0 (2.3)
u∂u
∂x+ v
∂u
∂y= −
fx
ρ−
1
ρ
dp
dx+ ν
∂2u
∂y2(2.4)
dp
dy= 0. (2.5)
It should be noted that wall-normal body forces fy are neglected whereaswall-tangential forces fx remain in the governing equations, which is validand of importance for the inclusion of DBD forcing discussed in Chapter3.5.2. The obtained equations (2.3) - (2.5) describe the physical phenomenawithin steady two-dimensional boundary-layer flow. A direct implicationof (2.5) is the independence of the pressure in wall-normal direction suchthat the pressure distribution is imposed from outside the boundary layer.Viscous effects vanish at the edge of the boundary layer such that the flow-field evolution Ue(x) can be calculated by potential-flow solvers. With thisquantity known, the relation
−1
ρ
dp
dx= Ue
dUe
dx, (2.6)
reduces the number of variables from four (u, v, p, fx) to only three (u, v,fx). Furthermore, the elliptical nature of the Navier-Stokes equations van-ishes in favor of a parabolic set of equations. Hence, no upstream influencesare considered which simplifies the solution of the equations dramatically.
12

2.1 Boundary-Layer Theory
The boundary conditions at the solid surface and in the undisturbed outerflow read
y = 0 : u = v = 0
y → ∞ : u = Ue(x).(2.7)
This simplified set of equations can be solved with numerical tools as de-scribed in Chapter 3.5.1. The Reynolds number
Re =Uref lref
ν(2.8)
defines the ratio between inertial and viscous forces within the flow at aspeed of Uref, lref being a characteristic length scale and ν the kinematicviscosity. For sufficiently low Reynolds numbers, viscous forces attenuateany fluctuations within the laminar flow. Beyond a certain Reynolds num-ber Recrit, the initially laminar boundary-layer flow becomes susceptibleto naturally present disturbances. By amplification of such instabilities,the flow approaches a turbulent state of chaotic fluid motion. This processis called transition and has been extensively studied experimentally andnumerically for boundary layers. If the characteristic reference length lref
is replaced by the distance x which the flow has traveled since impingingon the solid surface and the mean flow velocity U∞ is employed, the localReynolds number
Rex =U∞ x
ν(2.9)
is obtained. It then becomes clear that the transition process takes placeover a certain streamwise range and divides the domain into a laminar and aturbulent portion. For a low disturbance environment in two-dimensionalflow under moderate pressure gradients, the initial stage of this processis dominated by two-dimensional instabilities called Tollmien-Schlichtingwaves. The amplification or attenuation of such disturbances poses a sta-bility problem which can be assessed by linear stability theory (compareChapter 2.2). Subsequent amplification of oblique wave modes and non-linear interactions with the 2D-waves form secondary instabilities. Thesethree-dimensional structures amplify rapidly and give rise to the formationof turbulent spots. The initially two-dimensional instabilities thus initiatethe breakdown to fully turbulent motion within the boundary layer beyondthe transition Reynolds number Retrans.
The wall-normal extent of the boundary layer defines the region whereviscosity is of interest. Since the asymptotic convergence of the flow velocity
13

2 Hydrodynamic Stability
towards the outer flow inhibits a clear analytical definition of the boundary-layer thickness, integral quantities are employed to describe the boundarylayer. One of these is the displacement thickness δ1 which accounts for thedisplacement of streamlines of the outer flow
δ1 =
∫∞
0
(
1 −u
Ue
)
dy. (2.10)
If the displacement thickness is known and treated as an additional thick-ness on top of the limits of the immersed body, the outer flow field can betreated inviscidly. In combination with potential-flow solvers, this enablesan iterative solution of the full flow field and the boundary-layer equations(2.3) - (2.5). Apart from the displacement thickness δ1, another importantintegral boundary-layer quantity is the momentum thickness δ2 defined as
δ2 =
∫∞
0
[u
Ue
(
1 −u
Ue
)]
dy. (2.11)
The quantity accounts for the momentum loss due to the viscous forcesand is of interest concerning the momentum transfer due to DBD opera-tion. The displacement thickness as well as the overall wall-normal extentof the laminar boundary layer typically grow along the flow direction andshow even larger growth after transition to the turbulent state. In con-junction with the momentum loss thickness, this behavior will be used fortransition indication as described in Chapter 3.3.1. Due to the increasedmomentum exchange and mixing within the turbulent boundary layer, thevelocity distribution close to the wall deviates clearly from the laminarflow state. Different velocity profiles are included in Figure 2.1, illustratingthe difference in the wall-normal velocity gradient at the wall (subscript windicating y = 0). The friction along the surface
τw = µ
(∂u
∂y
)
w
(2.12)
is dominated by this gradient, which is higher for turbulent flow as com-pared to laminar one. Therefore it is desirable to maintain the laminar flowstate as long as possible. Active flow control, as reported later within thiswork, can be employed to accomplish this objective.
The wall-normal velocity gradients at the wall are also of importance forthe flow stability and the resistance against flow separation. The stream-wise momentum equation (2.13) is derived from (2.2) for a two-dimensionalflow case, normalized and considered at the wall.
14

2.1 Boundary-Layer Theory
U∞
u(y)
laminar
turbulent
y
( (∂ u∂ y w
τw ~
x
Figure 2.1: Laminar and turbulent boundary-layer profiles.
ρw
(∂u
∂t
∣∣∣∣w
︸ ︷︷ ︸
1
+ uw∂u
∂x
∣∣∣∣w
︸ ︷︷ ︸
2
+ vw∂u
∂y
∣∣∣∣w
︸ ︷︷ ︸
3
)
+∂p
∂x
∣∣∣∣w
︸ ︷︷ ︸
4
− fw︸︷︷︸
5
−µw∂2u
∂x2
∣∣∣∣w
︸ ︷︷ ︸
6
= µw∂2u
∂y2
∣∣∣∣w
(2.13)Gad-el-Hak [39] shows that the second derivative of the streamwise ve-
locity with respect to the wall-normal direction on the right hand sidedictates the stability properties and the resistance to flow separation. Theso-called stability modifiers on the left hand side of the equation includethe following mechanisms and may have stabilizing or destabilizing effects,depending on the sign and direction:
• wall motion: terms 1, 2 and 3• wall transpiration: term 3• pressure gradients: term 4• body forces: term 5• wall curvature: term 6• viscosity gradients: term 6 & right hand side
The stability of boundary layers can be enhanced by ensuring a fuller ve-locity profile, i.e. negative profile curvature. In gaseous media this can beachieved by compliant wall movement, wall suction, negative pressure gra-dients or streamwise body force fields as well as cooling to modify the vis-cosity at the wall. The linear superposition of any of these methods enablesa combination of passive and active flow-control approaches. Within thiswork, the modification of the stability properties due to dielectric barrierdischarge force fields will be investigated under various pressure gradients.
15
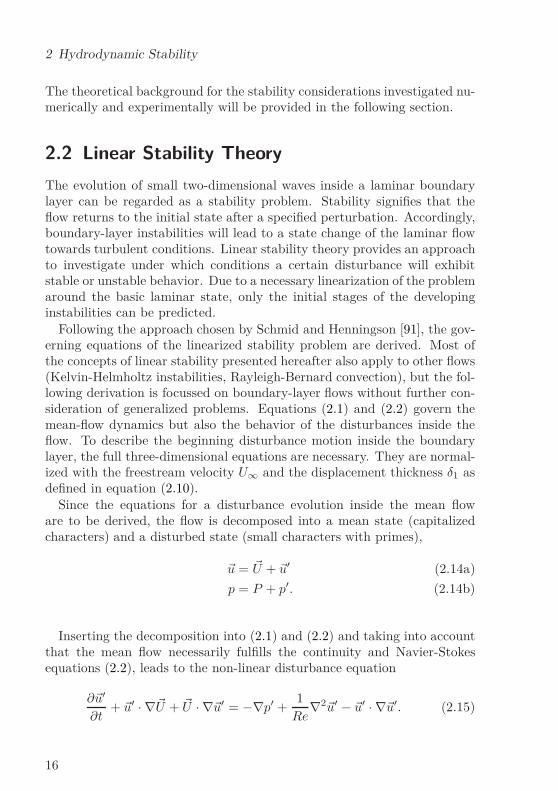
2 Hydrodynamic Stability
The theoretical background for the stability considerations investigated nu-merically and experimentally will be provided in the following section.
2.2 Linear Stability Theory
The evolution of small two-dimensional waves inside a laminar boundarylayer can be regarded as a stability problem. Stability signifies that theflow returns to the initial state after a specified perturbation. Accordingly,boundary-layer instabilities will lead to a state change of the laminar flowtowards turbulent conditions. Linear stability theory provides an approachto investigate under which conditions a certain disturbance will exhibitstable or unstable behavior. Due to a necessary linearization of the problemaround the basic laminar state, only the initial stages of the developinginstabilities can be predicted.
Following the approach chosen by Schmid and Henningson [91], the gov-erning equations of the linearized stability problem are derived. Most ofthe concepts of linear stability presented hereafter also apply to other flows(Kelvin-Helmholtz instabilities, Rayleigh-Bernard convection), but the fol-lowing derivation is focussed on boundary-layer flows without further con-sideration of generalized problems. Equations (2.1) and (2.2) govern themean-flow dynamics but also the behavior of the disturbances inside theflow. To describe the beginning disturbance motion inside the boundarylayer, the full three-dimensional equations are necessary. They are normal-ized with the freestream velocity U∞ and the displacement thickness δ1 asdefined in equation (2.10).
Since the equations for a disturbance evolution inside the mean floware to be derived, the flow is decomposed into a mean state (capitalizedcharacters) and a disturbed state (small characters with primes),
~u = ~U + ~u′ (2.14a)
p = P + p′. (2.14b)
Inserting the decomposition into (2.1) and (2.2) and taking into accountthat the mean flow necessarily fulfills the continuity and Navier-Stokesequations (2.2), leads to the non-linear disturbance equation
∂~u′
∂t+ ~u′ · ∇~U + ~U · ∇~u′ = −∇p′ +
1
Re∇2~u′ − ~u′ · ∇~u′. (2.15)
16

2.2 Linear Stability Theory
For boundary layers, a first but strong simplification is to consider thebase flow to be wall-parallel. A streamwise unidirectional flow with a ve-locity gradient in the wall-normal direction y
~U = [U(y), 0, 0]T (2.16)
is assumed and introduced into (2.15). These simplifications facilitate thederivation of the stability equations for a local approach. If the amplitudesof the disturbances ~u′ = [u′, v′, w′]T and p′ are sufficiently small (usually athreshold of approx. 1%U∞ is assumed for the velocity fluctuation ampli-tudes), non-linear interactions can be neglected. The continuity equationand the disturbance equations are simplified to
∂u′
∂x+∂v′
∂y+∂w′
∂z= 0 (2.17)
and
v′∂U
∂y+∂u′
∂t+ U
∂u′
∂x= −
∂p′
∂x+
1
Re∇2u′ (2.18a)
∂v′
∂t+ U
∂v′
∂x= −
∂p′
∂y+
1
Re∇2v′ (2.18b)
∂w′
∂t+ U
∂w′
∂x= −
∂p′
∂z+
1
Re∇2w′ (2.18c)
in component notation. The boundary conditions (2.7) are also trans-formed into the disturbance boundary conditions
y = 0 : u′ = v′ = w′ = 0
y → ∞ : u′ = v′ = w′ = 0.(2.19)
Stability theory considers the growth or decay of disturbances inside theboundary-layer flow. Since their correct form is generally unknown, themodal approach assumes a combination of wavelike disturbances. Eachpartial disturbance is a designated mode and may be considered as a trav-eling wave along the surface in the x-z-plane. The initial growth of thesmall wavelike disturbances can be described by an exponential ansatz
q′(x, y, z, t) = q(y)ei(αx+βz−ωt) (2.20)
with the shape functionq = (u, v, w, p)T (2.21)
17

2 Hydrodynamic Stability
where ω is the angular frequency and α and β represent the chordwise andspanwise wavenumbers.
The wavenumbers or the frequency are either complex or real values, de-pendent on whether the temporal or the spatial problem is considered.If the temporal evolution of a certain disturbance defined by the realwavenumber α or β is of interest, the angular frequency ω = ωr + iωi
is a complex quantity. The real part then describes the temporal frequencywhereas the imaginary part determines if the disturbance is exponentiallyamplified or damped, compare (2.20). Positive imaginary parts ωi provokeexponential growth of the disturbance whereas negative values indicate adecay of this mode. Contrarily, if the spatial evolution of a temporallyperiodic disturbance (ω is real) is considered, the imaginary part of thewavenumber α or β defines the growth or attenuation of the mode. Anegative value leads to growing amplitudes whereas positive values indi-cate stable conditions. In the following, the spatial approach is chosento consider the convective evolution of wavelike perturbations which growspatially in proportion to ~u′ ∝ e−αix+βiz. Here, the convective speed of asingle wave is defined by the phase velocity cr which is the real part of thequantity c = ω/α = cr +ici. If a single disturbance frequency is considered,the (complex) wavenumber α influences the phase velocity of the wave andvice versa. This will be of relevance for the results presented in Chapter4.2.
For a given frequency ω and a provided range of the local Reynolds num-ber Rex, the disturbance equations (2.18) in combination with the bound-ary conditions (2.19) pose an eigenvalue problem for the wavenumbers αand β. The procedure to solve this problem is discussed in Chapter 3.5.3.For a purely two-dimensional disturbance without spanwise modulation(β = 0), the problem is reduced to the analysis of the imaginary part of α,named the spatial growth rate. Since the eigenvalue problem yields a largenumber of eigenvalues, the most prominent one influencing the stability ofthe flow has to be identified. The obtained eigenvalues can be displayedin the complex plane as exemplarily illustrated in Figure 2.2 (a) for a sim-ple 2D-flow over an airfoil. Eigenvalues with negative real parts are notphysical, just like the so-called continuous spectrum forming a Y-shapedstructure. The relevant mode obtained for the indicated setting is found onthe right side of the figure and is marked with a red circle. It is the so-calledTollmien-Schlichting mode which is initially stable (positive growth ratesαi) but turns unstable during the downstream evolution, illustrated by thered crosses including negative values. Eventually, the mode returns to sta-
18

2.2 Linear Stability Theory
−0.05 0 0.05 0.1 0.15−0.05
0
0.05
0.1
0.15
αr
α i
(a) complex plane
Rex = U x / ν
ω
2 4 6 8 10 12
x 105
2
3
4
5
6
7
8
x 10−4
Recrit
II
I
(b) neutral stability curve
Figure 2.2: Eigenvalues in the complex plane (a) and the neutral stabil-ity curve plus N -factor evolution for combinations of Reynoldsnumber Re and disturbance frequencies ω (b).
ble conditions such that three phases during the downstream propagationcan be identified. First, the mode is damped until reaching a critical pointwhere the excitation of the mode is initiated. The disturbance amplitudeincreases up to a certain position from which on the disturbance is dampedagain. If the disturbance frequency f ∝ ω is systematically varied, thisbehavior can be illustrated in form of the so-called neutral stability curve.This tongue-shaped solid line in Figure 2.2 (b) encloses the region of dis-turbance amplification. The curve indicates the indifference of the spatialgrowth rate, i.e. αi = 0. The aforementioned differentiation into threeregions of stability for a distinct frequency is represented by branch I andII of the curve. This depiction immediately reveals to which disturbancefrequencies the flow will be sensitive at a given Reynolds number. It alsoshows the critical Reynolds number Recrit, namely the Reynolds-numberfor which a first amplification of disturbances is found.
Generally speaking, a negative velocity profile curvature as discussed inSection 2.1 increases the critical Reynolds number and decreases the growthrates of modal disturbances, accordingly enhancing the flow stability. In-tegration of the growth rates αi along the streamwise dimension x yieldsthe non-dimensional N -factor [108]
N = lnA
A0=
∫ x
xcrit
−αidx (2.22)
19

2 Hydrodynamic Stability
It is proportional to the logarithm of the ratio between the disturbanceamplitude A at a streamwise position x and the initial amplitude A0 at theneutral point xcrit. Based on this parameter, empirical correlations enablean estimation of the approximate transition location for low-disturbanceenvironments (Tu < 1%) with Tollmien-Schlichting wave domination. TheN -factor will be utilized in Chapter 5 to evaluate the impact of DBD flowcontrol on the stability of laminar boundary-layer flow. Although the N -factor method is not based on actual disturbance amplitudes but on dis-turbance amplification rates, results of stability computations may serve asa guide to evaluate experimental transition measurements [85]. This tech-nique is comprehensively reviewed by Arnal [5, pp. 105-158] and comparedto other empirical-based approaches.
20

3 Methodology
Detailed information on the experimental and numerical approaches to an-swer the key questions elaborated in Chapter 1.3 are provided in the fol-lowing. First, the dielectric barrier discharge plasma actuator and thenecessary equipment is introduced. Different flow quantities are reviewedwhich enable experimental observation of the boundary-layer state. Toinvestigate the impact of DBD actuators on natural boundary-layer tran-sition and to evaluate the effect of actuator placement on the flow-controleffectiveness, a generic flat plate setup is employed in a small scale windtunnel. The experimental details of these investigations are provided, fol-lowed by the introduction of the experimental setup for more sophisticatedflight experiments. Finally, the computational routines for the numericalanalysis of the boundary-layer flow under control of DBD actuators arepresented.
3.1 Dielectric Barrier Discharges
To investigate the flow-control effect of a DBD plasma actuator on lami-nar boundary-layer flow, the working principle of the device needs to beunderstood. The principal setup of a dielectric barrier discharge actua-tor is illustrated in Figure 3.1. DBD actuators consist of two electrodesseparated by a dielectric, non-conducting material. The material consti-tuting the dielectric barrier may be chosen arbitrarily, but high dielectricstrengths are desirable to achieve a maximized electric potential. Since theactuator needs to be implemented into the surface to avoid disturbances
embeddedelectrode
exposedelectrode
powersupply
dielectric
Figure 3.1: Sketch of DBD actuator setup for boundary-layer flow control.
21

3 Methodology
like roughness or surface imperfections, it is typically aimed for a low to-tal thickness of the actuator. One of the electrodes is exposed to the flowwhereas the other one is embedded under the dielectric, both consisting ofhighly conducting material to decrease the resistance and thermal dissipa-tion. The electrodes are usually applied in an asymmetric configuration toachieve a directed flow-control effect. If the potential difference betweenthe two electrodes is increased and surpasses a certain breakdown voltage,a surface discharge occurs and ionization of fluid molecules in the imme-diate proximity of the exposed electrode is observed, generating a weaklyionized plasma. The breakdown voltage is mainly determined by the geom-etry and spacing between the electrodes and defined through the dielectricmaterial and thickness. Ionized particles are accelerated in the directedelectric field and transfer momentum to neutral air molecules by particlecollisions. This momentum transfer may be regarded as a volume force fieldimposed on the surrounding fluid. The discharge is limited by saturation ofthe charge deposition on the dielectric barrier, such that sinusoidal supplyvoltages are generated for a repetitive force generation. During both halfcycles of the alternating potential, different ions are created and involved inthe force production. It has not finally been agreed within the communitywhether the force is directed in the same direction throughout the wholecycle [14, 65, 101]. Forte et al. [34] measured a temporal unsteadiness ofthe force production throughout the voltage cycle. For aerodynamic appli-cations, the relevant time scales are orders of magnitudes larger than thedischarge physics scales. To identify the impact on the averaged flow fieldsurrounding the DBD actuator, only the obtained quasi-steady net force inone direction is of relevance. Supply voltage frequencies in the Kilohertzrange provide a sufficiently high net force per time and ensure that modalflow receptivity to unsteady force production can be neglected.
For the experiments reported in this thesis, copper tape of 35µm thick-ness constitutes the exposed and embedded electrodes at a width of 2.5 mmand 10 mm, respectively. The principal sketch in Figure 3.1 illustrates theabutted placement of the electrodes in the horizontal direction. In thevertical dimension between the electrodes, five layers of Kapton tape witha total thickness of d = 300µm provide the dielectric barrier. The ac-tuator length in the third dimension depends on the desired applicationand ranges from 0.44 − 0.6 m in the reported experiments whereas supplyvoltages Vpp = 9 kV and 13 kV peak-to-peak are chosen dependent on thedesired force magnitude. Although several different power supplies for si-nusoidal wave generation are available, a GBS Elektronik MiniPuls 2.1 is
22

3.1 Dielectric Barrier Discharges
selected for all reported experiments. This power supply is implementableinto the flight setup due to its small dimensions of 160 mm × 300 mm andweight below 1 kg. An additional advantage is a 0 − 5 V input channel tocontrol the high voltage output between Vpp = 0 − 20 kV, sufficient for allemployed DBD configurations. The possibility to control the output basedon an analog signal is of relevance for the closed-loop performance controlpresented in Chapter 6.2.2. The use of one power supply for all experimentsreduces the number of parameters, although the resonance frequency maychange depending on the actuator length. For each setup, the resonancefrequency is chosen to obtain a maximum electrical efficiency and a robusthigh frequency generation. Despite the alternating polarity and associ-ated unsteadiness of the body force production, the resonant frequenciesfpl ≥ 6 kHz are well beyond the receptivity limit of the boundary-layerflows investigated. Stability analysis presented in Chapter 5 shows that alldisturbances in the high frequency range are effectively damped and do notinfluence the transition process.
Kriegseis et al. [62] investigated the force distribution created by anequally composed DBD actuator. For sufficiently long electrodes, the forcegeneration and fluid acceleration can be regarded to take place in a two-dimensional plane. In quiescent air, the actuator creates a laminar jettangential to the wall directed from the exposed electrode along the em-bedded electrode. This wall jet scales with similarity laws formulated byGlauert [41] and can be characterized by its thickness and maximum in-duced velocity. Above the exposed electrode, a suction region replenishesthe fluid volume and exhibits a small wall-normal force component. Parti-cle image velocimetry (PIV) provides the velocity field induced by the dis-charge and solving the Navier-Stokes equations for the body force revealsthe spatial force distribution in the vicinity of the electrodes as proposedby Wilke [116]. The analysis reveals that the main force is directed in wall-tangential direction and the wall-normal force component is one order ofmagnitude lower [58]. Figure 3.2 illustrates the spatial distribution of bothcomponents. The wall-tangential force exhibits a distinctive peak approx-imately 1 mm downstream of the exposed electrode, indicating the regionof maximum fluid acceleration. A parasitic force region close to the walldownstream of x = 2 mm illustrates self-induced, wall-friction drag leadingto a decay of the total force magnitude by approximately 30%, which is inagreement with observations by Enloe et al. [29]. A large portion of theinduced force is dissipated by wall-shear stress and small-scale turbulenceclose to the wall. The original force f and the residual thrust T need to be
23

3 Methodology
x [mm]
y [m
m]
0 2 4 60
1
2
10−
3 × f x [N
/m3 ]
−20246
(a) 10−3× fx
x [mm]
y [m
m]
0 2 4 60
1
2
10−
4 × f y [N
/m3 ]
−505
(b) 10−4× fy
Figure 3.2: Wall-tangential (fx) and wall-normal (fy) force distribution atVpp = 10kV, data from [58].
distinguished. Considering the net thrust T obtained by a single DBD, theintegral values range between 5 mN and 25 mN per meter actuator lengthand are validated by force balance measurements. It is obvious that thethrust production cannot be monitored during flow-control experimentsdue to the sensible balance equipment. This requires another measurablevariable to relate to the flow-control authority expressed by the net thrust.
Kriegseis et al. [59] describe a correlation between thrust measurementsand the power consumption P of DBD actuators. Both quantities are em-ployed to define the flow-control effectiveness η′ = T/P as a first approachto quantify the performance of DBD actuators for flow-control applica-tions. Though, it should be emphasized that only a small portion of theconsumed energy is transformed into fluidic kinetic energy. The majority isspent on dissipative heating of the electric circuit. The power consumptionis determined by the applied voltage and the dielectric material. It can bemeasured by integration of the actuator charge Q over the periodic voltageVpp during one cycle as introduced by Manley [71]. The charge Q can bemeasured by using a monitor capacitance between the embedded electrodeand electrical ground as first employed by Pons et al. [80]. The Lissajousplot, which illustrates the consumed power by the area enclosed betweenthe curves for charge over voltage, is shown in Figure 3.3 for a peak-to-peakvoltage amplitude of Vpp = 10 kV. In this configuration, the actuator con-sumes P = 45.9 W per meter actuator length, which is representative forthe presented actuator configuration. Since actuators of varying length areemployed in this work, the net power consumption is always related to theactuator length to facilitate a comparison. The electrical measurementsare conducted with a Tektronics TDS 3032C oscilloscope or a Picotech
PicoScope 4424 USB-based data-acquisition device. Details on the powermeasurements employing the same actuator configuration as in the presentwork are provided by Kriegseis et al. [60]. For a unique actuator config-
24

3.1 Dielectric Barrier Discharges
-5000 0 5000-5
0
5x 10
-7
V [V]
Q [
C]
Figure 3.3: Lissajous figure of actuator charge Q vs. voltage V .
uration, the power consumption P is related to the thrust production Tby a monotonic dependence. The relation between both values can be ap-proximated by a linear function even for different operating frequencies in[59], allowing a direct conversion between the two parameters if the elec-trical setup of the actuator is kept constant. Since an identical actuatorcomposed of five layers of Kapton and the same electrode material is usedin the present study, this analogy is exploited to relate the actuator thrustto the easily measurable power consumption.
Other quantities have been proposed to quantify the fluid mechanic im-pact of DBD actuator. The ratio between the maximum flow velocityinduced by an actuator in quiescent air and the freestream flow velocity iscommonly used [40, 70]. However, the maximum wall-jet velocity in quies-cent air alone does not sufficiently characterize the integral impact of theadditional momentum. Hence, it is emphasized that the integral actuatorthrust is a more relevant quantity for characterization of the flow-controlimpact. Since the consumed actuator power can be measured instanta-neously during any flow-control experiment, an experimental correlation tothe produced thrust is recommended and needs to be investigated for everyparticular actuator configuration. For the experiments described in the fol-lowing chapters, the corresponding integral thrust and power consumptionare indicated to put the actuator impact into context.
Several restrictions and limiting factors apply to the flow control by DBDactuation. The force magnitudes are limited by the maximum potential
25

3 Methodology
difference endured by the dielectric material. Additionally, recent inves-tigations [61, 70] report a deterioration of the DBD performance due toincreasing flow velocities. Bénard et al. [10, 11] discuss the impact of sur-rounding pressure and humidity on the DBD power consumption and forcemagnitude. For varying ambient conditions (e.g. atmospheric variationsduring flight), it is a prerequisite for systematic experiments to providea constant flow-control forcing. Hence, a closed-loop control method forconstant force production is necessary and developed in Chapter 6.2.2.
3.2 Transition Detection
In order to determine the state of the boundary layer and track the transi-tion process, several methods can be employed. For comparison of differentdata sets and correct quantification of a possible transition delay by DBDactuation, unambiguous and reliable criteria are necessary. The follow-ing section provides an overview of the most common methods which willbe utilized throughout the present investigations on various experimentalsetups.
Statistical measures of time-resolved boundary-layer data are commonlyemployed for analysis of the transition process. The semi-deterministic na-ture of the transition process provokes a broadband increase of the spectralcontent, complicates repeatability and sets high demands on experimentalaccuracy [106, pp. 886 - 896]. Amplified Tollmien-Schlichting waves andturbulent breakdown lead to an increasing standard deviation σ of veloci-ties inside the boundary layer or pressure on the wall. The so-called flowintermittency region contains randomly occurring turbulent spots (or Em-mons spots) such that the flow undergoes a stochastic state change betweenlaminar and turbulent. The position of this region is mainly governed bythe relation between the transitional and local Reynolds numbers. It be-comes accessible by varying the local Reynolds number Rex in a rangearound the transition Reynolds number Retrans, either by varying the flowspeed U or the measurement location x. Both approaches have specific ad-vantages, but in case of a velocity-dependent pressure gradient of the flow,a variation of the probe position should be favored over velocity variations.
If sufficiently long velocity or pressure measurements across the intermit-tency region are conducted, a characteristic evolution of the signal standarddeviation is obtained. The lines in Figure 3.4 (a) illustrate the standarddeviation σU = Urms of a hot wire placed at y/
√
xν/U∞ = 2.2 normalized
26

3.2 Transition Detection
Figure 3.4: Characteristic evolution of signal standard deviation (a) duringtransition along a flat plate. The lower plots illustrate the timesignal in the laminar (b) and fully turbulent (c) flow region.Circles without flow control, squares with roughness elements,from [37].
with the freestream velocity U∞ along a flat plate measured by Frans-son et al. [37]. The transition evolution under excited disturbance con-ditions is illustrated by the circled line. In the laminar region upstreamof x ≈ 1′000 mm, only small deterministic velocity fluctuations (b) arepresent limiting the standard deviation. As the disturbances grow and theflow temporally starts to experience turbulent spots, a steep increase of thestandard deviation is observed. With increasing temporal percentage of theturbulent content, the signal approaches an apex around x = 1350 mm. Be-yond this characteristic peak, the turbulent state starts to dominate andthe standard deviation decreases until settling at a constant level for fullyturbulent flow (c). Although the illustrated experiments were conductedwith artificially excited disturbances, the same trend can be seen duringnatural transition. The standard deviation of a measurement signal directlyat the wall can also be used, e.g. from static pressure measurements at hightemporal resolution or hot-film experiments [77]. Arnal and Archambaud[6] provide a review of several transition control experiments based on suchstandard deviation measurements.
The squares in Figure 3.4 (a) illustrate the behavior with flow controlby means of specially arranged roughness elements, totally mitigating the
27

3 Methodology
400 600 800 1000 1200 1400 1600 1800 2000 2200
0
0.04
0.08
0.12
0.16
x (mm)
0.25
0.5
0.75
1
= 0.5
γ = 0.1
∆xdelay∆xdelay
(a)
(b)
U/ U
rms
∞
0
g = 0.1
g = 0.5
g
Figure 3.5: Use of signal standard deviation (a) and intermittency factor(b) for quantification of the transition delay obtained by lam-inar flow control. Circles without, squares with roughness ele-ments, from [37].
transition process over the observed streamwise range. For transition con-trol experiments in boundary layers, the signal standard deviation σ is themost frequently chosen value to quantify the obtained effect on the transi-tion location. Its main advantages are the freedom of choice of the sensortype and no necessity to calibrate the sensor, as well as the possibility tomeasure either at the wall or inside the flow. To ensure reliable data, themeasurements need to be sufficiently long for statistical certainty and thetemporal resolution high enough to capture all relevant turbulence scales.Figure 3.5 illustrates additional measurements by Fransson et al. [37] to de-lay natural transition by means of roughness elements. The displacement ofthe standard deviation peak for two measurements is used to quantify thetransition delay ∆xdelay in 3.5 (a). Circles again illustrate the case withoutflow control whereas the controlled conditions are presented by squares.
Additionally, the intermittency factor γ is illustrated (b) which quantifiesthe temporal ratio between laminar and turbulent state of the boundarylayer. A balanced ratio of γ = 0.5 indicates equal distribution of lami-nar and turbulent flow during a measurement, and the streamwise position
28

3.2 Transition Detection
Figure 3.6: The shape factor during transition related to intermittent hot-wire signals, from [7].
where it is found coincides with the position of maximum standard devia-tion in (a). The unambiguous intermittency value ranges between 0 and 1in contrast to the standard deviation, which does not have a clearly definedabsolute maximum value even if normalized with the freestream velocityU∞. The main disadvantage is the existence of various definitions for γ,all based on empirical calibration constants. Three of the most commonlyused definitions, including the TERA and M-TERA methods, are reviewedby Zhang et al. [119] and a strong dependence on the calibration constantsis observed. Especially if different experimental setups are to be compared,a universal specification of these constants is difficult. The necessity tomeasure velocities inside the boundary layer inhibits the calculation of in-termittency factors from wall-mounted sensor data.
If velocity data across the whole boundary layer is acquired, the integralproperties of the velocity field are accessible. The shape of the profilescharacterizes the state of the flow and can be represented by the shapefactor H12 = δ1/δ2. The ratio between two integral quantities, the dis-placement thickness δ1 and the momentum loss thickness δ2 defined inequations (2.10) and (2.11), is a measure of the momentum distributionacross the boundary layer. Knowing that the shape factor is closely relatedto the stability properties of the flow, e.g. the critical Reynolds numberas shown by Wazzan et al. [112], it provides an indication of the hydro-dynamic stability. Laminar profiles experience strong shape changes dueto external pressure gradients such that the shape factor spans in a broad
29

3 Methodology
range, H12 ≈ 2.3 − 3.9. During transition the profiles become ’fuller’ andthe displacement thickness is locally decreased whereas the momentum lossthickness grows monotonically. The shape factor H12 shows a steep andcharacteristic decrease until settling at H12 = 1.4 for fully turbulent flow[90]. Figure 3.6 reports the shape factor and hot wire measurement signalsthroughout the transition region. The monotonic evolution of the shapefactor observed by Arnal et al. [7] without any characteristic peaks aggra-vates the exact quantification of the transition process. Nevertheless, itdelivers valuable information based on the whole flow profile as comparedto statistical data analysis at the wall. Within the laminar flow domain,the pressure gradient and some stability properties may additionally beestimated from available shape factor evolutions. Since knowledge of theexact wall position is crucial for accurate calculation of the displacementthickness δ1, a high spatial resolution of the velocity data with high statis-tical significance is required, rendering measurements time consuming anddifficult.
All above mentioned methods have been employed to analyze transitionalboundary-layer data on the different experimental setups reported in thefollowing.
3.3 Flat Plate Experiments
In order to enhance the understanding of DBD flow control imposed ontransitional boundary layers, controllable and well-defined flow conditionsare necessary. Although lacking relevance for practical application, genericflat plate setups have proven valuable to foster the understanding of fun-damental physical processes. Grundmann [43] showed the applicability ofDBD actuators for transition delay on a flat plate at flow velocities below8 m/s and under controlled disturbance conditions. The current projectaims to increase the Reynolds number range at which DBD actuators canbe applied successfully for delaying transition and to demonstrate theireffectiveness in a naturally occurring transition scenario. The easily acces-sible experimental data on the generic setup enables a parametric study ofdifferent actuator configurations. Additionally, a numerical analysis of theflat plate setup is straightforward and facilitates a validation and optimiza-tion of the flow-control application.
The transition experiments reported in Chapter 4 are conducted in anopen-circuit wind tunnel with a 1 : 24 contraction nozzle. The 450 mm× 450 mm test section contains a flat plate of 1600mm length with an 1 : 6
30

3.3 Flat Plate Experiments
350 mm
900 mm
27
0 m
m
DBD actuator
225 mm
disturbancesource
x = 0
Figure 3.7: Displacement body and flat plate in test section, includingflush-mounted DBD actuator and disturbance source. Maxi-mum contraction located at leading edge (x = 0).
elliptical leading edge and inclinable trailing-edge flap for adjustment of thestagnation point. The flat plate provides an insert centered 350 mm down-stream of the leading edge to flush mount single DBD actuators of 440 mmspanwise length. Since transition would naturally occur far downstream inthe test section for the projected freestream velocity U∞ = 20 m/s, a dis-placement body is installed on the tunnel ceiling to destabilize the laminarboundary-layer flow. The maximum thickness of the displacement body islocated at the beginning of the flat plate (x = 0) as illustrated in Figure3.7, creating an adverse pressure gradient downstream of the leading edge.At U∞ = 20 m/s, an average turbulence intensity of Tu = 0.24% is mea-sured at the inlet of the test section. This intensity, comparable to valuesfound by Weismüller [114] at elevated turbulence in flight, renders the flowquality acceptable for transition measurements. A disturbance source isinstalled 225 mm downstream of the leading edge. It consists of a spanwisearray of 12 miniature loudspeakers driving a flush-mounted brass bar. Byharmonic excitation with an amplified signal, a wall-normal displacementof the brass bar induces deterministic disturbances inside the boundary-layer flow. The disturbance source enables defined disturbance conditionsand experimental stability investigations. Although the focus of the workis the delay of naturally developing transition without external excitation,controlled disturbance conditions are valuable for the analysis of the inter-action between the flow-control device and a single modal disturbance, asdelineated in Chapter 4.2.
Various measurement techniques are utilized to quantify the transitionprocess and acquire data in close proximity of the force generating high-voltage electrodes. Since each measurement principle offers different ad-vantages, the potentially best-suited strategy is chosen to answer a variety
31

3 Methodology
of questions as explained in the following.
3.3.1 Hot-Wire Measurements
Under conditions of low freestream turbulence and in the absence of acous-tic disturbances or surface roughness, the boundary-layer transition alongthe flat plate is expected to be triggered by two-dimensional Tollmien-Schlichting waves. The linear amplification process of these modal distur-bances is governed by the stability of the boundary layer which is accessiblevia stability analysis as described in Chapter 3.5.3. The later stages of tran-sition are characterized by the breakdown of the Tollmien-Schlichting wavesinto three-dimensional, chaotic structures and increasing velocity fluctua-tions inside the boundary layer.
Hot-wire anemometry allows the acquisition of time-resolved velocity in-formation to resolve all relevant disturbance frequencies in the presented ex-periment. Throughout this work, all hot-wire measurements are conductedin a constant temperature anemometer (CTA) setting at sampling frequen-cies of 16 kHz. In the wind-tunnel experiments, a DISA 55M01 hot-wireanemometry Wheatstone bridge is used to measure flow velocities and fluc-tuations along the flat plate. A Dantec 55P15 type single-wire boundary-layer probe mounted on a Dantec 55H21 probe support can be traversedvia an Velmex BiSlide 2-axis automated system and is calibrated with areference Schildknecht MiniAir6 Micro vane anemometer. Data is sampledvia a National Instruments USB-6259 analog-digital converter and a DISA
55D26 analog signal conditioner provides a low-pass filter with a cutoffat 3.15 kHz. This cutoff frequency removes electromagnetic noise causedby the dielectric barrier discharge and enables determination of disturbancefrequencies in the expected flow instability range. A spectral analysis of thevelocity data enables identification of the critical disturbance frequenciesand a quantification of disturbance amplitudes. Measurements at differentstreamwise positions or variation of the flow velocity lead to a variation ofthe signal standard deviation σU and can provide an intermittency factorγ as described in Section 3.2. Hot-wire anemometry additionally enablesthe acquisition of averaged velocity profiles within the boundary layer asillustrated in Figure 2.1. The shape factor may be calculated to identifythe influence of the pressure gradient and to track the transitional behaviorof the full velocity field. Both techniques are employed in Chapter 4.1 toevaluate the impact of DBD actuation on the transition process on the flatplate.
32

3.3 Flat Plate Experiments
Since the technique is highly sensitive to changing ambient temperature,the fluid temperature Ta is monitored during the measurements and a tem-perature compensation according to Lemonis and Dracos [64]
Ecorr = Emeas
√TW − Ta0
TW − Ta
(3.1)
is applied. The measured hot-wire voltage Emeas is transformed into thecorrected value Ecorr by relating the hot wire operation temperature TW
to the ambient flow temperature during the hot-wire calibration Ta0 andthe actual flow temperature Ta during the measurement. The correctionis applied before conversion to the calibrated velocity UCTA according toKing’s law [74]
Ecorr =√
A+BUnCTA. (3.2)
The calibration factors A, B and n can be obtained by least-squares re-gression of multipoint reference data.
Hot-wire anemometry is advantageous for continuous data acquisition athigh temporal resolution, beneficial for a statistical analysis. The actua-tor effect in the immediate proximity of the exposed electrode cannot beassessed. The alternating, high electric potential induces disturbance cur-rents within the wire and poses the risk of arcing, eventually destroying theprobe and the Wheatstone bridge. Only non-intrusive methods are capa-ble of measuring fluid properties directly at the exposed electrode withouteither disturbing the flow field or damaging the sensor. Optical measure-ment techniques are predestined to quantify the interaction of the plasmawith the flow close to the high voltage electrodes (e.g. [23, 26, 34, 51, 81]).Two optical measurement techniques are introduced in the following tocharacterize the flow closer than 20 mm to the zone of ionization.
3.3.2 Particle Image Velocimetry
The mean flow field and the impact of DBD operation can be characterizedusing a Dantec Nano-S 2D− 2C particle image velocimetry system similarto the setup used by Duchmann et al. [23]. A Dantec FlowSense 2M CCDcamera with 1600 × 1200 pixel resolution and equipped with an AF Mikro
Nikkor 105 mm f = 2.0 lens is positioned outside of the test section. Theimaging plane is parallel to the x-y-plane of the test setup and adjustedto a field of view of 32 mm × 24 mm in the center of the test section. ANd:YAG Litron dual-cavity laser with a Dantec 80X70 light-sheet optic
33

3 Methodology
provides a maximum power output of 135 mJ per cavity to illuminate theDEHS-seeded wind-tunnel test section. The repetition rate of the laserpulses is limited to 15 Hz. In order to reduce background light reflectionsa monochromatic filter at the laser wavelength of λ = 532 nm is installedon the lens. 10 bit images are acquired in double-frame mode and for thecorrelation of the velocity vectors, an interrogation area size of 16 × 16pixels with an overlap of 50% is chosen. The main advantage of the PIVmeasurement is the acquisition of the whole flow field within the camerafield of view. Nevertheless, a large number of PIV images needs to beaveraged to obtain a reliable velocity field, rendering the measurement timeconsuming and difficult for varying flow conditions.
The current work employs a phase-locked approach to measure boundary-layer instabilities and their interaction with a DBD force field via particleimage velocimetry. Widmann et al. [115] introduce a method to mea-sure the spatial distribution and evolution of artificially excited Tollmien-Schlichting instabilities in laminar boundary layers and present details onthe experimental apparatus. The application of this method for the evalu-ation of disturbance damping by arbitrary flow-control actuators has beensuggested in the outlook and is realized for DBD actuation in the presentwork. In the context of flow stability, it is helpful to investigate the DBDflow-control effect on modal instabilities which eventually trigger transi-tion. Both the streamwise and the wall-normal velocity component of de-terministic modal disturbances are accessible via triggered particle imagevelocimetry.
In order to ensure repetitive boundary-layer disturbances of fixed fre-quency and amplitude, the disturbance source implemented at x = 225 mmcreates a two-dimensional convective disturbance. The disturbance sourceon the flat plate is energized with a sinusoidal reference signal, creating asingle frequency boundary-layer instability. A delay generator is employedto trigger the PIV data acquisition - by adjusting the time delay betweenthe reference signal and the data acquisition, arbitrary phase-relations Φto the disturbance signal can be chosen. By repetitive phase measurementsand ensemble averaging, the deterministic flow disturbance dominates overrandom velocity fluctuations and measurement errors. The accuracy of thevelocity quantification can be correlated to the standard deviation which isa function of the ensemble size. For increasing sample numbers, the stan-dard deviation asymptotically converges towards a fixed value. An ensem-ble of 1700 velocity fields is found to provide a good compromise betweenmeasurement accuracy and duration for the conducted experiments.
34

3.3 Flat Plate Experiments
An equidistant spacing of ∆Φ = 30 is chosen to resolve the disturbanceperiod by twelve different phases Φ. The raw data are cross-correlated withDantec Dynamic Studio and processed further using MATLAB. The singlevector fields undergo a range validation to eliminate spurious values due tolack of seeding material, reflections and variations of the freestream velocity.For clarity, the vector fields are decomposed into a streamwise componentu and the wall-normal component v. The postprocessing is exemplarilyexplained for the streamwise component but applies in the same way tothe wall-normal direction. One averaged two-dimensional velocity field uΦ
is calculated for each phase Φ. Averaging over all twelve uΦ eliminatesthe influence of the disturbances and yields the mean velocity field of theboundary layer u which would be found without disturbance excitation.The mean velocity field is finally subtracted from each uΦ to yield periodicflow fluctuations u′
Φ = uΦ − u. The results acquired with the describedmethod have been published in [26] and are recapitulated in Chapter 4.2.The observations are helpful to understand the interaction between flowdisturbances and the DBD device in direct vicinity of the force generation.
3.3.3 Laser Doppler Anemometry
Alternatively, laser Doppler anemometry (LDA) provides both the stream-wise and wall-normal velocity component in a point-like measurement vol-ume of approximately 0.2 mm diameter and 1 mm length. A Dantec Flow
Explorer 35 mW laser head emits two laser beam wavelengths and creates ainterferometric measurement volume at a focal distance of 300 mm. DEHSparticles seed the flow and provide the backscatter signal which is post-processed with the BSA Flow Software. In combination with an ISEL 3-axis traverse system the measurement volume can be positioned anywhereinside the wind-tunnel test section. The LDA setup measures velocity pro-files close to the DBD electrodes and enables a comparison of the boundarylayer’s momentum content with and without flow control. The wall-normalresolution is not limited by camera resolution or interrogation area size asin the case of the PIV setup. Therefore, high-precision velocity profile mea-surements with wall-normal spacings of 0.1 mm are available and shown inChapter 4.3. Such measurements complement the hot-wire measurementsfurther away from the actuator and enable a stability analysis reportedin Chapter 5.4. Since such stability analysis only requires averaged veloc-ity information, no phase-locking or disturbance excitation are necessaryduring the LDA measurements.
35

3 Methodology
3.4 Flight Setup
In the preceding chapter, the advantages of a generic flat plate setup tosystematically investigate certain aspects of DBD flow control have beenelaborated. Nevertheless, the application of such actuators under realisticconditions for a net gain is desirable and aimed at within the presentedproject. One promising task is the prolongation of laminar flow along anairfoil to reduce its friction drag. Initial success has been achieved bySéraudie et al. [97] showing a measurable transition delay on the ONERA-D airfoil at low Reynolds numbers (U∞ < 17 m/s and chord length c =0.35 m). At chord Reynolds numbers of approximately Re = 4 × 10⁵, atransition delay of up to 35% of the chord length is reported.
The imparted momentum due to the DBD forcing is limited and needsto be considered in relation to the freestream momentum. Therefore, DBDflow control at low Reynolds numbers is more effective than for the rangeabove Re > 1 × 10⁶ which is of interest for human flight. Apart from thenecessary increase of chord length and flow velocity to obtain sufficientlyhigh Reynolds number, the ambient conditions during flight are of eminentimportance. Changing humidity affects the DBD performance whereas in-coming turbulence and the absolute value of the pressure gradient alongthe airfoil dictate the transition behavior of the boundary layer. In orderto evaluate the limits of DBD flow control in the Reynolds number regimeof interest, an airborne flight setup on a double seated motorized glider ispresented. The realistic combination of all relevant parameters cannot beprovided in any wind-tunnel setting and therefore, flight tests are required.Nevertheless, initial wind-tunnel tests of the flight setup reduce the nec-essary installation and testing period due to simplified accessability. Theflight equipment was therefore designed such that it can alternatively beapplied on the wing of a full scale G109b motorized glider or within thelarge-scale NWK wind tunnel. Details on the wind tunnel are providedin Chapter 6.1 whereas the flight setup including the motorized glider areintroduced in the following sections.
3.4.1 Glider
A double-seated G109b motorized glider by Grob Aircraft is employed toinvestigate the effect of DBD actuation on boundary-layer transition underfree-flight conditions. The aircraft combines the advantages of vibration-less gliding flight with a 96 kW engine for autonomous take-off and effec-tive altitude gain. The Limbach 2400 DT1 turbo-charged motor can be
36

3.4 Flight Setup
2 2
1
3
1 - wing glove
2 - underwing storage pods
3 - ambient air data
acquisition
Figure 3.8: Flight setup including G109b glider and measurementequipment.
powered down and the Hoffmann propeller rotated into a gliding positionfor minimum vibrational, electromagnetic and acoustic disturbances duringtransition experiments. The wing and fuselage of the aircraft are composedof glass and carbon fibre reinforced plastics yielding an empty gross weightof 660 kg. The trapezoidal wing with a span of 17.4 m and aspect ratioof 15.9 comprises the E580 natural laminar flow airfoil designed by Epplerwith subtle forward sweep. With a taper ratio of 0.55, the sweep angle atthe leading edge is almost zero, minimizing spanwise pressure gradients andcreating almost two-dimensional flow along the chord such that amplifiedTollmien-Schlichting waves are expected to dominate the transition process.Several modifications of the airframe structure as well as non-permanentadjustments are necessary and certified by the German Federal AviationAuthority (LBA) in order to implement measurement equipment and hosta laminar wing glove which is in detail discussed in Section 3.4.2. Detailsof the airframe modifications for flight investigations are presented by Erb[30] and Weismüller [114]. Non-permanent modifications with valid LBAcertification include a vibration-isolated platform to host data acquisitionequipment in the rear part of the cockpit [117], a sting-mounted wind vanewith adjacent storage pod for ambient condition monitoring on the portwing and a NLF wing glove mounted on the starboard wing. To accountfor the additional payload, a temporary “permit to fly” is issued by theLBA to allow a maximum take-off weight of mMT OW = 950 kg. Underregulations of this permit to fly with increased weight, the maximum flight
37

3 Methodology
measurement
insert
storage
pod
LEADING EDGE
wing
OU
TB
OA
RD
INB
OA
RD
wing glovesocket for
boom
transition trip
pressure taps
storagecompartment
1350 mm
13
50
mm
11
00
mm
600 mm
Figure 3.9: Bottom view of wing glove dimensions fixed on the glider wing.
speed is limited to Umax = 44.5 m/s. The lower end of the flight envelopeis marked by stall speed with retracted air brakes at Umin = 20.3 m/s.Since for steady flight conditions the necessary lift is governed by the air-craft mass and glide angle, the angle of attack α has to be chosen accord-ingly. The angle of attack exploitable for the experiments range between−3 close to the speed limit and ∼ 13 just before complete flow sepa-ration. The Approved Flight Manual [57] and the Type Certificate DataSheet [67] provide additional data and limits of operation for the motorizedglider. The measurement system including the plane, the wing glove andthe ambient condition acquisition is illustrated in Figure 3.8. Details of themeasurement equipment are presented in the following.
3.4.2 Wing Glove
To quantify the influence of atmospheric turbulence on natural laminar flowairfoils, Weismüller [114] developed a wing glove for assembly on the rightglider wing. Such a wing glove slides over the outer section of the taperedwing and matches smoothly at one defined spanwise position as illustratedin Figure 3.9. The wing glove enables implementation of arbitrary sensorswithout interfering with the airframe structure. Similar experiments havebeen conducted [30, 94, 95] to measure the laminar-turbulent transitionprocess along a wing glove with hot-film anemometry. Since the wing glove
38

3.4 Flight Setup
slides over the wing and exhibits higher chord and thickness, it is speciallydesigned to match the lift and drag of the covered wing section. This isa necessity to retain the same flight characteristics with or without theasymmetric equipment installed. A custom designed airfoil based on theAlthaus AH93-157 with 5% higher thickness and 25% increased camberin combination with a steeper trailing edge angle was selected and formsa rectangular section of 1.35 m × 1.35 m. The characteristics of the pres-sure side of this airfoil predestines it for flow-control investigations since thepressure gradient is almost linear and adjustable between moderate positiveand negative values, expanding the region of possible transition locations.The flow over the wing glove was numerically investigated by Schulze [93]and shown to be largely two-dimensional, except for the lateral taperedregions connecting the wing glove to the glider wing. In the center portion,where an exchangeable measurement insert made from acrylic glas accom-modates a streamwise row of microphones described in detail in Section3.4.4, the boundary layer does not show crossflow velocity components.A laminar separation bubble on the pressure side detected by Weismüller[114] downstream of x/c = 0.8 would lead to a considerable drag increase.To avoid an influence of the separation bubble on the sensor readings, atransition trip is installed at x/c = 0.78. On the inboard side of the leadingedge, a connection socket enables installation of a front boom for hot wireand pressure measurements of the incoming flow. An underwing pod anda storage compartment for equipment complete the wing glove.
3.4.3 Exchangeable Insert
The exchangeable measurement inserts of 600 mm width and 1100 mmlength cover the central region of the pressure and suction side of the wingglove. To ensure surface smoothness and minimize streamwise and spanwisewaviness, the inserts are made from cast plexiglas of 2 mm thickness. Theyare connected to the wing glove via 3M adhesive tape for non-destructiveremoval and to avoid temperature induced stress. Such loads could be aconsequence of different thermal expansion coefficients as the glove surfaceis heated by the sun. The inserts can be replaced for different measurementtasks and sensor-actuator configurations. For the evaluation of DBD-basedboundary-layer transition control, the insert holds a disturbance source, asingle DBD actuator and wall-mounted sensors for transition detection.
A spanwise row of 20 miniature loudspeakers is implemented at x/c =0.17 on the pressure side and at x/c = 0.18 on the suction side to excite
39

3 Methodology
disturbances in the laminar portion of the boundary layer, artificially trig-gering the transition to turbulence. Such investigations are described inChapter 6.3 and enable a comprehensive analysis of the stability character-istics of the wing glove under flight conditions. The amplification of discretefrequencies can be evaluated and compared to numerical computations ofthe transition process or stability analysis as discussed in Chapter 5.
A single DBD actuator is placed at x/c = 0.33 on the pressure side,providing a body force in streamwise direction to influence the laminarboundary-layer flow. The geometric configuration is defined in Section 3.1and the actuator spans the whole width of the measurement insert in span-wise direction, namely 600 mm. A sinusoidal high voltage is applied viaa MiniPuls 2.1 generator installed in the storage compartment. The reso-nant frequency of this combination of actuator and high voltage generatoris fpl = 7.8 kHz and applied for all flight experiments. The thrust andpower consumptions during each flow-control experiment are referenced inthe corresponding Chapter 6.3.
Downstream of the DBD actuator, a streamwise array of microphones isimplemented to quantify the transition location and disturbance frequen-cies. More details on the sensors are provided in the following.
3.4.4 Sensors
The wing glove is designed for boundary-layer measurements and to quanti-tatively compare the transition process under the influence of DBD opera-tion to the case without flow control. For such a task, adequate sensors haveto be selected. Optical measurement techniques are non-intrusive and notinfluenced by electromagnetic disturbances in the proximity of the high-voltage ionization region, but they cannot be easily implemented in thenon-stationary and spatially confined flight setup. Horstmann and Miley[49] used surface-mounted hot-wire probes to detect Tollmien-Schlichtingwaves. The most significant disadvantage of such an approach is the dis-turbance of the flow downstream of the probe position such that the spatialevolution of disturbances cannot be tracked. Since the desired informationof the boundary-layer state is available from the wall-near region of theflow, surface implemented sensors can be chosen to characterize the flowstate around the wing glove.
Along the outboard portion of the wing glove, 64 pressure taps are dis-tributed over the suction and pressure side of the wing glove. The pressuretaps have an opening diameter of 0.2 mm and are drilled perpendicularlyinto the carbon-fibre reinforced surface, connecting to underlying, airtight
40

3.4 Flight Setup
brass pipes. A Pressure Systems ESP-64HD differential pressure scanner isconnected by 1.2 m long flexible PVC tubes enabling static pressure mea-surements. The pressure distribution along the wing glove facilitates com-parison of the experiments to numerical investigations and determinationof the correct angle of attack. The necessary tube lengths and the smallorifice restrict the resolvable frequencies of pressure variations. Sinclairand Robins [100] provide a formula based on assumed laminar pipe flow toestimate the time the pressure information requires to travel through thetubes. For the given setup, the temporal resolution is limited to less than10 Hz, which impedes quantification of the transition process through thepressure readings.
Wall-integrated microphones have been proposed by Nitsche and Brunn[74] for transition detection. In the past, various in-flight transition exper-iments have been successfully performed with either flush-mounted micro-phones or highly sensitive pressure transducers [32]. On the center portionof the pressure-side measurement insert, a streamwise row of 15 Sennheiser
KE 4-211-2 microphones is installed 2 mm underneath the surface. The mi-crophones are evenly distributed with 30 mm spacing between x/c = 0.36and x/c = 0.67 and the signals are conducted to a self-built amplifier. Theconnection to the flow is provided by one small orifice of 0.2 mm diameterfor each microphone. The maximum resolvable frequency fmax ≈ 8 kHz islimited by the inertia of the air volume contained inside the orifice, butsince the relevant flow instabilities inside the boundary layer are expectednot to exceed 2 kHz, the chosen setup is appropriate to track the streamwisedevelopment of transition in flight. For a complete calibration of the micro-phone array, the frequency response of each microphone needs to be known,requiring an acoustic laboratory. A simplified approach is selected and jus-tified by the similarity of the frequency responses of structurally identicalmicrophones. On ground, a loudspeaker is situated in sufficient distance tothe wing glove to create a quasi two-dimensional acoustic wave front witha white noise frequency distribution. A ROGA Instruments RG-50 refer-ence microphone is installed at the same distance to the sound source. Theroot-mean-square (RMS) values of the microphone output voltages are re-lated to the calibrated reference microphone sensing a sound pressure levelLp = 20 log10
prms
pref
in dB. The reference pressure pref = 20µPa is used andthe sensitivity of the sensors is evaluated based on the reference microphonesignal. The sensitivity of the single microphones varies between 6.78 and1.55 mV/Pa, and therefore requires a calibration coefficient si for everymicrophone to be determined, in order to compensate for similar output
41

3 Methodology
levels for the various sensors. The calibration factor for the first microphonewithin the array is s1 = 57.03 dB/V. Henceforth the logarithmic scale is ap-plied for all microphone signals. During the flight-measurement campaign,artificial triggering of transition upstream of the first microphone positionprovides a quasi-white noise signal. The turbulent boundary layer containsmulti-frequent disturbances of invariant intensity and allows for a checkupof the obtained calibration factors.
Weismüller [114] installed two booms in front of the wing glove leadingedge to enable pressure and hotwire measurements of the incoming flow. Anegative impact on the two-dimensionality of the flow was observed at highangles of attack. The flow separating on the protruding structure inducesturbulence on the wing glove flow, especially in the case of large additionalside slip angles β. In contrast to the reported experiments, only one boomis installed in the present study. The problematic angles of attack arewell beyond the interesting angles, such that these effects are neglected.A pitot and static pressure probe on the boom enables measurements ofthe flight speed. Both pressures are digitized with the differential pressurescanner described above. The maximum allowable pressure difference ofthis scanner is 24.8 hPa enabling the resolution of dynamic pressures andpressure distributions across the full flight envelope. The front boom canadditionally accommodate a X-shaped hot-wire probe for acquisition of theflow speed UCTA and angle of attack αCTA. Due to hardware problems withsensor crosstalk the corresponding data will not be discussed in this thesis.
Boundary-layer velocity profiles can be acquired with a Dantec 55P15
type hot-wire probe mounted to a 3D-traverse system described in moredetail in Section 3.4.6. All hot-wire sensors are connected to a multichan-nel constant temperature anemometer system based on Dantec MiniCTA
bridges contained inside the underwing storage pod. The hot-wire equip-ment is calibrated to the expected flight speed via King’s law and a tem-perature correction is applied as described in Section 3.3.1. The circuit-integrated analog filter is set to 3.15 kHz. Although higher frequencies canbe resolved, this filter is chosen to avoid aliasing and minimize disturb-ing effects due to high-frequency DBD operation. An overall sketch of thepressure side of the wing glove instrumented with the different sensors isprovided in Figure 3.10.
Microphone and hot-wire data are acquired via a modular National In-
struments 9074 cRIO real-time system equipped with 4 analog-digital con-verters of the type NI 9205. All flow measurements are acquired with asampling rate of 16 kHz to resolve the DBD operating frequency and avoid
42

3.4 Flight Setup
DBD actuator
traverse microphone
array
HW sensor
disturbance source
DBD controller
(covered)
measurement
insert
pressure taps
storage
pod
LEADING EDGE
wing
OU
TB
OA
RD
INB
OA
RD
wing glovesocket for
boom
transition trip
Figure 3.10: Overview of the wing glove pressure side with sensors andtraverse system installed.
aliasing effects. Additional flow temperature measurements are digitizedwith a NI 9211 module and a NI 9263 module enables the generation ofanalog output signals. The latter is relevant for closed-loop controlled DBDoperation as described in Chapter 6.2. Due to the large amount of datastreamed during measurements, a binary file format is chosen in the Lab-
View based acquisition software. The copilot foot compartment containsa 24 V battery providing the power for all measurement equipment andthe high-voltage generator, ensuring independence from the aircraft powersystem for 2 hours of measurement operation. All sensors are selected tounambiguously track the transition process on the wing glove and ensurerepeatability of the experiments. Since no severe post processing is nec-essary for the chosen measurement methods, online evaluation of the datain flight is available. This facilitates the appropriate reproduction of flightstates during the measurements since the momentary ambient conditionsare known.
3.4.5 Ambient Air Data Acquisition
The environmental conditions during flight are measured on the left wingwith a system introduced by Erb [30] and Weismüller [114]. Setra 270
& 239 absolute and differential pressure sensors are employed to acquirethe static and total pressure on static and pitot tubes at an additional
43

3 Methodology
boom, mounted upstream of the left wing. The ambient air temperatureis measured with a PT1000 temperature sensor neglecting the influenceof empirical recovery factors for the conversion between static and totaltemperature. A humidity sensor is installed to determine the current airdensity and to calculate the correct Reynolds number and true airspeedUTAS. A Dornier Flight Log, which is a wind vane following the incidentflow, is mounted on the boom and provides the angle of attack α as wellas the sideslip angle β. A GPS receiver installed on the suction side of theleft wing provides the longitudinal and latitudinal position as well as alti-tude information. All ambient data are sampled with 16 bit at a frequencyof 10 Hz with a National Instruments USB-6221 AD converter and trans-ferred to the measurement platform in the baggage compartment withinthe cockpit. The calibration functions and correction factors for all airdata measurement equipment can be reviewed in [114].
3.4.6 Boundary-Layer Traverse
Boundary-layer measurements along the wing-glove surface are crucial todetermine the state of the transitional boundary layer and measure theshape and amplitudes of contained disturbances. In order to acquire time-resolved velocity data along the exchangeable plexiglas measurement insert,a light-weight three-axis traversing system was developed which can be in-stalled on either side of the wing glove. A sketch of the traversing system isprovided in Figure 3.11 (a), indicating the single components with differentcolors. Two turrets (grey) are connected to variable mounting threads alongthe glove chord to both sides of the measurement insert. Both turret headsprovide coaxial pivot points on which a linear traversing assembly for thespanwise direction (blue) is supported. On the moving sledge of this lineartraverse, another linear traverse (green) is mounted enabling streamwisemovement of a hot-wire probe support. The set of linear traverses may berotated around the pivot point by a stepper motor positioned next to theinboard turret (red), leading to a wall-normal displacement of the hot-wiresupport with respect to the glove surface. The wall-normal positioning ac-curacy of the hot-wire probe is 0.1 mm for highly resolved boundary-layerprofiles. The lateral dimensions can be approached with approximately1 mm accuracy. NanoTech stepper motors with feedback encoders ensurerepeatability of the probe positioning.
Due to the convex nature of the wing glove and especially the non-monotonous curvature on the pressure side, the traverse kinematic illus-trated in Figure 3.11 (b) has to account for non-linear movements by ad-
44

3.5 Numerical Tools
(a) Sketch of single traverse compo-nents for application on pressure side.
βγba y
x
h
L(ξ)
ξ
(b) Kinematic of the traverse system onthe suction side during flight.
Figure 3.11: Sketch (a) and kinematic (b) of the traverse system forboundary-layer measurements on the wing glove.
equate software programming and stepper motor control. Small modifi-cations of the hardware and sign changes within the relative coordinatesystems are necessary when switching between pressure and suction sideinstallation. The software is implemented in LabView and allows for user-controlled single movements as well as automated positioning according topredefined schemes. The combination of linear and rotatory componentscreates a non-linear kinematic with mutual dependence of the positions ofeach stepper motor, requiring the definition of an absolute reference po-sition. In order to calculate the next probe motion in wall-normal andstreamwise direction, the actual probe location in relation to the absolutereference needs to be known. The curved surface contour is defined bythree reference positions and cubic spline interpolation within the stream-wise range of the traverse. Detailed information on the kinematics and thesoftware implementation are provided by Simon [99]. The in-flight tran-sition measurements on the NLF wing glove performed with this traversewill be presented in Chapter 6.3.
3.5 Numerical Tools
In contrast to experimental investigations with associated measurement un-certainties and limited spatial resolution of sensors, computational studiesoffer a detailed glance on any desired fluid property. A numerical treat-ment of the problem enables a detailed analysis of the flow-control mecha-nisms and exact repeatability for parametrical studies – if the problem isdescribed appropriately by the underlying equations and with the proper
45

3 Methodology
boundary conditions. Several assumptions and simplifications are usuallynecessary to enable a numeric treatment of fluid mechanic problems. Theboundary-layer and stability equations derived in Chapter 2.1 require ade-quate discretization and implementation into a computing environment.
3.5.1 Boundary-Layer Solver
For the evaluation of flow-control strategies and the effect on boundary-layer stability, the boundary-layer velocity distribution needs to be known.It can either be obtained by experimental measurements as described inSection 3.3 or by a numerical solution of the governing equations derived inChapter 2.1. Simplified solutions exist to compute the evolution of integralboundary-layer quantities like the displacement thickness δ1 or the shapefactor H12, e.g. the Thwaites [19] or Pohlhausen [79] methods. For anumerical treatment of flow-control effects, this is not sufficient and the fullboundary-layer information including velocity gradients and curvature needto be accessible. The boundary-layer problem (2.3) - (2.7) consists of partialdifferential equations for which no general analytical solution is available.Only for certain simplifications and conditions, analytical treatments (e.g.for the zero pressure-gradient Blasius flow) are applicable. For a numericalsolution of the problem, several transformations are necessary which arediscussed hereafter.
The solver numerically approximates the partial differential boundary-layer equations by finite differences based on a transformation of the physi-cal domain. Since the boundary-layer thickness increases during the down-stream development, the wall-normal coordinate y is conveniently normal-ized with dependence on the physical downstream coordinate x. A nor-malized wall-normal coordinate η is obtained by employing the so-calledFalkner-Skan transformation introducing the Blasius length scale δN ,
η = y/δN = y
√
ReUe(x)
x. (3.3)
With this transformation, the wall-normal coordinate is stretched to pre-serve a similar order of magnitude in the streamwise direction. Hence,the size of the computational grid cells can be maintained along the down-stream direction x without a loss of precision. Applying this transformationto (2.4) and employing (2.6), the streamwise momentum equation reads
u
(∂u
∂η
∂η
∂x+∂u
∂x
)
+ v∂u
∂η
∂η
∂y= fx + Ue
∂Ue
∂x+
1
Re
∂2u
∂η2
∂2η
∂y2. (3.4)
46

3.5 Numerical Tools
The boundary-conditions (2.7) remain valid in the transformed form
η = 0 : u = v = 0
η → ∞ : u = Ue(x)(3.5)
and the partial derivatives with respect to the normalized coordinate η are
∂η
∂x=
1
2η
(∂Ue/∂x
Ue
−1
x
)
∂η
∂y=
√
ReUe
x.
(3.6)
The necessary input for the computations is the velocity field at the outerlimit of the boundary layer Ue(x). Equation (2.6) enables the calculationof this quantity from a known pressure distribution which can be obtainedfrom potential flow solutions or measurements. Once the pressure distribu-tion is known, the stagnation point of the flow needs to be identified. Themeasured or computed pressure distribution generally does not cover theexact stagnation point, because of which the maximum pressure value islinearly extrapolated to approximate the position of the stagnation pointas accurately as possible. Directly at this position, no velocity profile forthe streamwise direction can be computed, requiring a special treatment toinitialize the boundary-layer solver. For the following approach, no bodyforce terms are allowed at the stagnation point. According to Cebeci andCousteix [19], the problem can be solved by computing the derivative of theboundary-layer equation (2.4) with respect to x. Neglecting force terms atthe leading edge, this results in
(∂u
∂x
)2
+ u︸︷︷︸
=0
∂2u
∂x2+∂v
∂x
∂u
∂y︸︷︷︸
=0
+v∂
∂y
∂u
∂x=
(∂Ue
∂x
)2
+ Ue︸︷︷︸
=0
∂2Ue
∂x2+
1
Rex
∂2
∂y2
∂u
∂x.
All terms containing the streamwise velocity u and its derivatives in wall-normal direction as well as the edge velocity at the stagnation point vanish,simplifying to
(∂u
∂x+ v
∂
∂y−
1
Rex
∂2
∂y2
)∂u
∂x=
(∂Ue
∂x
)2
. (3.7)
47
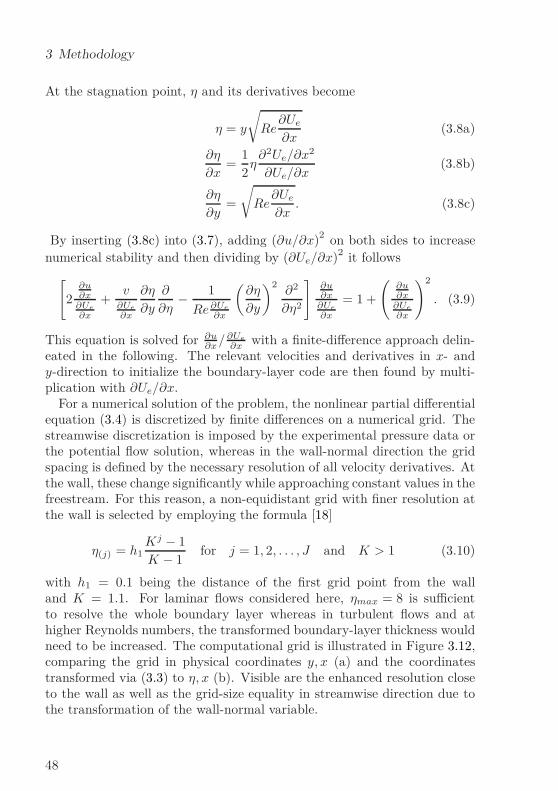
3 Methodology
At the stagnation point, η and its derivatives become
η = y
√
Re∂Ue
∂x(3.8a)
∂η
∂x=
1
2η∂2Ue/∂x
2
∂Ue/∂x(3.8b)
∂η
∂y=
√
Re∂Ue
∂x. (3.8c)
By inserting (3.8c) into (3.7), adding (∂u/∂x)2 on both sides to increasenumerical stability and then dividing by (∂Ue/∂x)2 it follows
[
2∂u∂x
∂Ue
∂x
+v
∂Ue
∂x
∂η
∂y
∂
∂η−
1
Re∂Ue
∂x
(∂η
∂y
)2∂2
∂η2
]∂u∂x
∂Ue
∂x
= 1 +
(∂u∂x
∂Ue
∂x
)2
. (3.9)
This equation is solved for ∂u∂x/∂Ue
∂xwith a finite-difference approach delin-
eated in the following. The relevant velocities and derivatives in x- andy-direction to initialize the boundary-layer code are then found by multi-plication with ∂Ue/∂x.
For a numerical solution of the problem, the nonlinear partial differentialequation (3.4) is discretized by finite differences on a numerical grid. Thestreamwise discretization is imposed by the experimental pressure data orthe potential flow solution, whereas in the wall-normal direction the gridspacing is defined by the necessary resolution of all velocity derivatives. Atthe wall, these change significantly while approaching constant values in thefreestream. For this reason, a non-equidistant grid with finer resolution atthe wall is selected by employing the formula [18]
η(j) = h1Kj − 1
K − 1for j = 1, 2, . . . , J and K > 1 (3.10)
with h1 = 0.1 being the distance of the first grid point from the walland K = 1.1. For laminar flows considered here, ηmax = 8 is sufficientto resolve the whole boundary layer whereas in turbulent flows and athigher Reynolds numbers, the transformed boundary-layer thickness wouldneed to be increased. The computational grid is illustrated in Figure 3.12,comparing the grid in physical coordinates y, x (a) and the coordinatestransformed via (3.3) to η, x (b). Visible are the enhanced resolution closeto the wall as well as the grid-size equality in streamwise direction due tothe transformation of the wall-normal variable.
48

3.5 Numerical Tools
(a) y, x (b) η, x
Figure 3.12: Comparison of the computational grid in physical (a) andtransformed (b) coordinates.
Throughout the boundary-layer calculation, several first and second or-der derivatives in the wall-normal and streamwise direction have to becomputed. The use of matrix multiplications is an elegant method to com-pute these. Exemplarily, the gradient of the edge velocity Ue(x) in thestreamwise direction x can be calculated based on finite-differences using adifferentiation operator
∂Ue(x)
∂x= D1Ue(x) (3.11)
where the subscript 1 stands for the first partial derivative in x-direction.To build such a differentiation operator D, the derivatives are approxi-mated by truncated Taylor series expansions neglecting terms of third andhigher order. A central differencing scheme is applied except for the firstand last positions x1 and xN where a forward and, respectively, backwardscheme need to be applied due to the lack of surrounding data. For thecentral differencing scheme, the Taylor series expansion centered at theposition xn yields
f(xn−1) = f(xn) + dn,1f′(xn) +
d2n,1
2f ′′(xn) + O(d3
n,1) (3.12a)
f(xn+1) = f(xn) + dn,2f′(xn) +
d2n,2
2f ′′(xn) + O(d3
n,2) (3.12b)
with
dn,1 = xn−1 − xn and dn,2 = xn+1 − xn. (3.13)
49

3 Methodology
Neglecting terms of third or higher order, the system (3.12) can be solvedfor f ′(xn) and f ′′(xn)
f ′(xn) = −dn,2
dn,1 (dn,1 − dn,2)f(xn−1) (3.14a)
−dn,1 + dn,2
dn,1dn,2f(xn) +
dn,1
dn,2 (dn,1 − dn,2)f(xn+1)
f ′′(xn) =2
dn,1 (dn,1 − dn,2)f(xn−1) (3.14b)
+2
dn,1dn,2f(xn) −
2
dn,2 (dn,1 − dn,2)f(xn+1).
A matrix representation of these equations for all streamwise positionsx1 − xN yields the tridiagonal differentiation operators D1 and D2 for thefirst and second derivatives. Such differentiation operators can be derivedfor the streamwise as well as the wall-normal direction and all necessarycomponents Di,j are comprehensively reviewed by Köhler [56] based on aformulation from Weideman and Reddy [113].
Once the differentiation operators are formulated to numerically repre-sent the nonlinear partial differential equation (3.4), a streamwise marchingprocedure is employed. Starting with the initializing solution at the stag-nation point, the next possible streamwise position is selected. Since onlyupstream information is available, a backward differencing scheme is em-ployed for the streamwise marching. The derivatives of the streamwisevelocity component in (3.4) are projected on discrete grid positions i andare expressed by
∂u(i)
∂x= Dx,nu
(n),(i) +Dx,n−1u(n−1) +Dx,n−2u
(n−2)
where the terms Dx,n to Dx,n−2 are the backward derivative terms in x-direction. Sorting already known terms on the right hand side, (3.4) isdiscretized as
[
Dx,nu(n),(i) +
(
u(i) ∂η
∂x+ v(i) ∂η
∂y
)∂
∂η−
1
Re
(∂η
∂y
)2∂2
∂η2
]
u(i) =
f (i)x + Ue
∂Ue
∂x− u(i)
(
Dx,n−1u(n−1) +Dx,n−2u
(n−2))
.
(3.15)
The equation can be written in matrix form and the boundary conditions(3.5) are imposed on the first and last rows of the resulting system. The
50

3.5 Numerical Tools
continuity equation (2.3) is utilized to find the wall-normal velocity com-ponent
v(i) = v(n)0 +
1∂η∂y
∫ ηmax
0
−∂u(i)
∂η
∂η
∂x
−(
Dx,nu(n),(i) +Dx,n−1u
(n−1) +Dx,n−2u(n−2)
)
dη
(3.16)
where v(n)0 is an optional blowing or suction velocity at the wall. An iter-
ative computation of the equations is performed until ∂u(i)/∂η at the firstgrid point above the wall convergence with a tolerance of 10−6. Once the it-eration condition is satisfied, the derivatives of the velocity components areobtained and the calculation starts at the next streamwise position. Sincethis method cannot deal with separating flows, the calculation is stoppedafter a maximum iteration count to avoid infinite loops and hence onlyresolves the attached laminar part of the boundary layer.
3.5.2 Force Model
In order to numerically analyze the flow under influence of DBD actuationand design a flow-control application, a model of the actuator is required.The spatial force distribution described in Section 3.1 is implemented in theboundary-layer solver. For comparison with experiments, the integral valueof the model force field needs to be equal to the actuator thrust. Kriegseiset al. [62] experimentally acquired force field distributions at various powerconsumption levels which enables a numeric treatment of different actua-tion magnitudes. Until now, no closed formulation of the actuator forceas a function of the power consumption is available. Nevertheless, the ex-perimentally chosen force magnitudes (compare Table 4.1) agree with theavailable force-field data to facilitate a comparison between numerics andexperiment. Maden et al. [69] proved the implementability of the forcefields for computational fluid dynamics (CFD) simulations by reproducingthe wall jet created in quiescent air.
The physical force f∗
x is normalized with the boundary-layer scales
fx =f∗
x
ρ∗l∗ref2 (3.17)
and l∗ref = δN as defined in (3.3) before it can be implemented in theboundary-layer computations. The discretized boundary-layer equation
51

3 Methodology
(3.15) contains a source term f(i)x for the streamwise force at each grid
point. Therefore, the force distribution needs to be discretized on thenumerical grid. This is conveniently achieved by a multi-dimensional inter-polation routine in MATLAB. Since no experience with implementation offorce fields in the mentioned boundary-layer code exists, a validation of thecomputations with experimental data is necessary. The generic flat platesetup introduced in Section 3.3 appears appropriate and the computationalresults are presented in Chapter 5.2.
3.5.3 Linear Stability Solver
The stability of experimentally (Chapter 4.3) and numerically (Chapter5) derived velocity profiles is analyzed based on the linear stability theoryexplained in Chapter 2.2. The aim is to quantify the impact of DBD flowcontrol on the flow stability and anticipate the transition behavior.
Introduction of the disturbance ansatz (2.20) into the equations (2.17)and (2.18a) - (2.18c) results in a set of second-order differential equations
iαu+ vy + iβw = 0 (3.18a)
−iωu+ vUy + iUαu+ iαp+1
Re
(α2u+ β2u− uyy
)= 0 (3.18b)
−iωv + iUαv + py +1
Re
(α2v + β2v − vyy
)= 0 (3.18c)
−iωw + iUαw + iβp+1
Re
(α2w + β2w − wyy
)= 0, (3.18d)
subscripts indicating differentiation in the corresponding direction. Theboundary conditions for this set of equation read
y = 0 : u = v = w = 0
y → ∞ : u = v = w = 0.(3.19)
The disturbance developments in time (expressed by the angular fre-quency ω) and space (characterized by the wavenumbers α and β) arephysically connected via a dispersion relation of the type
D(α, β, ω,Re) = 0 (3.20)
for which non-trivial solutions can be obtained via eigenvalue analysis. Ingeneral the quantities α, β and ω are complex and two of the three quanti-
52

3.5 Numerical Tools
ties must be known to enable a numerical treatment of the stability prob-lem. The stability equations (3.18) can be expressed in operator form as
Lq = 0 (3.21)
with the linear operator
L = A + B∂
∂y+ C
∂2
∂y2(3.22)
and formulation of the disturbance shape function q as in (2.21). Thematrices A - C are then found to be
A =
iα 0 iβ 0M Uy 0 iα0 M 0 00 0 M iβ
(3.23a)
B =
0 1 0 00 0 0 00 0 0 10 0 0 0
(3.23b)
C =
0 0 0 0− 1
Re0 0 0
0 − 1Re
0 00 0 − 1
Re0
(3.23c)
where
M = iω + iUα+1
Re
(α2 + β2
). (3.24)
For non-swept wings and TS-wave dominated transition in incompress-ible flow, Squire [103] proves that two-dimensional perturbations experiencelarger growth than three-dimensional instabilities and initiate the break-down to turbulence. For this reason, only two-dimensional disturbancesare considered in the framework of this thesis, rendering the spanwisewavenumber β zero. The eigenvalue problem is considered in the spatialframework to obtain the complex streamwise wavenumber α = αr + iαi fora predefined disturbance frequency ω.
The homogeneous boundary conditions (3.19) at the solid wall and out-side the boundary layer are conserved, posing a boundary-value problem forwhich no exact analytical solution is available. To enable a numerical solu-tion, a discretization scheme is applied. A spectral Chebyshev collocation
53

3 Methodology
method is chosen to approximate eigensolutions of q as accurately as pos-sible. The spectral approach leads to higher accuracy for the small growthrates αi based on a global approximation of the solution as compared toe.g. finite differences or finite element methods. A further advantage is thereduced number of necessary discretization points and the approximationof derivatives by analytical differentiation of the known basic function. Thespectral approach delineated in detail by Schmid and Henningson [91] isadapted to the necessities of the boundary-layer problem.
The dependent variable q is represented by truncated sums of first-kindChebyshev polynomials of the order j,
Tj(ξ) = cos (j arccos(ξ)) (3.25)
which can be alternatively be calculated by a recurrence relation
T0(ξ) = 1 (3.26a)
T1(ξ) = ξ (3.26b)
Tj+1(ξ) = 2ξTj(ξ) − Tj−1(ξ) (3.26c)
on a Gauss-Lobatto grid with N gridpoints defined as
ξi = cosiπ
N. (3.27)
This grid enables the discrete presentation of the independent variable yand is selected for its good applicability to spectral procedures. Since theGauss-Lobatto points are only defined on the finite domain ξ ∈ [−1, 1] thealgebraic function y(ξ) = δ
2 (1 + ξ) maps the grid points into the physicalboundary-layer domain y ∈ [0, δ].
The Chebyshev representation enables a reformulation of the problem interms of truncated polynomials (3.25) and differentiation matrices D
k,
q(ξ) =N∑
j=0
pjTj(ξ) = D0~p (3.28)
dk
dξkq(ξ) =
N∑
j=0
pjTkj (ξ) = D
k~p. (3.29)
(3.30)
54

3.5 Numerical Tools
The derivatives in equation (3.22) are reformulated employing the differen-tiation matrices D
0 − D2 which require the Chebyshev polynomial deriva-
tives to be known. These are again described by a recurrence relation
T(k)0 (ξi) = 0 (3.31a)
T(k)1 (ξi) = T
(k−1)0 (ξi) (3.31b)
T(k)2 (ξi) = 4T (k−1)
1 (ξi) (3.31c)
T(k)j (ξi) = 2jT (k−1)
j−1 (ξi) +j
j − 2T
(k)j−1(ξi) (3.31d)
where the superscript k ≥ 1 indicates the order of differentiation andj ≥ 3 the polynomial degree. The differentiation matrices are easily ob-tained through a MATLAB implemented routine according to Weidemanand Reddy [113]. The boundary conditions (3.19) are incorporated bysetting the lines inside the matrix L (3.21) to zeros which correspond tothe freestream and the solid wall. Subsequently, the matrix equations aresolved with built-in linear algebra functions. The computational cost islargely defined by the size of the discretization domain. Since ξ is a vectorof length N + 1, a matrix system of size (N + 1) × (N + 1) needs to besolved.
The numerical calculation of the eigenvalues α within the spatial frame-work reveals the amplification or attenuation of disturbances of given fre-quency ω. If the imaginary part αi is negative, the disturbance ansatzin equation (2.20) indicates exponential growth of the amplitudes in thestreamwise direction. The imaginary part αi is therefore also referred toas the growth rate of the instability. The growth rate of the most unsta-ble disturbance dictates the transition behavior of the boundary-layer flow.If the amplitude of this modal disturbance has grown large enough, sec-ondary stages of transition are triggered which subsequently induce three-dimensional structures. The simplified equations derived before do notaccount for such mechanisms which require special treatment beyond thescope of this work.
The downstream evolution of the linear growth rates can be utilized byempirical methods to predict when the fully turbulent state of the bound-ary layer will be reached. One of such methods is the N -factor methodintroduced in Chapter 2.2. Since the absolute disturbance amplitude Aat a given location x depends on the initial amplitude A0 as well as thegrowth rate αi, the ambient disturbance conditions are to be taken into
55

3 Methodology
account. The initial disturbance conditions, mainly governed by the turbu-lence intensity Tu of the freestream flow, play a crucial role for the absolutetransition location. It is generally agreed that transition is a continuousevolutionary process, nevertheless it will henceforth be assumed that thecritical N -factor Nt defines the position of completed transition, resultingin fully turbulent flow. Typical values for Nt in wind tunnels are in theorder of 8−9, depending on the bulk-flow quality. For flight investigations,the lower freestream turbulence levels require Nt = 9 − 11 [7].
For flat plate boundary-layer flow, Mack [68] proposes a functional rela-tionship between Nt from linear stability considerations and the freestreamturbulence intensity,
Nt = −8.34 − 2.4 ln(Tu). (3.32)
This correlation is derived from several experimental studies and com-parison to linear stability analysis. It is valid for turbulence intensities10−3 < Tu < 10−2 and is used in the present work to evaluate the criticalNt-factor for transition experiments on a flat plate in Chapter 4. Arnalet al. [7] elaborate that the functional relationship can be applied undervarying pressure gradients but care has to be taken to calibrate the methodwith experimental data. Since this function is only applicable to flat plateflow, it cannot simply be employed for transition prediction on any kindof airfoil. Here, another empirical correlation between the measured tran-sition location and the numerically derived N -factor evolution needs to beapplied. According to Arnal et al. [7], this cannot easily be done for con-ventional airfoils with steep pressure gradients as for example in [75]. Sincea NLF airfoil with moderate pressure gradients is employed in the currentwork, it is expected to facilitate the correlation between the experimentallymeasured transition location and the N -factor method.
In all cases, the combination of experiments and numerical stability anal-ysis helps to explain and correlate the effect of DBD actuators on thetransition process. The procedure was successfully applied for large eddysimulations by Quadros [83] to evaluate the effect of a pulsed DBD actuatoron the hydrodynamic stability of laminar boundary-layer flow presented in[24]. For continuously operated DBD, the stability calculations were vali-dated with direct numerical simulations by comparison of the growth rates[27], showing excellent agreement. In the following chapters, the approachis extended to flow-control experiments in wind tunnels and flight.
56

4 Flat Plate Experiments
A variety of different experimental setups is employed to quantify the im-pact of DBD plasma actuators on laminar boundary-layer flow. Primarily,a generic flat plate experiment in an open-circuit wind tunnel enables thequantification of the transition delay obtainable with different DBD actu-ator configurations. At the same time, the ionization region close to theelectrodes is accessible by optical measurement techniques to evaluate theactuator impact on laminar velocity profiles and contained modal instabil-ities.
The generic flat plate setup does not comprise all features of a realisticapplication, however it decreases the number of variables to be consid-ered and facilitates comparability with earlier experiments conducted byGrundmann [43]. The flat plate in combination with a displacement bodyreduces the dependence between pressure gradient and flow velocity to asimple linear relation. The sturdy setup presented in Chapter 3.3 enhancesthe repeatability of experiments and reduces the complexity of accompa-nying numerical investigations.
In order to quantify the pressure gradient imposed by the displacementbody, the freestream velocity is measured over a large portion of the platewhere transition occurs naturally. The results of the measurement for anominal freestream velocity of 20 m/s, which will be kept constant for allexperiments on the flat plate reported hereafter, are illustrated in Figure4.1. Circles indicate the dynamic pressure calculated from a reference vaneanemometer at the leading edge while squares illustrate simultaneous hot-wire measurements outside of the boundary layer (y = 25 mm) along theflat plate. A linearized fit for the hot-wire signal, converted into dynamicpressure, is applied and the function is indicated in the diagram. Whereasthe wind-tunnel bulk velocity Uref at the leading edge of the flat plateremains almost constant throughout all measurements, the downstreamevolution of decreasing hot-wire velocities UCTA indicates a positive pres-sure gradient of 83.6Pa/m along the test section. The pressure can benormalized by considering the evolution of cp = 1 − (UCT A/Uref)2 alongthe plate. The pressure gradient over the considered downstream region isalmost linear with ∆cp/∆x = 0.4m−1. The hot-wire measurements within
57

4 Flat Plate Experiments
0.2 0.3 0.4 0.5 0.6 0.7190
200
210
220
230
240
250
x [m]
ρ/2
*U2
[Pa
]
y = - 83.58x + 254
URef
U
linear
CTA
Figure 4.1: Pressure gradient along the flat plate at U∞ = 20 m/s. Illus-trated are the dynamic pressures calculated from the averagedreference velocity and the hot wire velocity signal.
the test section yield an average turbulence intensity of Tu = 0.24% out-side of the boundary layer (y = 50 mm). This value is of importance forempirical transition prediction since the inflow conditions largely influencethe transition process.
The DBD actuators applied in the following investigations are based onthe standard setup defined in Chapter 3.1 and extend 440 mm in the span-wise dimension, exerting the force in streamwise direction. The resonantfrequency of the combination of actuator and high voltage generator isfpl = 6 kHz, yielding optimal efficiency of the body-force generation. Thesupply voltages and power consumptions of all configurations experimen-tally investigated are listed in Table 4.1 together with the approximateintegral body force according to Kriegseis et al. [59]. All power and thrustvalues are normalized by the actuator length to facilitate a comparison ofexperiments with different actuator length and two-dimensional numericalcalculations. The results suggest a slight non-linear dependence betweenactuator voltage and power consumption and an approximately linear rela-tion between power consumption and produced thrust. Both observationsare in agreement with the cited reference. Kriegseis et al. [61] investigatethe impact of increasing flow velocities in the same wind-tunnel setting.Although a detrimental impact on the power consumption is reported athigher flow velocities and a corresponding decrease of the actuator thrust
58

Vpp [kV] P [W/m] T [mN/m]8 33.7 7.89 38.1 9.110 45.7 11.311 55.1 13.512 64.4 15.613 74.6 17.7
Table 4.1: Comparison of actuator voltage peak-to-peak amplitude Vpp,power consumption P and produced integral thrust T for theinvestigated actuator settings.
may be assumed, negligible effects are found at flow velocities below 30 m/s.Since the airspeed is kept constant at 20 m/s for the following flat plate ex-periment, such effects are neglected. Furthermore, a velocity impact wouldinfluence all reported power settings in a similar way, scaling the absolutevalues but preserving the relative dependencies.
It should nevertheless be emphasized that the relation between the highvoltage, power consumption and integral thrust is only known for the em-ployed actuator setup. Other dielectric materials, thicknesses, power sup-plies or any other modifications to the actuator configuration require newmeasurements of all values. For the present DBD actuator, all quantitiescan be referenced correspondingly. From a fluid dynamics point of view,the integral thrust is usually the only relevant one. Since in experimentsonly the high voltage and the power consumption are directly measurable,the latter will be indicated to relate to the integral thrust. In numericalinvestigations, the force is directly integrable from the predefined model dis-tributions. In all following experiments, the integral thrust will be primarilystated together with the power consumption to facilitate a comparison ofdifferent cases and to numerical studies presented in Chapter 5.
Excellent accessability of the flow by intrusive and optical measurementtechniques introduced in Chapter 3.3 is one major advantage of the reportedwind-tunnel setup. In the following, various measurements are presentedto characterize the transition of the boundary layer and the impact of DBDflow control.
59

4 Flat Plate Experiments
4.1 Hot-Wire Anemometry
A single boundary-layer hot wire is positioned directly at the surface ofthe flat plate and traversed along the streamwise direction. Each positionis measured for 2 seconds at a sample rate of 16 kHz. The solid lines inFigure 4.2 (a) illustrate the standard deviation of the velocity signal σU
within the intermittent region of the boundary layer, measured on threeconsecutive days. Starting from the laminar state with small velocity per-turbations, the flow exhibits increasingly random fluctuations leading toan increase of the standard deviation of the sensor signal. It culminateswithin the intermittency region where the flow alternates between lami-nar and turbulent state until finally converging at the fully turbulent level.This characteristic evolution comparable to Figure 3.4 is seen both for thecase without and with DBD actuation. As a first flow-control experiment,a single DBD actuator is applied x = 350 mm downstream of the lead-ing edge and operated with a supply voltage of Vpp = 10 kV. The circlesand dashed line indicate the results under DBD operation at a thrust ofT = 11.3 mN/m and a power consumption of P = 45.7 W/m. Despitecertain deviations due to the experimental sensitivity to changed ambientconditions, DBD operation moves the peak of the signal standard deviationto farther downstream locations in all three experiments. If the positionof the signal peak is taken as a reference, an average transition delay of∆xtrans ≈ 50 mm is observed. Considering the location of unaffected tran-sition at x = 500 mm, this corresponds to an increase of the transitionReynolds number Retrans = 6.6 × 10⁵ of 10%. These initial flow-controlexperiments show that, despite experimental uncertainties involved in thehighly sensitive transition experiments, repeatability is acceptable for thegeneric configuration to derive a flow-control effect.
The intermittency factor γ is illustrated in Figure 4.2 (b) for one of thepresented flow-control experiments. The intermittency is calculated withthe M-TERA method described by Zhang et al. [119] and a recommendedcalibration factor of C = 2.0. Although several different calibration factorswere investigated, γ = 0.5 does not coincide with the peak of σU as de-scribed in literature [7, 37]. In the shown results, the intermittency slopestarts at x = 410 mm, far upstream of the standard deviation increase.Nevertheless, the quantified transition delay of ∆xtrans ≈ 50 mm foundfrom the standard deviation approximately agrees with the offset of theintermittency factor curves. Because the calibration factor C needs to beadjusted for any new setup and since the intermittency slope is too steepto be adequately resolved at the chosen spatial resolution, the results of
60

4.1 Hot-Wire Anemometry
400 450 500 550 600 6500
0.5
1
1.5
2
2.5
3
x [mm]
σ U [m
/s]
DBD offDBD on
(a) standard deviation σU
400 450 500 550 600 6500
0.2
0.4
0.6
0.8
1
x [mm]
γ [−
]
DBD offDBD on
(b) intermittency γ
Figure 4.2: Transition behavior of boundary-layer flow at U∞ = 20 m/scharacterized by the hot-wire standard deviation σU (a) andthe intermittency factor γ (b), without and with DBD flowcontrol at T = 11.3 mN/m (P = 45.7 W/m).
intermittency investigations will not be shown henceforth.
In addition to the velocity standard deviation and the intermittencyalong the streamwise direction, the average velocity profiles and the distur-bance profiles along the wall-normal coordinate indicate the boundary-layerstate. Figure 4.3 illustrates the mean velocity profiles (solid lines) as wellas the disturbance profiles (dashed lines) at four different streamwise lo-cations, normalized with the freestream velocity U∞. The ordinate showsthe wall-normal position normalized with the displacement thickness δ1
of the corresponding profile. Two different cases, without (crosses) andwith (circles) DBD operation at T = 11.3 mN/m (P = 45.7 W/m), arepresented. Additionally, the solution of a laminar boundary-layer compu-tation as discussed in Chapter 3.5.1 is illustrated as a dotted line at thefirst streamwise position (a) to indicate the accurate agreement betweenmeasurements and computations. For the disturbance profiles the hot-wiresignal is bandpass filtered within the expected Tollmien-Schlichting insta-bility range (100 − 500 Hz, compare Chapter 5), the standard deviation iscalculated at each wall-normal location y and normalized with the meanflow velocity U∞. For better visualization, the values are multiplied by afactor of 100.
At the first measurement location (x = 400 mm downstream of the lead-ing edge) presented in Figure 4.3 (a), only small velocity fluctuations are
61

4 Flat Plate Experiments
0 0.2 0.4 0.6 0.8 10
1
2
3
4
5
y /δ
1[-
]
U / U∞
100 * URMS
/ U∞
[-]
Numerical
(a) x = 400 mm
0 0.2 0.4 0.6 0.8 10
1
2
3
4
5
y /δ
1[-
]
U / U∞
100 * URMS
/ U∞
[-]
(b) x = 480 mm
0 0.2 0.4 0.6 0.8 10
1
2
3
4
5
y /δ
1[-
]
U / U∞
100 * URMS
/ U∞
[-]
(c) x = 580 mm
0 0.2 0.4 0.6 0.8 10
1
2
3
4
5
y /δ
1[-
]
U / U∞
100 * URMS
/ U∞
[-]
(d) x = 640 mm
Figure 4.3: Velocity profiles (solid lines) and standard deviation of filteredhot-wire signal (100 Hz−500 Hz, dashed lines) for four differentstreamwise locations, without (x) and with (o) DBD operationat T = 11.3 mN/m (P = 45.7 W/m). Flow velocity U∞ =20 m/s.
62

4.1 Hot-Wire Anemometry
measurable inside the laminar boundary layer. The small differences forthe cases with and without DBD operation are hardly distinguishable frommeasurement noise and random velocity fluctuations. At this early stage,the boundary-layer disturbances are yet too small to experience a dramaticinfluence by the boundary-layer stabilization. The averaged velocity pro-files on the other hand do no longer show significant differences since thestabilizing impact is limited to a small region downstream of the actuator atx = 350 mm. As the disturbances propagate downstream (b), they are am-plified and eventually show typical characteristics of Tollmien-Schlichtingwaves. These are the global disturbance maximum within (y/δ1 ≈ 1) andanother local maximum on top of the boundary layer (y/δ1 ≈ 3), as wellas the minimum close to the boundary-layer edge (y/δ1 ≈ 2). Although animpact on the mean velocity profiles can hardly be distinguished, the distur-bance amplitude under the influence of the actuation is reduced. At fartherdownstream locations (c), the disturbance looses the typical TS-wave shapeas the breakdown into three-dimensional structures is initiated. Here, theactuated velocity profile still shows laminar characteristics whereas a tur-bulent or highly intermittent shape is obtained without flow control. In thefully turbulent flow (d), the maximum standard deviation decreases and issituated directly at the wall. As soon as the controlled flow is fully tur-bulent, it no longer exhibits any differences compared to the uncontrolledcase.
The averaged velocity profiles experience a dramatic shape change dur-ing transition which can be characterized by the shape factor H12 = δ1/δ2.Solid lines in Figure 4.4 illustrate the distribution of the shape factor H12
along the streamwise coordinate x without DBD operation. Lines with cir-cles as markers indicate experimental results obtained under operation ofthe single DBD actuator at T = 11.3 mN/m (P = 45.7 W/m). The scatterof the results for three different days is higher than for the standard de-viation measurements presented in Figure 4.2 (a). In the initially laminarphase between x = 400 − 470 mm, the shape factor H12 being larger than2.6 agrees with the theory for laminar flow subjected to adverse pressuregradients. Downstream of the actuator location it drops continuously to avalue of 1.4 characterizing a fully turbulent velocity profile. For the casewith DBD actuation, the slope starts farther downstream as comparedto the case without DBD forcing. Since the shape factor experiences amonotonous decrease throughout the transition region and no clearly spec-ified value relates to the onset or end of transition, a threshold has to bedefined to compare the cases with and without DBD actuation. To quantify
63

4 Flat Plate Experiments
400 450 500 550 600 6501
1.5
2
2.5
3
x [mm]
H12
[−]
DBD onDBD off
Figure 4.4: Transition behavior of boundary-layer flow at U∞ = 20 m/scharacterized by shape factor H12 without and with DBD ac-tuation at T = 11.3 mN/m (P = 45.7 W/m).
the distance ∆xtrans by which the transition is delayed, a value of H12 = 2is used in accordance with earlier investigations by Grundmann and Tro-pea [47]. This yields an average transition delay of ∆xtrans = 30 mm withsignificant scatter of the results of different days.
The spectral content of the hot wire velocity signal is evaluated viafast Fourier transformation (FFT) and plotted in Figure 4.5 for differentstreamwise locations. The dotted curve illustrates the frequency contentoutside of the boundary layer where only the broadband, low-amplitudefreestream turbulence is found. The solid line presents the data for a po-sition y = 0.1 mm above the flat plate without DBD forcing and is con-trasted with the case with DBD operation (dashed line) at T = 11.3 mN/m(P = 45.7 W/m). It should again be noted that a low-pass analog filter witha cutoff frequency of fc = 3.15 kHz is applied to remove electromagneticnoise produced by the DBD actuation. In the laminar region of the bound-ary layer (a), a prominent frequency range around 250 Hz dominates. Thenaturally amplified frequencies inside the boundary layer range between100 Hz and 500 Hz which agrees well with stability analysis (Chapter 5.2).The disturbance amplitudes increase during the downstream development(b), indicating the growth of two-dimensional Tollmien-Schlichting waves.For this position the positive influence of the DBD actuator becomes appar-ent. The velocity fluctuations without DBD actuation increase and startto spread to higher frequencies, whereas with the DBD actuator turned on,
64

4.1 Hot-Wire Anemometry
101
102
103
10-4
10-3
10-2
10-1
100
(a)
f [Hz]
u′[m
/s]
101
102
103
10-4
10-3
10-2
10-1
100
(b)
f [Hz]u′[m
/s]
101
102
103
10-4
10-3
10-2
10-1
100
(c)
f [Hz]
u′[m
/s]
101
102
103
10-4
10-3
10-2
10-1
100
(d)
f [Hz]
u′[m
/s]
free stream boundary layer, DBD off boundary layer, DBD on
Figure 4.5: Spectral analysis of hot-wire signal for positions (a) x =400 mm, (b) x = 440 mm, (c) x = 480 mm, (d) x = 640 mm.Dotted lines outside (y = 15 mm), solid lines inside (y =0.1 mm) the boundary layer at U∞ = 20 m/s. Band-pass filter-ing between 20 Hz and 3.15 kHz. Dashed lines inside boundarylayer with DBD forcing at T = 11.3 mN/m (P = 45.7 W/m).
65

4 Flat Plate Experiments
the state remains similar to that shown in (a). As the boundary layer tran-sitions (c) without the flow control, a broadband increase of the fluctuationsoccurs until finally reaching the chaotic, turbulent state characterized bythe monotonic spectrum at (d) x = 640 mm. For the actuated case, thistransitional behavior is postponed. Finally, the overall level of the fre-quency content of the laminar freestream is one order of magnitude lowerthan within the turbulent boundary layer.
The present investigation demonstrates that DBD actuation can delaytransition initiated by naturally developing Tollmien-Schlichting waves un-der adverse pressure gradients. The stabilizing effect does not only lead toan attenuation of single frequency disturbances as shown by Grundmannand Tropea [44], but also delays transition initiated by broadband multi-frequency instabilities. Statistical and integral, experimentally determinedquantities are compared concerning the quantifiability of the transitiondelay ∆xtrans. Comparing the results for σU , γ and H12, the observedtransition delay varies between 30 and 50 mm dependent on the consid-ered flow quantity. At DBD operating frequencies fpl ≥ 6 kHz, a neg-ative influence on the stability due to unsteady force production can beneglected since high frequency content is naturally damped by viscous ef-fects. With the presented configuration of a single DBD actuator operatingat T = 11.3 mN/m (P = 45.7 W/m), the transition Reynolds number canbe increased by approximately 10%. An experimental optimization of theobtainable transition delay by variation of the operating power or actuatorplacement is possible with the generic setup. Before such investigations arepresented in Section 4.4, other measurement techniques are employed tolearn more about the stability characteristics of the flow subject to DBDforcing.
4.2 Phase-Locked Particle Image Velocimetry
The phase-locked particle image velocimetry described in Chapter 3.3.2 isemployed to investigate the impact of DBD operation on deterministic flowinstabilities inside the laminar boundary layer. At a freestream velocity ofU∞ = 20 m/s, the disturbance source excites two-dimensional Tollmien-Schlichting (TS) instabilities at a frequency of fexc = 250 Hz and createsstreamwise wave amplitudes of approximately 0.8%U∞. Only being thisclose to the limit of linear disturbance evolution does the signal-to-noiseratio enable adequate acquisition of the wave amplitudes and propagation.
66

4.2 Phase-Locked Particle Image Velocimetry
y / δ
99
DBD off
12 12.5 13 13.5 14 14.5 15 15.50
1
2
3
4
U′ [
m/s
]
−1.5
−1
−0.5
0
0.5
1
1.5
x / λ [−]
y / δ
99
DBD on
12 12.5 13 13.5 14 14.5 15 15.50
1
2
3
4
U′ [
m/s
]
−1.5
−1
−0.5
0
0.5
1
1.5
(a) Streamwise fluctuation u’
y / δ
99
DBD off
12 12.5 13 13.5 14 14.5 15 15.50
1
2
3
4
V′ [
m/s
]
−0.2
−0.1
0
0.1
0.2
0.3
x / λ [−]
y / δ
99
DBD on
12 12.5 13 13.5 14 14.5 15 15.50
1
2
3
4
V′ [
m/s
]
−0.2
−0.1
0
0.1
0.2
0.3
(b) Wall-normal fluctuation v’
Figure 4.6: Comparison of streamwise (a) and wall-normal (b) disturbanceamplitudes at U∞ = 20 m/s and artificial disturbance excitationat fexc = 250 Hz. Cases without (upper) and with (lower) DBDoperation at T = 11.3 mN/m (P = 45.7 W/m).
The effect of a DBD actuator positioned at x = 350 mm is investigated.It covers the whole spanwise dimension of the test section (440 mm) suchthat a two-dimensional forcing can be assumed if the actuator is operatedat T = 11.3 mN/m (P = 45.7 W/m). The PIV system is aligned in thecenter plane of the test section and traversed to four different locationsdownstream of the actuator. This extended measurement region coversapproximately 4.5 disturbance wavelengths (λ = 31.5 mm) and allows theresolution of the spatial wave evolution. The wavelength λ is henceforthused to normalize the streamwise coordinate x.
The results presented in Figure 4.6 indicate that the application of thecontinuously operated DBD actuator at x/λ = 11.2 leads to a substantialreduction of average TS wave amplitudes. Illustrated are the contour levelsof the streamwise (a) and wall-normal (b) velocity fluctuation componentsu′
Φ and v′
Φ for one phase angle Φ after subtracting the mean flow u and v,respectively. The comparison of the streamwise component with and with-out DBD operation shows a reduction of 10% immediately downstream ofthe actuator. Interestingly, the wall-normal velocity component is signifi-cantly higher damped by 20 − 25%. Apart from the immediate amplitudereduction close to the actuator, the downstream evolution of the waves isof major importance for the transition process. As the flow propagatesdownstream, unstable waves are amplified and the growth rates become
67

4 Flat Plate Experiments
measurable. Without DBD operation, the streamwise amplitude increasesfrom 0.3 to 1 m/s over a distance of 4λ, the wall-normal component aswell triples from 0.06 m/s to 0.2 m/s. With the DBD in operation, a loweramplification by only a factor of 2 is observed up to x/λ = 15.
Furthermore, an acceleration of the disturbance propagation speed is ob-served through the flow-control effect. Until the end of the domain, the dis-turbances under influence of the DBD have traveled 0.3λ farther than with-out flow control. The phase speed of the waves is not abruptly increasedat the actuator location but continuously downstream. This suggests thatthe changed stability properties rather than an immediate flow accelerationlead to a change of the disturbance propagation behavior. The results arein quantitative agreement with linear stability analysis by Duchmann et al.[24] showing an increase of the phase speed by pulsed DBD operation in theorder of 10%. The observed change of the convective speed macroscopicallyindicates the changed stability properties. The induced momentum changesthe velocity distribution inside the boundary-layer profile and, hence, theambient conditions for disturbance propagation. Since the phase speedcr = ω/αr is coupled to the angular frequency ω = 2πf and the complexwavenumber α, it is plausible that a change of the flow stability leads toaltered propagation properties.
The macroscopic effects of DBD operation on TS instabilities becomeapparent by the chosen measurement method. Nevertheless, a more de-tailed focussing on the stability properties of the boundary-layer profiles isnecessary to understand the mechanisms of stability enhancement and toeventually optimize the DBD actuator for this task. In the following, thevelocity profiles in the zone of maximum acceleration due to the dischargewill be more thoroughly analyzed.
Analysis of the localized influence of DBD actuation on the boundary-layer profiles next to the exposed electrode allows a quantification of theimpact on the flow stability. Although the mean velocity profile is onlyslightly changed, the shape factor is altered significantly at the actuator lo-cation. A local change of this value indicates an impact on hydrodynamicstability and subsequently the expected transition location. Figure 4.7 illus-trates the shape factor H12 calculated for velocity profiles obtained by PIVwithout any phase locking upstream and downstream of the actuator. Inorder to resolve the actuator effect and to guarantee a sufficient resolutionof the boundary layer in wall-normal direction, the measurement window of32 mm width is traversed to four downstream locations, yielding a total fieldof view of 120 mm. To reduce the influence of measurement uncertainties
68

4.2 Phase-Locked Particle Image Velocimetry
0.29 0.31 0.33 0.35 0.37 0.39 0.412.2
2.3
2.4
2.5
2.6
2.7
2.8
2.9
3
3.1
x [m]
H1
2[-
]
x < xDBD
x > xDBD
Figure 4.7: Shape factor H12 around actuator location x = 0.35 m, de-rived from PIV measurements. U∞ = 20 m/s, T = 11 mN/m(P = 45.7 W/m).
and surface reflections on the calculated shape factor, ensemble averagingand spatial averaging in streamwise direction are necessary. Two thousandsingle velocity fields from PIV are ensemble averaged to reduce the impactof mean-flow velocity fluctuations and random errors. In streamwise di-rection, twenty velocity profiles are averaged in sections of 6 mm to reducethe error by surface reflections and enhance the accuracy close to the wall.From these averaged profiles, the local shape factor can be calculated toderive a trend of the development upstream and downstream of the actua-tor. Solid lines, which are fitted by a least square procedure, are illustratedto resolve the trends despite large data scatter. Upstream of the actuator,the shape factor slope due to the adverse pressure gradient is slightly exag-gerated caused by measurement uncertainties. Despite these uncertainties,a clear drop of the shape factor by approximately ∆H12 = 0.35 is notedat the actuator location. This local decrease may be interpreted similarto a local flow acceleration, which is stabilizing the flow. Downstream,the shape factor increases since the actuator effect is spatially confined.Albrecht et al. [2] showed for electromagnetically forced flow that a mono-tonic relation between the shape factor and the critical Reynolds numbercannot be assumed. Locally, the flow can be even more stable than anasymptotic exponential profile obtainable from continuous boundary-layersuction. Therefore, a linear stability analysis of the experimental velocity
69

4 Flat Plate Experiments
profiles has to be conducted, but spatially finer resolved velocity data isrequired than PIV can provide at the resolution used in this section. Dueto the opposing constraints to resolve the whole boundary-layer thicknessand provide sufficient data points close to the wall, a different measurementtechnique is chosen to obtain the necessary velocity profiles.
4.3 Laser Doppler Anemometry
Two-velocity component laser Doppler anemometry (LDA) enables highly-resolved pointwise flow measurements of two perpendicular velocity compo-nents. In the present work, the streamwise and the wall-normal velocitiesu and v within the boundary-layer flow are acquired. In contrast to thePIV measurements reported before, the following experiment focusses onthe accurate measurement of averaged boundary-layer profiles. The smallinterferometric sensor volume in combination with the transparent acrylicsurface of the flat plate avoids reflections and enables accurate velocitymeasurements close to the surface. This is of importance for the determi-nation of the exact wall distance and profile curvature. Since the velocityprofile curvature discussed in Chapter 2.1 is not only relevant for invis-cid instability mechanisms (see Fjørtoft [33]) but also for the consideredTollmien-Schlichting instability, it needs to be sufficiently well resolved foradequate analysis of the viscous flow stability.
Although only slight modifications of the laminar velocity profiles closeto the operating DBD actuator are attained, the flow stability is stronglyinfluenced. Figure 4.8 illustrates the averaged velocity profiles (circles), thefirst derivative (squares) and the second derivative (triangle) with respect tothe normalized wall normal coordinate y/δ1 at x = 360 mm, namely 10 mmdownstream of the single DBD actuator. The values are normalized withthe respective maximum to facilitate combination of all quantities in onegraph. Filled symbols illustrate the baseline case whereas empty symbolsrepresent DBD actuation at T = 13.5 mN/m (P = 55.1 W/m). A differencebetween the averaged profiles with and without DBD operation is hardlyvisible, but especially the second derivative shows a significant deviation byDBD actuation. Since the second derivative indicates the profile curvaturewhich is of major importance for the flow stability as described in Chapter2.1, a small alteration can have significant impact on the transition process.The acquisition of such accurate boundary-layer data is difficult and timeconsuming and should be limited to the region where an impact of DBD
70

4.4 Flow-Control Optimization
−1 −0.5 0 0.5 10
1
2
3
4
5
6
7
8
9
y / δ
1 [−]
u / |umax
|
u’ / |u’max
|
u’’ / |u’’max
|
Figure 4.8: Streamwise velocity profiles u(y) normalized with U∞ = 20 m/s(circles) as well as first (squares) and second (triangles) deriva-tives with respect to the wall-normal direction y, obtained withLDA measurements. Filled symbols without, empty symbolswith DBD actuation at T = 13.5 mN/m (P = 55.1 W/m).
forcing on the velocity profiles is expected. The finely resolved data is di-rectly analyzed with the linear stability code elaborated in Chapter 3.5.3and the results are presented in Chapter 5.3.
The different experimental measurement techniques enable the correct lo-calization of the transition process and quantification of its delay by DBDoperation. Laser-optical measurements resolve the immediate flow veloci-ties found within the acceleration region of the ionized plasma, illustratethe response of modal disturbances to the DBD forcing and contribute tothe discussion of the stabilizing actuator effect.
4.4 Flow-Control Optimization
For increased effectiveness of DBD flow control, an optimization of the ob-tainable transition delay is desired. Earlier investigations by Grundmann[43] demonstrated enhanced transition delay by increasing the actuatorthrust and changing the actuator location. Since the actuator thrust in-duces a certain momentum in the flow which has to be related to the
71

4 Flat Plate Experiments
0.45 0.5 0.55 0.6 0.650
0.05
0.1
0.15
0.2
0.25
0.3
0.35
x [m]
σ U [m
/s]
DBD off7.8 mN/m9.1 mN/m11.3 mN/m13.5 mN/m15.6 mN/m17.7 mN/m
Figure 4.9: Hotwire standard deviation σU along the flat plate as a functionof actuator thrust T .
freestream momentum, a monotonic influence on the achievable transitiondelay may be expected. Concerning the actuator placement, the non-trivialand frequency-dependent stability characteristics of the flow require con-sideration. By systematic variation of both parameters, the dependencebetween actuator forcing and the flow stability properties is explored andconclusions concerning the flow-control effectiveness are drawn.
4.4.1 Thrust Variation
The actuator thrust is varied to evaluate the influence on the transitiondelay. By systematically increasing the supply voltage, the power con-sumption and subsequently the force field magnitude increase according toTable 4.1. The peak of the hot-wire standard deviation σU is again uti-lized to quantify the transition delay ∆xtrans for a single DBD actuator atx = 350 mm, compare Figure 4.9. The transition location without DBDforcing is now found at x = 0.52 m due to a reconstruction of the windtunnel after the measurements presented in Section 4.1. The aim of thewind-tunnel modifications [15] was to enhance the flow quality by introduc-tion of improved screens and a honeycomb, leading to a reduced turbulenceintensity of Tu = 0.19% for the flow at U∞ = 20 m/s and a downstreamshift of the transition location even without flow control. At low actuatorthrust, the obtained transition delay is hardly measurable. Due to the na-
72

4.4 Flow-Control Optimization
T [mN/m] ∆xtrans [mm]7.8 109.1 1511.3 3013.5 5515.6 6517.7 95
Table 4.2: Transition delay dependent on integral actuator thrust.
ture of dielectric barrier discharges, a threshold voltage around Vpp = 3 kVexists below which no plasma is formed for the actual actuator configu-ration. Between 3 and 6 kV, an uneven plasma distribution characterizedby single filaments creates a three-dimensional force field. Although theforce magnitude is small, even a negative influence on transition is seenin some data points for T = 7.8 mN/m due to the random nature of thefilaments. The measurement at Vpp = 8 kV and T = 11.3 mN/m provides ahomogeneous surface discharge and a small delay of transition is observed.For higher applied body forces, the transition delay effect is enhanced, butcare has to be taken not to exceed the breakdown voltage which destroysthe actuator. This voltage is defined by the material and thickness of thedielectric. Excessively high voltages and associated fluid accelerations havethe additional disadvantage that an overshoot in the velocity profile canoccur. This leads to a destabilization of the flow, rendering the actuationuseless for transition delay. Riherd and Roy [86] analyzed the occurrenceof inviscid instability modes for excessively distorted velocity profiles. Forhigh forcing at T = 17.7 mN/m the typical shape of the σU -curve is dis-torted around x = 550 mm, indicating the onset of initial undesired effects.
A downstream shift of the transition location in the range of 10 − 95mmis obtained by varying the integral actuator thrust between 7.8 mN/m and17.7 mN/m. Grundmann [43] proposed the existence of an optimum bodyforce for transition delay at much lower flow velocities between U∞ = 6 −8 m/s. At the present flow speed and with the given actuator materials,no optimum can be identified due to breakdown-voltage limitations. Yetit remains promising to increase the DBD thrust if adequate dielectricmaterial is available, especially if flow control at even higher freestreamvelocities is attempted. Presently, it appears more promising to applyconsecutive actuator arrays with lower individual force magnitudes in the
73

4 Flat Plate Experiments
linear amplification range of Tollmien-Schlichting instabilities.
4.4.2 Actuator Arrays
After thorough analysis of the transition behavior influenced by a singleDBD actuator at a fixed location, the actuator position is focussed to en-hance the transition control effectiveness. Besides the position of a singleactuator, arrays of actuators consecutively placed in streamwise directionpromise a more homogeneous flow forcing at reduced force magnitude lev-els.
Three identical DBD actuators are flush-mounted on the flat plate atdifferent locations x1 = 320 mm, x2 = 350 mm and x3 = 380 mm. They canbe operated independently or in combination at any desired thrust withinthe range of Table 4.1. The DBD operating frequency fpl = 6 kHz is keptconstant to facilitate the comparison with the single-actuator experimentsat xmathrmDBD = x2 = 350 mm. The integral thrust is maintained at anintermediate level of T = 15.6 mN/m or corresponding power consumptionP = 64.4 W/m to avoid premature actuator damage and obtain a relativelylarge transition delay. In the case of multiple actuator arrays, the netactuator length increases and the total consumed power is multiplied bythe number of actuators.
First, the DBD actuators are operated independently at various locationsto evaluate the effect of positioning on the transition delay. Figure 4.10illustrates the hot-wire standard deviation along the flat plate for DBDoperation at the three positions x1−x3. At x1, almost no transition delay isobserved whereas DBD forcing at x2 approximately confirms the ∆xtrans =55 mm found from Table 4.2 for T = 15.6 mN/m (P = 64.4 W/m). Theslightly reduced ∆xtrans = 50 mm might derive from subtle variations ofthe wind-tunnel conditions. If operated at x3, the transition is significantlypostponed, yielding ∆xtrans = 120 mm. If the first and last actuator areoperated together (x1,3), the additional improvement of the transition delayis marginal, ∆xtrans = 140 mm, in comparison to separate operation of thethird actuator. By adding the remaining actuator (x1,2,3), another 25 mmare gained to xtrans = 165 mm.
In context of position variation of single DBD actuators, the placementat the farthest downstream position x3 is most effective to delay transition.Following this trend, the existence of an optimum location can be expectedsince the actuator will not be effective if positioned beyond the naturaltransition location. Further downstream placements would have requiredcomplex modifications of the test rig, such that no optimum location is
74

4.5 Conclusions
0.35 0.4 0.45 0.5 0.55 0.6 0.65 0.70
0.5
1
1.5
2
2.5
3
3.5
x [m]
σ U [m
/s]
offx
1
x2
x3
x1,3
x1,2,3
Figure 4.10: Transition positions as a function of actuator placementand array permutation, T = 15.6 mN/m (P = 64.4 W/m),U∞ = 20 m/s.
identified. If other actuators are added, only slight improvements are mea-sured at the cost of doubled or tripled power consumption. In terms ofefficiency, relating the net effect to the energy expenditure, operation of allthree actuators at the same power consumption cannot be recommendedalthough the effectiveness is enhanced. Adaption of the actuator magnitudeaccording to the respective position may be a final necessity to optimize theflow-control efficiency. Nevertheless, the presented results indicate that cor-rect actuator positioning is of higher importance for increasing the overalltransition-delay effectiveness.
4.5 Conclusions
Generic flat plate experiments are performed to demonstrate the controlof naturally occurring, TS-wave dominated transition by means of a singleDBD actuator. Statistical and integral evaluation of hot-wire measure-ments within the transitional boundary layer reveal a transition delay of30 − 50 mm, summing up to an increase of the transition Reynolds numberof 10%. Spectral analysis of the hot-wire data clarifies the stabilizing effectof DBD actuation over a broad range of flow instability frequencies, suchthat single frequency and multi-band disturbances are attenuated by thethrust field.
75

4 Flat Plate Experiments
Phase-locked PIV of artificially introduced disturbances illustrates theeffect of plasma forcing on the propagation speed of boundary-layer dis-turbances. A corresponding change of the mean-flow stability propertiesis validated by additional measurements attesting a significant impact onthe shape factor H12 of the laminar boundary layers next to the actua-tor location. The reduction of this value is related to an increase of thehydrodynamic flow stability, explaining the macroscopically observed tran-sition delay. A further non-intrusive measurement technique is employedto derive highly-resolved boundary-layer profiles for a stability analysis ofexperimental data presented in Chapter 5.4.
A variation of the DBD actuator thrust leads to an optimization of theflow-control application. Increased effectiveness is found for higher forcing;however no optimum is identified at the speed of U∞ = 20 m/s. The lim-ited momentum induced by the single actuator compared to the freestreammomentum restricts the obtainable effect. Due to the danger of dielectricbreakdown at excessively high voltages, a limitation of the actuator poweris necessary, such that the best achievable transition delay is limited by theactuator performance and not by stability effects. A variation of the actua-tor position and application of multiple-actuator arrays yields significantlyenhanced effectiveness for optimized locations. The adequate positioningof an actuator appears more important than a multiplication of the forcelocations and the power consumption. Numerical investigations can be ofgreat help to determine the most appropriate actuator location and sim-ulate array combinations. Therefore, the next chapter presents results ofsuch numerical investigations.
76

5 Stability Impact
Experiments on a generic flat plate setup in an open-circuit wind tunnelhave shown the sensitivity of DBD transition delay to actuator number,positioning and thrust magnitude. For more advanced flow geometries onlarger setups and if an optimization regarding the mutual dependence ofall parameters is coveted, experimental studies are too time- and cost-intensive. Availability of adequate numerical tools is a necessity to com-prehensively explore the parameter space and approach a net benefit oftransition control. Numerical methods with adequate implementation ofthe underlying physical laws have been described in Chapter 3.5. Never-theless, the incorporation of the DBD force needs to be validated based onexperiments. The antecedently described generic experimental setup is aconvenient test case for validation of the numerically simulated DBD effect.
In this chapter, a boundary-layer code with force implementation andsubsequent linear stability analysis will be validated against experimentalfindings from Chapter 4.1. An empirical transition-prediction law is em-ployed to relate the numerical stability analysis to experimentally measuredtransition locations. Alternatively, the stability analysis can be performeddirectly with experimentally measured boundary-layer profiles. Highly re-solved data is acquired for this purpose via laser-optical measurements aspresented in Chapter 4.3. The numerical analysis also facilitates the simula-tion of various thrust levels and multi-actuator geometries to be comparedwith measurements presented in Chapter 4.4. Linear stability analysis isutilized to relate the local flow stability properties to the variation of the ac-tuator position. The positive results ordain the numerical codes for designof DBD transition control applications. This tool kit is used to design aflow-control experiment on a laminar wing glove, for which in-flight resultswill be presented in Chapter 6.3.
77

5 Stability Impact
5.1 Code Validation by Comparison to
Numerical Data
The boundary-layer solver and stability code presented in Chapters 3.5.1and 3.5.3, respectively, have been employed for a parametrical study of air-foil boundary-layer flow by Köhler [56], comparing the results to anothernumerical tool kit extensively used at KTH in Stockholm. The good agree-ment of integral boundary-layer quantities evinces the applicability for flatplate and NLF airfoil boundary-layer flow. In addition to the boundary-layer solver, the linear stability analysis needs to be validated for predictionof TS-wave growth under the influence of DBD actuation. The linear stabil-ity code has proven its value for analysis of DBD influenced boundary-layerflows from large eddy simulations (LES) by Quadros [83] as shown in [24].A thorough validation of the numerical methods, employing different se-tups or benchmark flow situations, is beyond the scope of this project andnot provided in the manuscript. Nevertheless, some validatory computa-tions are pursued to prove the correct implementation of the force field andadequate representation of the actuator effect on the flow stability.
Lüdeke et al. [66] analyze results from direct numerical simulations (DNS)based on stability theory to validate a linear stability code. Therefore, sim-ulated TS waves are artificially introduced in the computations and the am-plitude evolution is compared to stability theory. Following this approach,the presently elaborated stability code is applied to DNS computations ofBlasius boundary-layer flow by Vieira et al. [111] as presented in [25]. TheDNS simulates flat-plate flow at U∞ = 10 m/s and artificial excitation oftwo-dimensional waves at x = 0.22 m at a frequency of f = 110 Hz. TwoDBD actuators, positioned at x1 = 0.325m and x2 = 0.425 m, are simu-lated with the experimentally derived force field discussed in Chapter 3.5.2and a thrust of T = 7.8 mN/m each. Figure 5.1 (a) compares the wave am-plitude evolution from DNS (markers) with a linear stability analysis (lines)of the averaged DNS velocity profiles for three different cases: without flowcontrol, with DBD operation at x1 and with simultaneous operation at x1
and x2. The integral N -factor, defined in equation (2.22) as the ratio of thelocal disturbance amplitude A and the amplitude A0 at the critical pointxcrit is illustrated over the streamwise direction. Almost coinciding evolu-tions for the numeric experiments via DNS and the amplification predictionby the linear stability solver are observed, although the DNS data comprisesa non-parallel base flow with increasing boundary-layer thickness over thedomain. Only in the exact proximity of the actuator location, the stability
78

5.2 Code Validation with Generic Flat Plate Experiments
0.2 0.3 0.4 0.5 0.6−5
−4
−3
−2
−1
0
1
2
x [m]
N =
ln (
A/A
0) [−
]
LSA DBD offDNS DBD offLSA DBD x
1
DNS DBD x1
LSA DBD x1 + x
2
DNS DBD x1 + x
2
Figure 5.1: Comparison between wave amplitude evolutions from direct nu-merical simulation (DNS) and linear stability analysis (LSA)for Blasius boundary-layer flow subjected to DBD forcing atx1 = 0.325 m and x2 = 0.425 m, from [25].
code predicts the amplitude decrease to be initiated slightly upstream ascompared to the DNS. This effect is assumed to derive from the local non-parallelism of the flow induced by the actuator, which cannot be accountedfor by linear stability analysis. Nevertheless, the downstream evolution ofdisturbance amplitudes is well captured by the LSA. As will be shown inthe following section, transition prediction based on N -factors from LSAand an empirical law regarding the mean-flow turbulence level by Mack [68]yields excellent agreement with measured transition locations. More detailson the application of LSA for transition prediction in boundary-layer flowsubjected to DBD actuation are elaborated in [28]. A final validation ofthe numerical procedure is provided in the following by comparing experi-mentally measured transition locations to transition positions predicted bythe LSA N -factor method.
5.2 Code Validation with Generic Flat Plate
Experiments
To enable parametric studies of DBD transition control situations, a numer-ical boundary-layer solver developed by Köhler [56] together with a linear
79

5 Stability Impact
stability code by Reeh [84] is employed. Both numerical methods are re-viewed in Chapter 3.5. The boundary-layer code has not been employedfor flow-control purposes before, such that a validation with experimen-tal data is desired. The generic flat plate setup discussed in Chapter 4 isideal for this purpose since integral boundary-layer quantities as well astransition measurements are available. Although the boundary-layer codecannot simulate flow transition, the combination with the linear stabilitycode facilitates a transition prediction based on the eN -method.
The input to the boundary-layer code is a pressure distribution alongthe flat plate. This can either be derived from measurements or simplifiednumerical approaches. The linearized pressure distribution from Figure4.1 allows a computation of the laminar boundary-layer profiles withinthe measurement region. It does not account for the whole plate lengthor the leading edge region which is not accessible with the experimentalequipment. Therefore, a simple Reynolds-averaged Navier-Stokes (RANS)computation of the experimental setup illustrated in Figure 3.7 providesthe pressure distribution along the flat plate. The code Open-FOAM isused since experience with various geometric configurations for numericDBD flow control is already available [63, 69]. A fully laminar calculationwithout any DBD forcing at the flow speed of U∞ = 20 m/s provides apressure distribution which is in good agreement with the experimentaldata within the measurement region. Further on, this finely-resolved nu-meric representation of the pressure distribution constitutes the necessaryinput to the boundary-layer solver. Alternatively, the pressure distributioncould have been obtained from a potential flow solution, but in this casethe boundary-layer growth would not have been accounted for, slightly in-fluencing the pressure gradient. The boundary-layer profiles are calculatedwith the finite-differences routine elaborated in Chapter 3.5.1.
The grid size in streamwise direction x is defined by the resolution ofthe input pressure distribution. Tests with different grid resolutions haveshown that an equidistant grid spacing of 2.5 mm is sufficient to resolve thefull length l = 1.8 m of the flat plate with 750 streamwise positions. Thewall-normal resolution scales with the Blasius length scale (3.3) for an op-timal resolution dependent on the streamwise position. After convergenceof the boundary-layer solution, this data is fed into the stability analy-sis routine described in Chapter 3.5.3. The accuracy of the wall-normaldiscretization by the spectral Chebyshev collocation method is validatedby varying the number of Gauss-Lobatto grid points between 60 and 240.During validation, a number of 100 points proved sufficient to accurately
80

5.2 Code Validation with Generic Flat Plate Experiments
x [m]
f [H
z]
0.2 0.4 0.6 0.8 1 1.2
200
300
400
500
600
N =
ln(A
/A0)
[−]
0
2
4
6
8
N [−]N = 0N = 6.14
Figure 5.2: N -factor contours and neutral stability curve (solid line) of flowwithout DBD actuation. The dotted line illustrates the iso-contour of N = 6.14, corresponding to the transition thresholdNt for Tu = 0.24%.
identify the most amplified Tollmien-Schlichting mode and compute thecritical Reynolds number Recrit = 519.08 of the zero-pressure gradient Bla-sius flow in close agreement with literature data (e.g. Recrit = 519.4 in[91]).
The spatial formulation of the stability equations is chosen to solve for thetwo-dimensional Tollmien-Schlichting mode in the flat plate case, predictingthe disturbance growth rates for given disturbance frequencies. Integrationof the growth rates along the streamwise direction starting from the point ofneutral stability allows the formulation of the N -factor as defined in equa-tion (2.22). Despite being based on linear theory and therefore neglectingimportant characteristics of the transition to turbulence, the eN -methodcan be utilized as an indicator for the transition occurrence. Figure 5.2illustrates the N -factor development of the flow along the flat plate with-out DBD operation. N -factor iso-contours are plotted as a function ofthe downstream position x and the dimensional frequency f . Althoughthe stability computations are conducted in normalized coordinates em-ploying the Blasius length scale, the results shown in the illustration arepresented in physical dimensions to facilitate comparison to the experi-ments in Chapter 4. The neutral stability curve is plotted as a thick solidline to separate the stable and unstable flow regime. An additional dotted
81

5 Stability Impact
isoline is included which represents the level of N = Nt = 6.14. This crit-ical N -factor value is calculated based on Mack’s equation (3.32) for theturbulence intensity Tu = 0.24% encountered during the initial transitionmeasurements presented in Chapter 4.1. It is first reached for a frequencyof f = 380 Hz in the vicinity of x = 0.48 m. This result differs by only4% from the experimentally determined location of maximum standard de-viation at x = 0.5 m without flow control seen in Figure 4.2 (a). A verygood agreement between the numerical prediction incorporating the am-bient turbulence intensity and experimentally observed transition withoutflow control can be attested. The next step is to check the agreement underDBD forcing.
In order to implement the DBD force field presented in Chapter 3.1 intothe boundary-layer code, the computational grid needs to be refined in thestreamwise dimension. The pressure distribution in the area around theactuator position is linearly interpolated on 100 additional grid points. Thisincreases the resolution of the boundary-layer grid and enables interpolationof the measured streamwise force field, compare Figure 3.2 (a), on the gridpoints. In order to guarantee comparability with the experimental results,the numerically implemented force field strength needs to coincide with thethrust magnitude in the experiments. For the thrust configurations betweenT = 7.8−15.6mN/m indicated in Table 4.1, experimentally measured forcefield distributions are available for numerical implementation. Only theseforce field distributions are used without modification for all numericalinvestigations, such that it is convenient to indicate the integral thrustmagnitude T for each computational result.
For the initial flat plate experiment described in Chapter 4.1, the in-tegral thrust is T = 11.3 mN/m. To experimentally validate the forceimplementation, the integral boundary-layer quantities under influence ofthe force field can be compared. A local decrease of the boundary-layerdisplacement thickness δ1 due to DBD operation is reported by severalauthors [24, 40, 46, 52, 83, 96], leading to a decrease of the shape factorH12. The shape factor evolution according to the numerical solution ofthe boundary-layer code is illustrated in Figure 5.3 (dashed line) and com-pared to experimental PIV (squares) and hot-wire (circles) measurementsfrom Chapter 4.2. Both the PIV measurements and the numerics indicatea sharp drop of the shape factor of ∆H12 = 0.3 at the actuator location.The numerical representation of the shape factor asymptotically convergestowards the initial value ahead of the actuator. A strong gradient withsubsequent asymptotical behavior appears physically reasonable due to the
82

5.2 Code Validation with Generic Flat Plate Experiments
0.3 0.35 0.4 0.45 0.5 0.55 0.6 0.651.2
1.4
1.6
1.8
2
2.2
2.4
2.6
2.8
3
x [m]
H12
[−]
Hot wireNumericalPIV
DBDposition
transitional
laminar
Figure 5.3: Shape factor evolution measured by hot-wire and PIV comparedto the numerical boundary-layer solution. Actuator forcing atx = 0.35 m with T = 11.3 mN/m.
local confinement of the actuator force, showing decreasing magnitude andspatial extent along the streamwise direction.
Also included in the plot are the experimental results from hot-wire mea-surements downstream of the single operated DBD actuator (solid line). Allpresented results are in good agreement between x = 0.3 m and x = 0.5 mconsidering the experimental difficulties of determining the shape factor.Since the boundary-layer solver does not predict transition and thereforedelivers a fully laminar solution, the development of the shape factor inthe transition region downstream of x = 0.5 m deviates from the measuredvalues obtained with hot-wire anemometry.
If the flow is controlled, a representation of the neutral stability curveas in Figure 5.2 is not expedient since the body force stabilizes the flowwithin the normally unstable region. The neutral stability curve cannotbe represented by a single line and contour plots reveal an unusual shape.Therefore, an analysis of the N -factor evolution for discrete disturbancefrequencies is more convenient. The disturbance evolutions are providedin Figure 5.4 (a) for the case without actuation. In agreement with theconclusions from Figure 5.2, the most amplified disturbance for the tran-sition threshold Nt = 6.14 is approximately f = 380 Hz in the vicinity ofx = 0.48 m. The effect of the local stabilization due to DBD operation isillustrated in Figure 5.4 (b). The cumulative growth factor downstream of
83

5 Stability Impact
0 0.2 0.4 0.6 0.8 1 1.2 1.40
1
2
3
4
5
6
7
8
9
10
x [m]
N [−
]
144 Hz204 Hz263 Hz322 Hz381 Hz440 Hz
(a) DBD off
0 0.2 0.4 0.6 0.8 1 1.2 1.40
1
2
3
4
5
6
7
8
9
10
x [m]
N [−
]
144 Hz204 Hz263 Hz322 Hz381 Hz440 Hz
(b) T = 11 mN/m
Figure 5.4: N -factor evolution for discrete disturbance frequencies (vari-ous markers) with transition threshold Nt = 6.14 (dashed line)without (a) and with (b) DBD actuation at T = 11.3 mN/m.
the actuator location x = 0.35 m is significantly reduced for all frequencies.The disturbance amplitudes start to grow again a few millimeters down-stream, but the location of crossing the transition threshold is moved tox = 0.54 m. This shift of the threshold location of approximately 55 mmdownstream slightly overpredicts the experimentally measured transitiondelay, quantified by 30 − 50 mm in Chapter 4.1. Additionally, the stabilityanalysis reveals that the frequency relevant for transition is shifted towardslower values, here to approximately f = 320 Hz.
For further validation of the numerical approach, a parametric simulationof the actuator thrust and position variation presented in Chapter 4.4 isperformed.
Figure 5.5 illustrates a comparison between the experimentally measuredand numerically predicted transition delay during variation of the actuatorthrust. The experimental data was already presented in tabular form inTable 4.2. The numerical transition prediction is based on Mack’s law(3.32) and a critical N -factor Nt = 7 accounting for the lower turbulenceintensity Tu = 0.19% after the wind-tunnel reconstruction mentioned inChapter 4.4. The trend of the transition prediction for various actuatorthrusts agrees well with the experimentally measured values. The variationof the turbulence intensity according to the changed wind-tunnel conditionsadditionally validates the applicability of the empirical transition predictionbased on the inflow conditions.
84

5.3 Numerical Optimization of Generic Flow Control Experiments
6 8 10 12 14 16 180
10
20
30
40
50
60
70
80
90
100
T [mN/m]
∆ x tr
ans [m
m]
ExperimentNumerics
Figure 5.5: Experimentally measured and numerically predicted transitiondelay for various thrust magnitudes. Transition threshold Nt =7 for a turbulence intensity of Tu = 0.19%.
5.3 Numerical Optimization of Generic Flow
Control Experiments
The good agreement of empirical transition prediction based on linear sta-bility analysis with experiments for different thrust levels predestines thenumerical tools for flow-control optimization. The experimental positionvariation presented in Chapter 4.4.2 suggests an optimal location for theforce allocation, although the absolute determination of such a position isbeyond the scope of the experiments. Experimental configurations withdifferent positions and combinations of multiple actuators are reproducedwith the boundary-layer solver and analyzed with the stability code. Table5.1 facilitates a comparison of these numerical results and the measure-ments for an assumed critical N -factor Nt = 7. The results indicate thatthe boundary-layer code with subsequent linear stability analysis repro-duces the trends of transition delay qualitatively correct without providinga quantitative match with the experiments. The numerical results underes-timate the importance of correct actuator positioning, whereas the effect ofstreamwise serialization of actuator arrays is overrated. Apparent reasonscould be the disregard of the position dependence of the absolute distur-bance amplitude and non-linear effects, rendering it a problem of the linearstability analysis.
85

5 Stability Impact
xDBD[mm] ∆xtrans, exp[mm] ∆xtrans, num[mm]330 15 38350 50 56380 120 72
330 & 380 140 140330 & 350 & 380 165 182
Table 5.1: Comparison of experimentally measured and numerically pre-dicted transition delay for varying actuator locations and arrayson a flat plate. The actuator thrust is fixed at T = 15.6 mN/min agreement with the experimental setup.
Nevertheless, the wave amplitude evolution in DNS computations formultiple actuator arrays by Vieira et al. [111] is in good agreement witha stability analysis of the DNS boundary-layer profiles as illustrated inFigure 5.1 (a). This partially validates the stability code and points towardsincorrect representation of multiple actuators in the boundary-layer code.After ruling out incorrect grid interpolation and scrutinizing the integralthrust within the computational domain of the boundary-layer code, it isdeemed possible that the cumulative effect of multiple actuators is treatedinappropriately as a simple linear addition of the stabilizing effects. Thefinite-differences solver requires further experimental validation with moreextensively distributed actuator arrays to determine the exact reasons forthese deviations.
The mentioned DNS computations by Vieira et al. [111] indicate in-creased effectiveness of multiple actuators for TS-wave attenuation withinthe linear evolution regime. Whereas a second actuator significantly re-duces the absolute amplitudes, a third actuator does not add supplemen-tary benefit for flat plate flow at U∞ = 10 m/s. This diminishing marginalutility renders large actuator arrays unappealing unless a complete sup-pression of the disturbance growth can be attained along the surface. Theeffect of large actuator arrays at very low thrust with minimized power con-sumption is simulated with the boundary-layer code and analyzed with thestability code. The results of distributed DBD forcing on the generic flatplate setup at U∞ = 20 m/s are presented in Figure 5.6. 26 DBD actuatorsbetween x = 0.33 − 0.58 m are simulated with 10 mm streamwise spacingto operate at a minimal thrust level of T = 7.8 mN/m. Downstream ofthe first actuator location, the resulting N -factor evolution shows almost
86

5.3 Numerical Optimization of Generic Flow Control Experiments
0 0.2 0.4 0.6 0.8 10
2
4
6
8
10
x [m]
N [−
]
156 Hz221 Hz285 Hz318 Hz350 Hz382 Hz447 Hz
Figure 5.6: N -factor evolution under distributed DBD forcing.
complete suppression of the wave amplitude over a large frequency rangeand attenuation to subcritical values for frequencies above 200 Hz. Such aconfiguration is presently not feasible in experiments due to spacing limi-tations imposed by the electric potential differences, but specialized futureDBD actuators may enable spatially continuous thrust generation. If thiscan be achieved, the flow-control impact can be compared to continuousboundary-layer suction yielding very stable flow conditions [35, 36].
A different approach to optimize the control effectiveness is a numeri-cal sensitivity analysis to find the most sensitive location for flow-controlforcing. For such an analysis, an adjoint formulation of the underlyingequations is additionally required. Brandt et al. [16] present a stabilitymethod to compute the sensitivity of zero-pressure gradient boundary-layerflow to mean-flow forcing. This method considers non-modal disturbanceinteractions and the results indicate maximum flow sensitivity to time-invariant forcing in streamwise direction between branch I and II of theneutral stability curve (as defined in Figure 2.2). Such results suggest thatflow control should be applied within this area to increase the flow-controleffectiveness. Additionally it is shown that streamwise forcing, optimizedto attenuate Tollmien-Schlichting waves, hardly affects other disturbancesmodes, e.g. lift-up mechanisms leading to streamwise streaks. A negativeeffect of the TS-transition control on other disturbance modes is thereforenot expected.
A similar sensitivity computation was conducted for a DBD flow-control
87

5 Stability Impact
y [m
m]
x/c [-]
0
1
2
3
4
5
0.2 0.4 0.6 0.8
Boundary-layer thickness
Figure 5.7: Gradient ofEΩ with respect to mean-flow forcing, computationsby A. Hanifi based on [16].
application on a flat plate. Figure 5.7 illustrates the gradient of the totalenergy E across the whole flow domain Ω as a function of the flow-controlposition. The highest negative gradient (blue) is found close to the surfaceat the normalized streamwise distance x/c = 0.685, indicating the positionfor best total energy reduction. Adversely, high positive gradients (red) fa-voring disturbance growth are found at the same streamwise positions butfurther away from the wall (y > 1 mm). The force field of DBD actuatorswith its limited extent in the wall-normal direction appears perfectly suit-able to benefit from this sensitivity distribution. The results also indicatethat actuation far downstream is more effective than close to the leadingedge, which is in agreement with the experimental and numerical positionvariation results compiled in Table 5.1.
5.4 Stability Analysis of Experimental Data
To validate the stability considerations based on boundary-layer compu-tations, experimentally acquired boundary-layer profiles are analyzed withthe linear stability code. The DBD actuator at xDBD = 350 mm is oper-ated at various thrust levels and laser Doppler anemometry provides theaveraged velocity profiles 10 mm downstream illustrated in Figure 4.8. Theexperimental data is converted into an adequate format by scaling the ve-
88

5.4 Stability Analysis of Experimental Data
0 0.2 0.4 0.6 0.80
2
4
6
8
10
x [m]
N [−
]
0: DBD off1: T = 11.3mN/m2: T = 13.5mN/m3: T = 15.6mN/m
(a) N-factor evolution
x [m]
f [H
z]
0
0
0
0
1
1
1
1
1
2
2
2
2
3
3
3
3
0.05 0.1 0.15 0.2 0.25 0.3 0.35
200
300
400
500
600
700
N =
ln(A
/A0)
[−]
0
0.5
1
1.5
(b) Neutral stability curves
Figure 5.8: N -factor evolution of a discrete disturbance frequency of 200 Hz(a) and neutral stability curves (b) for DBD thrust variationbetween T = 11.3 − 15.6 mN/m.
locity with the freestream speed and the wall-normal distance with theBlasius length scale. Subsequently, the normalized profile is projected inthe streamwise dimension by varying the Blasius length scale. This cor-responds to an assumption of self-similarity and an analytical variation ofthe local Reynolds number for the given profile. It is important to notethat the following considerations are of purely theoretical nature, since aconstant boundary-layer shape along the streamwise direction is assumed,only increasing the boundary-layer thickness according to theoretical scal-ing laws. In fact, the velocity profile is modified only within a short distancedownstream of the actuator. The following considerations can be under-stood as an approximation of a boundary-layer flow under the influence ofrepeated actuation, e.g. by an array of plasma actuators. The theoreticalamplification of disturbances along the streamwise direction can then becalculated with the linear stability code. The impact of DBD thrust vari-ations is quantified by the growth rate of single disturbance frequencies orin terms of the neutral stability curves, both approaches being visualizedin Figure 5.8. Figure 5.8 (a) portrays the predicted N -factor evolution ofa modal instability at f = 200 Hz under a variation of the actuator thrust.Without DBD operation, the flow under the effect of an adverse pressuregradient is unstable leading to increasing N -factors throughout the wholeinvestigated flow domain. Based on Nt = 6.14 used before for the empiricaltransition prediction, a transition location of x = 0.6 m would be expected.
89

5 Stability Impact
This agrees with the expectations since the flow stability at x = 0.36 mis still relatively high and decreases in the downstream direction. There-fore, an analysis based on the single velocity profile automatically yields apostponed transition location compared to the experimental data. If theDBD actuator is operated, attenuation of the growth rates with increasingactuator thrust is observed. This also agrees with expectations since theDBD actuation 10 mm upstream enhances the flow stability and leads to adelayed transition.
Since transition is not initiated by a single frequency disturbance, theanalysis of the neutral stability curve is more convenient. Unlike in theboundary-layer computations in Section 5.2, no localized stabilization isobserved. Based on the similarity approach, a global influence on the sta-bility is projected, avoiding discontinuities in the neutral curves. Figure5.8 (b) contains the neutral stability curves for the same DBD thrust levelswith the same line styles as in (a). The color levels additionally illustratethe N-factor evolution for the highest thrust case 3. The four neutral sta-bility curves show increasing values of the critical point xcr with increasingthrust. Whereas the critical point is hardly distinguishable without DBDoperation, it can be found at x = 0.072 m for T1 = 11.3 mN/m. At themaximum thrust level T3 = 15.6 mN/m, it is delayed until x = 0.117 m,which corresponds to an increase by 62% compared to the minimum thrustvalue.
To enable a stability analysis at various locations and to avoid the self-similar scaling approach, fine resolution is required not only of the wall-normal, but also of the streamwise direction. Such measurements wouldbe time consuming, but surely help to further quantify the stabilizationimpact and its gradient in the streamwise direction. If various thrust levelsare additionally incorporated in an extensive study, the dependence on thisparameter could also be experimentally quantified. As an additional out-come, force field calculations based on the spatial momentum distributionwithin the boundary-layer flow could be performed. Such data could beused to quantify the force field variations due to altering flow velocities.
5.5 Design Tool Kit for Flight Experiments
The following task is the application of the obtained insights for the de-sign of a DBD transition control experiment. The wing glove presented inChapter 3.4 is to be equipped with a DBD actuator for transition control.Power supply limitations restrict the experiment to a single DBD actua-tor of 600 mm length across the acrylic measurement insert on the glove
90

5.5 Design Tool Kit for Flight Experiments
x/c [−]
f [H
z]
0.1 0.2 0.3 0.4 0.5 0.6 0.7 0.8200
400
600
800
1000
1200
1400
1600
N =
ln(A
/A0)
[−]
2
4
6
8
10
12
14
16
Figure 5.9: Stability diagram of wing glove pressure side, α = 0.7 andUTAS = 38 m/s. Contour levels indicate N -factor magnitude.
pressure side. Positioning of this actuator at x/c = 0.33 is forseen and thepredicted beneficial influence on the transition location by actuation needsto be evaluated.
Earlier flight experiments by Weismüller [114] as well as initial wind-tunnel tests (described in Chapter 6.1) suggest a design angle-of-attackα = 0.7 and corresponding flight speed UTAS = 38 m/s for flow-control ex-periments. Boundary-layer computations (using a Xfoil pressure distribu-tion of the wing glove geometry with these flow parameters) are performedas shown in [56]. In contrast to the considerations in the previous section,the evolution of the boundary-layer velocity profiles along the streamwisedirection is correctly reproduced. Nevertheless, the laminar code divergesdownstream of x/c = 0.777 due to the strong pressure gradient imposedby the reflexed trailing edge, predicting laminar separation. In the exper-iment, the transition trip or rapid TS wave amplification are expected totrigger transition ahead of this position, which cannot be represented bythe numerical method. The results of a linear stability analysis of the flowcase are depicted in Figure 5.9. The first amplified disturbance is found atx/c = 0.12 for a frequency f = 1400 Hz yielding an approximate Reynoldsnumber of Recrit = 4.1 × 10⁵. Mack’s relation (3.32) is not directly ap-plicable for airfoil flow under atmospheric conditions due to the influenceof pressure gradients and inflow turbulence. Nevertheless, transition N -factors on airfoils between 9 and 11 are typically reported from aircraft
91

5 Stability Impact
0 0.1 0.2 0.3 0.4 0.5 0.6 0.7 0.80
2
4
6
8
10
12
14
x/c [−]
N [−
]
248 Hz 371 Hz 495 Hz 619 Hz 743 Hz 867 Hz 990 Hz1114 Hz
(a) DBD off
0 0.1 0.2 0.3 0.4 0.5 0.6 0.7 0.80
2
4
6
8
10
12
14
x/c [−]
N [−
]
248 Hz 371 Hz 495 Hz 619 Hz 743 Hz 867 Hz 990 Hz1114 Hz
(b) T = 15.6 mN/m
Figure 5.10: N -factor evolution of discrete disturbance frequencies (a) with-out and (b) with DBD thrust T = 15.6 mN/m.
flight measurements. A NLF wing glove was tested under atmosphericconditions in flight on a LFU 205 aircraft [49], reporting approximatelyNt = 10 from comparisons to stability computations as reviewed by Arnalet al. [7]. If this value is employed for the present and very similar setup,transition is expected at x/c = 0.485. For the design of the flow-controlexperiment, this imposes a limitation on the possible actuator location.Actuator placement in the turbulent region downstream of x/c = 0.485 isunlikely to provide any useful effects. On the upstream side, the imple-mented disturbance source at x/c = 0.18 requires a certain downstreamdistance to develop fully two-dimensional wave fronts. Although the mainaim is to control naturally developing transition, a systematic investigationinto artificially excited transition should not be made impossible at thedesign stage. The position x/c = 0.33 is a good compromise in the centerbetween the disturbance source and the expected transition location.
The boundary-layer code in connection with the implemented force modeland subsequent stability analysis is used to evaluate the impact of ac-tuator positioning at x/c = 0.33 on the pressure side of the wing gloveairfoil. The N -factor evolution of discrete disturbance frequencies is il-lustrated in Figure 5.10 (a) without DBD forcing. For comparison, thecase of maximized actuator thrusting at T = 15.6 mN/m is presented inFigure 5.10 (b). For the flow-control case, the expected critical N -factorNt = 10 is crossed at x/c = 0.503, yielding a predicted transition delayof ∆xtrans/c = 1.85%. Considering the flow speed and the large chord
92

5.5 Design Tool Kit for Flight Experiments
0.2 0.3 0.4 0.5 0.6 0.7 0.88.8
8.9
9
9.1
9.2
9.3
9.4
9.5
9.6
9.7
9.8
xDBD
/ c [−]
Nm
ax(x
/c=
0.77
7)
T = 11.3 mN/mT = 9.1 mN/m no DBD
Figure 5.11: Sensitivity of N -factor growth to actuator placement. Maxi-mum N -factor at end of the domain x/c = 0.777 for variousactuator locations xDBD/c and thrust levels T .
Reynolds number of approximately Rec = 3 × 10⁶, this transition delaycorresponding to ∆xtrans ≈ 25 mm would be a significant success.
Since the actuator force field can be arbitrarily positioned along the sur-face of the investigated body in numerical studies, the sensitivity of the flowstability to a variation of the actuator location can be evaluated. A crite-rion which represents the integral impact over the whole domain as definedin the adjoint-based sensitivity analysis presented in Figure 5.7 is beyondaccess with the presented method. Alternatively, the maximum N -factor atthe end of the domain is evaluated as a function of the actuator placement.The limitation of the boundary-layer code to laminar calculations leads toa prediction of N -factors by the stability code even in the range wherefully turbulent flow is expected. DBD forcing positions downstream of thetransition location are not sensible, nevertheless the maximum N -factorat x/c = 0.777 is taken to quantify the flow-control impact. Figure 5.11illustrates the results of these computations by comparing the maximumN -factors for different actuator positions and thrust magnitudes. The re-sults recommend a DBD placement at the location x/c = 0.25 where themaximum N -factor is minimized. Table 5.2 summarizes the predicted tran-sition locations xtrans = x(Nt = 10) for DBD actuation at the projectedx/c = 0.33 and the optimal x/c = 0.25. The results for various thrustmagnitudes and equivalent power consumption are listed, facilitating easy
93

5 Stability Impact
T [mN/m] P [W/m] xtrans/cxDBD/c = 0.33 xDBD/c = 0.25
0 0.0 0.485 0.4857.8 3.7 0.488 0.4889.1 38.1 0.492 0.49311.3 45.7 0.497 0.49813.5 55.1 0.503 0.50515.6 64.4 0.503 0.506
Table 5.2: Comparison of predicted transition locations for varied thrustand two optional DBD actuator locations, xDBD/c = 0.33 andxDBD/c = 0.25.
comparison of the investigated cases. As the actuator thrust is increased,higher transition-delay predictions are observed for both actuator positions.A saturating trend is observed for elevated thrust magnitudes, limiting thepossible transition delay. The overall impact on the transition location bychanging between the two actuator locations is negligible in comparison tooptimizing the actuator thrust. Based on this observation, the actuatoris positioned at x/c = 0.33 in the experimental setup due to simplifiedimplementation and cabling.
5.6 Conclusions
A numerical solution of the boundary-layer equations with implementedDBD actuator force distribution shows good agreement with experimen-tally measured integral boundary-layer properties. The shape factor dropmeasured close to the DBD actuator coincides closely with numerical sim-ulations based on a finite-difference approximation of the boundary-layerprofiles. Linear stability analysis is conducted with the resulting data, sug-gesting that the local growth rates are decreased for a broad range of fre-quencies. This implies that the boundary layer is locally stabilized againstlinear disturbances of such frequencies. Additional adjoint computationsshow a spatial variation of the flow sensitivity to mean-flow forcing.
The computational results support manifold experimental observationsof transition delay with DBD actuators, and validate the experimentallymeasured dependence of the achievable transition delay on the actuator
94

5.6 Conclusions
position. Under adequate conditions of operation, the imparted momentumlocally alters the boundary-layer profiles and increases the hydrodynamicstability of the boundary-layer flow. If the actuator is positioned withinthe linear disturbance regime, instabilities of all frequencies are damped,maintaining the laminar flow state.
Linear stability analysis shows increased critical Reynolds numbers andan overall diminution of the instability region, based on similarity-scalingof experimental velocity-profile data. A reduction of wave amplificationrates confirms the numerical observation of enhanced stability propertiesunder the influence of DBD forcing.
The measured transition locations reported in Chapter 4 correlate wellwith an empirical eN -prediction of numerical data under consideration ofthe measured freestream turbulence intensity. The chosen experimentalapproach confirms the results of the combined numerical method using alaminar boundary-layer computation together with linear stability anal-ysis. The qualitatively correct transition prediction for varying actuatorthrust and position predestine the numerical tool kit for a customized de-sign of DBD based transition control. Nevertheless, additional effort needsto be spent on the problems associated with multi-actuator arrays in thenumerical routine.
A flow-control application on a NLF wing glove is investigated, predict-ing a considerable delay of transition and associated drag reduction. Theobserved dependence of the flow-control effectiveness on the thrust levelas well as the overall agreement with the numerically predicted transitiondelay are experimentally verified in Chapter 6.
95

5 Stability Impact
96

6 Airfoil Experiments
Application of DBD actuators for flow control under realistic scenarios isa prerequisite to enhance the level of maturity of the devices and moti-vate further research. Wind-tunnel experiments on flat plates and airfoilshave so far demonstrated successful transition delay at limited Reynoldsnumbers. In order to investigate the flow-control impact of DBD actuatorsunder realistic flight conditions, a wing glove is fitted on a G109b motorglider.
Since no experience with flow control on the wing glove configuration(described in Chapter 3.4.2) is available, initial wind-tunnel experimentsare conducted to define a suitable parameter space for the following flightexperiments. The accessability of the measurement equipment and goodrepeatability of the flow conditions inside the wind tunnel enable a com-prehensive variation of parameters. Before the instrumentation equipmentcan finally be stored in the underwing pods and on the vibration-isolatedplatform in the fuselage, a suitable combination of flight speed and angle ofattack needs to be identified. The central requirements are that the tran-sition process is observable with the given sensor systems and controllablevia the implemented DBD actuator.
Once an opportune configuration is identified, the DBD actuator needs todemonstrate its value under flight conditions. Decreased ambient pressureand temperature with increasing flight altitude under varying humiditychange the thermodynamic and aerodynamic properties of the fluid. Tomaintain constant flow-control authority, it is desirable to obtain a con-stant forcing of the DBD actuator despite the variable ambient conditions.Therefore, the effects of these variable quantities on the DBD power con-sumption are identified and a closed-loop controller is developed to ensureequal flow-control impact across the whole flight mission.
Finally, the possible transition delay due to actuator operation is quan-tified in flight. Prior steps are the accurate determination of the transitionlocation and the identification of error sources of the different sensor sys-tems. This is more arduous to accomplish at 10′000 ft altitude in compari-son to the well-defined wind-tunnel conditions, which are described in thefollowing section.
97

6 Airfoil Experiments
G109b w
ing s
ection
wing glove
rotatingmodel
support
Figure 6.1: Overview of the NLF wing glove, mounted on the G109b sup-port wing section inside the NWK wind tunnel. The rotatingmodel support enables angle-of-attack variations.
6.1 Initial Windtunnel Experiments
The NLF wing glove (presented in Chapter 3.4.2) can alternatively beplaced on the glider wing or on a specially adjusted support to fit intothe 2.2 m × 2.9 m test section of the closed-loop NWK wind tunnel at TUDarmstadt. The support consists of an original wing section of a G109bglider suited to match the vertical dimension of the wind tunnel and isequipped with a bearing, allowing it to be mounted on a wind-tunnel bal-ance underneath the test section. Although no force measurements areconducted in the current investigation, the balance facilitates rotation ofthe wind-tunnel model around the vertical axis. For the given setup, thisenables an adjustment of the wind-tunnel support angle αsup of the wingglove. A six-bladed fan driven by a 300 kW direct-current motor acceleratesthe fluid and provides velocities up to 68 m/s downstream of a 1 : 12 con-traction nozzle. All steady flight states within the envelope of the glidercan be reproduced inside the test section. An overview of the setup isillustrated in Figure 6.1.
The turbulence intensities below 0.1% typically encountered in the atmo-
98

6.1 Initial Windtunnel Experiments
sphere are not reproducible inside the closed-loop tunnel. Here, they rangefrom 0.4% to 0.5% in the velocity range of 27 − 40 m/s relevant for theinvestigated configuration. The fluid density and pressure within the windtunnel are also mainly defined by the ambient conditions. The same appliesto the flow temperature which increases during the measurements due tothermal dissipation of the axial compressor. Although the motor is exter-nally cooled, the flow temperature Ta increases from approximately 10C to22C throughout the day during measurements in the winter season. Thethermodynamic properties of the fluid are measured and the speed can beadjusted, i.e. to compensate for a constant Reynolds number. Hot-wireanemometry measures the flow velocities inside the wing glove boundarylayer, requiring thorough calibration. Since this measurement technique isparticularly sensitive to temperature variations, a temperature correctionis applied, compare (3.1).
Due to the geometric angle of incidence of the setup, the true angle ofattack α of the wing glove relative to the flow and the support angle αsup
deviate by 0.7 which is accounted for by the relation
α = αsup − 0.7. (6.1)
For enhanced comparability to numerical and flight measurements, all datahereafter will be referred to α.
The wing glove and the supporting wing constrict the test section by theirmere presence, inducing blockage effects which become more pronouncedfor elevated angles of attack [114]. Since the experiments reported hereaftercover angles of attack between −1 and +2, the projected model area is inthe order of the maximum airfoil thickness of 0.16 m. This yields a blockedarea of 5.6% of the total cross section. Neither the overall circulation ofthe model nor the bulk velocity are decisively influenced. Nevertheless, asmall influence on the pressure distributions is noted in comparison to theflight cases. Reynolds-averaged computations of the Navier-Stokes equa-tions (RANS) have been performed by A. Hanifi at Linné FLOW Cen-ter, KTH Stockholm, to estimate the effect of wind-tunnel walls on thepressure distribution. Figure 6.2 compares the pressure distributions withwind-tunnel walls and under undisturbed conditions. The wind-tunnel walleffects are negligible as compared to the deviation from wind-tunnel mea-surements, additionally displayed including experimental error bars. Rea-sons for the differences between numerics and experiment are uncertaintiesof pressure tap locations and determination of the correct static pressureinside the wind tunnel. A more detailed discussion of the differences be-tween flight and wind-tunnel measurements with the wing glove setup is
99

6 Airfoil Experiments
0 0.2 0.4 0.6 0.8 1
−1
−0.5
0
0.5
1
x/c [−]
c p [−]
Experiment WindtunnelRANS WindtunnelRANS Flight
Figure 6.2: Pressure distributions from experiments and RANS computa-tions at α = 0.7.
provided in [114], including the deviations of the lift-drag polar (illustratedin Figure 6.28 for the later discussion on efficiency).
In steady gliding flight, one angle of attack α is coupled to an uniquetrue airspeed UTAS via the necessity to produce lift compensating the ac-tual aircraft weight. The relationship can either be derived from flightperformance considerations or from flight measurements with the actualaircraft, the latter approach being chosen here. Figure 6.3 illustrates therelation across the flight envelope for two segments of one measurementflight, indicating measurement uncertainties and a small spread due to fuel-consumption induced weight variation. The variable ambient conditions,discussed in Section 6.2.1, are additional reasons for the small deviationsin the data points. The shown relationship implies that the angle of attackand the flow speed have to be adjusted both at a time. This complicatesthe experimental procedure in the wind tunnel where constant lift is nota prerequisite. Since in the initial wind-tunnel tests only a qualitative es-timate for the transition location is strived for, a constant flow speed isselected and the angle of attack is marginally varied around a design pointin the order of ±2.
6.1.1 Identification of Adequate Transition Locations
To initiate successful flow-control measurements, the most promising flowconditions for transition experiments on the wing glove pressure side is
100

6.1 Initial Windtunnel Experiments
−1 0 1 2 3 4 5 6
30
35
40
45
α [°]
UT
AS [m
/s]
Figure 6.3: Relationship between true airspeed UTAS and true angle of at-tack α for constant lift, measured during two segments of onemeasurement flight. Variations are due to different fuel levelsand ambient condition deviations.
sought for. Contrary demands pose an optimization problem; low flowspeeds are required to retain a sufficient actuator effect due to its limitedforce field magnitude. On the other hand, low velocities are associated withhigh angles of attack which lead to a very stable flow on the pressure side.At high angles of attack, transition to turbulence occurs far downstreamand is likely to be triggered by the zig-zag tape close to the reflexed trailingedge. If transition occurs too far downstream, a DBD actuator positionedclose to the leading edge is unlikely to have an effect on the transition pro-cess. A compromise has to be found to ensure hydrodynamic unstable flowand transition locations accessible with the chosen measurement probes.
The transition process along an airfoil is most conveniently analyzed byvarying the local Reynolds number Rex = U x/ν. This can be achievedby maintaining the sensor position constant and systematically changingthe flow velocity U = UTAS and the corresponding angle of attack. Al-ternatively, the flow speed and angle-of-attack are kept constant and thesensor is traversed to several downstream locations x or distributed sensorarrays are employed. It has to be kept in mind that changing the flowstate might alter the transition process, such that multiple or relocatablesensors appear more appropriate in flight. In the present investigation,both approaches are pursued and even combined. If a quick overview over
101

6 Airfoil Experiments
x/c [−]
α [°
]
0.4 0.45 0.5 0.55 0.6 0.65
−2
−1.5
−1
−0.5
0
0.5
1
1.5
2
Figure 6.4: Microphone standard deviation related to the angle of attack.
the general transition behavior is desired, measurements with distributedsensors at various positions x in combination with a systematic change ofthe flow velocity UTAS are advantageous.
The flush-mounted microphone array in the center portion of the mea-surement insert monitors the level of velocity fluctuation associated withlaminar-turbulent transition along the wing glove chord x/c. The con-tour levels in Figure 6.4 illustrate the streamwise evolution of the micro-phone signal standard deviation σM as the angle of attack is varied betweenα = −2.2 and 2.3 for a constant flow velocity UTAS = 38 m/s. Bright col-ors represent high fluctuation levels, indicative for the flow intermittencyduring laminar-turbulent transition. By maintaining a fixed velocity andchanging the angle of attack of the model, the pressure gradient on thepressure side is varied and the resulting displacement of the standard de-viation peak is quantified. The dashed line, approximating the evolutionof the maximum standard deviation, clearly shows that the transition lo-cation can be adjusted within the measurement region x/c = 0.35 − 0.67for varying angles of attack α = −0.2 − −1.3. The initial parametricstudy yields an angle of attack of α = 0.7 as most promising to obtainthe boundary-layer transition approximately in the center of the exchange-able measurement insert. For this design angle and the corresponding flowspeed UTAS = 38 m/s, maximum intermittency is obtained at x/c = 0.51 atthe 8th microphone position. The local Reynolds number at this positionis Rex = 1.7 × 10⁶.
102

6.1 Initial Windtunnel Experiments
0 0.2 0.4 0.6 0.8 1
−1
−0.5
0
0.5
1
x/c [−]
c p [−]
α = −0.2°α = 0.7°α = 1.3°
Figure 6.5: Dimensionless pressure distribution for varying angles of attackat constant speed UTAS = 38 m/s.
The pressure distribution at UTAS = 38 m/s and varying angles of attackα = −0.2−1.3 is illustrated in Figure 6.5. The dimensionless pressure coef-ficient cp along the streamwise chord position x/c characterizes the pressuregradients on the suction and pressure side of the wing glove. For α = −0.2,a strong positive gradient of dcp/d(x/c) = 0.23 is found on the pressure sidein the relevant region x/c = 0.2−0.7, indicating highly unstable conditions.Under such low angles of attack, transition is expected to occur close tothe position of the DBD actuator at x/c = 0.33, and evidence can be foundin Figure 6.4 through the microphone data. At the higher α = 1.3, thepressure gradient is approximately neutral (dcp/d(x/c) = 0.01), leading toa much higher flow stability and postponed transition. For the design angleof attack α = 0.7, the dimensionless pressure gradient dcp/d(x/c) = 0.09is only slightly destabilizing the flow. Under such conditions, DBD flowcontrol is effective for transition delay as shown in the following.
6.1.2 Quantification of Transition Delay
After having found an adequate setup such that transition occurs on the ex-changeable acrylic insert and is measurable with the sensors, the transitioncontrol experiments are initiated. The primary objective of the followingwind-tunnel tests is to identify DBD actuator configurations to effectivelycontrol the transition.
103

6 Airfoil Experiments
Although arrays consisting of multiple actuators have shown to be veryeffective in delaying transition on a flat plate, a reduction of complexity isgained if only a single DBD actuator is applied. Thorough investigationsof a reduced parameter set decrease time consumption and the obtainedinsights are a necessary prerequisite for further enhancements. Owing topower supply limitations and ease of mechanical implementation, a singleDBD actuator is placed at x/c = 0.33. This position was numericallyinvestigated in Chapter 5.5 to ensure effective transition control.
As expected, application of the single DBD plasma actuator leads to adownstream shift of the transition process. This can be quantified eitherby integral boundary-layer quantities like the shape factor H12 or the stan-dard deviation of a sensor signal. All these values can be evaluated witha single hot-wire probe which is traversed with the 3-axis boundary-layertraverse described in Chapter 3.4.6. The hot wire enables acquisition ofaveraged boundary-layer velocity profiles as well as a statistical analysis ofthe anemometer signal. Figure 6.6 illustrates the effect of DBD actuationon the standard deviation σU of the velocity, acquired by a hot wire. Thesensor is positioned at the wall (y = 0 mm) and traversed in streamwisedirection x along the chord c. The peak of the signal fluctuation, encoun-tered during maximum intermittency of the flow between the laminar andturbulent state, is found at x/c = 0.47 without DBD actuation for anangle of attack of α = 0.7 and slightly downstream (x/c = 0.5) for theless unstable α = 0.8. With DBD actuation, these positions are moveddownstream, to x/c = 0.5 for α = 0.7 and even outside the observationregion for α = 0.8. Although these results show a first and very successfuldelay of transition at large Reynolds numbers, measurement uncertaintiesimpede an exact quantification of the actuator impact. Therefore, otherquantities are investigated to validate the observations.
The shape factor H12 of the boundary-layer profile is illustrative for thetransition process by combining the trends of the displacement thickness δ1
and the momentum loss thickness δ2. The shape factors of the same casesinvestigated before are illustrated in Figure 6.7, all showing a negative slopewhich is indicative for the ongoing transition. Despite data scatter andambiguous detection of the wall position, the solid lines without DBD op-eration are set off from the dashed lines (indicating the flow-control cases).If the chord positions of two cases are evaluated for the same shape factor,e.g. H12 = 1.8, an offset by approximately ∆x/c = 0.03 is observed. Thisvalue agrees quantitatively with the offset observed in the signal standarddeviation in Figure 6.6.
104

6.1 Initial Windtunnel Experiments
0.38 0.42 0.47 0.51 0.562.5
3
3.5
4
4.5
5
5.5
x/c [−]
σ U [m
/s]
α = 0.7°, DBD offα = 0.7°, DBD onα = 0.8°, DBD offα = 0.8°, DBD on
Figure 6.6: Standard deviation of hot-wire signal σU at the wall for vari-ous downstream locations x/c. The peaks indicate the maxi-mum flow intermittency which is representative for the transi-tion process.
0.38 0.42 0.47 0.51 0.56
1.4
1.6
1.8
2
2.2
2.4
2.6
2.8
x /c [−]
H12
[−]
α = 0.7°, DBD offα = 0.7°, DBD onα = 0.8°, DBD offα = 0.8°, DBD on
Figure 6.7: Shape factor H12 of the boundary layer as a function of thestreamwise position x for two different angles of attack α.
105

6 Airfoil Experiments
The measured offset of both quantities translates into a physical tran-sition delay of approximately ∆xtrans = 40 mm. This is far less than thegain on the flat plate reported in Chapter 4, but exceeds the expectationsof ∆xtrans ≈ 25 mm based on the numerical tools used in Chapter 5.5. Theexperiments are very successful considering the high freestream velocityand the pronounced adverse pressure gradient. The determined combina-tion of angles of attack and flow speed is promising for further investigationin flight.
Unfortunately, the microphone array is not helpful for the evaluation ofthe transition delay in the wind tunnel. For α = 0.7, the peak of themicrophone standard deviation σM at x/c = 0.58, indicated in Figure 6.8,quantitatively disagrees with the hot-wire readings presented in Figure 6.6.Additionally, DBD actuation does not produce any significant differencein this position, leading to the conclusion that wind-tunnel noise and thecoarse spacing of reliable microphones limits the chances of acquiring thecorrect transition location. Despite various approaches to correctly cali-brate the microphone array as described in Chapter 3.4.4, 7 sensors didnot provide sufficient signal-to-noise ratio under the conditions of wind-tunnel operation and were excluded from the data postprocessing. Thisbecomes visible by the coarse resolution of only 8 data points in streamwisedirection in Figure 6.8. The problem possibly derives from variant sensi-tivity of the microphones stated by the manufacturer (10 mV/Pa ±2.5 dB)or clogged surface orifices. Only after completion of the wind-tunnel tests,all microphones could be revised and the surface connection reestablished.During the flight measurements presented in Section 6.3 similar problemsoccurred, indicating that the sensitivity of single microphones was too lowto provide useful data. In the aftermath of the experiments it was found outthat the sealing between the inaccurate microphones and the surroundingacrylic was not airtight, effectively increasing the air volume and reducingthe signal accuracy.
Neither the functional microphones nor the hot-wire data reveal the fre-quencies involved in the transition process. Fourier transformations of allhot-wire and microphone measurements primarily reveal the disturbancefrequencies introduced by the wind tunnel. A broadband spectrum, il-lustrated in Figure 1.1, is audible even outside the test section duringwind-tunnel operation. The propulsion additionally causes periodic flowfluctuations, visible in the two low-frequency peaks of the solid curve inFigure 6.9, representing the frequency spectrum of the microphone signalsbetween 20 and 2’000 Hz. The 63 Hz peak and its 21 Hz subharmonic origi-
106

6.2 Constraints of Flight Operation
0.35 0.4 0.45 0.5 0.55 0.6 0.650.4
0.5
0.6
0.7
0.8
0.9
1
1.1
1.2
1.3
x/c [−]
σ M [V
]
DBD offDBD on
Figure 6.8: Standard deviation of the microphone signals σM at a fixedangle of attack α = 0.8.
nate from the blade passing of the six-bladed rotor inside the wind tunnel.Measurements at various speeds confirmed a dependency of these frequencypeaks on the rotatory speed of the motor. The same peaks at are found inthe hot-wire data (dashed line) at worse frequency resolution. The loweramplitudes of the peaks indicate towards an acoustic source since the hotwire is less sensitive to minute pressure fluctuations.
Despite problems with the microphone array and high acoustic distur-bances inside the wind-tunnel flow, a suitable setup and parameter rangefor flow-control experiments is identified. A delay of transition by approx.40 mm or 3% chord is achieved without further optimization. In the nextstep, the setup is mounted on the G109b glider wing to perform transitiondelay experiments in flight, based on the identified parameters. Before thesemeasurements can be successfully performed, some constraints of in-flightexperiments need to be addressed.
6.2 Constraints of Flight Operation
The flight conditions pose the problem of identifying the correct angle ofattack. Unlike in the wind-tunnel experiments, no geometric angle canbe measured or defined but the angle of attack αFL is available from theDornier Flight Log wind vane, introduced in Chapter 3.4.4. Since the geo-metric angle of incidence of the vane relative to the glove chord is difficultly
107

6 Airfoil Experiments
102
103
10−3
10−2
10−1
f [Hz]
PS
D [V
2 /Hz]
microphoneshot wire
Figure 6.9: Power spectral density of hot-wire signals across the boundarylayer (dashed) and microphone signals along the chord (solid).
measurable and the induced angle of attack αi depends on the actual an-gle of attack α, a constant offset cannot be expected and a calibration isnecessary. Weismüller [114] presents a calibration of the device by com-paring pressure measurements in flight to numerical data. The pressuredistribution over the wing glove measured during flights at constant αFL
is compared to a variety of two-dimensional flow calculations with Xfoil atdifferent α2D. A least-square-fit of the finely resolved pressure data yields areference between both angles. The same approach is chosen for the presentsetup and data from calibration flights composes Figure 6.10. The almostlinear relationship between the measured αFL and α = α2D is expressed bythe relation
α = 0.725 · αFL − 0.747. (6.2)
Again, all flight data will be related to α for comparability with wind-tunnelmeasurements and numerical results.
Lissajous figures composed of the supply voltage and the charge across amonitor capacitance describe the DBD power consumption as illustrated inFigure 3.3. In order to precisely evaluate the power consumption, it is notsufficient to sample these data at twice the plasma operating frequency. TheLissajous figure is highly sensitive to subtle variations of the exact shapeand phase lag of the periodic signals, requiring acquisition in the MHzrange. On ground, these quantities can be acquired using a digital oscillo-scope Tektronics TDS 3032C at sampling rates of up to 300 MHz. Size and
108

6.2 Constraints of Flight Operation
−4 −2 0 2 4 6−4
−2
0
2
4
6
8
α [°]
α FL [°
]
Figure 6.10: Functional relation between measured Flight Log angle of at-tack αFL and fitted 2D angle of attack α.
weight limitations as well as automatization demands prohibit the use ofsuch oscilloscopes during measurement flights. The available National In-
struments 9074 cRIO with various analog-digital converter modules cannotbe used for this task since the high sample rate would impose unnecessarydata density and performance requirements on the full flight data acqui-sition. Instead, a computer based digital oscilloscope Picotech PicoScope
4424 is connected via USB to the flight computer to sample two channels at1 MHz independently from the remaining data acquisition at 16 kHz. TheLabView environment facilitates the implementation of manifold acquisi-tion hardware and synchronized data recording.
Before the effect of DBD actuation on the flow can be quantified, theinfluence of the experimental conditions on the gas discharge requires con-sideration. A deterioration of DBD performance due to increasing flowvelocities has been reported [61, 70], and similar influences of pressure andhumidity have been investigated [10, 11]. The ranges of the ambient condi-tions, including the flight speed encountered during the measurements, aresummarized in Table 6.1. The table is divided into parameters with depen-dence on the actual flight altitude and independent quantities. The depen-dence between altitude, pressure, density and temperature is expressed bythe definition of the International Standard Atmosphere [50]. Functionalrelations between these parameters provide a reference frame for aviationmeasurement techniques, e.g. to calculate the altitude from static pres-
109

6 Airfoil Experiments
Altitude A 10′000 - 0 ftPressure p 0.7 - 1 barDensity ρ 0.86 - 1.3 kg/m3
Temperature t −20 - 30 C
Velocity U∞ 20.3 - 44.5 m/sTurbulence intensity Tu 0.02 - 0.5 %Relative humidity hrel 10 - 100 %
Table 6.1: Ambient conditions during measurement flights, divided into al-titude dependent (top) and independent (bottom) quantities.
sure data. Although non-standard conditions are typically encountered inthe atmosphere, the physical relations maintain their validity. They willnot be reviewed in detail but are exemplified by the ordering within thetable. With decreasing altitude, the pressure, density and temperature in-crease. The remaining factors are not functionally related to the altitudebut depend on the flight state and the weather.
In the past, several experimental investigations have aimed at mimick-ing flight conditions relevant for commercial aviation industry, in order toevaluate DBD actuator efficiency under such circumstances. Laboratorysetups lack the simultaneous agreement of all relevant quantities with re-alistic conditions. The separated investigation of single parameter effectsis commendable, but parametric studies have revealed effects which arepartially contradictory under flight conditions. Although only flight ex-periments with DBD actuators and simultaneous acquisition of ambientconditions enable a comprehensive discussion of the net impacts, severalparametric studies will be reviewed in the following.
Bénard and Moreau [8] investigate the decrease of pressure, temperatureand density associated with an altitude increase and identify the pressureto have the most prominent effect on DBD operation. With increasingaltitude, the maximum velocities induced by a DBD actuator in quiescentair are reduced. At the same time, the power consumption and extensionof the plasma along the surface increase.
Due to the primary importance of the pressure, several researchers con-centrate on the corresponding effect on the actuator performance. In gen-eral, increasing power consumption is found for decreasing pressure [1, 58],but conflicting observations are made concerning the flow-control authority.Either linear [42] or non-linear dependencies between ambient pressure and
110

6.2 Constraints of Flight Operation
the actuator thrust [1, 105, 107], induced mass flow [9] or maximum inducedvelocities [118] are derived. Others [110] describe a monotonic dependenceof ionization and plasma extent for pressures beyond 1′000 mbar which areirrelevant for testing under atmospheric conditions. The effectiveness ofDBD forcing at pressure levels summarized in Table 6.1 remains ambigu-ous since several authors identify peaks of the investigated quantities atdiffering pressures. Notwithstanding, the sensitivity of the gas dischargestowards pressure changes causes Chartier et al. [20] to suggest the appli-cation of DBD as pressure sensors. The referred investigations show theimportance of controlling either the pressure or the actuator performanceif a constant flow control output is desired. Only the latter is achievablefor atmospheric flight experiments and is described in Section 6.2.2.
The temperature effect has largely been neglected, systematic investiga-tions mainly concentrate on the impact of temperatures above the rangeof interest (e.g. for 30 < Ta < 200 in [110]). Nevertheless, the findingsforebode that for the ambient temperatures and small variations found inthe flight experiments, a significant impact is unlikely.
The flow velocities encountered in flight have an additional impact onthe actuator performance. The impact of a velocity variation on the powerconsumption reported by Kriegseis [58] suggests a linear dependency al-though the data shows significant spread below 50 m/s. Under transonicconditions, Pavon et al. [76] identify an impact of the actuator placementsince the velocity and pressure field experience drastic spatial variations.During most of the flight tests presented in Section 6.3, the pressure distri-bution and the flow velocity are kept as constant as possible to maintain asteady flight state. Only at steady flow conditions, the effect of the actua-tor can be appropriately identified with the sensor equipment. The flightexperiments are conducted during the early morning when the air is ascalm as possible. Only in the absence of thermals a desired flight state canbe maintained to ensure repeatability. For these experiments, neither ve-locity variations nor turbulence are expected to provoke undesired actuatorperformance variations.
The relative humidity φ is the ratio between the partial pressure of watervapor ew and the saturated vapor pressure e∗
w and therefore depends onthe temperature as well as the ambient pressure. This quantity is macro-scopically defined by the weather situation but locally dependent on thealtitude. The formation of clouds indicates saturation (φ = 100%), andflight through clouds is expected to provoke large humidity gradients. An-derson and Roy [4] perform a variation of the air humidity in a small range
111

6 Airfoil Experiments
between φ = 43 − 53% and find increasing DBD flow-control effective-ness for higher humidity. Nevertheless, the authors themselves stress thepreliminary character of the study and suggest thorough validation. Subse-quently, Bénard et al. [11] experience a non-monotonic behavior of humidityvariation on the power consumption: between φ = 0.4−0.6, the power con-sumption increases, for φ = 0.6−0.85 it decreases and grows again betweenφ = 0.85 − 1. The increase at high humidity levels is explained by localdeposition of water droplets and the resulting modification of the conduc-tance on the surface. Finally, a reduction of the induced velocities andmass flow rate at high humidity levels is reported which can be overcomeby adjusting the supply voltage. The important possibility to compensatefor these control authority variations enables closed-loop control of the ac-tuator impact. The monotonic relation between the force produced andthe power consumed by a DBD actuator reported by Kriegseis et al. [59]enables the evaluation of the actuator control authority by electrical powermeasurements and feedback adjustments to maintain it constant. Sincethe monotonic relation was evaluated during constant ambient conditions,a thorough experimental study of the force and power under varying con-ditions is highly recommended but beyond the experimental possibilities ofthis project.
To summarize, the pressure and humidity of the ambient air have a sig-nificant impact on the performance of DBD flow control. These singlequantities have to be monitored during all flight experiments and a quan-tification of the combined impacts is presented in the next section.
6.2.1 Quantification of Ambient Condition Influences
A comprehensive study of the isolated effects of the single parameters onthe DBD performance cannot be conducted in flight. Such an investigationis beyond the scope of this work since usually a combination of parame-ters varies either independently or with mutual dependence. Nevertheless,under some conditions, a predominant effect by one parameter can be iden-tified which will subsequently be discussed. In order to evaluate the effectsof the ambient condition on the power consumption of a single DBD actu-ator, the control voltage fed into the MiniPuls 2.1 supply is kept constant.Under steady conditions, a constant high voltage amplitude is provided andthe power consumption does not change over time. For the presented ex-periments, the single DBD actuator is operated at the resonance frequencyfpl = 7.8 kHz of the actuator combined with the power supply to achievemaximized electrical efficiency.
112

6.2 Constraints of Flight Operation
0 5 10 15 20 25 30 3549
49.5
50
50.5
51
51.5
P [W
]
t [s]
0 5 10 15 20 25 30 358.5
8.55
8.6
8.65
8.7
8.75x 10
4
p [P
a]
power Ppressure p
Figure 6.11: Power variation during pressure increase in gliding flight. Theabscissa illustrates the measurement duration in seconds.
The typical flight procedure for flow-control experiments (reported inSection 6.3) is a motorless gliding descent starting from 10′000 ft altitude.The descent rate depends on the flight velocity chosen for the measure-ment, and the actual altitude is calculated from pressure measurements.The static pressure from the ambient air data system is indicated in Figure6.11 during a typical measurement flight, showing increasing pressure dur-ing the descent. Due to the atmospheric dependence between temperatureand pressure, the temperature also increases slightly. The above describeddomination of the pressure influence on DBD performance renders the smalltemperature increase of approximately 1 C negligible. The air humidityduring this specific flight remains almost constant at 67%±2% whereas themomentary power consumption is illustrated to derive the dependence be-tween the pressure and DBD power consumption. The trend of decreasingpower consumption with increasing pressure agrees well with the obser-vations in [1, 8, 58]. A 3% pressure increase leads to a 4% decrease ofthe consumed power, Kriegseis [58] also reports a linear dependence in theorder of 1.
Air humidity is the next important parameter under investigation. Ahorizontal, motor-powered flight is conducted to remove the influence ofpressure changes while flying through air layers of varying humidity beneaththe cloud base level. A strong humidity variation by 30% is contrasted tothe power consumption in Figure 6.12. Due to saturation and condensation
113

6 Airfoil Experiments
0 10 20 30 40 50 607.5
8
8.5
9
t [s]
P [W
]
0 10 20 30 40 50 600.6
0.7
0.8
0.9
1
φ [−
]
power Phumidity φ
Figure 6.12: Power modification due to humidity variation.
on the surface, the humidity reads 100% at the beginning and the end ofthe flight segment. This cannot be resolved by the sensor but stronglyinfluences the power consumption as also reported by Bénard et al. [11].A gradient of the power consumption is therefore also found in regions ofsaturated, constant humidity. The power variation is in the order of 5%for a 30% humidity change.
Obviously, the relative sensitivity of DBD performance towards humiditygradients is minor than for pressure changes. Nevertheless, the pressure de-creases slightly but continuously during the measurement flights, whereasstrong humidity gradients can occur instantaneously. During regular at-mospheric flights both influences can couple and additional, unpredictedeffects may lead to DBD performance variation. Therefore, a closed-loopcontrol of the actuator power is desired to maintain a constant perfor-mance during flow-control measurements. The following section introducesthe concept and shows the successful application of a closed-loop controlalgorithm in the free-flight experiments.
6.2.2 Closed-Loop Performance Control
A necessity for real-time feedback control is adequate processing time ofinput and output signals. The National Instruments 9074 cRIO real-timemodule enables fast data acquisition and can even perform simple algorith-mic operations on a FPGA level. In principle, the Lissajous-based power
114

6.2 Constraints of Flight Operation
induced flow
plasma region
MP2.1
PicoP
PID
P
-ζψ
Figure 6.13: Sketch of the closed-loop power control setup including PIDcontroller, MiniPuls 2.1 (MP2.1) and PicoScope (Pico).
measurements provide a value for the consumed power for every plasmacycle, i.e. at 7.8 kHz. Averaging of several cycles is recommended dueto measurement uncertainties and still provides power data at a sufficientrate to compensate ambient condition variations in a frequency range of10−1 Hz.
The LabView based real-time data acquisition facilitates the implemen-tation of a control algorithm for the DBD performance. A feedback con-troller allows a comparison between the measured (P ) and the target (P )power value under any flight condition. The National Instruments NI 9263
digital-analog output module closes the loop and sends a control signal ζ tothe MiniPuls 2.1 power supply to adjust the operating voltage. The prin-cipal setup of a closed-loop control circuit for the DBD power surveillanceis illustrated in Figure 6.13.
A PID architecture is chosen for the software implementation of thecontrol algorithm. An available LabView PID subroutine is implementedin a loop structure to iteratively process the incoming data. The PIDcontroller comprises a combination of proportional, integral and differentialprocessing of the input signal ψ to determine a suitable output signal ζ.
ζ = kpψ +1
Ti
∫
ψdt+1
Td
dψ
dt(6.3)
While the dynamics of the controller are largely determined by the pro-portional and differential components, integration avoids any permanentcontrol offset. The parameters kp, Ti and Td need to be adjusted such thatthe power consumption is stably maintained over a wide range of powerlevels P while optimizing the dynamic behavior. Analytical or empiricalmethods are applicable to specify proper parameter combinations. For
115

6 Airfoil Experiments
180 190 200 210 220 230 240 25014.9
14.95
15
15.05
15.1
P [W
]
1.736
1.7365
1.737
1.7375
1.738
1.7385
ζ[V
]
t [s]
180 190 200 210 220 230 240 2500
0.2
0.4
0.6
0.8
φ [−
]
power Phumidity φoutput ζ
Figure 6.14: Closed-loop control of actuator power during humidityvariation.
analytical approaches, the transmission behavior of the complete controlcircuit needs to be known. Derivation of a model or system identificationare time consuming and avoided because the empirical Ziegler - Nicholsmethod [120] quickly revealed suitable parameters. A differential compo-nent was not necessary and only increased overshooting in case of abruptchanges of the reference power P . Hence, a suitable PI-combination isfound in kp = 0.011895 and Ti = 0.006199 applied in all following flightmeasurements.
Flight tests were performed to evaluate the operability of the power con-troller under varying conditions. Figure 6.14 illustrates measurements whilecrossing beneath a cloud base in motorized horizontal flight. The humidityincreases significantly and the controller output is adjusted while main-taining the power constant at P = P = 25 W/m. During the gliding flow-control flights reported in the following section, no such abrupt changesof the ambient conditions occur since these are performed either above orfar from clouds. Nevertheless, the aptitude of the controller to level outdifferent target powers under varying conditions needs to be demonstrated.Figures 6.15 (a) and 6.15 (b) indicate the maintained P = 34.5 W/m andP = 69.2 W/m power levels relevant for transition control reported in thefollowing section. Despite varying ambient conditions during the gliding
116

6.3 Transition Delay in Flight
50 100 150 200 250 300 35033
34
35
36P
[W/m
]
t [s]
50 100 150 200 250 300 3501.735
1.74
1.745
1.75
1.755
1.76
ζ [V
]
power Poutput ζ
(a) P = 34.5 W/m
0 5 10 15 20 2566
69
72
P [W
/m]
t [s]
0 5 10 15 20 25
2.278
2.28
2.282
ζ [V
]
power Poutput ζ
(b) P = 69.2 W/m
Figure 6.15: Closed-loop control of actuator power at different power levels.
flight (noticeable through the slight adjustments of the controller outputζ) the power level remains almost constant for both cases with a maximumdeviation of 0.5% P .
6.3 Transition Delay in Flight
In order to correctly quantify the impact of DBD flow control on transition,a steady flight state must be maintained. Several possible error sourcesrequire consideration for flight measurements. Small angle-of-attack or slipangle variations, vibrations or acoustic excitation can alter the transitionlocation on the wing glove.
To reduce the probability of such disturbances, all measurement flightsare performed with the motor turned off in quiescent air early in the morn-ing. After climbing to an altitude of 10′000 ft the motor is turned off and thepropeller rotated to a minimum resistance position. The pilot approachesthe selected angle of attack and ensures steady conditions before the mea-surement is started. At a minimum altitude of 3′500 ft, the measurement isstopped, the motor is turned on again and the next climb can be initiated.
Any abrupt control input by the pilot excites dynamic eigenmodes of theaircraft movement. Two of the most important eigenmodes are the shortperiod mode and the phugoid. The short period mode comprises strongangle-of-attack modulations but is highly damped and does not play asignificant role. The phugoid provokes an exchange between potential andkinetic energy, leading to periodic changes of the flight speed and altitude
117

6 Airfoil Experiments
0 10 20 30 4037
38
39U
TA
S [m/s
]
t [s]
0 10 20 30 401.5
2
2.5
3
t [s]
α [°
]
Figure 6.16: Phugoid eigenmode in measurement signals.
at almost constant angle of attack. The damping rate of the phugoid modeis inversely proportional to the high lift-to-drag ratio of the glider aircraft,because of which it cannot be neglected. The period of the phugoid is in theorder of 13−14 s, both visible in Figure 6.16 measured at an angle of attackof 2.3 as well as confirmed by AVL computations. A slightly dampedoscillation of the speed is observed for a constant angle of attack. For theflight experiments this means that a low-pass filtering (below 0.1 Hz) ofthe velocity data is necessary. After abruptly changing the flight state,3 − 5 seconds are necessary before the next measurement may be initiatedto allow for sufficient damping of oscillations. Therefore, constant angles ofattack are preferred and applied during most of the measurement flights.
Alternatively, a continuous change of the angle of attack leading to aconstant acceleration or deceleration may be beneficial to quickly charac-terize the transition process. If the angle of attack is continuously changedat a rate below |α| ≤ 0.1/s, the aircraft does not experience excitation ofan eigenmode and the flight state can be considered quasi-steady. Figure6.17 (a) shows the standard deviation of a single hot-wire signal close tothe wall during acceleration (α < 0) and subsequent deceleration (α > 0).For both signals shown in the plot, low values are found at high angles ofattack, depicting laminar boundary-layer flow due to the stable pressureconditions. At sufficiently low angles of attack, the boundary layer tran-
118

6.3 Transition Delay in Flight
0 1 2 3 4 5 60
0.1
0.2
0.3
0.4
0.5
0.6
0.7
0.8
α [°]
σ U [m
/s]
accelerationdeceleration
(a) Hysteresis of hot-wire signal duringacceleration and deceleration.
0 1 2 3 4 5 60
0.1
0.2
0.3
0.4
0.5
0.6
0.7
0.8
α [°]
σ U [m
/s]
β= 0°β= 2°β=−2°
(b) Influence of the sideslip angle β.
Figure 6.17: Hotwire signal standard deviation at the surface at x/c = 0.38for variation of the angle of attack.
sitions and exhibits the intermittency peak at α = 0.4. The transitionis characterized congruently for both the acceleration and the decelerationand no hysteresis is found. It can be concluded that the flight state isquasi-steady and boundary-layer transition is not influenced by dynamiceffects.
In a similar manner, the effect of slip-angle variations on the transitionprocess is investigated. Apart from angle-of-attack variations due to thephugoid, pilot commands or wind gusts, excessive slip angles also influencetransition. For negative slip angles, the sting mounted in front of the wingglove sheds vortices onto the leading edge. The β = −2 case in Figure 6.17(b) shows intermittency at higher angles of attack as compared to the neu-tral or positive slip angle. This illustrates the promotion of transition dueto the sting interference and suggests to perform flights rather at positiveslip angles β.
6.3.1 Microphone Measurements
In the following, measurements at a constant angle of attack are describedwhile observing sensor signals at different positions. The available wall-mounted microphone array enables synchronized measurements at 8 lo-cations distributed in streamwise direction. The problems with 7 of theoriginally 15 microphones, encountered during wind tunnel operation anddescribed in Section 6.1, could not be solved before the start of the flight
119

6 Airfoil Experiments
campaign such that the data of these sensors was not post-processed. De-spite the reduced spatial resolution, the boundary-layer state can quicklybe evaluated by considering the signal spectra as in Figure 6.9. If the spec-tral amplitudes of frequencies f are visualized for each streamwise sensorposition x/c in a contour level plot, Figure 6.18 (a) is obtained. The or-dinate shows the streamwise microphone positions whereas the frequenciesare found on the abscissa. Red illustrates high amplitude levels whereas lowamplitudes are blue. For α = 0.7 and without DBD operation, laminarflow is found at streamwise locations up to approximately x/c = 0.47, indi-cated by low disturbance amplitude levels. Only a confined range of higheramplitudes exists around f = 600 − 800 Hz, which represents the amplify-ing Tollmien-Schlichting instabilities. A broadband increase of disturbancemagnitudes associated with transition to turbulence occurs downstream ofx/c = 0.47. This transition location agrees well with the wind-tunnel mi-crophone measurements, illustrated in Figure 6.4. The effect of the singleDBD actuator operated at controlled P = 66.6 W/m and correspondingT = 16.2 mN/m becomes apparent in Figure 6.18 (b). A delay of the tran-sition is indicated by further downstream occurrence of the broadband am-plitude increase around x/c = 0.5. Due to the coarse microphone spacing,a correct quantification of the transition delay is difficult, but interpolationforebodes approximately 3%. These results show the first successful DBDtransition delay performed in flight under atmospheric conditions.
A variation of the actuator thrust and power shown in Figure 6.19 enablesefficiency optimization to find the highest possible transition delay at theleast necessary power consumption. At constant experimental conditionsof α = 0.7, increasing DBD power consumption leads to a downstreampropagation of the transition line. A limit is reached at x/c = 0.5 forP = 66.6 W/m beyond which no further effect can be noticed but energyexpenditure increases. This confirms the numerically predicted saturationof the actuator effectiveness presented in Table 5.2. In addition to un-necessary energy waste, higher power consumption and associated voltageamplitudes can lead to premature deterioration of the dielectric material.Based on these results it is advantageous to continue the flow-control ex-periments at a nominal thrust of T = 16.2 mN/m and power consumptionof P = 66.6 W/m.
The low disturbance conditions in flight favor measurements without in-stallation of the obstructive hot-wire traverse. To quantify the influence ofthe traverse on the transition location, the traverse is removed and micro-phone measurements are performed. Figure 6.20 (a) indicates the transition
120

6.3 Transition Delay in Flight
(a) DBD off (b) DBD on
Figure 6.18: Spectrogram of microphone signals for α = 0.7, traversesystem installed, DBD on/off at T = 16.2 mN/m (P =66.6 W/m). Low signal amplitudes indicated in blue, highlevels in red.
evolution at the same angle of attack as for the measurements with traversefrom Figure 6.18. If only the measurements without flow control are consid-ered, the results indicate that the removal of the traverse provokes a signifi-cant downstream shift of the transition location. Without the traverse, thetransition occurs approximately 11% further downstream at x/c = 0.58for the same angle of attack. This significant difference encountered inflight could not be quantified appropriately in the initial wind-tunnel ex-periments due to the acoustically disturbed conditions which preventedsuccessful microphone measurements. At the same time, the visibility ofthe natural instability frequencies is enhanced by removal of the traverse.The reasons for this behavior are found in the disturbance spectra of the mi-crophone data visualized in Figures 6.18 and 6.19, showing distinct peaksat 300 Hz and 600 Hz if the traverse is installed. These frequencies mayoriginate from structural vibrations due to the additional traverse instal-lation or from acoustic excitation. Systematic variation of the flight speedleads to varying disturbance frequencies, such that acoustic excitation dueto flow separation on the traverse appears to be the most likely explana-tion. An estimate of the Strouhal number, based on the average thicknessof the traverse components lref = 12 mm, the flight speed UTAS = 38 m/s
121

6 Airfoil Experiments
(a) DBD off (b) P = 15.8 W/m
(c) DBD off (d) P = 58.3 W/m
(e) DBD off (f) P = 66.6 W/m
(g) DBD off (h) P = 70 W/m
Figure 6.19: Spectrogram of microphone signals, actuator power variation.
122

6.3 Transition Delay in Flight
frequency [Hz]
x/c
0 500 1000 1500 2000
0.4
0.45
0.5
0.55
0.6amplitude [V]
0.0050.00450.0040.00350.0030.00250.0020.00150.0010.00050
(a) DBD off
frequency [Hz]
x/c
0 500 1000 1500 2000
0.4
0.45
0.5
0.55
0.6amplitude [V]
0.0050.00450.0040.00350.0030.00250.0020.00150.0010.00050
(b) DBD on
Figure 6.20: Spectrogram of microphone signals without traverse, DBDon/off at T = 16 mN/m (P = 66.6 W/m) for α = 0.7,UTAS = 38 m/s.
and the frequency f = 600 Hz, yields
St = flref
UTAS= 0.189 (6.4)
which is in close agreement to the expected value St = 0.2 for bluff bodyvortex shedding. A better aerodynamic fairing of the traverse structure toreduce the acoustic influences remains to be designed in the future.
The pressure distributions in Figure 6.21 underline the experienced differ-ences due to the traverse installation. Since the outboard traverse supportis fixed at x/c = 0.71 in immediate spanwise proximity of the pressure taps,the pressure measurements are corrupted along the aft quarter of the glovepressure side. Upstream of the support position, increased pressures areobserved due to a ram effect whereas flow acceleration leads to decreasedpressures downstream.
Without the traverse installation, the microphone data shows a muchsmoother frequency distribution and no singular peaks are found, facili-tating the comparison with numerical stability analysis. Boundary-layercomputations and stability analysis of the wing glove have been discussedin Chapter 5.5. The corresponding stability diagram for α = 0.7 andUTAS = 38 m/s is illustrated in Figure 5.9. The results can be compared tothe microphone data in Figure 6.20 (a) revealing good agreement of the in-stability frequencies. The tongue-shaped instability range shows a decrease
123

6 Airfoil Experiments
0 0.1 0.2 0.3 0.4 0.5 0.6 0.7 0.8 0.9 1
!
"#$
"#%
"#&
"#'
0
0.2
0.4
0.6
0.8
1
x_c
cp
no traverse
traverse
Figure 6.21: Effect of the traverse system on the pressure distribution, α =0.7, UTAS = 38 m/s.
of the unstable frequencies for increasing streamwise positions, both in theexperiments and the numerical stability analysis.
As indicated in Figure 6.20 (b), DBD operation does not delay the tran-sition for α = 0.7 but rather accelerates it if the traverse is not installed.Although the actuator mainly imparts momentum in streamwise direction,it may also induce disturbances if operated in the stable boundary-layerregion. The receptivity mechanism by which the presence and operationof the DBD is transformed into disturbances which trigger the transitioncannot be understood from these experiments and would require furthersystematic investigation. Nevertheless, it can be seen that the instabili-ties around 800 Hz in the region between x/c = 0.35 − 0.45 are effectivelyattenuated by the DBD operation. Disturbance frequencies below 100 Hzare strongly excited, but ground measurements in the absence of fluid flowshow similar frequency peaks at low frequencies if the DBD actuator isoperated. It is therefore likely that the observed frequencies derive fromelectromagnetical coupling to the measurement equipment.
In order to successfully delay transition, the actuator position in relationto the transition location must be chosen appropriately. Since the actuatorlocation cannot be easily adjusted in the experimental setup, the transitionlocation may be shifted to obtain better results. By lowering the angle ofattack to α = 0 for flights without the traverse, the flow speed and theadverse pressure gradients are increased by 2 m/s and dcp/d(x/c) = 0.2
124

6.3 Transition Delay in Flight
frequency [Hz]
x/c
0 500 1000 1500 2000
0.4
0.45
0.5
0.55
0.6amplitude [V]
0.0050.00450.0040.00350.0030.00250.0020.00150.0010.00050
(a) DBD off
frequency [Hz]
x/c
0 500 1000 1500 2000
0.4
0.45
0.5
0.55
0.6amplitude [V]
0.0050.00450.0040.00350.0030.00250.0020.00150.0010.00050
(b) DBD on
Figure 6.22: Spectrogram of microphone signals without traverse, DBDon/off at T = 16.2 mN/m (P = 66.6 W/m) for α = 0,UTAS = 40.3 m/s
and transition moves upstream. Figure 6.22 (a) illustrates the broadbanddisturbance increase at x/c = 0.46. This transition location is comparableto the case with traverse at α = 0.7, presented in Figure 6.18 (a). Again,the removal of singular disturbances at f = 300 and 600 Hz is achieved ascompared to the case with traverse. Activating the single DBD actuator atT = 16.2 mN/m (P = 66.6 W/m) as illustrated in Figure 6.22 (b), the ob-tained transition delay to x/c = 0.49 is in the same order of magnitude asfor the case with traverse. This is surprising since the conditions are muchmore destabilizing due to higher speed and a stronger adverse pressuregradient. These adverse effects may be compensated by the lack of deter-ministic instabilities introduced by the traverse installation. After all, anexact quantification based on the microphone data is difficult due to coarsespacing of functional sensors. Failing better flush-mountable sensors fortransition detection, the traverse is re-installed to quantify the obtainabletransition delay, condoning the disturbances introduced by the installationitself.
6.3.2 Hot-Wire Measurements
As in Chapters 4.1 and 6.1.2, the transition process is identified by hot-wiremeasurements. Figure 6.23 illustrates normalized velocity profiles acquiredat four streamwise positions within the transition zone on the wing glove
125

6 Airfoil Experiments
0 0.2 0.4 0.6 0.8 10
1
2
3
4
5
U/U∞ [−]
y [m
m]
x/c=0.425x/c=0.45x/c=0.475x/c=0.5x/c=0.425, DBD onx/c=0.45, DBD onx/c=0.475, DBD onx/c=0.5, DBD on
Figure 6.23: Velocity profiles on pressure side for α = 0.56,UTAS = 38.6 m/s, DBD on/off at T = 16 mN/m(P = 66.6 W/m). Wall offset not corrected.
at α = 0.56,UTAS = 38.6 m/s. The profiles have not been corrected forthe wall-normal offset; hence the impression may arise that the no-slip con-dition is not satisfied. Solid lines indicate measurements without, dashedlines with DBD operation at T = 16.2 mN/m (P = 66.6 W/m). With in-creasing streamwise distance, the velocities measured directly at the wallincrease continuously without flow control. This indicates the increasingmomentum exchange within the wall-near region associated with tempo-ral occurrence of turbulent spots. The last velocity profile at x/c = 0.5exhibits the turbulent characteristic of a fuller velocity distribution in theproximity of the wall. For the flow-control case, the velocity profiles do notshow significant variation along the streamwise dimension. The boundary-layer thickness increases insignificantly over the illustrated 10% chord andno evidence of initiated transition is found if the DBD actuator is operated.
Despite this indication of postponed transition in the case of DBD forc-ing, the uncertainty of the data acquisition needs to be addressed. Thevariation of the normalized freestream velocity at the boundary-layer edgeby 4% indicates that the flight state cannot be maintained throughout thecomplete measurement. Data acquisition at 45 wall-normal positions foreach velocity profile plus traversing of the probe sum up to six minutesduration for one complete set of data. Two seconds of measurement timeat each probe location are necessary to reduce the effect of vibrations in-duced by the traverse movements. A necessary limitation to four profiles
126

6.3 Transition Delay in Flight
impedes a detailed analysis of the shape factor evolution. During the mea-surement, the plane descends 3′000 ft and the Reynolds number increasesby 5.9% due to increasing air density and viscosity, even if the flight veloc-ity is maintained. To ensure the comparability of results, the same flightmaneuvers are performed once without and, after climbing to the initialaltitude, again with DBD actuation. Marginal attitude variations can ei-ther be induced by the pilot, plane eigenmodes or wind gusts and are likelyto occur during long measurements. For adequate characterization of thetransition location, a quicker measurement scheme is necessary.
If only the velocity fluctuation at the wall is considered, a finer resolu-tion in streamwise direction can be combined with lower acquisition timesthrough dramatic reduction of measurement positions. As shown before,the velocity standard deviation is indicative of the transition process andenables quantification of the transition delay. Figure 6.24 displays the evo-lution of the hot wire standard deviation at the wall (y = 0 mm) along thestreamwise coordinate for two different angles of attack α = 0.6 (a) andα = 0.4 (b). The hot wire is traversed to 25 wall-positions with 5 mmspacing, enhancing the spatial resolution by a factor of 6 in comparison tothe microphone measurements. Each position is held for 10 seconds duringwhich the DBD actuator is operated for 5 seconds. Due to the alternatingoperation and deactivation of the DBD actuator, the power consumptionis not closed-loop controlled but a constant control signal ζ = 2.7 V is pro-vided to the MiniPuls 2.1. The average power consumption during themeasurements is quantified with P = 54.2 ± 0.4 W/m, such that an ap-proximate thrust of T = 13.4 mN/m is exerted on the flow. This procedureensures similar ambient conditions and comparability of the datasets.
A trend of the hot wire fluctuations can be identified for flights withoutand with DBD actuation. A least-square-fitted trend line is approximatedby a 4th-order polynomial for each case. Measurements with activated flowcontrol at α = 0.6, UTAS = 38.6 m/s, shown in Figure 6.24(a), hardly re-veal the signal peak at the downstream end of the domain. Here, only theparallel displacement of the trend line slopes ∆par can be compared, ren-dering the transition delay 2.5%. A more precise quantification is possiblefor the decreased α = 0.4, UTAS = 39 m/s in Figure 6.24(b). For boththe controlled and uncontrolled cases, the intermittency peak is observedwithin the measurement area. The displacement of the peak ∆peak and ofthe slopes both indicate a transition delay of 2%. The trend of diminishingtransition delay for lower α is consistent with the decreasing boundary-layerstability due to flow speed and pressure gradient augmentation.
127

6 Airfoil Experiments
0.44 0.46 0.48 0.50
1
2
3
4
x/c [−]
σ U [m
/s]
DBD offDBD on
∆par
(a) α = 0.6,UTAS = 38.6 m/s
0.44 0.46 0.48 0.50
1
2
3
4
x/c [−]
σ U [m
/s]
DBD offDBD on
∆par
∆peak
(b) α = 0.4,UTAS = 39 m/s
Figure 6.24: Standard deviation of the hot-wire signals at the wall(y = 0 mm) under varying flight states, DBD on/off atT = 13.4 mN/m (P = 54.2 W/m).
Since the frequency spectra of the microphone signals provide valuableinformation about the boundary-layer state during the flight measurements,a spectral analysis of the hot-wire is conducted. For each of the 25 mea-surement positions along the streamwise direction, a one-second segmentof the hot wire signal is processed with FFT. An example is shown in Fig-ure 6.25 (a) for the hot-wire position x/c = 0.47, illustrating the abilityof the actuator to reduce fluctuations inside the boundary-layer flow. Thepower spectral density without flow control (solid line) exhibits broadbandcharacteristics and is one order of magnitude higher compared to the casewith DBD actuation (dashed line). The assumption of transitional flowwithout and laminar flow with DBD actuation at this streamwise positionis in agreement with the observations from Figure 6.24 (a).
Processing of the spectral content of all 25 hot-wire signals along thestreamwise direction in the same manner as for the microphones revealsthe contour plots in Figure 6.25 (b) and (c). Strong interferences at dis-crete frequencies due to the traverse system, as detected in the microphonespectra, are not visible in the hot-wire signals. This again supports thehypothesis that the disturbances are caused by acoustic noise instead ofmechanical vibrations since the hot wire is less sensitive to acoustic forcing.The contour plots basically show the same characteristics as the standarddeviation plot in Figure 6.24 (a). The broadband increase is postponedfrom x/c = 0.465 to x/c = 0.49 due to DBD forcing, indicating a transition
128

6.3 Transition Delay in Flight
delay of about 2.5% chord length. In close agreement with all experimen-tal results, this even exceeds the predictions of 1.8% based on a numericalsolution of the flow case presented in Chapter 5.5.
Another way to quantify the transition is to maintain the probe positionconstant and vary the flow speed. During the flight experiments, this isachieved by a constant acceleration or deceleration as described earlierin this section. The results obtained can be reviewed in Figure 6.17 (a)since no difference between flights without and with DBD operation, evenat different thrust settings T ≥ 16.2 mN/m, are gauged. One plausibleexplanation is the strong influence of changing angles of attack on thepressure distribution. The strengthening of the adverse pressure gradientduring acceleration leads to a fast upstream propagation of the transitionlocation. Since the DBD actuator is only effective if the distance to thetransition line is not excessively high, the possible beneficial effects may besuppressed by the continuous advancement of the transition line.
6.3.3 Forced Transition and Stability Analysis
Microphone data and stability computations clearly reveal an amplifiedfrequency range between 600 − 800 Hz ahead of the transition line for thecases without the traverse. To preclude that these frequencies originatefrom structural vibrations and demonstrate that they initiate the natu-ral transition, controlled disturbance experiments are conducted. Defineddisturbance conditions are useful to identify which frequencies most ef-fectively initiate the transition process. By comparing the experimentalresults (dashed line) in Figure 6.26 with a computational prediction of thespatial growth rates (contour) of a clean wing, unstable frequencies areidentified.
Multiple constant acceleration glides are performed while defined fre-quencies are excited by the disturbance source at x/c = 0.18. The signaldeviation of a hot wire positioned on the surface at x/c = 0.46 is monitoredto detect the angle of attack at which transition occurs. The disturbanceamplitude is chosen carefully to influence the transition process only andnot to bypass the process of Tollmien-Schlichting wave amplification, im-mediately triggering turbulent conditions. Separate acceleration flights areperformed for excited frequencies between fexc = 400 − 1100 Hz and theangle of attack at which the peak of the standard deviation occurs is iden-tified.
The corresponding angle of attack at each excitation frequency is illus-trated with a dashed line in Figure 6.26. The frequency of fexc = 800 Hz
129

6 Airfoil Experiments
102
103
10−5
10−4
10−3
10−2
10−1
100
f [Hz]
PS
D [V
2 /Hz]
DBD offDBD on
(a) Spectrum for hot-wire signal at x/c =0.47, DBD off (solid) and on (dashed)
frequency [Hz]
x/c
[-]
500 1000 1500 2000
0.44
0.46
0.48
0.5amplitude [V]
0.10.090.080.070.060.050.040.030.020.010
(b) Spectrogram of hot-wire signals,DBD off
frequency [Hz]
x/c
[-]
500 1000 1500 2000
0.44
0.46
0.48
0.5amplitude [V]
0.10.090.080.070.060.050.040.030.020.010
(c) Spectrogram of hot-wire signals,DBD on
Figure 6.25: Spectrum of hot-wire signals at the wall (y = 0 mm) between100 and 2’000 Hz, α = 0.6, UTAS = 38.6 m/s, DBD on/off atT = 13.4 mN/m (P = 54.2 W/m).
130

6.3 Transition Delay in Flight
α [°]
f exc [H
z]
−101234200
400
600
800
1000
1200
1400
− α
i [1/m
]
0
5
10
15
20
25
30
35
Figure 6.26: Spatial growth rates (contour levels) versus transition location(dashed line) for forced disturbance conditions.
enforces the signal peak to occur under the most stable conditions at α = 2
whereas other frequencies require more unstable angles of attack to ensuretransition at this streamwise position. This indicates that the boundarylayer is most receptive to this frequency at the given location, which is inagreement with the microphone measurements presented before. The un-derlying contour levels, indicating the streamwise spatial growth rates αi,are obtained from a stability analysis of a computational study. For thispurpose, the boundary-layer profiles at x/c = 0.46 on the wing glove pres-sure side are computed with the boundary-layer code for varying angles ofattack and the growth rates are obtained from linear stability analysis. Thetongue-shaped countour levels indicate the range of the unstable frequen-cies with maximum instability at f = 600 Hz. Of interest is the symmetricdistribution around the most unstable frequency, found both in the ex-perimental and the numerical data. The numerical growth rates indicatethe disturbance amplification relevant far ahead of the actual transitionlocation. It needs to be taken into account that the experimental data rep-resents the points of maximum intermittency, indicating advanced stages oftransition. The deviation of the frequencies may be explained by the shiftof relevant instabilities during the downstream evolution which has alsobeen observed in the experimental data, e.g. Figure 6.20. The influence ofthe hot-wire traverse also needs to be taken into account which cannot berepresented in the numerical study.
131

6 Airfoil Experiments
6.4 Efficiency Estimate
The effectiveness η∗ of DBD flow control is usually expressed by the ratioof a desired fluid mechanic effect, e.g. the produced thrust [58], to theconsumed energy. In this form, it is a dimensional quantity and cannotbe compared for different kinds of flow-control applications. More conve-niently, the efficiency of active flow control can be defined by relating thenet power savings to the invested energy per time. Moreau et al. [73] es-timate the power savings of boundary-layer flow control by integration ofthe momentum flux across a control volume. The change of the momen-tum distribution due to DBD operation is experimentally measured with apitot-tube and transformed into fluidic power by applying the conservationequation of kinetic energy.
In steady flight, the necessary propulsion power counterweights the air-craft resistance, which is to a large portion constituted by the wing drag.If the wing profile drag D can be reduced, the fluidic power consumption
Pp = DU∞ (6.5)
is diminished. The drag coefficient cD is necessary to calculate the profiledrag
D = cD
ρ
2lref U
2∞
(6.6)
where the reference length lref = 2.73 m is the circumferential arc lengthof the wing glove. The drag coefficient cD is composed of a pressure dragcomponent, cD,p, and a friction drag component, cD,f . The friction dragcoefficient accounts for the viscous interaction of the flow with the surfacewithin the boundary-layer. To calculate the friction drag coefficient cD,f
of an airfoil, the local skin friction coefficient cf is integrated along the arclength s
cD,f =
∫
cf ds. (6.7)
Computational fluid dynamics enables flow simulations deducing all flowquantities of interest. Simple panel methods are sufficient to deliver thelift and drag of airfoils at specified flow conditions. Here, Xfoil is employedto simulate the flight conditions on the wing glove at UTAS = 38 m/s andα = 0.7. The drag coefficients are derived from two simulations withfixed transition on the pressure side, conservatively representing either thenatural transition conditions (xtrans/c = 0.47) or the transition locationunder DBD influence (xtrans/c = 0.5), see Figure 6.18. For the density,
132

6.4 Efficiency Estimate
0 0.2 0.4 0.6 0.8 10
0.002
0.004
0.006
0.008
0.01
x/c [−]
c f [−]
DBD offDBD on
Figure 6.27: Friction coefficient along the glove pressure side derived fromXfoil for forced transition locations xtrans/c = 0.47 (DBD off,circles) and xtrans/c = 0.5 (DBD on, squares).
standard conditions (ρ = 1.225 kg/m3) are assumed. Figure 6.27 illustratesthe local skin friction coefficient cf along the pressure side of the glovewith and without flow control. Illustrative, the difference between the areaunder the particular curves clarifies the integral effect of 3% transitiondelay. The drag coefficient cD for the two cases is summarized in Table 6.2.In both simulated Xfoil cases, the pressure drag component is equal suchthat the drag coefficient reduction is caused only by the friction component,∆cD = ∆cD,f = 0.00008. If these values are processed with equations (6.5)and (6.6), a reduction of the necessary propulsion power by ∆Pp = 3.6 W/m
Solver xtrans/c cD
Xfoil 0.47 0.00539Xfoil 0.5 0.00531FLUENT 0.52 0.0048EDGE 0.55 0.00854EDGE 0.58 0.00841
Table 6.2: Comparison of drag coefficients from different numerical solvers.Transition is either triggered or computed at the indicated posi-tions on the wing glove pressure side.
133

6 Airfoil Experiments
is computed. The flow-control efficiency can hence be defined by the ratioof the saved propulsion power ∆Pp to the actuator power consumption P .
η =∆Pp
P(6.8)
The power consumed in the flight experiments is closed-loop controlled atP = 66.6 W/m, yielding an efficiency of η = 5.4%. In the current setting, nonet gain is achieved since the power consumption significantly exceeds thepower savings which is a typical result encountered in active flow-controlexperiments. The calculations do not include the electrical efficiency ηe
defined by Kriegseis [58] as the ratio of power supplied to the high voltagegenerator Pinput and the power P consumed for the force generation. Thisefficiency is maximized around 60% if the DBD actuator is operated atthe resonance frequency. Additionally, the simplified evaluation based onXfoil computations does not account for a local skin-friction increase at theactuator location due to the flow acceleration reported by Quadros [83]. Forthese reasons, the resulting power savings may be slightly overrated.
Nevertheless, positive effects are also disregarded. The propulsion thrustcreated by the actuator in flow direction could be utilized by a movingobject but cannot be considered in this simplification. The drag coefficientfrom Xfoil is compared to other CFD solvers and yields an intermediatevalue between FLUENT and EDGE computations, included in Table 6.2.The more sophisticated EDGE computations by A. Hanifi on unstructuredgrids predict higher drag savings based on a variation of the transitionlocation, such that the total efficiency may be even higher than evaluatedby Xfoil. Flight experiments by Weismüller [114] using the same wing glovegeometry show that Xfoil underestimates the absolute drag in comparisonto measurements with a wake rake, as illustrated in Figure 6.28. For therelevant lift coefficient of cL = 0.6 for flights at α = 0, the total drag isundervalued by a factor of approximately 0.75.
6.5 Conclusions
Initial wind-tunnel measurements on the pressure side of a NLF wing gloveindicate the possibility to delay natural transition occurring at moderateangles of attack α = 0.7 and flight speeds UTAS = 38 m/s. The obtaineddelay of 3% chord is quantified by hot-wire measurements of the boundary-layer shape factor as well as characteristic velocity fluctuations at the wall.
134

6.5 Conclusions
0 0.01 0.02 0.030
0.2
0.4
0.6
0.8
1
1.2
1.4
1.6
xfoil
wind tunnel
flight test
cl[−
]
cd [−]
Figure 6.28: Lift-drag polar of the wing glove airfoil from wind tunnel andflight measurements by Weismüller [114] compared to Xfoil
computations.
Microphone data does not provide valuable insights due to highly disturbedacoustic conditions in the wind-tunnel test section.
A qualitative evaluation of ambient condition changes on the performanceof DBD actuators is performed at the beginning of the flight measurementcampaign. A significant influence of air humidity and pressure is recog-nized, although a thorough quantification of the sensitivity towards eachfactor is impossible due to mutual coupling of the various effects. Neverthe-less, a closed-loop controller successfully counterbalances these influences.The stabilized control authority thereby enables the first genuine flight ap-plication of DBD actuators under non-laboratory conditions.
First flow-control flights show the influence of dynamic aircraft eigen-modes and slip angle variations on the transition location, requiring steadyand undisturbed flight conditions during the glides. To reduce the influenceof variable flow conditions, the measurement time needs to be as short aspossible, limiting the possible measurement approaches with the hot-wiretraverse. The traverse itself has a significant impact on the transitionprocess, promoting the intermittency peak to occur 11% upstream of theundisturbed location.
Nevertheless, the DBD actuator successfully delays the transition by 3%chord both with traverse installed as well as under the more unstable con-ditions of lower α without the traverse. The magnitude of the obtainabletransition delay in the wind-tunnel experiments and in flight coincide pleas-
135

6 Airfoil Experiments
ingly well, even though the absolute transition locations for the same flowconditions do not agree perfectly. This is explained by the high-disturbanceacoustics inside the wind tunnel which also inhibit the detection of naturalinstability frequencies.
These frequencies between 600 and 800 Hz are observed from microphonemeasurements in flight, showing good agreement with linear stability com-putations. A decrease of the primary instability frequency with increas-ing chordwise position is observed both in the experiments as well as inthe numerical investigations. These disturbance frequencies are effectivelyattenuated by the DBD operation, leading to the macroscopic transitiondelay. The relevance of this frequency range for the transition process isscrutinized by controlled disturbance experiments. Artificial excitation ofinstabilities confirms the major sensitivity of the transition process to fre-quencies around 800 Hz.
A rough estimate for the efficiency of the flow control is attempted basedon Xfoil computations. The measurable transition delay decreases the dragand the necessary propulsion power by 1.9%. Related to the energy con-sumption of the DBD operation, a net efficiency of η = 5.4% is achievedat U∞ = 38 m/s flight speed. Considering the novelty of the presentedexperiments and their preliminary nature, the calculated efficiency is closeto a revelation.
The importance of these first flight experiments for the maturity of DBDflow control cannot be underrated. A thorough discussion of all observa-tions, the lessons learnt and comprehensive conclusions are presented inthe following.
136

7 Discussion
The present work significantly improves the knowledge on transition delaycapabilities of dielectric barrier discharge plasma actuators. A combina-tion of experimental and numerical investigations is used to clarify theeffect of electro-hydrodynamic flow control on the stability properties oflaminar boundary-layer flow. The question how and under which condi-tions DBD forcing leads to a measurable transition delay is addressed bywind-tunnel and flight measurements. The possibility to delay naturallyoccurring, Tollmien-Schlichting wave dominated transition under elevatedflow velocities and Reynolds numbers is successfully explored. Validationof a newly developed numerical solver with the experimental data yieldsrespectable results, qualifying the numerical procedure for the design offlow-control experiments. Finally, the application of DBD actuators on amotorized glider results in the first successful flow-control application ofDBD actuators under elevated Reynolds numbers as well as atmosphericflight conditions, lifting the maturity of DBD flow control far beyond thestatus of academic laboratory research.
Several key questions concerning DBD flow-control experiments had beenstated in Chapter 1.3 and have been addressed in the current study. In thefollowing sections, these questions are recapitulated and comprehensivelydiscussed considering the insights gained in the single chapters. Startingwith a summary of the observations, the main discoveries and key messagesas well as shortcomings are discussed, paving the way for a prospectiveoutlook from a remote perspective.
7.1 DBD Effect on Stability
The experimental and numerical data obtained throughout the project en-hance the understanding of the stabilizing impact of DBD actuation onlaminar boundary-layer flow. Application of a linear stability solver to nu-merical and experimental boundary-layer data under the influence of DBDactuation yields increased critical Reynolds numbers and decreased am-plification rates for a broad frequency range of modal disturbances. Thebroadband disturbance attenuation explains the suitability of continuous
137

7 Discussion
DBD operation for the control of naturally occurring transition. The find-ings agree well with published observations of pulsed DBD actuation inlarge eddy simulations [24] due to the modification of the average velocityprofiles. In contrast to the stability analysis of generic combinations ofboundary-layer profiles with wall-jets investigated by Riherd and Roy [86],the present work employs an adequate numerical procedure for the approx-imation of the Navier-Stokes equations. The solutions from the boundary-layer solver with implemented body-force model enable an analysis of thestability properties. The overall reproducibility of modal disturbance evolu-tions by the stability method proves the relevance of the stabilizing actuatoreffect for the transition process. Speculations on instability deformationsby flow confinement and wall-normal velocity components can be discardedsince the modal instability attenuation is sufficient to explain the macro-scopic transition delay.
For the first time DBD flow-control data has been analyzed within thePSE framework, accounting for slightly non-parallel flow features. Thecomparison of linear stability theory and the PSE computations on valida-tory DNS data from Vieira et al. [111] reveals a better match of PSE inthe vicinity of the actuator. This underlines the importance of incorpo-rating non-parallel effects induced by the localized flow manipulation intostability considerations. Surprisingly, the downstream evolution of modaldisturbances is better quantified by the linear stability theory. Althoughthe exact reasons for this behavior remain unknown from the attainabledata, the availability of both procedures enables comparative investigationson additional computational setups. The initiated cooperation with KTHand their world-renown excellence in stability research will be helpful tofurther enhance the predictability of the Tollmien-Schlichting wave ampli-tude evolution under the influence of DBD actuation. Possibly a couplingof the different procedures or more sophisticated stability considerationswill lead to satisfactory results, enabling convenient and reliable transitionprediction for DBD flow-control applications.
Stability analysis of experimental boundary-layer profiles with high wall-normal resolution from optical measurements show an increase of the crit-ical Reynolds number due to actuator operation. The increasing criticalReynolds numbers for increasing actuator thrust agree with observationsfrom transition measurements, although a direct quantitative comparisonis hindered unless the high resolution is extended to the streamwise dimen-sion. Phase-locked particle image velocimetry reveals the quantitative evo-lution of artificially generated, single frequency Tollmien-Schlichting waves
138

7.2 Optimization and Flow Control Design
approximately 4.5 wavelengths along the streamwise direction. Instead oftripled velocity fluctuation magnitudes observed without flow control, DBDactuation reduces the growth over the investigated domain to a factor of2. More enlightening is the change of the propagation speed of the distur-bances due to the flow-control application. The gradual acceleration alongthe surface can only be explained by altered stability properties and notby localized acceleration of the flow and the contained disturbance.
The shape factor as an integral boundary-layer quantity may not be di-rectly used as a measure of flow stability in the proximity of flow-controldevices. Albrecht et al. [2] shows that a monotonic dependence betweenthe shape factor and the critical Reynolds number as described by Wazzanet al. [112] cannot be derived for electromagnetically forced flow. Neverthe-less, the present results evince a shape factor decrease by DBD operationcoupled to enhanced flow stability in laminar boundary layers. Both the ex-perimental as well as the numerical data indicate decreasing shape factorswhich correlate with the obtained transition delay and decreased growthrates.
7.2 Optimization and Flow Control Design
In addition to the stability implications of DBD forcing, several parametri-cal studies increase the knowledge about relevant parameters related to thedesign of DBD flow-control applications. For a variation of the actuatorthrust and position, an impact quantification based on transition mea-surements and boundary-layer computations is provided. The numericalprocedure combines a finite-difference solution of the laminar boundary-layer equations with a DBD force field model and linear stability analysis,enabling transition prediction based on empirical laws. The validation ofthis numerical method with generic wind-tunnel experiments yields goodagreement. The consistent data renders the introduced numerical methoda valuable tool kit for flow-control design and transition prediction underthe influence of DBD actuation.
Transition measurements on a flat plate and systematic variation of theactuator position suggest a strong impact of adequate device allocation.Dependent on the position within the flow, a DBD actuator exhibits acertain effectiveness for boundary-layer stabilization and resulting transi-tion delay. The spatial extent of the DBD force field in relation to theboundary-layer thickness is of importance for enhanced control authority.
139

7 Discussion
Experiments indicate that actuator positions far downstream are benefi-cial, but no optimum location can be determined. The maximum down-stream positioning is limited by the natural transition location since DBDtransition control is ineffective in already turbulent flow. Preliminary sen-sitivity calculations based on an adjoint formulation of the governing equa-tions indicate that the local stability properties of the boundary layer re-quire additional consideration. Numerical studies with the finite-differencesboundary-layer solver and the linear stability code reproduce the generaltrend of the position sensitivity but lack a correct quantitative estimate forthe effect on transition. A thorough revision of numerical possibilities toaccount for this influence is recommended. Further sensitivity calculationsin cooperation with A. Hanifi from KTH Stockholm will lead to a betterunderstanding of optimized actuator positioning and will help to validatethe newly developed numerical codes.
In terms of thrust optimization for transition delay on a flat plate, thepresent results do not yield an optimum at elevated magnitudes as reportedby Grundmann [43]. Unlike in the cited experiments, excessive distortionof the boundary-layer profile leading to a positive profile curvature anddestabilizing effects is not found in the present work due to operation inhigher freestream velocity surroundings. With increasing flow speed, higherenergy expenditure is required to maintain the effectiveness of the flow ma-nipulation. In the present work, the dielectric material limits the electricpotential difference such that the optimal forcing conditions cannot be ex-perimentally investigated.
7.3 In-Flight Application
Based on the numerical design tools developed in the course of this project,an experiment for the application of DBD transition control in flight hasbeen developed. Initial wind-tunnel measurements and following flight testson the G109b motorized glider demonstrate the possibility to delay natu-rally occurring transition by means of steadily operated DBD actuatorsunder varying ambient conditions.
The atmospheric conditions and their influence on the DBD power con-sumption have been thoroughly analyzed, identifying the pressure and thehumidity to provoke the largest detrimental effects. Flight measurementsmonitoring these quantities and the power consumed by DBD operationhave paved the way for a successful implementation of a closed-loop per-formance controller. Based on the assumption of constant correlation be-
140

7.3 In-Flight Application
tween actuator power consumption and integral thrust, the stabilization ofthe power under varying ambient conditions enables constant flow-controlauthority during measurement flights.
Although the presented effort is not the very first airborne DBD appli-cation, compare [98], it is the first and only one to show a desirable flow-control effect under realistic flight conditions. The respectable transitiondelay of 3% chord length during the first non-optimized flights coincideswith initial wind-tunnel measurements and exceeds the numerically pre-dicted effect. The flight experiments indicate a saturation of the controleffectiveness despite increasing thrust magnitude, such that an efficiencyconsideration between the energy expense and savings is necessary. A con-servative calculation of the net drag reduction by approximately 1.9% re-sults in a computed power efficiency of η = 5.4%. Comparing this value tothe flow control efficiency of DBD actuators (defined as the ratio betweenkinetic energy transferred into the fluid and the energy expenditure) whichreaches maxima of 0.1% [58] in quiescent air, the found power savings in-dicate the high leverage effect of DBD application for transition controlpurposes.
141

7 Discussion
142

8 Outlook
This thesis answers highly relevant questions related to the physical mech-anisms of DBD transition delay, control effectiveness optimization and theapplicability under non-laboratory conditions for higher Reynolds numberflows. From a remote perspective, the state-of-the-art of DBD transitioncontrol was significantly improved over the course of the project. Motivatedby low Reynolds number flat plate experiments with artificial disturbanceexcitation and little knowledge about the reasons for successful transitiondelay, the project results have contributed significantly in the maturityprocess of DBD transition control. Extensive parametrical studies have in-creased the knowledge on the stabilizing impact, leading to the developmentof numerical optimization tools for flow control. The successful proof-of-concept of in-flight transition delay defies natural transition mechanisms,high Reynolds numbers and varying atmospheric conditions. Future in-vestigations may aim at optimizing the transition control effectiveness orat increased efficiency for a net benefit. Both procedures are viable andcomplementarily connectable. Although many new insights into the topicof DBD transition control have been obtained, the results give rise to awhole set of new questions and interesting outlooks for future investiga-tions. It is the sincere hope of the author that further improvements ofthe experimental and numerical arrangements may lead to increased DBDflow-control effectiveness and eventually a positive net efficiency.
Fine-resolved boundary-layer profiles in both the wall-normal and stream-wise direction should be obtained by laser-optical wind-tunnel measure-ments in the proximity of different DBD configurations. Such data can beanalyzed with the available stability tools to provide a thorough experi-mental quantification of the stabilizing impact. As an additional benefit,it enables the force field distribution and the integral thrust to be com-puted. Varying the flow speed and the flow humidity, detrimental effectsof changing ambient conditions on the thrust can directly be quantified.Simultaneous power measurements or closed-loop control of this quantityis expected to confirm the equivalence of power consumption and forcemagnitude, which is a basic assumption of the presented work.
Shortcomings of the flight instrumentation, leading to imprecise tran-
143

8 Outlook
sition detection, have been identified within this thesis. These problemscan be overcome by replacing microphones with flush-mounted hot-filmsensors connected to a newly acquired multi-channel constant-temperatureanemometer. To facilitate the comparison to the numerical data, wisely dis-tributed hot-film sensor arrays may provide experimental instability growthrates, additionally mitigating the problems associated with the traverse in-stallation. Aerodynamic improvements of the prototype hot-wire traversewill reduce the impact on the pressure field and transition along the wingglove, yielding advanced flight measurement data in the future. Additionalimprovements of the aircraft are under way, an inertial navigation unitas well as acceleration measurements on the fuselage and the wings willenhance the maintainability and detection of steady flight states. Neatlycomplementing the research on the influence of atmospheric turbulence onthe transition process on the wing glove, a compensation of premature tran-sition tripping due to high ambient turbulence is deemed possible by meansof DBD flow control.
Sophisticated computations of the full wing glove airfoil with DBD imple-mentation and adequate representation of turbulence is desired to correctlysimulate the stabilizing effect and obtain a realistic estimate for the tran-sition process. Such an extensive study provides a quantification of theundesired friction increase close to the actuator which has been neglectedin the efficiency estimate. Additionally, it delivers a complete overview ofthe flow-control effect on the flow circulation, including lift and momentcoefficients of the the airfoil. A more exact estimation of the airfoil drag,agreeing with experimentally measured values, would additionally increasethe credibility of efficiency calculations. Direct numerical simulations re-veal all relevant data and additional features of the transition mechanism,including non-linear instability effects. Such a study has been started incooperation with D. Henningson at KTH Stockholm and is expected toenhance the overall effectiveness of various flow-control approaches on thelaminar wing glove.
Although a net energy gain is not yet observed in flight application,the two-digit percentage range of the efficiency during a proof-of-conceptrenders future enhancements credible, e.g. by ceramic dielectric materials.These do not only increase the actuator durability but also enhance theelectrical efficiency of the power cycle if the dielectric thickness can beminimized. Transition and separation control on the suction side of thewing glove may lead to a reduction of the friction and pressure drag on thewhole airfoil.
144

Finally, the use of actuator arrays staggered in streamwise direction onthe wing glove is suggested for an enhancement of the transition delay ef-fectiveness. Multiple actuators and adapted power at each position willreveal further optimization chances even at non-design flight states. Com-bining the stabilizing effect of DBD actuation with selective cancelationof Tollmien-Schlichting waves has proven outstandingly valuable in wind-tunnel measurements, and needs to be verified in flight. Although addi-tional sensors and sophisticated closed-loop control algorithms are neces-sary, the effort may eventually lead to a net benefit exceeding the powerinput, and further enhance the maturity of DBD flow control.
145

8 Outlook
146

Bibliography
[1] T. Abe, Y. Takizawa, and S. Sato. Experimental study for momentumtransfer in a dielectric barrier discharge plasma actuator. AIAA J.,46(9):2248–2256, 2008.
[2] T. Albrecht, R. Grundmann, G. Mutschke, and G. Gerbeth. On thestability of the boundary layer subject to a wall-parallel Lorentz force.Phys. Fluids, 18(9):098103–+, Sept. 2006.
[3] B. T. Anderson, R. R. Meyer, and H. R. Chiles. Techniques usedin the F-14 variable-sweep transition flight experiment. Technicalreport, NASA Dryden Flight Research Center, July 1988. Presentedat 4th AIAA Flight Test Conference, San Diego, Calif., 1988.
[4] R. Anderson and S. Roy. Preliminary experiments of barrier dischargeplasma actuators using dry and humid air. In 44th AIAA AerospaceSciences Meeting and Exhibit, Reno, Nevada, USA, 2006. AIAA 2006-0369.
[5] D. Arnal. Transition, Turbulence and Combustion Modelling, vol-ume 6 of ERCOFTAC Series. Kluwer Academic Publishers, Dor-drecht, Netherlands, 1999. ISBN 978-0-7923-5989-5.
[6] D. Arnal and J. Archambaud. Laminar-turbulent transition con-trol: NLF, LFC, HLFC. In AVT-151 RTO AVT/VKI Lecture Se-ries, Rhode St. Genèse, Belgium (RTO-EN-AVT-151-15), pages 9–13, 2008. ISBN 978-92-837-0900-6.
[7] D. Arnal, D. Casalis, and R. Houdeville. Practical transition pre-diction methods: Subsonic and transonic flows. In AVT-151 RTOAVT/VKI Lecture Series, Rhode St. Genèse, Belgium (RTO-EN-AVT-151-08), 2008. ISBN 978-92-837-0900-6.
[8] N. Bénard and E. Moreau. Effects of altitude on the electromechanicalcharacteristics of a single dielectric barrier discharge plasma actuator.In 41st Plasmadynamics and Lasers Conference, Chicago, Illinois,USA, Jun. 2010. AIAA 2010-4633.
147

Bibliography
[9] N. Bénard, N. Balcon, and E. Moreau. Electric wind produced by asingle dielectric barrier discharge actuator operating in atmosphericflight conditions - pressure outcome. In 39th Plasmadynamics andLasers Conference, Seattle, Washington, USA, 2008. AIAA 2008-3792.
[10] N. Bénard, N. Balcon, and E. Moreau. Electric wind produced by asurface dielectric barrier discharge operating in air at different pres-sures: aeronautical control insights. J. Phys. D: Appl. Phys., 41(4):042002 (5pp), Feb 2008.
[11] N. Bénard, N. Balcon, and E. Moreau. Electric wind produced by asurface dielectric barrier discharge operating over a wide range of rel-ative humidity. In 47th AIAA Aerospace Sciences Meeting, Orlando,Florida, USA, 2009. AIAA 2009-488.
[12] N. Bénard, E. Moreau, J. Griffin, and L. Cattafesta. Slope seekingfor autonomous lift improvement by plasma surface discharge. Exp.Fluids, 48(5):791–808, 2009.
[13] F. P. Bertolotti. Effect of atmospheric turbulence on a laminar bound-ary layer. In XXVI OSTIV Congress, Bayreuth, Germany, 1999.
[14] J. P. Boeuf, Y. Lagmich, T. Unfer, T. Callegari, and L. C. Pitchford.Electrohydrodynamic force in dielectric barrier discharge plasma ac-tuators. J. Phys. D: Appl. Phys., 40:652–662, Feb. 2007.
[15] A. Bousbia, C. Choucair, D. Freudenhammer, and M. Zimmer.Umgestaltung des Niedergeschwindigkeits-Windkanals (NWK2) derTU Darmstadt. Advanced Design Project, TU Darmstadt, 2011.
[16] L. Brandt, D. Sipp, J. O. Pralits, and O. Marquet. Effect of base-flowvariation in noise amplifiers: the flat-plate boundary layer. J. FluidMech., 687:503–528, 2011.
[17] L. N. Cattafesta and M. Sheplak. Actuators for active flow control.Annu. Rev. Fluid Mech., 43:247–272, 2011.
[18] T. Cebeci. An engineering approach to the calculation of aerodynamicflows. Horizons, Long Beach, California, 1999. ISBN 0966846125.
[19] T. Cebeci and J. Cousteix. Modeling and Computation of Boundary-Layer Flows. Springer, Berlin, Germany, 2nd edition, 2005. SIBN354024459X.
148

Bibliography
[20] B. J. Chartier, M. Arjomandi, and C. B. S. An investigation on theapplication of dbd plasma actuators as pressure sensors. In 47thAIAA Aerospace Sciences Meeting, Orlando, Florida, USA, 2009.AIAA 2009-651.
[21] T. C. Corke, M. L. Post, and D. M. Orlov. Single dielectric barrierdischarge plasma enhanced aerodynamics: Physics, modeling and ap-plications. Exp. Fluids, 46:1–26, 2009.
[22] A. Drake and R. A. Kennelly. Selected experiments in laminar flow:An annotated bibliography. Technical report, NASA Ames ResearchCenter, Dec. 1992.
[23] A. Duchmann, J. Kriegseis, S. Grundmann, and C. Tropea. Cus-tomizing DBD actuators for flow-control applications using PIV. In8th International Symposium on Particle Image Velocimetry, Mel-bourne, Australia, August 2009.
[24] A. Duchmann, A. Reeh, R. Quadros, J. Kriegseis, and C. Tropea.Linear stability analysis for manipulated boundary-layer flows usingplasma actuators. In G. M. L. Gladwell, R. Moreau, P. Schlatter, andD. S. Henningson, editors, Seventh IUTAM Symposium on Laminar-Turbulent Transition, volume 18 of IUTAM Bookseries, pages 153–158. Springer Netherlands, 2010. ISBN 978-90-481-3723-7.
[25] A. Duchmann, D. Vieira, S. Grundmann, M. Schäfer, and C. Tro-pea. Linear stability analysis of direct numerical simulations ofa boundary-layer flow controlled by plasma actuators. In 2nd In-ternational Conference on Computational Engineering, October 4-6,Darmstadt, October 2011.
[26] A. Duchmann, A. Kurz, A. Widmann, S. Grundmann, and C. Tro-pea. Characterization of Tollmien-Schlichting wave damping by DBDplasma actuators using phase-locked PIV. In 50th AIAA AerospaceSciences Meeting, Nashville, Tennessee, USA, 2012. AIAA 2012-903.
[27] A. Duchmann, D. Vieira, S. Grundmann, and C. Tropea. Stabiliza-tion of laminar boundary-layer flow using dielectric barrier discharges.In 83rd Annual Meeting of the International Association of AppliedMathematics and Mechanics, March 26 -30, Darmstadt, Germany,2012.
149

Bibliography
[28] A. Duchmann, D. Vieira, S. Grundmann, and C. Tropea. Stabiliza-tion of laminar boundary-layer flow using dielectric barrier discharges.In Proc. Appl. Math. Mech., volume 11. Wiley, December 2012.
[29] C. L. Enloe, M. G. McHarg, G. I. Font, and T. E. McLaughlin.Plasma-induced force and self-induced drag in the dielectric barrierdischarge aerodynamic plasma actuator. In 47th AIAA AerospaceSciences Meeting, Orlando, Florida, USA, 2009. AIAA 2009-1622.
[30] P. Erb. Untersuchung der Grenzschichttransition im Flugversuch.PhD thesis, TU Darmstadt, 2002.
[31] A. Filippone. Data and performances of selected aircraft and rotor-craft. Prog. Aeronaut. Sci., 36(8):629–654, 2000. ISSN 03760421.
[32] D. Fisher, K. H. Horstmann, and H. Riedel, editors. Flight Test Mea-surement Techniques for Laminar Flow, volume 23, October 2003.NATO RTO-AG-300-V23. ISBN 92-837-1107-6.
[33] R. Fjørtoft. Application of integral theorems in deriving criteria ofstability for laminar flows and for the baroclinic circular vortex. Ge-ofys. Publ., Oslo, 17(6):1–52, 1950.
[34] M. Forte, J. Jolibois, J. Pons, E. Moreau, G. Touchard, and M. Caza-lens. Optimization of a dielectric barrier discharge actuator by sta-tionary and non-stationary measurements of the induced flow veloc-ity: Application to airflow control. Exp. Fluids, 43:917–928, 2007.
[35] J. H. M. Fransson. Investigations of the asymptotic suction boundarylayer. Technical report, TRITA-MEK Tech. Rep. 2001:11. LicentiateThesis, KTH, Stockholm., 2001.
[36] J. H. M. Fransson and P. H. Alfredsson. On the disturbance growthin an asymptotic suction boundary layer. J. Fluid Mech., 482:51–90,2003.
[37] J. H. M. Fransson, A. Talamelli, L. Brandt, and C. Cossu. Delayingtransition to turbulence by a passive mechanism. Phys. Rev. Lett.,96(6):064501, Feb. 2006.
[38] M. Fujino, Y. Yoshizaki, and Y. Kawamura. Natural-laminar-flowairfoil development for a lightweight business jet. Journal of Aircraft,40(4):609–615, 2003.
150

Bibliography
[39] M. Gad-el-Hak. Flow control: passive, active, and reactive flow man-agement. Cambridge University Press, Cambridge, UK, 2000. ISBN0521770068.
[40] B. Gibson, M. Arjomandi, and R. M. Kelso. The response of a flatplate boundary layer to an orthogonally arranged dielectric barrierdischarge actuator. J. Phys. D: Appl. Phys., 45:025202, 2012.
[41] M. B. Glauert. The wall jet. J. Fluid Mech., 1(06):625–643, 1956.
[42] J. W. Gregory, C. L. Enloe, G. I. Font, and T. E. McLaughlin. Forceproduction mechanisms of a dielectric-barrier discharge plasma actu-ator. In 45th AIAA Aerospace Sciences Meeting and Exhibit, Reno,Nevada, USA, 2007. AIAA 2007-185.
[43] S. Grundmann. Transition Control using Dielectric Barrier DischargeActuators. PhD thesis, Technische Universität Darmstadt, 2008.
[44] S. Grundmann and C. Tropea. Experimental transition delay usingglow-discharge plasma actuators. Exp. Fluids, 42(4):653–657, April2007.
[45] S. Grundmann and C. Tropea. Active cancellation of artificially in-troduced Tollmien-Schlichting waves using plasma actuators. Exp.Fluids, 44:795–806, 2007.
[46] S. Grundmann and C. Tropea. Delay of boundary-layer transitionusing plasma actuators. In 46th AIAA Aerospace Science Meetingand Exhibit; Reno, Nevada, USA, 2008. AIAA 2008-1369.
[47] S. Grundmann and C. Tropea. Experimental damping of boundary-layer oscillations using DBD plasma actuators. Int. J. Heat FluidFlow, 30:394–402, 2009.
[48] M. Högberg and D. S. Henningson. Linear optimal control applied toinstabilities in spatially developing boundary layers. J. Fluid Mech.,470:151–179, 2002.
[49] K.-H. Horstmann and S. J. Miley. Data report of flight and wind-tunnel investigations of Tollmien-Schlichting waves on an aircraftwing. In DLR Institutsbericht IB 129-91/18, 1991.
[50] International Organization for Standardization, Geneva, Switzerland.ISO 2533:1975 standard atmosphere, 1975.
151

Bibliography
[51] J. Jacob, R. Rivir, C. Carter, and J. Estevadeordal. Boundary layerflow control using ac discharge plasma actuators. In AIAA 2nd FlowControl Meeting, Portland, Oregon, 2004. AIAA 2004 - 2128.
[52] J. D. Jacob and K. Ramakumar. Control of laminar and turbulentshear flows using plasma actuators. In 4th International Symposiumon Turbulence and Shear Flow Phenomena, Williamsburg, VA, 2005.
[53] R. D. Joslin. Aircraft laminar flow control. Annu. Rev. Fluid Mech.,30:1–29, Jan. 1998. ISSN 0066-4189, 1545-4479.
[54] T. N. Jukes and K.-S. Choi. Control of unsteady flow separation overa circular cylinder using dielectric-barrier-discharge surface plasma.Phys. Fluids, 21(9):094106, 2009.
[55] U. Kogelschatz. Dielectric-barrier discharges: Their history, dischargephysics, and industrial applications. Plasma Chem. Plasma Process.,23:1–46, 2003. ISSN 0272-4324.
[56] M. Köhler. Development and implementation of a method for solvingthe laminar boundary layer equations in airfoil flows. Master thesis,TU Darmstadt, August 2011. URN: urn:nbn:de:tuda-tuprints-31734.
[57] Korff + Co. KG. Flughandbuch Grob G109b, Triebwerk: LimbachL2400DT1, 1st edition, March 2002.
[58] J. Kriegseis. Performance Characterization and Quantification of Di-electric Barrier Discharge Plasma Actuators. PhD thesis, TU Darm-stadt, December 2011.
[59] J. Kriegseis, S. Grundmann, and C. Tropea. Power consumption,discharge capacitance and light emission as measures for thrust pro-duction of dielectric barrier discharge plasma actuators. J. Appl.Phys., 110(1):013305, 2011.
[60] J. Kriegseis, B. Möller, S. Grundmann, and C. Tropea. Capacitanceand power consumption quantification of dielectric barrier discharge(DBD) plasma actuators. J. Electrost., 69(4):302 – 312, 2011. ISSN0304-3886.
[61] J. Kriegseis, A. Kurz, A. Duchmann, S. Grundmann, and C. Tropea.Influence of air flow on the performance of DBD plasma actuators. In50th AIAA Aerospace Sciences Meeting, Nashville, Tennessee, USA,2012. AIAA 2012-406.
152

Bibliography
[62] J. Kriegseis, C. Schwarz, A. Duchmann, S. Grundmann, and C. Tro-pea. PIV-based estimation of DBD plasma-actuator force terms. In50th AIAA Aerospace Sciences Meeting, Nashville, Tennessee, USA,2012. AIAA 2012-411.
[63] K. Lackhove. Numerische Untersuchung der Ablösekontrolle mitDBD-Plasmaaktuatoren bei einem UAV. Bachelor thesis, TU Darm-stadt, April 2011.
[64] G. Lemonis and T. Dracos. A new calibration and data reductionmethod for turbulence measurement by multihotwire probes. Exp.Fluids, 18(5):319–328, 1995. ISSN 0723-4864.
[65] A. V. Likhanskii, M. N. Shneider, S. O. Macheret, and R. B. Miles.Modeling of dielectric barrier discharge plasma actuators driven byrepetitive nanosecond pulses. Phys. Plasmas, 14(7):073501, 2007.ISSN 1070-664X.
[66] H. Lüdeke, V. Wartemann, and A. Seitz. Direct numerical simulationof Tollmien-Schlichting waves to support linear stability analysis. In17. DGLR-Fach-Symposium der STAB, Berlin, Nov. 2010.
[67] Luftfahrtbundesamt. Gerätekennblatt Nr. 817, Muster: Grob G109,11th edition, August 1995.
[68] L. M. Mack. Transition prediction and linear stability theory. Tech-nical Report CP-224, AGARD Laminar-Turbulent Transition, 1977.22p.
[69] I. Maden, R. Maduta, J. Kriegseis, S. Jakirlic, C. Schwarz, S. Grund-mann, and C. Tropea. Experimental and computational study of theflow induced by a plasma actuator. In 9th International ERCOF-TAC Symposium on "Engineering Turbulence Modelling and Mea-surements", Thessaloniki, Greece, 2012.
[70] P. Magnier, V. Boucinha, B. Dong, R. Weber, A. Leroy-Chesneau,and D. Hong. Experimental study of the flow induced by a sinusoidaldielectric barrier discharge actuator and its effect on a flat plate nat-ural boundary layer. J. Fluids Eng., 131:011203, January 2009.
[71] T. C. Manley. The electric characteristics of the ozonator discharge.J. Electrochem. Soc., 84(1):83–96, 1943.
153

Bibliography
[72] E. Moreau. Airflow control by non-thermal plasma actuators. J.Phys. D: Appl. Phys., 40:605–636, 2007.
[73] E. Moreau, L. Léger, and G. Touchard. Effect of a dc surface-coronadischarge on a flat plate boundary layer for air flow velocity up to 25m/s. J. Electrost., 64(3-4):215 – 225, 2006.
[74] W. Nitsche and A. Brunn. Strömungsmesstechnik, volume 2. SpringerVerlag, Berlin, 2006.
[75] C. J. Obara and B. J. Holmes. Flight-measured laminar boundary-layer transition phenomena including stability theory analysis. Tech-nical Report 2417, NASA Technical Paper, April 1985.
[76] S. Pavon, P. Ott, P. Leyland, J.-L. Dorier, and C. Hollenstein. Effectsof a surface dielectric barrier discharge on transonic flows around anairfoil. In 47th AIAA Aerospace Sciences Meeting, Orlando, Florida,USA, 2009. AIAA 2009-649.
[77] I. Peltzer, A. Pätzold, and W. Nitsche. In-flight experiments fordelaying laminar-turbulent transition on a laminar wing glove. Proc.Inst. Mech. Eng., Part G, 223(6):619–626, 2009.
[78] W. Pfenninger and E. Groth. Low drag boundary layer suction ex-periments in flight on a wing glove of an F-94A airplane with suctionthrough a large number of fine slots. Boundary Layer and Flow Con-trol, II:981–999, 1961.
[79] K. Pohlhausen. Zur näherungsweisen Integration der Differential-gleichung der laminaren Grenzschicht. ZAMM - Journal of AppliedMathematics and Mechanics / Zeitschrift für Angewandte Mathe-matik und Mechanik, 1(4):252–290, Jan. 1921. ISSN 1521-4001.
[80] J. Pons, E. Moreau, and G. Touchard. Asymmetric surface dielectricbarrier discharge in air at atmospheric pressure: Electrical propertiesand induced airflow characteristics. J. Phys. D: Appl. Phys., 38(19):3635, 2005.
[81] C. Porter, A. Abbas, K. Cohen, T. McLaughlin, and C. L. Enloe.Spatially distributed forcing and jet vectoring with a dielectric barrierdischarge plasma actuator. In 46th AIAA Aerospace Sciences Meetingand Exhibit, Reno, Nevada, 2008. AIAA 2008-1374.
154

Bibliography
[82] L. Prandtl. Über Flüssigkeitsbewegung bei sehr kleiner Rei-bung. In Verhandlungen des dritten internationalen Mathematiker-Kongresses, volume III, page 484. Teubner, Leipzig, 1904.
[83] R. Quadros. Numerical Optimization of Boundary-Layer Control us-ing Dielectric Barrier Discharge Plasma Actuator. PhD thesis, TUDarmstadt, 2009.
[84] A. Reeh. Development and implementation of a method for linearstability analysis in natural and manipulated boundary layer flows.Studienarbeit, TU Darmstadt, 2008.
[85] E. Reshotko. Boundary-layer stability and transition. Annu. Rev.Fluid Mech., 8(1):311–349, 1976.
[86] M. Riherd and S. Roy. Linear stability analysis of a boundary layerwith plasma actuators. In 50th AIAA Aerospace Science Meetingand Exhibtion, 09 - 12 January, Nashville, Tennessee, 2012. AIAA2012-0290.
[87] J. P. Robert. Special course on skin friction drag reduction. Technicalreport, AGARD Report 786, 1992.
[88] J. R. Roth, D. Sherman, and S. P. Wilkinson. Boundary layer flowcontrol with a one atmosphere uniform glow discharge surface plasma.In 36th AIAA Aerospace Science Meeting and Exhibit; Reno, Nevada,USA, 1998. AIAA 1998-0328.
[89] L. J. Runyan, G. W. Bielak, R. A. Behbehani, A. W. Chen, and R. A.Rozendaal. The 757 NLF glove flight test results. Technical report,NASA Langley Research Center, Dec. 1987. Research in NaturalLaminar Flow and Laminar-Flow Control, Part 3; p 795-818.
[90] H. Schlichting and K. Gersten. Grenzschicht-Theorie. Springer, 2005.
[91] P. J. Schmid and D. S. Henningson. Stability and transition in shearflows. Springer, Berlin, 2001. ISBN 9780387989853.
[92] V. Schmitt, J. Archambaud, K. Horstmann, and A. Quast. Hy-brid laminar fin investigations. Technical report, RTO Symposium,Braunschweig, Germany, 2000.
[93] J. Schulze. Numerical simulation of various flow conditions on theg-109b research aircraft. Bachelor’s thesis, TU Darmstadt, 2010.
155

Bibliography
[94] A. Seitz. Freiflug-Experimente zum Übergang laminar-turbulent ineiner Tragflügelgrenzschicht. PhD thesis, TU Braunschweig, 2007.ISRN DLR-FB–2007-01, ISSN 1434-8454.
[95] A. Seitz and K.-H. Horstmann. In-flight investigations of Tollmien-Schlichting waves. In IUTAM Symposium on One Hundred Years ofBoundary Layer Research, volume 129 of Solid Mechanics and Its Ap-plications, pages 115–124. Springer, Berlin, 2006. ISBN 1402041497.
[96] A. Séraudie, E. Aubert, N. Naude, and C. J. P. Effect of plasma actu-ators on a flat plate laminar boundary layer in subsonic conditions.In 3rd AIAA Flow Control Conference, San Francisco, California,2006. AIAA 2006-3350.
[97] A. Séraudie, O. Vermeersch, and D. Arnal. DBD plasma actuatoreffect on a 2D model laminar boundary layer. Transition delay underionic wind effect. In 29th AIAA Applied Aerodynamics Conference,Honolulu, Hawaii, 2011. AIAA 2011-3515.
[98] A. A. Sidorenko, A. D. Budovsky, A. V. Pushkarev, and A. A. Maslov.Flight testing of DBD plasma separation control system. In 46thAIAA Aerospace Sciences Meeting and Exhibit, Reno, Nevada, 2008.AIAA 2008-3731.
[99] B. Simon. Freiflug-untersuchungen zur laminar-turbulenten transi-tion und deren beeinflussung mit dbd plasma-aktuatoren. Masterthesis, TU Darmstadt, 2012.
[100] A. R. Sinclair and A. W. Robins. A method for the determination ofthe time lag in pressure measuring systems incorporating capillaries.Technical Report Technical Note 2793, National Advisory Commiteefor Aeronautics, September 1952.
[101] K. P. Singh and S. Roy. Physics of plasma actuator operating inatmospheric air. Appl. Phys. Lett., 92(11):111502, 2008.
[102] J. H. Spurk. Strömungslehre: Einführung in die Theorie der Strö-mungen. Springer, Berlin, 4. edition, 1996. ISBN 3540613080.
[103] H. B. Squire. On the stability for three-dimensional disturbances ofviscous fluid flow between parallel walls. Proc. R. Soc. London, Ser.A, 142(847):621–628, 1933.
156

Bibliography
[104] D. Sturzebecher and W. Nitsche. Active cancellation of Tollmien-Schlichting instabilities on a wing using multi-channel sensor actuatorsystems. Int. J. Heat Fluid Flow, 24(4):572–583, 2003.
[105] M. Takagaki, S. Isono, H. Nagai, and K. Asai. Evaluation of plasmaactuator performance in martian atmosphere for applications to marsairplanes. In 4th AIAA Flow Control Conference, Seattle, Washing-ton, USA, 2008. AIAA 2008-3762.
[106] C. Tropea, A. L. Yarin, and J. F. Foss. Springer Handbook ofExperimental Fluid Mechanics. Springer, Berlin, 2007. ISBN9783540251415.
[107] J. A. Valerioti and T. C. Corke. Pressure dependence of dielectricbarrier discharge plasma flow actuators. AIAA J., 50(7):1490–1502,2012. ISSN 0001-1452.
[108] J. L. van Ingen. A suggested semi-empirical method for the calcula-tion of the boundary layer transition region. Technical report, DelftUniversity of Technology, January 1956.
[109] H. R. Velkoff and J. Ketcham. Effect of an electrostatic field onboundary-layer transition. AIAA J., 6:1381–1383, 1968.
[110] P. Versailles, V. Gingras-Gosselin, and H.-D. Vo. Impact of pressureand temperature on the performance of plasma actuators. AIAA J.,48(4):859–863, 2010.
[111] D. Vieira, J. Kriegseis, S. Grundmann, and M. Schäfer. Numericalsimulation of boundary-layer stabilization using plasma actuators. InEuropean Congress on Computational Methods in Applied Sciencesand Engineering, Vienna, Austria, 2012.
[112] A. Wazzan, C. Gazley Jr., and A. Smith. Tollmien-Schlichting wavesand transition: Heated and adiabatic wedge flows with application tobodies of revolution. Prog. Aeronaut. Sci., 18:351–392, 1979. ISSN0376-0421.
[113] J. Weideman and S. Reddy. A MATLAB Differentiation Matrix Suite.ACM - Transactions on Mathematical Software, 26(4):465–519, Dec2000.
157

Bibliography
[114] M. Weismüller. A new Approach to Aerodynamic Performance ofAircraft under Turbulent Atmospheric Conditions. PhD thesis, TUDarmstadt, June 2011.
[115] A. Widmann, A. Duchmann, A. Kurz, S. Grundmann, and C. Tropea.Measuring Tollmien-Schlichting Waves using Phase-Averaged ParticleImage Velocimetry. Exp. Fluids, 53(3):707 – 715, 2012.
[116] B. Wilke. Aerodynamische Strömungssteuerung mittels dielektrischenBarriereentladungs-Plasmaaktuatoren. PhD thesis, Technische Uni-versität Darmstadt, DLR Göttingen, 2009.
[117] A. Winterfeld. Auslegung und Konstruktion einer schwingung-sisolierten Instrumentierungs-Plattform für das ForschungsflugzeugG-109b. Studienarbeit, Technische Hochschule Darmstadt, 1988.
[118] Y. Wu, Y. Li, M. Jia, H. Song, Z. Guo, X. Zhu, and Y. Pu. In-fluence of operating pressure on surface dielectric barrier dischargeplasma aerodynamic actuation characteristics. Appl. Phys. Lett., 93(3):031503, 2008.
[119] D. Zhang, Y. Chew, and S. Winoto. Investigation of intermittencymeasurement methods for transitional boundary layer flows. Exp.Therm. Fluid Sci., 12(4):433 – 443, 1996. ISSN 0894-1777.
[120] J. G. Ziegler and N. B. Nichols. Optimum settings for automaticcontrollers. Trans. ASME, Vol. 64, No. 1:759–768, 1942.
158

Nomenclature
Latin letters
upper case
symbol SI unit description
A – disturbance amplitude
A0 – initial disturbance amplitude
A – hot wire calibration constant
B – hot wire calibration constant
C F capacitance
D N = kg m/s2 drag
Di,j – differentiation matrix coefficients
D1 – first order differentiation operator
D2 – second order differentiation operator
E V voltage
EΩ J total energy across flow domain
F N = kg m/s2 force
H12 – boundary-layer shape factor
I A electric current
L – linear operator
Lp dB sound pressure level
Ma – Mach number
N – N-factor
N – vector size
n – hot wire calibration constantP W actuator power consumption
P W nominal power consumption
Pinput W input power
159

Nomenclature
Pp W propulsion power
Q C electric charge
R Ω electric resistance
Re – Reynolds number
St – Strouhal number
T N = kg m/s2 thrust
T K temperature
Ta K ambient temperature
Td – controller differential coefficient
Ti – controller integral coefficient
Tj – Chebyshev polynomial
U m/s flow velocity
U∞ m/s free-stream velocity
Ue m/s boundary-layer edge velocity
UTAS m/s true airspeed
UCTA m/s calibrated hot wire velocity
V V actuator voltage
Vpp V actuator voltage amplitude (peak-to-peak)
lower case
symbol SI unit description
a m/s sonic speed
c m chord length
c m/s disturbance propagation speed
cp – pressure coefficient
cD – drag coefficient
cD,f – friction drag component
cD,p – pressure drag component
cf – friction coefficient
cL – lift coefficient
d m thickness of dielectric
160

Nomenclature
f N/m3 volume force
f Hz = 1/s disturbance frequency
fexc Hz excitation frequency
fc Hz filter cut-off frequency
fpl Hz DBD operation frequency
g m/s2 acceleration of gravity
h1 – grid parameter
k 1/m wavenumber
kp – controller proportional coefficient
l m length scale
m – dimensionless pressure gradient
m kg mass
mMTOW kg maximum take-off weight
p Pa = kg/m s2 static gas pressure
pt Pa total gas pressure
p0 Pa ambient pressure
q Pa = kg/m s2 dynamic pressure
q – disturbance shape function
q′ – disturbance amplitude
si dB/V microphone calibration factor
t s time
u m/s velocity component in x-direction
v m/s velocity component in y-direction
w m/s velocity component in z-direction
x m chordwise coordinate
y m wall-normal coordinate
z m spanwise coordinate
161

Nomenclature
Greek letters
upper case
symbol SI unit description
∆Pp W propulsion power saving
∆xtrans m chordwise transition delay
Φ phase angle
Ψ – stream function
Ω – flow domain
lower case
symbol SI unit description
α angle of attack
αFL Flight Log angle
αi induced angle of attack
αsup wind tunnel support angle
α2D two-dimensional reference angle of attack
α /s angle of attack change rate
αi 1/m streamwise spatial growth rate
β slip angle
βi 1/m spanwise spatial growth rate
γ – intermittency
δN m Blasius length scale
δ1 m displacement thickness
δ2 m momentum loss thickness
ζ V control output voltage
η – efficiency
η∗ [no standard] effectiveness
λ m wavelength
µ N s/m2 dynamic viscosity
162

Nomenclature
ν m2/s kinematic viscosity
ξ – Gauss-Lobatto grid points
ρ kg/m3 density
σ – standard deviation
τw Pa=N/m2 wall-shear stress
φ – relative humidity
ψ – control input
ω 1/s angular frequency
163

Nomenclature
Mathematical symbols
symbol description
∇ del operator∗ dimensional quantity
∂ partial derivative
¯ averaged quantity
ˆ quantity amplitude′ fluctuation quantity
Abbreviations
symbol description
a ambient
AC alternating current
AWC active wave cancelation
CCD charged coupled device
CFD computational fluid dynamics
corr corrected
crit critical
CTA constant temperature anemometry
DBD dielectric barrier discharge
DEHS di-ethyl-hexyl-sebacat
DNS direct numerical simulation
EHD electro-hydrodynamic
FL Flight Log
FFT fast Fourier transform
HLFC hybrid laminar flow control
HV high voltage
KTH Kungliga Tekniska högskolan
lam laminar
164

Nomenclature
LBA Luftfahrt Bundesamt
LDA laser Doppler anemometry
LES large eddy simulation
LFC laminar flow control
LFU Leichtflugtechnik Union GmbH
LSA linear stability analysis
max maximum
meas measured
MHD magneto-hydrodynamic
min minimum
MTOW maximum take-off weight
Nd:YAG neodymium-doped yttrium aluminum garnet
NLF natural laminar flow
NWK Göttinger-type wind tunnel facility
NWK2 Eiffel-type wind tunnel facility
PIV particle image velocimetry
PSD power spectral densitiy
PSE parabolized stability equations
RANS Reynolds averaged Navier-Stokes
ref reference
RMS root mean square
sup support
SNR signal-to-noise ratio
trans transition
TS Tollmien-Schlichting
TU Technische Universität
turb turbulent
UAV unmanned aerial vehicle
w wall
W wire
2D two-dimensional
3D three-dimensional
165

Nomenclature
166

List of Figures
1.1 Spectra of wind-tunnel and flight turbulence. . . . . . . . . 4
2.1 Laminar and turbulent boundary-layer profiles. . . . . . . . 152.2 Eigenvalues and neutral stability curve. . . . . . . . . . . . 19
3.1 Sketch of DBD actuator setup for boundary-layer flow control. 213.2 Wall-tangential (fx) and wall-normal (fy) force distribution 243.3 Lissajous figure of actuator charge Q vs. voltage V . . . . . 253.4 Characteristic evolution of velocity standard deviation (a)
during transition along a flat plate. . . . . . . . . . . . . . . 273.5 Use of signal standard deviation and intermittency factor for
quantification of transition delay. . . . . . . . . . . . . . . . 283.6 Shape factor during transition related to intermittent hot-
wire signals. . . . . . . . . . . . . . . . . . . . . . . . . . . . 293.7 Displacement body and flat plate in test section. . . . . . . 313.8 Flight setup including G109b glider and measurement equip-
ment. . . . . . . . . . . . . . . . . . . . . . . . . . . . . . . 373.9 Bottom view of wing glove dimensions fixed on the glider wing. 383.10 Overview of the wing glove pressure side with sensors and
traverse system installed. . . . . . . . . . . . . . . . . . . . 433.11 Sketch and kinematic of the traverse system for boundary-
layer measurements on the wing glove. . . . . . . . . . . . . 453.12 Comparison of the computational grid in physical (a) and
transformed (b) coordinates. . . . . . . . . . . . . . . . . . . 49
4.1 Pressure gradient along the flat plate. . . . . . . . . . . . . 584.2 Transition behavior of boundary-layer flow characterized by
the hot-wire standard deviation σU and the intermittencyfactor γ. . . . . . . . . . . . . . . . . . . . . . . . . . . . . . 61
4.3 Velocity profiles and standard deviation of filtered hot-wiresignal for four different streamwise locations. . . . . . . . . 62
4.4 Transition behavior of boundary-layer flow characterized byshape factor. . . . . . . . . . . . . . . . . . . . . . . . . . . 64
167

List of Figures
4.5 Spectral analysis of hot-wire signal. . . . . . . . . . . . . . . 654.6 Comparison of streamwise and wall-normal disturbance am-
plitudes. Artificial disturbance excitation at 250 Hz. . . . . 674.7 Shape factor H12 around actuator location derived from PIV
measurements. . . . . . . . . . . . . . . . . . . . . . . . . . 694.8 Streamwise velocity profiles, first and second derivatives with
respect to the wall-normal direction, obtained with LDAmeasurements. . . . . . . . . . . . . . . . . . . . . . . . . . 71
4.9 Hotwire standard deviation σU along the flat plate as a func-tion of actuator thrust T . . . . . . . . . . . . . . . . . . . . 72
4.10 Transition positions as a function of actuator placement andarray permutation. . . . . . . . . . . . . . . . . . . . . . . . 75
5.1 Comparison between wave amplitude evolutions from di-rect numerical simulation (DNS) and linear stability analy-sis (LSA) for Blasius boundary-layer flow subjected to DBDforcing. . . . . . . . . . . . . . . . . . . . . . . . . . . . . . 79
5.2 N -factor contours and neutral stability curve of flow withoutDBD actuation. . . . . . . . . . . . . . . . . . . . . . . . . . 81
5.3 Shape factor evolution measured by hot-wire and PIV com-pared to the numerical boundary-layer solution. . . . . . . . 83
5.4 N -factor evolution for discrete disturbance frequencies. . . . 845.5 Experimentally measured and numerically predicted transi-
tion delay for various thrust magnitudes. . . . . . . . . . . . 855.6 N -factor evolution under distributed DBD forcing. . . . . . 875.7 Gradient of EΩ with respect to mean-flow forcing, computa-
tions by A. Hanifi based on [16]. . . . . . . . . . . . . . . . 885.8 N -factor evolution of a discrete disturbance frequency and
neutral stability curves for DBD thrust variation. . . . . . . 895.9 Stability diagram of wing glove pressure side. . . . . . . . . 915.10 N -factor evolution of discrete disturbance frequencies. . . . 925.11 Sensitivity of N -factor growth to actuator placement. . . . 93
6.1 Overview of the NLF wing glove, mounted on the G109bsupport wing section inside the NWK wind tunnel. Therotating model support enables angle-of-attack variations. . 98
6.2 Pressure distributions from experiments and RANS compu-tations at α = 0.7. . . . . . . . . . . . . . . . . . . . . . . . 100
6.3 Relationship between true airspeed UTAS and true angle ofattack α for constant lift. . . . . . . . . . . . . . . . . . . . 101
168

List of Figures
6.4 Microphone standard deviation related to the angle of attack.1026.5 Dimensionless pressure distribution for varying angles of at-
tack at constant speed UTAS = 38 m/s. . . . . . . . . . . . . 1036.6 Standard deviation of hot-wire signal σU at the wall for var-
ious downstream locations x/c. . . . . . . . . . . . . . . . . 1056.7 Shape factor H12 of the boundary layer as a function of the
streamwise position x for two different angles of attack α. . 1056.8 Standard deviation of the microphone signals σM at a fixed
angle of attack α = 0.8. . . . . . . . . . . . . . . . . . . . . 1076.9 Power spectral density of hot-wire signals across the bound-
ary layer and microphone signals along the chord. . . . . . . 1086.10 Functional relation between measured Flight Log angle of
attack αFL and fitted 2D angle of attack α. . . . . . . . . . 1096.11 Power variation during pressure increase in gliding flight. . 1136.12 Power modification due to humidity variation. . . . . . . . . 1146.13 Sketch of the closed-loop power control setup including PID
controller. . . . . . . . . . . . . . . . . . . . . . . . . . . . . 1156.14 Closed-loop control of actuator power during humidity vari-
ation. . . . . . . . . . . . . . . . . . . . . . . . . . . . . . . 1166.15 Closed-loop control of actuator power at different power levels.1176.16 Phugoid eigenmode in measurement signals. . . . . . . . . . 1186.17 Hotwire signal standard deviation at the surface at x/c =
0.38 for variation of the angle of attack. . . . . . . . . . . . 1196.18 Spectrogram of microphone signals for α = 0.7, traverse
system installed. . . . . . . . . . . . . . . . . . . . . . . . . 1216.19 Spectrogram of microphone signals, actuator power variation. 1226.20 Spectrogram of microphone signals without traverse. . . . . 1236.21 Effect of the traverse system on the pressure distribution,
α = 0.7, UTAS = 38 m/s. . . . . . . . . . . . . . . . . . . . 1246.22 Spectrogram of microphone signals without traverse. . . . . 1256.23 Velocity profiles on pressure side. . . . . . . . . . . . . . . . 1266.24 Standard deviation of hot-wire signals under varying flight
states. . . . . . . . . . . . . . . . . . . . . . . . . . . . . . . 1286.25 Spectrum of hot-wire signals. . . . . . . . . . . . . . . . . . 1306.26 Spatial growth rates versus transition location for forced dis-
turbance conditions. . . . . . . . . . . . . . . . . . . . . . . 1316.27 Friction coefficient along the glove pressure side derived from
Xfoil for forced transition. . . . . . . . . . . . . . . . . . . . 133
169

List of Figures
6.28 Lift-drag polar of wing glove airfoil from wind tunnel andflight measurements compared to Xfoil computations. . . . 135
170

List of Tables
4.1 Comparison of actuator voltage peak-to-peak amplitude Vpp,power consumption P and produced integral thrust T for theinvestigated actuator settings. . . . . . . . . . . . . . . . . . 59
4.2 Transition delay dependent on integral actuator thrust. . . 73
5.1 Comparison of experimentally measured and numerically pre-dicted transition delay for varying actuator locations andarrays on a flat plate. . . . . . . . . . . . . . . . . . . . . . 86
5.2 Comparison of predicted transition locations for varied thrustand two optional DBD actuator locations, xDBD/c = 0.33and xDBD/c = 0.25. . . . . . . . . . . . . . . . . . . . . . . 94
6.1 Ambient conditions during measurement flights. . . . . . . . 1106.2 Comparison of drag coefficients cD from different numerical
solvers. . . . . . . . . . . . . . . . . . . . . . . . . . . . . . . 133
171

List of Tables
172

Alexander Joachim Duchmann
Born on April 28, 1982, in Frankfurt am Main, Germany
Education
02/2008 - 10/2012 Doctoral Research in Mechanical Engineering,Technische Universität Darmstadt,Darmstadt, Germany
10/2002 - 01/2008 Studies in Mechanical Engineering (Dipl.-Ing.),Technische Universität Darmstadt,Darmstadt, Germany
09/2004 - 10/2005 ERASMUS Study Period Abroad,Universitat Politècnica de Catalunya,Barcelona, Spain
08/1992 - 05/2001 Liebigschule, Frankfurt am Main, Germany
07/1988 - 07/1992 Hartmutschule, Eschborn, Germany
Employment
since 03/2013 Development Engineer Flight Test AnalysisEurocopter Deutschland GmbH, Germany
02/2008 - 02/2013 Research AssistantInstitute for Fluid Mechanics and Aerodynamics,Technische Universität Darmstadt, Germany
05/2007 - 11/2007 Research AssistantDepartment of Aerospace and Ocean Engineering,Virginia Polytechnic Institute and State University,Blacksburg, VA, USA
07/2005 - 10/2005 InternshipLufthansa Technik AG, Frankfurt, Germany