Boremap mapping of core drilled borehole KFM06C - SKB
24
Svensk Kärnbränslehantering AB Swedish Nuclear Fuel and Waste Management Co Box 250, SE-101 24 Stockholm Phone +46 8 459 84 00 P-07-233 Forsmark site investigation Boremap mapping of core drilled borehole KFM06C A comparative study of mapping in Oskarshamn and Forsmark Jan Ehrenborg, Mírab Mineral Resurser AB Peter Dahlin, Geosigma AB December 2008
-
Upload
khangminh22 -
Category
Documents
-
view
3 -
download
0
Transcript of Boremap mapping of core drilled borehole KFM06C - SKB
Svensk Kärnbränslehantering ABSwedish Nuclear Fueland Waste Management Co
Box 250, SE-101 24 Stockholm Phone +46 8 459 84 00
P-07-233
Forsmark site investigation
Boremap mapping of core drilled borehole KFM06C
A comparative study of mapping in Oskarshamn and Forsmark
Jan Ehrenborg, Mírab Mineral Resurser AB
Peter Dahlin, Geosigma AB
December 2008
CM
Gru
ppen
AB
, Bro
mm
a, 2
009

Tänd ett lager:
P, R eller TR.
Forsmark site investigation
Boremap mapping of core drilled borehole KFM06C
A comparative study of mapping in Oskarshamn and Forsmark
Jan Ehrenborg, Mírab Mineral Resurser AB
Peter Dahlin, Geosigma AB
December 2008
ISSN 1651-4416
SKB P-07-233
Keywords: KFM06C, Geology, Drill core mapping, Boremap, Fractures, BIPS, Forsmark.
This report concerns a study which was conducted for SKB. The conclusions and viewpoints presented in the report are those of the authors and do not necessarily coincide with those of the client.
Data in SKB’s database can be changed for different reasons. Minor changes in SKB’s database will not necessarily result in a revised report. Data revisions may also be presented as supplements, available at www.skb.se.
A pdf version of this document can be downloaded from www.skb.se.

3
Abstract
A comparative study has been accomplished for the Boremap mapping at the Oskarshamn and Forsmark investigation sites. The mapping was carried out in accordance with the methodology used in mapping of deep cored boreholes.
This report covers the comparative mapping of KFM06C in Forsmark mapped by the mapping team from Oskarshamn investigation site, Jan Ehrenborg (Mírab Mineral Resurser AB) and Peter Dahlin (Geosigma). The mapping interval was between 176.54 m and 335.5 m.

4
Sammanfattning
En jämförande studie har genomförts för Boremapkarteringen vid platsundersökningarna i Oskarshamn och Forsmark. Karteringen genomfördes i enlighet med den metodologi som används vid kartering av djupa kärnborrhål.
Föreliggande rapport redovisar den jämförande karteringen av KFM06C i Forsmark som karter-ats av karteringslaget från Oskarshamn, Jan Ehrenborg (Mírab Mineral Resurser AB) och Peter Dahlin (Geosigma). Det karterade intervallet sträcker sig från 176,54 m och ner till 335,5 m.
5
Contents
1 Introduction 7
2 Objective and scope 9
3 Equipment 113.1 Description of software 113.2 Other equipment 113.3 BIPS-image video film sequences 113.4 BIPS-image video film: resolution, contrast and quality 11
4 Execution 134.1 General 134.2 Preparations 134.3 Execution of measurements 13
4.3.1 Fracture definitions 144.3.2 Fracture alteration and joint alteration number 144.3.3 Mapping of fractures not visible in the BIPS-image 154.3.4 Definition of veins and dikes 154.3.5 Mineral codes 15
4.4 Data handling 164.5 Geological summary table, general description 16
4.5.1 Columns in the geological summary table 17
5 Results 195.1 Geological summary table for KFM06C 195.2 Orientation of broken fractures 205.3 Fracture mineralogies 21
Appendix 1 Geological summary table KFM06C 23
Appendix 2 Search paths for the geological summary table 25
Appendix 3 Stereographic projection of broken fractures KFM06C 27
Appendix 4 WellCad diagram of KFM06C 29

7
1 Introduction
This document reports data gained by Boremap mapping of borehole KFM06C within the site investigation at Forsmark (Figure 1-1). The work was carried out in accordance with activity plan AP PS 400-05-084 and AP PF 400-05-086 respectively. In Table 1-1 controlling documents for performing this activity are listed. Both activity plan and method descriptions are SKB´s internal controlling documents.
Table 1‑1. Controlling documents for the performance of the activity.
Activity plan Number VersionJämförande Boremapkartering på del av teleskopborrhål KFM06C och KLX07B
AP PS 400-05-084
AP PF 400-05-086
1.0
1.0
Method descriptions Number VersionNomenklatur vid Boremapkartering SKB MD 143.008 1.0Metodbeskrivning för Boremap-kartering SKB MD 143.006 2.0Mätsystembeskrivning för Boremap, Boremap v 3.0 SKB MD 146.005 1.0
Figure 1-1. Location of the core drilled borehole KFM06C.

8
Since 2002, SKB investigates two potential sites for a deep repository of nuclear waste in the Swedish Precambrian basement at approximately 500 m depth. These sites are Forsmark in northern Uppland and Simpevarp in eastern Småland. In order to make a preliminary evaluation of the rock mass down to a depth of about 1 km at these sites, SKB has initiated a drilling program using core drilled boreholes.
Detailed mapping of the drill cores is essential for a three dimensional understanding of the geology at depth. The mapping is based on the use of so called BIPS-images of the borehole wall and by the study of the drill core itself. The BIPS-images enable the study of orientations, since the Boremap software calculates strike and dip of planar structures such as foliations, rock contacts and fractures. Also the fracture apertures in the rock can be estimated.
9
2 Objective and scope
For the comparative study two boreholes KFM06C in Forsmark and KLX07B in Oskarshamn were used. One interval of each borehole were selected for Boremap mapping by each mapping team.
The mapping started at 176.54 m and ended at 335.5 m. It was decided by SKB that a compara-tive study of the drill core mapping with the Boremap method should be executed by the ordinary mapping teams from Forsmark and Oskarshamn. Each team mapped 4 x 8 hours on their ordinary locality and then changed and mapped the same interval as the crew in the other locality. The principal purpose was to detect systematical differences in the mapping process between the two investigation sites.
The results from the investigations that are carried out at the Oskarshamn and Forsmark inves-tigation sites will be compared before the choice of the site for the deep repository in Sweden is performed. It is important that the investigations at the two sites are performed in the same way and follow the same methodology. That is why method descriptions exist, but despite all control-ling documents different persons make different judgements, especially in uncertain cases. It has therefore been decided that a comparison between the two mapping teams from Forsmark and Oskarshamn should be conducted. The comparison is not covered in this report but will be performed by SKB´s analysis group.
The lithology is not crucial for the comparison since the invited mapping team lack experience from the bedrock in the local area. This is also true to some extent for the specific fracture mineralogy at each locality.
This report covers the comparative mapping of KFM06C at Forsmark as mapped by the ordinary mapping team from Oskarshamn site investigation, Jan Ehrenborg (Mírab Mineral Resurser AB) and Peter Dahlin (Geosigma).

11
3 Equipment
3.1 Description of softwareThe mapping was performed with Boremap v. 3.6, with bedrock and mineral standards of SKB. The final data presentation was made using StereoNet, WellCad v.4, and BIPS Image Print.
Boremap is the software that integrate orthodox core mapping with modern video mapping. The software deals with the mapping data as well as the internal communication between programs. Boremap shows the video image from BIPS (Borehole Image Processing System) and extracts the geometrical parameters: length, width, strike and dip from the image.
3.2 Other equipmentThe following equipment was used to facilitate the core mapping: folding rule and pen, hydrochloric acid, knife, water-filled atomizer and hand lens.
3.3 BIPS‑image video film sequencesThe BIPS video film of KFM06C covers the interval 102.10–992.15 m.
3.4 BIPS‑image video film: resolution, contrast and quality The visibility of thin fractures in BIPS depends on image resolution, image contrast and image quality.
The BIPS-image resolution is perhaps the principal reason why very thin fractures as well as very thin apertures are not visible in the BIPS-image. The resolution depends on the BIPS video camera pixel size and illumination angle.
Thick fractures are always visible in both drill core and the BIPS-image. However, the visibility of thin fractures depends strongly on the colour contrast between the fracture and the wall rock.
A light fracture in a dark rock is clearly visible in the BIPS-image. A light coloured fracture in a light coloured rock might, however, be clearly visible in the drill core but not visible in the BIPS-image, especially if the fracture and wall rock have the same colour. The opposite is true for dark fractures.
In the rare case when the BIPS-image contrast between a very thin fracture and the wall rock is very strong the fracture might be visible in the BIPS-image even if it is not visible in the drill core.
The BIPS-image quality is sometimes limited by disturbances such as:
1) blackish coatings probably related to the drilling equipment,
2) vertical bleached bands from the clayey mixture of drill cuttings and water,
3) light and dark bands at right angle to the drill hole related to the automatic aperture of the video camera,
4) vertical enlargements of pixels due to stick-slip movement of the camera probe.

12
Problems related to the video camera aperture and the enlargement of pixels can be neglected. The main disturbances caused by the BIPS-image quality are the vertical bleached bands and the blackish coatings.
The image quality is classified into four classes; good, acceptable, bad and very bad. With good quality means a more or less clear image which is easy to interpret. Acceptable quality means that the image is not good, but that the mapping can be performed without any problems. An image of bad quality is somewhat difficult to interpret while an image of very bad quality cannot be interpreted except from very obvious and outstanding features. It should be remembered that even if only 10–20% of the image is visible, this is often enough for an acceptable interpreta-tion. When the BIPS-image quality is so bad that fractures and structures can not be identified in the BIPS-image, they can still be oriented using the guide-line method (chapter 4.3.3). Better cleaning of the borehole could increase the mapping quality significantly.

13
4 Execution
4.1 GeneralThe Boremap-mapping of the telescopic drilled borehole KFM06C was performed and docu-mented according to activity plan AP PS 400-05-084 as well as AP-PF 400-05-086 (SKB, inter-nal document) referring to the Metodbeskrivning för Boremap-kartering (SKB MD 143.006, v.2.0, SKB, internal controlling document).
The drill cores were displayed on inclined roller tables and mapped in their entire length with the Boremap system at Simpevarp. The core mapping was carried out without any detailed geological knowledge of the area but with access to geophysical logs and rock samples.
In the first stage each mapping team mapped 4 x 8 hours on their ordinary locality. Thereafter the mapping teams switched boreholes and site and began mapping the same section on respec-tive drill core and worked 4 x 8 hours. The principal purpose was to detect systematic differ-ences in the mapping process between the two investigation sites. Each mapping team mapped in the same way as during the ordinary mapping in accordance with the Metodbeskrivning för Boremap-kartering, SKB MD 143.006 v.2.0 and Mätsystembeskrivning för Boremap, Boremap v.3.0, SKB MD 146.005 v.1.0. Software Boremap v.3.6 was used for the mapping, SKB internal documents.
The lithology was not crucial for the comparison since the invited mapping team lacked experi-ence from the local bedrock in the area. This is also true to some extent for the specific fracture mineralogy at each locality.
The mapped section of KFM06C covers the interval 176.54–335.5 m.
The mapping was performed by Jan Ehrenborg (Mírab Mineral Resurser AB) and Peter Dahlin (GEOSIGMA).
4.2 PreparationsAny depth registered in the BIPS-image deviates from the true depth in the borehole, a deviation which increases with depth. This problem is generally eliminated by adjusting the depth according to reference slots cut into the borehole every fiftieth metre. The level for each slot was measured in the BIPS-image and then adjusted to the correct level using the correct depth value from the Sicada database.
The different orientations of the observations were adjusted to true space. Data necessary for this adjustment were borehole diameter and deviation; both collected from the Sicada database.
This process had been accomplished by the ordinary mapping team in Forsmark before the map-ping team from Oskarshamn arrived. Recorded depth values were used during the comparative mapping.
4.3 Execution of measurementsNomenclature and definitions used during the core mapping, are defined in this chapter.
14
4.3.1 Fracture definitionsDefinitions of different fracture types, also crush and sealed fracture network, are found in Nomenklatur vid Boremapkartering, SKB MD 143.008 v.1.0 (SKB internal document). Apertures for broken fractures have been mapped in accordance with the definitions in this document.
In the mapping phase, fractures that split the core are mapped as BROKEN and fractures that have not parted the core are mapped as UNBROKEN. All fractures are described with their fracture minerals and other characteristics, e.g. width, aperture and roughness. Visible apertures are measured down to 1 mm in the BIPS-image. Smaller apertures, which are impossible to detect in the BIPS-image, are denoted a value of 0.5 mm. If the core pieces don’t fit well, the aperture is considered “probable”. If the core pieces do fit well, but the fracture surfaces are dull or altered, the aperture is considered “possible”.
All fractures that possess apertures > 0 mm, are in the Sicada database interpreted as OPEN. Only few BROKEN fractures are given the aperture = 0 mm. UNBROKEN fractures usually have apertures = 0 mm. If UNBROKEN fractures possess apertures > 0 mm, they are inter-preted as partly open and included in the OPEN-category. OPEN and SEALED fractures are finally frequency calculated and shown in Appendices 1 and 4.
4.3.2 Fracture alteration and joint alteration numberThe joint alteration number is principally related to the thickness of, and the clay content in a fracture. Thick fractures rich in clay minerals are given a joint alteration number between 2 and 3. The majority of the broken fractures are very thin to extremely thin and seldom contain clay minerals and receive a joint alteration number between 1 and 2.
A subdivision of fractures with joint alteration numbers between 1 and 2 was introduced to facilitate both the evaluation process for fracture alterations and the possibility to compare the alterations between different fractures in the boreholes. The subdivision is based on fracture mineralogy as follows:
a) fracture wall alterations
b) fracture mineral fillings assumed to have been deposited from circulating water-rich solutions
c) fracture mineral fillings most likely resulting from altered wall rock material
Joint alteration number equal to 1: Fractures with or without wall rock alteration, e.g. oxida-tion or epidotization, and without mineral fillings is considered as fresh. The joint alteration number is thus set to 1.
The minerals calcite, quartz, fluorite, zeolites, such as laumontite and sulphides are regarded as deposited by circulating water- rich solutions in broken fractures and not as true fracture altera-tion minerals. The joint alteration number is thus set to 1 also for these minerals.
Joint alteration number equal to 1.5: Minerals as epidote, prehnite, hematite, chlorite and/or clay minerals are regarded as fracture minerals most likely resulting from altered wall rock material. A weak alteration is thus assumed and the joint alteration number was set to 1.5. Extra considerations have been given to clay minerals since the occurrence of these minerals often resulted in a higher joint alteration number.
Joint alteration numbers higher than 1.5: When the mineral fillings is thick and contain a few mm of clay minerals, often together with minerals like epidote and chlorite, the joint alteration number is set to 2. In rare cases, when a fracture contains 5–10 mm thick clayey bands, together with chlorite, the joint alteration number is set to 3.
When the alteration of a fracture is too thick (and/or intense) to give the fracture the joint alteration number 1.5 and too thin and/or weak to give it a 2, 1.7 and 1.8 are used.

15
4.3.3 Mapping of fractures not visible in the BIPS‑imageNot all fractures are visible in the BIPS-images. These fractures are orientated by using the guide-line method, based on the following data:
• Absolutedepth.
• Amplitude(measuredalongthedrillcore).Theamplitudeistheintervalbetweenfractureextremes along the drill core.
• Therelationbetweentheorientationsofthefracturetrace,measuredonthedrillcoreanda well defined structure visible in the BIPS-image.
The error of orientating fractures using the guide-line method is not known but experience and an estimation using stereographic plots indicated that the error is most likely insignificant. Anyhow, the guide-line method is so far considered better than only marking fractures that are non-visible in the BIPS-images as planes perpendicular to the borehole. The fractures in ques-tion are mapped as “non-visible in BIPS” and can therefore be separated from fractures visible in BIPS which probably have a more accurate orientation.
When using the guide-line method the difference between the 50 mm drill core diameter and the 76 mm borehole diameter must be considered. This difference result in displacements of the structures seen in the drill core compared with the structures seen in the BIPS-image which represents the borehole walls. This displacement is zero for structures that cut the drill core at right angle and successively becomes larger as the orientation of the structure approximates the direction of the drill core axis. This displacement always has to be corrected for, since displace-ments of up to a few cm are common even if they seldom reach 10 cm.
Orientation of fractures and other structures with the guide-line method is done in the following way: The first step in the guide-line method is to calculate the amplitude of the fracture trace in the BIPS-image (with 76 mm diameter) from the fracture amplitude in the drill core (with 50 mm diameter). The second step is the correction of strike and dip. This is done by rotating the fracture trace in the BIPS-image relative to a feature with known orientation. The fracture trace is then put at the correct depth according to the depth measured on the drill core.
The guide-line method can be used to orientate any feature that is not visible in the BIPS-image. It is also a valuable tool to control that the personnel working with the drill core is observing the same feature as the personnel delineating the fracture trace in the BIPS-image, especially in intervals rich in fractures.
4.3.4 Definition of veins and dikesChiefly two different rock occurrences are mapped: veins and dikes. These two are differentiated by their respectively length in the core; veins are set to 0–20 cm and dikes are set to 20–100 cm. Rock occurrences that covers more than 100 cm of the drill core are mapped under the feature rock type.
4.3.5 Mineral codesIn the case where properties and/or minerals are not represented in the mineral list, following mineral codes have been used:
X5 whitish, bleached feldspar.
X6 the drill core is broken at a right angle and the broken surfaces have a polished appearance. This may indicate a sealed fracture that has been broken up during drilling. The two drill core parts have rotated against each other and worn down the mineral fillings.
X7 fracture with no detectable mineral fill.
16
4.4 Data handlingThe mapping is performed on-line on the SKB network, in order to obtain the best possible data security. Before every break (> 15 minutes) a back-up is saved on the local disk.
As a regular quality check every working day a summary report and a WellCad plot are printed in order to find possible misprints. The mapping is also quality checked by a routine in Boremap before it is exported to and archived in Sicada database. Personnel from SKB also perform spot test controls and regular quality revisions.
All primary data from KFM06C is stored in SKB´s database Sicada and only these quality-checked data are to be used for further interpretation and modelling.
4.5 Geological summary table, general descriptionAn overview of the geological parameters mapped with the Boremap system is collected in the Geological Summary table (Appendix 1). It also facilitates comparisons between Boremap information collected from different boreholes and is more objective than a pure descriptive borehole summary.
The Geological Summary table is the result of cooperation between Jan Ehrenborg from the mapping personnel at Simpevarp and Pär Kinnbom from PO (site investigation, Simpevarp). The aim was to make a standard form in handy A4-size, where all information is taken directly from the Sicada database using simple and well defined search paths for each geological parameter (Appendix 2).
The search paths are, however, yet not automatic and the geological information therefore has to be extracted from the Boremap database before it is reworked on separate Excel-files and finally presented in the Geological Summary table. At the moment it is only possible to extract the Rock Type and Alteration parameters directly from the Boremap database.
The main reason why the information in the Sicada database cannot be extracted automatically is the lack of a mathematical formula for calculation of frequencies for different parameters.
The Geological summary table is made up of 23 columns, each one representing a specific geological parameter. The geological parameters are presented as either intervals or frequencies. Intervalsarecalculatedforparameterswithawidth≥1mandfrequenciesforparameterswitha width < 1 m. Frequency information is treated as if it does not have any extension along the borehole axis. They are treated as point observations. It should be noted that parameters with a thickness of only 1 mm therefore has the same “value” as a similar parameter with a thickness of 999 mm since both are treated as point observations and used for frequency calculations.
Parameters are sometimes related in such a way that the mapping of one parameter cause a decrease in the frequency of another parameter. This type of intimate relationship between parameters has been noted for the following cases;
• Thereisadecreaseinthefrequencyofunbroken fractures with oxidized walls and without mineral fillings in intervals mapped with Alteration – oxidation.
• Nounbroken fractures are mapped in intervals of sealed fracture network.
• No broken fractures are mapped in intervals with crush.• Compositedikesgenerallyincludealargeamountoffinetomediumgrainedgraniteveins.
These veins are not mapped and the frequency presented for veins + dikes in column 6 (Appendix 1) are lower than the true frequency in composite dike intervals.
17
4.5.1 Columns in the geological summary tableThe Geological summary table includes the following 23 columns:
Column 1: Rock Type/Lithology, interval column. Only lithologies longer than 1 m are presented here. Shorter lithologies are presented in column 6. This column is identical with the ordinary WellCad presentation.
Column 2: Rock Type/Grain size, interval column. Interval limits follows column 1. This column is identical with the ordinary WellCad presentation.
Column 3: Rock Type/Texture, interval column. Interval limits follows column 1. This column is identical with the ordinary WellCad presentation.
Column 4: Alteration/Oxidation, interval column. No frequency column is presented for alteration/oxidation. The alteration/oxidation column is identical with the ordinary WellCad presentation.
Column 5: Alteration/intensity, interval column. This column is identical with the ordinary WellCad presentation.
Column 6: Rock Occurrence/Veins + Dikes < 1 m wide, frequency column. This rock type column can be seen as the frequency complement to the rock type/lithology interval column. Only rock type sections that are thinner than 1 m can be described as rock occurrences in Boremap. Thicker rock type sections are mapped as rock type.
Column 7: Structure/Shear Zone < 1 m wide, frequency column. This column includes ductile shear structures as well as brittle-ductile shear structures and these are mapped as rock occur-rences in Boremap. Ductile sections in mm – cm scale are mapped as shear structures and in dm – m scale as sections with foliation.
Column 8: Structure/Brecciated < 1 m wide, frequency column. Breccias < 1 m wide are mapped as rock occurrence in Boremap. Very thin micro breccias along sealed/natural fracture planes are generally not considered.
Column 9: Structure/Brecciated ≥ 1 m wide, interval column. Breccias > 1 m wide are mapped as rock type/structure in Boremap.
Column 10: Structure/Mylonite < 1 m wide, frequency column. Mylonites < 1 m wide are mapped as rock occurrence/structure in Boremap.
Column 11: Structure/Mylonite ≥ 1 m wide is an interval column. Mylonites > 1 m wide are mapped as rock type/structure in Boremap.
Column 12: Structure/Foliation < 1 m wide is a frequency column. Sections with foliation < 1 m wide are mapped as rock occurrence/structure in Boremap. Very thin sections with folia-tion are called ductile shear structures and presented in column 7.
Column 13: Structure/Foliation ≥ 1 m wide is an interval column. Sections with foliation > 1 m wide are mapped as rock type/structure in Boremap.
Column 14: Sealed fractures/All, frequency column. This column includes all fractures mapped as unbroken in the Boremap system and this includes unbroken fractures where the drill core is not broken as well as unbroken fractures interpreted to have broken up artificially during/after drilling.
Column 15: Sealed fractures/Broken fractures with aperture = 0, frequency column. This column includes unbroken fractures interpreted to have broken up artificially during/after drilling.
18
Column 16: Sealed fractures/Sealed Fracture Network < 1 m wide, frequency column. The sealed fracture network parameter is the only parameter that is generally evaluated directly from observations of the drill core. These types of sealed fractures can only in rare cases be observed in the BIPS-image.
Column 17: Sealed fractures/Sealed Fracture Network ≥ 1 m wide, interval column.
Column 18: Open fractures/All Apertures > 0, frequency column. This column includes all broken fractures, both fractures that with certainty were open before drilling and fractures that probably or possibly were open before drilling.
Column 19: Open fractures/Uncertain, Aperture = 0.5 probable + 0.5 possible, frequency column. This column includes fractures that probably or possibly were open before drilling.
Column 20: Open fractures/Certain Aperture = 0.5 certain and > 0.5, frequency column. This column includes fractures that with certainty were open before drilling.
Column 21: Open fractures/Joint alteration > 1.5, frequency column. This column show fractures with stronger joint alteration than normal. This parameter is generally correlated with the location of lithologies with a more weathered appearance.
Column 22: Open fractures/Crush < 1 m wide, frequency column. This column includes shorter sections with crush.
Column 23: Open fractures/Crush≥1 m wide, interval column. This column includes longer sections with crush.
19
5 Results
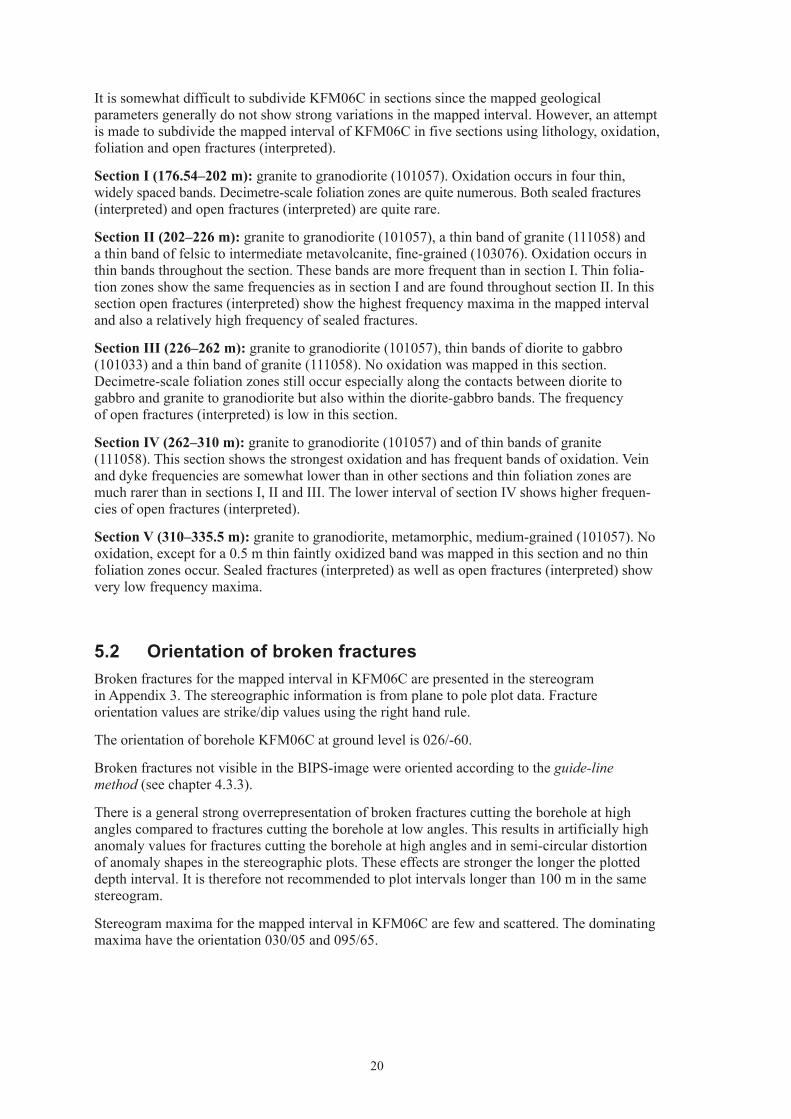
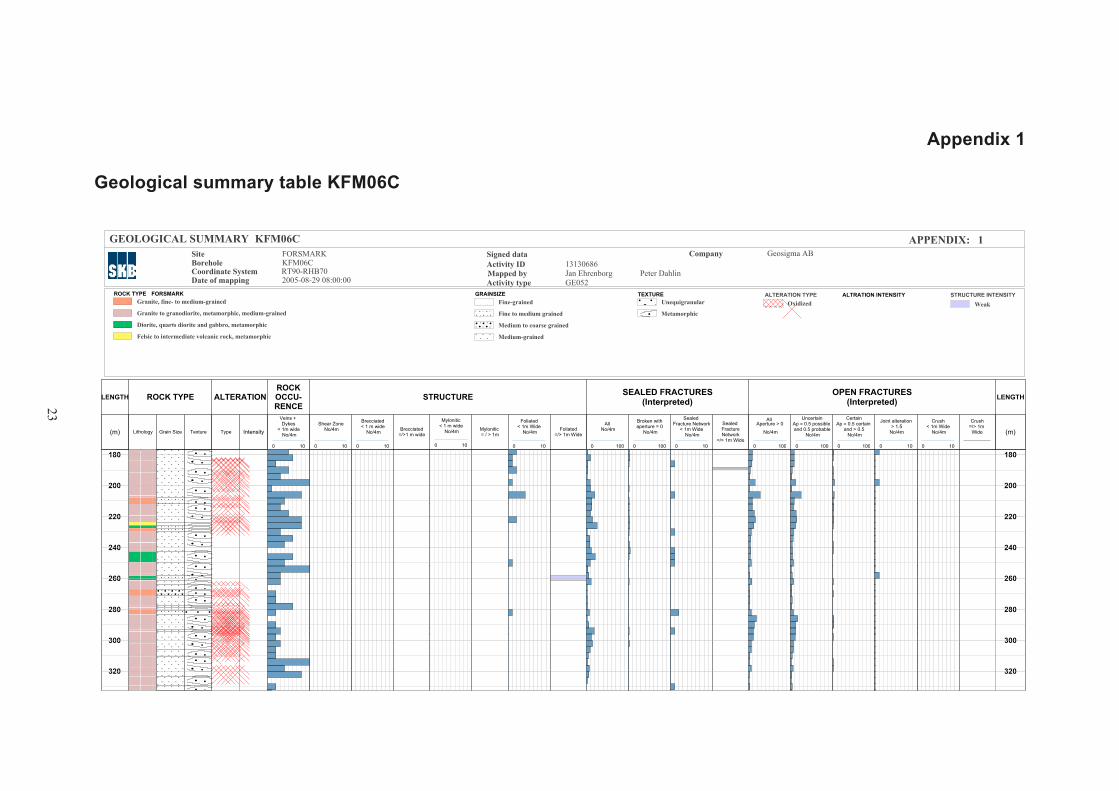
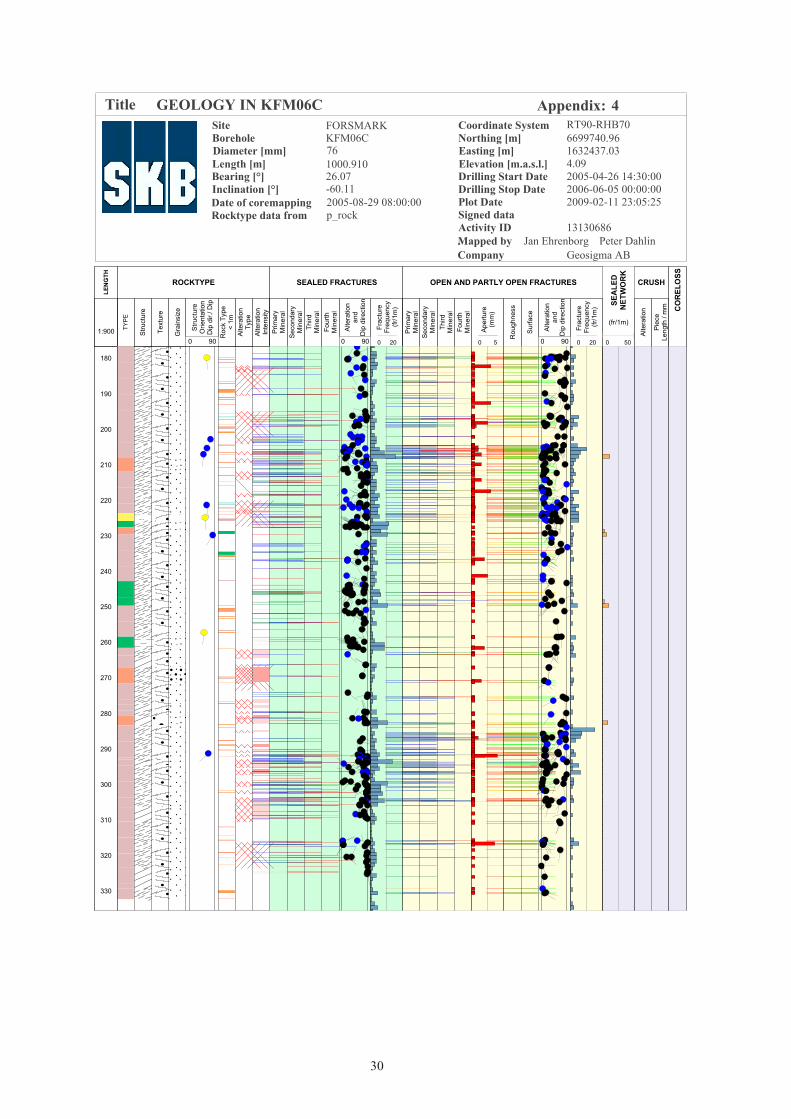
The result of the mapping of KFM06C is principally found in the appendices. The information in the Boremap database has been compressed to the size of an A4-sheet in the Geological Summary table, Appendix 1. The search paths for the Geological Summary table are presented in Appendix 2. Stereographic projection of the orientation of broken fractures are presented in Appendix 3. The WellCad diagram for the mapped interval is presented in Appendix 4.
5.1 Geological summary table for KFM06CThe Geological Summary table for the section 176.54–335.5 m in KFM06C is presented in Appendix 1.
All length information in this chapter is taken from the Geological Summary table (Appendix 1) and therefore may have an error of 5–10 m.
Rock types for the mapped section 176.54–335.5 m in KFM06C are shown in Table 5-1.
Granite to granodiorite, (101057) dominates the lithology in the interval 176.54–335.5 m of KFM06C with 78%. Minor lithologies are diorite to gabbro, (101033) with 10%, granite (111058) with 11% and felsic to intermediate metavolcanite (103076) with only 1%. The granite to granodiorite (101057) and diorite-gabbro (101033) show rather intense lineation but the lineation in the diorite-gabbro (101033) is occasionally weaker.
Oxidation occurs sparsely in short (0.5–9 m), faintly to weakly oxidized intervals. The interval 223.5–262 m lack oxidation, while short oxidized intervals are quite common in the interval 262–310 m.
Veins and dykes show a rather even distribution, with only minor frequency peaks in the mapped interval.
A few decimetre long sections where the foliation is stronger than the lineation, occur in the interval 178–261 m.
Sealed fractures (interpreted) show minor frequency maxima at 208 m, 228 m, 248 m and 294–306 m. Short sealed fracture network occur sparsely throughout the mapped section.
Open fractures (interpreted) are not frequent but minor frequency maxima occur at 206-210 m, 222–226 m and 286–298 m.
Table 5‑1. Rock types for section 176.54–335.5 m in KFM06C.
% Rock Type
78 Granite to granodiorite, metamorphic (101057)11 Granite, fine- to medium-grained (111058)10 Diorite to gabbro, metamorphic, medium-grained (101033)1 Felsic to intermediate metavolcanite fine-grained (103076)
20
It is somewhat difficult to subdivide KFM06C in sections since the mapped geological parameters generally do not show strong variations in the mapped interval. However, an attempt is made to subdivide the mapped interval of KFM06C in five sections using lithology, oxidation, foliation and open fractures (interpreted).
Section I (176.54–202 m): granite to granodiorite (101057). Oxidation occurs in four thin, widely spaced bands. Decimetre-scale foliation zones are quite numerous. Both sealed fractures (interpreted) and open fractures (interpreted) are quite rare.
Section II (202–226 m): granite to granodiorite (101057), a thin band of granite (111058) and a thin band of felsic to intermediate metavolcanite, fine-grained (103076). Oxidation occurs in thin bands throughout the section. These bands are more frequent than in section I. Thin folia-tion zones show the same frequencies as in section I and are found throughout section II. In this section open fractures (interpreted) show the highest frequency maxima in the mapped interval and also a relatively high frequency of sealed fractures.
Section III (226–262 m): granite to granodiorite (101057), thin bands of diorite to gabbro (101033) and a thin band of granite (111058). No oxidation was mapped in this section. Decimetre-scale foliation zones still occur especially along the contacts between diorite to gabbro and granite to granodiorite but also within the diorite-gabbro bands. The frequency of open fractures (interpreted) is low in this section.
Section IV (262–310 m): granite to granodiorite (101057) and of thin bands of granite (111058). This section shows the strongest oxidation and has frequent bands of oxidation. Vein and dyke frequencies are somewhat lower than in other sections and thin foliation zones are much rarer than in sections I, II and III. The lower interval of section IV shows higher frequen-cies of open fractures (interpreted).
Section V (310–335.5 m): granite to granodiorite, metamorphic, medium-grained (101057). No oxidation, except for a 0.5 m thin faintly oxidized band was mapped in this section and no thin foliation zones occur. Sealed fractures (interpreted) as well as open fractures (interpreted) show very low frequency maxima.
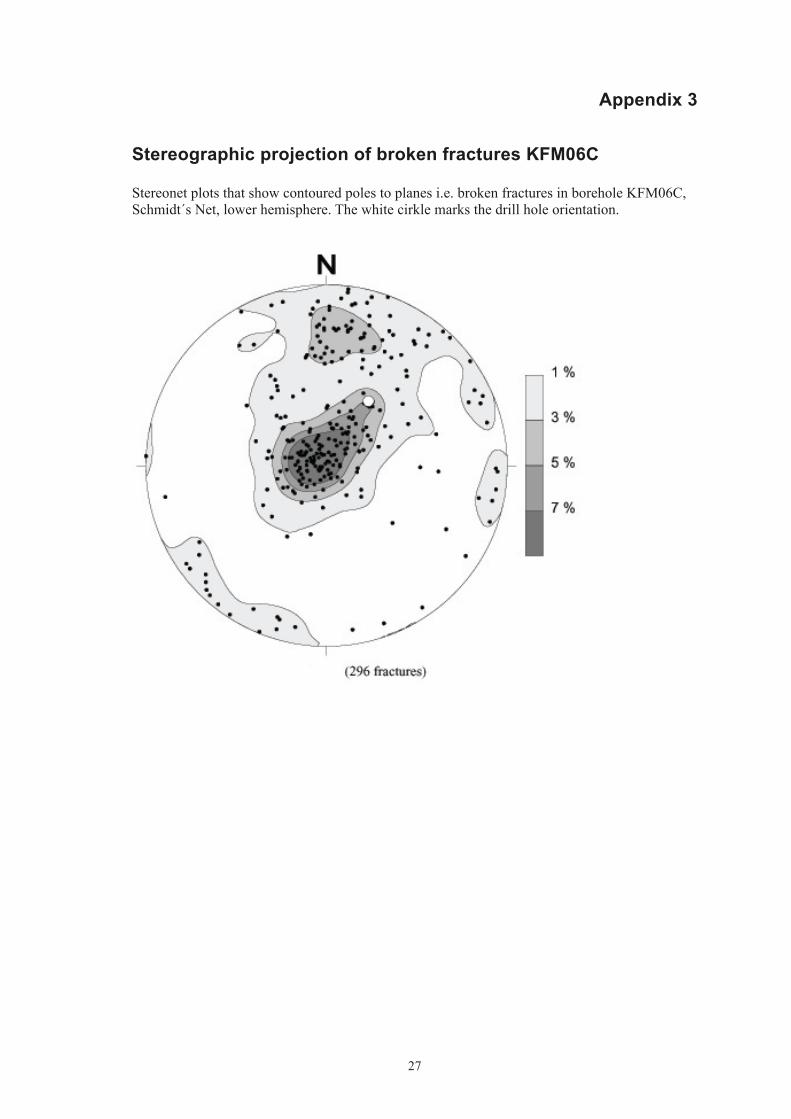
5.2 Orientation of broken fracturesBroken fractures for the mapped interval in KFM06C are presented in the stereogram in Appendix 3. The stereographic information is from plane to pole plot data. Fracture orientation values are strike/dip values using the right hand rule.
The orientation of borehole KFM06C at ground level is 026/-60.
Broken fractures not visible in the BIPS-image were oriented according to the guide-line method (see chapter 4.3.3).
There is a general strong overrepresentation of broken fractures cutting the borehole at high angles compared to fractures cutting the borehole at low angles. This results in artificially high anomaly values for fractures cutting the borehole at high angles and in semi-circular distortion of anomaly shapes in the stereographic plots. These effects are stronger the longer the plotted depth interval. It is therefore not recommended to plot intervals longer than 100 m in the same stereogram.
Stereogram maxima for the mapped interval in KFM06C are few and scattered. The dominating maxima have the orientation 030/05 and 095/65.

21
5.3 Fracture mineralogiesPercentages of open fracture minerals are shown in Table 5-2 and percentages of sealed fracture minerals are shown in Table 5-3.
The total amount of open fractures is 273 (an average of 1.7 open fractures per metre). 75% of all fracture minerals detected in open fractures are chlorite, calcite and clay minerals. Minerals that constitute less than 0.5% have been excluded in Table 5-2.
The total amount of sealed fractures is 327 (an average of 2.1 sealed fractures per metre), see Table 5-3.
Table 5‑2. Percentage of fracture minerals in open fractures, section 176.54–335.5 m in KFM06C.
% Mineral
32 Calcite31 Chlorite12 Clay minerals
9 Pyrite4 No detectable minerals3 Quartz3 Oxidized walls
~6 Sericite, Adularia, Hematite, Zeolite, Fluorite, Laumontite, Iron Hydroxide
Table 5‑3. Percentage of mineral fillings in sealed fractures, section 176.54–335.5 m in KFM06C.
% Mineral
28 Calcite20 Chlorite17 Oxidized walls10 Quartz9 Adularia2 Pyrite1 Hematite1 Laumontite0.5 Epidote
23
Appendix 1
Geological summary table KFM06C
Granite, fine- to medium-grained
Granite to granodiorite, metamorphic, medium-grained
Diorite, quarts diorite and gabbro, metamorphic
Felsic to intermediate volcanic rock, metamorphic
OxidizedFine-grained
Fine to medium grained
Medium to coarse grained
Medium-grained
Unequigranular
Metamorphic
STRUCTURE INTENSITY
Weak
Signed data
GRAINSIZE
Coordinate System RT90-RHB70 Mapped by Jan Ehrenborg Borehole KFM06C
Company Geosigma AB
ROCK TYPE FORSMARK
Site FORSMARK
Date of mapping 2005-08-29 08:00:00 Activity type GE052 ALTERATION TYPE
. Peter Dahlin
APPENDIX: 1
Activity ID 13130686
TEXTURE
GEOLOGICAL SUMMARY KFM06C
ALTRATION INTENSITY
(m)
LENGTH
Lithology TextureGrain Size
ROCK TYPE
Type Intensity
ALTERATION
Veins + Dykes
< 1m wide No/4m
0 10
ROCKOCCU-RENCE
Shear Zone No/4m
0 10
Brecciated< 1 m wide
No/4m
0 10
Brecciated=/>1 m wide
Mylonitic< 1 m wide
No/4m
0 10
Mylonitic = / > 1m
Foliated< 1m Wide
No/4m
0 10
Foliated=/> 1m Wide
STRUCTURE
All No/4m
0 100
Broken withaperture = 0
No/4m
0 100
Sealed Fracture Network
< 1m Wide No/4m
0 10
Sealed FractureNetwork
=/> 1m Wide
SEALED FRACTURES(Interpreted)
All Aperture > 0
No/4m
0 100
UncertainAp = 0.5 possible and 0.5 probable
No/4m
0 100
CertainAp = 0.5 certain
and > 0.5 No/4m
0 100
Joint alteration > 1.5
No/4m
0 10
Crush< 1m Wide
No/4m
0 10
Crush=/> 1m Wide
OPEN FRACTURES(Interpreted)
(m)
LENGTH
180
200
220
240
260
280
300
320
180
200
220
240
260
280
300
320
Page 1
25
Appendix 2
Search paths for the geological summary tableSEARCH PATH TABLE FOR THE GEOLOGICAL SUMMARY TABLE (Appendix:1) APPENDIX: 2
TABLE HEAD LINES INFORMATION SOURCE PRESENTATION Head lines Sub head lines Varcode First suborder Second suborder Interval / frequenceRock type Lithology 5 Sub 1 Interval
Grain size 5 Sub 5 IntervalTexture 5 Sub 6 Interval
Alteration Oxidation 7 Sub 1 = 700 IntervalOxidation intensity 7 Sub 1 = 700 Sub 2 Interval
Rock occurrence Vein + dyke 31 Sub 1 = 2 and 18 FrequenceStructure Shear zone 31 Sub 4 = 41 and 42 Frequence
Brecciated, < 1m wide 31 Sub 4 = 7 FrequenceBrecciated, >/= 1m wide 5 Sub 3 = 7 Sub 4; 101 and 102 = 102 Interval
5 Sub 3 = 7 Sub 4; 103 and 104 = 104Mylonite, < 1 m wide 31 Sub 4 = 34 FrequenceMylonite, >/= 1 m wide 5 Sub 3 = 34 Sub 4; 101 and 102 = 102 Interval
5 Sub 3 = 34 Sub 4; 103 and 104 = 104Foliation zone, < 1 m wide 31 Sub 4 = 81 FrequenceFoliation zone, >/= 1 m wide 5 Sub 3 = 81 Sub 4; 101 and 102 = 102 Interval
5 Sub 3 = 81 Sub 4; 103 and 104 = 104Sealed fracture All unbroken fractures 3 Frequence
and broken fractures 2 SNUM 11= 0Broken fractures, Aperture = 0 2 SNum 11 = 0 FrequenceSealed fracture network < 1 m wide 32 FrequenceSealed fracture network>/= 1 m wide 32 Interval
Open fractures All, Aperture > 0 2 and 3 SNum 11>0 FrequenceUncertain, Aperture = 0.5 possible 2 and 3 SNum 11>0 Sub 12 = 3 Frequence and 0.5 probable 2 and 3 SNum 11>0 Sub 12 = 2Certain, Aperture = 0.5 certain 2 and 3 SNum 11>0 Sub 12 = 1 FrequenceJoint alteration > 1.5 2 SNum16 > 1.5 FrequenceCrush < 1 m wide 4 FrequenceCrush >/= 1 m wide 4 Interval
27
Appendix 3
Stereographic projection of broken fractures KFM06C
Stereonet plots that show contoured poles to planes i.e. broken fractures in borehole KFM06C, Schmidt´s Net, lower hemisphere. The white cirkle marks the drill hole orientation.
29
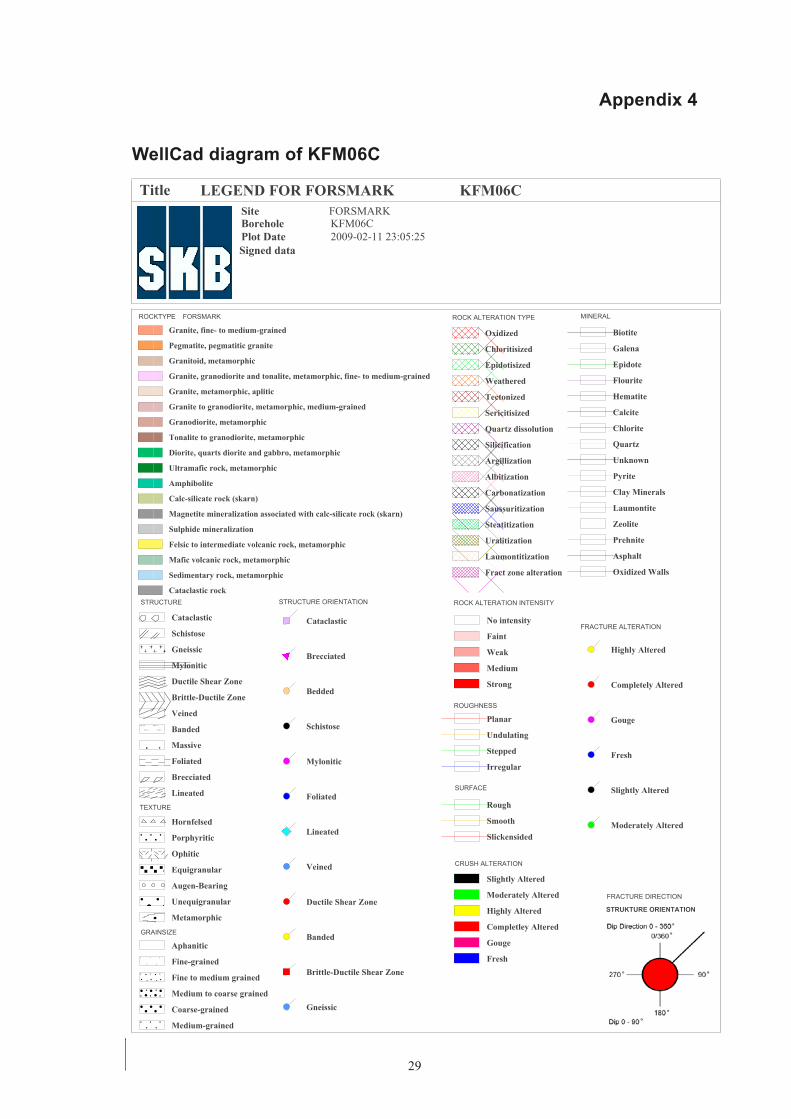
Appendix 4
WellCad diagram of KFM06C
Granite, fine- to medium-grained
Pegmatite, pegmatitic granite
Granitoid, metamorphic
Granite, granodiorite and tonalite, metamorphic, fine- to medium-grained
Granite, metamorphic, aplitic
Granite to granodiorite, metamorphic, medium-grained
Granodiorite, metamorphic
Tonalite to granodiorite, metamorphic
Diorite, quarts diorite and gabbro, metamorphic
Ultramafic rock, metamorphic
Amphibolite
Calc-silicate rock (skarn)
Magnetite mineralization associated with calc-silicate rock (skarn)
Sulphide mineralization
Felsic to intermediate volcanic rock, metamorphic
Mafic volcanic rock, metamorphic
Sedimentary rock, metamorphic
Cataclastic rock
Biotite
Galena
Epidote
Flourite
Hematite
Calcite
Chlorite
Quartz
Unknown
Pyrite
Clay Minerals
Laumontite
Zeolite
Prehnite
Asphalt
Oxidized Walls
No intensity
Faint
Weak
Medium
Strong
Cataclastic
Schistose
Gneissic
Mylonitic
Ductile Shear Zone
Brittle-Ductile Zone
Veined
Banded
Massive
Foliated
Brecciated
Lineated
Hornfelsed
Porphyritic
Ophitic
Equigranular
Augen-Bearing
Unequigranular
Metamorphic
Aphanitic
Fine-grained
Fine to medium grained
Medium to coarse grained
Coarse-grained
Medium-grained
Oxidized
Chloritisized
Epidotisized
Weathered
Tectonized
Sericitisized
Quartz dissolution
Silicification
Argillization
Albitization
Carbonatization
Saussuritization
Steatitization
Uralitization
Laumontitization
Fract zone alteration
Planar
Undulating
Stepped
Irregular
Rough
Smooth
Slickensided
Highly Altered
Completely Altered
Gouge
Fresh
Slightly Altered
Moderately Altered
Slightly Altered
Moderately Altered
Highly Altered
Completley Altered
Gouge
Fresh
STRUCTURE ORIENTATION
Cataclastic
Brecciated
Bedded
Schistose
Mylonitic
Foliated
Lineated
Veined
Ductile Shear Zone
Banded
Brittle-Ductile Shear Zone
Gneissic
STRUKTURE ORIENTATION
Signed data
GRAINSIZE
FRACTURE DIRECTION
SURFACE
ROCK ALTERATION INTENSITY
Title LEGEND FOR FORSMARK KFM06C
CRUSH ALTERATION
Borehole KFM06C Site FORSMARK
ROCK ALTERATION TYPE
ROUGHNESS
ROCKTYPE FORSMARK
FRACTURE ALTERATION
Plot Date 2009-02-11 23:05:25
STRUCTURE
TEXTURE
MINERAL
Page 1
30
Signed dataDate of coremapping 2005-08-29 08:00:00
Coordinate System RT90-RHB70
Length [m] 1000.910
Title GEOLOGY IN KFM06C
Diameter [mm] 76Elevation [m.a.s.l.] 4.09
Mapped by Jan Ehrenborg
Borehole KFM06C
Inclination [°] -60.11
Company Geosigma AB
Site FORSMARK Northing [m] 6699740.96Easting [m] 1632437.03
Appendix: 4
. Peter Dahlin
Drilling Stop Date 2006-06-05 00:00:00Plot Date 2009-02-11 23:05:25
Bearing [°] 26.07
Activity ID 13130686Rocktype data from p_rock
Drilling Start Date 2005-04-26 14:30:00
1:900
LEN
GTH
TYPE
Stru
ctur
e
Text
ure
Gra
insi
ze
Stru
ctur
eO
rient
atio
nD
ip d
ir./ D
ip
0 90
Roc
k Ty
pe<
1mAl
tera
tion
Type
Alte
ratio
nIn
tens
ity
ROCKTYPEPr
imar
yM
iner
alS
econ
dary
Min
eral
Third
Min
eral
Four
thM
iner
al
Alte
ratio
nan
dD
ip d
irect
ion
0 90
Frac
ture
Freq
uenc
y(fr
/1m
)
0 20
SEALED FRACTURES
Prim
ary
Min
eral
Sec
onda
ryM
iner
alTh
irdM
iner
alFo
urth
Min
eral
Rou
ghne
ss
Sur
face
Alte
ratio
nan
dD
ip d
irect
ion
0 90
Ape
rture
(mm
)
0 5
Frac
ture
Fr
eque
ncy
(fr/1
m)
0 20
OPEN AND PARTLY OPEN FRACTURES
Alte
ratio
n
Piec
eLe
ngth
/ m
m
CRUSH
(fr/1m)
0 50
SEA
LED
NET
WO
RK
CO
REL
OSS
180
190
200
210
220
230
240
250
260
270
280
290
300
310
320
330
Page 1