SPE/IADC-173023-MS The Effect of Borehole Pressure on the Drilling Process in Salt
18
SPE/IADC-173023-MS The Effect of Borehole Pressure on the Drilling Process in Salt D.A. Curry, A.M. Lourenco, L.W. Ledgerwood III, and R.L. Maharidge, Baker Hughes; S. da Fontoura and N. Inoue, Pontifical Catholic University of Rio de Janeiro Copyright 2015, SPE/IADC Drilling Conference and Exhibition This paper was prepared for presentation at the SPE/IADC Drilling Conference and Exhibition held in London, United Kingdom, 17–19 March 2015. This paper was selected for presentation by an SPE/IADC program committee following review of information contained in an abstract submitted by the author(s). Contents of the paper have not been reviewed by the Society of Petroleum Engineers or the International Association of Drilling Contractors and are subject to correction by the author(s). The material does not necessarily reflect any position of the Society of Petroleum Engineers or the International Association of Drilling Contractors, its officers, or members. Electronic reproduction, distribution, or storage of any part of this paper without the written consent of the Society of Petroleum Engineers or the International Association of Drilling Contractors is prohibited. Permission to reproduce in print is restricted to an abstract of not more than 300 words; illustrations may not be copied. The abstract must contain conspicuous acknowledgment of SPE/IADC copyright. Abstract Wells penetrate long intervals of salt to access hydrocarbon reservoirs in many locations. High mud weights are frequently used to stabilise the wellbore while drilling through salt formations. High borehole pressures reduce penetration rates in many sedimentary rocks. This effect is significant and contributes greatly to the low penetration rates and high costs associated with deep drilling. This paper presents the results of an integrated laboratory study of the effect of borehole pressure on the drilling process in salt. The study included full-scale laboratory drilling tests, visual single-point cutter tests and triaxial compression tests. The drilling tests were performed using a Polycrystalline Diamond Compact (PDC) bit and a synthetic-based drilling fluid typical of field practice. The visual single-point cutter tests used a clear drilling fluid, enabling observation and video recording of the salt cutting process at elevated borehole pressures along with simultaneous measurement of the cutting forces. The effect of borehole pressure on drilling salt is seen to be small; increasing borehole pressure does not reduce penetration rates in salt as much as it does in many other sedimentary rocks. In contrast to other sedimentary rocks, salt deforms plastically to relatively large strains in compression without loss of mechanical integrity, even at low confining pressures. In addition, the shear stress to achieve a given strain does not increase greatly with confining pressure. Rock cutting forces in the single-cutter tests increased only moderately as borehole pressure was increased from 300 to 6,000 psi. Full-scale bit penetration rates also decreased by relatively small amounts over the borehole pressure range investigated (1,000 to 6,000 psi). Mechanical specific energy levels showed corresponding small increases. These levels, however, were consistently much higher than the compressive stresses required to cause even large strains at a confining pressure equivalent to the borehole pressure. Observations of the deformation and cutting processes in salt combined with results of finite-element analyses of rock and metal cutting explain the low sensitivity to borehole pressure of halite penetration rates and its relatively high specific energy. This study fills a gap in industry knowledge of pressure effects in drilling and sheds light on the processes involved in drilling rock salt. The key practical conclusions are that penetration rates and mechanical specific energy in salt are not greatly influenced by borehole pressure. Consequently, if a high borehole pressure is required to stabilise the wellbore through a salt formation, there is little penetration rate penalty to be paid, except perhaps if increasing the mud weight involves significant changes to the drilling fluid properties other than its density. The comparison of results from visual single point cutter and full-scale bit tests suggests, unsurprisingly, that reducing bit cutter density and modifying drilling fluid properties may both offer routes to increase penetration rates in salt. The current study does not, however, investigate directly the impact of fluid properties on the drilling process in salt. Introduction In an increasing number of locations around the world, including the Rocky Mountains, the Gulf of Mexico, the Middle East, offshore Brazil and offshore West Africa, wells must be drilled through long intervals of salt to access underlying hydrocarbon reserves. In contrast to many of the other rocks in sedimentary basins which were formed by the deposition and subsequent compaction and cementation of rock fragments, rock salt was usually formed by precipitation when water evaporated from enclosed lakes or seas. Rock salt is composed primarily of the mineral halite (sodium chloride), but it can contain layers or inclusions of other evaporite minerals, clays and/or silts. Halite has relatively low density (2.17 gm/cc), low mineral hardness (2 to 2.5 on Mohs’ scale), low melting point (~800 ° C) and high water solubility compared to most of the minerals found in
-
Upload
independent -
Category
Documents
-
view
0 -
download
0
Transcript of SPE/IADC-173023-MS The Effect of Borehole Pressure on the Drilling Process in Salt

SPE/IADC-173023-MS
The Effect of Borehole Pressure on the Drilling Process in Salt D.A. Curry, A.M. Lourenco, L.W. Ledgerwood III, and R.L. Maharidge, Baker Hughes; S. da Fontoura and N. Inoue, Pontifical Catholic University of Rio de Janeiro
Copyright 2015, SPE/IADC Drilling Conference and Exhibition This paper was prepared for presentation at the SPE/IADC Drilling Conference and Exhibition held in London, United Kingdom, 17–19 March 2015. This paper was selected for presentation by an SPE/IADC program committee following review of information contained in an abstract submitted by the author(s). Contents of the paper have not been reviewed by the Society of Petroleum Engineers or the International Association of Drilling Contractors and are subject to correction by the author(s). The material does not necessarily reflect any position of the Society of Petroleum Engineers or the International Association of Drilling Contractors, its officers, or members. Electronic reproduction, distribution, or storage of any part of this paper without the written consent of the Society of Petroleum Engineers or the International Association of Drilling Contractors is prohibited. Permission to reproduce in print is restricted to an abstract of not more than 300 words; illustrations may not be copied. The abstract must contain conspicuous acknowledgment of SPE/IADC copyright.
Abstract Wells penetrate long intervals of salt to access hydrocarbon reservoirs in many locations. High mud weights are frequently used to stabilise the wellbore while drilling through salt formations. High borehole pressures reduce penetration rates in many sedimentary rocks. This effect is significant and contributes greatly to the low penetration rates and high costs associated with deep drilling.
This paper presents the results of an integrated laboratory study of the effect of borehole pressure on the drilling process in salt. The study included full-scale laboratory drilling tests, visual single-point cutter tests and triaxial compression tests. The drilling tests were performed using a Polycrystalline Diamond Compact (PDC) bit and a synthetic-based drilling fluid typical of field practice. The visual single-point cutter tests used a clear drilling fluid, enabling observation and video recording of the salt cutting process at elevated borehole pressures along with simultaneous measurement of the cutting forces.
The effect of borehole pressure on drilling salt is seen to be small; increasing borehole pressure does not reduce penetration rates in salt as much as it does in many other sedimentary rocks. In contrast to other sedimentary rocks, salt deforms plastically to relatively large strains in compression without loss of mechanical integrity, even at low confining pressures. In addition, the shear stress to achieve a given strain does not increase greatly with confining pressure. Rock cutting forces in the single-cutter tests increased only moderately as borehole pressure was increased from 300 to 6,000 psi. Full-scale bit penetration rates also decreased by relatively small amounts over the borehole pressure range investigated (1,000 to 6,000 psi). Mechanical specific energy levels showed corresponding small increases. These levels, however, were consistently much higher than the compressive stresses required to cause even large strains at a confining pressure equivalent to the borehole pressure. Observations of the deformation and cutting processes in salt combined with results of finite-element analyses of rock and metal cutting explain the low sensitivity to borehole pressure of halite penetration rates and its relatively high specific energy.
This study fills a gap in industry knowledge of pressure effects in drilling and sheds light on the processes involved in drilling rock salt. The key practical conclusions are that penetration rates and mechanical specific energy in salt are not greatly influenced by borehole pressure. Consequently, if a high borehole pressure is required to stabilise the wellbore through a salt formation, there is little penetration rate penalty to be paid, except perhaps if increasing the mud weight involves significant changes to the drilling fluid properties other than its density. The comparison of results from visual single point cutter and full-scale bit tests suggests, unsurprisingly, that reducing bit cutter density and modifying drilling fluid properties may both offer routes to increase penetration rates in salt. The current study does not, however, investigate directly the impact of fluid properties on the drilling process in salt.
Introduction In an increasing number of locations around the world, including the Rocky Mountains, the Gulf of Mexico, the Middle East, offshore Brazil and offshore West Africa, wells must be drilled through long intervals of salt to access underlying hydrocarbon reserves. In contrast to many of the other rocks in sedimentary basins which were formed by the deposition and subsequent compaction and cementation of rock fragments, rock salt was usually formed by precipitation when water evaporated from enclosed lakes or seas. Rock salt is composed primarily of the mineral halite (sodium chloride), but it can contain layers or inclusions of other evaporite minerals, clays and/or silts. Halite has relatively low density (2.17 gm/cc), low mineral hardness (2 to 2.5 on Mohs’ scale), low melting point (~800 ° C) and high water solubility compared to most of the minerals found in

2 SPE/IADC-173023-MS
clastic and carbonate rocks. Rock salt typically has very limited porosity and is effectively impermeable. Laboratory studies have shown rock salt to be relatively weak. Unlike clastic and carbonate rocks, it is capable of deforming to substantial strains in compression without loss of mechanical integrity, that is it experiences true plastic deformation, even at quite low confining stresses (Handin 1953; Price 1979). Further, it is known to deform under constant load (“creep”) at temperatures typical of those found at even relatively shallow depths (Handin 1986; Infante and Chenevert 1989).
Problems with tight hole and stuck pipe when drilling, and difficulties when running casing are frequently experienced in salt formations. Unsurprisingly, over-gauge hole is also common in salt formations drilled with unsaturated water based drilling fluids. After drilling, casing collapse can be a major problem (Khalaf and El Shennawy 1979; Sheffield et al 1983; Unger and Howard 1986; Holt and Johnson 1986; Infante and Chenevert 1989; Willson et al 2003). Tight hole in salt is usually associated with the salt creeping, that is deforming (“flowing”), into the wellbore with time under the influence of the difference between the earth stresses and the wellbore pressure. Consequently, high mud weights are often used when drilling salt in an attempt to control creep-induced tight hole.
It has long been known that high borehole pressures reduce penetration rates in many sedimentary and igneous rocks (Murray and Cunningham 1955; Eckel 1958; Cunningham and Eenink 1959; Garnier and Van Lingen 1959; Rowley et al 1961; Black and Green 1978; Walker et al 1986; Andersen and Azar 1993). A number of the early laboratory studies showed that it was the difference between the borehole pressure and the pore pressure adjacent to the workfront which controlled pressure effects on penetration rate in permeable rocks (Eckel 1958; Cunningham and Eenink 1959, Van Lingen 1962; Black et al 1985). In contrast, it has since been shown that in impermeable rocks, or at least in hard shales, the absolute borehole pressure controls penetration rate independent of the initial pore pressure (Gray-Stephens et al 1994). The studies investigated basalt, dolomite, limestones, sandstones, shales, and even loose sand. Given the substantial differences observed between the effect of confining pressure on the deformation and fracture properties of rock salt and on those of igneous and nonevaporite sedimentary rocks, it is not clear that the same pressure effects on the drilling process can be expected in salt as those seen in other rocks.
Whitfill at al (2002) published the results of a study of the effects of drilling fluid composition on penetration rates and hole size in rock salt. They did not, however, study the effect of borehole pressure. As far as the authors are aware, no systematic study has been published on the pressure effects on the drilling process in salt. The current study was, therefore, performed to address this apparent gap in industry knowledge. It integrates the results of triaxial compression tests, visual single-point cutter tests and laboratory drilling tests to establish the effect of borehole pressure on the drilling process in salt.
Experimental Equipment and Procedures Rock Salt
All tests reported in this study were performed on rock salt samples cored in-situ from an extensive Jurassic salt deposit. X-ray diffraction measurements confirmed the rock consisted almost entirely of halite, with only small amounts of quartz, calcite, anhydrite, dolomite and illite. Porosity and grain density were measured on several 1 in. and 1.5 in. diameter cores using a helium porosimeter. Porosity varied from 0.6% to 2.5% and average grain densities varied from 2.163 to 2.171 gm/cm3. The grain size was of order 1 mm, but varied quite widely with occasional grains as large as 10 mm in diameter.
Ultrasonic wave velocities were measured on two 1 in. diameter cores at room temperature as functions of hydrostatic stress using a standard pulsed through-transmission method, with measurements being made as the hydrostatic stress was first increased by steps from one value to the next and then decreased in steps back to ambient. Each core experienced one stress cycle. Bulk density was determined as the measured weight divided by the volume calculated from the measured core length and diameter at stress. Dynamic Young’s modulus and Poisson’s ratio values were calculated from the ultrasonic p- and s-wave velocities and the bulk density using industry standard formulae. The results are given in Table 1.
Triaxial Compression Tests
A number of 1.5in diameter cores were prepared for compression testing. They were cored, cut to length and end-ground using a light synthetic isoparaffin coolant. The prepared samples were wrapped in plastic and stored in an air-tight container until tested.
Compression tests were performed at three different strain rates (0.1%/min, 1%/min and 10%/min) and six different confining stresses (0, 300, 3000, 5000, 10,000 and 15,000 psi). All tests were conducted at room temperature (72°F). Test procedures and apparatus followed closely the ASTM recommended practices. A circumferential displacement gauge was wrapped around the rubber jacketed sample and used to measure changes in core circumference during testing. Two LVDTs inside the confining pressure vessel measured the change in the length of the core. The samples were initially loaded hydrostatically up to the desired confining stress at a constant rate of 250 psi/min. Thereafter, the axial deviatoric stress was increased at the desired strain rate. The test was terminated when one of the LVDTs reached its dynamic range limit of approximately 0.2 in. Axial strain was calculated from the LVDTs outputs and radial strain from the circumferential displacement gauge. Volumetric strain was calculated from the axial and radial strain values.
To investigate the salt’s high strain behaviour, two further compression tests were performed at a strain rate of 10%/min and a confining stress of 3,000 psi but on a different load frame and without using the circumferential displacement gauge or LVDTs. This arrangement allowed the samples to be loaded to an axial strain in excess of 20%. Axial deformation was measured using the load frame crosshead displacement.

SPE/IADC-173023-MS 3
After testing, several of the compression samples were mounted, impregnated with epoxy resin and sectioned for optical photo-microscopic examination. Visual Single Point Cutter Tests
Tests were performed using the visual single point cutter test machine shown in Fig. 1. This machine enables the axial, tangential and radial forces acting on a single PDC cutter to be measured while cutting a 7.5 in diameter rock sample under elevated fluid pressure. The cutter and rock sample are contained within a pressure vessel filled with a transparent nonaqueous liquid. The liquid can be pressurised up to 10,000 psi. There is no imposed liquid circulation during testing. The rock sample is rotated while the cutter is advanced into the rock under either axial load (weight on bit) or axial displacement (rate of penetration) control. Two optical ports enable the face and side of the cutter to be observed during testing. High speed digital cameras can be used to record videos of the cutting process at up to 1,000 frames/sec. Cutting forces can be recorded at a data rate of up to 5,120 Hz.
The current tests used a 0.625 in. (15.8 mm) diameter non-polished PDC cutter with a 0.016 in. (0.4 mm), 45° chamfer; it was mounted at a backrake angle of 20°. The drilling fluid was a polyalphaolefin (synthetic drilling fluid base oil) with kinematic viscosity of approximately 17 cSt at 100°F. The tests were performed at ambient temperature with a rock rotary speed of 60 RPM and a rate of cutter advance of 10 ft/hr (0.033 in./sec). This rotary speed corresponds to a linear cutting speed of approximately 1.5 ft/sec. Tests were performed at fluid pressures of 300, 1000, 3000 and 6000 psi. Cuttings were collected from the pressure vessel and photographed shortly after each test was completed. The cuttings from one test performed at 3,000 psi fluid pressure were also mounted in epoxy resin and prepared for photo-microscopy.
The ratio of tangential to axial cutter forces, referred to as the coefficient of friction by analogy with sliding friction and represented here by µ, was calculated from the measured forces:
µ = Ft / Fa ……………….……………………………………… (1)
where Ft is the tangential force and Fa the axial force acting on the cutter.
Mechanical specific energy (MSE) is defined as the energy required to destroy a unit volume of rock, a concept first introduced by Simon (1963). In these tests the work done by the tangential force was approximately 500 times greater than the work done by the axial force, therefore, the latter was ignored in calculating MSE. Consequently, MSE was determined from the tangential cutting force divided by the cross-sectional area of cut rock Ac:
MSE = Ft / Ac ……………………………………………………… (2)
The cut area of rock Ac was estimated from the area of cutter below the original horizontal surface of the rock minus the area of cut at the previous passage of the cutter over that point of the rock sample.
Laboratory Drilling Tests
Drilling tests were performed using a high pressure laboratory drilling test machine (Fig.s 2 and 3) (Ledgerwood and Kelly 1991, Isbell and Berzas 1999). The machine enables a jacketed cylindrical rock sample to be subjected to confining and overburden stresses equivalent to the earth stresses experienced at depth. The sample is drilled with a full size bit while drilling fluid is circulated through the bit at a pressure equivalent to the wellbore pressure at depth and at a flow rate representative of those used in field drilling operations with that bit. Tests can be operated using weight on bit or penetration rate control. Table 2 summarises the drilling test machine’s capabilities.
The tests were performed using rock cores with diameters of 16 in. and lengths of 36 in., cut from the quarried rock salt block. The combination of low, unconnected porosity and negligible permeability means pore pressure had limited significance in the simulation of downhole conditions. Consequently no attempt was made to saturate the samples before testing and the tests were conducted with the sample bases vented to atmospheric pressure.
An 8.75 in diameter M223 5-bladed PDC bit (Fig. 4) was used for all tests. It was fitted with a total of thirty six 0.625 in. (15.8 mm) diameter 0.016 in. (0.4 mm) chamfer cutters. 32 of these cutters were mounted on the face of the bit. The bit was fitted with 5 nozzles, all of 10/32 in. diameter.
An 11.6 ppg synthetic based mud was used for all tests. Table 3 summarises the mud properties measured before each test. A flow rate of 400 gpm was used for all tests, giving approximately 4.5 HSI at the bit.
Tests were run at borehole pressures of 1000, 3000 and 6000 psi. All tests followed the same pattern and protocol. The sample was sealed in the pressure vessel, the mud flow rate was progressively increased to the desired value, and the chokes adjusted to give the desired borehole pressure. Bit rotation was established, the bit was brought down to touch the top of the rock sample, the weight on bit was progressively increased and the bit enabled to drill ahead until the face of the bit was buried and the bottomhole pattern was established. At this point, the test proper started. Intervals were drilled with steady weights on bit of nominally 5000, 10,000 and 15,000 lbs at 60 and 120 RPM, and then with weights on bit of 5000 and 10,000 lbs at 180 RPM before ending the test with a repeat interval at 5,000 lbs and 60 RPM.
Key parameters characterizing the drilling environment, the bit operating parameters and the drilling response were recorded at high frequency throughout each test. After the test, the high-frequency data were sampled to generate a lower-

4 SPE/IADC-173023-MS
frequency data file. Several further parameters which are representative of the drilling process, that is penetration rate, mechanical specific energy and bit coefficient of friction, were computed from the low-frequency data. Penetration rate (ROP) was computed from bit depth and time using a moving window average. The concept of mechanical specific energy has been used to investigate energetic efficiency in rotary drilling (Teale 1964, Pessier and Fear 1992). The mechanical specific energy (MSE) was calculated from the test data using:
𝑀𝑆𝐸 = ! ∙!"#!∙!!
+ !"#∙!"#∙!"#!"#∙!!
...………….………………………...…………. (3)
where WOB is the weight on bit, RPM is the bit rotary speed in revolutions per minute, TOR is the bit torque, D the bit diameter and ROP the penetration rate (assuming consistent units for WOB, TOR, ROP, and D). Pessier and Fear (1992) also utilized a coefficient of friction µ to characterize the bit torque as a function of weight on bit. Representing the bit face as a disk pressed against a flat plate by a force equal to the weight on bit and assuming a uniform contact pressure, the relationship between torque and weight on bit becomes:
TOR = !∙!∙!"#
!" ...………….………………………...…...….……….….. (4)
The coefficient of friction µ was therefore calculated from:
µ = !"∙!"#
!∙!"#………………………………………………… ……….…. (5)
Intervals of steady drilling were identified and the key parameters averaged over each interval to generate “reduced data”
which represent the average conditions, operating parameters and drilling response for each steady drilling interval. The reciprocal nature of penetration rate means that a simple arithmetic mean of penetration rate values is not representative of the interval average. So the average penetration rate for the interval was instead computed from the distance drilled in that interval divided by the time taken to drill the interval. The mechanical specific energy value for the interval was computed using this interval penetration rate and the average weight on bit, rotary speed and torque values.
Results Triaxial Compression Tests
Fig.s 5(a), (b) and (c) show the total axial stress (that is the confining pressure plus the additional axial stress) plotted against axial and radial strain for all confining pressures at strain rates of 0.1%/min, 1%/min and 10%/min respectively. Distinctly non-linear stress :strain behavior was observed at all strain rates and confining pressures. There were no easily identified single values of Young’s modulus or Poisson’s ratio to represent the salt’s quasi-static elastic properties at any strain rate and confining stress. Only in the unconfined tests did the axial stress show a peak, enabling values of unconfined compressive strength (UCS) to be identified (Table 4). Within experimental variation, there was no discernable consistent effect of strain rate on UCS, which was approximately 3,500 psi at all three strain rates.
In contrast, the axial stress rose with increasing strain throughout all the confined tests. That is, no peak load was reached in any confined test. Fig.s 6(a), (b) and (c) show the deviatoric axial stress (total stress minus confining pressure) plotted against the axial strain for all confining pressures, again at strain rates of 0.1%/min, 1%/min and 10%/min respectively. The deviatoric stress for any given strain is somewhat higher in the confined tests than the unconfined. Otherwise, the deviatoric stress required to achieve any given strain increased little as the confining pressure increased above about 3,000 psi. Table 5 shows the total and deviatoric axial stresses at 1% axial strain from the tests at all strain rates and confining pressures. This strain, and hence the associated axial stress, can be thought of as representing the onset of large scale permanent deformation in the absence of any clearly defined yield stress. This deviatoric stress initially increased somewhat as the confining pressure was increased, but it became substantially independent of confining pressure for confining pressures above about 3,000 psi. There was a small but consistent trend for both the total and the deviatoric axial stresses at 1% strain at any given confining pressure to increase with increasing strain rate.
Inhomogeneous deformation, associated with particularly large grains, led to inconsistency in the radial and volumetric strain measurements at higher strains. In all cases, the sample volume decreased in the early stages of deviatoric loading but then began to increase with continued loading. The increases in volume were not large for example, the volume increased by less than 2% at 3% axial strain for all except the lowest confining pressures.
After being unloaded, all samples, including those tested unconfined, were seen to have deformed without obvious large scale cracking. This was even the case for the two samples deformed to strains in excess of 20% at a confining pressure of 3,000 psi. Fig.s 7 (a), (b) and (c) show the samples deformed to 3.5% strain at a strain rate of 10%/min unconfined, at 3,000 psi, and at 15,000 psi confining pressure respectively. Fig. 8 shows the sample deformed at the same strain rate to 25% strain at 3,000 psi confining pressure.

SPE/IADC-173023-MS 5
Visual Single Point Cutter Tests Fig.s 9 (a) to (e) are still images from both the front and profile high-speed cameras which show cuttings forming in the
visual single point cutter tests conducted at 300, 1000, 3000 and 6000 psi fluid pressures. The first pair of images is for a depth of cut of 0.02 in. at 300 psi fluid pressure. In all other instances, the depth of cut was approximately 0.065 in., which corresponded roughly to two revolutions of the sample after the cutter first engaged the rock surface. It can be seen that well developed long, ribbon-like cuttings were formedthat ran up the face of the cutter in the test performed at 300 psi borehole pressure. Many rocks show increasingly ductile behavior with increasing confining pressure, but the cuttings became less ribbon-like and more fragmented with increasing borehole pressure. Even at 300 psi confining pressure, the cuttings tended to be fragmented when the depth of cut was less than about 0.03 in.
Fig.s 10(a) and (b) are transmission optical micrographs of sections through triaxial test samples deformed to 3.5% and 25% strain respectively, at 3,000 psi confining pressure. Fig. 10 (c) shows a section through a sample of cuttings collected from the visual single point cutter test conducted at the same confining pressure. All sections are shown at the same magnification. The blue colouration indicates open cracks into which epoxy resin had penetrated during the infiltration process. Despite the lack of obvious cracking on the surface of the deformed triaxial test samples, the sections of both samples show a moderate amount of cracking around grains. The high strain sample also shows well developed macroscopic shear cracks. The grains themselves were relatively free from micro-cracking. In contrast the grains within the cutting were not only fragmented but also showed extensive micro-cracking within the grains. From this it is deduced that the material in the cutting experienced strain levels substantially in excess of those to which the triaxial test samples were subject.
Axial and tangential cutter forces from each of the tests are shown plotted against total depth of cut in Fig.s 11 and 12 respectively. It should be noted that the cutter advanced approximately 0.033 in. per revolution of the rock sample, so that the rock sample rotated about 6 times between the cutter starting to penetrate the rock surface and the end of the test. As expected, these forces rose with increasing depth of cut. However both axial and tangential forces showed considerable variation during any one test, with periodic and substantial transient decreases. Examination of the force : depth of cut records indicates that the significant force decreases tended to occur about every revolution of the rock sample, suggesting they resulted from some inhomogeneity in the rock. Overall the forces measured through the course of the test conducted at 300 psi fluid pressure were lower than those measured at the same depths of cut in the other tests. There was little difference between the axial forces measured in the other tests. The tangential forces measured in the test conducted at 6,000 psi fluid pressure tended to be higher than those measured at equivalent depths of cut in the other tests. The ratios of tangential to axial forces, that is the coefficients of friction µ, are shown as functions of depth of cut in Fig. 13. They were not well defined at very low depths of cut, but increased as the depth of cut increased up to about 0.05 in. After that, they remained more or less stable or decreased slightly with increasing depth of cut. The coefficient of friction was somewhat lower for the test conducted at 1,000 psi than it was for the other tests. Apart from this, it showed no obvious or consistent effect of fluid pressure. Fig. 14 presents the mechanical specific energy (MSE) values computed from measured tangential forces and areas of cut inferred from the cutter position shown as functions of depth of cut. In all tests MSE decreased initially quite rapidly with increasing depth of cut before stabilizing at a more or less constant value when the depth of cut exceeded about 0.05 to 0.075 in. (after about two revolutions of the sample). It should be noted that the chamfer on the cutter was 0.016 in. deep whereas the cutter advanced by 0.033 in. per revolution. As a result the area of the chamfer engaged with the rock continued to represent a non-negligible fraction of the total engaged area of the cutter throughout the tests. Table 6 gives the values of MSE and µ averaged over a depth of cut range of 0.05 to 0.20 in. The impact of fluid pressure on MSE was not great. The average MSE increased by about 20% as the fluid pressure increased from 300 to 3,000 psi. It increased by a larger proportion when fluid pressure was raised from 3,000 to 6,000 psi, but even then the increase was less than 45%.
Laboratory Drilling Tests
Fig. 15 shows the reduced penetration rate values from each test as functions of weight on bit. Unsurprisingly, the penetration rate at each borehole pressure increased with increasing weight on bit and rotary speed. The penetration rates at 1,000 and 3,000 psi borehole pressure were substantially the same for any given weight on bit and rotary speed. In other words, the penetration rate showed no consistent variation with borehole pressure over this pressure range. The penetration rates at 6,000 psi borehole pressure were, however, somewhat lower than those at the lower borehole pressures. For any given weight on bit and rotary speed, the penetration rate at 6,000 psi borehole pressure was around 70% of that at 1,000 or 3,000 psi borehole pressure.
Fig. 16 shows the bit torque in each test increased with increasing weight on bit but was independent of rotary speed. There was a trend for the torque values at 3,000 psi borehole pressure to be slightly higher than those at both 1,000 and 6,000 psi borehole pressure, but the difference is small and it is not at all clear that it is significant. Coefficients of friction µ calculated from the torque and weight on bit data are shown as functions of penetration per bit revolution (as discussed later, this is not necessarily identical to depth of cut) in Fig. 17. At all borehole pressures µ increased with increasing penetration per revolution. As would be expected from the torque data shown in Fig 16, the µ values were substantially independent of rotary speed. For any given penetration per revolution, the value of µ at 3,000 psi borehole pressure was slightly higher than those observed at borehole pressures of 1,000 and 6,000 psi.
Mechanical specific energy values from all tests are shown in Fig 18 as functions of penetration per revolution. At any one borehole pressure, MSE decreased with increasing penetration per revolution but was substantially independent of rotary

6 SPE/IADC-173023-MS
speed. MSE tended to be higher at higher borehole pressure; this trend increased with increasing penetration per revolution. For a penetration per revolution of 0.1 in, MSE at 6,000 psi borehole pressure was about 30% higher than that at 1,000 psi borehole pressure, but for a penetration per revolution of 0.05 in, it was only 20% higher. Discussion The first point to make is that the effects of borehole pressure on penetration rate and mechanical specific energy in salt are not large. Examination of the current results indicates that increasing the borehole pressure from 3,000 to 6,000 psi would most likely reduce the penetration rate by less than 20%, and increase the mechanical specific energy by less than 10%. In the case of a salt formation in a normally pressured hole interval, such an increase in borehole pressure is equivalent to going from 9 to 18 ppg mud weight at a depth of 6,400 ft. Experience suggests such extreme mud weights are not normally needed to control hole problems in salts; therefore, the penetration rate penalty paid for using a borehole pressure sufficient to provide adequate hole quality through most salt formations is likely to be low. This conclusion does require qualification. Increasing the drilling fluid density requires the addition of weighting material and a significant increase in density may also involve increasing the fluid’s viscosity to enable weighting solids to be held in suspension. The current study did not investigate fluid property effects on salt drilling. However, it can be inferred from comparison of the visual single point cutter and full scale drilling test results that the fluid properties may well influence the drilling process in salt. There is much debate about the extent to which solids may or may not influence the drilling process, as summarized by Curry et al (2013). Their study indicated that solids content per se did not directly influence penetration rates in the hard carbonates tested. The authors are not aware of any clear evidence that the addition of weighting solids reduces penetration rates in salt but this possibility certainly cannot be discounted. It has therefore to be acknowledged that a large change in drilling fluid density could potentially decrease salt penetration rates not by virtue of the increased borehole pressure but rather because of as yet unquantified effects of the fluid properties on the drilling process.
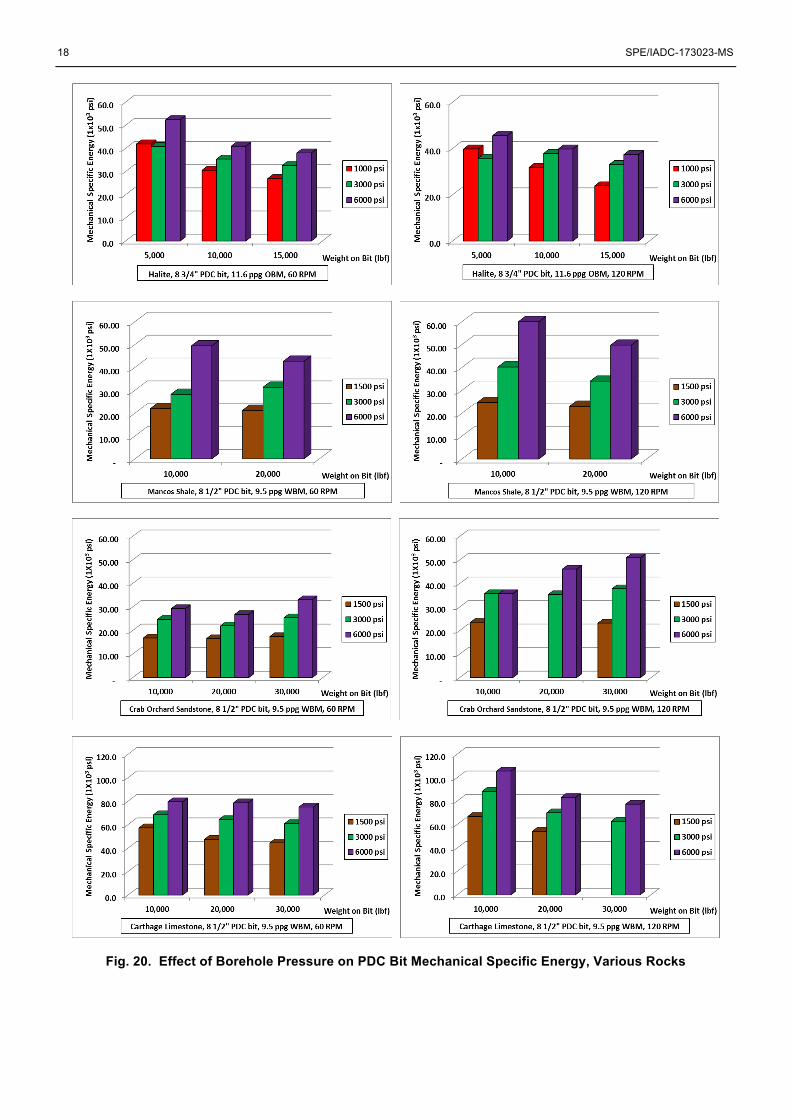
The magnitude of the observed effect of borehole pressure on salt drilling can be compared with that observed in other rocks. Fig.s 19 and 20 show penetration rates and mechanical specific energy data for several sedimentary rocks (Mancos shale, Crab Orchard sandstone, and Carthage limestone) drilled with an 8.5 in PDC bit (with 0.625 in cutters but 6 as opposed to the 5 blades used in the current study) and a 9.5 ppg water based mud at various weights on bit and rotary speeds and borehole pressures of approximately 1,500 to 5,500 psi. Overall, the salt showed fractional penetration rate reductions from 1,000 to 6,000 psi borehole pressure equivalent to those observed in the Carthage limestone over a smaller range of borehole pressures and smaller than those seen in the other rocks. The salt generally showed lower fractional increases in mechanical specific energy with increasing borehole pressure than the other rocks did over smaller borehole pressure ranges. Andersen and Azar (1993) reported PDC bit penetration rates at 1,750 psi borehole pressure in Catoosa shale which were only 25 to 50% of those at 1,000 psi. Other studies conducted with roller cone bits show large fractional reductions in penetration rate with increasing borehole pressure. Cheatham, Nahm and Heitkamp (1985) reported penetration rates in Mancos shale at 4,000 psi borehole pressure which were 33 to 60% lower than those at 1,000 psi borehole pressure, with the fractional reduction in penetration rate increasing as weight on bit increased. An extreme case, admittedly in tests performed with a microbit as opposed to a full size bit, is that reported by Cunningham and Eenink (1959). They measured a 90% reduction in penetration rate in Berea sandstone going from 1,000 to 6,000 psi borehole pressure. Overall, it is concluded that the efficiency of the drilling process in salt is less sensitive to increasing borehole pressure than it is in most other sedimentary rocks.
The salt’s compressive strength seen in the triaxial tests became substantially independent of confining pressure for confining pressures above about 3,000 psi. As described above, the penetration rate did not show equivalent independence of borehole pressure. Thus factors other than increasing compressive strength caused the observed, admittedly relatively small, reduction in penetration rate with increasing borehole pressure.
The mechanical specific energy levels in the full scale bit tests were roughly twice those at most depths of cut in the visual single point cutter tests. Typically, for any given fluid pressure, the full bit mechanical specific energy levels at 0.1 in penetration per revolution were similar to those in the equivalent visual single point cutter test at a depth of cut of 0.02 in. Both test machines are calibrated regularly, so this disparity in mechanical specific energy levels is considered to be a real effect and not simply an artefact of testing. It is plausible that two separate processes contributed to the disparity in specific energy values; one relating to bit geometry and the other to the fluid. With all PDC bits, the cutters on the bit face overlap when projected onto a single section containing the bit axis so much of the hole bottom is cut by more than one cutter per bit revolution. Put another way, the depth to which any one cutter penetrates the rock is usually less than the bit’s overall penetration per revolution. The number of times any point on the hole bottom is cut per revolution of the bit is sometimes referred to as the redundancy of the bit design. The bit used in these tests had 32 face cutters of 0.625 in. diameter. The sum of the cutter diameters is 4.57 times the bit radius. Taking a simplistic view, if the cutters are all buried to a depth equal to half their diameter, any point on the hole bottom is, on average, cut by 4.57 cutters per revolution of the bit. That is, the depth of cut of any one cutter can be as little as 1/4.57 (or 22%) of the overall penetration per revolution. The mechanical specific energy in the full scale bit tests at a depth of cut of 0.1 in. was in the range 28,000 to 38,000 psi depending on borehole pressure. The weight on bit necessary to achieve a given penetration per revolution increased with increasing borehole pressure, so this is greater than the range in mechanical specific energy for constant weight on bit and rotary speed. The mechanical specific energy at depths of cut of 0.022 in in the visual single point cutter tests was in the range 15,000 to 40,000 psi. The bit used in these tests would need a depth of cut of 0.3125 in. to achieve a level of redundancy even close to that

SPE/IADC-173023-MS 7
required to explain the observed difference between full bit and visual single point cutter test levels of mechanical specific energy. Hence it is concluded that another process caused at least some of this difference.
This other process is suspected to be related to the drilling fluid. The full scale tests were conducted with a drilling fluid typical of field operations, an invert emulsion of calcium chloride brine in a synthetic hydrocarbon base fluid, viscosified and weighted with suspended barite particles. The visual single point cutter tests used the base fluid alone, without the emulsion droplets, suspended solids or viscosifying agents. Otherwise the fluid would have been opaque and it would not have been possible to view the cutting process. Whitfill et al (2002) showed by review of field data that penetration rates in salt formations tended to be higher with synthetic based fluids than water based fluids. There is abundant evidence that drilling fluid composition influences the drilling process and drilling efficiency under otherwise constant borehole pressure and operating parameters, for instance as indicated recently by Black et al (2007) and Curry et al (2008). These latter studies showed markedly higher penetration rates and lower mechanical specific energy levels with PDC bits in Crab Orchard sandstone, a hard and tight sandstone, and Mancos shale, a moderately hard and relatively water insensitive shale, when drilled with base oil than when drilled with an invert emulsion field mud based on the same fluid but containing brine emulsion droplets, weighting material, viscosifying and fluid loss control agents. Therefore seems plausible that at least some of the disparity in mechanical specific energy levels between the visual single point cutter tests and the full scale drilling tests could have been the result of the differences in the drilling fluids.
This implies that a combination of the lowest possible bit cutter density (consistent with the demands of durability and hole bottom coverage) and an appropriate drilling fluid composition (this study does not give any guidance on what that may be except that it is likely to involve low viscosity and/or low solids) may provide the route to maximum penetration rate and minimum mechanical specific energy in salt drilling
Mechanical specific energy levels in salt were substantially higher than the compressive stresses observed in triaxial tests at confining pressures equivalent to the borehole pressure in the visual single point cutter and full bit tests. Typically the full bit mechanical specific energy was 6 to 8 times the deviatoric stress at 1% strain for the same fluid / confining pressure. The compressive stress increased with increasing strain (the salt displayed work hardening). Furthermore, the photo-micrographs show that the salt cuttings had experienced strains much greater than 25%. The evidence of this and earlier studies is that salt displays true ductility, in other words permanent deformation without loss of macroscopic integrity, when deformed under confining pressure at least for strains of up to approximately25%. The cuttings collected from the visual single point cutter tests were, however, heavily fragmented, indicating that salt does not have infinite ductility and, further, that the strains experienced in rock cutting exceed the salt’s ductility.
A review of the metal cutting literature (Guo, 2003) shows that strains of order 1 to 10, and strain rates of the order of 103 to 106 per sec are predicted by finite element analysis models. The finite element method has been used (Martinez, 2013) to model the rock cutting process in halite. That model predicted peak equivalent plastic strains of around 1.3 (not 1.3% but 1.3). By analogy with metal cutting, it is reasonable to expect the strain rate in rock cutting to be orders of magnitude higher than the highest (10%/min) used in the current triaxial tests. Those tests show that the salt’s flow stress (stress for any given strain) increased with increasing strain rate. The combination of a strain of 1.5 and a flow stress of 10,000 psi can explain a mechanical specific energy approaching 15,000 psi, but higher strain and/or flow stress would be required for a mechanical specific energy of around 30,000 psi as seen in the full scale bit tests. It is inferred, therefore, that the combination of low depth of cut and real world drilling fluid resulted in the salt exerting forces on the cutters even when the strain was much higher than that required to fragment the salt. With an elevated fluid pressure, the fluid pressure confining the cutting would give the cutting strength until such time as the fluid infiltrated the cracks between the salt fragments, thereby effectively removing their confinement, as has been argued for other rocks drilled under pressure (eg Garnier and Van Lingen 1958, Judzis et al 2007). In this way the confining pressure could influence the penetration rate and mechanical specific energy even if it did not have material influence on the rock strength. The triaxial tests did not examine strain rates close to those suspected from the various metal cutting models, and it has to be admitted that is possible that salt strength could display confining pressure sensitivity at high strain rates but not at lower.
The final point to merit comment is the unexpected observation from the visual single point cutter tests that the formation of ribbon like cuttings was suppressed by increasing borehole pressure. Normally the formation of ribbon like cuttings is associated with increasingly ductile behavior and sedimentary rocks typically show increasing ductility with increasing confining pressure. Rocks such as shales and limestones, which are brittle when unconfined, give ribbon- like cuttings when tested under moderate and high borehole pressures. In those instances, the rock is substantially comminuted into fine fragments by the action of the cutter. The ribbon like cuttings consist of finely powdered rock flour held together and strengthened by the confining effect of the fluid pressure. The cuttings lose their strength and their integrity when the fluid pressure is reduced and also, it is believed, as the fluid invades the cuttings. As argued above, the salt evidently has insufficient ductility to form continuous ribbon like cuttings analogous to those seen in cutting ductile metals. Rather the cuttings consist of heavily cracked, fragmented rock more like those seen in other sedimentary rocks. It is plausible that the fluid used in the visual single point cutter tests was able to invade the fragmented salt more rapidly at high borehole pressures than at low, so that its confining effect did not persist for long enough to enable ribbon like cuttings to form. This would require a higher effective permeability in the salt cuttings than in shale or limestone cuttings and it is not clear why this might be the case.

8 SPE/IADC-173023-MS
Conclusions 1. Penetration rate decreases and mechanical specific energy increases as the borehole pressure is increased when
drilling salt. These effects are not large and are smaller than those seen in a number of other sedimentary rocks. 2. The penetration rate penalty to be paid for using a high drilling fluid density to achieve acceptable hole quality when
drilling through salt formations will not be large, except perhaps if increasing the fluid density involves significant changes to the fluid’s properties other than its density.
3. Salt displays true ductile behavior, that is it deforms plastically without loss of integrity, when deformed in compression at confining pressures as low as 300 psi.
4. Visual single point cutter tests showed salt’s tendency to form ribbon like cuttings decreased with increasing fluid pressure.
5. The strains imposed during PDC bit drilling exceed salt’s ductility so that the cuttings formed do not have internal continuity; instead, they consist of fine, heavily micro-cracked salt grain fragments.
6. Mechanical specific energy values in visual single point cutter tests were lower for most depths of cut than those seen in full scale drilling tests at similar borehole pressures. This effect is believed to result from differences in depth of cut and fluid properties between the two types of tests.
Acknowledgements The authors gratefully acknowledge the work of all those who performed the tests reported here, including Paul Lutes, Wesley Moore, David Poss, Barrett Scrivner, Michael Wilson, Dee Moronkeji, Javier Franquet and Umesh Prasad.
This work is published by kind permission of Baker Hughes.
Nomenclature Ac: cut area of rock, L2, sq in. D: bit diameter, L, in. DOC: depth of cut, L, in. Fa: axial force on cutter, mLt-2, lbf. Ft: tangential force on cutter, mLt-2, lbf. MSE: mechanical specific energy, mL-1t-2, psi. µ: coefficient of friction. PDC: polycrystalline diamond compact. ROP: rate of penetration, Lt-1, ft/hr. TOR: torque, mL2t2, ft-lbf. WOB: weight on bit, mLt-2, lbf. References Andersen, E.E. and Azar, J.J. 1993. PDC Bit Performance under Simulated Borehole Conditions. SPE Drill Eng 8 3 184-188. SPE-20412-
PA. ASTM D7012-07, Standard Test Method for Compressive Strength and Elastic Moduli for Intact Rock Core Specimens under Varying States
of Stress and Temperatures. 2007. West Conshohochen, PA: ASTM International. Black, A., Bland, R., Curry, D., Ledgerwood, L., Robertson, H., Judzis, A., Prasad, U. and Grant, T. 2008. Optimization of deep drilling
performance with improvements in drill bit and drilling fluid design. Presented at 2008 IADC/SPE Drilling Conference, Orlando, FL (Mar 08). IADC/SPE paper SPE-112731-MS.
Black, A.D., Dearing, H.L and DiBona, B.G. 1985. Effects of Pore Pressure and Mud Filtration on Drilling Rates in a Permeable Sandstone. J Pet Technol 37 9 1671-1681. SPE-12117-PA. Black, A.D. and Green, S.J. 1978. Laboratory Simulation of Deep Well Drilling. Pet Engr Intl, Mar 1978, 40-48. Cheatham, C.A., Nahm, J.J and Heitkamp, N.D. 1985. Effects of Selected Mud Properties on Rate of Penetration in Full-Scale Shale
Drilling Simulations. Presented at 1985 SPE/IADC Drilling Conference, New Orleans, LA (Mr 1985). SPE-13465-MS. Cunningham, R. A. and Eenink, J. G. 1959. Laboratory Study of Effect of Overburden, Formation and Mud Column Pressures on Drilling
Rate of Permeable Formations. Pet Trans AIME, 217 9-17. SPE-1094-G. Curry, D., Bland, R., Lutes, P, Lomba, R, de Sa, H. and Fonseca, C. 2013. Full-Scale Laboratory Study of the Impact of Drilling Fluid
Composition and Properties on Penetration Rates in Brazilian Pre-Salt Carbonates. Presented at the SPE Annual Technical Conference and Exhibition held in New Orleans, Louisiana, USA, 30 September–2 October 2013. SPE-166325-MS.
Eckel, J.R. 1958. Effect of Pressure on Rock Drillability. Pet Trans AIME, 213 1-6. SPE-877-G. Garnier, A. J. and van Lingen, N. H. 1959. Phenomena Affecting Drilling Rates at Depth. Pet Trans AIME, 216 232-239. SPE-1097-G. Gray-Stephens, D., Cook, J.M. and Sheppard, M.C. 1994. Influence of Pore Pressure on Drilling Response in Hard Shales. SPE Drill Eng,
9 4 263-260. SPE-23414-PA. Guo, Y.B. 2003. An Integral Method to Determine the Mechanical Behaviour of Materials in Metal Cutting. J Mat Process Tech 142 72-
81. Handin, J. 1953. An Application of High Pressure in Geophysics: Experimental Rock Deformation. Trans ASME, 75 315. Handin, J., Russell, J.E. and Carter, N.L. 1986. Experimental Deformation of Rock Salt. In Mineral and Rock Deformation: Laboratory
Studies: The Paterson Volume, eds B E Hobbs and H C Heard, 117-160. Washington DC, American Geophysical Union.

SPE/IADC-173023-MS 9
Holt, C.A. and Johnson, J.B. 1986. A Method for Drilling Moving Salt Formations – Drilling and Underreaming Concurrently. SPE Drill Eng, Aug 1986, 315-324. SPE-13488 –PA.
Infante, E.F. and Chenevert, M.E. 1989. Stability of Boreholes Drilled Through Salt Formations Displaying Plastic Behaviour. SPE Drill Eng, Mar 1989, 57-65. SPE-15513-PA.
Isbell, M.R. and Berzas, S.K. 1999. Re-Engineered Drilling Laboratory is a Premium Tool Advancing Drilling Technology by Simulating Downhole Environments. Presented at ASME Energy Sources Technology Conference and Exhibition, Houston, TX, (Feb 1999). ASME paper ETCE99-6653.
Judzis, A., Bland, R.D., Curry, D.A., Black, A.D., Robertson, H., Meiners, M.J. and Grant, T.C. 2007. Optimization of Deep Drilling Performance: Benchmark Testing Drives ROP Improvement for Bits and Drilling Fluids. Presented at 2007 SPE/IADC Drilling Conference, Amsterdam, The Netherlands (Feb 2007). SPE/IADC paper SPE-105885-MS. Khanaf, F., and El Shennaway, H.M. 1979. Drilling of Gulf of Suez Evaporites. Presented at SPE Middle East Oil Technical Conference,
Manama, Bahrain, 25-29 March. SPE-7749-MS. Ledgerwood, L.W. and Kelly, J.L. 1991. High Pressure Facility Recreates Downhole Conditions in Testing of Full Size Drill Bits.
Presented at ASME Energy Sources Technology Conference and Exhibition, New Orleans, LA, 20-24 Jan 1991. ASME paper 91-PET-1.
Martinez, I.R., Fontoura, S.A.B., Inoue, N., Carrapatoso, C., Lourenco, A. and Curry, D. 2013. Simulation of Single Cutter Experiments in Evaporites through Finite Element Method. Presented at 2013 IADC/SPE Drilling Conference, Amsterdam, The Netherlands (Mar 2013). SPE/IADC paper SPE-163504-MS.
Murray, A.S and Cunningham, R. A. 1955. Effect of Mud Column Pressure on Drilling Rates. Pet Trans AIME 204 196-204. SPE-505-G. Pessier, R.C. and Fear, M.J. 1992. Quantifying Common Drilling Problems with Mechanical Specific Energy and a Bit-Specific Coefficient
of Friction. Presented at SPE Annual Technical Conference and Exhibition, Washington, DC, 4-7 October. SPE-24584-MS. Poiate, E., Costa, A.M. and Falcao, J.L. 2006. Well Design for Drilling Through Thick Evaporite Layers in Santos Basin – Brazil.
Presented at IADC/SPE Drilling Conference, Miami, FL, 21-23 February. SPE- 99161-MS. Price, A.M. 1979. The Effect of Confining Pressure on the Post-Yield Deformation Characteristics of Rock. PhD Thesis, University of
Newcastle-upon-Tyne, United Kingdom, (1979). Rowley, D.S, Howe, R.J. and Deily, F.H. 1961. Laboratory Drilling Performance of the Full-Scale Rock Bit. J Pet Technol, 13 71-81.
SPE-1545-G-PA. Sheffield, J.S., Collins, K.B. and Hackney, R.M. 1983. Salt Drilling in the Rocky Mountains. Presented at IADC/SPE Drilling Conference,
New Orleans, LA, 20-23 February. SPE-11374-MS. Simon, R. 1963. Energy Balance in Rock Drilling. SPE J., Dec 1963, 298-306. SPE-499-PA. Teale, R. 1965. The Concept of Specific Energy in Rock Drilling. Int J. Rock Mech Min Sci, 2, 1965, 57-73. Unger, K.W. and Howard, D.C. 1986. Drilling Techniques Improve Success in Drilling and Casing Deep Overthrust Belt Salt. SPE Drill Eng, June 1986, 183-192. SPE-13108-PA. Van Lingen, N.H. 1962. Bottom Scavenging – A Major Factor Governing Penetration Rates at Depth. J Pet Technol, 14 2, February 1962, 187-196. SPE-165-PA. Walker, B.H., Black, A.D., Klauber, W.P, Little, T. and Khodaverdian, M. 1986. Roller-Bit Penetration Rate Response as a Function of
Rock Properties and Well Depth. Presented at SPE Annual Technical Conference and Exhbition, New Orleans, LA, 5-8 October. SPE-15620-MS.
Willson, S.M., Fossum, A.F. and Fredrich, J.T. 2003. Assessment of Salt Loadings on Well Casing. SPE Drill & Compl, Mar 2003, 13-21. SPE-81820-PA.
Whitfill, D., Rachal, G., Lawson, J. and Armagost, K. 2002. Drilling Salt – Effect of Drilling Fluid on Penetration Rate and Hole Size. Presented at IADC/SPE Drilling Conference, Dallas, TX, 26-28 February. SPE-74546-MS.
Sample
Hydrostatic Stress (psi)
Bulk Density
(g/cc)
Young’s Modulus
(1x10⁶ psi)
Poisson’s Ratio
Reciprocal P-wave Velocity
(µsec/ft)
Reciprocal S-wave Velocity
(µsec/ft)
E2-A
0 2.169 N/D N/D N/D N/D 500 2.174 4.60 0.269 71.5 127
1500 2.179 5.12 0.258 68.6 120 3600 2.184 5.27 0.251 68.2 118 5000 2.186 5.31 0.256 67.6 118 3600 2.184 5.33 0.254 67.6 118 1500 2.181 5.31 0.252 67.8 118 500 2.178 5.31 0.252 67.7 118
E2-B
0 2.151 N/D N/D N/D N/D 500 2.158 N/D N/D N/D N/D
1500 2.164 4.89 0.235 71.5 121 3600 2.170 5.22 0.248 68.5 118 5000 2.173 5.25 0.249 68.2 118 3600 2.171 5.27 0.253 67.9 118 1500 2.168 5.28 0.261 67.1 118 500 2.165 5.24 0.257 67.7 118
Table 1. Dynamic Elastic Properties of Rock Salt

10 SPE/IADC-173023-MS
Bit Diameter 6 - 12.25 in Weight on Bit Up to 100,000 lbs Rotary Speed Up to 240 RPM
Borehole Pressure Up to 15,000 psi Mud Flow Rate Up to 480 gpm
Max Penetration Rate >200 ft/hr Max Torque at Bit 10,000 ft.lbs
Data Acquisition Rate 5,120 Hz
Table 2. Laboratory Drilling Test Machine Capabilities
Fluid Property Test #1 Test #2 Test #3 Mud Weight (ppg) 11.6 11.6 11.6 Oil / Water Ratio 81 / 19 81 / 19 80 / 20
Plastic Viscosity (cP) 22 22 21 Yield Point (lb/100 sq ft) 16 15 16
Gels (lb/100 sq ft) 10-sec / 10-min / 30-min 10 / 23 / 27 12 / 24 / 28 12 / 24 / 28 HPHT Filtrate at 250°F (ml) 6.8 5.2 3.8
Electrical Stability (V) 770 740 790 Water Phase Solids (% CaCl) 13.2 12.6 12.3 Water Phase Solids (% NaCl) 5.7 7.2 10.2
Low Gravity Solids (%) 5.2 4.7 3.4
Table 3. Drilling Fluid Properties Measured Before Each Drilling Test
Strain Rate (%/min) UCS (psi) 0.1 3,550 1 3,685
10 3,163
Table 4. Unconfined Compressive Strength
Strain Rate (%/min) Confining Pressure (psi) Axial Stress at 1% Axial Strain (psi) Total Deviatoric
0.1 0 2,500 2,500 300 3,250 2,950
3,000 6,950 3,950 5,000 9,850 4,850
10,000 14,125 4,125 15,000 19,350 4,350
1 0 2,900 2,900 300 3,950 3,650
3,000 7,425 4,425 5,000 9,950 4,950
10,000 15,500 5,500 15,000 20,750 5,750
10 0 700 700 300 4,400 4,100
3,000 8,450 5,450 5,000 10,400 5,400
10,000 15,300 5,300 15,000 20,525 5,525
Table 5. Axial Stresses at 1% Axial Strain
Fluid Pressure (psi) 300 1000 3000 6000 Average MSE (psi) 12.9 13.5 15.4 22.2
Average µ 0.99 0.58 0.92 0.79
Table 6. Average MSE and µ Values from Visual Single Point Cutter Tests

SPE/IADC-173023-MS 11
Fig. 1. Visual Single Point Cutter Test Machine
Fig. 2. Laboratory Drilling Test Machine Fig. 3. Drilling Test Laboratory Layout
Fig. 4. 8.75 in. 5-Bladed PDC Bit Used in Drilling Tests

12 SPE/IADC-173023-MS
(a) 0.1%/min Strain Rate
(b) 1%/min Strain Rate (c) 10%/min Strain Rate
Fig. 5. Total Axial Stress versus Axial and Radial Strain at Various Confining Pressures
(a) 0.1%/min Strain Rate
(b) 1%/min Strain Rate (c) 10%/min Strain Rate
Fig. 6. Deviatoric Axial Stress versus Axial Strain at Various Confining Pressures
SPE/IADC-173023-MS 13
(a) Unconfined (b) 3000 psi Confining Pressure (c) 15,000 psi Confining Pressure
Fig. 7. Compression Samples Deformed to 3.5% Strain at 10%/min Strain Rate
Fig. 8. Compression Sample Deformed to 25% Strain at 10%/min Strain Rate, 3,000 psi Confining Pressure
(a) 0.02 in. DOC, 300 psi (b) 0.065 in. DOC, 300 psi
(c) 0.065 in. DOC, 1000 psi (d) 0.065 in. DOC, 3000 psi
(e) 0.065 in. DOC, 6000 psi
Fig. 9. Face and Profile Views of Cuttings Forming Under Pressure

14 SPE/IADC-173023-MS
(a) (b) (c)
Fig. 10. Optical Micrographs of (a) Triaxial Test Sample Deformed to 3.5%, (b) Triaxial Test Sample Deformed to 25%, and (c) Cuttings, all from Tests Performed at 3,000 psi.
Fig. 11. Axial Forces from Visual Single Point Cutter Tests
Fig. 12. Tangential Forces from Visual Single Point Cutter Tests

SPE/IADC-173023-MS 15
Fig. 13. Coefficient of Friction from Visual Single Point Cutter Tests
Fig. 14. Mechanical Specific Energy from Visual Single Point Cutter Tests
Fig. 15. Penetration Rate as Function of Weight on Bit, Laboratory Drilling Tests

16 SPE/IADC-173023-MS
Fig. 16. Torque as Function of Weight on Bit, Laboratory Drilling Tests
Fig. 17. Coefficient of Friction as Function of Depth of Cut, Laboratory Drilling Tests
Fig. 18. Mechanical Specific Energy as Function of Depth of Cut, Laboratory Drilling Tests

SPE/IADC-173023-MS 17
Fig. 19. Effect of Borehole Pressure on PDC Bit Penetration Rate, Various Rocks
18 SPE/IADC-173023-MS
Fig. 20. Effect of Borehole Pressure on PDC Bit Mechanical Specific Energy, Various Rocks