Contemporary stress orientations in the Andean retroarc between 34°S and 39°S from borehole...
13
Contemporary stress orientations in the Andean retroarc between 34° S and 39° S from borehole breakout analysis C. Guzma ´n, 1 E. Cristallini, 1,2 and G. Bottesi 3 Received 27 February 2006; revised 15 February 2007; accepted 16 March 2007; published 27 June 2007. [1] In this paper we present the results of the analysis of borehole breakouts from 115 wells drilled within Neuque ´n Basin in the Andean retroarc between 34° and 39°S (Argentina). The first-order present-day stress orientation in the Andean retroarc is expected to be mainly controlled by the plate boundary forces (azimuth 80°) and the topographic forces (E–W). The obtained maximum horizontal stress (SH max ) has a preferred trend with a resultant direction of azimuth 88.7° and a 95% confidence interval of 13.3° consistent with the expected trend. The horizontal stress trajectory map achieved for this region shows that the SH max along the study area is not completely uniform. To the north of Colorado River, the SH max shows an ESE tendency interpreted as significant influenced by the topographic forces. To the south of Colorado River, SH max has an ENE trend similar to the expected based on plate boundary forces. To the southeast of the region, a NE direction was found, probably showing a basement structural control in the stress field geometry. The stress orientations obtained for the whole region show that plate boundary forces, drag basal, and topographic forces are strongly controlling the stress direction distribution. Citation: Guzma ´n, C., E. Cristallini, and G. Bottesi (2007), Contemporary stress orientations in the Andean retroarc between 34°S and 39°S from borehole breakout analysis, Tectonics, 26, TC3016, doi:10.1029/2006TC001958. 1. Introduction [2] A comprehensive knowledge of regional stress direc- tions is not only important in scientific terms and earthquake hazard assessment but also gives important information for optimizing petroleum recovery and exploration of fracture related reservoirs [Fuchs and Mu ¨ller , 2001]. The identification of global, regional and local patterns of stress distribution provides new insight into mountain building, evolution of sedimentary basins and characterization of active faults with earthquake potential [Zoback, 1992; Tingay et al., 2005]. [3] Zoback et al. [1989] started with the World Stress Map Project compiling information from different sources of stress directions measured in continental crust around the world [Zoback, 1992; J. Reinecker et al., The 2005 release of the World Stress Map, 2005, available at http:// www.world-stress-map.org]. The map in Figure 1 shows the direction of the maximum horizontal stress (SH max ) for South America compiled by the World Stress Map (J. Reinecker et al., The 2005 release of the World Stress Map, 2005, available at http://www.world-stress-map.org). Most of the information comes from earthquake focal mechanisms and geological field observations of recent and active faulting, and fewer data from borehole breakouts and volcanic alignments. Different authors have provided geologic information contributing with the knowledge of stress distribution, intensity and direction within this Andean region [e.g., Cobbold et al., 1999; Lavenu and Cembrano, 1999a, 1999b; Corte ´s, 2000; Folguera et al., 2002]; however, no good data have been published about current stress direction distribution. [4] To the southwest of the region analyzed in this study, Lavenu and Cembrano [1999a] examined the spatial distribution of the stress states during the Pliocene and Pleistocene in the Chilean Andes between the 38° and 42°30 0 S. They determined two tectonic events: (1) Pliocene compressive event characterized by a maximum compres- sional stress roughly oriented with an E–W direction and (2) Pleistocene event with stress partitioning where the fore arc has a NNE to S–N principal stress orientation and the intra-arc zone has a NE principal stress direction. [5] Coblentz and Richardson [1996] and Meijer et al. [1997] modeled the stress field acting in the South American plate. Coblentz and Richardson [1996] made three different stress models; they concluded that the stress field in the South American plate results from the interac- tion of two principal tectonic processes, the buoyancy or topographic forces and compressional stresses transmitted across plate boundaries. They proposed that the origin of the E–W compressive stress regime is the result of the inter- action between the ridge push force and the collisional forces acting along the western margin. The approach of Meijer et al. [1997] is an improvement of previous work on the Andes [e.g., Dalmayarc and Molnar, 1981; Richardson and Coblentz, 1994] in which the state of the stress in the mountain range has been addressed only in terms of vertical cross section. Their models also have some differences with Coblentz and Richardson’s [1996] model, especially because different types of forces are included. Meijer et TECTONICS, VOL. 26, TC3016, doi:10.1029/2006TC001958, 2007 Click Here for Full Articl e 1 Laboratorio de Modelado Geolo ´gico, Departamento de Ciencias Geolo ´gicas, Universidad de Buenos Aires, Buenos Aires, Argentina. 2 Consejo Nacional de Investigaciones Cientı ´ficas y Te ´cnicas, Buenos Aires, Argentina. 3 Repsol YPF, Buenos Aires, Argentina. Copyright 2007 by the American Geophysical Union. 0278-7407/07/2006TC001958$12.00 TC3016 1 of 13
Transcript of Contemporary stress orientations in the Andean retroarc between 34°S and 39°S from borehole...
Contemporary stress orientations in the Andean retroarc
between 34�S and 39�S from borehole breakout analysis
C. Guzman,1 E. Cristallini,1,2 and G. Bottesi3
Received 27 February 2006; revised 15 February 2007; accepted 16 March 2007; published 27 June 2007.
[1] In this paper we present the results of the analysisof borehole breakouts from 115 wells drilled withinNeuquen Basin in the Andean retroarc between 34�and 39�S (Argentina). The first-order present-daystress orientation in the Andean retroarc is expectedto be mainly controlled by the plate boundary forces(azimuth 80�) and the topographic forces (E–W).The obtained maximum horizontal stress (SHmax)has a preferred trend with a resultant direction ofazimuth 88.7� and a 95% confidence interval of 13.3�consistent with the expected trend. The horizontalstress trajectory map achieved for this region showsthat the SHmax along the study area is not completelyuniform. To the north of Colorado River, the SHmax
shows an ESE tendency interpreted as significantinfluenced by the topographic forces. To the south ofColorado River, SHmax has an ENE trend similar to theexpected based on plate boundary forces. To thesoutheast of the region, a NE direction was found,probably showing a basement structural control in thestress field geometry. The stress orientations obtainedfor the whole region show that plate boundaryforces, drag basal, and topographic forces arestrongly controlling the stress direction distribution.Citation: Guzman, C., E. Cristallini, and G. Bottesi (2007),
Contemporary stress orientations in the Andean retroarc between
34�S and 39�S from borehole breakout analysis, Tectonics, 26,
TC3016, doi:10.1029/2006TC001958.
1. Introduction
[2] A comprehensive knowledge of regional stress direc-tions is not only important in scientific terms andearthquake hazard assessment but also gives importantinformation for optimizing petroleum recovery andexploration of fracture related reservoirs [Fuchs and Muller,2001]. The identification of global, regional and localpatterns of stress distribution provides new insight intomountain building, evolution of sedimentary basins and
characterization of active faults with earthquake potential[Zoback, 1992; Tingay et al., 2005].[3] Zoback et al. [1989] started with the World Stress
Map Project compiling information from different sourcesof stress directions measured in continental crust aroundthe world [Zoback, 1992; J. Reinecker et al., The 2005release of the World Stress Map, 2005, available at http://www.world-stress-map.org]. The map in Figure 1 shows thedirection of the maximum horizontal stress (SHmax) forSouth America compiled by the World Stress Map(J. Reinecker et al., The 2005 release of the World StressMap, 2005, available at http://www.world-stress-map.org).Most of the information comes from earthquake focalmechanisms and geological field observations of recentand active faulting, and fewer data from borehole breakoutsand volcanic alignments. Different authors have providedgeologic information contributing with the knowledge ofstress distribution, intensity and direction within thisAndean region [e.g., Cobbold et al., 1999; Lavenu andCembrano, 1999a, 1999b; Cortes, 2000; Folguera et al.,2002]; however, no good data have been published aboutcurrent stress direction distribution.[4] To the southwest of the region analyzed in this study,
Lavenu and Cembrano [1999a] examined the spatialdistribution of the stress states during the Pliocene andPleistocene in the Chilean Andes between the 38� and42�300S. They determined two tectonic events: (1) Pliocenecompressive event characterized by a maximum compres-sional stress roughly oriented with an E–W direction and(2) Pleistocene event with stress partitioning where the forearc has a NNE to S–N principal stress orientation and theintra-arc zone has a NE principal stress direction.[5] Coblentz and Richardson [1996] and Meijer et al.
[1997] modeled the stress field acting in the SouthAmerican plate. Coblentz and Richardson [1996] madethree different stress models; they concluded that the stressfield in the South American plate results from the interac-tion of two principal tectonic processes, the buoyancy ortopographic forces and compressional stresses transmittedacross plate boundaries. They proposed that the origin of theE–W compressive stress regime is the result of the inter-action between the ridge push force and the collisionalforces acting along the western margin. The approach ofMeijer et al. [1997] is an improvement of previous work onthe Andes [e.g., Dalmayarc and Molnar, 1981; Richardsonand Coblentz, 1994] in which the state of the stress in themountain range has been addressed only in terms of verticalcross section. Their models also have some differences withCoblentz and Richardson’s [1996] model, especiallybecause different types of forces are included. Meijer et
TECTONICS, VOL. 26, TC3016, doi:10.1029/2006TC001958, 2007ClickHere
for
FullArticle
1Laboratorio de Modelado Geologico, Departamento de CienciasGeologicas, Universidad de Buenos Aires, Buenos Aires, Argentina.
2Consejo Nacional de Investigaciones Cientıficas y Tecnicas, BuenosAires, Argentina.
3Repsol YPF, Buenos Aires, Argentina.
Copyright 2007 by the American Geophysical Union.0278-7407/07/2006TC001958$12.00
TC3016 1 of 13

Figure 1
TC3016 GUZMAN ET AL.: STRESS FIELD IN THE ANDEAN RETROARC
2 of 13
TC3016
al. [1997] concluded that a uniform distribution of theresistance on the western margin of South America providesa better overall fit to the available observations than a dip-dependent distribution of resistance magnitude. Theirresults also suggest that an extra driving force, additionalto ridge push, may be acting on the South American Plate to‘‘sustain’’ the Andean Cordillera.[6] Although several authors have been contributing with
actual stress data within South America, still few data areavailable especially for the retroarc of southern SouthAmerica. Therefore the purpose of this paper is to introducefurther information of the horizontal stress acting in theAndean retroarc between 34� and 39�S, providing a largeamount of borehole breakout data for South America. Ananalysis of the obtained results is presented and discussedtaking into account the existing plate-wide scale numericalmodels which predict the stress orientation. In order toobtain the horizontal stress field, borehole breakoutorientations calculated using four-arm caliper data from115 wells drilled within Neuquen Basin in Argentina, wereused. Horizontal stress directions, calculated for theretroarc, were used to estimate the differences between theobtained stress field and the expected one, based onthe present convergence vector, the direction of the ridgepush and the topographic forces. A discussion of thesedifferences is presented taking into account the geologicaland structural features of the region.
2. Tectonic Setting
[7] The wells used for this study were drilled within theNeuquen Basin, in the retroarc of the Central Andesbetween 34�S and 39�S. The Neuquen Basin constitutesone of the major producers of oil and gas in Argentina. Itconsists of 2000–6000 m thick Mesozoic synrift andpostrift continental and marine deposits locally overlaidby moderately thick to thin Cretaceous and Tertiary forelanddeposits [Uliana et al., 1995].[8] The Neuquen Basin, as many other basins, has a
polygenetic origin [Cobbold et al., 1999] and may bebroadly considered a mainly marine retroarc basin fromEarly Jurassic to Early Cretaceous times [Ramos, 1989;Vergani et al., 1995]. It became a foreland basin early in theLate Cretaceous as the result of the Andean uplift [Zapata etal., 1999]. The development of the basin started in theTriassic as a rift-related basin with unconnected depocenters[Mendiberri and Carbone, 2002]. From the late EarlyJurassic, to the Early Cretaceous, the sedimentation wascharacterized by sag facies related to thermal subsidence[Turic et al., 1987] and controlled by global sea levelchanges [Legarreta and Uliana, 1996]. Nevertheless, someparts of the basin have been from time to time affected by
local inversions and transpressions [Uliana et al., 1995;Vergani et al., 1995; Pangaro et al., 2002; Mosquera, 2002;Mosquera and Ramos, 2005].[9] In the early Late Cretaceous, evidence of compression
and uplift were observed in the western part of the basin andcontinental deposits accumulated in a foreland tectonicsetting [Zamora Valcarce et al., 2005]. By this time, thesedimentation was influenced by arc and intra basin deriveddebris which may have reflected the regional arc uplift[Legarreta et al., 1989] and an incipient development of afold and thrust belt [Barrio, 1990]. The structure and upliftof this western fold and thrust belt began in the early LateCretaceous at about 100 Ma [Zapata et al., 1999; ZamoraValcarce et al., 2005].[10] The Andean fold and thrust belt between 34� and
39�S can be divided into three segments: The Malargue foldand thrust belt in the north (from �34� to �36�300S), theAgrio fold belt in the south (�37�300 to �39�S) and theBarrancas-Colorado segment between �36�300S and�37�300S (Figure 2).[11] The northern and central sectors (Malargue and
Barrancas-Colorado) are characterized by NNE trendingstructures clearly involving large basement blocks. In con-trast, the southern segment (Agrio fold belt) is characterizedby smaller NNW trending structures where the basement isincipiently involved. Traditionally, the participation of thePermo-Triassic volcaniclastic basement (Choiyoi Group) inthe deformation is explained as a Cretaceous-Tertiary tec-tonic inversion of Triassic extensional half graben faults[Kozlowski et al., 1990, 1993; Vines, 1990; Kozlowski,1991; Manceda and Figueroa, 1995; Ramos et al., 1996;Ramos, 1998; Zapata et al., 1999]. However, some authorsstate that the basement is involved by low-angle thrust faultsnot related with the original normal faults [Ploszkiewicz,1987; Yagupsky et al., 2007].[12] The recent tectonic history of this Andean region is
particularly interesting. During the last 25 Ma, changes inthe position of volcanic arc front and geochemistry suggestvariations in the Wadati-Benioff geometry [Munoz andStern, 1988; Stern, 1989; Ramos, 1998; Munoz et al.,2000; Folguera et al., 2002; Kay, 2005; Ramos andFolguera, 2005a]. A steep subduction zone was proposedbetween 25 and 15 Ma followed by a shallowing of theWadati-Benioff zone in the Late Miocene. During the last5 Ma, the Wadati-Benioff angle was steepened again andwide retroarc volcanism occurred within the study region[Ramos and Folguera, 2005b].
3. Borehole Breakout Analysis
[13] Borehole breakout formation has been extensivelydescribed in the literature [Cox, 1970; Babcock, 1978; Bell
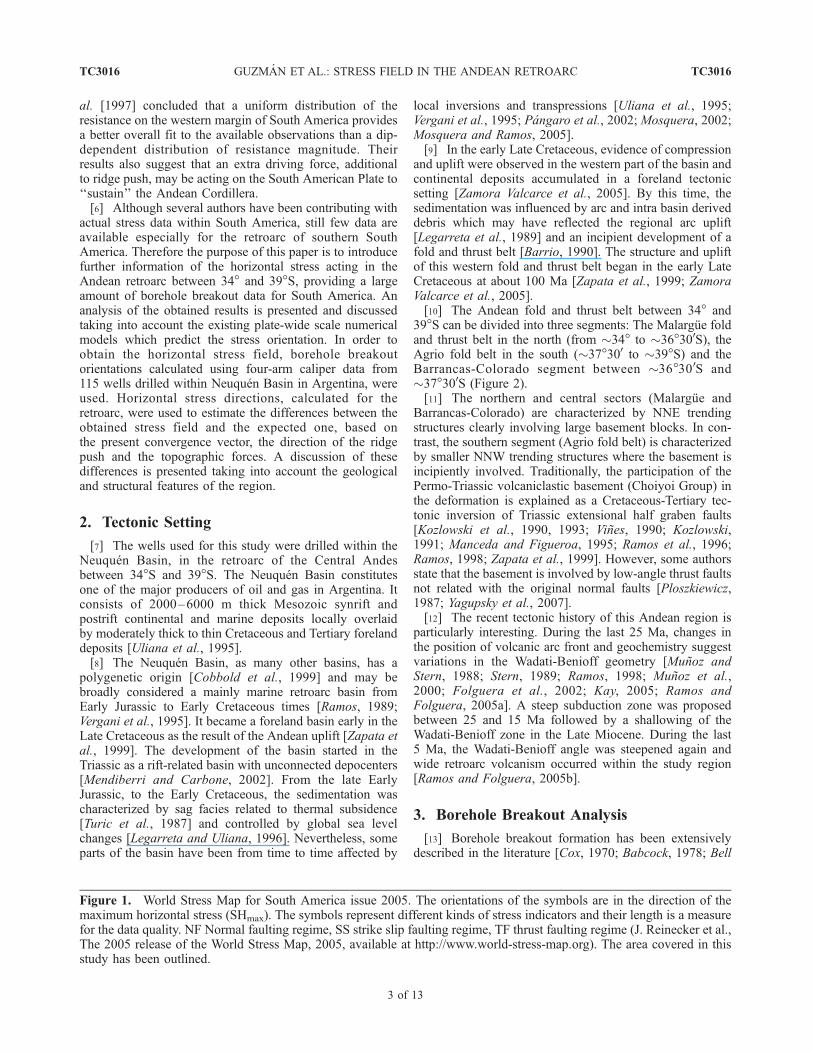
Figure 1. World Stress Map for South America issue 2005. The orientations of the symbols are in the direction of themaximum horizontal stress (SHmax). The symbols represent different kinds of stress indicators and their length is a measurefor the data quality. NF Normal faulting regime, SS strike slip faulting regime, TF thrust faulting regime (J. Reinecker et al.,The 2005 release of the World Stress Map, 2005, available at http://www.world-stress-map.org). The area covered in thisstudy has been outlined.
TC3016 GUZMAN ET AL.: STRESS FIELD IN THE ANDEAN RETROARC
3 of 13
TC3016
and Gough, 1979, 1982; Gough and Bell, 1979, 1981;Zoback et al., 1985; Plumb and Hickman, 1985; Bell andBabcock, 1986; Plumb and Cox, 1987; Zajac and Stock,1997]. Breakouts are stress-induced spalled regions on eachside of the wellbore. It has been demonstrated that breakoutorientation around a borehole is aligned with the least in situhorizontal stress [Bell and Babcock, 1986; Plumb and Cox,1987] direction where the greatest compressive stress isconcentrated [Gough and Bell, 1981; Bell and Gough, 1982;Zerwer and Yassir, 1994].[14] The estimation of the principal horizontal stress
directions using borehole breakouts is used by petroleumindustry and drilling engineers to determine the stressregime for wellbore stability analyses and reservoir simu-
lation. One of the oldest techniques for borehole breakoutidentification, first documented by Cox [1970], is usingfour-arm caliper data included in routine dipmeter logs. Inthe last years, more sophisticated and precise methods forbreakout identification have been developed using boreholeimages (i.e., Ultrasonic Borehole Imager, Fullbore Forma-tion Micro Imager Log, Full Bore Scanner Tool). However,the advantages of using four-arm caliper data to inferbreakout orientations reside in the widespread occurrenceof dipmeter information registered in deep explorationwells. The dipmeter logs are particularly useful in basinswhere the exploration period was concentrated when newtechniques were not available. This is the case of Neuquen
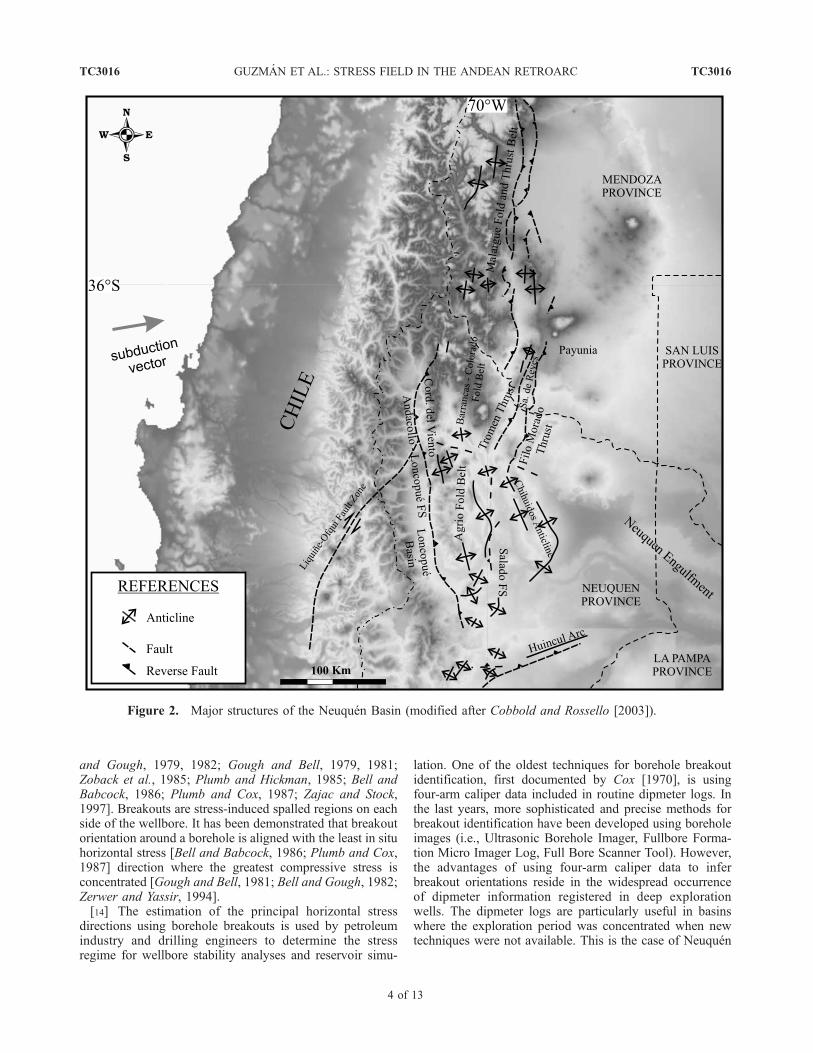
Figure 2. Major structures of the Neuquen Basin (modified after Cobbold and Rossello [2003]).
TC3016 GUZMAN ET AL.: STRESS FIELD IN THE ANDEAN RETROARC
4 of 13
TC3016
Basin where the main exploration has been developedbefore 1990.[15] To interpret borehole breakouts, four-arm dipmeter
caliper logs were used. The dipmeter tool ascends rotating
during log registration due to cable torque. Well diameterand reference arm orientation are continuously measured.When an elongation is present in the wellbore, the caliperpairs are differentially extended, the tool stops rotation and
Table 1. Quality Criterions Used by the World Stress Map Projecta
Criterion Description
A Wells that have 10 or more distinct breakouts zones with a combined length >300 m and with a standard deviation �12�B Wells that have at least six distinct breakout zones with combined length >100 m and with standard deviation �20�C Wells that have at least four distinct breakout zones with a combined length >30 m and with standard deviation �25�D Wells that have less than four breakout zones or a combined length <30 m or with standard deviation >25�E Wells with no reliable breakouts detected or with extreme scatter of breakout orientations (standard deviation >40�)
aFrom Sperner et al. [2003].
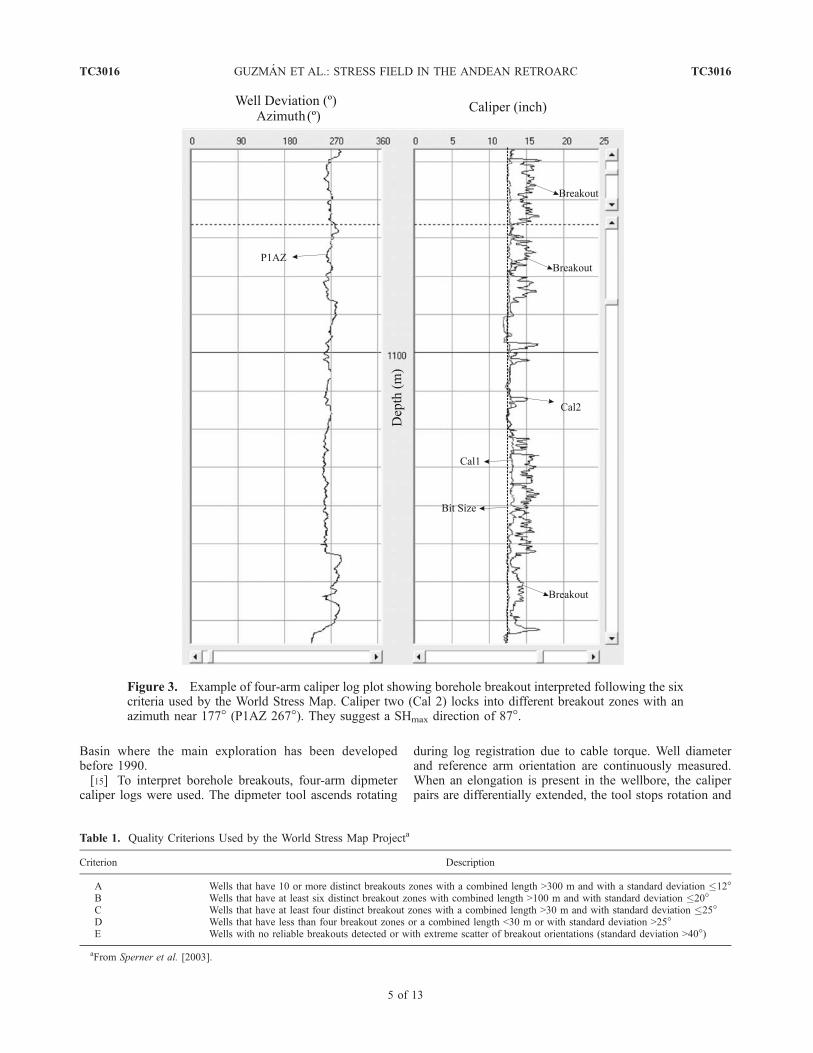
Figure 3. Example of four-arm caliper log plot showing borehole breakout interpreted following the sixcriteria used by the World Stress Map. Caliper two (Cal 2) locks into different breakout zones with anazimuth near 177� (P1AZ 267�). They suggest a SHmax direction of 87�.
TC3016 GUZMAN ET AL.: STRESS FIELD IN THE ANDEAN RETROARC
5 of 13
TC3016
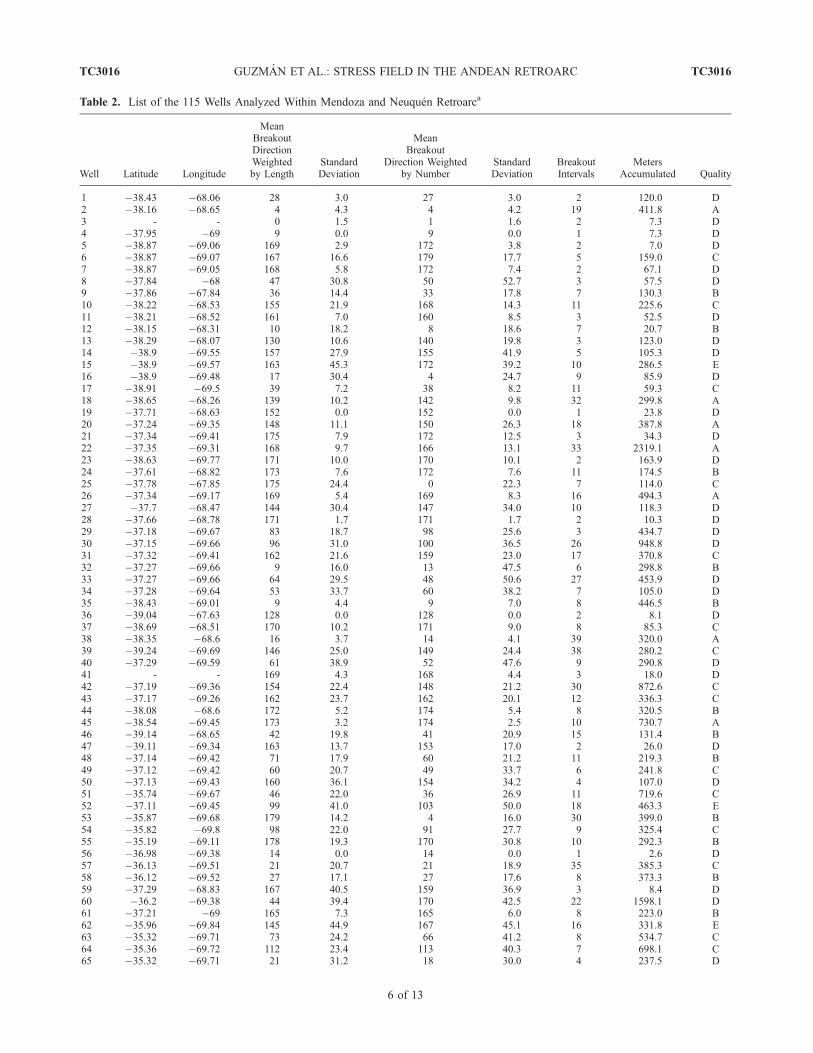
Table 2. List of the 115 Wells Analyzed Within Mendoza and Neuquen Retroarca
Well Latitude Longitude
MeanBreakoutDirectionWeightedby Length
StandardDeviation
MeanBreakout
Direction Weightedby Number
StandardDeviation
BreakoutIntervals
MetersAccumulated Quality
1 �38.43 �68.06 28 3.0 27 3.0 2 120.0 D2 �38.16 �68.65 4 4.3 4 4.2 19 411.8 A3 - - 0 1.5 1 1.6 2 7.3 D4 �37.95 �69 9 0.0 9 0.0 1 7.3 D5 �38.87 �69.06 169 2.9 172 3.8 2 7.0 D6 �38.87 �69.07 167 16.6 179 17.7 5 159.0 C7 �38.87 �69.05 168 5.8 172 7.4 2 67.1 D8 �37.84 �68 47 30.8 50 52.7 3 57.5 D9 �37.86 �67.84 36 14.4 33 17.8 7 130.3 B10 �38.22 �68.53 155 21.9 168 14.3 11 225.6 C11 �38.21 �68.52 161 7.0 160 8.5 3 52.5 D12 �38.15 �68.31 10 18.2 8 18.6 7 20.7 B13 �38.29 �68.07 130 10.6 140 19.8 3 123.0 D14 �38.9 �69.55 157 27.9 155 41.9 5 105.3 D15 �38.9 �69.57 163 45.3 172 39.2 10 286.5 E16 �38.9 �69.48 17 30.4 4 24.7 9 85.9 D17 �38.91 �69.5 39 7.2 38 8.2 11 59.3 C18 �38.65 �68.26 139 10.2 142 9.8 32 299.8 A19 �37.71 �68.63 152 0.0 152 0.0 1 23.8 D20 �37.24 �69.35 148 11.1 150 26.3 18 387.8 A21 �37.34 �69.41 175 7.9 172 12.5 3 34.3 D22 �37.35 �69.31 168 9.7 166 13.1 33 2319.1 A23 �38.63 �69.77 171 10.0 170 10.1 2 163.9 D24 �37.61 �68.82 173 7.6 172 7.6 11 174.5 B25 �37.78 �67.85 175 24.4 0 22.3 7 114.0 C26 �37.34 �69.17 169 5.4 169 8.3 16 494.3 A27 �37.7 �68.47 144 30.4 147 34.0 10 118.3 D28 �37.66 �68.78 171 1.7 171 1.7 2 10.3 D29 �37.18 �69.67 83 18.7 98 25.6 3 434.7 D30 �37.15 �69.66 96 31.0 100 36.5 26 948.8 D31 �37.32 �69.41 162 21.6 159 23.0 17 370.8 C32 �37.27 �69.66 9 16.0 13 47.5 6 298.8 B33 �37.27 �69.66 64 29.5 48 50.6 27 453.9 D34 �37.28 �69.64 53 33.7 60 38.2 7 105.0 D35 �38.43 �69.01 9 4.4 9 7.0 8 446.5 B36 �39.04 �67.63 128 0.0 128 0.0 2 8.1 D37 �38.69 �68.51 170 10.2 171 9.0 8 85.3 C38 �38.35 �68.6 16 3.7 14 4.1 39 320.0 A39 �39.24 �69.69 146 25.0 149 24.4 38 280.2 C40 �37.29 �69.59 61 38.9 52 47.6 9 290.8 D41 - - 169 4.3 168 4.4 3 18.0 D42 �37.19 �69.36 154 22.4 148 21.2 30 872.6 C43 �37.17 �69.26 162 23.7 162 20.1 12 336.3 C44 �38.08 �68.6 172 5.2 174 5.4 8 320.5 B45 �38.54 �69.45 173 3.2 174 2.5 10 730.7 A46 �39.14 �68.65 42 19.8 41 20.9 15 131.4 B47 �39.11 �69.34 163 13.7 153 17.0 2 26.0 D48 �37.14 �69.42 71 17.9 60 21.2 11 219.3 B49 �37.12 �69.42 60 20.7 49 33.7 6 241.8 C50 �37.13 �69.43 160 36.1 154 34.2 4 107.0 D51 �35.74 �69.67 46 22.0 36 26.9 11 719.6 C52 �37.11 �69.45 99 41.0 103 50.0 18 463.3 E53 �35.87 �69.68 179 14.2 4 16.0 30 399.0 B54 �35.82 �69.8 98 22.0 91 27.7 9 325.4 C55 �35.19 �69.11 178 19.3 170 30.8 10 292.3 B56 �36.98 �69.38 14 0.0 14 0.0 1 2.6 D57 �36.13 �69.51 21 20.7 21 18.9 35 385.3 C58 �36.12 �69.52 27 17.1 27 17.6 8 373.3 B59 �37.29 �68.83 167 40.5 159 36.9 3 8.4 D60 �36.2 �69.38 44 39.4 170 42.5 22 1598.1 D61 �37.21 �69 165 7.3 165 6.0 8 223.0 B62 �35.96 �69.84 145 44.9 167 45.1 16 331.8 E63 �35.32 �69.71 73 24.2 66 41.2 8 534.7 C64 �35.36 �69.72 112 23.4 113 40.3 7 698.1 C65 �35.32 �69.71 21 31.2 18 30.0 4 237.5 D
TC3016 GUZMAN ET AL.: STRESS FIELD IN THE ANDEAN RETROARC
6 of 13
TC3016
a constant direction is recorded for the reference arm[Zerwer and Yassir, 1994]. Several authors enumerateddifferent criteria to determine the borehole breakouts usingdipmeter caliper data [e.g., Plumb and Hickman, 1985;Zajac and Stock, 1997]. In this study the breakout detectionfollows the criteria suggested by the World Stress Map(J. Reinecker et al., Borehole breakout analysis from four-arm caliper logs, 2004, http://www.world-stress-map.org):
(1) Tool rotation must cease in the zone of enlargement.(2) There must be clear tool rotation into and out of theenlargement zone. (3) The smaller caliper reading is close tobit size; top and bottom of the breakout should be wellmarked. (4) Caliper difference has to exceed bit size by10%. (5) The enlargement orientation should not coincidewith the high side of the borehole in wells deviated by more
Well Latitude Longitude
MeanBreakoutDirectionWeightedby Length
StandardDeviation
MeanBreakout
Direction Weightedby Number
StandardDeviation
BreakoutIntervals
MetersAccumulated Quality
66 �35.29 �69.73 47 23.5 63 35.4 5 453.8 C67 �35.36 �69.73 37 23.0 32 43.3 8 489.5 C68 �36.68 �69.39 5 13.6 7 17.3 26 897.7 B69 �37.09 �68.62 81 35.9 114 34.5 3 34.5 D70 �36.1 �69.77 146 32.6 153 21.7 18 377.1 D71 �37.1 �69.55 101 27.9 130 43.2 15 961.3 D72 �37.07 �69.55 164 15.1 167 14.6 11 337.8 B73 �38.91 �69.41 12 12.5 17 15.4 6 284.3 B74 �35.94 �69.67 170 26.2 170 24.4 31 770.4 D75 �37.1 �69.14 21 4.0 18 5.2 3 163.5 D76 �35.47 �69.78 34 42.9 36 44.2 73 1297.2 E77 �34.94 �69.51 14 20.0 14 26.4 17 642.5 B78 �34.91 �69.52 161 41.8 113 33.0 4 87.0 E79 �34.93 �69.52 8 11.5 8 11.5 2 233.0 D80 �34.92 �69.52 14 14.1 11 24.5 7 559.8 B81 �35.46 �69.34 176 32.4 174 39.6 3 24.3 D82 �35.14 �69.69 46 46.5 33 45.8 15 358.3 E83 �36.89 �69.2 15 10.6 22 18.2 6 171.0 B84 �37.13 �69.44 17 49.4 154 27.3 19 464.5 E85 �36.39 �69.76 163 5.8 164 8.5 10 845.1 A86 �37.16 �69.15 164 7.5 160 17.4 9 376.1 B87 �35.27 �69.65 26 12.7 24 27.8 11 1011.0 B88 �36.82 �69.83 12 14.8 15 13.7 3 61.5 D89 �36.2 �69.52 9 20.6 15 23.0 20 798.3 C90 �36.19 �69.5 6 30.4 4 40.8 15 512.8 D91 �37.09 �69.48 81 7.1 79 5.3 7 276.0 B92 �37.13 �69.52 152 8.1 10 49.2 2 59.8 D93 �35.81 �69.48 30 44.0 24 37.3 7 219.5 E94 �34.68 �69.65 0 25.8 177 40.1 10 684.0 D95 �34.68 �69.67 173 39.3 179 35.7 13 1222.0 D96 �37.16 �69.48 8 39.1 17 53.7 15 481.3 D97 �38.48 �67.93 164 2.6 164 2.9 6 23.0 D98 �37.21 �69.25 138 65.4 158 38.1 7 123.8 E99 �37.59 �69.76 16 19.0 12 28.2 5 413.0 C100 �37.25 �69.1 150 32.3 150 29.5 14 438.8 D101 �39.03 �69.35 68 40.3 76 43.4 10 207.3 E102 �39.02 �69.35 18 25.3 21 41.8 9 206.5 D103 �39.03 �69.37 159 20.8 155 25.1 6 53.0 C104 �39.03 �69.36 150 23.5 148 23.1 8 153.3 C105 �39.03 �69.16 178 43.5 160 35.2 4 496.1 E106 �39.01 �69.13 152 3.8 155 4.6 2 90.0 D107 �37.48 �69.84 31 19.7 26 23.2 8 45.8 C108 �38.97 �69.42 172 15.0 175 21.9 8 244.5 B109 �37.7 �68.92 161 20.0 158 23.2 18 548.8 B110 �37.69 �68.92 131 46.9 68 57.5 12 119.0 E111 �37.71 �68.94 166 14.6 173 11.9 15 192.0 B112 �37.7 �68.88 169 5.4 169 8.1 14 160.0 B113 �37.69 �68.92 10 28.1 180 46.2 3 36.5 D114 - - 1 0.0 1 0.0 1 6.8 D115 �38.86 �69.95 153 28.3 152 38.7 19 1079.0 D
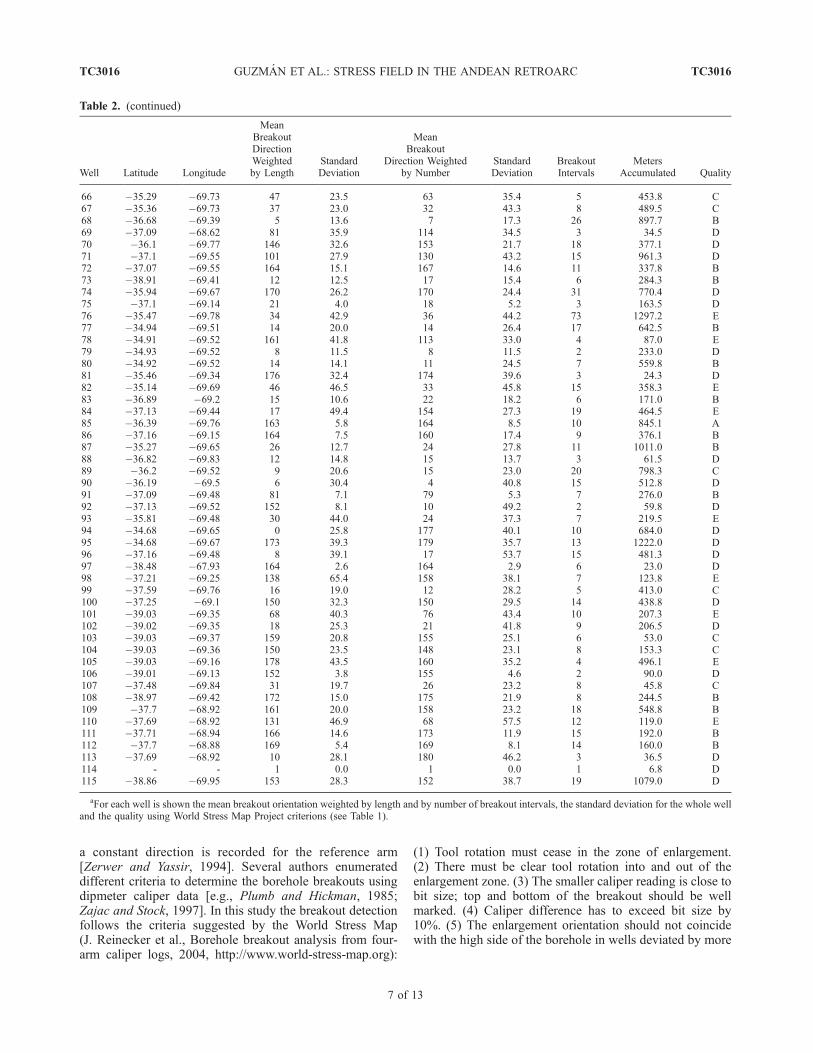
aFor each well is shown the mean breakout orientation weighted by length and by number of breakout intervals, the standard deviation for the whole welland the quality using World Stress Map Project criterions (see Table 1).
Table 2. (continued)
TC3016 GUZMAN ET AL.: STRESS FIELD IN THE ANDEAN RETROARC
7 of 13
TC3016

than 5�. (6) The length of enlargement zone must be greaterthan 1 m.[16] The combined use of these six criteria enables to
detect and distinguish zones of breakouts from other bore-hole enlargements such as washouts and key seats(J. Reinecker et al., Borehole breakout analysis from four-arm caliper logs, 2004, http://www.world-stress-map.org).In Figure 3, there is an example of four-arm caliper log plotshowing borehole breakouts interpreted following the abovecriteria.[17] The data have been ranked according to the World
Stress Map quality ranking scheme [Zoback and Zoback,1989, 1991; Sperner et al., 2003]. The classification allowsthe comparison of different indicators (e.g., focal mecha-nism solution, drilling-induced tensile fractures, overcoring,etc. (J. Reinecker et al., Borehole breakout analysis fromfour-arm caliper logs, 2004, http://www.world-stress-map.
org)). Sperner et al. [2003] present a revised quality rankingcriteria for stress orientations determined from breakoutscalculated from four-arm caliper logs for the World StressMap Project. The ranking scheme is based mainly on thenumber, accuracy, and length of measurements and is givenin Table 1.
4. Results
[18] From the large number of wells drilled in theNeuquen Basin, 115 were identified as having all thenecessary information needed for a borehole breakoutanalysis according to the procedure described in the previ-ous section. For each well the four-arm caliper data wereanalyzed, identifying breakout segments and calculating thestandard deviation of each breakout interval. It was alsocalculated the mean breakout orientation and the standard
Figure 4. Orientation and classification of maximum horizontal stress from 115 bore wells within theNeuquen Basin. The different symbols correspond to SHmax classification using the World Stress Mapcriteria.
TC3016 GUZMAN ET AL.: STRESS FIELD IN THE ANDEAN RETROARC
8 of 13
TC3016
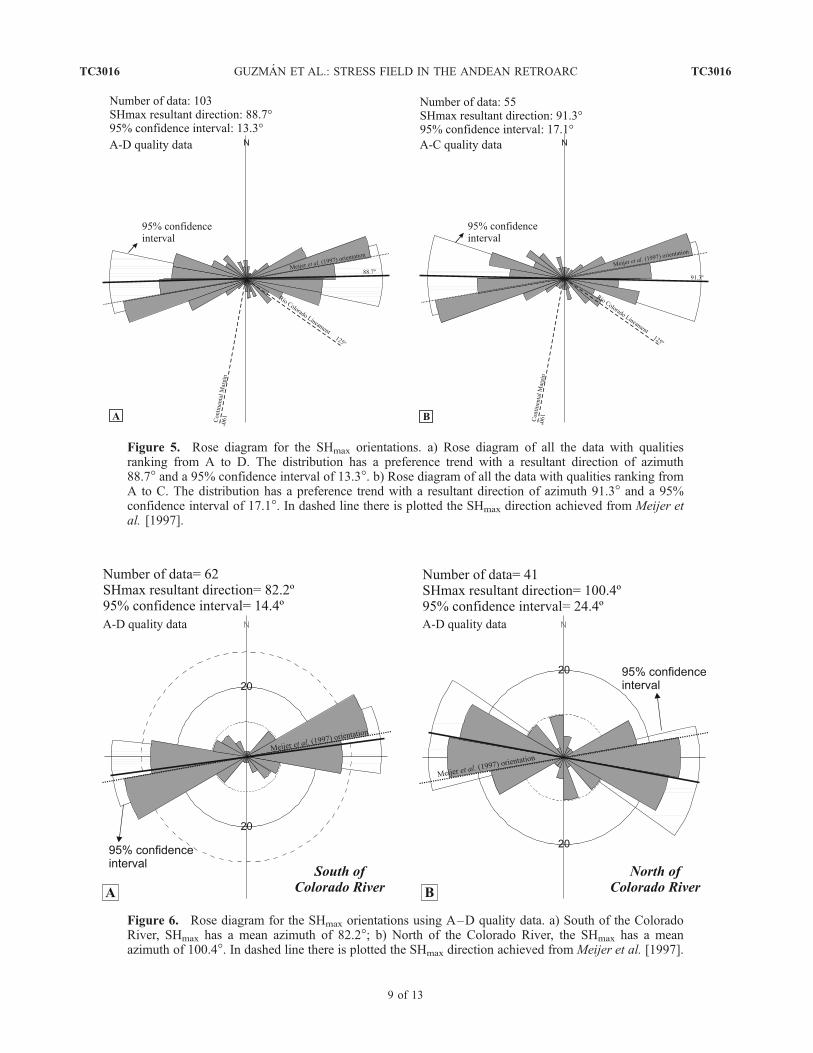
Figure 5. Rose diagram for the SHmax orientations. a) Rose diagram of all the data with qualitiesranking from A to D. The distribution has a preference trend with a resultant direction of azimuth88.7� and a 95% confidence interval of 13.3�. b) Rose diagram of all the data with qualities ranking fromA to C. The distribution has a preference trend with a resultant direction of azimuth 91.3� and a 95%confidence interval of 17.1�. In dashed line there is plotted the SHmax direction achieved from Meijer etal. [1997].
Figure 6. Rose diagram for the SHmax orientations using A–D quality data. a) South of the ColoradoRiver, SHmax has a mean azimuth of 82.2�; b) North of the Colorado River, the SHmax has a meanazimuth of 100.4�. In dashed line there is plotted the SHmax direction achieved from Meijer et al. [1997].
TC3016 GUZMAN ET AL.: STRESS FIELD IN THE ANDEAN RETROARC
9 of 13
TC3016
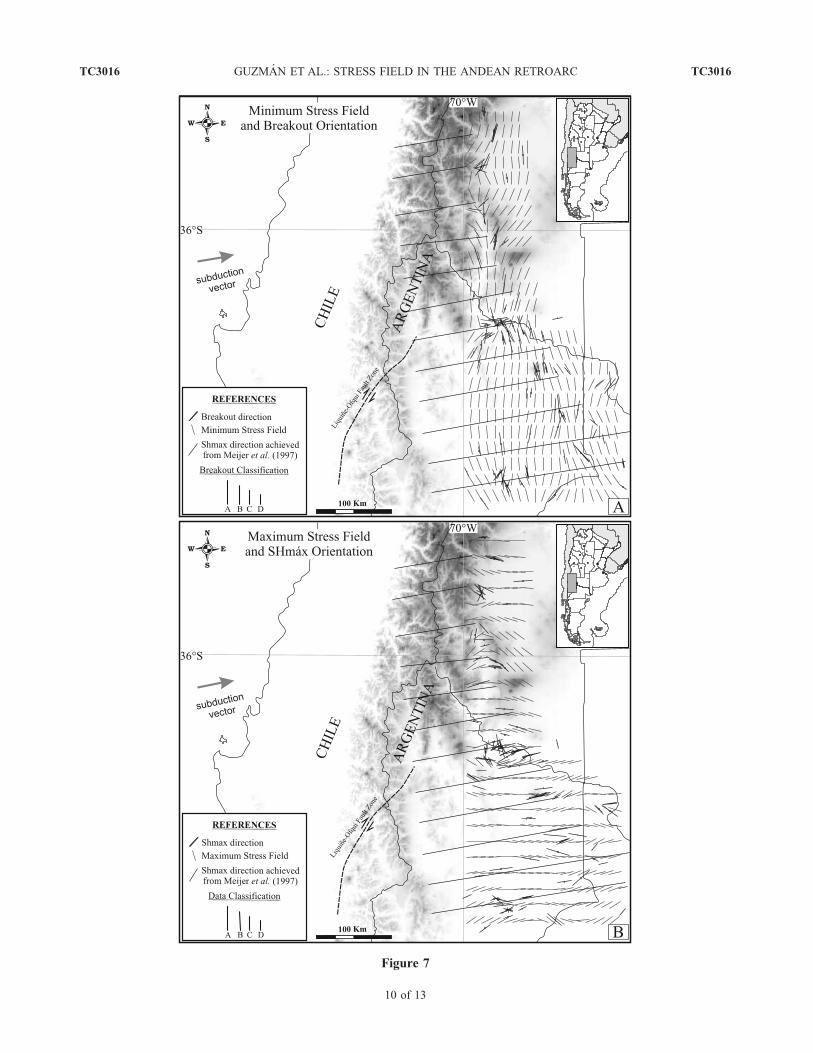
Figure 7
TC3016 GUZMAN ET AL.: STRESS FIELD IN THE ANDEAN RETROARC
10 of 13
TC3016
deviation for the whole well. The data were classified usingWorld Stress Map criterions (Table 1). Table 2 lists the115 wells with their location, the mean breakout directionwith its respective standard deviations (weighted by lengthand by number of breakout segments), the number ofbreakout intervals interpreted for each well, the accumulatedlength and the quality ranking.[19] Breakout orientations are perpendicular to the max-
imum horizontal stress (SHmax) directions; therefore SHmax
directions can be easily calculated. Figure 4 is a map withthe SHmax orientation interpreted for the 115 wells analyzedin the Andean retroarc (Mendoza and Neuquen provinces ofArgentina). The stress data are well distributed within thebasin and give a coherent picture of SHmax orientation in thestudy area (Table 2 and Figure 4). Most of the SHmax
orientations have a relative low to medium dispersion aboutthe mean orientation; taking into account that 8 data wereranked as A, 25 as B, 22 as C, 48 as D, and 12 as E (seeTables 1 and 2). The data were recorded between depths of17.3 and 4231 m.[20] The SHmax orientations deduced from borehole
breakout analysis have been plotted in two rose diagrams(Figure 5). In the first one (Figure 5a) only A–D qualitydata were used and in the second (Figure 5b) only A–Cquality data. This means that in the second diagram theSHmax is accurate within ±25�. The distribution for the firstdiagram has a preferred trend with a resultant direction ofazimuth 88.7� and a 95% confidence interval of 13.3�. Thesecond one has a resultant direction of azimuth 91.3� and a95% confidence interval of 17.1�. There are no significantdifferences between both mean directions and therefore allthe data with quality ranking from A to D were used in thefollowing analysis.[21] In a general view, SHmax is oriented near E–W
direction; however, it is not completely uniform within thewhole area. The first observation is that to the north andsouth of the Colorado River there is a small, but significantdifference. To the south the SHmax has a mean azimuth of82.2� (Figure 6a) and to the north a mean azimuth of 100.4�(Figure 6b). The95%confidence intervals of bothpopulationsare completely overlapped. The second observation is thatdata located southeast of the region tend to have a NEorientation,almostorthogonal to theNeuquenBasinboundaryand the Colorado River bearing. Finally, there are some SEto N–S orientations placed to the west of the area nearColorado River and Sierra de Reyes (see Figures 2 and 4).
5. Interpretation and Discussion
[22] According to Zoback [1992] the first-order stressfield pattern in an active continental margin is controlled bythe plate boundary forces. For this sector of the Andeanretroarc, the SHmax orientation should be controlled by the
convergence vector between the Nazca and South Americanplates (azimuth 080�) [Angermann et al., 1999; Norabuenaet al., 1999; Kendrick et al., 2003], the direction of the ridgepush (E–W) and the topographic forces (in general E–W,just perpendicular to the main topography axis). All of theforces are acting approximately with an E–W orientation inthis segment of the South American Plate [Coblentz andRichardson, 1996; Meijer et al., 1997]; therefore theexpected SHmax orientation should be approximately paral-lel to them.[23] In order to visualize the horizontal stress field in the
studied region, a trajectory map (Figure 7) was made usingthe 103 A–D quality data. Figures 7a and 7b representminimum (SHmin) and maximum (SHmax) horizontal stressfields, respectively. These maps show that the horizontalstress field along the study area is not completely uniform.However, its general trend is clearly consistent with theexpected first-order present-day stress orientation (E–W).We use Meijer et al.’s [1997] model as reference frame forthe expected stress field orientation, which incorporatestopographic forces and a driving basal shear stress (Figure 7).The calculated SHmax (see Table 2 and Figure 5) are generallynear the expected values. However, some deviations canbe observed in the SHmax direction within the study area(Figure 4). Some possible explanations for these deviationsare discussed below.[24] It has already been pointed out that to the north and
south of the Colorado River there is a small, but significantdeviation of the SHmax orientation. To the south of ColoradoRiver, the SHmax is almost parallel to the expected one(Figures 6a and 7) if plate boundary forces are considered asthe principal ones (ENE direction). In this sector, the dataare far from the high topographic front and a minortopographic influence is anticipated; however, the maintopography axis of this segment has a NNW trend(Figure 7), reinforcing an ENE orientation for the SHmax.[25] On the other hand, the stress data located to the north
of the Colorado River deviate 11.7� counterclockwise fromthe mean 88.7� SHmax orientation (Figure 5a) prevailing inthe region. The close relationship between stress trajectoriesand the topography (SHmax perpendicular to topography)observed for this sector suggests that either ancient struc-tural indenters are controlling the horizontal stress field, orthat topographic forces exert an important control on thestress field. The first hypothesis is consistent with thestructure of this region where huge basement blocks aredefining the NNE orogenic front of Malargue fold andthrust belt and may be pushing the retroarc undeformedrocks. This idea is also coherent with Brooks et al. [2003]hypothesis of three plates, where an Andean microplate ismodeled between Nazca and South American plates. Amore complex shape for the Andean microplate than theone proposed by these authors should be used to explain
Figure 7. Trajectory maps of the minimum (a) and maximum (b) horizontal stress field constructed using the breakoutand SHmax directions. To the north of Colorado River, the SHmax direction shows a tendency to be ESE. To the south theSHmax direction is more parallel to the ENE expected orientation. To the southeast of the region, a NE abnormal directionwas found. In dashed lines there is the SHmax proposed by Meijer et al. [1997].
TC3016 GUZMAN ET AL.: STRESS FIELD IN THE ANDEAN RETROARC
11 of 13
TC3016
SHmax orientation of this region. However, Brooks et al.based their idea not only on measured velocity vectors butalso on the abundant seismic activity concentrated in thefront of the Andean microplate, just to the north of thisregion. For the study area, there is almost no seismicactivity or neotectonic evidences in the orogenic front,indicating that this proposition may be not applicable tothis part of the Andean retroarc.[26] The second situation was proposed and justified by
other authors [Coblentz and Richardson, 1996; Meijer etal., 1997] and could also be supported by these SHmax
orientation. Figure 7 reveals that stress data located to thenorth of the Colorado River are closer to the high topo-graphic front than those placed to the south of ColoradoRiver and that the topographic axis of this Andean segmenthas a NNE bearing consistent with inducing an ESE SHmax
direction.[27] To the southeast of the region, a NE direction was
found (Figure 7), this orientation can be interpreted as theresponse to a regional basement structural control. Cristalliniet al. [2006] have shown that the principal Triassic-Jurassichalf graben faults of the northeastern Neuquen Basin have aNW trend, parallel to the minimum horizontal stress orien-tation found for this sector. The Neuquen Basin boundaryalso has the same direction and is parallel to the Rıo Coloradolineament. In the same way, the Triassic-Jurassic synrifttransference zones in this region have a NE orientation,parallel to the maximum horizontal stress.[28] Finally, there are some SHmax orientation, especially
to the west, close to Sierra de Reyes and Rıo Colorado,which are not following the regional trend (Figure 4). Theseare probably controlled by local perturbations due to localstructures, because most of them are inside the fold andthrust belt zone where the structure is more complex than inthe foreland. In addition, Folguera et al. [2005] have shownthat some NNW trending tensional basins are overprintedon the fold and thrust belt region during Quaternary. Thesestructures, together with SHmax rotations near complexstructures, can explain these data.
6. Conclusions
[29] The principal horizontal stress orientations acting inthe Andean retroarc between 34� and 39�S have been
calculated using breakout information interpreted fromdipmeter logs of 115 wells drilled in the Neuquen Basinalong Neuquen and Mendoza provinces of Argentina. Aresultant mean SHmax orientation of 88.7� and a 95%confidence interval of 13.3� were calculated for the wholearea. The breakout information of each well was qualityranked using the World Stress Map Project criterions and amap of the maximum and minimum horizontal stress fieldswas made based on 103 wells obtained after rejecting low-quality data (see Figure 7).[30] The obtained stress direction (Figure 7) is generally
aligned with the subduction vector of the Nazca plate andperpendicular to the topography. This is consistent withmodel 2 of Coblentz and Richardson [1996] which consid-ered a fixed collisional boundary and topographic forcesassociated with elevated continental crust and with Meijer etal. [1997] model which also assesses the topographicforces and assumes a driving basal shear stress of 0.5 MPa(Figure 7). From the comparison of the data obtained in thisresearch with the models presented by Coblentz andRichardson [1996] and Meijer et al. [1997], it can be seenthat the topographic, the plate boundary and the basal dragforces could be mainly controlling the stress field. Likewise,it is difficult to discern which of these forces is the mainlyresponsible for the stress alignment since they are all almostacting in the same direction.[31] Zooming into local scales some deviations from the
general E–W pattern are observed. To the north of ColoradoRiver, the SHmax shows an ESE tendency (Figures 6b and 7)and to the southeast of the region a NE direction was found(Figure 7). These local perturbations due to forces inducedby local non meridian topographic axis or to basementcontrols lead to small rotations with respect to the generaltrend.
[32] Acknowledgments. We want to express our gratitude to Repsol-YPF for providing the data needed for this research. This study has beendone with funding from Agencia Nacional de Promocion Cientıfica yTecnologica, CONICET (PEI 6465/04 and PEI 5758/05) and Universidadde Buenos Aires (01/X160). In addition, we particularly acknowledge MarkTingay, namely, for the reviews and important contributions to this research,and Victor Ramos for previous reviews of this paper. We also want toacknowledge the reviewers Oliver Heidbach and Benjamin Brooks forproviding a highly constructive evaluation.
ReferencesAngermann, D., J. Klotz, and C. Reigber (1999),
Space-geodetic estimation of the Nazca-SouthAmerica Euler vector, Earth Planet. Sci. Lett.,171, 329–334.
Babcock, E. A. (1978), Measurement of surface frac-tures from dipmeter logs, Am. Assoc. Pet. Geol.Bull., 62(7), 1111–1126.
Barrio, C. A. (1990), Late Cretaceous – early Tertiarysedimentation in a semi-arid foreland basin(Neuquen Basin, western Argentina), Sediment.Geol., 66, 255–275.
Bell, J. S., and E. A. Babcock (1986), The stress regimeof the Western Canadian Basin and the implicationsfor hydrocarbon production, Bull. Can. Pet. Geol.,34(3), 364 –378.
Bell, J. S., and D. I. Gough (1979), Northeast – south-west compressive stress in Alberta: Evidence fromoil wells, Earth Planet. Sci. Lett., 45, 475–482.
Bell, J. S., and D. I. Gough (1982), The use of boreholebreakouts in the study of crustal stress, U.S. Geol.Surv. Open File Rep., 82-1075, 539–557.
Brooks, B. A., M. Bevis, R. Smalley Jr., E. Kendrick,R. Manceda, E. Laurıa, R. Maturana, and M. Araujo(2003), Crustal motion in the Southern Andes(26�–36�S): Do the Andes behave like a micro-plate?, Geochem. Geophys. Geosyst., 4(10), 1085,doi:10.1029/2003GC000505.
Cobbold,P.R., andE.A.Rossello (2003),Aptian torecentcompressional deformation, foothills of the NeuquenBasin, Argentina,Mar. Pet. Geol., 20, 429–443.
Cobbold, P. R., M. Diraison, and E. A. Rossello (1999),Bitumen veins and Eocene transpression, NeuquenBasin, Argentina, Tectonophysics, 14, 423–442.
Coblentz, D. D., and R. M. Richardson (1996),Analysis of the South American intraplate stressfield, J. Geophys. Res., 101, 8643–8657.
Cortes, J. M. (2000), Fallas cuaternarias oblicuas alfrente montanoso en la Cordillera Frontal de Men-doza (34�34�300S), Asoc. Geol. Argent. Rev., Ser. DPubl. Especial, 4, 57– 62.
Cox, J. W. (1970), The high resolution dipmeter revealsdip – related borehole and formation characteristics,Trans. SPWLA Annu. Logging Symp., 11, 3 –6.
Cristallini, E. O., G. Bottesi, A. Gavarrino, L. Rodrıguez,R. Tomezzoli, and R. Comeron (2006), Synriftgeometry of the Neuquen Basin in northeasternNeuquen Province, Argentina, in Evolution of anAndeanMargin:ATectonicandMagmaticViewFromtheAndes to theNeuquenBasin (36 –39�S lat), editedby S.M. Kay andV. A. Ramos, Spec. Pap. Geol. Soc.Am., 407, 147–161.
Dalmayarc, B., and P. Molnar (1981), Parallel thrust andnormal faulting in Peru and constraints on the state ofstress, Earth Planet. Sci. Lett., 55, 473–481.
TC3016 GUZMAN ET AL.: STRESS FIELD IN THE ANDEAN RETROARC
12 of 13
TC3016
Folguera, A., V. Ramos, and D. Melnick (2002), Parti-cion de la deformacion en la zona del arco volca-nico de los Andes neuquinos en los ultimos30 millones de anos (36�–39�S), Rev. Geol. Chile,29(2), 151 –165.
Folguera, A., V. Ramos, T. R. Zapata, M. Spagnuolo,and F. Miranda (2005), Pliocene to Quaternaryretro-arc extension in the Andes at 35�–37�300S,paper presented at 6th International Symposiumon Andean Geodynamics, Inst. de Rec. Puor leDev., Barcelona.
Fuchs, K., and B. Muller (2001), World stress map ofthe Earth: A key to tectonic processes and techno-logical applications, Naturwissenschaften, 88,357–371.
Gough, D. I., and J. S. Bell (1979), Stress orientationsfrom borehole wall fractures with examples fromColorado, east Texas and northern Canada, Can.J. Earth Sci., 19, 1358–1370.
Gough, D. I., and J. S. Bell (1981), Stress orientationsfrom oil well fractures in Alberta and Texas, Can.J. Earth Sci., 18, 638–645.
Kay,S.M. (2005),Tertiary toRecent evolutionofAndeanarc and backarc magmas between 36�S and 38�S andevidence for Miocene shallowing of the Nazca plateunder the Neuquen Basin, paper presented at 6thInternational Symposium on Andean Geodynamics,Inst. de Rec. Puor le Dev., Univ. de Barcelona, Inst.Geol. y Minero de Esp., Barcelona.
Kendrick, E., M. Becis, R. Smalley Jr., B. Brooks, R. B.Vargas, E. Laurıa, and L. P. Souto Fortes (2003),The Nazca-South America Euler vector and its rateof change, J. South Am. Earth Sci., 16, 125–131.
Kozlowski, E. E. (1991), Structural geology of the NWNeuquen Basin, Argentina, paper presented at IVSimposio Bolivariano, Explor. Pet. en las CuencasSubandinas, Bogota, Colombia.
Kozlowski, E. E., C. Cruz, P. Condal, and R. Manceda(1990), Modelo estructural para el zocalo de laCuenca Neuquina, Mendoza, Argentina, paper pre-sented at XI Congreso Geologico Argentino, Asoc.Geol. Argent., San Juan.
Kozlowski, E. E., R. Manceda, and V. Ramos (1993),Estructura, in Geologıa y Recursos Naturales deMendoza, edited by V. A. Ramos, Rep. I(18),pp. 235–256, Asoc. Geol. Argent., Buenos Aires,Argentina.
Lavenu, A., and J. Cembrano (1999a), Compressionaland transpressional stress pattern for Pliocene andQuaternary brittle deformation in fore arc and intraarc zones (Andes of central and southern Chile),J. Struct. Geol., 21(12), 1669–1691.
Lavenu, A., and J. Cembrano (1999b), Estados deesfuerzo compresivo plioceno y compresivo-transpresivo pleistoceno, Andes del sur, Chile(38�–42�300S), Rev. Geol. Chile, 26(1), 67– 87.
Legarreta, L., and M. A. Uliana (1996), The Jurassicsuccession in west-central Argentina: Stratal pat-terns, sequences and paleogeographic evolution,Palaegeogr. Palaeoclimatol. Palaeoecol., 120,303–330.
Legarreta, L., D. A. Kokogian, and C. A. Gulisano(1989), Depositional sequences of the MalargueGroup (Upper Cretaceous –Lower Tertiary), Neu-quen Basin, Argentina, Cretaceous Res., 10, 337–356.
Manceda, R., and D. Figueroa (1995), Inversion ofMesozoicNeuquen rift in theMalargue foldand thrustbelt, Mendoza, Argentina, in Petroleum Basins ofSouth America, edited by A. J. Tankard, R. Suarez,and H. J. Welsnik, AAPGMem., 62, 369–382.
Meijer, P. T., R. Govers, and M. J. R. Wortel (1997),Forces controlling the present-day state of stress inthe Andes, Earth Planet. Sci. Lett., 148, 157–170.
Mendiberri, H., and O. Carbone (2002), Cuenca Neu-quina: Marco geologico y resena historica de laactividad petrolera, in Rocas Reservorio de lasCuencas Productivas de la Argentina, edited byM. Schiuma, G. Hinterwiummer, and G. Vergani,pp. 201 – 211, Inst. Arg. del Petrol. y del Gas,Buenos Aires, Argentina.
Mosquera, A. (2002), Inversion tectonica Jurasico Infer-ior enel sector centralde ladorsaldeHuincul, areaLosBastos,paperpresentedatVCongresodeExploraciony Desarrollo de Hidrocarburos, Asoc. Argent. deGeol. y Geofıs. Petrol., Mar del Plata, Argentina.
Mosquera, A., and V. Ramos (2005), Intraplate defor-mation in the Neuquen embayment, paper presentedat XVI Congreso Geologico Argentino, Asoc. Geol.Argent., La Plata, Argentina.
Munoz, J., and C. Stern (1988), The Quaternary volca-nic belt of the southern continental margin of SouthAmerica: Transverse structural and petrochemicalvariations across the segment between 38�S and39�S, J. South Am. Earth Sci., 1(2), 147 –161.
Munoz, J., R.Troncoso, P.Duhart, P.Crıgnola, L. Farmer,and C. Stern (2000), The relationship of the mid-Tertiary coastal magmatic belt in south-central Chileto the late Oligocene increase in plate convergencerate, Rev. Geol. Chile, 27(2), 177–203.
Norabuena, E., T. Dixon, S. Stein, and C. G. A. Harrison(1999), Decelerating Nazca-South America andNazca-Pacific motions, Geophys. Res. Lett., 26,3405–3408.
Pangaro, F., R. Veiga, and G. Vergani (2002), Evolu-cion tecto – sedimentaria del area de Cerro Bandera,Cuenca Neuquina, Argentina, paper presented at VCongreso de Exploracion y Desarrollo de Hidrocar-buros, Asoc. Argent. de Geol. y Geofıs. Petrol., Mardel Plata, Argentina.
Ploszkiewicz, J. V. (1987), Las zonas triangulares de lafaja fallada y plegada de la Cuenca NeuquinaArgentina, paper presented at X CongresoGeologico Argentino, Asoc. Geol. Argent., SanMiguel de Tucuman, Argentina.
Plumb, R. A., and J. W. Cox (1987), Stress directions ineastern North America determined to 4.5 km fromborehole elongation measurements, J. Geophys.Res., 92, 4805–4816.
Plumb, R. A., and S. H. Hickman (1985), Stressinduced borehole elongation: A comparisonbetween four arm dipmeter and the boreholeteleviewer in the Auburn Geothermal Well, J. Geo-phys. Res., 90, 5513–5521.
Ramos, V. A. (1989), The birth of southern SouthAmerica, Am. Sci., 77, 444 –450.
Ramos, V. A. (1998), Estructura del sector occidental de lafaja plegada y corrida del Agrio, Cuenca Neuquina,Argentina, paper presented at X Congreso Lati-noamericano de Geologıa and VI Congreso Nacio-nal de Geologıa Economica, Asoc. de Serv. Geol. yMineros de Iberoam., Buenos Aires, Argentina.
Ramos, V. A., and A. Folguera (2005a), Tectonicevolution of the Andes of Neuquen: Constraintsderived, from the magmatic arc and foreland defor-mation, in The Neuquen Basin, Argentina: A CaseStudy in Sequence Stratigraphy and BasinDynamics, edited by G. D. Veiga et al., Geol. Soc.Spec. Publ., 252, 15– 35.
Ramos, V. A., and A. Folguera (2005b), El origen dePayenia (Mendoza sur y norte de Neuquen): Evolu-cion estructural y tectonomagmatica de los Andes aestas latitudes, paper presented at XVI CongresoGeologico Argentino, Asoc. Geol. Argent.,La Plata, Argentina.
Ramos, V. A., M. Cegarra, and E. O. Cristallini (1996),Cenozoic tectonics of the high Andes of west-central Argentina (30�–36�S latitude),Tectonophysics,259, 185–200.
Richardson, R. M., and D. D. Coblentz (1994), Stressmodelling in the Andes: Constraints on SouthAmerican intraplate stress magnitudes, J. Geophys.Res., 99, 22,015–22,025.
Sperner, B., B. Muller, O. Heidbach, D. Delvaux,J. Reinecker, and K. Fuchs (2003), Tectonic stress inthe Earth’s crust: Advances in the World Stress MapProject, in New Insights Into Structural Interpreta-tion and Modeling, edited by D. Nieuwland, Geol.Soc. Spec. Publ., 212, 101 –116.
Stern, C. (1989), Pliocene to present migration of thevolcanic front, Andean Southern Volcanic Front,Rev. Geol. Chile, 16(2), 145–162.
Tingay, M., B. Muller, J. Reinecker, O. Haidbach,F. Wenzel, and P. Fleckenstein (2005), The WorldStress Map Project ‘‘Present-day stress in sedimen-tary basins’’ initiative: Building a valuable publicresource to understand tectonic stress in the oil patch,Leading Edge, 24(12), 1276–1282.
Turic,M., F.AramayoFlores,R.GomezOmil,R.Pombo,G. Peroni, J. Sciutto, D. Robles, and A. Caceres(1987), Geologıa de las cuencas petroleras de laArgentina, in Evaluacion de las Formaciones en laArgentina, vol. I(1), edited by S. A. Felder, p. 144,Schlumberger, Buenos Aires.
Uliana, M. A., M. E. Arteaga, L. Legarreta, J. J. Cerdan,and G. Peroni (1995), Inversion structures andhydrocarbon ocurrentes in Argentina, in Basin Inver-sion, edited by J. G. Buchman and P. G. Buchman,Geol. Soc. Spec. Publ., 88, 211 –233.
Vergani, G. D., A. J. Tankard, H. J. Belotti, and H. J.Welsink (1995), Tectonic evolution and paleogeo-graphy of the Neuquen Basin, Argentina, in Petro-leum Basins of South America, edited by A. J.Tankard, R. Suarez, and H. J. Welsink, AAPGMem., 62, 383–402.
Vines, R. (1990), Productive duplex imbrication at theNeuquen Basin thrust belt front, Argentina, inPetroleum and Tectonics in Mobile Belts, editedby J. Letouzey, pp. 69 –80, Technip, Paris.
Yagupsky, D. L., E. O. Cristallini, G. Zamora Valcarce,and R. Varade (2007), Sistema compresivosobreimpuesto a un rift oblicuo: Aplicaciones enla faja plegada y corrida de Malargue, sur deMendoza, Rev. Asoc. Geol. Argent., in press.
Zajac, B. J., and J. M. Stock (1997), Using boreholebreakouts to constrain the complete stress tensor:Results from the Sijan Deep Drilling Project andoffshore Santa Maria Basin, California, J. Geophys.Res., 102, 10,083–10,100.
Zamora Valcarce, G., T. Zapata, and D. del Pino (2005),Edad de la deformacion y magmatismo en la fajaplegada del Agrio, paper presented at XVI CongresoGeologico Argentino, Asoc. Geol. Argent., La Plata,Argentina.
Zapata, T., I. Brisson, and F. Dzelalija (1999), LaEstructura de la faja plegada y corrida andina enrelacion con el basamento de la Cuenca Neuquina,Bol. Inf. Pet., 60, 112 –121.
Zerwer, A., and N. A. Yassir (1994), Borehole breakoutinterpretation in the Gulf Coast, offshore Louisiana,in Rock Mechanics, edited by P. P. Nelson and S. E.Laubach, pp. 225–232, A. A. Balkema, Rotterdam,Netherlands.
Zoback, M. D., and M. L. Zoback (1991), Tectonicstress field of North America and relative plate mo-tions, in Neotectonics of North America DecadeMap, Volume I, edited by D. B. Slemmons et al.,pp. 339–366, Geol. Soc. of Am., Boulder, Colo.
Zoback, M. D., D. Moss, L. G. Mastin, and R. N.Anderson (1985), Well bore breakouts and in situstress, J. Geophys. Res., 90, 5523–5530.
Zoback, M. L. (1992), The first and second order pat-terns of stress in the lithosphere: The World StressMap Project, J. Geophys. Res., 97, 11,703–11,728.
Zoback, M. L., and M. D. Zoback (1989), Tectonicstress field of the conterminous United States, inGeophysical Framework of the Continental UnitedStates, edited by L. C. Pakiser and W. D. Mooney,Mem. Geol. Soc. Am., 172, 523–539.
Zoback, M. L., et al. (1989), Global patterns of tectonicstress, Nature, 341, 291–298.
���������G. Bottesi, Repsol YPF, Esmeralda 255, Piso 10,
Oficina 101E, Buenos Aires C1035ABE, Argentina.
E. Cristallini and C. Guzman, Laboratorio deModelado Geologico, Departamento de CienciasGeologicas, Universidad de Buenos Aires, Pabellon II,Buenos Aires C1428EHA, Argentina. ([email protected])
TC3016 GUZMAN ET AL.: STRESS FIELD IN THE ANDEAN RETROARC
13 of 13
TC3016