Rapid recovery of a fish assemblage following an ecosystem disruptive algal bloom
Upload
khangminh22Category
view
1download
0
Body size-dependent responses of a marine fishassemblage to climate change and fishing over acentury-long scale
M A R T I N J . G E N N E R *w , D AV I D W. S I M S *z, A L A N J . S O U T H WA R D *{ ,
G E O R G I N A C . B U D D *, PA T R I C I A M A S T E R S O N *, M A T T H E W M C H U G H *,
P E T E R R E N D L E *, E M I LY J . S O U T H A L L *, V I C T O R I A J . W E A R M O U T H * and
S T E P H E N J . H A W K I N S *§
*Marine Biological Association of the United Kingdom, The Laboratory, Citadel Hill, Plymouth PL1 2PB, UK, wSchool of Biological
Sciences, University of Bristol, Woodland Road, Bristol BS8 1UG, UK, zMarine Biology and Ecology Research Centre, School of
Biological Sciences, University of Plymouth, Drake Circus, Plymouth PL4 8AA, UK, §College of Natural Sciences, Memorial
Building, Bangor University, Gwynedd LL57 2UW, UK
Abstract
Commercial fishing and climate change have influenced the composition of marine fishassemblages worldwide, but we require a better understanding of their relative influence onlong-term changes in species abundance and body-size distributions. In this study, weinvestigated long-term (1911–2007) variability within a demersal fish assemblage in thewestern English Channel. The region has been subject to commercial fisheries throughoutmost of the past century, and has undergone interannual changes in sea temperature of over2.0 1C. We focussed on a core 30 species that comprised 99% of total individuals sampled in theassemblage. Analyses showed that temporal trends in the abundance of smaller multispeciessize classes followed thermal regime changes, but that there were persistent declines inabundance of larger size classes. Consistent with these results, larger-growing individualspecies had the greatest declines in body size, and the most constant declines in abundance,while abundance changes of smaller-growing species were more closely linked to precedingsea temperatures. Together these analyses are suggestive of dichotomous size-dependentresponses of species to long-term climate change and commercial fishing over a century scale.Small species had rapid responses to the prevailing thermal environment, suggesting theirlife history traits predisposed populations to respond quickly to changing climates. Largerspecies declined in abundance and size, reflecting expectations from sustained size-selectiveoverharvesting. These results demonstrate the importance of considering species traits whendeveloping indicators of human and climatic impacts on marine fauna.
Keywords: climate change, fisheries, life history traits, marine monitoring, overfishing
Received 9 February 2009; revised version received 21 June 2009 and accepted 29 June 2009
Introduction
Striking ecosystem-level changes have taken place in
marine coastal environments over the last century
through both natural and anthropogenic causes.
Commercial fishing has influenced the abundance of
many target marine fish species, with evidence from
both long-term monitoring and contemporary resur-
veys of sites for which historic datasets are avail-
able (Jennings & Kaiser, 1998; Jackson et al., 2001).
Although many fisheries are stable or recovering, sus-
tained fishing has negatively influenced the reproduc-
tive capacity of many populations, even to the extent
that a small number of formerly abundant marine
species are now economically or biologically extinct
(Reynolds et al., 2005). Fisheries target larger indivi-
duals within populations, often from slow-growing,
late-maturing and long-lived species that produce few
offspring (Jennings et al., 1999). As a consequence of
these life-history traits commercial target species can be
the least resilient to chronic fishing pressure (Jennings &
Kaiser, 1998). Importantly, such species are often top
Correspondence: M. J. Genner, School of Biological Sciences,
University of Bristol, Woodland Road, Bristol BS8 1UG, UK,
tel. 1 44 117 928 9827, fax 1 44 117 331 7985, e-mail:
{Deceased 27 October 2007.
Global Change Biology (2009), doi: 10.1111/j.1365-2486.2009.02027.x
r 2009 Blackwell Publishing Ltd 1

predators and their overharvesting can have broader
ecosystem-level implications, including cascading den-
sity-dependent effects on other trophic levels (Frank
et al., 2005; Myers et al., 2007).
In northern European waters commercial bottom-
trawl fisheries have operated since the late 18th century,
but marine fisheries using static gears such as long-lines
and fixed nets date back to medieval times (Barrett et al.,
2004). Industrialization and technological development
of fisheries in the region over the 20th century has led to
the increased concerns about the resilience of fished
stocks (Sims & Southward, 2006). Evidence of the
negative effects of unsustainably high fishing activity
is available for many regional stocks, including those
species with key commercial and ecological importance,
most notably Atlantic cod (Gadus morhua) (Cook et al.,
1997). Moreover, overfishing has been linked to the
regional extirpation of several other large-bodied de-
mersal species with less commercial importance includ-
ing common skate (Dipturus batis) from the Irish Sea
(Brander, 1981), and angel shark (Squatina squatina)
from the English Channel (Rogers & Ellis, 2000; Dulvy
et al., 2003).
Although the effects of fishing are pronounced, cli-
matic shifts have also been implicated as major causes
of fluctuations in marine fish diversity and abundance
in both pelagic and demersal assemblages (Alheit &
Hagen, 1997; Genner et al., 2004; Lehodey et al., 2006;
Hiddink & ter Hofstede, 2008). Long-term changes in
climate have been related to changes in recruitment
(Beaugrand et al., 2003), growth (Thresher et al., 2007),
migration phenology (Sims et al., 2004), depth distribu-
tions (Dulvy et al., 2008) and latitudinal distributions
(Perry et al., 2005). Given the consistent warming of
North Atlantic sea surface temperatures (SST) since the
mid-1980s (Mackenzie & Schiedek, 2007) and recent
predictions of a 0.5–4 1C increase over the next century
(Sheppard, 2004), there is a need to identify which
species are most likely to respond to climate change,
the nature of that response, and the timescales over
which this will take place. This is not least because
climate change effects have been suggested to have a
role in causing fish population declines (Schiermeier,
2004), in addition to well-documented widespread and
long-lasting declines due to overfishing (Jackson et al.,
2001).
Here, we examined changes in abundance and body
size within a demersal fish assemblage from the inshore
waters of the English Channel over a 97-year period
(1911–2007). This site contains a diverse fauna of south-
ern and northern-distributed fish species, with poten-
tially contrasting responses to climate and other factors
(Southward et al., 1995, 2005; Hawkins et al., 2003). We
used these data to first investigate long-term changes in
the abundance of size classes within the assemblage. We
then tested if larger-bodied species in the assemblage
have shown declines in abundance and body size over
the period, consistent with overfishing. We next tested if
smaller-bodied fish species, given their intrinsic poten-
tial for greater population growth (Denney et al., 2002),
and their known responses to climate in the North Sea
(Hiddink & ter Hofstede, 2008), have shown more
pronounced abundance responses to favourable cli-
matic conditions. Finally, we tested whether small and
large-bodied components of the species assemblage
have undergone parallel or contrasting long-term pat-
terns of structural change.
Materials and methods
Survey site and data collection
In total 1020 otter trawls were undertaken at 30–50 m
depth over a spatial scale of 51� 22 km (501080–501200N,
31550–041390W; Fig. S1) during 48 years from 1911 to
2007 (1911, 1913–14, 1919–22, 1950–58, 1967–79, 1983–94,
2001–07; Table S1). Abundance of 74 demersal fish taxa
were recorded, and of these five were treated as multi-
species groups, because records did not always identify
individuals to species. For brevity, each of these multi-
species groups (Table S2) is henceforth referred to as
one species. Pelagic taxa were excluded from analyses
as they were not recorded in all sampling years. Seven
vessels were used for sampling, ranging in overall
length from 18.3 to 39.0 m. Where data are available,
trawls were undertaken at the same speeds and were
comparable in dimensions: headline length range,
16.2–19.8 m; groundrope length range, 19.8–27.4 m;
main net stretched mesh diameter, 75–270 mm, and all
vessels used a fine-mesh cod end or a cover (Table S3).
The data analysed here are independent of commercial
landings and are not confounded by changes in fishing
practices, market forces or quota restrictions. The sur-
vey gears ensured that small noncommercial species
were sampled, species that would pass through the
wider mesh of commercial gears. The median number
of hauls per year was 16 (range 1–98), and the median
duration of each haul of the trawl was 60 min (range
8–210). Length data were collected during 1911,
1919–22, 1950–57, 1979–1986 and 2001–2007. Typically
in hauls where length data were collected, all indivi-
duals were measured, except when species were very
abundant which necessitated subsampling. Since 1911,
between 72 and 13 440 individuals have been measured
per species used in the analyses (Table S4). Mass data
were collected from measured specimens between 2001
and 2007.
2 M . J . G E N N E R et al.
r 2009 Blackwell Publishing Ltd, Global Change Biology, doi: 10.1111/j.1365-2486.2009.02027.x

Environmental data
SST data were derived from the Global Ocean Surface
Temperature (GISST) databank of the UK Meteorologi-
cal Office Hadley Centre via the British Atmospheric
Data Centre (http://badc.nerc.ac.uk). Data comprise
monthly means for 11 latitude and longitude units
dating back to 1871. Over the last century there have
been notable changes in SST of the English Channel:
following a cold period during the 1910s and 1920s
there was a rise in SST towards the 1950s, a slight
cooling from the 1960s to the early 1980s, and a rapid
warming since the mid-1980s (Southward et al., 2005).
These trends were most prominent in winter measure-
ments (Fig. 1a and b), and similar trends in SST have
taken place throughout the North-East Atlantic (Shep-
pard, 2004). In the sampling region, SST accurately
reflects bottom temperatures in winter; in summer the
waters are stratified leading to surface waters � 4 1C
warmer. To provide an indication of consistency of
fishing activity in the region, data on landings by area
of capture were collated from UK government records
(Fig 1c and d). Given mortality data for the assemblage
are largely absent, no attempts were made to derive
direct associations between fisheries effort and long-
term change in our focal assemblage.
Identification of core species in the assemblage
Temporal trends of rarer species can be difficult to
quantify accurately from trawl survey data. Thus, we
only examined abundance changes in common or ‘core’
species with the highest incidence (number of years
present in the dataset) over the sampling period. The 30
core species comprised 99.1% of the estimated 987 305
individuals sampled between 1911 and 2007.
Temporal change in abundance of size-classes in the corespecies assemblage
We used the survey data to explore temporal change
in mean annual catch per unit effort (CPUE) of indivi-
7.5
8.0
8.5
9.0
9.5
10.0
10.5
11.0(a)
(c)
0
2000
4000
6000
8000
10 000
12 000
14 000
16 000
18 000
Dem
ersa
l fis
h la
ndin
gs (
tonn
es)
14.0
14.5
15.0
15.5
16.0
16.5
17.0
17.5
Dem
ersa
l fis
h la
ndin
gs (
tonn
es)
(d)
(b)
0
500
1000
1500
2000
2500
3000
3500
1910 1930 1950 1970 1990 2010Year
1910 1930 1950 1970 1990 2010
1910 1930 1950 1970 1990 2010 1910 1930 1950 1970 1990 2010Year
Mea
n se
a su
rfac
e te
mpe
ratu
reJu
ly–S
epte
mbe
r (°
C)
Mea
n se
a su
rfac
e te
mpe
ratu
reJa
nuar
y–M
arch
(°C
)
Fig. 1 Mean (a) winter and (b) summer sea surface temperature (SST) 1910–2007 off Plymouth (grid square (50–511N, 04–051W). Data
from the UK Meteorological Office Hadley Centre, 5-year running means include the focal year and previous 4 years. For illustrative
purposes only, (c) UK fleet demersal fish landings from the English Channel (ICES areas VIId/e), and (d) landings at the port of
Plymouth. Data from UK Government Fisheries Statistics; grey areas indicate war years.
C L I M AT E , F I S H I N G A N D M A R I N E F I S H A S S E M B L A G E S 3
r 2009 Blackwell Publishing Ltd, Global Change Biology, doi: 10.1111/j.1365-2486.2009.02027.x

duals in multispecies size categories within the core
assemblage. We calculated the mean annual CPUE
(individuals caught per hour trawling) of each core
species across all hauls in the year. For each species
during each of these years we then calculated the
proportion of all sampled individuals belonging to each
size class, and multiplied these by the mean annual
species CPUE. This enabled us to calculate mean annual
CPUE of each multispecies size class. Substantial varia-
tion in body shape among sampled species is likely to
have influenced relative vulnerability to commercial
fishing gears, thus consideration of both mass and
length parameters is valuable. Since only total length
was available before 2001, we estimated individual
mass using species length–weight relationships derived
from specimens sampled for both parameters since 2001
(Table S4). Although these relationships may have
varied in the sampling area over time, we assume
variation would ensure only marginal influence on
larger-scale patterns in our results. We identified the
most likely drivers of variation in CPUE (log10[x 1 1]
transformed) of the smallest size category using multi-
ple regression, employing as predictor variables the
mean winter (January–March) SST for the focal and
previous year and the mean summer (July–September)
SST for the focal and previous year, as indicators of
climatic variability. We also included CPUE (log10[x 1 1]
transformed) of fish in the two largest size categories,
representing abundance of potential predators.
Changes in body size of species
As an index of the change in body size of sampled
individuals within each species over time, we measured
the slope of linear relationships between sampling year
and body size of all sampled individuals. Spearman’s
rank correlations (rs) were used to test for significant
cross-species associations between body size changes
and maximum species body sizes early in the time
series (1911–22), namely maximum total length (Lmax)
and maximum mass (Wmax).
Changes in abundance of species
As an index of change in abundance of core species
from 1911 to 2007 we used Pearson’s correlation coeffi-
cient (r) of log10(x 1 1) transformed mean annual CPUE
against year. As an index of climate-related change in
abundance of core species from 1911 to 2007 we used
Pearson’s correlation coefficient of log10(x 1 1) trans-
formed mean annual CPUE since 1911 against SST,
making the assumption of linearity of species re-
sponses. Correlation coefficients were used to quantify
abundance trends in preference to slope coefficients due
to their lack of dependence on average species abun-
dance across all sampling years. Multiple regression
was used to test for associations between abundance
trends, maximum body size, and northerly limits of
species distributions. Distributional data were sourced
from Fishbase (Froese & Pauly, 2008).
Size-dependent patterns of assemblage structural change
We divided the 30 core species into larger and small
species based on maximum body mass of individuals
sampled in 1911–1922 (large species Wmax4900 g; Table
S4). A matrix of quarterly average catch per hour for
each species (rows: year quarter; columns: species) was
calculated, and data for each species were log10(x 1 1)
transformed and standardized (mean 5 0; SD 5 1). To
condense multivariate variability into fewer dimensions
we used principal component analysis (PCA) on the
derived correlation matrix of Primer-6 (Primer-E Ltd,
Plymouth, UK). This enabled us to identify prominent
patterns of temporal structural change in the multivari-
ate data. Species contributing strongly to principal com-
ponent axis 1 (PC1), the primary descriptor of change,
were identified for descriptive purposes as those with
loadings 40.4 or o�0.4. Multiple regressions were used
to test for dependence of PC1 on sea temperatures.
Results
Abundance of size classes
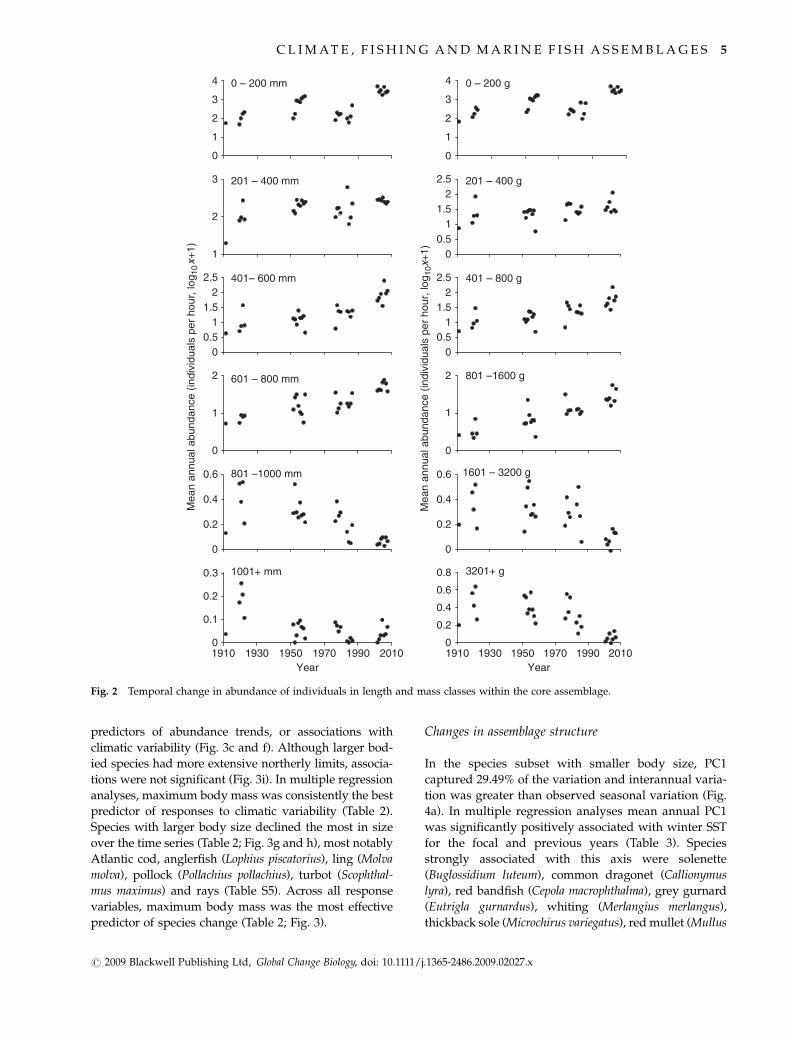
Individuals in the 0–200 mm and 0–200 g size categories
increased in abundance towards the 1950s, declined
towards the 1980s and increased from the late 1980s
onwards. Medium sized fishes in the 201–800 mm and
201–1600 g size categories gradually increased in abun-
dance throughout the time series. By contrast large
fishes 4801 mm and 41601 g declined in abundance
(Fig. 2). Small species dominated the assemblage by
number, with species o200 g comprising on average
87.4% (range 64–99%) of the core assemblage, and
species o200 mm on average comprising 63.3% (range
13.2–92.9%). In multiple regression analyses, log-trans-
formed abundance of smallest size categories was sig-
nificantly dependent on winter SSTs of the focal and
previous years (Table 1).
Body size as a predictor of abundance and size changes
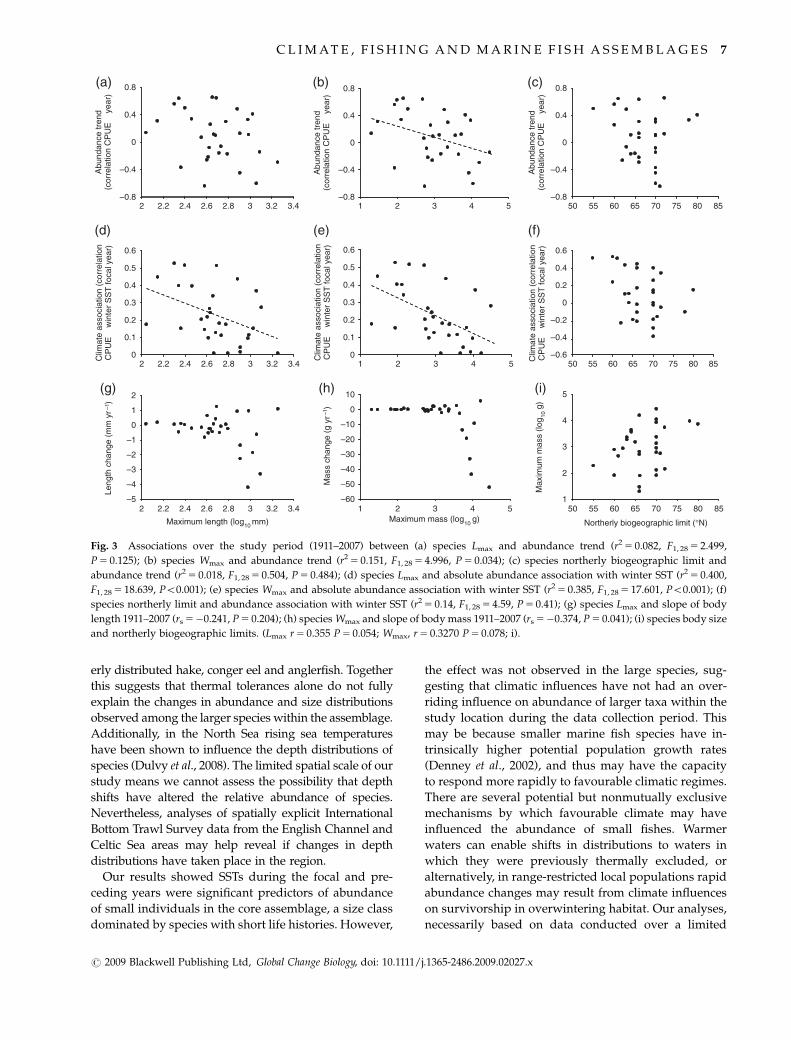
Species with greater maximum body size declined most
consistently in abundance over the sampling period
(Fig. 3a and b), while species with smaller body size
were more strongly associated with climatic variability
(Fig. 3d and e). Northerly limits were not significant
4 M . J . G E N N E R et al.
r 2009 Blackwell Publishing Ltd, Global Change Biology, doi: 10.1111/j.1365-2486.2009.02027.x
predictors of abundance trends, or associations with
climatic variability (Fig. 3c and f). Although larger bod-
ied species had more extensive northerly limits, associa-
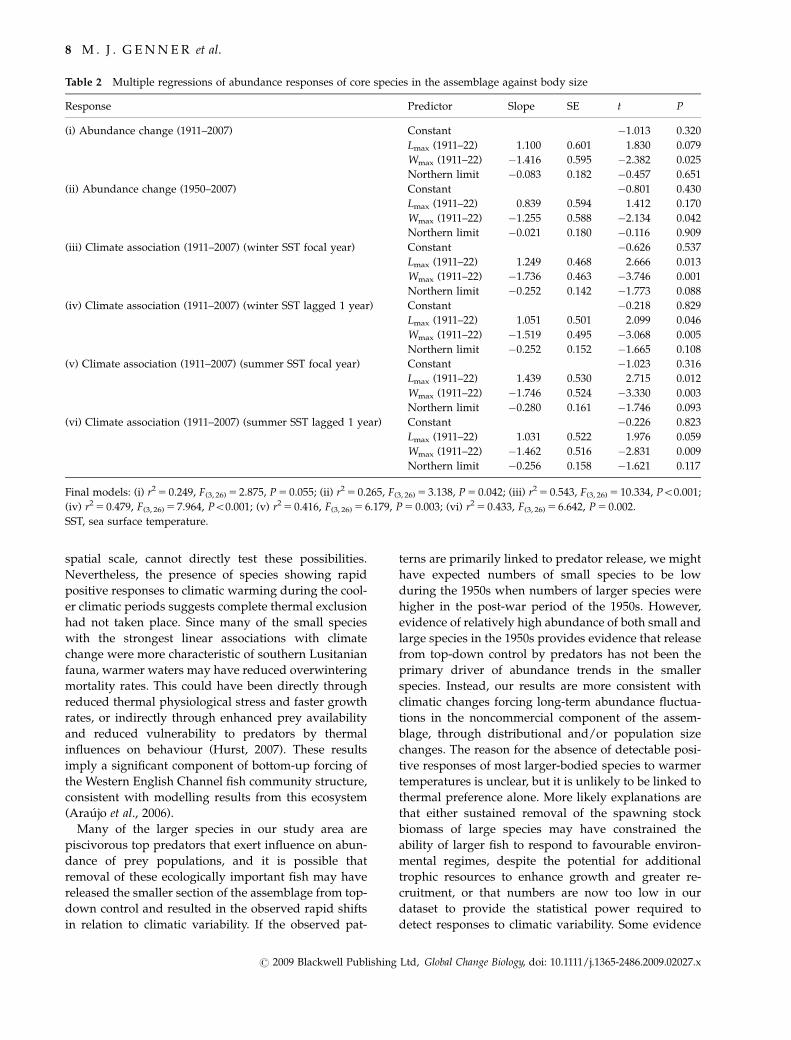
tions were not significant (Fig. 3i). In multiple regression
analyses, maximum body mass was consistently the best
predictor of responses to climatic variability (Table 2).
Species with larger body size declined the most in size
over the time series (Table 2; Fig. 3g and h), most notably
Atlantic cod, anglerfish (Lophius piscatorius), ling (Molva
molva), pollock (Pollachius pollachius), turbot (Scophthal-
mus maximus) and rays (Table S5). Across all response
variables, maximum body mass was the most effective
predictor of species change (Table 2; Fig. 3).
Changes in assemblage structure
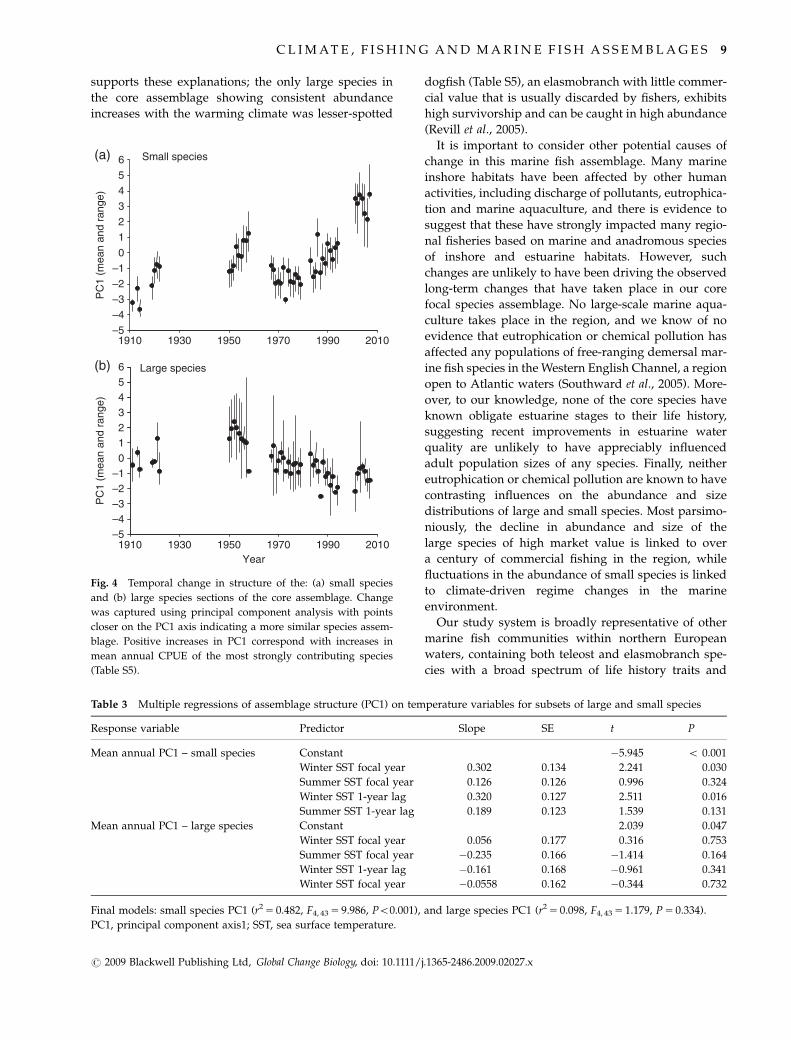
In the species subset with smaller body size, PC1
captured 29.49% of the variation and interannual varia-
tion was greater than observed seasonal variation (Fig.
4a). In multiple regression analyses mean annual PC1
was significantly positively associated with winter SST
for the focal and previous years (Table 3). Species
strongly associated with this axis were solenette
(Buglossidium luteum), common dragonet (Callionymus
lyra), red bandfish (Cepola macrophthalma), grey gurnard
(Eutrigla gurnardus), whiting (Merlangius merlangus),
thickback sole (Microchirus variegatus), red mullet (Mullus
0 – 200 mm
0
1
2
3
4
201 – 400 mm
1
2
3
401– 600 mm
Mea
n an
nual
abu
ndan
ce (
indi
vidu
als
per
hour
, log
10x+
1)
00.5
11.5
22.5
601 – 800 mm
801 –1000 mm
0
1
2
0
0.2
0.4
0.6
1001+ mm
0
0.1
0.2
0.3
1910Year
1930 1950 1970 1990 2010
0
1
2
3
4
00.5
11.5
22.5 201 – 400 g
Mea
n an
nual
abu
ndan
ce (
indi
vidu
als
per
hour
, log
10x+
1)
00.5
11.5
22.5 401 – 800 g
0
1
2
0
0.2
0.4
0.6
801 –1600 g
1910 1930 1950 1970 1990 2010Year
0
0.2
0.4
0.6
0.8 3201+ g
1601 – 3200 g
0 – 200 g
Fig. 2 Temporal change in abundance of individuals in length and mass classes within the core assemblage.
C L I M AT E , F I S H I N G A N D M A R I N E F I S H A S S E M B L A G E S 5
r 2009 Blackwell Publishing Ltd, Global Change Biology, doi: 10.1111/j.1365-2486.2009.02027.x
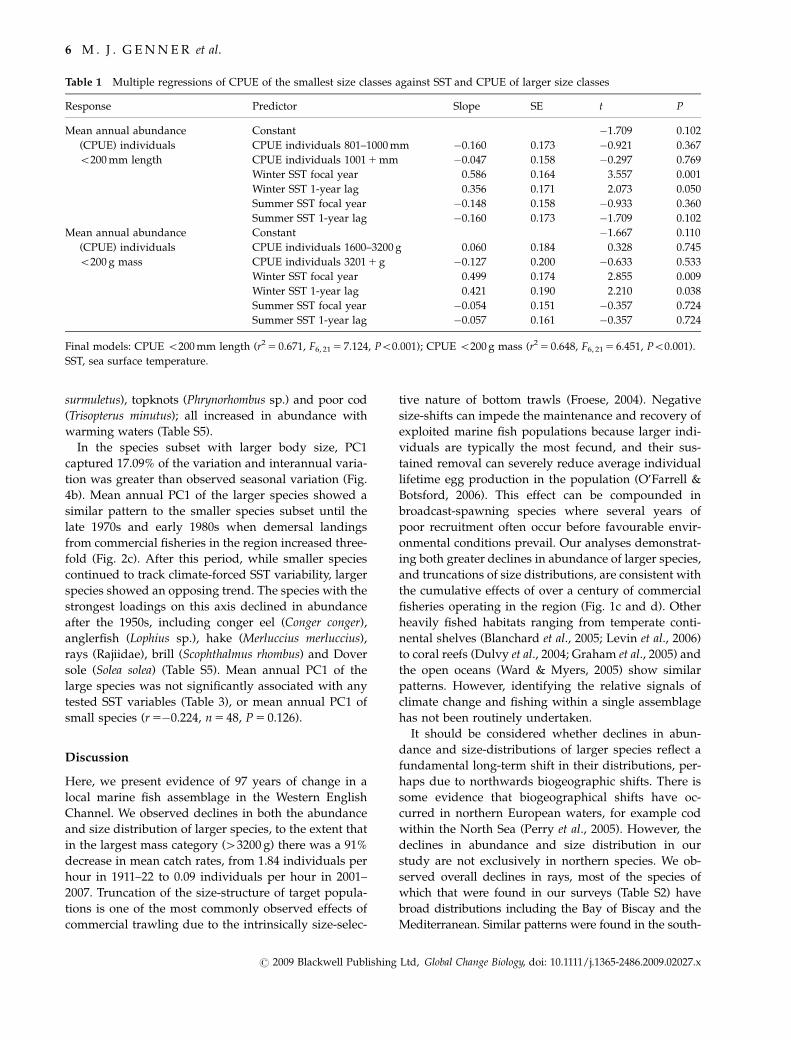
surmuletus), topknots (Phrynorhombus sp.) and poor cod
(Trisopterus minutus); all increased in abundance with
warming waters (Table S5).
In the species subset with larger body size, PC1
captured 17.09% of the variation and interannual varia-
tion was greater than observed seasonal variation (Fig.
4b). Mean annual PC1 of the larger species showed a
similar pattern to the smaller species subset until the
late 1970s and early 1980s when demersal landings
from commercial fisheries in the region increased three-
fold (Fig. 2c). After this period, while smaller species
continued to track climate-forced SST variability, larger
species showed an opposing trend. The species with the
strongest loadings on this axis declined in abundance
after the 1950s, including conger eel (Conger conger),
anglerfish (Lophius sp.), hake (Merluccius merluccius),
rays (Rajiidae), brill (Scophthalmus rhombus) and Dover
sole (Solea solea) (Table S5). Mean annual PC1 of the
large species was not significantly associated with any
tested SST variables (Table 3), or mean annual PC1 of
small species (r 5�0.224, n 5 48, P 5 0.126).
Discussion
Here, we present evidence of 97 years of change in a
local marine fish assemblage in the Western English
Channel. We observed declines in both the abundance
and size distribution of larger species, to the extent that
in the largest mass category (43200 g) there was a 91%
decrease in mean catch rates, from 1.84 individuals per
hour in 1911–22 to 0.09 individuals per hour in 2001–
2007. Truncation of the size-structure of target popula-
tions is one of the most commonly observed effects of
commercial trawling due to the intrinsically size-selec-
tive nature of bottom trawls (Froese, 2004). Negative
size-shifts can impede the maintenance and recovery of
exploited marine fish populations because larger indi-
viduals are typically the most fecund, and their sus-
tained removal can severely reduce average individual
lifetime egg production in the population (O’Farrell &
Botsford, 2006). This effect can be compounded in
broadcast-spawning species where several years of
poor recruitment often occur before favourable envir-
onmental conditions prevail. Our analyses demonstrat-
ing both greater declines in abundance of larger species,
and truncations of size distributions, are consistent with
the cumulative effects of over a century of commercial
fisheries operating in the region (Fig. 1c and d). Other
heavily fished habitats ranging from temperate conti-
nental shelves (Blanchard et al., 2005; Levin et al., 2006)
to coral reefs (Dulvy et al., 2004; Graham et al., 2005) and
the open oceans (Ward & Myers, 2005) show similar
patterns. However, identifying the relative signals of
climate change and fishing within a single assemblage
has not been routinely undertaken.
It should be considered whether declines in abun-
dance and size-distributions of larger species reflect a
fundamental long-term shift in their distributions, per-
haps due to northwards biogeographic shifts. There is
some evidence that biogeographical shifts have oc-
curred in northern European waters, for example cod
within the North Sea (Perry et al., 2005). However, the
declines in abundance and size distribution in our
study are not exclusively in northern species. We ob-
served overall declines in rays, most of the species of
which that were found in our surveys (Table S2) have
broad distributions including the Bay of Biscay and the
Mediterranean. Similar patterns were found in the south-
Table 1 Multiple regressions of CPUE of the smallest size classes against SST and CPUE of larger size classes
Response Predictor Slope SE t P
Mean annual abundance
(CPUE) individuals
o200 mm length
Constant �1.709 0.102
CPUE individuals 801–1000 mm �0.160 0.173 �0.921 0.367
CPUE individuals 1001 1 mm �0.047 0.158 �0.297 0.769
Winter SST focal year 0.586 0.164 3.557 0.001
Winter SST 1-year lag 0.356 0.171 2.073 0.050
Summer SST focal year �0.148 0.158 �0.933 0.360
Summer SST 1-year lag �0.160 0.173 �1.709 0.102
Mean annual abundance
(CPUE) individuals
o200 g mass
Constant �1.667 0.110
CPUE individuals 1600–3200 g 0.060 0.184 0.328 0.745
CPUE individuals 3201 1 g �0.127 0.200 �0.633 0.533
Winter SST focal year 0.499 0.174 2.855 0.009
Winter SST 1-year lag 0.421 0.190 2.210 0.038
Summer SST focal year �0.054 0.151 �0.357 0.724
Summer SST 1-year lag �0.057 0.161 �0.357 0.724
Final models: CPUE o200 mm length (r2 5 0.671, F6, 21 5 7.124, Po0.001); CPUE o200 g mass (r2 5 0.648, F6, 21 5 6.451, Po0.001).
SST, sea surface temperature.
6 M . J . G E N N E R et al.
r 2009 Blackwell Publishing Ltd, Global Change Biology, doi: 10.1111/j.1365-2486.2009.02027.x
erly distributed hake, conger eel and anglerfish. Together
this suggests that thermal tolerances alone do not fully
explain the changes in abundance and size distributions
observed among the larger species within the assemblage.
Additionally, in the North Sea rising sea temperatures
have been shown to influence the depth distributions of
species (Dulvy et al., 2008). The limited spatial scale of our
study means we cannot assess the possibility that depth
shifts have altered the relative abundance of species.
Nevertheless, analyses of spatially explicit International
Bottom Trawl Survey data from the English Channel and
Celtic Sea areas may help reveal if changes in depth
distributions have taken place in the region.
Our results showed SSTs during the focal and pre-
ceding years were significant predictors of abundance
of small individuals in the core assemblage, a size class
dominated by species with short life histories. However,
the effect was not observed in the large species, sug-
gesting that climatic influences have not had an over-
riding influence on abundance of larger taxa within the
study location during the data collection period. This
may be because smaller marine fish species have in-
trinsically higher potential population growth rates
(Denney et al., 2002), and thus may have the capacity
to respond more rapidly to favourable climatic regimes.
There are several potential but nonmutually exclusive
mechanisms by which favourable climate may have
influenced the abundance of small fishes. Warmer
waters can enable shifts in distributions to waters in
which they were previously thermally excluded, or
alternatively, in range-restricted local populations rapid
abundance changes may result from climate influences
on survivorship in overwintering habitat. Our analyses,
necessarily based on data conducted over a limited
–0.8
0
0.4
0.8(a) (b) (c)
–0.8
–0.4
0
0.4
0.8
–0.8
–0.4
0
0.4
0.8A
bund
ance
tren
d(c
orre
latio
n C
PU
E ×
yea
r)
–0.4
2 2.2 2.4 2.6 2.8 3 3.2 3.4 1 2 53 4 50 55 60 65 70 75 80 85
Abu
ndan
ce tr
end
(cor
rela
tion
CP
UE
× y
ear)
(d)
(g)
(e)
(h)
(f)
(i)
0
0.1
0.2
0.3
0.4
0.5
0.6
0
0.1
0.2
0.3
0.4
0.5
0.6
–0.6
–0.4
–0.2
0
0.2
0.4
0.6
Clim
ate
asso
ciat
ion
(cor
rela
tion
CP
UE
× w
inte
r S
ST
foca
l yea
r)
2 2.2 2.4 2.6 2.8 3 3.2 3.4 1 2 3 4 5 50 55 60 65 70 75 80 85
Clim
ate
asso
ciat
ion
(cor
rela
tion
CP
UE
× w
inte
r S
ST
foca
l yea
r)
–5
–4
–3
–2
–1
0
1
2
–60
–50
–40
–30
–20
–10
0
10
1
2
3
4
Maximum length (log mm) Maximum mass (log g)
Leng
th c
hang
e (m
m y
r )
5
2 2.2 2.4 2.6 2.8 3 3.2 3.4 1 2 3 4 5 50 55 60 65 70 75 80 85
Northerly biogeographic limit (°N)
Max
imum
mas
s (lo
g
g)
Mas
s ch
ange
(g
yr
)C
limat
e as
soci
atio
n (c
orre
latio
nC
PU
E ×
win
ter
SS
T fo
cal y
ear)
Abu
ndan
ce tr
end
(cor
rela
tion
CP
UE
× y
ear)
Fig. 3 Associations over the study period (1911–2007) between (a) species Lmax and abundance trend (r2 5 0.082, F1, 28 5 2.499,
P 5 0.125); (b) species Wmax and abundance trend (r2 5 0.151, F1, 28 5 4.996, P 5 0.034); (c) species northerly biogeographic limit and
abundance trend (r2 5 0.018, F1, 28 5 0.504, P 5 0.484); (d) species Lmax and absolute abundance association with winter SST (r2 5 0.400,
F1, 28 5 18.639, Po0.001); (e) species Wmax and absolute abundance association with winter SST (r2 5 0.385, F1, 28 5 17.601, Po0.001); (f)
species northerly limit and abundance association with winter SST (r2 5 0.14, F1, 28 5 4.59, P 5 0.41); (g) species Lmax and slope of body
length 1911–2007 (rs 5�0.241, P 5 0.204); (h) species Wmax and slope of body mass 1911–2007 (rs 5�0.374, P 5 0.041); (i) species body size
and northerly biogeographic limits. (Lmax r 5 0.355 P 5 0.054; Wmax, r 5 0.3270 P 5 0.078; i).
C L I M AT E , F I S H I N G A N D M A R I N E F I S H A S S E M B L A G E S 7
r 2009 Blackwell Publishing Ltd, Global Change Biology, doi: 10.1111/j.1365-2486.2009.02027.x
spatial scale, cannot directly test these possibilities.
Nevertheless, the presence of species showing rapid
positive responses to climatic warming during the cool-
er climatic periods suggests complete thermal exclusion
had not taken place. Since many of the small species
with the strongest linear associations with climate
change were more characteristic of southern Lusitanian
fauna, warmer waters may have reduced overwintering
mortality rates. This could have been directly through
reduced thermal physiological stress and faster growth
rates, or indirectly through enhanced prey availability
and reduced vulnerability to predators by thermal
influences on behaviour (Hurst, 2007). These results
imply a significant component of bottom-up forcing of
the Western English Channel fish community structure,
consistent with modelling results from this ecosystem
(Araujo et al., 2006).
Many of the larger species in our study area are
piscivorous top predators that exert influence on abun-
dance of prey populations, and it is possible that
removal of these ecologically important fish may have
released the smaller section of the assemblage from top-
down control and resulted in the observed rapid shifts
in relation to climatic variability. If the observed pat-
terns are primarily linked to predator release, we might
have expected numbers of small species to be low
during the 1950s when numbers of larger species were
higher in the post-war period of the 1950s. However,
evidence of relatively high abundance of both small and
large species in the 1950s provides evidence that release
from top-down control by predators has not been the
primary driver of abundance trends in the smaller
species. Instead, our results are more consistent with
climatic changes forcing long-term abundance fluctua-
tions in the noncommercial component of the assem-
blage, through distributional and/or population size
changes. The reason for the absence of detectable posi-
tive responses of most larger-bodied species to warmer
temperatures is unclear, but it is unlikely to be linked to
thermal preference alone. More likely explanations are
that either sustained removal of the spawning stock
biomass of large species may have constrained the
ability of larger fish to respond to favourable environ-
mental regimes, despite the potential for additional
trophic resources to enhance growth and greater re-
cruitment, or that numbers are now too low in our
dataset to provide the statistical power required to
detect responses to climatic variability. Some evidence
Table 2 Multiple regressions of abundance responses of core species in the assemblage against body size
Response Predictor Slope SE t P
(i) Abundance change (1911–2007) Constant �1.013 0.320
Lmax (1911–22) 1.100 0.601 1.830 0.079
Wmax (1911–22) �1.416 0.595 �2.382 0.025
Northern limit �0.083 0.182 �0.457 0.651
(ii) Abundance change (1950–2007) Constant �0.801 0.430
Lmax (1911–22) 0.839 0.594 1.412 0.170
Wmax (1911–22) �1.255 0.588 �2.134 0.042
Northern limit �0.021 0.180 �0.116 0.909
(iii) Climate association (1911–2007) (winter SST focal year) Constant �0.626 0.537
Lmax (1911–22) 1.249 0.468 2.666 0.013
Wmax (1911–22) �1.736 0.463 �3.746 0.001
Northern limit �0.252 0.142 �1.773 0.088
(iv) Climate association (1911–2007) (winter SST lagged 1 year) Constant �0.218 0.829
Lmax (1911–22) 1.051 0.501 2.099 0.046
Wmax (1911–22) �1.519 0.495 �3.068 0.005
Northern limit �0.252 0.152 �1.665 0.108
(v) Climate association (1911–2007) (summer SST focal year) Constant �1.023 0.316
Lmax (1911–22) 1.439 0.530 2.715 0.012
Wmax (1911–22) �1.746 0.524 �3.330 0.003
Northern limit �0.280 0.161 �1.746 0.093
(vi) Climate association (1911–2007) (summer SST lagged 1 year) Constant �0.226 0.823
Lmax (1911–22) 1.031 0.522 1.976 0.059
Wmax (1911–22) �1.462 0.516 �2.831 0.009
Northern limit �0.256 0.158 �1.621 0.117
Final models: (i) r2 5 0.249, F(3, 26) 5 2.875, P 5 0.055; (ii) r2 5 0.265, F(3, 26) 5 3.138, P 5 0.042; (iii) r2 5 0.543, F(3, 26) 5 10.334, Po0.001;
(iv) r2 5 0.479, F(3, 26) 5 7.964, Po0.001; (v) r2 5 0.416, F(3, 26) 5 6.179, P 5 0.003; (vi) r2 5 0.433, F(3, 26) 5 6.642, P 5 0.002.
SST, sea surface temperature.
8 M . J . G E N N E R et al.
r 2009 Blackwell Publishing Ltd, Global Change Biology, doi: 10.1111/j.1365-2486.2009.02027.x
supports these explanations; the only large species in
the core assemblage showing consistent abundance
increases with the warming climate was lesser-spotted
dogfish (Table S5), an elasmobranch with little commer-
cial value that is usually discarded by fishers, exhibits
high survivorship and can be caught in high abundance
(Revill et al., 2005).
It is important to consider other potential causes of
change in this marine fish assemblage. Many marine
inshore habitats have been affected by other human
activities, including discharge of pollutants, eutrophica-
tion and marine aquaculture, and there is evidence to
suggest that these have strongly impacted many regio-
nal fisheries based on marine and anadromous species
of inshore and estuarine habitats. However, such
changes are unlikely to have been driving the observed
long-term changes that have taken place in our core
focal species assemblage. No large-scale marine aqua-
culture takes place in the region, and we know of no
evidence that eutrophication or chemical pollution has
affected any populations of free-ranging demersal mar-
ine fish species in the Western English Channel, a region
open to Atlantic waters (Southward et al., 2005). More-
over, to our knowledge, none of the core species have
known obligate estuarine stages to their life history,
suggesting recent improvements in estuarine water
quality are unlikely to have appreciably influenced
adult population sizes of any species. Finally, neither
eutrophication or chemical pollution are known to have
contrasting influences on the abundance and size
distributions of large and small species. Most parsimo-
niously, the decline in abundance and size of the
large species of high market value is linked to over
a century of commercial fishing in the region, while
fluctuations in the abundance of small species is linked
to climate-driven regime changes in the marine
environment.
Our study system is broadly representative of other
marine fish communities within northern European
waters, containing both teleost and elasmobranch spe-
cies with a broad spectrum of life history traits and
–5
–4
–3
–2
–1
0
1
2
3
4
5
6
1910 1930 1950 1970 1990 2010
1910 1930 1950 1970 1990 2010–5–4–3–2–10123456
Year
(b)
(a)
PC
1 (m
ean
and
rang
e)P
C1
(mea
n an
d ra
nge)
Large species
Small species
Fig. 4 Temporal change in structure of the: (a) small species
and (b) large species sections of the core assemblage. Change
was captured using principal component analysis with points
closer on the PC1 axis indicating a more similar species assem-
blage. Positive increases in PC1 correspond with increases in
mean annual CPUE of the most strongly contributing species
(Table S5).
Table 3 Multiple regressions of assemblage structure (PC1) on temperature variables for subsets of large and small species
Response variable Predictor Slope SE t P
Mean annual PC1 – small species Constant �5.945 o 0.001
Winter SST focal year 0.302 0.134 2.241 0.030
Summer SST focal year 0.126 0.126 0.996 0.324
Winter SST 1-year lag 0.320 0.127 2.511 0.016
Summer SST 1-year lag 0.189 0.123 1.539 0.131
Mean annual PC1 – large species Constant 2.039 0.047
Winter SST focal year 0.056 0.177 0.316 0.753
Summer SST focal year �0.235 0.166 �1.414 0.164
Winter SST 1-year lag �0.161 0.168 �0.961 0.341
Winter SST focal year �0.0558 0.162 �0.344 0.732
Final models: small species PC1 (r2 5 0.482, F4, 43 5 9.986, Po0.001), and large species PC1 (r2 5 0.098, F4, 43 5 1.179, P 5 0.334).
PC1, principal component axis1; SST, sea surface temperature.
C L I M AT E , F I S H I N G A N D M A R I N E F I S H A S S E M B L A G E S 9
r 2009 Blackwell Publishing Ltd, Global Change Biology, doi: 10.1111/j.1365-2486.2009.02027.x
distributional ranges. Moreover, the region has been
subject to sustained fishing activity for over 100 years.
Thus, we suggest that our study site is representative of
many coastal habitats areas across northern Europe. It is
notable that although our study was limited in spatial
scale, similar trends have been reported in studies
undertaken over broader spatial scales, albeit over a
much shorter temporal scales. For example, analyses of
groundfish survey data from the Celtic Sea demon-
strated increases in the abundance of smaller size
classes and declines in abundance of larger individuals
between 1987 and 2003 (Blanchard et al., 2005). Equiva-
lent patterns of declines in mean trophic level of fish
caught were also detected in commercial landings data
from the same region (Pinnegar et al., 2002). Studies of
North Sea fish have found long-term declines in size
distributions (Greenstreet & Hall, 1996), and apparent
climate-related increases in the richness of smaller and
typically southern species (Hiddink & ter Hofstede,
2008). Comparisons of historic surveys with contem-
porary resurveys have also revealed declines in abun-
dance of long-lived species in the Irish Sea (Rogers &
Ellis, 2000). Taken together with our results over a
century-long scale, this evidence provides a compelling
case for widespread negative effects of fishing on size
distributions and abundance of larger species, and for
climatic influences across northern European seas.
In conclusion, we have provided evidence consistent
with contrasting effects of climate change and fishing
on different body-size components of a single marine
fish assemblage across a century-long time scale. How-
ever, reliable predictions of species responses to climate
change will require a greater understanding of popula-
tion dynamics within this system (Hart & Reynolds,
2002). This includes knowledge of behaviour in relation
to the immediate environment (Neat & Righton, 2007),
ecological interactions of species with other taxa (Beau-
grand et al., 2003), physiological tolerances (Portner &
Knust, 2007) and local evolutionary adaptations
(Hutchings et al., 2007). Our results closely match those
reported over broader spatial scales – but shorter tem-
poral scales – from other European marine fish com-
munities. As a consequence, we suggest that life history
traits are important to consider during development of
biological indicators of the effects of fishing and climate
change on marine assemblages (Rochet & Trenkel, 2003;
Blanchard et al., 2005; Greenstreet & Rogers, 2006).
Acknowledgements
We owe the availability of these data to our late co-author AlanSouthward who maintained this time series for over 40 years. Wethank captains and crew of MBA research vessels, and scientistswho contributed to these long-term data. We thank J. Partridge
and several anonymous reviewers for comments on the manu-script. This work was supported by a Great Western ResearchFellowship, the UK Department for Environment, Food andRural Affairs (Defra), and the UK Natural Environment ResearchCouncil (NERC) through Themes 6 and 10 of the Oceans 2025Strategic Research Programme, a grant-in-aid to the MBAbetween 1965 and 2007, and a NERC-Defra Sustainable MarineBioresources standard grant award NE/F001878/1.
References
Alheit J, Hagen E (1997) Long-term climate forcing of European herring
and sardine populations. Fisheries Oceanography, 6, 130–139.
Araujo JN, Mackinson S, Stanford RJ et al. (2006) Modelling food web
interactions, variation in plankton production, and fisheries in the
Western English Channel ecosystem. Marine Ecology Progress Series,
309, 175–187.
Barrett JH, Locker AM, Roberts CM (2004) The origin of intensive marine
fishing in medieval Europe: the English evidence. Proceedings of the
Royal Society of London B, 271, 2417–2421.
Beaugrand G, Brander KM, Lindley JA et al. (2003) Plankton effect on cod
recruitment in the North Sea. Nature, 426, 661–664.
Blanchard JL, Dulvy NK, Jennings S et al. (2005) Do climate and fishing
influence size-based indicators of Celtic Sea fish community structure?
ICES Journal of Marine Science, 62, 405–411.
Brander K (1981) Disappearance of common skate Raia batis from Irish
Sea. Nature, 290, 48–49.
Cook RM, Sinclair A, Stefansson G (1997) Potential collapse of North Sea
cod stocks. Nature, 385, 521–522.
Denney NH, Jennings S, Reynolds JD (2002) Life-history correlates of
maximum population growth rates in marine fishes. Proceedings of the
Royal Society of London B, 269, 2229–2237.
Dulvy NK, Polunin NVC, Mill AC et al. (2004) Size structural change in
lightly exploited coral reef fish communities: evidence for weak ecologi-
cal release. Canadian Journal of Fisheries and Aquatic Sciences, 61, 466–475.
Dulvy NK, Rogers SI, Jennings S et al. (2008) Climate change and
deepening of the North Sea fish assemblage: a biotic indicator of
warming seas. Journal of Applied Ecology, 45, 1029–1039.
Dulvy NK, Sadovy Y, Reynolds JD (2003) Extinction vulnerability in
marine populations. Fish and Fisheries, 4, 25–64.
Frank KT, Petrie B, Choi JS et al. (2005) Trophic cascades in a formerly cod
dominated ecosystem. Science, 308, 1621–1623.
Froese R (2004) Keep it simple: three indicators to deal with overfishing.
Fish and Fisheries, 5, 86–91.
Froese R, Pauly D (eds) (2008) FishBase. Available at http://www.fishbase.
org, version (10/2008) (accessed 1 January 2009).
Genner MJ, Sims DW, Wearmouth VJ et al. (2004) Regional climatic
warming drives long-term community changes of British marine fish.
Proceedings of the Royal Society of London B, 271, 655–661.
Graham NAJ, Dulvy NK, Jennings S et al. (2005) Size-spectra as indicators
of the effects of fishing on coral reef fish assemblages. Coral Reefs, 24,
118–124.
Greenstreet SPR, Hall SJ (1996) Fishing and the ground-fish assemblage
structure in the north-western North Sea: an analysis of long-term and
spatial trends. Journal of Animal Ecology, 65, 577–598.
Greenstreet SPR, Rogers SI (2006) Indicators of the health of the North Sea
fish community: identifying reference levels for an ecosystem approach
to management. ICES Journal of Marine Science, 63, 573–593.
Hart PJB, Reynolds JD (2002) Banishing ignorance: underpinning fisheries
with basic biology. In: Handbook of Fish Biology and Fisheries: Volume 1,
Fish Biology (eds Hart PJB, Reynolds JD), pp. 1–11. Blackwell Publish-
ing, Oxford.
10 M . J . G E N N E R et al.
r 2009 Blackwell Publishing Ltd, Global Change Biology, doi: 10.1111/j.1365-2486.2009.02027.x

Hawkins SJ, Southward AJ, Genner MJ (2003) Detection of environmental
change: evidence from the Western English Channel. Science of the Total
Environment, 310, 245–256.
Hiddink JG, ter Hofstede R (2008) Climate induced increases in species
richness of marine fishes. Global Change Biology, 14, 453–460.
Hurst TP (2007) Causes and consequences of winter mortality in fishes.
Journal of Fish Biology, 71, 315–345.
Hutchings JA, Swain DP, Rowe S et al. (2007) Genetic variation in life-
history reaction norms in a marine fish. Proceedings of the Royal Society of
London B, 274, 1693–1699.
Jackson JBC, Kirby MX, Berger WH et al. (2001) Historical overfishing and
the recent collapse of coastal ecosystems. Science, 293, 629–638.
Jennings S, Greenstreet SPR, Reynolds JD (1999) Structural change in an
exploited fish community: a consequence of differential fishing effects
on species with contrasting life histories. Journal of Animal Ecology, 68,
617–627.
Jennings S, Kaiser MJ (1998) The effects of fishing on marine ecosystems.
Advances in Marine Biology, 34, 201–352.
Lehodey P, Alheit J, Barange M et al. (2006) Climate variability, fish, and
fisheries. Journal of Climate, 19, 5009–5030.
Levin PS, Holmes EE, Piner KR et al. (2006) Shifts in a Pacific Ocean fish
assemblage: the potential influence of exploitation. Conservation Biology,
20, 1181–90.
Mackenzie BR, Schiedek D (2007) Daily ocean monitoring since the 1860s
shows record warming of northern European seas. Global Change
Biology, 13, 1335–1347.
Myers RA, Baum JK, Shepherd TD et al. (2007) Cascading effects of the loss
of apex predatory sharks from a coastal ocean. Science, 315, 1846–1850.
Neat F, Righton D (2007) Warm water occupancy by North Sea cod.
Proceedings of the Royal Society of London B, 274, 789–798.
O’Farrell MR, Botsford LW (2006) Estimating the status of nearshore
rockfish (Sebastes spp.) populations with length frequency data. Ecolo-
gical Applications, 16, 977–986.
Perry AL, Low PJ, Ellis JR et al. (2005) Climate change and distribution
shifts in marine fishes. Science, 308, 1912–1915.
Pinnegar JK, Jennings S, O’Brien CM, Polunin NVC (2002) Long-term
changes in the trophic level of the Celtic Sea fish community and fish
market price distribution. Journal of Applied Ecology, 39, 377–390.
Portner HO, Knust R (2007) Climate change affects marine fishes through
the oxygen limitation of thermal tolerance. Science, 315, 95–97.
Revill AS, Dulvy NK, Holst R (2005) The survival of discarded lesser-
spotted dogfish (Scyliorhinus canicula) in the Western English Channel
beam trawl fishery. Fisheries Research, 71, 121–124.
Reynolds JD, Dulvy NK, Goodwin NB et al. (2005) Biology of extinction
risk in marine fishes. Proceedings of the Royal Society of London B, 272,
2337–2344.
Rochet MJ, Trenkel VM (2003) Which community indicators can measure
the impact of fishing? A review and proposals. Canadian Journal of
Fisheries and Aquatic Sciences, 60, 86–99.
Rogers SI, Ellis JR (2000) Changes in the demersal fish assemblages of
British coastal waters during the 20th century. ICES Journal of Marine
Science, 57, 866–881.
Schiermeier Q (2004) Climate findings let fishermen off the hook. Nature,
428, 4.
Sheppard C (2004) Sea surface temperature 1871–2099 in 14 cells around
the United Kingdom. Marine Pollution Bulletin, 49, 12–16.
Sims DW, Southward AJ (2006) Dwindling fish numbers already of
concern in 1883. Nature, 439, 660.
Sims DW, Wearmouth VJ, Genner MJ et al. (2004) Low-temperature-
driven early spawning migration of a temperate marine fish. Journal
of Animal Ecology, 73, 333–341.
Southward AJ, Hawkins SJ, Burrows MT (1995) Seventy years’ obser-
vations of changes in distribution and abundance of zooplankton
and intertidal organisms in the western English Channel in relation
to rising sea temperature. Journal of Thermal Biology, 20, 127–155.
Southward AJ, Langmead O, Hardman-Mountford NJ et al. (2005) Long-
term oceanographic and ecological research in the western English
Channel. Advances in Marine Biology, 47, 1–105.
Thresher RE, Koslow JA, Morison AK et al. (2007) Depth-mediated
reversal of the effects of climate change on long-term growth rates of
exploited marine fish. Proceedings of the National Academy of Sciences
USA, 104, 7461–7465.
Ward P, Myers RA (2005) Shifts in open-ocean fish communities coincid-
ing with the commencement of commercial fishing. Ecology, 86,
835–847.
Supporting Information
Additional Supporting Information may be found in the
online version of this article:
Figure S1. The spatial distribution of trawling effort between
1911 and 2007 off Plymouth, UK. Numbers in boxes indicate
the number of trawls that have taken place in the location
during the time series. The most consistently surveyed lo-
cation (378 hauls) has been the long-term sampling station L4
(Southward et al., 2005).
Table S1. Temporal distribution of demersal hauls 1911–2007.
Table S2. Composition of multi-species groups used in
analyses.
Table S3. Ship and gears dimensions of survey vessels, from
available records.
Table S4. Species length-mass relationships, samples sizes,
and predictor variables used in cross-species analyses.
Table S5. Changes in core species body size and abundance.
PCA was conducted independently on the 15 largest core
species, and the 15 smallest core species. The most extreme
loadings (o�0.4, 40.4) are underlined.
Please note: Wiley-Blackwell are not responsible for the con-
tent or functionality of any supporting materials supplied by
the authors. Any queries (other than missing material) should
be directed to the corresponding author for the article.
C L I M A T E , F I S H I N G A N D M A R I N E F I S H A S S E M B L A G E S 11
r 2009 Blackwell Publishing Ltd, Global Change Biology, doi: 10.1111/j.1365-2486.2009.02027.x
Copyright © 2022 FDOKUMEN