Birefringence and refractive indices of ferroelectric SbSI
12
This article was downloaded by: [Vilnius Pedagogical University] On: 01 June 2012, At: 04:36 Publisher: Taylor & Francis Informa Ltd Registered in England and Wales Registered Number: 1072954 Registered office: Mortimer House, 37-41 Mortimer Street, London W1T 3JH, UK Phase Transitions: A Multinational Journal Publication details, including instructions for authors and subscription information: http://www.tandfonline.com/loi/gpht20 Birefringence and refractive indices of ferroelectric SbSI A. Audzijonis a , R. Sereika a & R. Žaltauskas a a Department of Physics, Vilnius Pedagogical University, Studentu 39, 08106 Vilnius, Lithuania Available online: 10 Nov 2011 To cite this article: A. Audzijonis, R. Sereika & R. Žaltauskas (2012): Birefringence and refractive indices of ferroelectric SbSI, Phase Transitions: A Multinational Journal, 85:6, 542-552 To link to this article: http://dx.doi.org/10.1080/01411594.2011.619905 PLEASE SCROLL DOWN FOR ARTICLE Full terms and conditions of use: http://www.tandfonline.com/page/terms-and- conditions This article may be used for research, teaching, and private study purposes. Any substantial or systematic reproduction, redistribution, reselling, loan, sub-licensing, systematic supply, or distribution in any form to anyone is expressly forbidden. The publisher does not give any warranty express or implied or make any representation that the contents will be complete or accurate or up to date. The accuracy of any instructions, formulae, and drug doses should be independently verified with primary sources. The publisher shall not be liable for any loss, actions, claims, proceedings, demand, or costs or damages whatsoever or howsoever caused arising directly or indirectly in connection with or arising out of the use of this material.
Transcript of Birefringence and refractive indices of ferroelectric SbSI

This article was downloaded by: [Vilnius Pedagogical University]On: 01 June 2012, At: 04:36Publisher: Taylor & FrancisInforma Ltd Registered in England and Wales Registered Number: 1072954 Registeredoffice: Mortimer House, 37-41 Mortimer Street, London W1T 3JH, UK
Phase Transitions: A MultinationalJournalPublication details, including instructions for authors andsubscription information:http://www.tandfonline.com/loi/gpht20
Birefringence and refractive indices offerroelectric SbSIA. Audzijonis a , R. Sereika a & R. Žaltauskas aa Department of Physics, Vilnius Pedagogical University, Studentu39, 08106 Vilnius, Lithuania
Available online: 10 Nov 2011
To cite this article: A. Audzijonis, R. Sereika & R. Žaltauskas (2012): Birefringence and refractiveindices of ferroelectric SbSI, Phase Transitions: A Multinational Journal, 85:6, 542-552
To link to this article: http://dx.doi.org/10.1080/01411594.2011.619905
PLEASE SCROLL DOWN FOR ARTICLE
Full terms and conditions of use: http://www.tandfonline.com/page/terms-and-conditions
This article may be used for research, teaching, and private study purposes. Anysubstantial or systematic reproduction, redistribution, reselling, loan, sub-licensing,systematic supply, or distribution in any form to anyone is expressly forbidden.
The publisher does not give any warranty express or implied or make any representationthat the contents will be complete or accurate or up to date. The accuracy of anyinstructions, formulae, and drug doses should be independently verified with primarysources. The publisher shall not be liable for any loss, actions, claims, proceedings,demand, or costs or damages whatsoever or howsoever caused arising directly orindirectly in connection with or arising out of the use of this material.
Phase TransitionsVol. 85, No. 6, June 2012, 542–552
Birefringence and refractive indices of ferroelectric SbSI
A. Audzijonis, R. Sereika* and R. Zaltauskas
Department of Physics, Vilnius Pedagogical University, Studentu 39,08106 Vilnius, Lithuania
(Received 10 August 2011; final version received 31 August 2011)
Electronic structure and refractive indices of SbSI crystal in paraelectric andferroelectric phases were investigated by full-potential linearized augmented planewave method with density functional theory. The temperature dependence ofrefractive indices along a-, b-, and c-axes and birefringence Dn¼ nc� na as afunction of photon energy were calculated near the phase transitions. Thetheoretical results were compared with experimental measurements of birefrin-gence. Comparison between calculated increment of the birefringence�(Dn0¼ nc� na) and experimental spontaneous polarization P2
s indicates theexistence of the second-order phase transition at Tc2� 240K and confirms itsrelation to the Ps.
Keywords: SbSI; birefringence; refractive indices; density functional theory
1. Introduction
The ferroelectric phase transition in SbSI is one of the most widely studied subjects in thiscrystal [1–8]. SbSI is an orthorhombic crystal belonging to the space group D16
2h (Pnma) inthe paraelectric phase and C9
2v (Pna21) in the ferroelectric phase. The Curie point is near19�C. The transition in this point is to be a first-order one, it is also reported that SbSIundergoes a second-order phase transition near �40�C from C9
2 to C22 [6], but this
transition passes the transition point very smoothly. More recent attempts to observethis transition using Raman scattering and X-ray measurements revealed no indicationof this transition, because the sensitivity of birefringence measurements is 103 to 104 timesas high as that obtainable with X-rays. Inushima et al. [7,8] by high-frequency polarizationmodulation method [9] measured the precise birefringence spectra of SbSI in theparaelectric and ferroelectric phases as a function of temperature. A drastic change of thebirefringence was observed at the first-order transition in the temperature range 16–19�Cand anomalous behavior was observed at the second-order transition temperature�36.61�C. From the log–log plot of birefringence versus T, their critical exponents (�) andtheir critical region (" ¼ jT� Tcj=Tc) were determined. For the second-order transition,� ¼ 0:51(T5Tc) and � ¼ 0:53(T4Tc) were obtained. As for the first-order transition, �shows the " dependence, and in "4 5� 10�3 region, � ¼ 0:38, but in "5 5� 10�3,� ¼ 0:53.
*Corresponding author. Email: [email protected]
ISSN 0141–1594 print/ISSN 1029–0338 online
� 2012 Taylor & Francis
http://dx.doi.org/10.1080/01411594.2011.619905
http://www.tandfonline.com
Dow
nloa
ded
by [
Viln
ius
Peda
gogi
cal U
nive
rsity
] at
04:
36 0
1 Ju
ne 2
012

In this study, we have shown that behavior of the birefringence near the transitionpoint may consider the mechanism related to the transitions in ferroelectric SbSI.However, the theoretical aspects of refractive indices and birefringence of SbSI near thephase transitions have been rarely studied; the most published data are related to theexperimental investigation. The modeling of electronic and optical properties by means offirst principle calculations has become a very useful tool for understanding the opticalproperties of various crystals near the phase transition.
The tasks of our study are: (1) calculation of refractive indices along a(x)-, b(y)-, andc(z)-axes as a function of photon energy and temperature; (2) calculation of thebirefringence as a function of photon energy and temperature near two phase transitions;and (3) comparison between theoretical and experimental results.
2. Computational methods of electronic structure, dielectric functions, and refractive
indices
The SbSI crystal consists of chains with atoms extended along the c(z)-axis. All atoms inSbSI crystal lie on mirror planes normal to the c-axis. The crystal contains double chains[(SbSI)1]2 consisting of two chains related by a two-fold screw axis and linked together bya short and strong Sb–S bond. Weak Van der Waals type bonds bind the double chains.The crystal structures, which consist of chains, oriented along the c-axis create anisotropicoptical properties.
For the theoretical ab initio calculation, the full-potential linearized augmented planewave method in the framework of density functional theory (DFT) along with thegeneralized gradient approximation (GGA) [10] implemented in the Wien2k code [11] wasused. The lattice constants and positions of the atoms in the unit cell were taken from Refs[12,13]. The calculation was performed with Rkmax¼ 7 (R is the radius of the smallestmuffin-tin sphere and kmax the largest k vector in the plane wave expansion) for theconvergence parameter for which the calculation stabilization and convergence in terms ofthe energy are achieved. The values of the muffin-tin radii are RSb¼ 2.45 for Sb, RS¼ 1.90for S, and RI¼ 2.19 for I. A mesh of 14� 29� 11 k-points in the irreducible part of theBrillouin zone was used. The iteration halted when the difference in the eigenvalues wasless than 0.0001 between steps of convergence criterion. The cut-off energy, which definesthe separation of valence and core states, was chosen as �6Ry.
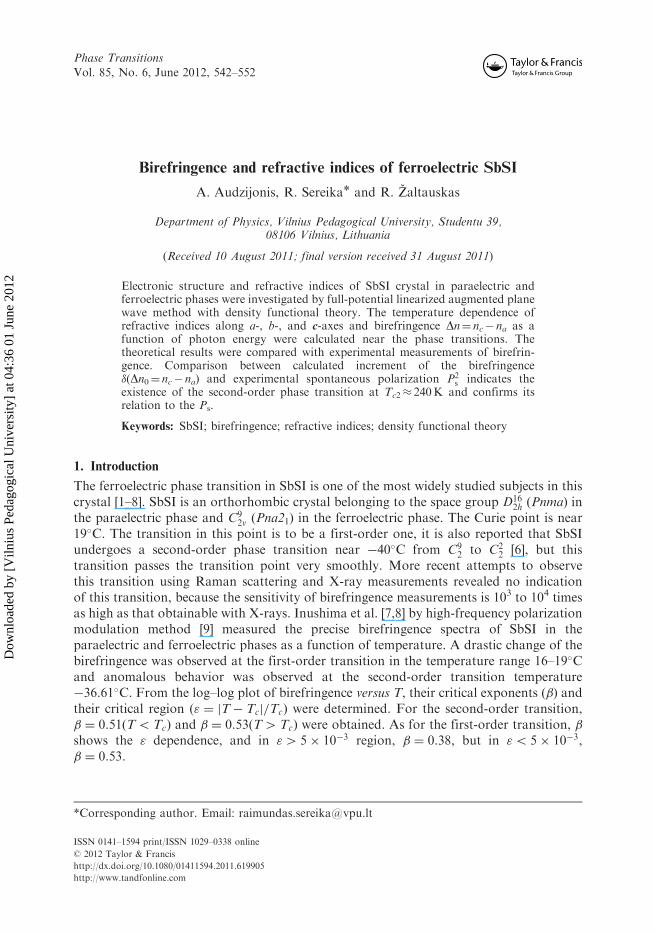
All physical properties are related to the total energy. The equilibrium lattice constantof a crystal is the lattice constant that minimizes the total energy. For calculating thelattice constant theoretically, the base state energy of the SbSI crystal is calculated fordifferent volumes around the experimental balance volume at T ¼ 285K. The total energyas a function of the volume of SbSI by the DFT under the GGA is shown in Figure 1.
The imaginary part of dielectric tensor can be computed from the knowledge of theelectronic band structure of a solid. In the limit of linear optics, we can use the followingwell-known relations [14,15]:
Im "finterg�� !ð Þ ¼�h2e2
�m2!2
Xc,v
Zd ~k ck p�
�� ��vk� �vk p��� ��ck� �
� � "ck � "vk � !� �
ð1Þ
where p is the momentum matrix element between states of bands � and � with crystalvector k
!
. In Equation (1), ck and vk are the crystal wave functions corresponding to theconduction and the valence bands, respectively, with crystal wave vector ~k.
Phase Transitions 543
Dow
nloa
ded
by [
Viln
ius
Peda
gogi
cal U
nive
rsity
] at
04:
36 0
1 Ju
ne 2
012
The interband expansion in the corresponding red parts is obtained by the Kramers–
Kroning transformation
Re "finterg�� !ð Þ ¼ ��� þ2
�P
Z 10
!0Im "�� !0ð Þ
!0ð Þ2�!2d!0: ð2Þ
Other optical properties can be derived from the complex dielectric function.Expression used for the refractive index n !ð Þ is given as follows:
nð!Þ ¼1ffiffiffi2p
ffiffiffiffiffiffiffiffiffiffiffiffiffiffiffiffiffiffiffiffiffiffiffiffiffiffiffiffiffiffiffiffiffiffiffiffiffiffiffiRe2"ð!Þ þ Im2"ð!Þ
q�Re"ð!Þ
� 12
: ð3Þ
3. Refractive indices of SbSI as function of photon energy and temperature near the phase
transition
The refractive indices calculated along a-, b-, and c-axes as a function of photon energy attemperature T¼ 285K are shown in Figure 2. For comparison, it shows the spectra of
refractive indices calculated with experimental and volume optimization of latticeparameters. The difference between two refractive indices at the same photon is about
0.5 in photon energy range from 2 to 6 eV. This difference between two refractive indices atthe same photon energy vanishes in photon energy ranges from 0 to 2 eV and from 7
to 20 eV.All refractive indices spectra in the energy range from 0 to 14 eV have two large
maxima. First refractive indices’ maximum is in photon energy range from 0 to 5.8 eV and
Figure 1. Dependence of total energy on unit cell volume of ferroelectric SbSI crystal at T¼ 285K.
544 A. Audzijonis et al.
Dow
nloa
ded
by [
Viln
ius
Peda
gogi
cal U
nive
rsity
] at
04:
36 0
1 Ju
ne 2
012

the second one is from 5.8 to 14 eV. In the range of first maximum (0–3 eV), the anisotropyof refractive indices na, nb, and nc is very large, but in the energy range 3–7.5 eV, theanisotropy between nb and nc relation lowers. In the photon energy range from 12 to 20 eV,anisotropy of refractive indices vanishes because na¼ nb¼ nc.
The energy of SbSI main peaks of refractive indices in the energy range from 0 to 9 eVat temperature T¼ 285K is presented in Table 1. The complex dielectric function andrefractive indices were computed using total density of state (DOS) and partial DOS ofvalence and conduction bands. Sb atom is coordinated with 2S and 1I atoms. Therefore,the valence band is constructed mainly by the boarding hybridization of Sb – 5p, Sb – 5s, S– 3p, S – 3s, I – 5s, and I – 5p orbitals. The valence band consists of there bands: the lowesttwo originate from Sb – 5s, S – 3s, and I–5s and the upper valence band consists ofhybridized Sb – 5p, S – 3p, and I–5p orbitals. The conduction band originated mainly from
Figure 2. Refractive indices na (a), nb (b), and nc (c) as a function of photon energy usingexperimental lattice parameters of unit cell (solid lines) and after volume optimization (dashed lines)at temperature T¼ 285K.
Table 1. The position of SbSI main peaks of refractive indices in the energy range 0–9 eV atT¼ 285K.
Energy (eV)
Refractive indices E1 E2 E3 E4 E5 E6 E7 E8 E9
na 1.8 2.4 2.9 3.25 3.8 4.3 5.1 6.5 9.0nb 1.8 2.5 2.9 3.25 3.8 4.3 5.1 6.5 8.0nc 1.8 2.5 2.9 3.25 3.8 4.3 4.8 6.5 8.0
Phase Transitions 545
Dow
nloa
ded
by [
Viln
ius
Peda
gogi
cal U
nive
rsity
] at
04:
36 0
1 Ju
ne 2
012
hybridizing of Sb – 5p, S – 3p, and I–5p orbitals. The energy of SbSI main peaks of partialDOS (p – DOS and s – DOS) at temperature T¼ 285K is presented in Table 2.
As seen from Tables 1 and 2, the energy of peaks of p-DOS of SbSI valence band inenergy range 0–9 eV approximately is in good argument with energy of peaks of refractiveindex spectra, particularly with peaks of nb(E) spectrum. Therefore, seven peaks ofrefractive index in energy range from 0 to 5 eV are mainly created by the excitation ofvalence electrons in s-orbitals of Sb, S, and I atoms. Two peaks of refractive index inenergy range from 7 to 9 eV are mainly created by the excitation of valence electrons inp-orbitals of S and I atoms.
As seen from Figure 2, na, nb, and nc depends on photon energy. Temperaturedependence of refractive indices may be investigated when photon energy E¼ constant.
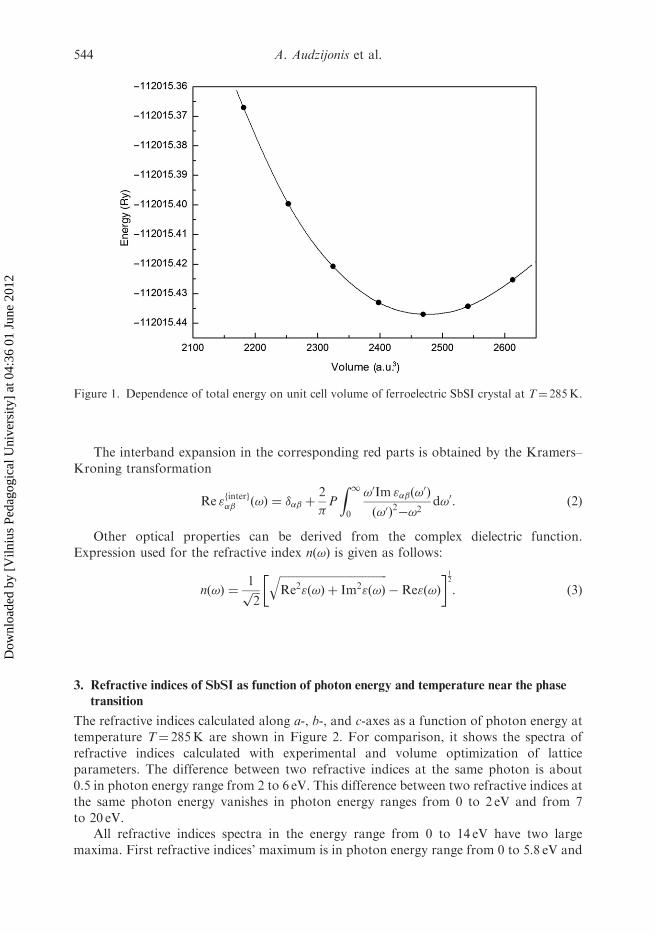
The temperature dependence of the refractive indices na, nb, and nc at photon energyE¼ 1.078 eV (�¼ 1.15 mm) and at E� 0 is shown in Figures 3 and 4. The indices areapproaching to linear above Tc¼ 292K in paraelectric phase. The temperature where theindices depart from the linear behavior is denoted as phase transition temperature. Inferroelectric state, indices depend on spontaneous polarization Ps and have negativetemperature dependence. The linear refractive index increment Dnc¼ nf� np is theincrement of refractive indices induced at the transition. The Dnc has been obtained bysubtracting from the linear temperature behavior of the np in the paraelectric phase and
Figure 3. Temperature dependence of the refractive indices na, nb, and nc at photon energyE¼ 1.078 eV (�¼ 1.15 mm). The background lines are shown as dashed lines.
Table 2. The position of main peaks (eV) of s-DOS and p-DOS of SbSI valance band in the energyrange 0–9 eV at T¼ 285K.
p-DOS from Sb, S, and I and s-DOS from Sb s-DOS from S and I
E1 E2 E3 E4 E5 E6 E7 E8 E9
1.2–1.9 2.4 2.8 3.25 3.8 4.3 4.8 7.0 8.8
546 A. Audzijonis et al.
Dow
nloa
ded
by [
Viln
ius
Peda
gogi
cal U
nive
rsity
] at
04:
36 0
1 Ju
ne 2
012

extrapolated to the ferroelectric phase (dashed lines in Figure 3). The increments inFigure 3 at the photon energy E¼ 1.078 eV and temperature T¼ 100K have the values:Dnc,S¼ 0.17 along the c-axis, Dnb,S¼ 0.12 – along the b-axis. These increments may becreated by spontaneous polarization Ps (by displacements DzSb and DzS of the atoms Sband S relative to the position of I atom) and by change of the unit cell volume DV.
The temperature-dependent DnS as function of DzSb, DzS, and DV were investigated bycalculating the refractive index spectra using different atomic coordinates and latticeparameters. The refractive indices n and n* spectra for all axis directions were calculatedusing atomic coordinates from Tables 3 and 4, respectively.
Modified atomic coordinates listed in Table 4 are made from z�Sb¼ zSbþDzSb for Sband z�S¼ zSþDzS for S. The displacements DzSb¼ 0.0384 and DzS¼ 0.0039 created byspontaneous polarization Ps along c-axis were defined from the shift of the atoms attemperatures between 100 and 285K. Therefore, modified atomic coordinates z* (Table 4)created by spontaneous polarization are set to z�Sb¼ 0.3060 and z�S¼ 0.2666. For bothcalculations, the same lattice parameters a¼ 8.5276, b¼ 10.1301, and c¼ 4.1098 were used.The lattice parameters and positions of the atoms in the unit cell were taken fromRefs [12,13].
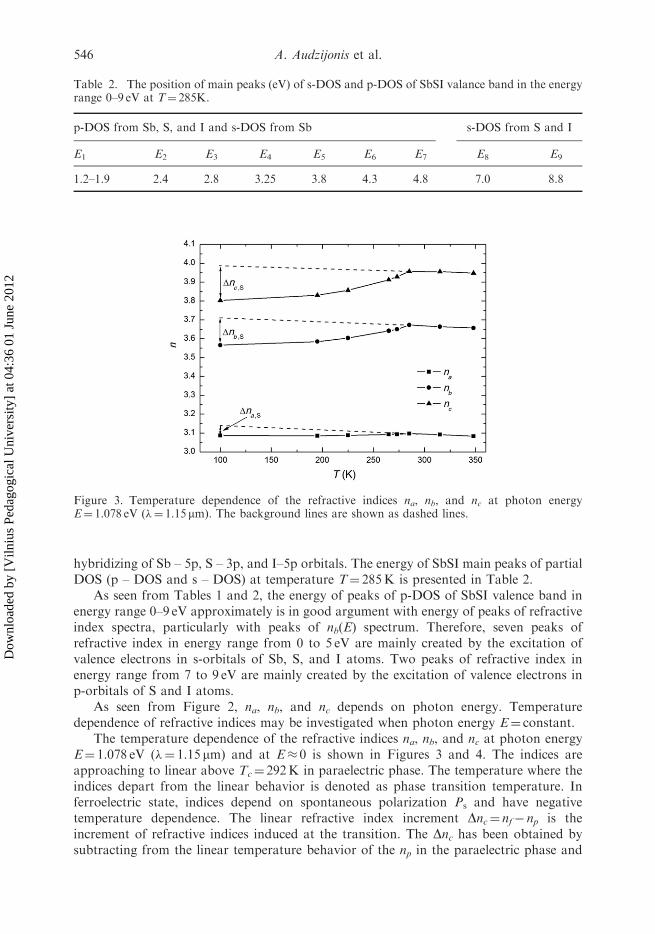
Calculated differences of refractive indices Dn�a,S¼ n�a� na; Dn�b,S¼ n�b� nb, andDn�c,S¼ n�c � nc as a function of photon energy are presented in Figure 5. As can be seen
Figure 4. Temperature dependence of the refractive indices na, nb, and nc at photon energy E� 0 eV.
Table 3. Atomic coordinates at T¼ 285K for the calculationof na, nb, and nc.
Atoms x y z
Sb 0.12035 0.12311 0.26760S 0.84486 0.04800 0.26268I 0.50794 0.82873 0.25000
Phase Transitions 547
Dow
nloa
ded
by [
Viln
ius
Peda
gogi
cal U
nive
rsity
] at
04:
36 0
1 Ju
ne 2
012
from Figure 5, the biggest changes are at lower photon energies. The differences ofrefractive indices Dn�c,S and Dn�b,S calculated at the photon energy E¼ 1.078 eV (Figure 5)and increments Dnc,S and Dnb,S from Figure 3 are in good agreement. Therefore, we cometo a conclusion that temperature dependence of increments Dnc,S and Dnb,S (Figure 3) ismainly created by spontaneous polarization Ps along c-axis.
4. Theoretical investigation of linear birefringence of SbSI crystal near the phase
transition
Birefringence Dn¼ nc� na spectra of SbSI crystal at temperatures T1¼ 100K andT2¼ 285K are shown in Figure 6. Birefringence Dn¼ nc� na spectra undergo positivevalues from 0 to 3 eV and from 7 to 8 eV, and negative values from 3 to 7.5 eV and zerovalue from 12 to 20 eV. A more detailed birefringence–temperature relation for twoselected photon energies E1� 0 eV and E2¼ 1.078 eV is shown in Figure 7. The linearbirefringence increment �(Dn) (Figure 8) in ferroelectric phase has been obtained fromFigure 7 by subtracting from the assumed linear temperature behavior of the Dnin the paraelectric phase (T4 292K) and extrapolated to the ferroelectric phase.In Figure 8, experimental �(Dn)exp temperature relation when the photon energy is
Figure 5. Calculated differences of refractive indices Dn�a,S¼ n�a � na, Dn�b,S¼ n�b � nb, andDn�c,S¼ n�c � nc as a function of photon energy.
Table 4. Modified atomic coordinates for the calculation ofn�a, n
�b, and n�c .
Atoms x y z*
Sb 0.12035 0.12311 0.30600S 0.84486 0.04800 0.26660I 0.50794 0.82873 0.25000
548 A. Audzijonis et al.
Dow
nloa
ded
by [
Viln
ius
Peda
gogi
cal U
nive
rsity
] at
04:
36 0
1 Ju
ne 2
012

E¼ 1.078 eV (�¼ 1.15 mm) [16] is also shown. Experimental curve �(Dn)exp ismeasured by high-frequency polarization modulation method described in Ref. [9].Theoretical and experimental results are similar, the curves have the same tendency(Figure 8).
The linear birefringence increment �(Dn0) at E¼ 0 eV in ferroelectric phase is inducedby spontaneous polarization Ps [17,18], because �(Dn0)¼R*
�P2s . Where R* is the electro-
optical coefficient and Ps the spontaneous polarization. According to this formula, thelinear proportionality of �(Dn0) and P2
s is hold.
Figure 6. Linear birefringence Dn¼ nc� na spectra of SbSI crystal at temperatures T1¼ 100K andT2¼ 285K.
Figure 7. Linear birefringence Dn¼ nc� na versus temperature at the photon energies E1� 0 andE2¼ 1.078 eV (�¼ 1.15 mm). The background line is also shown.
Phase Transitions 549
Dow
nloa
ded
by [
Viln
ius
Peda
gogi
cal U
nive
rsity
] at
04:
36 0
1 Ju
ne 2
012

As is shown in Figure 9 near �(Dn0)� 0.05, anomalous behavior of the theoretical
increments of birefringence �(Dn0) was observed. Near this region, �(Dn0) changes
approximately linearly in T, following the relations [8]:
�ðDn0Þ � AðT� Tc2Þ, T5Tc2, ð4Þ
�ðDn0Þ ffi BðT� Tc2Þ, T4Tc2ðTc2 � 240 KÞ: ð5Þ
Figure 8. Calculated linear birefringence increment �(Dn) (solid line with a square symbols) andexperimental curve �(Dn)exp (dots) [16] versus temperature. The laser photon energy is E¼ 1.078 eV.
Figure 9. Calculated birefringence increment �(Dn0) at E¼ 0 eV versus experimental spontaneouspolarization Ps taken from Ref. [19].
550 A. Audzijonis et al.
Dow
nloa
ded
by [
Viln
ius
Peda
gogi
cal U
nive
rsity
] at
04:
36 0
1 Ju
ne 2
012

This behavior is possibly related to the existence of the second-order transition which isdescribed in the literature [6–8]. The first line (T5Tc2) is in the temperature range from100 to 225K (P2
s from 0.06 to 0.14C2m�4) and the second line (T4Tc2) in thetemperature range from 250 to 285K (P2
s from 0.001 to 0.045C2m�4). These results meanthat the transition at Tc2� 240K is correlative to the polarization Ps along c-axis.
5. Conclusions
Optical refractive indices and birefringence as a function of the photon energy andtemperature of the quasi-1-D ferroelectric SbSI are presented in paraelectric andferroelectric phases. For calculation of the refractive indices and birefringence volume,optimized lattice parameters of unit cell are used.
The first strong maximum of refractive indices in photon energy range from 0 to 5 eV ismainly created by the excitation of valence electrons in the p-orbital of Sb, S, and I atoms,but the second maximum in photon energy from 6 to 14 eV is created by the excitation ofvalence electrons in the s-orbital of S and I atoms.
Theoretical investigation of the temperature dependence of refractive indices andbirefringence reveals that increments of refractive indices Dnc,S and Dnb,S and increment ofthe birefringence �(Dn0¼ nc� na) in ferroelectric phase depend on spontaneous polariza-tion Ps.
The anomalous behavior of theoretically calculated increments of the birefringence�(Dn0¼ nc� na) was observed near the temperature T� 240K. Comparison betweencalculated increment of the birefringence �(Dn0¼ nc� na) and experimental spontaneouspolarization P2
s indicates the existence of the second-order phase transition at Tc2� 240Kand confirms its relation to the Ps.
References
[1] V.M. Fridkin, Ferroelectric Semiconductors, Consultant Bureau, New York, NY, 1980.[2] I. Grigas, Microwave Dielectric Spectroscopy of Ferroelectrics and Related Materials, Gordon
and Breach Publications, Amsterdam, 1996.[3] A. Audzijonis, V. Paulikas, L. Zigas, A. Stasiukynas, J. Narusis, and S. Kvederavicius,
Ferroelectric phase transition in SbSI type crystals, Phase Transitions 67 (1998), pp. 437–446.
[4] E.I. Gerzanich, V.A. Lyakhovitskaya, V.M. Fridkin, and B.A. Popovkin, Current Topics in
Materials Science, Vol. 10, North-Holland Publishing Company, Amsterdam, 1982.[5] J. Grigas, A. Kajokas, A. Audzijonis, and L. Zigas, Peculiarities and properties of SbSI
electroceramics, J. Eur. Ceram. Soc. 21 (2001), pp. 1337–1340.[6] D.M. Bercha, I.V. Bercha, V. Yu. Slivka, I.D. Turyanitsa, and D.V. Chepur, Changing the
symmetry of SbSI crystals with second-order transition, Sov. Phys. Solid State 11 (1969),
pp. 1356–1358.[7] T. Inushima, K. Uchinokura, and E. Matsuura, Birefringence and phase transitions in SbSI,
J. Phys. Soc. Jpn. 44 (1978), pp. 1656–1963.
[8] T. Inushima, K. Uchinokura, and E. Matsuura, Phase transitions in SbSI, Solid State Commun.
26 (1978), pp. 29–33.[9] D.J. Benard and W.C. Walker, Modulated polarization measurement of structural phase
transitions in KMnF3, Rev. Sci. Instrum. 47 (1976), pp. 122–127.[10] M. Petersen, F. Wagner, L. Hufnagel, M. Scheffler, P. Blaha, and K. Schwarz, Improving the
efficiency of FP-LAPW calculations, Comput. Phys. Commun. 126 (2000), pp. 294–309.
Phase Transitions 551
Dow
nloa
ded
by [
Viln
ius
Peda
gogi
cal U
nive
rsity
] at
04:
36 0
1 Ju
ne 2
012

[11] P. Blaha, K. Schwarz, G. Madsen, D. Kvasnicka, and J. Luitz, WIEN2k: An Augmented PlaneWaveþLocal Orbitals Program for Calculating Crystals Properties, Technische UniversitatWien, Austria, 2001.
[12] K. Itoh and H. Matsunaga, A study of the crystal structure in ferroelectric SbSI, Z. Kristallogr.
152 (1980), pp. 309–315.[13] K. Lukaszewicz, A. Pietraszko, J. Stepien-Damm, and A. Kajokas, Crystal structure and phase
transitions of the ferroelectric antimony sulfoiodide SbSI. Part II. Crystal structure of SbSI in
phases I, II and II, Polish J. Chem. 71 (1997), pp. 1852–1857.[14] C. Ambrosch-Draxl and J.O. Sofo, Linear optical properties of solids within the full-potential
linearized augmented planewave method, Comput. Phys. Commun. 175 (2006), pp. 1–14.
[15] F. Wooten, Optical Properties of Solids, Academic Press, New York, NY, 1972.[16] K. Zickus, A. Audzijonis, J.V. Gurvic, A. Kindurys, and J. Lipavicius, Hydrostatic pressure
effect on the absorption edge of HGS-2 crystal, Solid State Phys. 27 (1985), pp. 1261–1262.
[17] M.E. Lines and A.M. Glass, Principles and Application of Ferroelectrics and Related Materials,Clarendon Press, Oxford, 1977.
[18] J. Fousek and J. Petzelt, Changes of refractive indices of crystals induced by structural phasetransitions, Phys. Status Solidi A 55 (1979), pp. 11–40.
[19] K. Zickus, A. Audzijonis, J. Batarunas, and A. Sileika, The fundamental absorption edge tail offerroelectric SbSI, Phys. Status Solidi B 125 (1987), pp. 645–651.
552 A. Audzijonis et al.
Dow
nloa
ded
by [
Viln
ius
Peda
gogi
cal U
nive
rsity
] at
04:
36 0
1 Ju
ne 2
012