correlation of birefringence and mechanical properties
112
CORRELATION OF BIREFRINGENCE AND MECHANICAL PROPERTIES OF LIVING SMOOTH MUSCLE Presented in Partial Fulfillment of the Requirements for the Degree of Doctor of Philosophy in the Graduate School of The Ohio State hy ARTHUR EBERSTEIN, B. S., M. S. WX-lH H t The Ohio State University 1957 DISSERTATION University Approved hy Department of Physiology
-
Upload
khangminh22 -
Category
Documents
-
view
2 -
download
0
Transcript of correlation of birefringence and mechanical properties
CORRELATION OF BIREFRINGENCE AND MECHANICAL PROPERTIESOF LIVING SMOOTH MUSCLE
Presented in Partial Fulfillment of the Requirements for the Degree of Doctor of Philosophy in the
Graduate School of The Ohio State
hyARTHUR EBERSTEIN, B. S., M. S.
WX-lHHt
The Ohio State University 1957
DISSERTATION
University
Approved hy
Department of Physiology
ACKNOWLEDGEMENTS
I wish to express my sincere appreciation for the guidance, enthusiasm, and aid of Dr. Ralph W. Stacy during the course of this work.
I also wish to express my gratitude to Gary Shaber for his aid in the construction of the apparatus.
I am grateful to all the members of the Laboratory of Biophysics for the aid that they offered. I wish particularly to thank Robert L. Farrow(who unselfishly gave his time in discussing the theory of this work.
ii

TABLE OF CONTENTS
PageINTRODUCTION .......................................... 1SURVEY OF LITERATURE.................................. 5
The Study of Molecular Structure . . . . ......... 5Birefringence and Muscle ......................... 7The Measurement of Rapid Changes of Birefringence . 12General Remarks ................................... lh
MATERIALS AND METHODS.................................. 17Instrumentation................................ 17
Selection and Preparation of Sample ............... 22Experimental Procedure ............................ 23Summary of Completed Experiments.................. 25Handling and Analysis of D a t a ..................... 26
RESULTS................................................ 28Phase Retardation and Passive Stretch ............. 28
Phase Retardation and Stress Relaxation ........... 29Comparison of Measured and Theoretical Values . . . . 32Phase Retardation and Isometric Contraction . . . . . 3h
DISCUSSION............................................. 35Significance of Birefringence ..................... 35
Birefringence before stretch . . .................. 37
Phase Retardation and Passive Stretch ............. 38
Passive Stretch and Molecular Structure........... IfO
iii
TABLE OF CONTENTS (Continued)
Phase Retardation After Rapid Elongation ..........Phase Retardation and Isometric Contraction .......Phase Retardation and Sample Thickness ............Comparison of Smooth and Striated Muscle . . . . . .General Discussion ...............................
SUMMARY AND CONCLUSIONS ...............................APPENDIX .............................................
Fundamental Theory of Birefringence .............The Senarmont 24ethod.............................The General Nature of the "Short-Long" System . . ..
BIBLIOGRAPHY .........................................AUTOBIOGRAPHY

LIS? OF TABLES
Number PageI Stress Relaxation, Data of September 23, 1956 . . . 62
II Stress Relaxation, Data of August 27, 1956 ......... 63III Stress Relaxation, Data of October 16, 1956 . . . . GJt-IV Stress Relaxation, Data of October 12, 1956 . . . . 65V Stress Relaxation, Data of September 12, 1956 . . . 66
VI Stress Relaxation, Data of September 17, 1956 . . . 67VII Stress Relaxation, Average Values . .............. 68
VIII Passive Stretch, Data of October 29, 1956 ........ 69IX Stress Relaxation, Data of April 9, 1957........... 70Xa Stress Relaxation, Data of April 8 , 1957, Records
1 and 2 ............................................ 71
Xb Stress Relaxation, Data of April 8 , 1957, Records3 and ^ ............................................ 72
XI Stress Relaxation, Data of April L, 1957, No. 2 . . 73XII Stress Relaxation, Data of April 2, 1957 ....... 7^
XIII Stress Relaxation, Data of April K, 1957, No. 1 . . 75
XIV Stress Relaxation, Comparison of Experimental andTheoretical Values................................ 76
XV Contraction, Data of October 29, 1956 ............. 77
XVI Contraction, Data of October 16, 1956 ............. 78
XVII Contraction, Data of October 12, 1956 ............. 79
XVIII Contraction, Data of September 2 8, 1956 . . . . . . SoXIX Contraction, Average Values........................ 3l
v
LIST OF ILLUSTRATIONS Figure Page1 Diagram showing arrangement of apparatus ............. 822 Typical record of light and tension variation ....... 023 Experimental arrangement of optical equipment ........ 83
• i Photograph of apparatus employed in this work.... 83
5 Enlarged view of muscle holder................... 8tG Front view of muscle stretcher ......................... 817 Average curves of phase retardation and tension during
stress relaxation........................... 85
8 Phase retardation changes following a rapid stretch . . . 86
9 Curves of phase retardation and tension after passivestretch.......................................... 87
10 Stress relaxation at different lengths (data of April 9).. 88
11 Passive stretch curves (data of April 9) ................ 89
12 Stress relaxation at different lengths (data of April 8 ).. 90
13 Passive stretch curves (data of April 8) ................ 91
ll Stress relaxation at different lengths (data of Aprilk, No. 2)................................................ 92
15 Passive stretch curves (data of April k, Ho. 2) .......... 93
16 Stress relaxation at different lengths (data of April 2).. 9l17 Passive stretch curves (data of April 2) ................ 9518 Stress relaxation at different lengths (data of April k,
No. 1 ) ............................................. 96
vi
LIST OF ILLUSTRATIONS (Continued)
Figure Page19 Passive stretch curves (data of April h, No. 1 ) .......... 07
20 Comparison or experimental and theoretical values during stress relaxation ........................................... 9U
21 Phase retardation and tension during isometric contraction . . . . . 99
vii
IHTRODUCTION
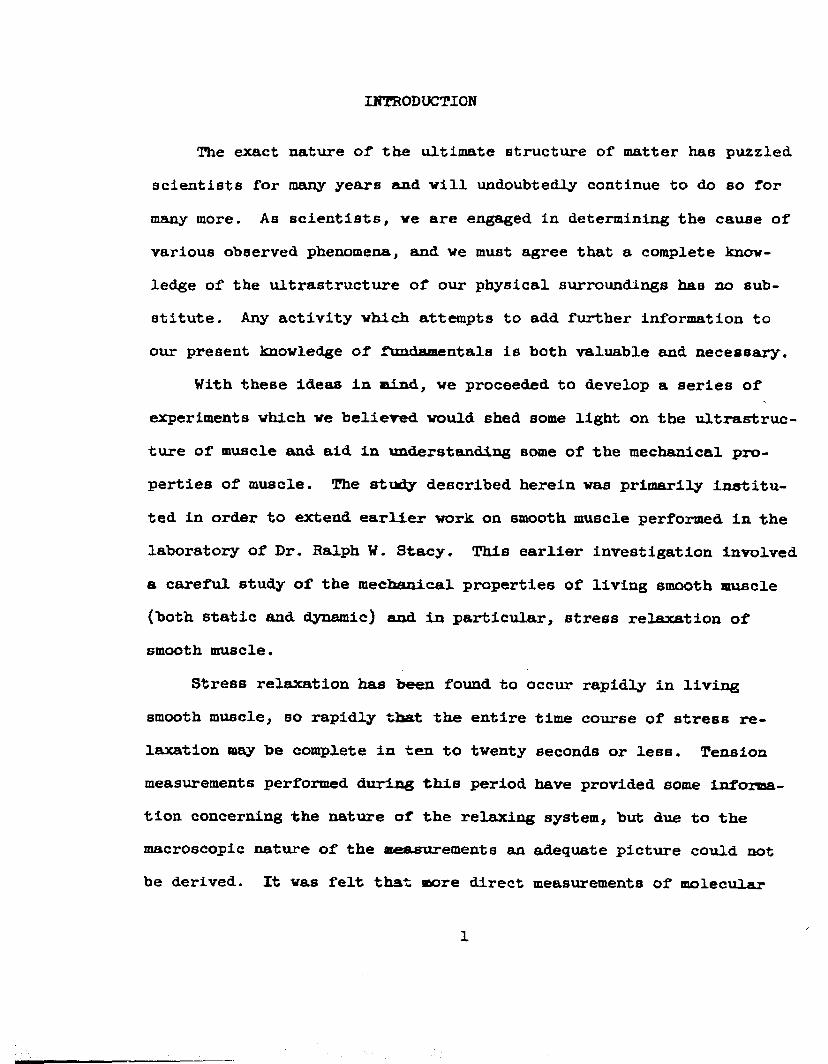
The exact nature of the ultimate structure of matter has puzzled scientists for many years and will undoubtedly continue to do so for many more. As scientists, ve are engaged in determining the cause of various observed phenomena, and we must agree that a complete knowledge of the ultrastructure of our physical surroundings has no substitute. Any activity which attempts to add further information to our present knowledge of fundamentals is both valuable and necessary.
With these ideas in mind, we proceeded to develop a series of experiments which we believed would shed some light on the ultrastructure of muscle and aid in understanding some of the mechanical properties of muscle. The study described herein was primarily instituted in order to extend earlier work on smooth muscle performed in the laboratory of Dr. Balph W. Stacy. This earlier investigation involved a careful study of the mechanical properties of living smooth muscle (both static and dynamic) and in particular, stress relaxation of smooth muscle.
Stress relaxation has been found to occur rapidly in living smooth muscle, so rapidly that the entire time course of stress relaxation may be complete in ten to twenty seconds or less. Tension measurements performed during this period have provided some information concerning the nature of the relaxing system, but due to the macroscopic nature of the measurements an adequate picture could not be derived. It was felt that more direct measurements of molecular
1

changes would be of greater value. At present several methods are available for the investigation of the submicro3coplc structure of muscle. These are: (1) x-ray diffraction, (2 ) birefringence and (3) electron microscopy.
Each of the three methods has disadvantages, with electron microscopy being the most questionable. The use of the electron microscope in biology is limited since the object to be Btudied must be thoroughly dried, placed in a high vacuum and subjected to an electron bombardment which is sufficient to destroy most biological objects. Comparing the use of polarized light and x-ray diffraction, the former involves less instrumentation and less injury to the living tissue than x-rays. Consequently the theory and practice of birefringence was chosen to indicate sub-microscopic changes in this invest igat ion.
Existing methods for the determination of birefringence are slow and do not allow for the rapid measurements which are necessary in this case. It thus became necessary to devise and construct an instrument utilizing the principles of polarized light analysis, which would permit accurate measurements of the changing birefringence over a short period of time. Fortunately we were able to design and construct such an instrument. Also, we achieved the added advantages of simultaneous tension measurement and ease of analysis.
It was found that this procedure could be satisfactorily used to measure rapid changes in birefringence and tension during physiological processes other than stress relaxation. By using polarized
light we can avoid certain objections frequently raised to morphological investigations, since with polarized light tissues may be examined in a fresh, unfixed condition. Hence, it was also possible to obtain data during contraction and during passive stretch of living smooth muscle.
In this work "stress relaxation" refers to the decrease of tension in muscle while maintained at constant length following a rapid stretch. It should be noted that this phenomenon haB been observed in many other polymers besides biological material, e. g., rubber, wool and strained gelatin gel. In all cases the exact nature of the relaxing mechanism is unknown; however, due to extensive studies of the viscoelastic properties of polymers undertaken in many laboratories acceptable explanations of this behavior have been derived.It will be shown in this study that the underlying mechanism for stress relaxation in rubber and muscle are quite similar.
Stress relaxation studies have provided much useful information regarding the viscoelastic properties of muscle and should aid in a final understanding of the mechanisms of contraction. A satisfactory relationship between structure and viscoelastic properties has not been completely developed as yet. However, a rather clear over-all picture of these phenomena appears to be emerging. Consequently, this problem was approached with the aim of fulfilling two purposes:
(l) to determine the relation between molecular structure and stress relaxation. This was carried out by simultaneously measuring birefringence and tension

4relaxation in smooth muscle.
(2 ) to present further information which will be useful in completely understanding the properties of living muscle. This was achieved with the measurements made of birefringence and tension during muscular contraction and a passive stretch.

oUHVKY OF LITE11A.TURE
Scientists of various fields have attempted for many years to determine the molecular structure of muscle. The complexity of the system has presented a challenge to every investigator in this field of study and undoubtedly will continue to do so for many more years. However, with the gradual development of better methods of investigation which are more sensitive and have higher resolution, further information on minute structural organization and its changes during stretch and contraction will be obtained. It is likely that the interpretation of the data and general behaviour of muscle will become quite simple and straight-forward.The Study of Molecular Structure
The electron microscope has been employed in the study of muscle only during the past few years, and although its use may be questioned because of artifacts produced in preparation of the sample (50), very useful pictures of the minute muscle structure have been derived. Almost all of the work done with the electron microscope has been performed on striated muscle. In early studies of striated muscle, Szent- Gyorgyi (45) and Schmitt (28) concluded that bundles of filaments in the myofibrils extended continuously through both the A- and I-bands. Later work performed by Huxley (33), following a new sectioning technique, revealed the presence of two types of filaments, one type lying in the I-band and a combination of the two in the A-band. From this, Huxley was able to present a picture of ninuue organizational structure
to explain the behavior of muscle during stretch and contraction (3 ^). Huxley's method of fixation and conclusions have recently been questioned by other workers (14, 5*0 so that we are still left with an incomplete concept of molecular structure.
The principles of diffraction employed with x-rays and white light have been used by some investigators to determine' minute structures of striated muscle. Hill (30, 31) found that the diffracted light decreased after a rapid stretch and after stimulation. Bear (5) and Astbury (*0, using x-rays, obtained considerable information concerning the orientation of atoms in the molecular structures. After a careful study of all x-ray data, Pauling et al. (44), in an excellent work, proposed possible structures for muscle in the extended and the contracted state. It must be remembered that x-rays have some effect on the material being studied so that great care must be exercised when interpreting x-ray diffraction patterns of muscle (32).
Of all the methods developed to study the molecular structure of muscle, the oldest and most frequently applied is that of birefringence. The physical phenomenon of birefringence has been known since 1690 when Huygens developed the wave theory of lightj however, it was only in 1858 that Brucke (9 ) discovered that muscle was birefringent. At that time he postulated that the birefringence was due to elongated particles in muscle arranged in a parallel manner. This work was th.e forerunner of many more such studies carried out on all types of muscles with highly sensitive equipment and more advanced theories of birefringence.

7Birefringence and Muscle
Brucke (9) was the first to show that the total birefringence for striated muscle decreased after an isotonic contraction. Later Hermann (29) was able to corroborate these findings. From then on and during the ensuing fifty years a considerable amount of data has been collected regarding birefringence and muscle.
A whole new field of study was introduced when Wiener (59) developed a mathematical relation between sign and strength of birefringence and certain spatial and optical conditions of micellar patterns. This theory supplied us with a method of separating crystalline and form birefringence to give total birefringence. Ambronn (2 ) was the first to test the theory experimentally for various non-biological materials, and Schmidt (U9 ) was the first to apply this method to biological objects. The procedure involved measuring the birefringence of the material as the index of refraction of the bathing solution is changed. Schmidt ’ s work indicated that muscle showed both crystalline and form birefringence.
Later the method was improved by Noll and Weber (^2) who confirmed the results of Schmidt and also showed that muscle fibers and myosin threads had similar double refraction. Fischer (19> 22) applied the Wiener theory to smooth muscle (retractor muscle of Thyone and retractor of Phascolosoma) and demonstrated that the total birefringence is made up of almost equal proportions of crystalline and form birefringence.
The results of the experiments of the various investigators, combined with the Wiener theory, led to the formation of our first
picture of subraicroscopic structure in muscle. According to the Wiener theory, a positive form birefringence must be due to the myofibril rod- lets oriented parallel to the fiber axis. Fischer (17) believes that the polypeptide chains are arranged in the myofibrils and give rise to crys
talline birefringence and x-ray diffraction patterns. Fischer (l8) paints out that the interpretations of the results of these experiments are not so unambiguous as they may seem, and that the imbibition method for measuring form birefringence of fixed muscles may be misleading even though it provides reproducible results. The main point to be kept in mind is that, in the case of muscle, the penetration of the imbibition fluid is apparently not completely restricted to the intermyofibrillar spaces, but advances also into the myofibrils themselves.
Measurements of the total birefringence of living smooth and striated muscle indicates that the ultrastructure of smooth muscle is similar to but not identical with the ultrastructure of the A-band of skeletal muscle. Buchthal and Knappeis (10) demonstrated that for isolated fibers of the frog, the birefringence of striated muscle is increased only a little by elongation beyond the length at which all fibers are straight and parallel. Those authors used a standard microscope with a Babinet compensator to measure phase differences. A few years later Fischer (2*0 obtained the same results using the rectus abdominis muscle of the mouse and a graduated quarts wedge for the cornpensat cr.
In contrast to the above results, it was found that elongation considerably increased birefringence of smooth muscle. Fischer (22,
923) and Bozler (6 ) showed this to be true for invertebrate smooth muscle, and Fischer (2*0 demonstrated this in mammalian smooth muscle. In the latter case, Fischer (2*0 studied the smooth component of the retractor penis muscle of the dog and the circular layer of muscle from dog Jejunum. Due to the striated properties of skeletal muscle and the dependence of birefringence of smooth muscle on length, an exact comparison of the birefringence of smooth and striated muscle is somewhat difficult.
Bozler (6), using a new technique for measuring the changes of birefringence, found for the retractor muscle of the snail, Helix pomatia, that the birefringence increases linearly with the square root of the length. For this work he used a mica wedge compensator which produced interference fringes, and he recorded the movement of the fringes with a camera. He believed that changes of birefringence are not directly associated with changes of tension or with activity in general, but are due to change of muscle length. The variation of birefringence with length could be explained by assuming that a greater number of molecules become oriented at the greater length.
The square root relationship was confirmed by Fischer (21) with the smooth retractor muscles of the Phascolosoma and Thyone. However, he (1 8) points out that this proportionality may hold for interte- brate smooth muscle and not for mammalian smooth muscle (such as, the retractor penis of the dog) for which the birefringence increase with stretch is considerably less than that predicted by the square root rule.
10
All investigators agree that in an isotonic contraction of both striated and smooth muscle the total birefringence decreases considerably (9, 52, 16). In the case of an isometric contraction the findings vary; some reporting no changes, some small decreases and some slight increases In birefringence. There seems to be no doubt that a change In birefringence during contraction is dependent more on the length of the contracted muscle than on the tension produced (17). The birefringence variation curve seems to correspond very closely to the time course of mechanical response.
Muralt (hO) found that appreciable birefringence decreases occur under isometric conditions for striated muscle at low initial length. Bozler (6 ) demonstrated that the birefringence of the frog sartorius may decrease 30# during an Isometric twitch at small initial tension. However, this decrease in birefringence during contraction becomes smaller and smaller with increased initial length until, at a relatively great length, the birefringence decrease is very small and difficult to measure (1 8).
For smooth muscle during an isometric contraction, birefringence decreases, but as with striated muscle, the decrease diminishes as the initial length Increases (22). Smooth muscle at great initial length will show no birefringence change (6 ), and, occasionally, small increases are observed (2h).
Fischer (20) explains the difference in the optical properties of smooth and striated muscle by presuming that molecular configuration of the two myosins are similar but not Identical. This is indicated by the similar but not identical flow birefringence and

11solubility properties for myosins extracted from smooth and striated muscles.
This latter view is strengthened by some recent work by Abbott and Lowy (1). From length-tension diagrams, quick stretch studies, and force-velocity work, they suspect that snail muscle (as well as all smooth muscle) has a parallel elastic component which produces resting tension at any length greater than the optimum length for isometric tension. They believe that the mechanical properties of smooth and striated muscle do not differ fundamentally.
Finally, it should be mentioned that the study of birefringence has played a very important role in determining the type of protein composition in muscle. In 1930 von Muralt and Edsall (kl) extracted minced muscle with salt solution of high ionic strength and purified them. Flow birefringence studies showed that the extracts had characteristics of solutions of fibrous molecules. Since the protein of the A-band is birefringent, the authors assumed correctly that this protein was present in the extracts.
In 193k Weber (61) showed that the "muscle globulin" of von Muralt and Edsall, when transformed into myosin threads, possessed a birefringence high enough to account for the birefringence of the A-bands. From then on, the protein in the A-band became generally known as myosin.
A few years later It was shown for the first time by Schramm and Weber (51) that myosin solutions contained more than one phase, a slowly sedimenting component with a low birefringence of flow

12(L-myosin) and several rapidly sedimenting components with high flow birefringence (actomyosin).
Comparisons have been made by Buchthal et al,(12, 11) and Weber (5 6) on the mechanical and optical behavior of extracted muscle preparations and actomyosin thread models. It was found that birefringence studies of extracted model fibers agreed very well with those performed on muscle. Weber states (57) that birefringence work had shown that passive changes in the length of actomyosin systems are due to passive changes in length of the individual protein filaments and the peptide chains which they contain.
The voluminous amount of facts collected regarding birefringence and muscle has resulted in the development of several excellent theories to explain muscle behavior and molecular structure, and has also shown the need for further study in this field. These theories, including the significance of the results of this study, will be discussed in a later section.The Measurement of Rapid Changes of Birefringence
The method described in this study for the measurement of rapid changes of birefringence is unique to the field of biology, but has been used in one form or another in the physical sciences. As will be seen in later sections, the instrument used in this work had the necessary simplicity of construction, high accuracy of measurement, and fairly high sensitivity desired for this type of experiment. Of course, improvements can and will be made In any future work.
The main Innovation of this method pertains to the rotating analyzer and the multiplier phototube. The rotating analyzer gives
13rise to a varying light intensity (sine wave variation) which is picked up by the phototube, amplified and recorded. Early investigators (3) used a similar procedure to study metal films and surfaces. In their work, they employed either a modulated light source or a rotating analyzer, photoelectric cells, an amplifier and a cathode-ray oscilloscope as a recorder.
Randall, in a recent work, described an accurate method for calibrating retardation plates by using a chopper to interrupt, at a suitable frequency, the light from the source. Again a photoelectric cell and an amplifier were used for the photo-electric transducer. (k8 )
In a study o f rubber properties, Gurnee et al. (27) designed an apparatus similaui- to the one used in our work and measured stress relaxation in extru.cLed polystyrene sheets. It is of interest to note that the stress relaxation obtained in rubber in these studies, although spread o v e r a longer interval of time (15 minutes), Is very similar to relaxation found in muscle. Gurnee (26) goes on to explain that even though, the polystyrene molecule is a long carbon chain the birefringence is probably due entirely to side-chains made up of phenyl groups. This Is an extremely interesting concept and will be applied to our present study.
Except for Bozler's work (6 ), no recent studies have been made in biology which Involve a rapid measurement of birefringent changes.The value of such a pursuit, especially during stress relaxation, isotonic and isometric contractions, is quite evident. Zatzman (61) has shown that stress relaxation in umbilical artery rings may be complete in 10 seconds, and In the penis retractor muscle (smooth

Illsection) of dogs, stress relaxation is complete in 30 seconds. Contractions are known to occur over very short periods of time. If we are to gain any insight Into these phenomena, accurate and rapid measuring devices must be designed and utilized.
In past work, the birefringence was measured at various steady states after elongation or contraction. Information was obtained before and after a contraction or before an elongation and then at different lengths after stretching. The entire procedure of measurement Is very accurate but slow.General Remarks
In this work we will be mainly interested in the various theories presented to explain muscle behavior from the point of view of molecular structure. At present, two main theories stand out; (a) the belief, strongly held by Huxley (3*0> that most of the mechanical and optical behavior of muscle can be explained by picturing the actin and myosin filaments slipping past each other, and (b) the theory that all behavior of muscle can be satisfactorily explained by considering two stable molecular states of existence with the distribution of the two states determining the condition of the muscle. The latter view is held by Polissar (k6) and Stacy (5 3) and implies no slipping during a reaction.
Huxley (3*0 bases his concept on phase-contrast microscope workand electron microscopy. Using extracted myofibrils, It was foundthat during stretch and contraction only the I-bands change in length,the A-bands remaining at constant length. This can be satisfactorily explained by assuming that the principal contractile proteins of

15muscle, actin and myosin, are organized into separate filaments, and the interaction of the two filaments with ATP causes them to slip past each other.
From electron micrographs of extracted myofibrils, Huxley (35) constructed a picture of striated muscle structure. Actin filaments extend from the Z-line of the I-band up to one side of the H-zone in the A-band where they are attached to an elastic component, this elastic component providing continuity between sets of actin from one Z-line to the next. The myosin filaments pass along the A-band through the H-zone to the other end of the A-band, and its length is unaltered by stretch or contraction down to the point where the sarcomere length is equal to the length of the A-band. Thus myosin and actin lie side by side in the A-band.
It should be pointed out that Carlsen and Knappeis (1*4-) reported results contradictory to those of Huxley, using fixed muscle fibers in a polarization microscope and myofibrils In an electron microscope. They demonstrated that the lengths of the A- and I- bands of living muscle changed Identically at different stretches. They explain Huxley's results by indicating that his fixation process introduces considerable change In the extensibility of the A- band as compared to the I-band.
The Pollssar-Stacy concept can be considered to be an advanced continuation of the "folding and unfolding" hypothesis first put forward by Meyer in 1929 and later expanded by Meyer and Mark (39). Meyer suggested that muscle contraction is due to folding and unfolding of myosin chains governed by chemical reactions. Stacy

16believes that the contractile material is made up of individual units arranged in long chains, and that each chain may consist of a large number of smaller units. Chains are parallel to the long axis of the muscle. These protein units may exist in either of tvo equil ibrium states, a "long" or "short" condition, with conversion from one to the other possible under suitable circumstances. For example the application of tension may change the equilibrium point and convert more short units to long units.
With the latter picture as a beginning, Stacy has been able to completely explain stress relaxation in smooth muscle. Zatzman (61) has presented a detailed discussion of this work. Ramsey (V7), in agreement with these ideas, has presented a similar model for striated muscle, and Buchthal et al. (13)> in. a very recent review of muscle behavior, reports that the "short-long" concept is consistent with recent findings of structural organization.
Our present study attempts to present further evidence for the support of either concept, and we shall later see that the "short- long" theory explains the facts much more acceptably.

MATERIALS AND METHODS
InstrumentationThe apparatus used, in this work was designed and assembled in
this laboratory. The work of designing the instrumentation was divided into three phases: optical, mechanical and electronic. Theoptical equipment involved the light collimating system and polarizing plates; the mechanical apparatus was made up of the muscle support and stretcher; the electronic equipment included the phototube, power supply and amplifier. With this assembled equipment, we vere able to measure rapid changes of birefringence and tension simultaneously.
The general scheme of the apparatus used in these experimentsis shown in Figure 1. The apparatus was mounted on an ordinary optical bench, as shown in Figure 3.
The light source was a Beckman 2260 Mercury Discharge Lamp requiring an a-c filament current of about seven amps at two volts anda d-c arc current of 0.3 amp at 60-90 volts. A Beckman Hydrogen Lamp Power Supply was used to supply the necessary power for the light source and regulate the arc current to the desired constancy. A small 60 cycle ripple was picked up by the phototube from the source and was eliminated by a filter in the amplifier circuit.
The light from the source was collimated into a parallel beam by a diaphragm and lens system, and the cross sectional area of this
17

18beam was regulated by a variable iris diaphragm, shown between the filter and polarizer in Figure 1. A green Kodak Wratten Filter No. 61 was used as the light filter, thereby obtaining a sharp line at 5^60 A°.
Both the polarizer and the analyzer used in our apparatus were made of polaroid material. The polarizer was placed in a rotatable mounting so that the azimuth of the linearly polarized light could be varied with respect to the sample.
A special container was constructed to hold the Tyrode solution in which the muscle was immersed. This water-tight container was made of plastic except for the two parallel sides in the path of the optical beam which were made of thin glass plates. A front view of the container and the polarizer behind it is Bhown in Figure 6 .
Between the sample and analyzer a mica quarter-wave retardation plate was mounted, and since the major axis of the plate is known, it was placed at a known angle with respect to the polarizer. The analyzer itself was mounted within the lumen of the inner race of a ball bearing held in an ordinary headstock piece. All parts of this assembly which were in line with the light path were painted a dull black to minimize reflections. The ball bearing race projecting beyond the headstock was connected by means of a step-down pulley arrangement to a ^-pole shaded pole induction motor of 1/70 H. P. and capable of 1550 rpm. The analyzer was rotated by means of the motor and pulley at a constant speed of 12 cps.

iyLight transmitted through the analyser was detected with a 931-A
multiplier phototube. This ten stage phototube was operated from a battery power supply providing 100 volts per dynode stage and 30 volts between dynode No. 9 and anode. The phototube was mounted in an enclosed container to prevent superfluous light reaching the cathode. The multiplier phototube mounted on the container holding the dynode resistors is shown on the left of Figure 3 with the lighttight enclosure removed.
The output of the phototube was connected to a Grass Model Pk Pre-Amplifier which is suitable for amplifying voltages from any source whose frequency falls within the range 1/3 to 20,000 cps. In this case the input signal to the amplifier was a constant frequency of 2k cps. A filtering circuit in the amplifier was used which allowed the passage of frequencies between about 5 to 50 cps.
The Grass amplifier was employed in our work since it operates from a battery power supply, thus eliminating ordinary interference, and, by having the connecting wires short in length and shielded, the noise level was kept to a minimum. This amplifier is seen at the bottom left of Figure k.
The output of the amplifier was connected to a Type Slk-C Hathaway Oscillograph, group Ho. h galwarnneter, which was employed as the recording device for this work. Tnis galvanometer has a sensitivity of 315 mm/ma/m, a flat response from DC to 9k cps, and
a galvanometer resistance of 32 ohms. The recording chart speed for
all our work was kO inches per second.

20During the course of on experiment it was necessary to know at
all times the exact position of the analyzer with resp>ect to the polarizer. To accomplish this purpose a short bar magnet (one inch in length) was mounted on the rotating pulley of the analyzer. At a short distance from the magnet, an electromagnetic pickup, consisting of a coil of wire around an iron core, was permanently mounted. Thus, once every cycle the magnet crossed the pickup and a large spike potential was obtained. The electromagnetic pickup was connected to one of the input coils (group No. h galvanometer) of the Hathaway recorder, a sharp spike being seen as a vertical line on the recording paper. In our experiments, the magnet was arranged so that whenever the azimuth of the analyzer was "crossed" with respect to the polarizer, without any sample present, a vertical line was recorded on the paper. By this simple method, the position of the analyzer was known at all times during the course of an experiment. As will be seen later, such information is very essential for making measurements. The type of vertical lines obtained by this procedure is shown on a typical record in Figure 2.
The three separate channels of the oscillograph recorded the following information:
1. light variation from the rotating analyzer2. tension of the muscle3. position of the analyzer with respect to the
polarizer

21Great care vas taken in constructing the muscle support and
stretcher since it was necessary to obtain a rapid stretch and ensure no slippage of the muscle within the holder after a stretch. A side view of this structure, with a sample in place, is shows in Figure 6 .
The bottom edge of the muscle layer is clamped to a rigid support made up of heavy brass parts, while the top edge is clamped to a holder connected by means of a light rod to a Statham strain gauge dynamometer. By means of a rack and pinion arrangement the height of the dynamometer could be adjusted to any desired level. Thus, the initial tension of the muscle could be easily regulated by adjusting the position of the dynamometer and the upper end of the sample. Sudden stretching was produced by pulling down on a lever attached to the dynamometer mount, a metal bolt at the top of the support serving as a stop for the movement. The amplitude of the stretch could be varied by changing the position of the bolt.
The strain gauge dynamometer employed in this work consists of four strain gauge elements mounted so that stress imposed on a pin projecting from the bottom of the gauge produces a strain on two elements and relaxes the other two. The elements form the arms of a Wheatstone bridge, so that the imbalance voltage of the bridge is directly proportional to the amount of stress applied. The strain gauge element exhibits very little displacement and the moving parts are small, so that the frequency response of the gauge alone is flat to about 2000 cps. The gauge was powered by a battery supply of 10 volts.

22The output of the strain gauge was connected to an inverter-
araplifler which was designed for the amplification of small DC potentials and for use with galvanometer oscillographs. It has a uniform frequency response in the range of 0-5*000 cps and an accuracy for voltage linearity of ]$> of full scale. This amplifier employs electronic inversion of the DC signal voltage* which in turn is amplified by means of an AC amplifier and then demodulated for driving galvanometers.
The inverter-amplifier was connected to group No. 6 galvanometer of the Hathaway Recorder. This galvanometer has a sensitivity of 1 2 .0 mm/ma/m, a flat frequency response from 0 -5 5 0 cps and a galvanometer resistance of 6.2 ohms. By placing known weights on the strain gauge we were able to calibrate its output as recorded on the film. Selection and Preparation of Sample
For this work we required a sample which was flat, relatively thin and had fibers aligned in one direction. It was found that the longitudinal layer of dog ileum approximated these conditions and also could be easily obtained. The present data represents experiments performed on muscle layers procured from 18 different dogs.
A piece of ileum about six inches long was taken from a dog anesthetized with Nembutal (30 rag/Kg) injected intravenously. The intestinal segment was washed, and placed in Tyrode's solution. The segment of ileum was then cut along the line of mesenteric attachment, unrolled and placed on a flat surface where, under careful dissection, it was possible to remove a plane section of the longitudinal

23layer. The sections used as samples were all approximately 1.0 cm in width, 1.5 cm in length and 0.10 nun in thickness.
An attempt was made to obtain ileum sections from approximately the same point along the small intestine of each dog in order to min imize variation from animal to animal. It is known that the thickness of the muscle layers of the small intestine varies along the length of the intestine.
After removing the section of longitudinal layer of saiscle it was placed in the Tyrode's solution again for about 30 minutes and then mounted on the muscle stretcher. The Tyrode solution used during an experiment was always freshly prepared, aerated at all times with a mixture of 9 5 02 and 5$ C02 and adjusted to pH 7*2-7*6.
It was found that the pH of the Tyrode bath containing the muscle remained constant during the course of an experiment. A Gamma pH meter was used to measure the acidity before and after an experiment. The muscle layer also maintained its contractility during an experiment as indicated by response to electrical stimulation. Experimental Procedure
In order to better clarify the procedure followed to obtain experimental data I will describe the pattern of a typical experiment.
After mounting a muscle in the muscle stretcher it was placed in the Tyrode's solution container and in the path of the polarized light. At this time the mercury discharge lamp was replaced by a white light source (a concentrated arc lamp of 150 watts), the green filter and quarter-wave plate removed, and the analyzer crossed with
2k
respect to the polarizer. A first-order red plate was then interposed between the Bample and analyzer, aild set with it’h slow axis at an angle of 5̂° with the azimuth of the polarizer. The red plate is simply a constant retardation plate of 5510 A°. The color of the sample was then observed and from this we could determine the sign of birefringence and an approximate value of the phase retardation (38). In all cases for the longitudinal layer of dog ileum we obtained a positive birefringence with respect to the longitudinal axis of the muscle layer and always stretched parallel to this axis. In most cases, as a check of the first-order red plate, a mica wedge was also used to give an approximate value of the phase retardation.
Knowing the approximate value of the retardation, we then replaced the mercury light source, the green filter, and quarter-wave plate, and removed the sample from the phth of the light beam. The quarter-wave plate was placed in the light path with its slow axis parallel to azimuth of the polarizer. With the instrument set at this condition, a short strip of record was obtained which showed whether the vertical lines of the record indicates the crossed position of the polarizer and analyzer. The muscle was then re-inserted with its longitudinal axis at k5° to the azimuth of the polarizer and a record made of the light and tension variation before and after a stretch. In most cases the initial tension was kept close to zero, and the amount of stretch was 20$ of the initial length of the muscle.
A series of experiments was performed in which stress relaxation
25was measured at BeveraX different lengths of the same muscle. For this series, the pre-stretch length of the muscle was varied beyond the initial length and given a rapid stretch at the nev length. At each length, the muscle was allowed to "stress relax" before a new stretch was applied.
To obtain records during contraction and passive stretch a similar procedure was followed. Contraction was initiated by adding acetylcholine to the Tyrode’s bath. The acetylcholine was taken directly from a 1 cc. ampule of acetylcholine obtained from Leader Laboratories, and the resulting bath concentration averaged about 1:5000. In the case of the passive stretch experiments, all measure-
f
ments of phase retardation and tension were made after stress relaxation had occurred.
At the end of an experiment the muscle was removed and, a short record made again to indicate whether the vertical lines were at the correct position. Known weights were added to the dynamometer and the strain gauge thereby calibrated.Summary of Completed Experiments
A total of 'eighteen dogs were used in this study, each muscle specimen being obtained from a different dog. In each experiment the muscle specimen was used within two hours after removal from the dog and kept in oxygenated Tyrode’s solution at all times. The Tyrode’s bath was maintained at room temperature (24°C.). Tae weight of the animals ranged from 12 to 16 kilograms. They were approximately 2 to 6 years old, and in most cases, were not fed for a

26period of about 17 hours prior to use.
Three different muscle layers were used in the passive stretch experiments to determine the magnitude of phase retardation and tension. at various lengths of the muscle. The lengths were increased stepwise by stretching the muscle, and a record at this new length was obtained after stress x-elaxation had occurred.
A series of experiments was performed with five muscle layers to determine the amount of stress relaxation at different muscle lengths. A rapid stretch was applied to the muscle at each new length and the resulting phase retardation and tension changes recorded for a period of about three seconds. An interval of five minutes was allowed to elapse after a stretch before a new stretch was applied to the muscle layer.
Six different muscle layers were used to determine the shape of the stress relaxation curve for phase retardation and tension for muscles under no initial tension. In each case the stress relaxation was recorded for a period of approximately three seconds.
To determine the change of phase retardation and tension during an isometric contraction, four experiments were performed utilizing four muscle layers. In each case, the initial tension of the muscle was relatively low (about 7 grams), and the contraction was initiated by adding acetylcholine to the bath. The resulting phase retardation and tension changes were recorded for a period of five seconds following stimulation.Handling ana Analysis of Data
Figure 2 shows a typical record obtained for a 3ongit™d*”?l
27layer of dog ileum after a rapid stretch. The vertical lines indicate the position of the analyzer when it is crossed with the polarizer (no sample present), the top curve represents the light variation picked up by the multiplier phototube, and the bottom curve is the tension variation.
The value of the phase retardation was obtained by measuring the distance A of Figure 2 all along the record and using the expression for phase angle derived from the Senarmont theory. A morecomplete description of the Senarmont method will be found in the appendix. In this case the desired expression would be.:
Phase Angle = 2 A + n 360 where A and phase angle were expressed in degrees. The phase retardation then becomes:
Phase Retardation = A ■% + n \T8owhere X is the wave length of the light used. The value of the integer (n) is found by approximating the value of the retardation with the first order red plate and white light.
With the analyzer rotating at 12 cps and a film recording speed of 40 inches per second, one cycle on the record paper had a length of k.2 cm. We could measure changes of phase retardation occurring every l/2^ of a second.

RESULTS
Phase Retardation and Passive StretchFor this study, the muscle vas stretched to different lengths,
allowed to stress relax at each new length, and then tension and phase retardation recorded. The initial length was approximately the same length the muscle had while attached to the ileum. Itshould be made clear that during the passive stretch experiments thelength of the muscle was increased continuously, i. e. the muscle was always stretched from its new length and was not returned toits original length after an elongation.
A series of three experiments was performed utilizing three different muscles, and Table VIII shows a typical record from one of these experiments. These values of phase retardation and tension plotted as a function of length are shown in graphical form in Figure 9* It is seen that as the muscle length is increased, tension is not developed until the length is about doubled. Stretching the muscle from its initial value of 1 .2 centimeters to about 2 centimeters has increased the phase retardation over 50 per cent from its original value. Further elongation of the muscle beyond 2 centimeters resulted in rapid increases of tension, whereas, the phase retardation during this period declined. It is seen that from a length of 2 cm to that of 5 cm, tension has increased sixty times the original value, while the phase retardation decreased about
28
2950 per cent of the initial value during this period.
The initial rapid rise of phase retardation, followed by the relatively slow decline of the retardation and the development of tension, leads one to believe that we are measuring both form and intrinsic birefringence. During the rise of retardation, form birefringence is increasing with muscle elongation, becomes a maximum at about 2 centimeters, and then remains constant for further stretching. The intrinsic birefringence continues to change at lengths greater than 2 centimeters.Phase Retardation and Stress Relaxation
To show the relationship between phase retardation and the decay of tension with time after a rapid stretch, data was collected from longitudinal muscle layers of six dogs. Tables I - VI show the values obtained in each case. Measurements of the tension and the distance A on the recording were started a few cycles before the stretch was initiated and then followed for a few seconds after stretch.
In Tables I - VI, the approximate phase retardation values before stretch (as obtained by using white light and the first-order red plate or the mica wedge) are given. These values indicate the order of magnitude of the phase retardation and determine the value of the integer (n) in the phase retardation equation. It is seen that our approximate values of phase retardation and the measured values differ by not more than 900 A° in any case, and thus (n) has the value of zero in the phase retardation equation.
The data of Tables I - VI pertaining to the variation of phase retardation with time is plotted in graphical form in Figure 8 . The numbers of each curve in the figure represents the corresponding table. We note that in each case the phase retardation increased after a rapid stretch and then slowly declined with time. The increase of phase retardation upon stretch varied from 8 - 2 0 per cent of the initial value, depending upon the initial length, thickness and amount of stretch. The decrease of phase retardation following the rise was about 50 per cent or more of the original change after a two second period.
The data of the six muscles was averaged together and plotted in Figure 7* We see that after a rapid stretch, both tension and phase retardation first rise and then fall with time. The initial tension was zero grams, increased to a value of 32 grams, and then decayed to about 16 grams after two seconds. Further observations showed that at these short muscle lengths the tension decayed to zero after 3 - ^ minutes. The phase retardation showed a 13 per cent increase of the initial value, upon stretch, and a decay to about 40 per cent of the original change after a two second period.
In line with this study, five experiments were performed in order to determine stress relaxation at different lengths of a muscle. Tables IX - XIII and Figures 10 - 19 show the results of this work. In each case, cm attempt was made to obtain stress relaxation data for muscle lengths which occur on each Bide of the peak of the passive stretch curve. It should be kept in mind that the passive

31stretch curve represents phase retardation and tension after stress relaxation has occurred. The passive stretch curves for the five muscles and the lengths at which rapid stretches were applied are shown in Figures 11, 13, 15, 17, and 19- Figures 10, 12, l1!-, 16, and 18 show the results of a rapid stretch applied to the muscles at the different lengths.
It is seen that for lengths below the peak of the passive stretch curve, a rapid stretch gave rise to an increase of tension which was followed by a slow decay. For these lengths, the initial tension was small (approximately zero), however, the tension increased to values of about 50 grams, for a three millimeter stretch, and then started to decline. At these lengths, it was observed that the tension decayed down to zero grams.
For muscle lengths below the peak of the passive stretch curve, phase retardation increased and then decayed with time, following a rapid stretch. It is seen that the amount of initial rise of retardation depends on the length of the muscle, i. e. as the muscle length approached the peak of the passive stretch curve a smaller rise was obtained upon stretch. This is clearly noted in curve (l) of Figure 12, obtained by stretching from a length of 0.9 centimeters, in which a rise and then a decay of retardation is seen; whereas, curve (2 ), obtained by stretching from a length of 1 . 1 centimeters and near the peak of the passive stretch curve, shows a smaller initial rise and then a decline to values below the prestretch value. In Figure 16, we have the cases of two muscle lengths
32which are below the peak of the passive stretch curve as seen in Figure 17. Here, a rapid stretch of three millimeters resulted in a relatively large initial rise of the retardation in both cases.
For lengths above the peak of the passive stretch curve, phase retardation started to drop immediately following a rapid stretch. This behavior was seen in all cases. The tension at these lengths did not decay to zero as before, but leveled off at tensions varying from 20 - 100 grams, depending on the 'muscle length and the amount of stretch. For example, curve (2) of Figure 10 shows that the phase retardation decreased from 2k05 A0 to 2330 A° in 2 seconds after a 3 millimeter stretch from the initial length of 2 . 7 cm.The pre-stretch length in this case was on the right side of the peak of the passive stretch curve. In all these experiments, the final values reached by the retardation and tension after a stretch agreed with the curve of passive stretch for that muscle.Comparison of Measured and Theoretical Values
In order to compare the observed curve for stress relaxation and a stress relaxation curve derived from the "short-long" theory, a graph was made showing the percent decline of phase retardation and tension from the peak value observed after a rapid stretch.These curves, plotted with the logarithm of time as the abscissa, are shown in Figure 20.
The observed values of retardation and tension were taken from the experimental curves of Figure 7 . We note from Figure 20 that the decay of phase retardation follows very closely the changes of
33tension. After one second of decay, both tension and phase retardation show a decrease of about per cent from their initial peak value,
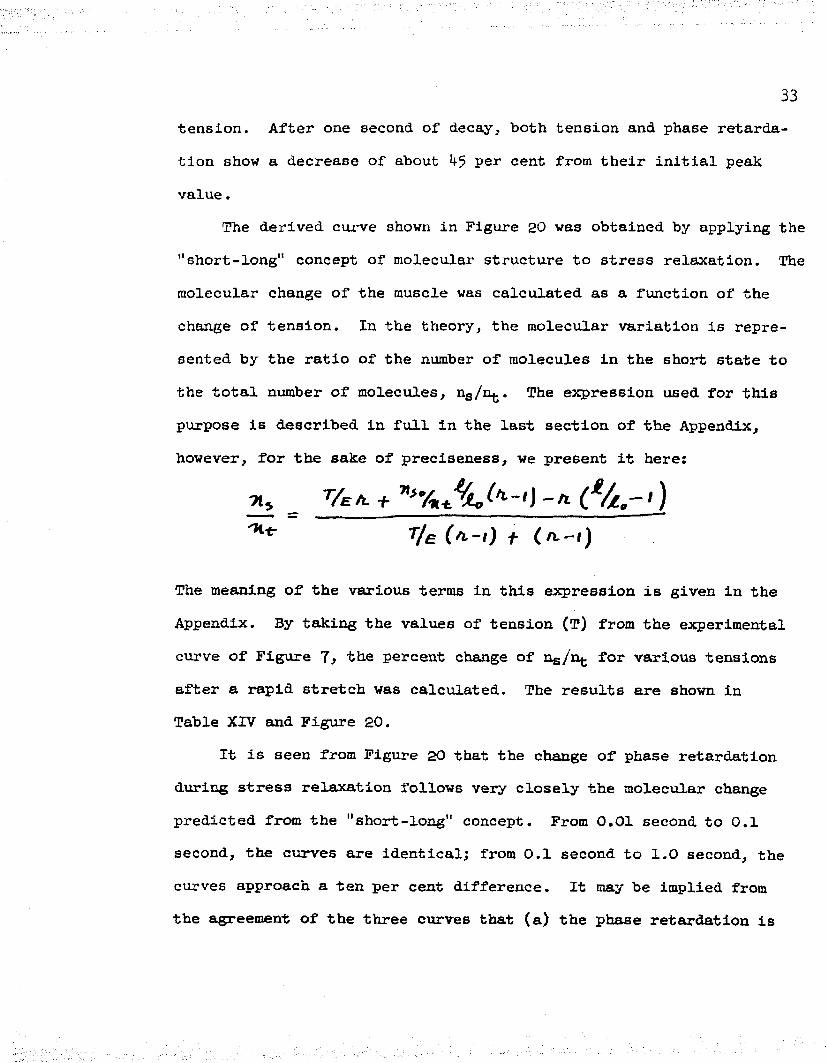
The derived curve shown in Figure 20 was obtained by applying the "short-long" concept of molecular structure to stress relaxation. The molecular change of the muscle was calculated as a function of the change of tension. In the theory, the molecular variation is represented by the ratio of the number of molecules in the short state to the total number of molecules, ng/n̂ .. The expression used for this purpose is described in full in the last section of the Appendix, however, for the sake of preciseness, we present it here:
The meaning of the various terms in this expression is given in the Appendix. By taking the values of tension (T) from the experimental curve of Figure 7> the percent change of ng/n̂ . for various tensions after a rapid stretch was calculated. The results are shown in Table XIV and Figure 20.
It is seen from Figure 20 that the change of phase retardation during stress relaxation follows very closely the molecular change predicted from the "short-long" concept. From 0.01 second to 0.1 second, the curves are identical; from 0 . 1 second to 1 . 0 second, the curves approach a ten per cent difference. It may be implied from the agreement of the three curves that (a) the phase retardation is
3^proportional to the changes of molecular structure, and (b) the tension changes are due to variations of molecular structure.Phase Retardation and Isometric Contraction
The data collected from experiments performed on the isometric contraction of the longitudinal layer of ileum from four dogs are shown in Tables XV - XVIII. In each case, the phase retardation decreased upon stimulation. The values obtained from these four muscle layers were averaged, as shown in Table XIX, and plotted in graphical form, Figure 21. It is seen that the initial tension of the muscle was fairly low, 7 . 5 grams, and upon stimulation, the tension increased to about 23 grams after five seconds. During this same period, the phase retardation fell from 28^0 A° to about 2700 A°.
The results of these experiments show that a tension increase of 15.5 grams resulted in a phase retardation decrease of 1*K) A° during an isometric contraction.
DISCUSSION
The results obtained in this study of stress relaxation and isometric contraction of the longitudinal layer of muscle of dog ileum agree with experimental findings of other researchers in this field. The agreement between our results and those of past workers applies to the sign and value computed for the birefringence of this smooth muscle, and the demonstrated qualitative variation of phase retardation and tension with elongation and contraction. Besides these consistencies, we have been able to present new quantitative evidence which may contribute to a satisfactory description of molecular structure and its changes during contraction and mechanical manipulation.Significance of Birefringence
Before we can correctly interpret our findings, a definite understanding of the cause of birefringence in anisotropic bodies is required. In the appendix, a description of the fundamental principles of birefringence is given; however, at present a more advanced concept of the cause of double refraction is presented.
The partial alignment of long molecular chains will produce a difference between the electronic polarizability in the direction of stretch and that in the direction perpendicular to the stretch. This anisotropy of electronic polarization will give rise to a difference between the refractive indices in these directions, which is "birefringence" by definition. Thus the electronic structure of
35

36a molecule or crystal is very significant to events occurring when a polarized beam of light is passed through an anisotropic material.
Denbigh (15)> in a discussion of the polarizabilities of elec-m
tronic bonds of molecules, states that the average polarizabillty of a molecule is the sum of the average polarizabilities of each bond, and it remains almost constant and independent of the compound in which the bond is present. This bond refraction or polarizability is a property of the bond itself and is found to increase uniformly with increasing bond order. Denbigh goes on to show that with the use of various known constants the magnitude of the mean polarizability of a bond can be resolved into polarizabilities in directions parallel and perpendicular to the bond. It should be kept in mind that the shared electrons of a bond will determine the amount of polarization of each bond, e. g. the refraction of the C-H bond can be taken as the sum of the atomic refraction of hydrogen and l/k- the atomic refraction of carbon.
A few years before Denbigh’s work, Bragg (7) demonstrated that the negative birefringence of calcite and aragonite (both crystalline forms of calcium carbonate) is due primarily to the peculiar structure of the carbonate group which consists of 3 oxygen atoms grouped around a central carbon atom and all lying in a plane. The oxygen atoms are more highly polarized by an imposed electric field than the other atoms in the crystal. Thus, the polarization and birefringence are probably due, for the most part, to the oxygen

37atoms. Bragg concluded that the birefringence of various crystals was due to the particular arrangement of the atoms within the crystal.
Gurnee (26), in a recent work, calculated the birefringence of polystyrene (composed of oriented polymer chains) by considering only the polarizabilities of the attached phenyl groups since the polarization anisotropy due to the C-H and C-C bonds in the chain are small and contribute very little to the total polarization.
We thus see that the birefringence of a substance will depend on the atoms engaged in the bonding, the order of the bond, and the orientation of the bond with respect to the azimuth of the imposed polarized light. It Is most likely that a mechanical stress may vary molecular orientation or structure and, thereby, cause a change in the birefringence.Birefringence Before Stretch
We will now consider the calculated value for the birefringence of the longitudinal layer of muscle of dog ileum before stretch. From the data we see that the phase retardation varied from about 2300 A° to 3900 A0. Of course, this variation is probably due to the fact that each layer had a different thickness since they came from a different dog and from different sections along the ileum. The appropriate measured thickness for these layers was 0.10 mm. If we apply the definition of birefringence;
B = phase retardation thickness
we obtain for the birefringence of this smooth muscle a range of
38valueB from 2 . 3 x 10“ ̂to 3*9 x 1 0 -̂ , or an average of 3*1 x 10"3 ,
Fischer (2*0 measured the birefringence of various smooth muscles and obtained the following values:
intestinal muscle of d o g ................ 2 , 9 x 10“3retractor penis muscle of dog - - - - - - 3 .2 x 10- 3
retractor muscle of Phascolosoma - - - - - 2 .6 x 10~3
It is seen that our value agrees very well with that of Fischer for intestinal smooth muscle.
Our measurements, as well as those of Fischer, indicate a positive birefringence for this muscle. The positive birefringence indicates that the fibers are aligned with the slow axis parallel to the longitudinal axis of the ileum. This follows from the fact that the longitudinal axis of the muscle was placed parallel to the slow axis of the first-order red plate, and it was then found that the slow axis of the muscle was parallel to its longitudinal axis. It is evident, therefore, that in this work the direction of muscle elongation was always parallel to the slow axis of the fiber.Phase Retardation and Passive Stretch
It was found that when the smooth muscle was stretched, tension was not developed until the original length was about doubled, at which time tension increased fairly rapidly with further extension. During the period of muscle lengthening Without the development of tension, the phase retardation increased very rapidly for short elongations. This agrees with the findings of Fischer (24) who obtained the same type of increase for the circular layer of muscle of dog

39Jejunum, and the retractor penis muscle.
The increase of phase retardation with increase of muscle length is less than that demanded by the square root rule of Bozler (6); however, Fischer (l8) points out that this relation between birefringence and length does not hold true for mammalfan smooth muscle, for which the birefringence increase with stretch is less than that required by the square root rule.
From Figure 9 , we note that the phase retardation begins to fall when tension first is developed in the muscle and continues to decrease as tension rises. This type of behavior was once obtained by Fischer (23) for "the retractor muscles of Thyone and Phascolosoma. However, he did not emphasize this finding and explained it as the probable breaking of contractile and elastic elements. We should note that Fischer was not measuring birefringence and tension simultaneously.
The question arises as to what would cause this type of variation. It was shown by Brocklehurst (8 ), using smooth muscle from ileum of cat, that the tension curve for the contractile element peaks at the point where tension first appears as the muscle is extended. He demonstrated this result by subtracting the tension developed in the smooth muscle during a passive stretch from that developed during a contraction. It is thus seen that the tension developed by the contractile element during a passive stretch is very similar to the phase retardation change obtained here during a passive stretch. The phase retardation appears to represent

kochanges of the contractile element of the muscle.Passive Stretch and Molecular Structure
Gurnee (26) compared the relative anisotropy between a randomly linked chain and a long "zigzag" type chain with extension. He shows that for very small extensions the polarization anisotropy of the random coiled chain will be zero and then increase slowly as extension proceeds; whereas, the zigzag chain increases very rapidly during extension and, in a network of zigzag chains, the birefringence will not be zero for small extensions. We note that in our case the retardation rose very rapidly with elongation and was not zero for small extensions, thus indicating a molecular structure of zigzag chains.
If we now apply the "short-long" concept of molecular structure we can derive a picture which will explain this demonstrated behavior of smooth muscle. This theory states that the protein units which make up the contractile material may exist in either of two states which are at all times in equilibrium with each other. The condition of equilibrium is determined by the rate of conversion of long molecules to short ones and short molecules to long ones (see Appendix) .
Before stretch, the molecules are arranged in a network of parallel long zigzag chains slightly disaligned from the longitudinal axis of the muscle. When the muscle is stretched and allowed to "stress relax", the molecules become more parallel to the longitudinal axis, and also, the equilibrium between the shorts" and "longs"

*4-1la shifted, toward a state in vhich the rate of conversion of short molecules to long ones is greater than the reverse process. Thus, due to the applied stress, ve obtain a realignment and an increase in the relative number of longer type molecules.
During the period of stretch below the peak of the passive stretch curve, two processes are occurring which ve may classify as changes in the form birefringence and the intrinsic birefringence. An elongation of the muscle will result in a reorientation of the molecules to positions more parallel to the direction of stretch, which will produce a change of the form birefringence. At the same time, following the stretch, changes are occurring within the molecule itself, such as, the conversion of short molecules to long molecules, and a change of the Intrinsic birefringence is obtained. The result of all these variations, after a stretch, is an increase of the phase retardation while the tension remains constant.
As we continue to Increase the length of the muscle beyond the peak of the passive stretch curve, it is seen that the tension begins to rise and the retardation starts to decrease. This occurs at the time when the molecules have been completely aligned with the longitudinal axis and further elongation at this point simply changes the molecular equilibrium between the "shorts"and "longs". Thus, at these greater lengths, a change in the molecular structure brings about a decrease of the retardation. The exact nature of the molecular structure change is unknown, it may be due to a variation of a bond or side-chain. The breaking of elements as pictured by

h2
Fischer would not explain the appearance of tension or the reversible nature of this passive stretch.
The important point to be considered in this analysis is that the birefringence of a long-chain molecule with various bonds and slde-chains may not be due to its length but to its side-chalns. Gurnee (26) showed that at times the birefringence of a long-chain molecule may be due entirely to side-chains and not the C-C or C-H bonds in the chain itself. This is seen in our passive stretch experiments. As the muscle is stretched and tension begins to rise rapidly, a molecular change occurs such that a decrease of birefringence is obtained. We take this molecular change to be a shifting of the molecules from the short to the long state; however, the exact nature of this change is as yet unknown.Phase Retardation After Rapid Elongation
After a rapid stretch, the muscle tension rises very rapidly and then, as the length is maintained constant, the tension falls with time. It is seen that the phase retardation follows the same course of events at short initial lengths, a rapid rise succeeded by a steady fall. We also note that the changes of tension retardation occur at the same time.
Since phase retardation is a representation of molecular changes and (if we follow the conclusion obtained from Brocklehurst) of the contractile element Itself, then the decrease of tension after a rapid stretch may be due to alterations of the molecular structure. Before stretch, there is an equilibrium between the short "* nng

^3
states of the molecules, and this equilibrium maintains the muscle tension. Imposing an external stress and rapidly extending the muscle will stretch, at first, the series elastic elements and give rise to an increase in tension. Also during this time, any disorientation of the molecules is eliminated by the stress and an increase of the birefringence is obtained. When the muscle elongation is stopped, the increased tension will cause a shift in the equilibrium maintained between the short and long molecules so that the rate of conversion of short molecules to long ones becomes greater than the reverse conversion. The "shorts" continue to change to "longs" until a new equilibrium between the two rates of oonversion is obtained, and during this time the tension decays and the phase retardation decreases. The decreasing retardation is evidence of the changing molecular structure during stress relaxation.
It should be noted that our results from the stress relaxation experiments agree with those of passive stretch. As we apply rapid stretches to the muscle at relatively short lengths (below the peak of the passive stretch curve), the orientation and structure of the molecules is altered in such a way as to bring about a change of the form and intrinsic birefringence. The fall of retardation following the stretch is due to alteration of the molecular structure. At pre-stretch lengths greater than the length equivalent to the maximum molecular orientation, the form birefringence will remain constant upon further stretch but the intrinsic birefringence will be altered. Thus, at long lengths also, phaBe retardation will decrease, following a rapid stretch, due to molecular

kkstructure changes.
Our reasoning that the stress relaxation is due to molecular variation, and the molecular changes are due to changes of the equilibrium state, is further supported by the agreement of the curves shown in Figure 20. Both the experimental values of tension and phase retardation are plotted as a function of the logarithm of time, and we note that the changes of tension and retardation are almost identical during the period of stress relaxation. The values for the curve marked ns/nt were obtained from an equation derived in the "short-long" theory (see Appendix) and represents the percent change of the number of short molecules with time. We see an excellent agreement between the decrease of short molecules and observed phase retardation changes of the muscle. This agreement between experimental and theoretical values provides considerable support for the applicability of the theory and the idea that phase retardation reflects molecular structure changes.Phase Retardation and Isometric Contraction
When this muscle was allowed to contract isometrically at low initial tension, tension increased and phase retardation decreased with time. As we pointed out earlier, this type of behavior has been observed by other workers.
Again following the concept of two stable states for the muscle molecule, we see that as the contraction is started, the conversion of long units to short units is favored. This conversion of "longs" to "shorts" results in an increase in tension arid a reduction of
retardation. As long as the action continues, the equilibrium between the rates of conversion of the two molecular states varies, and retardation and tension will change inversely. It is believed that the variation of phase retardation is due to molecular structure alterations. Simply the formation or breakage of second or third order bonds may give rise to relatively large changes of the muscle anisotropy.
It is stated in the literature that for very large extensions, the decrease of birefringence during an isometric contraction becomes very small. Fischer (22) has even measured very small increases of birefringence at high initial length. From our experiments on passive stretch we see that for large extensions the contractile elements are in a state favoring the long status of the molecules. An external stimulus tends to shift the conversion of long units to short units, however, with the presence of the initial tension, the equilibrium is not changed very much from the condition favoring the formation of long units. In a case like this, the small change of equilibrium will give rise to an increase of tension but no appreciable change of birefringence. It should be noted, from Figure 9, that if a muscle is allowed to shorten from a long initial length, the phase retardation will increase. If Fischer did not have a true isometric contraction, a small increase in birefringence would be obtained.Phase Retardation and Sample Thickness
The definition of phase retardation is given as:
i<-6
P - L (ne - Hq)
where /”* is phase retardation, L is the thickness, and (rig - n̂ ,) is the difference of indices of refraction. We see that phase retardation is a function of the thickness of the sample.
In all the experiments performed in this study the change of thickness was small compared to the change of the indices of refraction. This can be seen from the results. When the muscle is stretcted, it would be expected that the thickness would decrease and give rise to a fall in phase retardation; however, we note that the phase retardation increased upon stretch. Similarly, during a contraction, the muscle would thicken and cause the phase retardation to increase, but our results indicate a decrease of phase retardation. It thus appears that the change of atomic bonding and orientation is greater than the thickness change, and thereby the phase retardation reflects primarily the alteration of molecular structure and orientation. Comparison of Smooth and Striated Muscle
There are many researchers who believe that the fundamental structure of smooth and striated muscle are very much alike. In a recent work, Abbott and Lowy (l) present findings which strengthens this view. Weinstein and Ralph (58)j performing electron microscopy on the smooth muscle of turtle and chicken gut, found myofilaments very similar to those found in skeletal muscle. The tension developed by the contractile element of smooth muscle, as demonstrated by Brocklehurst (3), resembles the contraction curve of skeletal muscle.
From the results obtained in this work, it appears that the

kj
molecular structure oi’ smooth and striated muscle are similar and only differ, possibly, in the bonding of side-chains or the bonding between the long chain molecules.
There have been several concepts advanced to explain the stri- ations seen in skeletal muscle. Huxley (33) believes that the large myosin molecule in the A-band gives rise to its optical anisotropy; whereas, the disordered arrangement of the act in molecules in the I-band produce a negligible birefringence. It is difficult to see why the act in molecules, which are supposed to be continuous from the Z- to H-band and aligned in the A-band, would become disaligned in the I-band. Some years before this, Szent-Gyorgyl (55) reported that the striations are due to the spiral structure of myosin around actin, i. e. when the molecules are closely packed, as in skeletal muscle, the spirals are in phase across a section and thus give rise to striations. In smooth muscle, the spirals are far apart and no phase relationship exists to cause striations.
From the work of Gurnee (26) who showed that the birefringence of a material with long chain molecules may be primarily due to side- chains or high order bonds within the chain, it would appear that the striations could be explained very simply by a molecular difference between myosin and action of a side-chain. Because of this side-chain, the I-band would not show any birefringence, whereas the A-band would be anisotropic. This agrees with the general notion that the structure of the molecules are fundamentally alike except for small variations. These may cause differences in its optical properties.

48
The point we wish to make here is that our own results and the experimental findings of others can be explained satisfactorily by means of a simple picture which is consistent for all applications.
It is gratifying to see that this concept of molecular structure can be applied to smooth muscle and to striated muscle as well. General Discussion
We have attempted to show that the measurement and analysis of birefringence data represents a relatively simple method for the detection of microscopic changes in the ultra-structure of muscle.An unambiguous interpretation of the minute structural organization of muscle is not easy even with the theory of birefringence. However, by combining the results of birefringence and electron microscopy we may be able to develop the best, if not the true, picture of muscular ultrastructure.
In this work we have attempted to combine the work of many people in this field in order to develop a suitable concept which will explain our present results and those of others. Our considerations are based primarily on the fundamental theory of birefringence and the relationship of birefringence and molecular structure as derived by Gurnee (26) and Denbigh (1 5). They lave shown that the optical anisotropy of a substance is due to the nature of the bonding maintained in a molecular structure, and any changes of the birefringence is due to changes in the bond itself or the orientation of the bond. This, plus the concept of two stable states (short and long) for the muscle molecule, were combined anri directly

h9
applied to this study.The alteration of bonds or their orientation within the molecule
is the direct cause of our measured phase retardation changes which occur during stress relaxation and isometric contraction. These alterations are produced by the application or the development of tension which effects a balance between two stable states of the molecular structure and causes the demonstrated optical and tension changes. We have seen in this work that tension variation is a good reflection of the equilibrium point and phase retardation a good representation of the molecular changes which give rise to the variations of the equilibrium.
If we wish to go a step further and present a possible molecular structure of muscle we may indicate the organization developed by Pauling (Mt). His system is somewhat similar to the three states of folding proposed by Astbury: The superfolded state, the half-folded state (alpha), and the unfolded state (beta). Pauling considers the superfolded and the half-folded state to be made up of hydrogen-bonded helical structures, and the unfolded state to be a hydrogen-bonded layer structure of polypeptides. His presentations are derived from x-ray diffractions studies.
It is felt that further studies on smooth and striated muscleemploying birefringence, x-ray diffraction, and electron microscopyare very necessary. Since much work has been done in the past few years on striated muscle with the electron microscope, a study of the rapid changes ef birefringence of striated muscle with the instrument developed in this work would be interesting and very profitable.
SUMMARY AKD CONCLUSIONS
An instrument was.designed and constructed which could measure simultaneously changes of birefringence and tension ox" living muscle during stretch and contraction. This instrument, which could measure rapid changes of phase retardation and tension, was primarily composed of a polarizing microscope with a rotating analyzer and a strain gauge dynamometer. The Senarmont method was used to obtain the phase retardation as it was found that the data could be analyzed very easily this way.
This method was applied to a study of the longitudinal layer of muscle of dog ileum during various physiological processes. It was found that the resting longitudinal layer of muscle had an average birefringence of 3.1 x 1 0"3 # Phase retardation and tension were measured at different lengths of the musole, during an isometric contraction,and following a rapid stretch applied at various lengths.
The following results were obtained:1. Measurements of phase retardation and tension (after
stress relaxation had occurred) at different muscle lengths showed that the tension remained appreciably constant until the length was almost doubled, while the phase retardation increased linearly during this period. The tension started to increase when the muscle was extended beyond a point double its initial length, however, at this point, the phase retardation
50

started to decrease with elongation. The phase retardation curve for passive stretch showed a peak at about double the initial length of the muscle.
2. The phase retardation increased sharply and then decayed with time when rapid stretches were applied to muscles with lengths below the peak of the passive stretch curve for that muscle. At muscle lengths greater than the peak of the passive stretch curve, a rapid stretch resulted in an immediate decline of retardation. At all lengths, the tension first increased, upon stretching, and then decayed with time (stress relaxation); however, at long lengths the tension did not decay to its original level. For short elongations of the muscle, the curves showing the decay of retardation and tension with time following a rapid stretch were very similar in shape.
3. When the muscle was made to contract isometrically at low initial tension, tension increased and phase retardation decreased with time. Contraction was initiated by adding acetylcholine to the Tyrode bath solution.
To interpret these findings, the fundamental theory of birefringence, the relationship of birefringence and molecular structure, and the concept of two stable states (short and long) for the muscle molecule were combined and applied. It was found that the changes of tension and phase retardation were almost identical

52during stress relaxation, and that variations of molecular structure during this period as predicted by the "short-long" concept was in excellent agreement with the observed retardation changes.
It was concluded that the phase retardation changes of the muscle during stress relaxation is due to the alterations of bonds or their orientation within the molecule, and that these alterations, produced by the application or the development of tension, effected the equilibrium between the two stable states of the molecular structure. This variation of the equilibrium gives rise to the demonstrated optical and tension changes. The increase of phase retardation observed after a rapid stretch (at short muscle lengths) was explained as being due to a realignment of the molecules in a direction parallel to the longitudinal axis of the muscle.
APPENDIX

Fundamental Theory of Birefringence
An excellent discussion of the general principles of birefringence and its application to biological material is presented by Jones (38)* Wright (60) has written a mathematical treatment which covers the field of polarized light in detail. At present we would like to include a summary of the theory of optical anisotropy and its application.
The theory of birefringence is based, on the wave nature of light and represents the interaction of the electromagnetic variation of the light beam with the electric and magnetic forces of molecules and atoms. In a body made up of chains of atoms bound to each other by bonds, the electrons, participating in the bonds, can be readily displaced or polarized by an oscillating electromagnetic force acting on them.
These electrons will react in one manner to light with its electric vector polarized parallel to their equilibrium resonance pathway ( 3̂) and in a different manner to light polarized with its electric vector perpendicular to the resonance pathway. In a material made up of chains of carbon atoms which are aligned side by side, the effect of these reactions is that light polarized parallel to the carbon chains is transmitted more slowly than light oscillating transversely to the chains. Electrons in side-chain bonds can also effect the passage of polarized light through the system. The total velocity of transmission for each component of polarized light, that is, parallel and perpendicular to the long

55axis of the chain, depends on the integrated effect along that direction of the polarizability of all resonating electrons. In systems containing parallel long chain molecules with relatively unimportant side-chains, the slow axis of light transmission is parallel to the long axis of the chains.
For any beam of linearly polarized light of a given frequency passing through the system described above, there will be two different velocities of transmission or indices of refraction (velocity of transmission being related to the index of refraction)^.Such a material is classified as double refracting or birefringent, The term birefringence refers to the difference of refractive index measured in that direction corresponding to the slow axis of transmission as compared to the fast axis of transmission.
We may picture the impinging beam of linearly polarized light as resolved into two components of equal frequency, one component polarized with its electric vector parallel to the long axis of the molecule and the other polarized with its electric vector perpendicular to the molecule. Since the body is anistropic with respect to its molecular arrangement, the component parallel to the long axis will pass through with a velocity slower than the component perpendicular to the long chain axis. Hence we have a phase difference between the two components within the body. Upon emerging into the air, the two linearly polarized components will combine to give elliptically polarized, circularly polarized or again linearly polarized light depending on the phase difference. It can be easily

56shown (3 8) that the phase difference is given hy
& ’ A
where $ is expressed in cycles, 1 is the thickness of the sample, ne is the index of refraction measured along the slow axis, and iiq is the index of refraction measured along the fast axis.
We can also express this phase difference in terms of linear distance:
r - Awhere I la called phase retardation.
Since the birefringence is defined as the difference of index of refraction for the two directions, ve have for the birefringence B of a body
B “ ne - n<, =1
We note that birefringence is an intrinsic property of a body independent of its thickness, and depending only on the orientation and other characteristics of the chemical bonds within its structures.

The Senarmont Method
The Senarmont method for measuring phase differences involves the use of a quarter-wave compensator placed between the analyzer and the sample being studied. A detailed survey of different optical compensators, including the theory and method of use, is presented by Jerrard (36). An excellent mathematical treatment of the Senarmont compensator method is described by Goranson and Adams (25)•
The Senarmont compensator consists essentially of a mica or quartz quarter-wave plate, corresponding to the frequency of light used. The elliptically polarized light leaving the sample falls on the quarter-wave plate and is converted into linearly polarized light. In general, the light will be rotated by the compensator through a definite angle with respect to the polarized light, the analyzer serves to measure this angle of rotation.
The procedure for carrying out measurements by means of this method is as follows: Using a monochromatic light source, thepolarizer is set at a fixed angle and a reading made of the analyzer position set to obtain extinction, this angle taken as a.The quarter-wave plate is inserted between the sample and analyzer and adjusted so that its slow axis is parallel to the azimuth of the polarizer. The object is then inserted and oriented so that its slow axis is at an angle of with the polarizer azimuth.The analyzer is rotated until extinction is obtained again and the new position taken as angle b. The difference between the extinction
57

58angle of the analyzer vlthout the sample in the field and the extinction angle of the analyzer vith the sample is taken as angle A, or A » (a - b). The phase angle of the sample is then given as:
Phase Angle = 2A + n 360 where the phase angle and A are in degrees. The retardation of the object becomes:
Phase Retardation * A "\ + n1B0 A
where \ is the wave length of the monochromatic light source.The values of the integer (n) can be determined by approximat
ing the value of the retardation with a first order red plate or a quartz wedge in white light. With the first order red plate or quartz wedge, interference colors of the sample will be obtained and these can be compared to known values of retardation at various colors. A table of interference colors and retardation is given by Jones (38) in his discussion of polarized light.
The above method was used in this work to obtain the phase retardation of muscle.
Jessop (37) points out that with a properly adjusted optical system and a fairly good quarter-wave plate, the only error which should be considered in the most refined measurements is the error in the final setting of the analyzer. Since in our construction the analyzer was rotating and its instantaneous position recorded, this error was kept to a minimum.

The General Nature of the "Short-Long" System
Since we have based a large amount of the discussion on the somewhat new concept of two stable states of molecular structure, it was felt that the basic assumptions of this system should be presented.
The contractile material of this system is considered to be protein in nature with individual units arranged in long chains. These chains are of sufficient length such that a single chain may consist of a large number of individual units. The chains are parallel to the long axis of the muscle.
The protein units may exist in either of two equilibrium states in each of which attractive and repulsive forces are balanced. In the "long" condition, this balance occurs when the unit is about twice as long as in the "short" state.
Units in the short state may be converted to the long state, and vice versa, if the units are distorted to a degree sufficient to overcome an energy barrier. The application of tension to the system increases the potential energy of the units, short units are shifted closer to the condition of conversion to long units, and the long units are further removed from the possibility of conversion to short units.
Applying reaction rate kinetics, we can say that the reaction rate (Rs) for the conversion of short to long units Is given by
59

where T is the tension, Ns is the number of short units present, and Kg and Cs are constants. A similar expression applies for the rate of conversion (RL) of long units to short:
where T is the tension, is the number of long units present, and Kl and are constants.
With this system as a beginning it is possible to extend the analysis and derive expressions which predict the variation of tension with time after a rapid stretch. The expressions so derived have the following form:
rL * kL nL e’CLT
I
'tit (1)
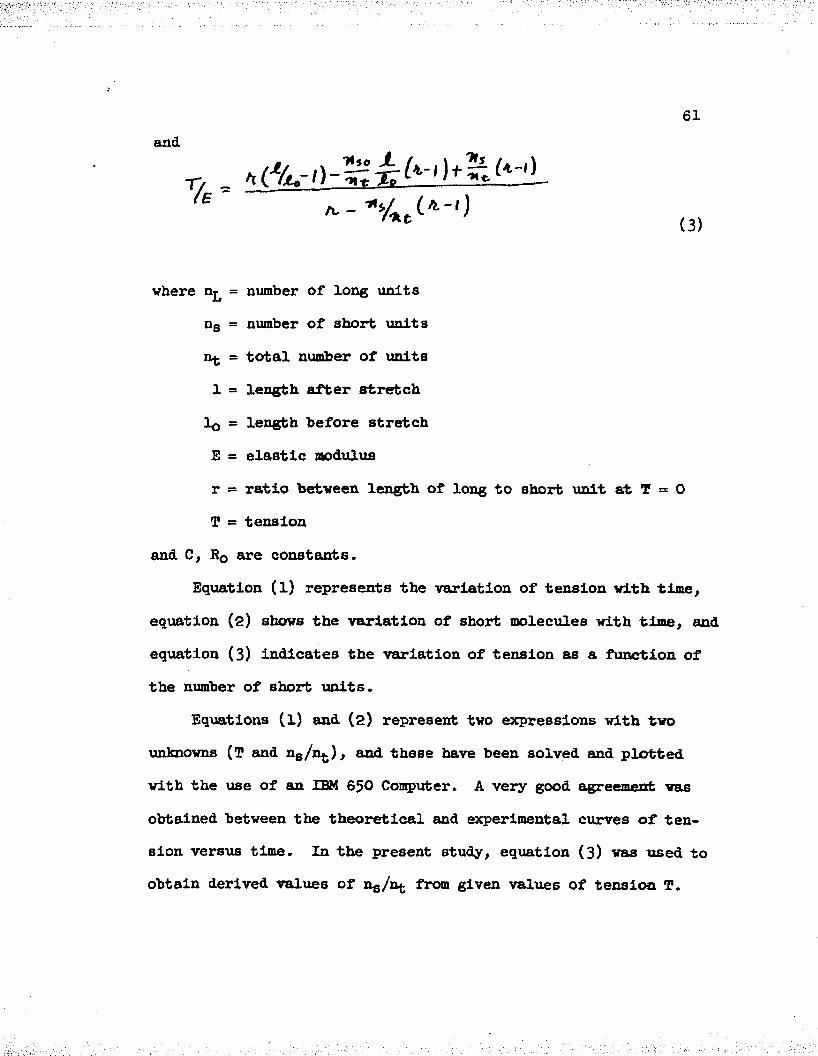
61and
7e~(3)
where n^ = number of long units ns = number of short units
= total number of units 1 = length after stretch lo = length before stretch E = elastic modulusr = ratio between length of long to short unit at T = 0 T = tension
and C, B0 are constants.Equation (1) represents the variation of tension with time,
equation (2) shows the variation of short molecules with time, and equation (3) indicates the variation of tension as a function of the number of short units.
Equations (l) and (2 ) represent two expressions with two unknowns (T and ng/n̂ .), and these have been solved and plotted with the use of an IBM 650 Computer. A very good agreement was obtained between the theoretical and experimental curves of tension versus time. In the present study, equation (3) was used to obtain derived values of ng/nj. from given values of tension T.

62
Table IStress Relaxation of Longitudinal Layer of Dog Ileum
Data of September 20, 1956
Approximate phase retardation before stretch = 2300 A° Length before stretch = 0.9 cm Amount of stretch = 2 mm Thickness before stretch - 0.10 mm
TimePhase
Retardation Tension(sec) (A°) (gas)0 .2 8 2369 0 . 00.34 2369 0 . 00.40 2369 0 . 00.48 26590 .5 6 . - 2849 2 5 . 00.64 2836 24.00.72 2 3 . 80 .8 0 23.10 .8 8 2779 2 2 . 60 .9 6 2 2 . 11.04 21.41 .1 2 2740 21.41 .2 0 2 1 . 21 .2 8 20.71.36 2690 2 0 . 21.44 2 0 . 21.52 2 0 . 01.60 2654 2 0 . 01 .6 8 19.71 .7 6 19-51.84 2651 19.01.92 19-22 .0 0 19-22 .0 8 2648 19-02.16 13.752.24 .G2.32 2636
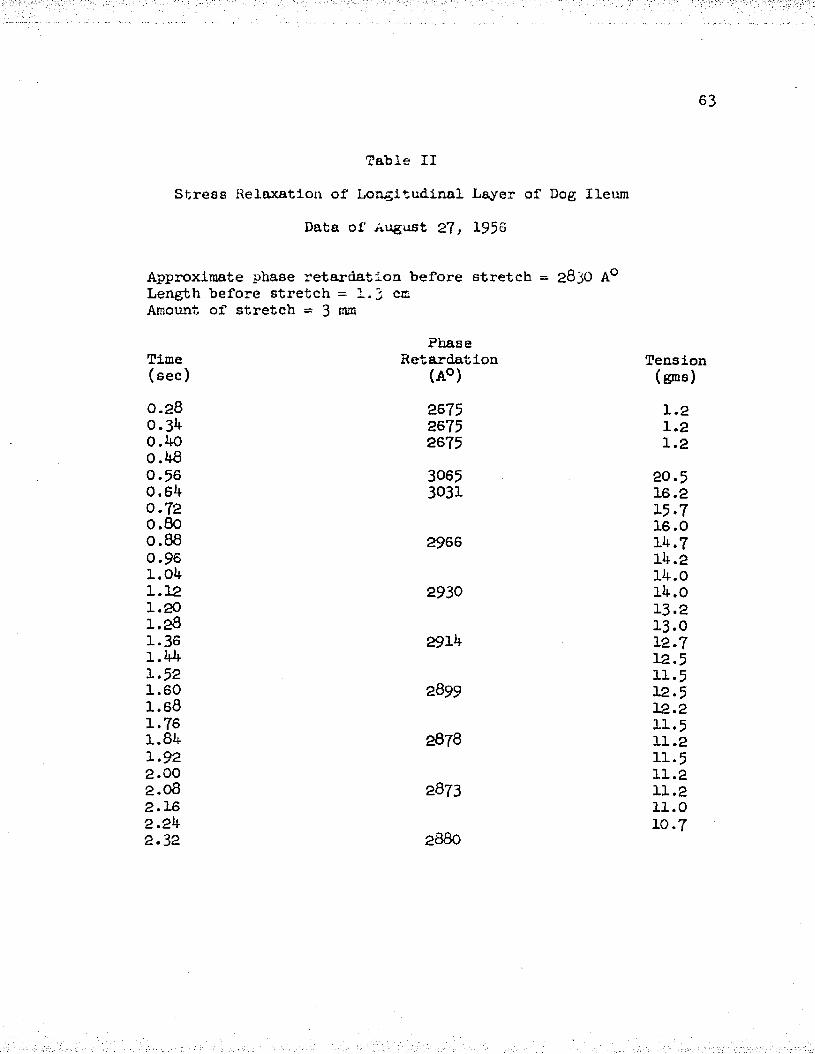
63
Table II
Stress Relaxation of Longitudinal Layer of Dog IleumData of August 27> 1956
Approximate phase retardation before stretch = 2830 A°Length before stretch = 1.3 cmAmount of stretch = 3 ram
PhaseTime Retardation Tension(sec) (A°) (gras)0 .2 8 2675 1 .20.34 2675 1 .20.40 2675 1 .20.480 .5 6 3065 20.50.64 3031 16.20.72 15-70 .8 0 16.00 .8 8 2966 14.70 .9 6 14.21.04 14.01 .1 2 2930 14.01 .2 0 13.21 .2 8 1 3 .01.36 2914 12.71.44 12.51.52 11.51.60 2899 12.51 .6 8 1 2 .21.76 11.51.84 2878 1 1 .21.92 11*52 .0 0 1 1 .22 .0 8 2873 1 1 .22.16 1 1 .02.24 10.72.32 2880

6U
Table IIIStress Relaxation of Longitudinal Layer of Dog Ileum
Data of October 16, 1956
Approximate phase retardation before stretch = 2830 A° Length before stretch = 0-9 cm Amount of stretch = 2 mm
PhaseTime Retardation Tension(sec) (A°) (gms)0 .2 8 2881 0 . 00.3*+ 2881 0 .00.1+0 2881 0 . 0OJ+8 29600 .5 6 3042 24.00.64 3013 2 2 .20 .7 2 2 0 .00 .8 0 2 0 .00 .8 8 2982 2 0 .00 .9 6 1 9 .01.04 1 8 .01 .1 2 2969 17.51 .2 0 17.21 .2 8 16.71.36 29431.44 16.51 .5 2 16.01.60 . 2922 16.01 .6 8 15.21 .76 1 5 .01.84 2919 14.51.92 14.02 .0 0 13.72 .0 8 2914 13.22.16 13.22.24 12.52.32 2904
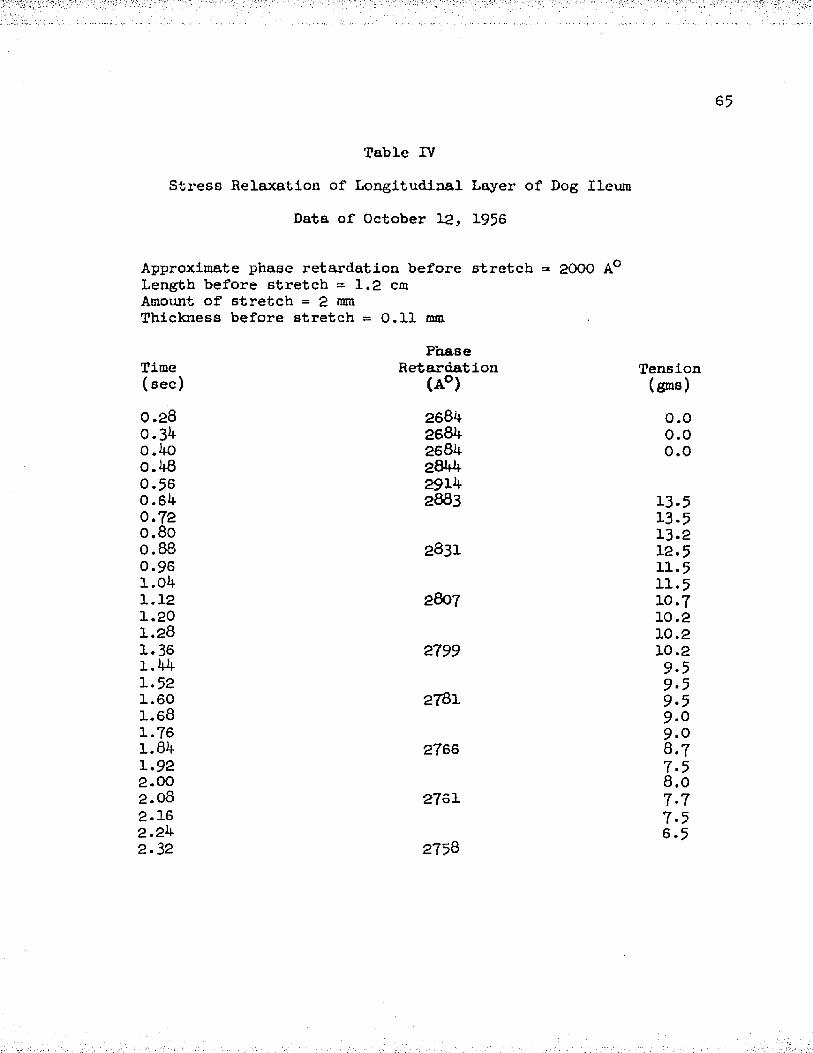
65
Table IVStress Relaxation of Longitudinal Layer of Dog Ileum
Data of October 12, 1956
Approximate phase retardation before stretch =* 2000 A° Length before stretch = 1.2 cm Amount of stretch = 2 mm Thickness before stretch = 0.11 be
TimePhase
Retardation Tension(sec) (A°) (gras)0 .2 8 2684 0 . 00.34 2684 0 .00.40 2684 0 . 00.48 28440 .5 6 29140.64 2883 13.50 .7 2 13-50 .8 0 13.20 .8 8 2831 12.50 .9 6 11.51.04 11.51 .1 2 2807 1 0 .71 .2 0 1 0 .21 .2 8 1 0 .21.36 2799 1 0 .21.44 9-51.52 9.51.60 2781 9-51 .6 8 9-01.76 9.01.84 2766 8.71.92 7.52 .0 0 8 .02 .0 8 2761 7-72.16 7.52.24 6.52-32 2758

66
Table VStress Relaxation of Longitudinal Layer of Dog Ileum
Data of September 12, 1956
Approximate phase retardation before stretch = 2000 A°Length before stretch = 1.5 Amount of stretch = 2 mm
cm
PhaseTime Retardation Tension(sec) (A°) (gms)0 .2 8 2935 0 . 00 . 34 2935 0 . 0o.Uo0 .1+8
2935 0 . 0
0 .5 6 3265 36.00.64 3198 32.50 .7 2 3 0 .00 .8 0 29-70 .8 8 3143 28.50 .9 6 29-51.04 2 8 .51 .1 2 3102 25.71 .2 0 27.01 .2 8 25.71.36 3091 25.51.44 25-21 .5 2 2 5 - 01.60 3073 25.01 .6 8 25.01 .7 6 2 5 .01.84 3070 23.21.92 23.22.00 23.22 .0 8 3060 2 2 .12.16 2 2 .12.24 21.72.32 3057

67
Table VIStress Relaxation of Longitudinal Layer of Dog Ileum
Data of September 17, 1956
Approximate phase retardation before stretch = 3600 A° Length before stretch = 1.0 cm Amount of stretch = 2 mm
PhaseTime Retardation Tension(sec) (A°) (gms)0 .2 8 3970 0.00.34 3970 0.00.40 3970 0.00.48 42050.56 4265 25*00.64 4228 2 0 .70 .7 2 21.2o.8o 20.00.88 4155 20.00.96 19-51.04 18 .01.12 4114 17.51.20 16.21 .2 8 17.01.36 4090 17 .01.44 1 5 .71-52 15 .01.60 4062 1 5 .71.68 1 5 .21.76 14 .51.84 4054 14.21.92 14.22.00 14.52.03 4043 14.52.16 14.52.24 14.52.32 4025

68
Table VIIStress Relaxation of Longitudinal Layer of Dog Ileura
Average Values from Tables I - VI
Time Phase Tension(sec) Retardation
(A°)(gms)
0 .2 8 2919 0.00.34 2919 0.00.40 2919 0.00.48 30450 .5 6 3233 26.00.64 3198 21.50.72 20.70 .8 0 20.50.88 3142 19.70 .9 6 1 9 .21.04 18.51.12 3110 17.71.20 17-51 .2 8 1 7 .21.36 3088 17.01.44 1 6 .51.52 16.21.60 3065 16.51.68 16.01.76 15.51.84 3057 1 5 .01.92 14.72.00 1 5 .02 .0 8 3050 14.52.16 U-52.24 14.02.32 3043

69
Table VIII
Passive Stretch of Longitudinal Layer of Dog Ileum Data of October 23j 1956
Approximate phase retardation before stretch = 2500 A° Length before stretch = 1.2 cm Thickness before stretch *= 0.09 nun
PhaseLength Retardation Tension(cm) (A°) (gms)1.20 23to 0.01.32 29ifO 0.0l.kj 3ifl0 0.01.56 3720 0.01.97 3825 0.02.58 3^90 4.03.52 29if0 13.0if .50 2520 30.05*06 2290 70.05.70 2210 8 7 .O5-20 2185 7lf.0
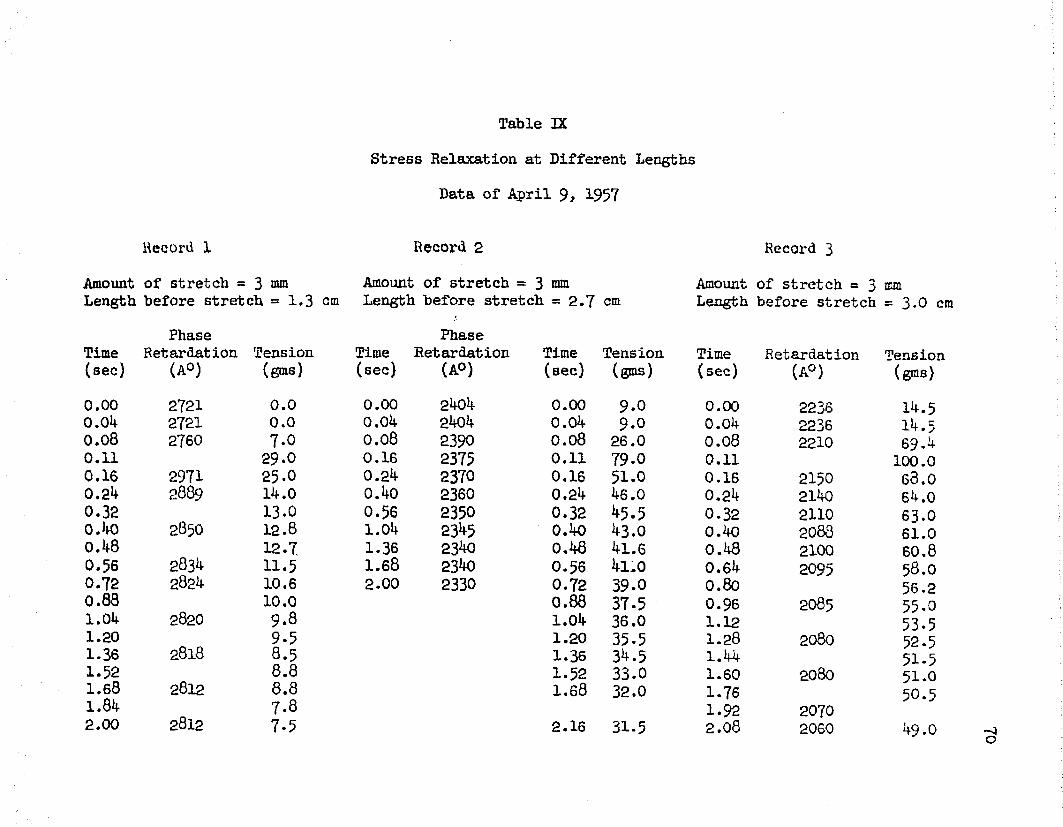
Table IX
Stress Relaxation at Different LengthsData of April 9> 1957
Record 1 Record 2 Record 3
Amount of stretch = 3 mm Amount of stretch = 3 ram 11 of stretch = 3 mmLength before stretch = 1.3 cm Length before stretch =2.7 cm Length before stretch = 3-0 cr
Phase PhaseTime Retardation Tension Time Retardation Time Tension Time Retardation Tension(sec) (a°) (gms) (sec) (A®) (sec) (gms) (sec) (a°) (gms)0 .0 0 2721 0 .0 0 .0 0 2404 0 .0 0 9.0 0 .0 0 2236 14.50.04 2721 0 .0 0.04 2404 0.04 9.0 0.04 2236 14.50 .0 8 2760 7-0 0 .0 8 2390 0 .0 8 26.0 0 .0 8 2210 69.40 .1 1 2 9 .0 0.16 2375 0 .1 1 79.0 0 .1 1 1 0 0 .00.16 2971 2 5 .0 0.24 2370 0.16 5 1 .0 0.16 2150 6 8 .00.24 2 889 14.0 0.40 2360 0.24 46.0 0.24 2140 64.00.32 13.0 0 .5 6 2350 0.32 45.5 0.32 2110 6 3 .00.40 2850 12.8 1.04 23^5 0.40 43.0 o.4o 2088 61.00.48 12.7 1.36 23^ 0.48 41.6 0.48 2100 60.80.56 2834 11.5 1.68 2340 0.56 4i.o 0.64 2095 58.00 .7 2 2824 10.6 2.00 2330 0.72 39.0 0 .8 0 56.20.88 10.0 0.88 37.5 0.96 2085 55-01.04 2820 9.8 1.04 36.0 1.12 53.51.20 9.5 1.20 3 5 .5 1 .2 8 2080 52.51.36 2818 8.5 1.36 34 .5 1.44 51.51.52 8.8 1.52 33.0 1.60 2080 5 1 .01.68 2812 8.8 1.68 32.0 1.76 50.51.84 7.8 1.92 20702.00 2812 7-5 2.16 31-5 2 .0 8 2060 49.0

71
T a b le Xa
S t r e s s R e la x a t io n a t D i f f e r e n t L e n g th s
D a ta o f A p r i l 8 , 1957
Record 1Amount of stretch = 3 mm Length before stretch = 0.9 cm
Record 2Amount of stretch = 3 turn Length before stretch = 1.1 cm
Phase PhaseTime Retardation Time Tension Time Retardation Tension(sec) (A°) (sec) (gms) (sec) (A°) (gms)0.00 1600 0.00 0.0 0.00 1686 3*20.04 1600 0.04 0.0 0.04 1686 3.20.16 1951 0 .0 8 20.5 0 . 0 8 1751 12.00.24 1760 0.11 35.0 0.11 51.50.32 1717 0.24 23.2 0.16 16000.48 1717 0.32 22.1 0.24 1520 34.00.64 1691 0.40 21.0 0.32 1465 33-80.96 1691 0.48 20.5 0.40 32.81 .2 8 1670 0.56 20.4 0.48 1460 33.01.60 1665 0.72 20.0 0.56 31.01 .9 4 1651 0 .8 0 1 9 .0 0.72 1460 30.0
1.04 1 8 .0 0 .8 8 29.560 1626 1.20 1 8 .0 1.04 29.01.36 1 7 .8 1.20 1420 2 8 .01.52 17.5 1.36 27.51.68 1 7 .2 1.52 14221.84 17.0 1.68 26.4
1.84 140060 2.65

72
T a b le Xb
S t r e s s R e la x a t io n a t D i f f e r e n t L e n g th s
D a ta o f A p r i l Q, 1957
Record 3Amount of stretch = 3 ram Length before stretch = 1.7 era
TimePhase
Retardation Tension(sec) (A°) (gras)0 .0 0 1176 1 7 .00.04 1176 1 7 .00 .0 8 1163 3 0 .00 .1 1 1 5 0 .00.16 1152 140.00.24 1120 1 1 0 .00.32 1104 106.5o.4o 1104 106.00.48 1109 1 0 3 .00 .5 6 1068 101.50.64 1077 1 0 0 .00 .8 0 1076 99.00 .9 6 1068 97.01 .1 2 1060 9 6 .01.44 1056 9 3 .51.78 1050 9 2 .51.94 1045 92.0
Record 4Amount of stretch = 3 mm Length before stretch = 2.0 cm
PhaseTime Retardation Tension(sec) (A0) (gms)0.00 1068 32.50.04 1068 32.50 .0 8 1013 84.00.11 2 1 5 .00.16 994 179.00.24 983 160.00.32 977 153.50.40 948 150.50.48 1 5 0 .00.56 940 148.50.64 145.00.72 945 144.00.88 934 142.01.04 140.01.20 928 138.41.36 9331 .5 2 931 136.01.84 928 133.52.16 928 133.5
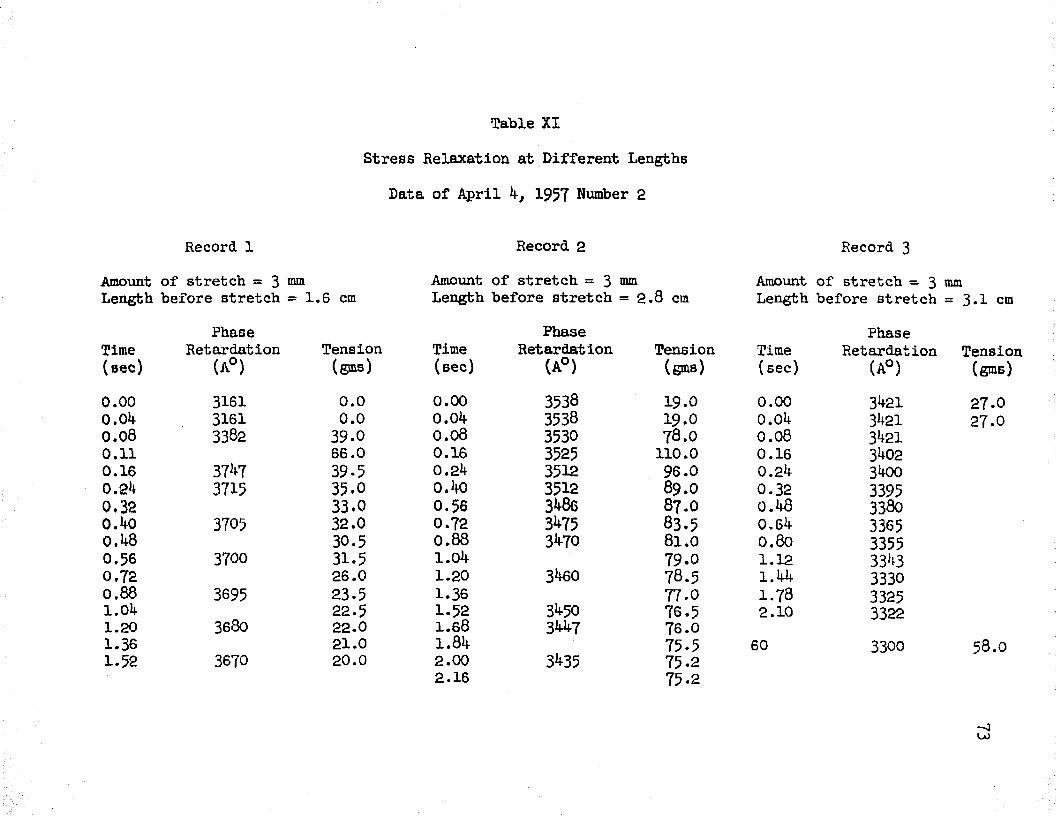
T a b le XI
S t r e s s R e la x a t io n a t D i f f e r e n t L engths
D ata o f A p r i l 4 , 1957 Number 2
Record 1 Record 2 Record 3
Amount of stretch = 3 mm Amount of stretch = 3 mm Amount of stretch = 3 naaLength before stretch = 1 .6 cm Length before stretch = 2 . 8 cm Length before stretch - 3 .1 cm
Phase Phase PhaseTime Retardation Tension Time Retardation Tension Time Retardation Tension(sec) (A0) (gms) (sec) (A°) (gmB) (sec) (A°) (gms)0 .0 0 3161 0 .0 0 .0 0 3538 1 9 .0 0 .0 0 3421 27-00.04 3161 0 .0 0 .01+ 3538 1 9 .0 0.04 3421 27.00 .0 8 3382 39-0 0 .0 8 3530 7 8 .0 0 .0 8 34210.11 66.0 0.16 3525 110.0 0.16 34020.16 3747 39-5 0.24 3512 96.0 0.24 34000.24 3715 35.0 0 .1+0 3512 8 9.O 0.32 33950.32 33.0 0.56 3486 8 7.O 0.1+8 3380o.i+o 3705 32.0 0.72 3475 83.5 0.64 33650.1+8 30.5 0.88 3470 8 1 .0 0 .8 0 33550.56 3700 31.5 1.04 79.0 1.12 33430.72 26.0 1.20 3460 78.5 1.44 33300.88 3695 23-5 1.36 77.0 1.78 33251.01+ 22.5 1.52 3450 76.5 2.10 33221.20 3680 22.0 1.68 3447 76.01.36 21.0 1.84 75.5 60 3300 5 8 .01.52 3670 20.0 2.00 3435 75.2
2.16 75.2
- 4U J

Table XII
S t r e s s R e la x a t io n a t D i f f e r e n t L en gth s
D ata o f A p r i l Q, 1957
Record 1 Record 2 Record 3
11 of stretch = 2 mm Amount of stretch = 2 mm Amount of stretch = 2 mmLength before stretch = 1.3 cm Length before stretch = 1 .6 cm Length before stretch = 2 .0 5 cm
Phase Phase PhaseTime Retardation Tension Time Retardation Tension Time Retardation Tension(sec) (A0) (gms) (sec) (A°) (gms) (sec) (A°) (gms)0 .0 0 3539 0 .0 0 .0 0 3877 0 .0 0 .0 0 4226 ^.50,0k 3539 0 .0 0.04 3877 0 .0 0.04 4226 4.50,06 3720 1 1 .8 0 .0 8 4348 0 .0 8 41700 ,1 1 35*5 0 .1 6 4348 0 .1 1 67-00.16 3980 1 8 .5 0.24 4335 0.16 4160 30.50.24 1 7 .0 0.32 4320 0.24 4150 2 8 .00.32 3960 16.0 0.32 27.0o.ko 14.8 0.48 4310 0.40 4135 26.0O.kQ 3950 14.0 0 .5 6 24.00 .5 6 39^0 13.5 0 .7 2 4300 0 .7 2 4120 2 2 .00 .7 2 39^ 12.0 1.04 4285 0.88 21.00.88 11.5 1.20 4280 1.04 4100 20.01.04 3930 11.0 1.52 4270 13.0 1.20 1 9 .01.20 10.0 1.36 4085 18.51.36 3930 9.5 1 .5 2 1 8 .01-52 9.0 1.68 4o8o 17.21.68 3925 7-5 1.84 17-01.81+ 7-4 2.00 4075 16.22.00 3900 7*2 2.16 4075 16.02.16 7.2

Table XIII
S t r e s s R e la x a t io n a t D if f e r e n t L en gth s
D ata o f A p r i l 4 , 1957 Number 1
Record 1 Record 2Amount of stretch = 3 mm Amount of stretch = 3 mmLength before stretch = 1.5 cm Length before stretch = 1.9 cm
Phase PhaseTime Retardation Tension Time Retardation Time Tension(sec) (A°) (gms) (sec) (AO) (sec) (gms)0.00 3431* 0.00 0.00 3486 0.00 4.50.04 3434 54.0 0.04 3486 0.04 4.50 .0 8 54.0 0 .0 8 3450 0 .0 8 1 5 .00.11 69.0 0.16 3460 0.10 105.00.16 3734 36.0 0.24 3437 0.16 75.00.24 3650 30.0 0.24 53.00.32 3625 29.5 o.4o 3440 0.32 49,00.40 3620 27.5 0.40 46.00.46 3610 25.0 0.64 3412 0.48 43.50.56 3602 24.5 0 .8 0 3408 0.64 41.00.72 3591 22.0 1.12 3405 0 .8 0 38.00.88 20.8 1.44 3395 0.96 35-01.0U 3600 19.5 1.60 3402 1.12 32.51.20 1 8 .0 1 .2 8 31.51.36 3590 16.0 1.44 30.0
1.60 29.01.76 2 8 .0
Record 3Amount of stretch = 3 nun Length before stretch = 2.4 cm
TimePhase
Retardation Tension(sec) (A°) (gms)0.00 3343 15.50.04 3343 15.50.08 3320 54.00.16 33000.24 32950.40 32860.48 3240O .56 88.00.72 3235 84.00.88 3226 8 1 .01.20 3210 78.01.36 3200 77.01.52 3195 76.51.84 3190 75.02.16 3197 75.060 3083 51.0
- 4
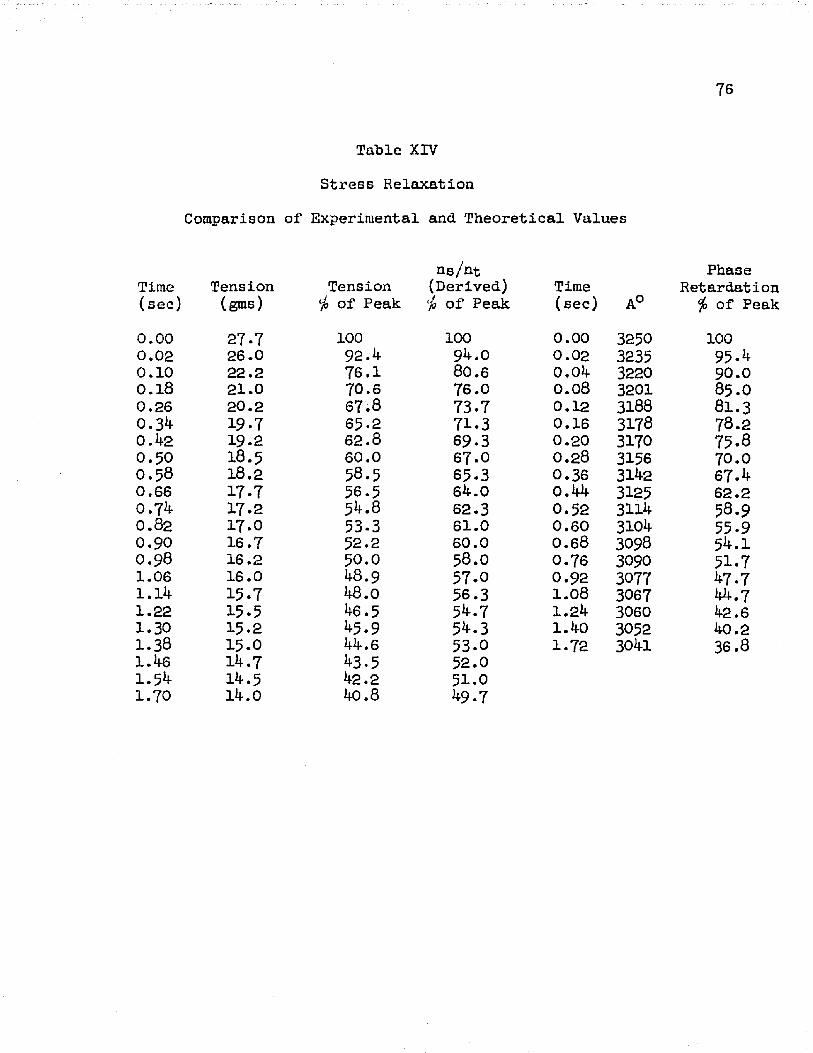
76
Table XIV Stress Relaxation
Comparison of Experimental and Theoretical Values
ns/nt PhaseTime Tension Tension (Derived) Time Retardat:(sec) (gms) io of Peak ia of Peak (sec) A° $ of Pi0.00 27.7 100 100 0.00 3250 1000.02 26.0 92.4 9 4 .0 0.02 3235 95.40.10 22.2 76.1 8 0 .6 0.04 3220 9 0 .00 . 1 8 21.0 7 0 .6 76.0 0 .0 8 3201 8 5 .O0.26 20.2 67.8 7 3 .7 0.12 3188 8 1 .30 .3 4 19.7 65-2 7 1 .3 0.16 3178 78.20.42 19.2 62.8 69-3 0.20 3170 75.80 . 5 0 18.5 60.0 67-0 0 .2 8 3156 7 0 .00.58 18.2 58.5 65.3 0.36 3142 67.40.66 17.7 56.5 64.0 0.44 3125 62.20.74 1 7 .2 54.8 62.3 0.52 3114 5 8 .90 .8 2 1 7 .0 53-3 61.0 0.60 3104 55.90.90 16.7 5 2 .2 60.0 0.68 3098 54.1O .9 8 16.2 5 0 .0 5 8 .0 0.76 3090 51.71.06 16.0 48.9 57.0 0.92 3077 47.71.14 15.7 48.0 56.3 1 .0 8 3067 44.71.22 15.5 46.5 54.7 1.24 3060 42.61.30 15.2 45.9 54.3 1.40 3052 40.21.38 1 5 .0 44.6 53-0 1.72 3041 36.81.46 14.7 43.5 52.01.54 14.5 42.2 5 1 .01.70 14.0 40.8 49.7
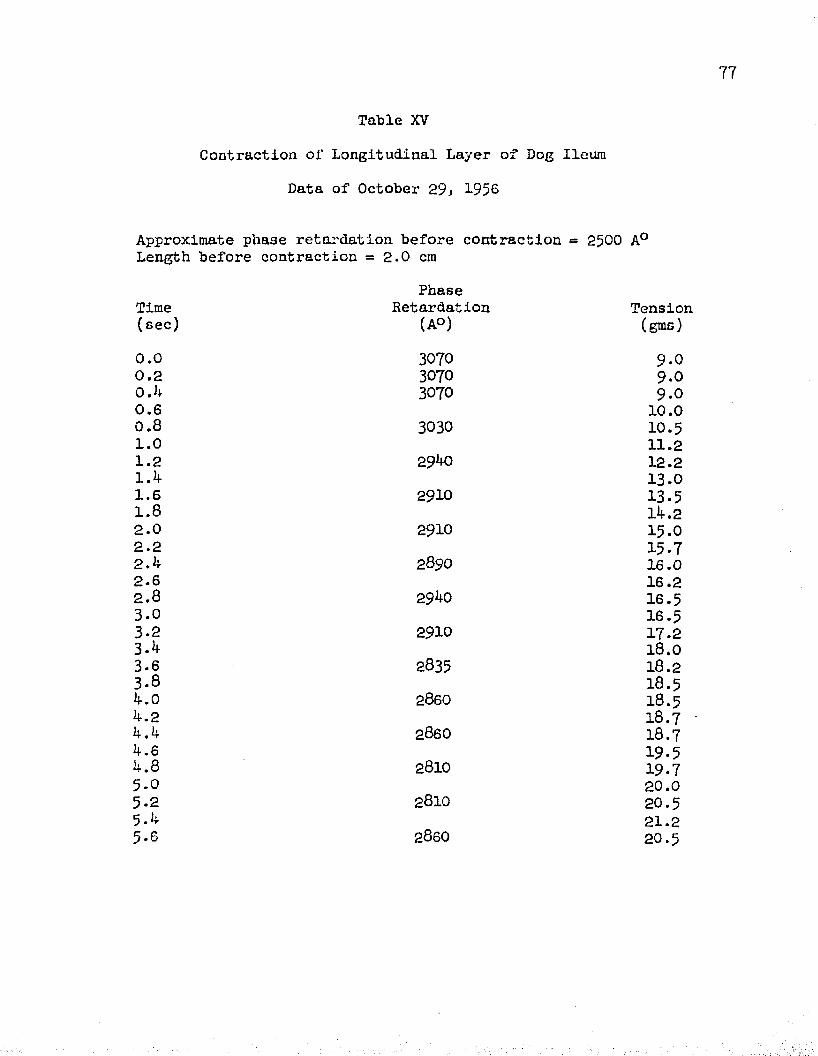
77
Table XV
Contraction of Longitudinal Layer of Dog Ileum Data of October 29, 1956
Approximate phase retardation before contraction = 2500 A° Length before contraction = 2.0 cm
TimePhase
Retardation Tension(sec) (A°) (gms)0 . 0 3070 9.00 . 2 3070 9.00.4 3070 9.00 . 6 1 0 .00 . 8 3030 1 0 .51 .0 1 1 .21 .2 2940 1 2 .21.4 1 3 .01 .6 2910 13.51 .8 14.22 . 0 2910 15.02 . 2 15.72.4 2890 16.02 .6 16.22 . 8 2940 16.53.0 1 6 .53-2 2910 1 7 .23.4 1 8 .03-6 2835 1 8 .23-8 1 8 .54.0 2860 1 8 .54.2 1 8 .74.4 2860 1 8 .74.6 19.54.8 2810 19.75.0 2 0 .05.2 2810 20.55.4 2 1 .25-6 2860 2 0 .5
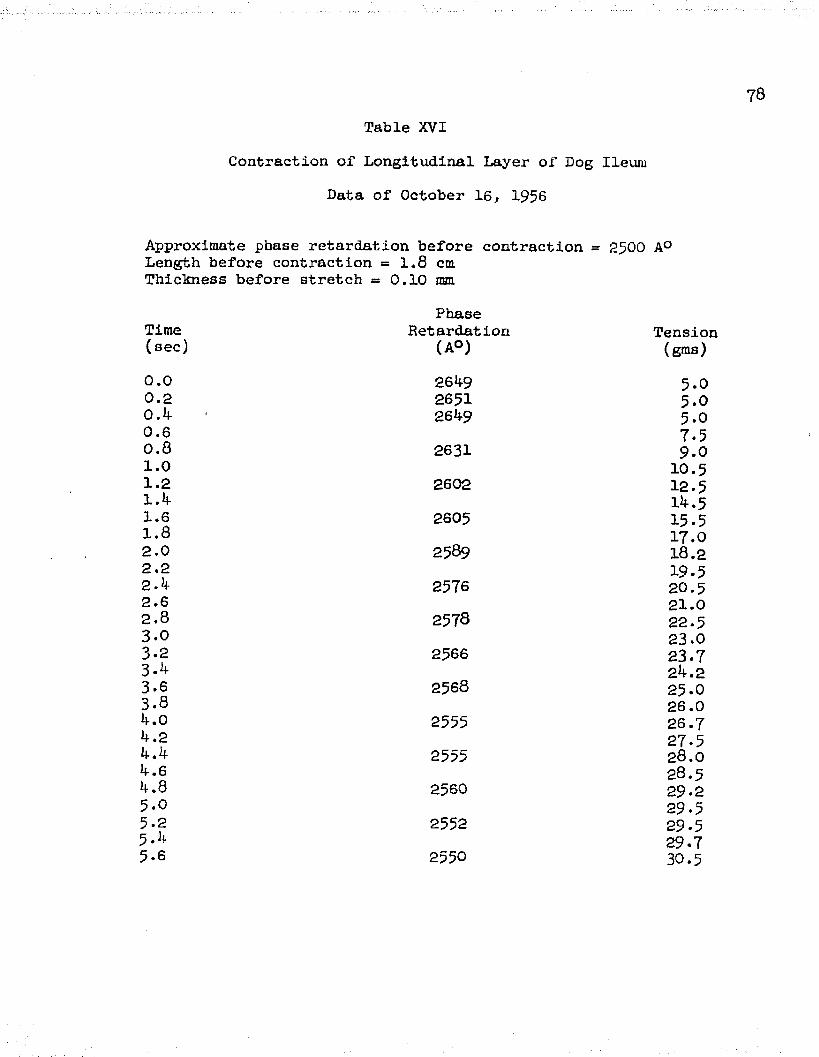
Table XVI
Contraction of Longitudinal Layer of Dog IleumData of October 16, 1956
Approximate phase retardation before contraction = 2500 A° Length before contraction = 1.8 cm Thickness before stretch = 0.10 mm
TimePhase
Retardation Tension(sec) (A°) (gms)0 . 0 2649 5-00 . 2 2651 5.00.4 2649 5.00 . 6 7.50 . 8 2631 9-01 . 0 1 0 .51 . 2 2602 12.51.4 14.51 . 6 2605 15.51 . 8 1 7 .02 . 0 2589 1 8 .22 . 2 19.52.4 2576 2 0 .52 . 6 2 1 .02 . 8 2578 22.53.0 23.03-2 2566 23.73-4 24.23.6 2 5 6 8 25-03.8 26.04.0 2555 26.74.2 27-54.4 2555 2 8 . 04.6 2 8 . 54.8 25 6 0 29-25.0 29.55-2 2552 29-55-4 29.75-6 2550 30.5

79
Table XVIIContraction of Longitudinal Layer of Dog Ileura
Data of October 12, 1956
Approximate phase retardation before contraction = 2500 A° Length before contraction = 1.8 cm Thickness before stretch = 0.11 mm
TimePhase
Retardation Tension(sec) (AO) (gms)0 . 0 2900 7.750 .2 2900 7.750.4 2900 7.750 .6 8 .20 . 8 2860 8.751 .0 8.751 .2 2865 9.21.4 9.71 .6 2845 9.71 .8 9*72 . 0 2842 1 0 .22 . 2 10.52.4 2833 10.52 .6 1 0 .72 . 8 2821 10.73.0 1 1 .03-2 2810 11.73.4 11.73-6 2812 11.73-8 12-54.0 2819 1 2 .04.2 12.74.4 2810 12.54.6 13.24.8 2806 12.55.0 13.55.2 2792 13.55-4 13.75.6 2794

Table XVIII
Contraction of Longitudinal Layer of Dog Ileum
Data of September 28, 1956
Approximate phase retardation before contraction = 2500 A° Length before contraction = 1.5 cm Thickness before stretch = 0.11 mm
TimePhase
Retardation Tension(sec) (A°) (gms)0.0 2735 13.50.2 2735 13.50.4 2735 13.50.6 14.00.8 2687 14.01.0 14.01.2 2660 15.21.4 15.51.6 2652 16.01.8 16.52.0 2643 1 7 .02.2 17.52.4 2632 1 7 .02.6 17.52.8 2616 18.03.03.2 2612 18.03.4 19.53.6 26103.8 20.54.0 2600 20.54.2 20.74.4 25874.6 21.22.8 25825.0 21.75.2 2585 22.25.4 22.25.6 2582

81
Table XIX
Contraction of Longitudinal Layer of Dog Ileum Average Data from Tables VIII - XI
TimePhase
Retardation Tension(sec) (A°) (gms)0 . 0 2 8 3 8 7.50 . 2 2838 7.50.4 2838 7.50 . 6 8 . 20 . 8 2802 9.71 . 0 1 0 .01 .2 2769 1 0 .71.4 1 1 .71.6 2753 1 2 .71.8 1 3 .22.0 2746 14.02.2 14.22.4 2733 1 5 .02.62.8 2739 16.03.0 16.23-2 27243.4 17.23.6 27063.84.0 2706 17.74.2 18.74.4 2703 20.04.64.8 2689 20.05-0 20.55.2 2685 21.05-4 21.25.6 2696 21.76.0 2682
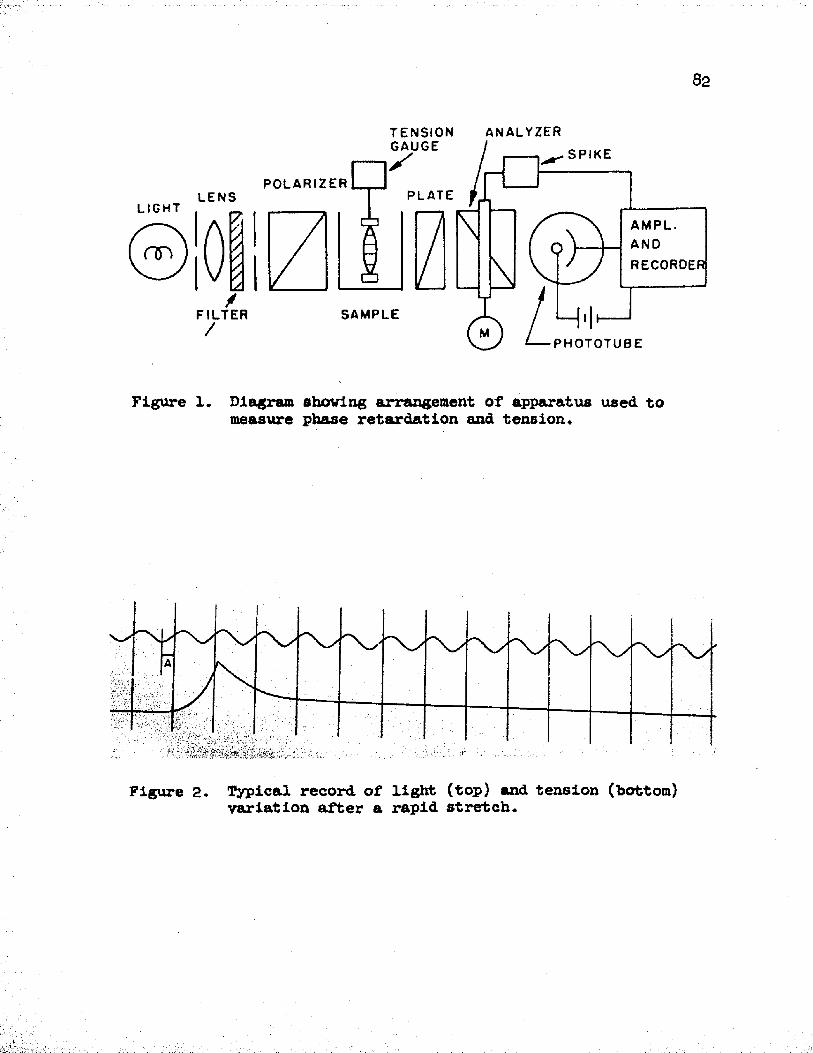
82
T E N S I O N A N A L Y Z E R G A U G E
S P I K E
P O L A R I Z E RP L A T EL E N S
L I G H TA M P L
\ R E C O R D E R
S A M P L EF I L T E R
P H O T O T U B E
Figure 1. Diagram showing arrangement of apparatus used to measure phase retardation and tension.
Figure 2. Typical record of light (top) and tension (bottom) variation after a rapid stretch.
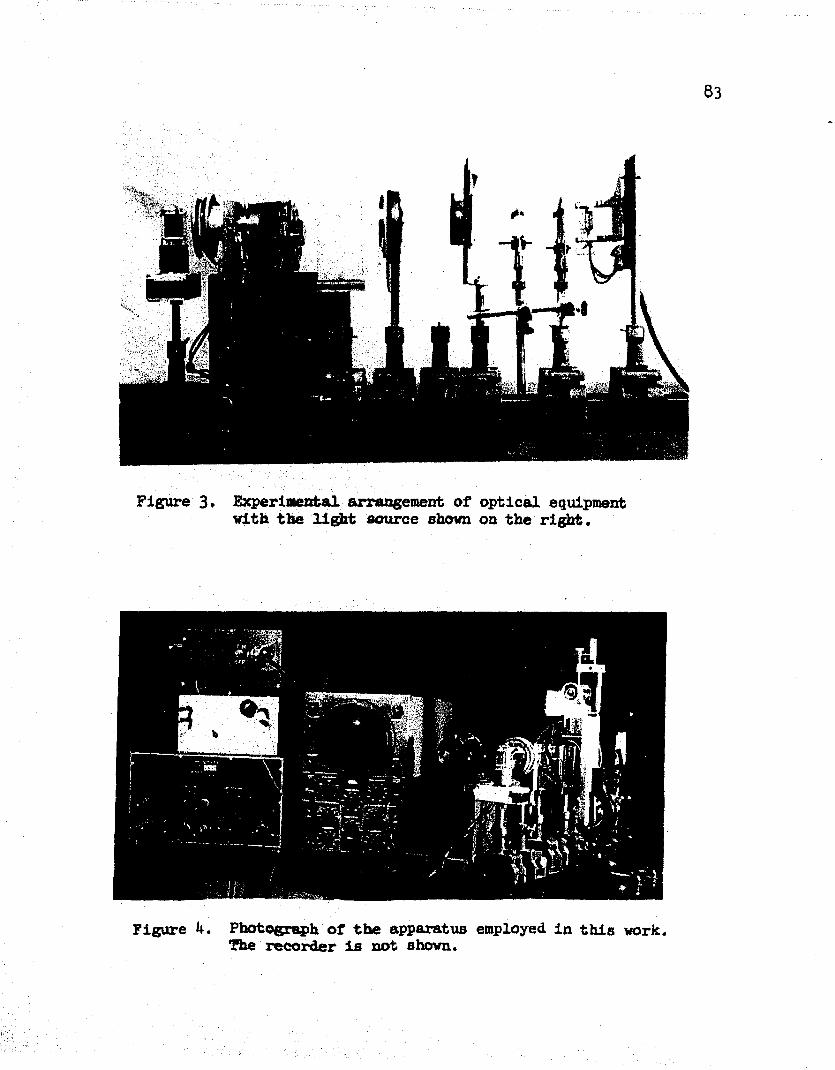
83
Figure 3. Experimental arrangement of optical equipment with the light source shown on the right.
Figure h. Photograph of the apparatus employed in this work. The recorder is not shown.

Figure 6. Front view of muscle stretchershowing muscle, immersed insolution, held in place by rigid Figure 5. Enlarged view of muscle holder,support and tension gauge.
03■jr
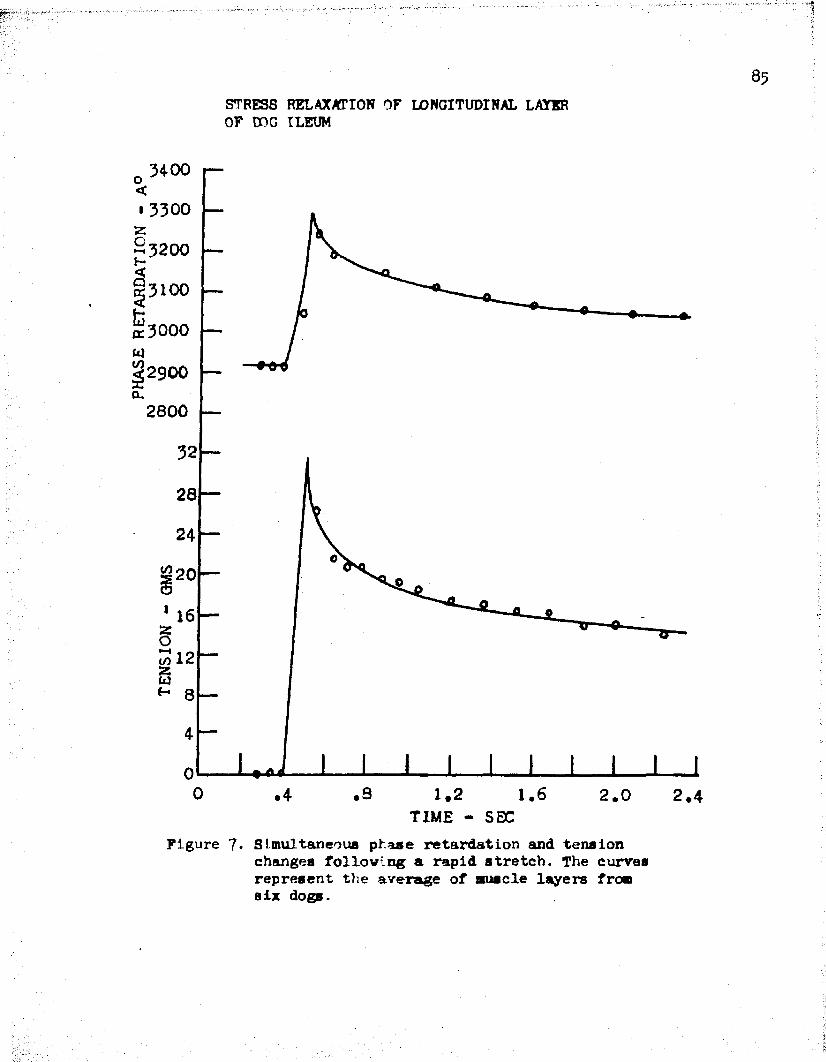
STRESS RELAXATION OF LONGITUDINAL LAYER OF COG ILEUM
3400
32003100
28
20
0 9 1.64 1 .2 2.0TIME - SBC
Figure 7* Simultaneous phase retardation and tensionchanges following a rapid stretch. The curves represent the average of muscle layers from s ix dogs.

4300
4100
3700
3500
3300
w (VI)--- - ------
-A 4.—(V)2700
2500
2300 2.0TIME - SEC
Figure 8. Phase retardation changes following a rapid stretch.

ph
as
e
rc
ta
ro
at
ion
-
1004000
RETARDATION*** 3600 60
3200 TENSION
2800
— 202400 —
2000L E N 6 T H - C m
Figure 9* Retardation and tension changes of longitudinal layer of dog ileum after stretch and stress relaxation.
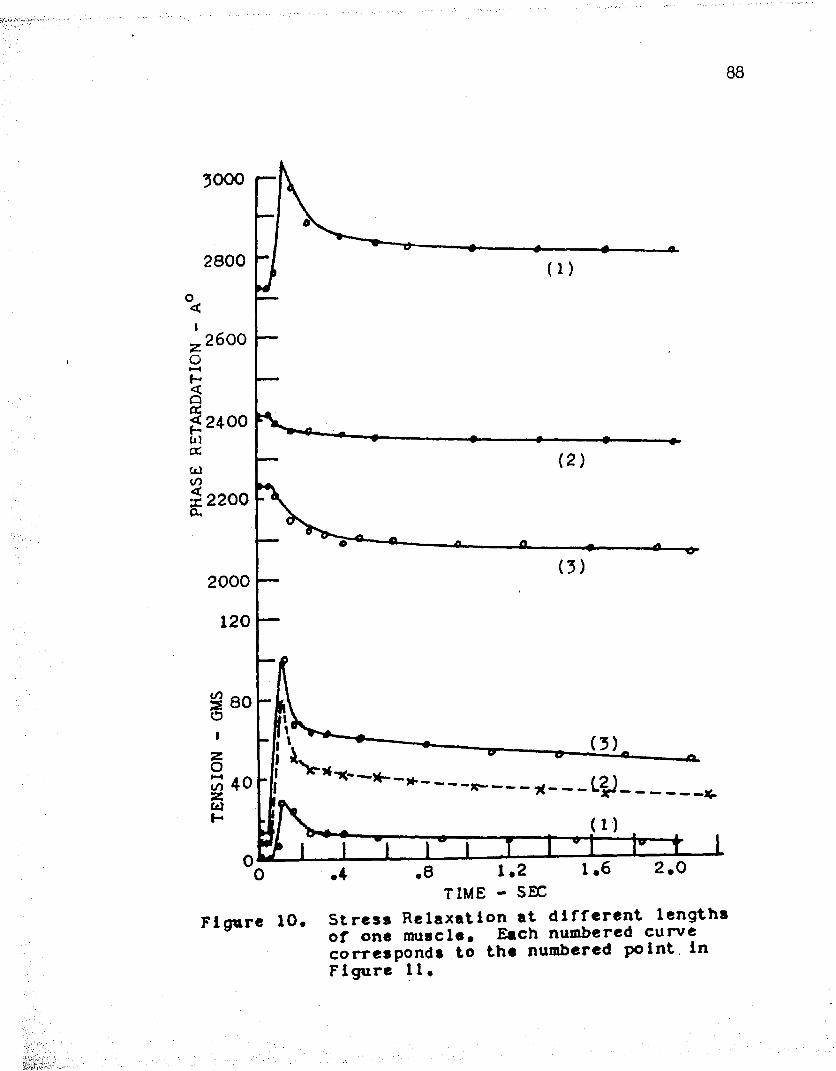
PHASE
RETA
RDAT
ION
8 8
3000
2800o<i2600
2400
2200
(3)2000120
S 80
.---- * LQ—
JCL.
JC-
2.01 .2TIME - SBC
Figure 10. Stress Relaxation at different lengths of one muscle. Each numbered curve corresponds to the numbered point, in Figure 11,

PHASE R
ETARDATI
ON -
89
BIREFRINGENCE2700
500 100o
80
602100
1900
201700
TENSION
1500 2.61.0 2.2 3.0LENGTH CM
Figure 11. Passive stretch curves for one muscle(data of April 9). The numbered points correspond to curves of Figure 10.
TENSION
- GM
S

PHASE
RETA
RDAT
ION
90
2100o<i
1700
900
200
160
(4)120
(3)80
40
4 .8 1*2 1.6 2,0TIME - SEC
Stress relaxation at d 1frerent lengths of one muscle (data of April 8 ). The numbered curves correspond to the
FI pure 12,

91
1700r—
BIREFRINGENCE
100150-
80
< 1100-
900-
20700-
TENSION
U 2 l.iLENGTH - CM
2.0
Figure 13. Passive stretch curves for one muscle (data of April 8). The numbered points correspond to curves of Figure 12.

PHASE
RETA
RDAT
ION
92
4000
3700o<i
3300 (3)
3100
120
c/>
2.01.2 TIME - SEC
Figure 14. Stress relaxation at different lengths of one muscle (data of April 4, No. 2). The numbered curves correspond to the similarly numbered points in Figure 15.
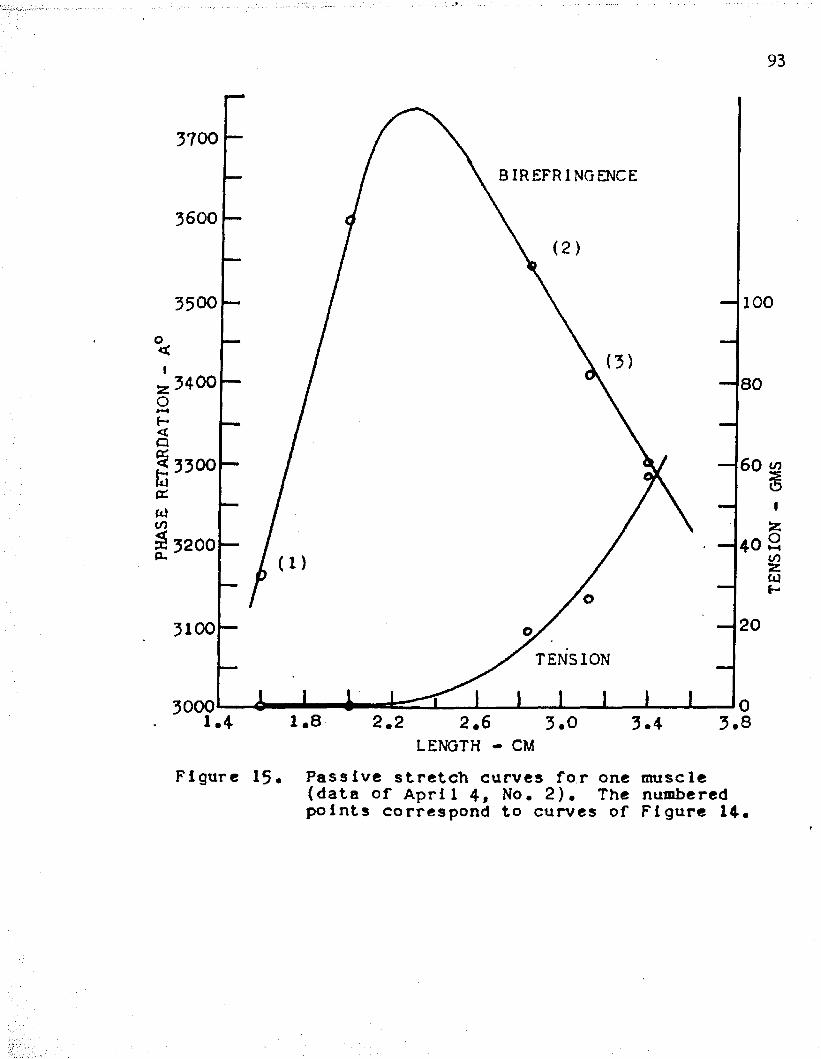
PHASE
RETA
RDAT
ION
93
3700
BIREFRINGENCE
3600
1003500o<i (3)
80
603300
3200
203100TENSION
3000 1.8 2.6LENGTH - CM
2.2 3.83.0 3.4
Figure 15. Passive stretch curves for one muscle(data of April 4# No. 2). The numbered points correspond to curves of Figure 14.
TENSION
- GM
S

PHASE
RETA
RDAT
ION
9b4600
o<i4200 (3)
3800
80
60
i/S
40
(3)
2.01.2 TIME - SEC
Figure 16. Stress relaxation at different lengths of one muscle (data of April 2). The numbered curves correspond to the similarly numbered points in Figure 17.

PHASE
RETA
RDAT
ION
95
(3)4200BIREFRINGENCE
1004000
3800 80
60
3400
3200 20TENSION
3000 2.62.2 LENGTH - CM
3.0
Figure 17. Passive stretch curves for one muscle(data of April 2). The numbered points correspond to curves of Figure 16.
TENSION
- GM
S

PHASE
RETA
RDAT
ION
3900
3700o<i
■cu
3500
(2 )3300
(3)3100
120
80
2.0TIME - SEC
Figure 18. Stress relaxation at different lengths of one muscle (data of April 4» No* 1) The numbered curves correspond to the similarly numbered points in Figure 19

PHASE
RETA
RDAT
ION
9 7
10035500
BIREFRINGENCE
3400 80o<1
3300 60
403200
203100
TENS ION3000 2*61 . 8
LENGTH2.2
- CM1.0 3.01.4
Figure 19. Passive stretch curves for onemuscle (data of April A, No* 1)* The numbered points correspond to curves of Figure 18.
TENSION
- GM
S

PER
CENT
OF PEA
K VA
LUE
STRESS RELAXATION100
PHASERETARDATION
80(DERIVED)
TENSION
1001TIME - SEC
Figure 20. Comparison of tension, phase retardation and theoretical values of Ng/N-p during stress relaxation*
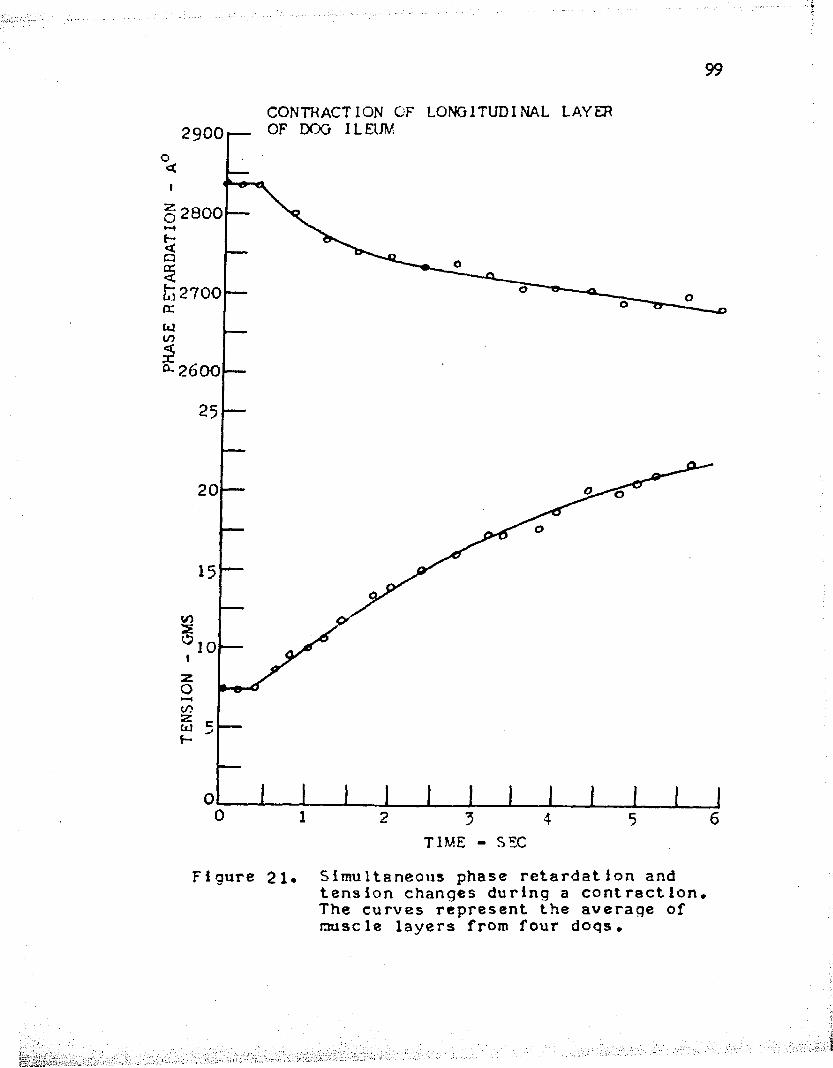
PHASE
RETA
RDAT
ION
99
CONTRACTION OF LONGITUDINAL LAYEROF DOG ILEUM2900
o<i2800
2700
2600
20
Wi
z
TIME - SECFigure 21* Simultaneous phase retardation and
tension changes during a contraction* The curves represent the average of muscle layers from four dogs*
BIBLIOGRAPHY
1. Abbott, B. C. and Lowy, J. Resting Tension in Snail Muscle.Nature, 178; W , 1956.
2. Ambronn, H. Ueber das Zusammenwirken von Stachendoppelbrechungund Eigendoppelbrechimg. Kollold Ztschr., 20:173, 1917*
3. Archard, J. F., Clegg, P. L., and Taylor, A. M. PhotoelectricMethods for Metal Optics. Research, jj:339, 1950.
U. Astbury, W. T. X-Ray Studies of Protein Structures. ColdSprings Harbor Symposia Quant. Biol., 2:15, 193^.
5. Bear, R. S. Small Angle X-Ray Diffraction Studies on Muscle.J. Amer. Chem. Soc., 62:1625, 19^5*
6. Bozler, E. and Cottrell, C. L. The Birefringence of Muscleand its Variation during Contraction. J. Cell, and Comp. Physiol., 10:16k, 1937*
7. Bragg, W. L. The Refractive Indices of Calclte and Aragonite.Roy. Soc. Proc., A, 105:370, 19Qh.
8. Brocklehurst, R. J. Studies on the Physiology of Plain Muscle.J. Physiol., 61:275, 1926.
9. Brucke, E. Untersuchungen uber den Bau der Muskelfasern mltHulfe des Polarisierten Lichtes. Denkschr. kaiserl. Akad. Wise. Math. -Naturv., 1£:69, 1858.
10. Buchthal, F. and Knappeis, G. G. Untersuchungen uber dieDoppelbrechung der einzelnen lebenden, quergestreifen Muskelfaser. Skand. Arch. Physiol., 2§:97, 1938.
11. Buchthal, F., Deutsch, A., and Knappeis, G. G. Release ofContraction and Changes in Birefringence Caused by Adenosine Triphosphate in Isolated Cross Striated Muscle Fibres. Acta Physiol. Scand., 8:271, 19kb.
12. Buchthal, F., Deutsch, A., Knappeis, G. G., and Munch-Peterson,A. On the Effect of Adenosine Triphosphate on Myosin Threads. Acta. Physiol. Scand., 1J:167, 19^7-
13. Buchthal, F., Svensmark, 0., and Rosenfalck, P. Mechanicaland Chemical Events in Muscle Contraction. Physiol.Review, 36:503, 1956.
100
101
11+. Carlsen, F. and Knappeis, G. G. The Anisotropic and IsotropicBands of Skeletal Muscle in Light and Electron Microscopy. Exptl. Cell Research, 8:329, 1955-
1 5. Denbigh, K. G. The Polarisabilities of Bonds. Trans. FaradaySoc., 36:936, 19*+0.
16. Ebner, V, von. Zur Frage der Negativen Schvankung der Doppel-brechung bel der Muskelkontraktion. Pflugers Arch. ges. Physiol., 163:179, 1916.
17. Fischer, E. Changes during Muscle Contraction as Related toCrystalline Pattern. Biol. Syinp., 3 :211, 19*+1.
18. Fischer, E. Birefringence and Ultrastructure of Muscle. Ann.New York Acad. Sc., 1+1:783, 19^7•
1 9. Fischer, E. The Submicroscopical Structure of Muscle and itsChanges during Contraction and Stretch. Cold Spring Harbor Syinp., l+:2ll+, 1936.
20. Fischer, E. Vertebrate Smooth Muscle. Physiol. Review, 2*+:1+67, 191+1+•
21. Fischer, E. The Birefringence of Smooth Muscle (Phascolosomaand Thyone) as related to Muscle Length, Tension and Tone. Amer. J. Physiol., 123:65, 1938.
22. Fischer, E. The Changes in Birefringence during Contractionand Stretch of a Smooth Muscle (Retractor of Phascolosoma). J. Cellular Comp. Physiol., 8:503, 1936.
23. Fischer, E. The Birefringence of Smooth Muscle (Phascolosomaand Thyone) as Related to Muscle Length, Tension and Tone. J. Cellular Comp. Physiol., 12:8 5, 1938.
2l+. Fischer, E. The Birefringence of Striated and Smooth MammalianMuscles. J. Cellular Comp. Physiol., 23:113, 19̂ +4.
25- Goranson, R. W. and Adams, L. H. A Method for the Precise Measurement of Optical Path-Difference, Especially in Stressed Glass. J. Franklin Inst., 216:1+75, 1933*
26. Gurnee, E. F. Theory of Orientation and Double Refraction in Polymers. J. of Ap. Physics, 25:1232, 195!+.

102
27* Gurnee, E. F., Patterson, L. T., and Andrews. Apparatus for Making Simultaneous Stress and Birefringence Measurements on Polymers. J. of Ap. Physics, 26:1106, 1955*
2 8 . Hall, C. E., Jakus, M. A., and Schmitt, F. 0. An Investigationof Cross Strlation and Myosin Filaments in Muscle. Biol. Bull., 22s32> 19^6.
29. Hermann, L. Ueber das Verhalten der Optischen Constanten desMuskels bei der Erregung, der Dehnung und der Contraction. Pflugers Arch. Ges. Physiol., 22i2hQ, 1 8 8 0.
30. Hill, D. K. The Optical Properties of Resting Striated Muscle.The Effect of Rapid Stretch on the Scattering and Diffraction of Light. J. Physiol., 119:W , 1953*
31. Hill, D. K. The Effect of Stimulation on the Diffraction ofLight by Striated Muscle. J. Physiol., 119:̂ , 1953.
32. Huxley, H. E. X-Ray Analysis and Problems of Muscle. Proc.Roy. Soc., London, 1^1:59, 1953.
33. Huxley, H. E. Electron Microscope Studies of the Organizationof the Filaments in Striated Muscle. Biochim. et Biophys.Acta, 12:387, 1953.
31*-. Huxley, H. E. Muscular Contraction. Endeavour, 15:177, 1956.35* Huxley, H. E. and Hanson, J. Changes in the Cross-Striations
of Muscle during Contraction and Stretch and their Structural Interpretations. Nature, 173:973, 195^.
36. Jerrard, H. G. Optical Compensators for Measurement ofElliptical Polarization. J. Opt. Soc. Amer., 3§:35, 19^8.
37. Jessop, H. T. On the Tardy and Senarmont Methods of Measuring Fractional Relative Retardations. British J. App. Physics, ^:138, 1938.
3 8. Jones, R. K. McClung*s Handbook of Microscopical Technique.New York: Paul B. Hoeber, Inc., 1950.
39* Meyer, K. H. and Mark, H. Biological Significance of Foldingand Unfolding of Protein Molecules. Nature, 167:^253, 1951.
103
I4.0. Muralt, A. von. Ueber das Verhalten der Doppelbrechung deeQuergestreifen Muskels vahrend der Kontraktion. Pflugers Arch. ges. Physiol., 230:299, 1932.
41. Muralt, A. von and Edsall, J. T. Studies in the PhysicalChemistry of Muscle Globulin. J. Biol. Chem., 89:315,1930.
42. Noll, D. and Weber, H. H. Polarisationsoptik und MolekularerFeinbau der Q-Abschnitte des Froschmuskels. Pflugers Arch. ges. Physiol., 235:23**, 1934.
43. Pauling, L. The Nature of the Chemical Bond. Ithaca: CornellUniversity Press, 19̂ *5.
44. Pauling, L., Corey, R. B., and Branson, H. R. The Structureof Proteins: Two Hydrogen-Bonded Helical Configurationsof the Polypeptide Chain. Proc. Natl. Acad. Sc., 37:205, 1951.
45. Philpott, D. E. and Szent-Gyorgyi, A. The Series ElasticComponent in Muscle. Biochim. et Biophys. Acta, 12:128, 1953.
46. Polissar, M. J. Physical Chemistry of the Contractile Processin Muscle. Amer. J. Physiol., 168:766, 1952.
47. Ramsey, R. W. Analysis of Contraction of Skeletal Muscle.Amer. J. Physiol., 181:688, 1955.
48. Randall, D. D. A New Photoelectric Method for the Calibrationof Retardation Plates. J. Opt. Soc. Amer. 44:600, 1954.
49. Schmidt, W. J. Ueber die Doppelbrechung der I-Gleider derquergestreifen Myofibrillen und das Wesen der Querstreifung uberhaupt. Ztschr. Zellforschg., 21:224, 1934.
50. Schmitt, F. 0. The Ultrastructure of Protoplasmic Constituents. Physiol. Review, 1£:270, 1939.
51. Schramm, G. and Weber, H. H. Ueber Monodisperse Myosinlosungen.Kolloid Z ., 100:242, 1942.
52. Schultz, P. Die Glatte Muskulatur der Wirbeltiere. Arch.f. Physiol., 516, 1895.
lO h
53* Stacy, R. W., Williams, D. T., Worden, R. E., and McMorris,R. D. Essentials of Biological and Medical Physics.New York: McGraw-Hill Book Co., Inc., 1955*
5^. Szent-Gyorgyi, A. G. and Mazia, D. On the Nature of the Cross- Strlation of Body Muscle. Biochim. et Biophys. Acta, 16: 339, 1955.
55. Szent-Gyorgyi, A. Contraction and Chemical Structure ofMuscle Fibril. J. Colloid Sc., 1:1, 19^*
56. Weber, H. H. Der Feinbau und die Mechanischen Eigenschaftendes Myosinfadens. Pflugers Arch. ges. Physiol., 235:205, 193^.
57* Weber, H. H. and Portzehl, H. Muscle Contraction of Fibrous Muscle Proteins. Advances in Protein Chem., 2*161, 1952.
58. Weinstein, H. J. and Ralph, H. J. Myofilaments from SmoothMuscle. Proc. Soc. Exp. Biol, and Med., 78:2, 1951.
59. Wiener, 0. Die Theorie des Mischkorpers. Abhandig. Sachs.Ges. Wiss. Math-physik., 32:379, 1912.
60. Wright, F. E. A Spherical Projection Chart for Use in theStudy of Elliptically Polarized Light. J. Opt. Soc.Amer., 20:529, 1930.
61. Zatzman, M. L. A Kinetic Basis for Time-Dependent Propertiesof Arterial Smooth Muscle. Unpublished Ph. D. dissertation, The Ohio State University, 1955*
AUTOBIOGRAPHY
I, Arthur Eberstein, was born in Chicago, Illinois, April 23, 1928. After graduating from the Harrison Technical High School of Chicago, I attended the Illinois Institute of Technology and received a B. S. degree in Physics in 1950* Following a year of graduate work at the University of Illinois, I received a M. S. degree in Physics.
Prior to entering the Ohio State University in 1952, I was employed as a physicist for the U. S. Navy in a guided missile development program. I enrolled in the Ohio State University as a research fellow under the guidance of Dr. Ralph W. Stacy.
After two years of graduate work, I was drafted Into the U. S. Army for a period of 21 months and returned to Ohio State in March, 1956 as a research fellow. I have held this position while completing the requirements for the degree Doctor of Philosophy.
105