Structural Properties, X-ray Birefringence and Crystal ... - CORE
168
Structural Properties, X-ray Birefringence and Crystal Growth of Solid Organic Inclusion Compounds by BENJAMIN ALEXANDER PALMER Thesis Submitted for DOCTOR OF PHILOSOPHY SCHOOL OF CHEMISTRY CARDIFF UNIVERSITY April 2012
-
Upload
khangminh22 -
Category
Documents
-
view
1 -
download
0
Transcript of Structural Properties, X-ray Birefringence and Crystal ... - CORE
Structural Properties, X-ray
Birefringence and Crystal Growth of
Solid Organic Inclusion Compounds
by
BENJAMIN ALEXANDER PALMER
Thesis Submitted for
DOCTOR OF PHILOSOPHY
SCHOOL OF CHEMISTRY
CARDIFF UNIVERSITY
April 2012

DECLARATION This work has not previously been accepted in substance for any degree and is not concurrently submitted in candidature for any degree. Signed ………………………………………… (candidate) Date ………………………… STATEMENT 1 This thesis is being submitted in partial fulfillment of the requirements for the degree of …………………………(insert MCh, MD, MPhil, PhD etc, as appropriate) Signed ………………………………………… (candidate) Date ………………………… STATEMENT 2 This thesis is the result of my own independent work/investigation, except where otherwise stated. Other sources are acknowledged by explicit references. Signed ………………………………………… (candidate) Date ………………………… STATEMENT 3 I hereby give consent for my thesis, if accepted, to be available for photocopying and for inter-library loan, and for the title and summary to be made available to outside organisations. Signed ………………………………………… (candidate) Date …………………………
i
Acknowledgements
I would like to express particular thanks to my supervisor, Professor Kenneth Harris, for
his invaluable guidance and unwavering support throughout my PhD. I am greatly indebted to
him for providing me with so many unique research opportunities during the project. Not
least, I would like to thank him for creating such an intellectually stimulating learning
environment within the group over three and a half formative years. I have benefited greatly
from his tutelage and from his deep insights on a wide range of scientific subjects.
I am also especially thankful to Dr. Benson Kariuki for his help with the single-crystal
X-ray diffraction work and for regular valuable scientific discussions.
I would like to acknowledge the help and support of collaborators at both the
University of Bordeaux and at the Diamond Light Source Synchroton. In particular, I would
like to thank Dr. François Guillaume at the University of Bordeaux for his invaluable
assistance in the spectroscopic aspect of the investigation and for warmly welcoming me to
Bordeaux on numerous occasions. I would like to acknowledge Professor Stephen Collins,
Dr. Igor Dolbnya, Dr. Kirsten Christensen, Dr. Sarah Barnett, Dr. Elizabeth Shotton and Dr.
Dave Allan at Diamond for being so generous in sharing their time and technical expertise
with me and for their constant enthusiasm in tackling some difficult scientific problems.
Furthermore, I would like to sincerely thank everyone in the Harris Group, both past
and present. In particular I would like to mention Dr. Colan Hughes, Dr. Anabel Morte
Ródenas, Gregory Edwards-Gau, Dr. Gin Keat Lim and Philip Andrew Williams who have
always been ready and willing to give their help. It has been extremely enjoyable and
rewarding working with you.
I would like to thank my dearest wife, Becky and all my family and friends for their
support and patience and for tolerating the sometimes long and unsociable hours.
Finally, I would like to acknowledge Cardiff University, the EPSRC and the Welsh
Livery Guild for the financial support that has made all this possible.
ii
Abstract
This thesis presents several new insights into the behaviour and properties of solid
organic inclusion compounds and explores some of the potential applications of these
properties. The thesis considers the structural properties, X-ray birefringence and crystal
growth of urea and thiourea inclusion compounds.
Chapter 1 provides an introduction to organic solid inclusion compounds, surveying
the physico-chemical properties and applications of urea and thiourea inclusion compounds.
In Chapter 2, the basic theory of the experimental techniques utilized in this thesis is
introduced. These techniques include single-crystal and powder X-ray diffraction, Raman
microspectrometry and differential scanning calorimetry.
Chapter 3 presents a novel strategy for retrospectively mapping the growth history of a
crystal. The new experimental strategy allows insights to be gained on the evolution of crystal
growth processes by analysis of crystals recovered at the end of crystallization. The feasibility
of the strategy is demonstrated by considering the crystal growth of a urea inclusion
compound containing a binary mixture of guest molecules. After the crystal has finished
growing, the composition of the crystal is determined using confocal Raman
microspectrometry, and is interpreted to yield insights into the growth history of the crystal.
In Chapter 4, new insights into the phase transition behaviour of thiourea inclusion
compounds are established. The structural properties of the bromocyclohexane/thiourea
inclusion compound are determined using both single-crystal and powder X-ray diffraction
over a range of temperatures above and below a first-order phase transition. The results
demonstrate marked contrasts to the phase transition behaviour in the prototypical
cyclohexane/thiourea inclusion compound, demonstrating that relatively small changes in
molecular geometry (in this case bromine substitution) can have a profound influence on the
structural properties of the low-temperature phase in such materials. This observation reflects
the fine energetic balances that pertain in such materials and the role of small and subtle
changes in intermolecular interactions involving the host and guest components.
iii
Chapter 5 reports the first definitive demonstration of the phenomenon of X-ray
birefringence, reporting a material that exhibits essentially ideal birefringence behaviour at X-
ray energies near the Br K-edge. The designed material, the 1-bromoadamantane/thiourea
inclusion compound gives experimental behaviour in excellent agreement with theoretical
predictions for the dependence of transmitted X-ray intensity on both X-ray energy and
crystal orientation. The results vindicate the potential to exploit this phenomenon to establish
a detailed understanding of molecular polarization, particularly as an experimental strategy to
determine the orientational distributions of specific bonds in solids, for example, in the case
of partially ordered materials or materials that undergo order-disorder phase transitions.
Building upon the fundamentally important observations of Chapter 5, Chapter 6
demonstrates that measurements of X-ray birefringence can be used to characterise changes in
molecular polarization and bond orientation in an anisotropic material. For the
bromocyclohexane/thiourea inclusion compound, measurements of X-ray birefringence are
used to determine the changes in the orientational distribution of the C–Br bonds of the guest
molecules, associated with an order-disorder phase transition in this material. Best-fits to
simulated data based on a structural model were performed, allowing quantitative structural
information on the guest molecules to be established. The structural properties determined
from X-ray birefringence correlate exquisitely with those obtained independently from
diffraction data, demonstrating the validity of the structural model and the reliability of this
novel experimental technique. These observations represent the basis of a new technique for
determining information on the structural properties of materials, where diffraction methods
may be unsuitable. The technique has huge potential to be utilised in the exploration and
discovery of new materials and in principle could be applied to any anisotropic system.
In Chapter 7, the first example of an incommensurate thiourea inclusion compound is
reported. X-ray diffraction studies reveal that the tunnel inclusion compound formed between
1-tert-butyl-4-iodobenzene and thiourea has an incommensurate relationship between the
periodicities of the host and guest substructures along the tunnel axis, representing the first
reported case of an incommensurate thiourea inclusion compound.
iv
Finally in Chapter 8, some general conclusions and outlooks for the field are stated.
This chapter conveys some of the overarching concepts and questions which motivated the
diverse studies presented in this thesis and also expresses some thoughts on the future outlook
for the field.
Table of Contents
Acknowledgments ....................................................................................................................... i
Abstract ....................................................................................................................................... ii
Chapter 1 – Introduction ......................................................................................................... 1
1.1 – Inclusion Compounds ........................................................................................................ 1
1.1.1 – A Historical Perspective ........................................................................................ 1
1.1.2 – Classification ......................................................................................................... 2
1.2 – Urea Inclusion Compounds ............................................................................................... 5
1.2.1 – Discovery and Motivation for Early Research ...................................................... 5
1.2.2 – Structural Overview .............................................................................................. 5
1.2.3 – Periodic Structural Properties ............................................................................... 6
1.2.4 – Guest Molecules .................................................................................................... 8
1.2.5 – Phase Transitions .................................................................................................. 9
1.3 – Thiourea Inclusion Compounds....................................................................................... 10
1.3.1 – Structural Overview ............................................................................................ 11
1.3.2 – Phase Transitions and Dynamic Properties of Guest Molecules ........................ 12
1.3.3 – Conformational Properties of Guest Molecules .................................................. 13
1.4 – Applications of Urea and Thiourea Inclusion Compounds ............................................. 14
1.5 – A Guide to this Thesis ..................................................................................................... 16
1.6 – References ....................................................................................................................... 17
Chapter 2 – Experimental Techniques ................................................................................. 22
2.1 – X-ray Diffraction ............................................................................................................. 22
2.1.1 – Fundamentals of Diffraction ............................................................................... 22
2.1.2 – Crystals and Symmetry ....................................................................................... 22
2.1.3 – Diffraction by Crystals ........................................................................................ 23
2.1.4 – X-ray Crystallography ......................................................................................... 24
2.1.5 – The Geometry of X-ray Diffraction: Bragg’s Law ............................................. 25
2.1.6 – The Intensities of Diffracted X-rays: the Structure Factor.................................. 26
2.1.7 – Single Crystal X-ray Diffraction ......................................................................... 28
2.1.7.1 – Obtaining the Unit Cell Geometry .......................................................... 28
2.1.7.2 – Determining the Symmetry of the Structure ........................................... 29
2.1.7.3 – Structure Solution .................................................................................. 29
2.1.7.4 – Structure Refinement .............................................................................. 30
2.1.7.5 – Rotation and Oscillation Photographs .................................................... 30
2.1.7.6 – Instrument and Methodology Details ..................................................... 32
2.1.8 – Powder X-ray Diffraction ................................................................................... 32
2.1.8.1 – Indexing the Powder Diffraction Pattern ................................................ 34
2.1.8.2 – Unit Cell Refinement .............................................................................. 35
2.2 – Raman Spectroscopy ....................................................................................................... 36
2.2.1 – Rayleigh, Stokes and Anti-Stokes Scattering ..................................................... 36
2.2.2 – Theoretical Background ...................................................................................... 37
2.2.3 – Raman Spectra .................................................................................................... 39
2.2.4 – Confocal Raman Microspectrometry .................................................................. 40
2.2.5 – Experimental Setup ............................................................................................. 41
2.3 – Differential Scanning Calorimetry .................................................................................. 43
2.4 – References ....................................................................................................................... 47
Chapter 3 – A Strategy for Retrospectively Mapping the Growth History of Crystals .. 49
3.1 – Abstract ............................................................................................................................ 49
3.2 – Introduction ..................................................................................................................... 49
3.3 – Strategy ............................................................................................................................ 53
3.4 – Experimental .................................................................................................................... 56
3.5 – Results and Discussion .................................................................................................... 57
3.6 – Conclusions and Further Work ........................................................................................ 61
3.7 – References ....................................................................................................................... 66
Chapter 4 – Structural Rationalization of the Phase Transition Behaviour in a Solid
Organic Inclusion Compound: Bromocyclohexane/Thiourea ............................................ 68
4.1 – Abstract ............................................................................................................................ 68
4.2 – Introduction ..................................................................................................................... 68
4.3 – Experimental .................................................................................................................... 71
4.4 – Results and Discussion .................................................................................................... 72
4.5 – Conclusions and Further Work ........................................................................................ 84
4.6 – References ....................................................................................................................... 86
Chapter 5 – X-ray Birefringence from a Model Anisotropic Crystal ................................ 88
5.1 – Abstract ............................................................................................................................ 88
5.2 – Theory of Birefringence .................................................................................................. 88
5.3 – Introduction ..................................................................................................................... 93
5.4 – Experimental .................................................................................................................... 96
5.5 – Results and Discussion .................................................................................................... 98
5.6 – Conclusions and Further Work ...................................................................................... 102
5.7 – References ..................................................................................................................... 104
Chapter 6 – Using X-ray Birefringence to Determine Changes in Bond Orientation in an
Anisotropic Material ............................................................................................................ 105
6.1 – Abstract .......................................................................................................................... 105
6.2 – Introduction ................................................................................................................... 106
6.3 – Experimental .................................................................................................................. 108
6.4 – Structural Model ............................................................................................................ 111
6.5 – Results and Discussion .................................................................................................. 113
6.6 – Conclusions and Further Work ...................................................................................... 123
6.7 – References ..................................................................................................................... 126
Chapter 7 – An Incommensurate Thiourea Inclusion Compound .................................. 127
7.1 – Abstract .......................................................................................................................... 127
7.2 – Introduction ................................................................................................................... 127
7.3 – Experimental .................................................................................................................. 130
7.4 – Results and Discussion .................................................................................................. 132
7.5 – Conclusions and Further Work ...................................................................................... 137
7.6 – References ..................................................................................................................... 139
Chapter 8 – General Conclusions and Outlook ................................................................. 141
8.1 – References ..................................................................................................................... 144
Appendix A1 – Le Bail Fitting of Powder X-ray Diffraction Patterns for
Bromocyclohexane/Thiourea ............................................................................................... 146

Appendix A2 – Temperature Dependence of the Lattice Parameters for
Bromocyclohexane/Thiourea ............................................................................................... 153
Appendix B – Theoretical Framework for X-ray Birefringence Simulations ................ 155
1
Chapter 1 – Introduction
1.1 – Inclusion Compounds
An inclusion compound is a type of chemical entity in which one chemical species (the
guest) is enclosed within another chemical species (the host). The association between the
host and guest components is dependent on non-covalent interactions and typically, the size
and shape of the host and the guest species determines whether inclusion will occur. A great
number of inclusion compounds are known, exhibiting considerable diversity in both their
chemical nature and their structural characteristics.
1.1.1 – A Historical Perspective
The history of inclusion compounds dates back to the discovery of zeolites by early
mineralogists[1]
and to the pioneering studies of Davy[2]
and Faraday[3]
on clathrate hydrates.
Following the researches of Davy and Faraday, a significant number of important inclusion
compounds were discovered, including the graphite intercalates[4]
in 1841, the cyclodextrin
inclusion compounds[5]
in 1891 and the choleic acid inclusion compounds[6]
in 1916.
However, Davies et al. point out[7]
that "at the time of their preparation, the nature of these
compounds was unknown". Indeed, for many years, the structural features of these curious
non-stoichiometric materials remained a mystery.
However, this situation changed with the landmark X-ray diffraction work of Powell in
the late 1940s, who was the first to elucidate the exact nature of the clathrate structure. In the
preceding century, researchers like Wöhler,[8]
Clemm[9]
and Mylius[10]
had observed that when
hydroquinone was crystallised from certain volatile liquids, unusual stable "complexes" were
formed. Mylius proposed[10]
that these complexes consisted of two components in which one
molecule was enclosed within the other.[11]
It was observed that the dry complexes had no
smell of the volatile guest component; however, when the complexes were heated or
dissolved in water, occluded gas molecules immediately evolved as the inclusion compound
decomposed,[12-14]
indicating that the host and guest components were interacting without
chemical bonding. Following these observations, between 1945 and 1950 Powell reported the
structures of various hydroquinone compounds,[15-22]
beginning with the SO2 clathrate of
2
hydroquinone.[15-17]
He found that the inclusion compounds were based on a cage-like host
structure formed from three hydrogen-bonded hydroquinone molecules, within which one
molecule of the liquid or gas is included.
Powell’s discoveries marked a pivotal moment in the development of inclusion
chemistry and according to Weber[23]
"opened-up a whole new science of the study of
inclusion phenomena". Following this breakthrough, interest in the field of inclusion
chemistry gained significant momentum, as Powell’s discoveries provided a stimulus for
others to begin exploring the intriguing physico-chemical properties of these materials in
detail, a quest which was facilitated by simultaneous advances in new characterisation
techniques such as X-ray diffraction. Researchers were not only attracted to the interesting
fundamental properties of these materials, but also to their significant potential for
exploitation in wider applications.[23]
Indeed, inclusion compounds have been utilised in a
wide variety of technologies, including applications in molecular separation processes[24-27]
and chromatography,[28-34]
as crystalline "reaction vessels" for performing unique
regioselective and stereoselective reactions,[35, 36]
as media for storing unstable species[7, 37]
and as sensors.[37]
Inclusion compounds have also shown significant potential for use as gas
storage materials[38-41]
and as optoelectrical devices.[42, 43]
1.1.2 – Classification
Inclusion compounds can be broadly classified into two main types.[44-46]
The first type
comprises molecular inclusion complexes, in which the host is a molecule containing some
form of cavity within which guest molecules can be included. Examples of the host
component in molecular inclusion complexes are crown ethers, cryptands, cyclodextrins and
calixarenes. Typically, such molecular host-guest complexes exist as associated entities in
both the solution and solid states. In the second type, the guest molecules reside within the
"inclusion spaces" of a crystalline host solid, which is comprised of a network of discrete
subunits (i.e., molecules, atoms or ions), which self-assemble through non-covalent
interactions upon crystallization. These compounds are known as solid inclusion compounds
and the association between the host and the guest is strictly a solid state phenomenon. The
3
cavities present within these crystalline host structures exhibit a wide range of topological
forms, such as cages, tunnels and interlamellar regions within layered hosts.
Solid inclusion compounds can be further subdivided into two categories by considering
the response of the host solid to the removal of the guest species. In one type, the host solid
remains stable upon removal of the guest species, as is the case with many inorganic inclusion
compounds (e.g. aluminosilicates, aluminophosphates, metalloaluminophosphates,
cyclophosphazenes, metal chalcogenides and metal phosphonates). In these cases, the host
structure is commonly referred to as a "hard" host. In the other type, the host solid collapses
upon removal of the guest species, as is the case with most organic host materials, which are
commonly referred to as "soft" hosts [e.g. urea, thiourea, tri-ortho-thymotide (TOT),
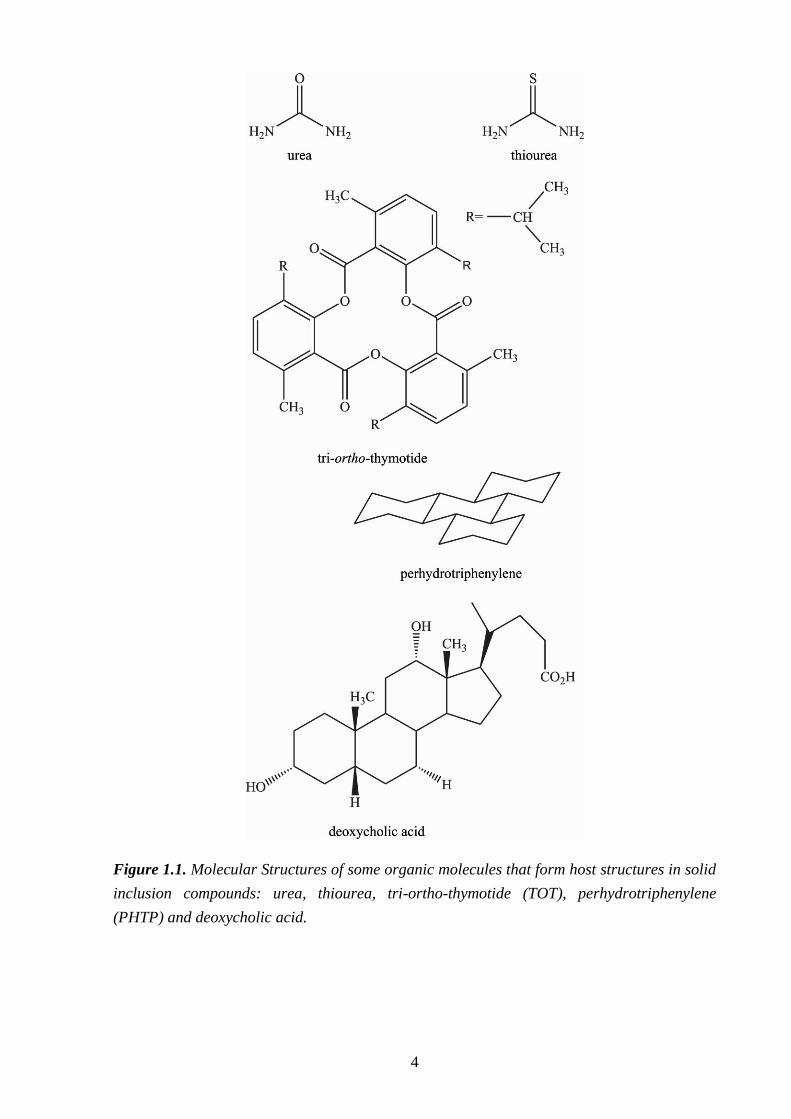
deoxycholic acid (DCA), cholic acid and perhydrotriphenylene (PHTP); Fig. 1.1]. This thesis
is concerned with organic solid inclusion compounds and is particularly focussed on the urea
and thiourea inclusion compounds.
4
Figure 1.1. Molecular Structures of some organic molecules that form host structures in solid
inclusion compounds: urea, thiourea, tri-ortho-thymotide (TOT), perhydrotriphenylene
(PHTP) and deoxycholic acid.
5
1.2 – Urea Inclusion Compounds
1.2.1 – Discovery and Motivation for Early Research
Urea inclusion compounds were discovered accidentally by Bengen[47]
in 1940 while he
was investigating the ability of urea to separate out the fats in milk. After adding a few drops
of octanol to the mixture to achieve better separation, he observed that crystals were formed at
the oil-water interface. These crystals turned out to be the inclusion compound of urea and
octanol. Later studies by Bengen and Schlenk demonstrated[48, 49]
that urea forms inclusion
compounds with many aliphatic straight-chain hydrocarbons provided they possess six or
more carbon atoms. Due to the specificity of urea in complexing almost exclusively with
straight-chain hydrocarbons and their derivatives, research was initially focussed on utilising
these materials in separation technologies. Indeed, numerous patents were issued[50-53]
relating
to the use of urea inclusion compounds for separating linear and branched hydrocarbons
relevant to the petroleum industry. To date, there have been over a thousand papers and
patents published on urea inclusion compounds exploring a wide range of fundamental
properties and applied aspects.
1.2.2 – Structural Overview
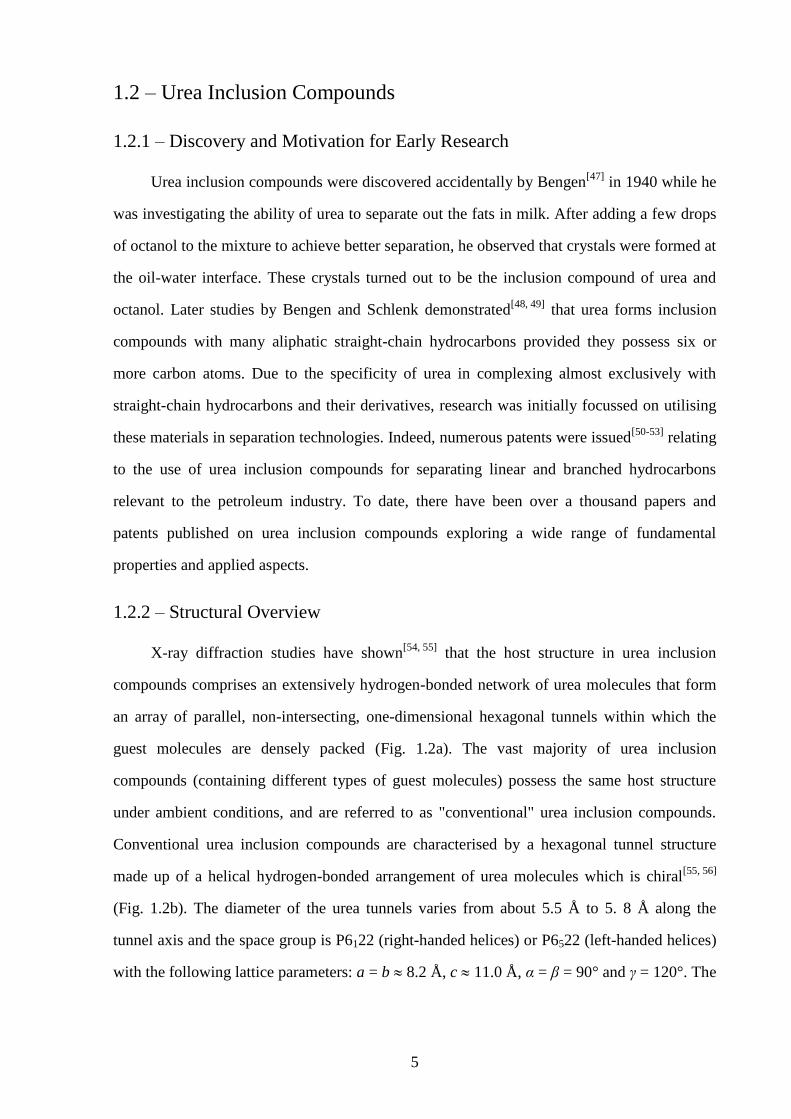
X-ray diffraction studies have shown[54, 55]
that the host structure in urea inclusion
compounds comprises an extensively hydrogen-bonded network of urea molecules that form
an array of parallel, non-intersecting, one-dimensional hexagonal tunnels within which the
guest molecules are densely packed (Fig. 1.2a). The vast majority of urea inclusion
compounds (containing different types of guest molecules) possess the same host structure
under ambient conditions, and are referred to as "conventional" urea inclusion compounds.
Conventional urea inclusion compounds are characterised by a hexagonal tunnel structure
made up of a helical hydrogen-bonded arrangement of urea molecules which is chiral[55, 56]
(Fig. 1.2b). The diameter of the urea tunnels varies from about 5.5 Å to 5. 8 Å along the
tunnel axis and the space group is P6122 (right-handed helices) or P6522 (left-handed helices)
with the following lattice parameters: a = b 8.2 Å, c 11.0 Å, α = β = 90° and γ = 120°. The
6
urea host structure is unstable if the guest molecules are removed, whereupon it collapses to
the tetragonal form of pure urea, which does not contain tunnels.[57, 58]
Figure 1.2. (a) Crystal structure of the hexadecane/urea inclusion compound (with van der
Waals radii) at ambient temperature, viewed along the tunnel axis (c-axis), showing the dense
packing of guest molecules. The guest molecules have been inserted into the tunnels
illustrating orientational disorder (Figure taken from Ref. [56]). (b) Crystal structure of the
1,10-dibromodecane/urea inclusion compound at ambient temperature, viewed perpendicular
to the tunnel axis (c-axis) showing the helical hydrogen-bonded arrangement of urea
molecules that make up the tunnel structure (crystallographic data taken from Ref. [80]).
1.2.3 – Periodic Structural Properties
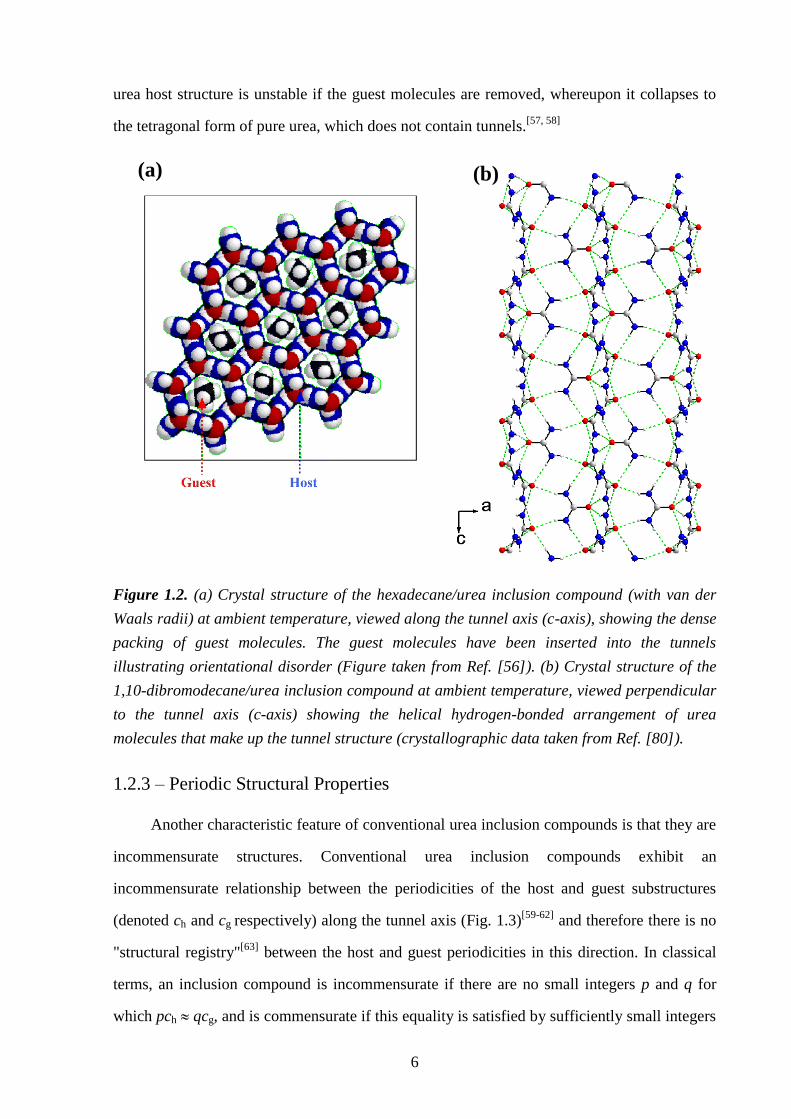
Another characteristic feature of conventional urea inclusion compounds is that they are
incommensurate structures. Conventional urea inclusion compounds exhibit an
incommensurate relationship between the periodicities of the host and guest substructures
(denoted ch and cg respectively) along the tunnel axis (Fig. 1.3)[59-62]
and therefore there is no
"structural registry"[63]
between the host and guest periodicities in this direction. In classical
terms, an inclusion compound is incommensurate if there are no small integers p and q for
which pch qcg, and is commensurate if this equality is satisfied by sufficiently small integers
(a) (b)
7
p and q. In an incommensurate inclusion compound, the ratio ch:cg is not equal to a rational
number.[64]
A more rigorous description of commensurate/incommensurate behaviour has
been developed in Ref.[59], including a distinction based on energetic characteristics. One of
the important conclusions that came out of this study was that, in an incommensurate
inclusion compound, the energy of the inclusion compound is "essentially independent of the
position of the guest substructure relative to the host substructure",[64]
which implies that
activationless translation of the guest substructure along the tunnel is possible. This feature
has been exploited in a number of studies investigating the transport of guest molecules along
the tunnels of urea inclusion compounds.[65-69]
A small number of inclusion compounds formed between urea and specific guest
molecules display commensurate structures [e.g. 1,6-dibromohexane/urea,[70]
sebaconitrile/urea[71]
and the (α + 1),( − 1)-alkanedione/urea[72]
family]. In these materials
the host structure is often distorted from the hexagonal tunnel structure shown in Fig. 1.2 to a
lower symmetry, and there is significant energetic lock-in between the host and the guest
substructures. For the incommensurate systems at ambient temperature and pressure, the guest
molecules typically have significant motional freedom within the tunnels and exhibit rapid
reorientation about the tunnel axis and translation along the tunnel axis.
Figure 1.3. Schematic representation of three adjacent tunnels in a urea inclusion compound
viewed perpendicular to the tunnel axis (with the tunnel axis horizontal). The terms ch, cg and
Δg are defined. The schematic shows an incommensurate relationship between the
periodicities of the host (ch) and guest (cg) substructures along the tunnel axis.
8
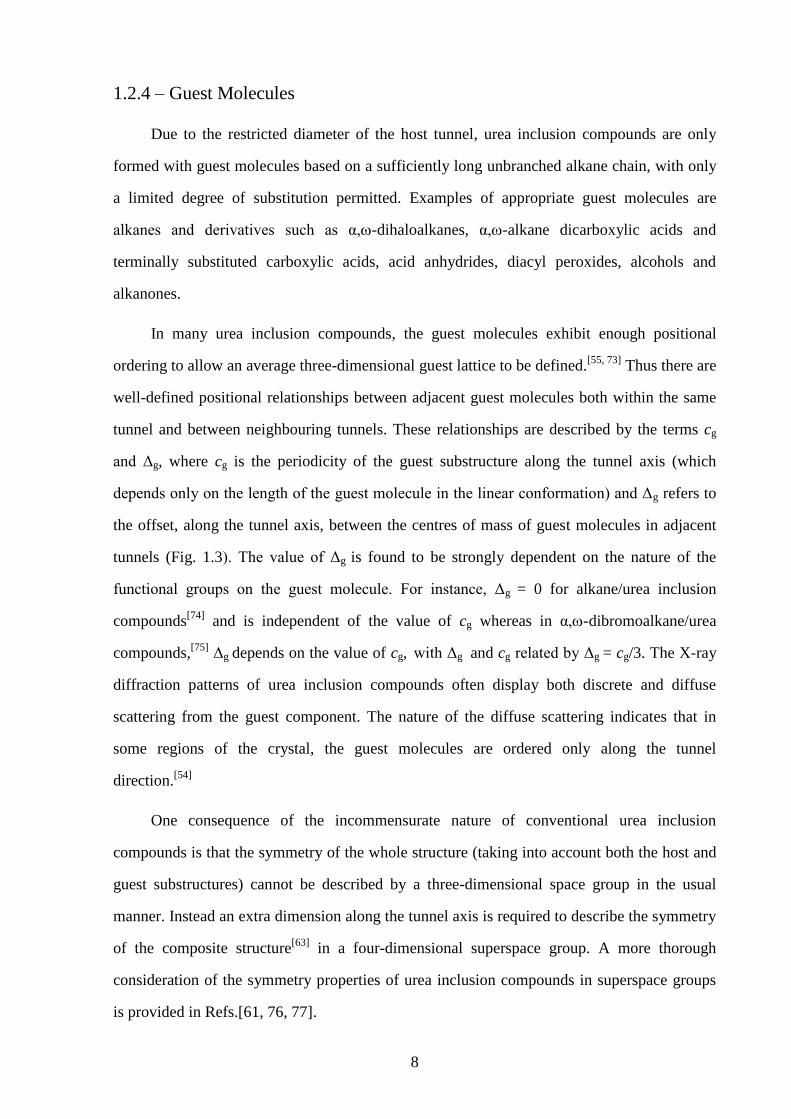
1.2.4 – Guest Molecules
Due to the restricted diameter of the host tunnel, urea inclusion compounds are only
formed with guest molecules based on a sufficiently long unbranched alkane chain, with only
a limited degree of substitution permitted. Examples of appropriate guest molecules are
alkanes and derivatives such as α,-dihaloalkanes, α,-alkane dicarboxylic acids and
terminally substituted carboxylic acids, acid anhydrides, diacyl peroxides, alcohols and
alkanones.
In many urea inclusion compounds, the guest molecules exhibit enough positional
ordering to allow an average three-dimensional guest lattice to be defined.[55, 73]
Thus there are
well-defined positional relationships between adjacent guest molecules both within the same
tunnel and between neighbouring tunnels. These relationships are described by the terms cg
and Δg, where cg is the periodicity of the guest substructure along the tunnel axis (which
depends only on the length of the guest molecule in the linear conformation) and Δg refers to
the offset, along the tunnel axis, between the centres of mass of guest molecules in adjacent
tunnels (Fig. 1.3). The value of Δg is found to be strongly dependent on the nature of the
functional groups on the guest molecule. For instance, Δg = 0 for alkane/urea inclusion
compounds[74]
and is independent of the value of cg whereas in α,-dibromoalkane/urea
compounds,[75]
Δg depends on the value of cg, with Δg and cg related by Δg = cg/3. The X-ray
diffraction patterns of urea inclusion compounds often display both discrete and diffuse
scattering from the guest component. The nature of the diffuse scattering indicates that in
some regions of the crystal, the guest molecules are ordered only along the tunnel
direction.[54]
One consequence of the incommensurate nature of conventional urea inclusion
compounds is that the symmetry of the whole structure (taking into account both the host and
guest substructures) cannot be described by a three-dimensional space group in the usual
manner. Instead an extra dimension along the tunnel axis is required to describe the symmetry
of the composite structure[63]
in a four-dimensional superspace group. A more thorough
consideration of the symmetry properties of urea inclusion compounds in superspace groups
is provided in Refs.[61, 76, 77].
9
1.2.5 – Phase Transitions
Most conventional urea inclusion compounds undergo an order-disorder phase
transition at low temperature. Both the structural[78-82]
and dynamic[83-88]
aspects of these
phase transitions have been investigated in detail for alkane/urea and α,-dibromoalkane/urea
inclusion compounds using a variety of techniques. These phase transitions are associated
with a distortion of the hexagonal urea host structure to a structure of lower symmetry
(usually orthorhombic) in the low temperature phase and a freezing out of the dynamics of the
guest molecules. The structural relationship between the host and the guest substructures
along the tunnel remains incommensurate across the phase transition. Although in qualitative
terms, most conventional urea inclusion compounds display similar phase transition
behaviour, the specific details of the structural changes associated with the phase transition
depend on the nature of the guest molecule.
Although several theories have been proposed to explain the phase transitions in urea
inclusion compounds, to date no unequivocal empirically derived mechanism describing the
transition exists. Using two different theoretical models Pemberton and Parsonage
suggested[89]
that the phase transition in alkane/urea inclusion compounds was due to a
correlation between the intratunnel and intertunnel guest-guest interactions. However, their
theory was based on the assumption that there is no change in the host structure across the
phase transition, which was later shown to be incorrect. In contrast, Fukao’s model[90]
assumed that interactions between guest molecules in adjacent tunnels are insignificant.
Instead, he suggested that the phase transition in alkane/urea inclusion compounds is caused
by a change in the amount of conformational defects in the high and low temperature phases.
In the low-temperature phase, the alkane guest molecules exist predominantly in the all-trans
conformation, whereas in the high-temperature phase conformational defects are present.
Lynden-Bell’s model
[91] emphasises the importance of host-guest interactions to the phase
transition behaviour. According to her model, orientational ordering of guest molecules in the
low temperature phase is caused by coupling between transverse acoustic phonons of the host
structure and the orientational order of the guest molecules.
10
1.3 – Thiourea Inclusion Compounds
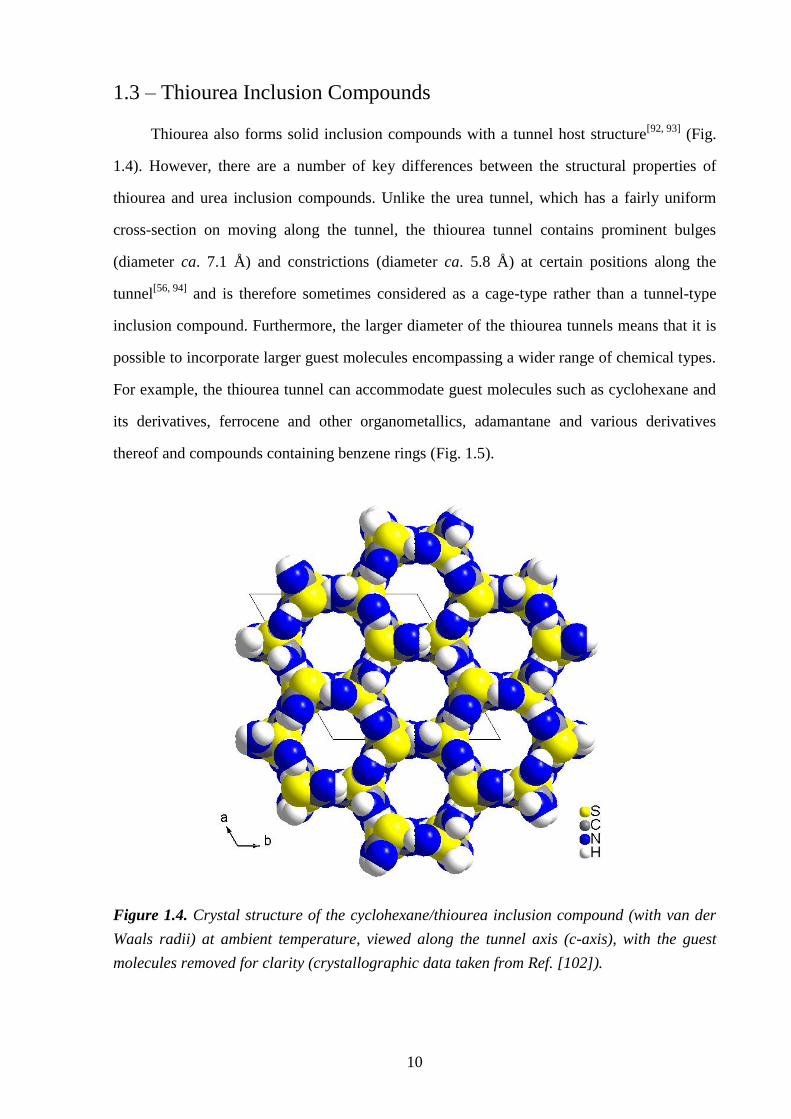
Thiourea also forms solid inclusion compounds with a tunnel host structure[92, 93]
(Fig.
1.4). However, there are a number of key differences between the structural properties of
thiourea and urea inclusion compounds. Unlike the urea tunnel, which has a fairly uniform
cross-section on moving along the tunnel, the thiourea tunnel contains prominent bulges
(diameter ca. 7.1 Å) and constrictions (diameter ca. 5.8 Å) at certain positions along the
tunnel[56, 94]
and is therefore sometimes considered as a cage-type rather than a tunnel-type
inclusion compound. Furthermore, the larger diameter of the thiourea tunnels means that it is
possible to incorporate larger guest molecules encompassing a wider range of chemical types.
For example, the thiourea tunnel can accommodate guest molecules such as cyclohexane and
its derivatives, ferrocene and other organometallics, adamantane and various derivatives
thereof and compounds containing benzene rings (Fig. 1.5).
Figure 1.4. Crystal structure of the cyclohexane/thiourea inclusion compound (with van der
Waals radii) at ambient temperature, viewed along the tunnel axis (c-axis), with the guest
molecules removed for clarity (crystallographic data taken from Ref. [102]).
11
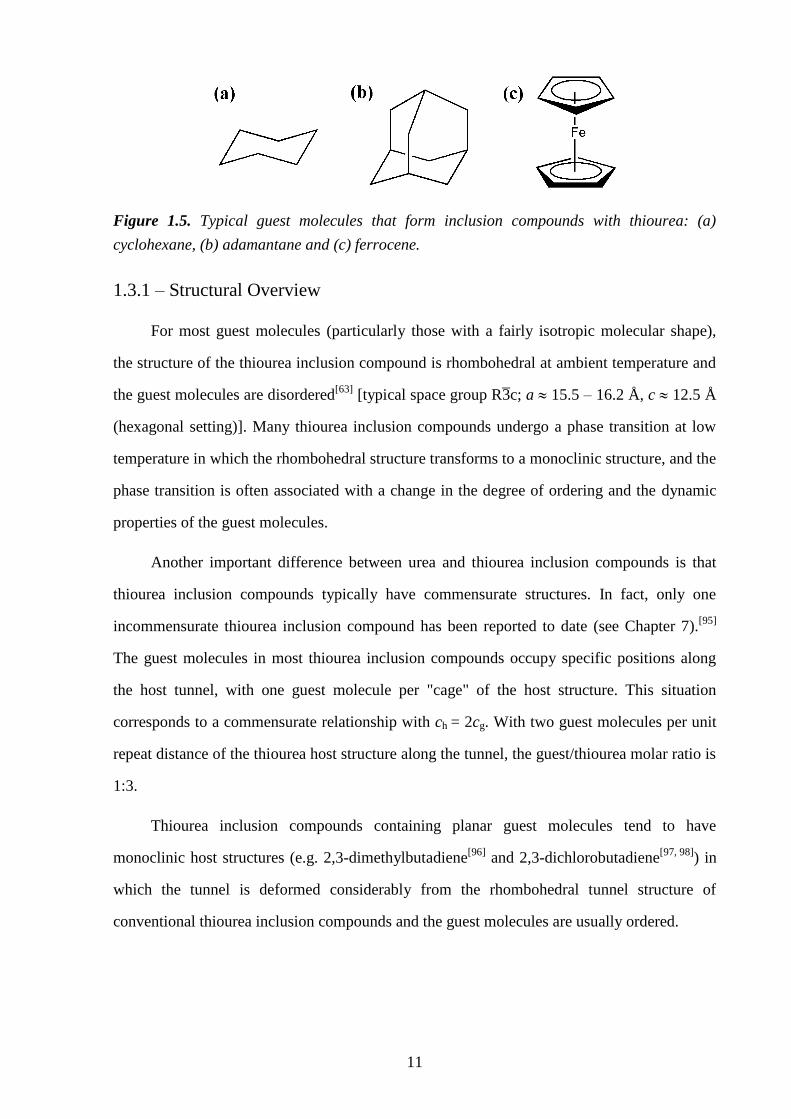
Figure 1.5. Typical guest molecules that form inclusion compounds with thiourea: (a)
cyclohexane, (b) adamantane and (c) ferrocene.
1.3.1 – Structural Overview
For most guest molecules (particularly those with a fairly isotropic molecular shape),
the structure of the thiourea inclusion compound is rhombohedral at ambient temperature and
the guest molecules are disordered[63]
[typical space group R3̄c; a 15.5 – 16.2 Å, c 12.5 Å
(hexagonal setting)]. Many thiourea inclusion compounds undergo a phase transition at low
temperature in which the rhombohedral structure transforms to a monoclinic structure, and the
phase transition is often associated with a change in the degree of ordering and the dynamic
properties of the guest molecules.
Another important difference between urea and thiourea inclusion compounds is that
thiourea inclusion compounds typically have commensurate structures. In fact, only one
incommensurate thiourea inclusion compound has been reported to date (see Chapter 7).[95]
The guest molecules in most thiourea inclusion compounds occupy specific positions along
the host tunnel, with one guest molecule per "cage" of the host structure. This situation
corresponds to a commensurate relationship with ch = 2cg. With two guest molecules per unit
repeat distance of the thiourea host structure along the tunnel, the guest/thiourea molar ratio is
1:3.
Thiourea inclusion compounds containing planar guest molecules tend to have
monoclinic host structures (e.g. 2,3-dimethylbutadiene[96]
and 2,3-dichlorobutadiene[97, 98]
) in
which the tunnel is deformed considerably from the rhombohedral tunnel structure of
conventional thiourea inclusion compounds and the guest molecules are usually ordered.
12
1.3.2 – Phase Transitions and Dynamic Properties of Guest Molecules
Many of the characteristics of conventional thiourea inclusion compounds are
exemplified by the cyclohexane/thiourea inclusion compound, which has been studied
intensively.[99, 100]
It is important to state that, although this material illustrates the type of
behaviour that can be observed in thiourea inclusion compounds, the specific details of the
physico-chemical properties (including the dynamic properties of the guest molecules and the
phase transition behaviour) depend on the specific guest molecule.
Cyclohexane/thiourea is known to exist in three distinct phases.[100-103]
At ambient
temperature, the host structure is the conventional rhombohedral thiourea tunnel structure[99]
with space group R3̄c [a = 15.83 Å, c = 12.46 Å (hexagonal setting)]. The stable phase at
ambient temperature (phase 1) undergoes a second-order phase transition at ca. 148 K to
produce phase 2, which then undergoes a first-order phase transition to phase 3 at ca. 127 K.
Both phase 2 and phase 3 have monoclinic metric symmetry with space group P21/a.
The guest molecules in the cyclohexane/thiourea inclusion compound are highly
disordered; solid-state 1H NMR,
[100, 103]
13C NMR,
[104]
2H NMR,
[102, 105, 106] incoherent
quasielastic neutron scattering,[107-110]
and molecular dynamics simulations[111]
have
demonstrated that the disorder of the guest molecules is dynamic in character. Detailed
insights into the dynamic properties of the guest molecules established in Ref.[102]. found
that, the disorder of the guest molecules in phase 1 can be described in terms of a model of
jumps of the molecular C3 axis between six orientations of equal probability (in accordance
with the D3 point group symmetry of the site occupied by the cyclohexane guest molecule
within the thiourea host structure), together with rapid reorientation of the cyclohexane about
its C3 axis. In phase 2, each cyclohexane molecule reorients among six inequivalent
orientations (with unequal populations as a consequence of the lowering of the symmetry of
the host structure), together with rapid reorientation about the molecular C3 axis. An abrupt
ordering of the guest molecules takes place in phase 3, as the motion of the C3 axis relative to
the host structure becomes frozen; however, rapid reorientation of each cyclohexane guest
molecule about its C3 axis still occurs in phase 3.
13
1.3.3 – Conformational Properties of Guest Molecules
Another interesting feature of thiourea inclusion compounds is that the guest molecules
often adopt very uncharacteristic conformations when they are constrained within the thiourea
tunnel structure and this fundamental aspect has attracted particular attention from
researchers. For example, for monohalogen substituted cyclohexanes in their liquid and
vapour phases,[112-116]
a dynamic equilibrium exists between the axial and equatorial
conformers and invariably the equatorial isomer predominates due to the unfavourable
repulsive 1,3-diaxial interactions that are present when the substituent is in the axial
position.[117]
Furthermore, in the pure solid state at sufficiently low temperature or high
pressure, these molecules exist exclusively in the equatorial conformation.[118, 119]
However, it
has been shown that when chlorocyclohexane, bromocyclohexane and iodocyclohexane are
included as guest molecules within the thiourea host tunnel structure, they exist
predominantly in the axial conformation – these results have been established from IR,[120-123]
Raman,[124]
high-resolution solid-state 13
C NMR,[117, 125-128]
EXAFS spectroscopy[129]
and
powder X-ray diffraction.[130]
The conformational behaviour of monosubstituted cyclohexanes included within the
thiourea host structure is known to depend strongly on the identity of the substituent.[117, 120,
123, 124, 126-128] For example, cyclohexanes containing Cl, Br, I, CN or NCO substituents exhibit
a strong preference for the axial conformer whereas cyclohexanes containing F, OH, NH2 or
CH3 exhibit a preference for the equatorial conformer.
A rationalization for the change in conformational behaviour displayed by
chlorocyclohexane when included inside the one-dimensional tunnels of an inclusion
compound was provided by Harris and co-workers.[131]
This behaviour was rationalized on the
basis of comparing the relative contributions of Eintra (the intramolecular potential for each
guest molecule, i.e., the energetic preference for the guest molecule to be in the axial or
equatorial conformation) and cg/ch (the optimum guest periodicity, i.e., the packing efficiency
of the guest molecules). The axial conformation can pack more densely within the tunnel,
which means that cg is smaller, giving a more favourable host-guest interaction energy per
unit length of the tunnel in the case of the axial conformation.
14
1.4 – Applications of Urea and Thiourea Inclusion Compounds
Both urea and thiourea inclusion compounds exhibit a diverse range of fundamentally
important physico-chemical properties which have been utilised in a number of applications,
some of which are briefly surveyed below.
As stated in Section 1.2.1, much of the early work on urea inclusion compounds was
motivated by the prospect of using these materials to separate linear and branched
hydrocarbons relevant to the petrochemical industry. Several examples of the use of urea
inclusion compounds in industrial separation processes were presented by Fetterly,[25]
who
reported the use of these compounds in the separation and production of jet fuels, paraffins,
lubricating oil bases and speciality waxes. However, urea inclusion compounds are no longer
used in these industries and have long since been superseded by zeolitic materials, which offer
numerous practical advantages in such applications. Nevertheless, the extractive
crystallisation potential of urea inclusion compounds continues to be utilised on the laboratory
scale by synthetic chemists to isolate linear molecules.
Both urea and thiourea inclusion compounds have also been exploited as environments
for carrying out chemical reactions involving the guest molecules. The reactivity of the guest
molecules in these solid inclusion compounds can often differ substantially from the reactivity
of the same molecules in dispersed phases, as described in a recent review.[36]
For example,
the highly confined regions of space within the urea and thiourea tunnel structures provide a
unique medium in which highly stereoselective polymerization reactions may be carried out
(Fig. 1.6). Many studies have exploited the constrained spatial environment of these inclusion
compounds to control the production of polymers with remarkable regularities (which could
not be achieved by conventional dispersed phase syntheses). In their seminal studies, Brown
and White[132]
found that highly stereoregular crystalline polymers of 2,3-dimethylbutadiene
and 2,3-dichlorobutadiene could be produced upon irradiation of the thiourea inclusion
compound containing the monomer molecule as the guest species. The 1,4-trans-polymer was
produced exclusively in both cases, in contrast to the results obtained for the same reaction in
other phases (Fig. 1.6).[133]
Similar highly stereospecific polymerisation reactions involving
smaller monomers have also been observed in urea inclusion compounds.[134]
15
R
R
R
R
R
R
R
R
R
R
R
R
R
R
R
R
R
R
R
R
h
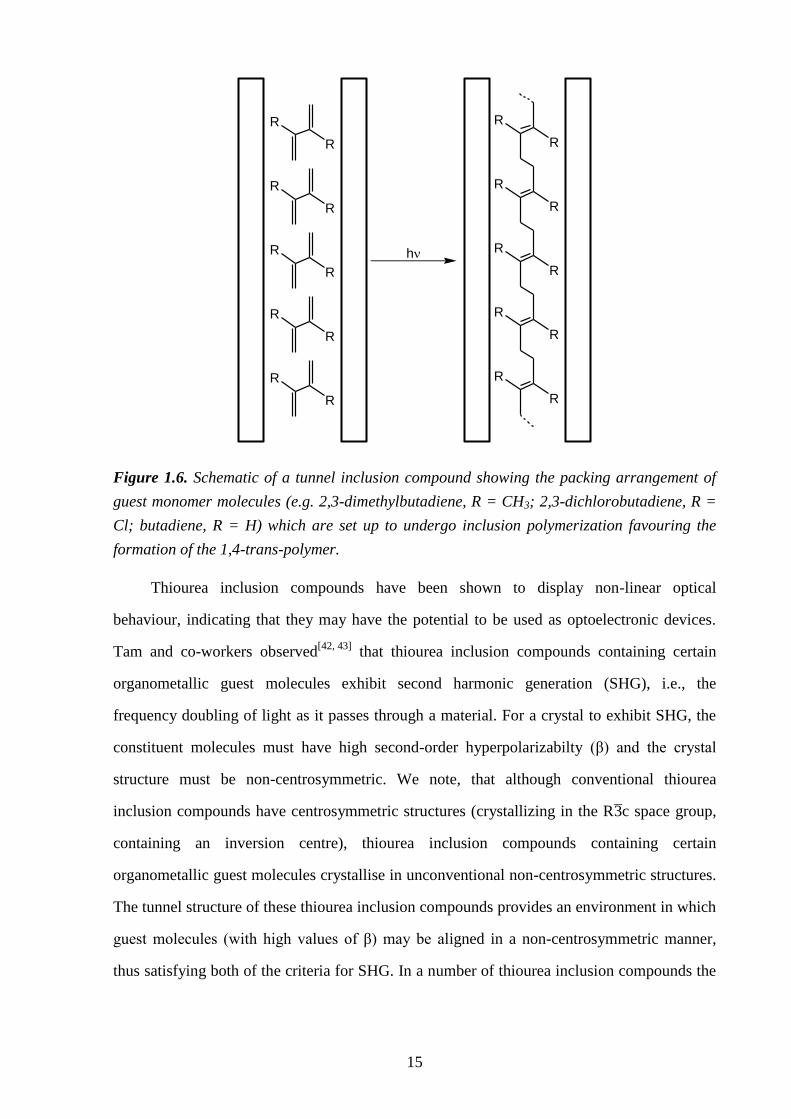
Figure 1.6. Schematic of a tunnel inclusion compound showing the packing arrangement of
guest monomer molecules (e.g. 2,3-dimethylbutadiene, R = CH3; 2,3-dichlorobutadiene, R =
Cl; butadiene, R = H) which are set up to undergo inclusion polymerization favouring the
formation of the 1,4-trans-polymer.
Thiourea inclusion compounds have been shown to display non-linear optical
behaviour, indicating that they may have the potential to be used as optoelectronic devices.
Tam and co-workers observed[42, 43]
that thiourea inclusion compounds containing certain
organometallic guest molecules exhibit second harmonic generation (SHG), i.e., the
frequency doubling of light as it passes through a material. For a crystal to exhibit SHG, the
constituent molecules must have high second-order hyperpolarizabilty (β) and the crystal
structure must be non-centrosymmetric. We note, that although conventional thiourea
inclusion compounds have centrosymmetric structures (crystallizing in the R3̄c space group,
containing an inversion centre), thiourea inclusion compounds containing certain
organometallic guest molecules crystallise in unconventional non-centrosymmetric structures.
The tunnel structure of these thiourea inclusion compounds provides an environment in which
guest molecules (with high values of β) may be aligned in a non-centrosymmetric manner,
thus satisfying both of the criteria for SHG. In a number of thiourea inclusion compounds the
16
dipole alignment of organometallic guest molecules was found to be favoured and these
compounds exhibited significant SHG.
Urea[135]
and thiourea[136, 137]
inclusion compounds containing certain guest molecules
have been found to be strongly X-ray dichroic, i.e., X-rays with polarization parallel to a
certain axis in the material are preferentially attenuated over X-rays with polarization
perpendicular to this axis. These materials have been applied successfully as X-ray dichroic
filter materials and have been shown to have considerable potential in applications such as
magnetic X-ray scattering[135]
and X-ray polarimetry.[137]
Very recently,[138]
the related
phenomenon of X-ray birefringence has been observed in the 1-bromoadamantane/thiourea
inclusion compound (Chapter 5) and this physical property has been applied to characterise
aspects of the phase transition in bromocyclohexane/thiourea (Chapter 6).
Other applications include using the confined tunnel structures of urea and thiourea to
increase the stability of readily oxidised substances for easier storage and handling[11, 139, 140]
and to orient guest molecules in unusual conformational states to enable spectroscopic studies
to be carried out.[141]
1.5 – A Guide to this Thesis
Building upon the foundation of these previous studies, this thesis explores new
research directions in organic solid inclusion compounds, reporting important new insights
into the behaviour of urea and thiourea inclusion compounds. In particular the thesis
examines; the crystal growth characteristics of urea inclusion compounds (Chapter 3), the
subtle structural features which effect phase transition behaviour in thiourea inclusion
compounds (Chapter 4), the phenomenon of X-ray birefringence (Chapter 5) and its
application in characterising changes in molecular polarization associated with phase
transitions in thiourea inclusion compounds (Chapter 6) and aperiodicity in thiourea inclusion
compounds (Chapter 7). In Chapter 8, some general conclusions are stated alongside a brief
analysis of the outlook for the field.
17
1.6 – References
[1] A. F. Cronstedt, Kongl. Vetenskaps Acad. Handl. Stockholm 1756, 17, 120.
[2] H. Davy, Phil. Trans. R. Soc. 1811, 101, 30.
[3] M. Faraday, Quart. J. Sci. 1823, 15, 71.
[4] C. Schafthäutl, J. Prakt. Chem. 1841, 21, 129.
[5] A. Villiers, C. R. Hebd. Acad. Sci. 1891, 112, 536.
[6] H. Wieland, H. Sorge, Hoppe-Seyler's Z. Physiol. Chem. 1916, 97, 1.
[7] J. E. D. Davies, W. Kemula, H. M. Powell, N. O. Smith, J. Incl. Phenom. 1983, 1, 3.
[8] F. Wöhler, Liebigs. Ann. Chem. 1849, 69, 297.
[9] A. Clemm, Liebigs. Ann. Chem. 1859, 110, 357.
[10] F. Mylius, Ber. Bunsen-Ges. Phys. Chem. 1886, 19, 999.
[11] S. G. Frank, J. Pharm. Sci. 1975, 64, 1585.
[12] R. K. Gosavi, C. N. R. Rao, Indian J. Chem. 1968, 6, 222.
[13] R. L. Deming, T. L. Carlisle, B. J. Lauerman, J. T. Muckerman, A. R. Muirhead, W.
C. Child Jr, J. Phys. Chem. 1969, 73, 1762.
[14] R. Clément, C. Mazières, Ann. Chim. France 1970, 5, 157.
[15] D. E. Palin, H. M. Powell, Nature 1945, 156, 334.
[16] D. E. Palin, H. M. Powell, J. Chem. Soc. 1947, 208.
[17] H. M. Powell, J. Chem. Soc. 1948, 16, 61.
[18] D. E. Palin, H. M. Powell, J. Chem. Soc. 1948, 2, 571.
[19] D. E. Palin, H. M. Powell, J. Chem. Soc. 1948, 815.
[20] H. M. Powell, J. Chem. Soc. 1950, 298.
[21] H. M. Powell, J. Chem. Soc. 1950, 300.
[22] H. M. Powell, J. Chem. Soc. 1950, 468.
[23] E. Weber, Top. Curr. Chem. 1987, 140, 1.
[24] H. M. Powell, Nature 1952, 170, 155.
[25] L. C. Fetterly, in Non-Stoichiometric Compounds (Ed.: L. Mandelcorn), Academic
Press, New York, 1964, p. 491.
[26] D. Worsch, F. Vögtle, Top. Curr. Chem. 1987, 140, 21.
[27] W. Schlenk, Liebigs. Ann. Chem. 1973, 1145.
[28] W. Kemula, D. Sybilska, Nature 1960, 185, 237.
[29] W. Kemula, D. Sybilska, Acta. Chim. Hung. 1961, 27, 137.
[30] K. Marik, E. Smolkova, J. Chromatogr. 1974, 91, 303.
[31] E. Smolkova-keulemansova, S. Krýsl, J. Chromatogr. 1980, 184, 347.
[32] S. Fanali, J. Chromatogr. A 1997, 792, 227.
[33] G. K. E. Scriba, J. Sep. Sci. 2008, 31, 1991.
[34] X. H. Lai, W. H. Tang, S. C. Ng, J. Chromatogr. A 2011, 1218, 5597.
[35] V. Ramamurthy, Tetrahedron 1986, 42, 5753.
[36] K. D. M. Harris, B. A. Palmer, G. R. Edwards-Gau, in Supramolecular Chemistry:
From Molecules to Materials (Eds.: P. A. Gale, J. W. Steed), John Wiley & Sons,
Chichester, 2012, p. 1589.
[37] V. Ramamurthy, D. F. Eaton, Chem. Mater. 1994, 6, 1128.
18
[38] V. V. Struzhkin, B. Militzer, W. L. Mao, H.-K. Mao, R. J. Hemley, Chem. Rev. 2007,
107, 4133.
[39] W. X. Wang, C. L. Bray, D. J. Adams, A. I. Cooper, J. Am. Chem. Soc. 2008, 130,
11608.
[40] B. O. Carter, W. X. Wang, D. J. Adams, A. I. Cooper, Langmuir 2010, 26, 3186.
[41] H. K. Srivastava, G. N. Sastry, J. Phys. Chem. A 2011, 115, 7633.
[42] A. G. Anderson, J. C. Calabrese, W. Tam, I. D. Williams, Chem. Phys. Lett. 1987,
134, 392.
[43] W. Tam, D. F. Eaton, J. C. Calabrese, I. D. Williams, Y. Wang, A. G. Anderson,
Chem. Mater. 1989, 1, 128.
[44] D. D. MacNicol, J. J. McKendrick, D. R. Wilson, Chem. Soc. Rev. 1978, 7, 65.
[45] K. D. M. Harris, in Monographs on Chemistry for the 21st Century: Interfacial
Chemistry (Ed.: M. W. Roberts), I.U.P.A.C/Blackwell Science, 1997, p. 21.
[46] L. R. Nassimbeni, Acc. Chem. Res. 2003, 36, 631.
[47] M. F. Bengen, Ger. Pat. Appl. 1940, OZ 123438.
[48] M. F. Bengen, W. Schlenk, Experientia 1949, 5, 200.
[49] M. F. Bengen, Angew. Chemie. 1951, 63, 207.
[50] V. M. Bhatnagar, Clathrate Compounds, Chemical Publishing Co. Inc., New York,
1962, p. 10.
[51] E. C. Maken, Sep. Purif. Methods 1972, 1, 371.
[52] P. Scudder, U.S. Pat. 1972, 3,703,503.
[53] R. Maas, British Pat. 1969, 1,154,760
[54] A. E. Smith, Acta Crystallogr. 1952, 5, 224.
[55] K. D. M. Harris, J. M. Thomas, J. Chem. Soc., Faraday Trans. 1990, 86, 2985.
[56] K. D. M. Harris, Supramol. Chem. 2007, 19, 47.
[57] H. G. McAdie, G. B. Frost, Can. J. Chem. 1958, 36, 635.
[58] H. G. McAdie, Can. J. Chem. 1962, 40, 2195.
[59] A. J. O. Rennie, K. D. M. Harris, Proc. R. Soc. London, Ser. A. 1990, 430, 615.
[60] D. Schmicker, S. van Smaalen, J. L. de Boer, C. Haas, K. D. M. Harris, Phys. Rev.
Lett. 1995, 74, 734.
[61] S. van Smaalen, K. D. M. Harris, Proc. R. Soc. London, Ser. A 1996, 452, 677.
[62] R. Lefort, J. Etrillard, B. Toudic, F. Guillaume, T. Breczewski, P. Bourges, Phys. Rev.
Lett. 1996, 77, 4027.
[63] M. D. Hollingsworth, K. D. M. Harris, in Comprehensive Supramolecular Chemistry
(Eds.: D. D. Macnicol, F. Toda, R. Bishop), Pergamon Press, Oxford, UK, 1996, Vol.
6, p. 177.
[64] K. D. M. Harris, Chem. Soc. Rev. 1997, 26, 279.
[65] A. A. Khan, S. T. Bramwell, K. D. M. Harris, B. M. Kariuki, M. R. Truter, Chem.
Phys. Lett. 1999, 307, 320.
[66] J. Marti-Rujas, A. Desmedt, K. D. M. Harris, F. Guillaume, J. Am. Chem. Soc. 2004,
126, 11124.
[67] J. Marti-Rujas, K. D. M. Harris, A. Desmedt, Mol. Cryst. Liq. Cryst. 2006, 456, 139.
[68] J. Marti-Rujas, A. Desmedt, K. D. M. Harris, F. Guillaume, J. Phys. Chem. B 2007,
111, 12339.
[69] J. Marti-Rujas, A. Desmedt, K. D. M. Harris, F. Guillaume, J. Phys. Chem. C 2009,
113, 736.
19
[70] M. D. Hollingsworth, U. Werner-Zwanziger, M. E. Brown, J. D. Chaney, J. C.
Huffman, K. D. M. Harris, S. P. Smart, J. Am. Chem. Soc. 1999, 121, 9732.
[71] M. D. Hollingsworth, B. D. Santarsiero, K. D. M. Harris, Angew. Chemie. Int. Ed.
1994, 33, 649.
[72] M. E. Brown, J. D. Chaney, B. D. Santarsiero, M. D. Hollingsworth, Chem. Mater.
1996, 8, 1588.
[73] K. D. M. Harris, J. Mol. Struct. 1996, 374, 241.
[74] K. Fukao, H. Miyaji, K. Asai, J. Chem. Phys. 1986, 84, 6360.
[75] K. D. M. Harris, S. P. Smart, M. D. Hollingsworth, J. Chem. Soc., Faraday Trans.
1991, 87, 3423.
[76] T. Weber, H. Boysen, F. Frey, R. B. Neder, Acta Crystallogr. B 1997, 53, 544.
[77] I. Peral, G. Madariaga, V. Petricek, T. Breczewski, Acta Crystallogr. B 2001, 57, 378.
[78] Y. Chatani, Y. Taki, H. Tadokoro, Acta Crystallogr. B 1977, 33, 309.
[79] K. D. M. Harris, I. Gameson, J. M. Thomas, J. Chem. Soc., Faraday Trans. 1990, 86,
3135.
[80] L. Yeo, K. D. M. Harris, Acta Crystallogr. B 1997, 53, 822.
[81] L. Yeo, B. M. Kariuki, H. Serrano-Gonzalez, K. D. M. Harris, J. Phys. Chem. B 1997,
101, 9926.
[82] H. Le Lann, C. Odin, B. Toudic, J. C. Ameline, J. Gallier, F. Guillaume, T.
Breczewski, Phys. Rev. B 2000, 62, 5442.
[83] H. L. Casal, D. G. Cameron, E. C. Kelusky, J. Chem. Phys. 1984, 80, 1407.
[84] K. D. M. Harris, P. Jonsen, Chem. Phys. Lett. 1989, 154, 593.
[85] F. Guillaume, C. Sourisseau, A. J. Dianoux, J. Chim. Phys. (Paris) 1991, 88, 1721.
[86] A. E. Aliev, S. P. Smart, I. J. Shannon, K. D. M. Harris, J. Chem. Soc., Faraday
Trans. 1996, 92, 2179.
[87] A. El Baghdadi, E. J. Dufourc, F. Guillaume, J. Phys. Chem. 1996, 100, 1746.
[88] R. Lefort, B. Toudic, J. Etrillard, F. Guillaume, P. Bourges, R. Currat, T. Breczewski,
Eur. Phys. J. B. 2001, 24, 51.
[89] N. G. Parsonage, R. C. Pemberton, T. Faraday Soc. 1967, 63, 311.
[90] K. Fukao, J. Chem. Phys. 1990, 92, 6867.
[91] R. M. Lynden-Bell, Mol. Phys. 1993, 79, 313.
[92] B. Angla, C. R. Hebd. Acad. Sci. 1947, 224, 1166.
[93] K. Takemoto, N. Sonoda, in Inclusion Compounds (Eds.: J. L. Atwood, J. E. D.
Davies, D. D. MacNicol), Academic Press: New York, 1984, Vol. 2, p. 47.
[94] K. D. M. Harris, in Encyclopedia of Supramolecular Chemistry (Eds.: J. L. Atwood, J.
W. Steed), Marcel Dekker, New York, 2004, Vol. 2, p. 1501.
[95] B. A. Palmer, B. M. Kariuki, V. K. Muppidi, C. E. Hughes, K. D. M. Harris, Chem.
Commun. 2011, 47, 3760.
[96] Y. Chatani, S. Nakatani, Z. Kristallogr. 1977, 144, 175.
[97] Y. Chatani, S. Nakatani, H. Tadokoro, Macromolecules 1970, 3, 481.
[98] Y. Chatani, S. Nakatani, Macromolecules 1972, 5, 597.
[99] H.-U. Lenné, Acta Crystallogr. 1954, 7, 1.
[100] R. Clément, C. Mazières, M. Gourdji, L. Guibé, J. Chem. Phys. 1977, 67, 5381.
[101] R. Clément, J. Jegoudez, C. Mazières, J. Solid State Chem. 1974, 10, 46.
20
[102] A. Desmedt, S. J. Kitchin, F. Guillaume, M. Couzi, K. D. M. Harris, E. H. Bocanegra,
Phys. Rev. B 2001, 64, 054106.
[103] R. Clément, M. Gourdji, L. Guibé, Mol. Phys. 1971, 21, 247.
[104] A. E. Aliev, K. D. M. Harris, D. C. Apperley, R. K. Harris, M. M. Sunnetcioglu, J.
Chem. Soc., Faraday Trans. 1993, 89, 3791.
[105] E. Meirovitch, T. Krant, S. Vega, J. Phys. Chem. 1983, 87, 1390.
[106] R. Poupko, E. Furman, K. Müller, Z. Luz, J. Phys. Chem. 1991, 95, 407.
[107] M. J. Jones, F. Guillaume, K. D. M. Harris, A. E. Aliev, P. Girard, A. J. Dianoux, Mol.
Phys. 1998, 93, 545.
[108] M. J. Jones, S. Camus, F. Guillaume, K. D. M. Harris, A.-J. Dianoux, Physica B 1998,
472, 241.
[109] A. Desmedt, F. Guillaume, J. Combet, A.-J. Dianoux, Physica B 2001, 301, 59.
[110] A. Desmedt, J. C. Soetens, F. Guillaume, R. E. Lechner, A.-J. Dianoux, Appl. Phys. A-
Mater. Sci. Process. 2002, 74, S1357.
[111] J. C. Soetens, A. Desmedt, F. Guillaume, K. D. M. Harris, Chem. Phys. 2000, 261,
125.
[112] M. Larnaudie, C. R. Hebd. Acad. Sci. 1952, 235, 154.
[113] M. Larnaudie, J. Phys-Paris 1954, 15, 650.
[114] O. Hassel, H. Viervoll, Tids. Kjemi. Bergvesen Met. 1943, 5, 35.
[115] K. Kozima, K. Sakashita, Bull. Chem. Soc. Jpn. 1958, 31, 796.
[116] P. Klaeboe, J. J. Lothe, K. Lunde, Acta Chem. Scand. 1956, 10, 1465.
[117] M. S. McKinnon, R. E. Wasylishen, Chem. Phys. Lett. 1986, 130, 565.
[118] P. Klaeboe, Acta Chem. Scand. 1969, 23, 2641.
[119] A. I. Fishman, W. A. Herrebout, B. J. van der Veken, Phys. Chem. Chem. Phys. 2002,
4, 5606.
[120] J. E. D. Davies, G. J. Nightingale, J. Struct. Chem. 1999, 40, 802.
[121] M. Nishikawa, Chem. Pharm. Bull. 1963, 11, 977.
[122] K. Fukushima, J. Mol. Struct. 1976, 34, 67.
[123] J. E. Gustavsen, P. Klaeboe, H. Kvila, Acta. Chem. Scand. A 1978, 32, 25.
[124] A. Allen, V. Fawcett, D. A. Long, J. Raman Spectrosc. 1976, 4, 285.
[125] S. Ternieden, K. Müller, J. Incl. Phenom. 1998, 30, 289.
[126] K. Muller, Magn. Reson. Chem. 1992, 30, 228.
[127] K. Müller, Magn. Reson. Chem. 1995, 33, 113.
[128] A. E. Aliev, K. D. M. Harris, J. Am. Chem. Soc. 1993, 115, 6369.
[129] I. J. Shannon, M. J. Jones, K. D. M. Harris, M. R. H. Siddiqui, R. W. Joyner, J. Chem.
Soc., Faraday Trans. 1995, 91, 1497.
[130] M. J. Jones, I. J. Shannon, K. D. M. Harris, J. Chem. Soc., Faraday Trans. 1996, 92,
273.
[131] P. A. Schofield, K. D. M. Harris, I. J. Shannon, A. J. O. Rennie, J. Chem. Soc., Chem.
Comm. 1993, 1293.
[132] J. F. Brown, D. M. White, J. Am. Chem. Soc. 1960, 82, 5671.
[133] F. Cotaldo, P. Ragni, O. Ursini, G. Angelini, Radiat. Phys. Chem. 2008, 77, 941.
[134] D. M. White, J. Am. Chem. Soc. 1960, 82, 5678.
[135] S. P. Collins, D. Laundy, K. D. M. Harris, B. M. Kariuki, C. L. Bauer, S. D. Brown, P.
Thompson, J. Phys.: Condens. Matter 2002, 14, 123.
21
[136] M. H. Chao, B. M. Kariuki, K. D. M. Harris, S. P. Collins, D. Laundy, Angew.
Chemie. Int. Ed. 2003, 42, 2982.
[137] N. P. Bannister, K. D. M. Harris, S. P. Collins, A. Martindale, P. S. Monks, G. Solan,
G. W. Fraser, Exp. Astron. 2006, 21, 1.
[138] B. A. Palmer, A. Morte-Ródenas, B. M. Kariuki, K. D. M. Harris, S. P. Collins, J.
Phys. Chem. Lett 2011, 2, 2346.
[139] R. T. Holman, S. Ener, J. Nutr. 1954, 53, 461.
[140] H. Schlenk, D. M. Sand, J. A. Tillotson, J. Am. Chem. Soc. 1955, 77, 3587.
[141] Q. Y. Shang, X. M. Dou, B. S. Hudson, Nature 1991, 352, 703.
22
Chapter 2 – Experimental Techniques
This chapter describes the background theory of the techniques that have been used in
this thesis, namely, single-crystal X-ray diffraction, powder X-ray diffraction, Raman
microspectrometry and differential scanning calorimetry (DSC).
2.1 – X-ray Diffraction
X-ray diffraction is the most commonly used and most powerful physical
characterization technique for determining the structure of crystalline solids. The technique is
used to determine precisely the atomic positions, bond lengths and bond angles in a crystal.
The main limitations of the technique are that there is a strict constraint on the type of
materials that can be studied (i.e., only crystalline solids) and furthermore, it provides a time-
averaged and space-averaged representation of a structure and therefore cannot be used to
identify defects or dopants within materials[1]
or used to follow fast dynamic processes.
2.1.1 – Fundamentals of Diffraction
Diffraction involves the elastic scattering of radiation by matter and arises from
constructive or destructive interference between two or more waves that have passed through
a diffraction grating. For diffraction to occur, the wavelength of the incident radiation must be
of the same order of magnitude as the periodic repeat distances in the scattering object. Thus,
X-rays (0.1 – 100 Å) are ideally suited for being diffracted by crystalline solids which consist
of atoms, molecules and ions with periodic repeat distances of the order of a few Ångströms
to several tens of Ångströms. The relative amplitudes and phases of scattered X-rays are
characteristic of the scattering object, constituting a unique "fingerprint" of the object.
Structural information of an object is thus "carried" in the relative intensities and phases of the
radiation being scattered from it,[2]
which is the fundamental reason why the phenomenon of
X-ray diffraction can be applied to determine the structure of materials.
2.1.2 – Crystals and Symmetry
A crystal comprises a very large number of atoms, molecules or ions arranged
periodically in three-dimensions to give a highly ordered structure. The basic three-
23
dimensional repeating unit of a crystal is the unit cell, and may comprise one or more atoms
or ions, a molecule, or an assembly of molecules. The whole crystal structure can be
constructed by replication of a single unit cell, by translation in three-dimensional space. The
unit cell is defined by three axis lengths, denoted a, b and c and by the angles between them,
α, β and γ (where α is the angle between b and c, β is between a and c and γ is between a and
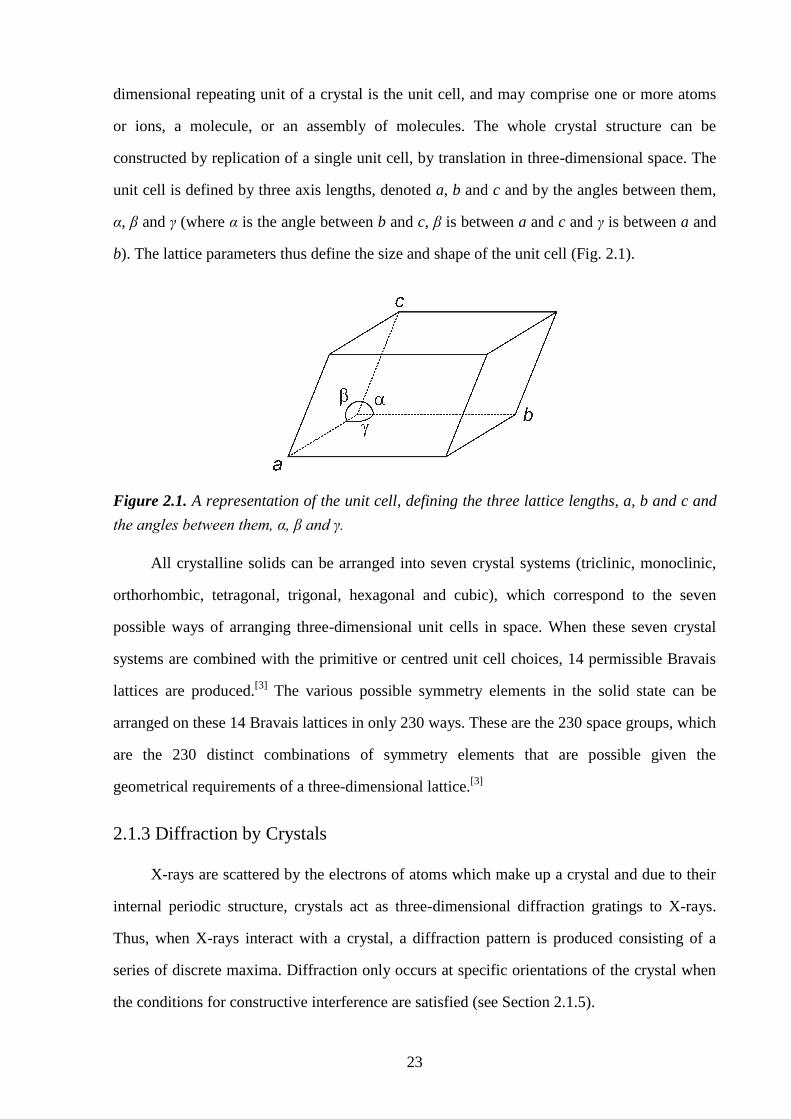
b). The lattice parameters thus define the size and shape of the unit cell (Fig. 2.1).
Figure 2.1. A representation of the unit cell, defining the three lattice lengths, a, b and c and
the angles between them, α, β and γ.
All crystalline solids can be arranged into seven crystal systems (triclinic, monoclinic,
orthorhombic, tetragonal, trigonal, hexagonal and cubic), which correspond to the seven
possible ways of arranging three-dimensional unit cells in space. When these seven crystal
systems are combined with the primitive or centred unit cell choices, 14 permissible Bravais
lattices are produced.[3]
The various possible symmetry elements in the solid state can be
arranged on these 14 Bravais lattices in only 230 ways. These are the 230 space groups, which
are the 230 distinct combinations of symmetry elements that are possible given the
geometrical requirements of a three-dimensional lattice.[3]
2.1.3 Diffraction by Crystals
X-rays are scattered by the electrons of atoms which make up a crystal and due to their
internal periodic structure, crystals act as three-dimensional diffraction gratings to X-rays.
Thus, when X-rays interact with a crystal, a diffraction pattern is produced consisting of a
series of discrete maxima. Diffraction only occurs at specific orientations of the crystal when
the conditions for constructive interference are satisfied (see Section 2.1.5).
24
Information on the structure of an object is carried in the relative intensities and phases
of radiation scattered from it and thus a diffraction pattern acts as a unique "fingerprint" of the
scattering object. For instance, a macroscopic object is observed when visible light rays
scattered from the object are instantaneously recombined on the retina to form an image of
that object.[2]
However, in the case of X-ray diffraction, the scattered X-rays cannot be
recombined with a lens. This means that the diffraction experiment must be divided into two
main stages: (i) recording a scattering pattern using a detector; and (ii) mathematical
recombination of the scattered X-rays by computational techniques to determine structural
information.
It is important to note the reciprocal relationship between the diffraction pattern and the
crystal structure. The lattice of the diffraction pattern is called the reciprocal lattice because it
is related to the direct lattice by reciprocal distances and perpendicular directions.
2.1.4 – X-ray Crystallography
X-ray crystallography involves the determination of the lattice parameters and the
atomic content of the unit cell. The complete crystal structure can be defined by knowledge of
the unit cell dimensions and its contents, since the unit cell is repeated in all dimensions of the
crystal by translation. It is important to note that X-rays are scattered by electrons and
therefore X-ray crystallography involves determination of the electron density in a crystal
(rather than the positions of the nuclei), which is interpreted in terms of the positions of
atoms. The atomic positions, bond distances and bond angles etc., can thus be inferred from
the electron density distribution.
An X-ray diffraction pattern is characterised by three key features; (i) geometry – a
series of discrete sharp spots at particular positions in reciprocal space, corresponding to the
restricted directions in which X-rays are diffracted by the three-dimensional lattice, (ii)
symmetry – rotation, reflection and inversion symmetry in the positions of the spots, (iii)
differing intensities of the Bragg maxima. Each of these features of the diffraction pattern is
related to a feature of the crystal structure. The geometry of the pattern is a consequence of
the crystal lattice and unit cell geometry. The symmetry of the diffraction pattern is related to
the symmetry of the crystal structure and is expressed in its crystal system and space group.
25
The intensities of the diffracted beams are related to the positions of the atoms within the unit
cell, i.e., by the geometry within the molecules themselves and by their arrangement within
the unit cell.
2.1.5 – The Geometry of X-ray Diffraction: Bragg’s Law
In his experiments on a crystal of copper sulphate in 1912, von Laue demonstrated[4]
that crystalline solids behave as three dimensional diffraction gratings to X-rays. However, it
was W.L. Bragg, along with his father, W.H. Bragg, who was the first to utilise the
phenomenon of X-ray diffraction to determine the structure of a crystal,[5-8]
for which they
were awarded the Nobel Prize in Physics in 1914.
Bragg showed that the angular distribution of diffracted X-rays could be rationalised by
assuming that the scattered X-rays behave as if they are reflected by sets of parallel planes
passing through lattice points in the crystal.[3]
This model is analogous to the reflection of
light by a mirror in that the angle of incidence must be equal to the angle of reflection.
However, unlike the reflection of light from a mirror, X-ray diffraction only occurs at specific
orientations of the crystal, when the conditions for constructive interference are satisfied.
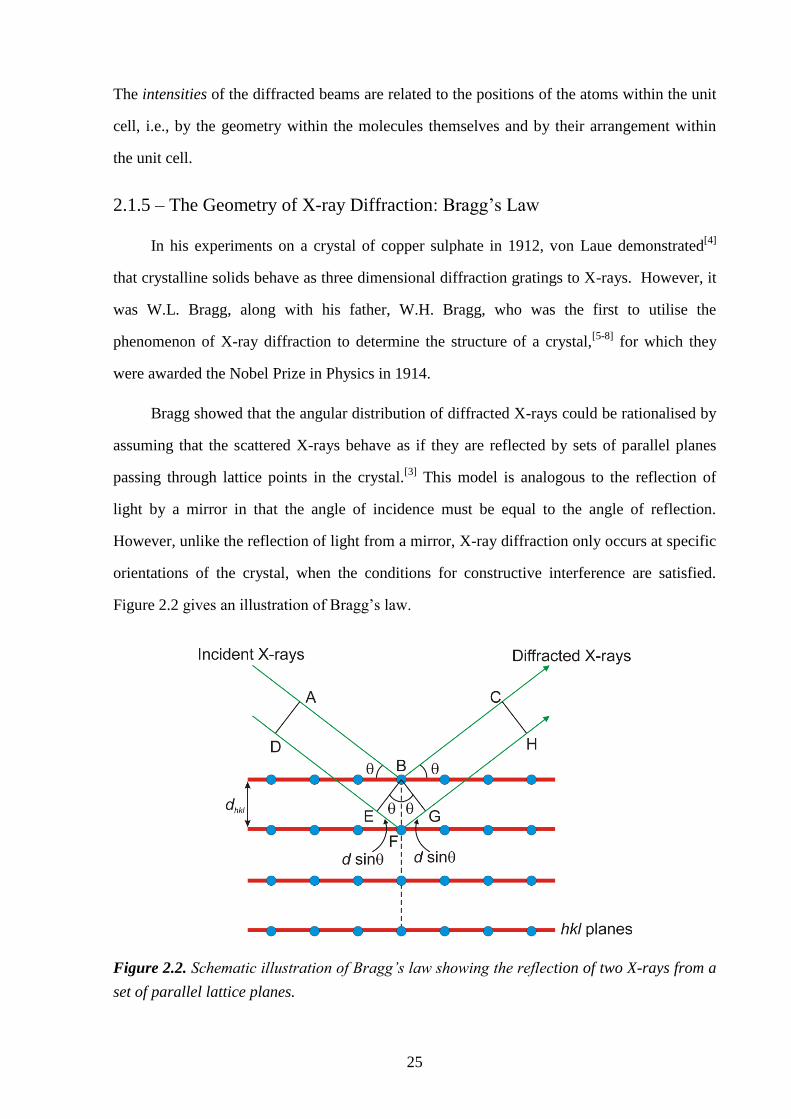
Figure 2.2 gives an illustration of Bragg’s law.
Figure 2.2. Schematic illustration of Bragg’s law showing the reflection of two X-rays from a
set of parallel lattice planes.
26
The diagram (Fig. 2.2) shows a set of parallel lattice planes which are assigned with
Miller indices hkl (defining the orientation of the planes with respect to the unit cell edges)
and an interplanar spacing dhkl, with a parallel beam of X-rays incident to the lattice planes at
an angle θhkl. For the reflected X-ray beams A and D to be diffracted with non-zero intensity,
constructive interference must take place and thus the two diffracted rays must be exactly in
phase with each other. For the rays to stay in phase, the difference in path length between the
two beams (EF + FG) must be equal to an integer number, n, of wavelengths, λ:
Path difference = EF + FG = nλ. (2.1)
From Fig. 2.2 it is clear that
EF = FG = dhklsinθ, (2.2)
and thus
Path difference = nλ = 2dsinθhkl. (2.3)
This is the Bragg equation which describes the geometric conditions that must be fulfilled to
observe a diffracted X-ray beam. For angles other than the Bragg angle, the scattered X-rays
are out of phase with each other and destructive interference occurs. The Bragg equation is
the basis from which the geometry of the unit cell can be determined from the diffraction
pattern.
2.1.6 –The Intensities of Diffracted X-rays: the Structure Factor
The Bragg equation allows the geometry of the unit cell to be obtained from the
geometry of the measured diffraction pattern; however this does not tell us anything about the
arrangement of the atoms within the unit cell. The positions of the atoms (or more precisely
the electron density distribution) within the unit cell are related, not to the geometry, but to
the relative intensities of the peaks in the diffraction pattern. Each reflection in a diffraction
pattern can be associated with an amplitude │F│ (which is proportional to the square root of
the intensity) and a phase φ, both of which depend on the positions of the atoms within the
unit cell. If the amplitudes and phases of each reflection in the diffraction pattern could be
measured then the arrangement of atoms within the unit cell could be calculated automatically
and, together with the unit cell geometry, provide the crystal structure. This relationship
27
between the amplitudes and phases of the reflections and the electron density distribution
within the unit cell is described by the structure factor [Eq. (2.4)]. Before we define the
equations which relate the X-ray diffraction pattern to the crystal structure we first need to
consider some fundamentals.
X-rays interact with the electrons in an atom and thus, as the number of electrons on an
atom increases, it scatters X-rays more strongly. The scattering factor (f) provides a measure
of the scattering effectiveness of an individual atom and depends on the atomic number (i.e.,
the number of electrons), the scattering angle (θ) and the wavelength of radiation. The
scattering factor decreases as the Bragg angle is increased, due to an increase in destructive
interference effects at higher angles. Each symmetry independent atom in the crystal structure
is described by its atomic scattering factor (f), a displacement parameter (U) and three
coordinates specifying its position (x, y, z).
When an object scatters radiation, the scattering pattern is related to the scattering object
by Fourier transformation. Thus, an X-ray diffraction pattern is the Fourier transform of the
crystal structure (the forward Fourier transform) and the crystal structure is the Fourier
transformation of the diffraction pattern (the reverse Fourier transform).
Each reflection (hkl) in a diffraction pattern is the resultant of the waves scattered by all
the individual atoms in the unit cell, in the particular direction specified by (hkl) and is
described by the structure factor F(hkl). The structure factor depends on the position of the
atom within the unit cell and its atomic scattering factor and is given by the forward Fourier
transform:
j
jjjhklj
hklj lzkyhxiU
fhklF )](2exp[sin8
exp)()(2
22
, (2.4)
where fj is the scattering factor for the jth
atom in the unit cell, (xj, yj, zj) are the fractional
coordinates of atom j within the unit cell and Uj is the isotropic displacement parameter of the
atom. This equation can be used to calculate the expected diffraction pattern from any known
crystal structure.
28
The opposite process of determining the electron density ρ(xyz) of a crystal structure
from the diffraction pattern is achieved using the reverse Fourier transform, given in the
expression below:
lkh
lzkyhxihklihklFV
xyz,,
)](2exp[)](exp[)(1
)( , (2.5)
where the terms are the same as Eq. (2.4), except that V is the unit cell volume and ρ is the
electron density. The equation shows that theoretically, information from the diffraction
pattern can be used to obtain the electron density of the crystal structure. However, this cannot
be achieved directly because only the amplitudes │F(hkl)│ of the reflections (derived from
the measured intensities) and not their relative phases are obtained from the experimental
diffraction pattern. This is known as the "phase problem". Since the phases cannot be
measured, they must be calculated and two methods devised to overcome this problem are
discussed very briefly in Section 2.1.7.3.
2.1.7 – Single Crystal X-ray Diffraction
We now consider very briefly how single crystal X-ray diffraction data can be used to
determine the structure of a crystal. A single-crystal X-ray diffraction experiment results in
the detection of series of diffraction spots surrounding the central point of the beam,
corresponding to "reflections" from different lattice planes. Each reflection can be assigned a
set of indices (h, k, l), a relative intensity I, and a value for the scattering angle 2θ. These data
are recorded using a diffractometer, which produces a structure factor amplitude |F(hkl)| for
each measured reflection. Four fundamental steps are involved in structure determination
from single-crystal X-ray diffraction data: (i) obtaining the unit cell geometry, (ii)
determining the symmetry of the structure (Laue group and space group symmetry), (iii)
structure solution and (iv) structure refinement.
2.1.7.1 – Obtaining the Unit Cell Geometry
The six unit cell parameters (a, b, c, α, β, γ) are typically determined from a subset of
high intensity reflections. Indexing of these reflections is performed using indexing programs
based on the Bragg equation, which take into consideration the positions of the diffraction
29
maxima. The calculated lattice parameters are subsequently refined by least squares
refinement.
2.1.7.2 – Determining the Symmetry of the Structure
The correct Laue group (which determines the crystal system) can be assigned by
comparing the intensities of reflections to assess which sets of reflections are symmetry
equivalent (i.e., with the same structure factor amplitudes). Once this has been accomplished,
the correct space group (or a small set of possible space groups) can be assigned by
considering systematic absences. Systematic absences are reflections that have zero intensity,
caused by the presence of translational symmetry elements, like screw axes and glide planes
and by unit cell centring.
2.1.7.3 – Structure Solution
This part of the process involves determining the positions of the atoms in the unit cell,
using the reverse Fourier transform [Eq. (2.5)]. The reverse Fourier transform uses the
amplitudes |F(hkl)| and phases φ of each reflection to determine the electron density
distribution inside the unit cell, and hence the atomic positions. However, although the
intensities (and thereby the amplitudes) can be measured, the relative phases are unknown.
This means that calculation cannot be carried out directly. The two methods most commonly
used for calculating the phases are the Patterson synthesis and Direct methods.
The Patterson synthesis is useful for structures containing a small number of heavy
atoms and involves performing the Fourier transform of the squared amplitudes |F(hkl)|2, with
all the phases set to zero [Eqn. (2.6)]:
lkh
lzkyhxihklFV
xyz,,
2)](2exp[)(
1)( . (2.6)
The Patterson map produced from this procedure resembles an electron density map, but, in
this case the peaks correspond to vectors between pairs of atoms with the strongest peaks
indicating the vectors between the heaviest atoms. Other Fourier methods are often adopted to
locate the positions of the lighter atoms in order to complete the structure. The Patterson map
30
becomes very congested if most of the atoms in the structure have similar atomic numbers
(i.e., in organic structures) and in this case, Direct methods is the preferred approach.
Direct methods uses a statistical approach to try and predict the phases of reflections
just from their measured intensities. The approach is based on the fact that the electron
density within the unit cell represents a positive probability distribution and is concentrated
into certain compact regions. This imposes strict constraints on the relationships of the phases
of different reflections. In Direct methods, the most intense reflections are selected as these
contribute the most to the Fourier transform. The probable relationships between the phases of
these reflections are calculated and a range of different possible phases are trialled to assess
how well they satisfy the probability relationships. Fourier transforms calculated for the most
promising trials are then analysed to see if they correspond to known molecular features.
2.1.7.4 – Structure Refinement
The result of structure solution is to give the approximate positions of the atoms in the
unit cell. Structure refinement involves optimising these positions by least squares refinement,
to find the best agreement between the observed and the calculated diffraction patterns. To do
this, the amplitudes of the observed │Fo│ and calculated │Fc│ diffraction patterns are
compared, as the structural parameters affecting │Fc│ are varied. The parameters usually
refined are the positions (x, y, z) and the vibrations (displacement parameters, U) of the atoms.
Changes made to these parameters inevitably produce changes in │Fc│. The R-factor
("reliability factor"), defined below, gives a measure of the "goodness of fit" between the
calculated and observed data and would typically be less than 5% following structure
refinement.
%100
hkl
hklo
hkl
hklc
hklo
F
FFR (2.7)
2.1.7.5 – Rotation and Oscillation Photographs
Throughout this thesis, single-crystal X-ray diffraction oscillation photography has been
employed as a method for determining the periodic structural properties of inclusion
31
compounds (see Chapter 7). In rotation and oscillation photography, the crystal is mounted on
the goniometer head and is rotated continuously (rotation photograph) or oscillated through a
defined angle (oscillation photograph) around a specific axis in direct space (usually one of
the unit cell axes).[3]
The resultant diffraction pattern, traditionally recorded using a piece of
cylindrical photographic film surrounding the crystal, is now recorded using a CCD detector.
Typically, the crystal is rotated about a direct axis orientated perpendicular to the incident X-
ray beam, for instance the c-axis. In this case, the a*b* reciprocal lattice plane is
perpendicular to the c-axis and hence perpendicular to the axis of rotation. As the crystal is
rotated, successive points along the reciprocal lattice are orientated in a manner which
satisfies the geometrical conditions for diffraction[9]
and Bragg maxima are detected. The
observed diffraction spots lie along a series of diffraction cones which are co-axial with the c-
axis.[10]
If the traditional photographic method is used, the film is unrolled and the diffraction
spots lie on a series of straight lines, which correspond to the points at which the cones of
diffraction intersect the film. If an area detector is used, the lines on the rotation photograph
are slightly curved at higher angles due to the flat face of the detector. The a*b* plane
contains the l = 0 reflections (normal incidence) and the l = 1, 2 etc. reflections lie in
equidistant planes parallel to it and perpendicular to the axis of rotation. These lines of
reflections are known as "layer lines" and the spacing between these layer lines gives, in this
case, the length of c-axis of the unit cell. An example of an oscillation photograph is given in
Fig. 2.3.
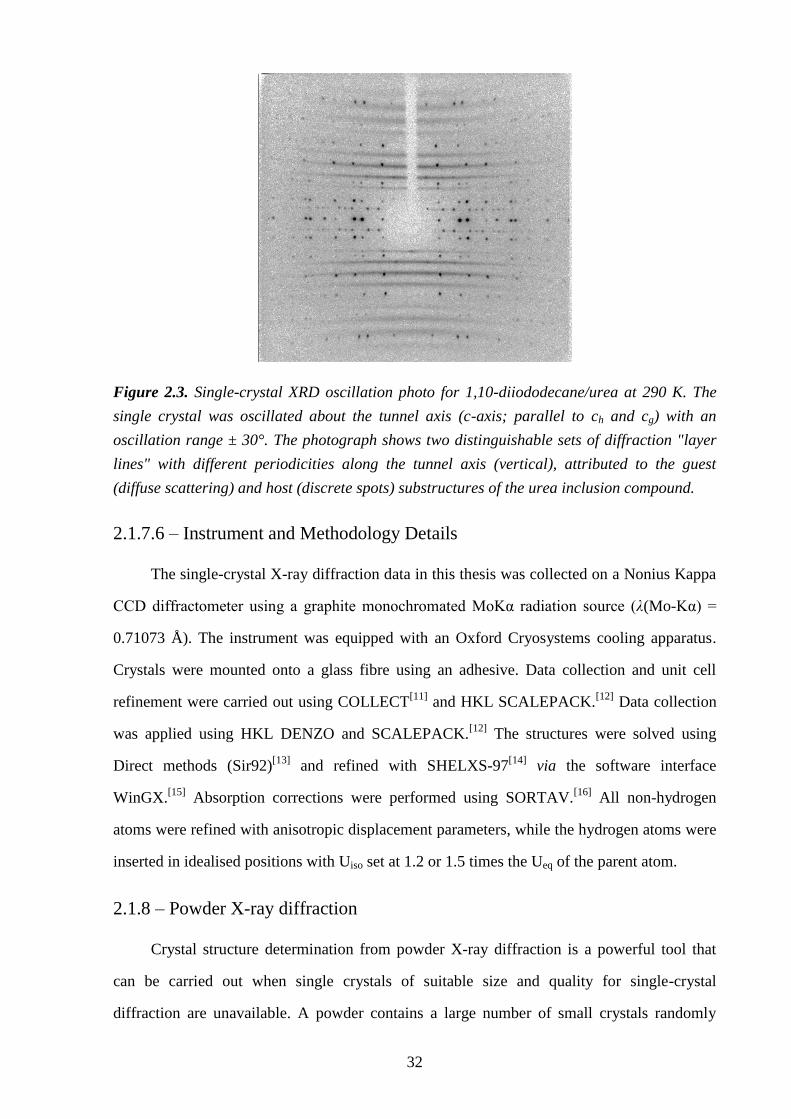
32
Figure 2.3. Single-crystal XRD oscillation photo for 1,10-diiododecane/urea at 290 K. The
single crystal was oscillated about the tunnel axis (c-axis; parallel to ch and cg) with an
oscillation range ± 30°. The photograph shows two distinguishable sets of diffraction "layer
lines" with different periodicities along the tunnel axis (vertical), attributed to the guest
(diffuse scattering) and host (discrete spots) substructures of the urea inclusion compound.
2.1.7.6 – Instrument and Methodology Details
The single-crystal X-ray diffraction data in this thesis was collected on a Nonius Kappa
CCD diffractometer using a graphite monochromated MoKα radiation source (λ(Mo-Kα) =
0.71073 Å). The instrument was equipped with an Oxford Cryosystems cooling apparatus.
Crystals were mounted onto a glass fibre using an adhesive. Data collection and unit cell
refinement were carried out using COLLECT[11]
and HKL SCALEPACK.[12]
Data collection
was applied using HKL DENZO and SCALEPACK.[12]
The structures were solved using
Direct methods (Sir92)[13]
and refined with SHELXS-97[14]
via the software interface
WinGX.[15]
Absorption corrections were performed using SORTAV.[16]
All non-hydrogen
atoms were refined with anisotropic displacement parameters, while the hydrogen atoms were
inserted in idealised positions with Uiso set at 1.2 or 1.5 times the Ueq of the parent atom.
2.1.8 – Powder X-ray diffraction
Crystal structure determination from powder X-ray diffraction is a powerful tool that
can be carried out when single crystals of suitable size and quality for single-crystal
diffraction are unavailable. A powder contains a large number of small crystals randomly
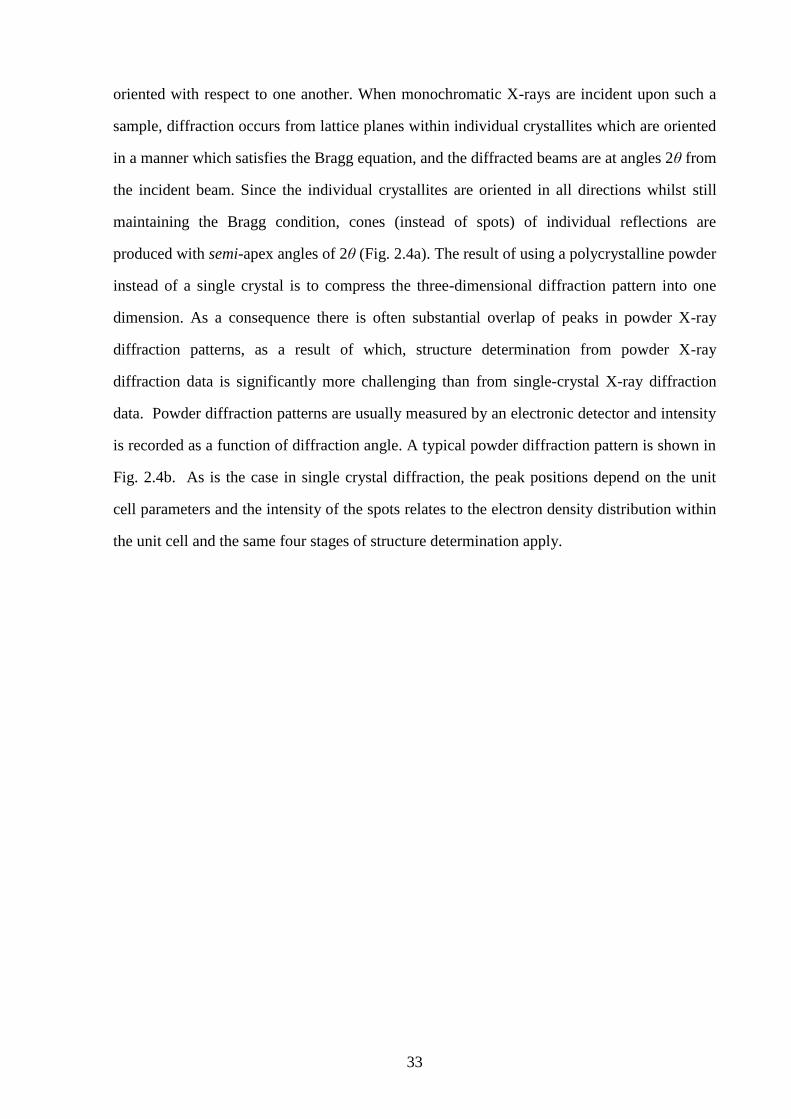
33
oriented with respect to one another. When monochromatic X-rays are incident upon such a
sample, diffraction occurs from lattice planes within individual crystallites which are oriented
in a manner which satisfies the Bragg equation, and the diffracted beams are at angles 2θ from
the incident beam. Since the individual crystallites are oriented in all directions whilst still
maintaining the Bragg condition, cones (instead of spots) of individual reflections are
produced with semi-apex angles of 2θ (Fig. 2.4a). The result of using a polycrystalline powder
instead of a single crystal is to compress the three-dimensional diffraction pattern into one
dimension. As a consequence there is often substantial overlap of peaks in powder X-ray
diffraction patterns, as a result of which, structure determination from powder X-ray
diffraction data is significantly more challenging than from single-crystal X-ray diffraction
data. Powder diffraction patterns are usually measured by an electronic detector and intensity
is recorded as a function of diffraction angle. A typical powder diffraction pattern is shown in
Fig. 2.4b. As is the case in single crystal diffraction, the peak positions depend on the unit
cell parameters and the intensity of the spots relates to the electron density distribution within
the unit cell and the same four stages of structure determination apply.
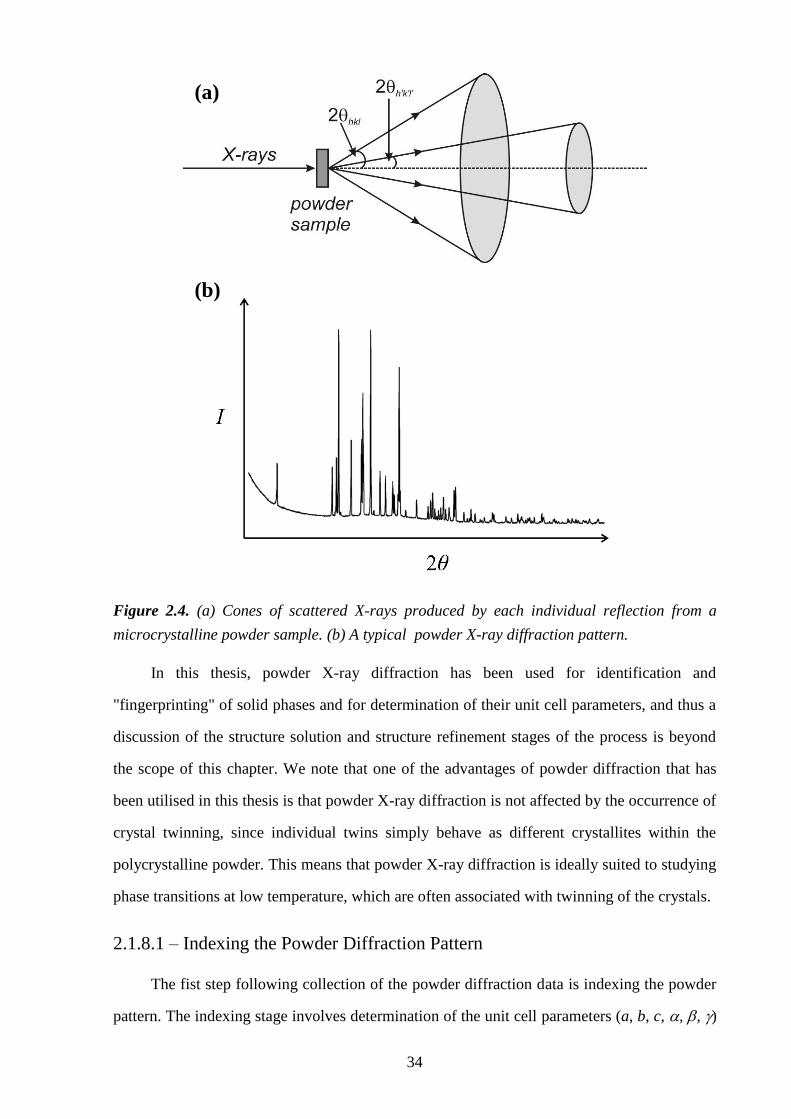
34
Figure 2.4. (a) Cones of scattered X-rays produced by each individual reflection from a
microcrystalline powder sample. (b) A typical powder X-ray diffraction pattern.
In this thesis, powder X-ray diffraction has been used for identification and
"fingerprinting" of solid phases and for determination of their unit cell parameters, and thus a
discussion of the structure solution and structure refinement stages of the process is beyond
the scope of this chapter. We note that one of the advantages of powder diffraction that has
been utilised in this thesis is that powder X-ray diffraction is not affected by the occurrence of
crystal twinning, since individual twins simply behave as different crystallites within the
polycrystalline powder. This means that powder X-ray diffraction is ideally suited to studying
phase transitions at low temperature, which are often associated with twinning of the crystals.
2.1.8.1 – Indexing the Powder Diffraction Pattern
The fist step following collection of the powder diffraction data is indexing the powder
pattern. The indexing stage involves determination of the unit cell parameters (a, b, c, , , )
(b)
(a)
35
using one of a range of auto-indexing programs, such as ITO,[17]
TREOR,[18]
DICVOL[19]
and
a Genetic algorithm program developed in the Harris group.[20]
These programs primarily
consider the peaks at low diffraction angles as peak overlap at high angles is considerable.
Once the correct unit cell parameters have been determined, the space group can be assigned
by examining systematic absences.
2.8.1.2 – Unit Cell Refinement
The Le Bail method[21]
is used to refine the unit cell parameters obtained from indexing,
if a high degree of accuracy is required. This method involves profile fitting of the diffraction
peaks and is operated in the GSAS program package.[22]
In Le Bail fitting, an approximate set
of lattice parameters together with the space group are input into the program. These values
give a predicted (calculated) set of peak profiles which are compared to the experimental
(observed) peak profiles using least squares refinement, from which a measure of the
"goodness of fit" is assigned (the profile R-factor, Rp or the weighted profile R-factor, Rwp).
The input lattice parameters, peak profiles, zero shift and background are then varied
iteratively to obtain the best fit between the observed and calculated data. It is important to
note that in the Le Bail fitting procedure, the intensities of the diffraction peaks are arbitrary
and are treated as "fittable" parameters. This is the fundamental difference between Le Bail
fitting and Rietveld refinement[23, 24]
which is used for structure refinement, for which the
intensities of the peaks are dependent on the structural parameters.
36
2.2 – Raman Spectroscopy
The fundamental physical basis of Raman spectroscopy is the inelastic scattering of
light, hence it is sometimes referred to as Raman scattering. The Raman effect was
discovered by Sir C. V. Raman in 1928 and has since been widely applied to study the
vibrational and rotational properties of molecules. In this thesis, the technique of Raman
microspectrometry has been employed to map the chemical composition of urea inclusion
compounds containing binary mixtures of guest molecules (Chapter 3). Sections 2.2.1 to 2.2.3
consider some of the fundamentals of Raman spectroscopy, which provide the theoretical
background for the more specialised technique of Raman microspectrometry discussed in
Section 2.2.4.
2.2.1 – Rayleigh, Stokes and Anti-Stokes Scattering
When incident photons of radiation collide with molecules they can be scattered and if
the collision is perfectly elastic, the energy of the scattered radiation is equal to the energy of
the incident radiation (Rayleigh scattering). This is the overwhelmingly most probable
outcome of any collision event.[25, 26]
However, photons can also collide with molecules
inelastically, whereupon the photons impart some of their energy to the molecule and emerge
with energy Eh . These scattered photons constitute the lower-frequency Stokes
radiation. Photons can also undergo collisions in which they receive energy from a molecule
in a vibrationally excited state and emerge with energy Eh . These scattered photons
constitute the higher-frequency anti-Stokes radiation. This inelastically scattered radiation is
known as Raman scattering, and the intensity measured as a function of scattering angle. The
improbability of the inelastic scattering events explains the low intensity Raman signals
typically observed in experiments. Typically, Stokes radiation is significantly more intense
than anti-Stokes radiation, since the majority of molecules occupy the ground state rather than
excited states at thermal equilibrium.
In Stokes and anti-Stokes scattering, incident radiation induces excitation to a higher
short-lived "virtual energy state" (actually a wide range of band-like energy states) before
irradiation and relaxation to a different vibrational energy state takes place. Fig. 2.5 shows a
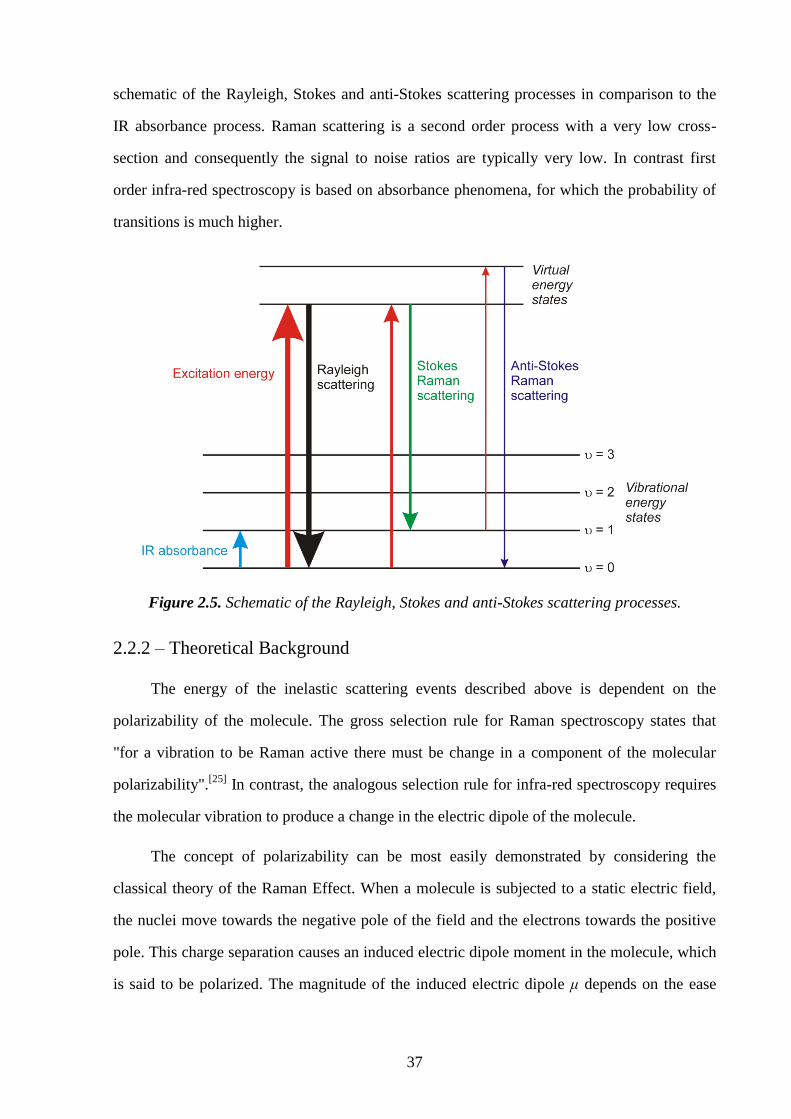
37
schematic of the Rayleigh, Stokes and anti-Stokes scattering processes in comparison to the
IR absorbance process. Raman scattering is a second order process with a very low cross-
section and consequently the signal to noise ratios are typically very low. In contrast first
order infra-red spectroscopy is based on absorbance phenomena, for which the probability of
transitions is much higher.
Figure 2.5. Schematic of the Rayleigh, Stokes and anti-Stokes scattering processes.
2.2.2 – Theoretical Background
The energy of the inelastic scattering events described above is dependent on the
polarizability of the molecule. The gross selection rule for Raman spectroscopy states that
"for a vibration to be Raman active there must be change in a component of the molecular
polarizability".[25]
In contrast, the analogous selection rule for infra-red spectroscopy requires
the molecular vibration to produce a change in the electric dipole of the molecule.
The concept of polarizability can be most easily demonstrated by considering the
classical theory of the Raman Effect. When a molecule is subjected to a static electric field,
the nuclei move towards the negative pole of the field and the electrons towards the positive
pole. This charge separation causes an induced electric dipole moment in the molecule, which
is said to be polarized. The magnitude of the induced electric dipole μ depends on the ease
38
with which a molecule can be distorted α (the polarizability), and on the magnitude of the
external field, E:
E . (2.8)
The degree with which a molecule becomes polarized will also depend on the orientation of
the molecule with respect to the applied field. This is because the electrons involved in the
bond will be more easily displaced when the field is applied along the bond axis than when it
is applied across the bond axis, and thus the polarizability is said to be anisotropic. In a
homonuclear diatomic molecule, the induced dipole moment for a given field applied along
the axis is about twice as large as when the same field is applied across the axis.
If a beam of radiation of frequency ν is incident upon a sample of such molecules, the
electric field, E, experienced by each molecule varies according to
tEE 2sin0 , (2.9)
where E0 is the magnitude of the applied field. This means that the induced dipole µ also
undergoes oscillations with a frequency ν:
tEE sin0 . (2.10)
This equation constitutes the classical explanation of Rayleigh scattering, describing an
oscillating dipole which emits radiation of its own oscillation frequency.
However, if the molecule also undergoes a vibration or a rotation that causes a change
in the polarizability, then the vibrational oscillation will be superimposed upon the oscillating
dipole. For a vibration of frequency νvib in which the polarizability is changed, then
tvib 2sin0 , (2.11)
where α0 represents the equilibrium polarizability and β is the rate of change of polarizability
with the vibration, and since:
E , (2.8)
then tEtvib 2sin)2sin( 00 . (2.12)
This expression can be expanded using the following trigonometric relation:
)}cos(){cos(sinsin 21 BABABA , (2.13)
39
and thus Eq. (2.13) can be re-written
})(2cos)(2{cos2sin 021
00 ttEtE vibvib . (2.14)
Thus, the oscillating dipole has components from both the exciting frequency ν and from
frequencies ν ± νvib. If there is no change in the polarizability of the molecule as a result of the
vibration, then β = 0 and the dipole will oscillate at the same frequency as the incident
radiation. This leads to the gross selection rule, which states that a rotation or vibration is only
Raman active if it is accompanied by a change in the molecular polarizability.
2.2.3 – Raman Spectra
For every vibrational mode, the following general energy expression can be written
(derived from the harmonic oscillator approximation):
2
21
21 )()( eee (ν = 0, 1, 2, …), (2.15)
where e is the vibrational frequency at equilibrium in wavenumbers and χe is the
anharmonicity constant. The selection rule for Raman spectroscopy states that
Δν = 0, ±1, ±2,… (2.16)
In Raman spectroscopy, the scattered light is of very low intensity and therefore only the
fundamental vibrational transitions (ν = 0 → ν = 1) are observed with high intensity. We can
obtain an expression for the fundamental transition energy by applying the selection rule Eq.
(2.16) to the energy level equation [Eq. (2.15)]:
ν = 0 → ν = 1: )21( eelFundamenta . (2.17)
Therefore, one would expect Raman lines to be observed at distances from the exciting line
which correspond to the active fundamental vibrations, such that:
lFundamentaexlFundamenta . . (2.18)
The minus sign in this equation represents the Stokes lines (for which a molecule has received
energy from the incident radiation and has been excited to the higher ν = 1 vibrational energy
state) and the plus sign represents the weaker intensity anti-Stokes lines (for which a molecule
in a higher vibrational state ν = 1 decays to ν = 0 and imparts energy to the radiation).
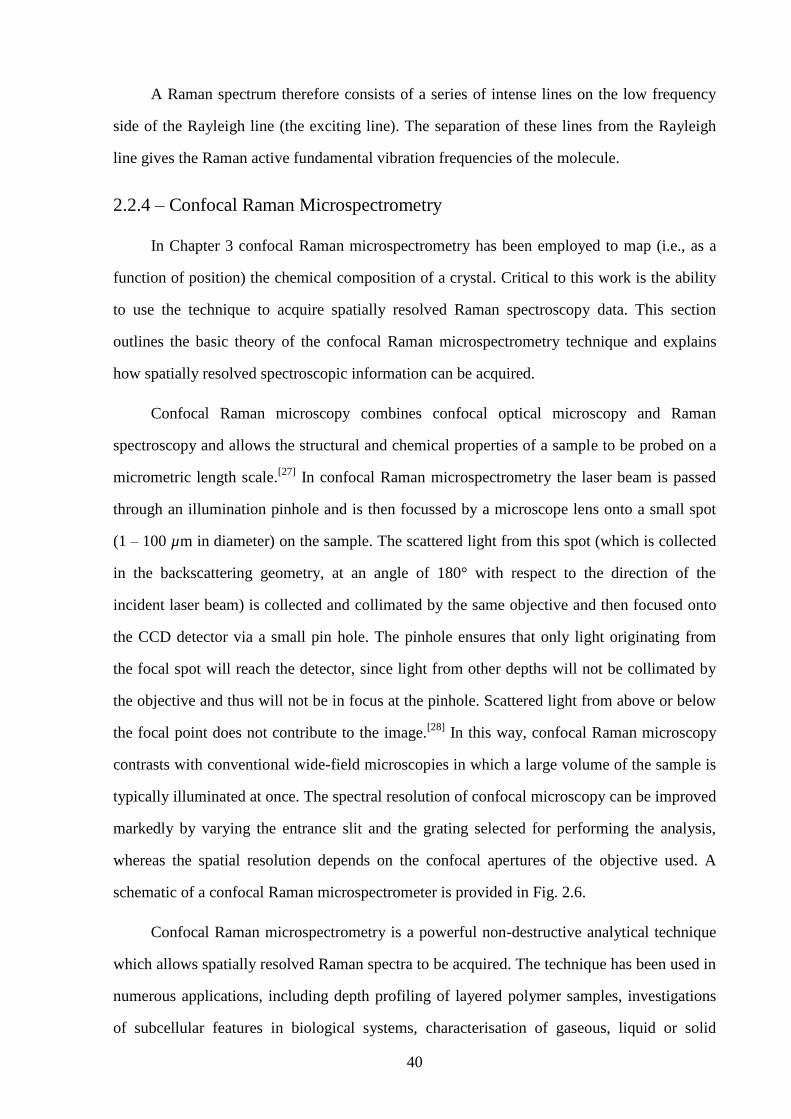
40
A Raman spectrum therefore consists of a series of intense lines on the low frequency
side of the Rayleigh line (the exciting line). The separation of these lines from the Rayleigh
line gives the Raman active fundamental vibration frequencies of the molecule.
2.2.4 – Confocal Raman Microspectrometry
In Chapter 3 confocal Raman microspectrometry has been employed to map (i.e., as a
function of position) the chemical composition of a crystal. Critical to this work is the ability
to use the technique to acquire spatially resolved Raman spectroscopy data. This section
outlines the basic theory of the confocal Raman microspectrometry technique and explains
how spatially resolved spectroscopic information can be acquired.
Confocal Raman microscopy combines confocal optical microscopy and Raman
spectroscopy and allows the structural and chemical properties of a sample to be probed on a
micrometric length scale.[27]
In confocal Raman microspectrometry the laser beam is passed
through an illumination pinhole and is then focussed by a microscope lens onto a small spot
(1 – 100 µm in diameter) on the sample. The scattered light from this spot (which is collected
in the backscattering geometry, at an angle of 180° with respect to the direction of the
incident laser beam) is collected and collimated by the same objective and then focused onto
the CCD detector via a small pin hole. The pinhole ensures that only light originating from
the focal spot will reach the detector, since light from other depths will not be collimated by
the objective and thus will not be in focus at the pinhole. Scattered light from above or below
the focal point does not contribute to the image.[28]
In this way, confocal Raman microscopy
contrasts with conventional wide-field microscopies in which a large volume of the sample is
typically illuminated at once. The spectral resolution of confocal microscopy can be improved
markedly by varying the entrance slit and the grating selected for performing the analysis,
whereas the spatial resolution depends on the confocal apertures of the objective used. A
schematic of a confocal Raman microspectrometer is provided in Fig. 2.6.
Confocal Raman microspectrometry is a powerful non-destructive analytical technique
which allows spatially resolved Raman spectra to be acquired. The technique has been used in
numerous applications, including depth profiling of layered polymer samples, investigations
of subcellular features in biological systems, characterisation of gaseous, liquid or solid
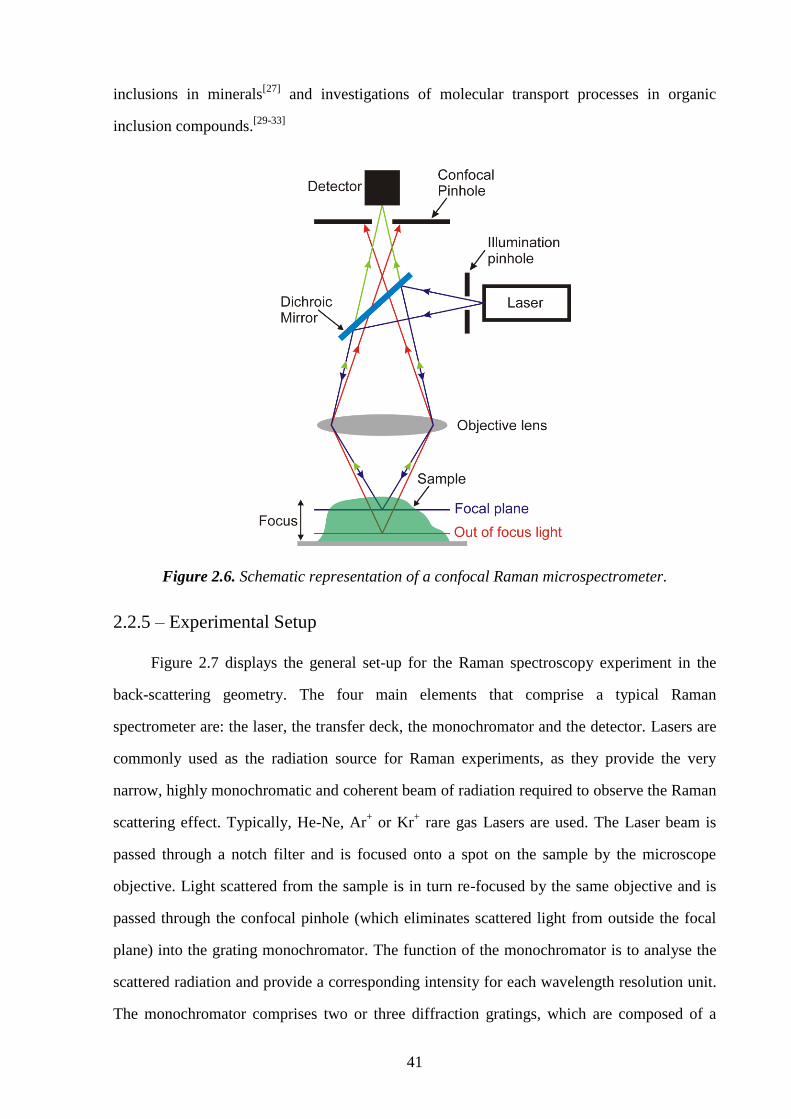
41
inclusions in minerals[27]
and investigations of molecular transport processes in organic
inclusion compounds.[29-33]
Figure 2.6. Schematic representation of a confocal Raman microspectrometer.
2.2.5 – Experimental Setup
Figure 2.7 displays the general set-up for the Raman spectroscopy experiment in the
back-scattering geometry. The four main elements that comprise a typical Raman
spectrometer are: the laser, the transfer deck, the monochromator and the detector. Lasers are
commonly used as the radiation source for Raman experiments, as they provide the very
narrow, highly monochromatic and coherent beam of radiation required to observe the Raman
scattering effect. Typically, He-Ne, Ar+ or Kr
+ rare gas Lasers are used. The Laser beam is
passed through a notch filter and is focused onto a spot on the sample by the microscope
objective. Light scattered from the sample is in turn re-focused by the same objective and is
passed through the confocal pinhole (which eliminates scattered light from outside the focal
plane) into the grating monochromator. The function of the monochromator is to analyse the
scattered radiation and provide a corresponding intensity for each wavelength resolution unit.
The monochromator comprises two or three diffraction gratings, which are composed of a
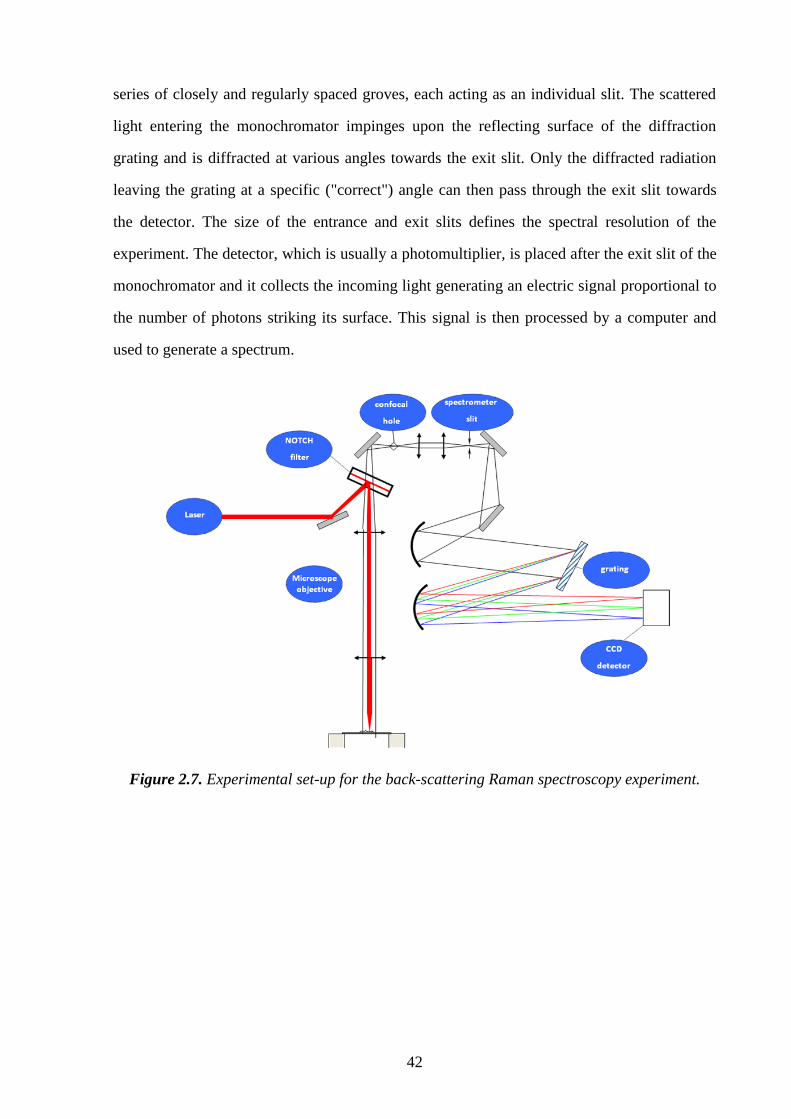
42
series of closely and regularly spaced groves, each acting as an individual slit. The scattered
light entering the monochromator impinges upon the reflecting surface of the diffraction
grating and is diffracted at various angles towards the exit slit. Only the diffracted radiation
leaving the grating at a specific ("correct") angle can then pass through the exit slit towards
the detector. The size of the entrance and exit slits defines the spectral resolution of the
experiment. The detector, which is usually a photomultiplier, is placed after the exit slit of the
monochromator and it collects the incoming light generating an electric signal proportional to
the number of photons striking its surface. This signal is then processed by a computer and
used to generate a spectrum.
Figure 2.7. Experimental set-up for the back-scattering Raman spectroscopy experiment.
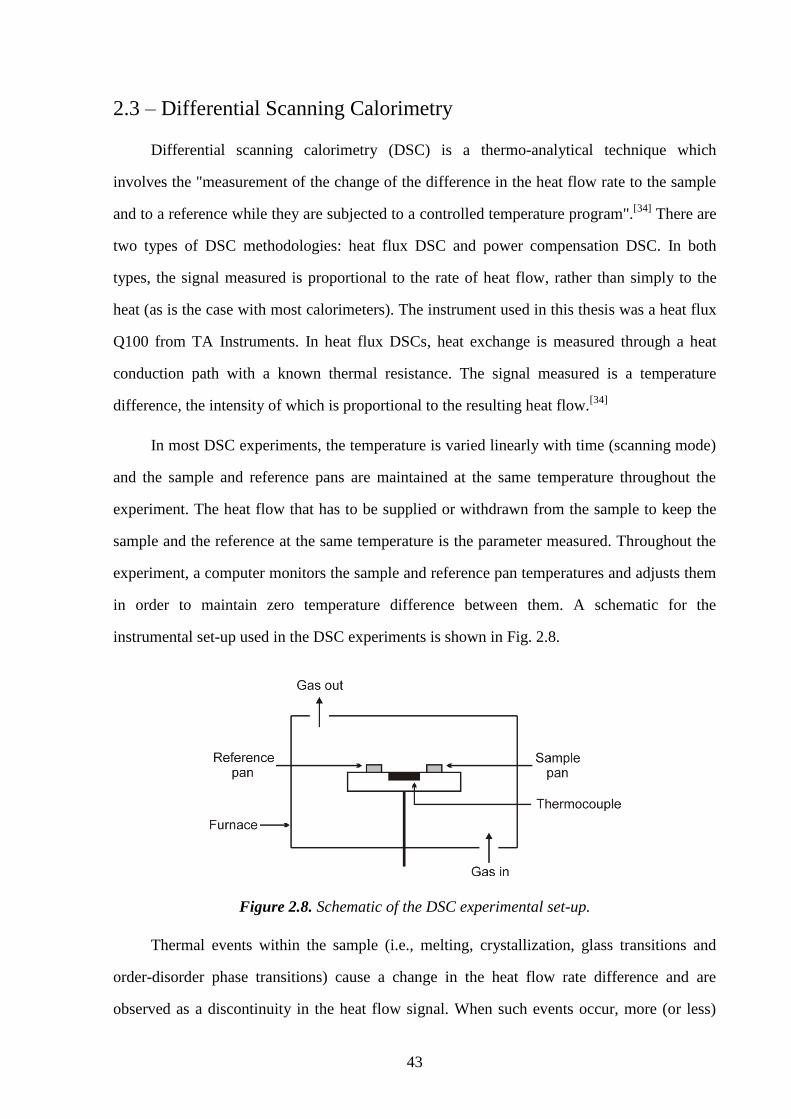
43
2.3 – Differential Scanning Calorimetry
Differential scanning calorimetry (DSC) is a thermo-analytical technique which
involves the "measurement of the change of the difference in the heat flow rate to the sample
and to a reference while they are subjected to a controlled temperature program".[34]
There are
two types of DSC methodologies: heat flux DSC and power compensation DSC. In both
types, the signal measured is proportional to the rate of heat flow, rather than simply to the
heat (as is the case with most calorimeters). The instrument used in this thesis was a heat flux
Q100 from TA Instruments. In heat flux DSCs, heat exchange is measured through a heat
conduction path with a known thermal resistance. The signal measured is a temperature
difference, the intensity of which is proportional to the resulting heat flow.[34]
In most DSC experiments, the temperature is varied linearly with time (scanning mode)
and the sample and reference pans are maintained at the same temperature throughout the
experiment. The heat flow that has to be supplied or withdrawn from the sample to keep the
sample and the reference at the same temperature is the parameter measured. Throughout the
experiment, a computer monitors the sample and reference pan temperatures and adjusts them
in order to maintain zero temperature difference between them. A schematic for the
instrumental set-up used in the DSC experiments is shown in Fig. 2.8.
Figure 2.8. Schematic of the DSC experimental set-up.
Thermal events within the sample (i.e., melting, crystallization, glass transitions and
order-disorder phase transitions) cause a change in the heat flow rate difference and are
observed as a discontinuity in the heat flow signal. When such events occur, more (or less)
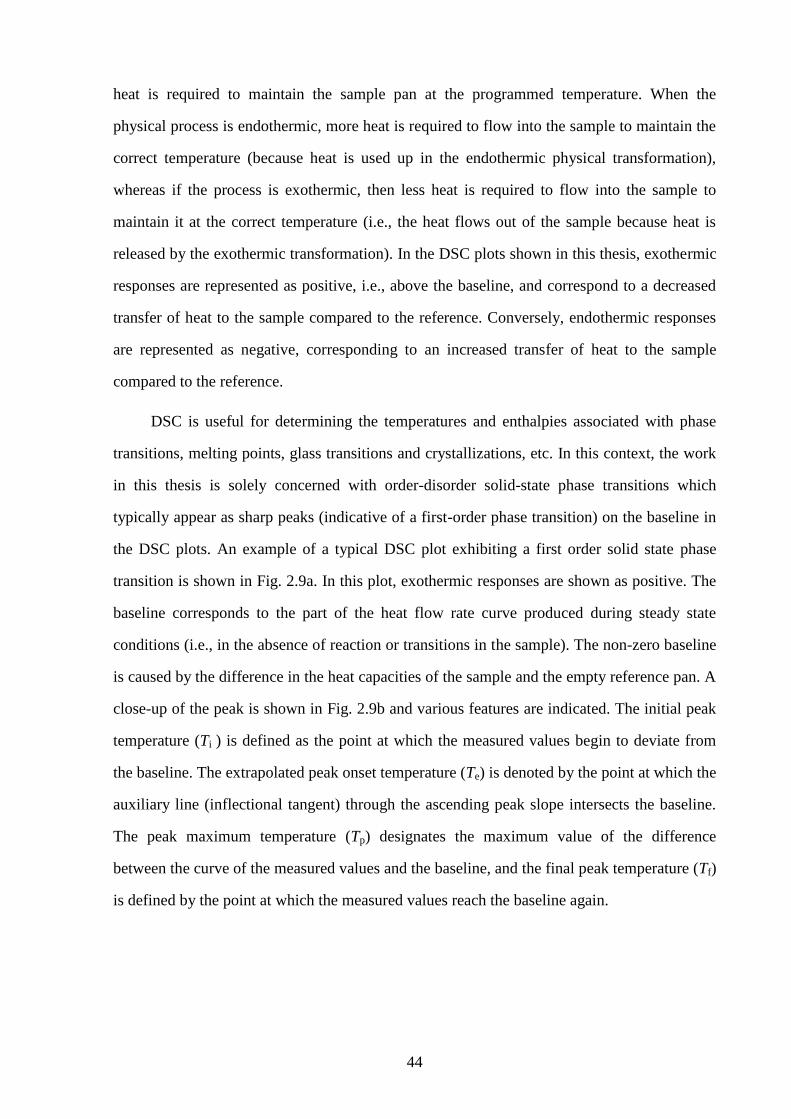
44
heat is required to maintain the sample pan at the programmed temperature. When the
physical process is endothermic, more heat is required to flow into the sample to maintain the
correct temperature (because heat is used up in the endothermic physical transformation),
whereas if the process is exothermic, then less heat is required to flow into the sample to
maintain it at the correct temperature (i.e., the heat flows out of the sample because heat is
released by the exothermic transformation). In the DSC plots shown in this thesis, exothermic
responses are represented as positive, i.e., above the baseline, and correspond to a decreased
transfer of heat to the sample compared to the reference. Conversely, endothermic responses
are represented as negative, corresponding to an increased transfer of heat to the sample
compared to the reference.
DSC is useful for determining the temperatures and enthalpies associated with phase
transitions, melting points, glass transitions and crystallizations, etc. In this context, the work
in this thesis is solely concerned with order-disorder solid-state phase transitions which
typically appear as sharp peaks (indicative of a first-order phase transition) on the baseline in
the DSC plots. An example of a typical DSC plot exhibiting a first order solid state phase
transition is shown in Fig. 2.9a. In this plot, exothermic responses are shown as positive. The
baseline corresponds to the part of the heat flow rate curve produced during steady state
conditions (i.e., in the absence of reaction or transitions in the sample). The non-zero baseline
is caused by the difference in the heat capacities of the sample and the empty reference pan. A
close-up of the peak is shown in Fig. 2.9b and various features are indicated. The initial peak
temperature (Ti ) is defined as the point at which the measured values begin to deviate from
the baseline. The extrapolated peak onset temperature (Te) is denoted by the point at which the
auxiliary line (inflectional tangent) through the ascending peak slope intersects the baseline.
The peak maximum temperature (Tp) designates the maximum value of the difference
between the curve of the measured values and the baseline, and the final peak temperature (Tf)
is defined by the point at which the measured values reach the baseline again.
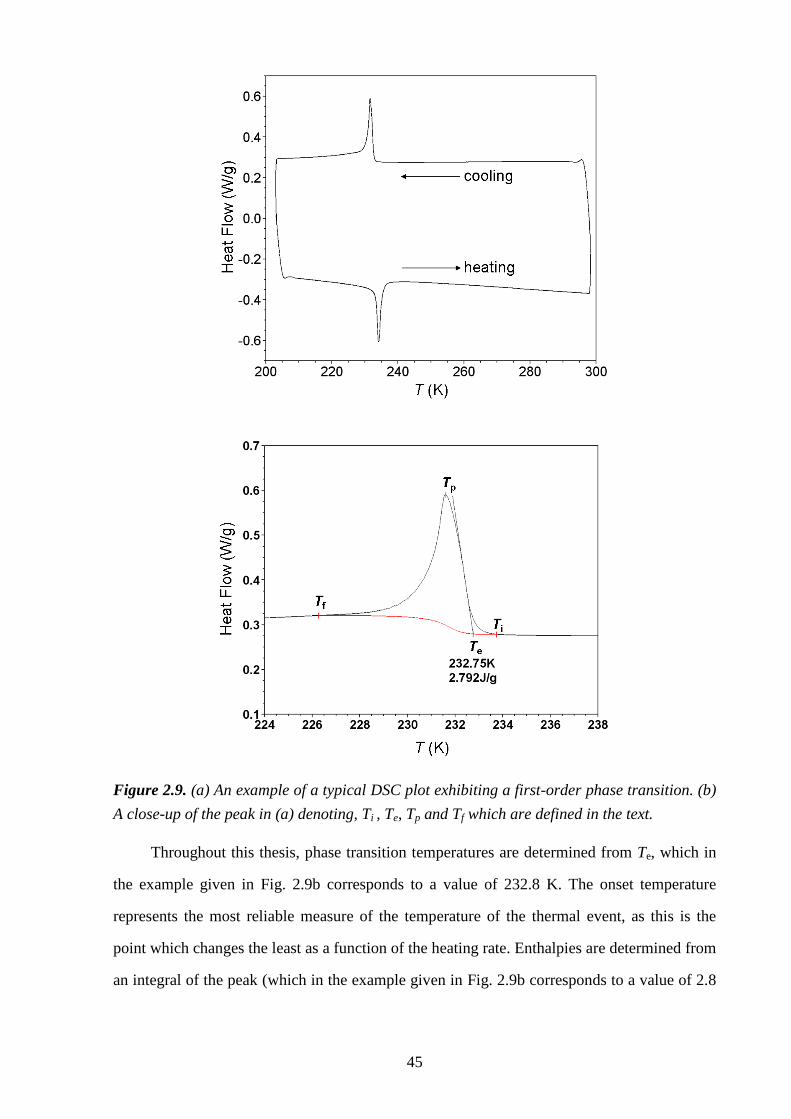
45
Figure 2.9. (a) An example of a typical DSC plot exhibiting a first-order phase transition. (b)
A close-up of the peak in (a) denoting, Ti , Te, Tp and Tf which are defined in the text.
Throughout this thesis, phase transition temperatures are determined from Te, which in
the example given in Fig. 2.9b corresponds to a value of 232.8 K. The onset temperature
represents the most reliable measure of the temperature of the thermal event, as this is the
point which changes the least as a function of the heating rate. Enthalpies are determined from
an integral of the peak (which in the example given in Fig. 2.9b corresponds to a value of 2.8
46
J/g) and from our experience those quoted in this thesis are of more qualitative than
quantitative significance.
47
2.4 – References
[1] L. Smart and E. Moore, Solid State Chemistry, An Introduction, Second Edition,
Chapman & Hall, London, 1995.
[2] W. Clegg, Crystal Structure Determination, Oxford University Press, Oxford, 1998.
[3] J. P. Glusker and K. N. Trueblood, Crystal Structure Analysis, A Primer, Second
Edition, Oxford University Press, Oxford, 1985.
[4] M. von-Laue, Sitz. math. phys. Klasse Bayer. Akad. Wiss. 1912, 303.
[5] W. L. Bragg, Proc. Camb. Phil. Soc. 1913, 17, 43.
[6] W. H. Bragg, Philosophical Magazine 1915, 30, 305.
[7] W. L. Bragg, Philosophical Magazine 1914, 28, 355.
[8] W. H. Bragg, Philosophical Magazine 1914, 27, 881.
[9] G. H. Stout and L. H. Jensen, X-Ray Structure Determination: A Practical Guide,
Second Edition, John Wiley & Sons, New York, 1989.
[10] M. M. Woolfson, An Introduction to X-ray Crystallography, First Edition, Cambridge
University Press, Cambridge, 1970.
[11] Nonius (1998), COLLECT, Nonius BV, Delft, The Netherlands.
[12] Z. Otwinowski, W. Minor, in Methods in Enzymology, Macromolecular
Crystallography, Part A (Eds.: C. W. Carter Jr, R. M. Sweet), Academic Press: New
York, 1997, Vol. 276, p. 307.
[13] A. Altomare, G. Cascarano, C. Giacovazzo, A. Guagliardi, J. Appl. Crystallogr. 1993,
26, 343.
[14] G. M. Sheldrick, Acta Crystallogr. Sect. A 2008, 64, 112.
[15] L. J. Farrugia, J. Appl. Crystallogr. 1999, 32, 837.
[16] R. H. Blessing, Acta Crystallogr. Sect A 1995, 51, 33.
[17] J. W. Visser, J. Appl. Crystallogr. 1969, 2, 89.
[18] P. E. Werner, L. Eriksson, M. Westdahl, J. Appl. Crystallogr. 1985, 18, 367.
[19] A. Boultif, D. Louër, J. Appl. Crystallogr. 1991, 24, 987.
[20] B. M. Kariuki, S. A. Belmonte, M. I. McMahon, R. L. Johnston, K. D. M. Harris, R. J.
Nelmes, J. Synchrotron Rad. 1999, 6, 87.
[21] A. Le Bail, H. Duroy, J. L. Fourquet, Mater. Res. Bull. 1988, 23, 447.
[22] A. C. Larson, R. B. V. Dreele, in Los Alamos Laboratory Report No. LA-UR-86-748,
Los Alamos National Laboratory, Los Alamos, NM, 1987.
[23] H. M. Rietveld, J. Appl. Crystallogr. 1969, 2, 65.
[24] R. A. Young, The Rietveld Method, IUCr/Oxford University Press, Oxford, 1993, p.
298.
[25] C. N. Banwell and E. M. McCash, Fundamentals of Molecular Spectroscopy, Fourth
Edition, McGraw-Hill, London, 1994.
[26] P. W. Atkins, Physical Chemistry, Fourth Edition, Oxford University Press, Oxford,
1990.
[27] J. L. Bruneel, J. C. Lassègues, C. Sourisseau, J. Raman Spectrosc. 2002, 33, 815.
[28] K. R. Allakhverdiev, D. Lovera, V. Altstadt, P. Schreier, L. Kador, Reviews on
Advanced Materials Science 2009, 20, 77.
48
[29] J. Marti-Rujas, A. Desmedt, K. D. M. Harris, F. Guillaume, J. Am. Chem. Soc. 2004,
126, 11124.
[30] J. Marti-Rujas, K. D. M. Harris, A. Desmedt, F. Guillaume, J. Phys. Chem. B 2006,
110, 10708.
[31] J. Marti-Rujas, K. D. M. Harris, A. Desmedt, Mol. Cryst. Liq. Cryst. 2006, 456, 139.
[32] J. Marti-Rujas, A. Desmedt, K. D. M. Harris, F. Guillaume, J. Phys. Chem. B 2007,
111, 12339.
[33] J. Marti-Rujas, A. Desmedt, K. D. M. Harris, F. Guillaume, J. Phys. Chem. C 2009,
113, 736.
[34] G. W. H. Höhne, W. F. Hemminger and H.-J. Fammersheim, Differential Scanning
Calorimetry, Second Edition, Springer-Verlag, Berlin, 2003.
49
Chapter 3 – A Strategy for Retrospectively Mapping
the Growth History of Crystals
3.1 – Abstract
In this chapter, a novel strategy for retrospectively mapping the growth history of a
crystal is presented. The experimental strategy allows insights to be gained on the evolution
of crystal growth processes by analysis of crystals recovered at the end of the crystallization
process. The feasibility of the strategy is demonstrated by considering the crystal growth of a
urea inclusion compound containing a binary mixture of guest molecules. In this case, the
composition of the growing surfaces of the crystal varies in a well-defined manner as a
function of time during the growth process, because the two types of guest compete for
inclusion within the host structure during crystal growth. After collecting a crystal at the end
of the growth process, the spatial distribution of composition within the crystal is measured
(using confocal Raman microspectrometry) and is interpreted to reveal details of the evolution
of crystal growth. Thus, a three-dimensional contour at a specific value of composition Ci
within the crystal, defines the three-dimensional shape of the crystal at the specific time
during the growth process at which the composition of the growing surfaces of the crystal was
C(t) = Ci. Contours corresponding to different values of Ci thus provide a representation of the
changes that occurred in the shape of the crystal as a function of time during growth. In some
respects, the approach is analogous to establishing the growth characteristics of a tree
retrospectively by observing the spatial variation of the rings of the tree (i.e.,
dendrochronology).
3.2 – Introduction
Crystal growth processes[1-7]
are ubiquitous in nature and play a crucial role in many
chemical and industrial contexts. To be able to optimize and ultimately control crystal growth
in such contexts, it is essential to establish an understanding of the sequence of events
involved in the growth process, rather than simply studying the morphological and structural
properties of the bulk crystals collected at the end of the crystallization. Knowledge of how
50
crystals actually evolve during growth can be established directly by applying experimental
techniques that allow crystal growth processes to be monitored in situ,[8-14]
but for a variety of
reasons, in situ studies may not be viable in many cases (e.g. due to limitations arising from
the crystallization apparatus, the specific experimental conditions required, or the timescales
involved).
For these reasons, we were motivated to devise a strategy that would allow insights to
be gained on the evolution of crystal growth processes, based not on in situ measurements but
based instead on the analysis of crystals recovered at the end of the process. This chapter
demonstrates the feasibility of a strategy that allows the growth history of a crystal to be
established retrospectively, after the crystal has been collected at the end of the crystallization
process.
The strategy is based on a crystallization system for which the composition C of the
growing surfaces of the crystal varies as a function of time C(t) during the growth process,
while the crystal structure remains constant with time. After collecting the crystal at the end
of the growth process, the distribution of composition C(x,y,z) within the crystal is measured
and is interpreted to reveal details of the evolution of crystal growth. Thus, a three-
dimensional contour at a specific value of composition C(x,y,z) = Ci within the crystal defines
the three-dimensional shape of the crystal at the specific time during the growth process at
which the composition of the growing surfaces of the crystal was C(t) = Ci. Three dimensional
contours corresponding to different values of Ci thus provide a representation of the changes
that occurred in the shape of the crystal as a function of time during growth. In some respects,
the approach is analogous to establishing the growth characteristics of a tree retrospectively
by observing the spatial variation of the rings of the tree (i.e., dendrochronology).
Solid inclusion compounds containing binary mixtures of guest molecules within a host
tunnel structure represent an ideal system for implementing the general strategy outlined
above. Variation of composition in this case arises because the two types of guest compete for
inclusion within the host structure during crystal growth, such that the relative proportions of
the two types of guest incorporated into the crystal vary in a well–defined manner as a
function of time. The host tunnel structure is independent of the relative proportions of the
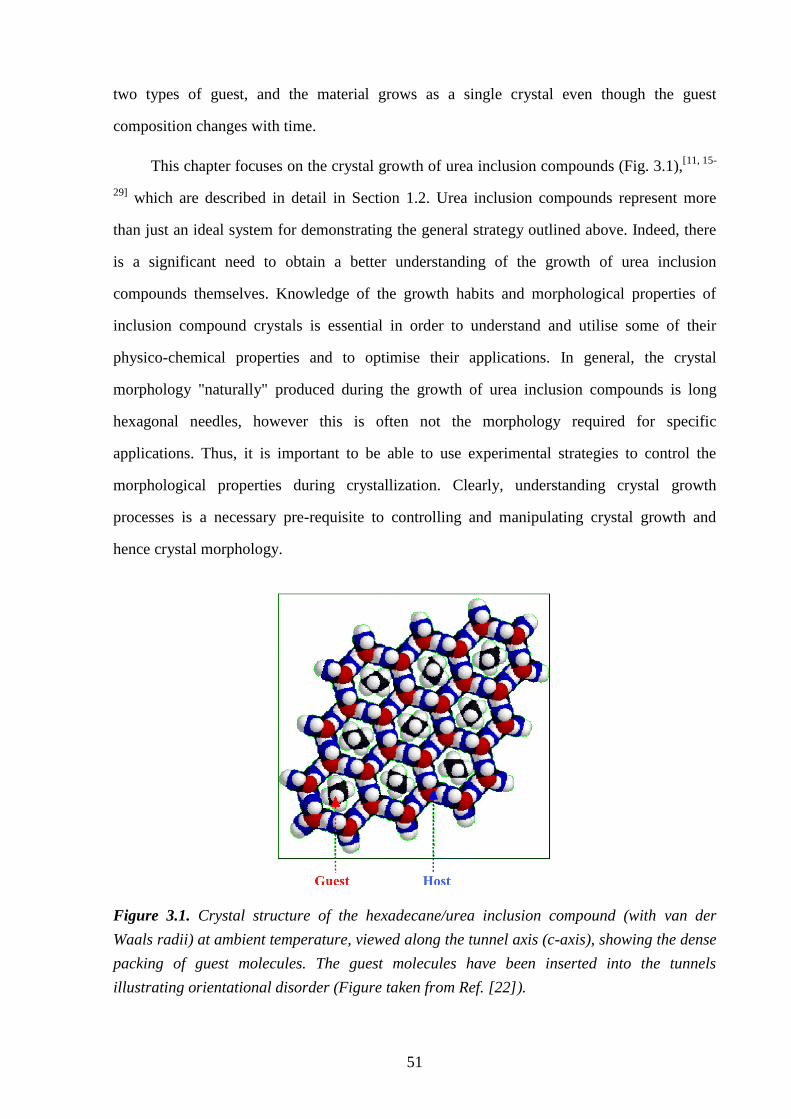
51
two types of guest, and the material grows as a single crystal even though the guest
composition changes with time.
This chapter focuses on the crystal growth of urea inclusion compounds (Fig. 3.1),[11, 15-
29] which are described in detail in Section 1.2. Urea inclusion compounds represent more
than just an ideal system for demonstrating the general strategy outlined above. Indeed, there
is a significant need to obtain a better understanding of the growth of urea inclusion
compounds themselves. Knowledge of the growth habits and morphological properties of
inclusion compound crystals is essential in order to understand and utilise some of their
physico-chemical properties and to optimise their applications. In general, the crystal
morphology "naturally" produced during the growth of urea inclusion compounds is long
hexagonal needles, however this is often not the morphology required for specific
applications. Thus, it is important to be able to use experimental strategies to control the
morphological properties during crystallization. Clearly, understanding crystal growth
processes is a necessary pre-requisite to controlling and manipulating crystal growth and
hence crystal morphology.
Figure 3.1. Crystal structure of the hexadecane/urea inclusion compound (with van der
Waals radii) at ambient temperature, viewed along the tunnel axis (c-axis), showing the dense
packing of guest molecules. The guest molecules have been inserted into the tunnels
illustrating orientational disorder (Figure taken from Ref. [22]).
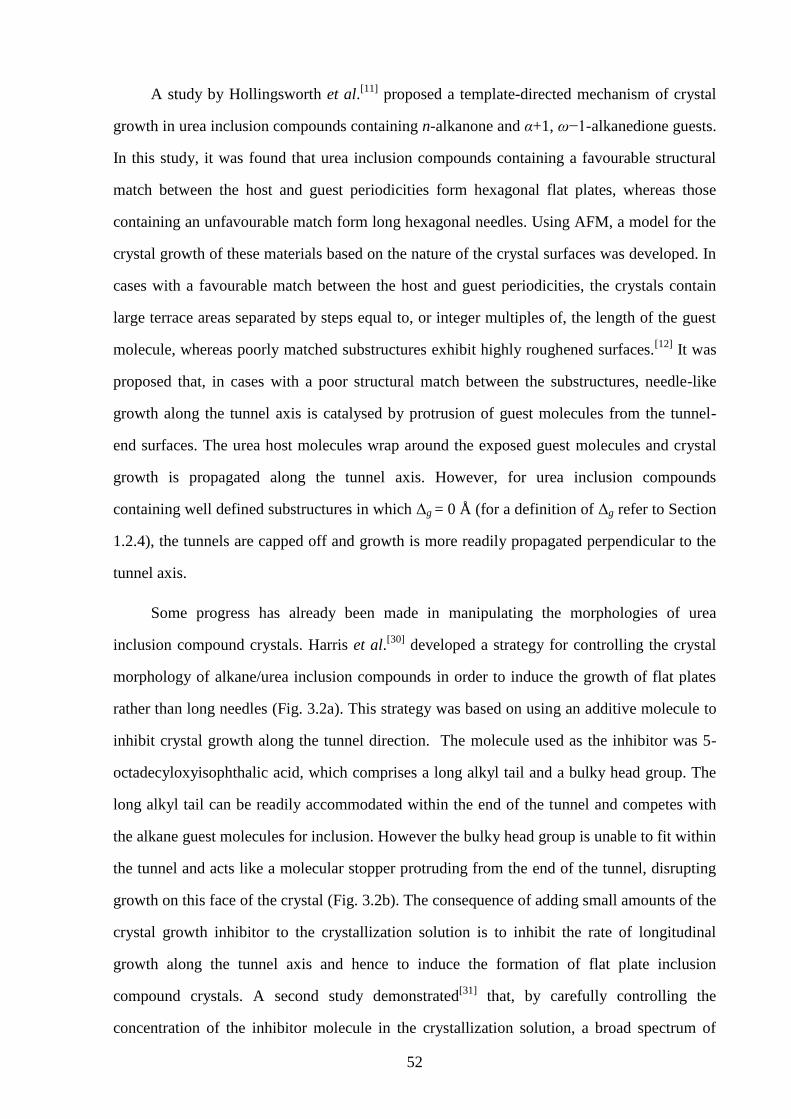
52
A study by Hollingsworth et al.[11]
proposed a template-directed mechanism of crystal
growth in urea inclusion compounds containing n-alkanone and α+1, ω−1-alkanedione guests.
In this study, it was found that urea inclusion compounds containing a favourable structural
match between the host and guest periodicities form hexagonal flat plates, whereas those
containing an unfavourable match form long hexagonal needles. Using AFM, a model for the
crystal growth of these materials based on the nature of the crystal surfaces was developed. In
cases with a favourable match between the host and guest periodicities, the crystals contain
large terrace areas separated by steps equal to, or integer multiples of, the length of the guest
molecule, whereas poorly matched substructures exhibit highly roughened surfaces.[12]
It was
proposed that, in cases with a poor structural match between the substructures, needle-like
growth along the tunnel axis is catalysed by protrusion of guest molecules from the tunnel-
end surfaces. The urea host molecules wrap around the exposed guest molecules and crystal
growth is propagated along the tunnel axis. However, for urea inclusion compounds
containing well defined substructures in which Δg = 0 Å (for a definition of Δg refer to Section
1.2.4), the tunnels are capped off and growth is more readily propagated perpendicular to the
tunnel axis.
Some progress has already been made in manipulating the morphologies of urea
inclusion compound crystals. Harris et al.[30]
developed a strategy for controlling the crystal
morphology of alkane/urea inclusion compounds in order to induce the growth of flat plates
rather than long needles (Fig. 3.2a). This strategy was based on using an additive molecule to
inhibit crystal growth along the tunnel direction. The molecule used as the inhibitor was 5-
octadecyloxyisophthalic acid, which comprises a long alkyl tail and a bulky head group. The
long alkyl tail can be readily accommodated within the end of the tunnel and competes with
the alkane guest molecules for inclusion. However the bulky head group is unable to fit within
the tunnel and acts like a molecular stopper protruding from the end of the tunnel, disrupting
growth on this face of the crystal (Fig. 3.2b). The consequence of adding small amounts of the
crystal growth inhibitor to the crystallization solution is to inhibit the rate of longitudinal
growth along the tunnel axis and hence to induce the formation of flat plate inclusion
compound crystals. A second study demonstrated[31]
that, by carefully controlling the
concentration of the inhibitor molecule in the crystallization solution, a broad spectrum of
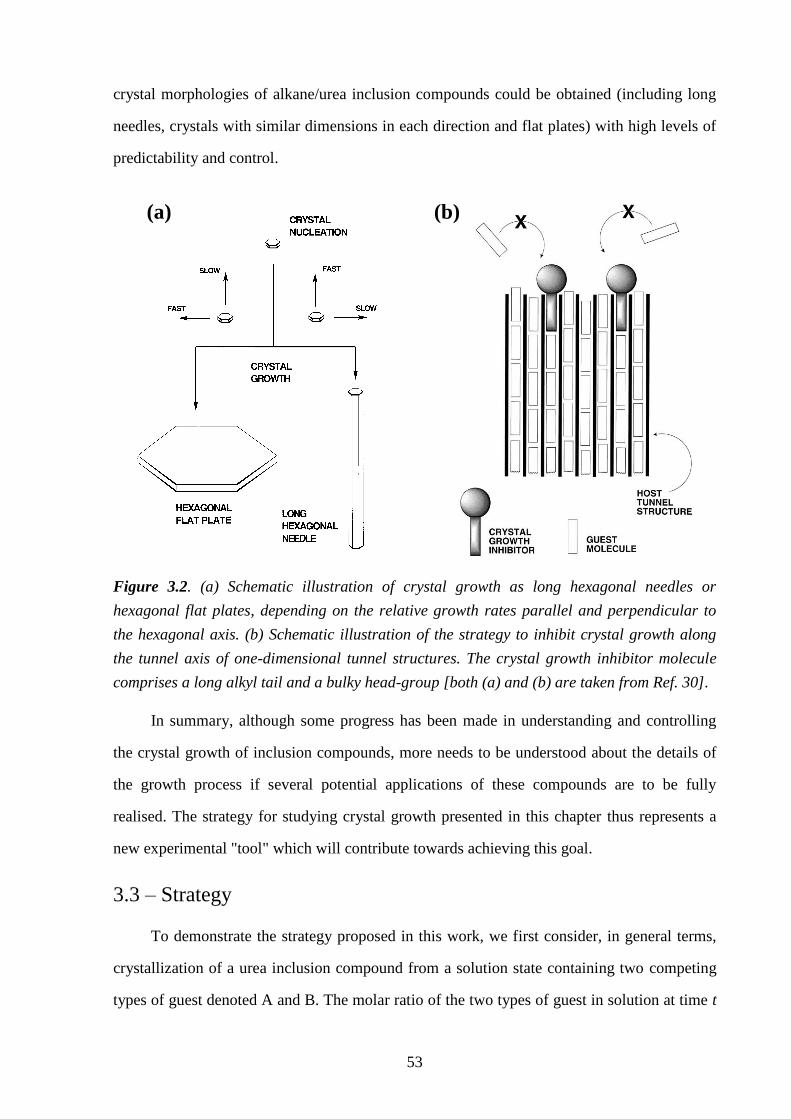
53
crystal morphologies of alkane/urea inclusion compounds could be obtained (including long
needles, crystals with similar dimensions in each direction and flat plates) with high levels of
predictability and control.
Figure 3.2. (a) Schematic illustration of crystal growth as long hexagonal needles or
hexagonal flat plates, depending on the relative growth rates parallel and perpendicular to
the hexagonal axis. (b) Schematic illustration of the strategy to inhibit crystal growth along
the tunnel axis of one-dimensional tunnel structures. The crystal growth inhibitor molecule
comprises a long alkyl tail and a bulky head-group [both (a) and (b) are taken from Ref. 30].
In summary, although some progress has been made in understanding and controlling
the crystal growth of inclusion compounds, more needs to be understood about the details of
the growth process if several potential applications of these compounds are to be fully
realised. The strategy for studying crystal growth presented in this chapter thus represents a
new experimental "tool" which will contribute towards achieving this goal.
3.3 – Strategy
To demonstrate the strategy proposed in this work, we first consider, in general terms,
crystallization of a urea inclusion compound from a solution state containing two competing
types of guest denoted A and B. The molar ratio of the two types of guest in solution at time t
(a) (b)
(a) (b)
54
is γA(t) = nA(t)/nB(t), where ni(t) is the number of moles of species i at time t. As discussed in
previous publications,[32-35]
the molar ratio of guest molecules incorporated at the growing
surfaces of the crystal at time t is
)()( ttm AA , (3.1)
where χ depends on the relative affinity of the host tunnel for inclusion of guests of types A
and B. It is important to note that mA(t) is the instantaneous value of the guest molar ratio
incorporated into the inclusion compound crystal at time t. The overall guest ratio within the
crystal at time t is given by integration of mA(t) from the start of the growth of the crystal
(t = 0) until time t. If inclusion of guests of type A is energetically favoured over inclusion of
guests of type B, then χ > 1 and hence mA(t) > γA(t). Thus, the composition of the guest
mixture incorporated within the growing surfaces of the crystal at time t [i.e. mA(t)] has a
higher proportion of guests of type A than the guest composition in the solution state at time t
[i.e. γA(t)]. As a consequence, depletion of molecules of type A from the solution state occurs
more rapidly than depletion of molecules of type B, and thus γA(t) must decrease
monotonically with time during crystal growth. From Eq. (3.1), mA(t) must also decrease
monotonically with time, and thus the guest composition included at the growing crystal
surfaces changes monotonically as a function of time. Clearly, γA(t) decreases (and hence
mA(t) decreases) until all guest molecules of type A initially present in the solution state have
been included within the crystal. At this stage, and during any subsequent crystal growth,
γA(t) = 0 and hence mA(t) = 0.
After collecting a crystal at the end of the crystallization, the spatial distribution
mA(x,y,z) of the two types of guest in the crystal is measured. Three-dimensional contours at a
specific value of mA within the crystal can be related to a specific value of time during the
crystal growth process [i.e. the time at which the composition of the growing crystal surfaces
had the same specific value of mA(t)]. As discussed above, mA(t) decreases monotonically
with time, and thus lower values of mA(x,y,z) correspond to later stages of the crystal growth
process, thus providing a basis for mapping the time-evolution of the growth of the crystal.
In the experiments discussed in this chapter, we focus on crystals of urea inclusion
compounds containing mixtures of 1,8-dibromooctane (1,8-DBrO) and pentadecane (PD)
55
guest molecules, with crystallization carried out using standard procedures (see Section 3.4).
Confocal Raman microspectrometry was employed to measure the guest composition as a
function of position within the crystal [i.e. mA(x,y,z)]. All results shown in this chapter were
obtained from analysis of the same crystal (experiments on other crystals prepared under the
same conditions confirm that the results are representative). PD and 1,8-DBrO were chosen as
the guest mixture because they have different Raman signatures (see below) and because
inclusion of PD within the urea tunnel structure is known to be energetically more favourable
than inclusion of 1,8-DBrO. Previous studies of urea inclusion compounds by confocal
Raman microspectrometry[36-38]
have shown that spatial distributions of alkane and α,ω-
dibromoalkane guests can be quantified by this technique. This previous work was focused on
mechanistic and kinetic aspects of guest exchange processes, and did not investigate binary
mixtures of guest molecules prepared by crystallization processes. For quantitative analysis,
we focus on the C–Br stretching ν(CBr) band for 1,8-DBrO (650 cm-1
; for the trans end-group
conformation), the methyl rocking r(CH3) band for PD (890 cm-1
) and the symmetric C–N
stretching νs(CN) band for urea (1024 cm-1
). Guest composition is assessed from the ratio
R = I(CBr)/I(CN) of the integrated intensities of the ν(CBr) and νs(CN) bands, which is then
normalized as RN = R/Ro, where Ro is the value of R for the urea inclusion compound
containing only 1,8-DBrO guests. The value of RN establishes the relative amounts of 1,8-
DBrO and PD guests in the probed region of the crystal, with higher RN indicating a higher
proportion of 1,8-DBrO. By definition, 0 ≤ RN ≤ 1, with the limiting values attained if only
1,8-DBrO (RN = 1) or if only PD (RN = 0) is present. The ratio RM = I(CH3)/I(CN) of
integrated intensities of the r(CH3) and νs(CN) bands is also considered. Clearly, higher RM
corresponds to a higher proportion of PD guests in the probed region of the crystal.
The characteristic crystal morphology of conventional urea inclusion compounds is long
needles with hexagonal cross-section (Fig. 3.3). The host tunnels are parallel to the needle
axis (Z-axis). Confocal Raman microspectrometry involved one-dimensional or two-
dimensional scans within the crystal as depicted (together with definition of the axis system)
in Fig. 3.3. The incident laser was parallel to the Y-axis, and Y = 0 represents the upper
surface of the crystal. Test experiments indicated that, for scans as a function of depth below
the upper surface of the crystal (i.e., parallel to Y), reliable quantitative information is
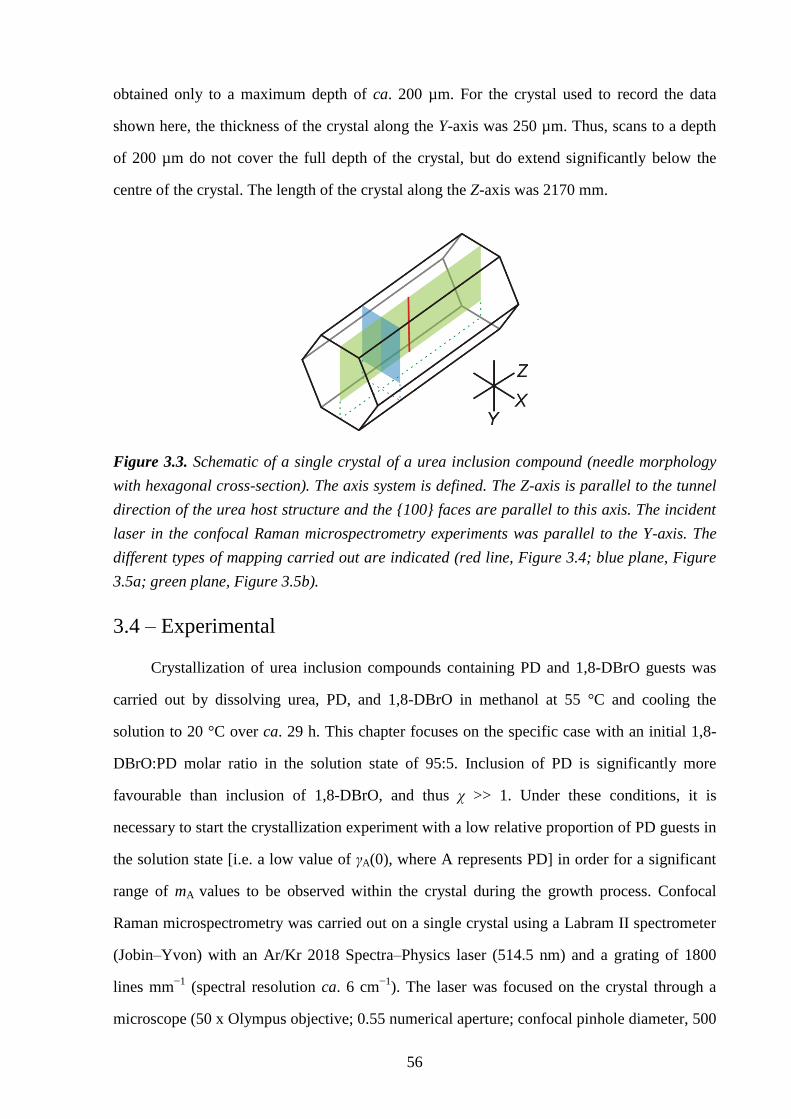
56
obtained only to a maximum depth of ca. 200 µm. For the crystal used to record the data
shown here, the thickness of the crystal along the Y-axis was 250 µm. Thus, scans to a depth
of 200 µm do not cover the full depth of the crystal, but do extend significantly below the
centre of the crystal. The length of the crystal along the Z-axis was 2170 mm.
Figure 3.3. Schematic of a single crystal of a urea inclusion compound (needle morphology
with hexagonal cross-section). The axis system is defined. The Z-axis is parallel to the tunnel
direction of the urea host structure and the {100} faces are parallel to this axis. The incident
laser in the confocal Raman microspectrometry experiments was parallel to the Y-axis. The
different types of mapping carried out are indicated (red line, Figure 3.4; blue plane, Figure
3.5a; green plane, Figure 3.5b).
3.4 – Experimental
Crystallization of urea inclusion compounds containing PD and 1,8-DBrO guests was
carried out by dissolving urea, PD, and 1,8-DBrO in methanol at 55 °C and cooling the
solution to 20 °C over ca. 29 h. This chapter focuses on the specific case with an initial 1,8-
DBrO:PD molar ratio in the solution state of 95:5. Inclusion of PD is significantly more
favourable than inclusion of 1,8-DBrO, and thus χ >> 1. Under these conditions, it is
necessary to start the crystallization experiment with a low relative proportion of PD guests in
the solution state [i.e. a low value of γA(0), where A represents PD] in order for a significant
range of mA values to be observed within the crystal during the growth process. Confocal
Raman microspectrometry was carried out on a single crystal using a Labram II spectrometer
(Jobin–Yvon) with an Ar/Kr 2018 Spectra–Physics laser (514.5 nm) and a grating of 1800
lines mm−1
(spectral resolution ca. 6 cm−1
). The laser was focused on the crystal through a
microscope (50 x Olympus objective; 0.55 numerical aperture; confocal pinhole diameter, 500
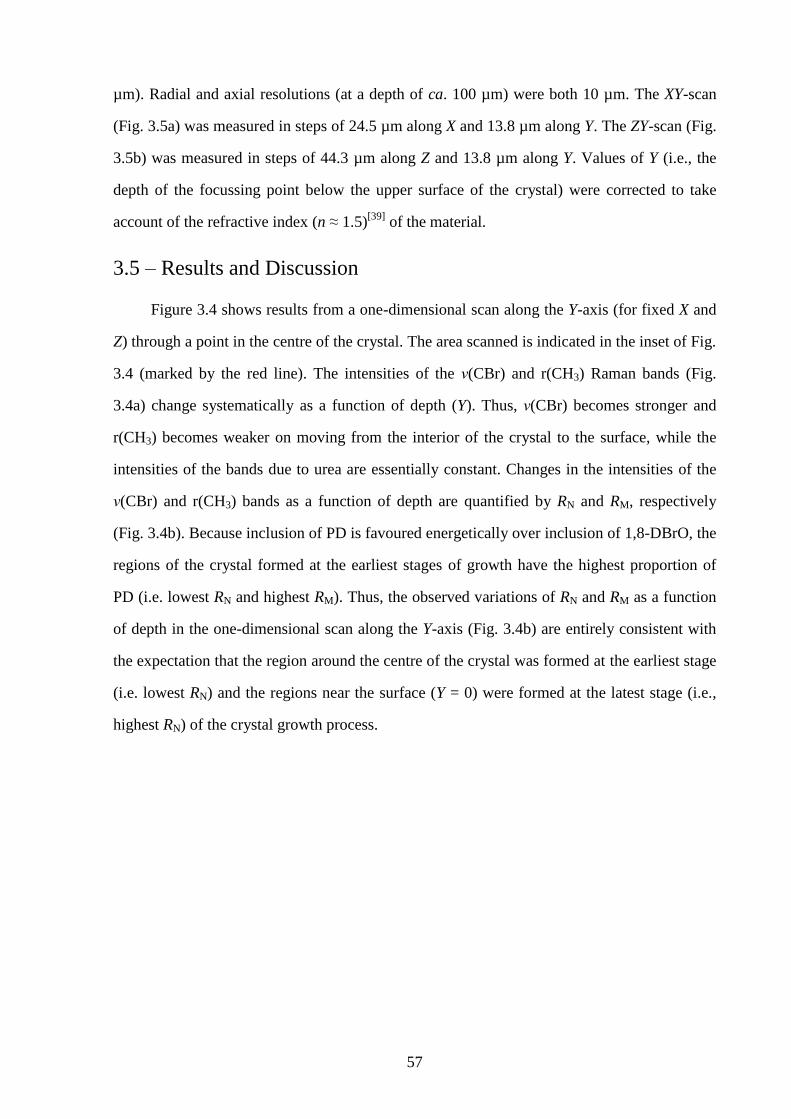
57
µm). Radial and axial resolutions (at a depth of ca. 100 µm) were both 10 µm. The XY-scan
(Fig. 3.5a) was measured in steps of 24.5 µm along X and 13.8 µm along Y. The ZY-scan (Fig.
3.5b) was measured in steps of 44.3 µm along Z and 13.8 µm along Y. Values of Y (i.e., the
depth of the focussing point below the upper surface of the crystal) were corrected to take
account of the refractive index (n ≈ 1.5)[39]
of the material.
3.5 – Results and Discussion
Figure 3.4 shows results from a one-dimensional scan along the Y-axis (for fixed X and
Z) through a point in the centre of the crystal. The area scanned is indicated in the inset of Fig.
3.4 (marked by the red line). The intensities of the ν(CBr) and r(CH3) Raman bands (Fig.
3.4a) change systematically as a function of depth (Y). Thus, ν(CBr) becomes stronger and
r(CH3) becomes weaker on moving from the interior of the crystal to the surface, while the
intensities of the bands due to urea are essentially constant. Changes in the intensities of the
ν(CBr) and r(CH3) bands as a function of depth are quantified by RN and RM, respectively
(Fig. 3.4b). Because inclusion of PD is favoured energetically over inclusion of 1,8-DBrO, the
regions of the crystal formed at the earliest stages of growth have the highest proportion of
PD (i.e. lowest RN and highest RM). Thus, the observed variations of RN and RM as a function
of depth in the one-dimensional scan along the Y-axis (Fig. 3.4b) are entirely consistent with
the expectation that the region around the centre of the crystal was formed at the earliest stage
(i.e. lowest RN) and the regions near the surface (Y = 0) were formed at the latest stage (i.e.,
highest RN) of the crystal growth process.
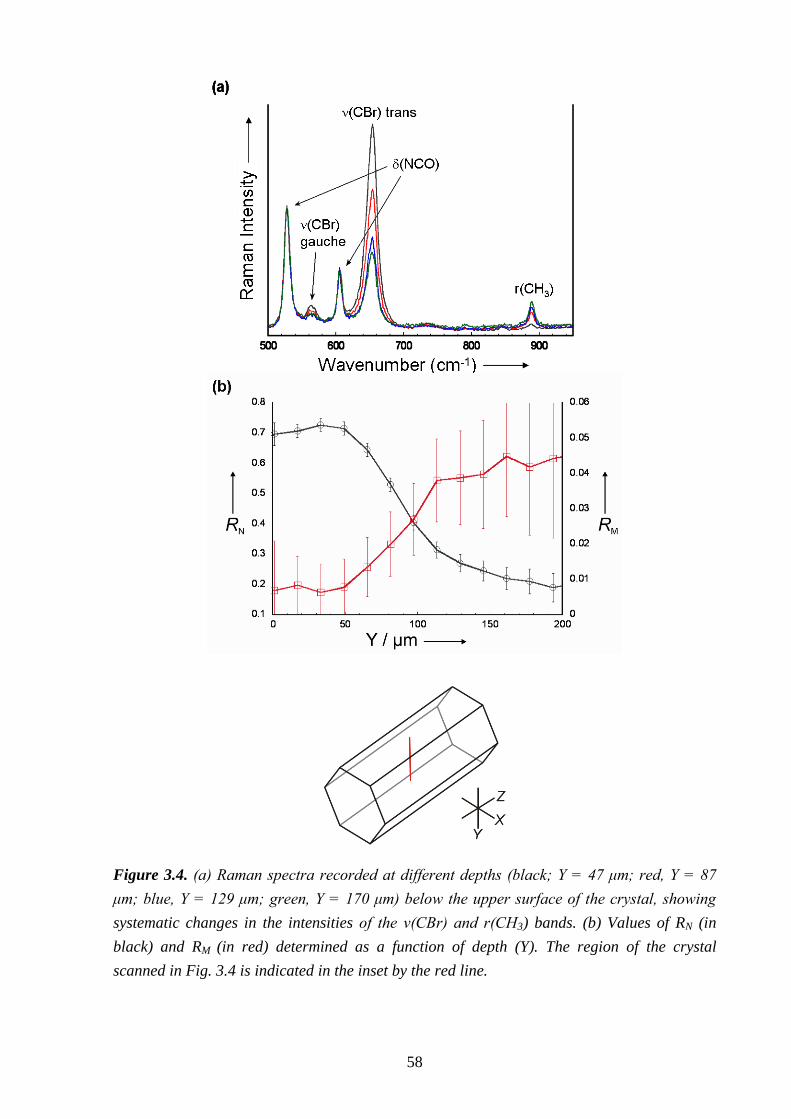
58
Figure 3.4. (a) Raman spectra recorded at different depths (black; Y = 47 μm; red, Y = 87
μm; blue, Y = 129 μm; green, Y = 170 μm) below the upper surface of the crystal, showing
systematic changes in the intensities of the ν(CBr) and r(CH3) bands. (b) Values of RN (in
black) and RM (in red) determined as a function of depth (Y). The region of the crystal
scanned in Fig. 3.4 is indicated in the inset by the red line.

59
More detailed insights on the evolution of the crystal growth process are obtained from
the two-dimensional scans shown below in Fig. 3.5.
Figure 3.5. Results from (a) an XY-scan (with Z fixed at Z = 0 µm), and (b) a ZY-scan (with X
fixed at X = 0 µm), showing the value of RN determined from the Raman spectra recorded as
a function of position within the crystal. In (b), the tunnel direction is horizontal (Z-axis). The
colour scheme for values of RN is defined in the inset.
Figure 3.5a shows results from a two-dimensional XY-scan (in the plane perpendicular
to the tunnel direction) and Fig. 3.5b shows results from a two-dimensional ZY-scan (in the
plane parallel to the tunnel direction). The regions of the crystal scanned in Fig. 3.5a and Fig.
3.5b are shown in Fig. 3.6 below, indicated by the blue plane and the green plane respectively.
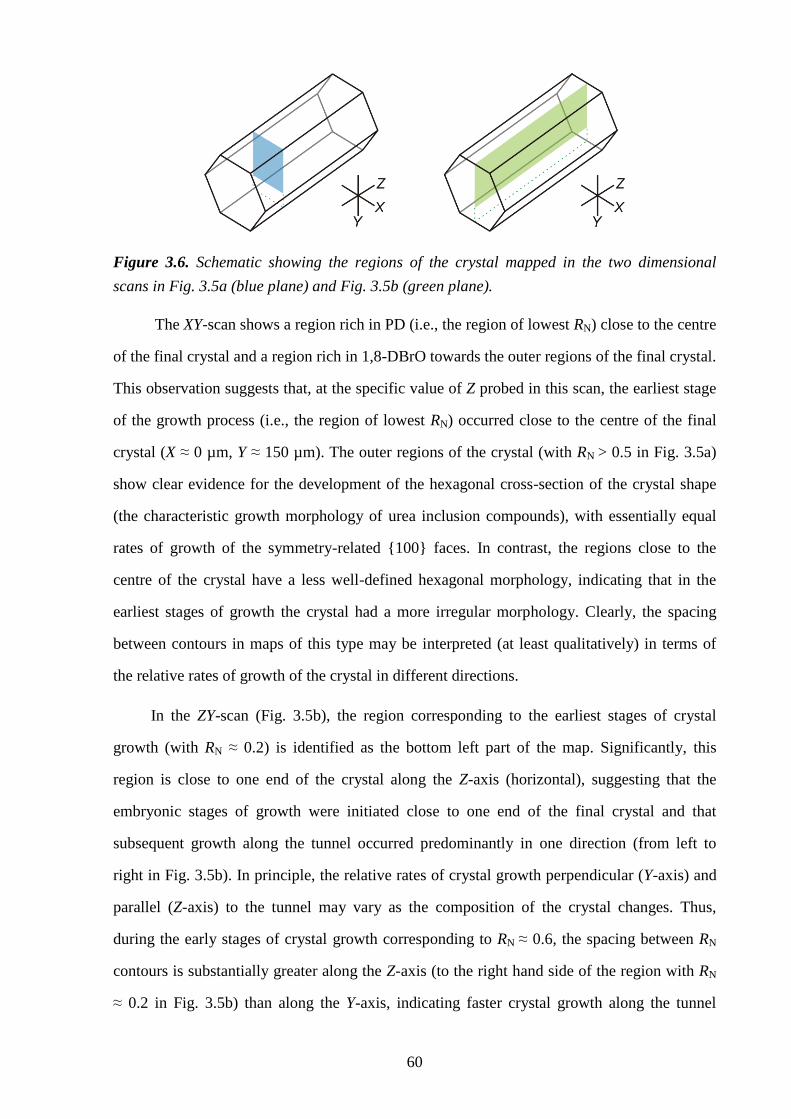
60
Figure 3.6. Schematic showing the regions of the crystal mapped in the two dimensional
scans in Fig. 3.5a (blue plane) and Fig. 3.5b (green plane).
The XY-scan shows a region rich in PD (i.e., the region of lowest RN) close to the centre
of the final crystal and a region rich in 1,8-DBrO towards the outer regions of the final crystal.
This observation suggests that, at the specific value of Z probed in this scan, the earliest stage
of the growth process (i.e., the region of lowest RN) occurred close to the centre of the final
crystal (X ≈ 0 µm, Y ≈ 150 µm). The outer regions of the crystal (with RN > 0.5 in Fig. 3.5a)
show clear evidence for the development of the hexagonal cross-section of the crystal shape
(the characteristic growth morphology of urea inclusion compounds), with essentially equal
rates of growth of the symmetry-related {100} faces. In contrast, the regions close to the
centre of the crystal have a less well-defined hexagonal morphology, indicating that in the
earliest stages of growth the crystal had a more irregular morphology. Clearly, the spacing
between contours in maps of this type may be interpreted (at least qualitatively) in terms of
the relative rates of growth of the crystal in different directions.
In the ZY-scan (Fig. 3.5b), the region corresponding to the earliest stages of crystal
growth (with RN ≈ 0.2) is identified as the bottom left part of the map. Significantly, this
region is close to one end of the crystal along the Z-axis (horizontal), suggesting that the
embryonic stages of growth were initiated close to one end of the final crystal and that
subsequent growth along the tunnel occurred predominantly in one direction (from left to
right in Fig. 3.5b). In principle, the relative rates of crystal growth perpendicular (Y-axis) and
parallel (Z-axis) to the tunnel may vary as the composition of the crystal changes. Thus,
during the early stages of crystal growth corresponding to RN ≈ 0.6, the spacing between RN
contours is substantially greater along the Z-axis (to the right hand side of the region with RN
≈ 0.2 in Fig. 3.5b) than along the Y-axis, indicating faster crystal growth along the tunnel
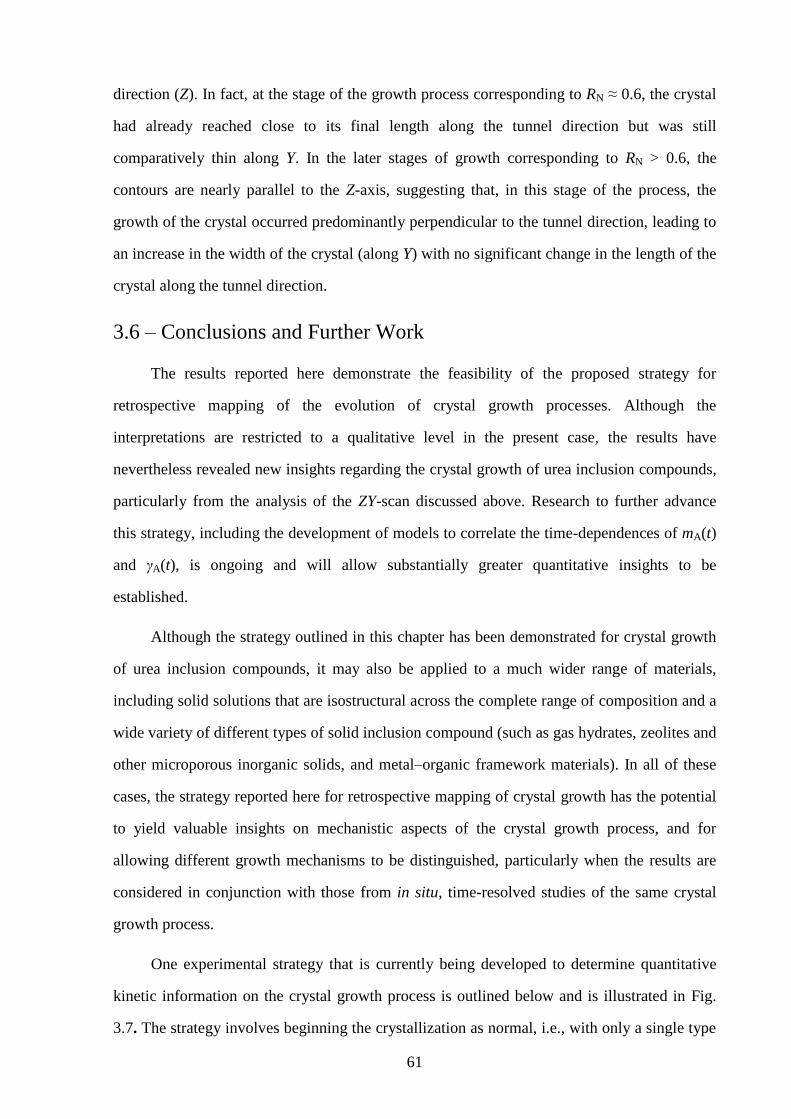
61
direction (Z). In fact, at the stage of the growth process corresponding to RN ≈ 0.6, the crystal
had already reached close to its final length along the tunnel direction but was still
comparatively thin along Y. In the later stages of growth corresponding to RN > 0.6, the
contours are nearly parallel to the Z-axis, suggesting that, in this stage of the process, the
growth of the crystal occurred predominantly perpendicular to the tunnel direction, leading to
an increase in the width of the crystal (along Y) with no significant change in the length of the
crystal along the tunnel direction.
3.6 – Conclusions and Further Work
The results reported here demonstrate the feasibility of the proposed strategy for
retrospective mapping of the evolution of crystal growth processes. Although the
interpretations are restricted to a qualitative level in the present case, the results have
nevertheless revealed new insights regarding the crystal growth of urea inclusion compounds,
particularly from the analysis of the ZY-scan discussed above. Research to further advance
this strategy, including the development of models to correlate the time-dependences of mA(t)
and γA(t), is ongoing and will allow substantially greater quantitative insights to be
established.
Although the strategy outlined in this chapter has been demonstrated for crystal growth
of urea inclusion compounds, it may also be applied to a much wider range of materials,
including solid solutions that are isostructural across the complete range of composition and a
wide variety of different types of solid inclusion compound (such as gas hydrates, zeolites and
other microporous inorganic solids, and metal–organic framework materials). In all of these
cases, the strategy reported here for retrospective mapping of crystal growth has the potential
to yield valuable insights on mechanistic aspects of the crystal growth process, and for
allowing different growth mechanisms to be distinguished, particularly when the results are
considered in conjunction with those from in situ, time-resolved studies of the same crystal
growth process.
One experimental strategy that is currently being developed to determine quantitative
kinetic information on the crystal growth process is outlined below and is illustrated in Fig.
3.7. The strategy involves beginning the crystallization as normal, i.e., with only a single type
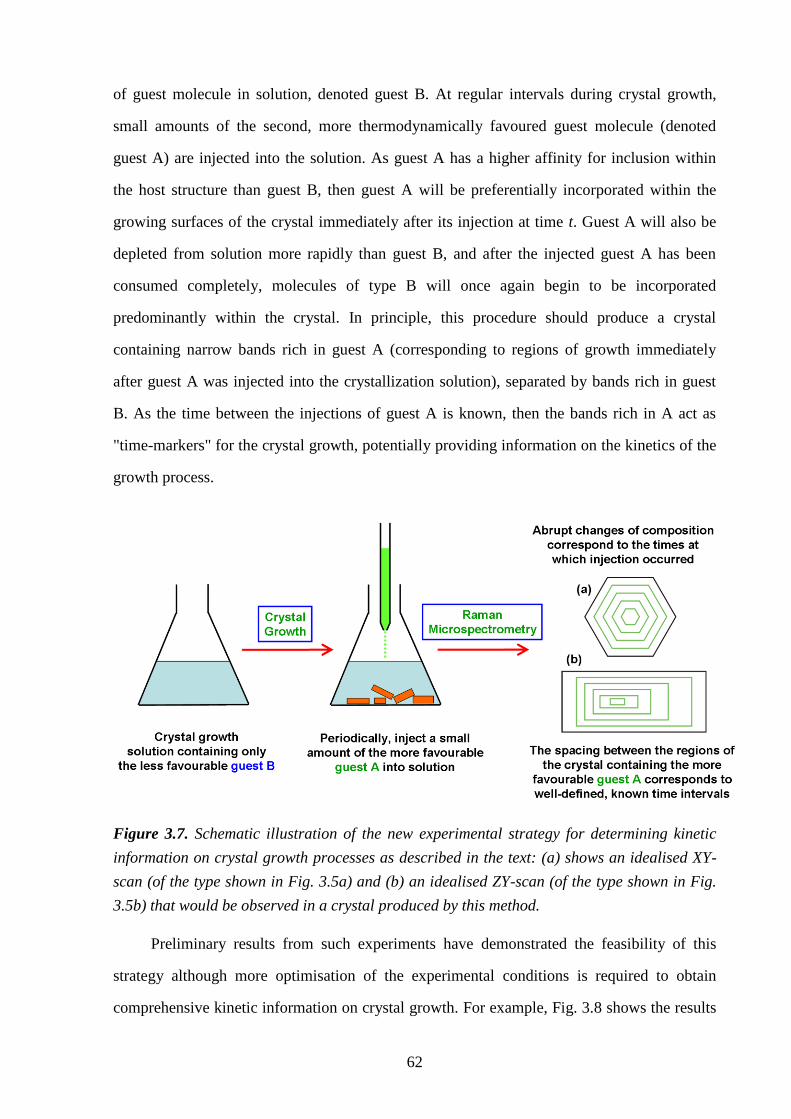
62
of guest molecule in solution, denoted guest B. At regular intervals during crystal growth,
small amounts of the second, more thermodynamically favoured guest molecule (denoted
guest A) are injected into the solution. As guest A has a higher affinity for inclusion within
the host structure than guest B, then guest A will be preferentially incorporated within the
growing surfaces of the crystal immediately after its injection at time t. Guest A will also be
depleted from solution more rapidly than guest B, and after the injected guest A has been
consumed completely, molecules of type B will once again begin to be incorporated
predominantly within the crystal. In principle, this procedure should produce a crystal
containing narrow bands rich in guest A (corresponding to regions of growth immediately
after guest A was injected into the crystallization solution), separated by bands rich in guest
B. As the time between the injections of guest A is known, then the bands rich in A act as
"time-markers" for the crystal growth, potentially providing information on the kinetics of the
growth process.
Figure 3.7. Schematic illustration of the new experimental strategy for determining kinetic
information on crystal growth processes as described in the text: (a) shows an idealised XY-
scan (of the type shown in Fig. 3.5a) and (b) an idealised ZY-scan (of the type shown in Fig.
3.5b) that would be observed in a crystal produced by this method.
Preliminary results from such experiments have demonstrated the feasibility of this
strategy although more optimisation of the experimental conditions is required to obtain
comprehensive kinetic information on crystal growth. For example, Fig. 3.8 shows the results
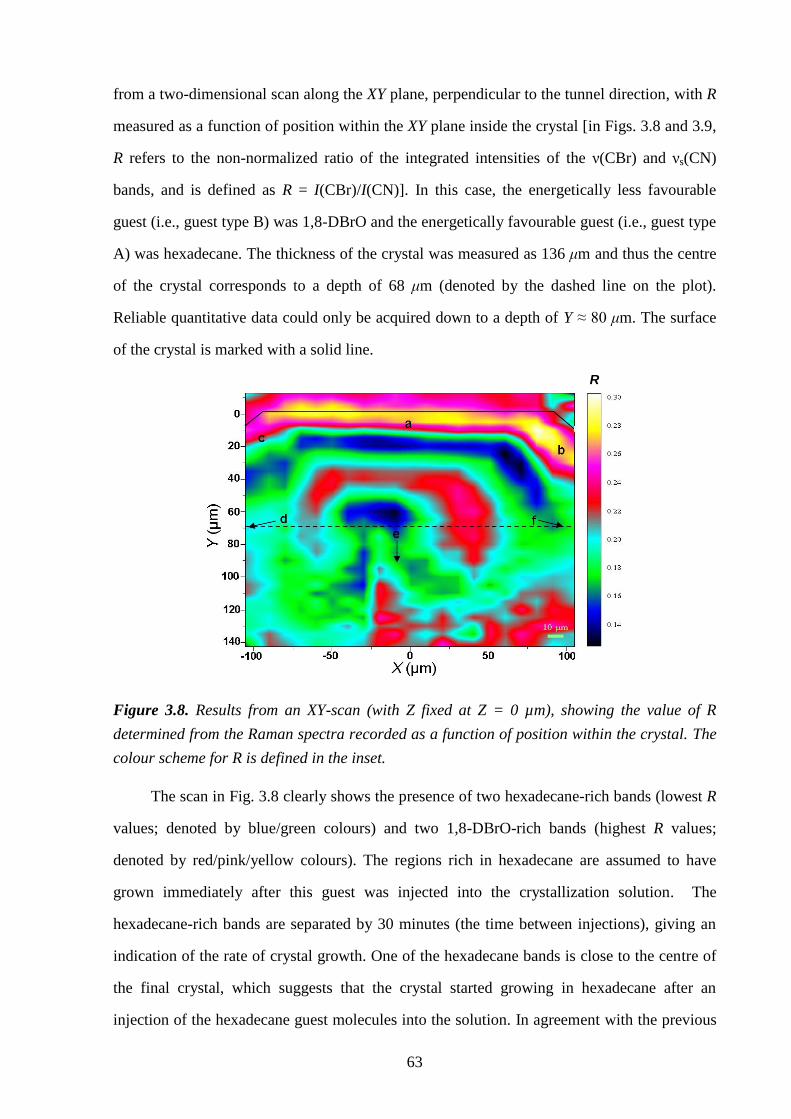
63
from a two-dimensional scan along the XY plane, perpendicular to the tunnel direction, with R
measured as a function of position within the XY plane inside the crystal [in Figs. 3.8 and 3.9,
R refers to the non-normalized ratio of the integrated intensities of the ν(CBr) and νs(CN)
bands, and is defined as R = I(CBr)/I(CN)]. In this case, the energetically less favourable
guest (i.e., guest type B) was 1,8-DBrO and the energetically favourable guest (i.e., guest type
A) was hexadecane. The thickness of the crystal was measured as 136 μm and thus the centre
of the crystal corresponds to a depth of 68 μm (denoted by the dashed line on the plot).
Reliable quantitative data could only be acquired down to a depth of Y ≈ 80 μm. The surface
of the crystal is marked with a solid line.
Figure 3.8. Results from an XY-scan (with Z fixed at Z = 0 µm), showing the value of R
determined from the Raman spectra recorded as a function of position within the crystal. The
colour scheme for R is defined in the inset.
The scan in Fig. 3.8 clearly shows the presence of two hexadecane-rich bands (lowest R
values; denoted by blue/green colours) and two 1,8-DBrO-rich bands (highest R values;
denoted by red/pink/yellow colours). The regions rich in hexadecane are assumed to have
grown immediately after this guest was injected into the crystallization solution. The
hexadecane-rich bands are separated by 30 minutes (the time between injections), giving an
indication of the rate of crystal growth. One of the hexadecane bands is close to the centre of
the final crystal, which suggests that the crystal started growing in hexadecane after an
injection of the hexadecane guest molecules into the solution. In agreement with the previous
R
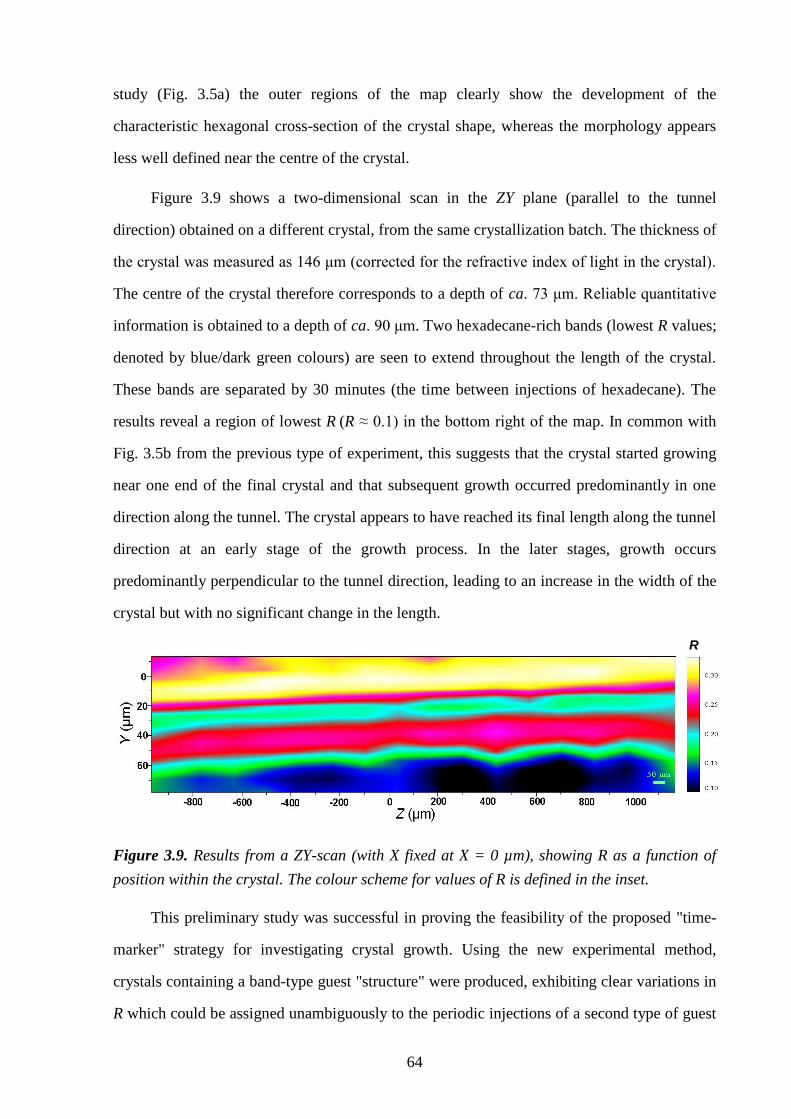
64
study (Fig. 3.5a) the outer regions of the map clearly show the development of the
characteristic hexagonal cross-section of the crystal shape, whereas the morphology appears
less well defined near the centre of the crystal.
Figure 3.9 shows a two-dimensional scan in the ZY plane (parallel to the tunnel
direction) obtained on a different crystal, from the same crystallization batch. The thickness of
the crystal was measured as 146 μm (corrected for the refractive index of light in the crystal).
The centre of the crystal therefore corresponds to a depth of ca. 73 μm. Reliable quantitative
information is obtained to a depth of ca. 90 μm. Two hexadecane-rich bands (lowest R values;
denoted by blue/dark green colours) are seen to extend throughout the length of the crystal.
These bands are separated by 30 minutes (the time between injections of hexadecane). The
results reveal a region of lowest R (R ≈ 0.1) in the bottom right of the map. In common with
Fig. 3.5b from the previous type of experiment, this suggests that the crystal started growing
near one end of the final crystal and that subsequent growth occurred predominantly in one
direction along the tunnel. The crystal appears to have reached its final length along the tunnel
direction at an early stage of the growth process. In the later stages, growth occurs
predominantly perpendicular to the tunnel direction, leading to an increase in the width of the
crystal but with no significant change in the length.
Figure 3.9. Results from a ZY-scan (with X fixed at X = 0 µm), showing R as a function of
position within the crystal. The colour scheme for values of R is defined in the inset.
This preliminary study was successful in proving the feasibility of the proposed "time-
marker" strategy for investigating crystal growth. Using the new experimental method,
crystals containing a band-type guest "structure" were produced, exhibiting clear variations in
R which could be assigned unambiguously to the periodic injections of a second type of guest
R
65
molecule into the crystallization solution. In practice, more "time-markers" are needed within
a single crystal to obtain quantitative kinetic information on crystal growth. However,
significant progress has been made towards this end.
66
3.7 – References
[1] "Crystal Growth and Nucleation": Faraday Discuss. 2007, 136.
[2] B. Kahr, J. M. McBride, Angew. Chemie. Int. Ed. 1992, 31, 1.
[3] S. Mann, D. D. Archibald, J. M. Didymus, T. Douglas, B. R. Heywood, F. C.
Meldrum, N. J. Reeves, Science 1993, 261, 1286.
[4] S. D. Durbin, G. Feher, Annu. Rev. Phys. Chem. 1996, 47, 171.
[5] I. Weissbuch, M. Lahav, L. Leiserowitz, Cryst. Growth Des. 2003, 3, 125.
[6] D. Erdemir, A. Y. Lee, A. S. Myerson, Current Opin. Drug Discov. Devel. 2007, 10,
746.
[7] M. R. Walsh, C. A. Koh, E. D. Sloan, A. K. Sum, D. T. Wu, Science 2009, 326, 1095.
[8] F. Rey, G. Sankar, J. M. Thomas, P. A. Barrett, D. W. Lewis, C. R. A. Catlow, S. M.
Clark, G. N. Greaves, Chem. Mater. 1995, 7, 1435.
[9] G. Sankar, J. M. Thomas, F. Rey, G. N. Greaves, J. Chem. Soc. Chem. Commun.
1995, 2549.
[10] C. A. Koh, J. L. Savidge, C. C. Tang, J. Phys. Chem. 1996, 100, 6412.
[11] M. D. Hollingsworth, M. E. Brown, A. C. Hillier, B. D. Santarsiero, J. D. Chaney,
Science 1996, 273, 1355.
[12] M. D. Ward, Chem. Rev. 2001, 101, 1697.
[13] H. Groen, K. J. Roberts, J. Phys. Chem. B 2001, 105, 10723.
[14] C. E. Hughes, K. D. M. Harris, J. Phys. Chem. A 2008, 112, 6808.
[15] L. C. Fetterly, in Non-Stoichiometric Compounds (Ed.: L. Mandelcorn), Academic
Press, New York, 1964, p. 491.
[16] K. Takemoto, N. Sonoda, in Inclusion Compounds (Eds.: J. L. Atwood, J. E. D.
Davies, D. D. MacNicol), Academic Press, New York, 1984, Vol 2, p. 47.
[17] K. D. M. Harris, J. Solid State Chem. 1993, 106, 83.
[18] K. D. M. Harris, J. Mol. Struct. 1996, 374, 241.
[19] K. D. M. Harris, Chem. Soc. Rev. 1997, 26, 279.
[20] F. Guillaume, J. Chim. Phys. (Paris) 1999, 96, 1295.
[21] M. D. Hollingsworth, Science 2002, 295, 2410.
[22] K. D. M. Harris, Supramol. Chem. 2007, 19, 47.
[23] A. E. Smith, Acta Crystallogr. 1952, 5, 224.
[24] K. D. M. Harris, J. M. Thomas, J. Chem. Soc., Faraday Trans. 1990, 86, 2985.
[25] A. R. George, K. D. M. Harris, J. Mol. Graphics 1995, 13, 138.
[26] M. D. Hollingsworth, B. D. Santarsiero, K. D. M. Harris, Angew. Chemie. Int. Ed.
1994, 33, 649.
[27] M. E. Brown, J. D. Chaney, B. D. Santarsiero, M. D. Hollingsworth, Chem. Mater.
1996, 8, 1588.
[28] M. D. Hollingsworth, U. Werner-Zwanziger, M. E. Brown, J. D. Chaney, J. C.
Huffman, K. D. M. Harris, S. P. Smart, J. Am. Chem. Soc. 1999, 121, 9732.
[29] M. D. Hollingsworth, M. E. Brown, M. Dudley, H. Chung, M. L. Peterson, A. C.
Hillier, Angew. Chemie. Int. Ed. 2002, 41, 965.
[30] S. O. Lee, K. D. M. Harris, Chem. Phys. Lett. 1999, 307, 327.
[31] N. E. Kelly, S. O. Lee, K. D. M. Harris, J. Am. Chem. Soc. 2001, 123, 12682.
67
[32] K. D. M. Harris, P. E. Jupp, Proc. R. Soc. London, Ser. A 1997, 453, 333.
[33] K. D. M. Harris, P. E. Jupp, S. O. Lee, J. Chem. Phys. 1999, 111, 9784.
[34] S. O. Lee, K. D. M. Harris, P. E. Jupp, L. Yeo, J. Am. Chem. Soc. 2001, 123, 12913.
[35] A. M. Pivovar, K. T. Holman, M. D. Ward, Chem. Mater. 2001, 13, 3018.
[36] J. Marti-Rujas, A. Desmedt, K. D. M. Harris, F. Guillaume, J. Am. Chem. Soc. 2004,
126, 11124.
[37] J. Marti-Rujas, K. D. M. Harris, A. Desmedt, F. Guillaume, J. Phys. Chem. B 2006,
110, 10708.
[38] J. Marti-Rujas, A. Desmedt, K. D. M. Harris, F. Guillaume, J. Phys. Chem. B 2007,
111, 12339.
[39] D. Schmicker, S. van Smaalen, C. Haas, K. D. M. Harris, Phys. Rev. B 1994, 49,
11572.
68
Chapter 4 – Structural Rationalization of the Phase
Transition Behaviour in a Solid Organic Inclusion
Compound: Bromocyclohexane/Thiourea
4.1 – Abstract
This chapter presents the structural properties of the bromocyclohexane/thiourea
inclusion compound that have been determined using both single-crystal and powder X-ray
diffraction over a range of temperatures above and below a first-order phase transition at 233
K in this material. Particular emphasis is placed on the effects of bromine substitution of the
guest molecule on structural aspects of the phase transition behaviour, by comparing the
structures of the low-temperature phases of the thiourea inclusion compounds containing
bromocyclohexane and cyclohexane guest molecules. The results reveal marked contrasts to
the phase transition behaviour in the prototypical cyclohexane/thiourea inclusion compound,
demonstrating that relatively small changes in molecular geometry (in this case bromine
substitution) can have a profound influence on structural properties of the low-temperature
phase in such materials.
4.2 – Introduction
Although urea inclusion compounds[1-10]
have been explored extensively with regard to
structural and dynamic properties, including detailed characterization of changes in these
properties that occur at low-temperature phase transitions, the corresponding family of
thiourea inclusion compounds[11-14]
have received much less attention even though thiourea
inclusion compounds offer potentially greater scope than urea inclusion compounds with
regard to materials applications,[15-19]
as the thiourea host tunnel can include a range of bulkier
guest molecules possessing a much wider diversity of chemical functionality.
A detailed description of the structural properties of thiourea inclusion compounds is
provided in Section 1.3. We reiterate now that the thiourea inclusion compound containing
cyclohexane (CH) guest molecules is, in many respects, the prototypical member of this
family of materials, and has been studied widely.[11, 20-24]
CH/thiourea has three distinct
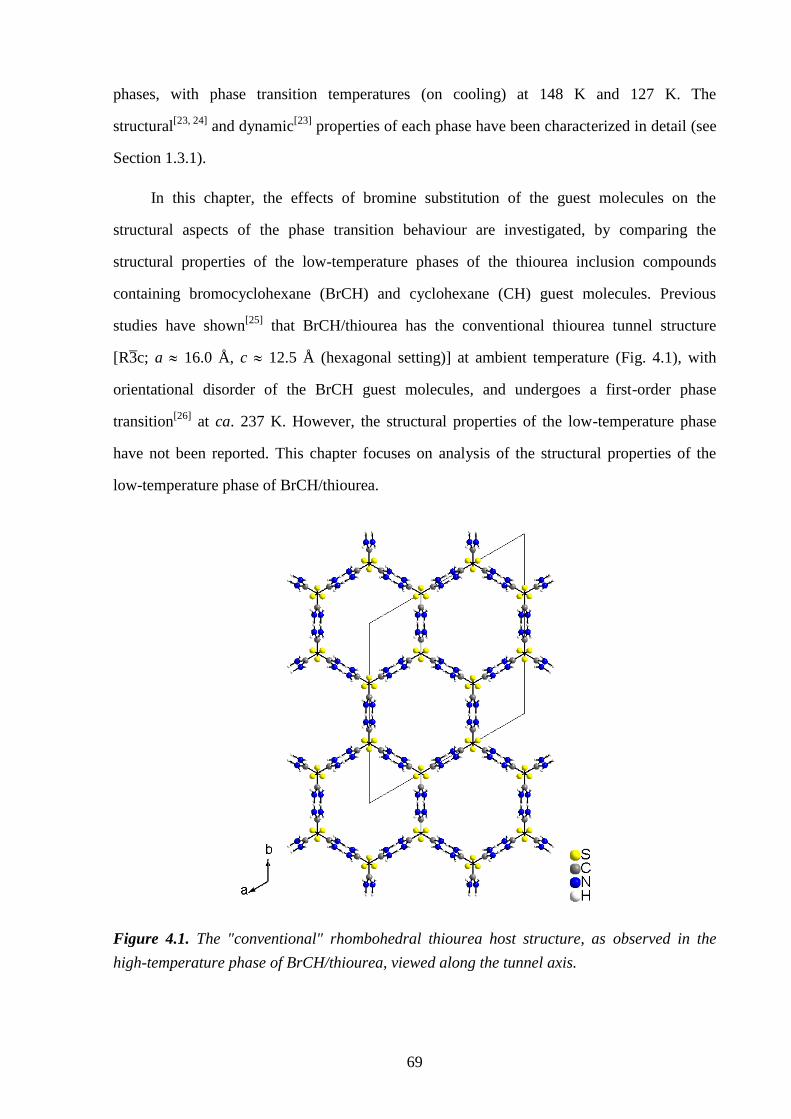
69
phases, with phase transition temperatures (on cooling) at 148 K and 127 K. The
structural[23, 24]
and dynamic[23]
properties of each phase have been characterized in detail (see
Section 1.3.1).
In this chapter, the effects of bromine substitution of the guest molecules on the
structural aspects of the phase transition behaviour are investigated, by comparing the
structural properties of the low-temperature phases of the thiourea inclusion compounds
containing bromocyclohexane (BrCH) and cyclohexane (CH) guest molecules. Previous
studies have shown[25]
that BrCH/thiourea has the conventional thiourea tunnel structure
[R3̄c; a 16.0 Å, c 12.5 Å (hexagonal setting)] at ambient temperature (Fig. 4.1), with
orientational disorder of the BrCH guest molecules, and undergoes a first-order phase
transition[26]
at ca. 237 K. However, the structural properties of the low-temperature phase
have not been reported. This chapter focuses on analysis of the structural properties of the
low-temperature phase of BrCH/thiourea.
Figure 4.1. The "conventional" rhombohedral thiourea host structure, as observed in the
high-temperature phase of BrCH/thiourea, viewed along the tunnel axis.
70
Several other studies have reported various aspects of the properties of the BrCH guest
molecules. For example, measurement of intermolecular Br∙∙∙Br distances in BrCH/thiourea
from Br K-edge EXAFS spectra[27]
suggests that head to head ordering of the guest molecules
exists in the inclusion compound. Furthermore, no abrupt changes were observed in the Br K-
edge EXAFS spectrum upon crossing the phase transition temperature, indicating that there is
no change in this behaviour as a function of temperature.
As discussed in Section 1.3.3, chlorocyclohexane, bromocyclohexane and
iodocyclohexane molecules adopt very uncharacteristic conformations when constrained as
guest molecules within the thiourea tunnel structure. In their liquid and vapour phases[28-32]
and in the pure solid state,[33, 34]
the equatorial conformer of these molecules predominates.
However, a variety of spectroscopic techniques, including IR,[35-38]
Raman,[39]
13
C NMR[26, 40-
43] and Br K-edge EXAFS
[27] have shown that these molecules exhibit a strong preference for
adopting the axial conformation when included in the thiourea tunnel structure (e.g. from 13
C
NMR[43]
the proportion of BrCH guest molecules with the axial conformation at 208 K is
estimated to be ca. 95%). Several of these studies demonstrated that there is a rapid chair-
chair inter-conversion of these guest molecules in the inclusion compound,[36, 41, 43]
the energy
barriers for which have been determined.[43]
Davies and Nightingale also observed[35]
from
variable temperature IR and Raman spectra that there is no detectable change in the relative
proportions of the guest conformations for either chlorocyclohexane or bromocyclohexane
guest molecules as a function of temperature (down to 74 K).
The dynamic properties of the BrCH guest molecules have been investigated using
solid-state 13
C NMR and 2H NMR techniques
[26, 41, 42] between 100 and 350 K. The results
suggest that rapid ring inversion occurs in the high-temperature phase, together with
essentially unrestricted reorientation of the whole molecule relative to the host tunnel. In this
phase, ring inversion of the guest species is the dominant relaxation mechanism. Upon
cooling below the phase transition, the inversion dynamics of the BrCH guests is completely
frozen out on the NMR timescale, and thus distinct NMR lines are observed for the axial and
equatorial conformers. However, there is no significant change in the ratio of the axial and
equatorial conformers above and below the phase transition in agreement with previously
71
mentioned spectroscopic investigations.[35]
In the higher temperature region of the low-
temperature phase, highly restricted but rapid overall motions of the BrCH guest molecules
still occur. However, at ca. 110 K and lower temperatures, rigid-limit spectra are observed,
indicating that the reorientational motions of the guest molecules are frozen in this
temperature regime.
4.3 – Experimental
The BrCH/thiourea inclusion compound was prepared by cooling a solution of thiourea
and BrCH (ca. 3:1 molar ratio) in methanol from 55 °C to 20 °C over ca. 29 hours. Needle-
shaped crystals were obtained (width ca. 0.25 – 2 mm, length ca. 5 – 10 mm), with cross-
sectional shape corresponding to a distorted hexagon (i.e., with angles of 120° between
adjacent sides, but with sides of unequal length). Powder X-ray diffraction confirmed that the
product was a monophasic sample of a conventional thiourea inclusion compound.
Differential scanning calorimetry (DSC) was carried out on a TA Instruments heat flux
Q100 DSC. The ground sample of BrCH/thiourea was subjected to a cycle of cooling and
heating between 298 and 203 K, at cooling/heating rates of 10 K min–1
. After cooling, the
sample was held at 203 K for 1 min before commencing the heating cycle.
Single-crystal X-ray diffraction was carried out on a Nonius Kappa CCD diffractometer
equipped with an Oxford Cryosystems cryostat. Data were recorded at several temperatures
on cooling from ambient temperature to 110 K and on heating back to ambient temperature.
The same crystal was used to record data over the entire temperature range. The transition
from the high-temperature phase to the low-temperature phase is accompanied by crystal
twinning, associated with the reduction in symmetry from rhombohedral to monoclinic, as
evident from splitting of diffraction maxima. On heating the crystal from the low-temperature
phase across the phase transition temperature, each set of split diffraction maxima coalesces
into a single maximum, and thus the twinning/de-twinning process is reversible. Structure
determination in the low-temperature phase involved analysis of the data from a single twin
component. Structure solution was carried out by direct methods using SHELXS-97.[44]
The
non-H atoms that were not located in the structure solution were found by difference Fourier
methods. For the low-temperature phase, inspection of difference Fourier maps following
72
initial refinement of the thiourea host structure revealed two relatively large peaks inside the
host tunnel, interpreted as the locations of two Br atoms with fractional occupancies and
suggesting that the BrCH guest molecule is disordered between two well-defined orientations.
At the lower temperatures studied in the low-temperature phase (ca. 110 K), it was possible to
locate the other non-H atoms of the BrCH molecule from difference Fourier maps.
Geometrical restraints were applied to the two BrCH orientations in the final stages of
refinement, and the fractional occupancies were refined. For non-H atoms, anisotropic
displacement parameters were refined. H atoms were inserted at calculated positions and
refined using a riding model. The isotropic displacement parameter of each H atom was 1.2
times the equivalent isotropic displacement parameter of the atom to which it is bonded.
Powder X-ray diffraction data were recorded at several temperatures between 295 K and
30 K on a Bruker D8 diffractometer (reflection mode; Ge monochromated CuKα1 radiation;
data range, 15° ≤ 2θ ≤ 41°; step size, 0.01607°; time per step, 6 s). Temperature was
controlled using an Oxford Cryosystems Phenix cryostat (accuracy ca. 0.1 K). However,
under the conditions of our powder X-ray diffraction measurement, the inclusion compound
undergoes partial decomposition (as a result of subjecting the sample to reduced pressure in
the cryostat), leading to the presence of some amount of pure thiourea[45, 46]
in the sample.
Thus, peaks due to pure thiourea (marked with asterisks in Fig. 4.4) are observed in the
powder X-ray diffraction patterns. Lattice parameters for BrCH/thiourea were determined by
profile fitting using the Le Bail method[47]
in the GSAS program package.[48, 49]
A two-phase
refinement was employed, involving simultaneous profile-fitting for both the BrCH/thiourea
inclusion compound and pure thiourea. Good quality fits were obtained in all cases (Fig. 4.5).
4.4 – Results and Discussion
Figure 4.2 shows a differential scanning calorigram of BrCH/thiourea. The DSC plot
indicates that BrCH/thiourea undergoes a first-order exothermic transition at 233 K on
cooling and an endothermic transition at 233 K on heating, in close agreement with the phase
transition temperature reported previously.[26, 41]
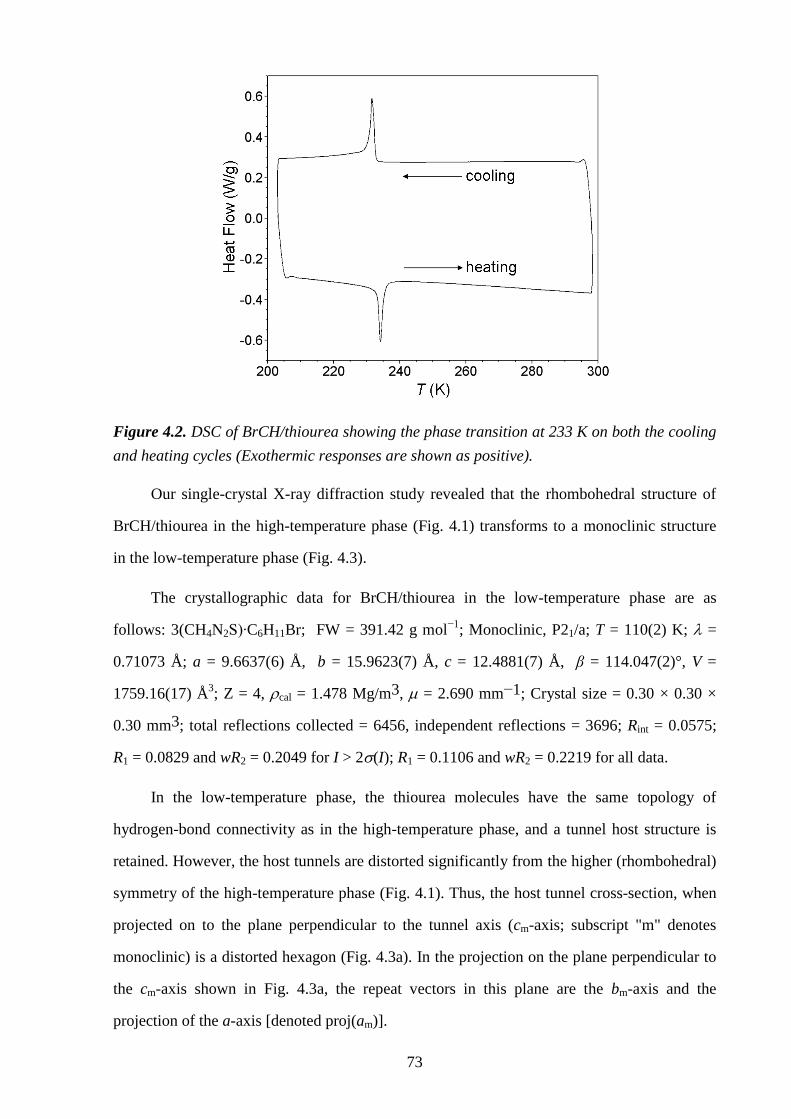
73
Figure 4.2. DSC of BrCH/thiourea showing the phase transition at 233 K on both the cooling
and heating cycles (Exothermic responses are shown as positive).
Our single-crystal X-ray diffraction study revealed that the rhombohedral structure of
BrCH/thiourea in the high-temperature phase (Fig. 4.1) transforms to a monoclinic structure
in the low-temperature phase (Fig. 4.3).
The crystallographic data for BrCH/thiourea in the low-temperature phase are as
follows: 3(CH4N2S)∙C6H11Br; FW = 391.42 g mol−1
; Monoclinic, P21/a; T = 110(2) K; =
0.71073 Å; a = 9.6637(6) Å, b = 15.9623(7) Å, c = 12.4881(7) Å, β = 114.047(2)°, V =
1759.16(17) Å3; Z = 4, cal = 1.478 Mg/m3, = 2.690 mm−1; Crystal size = 0.30 × 0.30 ×
0.30 mm3; total reflections collected = 6456, independent reflections = 3696; Rint = 0.0575;
R1 = 0.0829 and wR2 = 0.2049 for I > 2(I); R1 = 0.1106 and wR2 = 0.2219 for all data.
In the low-temperature phase, the thiourea molecules have the same topology of
hydrogen-bond connectivity as in the high-temperature phase, and a tunnel host structure is
retained. However, the host tunnels are distorted significantly from the higher (rhombohedral)
symmetry of the high-temperature phase (Fig. 4.1). Thus, the host tunnel cross-section, when
projected on to the plane perpendicular to the tunnel axis (cm-axis; subscript "m" denotes
monoclinic) is a distorted hexagon (Fig. 4.3a). In the projection on the plane perpendicular to
the cm-axis shown in Fig. 4.3a, the repeat vectors in this plane are the bm-axis and the
projection of the a-axis [denoted proj(am)].
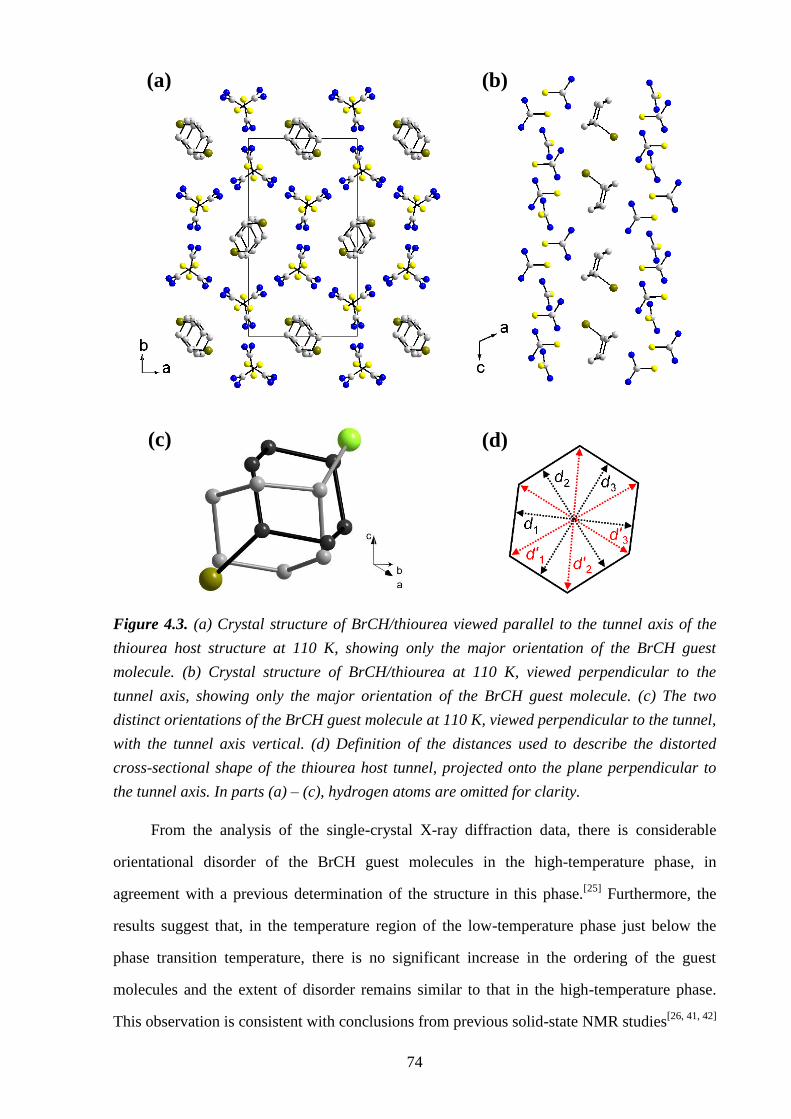
74
Figure 4.3. (a) Crystal structure of BrCH/thiourea viewed parallel to the tunnel axis of the
thiourea host structure at 110 K, showing only the major orientation of the BrCH guest
molecule. (b) Crystal structure of BrCH/thiourea at 110 K, viewed perpendicular to the
tunnel axis, showing only the major orientation of the BrCH guest molecule. (c) The two
distinct orientations of the BrCH guest molecule at 110 K, viewed perpendicular to the tunnel,
with the tunnel axis vertical. (d) Definition of the distances used to describe the distorted
cross-sectional shape of the thiourea host tunnel, projected onto the plane perpendicular to
the tunnel axis. In parts (a) – (c), hydrogen atoms are omitted for clarity.
From the analysis of the single-crystal X-ray diffraction data, there is considerable
orientational disorder of the BrCH guest molecules in the high-temperature phase, in
agreement with a previous determination of the structure in this phase.[25]
Furthermore, the
results suggest that, in the temperature region of the low-temperature phase just below the
phase transition temperature, there is no significant increase in the ordering of the guest
molecules and the extent of disorder remains similar to that in the high-temperature phase.
This observation is consistent with conclusions from previous solid-state NMR studies[26, 41, 42]
(a) (b)
(c) (d)
75
discussed above. It is only at sufficiently low temperatures within the low-temperature phase
that the orientational properties of the BrCH guest molecules become more localized, with
evidence from the single-crystal X-ray diffraction analysis that the guest substructure in this
temperature regime (below ca. 180 K) is characterized by two well-defined guest orientations
at each guest site within the host tunnel.
At the lowest temperature (110 K) studied, the guest substructure is described by a
model comprising two distinct orientations of the BrCH guest molecule (with total occupancy
of unity), centred at the same site in the host tunnel. For each guest orientation, the
cyclohexane ring has the chair conformation with the Br substituent in the axial position (Fig.
4.3b,c), in agreement with conclusions from spectroscopic studies (see Section 4.2) that the
axial conformation predominates for BrCH guest molecules in the thiourea host structure and
that there is no change in this preference at low temperatures. In accordance with the
conclusions from Br K-edge EXAFS spectra (Section 4.2),[27]
the single crystal results show
that head to head ordering of the guest molecules exists in the inclusion compound at these
temperatures.
At 110 K, the occupancies of the two guest orientations are ca. 80% (major component)
and 20% (minor component), confirmed from independent studies of two different crystals.
The shape of the structural "envelope" (van der Waals surface) occupied by the two guest
molecules is roughly prolate spheroidal, with the principal axis oriented at ca. 86°, 54° and
45° with respect to the am, bm and cm-axes respectively. The C–Br bonds in the major and
minor components of the guest are tilted from the tunnel axis (+c-axis) by 52.5° and 126.3°,
respectively, and the angle between the orientations of the C–Br bond in the two components
is ca. 98°. For the major component, the projection of the C–Br bond on to the plane
perpendicular to the tunnel (cm) axis forms an angle of 3.5° with the proj(am) axis and an
angle of 86.5° with the bm-axis. The two guest orientations occupy essentially the same
volume of space (see Fig. 4.3c), and it is reasonable to infer that the difference in host-guest
interaction energy between the two orientations must be comparatively small, such that both
orientations have significant populations at low temperature.
76
To further explore the extent of ordering of the BrCH guest molecules in the higher
temperature region of the low-temperature phase, the structure determined at 110 K was used
as the starting model for refinements at higher temperatures, in which the occupancies of the
two guest orientations were allowed to refine. On increasing temperature from 110 K to 220
K, the relative occupancies (ca. 4:1 at 110 K) of the two guest orientations converge to similar
values. However, the precision of the refined guest substructure decreases significantly as
temperature is increased, reflecting an increased degree of disorder such that the model
comprising two well-defined orientations of the guest molecule becomes inadequate, even
with refinement of large anisotropic displacement parameters to subsume the effects of
molecular motion. From single-crystal X-ray diffraction data recorded with temperature
cycling in the low-temperature phase, the relative occupancies of the two guest orientations
are found to vary reversibly as a function of temperature, suggesting that a process of
dynamic inter-conversion between the two guest orientations occurs inside the host tunnel.
To explore the temperature dependence of the lattice parameters in more detail, a
powder X-ray diffraction study was carried out to determine the unit cell parameters at a
significantly greater number of temperatures and covering a wider temperature range (down
to 30 K) than the single-crystal X-ray diffraction study. A selection of the experimental X-ray
powder diffraction patterns is shown in Fig. 4.4. The results demonstrate clearly that a
structural change occurs between 240 and 230 K. The X-ray diffraction pattern at 295 K can
be indexed on the basis of a rhombohedral lattice [a = 16.03 Å, c = 12.51 Å (hexagonal
setting)] and the systematic absences are consistent with space group R3̄c determined
previously from single crystal X-ray diffraction data.[25]
We note that pure thiourea may be
produced during grinding of the sample and when the sample is subjected to reduced pressure
conditions inside the cryostat. Thus, several peaks assigned to pure thiourea (marked with
asterisks in Fig. 4.4) can be indexed on the basis of the orthorhombic lattice of pure
thiourea[45, 46]
with space group Pnma at 295, 240 and 230 K and space group P21ma at 100
K. The unit cell parameters obtained from the powder X-ray diffraction data for
BrCH/thiourea were determined by profile fitting using the Le Bail method (see Section 4.3).
Figure 4.5 shows the results from the Le Bail fitting of the powder X-ray diffraction patterns
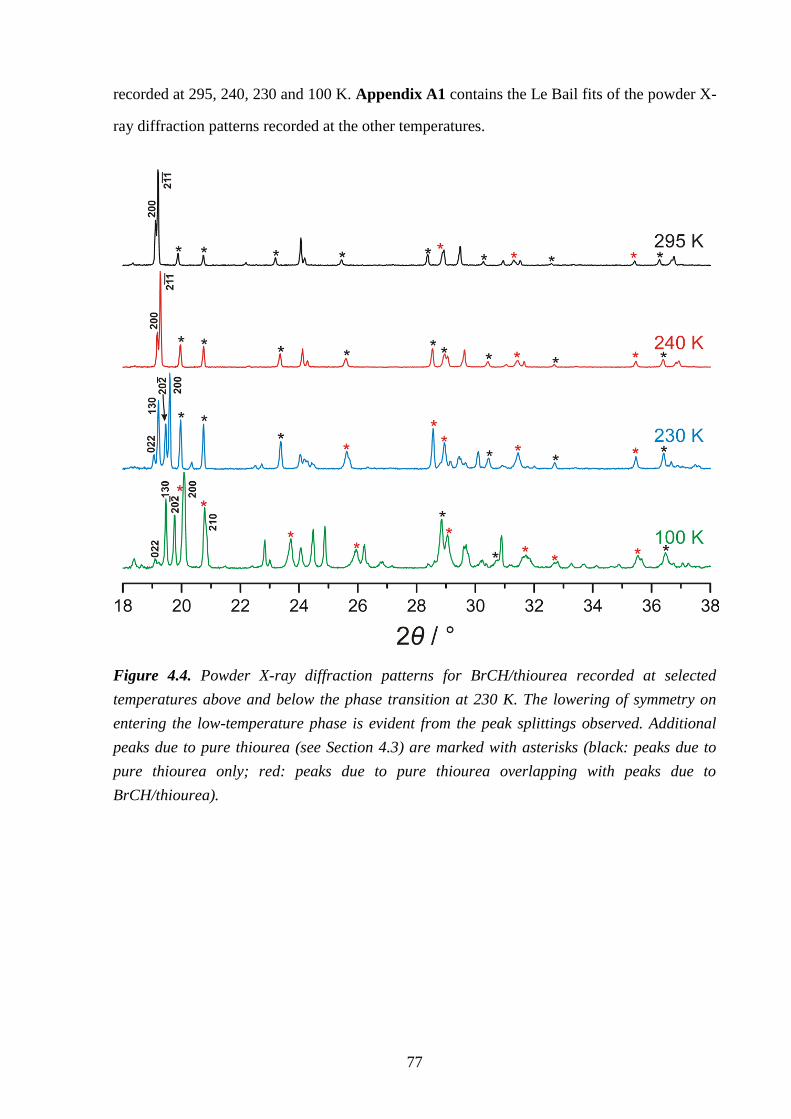
77
recorded at 295, 240, 230 and 100 K. Appendix A1 contains the Le Bail fits of the powder X-
ray diffraction patterns recorded at the other temperatures.
Figure 4.4. Powder X-ray diffraction patterns for BrCH/thiourea recorded at selected
temperatures above and below the phase transition at 230 K. The lowering of symmetry on
entering the low-temperature phase is evident from the peak splittings observed. Additional
peaks due to pure thiourea (see Section 4.3) are marked with asterisks (black: peaks due to
pure thiourea only; red: peaks due to pure thiourea overlapping with peaks due to
BrCH/thiourea).
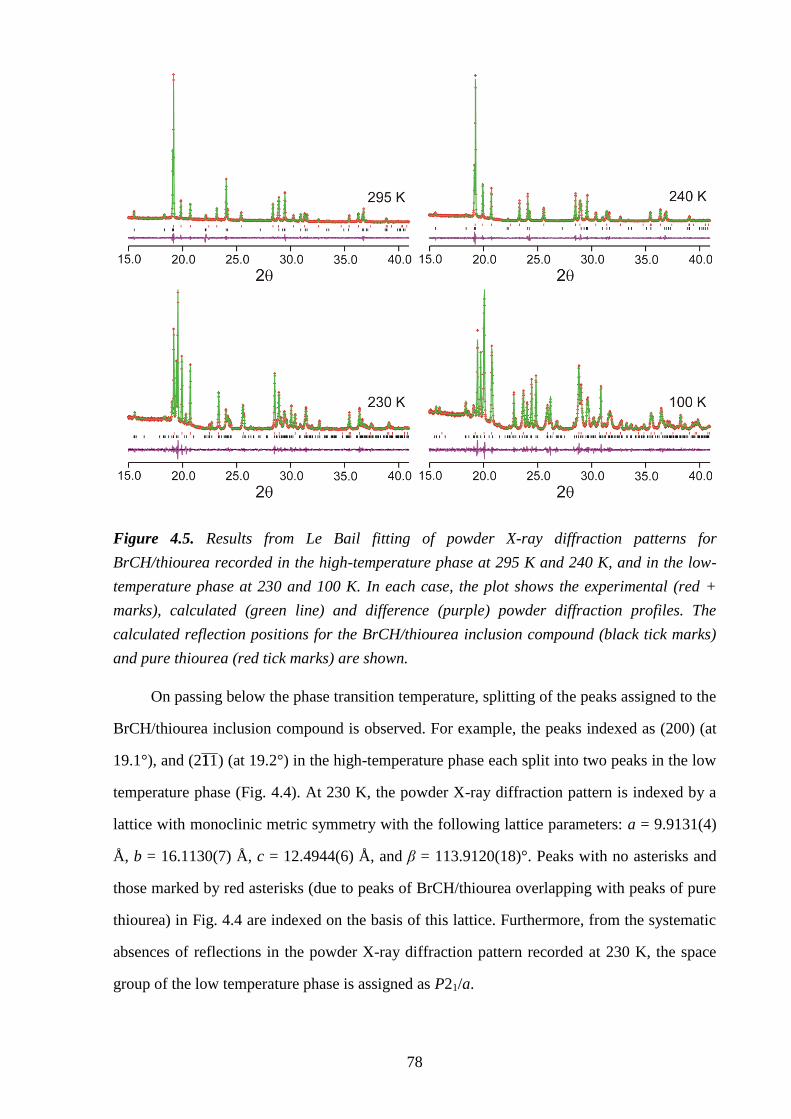
78
Figure 4.5. Results from Le Bail fitting of powder X-ray diffraction patterns for
BrCH/thiourea recorded in the high-temperature phase at 295 K and 240 K, and in the low-
temperature phase at 230 and 100 K. In each case, the plot shows the experimental (red +
marks), calculated (green line) and difference (purple) powder diffraction profiles. The
calculated reflection positions for the BrCH/thiourea inclusion compound (black tick marks)
and pure thiourea (red tick marks) are shown.
On passing below the phase transition temperature, splitting of the peaks assigned to the
BrCH/thiourea inclusion compound is observed. For example, the peaks indexed as (200) (at
19.1°), and (21̄11̄ ) (at 19.2°) in the high-temperature phase each split into two peaks in the low
temperature phase (Fig. 4.4). At 230 K, the powder X-ray diffraction pattern is indexed by a
lattice with monoclinic metric symmetry with the following lattice parameters: a = 9.9131(4)
Å, b = 16.1130(7) Å, c = 12.4944(6) Å, and β = 113.9120(18)°. Peaks with no asterisks and
those marked by red asterisks (due to peaks of BrCH/thiourea overlapping with peaks of pure
thiourea) in Fig. 4.4 are indexed on the basis of this lattice. Furthermore, from the systematic
absences of reflections in the powder X-ray diffraction pattern recorded at 230 K, the space
group of the low temperature phase is assigned as P21/a.
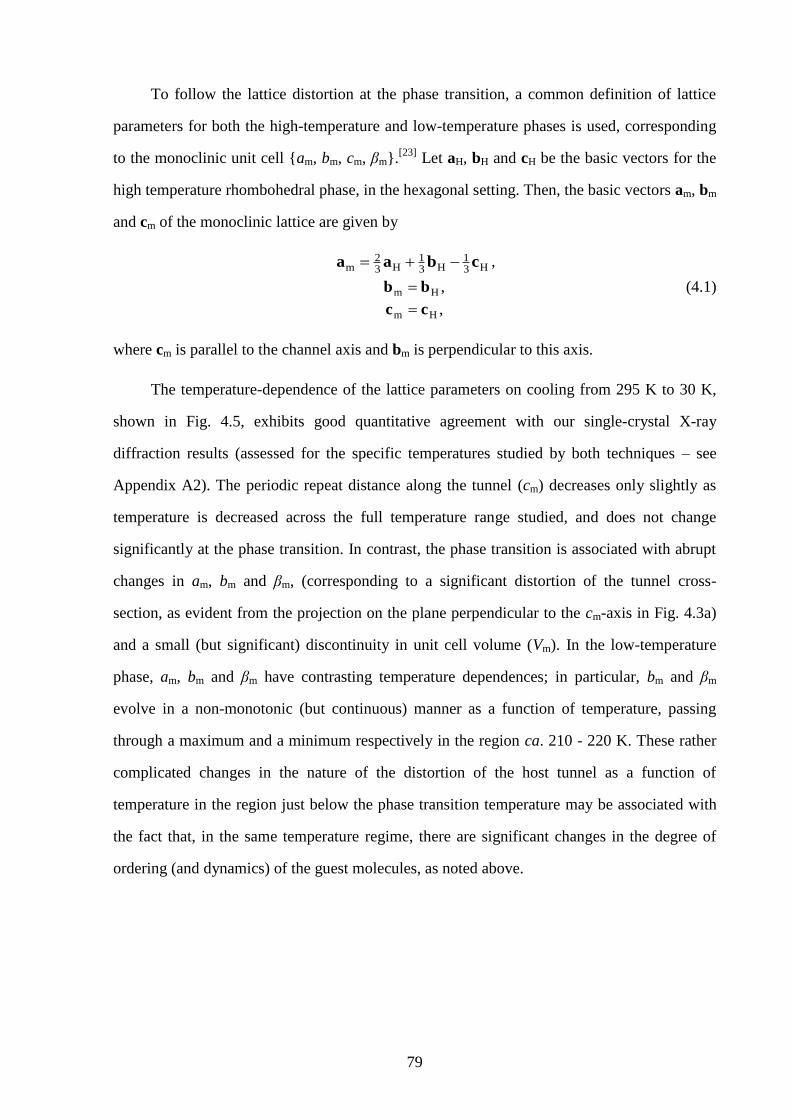
79
To follow the lattice distortion at the phase transition, a common definition of lattice
parameters for both the high-temperature and low-temperature phases is used, corresponding
to the monoclinic unit cell {am, bm, cm, βm}.[23]
Let aH, bH and cH be the basic vectors for the
high temperature rhombohedral phase, in the hexagonal setting. Then, the basic vectors am, bm
and cm of the monoclinic lattice are given by
H31
H31
H32
m cbaa ,
,Hm bb (4.1)
,Hm cc
where cm is parallel to the channel axis and bm is perpendicular to this axis.
The temperature-dependence of the lattice parameters on cooling from 295 K to 30 K,
shown in Fig. 4.5, exhibits good quantitative agreement with our single-crystal X-ray
diffraction results (assessed for the specific temperatures studied by both techniques – see
Appendix A2). The periodic repeat distance along the tunnel (cm) decreases only slightly as
temperature is decreased across the full temperature range studied, and does not change
significantly at the phase transition. In contrast, the phase transition is associated with abrupt
changes in am, bm and βm, (corresponding to a significant distortion of the tunnel cross-
section, as evident from the projection on the plane perpendicular to the cm-axis in Fig. 4.3a)
and a small (but significant) discontinuity in unit cell volume (Vm). In the low-temperature
phase, am, bm and βm have contrasting temperature dependences; in particular, bm and βm
evolve in a non-monotonic (but continuous) manner as a function of temperature, passing
through a maximum and a minimum respectively in the region ca. 210 - 220 K. These rather
complicated changes in the nature of the distortion of the host tunnel as a function of
temperature in the region just below the phase transition temperature may be associated with
the fact that, in the same temperature regime, there are significant changes in the degree of
ordering (and dynamics) of the guest molecules, as noted above.
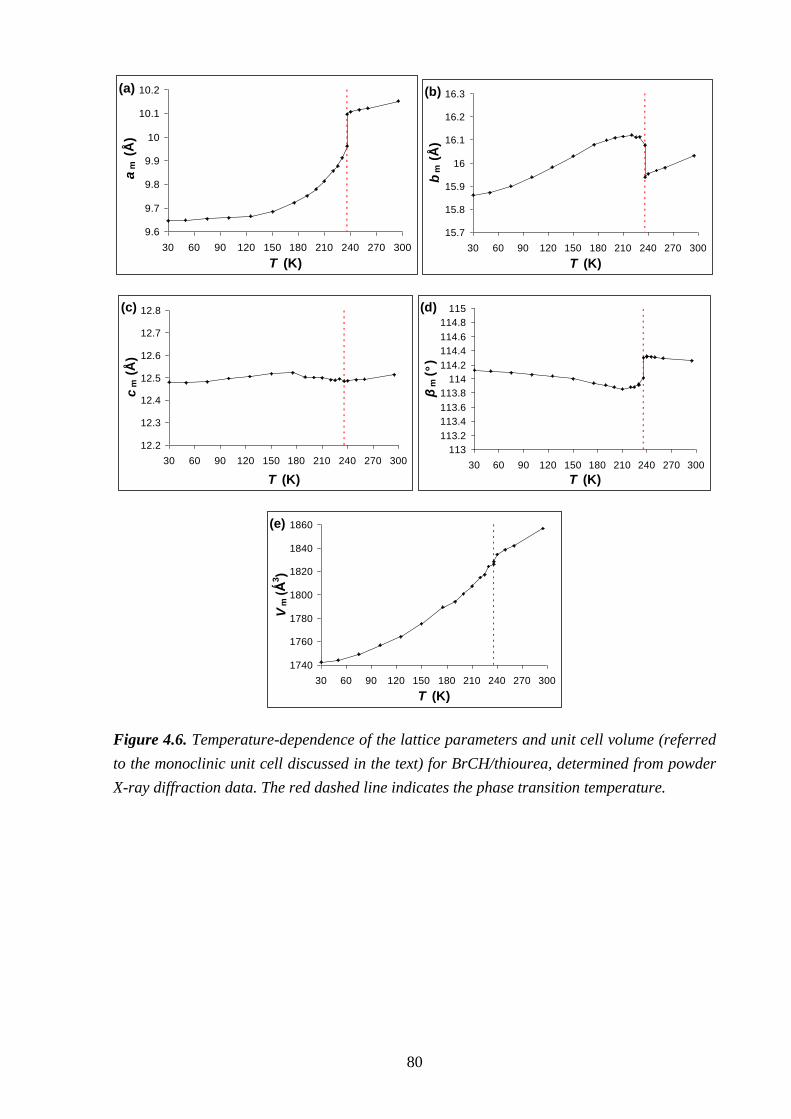
80
(a)
9.6
9.7
9.8
9.9
10
10.1
10.2
30 60 90 120 150 180 210 240 270 300
T (K)
am
(Å
)
(b)
15.7
15.8
15.9
16
16.1
16.2
16.3
30 60 90 120 150 180 210 240 270 300
T (K)
bm
(Å
)
(c)
12.2
12.3
12.4
12.5
12.6
12.7
12.8
30 60 90 120 150 180 210 240 270 300
T (K)
cm
(Å
)
(d)
113
113.2
113.4
113.6
113.8
114
114.2
114.4
114.6
114.8
115
30 60 90 120 150 180 210 240 270 300
T (K)
βm
(°
)
(e)
1740
1760
1780
1800
1820
1840
1860
30 60 90 120 150 180 210 240 270 300
T (K)
Vm
(Ǻ
3)
Figure 4.6. Temperature-dependence of the lattice parameters and unit cell volume (referred
to the monoclinic unit cell discussed in the text) for BrCH/thiourea, determined from powder
X-ray diffraction data. The red dashed line indicates the phase transition temperature.
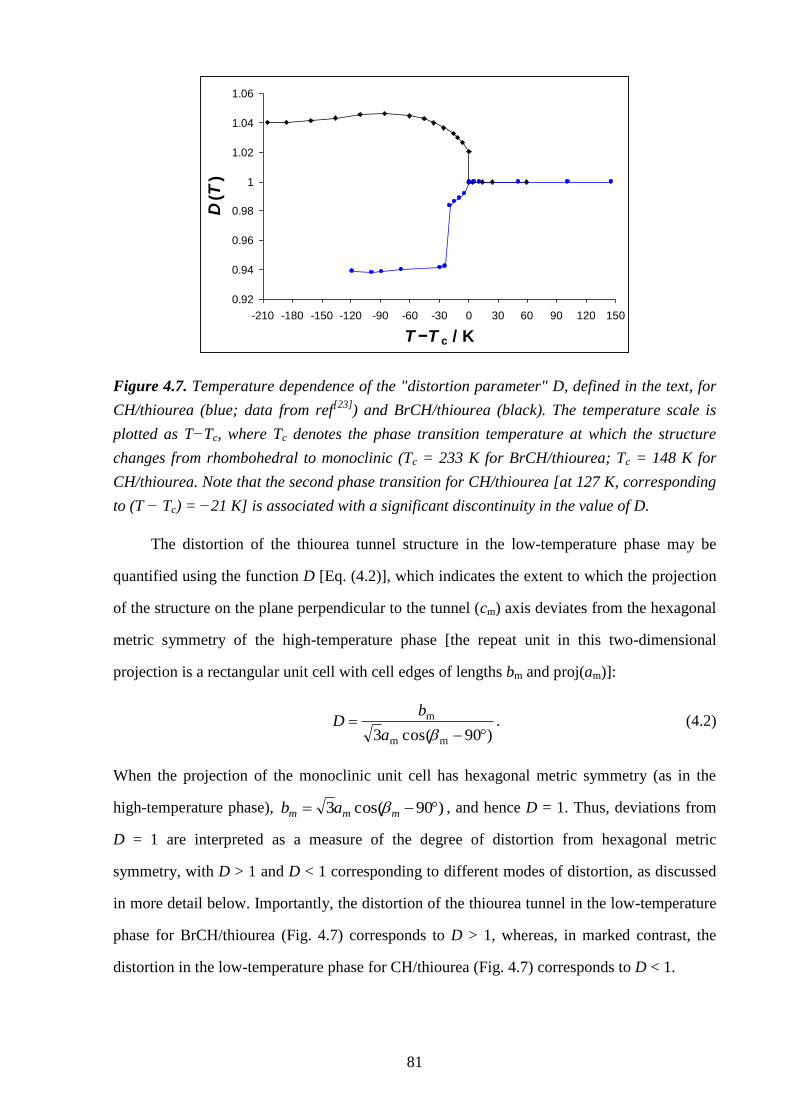
81
0.92
0.94
0.96
0.98
1
1.02
1.04
1.06
-210 -180 -150 -120 -90 -60 -30 0 30 60 90 120 150
T −T c / K
D(T
)
Figure 4.7. Temperature dependence of the "distortion parameter" D, defined in the text, for
CH/thiourea (blue; data from ref[23]
) and BrCH/thiourea (black). The temperature scale is
plotted as T−Tc, where Tc denotes the phase transition temperature at which the structure
changes from rhombohedral to monoclinic (Tc = 233 K for BrCH/thiourea; Tc = 148 K for
CH/thiourea. Note that the second phase transition for CH/thiourea [at 127 K, corresponding
to (T − Tc) = −21 K] is associated with a significant discontinuity in the value of D.
The distortion of the thiourea tunnel structure in the low-temperature phase may be
quantified using the function D [Eq. (4.2)], which indicates the extent to which the projection
of the structure on the plane perpendicular to the tunnel (cm) axis deviates from the hexagonal
metric symmetry of the high-temperature phase [the repeat unit in this two-dimensional
projection is a rectangular unit cell with cell edges of lengths bm and proj(am)]:
)90cos(3 mm
m
a
bD . (4.2)
When the projection of the monoclinic unit cell has hexagonal metric symmetry (as in the
high-temperature phase), )90cos(3 mmm ab , and hence D = 1. Thus, deviations from
D = 1 are interpreted as a measure of the degree of distortion from hexagonal metric
symmetry, with D > 1 and D < 1 corresponding to different modes of distortion, as discussed
in more detail below. Importantly, the distortion of the thiourea tunnel in the low-temperature
phase for BrCH/thiourea (Fig. 4.7) corresponds to D > 1, whereas, in marked contrast, the
distortion in the low-temperature phase for CH/thiourea (Fig. 4.7) corresponds to D < 1.
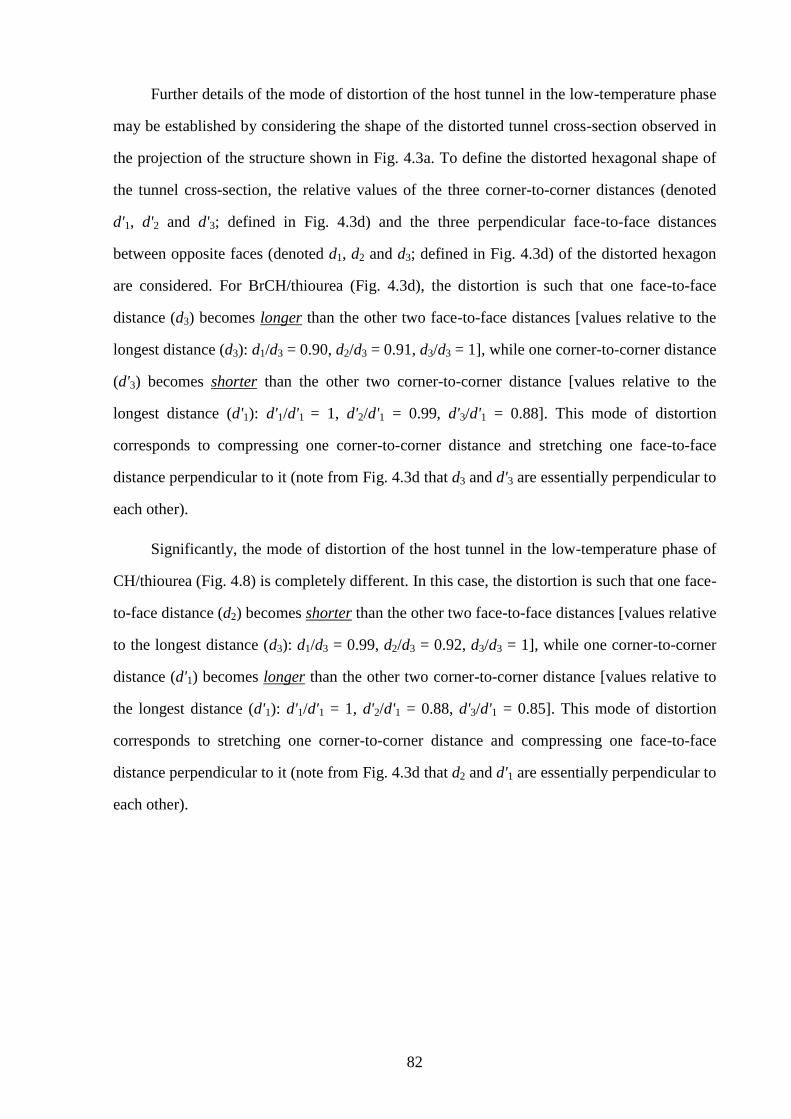
82
Further details of the mode of distortion of the host tunnel in the low-temperature phase
may be established by considering the shape of the distorted tunnel cross-section observed in
the projection of the structure shown in Fig. 4.3a. To define the distorted hexagonal shape of
the tunnel cross-section, the relative values of the three corner-to-corner distances (denoted
d'1, d'2 and d'3; defined in Fig. 4.3d) and the three perpendicular face-to-face distances
between opposite faces (denoted d1, d2 and d3; defined in Fig. 4.3d) of the distorted hexagon
are considered. For BrCH/thiourea (Fig. 4.3d), the distortion is such that one face-to-face
distance (d3) becomes longer than the other two face-to-face distances [values relative to the
longest distance (d3): d1/d3 = 0.90, d2/d3 = 0.91, d3/d3 = 1], while one corner-to-corner distance
(d'3) becomes shorter than the other two corner-to-corner distance [values relative to the
longest distance (d'1): d'1/d'1 = 1, d'2/d'1 = 0.99, d'3/d'1 = 0.88]. This mode of distortion
corresponds to compressing one corner-to-corner distance and stretching one face-to-face
distance perpendicular to it (note from Fig. 4.3d that d3 and d'3 are essentially perpendicular to
each other).
Significantly, the mode of distortion of the host tunnel in the low-temperature phase of
CH/thiourea (Fig. 4.8) is completely different. In this case, the distortion is such that one face-
to-face distance (d2) becomes shorter than the other two face-to-face distances [values relative
to the longest distance (d3): d1/d3 = 0.99, d2/d3 = 0.92, d3/d3 = 1], while one corner-to-corner
distance (d'1) becomes longer than the other two corner-to-corner distance [values relative to
the longest distance (d'1): d'1/d'1 = 1, d'2/d'1 = 0.88, d'3/d'1 = 0.85]. This mode of distortion
corresponds to stretching one corner-to-corner distance and compressing one face-to-face
distance perpendicular to it (note from Fig. 4.3d that d2 and d'1 are essentially perpendicular to
each other).
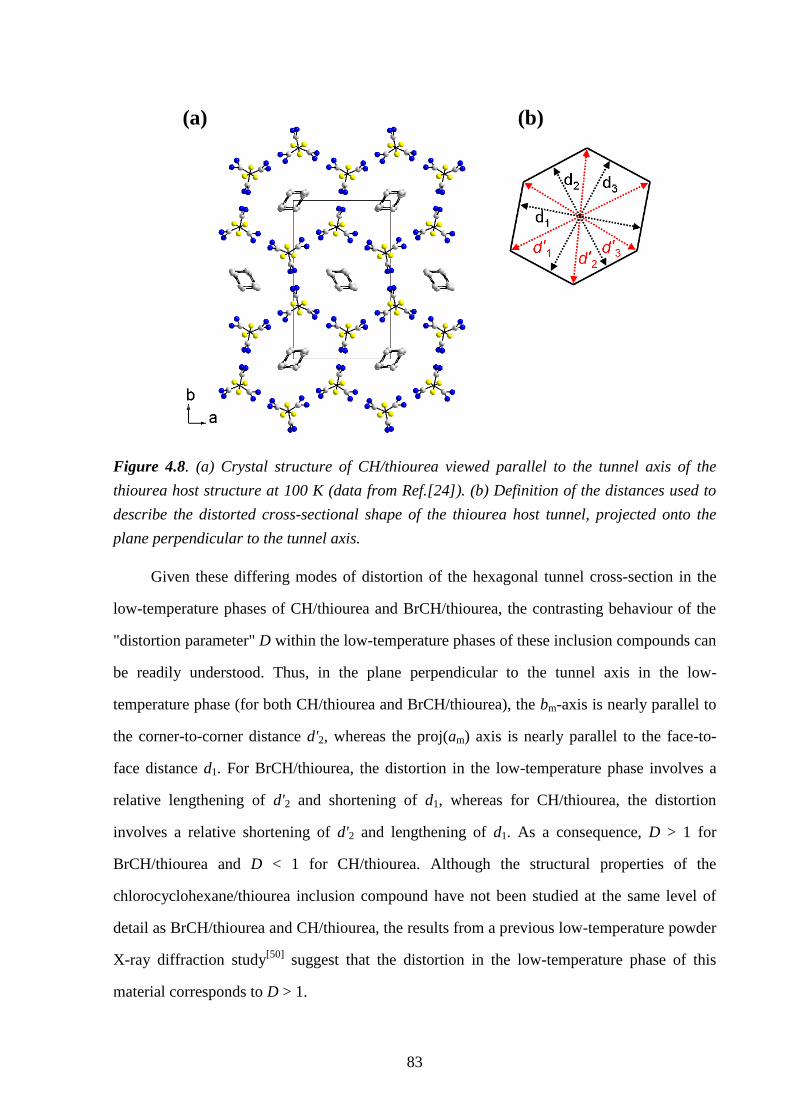
83
Figure 4.8. (a) Crystal structure of CH/thiourea viewed parallel to the tunnel axis of the
thiourea host structure at 100 K (data from Ref.[24]). (b) Definition of the distances used to
describe the distorted cross-sectional shape of the thiourea host tunnel, projected onto the
plane perpendicular to the tunnel axis.
Given these differing modes of distortion of the hexagonal tunnel cross-section in the
low-temperature phases of CH/thiourea and BrCH/thiourea, the contrasting behaviour of the
"distortion parameter" D within the low-temperature phases of these inclusion compounds can
be readily understood. Thus, in the plane perpendicular to the tunnel axis in the low-
temperature phase (for both CH/thiourea and BrCH/thiourea), the bm-axis is nearly parallel to
the corner-to-corner distance d'2, whereas the proj(am) axis is nearly parallel to the face-to-
face distance d1. For BrCH/thiourea, the distortion in the low-temperature phase involves a
relative lengthening of d'2 and shortening of d1, whereas for CH/thiourea, the distortion
involves a relative shortening of d'2 and lengthening of d1. As a consequence, D > 1 for
BrCH/thiourea and D < 1 for CH/thiourea. Although the structural properties of the
chlorocyclohexane/thiourea inclusion compound have not been studied at the same level of
detail as BrCH/thiourea and CH/thiourea, the results from a previous low-temperature powder
X-ray diffraction study[50]
suggest that the distortion in the low-temperature phase of this
material corresponds to D > 1.
(b) (a)
84
4.5 – Conclusions and Further Work
The studies presented in this chapter reveal that BrCH/thiourea undergoes a reversible
first-order phase transition at 233 K which involves a distortion of the host tunnel structure
from rhombohedral to monoclinic symmetry and is associated with a large discontinuity in
unit cell dimensions in the plane perpendicular to the tunnel axis. In agreement with previous
spectroscopic studies,[26, 41]
single-crystal X-ray diffraction reveals that the BrCH guest
molecules remain highly orientationally disordered in the temperature region just below the
phase transition temperature. Indeed, the orientational properties of the BrCH guest molecules
only become localised at sufficiently low temperatures within the low-temperature phase
(below ca. 180 K). This gradual increase in the ordering of the BrCH guest molecules as
temperature decreases reflects a reduction in the dynamics of the guest molecules which
slowly re-orient into one preferred direction as they lose mobility and as the host structure
contracts.
Comparison of the structural properties of the low-temperature phase of the
BrCH/thiourea inclusion compound presented in this chapter with those of the CH/thiourea
inclusion compound reported previously[23, 24]
reveal the subtle yet important changes that can
occur in phase transition behaviour simply by substitution of a single atom in the guest
molecule (in this case bromine substitution). This observation reflects the fine energetic
balances that pertain in such materials and the role of small and subtle changes in
intermolecular interactions involving the host and guest components.
To investigate this subtle phase transition behaviour in more detail and to determine the
relative importance of steric and electronic factors to the "mode of distortion" in thiourea
inclusion compounds, we propose repeating the measurements outlined in this chapter on a
series of thiourea inclusion compounds containing monosubstituted cyclohexanes as the guest
component. Initially, the experiment would investigate the structural properties of thiourea
inclusion compounds containing fluorocyclohexane, chlorocyclohexane, idodocyclohexane
and methylcyclohexane guest molecules as a function of temperature, above and below the
phase transitions in these materials. Knowledge of the structural properties and phase
transition behaviour of these materials may allow conclusions to be drawn on the physical
85
properties which control the phase transition behaviour. We note that chlorocyclohexane and
methycyclohexane possess similar steric features but contrasting electronic features. Thus,
comparing and contrasting the phase transition behaviour of the thiourea inclusion
compounds containing these two guest molecules could be particularly instructive for
deducing the factors which control the phase transition behaviour. It would also be
informative to know whether the thiourea inclusion compounds containing monohalogen-
substituted cyclohexane guest molecules (which possess similar electronic features but
diverse steric features) behave in a similar way to one another, and whether there are any
observable trends in their behaviour (for instance, in their phase transition temperatures,
lattice parameter changes and in the changes of the ordering of guest molecules).
The plots of the unit cell parameters of BrCH/thiourea as a function of temperature (Fig.
4.6), reveal rather complicated changes in the nature of the distortion of the host tunnel just
below the phase transition temperature. We suggest that this is associated with the significant
changes in the dynamics and degree of ordering of the guest molecules that take place in this
temperature regime. Clearly, more knowledge of the dynamic properties of the BrCH guest
molecules is required to be able to fully rationalise this behaviour. We propose performing
variable-temperature solid-state 2H NMR studies on thiourea inclusion compounds containing
deuterated BrCH guest molecules to investigate the dynamic properties of this material in
more detail.
The present study focussed on the changes in the structural properties of the
BrCH/thiourea inclusion compound as a function of temperature. We predict that similar
changes may also be observed as a result of varying the pressure applied to the inclusion
compound. We propose to repeat the measurements presented in this chapter as a function of
pressure instead of temperature, to determine whether the mode of distortion of the
BrCH/thiourea tunnel structure and the changes in the ordering of BrCH guest molecules are
the same in both cases.
86
4.6 – References
[1] L. C. Fetterly, in Non-Stoichiometric Compounds (Ed.: L. Mandelcorn), Academic
Press, New York, 1964, p. 491.
[2] M. D. Hollingsworth, K. D. M. Harris, in Comprehensive Supramolecular Chemistry
(Eds.: D. D. Macnicol, F. Toda, R. Bishop), Pergamon Press, Oxford, UK, 1996, Vol.
6, p. 177.
[3] K. D. M. Harris, J. Mol. Struct. 1996, 374, 241.
[4] K. D. M. Harris, Chem. Soc. Rev. 1997, 26, 279.
[5] K. D. M. Harris, Supramol. Chem. 2007, 19, 47.
[6] A. E. Smith, Acta Crystallogr. 1952, 5, 224.
[7] K. D. M. Harris, J. M. Thomas, J. Chem. Soc., Faraday Trans. 1990, 86, 2985.
[8] K. D. M. Harris, J. Solid State Chem. 1993, 106, 83.
[9] F. Guillaume, J. Chim. Phys. (Paris) 1999, 96, 1295.
[10] M. D. Hollingsworth, Science 2002, 295, 2410.
[11] H.-U. Lenné, Acta Crystallogr. 1954, 7, 1.
[12] E. Hough, D. G. Nicholson, J. Chem. Soc., Dalton Trans. 1978, 1, 15.
[13] R. Gopal, B. E. Robertson, J. S. Rutherford, Acta Crystallogr. Sect., C 1989, 45, 257.
[14] K. D. M. Harris, J. M. Thomas, J. Chem. Soc., Faraday Trans. 1990, 86, 1095.
[15] H. Clasen, Zeitschrift Für Elektrochemie 1956, 60, 982.
[16] J. F. Brown, D. M. White, J. Am. Chem. Soc. 1960, 82, 5671.
[17] W. Tam, D. F. Eaton, J. C. Calabrese, I. D. Williams, Y. Wang, A. G. Anderson,
Chem. Mater. 1989, 1, 128.
[18] M. H. Chao, B. M. Kariuki, K. D. M. Harris, S. P. Collins, D. Laundy, Angew.
Chemie. Int. Ed. 2003, 42, 2982.
[19] B. A. Palmer, A. Morte-Ródenas, B. M. Kariuki, K. D. M. Harris, S. P. Collins, J.
Phys. Chem. Lett 2011, 2, 2346.
[20] R. Clément, C. Mazières, M. Gourdji, L. Guibé, J. Chem. Phys. 1977, 67, 5381.
[21] E. Meirovitch, T. Krant, S. Vega, J. Phys. Chem. 1983, 87, 1390.
[22] R. Poupko, E. Furman, K. Müller, Z. Luz, J. Phys. Chem. 1991, 95, 407.
[23] A. Desmedt, S. J. Kitchin, F. Guillaume, M. Couzi, K. D. M. Harris, E. H. Bocanegra,
Phys. Rev. B 2001, 64, 054106.
[24] Z. Pan, A. Desmedt, E. J. MacLean, F. Guillaume, K. D. M. Harris, J. Phys. Chem. C
2008, 112, 839.
[25] T. Ishibashi, M. Machida, N. Koyano, J. Korean Phys. Soc. 2005, 46, 228.
[26] K. Müller, Magn. Reson. Chem. 1995, 33, 113.
[27] I. J. Shannon, M. J. Jones, K. D. M. Harris, M. R. H. Siddiqui, R. W. Joyner, J. Chem.
Soc., Faraday Trans. 1995, 91, 1497.
[28] M. Larnaudie, C. R. Hebd. Acad. Sci. 1952, 235, 154.
[29] M. Larnaudie, J. Phys-Paris 1954, 15, 650.
[30] O. Hassel, H. Viervoll, Tids. Kjemi. Bergvesen Met. 1943, 5, 35.
[31] K. Kozima, K. Sakashita, Bull. Chem. Soc. Jpn. 1958, 31, 796.
[32] P. Klaeboe, J. J. Lothe, K. Lunde, Acta Chem. Scand. 1956, 10, 1465.
87
[33] P. Klaeboe, Acta Chem. Scand. 1969, 23, 2641.
[34] A. I. Fishman, W. A. Herrebout, B. J. van der Veken, Phys. Chem. Chem. Phys. 2002,
4, 5606.
[35] J. E. D. Davies, G. J. Nightingale, J. Struct. Chem. 1999, 40, 802.
[36] M. Nishikawa, Chem. Pharm. Bull. 1963, 11, 977.
[37] K. Fukushima, J. Mol. Struct. 1976, 34, 67.
[38] J. E. Gustavsen, P. Klaeboe, H. Kvila, Acta. Chem. Scand. A 1978, 32, 25.
[39] A. Allen, V. Fawcett, D. A. Long, J. Raman Spectrosc. 1976, 4, 285.
[40] M. S. McKinnon, R. E. Wasylishen, Chem. Phys. Lett. 1986, 130, 565.
[41] S. Ternieden, K. Müller, J. Incl. Phenom. Mol. 1998, 30, 289.
[42] K. Muller, Magn. Reson. Chem. 1992, 30, 228.
[43] A. E. Aliev, K. D. M. Harris, J. Am. Chem. Soc. 1993, 115, 6369.
[44] G. M. Sheldrick, Acta Crystallogr. Sect. A 2008, 64, 112.
[45] N. R. Kunchur, M. R. Truter, J. Chem. Soc. 1958, 2551.
[46] M. R. Truter, Acta Crystallogr. 1967, 22, 556.
[47] A. Le Bail, H. Duroy, J. L. Fourquet, Mater. Res. Bull. 1988, 23, 447.
[48] A. C. Larson, R. B. V. Dreele, in Los Alamos Laboratory Report No. LA-UR-86-748,
Los Alamos National Laboratory, Los Alamos, NM, 1987.
[49] B. H. Toby, J. Appl. Crystallogr. 2001, 34, 210.
[50] M. J. Jones, I. J. Shannon, K. D. M. Harris, J. Chem. Soc., Faraday Trans. 1996, 92,
273.
88
Chapter 5 – X-ray Birefringence from a Model
Anisotropic Crystal
5.1 – Abstract
This chapter reports the first definitive demonstration of X-ray birefringence, reporting
a material that exhibits essentially ideal birefringence behaviour at X-ray energies near the Br
K-edge. The designed material, the 1-bromoadamantane/thiourea inclusion compound gives
experimental behaviour in excellent agreement with theoretical predictions for the
dependence of transmitted X-ray intensity on both X-ray energy and crystal orientation. The
results vindicate the potential to exploit this phenomenon to establish a detailed understanding
of molecular polarization and, in particular, to determine the orientational distributions of
specific bonds in solids.
5.2 – Theory of Birefringence
This section introduces the basic theory of the phenomenon of birefringence, providing
a foundation upon which the work presented in this chapter is based.
Birefringence is the phenomenon exhibited by anisotropic materials in which the
refractive index of light depends on the direction of polarization of the incident light.[1, 2]
Anisotropic materials have at least one unique crystallographic axis, which is termed the optic
axis and polarized light beams with the plane of polarization parallel and perpendicular to this
axis have different refractive indices. Birefringence Δn′ is defined as the difference between
the refractive indices in the planes parallel (ne) and perpendicular (no) to the optic axis:
oe nnn ' . (5.1)
When an unpolarized light beam is incident upon a birefringent material at a non-normal
incidence angle, the beam is decomposed into two linearly polarized light rays, known as the
ordinary ray (with polarization perpendicular to the optic axis) and the extraordinary ray (with
polarization parallel to the optic axis) as depicted in Fig. 5.1.[3]
This phenomenon is known as
double refraction and is manifest in the observation that, when an object illuminated with
unpolarized light is viewed through a transparent birefringent crystal, two images slightly
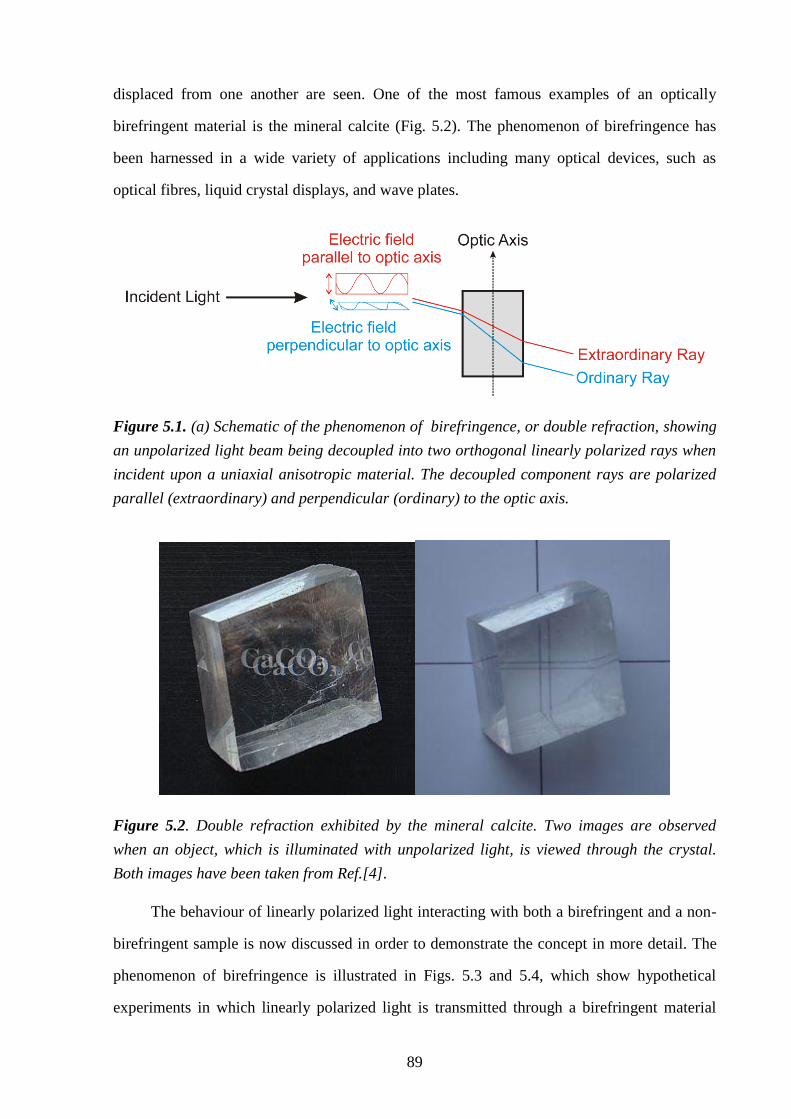
89
displaced from one another are seen. One of the most famous examples of an optically
birefringent material is the mineral calcite (Fig. 5.2). The phenomenon of birefringence has
been harnessed in a wide variety of applications including many optical devices, such as
optical fibres, liquid crystal displays, and wave plates.
Figure 5.1. (a) Schematic of the phenomenon of birefringence, or double refraction, showing
an unpolarized light beam being decoupled into two orthogonal linearly polarized rays when
incident upon a uniaxial anisotropic material. The decoupled component rays are polarized
parallel (extraordinary) and perpendicular (ordinary) to the optic axis.
Figure 5.2. Double refraction exhibited by the mineral calcite. Two images are observed
when an object, which is illuminated with unpolarized light, is viewed through the crystal.
Both images have been taken from Ref.[4].
The behaviour of linearly polarized light interacting with both a birefringent and a non-
birefringent sample is now discussed in order to demonstrate the concept in more detail. The
phenomenon of birefringence is illustrated in Figs. 5.3 and 5.4, which show hypothetical
experiments in which linearly polarized light is transmitted through a birefringent material
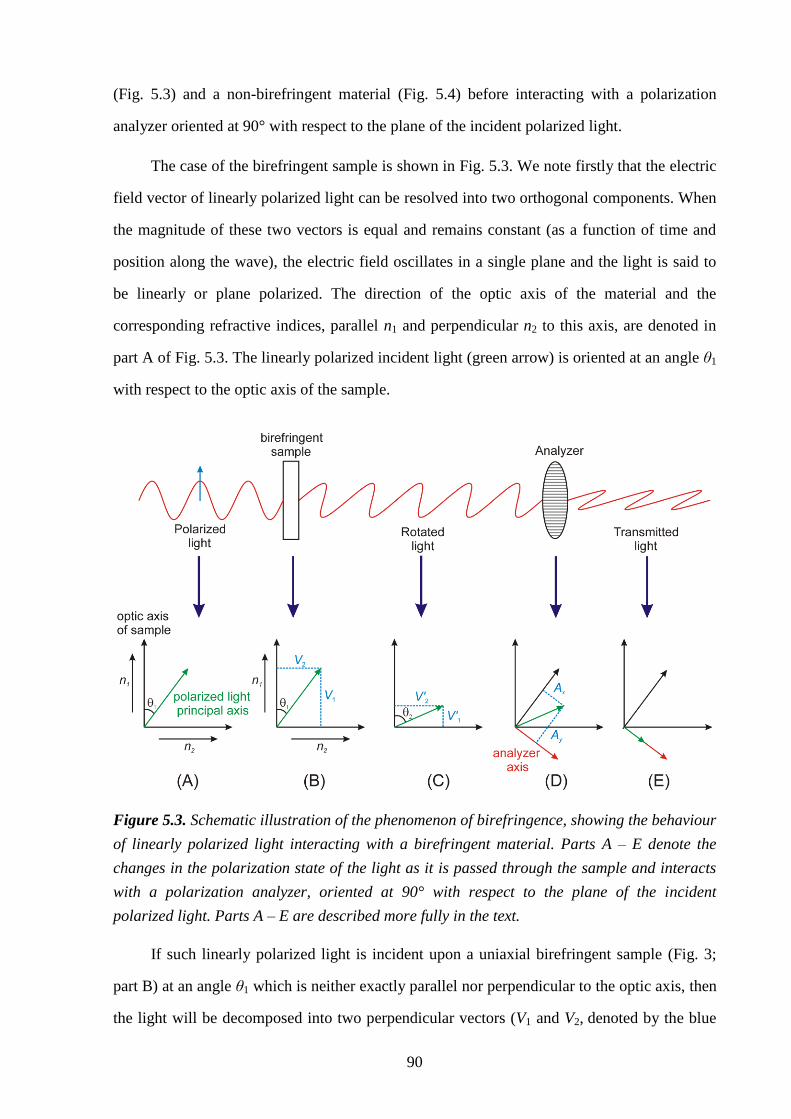
90
(Fig. 5.3) and a non-birefringent material (Fig. 5.4) before interacting with a polarization
analyzer oriented at 90° with respect to the plane of the incident polarized light.
The case of the birefringent sample is shown in Fig. 5.3. We note firstly that the electric
field vector of linearly polarized light can be resolved into two orthogonal components. When
the magnitude of these two vectors is equal and remains constant (as a function of time and
position along the wave), the electric field oscillates in a single plane and the light is said to
be linearly or plane polarized. The direction of the optic axis of the material and the
corresponding refractive indices, parallel n1 and perpendicular n2 to this axis, are denoted in
part A of Fig. 5.3. The linearly polarized incident light (green arrow) is oriented at an angle θ1
with respect to the optic axis of the sample.
Figure 5.3. Schematic illustration of the phenomenon of birefringence, showing the behaviour
of linearly polarized light interacting with a birefringent material. Parts A – E denote the
changes in the polarization state of the light as it is passed through the sample and interacts
with a polarization analyzer, oriented at 90° with respect to the plane of the incident
polarized light. Parts A – E are described more fully in the text.
If such linearly polarized light is incident upon a uniaxial birefringent sample (Fig. 3;
part B) at an angle θ1 which is neither exactly parallel nor perpendicular to the optic axis, then
the light will be decomposed into two perpendicular vectors (V1 and V2, denoted by the blue
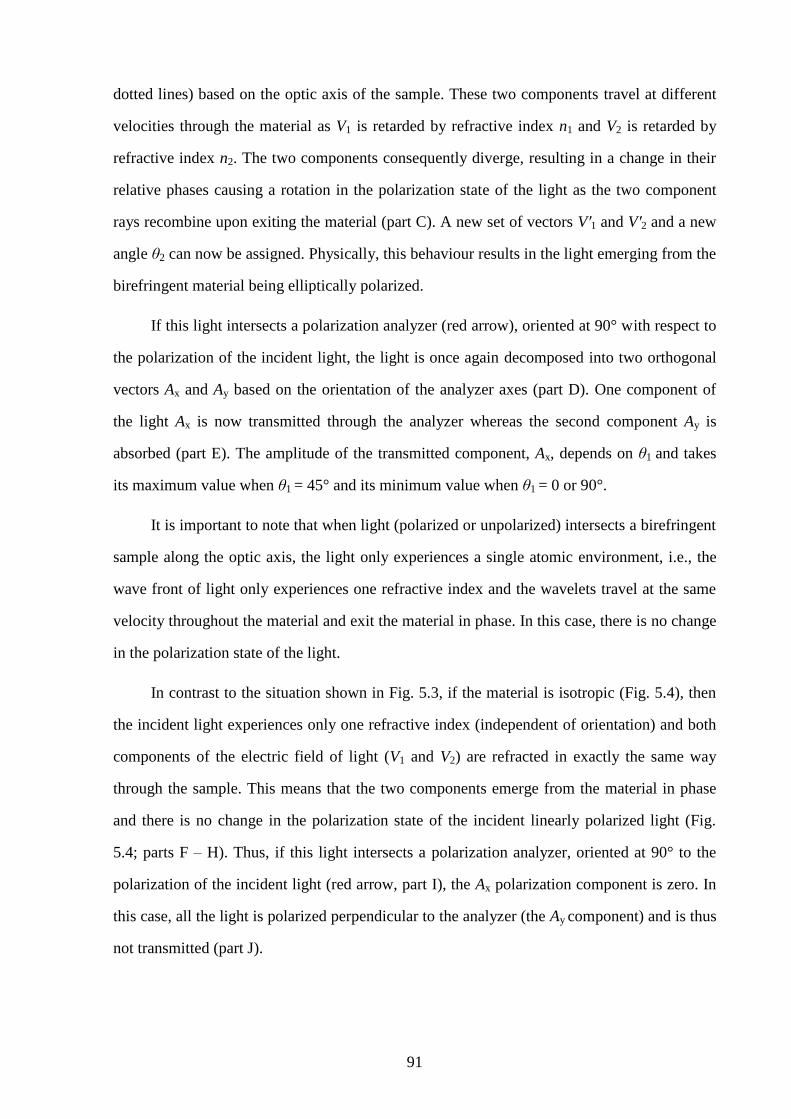
91
dotted lines) based on the optic axis of the sample. These two components travel at different
velocities through the material as V1 is retarded by refractive index n1 and V2 is retarded by
refractive index n2. The two components consequently diverge, resulting in a change in their
relative phases causing a rotation in the polarization state of the light as the two component
rays recombine upon exiting the material (part C). A new set of vectors V′1 and V′2 and a new
angle θ2 can now be assigned. Physically, this behaviour results in the light emerging from the
birefringent material being elliptically polarized.
If this light intersects a polarization analyzer (red arrow), oriented at 90° with respect to
the polarization of the incident light, the light is once again decomposed into two orthogonal
vectors Ax and Ay based on the orientation of the analyzer axes (part D). One component of
the light Ax is now transmitted through the analyzer whereas the second component Ay is
absorbed (part E). The amplitude of the transmitted component, Ax, depends on θ1 and takes
its maximum value when θ1 = 45° and its minimum value when θ1 = 0 or 90°.
It is important to note that when light (polarized or unpolarized) intersects a birefringent
sample along the optic axis, the light only experiences a single atomic environment, i.e., the
wave front of light only experiences one refractive index and the wavelets travel at the same
velocity throughout the material and exit the material in phase. In this case, there is no change
in the polarization state of the light.
In contrast to the situation shown in Fig. 5.3, if the material is isotropic (Fig. 5.4), then
the incident light experiences only one refractive index (independent of orientation) and both
components of the electric field of light (V1 and V2) are refracted in exactly the same way
through the sample. This means that the two components emerge from the material in phase
and there is no change in the polarization state of the incident linearly polarized light (Fig.
5.4; parts F – H). Thus, if this light intersects a polarization analyzer, oriented at 90° to the
polarization of the incident light (red arrow, part I), the Ax polarization component is zero. In
this case, all the light is polarized perpendicular to the analyzer (the Ay component) and is thus
not transmitted (part J).
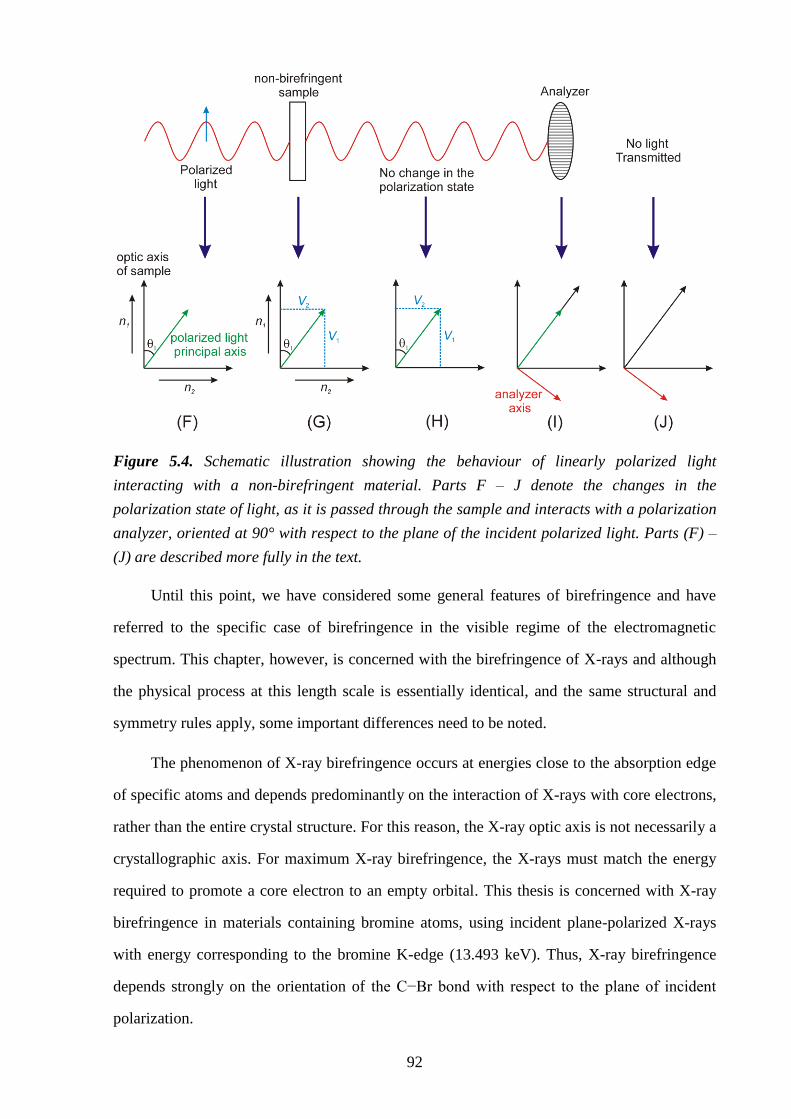
92
Figure 5.4. Schematic illustration showing the behaviour of linearly polarized light
interacting with a non-birefringent material. Parts F – J denote the changes in the
polarization state of light, as it is passed through the sample and interacts with a polarization
analyzer, oriented at 90° with respect to the plane of the incident polarized light. Parts (F) –
(J) are described more fully in the text.
Until this point, we have considered some general features of birefringence and have
referred to the specific case of birefringence in the visible regime of the electromagnetic
spectrum. This chapter, however, is concerned with the birefringence of X-rays and although
the physical process at this length scale is essentially identical, and the same structural and
symmetry rules apply, some important differences need to be noted.
The phenomenon of X-ray birefringence occurs at energies close to the absorption edge
of specific atoms and depends predominantly on the interaction of X-rays with core electrons,
rather than the entire crystal structure. For this reason, the X-ray optic axis is not necessarily a
crystallographic axis. For maximum X-ray birefringence, the X-rays must match the energy
required to promote a core electron to an empty orbital. This thesis is concerned with X-ray
birefringence in materials containing bromine atoms, using incident plane-polarized X-rays
with energy corresponding to the bromine K-edge (13.493 keV). Thus, X-ray birefringence
depends strongly on the orientation of the C−Br bond with respect to the plane of incident
polarization.
93
5.3 – Introduction
The interaction of linearly polarized visible light with solids is well understood,
including the phenomena of dichroism and birefringence,[2]
for which absorption (in the case
of dichroism) and refractive index (in the case of birefringence) depend on the orientation of
an anisotropic material with respect to the plane of polarization of the incident radiation. In
the case of linearly polarized visible light, the phenomenon of birefringence underpins the use
of the polarizing optical microscope.
However, while these phenomena have been widely studied for visible light, they are far
less established for linearly polarized X-rays. In fact, until recently the study of birefringence
using linearly polarized X-rays remained an essentially unexplored field. This fact is perhaps
surprising given that the interaction of polarized X-rays with solids could potentially provide
important new insights into materials properties that are hitherto unobtainable using radiation
with wavelengths on the scale of visible light.
Nevertheless, in the last few years, significant developments have been made by the
Harris group in the field of X-ray dichroism[5-8]
and a series of dichroic filter materials for
applications in magnetic X-ray scattering[6]
and X-ray astronomy[8]
have been reported.
Although the phenomena of dichroism and birefringence give rise to different effects on the
propagation of linearly polarized radiation through a material (dichroism causes rotation of
the plane of polarization and birefringence causes the polarization to become elliptical), these
phenomena are intimately related to each other, and are related mathematically by a Kramers-
Kronig transform.[9]
Thus, materials that exhibit linear dichroism generally also exhibit
birefringence, and these phenomena depend on the same structural (and symmetry) properties
of the material.
Given the previous development of materials that exhibit significant X-ray dichroism,[6-
8] we were motivated to explore the possibility that such materials may also exhibit X-ray
birefringence. Surprisingly, very few experimental studies of X-ray birefringence have been
reported,[10-12]
and significantly, all previous studies involved complex experimental set-ups to
detect extremely weak signals. In contrast, the model material studied here is shown to exhibit
a huge birefringence signal, which permits a very simple experimental arrangement to be
94
used, directly analogous to the set-up in the conventional polarizing microscope for studies of
optical birefringence. The observations reported in this chapter open up the realistic prospect
of exploiting the phenomenon of X-ray birefringence to probe small changes in molecular
polarization, as well as to probe the dynamic properties and spatial distribution of molecular
polarization in solids.
The successful development[6-8]
of X-ray dichroic filter materials suitable for operating
at X-ray energies near the Br K-edge was based on urea and thiourea inclusion compounds.[13-
19] The key advantage of exploiting such solid inclusion compounds in the development of
materials for applications based on X-ray dichroism (and here X-ray birefringence) devolves
upon the fact that the host structure exerts a very strong orienting influence on the guest
molecules, and thus with appropriate choice of both the host structure and the guest
molecules, materials can be designed in which the orientations of specific bonds of the guest
molecules (in the present case, C–Br bonds) can be exquisitely controlled.
The initial studies of X-ray dichroism in the urea inclusion compound containing 1,10-
dibromodecane guest molecules led to the theoretical prediction[6]
that optimal X-ray
dichroism at X-ray energies near the Br K-edge may be achieved for a material in which all
C–Br bonds are aligned parallel to each other (a situation not realized for 1,10-
dibromodecane/urea). On the basis of this prediction, a new material was designed –
specifically, a solid inclusion compound comprising 1-bromoadamantane (denoted 1-BA; Fig.
5.5a) guest molecules within the thiourea (Fig. 5.5a) host tunnel structure, designed on the
basis that the thiourea host structure would constrain the orientations of the 1-BA guest
molecules such that all C–Br bonds in the material would be parallel to each other. This
material was prepared, and determination of the crystal structure[7]
(Fig. 5.5b,c) vindicated the
success of the design strategy. The material was shown to exhibit optimal performance as an
X-ray dichroic filter near the Br K-edge, exhibiting the theoretically predicted maximum
difference in the absorption of linearly polarized incident X-rays between two crystal
orientations differing by 90° (specifically, the two orientations with the empty C–Br
antibonding orbital parallel and perpendicular to the plane of incident polarization). The
strong dependence on the orientation of the C–Br bond arises because the incident X-ray
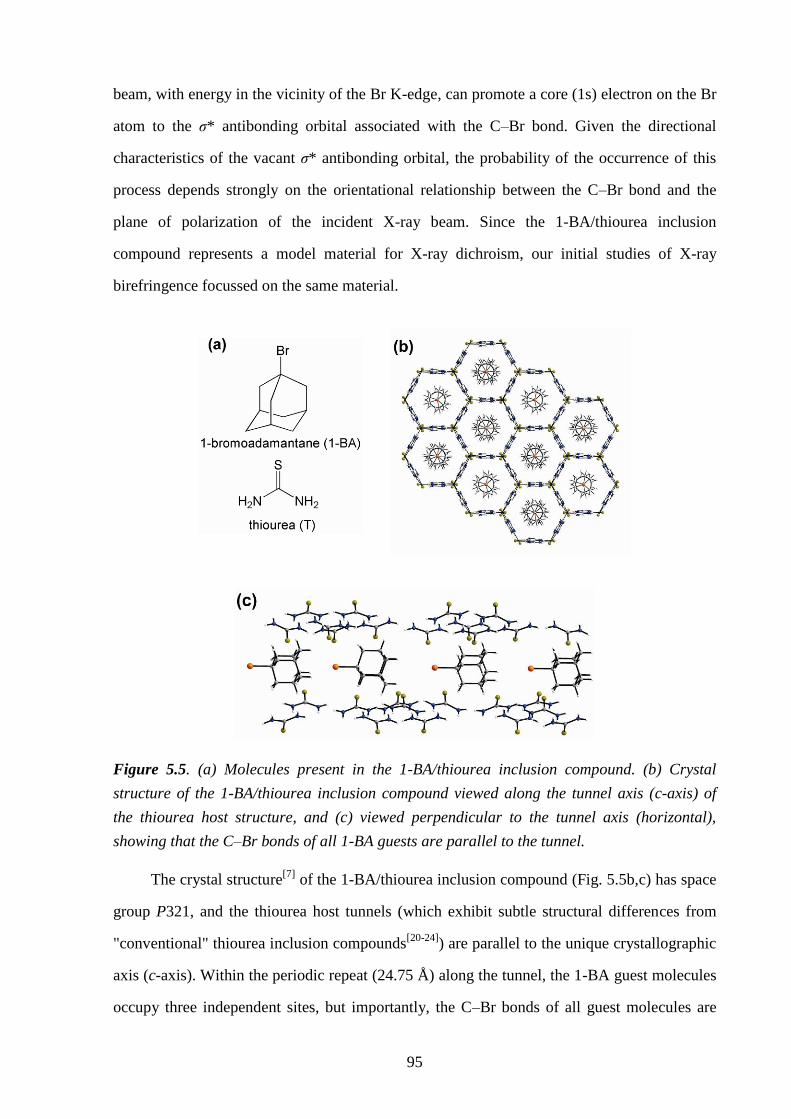
95
beam, with energy in the vicinity of the Br K-edge, can promote a core (1s) electron on the Br
atom to the σ* antibonding orbital associated with the C–Br bond. Given the directional
characteristics of the vacant σ* antibonding orbital, the probability of the occurrence of this
process depends strongly on the orientational relationship between the C–Br bond and the
plane of polarization of the incident X-ray beam. Since the 1-BA/thiourea inclusion
compound represents a model material for X-ray dichroism, our initial studies of X-ray
birefringence focussed on the same material.
Figure 5.5. (a) Molecules present in the 1-BA/thiourea inclusion compound. (b) Crystal
structure of the 1-BA/thiourea inclusion compound viewed along the tunnel axis (c-axis) of
the thiourea host structure, and (c) viewed perpendicular to the tunnel axis (horizontal),
showing that the C–Br bonds of all 1-BA guests are parallel to the tunnel.
The crystal structure[7]
of the 1-BA/thiourea inclusion compound (Fig. 5.5b,c) has space
group P321, and the thiourea host tunnels (which exhibit subtle structural differences from
"conventional" thiourea inclusion compounds[20-24]
) are parallel to the unique crystallographic
axis (c-axis). Within the periodic repeat (24.75 Å) along the tunnel, the 1-BA guest molecules
occupy three independent sites, but importantly, the C–Br bonds of all guest molecules are
96
aligned parallel to the tunnel and hence parallel to the c-axis. From the crystal symmetry, the
material is uniaxial, with the optic axis parallel to the c-axis, and is highly anisotropic with
respect to the orientations of the C–Br bonds. A single crystal of 1-BA/thiourea (as used in
the experiment discussed below) has a long-needle morphology, with the needle axis parallel
to the tunnel axis of the host structure (c-axis) and parallel to the direction of the C–Br bonds
of the 1-BA guest molecules. In general, the cross-section (ab plane) of the long-needle
morphology is hexagonal (with angles of 120° between adjacent faces in the hexagonal cross-
section), although the six sides of the hexagon are not necessarily of equal length.
5.4 – Experimental
The 1-BA/thiourea inclusion compound was prepared by slow cooling of a solution of
thiourea and 1-BA in methanol from 55 °C to 20 °C. Needle-shaped crystals were obtained,
with cross-sectional shape corresponding to a distorted hexagon (i.e., with angles of 120°
between adjacent sides, but with sides of unequal length). Powder X-ray diffraction confirmed
that the product was a monophasic sample of the 1-BA/thiourea inclusion compound.
To study X-ray birefringence, the transmission of linearly polarized X-rays through the
crystal was studied in the "crossed-polarizer" geometry shown in Fig. 5.6 for X-ray energies
near the Br K-edge. Measurements of X-ray dichroism employed the same experimental
arrangement but with no polarization analyzer (and with the detector placed along the
direction of propagation of the incident beam). The dimensions of the crystal were ca. 4 mm
along the c-axis and ca. 1 mm perpendicular to the c-axis, and the dimensions (fwhm) of the
focussed X-ray beam were 0.2 mm (horizontal) and 0.05 mm (vertical). The crystal c-axis was
maintained perpendicular to the direction of propagation (z-axis; Fig. 5.6) of the incident X-
ray beam, with an angle χ between the crystal c-axis and the direction of linear polarization of
the incident beam (horizontal). Thus, χ = 0° when the crystal c-axis is in the horizontal plane
(xz plane). The orientation of the crystal with respect to rotation around the c-axis is defined
by angle φ (Fig. 5.6), with φ = 0° corresponding to the orientation with the incident X-ray
beam (z-axis) parallel to the crystallographic a-axis (or a symmetry equivalent direction). The
experimental measurements of X-ray birefringence, using the setup in Fig. 5.6, were carried
out on beamline I16 at the Diamond Light Source. The X-ray polarization analyzer was highly
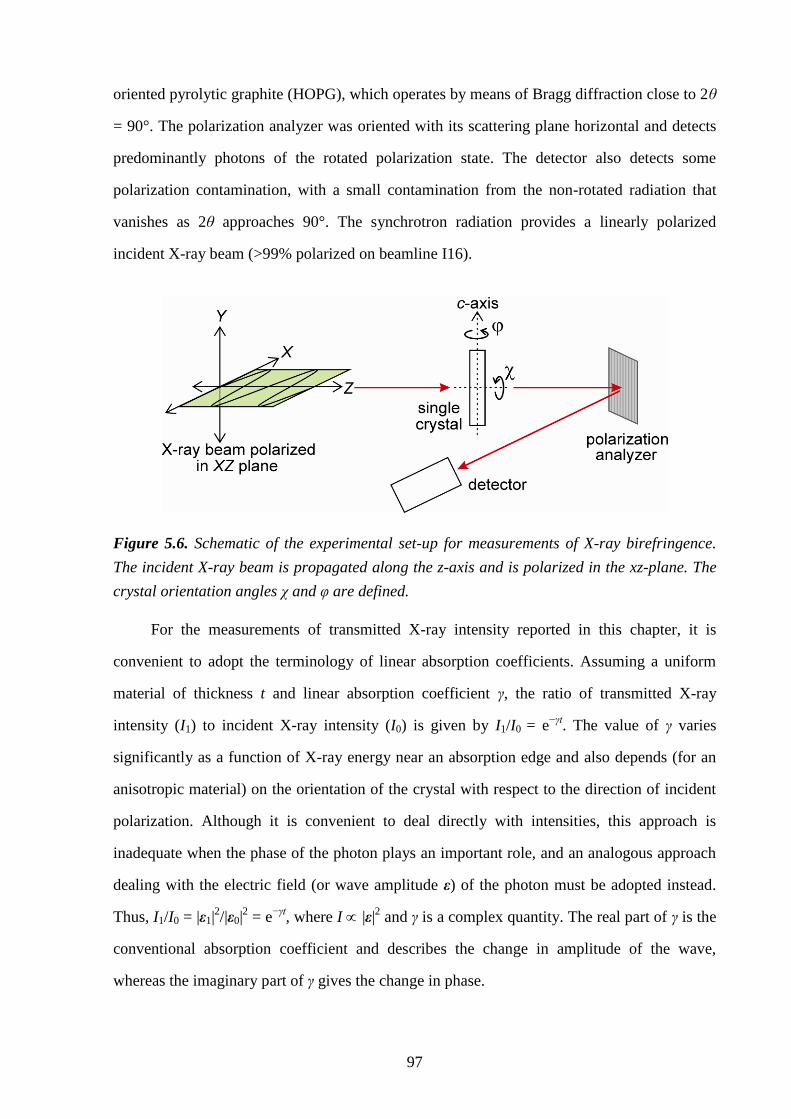
97
oriented pyrolytic graphite (HOPG), which operates by means of Bragg diffraction close to 2θ
= 90°. The polarization analyzer was oriented with its scattering plane horizontal and detects
predominantly photons of the rotated polarization state. The detector also detects some
polarization contamination, with a small contamination from the non-rotated radiation that
vanishes as 2θ approaches 90°. The synchrotron radiation provides a linearly polarized
incident X-ray beam (>99% polarized on beamline I16).
Figure 5.6. Schematic of the experimental set-up for measurements of X-ray birefringence.
The incident X-ray beam is propagated along the z-axis and is polarized in the xz-plane. The
crystal orientation angles χ and φ are defined.
For the measurements of transmitted X-ray intensity reported in this chapter, it is
convenient to adopt the terminology of linear absorption coefficients. Assuming a uniform
material of thickness t and linear absorption coefficient γ, the ratio of transmitted X-ray
intensity (I1) to incident X-ray intensity (I0) is given by I1/I0 = e−γt
. The value of γ varies
significantly as a function of X-ray energy near an absorption edge and also depends (for an
anisotropic material) on the orientation of the crystal with respect to the direction of incident
polarization. Although it is convenient to deal directly with intensities, this approach is
inadequate when the phase of the photon plays an important role, and an analogous approach
dealing with the electric field (or wave amplitude ε) of the photon must be adopted instead.
Thus, I1/I0 = |ε1|2/|ε0|
2 = e
−γt, where I |ε|
2 and γ is a complex quantity. The real part of γ is the
conventional absorption coefficient and describes the change in amplitude of the wave,
whereas the imaginary part of γ gives the change in phase.
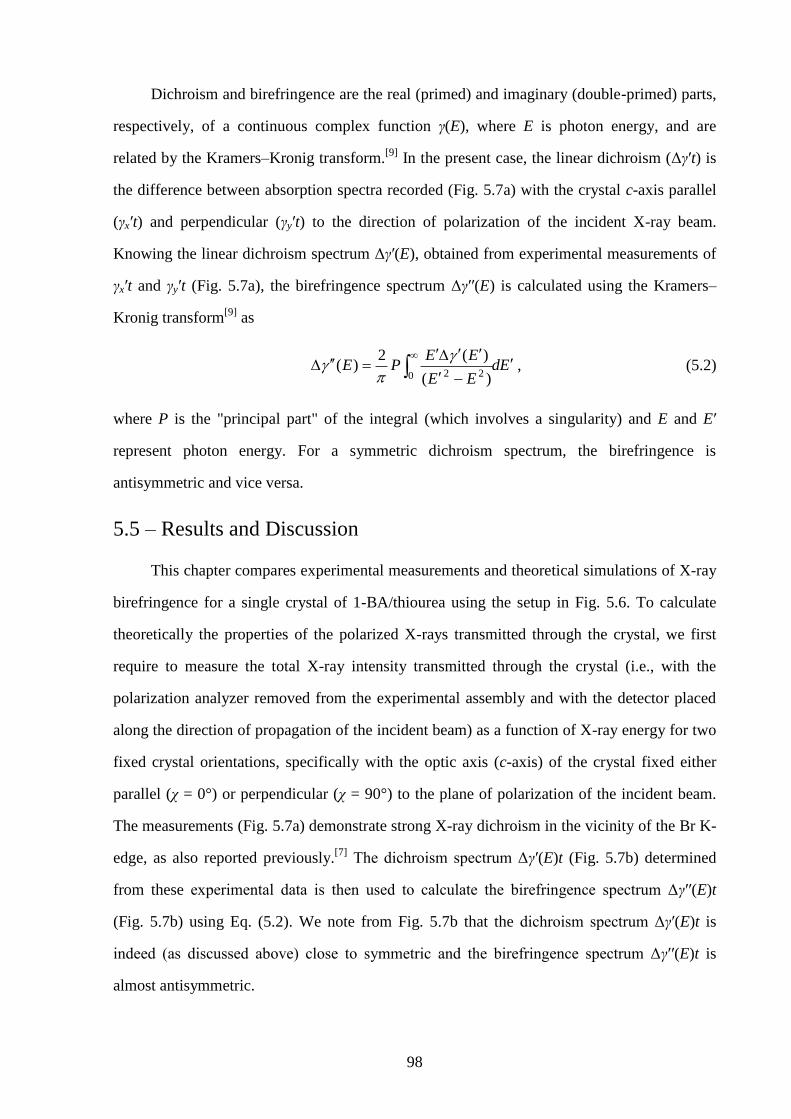
98
Dichroism and birefringence are the real (primed) and imaginary (double-primed) parts,
respectively, of a continuous complex function γ(E), where E is photon energy, and are
related by the Kramers–Kronig transform.[9]
In the present case, the linear dichroism (Δγ′t) is
the difference between absorption spectra recorded (Fig. 5.7a) with the crystal c-axis parallel
(γx′t) and perpendicular (γy′t) to the direction of polarization of the incident X-ray beam.
Knowing the linear dichroism spectrum Δγ′(E), obtained from experimental measurements of
γx′t and γy′t (Fig. 5.7a), the birefringence spectrum Δγ′′(E) is calculated using the Kramers–
Kronig transform[9]
as
EdEE
EEPE
0 22 )(
)(2)(
, (5.2)
where P is the "principal part" of the integral (which involves a singularity) and E and E′
represent photon energy. For a symmetric dichroism spectrum, the birefringence is
antisymmetric and vice versa.
5.5 – Results and Discussion
This chapter compares experimental measurements and theoretical simulations of X-ray
birefringence for a single crystal of 1-BA/thiourea using the setup in Fig. 5.6. To calculate
theoretically the properties of the polarized X-rays transmitted through the crystal, we first
require to measure the total X-ray intensity transmitted through the crystal (i.e., with the
polarization analyzer removed from the experimental assembly and with the detector placed
along the direction of propagation of the incident beam) as a function of X-ray energy for two
fixed crystal orientations, specifically with the optic axis (c-axis) of the crystal fixed either
parallel (χ = 0°) or perpendicular (χ = 90°) to the plane of polarization of the incident beam.
The measurements (Fig. 5.7a) demonstrate strong X-ray dichroism in the vicinity of the Br K-
edge, as also reported previously.[7]
The dichroism spectrum Δγ′(E)t (Fig. 5.7b) determined
from these experimental data is then used to calculate the birefringence spectrum Δγ′′(E)t
(Fig. 5.7b) using Eq. (5.2). We note from Fig. 5.7b that the dichroism spectrum Δγ′(E)t is
indeed (as discussed above) close to symmetric and the birefringence spectrum Δγ′′(E)t is
almost antisymmetric.
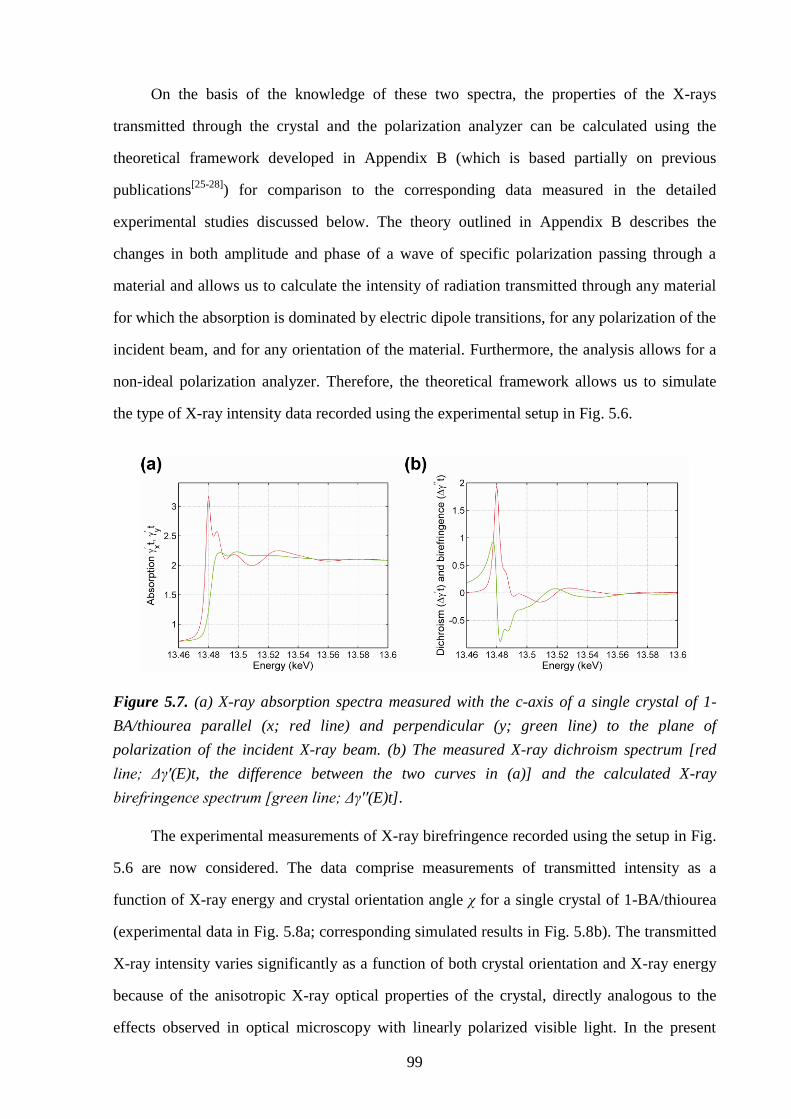
99
On the basis of the knowledge of these two spectra, the properties of the X-rays
transmitted through the crystal and the polarization analyzer can be calculated using the
theoretical framework developed in Appendix B (which is based partially on previous
publications[25-28]
) for comparison to the corresponding data measured in the detailed
experimental studies discussed below. The theory outlined in Appendix B describes the
changes in both amplitude and phase of a wave of specific polarization passing through a
material and allows us to calculate the intensity of radiation transmitted through any material
for which the absorption is dominated by electric dipole transitions, for any polarization of the
incident beam, and for any orientation of the material. Furthermore, the analysis allows for a
non-ideal polarization analyzer. Therefore, the theoretical framework allows us to simulate
the type of X-ray intensity data recorded using the experimental setup in Fig. 5.6.
Figure 5.7. (a) X-ray absorption spectra measured with the c-axis of a single crystal of 1-
BA/thiourea parallel (x; red line) and perpendicular (y; green line) to the plane of
polarization of the incident X-ray beam. (b) The measured X-ray dichroism spectrum [red
line; Δγ'(E)t, the difference between the two curves in (a)] and the calculated X-ray
birefringence spectrum [green line; Δγ''(E)t].
The experimental measurements of X-ray birefringence recorded using the setup in Fig.
5.6 are now considered. The data comprise measurements of transmitted intensity as a
function of X-ray energy and crystal orientation angle χ for a single crystal of 1-BA/thiourea
(experimental data in Fig. 5.8a; corresponding simulated results in Fig. 5.8b). The transmitted
X-ray intensity varies significantly as a function of both crystal orientation and X-ray energy
because of the anisotropic X-ray optical properties of the crystal, directly analogous to the
effects observed in optical microscopy with linearly polarized visible light. In the present
100
case, the effects arise from X-ray dichroism and X-ray birefringence, which depend directly
on local anisotropy at the atomic level. Therefore, the measured X-ray intensity depends on
the molecular anisotropy within the material, and, in particular, the orientational properties of
the C–Br bonds. The agreement between experimental and simulated results (Fig. 5.8) is very
satisfactory, indicating that the properties of the crystal and the physics underlying the
technique are well understood. At a given X-ray energy, the maximum transmitted intensity
arises when the optic axis of the crystal is at χ = 45° with respect to the plane of polarization
of the incident radiation, in agreement with the familiar result for birefringence between
crossed polarizers for visible light (e.g., in a polarizing optical microscope).
Figure 5.8. (a) Transmitted X-ray intensity recorded (for the set-up in Fig. 5.6) for a single
crystal of 1-BA/thiourea as a function of angle χ and X-ray energy, and (b) the corresponding
data simulated using the theoretical framework in Appendix B. The intensities are normalized
to a maximum of unity in each case. The transmitted signal is very strongly enhanced close to
the energy of the Br K-edge and passes through a maximum at χ = 45°.
This behaviour is examined more closely in Fig. 5.9a, which shows X-ray intensity as a
function of χ, with X-ray energy fixed at 13.4855 keV and with φ fixed at 0°. Clearly, the
results demonstrate the classical sinusoidal variation of transmitted intensity as a function of
χ, as familiar in the analogous case of birefringence of visible light.
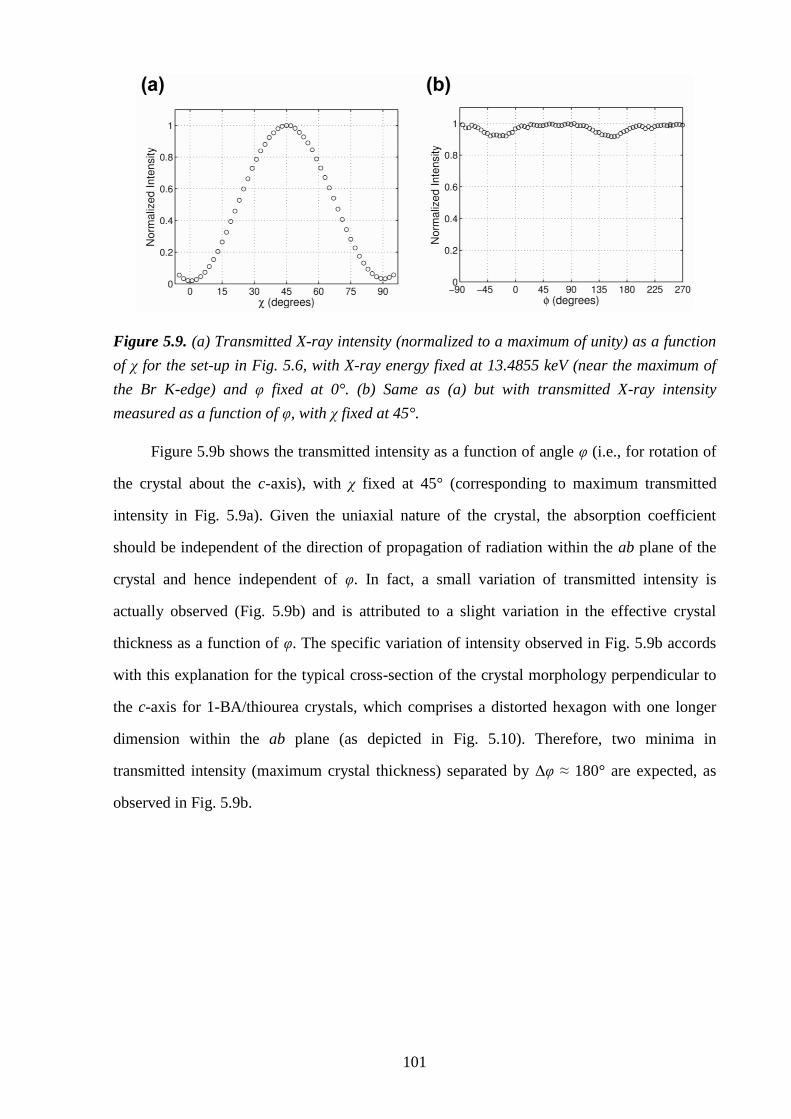
101
Figure 5.9. (a) Transmitted X-ray intensity (normalized to a maximum of unity) as a function
of χ for the set-up in Fig. 5.6, with X-ray energy fixed at 13.4855 keV (near the maximum of
the Br K-edge) and φ fixed at 0°. (b) Same as (a) but with transmitted X-ray intensity
measured as a function of φ, with χ fixed at 45°.
Figure 5.9b shows the transmitted intensity as a function of angle φ (i.e., for rotation of
the crystal about the c-axis), with χ fixed at 45° (corresponding to maximum transmitted
intensity in Fig. 5.9a). Given the uniaxial nature of the crystal, the absorption coefficient
should be independent of the direction of propagation of radiation within the ab plane of the
crystal and hence independent of φ. In fact, a small variation of transmitted intensity is
actually observed (Fig. 5.9b) and is attributed to a slight variation in the effective crystal
thickness as a function of φ. The specific variation of intensity observed in Fig. 5.9b accords
with this explanation for the typical cross-section of the crystal morphology perpendicular to
the c-axis for 1-BA/thiourea crystals, which comprises a distorted hexagon with one longer
dimension within the ab plane (as depicted in Fig. 5.10). Therefore, two minima in
transmitted intensity (maximum crystal thickness) separated by Δφ ≈ 180° are expected, as
observed in Fig. 5.9b.
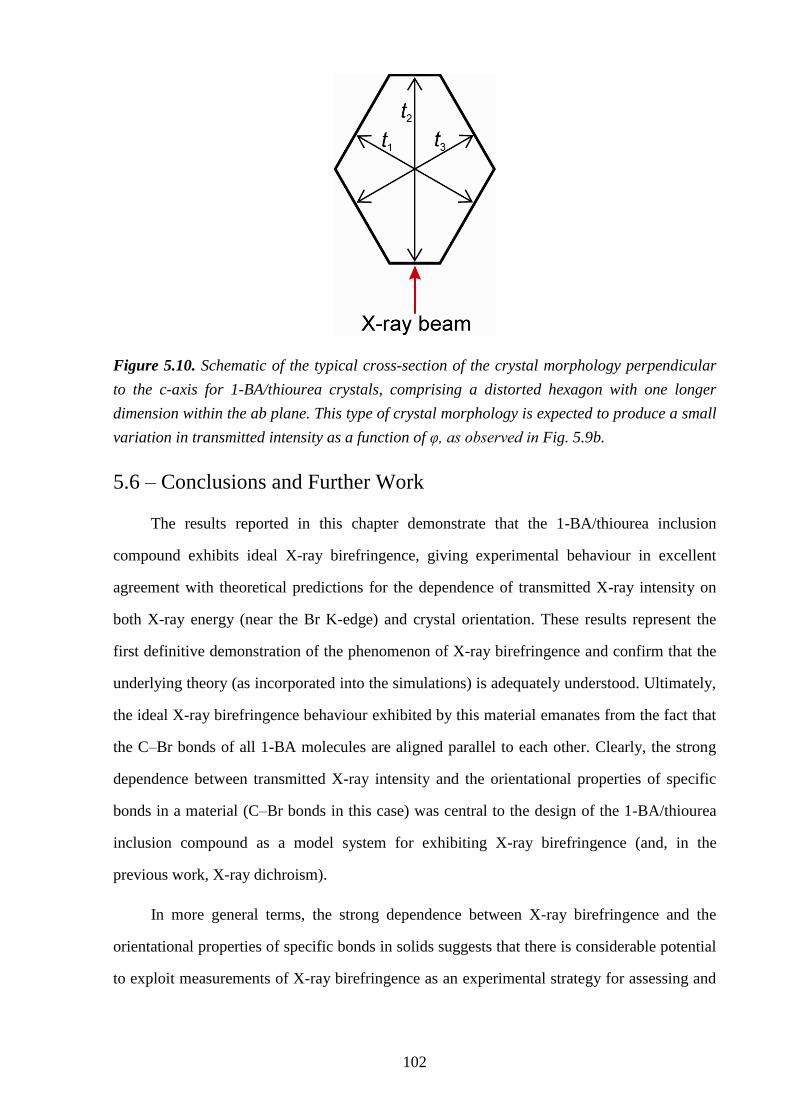
102
Figure 5.10. Schematic of the typical cross-section of the crystal morphology perpendicular
to the c-axis for 1-BA/thiourea crystals, comprising a distorted hexagon with one longer
dimension within the ab plane. This type of crystal morphology is expected to produce a small
variation in transmitted intensity as a function of φ, as observed in Fig. 5.9b.
5.6 – Conclusions and Further Work
The results reported in this chapter demonstrate that the 1-BA/thiourea inclusion
compound exhibits ideal X-ray birefringence, giving experimental behaviour in excellent
agreement with theoretical predictions for the dependence of transmitted X-ray intensity on
both X-ray energy (near the Br K-edge) and crystal orientation. These results represent the
first definitive demonstration of the phenomenon of X-ray birefringence and confirm that the
underlying theory (as incorporated into the simulations) is adequately understood. Ultimately,
the ideal X-ray birefringence behaviour exhibited by this material emanates from the fact that
the C–Br bonds of all 1-BA molecules are aligned parallel to each other. Clearly, the strong
dependence between transmitted X-ray intensity and the orientational properties of specific
bonds in a material (C–Br bonds in this case) was central to the design of the 1-BA/thiourea
inclusion compound as a model system for exhibiting X-ray birefringence (and, in the
previous work, X-ray dichroism).
In more general terms, the strong dependence between X-ray birefringence and the
orientational properties of specific bonds in solids suggests that there is considerable potential
to exploit measurements of X-ray birefringence as an experimental strategy for assessing and
103
quantifying the orientational distributions of bonds in solids, for example, in the case of
partially ordered materials or materials that undergo order–disorder phase transitions.
This potential is harnessed in Chapter 6, in which measurements of X-ray birefringence
are used to determine the changes in the orientational properties of bromocyclohexane guest
molecules, associated with an order-disorder phase transition in the
bromocyclohexane/thiourea inclusion compound. The results demonstrate that measurements
of X-ray birefringence can be used as a powerful experimental technique for determining the
changes in bond orientation in materials.
Other potential applications include materials for use as non-diffractive fixed-
wavelength X-ray phase retarders, which may be applied, for example, to convert linearly
polarized X-rays to circularly polarized X-rays. Devices based on this approach are
potentially quite efficient and far less sensitive to beam angle than diffractive devices (i.e., a
few degrees of divergence should have little effect, compared with divergence of the order of
millidegrees in the case of diffractive devices).
104
5.7 – References
[1] S. G. Lipson and H. Lipson, Optical Physics, Second Edition, Cambridge University
Press, Cambridge, 1981.
[2] M. Born and E. Wolf, Principles of Optics, Seventh Edition, Cambridge University
Press, Cambridge, UK, 1999.
[3] F. G. Smith and J. H. Thomson, Optics, Second Edition, John Wiley & Sons, New
York, 1988.
[4] http://www.itp.uni-hannover.de/~zawischa/ITP/kalcal.html.
[5] C. Brouder, J. Phys.: Condens. Matter 1990, 2, 701.
[6] S. P. Collins, D. Laundy, K. D. M. Harris, B. M. Kariuki, C. L. Bauer, S. D. Brown, P.
Thompson, J. Phys.: Condens. Matter 2002, 14, 123.
[7] M. H. Chao, B. M. Kariuki, K. D. M. Harris, S. P. Collins, D. Laundy, Angew.
Chemie. Int. Ed. 2003, 42, 2982.
[8] N. P. Bannister, K. D. M. Harris, S. P. Collins, A. Martindale, P. S. Monks, G. Solan,
G. W. Fraser, Exp. Astron. 2006, 21, 1.
[9] J. D. Jackson, Classical Electrodynamics, Third Edition, John Wiley & Sons, New
York, 1998.
[10] M. Sauvage, C. Malgrange, J.-F. Petroff, J. Appl. Crystallogr. 1983, 16, 14.
[11] K. Okitsu, T. Oguchi, H. Maruyama, Y. Amemiya, Proc. Soc. Photo-Opt. Instrum.
Eng. 1996, 2873, 100.
[12] H.-C. Mertins, P. M. Oppeneer, S. Valencia, W. Gudat, F. Senf, P. R. Bressler, Phys.
Rev. B 2004, 70, 235106.
[13] L. C. Fetterly, in Non-Stoichiometric Compounds (Ed.: L. Mandelcorn), Academic
Press, New York, 1964, p. 491.
[14] K. D. M. Harris, J. Mol. Struct. 1996, 374, 241.
[15] K. D. M. Harris, Chem. Soc. Rev. 1997, 26, 279.
[16] F. Guillaume, J. Chim. Phys. (Paris) 1999, 96, 1295.
[17] M. D. Hollingsworth, Science 2002, 295, 2410.
[18] K. D. M. Harris, Supramol. Chem. 2007, 19, 47.
[19] A. R. George, K. D. M. Harris, J. Mol. Graphics 1995, 13, 138.
[20] H. U. Lenné, Acta Crystallogr. 1954, 7, 1.
[21] E. Hough, D. G. Nicholson, J. Chem. Soc., Faraday Trans. 1978, 15.
[22] R. Gopal, B. E. Robertson, J. S. Rutherford, Acta Crystallogr. Sect., C 1989, 45, 257.
[23] K. D. M. Harris, J. M. Thomas, J. Chem. Soc., Faraday Trans. 1990, 86, 1095.
[24] B. A. Palmer, B. M. Kariuki, V. K. Muppidi, C. E. Hughes, K. D. M. Harris, Chem.
Commun. 2011, 47, 3760.
[25] S. W. Lovesey, Rep. Prog. Phys. 1993, 56, 257.
[26] S. P. Collins, J. Phys.: Condens. Matter 1999, 11, 1159.
[27] S. P. Collins, S. W. Lovesey, J. Synchrotron Rad. 2001, 8, 1065.
[28] S. P. Collins, A. Bombardi, in Magnetism and Synchrotron Radiation: New Trends
(Eds.: E. Beaurepaire, H. Bulou, F. Scheurer, J.-P. Kappler), Springer, 2010.
105
Chapter 6 – Using X-ray Birefringence to Determine
Changes in Bond Orientation in an Anisotropic
Material
6.1 – Abstract
Many important properties of materials and molecules depend on a particular type of
chemical bond being oriented in a specific direction. Therefore, determining the orientational
distribution of bonds is an essential prerequisite to understanding and developing the
properties of such materials. However, because many materials are either disordered or
partially ordered, conventional diffraction methods often cannot be used to determine this
information. In this chapter, we demonstrate that measurements of X-ray birefringence can be
used to determine changes in the orientational distributions of specific types of bonds in
anisotropic materials. For a crystalline anisotropic organic solid (specifically the
bromocyclohexane/thiourea inclusion compound), measurements of X-ray birefringence are
used to determine the changes in the orientational distribution of the C–Br bonds, associated
with an order-disorder phase transition in this material.
A least-squares fit of simulated birefringence data, based on a structural model, was
performed to allow quantitative structural information on the bromocyclohexane guest
molecules to be established, leading to excellent agreement between experimental and
simulated data. Furthermore, the structural properties determined from X-ray birefringence
correlate exquisitely with those obtained independently from X-ray diffraction data,
demonstrating the validity of the structural model and the reliability of this novel
experimental technique.
These observations represent the basis of a new technique for determining information
on the structural properties of materials, particularly in cases for which diffraction methods
may be unsuitable. The technique has huge potential to be utilised in the exploration and
discovery of new materials with important properties and in principle could be applied to any
anisotropic system.
106
6.2 – Introduction
Chapter 5 discussed the first definitive demonstration of X-ray birefringence, reporting
a material that exhibits essentially ideal birefringence behaviour at X-ray energies near the Br
K-edge. The designed material, the 1-bromoadamantane/thiourea inclusion compound gave
experimental behaviour in excellent agreement with theoretical predictions for the
dependence of transmitted X-ray intensity on both X-ray energy and crystal orientation. The
strong dependence between X-ray birefringence and the orientation of the C–Br bonds in this
material demonstrated the potential for using measurements of X-ray birefringence to
establish a detailed understanding of molecular polarization and in particular to determine the
orientational distributions of specific bonds in solids.[1]
In this chapter, measurements of X-ray birefringence are used to characterise changes in
the orientational distribution of molecules associated with an order-disorder phase transition
in the bromocyclohexane/thiourea (BrCH/thiourea) inclusion compound. In particular,
measurements of X-ray birefringence are used to determine changes in the orientation of the
C–Br bond of the BrCH guest molecules as a function of temperature, above and below the
phase transition.
Comparison of the structural properties of BrCH/thiourea determined from the X-ray
birefringence measurements with those determined from single-crystal X-ray diffraction data
demonstrates the validity of the X-ray birefringence results and shows that comparable
structural information can be obtained from the two approaches. These observations constitute
the basis of a new technique for determining the orientational distribution of bonds within
solids which may be of importance to the development of new materials.
In this study, we focus on the BrCH/thiourea inclusion compound. The structural
properties of this material have already been determined over a wide range of temperatures
using X-ray diffraction,[2, 3]
solid-state NMR[4-8]
and other techniques[9-11]
and are discussed in
detail in Chapter 4. At room temperature, the inclusion compound exhibits the conventional
rhombohedral thiourea host structure[2]
(Fig. 6.1) and the BrCH guest molecules (and thus the
C–Br bonds) are essentially isotropically disordered due to their dynamic properties, which
involve almost unrestricted reorientations within the tunnel.[2, 5, 7, 8]
However, the material is
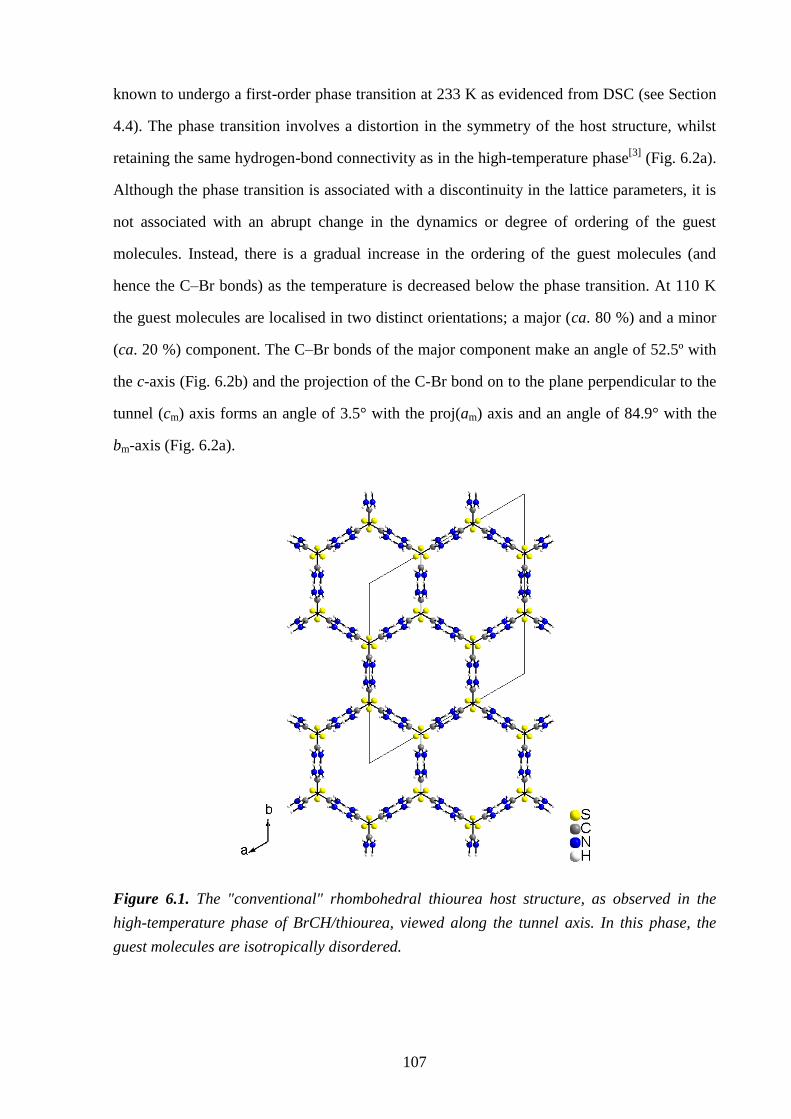
107
known to undergo a first-order phase transition at 233 K as evidenced from DSC (see Section
4.4). The phase transition involves a distortion in the symmetry of the host structure, whilst
retaining the same hydrogen-bond connectivity as in the high-temperature phase[3]
(Fig. 6.2a).
Although the phase transition is associated with a discontinuity in the lattice parameters, it is
not associated with an abrupt change in the dynamics or degree of ordering of the guest
molecules. Instead, there is a gradual increase in the ordering of the guest molecules (and
hence the C–Br bonds) as the temperature is decreased below the phase transition. At 110 K
the guest molecules are localised in two distinct orientations; a major (ca. 80 %) and a minor
(ca. 20 %) component. The C–Br bonds of the major component make an angle of 52.5º with
the c-axis (Fig. 6.2b) and the projection of the C-Br bond on to the plane perpendicular to the
tunnel (cm) axis forms an angle of 3.5° with the proj(am) axis and an angle of 84.9° with the
bm-axis (Fig. 6.2a).
Figure 6.1. The "conventional" rhombohedral thiourea host structure, as observed in the
high-temperature phase of BrCH/thiourea, viewed along the tunnel axis. In this phase, the
guest molecules are isotropically disordered.
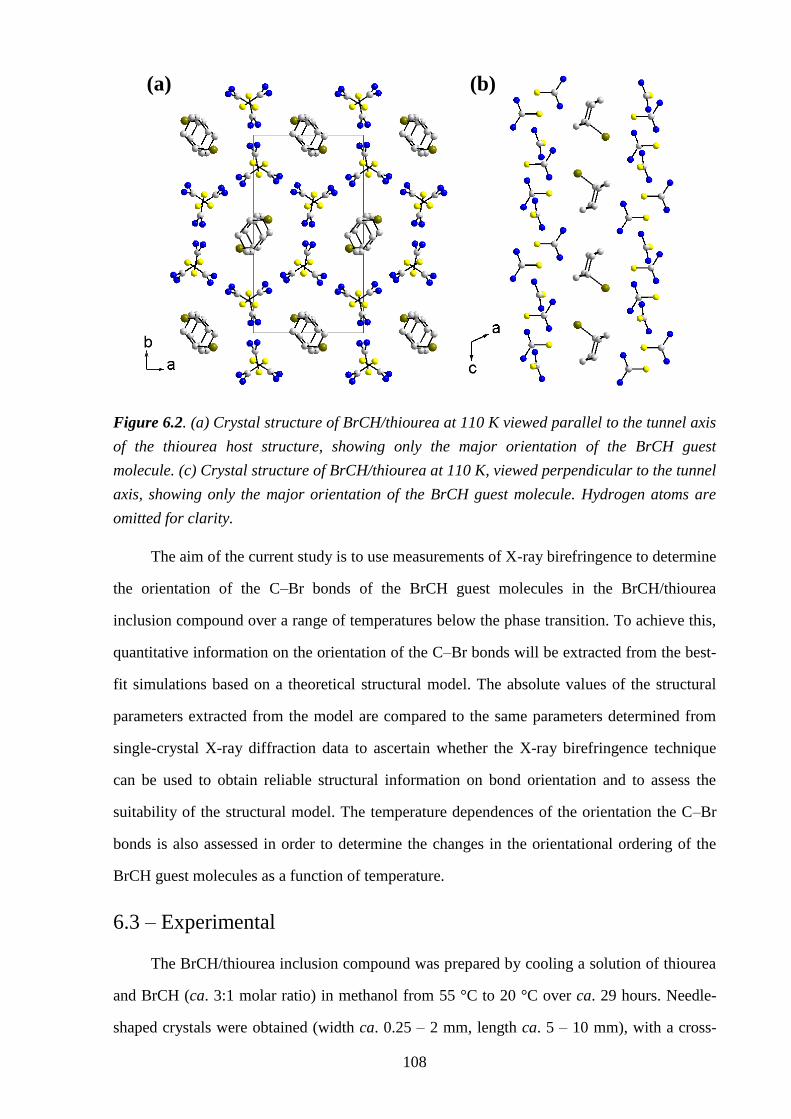
108
Figure 6.2. (a) Crystal structure of BrCH/thiourea at 110 K viewed parallel to the tunnel axis
of the thiourea host structure, showing only the major orientation of the BrCH guest
molecule. (c) Crystal structure of BrCH/thiourea at 110 K, viewed perpendicular to the tunnel
axis, showing only the major orientation of the BrCH guest molecule. Hydrogen atoms are
omitted for clarity.
The aim of the current study is to use measurements of X-ray birefringence to determine
the orientation of the C–Br bonds of the BrCH guest molecules in the BrCH/thiourea
inclusion compound over a range of temperatures below the phase transition. To achieve this,
quantitative information on the orientation of the C–Br bonds will be extracted from the best-
fit simulations based on a theoretical structural model. The absolute values of the structural
parameters extracted from the model are compared to the same parameters determined from
single-crystal X-ray diffraction data to ascertain whether the X-ray birefringence technique
can be used to obtain reliable structural information on bond orientation and to assess the
suitability of the structural model. The temperature dependences of the orientation the C–Br
bonds is also assessed in order to determine the changes in the orientational ordering of the
BrCH guest molecules as a function of temperature.
6.3 – Experimental
The BrCH/thiourea inclusion compound was prepared by cooling a solution of thiourea
and BrCH (ca. 3:1 molar ratio) in methanol from 55 °C to 20 °C over ca. 29 hours. Needle-
shaped crystals were obtained (width ca. 0.25 – 2 mm, length ca. 5 – 10 mm), with a cross-
(a) (b)
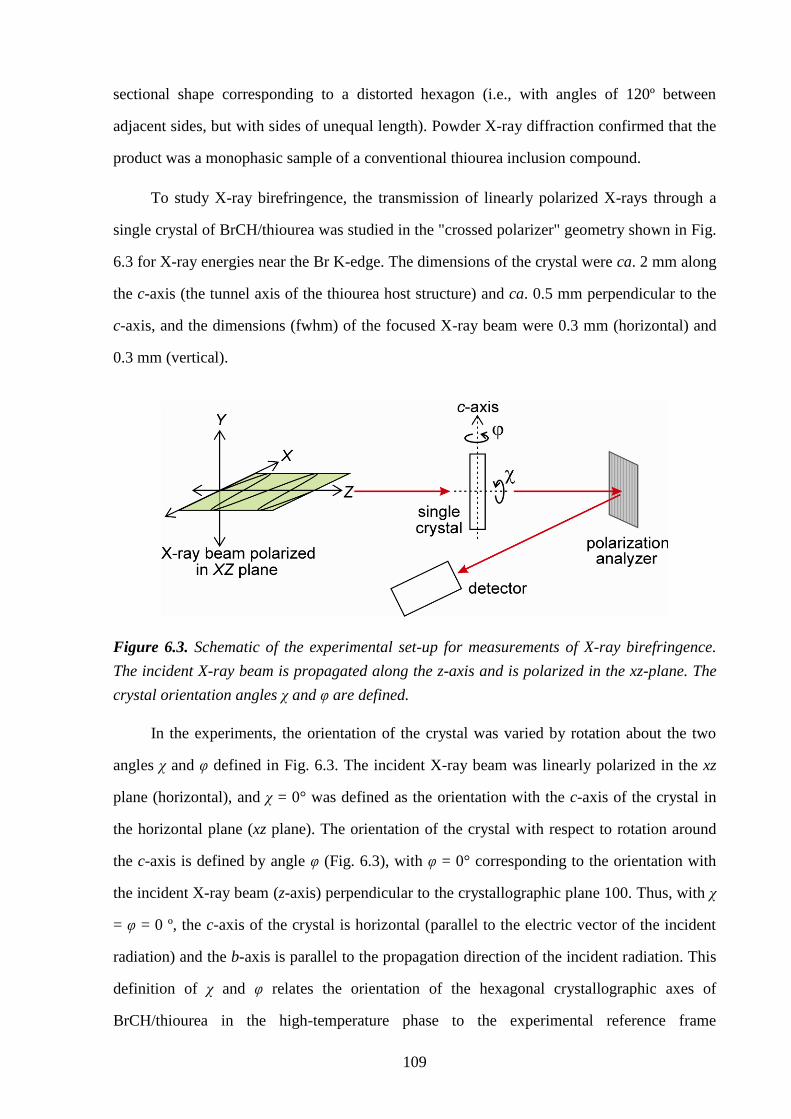
109
sectional shape corresponding to a distorted hexagon (i.e., with angles of 120º between
adjacent sides, but with sides of unequal length). Powder X-ray diffraction confirmed that the
product was a monophasic sample of a conventional thiourea inclusion compound.
To study X-ray birefringence, the transmission of linearly polarized X-rays through a
single crystal of BrCH/thiourea was studied in the "crossed polarizer" geometry shown in Fig.
6.3 for X-ray energies near the Br K-edge. The dimensions of the crystal were ca. 2 mm along
the c-axis (the tunnel axis of the thiourea host structure) and ca. 0.5 mm perpendicular to the
c-axis, and the dimensions (fwhm) of the focused X-ray beam were 0.3 mm (horizontal) and
0.3 mm (vertical).
Figure 6.3. Schematic of the experimental set-up for measurements of X-ray birefringence.
The incident X-ray beam is propagated along the z-axis and is polarized in the xz-plane. The
crystal orientation angles χ and φ are defined.
In the experiments, the orientation of the crystal was varied by rotation about the two
angles χ and φ defined in Fig. 6.3. The incident X-ray beam was linearly polarized in the xz
plane (horizontal), and χ = 0° was defined as the orientation with the c-axis of the crystal in
the horizontal plane (xz plane). The orientation of the crystal with respect to rotation around
the c-axis is defined by angle φ (Fig. 6.3), with φ = 0° corresponding to the orientation with
the incident X-ray beam (z-axis) perpendicular to the crystallographic plane 100. Thus, with χ
= φ = 0 º, the c-axis of the crystal is horizontal (parallel to the electric vector of the incident
radiation) and the b-axis is parallel to the propagation direction of the incident radiation. This
definition of χ and φ relates the orientation of the hexagonal crystallographic axes of
BrCH/thiourea in the high-temperature phase to the experimental reference frame
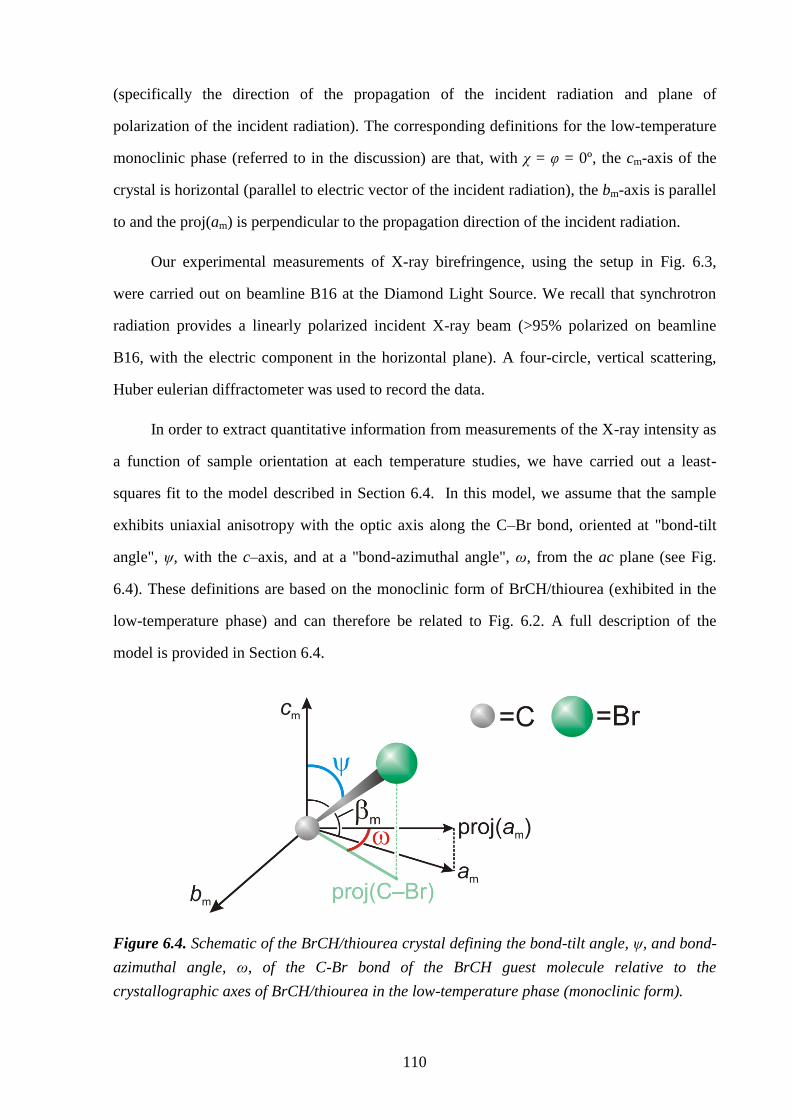
110
(specifically the direction of the propagation of the incident radiation and plane of
polarization of the incident radiation). The corresponding definitions for the low-temperature
monoclinic phase (referred to in the discussion) are that, with χ = φ = 0º, the cm-axis of the
crystal is horizontal (parallel to electric vector of the incident radiation), the bm-axis is parallel
to and the proj(am) is perpendicular to the propagation direction of the incident radiation.
Our experimental measurements of X-ray birefringence, using the setup in Fig. 6.3,
were carried out on beamline B16 at the Diamond Light Source. We recall that synchrotron
radiation provides a linearly polarized incident X-ray beam (>95% polarized on beamline
B16, with the electric component in the horizontal plane). A four-circle, vertical scattering,
Huber eulerian diffractometer was used to record the data.
In order to extract quantitative information from measurements of the X-ray intensity as
a function of sample orientation at each temperature studies, we have carried out a least-
squares fit to the model described in Section 6.4. In this model, we assume that the sample
exhibits uniaxial anisotropy with the optic axis along the C–Br bond, oriented at "bond-tilt
angle", ψ, with the c–axis, and at a "bond-azimuthal angle", ω, from the ac plane (see Fig.
6.4). These definitions are based on the monoclinic form of BrCH/thiourea (exhibited in the
low-temperature phase) and can therefore be related to Fig. 6.2. A full description of the
model is provided in Section 6.4.
Figure 6.4. Schematic of the BrCH/thiourea crystal defining the bond-tilt angle, ψ, and bond-
azimuthal angle, ω, of the C-Br bond of the BrCH guest molecule relative to the
crystallographic axes of BrCH/thiourea in the low-temperature phase (monoclinic form).
111
All data reported in this chapter were recorded on the same single crystal of
BrCH/thiourea. Apart from the results shown in Fig. 6.8, all data were recorded on the first
cooling cycle of the crystal. The data presented in Fig. 6.8 were recorded as the crystal was
warmed for the first time from 100 K to 270 K. The same measurement obtained on the first
cooling cycle indicated that there are no significant differences in the X-ray birefringence
behaviour of the crystal upon cooling and warming. We note that the entire experiment (Fig.
6.5 to 6.11) was repeated for a second cooling and warming cycle on the same crystal of
BrCH/thiourea and the results revealed no significant change in the X-ray birefringence
behaviour of the crystal as a function of temperature cycling.
For the experimental measurements in Fig. 6.7 and 6.11, χ was sampled at 10° intervals
from χ = −25° to 95°. At each of these values of χ, the transmitted X-ray intensity was
measured as a function of φ with φ varied between −135 and 135° in steps of 5°. The total
measurement time at each value of φ and χ was 2 s.
6.4 – Structural Model
The model assumes that the net direction of the C–Br bonds is the same throughout the
sampled region of the crystal, i.e., that the measurement probes a single orientational domain.
The generated model used to describe the data employs 13 parameters. However, the values
of several of these parameters are known and are fixed in the fitting procedure. Other
parameters are known only approximately, but are found to have very little effect on the
resulting fit other than a contribution to the overall scale factor. Given these considerations,
the parameters that are expected to vary with temperature are the parameters ψ and ω that
define the orientation of the C–Br bond with respect to the crystallographic axes, and an
overall "polarization factor", p, which acts as a prefactor for the complex anisotropic
absorption coefficient. The absolute value of this parameter cannot be extracted easily, but its
dependence on temperature can be obtained very precisely. The polarization factor, p,
quantifies the degree of polarization of the ensemble of BrCH guest molecules and can be
considered as the resultant of the direction of all the C–Br bonds. Thus, the polarization factor
will take its maximum value when there is a single orientation of the C–Br bonds (i.e., a
completely ordered situation where all the bonds are aligned in parallel) and will take its
112
minimum value when the C–Br bonds are isotropically disordered (in this case, there is no
resultant C–Br bond direction and the polarization factor will be 0). In this work, the
polarization factor is in the range from 1 (for a completely ordered situation with all guest
molecules having the same C–Br bond orientation) to 0 (for an isotropically disordered
situation with no preferred C–Br bond orientation and with every bond direction having an
equal population).
Interestingly, the fit to the data is significantly poorer when a small degree of circular
polarization in the incident beam is not incorporated into the model. The value P2 = −0.075
was extracted from each individual data set, suggesting that this type of measurement is so
sensitive to the circular polarization that is would make an extremely simple and effective
polarimeter. A modest circular component to the beam polarization is not surprising, and may
be caused by a small vertical misalignment of the slits that define the emission from the
bending magnet radiation source.
In the fitting procedure, three parameters were varied, with all other parameters fixed, as
shown in Table 6.1. For all data sets (shown in Figs. 6.7 and 6.11 and Table 6.2) considered
(comprising intensity versus χ and φ), good fits are obtained at all temperatures studied. The
results of this analysis vindicate our model and show very clearly that: (a) the degree of
polarization, p, increases as temperature decreases, but there is no significant change in the
net orientation of the C–Br bonds, and (b) the assumption of a single domain is valid.
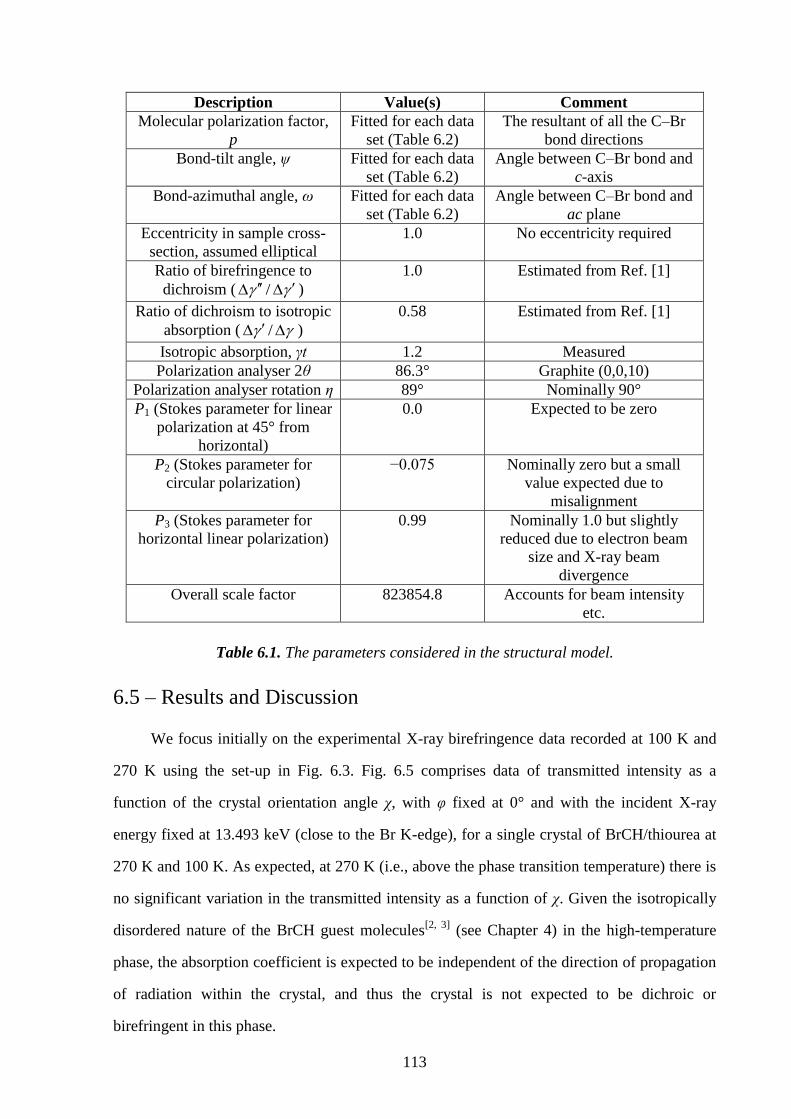
113
Description Value(s) Comment
Molecular polarization factor,
p
Fitted for each data
set (Table 6.2)
The resultant of all the C–Br
bond directions
Bond-tilt angle, ψ Fitted for each data
set (Table 6.2)
Angle between C–Br bond and
c-axis
Bond-azimuthal angle, ω Fitted for each data
set (Table 6.2)
Angle between C–Br bond and
ac plane
Eccentricity in sample cross-
section, assumed elliptical
1.0 No eccentricity required
Ratio of birefringence to
dichroism ( / )
1.0 Estimated from Ref. [1]
Ratio of dichroism to isotropic
absorption ( / )
0.58 Estimated from Ref. [1]
Isotropic absorption, γt 1.2 Measured
Polarization analyser 2θ 86.3° Graphite (0,0,10)
Polarization analyser rotation η 89° Nominally 90°
P1 (Stokes parameter for linear
polarization at 45° from
horizontal)
0.0 Expected to be zero
P2 (Stokes parameter for
circular polarization)
−0.075 Nominally zero but a small
value expected due to
misalignment
P3 (Stokes parameter for
horizontal linear polarization)
0.99 Nominally 1.0 but slightly
reduced due to electron beam
size and X-ray beam
divergence
Overall scale factor 823854.8 Accounts for beam intensity
etc.
Table 6.1. The parameters considered in the structural model.
6.5 – Results and Discussion
We focus initially on the experimental X-ray birefringence data recorded at 100 K and
270 K using the set-up in Fig. 6.3. Fig. 6.5 comprises data of transmitted intensity as a
function of the crystal orientation angle χ, with φ fixed at 0° and with the incident X-ray
energy fixed at 13.493 keV (close to the Br K-edge), for a single crystal of BrCH/thiourea at
270 K and 100 K. As expected, at 270 K (i.e., above the phase transition temperature) there is
no significant variation in the transmitted intensity as a function of χ. Given the isotropically
disordered nature of the BrCH guest molecules[2, 3]
(see Chapter 4) in the high-temperature
phase, the absorption coefficient is expected to be independent of the direction of propagation
of radiation within the crystal, and thus the crystal is not expected to be dichroic or
birefringent in this phase.
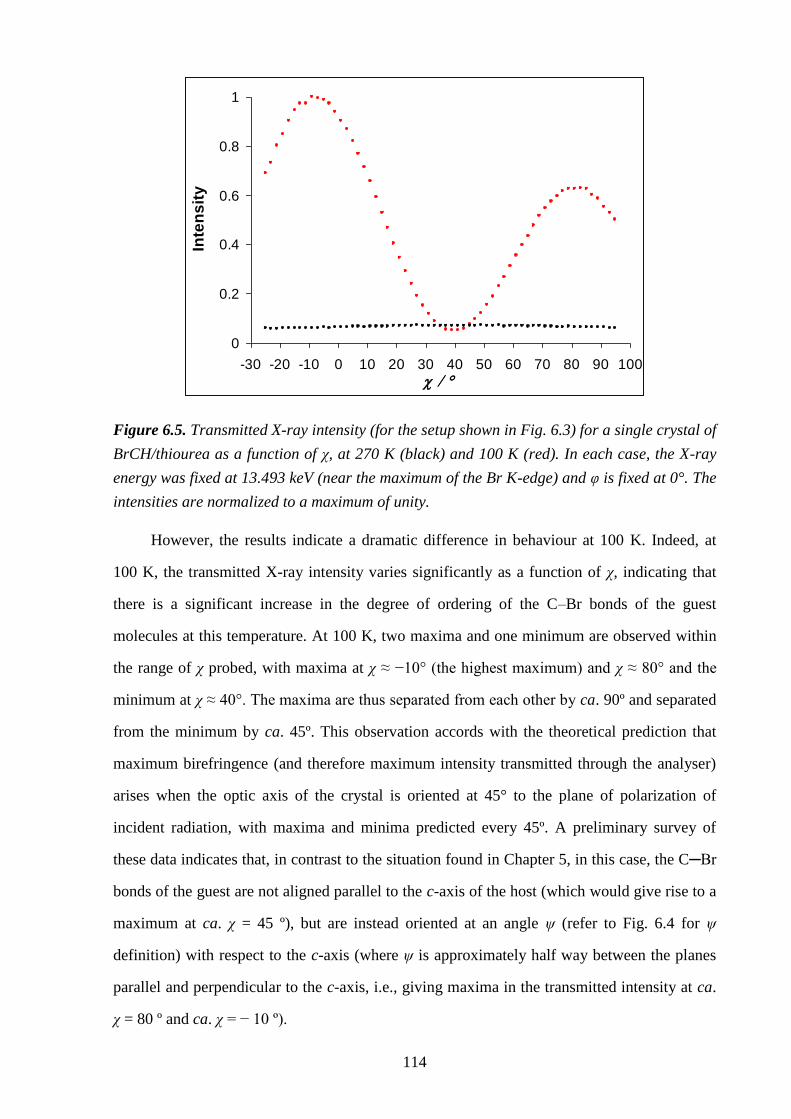
114
0
0.2
0.4
0.6
0.8
1
-30 -20 -10 0 10 20 30 40 50 60 70 80 90 100
Inte
ns
ity
Figure 6.5. Transmitted X-ray intensity (for the setup shown in Fig. 6.3) for a single crystal of
BrCH/thiourea as a function of χ, at 270 K (black) and 100 K (red). In each case, the X-ray
energy was fixed at 13.493 keV (near the maximum of the Br K-edge) and φ is fixed at 0°. The
intensities are normalized to a maximum of unity.
However, the results indicate a dramatic difference in behaviour at 100 K. Indeed, at
100 K, the transmitted X-ray intensity varies significantly as a function of χ, indicating that
there is a significant increase in the degree of ordering of the C–Br bonds of the guest
molecules at this temperature. At 100 K, two maxima and one minimum are observed within
the range of χ probed, with maxima at χ ≈ −10° (the highest maximum) and χ ≈ 80° and the
minimum at χ ≈ 40°. The maxima are thus separated from each other by ca. 90º and separated
from the minimum by ca. 45º. This observation accords with the theoretical prediction that
maximum birefringence (and therefore maximum intensity transmitted through the analyser)
arises when the optic axis of the crystal is oriented at 45° to the plane of polarization of
incident radiation, with maxima and minima predicted every 45º. A preliminary survey of
these data indicates that, in contrast to the situation found in Chapter 5, in this case, the C─Br
bonds of the guest are not aligned parallel to the c-axis of the host (which would give rise to a
maximum at ca. χ = 45 º), but are instead oriented at an angle ψ (refer to Fig. 6.4 for ψ
definition) with respect to the c-axis (where ψ is approximately half way between the planes
parallel and perpendicular to the c-axis, i.e., giving maxima in the transmitted intensity at ca.
χ = 80 º and ca. χ = − 10 º).
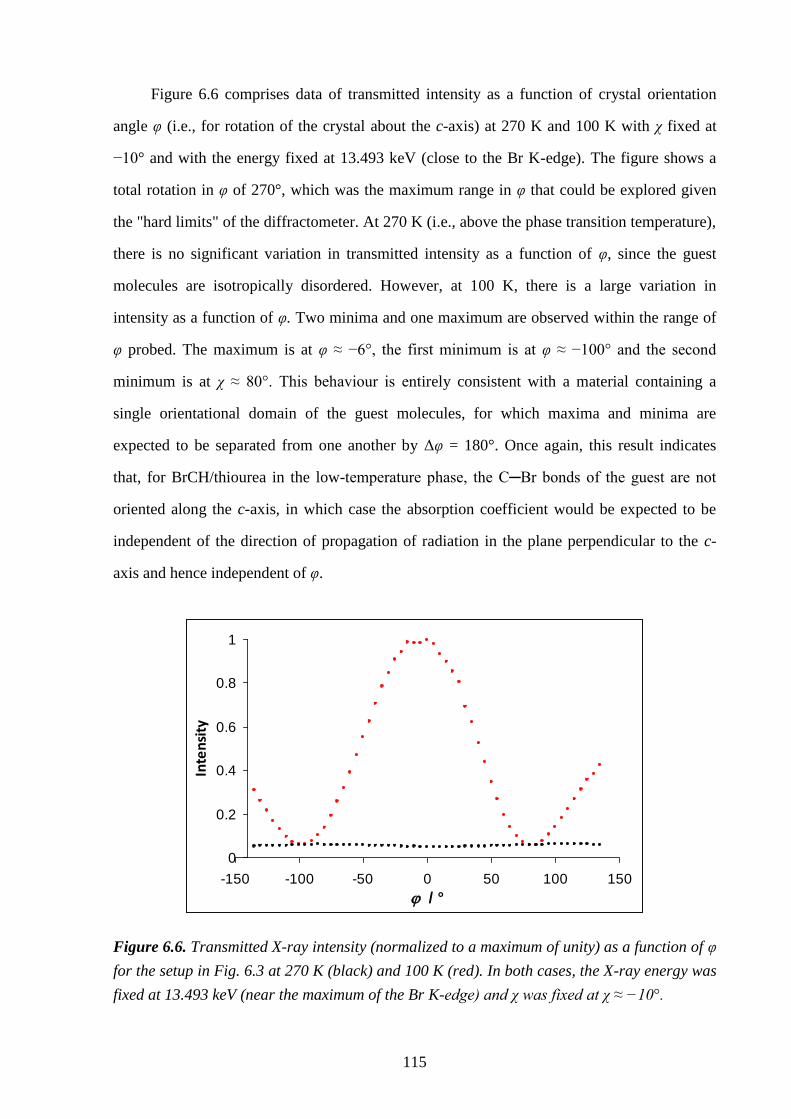
115
Figure 6.6 comprises data of transmitted intensity as a function of crystal orientation
angle φ (i.e., for rotation of the crystal about the c-axis) at 270 K and 100 K with χ fixed at
−10° and with the energy fixed at 13.493 keV (close to the Br K-edge). The figure shows a
total rotation in φ of 270°, which was the maximum range in φ that could be explored given
the "hard limits" of the diffractometer. At 270 K (i.e., above the phase transition temperature),
there is no significant variation in transmitted intensity as a function of φ, since the guest
molecules are isotropically disordered. However, at 100 K, there is a large variation in
intensity as a function of φ. Two minima and one maximum are observed within the range of
φ probed. The maximum is at φ ≈ −6°, the first minimum is at φ ≈ −100° and the second
minimum is at χ ≈ 80°. This behaviour is entirely consistent with a material containing a
single orientational domain of the guest molecules, for which maxima and minima are
expected to be separated from one another by Δφ = 180°. Once again, this result indicates
that, for BrCH/thiourea in the low-temperature phase, the C─Br bonds of the guest are not
oriented along the c-axis, in which case the absorption coefficient would be expected to be
independent of the direction of propagation of radiation in the plane perpendicular to the c-
axis and hence independent of φ.
0
0.2
0.4
0.6
0.8
1
-150 -100 -50 0 50 100 150
j / °
Intensity
Figure 6.6. Transmitted X-ray intensity (normalized to a maximum of unity) as a function of φ
for the setup in Fig. 6.3 at 270 K (black) and 100 K (red). In both cases, the X-ray energy was
fixed at 13.493 keV (near the maximum of the Br K-edge) and χ was fixed at χ ≈ −10°.
116
Both Figs. 6.5 and 6.6 show a striking difference between the X-ray birefringence
behaviour of BrCH/thiourea at 270 K and 100 K. At 270 K the transmitted intensity is
independent of both χ and φ, whereas at 100 K, the transmitted intensity is strongly dependent
on rotation of the crystal about both of these axes. The variation in the transmitted intensity at
100 K arises because of the anisotropic optical properties of the crystal. The effects arise from
X-ray dichroism and X-ray birefringence, which depend directly on local anisotropy at the
atomic level and, in particular, the orientational properties of the C–Br bonds. We attribute the
increase in X-ray birefringence to an increase in the degree of anisotropic ordering of the
guest molecules at 100 K (and hence ordering of the C–Br bonds).
These observations agree with the X-ray diffraction investigation in Chapter 4, which
concluded that, at sufficiently low temperature within the low-temperature phase, the
orientational properties of the BrCH guest molecules become localized and the C–Br bonds
are aligned in a specific preferred direction. For the present purpose, we make the reasonable
assumption that the X-ray birefringence is dominated by the major guest orientation
established from the X-ray diffraction study reported in Chapter 4.
We suggest, that the increase in the degree of molecular polarization of the BrCH guest
molecules at 100 K reflects a decrease in the dynamic properties of the guest molecules at
these temperatures[3]
(see Section 4.4 and 4.5). The well-behaved variation in χ and φ
indicates a single "set" of minima and maxima, which suggests that throughout the probed
region of the crystal, there is one dominant orientational domain of the guest molecules.
To investigate this behaviour in more detail and to extract quantitative information from
measurements of the X-ray intensity as a function of crystal orientation, a series of two-
dimensional scans of transmitted intensity versus χ and φ were recorded. A least-squares fit of
calculated data for the structural model described in Section 6.4 was then performed, allowing
the orientation of the C–Br bond of the BrCH guest molecules relative to the crystallographic
unit cell axes (as described by the bond-tilt angle, ψ, and the bond-azimuthal angle, ω, defined
in Fig. 6.4), to be established quantitively at each temperature studied.
The experimental and simulated data of transmitted X-ray intensity as a function of φ
and χ at 100 K are shown in Fig. 6.7. The results reveal an extremely close agreement
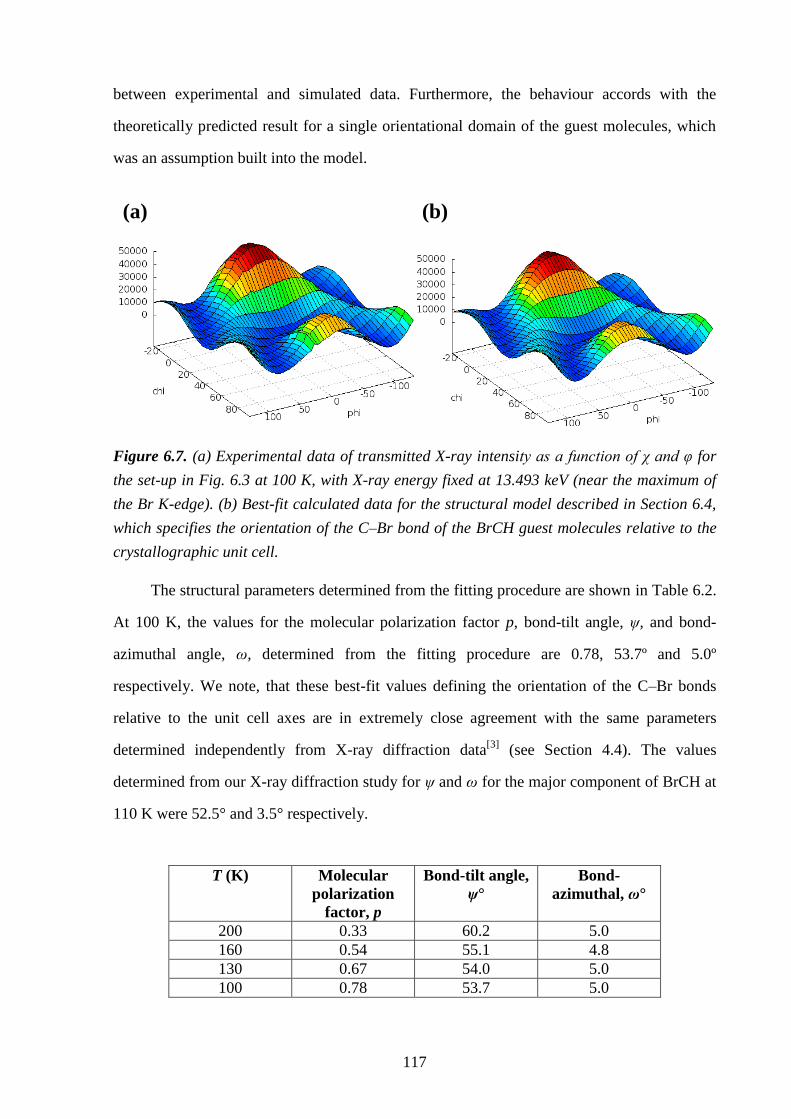
117
between experimental and simulated data. Furthermore, the behaviour accords with the
theoretically predicted result for a single orientational domain of the guest molecules, which
was an assumption built into the model.
Figure 6.7. (a) Experimental data of transmitted X-ray intensity as a function of χ and φ for
the set-up in Fig. 6.3 at 100 K, with X-ray energy fixed at 13.493 keV (near the maximum of
the Br K-edge). (b) Best-fit calculated data for the structural model described in Section 6.4,
which specifies the orientation of the C–Br bond of the BrCH guest molecules relative to the
crystallographic unit cell.
The structural parameters determined from the fitting procedure are shown in Table 6.2.
At 100 K, the values for the molecular polarization factor p, bond-tilt angle, ψ, and bond-
azimuthal angle, ω, determined from the fitting procedure are 0.78, 53.7º and 5.0º
respectively. We note, that these best-fit values defining the orientation of the C–Br bonds
relative to the unit cell axes are in extremely close agreement with the same parameters
determined independently from X-ray diffraction data[3]
(see Section 4.4). The values
determined from our X-ray diffraction study for ψ and ω for the major component of BrCH at
110 K were 52.5° and 3.5° respectively.
T (K) Molecular
polarization
factor, p
Bond-tilt angle,
ψ°
Bond-
azimuthal, ω°
200 0.33 60.2 5.0
160 0.54 55.1 4.8
130 0.67 54.0 5.0
100 0.78 53.7 5.0
(a) (b)
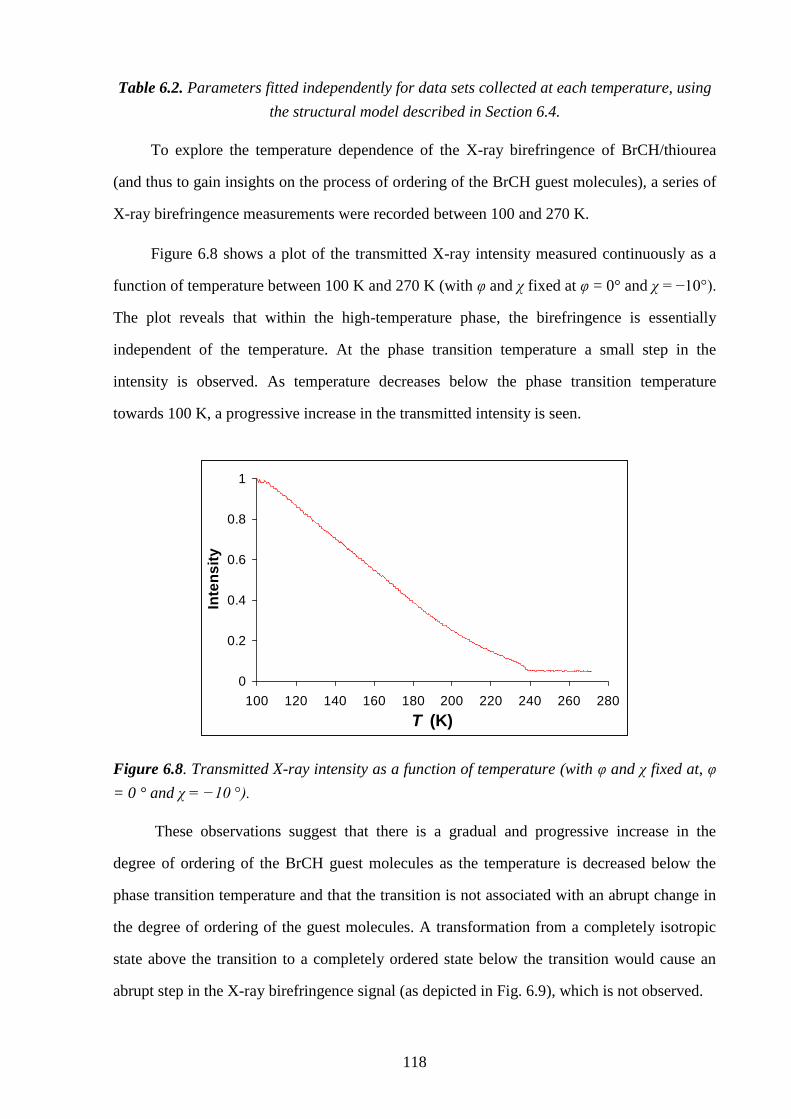
118
Table 6.2. Parameters fitted independently for data sets collected at each temperature, using
the structural model described in Section 6.4.
To explore the temperature dependence of the X-ray birefringence of BrCH/thiourea
(and thus to gain insights on the process of ordering of the BrCH guest molecules), a series of
X-ray birefringence measurements were recorded between 100 and 270 K.
Figure 6.8 shows a plot of the transmitted X-ray intensity measured continuously as a
function of temperature between 100 K and 270 K (with φ and χ fixed at φ = 0° and χ = −10°).
The plot reveals that within the high-temperature phase, the birefringence is essentially
independent of the temperature. At the phase transition temperature a small step in the
intensity is observed. As temperature decreases below the phase transition temperature
towards 100 K, a progressive increase in the transmitted intensity is seen.
0
0.2
0.4
0.6
0.8
1
100 120 140 160 180 200 220 240 260 280
T (K)
Inte
ns
ity
Figure 6.8. Transmitted X-ray intensity as a function of temperature (with φ and χ fixed at, φ
= 0 ° and χ = −10 °).
These observations suggest that there is a gradual and progressive increase in the
degree of ordering of the BrCH guest molecules as the temperature is decreased below the
phase transition temperature and that the transition is not associated with an abrupt change in
the degree of ordering of the guest molecules. A transformation from a completely isotropic
state above the transition to a completely ordered state below the transition would cause an
abrupt step in the X-ray birefringence signal (as depicted in Fig. 6.9), which is not observed.
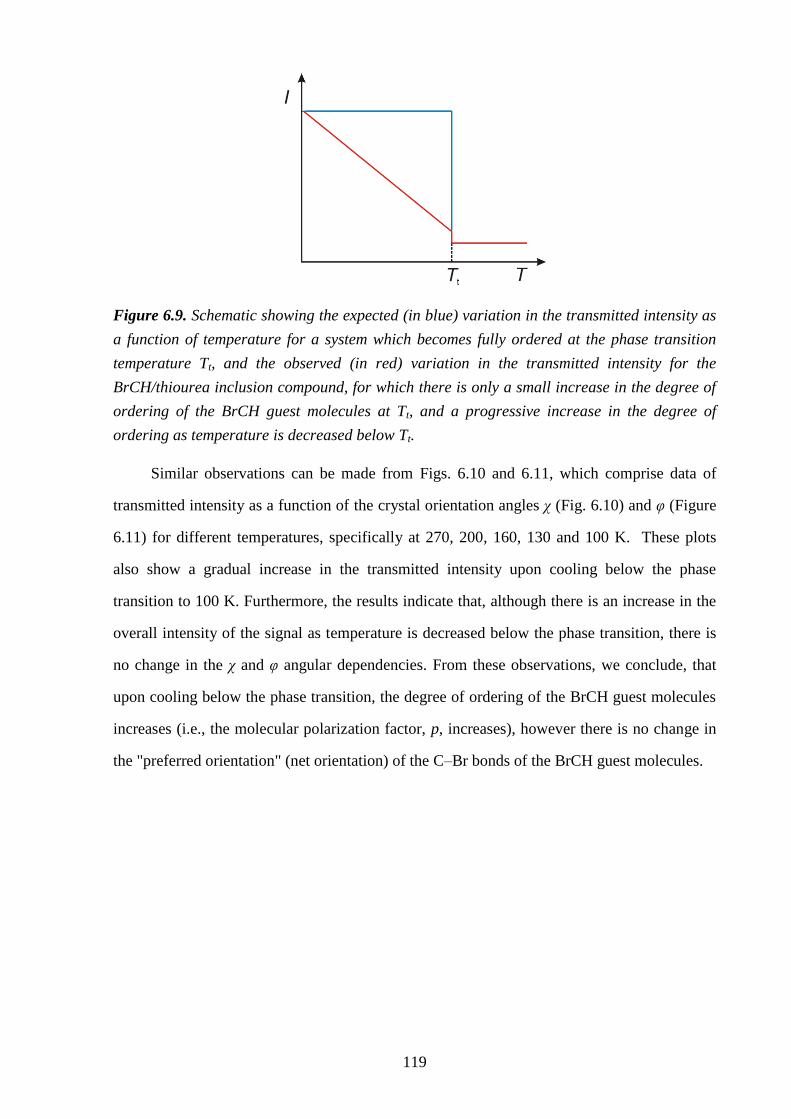
119
Figure 6.9. Schematic showing the expected (in blue) variation in the transmitted intensity as
a function of temperature for a system which becomes fully ordered at the phase transition
temperature Tt, and the observed (in red) variation in the transmitted intensity for the
BrCH/thiourea inclusion compound, for which there is only a small increase in the degree of
ordering of the BrCH guest molecules at Tt, and a progressive increase in the degree of
ordering as temperature is decreased below Tt.
Similar observations can be made from Figs. 6.10 and 6.11, which comprise data of
transmitted intensity as a function of the crystal orientation angles χ (Fig. 6.10) and φ (Figure
6.11) for different temperatures, specifically at 270, 200, 160, 130 and 100 K. These plots
also show a gradual increase in the transmitted intensity upon cooling below the phase
transition to 100 K. Furthermore, the results indicate that, although there is an increase in the
overall intensity of the signal as temperature is decreased below the phase transition, there is
no change in the χ and φ angular dependencies. From these observations, we conclude, that
upon cooling below the phase transition, the degree of ordering of the BrCH guest molecules
increases (i.e., the molecular polarization factor, p, increases), however there is no change in
the "preferred orientation" (net orientation) of the C–Br bonds of the BrCH guest molecules.
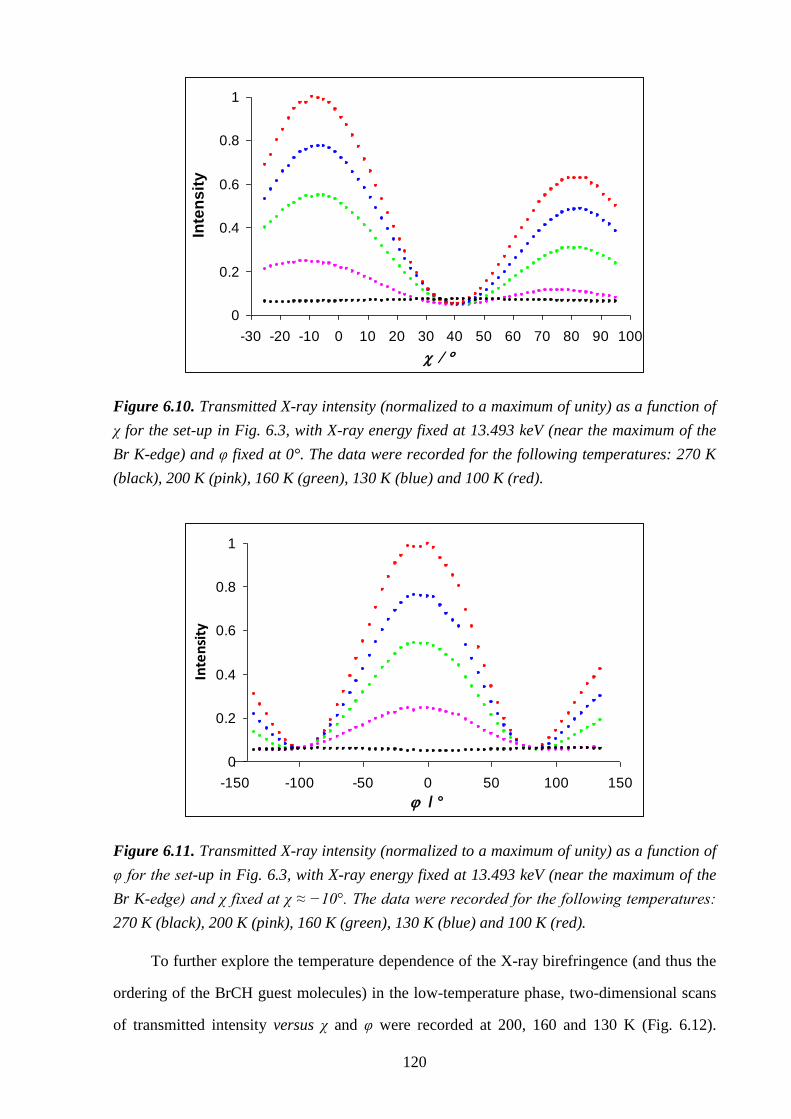
120
0
0.2
0.4
0.6
0.8
1
-30 -20 -10 0 10 20 30 40 50 60 70 80 90 100
Inte
ns
ity
Figure 6.10. Transmitted X-ray intensity (normalized to a maximum of unity) as a function of
χ for the set-up in Fig. 6.3, with X-ray energy fixed at 13.493 keV (near the maximum of the
Br K-edge) and φ fixed at 0°. The data were recorded for the following temperatures: 270 K
(black), 200 K (pink), 160 K (green), 130 K (blue) and 100 K (red).
0
0.2
0.4
0.6
0.8
1
-150 -100 -50 0 50 100 150
j / °
Intensity
Figure 6.11. Transmitted X-ray intensity (normalized to a maximum of unity) as a function of
φ for the set-up in Fig. 6.3, with X-ray energy fixed at 13.493 keV (near the maximum of the
Br K-edge) and χ fixed at χ ≈ −10°. The data were recorded for the following temperatures:
270 K (black), 200 K (pink), 160 K (green), 130 K (blue) and 100 K (red).
To further explore the temperature dependence of the X-ray birefringence (and thus the
ordering of the BrCH guest molecules) in the low-temperature phase, two-dimensional scans
of transmitted intensity versus χ and φ were recorded at 200, 160 and 130 K (Fig. 6.12).
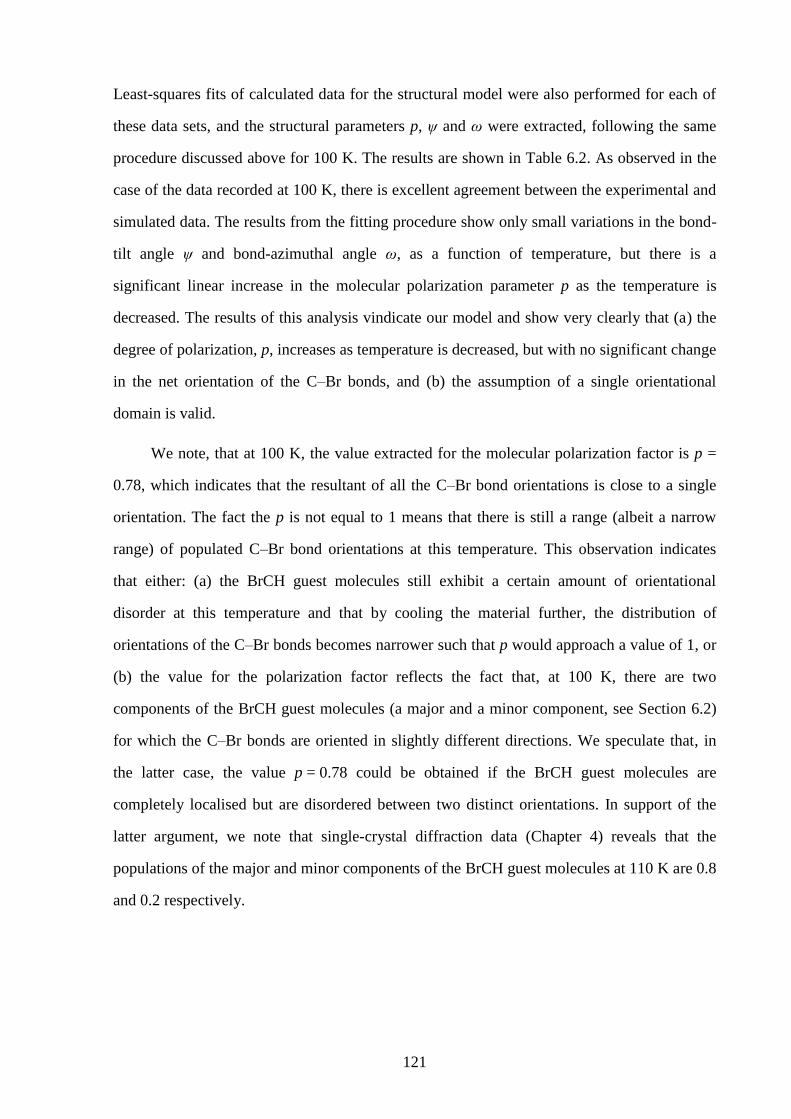
121
Least-squares fits of calculated data for the structural model were also performed for each of
these data sets, and the structural parameters p, ψ and ω were extracted, following the same
procedure discussed above for 100 K. The results are shown in Table 6.2. As observed in the
case of the data recorded at 100 K, there is excellent agreement between the experimental and
simulated data. The results from the fitting procedure show only small variations in the bond-
tilt angle ψ and bond-azimuthal angle ω, as a function of temperature, but there is a
significant linear increase in the molecular polarization parameter p as the temperature is
decreased. The results of this analysis vindicate our model and show very clearly that (a) the
degree of polarization, p, increases as temperature is decreased, but with no significant change
in the net orientation of the C–Br bonds, and (b) the assumption of a single orientational
domain is valid.
We note, that at 100 K, the value extracted for the molecular polarization factor is p =
0.78, which indicates that the resultant of all the C–Br bond orientations is close to a single
orientation. The fact the p is not equal to 1 means that there is still a range (albeit a narrow
range) of populated C–Br bond orientations at this temperature. This observation indicates
that either: (a) the BrCH guest molecules still exhibit a certain amount of orientational
disorder at this temperature and that by cooling the material further, the distribution of
orientations of the C–Br bonds becomes narrower such that p would approach a value of 1, or
(b) the value for the polarization factor reflects the fact that, at 100 K, there are two
components of the BrCH guest molecules (a major and a minor component, see Section 6.2)
for which the C–Br bonds are oriented in slightly different directions. We speculate that, in
the latter case, the value p = 0.78 could be obtained if the BrCH guest molecules are
completely localised but are disordered between two distinct orientations. In support of the
latter argument, we note that single-crystal diffraction data (Chapter 4) reveals that the
populations of the major and minor components of the BrCH guest molecules at 110 K are 0.8
and 0.2 respectively.
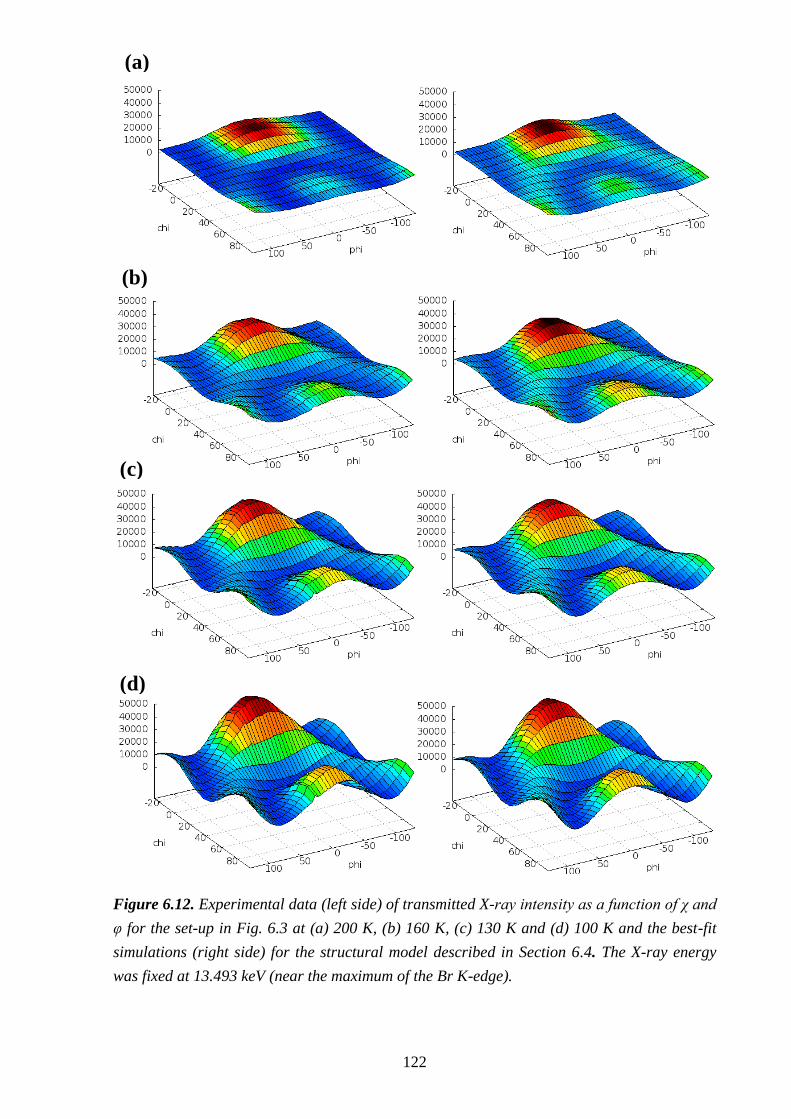
122
Figure 6.12. Experimental data (left side) of transmitted X-ray intensity as a function of χ and
φ for the set-up in Fig. 6.3 at (a) 200 K, (b) 160 K, (c) 130 K and (d) 100 K and the best-fit
simulations (right side) for the structural model described in Section 6.4. The X-ray energy
was fixed at 13.493 keV (near the maximum of the Br K-edge).
(a)
(b)
(c)
(d)
123
Our results from the X-ray birefringence study are in excellent agreement with both
independent single crystal diffraction and NMR studies,[3-8]
which revealed that in the low-
temperature phase just below the phase transition temperature, there is no significant increase
in the ordering of the guest molecules and the extent of disorder remains similar to that in the
high-temperature phase. It is only at sufficiently low temperatures within the low-temperature
phase that the orientational properties of the BrCH guest molecules become more localized.
The results show that there is a gradual and progressive increase in the ordering (and
molecular polarization) of the guest molecules as the temperature is decreased. We speculate
that this continuous ordering of the guest molecules is caused by a gradual reduction in the
dynamics of the guests below the phase transition temperature in which the guest molecules
gradually organise into one preferred direction as they lose mobility and as the host structure
contracts.
6.6 – Conclusions and Further Work
For the first time, measurements of X-ray birefringence have been employed to
determine changes in bond orientation in an anisotropic material. Specifically, X-ray
birefringence measurements have been used to determine the changes in the orientation of the
C–Br bonds in the BrCH/thiourea inclusion compound associated with an order-disorder
phase transition in this material.
Simulations based on a structural model have been used to determine the structural
properties of the BrCH guest molecule as a function of temperature. The results reveal an
extremely close agreement between the experimental and simulated data, thus demonstrating
the validity of the structural model. Furthermore, the extracted structural parameters obtained
from the X-ray birefringence data are in exquisite agreement with the same parameters
obtained independently from diffraction data. In particular, there is extremely close agreement
between the calculated values of the bond-tilt angle (ψ) and bond-azimuthal angle (ω) of the
C–Br bonds, determined from the X-ray birefringence data and those obtained from X-ray
diffraction measurements. This important result demonstrates that X-ray birefringence
measurements can be used to determine changes the orientational properties of specific bonds
in solids and is capable of providing reliable structural information on materials. This result
124
forms the basis of a new technique for determining bond orientation using X-ray
birefringence.
Temperature dependence studies revealed that, upon cooling below the phase transition
temperature there is a gradual increase in the polarization and degree of ordering of the BrCH
guest molecules which reflects a gradual reduction in the dynamics of the guest molecules as
a function of decreasing temperature. These results are in excellent agreement with previous
X-ray diffraction and NMR studies.
We propose performing measurements of transmitted X-ray intensity as a function of
temperature down to temperatures of ca. 20 K on the BrCH/thiourea material (i.e., a scan of
the type shown in Fig. 6.8). This will allow the full temperature dependence of this material to
be determined and will enable us to deduce whether there is a continued increase in the
ordering of the BrCH guest molecules at temperatures lower than 100 K. We anticipate the X-
ray birefringence signal will eventually "level off" as the BrCH guest molecules become
completely ordered at which stage the transmitted intensity will remain constant as a function
of temperature.
In principle the X-ray birefringence technique described in this chapter could be applied
to analyse bond orientations in any anisotropic material. In order to extend the scope of the X-
ray birefringence technique, we propose applying it to study a much wider range of materials
involving several different X-ray absorption edges. We suggest performing experiments on
solid inclusion compounds containing a range of guest molecules, using the same X-ray
birefringence set-up used in the present work (Fig. 6.3). We anticipate that these experiments
will demonstrate the sensitivity and utility of X-ray birefringence as a technique for exploring
molecular orientational distributions in solids, and will also further extend our structural
understanding of the specific materials selected for study.
In particular, we propose studying thiourea inclusion compounds containing several
organometallic guest molecules (such as ferrocene, benzene chromium tricarbonyl and
cyclohexadiene iron tricarbonyl) encompassing a range of transition metals with K-edge X-
ray energies. The benzene chromium tricarbonyl/thiourea inclusion compound (Cr K-edge)
serves as a model system, as there is orientational ordering of the guest molecules even at
125
ambient temperature. On the other hand, the ferrocene/thiourea inclusion compound (Fe K-
edge) is known to exhibit phase transitions at low-temperature involving orientational
ordering of the ferrocene guest molecules, and clearly a major aim of the proposed X-ray
birefringence studies would be to establish new insights on the nature of the orientational
ordering processes in this material. The cyclohexadiene iron tricarbonyl/thiourea inclusion
compound (Fe K-edge) has orientational ordering of the guest molecules, but with contrasting
orientational characteristics to benzene chromium tricarbonyl.
The experiments described in this chapter were carried out using a narrowly focused
incident X-ray beam, however in principle these studies could be carried out in "imaging
mode", specifically using a large (ca. 4 × 4 mm) unfocussed beam and imaging the whole
crystal simultaneously using an area detector. This set-up represents an X-ray analogue of the
polarizing optical microscope. This experimental set-up will allow the whole crystal to be
imaged at the same time, which in principle means that individual orientational domains
within the crystal could detected. Preliminary X-ray imaging experiments on the 1-
bromoadamantane/thiourea inclusion compound indicate that this is indeed a powerful
technique for determining information on bond-orientation in materials.
126
6.7 – References
[1] B. A. Palmer, A. Morte-Ródenas, B. M. Kariuki, K. D. M. Harris, S. P. Collins, J.
Phys. Chem. Lett 2011, 2, 2346.
[2] T. Ishibashi, M. Machida, N. Koyano, J. Korean Phys. Soc. 2005, 46, 228.
[3] B. A. Palmer, B. M. Kariuki, A. Morte-Ródenas, K. D. M. Harris, Crystal Growth &
Design 2012, 12, 577.
[4] M. S. McKinnon, R. E. Wasylishen, Chem. Phys. Lett. 1986, 130, 565.
[5] K. Müller, Magn. Reson. Chem. 1992, 30, 228.
[6] A. E. Aliev, K. D. M. Harris, J. Am. Chem. Soc. 1993, 115, 6369.
[7] K. Müller, Magn. Reson. Chem. 1995, 33, 113.
[8] S. Ternieden, K. Müller, J. Incl. Phenom. Mol. Recogn. Chem. 1998, 30, 289.
[9] A. Allen, V. Fawcett, D. A. Long, J. Raman Spectrosc. 1976, 4, 285.
[10] I. J. Shannon, M. J. Jones, K. D. M. Harris, M. R. H. Siddiqui, R. W. Joyner, J. Chem.
Soc., Faraday Trans. 1995, 91, 1497.
[11] J. E. D. Davies, G. J. Nightingale, J. Struct. Chem. 1999, 40, 802.
127
Chapter 7 – An Incommensurate Thiourea Inclusion
Compound
7.1 – Abstract
X-ray diffraction studies reveal that the tunnel inclusion compound formed between 1-
tert-butyl-4-iodobenzene and thiourea has an incommensurate relationship between the
periodicities of the host and guest substructures along the tunnel axis, representing the first
reported case of an incommensurate thiourea inclusion compound.
7.2 – Introduction
Aperiodic crystals are defined, in general terms, as materials that do not have three-
dimensional translational periodicity (and are thus distinct from conventional crystals), but yet
have aspects of long-range order that give rise to sharp Bragg reflections in their X-ray
diffraction patterns. Among the different classes of aperiodic structures,[1-5]
incommensurate
materials and quasicrystals have been widely studied, with examples from each of these
classes encompassing a wide range of chemical types. Interpretation of X-ray diffraction
patterns from aperiodic materials and elucidation of their structural properties often present
significant challenges that far exceed the challenges encountered in the study of conventional
crystals (i.e., those based on three-dimensional translational periodicity). From the viewpoint
of both diffraction physics and structural science, there is therefore considerable interest in
understanding the properties of aperiodic materials. In this regard, we note, that the 2011
Nobel Prize in Chemistry was awarded to Professor Dan Shechtman for the discovery of
quasicrystals.[6]
The discovery of the first member of a potentially wide family of
incommensurate materials, reported in this chapter, clearly has the potential to open new
avenues of investigation within this field.
A classic example of a family of incommensurate materials within organic solid-state
chemistry are the conventional urea inclusion compounds,[7-13]
which are discussed in detail in
Section 1.2. As outlined in Section 1.2.3, these materials are based on a urea tunnel host
structure and have an incommensurate relationship[14-18]
between the periodicities of the host
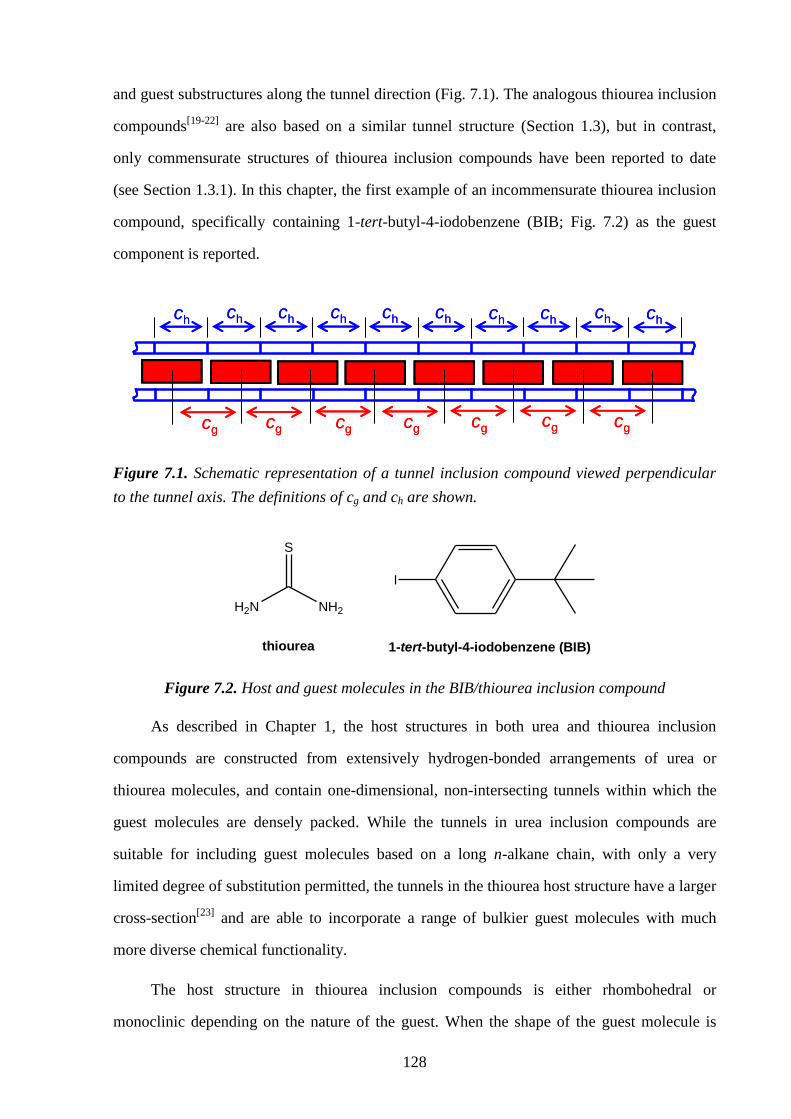
128
and guest substructures along the tunnel direction (Fig. 7.1). The analogous thiourea inclusion
compounds[19-22]
are also based on a similar tunnel structure (Section 1.3), but in contrast,
only commensurate structures of thiourea inclusion compounds have been reported to date
(see Section 1.3.1). In this chapter, the first example of an incommensurate thiourea inclusion
compound, specifically containing 1-tert-butyl-4-iodobenzene (BIB; Fig. 7.2) as the guest
component is reported.
cg cg cgcgcgcg cg
ch ch ch ch ch ch ch ch ch ch
cg cg cgcgcgcg cg
ch ch ch ch ch ch ch ch ch ch
Figure 7.1. Schematic representation of a tunnel inclusion compound viewed perpendicular
to the tunnel axis. The definitions of cg and ch are shown.
H2N NH2
S
thiourea 1-tert-butyl-4-iodobenzene (BIB)
I
Figure 7.2. Host and guest molecules in the BIB/thiourea inclusion compound
As described in Chapter 1, the host structures in both urea and thiourea inclusion
compounds are constructed from extensively hydrogen-bonded arrangements of urea or
thiourea molecules, and contain one-dimensional, non-intersecting tunnels within which the
guest molecules are densely packed. While the tunnels in urea inclusion compounds are
suitable for including guest molecules based on a long n-alkane chain, with only a very
limited degree of substitution permitted, the tunnels in the thiourea host structure have a larger
cross-section[23]
and are able to incorporate a range of bulkier guest molecules with much
more diverse chemical functionality.
The host structure in thiourea inclusion compounds is either rhombohedral or
monoclinic depending on the nature of the guest. When the shape of the guest molecule is
129
essentially isotropic (e.g. cyclohexane, adamantane or ferrocene), the thiourea host structure
at ambient temperature is usually rhombohedral and the guest molecules generally exhibit
orientational disorder (static and/or dynamic). This rhombohedral structure is termed the
"conventional" thiourea host structure. In some cases, thiourea inclusion compounds undergo
a phase transition to a monoclinic structure at low temperature (an example of this type of
phase transitions is described in Chapter 4).
For those crystalline solids that comprise an intergrowth of two chemically
distinguishable components, such as urea and thiourea inclusion compounds, the terms
incommensurate and commensurate refer to the relationship between the periodicities of the
two components within the structure, and define the level of structural registry between them
(Section 1.2.3). In the case of a tunnel inclusion compound, the periodicities of the guest and
host substructures along the tunnel axis are denoted cg and ch respectively (see Fig. 7.1). The
material is assigned as incommensurate if the ratio cg/ch is an irrational number, although it is
generally of more practical utility (given the experimental errors in the measurement of cg and
ch) to assign a material as incommensurate if the ratio cg/ch is not equal to a rational number
of low denominator – i.e., if there are no sufficiently small integers p and q for which
pch = qcg. Otherwise, if small integers p and q can be found that satisfy the relationship
pch = qcg, then the material is assigned as commensurate. In this case, the host and guest
substructures are locked in structural registry, and they share a common periodicity
c = pch = qcg along the tunnel direction. As four lattice vectors {a, b, ch, cg} are required to
describe the periodicity of an incommensurate tunnel inclusion compound, the symmetry of
the composite inclusion compound can be described only using a four-dimensional
superspace group.[13, 16]
While urea inclusion compounds generally have an incommensurate relationship
between the periodicities of the host and guest substructures along the tunnel axis (although
we note that urea inclusion compounds containing certain specific guest molecules are
actually commensurate – see Section 1.2.3), all thiourea inclusion compounds reported to date
have been commensurate structures. We note that, although an incommensurate model was
invoked to explain results of NQR spectroscopy for hexachloroethane/thiourea,[24, 25]
130
subsequent structure determination by single-crystal X-ray diffraction[26]
provided conclusive
evidence that this material is actually a conventional commensurate thiourea inclusion
compound (with significant disorder of the guest molecules). In this chapter, we report that
the thiourea inclusion compound containing BIB guest molecules is the first example of an
incommensurate thiourea inclusion compound.
7.3 – Experimental
Crystals of the BIB/thiourea inclusion compound were prepared by cooling a solution of
urea and BIB (ca. 3:1 molar ratio) in methanol from 55 °C to 20 °C over ca. 29 hrs.
Translucent needle-shaped crystals were obtained. Powder X-ray diffraction confirmed that a
sample of the inclusion compound was obtained, containing a small amount of the "pure"
crystalline phase of thiourea, which forms upon grinding the sample for the powder X-ray
diffraction measurement.
Differential scanning calorimetry (DSC) was carried out on a TA Instruments heat flux
Q100 DSC. The ground sample of BIB/thiourea was subjected to a cycle of cooling and
heating between 298 and 103 K at cooling/heating rates of 10 K min–1
. After cooling, the
sample was held at 103 K for 1 min before commencing the heating cycle.
Single-crystal X-ray diffraction oscillation photographs were recorded using a Bruker-
Nonius Kappa CCD diffractometer, with the tunnel axis (i.e., c-axis) of the single crystal
aligned parallel to the oscillation axis.
Single-crystal X-ray diffraction data were recorded at 100 K using graphite
monochromated MoKα radiation (λ = 0.71073 Å) on a Bruker-Nonius Kappa CCD
diffractometer with an Oxford Cryosystems cooling apparatus. Crystal size = 0.40 × 0.25 ×
0.25 mm3; no. of measured reflections = 3600; no. of independent reflections = 668; Rint =
0.0356, R1 = 0.0490, wR2 = 0.1303; λ = 0.71073. The data collection was based on a three-
dimensional reciprocal space corresponding to the "h" (defined in Ref.[13]) diffraction data
[denoted (hkl)h in Fig. 7.3] for the incommensurate structure. From these data, the thiourea
host structure was solved by direct methods and refined using SHELX-97.[27]
Non-hydrogen
atoms of thiourea were refined with anisotropic displacement parameters and hydrogen atoms
131
were inserted in idealized positions and a riding model was used with Uiso equal to 1.2 or 1.5
times the value of Ueq for the parent atom. In structure refinement from the "h" diffraction
data, the method of introducing guest electron density requires attention, recalling that the
(hk0) reflections are common to both the "h" and "g" diffraction patterns and thus contain
information about the guest substructure projected on to the ab-plane (i.e., perpendicular to
the tunnel axis). Initially, the positional parameters and anisotropic atomic displacement
parameters for the non-hydrogen atoms of thiourea were refined. The difference Fourier map
for this host-only model contains significant maxima located in the tunnel, representing guest
electron density. A carbon atom was added in the position of the highest maximum in the
difference Fourier map, and its positional parameters and isotropic atomic displacement
parameter were refined together with the parameters for the non-hydrogen atoms of the host
structure. This procedure was repeated, adding one carbon atom at a time, until the highest
peak in the difference Fourier map represented a thiourea hydrogen atom. Finally, hydrogen
atoms were added to thiourea according to standard geometric features and refined as
described above.
Powder X-ray diffraction data were recorded at room temperature on a Bruker D8
diffractometer (transmission mode; Ge monochromated CuKα1 radiation; data range, 4.000° ≤
2θ ≤ 50.832°; step size, 0.017°; time per step, 10 s). Lattice parameters for BIB/thiourea were
determined by profile fitting using the Le Bail method[28]
in the GSAS program package.[29, 30]
Upon grinding the BIB/thiourea sample, a small amount of "pure" thiourea was produced.
Thus, a two-phase refinement was employed, involving simultaneous profile-fitting for both
the BrCH/thiourea inclusion compound and pure thiourea. A good quality of fit was obtained
(Fig. 7.7).
Two solid-state 13
C NMR experiments were carried out to assess the mobility of the
molecules in the BIB/thiourea inclusion compound. Spectra were recorded on a Chemagnetics
Infinity Plus spectrometer operating at 75.48 MHz. The first experiment was a standard
ramped cross-polarization[31]
experiment performed at 20 °C with 8 kHz magic-angle
spinning, 83 kHz TPPM decoupling,[32]
a 3 s delay between scans and a total of 16384 scans.
The second experiment was a standard dipolar dephasing measurement, involving of a delay
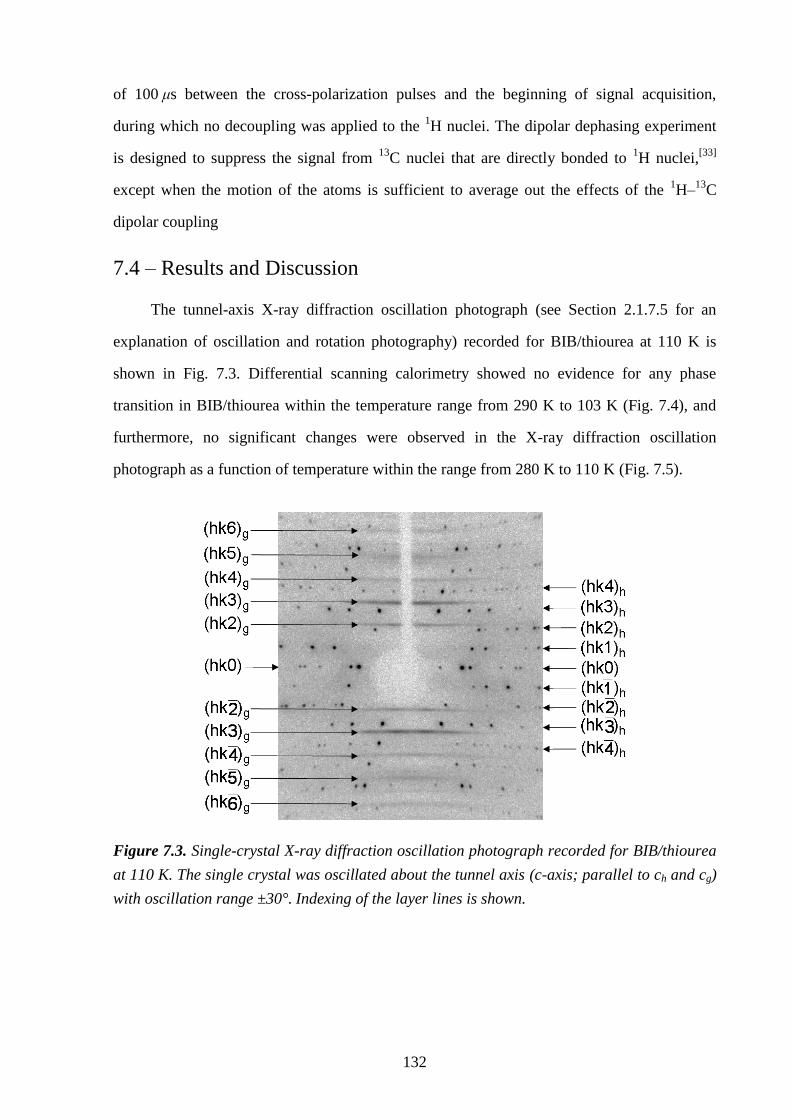
132
of 100 μs between the cross-polarization pulses and the beginning of signal acquisition,
during which no decoupling was applied to the 1H nuclei. The dipolar dephasing experiment
is designed to suppress the signal from 13
C nuclei that are directly bonded to 1H nuclei,
[33]
except when the motion of the atoms is sufficient to average out the effects of the 1H–
13C
dipolar coupling
7.4 – Results and Discussion
The tunnel-axis X-ray diffraction oscillation photograph (see Section 2.1.7.5 for an
explanation of oscillation and rotation photography) recorded for BIB/thiourea at 110 K is
shown in Fig. 7.3. Differential scanning calorimetry showed no evidence for any phase
transition in BIB/thiourea within the temperature range from 290 K to 103 K (Fig. 7.4), and
furthermore, no significant changes were observed in the X-ray diffraction oscillation
photograph as a function of temperature within the range from 280 K to 110 K (Fig. 7.5).
Figure 7.3. Single-crystal X-ray diffraction oscillation photograph recorded for BIB/thiourea
at 110 K. The single crystal was oscillated about the tunnel axis (c-axis; parallel to ch and cg)
with oscillation range ±30°. Indexing of the layer lines is shown.
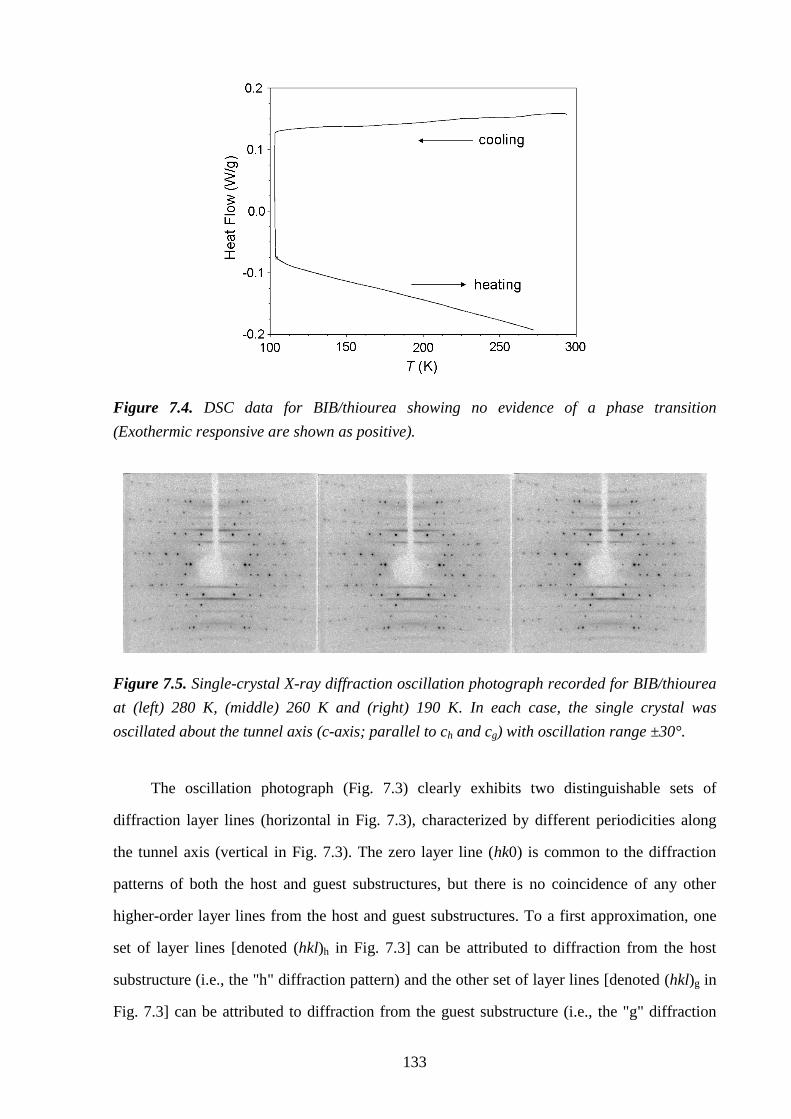
133
Figure 7.4. DSC data for BIB/thiourea showing no evidence of a phase transition
(Exothermic responsive are shown as positive).
Figure 7.5. Single-crystal X-ray diffraction oscillation photograph recorded for BIB/thiourea
at (left) 280 K, (middle) 260 K and (right) 190 K. In each case, the single crystal was
oscillated about the tunnel axis (c-axis; parallel to ch and cg) with oscillation range ±30°.
The oscillation photograph (Fig. 7.3) clearly exhibits two distinguishable sets of
diffraction layer lines (horizontal in Fig. 7.3), characterized by different periodicities along
the tunnel axis (vertical in Fig. 7.3). The zero layer line (hk0) is common to the diffraction
patterns of both the host and guest substructures, but there is no coincidence of any other
higher-order layer lines from the host and guest substructures. To a first approximation, one
set of layer lines [denoted (hkl)h in Fig. 7.3] can be attributed to diffraction from the host
substructure (i.e., the "h" diffraction pattern) and the other set of layer lines [denoted (hkl)g in
Fig. 7.3] can be attributed to diffraction from the guest substructure (i.e., the "g" diffraction
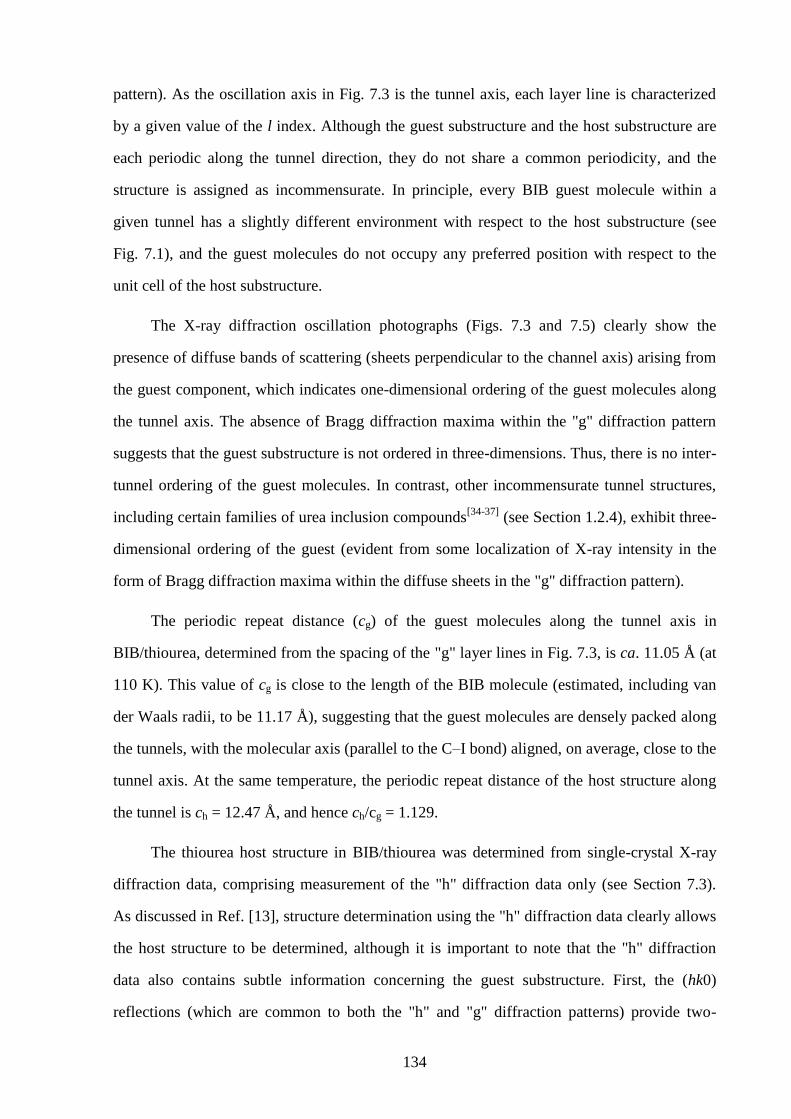
134
pattern). As the oscillation axis in Fig. 7.3 is the tunnel axis, each layer line is characterized
by a given value of the l index. Although the guest substructure and the host substructure are
each periodic along the tunnel direction, they do not share a common periodicity, and the
structure is assigned as incommensurate. In principle, every BIB guest molecule within a
given tunnel has a slightly different environment with respect to the host substructure (see
Fig. 7.1), and the guest molecules do not occupy any preferred position with respect to the
unit cell of the host substructure.
The X-ray diffraction oscillation photographs (Figs. 7.3 and 7.5) clearly show the
presence of diffuse bands of scattering (sheets perpendicular to the channel axis) arising from
the guest component, which indicates one-dimensional ordering of the guest molecules along
the tunnel axis. The absence of Bragg diffraction maxima within the "g" diffraction pattern
suggests that the guest substructure is not ordered in three-dimensions. Thus, there is no inter-
tunnel ordering of the guest molecules. In contrast, other incommensurate tunnel structures,
including certain families of urea inclusion compounds[34-37]
(see Section 1.2.4), exhibit three-
dimensional ordering of the guest (evident from some localization of X-ray intensity in the
form of Bragg diffraction maxima within the diffuse sheets in the "g" diffraction pattern).
The periodic repeat distance (cg) of the guest molecules along the tunnel axis in
BIB/thiourea, determined from the spacing of the "g" layer lines in Fig. 7.3, is ca. 11.05 Å (at
110 K). This value of cg is close to the length of the BIB molecule (estimated, including van
der Waals radii, to be 11.17 Å), suggesting that the guest molecules are densely packed along
the tunnels, with the molecular axis (parallel to the C–I bond) aligned, on average, close to the
tunnel axis. At the same temperature, the periodic repeat distance of the host structure along
the tunnel is ch = 12.47 Å, and hence ch/cg = 1.129.
The thiourea host structure in BIB/thiourea was determined from single-crystal X-ray
diffraction data, comprising measurement of the "h" diffraction data only (see Section 7.3).
As discussed in Ref. [13], structure determination using the "h" diffraction data clearly allows
the host structure to be determined, although it is important to note that the "h" diffraction
data also contains subtle information concerning the guest substructure. First, the (hk0)
reflections (which are common to both the "h" and "g" diffraction patterns) provide two-
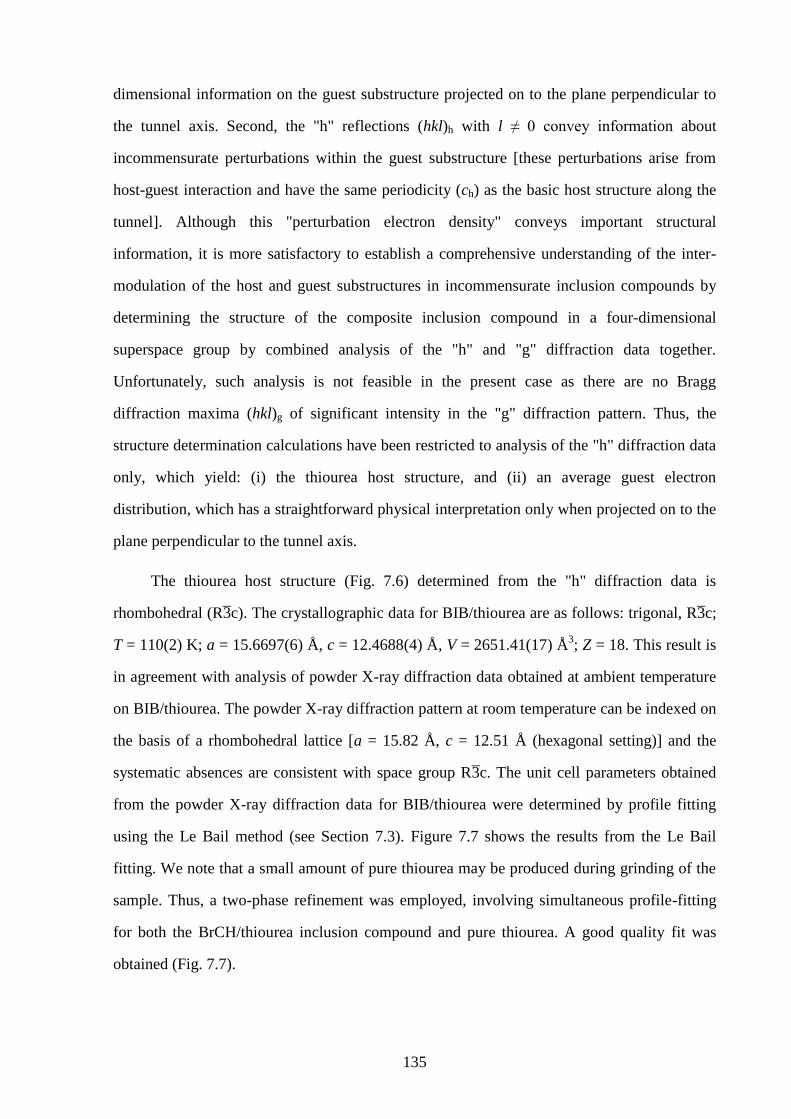
135
dimensional information on the guest substructure projected on to the plane perpendicular to
the tunnel axis. Second, the "h" reflections (hkl)h with l ≠ 0 convey information about
incommensurate perturbations within the guest substructure [these perturbations arise from
host-guest interaction and have the same periodicity (ch) as the basic host structure along the
tunnel]. Although this "perturbation electron density" conveys important structural
information, it is more satisfactory to establish a comprehensive understanding of the inter-
modulation of the host and guest substructures in incommensurate inclusion compounds by
determining the structure of the composite inclusion compound in a four-dimensional
superspace group by combined analysis of the "h" and "g" diffraction data together.
Unfortunately, such analysis is not feasible in the present case as there are no Bragg
diffraction maxima (hkl)g of significant intensity in the "g" diffraction pattern. Thus, the
structure determination calculations have been restricted to analysis of the "h" diffraction data
only, which yield: (i) the thiourea host structure, and (ii) an average guest electron
distribution, which has a straightforward physical interpretation only when projected on to the
plane perpendicular to the tunnel axis.
The thiourea host structure (Fig. 7.6) determined from the "h" diffraction data is
rhombohedral (R3̄c). The crystallographic data for BIB/thiourea are as follows: trigonal, R3̄c;
T = 110(2) K; a = 15.6697(6) Å, c = 12.4688(4) Å, V = 2651.41(17) Å3; Z = 18. This result is
in agreement with analysis of powder X-ray diffraction data obtained at ambient temperature
on BIB/thiourea. The powder X-ray diffraction pattern at room temperature can be indexed on
the basis of a rhombohedral lattice [a = 15.82 Å, c = 12.51 Å (hexagonal setting)] and the
systematic absences are consistent with space group R3̄c. The unit cell parameters obtained
from the powder X-ray diffraction data for BIB/thiourea were determined by profile fitting
using the Le Bail method (see Section 7.3). Figure 7.7 shows the results from the Le Bail
fitting. We note that a small amount of pure thiourea may be produced during grinding of the
sample. Thus, a two-phase refinement was employed, involving simultaneous profile-fitting
for both the BrCH/thiourea inclusion compound and pure thiourea. A good quality fit was
obtained (Fig. 7.7).
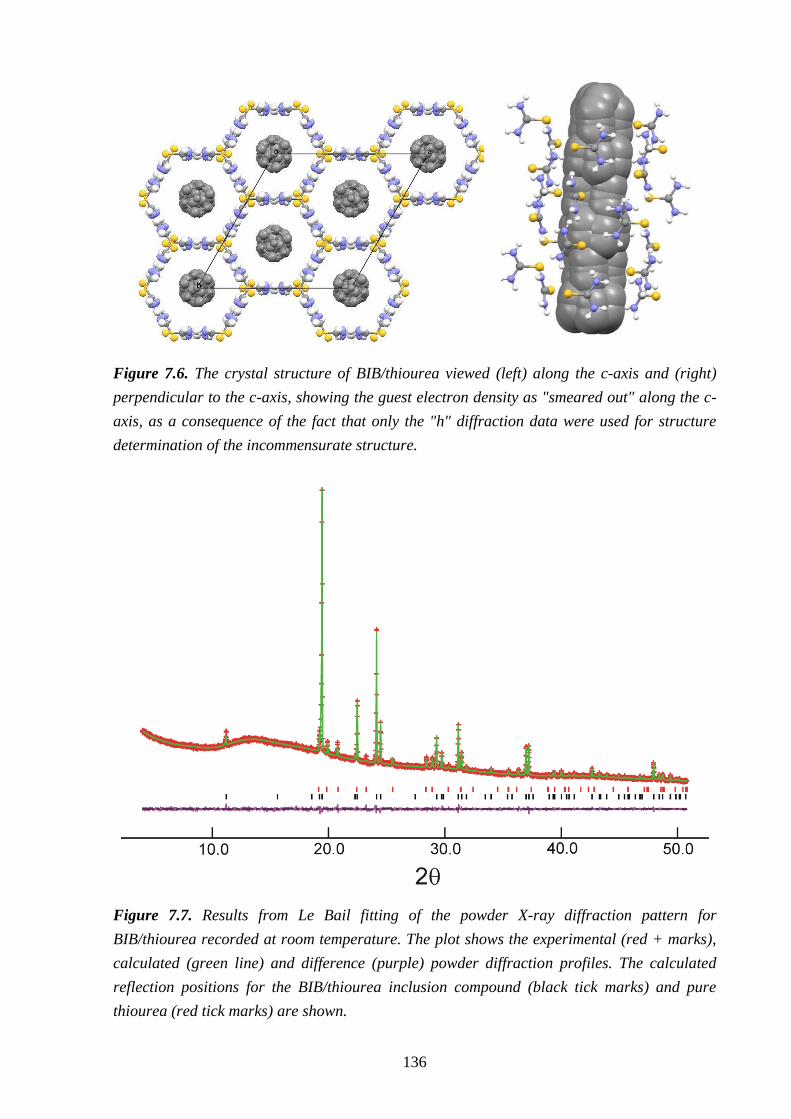
136
Figure 7.6. The crystal structure of BIB/thiourea viewed (left) along the c-axis and (right)
perpendicular to the c-axis, showing the guest electron density as "smeared out" along the c-
axis, as a consequence of the fact that only the "h" diffraction data were used for structure
determination of the incommensurate structure.
Figure 7.7. Results from Le Bail fitting of the powder X-ray diffraction pattern for
BIB/thiourea recorded at room temperature. The plot shows the experimental (red + marks),
calculated (green line) and difference (purple) powder diffraction profiles. The calculated
reflection positions for the BIB/thiourea inclusion compound (black tick marks) and pure
thiourea (red tick marks) are shown.
137
The thiourea host structure determined from single X-ray diffraction data does not
exhibit any significant differences from the conventional rhombohedral thiourea tunnel
structures reported previously. However, as discussed above, all cases of conventional
thiourea inclusion compounds reported previously have a commensurate relationship between
the host and guest substructures. Although the guest molecules have a well-defined
periodicity (cg) along the tunnel direction in BIB/thiourea, as evident from Fig. 7.3, there is no
ordering with regard to the positional relationships between the guest molecules in different
tunnels, and thus the guest substructure is periodic only in one dimension. Furthermore, the
projection of the guest electron density onto the plane perpendicular to the tunnel axis (Fig.
7.3) suggests that there is substantial orientational disorder of the guest molecules around the
tunnel.
In order to gain qualitative insights on whether the guest molecules in BIB/thiourea are
dynamic, high-resolution solid-state 13
C NMR spectra were recorded at 20 °C using both
standard CPMAS conditions and using dipolar dephasing.[33]
The dipolar dephasing
experiment is designed to suppress the signals from 13
C nuclei that are directly bonded to 1H
nuclei. However, when the 13
C–1H bond is sufficiently mobile to average out the effects of
13C...1H dipolar coupling, such signal suppression does not occur. For BIB/thiourea, no signal
suppression was observed, indicating that both the aryl ring and the tert-butyl group of the
BIB molecules are dynamic (as often observed for tert-butyl groups in solids[38]
). The
dynamics most likely constitute rotation about the tunnel axis, as no other reorientational
motion appears feasible given the geometric constraints imposed by the host tunnel
7.5 Conclusions and Further Work
This chapter has demonstrated that BIB/thiourea is the first example of an
incommensurate thiourea inclusion compound. Given the fact that a large number of thiourea
inclusion compounds, containing a diverse range of different types of guest molecules within
the thiourea tunnel structure, have been prepared and studied previously, it is perhaps
surprising that incommensurate structural properties have not been reported previously for
this class of inclusion compound. Research is currently focussed on exploring whether
BIB/thiourea represents a unique case, or whether other guest molecules (perhaps sharing
138
similar structural and geometric attributes to BIB) are also capable of forming
incommensurate inclusion compounds with thiourea. In particular, ongoing experiments are
investigating whether the thiourea inclusion compounds containing 1-tert-
butylbromobenzene, 1,4-di-tert-butylbenzene, adamantane-carboxylic acid and 4-tert-butyl-
benzylbromide exhibit incommensurate structures, to determine empircally whether there are
any trends in the geometric features of guest molecules that form incommensurate thiourea
inclusion compounds.
Conceptually, the diffraction properties and structural descriptions of incommensurate
materials extend beyond the normal crystallographic principles that are applicable to
conventional crystals, and clearly an important aspect is to obtain a deeper understanding of
the ways in which the physical properties of such materials are influenced by their
incommensurateness. In this regard, a theoretically proven[14]
feature of incommensurate
tunnel inclusion compounds is that diffusion of guest molecules along the tunnels is, in
principle, associated with no energy barrier, and it has been suggested that this feature is an
important component of uni-directional guest exchange processes that have been
demonstrated for incommensurate urea inclusion compounds.[39, 40]
We may envisage that
such guest transport processes may also occur in the case of incommensurate thiourea
inclusion compounds, such as BIB/thiourea.
139
7.6 – References
[1] T. Janssen, A. Janner, Adv. Phys. 1987, 36, 519.
[2] P. Bak, Rep. Prog. Phys. 1982, 45, 587.
[3] C. Janot, Quasicrystals A Primer, Second Edition, Oxford University Press, Oxford,
1994.
[4] A. P. Tsai, Acc. Chem. Res. 2003, 36, 31.
[5] W. Streurer, S. Deloudi, Acta. Crystallogr., Sect. A 2008, 64, 1.
[6] D. Shechtman, I. Blech, D. Gratias, J. W. Cahn, Phys. Rev. Lett. 1984, 53, 1951.
[7] L. C. Fetterly, in Non-Stoichiometric Compounds (Ed.: L. Mandelcorn), Academic
Press, New York, 1964, p. 491.
[8] M. D. Hollingsworth, K. D. M. Harris, in Comprehensive Supramolecular Chemistry
(Eds.: D. D. Macnicol, F. Toda, R. Bishop), Pergamon Press, Oxford, UK, 1996, Vol.
6, p. 177.
[9] K. D. M. Harris, J. Mol. Struct. 1996, 374, 241.
[10] K. D. M. Harris, Chem. Soc. Rev. 1997, 26, 279.
[11] K. D. M. Harris, Supramol. Chem. 2007, 19, 47.
[12] A. E. Smith, Acta Crystallogr. 1952, 5, 224.
[13] K. D. M. Harris, J. M. Thomas, J. Chem. Soc., Faraday Trans. 1990, 86, 2985.
[14] A. J. O. Rennie, K. D. M. Harris, Proc. R. Soc. London, Ser. A. 1990, 430, 615.
[15] D. Schmicker, S. van Smaalen, J. L. de Boer, C. Haas, K. D. M. Harris, Phys. Rev.
Lett. 1995, 74, 734.
[16] S. van Smaalen, K. D. M. Harris, Proc. R. Soc. London, Ser. A 1996, 452, 677.
[17] R. Lefort, J. Etrillard, B. Toudic, F. Guillaume, T. Breczewski, P. Bourges, Phys. Rev.
Lett. 1996, 77, 4027.
[18] J. Ollivier, C. Ecolivet, S. Beaufils, F. Guillaume, T. Breczewski, Europhys. Lett.
1998, 43, 546.
[19] H.-U. Lenné, Acta Crystallogr. 1954, 7, 1.
[20] E. Hough, D. G. Nicholson, J. Chem. Soc., Faraday Trans. 1978, 15.
[21] R. Gopal, B. E. Robertson, J. S. Rutherford, Acta Crystallogr. Sect. C 1989, 45, 257.
[22] K. D. M. Harris, J. M. Thomas, J. Chem. Soc., Faraday Trans. 1990, 86, 1095.
[23] A. R. George, K. D. M. Harris, J. Mol. Graphics 1995, 13, 138.
[24] Y. G. Krieger, S. G. Kozlova, S. P. Gabuda, G. N. Chekhova, Y. A. Dyadin, Fiz.
Tverd. Tela (S.-Peterburg) 1985, 27, 3121.
[25] A. R. Semenov, G. N. Chekhova, Y. G. Krieger, Y. A. Dyadin, 1997, 38, 716.
[26] S. F. Solodovnikov, G. N. Chekhova, G. V. Romanenko, N. V. Podberezskaya, Z. A.
Solodovnikova, D. V. Pinakov, A. R. Semenov, J. Struct. Chem 2007, 48, 340.
[27] G. M. Sheldrick, Acta Crystallogr. Sect. A 2008, 64, 112.
[28] A. Le Bail, H. Duroy, J. L. Fourquet, Mater. Res. Bull. 1988, 23, 447.
[29] B. H. Toby, J. Appl. Crystallogr. 2001, 34, 210.
[30] M. J. Jones, I. J. Shannon, K. D. M. Harris, J. Chem. Soc., Faraday Trans. 1996, 92,
273.
[31] G. Metz, X. L. Wu, S. O. Smith, J. Magn. Reson. A 1994, 110, 219.
140
[32] A.E. Bennett, C. M. Rienstra, M. Auger, K. V. Lakshmi, R. G. Griffin, J. Chem. Phys.
1995, 103, 6951.
[33] S. J. Opella, M. H. Frey, J. Am. Chem. Soc. 1979, 101, 5854.
[34] K. Fukao, H. Miyaji, K. Asai, J. Chem. Phys. 1986, 84, 6360.
[35] K. D. M. Harris, S. P. Smart, M. D. Hollingsworth, J. Chem. Soc., Faraday Trans.
1991, 87, 3423.
[36] K. D. M. Harris, M. D. Hollingsworth, Proc. Roy. Soc. London, Ser. A 1990, 431, 245.
[37] I. J. Shannon, N. M. Stainton, K. D. M. Harris, J. Mater. Chem. 1993, 3, 1085.
[38] F. G. Riddell, A. Arumugam, K. D. M. Harris, M. Rogerson, J. H. Strange, 1993, 115,
1881.
[39] A. A. Khan, S. T. Bramwell, K. D. M. Harris, B. M. Kariuki, M. R. Truter, Chem.
Phys. Lett. 1999, 307, 320.
[40] J. Marti-Rujas, A. Desmedt, K. D. M. Harris, F. Guillaume, J. Am. Chem. Soc. 2004,
126, 11124.
141
Chapter 8 – General Conclusions and Outlook
This thesis has explored several new directions in the field of solid organic inclusion
compounds. In particular, new insights have been gained into the crystal growth processes,
structural properties and X-ray birefringence phenomenon of urea and thiourea inclusion
compounds. The diverse studies presented in this thesis are unified by two overarching
questions, namely: Does the unique spatial environment imposed on the guest molecules by
the host framework in channel-type inclusion compounds impart important fundamental
physico-chemical properties to these materials and can these properties be exploited in the
discovery of new applications? It is the desire to explore these questions which has stimulated
research along a number of different pathways in this thesis.
For example, in chapter 3, the unique one-dimensional tunnel environment of the urea
host structure allows two different types of guest molecules to be incorporated into the crystal
simultaneously (without any change in crystal structure), thus enabling a new experimental
strategy to be developed for monitoring crystal growth processes retrospectively.[1]
In chapter 4, the importance of the spatial environment of the host and guest
components on the physical properties of these materials was highlighted, focussing on the
dependence of the phase transition behaviour of thiourea inclusion compounds on small
geometric changes in the guest molecules. The study revealed the subtle yet important
changes that can occur in phase transition behaviour simply by substitution of a single atom in
the guest molecule. This observation reflects the fine energetic balances that pertain in these
materials and the role of small changes in intermolecular interactions involving the host and
guest components.[2]
Furthermore, in chapters 5 and 6 we noted that the phenomena of X-ray dichroism and
X-ray birefringence (and related applications) are observed in these materials because of the
directing influence of the host structure on the orientation of the guest molecules. Indeed, the
ability of particular chemical bonds of the guests to align in these materials (a fundamental
pre-requisite for both X-ray dichroism and X-ray birefringence) is due to the strong orienting
influence of the host structure on the guest molecules. Thus, with appropriate choice of both
142
the host structure and the guest molecules, materials can be designed in which the orientations
of specific bonds of the guest molecules can be exquisitely controlled.[3]
Historically, these same questions motivated early endeavours in the field. Indeed, it
was the prospect of utilising the constrained spatial environment of one-dimensional channel
inclusion compounds that inspired early researchers to focus on applying these materials in
molecular separation technologies, particularly in the separation of linear and branched
hydrocarbons relevant to the petroleum industry.[4-7]
And we predict that these same questions
will also shape future advances in the field: In this regard, we highlight three potential
applications of inclusion compounds with significant potential for future development, each
of which depends critically on the one-dimensional tunnel structure of these materials.
Since the early days of inclusion compound research, both urea and thiourea inclusion
compounds have been exploited as environments for carrying out chemical reactions
involving the guest molecules.[8,9]
In most cases, the guest molecules are included into the
host structure upon crystallization and the reaction is initiated by irradiation of the material.
The reactivity of the guest molecules inside inclusion compounds often differs substantially
from the reactivity of the same molecules in dispersed phases, or in other solid phases (such
as their “pure” crystalline phase or as guest molecules in other host solids) as described in a
recent review.[10]
These differences devolve, to a large extent, on the structural and geometric
constraints imposed on the guest molecules by the host environment, and specific factors
include: (i) the guest molecules may be constrained to adopt an uncharacteristic conformation
within the inclusion compound, which may in turn lead to different chemical reactivity; (ii)
the guest molecules are generally less mobile than in the liquid phase, but generally more
mobile than in their “pure” crystalline phase; (iii) the specific intermolecular guest–guest
contacts in the inclusion compound may differ from those in the “pure” crystalline phase of
the same molecule, and may represent low-probability trajectories of approach of two free
molecules in dispersed phases; (iv) the relative energies of transition states with different
geometries (representing competing reaction pathways) within a solid host structure may be
very different from the relative energies of the transition states for the corresponding reactions
in other phases, leading to changes in the relative probabilities of different reaction pathways.
143
Utilising solid inclusion compounds as crystalline "reaction vessels" for performing
organic syntheses offers numerous advantages over traditional dispersed-phase techniques,
not least because of the increased regioselective and stereoselective control often afforded by
this methodology and because, in many cases, the same reaction products are difficult or
impossible to access via conventional solution based synthesis. In spite of this fact, however,
reactions in solid organic inclusion compounds remain totally unexploited within the domain
of synthetic organic chemistry. The quest to develop new and more imaginative ways of
exploiting reactivity within solid organic inclusion compounds is likely to remain a
scientifically stimulating and rewarding area of research activity for many years to come.
Secondly, thiourea inclusion compounds have been shown to display non-linear optical
behaviour, indicating that they may have the potential to be used in optoelectronic
devices.[11,12]
Thiourea inclusion compounds containing certain organometallic guest
molecules exhibit second harmonic generation (SHG), i.e., the frequency doubling of light as
it passes through a material. For a crystal to exhibit SHG, the constituent molecules must have
high second-order hyperpolarizabilty (β) and the crystal structure must be non-
centrosymmetric. The tunnel structure of certain thiourea inclusion compounds provides an
environment in which guest molecules (with high values of β) may be aligned in a non-
centrosymmetric manner, thus satisfying both of the criteria for SHG. In a number of thiourea
inclusion compounds, the dipole alignment of organometallic guest molecules was found to
be favoured and these compounds exhibit significant SHG. For these materials to become
fully integrated into optoelectrical devices, more work needs be done on increasing the variety
of host structures available, improving their stability and finding new guest molecules which
exhibit stronger SHG behaviour.
Finally, urea and thiourea inclusion compounds containing certain guest molecules have
been found to be strongly X-ray dichroic.[13-15]
These materials have been applied successfully
as X-ray dichroic filters and have been shown to have considerable potential in applications
such as magnetic X-ray scattering and X-ray polarimetry. As described in chapters 5 and 6,
the related phenomenon of X-ray birefringence has also been observed in several thiourea
inclusion compounds containing brominated guest molecules.[3]
The strong dependence
144
between X-ray birefringence and the orientational properties of the C–Br bonds in these solids
suggests that there is considerable potential to exploit measurements of X-ray birefringence as
an experimental technique for assessing and quantifying the orientational distributions of
bonds in solids, for example, in the case of partially ordered materials or materials that
undergo order–disorder phase transitions. To demonstrate the wider scope and relevance of
this technique, more materials containing different types of chemical bonds need to be
characterised. Other potential applications which depend on birefringence include materials
for use as non-diffractive fixed-wavelength X-ray phase retarders, which may be applied, for
example, to convert linearly polarized X-rays to circularly polarized X-rays. Devices based on
this approach are potentially quite efficient and far less sensitive to beam angle than
diffractive devices (i.e., a few degrees of divergence should have little effect, compared with
divergence of the order of millidegrees in the case of diffractive devices).
8.1 – References
[1] B. A. Palmer, K. D. M. Harris, F. Guillaume, Angew. Chemie. Int. Ed. 2010, 49, 5096.
[2] B. A. Palmer, B. M. Kariuki, A. Morte-Rodenas, K. D. M. Harris, Cryst. Growth. Des.
2012, 12, 577.
[3] B. A. Palmer, A. Morte-Rodenas, B. M. Kariuki, K. D. M. Harris, S. P. Collins, J.
Phys. Chem. Lett. 2011, 2, 2346.
[4] H. M. Powell, Nature 1952, 170, 155.
[5] L. C. Fetterly, in Non-Stoichiometric Compounds (Ed.: L. Mandelcorn), Academic
Press, New York, 1964, p.491.
[6] D. Worsch, F. Vögtle, Top. Curr. Chem. 1987, 140, 21.
[7] W. Schlenk, Liebigs. Ann. Chem. 1973, 1145.
[8] J. F. Brown, D. M. White, J. Am. Chem. Soc. 1960, 82, 5671.
[9] D. M. White, J. Am. Chem. Soc. 1960, 82, 5678.
[10] K. D. M. Harris, B. A. Palmer, G. R. Edwards-Gau, in Supramolecular Chemistry:
From Molecules to Materials (Eds.: P. A. Gale, J. W. Steed), John Wiley & Sons,
Chichester, 2012, p1589.
[11] A. G. Anderson, J. C. Calabrese, W. Tam, I. D. Williams, Chem. Phys. Lett. 1987,
134, 392.
[12] W. Tam, D. F. Eaton, J. C. Calabrese, I. D. Williams, Y. Wang, A. G. Anderson,
Chem. Mater. 1989, 1, 128.
[13] S. P. Collins, D. Laundy, K. D. M. Harris, B. M. Kariuki, C. L. Bauer, S. D. Brown, P.
Thompson, J. Phys.: Condens. Matter 2002, 12, 123.
[14] M. H. Chao, B. M. Kariuki, K. D. M. Harris, S. P. Collins, D. Laundy, Angew.
Chemie, Int. Ed. 2003, 42, 2982.
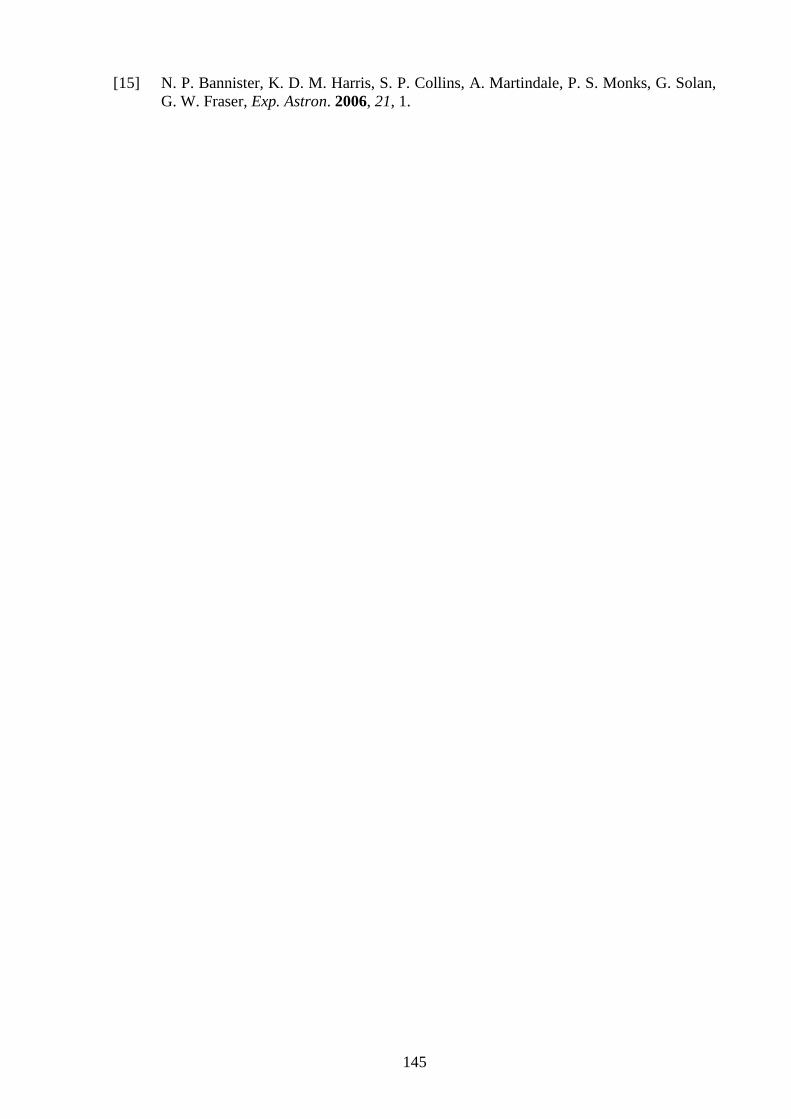
145
[15] N. P. Bannister, K. D. M. Harris, S. P. Collins, A. Martindale, P. S. Monks, G. Solan,
G. W. Fraser, Exp. Astron. 2006, 21, 1.
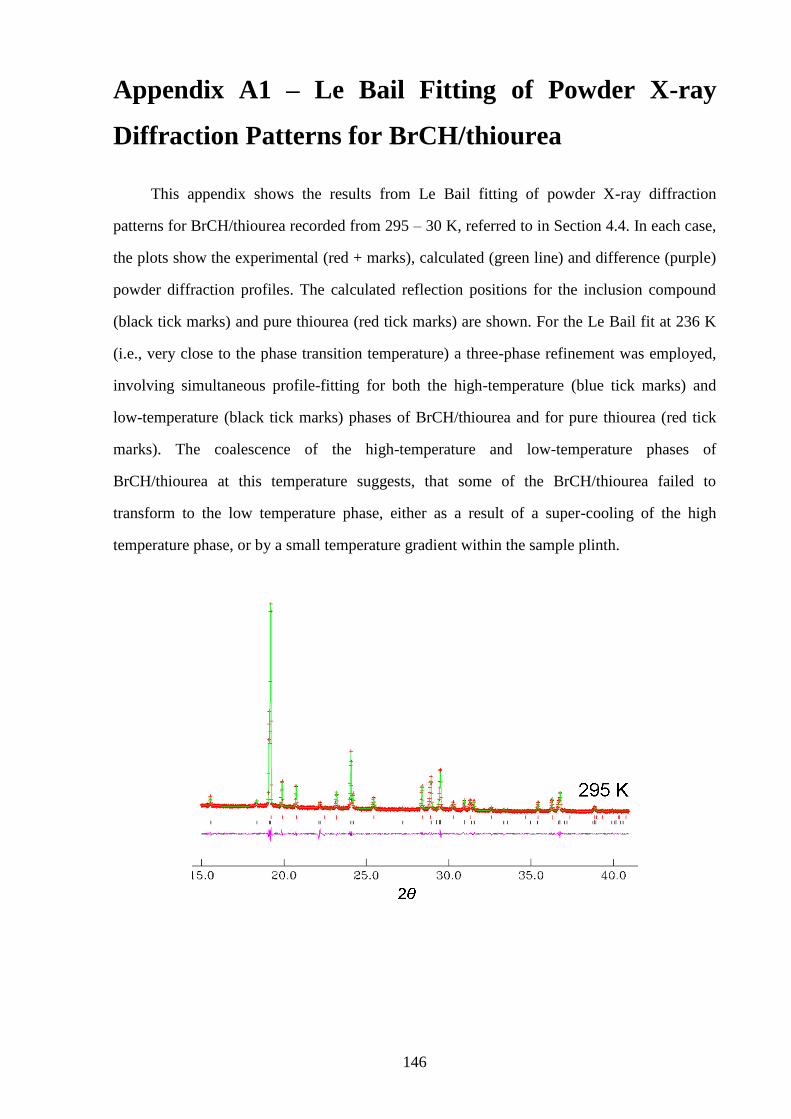
146
Appendix A1 – Le Bail Fitting of Powder X-ray
Diffraction Patterns for BrCH/thiourea
This appendix shows the results from Le Bail fitting of powder X-ray diffraction
patterns for BrCH/thiourea recorded from 295 – 30 K, referred to in Section 4.4. In each case,
the plots show the experimental (red + marks), calculated (green line) and difference (purple)
powder diffraction profiles. The calculated reflection positions for the inclusion compound
(black tick marks) and pure thiourea (red tick marks) are shown. For the Le Bail fit at 236 K
(i.e., very close to the phase transition temperature) a three-phase refinement was employed,
involving simultaneous profile-fitting for both the high-temperature (blue tick marks) and
low-temperature (black tick marks) phases of BrCH/thiourea and for pure thiourea (red tick
marks). The coalescence of the high-temperature and low-temperature phases of
BrCH/thiourea at this temperature suggests, that some of the BrCH/thiourea failed to
transform to the low temperature phase, either as a result of a super-cooling of the high
temperature phase, or by a small temperature gradient within the sample plinth.
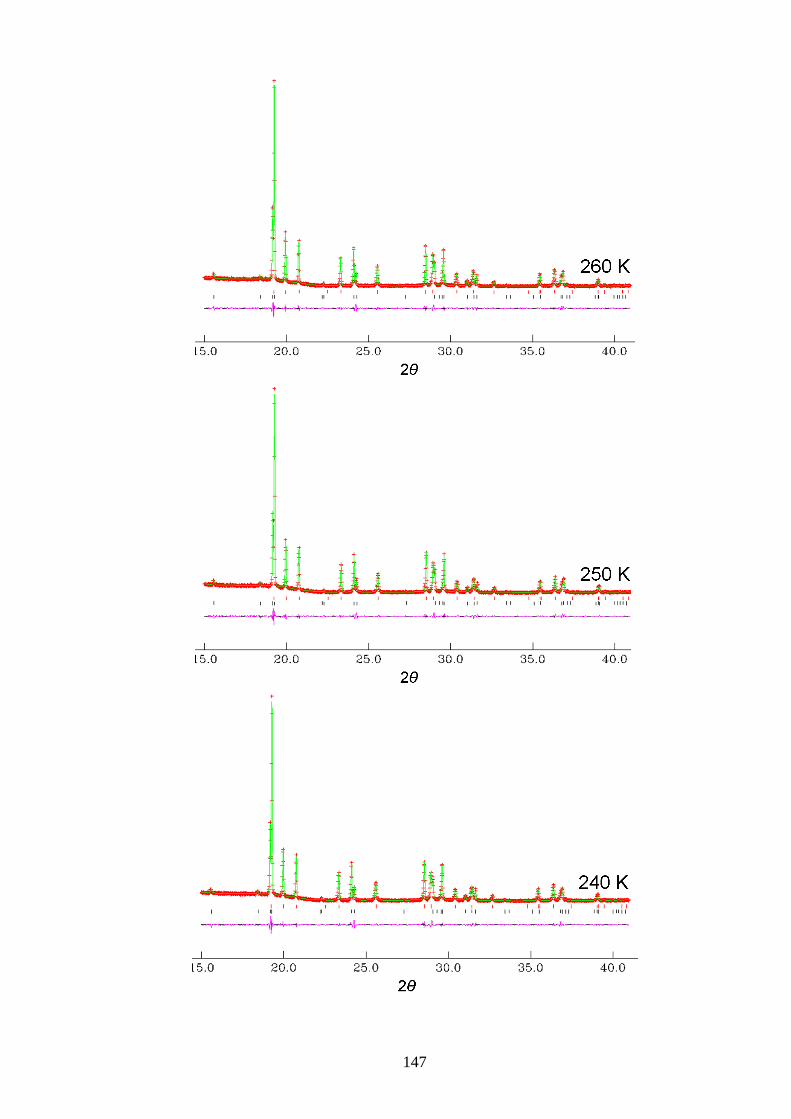
147
148
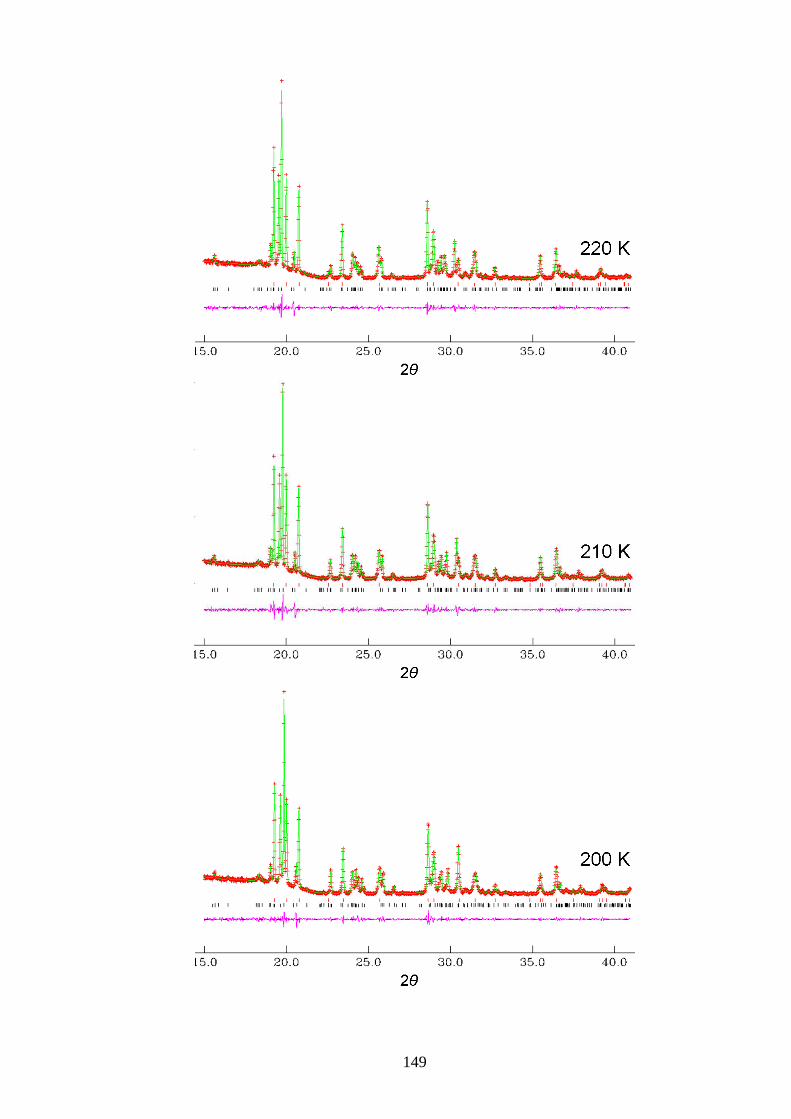
149
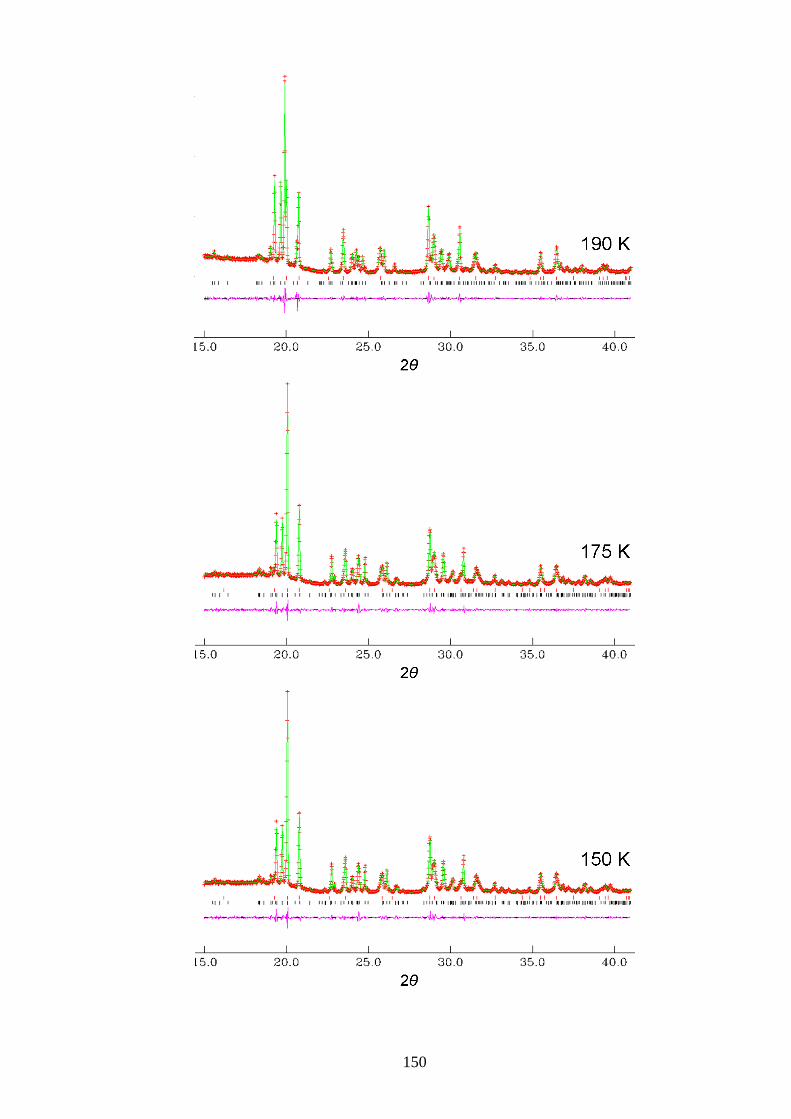
150
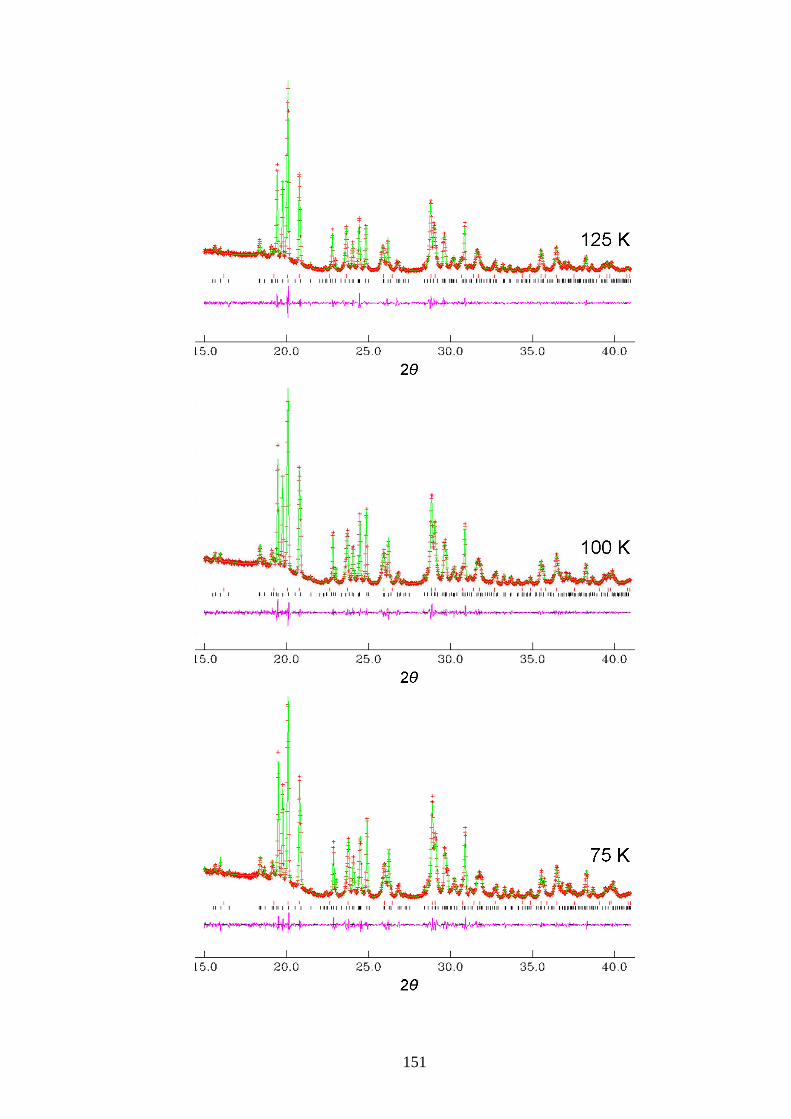
151
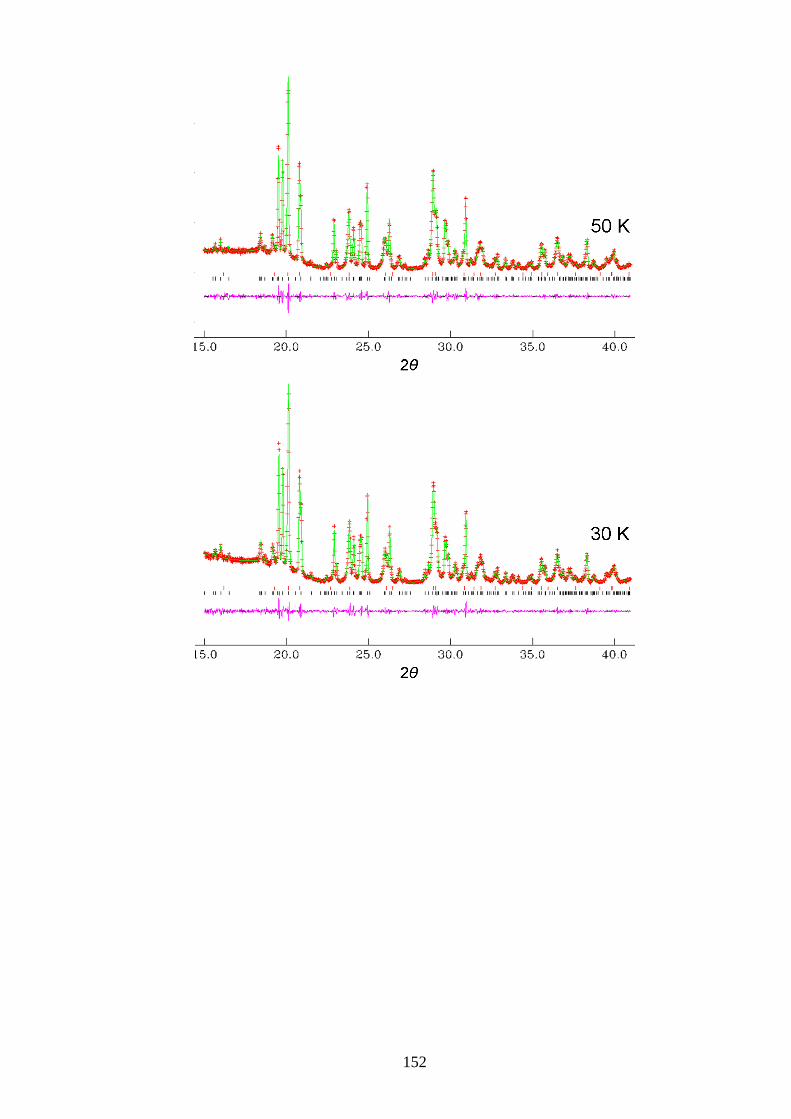
152
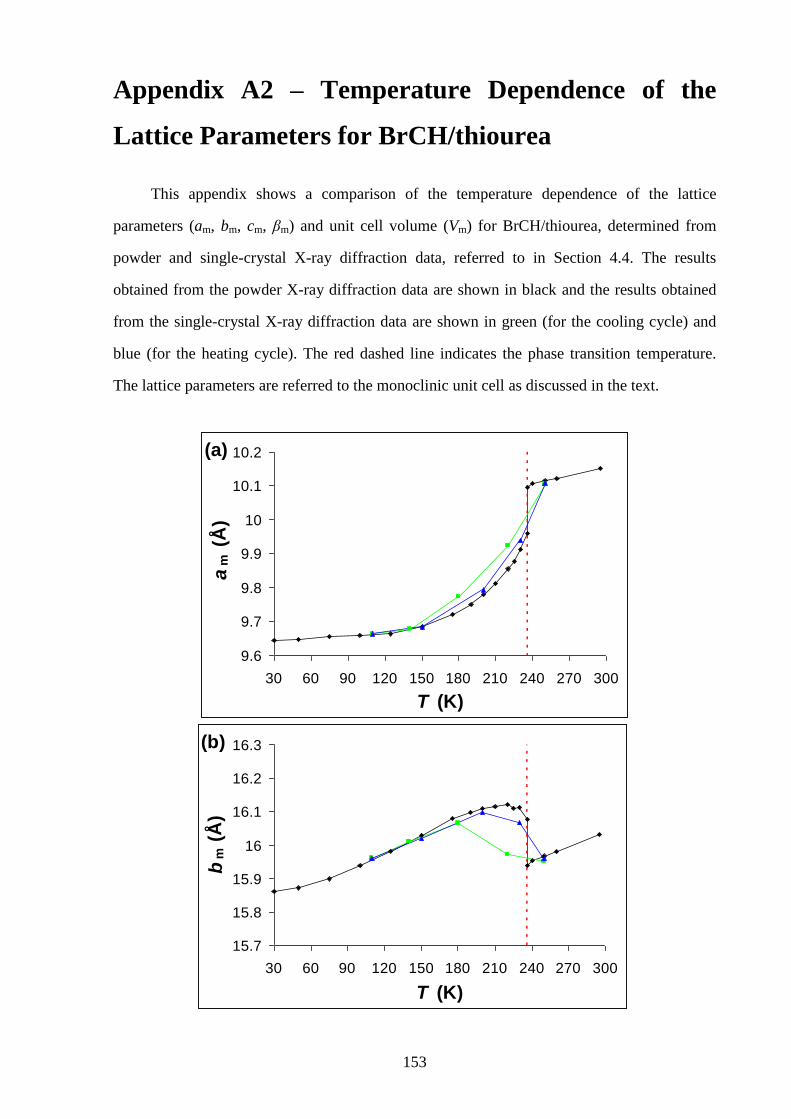
153
Appendix A2 – Temperature Dependence of the
Lattice Parameters for BrCH/thiourea
This appendix shows a comparison of the temperature dependence of the lattice
parameters (am, bm, cm, βm) and unit cell volume (Vm) for BrCH/thiourea, determined from
powder and single-crystal X-ray diffraction data, referred to in Section 4.4. The results
obtained from the powder X-ray diffraction data are shown in black and the results obtained
from the single-crystal X-ray diffraction data are shown in green (for the cooling cycle) and
blue (for the heating cycle). The red dashed line indicates the phase transition temperature.
The lattice parameters are referred to the monoclinic unit cell as discussed in the text.
(a)
9.6
9.7
9.8
9.9
10
10.1
10.2
30 60 90 120 150 180 210 240 270 300
T (K)
am
(Å
)
(b)
15.7
15.8
15.9
16
16.1
16.2
16.3
30 60 90 120 150 180 210 240 270 300
T (K)
bm
(Å
)
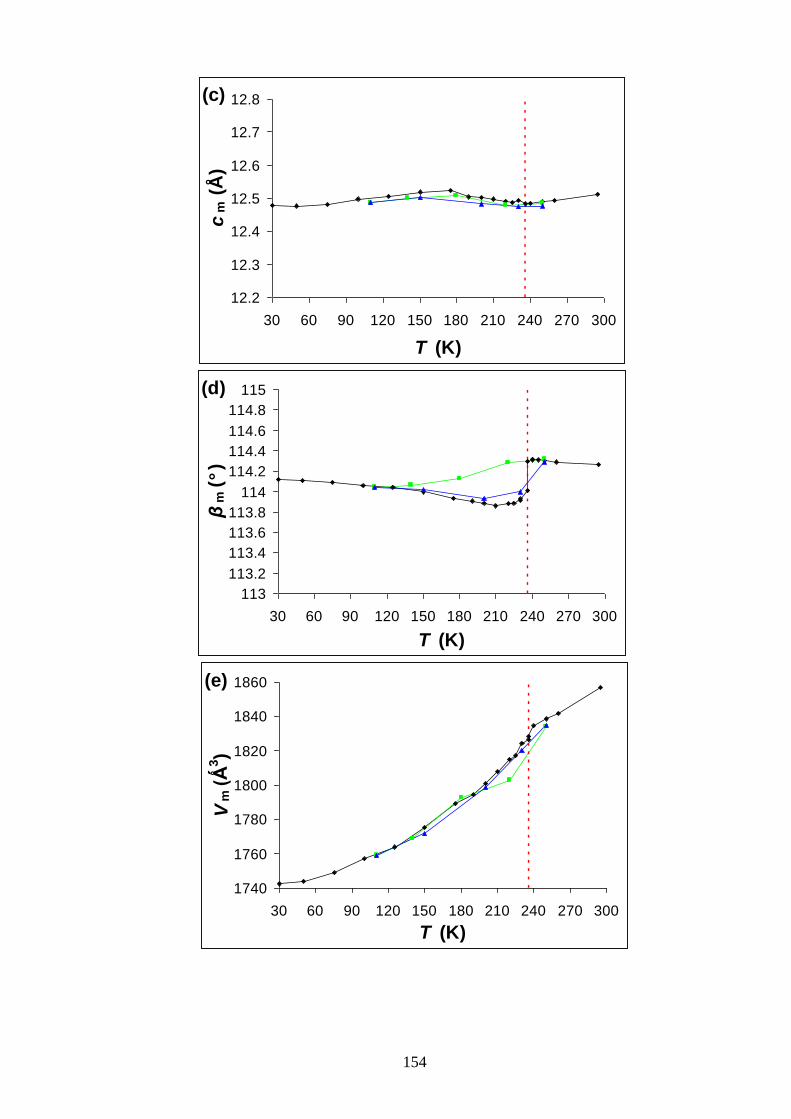
154
(c)
12.2
12.3
12.4
12.5
12.6
12.7
12.8
30 60 90 120 150 180 210 240 270 300
T (K)
cm
(Å
)
(d)
113
113.2
113.4
113.6
113.8
114
114.2
114.4
114.6
114.8
115
30 60 90 120 150 180 210 240 270 300
T (K)
βm
(°
)
(e)
1740
1760
1780
1800
1820
1840
1860
30 60 90 120 150 180 210 240 270 300
T (K)
Vm
(Ǻ
3)
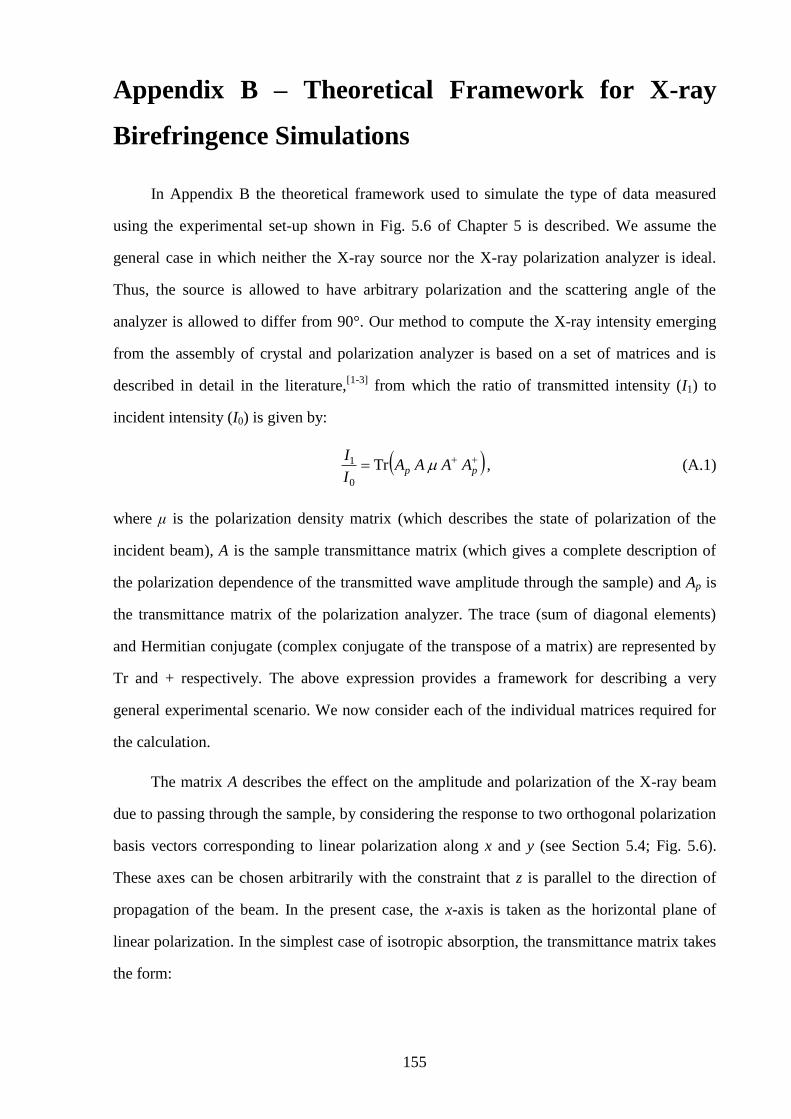
155
Appendix B – Theoretical Framework for X-ray
Birefringence Simulations
In Appendix B the theoretical framework used to simulate the type of data measured
using the experimental set-up shown in Fig. 5.6 of Chapter 5 is described. We assume the
general case in which neither the X-ray source nor the X-ray polarization analyzer is ideal.
Thus, the source is allowed to have arbitrary polarization and the scattering angle of the
analyzer is allowed to differ from 90°. Our method to compute the X-ray intensity emerging
from the assembly of crystal and polarization analyzer is based on a set of matrices and is
described in detail in the literature,[1-3]
from which the ratio of transmitted intensity (I1) to
incident intensity (I0) is given by:
pp AAAAI
ITr
0
1 , (A.1)
where μ is the polarization density matrix (which describes the state of polarization of the
incident beam), A is the sample transmittance matrix (which gives a complete description of
the polarization dependence of the transmitted wave amplitude through the sample) and Ap is
the transmittance matrix of the polarization analyzer. The trace (sum of diagonal elements)
and Hermitian conjugate (complex conjugate of the transpose of a matrix) are represented by
Tr and + respectively. The above expression provides a framework for describing a very
general experimental scenario. We now consider each of the individual matrices required for
the calculation.
The matrix A describes the effect on the amplitude and polarization of the X-ray beam
due to passing through the sample, by considering the response to two orthogonal polarization
basis vectors corresponding to linear polarization along x and y (see Section 5.4; Fig. 5.6).
These axes can be chosen arbitrarily with the constraint that z is parallel to the direction of
propagation of the beam. In the present case, the x-axis is taken as the horizontal plane of
linear polarization. In the simplest case of isotropic absorption, the transmittance matrix takes
the form:
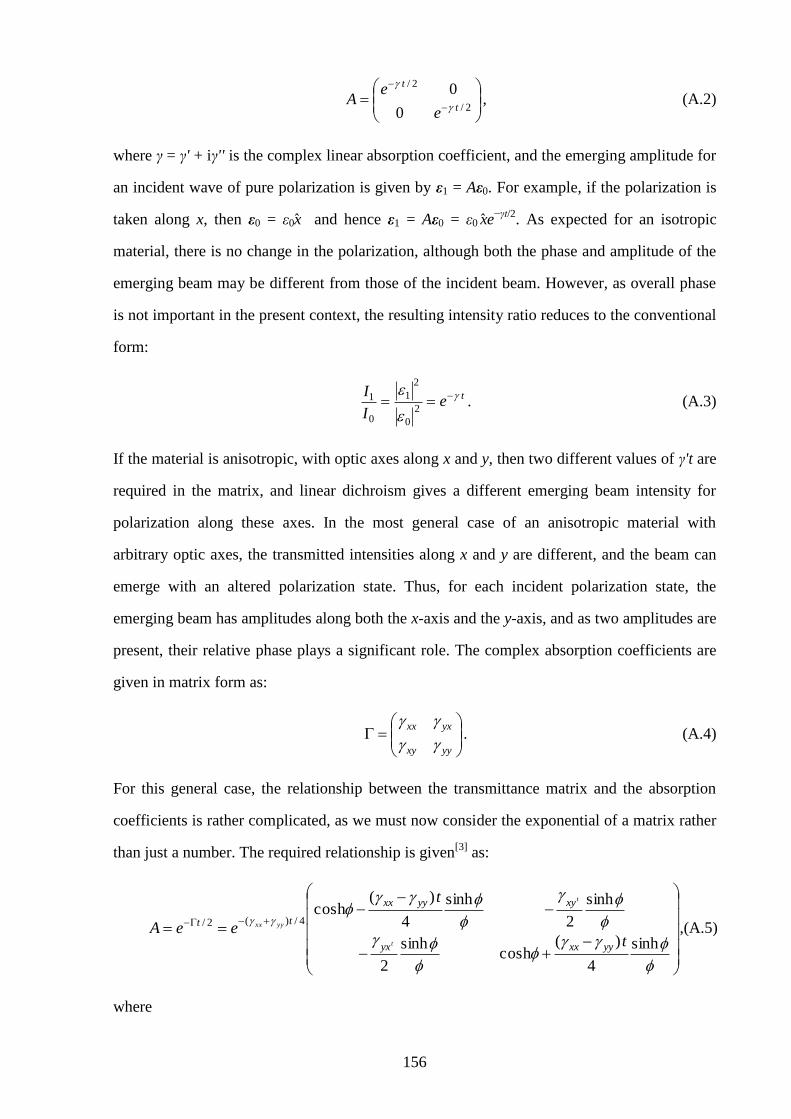
156
2/
2/
0
0t
t
e
eA
, (A.2)
where γ = γ' + iγ'' is the complex linear absorption coefficient, and the emerging amplitude for
an incident wave of pure polarization is given by ε1 = Aε0. For example, if the polarization is
taken along x, then ε0 = ε0x̂ and hence ε1 = Aε0 = ε0 x̂ e−γt/2
. As expected for an isotropic
material, there is no change in the polarization, although both the phase and amplitude of the
emerging beam may be different from those of the incident beam. However, as overall phase
is not important in the present context, the resulting intensity ratio reduces to the conventional
form:
te
I
I
2
0
2
1
0
1 . (A.3)
If the material is anisotropic, with optic axes along x and y, then two different values of γ't are
required in the matrix, and linear dichroism gives a different emerging beam intensity for
polarization along these axes. In the most general case of an anisotropic material with
arbitrary optic axes, the transmitted intensities along x and y are different, and the beam can
emerge with an altered polarization state. Thus, for each incident polarization state, the
emerging beam has amplitudes along both the x-axis and the y-axis, and as two amplitudes are
present, their relative phase plays a significant role. The complex absorption coefficients are
given in matrix form as:
yyxy
yxxx
. (A.4)
For this general case, the relationship between the transmittance matrix and the absorption
coefficients is rather complicated, as we must now consider the exponential of a matrix rather
than just a number. The required relationship is given[3]
as:
sinh
4
)(cosh
sinh
2
sinh
2
sinh
4
)(cosh
4/)(2/
t
t
eeAyyxxyx
xyyyxx
tt
t
t
yyxx ,(A.5)
where
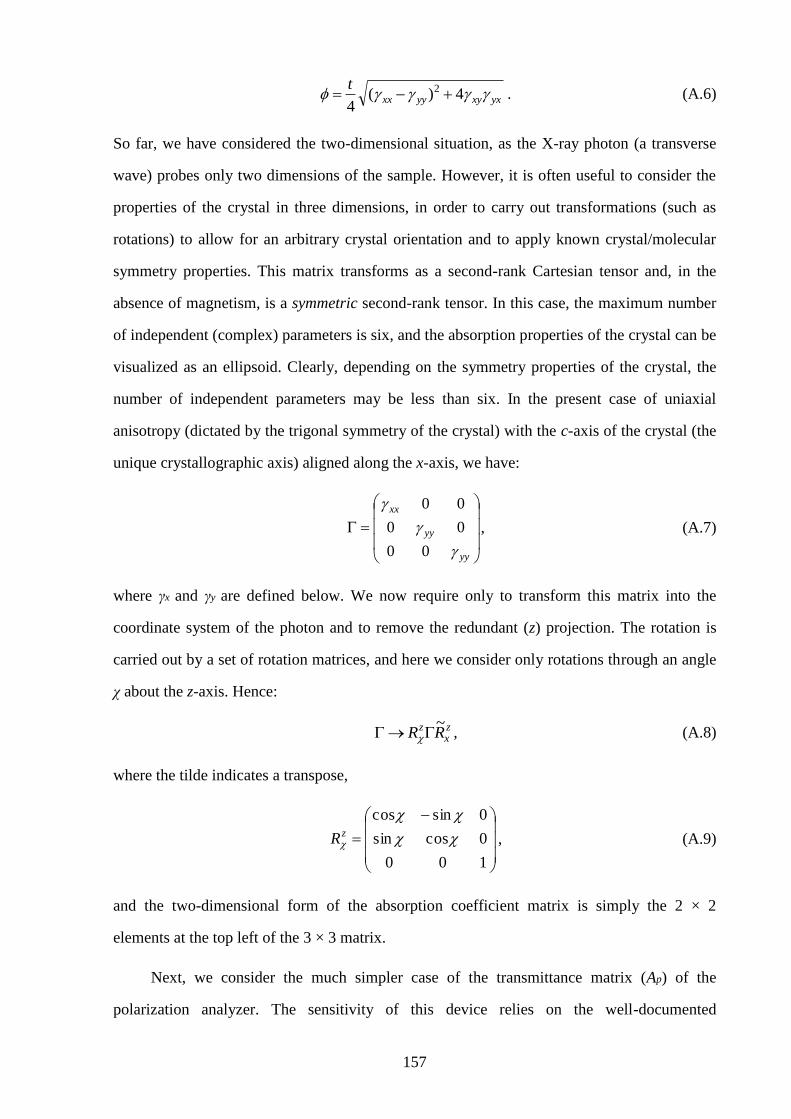
157
yxxyyyxx
t 4)(
4
2 . (A.6)
So far, we have considered the two-dimensional situation, as the X-ray photon (a transverse
wave) probes only two dimensions of the sample. However, it is often useful to consider the
properties of the crystal in three dimensions, in order to carry out transformations (such as
rotations) to allow for an arbitrary crystal orientation and to apply known crystal/molecular
symmetry properties. This matrix transforms as a second-rank Cartesian tensor and, in the
absence of magnetism, is a symmetric second-rank tensor. In this case, the maximum number
of independent (complex) parameters is six, and the absorption properties of the crystal can be
visualized as an ellipsoid. Clearly, depending on the symmetry properties of the crystal, the
number of independent parameters may be less than six. In the present case of uniaxial
anisotropy (dictated by the trigonal symmetry of the crystal) with the c-axis of the crystal (the
unique crystallographic axis) aligned along the x-axis, we have:
yy
yy
xx
00
00
00
, (A.7)
where γx and γy are defined below. We now require only to transform this matrix into the
coordinate system of the photon and to remove the redundant (z) projection. The rotation is
carried out by a set of rotation matrices, and here we consider only rotations through an angle
χ about the z-axis. Hence:
zx
z RR~
, (A.8)
where the tilde indicates a transpose,
100
0cossin
0sincos
zR , (A.9)
and the two-dimensional form of the absorption coefficient matrix is simply the 2 × 2
elements at the top left of the 3 × 3 matrix.
Next, we consider the much simpler case of the transmittance matrix (Ap) of the
polarization analyzer. The sensitivity of this device relies on the well-documented
158
polarization dependence in X-ray scattering. When the scattering angle 2θ is exactly 90°, the
device is a perfect polarizer, which transmits (albeit with some intensity loss) only the linear
polarization component perpendicular to the scattering plane. Details can be found in the
literature.[2, 4]
The corresponding matrix is:
cos2cossin2cos
sincospA , (A.10)
where η is the angle between the plane of polarization of the transmitted X-rays and the x-
axis. In the present case, η = 90° and so
02cos
10
pA , (A.11)
which selects mainly (and exclusively for η = 2θ = 90°) the y-polarized component. With
incident polarization along the x-axis, this situation corresponds to the "crossed-polarizer"
configuration.
The matrix μ describes the polarization state of an arbitrary, partially polarized incident
X-ray beam, and can be expressed in terms of Stokes parameters[1]
as:
321
213
1
1
2
1
PiPP
iPPP , (A.12)
where P3, P1 and P2 are, respectively, the Stokes parameters for linear polarization along x,
linear polarization at 45° from x in the xy-plane, and circular polarization. The total
polarization P is given by:
123
22
21
2 PPPP , (A.13)
with P = 1 for a completely polarized beam. For the present case, with almost perfect linear
polarization along the x-axis, we have P1 = P2 = 0 and P3 = 1, and hence:
00
01 . (A.14)
By inserting these matrices [given by equations (A.5), (A.11) and (A.14)] into equation (A.1),
we can simulate the X-ray intensity spectra recorded in the type of experimental set-up shown
in Fig. 5.6 for the general case of: (i) any sample for which the absorption is dominated by
159
electric dipole transitions, (ii) a non-ideal polarization analyzer, (iii) any polarization of the
incident beam, and (iv) any orientation of the crystal.
For illustration, we consider the case of a material with γxx = γ + Δγ/2 and γyy = γ – Δγ/2,
where Δγt << 1, which is rotated by 45° about the z-axis to give the maximum birefringence
signal. We consider the case of perfect linear polarization along x and a perfect polarization
analyzer that transmits only the (rotated) y component. This scenario produces a complex
absorption coefficient matrix:
2/
2/, (A.15)
leading to a transmitted intensity ratio given by:
222
40
1 ''' tteI
I. (A.16)
References
[1] S. W. Lovesey, Rep. Prog. Phys. 1993, 56, 257.
[2] S. P. Collins, J. Phys.: Condens. Matter 1999, 11, 1159.
[3] S. P. Collins, S. W. Lovesey, J. Synchrotron Radiat. 2001, 8, 1065.
[4] S. P. Collins, A. Bombardi, in Magnetism and Synchrotron Radiation: New Trends
(Eds.: E. Beaurepaire, H. Bulou, F. Scheurer, J.-P. Kappler), Springer, 2010.