Guest–host interaction in ferroelectric liquid crystal–nanoparticle composite system
19
1 Guest-Host interaction in ferroelectric liquid crystal-nanoparticle composite system DHARMENDRA PRATAP SINGH a , SWADESH KUMAR GUPTA a , SATYA PRAKASH YADAV a , P K SHARMA b , A C PANDEY b and RAJIV MANOHAR a * a Liquid Crystal Research Lab, Department of Physics, University of Lucknow, Lucknow-226007, India. b Nanotechnology application centre, University of Allahabad, Allahabad-211002, India. Abstract. The present paper deals with the characterization of a Ferroelectric liquid crystal-Nanoparticle (FLC-NP) composite system. The dielectric, electrical and polarization property of the FLC-NP composite system have been studied as a function of temperature and frequency. Ferroelectric Cu doped ZnO (Cu-ZnO) nanoparticles have been added to the pure ferroelectric liquid crystal (FLC) Felix 17/100. The nanoparticles are bigger in size as compared to FLC molecules; therefore, they distort the existing geometry of FLC matrix and set up an antiparallel correlation with the dipole moments of the host FLC molecules. This antiparallel correlation of Guest-Host geometry reduces the net ferroelectricity of the composite system and modifies all the physical properties of the pure FLC. The change in properties has been analyzed and explained in the light of Guest-Host interaction.
-
Upload
independent -
Category
Documents
-
view
3 -
download
0
Transcript of Guest–host interaction in ferroelectric liquid crystal–nanoparticle composite system

1
Guest-Host interaction in ferroelectric liquid crystal-nanoparticle
composite system
DHARMENDRA PRATAP SINGHa, SWADESH KUMAR GUPTA
a,
SATYA PRAKASH YADAVa, P K SHARMA
b, A C PANDEY
b and RAJIV
MANOHARa*
a Liquid Crystal Research Lab, Department of Physics, University of Lucknow, Lucknow-226007,
India.
b Nanotechnology application centre, University of Allahabad, Allahabad-211002, India.
Abstract. The present paper deals with the characterization of a Ferroelectric
liquid crystal-Nanoparticle (FLC-NP) composite system. The dielectric,
electrical and polarization property of the FLC-NP composite system have
been studied as a function of temperature and frequency. Ferroelectric Cu
doped ZnO (Cu-ZnO) nanoparticles have been added to the pure
ferroelectric liquid crystal (FLC) Felix 17/100. The nanoparticles are bigger
in size as compared to FLC molecules; therefore, they distort the existing
geometry of FLC matrix and set up an antiparallel correlation with the
dipole moments of the host FLC molecules. This antiparallel correlation of
Guest-Host geometry reduces the net ferroelectricity of the composite system
and modifies all the physical properties of the pure FLC. The change in
properties has been analyzed and explained in the light of Guest-Host
interaction.
2
Keywords. Ferroelectricity; nanoparticle; dielectric property; electro-optical
property.
*Author to correspond: E-Mail: [email protected]
Phone no: - (+91)9415000687
Fax No: - +91-522-269366
1. Introduction
The chiral smectic C (SmC*) liquid crystalline phase, has a helical stack of layers in
which molecules are uniformly tilted. The tilt of the molecules is coupled to the layer
thickness producing local biaxiality in the medium. Due to the chirality of the molecules, the
mirror symmetry in the system leads to the possibility of sustaining an electric polarization
(P), along the local twofold axis, spiraling uniformly about the twist axis of the helical
structure. The ferroelectric properties in liquid crystals (LCs), discovered by Meyer et al
(1975), are in a way lying hidden in its helicoidal structure. This helix can be unwound by
either application of electric field or by surface interactions, which make them proper
ferroelectrics having a net spontaneous polarization. Electro-optic effect in SmC* phase,
discovered by Clark and Lagerwall (1980) makes it important from application point of view
and alienate this phase from other class of LCs. Therefore, technologically this phase is very
useful and commonly used in device applications due to its threshold behavior, fast response
time etc. (S.T. Lagerwall 2000).

3
Scenario of the experimental research, in field of liquid crystal materials, has changed
with the development of nanoscience. The nanoparticles and carbon nanotubes are getting
importance due to their potential applications. Different types of nanoparticles and carbon
nanotubes have been used as dopant to improve the various physical properties of the nematic
and ferroelectric liquid crystalline materials (R Manohar et al 2000; J Prakash et al 2008; L S
Li and J Y Huang 2009; S Kaur et al 2007; P Arora et al 2009). The use of nanoparticles and
carbon nanotubes, to improve the physical and electro-optical properties of LCs, is a novel
method to change the LC parameters without synthesizing new LC material according to the
requirement. Therefore, the field of study of Guest-Host effect in LCs (A K Srivastava et al
2008) became much wider in the past few years from the research and application point of
view.
The ZnO Nanoparticle has attracted interest of researchers due to its semiconducting
property and a wider band gap of order 3.37eV. In addition to these properties, they have also
shown their importance in the fabrication of piezoelectric transducers, photonic crystals, photo
detectors, photodiodes etc. The surface defect in ZnO leads to some important and useful
features also. The effect of Cu2+
doping as a luminescence activator and as a compensator of
n-type material is of great importance for II–VI semiconductors. ZnO:Cu2+
Nanoparticle has
shown the green luminescence property with the variation of doping concentration of Cu (P K
Sharma et al 2011).
The present work is an attempt to explain the interactions between FLC molecules and
Cu-ZnO NPs. The change in FLC geometry, due to the addition of NPs, has also been
explained in the present paper. The behaviour of the conductivity of the doped FLC is
4
driven by the semiconducting nature of the Cu-ZnO NPs. The orientational configuration
of the pure ferroelectric liquid crystal matrix is also found to be changed with the mixing of
NPs. The dielectric, electrical and polarization properties have been well studied for a definite
temperature and frequency range for both the pure and the doped FLC.
2. Experimental
2.1 FLC and nanomaterial
The Ferroelectric Liquid Crystal (FLC) material used in the present study is Felix
17/100 (Clariant Chemicals Co.Ltd.) and the phase sequence of the sample is Cr, SmC*,
SmA*, N*, Iso at -200C, 72
0C, 82
0C and 95
0C. The nanoparticle doped sample of Felix
017/100 was prepared by the dispersion of nanoparticles (NPs) in 2% wt/wt concentration in
the pure FLC and termed as Doped FLC. The NPs, used for present study, are ZnO doped
with 10% of Cu. These NPs are prepared by solvothermal method using ethanol as solvent.
The whole preparation reaction is carried out in a high pressure autoclave. The average
crystallite size of NPs using Debye-Scherrer’s equation was found to be ~10 nm. The
scanning electron microscope (SEM) analysis of NPs provide the information about their rod
shape structure and its diameter in about 12-15 nm and length in about 40-80 nm (P K Sharma
et al 2011). To prepare the NPs doped FLC sample, an appropriate amount (in the weight
ratio) of NPs (2% in the present case) were mixed into the pure FLC and then homogenized
with an ultrasonic mixer at 900C for one hour and uniform dispersion of NPs was ensured.
The uniform distribution of the NPs in FLC matrix has been analyzed by the polarizing optical
microscope (POM) textures and Scanning electron microscopy (SEM).
2.2 Preparation for Sample Cell

5
The Dielectric study of NP doped FLC were conducted on planar geometry. The sand-
witched type (capacitor) cells were made using two optically flat glass substrates coated with
Indium tin oxide (ITO) layers. To obtain planar alignment the conducting layer were treated
with the adhesion promoter and coated with polymer nylon (6/6). After drying the polymer
layer, substrates were rubbed unidirectionally. The substrates were then placed one over
another to form a capacitor. The cell thickness was fixed by placing a Mylar spacer (6 m in
present study) in between the plates and then sealed with UV sealant. The empty sample cells
were calibrated using analytical reagent (AR) grade CCl4 (Carbon tetrachloride) and C6H6
(Benzene) as standard references for dielectric study. The LC nano-particle suspension was
prepared by mixing the weight ratio i.e. 2% wt/wt concentration of NPs in the pure FLC. The
assembled cells were filled with the pure and doped FLC at temperature slightly higher than
the isotropic temperature by means of capillary method and then cooled gradually up to room
temperature under the Small a.c. electric field. This ensures the uniform distribution of NPs in
the FLC. The alignment of the sample was checked by the polarizing microscope under the
crossed polarizer-analyzer arrangement.
2.3 Dielectric and Electro-Optical Measurement
The Dielectric measurements have been performed by a computer controlled
Impedance/Gain Analyzer (HP 4194 A) attached with a temperature controller in the
frequency range 100Hz to 10MHz. The dielectric measurements have been carried out as a
6
function of temperature by placing the sample on a computer controlled hot plate INSTEC
(HCS-302).The temperature stability was better than ±0.10C. Measurements in the higher
frequency range have been limited to 10 MHz because of the dominating effect of finite
resistance of ITO coated on glass plates and lead inductance (R Manohar et al 2007; A K
Srivastava et al 2007; R Manohar et al 2011).
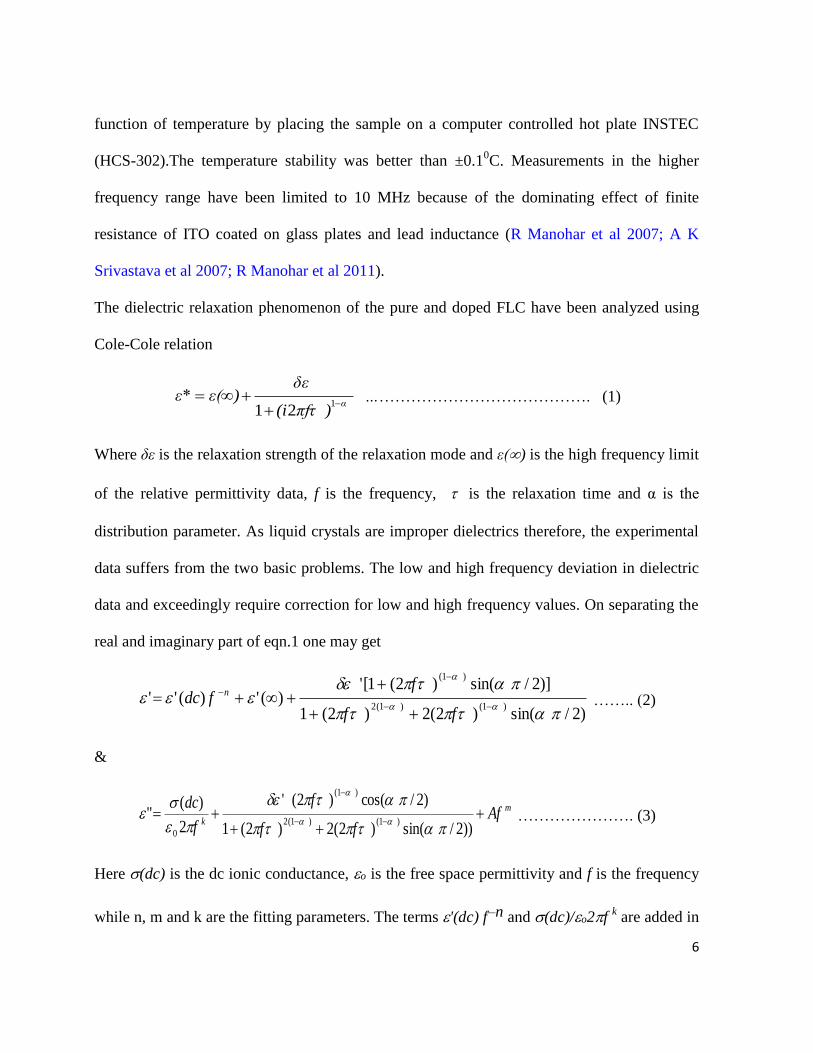
The dielectric relaxation phenomenon of the pure and doped FLC have been analyzed using
Cole-Cole relation
α)πfτ(i
δε)ε(ε*
1
21 ……………………………………. (1)
Where δε is the relaxation strength of the relaxation mode and ε() is the high frequency limit
of the relative permittivity data, f is the frequency, is the relaxation time and α is the
distribution parameter. As liquid crystals are improper dielectrics therefore, the experimental
data suffers from the two basic problems. The low and high frequency deviation in dielectric
data and exceedingly require correction for low and high frequency values. On separating the
real and imaginary part of eqn.1 one may get
)2/sin()2(2)2(1
)]2/sin()2(1[')(')(''
)1()1(2
)1(
ff
ffdc n
…….. (2)
&
m
kAf
ff
f
f
dc
))2/sin()2(2)2(1
)2/cos()2('
2
)("
)1()1(2
)1(
0
…………………. (3)
Here (dc) is the dc ionic conductance, o is the free space permittivity and f is the frequency
while n, m and k are the fitting parameters. The terms '(dc) f–n and (dc)/o2f k are added in

7
(2) & (3) for correcting the low frequency effect due to the electrode polarization capacitance
and ionic conductance. The Af m term is added in eqn. 3 for correcting the high frequency
effect due to the ITO resistance and lead inductance (A K Srivastava 2008; F M Gouda
1992).The other abbreviations are same as given for eqn1. The experimental data have been
fitted in these equations and corrected for low and high frequency values (D P Singh et al
2012).
The spontaneous polarization of the pure and the doped system was determined by
polarization reversal current method (K Kondo et al 2000; A K Srivastava 2008; F M Gouda
1992; A K Misra et al 2008). The detailed experimental arrangement for this measurement has
already been reported by our group (A K Misra et al 2008).
3. Results and Discussion
The variation of relative permittivity and dielectric loss on the
frequency scale at 360C has been plotted in the figure 1(a) and 1(b) respectively. The usual
trend of relative permittivity and dielectric loss on the frequency scale has been recorded for
both the pure and the doped FLC. The magnitude of relative permittivity and dielectric loss
for the doped FLC is lowered as compared to the pure FLC. This lowering in the value of
relative permittivity and dielectric loss is due to the antiparallel correlation between the dipole
moments of the guest nanoparticle and the host FLC (S Ghosh et al 2011). When we add
nanoparticles (NPs) in the FLC sample, the dipole moments of both the materials interacts
with each other. The parallel interaction between the dipole moments enhances the net dipole
moment of the doped system whereas the anti parallel interaction reduces the net dipole
8
moment. If net dipole moment of the doped system is greater than that of the host material, the
parameters like relative permittivity increases and vice verse. In the present investigation, the
relative permittivity and dielectric loss of the NPs doped FLC sample is lesser than the pure
FLC sample which indicates that the dipole moment of NPs interacts anti parallel with that of
the pure FLC molecules. In addition to this, the dielectric loss for the doped FLC is
lowered as compared to the pure FLC. This proves that the NPs provide a more ordered
FLC system in which loss factor reduces due to the presence of the NPs. It is clear from
figure 1(b) that only Goldstone mode (GM) of relaxation (GM appears due to the phase
angle fluctuation of the FLC molecules) was observed for both the pure and the doped
FLC.
Figure 2(a) depicts the temperature dependence of the inverse of relative
permittivity (IRP) for both the pure and the doped FLC at 133 Hz. The nature of IRP on
the temperature scale for both the pure and the doped FLC is non monotonic. For a
certain temperature, the IRP posses its least value on the temperature scales. The value
of IRP on both sides of this certain temperature increases. This least value of IRP is
analogous to the maximum relative permittivity of the undoped and doped FLC system
which is related with the maximum charge containing capacity of both the FLC systems.
The certain temperature at which FLC systems show maximum charge containing
capacity (or strength of the FLC system) is 510C and 57.5
0C for the pure and the doped
FLC system respectively. This result also suggests that the NPs doped FLC system can
be used as low charge consumption device for a wider temperature range as compared to
the pure FLC system.
9
In addition to this, the variation of the inverse of the relative permittivity for the
doped FLC is steeper than that of the pure FLC. The steeper nature of the inverse relative
permittivity temperature curve is due to the presence of the NPs. The presence of NPs causes
a rapid change in the liquid crystalline phase near the SmC*-SmA phase transition
temperature. It was also observed that the value of the relative permittivity for the doped
FLC is less than that of the pure FLC. The reduced value of the relative permittivity for the
doped FLC is due to the antiparallel correlation between the dipole moments of the guest NPs
and host FLCs. This correlation is possible if NPs are ferroelectric in nature. The
ferromagnetic nature of these NPs has already been reported by P.K. Sharma et al (2009).we
checked the ferroelectric nature of the NPs by plotting the polarization-electric field
hysteresis. The pure NPs do not posses proper ferroelectric hysteresis behaviour. A non-
switching ferroelectric hysteresis (T S Herng et al 2011) has been observed for the Cu-ZnO
NPs shown in the figure 2(b). As NPs are bulky in nature, therefore they required a strong
electric field to switch. In the present case, the electric field applied to the NPs was not
sufficient for complete switching which results non-switching ferroelectric hysteresis
behaviour of the NPs. We assumed that the antiparallel correlation of the dipole moments
holds between the guest NPs and the host FLC due to the ferroelectric nature of the NPs and
FLC molecules which results a reduced ferroelectricity in the composite system. Due to this
effect, a lowered relative permittivity of the doped FLC has been observed. We can also
understand the lowering of relative permittivity for the doped FLC on the basis of the size of
NPs in the FLC matrix. As the size of NPs is bigger than that of the FLC molecular
dimension, therefore, they perturb the FLC geometry and create hindrance in the motion of

10
FLC molecules. NPs also produce the lateral stress on the FLC molecules which alter the
smectic layer separation. This effect degrades the helical structure of FLC molecules in the
presence of NPs. Pratibha et al (2010) has reported the distortion of smectic layer due to the
presence of gold nanoparticle which supports our present assumption. This causes a lowering
in the value of the relative permittivity.
The relaxation frequency ( Rf ) has been plotted against the temperature in the figure 3
for both the pure and the doped FLC sample. This nature of relaxation frequency for the pure
FLC sample has already been reported by our group (A K Misra et al 2008). It is found that
the variation of relaxation frequency on the temperature scale for the doped FLC is little bit
changed as compared to the pure FLC. It increases slightly with the increase in the
temperature and achieves its maximum value at 420C temperature as compared to the pure
FLC and further increment in the temperature causes a decrease in the value of Rf (S Kundu
et al 2004). For the entire SmC* phase (from 300C-72
0C), the value of relaxation
frequency for the NPs doped FLC is lesser than the pure FLC. This decrement in the
value of relaxation frequency for the doped FLC sample can be explained by the following
relation
2
2
2qKfR ……………………………… (8)
Where, 2K is twist elastic constant, q be the wave vector of helix and γ is the rotational
viscosity.
With the addition of Cu-ZnO NPs in pure FLC geometry, the wave vector of helix is
altered. In addition to this, K2 and γ are also responsible to produce a change in relaxation

11
frequency. The temperature dependence of the K2 in the present case is small; therefore, we
considered that the effect produced by the twist elastic constant is negligible. The wave vector
of helix and rotational viscosity are two main factors by which relaxation frequency gets
affected. As the size of NPs is bigger than the FLC molecule, therefore, these NP penetrates
few adjacent smectic layers of FLC geometry which results a distortion in the helical structure
of FLC molecules. The rotational viscosity of the pure FLC system has been enhanced with
the addition of NPs which results a decrease in the value of relaxation frequency. The effect of
NP doping on the tilt angle and rotational viscosity of the pure FLC will be discussed later in
the paper. In the present case, we are not able to calculate the activation energy with the help
of the Arrhenius plot (a plot of log of relaxation frequency verses 1000/T) because the
Arrhenius plot is not monotonic for the entire range of the SmC* phase. The relaxation
frequency for the pure and the doped sample is inferior from 300C to 72
0C (the entire range of
SmC* phase).
In figure 4, the nature of the relaxation strength on the temperature scale is plotted for
the pure and the doped FLC sample. For the pure FLC sample, relaxation strength is almost
temperature independent and falls at the vicinity of SmC*-SmA* phase transition temperature.
A continuous and nonlinear increase of the relaxation strength on the temperature scale has
been observed for the doped FLC system in the entire SmC* phase. At the SmC*-SmA* phase
transition temperature, relaxation strength shows its maximum value and falls sharply when
SmC* phase changes into SmA* phase. This is due to the change in geometry of the phase as
it approaches from SmC* to SmA* phase. For the initial temperature interval (300C-55
0C) the
value of relaxation strength is lowered than that of the pure FLC sample whereas it overcome

12
the relaxation strength value of the pure FLC at 580C. This dual nature of relaxation strength
in SmC* phase for doped FLC system may be explained by the semiconducting property of
Cu-ZnO NPs. ZnO is a semiconducting material well known for its wide band gap and high
exceton bonding energy at room temperature. The doping of Cu metal in ZnO changes the
orbital of ZnO NPs in such a way that the character of ZnO and Cu-ZnO remains same (C
Wang et al 2011). The breakdown produced by the NPs near 500C causes a sharp increase in
the relaxation strength value for the doped FLC system.
The change in conductivity (F Kremer 2003) on the temperature scale for both the pure
and the doped FLC is depicted in the figure 5. The variation of conductivity with temperature
for the doped system shows an agreement with the relaxation strength. The conductivity of the
pure FLC is almost constant in the SmC* phase and decreases slightly in the vicinity of the
SmC*-SmA* phase transition temperature. The behavior of the conductivity of doped FLC is
not similar to that of the pure FLC. The conductivity of the doped FLC increases with the
increase in the temperature and achieve its maximum value near the SmC*-SmA* phase
transition temperature. The value of conductivity of doped FLC sharply decreases at the
SmC*-SmA* phase transition temperature. For the initial temperature interval (300C-50
0C),
the value of conductivity is lower than that of the pure FLC and becomes equivalent at 550C.
For higher temperature interval (i.e. 600C-72
0C), the conductivity of doped FLC overcomes to
that of the pure FLC. This behavior of conductivity again suggests that the semiconducting
nature of Cu-ZnO NPs affects the nature of the doped FLC and conductivity of the doped
system follows the semiconducting characteristics. The additional CuO phase, present in NPs,
traps the ionic carriers (reduced value of the conductivity in the temperature interval 300C-
13
500C) which make an easier path for the noise free and heat resistive electronic devices based
on the guest-host type composite system.
Figure 6 shows the variation of macroscopic polarization (P) as a function of
the applied bias voltage for both the pure and the doped FLC sample. The linear increase of P
with bias field corresponds to the field induced distortion (partial unwinding) of the helix.
The spontaneous polarization is the saturation value of the curves in the figure 6. A
remarkable change in the value of spontaneous polarization for doped FLC sample has been
observed. For the doped FLC system, the value of spontaneous polarization is 2.4 times lesser
(see table 1) than that of the pure FLC sample. This decrease in the value of spontaneous
polarization is due to the reduction of ferroelectricity in the composite system. The
ferroelectric nature of NPs and antiparallel correlation of dipole moments between the guest
NPs and host FLC molecules are responsible for the decrement in the net ferroelectricity of
the composite system. The presence of NPs in FLC sample also causes the distortion in
the layer structure of the FLC molecules. This distortion in the layer structure of the
FLC sample may also be a factor for the reduction of the effective polarization of the
NPs doped FLC sample. It is also clear from figure that the value of P saturates early on the
applied bias field scale for the doped FLC system as compared to the pure FLC. Due to the
effective dipole moment of the doped system, the FLC molecules coupled with Cu-ZnO NPs
could be switched by the application of lower value of applied bias field; therefore, we found
a lowering of the threshold voltage for the doped FLC system.
A detailed comparative study of rotational viscosity, tilt angle and spontaneous
polarization at 360C for both the pure and the doped FLC system is shown in table 1. The

14
value of Spontaneous polarization and tilt angle for the doped FLC system were found to
decrease after the doping of Cu-ZnO NPs while the value of rotational viscosity was increased
for the doped FLC system as compared to the pure FLC. This increased value of rotational
viscosity for the doped system is mainly responsible for the lowered value of relaxation
frequency. The spontaneous polarization- tilt angle ratio for the doped FLC has also been
reduced almost half as compared to the pure FLC which shows that the tilting of the FLC
molecules also changes when they interact with the NPs. Figure 7(a) and 7(b) show the
polarizing optical micrographs of the pure and the doped FLC sample at room temperature
under crossed polarizer-analyzer condition without any preferred alignment whereas the figure
7(c) is the SEM image of the NPs doped FLC sample. It is clear from the SEM image that the
NPs disperse almost uniformly in the FLC sample. The change in optical texture clearly
indicates the change in optical tilt of the FLC molecules due to the dispersion of the NPs. In
addition to this, the presence of NPs also perturbs the helical structure of the FLC molecules.
The presence of NPs also changes the intensity of transmitted light through the doped FLC
sample as compared with the pure FLC which is analogous to the change in contrast of the
doped FLC sample. The change in the helical structure and thus change in pitch is responsible
for the change in colour of the optical texture of the doped FLC sample as compared with the
pure FLC sample. When NPs are dispersed in FLC sample, it may cause the aggregation of
the NPs which affects the performance of the FLC sample; therefore, the dispersion of
nanoparticles in the FLC matrix is a difficult task for its application in devices. Thus, any
device fabrication based on nanoparticle-FLC composite needs a high degree of
alignment and dispersion quality.
15
4. Conclusions
The results of Guest-Host interaction can be summarized in the following points.
1. Almost all the physical parameters of ferroelectric liquid crystal material have been
altered with the dispersion of Cu-ZnO NPs. As the size of NPs is bigger than the FLC
molecules, therefore, it perturbs the FLC geometry as well as hinders the FLC
molecular dynamics which results the modification in electrical, polarization and
dielectric parameters.
2. The reduced value of relative permittivity indicates towards the reduction of
ferroelectricity in the doped FLC sample which may be due to the antiparallel
correlation between the dipole moments of the guest NPs and host FLC. The
distortion in the helical structure of the FLC molecules as well as the change in
orientational order may be another probable reason for the reduction in the
relative permittivity. The result of reduced relative permittivity for the doped
FLC gives a new idea about the LC based low charge consumption devices under
a wider temperature range.
3. Nonlinear increasing trend of relaxation strength in the entire SmC* phase for doped
FLC sample is explained by semiconducting nature of NPs. Semiconducting
breakdown and electronegative character of the additional CuO phase exist in the NPs
plays an important role to determine the present function of the doped FLC. The
behavior of conductivity of the doped FLC system is also influenced by the
semiconducting nature of the NPs.
16
4. Mixing of Cu-ZnO NPs in pure FLC sample for a definite concentration shows a
reduced value of spontaneous polarization which is the result of ferroelectric nature of
NPs and antiparallel correlation of dipole moments of FLC molecules and NPs. The
distortion in the helical structure of the FLC system and change in orientional
order are other factors by which the value of polarization gets affected. The
lowering of threshold voltage in case of the doped FLC system is also a meaningful
feature of the present study.
Acknowledgment
The authors are thankful to Department of Science and Technology, Government of
India for the financial assistance for present work in the form of project. S K Gupta is thankful
to CSIR New Delhi to provide the Senior Research fellowship. We are also thankful to Dr.
A.K. Srivastava, Department of ECE, Hong Kong University of Science and Technology,
Hong Kong and Dr. K. K. Pandey for fruitful discussion.
17
References
Meyer R B, Liebert L, Strzelecki L, and Keller P 1975 J. de Phys. Lett. 36 69.
Clark N A and Lagerwall S T 1980 Appl. Phys. Lett. 36 899.
Lagerwall S T 2000 Ferroelectric and Antiferroelectric Liquid Crystals (Weinheir: Wiley-
VCH Publishing Ltd).
Manohar R, Yadav S P, Srivastava A K, Misra A K, and Pandey K K 2009 Jpn. J. Appl. Phys.
48 101501.
Prakash J, Chaudhary A, Kumar A, Mehta D S, and Biradar A M 2008 Appl. Phys. Lett. 93
112904.
Li L S, and Huang J Y 2009 J. Phys. D: Appl. Phys. 42 (2009) 125413.
Kaur S, Singh S P, Biradar A M, Chaudhary A, and Sreenivas K 2007 Appl. Phys. Lett. 91
0231202007.
Arora P, Mikulko A, Podgornov F, and Haase W 2009 Mol. Cryst. Liq. Cryst. 502 1.
Srivastava A K, Misra A K, Chand P B, Manohar R, and Shukla J P 2008 Mol. Cryst. Liq.
Cryst. 495 194.
Sharma P K, Kumar M, and Pandey A C 2011 J. Nanopart. Res. 13 1629.
Manohar R, Misra A K, Srivastava A K, Chand P B, and Shukla J P 2007 Soft Materials 5(4)
207.
Srivastava A K, Misra A K, Chand P B, Manohar R, and Shukla J P 2007 Phys. Lett. A 371
490.
Manohar R, Srivastava A K, Tripathi P K, Singh D P 2011 J. Mater. Sci. 46 5969.
Kondo K, Roy S S, Majumder T P, and Roy S K 2000 Ferroelectrics 243 197.

18
Srivastava A K 2008 Ferroelectric liquid crystal versus guest-host ferroelectric liquid crystal,
Ph.D. thesis, University of Lucknow, Lucknow, India.
Gouda F M 1992 Dielectric relaxation spectroscopy of chiral smectic liquid crystals, PhD
thesis, Chalmers University of technology, Goteborg, Sweden.
Singh D P, Yadav S P, Tripathi P K, Tripathi P, Manohar R, Sharma P K, and Pandey A C
2012 Soft Materials. DOI: 10.1080/1539445X.2012.654582.
Misra A K, Srivastava A K, Shukla J P, and Manohar R 2008 Phys. Scr. 78 065602.
Ghosh S, Roy S K, Acharya S, Chakrabarti P K, Zurowska M and Dabrowski R 2011 EPL 96
47003.
Sharma P K, Dutta R K, and Pandey A C 2009 J. Mag. Mag. Mat. 321 4001.
Herng T S, Wong M F, Qi D, Yi J, Kumar A, Huang A, Kartawidjaja F C, and Smadici S
2011 Advanced Materials 23(14) 1635.
Pratibha R, Park W, Smalyukh I I 2010 J. Appl. Phys. 107 063511.
Kundu S, Roy T, Roy S S 2004 Jpn. J. Appl. Phys. 43 249.
Wang C, Xu S, Ye Li, Lei Wei, Cui Yiping 2011 J Mol Model 17 1075.
Kremer F 2003 Broadband Dielectric Spectroscopy Schonhals A (Eds.) (Berlin Heidelberg:
Springer-Verlag Chapter 1).

19
Table Caption
Table 1. The change in Electro-optical parameters of the pure FLC and the doped FLC at
360C.
Figure Caption
Figure 1. (a) Change in relative permittivity with the variation of frequency for the pure and
the doped FLC sample and (b) variation of dielectric loss on the frequency scale at 360C.
Figure 2. (a) Temperature dependent nature of the inverse of the relative permittivity for the
pure and the doped FLC sample at 133 Hz and (b) non-switching polarization-electric field
hysteresis of the pristine NPs to show the ferroelectric nature of the NPs.
Figure 3. The variation of relaxation frequency with the change in temperature for the pure
and the doped FLC sample.
Figure 4. The variation of relaxation strength on temperature scale for the pure and the doped
FLC sample.
Figure 5. The change in conductivity with temperature for the pure and the doped FLC.
Figure 6. The change in macroscopic polarization (P) as a function of applied bias voltage at
room temperature.
Figure 7. Polarizing optical micrographs (optical texture) under crossed polarizer-analyzer
condition at room temperature for (a) pure FLC, (b) doped FLC without using any preferred
alignment layer and (c) the scanning electron microscopic image (SEM image) of the NPs
doped FLC sample.