Biosensing enhancement using passive mixing structures for microarray-based sensors
9
Biosensing enhancement using passive mixing structures for microarray-based sensors N. Scott Lynn Jr. a , José-Israel Martínez-López b , Markéta Bocková a , Pavel Adam a , Victor Coello c , Héctor R. Siller b , Jiří Homola a,n a Institute of Photonics and Electronics, Chaberská 57, 18251 Prague, Czech Republic b Tecnológico de Monterrey, Eugenio Garza Sada 2501 Sur, C.P. 64849 Monterrey, N.L., México c Centro de Investigación Científica y de Educación Superior de Ensenada, Unidad Monterrey, Alianza Sur No. 105, Nueva Carretera Aeropuerto Km 9.5, Apodaca 66629, N.L., México article info Article history: Received 13 September 2013 Received in revised form 17 October 2013 Accepted 6 November 2013 Available online 25 November 2013 Keywords: Microarrays Microfluidics Microfluidic mixing Mass transfer Biosensors abstract The combination of microarray technologies with microfluidic sample delivery and real-time detection methods has the capability to simultaneously monitor 10–1000 s of biomolecular interactions in a single experiment. Despite the benefits that microfluidic systems provide, they typically operate in the laminar flow regime under mass transfer limitations, where large analyte depletion layers act as a resistance to analyte capture. By locally stirring the fluid and delivering fresh analyte to the capture spot, the use of passive mixing structures in a microarray environment can reduce the negative effects of these depletion layers and enhance the sensor performance. Despite their large potential, little attention has been given to the integration of these mixing structures in microarray sensing environments. In this study, we use passive mixing structures to enhance the mass transfer of analyte to a capture spot within a microfluidic flow cell. Using numerical methods, different structure shapes and heights were evaluated as means to increase local fluid velocities, and in turn, rates of mass transfer to a capture spot. These results were verified experimentally via the real-time detection of 20-mer ssDNA for an array of microspots. Both numerical and experimental results showed that a passive mixing structure situated directly over the capture spot can significantly enhance the binding rate of analyte to the sensing surface. Moreover, we show that these structures can be used to enhance mass transfer in experiments regarding an array of capture spots. The results of this study can be applied to any experimental system using microfluidic sample delivery methods for microarray detection techniques. & 2013 Elsevier B.V. All rights reserved. 1. Introduction A microarray is a two-dimensional set of specific biological capture probes deposited in an orderly grid of spots on a flat substrate, typically a glass slide. Each microarray spot contains one type of capture probe, and is immobilized to a region that is tens or hundreds of microns in diameter, herein referred to as a capture spot (Wu et al., 2012). Multiplexing capabilities are produced by spatially encoding the array, where each location serves as a reporter for a specific analyte (Situma et al., 2006). Microarrayers, the instruments used for the deposition of sample probes, typically operate with a positional resolution from 2.5 up to 5 mm, where the size of the spot can be varied through a selection of contact surface tips from around 30 to above 600 μm in diameter. To maximize the performance of the detection assays, it is important to increase the rate of mass transfer to the capture spot; an increase in the amount of captured analyte within a set assay time will lead to an assay with higher sensitivity. Microarray-based assays were initially carried out in a simple manner via the immersion of the microarray substrate into a target solution (Ekins and Chu, 1991). The sensitiv- ity of these static assays, measured as the diffusive analyte flux to the center of the capture spot, has shown to be inversely propor- tional to the capture spot diameter (Dandy et al., 2007; Ekins, 1998). In this static regime the flux remains proportional to the analyte diffusivity, and mass transfer rates remain low for assays involving larger biomolecules having inherently low diffusivities. Further increases in analyte mass transfer rates to a capture spot can be obtained through the addition of fluid convection to the system. The use of a shaking plate to stir fluid over a capture spot has been shown to provide dramatic increases in assay sensitivity (Kusnezow et al., 2006; Saviranta et al., 2004). To further exploit the use of convective fluid transport in the array sensors, many researchers have turned to the use of microfluidic Contents lists available at ScienceDirect journal homepage: www.elsevier.com/locate/bios Biosensors and Bioelectronics 0956-5663/$ - see front matter & 2013 Elsevier B.V. All rights reserved. http://dx.doi.org/10.1016/j.bios.2013.11.027 n Corresponding author. Tel.: þ420 266773404; fax: þ420 284681534. E-mail addresses: [email protected] (J.-I. Martínez-López), [email protected] (V. Coello), [email protected] (H.R. Siller), [email protected] (J. Homola). Biosensors and Bioelectronics 54 (2014) 506–514
Transcript of Biosensing enhancement using passive mixing structures for microarray-based sensors
Biosensing enhancement using passive mixing structuresfor microarray-based sensors
N. Scott Lynn Jr.a, José-Israel Martínez-López b, Markéta Bocková a,Pavel Adam a, Victor Coello c, Héctor R. Siller b, Jiří Homola a,n
a Institute of Photonics and Electronics, Chaberská 57, 18251 Prague, Czech Republicb Tecnológico de Monterrey, Eugenio Garza Sada 2501 Sur, C.P. 64849 Monterrey, N.L., Méxicoc Centro de Investigación Científica y de Educación Superior de Ensenada, Unidad Monterrey, Alianza Sur No. 105, Nueva Carretera Aeropuerto Km 9.5,Apodaca 66629, N.L., México
a r t i c l e i n f o
Article history:Received 13 September 2013Received in revised form17 October 2013Accepted 6 November 2013Available online 25 November 2013
Keywords:MicroarraysMicrofluidicsMicrofluidic mixingMass transferBiosensors
a b s t r a c t
The combination of microarray technologies with microfluidic sample delivery and real-time detectionmethods has the capability to simultaneously monitor 10–1000 s of biomolecular interactions in a singleexperiment. Despite the benefits that microfluidic systems provide, they typically operate in the laminarflow regime under mass transfer limitations, where large analyte depletion layers act as a resistance toanalyte capture. By locally stirring the fluid and delivering fresh analyte to the capture spot, the use ofpassive mixing structures in a microarray environment can reduce the negative effects of these depletionlayers and enhance the sensor performance. Despite their large potential, little attention has been givento the integration of these mixing structures in microarray sensing environments. In this study, we usepassive mixing structures to enhance the mass transfer of analyte to a capture spot within a microfluidicflow cell. Using numerical methods, different structure shapes and heights were evaluated as means toincrease local fluid velocities, and in turn, rates of mass transfer to a capture spot. These results wereverified experimentally via the real-time detection of 20-mer ssDNA for an array of microspots. Bothnumerical and experimental results showed that a passive mixing structure situated directly over thecapture spot can significantly enhance the binding rate of analyte to the sensing surface. Moreover, weshow that these structures can be used to enhance mass transfer in experiments regarding an array ofcapture spots. The results of this study can be applied to any experimental system using microfluidicsample delivery methods for microarray detection techniques.
& 2013 Elsevier B.V. All rights reserved.
1. Introduction
A microarray is a two-dimensional set of specific biologicalcapture probes deposited in an orderly grid of spots on a flatsubstrate, typically a glass slide. Each microarray spot contains onetype of capture probe, and is immobilized to a region that is tens orhundreds of microns in diameter, herein referred to as a capturespot (Wu et al., 2012). Multiplexing capabilities are produced byspatially encoding the array, where each location serves as areporter for a specific analyte (Situma et al., 2006). Microarrayers,the instruments used for the deposition of sample probes, typicallyoperate with a positional resolution from 2.5 up to 5 mm, where thesize of the spot can be varied through a selection of contact surfacetips from around 30 to above 600 μm in diameter. To maximize the
performance of the detection assays, it is important to increase therate of mass transfer to the capture spot; an increase in the amountof captured analyte within a set assay time will lead to an assaywith higher sensitivity. Microarray-based assays were initiallycarried out in a simple manner via the immersion of the microarraysubstrate into a target solution (Ekins and Chu, 1991). The sensitiv-ity of these static assays, measured as the diffusive analyte flux tothe center of the capture spot, has shown to be inversely propor-tional to the capture spot diameter (Dandy et al., 2007; Ekins, 1998).In this static regime the flux remains proportional to the analytediffusivity, and mass transfer rates remain low for assays involvinglarger biomolecules having inherently low diffusivities.
Further increases in analyte mass transfer rates to a capturespot can be obtained through the addition of fluid convection tothe system. The use of a shaking plate to stir fluid over a capturespot has been shown to provide dramatic increases in assaysensitivity (Kusnezow et al., 2006; Saviranta et al., 2004). Tofurther exploit the use of convective fluid transport in the arraysensors, many researchers have turned to the use of microfluidic
Contents lists available at ScienceDirect
journal homepage: www.elsevier.com/locate/bios
Biosensors and Bioelectronics
0956-5663/$ - see front matter & 2013 Elsevier B.V. All rights reserved.http://dx.doi.org/10.1016/j.bios.2013.11.027
n Corresponding author. Tel.: þ420 266773404; fax: þ420 284681534.E-mail addresses: [email protected] (J.-I. Martínez-López),
[email protected] (V. Coello), [email protected] (H.R. Siller),[email protected] (J. Homola).
Biosensors and Bioelectronics 54 (2014) 506–514
continuous flow cells. These microfluidic flow cells provide severalbenefits to array technologies, including a reduction of reagentconsumption, reduced footprints, and decreases in the character-istic time for diffusive mixing and surface reactions.
The use of microarray technologies in a microfluidic format hasbeen used in multiple instruments that can simultaneously sensethousands of different samples per square centimeter in a flowchamber (Campbell and Kim, 2007; Eddings et al., 2009; Homolaet al., 2005; Piliarik et al., 2010; Piliarik and Homola, 2008). Theability to simultaneously investigate large numbers of targets hasbeen effectively applied in genomics (DNA microarrays) andproteomics (protein microarrays) on a regular basis. These experi-ments are useful in many areas, including the identification ofbiomarker catalogs for diagnosis and prognosis, to relate physio-logical states to gene or protein expression patterns, and to studythe progression of diseases as well as cellular response to stimuli(Malic et al., 2011; Trevino et al., 2007).
Current microfluidic-based microarray technologies use simplerectangular microfluidic flow cells, where there is no change in themicrochannel cross-section over the length of the array. However,these benefits are also tied to the disadvantages of laminar flow,present due to the small characteristic lengths and fluid velocitiesencountered with microfluidics. For microarray systems undermass transfer limitations (where rates of analyte capture are muchgreater than the rate of analyte transport to the sensor), the lack ofturbulence can lead to large analyte depletion layers that act as aresistance to analyte capture and detection. These depletion layerscan also affect other similar capture spots situated directly down-stream, which are subjected to lower concentrations of analyte.Several authors have taken steps to mitigate the effects of thesedepletion layers with the use of more complex pumping techni-ques. Adey et al. (2002) used an air bladder to pump fluid back andforth across a microarray chamber to improve hybridization rates.Furthermore, several authors have used alternating pairs ofsyringe pumps to periodically alter the flow direction within amicrofluidic chamber, where the resulting flow profile serves toimprove the performance of the microarray assay (Hertzsch et al.,2007; McQuain et al., 2004; Raynal et al., 2007). It should be noted,however, that although periodic changes in the microfluidic flowdirection can serve to enhance the microarray performance, theydo not modify the flow field to mitigate the presence of anyanalyte depletion layers. In this area there remains an opportunityfor sensor improvement from the implementation of microfabri-cation techniques to modify the fluid flow profile only in thevicinity of each spot, while still allowing for the use of a simple,single source fluid delivery technique. Specifically, the use ofpassive mixing structures above each spot can serve to increaselocal rates of mass-transfer to each spot, thereby increasing thesensitivity of the assay.
Over the past 15 years there has been a large effort focused onenhancing the rate of mixing in microfluidic systems. These effortscan be divided into two broad categories, mixing via an active orpassive manner. Active systems manipulate and mix fluid quickly(often in an adjustable manner) through a variety of mechanisms,including piezoelectric, thermal, acoustic, and magnetic methods(Hessel et al., 2005). Although these systems possess the ability toprovide efficient mixing profiles, they are generally very complexand require additional equipment or materials. Furthermore, theyoften suffer from problems associated with heat transfer andbubble formation. In contrast, passive mixers have the ability toenhance fluid mixing without the requirement of supplementaryenergy while often employing a much simpler fabrication process(Beebe et al., 2002; Wu et al., 2004).
Despite the large amount of literature devoted to passivemixing techniques, there remains little information concerningthe use of these mixers for the enhancement of mass transfer to a
sensor surface. Liu et al. (2006) used a chaotic micromixer to mixthe target solution (and remove depletion layers) entering andleaving a hybridization chamber; however, the mixer was situatedoutside the boundaries of the microarray, and the system requireda built in peristaltic pump for operation. Several authors haveutilized microfluidic mixers situated directly over the sensingchamber. Kirtland et al. (2006) used theoretical and numericalmethods to show the benefits that chaotic mixing in a rectangularchannel can have on mass transfer to a channel surface. In anothernumerical study, Forbes and Kralj (2012) examined optimal geo-metric designs of the staggered herringbone mixer for theenhancement of interaction between fluid streamlines and asensing surface. Experimentally, Golden et al. (2007) demon-strated an enhancement of binding for an affinity assay in amicrochannel fabricated with grooved passive mixing structures.Similarly, Foley et al. (2008) showed only modest improvements inmass-transfer using similar structures. These studies utilizedsensing domains consisting of a long reactive boundary of length1–100 mm for the capture of a single analyte. Obviously, thischaracteristic size is much larger than that of a typical microarray,where within the same space using a microarray there might behundreds or thousands of reactive surfaces, each having specificityfor a unique analyte. To our knowledge there exists no informationon the use of passive mixing structures to enhance the masstransfer of an analyte to a reactive surface having a characteristicsize similar to a traditional microarray capture spot. The use ofsuch structures has great potential in the enhancement of thesemicroarrays; increases in mass transfer will lead to shorter assaytimes, and furthermore, a reduction in the microarray limit ofdetection.
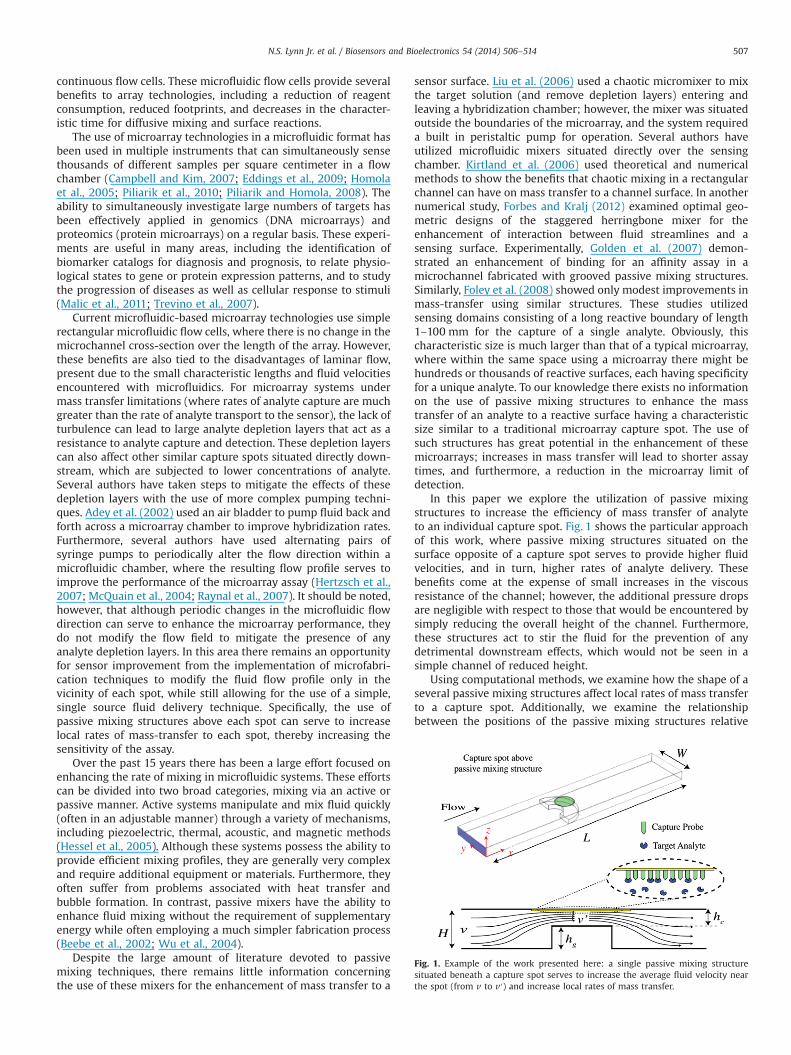
In this paper we explore the utilization of passive mixingstructures to increase the efficiency of mass transfer of analyteto an individual capture spot. Fig. 1 shows the particular approachof this work, where passive mixing structures situated on thesurface opposite of a capture spot serves to provide higher fluidvelocities, and in turn, higher rates of analyte delivery. Thesebenefits come at the expense of small increases in the viscousresistance of the channel; however, the additional pressure dropsare negligible with respect to those that would be encountered bysimply reducing the overall height of the channel. Furthermore,these structures act to stir the fluid for the prevention of anydetrimental downstream effects, which would not be seen in asimple channel of reduced height.
Using computational methods, we examine how the shape of aseveral passive mixing structures affect local rates of mass transferto a capture spot. Additionally, we examine the relationshipbetween the positions of the passive mixing structures relative
Fig. 1. Example of the work presented here: a single passive mixing structuresituated beneath a capture spot serves to increase the average fluid velocity nearthe spot (from v to v′) and increase local rates of mass transfer.
N.S. Lynn Jr. et al. / Biosensors and Bioelectronics 54 (2014) 506–514 507
to the positions of the reactive spots on the sensor performance.The numerical results are verified experimentally using a self-referencing surface plasmon resonance (SPR) imaging sensor forthe real-time detection of 20-mer single stranded DNA (ssDNA).We show that the passive mixing structures increase the bindingrate of an analyte to a microarray spot with respect to a referencechannel having no structures, both for a single spot as well asmultispot arrays.
The results of this study can be applied to any study usingmicroarray technologies with microfluidic analyte delivery tech-niques, including DNA biochips relying on fluorescent labeling(Stoughton, 2005) or biosensors based on surface plasmon reso-nance imaging (SPRi) (Piliarik et al., 2010). In addition to micro-array technologies, this methodology can be extended to othersystems requiring the delivery of target solute to a localized areapresent on the surface of a microchannel (e.g. electrochemicaldetector).
2. Methods
2.1. Computational simulations
The passive structures used in this study can be characterizedby having a height hg, with a gap in between the structure and thetop surface having a height hc (Fig. 1). In this configuration theupstream and downstream portions of the channel have a heightH¼hgþhc. The structures are located in a microchannel withwidth W, where a fluid with average velocity v (measured in theupstream portion of the channel) carries an analyte with concen-tration c and diffusivity D towards the capture spot.
The capture of an analyte by a microarray spot is a complexprocess, involving the time-dependent microscopic convectionand diffusion of analyte throughout the microfluidic flow cell.The analysis of this process can be simplified with a few well-justified assumptions. We first assume the binding of targetanalyte to capture probe follows an affinity relationship, wherethe analyte in the bulk solution reversibly binds to an immobilizedcapture probe. A good model system for this interaction is seen viathe hybridization of 20-mer DNA. For this model system, theforward and reverse reaction rate constants and the concentrationof surface probes can be assumed to be k1¼2�107 M�1 s�1,k2¼10�5 s�1, and bo¼5�10–14 mol mm�2, respectively (Lynnet al., 2013; Sipova et al., 2012). These values are also typical forother nucleic acid, antibody/antigen, and aptamer microarrays.The operation regime of heterogeneous affinity assays operatedunder convective means are best described by the ratio of reactiveto diffusive analyte flux to the capture spot, also known as theDamköhler number (Da),
Da¼ k1boδ=D; ð1Þwhere δ is the thickness of the analyte depletion layer above thecapture spot. If Da⪢1, then the reactive flux is much larger than thediffusive flux, and the system becomes mass transport limited.Conversely, if Da⪡1, the system is reaction limited. The depletionlayer thickness is a function of the Peclet number Pe¼ hcv=D, wherean estimate of δ can be calculated as δ� ðh2c L=6PeÞ1=3 (Squires et al.,2008). For a system with hc¼40 μm, v¼0.15 mm s�1, L¼200 μm,and D¼10�4 mm2 s�1, the Damköhler number can be calculated asDa¼96, and therefore it is safe to assume that the assay falls withinthe mass transfer limited regime in the early stages of the assay.Furthermore, for sufficiently low analyte concentrations, where c⪡Kd,we can assume that the sensor will not reach equilibrium in areasonable time.
With these assumptions, the distribution of analyte withinthe fluidic chamber will resemble the steady-state solution to
the convection–diffusion equation, where the analyte concentrationon each capture spot is set to zero. A good metric for the perfor-mance of each structure can then be calculated as the diffusive flux(J) of analyte normal to its respective capture spot.
The evaluation of the performance of each structure is carried outnumerically via the solution to the Navier–Stokes equations coupled tothe convection–diffusion equation. The solutions to these equationswere obtained using the COMSOL finite element package (ver. 4.2a),using linear and quadratic shape functions for the momentum andmass transport equations, respectively. The computational domainsextended from a distance W and 0.5W upstream and downstream ofeach structure (or capture spots), respectively. The boundary condi-tions consisted of a fully developed fluid velocity profile at the inletwith average fluid velocity v, a zero pressure condition on the outlet,and a condition of c¼0 on all capture spots. Using these boundaryconditions, the solution for the velocity, pressure, and analyte con-centrations were obtained using the Generalized Minimal Residualiterative solver, with a PARADISO course solver, using a successiveover-relaxation method for the pre- and post-smoother. After conver-gence of the solutions, the normal diffusive flux of analyte toward eachreactive spot was calculated using built in COMSOL functions. Thesolution to the convection–diffusion equation is prone to numericalerrors for flows having a high mass transfer Peclet number (Finlayson,1980); therefore, it is necessary to find an appropriate mesh densitysuch that all solutions converge to a state that is free from numericalerror. We examined the diffusive flux towards the sensor surface as afunction of the characteristic size of the mesh for simulations withconstant Pe¼150 (hc¼10 μm, H¼40 μm, v¼150 μm/s, D¼10�11
m2/s), where the mesh was composed of triangular elements in thex,y-plane that were swept in the z-direction to form a hexahedralelement. Amesh with a characteristic size of 1.5 mm (x,y-direction) and0.5 mm (z-direction) was found to provide solutions that were inde-pendent of the mesh density. This meshing scheme corresponds to atotal number of 3–5million degrees of freedom, varying for eachmicrostructure array.
2.2. SPR imaging system and microfluidic flow cell
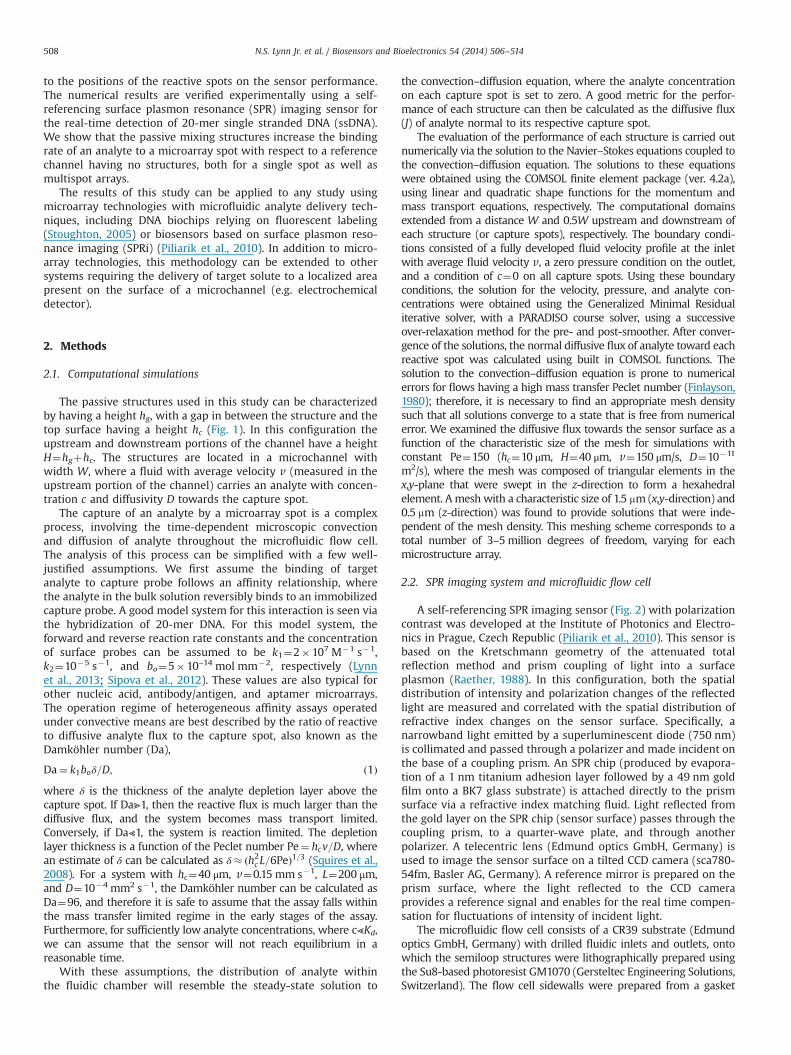
A self-referencing SPR imaging sensor (Fig. 2) with polarizationcontrast was developed at the Institute of Photonics and Electro-nics in Prague, Czech Republic (Piliarik et al., 2010). This sensor isbased on the Kretschmann geometry of the attenuated totalreflection method and prism coupling of light into a surfaceplasmon (Raether, 1988). In this configuration, both the spatialdistribution of intensity and polarization changes of the reflectedlight are measured and correlated with the spatial distribution ofrefractive index changes on the sensor surface. Specifically, anarrowband light emitted by a superluminescent diode (750 nm)is collimated and passed through a polarizer and made incident onthe base of a coupling prism. An SPR chip (produced by evapora-tion of a 1 nm titanium adhesion layer followed by a 49 nm goldfilm onto a BK7 glass substrate) is attached directly to the prismsurface via a refractive index matching fluid. Light reflected fromthe gold layer on the SPR chip (sensor surface) passes through thecoupling prism, to a quarter-wave plate, and through anotherpolarizer. A telecentric lens (Edmund optics GmbH, Germany) isused to image the sensor surface on a tilted CCD camera (sca780-54fm, Basler AG, Germany). A reference mirror is prepared on theprism surface, where the light reflected to the CCD cameraprovides a reference signal and enables for the real time compen-sation for fluctuations of intensity of incident light.
The microfluidic flow cell consists of a CR39 substrate (Edmundoptics GmbH, Germany) with drilled fluidic inlets and outlets, ontowhich the semiloop structures were lithographically prepared usingthe Su8-based photoresist GM1070 (Gersteltec Engineering Solutions,Switzerland). The flow cell sidewalls were prepared from a gasket
N.S. Lynn Jr. et al. / Biosensors and Bioelectronics 54 (2014) 506–514508
carved from a one-side soft vinyl sheet MACals 9800 PRO (MACtacPrague, Czech Republic). After alignment to the semiloop structures,the vinyl gasket acts to seal the flow cell when pressed against theSPR chip. The vinyl gasket was cut as to create a fluidic channel witha width of 750 μm, where the thickness of the gasket (aftercompression) was measured to be 6572 μm. In addition, the heightof the semiloop structured was measured to be 40.070.5 μm. Theheight and width of the fluidic channel was measured via an opticalprofilometer. A scan of the channel region containing the semiloopstructures can be seen in Fig. 2.
2.3. Sensing array and experimental conditions
The SPR chips were first washed with ethanol and deionizedwater (DI), dried with nitrogen, and placed in a UV ozone cleaner for10 min to remove any organic contaminants. After cleaning, the chipwas again washed with ethanol and DI, and dried with nitrogen. Anarray of 300 μm diameter ssDNA microspots were prepared on thechip using a 10 μM solution of thiolated DNA probes (5′-5/ThioMC6-D/TAT TAA CTT TAC TCC CTT CC-3′) in PBS buffer (10 mM phosphate,2.9 mM KCL, 137 mM NaCl, pH 7.4) using a commercial Omnigridmicroarrayer (Genomic Solutions) in an 85% humidity chamber. Thearray was left to incubate in the chamber for an additional 30 minbefore being mounted into the SPR imaging sensor. PBS was firstinjected into the sensing chamber at a volumetric flow rate of20 μL/min for 15 min, after which the complementary DNA target(5′-GGA AGG GAG TAA AGT TAA TA-3′) at a concentration of 100 nMin PBS was injected at the same flow rate for 20 min.
3. Results and discussion
In this study we consider the sensing enhancement throughthe use of passive mixing structures fabricated on the surface
opposite that of a capture spot. It is important to know how theshape of a passive mixing structure influences the rate of masstransfer to a capture spot (measured by the diffusive analyte flux J),how that rate of mass transfer compares to a reference channel ofheight H, and furthermore, the maximum level of mass transferenhancement obtainable by each structure. For all sensors, anincrease in J will result in an increase in the overall sensorperformance and will lead, in particular, to higher sensor sensitiv-ities as well as lower limits of detection (Dandy et al., 2007; Lynnet al., 2013; Sheehan and Whitman, 2005; Squires et al., 2008).
When comparing passive mixing structures of different shape,it is important to keep the ratio φ of the passive mixing structureheight to the overall height of the channel constant, whereφ¼ hg=H. This is due to the large effect of the average fluidvelocity in the vicinity of the reactive spot on the analyte flux(Squires et al., 2008). The steady-state diffusive flux of analyte to asensor surface of length L occupying the entire width of thechannel can be described as
J � c6D2vLH
!1=3
; ð2Þ
which was derived in a previous study using the same assumptionsdescribed above (Lynn et al., 2013). Fluid passing through theconstriction between the passive mixing structure and the sensorsurface will have an increased velocity on the order of v′¼ v=ð1�φÞ;however, the distribution of this increased velocity field (and thusthe distribution of increased J) will vary according to the overallshape of each structure.
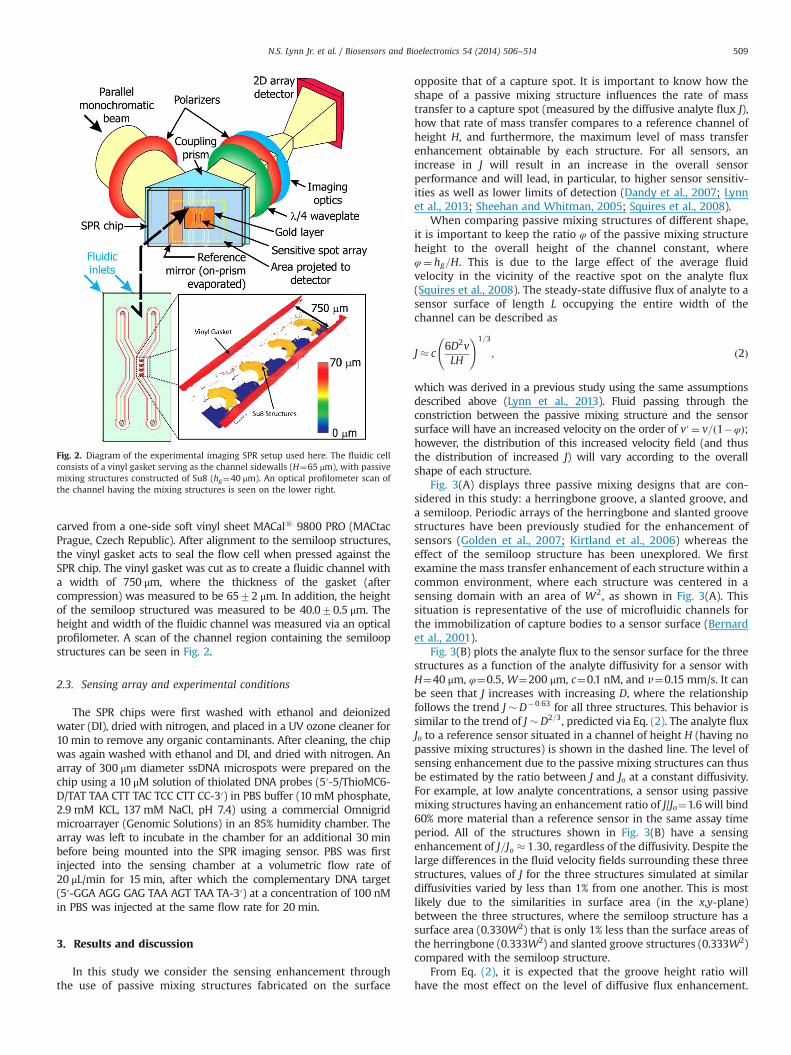
Fig. 3(A) displays three passive mixing designs that are con-sidered in this study: a herringbone groove, a slanted groove, anda semiloop. Periodic arrays of the herringbone and slanted groovestructures have been previously studied for the enhancement ofsensors (Golden et al., 2007; Kirtland et al., 2006) whereas theeffect of the semiloop structure has been unexplored. We firstexamine the mass transfer enhancement of each structure within acommon environment, where each structure was centered in asensing domain with an area of W2, as shown in Fig. 3(A). Thissituation is representative of the use of microfluidic channels forthe immobilization of capture bodies to a sensor surface (Bernardet al., 2001).
Fig. 3(B) plots the analyte flux to the sensor surface for the threestructures as a function of the analyte diffusivity for a sensor withH¼40 μm, φ¼0.5, W¼200 μm, c¼0.1 nM, and v¼0.15 mm/s. It canbe seen that J increases with increasing D, where the relationshipfollows the trend J �D�0:63 for all three structures. This behavior issimilar to the trend of J �D2=3, predicted via Eq. (2). The analyte fluxJo to a reference sensor situated in a channel of height H (having nopassive mixing structures) is shown in the dashed line. The level ofsensing enhancement due to the passive mixing structures can thusbe estimated by the ratio between J and Jo at a constant diffusivity.For example, at low analyte concentrations, a sensor using passivemixing structures having an enhancement ratio of J/Jo¼1.6 will bind60% more material than a reference sensor in the same assay timeperiod. All of the structures shown in Fig. 3(B) have a sensingenhancement of J=Jo � 1:30, regardless of the diffusivity. Despite thelarge differences in the fluid velocity fields surrounding these threestructures, values of J for the three structures simulated at similardiffusivities varied by less than 1% from one another. This is mostlikely due to the similarities in surface area (in the x,y-plane)between the three structures, where the semiloop structure has asurface area (0.330W2) that is only 1% less than the surface areas ofthe herringbone (0.333W2) and slanted groove structures (0.333W2)compared with the semiloop structure.
From Eq. (2), it is expected that the groove height ratio willhave the most effect on the level of diffusive flux enhancement.
Fig. 2. Diagram of the experimental imaging SPR setup used here. The fluidic cellconsists of a vinyl gasket serving as the channel sidewalls (H¼65 μm), with passivemixing structures constructed of Su8 (hg¼40 μm). An optical profilometer scan ofthe channel having the mixing structures is seen on the lower right.
N.S. Lynn Jr. et al. / Biosensors and Bioelectronics 54 (2014) 506–514 509
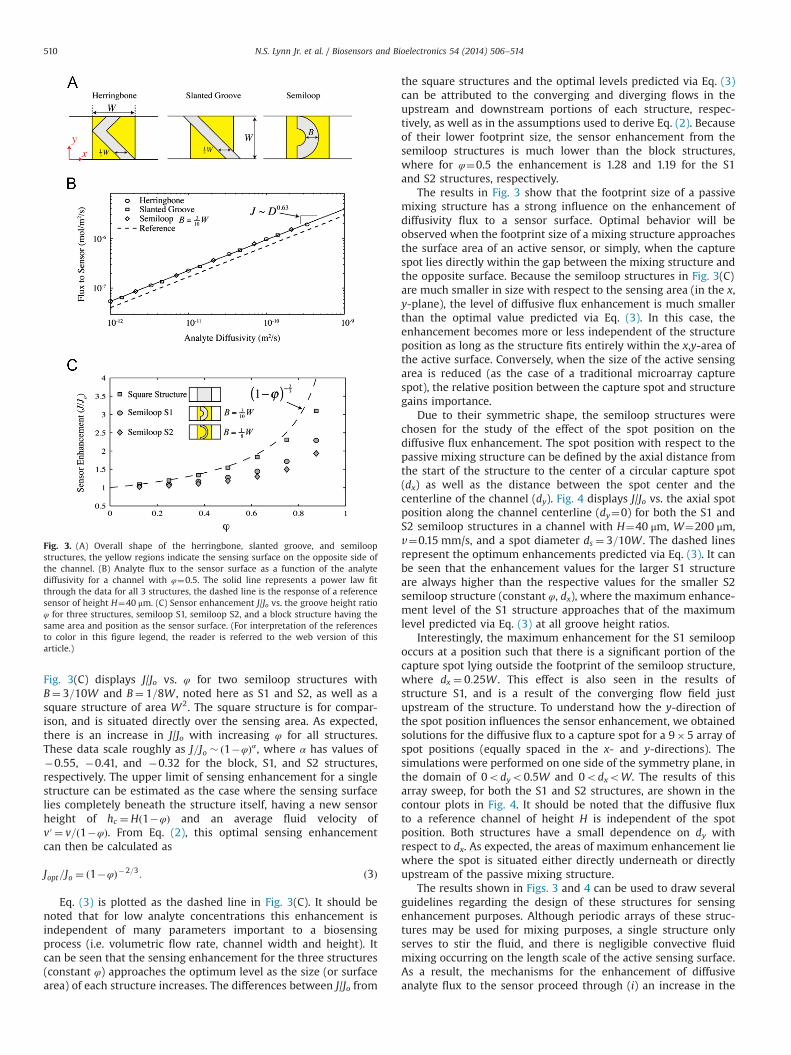
Fig. 3(C) displays J/Jo vs. φ for two semiloop structures withB¼ 3=10W and B¼ 1=8W , noted here as S1 and S2, as well as asquare structure of area W2. The square structure is for compar-ison, and is situated directly over the sensing area. As expected,there is an increase in J/Jo with increasing φ for all structures.These data scale roughly as J=Jo � ð1�φÞα, where α has values of�0.55, �0.41, and �0.32 for the block, S1, and S2 structures,respectively. The upper limit of sensing enhancement for a singlestructure can be estimated as the case where the sensing surfacelies completely beneath the structure itself, having a new sensorheight of hc ¼Hð1�φÞ and an average fluid velocity ofv′¼ v=ð1�φÞ. From Eq. (2), this optimal sensing enhancementcan then be calculated as
Jopt=Jo ¼ ð1�φÞ�2=3: ð3Þ
Eq. (3) is plotted as the dashed line in Fig. 3(C). It should benoted that for low analyte concentrations this enhancement isindependent of many parameters important to a biosensingprocess (i.e. volumetric flow rate, channel width and height). Itcan be seen that the sensing enhancement for the three structures(constant φ) approaches the optimum level as the size (or surfacearea) of each structure increases. The differences between J/Jo from
the square structures and the optimal levels predicted via Eq. (3)can be attributed to the converging and diverging flows in theupstream and downstream portions of each structure, respec-tively, as well as in the assumptions used to derive Eq. (2). Becauseof their lower footprint size, the sensor enhancement from thesemiloop structures is much lower than the block structures,where for φ¼0.5 the enhancement is 1.28 and 1.19 for the S1and S2 structures, respectively.
The results in Fig. 3 show that the footprint size of a passivemixing structure has a strong influence on the enhancement ofdiffusivity flux to a sensor surface. Optimal behavior will beobserved when the footprint size of a mixing structure approachesthe surface area of an active sensor, or simply, when the capturespot lies directly within the gap between the mixing structure andthe opposite surface. Because the semiloop structures in Fig. 3(C)are much smaller in size with respect to the sensing area (in the x,y-plane), the level of diffusive flux enhancement is much smallerthan the optimal value predicted via Eq. (3). In this case, theenhancement becomes more or less independent of the structureposition as long as the structure fits entirely within the x,y-area ofthe active surface. Conversely, when the size of the active sensingarea is reduced (as the case of a traditional microarray capturespot), the relative position between the capture spot and structuregains importance.
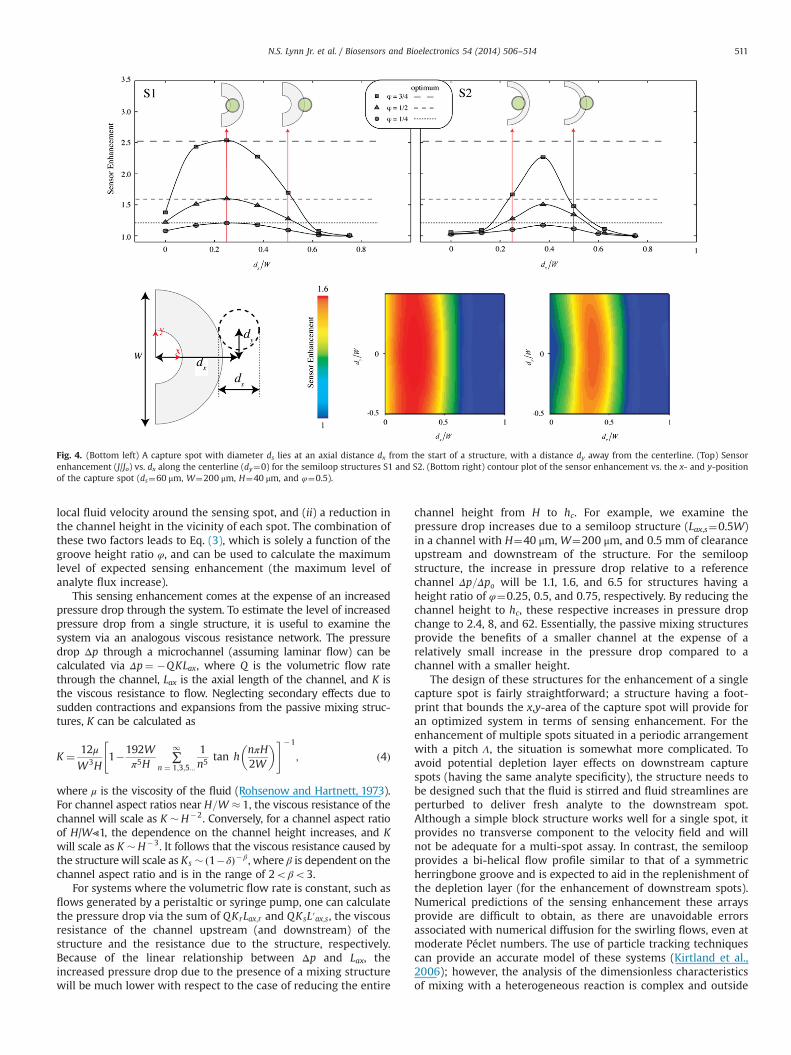
Due to their symmetric shape, the semiloop structures werechosen for the study of the effect of the spot position on thediffusive flux enhancement. The spot position with respect to thepassive mixing structure can be defined by the axial distance fromthe start of the structure to the center of a circular capture spot(dx) as well as the distance between the spot center and thecenterline of the channel (dy). Fig. 4 displays J/Jo vs. the axial spotposition along the channel centerline (dy¼0) for both the S1 andS2 semiloop structures in a channel with H¼40 μm, W¼200 μm,v¼0.15 mm/s, and a spot diameter ds ¼ 3=10W . The dashed linesrepresent the optimum enhancements predicted via Eq. (3). It canbe seen that the enhancement values for the larger S1 structureare always higher than the respective values for the smaller S2semiloop structure (constant φ, dx), where the maximum enhance-ment level of the S1 structure approaches that of the maximumlevel predicted via Eq. (3) at all groove height ratios.
Interestingly, the maximum enhancement for the S1 semiloopoccurs at a position such that there is a significant portion of thecapture spot lying outside the footprint of the semiloop structure,where dx ¼ 0:25W . This effect is also seen in the results ofstructure S1, and is a result of the converging flow field justupstream of the structure. To understand how the y-direction ofthe spot position influences the sensor enhancement, we obtainedsolutions for the diffusive flux to a capture spot for a 9�5 array ofspot positions (equally spaced in the x- and y-directions). Thesimulations were performed on one side of the symmetry plane, inthe domain of 0odyo0.5W and 0odxoW. The results of thisarray sweep, for both the S1 and S2 structures, are shown in thecontour plots in Fig. 4. It should be noted that the diffusive fluxto a reference channel of height H is independent of the spotposition. Both structures have a small dependence on dy withrespect to dx. As expected, the areas of maximum enhancement liewhere the spot is situated either directly underneath or directlyupstream of the passive mixing structure.
The results shown in Figs. 3 and 4 can be used to draw severalguidelines regarding the design of these structures for sensingenhancement purposes. Although periodic arrays of these struc-tures may be used for mixing purposes, a single structure onlyserves to stir the fluid, and there is negligible convective fluidmixing occurring on the length scale of the active sensing surface.As a result, the mechanisms for the enhancement of diffusiveanalyte flux to the sensor proceed through (i) an increase in the
Fig. 3. (A) Overall shape of the herringbone, slanted groove, and semiloopstructures, the yellow regions indicate the sensing surface on the opposite side ofthe channel. (B) Analyte flux to the sensor surface as a function of the analytediffusivity for a channel with φ¼0.5. The solid line represents a power law fitthrough the data for all 3 structures, the dashed line is the response of a referencesensor of height H¼40 μm. (C) Sensor enhancement J/Jo vs. the groove height ratioφ for three structures, semiloop S1, semiloop S2, and a block structure having thesame area and position as the sensor surface. (For interpretation of the referencesto color in this figure legend, the reader is referred to the web version of thisarticle.)
N.S. Lynn Jr. et al. / Biosensors and Bioelectronics 54 (2014) 506–514510
local fluid velocity around the sensing spot, and (ii) a reduction inthe channel height in the vicinity of each spot. The combination ofthese two factors leads to Eq. (3), which is solely a function of thegroove height ratio φ, and can be used to calculate the maximumlevel of expected sensing enhancement (the maximum level ofanalyte flux increase).
This sensing enhancement comes at the expense of an increasedpressure drop through the system. To estimate the level of increasedpressure drop from a single structure, it is useful to examine thesystem via an analogous viscous resistance network. The pressuredrop Δp through a microchannel (assuming laminar flow) can becalculated via Δp¼ �QKLax, where Q is the volumetric flow ratethrough the channel, Lax is the axial length of the channel, and K isthe viscous resistance to flow. Neglecting secondary effects due tosudden contractions and expansions from the passive mixing struc-tures, K can be calculated as
K ¼ 12μ
W3H1�192W
π5H∑1
n ¼ 1;3;5:::
1n5 tan h
nπH2W
� �" #�1
; ð4Þ
where μ is the viscosity of the fluid (Rohsenow and Hartnett, 1973).For channel aspect ratios near H=W � 1, the viscous resistance of thechannel will scale as K �H�2. Conversely, for a channel aspect ratioof H/W⪡1, the dependence on the channel height increases, and Kwill scale as K �H�3. It follows that the viscous resistance caused bythe structure will scale as Ks � ð1�δÞ�β , where β is dependent on thechannel aspect ratio and is in the range of 2oβo3.
For systems where the volumetric flow rate is constant, such asflows generated by a peristaltic or syringe pump, one can calculatethe pressure drop via the sum of QKrLax;r and QKsL′ax;s, the viscousresistance of the channel upstream (and downstream) of thestructure and the resistance due to the structure, respectively.Because of the linear relationship between Δp and Lax, theincreased pressure drop due to the presence of a mixing structurewill be much lower with respect to the case of reducing the entire
channel height from H to hc. For example, we examine thepressure drop increases due to a semiloop structure (Lax,s¼0.5W)in a channel with H¼40 μm, W¼200 μm, and 0.5 mm of clearanceupstream and downstream of the structure. For the semiloopstructure, the increase in pressure drop relative to a referencechannel Δp=Δpo will be 1.1, 1.6, and 6.5 for structures having aheight ratio of φ¼0.25, 0.5, and 0.75, respectively. By reducing thechannel height to hc, these respective increases in pressure dropchange to 2.4, 8, and 62. Essentially, the passive mixing structuresprovide the benefits of a smaller channel at the expense of arelatively small increase in the pressure drop compared to achannel with a smaller height.
The design of these structures for the enhancement of a singlecapture spot is fairly straightforward; a structure having a foot-print that bounds the x,y-area of the capture spot will provide foran optimized system in terms of sensing enhancement. For theenhancement of multiple spots situated in a periodic arrangementwith a pitch Λ, the situation is somewhat more complicated. Toavoid potential depletion layer effects on downstream capturespots (having the same analyte specificity), the structure needs tobe designed such that the fluid is stirred and fluid streamlines areperturbed to deliver fresh analyte to the downstream spot.Although a simple block structure works well for a single spot, itprovides no transverse component to the velocity field and willnot be adequate for a multi-spot assay. In contrast, the semiloopprovides a bi-helical flow profile similar to that of a symmetricherringbone groove and is expected to aid in the replenishment ofthe depletion layer (for the enhancement of downstream spots).Numerical predictions of the sensing enhancement these arraysprovide are difficult to obtain, as there are unavoidable errorsassociated with numerical diffusion for the swirling flows, even atmoderate Péclet numbers. The use of particle tracking techniquescan provide an accurate model of these systems (Kirtland et al.,2006); however, the analysis of the dimensionless characteristicsof mixing with a heterogeneous reaction is complex and outside
Fig. 4. (Bottom left) A capture spot with diameter ds lies at an axial distance dx from the start of a structure, with a distance dy away from the centerline. (Top) Sensorenhancement (J/Jo) vs. dx along the centerline (dy¼0) for the semiloop structures S1 and S2. (Bottom right) contour plot of the sensor enhancement vs. the x- and y-positionof the capture spot (ds¼60 μm, W¼200 μm, H¼40 μm, and φ¼0.5).
N.S. Lynn Jr. et al. / Biosensors and Bioelectronics 54 (2014) 506–514 511
the scope of this study. In that case, we turn to experimentalmethods for a proof of concept test of the use of these structuresfor sensing enhancement.
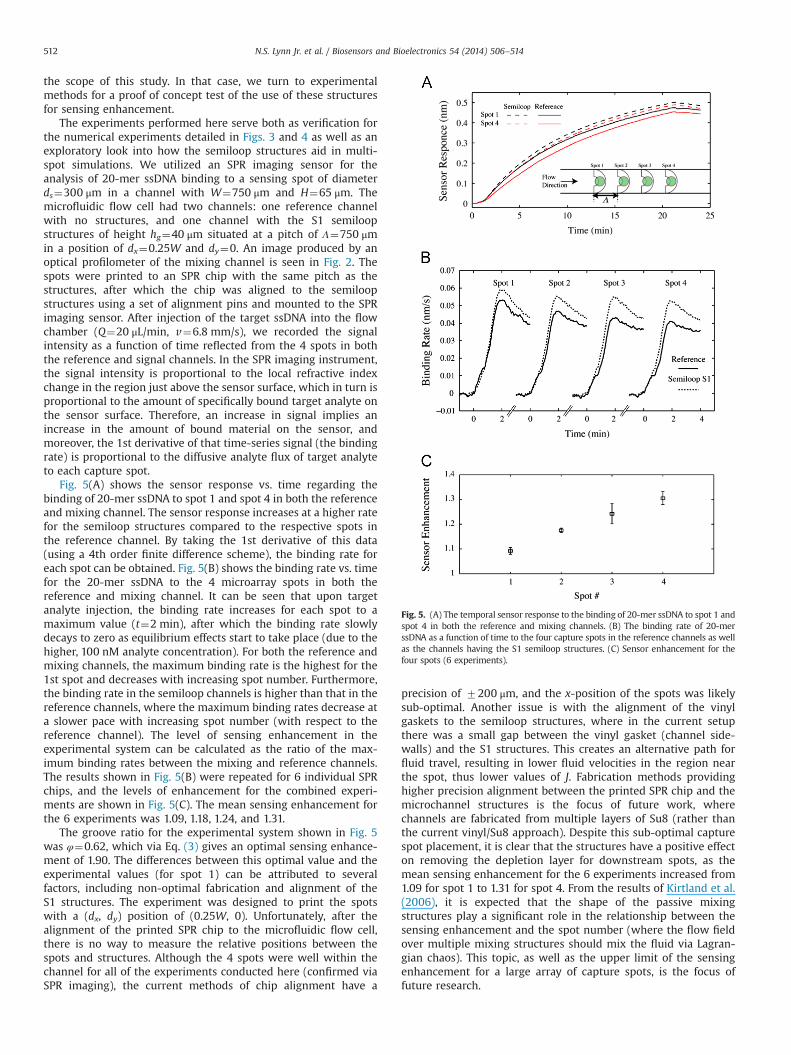
The experiments performed here serve both as verification forthe numerical experiments detailed in Figs. 3 and 4 as well as anexploratory look into how the semiloop structures aid in multi-spot simulations. We utilized an SPR imaging sensor for theanalysis of 20-mer ssDNA binding to a sensing spot of diameterds¼300 μm in a channel with W¼750 μm and H¼65 μm. Themicrofluidic flow cell had two channels: one reference channelwith no structures, and one channel with the S1 semiloopstructures of height hg¼40 μm situated at a pitch of Λ¼750 μmin a position of dx¼0.25W and dy¼0. An image produced by anoptical profilometer of the mixing channel is seen in Fig. 2. Thespots were printed to an SPR chip with the same pitch as thestructures, after which the chip was aligned to the semiloopstructures using a set of alignment pins and mounted to the SPRimaging sensor. After injection of the target ssDNA into the flowchamber (Q¼20 μL/min, v¼6.8 mm/s), we recorded the signalintensity as a function of time reflected from the 4 spots in boththe reference and signal channels. In the SPR imaging instrument,the signal intensity is proportional to the local refractive indexchange in the region just above the sensor surface, which in turn isproportional to the amount of specifically bound target analyte onthe sensor surface. Therefore, an increase in signal implies anincrease in the amount of bound material on the sensor, andmoreover, the 1st derivative of that time-series signal (the bindingrate) is proportional to the diffusive analyte flux of target analyteto each capture spot.
Fig. 5(A) shows the sensor response vs. time regarding thebinding of 20-mer ssDNA to spot 1 and spot 4 in both the referenceand mixing channel. The sensor response increases at a higher ratefor the semiloop structures compared to the respective spots inthe reference channel. By taking the 1st derivative of this data(using a 4th order finite difference scheme), the binding rate foreach spot can be obtained. Fig. 5(B) shows the binding rate vs. timefor the 20-mer ssDNA to the 4 microarray spots in both thereference and mixing channel. It can be seen that upon targetanalyte injection, the binding rate increases for each spot to amaximum value (t¼2 min), after which the binding rate slowlydecays to zero as equilibrium effects start to take place (due to thehigher, 100 nM analyte concentration). For both the reference andmixing channels, the maximum binding rate is the highest for the1st spot and decreases with increasing spot number. Furthermore,the binding rate in the semiloop channels is higher than that in thereference channels, where the maximum binding rates decrease ata slower pace with increasing spot number (with respect to thereference channel). The level of sensing enhancement in theexperimental system can be calculated as the ratio of the max-imum binding rates between the mixing and reference channels.The results shown in Fig. 5(B) were repeated for 6 individual SPRchips, and the levels of enhancement for the combined experi-ments are shown in Fig. 5(C). The mean sensing enhancement forthe 6 experiments was 1.09, 1.18, 1.24, and 1.31.
The groove ratio for the experimental system shown in Fig. 5was φ¼0.62, which via Eq. (3) gives an optimal sensing enhance-ment of 1.90. The differences between this optimal value and theexperimental values (for spot 1) can be attributed to severalfactors, including non-optimal fabrication and alignment of theS1 structures. The experiment was designed to print the spotswith a (dx, dy) position of (0.25W, 0). Unfortunately, after thealignment of the printed SPR chip to the microfluidic flow cell,there is no way to measure the relative positions between thespots and structures. Although the 4 spots were well within thechannel for all of the experiments conducted here (confirmed viaSPR imaging), the current methods of chip alignment have a
precision of 7200 μm, and the x-position of the spots was likelysub-optimal. Another issue is with the alignment of the vinylgaskets to the semiloop structures, where in the current setupthere was a small gap between the vinyl gasket (channel side-walls) and the S1 structures. This creates an alternative path forfluid travel, resulting in lower fluid velocities in the region nearthe spot, thus lower values of J. Fabrication methods providinghigher precision alignment between the printed SPR chip and themicrochannel structures is the focus of future work, wherechannels are fabricated from multiple layers of Su8 (rather thanthe current vinyl/Su8 approach). Despite this sub-optimal capturespot placement, it is clear that the structures have a positive effecton removing the depletion layer for downstream spots, as themean sensing enhancement for the 6 experiments increased from1.09 for spot 1 to 1.31 for spot 4. From the results of Kirtland et al.(2006), it is expected that the shape of the passive mixingstructures play a significant role in the relationship between thesensing enhancement and the spot number (where the flow fieldover multiple mixing structures should mix the fluid via Lagran-gian chaos). This topic, as well as the upper limit of the sensingenhancement for a large array of capture spots, is the focus offuture research.
Fig. 5. (A) The temporal sensor response to the binding of 20-mer ssDNA to spot 1 andspot 4 in both the reference and mixing channels. (B) The binding rate of 20-merssDNA as a function of time to the four capture spots in the reference channels as wellas the channels having the S1 semiloop structures. (C) Sensor enhancement for thefour spots (6 experiments).
N.S. Lynn Jr. et al. / Biosensors and Bioelectronics 54 (2014) 506–514512
The effect of the sensor enhancement seen both in the numerical(Figs. 3, 4) and experimental (Fig. 5) portions of this work arediscussed as follows. The sensor enhancement discussed hereinrelates the ratio of the initial flux to the sensor surface using apassive mixing structure (which, as shown experimentally, isproportional to the binding rate) to the flux of a reference channel.For a given transduction mechanism with a constant footprint, in asensor in the mass transfer limited regime (Da⪢1) having a higheranalyte flux, more material will bind to the sensor surface in a givenassay time. In this regime, the characteristic time τ for the sensor toachieve equilibrium can be expressed as τ� beq=J, the ratio of thesurface density of capture sites at equilibrium to the analyte flux tothe surface (Squires et al., 2008). Therefore sensors exhibiting ahigher analyte flux will reach equilibrium in a shorter time period.Furthermore, for assays restricted to a time such that equilibrium isnot reached, a sensor having a higher initial flux will obtain a higherdegree of hybridization between analyte and capture probe. Thiseffect can be seen experimentally in the results shown by Dandyet al. (2007).
In experimental systems, the number of free binding sites willdecrease over time as hybridization progresses. From Eq. (1), thesystem will then undergo a slow conversion from being masstransfer limited to one that is reaction limited. Therefore, theaverage flux to each capture spot will decrease as time increases.This effect, commonly seen in all time-series affinity assay bindingcurves, can also be seen in Fig. 5(B): after t¼2 min there is a slowdecrease in the binding rate over time, where the binding rate isproportional to J. It is important to note here that if a sensor has aninitial flux that is higher when compared to a reference, it willremain higher for the duration of the experiment. This can also beseen in Fig. 5, where the sensor response vs. time (Fig. 5(A)) aswell as the binding rate vs. time (Fig. 5(B)) are higher for thepassively mixed channels with respect to the reference channel forthe duration of the experiment. Therefore, it is expected that thesensors having the passive mixing structures will exhibit areduced limit of detection (LOD) with respect to a referencechannel and that, the reduction of LOD will be inversely propor-tional to the sensor enhancement. An example of this behavior canbe seen in our previous work, where an increase in the bindingrate of a sensor (produced by reducing the sensing chamber heightfrom H¼47 μm to 7 μm) resulted in a decrease in the LOD from20 pM to 5 pM (Lynn et al., 2013).
4. Conclusions
Here we have presented a method to enhance the sensingperformance of microarray-based microfluidic assays using pas-sive mixing structures. These mixing structures work by increasingthe local fluid velocity in the region between the structure and theopposite surface. This increase in fluid velocity, combined with adecrease in the channel height H, leads to an increase in thediffusive analyte flux J to the microarray spot with respect to areference channel with no structures. The use of these passivemixing structures will lead to a maximum sensor enhancement ofð1�φÞ�2=3, where φ is the ratio of the passive mixing structureheight hg to the channel height. The level of enhancement isrelated to the relative surface areas (as well as the relativepositions) between the microarray spot and the mixing structure,and comes at the expense of an increased pressure drop throughthe channel. In addition to enhancing a single spot, we haveshown that these passive mixing structures lead to the enhance-ment to multiple microarray spots situated downstream from oneanother. The involvement of the shape of each structure for mixingpurposes, as well as the optimum sensing enhancement thesestructures provide in large arrays of microspots, are the focus of
future work. The results of this study can be applied to any studyusing microarray technologies using microfluidic analyte deliverytechniques.
Acknowledgments
This research was supported by the Praemium Academiae ofthe Academy of Sciences of the Czech Republic and the CzechScience Foundation (Contract P205/12/G118). Coello-Cardenasacknowledges financial support from CONACyT Mexico, Project:CB-2009-01, 000000000127589. Additional support was providedby the Research Chair of Intelligent Machines at Tecnológico deMonterrey. The authors thank Ivo Tichy and Karel Chadt for theirhelp in the experimental portions of the project.
References
Adey, N.B., Lei, M., Howard, M.T., Jensen, J.D., Mayo, D.A., Butel, D.L., Coffin, S.C.,Moyer, T.C., Slade, D.E., Spute, M.K., Hancock, A.M., Eisenhoffer, G.T., Dalley, B.K.,McNeely, M.R., 2002. Gains in sensitivity with a device that mixes microarrayhybridization solution in a 25-mu m-thick chamber. Anal. Chem. 74 (24),6413–6417.
Beebe, D.J., Mensing, G.A., Walker, G.M., 2002. Physics and applications of micro-fluidics in biology. Annu. Rev. Biomed. Eng. 4, 261–286.
Bernard, A., Michel, B., Delamarche, E., 2001. Micromosaic immunoassays. Anal.Chem. 73 (1), 8–12.
Campbell, C.T., Kim, G., 2007. SPR microscopy and its applications to high-throughput analyses of biomolecular binding events and their kinetics. Bioma-terials 28 (15), 2380–2392.
Dandy, D.S., Wu, P., Grainger, D.W., 2007. Array feature size influences nucleic acidsurface capture in DNA microarrays. Proc. Natl. Acad. Sci. U.S.A. 104 (20),8223–8228.
Eddings, M.A., Eckman, J.W., Arana, C.A., Papalia, G.A., Connolly, J.E., Gale, B.K.,Myszka, D.G., 2009. Spot and hop: internal referencing for surface plasmonresonance imaging using a three-dimensional microfluidic flow cell array. Anal.Biochem. 385 (2), 309–313.
Ekins, R.P., 1998. Ligand assays: from electrophoresis to miniaturized microarrays.Clin. Chem. 44 (9), 2015–2030.
Ekins, R.P., Chu, F.W., 1991. Multianalyte microspot immunoassay—microanalyticalcompact-disk of the future. Clin. Chem. 37 (11), 1955–1967.
Finlayson, B.A., 1980. Nonlinear Analysis in Chemical Engineering. McGraw-HillInternational Book Co., New York; London.
Foley, J.O., Mashadi-Hossein, A., Fu, E., Finlayson, B.A., Yager, P., 2008. Experimentaland model investigation of the time-dependent 2-dimensional distribution ofbinding in a herringbone microchannel. Lab. Chip 8 (4), 557–564.
Forbes, T.P., Kralj, J.G., 2012. Engineering and analysis of surface interactions in amicrofluidic herringbone micromixer. Lab. Chip 12 (15), 2634–2637.
Golden, J.P., Floyd-Smith, T.M., Mott, D.R., Ligler, F.S., 2007. Target delivery in amicrofluidic immunosensor. Biosens. Bioelectron. 22 (11), 2763–2767.
Hertzsch, J.M., Sturman, R., Wiggins, S., 2007. DNA microarrays: design principlesfor maximizing ergodic, chaotic mixing. Small 3 (2), 202–218.
Hessel, V., Lowe, H., Schonfeld, F., 2005. Micromixers—a review on passive andactive mixing principles. Chem. Eng. Sci. 60 (8–9), 2479–2501.
Homola, J., Vaisocherova, H., Dostalek, J., Piliarik, M., 2005. Multi-analyte surfaceplasmon resonance biosensing. Methods 37 (1), 26–36.
Kirtland, J.D., McGraw, G.J., Stroock, A.D., 2006. Mass transfer to reactive boundariesfrom steady three-dimensional flows in microchannels. Phys. Fluids 18, 7.
Kusnezow, W., Syagailo, Y.V., Ruffer, S., Baudenstiel, N., Gauer, C., Hoheisel, J.D.,Wild, D., Goychuk, I., 2006. Optimal design of microarray immunoassays tocompensate for kinetic limitations—theory and experiment. Mol. Cell. Proteo-mics 5 (9), 1681–1696.
Liu, J., Williams, B.A., Gwirtz, R.M., Wold, B.J., Quake, S., 2006. Enhanced signals andfast nucleic acid hybridization by microfluidic chaotic mixing. Angew. Chem.Int. Ed. 45 (22), 3618–3623.
Lynn, N.S., Sipova, H., Adam, P., Homola, J., 2013. Enhancement of affinity-basedbiosensors: effect of sensing chamber geometry on sensitivity. Lab. Chip 13 (7),1413–1421.
Malic, L., Veres, T., Tabrizian, M., 2011. Nanostructured digital microfluidics forenhanced surface plasmon resonance imaging. Biosens. Bioelectron. 26 (5),2053–2059.
McQuain, M.K., Seale, K., Peek, J., Fisher, T.S., Levy, S., Stremler, M.A., Haselton, F.R.,2004. Chaotic mixer improves microarray hybridization. Anal. Biochem. 325(2), 215–226.
Piliarik, M., Bockova, M., Homola, J., 2010. Surface plasmon resonance biosensor forparallelized detection of protein biomarkers in diluted blood plasma. Biosens.Bioelectron. 26 (4), 1656–1661.
Piliarik, M., Homola, J., 2008. Self-referencing SPR imaging for most demandinghigh-throughput screening applications. Sensor Actuat. B—Chem 134 (2),353–355.
N.S. Lynn Jr. et al. / Biosensors and Bioelectronics 54 (2014) 506–514 513

Raether, H., 1988. Surface-plasmons on smooth and rough surfaces and on gratings.Springer Tr. Mod. Phys. 111, 1–133.
Raynal, F., Beuf, A., Plaza, F., Scott, J., Carriere, P., Cabrera, M., Cloarec, J.P.,Souteyrand, E., 2007. Towards better DNA chip hybridization using chaoticadvection. Phys. Fluids 19, 1.
Rohsenow, W.M., Hartnett, J.P., 1973. Handbook of Heat Transfer. McGraw-Hill, NewYork.
Saviranta, P., Okon, R., Brinker, A., Warashina, M., Eppinger, J., Geierstanger, B.H.,2004. Evaluating sandwich immunoassays in microarray format in terms of theambient analyte regime. Clin. Chem. 50 (10), 1907–1920.
Sheehan, P.E., Whitman, L.J., 2005. Detection limits for nanoscale biosensors. NanoLett. 5 (4), 803–807.
Sipova, H., Vrba, D., Homola, J., 2012. Analytical value of detecting an individualmolecular binding event: the case of the surface plasmon resonance biosensor.Anal. Chem. 84 (1), 30–33.
Situma, C., Hashimoto, M., Soper, S.A., 2006. Merging microfluidics with microarray-based bioassays. Biomol. Eng. 23 (5), 213–231.
Squires, T.M., Messinger, R.J., Manalis, S.R., 2008. Making it stick: convection,reaction and diffusion in surface-based biosensors. Nat. Biotechnol. 26 (4),417–426.
Stoughton, R.B., 2005. Applications of DNA microarrays in biology. Annu. Rev.Biochem. 74, 53–82.
Trevino, V., Falciani, F., Barrera-Saldana, H.A., 2007. DNA microarrays: a powerfulgenomic tool for biomedical and clinical research. Mol. Med. 13 (9–10),527–541.
Wu, D., Song, L.B., Chen, K., Liu, F., 2012. Modelling and hydrostatic analysis ofcontact printing microarrays by quill pins. Int. J. Mech. Sci. 54 (1), 206–212.
Wu, Z.G., Nguyen, N.T., Huang, X.Y., 2004. Nonlinear diffusive mixing in micro-channels: theory and experiments. J. Micromech. Microeng. 14 (4), 604–611.
N.S. Lynn Jr. et al. / Biosensors and Bioelectronics 54 (2014) 506–514514