Blind Source Separation Based Classification Scheme for Myoelectric Prosthesis Hand
Upload
khangminh22Category
view
0download
0
Western University Western University
Scholarship@Western Scholarship@Western
Electronic Thesis and Dissertation Repository
8-10-2021 10:00 AM
Biomaterial for Cervical Intervertebral Disc Prosthesis Biomaterial for Cervical Intervertebral Disc Prosthesis
Helium Mak, The University of Western Ontario
Supervisor: Wan, Wankei, The University of Western Ontario
A thesis submitted in partial fulfillment of the requirements for the Doctor of Philosophy degree
in Biomedical Engineering
© Helium Mak 2021
Follow this and additional works at: https://ir.lib.uwo.ca/etd
Part of the Biomaterials Commons, Biomechanical Engineering Commons, and the Biomedical
Devices and Instrumentation Commons
Recommended Citation Recommended Citation Mak, Helium, "Biomaterial for Cervical Intervertebral Disc Prosthesis" (2021). Electronic Thesis and Dissertation Repository. 7981. https://ir.lib.uwo.ca/etd/7981
This Dissertation/Thesis is brought to you for free and open access by Scholarship@Western. It has been accepted for inclusion in Electronic Thesis and Dissertation Repository by an authorized administrator of Scholarship@Western. For more information, please contact [email protected].

ii
Abstract
Recent long-term follow-up studies have shown that the cervical disc arthroplasty treatment
have potentials in developing surrounding heterotopic ossification (HO). While its cause
requires further investigation, this thesis has hypothesized that it may be the result of the
continual remodeling of the injured vertebrae caused by the prostheses with smaller
footprints introducing abnormal stresses. The research objective of this thesis is to develop a
new prosthesis material that can be molded into any form conforming to the size and shape of
the end-plates of the affected patient vertebrae. For prototype development, a composite
material consisting of 10wt% polyvinyl alcohol cryogel (PVA) with embedded long
circumferentially oriented bamboo fibers was proposed. An analytical model developed
predicts that the compressive strength of such prosthesis is a monotonous increasing function
of the fiber volumetric content. Specimens containing volumetric bamboo fiber contents of
0v% (control), 0.6v% and 3v% with 1xPBS were prepared for assessment. The cranial
compressive and torsional viscoelastic behavior of specimens were studied with emphasis on
its large-scale (till yield) characteristics measured under different strain rates. The
mechanical properties measured are compared to that of kangaroo C5-C6 IVDs as our animal
model.
Mechanical properties such as torsional stress, strain, modulus and impact resistance for
viscoelastic materials are not well defined in literatures. This thesis has proposed new
definitions for these properties and their derivation methods.
It was found that the cryogel process had resulted in a 37v% shrinkage of the composite
material which may have caused the bamboo fibers to wrinkle up. A pre-strain of 35% to
45% of the specimens was required to unwrinkled the mid portion of the 3v% composite to
match the strength prediction of the analytical model and that of the animal IVD. However,
the fiber has not increase much of the torsional strength.
With a higher fiber content (e.g., ~5v%), this material may provide the compressive strength
comparable to that of our animal model. A prosthesis fabricated with this composite material
will be functionally comparable to a class of FDA-approved IVD prostheses with the

iii
advantages that it can be molded quickly into patient specific size and shape with no spinal
axil rotational alignment required.
Keywords
Intervertebral disc, cervical IVD prosthesis, compressive and torsional viscoelasticity, impact
resistance, kangaroo cervical IVD, polyvinyl alcohol cryogel, bamboo fiber characterization,
composite compressive modeling.
Summary for Lay Audience
The intervertebral disc (IVD) that is sandwiched in between two vertebrae serves to support
the body weight, to provide spinal mobility and to provide shock-absorption in the spinal
column. Cervical IVD failure could be caused by neck injuries resulting from traumatic
incidents such as in automobile collisions, sports and uncontrolled falls, and the aging
process. IVD replacement is often required for correction. Long term follow-up studies have
identified problems related to postoperative abnormal bone growth around the device, known
as heterotopic ossification (HO), which may be the result of the continual remodeling of the
injured vertebrae caused by the prostheses with smaller footprints. The research aims at
developing a new prosthesis material that can be molded into any form conforming to the
size and shape of the end-plates of the affected patient vertebrae. The new material will have
mechanical properties closely matching that of the native IVD. Properties of the IVD from
kangaroo, a bipedal mammal with posture similar to human, will be used to guide this
development. We have prepared a polyvinyl alcohol – bamboo fiber composite hydrogel
using the low temperature thermal cycling process that has mechanical properties within the
range of interest for IVD device development. Prototype IVDs were designed and fabricated

iv
using this composite hydrogel with 3 different fiber contents. Their mechanical properties
were evaluated with reference to properties derived from the kangaroo data. Our results
showed that the trends of compressive and viscoelastic properties of the composite hydrogel
closely parallels to that of the animal model. An increase in the bamboo fiber contents in the
prototype may provide the mechanical properties required based on our animal model data.
Based on our study, it may be possible to create an improved IVD device using our design
and composite hydrogel material developed that is functionally comparable to currently
available IVD prostheses but would overcome the postoperative HO problems encountered.
In addition, patient specific manufacturing could also be envisioned.

v
Co-Authorship Statement
The “Summary for Lay Audience” section had been totally redrafted by Dr. Wan so that it
can fit within the word limit required.
I was responsible for the remainder of the work in the development of the theories and
mathematical models involved, the design of experiments and tools required, the preparation
of specimens and conducting the experiments, the results capturing, performing data analysis
and developing the software codes in MATLAB for data analysis.

vi
Acknowledgments
This research study would not have been possible without the help from numerous people
that I am deeply thankful to and want to express my sincere appreciations.
I would like to start by acknowledging my supervisor Dr. Wankei Wan for his continue
support of this study and tireless patience for my progress throughout these years. This study
would not be possible without his financial support for the materials used and machine labor
for constructing various pieces of tools required to perform my experiments. But above all,
my most appreciation was his valuable guidance on different points during the entire history
of this project. His suggestion on using bamboo fibers for my prosthesis composite has made
my prosthesis material concept realizable.
I would also like to thank all members of my advisory committee. Dr. Parham Rasoulinejad,
as an expert spinal orthopedic surgent, had provided me with valuable guidance in narrowing
my initial proposed research focus and scope. His suggestions on focusing study on IVD C5-
C6 and material properties in cranial compression and torsion only had minimized my
efforts. He had also taught me the method on how to identify vertebra T1 from an incomplete
spinal specimen. This had allowed me to locate an IVD C5-C6 reliably each time. Professor
John de Bruyn had provided me with valuable advices and encouragements in defining new
material properties for torsion to be used in this research. Dr. David Holdsworth had sparked
my interest on investigating ways to import my viscoelastic surfaces developed for kangaroo
IVDs to current finite element software systems.
I would like to thank Dr. Joseph Umoh for his extensive effort in performing the micro-CT
scanning of all my kangaroo spine specimens and the co-authorship in an abstract on
“Anatomical Measurement of Kangaroo Cervical (C3-C7) Vertebral Endplates Using Micro-
CT” for ImNO 2021 conference.
I would like to thank Dr. Thomas Jenkyn and Dr. Timothy Burkhart. Dr. Jenkyn had kindly
allowed me access to his laboratory and Dr. Burkhart in providing me technical assistances in
using their two-axis Instron material tester.

vii
I have also in debt to the kind contributions from Mr. Mark Hills, President, Hills Foods Ltd.
for importing the kangaroo specimens from Australia to Canada at cost and Dr. Natalie
Warburton of Murdoch University, Australia, for the help in identifying the kangaroo
cervical vertebrae.
I also want to thank National Research Council Canada allowing me to pursue my PhD study
in part-time and providing financial contributions to my tuition for three years. I also want to
thank the Senior Citizen Bursary of Western University which had provided me with partial
tuition assistance annually since 2016.
Finally, I would like to thank my family, especially my wife Amy, for her endless tolerance
to my time taken to study and patience in shouldering most of our household works so that I
can concentrate in my research. To these, I want to express my sincere thankfulness to her
support throughout these years.

viii
Table of Contents
Abstract ............................................................................................................................... ii
Summary for Lay Audience ............................................................................................... iii
Co-Authorship Statement.................................................................................................... v
Acknowledgments.............................................................................................................. vi
Table of Contents ............................................................................................................. viii
List of Tables ................................................................................................................... xiii
List of Figures .................................................................................................................. xiv
List of Abbreviations ...................................................................................................... xvii
Chapter 1 ............................................................................................................................. 1
1 Research Objectives and Background ............................................................................ 1
1.1 A Brief Background on Cervical Disc Arthroplasty (CDA) ................................... 1
1.1.1 Anatomy and pathologies of our intervertebral discs ................................. 1
1.1.2 Cervical surgical treatment ......................................................................... 4
1.1.3 CDA devices ............................................................................................... 4
1.1.4 Pathological studies on CDA ...................................................................... 5
1.2 Motivation and insights of this research ................................................................. 6
1.3 Research objective, focus and approach ................................................................. 8
1.3.1 Research objective ...................................................................................... 8
1.3.2 Research focus ............................................................................................ 8
1.3.3 Out of scope area (OOSA) .......................................................................... 9
1.3.4 Research Approach (RA) .......................................................................... 10
1.4 Chapter layout & summary ................................................................................... 12
Chapter 2 ........................................................................................................................... 16
2 Literature reviews on CDA prostheses ........................................................................ 16

ix
2.1 Bryan cervical disc ................................................................................................ 16
2.2 M6-CTM Artificial Cervical Disc (M6-C) ............................................................. 21
2.3 PRESTIGE Cervical Disc System (Prestige-ST) .................................................. 24
2.4 Prestige LP Cervical Disc (Prestige-LP)............................................................... 28
2.5 Cervical Prosthesis – Elastic Spine PAD (CP-ESP) ............................................. 34
2.6 Experimental devices ............................................................................................ 38
2.6.1 PHEMA/PMMA hydrogel composite IVD prosthesis from Antonio Gloria
et al ............................................................................................................ 38
2.6.2 PHEMA/HEMA hydrogel composite IVD prosthesis from Antonio Gloria
et al ............................................................................................................ 40
2.6.3 NeoDisc cervical disc ............................................................................... 41
2.7 Discussion ............................................................................................................. 43
2.7.1 Structure & core material .......................................................................... 43
2.7.2 Long-term effects ...................................................................................... 45
Chapter 3 ........................................................................................................................... 48
3 Viscoelasticity & Impact Resistance Characterization of Kangaroo Cervical
Intervertebral Disc ........................................................................................................ 48
3.1 Introduction ........................................................................................................... 49
3.2 Materials and Method ........................................................................................... 51
3.2.1 Sample preparation and IVD Test Unit (ITU) Construction .................... 51
3.2.2 Material testing ......................................................................................... 55
3.3 Data Analysis Method........................................................................................... 58
3.3.1 Generation of the viscoelastic surface ...................................................... 58
3.3.2 Torsional Stress, Strain and Modulus Definitions .................................... 58
3.3.3 Impact Resistance ..................................................................................... 60
3.4 Results ................................................................................................................... 63
3.4.1 Geometry and dimensions of kangaroo C5-C6 IVD................................. 63

x
3.4.2 Mechanical properties ............................................................................... 65
3.4.3 Viscoelasticity ........................................................................................... 67
3.4.4 Impact resistance ....................................................................................... 69
3.5 Discussion ............................................................................................................. 70
3.5.1 Kangaroo vs human C5-C6 IVD properties comparison .......................... 70
3.5.2 Linear viscoelasticity and Finite Element Methods (FEM) ...................... 72
3.5.3 Method limitations .................................................................................... 74
3.6 Conclusion ............................................................................................................ 74
Chapter 4 ........................................................................................................................... 76
4 IVD Prosthesis Development - Compression .............................................................. 76
4.1 Introduction ........................................................................................................... 76
4.2 Materials and Methods .......................................................................................... 78
4.2.1 Experimental approach ............................................................................. 78
4.2.2 Bamboo Fibers Characterization ............................................................... 79
4.2.3 Prosthesis samples preparation ................................................................. 82
4.2.4 Compressive Test ...................................................................................... 84
4.2.5 Hypothesis validation................................................................................ 86
4.3 Results ................................................................................................................... 88
4.3.1 Derivations from analytical model............................................................ 88
4.3.2 Bamboo fiber properties ........................................................................... 89
4.3.3 Prosthesis Compressive Test Results ........................................................ 94
4.3.4 Stress-Strain comparison for B0, B1 and B2 ............................................ 96
4.4 Discussion ............................................................................................................. 98
4.4.1 Suitability of the bamboo fiber ................................................................. 98
4.4.2 Validation on fiber filled content vs compressive strength of prosthesis
specimens .................................................................................................. 98

xi
4.4.3 Validating the accuracy of the analytical model ....................................... 99
4.4.4 Potential of the specimens as an IVD TDR device material ................... 101
4.5 Conclusion .......................................................................................................... 103
4.6 Appendix: Modeling the compressive behavior of an IVD prosthesis ............... 104
4.6.1 Variables definition ................................................................................. 104
4.6.2 Method & Results Summary ................................................................... 104
4.6.3 Geometric constrain on the compressed object ...................................... 106
4.6.4 Volume of the barrel ............................................................................... 106
4.6.5 Compression of a cylinder of incompressible material ........................... 106
4.6.6 Deriving the compressive modulus EN from EC ..................................... 107
4.6.7 Model of composite property with circumferential fiber reinforcement 110
4.7 Appendix: Tensile properties of 10wt% PVA .................................................... 111
4.7.1 Material and Methods ............................................................................. 111
4.7.2 Tensile Young’s modulus for 10wt% PVA ............................................ 112
Chapter 5 ......................................................................................................................... 113
5 IVD Prosthesis Development - Torsion ..................................................................... 113
5.1 Introduction ......................................................................................................... 114
5.2 Materials and Methods ........................................................................................ 115
5.2.1 The design of the prosthesis specimens .................................................. 115
5.2.2 Prosthesis specimen preparation ............................................................. 117
5.2.3 Torsional testing...................................................................................... 118
5.2.4 Test results extraction ............................................................................. 120
5.3 Results & Analysis .............................................................................................. 124
5.3.1 Geometric properties ............................................................................... 124
5.3.2 Torsional properties ................................................................................ 124
5.4 Discussion ........................................................................................................... 131
xii
5.4.1 Effect of fiber content and orientation on the torsional strength of the
specimens. ............................................................................................... 131
5.4.2 Suitability of specimens for IVD prosthesis material ............................. 132
5.5 Conclusion & Future works ................................................................................ 133
Chapter 6 ......................................................................................................................... 134
6 Conclusion and Future Work ..................................................................................... 134
6.1 Summary of Research ......................................................................................... 134
6.1.1 Motivation and Goal ............................................................................... 134
6.1.2 Results summary ..................................................................................... 135
6.1.3 Conclusion .............................................................................................. 136
6.2 Major Research Contributions ............................................................................ 138
6.3 Future work ......................................................................................................... 140
References ....................................................................................................................... 141
Curriculum Vitae ............................................................................................................ 154

xiii
List of Tables
Table 3-1: Compression Rates ................................................................................................ 56
Table 3-2: Rotation Rate ......................................................................................................... 57
Table 3-3: Dimensional properties of kangaroo C5-C6 IVD.................................................. 65
Table 3-4: Yield strength of kangaroo C5-C6 IVD ................................................................ 66
Table 3-5: Model polynomial P31 parameters pij values in Equation 3-1 ............................... 69
Table 4-1: Compression rates and the number of specimens involved .................................. 85
Table 4-2: Mean Young's modulus of bamboo fibers ............................................................. 93
Table 4-3: Bamboo fiber properties (n=19) ............................................................................ 94
Table 4-4: Geometric properties of the prosthesis specimens (n=92) .................................... 94
Table 4-5: Compressive properties of B2 specimens (n=18 out of 23). ................................. 95
Table 5-1: Rotation rates and the number of specimens involved ........................................ 119
Table 5-2: Geometric properties of prosthesis specimens (n=81) ........................................ 124
Table 5-3: Coefficients for fit polynomials of B5 and B3. ................................................... 130

xiv
List of Figures
Figure 1-1: Anatomic structure of an IVD ................................................................................ 3
Figure 2-1: Bryan cervical disc* ............................................................................................. 16
Figure 2-2: M6-C cervical disc* .............................................................................................. 21
Figure 2-3: The Prestige-ST cervical disc* ............................................................................. 25
Figure 2-4: Prestige LP cervical disc* ..................................................................................... 28
Figure 2-5: CP-ESP cervical disc* ......................................................................................... 35
Figure 2-6: An experimental device made from PHEMA/PMMA hydrogel composite* ....... 39
Figure 2-7: The NeoDisc cervical disc* ................................................................................. 42
Figure 3-2: Processed C5-C6 IVD test specimen ................................................................... 51
Figure 3-1: Kangaroo spine specimen .................................................................................... 51
Figure 3-2: Processed C5-C6 IVD test specimen ................................................................... 52
Figure 3-3: ITU casting jig ..................................................................................................... 53
Figure 3-4: ITU mechanical testing setup ............................................................................... 54
Figure 3-5: IVD Test Unit (ITU) ............................................................................................ 54
Figure 3-6: MEAD evaluation illustration .............................................................................. 61
Figure 3-7: Sagittal view of a kangaroo C5-C6 IVD and a human C6 vertebra. .................... 64
Figure 3-8: Kangaroo IVD ...................................................................................................... 64
Figure 3-9: Typical compression and torsional test results. ................................................... 66
Figure 3-10: Resulting compressive (A&B) and torsional (C&D) viscoelastic surfaces. ...... 68

xv
Figure 3-11: Impact resistance (MEAD) vs peak impulse stress S for a sawtooth impulse
waveform Equation 3-7........................................................................................................... 70
Figure 3-12: Compressive and torsional modulus. ................................................................. 73
Figure 4-1: Bamboo fibers ...................................................................................................... 80
Figure 4-2: Property measurement process of a bamboo fiber ............................................... 82
Figure 4-3: Prosthesis samples preparation process. .............................................................. 84
Figure 4-4: Prosthesis specimen mechanical testing setup ..................................................... 85
Figure 4-5: Typical test data of a specimen and processing. .................................................. 88
Figure 4-6: SEM images of the bamboo fibers ....................................................................... 89
Figure 4-7: FTIR results of bamboo fiber. .............................................................................. 90
Figure 4-8: The stress-strain properties of bamboo fibers. ..................................................... 92
Figure 4-9: Viscoelastic properties of B2 specimens ............................................................. 96
Figure 4-10: Stress-Strain curves for B0, B1 and B2 at the 6 selected strain rates. ............... 97
Figure 4-11: Validation of the analytical model using B2 specimens .................................. 100
Figure 4-12: Stress-strain curves of pre-strained B2 specimens in matching those of kangaroo
IVD C6-C6 specimens (KS) ................................................................................................. 102
Figure 4-13: Variables used in the analysis. ......................................................................... 104
Figure 4-14: The compressive function Fc vs compressive strain (N=1-L) value. ............ 110
Figure 4-15: Tensile properties for 10wt% PVA .................................................................. 112
Figure 5-1: Torsional specimen gluing tools ........................................................................ 116
Figure 5-2: Determining the major axis (a) and minor axis (b) of the ellipse using a scaled
photo in ImageJ software. ..................................................................................................... 116

xvi
Figure 5-3: Torsional test fixtures ......................................................................................... 117
Figure 5-4: Typical torsional test curves .............................................................................. 122
Figure 5-5: Specimen test results processing ........................................................................ 123
Figure 5-6: Torsional test results for specimens in B3, B4 and B5 ...................................... 126
Figure 5-7: Mean torsional stress vs torsional strain at different torsional strain rates for B5 &
B3 specimens ........................................................................................................................ 128
Figure 5-8: Viscoelastic surface P12 & P52 fits for B5 and B3 specimens test results with time
<= 10 sec. .............................................................................................................................. 129

xvii
List of Abbreviations
Abbreviations used in Chapter 2
Abbrev. Full name Explanation
ACDF Anterior Cervical
Discectomy and
Fusion
The common surgical treatment for cervical disc
problem by removing the damaged disc and fusing the
two adjacent vertebrae together with a bone graft. The
surgery is performed from the front of the neck.
ASD Adjacent
Segment
Degeneration /
Disease
Disc degeneration or disease above and below a given
index level that has been treated with ACDF or CDA.
COR Center of
Rotation
It is the center of rotation of the superior vertebrae in
relative to the inferior vertebrae in a spinal motion. The
instantaneous location of the COR of a natural IVD can
change during a complex spinal movement. For an IVD
prosthesis, the extends of the movement and the
capability of supporting variable instantaneous COR in
comparison with a natural IVD can be a measure on the
quality of vertebral motion provided by the
prosthesis31.
FDA Food and Drug
Administration
A US government authority to approve drugs and
medical devices to be used in US.
HO Heterotopic
Ossification
Abnormal bone growth from the adjacent surfaces of
the vertebrae of an IVD. For a CDA device, they are
typically formed postoperatively surrounding the

xviii
metallic endplates of the prosthesis. The degree of HO
is typically graded using the McAfee23 classification:
• Grade 0: no HO observed
• Grade 1: HO present but within the baseline of
the CDA device
• Grade 2: HO developed beyond the baseline of
the CDA device but not sufficient to interfere
with ROM
• Grade 3: HO developed with some degree of
interfering with the segmental ROM
• Grade 4: HO formation bridging the gap of the
CDA device leaving < 3o of flexion-extension
movement.
IDE Investigational
Device Exemption
An FDA process to allow the clinical trial of a medical
device prior to its approval. The trial is typical for 2
years.
JOA32 Japanese
Orthopedic
Association
A patient self-evaluated clinical score to establish
criteria for mild, moderate and severe impairment. In
some clinical studies a modified shorten version are
used (mJOA).
KL33 Kellgren-
Lawrence
Grading System
for Osteoarthritis
A grading system for the severity of osteoarthritis in
joints from interfering with their mobility function. It is
also used in classifying the pre-operative condition of
the vertebrae sandwiching a target IVD for treatment.
The gradings of severity are from Grade 0 to 4 similar

xix
to that of the McAfee system on HO. Grade 0 is no
osteoarthritis. Grade 1 is doubtful and Grade 4 most
severe.
NDI Neck Disability
Index
A clinical score completed by the patient to access the
severity of neck and upper back pain to evaluate how
do they affect the patient’s everyday life. It consists of
a set of 10 questions, each contains 6 graded answers
for the patient to choose from.
Odem’s
criteria34
A typical surgeon’s perspective on the surgical
outcome, which is either poor, fair, good or excellent.
ROM Range of motion Mobility of the spine. In many clinical studies, it is
typically measured on the sagittal plane using dynamic
radiographic techniques.
SF-12
SF-36
Short Form
Survey on 12 or
36 items
A patient completed questionnaires to evaluate the
quality-of-life measures. It may contain a physical
component summary (PCS) and mental component
summary (MCS) scores.
VAS35 Visual Analog
Scale
A patient self-evaluated clinical score to measure the
degree of pain. The scores are recorded by making a
mark on a 10 cm line ranging from no pain (left most)
to worst pain (right most).
xx
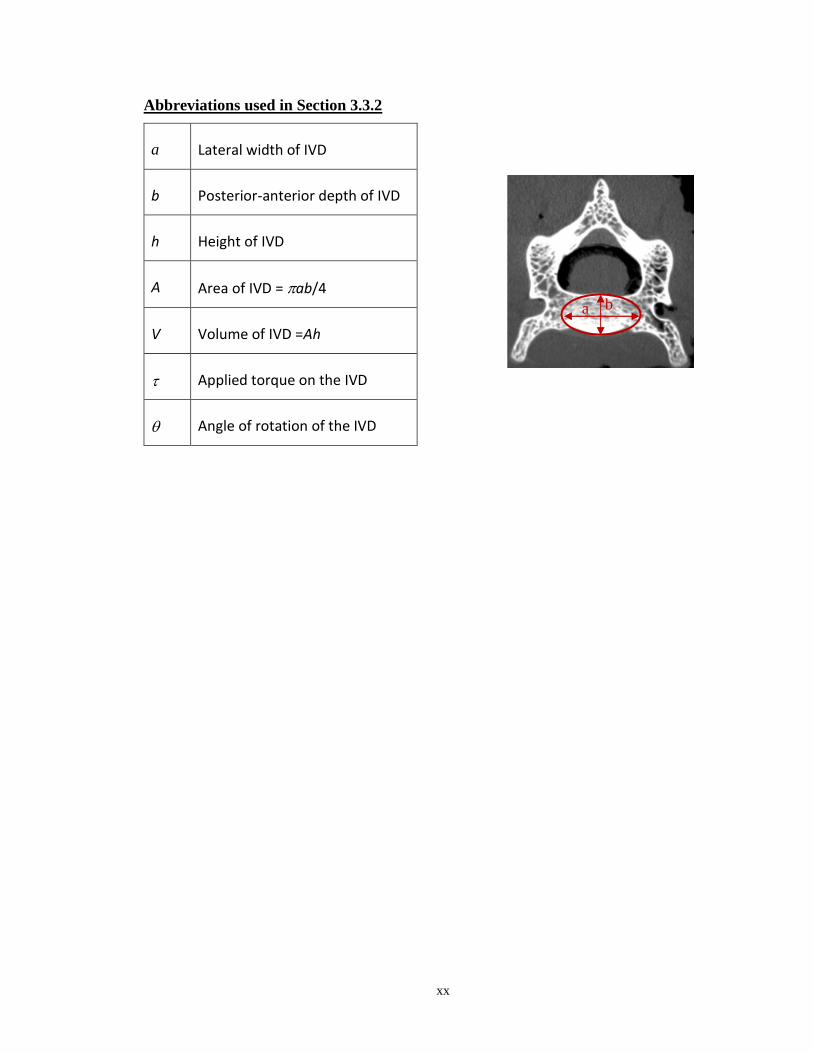
Abbreviations used in Section 3.3.2
a Lateral width of IVD
b Posterior-anterior depth of IVD
h Height of IVD
A Area of IVD = ab/4
V Volume of IVD =Ah
Applied torque on the IVD
Angle of rotation of the IVD
a b

xxi
Abbreviations used in Section 4.6
Variable Definition
SubC Subscript C represents entities in circumferential direction
SubN Subscript N represents entities in normal/vertical direction
Ro Original radius of the cylinder
Lo Initial half height of the cylinder
F Applied compressive force
Rm The radius at the mid-section of the barrel
rm Radius of the circular cross-section at a distance z.
r Radial distance from origin
L Half height of the barrel at half compression distance z
z Vertical distance from origin
L Ratio L/Lo, degree of compression in height
R Ratio Rm/Ro, degree of expansion in radius
Strain
Stress
E Young’s modulus
e Energy
f Force

xxii
Abbreviations used in Section 0
Variable Definition
Subm Subscript m stands for matrix entity
Subf Subscript f represents fibre entity
A Cross-sectional area of the slice perpendicular to the tensile force
p Volumetric percentage
F Force
Strain
E Young’s modulus

1
Chapter 1
1 Research Objectives and Background
This Chapter outlines the motivation, research objective and scope of research.
1.1 A Brief Background on Cervical Disc Arthroplasty (CDA)
1.1.1 Anatomy and pathologies of our intervertebral discs
Our spine consists of 33 vertebrae and 23 intervertebral discs (IVDs). Physiologically it is
divided into 5 regions: cervical(C), thoracic(T), lumbar(L), sacral(S) and coccyx. There
are 7, 12, 5, 5 and 4 vertebrae in each region respectively. The vertebrae are identified by
their position number in the region. For example, C1 to C7 for the 7 cervical vertebrae.
There is an IVD located in between each pair of vertebrae from C2 to S1. The vertebrae
in sacral and coccyx region are fused together. An IVD is identified by the pair of
vertebrae it is sandwiched in between. For example, IVD C5-C6.
The IVD is a fibrocartilage tissue. Its main functions are to support the body weight,
absorb shock waves from damaging our brain and provide the spinal mobility such as in
flexion/extension, lateral bending and rotation. Anatomically it consists of two regions:
an outer anulus fibrosus (AF) enclosing a nucleus pulposus (NP) (Figure 1-1). The AF
has a laminar structure. Each lamella consists of almost parallel type I collagen fibers
running at an angle approximately 30o to the horizontal. The angle reverses direction
from one lamella to another forming a crisscross pattern to resist compressive and
torsional forces. The NP is a gel-like material consists of mainly proteoglycan and water
held together by a network of type II collagen fibers and elastin. Combining the almost
impermeable nature of the AF and the incompressible gel-like nature of the NP, the IVD
provides a good viscoelastic compressive and impact resistant properties to support the
bodily weight and external impact forces. Unfortunately, the water content of the NP
decreases as one ages. At one’s childhood, the NP is fully hydrated. A normal
compressive force is evenly shared between the AF and NP across the entire surface of
the IVD in contact with the vertebrae. As one ages, the proteoglycan and water content
decreases and the load of a normal compressive force is gradually shifted towards the AF.

2
The height of the IVD decreases. The AF may also be compromised due to inflammation,
prolong daily activities or simply by wear and tear throughout our life. The NP contents
may be squeezed out from a weakened part of the AF forming different degree of bulging
and herniation. As the spinal cord is located posterior to the IVD, a heavy traffic of neural
network runs in-between the gaps provided by the IVDs from the spinal cord to our entire
body. As the height of the IVD decreases or it becomes herniated due to aging or other
factors, there is a possibility that some nearby nerves may get pinched (radiculopathy) or
the spinal cord get compressed (myelopathy). This may cause intractable pain to the
person. The whole symptom is called degenerated disc disease. In addition, our IVD can
also be damaged in impact-prompt sports such as weight lifting, American football,
basketball etc., traumatic incidents such as in an automotive accident or uncontrolled falls
such as slipping. Professions like heavy laborers or soldiers are more likely to have IVD
problems.

3
NP
AF
A
B
AF NP
endplate
C
Figure 1-1: Anatomic structure of an IVD
A: A horizontal cross-section of a porcine C5-C6 IVD showing the laminar
structure of the AF enclosing the gel-like nature of the NP.
B: A cut-out view of the AF laminae showing the alternate angle
arrangement of the Type 1 collagen fiber from one lamina to another.
C: A vertical cross-section of the IVD showing the cartilaginous endplates
and the vertebrae housing the IVD.

4
1.1.2 Cervical surgical treatment
Typical first treatments of pains originated from a damaged IVD is via physiotherapy or
medication to relax the surrounding tissues or numb the pain. If the pain persists, surgical
treatments may be required to replace the damaged IVD to decompress the pinched
nerves. The long standing standard surgical treatment for the cervical IVDs is the anterior
cervical discectomy and fusion (ACDF). The IVD is surgically removed from the anterior
position and replaced with a bone allograft to restore the natural height of the replaced
disc. In some cases, the bone graft is held in position by an anterior cervical metal bracket
(e.g., Caspar plating) to attach to the adjoining vertebrae body to stabilize the fusion site.
Patient’s live bone cells are added to the allograft to encourage the fusion of the vertebrae
bodies and the graft. Even though this approach relieves the pain caused by the
damaged/deteriorated IVD, the fused vertebrae will reduce the range of motion (ROM) of
the spine. Long term problems are reported to cause the adjacent IVDs to deteriorate, a
phenomenon called adjacent segment degeneration1 (ASD). To address this issue, an
emerging treatment is to replace the damaged IVD with a prosthetic device.
1.1.3 CDA devices
The aim of these prostheses is to restore some spinal mobilities apart from supporting the
bodily weight. A group of FDA(US) and CE(EU) approved devices have been developed
in the past 30 years improving in capabilities in mimicking the mechanical
behavior/properties of a human IVD. Earlier designs of the IVD prostheses employ a
simple ball-and-socket or ball-and-trough joint (e.g., Prestige-ST[Section 2.3], ProDisc-
C2) to provide the rotational capability. Second generation designs (e.g., Bryan [Section
2.1]) provide more degrees of freedom and have compressive and rotational
elasticity/resistivity in spinal mobilities. More recent ones (e.g., M6-C [Section 2.2], CP-
ESP [Section 2.5]) may have some degree of viscoelasticity, impact resistance and
variable instant center of rotation capabilities.
To anchor the device onto the inferior surface of the cranial and superior surface of the
caudal vertebra bodies (adjacent surfaces), most designs employ a pair of metal endplates
with anchoring features3 like keel, spikes, teeth, rails, ridges and screws. The main
5
function is to prevent the movement of the device especially from affecting the posterior
longitudinal ligament, which protects the spinal cord. As the devices come only in a set
of standard sizes, to surgically insert the device, after the removal of the IVD, a suitable
size is selected to fit the space available. The adjacent surfaces may have to be machined
to conform with the shape of the devices and to accommodate the anchoring features.
This will cut into the cortical and cancellous bone of the vertebra bodies. This may
trigger the continual remodeling of the vertebral bodies3.
Popular materials4 for the metal endplates are titanium alloys (e.g. TiAlV), stainless steel
alloys (e.g. 316LV) or cobalt chromium alloys (e.g. CoCrMo). The surfaces of the device
in contact with the vertebral bodies may be textured and chemically coated3,4 with
calcium phosphate (CaP), hydroxyapatite and plasma-sprayed titanium (CPTi) to aid the
osseous integration with the vertebral bodies.
The middle layer that articulates the mobility of the prosthesis may consist of sliding
surfaces3 (e.g., ball-and-socket, ball-and-trough), which, according to the materials used,
can be classified as metal on metal (Prestige ST), metal on polymer (e.g. UHMWPE or
polyurethane) (Bryan [Section 2.1], ProDisc-C2, ProDisc Vivo5), ceramic on polymer or
ceramic on ceramic (Prestige-LP [Section 2.4]) types. These designs may have wear and
tear concerns that produce harmful debris6. To address the debris issue, some designs
(Bryan, M6-C) include a cover-up membrane to enclose the entire middle layer to prevent
the debris from leaking out to the surrounding. Some designs consist of multiple
components (Bryan or M6-C) or a single block (CP-ESP).
1.1.4 Pathological studies on CDA
Even though the benefits of ACDF vs CDA treatments are still under debate7–11, the
FDA(US) & CE(EU) approved devices have reported benefits to the patient in clinical
studies2,5,20,12–19. Most of these reports are follow-up studies for postoperative results less
than 10 years. This may be due to the relatively short history of devices in this field. A
few reports of longer periods are coming out. Benefits reported include maintaining
physiological segmental spinal motion, improved preoperative clinical scores (Neck
Disability Index, Odom Criteria, Visual Analogue Scale, modified Japanese Orthopedic

6
Association scale, Short Form-12/36 PCS/MCS, etc.) on pain, health and quality of life,
lower rate of secondary revision surgeries, shorter hospital stay, lower incidents of
adjacent segment disease and degeneration, more cost effective21, etc. Even in studies of
less than 10 years and later validated in longer follow-up studies, reported problems
include adjacent segment disease and degeneration17,22(ASD), heterotopic
ossification17,19,22–24 (HO) of Class 3 or 4 in the McAfee classification25, increase Class 4
HO in time19,26, subsequent fusion or spontaneous ankylosis22, reduced ROM17,22,
postoperative kyphosis18,27, myelopathy and radiculopathy17. The nature of all these
studies was qualitative, the precise causes of these culprits remain unclear. Some studies
tried to correlate clinical observations with postoperative occurrence of ASD and HO.
Existence of preoperative conditions of ASD13 and HO23 may lead to the development of
similar postoperative conditions26; low preoperative lordosis with low postoperative
ASD7; kyphosis of the prosthesis with HO18; patients with postoperative anterior or
enlarging osteophyte formation with upper ASD18, prostheses with anterior lips with
lower occurrence of anterior HO23 (Bryan & Prestige ST/LP vs PCM), design of
prostheses with degree of HO (Bryan 49%, PCM 80%, Prestige LP 60%)23, preoperative
ossification with HO in the posterosuperior disc space23, etc.
1.2 Motivation and insights of this research
From the above-mentioned pathologies observed on CDA, apart from existence of
preoperative conditions, postoperative ASD & HO are likely to be induced by the
prosthesis. This shows that there are rooms for further improvements on current devices.
Borrowing knowledge from other fields of orthopedic research28,29 and biomechanics
may bring some insights into possible improvements affecting the occurrence of
postoperative ASD and HO. A possible cause may be these devices have introduced
foreign level or type of stresses to the adjacent vertebrae. The injured vertebrae just keep
remodeling to respond to these foreign stresses, HO, and these foreign stresses may affect
adjacent level IVDs to promote their deterioration, ASD.
From the view of this angle, there are a few observable drawbacks of existing prosthesis
devices.

7
Smaller footprint introducing concentrated stress
All IVD prostheses come in a set of standard sizes. All fitted devices must be smaller
than the space available of the replaced IVD. This means the body weight is now
concentrated into a smaller area, producing a higher level of stress in the middle of the
vertebral body instead of evenly spread over the entire adjacent surfaces of the vertebrae.
With the machining of the vertebrae surfaces for installing the devices, the cortical bone
may be removed exposing the full concentrated stress to the much weaker cancellous
bone of the vertebra body. The surrounding remaining areas of the fitted device are
exposed. There is no stoppage for the continuing ossification formation for the vertebrae
to heal themselves.
Fixed axes and center of rotation
To provide rotational freedom, most existing IVD prostheses use a design similar to ball-
on-socket that has fix axes and centers of rotations, while our IVDs can provide 6 degree
of freedom in motion capable of having variable axes and centers of rotations. The
restrained freedom of movement introduced by these prostheses require careful axes
alignment with the spine during the surgical insertion. Even with perfect alignment, and
worse if not, they will produce foreign torsional stresses on the vertebrae/spine during
spinal movements.
Mismatch device endplate material strength with vertebrae
Stanton et al4 tabled the Young’s modulus of the cortical and cancellous bone of the
vertebrae body to be 15,000 MPa and 1000 MPa respectively. The Young’s moduli of
common endplate material of devices for titanium alloy (TiAlV), stainless steel (316LV)
and cobalt chrome alloy (CoCrMo) are 100,000 MPa, 200,000 MPa and 230,000 MPa
respectively. The metal endplates materials are much stronger than those of the vertebra
bones. For IVD prostheses using a metal-to-metal articulation (e.g., Prestige-ST and
Prestige-LP), any compressive strain at the index level will be mainly borne by the
adjacent vertebrae instead of the prostheses.

8
1.3 Research objective, focus and approach
1.3.1 Research objective
The central idea of this research is on the proposal and evaluation of a new prosthesis
material. The prosthesis is constructed from a composite material of polyvinyl alcohol
cryogel (PVA) with embedded long circumferentially oriented bamboo fibers spiraling
from bottom to top. The length of the fiber should circle the circumference of the
prosthesis at least once. The PVA is chosen because of its biocompatibility, long-term
stability and moldability into any patient specific IVD shape. The prosthesis when under
compression, assuming the incompressibility of PVA, the mid-height portion of the
prosthesis will bulge out creating tensile forces on the embedded fiber, hence increase the
compressive strength of the prosthesis. When under torsion, the torsional strain may
stretch the circumferentially and spirally oriented fibers putting them in tension, hence
producing torsional strength. The compressive and torsional strength of this prosthesis
material will be tunable to match that of any IVD required by increasing or decreasing
the fiber contents.
Benefits of this prosthesis material will be the abilities of quickly (around a week)
moldable into any patient specific shape, strength tunable to match the requirement of
any IVD level, biocompatibility, long-term stability, single block structure and have
variable center of rotations. These may address many drawbacks of existing prosthesis.
The objective of this research is to perform a feasibility study on evaluating if this
new material can be a viable material for IVD prostheses.
1.3.2 Research focus
Focusing this research into certain area is to conserve research resources and time into a
manageable level without loss of generality.
Focus 1: IVD C5-C6
Our spine has 23 IVDs. For a feasibility study on the new prosthesis material, there is no
need to match the properties of all 23 IVDs individually simultaneously. This repetitive

9
work can be left for future work once this research has validated the concept. Hence this
research will focus only on studying the properties of the IVD C5-C6 as the target. The
techniques developed can apply to any IVD without loss of generality. Many studies
already exist on the lumbar section, while the cervical section was reported to lack
similar studies30. In addition, IVD C5-C6 has noticeably higher instances of surgical
treatments than other levels among CDA studies16,17 signifying the higher relevance of
this IVD among others in the cervical region.
Focus 2: Large-scale viscoelastic cranial compressive and torsional properties
Our IVD provides 6 degrees of freedoms (DOF). In terms of externally applied excitation
strains, they can be compression, shear and torsion in any of the 6 DOF. This study will
focus on cranial compression and torsion. Many existing studies are performed on
excitations within physiological limits and on determining the size of neutral zones. To
complement the existing knowledge in this area, this study will focus on characterizing
the large-scale unrestricted (all limiting structures and tissues removed) viscoelastic
behavior of IVD from zero to yield situation. This may contribute to the research in
cervical spinal behavior during a traumatic event such as in a whiplash injury study.
1.3.3 Out of scope area (OOSA)
Out of scope areas outlines research works to be performed for future studies not
included in this one. These areas may require special knowledge or areas of interest but
may be better to be studied in as separate studies that are not directly related to the
objective of this research.
OOSA 1: Prosthesis attachment method
One key concept on the design of this new prosthesis is to eliminate the metallic
endplates used in existing CDA devices. This will eliminate the need to cut into the
adjacent vertebra bodies for its installation. With the matching material properties of
existing IVD, the prosthesis may be transparent to the vertebrae as if a real IVD is in
place. This may reduce the occurrences of postoperative HO and ASD. For attachment to
the affected vertebra bodies, the superior and inferior surfaces of this new prosthesis

10
should have the shape exactly matching that of the adjacent vertebrae surfaces of the
patient CDA site. In addition, these surfaces may be molded to have shallow pockets to
grip the vertebra bodies in contact and hold the prosthesis in position under compression.
The shallow pocket idea is similar to existing IVDs as shown in Figure 1-1C. To further
increase its holding strength, a suitable adhesive may be added in a short-term solution.
For a long-term solution, these surfaces of the prosthesis can be functionalized to
encourage osseous integration with the vertebral bodies.
OOSA 2: Patient specific molding of prosthesis
The cross-linking of the PVA solution into hydrogel using freeze-thaw cycles require to
have the PVA solution contained in a water tight mold that allows for heat exchange.
This mold can be made starting from the CT scan of the patient’s affected vertebrae
intended for CDA treatment. Using an image processing software in the medical field
(e.g., 3D Slicer or MicroView), the surface geometry of the two vertebrae can be
extracted through segmentation techniques. The vertebral bodies can be pull apart to a
distance satisfying the decompression requirement. The geometry of the IVD prosthesis
required can be created by filing the space between the vertebrae. The geometry of the
mold can be made by subtracting the volume of this prosthesis within in a block of
material of dimensions large enough to cover the entire prosthesis. Air holes and a
removable cover can be incorporate into the mold. The final geometry of the mold can be
sent to a 3D printer to make the mold. The feasibility of this concept has been evaluated
using the 3D Slicer in creating the mold geometry but hasn’t physically 3D-printed it out.
As the actual geometry requirement of the prosthesis will be a result from OOSA 1. In
addition, the mold geometry has to be adjusted to accommodate any shrinkage of the
PVA hydrogel to obtain the desired geometry of the intended prosthesis. This research is
left as a future study.
1.3.4 Research Approach (RA)
Research approaches refer to the selected methods used on this study on how to carry out
the evaluation on the suitability of the new proposed material.

11
RA 1: Kangaroo IVD C5-C6 as animal model
The key underlying concept on this feasibility study is to measure and compare the
compressive and torsional viscoelastic behavior and strength of the new prosthesis
material to that of human IVD C5-C6. Unfortunately, large quantities of uniform human
IVD C5-C6 specimens are difficult to obtain, the kangaroo IVD C5-C6 is used instead.
The choice is based on the kangaroo’s similarity to human in bi-ped upright standing
posture, height and weight.
RA 2: Model based approach in fiber selection
Instead of blindly testing a matrix of different combinations of different types of fibers
and fiber contents to access their suitability for the prosthesis to meet the target
viscoelastic behavior and strength of kangaroo C5-C6 IVD measured, a model-based
approach is adopted to minimize this effort. A rough analytical model was first developed
relating the compressive strength of the prosthesis as a function of fiber strength and fiber
content. In this analytical model, the prosthesis geometry was modeled as a simple short
cylinder to simplify the mathematical derivations. Base on this model and the mean yield
strength measured from the kangaroo IVD, one can roughly determine the fiber
characteristics needed for preparing the prosthesis specimens for testing, such as fiber
length, the tensile strength (Young’s Modulus) and the volumetric content in the
prosthesis.
RA 3: Validating strategy on the strength tunable nature of the prosthesis
The ultimate goal of this study is to determine the volumetric content of the fiber to
match that of the kangaroo IVD measured. However, this will require a large number of
batches of specimen with different fiber contents to be prepared and testing efforts to
perform binary searching to determine the correct volumetric fiber content required. This
will involve too much testing efforts. Instead, this feasibility study took a different but
just as effective approach. The validating strategy was performed to validate the
monotonic increasing nature of the prosthesis compressive strength with volumetric fiber
contents as predicted by the analytical model. Once the tunable nature is established, one

12
can perform the binary search as future works. With this strategy, only three batches of
specimens of three volumetric fiber contents (0v%, 0.6v% and 3.0v%) are required. This
has simplified the specimen preparation and testing efforts.
1.4 Chapter layout & summary
This thesis consists of 5 chapters. Apart from Chapter 1 Background introduction,
Chapter 2 literature review and Chapter 6 Conclusion, Chapter 3 to 5 contain the research
work in this study. These three chapters are written in the paper manuscript format such
that they can be individually extracted to become a publishable paper. Hence, when
describing the motivation of the research, there may be some duplications in these
chapters. Each of these three chapters includes an abstract for the chapter and sections for
introduction, methods & materials, results, discussion and conclusion. A brief list of
research objectives is included in the beginning of each Chapter to highlight the research
focus (foci) of the Chapter.
Chapter 1
This Chapter contains a brief background on CDA, the motivation for this research, its
objective, focus, approach and out-of-scope areas.
Chapter 2
This Chapter provides literature review of currently FDA approved, CE certified and
experimental IVD prostheses relating to this research.
Chapter 3
This Chapter measures the compressive and torsional viscoelastic properties of kangaroo
IVDs C5-C6 with all movement restraining bone structures, muscles and tendons
removed (unrestricted). The measured properties are used as the gold standards for the
prosthesis specimens to compare with in Chapter 4 and 5. The individual geometries
(height and area) of each IVD are obtained by micro-CT scans. The individual yield
stress and yield strain are measured with a bi-axal material tester. As viscoelasticity is the
key material property of concern, a technique using a polynomial viscoelastic surface is

13
introduced to model the collective viscoelastic behavior of all the kangaroo IVDs
measured.
A few viscoelastic material properties, such as impact resistance, torsional stress and
strain, are not well defined in the literature. This Chapter attempts to propose new
definitions to these material properties.
This Chapter also introduces a new method for deriving mathematically the impact
resistance of a viscoelastic material from its viscoelastic surface when subjected to an
impulse stress of a given waveform. To demonstrate this method on the kangaroo IVDs,
this Chapter uses a set of simple sawtooth impact stresses of increasing peak values to
derive the impact resistance value in each case. With the new definitions for torsional
stress and strain, the impact resistance derivation can apply to both compressive and
torsional cases.
Chapter 4
The foci of this Chapter are to characterize the compressive viscoelastic behavior of a
proposed new composite material formed with 10wt% PVA and bamboo fibers and to
evaluate its suitability as an IVD prosthesis material candidate basing on the results
obtained from the kangaroo IVDs.
It derived a rough analytical model on the compressive behavior of the new prosthesis
material proposed. From this model, using 10wt% PVA as the matrix, it determines the
tensile modulus and the volumetric contents of the fiber required to achieve the strength
of the kangaroo IVD measured.
Using a small random sample (n=19) of the bamboo fiber, it measured the geometric and
tensile properties of the bamboo fiber and validated it is a suitability fiber candidate
basing on the requirements derived from the analytical model.
The compressive properties of 3 batches of specimens with 0v%(control), 0.6v% and
3v% fiber contents were measured using a set of different strain rates. The monotonic
increase of compressive strength of the specimen with increase of fiber volumetric
14
content was validated. The viscoelastic nature of the specimens was evaluated using the
test results of the batch with 3v% fiber content.
The test results of the 3v% specimen batch were found weaker than the model prediction.
This Chapter hypothesized that the main cause of this was due to the 37% volumetric
shrinkage of the PVA hydrogel during the 6 cycles of freeze-thaw process. As a result,
the bamboo fibers had to be wrinkled up within. To achieve the strength predicted in the
model, the specimens must be pre-strained to unwrinkled the embedded fibers. It had
demonstrated that with a pre-strain value of 35% to 45% on the 3v% specimens, the final
strength will match that of the kangaroo IVDs.
Chapter 5
This Chapter contains the characterization on the viscoelastic torsional behavior of the
proposed new prothesis material and evaluates its suitability as an IVD prosthesis
material basing on the results obtained from the kangaroo IVDs.
The torsional stress and strain values measured had used the same definition as in the
kangaroo section.
The torsional stress-strain behavior of 3 batches of specimens containing 0v%(control),
0.6v% and 3v% fiber contents were measured using a set of different torsional strain
rates.
It had found that the specimens had very low torsional strength (<1 MPa) as compared to
that of the kangaroo IVDs measured (~13 MPa). The fiber content had close to no effect
on the torsional strength of the specimens. It postulated that the low torsional strength
may be due to the 37v% shrinkage of the PVA matrix. With this shrinkage, the embedded
fibers may be wrinkled up inside. To stretch back the fiber so that they can provide the
tensile strength required in torsion, each layer of fibers has to subject to around 60o
rotation. This angle of rotation is cumulative from the bottom to the top of the specimen.
As the diameter of the fiber is around 21m, this will require a large torsional strain
applied before a meaningful torsional stress can be obtained.

15
Even with low torsional strength but has sufficient compressive strength, this new
material can be a viable material candidate for IVD prosthesis. Many existing FDA
approved IVD prosthesis using a ball-on-socket design have similar properties. In
addition, this material has the benefits that it can be molded into patient specific shape
and size and has no fix axes and center of rotation.
Chapter 6
This Chapter contains a summary of the research findings, conclusion and proposed
future works.

16
Chapter 2
2 Literature reviews on CDA prostheses
This section conducts a literature review on a set of CDA prosthesis devices. Some are
FDA (USA) or CE (EU) approved devices and some are still in their experimental stage.
They are selected basing on their popularity in published literatures and relevance to this
research. The main review focus is on the long-term effects of these CDA devices
especially on HO and ASD. It is conducted on a per device basis basing on the
assumption that these long-term effects are partly due to their unique design and material
used.
(For abbreviations, see section “List of Abbreviations”)
2.1 Bryan cervical disc
Owner: Medtronic Sofamor Danek, Memphis, TN, USA
FDA approval: Case P060023, May 12, 2009, single level
Construction36,37:
A B C
Figure 2-1: Bryan cervical disc*
Figure A shows the external view of a Bryan cervical disc showing its top and bottom titanium
alloy endplates with the mid-section fully enclosed by a polyurethane sheath.
Figure B is an exploded view of the internal components of the device.
Figure C is a cross-sectional schematic view showing how each component fits together.
*A: Reprint from article103 with permission from Spine (license # 5077671114136)
*B & C: Reprint from article104
with permission from Clinical Spine Surgery (license #
5077710310419)

17
The Bryan cervical disc employs a double ball-and-socket construction providing two
metal-on-polymer articulating surfaces at the top and bottom of the device for supporting
rotational movements and compression. It has a polyurethane inner nucleus (99%
polycarbonate-urethane, 1% silicon) sandwiched in between a top and bottom titanium
alloy (Ti-6Al-4V) roughly circular shell. The top and bottom surfaces of the inner
nucleus in contact with the outer metallic shells are part spherical. A circular pocket is
made in the center of the top spherical surface and a smaller diameter metal post is
inserted into the pocket from the center of the top shell. Same arrangement is made for
the bottom spherical surface. Both arrangements provide a soft stop to limit the rotational
movements of the device. The inner nucleus is totally enclosed in a flexible polyurethane
outer sheath (94% polyurethaneurea, 6% silicon) filled with saline and fixed to the side of
the top and bottom shells with retaining rings. The outer surfaces of the two shells are
coated with commercially pure titanium beads (CP Ti B.I. Thortex K-coat) to provide
porosity for promoting bone cell adhesion. Each shell has a small vertical anterior lip for
anchoring the device onto the adjacent vertebrae body with a screw.
The device is available in 5 sizes of diameter from 14 to 18mm in 1mm increments and
the resulting interbody height is approximately 6mm.
ROM & mechanical properties37:
• Flexion/Extension: 10o
• Lateral Bending: 11o
• Rotation: 7o
• Translation: 1 mm
• Axial compression: physiological 130N, max 1164N
Clinical studies:
A 24-months primary clinical study37 (IDE#G00123) was conducted by Medtronic at 30
sites in US with patients operated on between May 28, 2002 to October 8, 2004 and the

18
study was concluded on June 5, 2006. The prime objective of this study was to support
the FDA approval of the device by demonstrating it is non-inferior to the standard ACDF
treatment. A total of 300 patients (160 BRYAN, 140 ACDF) had completed the 2-year
follow-up study with evaluation points at 6 weeks, 3, 6, 12 and 24 months. The majority
of the treated IVD levels were at C5-C6 (57.9% BRYAN, 49.8% ACDF) and C6-C7
(36% BRYAN, 42.5% ACDF). The evaluation was based on pre-operative (< 4 weeks
before operation) and post-operative conditions on NDI, SF-36 (PCS & MCS), Neck Pain
Score, Arm Pain Score, radiography (to determine the FSU height and fusion) and axial
ROM (BRYAN only). The conclusion of the study on the BRYAN cervical disc was that
most clinical scores and safety data were non-inferior to ACDF and with superiority in
overall success, NDI results, lower rates of second surgical procedures related to
supplemental fixations and lower second surgery failure rate. For axial ROM, the mean
angular range of motion at 12- and 24-months values were 7.77o (n=226) and 7.74o
(n=154) respectively in comparison to preoperative value of 6.43o (n=214).
Lei Cheng et al38 had performed a 3 years follow-up study comparing with ACDF. Total
83 patients (41 BRYAN, 42 ACDF) were treated from December 2004 to September
2006 at one center. The study covered treatments at single level (58.5% BRYAN, 50%
ACDF), 2 levels (34.1% BRYAN, 40.5% ACDF) and 3 levels (7.3% BRYAN, 9.5%
ACDF). Evaluations were based on preoperative and postoperative scores of NDI,
Odom’s criteria, SF-36 and JOA scale taken at 1 and 6 week, 3, 6, and 12 months and 2
and 3 years. The study found BRYAN cervical disc had scored significantly better in
NDI, SF-36 and mJOA evaluations. It had fewer complications than the ACDF group.
Adverse complications included one dysphagia and one HO case.
Feifei Zhou et al26, 5-year follow-up concluding that patients with severe preoperative
spondylosis had higher rate of developing postoperative HO.
Justin Miller et al20, 7-year follow-up study on the ASD effect. Basing on the ratio of the
vertical disc height and the anteroposterior distance of the cephalad endplate of the
vertebral body below the adjacent level disc, it had concluded that there was a significant
decrease in disc height over time to indicate ASD in both the CDA and ACDF patients.
19
Gerald M.Y. Quan et al13, 8-year follow-up on clinical and radiological results finding
HO had tendency to increase from 17.8% at year 1 to 69.2% of Grade 3 & 4 at year 8.
ASD was detected in 19% of the related treated segment but all patients had same
preoperative conditions.
Suo Zhou Yan et al7, 8-year follow-up study on the ASD effect. In comparison between
CDA and ACDF patients, they found there had no significant differences of ASD
incidents between the two groups (44.83% vs 48.72%). However old age, low
preoperative overall and segmental lordosis were statistically correlated with ASD.
Yanbin Zhao et al17 had performed a 10 years follow-up study in 1 center in China. Total
33 patients had completed the study with 25 patients treated at single level, 7 at 2 levels
and 1 at 3 levels, total 42 levels included 3 @ C3-C4, 7 @ C4-C5, 26 @ C5-C6 and 6 @
C6-C7. The treatments were carried out between December 2003 to Jan 2005.
Evaluations were based on pre- and postoperative mJOA, NDI, VAS scores and
radiographic outcomes. This study found the mean ROM had decreased from 7.8o
(immediate after treatment) to 4.7o at the 10-year point. HO was observed in 29 (69%) of
the 42 levels, among which 14 (33.3%) at Grade 3 and 14 (33.3%) at Grade 4. A total of
63 adjacent segments were evaluated, of which 30 (47.6%) had developed ASD, but no
patient suffered from ASD. It concluded that the HO was common in BRYAN cervical
disc arthroplasty and patients might suffer reduced ROM.
Xiao Han et al39, 10-year follow-up on the CDA effect on patients with myelopathy and
radiculopathy. It reported the incident of Grade 3 & 4 HO was detected in 28.9% the
myelopathy patients and 32.1% in the radiculopathy patients. Segmental kyphosis was
detected in 21.1% of the myelopathy and 21.4% of the radiculopathy patients.
William F Lavelle et al40, FDA IDE 10-year follow-up concluding that, in comparing
CDA vs ACDF patients, a significantly higher overall success rate (81.3% vs 66.3%),
significant improvement in NDI score and good improvements on VAS neck and arm
score.

20
Vincent Pointillart et al18 had performed a 15 years follow-up study in the University
Hospital of Bordeaux in France. Total 18 patients (14 single level and 4 two levels total
22 implants) had completed the 15 years study. The locations of the implants were
2@C4-C5, 11@C5-C6 and 9@C6-C7. Treatments were performed between July 2000 to
July 2001. Evaluation matrix included Odom’s criteria, VAS, NDI, SF-12 (PCS & MCS)
and radiological analysis. It had found 15 of the 22 (68.2%) implants had maintain
mobility with 9o3.9o (range 4-15o) flexion-extension ROM. HO had developed in 12 of
the 22 levels (54.5%), among which 11 (50%) were of Grade 3 & 4, and 11 of 18 (64.7%)
patients had developed upper ASD. There was a positive correlation between kyphosis
and HO occurrences.
Discussion
Medtronic had started the clinical trials of the BRYAN Cervical Disc in 2000 outside
USA prior to the FDA approval, enabling it to have a longer (15-years) follow-up history
in comparison to other devices. This had provided valuable opportunity to observe its
long-term effects on patients. The common reported problems were HO, ASD and
kyphosis.
The clinical studies had shown HO might have started to develop after year 2 and its
severity had increased on time. Both the 10- and 15-year studies had shown over half of
the patients had developed severe (Grade 3 & 4) HO. This may render the effective
operation of the device, reducing ROM and clinical scores of the patients. Yong Jun Jin
et al23, by comparing BRYAN cervical disc with two other devices (PCM & Prestige-LP)
in a 46-month investigation, had found BRYAN cervical disc had a lower HO incidence
(49% vs 80% and 60%) and, might be due to its anchoring anterior lips, most HO
occurred in the uncovered posterosuperior disc space. They had also attributed this
development to the biomechanical compressive stress. This has linked the development
of HO to the design of the device. In addition, the location characteristics of HO may also
indicate that the smaller footprint issue may be a factor to consider. Vincent Pointillart et
al18 also linked HO with kyphosis.

21
ASD was also a common long-term problem, however Yanbin Zhao et al17 in their 10
years follow-up study had found no patients had suffered from ASD.
2.2 M6-CTM Artificial Cervical Disc (M6-C)
Owner: Spinal Kinetics LLC, Sunnyvale, CA, USA
FDA Approval: Case P170036, February 6, 2019, single level
Construction41,42:
The M6-C was designed to have 6 degrees of freedom in movements with progressive
resistances. It provides independent angular rotations in all three axes (flexion-extension,
lateral bending and axial rotation) and translational movements in all three axes (anterior-
posterior, lateral and axial compression).
It has a polycarbonate urethane (PCU) core sandwiched in between, in contact with but
not affixed to, a top and a bottom titanium alloy (Ti6Al4V) rectangular internal endplate.
PCU core
UHMWPE fibers
Inner endplate
Outer endplate
PCU sheath
Weld bands
Figure 2-2: M6-C cervical disc*
A schematic view of the device showing its internal components and
structure, especially its PCU core and how the UHMWPE fibers interweave
and loop between the top and bottom outer endplates giving the device its
torsional strength.
*Reprint from article43 with permission from International Journal of Spine Surgery.

22
Multilayers of strong polymer fibers (UHMWPE) were weaved in a wavy up-and-down
interlocking pattern surrounding the PCU core forming a simulated annulus. The polymer
fibers effectively elastically tie the relative movements of the upper and lower internal
endplate together. The whole mid portion of the device is enclosed in a flexible PCU
sheath to prevent debris, if any, from leaking outside. The sheath is retained by two
circular Ti6Al4V bands welded onto the inner endplates. Two outer Ti6Al4V endplates
with low profile anchoring fins are also welded onto the inner endplates. The external
surfaces of the outer endplates are coated with titanium plasma spray to enhance bone
cell adhesion.
M6-C comes in 4 width x depth combinations (15x12.5mm, 15x15mm, 17x14mm &
17x16mm) and 2 heights (6mm & 7mm) each making totally 8 sizes.
Characteristics42:
• Axial compression: 3.2kN (@ 0.2mm/s, no failure to 25kN)
• Compression-shear: 845N (45o with device in 7.5o extension @0.01mm/s, max
yield 6714 113N)
• Torsion: 4 Nm (@0.5o/s, max yield 10.26 1.23 Nm)
• Axial compressive creep: inter-endplate distance 1.0 mm under 100N
extrapolated to 100 years (100N for 42 days followed by a simulated 10 days of
sleep/wake cycle of 100N for 16hr and 53N for 8hrs)
• Lateral and anteroposterior translation: 3.5 mm (shear load 2kN + axial
compression 100N)
• The flexion-extension load-displacement curve (torque vs angle) compared
favorably with an intact human C5-C6 IVD.
Clinical studies:
Owner had performed a 2 years 12 sites investigational study in US (IDE#G050254) for
its FDA approval application. A total of 206 patients (152 M6-C, 46 ACDF) were treated
between May 2014 and June 2016 and had completed the full study period. 98 ACDF
23
patients’ data from a previous study was included to boost the total number of ACDF
patients to 144. The majority of the treated IVD levels were C5-C6 (51.3% M6-C, 54%
ACDF) and C6-C7 (40% M6-C, 38.6% ACDF). The study had concluded in May 2018.
Evaluations of NDI, VAS (neck and arm pain), SF-12/36 (PCS & MCS), Odom’s criteria
and patient satisfaction were performed at preoperative ( 30 days prior to surgery), 6-
week, 3-month, 6-month, 1-year and 2-year points. Radiographic evaluations were also
performed to investigate ROM, center of rotation, disc angle, disc height, device
condition, device subsidence, device migration, ASD and HO. At the 24-month point,
this study had produced multiple findings. Total ASD incidents, which required
subsequent surgical intervention, were 3.1% for M6-C and 2.1% for ACDF. Overall HO
(Grade 1 to 4) incidents were 59.3%, among which, severe HO (Grade 3 & 4) were
11.4% for the M6-C group while fusion was observed in 78.6% of the ACDF patients. In
quantifying the improvements in ROM between the M6-C and ACDF group,
comparisons were made on the measurements at pre-op and at month 24. The mean
flexion to extension rotation for the M6-C group was 8.33o (pre-op) and 8.78o (month-24)
and for ACDF were 8.02o and 1.16o respectively. The mean flexion to extension
translation for M6-C was 0.83 and 0.82 mm and for ACDF were 0.87 and 0.13 mm
respectively. The mean disc angle for the M6-C group was 2.21o and 7.21o and for the
ACDF group was 1.96o and 5.87o respectively. The mean disc height for M6-C group
was 3.22 and 5.31 mm and for ACDF group 3.32 and 4.27 mm respectively. The mean
lateral rotation for the M6-C group was 5.78o and 6.88o and for ACDF group was 5.77o
and 1.34o respectively. The ROM analysis had shown M6-C patients had improved the
pre-operation condition and maintained the physiological movements required throughout
the 24-months study but decreased in the ACDF group. The study had concluded that the
overall success rate for the M6-C subjects (86.8%) was non-inferior to the ACDF
subjects (79.3%).
Carl Lauryseen et al43 had conducted a 2-years investigational study on 1-level and 2-
levels treatments following FDA approval (IDE#G050254/S003) on March 12, 2008. The
study was conducted on 3 sites in US with total 28 patients (12 1-level, 16 2-levels). The
majority of treatments were at C5-C6 (56.2%) and C6-C7 (29.2%). The evaluation

24
protocol was similar to the main IDE study above. It had found that the M6-C implant
had provided a significant improvement on the anterior disc height (pre-op 4.2 mm,
month-24 7.0 mm), which might lead to the improvement of the mean disc angle (pre-op
2.8o, at month-24 6.5o). The compressibility of the device was associated with significant
improvements of clinical scores. If the device was positioned within 1 mm of the disc
midline, then the center of rotation would match that of the intact spine. Generally, there
were no significant differences between the two groups over the improvements on
clinical scores except in the neck pain VAS score where the 2-level patients had shown
significant improvements. The overall success rate was similar between the two groups
(83.3% 1-level, 93.3% 2-level).
V.A. Byval’tsev et al14 had conducted a 3 years study on 112 patients with single level
treatments in Russia (date unknown, prior to 2017). Comparing the pre-op and at month
36, patients had significant improvements over clinical scores (VAS, NDI) and mean
segmental ROM (6.42.5o pre-op, 8.82.6o month 36). Only initial (Grade 1) and
moderate (Grade 2) HO was detected in 15.1% and 10.7% patients respectively. ASD
was detected in 2.8% cases.
Discussion
M6-C represents a more advanced prosthesis design capable in providing 6 degrees of
freedom with progressive resistivities. This should mimic the biomechanical behavior of
natural IVD. Unfortunately, due to its short history, its long-term effects are unknown. In
short term ( 3 years), it had shown to provide improvements over clinical scores and
patients with better ROM. The only concern is on HO & ASD. Even at 2-year and 3-year
point, HO was detected with an unneglectable number in the Grade 3 & 4 level. It seems
it is not enough just to mimic the biomechanical properties of the intact IVD. The smaller
footprint that does not covering the entire IVD endplates may be an important factor to
consider.
2.3 PRESTIGE Cervical Disc System (Prestige-ST)
Owner: Medtronic Sofamor Danek, Memphis, TN, USA

25
FDA approval: Case P060018, July 16, 2007, single level
Construction44,45:
It consists of two surgical grade stainless steel (316) components forming a ball (top) and
trough (bottom) articulating structure. The flat potion of each piece in contact with the
vertebral endplate is grit blasted with aluminum oxide. Each piece has an anterior flange
and affixed to the vertebral body with 2 bone screws, which are locked in position with a
lock screw. The bone screws are put in a divergent position in the cephalic/caudal
direction but in a convergent position in the medial/lateral direction.
It comes in 10 disc-heights x depth configurations. The available disc heights are 6, 7 and
8 mm. The available depths are 12, 14, 16 and 18 mm but not all combinations exist.
ROM45:
• Flexion/Extension: 10o
• Lateral Bending: 10o
Figure 2-3: The Prestige-ST cervical disc*
Figure illustrates the construction of the device showing its ball-and-trough
structure and the anterior anchoring screws for the fixation of the device.
* Reprint from https://musculoskeletalkey.com/wp-
content/uploads/2016/07/B9781416067269000432_f043-001-9781416067269.jpg taken on May 18,
2021 with permission.

26
• Rotation: unconstrained
• Anterior/posterior translation: 2 mm
Mechanical properties45:
• Axial compression: 74N (@0.1mm/s, the mean load for 8mm x 12mm specimen
was 1343N at 2mm and 6279N at 5mm displacement)
• Compressive fatigue load: 74N and 10 million cycles (without failure to 10
million cycles under 225N axial load and 10 Hz sinusoidal load with an R values of
10)
• Subluxation shear force (force required to dislocate the upper from the lower
component when the device is at different extreme angle of flexion, extension
and lateral bending): 20N (shear force applied to the lower component @
0.1mm/s when device was at neutral, 10o lateral bending and 10o flexion
position)
• Push-out force in absent of screws: 20N (axial load applied at the posterior
portion @ 25mm/min until 10mm was reached, mean force measured is 129N)
• Pull-out force with screw fixations: 20N (pull force applied on the anterior edge
@ 25mm/min, for the 8mm x 12 mm specimen, the top portion measured was
200N and bottom portion was 251N)
Clinical studies:
Sponsor had performed a 2-years 32 sites investigational study45,46 (IDE#G010188) in US
for its FDA approval application. A total of 421 patients (223 Prestige-ST, 198 ACDF)
were treated to a single level (October 2002 to August 2004) and completed the 2-years
follow up evaluation. The majority of the treated IVD levels were C5-C6 (51.4%
Prestige-ST, 56.2% ACDF) and C6-C7 (40.9% Prestige-ST, 34.3% ACDF). Evaluations
of NDI, neck and arm pain, SF-36 (PCS & MCS), sergeant’s perception and patient
satisfaction were performed at preoperative (within 6 months of surgery), 6-week, 3-
month, 6-month, 1-year and 2-year points. Radiographic outcomes (only for smaller

27
subgroups) were used for elevating segmental ROM at treated and adjacent levels. For a
subgroup of 116 Prestige-ST patients, the mean angular motion was 7.55o pre-op vs 7.87o
@ month 24, the mean translational motion was 0.26 mm pre-op vs 0.28 mm @ month
24 and the mean lateral bending was ND pre-op vs 6.39o @ month 24. 73.3% passed the
angular motion test (>4o to 20o) and 26.7% failed at month 24. On a subgroup of 123
Prestige-ST patients, 99.2% patients had no bridging bone observed with 0.8% failure.
For second surgeries to treat ASD, 3 (1.1%) patients were treated in the Prestige-ST
group while 9 (3.4%) patients in the ACDF group.
Praveen V Mummaneni et al47 had continued with the 2-year IDE study and reported the
3-year’s and 5-year’s results. Total patients completing the 3-year and 5-year follow-up
evaluations were 347 and 111 respectively (didn’t specify the number in each of the
Prestige-ST group and ACDF group). It had found the 3rd-year NDI score of the
Prestige-ST group had significant improvement over the ACDF group but remained same
in the 5th-year. No significant was found in the SF-36 and VAS score between the two
groups. The Prestige-ST group had maintained a mean 7.1o in flexion and extension
throughout. HO and ASD were not reported.
J. Kenneth Burkus et al12 had completed a 7 years follow up clinical study as a
continuation from the initial IDE study above. A total of 395 patients (212 Prestige-ST,
183 ACDF) from the original group had completed the 7 years study. Same clinical
scores were continued to evaluate at 36, 60 and 84 months. The clinical score
improvements over the 6 weeks were maintained in both groups of patients at the 7 years.
The NDI scores of the Prestige-ST group were found significant improvements over the
ACDF group. The Prestige-ST group had maintained mean sagittal angular motion of
6.67o and 6.75o at 60 months and 84 months respectively. In addition, bridging bone (HO
Grade 4?) was observed to increase from 0.8% (of 250) Prestige-ST patients at 24 months
to 6.2% (of 209) at 60 months and 10% (of 201) at 84 months. The study did not cover
ASD, however it measured the sagittal angular motion of the superior adjacent segment
for both groups and compared to their original values and found that they had roughly
maintained their respective values from 6 weeks to 84 months.

28
Discussion
Prestige-ST has employed a basic design to provide spinal rotations. The center of
rotation should be fixed or within a very small range due to its ball-on-trough
mechanism. HO (bridging = Grade 4) had increased from 0.8% at 24 months to 10% at
year 7. Comparing this with the HO incidents of Bryan disc reported by Gerald M.Y.
Quan et al13, HO had increased from 17.8% at year 1 to 69.2% of Grade 3 & 4 at year 8.
Unfortunately, there will be typically higher number of HO patients in Grade 3 than
Grade 4. Hence, without knowing the breakdown of the Grade 3 and Grade 4 in the
Bryan case, comparison is not possible. With the FDA approval of the Prestige-ST on
2007, longer follow-up results may be available soon.
2.4 Prestige LP Cervical Disc (Prestige-LP)
Owner: Medtronic Sofamor Danek, Memphis, TN, USA
FDA approval: Case P090029, July 24, 2014, single level
Construction48,49:
A B
Figure 2-4: Prestige LP cervical disc*
Figure A shows the external feature of the device showing its fixation construction.
Figure B shows the open view of the ball-and-trough articulating structure of the
device.
* Reprint from article19 with permission from J Neurosurg Spine.

29
The device consists of two plates made from a titanium ceramic composite (Ti6Al4V
with 10% Titanium Carbide) forming a ball (upper plate) -and-trough (lower plate)
articulating structure to provide rotational freedom. The top of the upper plate and the
bottom of the lower plate both have two rails with teeth structures built-in intended to be
pressed fit into two pre-drilled holes in the adjacent vertebral bodies to prevent device
migration. The rail structures and areas in-between are plasma thermal spray-coated with
commercially pure titanium to encourage bony in-growth from the vertebral endplates.
The rest of the surfaces in contact with the vertebrae bodies are titanium ceramic
roughened to enhance fixation. The two plates are further secured onto the adjacent
vertebral bodies via 4 anterior screws.
The device comes in 10 disc-heights x depth configurations. The available disc heights
are 6, 7 and 8 mm. The available depths are 12, 14, 16 and 18 mm but not all
combinations exist.
Characteristics49:
• Shear forces required (applied to the inferior component) to dislocate the ball
from the trough feature in any direction and lordotic angulations: 20N (tested
mean max horizontal shear force was 357N)
• Axial compressive force without sinking device into the vertebral body
endplates: 74N (tested mean ultimate load was 513N with a stiffness of 442
N/mm)
• Push-Out force applied in the anterior/posterior direction @ 3mm/min with a
preload of 100N: 20N (tested mean ultimate load was 127.4N for the 6mm x
12mm device)
• Max static axial compression load applied @ 3mm/min: 74N (tested mean
failure load was 8808N for the 7mm x 18mm device)
• Compressive fatigue: 5M cycles (tested on two 7mm x 18mm devices and
found no failure to 10M cyclic loads of 225N with R value of 10, frequency not
specified but should be in the range of 0.1 to 8Hz50)

30
• Compressive-shear load (compression applied at 45o to normal50): 550N
(tested mean max 4962N with a mean stiffness of 6058N)
• Compressive-shear fatigue: 10M cycles (tested on two 5mm x 12 mm devices
with same condition as the compressive fatigue test).
Clinical studies:
Sponsor had performed a 2-years 20 sites investigational study49 (IDE#G040086) in US
for the device’s FDA approval application. A total of 262 patients were treated with the
device between January 13, 2005 to November 8, 2005 and the data collected till April
22, 2009. A total of 201 ACDF patients were taken from the previous Prestige-ST IDE
study (IDE#G010188) and used as the control group for this study. The majority of the
treated IVD levels were C5-C6 (52.5% Prestige-LD, 56.2% ACDF) and C6-C7 (38.6%
Prestige-LD, 34.3% ACDF). Evaluation procedures were the same as in the Prestige-ST
case [Section 2.3]. Radiographs were used to evaluate conditions of HO, angular ROM in
flexion/extension, ROM in lateral bending, translation, angular ROM of adjacent discs
(instead of ASD) and disc height. All clinical scores had shown comparable to superior
results in comparison with the ACDF control group. HO of Grade 4 (bridging) was found
to progress gradually from 0% at 6 weeks to 5.9% of patients at 24 months in the
investigational group. The mean angular ROMs of the investigation group (control group)
were 5.67o (7.87o) preoperative, 6.88o (0.53o) at 6 weeks and 6.15o (0.35o) at 24 months.
The lateral bending ROMs were N/A (N/A), 6.25o (N/A) and 6.15o (N/A) respectively.
The translation ROMs were N/A (0.26mm), 0.90mm (0.16mm), 1.03mm (0.15mm)
respectively. This showed an improved ROM for the investigational group over the
control group. There was a clear majority of 68.6% investigational group patients had
angular ROM >4o and 20o at 24 months, among which 67.8% had no grade 4 HO. There
were 30.7% patients had angular ROM 4o, among which a majority of 25.3% had no
grade 4 HO. Hence, HO grade 4 was not the major factor in limiting angular ROM. The
disc height was found to remain roughly the same values during the whole postoperative
period for both groups.

31
T. Wu et al.51 had performed a 24 months clinical trial on patients with non-contiguous 2-
level cervical degenerative disc disease in China. The intermediate segments (IS) were
normal in these cases. A total of 25 patients were treated with Prestige-LP from January
2008 to July 2015. The combined treated levels and the number of treated patients were
C3-C4/C5-C6 in 18 cases, C4-C5/C6-C7 in 5 cases, C3-C4/C6-C7(skipped 2 levels) in 1
case and C2-C3/C4-C5 in 1 case. Clinical scores of SF-36 (MCS & PCS), VAS, JOA and
NDI and radiographs (CT & MRI) were accessed preoperatively and post-operatively at
intervals of 1 week, 3, 4, 6, 12 and 24 months. All clinical scores had significant
improvements at the 24 months point over the preoperative scores. Radiographs were
used for evaluating cervical lordosis(+)/kyphosis(-) (CL), ROM of cervical spine, ROM
of Functional Spine Unit (FSU), disc height (DH) and HO. CL and different ROMs were
measured using the Cobb’s angle between different planes of the cervical spine (for
measurement details please refer to the paper). It was found that the CL was maintained
in all patients with no significant differences between preoperative (9.01o) and
postoperative (9.86o) conditions. The mean ROM of the IS had improved at the 3 months
point (14.54o) over the pre-operation (12.52o) but return back to the pre-op condition at
the 24 months point (12.91o). The mean DH of the upper and lower operated levels had
both remained roughly the same value throughout the 24 months postoperative period. At
the 24 months point, 1 patient (4%) had developed Grade 2 HO.
Guangzhou Li et al52 had performed a 48-months retroactive study on the correlation
between preoperative and postoperative HO developed at the treated levels. 69 patients
(total 89 treated levels) were selected having 1 to 3 contiguous levels treated with
Prestige-LP between January 2008 to June 2012. All patients had pre- and minimum 48
months postoperative follow-up data. There were 50 patients had one level treatment, 18
had 2-levels and 1 had 3-levels. For the treated levels, 1was at C3-C4, 14 at C4-C5, 58 at
C5-C6 and 16 at C6-C7. For the preoperative condition, the study used MRI and CT
radiographs and classification methods devised by Miyazaki et al53 and Kellgren-
Lawrence respectively. For postoperative HO, it used 3D reconstructions of the vertebrae
involved from CT scans and the McAfee classification system to evaluate the degree of
HO. This study had found the incidences of postoperative HO had progress from 17.4%
at 12 months, to 21.6% at 24 months and to 37.7% at 48 months. At 48 months there

32
were 15.7% at Grade 3 or 4. Comparing with the pre- and postoperative condition, it
found no significant correlation between them. However, segments with sever
preoperative degeneration might develop higher incidences of postoperative HO. It had
suggested that HO development might be a continuous degenerative process irrespective
of the CDA treatment.
Xu Hu et al54 had performed a 5 years study on the change of center of rotation (COR)
and ROM for a single level treatment using Prestige-LP. For an IVD prosthesis,
replicating the inherent COR is considered as an important factor in restoring the quality
of motion31. 42 patients were treated between January 2008 and July 2013. Cervical
radiographs (lateral statistic and dynamic) were taken preoperatively and postoperatively
at 3, 6, 12, 24, 36 and 60 months. Basing on the radiographs, flexion-extension ROM,
COR, disc height, FSU angles were measured (please refer to the paper for measurement
details). It found the mean disc height remained unchanged for all postoperative months.
The mean ROM had improved immediately from preoperative 7.5o to postoperative 10.1o
but decreased gradually and stablished at 7.8o at 60 months. The mean COR-x (+x points
from posterior to anterior direction) had remained unchanged throughout the
postoperative period. The mean COR-y (+y points from caudal to cranial direction) had a
significant gradual increasing cranial shift in postoperative period (-16.3% pre, 12,7% at
1 year, 15.4% at 3 years and 19.2% at 5 years). (The study did not explain the percentage
that the COR results were based on.)
Junfeng Zeng et al55 had performed a 6-year follow-up study of the Prestige-LP treated at
1 or 2 consecutive levels in China. 61 patients (total 77 implants) were treated between
January 2008 to July 2011 with 73.8% at one level and 26.2% at two consecutive levels.
The majority of the IVDs treated were 50.6% at C5-C6 and 31.2% at C6-C7. Clinical
(VAS, NDI and JOA scores) and radiographs (anteroposterior, lateral and dynamic
lateral) data were collected preoperatively and postoperatively at 1 week, 3, 6, 12, 24
months and biennially up to minimum of 72 months. Radiographs were used in
evaluating ROM of index and adjacent levels as well as degree of HO (McAfee). ASD
was detected as enlarged ossification of the anterior longitudinal ligament, narrowing of
the disc space > 30% or anterior enlarged osteophyte formation. The clinical scores were
33
found essentially stabilized throughout the postoperative period. The mean ROM for the
index, superior and inferior levels were also roughly stabilized throughout the
postoperative period. There was a progressive HO development. At the 2 years point
there were 10.4% (7.8% Grade 3, 2.6% Grade 4) incidences of sever HO and at the final
follow-up, there were 23.4% (13% Grade 3, 10.4% Grade 4). Since the clinical scores
remains stable, it suggested that the incidences of sever HO did not affect the clinical
score. ASD was detected in 29.5% of the patients at the final follow-up, however only
6.6% were symptomatic. With such a low symptomatic ASD level and sever HO didn’t
affect the clinical outcome, it concluded that the Prestige-LP was an effective CDA
device.
Matthew F. Gornet et al19 had conducted a 10 years FDA-approved IDE (NCT00667459)
post-approval study of a single level treatment with the Prestige-LP. Study protocols
were the same as in the approval application IDE study by the sponsor. Patients (CDA &
ACDF group) from the original study were followed-up to 10 years. Results were
compiled at 2, 5, 7 and 10 years. The number of CDA/ACDF patients at each follow-up
points were 280/263, 277/260, 277/260, 274/(no ACDF group at 10 years point)
respectively. All mean clinical scores (NDI (neck pain & success), Arm pain & success,
SF-36(PCS, MCS)) for both the CDA and ACDF group had shown improvements over
preoperative conditions and remained stable from 2 years to 10 years point. The CDA
group had shown consistently better scores than the ACDF group. The mean angular
ROM at the index level for the CDA group measured 6.88o at 6-week point, increase by
1o at the 1-year point and gradually returned back to 6.85o at the 10-year point. The same
ROM for ACDF group at the index level was almost immobile (~0.5o) over the entire
postoperative period. This study evaluated ASD using the mean angular ROM of the
superior and inferior adjacent levels and found both groups increased on average without
creating hypermobility and maintained overtime. The incidents of severe (Grade 3 & 4)
HO increased almost threefold over time. The total incidents of severe HO detected at the
2-year, 7-year and 10-year point were 10% (8.8% Grade 3, 1.2% Grade 4), 20.5% (15.9%
Grade 3, 4.6% Grade 4) and 28.5% (19.5% Grade 3, 9% Grade 4) respectively. However,
the severe HO apparently did not impact on patient-reported outcomes. It concluded that
the Prestige-LP with results stabled over 10 years was as an effective treatment as ACDF.

34
Discussion
Prestige-LP uses a similar construction as its predecessor, Prestige-ST, but with a harder
material (titanium carbide vs stainless steel 316). With such hard articular surfaces, it is
inconceivable to have any postoperative changes in its disc height, angular ROM and
center of rotation (COR) throughout the patient’s life. The first two points are validated
by all clinical studies of this device. For the COR, the Xu Hu et al54 study had found
COR-y had a cranial movement over time. Judging from the small differences (~6.5%)
between the results of the first and fifth year and the small patient size, the small upward
trend may be just caused by statistical noises. However, this is the only study found on
the COR for this device, it will need further studies to validate their discovery. The
development of ASD is difficult to compare between different clinical studies because
each had its own definition. The incidents of severe HO definitely increase over time. It
increases from 10% at 2-year point to 2.9 times at the 10 years point. Comparing this
with the Bryan disc from 17.8% at year 1 to 3.9 times at year 8. It seems it has a lower
initial postoperative incident of severe HO and a lower long-term incident than the Bryan
disc. Comparing with its predecessor, the Prestige-ST, the Grade 4 HO of the Prestige-LP
was 1.2% at year 2 and increased by 7.2 times at year 10, while the Grade 4 HO of the
Prestige-ST was 0.8% at year 2 and increased by 12.5 times at year 7. The Prestige-LP
has comparable initial postoperative Grade 4 HO incidents but lower long-term incidents.
2.5 Cervical Prosthesis – Elastic Spine PAD (CP-ESP)
Owner: Spine Innovations (France) (formerly FH Ortho)
CE Mark16: 2012
Construction16,56,57:

35
The CP-ESP is a viscoelastic deformable device designed to have 6 full degrees of
freedom with shock absorption capability and adaptive instantaneous center of rotation
(COR can change freely during motion). It provides elastic resistive and restoring
properties for translation, compression and rotational motions.
It consists of two titanium alloy (TiAl4V) endplates sandwiching a one-piece
polycarbonate-urethane (PCU, BionateTM 80A) core. The exterior surfaces of the two
endplates have anchoring pegs to provide fixation and are coated with plasma sprayed
A
B
Figure 2-5: CP-ESP cervical disc*
A: shows the construction of the device having two end-plates and a special
shaped PCU core. The male and female pegs on the endplates are for limiting
the movement of the PCU core within range.
B: shows the 6 DOF mobility of the device.
*A: Reprint from article16 with permission from Eur J Orthop Surg Traumatol.
*B: Reprint taken on May 27, 2021 from https://www.esp-disc.com/wp-
content/uploads/2020/11/Cervical-motion.jpg with permission from Spine Innovations, France.

36
pure titanium (T40) and hydroxyapatite (HAP) to promote vertebra bone cell adhesion.
The inner surfaces of the endplates also have a pair of male and female peg, together with
the geometry of the PCU core, help to limit the degree of compression, rotation and
translation to provide spinal stability. The PCU core is shaped in such a way to provide
the optimal mobility and control of translation and shear movements. It is “bonded to the
endplates via adhesion molding using a peripheral groove without using glue for
reinforcement”16.
It comes in 3 sizes (13x15, 14x17, 15x20 mm) and each with 3 heights (5, 6, 7 mm)
making a total of 9 combinations for CDA treatments.
ROM56:
• Flexion / extension: ±7o (natural IVD ±7o)
• Lateral flexion: ±5o (natural IVD ±6o)
• Axial rotation: ±3.5o (natural IVD ±4o)
• Anterior-posterior translation: 0.8 mm16
Mechanical properties16:
• Compressive stiffness: 733 N/mm (natural IVD 492 N/mm)
• Torsional stiffness for extension: 0.03 Nm/1o (natural IVD 0.5 Nm/1o)
• Torsional stiffness for flexion: 0.03 Nm/1o (natural IVD 0.03 Nm/1o)
• Torsional stiffness for lateral bending: 0.05 Nm/1o (natural IVD 0.9 Nm/1o)
• Torsional stiffness for axial rotation: 0.24 Nm/1o (natural IVD 0.8 Nm/1o)
Clinical studies:
J. Y. Lazennec et al16 had performed a preliminary 2 years follow-up study on 62 patients
with single (53 patients) and 2 levels (9 patients) treatments totaling 71 implants. The

37
majority of the single level treatments were at C5-C6 (42% of total 62 patients) and C6-
C7 (32%) and for 2 levels were at C4-C6/C5-C6 (3%) and C5-C6/C6-C7(10%). Clinical
scores (Neck and Arm VAS, NDI, SF-36 PCS & MCS) and X-rays were collected at pre-
op, 3, 6, 12 and 24 months. From the lateral X-rays, it measured the mean angular ROM
at the index, upper adjacent and lower adjacent levels at the 3-, 6-, 12- and 24-months
points. The mean ROM of the index level were 6.8o, 10.3o, 8.4o and 10.7o respectively.
For that of the upper adjacent level were 9.7o, 11.7o, 12.9o and 13.8o respectively and that
of the lower adjacent level were 6o, 10o, 9.4o and 11.1o respectively. It seemed the mean
ROM for all levels had stabilized or improved slightly on month 6 and onwards. The
paper also displayed the mean COR images of the 3 IVD levels for one patient with
global cervical kyphosis and with a single level treatment on the extension/flexion motion
from the pre-op to 24 months. Unfortunately, it did not provide any quantitative data or
analysis to relate any good results with the capabilities of the device. No incidents of HO
were observed.
J. Y. Lazennec et al58 had performed another 2 years follow-up study on 89 patients
treated with one (72 patients), two (16) and three-levels (1) between October 2012 to
December 2015. They published a brief summary of their preliminary results in a
proceeding supplement. It contained the clinical scores (VAS neck & arm, NDI, SF-36
PCS & MCS) obtained at pre-op, 3, 6, 12 and 24 months. It stated that they “did not
observe local ossifications” but had revised “one C5-C6 implant for bone ingrowth
failure at 6 months”. The ROM had stabilized from 6 month onwards and by monitoring
the location of mean COR at the index and adjacent levels “had demonstrated the
adaptation ability of the implant”. Unfortunately, the paper contained no further
information to substantiate these statements.
Discussion
The CP-ESP is an advance CDA device that has capabilities and mechanical behaviors to
mimic that of a natural IVD. However, even though it states that it is viscoelastic, no rate
depending data is found in the literature. By just relying on its PCU core material
properties, it is not known how tunable its IVD mimicking properties can be to match that

38
of a natural IVD. No HO observed (questionable) for the first two years may be a good
indicator in compare with other devices. Unfortunately, with its short history and no
follow-up studies beyond 2 years, its long-term benefits cannot be validated at the current
time.
2.6 Experimental devices
Many experimental or research-oriented devices have been developed in the past. While
most of them were only for research purpose but some even have performed some form
of IDE clinical studies. However, their official approval status is not clear. The ones that
are included here are those that have their concepts, designs or materials used relevant to
this research but not necessary only for cervical disc applications. Unfortunately, most of
them have only limited literature available to illustrate their full clinical relevance,
mechanical properties, construction and materials. Hence their correctness cannot be
thoroughly checked.
2.6.1 PHEMA/PMMA hydrogel composite IVD prosthesis from Antonio Gloria et al
Antonio Gloria et al59 had developed a device with swollen fiber-reinforced composite
hydrogels to mimic the structure of a natural IVD. They wound polyethylene
terephthalate (PET) fibers helically on a mandrel (with diameter comparable to that of the
NP) at an angle varied between 45 to 65o to mimic the structure of the AF of an IVD and
molded the fibers within the poly (2-hydroxyethyl methacrylate)/polymethyl
methacrylate (PHEMA/PMMA) 80/20 w/w chemically cross-linked hydrogel.
Hydroxyapatite (30% w/w) reinforcing hydrogel was added as endplates material.
They had tested the compressive properties of this device at strain-rates of 1, 5 and 10
mm/min and found no yield up to a load level of 17kN. The J-shaped test stress-strain
curves obtained had a toe region up to 0.09 strain followed by a linear region. The
Young’s moduli of the linear regions were 84 ± 9.8 MPa, 102 ± 11 MPa and 120 ± 12
MPa respectively for the three strain-rates. They had also performed compressive creep

39
tests on the device using an initial stress of 2 MPa and monitored the strain over 4500s.
The mean strain values obtained varied from initial 0.069 to final 0.12 after 4500s, which
were comparable to canine IVDs under same test conditions. The creep curves and the
compressive stress-strain curves at different strain-rates had validated the device was
viscoelastic. No torsional tests were performed.
Discussions
This device, even though using different materials, had employed a very similar
construction concept as the one proposed in this PhD research. From the no-yield
compressive load and the Young’s moduli of the three stress-strain curves, this is a much
stronger device in comparison with the findings from other researchers. Haisheng Yang
et al60 had measured the mean effective Young’s modulus of human IVD from T8 to L5
to be 17.0±9.8 MPa @ 0.05%/s and 25.5±8.6 MPa @ 20%/s. From the derivation of the
measurements reported by Manobar M. Panjabi et al61 on human IVD C2 to T1, the
Youngs’s modulus was around 14.5 MPa [Section 3.5.1]. Both were much lower than the
device. The device may be too strong for the CDA application. Unfortunately, the paper
Figure 2-6: An experimental device made from PHEMA/PMMA hydrogel
composite*
A: a schematic view of the device showing the helical winding angles of the PET
fibers core sandwiched in between the hydroxyapatite reinforced endplates.
B: shows a test specimen of the device.
* Reprint from article59 with permission from J Mater Sci Mater Med (Springer Nature license #
5075991423083)

40
did not provide a method on how to modify the strength of this device to suit the CDA
application.
Judging from the low slope of its creep curve and the closeness of its stress-strain curves
of the 3 strain-rates, the device is only slightly viscoelastic.
2.6.2 PHEMA/HEMA hydrogel composite IVD prosthesis from Antonio Gloria et al
Antonio Gloria et al62 had developed another similar device as their PHEMA/PMMA
device. In this device, instead of PMMA, it used 2-hydroxyethyl methacrylate (HEMA)
instead. The winding arrangement of the PET fibers remained unchanged. The endplate
material used became hydroxyapatite-reinforced polyethylene composite (HAPEXTM).
Anchoring pegs were added to the exterior surfaces of the two endplates to aid fixation of
the device. The kidney shaped geometry (core & endplates) of the device was derived
from an average of five porcine lumbar discs. They had performed compressive tests at a
rate of 1 mm/min until yield, compressive shear test (device positioned at 45o to
horizontal) with preload up to 20N at compressive rate of 1 mm/min up to 600N and
torsional tests with a compressive load of 500N at torsional rate of 0.1o/s up to a
maximum of 1 Nm torque. The mean compressive curve obtained was non-linear.
Initially it had a toe region, followed by a linear region, then a decrease of the slope and
then followed by an increase of slope before reaching the maximum load. The
compressive stiffness at the linear region was measured at 4.03 kN/mm. The nonlinearity
above 5.8kN as explained was due to the failure of the HAPEXTM at the outer contour of
the endplate. The compressive-shear curve was more linear with a small initial toe region.
The compressive-shear stiffness was found to be 205 ± 22 N/mm. The torsional curve
obtained had a steep initial rise from 0 to ~1/3o and followed by a plateau with a small
rising slop until failure at round 3.5o rotation. The plateau might signify plastic
deformations. The torsional stiffness found was 2.8 ± 0.3 Nm/deg.
Discussions
The compressive stiffness of this device was found to be 4.03 kN/mm. Same property of
those prostheses with metal-on-metal structures will be almost infinite. A reasonable

41
comparison will be with those having PCU cores. The CP-ESP had reported that its
compressive stiffness and that of a natural human IVD was 733N/mm and 492 N/mm
respectively [Section 2.5]. Basing on this, this PHEMA/HEMA device is much stiffer
than a human IVD.
Unfortunately, comparing stiffness is not meaningful because stiffness is dimension
dependent. Without knowing its geometric details such as cross-sectional geometry and
height, it is difficult to compare its compressive strength with other devices, even with
their previous PHEMA/PMMA device. Only comparisons with dimensionally
independent material properties (e.g., Young’s modulus) between devices will be
meaningful.
2.6.3 NeoDisc cervical disc
The NeoDisc63,64 is a CDA device originally developed by Health Innovation Support
(UK) and later sold to NuVasive Inc. (San Diego, California, USA). It consists of a solid
silicone elastomer core inserted into a jacket manufactured from polyester suture material
using computer-controlled embroidery. It is held in position to the adjacent vertebrae by 4
anterior titanium bone screws. Long-term fixation is expected from fibrous tissue
integration with the jacket material.

42
NuVasive had conducted a 2-years IDE (NCT00478088) clinical study64–66 in US
A
B C
Figure 2-7: The NeoDisc cervical disc*
A: provides the side and front view of the device showing its outer jacket
manufactured from polyester suture material using computer-controlled
embroidery.
B: shows its fixation method employed using 4 anterior screws.
C: shows a cross-section of the device with its silicone elastomer core.
*Reprint taken on May 25, 2021 from:
A: https://www.healthinnovationsupport.co.uk/wp-content/uploads/2017/04/Neodisc-1.png.
B: https://www.healthinnovationsupport.co.uk/wp-content/uploads/2017/04/Cross-
sectional-view-neodisc.png
C: https://www.healthinnovationsupport.co.uk/wp-content/uploads/2017/04/NeoDisc-
mounted-on-artificial-neck-bones.png
with permission from Health Innovation Support, UK.
43
involving 53 patients (28 NeoDisc, 25 ACDF) who had completed the 2-year follow-up
period. The patients were treated at a single level between September 2006 to August
2010 and followed-up to March 2012. Clinical scores (VAS, NDI, patient satisfaction)
and flexion/extension radiographs were evaluated on preoperation and at 6 months and 2
years follow-up. The success of the trial was defined as greater than 15 points
improvements in NDI. It was achieved in 89.3% of the NeoDisc group patients and 72%
in the ACDF group. As for ROM for the NeoDisc group, the pre-operative mean was
10.7o, 8.4o at the 6 months and 8.2o at 2-year follow-up. Unfortunately, for unknown
reasons, NuVasive had aborted this IDE study64 and the device is not yet approved by
FDA.
Discussion
The NeoDisc has a non-traditional design and construction. It does not have endplates.
The integration of the implant is designed to be via soft tissue ingrowth over its polyester
fabric material instead of ossification. With its embroidery construction, the control of its
initial translational ROM may be a concern. However, no mechanical test data found to
evaluate this yet. Even though the soft tissue integration had been validated via a sheep
model, its effectiveness and possibility of inflammatory response to the polyester material
might need further investigation64.
2.7 Discussion
2.7.1 Structure & core material
The CDA devices reviewed in this Chapter may be roughly classified into two classes:
hard core and elastomeric core construction. The hard core class of devices is mainly
based on the ball-in-trough construction, whose concept might be derived from the
Bristol-Cummins disc67 developed around 199168. This class of devices is mainly
constructed with hard materials (e.g., stainless steel) hence it is practically incompressible
and has fix COR. It supports the bodily weight, as an ACDF implant does, and provides 3
degree-of-freedom (DOF) in rotational ROMs. This provides the basic function of a CDA
device. The two CDA devices reviewed over here, Prestige-ST and Prestige-LP, belong
to this class. Other popular devices of this class in the literature include the Mobi-C69,

44
ProDisc-C2 and ProDisc Vivo5. The elastomeric core class of devices employs a
deformable polymeric material (e.g., PCU or its derivatives) as its core. It supports the
bodily weight (axil compression) by slight vertical deformation and 6 DOF of motion by
a combination of asymmetric deformations in opposite directions, rotation and
shear/compression. Its PCU (or derivative) core generally provides some degree of
viscoelasticity. Depending on its construction, there may be elastic restoration reactions.
The design intent of this class of devices is to mimic the mechanical properties/behaviors
of a natural IVD. The Bryan cervical disc, M6-C, CP-ESP, the two hydrogel composite
discs from Antonio Gloria et al and the NeoDisc reviewed in this Chapter belong to this
class. A few more examples can be found in the paper from C.A.M. Jacobs et al64. This
class of devices can adapt to any instantaneous COR in any spinal mobility as a natural
IVD, hence provides a better quality of motion.
The mono-block construction of some of the CDA devices (CP-ESP) may lead to a
reduced risk of wear problem as compared with those with sliding articulating surfaces.
Having a shielding sheath to enclose the entire core (Bryan Cervical & M6-C) does not
solve the wear problem but preventing the debris, if produced, from leaking out. Some
use extreme hard material (titanium carbide in Prestige-LP) to reduce the amount of
debris produced to an acceptable level.
In general, the devices with simple structures (mono-block, ball-in-socket) may have
lower chance of failure in long term. Christopher Brenke et al70 had analyzed the failure
case of an original version of a 6-year-old M6-C implant with a herniated core. The
surrounding fibers were found ruptured. Apart from intuitive reasoning, the main culprit
was difficult to identify after the fact in most cases. A newer version of the M6-C devise
with stronger fibers and modified endplate anchoring is now available.
The experimental devices in Section 2.6 and some described in the C.A.M. Jacobs et al64
paper have either no metallic endplates or totally without endplates. This type of devices
may have an advantage over those with mantellic endplates in that they do not produce
artefacts in follow-up MRI/CT radiographic images to investigate the status of the
implant and spinal movements. Another possible advantage is in better matching of

45
interfacial material properties between the device and the vertebral bones than hard
metallic materials.
2.7.2 Long-term effects
HO and ASD have been identified as long-term effects of many current CDA devices in
the literature. In this review, both were evaluated on a per device basis. Cross device
comparisons may be confounded by the differences of their design of the device and their
postoperative duration. However, a trend is clear. Many of the clinical studies of each
device having follow-up histories more than 2 years have shown both the number of
patients and their severity of HO have increased in time. Some researchers had attributed
the development of HO to predisposed osteoarthritis conditions at the index level.
Patients having preoperative ossification history at the index vertebrae may lead to higher
chance of postoperative HO. Although this can explain some of the cases, it does not
explain the same trend happened in many devices. Judging from the fact that the
ossification sites locate mainly on areas not covered by the endplates of the devices, this
may lead to a suggestion that a device with end profiles conforming exactly with the
adjacent vertebrae surfaces of a patient may reduce the incidents of HO. Hence a patient
specific prosthesis may solve the long-term HO development problem.
ASD had been identified in many of the clinical studies. Unfortunately, ASD does not
have a uniform definition even between clinical studies of the same device. This makes
the comparison of degree of ASD development difficult between different clinical
studies, let alone between different devices. Some clinical studies had used a simplified
approach by measuring the ROM of the superior and inferior IVD without analyzing their
HO status. Some had included both and other conditions. However, same as the HO
situation, many clinical studies had identified ASD also tends to increase in number of
patients and severity in time. Causes of the development of ASD are not currently
identified. It may be hypothesized to be caused by additional stresses exerted onto the
adjacent levels induced by the index level prosthesis device due to its spinal motion
limitations or mismatched mechanical properties. A device that can fully mimic the
material properties, ROM and DOF of an IVD, i.e., functions fully as a natural IVD, may
reduce the incidents of ASD development.

46
While both incidents of HO and ASD had shown increased in time within each of the
study groups, it is puzzling to find that some clinical studies had found that they did not
affect the mean clinical scores of the group throughout their entire follow-up period,
hence concluded that they didn’t affect the health condition of the patients. Common
sense will point out that a Grade 4 HO condition will turn a CDA device equivalent to an
ACDF implant. This leads one to puzzle how effective these common clinical scores and
lateral radiographic techniques employed can measure the quality of motion of a patient
in real life situation. The quality of motion in the majority of these clinical studies were
mainly determined by the simple flexion & extension ROM. May be a more complex
ROM derived from motions including combinations of flexion/extension, lateral bending,
axial rotation and translation would provide a better measure.
Current methods to quantify the mechanical strengths of an IVD prosthesis device in the
industry, as specified in the ASTM standard50, use compressive stiffness (force per
displacement, N/mm) and torsional stiffness (torque per degree of rotation, Nm/o).
Unfortunately, stiffness is device dimension dependent hence not a good property to
compare between a device with a human IVD or between devices. A better method will
be to use dimensionally independent or normalized properties like stress, strain and
modulus. In this research study, all compressive and torsional properties will be
quantified in these dimensional independent properties.
In summary, this literatures review section has led to the fact that current IVD prosthesis
devices haven’t fully mimic the size, shape, material properties and mechanical behaviors
(DOF and COR) provided by a natural IVD. The fixation damages to the vertebral bodies
may be a cause to trigger their continue remodeling resulting in long term HO. All these
mismatches and damages may lead to the long-term development of HO and ASD.
Improvements over existing devices may be in two main areas.
The geometry (size and shape) of the prosthesis should be the same as a healthy IVD as
the removed IVD of the patient. The device must have the same footprint as the IVD
removed, covering the entire end-plate areas (superior and inferior) of the affected

47
vertebrae and with the height adjusted to treat radiculopathy. This means the prosthesis
must be able to be patient-specifically molded/shaped into any shape and size required.
The device should mimic the mechanical properties of a healthy IVD in providing 6 DOF
in movement and extend in each direction and variable instantaneous COR. This requires
the material to be viscoelastic and has compressive and torsional strengths to match that
of a healthy IVD. A single block design may be preferable over a multiple components
construction to reduce the risks in component failures.
The above two themes are explored in the current research study.

48
Chapter 3
3 Viscoelasticity & Impact Resistance Characterization of Kangaroo Cervical Intervertebral Disc
Abstract
The goal of this study is to characterize the large-scale size-independent viscoelastic
behavior and impact-resistance of unrestricted bulk material properties of kangaroo
cervical C5-C6 intervertebral disc (IVD) under axial compression and torsion. The results
should be of interest to researches in IVD prosthesis development and spinal simulation
for traumatic events.
The viscoelasticity is characterized by modeling stress (compressive or torsional) as a
function of time and strain. In each case, a surface was fitted (least square error with
acceptable R2 value) over experimental data of stress measured under different strain
rates until yield (compression n=19 rate=0.25mm/min to 150 mm/s; torsion n=13
rate=1o/min to 90o/s). A polynomial surface of degree 3 in time and degree 1 in strain was
found to provide acceptable fit for compression and torsion separately. This shows
kangaroo cervical IVDs are linear viscoelastic under both compression and torsion.
A definition was proposed for quantifying the impact resistance of a viscoelastic material.
A derivation method was developed basing on the “viscoelastic surfaces” obtained. A
series of triangular impulse stress of 70ms duration of different peak stress values was
used to illustrate this method for compression and torsion separately.
For compression (n=19), the mean yield stress found was 11 MPa (sd 3.4) and mean yield
strain 0.55 (sd 0.2). The Young’s modulus ranges from 20.0 MPa (t=0) to 6.7 MPa
(t=379 s). For torsion (n=13), the mean yield stress was 13 MPa (sd 5.0) and mean yield
strain 0.66 (sd 0.17). The torsional modulus ranges from 20.7 MPa (t=0) to 2.7 MPa
(t=347 s). The comparison with human C5-C6 IVD properties, even though likely to be
comparable in strength, was inconclusive due to the lack of data in literature for human
C5-C6 IVD specimens tested under similar conditions.

49
3.1 Introduction
An IVD, being sandwiched in between two vertebrae, serves to support the bodily
weight, to provide spinal mobility and to provide shock-absorption in the spinal column.
Neck injuries, resulting from traumatic incidents such as in automobile collisions, sports
and uncontrolled falls, are current research areas. The characterization of the bulk
material properties of the cervical IVDs will allow better understanding of neck injuries
during these incidents. It will also benefit many fields of spinal research, such as in the
development of prosthesis for total disc arthroplasty, in the simulation of the spinal
performance using finite element methods (FEM) and in the development of personal
protective equipment to prevent neck injuries.
Many spinal researches have focused on the study of the lumbar section of the spine,
especially on the range of motion (ROM) in flexion-extension, bending and axil rotation.
Large scale viscoelastic behavior studies, especially torsional characterization and in the
cervical region, are limited. The ROM determination is important for daily activities.
However, in a traumatic situation, the major injury vector71 will not stop even after the
fracture of the ROM limiting structures (e.g. facet joints). To fully study the spinal
behavior in a traumatic event, one requires the native material properties as well as yield
characteristics of each component of the spine. This study had focused on the material
properties of the IVD free from any movement limiting structures (unrestricted).
Even though the importance of torsional behavior of IVD is still under debate due to their
limited ROM, some researches had shown that even low torsional motion below the yield
limit can damage the IVD72–74. Hence characterizing the torsional behavior is important.
Most earlier studies75,76 characterized the torsional behavior by measuring torque vs
rotation angle. This approach may limit the generalization of the results due to
differences in the IVD size and shape. Some recent studies72,77 had normalized the results
with the polar moment of inertia of the IVD, a similar technique used in the physics of
rotating shafts. However, they still fell short in defining a shape independent torsional
stress, strain and modulus properties. This study followed the traditional approach used
for the compression and shear behavior by defining these properties in such a way that

50
the area under the torsional stress-strain curve represents the same measure of the energy
(work-done) absorbed by the IVD per unit volume. With this approach, the torsional
analysis can use the same derivations from the compressive case, i.e., in modeling the
viscoelastic and impact resistant properties of the IVD.
Studies had shown that the integrity of the endplates of an IVD is susceptible to short
impact durations78. Damaged endplates correlate well to subsequent disc degeneration79.
Impact resistance capacity of a material is traditionally measured using an ASTM drop
test method such as the Charpy pendulum or free-falling weight. However, this method
will be difficult to apply to IVDs because they are embedded between two vertebrae.
Chamis et al80 had proposed an alternate method making use of the area under the stress-
strain curve of a material. This represents the energy (or work-done) absorbed by the
material per unit volume induced by the impact force. For a viscoelastic material, the
stress-strain behavior is also time dependent. This study extended this method to employ
a time average of an impulse force over the stress-strain-time behavior to quantify this
property. Effectively it is the mean energy absorbed by the material over the duration of
the impact force or torque.
Traditionally viscoelasticity is analyzed by either using a set of creep curves81, relaxation
curves82 or stress-strain curves at different strain rates. Unfortunately, even though all
three methods describe the same material property, deducing results of one from another
is not simple. This study introduces a “viscoelastic surface” method to model the stress-
strain-time relationship of the material behavior using a polynomial model. The creep,
relaxation and stress-strain curve at a given strain rate can be easily deduced from this
generalized model. An additional benefit of this method is that the impact resistance of
the material, when subject to an impulse force, can be derived mathematically.
The ideal candidate for studying the biomechanical properties of IVD is obviously
human. Unfortunately, due to the limited availability and choices of uniform human
specimens, animal models, typically quadrupeds75,82–86, have been widely used in the in
vitro spinal research. Due to our upright standing posture, our cervical IVDs are under
compression due to the weight of our head. This compressive pattern and magnitude are

51
different from those of the quadruped animals. This study hypothesized that kangaroos,
having similar upright standing posture, similar weight and height to young adult human,
will be a good model for IVD studies, especially in the cervical region.
The objective of this study was to characterize the large-scale cranial compressive and
torsional viscoelastic properties of the unrestricted C5-C6 cervical IVD using kangaroos
as the animal model. In addition, their statistical yield limits and impact resistance
capacities in each excitation type were also evaluated. Large-scale viscoelastic behavior
of unrestricted kangaroo C5-C6 IVDs were tested under very slow compression rate
(0.25mm/min) to very high compression rate (150mm/s) and at rotational speed of 1o/min
to 90o/s. Their corresponding yield stress and strain values were also measured. The
impact resistances were evaluated using a 70ms triangular impulse of various magnitude.
Finally, their size independent material properties were compared with those from human
C5-C6 IVD obtained from literature.
3.2 Materials and Method
3.2.1 Sample preparation and IVD Test Unit (ITU) Construction
Sixty freshly frozen kangaroo upper body spines [Figure 3-1] (Macropus rufus and
Macropus giganteus, 80-110 lbs body weight without head, unknown age and gender)
were procured from Australia (Hills Foods Ltd, BC, Canada). All were microCT-scanned
C5
C6
A
C B
Figure 3-2: Kangaroo spine specimen
(A) is a specimen of kangaroo spine in frozen state. (B) Its CT-scan image.
(C) Its segmented 3D image with C5 & C6 identified.

52
(GE Locus Ultra, 154µm 3D voxel, 80kV, 50mA) and kept frozen in -20oC. The
specimens chosen for testing was the IVD C5-C6 of the cervical spine. Each spine
specimen was defrosted (48 hours in 2oC) with C5 to C6 section dissected out, de-fleshed
and with posterior and part of lateral structures removed [Figure 3-2] to eliminate
obstructions to rotational and compressive movements of the vertebrae bodies.
The resulting specimen was cast into an IVD Test Unit (ITU) [Figure 3-5] in between 2
machine-cut ABS pipe sections (4” ID, 1-3/4” height) with top and bottom embedded
(~3/8”) into the casting compound (Denstone, Heraeus Kulzer, IN 46614-2517, USA).
The center line of C5 & C6 was positioned vertically (C5 on top) and aligned with the
center line of the two ABS sections using a jig specially designed for this process [Figure
3-3]. A wet paper towel was wrapped loosely around the exposed middle portion of the
ITU to maintain a humid environment around the specimen. Each ITU was placed in a
sealed plastic bag and kept frozen horizontally at -20oC before testing. Prior to testing,
each specimen was defrosted (48 hrs in 2oC) horizontally and brought back to room
temperature (21 oC) for ~4 hours. After testing, the IVD was transected horizontally to
inspect the health condition of the IVD to determine the acceptability of its test result.
A B
Figure 3-3: Processed C5-C6 IVD test specimen
(B) Anterior view (B) posterior view

53
Figure 3-4: ITU casting jig
This jig allows the center line alignment of the IVD specimen, the top and
the bottom cast section. The upper portion slides up and down via two
vertical rails. Both the top and bottom bracket have 4 mounting screws to
house the 4” (ID) ABS pipe section for casting. A removable inner insert
can be mounted in the upper bracket to house a center pin to indicate the
center of the ABS pipe section. This center pin is used for aligning the
center of the IVD specimen when casting the lower half of the ITU. The
lower part of the ITU is cast first. After the casting compound solidifies,
the lower ITU is removed from the jig’s lower bracket and mounted
upside down on the upper mounting bracket for casting the top part of the
ITU. The whole upper portion slides down with suitable distance to
immerse the upper part of the IVD specimen into the casting compound
and holds there for the upper ITU to solidify.

54
Figure 3-6: IVD Test Unit (ITU)
Then C5-C6 IVD specimen is casted with part of the vertebrae body
embedded within the casting compound.
Figure 3-5: ITU mechanical testing setup
The ITU is held in place with special brackets attached to the top load cell
and bottom stationary test platform. The top and bottom brackets are center
aligned before the attachment of the ITU.

55
3.2.2 Material testing
Mechanical testing was performed on a bi-axial Instron 8874 machine using a ± 10kN
and 100Nm load cell. Each ITU was mounted onto the load cell with C5 on top via 4
horizontal screws screwed into the ABS section on top and bottom of the ITU [Figure
3-4].
Geometric dimensions of each IVD were determined from its CT-scanned image
(MicroView). The IVD image was rotated in such a way that the Sagittal plane bisected
the spinous process and the Coronal plane touched the outmost point of both C5 at the top
and C6 in the bottom. The IVD image together with the scale on the Sagittal plane was
taken as a screen capture. The disc height was taken as the arithmetic mean of the
posterior, anterior and mid disc height measurements from the Sagittal image (ImageJ)
[Figure 3-7A]. Another screen capture was taken from the IVD image together with the
scale in a Transverse plane close to the cranial portion of C6. The disc area was measured
from the cross-sectional area of the C6 cranial surface (ImageJ).
3.2.2.1 Compressive Viscoelasticity Characterization
Each ITU was subjected to a two stage-pre-conditioning steps before compression
testing. The purpose was to revitalize their original condition in the animal body. The
specimen was compressed to a maximum load of 100 N at a rate of 0.25mm/min. The
ITU was held in position for 15 minutes before the load was removed. After a resting
period of 2 minutes, the specimen was compressed to a load of 50 N at the same rate
(0.25mm/min) with a holding time of 1 minute followed by an oscillating displacement
(sine wave, 0.1Hz, amplitude ±0.05mm) for 15 min. The sample was left to rest for 2
minutes before testing.
A total of 19 ITUs were compressed at constant displacement rates as given in Table 3-1
until they yield. The elastic portion of the stress-strain curve, c(c), and strain-time
curve, c(t), of each ITU were extracted (MS Excel) and the collective compressive
viscoelastic behavior of the C5-C6 IVDs, c(t, c), was derived as a polynomial surface
using least square error fitting method (Matlab) [Section 3.3].

56
3.2.2.2 Torsional Viscoelasticity Characterization
Each ITU for the torsional test was subjected to a similar pre-conditioning procedure as
in the compressive test case with the except that the second stage was performed by
compressing the specimen to a maximum load of 50 N at a rate of 0.25mm/min. The ITU
was held in position for 1 minute followed by an oscillating rotation (sine wave, 0.1Hz,
angular rotation ±2o) for 15 min. The sample was left to rest for 2 minutes before testing.
The positive direction of rotation was defined by the right-hand-screw rule with the
thumb pointing upwards.
A total of 13 ITU were tested using constant rotation speeds listed in Table 3-2. Each test
was initially rotated to -15o and then rotated in the positive direction until its yield point.
Torsional stress () and torsional strain () were derived as defined in Section 3.3.2.
The positive elastic portion of the stress-strain curve, (), and strain-time curve, (t),
of each ITU were extracted (MS Excel) and the collective torsional viscoelastic behavior
of the C5-C6 IVDs, (t, ), was derived as a polynomial surface using least square
error fitting method (Matlab) [Section 3.3].
Table 3-1: Compression Rates
Compression rate Strain rate* # of specimens
0.25 mm/min 0.09/min 3
0.408 mm/s 0.15/s 3
0.980 mm/s 0.35/s 2
2.315 mm/s 0.84/s 3
4.605 mm/s 1.66/s 3
50 mm/s 18.05/s 3
100 mm/s 36.10/s 1

57
150 mm/s 54.15/s 1
N=19
* Based on mean IVD geometry (Table 3-3).
Table 3-2: Rotation Rate
Rotation rate Strain rate* # of specimens
1 deg/min 0.03/min 4
23 deg/sec 0.71/s 3
45 deg/sec 1.39/s 3
68 deg/sec 2.09/s 2
90 deg/sec 2.77/s 1
N=13
*Based on mean IVD geometry (Table 3-3).
3.2.2.3 Impact Resistance
For each compression and torsion test, the impact resistance values were determined
using a series of 10 triangular impulses of 70 ms duration with increasing peak stress
values from 0 to the mean yield value determined were evaluated according to the
method described in Section 3.3.3.2.2 (Matlab). A graph of the impact resistance values
(MEAD) vs the peak stresses values were obtained (Excel).

58
3.3 Data Analysis Method
3.3.1 Generation of the viscoelastic surface
The viscoelastic surface (t, ) can be approximated mathematically by a polynomial
Pmn(t, ), or simply Pmn, of degree m in time t and n in strain . The coefficients of the
polynomial are determined by the least-square-error fitting method giving minimum m
and n values with acceptable high R2 value, e.g., R20.9.
𝜎(𝑡, 𝜀) ≅ 𝑃𝑚𝑛(𝑡, 𝜀) = ∑ ∑ 𝑝𝑖𝑗
𝑛
𝑗=0
𝑚
𝑖=0
𝑡𝑖𝜀𝑗 = [(
𝑝𝑚𝑛 … 𝑝0𝑛
⋮ 𝑝𝑖𝑗 ⋮𝑝𝑚0 ⋯ 𝑝00
) (𝑡𝑚
⋮1
)]
′
(𝜀𝑛
⋮1
)
As will be shown in the results and discussion section, we found that, in both the
compressive and torsional case, P31 provided a satisfactory fit for the experimental data.
Hence in this Chapter, all viscoelastic surfaces are in the following form:
Equation 3-1: Viscoelastic surface polynomial P31
𝜎(𝑡, 𝜀) ≅ 𝑃31(𝑡, 𝜀) = [(𝑝31 𝑝21
𝑝11 𝑝01
𝑝30 𝑝20 𝑝10 𝑝00) (
𝑡3
𝑡2
𝑡1
)]
′
(𝜀1
)
3.3.2 Torsional Stress, Strain and Modulus Definitions
The figure shows a horizontal cross-sectional view of an IVD. Assume the area of an
IVD can be approximated by an elliptical shape as shown in the figure.
(For variable definition see Section List of Abbreviations)
Perimeter of IVD ≅ 𝜋√𝑎2+𝑏2
2
For an equivalent circle of radius �̅� having the same perimeter:
�̅� =1
2√
(𝑎2 + 𝑏2)
2
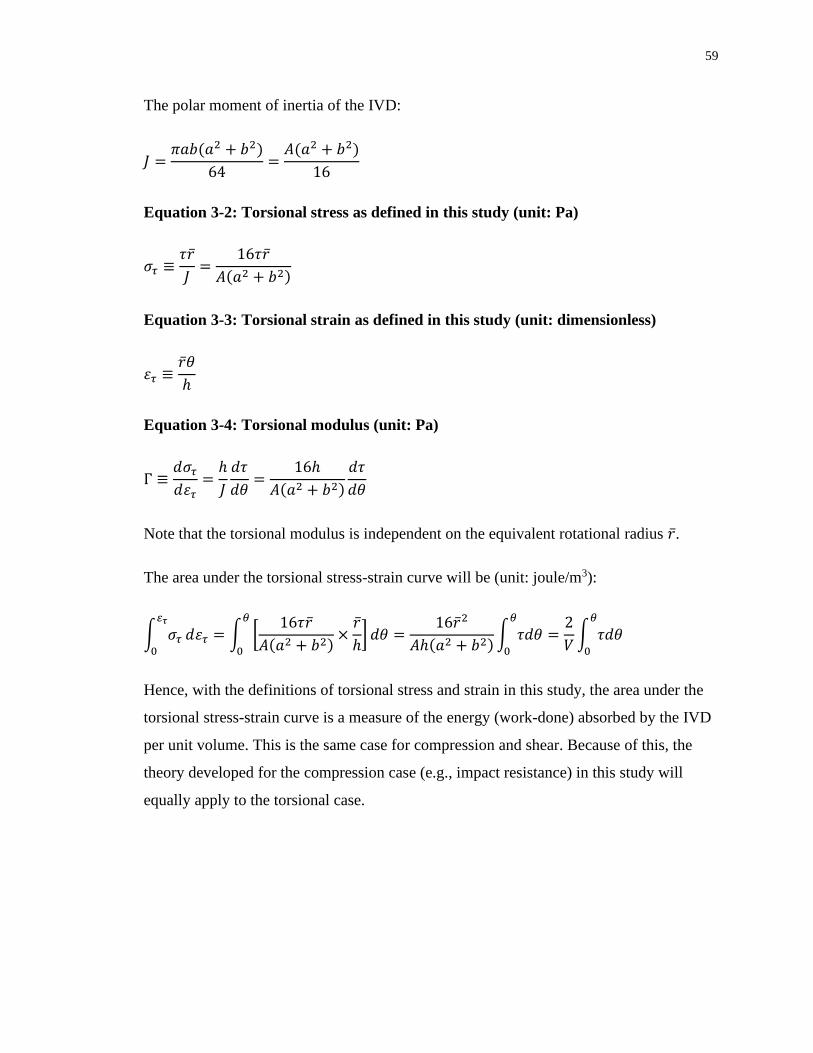
59
The polar moment of inertia of the IVD:
𝐽 =𝜋𝑎𝑏(𝑎2 + 𝑏2)
64=
𝐴(𝑎2 + 𝑏2)
16
Equation 3-2: Torsional stress as defined in this study (unit: Pa)
𝜎𝜏 ≡𝜏�̅�
𝐽=
16𝜏�̅�
𝐴(𝑎2 + 𝑏2)
Equation 3-3: Torsional strain as defined in this study (unit: dimensionless)
𝜀𝜏 ≡�̅�𝜃
ℎ
Equation 3-4: Torsional modulus (unit: Pa)
Γ ≡𝑑𝜎𝜏
𝑑𝜀𝜏=
ℎ
𝐽
𝑑𝜏
𝑑𝜃=
16ℎ
𝐴(𝑎2 + 𝑏2)
𝑑𝜏
𝑑𝜃
Note that the torsional modulus is independent on the equivalent rotational radius �̅�.
The area under the torsional stress-strain curve will be (unit: joule/m3):
∫ 𝜎𝜏
𝜀𝜏
0
𝑑𝜀𝜏 = ∫ [16𝜏�̅�
𝐴(𝑎2 + 𝑏2)×
�̅�
ℎ]
𝜃
0
𝑑𝜃 =16�̅�2
𝐴ℎ(𝑎2 + 𝑏2)∫ 𝜏𝑑𝜃
𝜃
0
=2
𝑉∫ 𝜏𝑑𝜃
𝜃
0
Hence, with the definitions of torsional stress and strain in this study, the area under the
torsional stress-strain curve is a measure of the energy (work-done) absorbed by the IVD
per unit volume. This is the same case for compression and shear. Because of this, the
theory developed for the compression case (e.g., impact resistance) in this study will
equally apply to the torsional case.

60
3.3.3 Impact Resistance
3.3.3.1 Definition of impact resistance for viscoelastic materials
When a material is subjected to an impulse stress wave 𝜎𝐼(𝑡) = ∫ 𝜎𝐼𝑇
0(𝑡) 𝑑𝑡 of peak
value S and duration T, the impact resistance (or the shock absorption) capacity of the
material is defined as the mean energy absorbing capability per unit volume (initial), or
the mean energy absorption density (MEAD), of the material on this impulse stress.
In general, the energy absorbed density (EAD) by a material under a stress producing a
strain value 1 can be derived from the area under the stress-strain curve:
𝐸𝐴𝐷 = ∫ 𝜎(𝜀)𝑑𝜖𝜀1
0
For a viscoelastic material, the stress is also time dependent. The mean energy absorbed
density by the viscoelastic material is defined as:
Equation 3-5: Mean energy absorption density
𝑀𝐸𝐴𝐷 ≡ 1
𝑇∫ [∫ 𝜎𝐼(𝑡, 𝜀)𝑑𝑡
𝑡=𝑇
𝑡=0
]𝜀1
𝜀=0
𝑑𝜀 =1
𝑇∫ ∫ 𝜎𝐼
𝜀1
𝜀=0
𝑡=𝑇
𝑡=0
(𝑡, 𝜀)𝑑𝜀 𝑑𝑡
3.3.3.2 Deriving MEAD
3.3.3.2.1 Solving for I(t)
I(t, ) in Equation 3-5 is the horizontal projection of the impulse stress I(t) onto the
viscoelastic surface (t, ) [Figure 3-6], every point on the I(t, ) surface should satisfy
the following constrain:
𝜎(𝑡, 𝜀) = 𝜎𝐼(𝑡) , or
Equation 3-6: Constrain for projected impulse stress onto the viscoelastic surface
𝜎(𝑡, 𝜀) − 𝜎𝐼(𝑡) = 0

61
This is an equation in t and only. One can solve in terms of t giving I(t).
I(t) is typically the smallest positive real root of Equation 3-6 for points within the
boundary of the impulse stress pulse and within the physical extend of the viscoelastic
surface of the material (i.e. within the elastic range of the material).
3.3.3.2.2 Deriving MEAD using a sawtooth impulse stress as an illustration.
The MEAD can be calculated numerically for any impulse stress waveform for any given
material with its viscoelastic surface determined. In this study, as an illustration, a “saw-
tooth” waveform was used for the impulse stress:
Equation 3-7: Saw-tooth impulse stress waveform
𝜎𝐼(𝑡) = { 𝑆
𝑇𝑡, 0 ≤ 𝑡 ≤ 𝑇
0, 𝑇 < 𝑡
Substituting Equation 3-7 and Equation 3-1 into Equation 3-6 giving:
t
S
T
Figure 3-7: MEAD evaluation illustration
(A) shows the projection of an impulse stress I(t) (blue) onto the viscoelastic
surface (t,) (light orange) producing the projected surface I(t,) (deep orange).
(B) shows the vertical cross-section (green) of the projected surface at a given time
t=t’. The hashed area is the projection of I(t,) onto the -t plane where I(t)
locates at its boundary.
(t,)
I(t)
I(t,)
t
I(t,)
t
I(t)
t=t’
t=t’ plane
T
I(t’,)
(A) (B)

62
(𝑝00 + 𝑝10𝑡 + 𝑝20𝑡2 + 𝑝30𝑡3) + (𝑝01 + 𝑝11𝑡 + 𝑝21𝑡2 + 𝑝31𝑡3)𝜀 −𝑆
𝑇𝑡 = 0
Solving for I(t):
Equation 3-8: Boundary curve for the sawtooth impulse stress projected onto the
viscoelastic surface and then projected onto the strain-time plane
𝜀𝐼(𝑡) = −𝑝00 + (𝑝10 −
𝑆𝑇)𝑡 + 𝑝20𝑡2 + 𝑝30𝑡3
𝑝01 + 𝑝11𝑡 + 𝑝21𝑡2 + 𝑝31𝑡3
Evaluating the inner integral of Equation 3-5 using P31 approximation
Equation 3-9: Inner integral of MEAD equation
∫ 𝜎𝐼
𝜀𝐼(𝑡)
0
(𝑡, 𝜀) 𝑑𝜀 ≅ ∫ 𝑃31
𝜀𝐼(𝑡)
0
(𝑡, 𝜀) 𝑑𝜀
= ∫ {[(𝑝31 𝑝21
𝑝11 𝑝01
𝑝30 𝑝20 𝑝10 𝑝00) (
𝑡3
𝑡2
𝑡1
)]
′
(𝜀1
)}𝜀𝐼(𝑡)
0
𝑑𝜀
= [(𝑝31 𝑝21
𝑝11 𝑝01
𝑝30 𝑝20 𝑝10 𝑝00) (
𝑡3
𝑡2
𝑡1
)]
′
(1
2𝜀𝐼(𝑡)2
𝜀𝐼(𝑡))
Approximate the continuous time interval of the impulse stress from 0 to T by a series of
discrete values of fixed interval T:
[0…T] [0, T, 2T, …, iT, …, nT=T] where T=T/n
For a given viscoelastic surface, all pij are known. For every ti= iT, i=0…n-1, one can
calculate I(ti) from Equation 3-8 and the area under the stress-strain curve at ti from
Equation 3-9. The outer integral can be approximated by the summation of the volumes
of width T and area at ti. Hence,
Equation 3-10: MEAD approximation based on equal discrete time steps

63
𝑀𝐸𝐴𝐷 ≡1
𝑇∫ ∫ 𝜎𝐼
𝜀𝐼(𝑡)
𝜀=0
𝑡=𝑇
𝑡=0
(𝑡, 𝜀)𝑑𝜀 𝑑𝑡 ≅1
𝑇∑ [∫ 𝜎𝐼(𝑡𝑖
𝜀𝐼(𝑡𝑖)
𝜀=0
, 𝜀) 𝑑𝜀]
𝑛−1
𝑖=0
∆𝑇
=1
𝑛∑ [∫ 𝜎𝐼(𝑡𝑖
𝜀𝐼(𝑡𝑖)
𝜀=0
, 𝜀) 𝑑𝜀]
𝑛−1
𝑖=0
3.4 Results
The objective of this study was to characterize the large‐range (till yield) cranial
compressive and torsional viscoelastic properties of the unrestricted C5‐C6 cervical IVD
using kangaroos as the animal model.
3.4.1 Geometry and dimensions of kangaroo C5-C6 IVD
Kangaroo IVD has a structure similar to that of human IVD. It consists of an outer
annulus fibrosus (AF) with concentric ring‐like layers enclosing a gel‐like nucleus
pulposus (NP). Although the boundary between the AF and NP is not clearly visible, one
can feel the boundary mechanically using a sharp object moving within the NP region.
The NP is typically about 1/3 of the width and depth of the IVD. Figure 3-8A shows a
cranial view of the C5 vertebra from its sectioned C4-C5 IVD. Figure 3-8B shows the
cranial view of its C6 vertebra from its sectioned C5-C6 IVD. Both show a concentric
ring like structure of the AF surrounding the NP.
A kangaroo C5‐C6 vertebra is imaged using high resolution CT scan and the sagittal view
is shown in Figure 3-7. It shows that the superior surface of a kangaroo C6 vertebra is
convex. This is in contrast to that of the human C6 vertebra that is concave. The height or

64
thickness of the IVD at the center relative to the anterior and posterior locations would be
larger in human than in kangaroo.
A B
Figure 3-9: Kangaroo IVD
Figure shows the structure of kangaroo IVDs with the AF and NP region. (A) is a
cranial view of C5 (C4-C5 IVD). (B) shows a cranial view of C6 (C5-C6 IVD). Both
pictures belong to the same kangaroo specimen.
Figure 3-8: Sagittal view of a kangaroo C5-C6 IVD and a human C6
vertebra.
Figure A shows the convex nature of C6 superior surface making the mid height
of the IVD shorter than its posterior and anterior height.
Figure B shows a sagittal cross-sectional view of a human C6 vertebra showing
the superior surface is typically concave.
C5
C6
A P
A
B
* Created in Complete Anatomy
version 6.4.0, with permission from
3D4Medical Ltd, USA.
Human C6 vertebra*

65
Using high resolution CT, frozen C5‐C6 vertebral segment samples were scanned.
Geometric dimensional properties of the C5‐C6 IVD are collected and shown in Table
3-3. There are different ways to determine the height of an IVD in the literature.
Measurements at the anterior position and at the disc center have been reported. We
define the height or thickness of the disc to be the arithmetic mean of the anterior, mid
and posterior height of the IVD measured on the sagittal plane. This is because the
kangaroo spines we received are in frozen foldback states [Figure 3-1A&B]. Comparing
to the human C5‐C6 IVD, the height we determined for kangaroo IVD is about 2.8 mm,
which is about 2/3 of that of human [Section 3.5.1]. The corresponding cross‐sectional
area of the kangaroo IVD is around 85 mm2, which is about ¼ of the human counterpart
[Section 3.5.1].
Table 3-3: Dimensions of kangaroo C5-C6 IVD
Dimensional properties mean SD n min max unit
Height 2.77 0.33 53 2.07 3.57 mm
Area 85.40 15.40 24 60.55 112.50 mm2
Width a (left to right) 11.96 2.16 20 8.45 15.96 mm
Depth b (posterior to anterior) 6.93 0.95 20 5.74 6.93 mm
3.4.2 Mechanical properties
Stress‐strain relationships of C5‐C6 IVD were determined under compressive and
torsional loads at different strain rates to failure. Typical test results are shown in Figure
3-9. The arrows in the Figure indicated the end of the elastic region. We measured their
mechanical behavior and marked the end of their elastic regions, which we reported as
their yield strengths. Some specimens failed right after the end of their elastic region

66
(Figure 3-9A and D), and some had a long plastic deformation region (Figure 3-9B and
C). Table 3-4 is a summary of the measured yield strength of the IVD.
Table 3-4: Yield strength of kangaroo C5-C6 IVD
Type Property mean SD n min max unit
Comp yield load 867.01 259.69 19 520.85 1671.89 N
displacement 1.41 0.36 19 1.00 2.11 mm
strain 0.55 0.17 19 0.36 0.87 -
stress 10.88 3.42 19 5.16 20.18 MPa
Figure 3-10: Typical compression and torsional test results.
At the end of their elastic region, some specimens failed immediately (A, D) while
others continued to deform plastically (B, C). The arrow marks the end of its elastic
region in each case and was taken as its yield strength.

67
Tor yield torque 2.09 0.94 20 0.84 3.94 Nm
angle 21.94 5.55 20 9.28 32.60 deg
strain 0.66 0.17 20 0.25 1.01 -
stress 13.31 5.00 20 4.26 21.80 MPa
3.4.3 Viscoelasticity
Mechanical behavior of the C5‐C6 IVD is represented using a viscoelastic surface to
correlate the stress, strain and time parameters. In this approach, a polynomial model has
been found to approximate the collective viscoelastic behavior of all the specimens. The
surface was generated using the least‐square‐error surface fitting method over all the test
data of the specimens within their elastic ranges.
The use of viscoelastic surface has many advantages. The traditional viscoelastic
behaviors such as creep, relaxation and stress‐strain at different strain rate can be easily
derived from this surface. To obtain a stress‐strain curve of constant strain rate 𝜀̇, a stress
relaxation curve of initial strain 0 and a creep curve of initial stress 0, just substitute 𝑡 =
𝜀 𝜀̇⁄ , = 0 and = 0 respectively into Equation 3-1. In addition, it also allows the
deduction of other material properties such as the impact resistance capacity of a given
impulse stress mathematically [Section 3.3.3]. It can also be readily imported into most of
the analysis software [Section 3.5.2].
The viscoelastic surfaces for compression and torsion of the C5‐C6 IVD were generated
using the procedure outlined and are shown in Figure 3-10. Two surfaces in each case
were generated over time intervals of 0 to 500 s and 0 to 0.1 s. The long-time interval
surface (Figure 3-10 A&C) indicated that the IVD is both compressive and torsional
viscoelastic. The short duration plots (Figure 3-10 B&D) were used for deriving the IVD
impact resistance for a series of 70 ms impulse stresses. The goodness of fit R2 value is

68
shown in each case. Table 3-5 contains the coefficients (pij) of the fitted viscoelastic
surface (P31) of Equation 3-1.
Time Compression c(t, c) Torsion (t, )
0 to
500
sec
R2=0.9254 (n=19) R2=0.8588 (n=13)
0 to
0.1
sec
R2=0.9475 (n=15) R2=0.9366 (n=10)
Figure 3-11: Resulting compressive (A&B) and torsional (C&D) viscoelastic surfaces.
Figure shows the resulting compressive (A&B) and torsional (C&D) viscoelastic surfaces
providing the R2 values of the goodness of fit and the number of specimens involved. A & C
show that kangaroo IVDs are both compressive and torsional viscoelastic. The black dotted lines
are the stress-strain data of an IVD tested under a constain strain rate. The color represents the
residual error at the region. Dark colour is low and light is high.
The time axis: A&C 0→500s in 50s icrements, B&D 0→0.1s in 0.01s.
The strain axis: A&C 0→0.8 in 0.2 increments, B 0→0.6 in 0.2 and D 0→0.3 in 0.1.
The stress axis: A 0→14 MPa in 2MPa increments, B 0→10 in 2MPa, C 0→20 MPa in 2 MPa
and D 0→3 MPa in 0.5 MPa
A
B
C
D
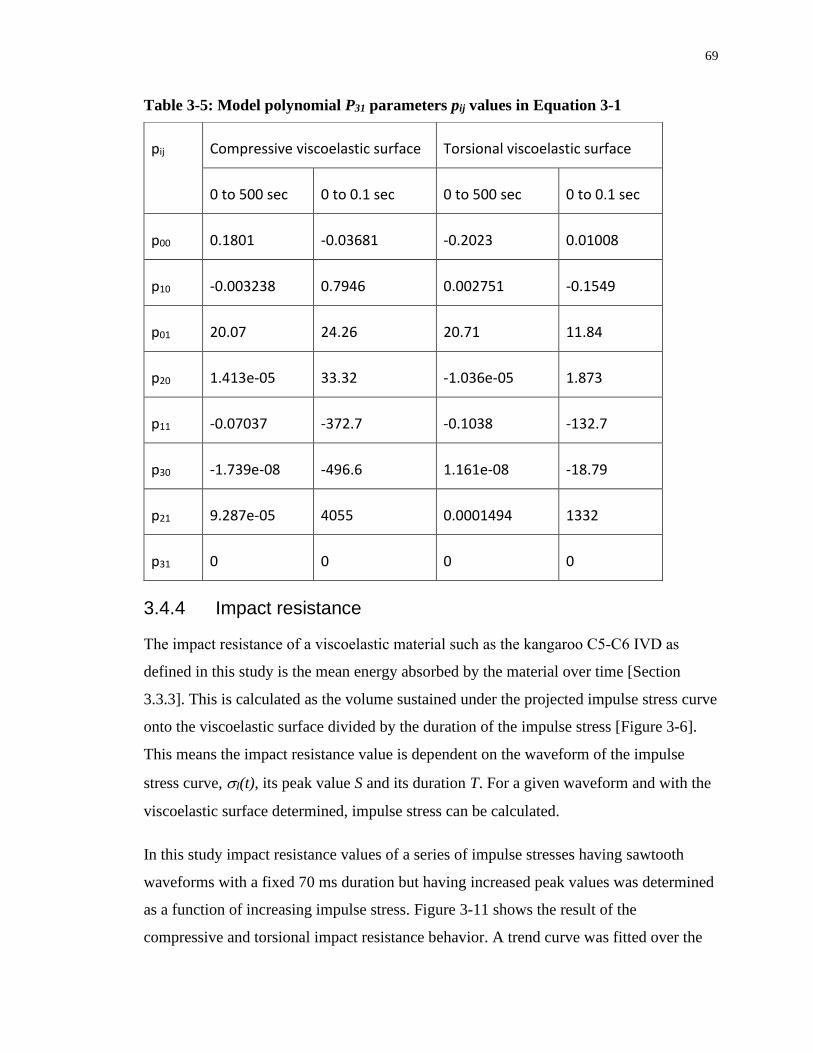
69
Table 3-5: Model polynomial P31 parameters pij values in Equation 3-1
3.4.4 Impact resistance
The impact resistance of a viscoelastic material such as the kangaroo C5‐C6 IVD as
defined in this study is the mean energy absorbed by the material over time [Section
3.3.3]. This is calculated as the volume sustained under the projected impulse stress curve
onto the viscoelastic surface divided by the duration of the impulse stress [Figure 3-6].
This means the impact resistance value is dependent on the waveform of the impulse
stress curve, I(t), its peak value S and its duration T. For a given waveform and with the
viscoelastic surface determined, impulse stress can be calculated.
In this study impact resistance values of a series of impulse stresses having sawtooth
waveforms with a fixed 70 ms duration but having increased peak values was determined
as a function of increasing impulse stress. Figure 3-11 shows the result of the
compressive and torsional impact resistance behavior. A trend curve was fitted over the
pij Compressive viscoelastic surface Torsional viscoelastic surface
0 to 500 sec 0 to 0.1 sec 0 to 500 sec 0 to 0.1 sec
p00 0.1801 -0.03681 -0.2023 0.01008
p10 -0.003238 0.7946 0.002751 -0.1549
p01 20.07 24.26 20.71 11.84
p20 1.413e-05 33.32 -1.036e-05 1.873
p11 -0.07037 -372.7 -0.1038 -132.7
p30 -1.739e-08 -496.6 1.161e-08 -18.79
p21 9.287e-05 4055 0.0001494 1332
p31 0 0 0 0
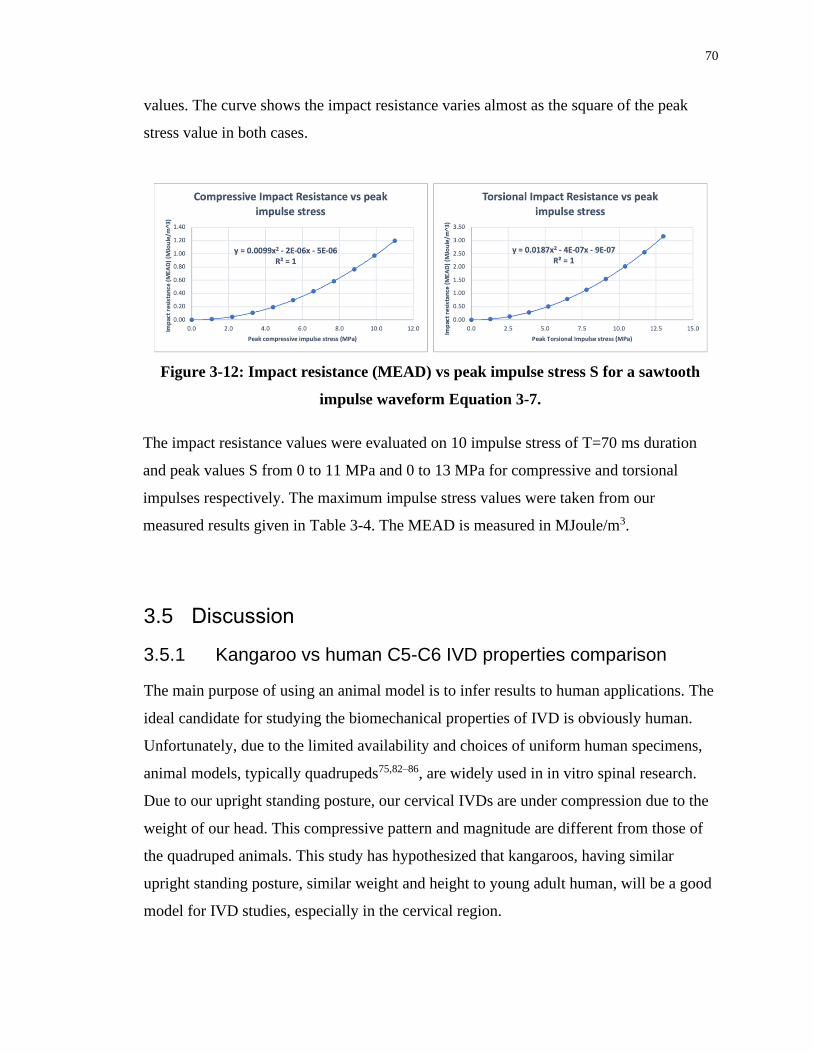
70
values. The curve shows the impact resistance varies almost as the square of the peak
stress value in both cases.
3.5 Discussion
3.5.1 Kangaroo vs human C5-C6 IVD properties comparison
The main purpose of using an animal model is to infer results to human applications. The
ideal candidate for studying the biomechanical properties of IVD is obviously human.
Unfortunately, due to the limited availability and choices of uniform human specimens,
animal models, typically quadrupeds75,82–86, are widely used in in vitro spinal research.
Due to our upright standing posture, our cervical IVDs are under compression due to the
weight of our head. This compressive pattern and magnitude are different from those of
the quadruped animals. This study has hypothesized that kangaroos, having similar
upright standing posture, similar weight and height to young adult human, will be a good
model for IVD studies, especially in the cervical region.
Figure 3-12: Impact resistance (MEAD) vs peak impulse stress S for a sawtooth
impulse waveform Equation 3-7.
The impact resistance values were evaluated on 10 impulse stress of T=70 ms duration
and peak values S from 0 to 11 MPa and 0 to 13 MPa for compressive and torsional
impulses respectively. The maximum impulse stress values were taken from our
measured results given in Table 3-4. The MEAD is measured in MJoule/m3.

71
The properties of kangaroo C5-C6 IVD can be compared to that of human in two areas:
• Yield stress & strain [Table 3-4]
• Compressive and torsional modulus values at same strain level and strain rate [Figure 3-12].
In this study, all yield stresses (compression & torsion) were measured under unrestricted
(posterior and restricted structures removed) condition [Figure 3-2]. Most studies in the
literature were performed with intact vertebral bodies. No values could be found for
human C5-C6 IVD tested under same/similar conditions.
For compressive Young’s modulus, Panjabi et al61 had provided the following human C2-
T1 IVD data (spine #87 C2-C6, #90 C3-T1, #105 C2-C7 & #106 C3-C7):
• Ellipse major axis a = mean disc width for all IVDs = 19.22 mm
• Ellipse minor axis b = mean disc depth for all IVDs = 15.36 mm
• Disc height = total disc height for all IVDs/# spines = 95.5/4= 23.88 mm
• Mean axil compression flexibility coefficient Ty = 7.1 ( 8.4) mm/kN @ 0.7 mm
• Measurements were taken 30s after each load step application
The Young’s modulus for human C2-T1 basing on these data is 14.5 MPa @ strain 0.03.
The compressive Young’s modulus for kangaroo found ranges from 20.0 MPa (t=0) to
6.7 MPa (t=379 s) [Figure 3-12]. At t=30s, E=18.0 MPa. Comparing these results, it
would appear that the compressive strength of human C2-T1 IVD is in the same order of
magnitude as that of kangaroo. However, the human IVD specimens tested was from C2-
T1, not just C5-C6, and with full posterior and anterior bone structures.
For torsional modulus, human C5-C6 IVD data are taken from the following sources:
• Ellipse major axis a87 = mean (C5 EPWi, C6 EPWu) = 18.95 mm
• Ellipse minor axis b87 = mean (C5 EPDi, C6 EPDu) = 17.15 mm
• C5-C6 disc height88 = IDH = 4.4 mm
• Secant stiffness76 @ 11o = +RY = 1.033 Nm/deg
Applying Equation 3-4 on these data, the torsional modulus of human C5-C6 IVD is
about 25 MPa. The torsional modulus for kangaroo found ranges from 20.7 MPa (t=0) to
2.7 MPa (t=347 s) [Figure 3-12]. Compare with the findings of this study, the torsional
strength of human IVD would be about 17% stronger than the highest value of kangaroo
but in the same order of magnitude. However, the human IVDs tested in that study had

72
full vertebral and discoligamentous structures preserved. Under this condition, the
torsional strength measured should be higher than the unrestricted condition. In addition,
the strain rate applied was not specified.
For impact resistance capacities for both compressive and torsional impact, to the best of
our knowledge, we could not find comparable data in the literature for human C5-C6
IVDs evaluated or tested under similar condition to compare with the results obtained in
this study.
In general, it is difficult to compare experimental results between studies because of the
differences in test and data analysis methods used. In this case, due to the lack of human
C5-C6 data in literature30,89 tested under similar situation, the comparison between the
kangaroo C5-C6 properties with human is inconclusive, however, they are likely to be in
the same order of magnitude. In summary, our hypothesis that kangaroo cervical IVD is a
good animal model for human counterpart research, though not proven, is plausible.
3.5.2 Linear viscoelasticity and Finite Element Methods (FEM)
One goal of this study, as mentioned in the Introduction section, is to derive the
unrestricted viscoelastic behavior of the IVD to be used in FEM for simulating the spinal
performance in a traumatic situation. In this discussion we will show how to incorporate
the IVD material properties into a popular FEM software.
Linear viscoelasticity refers to viscoelastic material whose stress property is linear with
respect to its strain value and only time dependent. Since the stress‐strain relationship of
the kangaroo IVD is represented by P31 polynomial [Equation 3-1], its Young’s (or
torsional) modulus can be derived in Equation 3-11, which is independent of strain. This
means that the kangaroo C5‐C6 IVD is both compressive and torsional linear
viscoelastic.
Equation 3-11: Compressive and torsional modulus
𝐸(𝑡) ≡𝜕𝜎
𝜕𝜀≅
𝜕𝑃31
𝜕𝜀= 𝑝31𝑡3 + 𝑝21𝑡2 + 𝑝11𝑡 + 𝑝01

73
The time dependent compression and torsion modulus are plotted in Figure 3-12.
Many FEM software (e.g., ABAQUS and ANSYS) model viscoelastic behavior using the
Prony series assuming the material is linear viscoelastic (at least for small strain
changes). The Prony series90 is defined as:
Equation 3-12: Prony series
𝐸(𝑡) = 𝐸0 − ∑ 𝐸𝑖 (1 − 𝑒−𝑡𝜏𝑖 )
𝑛
𝑖=1
Where Ei is the modulus from t=0 to time interval i, E0=E(t=0)=p01 and i is the effective
time constant from t=0 to time interval i. The values of Ei and i in Equation 3-12 can be
obtained by using the least-square-error fitting of Equation 3-11 with minimum value of
n having an acceptable R2 value.
Currently most FEM software can accept the definition of a custom viscoelastic material
by entering the experimental values of the Prony series, a relaxation curve, or a creep
curve or both. For future development, in our opinion, the viscoelastic surface may be a
more appropriate model and easier to implement. It can model both linear and non-linear
viscoelasticity.
Figure 3-13: Compressive and torsional modulus.
Both were derived from the pij coefficients in Table 3-5 through Equation 3-1.

74
3.5.3 Method limitations
A major drawback of this method in deriving a quality representative viscoelastic surface
is it requires a large number of specimens. This may be inappropriate for human
specimens because of the cost and availability. In this study, due to the limited quantity
of kangaroo IVDs available, the strain rates selected were more biased towards the high
end for the impact resistance derivation. The mid-range was sparse resulting a slight
saddle shape instead of a more ideal continuous decreasing value. An improvement can
be achieved by adding a few stress-relaxation curves of high initial strain values to the
data set.
Another limitation was due to Matlab. In deriving the viscoelastic surface using the
Matlab curve fitting toolbox, it always returns p31=0. This effectively reduces the
modulus [Equation 3-11] to a quadratic relationship with t [Figure 3-12]. Since 𝑑2𝐸
𝑑𝑡2 =
2𝑝21 > 0 for both compression and torsion [Equation 3-11], E decreases from its initial
value p01 to its minimum at t=-p11/2p21. After that it will increase. This has presented a
limitation in the time range for practical applications in using this model. The time limit
for practical applications of the resulting model for the case of compression and torsion
are t=379s and 347s respectively.
The resulting viscoelastic surfaces in this study were obtained by fitting only on the
positive stress and strain values and assumed stress = 0 for strain = 0 for all time t. This
essentially had ignored the small (compared to the yield value) neutral zone due to the
hysteresis of the stress/strain curve in cyclic excitation situation, as in our torsional tests.
3.6 Conclusion
In this study, we have proposed a viscoelastic surface modeling method to characterize
the unrestricted bulk material properties of the kangaroo C5-C6 IVD under axial
compression and torsion. It has shown that they both are linearly viscoelastic. We have
shown how traditional creep and relaxation behaviors can be derived from this
generalized model and how to derive the Prony series constants to incorporate into
popular FEM software. We have also used a simple triangular impact stress wave of

75
70ms duration to illustrate how one can derive the impact resistance of this impact stress
from the model. Same method can be extended to a more complex impact stress wave
once its stress waveform is known. The comparison of the kangaroo C5-C6 properties to
that of human was inconclusive due to the lack of literature data tested under similar
condition. Future studies will provide data for more conclusive comparisons. The
viscoelastic surface model used in this study only models stress as a function of time and
strain. The method is general enough to be extended to include multi-dimensional
parameters such as temperature for example. Although temperature variation is not
important for this study, other temperature sensitive viscoelastic materials can benefit
from this method.

76
Chapter 4
4 IVD Prosthesis Development - Compression
Abstract
Although Artificial Disc Replacement (ADR) devices have been introduced for around
30 years, the long-term effects are still unclear. Recent studies on FDA-approved ADRs
have reported development of adjacent segment degeneration (ASD), heterotopic
ossification (HO), reduced range of motion (ROM) and subsequent fusion. This indicates
rooms for improvements. We hypothesize that the culprit may due to the injuries and
unnatural stress pattern introduced by current ADR devices over the affected vertebral
surfaces triggering their over remodeling. To address this issue, we have developed the
concept of a material candidate for an IVD prosthesis and conducted its feasibility study.
The material can be patient-specifically molded into shape and fine-tuned to match the
mechanical strength of an IVD. The material selected is a composite made from 10wt%
polyvinyl alcohol cryo-gel (PVA) reinforced by long circumferentially oriented bamboo
fibers. We have developed an analytical model on the compressive behavior of such a
prosthesis. Basing on this model, we have derived the requirements of the fiber involved
and have performed an evaluation on the suitability of the bamboo fiber chosen. This
study has validated that the strength of the composite can be increase or decrease by
changing the fiber content in the composite. The compressive results of prosthesis
specimens at different strain-rates were measured and compared with that of the C5-C6
IVD obtained from our previous study using kangaroo as our animal model. Due to the
unexpected substantial shrinkage of the PVA, the test results were weaker than the
prediction of the analytical model and the measured animal IVD strength. However, we
have shown that a 35% to 45% pre-strain of the material may resolve this issue.
4.1 Introduction
The Artificial Disc Replacement (ADR) treatment has emerged as an improvement over
the traditional spinal decompression and fusion treatment by providing higher degree of
spinal mobility for patients suffering from intractable radiculopathy originating from

77
degenerative disc diseases. One of its goals3,22,91 was to prevent the onset of adjacent
segment degeneration (ASD) observed in the fusion approach by preserving better natural
spinal kinematics. Few such prosthetic devices have obtained FDA(US) and CE(EU)
approval today [e.g. Bryan13,18, ESP16,92, M615,91, Mobi93, Prestige ST12,94, ProDisc95,
etc.]. Even though short term (< 4 years) evaluations are favorable15,38,91,94,96, the long-
term effects (>10 years) of these devices are still unclear. Some of the recently reported
long-term problems include ASD17,22, heterotopic ossification17,22–24 (HO), subsequent
fusion or spontaneous ankylosis22, reduced ROM17,22, postoperative kyphosis27,
myelopathy and radiculopathy17. While no main cause of culprit has been identified, the
HO, reduced ROM and subsequent fusion may suggest that the vertebrae affected had
been over remodeled to recover from injuries22. From other fields of orthopedic
research28,29, we learn that one main cause for bones keep remodeling is stress related,
either on mismatch in stress distribution pattern or in material strength provided by the
prothesis. Studying the design of current ADR devices and their associated surgical
operations, we may hypothesize some of the causes of this mismatch. Due to their fixed
sizes limitation, all ADR devices will have a smaller footprint than the patient’s IVD
replaced. This produces an unnatural higher stress pattern concentration in the middle
part of the vertebrae. Most of the ADR devices are constructed with upper and lower
metal plates. The vertebrae endplates have to be reshaped mechanically to fit these
anchoring plates. While this does not just introduce injuries to the vertebrae, the metal
plates are of much harder material. Furthermore, the contact between two hard surfaces
will be spotty at best, creating micro concentrated stress points across the injured surfaces
of the vertebrae. Some of the existing ADR devices are designed with fix axes of rotation
or adopting a ball baring construction94,95. These devices only provide 3 degrees of
freedom which are less than that of the human IVD. The axial alignment with patient’s
spine may become a problem creating different stress distribution in patient’s mobility27.
In short, there are rooms for improvements.
Our long-term research goal is to develop a prosthesis that can mimic closely the shape
and mechanical properties of the human IVD. The material properties can be fine-tuned
to match that of any IVD in any position in the spine. The shape can be molded to fit the
target IVD of individual patient. The contact surfaces of the prosthesis with the vertebrae

78
should be able to adapt automatically to that of the vertebrae endplates. The aim is to
maintain the original footprint of the replaced IVD, to control the stress distribution over
the entire contact surfaces of the vertebrae and to reduce the damages to the affected
vertebrae for its implantation. The goal of this feasibility study is to develop a proof-of-
concept material candidate for such a prosthesis. The development of an actual prosthesis
prototype and related implantation issues are left for future studies.
The material candidate we had chosen for this study is a composite of thermally cross-
linked 10wt% polyvinyl alcohol hydrogel (PVA) reinforced by long circumferentially
arranged bamboo fibers. The PVA provides a biocompatible and long-term stable body
for this prosthesis. The circumferential reinforced fibers provide compressive strength to
the composite body. Bamboo fiber is a renewable plant cellulosic fiber with possible
antimicrobial properties97,98. The mechanical properties of PVA, bamboo fiber and
composite and their suitability for IVD prosthesis are studied in this Chapter.
4.2 Materials and Methods
4.2.1 Experimental approach
To analyze the requirements for our IVD prosthesis material, an analytical model
[Section 4.6] has been developed for the compressive behavior of a simplified IVD
prosthesis (short cylindrical shape) constructed from a composite material with long
circumferentially oriented embedded fibers. The assumptions of this derivation are based
on ideal incompressible materials and energy conservation during the compression.
The analytic model predicts the compressive strength S (stress value) of such a
composite, at a given strain value, is dependent on the Young’s Modulus of the fiber Ef
used and increases monotonically with the volumetric percentage of fiber content f within
the composite.
The goal of the experimental validation is to establish the feasibility that, for any IVD of
given strength and a given fiber type, one can find f that will meet the compressive
strength of the IVD within its physiological range. Hence the key concept employed in
our experiment is to validate the monotonous increasing relationship as predicted by the

79
model. Once this relationship is validated, one can simply use a binary search technique
to find the exact fiber content f for this IVD. This search is left outside the scope of this
study.
The experiment in this study is to validate the hypothesis that, for 3 batches of specimens
of different fiber content f and measured strength S at a given strain, if f2 > f1 > f0=0
(control) then S2 > S1 > S0 (control) for all strain values.
To validate this hypothesis, the stress-strain test results of specimens from the three
batches tested at the same compression rate are compared with each other. This will
indicate the strength of each batch relative to the others. Because there are 11 strain rates
involved, to limit the number of comparisons, we only choose the test results from a set
of 6 representing strain rates for this comparison exercise. The chosen strain rates spread
throughout the entire range used within the experiment.
The C5-C6 IVD is chosen as the prosthesis development target. Its mechanical behavior
(compressive and torsional) has been measured from kangaroo C5-C6 IVDs as the animal
model from a previous study [Section 3]. Basing on the results of this study, the
requirements for the selection of our fiber are derived.
To validate the suitability of the specimen material as a candidate for IVD prosthesis, the
stress-strain curves of the kangaroo IVD at the set of 6 chosen strain rates are derived
from the viscoelastic surface of the kangaroo IVD. Comparisons are made between the
kangaroo stress-strain curves with those from the strongest batch found from previous
comparison.
4.2.2 Bamboo Fibers Characterization
Two pounds of undyed natural spinning bamboo fiber in 4 oz bundles were procured
from Fiberlady (438 South Fork Drive, Lewisville, TX, USA) [Figure 4-1].

80
4.2.2.1 Basic properties investigation
The fiber density was measured using volume displacement method. 20.7g pre-weighted
fiber was submerged fully into a pre-measured 500ml DI-water (at room temperature).
The displaced volume was measured (measuring cylinder graduated in ml).
The morphology of the fibers was imaged using SEM (LEO 1540XB, precoated 5nm
Osmium). The material was investigated using FTIR (Bruker model Vector22, resolution
2 cm-1, 64 scans) and results analyzed by Bio-Rad software (KnowItAll with IR Spectral
Library).
4.2.2.2 Fiber dimension and strength measurement
19 randomly sampled fibers were individually identified, length measured using scaled
photo method (iPhone 6S, 6” steel ruler, ImageJ) and mean diameter determined using
optical microscope (Olympus BX60, 8 to 10 50X images taken along the full length of
A B
Figure 4-1: Bamboo fibers
“A” shows one of the 8 bundles of fibers purchased scaled by a 6” steel ruler. “B”
is a close-up view of a random sample of the fiber selected from the bundle
revealing the highly aligned nature of the fibers.

81
the fiber, 6 to 10 diameter measurements on each image using ImageJ, mean diameter
averaged over all measurements of the fibers).
The tensile stress-strain characteristic of each fiber specimen was determined using a
mechanical tester (Instron 8874, calibrated Transducer Techniques 1000g load cell, self-
designed fiber attachment fixture) at a displacement rate of 0.125 mm/sec. The mean
stress-strain curve, yield stress and strain value were calculated based on the 19 samples
(MS Excel).
Figure 4-2 shows the complete measurement process applied to each fiber selected.

82
4.2.3 Prosthesis samples preparation
The 10wt% Polyvinyl Alcohol (PVA) solution was prepared by adding PVA (Sigma-
Aldrich Pcode 363065-500G) to 1X PBS (fisher scientific CAS 7647-14-5,7447-40-7)
solution in 1:9 ratio by weight. The solution was mechanically stirred in a container
Figure 4-2: Property measurement process of a bamboo fiber
This series of photos illustrate the complete process applied to measure the
geometric and mechanical properties of a typical bamboo fiber. “A” shows the
length measurement using a scaled photo technique. “B” shows the fiber mounted
on a microscope slide for diameter measurements under an optical microscope. “C”
shows a 50X image of a portion of the fiber for diameter measurements. “D” shows
the fiber mounted on a specially designed mechanical test jig. “E” shows the fiber
mounted for mechanical testing.
A
B
C
D
E

83
immersed in a paraffin oil bath maintained at 90oC. The solution was stirred continuously
until the PVA was fully dissolved.
Three batches (B0, B1 and B2) of 50 samples each (mold diameter 23mm and thickness
8.67mm in 5x5 formation) were prepared containing bamboo fibers of weight 0g (control,
f0=0v%), 37.3mg (sd 0.8) (f10.6v%) and 175.4mg (sd 1.6) (f23v%) respectively. The
fibers were wound loosely around a 5mm spindle in a fixed direction spiraling along the
length of the spindle before inserted and packed down into each mold. The spindle
created a void region in the center of the mold mimicking the NP region of an IVD. Hot
(~80oC) 10w% PVA solution was added to fill the molds. The molds were sealed by
sandwiching in between two 3mm thick rubber sheets and two 4mm thick aluminum
plates. The molds were held watertight by surrounding screws and totally immersed into
a 50% antifreeze bath to go through 6 freeze-thaw cycles (FTC, +20oC -20oC). After
the FTCs, the samples were removed from the mold and visually inspected to eliminate
defective ones (bubbles, holes, deformation, etc.). Each remaining specimen was
individually identified, cross-section area measured (average of top and bottom surface)
using scale photo technique (iPhone 6S, 6” steel ruler, ImageJ) and stored individually in
1X PBS solution before testing. This had harvested 35, 31 and 26 specimens for B0, B1
and B2 respectively for compression testing.
Figure 4-3 shows some stage results of this process.

84
4.2.4 Compressive Test
Mechanical testing was performed on an Instron 8874 machine using a ± 10kN and
100Nm load cell between two flat parallel aluminum surfaces. Testing was performed
within a 1X PBS solution bath [Figure 4-4].
A
B D
C E
F
Figure 4-3: Prosthesis samples preparation process.
Picture “A” shows the area measurement of one specimen using scaled photo
technique. Picture “B” shows samples of batch B0 (control) with no fibers. Picture
C and D shows samples of batch B1 containing 0.6v% of bamboo fibers. Picture E
and F shows samples of batch B2 containing 3v% of bamboo fibers. Picture C & E
shows the bamboo fibers were inserted mainly in the outer region of the samples
and wound circumferentially in one direction leaving a void center to mimic the
NP region of an IVD. Note the shrinkage of the samples within the molds in B, D
and F as a result of the 6 FTCs of the 10% PVA hydrogel cross-linking process.

85
Each sample was subjected to a two-stage pre-conditioning steps. The purpose was to
reduce the internal stresses built-up during the FTCs of the PVA process. The initial
height of the sample was determined by lowering the distance of the two compression
surfaces until a 1N force was registered. It was then slowly compressed by 0.8 mm at a
rate of 0.25mm/min. The position was held for 1min and then subjected to a sine
oscillation at 0.1Hz, amplitude 0.25mm for 15 minutes. Load was removed for 2 minutes
to allow the sample to fully relax before the main compression test.
The height of each sample prior to the compression test was first measured by lowering
the compression surfaces until a 1N force was registered. Each sample was compressed
to about 0.9 strain at a compression rates given in Table 4-1. Table 4-1 also shows the
number of samples in each batch using the same compression rate.
Table 4-1: Compression rates and the number of specimens involved
Compression rates Strain Rate* B0 (f0=0v%) B1 (f10.6v%) B2 (f23v%)
0.25 mm/min 0.04/min 3 3 3
Figure 4-4: Prosthesis specimen mechanical
testing setup
Each specimen was tested between two parallel
circular plates immersed in a 1X PBS solution
bath.

86
1.5 mm/min 0.21/min 3 - 2
0.125 mm/s 0.02/s 3 2 -
0.25 mm/s 0.04/s 2 3 3
0.5 mm/s 0.07/s 3 3 -
1 mm/s 0.14/s 3 3 3
2 mm/s 0.29/s 2 3 -
5 mm/s 0.71/s 3 3 3
10 mm/s 1.42/s 3 3 3
25 mm/s 3.57/s 3 3 3
50 mm/s 7.14/s 3 3 3
Total specimens 31 29 23
* Approximate strain rate based on mean specimen height of 7.0 mm (Table 4-4).
4.2.5 Hypothesis validation
Figure 4-5 A&B shows the test data of a typical specimen. There were short durations of
delay and possible load vibrations at the beginning and end of motion. Avoiding these
transient regions, the raw test data was extracted from the elastic region and converted to
stress and strain values basing on the geometry of the specimen under test [Figure 4-5
C&D]. Two equations were extracted (MS Excel) from the test data: (1) the strain vs time
equation and (2) the stress vs strain equation. Because of a constant compression rate
used, equation (1) was a linear equation. Equation (2) was a polynomial of degree n <=5.
The start and end points of equation (1) and (2) were recorded. The t1, t2, 1 and 2
specified the valid range of the experimental data for this specimen.

87
Equation (1), t1 and t2 were measured in the experimental time domain. The viscoelastic
surface should be in model time domain, i.e., the stress and strain start from time zero. To
convert from experimental time to model time, Equation (1) was extended to cut the
experimental time axis at t0. Equation (1) was then time shifted by t0, then t1 and t2
became t1’ and t2’ respectively. The slope of Equation (1) also represented the strain rate
the specimen was tested under. To regenerate the test data of the specimen in the
viscoelastic model domain, 100 equal time intervals were inserted between t1’ and t2’. If
t2’ was greater than 500 seconds, it was held to a maximum of 500 seconds to limit the
time range of the model. For the time at the end of each time interval, the strain and stress
values were generated from the time shifted Equation (1) and Equation (2) respectively.
The regenerated data of all specimens in the batch were plotted in the stress-time-strain
domain (MATLAB). A polynomial surface Pmn(t, ) was fitted using least-square-error
technique (MATLAB Curve Fitting tool) over all these data finding the minimum m and
n to result in an acceptable R2 value. The coefficients of this polynomial and the mean
end stress (or yield stress) and the mean end strain (or yield strain) were calculated as the
valid boundaries of the viscoelastic surface.
To validate the strength of each batch of specimens, the stress-strain data for all
specimens tested within the approximate strain rates of 0.04/min (0.25mm/min), 0.04/s
(0.25mm/s), 0.14/s (1mm/s), 0.71/s (5mm/s), 1.42/s (10mm/s) and 3.57/s (25mm/s) are
plotted on the same graph, one for each strain rate.
To validate the suitability of the specimen material as an IVD prosthesis material
candidate, the stress-strain data of the kangaroo IVD for the set of 6 strain rates was also
generated basing on the 500 second viscoelastic surface of the kangaroo IVD derived
from Error! Reference source not found. and plotted against those of the mean stress-
strain curve of all the specimens in the strongest batch found in the previous comparison.

88
4.3 Results
4.3.1 Derivations from analytical model
The C5-C6 IVD was used as our prosthesis development target. We used kangaroo C5-
C6 IVDs as our animal model and measured their compressive behavior in a previous
study [Section 3]. Assuming the physiological compression of the IVD is around 10%.
The mean compressive modulus of the kangaroo IVD (n=19) measured was 19.8 MPa
(compression rate 0.14/s). At strain value of 10% and the tensile modulus of 10% PVA-C
measured in Section 4.7 was 0.17 MPa (tensile strain rate 0.1/s), the analytical model
A
B
C
D
Figure 4-5: Typical test data of a specimen and processing.
“A” and “B” are data captured of the displacement vs time and load vs time
respectively. “C” and “D” are the extracted elastic region from “A” and “B”
and converted into stress and strain values basing on the geometry of the
specimen. The linear equation of strain vs time is obtained from data in “C”
and the polynomial equation of stress vs strain is obtained from the data in “D”.

89
predicts the tensile modulus Ef required for the chosen fibre with volumetric fill of 0.6%,
3%, 5% and 10% are found to be 9.8 GPa, 2.0 GPa, 1.8 GPa and 590 MPa respectively.
In addition, the analytical model assumes the fibers should wind continuously around the
circumference of the prosthesis, this gives additional requirements to the fiber: (1) the
fibers should be highly aligned in a bundle and (2) the individual fiber length should be
greater than 72mm for a 23mm diameter mold.
4.3.2 Bamboo fiber properties
Under SEM [Figure 4-6] and high-power optical microscope [Figure 4-2 C] observations,
each strand of the bamboo fiber sampled for mechanical testing [Figure 4-2] was actually
formed by a bundle (> 6) of fibrils (typical diameter < 10 m) bounded together.
A B
Figure 4-6: SEM images of the bamboo fibers
“A” was at 250X and “B” at 1000X magnification. The images reveal that each
strand of the bamboo fiber used in this experiment was actually consisting of a
bundle of fibrils bounded together.

90
Figure 4-7: FTIR results of bamboo fiber.
A: The FTIR results of a washed sample and an original sample of the bamboo
fiber. The washed sample were washed with and immersed in DI-water at room
temperature for 3 days with water replaced daily and then air dried.
B: The FTIR data of the original sample was analyzed by Bio-Rad KnowItAll
software, indicating that the sample’s FTIR signature matches that of alpha-
cellulose at 99.5%.
A
B

91
Figure 4-7A shows the FTIR results of a washed sample and an unwashed sample of
bamboo fiber. The similar FTIR pattern indicates the washing did not alter the chemical
contents of the fiber. Figure 4-7B shows the FTIR results of the unwashed fiber analyzed
by BIO-RAD KnowItAll software revealing that the signature of the fibers matches those
of alpha-cellulose at 99.5%. This had validated the plant origin of the fibers, however,
didn’t identify that they were bamboo fibers.
Figure 4-7A has identified the absorption peaks attributed to the chemical bonds99–102 in
the samples. The FTIR signature compared significantly well with those for bamboo
fibers reported by Liew et al99 and Wang et al101. The absorption peaks around 1018 and
1155 cm-1 are signatures for the C-O and C-C bonds for cellulose102. The C=C stretching
vibration in the aromatic ring of lignin can be attributed99 to the absorption peak around
1515 cm-1. The C-H stretching vibration present in cellulose molecules commonly related
to the lignin component can also be accounted100 for the peak around 2880 cm-1. Both
indicate the existence of lignin in the sample.
For the density measurement, the volume displaced by 20.7g of fiber was 12.9 ml 0.5
ml, hence the density of the fiber was about 1.6 g/cc. The volumetric fiber content for
batch B1 and B2 was based on this density measurement.
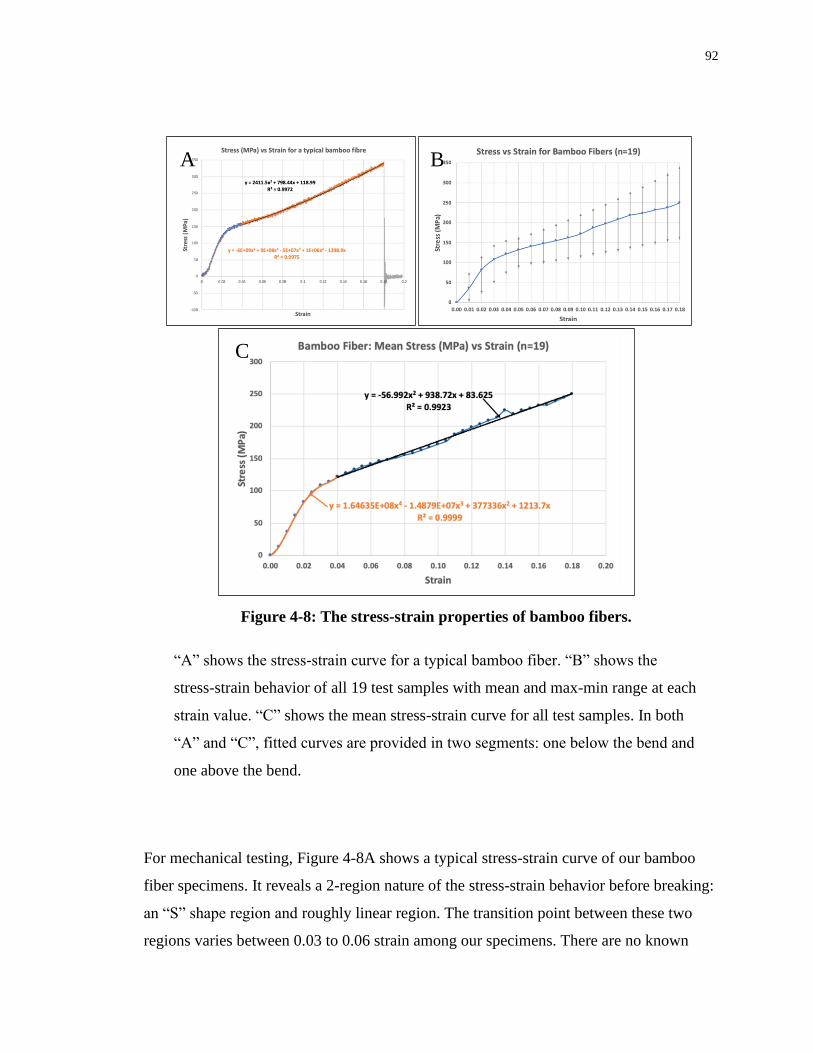
92
For mechanical testing, Figure 4-8A shows a typical stress-strain curve of our bamboo
fiber specimens. It reveals a 2-region nature of the stress-strain behavior before breaking:
an “S” shape region and roughly linear region. The transition point between these two
regions varies between 0.03 to 0.06 strain among our specimens. There are no known
A B
C
Figure 4-8: The stress-strain properties of bamboo fibers.
“A” shows the stress-strain curve for a typical bamboo fiber. “B” shows the
stress-strain behavior of all 19 test samples with mean and max-min range at each
strain value. “C” shows the mean stress-strain curve for all test samples. In both
“A” and “C”, fitted curves are provided in two segments: one below the bend and
one above the bend.

93
explanations found in the literature for the cause of these two regions for bamboo fibers.
The SEM images [Figure 4-6] had revealed the multi-stranded substructure of the fiber;
however, it is not known that each fibril within the fiber had extended the full length of
the fiber. We postulate that the initial “S” curve might be due to the strength of the
bundle held together by lignin. The linear region may be due to the sliding of the fibrils
within the bundle. Figure 4-8B shows the mean and extend of the stress-strain values
measured among our 19 samples and Figure 4-8C and Equation 4-1 provide the two
fittings of the mean stress-strain curve of all our specimen (n=19).
Equation 4-1: Mean Stress-Strain curve of bamboo fibers (n=19)
𝜎 = {1.65 × 10⁸𝜀4 − 1.49 × 10⁷𝜀3 + 377336𝜀2 + 1213.7𝜀 0 ≤ 𝜀 < 0.04−56.992𝜀2 + 938.72𝜀 + 83.625 0.04 ≤ 𝜀 < 0.18
Basing on Equation 4-1, we can calculate the Young’s modulus of the fiber at different
strain value [Table 4-2]. Its Young’s modulus ranges from 4.95 GPa to 1.46 GPa in the S
region and approximately 926 MPa in the linear region.
Table 4-2 provides the Young’s modulus of the bamboo fiber at a set of strain values
basing on Equation 4-1.
Table 4-2: Mean Young's modulus of bamboo fibers
Strain Young’s modulus Unit
0.01 4.95 GPa
0.02 3.72 GPa
0.03 1.46 GPa
0.04 ~926 MPa
Table 4-3 summarizes the results of our findings on the bamboo fiber properties.

94
Table 4-3: Bamboo fiber properties (n=19)
Fiber Properties Mean SD Min Max Unit
Fiber length 92.68 10.35 78.60 120.00 mm
Fiber diameter 20.79 1.87 17.35 24.94 m
Yield* force 64.4 15.99 32.9 89.8 mN
Yield* strain 0.108 0.055 0.025 0.193
Yield* stress 190 64.17 102.5 338.3 MPa
* Yield represents the end of the linear region which is also the break point of the fiber.
4.3.3 Prosthesis Compressive Test Results
4.3.3.1 Dimensional and yield properties
As shown in Figure 4-3B, D and F the specimens had considerable shrinkage after the 6
FTCs. Table 4-4 summarizes the measured geometric properties of the prosthesis
specimens and the shrinkage calculated based on a 23mm diameter 8.7mm height mold.
This unexpected shrinkage has presented a considerable deviation from the prediction of
the analytical model.
Table 4-4: Geometric properties of the prosthesis specimens (n=92)
Properties Mean SD Min Max Unit Mold Shrinkage
Height 7.0 0.4 5.4 7.6 mm 8.7 20%
Area 328.7 23.4 281.4 385.3 mm2 415.5 21%
Volume 2285.0 124.8 1913.8 2583.4 mm3 3614.6 37%

95
The compression of specimens in B0 and B1 did not yield up to 0.9 strain. The same was
true for specimens in B2 at compression rate of 0.25mm/min (~0.04/min). Yields only
occurred for specimens in B2 at or above strain rate 0.04/s. Table 4-5 shows the yield
characteristics of specimens in B2 (n=18 out of 23).
Table 4-5: Compressive properties of B2 specimens (n=18 out of 23).
Properties Mean STD Min Max Unit
Yield* Load 3.23 0.81 2.28 5.03 kN
Yield* Strain 0.76 0.08 0.58 0.87
Yield* Stress 8.95 2.30 6.22 14.34 MPa
* Yield represents the end of the elastic region.
4.3.3.2 Viscoelastic properties evaluation
Figure 4-9 performs an evaluation on the viscoelasticity of the prosthesis using specimens
in B2. Each stress-strain curve is the mean (n=3) of the specimens at that strain rate
group. The increasing strength of specimen at higher strain rate has validated that the
specimens are viscoelastic. The same results are true for specimens in B0 and B1 but at a
lesser degree. Figure 4-9 also derived the mean stress-strain curve of B2 specimens:
Equation 4-2: Mean stress-strain curve for B2 prosthesis specimens
𝜎 = −3.4621𝜀3 + 18.516𝜀2 − 3.7763𝜀 + 0.0759

96
4.3.4 Stress-Strain comparison for B0, B1 and B2
To compare the strength of specimens in B0 (0v%), B1 (0.6v%) and B2 (3.0v%), their
stress-strain test results of specimens at the 6 selected strain rates were plotted against
each other. The color code used is B0 (0v%) in green, B1 (0.6v%) in blue and B2
(3.0v%) in orange.
Figure 4-9: Viscoelastic properties of B2 specimens
This figure contains the mean stress-strain curve of all specimens of B2 tested at
each strain rate from 0.04/min to 7.14/s showing the mean strength of the
specimens increases at increasing strain rates. This illustrates that the material is
viscoelastic.

97
Figure 4-10: Stress-Strain curves for B0, B1 and B2 at the 6 selected strain
rates.
The stress-strain compression test results for specimens in B0 (0v%) in green, B1
(0.6v%) in blue and B2 (3.0v%) in orange for the 6 selected strain rates. It
illustrates that, apart from very slow strain rate (0.04/min), the strength of each
sample of B2 is greater than any sample in B1 and each sample in B1 is greater
than any sample in B0.

98
4.4 Discussion
The objective of this study is to perform a proof-of-concept evaluation on a new IVD
prosthesis candidate for an ADR device. We used a model-based approach in this study.
We derived an analytical model to model the compressive behavior of such a prosthetic
device. From this model, we deduced the requirements of the fibers needed, validated the
properties of bamboo fibers that fit this requirement, created the prosthesis specimens,
and tested the specimens. This section will discuss three main issues of this study (1)
validating the prediction of the model on the fiber content vs compressive strength of the
specimens. (2) the accuracy of the model. (3) the suitability of the prosthesis as cervical
IVDs ADR devices. For the last point, we use kangaroo C5/C6 IVDs as the animal model
from our previous study for the mechanical strength target.
4.4.1 Suitability of the bamboo fiber
Basing on our test results, the procured bamboo fibers had satisfied our model predicted
requirements on fiber orientation [Figure 4-1] and fiber length [Table 4-3]. The Young’s
Modulus of the bamboo fibers [Table 4-2] required for 3v% filled specimen was weaker
than required. A more suitable fiber filled content would be 5v% or 10v% as predicted by
the model. The 3v% fill was chosen basing on the limitation of our dry packing
technique. This was found to be close to the maximum volume of fibers that we could fill
the mold with. For future studies, the fibers may be pre-wetted with the 10wt% PVA
solution. This will allow specimens of higher fiber filled contents to be made.
As a proof-of-concept study, there are many requirements for bamboo fibers on
biomedical application were not included. These will be left for future studies once its
usability is established.
4.4.2 Validation on fiber filled content vs compressive strength of prosthesis specimens
The analytical model predicts the compressive strength of prosthesis specimens increases
monotonically as the fiber filled content increases. Figure 4-10 provides the compressive
stress-strain curves of all the prosthesis specimens in B0, B1 and B2 at the 6 chosen

99
strain-rates. Apart from the very low strain rate of 0.04/min, it is clear that the
compressive stress at any given strain value increases with the fiber content. The
hypothesis of if f2 > f1 > f0=0 (control) then S2 > S1 > S0 (control) has been validated from
the experimental results.
The stress-strain curves of all specimens in each batch of the same strain rate are closely
packed together. This indicates that the results are repeatable, hence predictable. This
characteristic will help in determining the correct fiber content to match the strength of a
given IVD required.
4.4.3 Validating the accuracy of the analytical model
From the test results shown in Figure 4-9, the prosthesis specimens are viscoelastic. Since
the source of this viscoelasticity is unknown, this property is not currently incorporated
within the model. To compare with the analytical model, we took the measured mean
stress-strain curve of the B2 specimens as shown in Figure 4-9 and Equation 4-2 to derive
the Young’s modulus vs strain for the B2 specimens.
The volumetric and area shrinkage of the specimens had presented another problem in
this validation. The volumetric shrinkage will result in a higher fiber filled content. With
the 37% volumetric shrinkage [Table 4-4], the effective fiber fill content of B2 will
become 4.7v%. The effect of the area shrinkage of the specimen on the circumferentially
oriented fibers are not known. We postulate that the fiber may be wrinkled up within the
specimen. Until they are stretched back to their original state, they cannot share the load
with the matrix material. The 21% area shrinkage [Table 4-4] represents a 11.1%
shrinkage in the circumference of the specimens. To restore to their original
circumference in the mid height of the specimen, a compressive strain of 0.148 [Equation
4-7, R=1.124, L=0.852] must be applied on the specimen. This may explain the fact
that all specimens do not show significant strength before 0.15 strain [Figure 4-10 and
Figure 4-9]. To compare with the analytic model, the mean Young’s modulus of B2 is
pre-strained by 0.15. However, this pre-strain value only represents the unwrinkled state
of the fibers in the mid height of the specimen, the fibers in the rest of the specimen will
still be in the wrinkled-up state and cannot reinforce the specimen until further

100
compression. Hence, the measured result should be weaker than the model prediction at
lower strain value and approaches that of the model prediction at higher strain value.
Figure 4-11 shows the comparison results between B2 specimens and the model. The
blue line is the predicted Young’s modulus of a 4.7v% specimen from the model. The
solid red line is the mean Young’s modulus of the B2 specimens measured [Equation
4-2]. The dotted red line is the Young’s modulus of the B2 specimens pre-strained by
0.15. The green line represents the percentage difference of the B2 specimens (pre-
strained) from the model prediction (M). It falls form 77% at 0.05 strain to a minimum of
35% at 0.5 strain. This trend agrees with our prediction from our postulation.
Figure 4-11: Validation of the analytical model using B2 specimens
The blue line represents the model prediction on the performance of a prothesis
specimen with 4.7v% fiber fill content. The solid red line is the measured mean
performance of all B2 specimens. The dotted red line is the performance of B2
specimens pre-strained by 15%. The green line represents the percentage difference
between the model and the pre-strained B2 specimens.

101
4.4.4 Potential of the specimens as an IVD TDR device material
The key focus of this study is to evaluate if the strength of the material proposed is
suitable for IVD prosthesis devices or not. To accomplish this, we compare the strength
of the cervical IVD we measured from a previous study using kangaroo C5-C6 IVD as
animal model with those of the B2 specimens measured in this study.
In a previous study, we measured the viscoelastic material property of kangaroo C5-C6
IVDs in compressive stress () as a function of both time (t) and strain () at different
strain rates (r) up to their yield points. The fitted experimental data (n=19, R2=0.93)
obtained is a 3D surface, which we called the compressive viscoelastic surface. It is given
as:
Equation 4-3: Viscoelastic model of kangaroo C5-C6 IVD
𝜎(𝑡, 𝜀) ≅ [(𝑝31 𝑝21
𝑝11 𝑝01
𝑝30 𝑝20 𝑝10 𝑝00) (
𝑡3
𝑡2
𝑡1
)]
′
(𝜀1
)
Where p31=0, p21=9.287e-05, p11=-0.07037, p01=20.07, p30=-1.739e-08, p20=1.413e-05,
p10=-0.003238 and p00=0.1801.
The units of this viscoelastic surface are in MPa for stress and seconds for time. The
boundaries of the surface are derived from mean yield points and experimental
limitations. They are stress less than 10.88 MPa, strain less than 0.55 and time less than
379s.
To obtain the stress-strain curves for the 6 strain rates (r) [Section 4.2.5] used in this
evaluation for kangaroo IVD specimens, one can substitute t=/r into Equation 4-3 and
then evaluate the stress values at different strain values (MATLAB).
Figure 4-12 shows the stress-strain curves of kangaroo specimens (KS) (in blue) and B2
specimens (in red) measured at strain rates from 0.04/min to 3.57/s.

102
Figure 4-12: Stress-strain curves of pre-strained B2 specimens in matching
those of kangaroo IVD C6-C6 specimens (KS)
This figure shows the stress-strain curves of B2 specimens (in red), with 35% pre-
strain (in black), 45% pre-strain (in green) and kangaroo C5-C6 IVD specimens (in
blue).

103
It is apparent from Figure 4-12 that the B2 specimens as a raw material is much weaker
than that of KS under all strain rate conditions. However, B2 specimens have a high
mean yield strain value of 0.76 [Table 4-5]. Taking advantage of this property and with
the inspiration from Section 4.4.3, the B2 specimen material can be pre-strained by 35%
to 45% to fulfill the required strength of IVD and still leave sufficient physiological
operating room for practical IVD prosthesis application. Figure 4-12 also includes the
pre-strained properties of B2 specimens with pre-strain values of 35% (in black) and 45%
(in green). It is apparent that a pre-strain value of 35% provides a good match of the KS
properties under a wide strain-rate values.
4.5 Conclusion
In this study, we have developed a composite material for an IVD prosthesis using
10wt% PVA and bamboo fibers arranged circumferentially. We have developed and
validated an analytical model for the compressive behavior of such a prosthesis. We have
validated that the strength of the prosthesis can be increase or decrease to match the
mechanical properties of an IVD by changing its fiber content and applied a suitable pre-
strain value. The prosthesis can be molded into any shape to fit the IVD of individual
patient. Its top and bottom surfaces, even though molded flat, will conform perfectly with
the vertebral endplates under compression providing even stress distribution over the
entire endplates. This may address the reported drawbacks of existing ADR devices.
Future development may improve the shrinkage issue of the PVA and develop an
anchoring method without the need to machine the vertebral bodies.

104
4.6 Appendix: Modeling the compressive behavior of an IVD prosthesis
4.6.1 Variables definition
(For variable definitions see “List of Abbreviations”)
4.6.2 Method & Results Summary
In this study, we used a simple short cylindrical form for our IVD prosthesis specimens.
The material was made from a composite of 10wt% PVA cryogel with long
circumferentially oriented fibers embedded. Under normal compression, the specimen
will shorten in height and expand circumferentially forming a barrel shaped object. This
will put the circumferentially reinforced fibers under tension, providing compressive
strength to the specimen. The goal of this appendix is to derive an analytical model for
the compressive behavior of such a composite specimen. The aim is to deduce the
selection criterions for the fiber required to satisfy a given IVD strength.
In this derivation the composite material is assumed to be incompressible and linear. The
compression process is also assumed to be energy conservative.
z
r
Ro
Rm
L
L
F
F
Lo
Lo
z
z
rm
z
z
Figure 4-13: Variables used in the
analysis.
The original cross-section of the
cylindrical specimen (dotted orange
rectangle) is compressed into a barrel
shaped cross-section.

105
In this derivation, basing on the geometry and incompressible material assumption, we
first derive the relationship between the normal compression ratio in height (L) to the
circumferential radius expansion ratio (R) at the middle section of the specimen
[Equation 4-7]. We then derive the internal energy stored in the barrel body due to the
compression [Section 4.6.6.2] and equate this to the work done by the external
compressive force [Section 4.6.6.3]. This generates the relationship between the normal
compressive Young’s modulus EN of the specimen with its circumferential tensile
modulus EC and a function of the degree of compression L [Equation 4-9]. We call this
function the compressive function FC [Equation 4-10] and plot its value against a range of
normal compressive strain value in height L (=1-L). After this, the next step is to derive
the composite circumferential tensile modulus EC from the properties of its components
[Section 0]. We take a cylindrical shell of this composite material, cut it open along the
length to form a sheet of material. When the specimen expands circumferentially, this
sheet of material is under a tensile force. With the circumferential orientation of the long
fibers, the fibers within this sheet of material are connected essentially in parallel with the
matrix material to withstand the tensile force together. Basing on this approximation, we
derive the relationship of the composite circumferential tensile strength EC to the tensile
modulus of its matrix Em, its fiber Ef and the percentage volumetric fiber content pf
[Equation 4-11]. With equations Equation 4-7 and Equation 4-11 and the tensile strength
Em of the matrix measured, we can derive the tensile strength requirement of the fiber Ef
and the percentage fiber content pf in the composite to suit a given compressive strength
EN of an IVD.
Our study goal is to develop an IVD prosthesis to match the compressive strength of our
C5-C6 IVD. We use kangaroo C5-C6 IVDs as our animal model in a previous study
[Chapter 3]. Assume the physiological strain on a C5-C6 IVD is approximately 10%. The
mean compressive modulus of the kangaroo IVD (n=19) measured is 19.8 MPa
(compression rate 0.14/s). At strain value of 10% (L=0.9), the value of FC1.5. This
gives EN0.34*EC. With EN=19.8 MPa, this gives EC59.2 MPa. The tensile modulus Em
of 10% PVA-C measured in this study was 0.17 MPa (=10%, tensile strain rate 0.1/s).

106
From all these data, the tensile modulus Ef required for fiber with volumetric fill of 0.6%,
3%, 5% and 10% are found to be 9.8 GPa, 2.0 GPa, 1.2 GPa and 5.9 MPa respectively.
4.6.3 Geometric constrain on the compressed object
4.6.3.1 Profile curve of the barrel
Assume the profile is a parabolic curve of the form:
𝑟𝑚 = 𝑎𝑧2 + 𝑏𝑧 + 𝑐
With conditions (z=0, rm=Rm), (z=L, rm=R0) and (z=-L, rm=R0), then the profile curve
becomes:
Equation 4-4: Profile curve equation of compressed specimen
𝑟𝑚 = 𝑅𝑚 −𝑅𝑚 − 𝑅𝑜
𝐿2𝑧2
4.6.4 Volume of the barrel
Take a slice of thickness dz, at a distance z, the volume of the slice:
𝑑𝑣 = 𝜋𝑟𝑚2𝑑𝑧
Hence the volume V of the barrel:
Equation 4-5: Volume of compressed specimen
𝑉 = ∫ 𝜋𝑟𝑚2
𝐿
−𝐿
𝑑𝑧 = 𝜋 ∫ (𝑅𝑚 −𝑅𝑚 − 𝑅𝑜
𝐿2𝑧2)
2
𝑑𝑧𝐿
−𝐿
=2𝜋𝐿
15(8𝑅𝑚
2 + 4𝑅𝑚𝑅𝑜 + 3𝑅𝑜2)
4.6.5 Compression of a cylinder of incompressible material
When a cylindrical object is deformed into a barrel shape under a pair of compressive
force applied from top and bottom, assuming the material is incompressible, the volume
of the cylinder should be the same as the barrel.

107
𝜋𝑅𝑜22𝐿𝑜 =
2𝜋𝐿
15(8𝑅𝑚
2 + 4𝑅𝑚𝑅𝑜 + 3𝑅𝑜2)
Solving for Rm and taking only the positive root:
Equation 4-6: Equation for Rm
𝑅𝑚 =𝑅𝑜
4[−1 + √5 (
6𝐿𝑜
𝐿− 1)]
Substitute 𝛼𝐿 =𝐿
𝐿𝑜 and 𝛼𝑅 =
𝑅𝑚
𝑅𝑜 into Equation 4-6:
Equation 4-7: Compressive ratio of circumference in terms of height ratio
𝛼𝑅 =1
4[√5 (
6
𝛼𝐿− 1) − 1]
4.6.6 Deriving the compressive modulus EN from EC
4.6.6.1 Energy stored in a cross-sectional slice
Take a thin circular cross-sectional slice of thickness dz at a
distance z from the center of the barrel. Then the radius of
the slice is rm.
Consider a ring at a distance r from the center and thickness
dr, then the length of this circular element will be:2𝜋𝑟
Since the original radius of the slice before compression should be Ro and now with the
compression, the radius of the slice becomes rm, hence assuming uniform expansion, then
the original radius of the ring will be:
𝑟𝑜,𝑟 =𝑅𝑜
𝑟𝑚𝑟
The elongation of this ring is:
rm
r
dr

108
Δℓ = 2𝜋𝑟 − 2𝜋𝑟𝑜,𝑟 = 2𝜋𝑟 − 2𝜋𝑅𝑜
𝑟𝑚𝑟 = 2𝜋𝑟 (1 −
𝑅𝑜
𝑟𝑚) = 2𝜋 (
𝑟𝑚 − 𝑅𝑜
𝑟𝑚) 𝑟
The circumferential strain of this ring due to compression of the cylinder is:
𝜀𝑟,𝑐 =2𝜋𝑟 − 2𝜋𝑟𝑜,𝑟
2𝜋𝑟𝑜,𝑟=
𝑟 −𝑅𝑜
𝑟𝑚𝑟
𝑅𝑜
𝑟𝑚𝑟
=𝑟𝑚 − 𝑅𝑜
𝑅𝑜
Note: the circumferential strain is independent of r.
If the circumferential Young’s Modulus is Ec, then the circumferential tensile stress:
𝜎𝑟,𝑐 = 𝐸𝑐𝜀𝑟,𝑐 = 𝐸𝑐
𝑟𝑚 − 𝑅𝑜
𝑅𝑜
Note: the circumferential tensile stress, 𝜎𝑟,𝑐, is also independent on the radius r.
The tensile force acting on the surface of this drdz element is: 𝑓𝑟,𝑐 = 𝜎𝑟,𝑐𝑑𝑧𝑑𝑟.
Hence the energy (or work done on) stored in the elongation of this element:
𝑑𝑒 = 𝑓𝑟,𝑐Δℓ = 𝐸𝑐
𝑟𝑚 − 𝑅𝑜
𝑅𝑜𝑑𝑧𝑑𝑟2𝜋 (
𝑟𝑚 − 𝑅𝑜
𝑟𝑚) 𝑟 = 2𝜋𝐸𝑐
(𝑟𝑚 − 𝑅𝑜)2
𝑟𝑚𝑅𝑜𝑑𝑧 𝑟𝑑𝑟
The total energy stored by the slice at distance z:
𝑒𝑧 = ∫ 2𝜋𝐸𝑐
(𝑟𝑚 − 𝑅𝑜)2
𝑟𝑚𝑅𝑜𝑑𝑧 𝑟𝑑𝑟
𝑟𝑚
0
= 𝜋𝐸𝑐(𝑟𝑚 − 𝑅𝑜)2𝑟𝑚
𝑅𝑜𝑑𝑧
4.6.6.2 Energy stored in a compressed cylinder
Total energy stored in the barrel as a result of compressing the cylinder:
Equation 4-8: Energy stored in the compressed specimen
𝑒2𝐿 = ∫ 𝜋𝐸𝑐(𝑟𝑚 − 𝑅𝑜)2𝑟𝑚
𝑅𝑜𝑑𝑧 =
𝐿
−𝐿
𝜋𝐸𝑐
𝑅𝑜∫ (𝑟𝑚
3 − 2𝑅𝑜𝑟𝑚2 + 𝑅𝑜
2𝑟𝑚)𝑑𝑧𝐿
−𝐿

109
Substituting Equation 4-4 into Equation 4-8 and solving the integral:
𝑒2𝐿 =16𝜋𝐸𝑐𝐿
35𝑅𝑜
(𝑅𝑚 − 𝑅𝑜)2 (2𝑅𝑚 +1
3𝑅𝑜)
4.6.6.3 Work done by external force on the cylinder
𝑒𝑁 = 𝐹𝑁2∆𝑧𝑜 = 𝜎𝑁𝜋𝑅𝑜22(𝐿𝑜 − 𝐿) = 𝐸𝑁𝜀𝑁2𝜋𝑅𝑜
2(𝐿𝑜 − 𝐿) = 𝐸𝑁2𝜋𝑅𝑜2
(𝐿𝑜 − 𝐿)2
𝐿𝑜
4.6.6.4 Deriving equivalent normal Young’s modulus EN
Assuming energy conservation, the work done provided by the external normal stress will
be mainly stored in the deformed cylinder (barrel shape). Hence, 𝑒𝑁 = 𝑒2𝐿, giving
𝐸𝑁2𝜋𝑅𝑜2
(𝐿𝑜 − 𝐿)2
𝐿𝑜=
16𝜋𝐸𝑐𝐿
35𝑅𝑜
(𝑅𝑚 − 𝑅𝑜)2 (2𝑅𝑚 +1
3𝑅𝑜)
Solving for EN,
𝐸𝑁 =8
35×
𝐿𝑜𝐿
(𝐿𝑜 − 𝐿)2×
(𝑅𝑚 − 𝑅𝑜)2(2𝑅𝑚 + 13𝑅𝑜)
𝑅𝑜3 𝐸𝑐
Substituting 𝛼𝐿 =𝐿
𝐿𝑜 and 𝛼𝑅 =
𝑅𝑚
𝑅𝑜 into above equation, giving
Equation 4-9: Normal compressive Young's modulus of specimen
𝐸𝑁 =8
35×
𝛼𝐿
(1 − 𝛼𝐿)2× (𝛼𝑅 − 1)2 (2𝛼𝑅 +
1
3) 𝐸𝑐
As R is a function of L [Equation 4-7], Equation 4-9 provides the relationship of the
effective compressive Young’s modulus EN to the circumferential Young’s modulus EC
and the compressive strain (N=1-L) value.
4.6.6.5 Compressive function
Defining a compressive function FC(L):

110
Equation 4-10: Compressive function Fc
𝐹𝑐(𝛼𝐿) =𝛼𝐿
(1 − 𝛼𝐿)2× (𝛼𝑅 − 1)2 (2𝛼𝑅 +
1
3)
The value of FC(L) is a function of the degree of compression L. Figure 4-14 plots the
value of this compressive function at different strain value.
4.6.7 Model of composite property with circumferential fiber reinforcement
Assuming the embedded fibers in the cylinder are long (wound over more than one
circle) and oriented roughly circumferentially in a horizontal
position. Take a circular slice from the cylinder and cut it
open. Assuming the majority of the fibers are in a
horizontal position [Note 1], when the slice is subjected
to a tensile force, the matrix material and the fibers are
effectively connected in a parallel condition.
Then,
𝐹𝐶 = 𝐹𝑓 + 𝐹𝑚
𝐸𝐶𝜀(𝐴𝑓 + 𝐴𝑚) = 𝐸𝑓𝜀𝐴𝑓 + 𝐸𝑚𝜀𝐴𝑚
r
2L
2r
FC FC
Figure 4-14: The compressive
function Fc vs compressive
strain (N=1-L) value.

111
𝐸𝐶 =𝐴𝑓
(𝐴𝑓 + 𝐴𝑚)𝐸𝑓 +
𝐴𝑚
(𝐴𝑓 + 𝐴𝑚)𝐸𝑚
Since (pf = 1-pm), giving:
Equation 4-11: Circumferential tensile modulus of specimen in terms of volumetric
fiber content, tensile modulus of fiber and tensile modulus of matrix.
𝐸𝐶 = 𝑝𝑓𝐸𝑓 + (1 − 𝑝𝑓)𝐸𝑚
Note 1:
If the fiber is making an angle to the horizontal, the horizontal tensile force from the
fiber will be 𝐹𝑓 cos 𝜃. The maximum angle that can be made will be one in a diagonal
position. In our case, the mold diameter is 23mm and height 8.7mm [Section 4.2.3]. The
maximum angle will be tan−1 8.7
23∗𝜋= 6.7𝑜. Since most of the fibers are packed down in
the mold. The actual inclination angle in one circumferential length will be much less
than 6.7o. The cos of this small angle can be approximately equal to 1.
4.7 Appendix: Tensile properties of 10wt% PVA
The analytical model requires the tensile properties of 10%PVA. To complete the
assessment of the model, its measurement was included as a side study.
4.7.1 Material and Methods
An approximate 5”x5”x 2mm thick sheet of 10wt%PVA after 6 FTCs was prepared in
same manner as described in Section 4.2.3. Samples were cut from the center portion of
the sheet using parallel blades 5 mm apart and 3 cm long. 8 specimens with thickness and
width measured were tensile tested using an Instron 8870 machine with a Transducer
Techniques 1000 g load cell at a displacement rate of 1mm/s to 0.8 strain value.
The stress-strain values were derived for the 8 specimens. The mean stress-strain curve
for the 8 specimens were extracted and the Young’s modulus at 10% strain was derived
(Excel).

112
4.7.2 Tensile Young’s modulus for 10wt% PVA
The analytical prosthesis compressive model requires the tensile Young’s modulus for
the matrix material (i.e. 10wt% PVA). Figure 4-15 provides the test result for 8
specimens of pure 10wt% PVA after 6 FTCs. It provides the mean stress-strain curve and
the extend (max and min) of the stress value at each strain value. The fitted stress-strain
curve provides the following equation:
Equation 4-12: Mean tensile stress vs strain for 10wt% PVA
𝜎 = 0.1268 𝜀2 + 0.1418 𝜀 − 0.0002
Equation 4-12 provides the tensile Young’s modulus of 10wt% PVA to be 0.167 MPa at
0.1 strain and at a tensile strain rate of ~0.1/s.
Figure 4-15: Tensile properties for 10wt% PVA

113
Chapter 5
5 IVD Prosthesis Development - Torsion
Abstract
An unrestricted IVD, as illustrated with kangaroo specimens, has shown substantial
torsional strength and viscoelasticity. Even though the importance of torsional behavior
of IVD is still under debate due to their limited ROM, some researches had shown that
even low torsional motion below the yield limit can damage the IVD. The compressive
properties of the prosthesis material proposed was fully accessed in previous Chapter 4.
In this Chapter, its torsional properties are evaluated. Torsional specimens were created
by gluing the composite specimen with aligned top and bottom aluminum plates and
tested in specially designed jigs and a dual axis material tester. The torsional stress and
torsional strain are calculated based on the definitions used for the kangaroo specimens.
Three batches, B3, B4 and B5 of 27 specimens each containing fiber contents of 0v%,
0.6v% and 3.0v% respectively were used in the torsional tests. 9 strain-rates (0.03/min to
4.66/s) were used to measure the torsional stress vs strain behaviors of the specimens in
each batch. The results were compared to those of kangaroo specimens. Unfortunately,
the torsional strength (< 1 MPa) of specimens with fibers (B4 & B5) show
indistinguishable value from those of the pure PVA specimens (B3) and much weaker
than those of kangaroo specimens (mean yield stress = 13.31 MPa). The hypothesis of
monotonous increase of torsional strength with increase of fiber content has not been
validated. The material has a complex torsional stress vs strain-rate relationship. The
weak torsional stress property may be attributed to the fibers wrinkled up caused by the
PVA shrinkage due to the cryogel process. Even though it has only weak torsional
strength, it is found that the material can sustain a high torsional strain value (>2.5)
without yield. Compared the yield torsional strain of 0.66 obtained from the kangaroo
specimens, it can provide more than adequate capability for IVD prosthesis application.
Combining the compressive and torsional properties, the material proposed can
functionally equivalent to the class of FDA approved IVDs such as ProDisc-C and
Prestige ST. In addition, it provides extensive mobile-core rotational kinematics,
important for cervical disc arthroplasty24, not supported by these protheses.
114
5.1 Introduction
As the only non-rigid components of our spine, all spinal mobilities (flexion, extension
and rotation) are provided mainly through our IVDs. They also provide shock absorptions
in all directions to protect our brain from harm in a traumatic incident. In this study, we
limit our study to cranial compression and torsion only. As shown in Section 3.4.3 and
3.4.4 using kangaroo IVD C5-C6 as our animal model, we have validated that the
unrestricted IVDs [Section 3.1] have both compressive and torsional viscoelastic
properties and shock absorption capabilities in both cases.
Even though the importance of torsional behavior of IVD is still under debate due to their
limited ROM, some researches had shown that even low torsional motion below the yield
limit can damage the IVD72–74. Hence it is important to characterize the torsional
behavior of an IVD prosthesis to compare that with a human IVD. Despite the
importance of torsional resistance and we had validated its substantial value in
unrestricted kangaroo IVDs [Table 3-4], not all existing FDA(US) and CE(EU) approved
IVD prostheses provide this capability. For example, ProDisc95, SB Charite96 and
Prestige ST12,94 will have questionable torsional resistance because of their design while
Bryan [Section 2.1Figure 2-1], M6-C15,91[Section 2.2] and CP-ESP16,92[Section 2.5] have
this capability specially incorporate in their structure. In the absence of this capability of
an IVD prosthesis, the torsional resistance must be offloaded to surrounding
discoligamentous structures in the spine. This may increase their operating stress level.
In Chapter 3we have introduced the concept of a possible IVD prosthesis material
candidate using a composite of 10wt% PVA cryogel with long circumferentially oriented
bamboo fibers and have studied its compressive properties. This Chapter is devoted to
evaluating the torsional characteristics of the specimens prepared using the same
materials and methods as described in the compression case [Section 4.2.3].
Similar to the case in compression, the experiment goal is to valid the hypothesis that the
torsional strength will increase monotonically with increasing fiber content. Using three
batches of specimens, B3, B4 and B5, of fiber volumetric content f and torsional strength
S, we will try to validate experimentally the hypothesis that if f5 > f4 > f3=0 (control), then

115
S5 > S4 > S3. Unfortunately, unlike in the compression case, no analytic model was
developed for the torsion case. The three fiber contents chosen remains the same as in the
compression test, i.e., 0v%(control), 0.6v% and 3.0v% for B3, B4 and B5 respectively.
To validate this hypothesis, all strain rates given in Table 5-1 are used. Stress-strain
curves were taken from the experimental results of each batch for each strain rate.
Comparisons of the strength of the three batches are made basing on their stress-strain
curves of the approximate same strain rate.
To validate the suitability of the specimen as a candidate for IVD prosthesis, the
maximum torsional stress obtained from all stress-strain curves of all specimens was
compared with the mean yield torsional stress of the kangaroo C5-C6 specimens.
5.2 Materials and Methods
5.2.1 The design of the prosthesis specimens
The specimens prepared for the compressive tests alone were inadequate for torsional
testing because it is difficult to transmit the torque onto the specimens without slippage.
To overcome this problem, two square aluminum plates were glued to the top and bottom
of the specimen surfaces [Figure 5-1B]. The torque was applied to the top aluminum
plate with the bottom one held stationary [Figure 5-3B]. The thickness of the top and
bottom aluminum plates was eliminated in the specimen height calculation. Care had
been taken to ensure the proper alignment of the top and bottom plates and the center of
the specimen body (axis of rotation). In addition, the top surface of each specimen was
carefully preserved from the PVA mold to the gluing process, so that the torque applied is
always in the same direction of the fiber orientation. Special tools had been designed for
aiding the gluing process [Figure 5-1] and specimens testing [Figure 5-3]. The torsional
analysis method is as described in Section 3.3.2.

116
Figure 5-1: Torsional specimen gluing tools
A: gluing jig for aligning the top and bottom aluminum plates onto the specimen
body during the gluing process.
B: torsional test specimen showing its specimen ID and top surface orientation.
C: centering template for aligning the axis of rotation of the specimen body and
its top and bottom aluminum plates.
D: brass weight to provide consistent pressure onto the specimen during the glue
hardening process.
A B
C
D
Figure 5-2: Determining the major
axis (a) and minor axis (b) of the
ellipse using a scaled photo in ImageJ
software.

117
5.2.2 Prosthesis specimen preparation
Three batches (B3, B4 and B5) of 50 samples each were made using same process and
materials as described in the compressive case (Section 4.2.3) containing fibers of mean
weight 0g (control, f3=0v%), 36.6mg (SD 0.4) (f40.6v%) and 173.6mg (SD 0.4)
(f53v%) respectively. After removing defective ones via visual inspection, the resulting
number of specimens in B3, B4 and B5 was 27, 27 and 36 respectively.
Basing on the knowledge that there is shrinkage of the specimen from the mold after the
freeze-thaw process [Table 4-4] and no proof of uniform shrinkage in any two orthogonal
A B
Figure 5-3: Torsional test fixtures
A: The design of the testing fixtures. The bottom cylindrical holder contains a
square pocket machined into the top surface to house the bottom aluminum
plate of the test specimen. Same arrangement is provided for the top holder.
B: The complete test assembly. The test specimen is fully immersed in 1x PBS
solution and the top and bottom aluminum plates are inserted tightly into the
pockets of the test fixtures.

118
directions, the cross-section of the specimen was approximated by an ellipse instead of a
circle.
To determine the polar moment of inertia J of the specimen [Section 3.3.2], each
specimen was individually identified. Its top surface was fitted with an ellipse and its
major and minor axis measured using scale photo technique (iPhone 6S, 6” steel ruler,
ImageJ) [Figure 5-2]. Same was performed for the bottom surface. The major (a) and
minor axis (b) of the specimen were taken as the corresponding mean values of its top
and bottom surfaces. The cross-sectional area of the specimen was calculated to
determine its shrinkage from the mold.
300 aluminum plates (28mm square, 2mm thick) were machine-cut to precise
dimensions, bead-blasted to roughen both surfaces and detergent-washed to remove
possible surface greases. These arrangements were to ensure good adhesion surfaces for
the PVA composite specimen body. The adhesive used was a high viscosity
cyanoacrylate adhesive (Sigma-Aldrich, PCode 1002603306) to limit the penetration of
the adhesive into the PVA body.
The specimens were constantly immersed in 1x PBS solution (Fisher Scientific CAS
7647-14-5,7447-40-7) throughout the preparation process except the shot duration during
gluing (~60 second). Afterwards they were stored in 1x PBS solution at room
temperature until testing.
5.2.3 Torsional testing
5.2.3.1 Test machine setup
All specimens were tested on an Instron 8874 dual axis machine with a load cell model
49139 (10kN/100Nm) and our special test fixture installed together with a 1xPBS bath
[Figure 5-3B]. The top and bottom cylindrical specimen holders were properly aligned by
adjusting the position of the bottom holder. The top and bottom square pockets were
aligned by rotating the top holder via the Instron upper arm.

119
To measure the height of the specimens with the thickness of the top and bottom plates
eliminated, an eraser of known height (61.10 mm) was placed in between two spare
aluminum plates inserted in the upper and lower pockets of the fixture. The upper arm of
the tester was lowered until a load of 1N was registered. With the known height of the
eraser and the measured distance of the Instron upper arm, the height of each specimen
body, without the top and bottom aluminum plates, could be derived.
5.2.3.2 Torsion test
The position of the top and bottom square pockets of the fixture were properly aligned
before any specimen was inserted into the pockets.
The positive direction of rotation was determined using the right-hand screw rule with the
thumb pointing up.
Each specimen was first subjected to a pre-conditioning step. The purpose was to reduce
the internal stresses built-up during the FTCs of the PVA process. The initial height of
the sample was determined by lowering the upper machine arm until a 1N force was
registered. It was then slowly compressed by 1 mm at a rate of 0.25mm/min. The position
was held for 1 minute and then subjected to a sinusoidal oscillation at 0.1Hz, amplitude
2o for 90 cycles (15 minutes). Load was removed for 2 minutes to allow the sample to
relax before the main torsion test.
The height of each sample prior to the torsion test was again measured by lowering the
upper machine arm until a 1N force was registered. Each sample was then compressed
by 1 mm at 0.25mm/min and hold position for 1 min. Using the rotation rates given in
Table 5-1, it was first rotated to -15o and then to +90o. Table 5-1 also shows the number
of samples in each batch using the same rotation rate.
Table 5-1: Rotation rates and the number of specimens involved
Rotation rates Strain rate* B3 (f3=0v%) B4 (f40.6v%) B5 (f53.0v%)

120
1o /min 0.03/min 3 3 3
7o /min 0.18/min 3 3 3
11o /s 0.28/s 3 3 3
23o /s 0.60/s 3 3 3
45o /s 1.17/s 3 3 3
68o /s 1.76/s 3 3 3
90o /s 2.33/s 3 3 3
135o /s 3.50/s 3 3 3
180o /s 4.66/s 3 3 3
Total 27 27 27
*The strain rate is calculated from the mean geometric properties of the prosthesis
specimens [Table 5-2].
5.2.4 Test results extraction
Figure 5-4 shows the test data of a typical specimen. Except for those tests using very
low rotation rates, there are short durations of vibrations at each start and stop motion
[Figure 5-4B]. To avoid these vibrations, the specimen is first rotated in the negative
direction slightly (-15o) before rotating in the positive direction to the final position
(+90o). The captured torque and rotation values were converted to torsional stress and
torsional strain according to the methods described in Section 3.3.2 and the measured
geometry of the specimen. Only the data in the positive strain and positive stress region
are considered [Figure 5-5]. Two equations were extracted (MS Excel) from the test data:

121
(1) the strain vs time equation and (2) the stress vs strain equation. Because of a constant
rotation rate used, equation (1) is a linear equation. Equation (2) is a polynomial of
degree n <=4 [Figure 5-5B]. The initial time t1 of equation (1) and the end strain value 2
(end of elastic region or yield) of equation (2) are taken. From equation (1) the start strain
value 1 and the end time t2 are derived. The t1, t2, 1 and 2 specify the valid range of
the experimental data for this specimen.

122
A
B
Figure 5-4: Typical torsional test curves
A: the driving function: rotation vs time. The specimen is first rotated to -15o, stop
and then rotate to +90o. The stop was introduced by the Instron controller.
B: the measured torque vs time showing transient vibrations in the measured torque
when the rotation starts, stops and changing direction.

123
A
B
Figure 5-5: Specimen test results processing
Basing on the geometry of the specimen, its torsional stress vs strain curve
(B) was extracted from the experiment data. The stress/strain curve extracted
covers only the positive range of the stress and strain value. The start (1) and
end strain (2) values were identified for each specimen to indicate the valid
range of the fitted stress/strain curve. The time curve (A) provides the actual
strain rate the specimen was tested in.

124
5.3 Results & Analysis
5.3.1 Geometric properties
As shown in Figure 4-3, the specimens had considerable shrinkage after the 6 FTCs.
Table 5-2 shows the measured geometric properties of the specimens used for torsional
testing. The shrinkage is calculated basing on the dimension of the mold with 23 mm
diameter and 8.7 mm height.
Table 5-2: Geometric properties of prosthesis specimens (n=81)
Properties Mean SD Min Max Unit Mold Shrinkage
Major axis a 20.2 0.8 18.8 21.6 mm 23.0 12%
Minor axis b 19.8 0.7 18.4 21.0 mm 23.0 14%
Area 314.5 23.5 272.2 353.1 mm2 415.5 24%
Height 6.74 0.7 4.9 7.7 mm 8.7 22%
Volume 2119.2 241.9 1355.1 2511.0 mm3 3614.6 41%
5.3.2 Torsional properties
5.3.2.1 Torsional strength comparison between B3, B4 and B5
For the torsional test, none of the specimens had yield under the maximum torsional
strain condition applied and all of the aluminum plates remain attached to the specimen
body, indicating that the glue chosen was effective.
The three batches of specimens were tested using rotation rates described in Section
5.2.3.2 and the test results extracted as described in Section 5.2.4 are shown in Figure
5-6.

125
0v% (control) B3
0.6v% B4
3.0v% B5

126
The torsional test results for the specimens in B3, B4 and B5 are shown in Figure 5-6.
The stress/strain curves of the specimens at different strain rate in each batch were
generally closely bundled together, indicating that the results are probably reproducible.
It is also seen that the specimens had much weaker peak torsional strength (<1 MPa) as
compared with the mean torsional yield strength of 13.31 MPa measured from kangaroo
specimens (Table 3-4). However, all specimens in B3, B4 and B5 can withstand much
higher strain (around 2.5 to 3) without yield than those of kangaroo (mean yield strain =
0.66, Table 3-4). There is no clear trend in comparing the strength between specimens at
different torsional strain rates in the three batches of different fiber contents. Hence the
hypothesis of monotonous torsional strength increases with increase of fiber contents
[Section 5.1] has not been validated.
5.3.2.2 Torsional viscoelastic behavior analysis
Viscoelasticity is the effect of strain rate on stress. Figure 5-6 has indicated that the
specimens had a complex torsional stress vs torsional strain rate relationship. Figure 5-7
Figure 5-6: Torsional test results for specimens in B3, B4 and B5
Shows the torsional test results of all specimens in batch B3 (0v%), B4
(0.6v%) and B5 (3.0v%) with the 9 strain rates given in Table 5-1. For the
test results of strain rate 0.03/min, the test result of the B4 specimens
were hidden behind those of the B5 specimens.

127
provides a better illustration on this relationship using the mean stress value vs strain for
specimens tested within the same strain rate and compare that between specimens in B5
and B3(control). Even though plot A and C show some aspect of this relationship, plot B
and D illustrate this relationship better. For specimens in B5, at each strain level, plot B
shows the stress value increases from very low value to a dominant peak around strain-
rate =1.76/s and then decreases. For specimens in B3 (control), at each strain level, plot D
shows a few weak peaks for stress vs strain rate. A weak peak also appears at strain-rate
= 1.76/s as in plot B, but a more dominate peak obtained at 3.5/s. In both B5 and B3,
there are no monotonous increase relationship between torsional stress vs torsional strain-
rate, however, torsional stress increases monotonously with increasing strain.

128
The torsional viscoelasticity can also be modelled using the viscoelasticity surfaces
method (stress vs time & strain) as illustrated in the kangaroo case (Figure 3-10). Figure
5-8 provides the surfaces of a low time order fit (P12) and a high time order fit (P52) on
the test results of specimens in B5 and B3. The coefficients (pij) of the polynomials P12
and P52 of both B5 and B3 are provided in Table 5-3.
A
B
C
D
Figure 5-7: Mean torsional stress vs torsional strain at different torsional strain
rates for B5 & B3 specimens
A & C: Mean (n=3) torsional stress vs strain curves at different strain rate. A is for
specimens in B5 and C is for specimens in B3 (control)
B & D: Mean (n=3) torsional stress vs strain-rate at given strain level. B is for
specimens in B5 and D is for specimens in B3 (control)

129
However, it is found that, even though with acceptable R2 fit values, both lower and
higher order surface fits, Pmn (Matlab limits m & n <=5), do not show the stress vs strain-
rate behavior as clear as that in Figure 5-7 plot B & D.
B5 B3
P12
R2=0.983 R2=0.986
P52
R2=0.986 R2=0.987
Figure 5-8: Viscoelastic surface P12 & P52 fits for B5 and B3 specimens test results
with time <= 10 sec.
The time axes for all plots are 0→10s in 1s increments.
The torsional strain axes for all plots are 0→2 in 1 increment.
The torsional stress axes for B5 plots are 0→1MPa in 0.1MPa increments and for B3 are
0→0.9MPa in 0.1MPa increments.

130
Table 5-3: Coefficients for fit polynomials of B5 and B3.
pij B5 B3
P12 P52 P12 P52
p00 -0.001535 -0.004403 -0.0004806 -0.00305
p10 0.0002446 0.005504 0.0001078 0.004904
p01 0.1312 0.1442 0.08455 0.08792
p20 -0.002975 -0.002504
p11 -0.01351 -0.001191 -0.005734 -0.01835
p02 0.1006 0.07259 0.1442 0.1571
p30 0.0007398 0.0005582
p21 -0.02792 0.007346
p12 0.0466 -0.01889
p40 -8.21e-05 -5.599e-05
p31 0.008948 -0.001752
p22 -0.01686 0.006244
p50 3.304e-06 2.07e-06
p41 -0.0006975 0.000123
p32 0.001392 -0.0004864

131
5.4 Discussion
5.4.1 Effect of fiber content and orientation on the torsional strength of the specimens.
As stated in Section 5.3.2.1, the hypothesis on the monotonous increasing of torsional
strength with increasing fiber content has not been validated experimentally. Comparing
the peak torsional strength of B5 and B3 at strain = 2.0 (Figure 5-7 plot B & D) and
strain-rate=1.76/s are roughly the same. This shows that the fiber content has little effect
on the torsional strength of the specimens.
The original idea of embedding fibers circumferentially to increase the torsional strength
of the specimens is, when the specimen is under torsion, the rotation will extend the
fibers in each layer of the composite material to provide a tensile strength to resist the
torque applied. However, the geometric shrinkage introduced by the PVA cryogel
process has introduced an unknown effect on the torsional strength of the specimens. For
compression, it has shown a strain shift effect on its compressive strength (Sections 4.4.3
& 4.4.4) due to the circumferential wrinkled fibers. The compression has theoretically
unstretched the fibers in the mid portion of the prosthesis body. Under the same
assumption, the fibers have to be fully unwrinkled before they can start to provide the
tensile strength expected. Consider one fiber on the outer-circumference of the specimen
and for one circumferential length, if ro is the initial radius of the specimen and rs is the
shrunk radius after the PVA cryogel process (rs <= ro), then to un-wrinkle this fiber, one
has to rotate the top surface of the slice of the specimen where the fiber is embedded in
by an angle along the orientation of the fiber. (in radian) can be determined by this
relation: (2𝜋 + 𝜃)𝑟𝑠 = 2𝜋𝑟𝑜,
Giving: 𝜃 = 2𝜋 (𝑟𝑜
𝑟𝑠− 1).
Taking the mean values from Table 5-2, 𝑟𝑜 = 23𝑚𝑚/2 and 𝑟𝑠 ≈ √𝑎𝑏 4⁄ =
√20.2 ∗ 19.8 4⁄ . This gives 𝜃 = 0.94 𝑟𝑎𝑑 = 54𝑜.

132
As the fibers are packed in the mold, one circumferential travel of the fiber will be
embedded into a very thin slice of the specimen. will be accumulated from all these thin
slices from the bottom of the specimen to the top of the specimen. This means there have
to be substantial rotation (i.e., torsional strain) of the specimen before the fibers can reach
the unwrinkled state to produce torsional strength. This may explain the low torsional
stress measured from the specimens even at high strain value [Figure 5-6]. This may also
explain the reason why there are not many differences in torsional stress values between
the three batches of different fiber contents. Because of the non-contributing fiber, the
specimens with zero fiber contents (B3) had shown a slightly higher torsional strength
than those in B4 & B5 under the strain-rates tested in.
In this research, the aim was to evaluate the feasibility of the circumferentially embedded
fiber concept. All specimens were prepared with fibers embedded in a fixed orientation
following the right-hand-screw rule with thumb pointing upwards. All specimens were
carefully tested with torsional strain applied in this direction. Under this construction, the
torsional strength of the specimens is unidirectional. For real IVD prosthesis application,
half of the fibers should be packed in another direction to provide bi-directional torsional
strength. The fiber orientation should have no effect on the compressive strength.
However, the shrinkage of the PVA matrix has to be solved before any possible torsional
strength can be obtained.
No explanation can be found on the complex torsional strength vs strain-rate relationship
as shown in Figure 5-7 plot B & D. The fiber in B5 seems to smooth out the peaks and
valleys in the control B3. Fiber slippage or yield due to tensional stresses may be factors
to consider to explain the rise and fall of torsional strength vs strain-rate in B5. However,
the reasons for the variations of torsional strength vs strain-rate in B3 still need further
investigation.
5.4.2 Suitability of specimens for IVD prosthesis material
The compressive properties measured in Section 4.3 & 4.4 have shown that the prosthesis
specimens with 3v% fiber contents have comparable compressive strength as the
kangaroo specimens measured after applying a pre-strain value about 35% to 45%

133
(Section 4.4.4). As the hypothesis on monotonous increasing compressive strength vs
fiber contents has been validated (Section 4.3.4), by increasing the fiber content to about
5v% to 10v% will increase the compressive strength of the specimens and decreases the
pre-strain value required to match that of the kangaroo specimens. The specimen material
is feasible for supporting the upper body weight required by the IVD.
The torsional properties measured in Section 5.3.2 has shown that the specimen material
has very low torsional strength. The properties measured was under no pre-strain
condition. The fiber content does not substantially increase the torsional strength of the
pure PVA cryogel (Section 5.4.1). Even though it has little torsional strength, it can
withstand a high torsional strain (> 2.5) without yield. Comparing with the torsional yield
strain of 0.66 for kangaroo specimens (Table 3-4), the material is more than adequate to
provide the torsional strain required for an IVD prosthesis.
Combining the compressive and torsional properties, the material is functionally
comparable with those FDA approved IVD prostheses such as the ProDisc-C95 and
Prestige ST12,94. In addition, the material candidate can provide extensive mobile-core
rotational kinematics, important for cervical disc arthroplasty24, not supported by these
protheses.
5.5 Conclusion & Future works
Unlike the compressive strength, the torsional strength does not increase monotonously
with the fiber content. It is essentially the same as that of straight 10% PVA cryogel.
There is a doubt that the lack of torsional strength may be due to the shrinkage introduced
by the PVA cryogel process. With a 35% to 45% pre-strain condition applied, the fibers
in the mid portion of the specimens may be stretched to remove the wrinkle introduced
by the PVA shrinkage. Torsional test conducted under this condition may eliminate this
doubt. This is left for future research work.

134
Chapter 6
6 Conclusion and Future Work
This Chapter provides a short recapitulation of this research including motivation,
objectives, results obtained and final conclusion. A summary of the contributions of this
research is included. Recommendations for future works is also provided.
6.1 Summary of Research
6.1.1 Motivation and Goal
Many of the CDA devices have been developed within the last 30 years to improve on the
clinical outcomes of the standard ACDF approach. Their main goal, apart from the
primary function to treat pain originated from myelopathy and radiculopathy, is to
improve the patient’s quality of life by providing improved range of mobility. Earlier
designs following the Bristol-Cummins disc concept using a ball-and-socket construction
to provide 3 degrees of rotational freedom. More recent ones employ a polycarbonate
urethane (PCU) core to provide 6 degrees of freedom (DOF) to mimic the natural
mechanical and material properties of the human IVD. Due to the material properties of
the PCU, these CDA devices may provide some degree of viscoelasticity. Even though
with the added new degree of freedom, many papers in the literature had reported
incidents of heterotopic ossification (HO) and adjacent segment degeneration/disease
(ASD). The literature reviews in Chapter 2 have pointed to the same observation and also
shown that the number of incidents and severity may increase in time. Unfortunately,
their cause(s) are still unknown.
This research has hypothesized on these outcomes may be attributed to the mismatched
footprints to the vertebrae endplates, mismatched material properties to a healthy IVD
and the injuries introduced to the vertebrae endplates due to their intrusive fixation
methods.
This research has proposed a new prosthesis that can be made patient specific to match
the size and shape of the vertebrae endplates involved. This will leave no room for HO to
develop. The material properties should be viscoelastic to provide shock absorption

135
properties and 6 DOF. Its strength can be fine-tuned with simple parameters to match that
of the human IVD. This will reduce abnormal stresses introduced by the prosthesis, hence
will reduce the chance of ASD development. It should employ a non-intrusive fixation
method to minimize the injuries introduced to the vertebrae body, hence will eliminate
the triggering of the remodeling process of vertebrae which may result in HO
development.
The material proposed is a composite made from 10wt% polyvinyl alcohol cryogel
(PVA) with embedded long and circumferentially-oriented bamboo fibers. The material
can be molded into any required shape via a suitable mold through the freeze-thaw
process.
Theoretically when such a specimen is under compression, as its height decreases the
middle of the specimen will enlarge putting the circumferentially- and helically-oriented
embedded fibers in tension. This will enhance the compressive strength of the specimen.
When it is under torsion, the rotational torque will put the embedded fibers under tension
to provide torsional strength. Such a specimen will have 6 DOF in motion and variable
instantaneous center of rotation.
The goal of this research is to validate if this new material can be a viable material for a
cervical IVD prosthesis material.
6.1.2 Results summary
Due to the scarcity of the human cervical IVD data in the literature tested under similar
conditions, the C5-C6 IVD of kangaroo was used as our animal model and the data
extracted served as the gold standard for comparison with the prosthesis specimens
prepared. In comparison with the human IVD from data in the literature, though
inconclusive, this study had shown that the compressive strength of kangaroo IVD and
human IVD were in the same order of magnitude.
The experimental results of the prosthesis specimens had shown that the material is
compressive viscoelastic, i.e., strength increases with compressive strain-rate. The
compressive strength increases with the volumetric fiber content, i.e., the material

136
compressive strength can be fine-tuned by changing the volumetric content of fibers to
match the required strength of any IVD. The compressive strength of the specimens with
3v% fiber content measured is found lower than that of the model prediction by about
40% (between a strain value of 0.3 to 0.6). This may be attributed to the 37% volumetric
and/or 21% cross-sectional area shrinkages of the 10wt% PVA matrix material putting
the embedded fibers in a wrinkle state. The embedded fibers will not contribute to the
compressive strength of the specimen until the cross-sectional area at mid height of the
specimen enlarge enough to unwrinkled the fibers at that section. For the specimens with
3v% fiber content, it was found a 35% to 45% pre-strain value of the specimen can match
the compressive stress-strain curves of the kangaroo IVD at a wide range of strain-rates.
Hence by increasing the bamboo fiber content to, say, 5v%, a lower pre-strain value can
be achieved to match the same requirement of the kangaroo IVD.
The experimental test data had shown all specimens had very weak torsional strength. No
trend was found between specimens with different fiber contents. However, no yield
condition detected in any of the specimen up to the maximum rotation (-15o to +90o,
about a torsional strain value of 2.5). The specimens were found to have a complex
torsional stress vs torsional strain-rate relationship. The torsional stress for the specimens
with 3v% fiber content was found to increase with strain-rate initially until a peak value
around 1.8/s strain-rate and dropped back down slowly. No logical explanation of this
behavior was found at present. As for the weak torsional strength, similar to the
compression case, it can be attributed to the 41% volumetric and 24% cross-sectional
area shrinkages of the specimens. Only under a substantial rotation (about 54o per layer
of fiber accumulating from the bottom to the top of the specimen) before the fibers can be
unwrinkled to provide the rotational strength required.
6.1.3 Conclusion
The positive attributes of the proposed composite material to be used as an IVD
prosthesis material are:
1. It can be molded into any shape and size required to conform with the cervical
IVD requirement at any location and for any patient.

137
2. Its compressive strength can be tuned to match that of any health IVD by simply
changing its fiber content.
3. It is resistive viscoelastic. It can provide shock absorption.
4. It can provide 6 DOF in motion and can permit variable instantaneous center of
rotation of the attached vertebrae.
5. The pre-strain requirement may reduce the surgeon’s work in preparing the
fixation site. Even the specimen is molded with flat top and bottom surfaces, it
will expand automatically to conform with the contours of the attached superior
and inferior vertebrae endplates.
6. It is cost effective and can be made in about a week.
The drawbacks of the proposed composite material are:
1. It lacks the torsional strength required. This may put the burden on the
surrounding tissues.
2. The PVA shrinkage may introduce technical challenges in the mold design to fit a
specific shape and size required. A compensation strategy has to be developed to
counteract with the volumetric and area shrinkage.
3. For a given required disc height, the pre-strain requirement will put additional
complications on the mold design.
4. Among the 6 DOF, this research had tested only two DOF and found only the
cranial compression motion has shown to have restorative resistance to motion.
Very little resistance to motion was found on cranial rotation. The other 4 degrees
of motion had not been tested, hence unknown.
Taking all the pros and cons of this material in consideration, an IVD prosthesis made
from this material will mimic our natural IVD behavior better than those in the market
using a ball-and-socket design. Both types will have 3 degrees of rotational freedom with

138
no torsional resistance. On top of this, the proposed material is simple in design and
construction, will provide 6 DOFs in motion, 1 DOF with resistive viscoelastic property
and variable instantaneous center of rotation. In conclusion, this material, though
improvements may still be needed, is a suitable material candidate for IVD prosthesis.
6.2 Major Research Contributions
In biomedical application, this research has demonstrated that the proposed composite
material, even though lacks torsional strength but has sufficient compressive strength, can
become a viable cervical IVD prosthesis material. It is also very cost effective. This can
benefit patients in parts of the world that cost of the prosthesis may be a prohibiting
factor preventing them from receiving a suitable CDA treatment.
Another contribution of this research is in the area of modeling and analyzing the
mechanical properties of viscoelastic materials, including but not limited to IVD. This is
necessary because the mechanical behaviors of viscoelastic materials in many areas are
typically poorly or insufficiently defined in the literature.
This research has proposed to use a multivariable polynomial to formulate the stress
behavior of a viscoelastic object under the influences of strain and time and employed a
least-square surface fitting method to extract the coefficients of this polynomial from a
set of experimental test data. The resulting surface is tentatively called a “viscoelastic
surface” in this research. A 3-d plot of the stress over strain and time is not a new
concept. However, the proposed multivariable polynomial method has provided a good
mathematical description of the mechanical behavior of a viscoelastic material. Basing on
this mathematical model, other properties (such as impact resistance) can be derived
analytically. The viscoelastic surface can model the mechanical behavior of both linear
and nonlinear viscoelastic materials. This may be a better method over the Prony series
which is limited to linear viscoelastic materials only. The Prony series method is widely
used in current finite element modeling software. The multivariable polynomial approach
can be further extended to cover other independent variables (such as temperature) that
can influence the stress behavior of a viscoelastic material. The viscoelastic surface can
be treated as a unifying mechanical behavior model of the material, through which, all

139
traditional methods (such as sets of stress-relaxing, creep and constant strain-rate curves)
can be derived from it.
The torsional behavior of a material is traditionally derived through its shear modulus G
by integrating the effect on an infinitesimal layer from the bottom of the object to the top.
This derivation is good for a linear material in which G is a constant. However, for a non-
linear material, G is shear strain dependent and not a constant. A viscoelastic material
provides even further complications, G is also strain-rate dependent. The derivation, if
possible, becomes very complicated. A more direct approach would be through torsional
stress and torsional strain similar to compression and shear. However, these two
mechanical properties are not well defined in the literature. This research has proposed
new definitions for these two mechanical properties with the geometry of the object taken
into account. They are defined in such a way that the area under the torsional stress-strain
curve measures the work-done on (energy absorbed by) the object by the torsional force
applied. This is exactly the same as in the compression and shear cases. A new material
property, torsional modulus, is also defined accordingly (hopefully it should be
dimensional independent like the Young’s and shear modulus but have not been validated
in this research). With the new definitions, all energy-based derivations (e.g., impact
resistance) for the compression or shear can be applied equally to the torsion case.
How to quantify the impact resistance of a viscoelastic object when subject to an external
impact force (compressive, shear or torsional) is not well defined in the literature. It is
because this value is dependent on the waveform (magnitude and time) of the impact
force interacting with the strain and strain-rate dependent behavior of the object. This
research has proposed a definition for this property and the method to derive it
analytically from the viscoelastic surface of the object. Using an impact force with a
simple sawtooth waveform as an example, this research has demonstrated the method
proposed to evaluate the impact resistance of the kangaroo C5-C6 IVD. Impact resistance
is an important attribute for researches on injuries involving in an automotive accident
and the design of related personal protective equipment. Hopefully this research can
contribute to the improvements on these researches in future.

140
The new material properties and derivation methods proposed in this research are just an
initial attempt to formulate these concepts in better forms. Hoping future researchers can
continue to improve on these so that one day we all can have better understanding on the
behavior of more complex viscoelastic objects like the human body.
6.3 Future work
The key factor preventing the material to achieve its theoretical strength is the shrinkage
of the PVA. Future research effort should address this issue. It may be necessary to
replace the PVA with a biocompatible and stable matrix material with zero or little
shrinkage.
In outlining the scope of this research, Chapter 1 has identified two out-of-scope areas
that were explicitly excluded from current research domain. Reasons for the exclusion
were explained. Future research efforts should address these areas.
This research had only studied the strength of 2 of the 6 DOFs provided by our IVD to
conserve research effort. Future research efforts should cover the characterization of the
other 4 DOFs to complete the coverage.
Current clinical studies mainly measure the flexion-extension ROM to access the quality
of motion of the patients. This may not be a good yardstick. Movements with a
combination of compression, torsion and translation in different direction may provide a
better measure to access the quality of motion for the patients treated with CDA.

141
References
1. Alhashash M, Shousha M, Boehm H. Adjacent Segment Disease after Cervical
Spine Fusion. Spine (Phila Pa 1976). 2018;43(9):605-609.
doi:10.1097/BRS.0000000000002377
2. Delamarter RB, Zigler J. Five-year reoperation rates, cervical total disc
replacement versus fusion, results of a prospective randomized clinical trial. Spine
(Phila Pa 1976). 2013;38(9):711-717. doi:10.1097/BRS.0b013e3182797592
3. Staudt MD, Das K, Duggal N. Does design matter? Cervical disc replacements
under review. Neurosurg Rev. 2018;41(2):399-407. doi:10.1007/s10143-016-0765-
0
4. Stanton P, Eck JC. Materials and design characteristics of cervical arthroplasty
devices. Tech Orthop. 2010;25(2):93-96. doi:10.1097/BTO.0b013e3181df2ef3
5. Mehren C, Heider F, Sauer D, et al. Clinical and Radiological Outcome of a New
Total Cervical Disc Replacement Design. Spine (Phila Pa 1976).
2019;44(4):E202-E210. doi:10.1097/BRS.0000000000002799
6. Veruva SY, Steinbeck MJ, Toth J, Alexander DD, Kurtz SM. Which Design and
Biomaterial Factors Affect Clinical Wear Performance of Total Disc
Replacements? A Systematic Review. Clin Orthop Relat Res. 2014;472(12):3759-
3769. doi:10.1007/s11999-014-3751-2
7. Yan SZ, Di J, Shen Y. Adjacent segment degeneration following anterior cervical
discectomy and fusion versus the bryan cervical disc arthroplasty. Med Sci Monit.
2017;23:2692-2700. doi:10.12659/MSM.905178
8. Zou S, Gao J, Xu B, Lu X, Han Y, Meng H. Anterior cervical discectomy and
fusion (ACDF) versus cervical disc arthroplasty (CDA) for two contiguous levels
cervical disc degenerative disease: a meta-analysis of randomized controlled trials.
Eur Spine J. 2017;26(4):985-997. doi:10.1007/s00586-016-4655-5
142
9. Coric D, Kim PK, Clemente JD, Boltes MO, Nussbaum M, James S. Prospective
randomized study of cervical arthroplasty and anterior cervical discectomy and
fusion with long-term follow-up: Results in 74 patients from a single site -
Presented at the 2012 Joint Spine Section Meeting. Clinical article. J Neurosurg
Spine. 2013;18(1):36-42. doi:10.3171/2012.9.SPINE12555
10. Verma K, Gandhi SD, Maltenfort M, et al. Rate of adjacent segment disease in
cervical disc arthroplasty versus single-level fusion: Meta-analysis of prospective
studies. Spine (Phila Pa 1976). 2013;38(26):2253-2257.
doi:10.1097/BRS.0000000000000052
11. MacDowall A, Canto Moreira N, Marques C, et al. Artificial disc replacement
versus fusion in patients with cervical degenerative disc disease and radiculopathy:
A randomized controlled trial with 5-year outcomes. J Neurosurg Spine.
2019;30(3):323-331. doi:10.3171/2018.9.SPINE18659
12. Burkus JK, Traynelis VC, Haid RW, Mummaneni P V. Clinical and radiographic
analysis of an artificial cervical disc: 7-year follow-up from the Prestige
prospective randomized controlled clinical trial. J Neurosurg Spine.
2014;21(4):516-528. doi:10.3171/2014.6.SPINE13996
13. Quan GMY, Vital JM, Hansen S, Pointillart V. Eight-year clinical and radiological
follow-up of the bryan cervical disc arthroplasty. Spine (Phila Pa 1976).
2011;36(8):639-646. doi:10.1097/BRS.0b013e3181dc9b51
14. Byval’tsev VA, Kalinin AA, Stepanov IA, Pestryakov YY, Shepelev V V.
Analysis of the results of total cervical disc arthroplasty using a M6-C prosthesis: a
multicenter study. Vopr neirokhirurgii Im NN Burdenko. 2017;81(5):46.
doi:10.17116/neiro201781546-55
15. Pham M, Phan K, Teng I, Mobbs RJ. Comparative Study Between M6-C and
Mobi-C Cervical Artificial Disc Replacement: Biomechanical Outcomes and
Comparison with Normative Data. Orthop Surg. 2018;10(2):84-88.
doi:10.1111/os.12376
143
16. Lazennec J yves, Aaron A, Ricart O, Rakover JP. The innovative viscoelastic CP
ESP cervical disk prosthesis with six degrees of freedom: biomechanical concepts,
development program and preliminary clinical experience. Eur J Orthop Surg
Traumatol. 2016;26(1):9-19. doi:10.1007/s00590-015-1695-1
17. Zhao Y, Zhang Y, Sun Y, Pan S, Zhou F, Liu Z. Application of cervical
arthroplasty with bryan cervical disc 10-year follow-up results in China. Spine
(Phila Pa 1976). 2016;41(2):111-115. doi:10.1097/BRS.0000000000001145
18. Pointillart V, Castelain JE, Coudert P, Cawley DT, Gille O, Vital JM. Outcomes of
the Bryan cervical disc replacement: fifteen year follow-up. Int Orthop.
2018;42(4):851-857. doi:10.1007/s00264-017-3745-2
19. Gornet MF, Burkus JK, Shaffrey ME, Schranck FW, Copay AG. Cervical disc
arthroplasty: 10-year outcomes of the Prestige LP cervical disc at a single level. J
Neurosurg Spine. 2019;31(3):317-325. doi:10.3171/2019.2.SPINE1956
20. Miller J, Sasso R, Anderson P, Riew KD, McPhilamy A, Gianaris T. Adjacent
Level Degeneration. Clin Spine Surg. 2018;31(2):E98-E101.
doi:10.1097/bsd.0000000000000598
21. Radcliff K, Lerner J, Yang C, Bernard T, Zigler JE. Seven-year cost-effectiveness
of ProDisc-C total disc replacement: Results from investigational device
exemption and post-approval studies. J Neurosurg Spine. 2016;24(5):760-768.
doi:10.3171/2015.10.SPINE15505
22. Putzier M, Funk JF, Schneider S V., et al. Charité total disc replacement - Clinical
and radiographical results after an average follow-up of 17 years. Eur Spine J.
2006;15(2):183-195. doi:10.1007/s00586-005-1022-3
23. Jin YJ, Park SB, Kim MJ, Kim KJ, Kim HJ. An analysis of heterotopic ossification
in cervical disc arthroplasty: A novel morphologic classification of an ossified
mass. Spine J. 2013;13(4):408-420. doi:10.1016/j.spinee.2012.11.048
24. Zeng J, Liu H, Chen H, et al. Comparison of Heterotopic Ossification After Fixed-
144
and Mobile-Core Cervical Disc Arthroplasty. World Neurosurg. 2018;120:e1319-
e1324. doi:10.1016/j.wneu.2018.09.075
25. McAfee PC, Cunningham BW, Devine J, Williams E, Yu-Yahiro J. Classification
of heterotopic ossification (HO) in artificial disk replacement. J Spinal Disord
Tech. 2003;16(4):384-389. doi:10.1097/00024720-200308000-00010
26. Zhou F, Ju KL, Zhao Y, et al. Progressive bone formation after cervical disc
replacement: Minimum of 5-year follow-up. Spine (Phila Pa 1976).
2018;43(3):E163-E170. doi:10.1097/BRS.0000000000002264
27. Yanbin Z, Yu S, Zhongqiang C, Zhongjun L. Sagittal alignment comparison of
Bryan disc arthroplasty with ProDisc-C arthroplasty: A prospective, randomized
controlled clinical trial. J Spinal Disord Tech. 2011;24(6):381-385.
doi:10.1097/BSD.0b013e318201855f
28. Li C, Granger C, Del Schutte H, Biggers SB, Kennedy JM, Latour RA. Failure
analysis of composite femoral components for hip arthroplasty. J Rehabil Res Dev.
2003;40(2):131-145. doi:10.1682/jrrd.2003.03.0133
29. Bennett D., Hill J., Dennison J, et al. Metal-Carbon Fiber Composite Femoral
Stems in Hip Replacements. J Bone Jt Surgery-American Vol. 2014;96(24):2062-
2069. doi:10.2106/jbjs.m.01542
30. Oxland TR. Fundamental biomechanics of the spine-What we have learned in the
past 25 years and future directions. J Biomech. 2016;49(6):817-832.
doi:10.1016/j.jbiomech.2015.10.035
31. Anderst W, Baillargeon E, Donaldson W, Lee J, Kang J. Motion path of the instant
center of rotation in the cervical spine during in vivo dynamic flexion-extension:
Implications for artificial disc design and evaluation of motion quality after
arthrodesis. Spine (Phila Pa 1976). 2013;38(10).
doi:10.1097/BRS.0b013e31828ca5c7
32. Tetreault L, Kopjar B, Nouri A, et al. The modified Japanese Orthopaedic

145
Association scale: establishing criteria for mild, moderate and severe impairment
in patients with degenerative cervical myelopathy. Eur Spine J. 2017;26(1):78-84.
doi:10.1007/s00586-016-4660-8
33. KELLGREN JH, LAWRENCE JS. Radiological assessment of osteo-arthrosis.
Ann Rheum Dis. 1957;16(4):494-502. doi:10.1136/ard.16.4.494
34. Broekema AEH, Molenberg R, Kuijlen JMA, Groen RJM, Reneman MF, Soer R.
The Odom Criteria: Validated at Last: A Clinimetric Evaluation in Cervical Spine
Surgery. J Bone Jt Surg - Am Vol. 2019;101(14):1301-1308.
doi:10.2106/JBJS.18.00370
35. Delgado DA, Lambert BS, Boutris N, et al. Validation of Digital Visual Analog
Scale Pain Scoring With a Traditional Paper-based Visual Analog Scale in Adults.
JAAOS Glob Res Rev. 2018;2(3):e088. doi:10.5435/jaaosglobal-d-17-00088
36. Food and Drug Administration. P060023A Premarket Approval (BRYAN Cervical
Disc).(2009). www.fda.gov.
37. Food and Drug Administration. P060023B Summary of Safety and Effectiveness
Data (BRYAN Cervical Disc).(2009). www.fda.gov.
38. Cheng L, Nie L, Li M, Huo Y, Pan X. Superiority of the Bryan ® disc prosthesis
for cervical myelopathy: A randomized study with 3-year followup. Clin Orthop
Relat Res. 2011;469(12):3408-3414. doi:10.1007/s11999-011-2039-z
39. Han X, He D, Zhang N, Song Q, Wang J, Tian W. Comparison of 10-year
Outcomes of Bryan Cervical Disc Arthroplasty for Myelopathy and
Radiculopathy. Orthop Surg. 2019;11(6):1127-1134. doi:10.1111/os.12565
40. Lavelle WF, Riew KD, Levi AD, Florman JE. Ten-year Outcomes of Cervical
Disc Replacement with the BRYAN Cervical Disc: Results from a Prospective,
Randomized, Controlled Clinical Trial. Spine (Phila Pa 1976). 2019;44(9):601-
608. doi:10.1097/BRS.0000000000002907

146
41. Food and Drug Administration. P170036A Premarket Approval (M6-C).(2019).
www.fda.gov.
42. Food and Drug Administration. P170036B Summary of Safety and Effectiveness
Data (M6-C).(2019). www.fda.gov.
43. Lauryssen C, Coric D, Dimmig T, Musante D, Ohnmeiss DD, Stubbs HA. Cervical
total disc replacement using a novel compressible prosthesis: Results from a
prospective Food and Drug Administration-regulated feasibility study with 24-
month follow-up. Int J Spine Surg. 2012;6(1):71-77.
doi:10.1016/j.ijsp.2012.02.001
44. Food and Drug Administration. P060018A Premarketing Approval (Prestige-
ST).(2007). www.fda.gov.
45. Food and Drug Administration. P060018B Summary of Safety and Effectiveness
Data (Pestige-ST).(2007). www.fda.gov.
46. Mummaneni P V., Burkus JK, Haid RW, Traynelis VC, Zdeblick TA. Clinical and
radiographic analysis of cervical disc arthroplasty compared with allograft fusion:
A randomized controlled clinical trial. J Neurosurg Spine. 2007;6(3):198-209.
doi:10.3171/spi.2007.6.3.198
47. Mummaneni P V., Haid RW, Zdeblick TA, Burkus JK, Traynelis VC. Three- and
5-year Results from a Prospective, Randomized United States Investigational
Device Exemption Study of the PRESTIGE ST Cervical Disc. Neurosurgery.
2009;65(2):408-408. doi:10.1227/01.neu.0000358693.71422.3b
48. Food and Drug Administration. P090029A Premarketing Approval (Prestige-
LP).(2014). www.fda.gov.
49. Food and Drug Administration. P090029B Summary of Safety and Effective Ness
Data (Prestige-LP).(2014). www.fda.gov.
50. ASTM International. F2346-18: Standard Test Methods for Static and Dynamic

147
Characterization of Spinal Artificial Discs. doi:10.1520/F2346-18
51. Wu T, Wang B, Ding C, et al. Artificial cervical disc replacement with the
Prestige-LP prosthesis for the treatment of non-contiguous 2-level cervical
degenerative disc disease: A minimum 24-month follow-up. Clin Neurol
Neurosurg. 2017;152:57-62. doi:10.1016/j.clineuro.2016.11.015
52. Li G, Wang Q, Liu H, Yang Y. Postoperative Heterotopic Ossification After
Cervical Disc Replacement Is Likely a Reflection of the Degeneration Process.
World Neurosurg. 2019;125:e1063-e1068. doi:10.1016/j.wneu.2019.01.244
53. Miyazaki M, Hong SW, Yoon SH, Morishita Y, Wang JC. Reliability of a
magnetic resonance imaging-based grading system for cervical intervertebral disc
degeneration. J Spinal Disord Tech. 2008;21(4):288-292.
doi:10.1097/BSD.0b013e31813c0e59
54. Hu X, Jiang M, Liu H, et al. Five-Year Trends in Center of Rotation After Single-
Level Cervical Arthroplasty with the Prestige-LP Disc. World Neurosurg.
2019;132:e941-e948. doi:10.1016/j.wneu.2019.07.042
55. Zeng J, Liu H, Rong X, et al. Clinical and radiographic outcomes of cervical disc
arthroplasty with Prestige-LP Disc: a minimum 6-year follow-up study. BMC
Musculoskelet Disord. 2018;19(1):1-7. doi:10.1186/s12891-018-2201-9
56. Orthopedics F. CP LP ESP documentation. https://spine-innovations.com/wp-
content/uploads/2020/09/doc_cp_lp_esp_eng.pdf. Accessed March 27, 2021.
57. Orthopedics F. Material composition CP ESP. https://spine-innovations.com/wp-
content/uploads/2020/09/ft_composition_disc_esp_eng.pdf. Accessed March 27,
2021.
58. Lazennec JY, Rischke B, Rakover JP, Ricart O, Rousseau MA. CP-ESP
VISCOELASTIC CERVICAL DISC REPLACEMENT: TWO YEARS’
FOLLOW-UP WITH CLINICAL AND RADIOLOGICAL RESULTS.
EVOLUTION OF SEGMENTAL MOBILITY AND LOCATION OF MEAN

148
CENTRES OF ROTATION. Orthopaedic Proceedings. doi:10.1302/1358-
992X.2019.5.096
59. Gloria A, Causa F, De Santis R, Netti PA, Ambrosio L. Dynamic-mechanical
properties of a novel composite intervertebral disc prosthesis. J Mater Sci Mater
Med. 2007;18(11):2159-2165. doi:10.1007/s10856-007-3003-z
60. Yang H, Jekir MG, Davis MW, Keaveny TM. Effective modulus of the human
intervertebral disc and its effect on vertebral bone stress. J Biomech.
2016;49(7):1134-1140. doi:10.1016/j.jbiomech.2016.02.045
61. Panjabi MM, Summers DJ, Pelker RR, Videman T, Friedlaender GE, Southwick
WO. Three-dimensional load-displacement curves due to force on the cervical
spine. J Orthop Res. 1986;4:152-161.
62. Gloria A, De Santis R, Ambrosio L, Causa F, Tanner KE. A multi-component
fiber-reinforced PHEMA-based hydrogel/HAPEXTM device for customized
intervertebral disc prosthesis. J Biomater Appl. 2011;25(8):795-810.
doi:10.1177/0885328209360933
63. McLeod A. NeoDisc. https://www.healthinnovationsupport.co.uk/experience/.
Accessed April 3, 2021.
64. Jacobs CAM, Siepe CJ, Ito K. Viscoelastic cervical total disc replacement devices:
Design concepts. Spine J. 2020;20(12):1911-1924.
doi:10.1016/j.spinee.2020.08.007
65. NuVasive. Evaluating The Safety and Effectiveness of The NeoDiscTM Versus
ACDF in Subjects With Single-Level Cervical Disc Disease (NeoDiscTM).
https://www.clinicaltrials.gov/ct2/show/NCT00478088. Accessed April 3, 2021.
66. Pettine KA. Clinical and Radiographic Outcome of the NeoDisc Cervical Total
Disc Replacement (TDR) at 2-Year Follow-up. Spine J. 2010;10(9):S44.
doi:10.1016/j.spinee.2010.07.123

149
67. Mummaneni P V., Robinson JC, Haid RW. Cervical arthroplasty with the
PRESTIGE LP cervical disc. Neurosurgery. 2007;60(4 SUPPL. 2):310-315.
doi:10.1227/01.NEU.0000255376.42099.13
68. Kim DH. Dynamic Reconstruction of the Spine . 2nd ed. Stuttgart, [Germany:
Thieme; 2015.
69. Radcliff K, Davis RJ, Hisey MS, et al. Long-term evaluation of cervical disc
arthroplasty with the Mobi-C© cervical disc: A randomized, prospective,
multicenter clinical trial with seven-year follow-up. Int J Spine Surg.
2017;11(4):244-262. doi:10.14444/4031
70. Brenke C, Schmieder K, Barth M. Core herniation after implantation of a cervical
artificial disc: case report. Eur Spine J. 2015;24:536-539. doi:10.1007/s00586-014-
3677-0
71. White A, Panjabi M. Clinical Biomechanics of the Spine. 2nd ed. J.B. Lippincott
Company; 1990.
72. Showalter BL, Beckstein JC, Martin JT, et al. Comparison of animal discs used in
disc research to human lumbar disc: Torsion mechanics and collagen content.
Spine (Phila Pa 1976). 2012;37(15). doi:10.1097/BRS.0b013e31824d911c
73. Espinoza Orías AA, Mammoser NM, Triano JJ, An HS, Andersson GBJ, Inoue N.
Effects of Axial Torsion on Disc Height Distribution: An in Vivo Study. J
Manipulative Physiol Ther. 2016;39(4):294-303. doi:10.1016/j.jmpt.2016.03.002
74. Bezci SE, Eleswarapu A, Klineberg EO, O’Connell GD. Contribution of facet
joints, axial compression, and composition to human lumbar disc torsion
mechanics. J Orthop Res. 2018;36(8):2266-2273. doi:10.1002/jor.23870
75. Wilke HJ, Krischak S, Claes L. Biomechanical comparison of calf and human
spines. J Orthop Res. 1996;14(3):500-503. doi:10.1002/jor.1100140321
76. Wen N, Lavaste F, Santin JJ, Lassau JP. Three-dimensional biomechanical

150
properties of the human cervical spine in vitro. I. Analysis of normal motion . Eur
spine J Off Publ Eur Spine Soc Eur Spinal Deform Soc Eur Sect Cerv Spine Res
Soc . 1993;2(1):2-11. doi:10.1007/BF00301048
77. Bezci SE, Klineberg EO, O’Connell GD. Effects of axial compression and rotation
angle on torsional mechanical properties of bovine caudal discs. J Mech Behav
Biomed Mater. 2018;77(June 2017):353-359. doi:10.1016/j.jmbbm.2017.09.022
78. Nikkhoo M, Wang JL, Parnianpour M, El-Rich M, Khalaf K. Biomechanical
response of intact, degenerated and repaired intervertebral discs under impact
loading – Ex-vivo and In-Silico investigation. J Biomech. 2018;70:26-32.
doi:10.1016/j.jbiomech.2018.01.026
79. Dudli S, Haschtmann D, Ferguson SJ. Fracture of the vertebral endplates, but not
equienergetic impact load, promotes disc degeneration in vitro. J Orthop Res.
2012;30(5):809-816. doi:10.1002/jor.21573
80. Chamis CC, Hanson MP, Serafini TT. Designing for impact resistance with
unidirectional fiber composites. Composites. 2003. doi:10.1016/0010-
4361(72)90390-4
81. Van der Veen AJ, Bisschop A, Mullender MG, van Dieën JH. Modelling creep
behaviour of the human intervertebral disc. J Biomech. 2013;46(12):2101-2103.
doi:10.1016/j.jbiomech.2013.05.026
82. Cassidy JJ, Hiltner A, Baer E. The response of the hierarchical structure of the
intervertebral disc to uniaxial compression. J Mater Sci Mater Med. 1990;1(2):69-
80. doi:10.1007/BF00839071
83. Smit TH. The use of a quadruped as an in vivo model for the study of the spine -
Biomechanical considerations. Eur Spine J. 2002;11(2):137-144.
doi:10.1007/s005860100346
84. Wilke HJ, Geppert J, Kienle A. Biomechanical in vitro evaluation of the complete
porcine spine in comparison with data of the human spine. Eur Spine J.

151
2011;20(11):1859-1868. doi:10.1007/s00586-011-1822-6
85. Wang CS, Chang JH, Chang TS, Chen HY, Cheng CW. Loading effects of anterior
cervical spine fusion on adjacent segments. Kaohsiung J Med Sci.
2012;28(11):586-594. doi:10.1016/j.kjms.2012.04.024
86. Ohnishi T, Sudo H, Tsujimoto T, Iwasaki N. Age-related spontaneous lumbar
intervertebral disc degeneration in a mouse model. J Orthop Res. 2018;36(1):224-
232. doi:10.1002/jor.23634
87. Panjabi MM, Duranceau J, Goel V, Oxland T, Takata K. Cervical human
vertebrae. Quantitative three-dimensional anatomy of the middle and lower regions
. Spine . 1991;16(8):861-869. doi:10.1097/00007632-199108000-00001
88. Busscher I, Ploegmakers JJW, Verkerke GJ, Veldhuizen AG. Comparative
anatomical dimensions of the complete human and porcine spine. Eur Spine J.
2010;19(7):1104-1114. doi:10.1007/s00586-010-1326-9
89. Newell N, Little JP, Christou A, Adams MA, Adam CJ, Masouros SD.
Biomechanics of the human intervertebral disc: A review of testing techniques and
results. J Mech Behav Biomed Mater. 2017;69(January):420-434.
doi:10.1016/j.jmbbm.2017.01.037
90. Barrientos E, Pelayo F, Noriega Á, Lamela MJ, Fernández-Canteli A, Tanaka E.
Optimal discrete-time Prony series fitting method for viscoelastic materials. Mech
Time-Dependent Mater. 2018:1-14. doi:10.1007/s11043-018-9394-z
91. Thomas S, Willems K, Van Den Daelen L, Linden P, Ciocci MC, Bocher P. The
M6-C cervical disk prosthesis first clinical experience in 33 patients. Clin Spine
Surg. 2016;29(4):E182-E187. doi:10.1097/BSD.0000000000000025
92. Lazennec JY, Aaron A, Brusson A, Rakover JP, Rousseau MA. The LP-ESP®
lumbar disc prosthesis with 6 degrees of freedom: Development and 7 years of
clinical experience. Eur J Orthop Surg Traumatol. 2013;23(2):131-143.
doi:10.1007/s00590-012-1166-x

152
93. Patwardhan AG, Havey RM. Prosthesis design influences segmental contribution
to total cervical motion after cervical disc arthroplasty. Eur Spine J.
2019;(0123456789):1-9. doi:10.1007/s00586-019-06064-4
94. Wu JC, Huang WC, Mummaneni P V. Prestige cervical arthroplasty. Tech Orthop.
2010;25(2):108-113. doi:10.1097/BTO.0b013e3181de1aa4
95. Garg H, Ramachandran R, Yue J. ProDisc-C. Tech Orthop. 2010;25(2):118-126.
doi:10.1097/BTO.0b013e3181df2f8e
96. McAfee PC, Fedder IL, Saiedy S, Shucosky EM, Cunningham BW. SB Charité
Disc Replacement. J Spinal Disord Tech. 2003;16(4):424-433.
doi:10.1097/00024720-200308000-00016
97. Qin G, Liu J, Xue Y, et al. Enhanced stability of antimicrobial bamboo fiber by
launching ultra fine silver particles in a sodium dodecyl sulfate microemulsion
system. Text Res J. 2017;87(20):2505-2512. doi:10.1177/0040517516673329
98. Afrin T, Kanwar RK, Wang X, Tsuzuki T. Properties of bamboo fibres produced
using an environmentally benign method. J Text Inst. 2014;105(12):1293-1299.
doi:10.1080/00405000.2014.889872
99. Liew FK, Hamdan S, Rahman MR, et al. Synthesis and characterization of
cellulose from green bamboo by chemical treatment with mechanical process. J
Chem. 2015;2015(March). doi:10.1155/2015/212158
100. Pacheco CM, Bustos C, Reyes G, Aguayo MG, Rojas OJ. Characterization of
Residues from Chilean Blueberry Bushes: A Potential Source of Cellulose.
BioResources. 2018;13(4). doi:10.15376/biores.13.4.7345-7359
101. Yueping W, Ge W, Haitao C, et al. Structures of Bamboo Fiber for Textiles. Text
Res J. 2010;80(4):334-343. doi:10.1177/0040517509337633
102. Afrin T, Tsuzuki T, Wang X. UV absorption property of bamboo. J Text Inst.
2012;103(4):394-399. doi:10.1080/00405000.2011.580543

153
103. Heller JG, Sasso RC, Papadopoulos SM, et al. Comparison of BRYAN cervical
disc arthroplasty with anterior cervical decompression and fusion: Clinical and
radiographic results of a randomized, controlled, clinical trial. Spine (Phila Pa
1976). 2009;34(2):101-107. doi:10.1097/BRS.0b013e31818ee263
104. Sasso RC, Smucker JD, Hacker RJ, Heller JG. Clinical outcomes of BRYAN
cervical disc arthroplasty: a prospective, randomized, controlled, multicenter trial
with 24-month follow-up. J Spinal Disord Tech. 2007;20(7):481-491.
doi:10.1097/BSD.0b013e3180310534

154
Curriculum Vitae
Name: Helium Mak
Post-secondary Hong Kong Polytechnic University
Education and Hong Kong, China
Degrees: 1972-1974 Higher Diploma in Electronic Engineering
1975 Associateship in Electronic Engineering
Twickenham College of Technology
London Borough of Richmond upon Thames, UK
1977-1978 Diploma in Electrical, Electronic and Control Eng.
Brunel University
Uxbridge, London, UK
1978-1982 (Part-time) MSc in Digital System
Honours and Professional Engineer (P. Eng)
Awards: Professional Engineers Ontario, Canada
2016 - now
Related Work Senior Research Officer
Experience National Research Council Canada
1991-2015, Ottawa & London, Canada
Project Leader
Gandalf Data Limited
1989-1991, Ottawa, Canada
Product Development Manager
Bell Northern Research (Nortel)
1982-1989, Ottawa, Canada
Engineering Manager
Beale Electronics
1979-1982, London, UK
Development Engineer
Euromatic Flowmeter
1978-1979, London, UK
Laboratory Technician & Part-time Lecturer
Hong Kong Polytechnic University

155
1975-1977, Hong Kong, China.
Publications: Wankei Wan, A Dawn Bannerman, Lifang Yang, Helium Mak. Poly (vinyl alcohol) cryogels for biomedical applications. Springer, Cham. Polymeric Cryogels (2014), 283-321
Copyright © 2022 FDOKUMEN