
Biological Function and Molecular Mapping of M Antigen in Yeast Phase of Histoplasma capsulatum
17
Biological Function and Molecular Mapping of M Antigen in Yeast Phase of Histoplasma capsulatum Allan Jefferson Guimara ˜es 1,2 , Andrew John Hamilton 3 , Herbert Leonel de M. Guedes 2,4 , Joshua Daniel Nosanchuk 1. *, Rosely Maria Zancope ´ -Oliveira 2. 1 Division of Infectious Diseases, Department of Medicine and Microbiology and Immunology, Albert Einstein College of Medicine of Yeshiva University, Bronx, New York, United States of America, 2 Laborato ´ rio de Micologia - Setor de Imunodiagno ´ stico - Instituto de Pesquisa Clı ´nica Evandro Chagas, Fundac ¸a ˜ o Oswaldo Cruz, Rio de Janeiro, Brazil, 3 St John’s Institute of Dermatology, Guy’s Hospital, King’s College, London, United Kingdom, 4 Laborato ´ rio de Bioquı ´mica de Proteı ´nas e Peptı ´deos, Instituto Oswaldo Cruz, Fundac ¸a ˜o Oswaldo Cruz, Rio de Janeiro, Brazil Abstract Histoplasmosis, due to the intracellular fungus Histoplasma capsulatum, can be diagnosed by demonstrating the presence of antibodies specific to the immunodominant M antigen. However, the role of this protein in the pathogenesis of histoplasmosis has not been elucidated. We sought to structurally and immunologically characterize the protein, determine yeast cell surface expression, and confirm catalase activity. A 3D-rendering of the M antigen by homology modeling revealed that the structures and domains closely resemble characterized fungal catalases. We generated monoclonal antibodies (mAbs) to the protein and determined that the M antigen is present on the yeast cell surface and in cell wall/cell membrane preparations. Similarly, we found that the majority of catalase activity was in extracts containing fungal surface antigens and that the M antigen is not significantly secreted by live yeast cells. The mAbs also identified unique epitopes on the M antigen. The localization of the M antigen to the cell surface of H. capsulatum yeast and the characterization of the protein’s major epitopes have important implications since it demonstrates that although the protein may participate in protecting the fungus against oxidative stress it is also accessible to host immune cells and antibody. Citation: Guimara ˜es AJ, Hamilton AJ, de M. Guedes HL, Nosanchuk JD, Zancope ´ -Oliveira RM (2008) Biological Function and Molecular Mapping of M Antigen in Yeast Phase of Histoplasma capsulatum. PLoS ONE 3(10): e3449. doi:10.1371/journal.pone.0003449 Editor: Kirsten Nielsen, University of Minnesota, United States of America Received July 3, 2008; Accepted September 24, 2008; Published October 17, 2008 Copyright: ß 2008 Guimara ˜ es et al. This is an open-access article distributed under the terms of the Creative Commons Attribution License, which permits unrestricted use, distribution, and reproduction in any medium, provided the original author and source are credited. Funding: This work was supported by The Wellcome Trust 061158/Z/00/JC/KO, CNPq 476055/2003-2, and FAPERJ E-26/170.308/2002. A.J.G. was supported in part by an Interhemispheric Research Training Grant in Infectious Diseases, Fogarty International Center (NIH D43-TW007129). J.D.N. is supported in part by NIH AI52733 and AI056070-01A2, and the Center for AIDS Research at the Albert Einstein College of Medicine and Montefiore Medical Center (NIH AI-51519). R.M.Z.O. is in part supported by CNPq 306288/2006-0. Competing Interests: The authors have declared that no competing interests exist. * E-mail: [email protected] . These authors contributed equally to this work. Introduction The dimorphic fungus Histoplasma capsulatum is the causative agent of the systemic mycosis histoplasmosis. H. capsulatum has a worldwide distribution with areas of high endemicity, such as the Mississippi and Ohio river valleys of the USA and the South and Southeast of Brazil [1]. Human infection primarily occurs after inhalation of microconidia, which are deposited in the distal alveoli where they are phagocytosed by macrophages and undergo morphogenic change into a yeast form [2,3]. In the phagosome of these cells, the fungus is exposed to stress conditions including changes in pH and reactive oxygen species [4]. One mechanism that H. capsulatum purportedly utilizes to evade oxidative stress is the production of catalases [5]. Catalases are ubiquitous enzymes that, independent of their origin, function to degrade two molecules of hydrogen peroxide into two of water and one of oxygen. Catalase species are widely distributed in the prokaryotic kingdom and lower eukaryotes (catalase-peroxidase), as well as in higher eukaryotes (homotetramic, heme containing enzymes) [6,7]. Cellular metabolism usually generates toxic species mediated by products from the univalent reduction of molecular oxygen, including species such as superoxide radicals (O 2 2 ), peroxide (O 2 22 ) and hydroxyl (OH 2 ). Additionally, infectious organisms can be damaged by exposure to these same radicals. Diverse mechanisms have been described to damage as a consequence of oxidative stress on microbes, including peroxisome proliferation and DNA breakage [5,8]. Microbial enzymes, such as catalases, involved in defense against oxidative stress have been associated with pathogenicity and virulence in certain human fungal pathogens. Aspergillus fumigatus has two mycelial catalases and one conidial catalase whose actions counteract the oxidative defense reaction mecha- nism in host phagocytes [9]. Induction of catalases in Paracoccid- ioides brasiliensis protects the fungus against endogenously produced oxygen radicals and H 2 O 2 [10]. P. brasiliensis catalases are transcriptionally up-regulated during yeast development and also increase during mycelium to yeast conversion. Although rarely pathogenic, Saccharomyces cerevisae has two catalases, one peroxi- somal catalase (catalase A) and one cytosolic catalase (catalase T), which play especially important roles in tolerance to oxidative stress in the adaptive response of these cells [11]. Catalase disruptants of Candida albicans are fully viable under normal culture conditions, but are extremely sensitive to oxidative stress by hydrogen peroxide and are cleared more rapidly than wild type cells in a murine infection model [12]. Although the role of catalase in Penicillium marneffei has not been elucidated, its catalase PLoS ONE | www.plosone.org 1 October 2008 | Volume 3 | Issue 10 | e3449
-
Upload
independent -
Category
Documents
-
view
0 -
download
0
Transcript of Biological Function and Molecular Mapping of M Antigen in Yeast Phase of Histoplasma capsulatum
Biological Function and Molecular Mapping of M Antigenin Yeast Phase of Histoplasma capsulatumAllan Jefferson Guimaraes1,2, Andrew John Hamilton3, Herbert Leonel de M. Guedes2,4, Joshua Daniel
Nosanchuk1.*, Rosely Maria Zancope-Oliveira2.
1 Division of Infectious Diseases, Department of Medicine and Microbiology and Immunology, Albert Einstein College of Medicine of Yeshiva University, Bronx, New York,
United States of America, 2 Laboratorio de Micologia - Setor de Imunodiagnostico - Instituto de Pesquisa Clınica Evandro Chagas, Fundacao Oswaldo Cruz, Rio de Janeiro,
Brazil, 3 St John’s Institute of Dermatology, Guy’s Hospital, King’s College, London, United Kingdom, 4 Laboratorio de Bioquımica de Proteınas e Peptıdeos, Instituto
Oswaldo Cruz, Fundacao Oswaldo Cruz, Rio de Janeiro, Brazil
Abstract
Histoplasmosis, due to the intracellular fungus Histoplasma capsulatum, can be diagnosed by demonstrating the presenceof antibodies specific to the immunodominant M antigen. However, the role of this protein in the pathogenesis ofhistoplasmosis has not been elucidated. We sought to structurally and immunologically characterize the protein, determineyeast cell surface expression, and confirm catalase activity. A 3D-rendering of the M antigen by homology modelingrevealed that the structures and domains closely resemble characterized fungal catalases. We generated monoclonalantibodies (mAbs) to the protein and determined that the M antigen is present on the yeast cell surface and in cell wall/cellmembrane preparations. Similarly, we found that the majority of catalase activity was in extracts containing fungal surfaceantigens and that the M antigen is not significantly secreted by live yeast cells. The mAbs also identified unique epitopes onthe M antigen. The localization of the M antigen to the cell surface of H. capsulatum yeast and the characterization of theprotein’s major epitopes have important implications since it demonstrates that although the protein may participate inprotecting the fungus against oxidative stress it is also accessible to host immune cells and antibody.
Citation: Guimaraes AJ, Hamilton AJ, de M. Guedes HL, Nosanchuk JD, Zancope-Oliveira RM (2008) Biological Function and Molecular Mapping of M Antigen inYeast Phase of Histoplasma capsulatum. PLoS ONE 3(10): e3449. doi:10.1371/journal.pone.0003449
Editor: Kirsten Nielsen, University of Minnesota, United States of America
Received July 3, 2008; Accepted September 24, 2008; Published October 17, 2008
Copyright: � 2008 Guimaraes et al. This is an open-access article distributed under the terms of the Creative Commons Attribution License, which permitsunrestricted use, distribution, and reproduction in any medium, provided the original author and source are credited.
Funding: This work was supported by The Wellcome Trust 061158/Z/00/JC/KO, CNPq 476055/2003-2, and FAPERJ E-26/170.308/2002. A.J.G. was supported inpart by an Interhemispheric Research Training Grant in Infectious Diseases, Fogarty International Center (NIH D43-TW007129). J.D.N. is supported in part by NIHAI52733 and AI056070-01A2, and the Center for AIDS Research at the Albert Einstein College of Medicine and Montefiore Medical Center (NIH AI-51519). R.M.Z.O.is in part supported by CNPq 306288/2006-0.
Competing Interests: The authors have declared that no competing interests exist.
* E-mail: [email protected]
. These authors contributed equally to this work.
Introduction
The dimorphic fungus Histoplasma capsulatum is the causative
agent of the systemic mycosis histoplasmosis. H. capsulatum has a
worldwide distribution with areas of high endemicity, such as the
Mississippi and Ohio river valleys of the USA and the South and
Southeast of Brazil [1]. Human infection primarily occurs after
inhalation of microconidia, which are deposited in the distal alveoli
where they are phagocytosed by macrophages and undergo
morphogenic change into a yeast form [2,3]. In the phagosome of
these cells, the fungus is exposed to stress conditions including
changes in pH and reactive oxygen species [4]. One mechanism
that H. capsulatum purportedly utilizes to evade oxidative stress is the
production of catalases [5]. Catalases are ubiquitous enzymes that,
independent of their origin, function to degrade two molecules of
hydrogen peroxide into two of water and one of oxygen.
Catalase species are widely distributed in the prokaryotic
kingdom and lower eukaryotes (catalase-peroxidase), as well as
in higher eukaryotes (homotetramic, heme containing enzymes)
[6,7]. Cellular metabolism usually generates toxic species mediated
by products from the univalent reduction of molecular oxygen,
including species such as superoxide radicals (O22), peroxide
(O222) and hydroxyl (OH2). Additionally, infectious organisms
can be damaged by exposure to these same radicals. Diverse
mechanisms have been described to damage as a consequence of
oxidative stress on microbes, including peroxisome proliferation
and DNA breakage [5,8].
Microbial enzymes, such as catalases, involved in defense
against oxidative stress have been associated with pathogenicity
and virulence in certain human fungal pathogens. Aspergillus
fumigatus has two mycelial catalases and one conidial catalase
whose actions counteract the oxidative defense reaction mecha-
nism in host phagocytes [9]. Induction of catalases in Paracoccid-
ioides brasiliensis protects the fungus against endogenously produced
oxygen radicals and H2O2 [10]. P. brasiliensis catalases are
transcriptionally up-regulated during yeast development and also
increase during mycelium to yeast conversion. Although rarely
pathogenic, Saccharomyces cerevisae has two catalases, one peroxi-
somal catalase (catalase A) and one cytosolic catalase (catalase T),
which play especially important roles in tolerance to oxidative
stress in the adaptive response of these cells [11]. Catalase
disruptants of Candida albicans are fully viable under normal culture
conditions, but are extremely sensitive to oxidative stress by
hydrogen peroxide and are cleared more rapidly than wild type
cells in a murine infection model [12]. Although the role of
catalase in Penicillium marneffei has not been elucidated, its catalase
PLoS ONE | www.plosone.org 1 October 2008 | Volume 3 | Issue 10 | e3449
gene displays a high level of expression when temperature is
shifted from 25uC to 37uC inducing the morphogenesis of the
fungus from a mould to yeast forms. The up-regulation of the P.
marneffei catalase purportedly promotes the survival of this
dimorphic fungus in host cells [13]. A catalase (catalase B) from
Magnaporthe grisea is important for the maintenance of fungal cell-
wall integrity during plant cell infection and invasion [14]. The
catalase B gene is 600-fold up-regulated during infection and
disruption of the gene attenuates the virulence of the fungi.
Three different catalases have been described in H. capsulatum
and each catalase gene is present in a single copy [5]. Catalase P is
a small-subunit monofunctional peroxisomal catalase, composed
of a single chain of 57 KDa that has high similarity with the
monofunctional catalase P of P. brasiliensis [10]. H. capsulatum
catalase A and B are large-subunit bifunctional (catalase-
peroxidase) enzymes that usually form quaternary structures in
solution [6,7]. Catalase B and P are constitutively expressed,
whereas catalase A is induced upon H2O2 stress. Catalase B is also
known as the M antigen, which is a major diagnostic antigen of H.
capsulatum as it elicits both humoral and cellular immune responses
[1,15–19]. It is noteworthy that the M antigen (catalase B) has
previously been described as a secreted enzyme [15,20,21].
The M glycoprotein induces the first precipitins to arise in acute
histoplasmosis and is also present in all subsequent phases of
disease [22,23]. The immunodominant M antigen of H. capsulatum
has previously been purified using chromatographic methods and
characterized by a combination of immunochemical assays. The
relative molecular weight varies depending on glycosylation and
ranges from ,70–94 kDa, and the molecule contains species-
specific and non-specific protein and carbohydrate epitopes [24–
26]. Cross-reactivity with sera from patients with infections other
than histoplasmosis has been attributed to the presence of these
glycosylated residues and can be minimized by chemical and
enzymatic deglycosylation methods [22,23,26,27]. Furthermore,
the gene sequence of the M antigen has allowed for the design of
primers to develop a highly specific and sensitive PCR for the
identification of H. capsulatum atypical isolates [28], suggesting that
the M antigen has specific epitopes, as well as common epitopes
shared with numerous other catalases from diverse sources.
The purpose of our study is to show that the M glycoprotein is
expressed on the fungal cell surface where it may interact with host
cells and antibody. We demonstrate that the most immunogenic
epitopes are located on the surface of the proposed 3-D model and
are thus sterically accessible to antibodies and effector cells of the
immune system. Also, we identified a species-specific mAbs that
may be applied to the serodiagnosis of histoplasmosis.
Methods
Fungal strains and culture conditionsH. capsulatum strain ATCC G217B and CDC6623 (ATCC
26320) were obtained from the American Type Culture Collection
(ATCC, Rockville, Maryland, USA). Yeast forms were maintained
by cultivation at 37uC in Ham’s F-12 medium as previously
described [29]. P. brasiliensis strain CIB Pb 339 was obtained from
the Corporacion para Investigaciones Biologicas (CIB, Colombia)
and yeasts were cultivated in Fava Netto’s medium at 37uC for 6
days [30], while filamentous forms were cultivated for 15 days at
25uC in the same medium. Sporothrix schenckii (Ssl7 - St. John’s
Institute of Dermatology, London, United Kingdom) yeasts were
grown in Brain Heart Infusion (BHI) broth for 3 days at 37uC[31]. Blastomyces dermatitidis (NCPF 4076-National Collection of
Pathogenic Fungi, Colindale, London, United Kingdom) yeasts
were grown in BHI at 37uC for five days [32]. A. fumigatus (strain
3111 – Laboratorio de Micologia, Instituto de Pesquisa Clınica
Evandro Chagas, FIOCRUZ, Brazil) was grown in Sabouraud
Broth at 37uC for 96 h (cellular extract) or 3 weeks (culture
filtrate). All the strains were incubated with shaking at 150 rpm.
Mycobacterium tuberculosis cell extract was a gift from Dr. Beatriz
Gomez (CDC, Atlanta, GA).
Antigen preparationsAntigens were obtained from H. capsulatum yeast and other
microorganisms that often cross-react with H. capsulatum by
immunoprecipitation techniques [1,33,34]. Yeast cells of H.
capsulatum, P. brasiliensis, S. schenckii, and B. dermatitidis were
harvested by centrifugation and cytoplasmic yeast antigens
(CYA) were prepared as described by Hamilton et al [35,36].
CYA antigens were obtained by suspending 109 yeast cells in
phosphate buffered saline (PBS- 10 mM NaH2PO4, 10 mM
Na2HPO4 pH 7.0 and 150 mM NaCl) containing protease
inhibitor cocktail (Roche IN, USA) followed by disruption of the
cells using a bead beater at 4uC with 10 cycles of 1 minute
followed by 1 minute incubations on ice. The lysates were then
centrifuged at 11,3006g for 20 min and the supernatant
containing the cytoplasmic fraction were collected. Filtered
antigens from A. fumigatus and P. brasiliensis filamentous cultures
were prepared by filtration of the culture supernatant using a
0.45 mm Millipore membrane (Billerica, MA USA) and the flow
through concentrated 1006. Two other antigenic preparations
from A. fumigatus and M. tuberculosis were obtained by disruption of
the cells using a bead beater (Biospec Products, Bartlesville, Okla.)
at 4uC with 10 cycles of 1 min alternating with incubations on ice
for 1 min [37]. Purified histoplasmin was prepared from mycelial
cultures of H. capsulatum CDC6623 (ATCC 26320) as described
[24]. Histoplasmin fractions were pooled and glycosyl residues
oxidized by treatment with sodium m-periodate (NaIO4) [26].
Protein concentrations were determined using a dye-binding assay
as described [38], using bovine serum albumin as a standard.
Sequence analysis and phylogeny of the M antigenStudies of the primary sequence of the M antigen were done
based on the sequence of accession number AAB84182 from
Swiss-Prot/ TrEMBL. JPRED (www.compbio.dundee.ac.uk/
www-jpred/) was used to determine sequences similar to the M
antigen and predict the secondary structure. Catalase from
Penicillium vitale (PDB ID 2IUF-E, 1.71-A resolution) [39] and
Escherichia coli (PDB ID 1QF7-A 2.20-A resolution) [40] were used
as templates in the modeling procedure. To study the phylogenetic
relationship of M antigen among catalases of the Ascomycota class
and determine the phylogenetic distance of the two catalases used
to construct the M antigen model, we identified similar sequences
using the BLAST algorithm (http://www.ncbi.nlm.nih.gov/blast)
and sequences databases (GenBank and Swiss-Prot/ TrEMBL).
Alignment of the identified sequences was done using the Clustal
W and Meg Align (5.03) software from DNASTAR package
(Madison, Wisconsin University, USA) and homologous proteins
to this antigen were determined. This resulted in a final alignment
of 26 taxa and 901 sites using MEGA program version 4 [41]. The
neighbor-joining with maximum-parsimony method was used to
construct the phylogenetic tree. All bootstrap support values were
based on 500 replicates.
Homology modelingThe sequence of the M antigen was submitted to the Swiss-
model automated modeling server [42] to derive a 3D model using
the two catalases cited above as a template. The study was assessed
with the analytical tools available in SwissPDB viewer v. 3.6 and
M Antigen
PLoS ONE | www.plosone.org 2 October 2008 | Volume 3 | Issue 10 | e3449
with the programs in the PROCHECK suite for model validation
[43]. The molecular model of M antigen was submitted to model
refinement and energy minimization conducted with the GRO-
MOS96 v.43B1 force field implemented in the SwissPDB viewer
v.3.7b2. The final refined theoretical structure of M antigen was
achieved by a harmonic constraint with 20 steps of steepest
descent in all residues followed by 1,000 steps of steepest descent
and conjugated gradient minimization methods until the energy
difference between the two steps was below 0.01 kJ/mol.
Additional refinements of the M antigen model were performed
using a similar minimization protocol in which the type of residues
constrained during the minimization were varied: initially, only
residues out of the most favored regions of the Ramachandran plot
were allowed to move, then residues with a high model B-factor
and/or force field energy were included.
Cloning, expression and purification of the recombinantM antigen
PCR was used to amplify the sequence of the M antigen from
50 ng of cDNA as a template in the presence of 2 U of Platinum
Taq DNA polymerase (Invitrogen, CA, USA), 50 mM KCl,
10 mM Tris-HCl (pH 8.4), 2.5 mM MgCl2, 100 mM of each
deoxynucleotide triphosphate, 0.5 mM sense primer cDNAF (59-
CGCAATTCAGATCTGACCCTACGGACCAG-39) and anti-
sense primer cDNAR (59-ACCAAGCTTCTAGCTTCTATC-
CAACGGGAA-39). The cDNAF primer contained the restriction
enzyme site for BglII and the cDNAR primer contained HindIII.
The conditions of the PCR were 94uC for 2 min, thirty-five cycles
94uC for 45 s, 55uC for 45 s and 72uC for 1 min and a final
extension for 2 min at 72uC. The PCR product was digested with
BglII and HindIII and ligated into pQE40 expression plasmid
(Qiagen, CA, USA). The construct was used to transform M15 E.
coli strains (Qiagen, CA, USA) and the bacteria were plated on
medium contained ampicillin (100 mg/mL) and kanamycin
(25 mg/mL). Clones were screened by PCR using the same pair
of primers described above and by restriction mapping of the
plasmid, followed by sequencing. One positive clone was selected
(M-5) and grown at 37uC with shaking in liquid Luria-Bertani
medium containing selective antibiotics. Culture was performed
until the absorbance reached 0.4–0.6 at 600 nm and recombinant
protein expression was induced by addition of IPTG (0.1 mM).
Cells were incubated at 37uC for 4 h with 300 rpm shaking. Cells
were harvested at 1,1006g and suspended in a buffer containing
5 mM imidazole, 20 mM Tris (pH 7.9), 500 mM NaCl and the
protease inhibitor cocktail (Roche, Mannheim, Germany). Cells
were disrupted using glass beads and ultrasonication with 10 cycles
of 1 min followed by incubations on ice. The cell lysate was
centrifuged at 11,3006g to separate the soluble from the insoluble
particles. The insoluble pellet was suspended in a buffer containing
6 M urea, 5 mM imidazole, 20 mM Tris (pH 7.9), 500 mM NaCl
and the insoluble fractions were separated by centrifugation at
11,3006g. Supernatant was passed through a 0.22 mm PTFE
syringe filter (Fisher Scientific, USA) and loaded onto a pre-
equilibrated Ni-NTA agarose column (Quiagen CA, USA). The
column was washed with 10 bed volumes of washing buffer
(10 mM imidazole, 6 M urea, 20 mM Tris pH 7.9, 500 mM
NaCl) and the recombinant M antigen was eluted with 500 mM
imidazole, 6 M urea, 20 mM Tris pH 7.9, 500 mM NaCl. The
eluted fractions were measured in a spectrophotometer at 280 nm
and the fractions containing the higher amount of proteins were
evaluated by SDS-PAGE for the presence of the recombinant M
protein (rM). Fractions containing the rM antigen were pooled for
use in subsequent experiments. For immunizations, rM protein
was dialyzed against a buffer containing 10 mM Tris pH 7.3 and
150 mM NaCl with decreasing urea concentrations.
Epitope mapping of the rM antigenIn silico analysis was performed to determine sequences
displaying antigenic properties. Epitope mapping predictions for
antigenicity were calculated using the Jamenson-Wolf algorithm in
the Protean program (DNASTAR Inc, Madison, Wis., USA).
Protean program and ProtoParame ProtScale (www.expasy.ch)
were used to characterize the physical-chemical properties of the
identified antigenic regions. The strategy used for epitope mapping
of the rM was the fragmentation of the M antigen in three non-
overlapping fragments, F1 (from amino acid 18 to 211), F2 (from
212 to 442), and F3 (from 443 to 705). The fragments were
obtained by PCR reaction using a cDNA template and the primers
designed specifically for the amplification of each fragment are
shown in the Table 1. The PCR, cloning strategy and purifications
were performed as described above for the entire protein. The
yield of purification and the presence of the fragments of interest
were assessed by SDS-PAGE and the proteins were dialyzed to
remove urea. The protein concentration was obtained by a dye-
binding assay and immunoblot was used to evaluate the binding of
the panel of mAbs produced.
Fragments of the rM antigen were used to determine the overall
antibody response in sera of patients with histoplasmosis and to
evaluate the relative reactivity of each fragment. Sera were
obtained from fourteen patients with culture confirmed histoplas-
mosis from the Instituto de Pesquisa Clınica Evandro Chagas
(FIOCRUZ, Rio de Janeiro, RJ, Brazil). Additionally, the patients
had positive immunodiffusion results to the M antigen using
histoplasmin. The serum samples were from a serum bank at
FIOCRUZ with approved use by the Ethics Committee of the
institution and were stored at 220uC prior to use. The reactivity
for H. capsulatum of each patient’s serum was measured by ELISA
as described [33]. Briefly, rM antigen and fragments were diluted
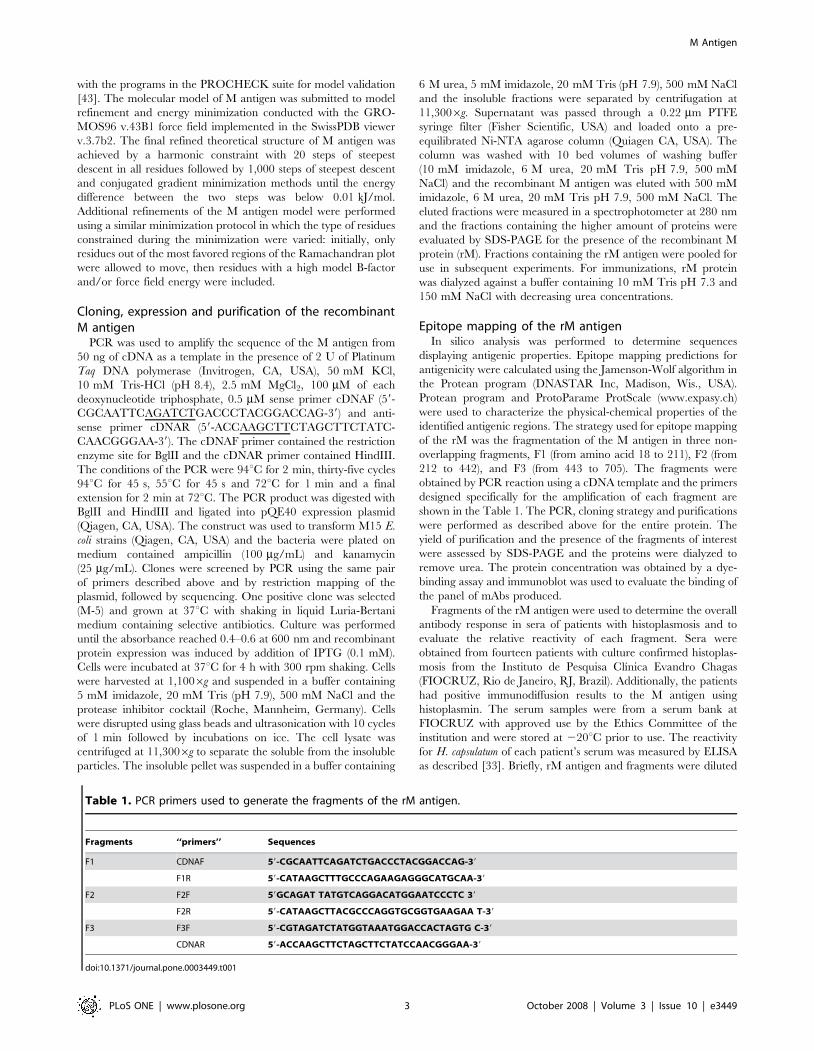
Table 1. PCR primers used to generate the fragments of the rM antigen.
Fragments ‘‘primers’’ Sequences
F1 CDNAF 59-CGCAATTCAGATCTGACCCTACGGACCAG-39
F1R 59-CATAAGCTTTGCCCAGAAGAGGGCATGCAA-39
F2 F2F 59GCAGAT TATGTCAGGACATGGAATCCCTC 39
F2R 59-CATAAGCTTACGCCCAGGTGCGGTGAAGAA T-39
F3 F3F 59-CGTAGATCTATGGTAAATGGACCACTAGTG C-39
CDNAR 59-ACCAAGCTTCTAGCTTCTATCCAACGGGAA-39
doi:10.1371/journal.pone.0003449.t001
M Antigen
PLoS ONE | www.plosone.org 3 October 2008 | Volume 3 | Issue 10 | e3449
in coating buffer (63 mM; pH 9.6) to a concentration of 0.01 mg/
mL and 50 mL/well were added to a 96-well microtiter plates
(Nunc-Immuno Starwell, MaxiSorp Surface) and incubated for
1 h at 37uC followed by an overnight incubation at 4uC. Plates
were washed three times with washing buffer (TBS) and blocked
with 200 ml blocking buffer (1% BSA diluted in TBS) for 2 h at
37uC. Then the plates were again washed three times with
washing buffer and serum samples were added in duplicate at a
dilution of 1:1,000 in 50 mL of blocking buffer. Plates were
incubated for 1 h at 37uC and after three further washes, plates
were incubated with either anti-human IgM, IgA, IgG or IgE
alkaline phosphatase conjugate (Jackson Immunoresearch) 1:2000
diluted in 100 mL of blocking buffer, at 37uC for 1 h. After three
subsequent washes, the reaction was developed using 50 mL of
pNPP diluted in substrate buffer (1 mM MgCl2, 50 mM Na2CO3)
and measured at 405 nm. The relative reactivity of the sera to
each fragment was calculated based on the value of the absorbance
obtained for each sample for a specific fragment, divided by the
sum of all the absorbances.
Generation of monoclonal antibodies (mAbs) to rMFour 6-week old female BALB/c mice were bled and the sera
tested to document the absence of antibodies to rM antigen. The
animals were then immunized with intraperitoneal injections of
20 mg of the rM antigen emulsified 1:1 (vol/vol) in complete
Freund’s adjuvant (Sigma). At 2 and 4 weeks after the first
immunization, additional doses of 20 mg of rM protein emulsified
in incomplete Freund’s adjuvant were administered. Two weeks
after each immunization, sera were obtained and analyzed for
reactivity to rM assessed by an indirect ELISA developed for this
study using 1 mg of rM antigen diluting in 50 mL (1 mg/well) of
coating buffer (63 mM Na2CO3, 63 mM NaHCO3 pH 9.6) to
coat each well of the 96-well plates. After 3 washes with TBS
(10 mM Tris-HCl pH7.2, 150 mM NaCl, 0.1% Tween 20), plates
were blocked with 1% bovine serum albumin (BSA) in TBS buffer
for 1 h at 37uC. Animal serum was diluted 1:100 in 1% BSA
blocking buffer and added to the wells in duplicate. Serial dilutions
were made and the plates were incubated for 1 h at 37uC. After
three washes, plates were further incubated with a 1:2,000 dilution
of anti-mouse immunoglobulin (Ig) alkaline phosphatase conjugate
(Jackson Immunoresearch) for 1 h at 37uC, and then the reactions
were developed with p-nitrophenyl phosphate (pNPP) and read at
405 nm. The animal with the highest titer two weeks after the last
immunization (week 6) was boosted intravenously with 20 mg of
antigen for 3 consecutive days and then its splenocytes were used
to produce hybridomas according to protocol [36]. Isotyping of
mAbs was assessed using the Isotyping Kit Enzyme Immunoassay
(Boehring Mannhein, Germany) according to the manufacturer’s
instructions. The concentration of mAbs was determined by
capture ELISA as described [44]. Briefly, ELISA plates were
coated with unlabeled antibodies specific to different Ig isotype
and then blocked with 1% BSA in TBS. The purified antibodies to
rM protein and Ig standards were serially diluted and incubated
for 1 h at 37uC. A secondary isotype specific mAb conjugated with
alkaline phosphatase was added and the reaction developed using
p-nitrophenyl phosphate (pNPP). The absorbances of the samples
were compared to the Ig standard and the concentration
determined.
Evaluation of the mAb specificityA membrane based technique was used to evaluate the
reactivity of the generated mAbs to rM antigen, H. capsulatum
CYA, purified and metaperiodate treated histoplasmin (ptHMIN),
P. brasiliensis CYA, P. brasiliensis filtered supernatant- Pb(f), A.
fumigatus filtered supernatant- Af(f), sonicated cells of A. fumigatus
and M. tuberculosis, S. schenckii CYA, B. dermatitidis CYA. Each
antigen sample was treated at 100uC for 10 min with 0.125 M
Tris-HCl buffer (pH 6.8), 2% sodium dodecyl sulfate (SDS), 10%
glycerol, 5% 2-mercaptoethanol and 0,025% bromophenol blue.
Electrophoresis and immunoblot was conducted as previously
described [22]. Membranes were blocked using 5% skin milk
solution in TBS. After 3 washes with TBS, membranes were cut
and probed separately by incubating with 5 mg/mL of each mAb.
Yeast damage by oxidative stress conditionThe sensitivity of yeast cells to oxidative stress was measured by
two different assays.
(i) Halo assay. H. capsulatum yeast cells (105) were plated on
HAM-F12 agar plates with 5-mm-diameter filter paper discs
(Whatman- Maidstone, England) embedded with different
stock concentrations of H2O2 (0, 0.5. 1, 2, 3 M) at the center
of the plates. Plates were incubated for 7 days at 37uC. The
diameter of the clearance zone was measured by multiplying
the distance from the embedded H2O2–containing disk to
the nearest colony by two.
(ii) Liquid cultures. Oxidative stress in liquid culture was
evaluated by growing the cells with different concentrations
of H2O2 (0, 0.5, 1, 1.2, 1.4, 1.6, 1.8, 2, 5, 10, 20 mM). Yeast
cells were inoculated onto 50 mL of HAM’s F-12 medium at
an initial concentration of 106 cells/mL and grown at 37uCwith 150 rpm shaking. Growth was determined by hemo-
cytometer counts and by colony forming units (CFU) by
plating aliquots from the culture every 24 h on BHI agar,
supplemented with sheep blood cells (50 mL per liter of
medium) (Colorado Serum Company, Denver).
Catalase activityTwo methods were used to assay catalase activity in H.
capsulatum. First, yeasts were grown in HAM F-12 at 37uC and
aliquots from culture were collected at different intervals. Catalase
activity was measured as described in the Worthington enzyme
manual (Worthington Biochemical Corp., Freehold, N.J.,
1972)[45]. Decomposition of hydrogen peroxide was measured
spectrophotometrically at 240 nm. Measurements were made at
20-s intervals for the first 3 min after the cells were mixed with the
substrate. One unit of catalase was defined as the amount required
to catalyze the decomposition of 1 mmol of hydrogen peroxide per
min in 0.05 M hydrogen peroxide at 25uC.
The presence of the catalase activity in different cellular
fractions of yeasts was also evaluated using the Catalase Assay
kit (Cayman Chemical, Ann Arbor, MI, USA). Supernatants,
intact cells, acetone permeabilized cells, sonicated cells, disrupted
cells plus supernatant, soluble fractions after disruption and
centrifugation, soluble fractions after disruption and centrifugation
plus supernatants were used in this experiment. First, 106 H.
capsulatum yeast cells were inoculated in 100 mL of HAM’s F-12
medium and aliquots of 1 mL of the culture obtained daily during
the growth (24, 48, 72, 96, 120 and 144 h) and the number of
yeasts determined. Supernatants were obtained after centrifuga-
tion of the aliquots at 1,1006g for 10 min. Equal number of cells
from each day were permeabilized using acetone for 20 min at
220uC or disrupted using ultrasonication with 10 cycles of 1 min
followed by incubations on ice. Cells were disrupted in the
presence (characterizing total activity) or absence of supernatant
and submitted to centrifugation at 11,3006g for 10 min to isolate
the soluble cellular fractions. The fractions were suspended in
M Antigen
PLoS ONE | www.plosone.org 4 October 2008 | Volume 3 | Issue 10 | e3449
50 mM potassium phosphate pH 7.0 containing 1 mM EDTA.
The assay was performed using formaldehyde as a standard for the
catalase reactions and bovine liver catalase was used as a positive
control. Assay buffer containing hydrogen peroxide was added to
each well of the plate and the reactions incubated on a shaker at
room temperature for 20 min. Reactions were stopped by adding
potassium hydroxide and developed with Purpald (4-amino-3-
hydrazino-5-mercapto-1,2,4-triazole, Cayman) which specifically
forms a bicyclic heterocycle with formaldehyde and turns purple
when oxidized. Plates were read at 540 nm. The catalase activity
for each sample was calculated based on the standard curve
obtained from formaldehyde samples and plots of catalase activity
versus time were constructed for each cellular fraction evaluated.
Localization of the M antigenCell wall/membrane extracts (CW/M) of strain G217B were
produced as described [37]. Briefly, yeast cells were centrifuged at
1,1006g for 10 min and pellet washed three times with PBS.
Yeasts were killed by treatment for 1 h at 25uC with thimerosal
(1:10,000) and suspended in PBS containing protease inhibitor
cocktail (Complete Mini – Roche, Mannhein, Germany). Cell
disruption in an ultrasonicator was conducted with 10 cycles of
1 min followed by 1 min incubations on ice and the efficacy of
disruption was confirmed by microscopy (Figure S1A and B). The
yeast homogenate was centrifuged at 1,1006g for 10 min. Pellet
and supernatant were collected and the supernatant centrifuged at
11,0006g for 20 min at 4uC and isolated. The two pellets were
pooled and washed three times using PBS. Then, the particulate
material was boiled in 125 mM Tris pH 6.9, containing 6 M urea,
20 mM b-mercaptoethanol and 1% Tween 20 for 10 min. The
samples were incubated at 4uC overnight to optimize the
solubilization of the material. Supernatant was isolated after
centrifugation and the soluble material dialyzed against PBS for
36 h to remove detergent. Immunoblots using 1 mg/mm of CW/
M preparation and mAbs against M antigen were done as
described above.
ImmunofluorescenceH. capsulatum yeast cells grown for 72 h at 37uC were
centrifuged at 1,1006g for 10 min and the pellet washed three
times with PBS. The concentration of cells was enumerated by
hemocytometer and 56106 yeasts were suspended in 100 ml of a
solution containing 10 mg/mL of a mAb against the rM diluted or
an isotype control mAb (Mouse IgG2a-unlabeled, clone HOPC-1,
Southern Biotechnology) in blocking buffer (BSA 1% in PBS). The
cells were incubated for 1 h at 37uC, washed three times with PBS
and the pellet suspended in 100 ml of anti-mouse IgG conjugated
with FITC at a 1:100 dilution in blocking buffer and incubated for
1 h at 37uC. After 3 washes, cells were suspended in 50 ml of a
mounting solution containing 0.01 M of N-propyl galate diluted in
PBS/glycerol (1:1 vol/vol). Ten microliters of the suspension was
applied to a microscopy slide and examined in a fluorescence
microscope using a 495 nm filter, with a magnificence of 1006.
Co-immunoprecipitationCell-wall extracts obtained as described above, except that no
urea was present in the extraction buffer, were pre-incubated with
the mAb 6F12 and an isotype control mAb (Mouse IgG2a-
unlabeled, clone HOPC-1, Southern Biotechnology) overnight at
4uC. Protein A/G UltraLink resin slurry was added to the mixture
(Pierce Biotechnology) and incubated for 2 h at room tempera-
ture. The agarose beads were pelleted by centrifugation at 25006g
for 5 min and supernatants used to measure the catalase activity
by spectophotometric assay at 240 nm, as previously described
[45]. Co-immunoprecipitates were additionally treated with
glycine buffer (0.1 M, pH 2.5) and catalase activity evaluated, as
well as immunoblots to detect the presence of the M antigen in this
fractions.
Catalase detection during cell growthYeast cells were grown in HAM F-12 medium and aliquots were
taken from the culture daily for 14 days. Yeast cells were
centrifuged at 1,1006g for 10 min and supernatants were
collected. The pelleted yeast cells were washed three times with
PBS then disrupted as described above. The yeast homogenates
were centrifuged at 1,1006g for 10 min then the pellets and
supernatants were collected. The supernatants were centrifuged at
11,0006g for 20 min at 4uC and isolated (cytoplasmic fraction).
The pellets were pooled and used for cell wall/membrane
extraction as described previously. All collected material was
stored at 220uC prior to testing. The presence of M antigen in the
supernatant was evaluated by immunoblot using a mAb to the rM
protein. The viability of cells during growth was assessed by
counting using propidium iodine, CFU plating and measurement
of lactate dehydrogenase activity (LDH) in supernatant (concen-
trated 206) and cytoplasmic fractions (Cytotoxity detection kit,
Roche, Mannheim, Germany).
Statistical analysisAll the statistical analysis was performed using GraphPad Prism
version 5.00 for Windows (GraphPad Software, San Diego
California USA). A one way ANOVA using a Kruskall-Wallis
non-parametrical test was used to compare the differences
between groups. A 95% confidence interval was considered in
all experiments.
Results
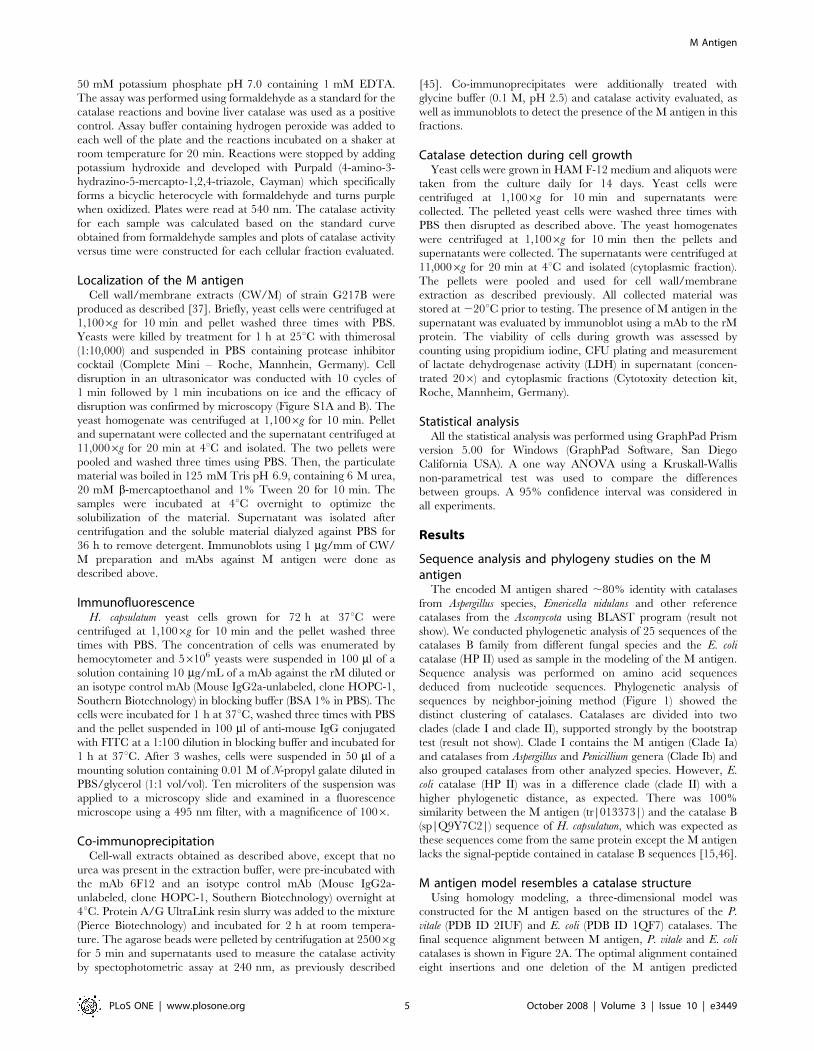
Sequence analysis and phylogeny studies on the Mantigen
The encoded M antigen shared ,80% identity with catalases
from Aspergillus species, Emericella nidulans and other reference
catalases from the Ascomycota using BLAST program (result not
show). We conducted phylogenetic analysis of 25 sequences of the
catalases B family from different fungal species and the E. coli
catalase (HP II) used as sample in the modeling of the M antigen.
Sequence analysis was performed on amino acid sequences
deduced from nucleotide sequences. Phylogenetic analysis of
sequences by neighbor-joining method (Figure 1) showed the
distinct clustering of catalases. Catalases are divided into two
clades (clade I and clade II), supported strongly by the bootstrap
test (result not show). Clade I contains the M antigen (Clade Ia)
and catalases from Aspergillus and Penicillium genera (Clade Ib) and
also grouped catalases from other analyzed species. However, E.
coli catalase (HP II) was in a difference clade (clade II) with a
higher phylogenetic distance, as expected. There was 100%
similarity between the M antigen (tr|013373|) and the catalase B
(sp|Q9Y7C2|) sequence of H. capsulatum, which was expected as
these sequences come from the same protein except the M antigen
lacks the signal-peptide contained in catalase B sequences [15,46].
M antigen model resembles a catalase structureUsing homology modeling, a three-dimensional model was
constructed for the M antigen based on the structures of the P.
vitale (PDB ID 2IUF) and E. coli (PDB ID 1QF7) catalases. The
final sequence alignment between M antigen, P. vitale and E. coli
catalases is shown in Figure 2A. The optimal alignment contained
eight insertions and one deletion of the M antigen predicted
M Antigen
PLoS ONE | www.plosone.org 5 October 2008 | Volume 3 | Issue 10 | e3449
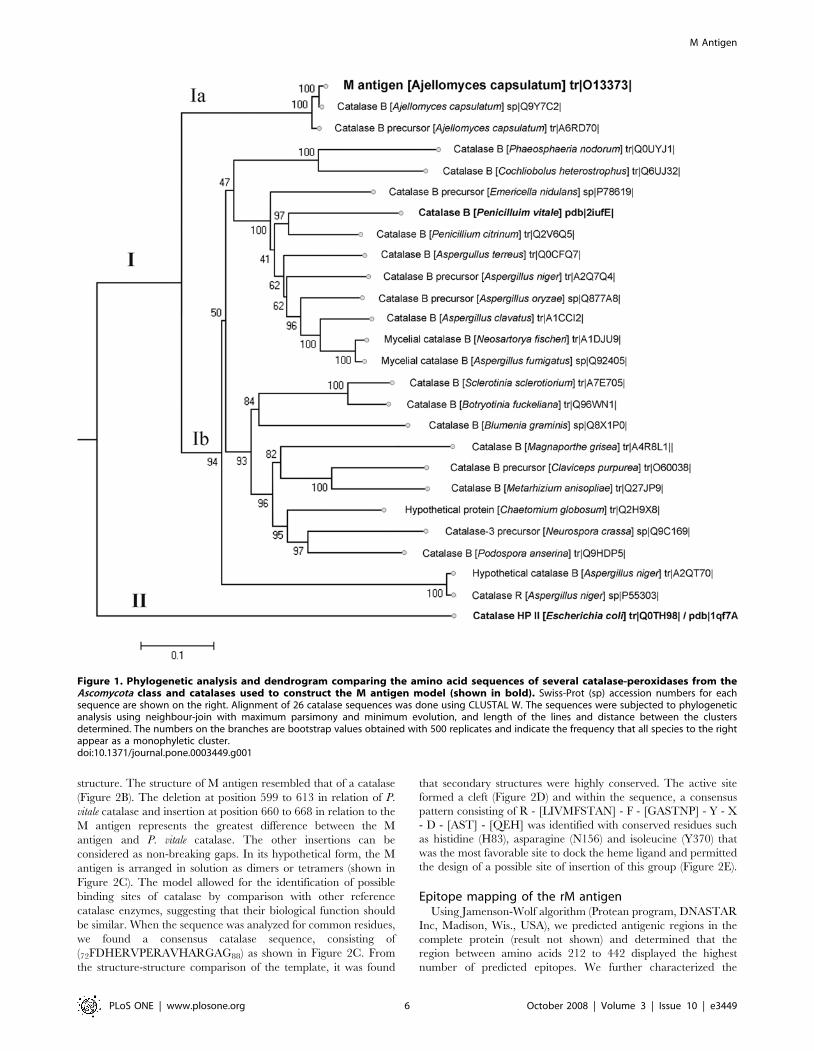
structure. The structure of M antigen resembled that of a catalase
(Figure 2B). The deletion at position 599 to 613 in relation of P.
vitale catalase and insertion at position 660 to 668 in relation to the
M antigen represents the greatest difference between the M
antigen and P. vitale catalase. The other insertions can be
considered as non-breaking gaps. In its hypothetical form, the M
antigen is arranged in solution as dimers or tetramers (shown in
Figure 2C). The model allowed for the identification of possible
binding sites of catalase by comparison with other reference
catalase enzymes, suggesting that their biological function should
be similar. When the sequence was analyzed for common residues,
we found a consensus catalase sequence, consisting of
(72FDHERVPERAVHARGAG88) as shown in Figure 2C. From
the structure-structure comparison of the template, it was found
that secondary structures were highly conserved. The active site
formed a cleft (Figure 2D) and within the sequence, a consensus
pattern consisting of R - [LIVMFSTAN] - F - [GASTNP] - Y - X
- D - [AST] - [QEH] was identified with conserved residues such
as histidine (H83), asparagine (N156) and isoleucine (Y370) that
was the most favorable site to dock the heme ligand and permitted
the design of a possible site of insertion of this group (Figure 2E).
Epitope mapping of the rM antigenUsing Jamenson-Wolf algorithm (Protean program, DNASTAR
Inc, Madison, Wis., USA), we predicted antigenic regions in the
complete protein (result not shown) and determined that the
region between amino acids 212 to 442 displayed the highest
number of predicted epitopes. We further characterized the
Figure 1. Phylogenetic analysis and dendrogram comparing the amino acid sequences of several catalase-peroxidases from theAscomycota class and catalases used to construct the M antigen model (shown in bold). Swiss-Prot (sp) accession numbers for eachsequence are shown on the right. Alignment of 26 catalase sequences was done using CLUSTAL W. The sequences were subjected to phylogeneticanalysis using neighbour-join with maximum parsimony and minimum evolution, and length of the lines and distance between the clustersdetermined. The numbers on the branches are bootstrap values obtained with 500 replicates and indicate the frequency that all species to the rightappear as a monophyletic cluster.doi:10.1371/journal.pone.0003449.g001
M Antigen
PLoS ONE | www.plosone.org 6 October 2008 | Volume 3 | Issue 10 | e3449
M Antigen
PLoS ONE | www.plosone.org 7 October 2008 | Volume 3 | Issue 10 | e3449
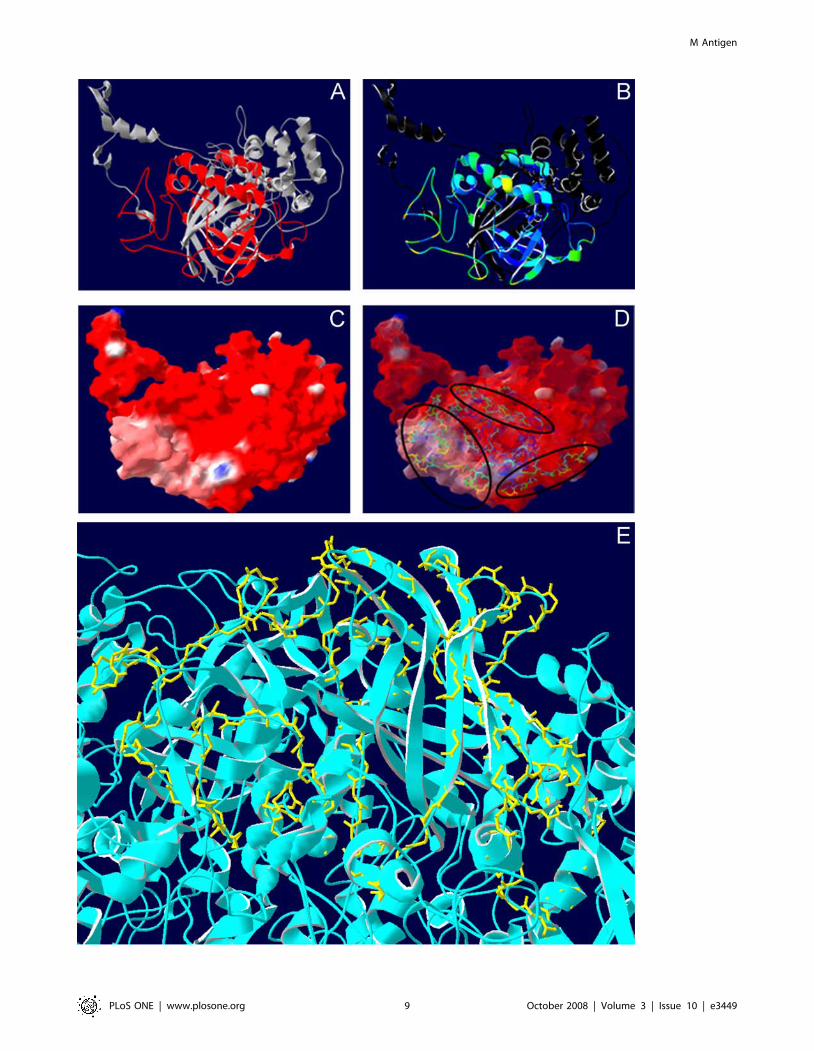
localization, secondary structure, solvent accessibility and molec-
ular surfaces of F2 in the constructed structure of the M antigen
with the SwissPDB Viewer v3.7 software (Figure 3). F2 was present
at the surface of the molecule (Figure 3A) and had a very high
accessibility to solvents (Figure 3B). When the surface of the
structure was mapped and colored according to electrostatic
potential, most of F2 was exposed, displaying a neutral charge
(Figure 3C) and readily accessible to antibodies or host effector
cells (Figure 3D). In the tetramer structure of the M antigen
(Figure 3E), F2 remained exposed on the surface.
Based on this analysis, we decided to clone this fragment, called
fragment 2 (F2), as well as the sequence before fragment 2, called
fragment 1 (F1), and the sequence after, fragment 3 (F3). The sum
of the area for all the epitopes identified (i.e., the sum of antigenic
index of each residue) in each fragment by the DNAstar was
compared with the results of specificity of Ig detection in sera from
patients with histoplasmosis. F2 showed an area under curve
(AUC) 28.8% higher than F1 or F3 (p,0.001), and there was no
statistical difference between the AUCs of F1 and F3. Table 2
shows the comparison among the fragments and the immunodo-
minant score of F2.
Reactivity of sera from patients with histoplasmosis against rM
and rM fragments were evaluated for the presence of IgA, IgM, IgG
and IgE and the reactivity of each fragment was compared.
Intragroup reactivity was defined as the reactivity of each class of Ig
for each fragment specifically, and intergroup reactivity was the
reactivity of a single class of Ig to each fragment. The relative
reactivity inter/intragroup (percentage of total reactivity) deter-
mined in each case is shown in Figure 4. For each fragment, IgGs
were the most reactive, followed by IgAs, IgMs and IgEs (p,0.001).
When antibody classes against F1 and F3 were assessed, the IgGs
recognized epitopes on F2 better than Igs from the other groups
(p,0.001) (Figure 4A and C). For F2, the IgGs were the most
reactive (p,0.001), but IgAs and IgMs also accounted for a greater
percentage of reactivity compared to the results from F1 and F3
(Figure 4B). This was further clarified when the specificities of each
class of Ig were compared for each fragment where IgAs and IgMs
were shown to have the most reactivity to epitopes on F2 (p,0.001)
(Figures 4D and E, respectively). In contrast, IgGs reacted equally
against the three fragments tested and no statistical difference was
observed (p.0.05) (Figure 4F). Although IgEs contributed the least
to overall reactivity, most reactivity occurred to F3 (p,0.001)
(Figure 4G). These results support the hypothesis that different
classes of Ig recognize different epitopes in distinct regions of the
antigen and that the Igs have different specificities. Comparing data
from ELISAs with the results of epitope mapping and prediction
using bioinformatics, the fragment ELISA for epitope mapping and
the computed antigenic indices show that F2 was the most
immunogenic segment of M antigen.
mAbs against rM proteinThe three mAbs to rM antigen with the highest reactivity by
ELISA (IgM mAb 7C7 and IgG2a mAbs 6F12 and 8H2, data not
shown) were used to probe antigenic preparations from microor-
ganisms that historically cross react in serologic tests with H.
capsulatum. The reactivity profiles of mAbs were determined
according to the bands seen after developing immunoblots and
calculations of the respective molecular weights (Table 3, Figure
S2). The mAb 8H2 showed the highest specificity, since it did not
recognize any protein in the antigenic extracts from P. brasiliensis,
A. fumigatus, S. schenckii, B. dermatitidis or M. tuberculosis. MAbs 7C7
and 6F12 recognized multiple bands in the molecular weight
range of 60 to 80 KDa from filtered antigens of mycelial P.
brasiliensis. These mAbs also reacted nonspecifically against CYA
antigen from P. brasiliensis. None of the mAbs tested reacted
against antigenic preparations from A. fumigatus. MAb 6F12
showed reactivity with a 60 KDa and a 17 KDa protein from S.
schenckii extract. Multiple bands could be the result of protein
degradation and/or that the epitope recognized by the mAbs are
shared by different antigens. In the case of the immunoblots with
the rM antigen, the multiple bands observed are due to protein
degradation during the purification process. Hence, mAb 8H2
appears to be specific for the M antigen of H. capsulatum and may
have potential use in the diagnosis of histoplasmosis.
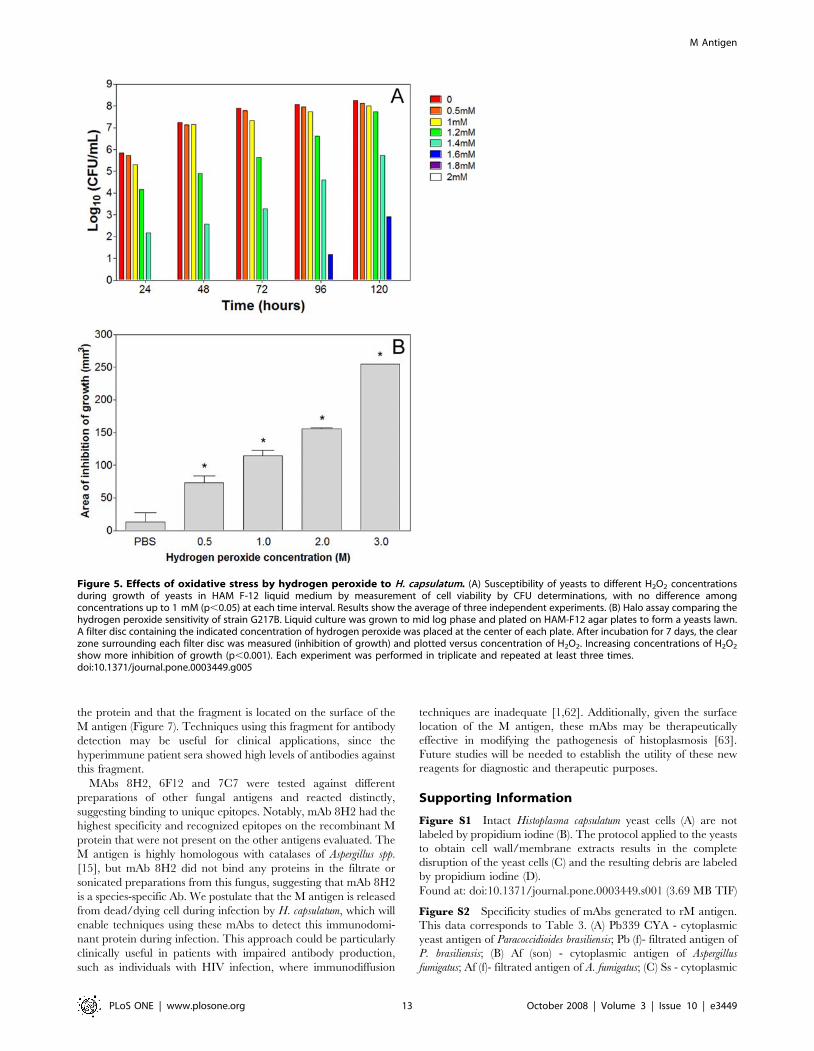
Fungal susceptibility to oxidative stress by hydrogenperoxide
To determine the role of catalases to H. capsulatum sensitivity to
oxidative stress in vitro, strain G127B was grown in different
concentrations of H2O2 (0, 0.5, 1, 1.2, 1.4, 1.6, 1.8, 2, 5, 10,
20 mM). There was no statistical difference in the rate of growth of
H. capsulatum yeasts as enumerated by hemacytometer with
concentrations ranging from 0 to 1.0 mM of hydrogen peroxide
(p.0.05), whereas progressive reduction in growth was observed
with increased concentrations of hydrogen peroxide up to 1.6 mM
and no growth occurred by 120 h at concentrations $1.6 mM
(p,0.001). CFU determinations revealed that no viable cells were
recovered from cultures with concentrations $1.8 mM of
hydrogen peroxide (Figure 5A). As described previously [47],
H2O2 challenge in liquid medium represents a short duration
exposure for catalase expressed by microorganisms (since H2O2 is
intrinsically unstable). To test the effect of a more prolonged
exposure, the halo assay was performed. Figure 5B shows the halo
diameter of the yeast after placing the filter discs with H2O2
concentrations ranging from 0 to 3 M. As expected, more killing
occurred with increased oxidative stress and, consequently, a
bigger halo was formed compared to the PBS control (p,0.001).
Catalase activityWe measured the catalase activity in the supernatant of H.
capsulatum yeast cultures by exploiting the absorption spectra of
hydrogen peroxide to provide an indirect method of observation
and quantification of catalase activity. Absorption of UV light
(240 nm) corresponds to levels of hydrogen peroxide present in the
sample. Aliquots from the culture at early stages of growth (0 to
61 hrs) had undetectable catalase activity, whereas degradation of
Figure 2. Studies of homology modeling of the M antigen. (A) Sequence alignment by CLUSTAL-W and comparison of catalases ofHistoplasma capsulatum (M antigen), Penicillium vitale (2iufE) and Escherichia coli (1qf7A) used in the construction of the 3-D model of the M antigen.Amino acids are shown in single-letter code and stars indicate conserved amino acids residues and exact identity among the sequences. Residueshighlighted in red and in yellow show a-helix and b-sheet secondary structures, respectively, determined by JPRED. Residues aligned in grayrepresent the catalase proximal active site signature. Boxes indicate the most favorable sites for heme ligand docking (H83, N156, Y370). Numbering ofthe residues and identifications for each protein are indicated to the left of the protein sequences. (B) Hypothetical model of the M antigen based instructure homology with other catalases. The proximal active site signature is shown in pink within the sequence. Cylinders represent alpha helixesand arrows, beta sheets. (C) Hypothetical model of the M antigen as a tetramer showing the N-terminal (blue), barrel shaped domain (red), bindingdomain (yellow) and helicoidal domain (green). (D) Structure showing the signature site of M antigen as a catalase and (E) Folded structure showingthe insertion of the heme group (green) by docking, showing the respective interaction sites, H83 (magenta), N156 (orange), Y370 (pink).doi:10.1371/journal.pone.0003449.g002
M Antigen
PLoS ONE | www.plosone.org 8 October 2008 | Volume 3 | Issue 10 | e3449
M Antigen
PLoS ONE | www.plosone.org 9 October 2008 | Volume 3 | Issue 10 | e3449
hydrogen peroxide was observed in aliquots from cultures older
than 61 hours (Figure 6A). When the catalase activity was
normalized by the number of cells, no difference was observed
(data not shown).
Different cellular fractions were obtained by sonication/
centrifugation protocols from the H. capsulatum yeast grown in
liquid medium and the catalase activity of the materials
sequentially obtained were measured (Figure 6B). Catalase activity
was not detectable in supernatants with the system used. Intact
cells were used to confirm the hypothesis that catalase was not
been secreted and it could be localized to the cell wall and the cells
showed higher catalase activity after 6 days of growth. Cytoplas-
mic extracts obtained by cellular permeabilization showed an
absence of intracellular enzyme activity. The catalase activity in
the disrupted cell fraction was lower than to the intact cell group,
suggesting that the main location of activity resides on the H.
capsulatum yeast cell surface. Notably, a reduction in activity was
observed in the soluble fractions of the yeast cells when compared
to disrupted cells (,100 nmol/min/mL), indicating that the
catalases are distributed in soluble and insoluble fractions, which
are precipitated at high speeds, possibly on fragments of cell wall.
These results support the hypothesis that the catalases are located
where they can protect the cell wall against oxidative stress.
M antigen localization on yeast cells of H. capsulatumThe results obtained with localization of catalase activity led us
to further study the location of the M antigen on yeast cells by
immunofluorescence and immunoblot using the highly immuno-
reactive purified mAbs. The mAbs brightly reacted with H.
capsulatum yeast by immunofluorescence of both mother and
daughter cells (Figure 6C and D). Since the yeast was not
permeabilized, this result suggests that the M antigen was in fact
accessible at the cell surface. No reaction was observed using an
irrelevant immunoglobulin as a negative control and mAbs against
M antigen did not label yeasts of P. brasiliensis (Figure S3A and B).
Furthermore, mAbs 8H12, 6F12 and 7C7 recognized a protein of
,85 KDa on the immunoblot, consistent with the molecular
weight of the M antigen (Figure 6E and F).
Co-immunoprecipitation of cell wall extracts with the specific
mAb 6F12 against the M antigen showed a reduction of the
catalase activity in this cell fraction. This mAb was used due to the
best binding to the M antigen in its native conformation, as
determined by ELISA (Figure S4A). After immunoprecipitating
the M antigen in this fraction, a reduction of 60% and 53% in the
catalase activity was observed compared to the PBS and mAb
isotype control groups (p,0.001, Figure 6G). The co-immuno-
precipitates of each condition were also evaluated for catalase
activity and for the presence of the M antigen by immunoblot. The
catalse activity in the mAb 6F12 co-immunoprecipitates were five
times higher than controls and a more intense band was observed
in immunoblots from the mAb 6F12 co-immunoprecipitates
(Figure S4C and D, respectively). These data suggest that this
protein is principally located at the cell wall where it may
participate in protecting the fungus from oxidative stresses.
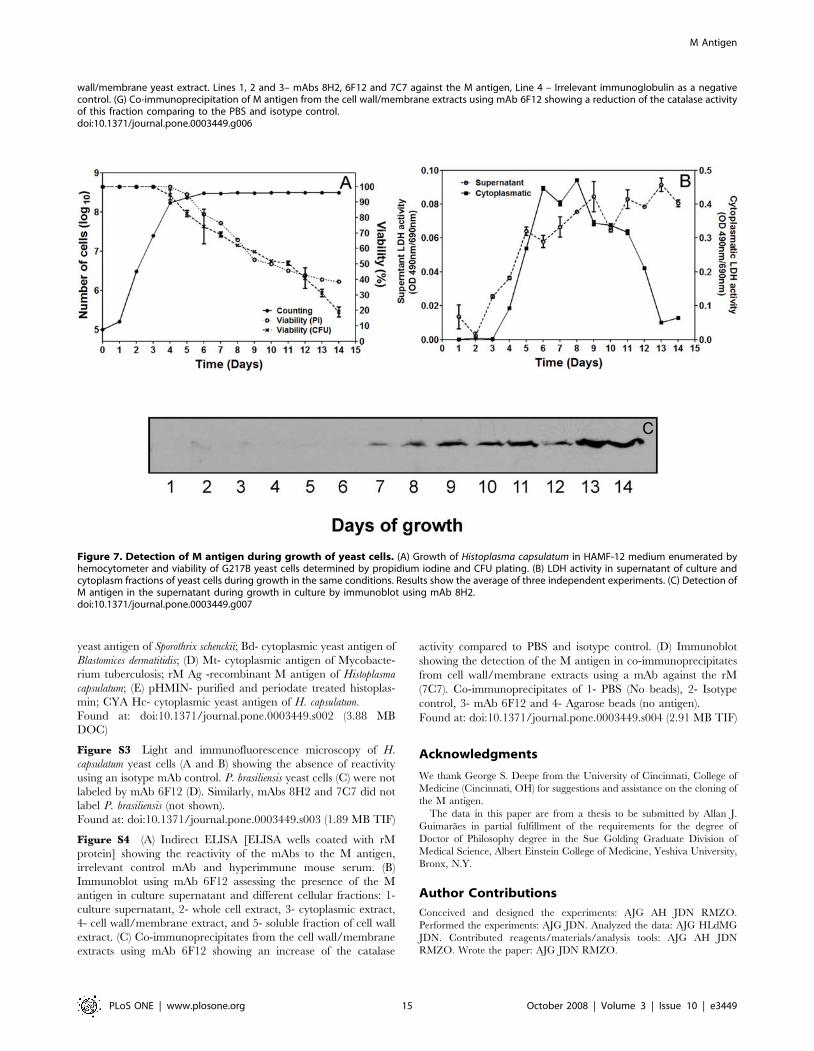
When H. capsulatum was grown in HAM F-12 medium for two
weeks, the M antigen was detected in the supernatant when the
yeast cells viability was lower than 70% (Figure 7A) and LDH
activity concomitantly increased, consistent with cell death
(Figure 7B). This suggests that the M antigen released from the
yeast cells to the supernatant starting at day 7 (Figure 7C) arises
from yeast cell lysis with release of cytoplasmic contents, and not
from secretion into the supernatant as exoantigen as described
previously for the filamentous phase of the fungus [48,49].
Discussion
The M antigen of H. capsulatum has been characterized as a
catalase (CatB) by molecular methods [15], yet little is known
about its biological function. In H. capsulatum, there are three
identified catalases that are non-related, but all have a heme group
in their theoretical structures and show a conserved core (N-
terminal, barrel shaped domain, binding domain and helical
domain) of 300 amino acids. The highest similarity of the M
antigen to other catalases is found in the region surrounding the
distal and proximal tyrosine and the catalase signature site [7,50].
The molecular model of the M antigen resembles the structures
and domains of a catalase, including the heme binding site, such as
the ligands H107, N180 and Y394 (Figure 2C and D).
To study the importance of H. capsulatum catalases, we evaluated
fungal susceptibility to oxidative stress by hydrogen peroxide. The
physiological concentration of H2O2 ranges 30–50 mM [51,52].
We found that the growth and morphology of H. capsulatum was
not affected by exposure to 1 mM H2O2, twenty-times higher than
physiological concentration. H. capsulatum defense against damage
by H2O2 could be achieved using catalases by either of two
strategies: catalases could be localized on the cell wall providing
local protection and/or could be secreted into the extracellular
milieu to detoxify the local growth environment.
Catalases have been detected in cell-free extracts or in solution
after permeabilizing yeasts of H. capsulatum, suggesting that these
were secreted enzymes [53]. We evaluated several cellular
fractions from H. capsulatum yeast cells for catalase activity. The
highest activity was seen in intact cells and the activity of disrupted
cells plus collected cytoplasmic extracts were statistically similar
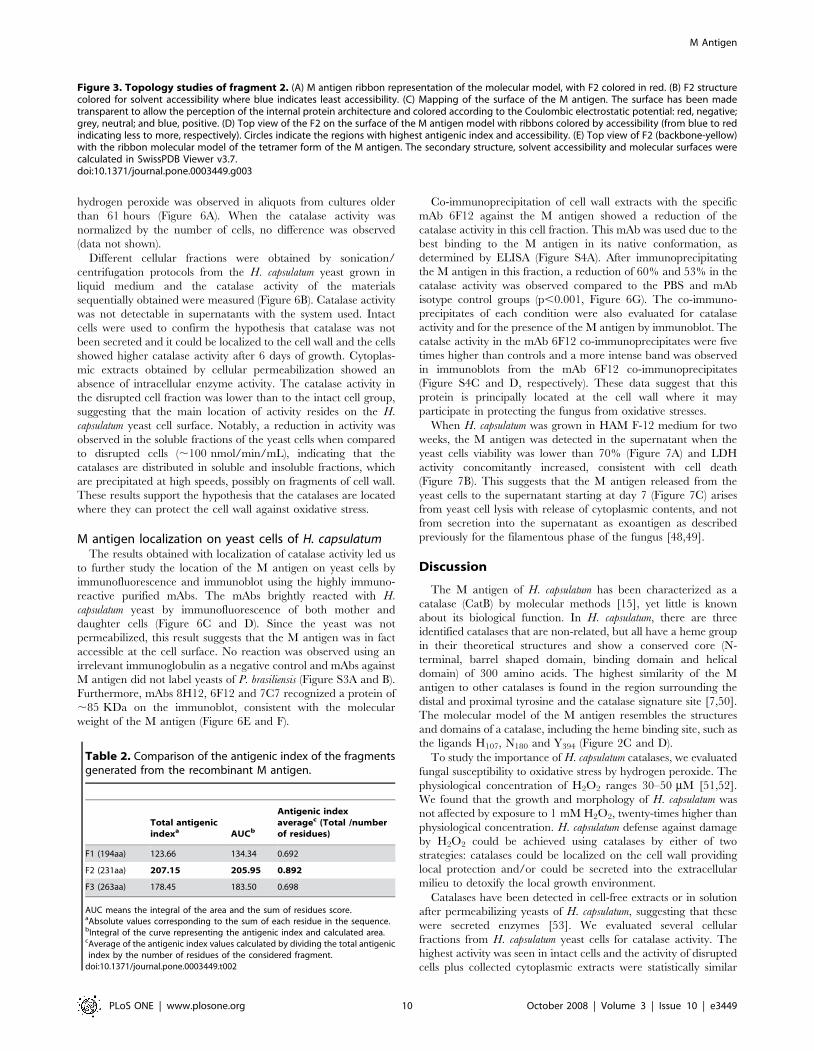
Table 2. Comparison of the antigenic index of the fragmentsgenerated from the recombinant M antigen.
Total antigenicindexa AUCb
Antigenic indexaveragec (Total /numberof residues)
F1 (194aa) 123.66 134.34 0.692
F2 (231aa) 207.15 205.95 0.892
F3 (263aa) 178.45 183.50 0.698
AUC means the integral of the area and the sum of residues score.aAbsolute values corresponding to the sum of each residue in the sequence.bIntegral of the curve representing the antigenic index and calculated area.cAverage of the antigenic index values calculated by dividing the total antigenicindex by the number of residues of the considered fragment.
doi:10.1371/journal.pone.0003449.t002
Figure 3. Topology studies of fragment 2. (A) M antigen ribbon representation of the molecular model, with F2 colored in red. (B) F2 structurecolored for solvent accessibility where blue indicates least accessibility. (C) Mapping of the surface of the M antigen. The surface has been madetransparent to allow the perception of the internal protein architecture and colored according to the Coulombic electrostatic potential: red, negative;grey, neutral; and blue, positive. (D) Top view of the F2 on the surface of the M antigen model with ribbons colored by accessibility (from blue to redindicating less to more, respectively). Circles indicate the regions with highest antigenic index and accessibility. (E) Top view of F2 (backbone-yellow)with the ribbon molecular model of the tetramer form of the M antigen. The secondary structure, solvent accessibility and molecular surfaces werecalculated in SwissPDB Viewer v3.7.doi:10.1371/journal.pone.0003449.g003
M Antigen
PLoS ONE | www.plosone.org 10 October 2008 | Volume 3 | Issue 10 | e3449
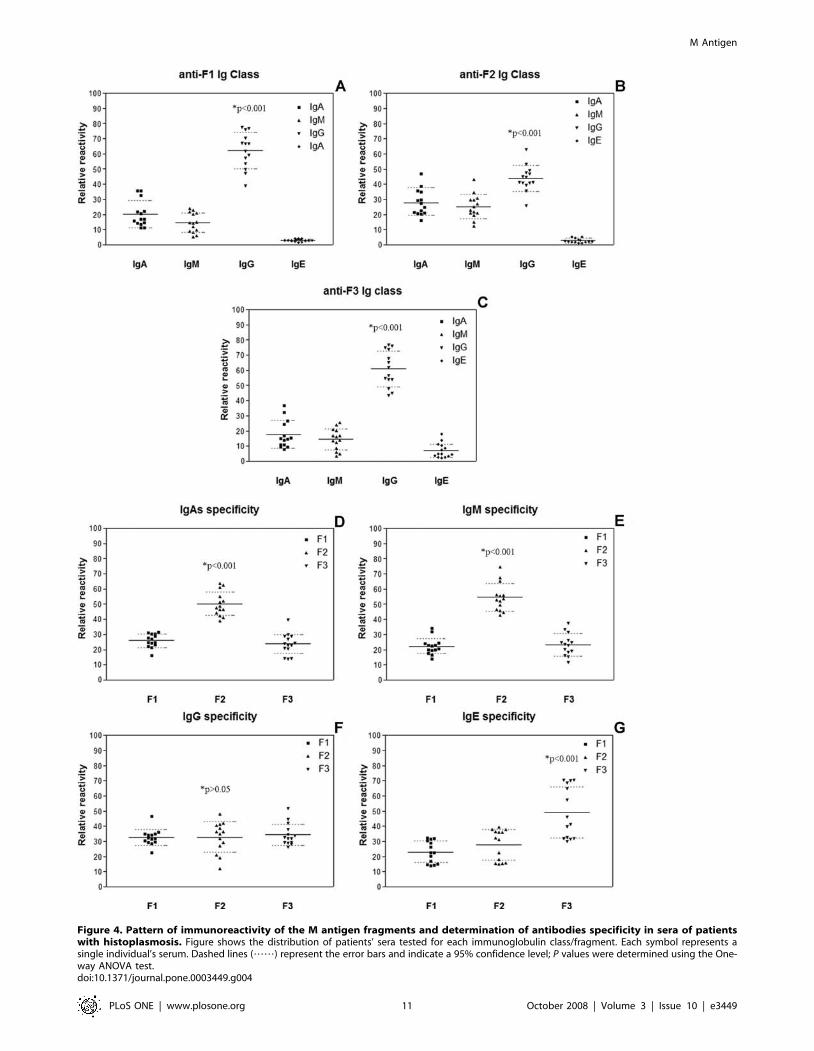
Figure 4. Pattern of immunoreactivity of the M antigen fragments and determination of antibodies specificity in sera of patientswith histoplasmosis. Figure shows the distribution of patients’ sera tested for each immunoglobulin class/fragment. Each symbol represents asingle individual’s serum. Dashed lines (……) represent the error bars and indicate a 95% confidence level; P values were determined using the One-way ANOVA test.doi:10.1371/journal.pone.0003449.g004
M Antigen
PLoS ONE | www.plosone.org 11 October 2008 | Volume 3 | Issue 10 | e3449
(p,0.05). This data suggests that the enzyme was not significantly
secreted in the conditions used and/or that it accumulated on the
cell wall. Interestingly, we recently detected by mass spectro-
graphic methods M antigen in extracellular vesicles of H.
capsulatum isolated by ultracentrifugation from 2 day old cultures
[54]. Hence, there may be some secretion of M antigen, but it is
below the level of detection using the assays used in the current
work (limit of detection of catalase activity by our microplate test is
0.0155 mg/ml (data not shown). Furthermore, it is likely that the
M antigen is transported in vesicles to the cell surface and the
isolated vesicles had not yet been trafficked to their appropriate
location and deposited their cargo. In solid media, catalase activity
could not be detected in the agar surrounding colonies of H.
capsulatum, suggesting that this enzyme is not constitutively secreted
(data not shown). Our results from the detection of the M antigen
by immunoblot using mAb 8H2 and a cell wall/membrane extract
confirmed the presence of the antigen in this fraction.
Although the M antigen had been characterized as an
exoantigen in the mycelial phase, our results indicate that M
antigen is not secreted in the yeast phase. We cannot discard the
possibility that previous studies on mould forms of the fungus were
either detecting catalase in the supernatant arising from dying/
dead cells in the stationary phase in culture or that the mould
forms have mechanisms for the extracellular secretion of this
protein. Additionally, acetone treatment previously used during
isolations could have extracted this protein from the cell wall. In
the yeast stage, catalase activity in supernatant and the M antigen
could be detected only after seven days, when H. capsulatum
cultures display a high cell death rate. Hence, detection of the M
antigen in supernatant is based on liberation of the protein after
cell lysis.
Catalases are involved in detoxification and in virulence, and
they have been reported to be located mainly on cell surfaces
[55,56]. During H. capsulatum yeast phase growth, the M antigen
(catB) and catalase P (catP) are constitutively expressed, whereas
catalase A (catA) is poorly expressed [5,53]. The catP has been
described to traffic to peroxisomes, were they can facilitate
detoxification of hydrogen peroxide generated during metabolism
[5]. P. brasiliensis, catP was similarly localized within cytoplasmic
yeast extracts [10]. Using mAbs to the H. capsulatum M antigen, we
determined that the protein is located on the yeast cell surface,
presumably making the M antigen the most important catalase for
detoxification of host derived peroxides. We cannot discard the
importance of the H. capsulatum catP, since its definitive
cytoplasmatic localization is yet to be proven. In addition,
previous results from our group showed the presence of the M
antigen in the cell wall of mycelial phase of the fungus [57]
suggesting that this protein is on the surface of the infectious form
where it might be involved in evading oxidative stress, permitting
the conversion of the fungus from mycelia to the parasitic yeast.
The strong reaction of the mAbs to rM protein with the surface of
the yeast form of H. capsulatum reinforces this hypothesis and
corroborates the data previously described indicating that the catB
gene is expressed in both forms of H. capsulatum [5]. Hence, we
surmise that the catalase activity detected on the surface is due to
the M antigen, though this needs to be confirmed in future
experiments using gene deletion or RNAi methods.
The catalase family of proteins is an important target for
humoral immune responses in several mycoses, including during
A. fumigatus infection [58], due to its localization on the cell surface.
Since the M antigen induces the first antibodies detectable by
standard laboratory methodologies during the host immune
response to infection with H. capsulatum [59,60], we undertook
the mapping of the epitopes on the protein in order to define the
highest antigenic residues with the intent of gaining insights into its
functional roles to facilitate the future development of more
specific and sensitive diagnostic methods and for vaccine studies.
We first computationally mapped the putative epitopes of the M
using the Jameson-wolf algorithm [61] and predicted the region
with the highest antigenic index. Subsequently three different
fragments from the M antigen structure were generated and the
binding of a series of mAbs produced using the whole protein were
mapped. Sera from human patients with histoplasmosis were also
used to assess the immunodominance of the three fragments,
revealing that F2 was the most immunogenic region due to the
presence of higher titers of antibodies from different classes of Igs
against this fragment. Furthermore, we showed by modeling the M
antigen that F2 contains the major immunodominant epitopes of
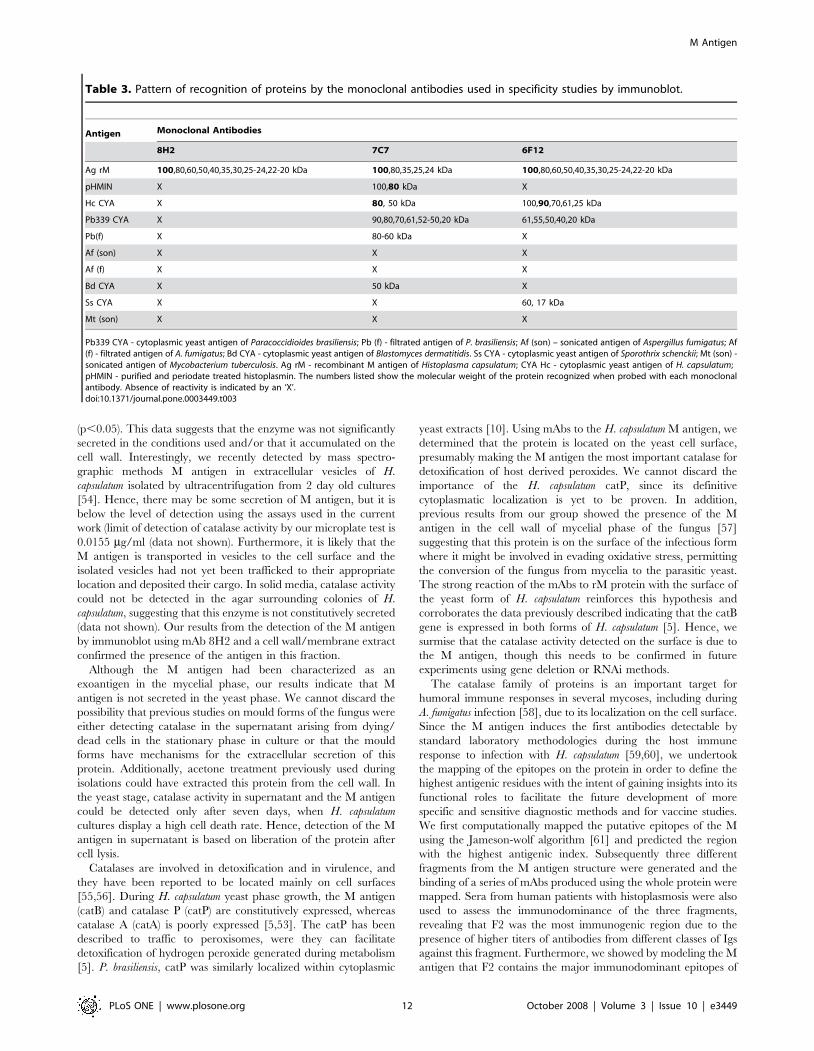
Table 3. Pattern of recognition of proteins by the monoclonal antibodies used in specificity studies by immunoblot.
Antigen Monoclonal Antibodies
8H2 7C7 6F12
Ag rM 100,80,60,50,40,35,30,25-24,22-20 kDa 100,80,35,25,24 kDa 100,80,60,50,40,35,30,25-24,22-20 kDa
pHMIN X 100,80 kDa X
Hc CYA X 80, 50 kDa 100,90,70,61,25 kDa
Pb339 CYA X 90,80,70,61,52-50,20 kDa 61,55,50,40,20 kDa
Pb(f) X 80-60 kDa X
Af (son) X X X
Af (f) X X X
Bd CYA X 50 kDa X
Ss CYA X X 60, 17 kDa
Mt (son) X X X
Pb339 CYA - cytoplasmic yeast antigen of Paracoccidioides brasiliensis; Pb (f) - filtrated antigen of P. brasiliensis; Af (son) – sonicated antigen of Aspergillus fumigatus; Af(f) - filtrated antigen of A. fumigatus; Bd CYA - cytoplasmic yeast antigen of Blastomyces dermatitidis. Ss CYA - cytoplasmic yeast antigen of Sporothrix schenckii; Mt (son) -sonicated antigen of Mycobacterium tuberculosis. Ag rM - recombinant M antigen of Histoplasma capsulatum; CYA Hc - cytoplasmic yeast antigen of H. capsulatum;pHMIN - purified and periodate treated histoplasmin. The numbers listed show the molecular weight of the protein recognized when probed with each monoclonalantibody. Absence of reactivity is indicated by an ‘X’.doi:10.1371/journal.pone.0003449.t003
M Antigen
PLoS ONE | www.plosone.org 12 October 2008 | Volume 3 | Issue 10 | e3449
the protein and that the fragment is located on the surface of the
M antigen (Figure 7). Techniques using this fragment for antibody
detection may be useful for clinical applications, since the
hyperimmune patient sera showed high levels of antibodies against
this fragment.
MAbs 8H2, 6F12 and 7C7 were tested against different
preparations of other fungal antigens and reacted distinctly,
suggesting binding to unique epitopes. Notably, mAb 8H2 had the
highest specificity and recognized epitopes on the recombinant M
protein that were not present on the other antigens evaluated. The
M antigen is highly homologous with catalases of Aspergillus spp.
[15], but mAb 8H2 did not bind any proteins in the filtrate or
sonicated preparations from this fungus, suggesting that mAb 8H2
is a species-specific Ab. We postulate that the M antigen is released
from dead/dying cell during infection by H. capsulatum, which will
enable techniques using these mAbs to detect this immunodomi-
nant protein during infection. This approach could be particularly
clinically useful in patients with impaired antibody production,
such as individuals with HIV infection, where immunodiffusion
techniques are inadequate [1,62]. Additionally, given the surface
location of the M antigen, these mAbs may be therapeutically
effective in modifying the pathogenesis of histoplasmosis [63].
Future studies will be needed to establish the utility of these new
reagents for diagnostic and therapeutic purposes.
Supporting Information
Figure S1 Intact Histoplasma capsulatum yeast cells (A) are not
labeled by propidium iodine (B). The protocol applied to the yeasts
to obtain cell wall/membrane extracts results in the complete
disruption of the yeast cells (C) and the resulting debris are labeled
by propidium iodine (D).
Found at: doi:10.1371/journal.pone.0003449.s001 (3.69 MB TIF)
Figure S2 Specificity studies of mAbs generated to rM antigen.
This data corresponds to Table 3. (A) Pb339 CYA - cytoplasmic
yeast antigen of Paracoccidioides brasiliensis; Pb (f)- filtrated antigen of
P. brasiliensis; (B) Af (son) - cytoplasmic antigen of Aspergillus
fumigatus; Af (f)- filtrated antigen of A. fumigatus; (C) Ss - cytoplasmic
Figure 5. Effects of oxidative stress by hydrogen peroxide to H. capsulatum. (A) Susceptibility of yeasts to different H2O2 concentrationsduring growth of yeasts in HAM F-12 liquid medium by measurement of cell viability by CFU determinations, with no difference amongconcentrations up to 1 mM (p,0.05) at each time interval. Results show the average of three independent experiments. (B) Halo assay comparing thehydrogen peroxide sensitivity of strain G217B. Liquid culture was grown to mid log phase and plated on HAM-F12 agar plates to form a yeasts lawn.A filter disc containing the indicated concentration of hydrogen peroxide was placed at the center of each plate. After incubation for 7 days, the clearzone surrounding each filter disc was measured (inhibition of growth) and plotted versus concentration of H2O2. Increasing concentrations of H2O2
show more inhibition of growth (p,0.001). Each experiment was performed in triplicate and repeated at least three times.doi:10.1371/journal.pone.0003449.g005
M Antigen
PLoS ONE | www.plosone.org 13 October 2008 | Volume 3 | Issue 10 | e3449
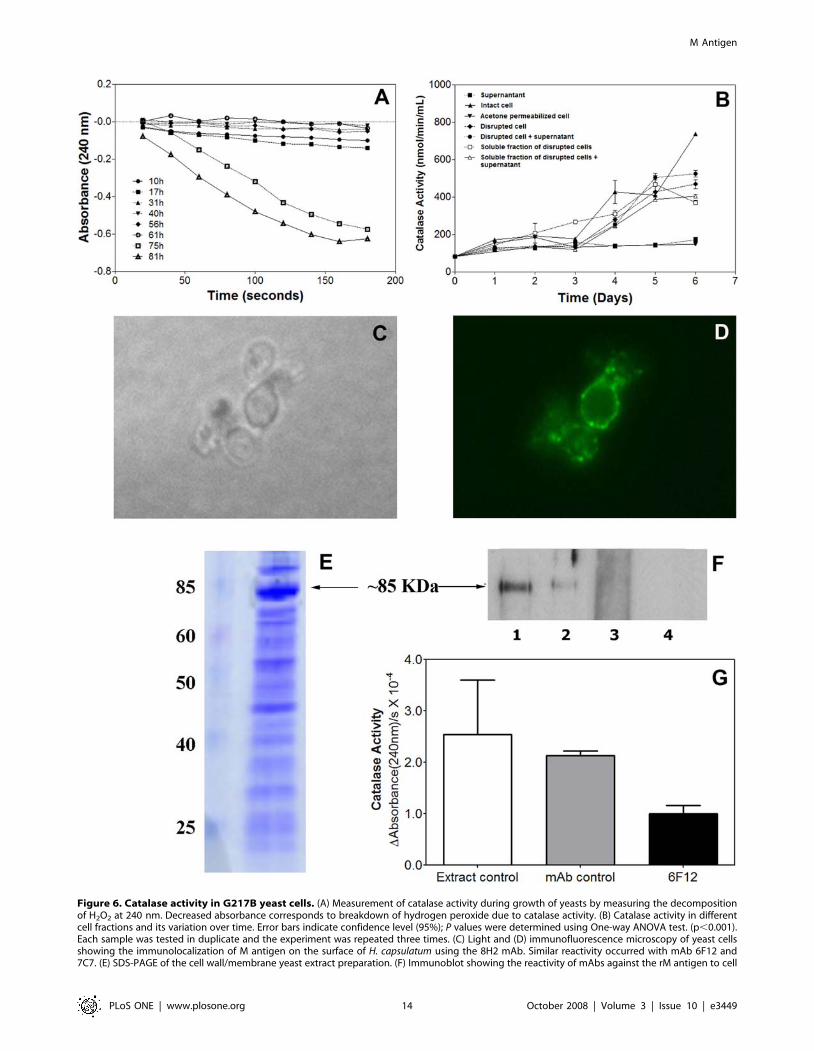
Figure 6. Catalase activity in G217B yeast cells. (A) Measurement of catalase activity during growth of yeasts by measuring the decompositionof H2O2 at 240 nm. Decreased absorbance corresponds to breakdown of hydrogen peroxide due to catalase activity. (B) Catalase activity in differentcell fractions and its variation over time. Error bars indicate confidence level (95%); P values were determined using One-way ANOVA test. (p,0.001).Each sample was tested in duplicate and the experiment was repeated three times. (C) Light and (D) immunofluorescence microscopy of yeast cellsshowing the immunolocalization of M antigen on the surface of H. capsulatum using the 8H2 mAb. Similar reactivity occurred with mAb 6F12 and7C7. (E) SDS-PAGE of the cell wall/membrane yeast extract preparation. (F) Immunoblot showing the reactivity of mAbs against the rM antigen to cell
M Antigen
PLoS ONE | www.plosone.org 14 October 2008 | Volume 3 | Issue 10 | e3449
yeast antigen of Sporothrix schenckii; Bd- cytoplasmic yeast antigen of
Blastomices dermatitidis; (D) Mt- cytoplasmic antigen of Mycobacte-
rium tuberculosis; rM Ag -recombinant M antigen of Histoplasma
capsulatum; (E) pHMIN- purified and periodate treated histoplas-
min; CYA Hc- cytoplasmic yeast antigen of H. capsulatum.
Found at: doi:10.1371/journal.pone.0003449.s002 (3.88 MB
DOC)
Figure S3 Light and immunofluorescence microscopy of H.
capsulatum yeast cells (A and B) showing the absence of reactivity
using an isotype mAb control. P. brasiliensis yeast cells (C) were not
labeled by mAb 6F12 (D). Similarly, mAbs 8H2 and 7C7 did not
label P. brasiliensis (not shown).
Found at: doi:10.1371/journal.pone.0003449.s003 (1.89 MB TIF)
Figure S4 (A) Indirect ELISA [ELISA wells coated with rM
protein] showing the reactivity of the mAbs to the M antigen,
irrelevant control mAb and hyperimmune mouse serum. (B)
Immunoblot using mAb 6F12 assessing the presence of the M
antigen in culture supernatant and different cellular fractions: 1-
culture supernatant, 2- whole cell extract, 3- cytoplasmic extract,
4- cell wall/membrane extract, and 5- soluble fraction of cell wall
extract. (C) Co-immunoprecipitates from the cell wall/membrane
extracts using mAb 6F12 showing an increase of the catalase
activity compared to PBS and isotype control. (D) Immunoblot
showing the detection of the M antigen in co-immunoprecipitates
from cell wall/membrane extracts using a mAb against the rM
(7C7). Co-immunoprecipitates of 1- PBS (No beads), 2- Isotype
control, 3- mAb 6F12 and 4- Agarose beads (no antigen).
Found at: doi:10.1371/journal.pone.0003449.s004 (2.91 MB TIF)
Acknowledgments
We thank George S. Deepe from the University of Cincinnati, College of
Medicine (Cincinnati, OH) for suggestions and assistance on the cloning of
the M antigen.
The data in this paper are from a thesis to be submitted by Allan J.
Guimaraes in partial fulfillment of the requirements for the degree of
Doctor of Philosophy degree in the Sue Golding Graduate Division of
Medical Science, Albert Einstein College of Medicine, Yeshiva University,
Bronx, N.Y.
Author Contributions
Conceived and designed the experiments: AJG AH JDN RMZO.
Performed the experiments: AJG JDN. Analyzed the data: AJG HLdMG
JDN. Contributed reagents/materials/analysis tools: AJG AH JDN
RMZO. Wrote the paper: AJG JDN RMZO.
Figure 7. Detection of M antigen during growth of yeast cells. (A) Growth of Histoplasma capsulatum in HAMF-12 medium enumerated byhemocytometer and viability of G217B yeast cells determined by propidium iodine and CFU plating. (B) LDH activity in supernatant of culture andcytoplasm fractions of yeast cells during growth in the same conditions. Results show the average of three independent experiments. (C) Detection ofM antigen in the supernatant during growth in culture by immunoblot using mAb 8H2.doi:10.1371/journal.pone.0003449.g007
wall/membrane yeast extract. Lines 1, 2 and 3– mAbs 8H2, 6F12 and 7C7 against the M antigen, Line 4 – Irrelevant immunoglobulin as a negativecontrol. (G) Co-immunoprecipitation of M antigen from the cell wall/membrane extracts using mAb 6F12 showing a reduction of the catalase activityof this fraction comparing to the PBS and isotype control.doi:10.1371/journal.pone.0003449.g006
M Antigen
PLoS ONE | www.plosone.org 15 October 2008 | Volume 3 | Issue 10 | e3449
References
1. Guimaraes AJ, Nosanchuk JD, Zancope-Oliveira RM (2006) Diagnosis ofHistoplasmosis. Brazilian Journal of Microbiology 37: 1–13.
2. Maresca B, Kobayashi GS (1989) Dimorphism in Histoplasma capsulatum: a model for
the study of cell differentiation in pathogenic fungi. Microbiol Rev 53: 186–209.
3. Medoff G, Kobayashi GS, Painter A, Travis S (1987) Morphogenesis and
pathogenicity of Histoplasma capsulatum. Infect Immun 55: 1355–1358.
4. Eissenberg LG, Goldman WE (1991) Histoplasma variation and adaptivestrategies for parasitism: new perspectives on histoplasmosis. Clin Microbiol
Rev 4: 411–421.
5. Johnson CH, Klotz MG, York JL, Kruft V, McEwen JE (2002) Redundancy,phylogeny and differential expression of Histoplasma capsulatum catalases.
Microbiology 148: 1129–1142.
6. Klotz MG, Klassen GR, Loewen PC (1997) Phylogenetic relationships amongprokaryotic and eukaryotic catalases. Mol Biol Evol 14: 951–958.
7. Chelikani P, Fita I, Loewen PC (2004) Diversity of structures and properties
among catalases. Cell Mol Life Sci 61: 192–208.
8. Bai Z, Harvey LM, McNeil B (2003) Oxidative stress in submerged cultures offungi. Critical Reviews in Biotechnology 23: 267–302.
9. Paris S, Wysong D, Debeaupuis JP, Shibuya K, Philippe B, et al. (2003)
Catalases of Aspergillus fumigatus. Infect Immun 71: 3551–3562.
10. Moreira SF, Bailao AM, Barbosa MS, Jesuino RS, Felipe MS, et al. (2004)
Monofunctional catalase P of Paracoccidioides brasiliensis: identification, character-
ization, molecular cloning and expression analysis. Yeast 21: 173–182.
11. Izawa S, Inoue Y, Kimura A (1996) Importance of catalase in the adaptive
response to hydrogen peroxide: analysis of acatalasaemic Saccharomyces cerevisiae.
Biochem J 320(Pt 1): 61–67.
12. Nakagawa Y, Kanbe T, Mizuguchi I (2003) Disruption of the human pathogenic
yeast Candida albicans catalase gene decreases survival in mouse-model infection
and elevates susceptibility to higher temperature and to detergents. MicrobiolImmunol 47: 395–403.
13. Pongpom P, Cooper CR Jr, Vanittanakom N (2005) Isolation and character-
ization of a catalase-peroxidase gene from the pathogenic fungus, Penicillium
marneffei. Med Mycol 43: 403–411.
14. Skamnioti P, Henderson C, Zhang Z, Robinson Z, Gurr SJ (2007) A novel role
for catalase B in the maintenance of fungal cell-wall integrity during hostinvasion in the rice blast fungus Magnaporthe grisea. Mol Plant Microbe Interact
20: 568–580.
15. Zancope-Oliveira RM, Reiss E, Lott TJ, Mayer LW, Deepe GS Jr (1999)Molecular cloning, characterization, and expression of the M antigen of
Histoplasma capsulatum. Infect Immun 67: 1947–1953.
16. Deepe GS Jr (1994) The immune response to Histoplasma capsulatum: unearthingits secrets. J Lab Clin Med 123: 201–205.
17. Deepe GS Jr, Durose GG (1995) Immunobiological activity of recombinant H
antigen from Histoplasma capsulatum. Infect Immun 63: 3151–3157.
18. Hamilton AJ (1998) Serodiagnosis of histoplasmosis, paracoccidioidomycosis and
penicilliosis marneffei; current status and future trends. Med Mycol 36: 351–364.
19. Hamilton AJ, Bartholomew MA, Figueroa J, Fenelon LE, Hay RJ (1990)Evidence that the M antigen of Histoplasma capsulatum var. capsulatum is a catalase
which exhibits cross-reactivity with other dimorphic fungi. J Med Vet Mycol 28:479–485.
20. DiSalvo AF, Sekhon AS, Land GA, Fleming WH (1980) Evaluation of the
exoantigen test for identification of Histoplasma species and Coccidioides immitis
cultures. J Clin Microbiol 11: 238–241.
21. Standard PG, Kaufman L (1976) Specific immunological test for the rapid
identification of members of the genus Histoplasma. J Clin Microbiol 3: 191–199.
22. Pizzini CV, Zancope-Oliveira RM, Reiss E, Hajjeh R, Kaufman L, et al. (1999)Evaluation of a western blot test in an outbreak of acute pulmonary
histoplasmosis. Clin Diagn Lab Immunol 6: 20–23.
23. Guimaraes AJ, Pizzini CV, Santoro DO, Albuquerque PC, Pimenta MA, et al.(2005) Evaluation of Enzyme Linked Immunosorbent Assay (ELISA) for
Antibody Response in the Clinical Forms of Histoplasmosis, abstr. F-017, p049 Abstr 105th Gen Meet Am Soc Microbiol American Society for
Microbiology, Washington, DC:.
24. Zancope-Oliveira RM, Bragg SL, Hurst SF, Peralta JM, Reiss E (1993)Evaluation of cation exchange chromatography for the isolation of M
glycoprotein from histoplasmin. J Med Vet Mycol 31: 29–41.
25. Zancope-Oliveira RM, Bragg SL, Reiss E, Peralta JM (1994) Immunochemicalanalysis of the H and M glycoproteins from Histoplasma capsulatum. Clin Diagn
Lab Immunol 1: 563–568.
26. Zancope-Oliveira RM, Bragg SL, Reiss E, Wanke B, Peralta JM (1994) Effectsof histoplasmin M antigen chemical and enzymatic deglycosylation on cross-
reactivity in the enzyme-linked immunoelectrotransfer blot method. Clin Diagn
Lab Immunol 1: 390–393.
27. Reiss E, Obayashi T, Orle K, Yoshida M, Zancope-Oliveira RM (2000) Non-
culture based diagnostic tests for mycotic infections. Med Mycol 38: 147–159.
28. Guedes HL, Guimaraes AJ, Muniz Mde M, Pizzini CV, Hamilton AJ, et al.(2003) PCR assay for identification of Histoplasma capsulatum based on the
nucleotide sequence of the M antigen. J Clin Microbiol 41: 535–539.
29. Allendoerfer R, Biovin GP, Deepe GS Jr (1997) Modulation of immuneresponses in murine pulmonary histoplasmosis. J Infect Dis 175: 905–914.
30. Fava Netto C (1955) Estudos quantitativos sobre a fixacao do complemento na
blastomicose sul-americana com antigeno polissacaridico. Arq Cir Clin Exp 18:197–253.
31. Scott EN, Muchmore HG (1989) Immunoblot analysis of antibody responses to
Sporothrix schenckii. J Clin Microbiol 27: 300–304.
32. Sestero CM, Scalarone GM (2006) Detection of IgG and IgM in sera fromcanines with blastomycosis using eight Blastomyces dermatitidis yeast phase lysate
antigens. Mycopathologia 162: 33–37.
33. Guimaraes AJ, Pizzini CV, De Matos Guedes HL, Albuquerque PC, Peralta JM,et al. (2004) ELISA for early diagnosis of histoplasmosis. J Med Microbiol 53:
509–514.
34. Wheat J, French ML, Kamel S, Tewari RP (1986) Evaluation of cross-reactionsin Histoplasma capsulatum serologic tests. J Clin Microbiol 23: 493–499.
35. Hamilton AJ, Bartholomew MA, Fenelon L, Figueroa J, Hay RJ (1990)
Preparation of monoclonal antibodies that differentiate between Histoplasma
capsulatum variant capsulatum and H. capsulatum variant duboisii. Trans R Soc TropMed Hyg 84: 425–428.
36. Hamilton AJ, Bartholomew MA, Fenelon LE, Figueroa J, Hay RJ (1990) A
murine monoclonal antibody exhibiting high species specificity for Histoplasma
capsulatum var. capsulatum. J Gen Microbiol 136: 331–335.
37. Gomez FJ, Gomez AM, Deepe GS Jr (1991) Protective efficacy of a 62-
kilodalton antigen, HIS-62, from the cell wall and cell membrane of Histoplasma
capsulatum yeast cells. Infect Immun 59: 4459–4464.
38. Bradford MM (1976) A rapid and sensitive method for the quantitation of
microgram quantities of protein utilizing the principle of protein-dye binding.Anal Biochem 72: 248–254.
39. Murshudov G, Borovik A, Grebenko A, Barynin V, Vagin A, et al. (2006) The
structure of Penicillium vitale catalase: resting state, oxidised state (compound I)and complex with aminotriazole. PDB Data Bank doi:102210/pdb2iuf/pdb.
40. Mate MJ, Sevinc MS, Hu B, Bujons J, Bravo J, et al. (1999) Mutants that alter
the covalent structure of catalase hydroperoxidase II from Escherichia coli.JBiolChem 274: 27717–27725.
41. Kumar S, Nei M, Dudley J, Tamura K (2008) MEGA: A biologist-centric
software for evolutionary analysis of DNA and protein sequences. BriefBioinform.
42. Guex N, Peitsch MC (1997) SWISS-MODEL and the Swiss-PdbViewer: an
environment for comparative protein modeling. Electrophoresis 18: 2714–2723.
43. Laskowski RA, MacArthur MW, Moss DS, Thornton JM (1993) PROCHECK:a program to check the stereochemical quality of protein structures. J Appl Cryst
26: 283–291.
44. Casadevall A, Mukherjee J, Scharff MD (1992) Monoclonal antibody basedELISAs for cryptococcal polysaccharide. J Immunol Methods 154: 27–35.
45. Li Y, Schellhorn HE (2007) Rapid kinetic microassay for catalase activity.
J Biomol Tech 18: 185–187.
46. Calera JA, Paris S, Monod M, Hamilton AJ, Debeaupuis JP, et al. (1997)Cloning and disruption of the antigenic catalase gene of Aspergillus fumigatus.
Infect Immun 65: 4718–4724.
47. Kim JA, Sha Z, Mayfield JE (2000) Regulation of Brucella abortus catalase.Infect Immun 68: 3861–3866.
48. Kaufman L, Standard P, Padhye AA (1983) Exoantigen tests for the
immunoidentification of fungal cultures. Mycopathologia 82: 3–12.
49. Kaufman L, Standard PG (1987) Specific and rapid identification of medicallyimportant fungi by exoantigen detection. Annu Rev Microbiol 41: 209–225.
50. Zamocky M, Koller F (1999) Undertanding the structure and function of
catalases: clues from molecular evolution and in vitro mutagenesis. Progress inBiophisics and Molecular Biology 72: 19–66.
51. Gautman DK, Misro MM, Chaki SP, Sehgal N (2005) H2O2 at physiological
concentration modulates Leydig cell function inducing oxidative stress andapoptosis. Apoptosis 11: 39–46.
52. Bleau G, Giasson C, Brunette I (1998) Measurement of hydrogen peroxide in
biological samples containing high levels of ascorbic acid. Anal Biochem 263:
13–17.53. Howard DH (1983) Studies on the catalase of Histoplasma capsulatum. Infect
Immun 39: 1161–1166.
54. Albuquerque PC, Nakayasu ES, Rodrigues ML, Frases S, Casadevall A, et al.(2008) Vesicular transport in Histoplasma capsulatum: an effective mechanism
for trans-cell wall transfer of proteins and lipids in ascomycetes. Cell Microbiol
10: 1695–1710.
55. Sels AA, Brygier J (1980) Inhibition studies in situ of yeast catalases.Eur J Biochem 112: 283–291.
56. Garre V, Tenberge KB, Eising R (1998) Secretion of a Fungal Extracellular
Catalase by Claviceps purpurea During Infection of Rye: Putative Role inPathogenicity and Suppression of Host Defense. Biochemistry and Cell Biology
88: 744–753.
57. Albuquerque PC, Pizzini CV, Guimaraes AJ, Peralta JM, Hamilton AJ, et al.(2003) Immunolocalization of M antigen of Histoplasma capsulatum, abstr. MI-095,
p 086 Abstr Anais do XXII Congresso Brasileiro de Microbiologia XXIICongresso Brasileiro de Microbiologia, Florianopolis, Brazil.
58. Rementeria A, Lopez-Molina N, Ludwig A, Vivanco AB, Bikandi J, et al. (2005)
Genes and molecules involved in Aspergillus fumigatus virulence. Rev IberoamMicol 22: 1–23.
M Antigen
PLoS ONE | www.plosone.org 16 October 2008 | Volume 3 | Issue 10 | e3449
59. Kaufman L (1992) Laboratory methods for the diagnosis and confirmation of
systemic mycoses. Clin Infect Dis 14: S23–29.60. Klite PD (1965) The interpretation of agar-gel precipitin reactions in
histoplasmosis. J Lab Clin Med 66: 770–787.
61. Jameson BA, Wolf H (1988) Antigenic Index: a novel algorithm for predictingantigenic determinants. Comp Appl Biosci 4: 181–186.
62. Gomez BL, Figueroa JI, Hamilton AJ, Ortiz BL, Robledo MA, et al. (1997)
Development of a novel antigen detection test for histoplasmosis. J ClinMicrobiol 35: 2618–2622.
63. Nosanchuk JD, Steenbergen JN, Shi L, Deepe GSJ, Casadevall A (2003)
Antibodies to a cell surface histone-like protein protect against Histoplasma
capsulatum. J Clin Invest 112: 1164–1175.
M Antigen
PLoS ONE | www.plosone.org 17 October 2008 | Volume 3 | Issue 10 | e3449