BioBits®: Protein Structure and Function - miniPCR
38
miniPCR bio TM Learning Lab TM BioBits®: Protein Structure and Function miniPCR bio TM Learning Lab TM BioBits ® : Protein Structure and Function Instructor’s and Student’s Guide Version: 1.1 Release: March 2021 © 2021 by miniPCR bio™
-
Upload
khangminh22 -
Category
Documents
-
view
1 -
download
0
Transcript of BioBits®: Protein Structure and Function - miniPCR
miniPCR bioTM Learning LabTM
BioBits®: Protein Structureand Function
miniPCR bioTM Learning LabTM
BioBits®: Protein Structure and Function
Instructor’s and Student’s Guide
Version: 1.1
Release: March 2021
© 2021 by miniPCR bio™

miniPCR bio Learning LabsTM. BioBits®: Protein Structure and Function Student’s Guide
Version: 1.1 - Release: March 2021 - © 2021 by miniPCR bio™
Student’s Guide
P./2
Background information P.07
Today’s lab P.11
Pre-laboratory activity P.12
Laboratory guide P.21
Study questions P.26
CER table P.33
Extension: Making biology brighter P.36
Student’s Guide Contents
miniPCR bio Learning LabsTM. BioBits®: Protein Structure and Function Student’s Guide
Version: 1.1 - Release: March 2021 - © 2021 by miniPCR bio™
Student’s Guide
P./3
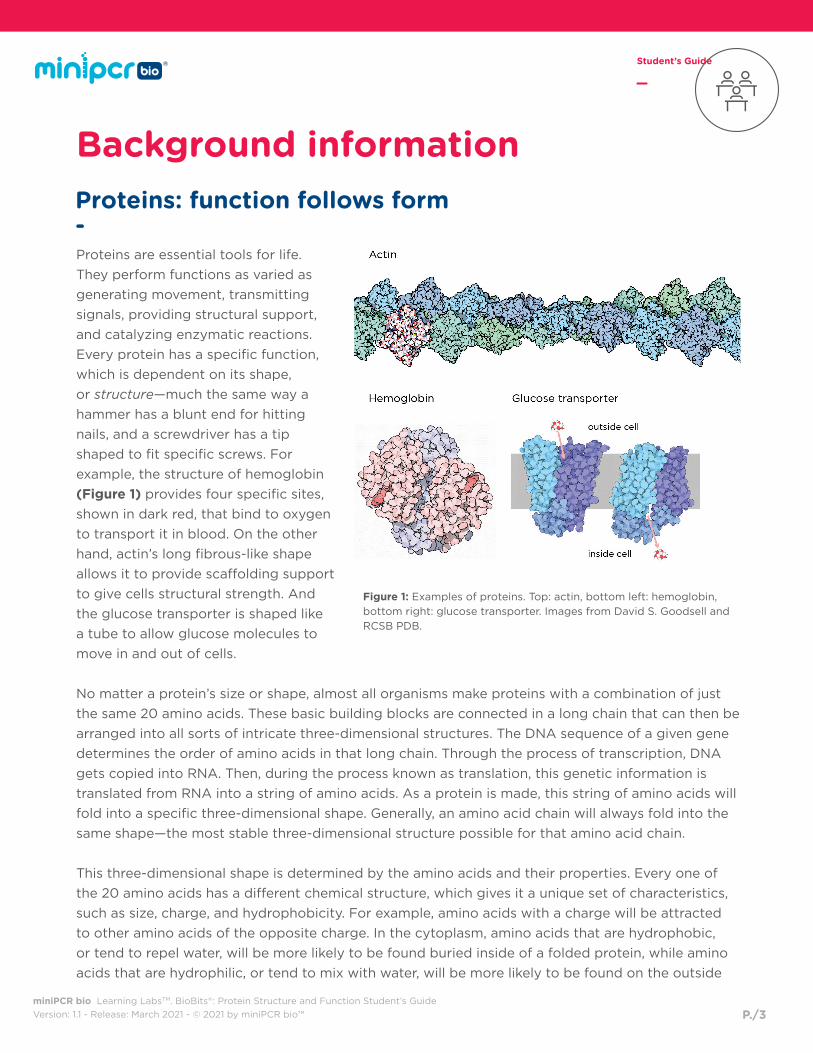
Background information Proteins: function follows form-Proteins are essential tools for life.
They perform functions as varied as
generating movement, transmitting
signals, providing structural support,
and catalyzing enzymatic reactions.
Every protein has a specific function,
which is dependent on its shape,
or structure—much the same way a
hammer has a blunt end for hitting
nails, and a screwdriver has a tip
shaped to fit specific screws. For
example, the structure of hemoglobin
(Figure 1) provides four specific sites,
shown in dark red, that bind to oxygen
to transport it in blood. On the other
hand, actin’s long fibrous-like shape
allows it to provide scaffolding support
to give cells structural strength. And
the glucose transporter is shaped like
a tube to allow glucose molecules to
move in and out of cells.
No matter a protein’s size or shape, almost all organisms make proteins with a combination of just
the same 20 amino acids. These basic building blocks are connected in a long chain that can then be
arranged into all sorts of intricate three-dimensional structures. The DNA sequence of a given gene
determines the order of amino acids in that long chain. Through the process of transcription, DNA
gets copied into RNA. Then, during the process known as translation, this genetic information is
translated from RNA into a string of amino acids. As a protein is made, this string of amino acids will
fold into a specific three-dimensional shape. Generally, an amino acid chain will always fold into the
same shape—the most stable three-dimensional structure possible for that amino acid chain.
This three-dimensional shape is determined by the amino acids and their properties. Every one of
the 20 amino acids has a different chemical structure, which gives it a unique set of characteristics,
such as size, charge, and hydrophobicity. For example, amino acids with a charge will be attracted
to other amino acids of the opposite charge. In the cytoplasm, amino acids that are hydrophobic,
or tend to repel water, will be more likely to be found buried inside of a folded protein, while amino
acids that are hydrophilic, or tend to mix with water, will be more likely to be found on the outside
Figure 1: Examples of proteins. Top: actin, bottom left: hemoglobin, bottom right: glucose transporter. Images from David S. Goodsell and RCSB PDB.
miniPCR bio Learning LabsTM. BioBits®: Protein Structure and Function Student’s Guide
Version: 1.1 - Release: March 2021 - © 2021 by miniPCR bio™
Student’s Guide
P./4
amino acidsPrimary Structure: Tertiary Structure:
beta-sheet
Secondary Structure:
alpha helix
of the folded protein. The size of an amino acid will also play into how it fits and interacts with other
amino acids in the protein.
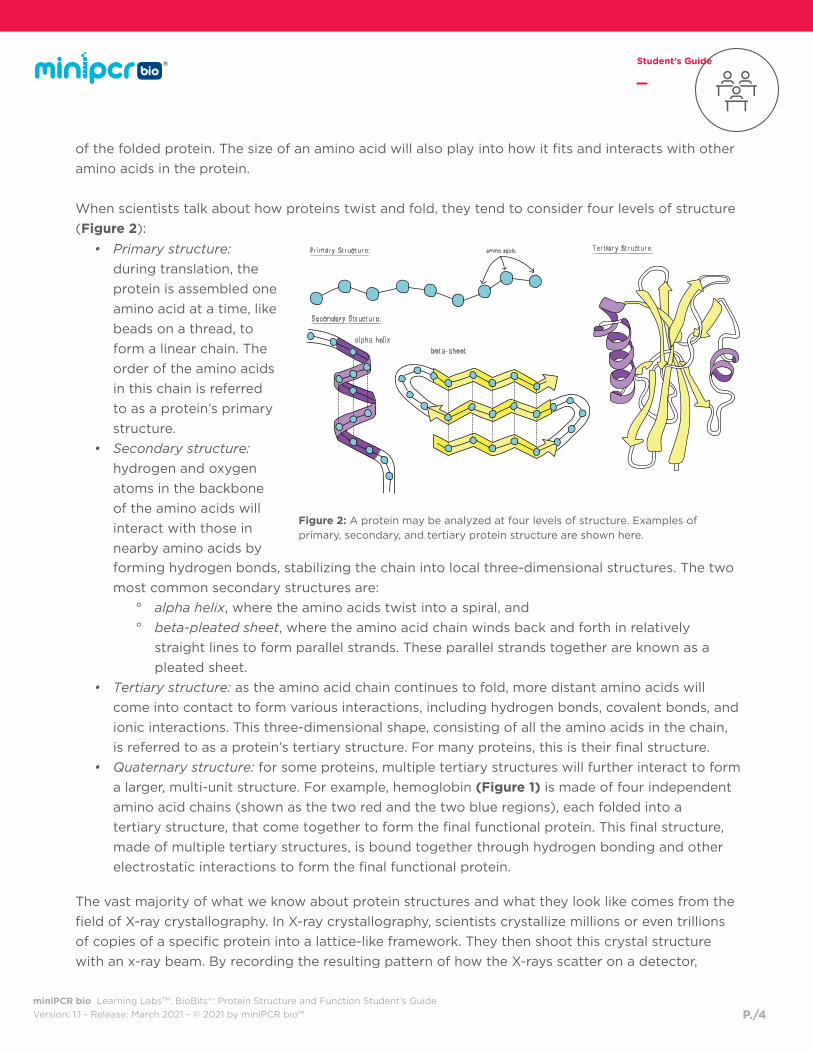
When scientists talk about how proteins twist and fold, they tend to consider four levels of structure
(Figure 2):
Figure 2: A protein may be analyzed at four levels of structure. Examples of primary, secondary, and tertiary protein structure are shown here.
forming hydrogen bonds, stabilizing the chain into local three-dimensional structures. The two
most common secondary structures are:
° alpha helix, where the amino acids twist into a spiral, and
° beta-pleated sheet, where the amino acid chain winds back and forth in relatively
straight lines to form parallel strands. These parallel strands together are known as a
pleated sheet.
• Tertiary structure: as the amino acid chain continues to fold, more distant amino acids will
come into contact to form various interactions, including hydrogen bonds, covalent bonds, and
ionic interactions. This three-dimensional shape, consisting of all the amino acids in the chain,
is referred to as a protein’s tertiary structure. For many proteins, this is their final structure.
• Quaternary structure: for some proteins, multiple tertiary structures will further interact to form
a larger, multi-unit structure. For example, hemoglobin (Figure 1) is made of four independent
amino acid chains (shown as the two red and the two blue regions), each folded into a
tertiary structure, that come together to form the final functional protein. This final structure,
made of multiple tertiary structures, is bound together through hydrogen bonding and other
electrostatic interactions to form the final functional protein.
The vast majority of what we know about protein structures and what they look like comes from the
field of X-ray crystallography. In X-ray crystallography, scientists crystallize millions or even trillions
of copies of a specific protein into a lattice-like framework. They then shoot this crystal structure
with an x-ray beam. By recording the resulting pattern of how the X-rays scatter on a detector,
• Primary structure:
during translation, the
protein is assembled one
amino acid at a time, like
beads on a thread, to
form a linear chain. The
order of the amino acids
in this chain is referred
to as a protein’s primary
structure.
• Secondary structure:
hydrogen and oxygen
atoms in the backbone
of the amino acids will
interact with those in
nearby amino acids by
miniPCR bio Learning LabsTM. BioBits®: Protein Structure and Function Student’s Guide
Version: 1.1 - Release: March 2021 - © 2021 by miniPCR bio™
Student’s Guide
P./5
scientists can deduce the precise atomic structure of the protein. Essentially, the X-rays are used to
make very fine shadows of the protein, so that by analyzing these fine shadows, we can deduce the
architecture of the protein—down to the level of single atoms. All the structures shown in this guide
are based on data collected using X-ray crystallography.
Using what we know to design new proteins-Proteins perform all sorts of important functions, and many of these functions have been harnessed
by scientists for applied uses in industry. For example, certain enzymes have been used for
decades in laundry detergents to make the detergent effective even in cold water. Yet, for all their
varied shapes and functions, proteins that already exist in nature can only perform a limited set
of functions. Now, imagine a world where scientists could design a protein to do exactly what
they wanted—an enzyme that could catalyze chemical reactions to produce biofuels or one that
could capture the excess of carbon dioxide in the atmosphere to combat global warming. Imagine
designing an antibody that specifically targeted cancerous cells or an antigen that could be used
in a vaccine against an emerging new virus. You’ve just entered the field of protein engineering,
where the eventual goal is to improve existing protein structures to carry out specific functions more
efficiently or new structures that are not currently found in nature.
To create these new or improved functions, scientists will either 1) change some of the amino acids
in a protein of known structure or, 2) select new structures with the desired function from a pool of
randomly generated ones. We’ll focus on the first approach, termed ‘rational design’.
Protein engineers often select a protein that functions similarly to their target function, giving them
a significant head start in designing a protein that meets their criteria. They can then make educated
guesses on how to modify it. This is similar to how a chef may use an old recipe as a starting point
when creating a new dish. The key is to remember that function follows form. For example, if we
want to create an enzyme to bind and interact with a specific substrate, we will need to design the
enzyme’s shape such that its three-dimensional structure perfectly fits the substrate. The catch is
that we cannot directly modify a protein’s tertiary structure. We can only directly modify the primary
structure—that is, the amino acid sequence.
When substituting amino acids to design a new protein, it is important to consider the chemical
properties of amino acids. Changing an amino acid into one that has different properties can
drastically change the way the protein folds and functions. Because there are many different
possible interactions between the amino acids within a protein sequence, correctly predicting a
protein’s structure is extremely complicated. To help determine what kind of impact amino acid
substitutions may actually have, scientists can create computational models that aim to predict how
a newly designed protein sequence will fold and what its final three-dimensional shape will be.
miniPCR bio Learning LabsTM. BioBits®: Protein Structure and Function Student’s Guide
Version: 1.1 - Release: March 2021 - © 2021 by miniPCR bio™
Student’s Guide
P./6
Starting in the 1990s, as computers became more and more powerful, protein engineers began
to make progress in analyzing amino acid interactions and predicting how proteins will fold. Recent
advancements in artificial intelligence have made remarkable strides in this field, demonstrating the
ability to predict many protein structures and opening up exciting possibilities in protein engineering
that weren’t achievable before. But still, even with the current computing power, not every protein
structure can be modeled. And even if the structure can be predicted, sometimes small changes in
structure can have unexpectedly large effects on a protein’s precise function. Actual experiments are
still needed to confirm the predictions made by computers.
At the end of the day, a protein engineer’s job often involves at least as much tinkering as it does
rational design—once we find out where the functionally important amino acids reside within a
protein’s structure, we can modify them through trial and error to obtain new and exciting functions.
miniPCR bio Learning LabsTM. BioBits®: Protein Structure and Function Student’s Guide
Version: 1.1 - Release: March 2021 - © 2021 by miniPCR bio™
Student’s Guide
P./7
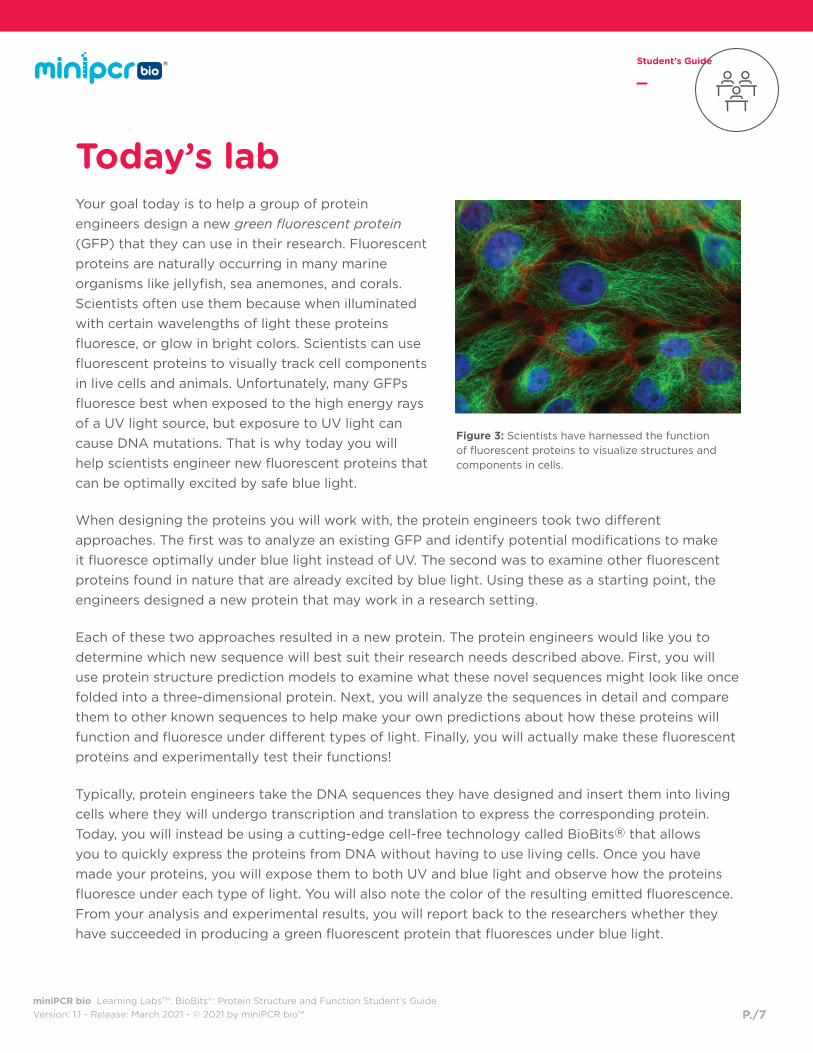
Today’s labYour goal today is to help a group of protein
engineers design a new green fluorescent protein
(GFP) that they can use in their research. Fluorescent
proteins are naturally occurring in many marine
organisms like jellyfish, sea anemones, and corals.
Scientists often use them because when illuminated
with certain wavelengths of light these proteins
fluoresce, or glow in bright colors. Scientists can use
fluorescent proteins to visually track cell components
in live cells and animals. Unfortunately, many GFPs
fluoresce best when exposed to the high energy rays
of a UV light source, but exposure to UV light can
cause DNA mutations. That is why today you will
help scientists engineer new fluorescent proteins that
can be optimally excited by safe blue light.
Figure 3: Scientists have harnessed the function of fluorescent proteins to visualize structures and components in cells.
When designing the proteins you will work with, the protein engineers took two different
approaches. The first was to analyze an existing GFP and identify potential modifications to make
it fluoresce optimally under blue light instead of UV. The second was to examine other fluorescent
proteins found in nature that are already excited by blue light. Using these as a starting point, the
engineers designed a new protein that may work in a research setting.
Each of these two approaches resulted in a new protein. The protein engineers would like you to
determine which new sequence will best suit their research needs described above. First, you will
use protein structure prediction models to examine what these novel sequences might look like once
folded into a three-dimensional protein. Next, you will analyze the sequences in detail and compare
them to other known sequences to help make your own predictions about how these proteins will
function and fluoresce under different types of light. Finally, you will actually make these fluorescent
proteins and experimentally test their functions!
Typically, protein engineers take the DNA sequences they have designed and insert them into living
cells where they will undergo transcription and translation to express the corresponding protein.
Today, you will instead be using a cutting-edge cell-free technology called BioBits® that allows
you to quickly express the proteins from DNA without having to use living cells. Once you have
made your proteins, you will expose them to both UV and blue light and observe how the proteins
fluoresce under each type of light. You will also note the color of the resulting emitted fluorescence.
From your analysis and experimental results, you will report back to the researchers whether they
have succeeded in producing a green fluorescent protein that fluoresces under blue light.
miniPCR bio Learning LabsTM. BioBits®: Protein Structure and Function Student’s Guide
Version: 1.1 - Release: March 2021 - © 2021 by miniPCR bio™
Student’s Guide
P./8
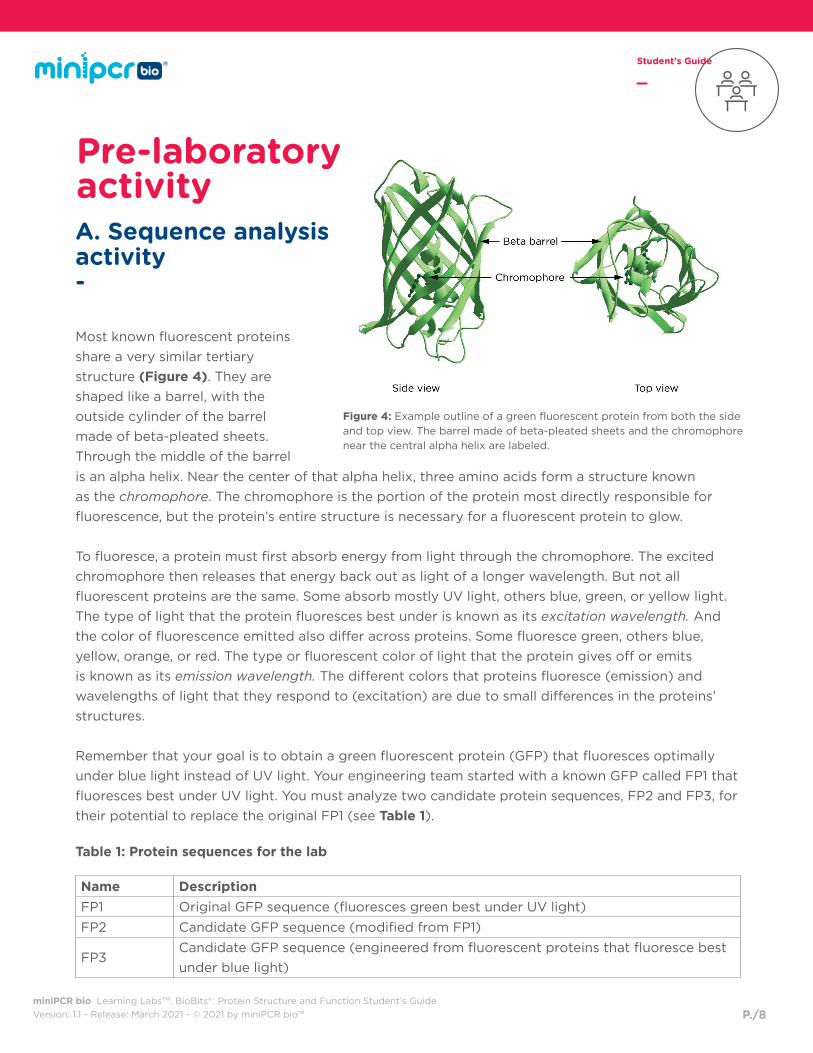
Most known fluorescent proteins
share a very similar tertiary
structure (Figure 4). They are
shaped like a barrel, with the
outside cylinder of the barrel
made of beta-pleated sheets.
Through the middle of the barrel
Figure 4: Example outline of a green fluorescent protein from both the side and top view. The barrel made of beta-pleated sheets and the chromophore near the central alpha helix are labeled.
is an alpha helix. Near the center of that alpha helix, three amino acids form a structure known
as the chromophore. The chromophore is the portion of the protein most directly responsible for
fluorescence, but the protein’s entire structure is necessary for a fluorescent protein to glow.
To fluoresce, a protein must first absorb energy from light through the chromophore. The excited
chromophore then releases that energy back out as light of a longer wavelength. But not all
fluorescent proteins are the same. Some absorb mostly UV light, others blue, green, or yellow light.
The type of light that the protein fluoresces best under is known as its excitation wavelength. And
the color of fluorescence emitted also differ across proteins. Some fluoresce green, others blue,
yellow, orange, or red. The type or fluorescent color of light that the protein gives off or emits
is known as its emission wavelength. The different colors that proteins fluoresce (emission) and
wavelengths of light that they respond to (excitation) are due to small differences in the proteins’
structures.
Remember that your goal is to obtain a green fluorescent protein (GFP) that fluoresces optimally
under blue light instead of UV light. Your engineering team started with a known GFP called FP1 that
fluoresces best under UV light. You must analyze two candidate protein sequences, FP2 and FP3, for
their potential to replace the original FP1 (see Table 1).
Table 1: Protein sequences for the lab
Name DescriptionFP1 Original GFP sequence (fluoresces green best under UV light)
FP2 Candidate GFP sequence (modified from FP1)
FP3Candidate GFP sequence (engineered from fluorescent proteins that fluoresce best
under blue light)
Pre-laboratoryactivityA. Sequence analysisactivity-
miniPCR bio Learning LabsTM. BioBits®: Protein Structure and Function Student’s Guide
Version: 1.1 - Release: March 2021 - © 2021 by miniPCR bio™
Student’s Guide
P./9
You will analyze the proteins’ primary, secondary and tertiary structures, and then, you will perform
a detailed analysis of the amino acids in the chromophore region. From your analysis, you must
predict which protein will best meet the engineering team’s goal. You will then test your predictions
experimentally by producing these proteins in BioBits® cell-free reactions.
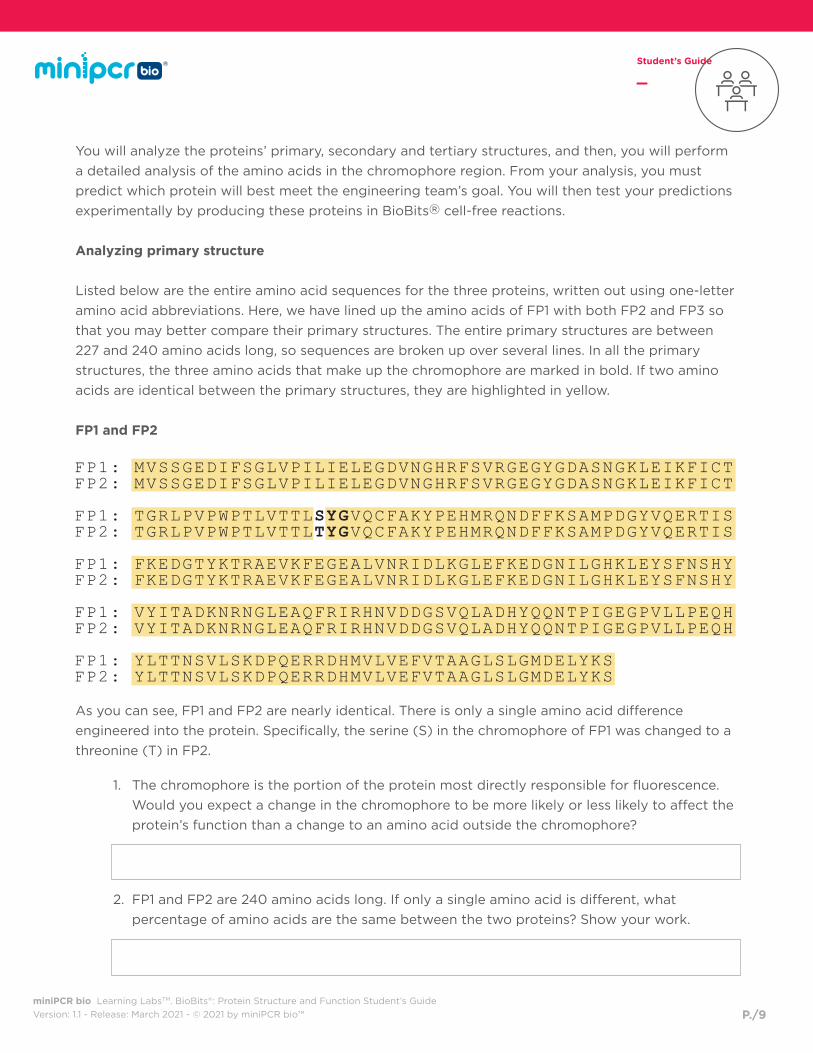
Analyzing primary structure
Listed below are the entire amino acid sequences for the three proteins, written out using one-letter
amino acid abbreviations. Here, we have lined up the amino acids of FP1 with both FP2 and FP3 so
that you may better compare their primary structures. The entire primary structures are between
227 and 240 amino acids long, so sequences are broken up over several lines. In all the primary
structures, the three amino acids that make up the chromophore are marked in bold. If two amino
acids are identical between the primary structures, they are highlighted in yellow.
FP1 and FP2
As you can see, FP1 and FP2 are nearly identical. There is only a single amino acid difference
engineered into the protein. Specifically, the serine (S) in the chromophore of FP1 was changed to a
threonine (T) in FP2.
1. The chromophore is the portion of the protein most directly responsible for fluorescence.
Would you expect a change in the chromophore to be more likely or less likely to affect the
protein’s function than a change to an amino acid outside the chromophore?
2. FP1 and FP2 are 240 amino acids long. If only a single amino acid is different, what
percentage of amino acids are the same between the two proteins? Show your work.
FP1: MVSSGEDIFSGLVPILIELEGDVNGHRFSVRGEGYGDASNGKLEIKFICTFP2: MVSSGEDIFSGLVPILIELEGDVNGHRFSVRGEGYGDASNGKLEIKFICT
FP1: TGRLPVPWPTLVTTLSYGVQCFAKYPEHMRQNDFFKSAMPDGYVQERTISFP2: TGRLPVPWPTLVTTLTYGVQCFAKYPEHMRQNDFFKSAMPDGYVQERTIS
FP1: FKEDGTYKTRAEVKFEGEALVNRIDLKGLEFKEDGNILGHKLEYSFNSHYFP2: FKEDGTYKTRAEVKFEGEALVNRIDLKGLEFKEDGNILGHKLEYSFNSHY
FP1: VYITADKNRNGLEAQFRIRHNVDDGSVQLADHYQQNTPIGEGPVLLPEQHFP2: VYITADKNRNGLEAQFRIRHNVDDGSVQLADHYQQNTPIGEGPVLLPEQH
FP1: YLTTNSVLSKDPQERRDHMVLVEFVTAAGLSLGMDELYKSFP2: YLTTNSVLSKDPQERRDHMVLVEFVTAAGLSLGMDELYKS
miniPCR bio Learning LabsTM. BioBits®: Protein Structure and Function Student’s Guide
Version: 1.1 - Release: March 2021 - © 2021 by miniPCR bio™
Student’s Guide
P./10
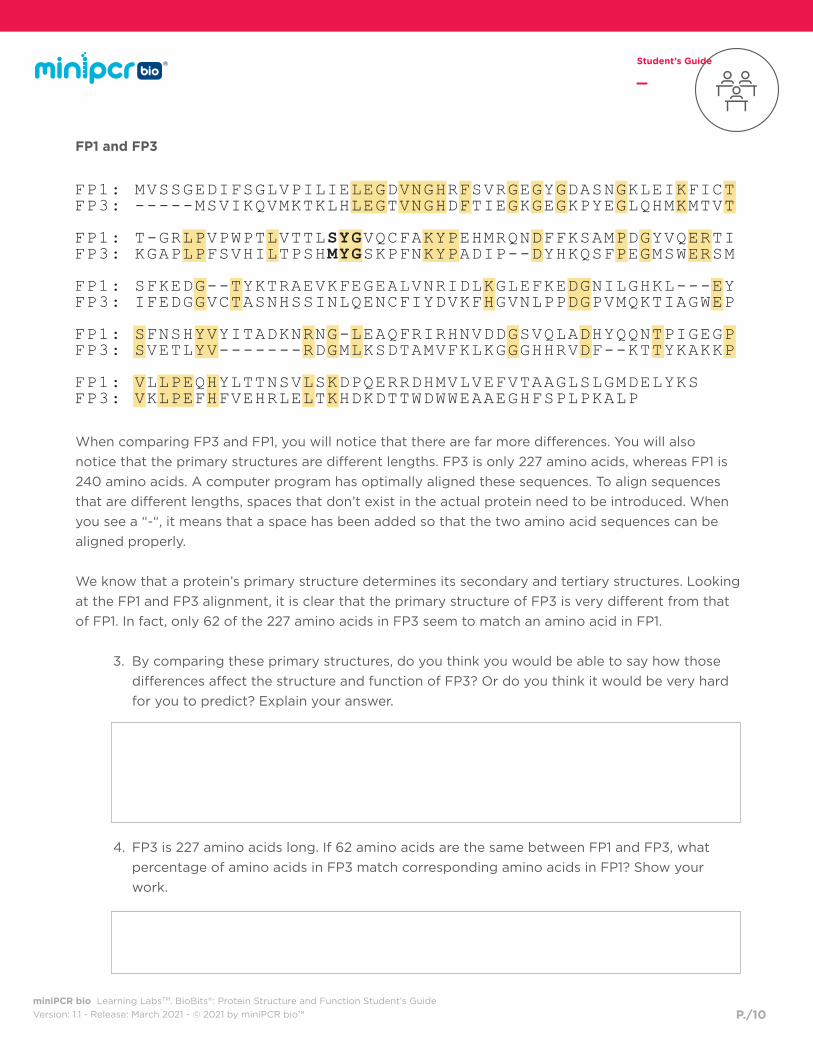
When comparing FP3 and FP1, you will notice that there are far more differences. You will also
notice that the primary structures are different lengths. FP3 is only 227 amino acids, whereas FP1 is
240 amino acids. A computer program has optimally aligned these sequences. To align sequences
that are different lengths, spaces that don’t exist in the actual protein need to be introduced. When
you see a “-“, it means that a space has been added so that the two amino acid sequences can be
aligned properly.
We know that a protein’s primary structure determines its secondary and tertiary structures. Looking
at the FP1 and FP3 alignment, it is clear that the primary structure of FP3 is very different from that
of FP1. In fact, only 62 of the 227 amino acids in FP3 seem to match an amino acid in FP1.
3. By comparing these primary structures, do you think you would be able to say how those
differences affect the structure and function of FP3? Or do you think it would be very hard
for you to predict? Explain your answer.
4. FP3 is 227 amino acids long. If 62 amino acids are the same between FP1 and FP3, what
percentage of amino acids in FP3 match corresponding amino acids in FP1? Show your
work.
FP1 and FP3
FP1: MVSSGEDIFSGLVPILIELEGDVNGHRFSVRGEGYGDASNGKLEIKFICTFP3: -----MSVIKQVMKTKLHLEGTVNGHDFTIEGKGEGKPYEGLQHMKMTVT
FP1: T-GRLPVPWPTLVTTLSYGVQCFAKYPEHMRQNDFFKSAMPDGYVQERTIFP3: KGAPLPFSVHILTPSHMYGSKPFNKYPADIP--DYHKQSFPEGMSWERSM
FP1: SFKEDG--TYKTRAEVKFEGEALVNRIDLKGLEFKEDGNILGHKL---EYFP3: IFEDGGVCTASNHSSINLQENCFIYDVKFHGVNLPPDGPVMQKTIAGWEP
FP1: SFNSHYVYITADKNRNG-LEAQFRIRHNVDDGSVQLADHYQQNTPIGEGPFP3: SVETLYV-------RDGMLKSDTAMVFKLKGGGHHRVDF--KTTYKAKKP
FP1: VLLPEQHYLTTNSVLSKDPQERRDHMVLVEFVTAAGLSLGMDELYKSFP3: VKLPEFHFVEHRLELTKHDKDTTWDWWEAAEGHFSPLPKALP
miniPCR bio Learning LabsTM. BioBits®: Protein Structure and Function Student’s Guide
Version: 1.1 - Release: March 2021 - © 2021 by miniPCR bio™
Student’s Guide
P./11
Analyzing secondary and tertiary structure
To understand how a protein will function however, we need to know something about its structure.
Predicting secondary structures based on primary structure alone can now be done quite reliably
using computers. But predicting tertiary structure from primary structure or secondary structure
alone is quite difficult and generally unreliable even with the best models.
Luckily, computer algorithms are quite good at recognizing protein sequences that are similar to
other proteins with a known structure. The computer can then predict the structure of the new
protein through comparison. This is called homology modeling.
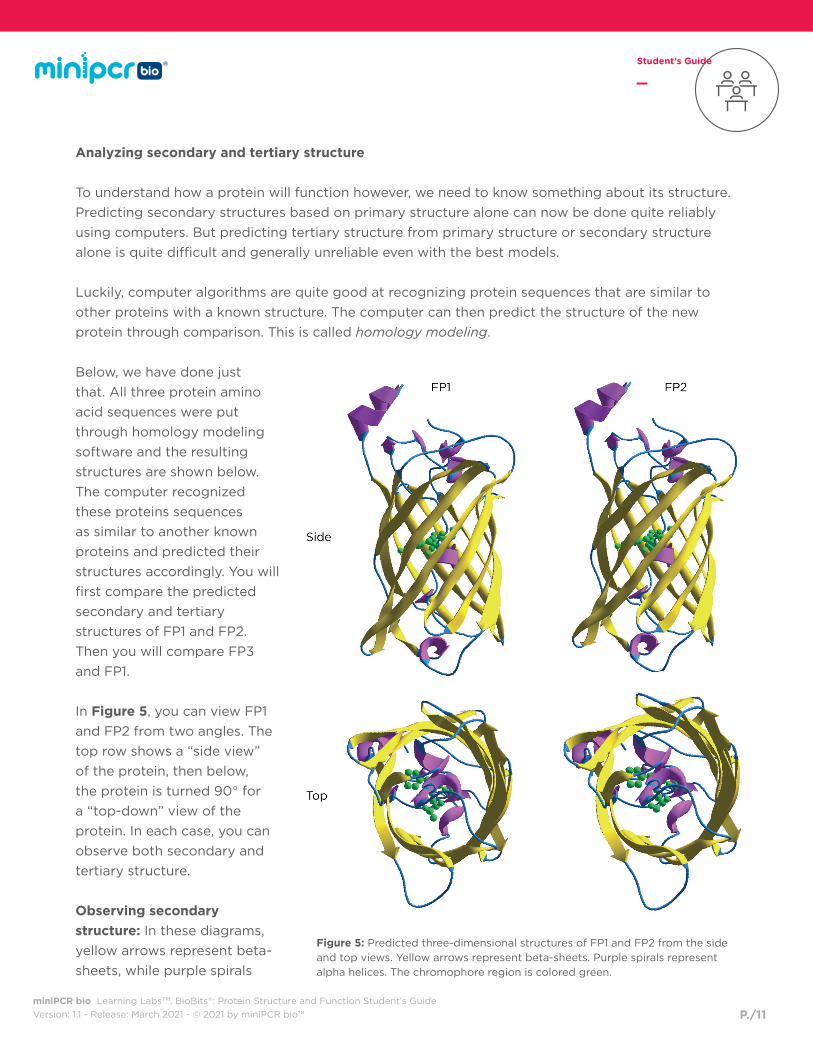
Figure 5: Predicted three-dimensional structures of FP1 and FP2 from the side and top views. Yellow arrows represent beta-sheets. Purple spirals represent alpha helices. The chromophore region is colored green.
Below, we have done just
that. All three protein amino
acid sequences were put
through homology modeling
software and the resulting
structures are shown below.
The computer recognized
these proteins sequences
as similar to another known
proteins and predicted their
structures accordingly. You will
first compare the predicted
secondary and tertiary
structures of FP1 and FP2.
Then you will compare FP3
and FP1.
In Figure 5, you can view FP1
and FP2 from two angles. The
top row shows a “side view”
of the protein, then below,
the protein is turned 90° for
a “top-down” view of the
protein. In each case, you can
observe both secondary and
tertiary structure.
Observing secondary structure: In these diagrams,
yellow arrows represent beta-
sheets, while purple spirals

miniPCR bio Learning LabsTM. BioBits®: Protein Structure and Function Student’s Guide
Version: 1.1 - Release: March 2021 - © 2021 by miniPCR bio™
Student’s Guide
P./12
depict alpha helices. Areas with no regular predicted secondary structure are depicted as blue lines.
Observing tertiary structure: The beta-sheets form the outer barrel of the protein. The alpha helices
are found through the center of the barrel and also at the top and bottom of the barrel. (Again,
regions that do not form a known secondary structure are colored blue.) Finally, the predicted
chromophore is colored green and is shown as a ball and stick model in the center of the barrel. Ball
and stick models show the arrangement of all the atoms in an amino acid.
From the similarities between other known proteins and the predicted structures, the computer
algorithm identified all three proteins as having tertiary structures consistent with fluorescent
proteins.
FP1 and FP2 show no obvious differences in their predicted secondary or tertiary structures. If you
look very closely, you may be able to see the single amino acid difference in the ball and stick model
of the chromophore.
1. Look closely at the “top-down” view. Can you identify the difference in the chromophore
region? Put a star (*) next to any differences you see between the two models.
2. Review the two proteins’ primary structures once again (page 13). After reviewing the
primary structures, does it surprise you that the tertiary structures are so similar? Why or
why not?
miniPCR bio Learning LabsTM. BioBits®: Protein Structure and Function Student’s Guide
Version: 1.1 - Release: March 2021 - © 2021 by miniPCR bio™
Student’s Guide
P./13
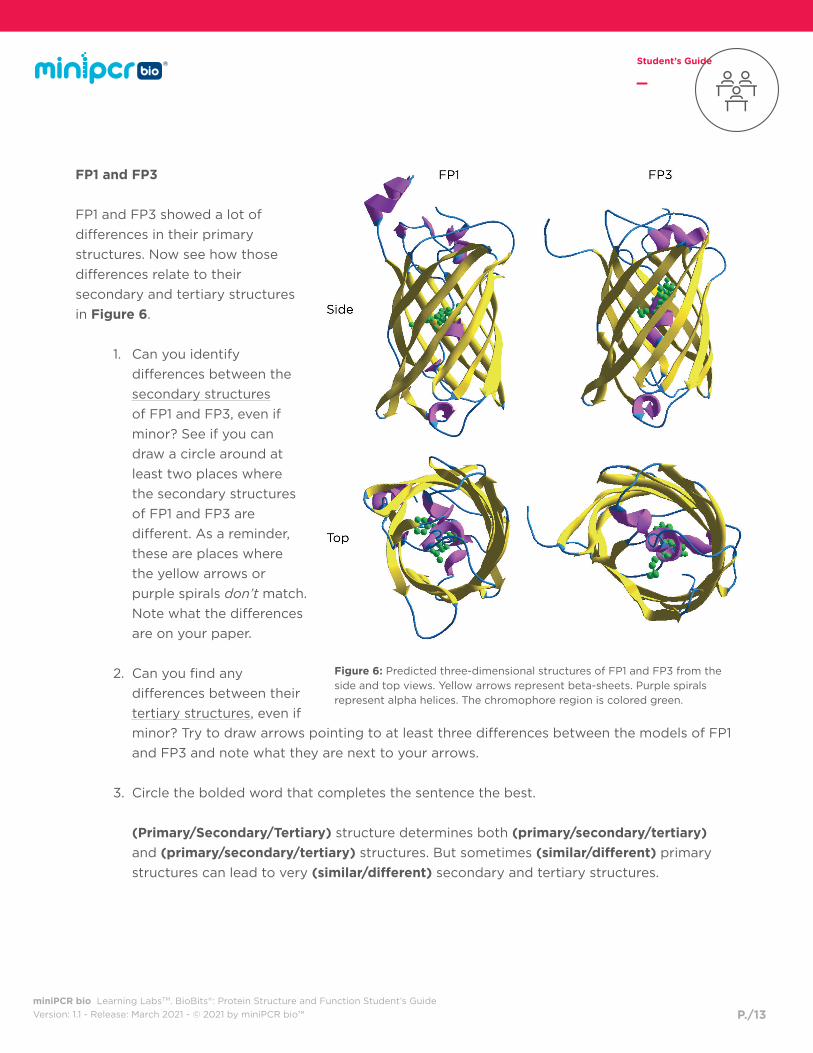
FP1 and FP3
FP1 and FP3 showed a lot of
differences in their primary
structures. Now see how those
differences relate to their
secondary and tertiary structures
in Figure 6.
1. Can you identify
differences between the
secondary structures
of FP1 and FP3, even if
minor? See if you can
draw a circle around at
least two places where
the secondary structures
of FP1 and FP3 are
different. As a reminder,
these are places where
the yellow arrows or
purple spirals don’t match.
Note what the differences
are on your paper.
2. Can you find any
differences between their
tertiary structures, even if
Figure 6: Predicted three-dimensional structures of FP1 and FP3 from the side and top views. Yellow arrows represent beta-sheets. Purple spirals represent alpha helices. The chromophore region is colored green.
minor? Try to draw arrows pointing to at least three differences between the models of FP1
and FP3 and note what they are next to your arrows.
3. Circle the bolded word that completes the sentence the best.
(Primary/Secondary/Tertiary) structure determines both (primary/secondary/tertiary) and (primary/secondary/tertiary) structures. But sometimes (similar/different) primary
structures can lead to very (similar/different) secondary and tertiary structures.
miniPCR bio Learning LabsTM. BioBits®: Protein Structure and Function Student’s Guide
Version: 1.1 - Release: March 2021 - © 2021 by miniPCR bio™
Student’s Guide
P./14
Making final predictions using homology
Looking at the predicted secondary and tertiary structures of our proteins, it is clear that we
are working with fluorescent proteins. The computer program we used to model their structures
recognized them to be most similar to other fluorescent proteins whose structures are already
known. From that, we can see that the three proteins we are analyzing have the barrel shape with a
central alpha helix common to fluorescent proteins.
To more specifically predict how each protein will function, we will focus on the region surrounding
the chromophore for clues. We will compare this 25-amino-acid section to several other known
fluorescent proteins.
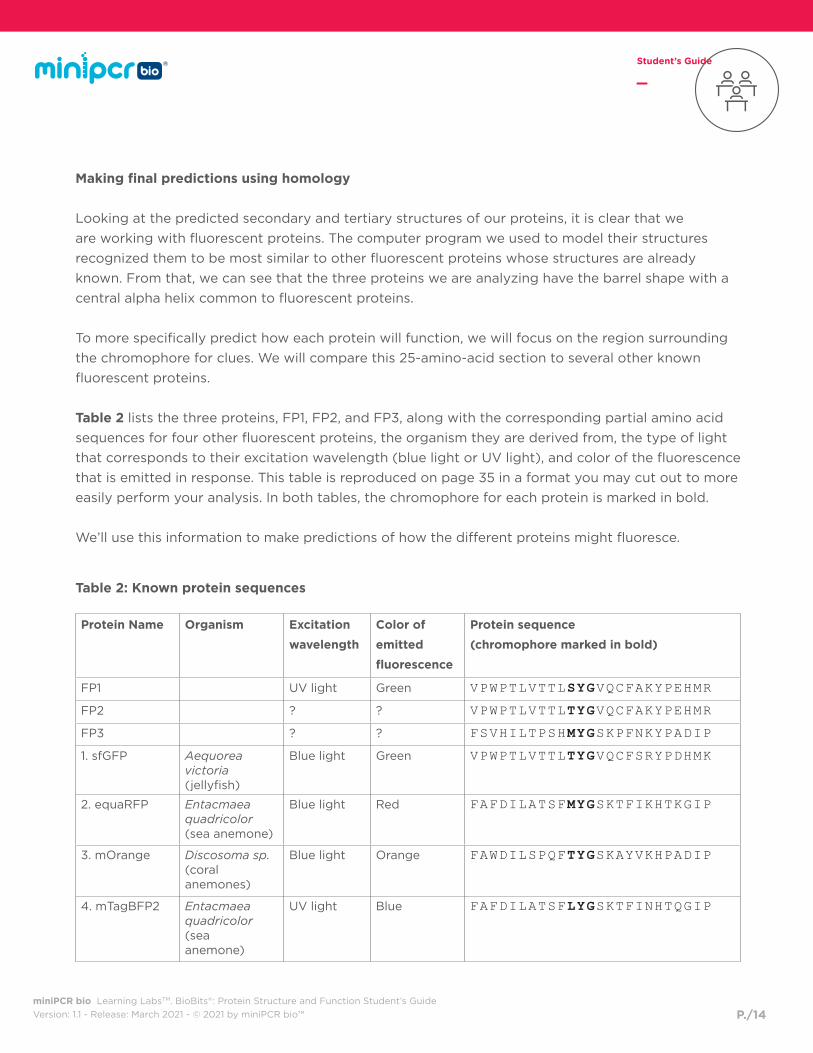
Table 2 lists the three proteins, FP1, FP2, and FP3, along with the corresponding partial amino acid
sequences for four other fluorescent proteins, the organism they are derived from, the type of light
that corresponds to their excitation wavelength (blue light or UV light), and color of the fluorescence
that is emitted in response. This table is reproduced on page 35 in a format you may cut out to more
easily perform your analysis. In both tables, the chromophore for each protein is marked in bold.
We’ll use this information to make predictions of how the different proteins might fluoresce.
Table 2: Known protein sequences
Protein Name Organism Excitation
wavelength
Color of
emitted
fluorescence
Protein sequence
(chromophore marked in bold)
FP1 UV light Green VPWPTLVTTLSYGVQCFAKYPEHMR
FP2 ? ? VPWPTLVTTLTYGVQCFAKYPEHMR
FP3 ? ? FSVHILTPSHMYGSKPFNKYPADIP
1. sfGFP Aequoreavictoria(jellyfish)
Blue light Green VPWPTLVTTLTYGVQCFSRYPDHMK
2. equaRFP Entacmaeaquadricolor(sea anemone)
Blue light Red FAFDILATSFMYGSKTFIKHTKGIP
3. mOrange Discosoma sp.(coralanemones)
Blue light Orange FAWDILSPQFTYGSKAYVKHPADIP
4. mTagBFP2 Entacmaeaquadricolor(seaanemone)
UV light Blue FAFDILATSFLYGSKTFINHTQGIP
miniPCR bio Learning LabsTM. BioBits®: Protein Structure and Function Student’s Guide
Version: 1.1 - Release: March 2021 - © 2021 by miniPCR bio™
Student’s Guide
P./15
1. Draw a box around the amino acids that are the same across all seven proteins.
2. As we’ve seen from the previous analysis, there can be differences in primary structure that
do not lead to changes in three-dimensional structure. But certain amino acids seem to
remain the same across different proteins. This suggests those particular amino acids are
critical for the correct function of the protein.
a. Knowing this, compare how similar the chromophore region is compared to the other
amino acids in the sequence. Are there any other amino acids that are the same
across all the proteins?
b. If an amino acid is the same across all proteins, what might that suggest about its
importance for the proper function of fluorescent proteins?
For the following questions it may be easier to use the
cutout activity provided on page 35. If you have not
cut out the activity, do so now.
We’ve mentioned before that the chromophore region (written
in bold) is the region mainly responsible for fluorescence. Let’s look
at the chromophore region in these four known proteins (sfGFP,
equaRFP, mOrange, and mTagBFP2).
3. Let’s look at chromophore regions. Which known protein sequence(s) has/have the same
three amino acids in their chromophore as our candidate proteins? Record your answers in
the “Proteins with identical chromophore(s)” column of Table 3.
4. Amino acids outside the chromophore can also have an important role in the function of
the protein. For each of our unknown proteins, identify the known protein sequence(s) that
seem the most similar to it. Record this in the “Most similar known sequences(s)” column in
Table 3.
FP
1M
ax excitatio
n:
UV
ligh
tE
missio
n:
Gre
en
Em
ission
:?E
missio
n:
?Em
ission
:G
reen
Em
ission
:R
ed
Em
ission
:O
ran
ge
Em
ission
:B
lue
Max excitatio
n:
?Max excitatio
n:
?Max excitatio
n:
Blu
e lig
ht
Max excitatio
n:
Blu
e lig
ht
Max excitatio
n:
Blu
e lig
ht
Max excitatio
n:
UV
ligh
t
FP
2
FP
3
sfGF
P
eq
uaR
FP
mO
ran
ge
mTa
gB
FP
2
VPWPTLVTTLSYGVQCFAKYPEHMR
VPWPTLVTTLTYGVQCFAKYPEHMR
FSVHILTPSHMYGSKPFNKYPADIP
VPWPTLVTTLTYGVQCFSRYPDHMK
FAFDILATSFMYGSKTFIKHTKGIP
FAWDILSPQFTYGSKAYVKHPADIP
FAFDILATSFLYGSKTFINHTQGIP
See page 35

miniPCR bio Learning LabsTM. BioBits®: Protein Structure and Function Student’s Guide
Version: 1.1 - Release: March 2021 - © 2021 by miniPCR bio™
Student’s Guide
P./16
Table 3: Comparisons and Predictions
Protein Protein(s)
with identical
chromophores
Most similar
known
sequence(s)
Predicted excitation
light
Predicted color of
emitted fluorescence
FP1 none sfGFP UV or blue light: UV Color: GreenFP2 UV or blue light: Color:
Justification:
FP3 UV or blue light:
Justification:
Color:
Justification:
6. As a reminder, the goal of the researchers is to identify a new fluorescent protein that glows
green and is best excited by blue light. This is difficult to do with just sequence analysis,
and we will have to test our predictions to know for sure. But looking at your predictions in
Table 3, which protein, FP2 or FP3, do you think is most likely to suit these requirements?
Justify your answer.
5. Based on your answers to both questions 3 and 4, what do you think the excitation light
and the emitted color will be for each of the unknown proteins in the experiment? Fill out
Table 3 with your predictions and justify your answers. FP1 has already been filled out, as we
already know its fluorescent properties.
miniPCR bio Learning LabsTM. BioBits®: Protein Structure and Function Student’s Guide
Version: 1.1 - Release: March 2021 - © 2021 by miniPCR bio™
Student’s Guide
P./17
Laboratory guideProtective gloves and eyewear should be worn for the entirety of this experiment.
1 2 3 4
1 2 3 4
1 2 3 4
1 2 3 4
You will use the BioBits® cell-free system to express 3 fluorescent proteins. Because you will also
have a negative control, there will be 4 samples total. Be sure to complete the pre-lab activity prior
to starting the lab.
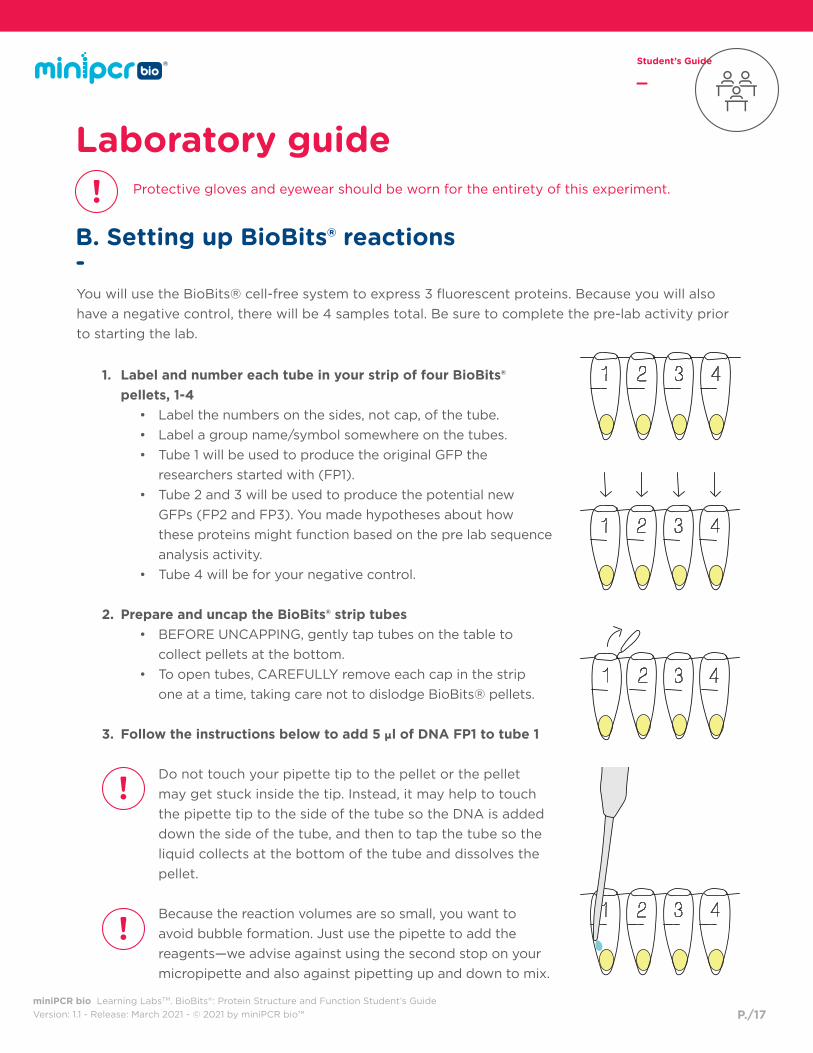
1. Label and number each tube in your strip of four BioBits® pellets, 1-4
• Label the numbers on the sides, not cap, of the tube.
• Label a group name/symbol somewhere on the tubes.
• Tube 1 will be used to produce the original GFP the
researchers started with (FP1).
• Tube 2 and 3 will be used to produce the potential new
GFPs (FP2 and FP3). You made hypotheses about how
these proteins might function based on the pre lab sequence
analysis activity.
• Tube 4 will be for your negative control.
2. Prepare and uncap the BioBits® strip tubes• BEFORE UNCAPPING, gently tap tubes on the table to
collect pellets at the bottom.
• To open tubes, CAREFULLY remove each cap in the strip
one at a time, taking care not to dislodge BioBits® pellets.
3. Follow the instructions below to add 5 μl of DNA FP1 to tube 1
. Do not touch your pipette tip to the pellet or the pellet
may get stuck inside the tip. Instead, it may help to touch
the pipette tip to the side of the tube so the DNA is added
down the side of the tube, and then to tap the tube so the
liquid collects at the bottom of the tube and dissolves the
pellet.
. Because the reaction volumes are so small, you want to
avoid bubble formation. Just use the pipette to add the
reagents—we advise against using the second stop on your
micropipette and also against pipetting up and down to mix.
B. Setting up BioBits® reactions-
miniPCR bio Learning LabsTM. BioBits®: Protein Structure and Function Student’s Guide
Version: 1.1 - Release: March 2021 - © 2021 by miniPCR bio™
Student’s Guide
P./18
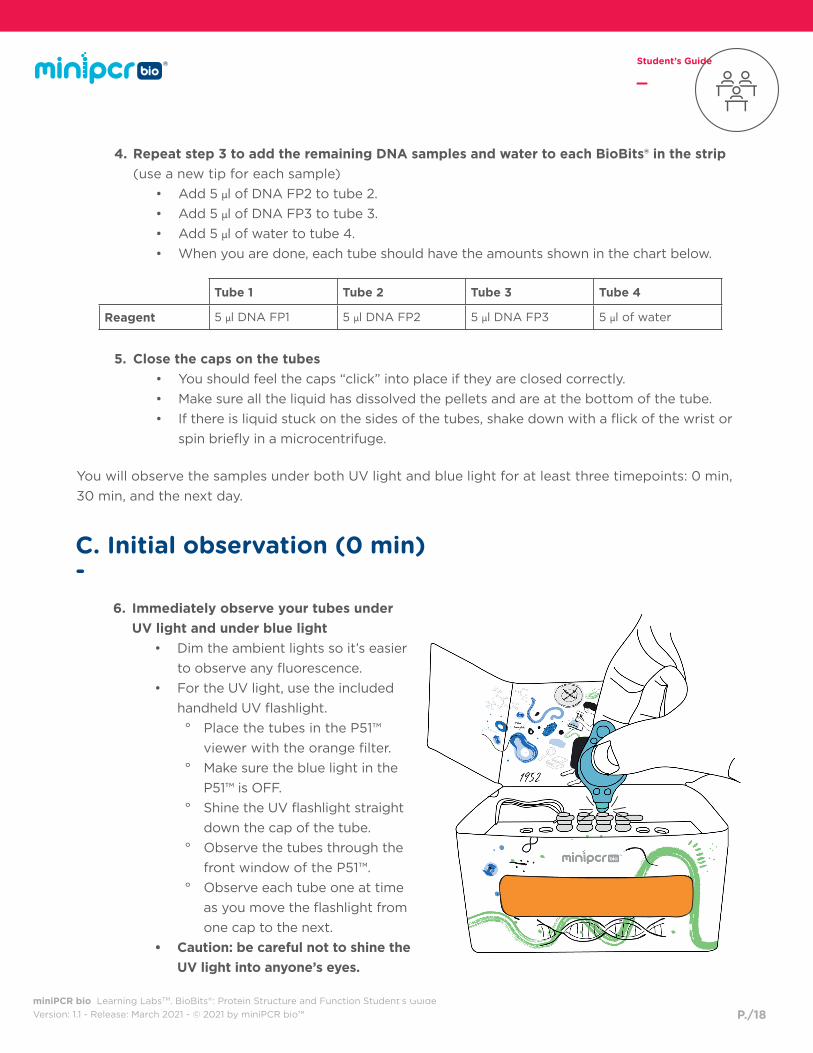
4. Repeat step 3 to add the remaining DNA samples and water to each BioBits® in the strip (use a new tip for each sample)
• Add 5 μl of DNA FP2 to tube 2.
• Add 5 μl of DNA FP3 to tube 3.
• Add 5 μl of water to tube 4.
• When you are done, each tube should have the amounts shown in the chart below.
5. Close the caps on the tubes• You should feel the caps “click” into place if they are closed correctly.
• Make sure all the liquid has dissolved the pellets and are at the bottom of the tube.
• If there is liquid stuck on the sides of the tubes, shake down with a flick of the wrist or
spin briefly in a microcentrifuge.
You will observe the samples under both UV light and blue light for at least three timepoints: 0 min,
30 min, and the next day.
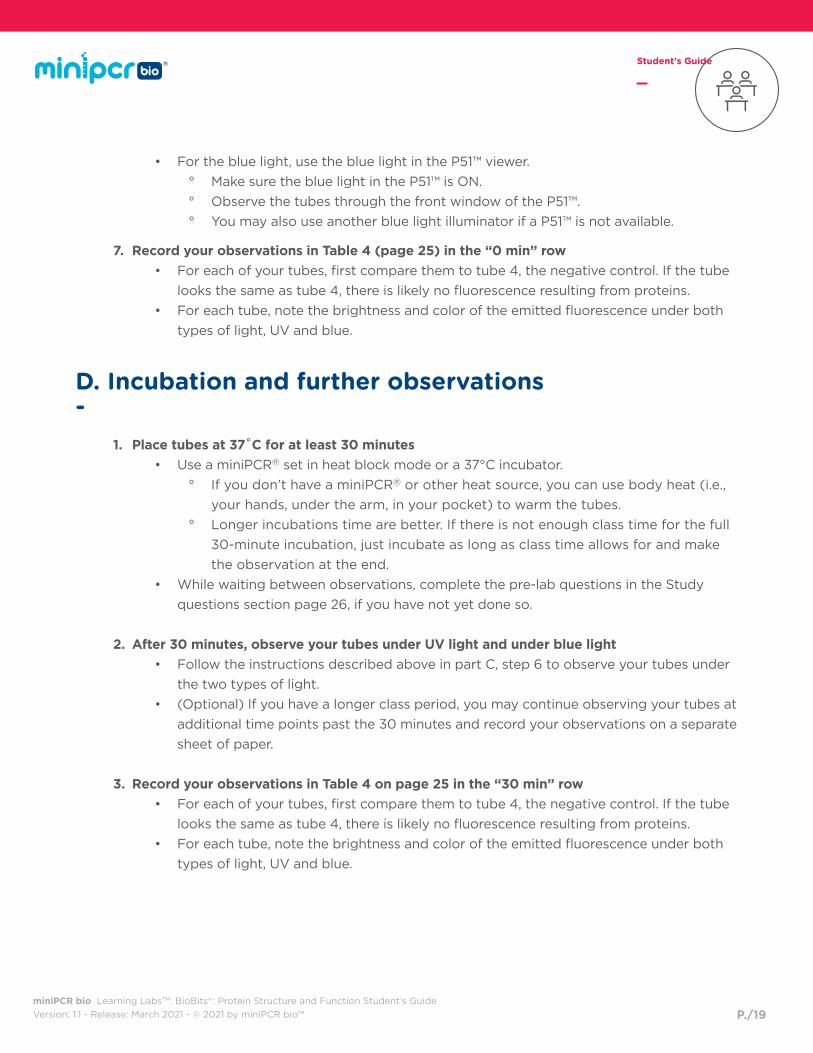
6. Immediately observe your tubes under UV light and under blue light
• Dim the ambient lights so it’s easier
to observe any fluorescence.
• For the UV light, use the included
handheld UV flashlight.
° Place the tubes in the P51™
viewer with the orange filter.
° Make sure the blue light in the
P51™ is OFF.
° Shine the UV flashlight straight
down the cap of the tube.
° Observe the tubes through the
front window of the P51™.
° Observe each tube one at time
as you move the flashlight from
one cap to the next.
• Caution: be careful not to shine the UV light into anyone’s eyes.
Tube 1 Tube 2 Tube 3 Tube 4
Reagent 5 μl DNA FP1 5 μl DNA FP2 5 μl DNA FP3 5 μl of water
C. Initial observation (0 min)-
miniPCR bio Learning LabsTM. BioBits®: Protein Structure and Function Student’s Guide
Version: 1.1 - Release: March 2021 - © 2021 by miniPCR bio™
Student’s Guide
P./19
• For the blue light, use the blue light in the P51™ viewer.
° Make sure the blue light in the P51™ is ON.
° Observe the tubes through the front window of the P51™.
° You may also use another blue light illuminator if a P51™ is not available.
7. Record your observations in Table 4 (page 25) in the “0 min” row• For each of your tubes, first compare them to tube 4, the negative control. If the tube
looks the same as tube 4, there is likely no fluorescence resulting from proteins.
• For each tube, note the brightness and color of the emitted fluorescence under both
types of light, UV and blue.
D. Incubation and further observations-
1. Place tubes at 37˚C for at least 30 minutes• Use a miniPCR® set in heat block mode or a 37°C incubator.
° If you don’t have a miniPCR® or other heat source, you can use body heat (i.e.,
your hands, under the arm, in your pocket) to warm the tubes.
° Longer incubations time are better. If there is not enough class time for the full
30-minute incubation, just incubate as long as class time allows for and make
the observation at the end.
• While waiting between observations, complete the pre-lab questions in the Study
questions section page 26, if you have not yet done so.
2. After 30 minutes, observe your tubes under UV light and under blue light• Follow the instructions described above in part C, step 6 to observe your tubes under
the two types of light.
• (Optional) If you have a longer class period, you may continue observing your tubes at
additional time points past the 30 minutes and record your observations on a separate
sheet of paper.
3. Record your observations in Table 4 on page 25 in the “30 min” row• For each of your tubes, first compare them to tube 4, the negative control. If the tube
looks the same as tube 4, there is likely no fluorescence resulting from proteins.
• For each tube, note the brightness and color of the emitted fluorescence under both
types of light, UV and blue.
miniPCR bio Learning LabsTM. BioBits®: Protein Structure and Function Student’s Guide
Version: 1.1 - Release: March 2021 - © 2021 by miniPCR bio™
Student’s Guide
P./20
4. Store tubes at room temperature• Leave the reaction to proceed overnight at room temperature.
• You can leave the tubes in the P51™ (make sure the blue light is off) or lying flat on the
lab bench or table.
• Avoid storing your tubes under direct sunlight (ambient indoor light is fine).
E. Final observations-(to be taken between 8 and 72 hours later)
1. Observe your tubes under UV light and under blue light• Follow the instructions described above in part C, step 6 to observe your tubes under
the two types of light.
2. Record your observations in Table 4 on page 25 in the “Day 2” row• For each of your tubes, first compare them to tube 4, the negative control. If the tube
looks the same as tube 4, there is likely no fluorescence resulting from proteins.
• For each tube, note the brightness and color of the emitted fluorescence under both
types of light, UV and blue.
miniPCR bio Learning LabsTM. BioBits®: Protein Structure and Function Student’s Guide
Version: 1.1 - Release: March 2021 - © 2021 by miniPCR bio™
Student’s Guide
P./21
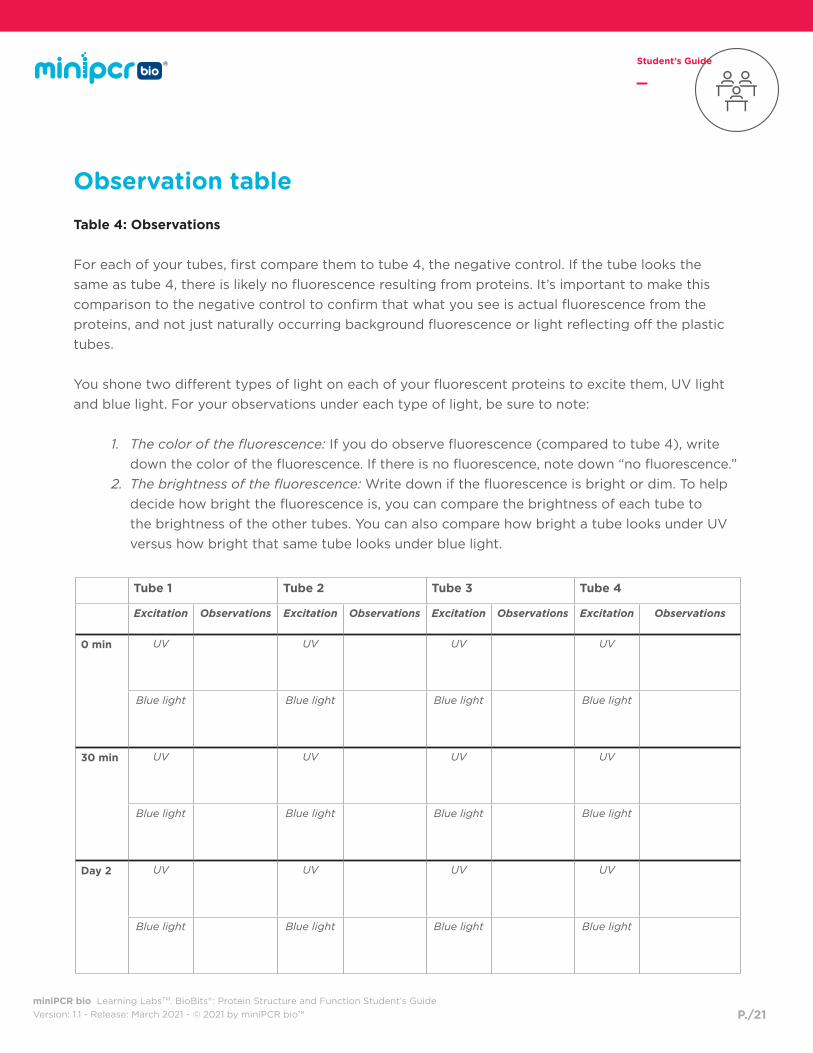
Observation tableTable 4: Observations
For each of your tubes, first compare them to tube 4, the negative control. If the tube looks the
same as tube 4, there is likely no fluorescence resulting from proteins. It’s important to make this
comparison to the negative control to confirm that what you see is actual fluorescence from the
proteins, and not just naturally occurring background fluorescence or light reflecting off the plastic
tubes.
You shone two different types of light on each of your fluorescent proteins to excite them, UV light
and blue light. For your observations under each type of light, be sure to note:
1. The color of the fluorescence: If you do observe fluorescence (compared to tube 4), write
down the color of the fluorescence. If there is no fluorescence, note down “no fluorescence.”
2. The brightness of the fluorescence: Write down if the fluorescence is bright or dim. To help
decide how bright the fluorescence is, you can compare the brightness of each tube to
the brightness of the other tubes. You can also compare how bright a tube looks under UV
versus how bright that same tube looks under blue light.
Tube 1 Tube 2 Tube 3 Tube 4
Excitation Observations Excitation Observations Excitation Observations Excitation Observations
0 min UV UV UV UV
Blue light Blue light Blue light Blue light
30 min UV UV UV UV
Blue light Blue light Blue light Blue light
Day 2 UV UV UV UV
Blue light Blue light Blue light Blue light

miniPCR bio Learning LabsTM. BioBits®: Protein Structure and Function Student’s Guide
Version: 1.1 - Release: March 2021 - © 2021 by miniPCR bio™
Student’s Guide
P./22
Study questions - pre-lab-
Review
Refer back to the Background information section for help.
1. The _______________________ of the protein plays a major role in determining its function.
2. The background section talked a lot about the structure and function of proteins. Ultimately,
what contains the information for how a protein is built?
3. Name one similarity and one difference between an alpha helix and a beta-sheet secondary
structure.
Similarity: Difference:
4. If you are told that the amino acids in a protein are ordered:
isoleucine, proline, alanine, threonine, cysteine, valine
What level of structure did we just describe to you? Explain your answer.
5. If you are told that two amino acids from different regions of the protein form a covalent
bond, what level of structure does that describe? Explain your answer.
6. Name one potential benefit of being able to design a new protein from scratch.

miniPCR bio Learning LabsTM. BioBits®: Protein Structure and Function Student’s Guide
Version: 1.1 - Release: March 2021 - © 2021 by miniPCR bio™
Student’s Guide
P./23
7. Which level of structure is it easiest for protein engineers to change directly? Explain why.
8. What properties of an amino acid will determine how that amino acid interacts with other
amino acids?
9. What is the advantage of starting with an existing protein to modify, instead of designing one
from scratch?
Critical thinking
10. Look back at the amino acids listed in question 4 (isoleucine (I), proline (P), alanine (A),
threonine (T), cysteine (C), valine (V)). Using those same six amino acids, design what you
think is a different primary structure than the one listed there. Use the one-letter amino acid
abbreviations to make things easier.
Explain why your answer represents a new primary structure.
You just changed the primary structure of the protein. Could this change also affect other
levels of structure? If so, which ones? Explain your answer.

miniPCR bio Learning LabsTM. BioBits®: Protein Structure and Function Student’s Guide
Version: 1.1 - Release: March 2021 - © 2021 by miniPCR bio™
Student’s Guide
P./24
11. Imagine that you are redesigning a protein that is an enzyme. Consider the following three
amino acids from this hypothetical protein:
• An arginine (R) (a large positively charged amino acid) located in the active site
of the enzyme (the place on the enzyme that interacts with the substrate).
• A tyrosine (Y) (a large hydrophobic amino acid) located near the center of the
three-dimensional structure of the protein.
• A threonine (T) (a small hydrophilic amino acid) located on the outside of the
enzyme far away from the active site.
a. Propose changing just one of the three amino acids above to a new amino acid in a
way that would very likely have a large effect on the function of the enzyme. You may
describe the change generally (e.g., bigger to smaller, keep the charge the same, etc.)
or suggest a specific amino acid if you are able.
Explain why you think the change you suggested would have a large effect on the
function of the enzyme.
b. Propose changing just one of the three amino acids above to a new amino acid in
a way that you think would be likely to have very little effect on the function of the
enzyme. You may describe the change generally (e.g., bigger to smaller, keep the
charge the same, etc.) or suggest a specific amino acid if you are able.
Explain why you think the change you suggested would have little effect on the
function of the enzyme.

miniPCR bio Learning LabsTM. BioBits®: Protein Structure and Function Student’s Guide
Version: 1.1 - Release: March 2021 - © 2021 by miniPCR bio™
Student’s Guide
P./25
Using computational thinking
Using the 20 standard amino acids, the total possible primary structures that could exist is equal
to 20n, where n is the number of amino acids in the sequence. For example, if you have an amino
acid sequence that is just two amino acids long, there would be 202 possible amino acid sequences.
Because 202 = 400, there are 400 unique sequences that are two amino acids long.
12. How many possible proteins can you make that are just five amino acids long? You should
use a calculator, but show your work.
13. The FP1 used in this lab is 240 amino acids long. How many other 240 amino acid proteins
could theoretically be made? You should use a calculator, but show your work.
14. Beta-galactosidase, a common enzyme that breaks down sugars, is composed of about
1,020 amino acids. How many other 1,020 amino acid proteins could theoretically be made?
You should use a calculator, but show your work.
15. What do the answers to questions 1, 2, and 3 tell you about how many different proteins
could possibly exist?

miniPCR bio Learning LabsTM. BioBits®: Protein Structure and Function Student’s Guide
Version: 1.1 - Release: March 2021 - © 2021 by miniPCR bio™
Student’s Guide
P./26
Advanced discussion questions
16. Your sequence analysis looked at 25 of the more than 200 amino acids in this lab activity’s
fluorescent proteins. This subset was chosen to include the chromophore region and
surrounding amino acids. Why do you think this region was chosen for analysis?
17. Look back at the primary structure alignments (pages 13 and 14). Based on this information,
are there other regions that you think may be especially important for maintaining the
structure and function of fluorescent proteins? If so, how did you recognize those regions?
18. Refer back to the homology exercise (Table 2, page 18). Imagine you wanted to make a red
fluorescent protein that would fluoresce under UV light. Select a protein from this table to
start with and suggest which amino acid modifications you would try first. (Hint: Use the
other proteins in the table to help guide your answer.)
It’s OK if you are unsure about your answer. Remember, a lot of protein engineering is
making educated guesses. It is more important that you justify your choices.
Starter protein: Amino acid(s) modifications:
Justify your answer:

miniPCR bio Learning LabsTM. BioBits®: Protein Structure and Function Student’s Guide
Version: 1.1 - Release: March 2021 - © 2021 by miniPCR bio™
Student’s Guide
P./27
Study questions - post-lab-
Interpreting results
1. Review the predictions you made in Table 3 (page 20) and summarize them in one sentence
in the “Predictions” column below. Review the observations you made in Table 4 (page 25)
and summarize them in one or two sentences in the “Observations” column below.
Table 5: Predictions vs. Observations
2. How well did your predictions match your observations for each protein?
FP2: FP3:
3. Tube 4 was a control. Why is having this control important for your experiment?
4. If tube 4 was not included in this lab, what incorrect conclusions could be made?
Sequence Predictions Observations
FP2 (tube 2)
FP3 (tube 3)

miniPCR bio Learning LabsTM. BioBits®: Protein Structure and Function Student’s Guide
Version: 1.1 - Release: March 2021 - © 2021 by miniPCR bio™
Student’s Guide
P./28
Critical thinking
5. In making your predictions for this lab, you compared FP2 and FP3 to the known protein
FP1 and several other fluorescent proteins. Overall, how helpful do you think primary,
secondary and tertiary structure analysis were for predicting the function of FP2 and FP3?
Primary:
Secondary:
Tertiary:
6. If I gave you a protein you knew nothing about (not a fluorescent protein) and asked you
to predict its function, which do you think would be most helpful to analyze, primary,
secondary or tertiary structure? Justify your answer using evidence from the lab.

miniPCR bio Learning LabsTM. BioBits®: Protein Structure and Function Student’s Guide
Version: 1.1 - Release: March 2021 - © 2021 by miniPCR bio™
Student’s Guide
P./29
CER TableFill in the table based on your results from the lab. Use the rubric on the next page to help your
answers.
Question:
Some people argue that tertiary structure is most important for a protein’s function.Some people argue primary structure is most important. What do you think: is primary or tertiary structure most important for the function of a protein?
(People are likely to disagree with you, so be sure to back up your answer with evidence from the lab and to explain your reasoning.)
Claim
Make a clear statementthat answers the above question.
Evidence
Provide data from the lab that supports your claim (both from the pre-lab analysis activity and the lab).
Reasoning
Explain clearly why the data you presented supports your claim. Include the underlying scientific principles that link your evidence to your claim.
miniPCR bio Learning LabsTM. BioBits®: Protein Structure and Function Student’s Guide
Version: 1.1 - Release: March 2021 - © 2021 by miniPCR bio™
Student’s Guide
P./30
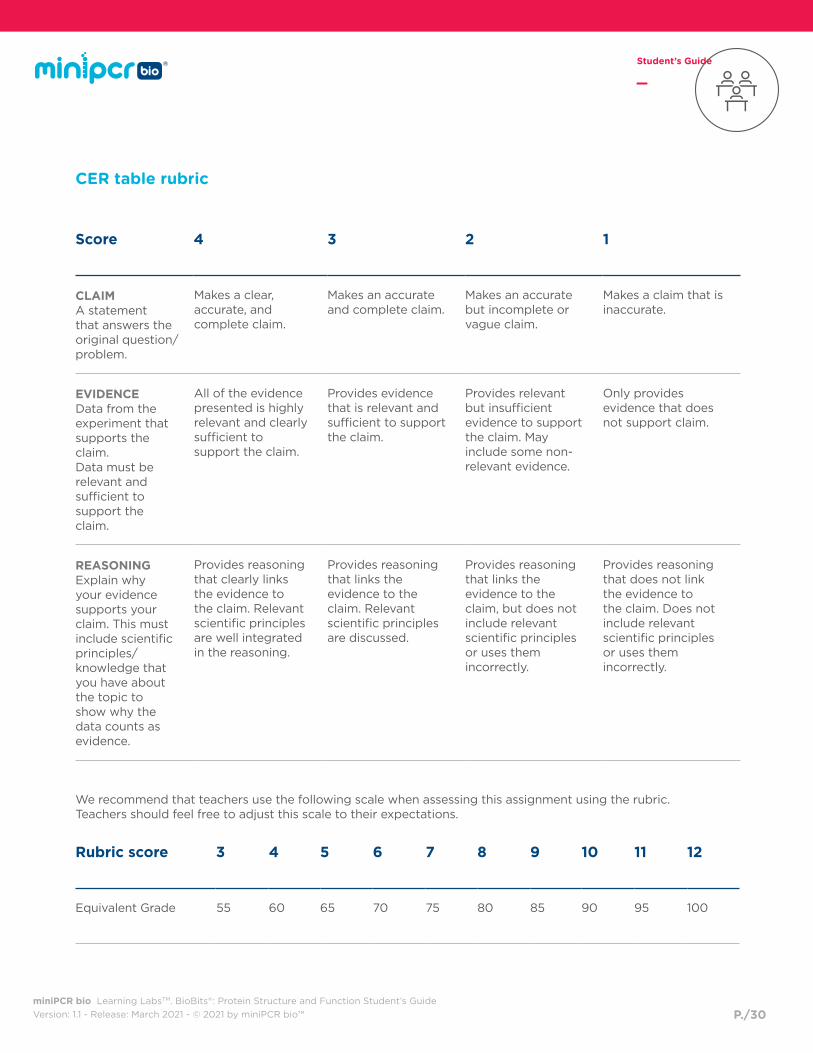
Score 4 3 2 1
CLAIMA statement that answers the original question/ problem.
Makes a clear, accurate, and complete claim.
Makes an accurate and complete claim.
Makes an accurate but incomplete or vague claim.
Makes a claim that is inaccurate.
EVIDENCEData from the experiment that supports the claim.Data must be relevant and sufficient to support the claim.
All of the evidencepresented is highlyrelevant and clearly sufficient to support the claim.
Provides evidence that is relevant and sufficient to support the claim.
Provides relevant but insufficient evidence to support the claim. May include some non-relevant evidence.
Only provides evidence that does not support claim.
REASONINGExplain why your evidence supports your claim. This must include scientific principles/knowledge that you have about the topic to show why the data counts as evidence.
Provides reasoning that clearly links the evidence to the claim. Relevant scientific principles are well integrated in the reasoning.
Provides reasoning that links the evidence to the claim. Relevant scientific principles are discussed.
Provides reasoning that links the evidence to the claim, but does not include relevant scientific principles or uses them incorrectly.
Provides reasoning that does not link the evidence to the claim. Does not include relevant scientific principles or uses themincorrectly.
Rubric score 3 4 5 6 7 8 9 10 11 12
Equivalent Grade 55 60 65 70 75 80 85 90 95 100
We recommend that teachers use the following scale when assessing this assignment using the rubric.Teachers should feel free to adjust this scale to their expectations.
CER table rubric
miniPCR bio Learning LabsTM. BioBits®: Protein Structure and Function Student’s Guide
Version: 1.1 - Release: March 2021 - © 2021 by miniPCR bio™
Student’s Guide
P./31
FP
1M
ax excitatio
n:
UV
ligh
tE
missio
n:
Gre
en
Em
ission
:?E
missio
n:
?Em
ission
:G
reen
Em
ission
:R
ed
Em
ission
:O
ran
ge
Em
ission
:B
lue
Max excitatio
n:
?Max excitatio
n:
?Max excitatio
n:
Blu
e lig
ht
Max excitatio
n:
Blu
e lig
ht
Max excitatio
n:
Blu
e lig
ht
Max excitatio
n:
UV
ligh
t
FP
2
FP
3
sfGF
P
eq
uaR
FP
mO
ran
ge
mTa
gB
FP
2
VPWPTLVTTLSYGVQCFAKYPEHMR
VPWPTLVTTLTYGVQCFAKYPEHMR
FSVHILTPSHMYGSKPFNKYPADIP
VPWPTLVTTLTYGVQCFSRYPDHMK
FAFDILATSFMYGSKTFIKHTKGIP
FAWDILSPQFTYGSKAYVKHPADIP
FAFDILATSFLYGSKTFINHTQGIP
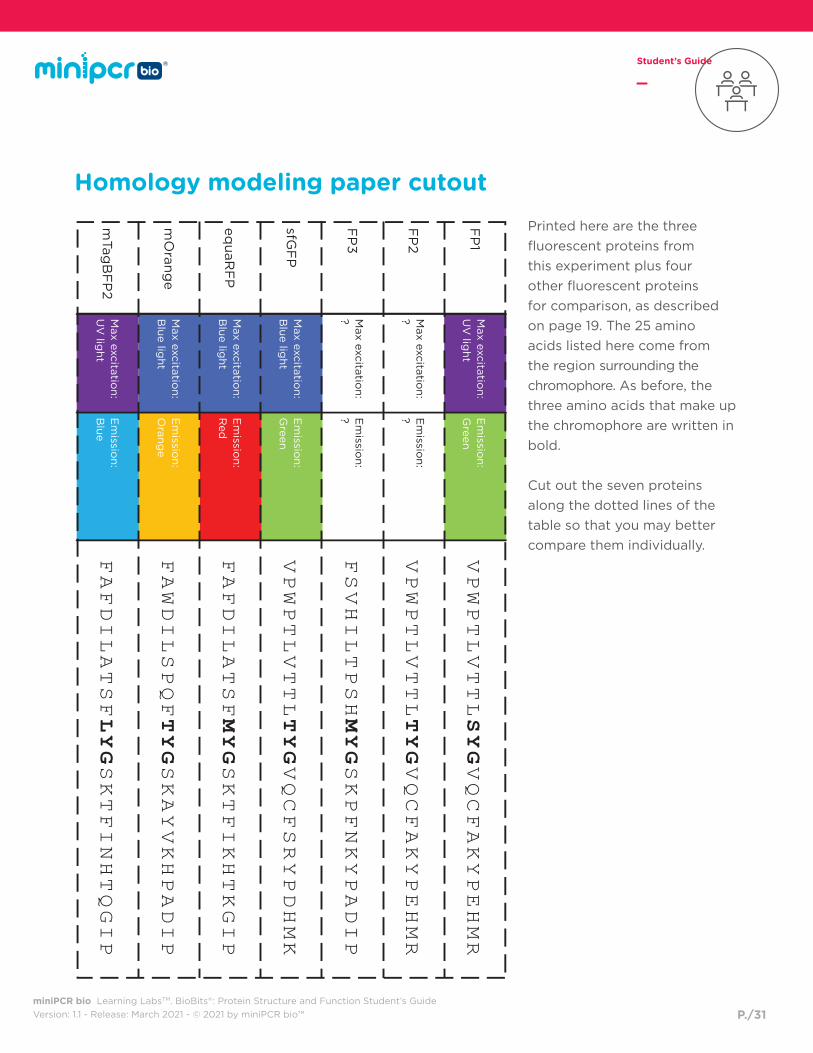
Printed here are the three
fluorescent proteins from
this experiment plus four
other fluorescent proteins
for comparison, as described
on page 19. The 25 amino
acids listed here come from
the region surrounding the
chromophore. As before, the
three amino acids that make up
the chromophore are written in
bold.
Cut out the seven proteins
along the dotted lines of the
table so that you may better
compare them individually.
Homology modeling paper cutout

miniPCR bio Learning LabsTM. BioBits®: Protein Structure and Function Student’s Guide
Version: 1.1 - Release: March 2021 - © 2021 by miniPCR bio™
AdditionalSupports
P./32
Extension:Making biologybrighter
miniPCR bio Learning LabsTM. BioBits®: Protein Structure and Function Student’s Guide
Version: 1.1 - Release: March 2021 - © 2021 by miniPCR bio™
AdditionalSupports
P./33
Extension - Making biologybrighterA Nobel Prize winning discovery-
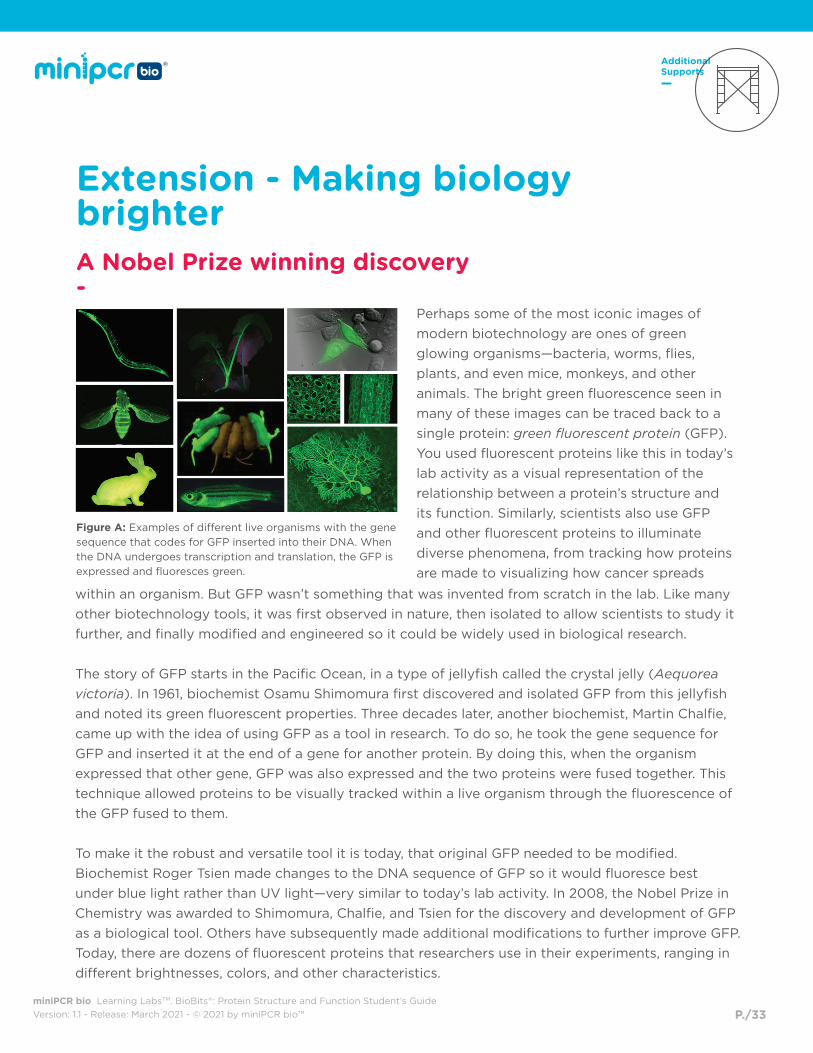
Perhaps some of the most iconic images of
modern biotechnology are ones of green
glowing organisms—bacteria, worms, flies,
plants, and even mice, monkeys, and other
animals. The bright green fluorescence seen in
many of these images can be traced back to a
single protein: green fluorescent protein (GFP).
You used fluorescent proteins like this in today’s
lab activity as a visual representation of the
relationship between a protein’s structure and
its function. Similarly, scientists also use GFP
and other fluorescent proteins to illuminate
diverse phenomena, from tracking how proteins
are made to visualizing how cancer spreads
Figure A: Examples of different live organisms with the gene sequence that codes for GFP inserted into their DNA. When the DNA undergoes transcription and translation, the GFP is expressed and fluoresces green.
within an organism. But GFP wasn’t something that was invented from scratch in the lab. Like many
other biotechnology tools, it was first observed in nature, then isolated to allow scientists to study it
further, and finally modified and engineered so it could be widely used in biological research.
The story of GFP starts in the Pacific Ocean, in a type of jellyfish called the crystal jelly (Aequorea
victoria). In 1961, biochemist Osamu Shimomura first discovered and isolated GFP from this jellyfish
and noted its green fluorescent properties. Three decades later, another biochemist, Martin Chalfie,
came up with the idea of using GFP as a tool in research. To do so, he took the gene sequence for
GFP and inserted it at the end of a gene for another protein. By doing this, when the organism
expressed that other gene, GFP was also expressed and the two proteins were fused together. This
technique allowed proteins to be visually tracked within a live organism through the fluorescence of
the GFP fused to them.
To make it the robust and versatile tool it is today, that original GFP needed to be modified.
Biochemist Roger Tsien made changes to the DNA sequence of GFP so it would fluoresce best
under blue light rather than UV light—very similar to today’s lab activity. In 2008, the Nobel Prize in
Chemistry was awarded to Shimomura, Chalfie, and Tsien for the discovery and development of GFP
as a biological tool. Others have subsequently made additional modifications to further improve GFP.
Today, there are dozens of fluorescent proteins that researchers use in their experiments, ranging in
different brightnesses, colors, and other characteristics.
miniPCR bio Learning LabsTM. BioBits®: Protein Structure and Function Student’s Guide
Version: 1.1 - Release: March 2021 - © 2021 by miniPCR bio™
AdditionalSupports
P./34
Designing a free-use GFP-There are many reasons why scientists have modified GFP for use in different experiments, such as
to improve the stability of GFP, the temperature at which it best functions, or the
brightness of the fluorescence that’s emitted. This case study is about another kind of motivation—
one that’s rooted in a legal reason rather than a biological one: patents.
Patents ensure that inventors are recognized for their innovations. The holder of a patent for a
given protein has the right to define the terms under which the protein can be used for research or
commercial purposes, including monetary compensation.
Since most fluorescent proteins are protected by patents, an Australian research group led by
Dr. Nicholas Coleman decided to create new fluorescent proteins that could be freely accessible
to anyone and not infringe on existing patent rights so that anyone in the world could use them.
Specifically, they wanted to create versions of one of the commonly used GFP variants, called
superfolder GFP (sfGFP), which is easy to use in biological experiments because it folds quickly
and fluoresces very brightly. Under the legal terms of the patent for sfGFP, their new free-use GFP
had to have an amino acid sequence that was at least 20% different than the sfGFP sequence to be
considered a different protein. This means that one in five of the amino acids in the sfGFP sequence
had to be replaced, all while still maintaining the protein’s overall three-dimensional structure and
bright green fluorescent function.
One of the researchers in Coleman’s group, Mark Somerville, took on this engineering challenge.
First, he analyzed the sequences of many different fluorescent proteins that also glow green like
sfGFP to identify regions that had the same amino acids across these different sequences. These
regions would be considered highly conserved across different green fluorescent proteins and
were likely to be more important for green fluorescent function. From there, he designed four new
potential GFP sequences, keeping the conserved positions untouched but swapping out amino
acids in non-conserved spots for others. Even though the non-conserved spots were less likely to
be important for fluorescent function, they still contribute to the overall shape and structure of the
protein, so he made sure the new substituted amino acids had similar chemical properties to the
original ones.
Somerville’s initial approach worked—sort of. The proteins he made fluoresced, but unfortunately,
they were not as brightly fluorescent as the original sfGFP. It also wasn’t clear what changes could
make them better. The next step was to try a protein engineering technique called gene shuffling.
Instead of trying to make directed changes, amino acid by amino acid, gene shuffling allowed
Somerville to make hundreds of new proteins very quickly, all based on the four proteins he already
designed.
miniPCR bio Learning LabsTM. BioBits®: Protein Structure and Function Student’s Guide
Version: 1.1 - Release: March 2021 - © 2021 by miniPCR bio™
AdditionalSupports
P./35
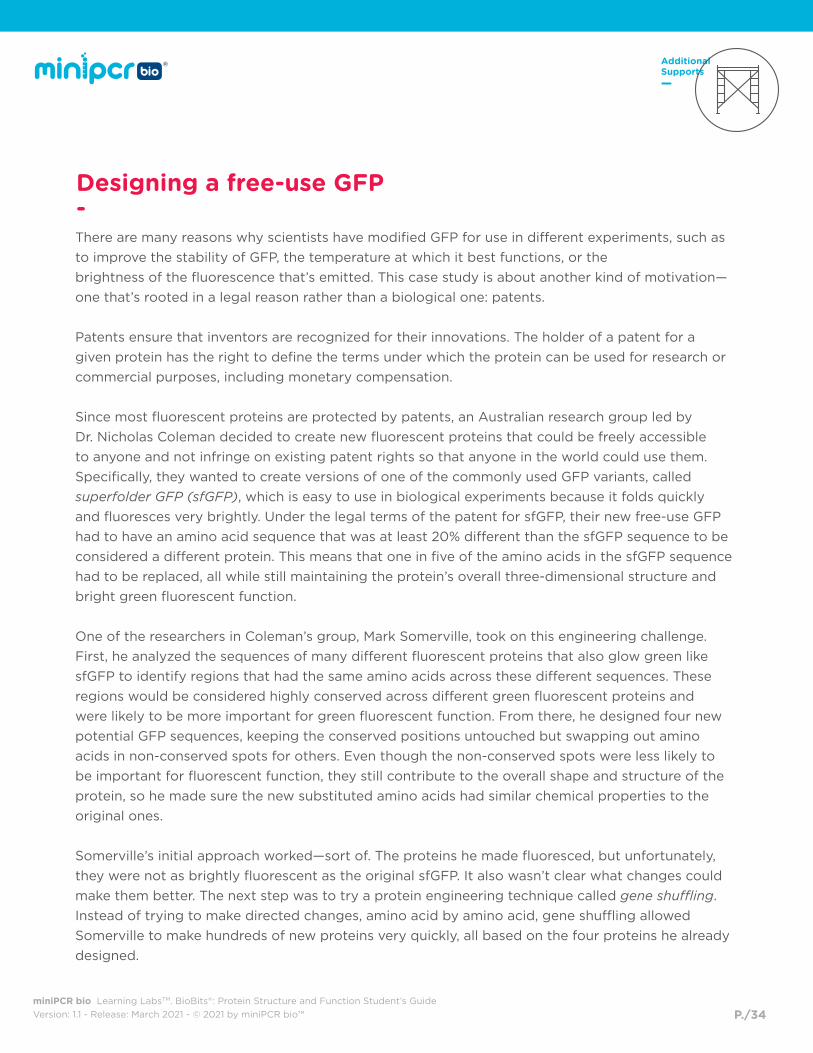
He did so by taking copies of the DNA that coded for his four GFP sequences and chopping the
DNA up into randomly sized fragments using an enzyme. Then, these chopped-up pieces were
mixed together and reassembled. The new genes had all the DNA needed to make a fluorescent
protein, but they might have the beginning from one DNA sequence, the end of another, with the
middle made of a third. And because there were many copies of the DNA sequences being shuffled,
all chopped up into different fragments of random sizes that reassembled in many different ways,
Somerville ended up with hundreds of new gene combinations to test 1.
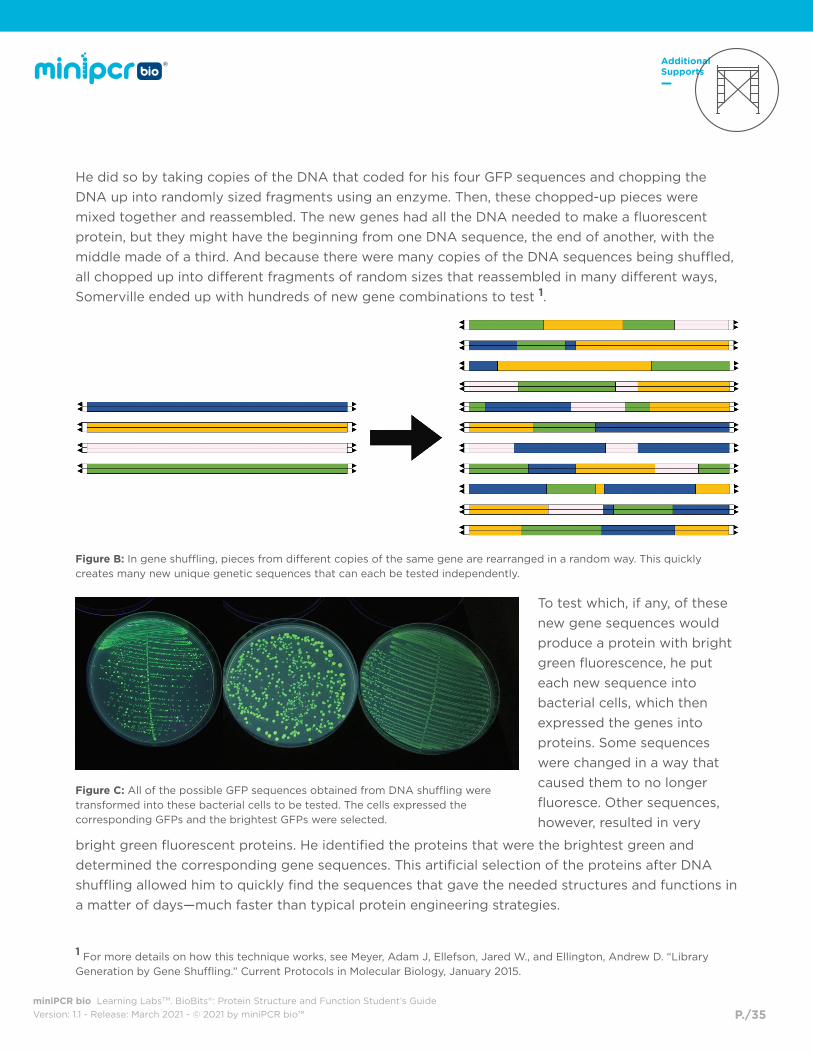
Figure C: All of the possible GFP sequences obtained from DNA shuffling were transformed into these bacterial cells to be tested. The cells expressed the corresponding GFPs and the brightest GFPs were selected.
Figure B: In gene shuffling, pieces from different copies of the same gene are rearranged in a random way. This quickly creates many new unique genetic sequences that can each be tested independently.
bright green fluorescent proteins. He identified the proteins that were the brightest green and
determined the corresponding gene sequences. This artificial selection of the proteins after DNA
shuffling allowed him to quickly find the sequences that gave the needed structures and functions in
a matter of days—much faster than typical protein engineering strategies.
1 For more details on how this technique works, see Meyer, Adam J, Ellefson, Jared W., and Ellington, Andrew D. “Library Generation by Gene Shuffling.” Current Protocols in Molecular Biology, January 2015.
To test which, if any, of these
new gene sequences would
produce a protein with bright
green fluorescence, he put
each new sequence into
bacterial cells, which then
expressed the genes into
proteins. Some sequences
were changed in a way that
caused them to no longer
fluoresce. Other sequences,
however, resulted in very
miniPCR bio Learning LabsTM. BioBits®: Protein Structure and Function Student’s Guide
Version: 1.1 - Release: March 2021 - © 2021 by miniPCR bio™
AdditionalSupports
P./36
In the end, this shuffling technique resulted in some new DNA sequences that produced proteins just
as bright as sfGFP. After a few more small tweaks to make sure that a full 20% of amino acids were
different from the original sfGFP (as required by patent law), they had a few new free-use GFPs that
functioned just as well as the patented version. In fact, these are the very same green fluorescent
proteins you used in today’s lab. Not only did this project result in fluorescent proteins that can
be freely used by anyone, but it also explored a whole range of amino acid sequences that can all
produce functional GFPs. In this way, the process of protein engineering can shed even more light on
the protein structure and function relationship.
Study questions-Review
1. Was the original GFP discovered or invented by scientists?
2. How can GFP be attached to other proteins?
Why might you want to do this in a cell?
3. Name one modification that was made to GFP to improve it for use as a tool in experiments.
4. What is one reason a researcher may wish to patent a protein they engineer?

miniPCR bio Learning LabsTM. BioBits®: Protein Structure and Function Student’s Guide
Version: 1.1 - Release: March 2021 - © 2021 by miniPCR bio™
AdditionalSupports
P./37
5. Mark Somerville’s first approach to engineering a new protein consisted of switching amino
acids for ones with similar chemical properties. How well did this work?
Does this surprise you or is this what you would expect? Explain your answer.
6. Using the process of gene shuffling, roughly how many new proteins was Somerville able to
generate?
How long did it take him?
7. When selecting the proteins to use after gene shuffling, did Somerville know the amino acid
sequence of the proteins before or after he knew which ones functioned the best?
8. In your own words, explain how it is possible to change more than 20% of the amino acid
sequence of a protein and still result in a protein with nearly identical tertiary structure and
function.

miniPCR bio Learning LabsTM. BioBits®: Protein Structure and Function Student’s Guide
Version: 1.1 - Release: March 2021 - © 2021 by miniPCR bio™
AdditionalSupports
P./38
Critical thinking
9. Where would you predict the conserved positions in GFP to be more likely found: in the
chromophore region or in the barrel region? Justify your answer.
10. Gene shuffling is sometimes used as a part of a protein engineering technique called
“directed evolution.” In directed evolution, scientists introduce random genetic changes
in ways that are similar to natural processes, like mutation and recombination. From these
new variants, the scientist selects the proteins that function the best and then repeats the
process. In each round of random change and selection, the protein’s function improves.
Is gene shuffling more similar to the natural process of mutation or recombination? Explain
your answer in as much detail as you are able.
References-Figure A: Chalfie, Martin. “GFP: Lighting up life.” Proceedings of the National Academy of Sciences,
June 2009.
Figure C: Somerville, Mark. Nicholas Coleman Lab at the University of Sydney.
https://coleman-lab.org/