Recognition of protein Function Using the Local Similarity
17
Journal of Bioinformatics and Computational Biology Vol. 6, No. 4 (2008) 709–725 c Imperial College Press RECOGNITION OF PROTEIN FUNCTION USING THE LOCAL SIMILARITY KIRILL ALEXANDROV ∗ , BORIS SOBOLEV † , DMITRY FILIMONOV ‡ and VLADIMIR POROIKOV § Laboratory for Structure-Function Based Drug Design Institute of Biomedical Chemistry, Russian Academy of Medical Sciences Pogodinskaya Str. 10, Moscow 119121, Russia ∗ [email protected] † [email protected] ‡ dmitry.fi[email protected] § [email protected] Received 15 October 2007 Revised 14 December 2007 Accepted 19 January 2008 The functional annotation of amino acid sequences is one of the most important problems in bioinformatics. Different programs have been successfully applied for recognition of some functional classes; nevertheless, many functional groups still cannot be predicted with the required accuracy. We developed a new method for protein function recognition using the original approach of sequence description. Each sequence of the training set is compared with the query sequence, and the local similarity scores are calculated for the query sequence positions and used as input data for the original classifier. The method was tested using leave-one-out cross-validation for three data sets covering 58 enzyme classes. Two tested sets including noncrossing functional classes were recognized with high accuracy at various levels of classification hierarchy. The majority of these classes were predicted with 100% accuracy, showing a prediction ability comparable with the HMMer method and an accuracy superior to the SVM-Prot program. When the tested set was composed of intersected classes of ligand specificity, the prediction accuracy was less; however, the accuracy increased as the size of the predicted class expanded. The proposed method can be used for both predicting protein functional class and selecting the functionally significant sites in a sequence. Keywords : Functional annotation of proteins; sequence similarity; machine learning; recognition of functional classes. 1. Introduction Functional annotation of newly sequenced genes presents one of the most important challenges in bioinformatics. Since only a small part of encoded proteins is char- acterized experimentally, the methods of computational functional classification of new amino acid sequences are being intensively developed. Homology-derived anno- tation based on pairwise sequence alignment was a general way to predict protein function for a long time. This approach is shown to have certain limitations. 1,2 709
Transcript of Recognition of protein Function Using the Local Similarity

August 14, 2008 16:57 WSPC/185-JBCB 00359
Journal of Bioinformatics and Computational BiologyVol. 6, No. 4 (2008) 709–725c© Imperial College Press
RECOGNITION OF PROTEIN FUNCTION USINGTHE LOCAL SIMILARITY
KIRILL ALEXANDROV∗, BORIS SOBOLEV†,DMITRY FILIMONOV‡ and VLADIMIR POROIKOV§
Laboratory for Structure-Function Based Drug DesignInstitute of Biomedical Chemistry, Russian Academy of Medical Sciences
Pogodinskaya Str. 10, Moscow 119121, Russia∗[email protected]
†[email protected]‡[email protected]§[email protected]
Received 15 October 2007Revised 14 December 2007Accepted 19 January 2008
The functional annotation of amino acid sequences is one of the most important problemsin bioinformatics. Different programs have been successfully applied for recognition ofsome functional classes; nevertheless, many functional groups still cannot be predictedwith the required accuracy. We developed a new method for protein function recognitionusing the original approach of sequence description. Each sequence of the training set iscompared with the query sequence, and the local similarity scores are calculated for thequery sequence positions and used as input data for the original classifier. The methodwas tested using leave-one-out cross-validation for three data sets covering 58 enzymeclasses. Two tested sets including noncrossing functional classes were recognized withhigh accuracy at various levels of classification hierarchy. The majority of these classeswere predicted with 100% accuracy, showing a prediction ability comparable with theHMMer method and an accuracy superior to the SVM-Prot program. When the testedset was composed of intersected classes of ligand specificity, the prediction accuracy wasless; however, the accuracy increased as the size of the predicted class expanded. Theproposed method can be used for both predicting protein functional class and selectingthe functionally significant sites in a sequence.
Keywords: Functional annotation of proteins; sequence similarity; machine learning;recognition of functional classes.
1. Introduction
Functional annotation of newly sequenced genes presents one of the most importantchallenges in bioinformatics. Since only a small part of encoded proteins is char-acterized experimentally, the methods of computational functional classification ofnew amino acid sequences are being intensively developed. Homology-derived anno-tation based on pairwise sequence alignment was a general way to predict proteinfunction for a long time. This approach is shown to have certain limitations.1,2
709

August 14, 2008 16:57 WSPC/185-JBCB 00359
710 K. Alexandrov et al.
Phylogenetic methods combined with the established experimental annotations(so-called “phylogenomics”) reveal significant advantages in the characterizationof large, functionally diverged protein families, but these methods usually requirethe intensive interference of the expert in annotation procedures.3 In contrast, themachine learning approach underlies automated functional annotation based onthe training set of experimentally annotated proteins. The following methods havebeen used for protein function prediction: naive Bayes classifier, artificial neuralnetwork, k-nearest neighbor, decision tree, and support vector machine.4 Thesemethods enable to avoid the sequence alignment procedure by using different val-ues representing the protein sequences, such as amino acid composition; dipeptide,tripeptide, and tetrapeptide compositions; and descriptors showing the distributionof amino acid residues within the sequence.4–6
Machine learning methods show high accuracy of the functional class recog-nition — exceeding 95% for certain functional classes. However, many functionalgroups cannot be predicted with reasonable accuracy.7 Thus, the problem of proteinfunction prediction is far from the final solution.
Earlier, to predict the functional classes of proteins based on their amino acidsequences, we used the original classification algorithm PASS. The sequences wererepresented by structural Multilevel Neighborhoods of Atom (MNA) descriptors.8
This approach provides high accuracy of prediction, but the use of MNA descriptorsrequires significant computational resources.
In this study, we propose a new method of sequence representation that enablesto represent a query sequence in terms of local similarity with the proteins of thetraining set. Similarity scores calculated for all amino acid positions are the inputdata for the classifier program. In the new approach, one can adapt the programto define the protein features associated with single or multiple sequence regions ofdifferent lengths. The simplicity and high computational speed allow an automatedsearch for optimal parameters. The functional annotation also includes the detectionof functionally significant amino acid residues. This task can be solved using thesequences, alignments, and phylogenetic trees as input data.9,10 As the suggestedprocedure directly assigns similarity scores to the amino acid positions in the querysequence, it is easy to select functionally significant positions and obtain functionalmaps of proteins without construction of the alignment. The new method is namedProjections of Amino Acid Sequences (PAAS).
2. Method
2.1. Local sequence similarity
We have suggested the description of the amino acid sequence A by its local sim-ilarity to a sequence B. At first, raw similarity scores are detected by shifting thesequences A and B each to the others (Fig. 1). Each region of sequence A is com-pared with each superposed region of sequence B. The raw score is calculated asthe sum of scores determined for each pair of superposed residues.

August 14, 2008 16:57 WSPC/185-JBCB 00359
Recognition of Protein Function Using the Local Similarity 711
Fig. 1. Calculation of raw similarity scores. The training set sequence (upper strings) is comparedwith the query sequence (lower string) at different shifts (from −3 to 3 amino acid residues), andthe maximal scores calculated at the given frame are detected for the query sequence positions.The black boxes denote the amino acid matches.
Thus, the raw similarity scores are calculated as
Rk = maxj
(Ik+F−1,j − Ikj), Ikj =k∑
i=1
s(ai, bi+j), Ml ≤ j ≤ Mr, (1)
where Rk is the raw similarity score in position k of sequence A; F is the lengthof the comparable sequence fragments or a “frame”; s(ai, bi+j) is the similarity ofamino acids ai and bi+j ; j is the current shift; and Ml and Mr are the maximalallowable shifts at the left and right sequence edges, respectively. In Fig. 1, F = 20,Ml = −3, Mr = 3, and Rk = 9 for the left edge position in the frame “FGMGK. . .”of the query sequence.
To run the local similarity calculation, the following parameters should bedefined: the frame and the maximal band (maxB). The second value specifiesMl and Mr, depending on the relation between the lengths of query and train-ing sequences (Lq and Lt, respectively).
Ml =
{max B/2|Lq ≤ Lt
−maxB/2 − Lq + Lt|Lq > Lt
Mr =
{−maxB/2|Lq ≥ Lt
−maxB/2 + Lt − Lq|Lq < Lt
(2)
In this study, we used the simplest measure of similarity between the aminoacid residues: 1 for identical residues and 0 for different ones. It was shown thatthe use of substitution matrices does not increase the accuracy of prediction. The
August 14, 2008 16:57 WSPC/185-JBCB 00359
712 K. Alexandrov et al.
local score Sk(A, B) calculated for position k of sequence A is estimated by themaximum of the values Rk calculated for all frames in which this position put in:
Sk(A, B) = maxm
Rk+m,−(F − 1) ≤ m ≤ F − 1. (3)
The query sequence A is compared to each sequence B of the training set. Thus,we obtain the local similarity scores of the query sequence with all training setsequences.
The suggested procedure is similar to the well-known dot-matrix method.11
Sequence alignment can be considered as the joining of diagonal fragments, whichfit into the narrow band providing the best alignment score.12
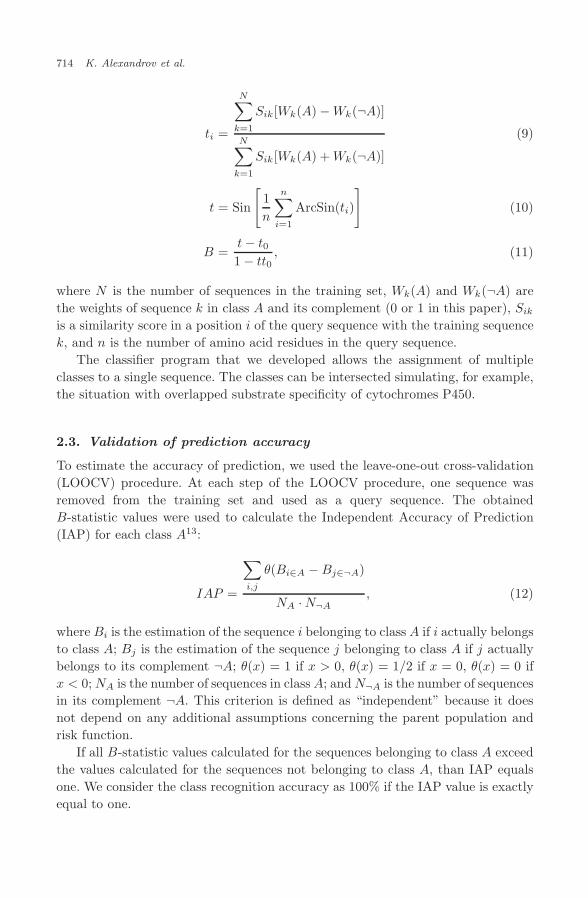
In PAAS, local similarity scores are used as the input data for the classifier pro-gram. Note that many positions, which could be ignored in alignment, are accountedfor in this procedure. The number of scores representing each training set sequenceequals the length of the query sequence. If the scores calculated for proteins belong-ing to a certain class are averaged for each query sequence position, one obtains theclass projection on the query sequence (Fig. 2). The averaged local similarity scoresobviously represent the motifs that determine the functional similarity or differencebetween the studied proteins.
2.2. Classification algorithm
We adopted an algorithm that was originally proposed for the prediction of biolog-ical activity spectra for chemical substances (PASS) based on a well-known naive
Fig. 2. Projecting the training set sequences on the query sequence. The local similarity scores areaveraged over the classes, whose EC numbers are shown in the top right corner. The native classof the query protein is shown in bold.

August 14, 2008 16:57 WSPC/185-JBCB 00359
Recognition of Protein Function Using the Local Similarity 713
Bayes classifier.13 It is assumed that amino acid sequence is described by a set ofdescriptors {D1, . . . , Dn}, and the probability of its belonging to a given class A isestimated by the conditional probability P (A|D1, . . . , Dn). As follows from Bayestheorem,
P (A|D1, . . . , Dn) =P (D1, . . . , Dn|A)P (A)
P (D1, . . . , Dn), (4)
where P (D1, . . . , Dn|A) is the conditional probability of the descriptor set{D1, . . . , Dn} occurrence in a sequence from class A, P (A) is the class A priorprobability, and P (D1, . . . , Dn) is the descriptor set {D1, . . . , Dn} prior probabil-ity. According to the naive Bayes approach, classification features are independent.Therefore,
P (D1, . . . , Dn|A) ∼= P (D1|A)P (D2|A)P (D3|A) · · ·P (Dn|A) = ΠiP (Di|A). (5)
As a result, the log-likelihood ratio of the conditional probability P (A|D1, . . . , Dn)of class A to P (¬A|D1, . . . , Dn) of its complement ¬A can be expressed as
ln[
P (A|D1, . . . , Dn)P (¬A|D1, . . . , Dn)
]= ln
[P (A)P (¬A)
]+
∑i
ln[
P (Di|A)P (Di|¬A)
]. (6)
Taking into account that P (¬A|D1, . . . , Dn) = 1 − P (¬A|D1, . . . , Dn) and usingBayes’ theorem for ratios P (Di|A)/P (Di|¬A), we find
ln[
P (A|D1, . . . , Dn)1 − P (A|D1, . . . , Dn)
]= ln
[P (A)
1 − P (A)
]
+∑
i
{ln
[P (A|Di)
1 − P (A|Di)
]− ln
[P (A)
1 − P (A)
]}. (7)
The use of the naive Bayes approach faces several problems. As it is known,the logarithm of the probability ratio tends to ±∞. We substituted the logarithmsof probability ratios ln[P (A|Di)/(1 − P (A|Di))] for ArcSin(2P (A|Di) − 1). TheArcSin(2P (A|Di)−1) shape coincides with the shape of ln[P (A|Di)/(1−P (A|Di))]for almost all values of P (A|Di), but the ArcSin(2P (A|Di) − 1) value is boundedby ±π/2. To take into account the interdependencies of similarity scores, we usethe averaging of arcsine values instead of the sum of the logarithmic values.
In this study, the query protein belonging to class A is estimated by theB-statistic, calculated as follows:
t0 =
N∑k=1
[Wk(A) − Wk(¬A)]
N∑k=1
[Wk(A) + Wk(¬A)]
(8)
August 14, 2008 16:57 WSPC/185-JBCB 00359
714 K. Alexandrov et al.
ti =
N∑k=1
Sik[Wk(A) − Wk(¬A)]
N∑k=1
Sik[Wk(A) + Wk(¬A)]
(9)
t = Sin
[1n
n∑i=1
ArcSin(ti)
](10)
B =t − t01 − tt0
, (11)
where N is the number of sequences in the training set, Wk(A) and Wk(¬A) arethe weights of sequence k in class A and its complement (0 or 1 in this paper), Sik
is a similarity score in a position i of the query sequence with the training sequencek, and n is the number of amino acid residues in the query sequence.
The classifier program that we developed allows the assignment of multipleclasses to a single sequence. The classes can be intersected simulating, for example,the situation with overlapped substrate specificity of cytochromes P450.
2.3. Validation of prediction accuracy
To estimate the accuracy of prediction, we used the leave-one-out cross-validation(LOOCV) procedure. At each step of the LOOCV procedure, one sequence wasremoved from the training set and used as a query sequence. The obtainedB-statistic values were used to calculate the Independent Accuracy of Prediction(IAP) for each class A13:
IAP =
∑i,j
θ(Bi∈A − Bj∈¬A)
NA · N¬A, (12)
where Bi is the estimation of the sequence i belonging to class A if i actually belongsto class A; Bj is the estimation of the sequence j belonging to class A if j actuallybelongs to its complement ¬A; θ(x) = 1 if x > 0, θ(x) = 1/2 if x = 0, θ(x) = 0 ifx < 0; NA is the number of sequences in class A; and N¬A is the number of sequencesin its complement ¬A. This criterion is defined as “independent” because it doesnot depend on any additional assumptions concerning the parent population andrisk function.
If all B-statistic values calculated for the sequences belonging to class A exceedthe values calculated for the sequences not belonging to class A, than IAP equalsone. We consider the class recognition accuracy as 100% if the IAP value is exactlyequal to one.

August 14, 2008 16:57 WSPC/185-JBCB 00359
Recognition of Protein Function Using the Local Similarity 715
3. Testing the Prediction
The accuracy of the method was evaluated on three protein collections representingthe serine protease set, the “gold standard”, and the cytochrome P450 superfamily.
3.1. Serine proteases
At first, the method was tested on the serine proteases (Enzyme ClassificationNumber 3.4.21.X). Proteins of this class are known to be successfully recognizedby the phylogenomic approach.14 Due to this reason, 623 amino acid sequencescomposing 28 classes were selected to test the efficiency of our method. Theseclasses were defined by the fourth value of the EC Number and therefore did notintersect each to the others. As can be seen from Fig. 3, the prediction accuracyincreased with the extension of the frame and a maximal band parameter. Theaverage accuracy reached the maximum (close to one) at the maximal band of50 and frame of 50. Twenty-four of 28 classes were recognized at these parametervalues with 100% accuracy.
3.2. Gold standard
At the next stage, we tested the method vs. the so-called “gold standard”. Thegold standard is the training set especially designed for testing of the functionalannotation methods. It represents experimentally characterized proteins as wellas their very close homologs.15 The gold standard sequences belong to five enzymesuperfamilies — amidohydrolases, crotonases, enolases, haloacid dehalogenases, andproteins forming vicinal oxygen chelates. These superfamilies are divided into 98families. Forty-two families represented by the single sequences were excluded from
Fig. 3. Testing of the method vs. the serine proteases. Dependence of the recognition accuracy onparameter values.

August 14, 2008 16:57 WSPC/185-JBCB 00359
716 K. Alexandrov et al.
the original set, so the used evaluation set contained 832 sequences. Thus, thetraining set consisted of nonintersecting protein classes. Each protein belongs toa single family and a single superfamily. LOOCV testing of our program includedtwo tasks: classification by families and superfamilies.
High accuracy of recognition was obtained at both superfamily and family levels.The average IAP values calculated for the majority of parameter pairs (maximalband/frame) exceeded 0.99. Given the most favorable parameter values, 4 super-families were recognized with 100% accuracy and 1 family was recognized withIAP = 0.9996, while 45 families were recognized with IAP = 1 and 11 families wererecognized with IAP > 0.96 (Table 1).
Table 1. Accuracy of recognition of gold standard families obtained using theLOOCV test (adopted from Brown et al.15).
Family EC numbera IAP
1,2-dihydroxynaphthalene dioxygenase n/a 0.99961,4-dihydroxy-2-napthoyl-CoA synthase n/a 12,2’,3-trihydroxybiphenyl dioxygenase n/a 0.99942,3-dihydroxybiphenyl dioxygenase 1.13.11.39 0.99292,3-dihydroxy-p-cumate-3,4-dioxygenase n/a 12,4,5-trihydroxytoluene oxygenase n/a 12,6-dichlorohydroquinone dioxygenase n/a 12-haloacid dehalogenase 3.8.1.2 13,4-dihydroxy-phenylacetate 2,3-dioxygenase 1.13.11.15 13-hydroxyisobutyryl-CoA hydrolase 3.1.2.4 13-isopropylcatechol-2,3-dioxygenase n/a 0.99883-methylcatechol 2,3-dioxygenase n/a 0.95874-hydroxyphenylpyruvate dioxygenase 1.13.11.27 1adenosine deaminase 3.5.4.4 1allantoinase 3.5.2.5 1ammelide aminohydrolase n/a 1AMP deaminase 3.5.4.6 1aryldialkylphosphatase 3.1.8.1 1catechol 2,3-dioxygenase 1.13.11.2 0.9979chloromuconate cycloisomerase 5.5.1.7 0.9969crotonobetainyl-CoA hydratase n/a 1
cytosine deaminase 3.5.4.1 1delta(3,5)-delta(2,4)-dienoyl-CoA isomerase n/a 1deoxy-d-mannose-octulosonate 8-phosphate phosphatase 3.1.3.45 1d-hydantoinase 3.5.2.2 1dihydroorotase1 3.5.2.3 1dihydroorotase2 3.5.2.3 1dihydroorotase3 3.5.2.3 1dipeptide epimerase n/a 0.9740dodecenoyl-CoA delta-isomerase (mit.) 5.3.3.8 1enolase 4.2.1.11 1enoyl-CoA hydratase 4.2.1.17 0.9999epoxide hydrolase n-terminal phosphatase n/a 1feruloyl-CoA hydratase/lyase n/a 1fosfomycin resistance protein FosA 2.5.1.18 1

August 14, 2008 16:57 WSPC/185-JBCB 00359
Recognition of Protein Function Using the Local Similarity 717
Table 1. (Continued)
Family EC numbera IAP
galactonate dehydratase 4.2.1.6 1glucarate dehydratase 4.2.1.40 1glyoxalase I 4.4.1.5 1histone acetyltransferase 2.3.1.48 1guanine deaminase 3.5.4.3 1isoaspartyl dipeptidase n/a 1l-hydantoinase 3.5.2.2 1
mandelate racemase 5.1.2.2 1methylaspartate ammonia-lyase 4.3.1.2 1methylglutaconyl-CoA hydratase 4.2.1.18 1methylmalonyl-CoA epimerase 5.1.99.1 1muconate cycloisomerase 5.5.1.1 0.9993n-acetylgalactosamine-6phosphate deacetylase n/a 1n-acyl-d-amino-acid deacylase 3.5.1.81 1o-succinylbenzoate synthase n/a 0.9969phosphonoacetaldehyde hydrolase 3.11.1.1 1phosphoserine phosphatase 3.1.3.3 1
an/a designates that an EC number is not assigned to this class.
Table 2. Testing the method vs. the gold standard set grouped by families:averaged IAP values.
Frame
10 20 30 40 50
Maximal band 10 0.54434 0.99395 0.99673 0.99708 0.9977420 0.99865 0.99868 0.99870 0.99863 0.9986030 0.99862 0.99864 0.99660 0.99848 0.9984840 0.99842 0.99849 0.99847 0.99838 0.9983350 0.99852 0.99854 0.99852 0.99847 0.99847
Table 3. Testing the method vs. the gold standard set grouped by super-families: averaged IAP values.
Frame
10 20 30 40 50
Maximal band 10 0.97193 0.98471 0.99193 0.99508 0.9965220 0.99598 0.99849 0.99945 0.99979 0.9998730 0.99887 0.99959 0.99988 0.99995 0.9999740 0.99952 0.99985 0.99996 0.99998 0.9999950 0.99971 0.99987 0.99995 0.99997 0.99997
The accuracy of superfamily prediction reached the highest values at the max-imal frame, while the accuracy of family prediction reached the maximal valuesat the less frames (Tables 2 and 3; Figs. 4 and 5). Superfamilies are better rec-ognized at the frame of 50, while accuracy of the family recognition reached themaximum at the frame of 30. The superfamilies seem to be clearly recognized

August 14, 2008 16:57 WSPC/185-JBCB 00359
718 K. Alexandrov et al.
Fig. 4. Testing of the method vs. the gold standard set grouped by families. Dependence ofrecognition accuracy on parameter values. Curves for some frame values look very similar and aregiven as a single curve.
Fig. 5. Testing of the method vs. the gold standard set grouped by superfamilies. Dependence ofrecognition accuracy on parameter values. Curves for some frame values look very similar and aregiven as a single curve.
by alignment-based methods; however, families of the same superfamily are worserecognized by the analysis of aligned sequences with phylogenomics methods.4 Ourapproach enables to successfully recognize different functional classes belonging tothe same superfamily.
3.3. Cytochrome P450 superfamily
The cytochrome P450 superfamily represents quite a challenging task. Many of theP450 members are characterized by the wide ligand spectrum, and the subclasses

August 14, 2008 16:57 WSPC/185-JBCB 00359
Recognition of Protein Function Using the Local Similarity 719
of ligand specificity are intersected. As it was shown in our previous study, strongcorrespondence between the homology of proteins and the similarity of their lig-ands was not found for several P450 families.16 In any case, clustering the alignedsequences is not an absolutely reliable way to annotate P450 sequences. Wetested our program to understand whether the local similarity features, whichallow the recognition of ligand specificity, exist. The data sets of experimentallyannotated P450 proteins were retrieved from the Cytochrome Protein Database(http://cpd.ibmh.msk.su/).17 We collected two training sets representing speci-ficity subclasses composed of two or more proteins. The first set represented 211proteins, metabolizing 578 substrates. The second set represented 139 proteins,induced by 272 compounds. The proteins specifically interacting with the sameligand were considered as belonging to the same subclass of substrate or inducerspecificity.
The LOOCV procedure showed that prediction accuracy is significantly lessthan in the case of other studied sets (Fig. 6). However, we can see a clear trendof increasing accuracy with an increasing size of functional group for both thesubstrate and inducer specificities.
Though the ligand specificity of cytochrome P450 does not reveal clear cor-relation with homology,16 P450 families are perfectly separated by alignment.Therefore, the different methods predict P450 ligand specificity with relativelylow accuracy. PAAS recognizes the P450 substrate and inducer specificities withlow efficiency too. On the other hand, the larger subclass sets provide a relativelyhigher accuracy obtained with our method due to the larger representation of dif-ferent families in the P450 set. The possible contribution of certain local motifs onspecificity recognition is the subject of further study.
3.4. Comparison with other methods
In order to estimate the comparative power of the suggested method, we performedfunctional class prediction with two existing methods: the HMMer program, whichuses hidden Markov models (HMMs) based on the sequence alignments18; and theSVM-Prot program, which implements the machine learning algorithm using theunaligned sequences.19 The comparative results are shown in Table 4.
We extracted the evaluation set from the gold standard. It represented allsuperfamilies (designated by “sf” in Table 4) and 10 families (designated as “f”in Table 4). The families were selected so that they were rather large (from 7to 215 proteins) and had EC numbers (to evaluate the SVM-Prot prediction).Eight families predicted with the highest accuracy (IAP = 1), and two fami-lies predicted with the minimal IAP value. The HMMer program was tested bybuilding the models for all evaluated families and scanning each model vs. theevaluation set. The SVM-Prot program was used with its own training set andtested by three sequences belonging to each evaluated family, which used inputdata for the SVM-Prot server (http://jing.cz3.nus.edu.sg/cgi-bin/svmprot.cgi/).

August 14, 2008 16:57 WSPC/185-JBCB 00359
720 K. Alexandrov et al.
(a)
(b)
Fig. 6. Testing the prediction of (a) substrate and (b) inducer specificity of cytochromes P450.The results are shown for groups including two or more members. The frame and maximal bandvalues are 20 and 100, respectively.
The superfamilies were predicted by only HMMer and our method because theEC numbers cannot be assigned to these classes.
The output data were formalized for our method and HMMer as follows:
• “+ + +” designates 100% accuracy of prediction; and• “+ +” designates that our method predicts the corresponding class with 0.9 <
IAP < 1, and that HMMer predicts the same class with the number of true-positive (TP) results higher than the sum of false-positive (FP) and false-negative(FN) ones.
The threshold for HMMer results was determined from the program output data.It was equal to the maximal E-value of the correctly predicted proteins belonging to

August 14, 2008 16:57 WSPC/185-JBCB 00359
Recognition of Protein Function Using the Local Similarity 721
Table 4. Accuracy of protein functional class prediction with different methods.
Protein class PAAS HMMer SVM-Prot
Amidohydrolase (sf) + + + + + +Crotonase (sf) + + + + + +Enolase (sf) + + + + + + ?VOC (sf) + + + + + +Haloacid dehalogenase (sf) ++ + + +Histone acetiltransferase (f) + + + + + + ++Enolase (f) + + + + + + + + +AMP deaminse (f) + + + + + + + + +d-hydantoinase (f) + + + + + + +dihydroorotase2 (f) + + + + + + —Guanine deaminase (f) + + + + + + ++p-type atpase (f) + + + + + + —Urease (f) + + + + + + + + +2,3-dihydroxybiphenyl dioxygenase (f) ++ ++ +chloromuconate cycloisomerase (f) ++ + + + ++
a given family. For four superfamilies, the maximal E-value significantly exceededthe bounds of the threshold proposed by the authors of HMMer.
In the case of SVM-Prot, the number of “+” signs corresponds to the numberof correctly annotated sequences of three evaluated ones with the highest P-values.It should be noted that SVM-Prot predicts only two first positions of EC number(the superfamilies are not assigned to any EC numbers).
The sign “—” denotes that the method does not recognize this protein family.Hidden Markov models (HMM) were built without removal of the query
sequences. SVM-Prot uses its own training set, which may also contain the querysequences. So, the accuracy of the recognition performed by these two programscould be somewhat overestimated due to the self-recognition. Keeping in mind thisfact, we estimate the prediction results obtained by HMMer and PAAS as compa-rable. The results obtained with SVM-Prot are less accurate than the predictionperformed by PAAS and HMMer.
4. Conclusions
The proposed approach revealed high efficiency in protein function prediction. Ahigh accuracy of prediction was obtained for different levels of protein functionalclassifications. We showed that our method enables to predict effectively the func-tional class of proteins when these classes do not intersect with each other. Theprediction accuracy is high — up to 100% recognition for the majority of theseclasses. These results are comparable with data obtained from alignment-basedmethods. However, the PAAS method has the following advantages:
(1) The PAAS method provides fine tuning (by changing of the band andframe values) of the program for searching both the global and local
August 14, 2008 16:57 WSPC/185-JBCB 00359
722 K. Alexandrov et al.
sequence similarities. This feature enables to classify and functionally map newsequences.
(2) The PAAS method takes into account more information about sequence simi-larity than alignment methods. The local similarity scores ignored by alignmentcan make a contribution to protein class recognition.
(3) The PAAS method runs without a preliminary alignment procedure, whichoften requires expert interference.
(4) HMM building is a time-consuming procedure, while our relatively sim-ple algorithm provides the sequence recognition at a very high speed. Itis especially important for detection of the parameter values optimizing acertain class recognition, as the solution of this task can require multiplerecalculations.
The suggested approach provides a more accurate prediction compared to themachine learning method (SVM-Prot). Our method provides accurate distinguish-ing of the large protein superfamilies as well as functional subclasses related to thesame superfamily. So, the method allows perfect recognition at the different levelsof structural and functional specificity.
We suggest that our method can be adapted for different types of sequence simi-larity. The classes associated with global sequence similarity are perfectly predictedby our program. We suggest that related features with separate sequential motifsshould also be recognized by this approach. The superfamilies seem to be clearly rec-ognized by alignment-based methods; however, the families of the same superfamilyare worse recognized by the analysis of aligned sequences. Our approach enables torecognize different functional classes belonging to the same superfamily. The fami-lies are predicted with maximal accuracy at shorter frame values compared to thesuperfamily level. Thus, the relatively short sequential motifs are more importantfor recognition of the classified groups, which are closer to each other.
Testing of the method vs. the P450 superfamily reveals a less accurate recogni-tion of broadly intersected functional subclasses within the large group of homolog-ical proteins. Sophisticated sequence–function relationships result in the difficultiesof function recognition. However, the larger groups were predicted with significantlyhigher accuracy. It is possible that remote homologs can have three-dimensionalstructural features that provide affinity to the same ligands, which are not recog-nized in a sequence.
Our approach can be applied for both functional specificity prediction andsequence mapping, i.e. to reveal local determinants of the functional specificity.
Acknowledgments
This work was supported by the Russian Federation of Basic Research (grant N 04-04-49390-a). We are grateful to A. V. Lisitsa for providing the data on cytochromeP450 substrate and inducer specificity.

August 14, 2008 16:57 WSPC/185-JBCB 00359
Recognition of Protein Function Using the Local Similarity 723
References
1. Devos D, Valencia A, Practical limits of function prediction, Proteins 41:98–107, 2000.2. Devos D, Valencia A, Intrinsic errors in genome annotation, Trends Genet 17(8):429–
431, 2001.3. Sjolander K, Phylogenomic inference of protein molecular function: Advances and
challenges, Bioinformatics 20:170–179, 2004.4. Han L, Cui J, Lin H, Ji Z, Cao Z, Li Y, Chen Y, Recent progresses in the application
of machine learning approach for predicting protein functional class independent ofsequence similarity, Proteomics 6(14):4023–4037, 2006.
5. Andorf C, Silvescu A, Dobbs D, Honavar V, Learning classifiers for assigning proteinsequences to gene ontology (GO) functional families, Proceedings of the Fifth Inter-national Conference on Knowledge Based Computer Systems (KBCS), pp. 256–265,2004.
6. Saha S, Raghava GP, VICMpred: An SVM-based method for the prediction of func-tional proteins of Gram-negative bacteria using amino acid patterns and composition,Genomics Proteomics Bioinformatics 4:42–47, 2006.
7. Jensen J, Gupta R, Stærfeldt H-H, Brunak S, Prediction of human protein functionaccording to Gene Ontology categories, Bioinformatics 19:635–642, 2003.
8. Fomenko A, Filimonov D, Sobolev B, Poroikov V, Prediction of protein functionalspecificity without an alignment, OMICS 10:56–65, 2006.
9. Kalinina OV, Novichkov PS, Mironov AA, Gelfand MS, Rakhmaninova AB, SDPpred:A tool for prediction of amino acid residues that determine differences in functionalspecificity of homologous proteins, Nucleic Acids Res 32(Web Server issue):W424–W428, 2004.
10. Kalinina OV, Rassel RB, Rakhmaninova AB, Gelfand MS, Computational method forprediction of protein functional sites using specificity determinants, Mol Biol (Mosk)41(1):151–162, 2007.
11. McLachlan AD, Test for comparing related amino acid sequences: Cytochrome C andcytochrome C551, J Mol Biol 61:409–424, 1971.
12. Barton GJ, Protein sequence alignment and database scanning, in Sternberg MJE(ed.), Protein Structure Prediction — A Practical Approach, IRL Press at OxfordUniversity Press, Oxford, 31–64, 1996.
13. Lagunin A, Stepanchikova A, Filimonov D, Poroikov V, PASS: Prediction of activityspectra for biologically active substances, Bioinformatics 16(8):747–748, 2000.
14. Rose T, Di Cera E, Substrate recognition drives the evolution of serine proteases,J Biol Chem 277(22):19243–19246, 2002.
15. Brown SD, Gerlt JA, Seffernick JL, Babbitt PC, A gold standard set of mechanisti-cally diverse enzyme superfamilies, Genome Biol 7(1):R8, 2006.
16. Borodina Y, Lisitsa A, Poroikov V, Filimonov D, Sobolev B, Archakov A, If thereexists correspondence between similarity of substrates and protein sequences incytochrome P450 superfamily?, Nova Acta Leopold 87(329):47–55, 2003.
17. Lisitsa AV, Ponomarenko EA, Gusev SA, Kuznetsova GP, Karuzina II, LewiP, Archakov AI, Cytochrome P450 knowledgebase: Structure and functionality,Proceedings of the 14th International Conference on Cytochromes P450: Biophysicsand Bioinformatics, pp. 29–34, 2005.
18. Durbin R, Eddy S, Krogh A, Mitchison G, Biological Sequence Analysis: ProbabilisticModels of Proteins and Nucleic Acids, Cambridge University Press, Cambridge, 1998.
19. Cai CZ, Han LY, Ji ZL, Chen X, Chen YZ, SVM-Prot: Web-based support vectormachine software for functional classification of a protein from its primary sequence,Nucleic Acids Res 31:3692–3697, 2003.

August 14, 2008 16:57 WSPC/185-JBCB 00359
724 K. Alexandrov et al.
Kirill Alexandrov received his Diploma from the Russian StateMedical University of the Russian Academy of Medical Sciences,Moscow, Russia, in 2006. Since then, he has been a Ph.D. studentat the Laboratory for Structure-Function Based Drug Designof the Institute of Biomedical Chemistry, Russian Academy ofMedical Sciences. Alexandrov’s field of interests include proteinfunction recognition and search for functional determinants inamino acid sequences.
Boris Sobolev received his Ph.D. degree at the Ivanovsky Insti-tute of Virology of the Russian Academy of Medical Sciences in1993. From 1994 to 1995, he was in Bakh Institute of Biochem-istry of the Russian Academy of Sciences as a senior scientist.He is currently in the Orechovich Institute of Biomedical Chem-istry of the Russian Academy of Medical Sciences, Laboratoryfor Structure-Function Based Drug Design, as a leading scientist.His research focuses on protein function prediction and searchof potential drug targets.
Dmitry Filimonov graduated in Mathematics, Physics, andBiophysics from the Moscow Institute of Physics and Technology.He is a leading scientist at the Laboratory for Structure-FunctionBased Drug Design of the Institute of Biomedical Chemistry,the Russian Academy of Medical Sciences. He is a member ofthe Cheminformatics and QSAR Society. Dr. Filimonov’s fieldof research is bioinformatics and computer-aided drug design.
Vladimir Poroikov graduated from the Department of Physicsof Moscow State University in 1974, with an M.Sc. in Physics. Hehas since then received a Professor in Biochemistry (Institute ofBiomedical Chemistry, Russian Academy of Medical Sciences,Moscow, 2000), D.Sc. in Pharmacology (National ResearchCenter for Biologically Active Compounds, Staraya Kupavna,Moscow, 1995), and Ph.D. in Biophysics (Department of Biology,Moscow State University, 1981). Deputy Director (Research) in
the Institute of Biomedical Chemistry of the Russian Academy of Medical Sciences(IBMC, Moscow) since 1998, he has also been Head of the Laboratory for Structure-Function Based Drug Design in the IBMC since 1995 and Professor of the Medical

August 14, 2008 16:57 WSPC/185-JBCB 00359
Recognition of Protein Function Using the Local Similarity 725
and Biological Faculty of the Russian State Medical University since 1996. He hasbeen a member of the organizing committee and/or invited speaker of more than10 international conferences during the past 4 years, and is a co-author of morethan 300 published works and 12 non-open published R&D reports of new phar-maceuticals. Poroikov’s field of interest is bioinformatics, chemoinformatics, andcomputer-aided drug design.