Using similarity learning to improve network-based gene function prediction
6
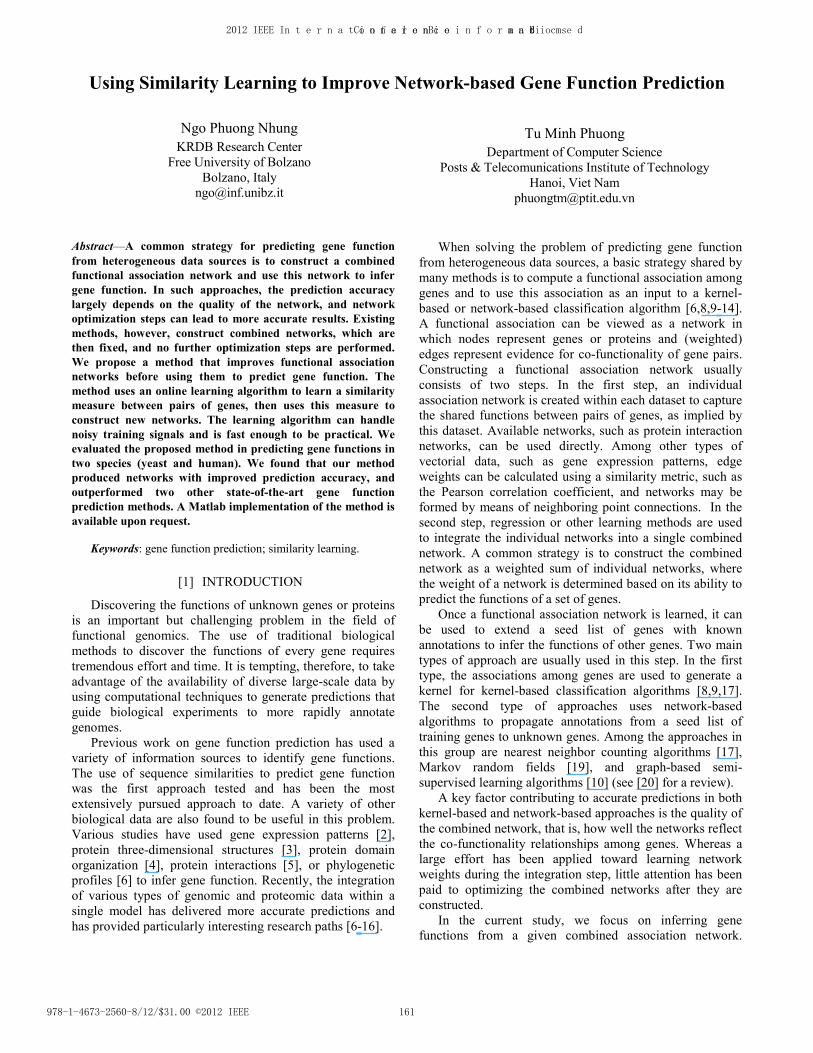
Using Similarity Learning to Improve Network-based Gene Function Prediction Ngo Phuong Nhung KRDB Research Center Free University of Bolzano Bolzano, Italy [email protected] Tu Minh Phuong Department of Computer Science Posts & Telecomunications Institute of Technology Hanoi, Viet Nam [email protected] Abstract—A common strategy for predicting gene function from heterogeneous data sources is to construct a combined functional association network and use this network to infer gene function. In such approaches, the prediction accuracy largely depends on the quality of the network, and network optimization steps can lead to more accurate results. Existing methods, however, construct combined networks, which are then fixed, and no further optimization steps are performed. We propose a method that improves functional association networks before using them to predict gene function. The method uses an online learning algorithm to learn a similarity measure between pairs of genes, then uses this measure to construct new networks. The learning algorithm can handle noisy training signals and is fast enough to be practical. We evaluated the proposed method in predicting gene functions in two species (yeast and human). We found that our method produced networks with improved prediction accuracy, and outperformed two other state-of-the-art gene function prediction methods. A Matlab implementation of the method is available upon request. Keywords: gene function prediction; similarity learning. [1] INTRODUCTION Discovering the functions of unknown genes or proteins is an important but challenging problem in the field of functional genomics. The use of traditional biological methods to discover the functions of every gene requires tremendous effort and time. It is tempting, therefore, to take advantage of the availability of diverse large-scale data by using computational techniques to generate predictions that guide biological experiments to more rapidly annotate genomes. Previous work on gene function prediction has used a variety of information sources to identify gene functions. The use of sequence similarities to predict gene function was the first approach tested and has been the most extensively pursued approach to date. A variety of other biological data are also found to be useful in this problem. Various studies have used gene expression patterns [2], protein three-dimensional structures [3], protein domain organization [4], protein interactions [5], or phylogenetic profiles [6] to infer gene function. Recently, the integration of various types of genomic and proteomic data within a single model has delivered more accurate predictions and has provided particularly interesting research paths [6-16]. When solving the problem of predicting gene function from heterogeneous data sources, a basic strategy shared by many methods is to compute a functional association among genes and to use this association as an input to a kernel- based or network-based classification algorithm [6,8,9-14]. A functional association can be viewed as a network in which nodes represent genes or proteins and (weighted) edges represent evidence for co-functionality of gene pairs. Constructing a functional association network usually consists of two steps. In the first step, an individual association network is created within each dataset to capture the shared functions between pairs of genes, as implied by this dataset. Available networks, such as protein interaction networks, can be used directly. Among other types of vectorial data, such as gene expression patterns, edge weights can be calculated using a similarity metric, such as the Pearson correlation coefficient, and networks may be formed by means of neighboring point connections. In the second step, regression or other learning methods are used to integrate the individual networks into a single combined network. A common strategy is to construct the combined network as a weighted sum of individual networks, where the weight of a network is determined based on its ability to predict the functions of a set of genes. Once a functional association network is learned, it can be used to extend a seed list of genes with known annotations to infer the functions of other genes. Two main types of approach are usually used in this step. In the first type, the associations among genes are used to generate a kernel for kernel-based classification algorithms [8,9,17]. The second type of approaches uses network-based algorithms to propagate annotations from a seed list of training genes to unknown genes. Among the approaches in this group are nearest neighbor counting algorithms [17], Markov random fields [19], and graph-based semi- supervised learning algorithms [10] (see [20] for a review). A key factor contributing to accurate predictions in both kernel-based and network-based approaches is the quality of the combined network, that is, how well the networks reflect the co-functionality relationships among genes. Whereas a large effort has been applied toward learning network weights during the integration step, little attention has been paid to optimizing the combined networks after they are constructed. In the current study, we focus on inferring gene functions from a given combined association network. 2012 IEEE International Conference on Bioinformatics and Biomedi 978-1-4673-2560-8/12/$31.00 ©2012 IEEE 161
-
Upload
independent -
Category
Documents
-
view
3 -
download
0
Transcript of Using similarity learning to improve network-based gene function prediction
Using Similarity Learning to Improve Network-based Gene Function Prediction
Ngo Phuong Nhung KRDB Research Center
Free University of Bolzano Bolzano, Italy
Tu Minh Phuong Department of Computer Science
Posts & Telecomunications Institute of Technology Hanoi, Viet Nam
Abstract—A common strategy for predicting gene function from heterogeneous data sources is to construct a combined functional association network and use this network to infer gene function. In such approaches, the prediction accuracy largely depends on the quality of the network, and network optimization steps can lead to more accurate results. Existing methods, however, construct combined networks, which are then fixed, and no further optimization steps are performed. We propose a method that improves functional association networks before using them to predict gene function. The method uses an online learning algorithm to learn a similarity measure between pairs of genes, then uses this measure to construct new networks. The learning algorithm can handle noisy training signals and is fast enough to be practical. We evaluated the proposed method in predicting gene functions in two species (yeast and human). We found that our method produced networks with improved prediction accuracy, and outperformed two other state-of-the-art gene function prediction methods. A Matlab implementation of the method is available upon request.
Keywords: gene function prediction; similarity learning.
[1] INTRODUCTION
Discovering the functions of unknown genes or proteins is an important but challenging problem in the field of functional genomics. The use of traditional biological methods to discover the functions of every gene requires tremendous effort and time. It is tempting, therefore, to take advantage of the availability of diverse large-scale data by using computational techniques to generate predictions that guide biological experiments to more rapidly annotate genomes.
Previous work on gene function prediction has used a variety of information sources to identify gene functions. The use of sequence similarities to predict gene function was the first approach tested and has been the most extensively pursued approach to date. A variety of other biological data are also found to be useful in this problem. Various studies have used gene expression patterns [2], protein three-dimensional structures [3], protein domain organization [4], protein interactions [5], or phylogenetic profiles [6] to infer gene function. Recently, the integration of various types of genomic and proteomic data within a single model has delivered more accurate predictions and has provided particularly interesting research paths [6-16].
When solving the problem of predicting gene function from heterogeneous data sources, a basic strategy shared by many methods is to compute a functional association among genes and to use this association as an input to a kernel-based or network-based classification algorithm [6,8,9-14]. A functional association can be viewed as a network in which nodes represent genes or proteins and (weighted) edges represent evidence for co-functionality of gene pairs. Constructing a functional association network usually consists of two steps. In the first step, an individual association network is created within each dataset to capture the shared functions between pairs of genes, as implied by this dataset. Available networks, such as protein interaction networks, can be used directly. Among other types of vectorial data, such as gene expression patterns, edge weights can be calculated using a similarity metric, such as the Pearson correlation coefficient, and networks may be formed by means of neighboring point connections. In the second step, regression or other learning methods are used to integrate the individual networks into a single combined network. A common strategy is to construct the combined network as a weighted sum of individual networks, where the weight of a network is determined based on its ability to predict the functions of a set of genes.
Once a functional association network is learned, it can be used to extend a seed list of genes with known annotations to infer the functions of other genes. Two main types of approach are usually used in this step. In the first type, the associations among genes are used to generate a kernel for kernel-based classification algorithms [8,9,17]. The second type of approaches uses network-based algorithms to propagate annotations from a seed list of training genes to unknown genes. Among the approaches in this group are nearest neighbor counting algorithms [17], Markov random fields [19], and graph-based semi-supervised learning algorithms [10] (see [20] for a review).
A key factor contributing to accurate predictions in both kernel-based and network-based approaches is the quality of the combined network, that is, how well the networks reflect the co-functionality relationships among genes. Whereas a large effort has been applied toward learning network weights during the integration step, little attention has been paid to optimizing the combined networks after they are constructed.
In the current study, we focus on inferring gene functions from a given combined association network.
2012 IEEE International Conference on Bioinformatics and Biomedicine
978-1-4673-2560-8/12/$31.00 ©2012 IEEE 161
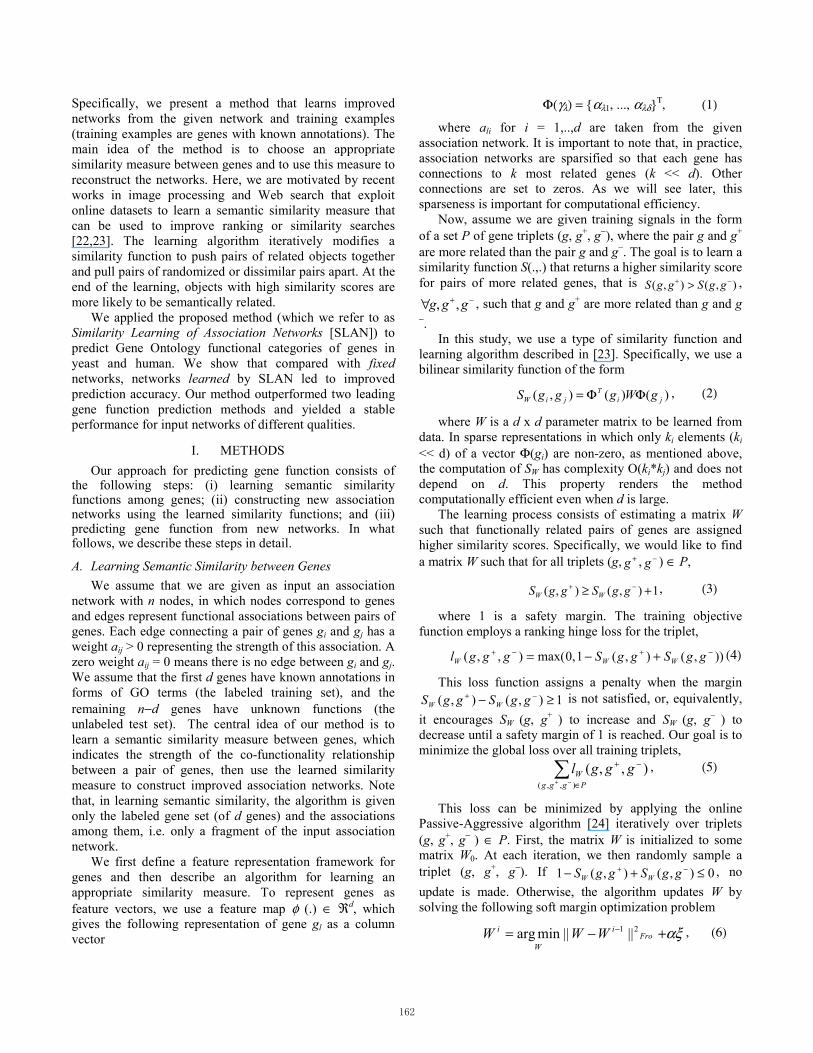
Specifically, we present a method that learns improved networks from the given network and training examples (training examples are genes with known annotations). The main idea of the method is to choose an appropriate similarity measure between genes and to use this measure to reconstruct the networks. Here, we are motivated by recent works in image processing and Web search that exploit online datasets to learn a semantic similarity measure that can be used to improve ranking or similarity searches [22,23]. The learning algorithm iteratively modifies a similarity function to push pairs of related objects together and pull pairs of randomized or dissimilar pairs apart. At the end of the learning, objects with high similarity scores are more likely to be semantically related.
We applied the proposed method (which we refer to as Similarity Learning of Association Networks [SLAN]) to predict Gene Ontology functional categories of genes in yeast and human. We show that compared with fixed networks, networks learned by SLAN led to improved prediction accuracy. Our method outperformed two leading gene function prediction methods and yielded a stable performance for input networks of different qualities.
I. METHODS Our approach for predicting gene function consists of
the following steps: (i) learning semantic similarity functions among genes; (ii) constructing new association networks using the learned similarity functions; and (iii) predicting gene function from new networks. In what follows, we describe these steps in detail.
A. Learning Semantic Similarity between Genes We assume that we are given as input an association
network with n nodes, in which nodes correspond to genes and edges represent functional associations between pairs of genes. Each edge connecting a pair of genes gi and gj has a weight aij > 0 representing the strength of this association. A zero weight aij = 0 means there is no edge between gi and gj. We assume that the first d genes have known annotations in forms of GO terms (the labeled training set), and the remaining n−d genes have unknown functions (the unlabeled test set). The central idea of our method is to learn a semantic similarity measure between genes, which indicates the strength of the co-functionality relationship between a pair of genes, then use the learned similarity measure to construct improved association networks. Note that, in learning semantic similarity, the algorithm is given only the labeled gene set (of d genes) and the associations among them, i.e. only a fragment of the input association network.
We first define a feature representation framework for genes and then describe an algorithm for learning an appropriate similarity measure. To represent genes as feature vectors, we use a feature map φ (.) ∈ ℜd, which gives the following representation of gene gl as a column vector
Φ(γλ) = {αλ1, ..., αλδ}Τ, (1)
where ali for i = 1,..,d are taken from the given association network. It is important to note that, in practice, association networks are sparsified so that each gene has connections to k most related genes (k << d). Other connections are set to zeros. As we will see later, this sparseness is important for computational efficiency.
Now, assume we are given training signals in the form of a set P of gene triplets (g, g+, g−), where the pair g and g+ are more related than the pair g and g−. The goal is to learn a similarity function S(.,.) that returns a higher similarity score for pairs of more related genes, that is ),(),( −+ > ggSggS ,
−+∀ ggg ,, , such that g and g+ are more related than g and g −.
In this study, we use a type of similarity function and learning algorithm described in [23]. Specifically, we use a bilinear similarity function of the form
)()(),( jiT
jiW gWgggS ΦΦ= , (2)
where W is a d x d parameter matrix to be learned from data. In sparse representations in which only ki elements (ki << d) of a vector Φ(gi) are non-zero, as mentioned above, the computation of SW has complexity O(ki*kj) and does not depend on d. This property renders the method computationally efficient even when d is large.
The learning process consists of estimating a matrix W such that functionally related pairs of genes are assigned higher similarity scores. Specifically, we would like to find a matrix W such that for all triplets (g, +g , −g ) ∈ P,
1),(),( +≥ −+ ggSggS WW , (3)
where 1 is a safety margin. The training objective function employs a ranking hinge loss for the triplet,
)),(),(1 ,0max(),,( −+−+ +−= ggSggSgggl WWW (4)
This loss function assigns a penalty when the margin 1),(),( ≥− −+ ggSggS WW is not satisfied, or, equivalently,
it encourages SW (g, g+ ) to increase and SW (g, g− ) to decrease until a safety margin of 1 is reached. Our goal is to minimize the global loss over all training triplets,
∑∈
−+
−+ PgggW gggl
),,(
),,( , (5)
This loss can be minimized by applying the online Passive-Aggressive algorithm [24] iteratively over triplets (g, g+, g− ) ∈ P. First, the matrix W is initialized to some matrix W0. At each iteration, we then randomly sample a triplet (g, g+, g−). If 0),(),(1 ≤+− −+ ggSggS WW , no update is made. Otherwise, the algorithm updates W by solving the following soft margin optimization problem
αξ+−= −Fro
i
W
i WWW 21 ||||minarg , (6)
162
while enforcing the constraints
ξ−≥− −+ 1),(),( ggSggS WW , ξ ε 0, (7)
where ξ is a slack variable, and ||.||Frob is the Frobenius norm. Intuitively, at each iteration, the algorithm attempts to keep Wi close to previous values Wi-1 while minimizing the loss on the current triplet. α is the “aggressiveness” parameter that controls the trade-off between these two objectives. Solving this optimization problem by the Lagrange method gives the following update for W:
ii
ii VWW τ+= −1 , (8)
where }||||
),,(,min{ 2
1
Frobi
Wi V
gggl i−+
−= ατ , (9)
andT
di ggggggV ))]()(()()),...,()(()([ 1
−+−+ Φ−ΦΦΦ−ΦΦ= ,
where ig)(Φ is the i-the element of )(gΦ .
This iterative training process continues until a stopping criterion is satisfied. In practice, as shown in [24], selecting the best W by using a hold-out validation set leads to better generalization while reducing training time.
B. Selecting Training Examples Given a labeled set of d genes, choosing a right training
set of triplets (g, g+, g− ) is important for learning semantic similarities. This task is non-trivial given the hierarchical nature of Gene Ontology (GO) or FunCat categories [24,25]. To quantify the functional similarities between genes with GO-based annotations, we rely on previous works on GO term semantic similarity assessment. The semantic similarity between two GO terms is determined using Resnik’s measure [27], which is one of the most commonly used and stable metrics for GO [28]. The Resnik measure gauges the similarity between two GO terms c1 and c2 according to the information content of their most informative common ancestor (MICA) in the GO graph:
Sim(c1, c2) = IC(cMICA), where the information content of a GO term is calculated
from its frequency in a corpus of gene annotations. For genes annotated with more than one GO term, the
similarity between a pair of genes is obtained by the best-match average combination strategy, which considers only the best matched terms and computes their average similarities. [28]. In this work, we used the GoSemSim package [29] to compute the Resnik-based pairwise similarity between genes.
C. Learning Function Specific Similarity Measure The algorithm above can be used to learn a single
similarity measure S with parameter matrix W for all functional categories of genes. However, given the fact that genes can have multiple functions, it may be insufficient to use a single matrix W to capture all of the complex co-functionality relationships among genes. Thus, for each
gene functional category C we learn and store a function specific matrix WC , which we will later use to construct an association network for C. For a given functional class C, we choose a triplet for training as follows. First, we uniformly sample a gene annotated with C as g, and uniformly sample another gene annotated with C as an instance of g+. Then, we randomly pick a gene g- from those satisfying the following: (i) they are not annotated with the current GO term or one of its descendant terms, and (ii) the similarity scores comparing genes with g are lower than a cutoff value, where similarity scores are defined as described above. In our experiments, we used a cutoff value of 0.4, and pairs of genes that had a similarity score below this cutoff were deemed to be dissimilar.
We initialized W0C = I (an identity matrix) and used a
held-out validation set for selecting the best WC and corresponding number of training iterations. Specifically, the prediction accuracy was measured on the held-out set after a predefined number of iterations, the algorithm stopped when accuracy saturated and the corresponding W is returned.
D. Reconstructing Association Networks After similarity functions are learned, we construct new
association networks and use them to predict gene function. First, for each gene gi , i = 1..n, from both labeled and unlabeled sets, its vector representation is created as described above:
Φ(gi) = {ai1, ..., aid}T Then, for each functional category (GO term) C, the
strength of association a’ij between gene gi and gene gj is computed as the similarity score using the similarity function
CWS with parameter WC (for simplicity we omit index C from the notation of a’ij ). Since the similarity function
CWS is not symmetric, we calculate the a’ij as
2/)),(),((' ijWjiWji ggSggSaCC
+= (10)
We sparsify the newly constructed networks by keeping k largest edges for each gene and set the rest to zeros.
E. Predicting Gene Function We use the graph-based learning algorithm proposed in
[33] to predict gene function from a network njiaA ij ...1,},{ '' == . Let us assume a label vector y, where
yi is the prior knowledge about gene i having the function of interest. Known positive genes, that is, genes annotated with the given function, are assigned labels +1 and negative genes are assigned labels −1. Here, genes that are not annotated with the given function or any of its descendants are considered to be negative. Following Mostafavi et al. [11], we set a prior label
−+
−+
+−=
nnnnyi
for unknown genes,
where n+ and n− are the number of positive and negative genes, respectively. This prior value is important for
163
learning in unbalanced classification settings, such as gene function prediction.
In learning, the algorithm computes a score fi ∈ [−1,1] for each gene i, and in prediction, genes are classified by thresholding the scores. One can obtain fi by minimizing the following objective function:
,)()()(')(1,
2
1
2 Lfffyfyffafy TTn
jijiij
n
iii σσ +−−=−+− ∑∑
==
where L = D – A’ is the graph Laplacian matrix and D is a diagonal matrix with ∑ =
= n
j iji ad1
' . The first term of the
objective function constrains the scores to remain close to the prior labels y, and the second term keeps the score fi close to those of adjacent nodes. Parameter σ is the trade-off between the two terms and was set to 1 in our experiments. The solution to this problem is f = (I + σL ) -1 y, (12)
where I is an identity matrix. In our experiments, we used a conjugate gradient-based implementation of the solver from [12] to solve for f.
F. Input Networks In the descriptions above, we assumed that the input for
the method, that is, a functional association network, was provided. In general, any network integration method can be used to generate such a network. In this study, we consider a simple integration of individual networks using uniform weights, i.e. the composite network is formed by summing over the individual networks. As described in [12], we sparsified the individual and composite networks by retaining 50 connections with the largest weights for each gene, and setting the rest to zeros.
G. Dataset To evaluate the proposed method, we used two datasets
for two species: yeast and human. Yeast. The first dataset was the same one used by
Barutcuoglu et al.[22] and contained heterogeneous data for 4524 yeast genes. Genes were annotated with a subset of 105 GO terms from the biological_process hierarchy of the Gene Ontology. Annotations were up-propagated so that a gene annotated to a node in the GO hierarchy was also annotated to all ancestors of this node. This ensured consistency among the training labels, and the convention was used in all experiments. The input features for each gene consisted of four types of data: pairwise interactions, colocalization of gene products in a cell, transcription factor binding sites, and microarray data. The first three types of data were binary, and the last one was real-valued.
Human. For the human dataset, we used the dataset provided in [12]. This dataset was compiled from eight sources, including gene expression data, protein interactions, domain compositions, OMIM diseases, and transcriptional modification data for 13281 human genes. Each gene was annotated with GO terms from a subset of
the Gene Ontology biological process hierarchy. As with the yeast data set, all labels were up-propagated in this work. We used networks provided by the authors of [11] to guarantee identical experimental conditions. Those networks were constructed as follows: protein interaction networks were used directly, and additional networks were constructed from the protein interaction data using Pearson correlation coefficients (PCC). PCCs were also applied to other data types, e.g. microarray data, to form networks. All negative PCC values were set to zeros.
II. RESULTS AND DISCUSSION We evaluated the performance of our method (SLAN) in
predicting GO functional categories and compared our results to those of several other methods using 3-fold cross validation. For each partition of the training and test sets, we computed the receiver operating characteristic (ROC) score, which is the area under the ROC curve (AUC). We then averaged over all three partitions. An ROC curve plots the sensitivity (true positive rate) as function of 1-specificity (false positive rate) for different decision thresholds. An AUC value of 0.5 corresponds to random guessing, and an AUC value of 1 indicates that the method successfully separated positive examples from negative ones. For each training/test split, 25% of the training examples were withheld and used as a validation set for selecting the number of training iterations. The AUC of the ROC was measured for each GO term every 2000 iterations, and learning was stopped once the accuracy became saturated.
A. Performance on the Yeast Dataset Comparison with SW.
We first compared the proposed method with the SW algorithm [12], a method that showed state-of-the-art performances in a number of benchmarks [21]. In our experiments we used the code provided by the authors of SW with default parameters.
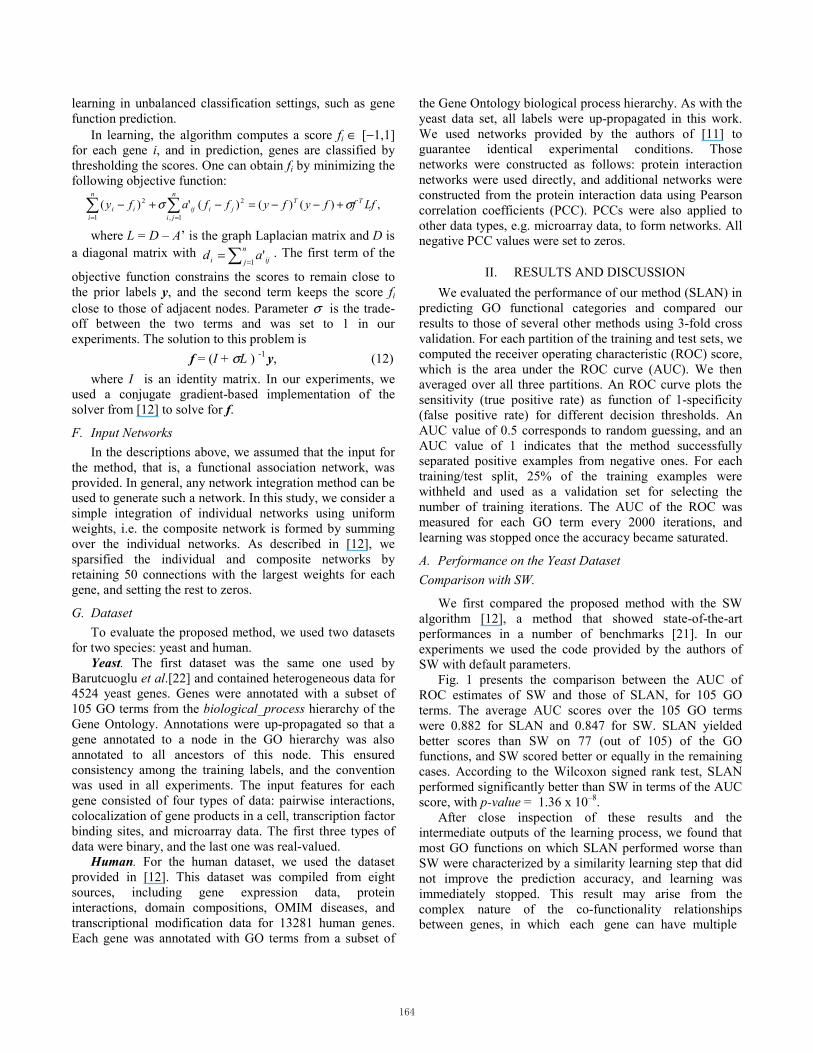
Fig. 1 presents the comparison between the AUC of ROC estimates of SW and those of SLAN, for 105 GO terms. The average AUC scores over the 105 GO terms were 0.882 for SLAN and 0.847 for SW. SLAN yielded better scores than SW on 77 (out of 105) of the GO functions, and SW scored better or equally in the remaining cases. According to the Wilcoxon signed rank test, SLAN performed significantly better than SW in terms of the AUC score, with p-value = 1.36 x 10⁻⁸.
After close inspection of these results and the intermediate outputs of the learning process, we found that most GO functions on which SLAN performed worse than SW were characterized by a similarity learning step that did not improve the prediction accuracy, and learning was immediately stopped. This result may arise from the complex nature of the co-functionality relationships between genes, in which each gene can have multiple
164
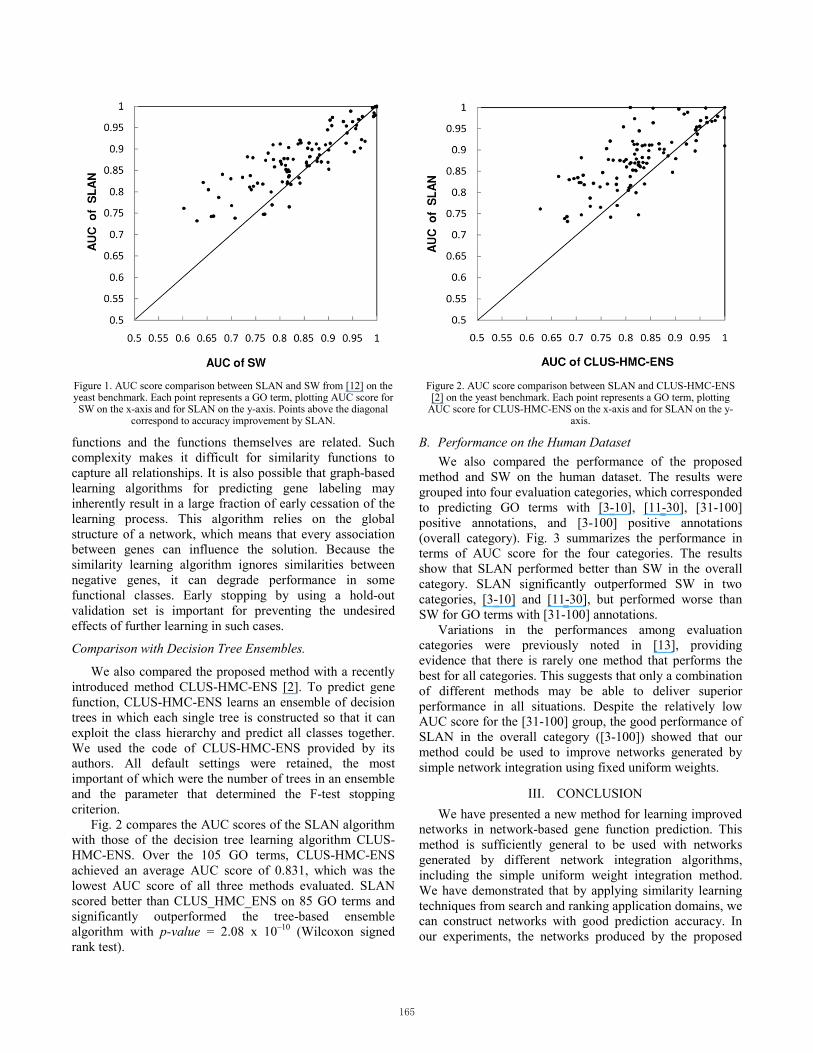
Figure 1. AUC score comparison between SLAN and SW from [12] on the yeast benchmark. Each point represents a GO term, plotting AUC score for SW on the x-axis and for SLAN on the y-axis. Points above the diagonal
correspond to accuracy improvement by SLAN.
functions and the functions themselves are related. Such complexity makes it difficult for similarity functions to capture all relationships. It is also possible that graph-based learning algorithms for predicting gene labeling may inherently result in a large fraction of early cessation of the learning process. This algorithm relies on the global structure of a network, which means that every association between genes can influence the solution. Because the similarity learning algorithm ignores similarities between negative genes, it can degrade performance in some functional classes. Early stopping by using a hold-out validation set is important for preventing the undesired effects of further learning in such cases.
Comparison with Decision Tree Ensembles.
We also compared the proposed method with a recently introduced method CLUS-HMC-ENS [2]. To predict gene function, CLUS-HMC-ENS learns an ensemble of decision trees in which each single tree is constructed so that it can exploit the class hierarchy and predict all classes together. We used the code of CLUS-HMC-ENS provided by its authors. All default settings were retained, the most important of which were the number of trees in an ensemble and the parameter that determined the F-test stopping criterion.
Fig. 2 compares the AUC scores of the SLAN algorithm with those of the decision tree learning algorithm CLUS-HMC-ENS. Over the 105 GO terms, CLUS-HMC-ENS achieved an average AUC score of 0.831, which was the lowest AUC score of all three methods evaluated. SLAN scored better than CLUS_HMC_ENS on 85 GO terms and significantly outperformed the tree-based ensemble algorithm with p-value = 2.08 x 10⁻¹⁰ (Wilcoxon signed rank test).
Figure 2. AUC score comparison between SLAN and CLUS-HMC-ENS [2] on the yeast benchmark. Each point represents a GO term, plotting
AUC score for CLUS-HMC-ENS on the x-axis and for SLAN on the y-axis.
B. Performance on the Human Dataset We also compared the performance of the proposed
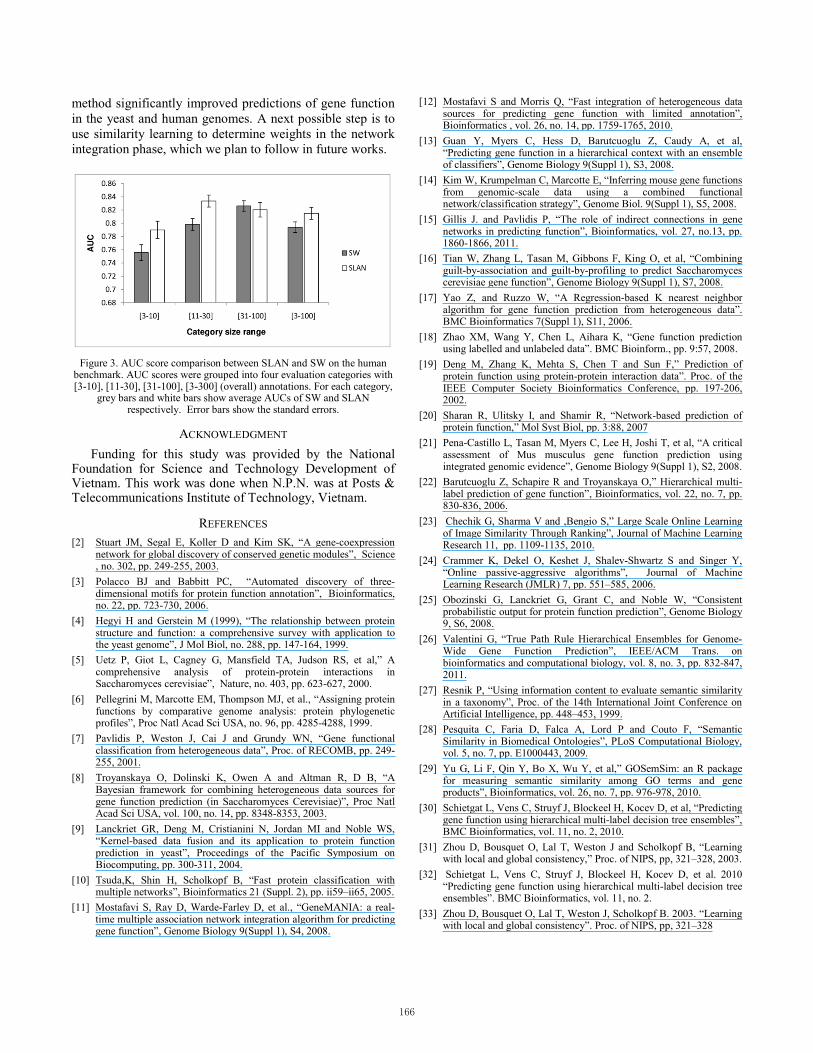
method and SW on the human dataset. The results were grouped into four evaluation categories, which corresponded to predicting GO terms with [3-10], [11-30], [31-100] positive annotations, and [3-100] positive annotations (overall category). Fig. 3 summarizes the performance in terms of AUC score for the four categories. The results show that SLAN performed better than SW in the overall category. SLAN significantly outperformed SW in two categories, [3-10] and [11-30], but performed worse than SW for GO terms with [31-100] annotations.
Variations in the performances among evaluation categories were previously noted in [13], providing evidence that there is rarely one method that performs the best for all categories. This suggests that only a combination of different methods may be able to deliver superior performance in all situations. Despite the relatively low AUC score for the [31-100] group, the good performance of SLAN in the overall category ([3-100]) showed that our method could be used to improve networks generated by simple network integration using fixed uniform weights.
III. CONCLUSION We have presented a new method for learning improved
networks in network-based gene function prediction. This method is sufficiently general to be used with networks generated by different network integration algorithms, including the simple uniform weight integration method. We have demonstrated that by applying similarity learning techniques from search and ranking application domains, we can construct networks with good prediction accuracy. In our experiments, the networks produced by the proposed
165
method significantly improved predictions of gene function in the yeast and human genomes. A next possible step is to use similarity learning to determine weights in the network integration phase, which we plan to follow in future works.
Figure 3. AUC score comparison between SLAN and SW on the human
benchmark. AUC scores were grouped into four evaluation categories with [3-10], [11-30], [31-100], [3-300] (overall) annotations. For each category,
grey bars and white bars show average AUCs of SW and SLAN respectively. Error bars show the standard errors.
ACKNOWLEDGMENT Funding for this study was provided by the National
Foundation for Science and Technology Development of Vietnam. This work was done when N.P.N. was at Posts & Telecommunications Institute of Technology, Vietnam.
REFERENCES [2] Stuart JM, Segal E, Koller D and Kim SK, “A gene-coexpression
network for global discovery of conserved genetic modules”, Science , no. 302, pp. 249-255, 2003.
[3] Polacco BJ and Babbitt PC, “Automated discovery of three-dimensional motifs for protein function annotation”, Bioinformatics, no. 22, pp. 723-730, 2006.
[4] Hegyi H and Gerstein M (1999), “The relationship between protein structure and function: a comprehensive survey with application to the yeast genome”, J Mol Biol, no. 288, pp. 147-164, 1999.
[5] Uetz P, Giot L, Cagney G, Mansfield TA, Judson RS, et al,” A comprehensive analysis of protein-protein interactions in Saccharomyces cerevisiae”, Nature, no. 403, pp. 623-627, 2000.
[6] Pellegrini M, Marcotte EM, Thompson MJ, et al., “Assigning protein functions by comparative genome analysis: protein phylogenetic profiles”, Proc Natl Acad Sci USA, no. 96, pp. 4285-4288, 1999.
[7] Pavlidis P, Weston J, Cai J and Grundy WN, “Gene functional classification from heterogeneous data”, Proc. of RECOMB, pp. 249-255, 2001.
[8] Troyanskaya O, Dolinski K, Owen A and Altman R, D B, “A Bayesian framework for combining heterogeneous data sources for gene function prediction (in Saccharomyces Cerevisiae)”, Proc Natl Acad Sci USA, vol. 100, no. 14, pp. 8348-8353, 2003.
[9] Lanckriet GR, Deng M, Cristianini N, Jordan MI and Noble WS, “Kernel-based data fusion and its application to protein function prediction in yeast”, Proceedings of the Pacific Symposium on Biocomputing, pp. 300-311, 2004.
[10] Tsuda,K, Shin H, Scholkopf B, “Fast protein classification with multiple networks”, Bioinformatics 21 (Suppl. 2), pp. ii59–ii65, 2005.
[11] Mostafavi S, Ray D, Warde-Farley D, et al., “GeneMANIA: a real-time multiple association network integration algorithm for predicting gene function”, Genome Biology 9(Suppl 1), S4, 2008.
[12] Mostafavi S and Morris Q, “Fast integration of heterogeneous data sources for predicting gene function with limited annotation”, Bioinformatics , vol. 26, no. 14, pp. 1759-1765, 2010.
[13] Guan Y, Myers C, Hess D, Barutcuoglu Z, Caudy A, et al, “Predicting gene function in a hierarchical context with an ensemble of classifiers”, Genome Biology 9(Suppl 1), S3, 2008.
[14] Kim W, Krumpelman C, Marcotte E, “Inferring mouse gene functions from genomic-scale data using a combined functional network/classification strategy”, Genome Biol. 9(Suppl 1), S5, 2008.
[15] Gillis J. and Pavlidis P, “The role of indirect connections in gene networks in predicting function”, Bioinformatics, vol. 27, no.13, pp. 1860-1866, 2011.
[16] Tian W, Zhang L, Tasan M, Gibbons F, King O, et al, “Combining guilt-by-association and guilt-by-profiling to predict Saccharomyces cerevisiae gene function”, Genome Biology 9(Suppl 1), S7, 2008.
[17] Yao Z, and Ruzzo W, “A Regression-based K nearest neighbor algorithm for gene function prediction from heterogeneous data”. BMC Bioinformatics 7(Suppl 1), S11, 2006.
[18] Zhao XM, Wang Y, Chen L, Aihara K, “Gene function prediction using labelled and unlabeled data”. BMC Bioinform., pp. 9:57, 2008.
[19] Deng M, Zhang K, Mehta S, Chen T and Sun F,” Prediction of protein function using protein-protein interaction data”. Proc. of the IEEE Computer Society Bioinformatics Conference, pp. 197-206, 2002.
[20] Sharan R, Ulitsky I, and Shamir R, “Network-based prediction of protein function,” Mol Syst Biol, pp. 3:88, 2007
[21] Pena-Castillo L, Tasan M, Myers C, Lee H, Joshi T, et al, “A critical assessment of Mus musculus gene function prediction using integrated genomic evidence”, Genome Biology 9(Suppl 1), S2, 2008.
[22] Barutcuoglu Z, Schapire R and Troyanskaya O,” Hierarchical multi-label prediction of gene function”, Bioinformatics, vol. 22, no. 7, pp. 830-836, 2006.
[23] Chechik G, Sharma V and ,Bengio S,” Large Scale Online Learning of Image Similarity Through Ranking”, Journal of Machine Learning Research 11, pp. 1109-1135, 2010.
[24] Crammer K, Dekel O, Keshet J, Shalev-Shwartz S and Singer Y, “Online passive-aggressive algorithms”, Journal of Machine Learning Research (JMLR) 7, pp. 551–585, 2006.
[25] Obozinski G, Lanckriet G, Grant C, and Noble W, “Consistent probabilistic output for protein function prediction”, Genome Biology 9, S6, 2008.
[26] Valentini G, “True Path Rule Hierarchical Ensembles for Genome-Wide Gene Function Prediction”, IEEE/ACM Trans. on bioinformatics and computational biology, vol. 8, no. 3, pp. 832-847, 2011.
[27] Resnik P, “Using information content to evaluate semantic similarity in a taxonomy”, Proc. of the 14th International Joint Conference on Artificial Intelligence, pp. 448–453, 1999.
[28] Pesquita C, Faria D, Falca A, Lord P and Couto F, “Semantic Similarity in Biomedical Ontologies”, PLoS Computational Biology, vol. 5, no. 7, pp. E1000443, 2009.
[29] Yu G, Li F, Qin Y, Bo X, Wu Y, et al,” GOSemSim: an R package for measuring semantic similarity among GO terms and gene products”, Bioinformatics, vol. 26, no. 7, pp. 976-978, 2010.
[30] Schietgat L, Vens C, Struyf J, Blockeel H, Kocev D, et al, “Predicting gene function using hierarchical multi-label decision tree ensembles”, BMC Bioinformatics, vol. 11, no. 2, 2010.
[31] Zhou D, Bousquet O, Lal T, Weston J and Scholkopf B, “Learning with local and global consistency,” Proc. of NIPS, pp, 321–328, 2003.
[32] Schietgat L, Vens C, Struyf J, Blockeel H, Kocev D, et al. 2010 “Predicting gene function using hierarchical multi-label decision tree ensembles”. BMC Bioinformatics, vol. 11, no. 2.
[33] Zhou D, Bousquet O, Lal T, Weston J, Scholkopf B. 2003. “Learning with local and global consistency”. Proc. of NIPS, pp, 321–328
166