Prediction of popular tweets using Similarity Learning
6
Prediction of Popular Tweets Using Similarity Learning Hasnat Ahmed, Muhammad Asif Razzaq, Ali Mustafa Qamar School of Electrical Engineering and Computer Science (SEECS) National University of Sciences and Technology (NÜST) Islamabad, Pakistan 1 Omsithahmed@seecs. edu.pk, 1 Omsitmrazzaq@ seecs. edu.pk, mustafa. qamar@seecs. edu.pk Abstract—Social media is gaining popularity due to its information spreading feature. Twitter is one of the most powerful source of information sharing because of its massive users. Consequently, Twitter has become a popular resource in order to analyze the data for different research purposes like social engineering, sentiment analysis, business purposes etc. due to its easy data availability. In Twitter, the information may be categorized as important or un-important Whatever information spreads through re-tweets becomes important or popular. As popular messages contain vital information for the users, one has to study the characteristics of such messages since it is related to breaking news identification, viral mar- keting and other similar tasks. In this research, we investigate the prediction of the popularity of messages by the number of re-tweets. We transform this task into a classification problem and existing Similarity Learning Algorithm (SiLA) is applied. SiLA, an extension of voted perceptron algorithm, learns the similarity matrix for kNN classification before classifying tweets as either popular or un-popular based on the content features. We classify tweets in binary as well as multi-class classification. For the former case, we consider that either the tweet has been re-tweeted (meaning popular) or not (unpopular). However, in the case of multi-class classification, SiLA uses different popular bands, defined by the number of re-tweet count. The binary classification algorithm achieved 85% accuracy and the multi-class classification achieved 73% accuracy. Experimental results show that learning similarity measures improve the accuracy when compared with other kNN based methods like cosine similarity and Euclidean distance. AfeywonJs-Similarity learning; SiLA algorithm; kNN classifi- cation; popular tweets; social networks I. INTRODUCTION In this era of computing, social media is becoming more popular day by day. Social media is a source of communication and information sharing. Social networking sites (Twitter, Facebook etc.) are an easy way for people interaction across the globe. This social interaction plays a role when we try to find out the causes of Egypt rev- olution [1], The Egyptians used social networking sites in order to schedule their protests. This revolution has been termed as Twitter Revolution or Facebook Revolution. Twitter is one of the most famous social networking site where 400 millions of tweets are sent per day [2], It has a micro-blogging service feature, which enables to post text messages. These messages are called Tweets. Tweets contain information regarding events, news, opinions etc. Twitter data is publically available for research and analysis purposes. Such social interaction websites are increasingly being used for communicating breaking news, eyewitness accounts and organizing group meetings. The trending topics feature of Twitter shows the immediately popular topics over the twitter network. The prediction of popular messages has not received much attention. On the other hand, researchers have shown interest to study various tweet characteristics. This research uses existing SiLA [3] algorithm so as to predict the popular messages. SiLA is a Similarity Learning algorithm for nearest neigh- bor classification. It works on the principle of bringing the neighbors closer to the input example having the same class (also known as target neighbors) and pushing away the near- est neighbors having different class (called as impostors). The similarity function between two examples x and y can be written as: where T refers to the transpose, A is the similarity matrix learned on the training data where as N(x, y) denotes the normalization. The similarity function sa gives a value in the range [-1, 1], Several similarity functions can be derived from Eq. 1 i.e. cosine measure. Cosine measure is famous for text retrieval and can be obtained from Eq. 1 by putting the Identity matrix I in place of A. SiLA is defined for classification using nearest neighbor approach. We know of no work whereby SiLA has been run on Twitter data. The rest of the paper is organized as follows: Section 2 describes the related work. This is followed by a short introduction of SiLA algorithm along with its mathematical interpretation in Section 3. Section 4 contains the steps to achieve the goal where as Section 5 includes the experimen- tal results. Finally, Section 6 covers the conclusion as well as the future work. II. RELATED WORK Extensive research has been carried out on Twitter data during the recent years. In order to classify text, the most common technique used is known as Bag-of-Words (BOW). It considers the words from the sentence (and eventually document) in an unordered way. Word occurrence has been 978-1-4799-3457-7/13/$31.00 ©2013 IEEE
Transcript of Prediction of popular tweets using Similarity Learning
Prediction of Popular Tweets Using Similarity Learning
Hasnat Ahmed, Muhammad Asif Razzaq, Ali Mustafa Qamar School of Electrical Engineering and Computer Science (SEECS)
National University of Sciences and Technology (NÜST) Islamabad, Pakistan
1 Omsithahmed@seecs. edu.pk, 1 Omsitmrazzaq@ seecs. edu.pk, mustafa. qamar@seecs. edu.pk
Abstract—Social media is gaining popularity due to its information spreading feature. Twitter is one of the most powerful source of information sharing because of its massive users. Consequently, Twitter has become a popular resource in order to analyze the data for different research purposes like social engineering, sentiment analysis, business purposes etc. due to its easy data availability. In Twitter, the information may be categorized as important or un-important Whatever information spreads through re-tweets becomes important or popular. As popular messages contain vital information for the users, one has to study the characteristics of such messages since it is related to breaking news identification, viral mar-keting and other similar tasks. In this research, we investigate the prediction of the popularity of messages by the number of re-tweets. We transform this task into a classification problem and existing Similarity Learning Algorithm (SiLA) is applied. SiLA, an extension of voted perceptron algorithm, learns the similarity matrix for kNN classification before classifying tweets as either popular or un-popular based on the content features. We classify tweets in binary as well as multi-class classification. For the former case, we consider that either the tweet has been re-tweeted (meaning popular) or not (unpopular). However, in the case of multi-class classification, SiLA uses different popular bands, defined by the number of re-tweet count. The binary classification algorithm achieved 85% accuracy and the multi-class classification achieved 73% accuracy. Experimental results show that learning similarity measures improve the accuracy when compared with other kNN based methods like cosine similarity and Euclidean distance.
AfeywonJs-Similarity learning; SiLA algorithm; kNN classifi-cation; popular tweets; social networks
I . INTRODUCTION
In this era of computing, social media is becoming more popular day by day. Social media is a source of communication and information sharing. Social networking sites (Twitter, Facebook etc.) are an easy way for people interaction across the globe. This social interaction plays a role when we try to find out the causes of Egypt rev-olution [1], The Egyptians used social networking sites in order to schedule their protests. This revolution has been termed as Twitter Revolution or Facebook Revolution. Twitter is one of the most famous social networking site where 400 millions of tweets are sent per day [2], It has a micro-blogging service feature, which enables to post text messages. These messages are called Tweets. Tweets contain information regarding events, news, opinions etc.
Twitter data is publically available for research and analysis purposes. Such social interaction websites are increasingly being used for communicating breaking news, eyewitness accounts and organizing group meetings. The trending topics feature of Twitter shows the immediately popular topics over the twitter network. The prediction of popular messages has not received much attention. On the other hand, researchers have shown interest to study various tweet characteristics. This research uses existing SiLA [3] algorithm so as to predict the popular messages.
SiLA is a Similarity Learning algorithm for nearest neigh-bor classification. It works on the principle of bringing the neighbors closer to the input example having the same class (also known as target neighbors) and pushing away the near-est neighbors having different class (called as impostors). The similarity function between two examples x and y can be written as:
where T refers to the transpose, A is the similarity matrix learned on the training data where as N(x, y) denotes the normalization. The similarity function sa gives a value in the range [-1, 1], Several similarity functions can be derived from Eq. 1 i.e. cosine measure. Cosine measure is famous for text retrieval and can be obtained from Eq. 1 by putting the Identity matrix I in place of A.
SiLA is defined for classification using nearest neighbor approach. We know of no work whereby SiLA has been run on Twitter data.
The rest of the paper is organized as follows: Section 2 describes the related work. This is followed by a short introduction of SiLA algorithm along with its mathematical interpretation in Section 3. Section 4 contains the steps to achieve the goal where as Section 5 includes the experimen-tal results. Finally, Section 6 covers the conclusion as well as the future work.
I I . RELATED W O R K
Extensive research has been carried out on Twitter data during the recent years. In order to classify text, the most common technique used is known as Bag-of-Words (BOW). It considers the words from the sentence (and eventually document) in an unordered way. Word occurrence has been
978-1-4799-3457-7/13/$31.00 ©2013 IEEE
used as a feature to train the classifier. Researchers have ef-fectively performed the classification of short text messages in a set of pre-defined classes such as news, events, opinions etc. 8F organizes incoming tweets with the assistance of user's profile information and features within the tweets. The proposed approach achieves 32.1% improvement in Naïve Bayes algorithm as compared to the commonly used BOW approach [4],
kNNis a simple yet efficient classification method. It looks for the nearest neighbors in order to classify an object. k denotes the number of neighbors which is used by the algorithm to construct its feature space. The choice of the distance or similarity function plays an important role in kNN and learning metrics further improves the performance. Qamar et al. [3] have proposed the SiLA algorithm which first learns the similarity matrix with the help of kNN clas-sification. The analysis of their results depict that learning similarity measure has improved the accuracy as compared to the simple kNN on several UCI data collections. We followed these steps to evaluate the performance of SiLA on twitter dataset.
Asur and Huberman [5] have analyzed various businesses using tweets. After launching a product, a company is generally more interested to gather the response of the general public. By adopting different marketing strategies, they can earn more profit. The number of social media users is increasing day by day. An important feature of social media is that a person can share his/her feelings or opinions about any object, topic or event. They have demonstrated how social media content can be used to predict the real world outcomes. They proposed a model which forecasts the box-office revenues of movies even before their release. They formed a set of movies and collected relevant tweets. Later, they analyzed the sentiments of users' for the selected movies. A rank was assigned after performing the evaluation step in tweet's text. Every rank has a range of revenue. They achieved 97% accuracy when compared with real world profit.
Suh et al. [6] have done detailed analysis to answer the questions regarding message spread as well as stoppage. A user can forward the information by re-tweeting but it is not easy to find out the characteristics of the message which is re-tweeted. They detected various features like usage of URL, news about celebrity etc. that may have an effect on re-tweeting.
Twitter has also got an important and powerful feature called Trending Topics, which contains the popular topics among the users of Twitter. Some users are also exploiting this facility by posting unrelated tweets just to make it popular. In order to overcome the situation, Irani et al. [7] gained more accuracy using text classification techniques to deal with such type of useless messages. Hong et al. [8] have also predicted the popularity of messages. Moreoever, they studied the factors which could cause popularity. They
converted the task into a classification problem and consid-ered two of its variants by investigating a wide spectrum of features based on the content of the messages, temporal information, metadata of messages and users, as well as structural properties of the userâĂZs social graph on a large scale dataset.
Kong et al. [9] have also worked on predicting the lifespan of the tweets. By lifespan, they mean how long a tweet will remain popular. In their approach, the static characteristics and dynamic re-tweeting patterns have been studied. They generated a time series of potentially popular tweets. The time series contains its first hour re-tweeting information. It was then compared to the historic tweets of the same author and post time. Lastly, the top n historic tweets are gathered along with the estimation of their mean lifespan, which was the lifespan of the new tweet.
I I I . SIMILARITY LEARNING ALGORITHM
SiLA - Training Algo [3] Input: training set ((a^1), c ^ ) , • • •, (x^, c^)) of n vectors in Mp, number of epochs M; Ami denotes the element of A at row m ad column I
Output: list of weighted (p x p) matrices
Initialization t = 1, ¿( i) = 0 (null matrix), wi = 0
Repeat M times (epochs) 1. for i = 1, • • • ,n 2. B{i) =kNN(AW,xW,cW) 3- if E y e n i ) 'A(XW,V) - E z 6 B ( i ) sa(XW,Z) < 0
4. V(ra, I), 1 <m,l < p,
Ami = Aml + EyeT(i) fml(x{l),y) - E zeB{i)fml{x^,z)
5. wt+1 = 1 6. t = t+l
7. else 8. wt = wt + 1
SiLA (Similarity Learning Algorithm) is a variant of Voted Perception algorithm. It learns diagonal, symmetric or square matrices depending on the problem to solve. Although the main algorithm is online, there is also an online to batch conversion. The online update iteratively improves the similarity matrix A whenever the current similarity matrix fails to correctiy classify an example.
After applying SiLA on the training data, we get a weighted matrix which is later used for classification pur-pose. We learn the similarity function from the provided training set before classifying the test data. The training set is ((xi ,ci) , (x%, C2),.. . , (xn,cn)) whereby x represents the examples and c stands for the different class labels. A is the learned matrix initially set to 0. There are two type of neighbors of each example: target neighbors (neighbors
belonging to the same class as that of a training example) and impostors (neighbors belonging to the different classes). The target neighbors' set is denoted by T(i). Similarly the set of impostors is denoted by B(i).
The sum of similarities between a training example and the target neighbors as well as with the impostors is calculated. This is followed by the calculation of the difference of their sums. If an input example does not have a greater similarity with its target neighbors as compared to the impostors, the algorithm will update the A matrix by taking the difference of the similarity with the target neighbors and with the impostors. On the other hand, when the algorithm correctly classifies the input example, it will increase the weight of the current similarity matrix A* by 1. This process is repeated until the last input example has been encountered. Finally we get the weighted matrix whereby the target neighbors are closer and the impostors are separated. The fmi is a function which depends upon on the kind of matrices. If the matrix is diagonal, this function will be as shown in Eq. 2
8(ml)xmyi fmi(x, y) = (2) N(x,y)
where S represents the Kronecker symbol. For a symmetric
XmVl + XlVm matrix,
fml(x,y) = N(x,y)
Similarly, in the case of a square matrix: XmVl fml(x, V) = N(x,y)
(3)
(4)
I V . METHODOLOGY
This section explains the data set along with the results and analysis. Fig. 1 shows the flow chart for the classification task.
A. Data Collection Twitter provides a free of charge API to access its data.
It requires an active user account. The data can be down-loaded either in JSON or XML format. For experimental evaluation, 90,000 tweets were downloaded in JSON format using python tweetstream API [10]. As discussed earlier, re-tweeting is the key mechanism for information diffusion in Twitter. The Twitter API helps in order to target the specific data by giving the option of search words. Since Twitter adds a text indicator (RT, via) followed by the user name of the original author in tweet's text in case of retweeting, so search words (RT @, via @) were used in downloading tweet dataset to target the shared tweets.
B. Tweet Analysis The downloaded dataset contains detailed information
for each tweet in the form of attributes. It was observed that a tweet which is never re-tweeted has less amount of
information as compare to a re-tweeted tweet. All of the tweet attributes were analyzed to select the best attributes related to this research. The attributes such as tweet's text and retweet_count were selected in our case. The raw tweet's text contains many different types of redundant data e.g. stop words, emoticons, URLs, hash-tags etc. All of the unnecessary data must be removed in order to make it more meaningful. The more the data is clean, the more accuracy will be obtained by the classification algorithms. Generally this phase involves three steps:
• Understand the format of data • Select useful attributes to achieve the research interest • Identify pre-processing tasks to make the data more
convenient for further processing (data cleaning pro-cess)
C. PreProcessing Tasks The following pre-processing tasks were performed for
the tweet: • Stanford parser [11] is used to parse the English tweets. • The removal of URLs was acheived through perl script-
ing. • Removal of terms likes RT @ username, via @ user-
name through perl scripting regular expressions • Removal of other unnecessary words or emoticons etc.
through perl scripting • Removal of duplicate tweets with the help of python
scripting The data was reduced to 1659 tweets after performing
aforementioned pre-processing tasks.
D. Internal Features Selection The Rainbow package [12] was used to detect the con-
tent features of every tweet. This package builds a global dictionary, where all words from the data are present. It forms a document matrix under the restriction of treating every single tweet as a document. The document-term matrix contains a row for each document/tweet. The value indicates whether the word is present (1) or not (0). Rainbow reads the documents/tweets and writes a model to disk, containing their statistics. Using the model, Rainbow performs different diagnostics. Moreover, there are many other functionalities like stop word removal, stemming etc.
The labeling of tweet dataset was performed on the basis of re-tweet count feature. The document matrix represen-tation along with the class information was required as an input for SiLA.
1 ) Dimensionality Reduction: When the number of fea-tures is very large, researchers try to reduce the features or the dimensions in order to improve the performance of classifier. This is done because of the presence of many irrelevant features. In this case, a new vector space d is formed from original vector space D. This will also reduce the computation cost. We have reduced the dimensions
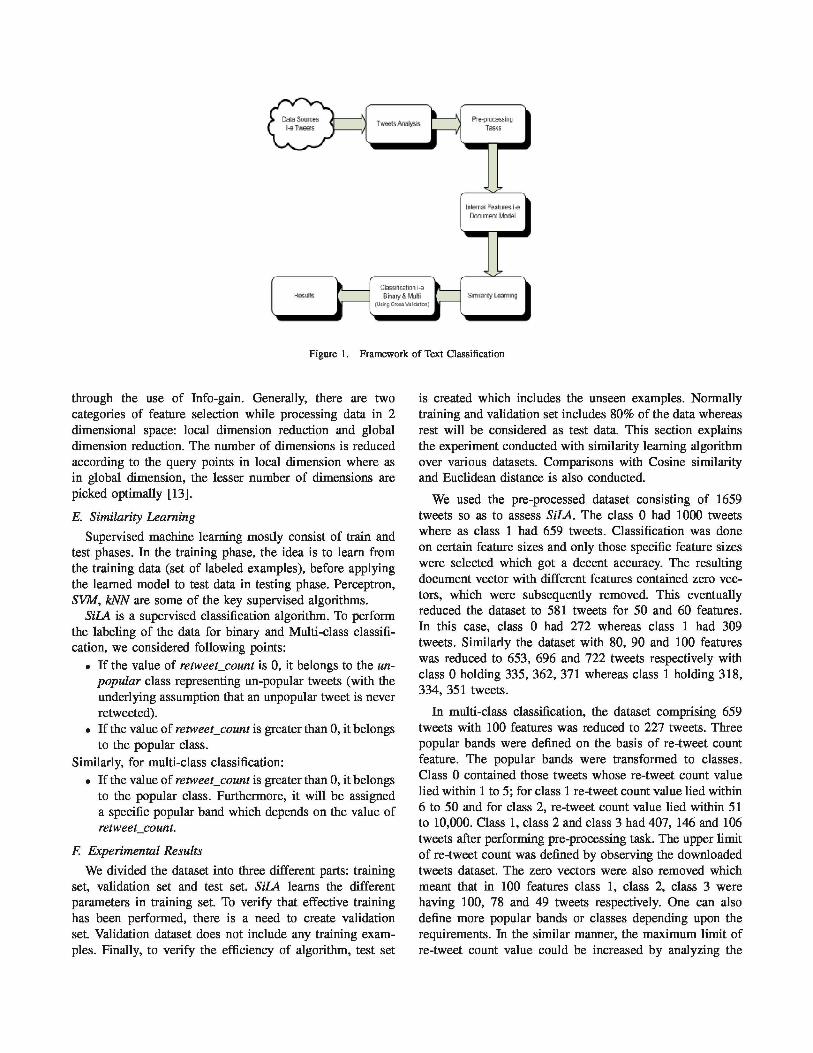
Figure 1. Framework of Text Classification
through the use of Info-gain. Generally, there are two categories of feature selection while processing data in 2 dimensional space: local dimension reduction and global dimension reduction. The number of dimensions is reduced according to the query points in local dimension where as in global dimension, the lesser number of dimensions are picked optimally [13].
E. Similarity Learning Supervised machine learning mostly consist of train and
test phases. In the training phase, the idea is to learn from the training data (set of labeled examples), before applying the learned model to test data in testing phase. Perceptron, SVM, kNN are some of the key supervised algorithms.
SiLA is a supervised classification algorithm. To perform the labeling of the data for binary and Multi-class classifi-cation, we considered following points:
• If the value of retweet_count is 0, it belongs to the un-popular class representing un-popular tweets (with the underlying assumption that an unpopular tweet is never retweeted).
• If the value of retweet_count is greater than 0, it belongs to the popular class.
Similarly, for multi-class classification: • If the value of retweet_count is greater than 0, it belongs
to the popular class. Furthermore, it will be assigned a specific popular band which depends on the value of retweet_count.
F. Experimental Results We divided the dataset into three different parts: training
set, validation set and test set. SiLA learns the different parameters in training set. To verify that effective training has been performed, there is a need to create validation set. Validation dataset does not include any training exam-ples. Finally, to verify the efficiency of algorithm, test set
is created which includes the unseen examples. Normally training and validation set includes 80% of the data whereas rest will be considered as test data. This section explains the experiment conducted with similarity learning algorithm over various datasets. Comparisons with Cosine similarity and Euclidean distance is also conducted.
We used the pre-processed dataset consisting of 1659 tweets so as to assess SiLA. The class 0 had 1000 tweets where as class 1 had 659 tweets. Classification was done on certain feature sizes and only those specific feature sizes were selected which got a decent accuracy. The resulting document vector with different features contained zero vec-tors, which were subsequently removed. This eventually reduced the dataset to 581 tweets for 50 and 60 features. In this case, class 0 had 272 whereas class 1 had 309 tweets. Similarly the dataset with 80, 90 and 100 features was reduced to 653, 696 and 722 tweets respectively with class 0 holding 335, 362, 371 whereas class 1 holding 318, 334, 351 tweets.
In multi-class classification, the dataset comprising 659 tweets with 100 features was reduced to 227 tweets. Three popular bands were defined on the basis of re-tweet count feature. The popular bands were transformed to classes. Class 0 contained those tweets whose re-tweet count value lied within 1 to 5; for class 1 re-tweet count value lied within 6 to 50 and for class 2, re-tweet count value lied within 51 to 10,000. Class 1, class 2 and class 3 had 407, 146 and 106 tweets after performing pre-processing task. The upper limit of re-tweet count was defined by observing the downloaded tweets dataset. The zero vectors were also removed which meant that in 100 features class 1, class 2, class 3 were having 100, 78 and 49 tweets respectively. One can also define more popular bands or classes depending upon the requirements. In the similar manner, the maximum limit of re-tweet count value could be increased by analyzing the
downloaded dataset. Two prediction rules were used, Standard kNN (classi-
fication on the k nearest neighbors) and symmetric kNN (difference of similarity between k nearest neighbors from the same class and k from other classes) known as S kNN. This gave us four kNN based methods:
• Standard kNN rule with the similarity learning denoted as kNN-A
• Symmetric kNN rule with similarity learning denoted as SkNN-A
• Standard kNN rule with the cosine similarity denoted as kNN-cos
• Standard kNN rule with the Euclidean distance denoted as kNN-Eue
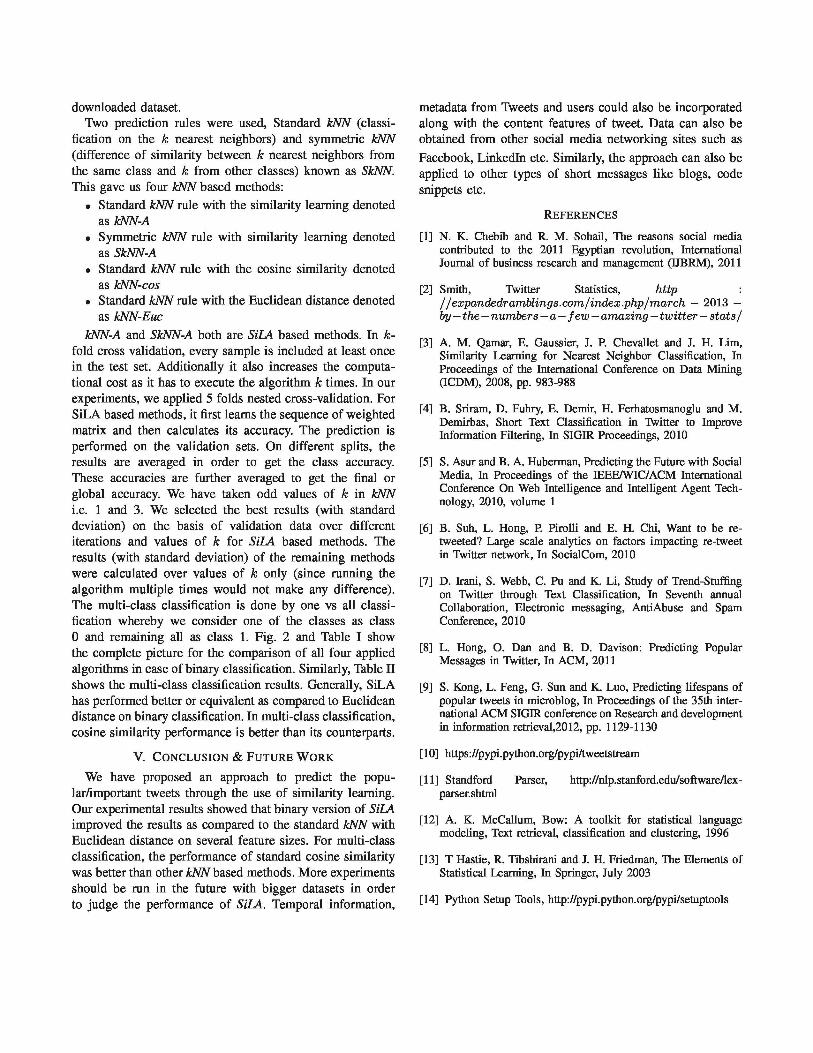
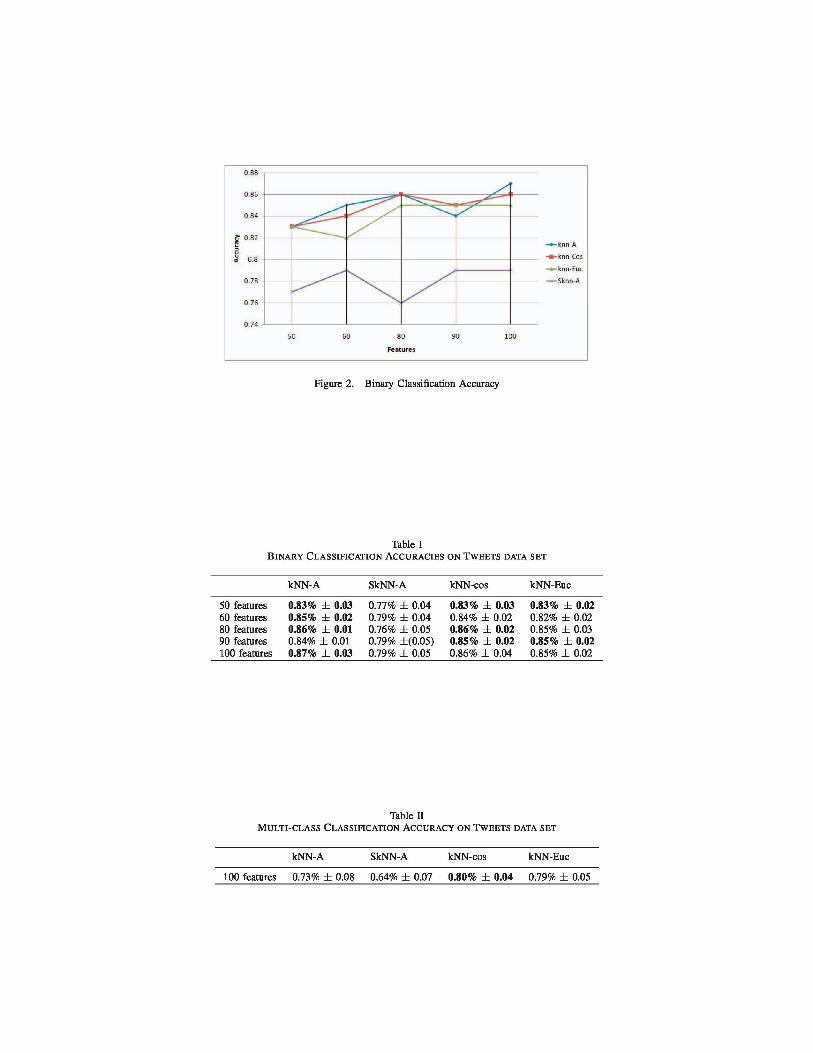
kNN-A and SkNN-A both are SiLA based methods. In k-fold cross validation, every sample is included at least once in the test set. Additionally it also increases the computa-tional cost as it has to execute the algorithm k times. In our experiments, we applied 5 folds nested cross-validation. For SiLA based methods, it first learns the sequence of weighted matrix and then calculates its accuracy. The prediction is performed on the validation sets. On different splits, the results are averaged in order to get the class accuracy. These accuracies are further averaged to get the final or global accuracy. We have taken odd values of k in kNN i.e. 1 and 3. We selected the best results (with standard deviation) on the basis of validation data over different iterations and values of k for SiLA based methods. The results (with standard deviation) of the remaining methods were calculated over values of k only (since running the algorithm multiple times would not make any difference). The multi-class classification is done by one vs all classi-fication whereby we consider one of the classes as class 0 and remaining all as class 1. Fig. 2 and Table I show the complete picture for the comparison of all four applied algorithms in case of binary classification. Similarly, Table II shows the multi-class classification results. Generally, SiLA has performed better or equivalent as compared to Euclidean distance on binary classification. In multi-class classification, cosine similarity performance is better than its counterparts.
V. CONCLUSION & FUTURE W O R K
We have proposed an approach to predict the popu-lar/important tweets through the use of similarity learning. Our experimental results showed that binary version of SiLA improved the results as compared to the standard kNN with Euclidean distance on several feature sizes. For multi-class classification, the performance of standard cosine similarity was better than other kNN based methods. More experiments should be run in the future with bigger datasets in order to judge the performance of SiLA. Temporal information,
metadata from Tweets and users could also be incorporated along with the content features of tweet. Data can also be obtained from other social media networking sites such as Facebook, Linkedln etc. Similarly, the approach can also be applied to other types of short messages like blogs, code snippets etc.
REFERENCES
[1] N. K. Chebib and R. M. Sohail, The reasons social media contributed to the 2011 Egyptian revolution, International Journal of business research and management (DBRM), 2011
[2] Smith, Twitter Statistics, http : //expandedramblings.com/index.php/march — 2013 — by—the—numbers—a—few—amazing—twitter — stats /
[3] A. M. Qamar, E. Gaussier, J. P. Chevallet and J. H. Lim, Similarity Learning for Nearest Neighbor Classification, In Proceedings of the International Conference on Data Mining (ICDM), 2008, pp. 983-988
[4] B. Sriram, D. Fuhry, E. Demir, H. Ferhatosmanoglu and M. Demirbas, Short Text Classification in Twitter to Improve Information Filtering, In SIGIR Proceedings, 2010
[5] S. Asur and B. A. Huberman, Predicting the Future with Social Media, In Proceedings of the IEEE/WIC/ACM International Conference On Web Intelligence and Intelligent Agent Tech-nology, 2010, volume 1
[6] B. Suh, L. Hong, P. Pirolli and E. H. Chi, Want to be re-tweeted? Large scale analytics on factors impacting re-tweet in Twitter network, In SocialCom, 2010
[7] D. Irani, S. Webb, C. Pu and K. Li, Study of Trend-Stuffing on Twitter through Text Classification, In Seventh annual Collaboration, Electronic messaging, AntiAbuse and Spam Conference, 2010
[8] L. Hong, O. Dan and B. D. Davison: Predicting Popular Messages in Twitter, In ACM, 2011
[9] S. Kong, L. Feng, G. Sun and K. Luo, Predicting lifespans of popular tweets in microblog, In Proceedings of the 35th inter-national ACM SIGIR conference on Research and development in information retrieval,2012, pp. 1129-1130
[ 10] https://pypi.python.org/pypi/tweetstream
[11] Standford Parser, http://nlp.stanford.edu/software/lex-parser.shtml
[12] A. K. McCallum, Bow: A toolkit for statistical language modeling, Text retrieval, classification and clustering, 1996
[13] T Hastie, R. Tibshirani and J. H. Friedman, The Elements of Statistical Learning, In Springer, July 2003
[14] Python Setup Tools, http://pypi.python.org/pypi/setuptools
—•— fcri ri A -•-knn-Cos -*- bin ! lie
rik!l!l A
0 . 8 2
Figure 2. Binary Classification Accuracy
Table I BINARY CLASSIFICATION ACCURACIES ON TWEETS DATA SET
kNN-A SkNN-A kNN-cos kNN-Euc
50 features 0.83% ± 0.03 0.77% ± 0.04 0.83% ± 0.03 0.83% ± 0.02 60 features 0.85% ± 0.02 0.79% ± 0.04 0.84% ± 0.02 0.82% ± 0.02 80 features 0.86% ± 0.01 0.76% ± 0.05 0.86% ± 0.02 0.85% ± 0.03 90 features 0.84% ± 0.01 0.79% ±(0.05) 0.85% ± 0.02 0.85% ± 0.02 100 features 0.87% ± 0.03 0.79% ± 0.05 0.86% ± 0.04 0.85% ± 0.02
Table H MULTI-CLASS CLASSIFICATION ACCURACY ON TWEETS DATA SET
kNN-A SkNN-A kNN-cos kNN-Euc
100 features 0.73% ± 0.08 0.64% ± 0.07 0.80% ± 0.04 0.79% ± 0.05