Bioaccumulation of trace metals in the Antarctic amphipod Paramoera walkeri (Stebbing, 1906):...
32
Bioaccumulation of trace metals in the Antarctic amphipod Paramoera walkeri (Stebbing, 1906): Comparison of two-compartment and hyperbolic toxicokinetic models * B. Clason 1 , S. Duquesne 2 , M. Liess 3 , R. Schulz 3 and G.-P. Zauke 1 ** 1 Carl von Ossietzky Universität Oldenburg, Institut für Chemie und Biologie des Meeres (ICBM), Postfach 2503, D-26111 Oldenburg, Germany 2 Faculty of Applied Sciences, University of the West of England Frenchay Campus, Coldharbour Lane, Bristol BS16 1QY, UK 3 Zoologisches Institut der TU Fasanenstrasse 3, D-38092 Braunschweig, Germany ** corresponding author; e-mail: [email protected] Abstract Bioaccumulation of Cd, Pb, Cu and Zn in the Antarctic gammaridean amphipod Paramoera walkeri (Stebbing, 1906) was investigated at Casey station (Australian Antarctic Territory). The main goals were to provide information on accumulation strategies of the organisms tested and to verify toxicokinetic models as a predictive tool. The organisms accumulated metals upon exposure and it was possible to estimate significant model parameters of two- compartment and hyperbolic models. These models were successfully verified in a second toxicokinetic study. However, the application of hyperbolic models appears to be more promising as a predictive tool for metals in amphipods compared to compartment models, which have failed to adequately predict metal accumulation in experiments with increasing external exposures in previous studies. The following kinetic BCFs for the theoretical equilib- rium were determined: 150 - 630 (Cd), 1600 - 7000 (Pb), 1700 - 3800 (Cu) and 670 - 2400 (Zn). We find decreasing BCFs with increasing external metal dosing but similar results for treatments with and without natural UV radiation and for the combined effect of different ex- posure regimes (single vs. multiple metal exposure) and/or the amphipod collective involved (Beall vs. Denison Island). A tentative estimation showed the following sequence of sensitiv- ity of P. walkeri to an increase of soluble metal exposure: 0.2 - 3.0 μg Cd l -1 , 0.12 - 0.25 μg Pb l -1 , 0.9 - 3.0 μg Cu l -1 and 9 - 26 μg Zn l -1 . Thus, the amphipod investigated proved to be more sensitive as biomonitor compared to gammarids from German coastal waters (with the exception of Cd) and to copepods from the Weddell Sea inferred from literature data. Key words: Antarctic, metals, toxicokinetic models, amphipods, life-history, UV radiation. * pre-print – Aquatic Toxicology 65: 117-140 (2003)
Transcript of Bioaccumulation of trace metals in the Antarctic amphipod Paramoera walkeri (Stebbing, 1906):...
Bioaccumulation of trace metals in the Antarctic amphi pod Paramoera walkeri
(Stebbing, 1906): Comparison of two-compartment
and hyperbolic toxicokinetic models *
B. Clason 1, S. Duquesne 2 , M. Liess 3, R. Schulz 3 and G.-P. Zauke 1**
1Carl von Ossietzky Universität Oldenburg,Institut für Chemie und Biologie des Meeres (ICBM),
Postfach 2503, D-26111 Oldenburg, Germany2Faculty of Applied Sciences, University of the West of EnglandFrenchay Campus, Coldharbour Lane, Bristol BS16 1QY, UK
3 Zoologisches Institut der TUFasanenstrasse 3, D-38092 Braunschweig, Germany
** corresponding author; e-mail: [email protected]
Abstract
Bioaccumulation of Cd, Pb, Cu and Zn in the Antarctic gammaridean amphipod Paramoerawalkeri (Stebbing, 1906) was investigated at Casey station (Australian Antarctic Territory).The main goals were to provide information on accumulation strategies of the organismstested and to verify toxicokinetic models as a predictive tool. The organisms accumulatedmetals upon exposure and it was possible to estimate significant model parameters of two-compartment and hyperbolic models. These models were successfully verified in a secondtoxicokinetic study. However, the application of hyperbolic models appears to be morepromising as a predictive tool for metals in amphipods compared to compartment models,which have failed to adequately predict metal accumulation in experiments with increasingexternal exposures in previous studies. The following kinetic BCFs for the theoretical equilib-rium were determined: 150 - 630 (Cd), 1600 - 7000 (Pb), 1700 - 3800 (Cu) and 670 - 2400(Zn). We find decreasing BCFs with increasing external metal dosing but similar results fortreatments with and without natural UV radiation and for the combined effect of different ex-posure regimes (single vs. multiple metal exposure) and/or the amphipod collective involved(Beall vs. Denison Island). A tentative estimation showed the following sequence of sensitiv-ity of P. walkeri to an increase of soluble metal exposure: 0.2 - 3.0 µg Cd l-1, 0.12 - 0.25 µgPb l-1, 0.9 - 3.0 µg Cu l-1 and 9 - 26 µg Zn l-1. Thus, the amphipod investigated proved to bemore sensitive as biomonitor compared to gammarids from German coastal waters (with theexception of Cd) and to copepods from the Weddell Sea inferred from literature data.
Key words : Antarctic, metals, toxicokinetic models, amphipods, life-history, UV radiation.
* pre-print – Aquatic Toxicology 65: 117-140 (2003)

B. Clason, S. Duquesne, M. Liess, R. Schulz & G.-P. Zauke: Bioaccumuation of trace metals in Paramoera walkeri 2_____________________________________________________________________________________________
1. Introduction
Natural and anthropogenic metal inputs influence the bioavailable metal supply in aquaticsystems. This bioavailable fraction can only be determined by measuring the metal accumu-lated into organisms, which is the main goal in biomonitoring (e.g. Rainbow, 1993; Ritterhoffet al., 1996). To detect potential human impact on ecosystems, natural background concen-trations of chemicals in organisms and their fluctuations have to be well established (Petriand Zauke, 1993; Zauke and Petri, 1993). Thus, investigations in remote areas like the Ant-arctic Ocean are of continuing interest. Another pre-condition is the knowledge of accumula-tion strategies. This depends on the biological species and the chemical element considered(Rainbow et al., 1990), the exposure regime applied (Borgmann and Norwood, 1995), cationhomeostasis mechanisms (e.g. Viarengo and Nott, 1993) as well as life-history influences onmetal accumulation and the development of an adequate experimental design on differentspatial and temporal scales (Zauke et al., 1996b and literature cited therein).
Different theoretical backgrounds on intracellular mechanisms have severe implications forthe suitability of bioaccumulation models as predictive tools. First-order kinetics are implicitlyrelated to compartment models (i.e. the rate of transfer of a chemical is directly proportionalto the concentration in the compartment) unless a nonlinear process is explicitly incorporatedinto it (Barron et al., 1990). Thus, when passive diffusion is the main uptake process, first-order kinetics will yield reasonable predictions over a wide range of exposure concentrations,independently of the duration of the experiments. If this pre-condition is not met as in thecase of uptake via ion channels or carriers (Rainbow, 1997), a limitation of the uptake rateshould occur at higher exposures, due to the limited amount of entering sites (viz. ion chan-nels, carriers and pumps). As a consequence, the relationship between net metal uptake andincreasing exposure concentrations will follow a saturation curve (Hudson, 1998; Sunda andHuntsman, 1998; Vanginneken et al., 1999). In this case, a verification or extrapolation of(linear) model predictions derived from first-order kinetics will only be successful for the lowerrange of exposure concentrations, where the uptake process is not limiting the rate of uptake(Bernds et al., 1998; Clason and Zauke, 2000; Ritterhoff and Zauke, 1997a). In this situation,application of hyperbolic models might be promising, since they assume a nonlinear process(Kahle and Zauke, 2002a; Kahle and Zauke, 2002b).
Gammaridean amphipods are widespread and important components of eulittoral marine,estuarine and freshwater ecosystems and are thus interesting candidates for biomonitoringand the development of bioindicator systems (e.g. Rainbow, 1995; Rinderhagen et al., 2000).Regarding bioaccumulation of metals they often show a net accumulation strategy(Borgmann and Norwood, 1995; Clason and Zauke, 2000; Rainbow and White, 1989; Ritter-hoff et al., 1996; Xu and Pascoe, 1993; Zauke et al., 1995), an important pre-condition fortheir employment as biomonitors. Nevertheless, they are less frequently used in routine bio-monitoring programs, in contrast to bivalves.
This work is part of a larger study which aims at analysing toxicokinetic models as a predic-tive tool to assess the potential of gammarids for biomonitoring of selected metals on a largegeographical scale, taking into account areas with different anthropogenic impacts. While thebasic concept was evaluated using gammarids from German coastal waters (Clason andZauke, 2000; Ritterhoff et al., 1996; Zauke et al., 1996a; Zauke et al., 1996b), more detailedexperiments were actually carried out with gammarids from English coastal waters, Ply-mouth, Devon (Clason et al., submitted-b), which can be regarded as anthropogenically in-fluenced (Bryan and Langston, 1992) and from Norwegian coastal waters, Tromsø (Clasonet al., submitted-a), which can be rather regarded as pristine (AMAP, 1997; AMAP, 1998).The present study was carried out using the Antarctic gammaridean amphipod Paramoerawalkeri (Stebbing, 1906). First results on toxicity and bioaccumulation of metals in this spe-

B. Clason, S. Duquesne, M. Liess, R. Schulz & G.-P. Zauke: Bioaccumuation of trace metals in Paramoera walkeri 3_____________________________________________________________________________________________
cies have been published in Duquesne et al. (2000). The objective of the present study is toevaluate further its suitability as biomonitor for trace metals (Cd, Pb, Cu, Zn) and to analysewhether the toxicokinetic models mentioned above (viz. two-compartment and hyperbolicmodels) can be used as predictive tools to assess the environmental quality.
Studies on metals in Antarctic systems have been often carried out to obtain backgroundvalues (Bargagli et al., 1999; Hindell et al., 1999; Marquez et al., 1998; Ravanelli et al., 1997;Scharek et al., 1997). However, even in such remote areas global inputs are detectable (Sunand Xie, 2001) as well as local phenomena (e.g. due to melting of ice; Frache et al., 2001) orwaste disposal sites (Duquesne and Liess, submitted; Duquesne and Riddle, 2002; Snape etal., 2001), eventually influencing metal concentrations in the environment. Moreover, in-creased Cd concentrations have been frequently reported in marine biota from polar regions,referred to as polar cadmium-anomaly, reporting whole body Cd concentrations up to 10 mgkg-1 (DW) in cephalopods (Bustamante et al., 1998a; Bustamante et al., 1998b), 45 mg kg-1
in molluscs (Adamussium colbecki; Minganti et al., 1998) or 15 mg kg-1 in decapods (Cho-rismus antarcticus, Notocrangon antarcticus; Petri and Zauke, 1993). Thus, a critical evalua-tion is necessary before polar biota may be used to derive background values and the aspectof trophic transfer must be taken into account (Bargagli et al., 1996; Bustamante et al.,1998a; Zauke et al., 1999).
Detailed experimental studies on bioaccumulation of metals in Antarctic invertebrates andthe development and verification of toxicokinetic models as a predictive tool are largelymissing as yet, with the exception of zooplankton from the Weddell Sea (Kahle and Zauke,2002a; Kahle and Zauke, 2002b). The present study contributes to fill this gap for littoral am-phipods. As shown in previous bioaccumulation experiments with gammarids the variabilityof metal uptake proved to be relatively high (Clason and Zauke, 2000; Ritterhoff et al., 1996;Zauke et al., 1995). Therefore, we analysed selected life-history traits of P. walkeri (growthstatus, moulting, food consumption and mortality) and their possible influence on metal ac-cumulation. Furthermore, the possible effect of multiple vs. single element dosing was takeninto account. Finally, the effect of different exposures to natural UV radiation on bioaccumu-lation was tested, since first indications of such an effect have been previously reported forP. walkeri (Liess et al., 2001).
2. Materials and Methods
2.1. Sampling and organisms studied
The study was untertaken at Casey station (Australian Antarctic Territory, Wilkes Land) fromNovember 1999 until January 2000 (geographical position and details of the sampling loca-tions in Fig. 1). Both locations were chosen to guarantee the absence of any possible con-tamination which might locally occur in the direct neigbourhood of the station. The shorelineat both locations was characterised by large stones covered with macroalgae.The am-phipods were collected with nets (mesh size 5 – 10 mm). At both locations, the gammaridParamoera walkeri (Stebbing, 1906) was dominant. This detritivore-omnivore species isfound throughout Antarctica and the Antarctic Peninsula, South Shetland Islands, and SouthGeorgia Island from intertidal to 310 meters depth. It lives usually in shallow water and, atsome locations, can be the most abundant benthic animal from 0 to 15 meters depth(http://scilib.ucsd.edu/sio/nsf/fguide/arthropoda3.html).
B. Clason, S. Duquesne, M. Liess, R. Schulz & G.-P. Zauke: Bioaccumuation of trace metals in Paramoera walkeri 4_____________________________________________________________________________________________
2.2. Setup of the toxicokinetic studies
2.2.1. General design, UV treatments and acclimatisation
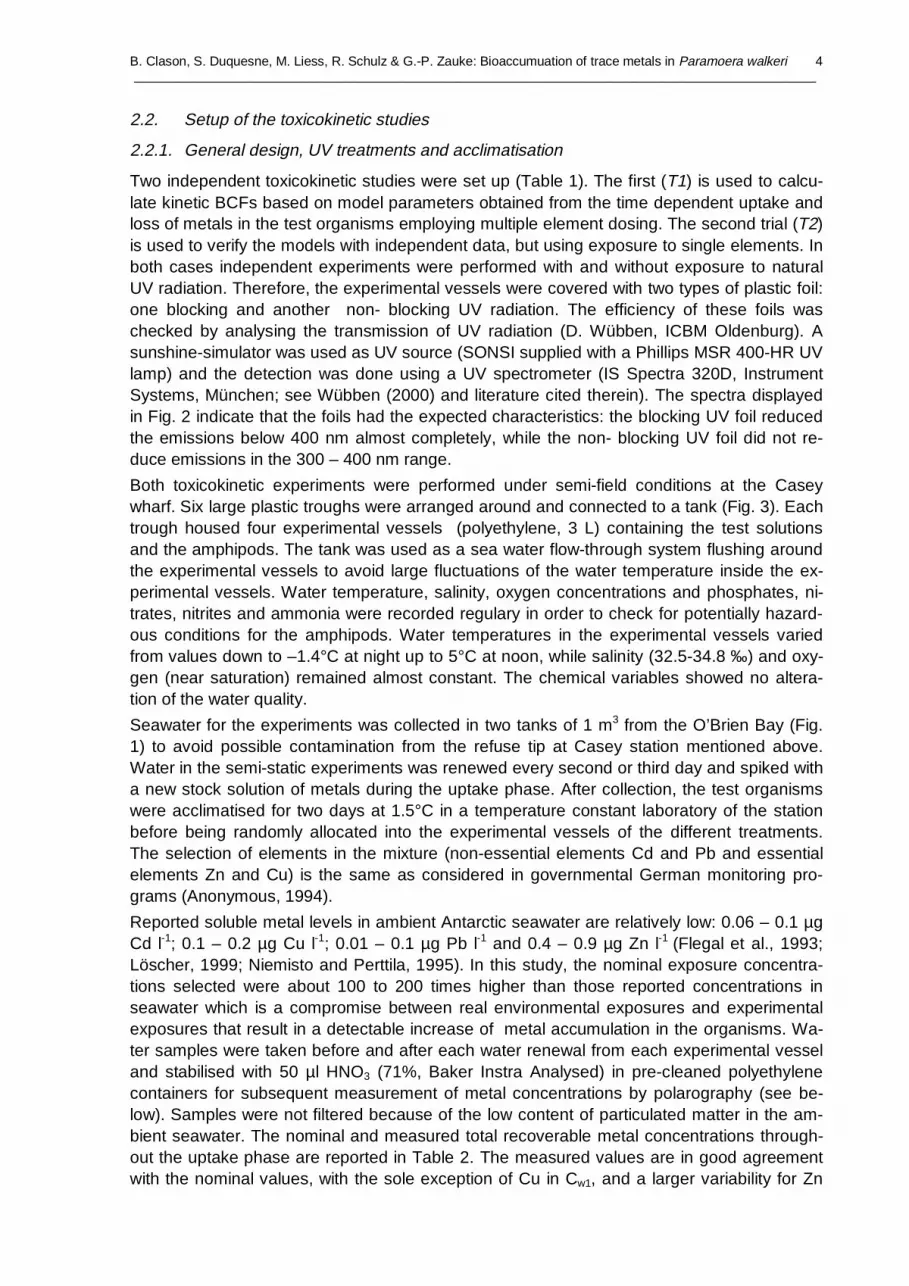
Two independent toxicokinetic studies were set up (Table 1). The first (T1) is used to calcu-late kinetic BCFs based on model parameters obtained from the time dependent uptake andloss of metals in the test organisms employing multiple element dosing. The second trial (T2)is used to verify the models with independent data, but using exposure to single elements. Inboth cases independent experiments were performed with and without exposure to naturalUV radiation. Therefore, the experimental vessels were covered with two types of plastic foil:one blocking and another non- blocking UV radiation. The efficiency of these foils waschecked by analysing the transmission of UV radiation (D. Wübben, ICBM Oldenburg). Asunshine-simulator was used as UV source (SONSI supplied with a Phillips MSR 400-HR UVlamp) and the detection was done using a UV spectrometer (IS Spectra 320D, InstrumentSystems, München; see Wübben (2000) and literature cited therein). The spectra displayedin Fig. 2 indicate that the foils had the expected characteristics: the blocking UV foil reducedthe emissions below 400 nm almost completely, while the non- blocking UV foil did not re-duce emissions in the 300 – 400 nm range.
Both toxicokinetic experiments were performed under semi-field conditions at the Caseywharf. Six large plastic troughs were arranged around and connected to a tank (Fig. 3). Eachtrough housed four experimental vessels (polyethylene, 3 L) containing the test solutionsand the amphipods. The tank was used as a sea water flow-through system flushing aroundthe experimental vessels to avoid large fluctuations of the water temperature inside the ex-perimental vessels. Water temperature, salinity, oxygen concentrations and phosphates, ni-trates, nitrites and ammonia were recorded regulary in order to check for potentially hazard-ous conditions for the amphipods. Water temperatures in the experimental vessels variedfrom values down to –1.4°C at night up to 5°C at noon, while salinity (32.5-34.8 ‰) and oxy-gen (near saturation) remained almost constant. The chemical variables showed no altera-tion of the water quality.
Seawater for the experiments was collected in two tanks of 1 m3 from the O’Brien Bay (Fig.1) to avoid possible contamination from the refuse tip at Casey station mentioned above.Water in the semi-static experiments was renewed every second or third day and spiked witha new stock solution of metals during the uptake phase. After collection, the test organismswere acclimatised for two days at 1.5°C in a temperature constant laboratory of the stationbefore being randomly allocated into the experimental vessels of the different treatments.The selection of elements in the mixture (non-essential elements Cd and Pb and essentialelements Zn and Cu) is the same as considered in governmental German monitoring pro-grams (Anonymous, 1994).
Reported soluble metal levels in ambient Antarctic seawater are relatively low: 0.06 – 0.1 µgCd l-1; 0.1 – 0.2 µg Cu l-1; 0.01 – 0.1 µg Pb l-1 and 0.4 – 0.9 µg Zn l-1 (Flegal et al., 1993;Löscher, 1999; Niemisto and Perttila, 1995). In this study, the nominal exposure concentra-tions selected were about 100 to 200 times higher than those reported concentrations inseawater which is a compromise between real environmental exposures and experimentalexposures that result in a detectable increase of metal accumulation in the organisms. Wa-ter samples were taken before and after each water renewal from each experimental vesseland stabilised with 50 µl HNO3 (71%, Baker Instra Analysed) in pre-cleaned polyethylenecontainers for subsequent measurement of metal concentrations by polarography (see be-low). Samples were not filtered because of the low content of particulated matter in the am-bient seawater. The nominal and measured total recoverable metal concentrations through-out the uptake phase are reported in Table 2. The measured values are in good agreementwith the nominal values, with the sole exception of Cu in Cw1, and a larger variability for Zn

B. Clason, S. Duquesne, M. Liess, R. Schulz & G.-P. Zauke: Bioaccumuation of trace metals in Paramoera walkeri 5_____________________________________________________________________________________________
concentration than for the other elements. The adsorptive capacity of the experimental ves-sels was saturated by pre-soaking with the test solutions for three days prior to the start ofthe experiments. The semi-static approach (which is in line with official test protocols, e.g.OECD, 1981) was selected in this study because of its simplicity and convenience.
Exactly 200 animals were introduced in each of the 24 vessels which ratio between the bio-mass introduced and the water volume was relatively large. The sampling scheme for toxico-kinetic study 1 and 2 is described below. Each sample was made of 5 to 10 amphipods de-pending on their body size, rinsed with double-distilled water, and partly dried by placingthem on appropriate filter paper (Typ 613, Schleicher and Schull, Germany; Zauke et al.,1996a). The animals were subsequently stored in Eppendorf reaction tubes (1.5 ml, polypro-pylene) using Teflon tweezers. Three independent replicates (sensu Hurlbert, 1984) pertreatment were thus obtained. All samples for metal determination were oven dried at 30°Cat Casey station and subsequently transported to the laboratory in Oldenburg.
The amphipods were fed during the experiments to keep them healthy and in good condi-tions over the duration of the experiments. To determine the food consumption rate duringthe experiments, the amphipods were fed with artificial bread prepared from flour and dou-ble-distilled water and dried at 70°C. Before the preceeding ration was consumed, the re-mainig bread was removed and weighted and a new amount of 50 mg was supplied in eachexperimental vessel.
2.2.2. Toxicokinetic study T1: modelling of uptake and clearance kinetics
To study the time course of metal uptake and clearance, gammarids from Denison Island(Fig. 1) were exposed for a 11-day uptake phase to a metal mixture; this was followed by a9-day clearance phase (Table 1). The experiments were run in three independent vesselsper treatment: three exposures (Table 2: Cw1 - Cw3) and one control with and without expo-sure to natural UV radiation, respectively, resulting in six blocks of four setups (experimentalvessels with different treatments, Fig. 3). During the uptake phase amphipods were randomlysampled from each experimental vessel on days 0.5, 1, 2, 3, 4, 6, 8 and 11. During theclearance phase, samples were taken on days 12, 13, 15, 17 and 20.
2.2.3. Toxicokinetic study T2: verification of toxicokinetic model parameters
An independent toxicokinetic study (T2) was set up to achieve a first verification of model pa-rameters obtained from study T1, and to test whether different amphipod collectives and/orexposure conditions have effects on the bioaccumulation. Gammarids from Beall Island (Fig.1) were exposed for a 11-days uptake phase to single exposures of Cd, Pb and Cu, followedby a 5-days clearance phase (Table 1). The nominal and measured total recoverable metalconcentrations throughout the uptake phase are reported in Table 2. With the exception ofthe shorter clearance phase (5 days in T2 versus 9 days in T1 due to tight time schedule)and of single exposure in T2 versus multiple exposure in T1, further details of the experi-mental design, especially sampling of test organisms, were as in T1.
2.2.4. Life-history status of gammarids in the toxicokinetic experiments
Every day, dead animals and exuvia were recorded and removed from the experimental ves-sels. Remaining individuals at the end of the experiments (after collection of those subjectedto metal analysis) were taken to analyse weight-length relationships. Thus, the total length(from distal end of the rostrum to the base of the telson; Kolding, 1981; Meurs and Zauke,1988) was determined with the aid of a binocular microscope and a millimeter scale. The in-dividual wet and dry weights (after drying for 48 h at 30°C) were also determined. The three

B. Clason, S. Duquesne, M. Liess, R. Schulz & G.-P. Zauke: Bioaccumuation of trace metals in Paramoera walkeri 6_____________________________________________________________________________________________
independent replicates per treatment were pooled for calculation yielding 60 - 120 am-phipods per treatment in T1 and 180 - 220 in T2 (due to the shorter clearance phase). Therelationship was analysed by nonlinear regression (SYSTAT 10; Engelman, 2000) using theequation:
Ka*lengthweight= [eq 1]
with a as constant and K as the Brody growth coefficient (Jennings et al., 2001), normallyyielding a value around 3 in the case of allometric growth.
2.3. Analytical procedures
Upon arrival in the laboratory in Oldenburg, the dry amphipod samples were subjected to ad-ditional freeze-drying for 48h to remove remaining water (LYOVAG GT2, Leybold Heraeus).Then the samples were homogenised using a small boron carbide mortar and pestle to avoidlosses of biomass. Aliquots of about 10 mg dried material were digested for 3h at 80°C with100 µl HNO3 (65 %, suprapure) in tightly closed 2 ml Eppendorf reaction tubes (Clason andZauke, 2000). The digests were made up to 2 ml volume with double distilled water. After ap-propriate dilution, the final sample and standard solutions were adjusted to concentrations of3.25 % HNO3.
Metal determinations in biological samples were performed using a Varian SpectrAA 880Zeeman instrument and a GTA 110 graphite tube atomiser with Zeeman background correc-tion (according to Kahle et al., 2003). Ashing and atomisation temperatures were 600 and1800 °C for Cd; 1000 and 2200 °C for Pb as well as 800 and 2300 °C for Cu. For Cd and Pb,palladium and magnesium nitrate modifiers were applied. Zn was assayed using an air-acetylene flame (SpectrAA-300, deuterium background correction) and a manual micro-injection method (100 µl sample volume). All metal concentrations in biological tissues arereported in mg kg-1 (µg g-1) dry weight (DW).
Quality assurance was performed in line with German GLP regulations (Anonymous, 1999),using the following documented criteria: stability of instrumental recalibration, precision ofparallel injections (normally showing a coefficient of variation of 1-5%) and analytical blanks(also reflecting the digestion procedure). For biological samples, the precision and validitywas evaluated using two certified reference materials which were randomly allocated withinthe determinations (see Table 3). The analysed values for the reference materials are largelyin good agreement with the certified values. Limits of detection were calculated according toBüttner et al. (1980).
Water samples from the exposure treatments were analysed in standard addition mode bypolarography (Metrohm 746 VA Trace Analyser, 747 Stand, CH-9101 Herisau, Programm5.746.0100, following DIN 38406 Teil 16) using a hanging mercury drop electrode (HMDE)and a reference electrode filled with 3M KCl. The linearity of the additions was checked bylinear regression analysis leading to adjusted R2-values ≥ 0.999. Prior to analyses, sampleswere degassed with nitrogen (grade 5.0). Peaks were detected employing differential pulseanodic stripping voltametry (DPASV) at -0.97 V (Zn), -0.60 V (Cd), -0.39 V (Pb) and -0.16 V(Cu). Quality assurance for water samples was done by analysis of an independent externalstandard solution (means ± 95% confidence intervals, N = 18 - 25, nominal values in brack-ets): 5.3 ± 0.2 (5) µg Cd l-1; 21 ± 0.4 (20) µg Pb l-1; 32 ± 1 (30) µg Cu l-1 and 71 ± 1 (60) µg Znl-1. The measured values are largely in good agreement with the nominal ones, only for Znwe find a slightly increased result. Limits of detection for seawater samples were again cal-culated according to Büttner et al. (1980): 0.05 µg Cd l-1; 0.4 µg Pb l-1; 0.4 µg Cu l-1 and 2 µgZn l-1.
B. Clason, S. Duquesne, M. Liess, R. Schulz & G.-P. Zauke: Bioaccumuation of trace metals in Paramoera walkeri 7_____________________________________________________________________________________________
2.4. Data evaluation
2.4.1. Two-compartment and hyperbolic models
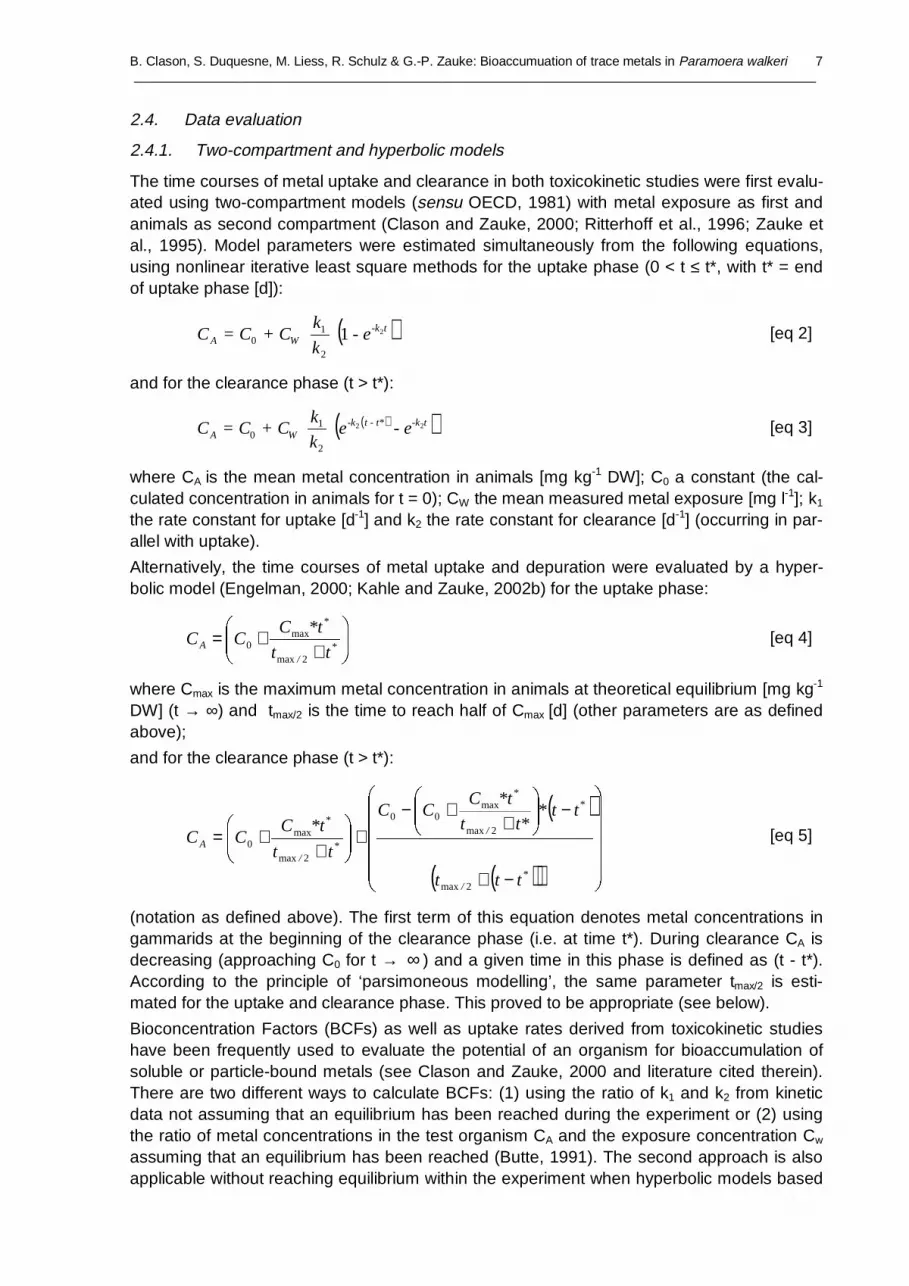
The time courses of metal uptake and clearance in both toxicokinetic studies were first evalu-ated using two-compartment models (sensu OECD, 1981) with metal exposure as first andanimals as second compartment (Clason and Zauke, 2000; Ritterhoff et al., 1996; Zauke etal., 1995). Model parameters were estimated simultaneously from the following equations,using nonlinear iterative least square methods for the uptake phase (0 < t ≤ t*, with t* = endof uptake phase [d]):
( )t-kW A - e
k
k + C = CC 21
2
10 [eq 2]
and for the clearance phase (t > t*):
( )( )t-kt - t*-kW A - ee
k
k + C = CC 22
2
10 [eq 3]
where CA is the mean metal concentration in animals [mg kg-1 DW]; C0 a constant (the cal-culated concentration in animals for t = 0); CW the mean measured metal exposure [mg l-1]; k1
the rate constant for uptake [d-1] and k2 the rate constant for clearance [d-1] (occurring in par-allel with uptake).
Alternatively, the time courses of metal uptake and depuration were evaluated by a hyper-bolic model (Engelman, 2000; Kahle and Zauke, 2002b) for the uptake phase:
++=
*/
*
A tt
*tCCC
2max
max0 [eq 4]
where Cmax is the maximum metal concentration in animals at theoretical equilibrium [mg kg-1
DW] (t → ∞) and tmax/2 is the time to reach half of Cmax [d] (other parameters are as definedabove);
and for the clearance phase (t > t*):
( )
( )( )
−+
−
++−
+
++=
*/
*
/
*
*/
*
A
ttt
tt*t*t
*tCCC
tt
*tCCC
2max
2max
max00
2max
max0
[eq 5]
(notation as defined above). The first term of this equation denotes metal concentrations ingammarids at the beginning of the clearance phase (i.e. at time t*). During clearance CA isdecreasing (approaching C0 for t → ∞ ) and a given time in this phase is defined as (t - t*).According to the principle of ‘parsimoneous modelling’, the same parameter tmax/2 is esti-mated for the uptake and clearance phase. This proved to be appropriate (see below).
Bioconcentration Factors (BCFs) as well as uptake rates derived from toxicokinetic studieshave been frequently used to evaluate the potential of an organism for bioaccumulation ofsoluble or particle-bound metals (see Clason and Zauke, 2000 and literature cited therein).There are two different ways to calculate BCFs: (1) using the ratio of k1 and k2 from kineticdata not assuming that an equilibrium has been reached during the experiment or (2) usingthe ratio of metal concentrations in the test organism CA and the exposure concentration Cw
assuming that an equilibrium has been reached (Butte, 1991). The second approach is alsoapplicable without reaching equilibrium within the experiment when hyperbolic models based
B. Clason, S. Duquesne, M. Liess, R. Schulz & G.-P. Zauke: Bioaccumuation of trace metals in Paramoera walkeri 8_____________________________________________________________________________________________
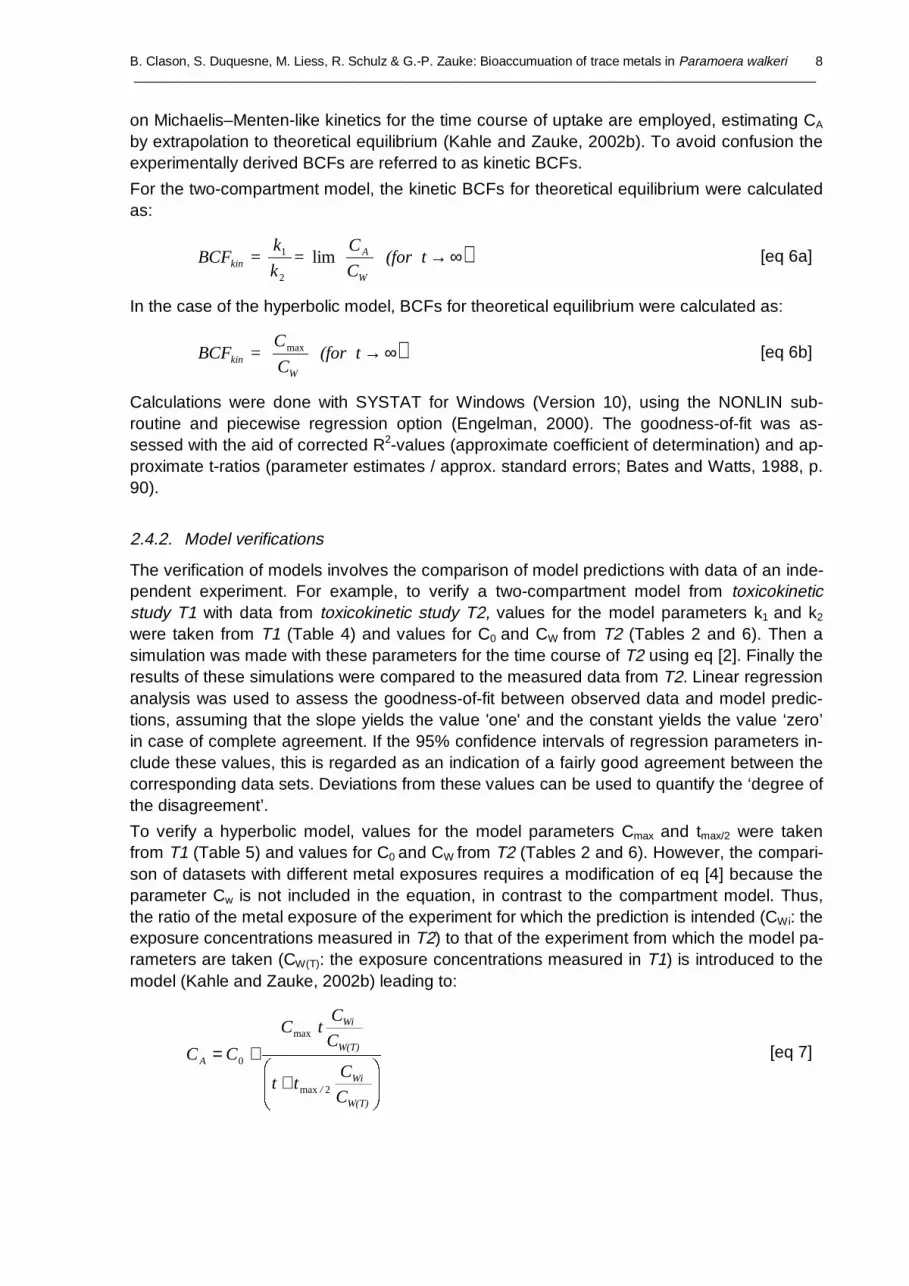
on Michaelis–Menten-like kinetics for the time course of uptake are employed, estimating CA
by extrapolation to theoretical equilibrium (Kahle and Zauke, 2002b). To avoid confusion theexperimentally derived BCFs are referred to as kinetic BCFs.
For the two-compartment model, the kinetic BCFs for theoretical equilibrium were calculatedas:
)∞→ (for tC
C =
k
k = BCF
W
A
kin lim
2
1 [eq 6a]
In the case of the hyperbolic model, BCFs for theoretical equilibrium were calculated as:
)∞→ (for tC
C = BCF
W kin
max [eq 6b]
Calculations were done with SYSTAT for Windows (Version 10), using the NONLIN sub-routine and piecewise regression option (Engelman, 2000). The goodness-of-fit was as-sessed with the aid of corrected R2-values (approximate coefficient of determination) and ap-proximate t-ratios (parameter estimates / approx. standard errors; Bates and Watts, 1988, p.90).
2.4.2. Model verifications
The verification of models involves the comparison of model predictions with data of an inde-pendent experiment. For example, to verify a two-compartment model from toxicokineticstudy T1 with data from toxicokinetic study T2, values for the model parameters k1 and k2
were taken from T1 (Table 4) and values for C0 and CW from T2 (Tables 2 and 6). Then asimulation was made with these parameters for the time course of T2 using eq [2]. Finally theresults of these simulations were compared to the measured data from T2. Linear regressionanalysis was used to assess the goodness-of-fit between observed data and model predic-tions, assuming that the slope yields the value 'one' and the constant yields the value ‘zero’in case of complete agreement. If the 95% confidence intervals of regression parameters in-clude these values, this is regarded as an indication of a fairly good agreement between thecorresponding data sets. Deviations from these values can be used to quantify the ‘degree ofthe disagreement’.
To verify a hyperbolic model, values for the model parameters Cmax and tmax/2 were takenfrom T1 (Table 5) and values for C0 and CW from T2 (Tables 2 and 6). However, the compari-son of datasets with different metal exposures requires a modification of eq [4] because theparameter Cw is not included in the equation, in contrast to the compartment model. Thus,the ratio of the metal exposure of the experiment for which the prediction is intended (CWi: theexposure concentrations measured in T2) to that of the experiment from which the model pa-rameters are taken (CW(T): the exposure concentrations measured in T1) is introduced to themodel (Kahle and Zauke, 2002b) leading to:
+
+=
W(T)
Wi/
W(T)
Wi
A
C
Ctt
C
C tC
CC
2max
max
0 [eq 7]

B. Clason, S. Duquesne, M. Liess, R. Schulz & G.-P. Zauke: Bioaccumuation of trace metals in Paramoera walkeri 9_____________________________________________________________________________________________
2.4.3. Sensitivity of gammarids as biomonitors
The assessment of the sensitivity of organisms is a crucial part of the concept of biomoni-toring: how large must an increase of exposure be to produce a detectable increase of metalconcentrations in the organisms? The following calculations aim at providing a first approxi-mative solution to this problem (Clason and Zauke, 2000). The minimum increment in bodyconcentration that can be detected (min∆CA) is obtained from the following equations:
2
Ref
2
min100min
∗∗
=
∗=A
con
A ∆C
*CCVt
∆C
SDtN [eq 8]
with SD = CVRef /100*Ccon and with some re-arrangement leading to:
conA *CCV
N
t∆C
100min Ref∗= [eq 9]
where t is the t-Value, SD the standard deviation, CVRef the coefficient of variation of refer-ence materials and Ccon the metal concentration in gammarids from the control.
The result is strongly depending on the number of measurements (N). To obtain a conserva-tive estimate we assume N to be three (according to the independent replicates in this study)leading to a t-value of 2.92 (one-sided, α = 0.05). Inserting these figures in eq [9], the mini-mum increment in body concentration which can be detected is:
conA CCV
C ∗∗=∆1003
92.2min Ref
5.0[eq 10]
In the next step, simulations of a 10-days uptake phase were performed for compartmentmodels using eq [2] and for hyperbolic models using eq [7]. The metal exposures (CWi) werevaried systematically until the metal concentrations in gammarids (CA) exceeded the value ofCcon + min∆CA (Clason and Zauke, 2000). The resulting exposure is referred to as the mini-mal increment in exposure concentrations (min∆CW) and can be regarded as the sensitivityof organisms as biomonitors.
3. Results
3.1. Life-history status of gammarids in the toxicokinetic experiments
The cumulative moulting of Paramoera walkeri is displayed in Fig. 4. Both toxicokinetic stu-dies differ distinctly. In T1 moulting is much more intensive compared to T2. Furthermore, wefind slightly higher values in T1 in the control and CW3 with natural UV radiation compared tothe treatments without UV. The cumulative mortality of gammarids is displayed in Fig. 5. InT1 a distinct increase is obvious in all treatments from day 11 on, viz predominantly in theclearance phase. At the end of the experiment, mortality in treatments with natural UV radia-tion is distinctly higher than in those without UV and show a positive relationship to previousincreasing multiple metal exposure in the uptake phase. The impact of UV on mortality is al-so visible in T2, reaching the highest value in the Cu treatment with UV and the lowest valuein the control.
Nonlinear regression analysis of the weight-length relationships yielded Brody growth coeffi-cient (based on fresh weight) in field samples of P. walkeri and T1 largely around 3, indicat-ing allometric growth in all treatments (means ± 95% confidence intervals, N=70 to 160): field(2.9 ± 0.2); with natural UV radiation (control: 3.3 ± 0.3; CW1: 2.8 ± 0.2; CW2: 2.9 ± 0.3; CW3:no data available); without natural UV radiation (control: 3.4 ± 0.2; CW1: 2.3 ± 0.2; CW2: 2.8 ±0.2; CW3: 2.9 ± 0.2). Regarding T2, the coefficients tend to be lower in all treatments ana-

B. Clason, S. Duquesne, M. Liess, R. Schulz & G.-P. Zauke: Bioaccumuation of trace metals in Paramoera walkeri 10_____________________________________________________________________________________________
lysed (only limited data available): with natural UV radiation (control: 1.8 ± 0.2); without natu-ral UV radiation (control: 2.2 ± 0.1; Cu: 1.9 ± 0.1).
In all treatments of toxicokinetic studies T1 and T2 P. walkeri consumed high amounts ofbread during the first five days (T1: 0.25 - 0.4 mg bread d-1 animal-1; T2: 0.4-0.8 mg bread d-1
animal-1). Then values dropped down to 0.1 mg bread d-1 animal-1 (T1) or even below thisvalue (T2) with a short intermediate increase on days 10 - 13 (in both T1 and T2), respecti-vely.
3.2. Bioaccumulation of metals in gammarids
The time courses for uptake and clearance of metals in P. walkeri are shown in Figs. 6, 7(toxicokinetic study T1) and 8 (toxicokinetic study T2), and the estimated parameters of thetwo-compartment and hyperbolic models appear in Tables 4, 5 (T1) and 6, 7 (T2). Generally,the organisms accumulate metals upon external metal exposure and do not reach a plateauwithin the uptake phase, with the sole exception of Cd (Fig 6 and 7). Furthermore, the am-phipods eliminate distinctly accumulated metals during the clearance phase. Statistical in-formation from these Tables and inspection of these Figures suggest that estimated modelsfor T1 and T2 give a fair description of the observed data for both types of models employed.
The kinetic BCFs for theoretical equilibrium yield similar results for both types of models anddecreased in the order of (Pb ≈ Cu ≈ Zn) > Cd. Regarding approximate t-ratios, all model pa-rameters for metal uptake and clearance are significantly different from zero (since the confi-dence intervals do not include the value zero) and the corrected R2 values indicate that ahigh proportion of the variance is represented by both the compartment (Tables 4 and 6) andhyperbolic models (Tables 5 and 7). Only for Cd we find somewhat lower R2 values, obvi-ously due to an increased variablility of the data. There is largely a good agreement betweenthe measured control levels Ccon and the model constants C0 with the sole exception of Pb inT1 and T2.
The results of the assessment of the goodness-of-fit between observed data and model pre-dictions are presented in Table 8 (toxicokinetic study T1 with exposure to CW2 and CW3 versusmodel predictions derived from exposure CW1 of T1), Table 9 (toxicokinetic study T1 with ex-posure to CWi with natural UV radiation versus model predictions derived from exposure CWi
of T1 without natural UV radiation) and Table 10 (toxicokinetic study T2 with exposure to CW3
versus model predictions derived from exposure CW3 of T1).
4. Discussion
4.1. Modelling of uptake and clearance kinetics — inferences about accumulation strategy
As mentioned above, statistical information compiled in Tables 4 - 7 for Paramoera walkerigenerally suggest good model estimates: the parameters are statistically different from zeroand the R2 values indicate that a high proportion of the variance is represented by the mod-els. These R2 values are in good agreement with those reported in the literature for bioaccu-mulation studies in various marine invertebrates such as amphipods, copepods or poly-chaetes (Bernds et al., 1998; Clason and Zauke, 2000; Ritterhoff and Zauke, 1997b; Ritter-hoff et al., 1996; Zauke et al., 1995). The good agreement of kinetic BCFs derived from two-compartment and hyperbolic models in this study support results previously reported for Ant-arctic copepods (Metridia gerlachei, Kahle and Zauke, 2002a; Calanoides acutus, Kahle andZauke, 2002b). Thus, both types of models are adequate to fit single toxicokinetic experi-ments. Furthermore, this result supports the approach to use only one parameter tmax/2 for theuptake and clearance phase in hyperbolic models.

B. Clason, S. Duquesne, M. Liess, R. Schulz & G.-P. Zauke: Bioaccumuation of trace metals in Paramoera walkeri 11_____________________________________________________________________________________________
Kinetic BCFs obtained in our experiments (150 - 630 for Cd, 1600 - 7000 for Pb, 1700 - 3800for Cu and 670 - 2400 for Zn; valid for single and multiple exposure) are largely within therange reported in literature for other amphipods. Observed 12-days BCFs reported for P.walkeri from Casey in another study were around 2000 for Cu (single exposure 10 - 100 µgCu l-1) and 300 for Cd (single exposure 30 µg Cd l-1; Duquesne et al., 2000). Previous studieson Gammarus zaddachi showed kinetic BCFs of 400 - 500 for Cd, 970 - 1200 for Pb, 1700for Cu and 280 for Zn with metal exposures of 10 µg Cd l-1, 30 µg Pb l-1, 120 µg Cu l-1, and240 µg Zn l-1, respectively (multiple exposure; Clason and Zauke, 2000). Reported kineticBCFs for Cd in G. zaddachi and G. salinus were in the range of 400 – 1200 with Cd expo-sures ranging from 17 to 52 Cd µg l-1 (Ritterhoff et al., 1996; Zauke et al., 1995). More infor-mation is available for the Arctic marine amphipod Themisto abyssorum, where reported ki-netic BCFs for Pb (1800), Cu (1400) and Zn (190) (Ritterhoff and Zauke, 1997b) agree wellwith our current data. Kinetic BCFs are also available for the freshwater amphipod Hyalellaazteca yielding 1900 for Pb (exposure 100 Pb µg l-1; MacLean et al., 1996) and 4600 for Cuand 5100 for Zn (exposure 50 Cu µg l-1 and 300 Zn µg l-1; Borgmann and Norwood, 1995).
An important pre-condition for using organisms as biomonitors is a net accumulation strategy(Zauke et al., 1996b). In our study this condition is met to a great extent, since a plateauphase is not readily reached at the end of the uptake phase in both experiments (Figs. 6 - 8),at least under our experimental conditions (levels and durations of exposure). However, forCd a slight tendency towards saturation during the uptake phase was observed. Neverthe-less, an elimination of this element in the clearance phase is obvious.
In agreement with the present study, net accumulation in amphipods was also reported forCd, Pb, Cu and Zn in G. zaddachi (Clason and Zauke, 2000), Cu in Echinogammarus pirloti(Rainbow and White, 1989), Pb in Gammarus pseudolimnaeus (MacLean et al., 1996), Cd inGammarus salinus and G. zaddachi (Ritterhoff et al., 1996; Zauke et al., 1995) and in Gam-marus pulex (Stuhlbacher and Maltby, 1992) and Cu and Pb in Themisto abyssorum(Ritterhoff and Zauke, 1997a; Ritterhoff and Zauke, 1997b). Borgmann and Norwood (1995)found a net uptake of Cu and Zn in Hyalella azteca in short term experiments, but in longterm experiments the animals were able to regulate Cu, while a net accumulation strategywas reported for Cd and Pb (Borgmann and Norwood, 1999; Borgmann et al., 1993). A ten-dency for Zn regulation was described for H. azteca (Borgmann et al., 1993) and some de-capod crustaceans (Rainbow, 1993), whereas for Gammarus pulex and Elminius modestusnet accumulations were reported (Rainbow, 1993; Rainbow and White, 1989; Xu and Pas-coe, 1993).
4.2 Verification of toxicokinetic model parameters — experimental constraints and poten-tial influence of the life-history status of Paramoera walkeri on bioaccumulation
To demonstrate the potential of toxicokinetic models as a predictive tool, model data wereverified with independent experimental data (Clason and Zauke, 2000; Kahle and Zauke,2002b; Ritterhoff and Zauke, 1997a). This is an important step in the calibration of biomoni-tors. To do so, observed metal concentrations in P. walkeri obtained from particular toxicoki-netic experiments were compared with model predictions obtained from independent experi-ments performed under different conditions (Tables 8 - 10).
In toxicokinetic study T1, three metal exposures were available to test whether a prediction ispossible from exposure CW1 to CW2 and CW3 (Table 8). Regarding Cd, such a prediction is notpossible, neither for the compartment nor for the hyperbolic model, as indicated by values forthe slopes distinctly exceeding the value 1 (for both UV treatments). This result is probablydue to the large variability of the data and to the fact that Cd concentrations in amphipods donot increase significantly with increasing exposure concentrations. The reason for both ef-

B. Clason, S. Duquesne, M. Liess, R. Schulz & G.-P. Zauke: Bioaccumuation of trace metals in Paramoera walkeri 12_____________________________________________________________________________________________
fects are the relatively high Cd concentrations in P. walkeri from the field (2.8 mg kg-1) incontrast to gammarids from other studies (e.g. 0.14 mg kg-1 in G. zaddachi; Clason andZauke, 2000). Under these circumstances, the Cd exposure concentration is not high enoughto produce a distinct incease in the amphipods. A similar situation was reported for Themistoabyssorum (Ritterhoff and Zauke, 1997b) with Cd in field samples and control organisms ap-proaching 25 mg kg-1 DW. For the other elements analysed adequate predictions were ob-tained for CW2, at least without natural UV radiation, as indicated by the 95%-CIs includingthe value 1. Regarding exposure CW3, a good agreement between observed and predicteddata was only found for Cu and Pb using the hyperbolic model. This is an indication that themetal uptake with increasing metal exposure is probably not linear but follows a saturationcurve. This conclusion is supported by decreasing kinetic BCFs with inceasing exposures inthis study (Tables 4 and 5) and for Cu as reported by Duquesne et al. (2000). Thus, the ap-plication of hyperbolic models appears to be more promising as a predictive tool for metals inP. walkeri compared to compartment models, which have failed to adequately predict metalaccumulation at higher external exposures in previous studies (Clason and Zauke, 2000;Ritterhoff and Zauke, 1997a).
In addition, results from toxicokinetic study T1 provide the basis to test, whether the UV-status has an effect on the bioaccumulation of metals (Table 9), regarding exposures CW1 -CW3, respectively. With the sole exception of Cd in CW1, the 95%-CIs of the slopes includingthe value 1 and constants not significantly different from zero indicate an excellent agree-ment of bioaccumulation in both treatments. Thus, a distinct effect of UV on bioaccumulationof metals in P. walkeri is not obvious.
The comparison of observed data for toxicokinetic study T2 with model predictions derivedfrom exposure CW3 of T1 (Table 10) does not allow to discriminate the potential effects of theexposure status (single vs. multiple exposure) and the amphipod collective involved (Beallvs. Denison Island), but only the assessment of the combined effects. 95%-CIs of the slopesincluding the value 1 and constants not significantly different from zero indicate an excellentagreement for the compartment model and Pb and for the hyperbolic model and Cu (with andwithout natural UV radiation). The assessment of Cd is difficult, due to the large variability ofthe data, but there is some indication of an adequate agreement for the hyperbolic model (+UV). Due to this agreement we can infer, that a multiple element exposure will not distinctlyinfluence accumulation of a particular element. This is often a point of concern discussing thedesign of such experiments.
Another point of concern in the study of bioaccumulation is whether moulting, mortality orother life-history traits eventually influence the bioaccumulation of metals. In toxicokineticstudy T1 we find a distinct increase of cumulative moulting with increasing metal exposure,especially in the treatments with natural UV radiation (Fig. 4). This can be regarded as an in-dication of stress. However, the total number of exuvia (95-146) is relatively small comparedto the number of amphipods allocated to each treatment (600). Thus we can infer, thatmoulting does not contribute distinctly to the elimination of metals from the amphipods (viz. tok2 in the compartment models), especially since there is a tendency to saturation in theclearance phase after day 11. In toxicokinetic study T2 even lower cumulative casts of exuviafurther support this hypothesis.
Regarding the cumulative mortality of amphipods (Fig. 5), the exposure to natural UV radia-tion has a stronger effect than the metal exposures. In all treatments without natural UV ra-diation, mortality remains low (below 50 in T1 and below 30 in T2, out of 600 specimen allo-cated to each treatment), indicating that mortality is no severe constraint regarding bioaccu-mulation. This conclusion also applies to the treatments with UV, due to the fact that mortalityremains low (below 50) during the uptake phase and only increases in the clearance phase.
B. Clason, S. Duquesne, M. Liess, R. Schulz & G.-P. Zauke: Bioaccumuation of trace metals in Paramoera walkeri 13_____________________________________________________________________________________________
Thus, a potential effect on bioaccumulation would have been detected by the animals col-lected during the uptake phase.
Regarding the Brody growth coefficients we do not find distinct differences between themetal exposure and UV treatments in T1. The values are well within the range reported inother applied studies with amphipods (Ritterhoff and Zauke, 1997c; Wang and Zauke, 2002).Furthermore, the data on food consumption do not show any clear relationships with in-creasing metal exposure. Thus, the indicators of the growth status tested (viz. Brody growthcoefficients and food consumption rates) seem to be no point of concern in these bioaccu-mulation trials.
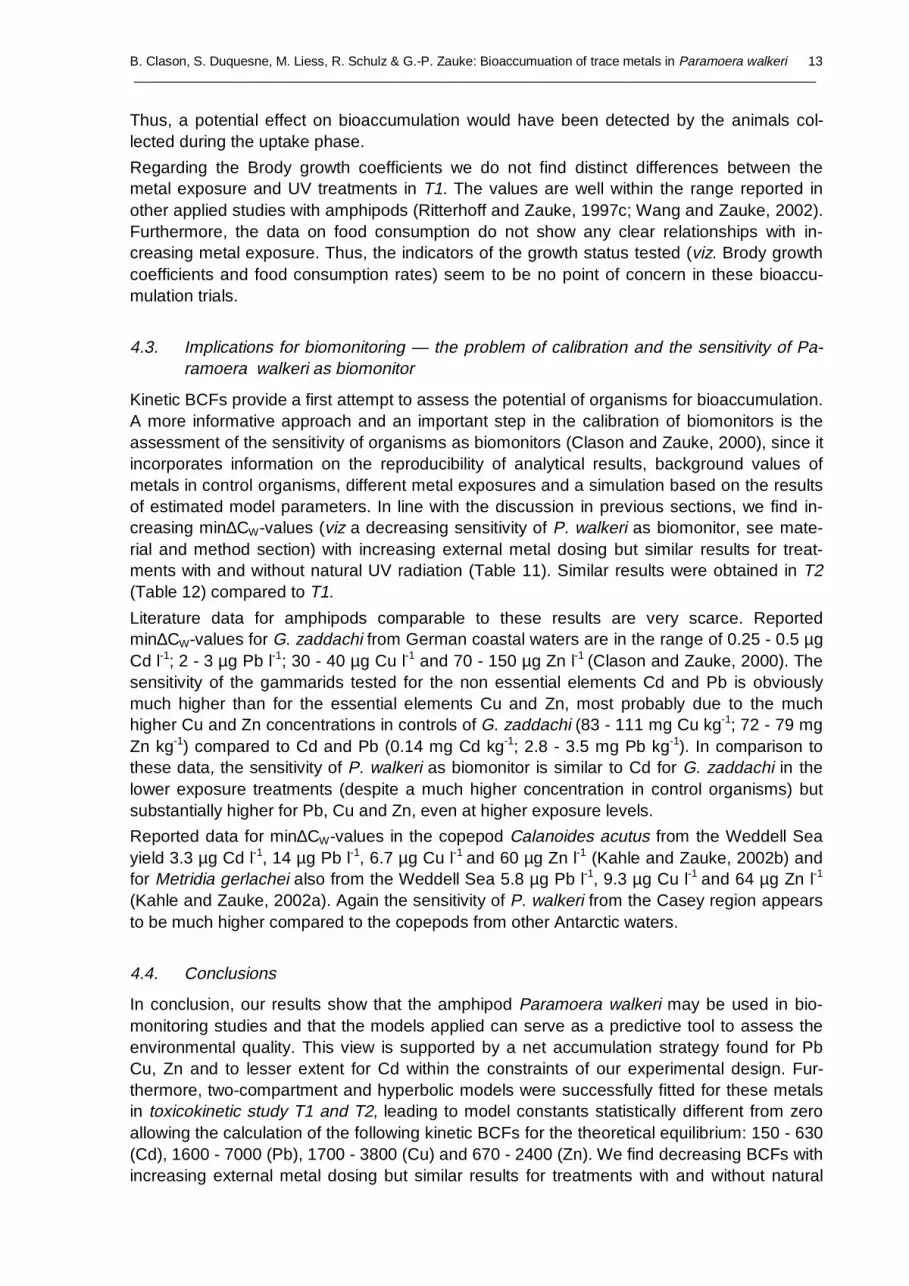
4.3. Implications for biomonitoring — the problem of calibration and the sensitivity of Pa-ramoera walkeri as biomonitor
Kinetic BCFs provide a first attempt to assess the potential of organisms for bioaccumulation.A more informative approach and an important step in the calibration of biomonitors is theassessment of the sensitivity of organisms as biomonitors (Clason and Zauke, 2000), since itincorporates information on the reproducibility of analytical results, background values ofmetals in control organisms, different metal exposures and a simulation based on the resultsof estimated model parameters. In line with the discussion in previous sections, we find in-creasing min∆CW-values (viz a decreasing sensitivity of P. walkeri as biomonitor, see mate-rial and method section) with increasing external metal dosing but similar results for treat-ments with and without natural UV radiation (Table 11). Similar results were obtained in T2(Table 12) compared to T1.
Literature data for amphipods comparable to these results are very scarce. Reportedmin∆CW-values for G. zaddachi from German coastal waters are in the range of 0.25 - 0.5 µgCd l-1; 2 - 3 µg Pb l-1; 30 - 40 µg Cu l-1 and 70 - 150 µg Zn l-1 (Clason and Zauke, 2000). Thesensitivity of the gammarids tested for the non essential elements Cd and Pb is obviouslymuch higher than for the essential elements Cu and Zn, most probably due to the muchhigher Cu and Zn concentrations in controls of G. zaddachi (83 - 111 mg Cu kg-1; 72 - 79 mgZn kg-1) compared to Cd and Pb (0.14 mg Cd kg-1; 2.8 - 3.5 mg Pb kg-1). In comparison tothese data, the sensitivity of P. walkeri as biomonitor is similar to Cd for G. zaddachi in thelower exposure treatments (despite a much higher concentration in control organisms) butsubstantially higher for Pb, Cu and Zn, even at higher exposure levels.
Reported data for min∆CW-values in the copepod Calanoides acutus from the Weddell Seayield 3.3 µg Cd l-1, 14 µg Pb l-1, 6.7 µg Cu l-1
and 60 µg Zn l-1 (Kahle and Zauke, 2002b) and
for Metridia gerlachei also from the Weddell Sea 5.8 µg Pb l-1, 9.3 µg Cu l-1 and 64 µg Zn l-1
(Kahle and Zauke, 2002a). Again the sensitivity of P. walkeri from the Casey region appearsto be much higher compared to the copepods from other Antarctic waters.
4.4. Conclusions
In conclusion, our results show that the amphipod Paramoera walkeri may be used in bio-monitoring studies and that the models applied can serve as a predictive tool to assess theenvironmental quality. This view is supported by a net accumulation strategy found for PbCu, Zn and to lesser extent for Cd within the constraints of our experimental design. Fur-thermore, two-compartment and hyperbolic models were successfully fitted for these metalsin toxicokinetic study T1 and T2, leading to model constants statistically different from zeroallowing the calculation of the following kinetic BCFs for the theoretical equilibrium: 150 - 630(Cd), 1600 - 7000 (Pb), 1700 - 3800 (Cu) and 670 - 2400 (Zn). We find decreasing BCFs withincreasing external metal dosing but similar results for treatments with and without natural

B. Clason, S. Duquesne, M. Liess, R. Schulz & G.-P. Zauke: Bioaccumuation of trace metals in Paramoera walkeri 14_____________________________________________________________________________________________
UV radiation and for the combined effect of different exposure regimes (single vs. multipleexposure) and/or the amphipod collective involved (Beall vs. Denison Island).
A tentative estimation showed the following sequence of sensitivity of Paramoera walkeri toan increase of experimental waterborne metal concentrations: 0.8 - 3.0 µg Cd l-1, 0.12 - 0.25µg Pb l-1, 0.9 - 3.0 µg Cu l-1 and 9 - 26 µg Zn l-1. The Antarctic amphipod tested proved to bemuch more sensitive compared to gammarids from German waters (with the sole exceptionof Cd) and to copepods from the Weddell Sea. These estimates of sensitivity for biomoni-toring derived from toxicokinetic experiments are, however, suggested to be substantiallylower under field conditions (Kahle and Zauke, 2002a; Kahle and Zauke, 2002b). To test thishypothesis further studies are required.
Acknowledgements
This study is part of the PhD thesis of B. Clason at the Carl von Ossietzky Universität Oldenburgfunded by the Government of Lower Saxony, Hannover. Travel of B.C. to Casey was supported byDAAD, Bonn. The Australian Antarctic Division and Dr. Martin Riddle, leader of the Human ImpactProgram, kindly provided opportunity to work at the Casey Station. This study was part of a projectsupported by a grant from the Australian Antarctic Science Advisory Committee.
Literature
AMAP, 1997. Arctic pollution issues: A state of the Arctic environment report. Oslo, Arctic Monitoringand Assessment Programme (AMAP).
AMAP, 1998. AMAP assessment report: Arctic pollution issues. Arctic Monitoring and AssessmentProgramme (AMAP), Oslo, Norway.
Anonymous, 1999. Chemikaliengesetz: Gesetz zum Schutz vor gefährlichen Stoffen. Anhang 1 (zu §19a Abs. 1) - Grundsätze der guten Laborpraxis (GLP). In: Steinberg, C., Bernhardt, H., Calmano,W., Klapper, H., Wilken, R.-D. (Eds.), Handbuch angewandte Limnologie, Chapter IX-5, 7. Erg.Lfg.4/99. ecomed, Landsberg am Lech.
Anonymous, 1994. Gemeinsames Bund/Länder-Meßprogramm für die Nordsee. Gewässergütemes-sungen im Küstenbereich der Bundesrepublik Deutschland, Gütedaten 1992/93, Niedersächsis-ches Umweltministerium. Hannover, Germany.
Bargagli, R., Nelli, L., Ancora, S., Focardi, S., 1996. Elevated cadmium accumulation in marine or-ganisms from Terra Nova Bay (Antarctica). Polar Biol. 16, 513-520.
Bargagli, R., Sanchezhernandez, J.C., Monaci, F., 1999. Baseline concentrations of elements in theAntarctic macrolichen Umbilicaria decussata. Chemosphere 38, 475-487.
Barron, M.G., Stehly, G.R., Hayton, W.L., 1990. Review: pharmacokinetic modeling in aquatic animals.I. Models and concepts. Aquat. Toxicol. 18, 61-86.
Bates, D.M., Watts, D.G., 1988. Nonlinear regression analysis and its applications. John Wiley, NewYork, USA.
Bernds, D., Wübben, D., Zauke, G.-P., 1998. Bioaccumulation of trace metals in polychaetes from theGerman Wadden Sea: Evaluation and verification of toxicokinetic models. Chemosphere 37, 2573-2587.
Borgmann, U., Norwood, W.P., 1995. Kinetics of excess (above background) copper and zinc inHyalella azteca and their relationship to chronic toxicity. Can. J. Fish. Aquat. Sci. 52, 864-874.
Borgmann, U., Norwood, W.P., 1999. Assessing the toxicity of lead in sediments to Hyalella azteca:the significance of bioaccumulation and dissolved metal. Can. J. Fish. Aquat. Sci. 56, 1494-1503.

B. Clason, S. Duquesne, M. Liess, R. Schulz & G.-P. Zauke: Bioaccumuation of trace metals in Paramoera walkeri 15_____________________________________________________________________________________________
Borgmann, U., Norwood, W.P., Clarke, C., 1993. Accumulation, regulation and toxicity of copper, zinc,lead and mercury in Hyalella azteca. Hydrobiologia 259, 79-89.
Bryan, G.W., Langston, W.J., 1992. Bioavailability, accumulation and effects of heavy metals in sedi-ments with special reference to United Kingdom estuaries: A review. Environ. Pollut. 76, 89-131.
Bustamante, P., Caurant, F., Fowler, S.W., Miramand, P., 1998a. Cephalopods as a vector for thetransfer of cadmium to top marine predators in the north-east Atlantic Ocean. Sci. Total Environ.220, 71-80.
Bustamante, P., Cherel, Y., Caurant, F., Miramand, P., 1998b. Cadmium, copper and zinc in octo-puses from Kerguelen Islands, Southern Indian Ocean. Polar Biol. 19, 264-271.
Butte, W., 1991. Mathematical describtion of uptake, accumulation and elimination of xenobiotics in afish/water system. In: Nagel, R., Loskill, R. (Eds.), Bioaccumulation in aquatic systems. VCH Ver-lagsgesellschaft, Weinheim, pp. 29-42.
Büttner, J.R., Borth, R., Boutwell, H.J., Broughton, P.M.G., Bowyer, R.C., 1980. Approved recommen-dation (1978) on quality control in clinical chemistry. J. Clin. Chem. Clin. Biochem. 18, 78-88.
Clason, B., Gulliksen, B., Zauke, G.P., submitted-a. Bioaccumulation of trace metals in the amphipodGammarus oceanicus Segerstrale, 1947 from Grunnfjord (Northern Norway): Comparison of two-compartment and hyperbolic toxicokinetic models. Sci. Total Environ.
Clason, B., Langston, W.J., Zauke, G.P., submitted-b. Bioaccumulation of trace metals in the amphi-pod Chaetogammarus marinus (Leach, 1815) from the Avon- and Tamar-estuary (Devon, UK):Comparison of two-compartment and hyperbolic toxicokinetic models. Mar. Environ. Res.
Clason, B., Zauke, G.-P., 2000. Bioaccumulation of trace metals in marine and estuarine amphipods:Evaluation and verification of toxicokinetic models. Can. J. Fish. Aquat. Sci. 57, 1410-1422.
Duquesne, S., Liess, M., submitted. Ecological risk assessment of heavy metal contamination in Ant-arctic shoreline waters; evidence of increased sensitivity due to UV radiation. Mar. Ecol. Prog. Ser.
Duquesne, S., Riddle, M., 2002. Biological monitoring of heavy metal contamination in coastal watersoff Casey station, Windmill Islands, East Antarctica. Polar Biol. 25, 206-215.
Duquesne, S., Riddle, M., Schulz, R., Liess, M., 2000. Effects of contaminants in the Antarctic envi-ronment - potential of the gammarid amphipod crustacean Paramoera walkeri as a biological indi-cator for Antarctic ecosystems based on toxicity and bioaccumulation of copper and cadmium.Aquat. Toxicol. 49, 131-143.
Engelman, L., 2000. Nonlinear models. In: Anonymous (Eds.), SYSTAT 10: Statistics II. SPSS Inc,Chicago, IL, pp. 147-196.
Flegal, A.R., Maring, H., Niemeyer, S., 1993. Anthropogenic lead in Antarctic sea water. Nature 365,242-244.
Frache, R., Abelmoschi, M.L., Grotti, M., Ianni, C., Magi, E., Soggia, F., Capodaglio, G., Turetta, C.,Barbante, C., 2001. Effects of ice melting on Cu, Cd and Pb profiles in Ross Sea waters (Antarc-tica). Int. J. Environ. Anal. Chem. 79, 301-313.
Hindell, M.A., Brothers, N., Gales, R., 1999. Mercury and cadmium concentrations in the tissues ofthree species of southern albatrosses. Polar Biol. 22, 102-108.
Hudson, R.J.M., 1998. Which aqueous species control the rates of trace metal uptake by aquatic bi-ota? Observations and predictions of non-equilibrium effects. Sci. Total Environ. 219, 95-115.
Hurlbert, S.H., 1984. Pseudoreplication and the design of ecological field experiments. Ecol. Monogr.54, 187-211.
Jennings, S., Kaiser, M.J., Reynolds, J.D., 2001. Marine fisheries ecology. Blackwell Science, Oxford.

B. Clason, S. Duquesne, M. Liess, R. Schulz & G.-P. Zauke: Bioaccumuation of trace metals in Paramoera walkeri 16_____________________________________________________________________________________________
Kahle, J., Clason, B., Zauke, G.-P., 2003. Sequential determination of Cd, Cu, Pb, Co and Ni in mari-ne invertebrates by graphite furnace atomic absorption spectroscopy and Zeeman background cor-rection. Varian AA at Work No. 129, 1-15.
Kahle, J., Zauke, G.-P., 2002a. Bioaccumulation of trace metals in the calanoid copepod Metridiagerlachei from the Weddell Sea (Antarctica). Sci. Total Environ. 295, 1-16.
Kahle, J., Zauke, G.-P., 2002b. Bioaccumulation of trace metals in the copepod Calanoides acutusfrom the Weddell Sea (Antarctica): Comparison of two-compartment and hyperbolic toxicokineticmodels. Aquat. Toxicol. 59, 115-135.
Kolding, S., 1981. Habitat selection and life cycle characteristics of five species of amphipod genusGammarus in the Baltic. Oikos 37, 173-178.
Liess, M., Champeau, O., Riddle, M., Schulz, R., Duquesne, S., 2001. Combined effects of ultraviolett-B radiation and food shortage on the sensitivity of the Antarctic amphipod Paramoera walkeri tocopper. Environ. Toxicol. Chem. 20, 2088-2092.
Löscher, B., 1999. Relationships among Ni, Cu, Zn, and major nutrients in the Southern Ocean. Mar.Chem. 67, 67-102.
MacLean, R.S., Borgmann, U., Dixon, D.G., 1996. Bioaccumulation kinetics and toxicity of lead inHyalella azteca (Crustacea, Amphipoda). Can. J. Fish. Aquat. Sci. 53, 2212-2220.
Marquez, M., Vodopivez, C., Casaux, R., Curtosi, A., 1998. Metal (Fe, Zn, Mn and Cu) levels in theAntarctic fish Notothenia coriiceps. Polar Biol. 20, 404-408.
Meurs, H.-G., Zauke, G.-P., 1988. Regionale und zeitliche Aspekte der Besiedlung des Elbe-, Weser-und Ems-Ästuars mit euryhalinen Gammariden (Crustacea: Amphipoda). Arch. Hydrobiol. 113,213-230.
Minganti, V., Capelli, R., Depellegrini, R., 1998. The concentrations of Pb, Cd, Cu, Zn, and V in Ada-mussium colbecki from Terra Nova Bay (Antarctica). Int. J. Environ. Anal. Chem. 71, 257-263.
Niemisto, L., Perttila, M., 1995. Trace elements in the Weddell Sea water and sediments in the conti-nental shelf area. Chemosphere 31, 3643-3650.
OECD, 1981. Guideline for testing chemicals. Paris, France.
Petri, G., Zauke, G.-P., 1993. Trace metals in crustaceans in the Antarctic Ocean. Ambio 22, 529-536.
Rainbow, P.S., 1993. The significance of trace metal concentration in marine invertebrates. In: Dallin-ger, R., Rainbow, P. S. (Eds.), Ecotoxicology of metals in invertebrates. Lewis Publishers, BocaRaton, USA, pp. 4-23.
Rainbow, P.S., 1995. Physiology, physicochemistry and metal uptake - A crustacean perspective. Mar.Pollut. Bull. 31, 55-59.
Rainbow, P.S., 1997. Ecophysiology of trace metal uptake in crustaceans. Estuarine Coastal ShelfSci. 44, 169-175.
Rainbow, P.S., Phillips, D.J.H., Depledge, M.H., 1990. The significance of trace metal concentrationsin marine invertebrates, a need for laboratory investigation of accumulation strategies. Mar. Pollut.Bull. 21, 321-324.
Rainbow, P.S., White, S.L., 1989. Comparative strategies of heavy metal accumulation by crusta-ceans: Zinc, copper and cadmium in a decapod, an amphipod and a barnacle. Hydrobiologia 174,245-262.
Ravanelli, M., Tubertini, O., Valcher, S., Martinotti, W., 1997. Heavy metal distribution in sedimentcores from Western Ross Sea (Antarctica). Water Air Soil Pollut. 99, 697-704.
Rinderhagen, M., Ritterhoff, J., Zauke, G.-P., 2000. Crustaceans as bioindicators. In: Gerhardt, A.(Eds.), Biomonitoring of Polluted Water - Reviews on Actual Topics. Trans Tech Publications -Scitech Publications, Environmental Research Forum Vol. 9, Uetikon-Zuerich, pp. 161-194.

B. Clason, S. Duquesne, M. Liess, R. Schulz & G.-P. Zauke: Bioaccumuation of trace metals in Paramoera walkeri 17_____________________________________________________________________________________________
Ritterhoff, J., Zauke, G.-P., 1997a. Bioaccumulation of trace metals in Greenland Sea copepod andamphipod collectives on board ship: verification of toxicokinetic model parameters. Aquat. Toxicol.40, 63-78.
Ritterhoff, J., Zauke, G.-P., 1997b. Evaluation of trace metal toxicokinetics in Greenland Sea copepodand amphipod collectives from semi-static experiments on board ship. Polar Biol. 17, 242-250.
Ritterhoff, J., Zauke, G.-P., 1997c. Influence of body length, life-history status and sex on trace metalconcentrations in selected zooplankton collectives from the Greenland Sea. Mar. Pollut. Bull. 34,614-621.
Ritterhoff, J., Zauke, G.-P., Dallinger, R., 1996. Calibration of the estuarine amphipods, Gammaruszaddachi Sexton (1912), as biomonitors: toxicokinetics of cadmium and possible role of induciblemetal binding proteins in Cd detoxification. Aquat. Toxicol. 34, 351-369.
Scharek, R., Vanleeuwe, M.A., Debaar, H.J.W., 1997. Responses of Southern Ocean phytoplanktonto the addition of trace metals. Deep - Sea Res. Part II Top. Stud. Oceanogr. 44, 209-227.
Snape, I., Stark, J.S., Cole, C.M., Gore, D.G., Duquesne, S., Riddle, M.J., 2001. Management andremediation of contaminated sites at Casey Station, Antarctica. Polar Rec. 37, 199-214.
Stuhlbacher, A., Maltby, L., 1992. Cadmium resistence in Gammarus pulex (L.). Arch. Environ. Con-tam. Toxicol. 22, 319-324.
Sun, L.G., Xie, Z.Q., 2001. Changes in lead concentration in Antarctic penguin droppings during thepast 3,000 years. Environ. Geol. 40, 1205-1208.
Sunda, W.G., Huntsman, S.A., 1998. Processes regulating cellular metal accumulation and physio-logical effects: Phytoplankton as model systems. Sci. Total Environ. 219, 165-181.
Vanginneken, L., Chowdhury, M.J., Blust, R., 1999. Bioavailability of cadmium and zinc to the com-mon carp, Cyprinus carpio, in complexing environments: A test for the validity of the free ion activitymodel. Environ. Toxicol. Chem. 18, 2295-2304.
Viarengo, A., Nott, J.A., 1993. Mini-review. Mechanisms of heavy metal cation homeostasis in marineinvertebrates. Comp. Biochem. Physiol. C Comp. Toxicol. 104C, 355-372.
Wang, X., Zauke, G.-P., 2002. Relationship between growth parameters of the amphiod Gammaruszaddachi (Sexton 1912) and the permeable body surface area determined by the acid-base titrationmethod. Hydrobiologia 482, 179-189.
Wübben, D.L., 2000. UV-induced mortality of zoea I larvae of brown shrimp Crangon crangon (Lin-naeus, 1758). J. Plankton Res. 22, 2095-2104.
Xu, Q., Pascoe, D., 1993. The bioconcentration of zinc by Gammarus pulex (L.) and the application ofa kinetic model to determine bioconcentration factors. Water Res. 27, 1683-1688.
Zauke, G.-P., Krause, M., Weber, A., 1996a. Trace metals in mesozooplankton of the North Sea: Con-centrations in different taxa and preliminary results on bioaccumulation in copepod collectives(Calanus finmarchicus / C. helgolandicus). Int. Revue Ges. Hydrobiol. 81, 141-160.
Zauke, G.-P., Petri, G., 1993. Metal concentrations in Antarctic Crustacea. The problem of backgroundlevels. In: Dallinger, R., Rainbow, P. S. (Eds.), Ecotoxicology of metals in invertebrates. Lewis Pub-lishers, Boca Raton, USA, pp. 73-101.
Zauke, G.-P., Petri, G., Ritterhoff, J., Meurs, H.-G., 1996b. Theoretical background for the assessmentof the quality status of ecosystems: lessons from studies of heavy metals in aquatic invertebrates.Senckenbergiana marit. 27, 207-214.
Zauke, G.P., Savinov, V.M., Ritterhoff, J., Savinova, T., 1999. Heavy metals in fish from the BarentsSea (Summer 1994). Sci. Total Environ. 227, 161-173.
Zauke, G.-P., von Lemm, R., Meurs, H.-G., Butte, W., 1995. Validation of estuarine gammarid collec-tives (Amphipoda: Crustacea) as biomonitors for cadmium in semi-controlled toxicokinetic flow-through experiments. Environ. Pollut. 90, 209-219.

B. Clason, S. Duquesne, M. Liess, R. Schulz & G.-P. Zauke: Bioaccumuation of trace metals in Paramoera walkeri 18_____________________________________________________________________________________________
Table 1 : Experimental design of the bioaccumulation experiments in Casey (locations seeFig. 1).
toxicokineticstudy
test organisms experimental design
T1 Paramoera walkeri (Denison Island)
uptake phase: 11 d; clearance phase: 9 d;soluble multiple exposure to Zn, Cu, Cd and Pb in three
different concentrations (CW1 - CW3 in Table 2);with and without exposure to natural UV radiation
T2 Paramoera walkeri (Beall Island)
uptake phase: 11 d; clearance phase: 5 d;soluble single exposure to Cu, Cd and Pb in one concen-
tration (CW3 in Table 2);with and without exposure to natural UV radiation
Table 2 : Nominal (in brackets, n) and measured total recoverable metal concentrations(mean ± 95 CI, m) throughout the uptake phase in toxicokinetic study T1 (µg l-1, multiplemetal exposure) and T2 (µg l-1, single metal exposure).
toxicokineticstudy
expo-sure
Cd Cu Pb Zn
T1 CW1 mn
3.0 ± 0.2(2.5)
25 ± 3(15)
12 ± 1(10)
n.a.(30)
T1 CW2 mn
5.4 ± 0.3(5)
37 ± 7(30)
22 ± 4(20)
77 ± 29(60)
T1 CW3 mn
10 ± 1(10)
65 ± 8(60)
40 ± 5(40)
149 ± 14(120)
T2 CW3 mn
12 ± 110
76 ± 460
41 ± 440
--
n.a.: no data available due to technical reasons
Table 3 : Quality assurance using certified reference materials randomly allocated within thedeterminations. Values are means ± 95% CI [mg kg-1 DW].
TORT – 2 NRC CRM 278R
Lobster Hepathopancreas Mussel Tissue
analysed N certified Analysed N certified
Cd 26.2 ± 1.4 16 26.7 ± 0.6 0.35 ± 0.01 32 0.348 ± 0.007
Cu 107 ± 4 13 106 ± 10 9.0 ± 0.6 13 9.45 ± 0.13
Pb 0.35 ± 0.05 32 0.35 ± 0.13 1.93 ± 0.13 32 2.00 ± 0.04
Zn 182 ± 3 19 180 ± 6 85 ± 4 31 83.1 ± 1.7
limits of detection for biological material: 0.07 (Cd), 2.6 (Cu), 0.4 (Pb) und 28 (Zn) mg kg-1 DW ac-cording to Büttner et al. (1980) (mean blank + 2.6*SD of a 'low value').
B. Clason, S. Duquesne, M. Liess, R. Schulz & G.-P. Zauke: Bioaccumuation of trace metals in Paramoera walkeri 19_____________________________________________________________________________________________
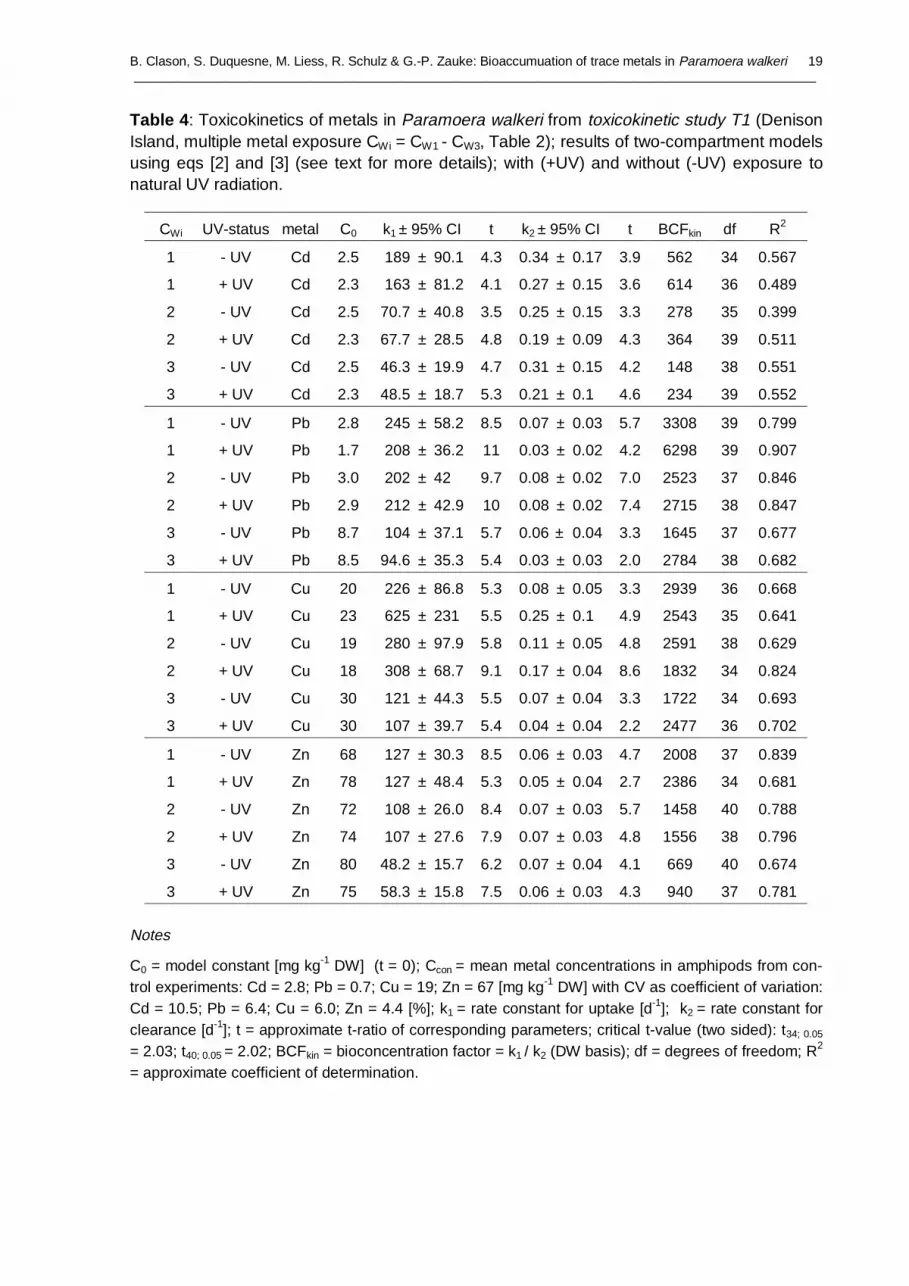
Table 4 : Toxicokinetics of metals in Paramoera walkeri from toxicokinetic study T1 (DenisonIsland, multiple metal exposure CWi = CW1 - CW3, Table 2); results of two-compartment modelsusing eqs [2] and [3] (see text for more details); with (+UV) and without (-UV) exposure tonatural UV radiation.
CWi UV-status metal C0 k1 ± 95% CI t k2 ± 95% CI t BCFkin df R2
1 - UV Cd 2.5 189 ± 90.1 4.3 0.34 ± 0.17 3.9 562 34 0.567
1 + UV Cd 2.3 163 ± 81.2 4.1 0.27 ± 0.15 3.6 614 36 0.489
2 - UV Cd 2.5 70.7 ± 40.8 3.5 0.25 ± 0.15 3.3 278 35 0.399
2 + UV Cd 2.3 67.7 ± 28.5 4.8 0.19 ± 0.09 4.3 364 39 0.511
3 - UV Cd 2.5 46.3 ± 19.9 4.7 0.31 ± 0.15 4.2 148 38 0.551
3 + UV Cd 2.3 48.5 ± 18.7 5.3 0.21 ± 0.1 4.6 234 39 0.552
1 - UV Pb 2.8 245 ± 58.2 8.5 0.07 ± 0.03 5.7 3308 39 0.799
1 + UV Pb 1.7 208 ± 36.2 11 0.03 ± 0.02 4.2 6298 39 0.907
2 - UV Pb 3.0 202 ± 42 9.7 0.08 ± 0.02 7.0 2523 37 0.846
2 + UV Pb 2.9 212 ± 42.9 10 0.08 ± 0.02 7.4 2715 38 0.847
3 - UV Pb 8.7 104 ± 37.1 5.7 0.06 ± 0.04 3.3 1645 37 0.677
3 + UV Pb 8.5 94.6 ± 35.3 5.4 0.03 ± 0.03 2.0 2784 38 0.682
1 - UV Cu 20 226 ± 86.8 5.3 0.08 ± 0.05 3.3 2939 36 0.668
1 + UV Cu 23 625 ± 231 5.5 0.25 ± 0.1 4.9 2543 35 0.641
2 - UV Cu 19 280 ± 97.9 5.8 0.11 ± 0.05 4.8 2591 38 0.629
2 + UV Cu 18 308 ± 68.7 9.1 0.17 ± 0.04 8.6 1832 34 0.824
3 - UV Cu 30 121 ± 44.3 5.5 0.07 ± 0.04 3.3 1722 34 0.693
3 + UV Cu 30 107 ± 39.7 5.4 0.04 ± 0.04 2.2 2477 36 0.702
1 - UV Zn 68 127 ± 30.3 8.5 0.06 ± 0.03 4.7 2008 37 0.839
1 + UV Zn 78 127 ± 48.4 5.3 0.05 ± 0.04 2.7 2386 34 0.681
2 - UV Zn 72 108 ± 26.0 8.4 0.07 ± 0.03 5.7 1458 40 0.788
2 + UV Zn 74 107 ± 27.6 7.9 0.07 ± 0.03 4.8 1556 38 0.796
3 - UV Zn 80 48.2 ± 15.7 6.2 0.07 ± 0.04 4.1 669 40 0.674
3 + UV Zn 75 58.3 ± 15.8 7.5 0.06 ± 0.03 4.3 940 37 0.781
Notes
C0 = model constant [mg kg-1 DW] (t = 0); Ccon = mean metal concentrations in amphipods from con-trol experiments: Cd = 2.8; Pb = 0.7; Cu = 19; Zn = 67 [mg kg-1 DW] with CV as coefficient of variation:Cd = 10.5; Pb = 6.4; Cu = 6.0; Zn = 4.4 [%]; k1 = rate constant for uptake [d-1]; k2 = rate constant forclearance [d-1]; t = approximate t-ratio of corresponding parameters; critical t-value (two sided): t34; 0.05
= 2.03; t40; 0.05 = 2.02; BCFkin = bioconcentration factor = k1 / k2 (DW basis); df = degrees of freedom; R2
= approximate coefficient of determination.

B. Clason, S. Duquesne, M. Liess, R. Schulz & G.-P. Zauke: Bioaccumuation of trace metals in Paramoera walkeri 20_____________________________________________________________________________________________
Table 5 : Toxicokinetics of metals in Paramoera walkeri from toxicokinetic study T1 (DenisonIsland, multiple metal exposure CWi = CW1 - CW3, Table 2); results of hyperbolic models usingeqs [4] and [5] (see text for more details); with (+UV) and without (-UV) exposure to naturalUV radiation.
CWi UV-status metal Cmax ± 95% CI t tmax1/2 ± 95% CI t BCFkin df R2
1 - UV Cd 1.7 ± 0.7 4.8 0.8 ± 0.6 2.6 569 30 0.365
1 + UV Cd 1.9 ± 0.8 5.1 1.1 ± 0.8 2.9 632 31 0.428
2 + UV Cd 1.9 ± 0.7 5.3 1.4 ± 0.9 3.3 354 35 0.421
3 - UV Cd 1.4 ± 0.6 4.8 0.6 ± 0.5 2.3 136 34 0.312
3 + UV Cd 2.6 ± 0.9 5.9 1.7 ± 1.1 3.2 249 35 0.419
1 - UV Pb 47.8 ± 7.7 13 10.8 ± 3.6 6.1 4160 39 0.826
1 + UV Pb 81.2 ± 22.5 7.3 26.4 ± 10.9 4.9 7059 39 0.910
2 - UV Pb 67.8 ± 8.9 15 10.2 ± 2.9 7.2 3112 37 0.868
2 + UV Pb 72.6 ± 9.8 15 10.9 ± 3.0 7.3 3331 38 0.862
3 - UV Pb 89.3 ± 20.4 8.9 11.1 ± 5.2 4.3 2215 37 0.712
3 + UV Pb 124 ± 44.4 5.7 18.4 ± 11.3 3.3 3070 38 0.698
1 - UV Cu 92.7 ± 27.9 6.7 7.5 ± 4.2 3.6 3768 36 0.653
1 + UV Cu 85.6 ± 17.2 10 2.5 ± 1.3 4.0 3478 35 0.653
2 - UV Cu 123 ± 27.6 9.0 6.3 ± 2.9 4.4 3296 38 0.627
2 + UV Cu 118 ± 30.8 7.7 7.2 ± 3.7 3.9 3157 38 0.541
3 - UV Cu 144 ± 36.9 7.9 7.1 ± 3.5 4.1 2219 34 0.720
3 + UV Cu 172 ± 50.0 7.0 9.9 ± 5.3 3.8 2652 36 0.713
Notes
Cmax = maximal metal concentration in animals at theoretical equilibrium [mg kg-1 DW]; tmax/2 = timeneeded to reach half of Cmax [d]; critical t-value (two sided): t30; 0.05 = 2.04; t40; 0.05 = 2.02; otherwise as inTable 4. No models could be estimated for CW2 (+ UV) and Zn.

B. Clason, S. Duquesne, M. Liess, R. Schulz & G.-P. Zauke: Bioaccumuation of trace metals in Paramoera walkeri 21_____________________________________________________________________________________________
Table 6 : Toxicokinetics of metals in Paramoera walkeri from toxicokinetic study T2 (Beall Is-land, single metal exposure CW3, Table 2); results of two-compartment models using eqs [2]and [3] (see text for more details); with (+UV) and without (-UV) exposure to natural UV ra-diation.
UV-status metal C0 k1 ± 95% CI t k2 ± 95% CI t BCFkin df R2
- UV Cd 2.6 46.7 ± 27.6 3.5 0.14 ± 0.1 2.9 338 31 0.512
+ UV Cd 2.7 54.5 ± 45.5 2.5 0.22 ± 0.20 2.3 249 31 0.357
- UV Pb 4.8 100 ± 30.2 6.8 0.07 ± 0.04 3.4 1473 33 0.852
+ UV Pb 4.2 114 ± 28.2 8.2 0.09 ± 0.03 5.4 1198 34 0.875
- UV Cu 23 167 ± 43.9 7.7 0.11 ± 0.04 5.6 1529 34 0.852
+ UV Cu 22 174 ± 58.5 6.1 0.12 ± 0.05 4.6 1491 34 0.773
Notes
Ccon: Cd = 2.6; Pb = 0.4; Cu = 26 [mg kg-1 DW]; CV: Cd = 16.2; Pb = 11.8; Cu = 10.8 [%]; critical t-value (two sided): t31; 0.05 = 2.04; t40; 0.05 = 2.02; otherwise as in Table 4 and 5.
Table 7 : Toxicokinetics of metals in Paramoera walkeri from toxicokinetic study T2 (Beall Is-land, single metal exposure CW3,Table 2); results of hyperbolic models using eqs [4] and [5](see text for more details); with (+UV) and without (-UV) exposure to natural UV radiation.
UV-status metal Cmax ± 95% CI t tmax1/2 ± 95% CI t BCFkin df R2
- UV Pb 74.5 ± 16.1 9.4 10.9 ± 4.5 4.9 1812 33 0.874
+ UV Pb 65.9 ± 9.7 14 8.9 ± 2.7 6.6 1602 34 0.902
- UV Cu 150 ± 31.2 9.8 6.8 ± 2.8 4.9 1971 34 0.838
+ UV Cu 146 ± 34.3 8.6 6.5 ± 3.0 4.3 1914 34 0.765
Notes
critical t-value (two sided): t34;0.05 = 2.03; otherwise as in Table 4 and 5. No models could be estimatedfor Cd.

B. Clason, S. Duquesne, M. Liess, R. Schulz & G.-P. Zauke: Bioaccumuation of trace metals in Paramoera walkeri 22_____________________________________________________________________________________________
Table 8 : Linear regression of observed metal concentrations in Paramoera walkeri from toxi-cokinetic study T1 (Denison Island, multiple metal exposure CW2 and CW3, Table 2) versusmodel predictions derived from exposure CW1 of T1 regarding compartment (CW1-C) andhyperbolic models (CW1-H); with (+UV) and without (-UV) exposure to natural UV radiation.
metal UV-status observedfrom CWi
predictedfrom model
constant slope t 95% CI of slope R2
Cd - UV CW2 CW1-C 1.7* 0.29 1.91 -0.02 - 0.60 0.099
Cd - UV CW2 CW1-H 1.8* 0.28 1.66 -0.07 - 0.62 0.068
Cu - UV CW2 CW1-C -3.1 1.18 10.0 0.93 - 1.42 0.802
Cu - UV CW2 CW1-H -2.4 1.04 9.75 0.82 - 1.25 0.797
Pb - UV CW2 CW1-C 1.2 0.92 18.4 0.81 - 1.02 0.939
Pb - UV CW2 CW1-H 0.7 1.20 18.4 1.07 - 1.34 0.939
Zn - UV CW2 CW1-C 13 0.86 13.0 0.73 - 1.00 0.870
Cd - UV CW3 CW1-C 2.1* 0.21 4.20 0.12 - 0.32 0.409
Cd - UV CW3 CW1-H 1.9* 0.26 4.22 0.13 - 0.39 0.412
Cu - UV CW3 CW1-C 19* 0.54 7.40 0.39 - 0.69 0.682
Cu - UV CW3 CW1-H 16* 0.67 7.44 0.48 - 0.85 0.685
Pb - UV CW3 CW1-C 7.6* 0.45 6.37 0.30 - 0.59 0.633
Pb - UV CW3 CW1-H 8.0* 0.89 6.06 0.58 - 1.19 0.608
Zn - UV CW3 CW1-C 55* 0.37 7.71 0.27 - 0.47 0.700
Cd + UV CW2 CW1-C 1.0 0.48 4.28 0.25 - 0.72 0.409
Cd + UV CW2 CW1-H 1.3* 0.40 3.19 0.14 - 0.66 0.276
Cu + UV CW2 CW1-C 5.0 0.61 15.8 0.53 - 0.69 0.916
Cu + UV CW2 CW1-H 4.8 0.57 14.8 0.49 - 0.65 0.905
Pb + UV CW2 CW1-C 1.6 0.98 14.4 0.84 - 1.12 0.899
Pb + UV CW2 CW1-H 1.2 1.55 16.1 1.34 - 1.75 0.924
Zn + UV CW2 CW1-C 19* 0.82 10.1 0.65 - 0.99 0.801
Cd + UV CW3 CW1-C 1.6* 0.32 4.89 0.18 - 0.45 0.489
Cd + UV CW3 CW1-H 1.4* 0.39 4.78 0.22 - 0.56 0.477
Cu + UV CW3 CW1-C 14* 0.39 10.5 0.31 - 0.46 0.821
Cu + UV CW3 CW1-H 15* 0.43 9.62 0.34 - 0.52 0.792
Pb + UV CW3 CW1-C 8.8* 0.41 5.36 0.25 - 0.57 0.545
Pb + UV CW3 CW1-H 8.6* 1.06 5.23 0.64 - 1.48 0.534
Zn + UV CW3 CW1-C 47* 0.46 9.03 0.33 - 0.52 0.771
Notes
* constant significantly different from zero (α = 0.05); t: t-value of the slope; critical t-value (two sided):t25;0.05 = 2.06; otherwise as in Table 4 and 5.

B. Clason, S. Duquesne, M. Liess, R. Schulz & G.-P. Zauke: Bioaccumuation of trace metals in Paramoera walkeri 23_____________________________________________________________________________________________
Table 9 : Linear regression of observed metal concentrations in Paramoera walkeri from toxi-cokinetic study T1 (Denison Island, multiple metal exposure CWi = CW1 - CW3, Table 2, with(+UV) exposure to natural UV radiation) versus model predictions derived from exposure CWi
of T1 without (-UV) exposure to natural UV radiation regarding compartment (CWi-C) and hy-perbolic models (CWi-H).
metal observed fromCWi (+ UV)
predicted frommodel (- UV)
constant slope t 95% CI of slope R2
Cd CW1 CW1-C -0.1 0.92 3.88 0.43 - 1.41 0.379
Cd CW1 CW1-H 0.4 0.74 2.74 0.18 - 1.29 0.221
Cu CW1 CW1-C 2.6 1.39 5.98 0.91 - 1.87 0.582
Cu CW1 CW1-H 2.9 1.10 7.28 0.79 - 1.41 0.675
Pb CW1 CW1-C 0.5 0.98 17.0 0.86 - 1.10 0.920
Pb CW1 CW1-H -0.3 0.90 16.5 0.79 - 1.02 0.916
Zn CW1 CW1-C -78* 2.29 7.11 1.63 - 2.96 0.673
Cd CW2 CW2-C -0.6 1.07 4.41 0.57 - 1.57 0.424
Cd CW2 CW2-H 0.5 0.71 2.36 0.09 - 1.34 0.155
Cu CW2 CW2-C 3.0 0.89 16.9 0.78 - 1.00 0.925
Cu CW2 CW2-H 3.5 0.72 17.0 0.63 - 0.81 0.926
Pb CW2 CW2-C 0.5 1.23 14.0 1.05 - 1.42 0.895
Pb CW2 CW2-H -0.5 1.08 13.2 0.91 - 1.25 0.882
Zn CW2 CW2-C 2.2 1.06 10.1 0.84 - 1.27 0.801
Cd CW3 CW3-C -0.9 1.22 4.65 0.68 - 1.76 0.463
Cd CW3 CW3-H - n.a. - - -
Cu CW3 CW3-C 10 0.95 7.36 0.69 - 1.22 0.689
Cu CW3 CW3-H 10 0.68 9.42 0.53 - 0.83 0.785
Pb CW3 CW3-C 7.4* 0.98 5.74 0.62 - 1.33 0.582
Pb CW3 CW3-H 5.5 0.76 6.63 0.52 - 1.00 0.651
Zn CW3 CW3-C -8.8 1.24 9.39 0.97 - 1.51 0.784
Notes
* constant significantly different from zero (α = 0.05); t: t-value of the slope; critical t-value (two sided):t25;0.05 = 2.06; n.a.: not applicable; otherwise as in Table 4 and 5.

B. Clason, S. Duquesne, M. Liess, R. Schulz & G.-P. Zauke: Bioaccumuation of trace metals in Paramoera walkeri 24_____________________________________________________________________________________________
Table 10 : Linear regression of observed metal concentrations in Paramoera walkeri fromtoxicokinetic study T2 (Beall Island, single metal exposure CW3, Table 2) versus model pre-dictions derived from exposure CW3 of T1 (Denison Island, multiple metal exposure, Table 2)regarding compartment (CW3-C) and hyperbolic models (CW3-H); with (+UV) and without(-UV) exposure to natural UV radiation.
metal UV-status predicted frommodel (T1)
constant slope t 95% CI of slope R2
Cd - UV CW3-C -2.2 1.76 5.28 1.06 - 2.45 0.562
Cd - UV CW3-H - n.a. - - -
Cu - UV CW3-C -18* 1.46 13.1 1.23 - 1.70 0.885
Cu - UV CW3-H -7.5 0.95 10.4 0.76 - 1.14 0.830
Pb - UV CW3-C 2.9 1.12 11.7 0.92 - 1.32 0.861
Pb - UV CW3-H 1.7 0.81 13.9 0.69 - 0.93 0.900
Cd + UV CW3-C -1.8 1.53 4.97 0.89 - 2.17 0.530
Cd + UV CW3-H -1.2 1.25 4.07 0.61 - 1.89 0.426
Cu + UV CW3-C -27* 1.75 10.8 1.42 - 2.10 0.840
Cu + UV CW3-H -12 1.05 9.34 0.81 - 1.28 0.797
Pb + UV CW3-C 2.7* 1.06 15.2 0.91 - 1.20 0.912
Pb + UV CW3-H 2.0 0.84 17.7 0.75 - 0.94 0.934
Notes
* constant significantly different from zero (α = 0.05); t: t-value of the slope; critical t-value (two sided):t25;0.05 = 2.06; n.a.: not applicable; otherwise as in Table 4 and 5.

B. Clason, S. Duquesne, M. Liess, R. Schulz & G.-P. Zauke: Bioaccumuation of trace metals in Paramoera walkeri 25_____________________________________________________________________________________________
Table 11 : Sensitivity of Paramoera walkeri from toxicokinetic study T1 (Denison Island, mul-tiple metal exposure CWi = CW1 - CW3, Table 2) as biomonitor; with (+UV) and without (-UV)exposure to natural UV radiation.
CWi UV-status metal BCFkin min∆CA min∆CW
1 - UV Cd 562 0.42 0.8
1 + UV Cd 614 0.42 0.8
2 - UV Cd 278 0.42 1.6
2 + UV Cd 364 0.42 1.4
3 - UV Cd 148 0.42 3.0
3 + UV Cd 234 0.42 2.2
1 - UV Pb 3308 0.19 0.12
1 + UV Pb 6298 0.19 0.12
2 - UV Pb 2523 0.19 0.14
2 + UV Pb 2715 0.19 0.14
3 - UV Pb 1645 0.19 0.25
3 + UV Pb 2784 0.19 0.25
1 - UV Cu 2939 2.1 1.4
1 + UV Cu 2543 2.1 0.9
2 - UV Cu 2591 2.1 1.3
2 + UV Cu 1832 2.1 1.4
3 - UV Cu 1722 2.1 2.5
3 + UV Cu 2477 2.1 2.5
1 - UV Zn 2008 8.8 9.5
1 + UV Zn 2386 8.8 9.2
2 - UV Zn 1458 8.8 12
2 + UV Zn 1556 8.8 12
3 - UV Zn 669 8.8 26
3 + UV Zn 940 8.8 21
Notes
CVRef = coefficient of variation of reference materials: Cd = 9.0; Pb = 16; Cu = 6.0; Zn = 8.0 [%]; Ccon:metal concentration in gammarids from the control: Cd = 2.8; Pb = 0.7; Cu = 19; Zn = 67 [mg kg-1 DW];min∆CA = minimum increment in body concentration which can be detected [mg kg-1, DW]; min∆CW =minimal increment in exposure concentrations necessary to exceed the value of Ccon + min∆CA in theamphipods during a simulation of a 10-days uptake phase [µg l-1]; see text (material and method sec-tion) for more details; otherwise as in Table 4 and 5.
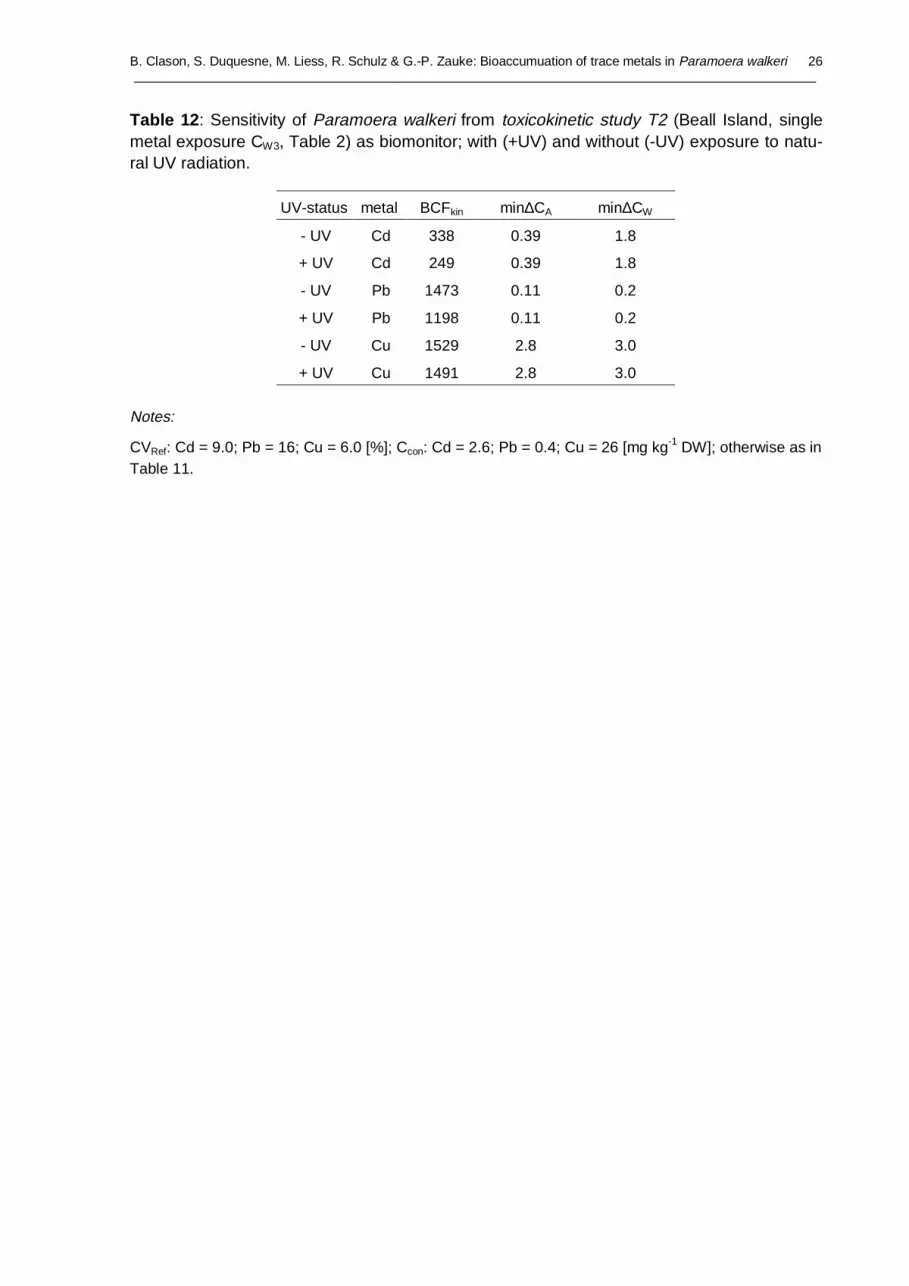
B. Clason, S. Duquesne, M. Liess, R. Schulz & G.-P. Zauke: Bioaccumuation of trace metals in Paramoera walkeri 26_____________________________________________________________________________________________
Table 12 : Sensitivity of Paramoera walkeri from toxicokinetic study T2 (Beall Island, singlemetal exposure CW3, Table 2) as biomonitor; with (+UV) and without (-UV) exposure to natu-ral UV radiation.
UV-status metal BCFkin min∆CA min∆CW
- UV Cd 338 0.39 1.8
+ UV Cd 249 0.39 1.8
- UV Pb 1473 0.11 0.2
+ UV Pb 1198 0.11 0.2
- UV Cu 1529 2.8 3.0
+ UV Cu 1491 2.8 3.0
Notes:
CVRef: Cd = 9.0; Pb = 16; Cu = 6.0 [%]; Ccon: Cd = 2.6; Pb = 0.4; Cu = 26 [mg kg-1 DW]; otherwise as inTable 11.

B. Clason, S. Duquesne, M. Liess, R. Schulz & G.-P. Zauke: Bioaccumuation of trace metals in Paramoera walkeri 27_____________________________________________________________________________________________
South America
Mawson Heard Island
Davis
Casey
Afrika
Macquary Island
New Zealand
90o W
60 o S
40 o S
180o
90o E
0o
Antarctica
Australia
Beall Island
Shirley Island
McMullin Island
O‘Brien Bay
BrownBay
Bailey Peninsula
Casey
Denison Island
Fig. 1 : Geographical position of the Australian Station Casey, Wilkes Land, Antarctica (left);details of the sampling locations (black arrows) at Denison Island (66° 18‘ 04‘‘ N, 110° 27‘01‘‘ E) and Beall Island (66° 27‘ 06‘‘N, 110° 27‘ 06‘‘E); modified from topographical chart 1:50000, Australian Antarctic Territory, Windmill Islands, Edition 2, based on the World GeodeticSystem 1984, WGS84 (right).
0
20
40
60
80
100
250 300 350 400 450 500 550 600
Wavelength [nm]
Tra
nsm
issi
on [%
]
UV blocking foil
UVpermeablefoil
Fig. 2 : Transmission of UV A and B radiation through UV blocking and UV permeable plasticfoils used in the bioaccumulation experiments (Analysis: D. Wübben); see text for more de-tails.

B. Clason, S. Duquesne, M. Liess, R. Schulz & G.-P. Zauke: Bioaccumuation of trace metals in Paramoera walkeri 28_____________________________________________________________________________________________
Fig. 3 : Schematic representation of the technical test arrangement for the bioaccumulationstudy at Casey wharf. Left: cross-section; right: view from above; 1: ambient sea water, 2:water tank, 3: frame with folie, 4: overflow, 5: platform, 6: experimental vessels, 7: gravime-tric flow-trough, 8: warf, 9: submerged pumps, 10: sea water flow-trough system, 11: aerationsystem, 12: plastic troughts, see text for more details.
(a) T1 , +UV
0
40
80
120
160
0 5 10 15 20
(b) T1 , -UV
0
40
80
120
160
0 5 10 15 20
(c) T2 , +UV
0
10
20
30
0 5 10 15 20
(d) T2, -UV
0
10
20
30
0 5 10 15 20
Fig. 4 : Cumulative moulting of gammarids in the toxicokinetic experiments (pooled results ofthree independent replicates per treatment). Top (a, b): T1 (Paramoera walkeri; Denison Is-land, multiple element exposure, Table 1); bottom (c, d): T2 (P. walkeri; Beall Island, singleelement exposure); with (+UV) and without (-UV) exposure to natural UV radiation.
1
2
3
567
98
49
1
2
612
1110
con
CW1
CW2
CW3
con
CW1
CW2
CW3
con
Cd
Pb
Cucon
Cd
Pb
Cu
Time (d) Time (d)
coun
tco
unt

B. Clason, S. Duquesne, M. Liess, R. Schulz & G.-P. Zauke: Bioaccumuation of trace metals in Paramoera walkeri 29_____________________________________________________________________________________________
(a) T1 , +UV
0
50
100
150
200
0 5 10 15 20
(b) T1 , -UV
0
50
100
150
200
0 5 10 15 20
(c) T2 , +UV
0
20
40
60
0 5 10 15 20
(d) T2 , -UV
0
20
40
60
0 5 10 15 20
Fig. 5 : Cumulative mortality of gammarids in the toxicokinetic experiments (pooled results ofthe three independent replicates per treatment). Top (a, b): T1 (Paramoera walkeri; DenisonIsland, multiple element exposure, Table 1); bottom (c, d): T2 (P. walkeri; Beall Island, singleelement exposure); with (+UV) and without (-UV) exposure to natural UV radiation.
concon
CW1
CW1
CW2
CW2
CW3
CW3
con
CdPb
Cu
conCd Pb
Cu
Time (d) Time (d)
coun
tco
unt

B. Clason, S. Duquesne, M. Liess, R. Schulz & G.-P. Zauke: Bioaccumuation of trace metals in Paramoera walkeri 30_____________________________________________________________________________________________
(a) Pb: CW1 (-UV)
0
20
40
60
0 5 10 15 20
(b) Pb: CW2 (-UV)
0
20
40
60
0 5 10 15 20
(c) Pb: CW3 (-UV)
0
20
40
60
0 5 10 15 20
(d) Pb: CW1 (+UV)
0
20
40
60
0 5 10 15 20
(e) Pb: CW2 (+UV)
0
20
40
60
0 5 10 15 20
(f) Pb: CW3 (+UV)
0
20
40
60
0 5 10 15 20
(g): Cd: CW1 (-UV)
0
2
4
6
0 5 10 15 20
(h) Cd: CW2 (-UV)
0
2
4
6
0 5 10 15 20
(i) Cd: CW3 (-UV)
0
2
4
6
0 5 10 15 20
(j) Cd: CW1 (+UV)
0
2
4
6
0 5 10 15 20
(k) Cd: CW2 (+UV)
0
2
4
6
0 5 10 15 20
c
(l) Cd: CW3 (+UV)
0
2
4
6
0 5 10 15 20
Fig. 6 : Time course of uptake and clearance of Pb and Cd in Paramoera walkeri from toxico-kinetic study T1 (Denison Island, multiple metal exposure CW1 - CW3, Table 2), comparing ob-served net uptake (open circles) with model predictions calculated by eqs [2] and [3] forcompartment models (thick line; C) and eqs [4] and [5] for hyperbolic models (thin line; H);with (+UV) and without (-UV) exposure to natural UV radiation; toxicokinetic parameters inTables 4 and 5.
mg
kg-1
mg
kg-1
mg
kg-1
mg
kg-1
Time (d)Time (d) Time (d)
C
H
C
H
C
H
C
H
C
H
C
H
C
H
C
C
H
C
H
C
H
C
H

B. Clason, S. Duquesne, M. Liess, R. Schulz & G.-P. Zauke: Bioaccumuation of trace metals in Paramoera walkeri 31_____________________________________________________________________________________________
(a) Cu: CW1 (-UV)
0
40
80
120
0 5 10 15 20
(b) Cu: CW2 (-UV)
0
40
80
120
0 5 10 15 20
(c) Cu: CW3 (-UV)
0
40
80
120
0 5 10 15 20
(d) Cu: CW1 (+UV)
0
40
80
120
0 5 10 15 20
(e) Cu: CW2 (+UV)
0
40
80
120
0 5 10 15 20
(f) Cu: CW3 (+UV)
0
40
80
120
0 5 10 15 20
(g) Zn: CW1 (-UV)
0
40
80
120
160
0 5 10 15 20
(h) Zn: CW2 (-UV)
0
40
80
120
160
0 5 10 15 20
(i) Zn: CW3 (-UV)
0
40
80
120
160
0 5 10 15 20
(j) Zn: CW1 (+UV)
0
40
80
120
160
0 5 10 15 20
(k) Zn: CW2 (+UV)
0
40
80
120
160
0 5 10 15 20
(l) Zn: CW3 (+UV)
0
40
80
120
160
0 5 10 15 20
Fig. 7 : Time course of uptake and clearance of Cu and Zn in Paramoera walkeri from toxico-kinetic study T1 (Denison Island, multiple metal exposure CW1 - CW3, Table 2), comparing ob-served net uptake (open circles) with model predictions calculated by eqs [2] and [3] forcompartment models (thick line; C) and eqs [4] and [5] for hyperbolic models (thin line; H);with (+UV) and without (-UV) exposure to natural UV radiation; toxicokinetic parameters inTables 4 and 5.
mg
kg-1
mg
kg-1
mg
kg-1
mg
kg-1
Time (d)Time (d) Time (d)
C
H
C
H
C
H
C
H
C
H
C
H
C C
C
C
C C

B. Clason, S. Duquesne, M. Liess, R. Schulz & G.-P. Zauke: Bioaccumuation of trace metals in Paramoera walkeri 32_____________________________________________________________________________________________
(a) Cd: CW3 (-UV)
0
2
4
6
8
10
0 4 8 12 16
(b) Pb: CW3 (-UV)
0
10
20
30
40
0 4 8 12 16
(c) Cu: CW3 (-UV)
0
30
60
90
120
0 4 8 12 16
(d) Cd: CW3 (+UV)
0
2
4
6
8
10
0 4 8 12 16
(e) Pb: CW3 (+UV)
0
10
20
30
40
0 4 8 12 16
(f) Cu: CW3 (+UV)
0
30
60
90
120
0 4 8 12 16
Fig. 8 : Time course of uptake and clearance of Cd, Pb and Cu in Paramoera walkeri from to-xicokinetic study T2 (Beall Island, single metal exposure CW3, Table 2), comparing observednet uptake (open circles) with model predictions calculated by eqs [2] and [3] for compart-ment models (thick line; C) and eqs [4] and [5] for hyperbolic models (thin line; H); with (+UV)and without (-UV) exposure to natural UV radiation; toxicokinetic parameters in Tables 6 and7.
mg
kg-1
mg
kg-1
Time (d) Time (d)Time (d)
H
C
C
H
C
H
C
HC
C