Binding of antioxidant flavonol morin to the native state of bovine serum albumin: Effects of urea...
11
Binding of antioxidant flavonol morin to the native state of bovine serum albumin: Effects of urea and metal ions on the binding Atanu Singha Roy 1 , Amit Kumar Dinda, Susmitnarayan Chaudhury, Swagata Dasgupta n Department of Chemistry, Indian Institute of Technology, Kharagpur 721302, India article info Article history: Received 20 May 2013 Received in revised form 23 August 2013 Accepted 23 August 2013 Available online 30 August 2013 Keywords: Morin Interaction Bovine serum albumin Urea Anisotropy Docking abstract In consideration of the various medicinal aspects of the flavonoid polyphenols, the interaction of morin with bovine serum albumin (BSA) has been investigated using multi-spectroscopic approaches. The pKa 1 of morin being 5.09, which is below physiological pH, binding studies provide important insights into its potential use as a biotherapeutic. The binding was performed under different pH (5, 7 and 9) conditions and in absence and presence of Cu(II) and Fe(III) ions. It is observed that the presence of metal ions affect the binding of morin towards BSA. The binding with BSA results in a motional restriction of morin in solution that causes an increase in anisotropy (r), rotational correlation time (t r ) and steady-state lifetime (t av ) of the ligand. Urea causes denaturation of BSA resulting in the release of morin from the protein core as determined from both the steady-state fluorescence and anisotropy (r) measurements. The possibility of non-radiative energy transfer from the donor tryptophan to the acceptor morin is detected following the Förster's theory. The site marker displacement studies along with the molecular docking results indicated that morin binds to the hydrophobic pocket of site 1 (subdomain IIA) near Trp 213 of BSA. & 2013 Elsevier B.V. All rights reserved. 1. Introduction The most abundant carrier proteins of blood plasma, the serum albumins are involved in the transportation and distribution of exogenous and endogenous materials in blood. They are capable of binding with various biologically important components (drugs, fatty acids, steroids, dyes etc.) in the body [1,2]. Bovine serum albumin (BSA) is a globular protein having 76% sequence homology with human serum albumin [3]. It has three homo- logous domains (I, II, III) each comprised of two subdomains A and B that are divided into nine loops (L1–L9) with a total of 17 disulfide bonds [3–5]. Sudlow site 1, which is located in subdo- main IIA [3,6] is known as the warfarin binding site. Sudlow site 2, located in subdomain IIIA is the ibuprofen binding site [3,6]. Site 1 has a significant preference for large heterocyclic charged compounds, while site 2 prefers small aromatic carboxylic acid moieties [7]. BSA contains two tryptophans (Trp 134 and Trp 213), of which Trp 213 is situated in a hydrophobic pocket like Trp 214 in HSA and Trp 134 is on the surface of the protein [3,4,8]. The potential of the flavonoid family members as antioxidant, antitumor, anti-inflammatory and anticancer agents has led to a lot of research [9–12]. As the elimination of polyphenols from the human body is generally a rapid process, daily consumption is required to replenish the lost amounts. The transportation of these compounds to cells through body circulation via plasma proteins is thus crucial. The flavonol morin (3,5,7,2′,4′-pentahydroxyflavone, Fig. 1), isolated from Maclura pomifera (Osage orange), Maclura tinctoria (old fustic) and from leaves of Psidium guajava (common guava) is capable of acting as a multi-functional compound [13]. Morin is found to reduce the free radical mediated damage to cardiovascular cells [14]. It is reported to be efficient for cardio- protection against myocardial injury [15] and also inhibits the aggregation of the amyloid β-peptide [16]. A recent study showed that these flavonoids are beneficial agents against the lipid membrane damage capability of α-synuclein aggregates in vitro [17]. Morin functions by the activation or structural modification of enzymes [18,19], hence an insight into its binding with serum albumins is significant from its biological applications point of view. While this manuscript was under preparation, Hu et. al. [20] published a work on the binding study of morin with BSA. They performed the binding of morin with BSA using fluorescence spectroscopy at four different temperatures in Tris–HCl buffer of pH 7.4. Conformations changes of BSA after binding with the ligand have been investigated using CD measurements by Hu et al. [20]. Wang et al. [21] recently reported the interaction pattern of Contents lists available at ScienceDirect journal homepage: www.elsevier.com/locate/jlumin Journal of Luminescence 0022-2313/$ - see front matter & 2013 Elsevier B.V. All rights reserved. http://dx.doi.org/10.1016/j.jlumin.2013.08.054 Abbreviations: BSA, Bovine serum albumin; UV–vis, UV–visible; CD, Circular dichroism; MALDI-TOF, Matrix assisted laser desorption ionization-time of flight. n Corresponding author. Tel.: þ91 3222 283306; fax: þ91 3222 255303. E-mail address: [email protected] (S. Dasgupta). 1 Present address: Department of Chemistry, School of Physical Sciences, Lovely Professional University, Punjab 144411, India. Journal of Luminescence 145 (2014) 741–751
-
Upload
independent -
Category
Documents
-
view
2 -
download
0
Transcript of Binding of antioxidant flavonol morin to the native state of bovine serum albumin: Effects of urea...
Binding of antioxidant flavonol morin to the native state of bovineserum albumin: Effects of urea and metal ions on the binding
Atanu Singha Roy 1, Amit Kumar Dinda, Susmitnarayan Chaudhury, Swagata Dasgupta n
Department of Chemistry, Indian Institute of Technology, Kharagpur 721302, India
a r t i c l e i n f o
Article history:Received 20 May 2013Received in revised form23 August 2013Accepted 23 August 2013Available online 30 August 2013
Keywords:MorinInteractionBovine serum albuminUreaAnisotropyDocking
a b s t r a c t
In consideration of the various medicinal aspects of the flavonoid polyphenols, the interaction of morinwith bovine serum albumin (BSA) has been investigated using multi-spectroscopic approaches. The pKa1of morin being 5.09, which is below physiological pH, binding studies provide important insights into itspotential use as a biotherapeutic. The binding was performed under different pH (5, 7 and 9) conditionsand in absence and presence of Cu(II) and Fe(III) ions. It is observed that the presence of metal ions affectthe binding of morin towards BSA. The binding with BSA results in a motional restriction of morin insolution that causes an increase in anisotropy (r), rotational correlation time (tr) and steady-state lifetime(tav) of the ligand. Urea causes denaturation of BSA resulting in the release of morin from the protein coreas determined from both the steady-state fluorescence and anisotropy (r) measurements. The possibilityof non-radiative energy transfer from the donor tryptophan to the acceptor morin is detected followingthe Förster's theory. The site marker displacement studies along with the molecular docking resultsindicated that morin binds to the hydrophobic pocket of site 1 (subdomain IIA) near Trp 213 of BSA.
& 2013 Elsevier B.V. All rights reserved.
1. Introduction
The most abundant carrier proteins of blood plasma, the serumalbumins are involved in the transportation and distribution ofexogenous and endogenous materials in blood. They are capable ofbinding with various biologically important components (drugs,fatty acids, steroids, dyes etc.) in the body [1,2]. Bovine serumalbumin (BSA) is a globular protein having �76% sequencehomology with human serum albumin [3]. It has three homo-logous domains (I, II, III) each comprised of two subdomains A andB that are divided into nine loops (L1–L9) with a total of 17disulfide bonds [3–5]. Sudlow site 1, which is located in subdo-main IIA [3,6] is known as the warfarin binding site. Sudlow site 2,located in subdomain IIIA is the ibuprofen binding site [3,6]. Site1 has a significant preference for large heterocyclic chargedcompounds, while site 2 prefers small aromatic carboxylic acidmoieties [7]. BSA contains two tryptophans (Trp 134 and Trp 213),of which Trp 213 is situated in a hydrophobic pocket like Trp 214in HSA and Trp 134 is on the surface of the protein [3,4,8].
The potential of the flavonoid family members as antioxidant,antitumor, anti-inflammatory and anticancer agents has led to alot of research [9–12]. As the elimination of polyphenols from thehuman body is generally a rapid process, daily consumption isrequired to replenish the lost amounts. The transportation of thesecompounds to cells through body circulation via plasma proteins isthus crucial. The flavonol morin (3,5,7,2′,4′-pentahydroxyflavone,Fig. 1), isolated from Maclura pomifera (Osage orange), Macluratinctoria (old fustic) and from leaves of Psidium guajava (commonguava) is capable of acting as a multi-functional compound [13].Morin is found to reduce the free radical mediated damage tocardiovascular cells [14]. It is reported to be efficient for cardio-protection against myocardial injury [15] and also inhibits theaggregation of the amyloid β-peptide [16]. A recent study showedthat these flavonoids are beneficial agents against the lipidmembrane damage capability of α-synuclein aggregates in vitro[17]. Morin functions by the activation or structural modificationof enzymes [18,19], hence an insight into its binding with serumalbumins is significant from its biological applications pointof view.
While this manuscript was under preparation, Hu et. al. [20]published a work on the binding study of morin with BSA. Theyperformed the binding of morin with BSA using fluorescencespectroscopy at four different temperatures in Tris–HCl buffer ofpH 7.4. Conformations changes of BSA after binding with theligand have been investigated using CD measurements by Hu et al.[20]. Wang et al. [21] recently reported the interaction pattern of
Contents lists available at ScienceDirect
journal homepage: www.elsevier.com/locate/jlumin
Journal of Luminescence
0022-2313/$ - see front matter & 2013 Elsevier B.V. All rights reserved.http://dx.doi.org/10.1016/j.jlumin.2013.08.054
Abbreviations: BSA, Bovine serum albumin; UV–vis, UV–visible;CD, Circular dichroism; MALDI-TOF, Matrix assisted laser desorptionionization-time of flight.
n Corresponding author. Tel.: þ91 3222 283306; fax: þ91 3222 255303.E-mail address: [email protected] (S. Dasgupta).1 Present address: Department of Chemistry, School of Physical Sciences,
Lovely Professional University, Punjab 144411, India.
Journal of Luminescence 145 (2014) 741–751

morin–BSA system under different pH conditions depending ontheir individual intrinsic fluorescence properties. They have alsoinvestigated the effects of interference from various externalsubstances. The spectroscopic characterization of the interactionof morin–Zinc(II) complex with BSA reports the effect of chelationof Zn(II) with morin on the binding and structural aspects of BSA[22]. In recent times there are lots of reports from differentresearch groups on the binding aspects of BSA with small druglike molecules using multi-spectroscopic approaches [20–27]. Theeffect of chemical denaturants (e.g. urea) on the binding of smallmolecules with the proteins as also their refolding on dilution hasbeen investigated [28–30]. Denaturation of the protein structureresulted in a reduction of the binding affinity of serum albuminstowards the ligand as found in the case of cinchonidine–BSAcomplex [30].
In our present work we have investigated the binding of morinwith BSA under physiological conditions. Differential spectroscopicmethods such as UV–vis, fluorescence, CD and MALDI-TOF measure-ments were employed for this study. Our work is different from thereported interactions of the system in the following aspects. Theeffect of urea on the binding of morin with BSA has been looked intousing steady-state fluorescence and anisotropy measurements. Thesteady-state anisotropy of morinwas found to increase in presence ofBSA, which is also supported by the calculation of rotational correla-tion time obtained from Perrin's equation. Förster's theory has beenemployed to estimate the energy transfer parameters during thebinding processes at different pH. The rate of energy transfer atdifferent temperatures and pH were estimated from these para-meters. Site marker (warfarin and ibuprofen) displacement studies toidentify the preferential site of binding have also been conductedusing steady-state fluorescence and anisotropy estimations. Thefluorescence lifetime of morin (and BSA) in absence and presenceof BSA (and morin) were recorded. The effect of Cu(II) and Fe(III) onthe binding of morin with BSA have been carried out at 298 K in20 mM phosphate buffer of pH 7.0. Thermodynamic parameterswere calculated frommeasurements of binding constants at differenttemperatures, indicative of the presence of electrostatic interactionswith a partial hydrophobic association that results in a positivechange in standard entropy (ΔS1). The binding constants for theinteraction were calculated under different pH conditions at 298 K.Near-UV CD was also performed to check the effect of the ligand onthe tertiary structure of the protein. Finally, protein ligand dockingstudies followed by the calculation of accessible surface area give aninsight into the possible residues involved in the interaction.
2. Experimental section
2.1. Materials
Fatty acid free BSA (fraction V, purity497%), morin (productnumber M4008), warfarin (product number A 2250, purity 98%)
and ibuprofen (product number I 110) were purchased fromSigma-Aldrich Chemical Co. Limited (St. Louis, MO, USA) and allother analytical grade reagents were obtained from SRL, India. Thesolution of morin was prepared in spectroscopic grade ethanol andused further by appropriate dilution by buffer solution.The concentration of BSA was measured spectrophotometrically(Shimadzu UVPC 2450, a double-beam spectrophotometer) bydissolving it in 20 mM phosphate buffer of pH 7.0 using a molarextinction coefficient of 43,800 M�1 cm�1 at 280 nm [31]. Theconcentrations of warfarin and ibuprofen were measured follow-ing the same procedure using their respective molar extinctioncoefficients: ε308 (warfarin)¼12,500 M�1 cm�1 [32], ε222(ibuprofen)¼12,700 M�1 cm�1 [33]. All experiments were carriedout in phosphate buffer keeping the alcohol content less than 5%.
2.2. UV–vis study
UV–vis studies were carried out on a Shimadzu UVPC 2450spectrophotometer at room temperature in the range of 200–500 nm using a 1 cm quartz cuvette in 20 mM phosphate buffer ofdifferent pH (5, 7 and 9). An aliquot of 1 mL of 20 μM morin inphosphate buffer was titrated with successive addition of BSA (0–25 μM) under different pH conditions. UV–vis studies for thecomplexation of morin with Cu(II) and Fe(III) in phosphate bufferof pH 7.0 were performed and the ground-state associationconstant (Ka) for the 1:1 complex formation was calculatedaccording to the Benesi–Hildebrand equation [34].
2.3. Fluorescence spectroscopy
All fluorometric measurements were performed on a HoribaJobin Yvon spectrofluorometer (Fluoromax 4) with a 1 cm quartzcell. A 3 mL aliquot of 2 μM BSA was titrated with successiveaddition of morin (0–20 μM) at two different temperatures (298and 308 K) at pH 7.0. The fluorescence emission spectra werecollected following excitation at 295 nm with the slit widths keptas 5/5 nm each. All blank spectra were recorded under the sameexperimental conditions and subtracted from each of the BSAbound morin spectra at the respective temperatures. The bindingconstants were also analyzed in presence of Cu(II) and Fe(III) ions.The solutions containing BSA (2 μM) and metal ions (100 μM)were kept for 1 h, and titrated with successive addition of morin(0–20 μM) at 298 K in pH 7.0 only. The excitation spectra of BSAwere collected taking emission at 347 nm using excitation wave-lengths ranging from 200 to 320 nm at 298 K and at pH 7.0.
The steady-state fluorescence spectra of morin (15 μΜ,λex¼390 nm) after successive addition of BSA (0–40 μΜ) at pH7 has been recorded in the range of 400–700 nm. The excitationspectra of morin (15 μM) in BSA has been carried out usingλem¼515 nm in 20 mM phosphate buffer of pH 7.0. The quenching,binding and thermodynamic parameters for the interactions ofmorin with BSA have been estimated using the standard equationsfrom available literature that are given in the supplementarysection [10,35].
2.4. Fluorescence lifetime and anisotropy measurements
The fluorescence lifetime measurements were performed on anEasyLife TM V instrument of Optical Building Blocks Corporationwith a pulsed width of 1.5 ns. Decay data were analyzed using theEasyLife TM V Software available with the instrument. Thefluorescence decay was recorded in the range of 70–95 ns withaverages of 20 using 200 channels. The excitation wavelength waschosen as 380 nm to excite specifically morin (15 μM) and not theprotein. The decay data for morin at different BSA concentrations(0–30 μM) were calculated under the same experimental
Fig. 1. Chemical structure of morin.
A. Singha Roy et al. / Journal of Luminescence 145 (2014) 741–751742
conditions. The steady-state anisotropic measurements were car-ried out to obtain the anisotropy (r) of morin (15 mM) in presenceof BSA (0–17 mM) that was recorded using excitation and emissionwavelengths of 390 and 517 nm respectively using a slit width of10/10 nm.
The rotational correlation time (tr) for the bound morin to BSAwere estimated using the Perrin's equation [35] to support theanisotropy (r) measurements.
r0r¼ 1þ t
trð1Þ
where r0 stands for the maximum anisotropy and t is thefluorescence lifetime of morin in presence of BSA.
2.5. Site-selectivity of morin
The site-selectivity of morin in BSA has been carried out usingsteady-state fluorescence and anisotropy measurements. The mix-ture of BSA–warfarin and BSA–ibuprofen were excited at 295 nmand emission monitored from 305 to 500 nm with successiveaddition of morin (0–20 μM) at 298 K in pH 7.0. The bindingconstants were calculated using the same equation as statedabove. Warfarin (2 μM) or ibuprofen (2 μM) and BSA (2 μM)mixtures were kept for 1 h and then titrated with increasingconcentrations of morin (0–28 μM).
2.6. Effect of urea on binding
The effect of urea (0–7 M) on bound morin (20 mM) to BSA(20 mM) has been investigated by steady-state fluorescence andanisotropic measurements. The morin–BSA system was excited at390 nm and the emission monitored from 400 to 650 nm keepingthe slit widths of 5/5 nm. The anisotropy measurements werecarried out using the same technique as stated earlier.
2.7. Fluorescence resonance energy transfer
Förster non-radiative energy transfer theory is useful in manybiological systems to estimate the distance (d) between donor andacceptor [36]. The related equations (8, 9 and 10) are provided inthe supplementary information. The fluorescence quenching ofBSA containing morin (1:1 M concentration ratio) in absence andpresence of Cu(II) and Fe(III) were collected in the range of 305–500 nm using λex¼295 nm. The UV–vis spectrum of 2 μM flavonolat different pH was recorded at room temperature in the range of200–500 nm with the help of a 1 cm quartz cuvette.
The rate of energy transfer (KET) from the protein to morin atdifferent pH has been calculated with the help of the followingequation [35]:
KET ¼ τ�1D
Rr
� �6
ð2Þ
where τD is the lifetime of donor molecule.
2.8. MALDI-TOF measurements
The binding of morin with BSA has also been carried out usingMALDI-TOF measurements. The positive ion mode mass spectrawere recorded on a MALDI-TOF instrument (Voyager-De Pro fromApplied Biosystems, USA). Free BSA and BSA–morin combinedsolutions were prepared in 20 mM phosphate buffer of pH 7.0 andincubated for 12 h. The solutions were then mixed with the matrixsolution (50:50 v/v) for the measurements. The matrix for theMALDI-TOF measurements was prepared by dissolving 20 mg/mlsinapinic acid in 50:50 v/v water and acetonitrile (HPLC grade)containing 0.1% TFA just before the experiments. The samples were
then spotted on the steel plates and left for 6 h for completedrying. MALDI-TOF scanning was carried out using an acceleratingvoltage of 25 kV and an acquisition mass range over an m/z from20 to 80 kDa.
2.9. Circular dichroism measurements
The near UV CD experiments were performed on a Jasco-810automatic spectrophotometer using a 1.0 cm cell path length atroom temperature in buffer of pH 7. The spectra were recorded inthe range of 250–400 nmwith a scan speed of 100 nm/min using aresponse time of 4 s. Three sets of solutions containing BSA:morin1:0, 1:1 and 1:2 M ratios were prepared. For the measurements ofnear UV CD spectra, the protein concentration was kept 100 μM.
2.10. Molecular docking
Protein ligand binding was also monitored by moleculardocking using FlexX, a part of the Sybyl 6.92 (Tripos Inc., St.Louis, USA) software suite. The crystal structure of the protein(PDB ID: 4F5S) [37] was downloaded from the Protein Data Bank[38]. The energy optimized structure of morin was obtainedfrom Sybyl 6.92 using a Tripos force field and Gasteiger–Hückelcharges with a gradient of 0.005 kcal mol�1. Other parameterssuch as dielectric constant, number of iterations and maximumdisplacement were fixed at 1.0, 1000 and 0.01. Docking of morinwith BSA was performed with FlexX and PyMol was used tovisualize the docked conformations [39].
NACCESS was used to measure the accessible surface area (ASA)for both free and complexed BSA [40]. The changes in ASA for theresidue i was calculated using ΔASAi¼ASAi (free BSA)�ASAi
(morin–BSA complex). If a residue showed a loss in ΔASA greaterthan 10 Å2 it was considered to be involved in the interaction withthe bound ligand molecule.
3. Results and discussion
3.1. UV–vis study
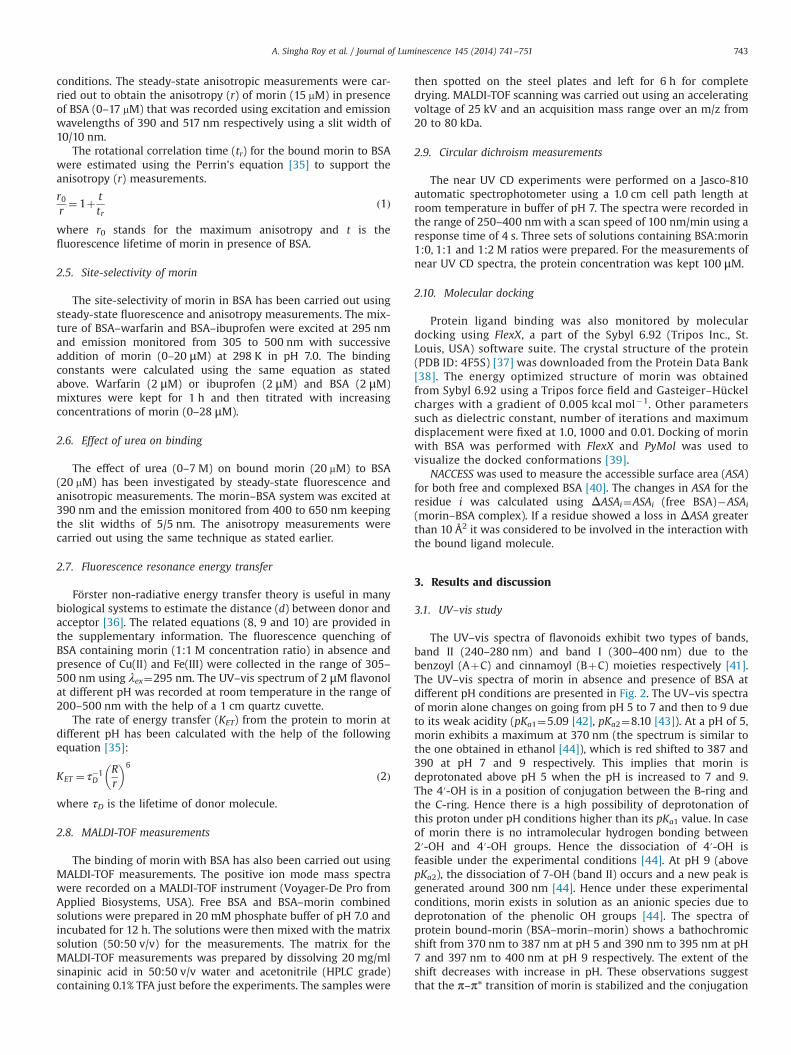
The UV–vis spectra of flavonoids exhibit two types of bands,band II (240–280 nm) and band I (300–400 nm) due to thebenzoyl (AþC) and cinnamoyl (BþC) moieties respectively [41].The UV–vis spectra of morin in absence and presence of BSA atdifferent pH conditions are presented in Fig. 2. The UV–vis spectraof morin alone changes on going from pH 5 to 7 and then to 9 dueto its weak acidity (pKa1¼5.09 [42], pKa2¼8.10 [43]). At a pH of 5,morin exhibits a maximum at 370 nm (the spectrum is similar tothe one obtained in ethanol [44]), which is red shifted to 387 and390 at pH 7 and 9 respectively. This implies that morin isdeprotonated above pH 5 when the pH is increased to 7 and 9.The 4′-OH is in a position of conjugation between the B-ring andthe C-ring. Hence there is a high possibility of deprotonation ofthis proton under pH conditions higher than its pKa1 value. In caseof morin there is no intramolecular hydrogen bonding between2′-OH and 4′-OH groups. Hence the dissociation of 4′-OH isfeasible under the experimental conditions [44]. At pH 9 (abovepKa2), the dissociation of 7-OH (band II) occurs and a new peak isgenerated around 300 nm [44]. Hence under these experimentalconditions, morin exists in solution as an anionic species due todeprotonation of the phenolic OH groups [44]. The spectra ofprotein bound-morin (BSA–morin–morin) shows a bathochromicshift from 370 nm to 387 nm at pH 5 and 390 nm to 395 nm at pH7 and 397 nm to 400 nm at pH 9 respectively. The extent of theshift decreases with increase in pH. These observations suggestthat the π–π* transition of morin is stabilized and the conjugation
A. Singha Roy et al. / Journal of Luminescence 145 (2014) 741–751 743
in phenyl rings increases after interacting with the residues of BSAdue to involvement of electrostatic forces between morin and BSA[44–46]. The effect of pH on the complex formation of BSA andmorin shows a distinct effect on the association constant values(Table 1). A structural change occurs due to a change in pH from7 to 5 which involves a transition from a native (N) state to a fastermigrating state (F). This is referred to as the N–F transition [47,48].This causes an unfolding of subdomain III of the protein and leadsto a gradual decrease in the α-helical content under lower pHconditions [48,49]. The conformational change associated with achange in pH from 5 to 2 is referred to as an F to E (fully extendedstate) transition [49,50] and the corresponding change in con-formation due to a change in pH from 7 to 9 is known as the N to B(basic form) transition [49]. In a similar study from this laboratory,the interaction of fisetin with HSA under different pH conditionsalso exhibited pH dependent conformational changes [51]. At pH 7,the equilibrium constant (Ka) value, 7.8571.35�104 M�1 isgreater than the Ka value obtained at pH 5 (Table 1). This isindicative of a stronger binding affinity for the native state of theprotein toward the ligand. The Ka values obtained for the interac-tion of morin with BSA at pH 7 and 9 are close to each other(Table 1). This suggests that the binding site of morin in BSA doesnot change significantly in basic pH, which implies that thedeprotonation of the 7-OH has no such strong effect on thebinding between morin and BSA.
3.2. Fluorescence quenching
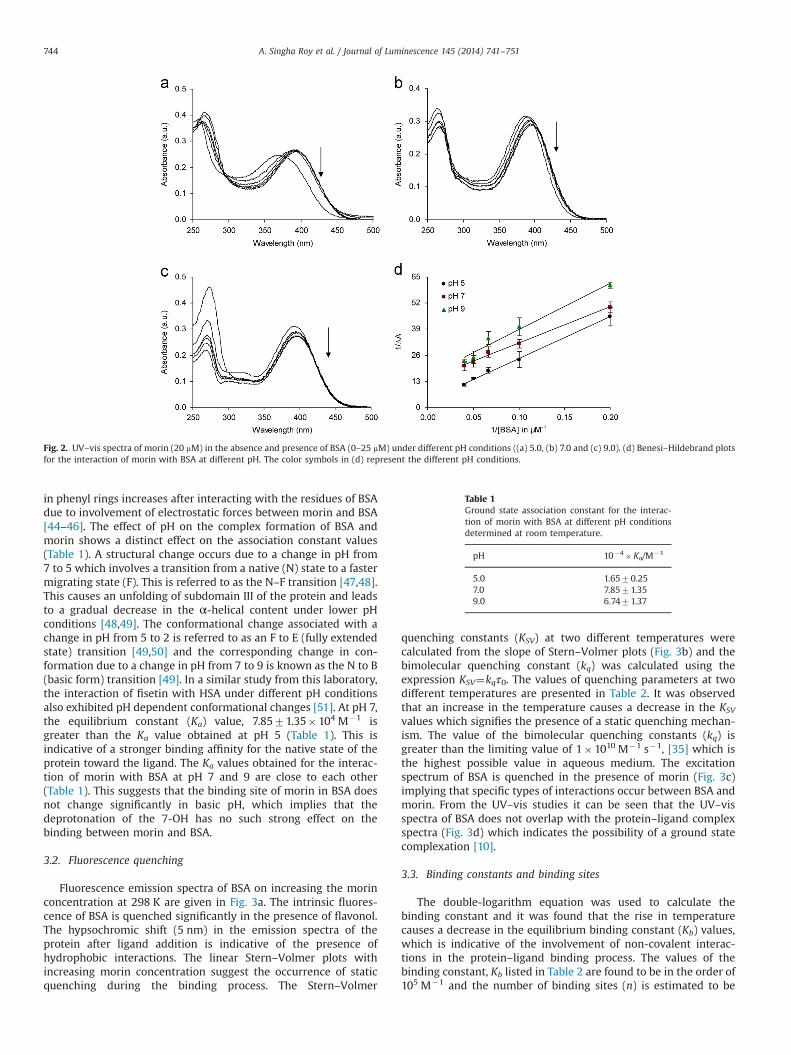
Fluorescence emission spectra of BSA on increasing the morinconcentration at 298 K are given in Fig. 3a. The intrinsic fluores-cence of BSA is quenched significantly in the presence of flavonol.The hypsochromic shift (5 nm) in the emission spectra of theprotein after ligand addition is indicative of the presence ofhydrophobic interactions. The linear Stern–Volmer plots withincreasing morin concentration suggest the occurrence of staticquenching during the binding process. The Stern–Volmer
quenching constants (KSV) at two different temperatures werecalculated from the slope of Stern–Volmer plots (Fig. 3b) and thebimolecular quenching constant (kq) was calculated using theexpression KSV¼kqτ0. The values of quenching parameters at twodifferent temperatures are presented in Table 2. It was observedthat an increase in the temperature causes a decrease in the KSV
values which signifies the presence of a static quenching mechan-ism. The value of the bimolecular quenching constants (kq) isgreater than the limiting value of 1�1010 M�1 s�1, [35] which isthe highest possible value in aqueous medium. The excitationspectrum of BSA is quenched in the presence of morin (Fig. 3c)implying that specific types of interactions occur between BSA andmorin. From the UV–vis studies it can be seen that the UV–visspectra of BSA does not overlap with the protein–ligand complexspectra (Fig. 3d) which indicates the possibility of a ground statecomplexation [10].
3.3. Binding constants and binding sites
The double-logarithm equation was used to calculate thebinding constant and it was found that the rise in temperaturecauses a decrease in the equilibrium binding constant (Kb) values,which is indicative of the involvement of non-covalent interac-tions in the protein–ligand binding process. The values of thebinding constant, Kb listed in Table 2 are found to be in the order of105 M�1 and the number of binding sites (n) is estimated to be
Table 1Ground state association constant for the interac-tion of morin with BSA at different pH conditionsdetermined at room temperature.
pH 10�4�Ka/M�1
5.0 1.6570.257.0 7.8571.359.0 6.7471.37
Fig. 2. UV–vis spectra of morin (20 mM) in the absence and presence of BSA (0–25 mM) under different pH conditions ((a) 5.0, (b) 7.0 and (c) 9.0). (d) Benesi–Hildebrand plotsfor the interaction of morin with BSA at different pH. The color symbols in (d) represent the different pH conditions.
A. Singha Roy et al. / Journal of Luminescence 145 (2014) 741–751744
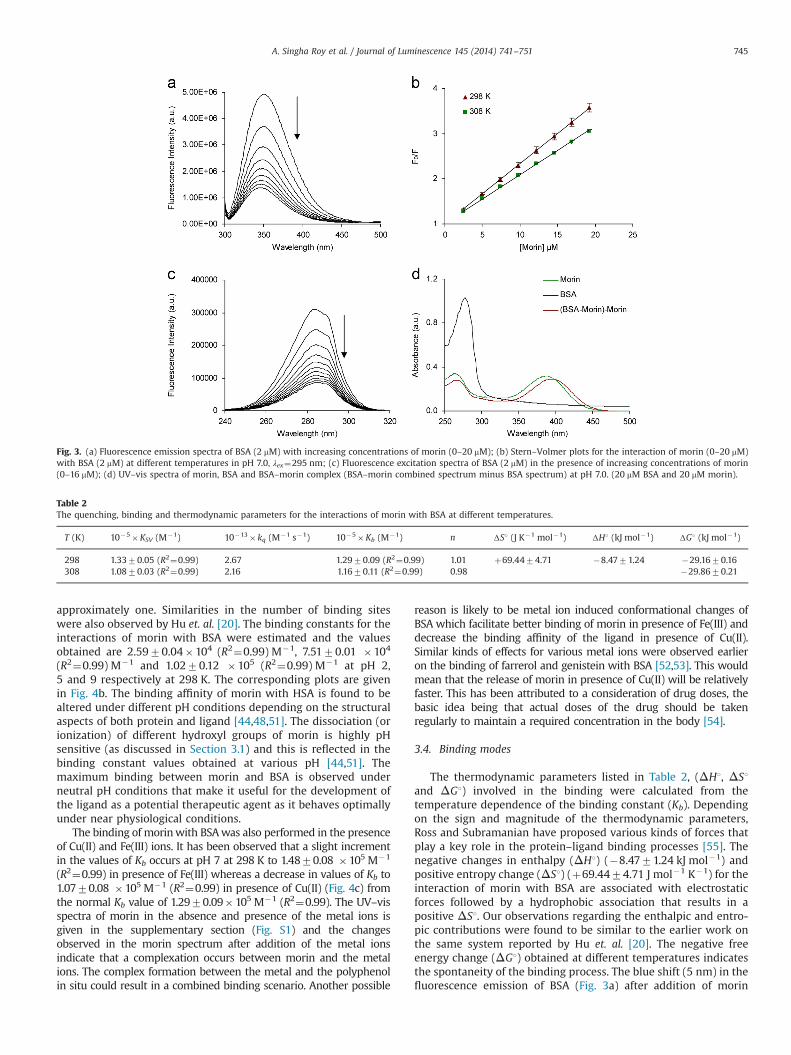
approximately one. Similarities in the number of binding siteswere also observed by Hu et. al. [20]. The binding constants for theinteractions of morin with BSA were estimated and the valuesobtained are 2.5970.04�104 (R2¼0.99) M�1, 7.5170.01 �104
(R2¼0.99) M�1 and 1.0270.12 �105 (R2¼0.99) M�1 at pH 2,5 and 9 respectively at 298 K. The corresponding plots are givenin Fig. 4b. The binding affinity of morin with HSA is found to bealtered under different pH conditions depending on the structuralaspects of both protein and ligand [44,48,51]. The dissociation (orionization) of different hydroxyl groups of morin is highly pHsensitive (as discussed in Section 3.1) and this is reflected in thebinding constant values obtained at various pH [44,51]. Themaximum binding between morin and BSA is observed underneutral pH conditions that make it useful for the development ofthe ligand as a potential therapeutic agent as it behaves optimallyunder near physiological conditions.
The binding of morinwith BSAwas also performed in the presenceof Cu(II) and Fe(III) ions. It has been observed that a slight incrementin the values of Kb occurs at pH 7 at 298 K to 1.4870.08 �105 M�1
(R2¼0.99) in presence of Fe(III) whereas a decrease in values of Kb to1.0770.08 �105 M�1 (R2¼0.99) in presence of Cu(II) (Fig. 4c) fromthe normal Kb value of 1.2970.09�105 M�1 (R2¼0.99). The UV–visspectra of morin in the absence and presence of the metal ions isgiven in the supplementary section (Fig. S1) and the changesobserved in the morin spectrum after addition of the metal ionsindicate that a complexation occurs between morin and the metalions. The complex formation between the metal and the polyphenolin situ could result in a combined binding scenario. Another possible
reason is likely to be metal ion induced conformational changes ofBSA which facilitate better binding of morin in presence of Fe(III) anddecrease the binding affinity of the ligand in presence of Cu(II).Similar kinds of effects for various metal ions were observed earlieron the binding of farrerol and genistein with BSA [52,53]. This wouldmean that the release of morin in presence of Cu(II) will be relativelyfaster. This has been attributed to a consideration of drug doses, thebasic idea being that actual doses of the drug should be takenregularly to maintain a required concentration in the body [54].
3.4. Binding modes
The thermodynamic parameters listed in Table 2, (ΔH1, ΔS1and ΔG1) involved in the binding were calculated from thetemperature dependence of the binding constant (Kb). Dependingon the sign and magnitude of the thermodynamic parameters,Ross and Subramanian have proposed various kinds of forces thatplay a key role in the protein–ligand binding processes [55]. Thenegative changes in enthalpy (ΔH1) (�8.4771.24 kJ mol�1) andpositive entropy change (ΔS1) (þ69.4474.71 J mol�1 K�1) for theinteraction of morin with BSA are associated with electrostaticforces followed by a hydrophobic association that results in apositive ΔS1. Our observations regarding the enthalpic and entro-pic contributions were found to be similar to the earlier work onthe same system reported by Hu et. al. [20]. The negative freeenergy change (ΔG1) obtained at different temperatures indicatesthe spontaneity of the binding process. The blue shift (5 nm) in thefluorescence emission of BSA (Fig. 3a) after addition of morin
Fig. 3. (a) Fluorescence emission spectra of BSA (2 mM) with increasing concentrations of morin (0–20 mM); (b) Stern–Volmer plots for the interaction of morin (0–20 mM)with BSA (2 mM) at different temperatures in pH 7.0, λex¼295 nm; (c) Fluorescence excitation spectra of BSA (2 mM) in the presence of increasing concentrations of morin(0–16 mM); (d) UV–vis spectra of morin, BSA and BSA–morin complex (BSA–morin combined spectrum minus BSA spectrum) at pH 7.0. (20 mM BSA and 20 mM morin).
Table 2The quenching, binding and thermodynamic parameters for the interactions of morin with BSA at different temperatures.
T (K) 10�5�KSV (M�1) 10�13� kq (M�1 s�1) 10�5�Kb (M�1) n ΔS1 (J K�1 mol�1) ΔH1 (kJ mol�1) ΔG1 (kJ mol�1)
298 1.3370.05 (R2¼0.99) 2.67 1.2970.09 (R2¼0.99) 1.01 þ69.4474.71 �8.4771.24 �29.1670.16308 1.0870.03 (R2¼0.99) 2.16 1.1670.11 (R2¼0.99) 0.98 �29.8670.21
A. Singha Roy et al. / Journal of Luminescence 145 (2014) 741–751 745
suggests the involvement of hydrophobic forces in the interaction.These results have been substantiated later (Section 3.11) with thehelp of protein–ligand binding studies through molecular docking.
3.5. Site-selectivity of morin in BSA
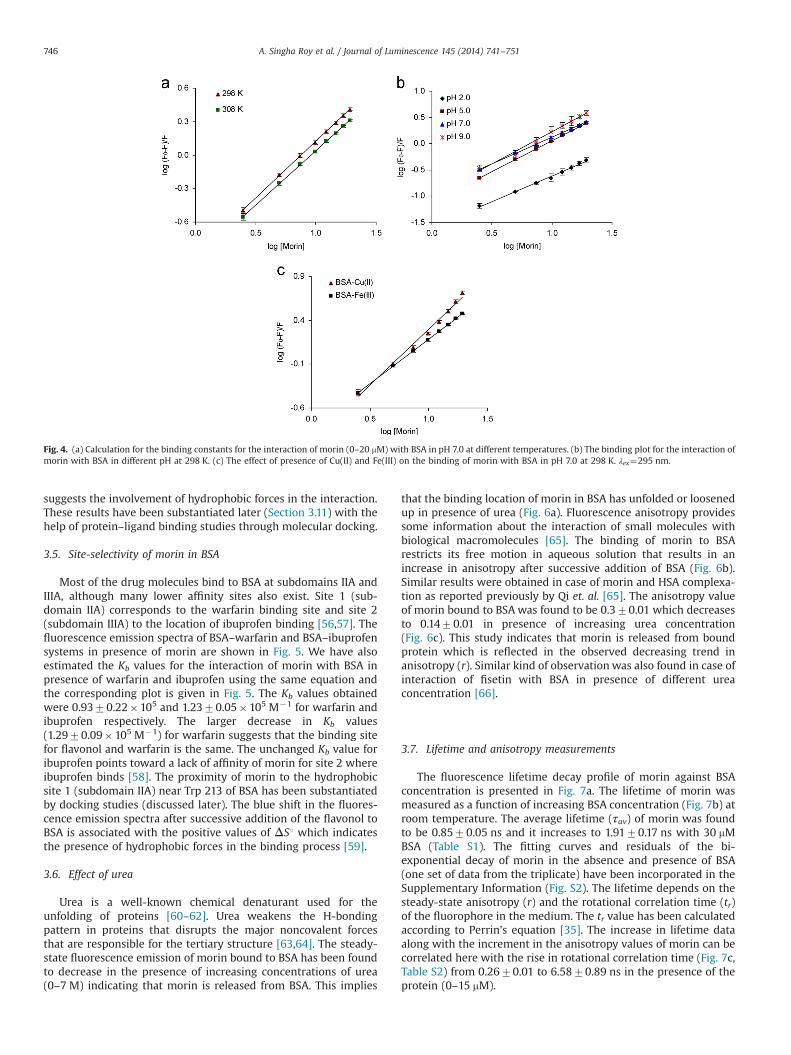
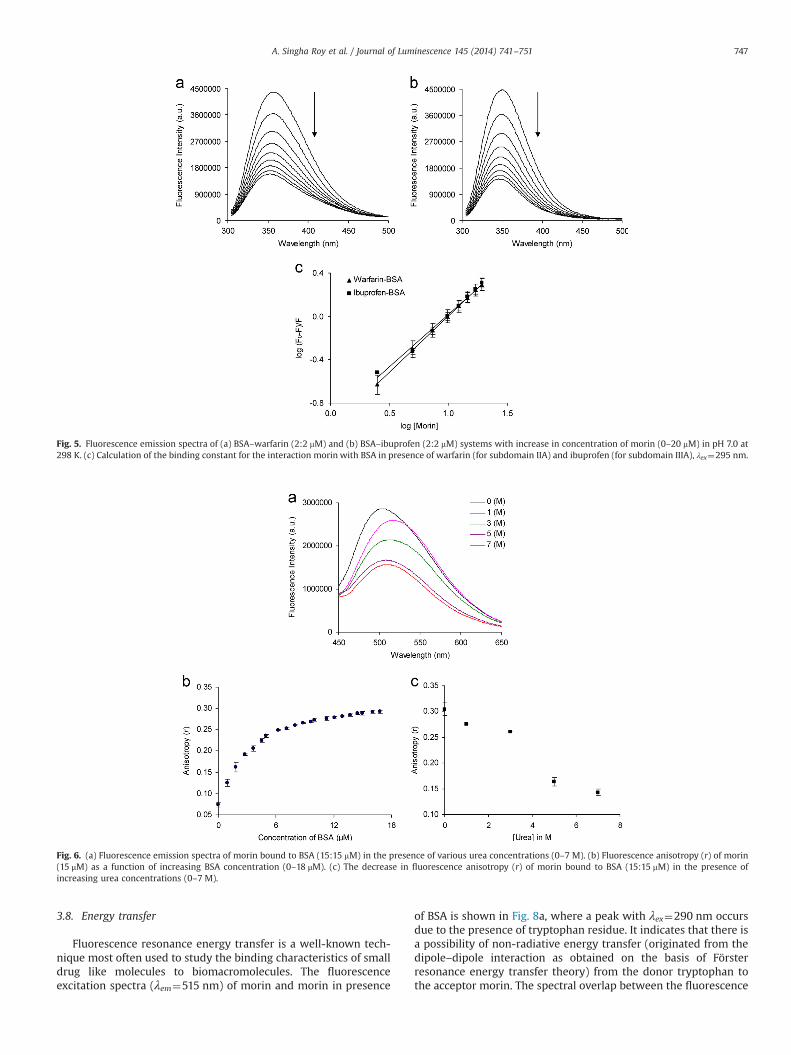
Most of the drug molecules bind to BSA at subdomains IIA andIIIA, although many lower affinity sites also exist. Site 1 (sub-domain IIA) corresponds to the warfarin binding site and site 2(subdomain IIIA) to the location of ibuprofen binding [56,57]. Thefluorescence emission spectra of BSA–warfarin and BSA–ibuprofensystems in presence of morin are shown in Fig. 5. We have alsoestimated the Kb values for the interaction of morin with BSA inpresence of warfarin and ibuprofen using the same equation andthe corresponding plot is given in Fig. 5. The Kb values obtainedwere 0.9370.22�105 and 1.2370.05�105 M�1 for warfarin andibuprofen respectively. The larger decrease in Kb values(1.2970.09�105 M�1) for warfarin suggests that the binding sitefor flavonol and warfarin is the same. The unchanged Kb value foribuprofen points toward a lack of affinity of morin for site 2 whereibuprofen binds [58]. The proximity of morin to the hydrophobicsite 1 (subdomain IIA) near Trp 213 of BSA has been substantiatedby docking studies (discussed later). The blue shift in the fluores-cence emission spectra after successive addition of the flavonol toBSA is associated with the positive values of ΔS1 which indicatesthe presence of hydrophobic forces in the binding process [59].
3.6. Effect of urea
Urea is a well-known chemical denaturant used for theunfolding of proteins [60–62]. Urea weakens the H-bondingpattern in proteins that disrupts the major noncovalent forcesthat are responsible for the tertiary structure [63,64]. The steady-state fluorescence emission of morin bound to BSA has been foundto decrease in the presence of increasing concentrations of urea(0–7 M) indicating that morin is released from BSA. This implies
that the binding location of morin in BSA has unfolded or loosenedup in presence of urea (Fig. 6a). Fluorescence anisotropy providessome information about the interaction of small molecules withbiological macromolecules [65]. The binding of morin to BSArestricts its free motion in aqueous solution that results in anincrease in anisotropy after successive addition of BSA (Fig. 6b).Similar results were obtained in case of morin and HSA complexa-tion as reported previously by Qi et. al. [65]. The anisotropy valueof morin bound to BSA was found to be 0.370.01 which decreasesto 0.1470.01 in presence of increasing urea concentration(Fig. 6c). This study indicates that morin is released from boundprotein which is reflected in the observed decreasing trend inanisotropy (r). Similar kind of observation was also found in case ofinteraction of fisetin with BSA in presence of different ureaconcentration [66].
3.7. Lifetime and anisotropy measurements
The fluorescence lifetime decay profile of morin against BSAconcentration is presented in Fig. 7a. The lifetime of morin wasmeasured as a function of increasing BSA concentration (Fig. 7b) atroom temperature. The average lifetime (τav) of morin was foundto be 0.8570.05 ns and it increases to 1.9170.17 ns with 30 mMBSA (Table S1). The fitting curves and residuals of the bi-exponential decay of morin in the absence and presence of BSA(one set of data from the triplicate) have been incorporated in theSupplementary Information (Fig. S2). The lifetime depends on thesteady-state anisotropy (r) and the rotational correlation time (tr)of the fluorophore in the medium. The tr value has been calculatedaccording to Perrin's equation [35]. The increase in lifetime dataalong with the increment in the anisotropy values of morin can becorrelated here with the rise in rotational correlation time (Fig. 7c,Table S2) from 0.2670.01 to 6.5870.89 ns in the presence of theprotein (0–15 mM).
Fig. 4. (a) Calculation for the binding constants for the interaction of morin (0–20 mM) with BSA in pH 7.0 at different temperatures. (b) The binding plot for the interaction ofmorin with BSA in different pH at 298 K. (c) The effect of presence of Cu(II) and Fe(III) on the binding of morin with BSA in pH 7.0 at 298 K. λex¼295 nm.
A. Singha Roy et al. / Journal of Luminescence 145 (2014) 741–751746
3.8. Energy transfer
Fluorescence resonance energy transfer is a well-known tech-nique most often used to study the binding characteristics of smalldrug like molecules to biomacromolecules. The fluorescenceexcitation spectra (λem¼515 nm) of morin and morin in presence
of BSA is shown in Fig. 8a, where a peak with λex¼290 nm occursdue to the presence of tryptophan residue. It indicates that there isa possibility of non-radiative energy transfer (originated from thedipole–dipole interaction as obtained on the basis of Försterresonance energy transfer theory) from the donor tryptophan tothe acceptor morin. The spectral overlap between the fluorescence
Fig. 6. (a) Fluorescence emission spectra of morin bound to BSA (15:15 mM) in the presence of various urea concentrations (0–7 M). (b) Fluorescence anisotropy (r) of morin(15 μM) as a function of increasing BSA concentration (0–18 μM). (c) The decrease in fluorescence anisotropy (r) of morin bound to BSA (15:15 mM) in the presence ofincreasing urea concentrations (0–7 M).
Fig. 5. Fluorescence emission spectra of (a) BSA–warfarin (2:2 mM) and (b) BSA–ibuprofen (2:2 mM) systems with increase in concentration of morin (0–20 mM) in pH 7.0 at298 K. (c) Calculation of the binding constant for the interaction morin with BSA in presence of warfarin (for subdomain IIA) and ibuprofen (for subdomain IIIA), λex¼295 nm.
A. Singha Roy et al. / Journal of Luminescence 145 (2014) 741–751 747
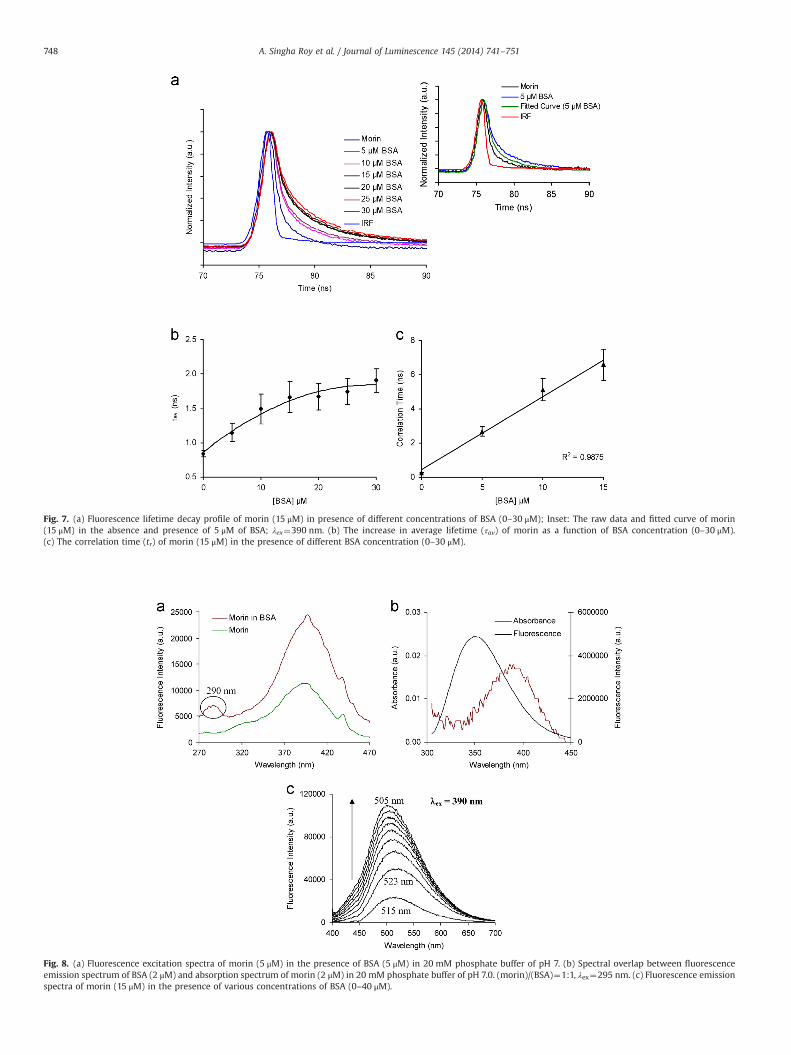
Fig. 7. (a) Fluorescence lifetime decay profile of morin (15 μM) in presence of different concentrations of BSA (0–30 μM); Inset: The raw data and fitted curve of morin(15 μM) in the absence and presence of 5 μM of BSA; λex¼390 nm. (b) The increase in average lifetime (τav) of morin as a function of BSA concentration (0–30 μM).(c) The correlation time (tr) of morin (15 μM) in the presence of different BSA concentration (0–30 μM).
Fig. 8. (a) Fluorescence excitation spectra of morin (5 μM) in the presence of BSA (5 μM) in 20 mM phosphate buffer of pH 7. (b) Spectral overlap between fluorescenceemission spectrum of BSA (2 μM) and absorption spectrum of morin (2 μM) in 20 mM phosphate buffer of pH 7.0. (morin)/(BSA)¼1:1, λex¼295 nm. (c) Fluorescence emissionspectra of morin (15 μM) in the presence of various concentrations of BSA (0–40 μM).
A. Singha Roy et al. / Journal of Luminescence 145 (2014) 741–751748
emission spectrum of BSA with the absorption spectrum of morinat pH 7 is provided in Fig. 8b and the corresponding energytransfer parameters under different conditions have been sum-marized in Table S3. Using the values of κ2, N and QD as 2/3, 1.336and 0.118 respectively [25], the energy transfer parameters werecalculated under different conditions as stated earlier. It wasobserved that in presence of metal ions the relative distancebetween morin and BSA does not change significantly. One ofthe reasons for this observation is a possible complexation ofmorin with the metal ions. The rate of energy transfer (KET) hasbeen calculated at different pH and in presence of metal ions andis presented in Table S3. The metal ions cause an increase in theKET values at pH 7. It was noticed that the distances were less than7 nm and were in the range of 0.5R0odo2R0, indicating thehigher possibility of energy transfer from Trp 213 to morin in allthe cases [35]. The emission spectra of morin (λex¼390 nm) inphosphate buffer of pH 7 was recorded as a function of increasingconcentration of BSA (0–40 mM). It has been observed that theemission maxima at 515 nm shifted to 523 nm after addition ofBSA. A gradual shift to 505 nm with a significant increase influorescence intensity was then observed (Fig. 8c). This spectralbehavior indicates that a greater number of molecules of morinbind in the hydrophobic region of BSA as found in the case of theinteraction of 7-hydroxy flavone with human serum albumin(HSA) [67]. As morin is present in the anionic state at pH 7, itsbinding at site 1 near Trp 214 is possible due to the presence ofpositively charged amino acid residues surrounding the hydro-phobic cavity. The blue shift in the emission maximum of morinmay be attributed to the restriction on the solvent dipolarrelaxation compelled by the motionally constrained environmentof the ligand in BSA which is similar to the observation in case ofbinding of 7-hydroxy flavone with HSA [67].
3.9. MALDI-TOF
The binding of morin with BSA has also been supported by theMALDI-TOF measurements. BSA (Sigma-Aldrich) shows an m/z of66479.54 Da, whereas the m/z has increased to 66804.01 Da aftercomplexation with morin (Supplementary section, Fig. S3). Since themolecular weight of morin is 302.24 Da, we can conclude that thereoccurs a 1:1 binding between BSA and morin. This result also supportsthe number of binding sites (n) obtained from fluorescence spectro-scopy data. Similar types of results have been reported in case ofbinding of triethoxy flavone and coumaroyltyramine with HSA [68,69].
3.10. Circular dichroism results
The effect of morin on the tertiary structure of BSA has alsobeen explained from near-UV CD experiments. The near-UV CD
spectrum of HSA and BSA exhibit two minima at 263 and 267 nmfor disulfide bonds and two humps at 279 and 289 nm that arecharacteristic of aromatic chromophores and an asymmetricenvironment [70]. The positions of the peaks (Supplementarysection, Fig. S4) shifts after binding with morin suggesting thatthe microenvironment around the aromatic residues and disulfidebonds is affected on binding.
3.11. Molecular docking results
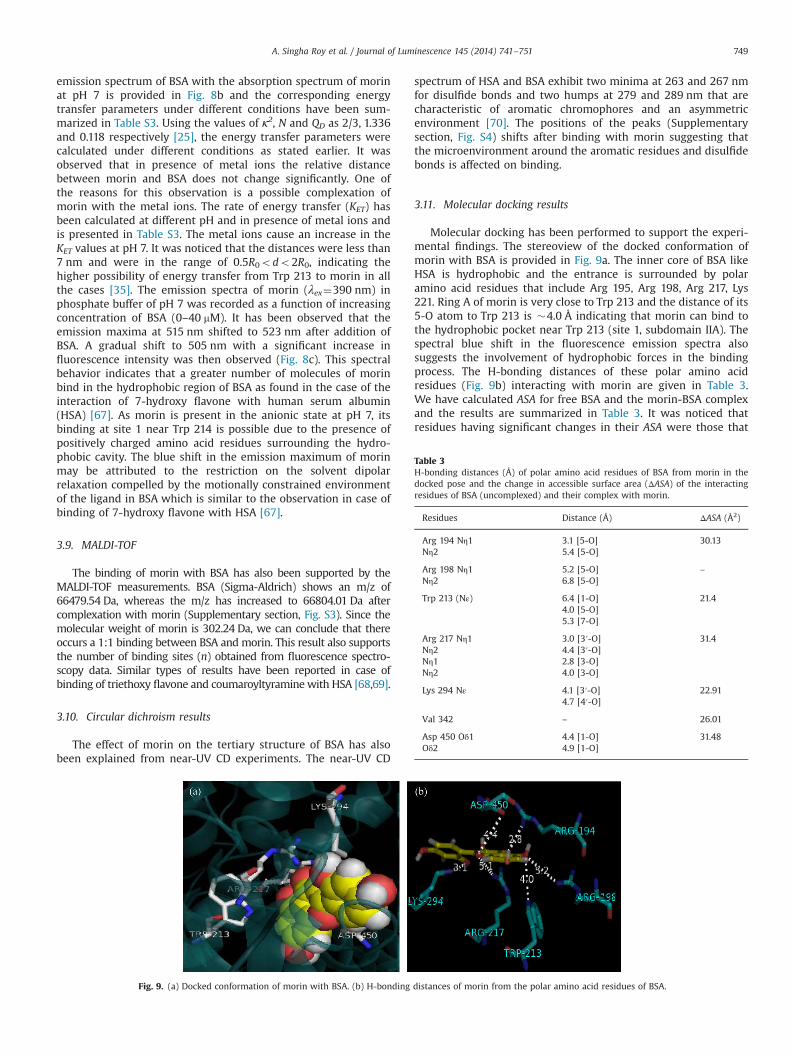
Molecular docking has been performed to support the experi-mental findings. The stereoview of the docked conformation ofmorin with BSA is provided in Fig. 9a. The inner core of BSA likeHSA is hydrophobic and the entrance is surrounded by polaramino acid residues that include Arg 195, Arg 198, Arg 217, Lys221. Ring A of morin is very close to Trp 213 and the distance of its5-O atom to Trp 213 is �4.0 Å indicating that morin can bind tothe hydrophobic pocket near Trp 213 (site 1, subdomain IIA). Thespectral blue shift in the fluorescence emission spectra alsosuggests the involvement of hydrophobic forces in the bindingprocess. The H-bonding distances of these polar amino acidresidues (Fig. 9b) interacting with morin are given in Table 3.We have calculated ASA for free BSA and the morin-BSA complexand the results are summarized in Table 3. It was noticed thatresidues having significant changes in their ASA were those that
Fig. 9. (a) Docked conformation of morin with BSA. (b) H-bonding distances of morin from the polar amino acid residues of BSA.
Table 3H-bonding distances (Å) of polar amino acid residues of BSA from morin in thedocked pose and the change in accessible surface area (ΔASA) of the interactingresidues of BSA (uncomplexed) and their complex with morin.
Residues Distance (Å) ΔASA (Å2)
Arg 194 Nη1 3.1 [5-O] 30.13Nη2 5.4 [5-O]
Arg 198 Nη1 5.2 [5-O] –
Nη2 6.8 [5-O]
Trp 213 (Nε) 6.4 [1-O] 21.44.0 [5-O]5.3 [7-O]
Arg 217 Nη1 3.0 [3′-O] 31.4Nη2 4.4 [3′-O]Nη1 2.8 [3-O]Nη2 4.0 [3-O]
Lys 294 Nε 4.1 [3′-O] 22.914.7 [4′-O]
Val 342 – 26.01
Asp 450 Oδ1 4.4 [1-O] 31.48Oδ2 4.9 [1-O]
A. Singha Roy et al. / Journal of Luminescence 145 (2014) 741–751 749
belonged to subdomain IIA of BSA. The distance from Trp 213 issuch that it can facilitate non-radiative energy transfer from Trp213 to morin [71]. The binding of morin within the central part ofdifferent helix region of various subdomains near Trp 213 of BSA islikely to be responsible for its helical stabilization properties[72,73].
4. Conclusion
The binding of morin with BSA has been studied underdifferent pH conditions using UV–vis, fluorescence, CD, andmolecular docking methods. The binding of morin with BSA occursthrough electrostatic interactions along with a hydrophobic asso-ciation that results in a positive entropy change during theprocess. The molecular docking studies are in agreement withthe experimental findings and point toward a complex formationbetween BSA and morin. The affinity of morin towards BSA isgreater at pH 7 in comparison pH 5 (determined from UV–vis andfluorescence measurements). Depending on the experimentalconditions the structures of morin and BSA change accordingly.Hence the changes in the binding constants values are observed.The presence of Fe(III) resulted in an enhancement of the bindingconstant at 25 1C, indicative of a better binding of morin with BSA.In case of Cu(II), the binding constant value is reduced. Theimplication of these studies lies in the effectiveness of themolecule and its development as a therapeutic agent based onits interaction with components present in its immediate environ-ment in a physiological system. From the Förster theory it hasbeen found that the distance of morin from Trp 213 was �3 nm,which predicts that there is a possibility of energy transfer fromthe Trp donor to morin. The steady-state anisotropy and lifetime ofmorin along with the rotational correlation time was found toincrease with BSA concentration. Negative values of ΔG1 atdifferent temperatures indicate the spontaneity of binding ofmorin to BSA. The interaction of morin with BSA at the molecularlevel provides a further understanding to the utility of themolecule in biopharmaceutics in line with the molecules of theflavonoid category.
Acknowledgments
SD is grateful to the Department of Science and Technology,Government of India for funding. The authors are also thankful tothe Central Research Facility, IIT Kharagpur for providing experi-mental facilities. ASR and AKD thank CSIR and SNC thanks UGC,New Delhi respectively for Research Fellowships.
Appendix A. Supplementary materials
Supplementary data associated with this article can be found inthe online version at http://dx.doi.org/10.1016/j.jlumin.2013.08.054.
References
[1] U. Kragh-Hansen, Pharmacol. Rev. 33 (1981) 17.[2] P.A. Zunszain, J. Ghuman, T. Komatsu, E. Tsuchida, S. Curry, BMC Struct. Biol. 3
(2003) 6.[3] S. Sugio, A. Kashima, S. Mochizuki, M. Noda, K. Kobayashi, Protein Eng. 12
(1999) 439.[4] D.C. Carter, B. Chang, J.X. Ho, K. Keeling, Z. Krishnasami, Eur. J. Biochem. 226
(1994) 1049.[5] X.M. He, D.C. Carter, Nature 358 (1992) 209.[6] I. Petitpas, A.A. Bhattacharya, S. Twine, M. East, S. Curry, J. Biol. Chem. 276
(2001) 22804.
[7] J. Ghuman, P.A. Zunszain, I. Petitpas, A.A. Bhattacharya, M. Otagiri, S. Curry, J.Mol. Biol. 353 (2005) 38.
[8] B.F. Peterman, K.J. Laidler, Arch. Biochem. Biophys. 199 (1980) 158.[9] I. Matei, S. Ionescu, M. Hillebrand, J. Lumin. 131 (2011) 1629.[10] A.Singha Roy, D.R. Tripathy, A. Chatterjee, S. Dasgupta, JBPC 1 (2010) 141.[11] I. Matei, M. Hillebrand, J. Pharma. Biomed. Anal. 51 (2010) 768.[12] L. Wang, Y. Ling, Y. Chen, C.L. Li, F. Feng, Q.D. You, N. Lu, Q.L. Guo, Cancer Lett.
297 (2010) 42.[13] P. Pongsak, P. Parichat, Fitoterapia 78 (2007) 434.[14] L.D. Kok, Y.P. Wong, T.W. Wu, H.C. Chan, T.T. Kwok, K.P. Fung, Life Sci. 67 (2000)
91.[15] B.K. Bogula, M.K. Maharanjan, D.R. Oddepalli, L. Boini, M. Arella, D.
Q. Sabarimuthu, J. Physiol. Biochem. 68 (2012) 433.[16] J.A. Lemkul, D.R. Bevan, Biochemistry 51 (2012) 5990.[17] M. Caruana, J. Neuner, T. Hogen, F. Schmidt, F. Kamp, C. Scerri, A. Giese,
N. Vassallo, Biochim. Biophys. Acta 1818 (2012) 2502.[18] D.G. Kang, M.K. Moon, E.J. Sohn, D.H. Lee, H.S. Lee, Biol. Pharm. Bull. 27 (2004)
1779.[19] C.Y. Hsiang, S.L. Wu, T.Y. Ho, Biochem. Pharmacol. 69 (2005) 1603.[20] Y.J. Hu, H.L Yue, X.L. Li, S.S. Zhang, E. Tang, L.P. Zhang, J. Photochem. Photobiol.
B 112 (2012) 16.[21] F. Wang, W. Huang, X. Miao, B. Tong, Spectrochim. Acta A 99 (2012) 373.[22] H. Zhang, P. Mei, Biol. Trace Elem. Res. 143 (2011) 677.[23] M. Sarkar, S.S. Paul, K.K. Mukherjea, J. Lumin. 142 (2013) 220.[24] R. Mi, P.Q. Li, Y.J. Hu, X.Y. Fan, H.Y. Li, X.C. Yu, Y. Ouyang, Mol. Biol. Rep. 40
(2013) 4397.[25] P. Abassi, F. Abassi, F. Yari, M. Hashemi, S. Nafisi, J. Photochem. Photobiol. B 122
(2013) 61.[26] J. Jayabharathi, K. Jayamoorthy, V. Thanikachalam, R. Sathishkumar, Spectro-
chim. Acta A 108 (2013) 146.[27] J. Ma, Y.M. Yin, H.L. Liu, M.X. Xie, Curr. Org. Chem. 15 (2011) 2627.[28] C. Barakat, D. Patra, Luminescence 28 (2013) 149.[29] D. Patra, C. Barakat, R.M. Tafech, Colloids Surf. B 94 (2012) 354.[30] T. Zhang, D. Li, Spectrochim. Acta A 112 (2013) 15.[31] C.N. Pace, F. Vajdos, L. Fee, G. Grimsley, T. Gray, Protein Sci. 4 (1995) 2411.[32] J.L. Perry, M.R. Goldsmith, T.R. Williams, K.P. Radack, T. Christensen, J. Gorham,
M.A. Pasquinelli, E.J. Toone, D.N. Beratan, J.D. Simon, Photochem. Photobiol. 82(2006) 1365.
[33] J.H. Tang, F. Luan, X.G. Chen, Bioorg. Med. Chem. 14 (2006) 3210.[34] H.A. Benesi, J.H. Hildebrand, J. Am. Chem. Soc. 71 (1949) 2703.[35] J.R. Lakowicz, Principles of Fluorescence Spectroscopy, third ed., Springer, New
York, 2006.[36] T. Förster, Ann. Phys. 2 (1948) 55.[37] A. Bujacz, Acta Crystallogr. D 68 (2012) 1278.[38] H.M. Berman, J. Westbrook, Z. Feng, G. Gilliland, T.N. Bhat, H. Weissig
I.N. Shindyalov, P.E. Bourne, Nucleic Acids Res. 28 (2000) 235.[39] W.L. DeLano, The PyMoL Molecular Graphics System, DeLano Scientific, San
Carlos, (CA), 2004 ⟨http://www.pymol.sourceforge.net⟩.[40] S.J. Hubbard, J.M. Thornton, ‘NACCESS.’ Computer Program, Department of
Biochemistry and Molecular BiologyUniversity College of London, 1993.[41] T.J. Mabry, K.R. Markham, M.B. Thomas, The Systematic Identification of
Flavonoids, Springer-Verlag, New York, 1970.[42] J.M. Herrero-Martinez, F.Z. Oumada, M. Roses, E. Bosch, C. Rafols, J. Sep. Sci. 30
(2007) 2493.[43] S.V. Jovanovic, S. Steenken, M. Tosic, B. Marjanovic, M.G. Simic, J. Am. Chem.
Soc. 116 (1994) 4846.[44] M.X. Xie, M. Long, Y. Liu, C. Qin, Y.D. Wang, Biochim. Biophys. Acta 1760 (2006)
1184.[45] F. Zsila, Z. Bikadi, M. Simonyi, Biochem. Pharmacol. 63 (2003) 447.[46] Y. Ni, X. Zhang, S. Kokot, Spectrochim. Acta A 71 (2009) 1865.[47] J.F. Foster, in: F.W. Putnam (Ed.), Plasma Albumin. In The Plasma Proteins,
Academic Press, New York, 1960, pp. 179–239.[48] J.F. Foster, in: V.M. Rosenoer, M. Oratz, M.A. Rothschild (Eds.), Binding
Properties of Albumin. In Albumin Structure, Function and Uses, PergamonPress, Oxford, 1977, pp. 53–84.
[49] M. Dockal, D.C. Carter, F. Rüker, J. Biol. Chem. 275 (2000) 3042.[50] P.J Sadler, A. Tucker, Eur. J. Biochem. 212 (1993) 811.[51] A. Singha Roy, A.K. Dinda, S. Dasgupta, Protein Pept. Lett. 19 (2012) 604.[52] D. Li, Y. Wang, J. Chen, B. Ji, Spectrochim. Acta A 79 (2011) 680.[53] A. Singha Roy, D.R. Tripathy, A. Chatterjee, S. Dasgupta, Spectrochim. Acta A
102 (2013) 393.[54] Y. Zhang, S. Shi, Y. Liu, X. Chen, M. Peng, J. Pharm. Biomed. Anal. 56 (2011)
1064.[55] P.D. Ross, S. Subramanian, Biochemistry 20 (1981) 3096.[56] G. Sudlow, D.J. Birkett, D.N. Wade, Mol. Pharmacol. 11 (1975) 824.[57] G. Sudlow, D.J. Birkett, D.N. Wade, Mol. Pharmacol. 12 (1976) 1052.[58] Z. Chi, R. Liu, Biomacromolecules 12 (2011) 203.[59] G.Z. Chen, X.Z. Huang, J.G. Xu, Z.Z. Zheng, Z.B. Wang, Methods of Fluorescence
Analysis, second ed., Science Press, Beijing, 1990.[60] J. Gonzalez-Jimenez, M. Cortijo, J. Protein Chem. 21 (2002) 75.[61] M.Y. Khan, S.K. Agarwal, S. Hangloo, J. Biochem. 102 (1987) 313.[62] B. Ahmad, M.K.A. Khan, S.K. Haq, R.H. Khan, Biochem. Biophys. Res. Commun.
314 (2004) 166.[63] A. Sułkowskaa, B. Bojkoa, J. Ro´wnickaa, D. Pentakb, W. Sułkowskib, J. Mol.
Struct. 651 (2003) 237.[64] E. Liepinsh, G. Otting, J. Am. Chem. Soc. 116 (1994) 9670.
A. Singha Roy et al. / Journal of Luminescence 145 (2014) 741–751750

[65] Z. Qi, Y. Zhang, F. Liao, Y.O. Yang, Y. Liu, X. Yang, J. Pharm. Biomed. Anal. 46(2008) 699.
[66] A. Singha Roy, N.K. Pandey, S. Dasgupta, Mol. Biol. Rep. 40 (2013) 3239.[67] A. Banerjee, K. Basu, P.K. Sengupta, J. Photochem. Photobiol. B 90 (2008) 33.[68] M. Gokara, B. Sudhamalla, D.G. Amroou, R. Subramanyam, PLoS One 5 (2000)
e8834.[69] S. Neelam, M. Gokara, B. Sudhamalla, D.G. Amooru, R. Subramanyam, J. Phys.
Chem. B 114 (2010) 3005.
[70] V.N. Uversky, N.V. Narizhneva, T.V. Ivanova, A.Y. Tomashevski, Biochemistry494 (1997) 13638.
[71] A. Sytnik, I. Lritvinyuk, Proc. Natl. Acad. Sci. U.S.A 93 (1996) 12959.[72] D. Roy, S. Dutta, S.S. Maity, S. Ghosh, A. Singha Roy, K.S. Ghosh, S. Dasgupta, J
Lumin. 132 (2012) 1364.[73] A. Singha Roy, D.R. Tripathy, A.K. Ghosh, S. Dasgupta, J. Lumin. 132 (2012)
2943.
A. Singha Roy et al. / Journal of Luminescence 145 (2014) 741–751 751