Pelagic bacteria and phytoplankton in oceanic waters near the Canary Islands in summer
Upload
independentCategory
view
2download
0
45Animal Biodiversity and Conservation 31.2 (2008)
© 2008 Museu de Ciències NaturalsISSN: 1578–665X
Carrascal, L. M., Seoane, J. & Palomino, D., 2008. Density bias estimations using strip transects in dry open–country environments in the Canary Islands. Animal Biodiversity and Conservation, 31.2: 45–50.
AbstractDensity bias estimations using strip transects in dry open–country environments in the Canary Islands.— We studied bias in density estimations derived from strip transects in dry open–country in the Canary Islands. We also present some critical remarks on García–del–Rey’s (2005) paper regarding strip transects and the validity of comparisons based on population densities of birds in scrublands on Tenerife island using two dif-ferent methods: territory mapping and strip transect sampling. Although strip transects with census belts of 25 m do not account for detectability, this method only slightly undervalues true density estimates, and allowed to detect more than 85% of birds present in poorly vegetated environments in the Canary Islands. Previously published works on distribution and abundance of terrestrial birds in the Canary Islands using the strip transect sampling with belts of 25 m on both sides of the observer, thus provide reliable information that only slightly underestimates true densities.
Key words: Birds, Canary Islands, Census methods, Strip transects, Open–country environments, Population density, Territory mapping.
ResumenSesgos en la obtención de estimas de densidad obtenidas por medio de transectos lineales en ambientes estepáricos de las Islas Canarias.— Se estudin los sesgos derivados del empleo del método del taxiado (transectos lineales con bandas de 25 m a cada lado del observador) para obtener densidades en ambientes estepáricos de las Islas Canarias. También se presentan algunos comentarios críticos al trabajo de García–del–Rey (2005) que compara estimas de densidad obtenidas en Tenerife utilizando dos métodos diferentes: mapeo de territorios y transecto lineal. Aunque el método del taxiado estima densidades relativas no corregi-das por la detectabilidad de las especies, este método proporciona valores de densidad muy parecidos a los reales, ya que permite detectar en ambientes con poca cobertura vegetal a más del 85% de los individuos dentro de bandas de 25 m a cada lado del observador. Por tanto, los trabajos previamente publicados sobre densidades de aves en Canarias proporcionan estimas fiables sólo ligeramente infravaloradas.
Palabras clave: Aves, Islas Canarias, Métodos de censo, Transecto lineal, Ambientes estepáricos, Densidad de población, Mapeo de territorios.
(Received: 31 III 08; Conditional acceptance: 9 V 08; Final acceptance: 4 VII 08)
Luis M. Carrascal, Dept. Biodiversidad y Biología Evolutiva, Museo Nacional de Ciencias Naturales–CSIC, c/ José Gutiérrez Abascal 2, 28006 Madrid, Spain.– Javier Seoane, Dept. Interuniversitario de Ecología, Fac. de Ciencias, Univ. Autónoma de Madrid, 28049 Madrid, Spain.– David Palomino, Área de Estudio y Seguimiento de Aves, SEO/BirdLife, c/ Melquiades Biencinto 34, 28053 Madrid, Spain.
Bias in density stimations using strip transects in dry open–country environments in the Canary Islands
L. M. Carrascal, J. Seoane & D. Palomino

46 Carrascal et al.
Introduction
Macroecology and ecological biogeography require reliable information concerning the dis-tribution and abundance of organisms. Much of the presently available information was obtained decades ago when sampling methods were not well established or calibrated, or it was gathered following pragmatic sampling protocols over large areas. As a result, abundance measurements may be biased and lack precision and exactitude. One of the most commonly used methods to estimate bird abundance for large–scale monitoring pro-grammes is the strip transect method (also named fixed-width method; i.e., counting all objects within a predeterminated distance of the line travelled, Thomas et al., 2002). This approach provides relative densities that are perfectly comparable within–species across different environments, but biased in interspecific comparisons (Franzeb, 1981; Tellería, 1986; Bibby et al., 2000). The lack of exactitude is mainly due to the fact that this method does not account for detectability, and although it produces abundance estimates that are highly correlated with "true" densities, these are lower than those obtained by variable–width estimates (e.g., Shankar, 2003), and the magni-tude of the difference is species–specific.
Carrascal & Palomino (2005) studied the species–specific habitat preferences, density and species richness of bird communities in Tenerife (Canary Islands). They used strip transects with census belts of 25 m on each side of the observer to obtain population densities in 26 different habitats. García–del–Rey (2005) estimated the population density of passerine bird species in coastal scrub-lands of Tenerife island using two different methods: territory mapping and the strip transect method (labeled by him as line transect method). Compar-ing previously published bird abundance estimates in Tenerife (Carrascal & Palomino, 2005) with his own work, he concluded that strip transects using census belts of 25 m on both sides of the observer gave skewed density estimates and questioned the validity of previous published works. The author recommended a more reliable approach should be used in future studies to estimate abundance and advocated the use of distance sampling (Buckland et al., 2001).
In this short paper we provide new insights on density bias estimates when working with strip transects, and analyse the detectability patterns of the three most common bird species in the dry open–country environments of Tenerife: Anthus ber-thelotii, Sylvia conspicillata and Lanius meridionalis. These three passerines have very different foraging strategies (cursorial on the ground, sit–and–wait on perches of good visibility, or gleaners ambushed within bushes) in dry and poorly vegetated areas in the Canary Islands. Our main goal was to determine the degree to which density estimates made with strip transects using belts of 25 m on each side of an observer differ from "good" densities obtained
by more precise methods. The paper also includes critical comment on García–del–Rey’s (2005) paper regarding the experimental design he used and the validity of comparisons made therein.
Material and methods
We used the data obtained in an extensive survey program in Lanzarote and Fuerteventura in 2005 and 2006 (1,071 km of line transects; see Car-rascal et al., 2006, 2007; Palomino et al., 2008). Line transect sampling was used; this technique is frequently applied in extensive assessments of abundance, distribution patterns and habitat prefer-ences of birds (Bibby et al., 2000). The transects were carried out on windless, rainless days, walk-ing cross country or following little–used dirt tracks at a low speed (1–3 km/h approximately), in the 4 hours after dawn and the 2.5 hours before dusk. For each detected bird, the distance perpendicular to the observer’s trajectory was estimated. Training with a laser range–finder (Leica Rangemaster LRF 900) helped to improve distance estimates and to reduce inter–observer variability.
Detectability was estimated with the sampled distances (Thomas et al., 2002). To model detecta-bility, we fitted three canonical models (half–normal, negative exponential and hazard–rate, trying to include a suitable series expansion in each one) that are commonly used to explain the loss of detectability as a function of the distance from the transect line (the further the distance the lower the probability of detecting an individual). We also built more elaborate models to take possible observer effects into account (adding a factor with five levels corresponding to five observers) and vegetation structure (adding a continuous covariate calculated as mean shrub cover multiplied by mean shrub height). These models were used to estimate the probability of detection and the effective census strip width. Models were evaluated according to AICc. AICc is a second order correction of AIC for small sample sizes. Since AICc converges to AIC as n increases, AICc should be employed re-gardless of sample size. We calculated a weighted average of the detection probabilities derived from the models according to weights (W) obtained from AICc values, where
Wi = exp [–0.5 · DAICci] / S exp [–0.5 · DAICci]
Burnham & Anderson, 2002). Detectability models were built with Distance 5.0 software (Thomas et al., 2004). Using this approach, it was also possible to calculate the probability of detection within 25 m–wide belts on both sides of the observer.
Results
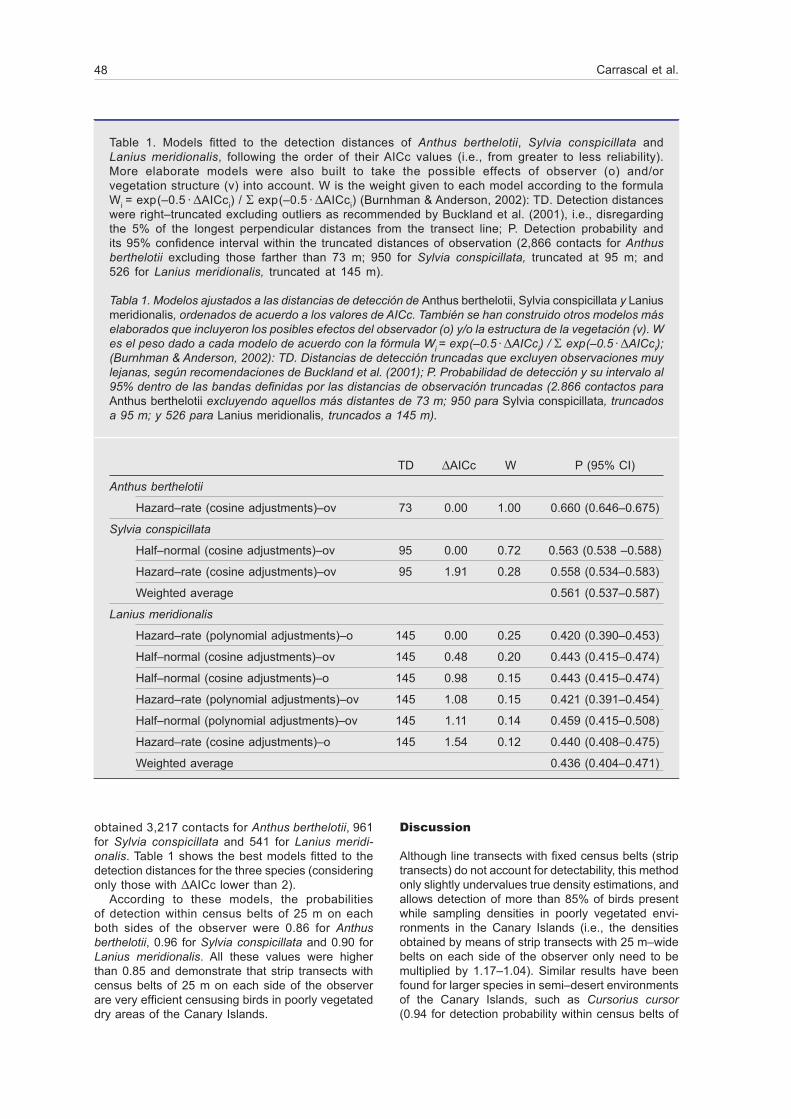
Figure 1 shows the variation of birds detected with the perpendicular distance to the observer. We

Animal Biodiversity and Conservation 31.2 (2008) 47
Fig. 1. Number of birds at different distance to the observer in 1,071 km of transects in dry open–country areas of Fuerteventura and Lanzarote. We obtained 3,217 records for Anthus berthelotii, 961 for Sylvia conspicillata and 541 for Lanius meridionalis. The curves represent the models fitted to the truncated data (see truncated distances in table 1).
Fig. 1. Variación del número de aves detectadas a diferentes distancias del observador en 1.071 km de transectos en ambientes estepáricos de Fuerteventura y Lanzarote. Se obtuvieron 3.217 contactos para Anthus berthelotii, 961 para Sylvia conspicillata y 541 para Lanius meridionalis. Las curvas sobre los histogramas representan los modelos ajustados a los datos truncados (véase la tabla 1).
Anthus berthelotii
Sylvia conspicilata
Lanius meridionalis
450
400
350
300
250
200
150
100
50
0 5 20 35 50 65 80 95 110 125 140 155
5 20 35 50 65 80 95 110 125 140 155 Distance to observer (m)
5 25 45 65 85 105 125 145 165 185 205 225 245 265 # of contacts
120
100
80
60
40
20
0
# of
con
tact
s#
of c
onta
cts
# of
con
tact
s
60
50
40
30
20
10
0
48 Carrascal et al.
obtained 3,217 contacts for Anthus berthelotii, 961 for Sylvia conspicillata and 541 for Lanius meridi-onalis. Table 1 shows the best models fitted to the detection distances for the three species (considering only those with DAICc lower than 2).
According to these models, the probabilities of detection within census belts of 25 m on each both sides of the observer were 0.86 for Anthus berthelotii, 0.96 for Sylvia conspicillata and 0.90 for Lanius meridionalis. All these values were higher than 0.85 and demonstrate that strip transects with census belts of 25 m on each side of the observer are very efficient censusing birds in poorly vegetated dry areas of the Canary Islands.
Discussion
Although line transects with fixed census belts (strip transects) do not account for detectability, this method only slightly undervalues true density estimations, and allows detection of more than 85% of birds present while sampling densities in poorly vegetated envi-ronments in the Canary Islands (i.e., the densities obtained by means of strip transects with 25 m–wide belts on each side of the observer only need to be multiplied by 1.17–1.04). Similar results have been found for larger species in semi–desert environments of the Canary Islands, such as Cursorius cursor (0.94 for detection probability within census belts of
Table 1. Models fitted to the detection distances of Anthus berthelotii, Sylvia conspicillata and Lanius meridionalis, following the order of their AICc values (i.e., from greater to less reliability). More elaborate models were also built to take the possible effects of observer (o) and/or vegetation structure (v) into account. W is the weight given to each model according to the formula Wi = exp (–0.5 · DAICci) / S exp (–0.5 · DAICci) (Burnhman & Anderson, 2002): TD. Detection distances were right–truncated excluding outliers as recommended by Buckland et al. (2001), i.e., disregarding the 5% of the longest perpendicular distances from the transect line; P. Detection probability and its 95% confidence interval within the truncated distances of observation (2,866 contacts for Anthus berthelotii excluding those farther than 73 m; 950 for Sylvia conspicillata, truncated at 95 m; and 526 for Lanius meridionalis, truncated at 145 m).
Tabla 1. Modelos ajustados a las distancias de detección de Anthus berthelotii, Sylvia conspicillata y Lanius meridionalis, ordenados de acuerdo a los valores de AICc. También se han construido otros modelos más elaborados que incluyeron los posibles efectos del observador (o) y/o la estructura de la vegetación (v). W es el peso dado a cada modelo de acuerdo con la fórmula Wi = exp (–0.5 · DAICci) / S exp (–0.5 · DAICci); (Burnhman & Anderson, 2002): TD. Distancias de detección truncadas que excluyen observaciones muy lejanas, según recomendaciones de Buckland et al. (2001); P. Probabilidad de detección y su intervalo al 95% dentro de las bandas definidas por las distancias de observación truncadas (2.866 contactos para Anthus berthelotii excluyendo aquellos más distantes de 73 m; 950 para Sylvia conspicillata, truncados a 95 m; y 526 para Lanius meridionalis, truncados a 145 m).
TD DAICc W P (95% CI)
Anthus berthelotii
Hazard–rate (cosine adjustments)–ov 73 0.00 1.00 0.660 (0.646–0.675)
Sylvia conspicillata
Half–normal (cosine adjustments)–ov 95 0.00 0.72 0.563 (0.538 –0.588)
Hazard–rate (cosine adjustments)–ov 95 1.91 0.28 0.558 (0.534–0.583)
Weighted average 0.561 (0.537–0.587)
Lanius meridionalis
Hazard–rate (polynomial adjustments)–o 145 0.00 0.25 0.420 (0.390–0.453)
Half–normal (cosine adjustments)–ov 145 0.48 0.20 0.443 (0.415–0.474)
Half–normal (cosine adjustments)–o 145 0.98 0.15 0.443 (0.415–0.474)
Hazard–rate (polynomial adjustments)–ov 145 1.08 0.15 0.421 (0.391–0.454)
Half–normal (polynomial adjustments)–ov 145 1.11 0.14 0.459 (0.415–0.508)
Hazard–rate (cosine adjustments)–o 145 1.54 0.12 0.440 (0.408–0.475)
Weighted average 0.436 (0.404–0.471)

Animal Biodiversity and Conservation 31.2 (2008) 49
25 m; a figure obtained from fitted detection models in Carrascal et al., 2007) and Chlamydotis undulata (0.98; Carrascal et al., 2006). Therefore, previously published works on distribution and abundance of terrestrial birds in the Canary Islands, using the strip transect method with belts of 25 m on each side of the observer, provide reliable information that only slightly underestimates true densities.
The comparison between census methods in a paper by García–del–Rey (2005) is questionable as the experimental design does not adequately take important sources of variation into account. Spatial variability, for example, was not considered because García–del–Rey compared strip transects in four localities with territory mapping in just one (the study plot for territory mapping is in site 4, far from the rest of the sites, according to figure 1 in García–del–Rey [2005]). Besides, when the author used data from the same site, it was not stated whether the survey line transects and territory mapping were made over ex-actly the same area. Furthermore, the size of the area surveyed differed between the two methods because the 5.2 km of transects using belts of 25 m in site 4 covered a surface of 26 ha (5.2 km x 50 m = 26 ha), while with territory mapping the author covered 68 ha. More problematic is the fact that García–del–Rey made the strip transect in site 4 only on one date (5 March), and this did not overlap with the timing of territory mapping at the same site (3, 11, 18, 25 January, 1, 8, 15, 22 February).
It is also surprising that García–del–Rey’s (2005) density estimations derived from the territory map-ping method were nearly 100% lower than those obtained by means of strip transects in the two species that were most abundant and had most data (Anthus berthelotii and Sylvia conspicillata). This finding contradicts that found in previous works comparing the two methods (Emlen, 1977; Järvinen, 1978; Tellería, 1986; Shankar, 2003).
It is not unusual to find spatial variation in density when counting birds due to changes in habitat structure (see Illera, 2001, Carrascal et al., 2006, Illera et al., 2006, and Palomino et al., 2008 for some examples with open–country canary birds). In view of the lack of information on habitat structure in García–del–Rey’s (2005) study no conclusion can be reached regarding the validity of any one method or survey program when comparing density estimations obtained in different studies (Carrascal & Palomino [2005] provide detailed information on habitat structure of the environments censused).
Therefore, the criticisms made by García–del–Rey (2005) on the line transect method with belts of 25 m are flawed according to experimental design when comparing the methods, because differences found in density estimations may be due to phenological shifts in detectability, seasonal or spatial changes in actual densities, or differ-ences in habitat structure on areas where census work was carried out. Strip transect sampling with narrow census belts is a good survey method to estimate bird abundance for large–scale monitoring
programmes where distance estimations may be difficult to obtain or barely comparable among many different observers, as it only slightly undervalues true density estimations.
References
Bibby, C. J., Burgess, N. D. & Hill, D. A., 2000. Bird Census Techniques (2nd edition). Academic Press, London.
Buckland, S. T., Anderson, D. R., Burham, K. P., Laake, J. L., Borchers, D. L. & Thomas, L., 2001. Introduction to Distance Sampling. Oxford Univer-sity Press, New York.
Burnham, K. P. & Anderson, D. R., 2002. Model selection and multimodel inference. A practical information–theoric approach. Springer–Verlag, New York.
Carrascal, L. M. & Palomino, D., 2005. Preferencias de hábitat, densidad y diversidad de las comuni-dades de aves en Tenerife (islas Canarias). Animal Biodiversity and Conservation, 28: 101–119.
Carrascal, L. M., Seoane, J., Palomino, D. & Alonso, C. L., 2006. Preferencias de hábitat, es-tima y tendencias poblacionales de la Avutarda Hubara (Chlamydotis undulata) en Lanzarote y La Graciosa (Islas Canarias). Ardeola, 53: 251–269.
– 2007. El corredor sahariano en España. I Censo Nacional (2005–2006). Monografía nº 14. SEO/BirdLife, Madrid.
Emlen, J. T., 1977. Estimating breeding season bird densities from transect counts. Auk, 94: 455–468.
Franzeb, K.E. 1981. The determination of avian densities using the variable–strip and fixed–width transect surveying methods. Stud. Avian Biol., 6: 139–145.
García–del–Rey, E., 2005. Density estimates of pas-serine bird species in Tenerifean coastal scrub using two different methods (Canary Islands). Vieraea, 33: 193–199.
Illera, J. C., 2001. Habitat selection by the Canary Islands stonechat (Saxicola dacotiae) (Meade–Waldo, 1889) in Fuerteventura Island: a two–tier habitat approach with implications for its conser-vation. Biological Conservation, 97: 339–345.
Illera, J. C., Diaz, M. & Nogales, M., 2006. Ecological traits influence the current distribution and range of an island endemic bird. Journal of Biogeography, 33: 1192–1201.
Järvinen, O., 1978. Species–specific census ef-ficiency in line transects. Ornis Scandinavica, 9: 164–167.
Palomino, D., Seoane, J., Carrascal, L. M. & Alonso, C. L., 2008. Competing effects of topographic, lithological, vegetation structure and human impact in the habitat preferences of the Cream–coloured Courser. Journal of Arid Environments, 72: 401–410.
Shankar, T. R., 2003. Assessment of census tech-niques for interspecific comparisons of tropical

50 Carrascal et al.
rainforest bird densities: a field evaluation in the Western Ghats, India. Ibis, 145: 9–21.
Tellería, J. L., 1986. Manual para el censo de los vertebrados terrestres. Raíces, Madrid.
Thomas, L., Buckland, S. T., Burnham, K. P., Ander-son, D. R., Laake, J. L., Borchers, D. L. & Strind-berg, S., 2002. Distance sampling. In: Encyclopedia of Environmetrics: 544–552 (A. H. El–Shaarawi
& W. W. Piegorsch, Eds.). John Wiley & Sons, Chichester.
Thomas, L., Laake, J. L., Strindberg, S., Marques, F. F. C., Buckland, S., Borchers, D. L., Anderson, D. R., Burnham, K. P., Hedley, S. L., Pollard, J. H. & Bishop, J. R. B., 2004. Distance 5.0, Release Beta 2. Research Unit for Wildlife Population Assessment, St. Andrews.
Copyright © 2022 FDOKUMEN