Estimations of isoprenoid emission capacity from enclosure studies: measurements, data processing,...
38
Biogeosciences, 8, 2209–2246, 2011 www.biogeosciences.net/8/2209/2011/ doi:10.5194/bg-8-2209-2011 © Author(s) 2011. CC Attribution 3.0 License. Biogeosciences Estimations of isoprenoid emission capacity from enclosure studies: measurements, data processing, quality and standardized measurement protocols ¨ U. Niinemets 1 , U. Kuhn 2 , P. C. Harley 3 , M. Staudt 4 , A. Arneth 5,6 , A. Cescatti 7 , P. Ciccioli 8 , L. Copolovici 1 , C. Geron 9 , A. Guenther 3 , J. Kesselmeier 10 , M. T. Lerdau 11 , R. K. Monson 12 , and J. Pe ˜ nuelas 13 1 Institute of Agricultural and Environmental Sciences, Estonian University of Life Sciences, Kreutzwaldi 1, Tartu 51014, Estonia 2 Institut f ¨ ur Energie und Klimaforschung – Troposph¨ are (IEK-8), Forschungszentrum J¨ ulich, J ¨ ulich, Germany 3 National Center for Atmospheric Research, P.O. Box 3000, Boulder, CO 80307-3000, USA 4 Centre d’Ecologie Fonctionnelle et Evolutive (CEFE-CNRS), 1919, Route de Mende, 34293 Montpellier cedex 5, France 5 Division of Physical Geography and Ecosystem Analysis, Lund University, S¨ olvegatan 12, 22362 Lund, Sweden 6 Karlsruhe Institute of Technology, Institute for Meteorology and Climate/Atmospheric Environmental Research, Kreuzeckbahnstr. 19, 82467 Garmisch-Partenkirchen, Germany 7 European Commission, Joint Research Center, Institute for Environment and Sustainability, 21020 Ispra, Italy 8 Istituto di Metodologie Chimiche del CNR, Area della Ricerca di Roma 1, 00016 Monterotondo Scalo, Italy 9 US Environmental Protection Agency, National Risk Management Research Laboratory, Mail Drop E305-02, 109 TW Alexander Dr., Research Triangle Park, NC 27711, USA 10 Biogeochemistry Department, Max Planck Institute for Chemistry, P.O. Box 3060, 55020 Mainz, Germany 11 Department of Environmental Sciences, University of Virginia, Charlottesville, VA 22904-4123, USA and Xishuangbanna Tropical Botanic Garden, Melung, Yunnan, China 12 Department of Ecology and Evolutionary Biology and Cooperative Institute for Research in Environmental Sciences, University of Colorado, Boulder, CO 80309-0334, USA 13 Global Ecology Unit CSIC-CEAB-CREAF, Facultat de Ci` encies, Univ. Aut` onoma de Barcelona, 08193 Bellaterra, Spain Received: 4 April 2011 – Published in Biogeosciences Discuss.: 12 May 2011 Revised: 4 August 2011 – Accepted: 5 August 2011 – Published: 18 August 2011 Abstract. The capacity for volatile isoprenoid production under standardized environmental conditions at a certain time (E S , the emission factor) is a key characteristic in con- structing isoprenoid emission inventories. However, there is large variation in published E S estimates for any given species partly driven by dynamic modifications in E S due to acclimation and stress responses. Here we review additional sources of variation in E S estimates that are due to measure- ment and analytical techniques and calculation and averag- ing procedures, and demonstrate that estimations of E S crit- ically depend on applied experimental protocols and on data processing and reporting. A great variety of experimental setups has been used in the past, contributing to study-to- Correspondence to: ¨ U. Niinemets ([email protected]) study variations in E S estimates. We suggest that past exper- imental data should be distributed into broad quality classes depending on whether the data can or cannot be considered quantitative based on rigorous experimental standards. Apart from analytical issues, the accuracy of E S values is strongly driven by extrapolation and integration errors introduced dur- ing data processing. Additional sources of error, especially in meta-database construction, can further arise from incon- sistent use of units and expression bases of E S . We propose a standardized experimental protocol for BVOC estimations and highlight basic meta-information that we strongly rec- ommend to report with any E S measurement. We conclude that standardization of experimental and calculation proto- cols and critical examination of past reports is essential for development of accurate emission factor databases. Published by Copernicus Publications on behalf of the European Geosciences Union.
Transcript of Estimations of isoprenoid emission capacity from enclosure studies: measurements, data processing,...

Biogeosciences, 8, 2209–2246, 2011www.biogeosciences.net/8/2209/2011/doi:10.5194/bg-8-2209-2011© Author(s) 2011. CC Attribution 3.0 License.
Biogeosciences
Estimations of isoprenoid emission capacity from enclosure studies:measurements, data processing, quality and standardizedmeasurement protocols
U. Niinemets1, U. Kuhn2, P. C. Harley3, M. Staudt4, A. Arneth5,6, A. Cescatti7, P. Ciccioli8, L. Copolovici1, C. Geron9,A. Guenther3, J. Kesselmeier10, M. T. Lerdau 11, R. K. Monson12, and J. Penuelas13
1Institute of Agricultural and Environmental Sciences, Estonian University of Life Sciences, Kreutzwaldi 1,Tartu 51014, Estonia2Institut fur Energie und Klimaforschung – Troposphare (IEK-8), Forschungszentrum Julich, Julich, Germany3National Center for Atmospheric Research, P.O. Box 3000, Boulder, CO 80307-3000, USA4Centre d’Ecologie Fonctionnelle et Evolutive (CEFE-CNRS), 1919, Route de Mende, 34293 Montpellier cedex 5, France5Division of Physical Geography and Ecosystem Analysis, Lund University, Solvegatan 12, 22362 Lund, Sweden6Karlsruhe Institute of Technology, Institute for Meteorology and Climate/Atmospheric Environmental Research,Kreuzeckbahnstr. 19, 82467 Garmisch-Partenkirchen, Germany7European Commission, Joint Research Center, Institute for Environment and Sustainability, 21020 Ispra, Italy8Istituto di Metodologie Chimiche del CNR, Area della Ricerca di Roma 1, 00016 Monterotondo Scalo, Italy9US Environmental Protection Agency, National Risk Management Research Laboratory, Mail Drop E305-02,109 TW Alexander Dr., Research Triangle Park, NC 27711, USA10Biogeochemistry Department, Max Planck Institute for Chemistry, P.O. Box 3060, 55020 Mainz, Germany11Department of Environmental Sciences, University of Virginia, Charlottesville, VA 22904-4123, USA andXishuangbanna Tropical Botanic Garden, Melung, Yunnan, China12Department of Ecology and Evolutionary Biology and Cooperative Institute for Research in Environmental Sciences,University of Colorado, Boulder, CO 80309-0334, USA13Global Ecology Unit CSIC-CEAB-CREAF, Facultat de Ciencies, Univ. Autonoma de Barcelona, 08193 Bellaterra, Spain
Received: 4 April 2011 – Published in Biogeosciences Discuss.: 12 May 2011Revised: 4 August 2011 – Accepted: 5 August 2011 – Published: 18 August 2011
Abstract. The capacity for volatile isoprenoid productionunder standardized environmental conditions at a certaintime (ES, the emission factor) is a key characteristic in con-structing isoprenoid emission inventories. However, thereis large variation in publishedES estimates for any givenspecies partly driven by dynamic modifications inES due toacclimation and stress responses. Here we review additionalsources of variation inES estimates that are due to measure-ment and analytical techniques and calculation and averag-ing procedures, and demonstrate that estimations ofES crit-ically depend on applied experimental protocols and on dataprocessing and reporting. A great variety of experimentalsetups has been used in the past, contributing to study-to-
Correspondence to:U. Niinemets([email protected])
study variations inES estimates. We suggest that past exper-imental data should be distributed into broad quality classesdepending on whether the data can or cannot be consideredquantitative based on rigorous experimental standards. Apartfrom analytical issues, the accuracy ofES values is stronglydriven by extrapolation and integration errors introduced dur-ing data processing. Additional sources of error, especiallyin meta-database construction, can further arise from incon-sistent use of units and expression bases ofES. We proposea standardized experimental protocol for BVOC estimationsand highlight basic meta-information that we strongly rec-ommend to report with anyES measurement. We concludethat standardization of experimental and calculation proto-cols and critical examination of past reports is essential fordevelopment of accurate emission factor databases.
Published by Copernicus Publications on behalf of the European Geosciences Union.

2210 U. Niinemets et al.: Estimations of isoprenoid emission capacity from enclosure studies
1 Introduction
Volatile isoprenoids, including isoprene, mono- andsesquiterpenes, are the major reactive plant compounds emit-ted into the atmosphere, and play vital roles in gas-phase at-mospheric photochemistry (Chameides et al., 1988; Fuenteset al., 2000) and heterogeneous-phase chemistry that in-fluences the optical depth of the atmosphere, e.g. throughsecondary organic aerosol formation (Cahill et al., 2006;Chen and Hopke, 2009; Hallquist et al., 2009; Helmig etal., 2006; Kleindienst et al., 2007; Spracklen et al., 2008;Zhang et al., 2007) and cloud formation (Huff Hartz et al.,2005; Spracklen et al., 2008). The vegetation source-strengthfor volatile isoprenoids is typically estimated using modelsbased on species- or vegetation-specific emission capacityfor different volatile isoprenoid classes under standardizedenvironmental conditions (ES, the emission factor) and en-vironmental correction functions initially developed for lightand temperature (so-called Guenther et al. algorithms, Guen-ther et al., 1991, 1993), and more recently for CO2 concen-tration (Niinemets et al., 2010c; Wilkinson et al., 2009).
ES varies depending on past environmental conditions,plant physiological status (stressed/non-stressed), and phe-nology (Fischbach et al., 2002; Gray et al., 2006; Lavoir etal., 2009; Loreto et al., 2006; Niinemets, 2010a, b, c; Staudtet al., 2003), and some of these factors have also been con-sidered in models to a certain extent (Arneth et al., 2008;Guenther et al., 2000, 2006; Keenan et al., 2009; Lehninget al., 2001). In addition to the naturally dynamic natureof ES over days, weeks and months and genetic variability,uncertainties in emission inventories are associated with theempirical precision and accuracy ofES estimations. Mod-elers tend to accept the reported values ofES as infinitelyprecise and accurate. However, no standardized protocol forBVOC emissions has been established, and vastly differentapproaches have been used to assess emission potentials inlaboratory and field studies (for reviews Brancaleoni et al.,1999; Komenda et al., 2001; Ortega and Helmig, 2008; Or-tega et al., 2008; Tani et al., 2003). Intercomparisons amongdifferent experimental setups have demonstrated large differ-ences, sometimes exceeding 100 % among different BVOCquantification systems (Dindorf et al., 2006; Larsen et al.,1997; Steinbrecher et al., 1994). For more reactive com-pounds such as certain mono- and sesquiterpenes, completecompound loss has been shown to occur during analysiswith some instrumental systems (Arnts, 2008; Fuentes et al.,2000; Helmig et al., 2003, 2004; Larsen et al., 1997; Poll-mann et al., 2005; Steinbrecher et al., 1994). Lack of quanti-tative recovery of a major BVOC fraction has also been sug-gested, through indirect means, based on atmospheric reac-tivity measurements above vegetation (Di Carlo et al., 2004;Sinha et al., 2010).
In addition to emission measurements themselves, relia-bility of ES values also depends on the way the emissiondata are processed. Often field measurements cannot be con-
ducted under environmental conditions used for standardiza-tion of ES values (typically leaf temperature of 30◦C andincident light intensity of 1000 µmol m−2 s−1), andES is de-termined from measurements made under arbitrary temper-atures and light intensities that are “corrected” to standardconditions by applying the Guenther et al. (1991, 1993) emis-sion algorithms. Such an approach can lead to significant in-accuracies, especially if extrapolations over a large tempera-ture or incident light range are needed. For example, in sub-arctic, boreal and cool temperate climates, as well as duringearly and late growing season in seasonal climates, observa-tions are made across a broad range of temperatures, withnone of the measurements or very few extending to 30◦C. Inthis situation, it has been demonstrated that the way emissiondata are scaled to the standard conditions can significantlyalter the estimate ofES (Ruuskanen et al., 2007), but possi-ble extrapolation problems are often ignored when preparingemission factor databases.
Due to highly non-linear light and temperature responsesof BVOC emission, estimations ofES are also vulnerableto integration and extrapolation errors. In accordance withJensen’s inequality rules, non-linearity introduces errors inES estimates when average values of environmental condi-tions are used (for an outline of the integration problem seeCescatti and Niinemets, 2004; Niinemets and Anten, 2009).This can be a problem also when the averaging is done em-pirically as the result of sampling strategy, rather than mathe-matically. For example, averaging errors can occur when us-ing cartridge-measurements of enclosure air (time-averaged)to deriveES as well as when using enclosures containinga large amount of leaf area, leading to measurement acrossspatial heterogeneities in light intensity and leaf temperature.Analogous problems arise in using low resolution environ-mental data for extrapolation of emission data to determineES values. So far, such integration issues have not been ad-dressed inES determinations.
Finally, many past emission measurements were accom-panied by no information on plant physiological status(e.g. photosynthetic activity), on preceding environmentalconditions, or on leaf developmental status, making it im-possible to consider such effects a posteriori. Lack of cru-cial meta-information from the time surrounding the mea-surement makes it difficult, if not impossible, to assess thequality and representative nature of existing emission fac-tor databases. Because of several technical and computa-tional deficiencies in previous determinations ofES, and thelack of critical meta-information, several of us working withemission observations, and attending a recent conference onemissions observations and modeling1, have reached the con-sensus that many existing emission factors require revision.
1 European Science Foundation (VOCBAS and INTROP pro-grammes) science meetingBiogenic Volatile Organic Compounds:Sources and Fates in a Changing World, 2–5 October 2007, CNRSMontpellier, France
Biogeosciences, 8, 2209–2246, 2011 www.biogeosciences.net/8/2209/2011/
U. Niinemets et al.: Estimations of isoprenoid emission capacity from enclosure studies 2211
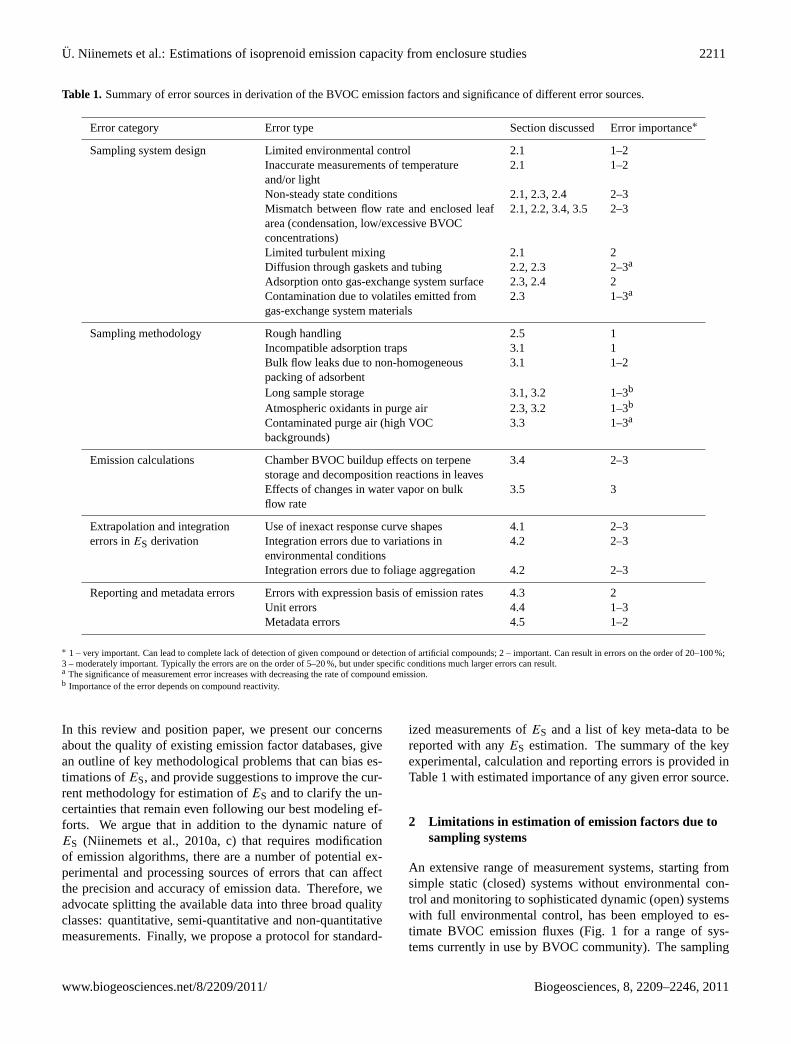
Table 1. Summary of error sources in derivation of the BVOC emission factors and significance of different error sources.
Error category Error type Section discussed Error importance∗
Sampling system design Limited environmental control 2.1 1–2Inaccurate measurements of temperatureand/or light
2.1 1–2
Non-steady state conditions 2.1, 2.3, 2.4 2–3Mismatch between flow rate and enclosed leafarea (condensation, low/excessive BVOCconcentrations)
2.1, 2.2, 3.4, 3.5 2–3
Limited turbulent mixing 2.1 2Diffusion through gaskets and tubing 2.2, 2.3 2–3a
Adsorption onto gas-exchange system surface 2.3, 2.4 2Contamination due to volatiles emitted fromgas-exchange system materials
2.3 1–3a
Sampling methodology Rough handling 2.5 1Incompatible adsorption traps 3.1 1Bulk flow leaks due to non-homogeneouspacking of adsorbent
3.1 1–2
Long sample storage 3.1, 3.2 1–3b
Atmospheric oxidants in purge air 2.3, 3.2 1–3b
Contaminated purge air (high VOCbackgrounds)
3.3 1–3a
Emission calculations Chamber BVOC buildup effects on terpenestorage and decomposition reactions in leaves
3.4 2–3
Effects of changes in water vapor on bulkflow rate
3.5 3
Extrapolation and integration Use of inexact response curve shapes 4.1 2–3errors inES derivation Integration errors due to variations in
environmental conditions4.2 2–3
Integration errors due to foliage aggregation 4.2 2–3
Reporting and metadata errors Errors with expression basis of emission rates 4.3 2Unit errors 4.4 1–3Metadata errors 4.5 1–2
∗ 1 – very important. Can lead to complete lack of detection of given compound or detection of artificial compounds; 2 – important. Can result in errors on the order of 20–100 %;3 – moderately important. Typically the errors are on the order of 5–20 %, but under specific conditions much larger errors can result.a The significance of measurement error increases with decreasing the rate of compound emission.b Importance of the error depends on compound reactivity.
In this review and position paper, we present our concernsabout the quality of existing emission factor databases, givean outline of key methodological problems that can bias es-timations ofES, and provide suggestions to improve the cur-rent methodology for estimation ofES and to clarify the un-certainties that remain even following our best modeling ef-forts. We argue that in addition to the dynamic nature ofES (Niinemets et al., 2010a, c) that requires modificationof emission algorithms, there are a number of potential ex-perimental and processing sources of errors that can affectthe precision and accuracy of emission data. Therefore, weadvocate splitting the available data into three broad qualityclasses: quantitative, semi-quantitative and non-quantitativemeasurements. Finally, we propose a protocol for standard-
ized measurements ofES and a list of key meta-data to bereported with anyES estimation. The summary of the keyexperimental, calculation and reporting errors is provided inTable 1 with estimated importance of any given error source.
2 Limitations in estimation of emission factors due tosampling systems
An extensive range of measurement systems, starting fromsimple static (closed) systems without environmental con-trol and monitoring to sophisticated dynamic (open) systemswith full environmental control, has been employed to es-timate BVOC emission fluxes (Fig. 1 for a range of sys-tems currently in use by BVOC community). The sampling
www.biogeosciences.net/8/2209/2011/ Biogeosciences, 8, 2209–2246, 2011

2212 U. Niinemets et al.: Estimations of isoprenoid emission capacity from enclosure studies
(a)
(b)
(c)
(e)
(d)
Fig. 1. Comparison of various enclosure systems currently used for measurement of BVOC emissions from plants:(a) two-halved glasscuvette with a polymer gasket and thermoelectric (Peltier) temperature control for field measurements (Peter C. Harley, NCAR, Boulder,USA), (b) double-layered glass cuvette with thermostatted water between the two glass layers for laboratory measurements (for detaileddescription see Copolovici and Niinemets, 2010; Rasulov et al., 2009a),(c) Teflon® (FEP) film branch enclosure for field measurementswith artificial illumination by blue and red LEDs (Jurgen Kesselmeier, Max Planck Institute for Chemistry, Mainz, Germany),(d) Teflon®
(FEP) film branch enclosure system for measurements under natural illumination and under ambient temperatures; the system consists oftwo enclosures of 75 l (air flow rate 40 l min−1), one for reference air sampling and the other for plant sampling, and each enclosure isequipped with 2 light sensors and 4 thermocouples, two attached on the leaves at the lower part of the branch and two at the upper part(for details Dindorf et al., 2006; Kuhn et al., 2002b), and(e) polyvinylfluoride (PVF, Tedlar®) bag for field measurements (Chris D. Geron,US EPA). The enclosures are installed on tropical evergreen dipterocarpsDipterocarpus applanatus(a) andDryobalanops aromatica(e,both experiments conducted in Danum Valley Field Centre, Sabah, Borneo, Malaysia (117◦49′ E and 5◦01′ N) in June 2008), on temperatedeciduous shrubSalix viminalis(b) in the lab, on temperate deciduous treeFagus sylvatica(d, experiments conducted in deciduous broad-leaved forest close to Julich, Germany, 50◦54′ N, 6◦25′ E), while an empty cuvette is shown in(c).
protocols used for BVOC measurements have also variedgreatly among different studies, undergoing significant evo-lution as more information on the performance of differentadsorbents and measurement system materials has accumu-lated and techniques for determination of less volatile com-pounds have been developed (Helmig et al., 2003, 2004;Kesselmeier et al., 1993, 1996, 1997; Kuhn et al., 2002a;Pollmann et al., 2005; Schafer et al., 1992; Tholl et al.,2006). Due to a lack of detailed technical specifications suchas air turnover time, changes in chamber conditions withgiven incident radiation load, etc., measurement system ar-tifacts and influences of variation in sampling protocols aredifficult to assess for any single study. Analytical uncertain-ties have been estimated to be on the order of 20 % in singlelab studies (Owen, 1998). However, inter-comparisons ofvarious measurement systems demonstrate that uncertaintiescan be much larger, exceeding 100 % in some cases (Larsen
et al., 1997; Steinbrecher et al., 1994). In fact, use of incom-patible sampling methods ignoring environmental conditions(ozone presence in ambient air, for example) can lead to com-plete lack of detection of more reactive and/or less volatilecompounds (Fuentes et al., 2000; Helmig et al., 2004; Larsenet al., 1997; Ortega and Helmig, 2008; Steinbrecher et al.,1994; Stewart-Jones and Poppy, 2006).
The methods for BVOC chemical detection and calibra-tion, and to some degree sampling systems, have been re-viewed recently (Ciccioli et al., 2002; Komenda et al., 2001;Ortega and Helmig, 2008; Tani et al., 2003; Tholl et al.,2006). In this section, we focus on uncertainties resultingfrom enclosure types and outline issues relevant for sam-pling techniques and flux calculations (Sect. 3), and data in-terpretation and further processing (Sect. 4), mainly focusingon dynamic systems. Although closed systems can provideuseful information on species capacity to emit BVOC, we
Biogeosciences, 8, 2209–2246, 2011 www.biogeosciences.net/8/2209/2011/

U. Niinemets et al.: Estimations of isoprenoid emission capacity from enclosure studies 2213
believe that the inherent uncertainties associated with suchsystems, including excessive depletion of CO2, extensive al-teration of environmental conditions such as build-up of hu-midity and increase in temperature, large increase in BVOCconcentrations, BVOC adsorption and sustained memory ef-fects, mass-flow leaks, and risk of induction of BVOC emis-sions due to altered environment, are so large that these sys-tems should not be used for quantitative characterization ofBVOC emissions. Such systems might be useful for iden-tifying types of BVOC emissions from given plant species,but accurate determination of emission flux rates is extremelydifficult with closed systems.
2.1 Enclosure chamber type and size
The disturbance of environmental conditions (e.g. radiation,temperature, humidity, trace gas concentrations), leading toaccumulation of heat and water vapor and depletion of CO2by measurement installations should be minimized to ensureoptimum plant physiological activity and maximum sensi-tivity of emission measurements. Ideally, measurements ofBVOC concentrations are conducted under steady-state con-ditions. The key requirements for reliable steady-state gas-exchange measurements are simple: good seal, stable gas-concentrations and environment in the enclosure, stable flowrate, well-mixed air (turbulent conditions) inside the enclo-sure, and accurate gas concentration measurements. Formeasurement of the environmental response curves (light,temperature, CO2), the capacity to control the major envi-ronmental variables, light, temperature, humidity and gasconcentrations inside the cuvette is also needed. In fact,to assess plant physiological parameters in a steady-state,the capacity to keep key environmental factors, tempera-ture and incident light, stable for at least over several min-utes is required. Decades of gas-exchange research in plantphysiology have resulted in construction of sophisticatedenvironment-controlled leaf, branch and whole-plant cham-bers (Field et al., 1989; Long and Bernacchi, 2003; Longet al., 1996; Niinemets, 2011). However, in surveys and in-ventory studies in remote areas, fulfilling all these require-ments can be difficult. Thus, simple Teflon® or Tedlar® bagsystems, or large whole branch chambers without environ-mental control and limited turbulent mixing of air have oftenbeen used in BVOC studies (Fig. 1). Such systems imposelimitations on the development ofES databases since mea-surements can only be made under existing and often fluctu-ating environmental conditions, which are typically modifiedby the enclosure itself. Because of the lack of environmentalcontrol in the bag or chamber, foliage temperatures often risesubstantially above ambient (Fig. 2), while foliage cluster-ing leads to within-branch shading, implying imprecisely de-fined and heterogeneously-distributed leaf temperatures andincident quantum flux densities.
Leaf temperature is generally measured using thermocou-ples. Typically a single thermocouple is attached to the lower
Fig. 2. Illustration of a whole plant BVOC measurement cham-ber for estimation of the distribution of BVOC concentrations andleaf temperatures throughout the chamber(a), and BVOC concen-tration (b) and leaf temperature(c) gradients with and without themixing fan on. The vertically orientated blades of the fan and thebaffles of the chamber frame optimize turbulent air mixing, thusgenerating a homogenous atmosphere at relatively low wind speeds(Staudt et al., 2000 for a more detailed description of the chambersystem). A young Norway spruce (Picea abies) tree was enclosedin the chamber, and BVOC concentrations(b) and needle tempera-tures(c) were simultaneously measured at nine different positionsinside the chamber either with the mixing fan off (upper plots) orwith the fan on (lower plots). The chamber was located in coolair-conditioned greenhouse. BVOC concentrations and leaf tem-peratures are much more homogenous with the fan running thanwhen the fan is stopped. Furthermore, when the fan is switchedoff, leaf and air temperatures inside the chamber increase due to de-creased heat exchange between the chamber and the cool air outsidethe chamber in the air-conditioned greenhouse, and consequentlyBVOC emissions and concentrations increase. When the fan is off,highest BVOC concentrations occur in the lower part of the cham-ber, while the highest temperatures are in the upper part, reflectingthe strongly asymmetric biomass distribution in the spruce trees aswell as lack of mixing of chamber air. The measurement positionsare defined for the horizontal as: 3 – west, 2 – middle, 1 – east; andfor the vertical: 3 – top, 2 – middle and 1 – bottom (based on thedata of Staudt, 1997).
www.biogeosciences.net/8/2209/2011/ Biogeosciences, 8, 2209–2246, 2011

2214 U. Niinemets et al.: Estimations of isoprenoid emission capacity from enclosure studies
LAI = 0.5 m m2 -2
0
10
20
30
40
50
0
10
20
30
40
Relative quantum flux density
0.0 0.2 0.4 0.6 0.8 1.0 1.2 1.40
10
20
30
40
Fre
qu
en
cy (
%)
LAI = 1.5 m m2 -2
LAI = 3 m m2 -2
Average ± SD = 0.62 0.36±
Average ± SD = 0.45 0.38±
Average ± SD = 0.31 0.35±
(a)
(b)
(c)
Fig. 3. Frequency distribution of light intensity on leaf surfacewithin branch enclosures including progressively more leaf area.As a measure of leaf area enclosed in the measurement chamber,branch leaf area index, i.e. leaf area per unit flat surface area, isused. Light intensity relative to the intensity on a flat surface abovethe branch is computed for a solar angle of 45◦ and assuming 80 %of direct radiation. The simulation was performed with a ray trac-ing model for circular flat leaves having a spherical leaf angle dis-tribution and random dispersion (Cescatti and Niinemets, 2004 fordetails). The gradients of light are expected to be even strongerfor aggregated foliage dispersions as is common in most conifers(Cescatti and Zorer, 2003; Niinemets et al., 2006).
surface of a leaf. Due to heterogeneous distribution of leaftemperatures in the chamber, however, this single measure-ment is likely an inaccurate representation of the thermalstate of the enclosed foliage (Fig. 2). In more elaboratesystems, such as large branch enclosures (Fig. 1d) up to 4thermocouples are used, resulting in better characterizationof temperature environment, which nevertheless is far fromideal. Analogously, quantum flux density is measured abovethe foliage, commonly in one location in the given cham-ber. However, light availability strongly varies within a givenbranch (Fig. 3 for variation in quantum flux density), im-plying that one or even multiple estimates of light intensityabove the branch provide limited information on the light in-tensity incident to individual leaves (e.g. Palva et al., 1998a,b).
For a given analytical system, exchange measurements bythe dynamic chamber method are generally limited by the
minimum detectable trace gas concentration difference be-tween incoming and outgoing air. This concentration dif-ference is proportional to the emission rate and leaf areaenclosed in the chamber, and inversely proportional to thechamber air flow rate. In the case of compound pre-concentration systems such as trapping on sorbent cartridgesor on cryo-traps, the overall sensitivity is proportional to thetime of sampling, but ideally the sampling time is kept asshort as possible to avoid changes in plant physiological sta-tus during sampling. Thus, the choice of the purging air flowrate is usually a compromise between different and partlyconflicting requirements for the enclosure system (detectionlimit of exchange rate, versus time response and modifica-tion of ambient conditions and avoidance of plant physio-logical status). The use of larger chambers usually involveslonger air residence times unless very high flow rates areused (Niinemets, 2011 for a review of chamber size vs. airexchange time). The time-dependent change in chamber gasconcentration of an empty chamber,Cchamber, can be ex-pressed as (Li-Cor Inc., 2001; Niinemets, 2011):
dCchamber
dt=
F
V(Cin −Cchamber), (1)
whereF is the flow rate through the system (l min−1), V
is the chamber volume (l),t is time andCin is the incom-ing gas concentration. When a plant sample is included inthe chamber or when there is compound adsorption on thesurface or desorption from the surface of the gas-exchangesystem, full mass balance equation needs to include sourceand/or sink terms (see Eq. 4). Integrating, and determiningthe integration constant att = 0 when the initial chamber gasconcentration isCchamber,s, yields the following expressionof chamber gas concentration:
Cchamber(t) = Cin −(Cin −Cchamber,s
)exp
(−
F
Vt
). (2)
The ratio F /V is the first order rate constant of time-dependent changes in the chamber gas concentration. Thechamber flushing half-time is given as:
τc = ln(2)/(F/V ) (3)
A time of 4τc is needed for 94 % of full system response,and this time can be taken as a satisfactory approximationof that required to reach a steady-state, assuming a constantflux. Thus, a chamber with a volume of 5 l and a flow rateof 1 l min−1, reaches the steady-state in ca. 14 min, whilethe same chamber with a flow rate of 5 l min−1 reaches thesteady-state in ca. 3 min. At the extreme, large whole-plantchambers used in BVOC studies may take more than an hourto reach the steady-state (for examples see Huve et al., 2007;Niinemets, 2011).
The Eqs. (1–3) are based on ideal turbulent mixing in thechamber without the plant. In real chambers, especially whenthey contain large quantities of plant material, reaching the
Biogeosciences, 8, 2209–2246, 2011 www.biogeosciences.net/8/2209/2011/

U. Niinemets et al.: Estimations of isoprenoid emission capacity from enclosure studies 2215
steady state typically takes longer than what was predictedhere (Niinemets, 2011), and it is recommended to wait sig-nificantly longer than the minimum times predicted by firstorder decay kinetics, ideally checking the chamber respon-siveness with a plant with real-time BVOC sensors (see be-low). These equations emphasize that vigorous mixing witha fan is essential for reliable measurements (Fig. 2). Toavoid gas concentration gradients or pockets of dead air inthe chamber, and thus excessively long chamber half-times,one must maintain a reasonable balance between the cham-ber size, flow rate and the amount of biomass enclosed in thechamber. As an example of a quantitative description of themodification of turbulent transport in an enclosure as com-pared to undisturbed ambient conditions we refer to Pape etal. (2009).
Apart from the long times needed to reach a steady-state,low flow rate through the chamber can lead to CO2 depletionand high chamber humidity or condensation due to plant gasexchange activity as well as to BVOC buildup due to plantemissions. These alterations in the chamber atmosphere candirectly affect isoprenoid emission or, in the case of excessivehumidity, generate considerable problems and errors down-stream in BVOC sampling and in CO2/H2O gas exchangemeasurements, especially if condensation of water occurson the surface of sampling lines and measurement chamber(Sect. 3.3 for the effects of BVOC ambient concentrations).Such problems can be avoided by matching the flow rate tothe amount of biomass in the chamber.
Although smaller well-mixed chambers generally reach asteady-state rapidly, within seconds to minutes (Rasulov etal., 2010 for the use of an ultra-fast system in isoprene mea-surements), care needs to be taken to allow the leaf BVOCconcentrations and physiological status to equilibrate withchamber conditions after leaf enclosure. This is neededas mono- and sesquiterpenes can be non-specifically storedwithin the leaves and leaf surface after synthesis (Niinemetset al., 2010c; Niinemets and Reichstein, 2002). This meansthat even if the system and plant responses can be decon-voluted, sufficient time is needed for plant emission rates toreach a steady-state for accurate estimation of the emissionrate. On the basis of the Niinemets and Reichstein (2002)storage model, it can be predicted that for evergreen broad-leaved sclerophyllicQuercus ilex, reaching at 99 % steady-state monoterpene emission response after a stepwise in-crease in irradiance takes ca. 10 min, but this time may dif-fer for single monoterpene compounds depending on theirphysico-chemical properties that affect their non-specificstorage.
Biochemical induction also can introduce significant de-lays in emission responses. For non-induced leaves, for in-stance after prolonged darkening, biochemical induction ofphotosynthesis and monoterpene (Noe et al., 2010) and iso-prene (Rasulov et al., 2009b) emissions may take 20–30 min(Niinemets et al., 2010c for a review). Such non-specificstorage effects and induction responses can be monitored by
fast online BVOC detector systems and reaching a steady-state emission rate can be appropriately estimated. In thecase of BVOC sampling on cartridges and subsequent of-fline gas-chromatographic analysis, ample time should be al-lowed for stabilization of the emission fluxes before the startof sampling. For offline systems, it is recommended that aperiod of at least 30 min be allowed for leaf stabilization af-ter changes in environmental conditions before sampling ofBVOCs, even when using chambers with rapid air turnover.Of course, for investigation of rapid transient responses, fastsampling is needed, but forES, commonly defined as theemission rate under steady-state conditions (Niinemets et al.,2010c for a review), both chamber and plant physiology mustreach a steady-state.
2.2 Diffusion problems associated with small chambers
The use of small commercial clamp-on chambers with envi-ronmental control (temperature, light and chamber gas con-centrations) is currently gaining popularity in field studiesand in many lab studies for simultaneous monitoring of leafgas exchange activities and measurement of BVOC emis-sions either using fast online VOC detectors such as ProtonTransfer Reaction Mass Spectroscopy (PTR-MS) or by sam-pling onto cartridges for offline gas-chromatographic anal-yses (e.g. Brilli et al., 2009; Calfapietra et al., 2008; Ek-berg et al., 2009; Geron et al., 2001, 2006a, b; Lavoir etal., 2009; Okumura et al., 2008; Penuelas et al., 2009). Thesmaller well-mixed chambers generally reach steady-statemore quickly, within seconds to minutes, than larger cham-bers. For instance, with a typical flow rate of 350 µmol s−1
(0.47 l min−1), Li-Cor 6400 (Li-Cor, Inc., Lincoln, Ne-braska, USA), standard 2× 3 cm (6 cm2) chamber is pre-dicted to reach a steady state (Eqs. 2–3) in 21 s. Despite thefast response, use of small chambers carries other challengesfor accurate characterization of BVOC emissions. First,when the chambers are operated at high air flow rates, theBVOC detection limit will be poor, limiting measurementof low emissions. However, when the flow rate is kept lowto result in higher BVOC concentration differences, cham-bers with small cross-sectional area and large chamber in-ner surface exposed gasket area for diffusion can generateerrors in flux estimations due to diffusion of gases from thechamber air space with relatively high BVOC concentrationinto the ambient air with lower BVOC concentration (Flexaset al., 2007; Rodeghiero et al., 2007), especially for com-pounds with relatively small diffusion volume and high diffu-sion coefficient such as isoprene (Niinemets and Reichstein,2003b for a comparison of diffusion coefficients for variousBVOCs). In addition to BVOC, in leaf chambers, the watervapor concentration typically also increases above ambientdue to leaf transpiration, resulting in diffusion of water vaporout of the chamber through the gaskets. This leads to an un-derestimation of transpiration rate and stomatal conductance,and erroneous interpretation of the physiological controls on
www.biogeosciences.net/8/2209/2011/ Biogeosciences, 8, 2209–2246, 2011

2216 U. Niinemets et al.: Estimations of isoprenoid emission capacity from enclosure studies
isoprenoid emission (Rodeghiero et al., 2007). The modifi-cation of chamber CO2 concentration relative to ambient dueto photosynthesis alone is relatively minor for major diffu-sion problems to occur. However, in studies investigating theCO2 responsiveness of isoprenoid emission, in which cham-ber CO2 concentration is varied over a large range, signifi-cant CO2 concentration gradients between chamber and am-bient air can be present. These gradients can result in arti-ficial increases or decreases of apparent leaf photosyntheticrate depending on the sign of the concentration gradient, withthe effects being especially large for leaves with low pho-tosynthetic capacity (Flexas et al., 2007; Rodeghiero et al.,2007). Such errors in photosynthesis measurements causebias in photosynthesis vs. BVOC emission relations. Further-more, changes in CO2 concentration and water vapor pres-sure within the enclosure will affect stomatal conductance(for classical studies on stomatal responsiveness to environ-mental drivers see, Ball et al., 1987; Morison, 1987; Schulzeet al., 1987).
In general, the diffusion problems are larger for smallerchambers operated at high flow rates. To reduce the er-rors due to diffusion, chambers with relatively large enclosedleaf area (AL) to exposed gasket surface area (AG) are rec-ommended. For instance, large diffusion problems havebeen denoted for Li-Cor 6400 2 cm2 chamber (AL /AG ≈
0.67 cm cm−2), while the errors are considerably less for Li-Cor 6400 6 cm2 standard chamber (AL /AG ≈ 1.0 cm cm−2),or for Walz GFS-3000 8 cm2 standard chamber (AL /AG ≈
1.11 cm cm−2) (Rodeghiero et al., 2007). Apart from dif-fusion, adsorption/desorption problems, as outlined below,also scale with the exposed enclosure surface, in particularexposed polymeric gasket surface to enclosure volume ra-tio, further emphasizing that the use of enclosures with smallvolume and large polymeric surface area should be avoided.
2.3 Materials used in gas-exchange systems
In addition to diffusion problems, terpene adsorption canoccur on chamber walls and gasket surfaces as well as onsystem tubing and O-rings. Standard foam gaskets used incommercial gas-exchange systems initially designed to mon-itor CO2 and water vapor exchange, such as those manu-factured by Li-Cor, Inc., PP-Systems, Inc., ADC Bioscien-tific, Ltd., Walz GmbH etc., are made of neoprene (poly-chloroprene) rubber (black gaskets used by default), whilethe O-rings are made of butyl-rubber. In addition, polyethy-lene foam (white foam) is also used in manufacturing gas-kets. Polyethylene and combinations of polyethylene withother polymers (e.g. Bev-A-Line – polyethylene lined withethylenvinyl acetate) are typical materials for tubing in com-mercial gas-exchange systems. All these materials can ad-sorb significant quantities of organic compounds (Harogop-pad and Aminabhavi, 1991). Although the adsorption anddesorption characteristics of polymers used most frequentlyin emission studies have not been studied quantitatively for
key volatiles emitted from plants, studies on organic vaporsof environmental concern have suggested that polymers suchas neoprene and low-density polyethylene, used by defaultin commercial systems, have potentially significant adsorp-tion/desorption problems for VOC studies (Allaire et al.,2003; Avison et al., 2001; Hartman, 1999; Hodgson et al.,1998; Manura, 1999). Apart from adsorption on polymers,in commercial gas-exchange systems, traces of silicone oilare present in O-ring seals, and in CO2 cartridges, and inthe match valve of Li-Cor 6400 system, introducing addi-tional memory effects and contamination problems due tosolubilization and evaporation of anthropogenic and biogenicVOCs in oil (Geron et al., 2006a).
In addition to significant compound adsorption, the poly-mers used by default in the commercial systems are perme-able to volatile compounds to a certain degree, amplifyingthe diffusion problems discussed above. As the result of slowtime- and temperature-dependent decomposition, rubber andplastic materials may also constitute a contamination sourceof VOCs inherent to the material (Ezquerro et al., 2003; Fujiiet al., 2003; Hartman, 1999; Hodgson et al., 1998; Stewart-Jones and Poppy, 2006; Westerhout et al., 1997). Apart fromtubing and chamber wall materials, adhesive tapes are oftenused to attach films or tubing to support structures or to attachheating wires to tubing. This can constitute a further prob-lem as the adhesives of the tapes can further contribute to thebackground VOC level. This release of VOCs, together withre-emission of previously adsorbed plant BVOCs on tubingand chamber materials, generates a high level of backgroundnoise and memory effects and makes the identification andquantification of trace emissions difficult. Any adsorptioneffect can result in artificial time-lags between the emissionfrom plants and detection by BVOC sensors, thus obscur-ing the emission kinetics. This can be especially annoyingin rapid screening of plant species for BVOC emissions, es-pecially if offline systems involving trapping onto cartridgesare used and baseline emissions of empty sampling systemcannot be continuously monitored, or if slow-response GC-based online systems with long sampling lines are used formeasuring BVOC emission fluxes.
Adsorption to surface also increases the residence time ofcompounds in the chamber and thus enhances the probabilityof their oxidative destruction. This can be particularly sig-nificant for assessment of highly reactive monoterpene andsesquiterpene emissions (Fig. 4), especially if atmosphericoxidants such as ozone are not removed from the purge airduring BVOC measurements (Sect. 3.2).
To reduce the adsorption and diffusion effects, a variety ofmaterials with lower gas permeability and better adsorptioncharacteristics has been used. A huge number of polymerswith different brand names are available (Massey, 2003),making the selection of appropriate materials difficult. Fur-thermore, large differences in physico-chemical characteris-tics exist even within the same family of polymers (Sturm etal., 2004 for comparison of various polytetrafluoroethylene,
Biogeosciences, 8, 2209–2246, 2011 www.biogeosciences.net/8/2209/2011/

U. Niinemets et al.: Estimations of isoprenoid emission capacity from enclosure studies 2217
0
20
40
60
80
100
0 50 100 150
Ozone concentration (nmol mol )-1
Recovery
(%
)
Camphene, = 24 mol mol sk-1 -1
Sabinene,= 2370 mol mol sk
-1 -1
Trans- -ocimene,= 15050 mol mol s
b
k-1 -1
b-Caryophyllene= 312000 mol mol sk
-1 -1
Fig. 4. Comparison of the recovery of terpenes with various reactiv-ity sampled on polymeric adsorbent Tenax TA in atmospheres withvarying ozone concentration (data from Calogirou et al., 1996). Thereactivity of different terpenes is characterized by the atmosphericreaction rate constant for ozone (k). The reaction rate constants ascompiled in Calogirou et al. (1996).
PTFE, such as Teflon® grades). The important points toconsider for gaskets and O-rings in BVOC studies are gas-permeability, adsorption capacity and flexibility (hardness).Based on comparison of physico-chemical properties andfield testing (Geosyntec consultants Inc., 2009; Hayes et al.,2006; Jasse et al., 1999; Parkinson, 1985; Stewart-Jonesand Poppy, 2006; Sturm et al., 2004), preferred polymericmaterials for gas-exchange and BVOC studies can be out-lined. For gaskets and O-rings, fluorinated hydrocarbonstypically have significantly better physico-chemical proper-ties than polyethylene, silicone, chloroprene or butyl rubber(Sturm et al., 2004). Among the recommended materials arefluoroelastomers (FKM/FPM) such as certain Viton® fami-lies (e.g. higher flexibility B and F types) and perfluorinatedelastomers (FFPM/FFKM) such as Kalrez® or Parofluor®
as well as polychlorotrifluoroethylene (PCTFE) such as Kel-F® (for an overview of physico-chemical characteristics ofvarious polymers see Rodeghiero et al., 2007; Sturm et al.,2004). Although some of these materials such as PCTFEhave exceptionally low gas permeabilities and adsorption ca-pacities, disadvantage of polymers with such extraordinaryphysico-chemical characteristics can be excessive hardness,making it difficult to get a good seal (Sturm et al., 2004).A recommended compromise is the application of commer-cially available PFA-covered Viton® rings, which combinean acceptable inner hardness with good sealing propertiesand surface inertness.
For tubing, flexible polymer tubing with high amorphousphase polymer such as low-density polyethylene, latex, sili-
cone and neoprene rubber is not recommended due to highpermeability and adsorption problems (Geosyntec consul-tants Inc., 2009; Hayes et al., 2006). For instance, completeloss of sesquiterpenes was noted after passage through sili-cone tubing (Helmig et al., 2004). Low adsorption and per-meability probably make stainless steel, in particular withamorphous silicone coating (e.g. SilcoSteel®, Sulfinert®)or with electropolished surface, the best material for tubing(Arnts, 2010; Geosyntec consultants Inc., 2009; Helmig etal., 2004). Good recovery of volatile terpenoids has alsobeen observed for copper tubing, but copper tends to ad-sorb water vapor, which limits its utility in plant physiologi-cal studies where transpiration or conductance are of interest(Helmig et al., 2004). However, the limitation of metal tub-ing is low flexibility and difficulties in making good seals atconnections. Among polymers, physico-chemical propertiesfor VOC system construction are generally suitable for rigidpolymers with low amorphous phase (high crystalline phase)fraction such as fluorinated hydrocarbons – PFA (perfluo-roalkoxy), FEP (fluorinated ethylene propylen), and PTFEbrands (e.g. Teflon® and Chemfluor®) (Geosyntec consul-tants Inc., 2009; Hayes et al., 2006). Polyetheretherketone(PEEK) (Wang et al., 2006 for physico-chemical character-istics) and certain nylon brands (Massey, 2003 for physico-chemical characteristics) can also yield satisfactory resultsand are used in VOC sampling systems (Geosyntec consul-tants Inc., 2009; Hayes et al., 2006).
For gas exchange enclosures (cuvettes), glass, althoughfragile, typically has very low adsorption capacity for mostVOCs and therefore has been used in many sampling systems(Beauchamp et al., 2005; Copolovici et al., 2011; Copoloviciand Niinemets, 2010; Fuentes et al., 1995; Huve et al.,2007; Matsunaga et al., 2008; Papiez et al., 2009; Rasulovet al., 2009a; Wildt et al., 2003). Glass cuvettes without(Beauchamp et al., 2005; Copolovici et al., 2011; Huve etal., 2007; Wildt et al., 2003) and with temperature controlhave been used (Fig. 1a, b, Copolovici and Niinemets, 2010;Matsunaga et al., 2008; Papiez et al., 2009; Rasulov et al.,2009a). Cuvettes made of stainless steel with glass win-dows and polymer seals have also been found to have sat-isfactory terpenoid recovery, although memory effects lead-ing to long equilibration times have been noted as a majordisadvantage (Helmig et al., 2004). Among recommendedpolymers for sampling are transparent fluorinated hydrocar-bon films – like FEP and PFA, or opal PTFE (Teflon®), PVF(polyvinylfluoride, Tedlar®), PVDF (polyvinylidenfluoride,Kynar®, Dyneon®, Solef®) (e.g. Kesselmeier et al., 1993,1996; Matsunaga et al., 2008; Niinemets et al., 2002a; Papeet al., 2009; Steinbrecher and Hauff, 1996). In addition,“polyester” (polyethylene terephthalate, PETE) films such asMylar®, and Nylon-6 films (so-called “cooking bags”) havebeen often used in chemical ecology (Raguso et al., 2003;Stewart-Jones and Poppy, 2006; Theis, 2006). Significantbackground emissions due to impurities such as phthalates,
www.biogeosciences.net/8/2209/2011/ Biogeosciences, 8, 2209–2246, 2011

2218 U. Niinemets et al.: Estimations of isoprenoid emission capacity from enclosure studies
often applied as a softener in polymers, and aliphatic hydro-carbons were noted particularly for Nylon-6, but also fromPETE bags, but these interfering emissions could be reducedby pre-heating and extended purging of the bags with puri-fied air before the measurements (Stewart-Jones and Poppy,2006). After preconditioning, the recovery of volatile com-pounds for PETE bags was similar to glass, but lower forNylon-6 (Stewart-Jones and Poppy, 2006). Although rela-tively inert polymers can be found for branch or whole-plantenclosures, the key problem inherent to such systems is lackof temperature control unless a very high flow-through rateis used, and for non-rigid “bag-type” systems, difficulties inmaintaining enclosure volume and avoiding contact with theplant material (rough handling problems, Sect. 2.5). As tothe adhesive tapes in BVOC studies, they are best avoided,but whenever they need to be used, low VOC emission tapesare recommended.
In general, absolutely inert materials for BVOC measure-ments have not been found, and experimentation with dif-ferent polymer families marketed under different brands, canbe very costly. Nevertheless, several fluorinated hydrocar-bon polymers, stainless steel and glass exhibit superior per-formance over conventional polymers used in commercialgas-exchange systems, and are therefore recommended forBVOC measurements.
2.4 Correcting for chamber size and other memoryeffects
Allowing the system to reach a steady-state is the safest wayto avoid problems resulting from system memory effects.However, excessive waiting times, sometimes many hours,are needed for very sticky compounds such as sesquiterpenes(Helmig et al., 2003, 2004). With development of fast onlineBVOC sensors such as PTR-MS, researchers are increasinglyinterested in rapid measurements ofES as well as in rapidregulation of BVOC emissions in response to environment.However, not only do these long waiting times preclude fastmeasurements, plant physiological status may change dur-ing the time needed for the system to reach the steady-state,and the emission rate may not be stable throughout the ex-tended waiting periods (Bertin and Staudt, 1996 for changesin monoterpene emissions under continuous constant illu-mination). To disentangle the system and plant effects, thechange in the mass of the BVOC in the system can, in thesimplest way, be expressed as (cf. Eq. 1):
dCoutVs
dt= F (Cin −Cout)+ALE+ATη, (4)
where Vs is the system volume (m3, chamber plus sam-ple tubing volume),Cout is the BVOC concentration in thesystem (mol m−3), Cin is the BVOC concentration in in-coming air,AL (m2) is the plant leaf area enclosed in thesystem,E (mol m−2 s−1) is the plant BVOC emission rate,AT is the tubing and enclosure inner area, andη is the ad-
sorption/desorption rate.Cout times Vs gives the BVOCmass in the system.η is a function of the difference be-tween the compound concentrations in the chamber or tubeair (approximated byCout in the leaf chamber and down-stream the chamber) and at chamber or tube surface (CS).The wayη scales with this concentration difference dependson compound- and material-specific adsorption/desorptionisotherms. Equation (4) is a crude simplification asη can bedifficult to predict due to lack of information onCS and theshape of the adsorption/desorption isotherms and because, inreality, Cout andCS are not constant throughout the system,but can vary up- and downstream of the measurement cham-ber due to plant emission and adsorption/desorption effects.In addition, material properties can vary in different partsof the system, and separate adsorption/desorption terms maybe needed for various components of the system in Eq. (4).Thus, quantitative consideration of the memory effects re-sulting from system size and adsorption of BVOC on cham-ber and sample line surfaces may be impossible using the-oretical models such as Eq. (4), or the models may becomeoverly complex. In practice, such effects can be consideredby monitoring the rise and decay of BVOC concentrations inan empty measurement system using a stable air flow withspecified BVOC concentration (Fig. 5, Rasulov et al., 2009afor further details). Such empirical responses can be consid-ered together with models such as Eq. (4) to deconvolute themeasurement system and plant BVOC emission responses.We again emphasize that water condensation in the systemshould be avoided as this would heavily delay the systemresponse, especially for water soluble compounds such asmethylbutenol and oxygenated monoterpenes (e.g. linalooland 1,8-cineole), and alter the system response coefficient.Thus, under high humidity experimental conditions, applica-tion of tube heating is recommended, specifically for all tub-ing downstream of the enclosure, where higher humiditiesare expected due to (i) addition of water vapor by transpira-tion and (ii) potentially lower ambient temperatures relativeto the sunlit cuvette. Tube heating also reduces the adsorp-tion of compounds on tubing surface, thereby speeding upthe system response.
2.5 Rough handling
In species with specialized storage tissues for BVOCs suchas glandular trichomes (species ofMentha, Salvia, Artemisia,Nicotiana etc.), oil glands (Citrus, Eucalyptus) and resinducts (most commonly in conifers) clamp-on leaf chambersas well as non-rigid enclosure structures such as inflatedbags may crush and break the terpene storage tissues, arti-ficially increasing the emission rate. In species possessingspecialized storage tissues, extremely high emission rateshave been demonstrated after mechanical damage (Fig. 6,and e.g. Loreto et al., 2000). As the half-time for the evapo-ration of terpenes from crushed storage pools is typically onthe order of hours to days (Fig. 6, e.g. Loreto et al., 2000;
Biogeosciences, 8, 2209–2246, 2011 www.biogeosciences.net/8/2209/2011/

U. Niinemets et al.: Estimations of isoprenoid emission capacity from enclosure studies 2219
0
5
10
15
20
Withplant
Withoutplant
Light off
Isoprene off
0 100 200 300
Time since darkening orstopping isoprene flow (s)
No
rmaliz
ed r
eduction
of
iso
pre
ne
for
em
pty
cha
mbe
r (n
mo
l m
s)
-2-1
Le
af iso
pre
ne e
mis
sio
nra
te (
nm
ol m
s)
-2-1
Fig. 5. Comparison of the transient responses of empty chamberand chamber with a hybrid aspen (Populus tremula× P. tremu-loides, clone 200) plant included (modified from Rasulov et al.,2009a). To assess the transient response of the measurement sys-tem, a stable isoprene flow through the chamber was establishedusing an artificial isoprene source. After the steady-state isopreneflow was reached, isoprene supply was stopped and the system tran-sient response was recorded. In the case of measurements with theplant, the plant was kept at given environmental conditions (light in-tensity of 500 µmol m−2 s−1, temperature 28–30◦C) until a steady-state emission rate was established. After reaching the steady-state,light was switched off, and the postillumination isoprene releaserecorded. The empty chamber system-specific response curve wasscaled to given plant isoprene emission rate at steady-state condi-tions. Isoprene emission rate was measured with a Fast IsopreneAnalyzer equipped with ozone generator (Hills Scientific, Boulder,CO, USA). The inset shows the 4 l glass chamber used in these ex-periments (flow rate was 4 l min−1).
Schuh et al., 1996), such artificial emissions can result inserious errors in derivation ofES values. In species withspecialized storage tissues, there is also evidence of signifi-cantly elevated terpene emissions with slow time-dependentdecay after foliage enclosure in clamp-on chambers. In fact,in the pivotal study by Guenther et al. (1991), used to de-velop the terpene emission model from vegetation (Sect. 4.1for Guenther et al. algorithms), time-dependent reductions inmonoterpene emission rate were observed after enclosure ofthe foliage of the model species,Eucalyptus, in the measure-ment cuvette.
The emissions after damage eventually cease as the ex-posed terpenes evaporate and the wounding site is progres-sively sealed by oxidized terpenoids (Loreto et al., 2000).However, mechanical damage itself induces de novo syn-thesis of a variety of BVOCs, including rapid production ofvolatile compounds of lipoxygenase pathway such as sev-eral C6 aldehydes (green leaf volatiles) (e.g. Matsui, 2006;Vuorinen et al., 2004), and a variety of terpenoids (Fig. 6,Litvak and Monson, 1998; Vuorinen et al., 2004; Wang andLincoln, 2004). Similarly, substantially increased formic
0
20
40
60
80
100
24 12 24 12 24 12 24Time (h)
Mo
no
terp
en
e e
mis
sio
nra
te (
nm
ol g
h)
-1-1
0.1
1
10
100
Mechanicalstress
Picea abies
Fig. 6. Effect of mechanical disturbance on monoterpene emis-sions from a 7 yr old temperate coniferPicea abiestree. The wholetree crown was enclosed in the chamber (Fig. 2a for the systemoverview), and the emissions were monitored over three days. Inthe morning of day 2 the tree was shaken for 3 min (denoted by anarrow), causing a sudden increase in the emission rates by almosttwo orders of magnitude. The inset shows the emissions on a log-arithmic scale, emphasizing that the emissions were still elevatedtwo days after the mechanical stress. Dark periods are denoted byhorizontal bars (modified from Staudt, 1997).
and acetic acid emissions from several plant species werereported by Kesselmeier et al. (1998) for several hours af-ter enclosure of the sample. Artificially elevated emissionstogether with induction of emissions imply that mechani-cal damage makes reliable estimation of constitutive terpeneemission potentials impossible. To avoid damage of the stor-age pools of terpenes, rigid chambers enclosing the entireshoot in needle-leaved species or entire leaf in the case ofbroad-leaved species should be used for measurements inspecies with specialized terpene storage tissues. In addition,petioles and shoot axes should be sealed in the leaf chamberwith great care, ideally at least 24 h before the measurementsto avoid release of volatiles from the site of petiole or shootaxis enclosure after removal of interfering needles/leaves andmild shoot axis compression. Ways of preparing the site ofenclosure can include wrapping the shoot axis or petiole partremaining under the seal by inert tape (e.g. Teflon® tape),using low-emission glues etc.
3 Problems of sampling and calculation of emissionrates
Apart from the measurement systems, large uncertainties, in-cluding lack of detection of some compounds, can be as-sociated with sampling methodology. While fast BVOCsensors for online measurements such as chemiluminescence
www.biogeosciences.net/8/2209/2011/ Biogeosciences, 8, 2209–2246, 2011

2220 U. Niinemets et al.: Estimations of isoprenoid emission capacity from enclosure studies
detection for isoprene (Hills and Zimmerman, 1990) andproton transfer reaction mass-spectrometry (PTR-MS) formethylbutenol, isoprene, and total mono- and sesquiterpenes(Lindinger et al., 1998a, b) are available, and higher massresolution techniques such as time-of-flight (TOF) mass-spectrometry (PTR-TOF-MS, Bamberger et al., 2011; Cap-pellina et al., 2010) are becoming available, quantitative andqualitative separation of mono- and sesquiterpene specieswith the same molecular mass requires gas-chromatographicseparation, for which samples need to be concentrated. Gas-chromatographic analysis is also recommended to avoid arti-facts in isoprenoid emission measurements by PTR-MS dueto protonated parent ions or fragment ions with the samem/zas the isoprenoid studied. For example, methylbutenol andseveral other alcohols and aldehydes can form fragment ionswith m/zof 69+, i.e. with the samem/zas the protonated par-ent ion for isoprene (Fall et al., 2001; Karl et al., 2001), andseveral C6 aldehydes and monoterpenes can form fragmentswith m/z81+ (Fall et al., 2001; Ishizuka et al., 2010).
Here we describe several caveats associated with samplingon cartridges as this is the methodology most commonlyused for quantitative BVOC emission studies. Although elec-tropolished stainless steel canisters or bags made of inertmaterials can also be used to store air samples (e.g. Apelet al., 1999; Janson et al., 1999; Plass-Dulmer et al., 2006;Wang and Austin, 2006) with the advantage that no adsorp-tion/desorption steps are needed, they are not commonlyused for field BVOC measurements due to their high cost,extra precautions needed to avoid leaks, difficulties in eval-uation of compound losses during storage, and problems incoupling canisters to open gas-exchange systems, especiallyfor replicate measurements (for possible caveats see Apel etal., 1999; Batterman et al., 1998; Plass-Dulmer et al., 2006;Wang and Austin, 2006).
After measurement of BVOC concentrations, emissionflux rates need to be computed. Calculations for photosyn-thesis and transpiration rates have been elaborated in theplant physiological literature (Ball, 1987; von Caemmererand Farquhar, 1981), but little attention has been paid to cal-culations of BVOC emission rates. Here we highlight theeffects of BVOC ambient air concentrations, BVOC buildupin the measurement enclosure and the influences of changesin water vapor concentration on BVOC flux calculations.
3.1 Caveats with sampling on cartridges
In the absence of real-time portable on-line BVOC analyz-ers,ES measurements in the field commonly combine trap-ping of BVOC from plant enclosures with subsequent off-line analysis in the laboratory. With real-time fast analyzerssuch as PTR-MS that cannot distinguish between compoundswith the same molecular mass, off-line analysis by gas-chromatographic systems is also needed to identify emittedmono- and sesquiterpenes. For practical purposes, BVOCsare most commonly trapped by passing a known volume
of chamber air through adsorbent cartridges. The trappedBVOCs are subsequently eluted from the adsorbent, usuallyby one or two stage thermodesorption, resulting in flash in-jection of the total amount of sampled BVOCs into the ana-lytical system (Ciccioli et al., 2002).
Cartridges for BVOC sampling are made of glass or stain-less steel internally coated with fused silica and contain adefined amount of adsorbent(s) for BVOC trapping. The re-quirements for the solid adsorbents for sampling volatile iso-prenoids are simple: they should retain at ambient temper-atures the largest number of compounds ranging from C5 toC15 present at ppt to ppb level in ca. 5 l samples. At the sametime, they must be able to quantitatively release all of them attemperatures that prevent possible decomposition of BVOCs(∼250◦C). The adsorbents used in BVOC studies can bepolymer-resin based such as Tenax® TA, graphitized carbonblacks such as Carbopack®, Carbotrap® and Carbograph®,resin-derived carbon molecular sieves such as Carboxen® orCarbosieve® or combined polymer resin/graphitized carbonadsorbents such as Tenax® GR. The choice of adsorbent forBVOC sampling depends on the compounds under investi-gation and on the measuring conditions. Lower molecularweight highly volatile isoprenoids such as isoprene requirethe use of stronger polymeric or graphitized carbon-basedadsorbents with larger specific surface area to avoid break-through during sampling (for surface area estimates of dif-ferent adsorbents see e.g. Ciccioli et al., 2002; Dettmer andEngewald, 2002). For isoprene, graphitized carbon based ad-sorbents with large specific surface area (100–500 m2 g−1)
such as Carbotrap B, Carbopack X and Carbograph 5 or car-bon molecular sieves such as Carboxen 569 have been usedsuccessfully (Brancaleoni et al., 1999; Dettmer et al., 2000;Larstad et al., 2002; Loivamaki et al., 2008; Loreto et al.,2001).
However, adsorbents used for isoprene are not necessar-ily suitable for less volatile isoprenoids such as mono- andsesquiterpenes that can be bound too strongly or even irre-versibly to strong adsorbents, such that their release duringthermal desorption would require excessive temperatures. Inpractice, such high temperatures result in compound ther-modestruction and condensation, leading to major compoundlosses. For instance, rearrangement of monoterpenes at hightemperatures needed for desorption has been noted for adsor-bents with high surface area such as polymeric adsorbents(Chromosorb 101, 103, 105, 106, and Ambersorb XE340,surface area 400–800 m2 g−1) as well as for carbon molecu-lar sieves (Spherocarb with surface area of 730 m2 g−1, Car-boxen 569 with surface area of 485 m2 g−1) (Cao and He-witt, 1993; Coeur et al., 1997; Matisova andSkrabakova,1995; Riba et al., 1985). Decomposition of monoterpenesat high temperatures has also been noted for strong graphi-tized carbon based adsorbents such as Carbotrap B (surfacearea 100 m2 g−1) (Cao and Hewitt, 1993; Rothweiler et al.,1991) and for carbon molecular sieves such as Carboxen 569
Biogeosciences, 8, 2209–2246, 2011 www.biogeosciences.net/8/2209/2011/

U. Niinemets et al.: Estimations of isoprenoid emission capacity from enclosure studies 2221
(Coeur et al., 1997). Therefore, other adsorbents such as Car-botrap C (10 m2 g−1) and Tenax TA (35 m2 g−1) with lowersurface area are commonly used for quantitative samplingand recovery of higher molecular weight isoprenoids (Arnts,2010; Helmig et al., 2004).
On the other hand, adsorbents suitable for sesquiterpeneshave little capacity for isoprene adsorption, and thus, havelow breakthrough volumes for isoprene. To efficiently cap-ture a broad range of compounds, multi-layered adsorbentcartridges combining several size fractions and/or types ofadsorbents have been used (Brancaleoni et al., 1999; Cicci-oli et al., 1992, 1993, 2002; Copolovici et al., 2009; Llusiaand Penuelas, 2000; Mastrogiacomo et al., 1995). Whenusing multi-adsorbent traps, the amount of each adsorbentmust be sufficient to trap quantitatively the diverse com-pound classes under all sampling conditions. For instance,as compound volatility increases exponentially with temper-ature, the breakthrough volume of any adsorbent is stronglytemperature dependent (principle of thermodesorption) andthis should be considered in construction of cartridges forfield sampling. For multi-bed cartridges, it is also criticalto respect the flow directions during sampling and desorp-tion. During sampling, air should first pass through the weak-est adsorbent, followed by increasingly stronger adsorbents,while the flow direction should be reverse during desorption.
In general, different adsorbents with similar surface areaand mesh size have broadly similar compound adsorptionefficiencies (Ciccioli et al., 2002; Dettmer and Engewald,2002). However, there are several key differences amongvarious adsorbents with important implications for field sam-pling. In particular, different adsorbents vary greatly in wa-ter vapor adsorption capacity (Dettmer and Engewald, 2002;Helmig and Vierling, 1995). Typically, graphitized carbonblacks and Tenax-type of polymeric adsorbents, which retainmolecules by pure physical adsorption and do not tend toform hydrogen bonds with water (hydrophobic adsorbents),have low water adsorption capacity, while carbon molecularsieves have high water adsorption capacity (Ciccioli et al.,2002; Dettmer and Engewald, 2002, 2003; Gawlowski et al.,1999; Helmig and Vierling, 1995), likely reflecting the pres-ence of surface oxides in carbon molecular sieves leading tohydrogen bond formation (Dettmer and Engewald, 2002) ordue to generation of strong adsorption fields inside the micro-pores of 5–7A as the result of overlapping dispersion forcesof neighboring pore walls (Ciccioli et al., 2002; Gawlowskiet al., 1999). For adsorbents with high water affinity, wa-ter vapor can reduce BVOC adsorption efficiency by block-ing adsorption sites and thus, reducing the surface area avail-able for BVOC adsorption (Ciccioli et al., 1992; Helmig andVierling, 1995). Presence of adsorbed water can also cre-ate large problems in gas-chromatographic analysis, includ-ing clogging cryo-focusing traps with ice, shifts in retentiontime as well as interference with compound detection (Ci-ccioli et al., 1992; Gawrys et al., 2001; Helmig and Vier-ling, 1995; McClenny et al., 2002; Palluau et al., 2007). In
addition, adsorbed water can lead to terpene rearrangementsduring desorption (Zabaras and Wyllie, 2002). As water ad-sorption scales with atmospheric humidity (Helmig and Vier-ling, 1995; Ortega and Helmig, 2008), sampling in the fieldwhere atmospheric humidity is often high can be particularlyproblematic. In addition, to maintain high plant physiologi-cal activity, measurements of plant gas exchange and BVOCemissions are preferably made in humid (>50 % relative hu-midity) chamber atmospheres, i.e. in atmospheres with highenough humidity that can result in large amounts of wateradsorbed, leading to serious problems (Gawrys et al., 2001).Moderate heating up of the traps during sampling can sig-nificantly reduce water adsorption (Gawrys et al., 2001), butunfortunately, also BVOC adsorption. Traps filled with wa-ter absorbing chemicals can be used in front of the BVOCadsorption cartridges, but these can lead to compound lossesand memory effects (Dettmer and Engewald, 2003). Alter-natively, Nafion®, a copolymer of PTFE (Teflon®) and sul-fonated tetrafluoroethylene, membranes have been used toremove the water vapor with good VOC recovery in mostcases, except for smaller volatiles that may also penetratethe membrane (Dettmer and Engewald, 2003; Palluau et al.,2007).
Stability of different adsorbents also varies widely, withimportant implications for repeated use of cartridges. Re-peated heating cycles during thermodesorption and precon-ditioning can lead to decomposition of polymeric adsorbentssuch as Tenax, resulting in shrinking of the adsorbent (but seeArnts, 2010; Helmig et al., 2004). For quantitative BVOCsampling, any adsorption material must be homogenouslypacked in the cartridges and secured at both ends by glasswool to ensure the passage of sample air only through the ad-sorbent column and avoid any bulk flow leaks (channeling)bypassing the adsorbent. However, it is important to con-sider that the glass wool itself can function as an adsorbent(Arnts, 2010). In addition, cartridge wall material can affectthe compound recovery as well due to adsorption and chemi-cal reactions on wall surface (Arnts, 2010). To further reducethe risk of air-channeling and reactions on the wall surface,vertical arrangement of cartridges during both sampling andthe desorption procedure is recommended (e.g. Kuhn et al.,2005). Due to loss of volume during repeated heating cycles,polymeric adsorbent cartridges have to be regularly repackedor replaced. For polymeric adsorbents susceptible to volumechanges, adsorption tubes made of glass are recommendedas these allow for visual inspection of the condition of thepacking.
In summary, a wide variety of adsorbents and adsorbentmixtures has been used in the past, and is currently beingused in different laboratories. Although BVOCs of inter-est can be efficiently captured and desorbed using differentadsorbents or different mixtures of adsorbents (Brancaleoniet al., 1999; Ciccioli et al., 2002; Helmig et al., 2004), alladsorbents are vulnerable to artifacts and analytical problems
www.biogeosciences.net/8/2209/2011/ Biogeosciences, 8, 2209–2246, 2011

2222 U. Niinemets et al.: Estimations of isoprenoid emission capacity from enclosure studies
as no perfectly inert adsorbent exists in nature. Combiningdifferent adsorbents in multibed cartridges as well as usingless hydrophobic adsorbents can minimize such potential ar-tifacts. Unfortunately, it is virtually impossible to retrospec-tively assess the error inES determinations in past studiesdue to problems with compound adsorption.
3.2 Sampling in polluted atmospheres
BVOC sampling in polluted atmospheres can constitute an-other challenge due to artifact formation and significantlosses of highly reactive compounds such as certain mono-and sesquiterpenes. In particular, the polymeric adsorbentTenax has been shown to react with ozone and NO2 resultingin formation of artifacts (Clausen and Wolkoff, 1997; Klenøet al., 2002; Lee et al., 2006; McClenny et al., 2002). Apartfrom reactions of air pollutants with polymer molecules, ox-idation of sampled BVOC can occur on adsorbent surface.For instance, sampling at an ambient ozone concentrationof 50 nmol mol−1 led to complete loss of highly reactiveβ-caryophyllene, but only to a minor loss of the less re-active limonene (Fuentes et al., 2000). Surface-oxidationof sampled BVOC molecules has been observed for bothTenax (Calogirou et al., 1996; Lee et al., 2006) and carbon-based adsorbents (Carbopack B, Carbosieve III etc.) (Fig. 4,Bates et al., 2000; Calogirou et al., 1996; Lee et al., 2006;McClenny et al., 2002; Palluau et al., 2007; Pellizzari andKrost, 1984; Pollmann et al., 2005). Although it has beenstated that decomposition of BVOC is less of a problem oncarbon-based adsorbents (Larsen et al., 1997), Pollman etal. (2005) observed that some reactive sesquiterpenes weredecomposed to a similar degree whether trapped on TenaxTA, Tenax GR, or Carbotrap C and Carbotrap B (previouslymarketed as Carbotrap). Sesquiterpene oxidation results inthe formation of oxidized sesquiterpenes and formaldehyde(Calogirou et al., 1997b), and such oxidized decompositionproducts may be erroneously considered to be plant emis-sions. The oxidation or thermal decomposition problemsmay explain observed emissions of compounds considerednon-biogenic such as reported toluene emissions from plants(Heiden et al., 1999).
Even for less reactive compounds, decomposition losseson cartridges can be large if the samples are stored over longperiods extending several days to weeks. The decomposi-tion losses lead to overall underestimation of the emissionrates, and can also strongly distort the emission signatures,specifically reducing the concentrations of more reactive iso-prenoids (Calogirou et al., 1996). Such decomposition lossesof BVOC can be reduced for any type of cartridge packingif ozone and water are removed from traps immediately aftersampling. This can be achieved by purging the trap with a de-fined amount of an inert gas such as helium or pure nitrogen(Oliver et al., 1996; US Environmental Protection Agency,1999). By reducing the contact between adsorbed BVOCsand ozone, losses arising from long-time storage can also
be limited. Although this method can reduce the losses ofalready trapped BVOCs, it does not remedy for losses in-evitably occurring within the gas-exchange chamber beforetrapping unless ozone is removed from the air entering thecuvette.
As oxidant scrubbers are commonly positioned in front ofthe plant chamber, such effects are more of a problem formeasuring ambient air BVOC concentrations than for enclo-sure studies. So far, a variety of oxidant, in particular, ozonetraps has been suggested (Bates et al., 2000; Calogirou et al.,1997a; Ciccioli et al., 1999; Helmig, 1997; Hoffmann, 1995;Ortega and Helmig, 2008; Pollmann et al., 2005), but dif-ferent traps have varying efficiency of ozone-capture and canthemselves lead to artifact formation as the result of reactionswith VOCs sampled as well as adsorption/desorption effects(Fick et al., 2001; Helmig, 1997; Helmig and Greenberg,1995). For monoterpene sampling, most ozone traps seemto perform well (Fick et al., 2001), but it has been observedthat commercial manganese dioxide scrubbers can result inadsorption effects if the air is completely dry (U. Kuhn et al.,unpublished data, 2004); and complete loss of some mono-and sesquiterpenes even in ozone-free atmospheres has alsobeen shown (Arnts, 2008; Pollmann et al., 2005). A promis-ing method to control ozone is the addition of a low flow ofreactive hydrocarbon not produced by plants, such as trans-2-butene, into the air stream, effectively scavenging the bulkof the ozone, while not interfering with gas-chromatographicdetection of BVOC (Arnts, 2008).
Efficiency of BVOC storage on cartridges also varies fordifferent adsorbents. Dettmer et al. (2000) demonstratedlarge losses of isoprene on carbon molecular sieve adsor-bents (Carboxen 569, Carboxen 1003 and Carbosieve SIII)even after only 24 h storage, but no losses from the graphi-tized carbon adsorbent Carbotrap X. Analogous results wereobtained by Larstad et al. (2002). This may indicate decom-position reactions taking place with adsorbent surface oxides,irreversible adsorption (Dettmer et al., 2000), and polymer-ization (Dettmer and Engewald, 2002, 2003) in the carbonmolecular sieve adsorbents. Keeping sampled traps at tem-peratures below 0◦C significantly slows down BVOC degra-dation, and is recommended to limit decomposition lossesduring cartridge storage (Ciccioli et al., 2002).
Apart from adsorbent-adsorbate reactions occurring in-side the cartridges, decomposition reactions also occur inthe gas-phase within the measurement chamber as well ason chamber wall surface, especially when water conden-sation occurs, leading to liquid-phase oxidation reactions.Such reactions are of particular concern for enclosures withlong air turnover times, where BVOC concentrations buildup (Sects. 3.3 and 3.4). Wall losses due to selective ad-sorption and partition processes can be particularly severefor some polar monoterpenoid compounds, such as linalool,menthol or 1,8-cineol (eucalyptol), as they tend to stick onsolid surfaces and dissolve into water droplets more readilythan non-polar compounds. Thus, BVOC concentrations
Biogeosciences, 8, 2209–2246, 2011 www.biogeosciences.net/8/2209/2011/

U. Niinemets et al.: Estimations of isoprenoid emission capacity from enclosure studies 2223
may significantly decrease due to such decomposition reac-tions before compound adsorption on the adsorbents. Thiscan significantly reduce the apparent emission rate of reac-tive isoprenoids, in particular for chambers operated withlong air residence times (Kulmala et al., 1999). Such reac-tions can also increase the apparent emission of compoundsproduced secondarily from primary emissions (Neeb et al.,1996). Models can be used to determine the chamber BVOCconcentrations in the absence of atmospheric oxidants (Kul-mala et al., 1999; Neeb et al., 1996), but application of thesemodels is subject to significant uncertainties due to lack ofpertinent rate coefficients as well as difficulties in determin-ing OH and NO−3 radical concentrations. Clearly, use of ox-idant traps in front of the plant chamber is recommendedto gain insight into plant capacity to emit BVOC. From acautionary perspective, chronic ozone exposure itself can af-fect the leaf’s capacity for isoprene and monoterpene emis-sions (Velikova et al., 2005a, b), and removal of ozone wouldabolish such effects. However, modification of foliage ca-pacity for isoprene and monoterpene emissions by ozone istypically time-consuming, taking from several hours (for ex-ceptionally high ozone concentrations) to days (Loreto andSchnitzler, 2010), and thus, the effects of ozone removal onthe emission capacity are of concern only for longer termmeasurements.
3.3 Influence of ambient BVOC air concentrations oncalculation of emission rates
In field environments, when ambient air is used, backgroundatmospheric BVOC concentrations and air pollutants can in-terfere with the measurements. For isoprene, daytime am-bient air concentrations as high as 2–10 nmol mol−1 (ppb)can be observed above vegetation in rural sites dominatedby broad-leaved evergreenEucalyptusplantations (Cerqueiraet al., 2003), evergreen coniferAbies borisii-regisforests(Harrison et al., 2001), mixed deciduous broad-leavedQuer-cusand evergreenJuniperuswoodlands (Wiedinmyer et al.,2001), mixed deciduous broad-leavedPopulusand evergreenPicea forests (Tiwary et al., 2007), and at remote tropi-cal rain-forests during wet season (Kesselmeier et al., 2000,2002). Isoprene concentrations as high as 30 nmol mol−1
have been observed above remote tropical rainforest ecosys-tems during the dry season (Kesselmeier et al., 2002).
In the case of monoterpenes, ambient air concentrationsduring the day are significantly less, typically between0.2–0.7 nmol mol−1 in rural sites supporting monoterpene-emitting species (Cerqueira et al., 2003; Filella and Penuelas,2006; Harrison et al., 2001; Kesselmeier et al., 2000, 2002),mainly as the result of lower emission rates and rapid re-actions with OH radicals and ozone in the case of most re-active monoterpenes (Harrison et al., 2001). A few studieshave looked at ambient concentrations inside the vegetationcanopy, and these data suggest that much higher concentra-tions are present within the vegetation. In undisturbedPi-
nus sylvestrisforest, ambient air monoterpene concentrationsas high as 0.5–1.5 nmol mol−1 were observed (Raisanen etal., 2008). In disturbed forests, the concentrations can in-crease to more than 3 nmol mol−1, for instance after clear-cutting (Raisanen et al., 2008) or in resin-tapped pine forests(Pio and Valente, 1998). To correct for the backgroundconcentrations, ambient air can be sampled and concentra-tions subtracted from those measured in air exiting the cu-vette. Although the air entering the cuvette is often sam-pled to estimate the background concentration, a true back-ground estimate is obtained by sampling the air exiting thesampling chamber without leaf (BVOC concentration,Xin,mol BVOC m−3). In this way, possible background due toBVOC adsorbed on the sampling system surface can be ac-counted for. Ideally, the background sample is taken beforeand after taking the sample with the leaf enclosed. Simulta-neous use of two cuvettes, one enclosing the plant and onereference (empty) cuvette can also be used (Fig. 1d), avoid-ing the problem with possible temporal variation of incom-ing air BVOC concentration that can occur if the blank sam-ple is taken before or/and after sampling with foliage en-closed. However, in such a case, possible memory effects ofthe empty chamber due to former presence of foliage cannotbe assessed.
Determining the concentration of BVOC in the exhaustair with the leaf enclosed (Xout), the emission rateE(mol m−2 s−1) is given as:
E =(Xout−Xin)
ALF, (5)
where AL (m2) is enclosed leaf area, andF (m3 s−1) isthe flow rate through the measurement system. Convert-ing BVOC concentrations to molar units (nmol mol−1), thebuild-up of BVOC concentration inside the chamber,1σ ,can be expressed from Eq. (5) as:
1σ = (σout−σin) =EAL
Fm, (6)
whereσout is the BVOC concentration (nmol mol−1) in thecuvette exhaust air andσin that in incoming air, andFm is themolar flow rate (mol s−1). Thus, for a moderately high iso-prene emission rate of 30 nmol m−2 s−1, enclosed leaf areaof 6 cm2 (Li-Cor 6400 standard cuvette) and a flow rate of500 µmol s−1 (∼0.67 standard l min−1) typically used withthe Li-Cor 6400 system, the predicted isoprene buildup in thechamber is 36 nmol mol−1. For a moderate emission rate of5 nmol m−2 s−1, 1σ is 6 nmol mol−1, and for a low emissionrate of 1 nmol m−2 s−1, 1σ is only 1.2 nmol mol−1. Thus,the1σ in low and moderate emitters can be of the same mag-nitude as ambient air isoprene concentrations. Consequently,even small fluctuations in ambient BVOC concentration, onthe order of 0.5–1 nmol mol−1, can result in large uncertain-ties in the estimation of emission potentials under high am-bient background conditions for low to moderate emitters.
www.biogeosciences.net/8/2209/2011/ Biogeosciences, 8, 2209–2246, 2011

2224 U. Niinemets et al.: Estimations of isoprenoid emission capacity from enclosure studies
Although ambient monoterpene concentrations are typicallylower than those of isoprene during the daytime, monoter-pene emission rates are frequently small, and ambient airmonoterpene concentrations of 0.5–1.5 nmol mol−1 will leadto analogous problems in measuring monoterpene emissions.
To remedy the problems with high background concen-trations, incoming air can be scrubbed of BVOC along withozone using scrubbers, e.g. charcoal filters (Geron et al.,2006b; Manes et al., 1999; Okumura et al., 2008) or catalyticconverters (pure air generator), or alternatively, synthetic aircan be used. Nevertheless, it is important to be aware thatmost methods for gas cleaning provide zero air with certainbackground of impurities. In some cases, the hydrocarbonbackground can be moderately high such as for the syntheticair prepared from technical grade N2, O2 and CO2 (commonin photosynthesis measurements) relative to the synthetic airprepared using GC-grade component gases. In addition, dif-fusion of BVOCs from the ambient air into the measurementenclosure can still result in background air effects under par-ticularly high ambient BVOC levels.
3.4 Effects of BVOC buildup in the measurementchamber on calculated emission rates
As seen above, high emissions coupled with relatively lowflow rates can lead to a large buildup of BVOC in the enclo-sure. BVOC buildup in the cuvette may potentially inhibitthe emission rate, and may even result in BVOC uptake atvery high cuvette BVOC concentrations. In a steady-state,the emission rate,E, can be expressed in dependence on cu-vette BVOC concentration,σa (σa= σout for turbulent mixingin the cuvette as is typical in most systems), BVOC concen-tration in the gas-phase in intercellular air space inside theleaf (σi) and in the leaf liquid phase (σL), and stomatal (gs)
and liquid-phase (gL) conductances (mol m−2 s−1) for spe-cific BVOC species (Niinemets and Reichstein, 2003b):
E = gs(σi−σa) = gL
(σL−
σi
Hcc
), (7)
where Hcc (mol mol−1) is the dimensionless Henry’s lawconstant (gas-liquid phase partition coefficient) that convertsthe gas-phase concentration to liquid-phase equivalent con-centration. Implicit in this equation is that the diffusionflux of BVOC occurs through stomata. This assumption hasbeen experimentally verified for isoprene and monoterpenes,where bulk of the emission flux occurred through the leaflower side harboring the stomata (Fall and Monson, 1992;Loreto et al., 1996). In addition, very low cuticular monoter-pene permeabilities have been demonstrated (Schmid, 1991).
Analogously,E can be expressed in dependence on lipid-(σLip) and liquid-phase concentrations, and lipid-phase con-ductance (gLip) (mol m−2 s−1) to given BVOC species (Ni-inemets et al., 2002b):
E = gs(σi−σa) ≈ gLip(σLip−σLKOW
), (8)
whereKOW (mol mol−1) is the octanol to water partition co-efficient that approximately converts liquid-phase concentra-tion to lipid-phase equivalent concentration. Whenσi � σa,ambient BVOC concentrations and mild BVOC build-up inthe cuvette do not significantly affect isoprenoid emission.However, in weak emitters and non-emitters, the values ofσiandσa may be similar. Whenσi = σa, there is no net emis-sion from the leaves, i.e. BVOC uptake and emission ratesare equal (BVOC compensation point). Whenσi < σa, plantswill absorb BVOC from the ambient air. For instance, ter-pene uptake from the ambient air has been measured both innon-emitting and emitting species (Copolovici et al., 2005;Noe et al., 2008).
From Eqs. (7) and (8), it becomes clear that the degree towhich the ambient gas-phase BVOC concentrations can af-fect emissions depends on the compound partitioning to leafliquid and lipid phases, i.e. the capacity ofσi to rise aboveσa. A compound that is strongly partitioned to leaf liquid(low H) and/or lipid phases (highKOW) supports lowerσiand accordingly, the equilibriumσi = σa is reached at lowerambient BVOC concentrations. Isoprene and most terpenesare preferably partitioned to the gas phase, but can be sig-nificantly stored in the leaf lipid phase, while oxygenatedterpenes support a much lower gas-phase concentration forgiven leaf liquid and lipid phase concentrations (Copoloviciand Niinemets, 2005). Thus, significant ambient air concen-trations more readily affect the apparent emission rates ofoxygenated terpenes.
The use of synthetic air or scrubbed air without BVOCmay also be criticized on the grounds that low BVOC con-centrations inside the chamber produce an artificial plantto atmosphere BVOC gradient, and that this results in anoverestimation of natural emission rates. In contrast, useof ambient air can even result in reversal of the flux direc-tion in the case of strong deposition velocities, especiallyfor compounds with high potential deposition rate such ashighly lipid-soluble terpenoids and highly water-soluble oxy-genated compounds (Bamberger et al., 2011; Karl et al.,2005; Noe et al., 2008). However, as shown above, in reality,this is only a potential problem in species with low emissionrates that can build up only a low chamber BVOC concentra-tion close to or below typical ambient concentrations.
While the compound buildup is generally moderate in dy-namic flow-through systems (but dependent on flow rate),much larger BVOC build-up occurs in static (closed) sys-tems. In the static system, the emission rate can be derivedassuming a constant rate of emission during the sampling:
E =1XBVB
AL1t, (9)
where1XB (nmol m−3) is the buildup of BVOC volumet-ric concentration in the enclosure (difference between theconcentrations inside and outside the enclosure),VB (m3)
is the enclosure volume and1t is the time for sampling.
Biogeosciences, 8, 2209–2246, 2011 www.biogeosciences.net/8/2209/2011/

U. Niinemets et al.: Estimations of isoprenoid emission capacity from enclosure studies 2225
This equation is valid only when the compound concentra-tion is far from saturating concentration. In fact, for mostcommon plant BVOCs, the saturating concentrations are rel-atively large. For instance, at 25◦C, the saturating concen-tration is 0.727 mol mol−1 for isoprene and 5840 µmol mol−1
(ppm) for α-pinene (Copolovici and Niinemets, 2005 for areview of vapor pressures of key plant VOCs). Given anemission rate of 30 nmol m−2 s−1 from an enclosed foliagearea of 300 cm2 (0.03 m2) in 4 l bag for 10 min, and zero am-bient BVOC concentration, BVOC concentration in the bagwill rise to a value of 3024 nmol mol−1 (ca. 3 ppm). Thisconcentration is small compared with the saturating concen-tration, but is still much larger than observed in ambient at-mospheres under normal conditions, leading to a large equi-librium concentration inside the leaf.
A crude estimate of the underestimation of the emissionrate due to BVOC buildup can be obtained by determin-ing the within-leaf storage of the synthesized BVOC af-ter enclosure of the foliage in the bag (Kirschbaum et al.,2007 for calculations). Assuming a leaf dry mass per unitarea of 90 g m−2, leaf tissue density of 0.4 g cm−3, totalplant mass in the bag will be 2.7 g and total plant volume6.75 cm3. Assuming further that leaf air space volume frac-tion is 0.3 m3 m−3 (Kirschbaum et al., 2007; Niinemets andReichstein, 2003a), leaf dry to fresh mass ratio is 0.4 g g−1
(Poorter et al., 2010) and crude leaf lipid content is 5 % andgiven the lipid density of 0.8 g cm−3 (Noe et al., 2008), leafgas-phase volume is 2.03 cm3, liquid volume is 4.05 cm3 andlipid volume 0.17 cm3. Using the values ofH andKOW forisoprene (Copolovici and Niinemets, 2005), the amount ofisoprene stored in leaf gas, liquid and lipid phases is 2.3 nmolthat corresponds to ca. 0.5 % of that synthesized in the bagduring the 10 min time period. In contrast, for more-lipid sol-ubleα-pinene (Copolovici and Niinemets, 2005 for physico-chemical characteristics), the corresponding value will beca. 123 nmol, i.e. 22 % of the total amount (that inside theleaf + that in the bag) synthesized, leading to a very large un-derestimation ofα-pinene emission. Of course, this is a verysimplified calculation not considering possible inhibition ofBVOC synthesis by product buildup inside the leaves thatcan reduce the emissions much more dramatically (for in-hibitory effect of terpenes on metabolism see e.g. Copoloviciet al., 2005; Gog et al., 2005; Klingler et al., 1991). Evenif the BVOC concentration inside the chamber is far fromsaturation, such an inhibition of BVOC emission by productbuildup would lead to a non-linearity of BVOC concentra-tion increase in the chamber that can be detected by on-lineanalyzers such as PTR-MS.
These calculations also do not consider the possible con-sumption of BVOC inside the leaves. Although there is ap-parently no rapid enzymatic turnover of volatile isoprenoidsinside the leaves (e.g. Gershenzon et al., 1993), both isopreneand monoterpenes can react inside the leaves with reactiveoxygen species (ROS) (Copolovici et al., 2005; Loreto andVelikova, 2001). Thus, especially under stressed conditions
when ROS concentration is expected to be high, and stomataare closed, an increase in BVOC concentrations inside theleaves may imply that the leaves become a stronger biochem-ical sink for BVOC. In addition to storage inside the leaves,there can be further BVOC deposition on leaf surfaces, e.g. inthe cuticular wax (Guth and Frenzel, 1989), further reducingapparent emission rate. Huge bag concentrations also resultin an extensive diffusion gradient between the bag and out-side air, making the closed system very vulnerable to diffu-sion leaks.
The capacity of plants to store non-oxygenated terpenesin the leaf lipid phase and oxygenated terpenes in the liquidphase implies that terpenes may be exchanged with ambi-ent air even by species not synthesizing them. If ambientconcentrations are high, uptake can occur, and these com-pounds may then be re-emitted when ambient concentrationsare low (Himanen et al., 2010; Niinemets, 2008; Noe etal., 2008). When the foliage of “non-emitting” species thathas previously been exposed to ambient air with significantBVOC concentrations is enclosed, and synthetic air with noBVOC or ambient air with lower than the equilibriumσa isbeing used, apparent emissions of monoterpenes have beenobserved from the foliage of species incapable of synthesiz-ing the terpenes themselves (Himanen et al., 2010; Noe et al.,2008). Such effects may partly explain why some species arefound to be low-level terpene-emitters in certain studies butnot in others, and may also explain trace-level emissions ofcompounds considered anthropogenic in origin.
3.5 Consideration of water vapor effect on calculatedemission rates
So far, we have not considered the effect of water vapor con-centration on the calculation of emission rates. However,water vapor is the third major component of the atmosphereafter N2 and O2 with concentrations typically varying be-tween 1–5 %. After leaf enclosure in the chamber, watervapor concentrations increase as the result of plant transpi-ration. As the saturated water vapor concentration increasesexponentially with temperature, plant transpiration rate com-monly increases with increasing temperature, even if the clo-sure of stomata at high temperature partly inhibits the riseof transpiration rate. Thus, the increase in chamber water va-por concentration is particularly dramatic in non-temperaturecontrolled cuvettes where temperature also increases afterfoliage enclosure, especially in low turbulence conditions(Fig. 2). For BVOC emission rate calculations, it is importantto recognize that the increase in water vapor concentrationdilutes chamber BVOC concentration and thereby reducesthe apparent emission rate calculated by Eqs. (5) and (9).Due to water vapor buildup, the incoming air flow rate,Fin(mol s−1), typically measured by mass flow controllers incommercial gas-exchange systems, is actually smaller thanthe outgoing air flow rateFout (mol s−1) that is normally not
www.biogeosciences.net/8/2209/2011/ Biogeosciences, 8, 2209–2246, 2011

2226 U. Niinemets et al.: Estimations of isoprenoid emission capacity from enclosure studies
measured. The mass balance of water vapor in the system isgiven as:
λAL = FoutWout−FinWin, (10)
whereWin is the water vapor concentration of air entering,and Wout (mol mol−1) of that exiting the enclosure, andλ(mol m−2 s−1) is the leaf transpiration rate.Fout= Fin +λAL ,and thus,
λAL = (Fin +ALλ)Wout−FinWin. (11)
From this,λ becomes
λ =Wout−Win
AL (1−Wout)Fin. (12)
Analogously, the incoming and outgoing flow rates are actu-ally different in Eq. (5). The true mass balance for the BVOCis:
EAL = Foutσout−Finσin = (Fin +ALλ)σout−Finσin. (13)
Rearranging:
E =σout−σin
ALFin +λσout. (14)
For the Li-Cor 6400 6 cm2 cuvette,Fin of 500 µmol s−1, andrelatively high transpiration rate of 9 mmol m−2 s−1 corre-sponding to stomatal conductance of water vapor (gs) of0.3 mol m−2 s−1 and water vapor deficit between the leaf andambient air (ν) of 0.03 mol mol−1 (λ = gsν), the contributionof the transpiration correction will be ca. 1 % ofE. How-ever, the correctionλσ out very much depends on the flow ratethrough the system that altersσ out, and on transpiration rate.The rate of transpiration scales positively with temperaturedue to temperature effects onν (nearly exponentially whenvapor pressure is far from saturation), and temperature alsopositively affectsσ out. For non-climatized cuvettes, whereleaf temperature increases well above ambient, the transpi-ration correction may be 10 % or more, especially if a largeamount of leaf area (relative to cuvette flow rate, Eq. 2) isenclosed (Fig. 7). Many BVOC emission studies do not in-clude concomitant measurements ofλ, and in such cases, nocorrection for water vapor buildup can be made.
4 Extrapolations, units, meta-data and other scalinglimitations
In addition to the importance of precise measurements ofBVOC emission rates, the accuracy ofES values can stronglydepend on the way the emission measurements are standard-ized and summarized.ES values used in the simulation mod-els are frequently taken not from primary literature, but fromdatabases that have already synthesized information frommultiple studies. Meta-database construction typically in-volves evaluation of the quality of the data (use/do not use),
0
5
10
15
20
25
0 200 400 600 800 1000
Air flow rate ( mol s )m-1
Tra
nspiration c
orr
ection (
%)
AL = 6 cm2
AL = 15 cm2
Fig. 7. Simulation of the effect of transpiration correction (Eq. 14)on the emission rate in dependence on the incoming air flow rate forcuvettes enclosing 6 cm2 and 15 cm2 leaf area. In these simulations,we used a moderately high transpiration rate of 9 mmol m−2 s−1,incoming BVOC concentration of 3 nmol mol−1 and an emissionrate of 12 nmol m−2 s−1. For given air flow rate and leaf area, thecorrection is the larger the larger is the leaf transpiration rate andthe larger is the BVOC concentration in incoming air.
unit harmonization, data scaling to common environmentalconditions and averaging. All these steps can have a majoreffect on the quality of theES values in the meta-databases,and therefore on the quality of BVOC model predictions.
4.1 Standard conditions forES and the influence ofextrapolations
Standardized conditions in seminal papers definingES were30◦C for leaf temperature (TL) and 1000 µmol m−2 s−1 forincident quantum flux density (Q) (Guenther et al., 1991,1993). Ideally, the measurements ofES should be conductedat standardized conditions. However, this is often not possi-ble, especially when the measurements are carried out in thefield using simple non-climatized cuvettes (Fig. 1). In theworst cases, in simple static bag systems under high radia-tion loads, leaf temperatures may easily rise more than 10◦Cabove ambient (Stewart-Jones and Poppy, 2006). The emis-sion measurements conducted at these “non-standard” envi-ronmental conditions are then converted to desiredTL andQ
using light,f (Q), and temperature,f (TL), response func-tions (Guenther et al., 1991, 1993) (see also Niinemets et al.,2010c for a review). For light-dependent emissions of iso-prene and monoterpenes in non-storing species, the emissionrate is given as:
E = ESf (Q)fS(TL) (15)
Biogeosciences, 8, 2209–2246, 2011 www.biogeosciences.net/8/2209/2011/

U. Niinemets et al.: Estimations of isoprenoid emission capacity from enclosure studies 2227
wherefS(TL) is the temperature response function for BVOCsynthesis. The light response function is defined as:
f (Q) =CL1αQ√1+α2Q2
, (16)
where α is the apparent (standardized) quantum yield ofisoprenoid emission andCL1 is a scaling constant to yieldf (Q) = 1.0 at the standardized value ofQ (Guenther et al.,1991, 1993). The temperature response function describes acurve with an optimum atTm (Guenther et al., 1991, 1993):
fS(TL) =
exp[
CT1(TL−TS)
RTSTL
]1+exp
[CT2(TL−Tm)
RTSTL
] . (17)
In this equation,CT1 andCT2 are parameters (J mol−1) de-scribing the activation and deactivation energies of the emis-sion, R is the gas constant (8.314 J mol−1 K−1), TL is theabsolute leaf temperature andTS is the standard temperature(typically 303.16 K). The equation parameters,CT1 andCT2,are typically chosen to yieldfS(TS) = 1, although as orig-inally parameterized in Guenther et al. (1993)fS(TS) was0.946.
For emissions assumed to result only from compoundevaporation from specialized storage tissues such as resinducts in conifers, the emissions are assumed to be insensi-tive to light and only depend on temperature (Guenther et al.,1991, 1993):
E = ESfE(TL), (18)
and the temperature response function is given as:
fE(TL) = exp[β(TL −TS)] , (19)
whereβ (K−1) is a scaling coefficient assumed to describethe exponential increase of the terpene vapor pressure andvelocity of diffusion with increasing temperature. However,a significant part of monoterpene emission from conifers canoriginate from synthesis (Ghirardo et al., 2010; Shao et al.,2001), and in such cases hybrid algorithms based on bothtemperature effects on synthesis and emission may need tobe used for data standardization (Niinemets et al., 2010c).
To compare the temperature responsiveness of differentprocesses, so calledQ10 values, reflecting the increase inprocess rate resulting from a 10◦C increase in temperature,are often used:
Q10=f (TL +10)
f (TL). (20)
The Q10 concept assumes strictly exponential increase ofprocess rate (Eq. 19, whereQ10 = exp(10β)), but since theinitial part of the temperature dependence is exponential forboth Eqs. (17) and (19), theQ10 concept is also approxi-mately valid for the exponentially increasing parts of bio-logical response functions having an optimum. Using the
original parameterizations reported by Guenther et al. (1991,1993), Q10 of 3.5 for the rise of temperature from 20 to30◦C is obtained for isoprene (Eq. 17, also employed formonoterpenes not stored in specialized tissues) andQ10 of2.5 for monoterpenes emitted from specialized storage pools(Eq. 19).
As the information on light and temperature responsefunction parameters,α, CL1, CT1, CT2, Tm, and β is sel-dom available for given leaves, the values originally definedin Guenther et al. (1991, 1993) are commonly employed toextrapolate from measurements conducted under some ar-bitrary set of conditions to standard conditions. This is areasonable approximation if the deviations of experimen-tal conditions from standard conditions are small. How-ever, when measurements are made under conditions differ-ing greatly from the standard conditions (e.g. Lindskog andPotter, 1995), the extensive extrapolations required can re-sult in large errors inES due to both light and temperaturestandardization procedures.
The key problem with data extrapolation using previouslypublished response curve parameterizations is that the shapesof both light and temperature response functions can varyamong species and upon acclimation to different environ-mental conditions (Niinemets et al., 2010c for a review).Moreover, it is even not always known whether the emis-sions come directly from synthesis, indicating that Eq. (17)is appropriate for standardization, or rely on storage, sug-gesting that Eq. (19) should be used for standardization. Forinstance, due to lack of knowledge of the emission con-trols in broad-leaved temperate deciduousBetula pendula,the emissions were standardized based on terpene evapora-tion (Eq. 19) in Hakola et al. (1998). However, now it hasbeen established that the temperature response of monoter-pene emissions in this species can be described by temper-ature effects on terpene synthesis (Eq. 17) (Ghirardo et al.,2010).
Any discrepancy between the “true” and “standard” curveswill result in errors, but how large are such extrapolation er-rors? In the case of temperature,Q10 values of biochemicalreactions typically vary between 2–3, but for terpene emis-sions, the range can be as high as 2–6, possibly due to theinteraction of temperature effects on physico-chemical ter-pene characteristics (volatility) with temperature effects onterpene synthesis (Niinemets et al., 2010c for a review). Theemission rate at temperature,T2, ET2, is related to the emis-sion rate at temperatureT1, ET1 andQ10 as:
ET2 = ET1 exp
(T2−T1
10LnQ10
). (21)
From Eq. (21), one can calculate that when the measure-ments are conducted at 25◦C, extrapolation to 30◦C withQ10= 3 will overestimate the “true”ES by 22 % if the “true”Q10 = 2, and underestimateES by 13 % if “true” Q10 = 4.Extrapolating from 20 to 30◦C, the extrapolation error in-creases to 50 % for the first and 25 % for the second scenario.
www.biogeosciences.net/8/2209/2011/ Biogeosciences, 8, 2209–2246, 2011
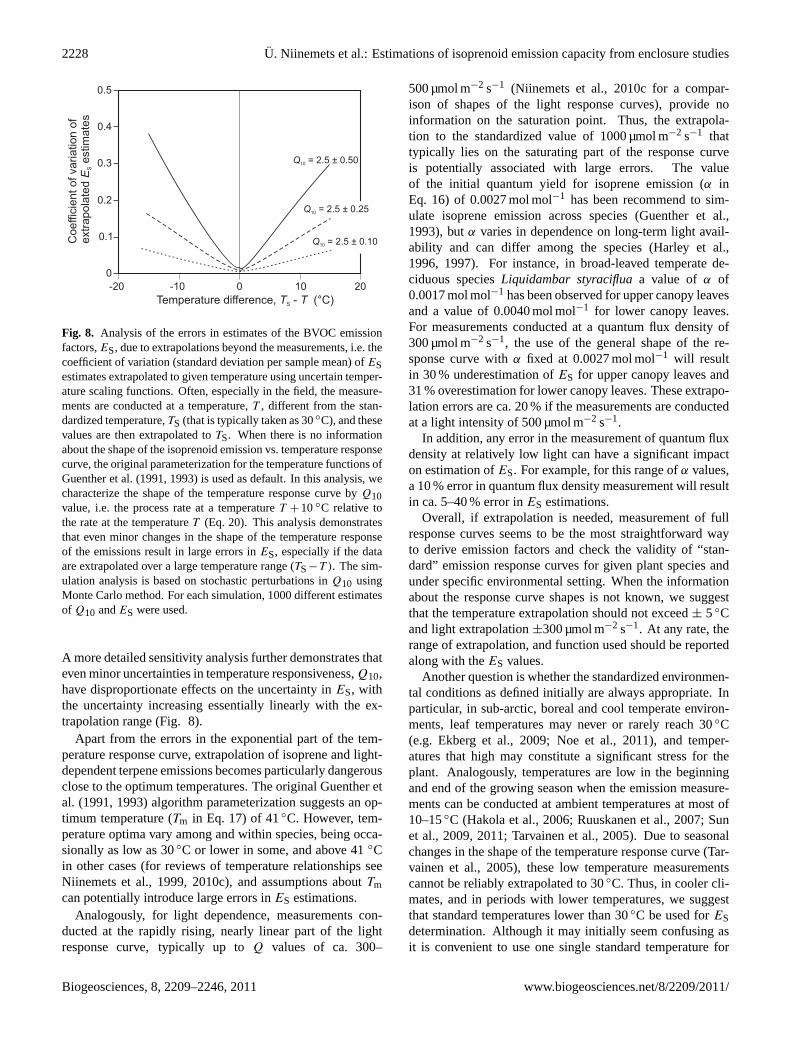
2228 U. Niinemets et al.: Estimations of isoprenoid emission capacity from enclosure studies
0
0.1
0.2
0.3
0.4
0.5
-20 -10 0 10 20
Temperature difference, - (°C)T TS
Q10 = 2.5 ± 0.50
Co
effic
ien
t o
f va
ria
tio
n o
fe
xtr
ap
ola
ted
estim
ate
sE
S
Q10 = 2.5 ± 0.25
Q10 = 2.5 ± 0.10
Fig. 8. Analysis of the errors in estimates of the BVOC emissionfactors,ES, due to extrapolations beyond the measurements, i.e. thecoefficient of variation (standard deviation per sample mean) ofESestimates extrapolated to given temperature using uncertain temper-ature scaling functions. Often, especially in the field, the measure-ments are conducted at a temperature,T , different from the stan-dardized temperature,TS (that is typically taken as 30◦C), and thesevalues are then extrapolated toTS. When there is no informationabout the shape of the isoprenoid emission vs. temperature responsecurve, the original parameterization for the temperature functions ofGuenther et al. (1991, 1993) is used as default. In this analysis, wecharacterize the shape of the temperature response curve byQ10value, i.e. the process rate at a temperatureT + 10◦C relative tothe rate at the temperatureT (Eq. 20). This analysis demonstratesthat even minor changes in the shape of the temperature responseof the emissions result in large errors inES, especially if the dataare extrapolated over a large temperature range (TS−T ). The sim-ulation analysis is based on stochastic perturbations inQ10 usingMonte Carlo method. For each simulation, 1000 different estimatesof Q10 andES were used.
A more detailed sensitivity analysis further demonstrates thateven minor uncertainties in temperature responsiveness,Q10,have disproportionate effects on the uncertainty inES, withthe uncertainty increasing essentially linearly with the ex-trapolation range (Fig. 8).
Apart from the errors in the exponential part of the tem-perature response curve, extrapolation of isoprene and light-dependent terpene emissions becomes particularly dangerousclose to the optimum temperatures. The original Guenther etal. (1991, 1993) algorithm parameterization suggests an op-timum temperature (Tm in Eq. 17) of 41◦C. However, tem-perature optima vary among and within species, being occa-sionally as low as 30◦C or lower in some, and above 41◦Cin other cases (for reviews of temperature relationships seeNiinemets et al., 1999, 2010c), and assumptions aboutTmcan potentially introduce large errors inES estimations.
Analogously, for light dependence, measurements con-ducted at the rapidly rising, nearly linear part of the lightresponse curve, typically up toQ values of ca. 300–
500 µmol m−2 s−1 (Niinemets et al., 2010c for a compar-ison of shapes of the light response curves), provide noinformation on the saturation point. Thus, the extrapola-tion to the standardized value of 1000 µmol m−2 s−1 thattypically lies on the saturating part of the response curveis potentially associated with large errors. The valueof the initial quantum yield for isoprene emission (α inEq. 16) of 0.0027 mol mol−1 has been recommend to sim-ulate isoprene emission across species (Guenther et al.,1993), butα varies in dependence on long-term light avail-ability and can differ among the species (Harley et al.,1996, 1997). For instance, in broad-leaved temperate de-ciduous speciesLiquidambar styracifluaa value ofα of0.0017 mol mol−1 has been observed for upper canopy leavesand a value of 0.0040 mol mol−1 for lower canopy leaves.For measurements conducted at a quantum flux density of300 µmol m−2 s−1, the use of the general shape of the re-sponse curve withα fixed at 0.0027 mol mol−1 will resultin 30 % underestimation ofES for upper canopy leaves and31 % overestimation for lower canopy leaves. These extrapo-lation errors are ca. 20 % if the measurements are conductedat a light intensity of 500 µmol m−2 s−1.
In addition, any error in the measurement of quantum fluxdensity at relatively low light can have a significant impacton estimation ofES. For example, for this range ofα values,a 10 % error in quantum flux density measurement will resultin ca. 5–40 % error inES estimations.
Overall, if extrapolation is needed, measurement of fullresponse curves seems to be the most straightforward wayto derive emission factors and check the validity of “stan-dard” emission response curves for given plant species andunder specific environmental setting. When the informationabout the response curve shapes is not known, we suggestthat the temperature extrapolation should not exceed± 5◦Cand light extrapolation±300 µmol m−2 s−1. At any rate, therange of extrapolation, and function used should be reportedalong with theES values.
Another question is whether the standardized environmen-tal conditions as defined initially are always appropriate. Inparticular, in sub-arctic, boreal and cool temperate environ-ments, leaf temperatures may never or rarely reach 30◦C(e.g. Ekberg et al., 2009; Noe et al., 2011), and temper-atures that high may constitute a significant stress for theplant. Analogously, temperatures are low in the beginningand end of the growing season when the emission measure-ments can be conducted at ambient temperatures at most of10–15◦C (Hakola et al., 2006; Ruuskanen et al., 2007; Sunet al., 2009, 2011; Tarvainen et al., 2005). Due to seasonalchanges in the shape of the temperature response curve (Tar-vainen et al., 2005), these low temperature measurementscannot be reliably extrapolated to 30◦C. Thus, in cooler cli-mates, and in periods with lower temperatures, we suggestthat standard temperatures lower than 30◦C be used forESdetermination. Although it may initially seem confusing asit is convenient to use one single standard temperature for
Biogeosciences, 8, 2209–2246, 2011 www.biogeosciences.net/8/2209/2011/
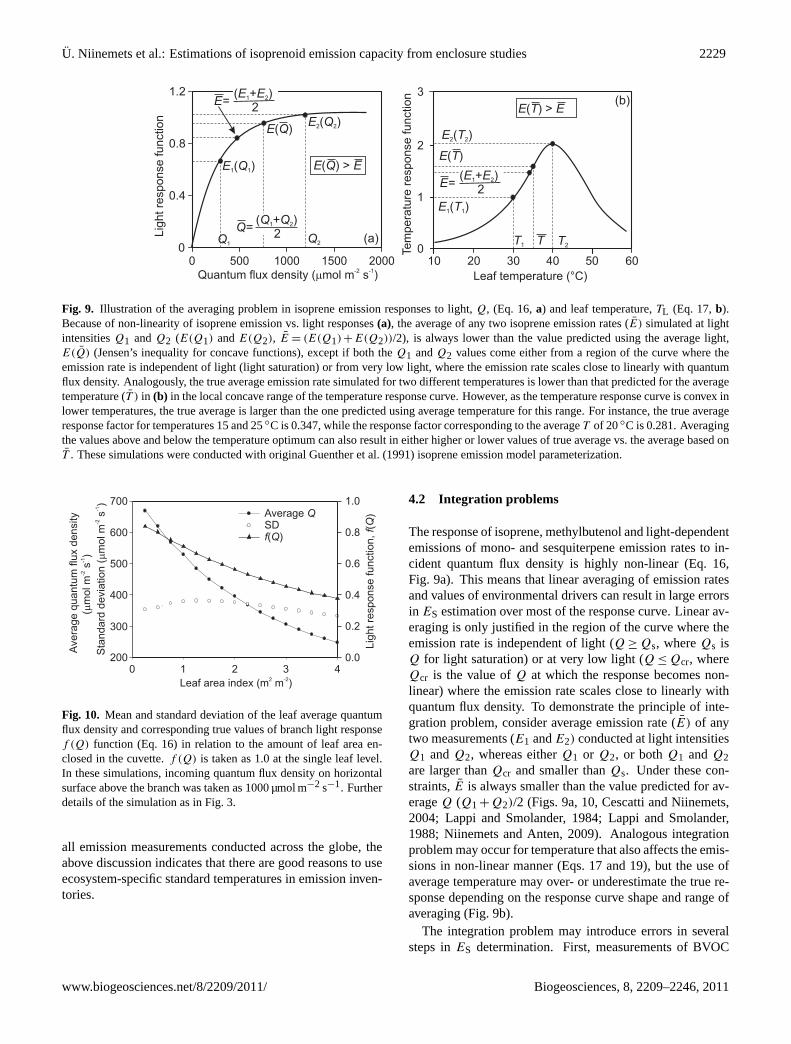
U. Niinemets et al.: Estimations of isoprenoid emission capacity from enclosure studies 2229
0 500 1000 1500 2000
Quantum flux density ( mol m s )m-2 -1
Leaf temperature (°C)
(a)
(b)
Q1Q2
E Q1 1( )
E Q2 2( )E Q( )
E Q E( ) >
Q=( + )Q Q1 2
2
E=( + )E E1 2
2
E T1 1( )
E T2 2( )
E T( )
E T E( ) >
E=( + )E E1 2
2
T1 T2T0
1
2
3
10 20 30 40 50 60
Tem
pera
ture
response function
0
0.4
0.8
1.2
Lig
ht re
sponse function
Fig. 9. Illustration of the averaging problem in isoprene emission responses to light,Q, (Eq. 16,a) and leaf temperature,TL (Eq. 17,b).Because of non-linearity of isoprene emission vs. light responses(a), the average of any two isoprene emission rates (E) simulated at lightintensitiesQ1 andQ2 (E(Q1) andE(Q2), E = (E(Q1)+E(Q2))/2), is always lower than the value predicted using the average light,E(Q) (Jensen’s inequality for concave functions), except if both theQ1 andQ2 values come either from a region of the curve where theemission rate is independent of light (light saturation) or from very low light, where the emission rate scales close to linearly with quantumflux density. Analogously, the true average emission rate simulated for two different temperatures is lower than that predicted for the averagetemperature (T ) in (b) in the local concave range of the temperature response curve. However, as the temperature response curve is convex inlower temperatures, the true average is larger than the one predicted using average temperature for this range. For instance, the true averageresponse factor for temperatures 15 and 25◦C is 0.347, while the response factor corresponding to the averageT of 20◦C is 0.281. Averagingthe values above and below the temperature optimum can also result in either higher or lower values of true average vs. the average based onT . These simulations were conducted with original Guenther et al. (1991) isoprene emission model parameterization.
Leaf area index (m m )2 -2
0 1 2 3 4200
300
400
500
600
700
0.0
0.2
0.4
0.6
0.8
1.0Average Q
SDf Q( )
Avera
ge q
uantu
m flu
x d
ensity
(m
ol m
s)
m-2
-1
Sta
ndard
devia
tion (
mol m
s)
m-2
-1
Lig
ht re
sponse function, (
)f
Q
Fig. 10. Mean and standard deviation of the leaf average quantumflux density and corresponding true values of branch light responsef (Q) function (Eq. 16) in relation to the amount of leaf area en-closed in the cuvette.f (Q) is taken as 1.0 at the single leaf level.In these simulations, incoming quantum flux density on horizontalsurface above the branch was taken as 1000 µmol m−2 s−1. Furtherdetails of the simulation as in Fig. 3.
all emission measurements conducted across the globe, theabove discussion indicates that there are good reasons to useecosystem-specific standard temperatures in emission inven-tories.
4.2 Integration problems
The response of isoprene, methylbutenol and light-dependentemissions of mono- and sesquiterpene emission rates to in-cident quantum flux density is highly non-linear (Eq. 16,Fig. 9a). This means that linear averaging of emission ratesand values of environmental drivers can result in large errorsin ES estimation over most of the response curve. Linear av-eraging is only justified in the region of the curve where theemission rate is independent of light (Q ≥ Qs, whereQs isQ for light saturation) or at very low light (Q ≤ Qcr, whereQcr is the value ofQ at which the response becomes non-linear) where the emission rate scales close to linearly withquantum flux density. To demonstrate the principle of inte-gration problem, consider average emission rate (E) of anytwo measurements (E1 andE2) conducted at light intensitiesQ1 andQ2, whereas eitherQ1 or Q2, or bothQ1 andQ2are larger thanQcr and smaller thanQs. Under these con-straints,E is always smaller than the value predicted for av-erageQ (Q1+Q2)/2 (Figs. 9a, 10, Cescatti and Niinemets,2004; Lappi and Smolander, 1984; Lappi and Smolander,1988; Niinemets and Anten, 2009). Analogous integrationproblem may occur for temperature that also affects the emis-sions in non-linear manner (Eqs. 17 and 19), but the use ofaverage temperature may over- or underestimate the true re-sponse depending on the response curve shape and range ofaveraging (Fig. 9b).
The integration problem may introduce errors in severalsteps inES determination. First, measurements of BVOC
www.biogeosciences.net/8/2209/2011/ Biogeosciences, 8, 2209–2246, 2011

2230 U. Niinemets et al.: Estimations of isoprenoid emission capacity from enclosure studies
emissions using sampling on cartridges are time-consuming.Typically, the chamber air is sampled for 10–30 min. In fieldconditions, for non-climatized cuvettes, both incident light,and leaf temperature can fluctuate during this time period.The conventional approach to cope with this variability is tofind average light,Q, and temperature,T , and use these val-ues to deriveES estimates as described in Sect. 4.1. Thiswill necessarily introduce integration errors as outlined inFig. 9. Analogous integration errors can occur if differentestimates of emission rate conducted under different environ-mental conditions, for instance for different leaves sampledduring various parts of the season, are averaged and again av-erageQ andT values for these leaves are used in convertingthe emission rates to standardized conditions (Sect. 4.1). Asan example of integration problems, differentES estimateshave been obtained usingQ andT andE averaged for entireday or using instantaneous estimates (e.g. as in Owen, 1998;Owen et al., 2001; Street et al., 1997).
In the case of multiple estimates ofE measured under dif-ferent light and temperature conditions, correct averageEScan be determined by first computingES values for eachemission rate estimate using instantaneousQ andT valuesand then calculating the average. CorrectES values can alsobe obtained by fittingE against the productf (Q) fS(TL)
(Eq. 15) orfE(TL) (Eq. 18) when appropriate.Sampling on cartridges under fluctuating light and tem-
perature conditions constitutes a special case of integration.Upon sampling on a cartridge, there is only one estimate ofemission rate and no instantaneousQ andT correspondingto the time-averagedE derived from the cartridge measure-ments. Nevertheless,ES values free from integration prob-lems can be obtained by considering that:
E =ES
t2−t1
t2∫t1
f (Q)fs(TL)dt, (22)
where t2 − t1 is the time period of measurements, and thelight and temperature functions are as defined by Eqs. (16)and (17). When the measurements orE, Q andTL are con-ducted with equal time steps, Eq. (22) simplifies to:
E = ES
n∑i
f (Qi)fS(TL,i)
n, (23)
whereQi and TL,i are the instantaneous estimates of lightand temperature andn is the number of measurements ofQ
and T conducted during sampling on the cartridge. How-ever, as discussed in Sect. 4.1, all these approaches criti-cally depend on the availability of correct shapes of responsecurvesf (Q) andf (T ). Overall, integration problems arebest avoided by reducing environmental fluctuations duringsampling, for instance by using artificial light sources andtemperature-controlled cuvettes.
Apart from these issues duringES determination, integra-tion problems also occur if aggregated foliage samples are
used for BVOC emission measurements. As discussed in 2.1,big chambers enclosing a large amount of foliage biomasssuch as a branch or a whole plant have been used in manyBVOC studies. However, due to non-linearity of isoprenoidemissions to light and temperature, the response of a col-lection of leaves exposed to incident light and ambient tem-perature is different than the response of a single leaf ex-posed to given light and temperature. Typically, in large en-closures, incidentQ and chamber air temperatures or tem-peratures of one or more leaves are used in determiningESvalues. Because a significant fraction of enclosed plant fo-liage is shaded and have diverse orientation relative to thesun or artificial light source, using these values of climaticdrivers results in a biased estimate ofES. Even if Q andT
can be determined for a collection of leaves, these averagevalues still lead to significant integration errors (Figs. 9, 10).Thus, it is important to consider thatES values estimated us-ing branch or whole plant measurements (e.g. for whole treemeasurements see Lindskog and Potter, 1995; Pier, 1995;Pier and McDuffie, 1997) include both physiological effects(the emission capacity) and structural effects (the degree ofshading within the plant foliage), and are therefore not equiv-alent with estimates made on a single leaf, even if the valuesare expressed per unit leaf area enclosed.
No simple conversion procedure is available to convertshoot-level, branch-level or whole-plant emission factors toleaf-level emission factors because foliage inclination anglesand spatial aggregation are highly variable (e.g. Cescatti andNiinemets, 2004). Nevertheless, whole-plant emission fac-tors can be valuable on their own in parameterization of“big-leaf” BVOC emission models and for verification oflayered models parameterized on the basis of leaf-levelESvalues (Niinemets et al., 2010c). Analogously, shoot- orbranch-level emission factors can be employed in parame-terization of canopy models employing shoots or branches asfunctional units (Fleck, 2003; Planchais and Sinoquet, 1998;Stenberg et al., 1994, 1998). What can be highly misleadingis that all the differentES estimates are commonly expressedper unit leaf area, although they will be numerically differentdue to the integration issues outlined above.
One more point concerning the differences among leaf-level and aggregated emission factors is that the measure-ments made using bigger cuvettes include VOC exchange ofthe stem and bark. This can be especially significant for mea-surements of young branches with developing leaves and rel-atively large bark to leaf area ratio. As little is known of barkemissions, the effect of the presence of woody tissue in themeasurement cuvette is difficult to assess. Yet, bark emis-sions can be significant in certain plant genera, e.g. in pineswhere they play an important role in deterring bark beetles(e.g.Dendroctonusspp.) (Seybold et al., 2006). Due to largeterpene storage in bark and woody tissue in conifers, theseemissions can significantly increase in response to mechani-cal damage (Schade and Goldstein, 2003).
Biogeosciences, 8, 2209–2246, 2011 www.biogeosciences.net/8/2209/2011/

U. Niinemets et al.: Estimations of isoprenoid emission capacity from enclosure studies 2231
In conclusion, we argue that in compilations of BVOCemission factors, it is important to clearly distinguish be-tween leaf (ES,leaf), shoot (ES,shoot), branch (ES,branch) andwhole plant (ES,plant) emission measurements, and use thesedifferent estimates only in appropriate model frameworks.
4.3 Expression basis ofES
IsoprenoidES values can be expressed on the basis of eitherleaf area (ES,A), dry mass (ES,DM) or fresh mass (ES,FM),and all have been used in different studies. These three dif-ferent bases of expression are related as:
ES,A = ES,DMMA = ES,FMMA/DF (24)
whereMA is the leaf dry mass per unit area (g m−2) andDF is the leaf dry to fresh mass ratio (g g−1). Both MAandDF vary significantly both within and between species(for reviews see Poorter et al., 2009a, b). For instance,MAincreases 2 to 4-fold from bottom to top of plant canopies(e.g. Niinemets, 2007; Niinemets et al., 2010b), with increas-ing leaf age from developing to fully mature leaves (Hansonet al., 1994; Jurik, 1986; Niinemets et al., 2004) and fromseedlings to mature trees (Day et al., 2001; Niinemets, 2002,2010a).
Among the three bases of expression,ES,FM is discour-aged in BVOC studies, because fresh mass is a less sta-ble characteristic than either leaf area or dry mass. Apartfrom environmental and developmental modifications,DFcan vary due to changes in plant water status, over the courseof a day or during the season, andES expressed on a freshmass basis will track all these changes that are not directlyassociated with modifications in foliage BVOC emission ca-pacity.
In species with non-laminar foliage elements, such asconifers, the estimates ofES,A will differ depending onwhether projected (AP, ES,AP) or total (AT, ES,AT) leaf sur-face area is used. These two different expression bases arerelated as:
ES,AP = ES,ATAT/AP, (25)
where AT/AP is the leaf total to projected area ratio. Inconifers,AT/AP ratio is typically larger for thicker high-lightacclimated foliage and smaller for thinner low-light accli-mated foliage, andAT/AP ratio can vary more than by afactor of two within plant canopies (Niinemets, 2007 for areview). So far, there is no consensus on the appropriate ba-sis of expression ofES,A in conifers, and some studies reportvalues expressed per unitAP, some per unitAT.
To further complicate the matters, some studies also reportthe ES values of broad-leaved species with laminar foliageelements on a total surface area basis, dividing the projectedarea based values by 2 to account for the doubling of surfacearea (e.g. Steinbrecher et al., 1997). This is highly confus-ing as the majority ofES values in broad-leaved species areexpressed per unit projected area. Projected area for laminar
leaves is also the standard for expression of physiologicalactivities of broad-leaved species in ecology and physiology.We believe that for broad-leaved species, projected leaf areashould be used. For conifers and for other species with non-laminar foliage, the expression basis can be either projectedor total area, but the expression basis should be clearly stated.We strongly recommend thatAT/AP ratio estimates be pro-vided for conifers.
In general, we feel that the expression basis ofES has notbeen given due weight in BVOC studies with a few excep-tions (e.g. Komenda et al., 2001 for due consideration of totalto projected surface area and dry mass estimations). Detailsof dry mass, fresh mass and leaf area determination are oftenlacking. In extreme cases, results have been reported with-out stating whether the emission rates are expressed per unitdry or fresh mass, or per unit projected or total area. In addi-tion, area-based values may be incorrectly converted to massbased values, for instance, due to incorrectMA values. Evenlack of details of dry mass estimation can be a problem as thedry mass depends on the duration of drying and temperatureduring drying (Garnier et al., 2001). The reported temper-atures used for foliage drying among different studies varybetween 40–105◦C, and this alone can result in differencesin dry mass of ca. 10–15 % (Zeiller et al., 2007). Severalfactors need standardization for representative values of leafarea, dry and fresh mass with particular care needed for leaffresh mass estimation (Garnier et al., 2001). We suggest thatfor BVOC studies, dry mass should be determined after dry-ing for at least 48 h at 60–70◦C.
Given the large variations inMA , DF andAT/AP due toenvironment, and significant variations inMA andDF due toexperimental protocols, the expression basis ofES values isnot trivial. In particular, environmental sources of variation,such as within-canopy gradients in light, can easily introduceseveral-fold variation inES estimates per unit area and drymass (e.g. Niinemets et al., 2010b). Thus, we strongly sug-gest thatMA values be reported along with either area- ormass-basedES estimates in all BVOC emission inventories.
4.4 Standardized units
In addition to the basis of expression, a variety of units hasbeen used to express the area- and mass-basedES values.In BVOC emission studies,ES,A is typically expressed innmol m−2 s−1and ES,DM as µg g−1 h−1. However, BVOCmass units have been used in the case of leaf area-expressedvariables (e.g. µg m−2 s−1) and BVOC molar units in the caseof leaf mass-based estimates (e.g. nmol g−1 h−1). Differentunits have also been used in the denominator, e.g. cm2 forarea, min for time etc. Some studies have chosen to avoidunit prefixes and multiply theES units by powers of ten.This may seem a trivial point, since one can obviously con-vert from one set of units to another, but for the novice inthe field, this heterogeneity of units can be highly confus-ing, and even for experienced users, lack of consistent units
www.biogeosciences.net/8/2209/2011/ Biogeosciences, 8, 2209–2246, 2011

2232 U. Niinemets et al.: Estimations of isoprenoid emission capacity from enclosure studies
is very frustrating and requires heightened scrutiny in meta-database construction.
With mass-based measures of BVOC amounts, a furtherdifficulty is that some studies report the values as µg C emit-ted (especially BVOC inventory studies conducted by USauthors, e.g. Geron et al., 2000b) (but also in some stud-ies by European authors, e.g. Kuhn et al., 2004), whileother studies report the values as µg BVOC emitted (espe-cially BVOC inventory studies conducted by European au-thors, e.g. Kesselmeier and Staudt, 1999). It is importantto consider that these two ways of expressing the amountsof emitted BVOC are not the same. Isoprene and non-oxygenated monoterpenes such asα-pinene contain 88.1 %carbon. Thus, in the case of the unit using BVOC content,the ES value is 1.135 times larger than if the unit is basedon C-content. Oxygenated monoterpenes such as linaloolandα-terpineol contain 77.8 % carbon, and accordingly theconversion factor is 1.29. In some cases, these two waysof expressingES values have been used interchangeably inthe same paper (e.g. Street et al., 1997), while many pa-pers fail to report which way the numerators have been ex-pressed. Lack of clear explanation has led to mixing up C andmass-based units in some meta-analyses based on publisheddata, e.g. Drewitt et al. (1998) data in the meta-analysis ofKesselmeier and Staudt (1999).
Given that the stoichiometry of chemical reactions, in-cluding atmospheric oxidation reactions, follows molar sto-ichiometry not mass stoichiometry, we suggest that all mea-surements of BVOC emissions should always be reportedonly in molar units, whether expressed per unit leaf mass orarea. Consistent use of molar units would avoid the confu-sion with numerators based on the mass of C or the mass ofBVOC emitted. Also, we strongly encourage the communityto consistently use SI units with appropriate unit prefixes,typically nmol m−2 s−1 for area-based and pmol g−1 s−1 formass-based estimates. Unit multiplication by powers of tenis discouraged; where necessary, tabulated values ofES, notunits, can be multiplied by powers of ten. Overall, given thatlight interception scales with leaf area, we encourage use ofarea-based values, especially if the further goal is to employthese emission data in modeling BVOC emissions from leafto stand.
4.5 Meta-data errors
When Zimmerman (1979) compiled emission rate measure-ments into the first emission factor database used for regionalgridded biogenic emission estimates, e.g. in BEIS (Pierceand Waldruff, 1991), it was a fairly straightforward exercisebecause there was only one available dataset. Guenther etal. (1994) were faced with a somewhat more challenging taskwhen they combined observations reported by six researchgroups using different emission measurement techniques toconstruct the updated emission factor database that was usedin BEIS2. Among the concerns associated with that activ-
ity were that some studies had only one or a few measure-ments on a species or genus and that some investigators usedtechniques that likely resulted in biased emission factor esti-mates. In particular, the earliest studies were thought to haveoverestimated monoterpene emission rates by disturbing thefoliage and underestimated isoprene emission rates by pri-marily using shaded branches that are found in the more eas-ily accessed part of a canopy. Guenther et al. (1994) used anapproach of assigning tree genera to just four (for isoprene),five (for monoterpenes) or one (for other BVOC) broad emis-sion factor categories which emphasized that most of the ob-servations were semi-quantitative and that there was a largerange in the reported values for these emission factors. Theimpact of the updated emission factors was dramatic withBEIS2 estimating isoprene emission rates that were about afactor of 5 higher than BEIS (Geron et al., 1994). Guentheret al. (1995) extended this approach to the global scale usingthe results of 22 field studies. A significant difference in theGuenther et al. (1995) approach was that they did not averagethe results of the 22 studies, but instead used the study con-sidered to have most accurate observations when there was adifference between two or several studies.
Currently, with richer information on species emission po-tentials, BVOC emission modelers commonly use reviewpapers and databases summarizing the species-specific esti-mates ofES (e.g. Kesselmeier and Staudt, 1999; Ortega et al.,2008; Wiedinmyer et al., 2004) (http://bai.acd.ucar.edu/Data/BVOC/index.shtmlandhttp://www.es.lancs.ac.uk/cnhgroup/iso-emissions.pdf). In addition, several modeling studieshave derived their own emission factor estimates based on theaforementioned meta-studies and additional literature obser-vations (Parra et al., 2004; Simpson et al., 1995, 1999; UN-ECE/EMEP Task Force on Emissions Inventories and Pro-jections, 2007). However, many previous meta-analyses haveconsisted of mechanical collection of emission factors with-out considering attached information on experimental condi-tions during the sampling, sampling methodology or scalingmethod (for exceptions Ortega et al., 2008) (http://bai.acd.ucar.edu/Data/BVOC/index.shtml). Once published in thedatabase, species-specific values have been accepted at facevalue in many simulation studies to follow. YetES estimatesin these early databases were frequently less reliable, and wehave learned now that the estimates reported for some specieswere wrong. For instance, important wide-spread species in-cluding the Mediterranean evergreenQuercus suberand tem-perate deciduousBetulaspp. andFagus sylvaticawere ini-tially reported as non-emitters, whereas recent studies haveshown that these species are important monoterpene emitters(Dindorf et al., 2006; Hakola et al., 2001, 1998; Moukhtar etal., 2005; Staudt et al., 2004).
Benjamin et al. (1996) introduced an approach where theaverages of all isoprene and monoterpene emission factorsreported in the literature were used to derive emission fac-tors for individual species, including species which had notbeen measured. The average for the genus or family was
Biogeosciences, 8, 2209–2246, 2011 www.biogeosciences.net/8/2209/2011/

U. Niinemets et al.: Estimations of isoprenoid emission capacity from enclosure studies 2233
used if there were no reported measurements for a speciesor genus. This resulted in errors due to within genera andfamily variability, e.g. Benjamin et al. (1996) assigned toMediterranean evergreen speciesQuercus ilexandQ. suber,which had not been measured, the genus average isopreneemission rate of 24.8 µg g−1 h−1 and monoterpene emissionrate of 0.6 µg g−1 h−1. However, both species turned out tohave very low, if any, isoprene emissions and to be strongmonoterpene emitters (Kesselmeier et al., 1996; Owen et al.,2001; Staudt et al., 2004). On the other hand, some stud-ies have reported exceptionally high emissions not substanti-ated by other investigations. For instance, Owen et al. (2002)reported significant isoprene emissions from MediterraneanPinus pinea, in contrast to all other studies (Nunez et al.,2002; Sabillon and Cremades, 2001; Staudt et al., 2000,1997).
Additional errors were associated with emission rates as-signed based on studies that employed semi-quantitativeor non-quantitative techniques. For example, Benjamin etal. (1996) assigned to some North American oaks, e.g.Quer-cus lobata, Quercus prinus, emission rates between 3 and9 µg g−1 h−1 which was an order of magnitude lower thanthe later measurements (Geron et al., 2001). Overall, theearly studies and emission databases focused more heav-ily on isoprene emission potentials. Lack of evidence forsignificant monoterpene emissions was often interpreted aszero emission in the modeling community. This early focuson isoprene was due in large part to the perceived impor-tance of isoprene in atmospheric chemistry models and theearly development of experimental sampling systems wellsuited for quantifying isoprene emissions (Sect. 3.1); analo-gous systems for accurate measurement of many other morechallenging BVOC lagged behind. Although significant er-rors can result from the taxonomic approach, it is still usedfor species-rich floras such as Amazonian rainforests due topractical reasons (Harley et al., 2004). In such species-richfloras, canopy-scale emission factors derived from flux mea-surements could be more practical for predictive purposes(Guenther et al., 2006) than trying to measure every singlespecies.
A further problem with large screening exercises andmeta-databases is accurate species identification. In particu-lar, species misidentification can occur in species-rich floraswhere important traits for species identification such as gen-erative organs may not be present for all species sampled,but also lack of botanical experience with the novel florasmay result in such identification problems even with the helpof local botanists. On the other hand, synonymous scientificnames can generate problems in meta-database construction.Taxonomy is not a trivial point because different chemotypeshave been observed even within a species (e.g. Niinemets etal., 2002a), and large variability inES values can occur de-pending on species genetic origin (Staudt et al., 2004). Thisinherent variability raises the question of how best allocatethe resources to describe the emission potential of a certain
flora. In the case of complete lack of information of speciesemission capacity, a stepwise procedure is recommended,conducting first crude measurements to gain insight into theoverall variability in emission potentials among the species,and then focusing on the emission controls in species identi-fied as key emitters in the area.
Part of the problem with the early meta-databases is thatmany entries were not based on publications in mainstreampeer-refereed journals, but were taken from hard to access re-search reports and graduate theses. In addition, many valuesin the databases were taken from reviews rather than fromprimary literature. Use of non-primary literature is partic-ularly dangerous as it leads to propagation of errors fromstudy to study. In some modeling studies, it has even beendeemed acceptable not to mention the data sources used foremission inventory construction (e.g. for partly missing datasources see Parra et al., 2004). Thus, the whole range of re-porting errors discussed above (Sects. 4.2–4.4) can be propa-gated, including those associated with unit conversions, basisof expression and standardization and averaging errors. Non-standard problems such as different emission factors derivedon the basis of the same studies can also occur.
As BVOC modeling work relies heavily on meta-data,more care is needed in constructing emission inventorydatabases. BVOC emission databases should be based onlyon peer-reviewed primary data which include sufficient in-formation on the experimental protocols necessary to assessthe data quality. This philosophy of database construction isincreasingly being followed in recent undertakings (Ortega etal., 2008) and to some extent inhttp://bai.acd.ucar.edu/Data/BVOC/index.shtml), but many modeling studies continue touncritically use values reported in early databases. In thefollowing, we suggest standardized protocols for obtainingreliableES data and for assessing the quality of past studies.
5 Towards a standardized emission inventory
As discussed in Sects. 2 and 3, the BVOC emission mea-suring community employs a wide variety of sampling de-vices and methodologies. In addition, a variety of meth-ods is employed in calculating BVOC emission factors andthe results are often expressed in non-standard units. Allthese issues contribute to study-to-study variations inES es-timates and complicate construction of reliable emission in-ventories. Given this vast heterogeneity in the field, we ar-gue that a standardized protocol for measuring and report-ing BVOC emission data is urgently needed. Apart from thesampling and reporting issues highlighted here, additional er-ror sources can be associated with compound quantificationand identification. Detailed consideration of these issues isbeyond this review, but we note that more intercomparisonexercises between different analytical systems are clearly re-quired, and availability of common BVOC standards would
www.biogeosciences.net/8/2209/2011/ Biogeosciences, 8, 2209–2246, 2011

2234 U. Niinemets et al.: Estimations of isoprenoid emission capacity from enclosure studies
greatly contribute towards standardization of different ana-lytical procedures.
5.1 Standardization of measurement andsampling systems used forES determination
Given the large problems, such as diffusion leaks, excessivealteration of chamber environment etc., associated with staticor closed systems, we suggest that only dynamic, open sys-tems be used for quantitative sampling of BVOC emissions.The open systems used for BVOC sampling need to satisfythe following criteria:
1. the measurement chamber should have well-mixed (tur-bulent) atmosphere, such that no concentration gradi-ents or pockets of dead air are present in the chamber;
2. flow rate through the system must be sufficiently high toassure complete exchange of chamber air at least every2–3 min and avoid water condensation onto the enclo-sure walls;
3. preferably, leaf-scale emission factors should be es-timated on single leaves, except for species such asneedle-leaved conifers, with small leaves and/or highlyclumped foliage. In the case of measurements withaggregated foliage elements, the degree of aggregationshould be clearly denoted in reporting the emission fac-tors (shoot, branch, whole plant emission factors). Inthe case of measurements with aggregated foliage, tak-ing of digital images of the enclosed plant part are ide-ally included in experimental protocols;
4. chamber, sampling lines and fittings should be madeof inert materials, minimizing memory effects dueto BVOC adsorption/desorption on system surfaces.Chambers should minimize the gasket area relative tochamber cross-sectional area. In the case of availablecommercial clip-on chambers, chambers with cross-sectional area of at least 6–8 cm2 should be used to min-imize errors associated with diffusion leaks and adsorp-tion/desorption;
5. in species with specialized storage tissues for BVOC,such as conifers with resin ducts,EucalyptusandCit-rus species and species from Labiatae with internaland/or surface oil glands, chambers that minimize thecontact between the plant surface and chamber partsshould be used to avoid “rough handling” problems(Sect. 2.5). The site of leaf or shoot insertion shouldbe carefully prepared (e.g. stem axis remaining insidethe seal wrapped in Teflon® tape) at least 24 h beforethe measurements;
6. to assess plant physiological status, the systems shouldinclude fast (infra-red) CO2 and water vapor analyzersto measure plant photosynthesis and transpiration rates,and allow for water vapour flow corrections;
7. ideally, chambers with temperature, humidity, light andCO2 control should be used so that measurements canbe made under ambient conditions as well as under con-trolled conditions differing from ambient. In all cases,the systems should be equipped with quantum flux,chamber air and leaf temperature sensors;
8. studies investigating more reactive BVOCs such assome mono- and sesquiterpenes should use air purifiedby oxidant scrubbers or synthetic air (i.e. oxidant-freeair) to correctly assess the plant source strength;
9. steady-state conditions should be established beforetaking the emission rate readings, considering chamberresponsiveness, memory effects and plant physiologicalstatus;
10. when sampling onto adsorbent cartridges, multi-bedcartridges filled with different hydrophobic adsorbentshaving surface areas ranging from 8–10 to 200–300 m2 g−1 are suggested to quantitatively assess theentire spectrum of volatile isoprenoids (Sect. 3.1). Af-ter sampling, it is advisable to remove the bulk of ozoneand water from the sampled cartridge using helium orpure nitrogen flow, and store the cartridges in a cooledcontainer kept atT < 0◦C.
If such a protocol is followed, high-quality BVOC emissiondata for estimation ofES values as well as data for ver-ification of BVOC emission models under field conditionscan be obtained, although we are conscious that under somecircumstances compromises have to be made, for instance,when studying BVOCs emitted at very low rates. Whilemany measurements in the past have been conducted fol-lowing rigorous protocols satisfying all or most of the cri-teria outlined here, the majority have not. As discussed inSects. 2 and 3 and summarized in Table 1, there are inher-ent errors associated with failure to satisfy these criteria. Inaddition, some experimental approaches are inherently moreaccurate, and exhibit higher resolution power, than others.Thus, to some degree, uncertainties in reportedES can beconstrained by a prioritization of techniques, with assign-ment of greatest weight to those techniques with the high-est accuracy. However, the exact magnitude of experimentalerrors is often impossible to quantify a posteriori. As emis-sion measurement techniques have improved in the past fourdecades, distinctions in the quality of emission measurementdata have emerged, but it remains difficult to quantify theaccuracy of any reported emission factor. Most studies ei-ther do not report an uncertainty estimate or they present avalue based on measurable uncertainties (e.g. flow rates, leafarea, VOC measurement precision) but ignore other equallyimportant components (e.g. disturbances associated with thepresence of the enclosure). Developers of emission factordatabases thus typically select the best available observa-tions, rather than the average of all observations, but this is
Biogeosciences, 8, 2209–2246, 2011 www.biogeosciences.net/8/2209/2011/

U. Niinemets et al.: Estimations of isoprenoid emission capacity from enclosure studies 2235
done in a subjective manner given the lack of quantitativeuncertainties associated with emission rate data. Therefore,we suggest that past measurements should be divided intothree different quality classes depending on the way mea-surements have been carried out: A – quantitative measure-ments, B – semi-quantitative measurements, and C – non-quantitative measurements. Quantitative, class A, measure-ments are those conducted according to rigorous protocolssatisfying the criteria specified above. Semi-quantitative,class B, measurements are those failing in one or several cri-teria, but nevertheless providing information on the magni-tude ofES. Non-quantitative, class C, measurements provideinformation on whether or not a given species can emit givenBVOCs (emitter vs. non-emitter), but the potential errors aresufficiently large, more than an order of magnitude, that themagnitude of the emissions cannot be assessed with any ac-curacy. For instance, measurements conducted with closed(no flow through) or semi-closed (flow-through rate approx-imately equals the low flow rate used to draw the air for car-tridges) systems without quantifying environmental driversand imprecisely estimating the emission flux will typicallyfall into class C.
While class A and to a certain extent class B data can beused for constructing BVOC emission inventories, class Cdata should serve only as a basis for further measurements,and not be used for BVOC modeling. We recommend thatthe data in existing BVOC databases be critically examinedfor reliability and distributed into these broad quality classes.In some regions the best available observations may be semi-quantitative measurements obtained using a quick screeningapproach. These can still be useful inputs as they were withthe Zimmerman (1979) data when they were the only existingemission rate data. Regions that currently have no reportedBVOC emission rate observations can benefit from local sci-entists utilizing simple and inexpensive emission screeningtechniques, but emission rate measurement studies in Eu-rope, US and other regions where considerable emission dataare already available should be limited to quantitative emis-sion estimates.
We suggest that the future models need to explicitly dealwith the problem ofES experimental uncertainties. For ex-ample, Bayesian approaches allow accommodation of a pri-ori probability distributions ofES parameter, and yield ap-propriate uncertainties in model simulations. So far, the useof Bayesian approaches in BVOC emission simulations hasfocused on spatial variability inES and species-to-speciesvariabilities, but the error sources ofES estimations for anygiven species have not been addressed (Curci et al., 2010;Shim et al., 2005).
5.2 Set of variables to be reported in standard emissioninventories
Apart from standardization of emission measurement proto-cols, it is equally important to agree on a minimum set of
variables to be reported with the emission measurements.As shown in Sect. 4 and Table 1, shortcomings in data pro-cessing and reporting can lead to errors as significant as themeasurement errors. The data characterizing every BVOCemission measurement can be divided into four broad cate-gories: (1)ES and associated meta-data; (2) sample-specificstructural and chemical data; (3) sample-specific physiologi-cal data and (4) plant- and site-specific data.
ES and associated data include theES value itself, andlight and temperature for measurement and standardization.We recommend that the studies also report the ambient CO2concentration in the chamber to allow for correction of CO2effects (Niinemets et al., 2010c; Wilkinson et al., 2009). Al-though the BVOC emission data are not routinely standard-ized for CO2 effects, and CO2 responses of BVOC emissionsare not yet sufficiently understood, especially for sesquiter-penes and (stored) monoterpenes (Niinemets et al., 2010c;Penuelas and Staudt, 2010), such standardization may beneeded for constructing BVOC emission models for futureclimates. When the data are normalized to standard lightand temperature conditions, the studies should clearly reportthe function together with actual parameterization used forextrapolation and the extrapolation range. For mono- andsesquiterpenes, the compound spectrum should also be re-ported, if available.
Sample-specific structural and chemical data include leafdry mass per unit area (MA), total to projected area ratio(AT/AP) for conifers, temperature and duration of drying forleaf dry mass estimation, and a clear indication of the basisof expression (projected area, total area). Ideally, the contentof carbon and key mineral nutrients (N, P), providing infor-mation of plant nutrient status, should also be measured.
Sample-specific physiological data serve to determinewhether the plants were measured under non-stressed orstressed conditions. The data best serving this task are therate of photosynthesis (P), stomatal conductance (gs) and in-tercellular CO2 concentration, calculated fromP , gs and am-bient CO2 concentration (e.g. Flexas et al., 2004 for a reviewof stress-driven changes in photosynthesis rates and stom-atal openness). In addition, chemical signatures of emittedBVOCs are highly useful, e.g. hexenals and other C6 com-pounds are characteristic of mechanical damage (Loreto etal., 2006) and ozone stress (Beauchamp et al., 2005), andocimenes, dimethylnonatriene (DMNT),α-farnesene andlinalool are often indicators of recent herbivory (Arimura etal., 2000; Copolovici et al., 2011; Pare and Tumlinson, 1997,1999; Wu and Baldwin, 2009).
Sample, plant- and site-specific data should include theexact species identity, i.e. the date of sampling, infor-mation about phenological characteristics (leaf age status,e.g. young, adult, senescent) and position in the canopy, ex-act scientific name with authorship, origin and provenanceof plant, approximate plant age, geographical coordinatesof the site, altitude and quantitative description of the standcharacteristics (height, density, age) and site climate (annual
www.biogeosciences.net/8/2209/2011/ Biogeosciences, 8, 2209–2246, 2011

2236 U. Niinemets et al.: Estimations of isoprenoid emission capacity from enclosure studies
and growing season temperature, and precipitation). Ide-ally, information of plant water status, and information aboutpast environmental conditions (e.g. average temperature andlight conditions during the 48 h preceding the measurements)should also be provided as these environmental drivers arestrongly correlated withES values in the field (e.g. Geron etal., 2000a; Sharkey et al., 1999). Although such informationmight be difficult to obtain for any given sample location,nearby meteorological stations can provide highly valuableinformation, useful for interpreting variations inES valuesfrom any given study or between different studies. As themost simple estimate of water availability, soil water content(as e.g. incorporated in MEGAN, Guenther et al., 2006) canbe used. If possible, more sophisticated estimates includ-ing predawn leaf water potential and stomatal conductancewould be highly informative. Any visible signs of presentor past herbivory and pathogen attack, if available, shouldalso be noted as this can provide important information forinduced BVOC emissions (some specific monoterpenes andsesquiterpenes) (Niinemets, 2010a for a review).
Although the amount of meta-information required for anysingleES measurement might seem large, this information ishighly useful for understanding the variations inES valuesand thus, for developing more reliable emission inventories.Given thatES strongly varies with leaf ontogeny, position inthe canopy and with previous average environmental condi-tions and stress history (Niinemets et al., 2010a for physio-logical and ontogenetic controls), even infinitely preciseESmeasurements are insufficient for making reliable emissionpredictions without attached meta-information.
6 Conclusions
This analysis demonstrates that in addition to inherently dy-namic nature of the BVOC emission factor,ES, importantuncertainties in the experimental estimation of the emissioncapacity at any given moment of time can be associated withanalytical shortcomings as well as with data processing fol-lowing emission measurements (Table 1). In particular, theuse of a wide variety of experimental approaches and thelack of a standardized measurement protocol contribute sig-nificantly to uncertainties inES measurements. Incompat-ible adsorbents as well as incompatible sampling methods,e.g. sampling in O3 enriched atmospheres without remov-ing O3 from the enclosures during sampling, can result incomplete loss of sampled compounds as well as modifiedemission composition, emphasizing that the analytical errorscan potentially be substantial. Interlaboratory comparisonshave demonstrated large, several-fold, variations in the quan-tification of major BVOC species among different analyti-cal setups (BVOC trapping, desorption and GC separation)(Larsen et al., 1997). Bad cuvette design and use of infe-rior tubing and cuvette materials can result in similarly largevariability, i.e. from non-detection to ideal detection. Obvi-
ously, more intercomparisons of field sampling designs andlab analysis systems are needed andES estimates obtained inthe past using methodology currently considered problematicneed re-assessment.
Extrapolation, integration, experimental setup and unit er-rors can contribute to errors inES equal to or greater than an-alytical limitations. We call for consistent application of thesuggested experimental protocol and rigorous documentationof the measurements, collectively making it possible to de-velop high quality emission factor databases. Reliable leaf-levelES databases serve as a valuable foundation that can bedirectly used for atmospheric chemistry models scaling fromleaf to canopy and landscape and that can be used to developcanopy-level emission factors for models operating at largerscales (Guenther et al., 2006). A community effort to sys-tematically and quantitatively assess the accuracy and pre-cision of enclosure BVOC emission rate measurement sys-tems is required and needs to include comparison with abovecanopy eddy covariance techniques that do not have the in-herent disturbance of an enclosure. Issues such as the num-ber of samples required to represent a population mean couldbe established in this way. This activity should also be inte-grated with efforts to examine the factors that contribute toemission variability but are not accounted for in current ap-proaches for calculating emission factors (e.g. stress, chemo-type variability). This would improve our understanding ofhow these data can be used to parameterize emission modelsand would guide efforts to further standardize the protocolsfor measuring and reporting BVOC emission data.
Acknowledgements.We thank the European Science Foundation(VOCBAS and INTROP programs) for travel support. The authors’studies on BVOCs have been funded by the Estonian Ministryof Science and Education (grant SF1090065s07), the EstonianScience Foundation (grant 7645), European Commission throughEuropean Regional Fund (the Center of Excellence in Environmen-tal Adaptation), the US National Science Foundation and the USEnvironmental Protection Agency, the Spanish Ministry of Science(grants CGL2006-04025/BOS and Consolider-Ingenio MontesCSD2008-00040), the Catalan Department of Science (grant SGR2009-458), and the Max Planck Society.U. N., A. A., and R. K. M.acknowledge support from the Human Frontier Science Program.
Edited by: G. Wohlfahrt
References
Allaire, S. E., Yates, S. R., Ernst, F., and Papiernik, S. K.:Gas-phase sorption-desorption of propargyl bromide and 1,3-dichloropropene on plastic materials, J. Environ. Qual., 32,1915–1921, 2003.
Apel, E. C., Calvert, J. G., Gilpin, T. M., Fehsenfeld, F. C., Par-rish, D. D., and Lonneman, W. A.: The nonmethane hydrocarbonintercomparison experiment (NOMHICE): task 3, J. Geophys.Res.-Atmos., 104, 26069–26086, 1999.
Arimura, G. I., Tashiro, K., Kuhara, S., Nishioka, T. O. R., and Tak-abayashi, J.: Gene responses in bean leaves induced by herbivory
Biogeosciences, 8, 2209–2246, 2011 www.biogeosciences.net/8/2209/2011/

U. Niinemets et al.: Estimations of isoprenoid emission capacity from enclosure studies 2237
and by herbivory-induced volatiles, Biochem. Bioph. Res. Com-mun., 277, 305–310, 2000.
Arneth, A., Schurgers, G., Hickler, T., and Miller, P. A.: Effectsof species composition, land surface cover, CO2 concentrationand climate on isoprene emissions from European forests, PlantBiol., 10, 150–162, 2008.
Arnts, R. R.: Reduction of biogenic VOC sampling losses fromozone via trans-2-butene addition, Environ. Sci. Technol., 42,7663–7669, 2008.
Arnts, R. R.: Evaluation of adsorbent sampling tube materials andTenax-TA for analysis of volatile biogenic organic compounds,Atmos. Environ., 44, 1579–1584, 2010.
Avison, S. J., Gray, D. A., Davidson, G. M., and Taylor, A. J.: Infu-sion of volatile flavor compounds into low-density polyethylene,J. Agr. Food Chem., 49, 270–275, 2001.
Ball, J. T.: Calculations related to gas exchange, in: Stomatal func-tion, edited by: Zeiger, E., Farquhar, G. D., and Cowan, I. R.,Stanford University Press, Stanford, 445–476, 1987.
Ball, J. T., Woodrow, I. E., and Berry, J. A.: A model predict-ing stomatal conductance and its contribution to the controlof photosynthesis under different environmental conditions, in:Progress in photosynthesis research. Proc. VII Int. Photosynthe-sis congress, edited by: Biggens, J., Martinus Nijhoff Publishers,Dordrecht, 221–224, 1987.
Bamberger, I., Hortnagl, L., Ruuskanen, T. M., Schnitzhofer, R.,Muller, M., Graus, M., Karl, T., Wohlfahrt, G., and Hansel, A.:Deposition fluxes of terpenes over grassland, J. Geophys. Res.-Atmos., 116, D14305,doi:10.1029/2010JD015457, 2011.
Bates, M. S., Gonzalez-Flesca, N., Sokhi, R., and Cocheo, V.:Atmospheric volatile organic compound monitoring. Ozone in-duced artefact formation, Environ. Monit. Assess., 65, 89–97,2000.
Batterman, S. A., Zhang, G.-Z., and Baumann, M.: Analysis andstability of aldehydes and terpenes in electropolished canisters,Atmos. Environ., 32, 1647–1655, 1998.
Beauchamp, J., Wisthaler, A., Hansel, A., Kleist, E., Miebach, M.,Niinemets,U., Schurr, U., and Wildt, J.: Ozone induced emis-sions of biogenic VOC from tobacco: relations between ozoneuptake and emission of LOX products, Plant Cell Environ., 28,1334–1343, 2005.
Benjamin, M. T., Sudol, M., Bloch, L., and Winer, A. M.: Low-emitting urban forests: a taxonomic methodology for assigningisoprene and monoterpene emission rates, Atmos. Environ., 30,1437–1452, 1996.
Bertin, N. and Staudt, M.: Effect of water stress on monoterpeneemissions from young potted holm oak (Quercus ilexL.) trees,Oecologia, 107, 456–462, 1996.
Brancaleoni, E., Scovaventi, M., Frattoni, M., Mabilia, R., and Cic-cioli, P.: Novel family of multi-layer cartridges filled with a newcarbon adsorbent for the quantitative determination of volatileorganic compounds in the atmosphere, J. Chromatogr. A, 845,317–328, 1999.
Brilli, F., Ciccioli, P., Frattoni, M., Prestininzi, M., Spanedda, A.F., and Loreto, F.: Constitutive and herbivore-induced monoter-penes emitted byPopulus x euroamericanaleaves are keyvolatiles that orientChrysomela populibeetles, Plant Cell En-viron., 32, 542–552, 2009.
Cahill, T. M., Seaman, V. Y., Charles, M. J., Holzinger, R., andGoldstein, A. H.: Secondary organic aerosols formed from ox-
idation of biogenic volatile organic compounds in the SierraNevada Mountains of California, J. Geophys. Res.-Atmos., 111,D16312,doi:10.1029/2006JD007178, 2006.
Calfapietra, C., Scarascia Mugnozza, G., Karnosky, D. F., Loreto,F., and Sharkey, T. D.: Isoprene emission rates under elevatedCO2 and O3 in two field-grown aspen clones differing in theirsensitivity to O3, New Phytol., 179, 55–61, 2008.
Calogirou, A., Larsen, B. R., Brussol, C., Duane, M., and Kotzias,D.: Decomposition of terpenes by ozone during sampling onTenax, Anal. Chem., 68, 1499–1506, 1996.
Calogirou, A., Duane, M., Kotzias, D., Lahaniati, M., and Larsen,B. R.: Polyphenylensulfide, Noxon®, and ozone scavenger forthe analysis of oxygenated terpenes in air, Atmos. Environ., 31,2741–2751, 1997a.
Calogirou, A., Kotzias, D., and Kettrup, A.: Product analysis ofthe gas-phase reaction ofβ-caryophyllene with ozone, Atmos.Environ., 31, 283–285, 1997b.
Cao, X.-L. and Hewitt, C. N.: Thermal desorption characteristicsof four adsorbent/adsorbate systems commonly used in air sam-pling programmes, Chemosphere, 27, 695–705, 1993.
Cappellina, L., Biasioli, F., Fabris, A., Schuhfried, E., Soukoulis,C., Mark, T. D., and Gasperi, F.: Improved mass accuracy inPTR-TOF-MS: another step towards better compound identifica-tion in PTR-MS, Int. J. Mass Spectrom., 290, 60–63, 2010.
Cerqueira, M. A., Pio, C. A., Gomes, P. A., Matos, J. S., and Nunes,T. V.: Volatile organic compounds in rural atmospheres of centralPortugal, Sci. Total Environ., 313, 49–60, 2003.
Cescatti, A. and Niinemets,U.: Sunlight capture. Leaf to landscape,in: Photosynthetic adaptation. Chloroplast to landscape, editedby: Smith, W. K., Vogelmann, T. C., and Chritchley, C., Ecolog-ical Studies, 178, Springer Verlag, Berlin, 42–85, 2004.
Cescatti, A. and Zorer, R.: Structural acclimation and radiationregime of silver fir (Abies albaMill.) shoots along a light gra-dient, Plant Cell Environ., 26, 429–442, 2003.
Chameides, W., Lindsay, R., Richardson, J., and Kiang, C.: The roleof biogenic hydrocarbons in urban photochemical smog: Atlantaas a case study, Science, 241, 1473–1475, 1988.
Chen, X. and Hopke, P. K.: A chamber study of secondary organicaerosol formation by linalool ozonolysis, Atmos. Environ., 43,3935–3940, 2009.
Ciccioli, P., Cecinato, A., Brancaleoni, E., Frattoni, M., and Liberti,A.: Use of carbon adsorption traps combined with high resolu-tion gas chromatography – mass spectrometry for the analysisof polar and non-polar C4-C14 hydrocarbons involved in photo-chemical smog pollution, J. High Res. Chromatog., 15, 75–84,1992.
Ciccioli, P., Brancaleoni, E., Cecinato, A., Sparapani, R., and Frat-toni, M.: Identification and determination of volatile organiccompounds in forest areas of Northern and Southern Europeand remote sites of the Himalaya region by high-resolution gaschromatography-mass spectrometry, J. Chromatogr. A, 643, 55–69, 1993.
Ciccioli, P., Brancaleoni, E., Frattoni, M., Di Palo, V., Valentini, R.,Tirone, G., Seufert, G., Bertin, N., Hansen, U., Csiky, O., Lenz,R., and Sharma, M.: Emission of reactive terpene compoundsfrom orange orchards and their removal by within-canopy pro-cesses, J. Geophys. Res., 104, 8077–8094, 1999.
Ciccioli, P., Brancaleoni, E., and Frattoni, M.: Sampling of atmo-spheric volatile organic compounds (VOCs) with sorbent tubes
www.biogeosciences.net/8/2209/2011/ Biogeosciences, 8, 2209–2246, 2011

2238 U. Niinemets et al.: Estimations of isoprenoid emission capacity from enclosure studies
and their analysis by GC-MS, in: Environmental monitoringhandbook, edited by: Burden, F. R., McKelvie, I., Forstner, U.,and Guenther, A., McGraw-Hill, New York, 21.21–21.85, 2002.
Clausen, P. A. and Wolkoff, P.: Degradation products of Tenax TAformed during sampling and thermal desorption analysis: indica-tors of reactive species indoors, Atmos. Environ., 31, 715–725,1997.
Coeur, C., Jacob, V., Denis, I., and Foster, P.: Decomposition ofα-pinene and sabinene on solid sorbents, Tenax TA and Carboxen,J. Chromatogr. A, 786, 185–187, 1997.
Copolovici, L. and Niinemets,U.: Flooding induced emissions ofvolatile signalling compounds in three tree species with differ-ing waterlogging tolerance, Plant Cell Environ., 33, 1582–1594,doi:10.1111/j.1365-3040.2010.02166.x, 2010.
Copolovici, L., Kannaste, A., and Niinemets,U.: Gaschromatography-mass spectrometry method for determination ofmonoterpene and sesquiterpene emissions from stressed plants,Stud. Univ. Babes-Bol. Chemia, 54, 329–339, 2009.
Copolovici, L., Kannaste, A., Remmel, T., Vislap, V., andNiinemets,U.: Volatile emissions fromAlnus glutinosainducedby herbivory are quantitatively related to the extent of damage, J.Chem. Ecol., 37, 18–28, 2011.
Copolovici, L. O. and Niinemets,U.: Temperature dependenciesof Henry’s law constants and octanol/water partition coefficientsfor key plant volatile monoterpenoids, Chemosphere, 61, 1390–1400,doi:10.1016/j.chemosphere.2005.05.003, 2005.
Copolovici, L. O., Filella, I., Llusia, J., Niinemets,U., and Penuelas,J.: The capacity for thermal protection of photosynthetic electrontransport varies for different monoterpenes inQuercus ilex, PlantPhysiol., 139, 485–496, 2005.
Curci, G., Palmer, P. I., Kurosu, T. P., Chance, K., and Visconti,G.: Estimating European volatile organic compound emissionsusing satellite observations of formaldehyde from the OzoneMonitoring Instrument, Atmos. Chem. Phys., 10, 11501–11517,doi:10.5194/acp-10-11501-2010, 2010.
Day, M. E., Greenwood, M. S., and White, A. S.: Age-relatedchanges in foliar morphology and physiology in red spruce andtheir influence on declining photosynthetic rates and productivitywith tree age, Tree Physiol., 21, 1195–1204, 2001.
Dettmer, K. and Engewald, W.: Adsorbent materials commonlyused in air analysis for adsorptive enrichment and thermal des-orption of volatile organic compounds, Anal. Bioanal. Chem.,373, 490–500, 2002.
Dettmer, K. and Engewald, W.: Ambient air analysis ofvolatile organic compounds using adsorptive enrichment, Chro-matographia, 57, S339–S347, 2003.
Dettmer, K., Knobloch, T., and Engewald, W.: Stability of reactivelow boiling hydrocarbons on carbon based adsorbents typicallyused for adsorptive enrichment and thermal desorption, Fresen.J. Anal. Chem., 366, 70–78, 2000.
Di Carlo, P., Brune, W. H., Martinez, M., Harder, H., Lesher, R.,Ren, X., Thornberry, T., Carroll, M. A., Young, V., Shepson, P.B., Riemer, D., Apel, E., and Campbell, C.: Missing OH reac-tivity in a forest: evidence for unknown reactive biogenic VOCs,Science, 304, 722–724, 2004.
Dindorf, T., Kuhn, U., Ganzeveld, L., Schebeske, G., Ciccioli, P.,Holzke, C., Koble, R., Seufert, G., and Kesselmeier, J.: Sig-nificant light and temperature dependent monoterpene emissionsfrom European beech (Fagus sylvaticaL.) and their potential im-
pact on the European volatile organic compound budget, J. Geo-phys. Res.-Atmos., 111, D16305,doi:10.1029/2005JD006751,2006.
Drewitt, G. B., Curren, K., Steyn, D. G., Gillesspie, T. J., and Niki,H.: Measurement of biogenic hydrocarbon emissions from veg-etation in the lower Fraser Valley, British Columbia, Atmos. En-viron., 32, 3457–3466, 1998.
Ekberg, A., Arneth, A., Hakola, H., Hayward, S., and Holst, T.:Isoprene emission from wetland sedges, Biogeosciences, 6, 601–613,doi:10.5194/bg-6-601-2009, 2009.
Ezquerro, O., Pons, B., and Tena, M. T.: Direct quantita-tion of volatile organic compounds in packaging materialsby headspace solid-phase microextraction-gas chromatography-mass spectrometry, J. Chromatogr. A, 985, 247–257, 2003.
Fall, R. and Monson, R. K.: Isoprene emission rate and intercellularisoprene concentration as influenced by stomatal distribution andconductance, Plant Physiol., 100, 987–992, 1992.
Fall, R., Karl, T., Jordan, A., and Lindinger, W.: Biogenic C5VOCs: release from leaves after freeze-thaw wounding and oc-currence in air at a high mountain observatory, Atmos. Environ.,35, 3905–3916, 2001.
Fick, J., Pommer, L., Andersson, B., and Nilsson, C.: Ozone re-moval in the sampling of parts per billion levels of terpenoidcompounds: an evaluation of different scrubber materials, En-viron. Sci. Technol., 35, 1458–1462, 2001.
Field, C. B., Ball, J. T., and Berry, J. A.: Photosynthesis: principlesand field techniques, in: Plant physiological ecology. Field meth-ods and instrumentation, edited by: Pearcy, R. W., Ehleringer, J.R., Mooney, H. A., and Rundel, P. W., Chapman and Hall, Lon-don – New York, 209–253, 1989.
Filella, I. and Penuelas, J.: Daily, weekly, and seasonal time coursesof VOC concentrations in a semi-urban area near Barcelona, At-mos. Environ., 40, 7752–7769, 2006.
Fischbach, R. J., Staudt, M., Zimmer, I., Rambal, S., and Schnit-zler, J. P.: Seasonal pattern of monoterpene synthase activitiesin leaves of the evergreen treeQuercus ilex, Physiol. Plant., 114,354–360, 2002.
Fleck, S.: Integrated analysis of relationships between 3D-structure,leaf photosynthesis, and branch transpiration of matureFagussylvatica and Quercus petraeatrees in a mixed forest stand,Bayreuther ForumOkologie, 97, BITOK, Bayreuth, 183 pp.,2003.
Flexas, J., Bota, J., Loreto, F., Cornic, G., and Sharkey, T. D.: Dif-fusive and metabolic limitations to photosynthesis under droughtand salinity in C3 plants, Plant Biol., 6, 269–279, 2004.
Flexas, J., Dıaz-Espejo, A., Berry, J. A., Cifre, J., Galmes, J.,Kaldenhoff, R., Medrano, H., and Ribas-Carbo, M.: Analysis ofleakage in IRGA’s leaf chambers of open gas exchange systems:quantification and its effects in photosynthesis parameterization,J. Exp. Bot., 58, 1533–1543, 2007.
Fuentes, J. D., Wang, D., den Hartog, G., Neumann, H. H., Dann, T.F., and Puckett, K. J.: Modelled and field measurements of bio-genic hydrocarbon emissions from a Canadian deciduous forest,Atmos. Environ., 29, 3003–3017, 1995.
Fuentes, J. D., Lerdau, M., Atkinson, R., Baldocchi, D., Botten-heim, J. W., Ciccioli, P., Lamb, B., Geron, C., Gu, L., Guenther,A., Sharkey, T. D., and Stockwell, W.: Biogenic hydrocarbons inthe atmospheric boundary layer: A review, Bull. Am. Meteorol.Soc., 81, 1537–1575, 2000.
Biogeosciences, 8, 2209–2246, 2011 www.biogeosciences.net/8/2209/2011/
U. Niinemets et al.: Estimations of isoprenoid emission capacity from enclosure studies 2239
Fujii, M., Shinohara, N., Lim, A., Otake, T., Kumagai, K., andYanagisawa, Y.: A study on emission of phthalate esters fromplastic materials using a passive flux sampler, Atmos. Environ.,37, 5495–5504, 2003.
Garnier, E., Shipley, B., Roumet, C., and Laurent, G.: A standard-ized protocol for the determination of specific leaf area and leafdry matter content, Funct. Ecol., 15, 688–695, 2001.
Gawlowski, J., Gierczak, T., Jezo, A., and Niedzielski, J.: Adsorp-tion of water vapour in the solid sorbents used for the samplingof volatile organic compounds, The Analyst, 124, 1553–1558,1999.
Gawrys, M., Fastyn, P., Gawlowski, J., Gierczak, T., and Niedziel-ski, J.: Prevention of water vapour adsorption by carbon molecu-lar sieves in sampling humid gases, J. Chromatogr. A, 933, 107–116, 2001.
Geosyntec consultants Inc.: Final scoping assessment of soil vapourmonitoring protocols for evaluating subsurface vapour intrusioninto indoor air. Prepared for Canadian Council of Ministers of theEnvironment, Report PN 1427, Canadian Council of Ministers ofthe Environment, Guelph, Ontario, 49 pp., 2009.
Geron, C., Guenther, A., Sharkey, T., and Arnts, R. R.: Temporalvariability in basal isoprene emission factor, Tree Physiol., 20,799–805, 2000a.
Geron, C., Rasmussen, R., Arnts, R. R., and Guenther, A.: A re-view and synthesis of monoterpene speciation from forests in theUnited States, Atmos. Environ., 34, 1761–1781, 2000b.
Geron, C., Harley, P., and Guenther, A.: Isoprene emission capacityfor US tree species, Atmos. Environ., 35, 3341–3352, 2001.
Geron, C., Guenther, A. B., Greenberg, J., Karl, T., and Rasmussen,R.: Biogenic volatile organic compound emissions from desertvegetation of the southwestern US, Atmos. Environ., 40, 1645–1660, 2006a.
Geron, C., Owen, S., Guenther, A., Greenberg, J., Karl, T., Ras-mussen, R., Bai, J. H., Li, Q.-J., and Baker, B.: Volatile or-ganic compounds from vegetation in southern Yunnan Province,China: emission rates and some potential regional implications,Atmos. Environ., 40, 1759–1773, 2006b.
Geron, C. D., Guenther, A. B., and Pierce, T. E.: An improvedmodel for estimating emissions of volatile organic compoundsfrom forests in the eastern United States, J. Geophys. Res., 99,12773–12791, 1994.
Gershenzon, J., Murtagh, G. J., and Croteau, R.: Absence ofrapid terpene turnover in several diverse species of terpene-accumulating plants, Oecologia, 96, 583–592, 1993.
Ghirardo, A., Koch, K., Taipale, R., Zimmer, I., Schnitzler, J. P., andRinne, J.: Determination of de novo and pool emissions of ter-penes from four common boreal/alpine trees by13CO2 labellingand PTR-MS analysis, Plant Cell Environ., 33, 781–792, 2010.
Gog, L., Berenbaum, M. R., DeLucia, E. H., and Zangerl, A. R.:Autotoxic effects of essential oils on photosynthesis in parsley,parsnip, and rough lemon, Chemoecology, 15, 115–119, 2005.
Gray, D. W., Goldstein, A. H., and Lerdau, M.: Thermal historyregulates methylbutenol basal emission rate inPinus ponderosa,Plant Cell Environ., 29, 1298–1308, 2006.
Guenther, A., Zimmerman, P. R., and Wildermuth, M.: Naturalvolatile organic compound emission rates for U.S. woodlandlandscapes, Atmos. Environ., 28, 1197–1210, 1994.
Guenther, A., Hewitt, C. N., Erickson, D., Fall, R., Geron, C.,Graedel, T., Harley, P., Klinger, L., Lerdau, M., McKay, W. A.,
Pierce, T., Scholes, B., Steinbrecher, R., Tallamraju, R., Taylor,J., and Zimmerman, P.: A global model of natural volatile com-pound emissions, J. Geophys. Res., 100, 8873–8892, 1995.
Guenther, A., Geron, C., Pierce, T., Lamb, B., Harley, P., andFall, R.: Natural emissions of non-methane volatile organic com-pounds, carbon monoxide, and oxides of nitrogen from NorthAmerica, Atmos. Environ., 34, 2205–2230, 2000.
Guenther, A., Karl, T., Harley, P., Wiedinmyer, C., Palmer, P. I.,and Geron, C.: Estimates of global terrestrial isoprene emissionsusing MEGAN (Model of Emissions of Gases and Aerosols fromNature), Atmos. Chem. Phys., 6, 3181–3210,doi:10.5194/acp-6-3181-2006, 2006.
Guenther, A. B., Monson, R. K., and Fall, R.: Isoprene andmonoterpene emission rate variability: observations withEu-calyptusand emission rate algorithm development, J. Geophys.Res., 96, 10799–10808, 1991.
Guenther, A. B., Zimmerman, P. R., Harley, P. C., Monson, R. K.,and Fall, R.: Isoprene and monoterpene emission rate variability:model evaluations and sensitivity analyses, J. Geophys. Res., 98,12609–12617, 1993.
Guth, S. and Frenzel, B.: Epicuticular wax of silver fir (Abies albaMill.) and the present forest decline. 2. The chemical composi-tion of cuticular waxes and needle lipids, Angew. Bot., 63, 259–277, 1989.
Hakola, H., Rinne, J., and Laurila, T.: The hydrocarbon emissionrates of tea-leafed willow (Salix phylicifolia), silver birch (Betulapendula) and European aspen (Populus tremula), Atmos. Envi-ron., 32, 1825–1833, 1998.
Hakola, H., Laurila, T., Lindfors, V., Hellen, H., Gaman, A., andRinne, J.: Variation of the VOC emission rates of birch speciesduring the growing season, Boreal Environ. Res., 6, 237–249,2001.
Hakola, H., Tarvainen, V., Back, J., Ranta, H., Bonn, B., Rinne,J., and Kulmala, M.: Seasonal variation of mono- and sesquiter-pene emission rates of Scots pine, Biogeosciences, 3, 93–101,doi:10.5194/bg-3-93-2006, 2006.
Hallquist, M., Wenger, J. C., Baltensperger, U., Rudich, Y., Simp-son, D., Claeys, M., Dommen, J., Donahue, N. M., George,C., Goldstein, A. H., Hamilton, J. F., Herrmann, H., Hoff-mann, T., Iinuma, Y., Jang, M., Jenkin, M. E., Jimenez, J. L.,Kiendler-Scharr, A., Maenhaut, W., McFiggans, G., Mentel, Th.F., Monod, A., Prevot, A. S. H., Seinfeld, J. H., Surratt, J. D.,Szmigielski, R., and Wildt, J.: The formation, properties andimpact of secondary organic aerosol: current and emerging is-sues, Atmos. Chem. Phys., 9, 5155–5236,doi:10.5194/acp-9-5155-2009, 2009.
Hanson, P. J., Samuelson, L. J., Wullschleger, S. D., Tabberer, T. A.,and Edwards, G. S.: Seasonal patterns of light-saturated photo-synthesis and leaf conductance for mature and seedlingQuercusrubra L. foliage: differential sensitivity to ozone exposure, TreePhysiol., 14, 1351–1366, 1994.
Harley, P., Guenther, A., and Zimmerman, P.: Effects of light, tem-perature and canopy position on net photosynthesis and isopreneemission from sweetgum (Liquidambar styraciflua) leaves, TreePhysiol., 16, 25–32, 1996.
Harley, P., Guenther, A., and Zimmerman, P.: Environmental con-trols over isoprene emission in deciduous oak canopies, TreePhysiol., 17, 705–714, 1997.
Harley, P., Vasconcellos, P., Vierling, L., De S. Pinheiro, C.,
www.biogeosciences.net/8/2209/2011/ Biogeosciences, 8, 2209–2246, 2011

2240 U. Niinemets et al.: Estimations of isoprenoid emission capacity from enclosure studies
Greenberg, J., Guenther, A., Klinger, L., Soares De Almeida,S., Neill, D., Baker, T., Phillips, O., and Malhi, Y.: Variation inpotential for isoprene emissions among Neotropical forest sites,Glob. Change Biol., 10, 630–650, 2004.
Harogoppad, S. B. and Aminabhavi, T. M.: Diffusion and sorptionof organic liquids through polymer membranes. II. Neoprene,SBR, EPDM, NBR, and natural rubber versus n-alkanes, J. Appl.Polym. Sci., 42, 2329–2336, 1991.
Harrison, D., Hunter, M. C., Lewis, A. C., Seakins, P. W., Bon-sang, B., Gros, V., Kanakidou, M., Touaty, M., Kavouras, I., Mi-halopoulos, N., Stephanou, E., Alves, C., Nunes, T., and Pio, C.:Ambient isoprene and monoterpene concentrations in a Greek fir(Abies borisii-regis) forest. Reconciliation with emissions mea-surements and effects on measured OH concentrations, Atmos.Environ., 35, 4699–4711, 2001.
Hartman, T.: Determination of off-odors and other volatile organ-ics in food packaging films by direct thermal analysis-GC-MS,SISWEB Application Note, 1a, 7 pp., 1999.
Hayes, H. C., Benton, D. J., and Khan, N.: Impact of samplingmedia on soil gas measurements, A&WMA “Vapor Intrusion –The Next Great Environmental Challenge – An Update”, 13–15September 2006, Los Angeles, CA, USA, 2006.
Heiden, A. C., Kobel, K., Komenda, M., Koppmann, R., Shao, M.,and Wildt, J.: Toluene emissions from plants, Geophys. Res.Lett., 26, 1283–1286, 1999.
Helmig, D. and Greenberg, J.: Artifact formation from the useof potassium-iodide-based ozone traps during atmospheric sam-pling of trace organic gases, J. High Res. Chromatog., 18, 15–18,1995.
Helmig, D. and Vierling, L.: Water adsorption capacity of the solidadsorbents Tenax TA, Tenax GR, Carbotrap, Carbotrap C, Car-bosive SIII and Carboxen 569 and water management techniquesfor the atmospheric sampling of volatile organic trace gases,Anal. Chem., 67, 4380–4386, 1995.
Helmig, D.: Ozone removal techniques in the sampling of atmo-spheric volatile organic trace gases, Atmos. Environ., 31, 3635–3651, 1997.
Helmig, D., Revermann, T., Pollmann, J., Kaltschmidt, O., Hernan-dez, A. J., Bocquet, F., and David, D.: Calibration system andanlytical considerations for quantitative sesquiterpene measure-ments in air, J. Chromatogr. A, 1002, 193–211, 2003.
Helmig, D., Bocquet, F., Pollmann, J., and Revermann, T.: Ana-lytical techniques for sesquiterpene emission rate studies in veg-etation enclosure experiments, Atmos. Environ., 38, 557–572,2004.
Helmig, D., Ortega, J., Guenther, A., Herrick, J. D., and Geron, C.:Sesquiterpene emissions from loblolly pine and their potentialcontribution to biogenic aerosol formation in the SoutheasternUS, Atmos. Environ., 40, 4150–4157, 2006.
Hills, A. J. and Zimmerman, P. R.: Isoprene measurement byozone-induced chemiluminescence, Anal. Chem., 62, 1055–1060, 1990.
Himanen, S. J., Blande, J. D., Klemola, T., Pulkkinen, J., Heijari, J.,and Holopainen, J. K.: Birch (Betulaspp.) leaves adsorb and re-release volatiles specific to neighbouring plants – a mechanismfor associational herbivore resistance?, New Phytol., 186, 722–732, 2010.
Hodgson, S. C., O’Connor, M. J., Casey, R. J., and Bigger, S. W.:Toward an optimized dynamic headspace method for the study
of volatiles in low-density polyethylene, J. Agr. Food Chem., 46,1397–1405, 1998.
Hoffmann, T.: Adsorptive preconcentration technique including ox-idant scavenging for the measurement of reactive natural hydro-carbons in ambient air, Fresen. J. Anal. Chem., 351, 41–47, 1995.
Huff Hartz, K. E., Rosenørn, T., Ferchak, S. R., Raymond, T. M.,Bilde, M., Donahue, N. M., and Pandis, S. N.: Cloud conden-sation nuclei activation of monoterpene and sesquiterpene sec-ondary organic aerosol, J. Geophys. Res.-Atmos., 110, D14208,doi:14210.11029/12004JD005754, 2005.
Huve, K., Christ, M. M., Kleist, E., Uerlings, R., Niinemets,U.,Walter, A., and Wildt, J.: Simultaneous growth and emissionmeasurements demonstrate an interactive control of methanol re-lease by leaf expansion and stomata, J. Exp. Bot., 58, 1783–1793,2007.
Ishizuka, Y., Tokumura, M., Mizukoshi, A., Noguchi, M., andYanagisawa, Y.: Measurement of secondary products during ox-idation reactions of terpenes and ozone based on the PTR-MSanalysis: effects of coexistent carbonyl compounds, Int. J. Envi-ron. Res. Public Health, 7, 3853–3870, 2010.
Janson, R., De Serves, C., and Romero, R.: Emission of isopreneand carbonyl compounds from a boreal forest and wetland inSweden, Agr. Forest Meteorol., 98–99, 671–681, 1999.
Jasse, B., Seuvre, A. M., and Mathlouthi, M.: Permeability andstructure in polymer packaging materials, in: Food packagingand preservation, edited by: Mathlouthi, M., Aspen Publishers,Inc., Gaithersburg, Maryland, 1–22, 1999.
Jurik, T. W.: Temporal and spatial patterns of specific leaf weightin successional northern hardwood tree species, Am. J. Bot., 73,1083–1092, 1986.
Karl, T., Prazeller, P., Mayr, D., Jordan, A., Rieder, J., Fall, R.,and Lindinger, W.: Human breath isoprene and its relation toserum cholesterol levels: measurements and modelling, J. Appl.Physiol., 91, 762–770, 2001.
Karl, T., Harley, P., Guenther, A., Rasmussen, R., Baker, B., Jar-dine, K., and Nemitz, E.: The bi-directional exchange of oxy-genated VOCs between a loblolly pine (Pinus taeda) planta-tion and the atmosphere, Atmos. Chem. Phys., 5, 3015–3031,doi:10.5194/acp-5-3015-2005, 2005.
Keenan, T., Niinemets,U., Sabate, S., Gracia, C., and Penuelas,J.: Seasonality of monoterpene emission potentials inQuer-cus ilex and Pinus pinea: Implications for regional BVOCemissions modelling, J. Geophys. Res.-Atmos., 114, D22202,doi:10.1029/2009JD011904, 2009.
Kesselmeier, J. and Staudt, M.: Biogenic volatile organic com-pounds (VOC): an overview on emission, physiology and ecol-ogy, J. Atmos. Chem., 33, 23–88, 1999.
Kesselmeier, J., Meixner, F. X., Hofmann, U., Ajavon, A., Le-imbach, S., and Andreae, M. O.: Reduced sulfur compoundexchange between the atmosphere and tropical tree species insouthern Cameroon, Biogeochemistry, 23, 23–45, 1993.
Kesselmeier, J., Schafer, L., Ciccioli, P., Brancaleoni, E., Ceci-nato, A., Frattoni, M., Foster, P., Jacob, V., Denis, J., Fugit,J. L., Dutaur, L., and Torres, L.: Emission of monoterpenesand isoprene from a Mediterranean oak speciesQuercus ilexL.measured within the BEMA (biogenic emissions in the Mediter-ranean area) project, Atmos. Environ., 30, 1841–1850, 1996.
Kesselmeier, J., Bode, K., Hofmann, U., Muller, H., Schafer, L.,Wolf, A., Ciccioli, P., Brancaleoni, E., Cecinato, A., Frattoni, M.,
Biogeosciences, 8, 2209–2246, 2011 www.biogeosciences.net/8/2209/2011/
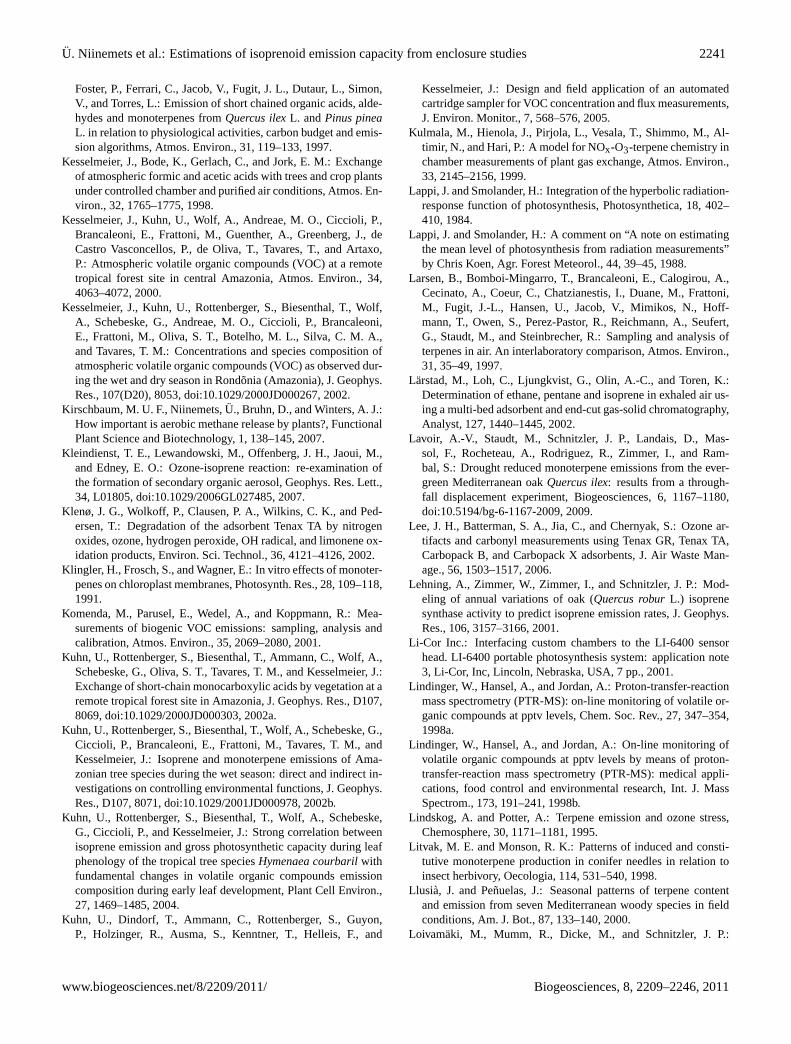
U. Niinemets et al.: Estimations of isoprenoid emission capacity from enclosure studies 2241
Foster, P., Ferrari, C., Jacob, V., Fugit, J. L., Dutaur, L., Simon,V., and Torres, L.: Emission of short chained organic acids, alde-hydes and monoterpenes fromQuercus ilexL. andPinus pineaL. in relation to physiological activities, carbon budget and emis-sion algorithms, Atmos. Environ., 31, 119–133, 1997.
Kesselmeier, J., Bode, K., Gerlach, C., and Jork, E. M.: Exchangeof atmospheric formic and acetic acids with trees and crop plantsunder controlled chamber and purified air conditions, Atmos. En-viron., 32, 1765–1775, 1998.
Kesselmeier, J., Kuhn, U., Wolf, A., Andreae, M. O., Ciccioli, P.,Brancaleoni, E., Frattoni, M., Guenther, A., Greenberg, J., deCastro Vasconcellos, P., de Oliva, T., Tavares, T., and Artaxo,P.: Atmospheric volatile organic compounds (VOC) at a remotetropical forest site in central Amazonia, Atmos. Environ., 34,4063–4072, 2000.
Kesselmeier, J., Kuhn, U., Rottenberger, S., Biesenthal, T., Wolf,A., Schebeske, G., Andreae, M. O., Ciccioli, P., Brancaleoni,E., Frattoni, M., Oliva, S. T., Botelho, M. L., Silva, C. M. A.,and Tavares, T. M.: Concentrations and species composition ofatmospheric volatile organic compounds (VOC) as observed dur-ing the wet and dry season in Rondonia (Amazonia), J. Geophys.Res., 107(D20), 8053,doi:10.1029/2000JD000267, 2002.
Kirschbaum, M. U. F., Niinemets,U., Bruhn, D., and Winters, A. J.:How important is aerobic methane release by plants?, FunctionalPlant Science and Biotechnology, 1, 138–145, 2007.
Kleindienst, T. E., Lewandowski, M., Offenberg, J. H., Jaoui, M.,and Edney, E. O.: Ozone-isoprene reaction: re-examination ofthe formation of secondary organic aerosol, Geophys. Res. Lett.,34, L01805,doi:10.1029/2006GL027485, 2007.
Klenø, J. G., Wolkoff, P., Clausen, P. A., Wilkins, C. K., and Ped-ersen, T.: Degradation of the adsorbent Tenax TA by nitrogenoxides, ozone, hydrogen peroxide, OH radical, and limonene ox-idation products, Environ. Sci. Technol., 36, 4121–4126, 2002.
Klingler, H., Frosch, S., and Wagner, E.: In vitro effects of monoter-penes on chloroplast membranes, Photosynth. Res., 28, 109–118,1991.
Komenda, M., Parusel, E., Wedel, A., and Koppmann, R.: Mea-surements of biogenic VOC emissions: sampling, analysis andcalibration, Atmos. Environ., 35, 2069–2080, 2001.
Kuhn, U., Rottenberger, S., Biesenthal, T., Ammann, C., Wolf, A.,Schebeske, G., Oliva, S. T., Tavares, T. M., and Kesselmeier, J.:Exchange of short-chain monocarboxylic acids by vegetation at aremote tropical forest site in Amazonia, J. Geophys. Res., D107,8069,doi:10.1029/2000JD000303, 2002a.
Kuhn, U., Rottenberger, S., Biesenthal, T., Wolf, A., Schebeske, G.,Ciccioli, P., Brancaleoni, E., Frattoni, M., Tavares, T. M., andKesselmeier, J.: Isoprene and monoterpene emissions of Ama-zonian tree species during the wet season: direct and indirect in-vestigations on controlling environmental functions, J. Geophys.Res., D107, 8071,doi:10.1029/2001JD000978, 2002b.
Kuhn, U., Rottenberger, S., Biesenthal, T., Wolf, A., Schebeske,G., Ciccioli, P., and Kesselmeier, J.: Strong correlation betweenisoprene emission and gross photosynthetic capacity during leafphenology of the tropical tree speciesHymenaea courbarilwithfundamental changes in volatile organic compounds emissioncomposition during early leaf development, Plant Cell Environ.,27, 1469–1485, 2004.
Kuhn, U., Dindorf, T., Ammann, C., Rottenberger, S., Guyon,P., Holzinger, R., Ausma, S., Kenntner, T., Helleis, F., and
Kesselmeier, J.: Design and field application of an automatedcartridge sampler for VOC concentration and flux measurements,J. Environ. Monitor., 7, 568–576, 2005.
Kulmala, M., Hienola, J., Pirjola, L., Vesala, T., Shimmo, M., Al-timir, N., and Hari, P.: A model for NOx-O3-terpene chemistry inchamber measurements of plant gas exchange, Atmos. Environ.,33, 2145–2156, 1999.
Lappi, J. and Smolander, H.: Integration of the hyperbolic radiation-response function of photosynthesis, Photosynthetica, 18, 402–410, 1984.
Lappi, J. and Smolander, H.: A comment on “A note on estimatingthe mean level of photosynthesis from radiation measurements”by Chris Koen, Agr. Forest Meteorol., 44, 39–45, 1988.
Larsen, B., Bomboi-Mingarro, T., Brancaleoni, E., Calogirou, A.,Cecinato, A., Coeur, C., Chatzianestis, I., Duane, M., Frattoni,M., Fugit, J.-L., Hansen, U., Jacob, V., Mimikos, N., Hoff-mann, T., Owen, S., Perez-Pastor, R., Reichmann, A., Seufert,G., Staudt, M., and Steinbrecher, R.: Sampling and analysis ofterpenes in air. An interlaboratory comparison, Atmos. Environ.,31, 35–49, 1997.
Larstad, M., Loh, C., Ljungkvist, G., Olin, A.-C., and Toren, K.:Determination of ethane, pentane and isoprene in exhaled air us-ing a multi-bed adsorbent and end-cut gas-solid chromatography,Analyst, 127, 1440–1445, 2002.
Lavoir, A.-V., Staudt, M., Schnitzler, J. P., Landais, D., Mas-sol, F., Rocheteau, A., Rodriguez, R., Zimmer, I., and Ram-bal, S.: Drought reduced monoterpene emissions from the ever-green Mediterranean oakQuercus ilex: results from a through-fall displacement experiment, Biogeosciences, 6, 1167–1180,doi:10.5194/bg-6-1167-2009, 2009.
Lee, J. H., Batterman, S. A., Jia, C., and Chernyak, S.: Ozone ar-tifacts and carbonyl measurements using Tenax GR, Tenax TA,Carbopack B, and Carbopack X adsorbents, J. Air Waste Man-age., 56, 1503–1517, 2006.
Lehning, A., Zimmer, W., Zimmer, I., and Schnitzler, J. P.: Mod-eling of annual variations of oak (Quercus roburL.) isoprenesynthase activity to predict isoprene emission rates, J. Geophys.Res., 106, 3157–3166, 2001.
Li-Cor Inc.: Interfacing custom chambers to the LI-6400 sensorhead. LI-6400 portable photosynthesis system: application note3, Li-Cor, Inc, Lincoln, Nebraska, USA, 7 pp., 2001.
Lindinger, W., Hansel, A., and Jordan, A.: Proton-transfer-reactionmass spectrometry (PTR-MS): on-line monitoring of volatile or-ganic compounds at pptv levels, Chem. Soc. Rev., 27, 347–354,1998a.
Lindinger, W., Hansel, A., and Jordan, A.: On-line monitoring ofvolatile organic compounds at pptv levels by means of proton-transfer-reaction mass spectrometry (PTR-MS): medical appli-cations, food control and environmental research, Int. J. MassSpectrom., 173, 191–241, 1998b.
Lindskog, A. and Potter, A.: Terpene emission and ozone stress,Chemosphere, 30, 1171–1181, 1995.
Litvak, M. E. and Monson, R. K.: Patterns of induced and consti-tutive monoterpene production in conifer needles in relation toinsect herbivory, Oecologia, 114, 531–540, 1998.
Llusia, J. and Penuelas, J.: Seasonal patterns of terpene contentand emission from seven Mediterranean woody species in fieldconditions, Am. J. Bot., 87, 133–140, 2000.
Loivamaki, M., Mumm, R., Dicke, M., and Schnitzler, J. P.:
www.biogeosciences.net/8/2209/2011/ Biogeosciences, 8, 2209–2246, 2011

2242 U. Niinemets et al.: Estimations of isoprenoid emission capacity from enclosure studies
Isoprene interferes with the attraction of bodyguards by herba-ceous plants, Proc. Natl. Acad. Sci. USA, 105, 17430–17435,2008.
Long, S. P. and Bernacchi, C. J.: Gas exchange measurements, whatcan they tell us about the underlying limitations to photosynthe-sis? Procedures and sources of error, J. Exp. Bot., 54, 2393–2401, 2003.
Long, S. P., Farage, P. K., and Garcia, R. L.: Measurement of leafand canopy photosynthetic CO2 exchange in the field, J. Exp.Bot., 47, 1629–1642, 1996.
Loreto, F. and Schnitzler, J.-P.: Abiotic stresses and inducedBVOCs, Trends Plant Sci., 15, 154–166, 2010.
Loreto, F. and Velikova, V.: Isoprene produced by leaves protectsthe photosynthetic apparatus against ozone damage, quenchesozone products, and reduces lipid peroxidation of cellular mem-branes, Plant Physiol., 127, 1781–1787, 2001.
Loreto, F., Ciccioli, P., Cecinato, A., Brancaleoni, E., Frattoni, M.,and Tricoli, D.: Influence of environmental factors and air com-position on the emission ofα-pinene fromQuercus ilexleaves,Plant Physiol., 110, 267–275, 1996.
Loreto, F., Nascetti, P., Graverini, A., and Mannozzi, M.: Emissionand content of monoterpenes in intact and wounded needles ofthe Mediterranean pine,Pinus pinea, Funct. Ecol., 14, 589–595,2000.
Loreto, F., Mannozzi, M., Maris, C., Nascetti, P., Ferranti, F., andPasqualini, S.: Ozone quenching properties of isoprene and itsantioxidant role in leaves, Plant Physiol., 126, 993–1000, 2001.
Loreto, F., Barta, C., Brilli, F., and Nogues, I.: On the induction ofvolatile organic compound emissions by plants as consequenceof wounding or fluctuations of light and temperature, Plant CellEnviron., 29, 1820–1828, 2006.
Manes, F., Seufert, G., Vitale, M., Donate, E., Csiky, O., and Silli,V.: Ecophysiological characterization ofCitrus sinensis(L.) Os-beck and relationships with type and amount of biogenic emis-sions, Phys. Chem. Earth B, 24, 699–703, 1999.
Manura, J. J.: Detection and identification of volatile and semi-volatile organics in synthetic polymers used in food and phar-maceutical packaging, SISWEB Application Note, 21a, 5 pp.,1999.
Massey, L. K.: Properties of plastics and elastomers. A guide topackaging and barrier materials, 2nd edn., Plastic Design Li-brary, William Andrew Publishing, Norwick, NY, 601 pp., 2003.
Mastrogiacomo, A. R., Pierini, E., and Sampaolo, L.: A com-parison of the critical parameters of some adsorbents employedin trapping and thermal desorption of organic pollutants, Chro-matographia, 41, 599–604, 1995.
Matisova, E. andSkrabakova, S.: Carbon sorbents and their uti-lization for the preconcentration of organic pollutants in environ-mental samples, J. Chromatogr. A, 707, 145–179, 1995.
Matsui, K.: Green leaf volatiles: hydroperoxide lyase pathwayof oxylipin metabolism, Curr. Opin. Plant Biol., 9, 274–280,doi:10.1016/j.pbi.2006.03.002, 2006.
Matsunaga, S. N., Guenther, A. B., Potosnak, M. J., and Apel, E.C.: Emission of sunscreen salicylic esters from desert vegetationand their contribution to aerosol formation, Atmos. Chem. Phys.,8, 7367–7371,doi:10.5194/acp-8-7367-2008, 2008.
McClenny, W. A., Oliver, K. D., Jacumin Jr., H. H., and Daugh-trey Jr., E. H.: Ambient level volatile organic compound (VOC)monitoring using solid adsorbents – Recent US EPA studies, J.
Environ. Monit., 4, 695–705, 2002.Morison, J. I. L.: Intercellular CO2 concentration and stomatal re-
sponse to CO2, in: Stomatal function, edited by: Zeiger, E., Far-quhar, G. D., and Cowan, I. R., Stanford University Press, Stan-ford, 229–251, 1987.
Moukhtar, S., Bessagnet, B., Rouil, L., and Simon, V.: Monoter-pene emissions from beech (Fagus sylvatica) in a French forestand impact on secondary pollutants formation at regional scale,Atmos. Environ., 39, 3535–3547, 2005.
Neeb, P., Bode, K., Beck, J., Schafer, L., Kesselmeier, J., andMoortgart, G. K.: Influence of gas-phase oxidation on estimatedemission rates of biogenic hydrocarbons, in: The oxidizing ca-pacity of the troposphere. Proceedings of the 7th European sym-posium on physico-chemical behavior of atmospheric pollutants,edited by: Larson, B., Versino, B., and Angeletti, G., EuropeanCommission, Brussels, 295–299, 1996.
Niinemets,U.: Stomatal conductance alone does not explain thedecline in foliar photosynthetic rates with increasing tree age andsize inPicea abiesandPinus sylvestris, Tree Physiol., 22, 515–535, 2002.
Niinemets,U.: Photosynthesis and resource distribution throughplant canopies, Plant Cell Environ., 30, 1052–1071, 2007.
Niinemets,U.: Getting hold of terpene emissions from vegetation,ILeaps Newsletter, 5, 40–42,www.ileaps.org, 2008.
Niinemets, U.: A review of light interception in plant standsfrom leaf to canopy in different plant functional types and inspecies with varying shade tolerance, Ecol. Res., 25, 693–714,doi:10.1007/s11284-010-0712-4, 2010a.
Niinemets, U.: Mild versus severe stress and BVOCs: thresh-olds, priming and consequences, Trends Plant Sci., 15, 145–153,2010b.
Niinemets,U.: Whole plant photosynthesis, in: Terrestrial photo-synthesis in a changing environment. The molecular, physiologi-cal and ecological bases of photosynthesis driving its response tothe environmental changes, edited by: Flexas, J., Loreto, F., andMedrano, H., Cambridge University Press, Cambridge, in press,2011.
Niinemets,U. and Anten, N. P. R.: Packing photosynthesis machin-ery: from leaf to canopy, in: Photosynthesis in silico: under-standing complexity from molecules to ecosystems, edited by:Laisk, A., Nedbal, L., and Govindjee, Advances in photosynthe-sis and respiration, 29, Springer Verlag, Berlin, 363–399, 2009.
Niinemets,U. and Reichstein, M.: A model analysis of the ef-fects of nonspecific monoterpenoid storage in leaf tissues onemission kinetics and composition in Mediterranean sclero-phyllous Quercusspecies, Global Biogeochem. Cy., 16, 1110,doi:1110.1029/2002GB001927, 2002.
Niinemets,U. and Reichstein, M.: Controls on the emission of plantvolatiles through stomata: a sensitivity analysis, J. Geophys.Res.-Atmos., 108, 4211, doi:4210.1029/2002JD002626, 2003a.
Niinemets,U. and Reichstein, M.: Controls on the emission ofplant volatiles through stomata: sensitivity or insensitivity of theemission rates to stomatal closure explained, J. Geophys. Res.-Atmos., 108, 4208, doi:4210.1029/2002JD002620, 2003b.
Niinemets,U., Tenhunen, J. D., Harley, P. C., and Steinbrecher,R.: A model of isoprene emission based on energetic require-ments for isoprene synthesis and leaf photosynthetic propertiesfor Liquidambarand Quercus, Plant Cell Environ., 22, 1319–1336, 1999.
Biogeosciences, 8, 2209–2246, 2011 www.biogeosciences.net/8/2209/2011/

U. Niinemets et al.: Estimations of isoprenoid emission capacity from enclosure studies 2243
Niinemets,U., Hauff, K., Bertin, N., Tenhunen, J. D., Steinbrecher,R., and Seufert, G.: Monoterpene emissions in relation to fo-liar photosynthetic and structural variables in Mediterranean ev-ergreenQuercusspecies, New Phytol., 153, 243–256, 2002a.
Niinemets,U., Seufert, G., Steinbrecher, R., and Tenhunen, J. D.:A model coupling foliar monoterpene emissions to leaf pho-tosynthetic characteristics in Mediterranean evergreenQuercusspecies, New Phytol., 153, 257–276, 2002b.
Niinemets,U., Kull, O., and Tenhunen, J. D.: Within canopy vari-ation in the rate of development of photosynthetic capacity isproportional to integrated quantum flux density in temperate de-ciduous trees, Plant Cell Environ., 27, 293–313, 2004.
Niinemets,U., Tobias, M., Cescatti, A., and Sparrow, A. D.: Size-dependent variation in shoot light-harvesting efficiency in shade-intolerant conifers, Int. J. Plant Sci., 167, 19–32, 2006.
Niinemets,U., Arneth, A., Kuhn, U., Monson, R. K., Penuelas,J., and Staudt, M.: The emission factor of volatile iso-prenoids: stress, acclimation, and developmental responses,Biogeosciences, 7, 2203–2223,doi:10.5194/bg-7-2203-2010,2010a.
Niinemets,U., Copolovici, L., and Huve, K.: High within-canopyvariation in isoprene emission potentials in temperate trees: im-plications for predicting canopy-scale isoprene fluxes, J. Geo-phys. Res.-Biogeo., 115, G04029,doi:10.1029/2010JG001436,2010b.
Niinemets,U., Monson, R. K., Arneth, A., Ciccioli, P., Kesselmeier,J., Kuhn, U., Noe, S. M., Penuelas, J., and Staudt, M.: The leaf-level emission factor of volatile isoprenoids: caveats, model al-gorithms, response shapes and scaling, Biogeosciences, 7, 1809–1832,doi:10.5194/bg-7-1809-2010, 2010c.
Noe, S. M., Copolovici, L., Niinemets,U., and Vaino, E.: Foliarlimonene uptake scales positively with leaf lipid content: “non-emitting” species absorb and release monoterpenes, Plant Biol.,10, 129–137,doi:10.1055/s-2007-965239, 2008.
Noe, S. M., Niinemets,U., and Schnitzler, J.-P.: Modeling the tem-poral dynamics of monoterpene emission by isotopic labeling inQuercus ilexleaves, Atmos. Environ., 44, 392–399, 2010.
Noe, S. M., Kimmel, V., Huve, K., Copolovici, L., Portillo-Estrada,M., Puttsepp,U., Jogiste, K., Niinemets,U., Hortnagl, L., andWohlfahrt, G.: Ecosystem-scale biosphere-atmosphere interac-tions of a hemiboreal mixed forest stand at Jarvselja, Estonia,Forest Ecol. Manag., 262, 71–81, 2011.
Nunez, L., Plaza, J., Perez-Pastor, R., Pujadas, M., Gimeno, B. S.,Bermejo, V., and Garcıa-Alonso, S.: High water vapour pressuredeficit influence onQuercus ilexandPinus pineafield monoter-pene emission in the central Iberian Peninsula (Spain), Atmos.Environ., 36, 4441–4452, 2002.
Okumura, M., Tani, A., Kominami, Y., Takanashi, S., Kosugi, Y.,Miyama, T., and Tohno, S.: Isoprene emission characteristics ofQuercus serratain a deciduous broad-leaved forest, Journal ofAgricultural Meteorology, Japan, 64, 49–60, 2008.
Oliver, K. D., Adams, J. R., Daughtrey Jr., E. H., McClenny, W.A., Yoong, M. J., and Pardee, M. A.: Technique for monitor-ing ozone precursor hydrocarbons in air at photochemical assess-ment monitoring stations: sorbent preconcentration, closed-cyclecooler cryofocusing, and GC-FID analysis, Atmos. Environ., 30,2751–2757, 1996.
Ortega, J. and Helmig, D.: Approaches for quantifying reactive andlow-volatility biogenic organic compound emissions by vegeta-
tion enclosure techniques – Part A, Chemosphere, 72, 343–364,2008.
Ortega, J., Helmig, D., Daly, R. W., Tanner, D. M., Guenther, A.B., and Herrick, J. D.: Approaches for quantifying reactive andlow-volatility biogenic organic compound emissions by vegeta-tion enclosure techniques – Part B: applications, Chemosphere,72, 365–380, 2008.
Owen, S.: Emissions of isoprene and monoterpenes from nativeMediterranean vegetation, Ph.D. thesis, Lancaster University,Lancaster, 1998.
Owen, S. M., Boissard, C., and Hewitt, C. N.: Volatile organic com-pounds (VOCs) emitted from 40 Mediterranean plant species:VOC speciation and extrapolation to habitat scale, Atmos. En-viron., 35, 5393–5409, 2001.
Owen, S. M., Harley, P., Guenther, A., and Hewitt, C. N.: Light de-pendency of VOC emissions from selected Mediterranean plantspecies, Atmos. Environ., 36, 3147–3159, 2002.
Palluau, F., Mirabel, P., and Millet, M.: Influence of relative humid-ity and ozone on the sampling of volatile organic compounds onCarbotrap/Carbosieve adsorbents, Environ. Monit. Assess., 127,177–187, 2007.
Palva, L., Garam, E., Manoochehri, F., Sepponen, R., Hari, P., Ra-jala, K., Ruotoistenmaki, H., and Seppala, I.: A novel multi-point measuring system of photosynthetically active radiation,Agr. Forest Meteorol., 89, 141–147, 1998a.
Palva, L., Garam, E., Siivola, E., Sepponen, R., and Hari, P.: Quan-tifying spatial variability of photosynthetically active radiationwithin canopies using a multipoint measuring system, Agr. For-est Meteorol., 92, 163–171, 1998b.
Pape, L., Ammann, C., Nyfeler-Brunner, A., Spirig, C., Hens, K.,and Meixner, F. X.: An automated dynamic chamber systemfor surface exchange measurement of non-reactive and reactivetrace gases of grassland ecosystems, Biogeosciences, 6, 405–429,doi:10.5194/bg-6-405-2009, 2009.
Papiez, M. R., Potosnak, M. J., Goliff, W. S., Guenther, A. B., Mat-sunaga, S. N., and Stockwell, W. R.: The impacts of reactive ter-pene emissions from plants on air quality in Las Vegas, Nevada,Atmos. Environ., 43, 4109–4123, 2009.
Pare, P. W. and Tumlinson, J. H.: De novo biosynthesis of volatilesinduced by insect herbivory in cotton plants, Plant Physiol., 114,1161–1167, 1997.
Pare, P. W. and Tumlinson, J. H.: Plant volatiles as a defense againstinsect herbivores, Plant Physiol., 121, 325–331, 1999.
Parkinson, K. J.: Porometry, in: Instrumentation for environmentalphysiology, edited by: Marshall, B. and Woodward, F. I., Societyfor experimental biology seminar series, 22, Cambridge Univer-sity Press, Cambridge – New York – New Rochelle – Melbourne– Sydney, 171–191, 1985.
Parra, R., Gasso, S., and Baldasano, J. M.: Estimating the biogenicemissions of non-methane volatile organic compounds from theNorth Western Mediterranean vegetation of Catalonia, Spain,Sci. Total Environ., 329, 241–259, 2004.
Pellizzari, E. D. and Krost, K. J.: Chemical transformations duringambient air sampling for organic vapors, Anal. Chem., 56, 1813–1819, 1984.
Penuelas, J. and Staudt, M.: BVOCs and global change, TrendsPlant Sci., 15, 133–144, 2010.
Penuelas, J., Filella, I., Seco, R., and Llusia, J.: Increase in iso-prene and monoterpene emissions after re-watering of droughted
www.biogeosciences.net/8/2209/2011/ Biogeosciences, 8, 2209–2246, 2011

2244 U. Niinemets et al.: Estimations of isoprenoid emission capacity from enclosure studies
Quercus ilexseedlings, Biol. Plant., 53, 351–354, 2009.Pier, P. A.: Isoprene emission rates from northern red oak using a
whole-tree chamber, Atmos. Environ., 29, 1347–1353, 1995.Pier, P. A. and McDuffie Jr., C.: Seasonal isoprene emission rates
and model comparisons using whole-tree emissions from whiteoak, J. Geophys. Res.-Atmos., 102, 23963–23971, 1997.
Pierce, T. E. and Waldruff, P. S.: PC-BEIS – a personal-computerversion of the biogenic emissions inventory system, J. Air WasteManage., 41, 937–941, 1991.
Pio, C. A. and Valente, A. A.: Atmospheric fluxes and concentra-tions of monoterpenes in resin-tapped pine forests, Atmos. Env-iron., 32, 683–691, 1998.
Planchais, I. and Sinoquet, H.: Foliage determinants of light inter-ception in sunny and shaded branches ofFagus sylvaticaL., Agr.Forest Meteorol., 89, 241–253, 1998.
Plass-Dulmer, C., Schmidbauer, N., Slemr, J., Slemr, F., andD’Souza, H.: European hydrocarbon intercomparison experi-ment AMOHA part 4: Canister sampling of ambient air, J. Geo-phys. Res.-Atmos., 111, D04306,doi:10.1029/2005JD006351,2006.
Pollmann, J., Ortega, J., and Helmig, D.: Analysis of atmosphericsesquiterpenes: sampling losses and mitigation of ozone interfer-ences, Environ. Sci. Technol., 39, 9620–9629, 2005.
Poorter, H., Niinemets,U., Poorter, L., Wright, I. J., and Villar,R.: Tansley review. Causes and consequences of variation in leafmass per area (LMA): a meta-analysis, New Phytol., 182, 565–588, 2009a.
Poorter, H., Walter, A., Fiorani, F., Schurr, U., and Niinemets,U.: Meta-phenomics: building a unified framework for interpret-ing plant growth responses to diverse environmental variables,Comp. Biochem. Physiol. A, 153, p. S224, 2009b.
Poorter, H., Niinemets,U., Walter, A., Fiorani, F., and Schurr, U.:A method to construct dose-response curves for a wide rangeof environmental factors and plant traits by means of a meta-analysis of phenotypic data, J. Exp. Bot., 61, 2043–2055, 2010.
Raguso, R. A., Levin, R. A., Foose, S. E., Holmberg, M. W., andMcDade, L. A.: Fragrance chemistry, nocturnal rhythms andpollination “syndromes” inNicotiana, Phytochemistry, 63, 265–284, 2003.
Raisanen, T., Ryyppo, A., and Kellomaki, S.: Impact of timberfelling on the ambient monoterpene concentration of a Scots pine(Pinus sylvestrisL.) forest, Atmos. Environ., 42, 6759–6766,2008.
Rasulov, B., Copolovici, L., Laisk, A., and Niinemets,U.: Postillu-mination isoprene emission: in vivo measurements of dimethy-lallyldiphosphate pool size and isoprene synthase kinetics in as-pen leaves, Plant Physiol., 149, 1609–1618, 2009a.
Rasulov, B., Huve, K., Valbe, M., Laisk, A., and Niinemets,U.:Evidence that light, carbon dioxide and oxygen dependencies ofleaf isoprene emission are driven by energy status in hybrid as-pen, Plant Physiol., 151, 448–460, 2009b.
Rasulov, B., Huve, K., Bichele, I., Laisk, A., and Niinemets,U.:Temperature response of isoprene emission in vivo reflects acombined effect of substrate limitations and isoprene synthaseactivity: a kinetic analysis, Plant Physiol., 154, 1558–1570,2010.
Riba, M. L., Randrianalimanana, E., Mathieu, J., Torres, L., andNamiesnik, J.: Preconcentration of atmospheric terpenes on solidsorbents, Int. J. Environ. An. Ch., 19, 133–143, 1985.
Rodeghiero, M., Niinemets,U., and Cescatti, A.: Major diffusionleaks of clamp-on leaf cuvettes still unaccounted: how erroneousare the estimates of Farquhar et al. model parameters?, Plant CellEnviron., 30, 1006–1022, 2007.
Rothweiler, H., Wager, P. A., and Schlatter, C.: Comparison ofTenax TA and Carbotrap for sampling and analysis of volatile or-ganic compounds in air, Atmos. Environ., 25B, 231–235, 1991.
Ruuskanen, T. M., Hakola, H., Kajos, M. K., Hellen, H., Tarvainen,V., and Rinne, J.: Volatile organic compound emissions fromSiberian larch, Atmos. Environ., 41, 5807–5812, 2007.
Sabillon, D. and Cremades, L. V.: Diurnal and seasonal variationof monoterpene emission rates for typical Mediterranean species(Pinus pineaandQuercus ilex) from field measurements – rela-tionship with temperature and PAR, Atmos. Environ., 35, 4419–4431, 2001.
Schade, G. W. and Goldstein, A. H.: Increase of monoter-pene emissions from a pine plantation as a result ofmechanical disturbances, Geophys. Res. Lett., 30, 1380,doi:10.1029/2002GL016138, 2003.
Schafer, L., Kesselmeier, J., and Helas, G.: Formic and acetic acidemission from conifers measured with a “cuvette” technique, in:Field measurements and interpretation of species related to pho-tooxidants and acid deposition. CEC air pollution research, 39,edited by: Beilke, S., Slanina, J., and Angeletti, G., EuropeanCommission, Brussels, 23–45, 1992.
Schmid, C.: Sorptions- und Permeationseigenschaften der pflan-zlichen Kutikula fur Monoterpene, Dr. rer. nat. Thesis, Technis-che Universitat Munchen, 1991.
Schuh, G., Wildt, J., and Kley, D.: Bestimmung von Emis-sionsraten pflanzlicher Kohlenwasserstoffe bei Sonnenblumenin Abhangigkeit von Temperatur, Lichtintensitat und Streß,insbesondere von der Belastung mit Ozon, Berichte desForschungszentrums Julich, 3261, Institut fur Chemie und Dy-namik der Geosphare 2: Chemie der Belasteten Atmosphare,Forschungszentrum Julich, Julich, 225 pp., 1996.
Schulze, E. D., Turner, N. C., Gollan, T., and Schackel, K. A.:Stomatal responses to air humidity and to soil drought, in: Stom-atal function, edited by: Zeiger, E., Farquhar, G. D., and Cowan,I. R., Stanford University Press, Stanford, 311–321, 1987.
Seybold, S. J., Huber, D. P. W., Lee, J. C., Graves, A. D., andBohlmann, J.: Pine monoterpenes and pine bark beetles: a mar-riage of convenience for defense and chemical communication,Phytochem. Rev., 5, 143–178, 2006.
Shao, M., Czapiewski, K. V., Heiden, A. C., Kobel, K., Komenda,M., Koppmann, R., and Wildt, J.: Volatile organic compoundemissions from Scots pine: mechanisms and description by al-gorithms, J. Geophys. Res., 106, 20483–20491, 2001.
Sharkey, T. D., Singsaas, E. L., Lerdau, M. T., and Geron, C. D.:Weather effects on isoprene emission capacity and applicationsin emissions algorithms, Ecol. Appl., 9, 1132–1137, 1999.
Shim, C., Wang, Y., Choi, Y., Palmer, P. I., Abbot, D. S.,and Chance, K.: Constraining global isoprene emissions withGlobal Ozone Monitoring Experiment (GOME) formaldehydecolumn measurements, J. Geophys. Res.-Atmos., 110, D24301,doi:10.1029/2004JD005629, 2005.
Simpson, D., Guenther, A., Hewitt, C. N., and Steinbrecher, R.:Biogenic emissions in Europe. 1. Estimates and uncertainties, J.Geophys. Res., 100, 22875–22890, 1995.
Simpson, D., Winiwarter, W., Borjesson, G., Cinderby, S., Ferreiro,
Biogeosciences, 8, 2209–2246, 2011 www.biogeosciences.net/8/2209/2011/

U. Niinemets et al.: Estimations of isoprenoid emission capacity from enclosure studies 2245
A., Guenther, A., Hewitt, C. N., Janson, R., Khalil, M. A. K.,Owen, S., Pierce, T. E., Puxbaum, H., Shearer, M., Skiba, U.,Steinbrecher, R., Tarrason, L., andOquist, M. G.: Inventoryingemissions from nature in Europe, J. Geophys. Res.-Atmos., 104,8113–8152, 1999.
Sinha, V., Williams, J., Lelieveld, J., Ruuskanen, T. M., Kajos, M.K., Patokoski, J., Hellen, H., Hakola, H., Mogensen, D., Boy,M., Rinne, J., and Kulmala, M.: OH reactivity measurementswithin a boreal forest: evidence for unknown reactive emissions,Environ. Sci. Technol., 44, 6614–6620,doi:10.1021/es101780b,2010.
Spracklen, D. V., Bonn, B., and Carslaw, K. S.: Boreal forests,aerosols and the impacts on clouds and climate, Philos. T. R.Soc. Lond., 366, 4613–4626, 2008.
Staudt, M.: Untersuchungen der Monoterpen-Abgabe an eu-ropaischen Nadelbaumarten in Abhangigkeit von Umweltfak-toren, Documenta Naturae, 111, Ph.D. thesis, University ofStuttgart-Hohenheim, 166 pp., 1997.
Staudt, M., Bertin, N., Hansen, U., Seufert, G., Ciccioli, P., Foster,P., Frenzel, B., and Fugit, J. L.: Seasonal and diurnal patterns ofmonoterpene emissions fromPinus pinea(L.) under field condi-tions, Atmos. Environ., 31, 145–156, 1997.
Staudt, M., Bertin, N., Frenzel, B., and Seufert, G.: Seasonal vari-ation in amount and composition of monoterpenes emitted byyoungPinus pineatrees – implications for emission modeling, J.Atmos. Chem., 35, 77–99, 2000.
Staudt, M., Joffre, R., and Rambal, S.: How growth conditions af-fect the capacity ofQuercus ilexleaves to emit monoterpenes,New Phytol., 158, 61–73, 2003.
Staudt, M., Mir, C., Joffre, R., Rambal, S., Bonin, A., Landais, D.,and Lumaret, R.: Isoprenoid emissions ofQuercusspp. (Q. suberandQ. ilex) in mixed stands contrasting in interspecific geneticintrogression, New Phytol., 163, 573–584, 2004.
Steinbrecher, R., Eichstadter, G., Schurmann, W., Torres, L.,Clement, B., Simon, V., Kotzias, D., Daiber, R., and van Eijsk,J.: Monoterpenes in air samples: European intercomparison ex-periments, Int. J. Environ. An. Ch., 54, 283–297, 1994.
Steinbrecher, R., Hauff, K., Rabong, R., and Steinbrecher, J.: Iso-prenoid emission of oak species typical for the Mediterraneanarea: source strength and controlling variables, Atmos. Environ.,31, 79–88, 1997.
Steinbrecher, R. and Hauff, K.: Isoprene and monoterpene emissionfrom Mediterranean oaks, in: The proceedings of EUROTRACsymposium ’96, edited by: Borrell, P. M., Borrell, P., Cvitas,T., Kelly, K., and Seiler, W., Computational Mechanics Publica-tions, Southampton, 229–233, 1996.
Stenberg, P., Linder, S., Smolander, H., and Flower-Ellis, J.: Perfor-mance of the LAI-2000 plant canopy analyzer in estimating leafarea index of some Scots pine stands, Tree Physiol., 14, 981–995,1994.
Stenberg, P., Smolander, H., Sprugel, D. G., and Smolander, S.:Shoot structure, light interception, and distribution of nitrogen inanAbies amabiliscanopy, Tree Physiol., 18, 759–767, 1998.
Stewart-Jones, A. and Poppy, G. M.: Comparison of glass vesselsand plastic bags for enclosing living plant parts for headspaceanalysis, J. Chem. Ecol., 32, 845–864, 2006.
Street, R. A., Hewitt, C. N., and Mennicken, S.: Isoprene andmonoterpene emissions from aEucalyptusplantation in Portu-gal, J. Geophys. Res.-Atmos., 102, 15875–15887, 1997.
Sturm, P., Leuenberger, M., Sirignano, C., Neubert, R. E. M., Mei-jer, H. A. J., Langenfelds, R., Brand, W. A., and Tohjima, Y.: Per-meation of atmospheric gases through polymer O-rings used inflasks for air sampling, J. Geophys. Res.-Atmos., 109, D04309,doi:04310.01029/02003JD004073, 2004.
Sun, Z., Niinemets, U., and Copolovici, L.: Foliar iso-prene emission during autumn senescence in aspen (Pop-ulus tremula), Geochim. Cosmochim. Ac., 73, A1295,doi:10.1016/j.gca.2009.05.015, 2009.
Sun, Z., Copolovici, L., and Niinemets,U.: Can the capacity for iso-prene emissions acclimate to environmental modifications duringautumn senescence in aspen (Populus tremula)?, J. Plant Res.,doi:10.1007/s10265-011-0429-7, in press, 2011.
Tani, A., Hayward, S., and Hewitt, C. N.: Measurement of monoter-penes and related compounds by proton transfer reaction-massspectrometry (PTR-MS), Int. J. Mass Spectrom., 223–224, 561–578, 2003.
Tarvainen, V., Hakola, H., Hellen, H., Back, J., Hari, P., andKulmala, M.: Temperature and light dependence of the VOCemissions of Scots pine, Atmos. Chem. Phys., 5, 989–998,doi:10.5194/acp-5-989-2005, 2005.
Theis, N.: Fragrance of Canada thistle (Cirsium arvense) attractsboth floral herbivores and pollinators, J. Chem. Ecol., 32, 917–927, 2006.
Tholl, D., Boland, W., Hansel, A., Loreto, F., Rose, U. S. R., andSchnitzler, J.-P.: Practical approaches to plant volatile analysis,Plant J., 45, 540–560, 2006.
Tiwary, A., Fuentes, J. D., Barr, J. G., Wang, D., and Colls, J. J.:Inferring the source strength of isoprene from ambient concen-trations, Environ. Modell. Softw., 22, 1281–1293, 2007.
US Environmental Protection Agency: Compendium of methodsfor the determination of toxic organic compounds in ambientair, 2nd edn., U.S. Environmental Protection Agency, Officeof Research and Development, National Risk Management Re-search Laboratory, Center for Environmental Research Informa-tion, Cincinnati, Ohio, 37 pp., 1999.
UNECE/EMEP Task Force on Emissions Inventories and Projec-tions: Group 11. Other sources and sinks, in: EMEP/CORINAIRemission inventory guidebook – 2007, Technical report, 16/2007,EEA (European Environment Agency), 2007.
Velikova, V., Pinelli, P., Pasqualini, S., Reale, L., Ferranti, F., andLoreto, F.: Isoprene decreases the concentration of nitric oxidein leaves exposed to elevated ozone, New Phytol., 166, 419–426,2005a.
Velikova, V., Tsonev, T., Pinelli, P., Alessio, G. A., and Loreto, F.:Localized ozone fumigation system for studying ozone effects onphotosynthesis, respiration, electron transport rate and isopreneemission in field-grown Mediterranean oak species, Tree Phys-iol., 25, 1523–1532, 2005b.
von Caemmerer, S. and Farquhar, G. D.: Some relationships be-tween the biochemistry of photosynthesis and the gas exchangeof leaves, Planta, 153, 376–387, 1981.
Vuorinen, T., Reddy, G. V. P., Nerg, A.-M., and Holopainen, J.K.: Monoterpene and herbivore-induced emissions from cabbageplants grown at elevated atmospheric CO2 concentration, Atmos.Environ., 38, 675–682, 2004.
Wang, D., Jiang, W., Gao, H., and Jiang, Z.: Diffusion and swellingof carbon dioxide in amorphous poly(ether ether ketone)s, J.Membrane Sci., 281, 203–210, 2006.
www.biogeosciences.net/8/2209/2011/ Biogeosciences, 8, 2209–2246, 2011

2246 U. Niinemets et al.: Estimations of isoprenoid emission capacity from enclosure studies
Wang, D. K. W. and Austin, C. C.: Determination of complexmixtures of volatile organic compounds in ambient air: canistermethodology, Anal. Bioanal. Chem., 386, 1099–1120, 2006.
Wang, M. and Lincoln, D. E.: Effects of light intensity and artificialwounding on monoterpene production inMyrica cerifera fromtwo different ecological habitats, Can. J. Bot., 82, 1501–1508,2004.
Westerhout, R. W. J., Waanders, J., Kuipers, J. A. M., and vanSwaaij, W. P. M.: Kinetics of the low-temperature pyrolysis ofpolyethylene, polypropylene, and polystyrene modeling, experi-mental determination, and comparison with literature models anddata, Ind. Eng. Chem. Res., 36, 1955–1964, 1997.
Wiedinmyer, C., Friedfeld, S., Baugh, W., Greenberg, J., Guenther,A., Fraser, M., and Allen, D.: Measurement and analysis of at-mospheric concentrations of isoprene and its reaction products incentral Texas, Atmos. Environ., 35, 1001–1013, 2001.
Wiedinmyer, C., Guenther, A., Harley, P., Hewitt, C. N., Geron, C.,Artaxo, P., Steinbrecher, R., and Rasmussen, R.: Global organicemissions from vegetation, in: Emissions of atmospheric tracecompounds, edited by: Granier, C., Artaxo, P., and Reeves, C. E.,Kluwer Academic Publishers Dordrecht, The Netherlands, 115–170, 2004.
Wildt, J., Kobel, K., Schuh-Thomas, G., and Heiden, A. C.: Emis-sions of oxygenated volatile organic compounds from plants.Part II: Emissions of saturated aldehydes, J. Atmos. Chem., 45,173–196, 2003.
Wilkinson, M. J., Monson, R. K., Trahan, N., Lee, S., Brown, E.,Jackson, R. B., Polley, H. W., Fay, P. A., and Fall, R.: Leaf iso-prene emission rate as a function of atmospheric CO2 concentra-tion, Glob. Change Biol., 15, 1189–1200, 2009.
Wu, J. and Baldwin, I. T.: Herbivory-induced signalling in plants:perception and action, Plant Cell Environ., 32, 1161–1174, 2009.
Zabaras, D. and Wyllie, S. G.: Rearrangement of p-menthane ter-penes by Carboxen during HS-SPME, J. Sep. Sci., 25, 685–690,2002.
Zeiller, E., Benetka, E., Koller, M., and Schorn, R.: Dry mass de-termination: what role does it play in combined measurementuncertainty? A case study using IAEA 392 and IAEA 413 algaereference materials, Accredit. Qual. Assur., 12, 295–302, 2007.
Zhang, Y., Huang, J.-P., Henze, D. K., and Seinfeld, J. H.:Role of isoprene in secondary organic aerosol formation ona regional scale, J. Geophys. Res.-Atmos., 112, D20207,doi:10.1029/2007JD008675, 2007.
Zimmerman, P. R.: Determination of emission rates of hydrocar-bons from indigenous species of vegetation in the Tampa/St Pe-tersburg, Florida Area. EPA Contract No. 904/9-77-028, pre-pared for Environmental Protection Agency, Environmental Pro-tection Agency, Atlanta, Georgia, USA, 1979.
Biogeosciences, 8, 2209–2246, 2011 www.biogeosciences.net/8/2209/2011/