Benchmarking Advisory Board Management at Large Pharmaceutical Organization
13
Strategic Benchmarking Research & Analysis www.best-in-class.com Benchmarking Advisory Board Management At Large Pharmaceutical & Medical Device Organizations
-
Upload
best-in-class -
Category
Documents
-
view
1 -
download
0
Transcript of Benchmarking Advisory Board Management at Large Pharmaceutical Organization
Strategic Benchmarking Research & Analysiswww.best-in-class.com
Benchmarking Advisory Board Management At Large Pharmaceutical & Medical Device Organizations
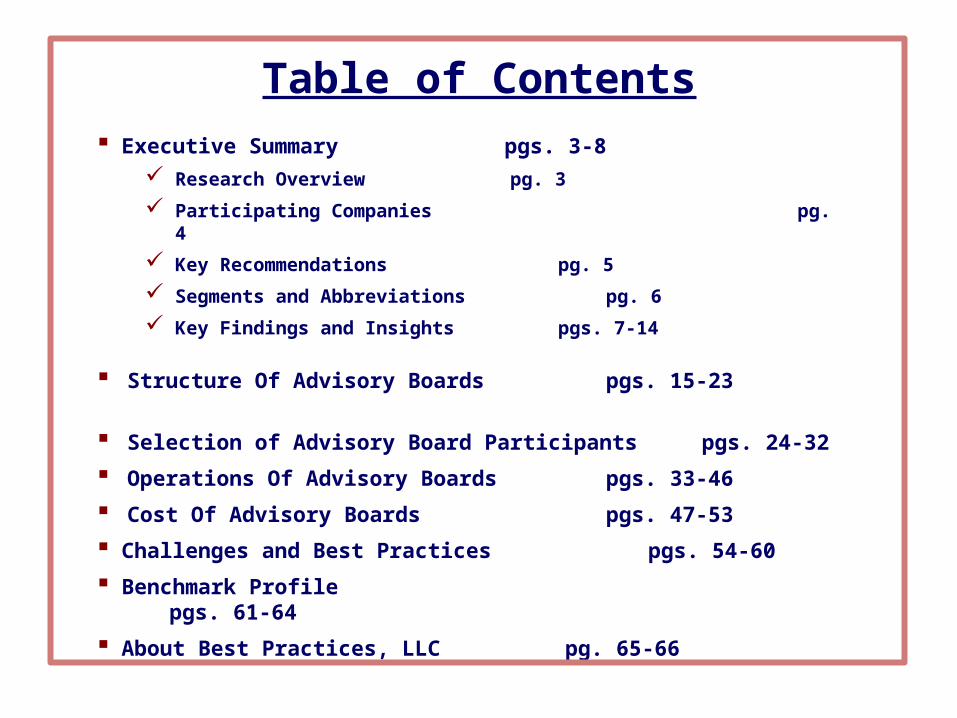
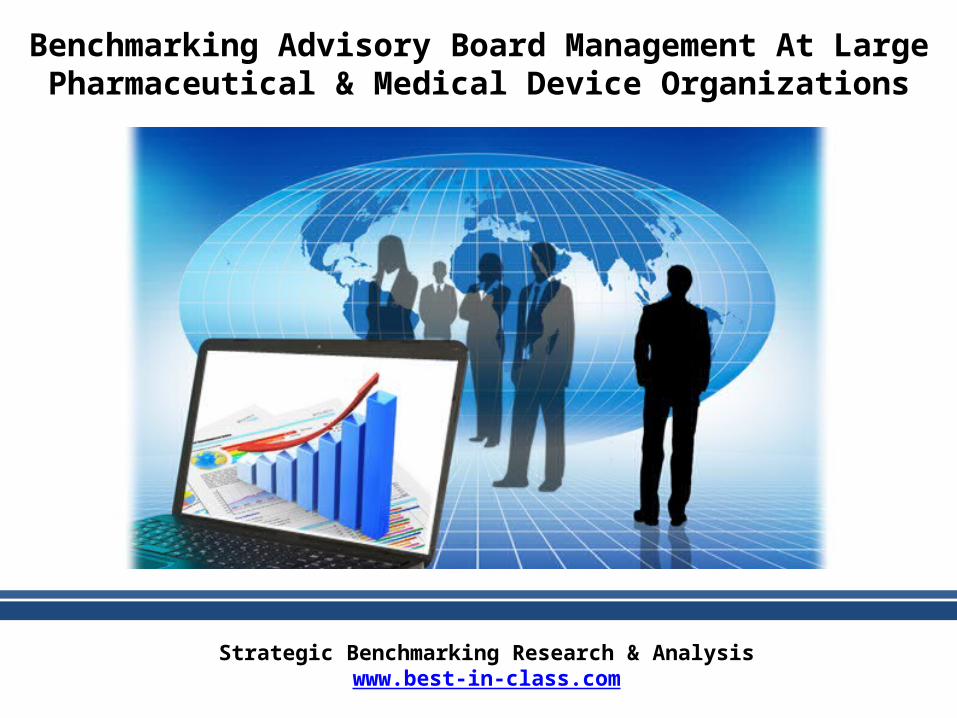
Table of Contents Executive Summary pgs. 3-8
Research Overview pg. 3 Participating Companies pg.
4 Key Recommendations pg. 5 Segments and Abbreviations pg. 6 Key Findings and Insights pgs. 7-14
Structure Of Advisory Boards pgs. 15-23
Selection of Advisory Board Participants pgs. 24-32 Operations Of Advisory Boards pgs. 33-46 Cost Of Advisory Boards pgs. 47-53 Challenges and Best Practices pgs. 54-60 Benchmark Profile
pgs. 61-64 About Best Practices, LLC pg. 65-66
Page | 3
Field Research & Insight Development:
Thirty-five survey responses from Medical Affairs, Marketing and Patient Advocacy leaders at 29 biopharmaceutical and Medical Device companies. This reports captures insights across Large, Mid-Size and Small companies.
Additional deep-dive interviews with 7 selected executives who participated in the study.
• Identify Critical Benchmarks for advisory board Operations
• Provide Cost Benchmarks for Running advisory boards
Research Objectives & Methodology
Research Objectives: Best Structure for Various Types of Advisory Boards Selection of Advisory Board Participants Benchmarking Operations Of Advisory Boards Cost Of Conducting Advisory Boards Top Challenges and Best Practices Of Conducting Advisory Boards
Business Objectives:
A well-run advisory board requires optimum investment in resources and operations. To maximize the return on investment, life science professionals must ensure that the quality of meetings and dialogue with the board is excellent. This research can help pharmaceutical and medical device executives to best run and organize advisory boards.
Page | 4
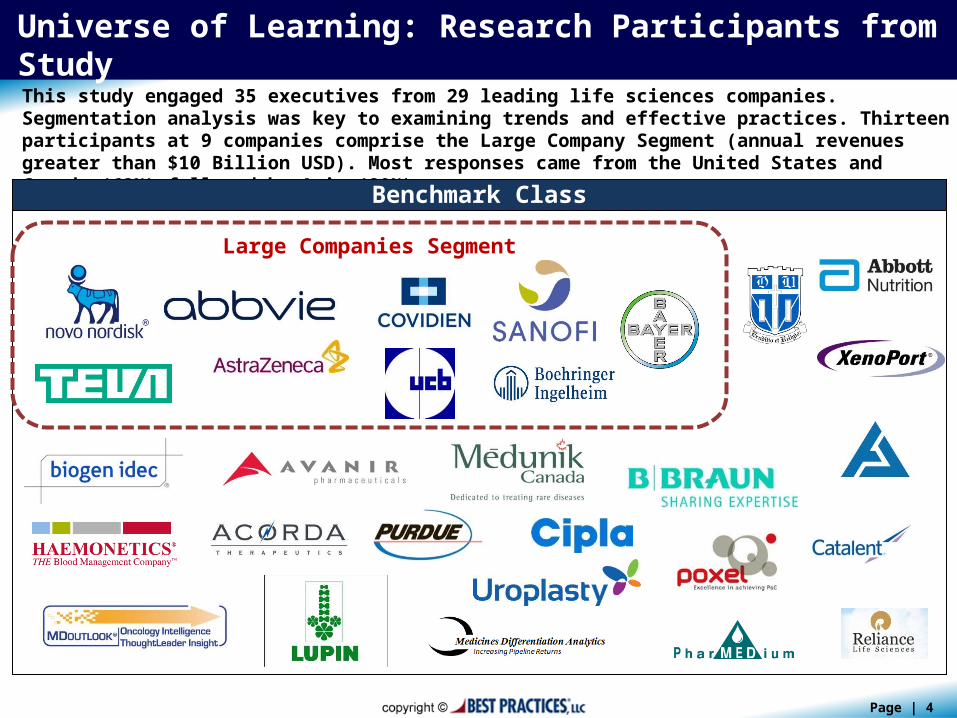
Universe of Learning: Research Participants from StudyThis study engaged 35 executives from 29 leading life sciences companies. Segmentation analysis was key to examining trends and effective practices. Thirteen participants at 9 companies comprise the Large Company Segment (annual revenues greater than $10 Billion USD). Most responses came from the United States and Canada (63%) followed by Asia (20%). Benchmark Class
Large Companies Segment

Segments and Abbreviations
Segments:
• TBC: Total Benchmark Class
• Large Companies Segment (LC): LC is defined as companies with >$10B annual revenue.
Abbreviations:
• TBC: Total Benchmark Class• LC: Large Companies
Page | 6
Key Findings & Insights: Structure Of Advisory Boards
Physician & Clinical Advisory Boards Most Common: Six out of 10 benchmarked companies maintain physician and clinical advisory boards.
Segments: Large Companies utilize all the types of advisory boards studied in this research. Sixty-two percent of large companies have physician advisory boards and 69% have clinical advisory boards. Half of large companies also host marketing advisory boards.
Number of Participants Range From 9-11 Across Different Advisory Boards: Payer and clinical advisory boards average around 9 participants while marketing advisory board participants’ average at 11 and physician advisory boards at 10.
Segment: Large companies have a similar number of advisory board participants as the total benchmark class.
National Participants Preferred for Advisory Boards: A majority of companies prefer participants with a national reach for clinical and payer advisory boards. Almost half of benchmarked companies prefer national participants for marketing advisory board while 30% prefer regional participants. Similarly, for physician advisory boards 48% of companies like national member, while more than a third prefer a mix of both national and regional participants.
Large Companies Prefer National Participants for Physician Advisory Boards: Unlike some benchmarked companies, 56% of large companies prefer national participants as a part of their physician advisory boards while 33% like a mix of both national and regional.
The following key findings and insights emerged from this study.
Page | 7
Key Findings & Insights: Structure Of Advisory Boards
Top Challenges: The top three challenges that study participants face when conducting advisory board meetings are selecting members/location(45%), managing advisory boards (36%), & physician availability (36%).
The following key findings and insights emerged from this study.

Page | 8
Others
Payer Advisory Board
Marketing Advisory Board
Clinical Advisory Board
Physician Advisory Board
23%
46%
54%
69%
62%
20%
29%
49%
60%
60%
Total Benchmark Class Large Companies
Q. Please indicate the advisory board(s) that currently has a presence in your organization.
Compared to small and mid-cap pharma companies, large companies host a greater variety of advisory boards. All companies are more inclined to have physician or clinical advisory boards, but even large pharma companies do not always organize and conduct marketing or payer advisory boards as part of their organizational strategy.
Large Companies Are More Inclined to Implement Advisory Boards Across Various Perspectives
% Respondents
N=35
Others: PatientScientific Advisory Boardad hoc only
Type of Advisory Board Used:
N=13

Page | 9
Q, Please indicate the preferred reach of advisory board members.
N=14-26
Companies continue to seek out national participants or create advisory boards with a national reach, as opposed to a regional reach. That said, regional participants can be important for both physician and payer advisory boards as companies will explore regional regulations and differences that can influence how a drug is presented in a specific geography
National Participants and Reach Favored for Most Advisory Boards
% Respondents
Reach of Participants
Clinical Advisory Board
Marketing Advisory Board
Payer Advisory Board
Physician Advisory Board
88%48% 57% 48%
4%
30%43%
16%
8%22% 36%
National Regional Both
Total Benchmark Class
Clinical Advisory Board
Marketing Advisory Board
Payer Advisory Board
Physician Advisory Board
88%
42%60% 56%
12% 29% 33%
29%
40%11%Large Companies
N=5-9
Page | 10
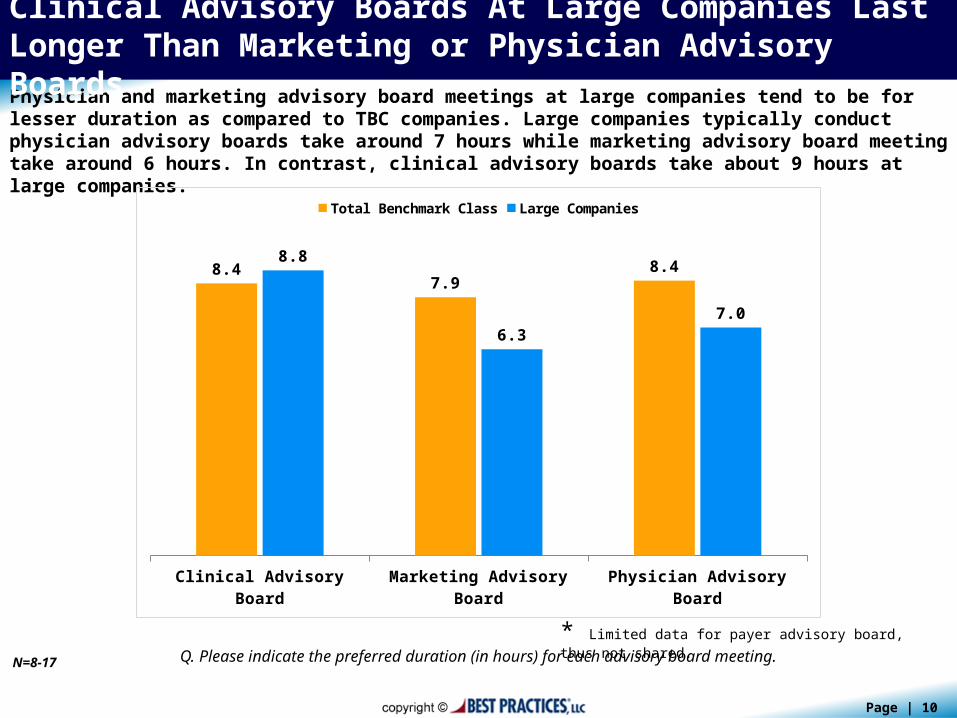
Q. Please indicate the preferred duration (in hours) for each advisory board meeting.
Physician and marketing advisory board meetings at large companies tend to be for lesser duration as compared to TBC companies. Large companies typically conduct physician advisory boards take around 7 hours while marketing advisory board meeting take around 6 hours. In contrast, clinical advisory boards take about 9 hours at large companies.
Clinical Advisory Boards At Large Companies Last Longer Than Marketing or Physician Advisory Boards
N=8-17
* Limited data for payer advisory board, thus not shared.
Clinical Advisory Board
Marketing Advisory Board
Physician Advisory Board
8.47.9
8.48.8
6.37.0
Total Benchmark Class Large Companies
Page | 11
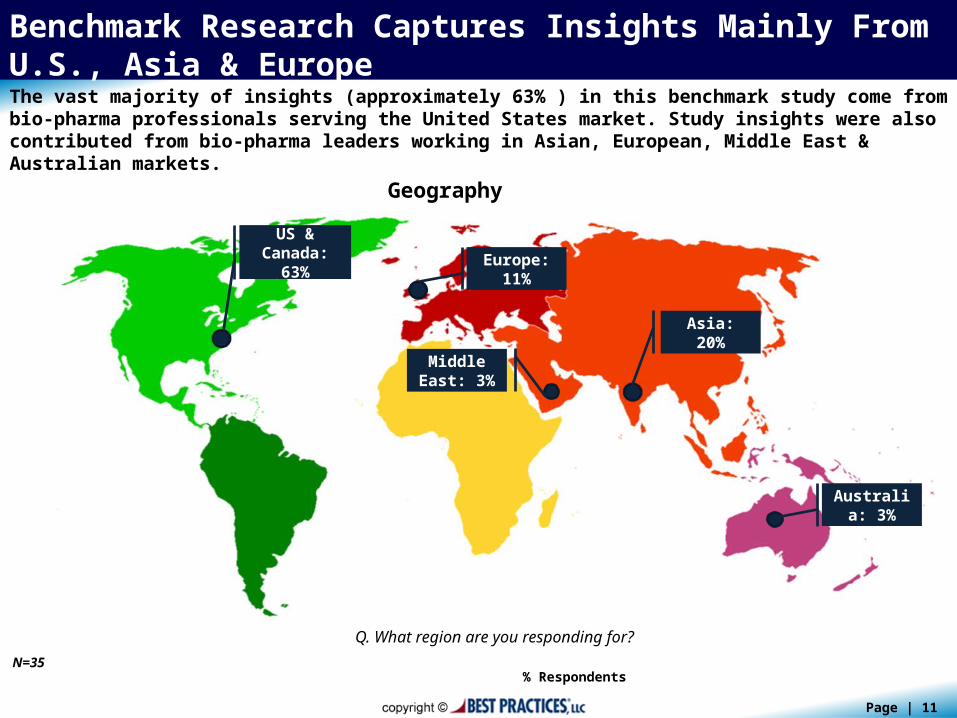
N=35
The vast majority of insights (approximately 63% ) in this benchmark study come from bio-pharma professionals serving the United States market. Study insights were also contributed from bio-pharma leaders working in Asian, European, Middle East & Australian markets.
Benchmark Research Captures Insights Mainly From U.S., Asia & Europe
% Respondents
US & Canada:
63% Europe: 11%
Asia: 20%
Middle East: 3%
Australia: 3%
Q. What region are you responding for?
Geography

Page | 12Q. Please indicate your industry. [Choose all that apply.]
Participation came from across various industries in each segments. Overall 71% of companies represented pharma industry while around 20% were from bio-tech and medical devices each.
Insights Harvested from Organizations Representing Different Industries
% Respondents
N=35Others: Nutrition Service provider
Industry
Pharmaceutical
Biotechnology
Medical Device
Diagnostic
Other
71%
23%
20%
9%
6%
77%
30%
67%
0%
0%
80%
20%
20%
10%
10%
58%
25%
25%
17%
8%
Small Companies Mid-cap Companies Large Companies Total Benchmark Class
Page | 13
Best Practices®, LLC is an internationally recognized thought leader in the field of best practice benchmarking®. We are a research, consulting, benchmark database, publishing and advisory firm that conducts work based on the simple yet profound principle that organizations can chart a course to superior economic performance by leveraging the best business practices, operating tactics and winning strategies of world-class companies.
6350 Quadrangle Drive, Suite 200 Chapel Hill, NC 27517(Phone): 919-403-0251www.best-in-class.com
Download Full Report
Learn More About Our Company: