Behavioral Psychology's Matching Law Describes the ...
11
Behavioral Psychology’s Matching Law Describes the Allocation of Covert Attention: A Choice Rule for the Mind Gene M. Heyman and Sebastian Moncaleano Boston College The matching law describes the allocation of behavior over a wide range of settings, including laboratory experimental chambers, forest foraging patches, sports arenas, and board games. Interestingly, matching persists in settings in which economic analyses predict quite different distributions of behavior, and it also differs systematically from probability matching. We tested whether the matching law also describes the allocation of covert cognitive processes. Sixty-four participants viewed 2, small, vertically arranged adjacent stimuli that projected an image that fit within the fovea. A trial version of the reward contingencies used in matching law experiments determined which stimulus was the target. For example, in 1 condition, the top stimulus was the target 3 times more frequently than the bottom stimulus. However, the amount of time the stimuli were available was tailored to each participant so that they were not able to make use of the information in both stimuli even though an eye-tracking experiment confirmed that they saw both. The implication of this restriction is that participants had to decide which stimulus to attend to prior to each trial. The only available objective basis for this decision was the relative frequencies that a stimulus was the target. The matching law predicted the correlation between the relative frequency that a stimulus was the target and the proportion of trials that it was attended to. The results support the claim that the matching law is a general choice principle— one that describes the allocation of covert mental processes as well as overt behavioral responses. Keywords: matching law, choice, attention allocation, covert attention, visual attention Everyday language distinguishes between thought and behavior. Psychologists do the same. Their job titles, textbooks, and journal articles reflect the split between cognitive psychology and behav- ioral psychology. Nevertheless, thought and behavior share a fun- damental property. Both are limited capacities. At any one moment there is more to consider than can be considered, and there is more to do than can be done. By definition, attention and choice are selective, and in both domains, reward plays a key role in what is selected (e.g., Chelazzi, Perlato, Santandrea, & Della Libera, 2013). Our experiment follows from these observations. It tests whether a quantitative principle that guides choice under an ex- tremely wide range of conditions also guides the allocation of cognition The choice principle has come to be known as “the matching law” (Herrnstein, 1970; Herrnstein, Rachlin, & Laibson, 1997), and the experimental task that we use to test matching involves covert shifts in attention between two small, adjacent visual stimuli. There were no explicit rewards in the experiment, rather there was an objective relative rate of correct targets and, of course, the participant’s judgment as to whether he or she had made a correct response. Our analyses relied largely on the former measure. Thus, our experiment tests whether the matching law provides a precise quantitative description of the relationship be- tween covert shifts in attention and the arranged frequencies of correct answers for such shifts. At a more general level, the experiment tests whether the matching law applies to the allocation of limited mental processes as well as it applies to the allocation of limited behavioral processes. To our knowledge, this is the first experiment that evaluates this question. The Matching Law According to the matching law, the overall distribution of choices approximates the overall distribution of rewards. For in- stance, if there are just two options, as is the case in many experimental studies, then B 1 /(B1 B 2 ) R 1 /(R 1 R 2 ), (1) where B i is the frequency of choices 1 and 2, and R i is the frequency of the rewards associated with choices 1 and 2. Its simplicity notwithstanding, Equation 1 applies widely. Pigeons served as subjects in the initial experiment (Herrnstein, 1970). In subsequent experiments, matching was found in rats, monkeys, cows, humans, and even insects (e.g., Davison & McCarthy, 1988; De Carlo & Abramson, 2012; Grace & Hucks, 2013). The settings have included but are not restricted to lever pressing in experi- mental chambers, signal detection tasks, foraging in natural set- tings, the opening moves in chess games, two- versus three-point shots in college basketball, and point-after-touchdown plays in the X Gene M. Heyman, Department of Psychology and Neuroscience, Boston College; Sebastian Moncaleano, Department of Measurement, Evaluation, Statistics and Assessment, Boston College. Correspondence concerning this article should be addressed to Gene M. Heyman, Department of Psychology and Neuroscience, Boston College, 300 McGuinn Hall, 140 Commonwealth Avenue, Chestnut Hill, MA 02467. E- mail: [email protected] This document is copyrighted by the American Psychological Association or one of its allied publishers. This article is intended solely for the personal use of the individual user and is not to be disseminated broadly. Journal of Experimental Psychology: General © 2020 American Psychological Association 2020, Vol. 2, No. 999, 000 ISSN: 0096-3445 http://dx.doi.org/10.1037/xge0000919 1 AQ: au AQ: 1 AQ: 8 AQ: 9 tapraid5/zfr-xge/zfr-xge/zfr99920/zfr3409d20z xppws S1 7/23/20 15:36 Art: 2019-2274 APA NLM
-
Upload
khangminh22 -
Category
Documents
-
view
0 -
download
0
Transcript of Behavioral Psychology's Matching Law Describes the ...

Behavioral Psychology’s Matching Law Describes the Allocation of CovertAttention: A Choice Rule for the Mind
Gene M. Heyman and Sebastian MoncaleanoBoston College
The matching law describes the allocation of behavior over a wide range of settings, including laboratoryexperimental chambers, forest foraging patches, sports arenas, and board games. Interestingly, matchingpersists in settings in which economic analyses predict quite different distributions of behavior, and italso differs systematically from probability matching. We tested whether the matching law also describesthe allocation of covert cognitive processes. Sixty-four participants viewed 2, small, vertically arrangedadjacent stimuli that projected an image that fit within the fovea. A trial version of the rewardcontingencies used in matching law experiments determined which stimulus was the target. For example,in 1 condition, the top stimulus was the target 3 times more frequently than the bottom stimulus.However, the amount of time the stimuli were available was tailored to each participant so that they werenot able to make use of the information in both stimuli even though an eye-tracking experimentconfirmed that they saw both. The implication of this restriction is that participants had to decide whichstimulus to attend to prior to each trial. The only available objective basis for this decision was therelative frequencies that a stimulus was the target. The matching law predicted the correlation betweenthe relative frequency that a stimulus was the target and the proportion of trials that it was attended to.The results support the claim that the matching law is a general choice principle—one that describes theallocation of covert mental processes as well as overt behavioral responses.
Keywords: matching law, choice, attention allocation, covert attention, visual attention
Everyday language distinguishes between thought and behavior.Psychologists do the same. Their job titles, textbooks, and journalarticles reflect the split between cognitive psychology and behav-ioral psychology. Nevertheless, thought and behavior share a fun-damental property. Both are limited capacities. At any one momentthere is more to consider than can be considered, and there is moreto do than can be done. By definition, attention and choice areselective, and in both domains, reward plays a key role in what isselected (e.g., Chelazzi, Perlato, Santandrea, & Della Libera,2013). Our experiment follows from these observations. It testswhether a quantitative principle that guides choice under an ex-tremely wide range of conditions also guides the allocation ofcognition The choice principle has come to be known as “thematching law” (Herrnstein, 1970; Herrnstein, Rachlin, & Laibson,1997), and the experimental task that we use to test matchinginvolves covert shifts in attention between two small, adjacentvisual stimuli. There were no explicit rewards in the experiment,rather there was an objective relative rate of correct targets and, ofcourse, the participant’s judgment as to whether he or she had
made a correct response. Our analyses relied largely on the formermeasure. Thus, our experiment tests whether the matching lawprovides a precise quantitative description of the relationship be-tween covert shifts in attention and the arranged frequencies ofcorrect answers for such shifts. At a more general level, theexperiment tests whether the matching law applies to the allocationof limited mental processes as well as it applies to the allocation oflimited behavioral processes. To our knowledge, this is the firstexperiment that evaluates this question.
The Matching Law
According to the matching law, the overall distribution ofchoices approximates the overall distribution of rewards. For in-stance, if there are just two options, as is the case in manyexperimental studies, then
B1 ⁄ (B1 � B2) � R1 ⁄ (R1 � R2), (1)
where Bi is the frequency of choices 1 and 2, and Ri is thefrequency of the rewards associated with choices 1 and 2. Itssimplicity notwithstanding, Equation 1 applies widely. Pigeonsserved as subjects in the initial experiment (Herrnstein, 1970). Insubsequent experiments, matching was found in rats, monkeys,cows, humans, and even insects (e.g., Davison & McCarthy, 1988;De Carlo & Abramson, 2012; Grace & Hucks, 2013). The settingshave included but are not restricted to lever pressing in experi-mental chambers, signal detection tasks, foraging in natural set-tings, the opening moves in chess games, two- versus three-pointshots in college basketball, and point-after-touchdown plays in the
X Gene M. Heyman, Department of Psychology and Neuroscience,Boston College; Sebastian Moncaleano, Department of Measurement,Evaluation, Statistics and Assessment, Boston College.
Correspondence concerning this article should be addressed to Gene M.Heyman, Department of Psychology and Neuroscience, Boston College, 300McGuinn Hall, 140 Commonwealth Avenue, Chestnut Hill, MA 02467. E-mail: [email protected]
Thi
sdo
cum
ent
isco
pyri
ghte
dby
the
Am
eric
anPs
ycho
logi
cal
Ass
ocia
tion
oron
eof
itsal
lied
publ
ishe
rs.
Thi
sar
ticle
isin
tend
edso
lely
for
the
pers
onal
use
ofth
ein
divi
dual
user
and
isno
tto
bedi
ssem
inat
edbr
oadl
y.
Journal of Experimental Psychology: General© 2020 American Psychological Association 2020, Vol. 2, No. 999, 000ISSN: 0096-3445 http://dx.doi.org/10.1037/xge0000919
1
AQ: au
AQ: 1
AQ: 8
AQ: 9
tapraid5/zfr-xge/zfr-xge/zfr99920/zfr3409d20z xppws S�1 7/23/20 15:36 Art: 2019-2274APA NLM

NFL (e.g., Cero & Falligant, 2020; Falligant, Boomhower, &Pence, 2016; Houston, 1986; Vollmer & Bourret, 2000). Therewards have included but are not restricted to food, money, brainstimulation, drugs, alcohol, and social approval (e.g., Conger &Killeen, 1974). This generality has attracted the interest of socialpsychologists (Gray, Stafford, & Tallman, 1991), clinicians (Bor-rero & Vollmer, 2002), criminologists (e.g., Rees & Winfree,2017), behavioral economists (Foxall, James, Oliveira-Castro, &Ribier, 2010) and neuroscientists (Arvanitogiannis & Shizgal,2008; Soltani & Wang, 2006). There are studies on the neuralbases of matching (Loewenstein, Seung, & Newsome, 2006) andan extensive literature on the relations between the matching lawand maximizing as understood in biology and economics (e.g.,Heyman & Luce, 1979; Houston, McNamara, & Steer, 2012;Kubanek, 2017). This high degree of generality helps explain whyEquation 1 is often referred to as a “law.” But in the hundreds ofmatching law studies the dependent variable was invariably amanifest activity, an action that could be videotaped.
A Procedure for Quantifying the Allocation of CovertAttention
The current experiment builds on two earlier studies from ourlaboratory (Heyman, Grisanzio, & Liang, 2016; Heyman, Monte-mayor, & Grisanzio, 2017). In these studies, a computer monitordisplayed two, small, adjacent stimuli. A fixed probability deter-mined which one was the target (as in probability matching stud-ies), and, accordingly, the participant’s task was to report on thecontents of this stimulus. Although the two stimuli projected animage that did not exceed the dimensions of the fovea, (e.g.,Wandell, 1995), which we confirmed in an eye-tracking study,(Heyman et al., 2017), the stimulus duration times were tailored toeach participant so that he or she could report correctly on onestimulus, but not both. That is, the participants “saw” both stimulibut were able to identify the contents of just one. We developed amathematical model of the procedure that allowed us to determinewhich stimulus they had actually attended. The equation includeda term for correct guessing, and it was arranged so that the solutionto the equation was the proportion of trials the participant hadattended the target stimulus. That is, we calculated the allocationof covert attention.
A key feature of the procedure (and its mathematical model)was that the probabilities that the two stimuli provided the infor-mation necessary for a correct response summed to 1.0 in eachtrial. However, in most matching law experiments, two or moreindependent timers, each linked to one of the options, determineswhen a choice produces a reward. At any instant, one, both orneither option provides access to the rewards, and these probabil-ities necessarily increase as a function of time since the lastobtained reward (in effect, they replenish). We modified the prob-ability approach of the previous studies so that it mimicked thetemporal, rate-based reinforcement contingences in matching lawstudies. As in matching law studies, on any given trial, onestimulus, both stimuli, or neither stimulus were the targets, andalthough a trial procedure, a clock-like probability device deter-mined whether a stimulus was a target. For instance, as in match-ing law studies, the likelihood that a stimulus was the targetincreased as a function of the number of trials since the last correctchoice; see the Method section for details (notice that this proce-
dure differs from procedures in which the probabilities that thestimulus is correct remains fixed across trials; e.g., Shanks, Tun-ney, & McCarthy, 2002; Shaw & Shaw, 1977).
Reward and Attention
Over the last 20 years or so there has been growing interest inthe degree and manner in which the stimulus’s reward valueinfluences attention (e.g., Anderson & Yantis, 2013; Chelazzi etal., 2013; Lee & Shomstein, 2014; Shahan & Podlesnik, 2006;Small et al., 2005). In a particularly striking example, reward valueundermined the much studied “attentional blink phenomenon”(Raymond & O’Brien, 2009), and several studies show that stimulithat predict rewards can come to control attention in much thesame manner as do highly salient physical features, such as abruptonset times or striking color contrasts (e.g., Le Pelley, Vadillo, &Luque, 2013). In a review of this literature, Chelazzi and hiscolleagues (2013) concluded with the sentence, “it may seemparadoxical that learning principles developed to explain overtbehavior, within a theoretical framework that was skeptical aboutthe hidden and impalpable intricacies of cognition . . . appear. . .perfectly suited to account for reward-based changes in attentionalpriority.” (p. 70). However, it is also the case that studies of howreward influences attention differ in a number of interesting waysfrom traditional behavioral studies. These differences include astrong interest in the neural correlates of attention and an interestin how different sources of stimulus salience combine to guideattention, whereby different sources, the researchers cite statisticallearning, semantic relations, and reward (see, e.g., Chelazzi, Bis-ley, & Bartolomeo, 2018; Jiang, 2018; Todd & Manaligod, 2018).In the Discussion section, we point out that this theoretical orien-tation sheds light on an interesting feature of our results.
Predictions
We tested three quantitative hypotheses. First, that the matchinglaw will predict the allocation of cognition about as well as itpredicts the distribution of choices in behavioral studies. Second,we predict that the trial-by-trial shifts in attention will vary sys-tematically as a function of the overall allocation of attention in amanner analogous to the relationship between moment-to-momentchanges in preference and overall (e.g., session-wide) preferencein behavioral experiments. Third, on the basis of our previousstudies, we predicted that in trials in which the participants at-tended to the stimulus that provided the information necessary fora correct response, they will select the correct answer at least 90%of the time, whereas in trials in which the participants attended tothe stimulus that did not provide the information necessary for acorrect answer, they will perform at chance levels—which in thisexperiment was 14.3%.
A caveat is in order. Our procedure and measures allow for morethan one cognitive bottleneck. One stimulus may have left aweaker “initial trace,” engendered weaker encoding, or, during theprocessing of the information in the attended to stimulus, theencoded initial trace of the other stimulus may have faded frommemory. These are not mutually exclusive nor exhaustive possi-bilities. We say more about the constraints on cognition in theDiscussion section of this paper. Put another way, when we use theword attention we are referring to the selective allocation of
Thi
sdo
cum
ent
isco
pyri
ghte
dby
the
Am
eric
anPs
ycho
logi
cal
Ass
ocia
tion
oron
eof
itsal
lied
publ
ishe
rs.
Thi
sar
ticle
isin
tend
edso
lely
for
the
pers
onal
use
ofth
ein
divi
dual
user
and
isno
tto
bedi
ssem
inat
edbr
oadl
y.
2 HEYMAN AND MONCALEANO
tapraid5/zfr-xge/zfr-xge/zfr99920/zfr3409d20z xppws S�1 7/23/20 15:36 Art: 2019-2274APA NLM
HEYMANG
Sticky Note
probability
HEYMANG
Highlight
HEYMANG
Sticky Note
The highlighted word should be "probability" not "probabilities." thank-you

cognitive resources, which may or may not include the perceptual-cognitive processes engendered by the experimental task.
Method
Participants
We tested 64 participants. Each completed two experimentalsessions. The average age was 18.58 years (SD � 1.54); 45 werewomen. Prior to the start of the experiment, participants signed aconsent form according to the protocols established by the BostonCollege Institutional Review Board (IRB). The experimenter thenread aloud a brief set of instructions (which were presented againon the monitor at the start of the study). The participants earnedcourse credit for participating in the study. The procedure wasapproved by the Boston College IRB.
The number of participants was determined by our previousresearch with a similar version of the procedure used in the presentstudy (Heyman et al., 2016). That experiment produced orderlyand statistically significant results with 41 participants. We in-creased the number of participants in the present study in case theprocedural changes led to more variable results.
Equipment
The experiment was conducted on a laptop computer. Thescreen measured 31.1 cm � 17.5 cm and was set at a resolution of1,366 pixels � 768 pixels. The participants sat at their preferreddistance from the computer, which varied from approximately 43cm to 65 cm.
The Parameterized Matching Law
On the basis of the first generation of matching law experiments,Baum (1974) introduced a more general, ratio version of Herrn-stein’s initial formulation (Equation 1). It included two free (fitted)parameters that captured systematic regularities in the data. Weused this version to describe how the participants divided theirattention between the two stimuli. In logarithmic coordinates, thereformulation of Equation 1 is a linear equation, in which thefitted, free parameters are the intercept and slope:
log(B1 ⁄ B2) � loga � blog(R1 ⁄ R2) (2)
.According to much research, the intercept, log a, measures
asymmetries in the values of the alternatives, say a participant’sside bias or systematic differences in the rewards (say, dollars vs.quarters), and the slope, b, reflects the degree to which participantsaccurately discriminate the rates of reward. (Baum, 1974, 1979). Inmost experiments, the bias parameter differs from zero and par-ticipants do not perfectly discriminate between the competing ratesof reward.
Key Features of the Procedure
Figure 1 outlines the procedure. It shows the different displaysthat made up a trial, their order, and duration. The participant’stask was to find the number in the response screen that was equalto the sum of the three digits in the top or bottom row of the
stimulus screen. For example, in Figure 1, the three digits of thebottom row of the stimulus display add up to nine, and 9 is the fifthsum in the response display. Thus, the bottom row was the targetstimulus, and the keyboard button labeled 5 was the correct re-sponse. What made this task challenging was that the duration ofthe stimulus screen had been tailored to each participant so that heor she had just enough time to reliably find the sum of one row ofthe stimulus display, but not enough time to find the sums of bothrows (see the Calibration Procedure section). This means that theparticipants had to decide which stimulus to attend to prior to thestart of a trial.
Whether the top or bottom stimulus was the target varied proba-bilistically. The nominal values expressed as overall ratios were1:9, 1:3, 1:1, 3:1, and 9:1. For instance, in the 1:9 condition, thebottom stimulus was the target about nine times more frequentlyand conversely so in the 9:1 condition. Each participant experi-enced just one ratio and completed two sessions at this ratio. Theparticipants learned the task readily but differed in terms of howmuch time the stimulus display needed to remain visible to cor-rectly add the three digits of one row.
Calibrating the stimulus screen duration. At the start ofeach session, the participant completed a series of calibrationtrials. Our goal was to find the shortest stimulus display durationthat supported correct responses. The calibration trials were orga-nized into blocks of four, eight, and 16 trials. In three-quarters ofthe trials, a cue informed the participant whether the top or bottomstimulus was correct, with a 50% chance for one or the other. Allparticipants were tested at exposure durations of 600 ms, 400 ms,300 ms, 200 ms, and 150 ms in descending order in four-trialblocks. Next, we adjusted the exposure durations in smaller stepsand increased the number of trials per block to eight or 16. Theadjustments continued until the participant correctly identifiedthe number in the response display that corresponded to the sumof the three digits of the target stimulus at least 87.5% of thetime in the cued trials, while performing at approximatelychance levels in uncued trials.
Trial structure. Following the calibration procedure, the ex-perimental session began. Each trial was initiated by a preparatory,countdown period, marked by asterisks that disappeared at a rate of1/s, with a 100-ms interscreen interval (see Figure 1). Followingthe last asterisk, there was a 1-s screen that displayed the wordsTop or Bottom when it was a cued trial, or No Cue when it was anoncued trial. Next was the stimulus display; it remained on for theperiod determined by the calibration procedure—typically about130 ms to 140 ms.
The digits of the stimulus display were drawn from a listcomposed of the numbers 1 to 7 and were selected according to thefollowing constraints: a row could not contain three instances ofthe same digit, the digits had to sum to a number on the interval 7to 17, each of the 11 possible sums had to appear equally often,and the sums associated with the top and bottom stimuli had todiffer. Next the probe display asked the participant whether he orshe had attended the top row, the bottom row, or “other.” Theparticipant’s response was our measure of attention allocation (wetested whether the participants’ responses were valid, as describedin the Results section). Last, if it was a trial in which there was notarget stimulus, as described next, the display read: “Press spacebar to continue.” Otherwise, the response display listed a columnof seven sums, as shown in Figure 1. The participant’s response
Thi
sdo
cum
ent
isco
pyri
ghte
dby
the
Am
eric
anPs
ycho
logi
cal
Ass
ocia
tion
oron
eof
itsal
lied
publ
ishe
rs.
Thi
sar
ticle
isin
tend
edso
lely
for
the
pers
onal
use
ofth
ein
divi
dual
user
and
isno
tto
bedi
ssem
inat
edbr
oadl
y.
3A MATCHING LAW ACCOUNT OF ATTENTION ALLOCATION
F1
tapraid5/zfr-xge/zfr-xge/zfr99920/zfr3409d20z xppws S�1 7/23/20 15:36 Art: 2019-2274APA NLM

was recorded as correct or not, and it initiated the countdownperiod for the next trial.
Trial simulation of two independent variable timers. In themost widely used procedure for matching law choice studies, twoindependent timers, each stocked with a series of intervals ofvarying duration, determine whether a response will produce areward. We arranged a trial version of this contingency. Therewere two general cases: those in which the history of the previoustrial did not matter (the usual case) and those in which there wascarryover from the previous trial.
Each stimulus was linked to an array of 30 numbers, spanningthe interval of 1 to 30. At the start of the trial a number wasselected at random without replacement from each array. If theselected number met the criteria for setting up a correct response(described subsequently), the sum of the three digits of its linkedstimulus row in the stimulus display screen appeared as one of the
seven possible options in the response display screen. For the 1:1ratio, the numbers 1 to 10 of Array 1 established that the threedigits of the top row of the stimulus display was the targetstimulus, and the numbers 11 to 20 of Array 2 established that thethree digits of the bottom row of the stimulus display was thetarget stimulus. Other numbers had no effect. For the 3:1, 1:3, 9:1,and 1:9 conditions analogous strategies established whether thesum of the three digits of the top and bottom stimuli appeared inthe response display, which is to say, whether the stimulus was atarget. Notice that this approach yielded three possible outcomes:(1) neither stimulus had a match in the response display, (2) eitherthe top stimulus or the bottom stimulus had a match in the responsedisplay, or (3) both the top and bottom stimulus had a match in theresponse display. As noted, on those trials in which the proceduredid not produce a target stimulus, the response display did not
Figure 1. Schematic account of the procedure, including the durations for each step, when appropriate. Eachtrial began with a preparatory, countdown period, marked by three asterisks. They disappeared at a rate of 1/sec,with a 100 msec inter-screen interval. Following the last asterisk, a 1-sec screen displayed the words “Top” or“Bottom” when it was a cued trial or “No Cue” when it was a non-cued trial. Next was the Stimulus Display;its duration was determined by the calibration procedure—typically about 130 – 140 msec. This was followedby a 100 msec mask and the two response displays.
Thi
sdo
cum
ent
isco
pyri
ghte
dby
the
Am
eric
anPs
ycho
logi
cal
Ass
ocia
tion
oron
eof
itsal
lied
publ
ishe
rs.
Thi
sar
ticle
isin
tend
edso
lely
for
the
pers
onal
use
ofth
ein
divi
dual
user
and
isno
tto
bedi
ssem
inat
edbr
oadl
y.
4 HEYMAN AND MONCALEANO
AQ: 10
tapraid5/zfr-xge/zfr-xge/zfr99920/zfr3409d20z xppws S�1 7/23/20 15:36 Art: 2019-2274APA NLM

appear, and the screen read, “Press space bar.” This initiated thenext trial.
The second case is when the 30-digit arrays arranged for thepossibility of a correct response, but the participant failed tochoose the correct sum in the response display. When this hap-pened the target stimulus remained the target, but it displayed anew combination of digits on the next trial. In addition, it remainedpossible for the other stimulus to become a target (assuming it wasnot one already).
Although a trial procedure, the manner in which the opportunity forcorrect responses was arranged approximated the manner in which theopportunity for rewards are established in matching law experimentswith variable interval schedules. First, the likelihood that a stimulushad become a target increased as a function of the number of trialssince it last yielded a correct response. Second, given that the dura-tions of the countdown periods and cue display were fixed, summingto 4.4 s, the probabilities that a stimulus was a target had a temporalcounterpart. For instance, in the 1:1 condition, each array arranged anoverall 0.33 probability that its stimulus (row) was the target, so thatthe expected temporal interval from the last correct response was 13.2s. For the 3:1 and 1:3 conditions, the expected overall average timesfor the corresponding cases were 8.8 and 26.4 s (and vice versa), andin the 9:1 and 1:9 conditions, the expected average times were 7.4 and66.6 s (and vice versa). Third, once one of the two stimuli became atarget, it remained so until the participant correctly identified it in theresponse display. Thus, in a manner analogous to how rewards set upin laboratory matching law studies, the likelihood that a stimulus wasthe target increased over time and once a stimulus became a target itremained so until correctly identified.
Stimulus properties and size relative to the fovea. Eachdigit of the stimulus display measured approximately 0.18 cm �0.32 cm and each row of three digits measured 0.71 cm � 0.32 cm,with a space of 0.24 cm between each row. Thus, depending on theparticipant’s viewing distance: the entire stimulus array subtendedvisual angles of 0.63 � 0.78 to 0.95 � 1.17 degrees, each digitsubtended visual angles of about 0.18 � 0.28 to 0.27 � 0.43degrees, each row subtended angles of about 0.63 � 0.28 to0.95 � 0.43 degrees, and the border between the two rows sub-tended visual angles of about 0.63 � 0.21 to 0.95 � 0.32 degrees.Visual angles of less than 5.0 degrees are described as “small” or“narrow” (De Cesarei and Codispoti, 2008; Goolkasian, 1991).This judgment is based on the sizes of the fovea and foveola,which, according to standard texts, are approximately 5.0 and 1.2degrees, respectively (Wandell, 1995). Thus, the entire stimulusarray (top and bottom stimulus together) were well within the viewof a fixed gaze.
Session structure. Each session was 132 trials long: 22 werecued and 110 were noncued. Eleven of the cued trials occurred inthe first half of the session. After Trial 66, the participants had theopportunity to take a break of up to 3 minutes. The purpose ofincluding some cued trials in the experimental session was tocheck whether the calibration procedure provided the participantsenough time to add correctly the three digits when they knewahead of time which stimulus was the target—and by extension, todetermine whether they had enough time to respond correctly onuncued trials when they had attended the target stimulus. In thecued trials, the top and bottom stimuli were equally likely to be thetarget.
Departures from standard practice. We should point outthree features of the present study that are atypical. In matchinglaw studies, researchers typically evaluate the relationship betweenchoice proportions and the obtained reward proportions. However,choice proportions can affect the obtained reward proportions. Forexample, if all choices went to just one reward source then theallocation of choices would perfectly match the allocation ofrewards (both equaling 100%), but it would be unclear as towhether the independent variable was choice or the consequencesof choice. Accordingly, our approach was to evaluate attentionallocation as a function of the experimentally arranged number oftrials that the top row stimulus was the target relative to theexperimentally arranged number of trials that the bottom rowstimulus was the target. This provides a less ambiguous, moreinformative account of the relations between attention and correctresponses.
Second, the consequence of attending to the target stimulus wasa correct answer (assuming that the three digits were added to-gether correctly). The instructions described what counted as acorrect answer, and participants were told to get as many correctanswers as possible. However, the procedure did not provideexplicit feedback as to whether a response was correct or not.Thus, the consequences for attending to a stimulus, like attentionitself, were covert.
Third, in our previous attention studies, we inferred the alloca-tion of attention and the correct guess rates by solving linear andquadratic equations that modeled performance. In this version ofthe procedure, we simply asked the participants which stimulusthey had attended to. As shown in the Results section, the partic-ipants’ responses were valid.
Results
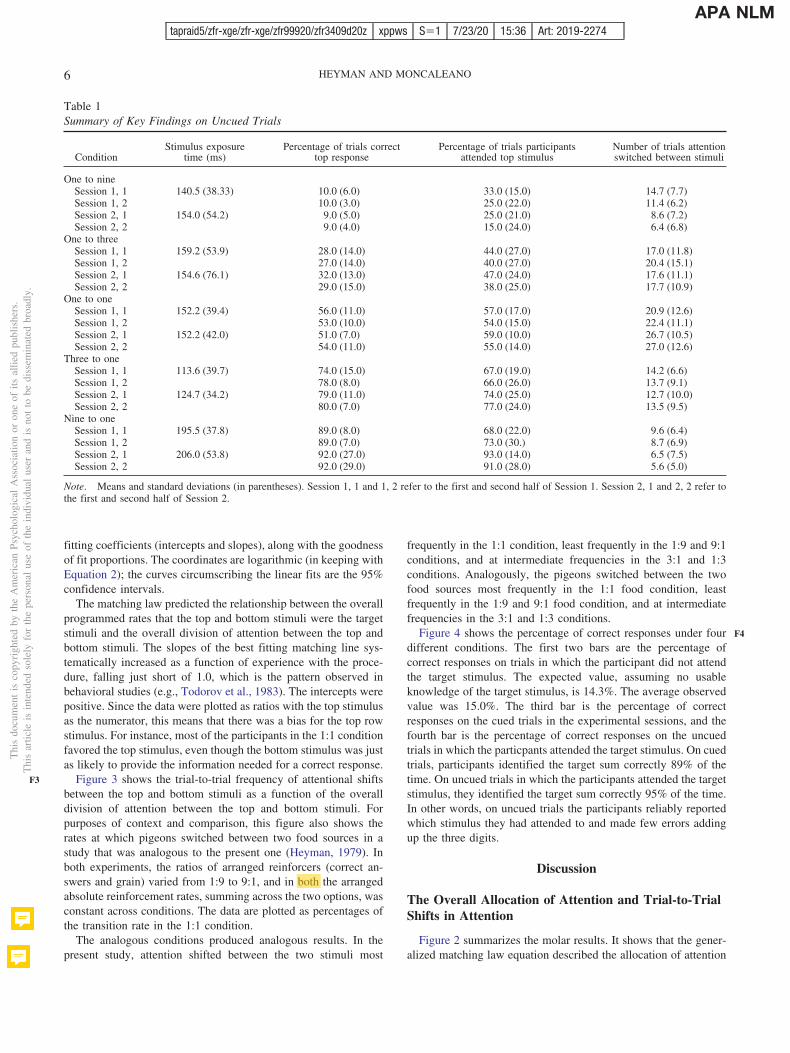
We aggregated the results into half session units for each of thetwo sessions of each of the five conditions. Table 1 lists the mainfindings. Here and throughout, the results are for the uncued trials,unless stated otherwise. The second column lists the averageexposure times, which were determined by the calibration proce-dure. Averaging across the five conditions, the overall averageexposure time in Session 1 was 156.7 ms (with a minimum andmaximum of 70 ms and 370 ms), and in Session 2 the average was150.2 ms (with a minimum and maximum of 50 ms and 275 ms).The third column lists the average percentage of trials that theparticipants correctly identified the sum of the three digits in thetop row stimulus. The third column lists the average percentage oftrials the participants attended the top row stimulus. And the fourthcolumn lists the average number of times that attention switchedfrom one stimulus to the other in each 55-trial block. In eachcondition, attention shifted to better approximate the percentage oftrials that the top stimulus was the target. Figure 2 shows this trendmore clearly.
Figure 2 plots the results as ratios according to Equation 2 foreach half session. In contrast to Table 1, which lists the obtainedpercentage of correct top stimulus identifications, the x-axis is theratio of the number of times the top stimulus was the assignedtarget relative to the number of times the bottom stimulus was theassigned target. As noted in the introductory paragraphs, thisseemed to us a more rigorous test of the matching law predictionsfor the procedure used in this study. The equations list the best
Thi
sdo
cum
ent
isco
pyri
ghte
dby
the
Am
eric
anPs
ycho
logi
cal
Ass
ocia
tion
oron
eof
itsal
lied
publ
ishe
rs.
Thi
sar
ticle
isin
tend
edso
lely
for
the
pers
onal
use
ofth
ein
divi
dual
user
and
isno
tto
bedi
ssem
inat
edbr
oadl
y.
5A MATCHING LAW ACCOUNT OF ATTENTION ALLOCATION
T1, AQ:2
F2
tapraid5/zfr-xge/zfr-xge/zfr99920/zfr3409d20z xppws S�1 7/23/20 15:36 Art: 2019-2274APA NLM
fitting coefficients (intercepts and slopes), along with the goodnessof fit proportions. The coordinates are logarithmic (in keeping withEquation 2); the curves circumscribing the linear fits are the 95%confidence intervals.
The matching law predicted the relationship between the overallprogrammed rates that the top and bottom stimuli were the targetstimuli and the overall division of attention between the top andbottom stimuli. The slopes of the best fitting matching line sys-tematically increased as a function of experience with the proce-dure, falling just short of 1.0, which is the pattern observed inbehavioral studies (e.g., Todorov et al., 1983). The intercepts werepositive. Since the data were plotted as ratios with the top stimulusas the numerator, this means that there was a bias for the top rowstimulus. For instance, most of the participants in the 1:1 conditionfavored the top stimulus, even though the bottom stimulus was justas likely to provide the information needed for a correct response.
Figure 3 shows the trial-to-trial frequency of attentional shiftsbetween the top and bottom stimuli as a function of the overalldivision of attention between the top and bottom stimuli. Forpurposes of context and comparison, this figure also shows therates at which pigeons switched between two food sources in astudy that was analogous to the present one (Heyman, 1979). Inboth experiments, the ratios of arranged reinforcers (correct an-swers and grain) varied from 1:9 to 9:1, and in both the arrangedabsolute reinforcement rates, summing across the two options, wasconstant across conditions. The data are plotted as percentages ofthe transition rate in the 1:1 condition.
The analogous conditions produced analogous results. In thepresent study, attention shifted between the two stimuli most
frequently in the 1:1 condition, least frequently in the 1:9 and 9:1conditions, and at intermediate frequencies in the 3:1 and 1:3conditions. Analogously, the pigeons switched between the twofood sources most frequently in the 1:1 food condition, leastfrequently in the 1:9 and 9:1 food condition, and at intermediatefrequencies in the 3:1 and 1:3 conditions.
Figure 4 shows the percentage of correct responses under fourdifferent conditions. The first two bars are the percentage ofcorrect responses on trials in which the participant did not attendthe target stimulus. The expected value, assuming no usableknowledge of the target stimulus, is 14.3%. The average observedvalue was 15.0%. The third bar is the percentage of correctresponses on the cued trials in the experimental sessions, and thefourth bar is the percentage of correct responses on the uncuedtrials in which the particpants attended the target stimulus. On cuedtrials, participants identified the target sum correctly 89% of thetime. On uncued trials in which the participants attended the targetstimulus, they identified the target sum correctly 95% of the time.In other words, on uncued trials the participants reliably reportedwhich stimulus they had attended to and made few errors addingup the three digits.
Discussion
The Overall Allocation of Attention and Trial-to-TrialShifts in Attention
Figure 2 summarizes the molar results. It shows that the gener-alized matching law equation described the allocation of attention
Table 1Summary of Key Findings on Uncued Trials
ConditionStimulus exposure
time (ms)Percentage of trials correct
top responsePercentage of trials participants
attended top stimulusNumber of trials attentionswitched between stimuli
One to nineSession 1, 1 140.5 (38.33) 10.0 (6.0) 33.0 (15.0) 14.7 (7.7)Session 1, 2 10.0 (3.0) 25.0 (22.0) 11.4 (6.2)Session 2, 1 154.0 (54.2) 9.0 (5.0) 25.0 (21.0) 8.6 (7.2)Session 2, 2 9.0 (4.0) 15.0 (24.0) 6.4 (6.8)
One to threeSession 1, 1 159.2 (53.9) 28.0 (14.0) 44.0 (27.0) 17.0 (11.8)Session 1, 2 27.0 (14.0) 40.0 (27.0) 20.4 (15.1)Session 2, 1 154.6 (76.1) 32.0 (13.0) 47.0 (24.0) 17.6 (11.1)Session 2, 2 29.0 (15.0) 38.0 (25.0) 17.7 (10.9)
One to oneSession 1, 1 152.2 (39.4) 56.0 (11.0) 57.0 (17.0) 20.9 (12.6)Session 1, 2 53.0 (10.0) 54.0 (15.0) 22.4 (11.1)Session 2, 1 152.2 (42.0) 51.0 (7.0) 59.0 (10.0) 26.7 (10.5)Session 2, 2 54.0 (11.0) 55.0 (14.0) 27.0 (12.6)
Three to oneSession 1, 1 113.6 (39.7) 74.0 (15.0) 67.0 (19.0) 14.2 (6.6)Session 1, 2 78.0 (8.0) 66.0 (26.0) 13.7 (9.1)Session 2, 1 124.7 (34.2) 79.0 (11.0) 74.0 (25.0) 12.7 (10.0)Session 2, 2 80.0 (7.0) 77.0 (24.0) 13.5 (9.5)
Nine to oneSession 1, 1 195.5 (37.8) 89.0 (8.0) 68.0 (22.0) 9.6 (6.4)Session 1, 2 89.0 (7.0) 73.0 (30.) 8.7 (6.9)Session 2, 1 206.0 (53.8) 92.0 (27.0) 93.0 (14.0) 6.5 (7.5)Session 2, 2 92.0 (29.0) 91.0 (28.0) 5.6 (5.0)
Note. Means and standard deviations (in parentheses). Session 1, 1 and 1, 2 refer to the first and second half of Session 1. Session 2, 1 and 2, 2 refer tothe first and second half of Session 2.
Thi
sdo
cum
ent
isco
pyri
ghte
dby
the
Am
eric
anPs
ycho
logi
cal
Ass
ocia
tion
oron
eof
itsal
lied
publ
ishe
rs.
Thi
sar
ticle
isin
tend
edso
lely
for
the
pers
onal
use
ofth
ein
divi
dual
user
and
isno
tto
bedi
ssem
inat
edbr
oadl
y.
6 HEYMAN AND MONCALEANO
F3
F4
tapraid5/zfr-xge/zfr-xge/zfr99920/zfr3409d20z xppws S�1 7/23/20 15:36 Art: 2019-2274APA NLM
HEYMANG
Highlight
HEYMANG
Sticky Note
both,
HEYMANG
Sticky Note
please insert comma after "both"

at least as well as it describes behavior in choice experiments. Itaccounted for 95% to 99% of the variance in attention allocationratios, and, as observed in behavioral studies (e.g., Todorov et al.,1983), the slopes of the fitted functions—which reflect the influ-ence of variation in reward ratios—increased as a function ofexposure to the procedure, approaching a value of 1.0. The inter-cepts were consistently greater than 0.0, implying a bias in favor ofthe top row stimulus.
Figure 3 summarizes the trial-to-trial shifts in attention alongwith the changeover rates from a pigeon study. As described in thepreceding text, the procedure in the pigeon experiment was anal-ogous to the one used in the present study: the overall programmedrates of reinforcement were constant (counting both variable in-terval schedules), whereas the relative rates varied over the rangeof 1:9 to 9:1, just as in the present study. In both experiments,transition rates were greatest at about a 50:50 allocation of theactivity in question and then trailed off symmetrically as choiceproportions became more extreme. As explained elsewhere, this isprecisely the expected (and observed) pattern if the moment-to-moment probabilities of a transition are stationary, as in a simple,two-state Markov processes (Heyman, 1979, 1982). Thus, the
relationship between moment-to-moment shifts in attention andthe overall division of attention followed the quantitative patternobserved in behavioral studies in which the probability of switch-ing from one food source to the other was relatively constant overtime.
Tests of Our Key Assumptions
We have assumed that in each trial, (1) the participants’ self-reports faithfully reflected which stimulus they attended to, (2) thatif the participant attended to a stimulus, he or she correctly addedup the digits, and (3) that participants had no usable knowledge ofthe stimulus that they did not attend to. The findings supportedthese assumptions. On uncued trials, accuracy rate was 95% for thestimulus that the participants said they had attended to. In contrast,accuracy rate was nearly chance (15.0 vs. 14.3%) on trials in whichattention was allocated to the stimulus that did not provide thecorrect information. These numbers closely approximate the per-formance of an ideal participant who on any given trial attended toone stimulus, added the three digits correctly, but did not attend toboth stimuli.
Figure 2. Attention allocation ratios as a function of the number of trials the top stimulus was the target relativeto the number of trials the bottom stimulus was the target (in logarithmic coordinates). The data points are groupaverages, and the bowed lines trace out the 95% confidence intervals. The intercepts and slopes in the equationsare the best fitting parameters for the generalized matching law. See the online article for the color version ofthis figure.
Thi
sdo
cum
ent
isco
pyri
ghte
dby
the
Am
eric
anPs
ycho
logi
cal
Ass
ocia
tion
oron
eof
itsal
lied
publ
ishe
rs.
Thi
sar
ticle
isin
tend
edso
lely
for
the
pers
onal
use
ofth
ein
divi
dual
user
and
isno
tto
bedi
ssem
inat
edbr
oadl
y.
7A MATCHING LAW ACCOUNT OF ATTENTION ALLOCATION
O CN OL LI ON RE
tapraid5/zfr-xge/zfr-xge/zfr99920/zfr3409d20z xppws S�1 7/23/20 15:36 Art: 2019-2274APA NLM

The results also replicate our earlier results (Heyman et al.,2016). In the initial study, the correct guess rate was 16.2% and thepercentage of trials in which the participants correctly identifiedthe three-digit sum on cued trials was 90%. However, in contrastto the present experiment, the correct guess rate was one of thesolutions to the mathematical model that calculated how attentionwas allocated. That is, correct guess rates determined by self-report and correct guess rates determined by mathematical infer-ence differed by no more than an average of 1.2%.
Relations With Previous Research
The overall attention allocation measures (see Figure 2) and therate at which attention shifted between the two stimuli on atrial-to-trial basis closely replicate the results from typical labora-tory matching law studies, differences in species and type ofreward notwithstanding. However, it is also the case that theresults in this study differed from those reported in the behavioralliterature to some degree.
First, in each of the four conditions summarized in Figure 2, theintercept for the best fitting matching law equation was positive.This means that there was a bias for the top stimulus. For example,in the 1:1 condition, the average allocation ratio was 1.28/1.00,even though the programmed likelihood that the top stimulus wasthe target was precisely 1:1. In behavioral studies, nonzero inter-cepts reflect a side bias or a qualitative difference in the competingrewards. In this experiment, there were no “sides” or explicitrewards that could differ. However, in studies of cognition thatalso arranged brief exposures to 2 � 4 stimulus matrices, partic-ipants were more likely to report elements from the first row (e.g.,Sperling, 1960; Lass, Yan, Chen, Becker, & Luer, 2008), an effect
that Lass et al. attribute to reading habits. This interpretation isconsistent with recent research programs that emphasize that inlaboratory studies, as in everyday life, attention is guided by a hostof factors, including implicit, long-term cognitive patterns, such asreading text from top to bottom (see Chelazzi et al., 2018; Todd &Manaligod, 2018).
Second, in trials in which participants reported attending thestimulus that was not the target, they were correct on 15% of thetrials. This result closely approximates the expected guess rate(1/7), which implies that that the participants had virtually nousable knowledge of the unattended stimulus. This is consistentwith “winner take all” attention models (see, e.g., Zénon, BenHamed, Duhamel, & Olivier, 2009). However, as noted in theLimitations section, there are good reasons to believe that thewinner take all aspect of the present results emerged either as afunction of repeated exposure to the procedure and/or late in theperceptual/cognitive processes that mediated the participants’choices in the response display stage of the experiment.
Limitations
In the introductory paragraphs, we pointed out that our proce-dure and measures do not locate the constraints on cognition.Viewed in isolation, the results are equally compatible with atten-tion models that emphasize early selection processes (e.g., Treis-man, 1969) and those that emphasize late selection processes (e.g.,Duncan, 1980; Lavie, Hirst, de Fockert, & Viding, 2004). How-ever, the research literature suggests that it is more likely that lateselection processes played a more important role First, in a muchreferenced study that used stimuli that were roughly the same sizeas those in the present experiment, Eriksen and Hoffman (1973)
Figure 3. The filled circles show shifts in attention from the last half of the second session. The filled triangles showchangeover rate for four pigeons, averaged across the last five sessions of each condition. The results from the presentexperiment are group averages, and the error bars indicate the standard errors. For the data from the present study, the x-axislists the overall division of attention between the two stimuli (as percentages). For the pigeon experiment, the x-axis lists theoverall division of time spent at each food source. See the online article for the color version of this figure.
Thi
sdo
cum
ent
isco
pyri
ghte
dby
the
Am
eric
anPs
ycho
logi
cal
Ass
ocia
tion
oron
eof
itsal
lied
publ
ishe
rs.
Thi
sar
ticle
isin
tend
edso
lely
for
the
pers
onal
use
ofth
ein
divi
dual
user
and
isno
tto
bedi
ssem
inat
edbr
oadl
y.
8 HEYMAN AND MONCALEANO
AQ: 11
O CN OL LI ON RE
tapraid5/zfr-xge/zfr-xge/zfr99920/zfr3409d20z xppws S�1 7/23/20 15:36 Art: 2019-2274APA NLM

found evidence that there is an irreducible limit on the “size” ofattentional focus that corresponds to 1.0 degree of visual angle. Ifthis is correct, not only did a gaze encompass both the top andbottom stimuli but so did visual-spatial attention in the initialstimulus display. Second, in support of this suggestion, numerousstudies show that in simple attention tasks (such as identifying aparticular letter or slanted line), participants are capable of attend-ing two spatial locations that are further apart than the top andbottom stimuli in the present study (e.g., Jonides, 1983; Bay &Wyble, 2014; Wolfe, 1992). Thus, it is reasonable to suppose thatin this study participants were capable of attending to both the topand bottom stimuli in the stimulus display stage of each trial. Whythen, did the participants have no usable knowledge of the unat-tended to stimulus when selecting a response in the final, responsedisplay stage of each trial? The simplest account is that theunattended stimulus was not as fully encoded or disappeared fromworking memory in the process of adding together the three digitsof the attended row. In addition, it is possible that as the partici-pants learned which stimulus was more likely to be the target,suppressive or inhibitory processes were triggered that limitedearly processing of the unattended stimulus (e.g., Bridwell &Srinivasan, 2012; Wuhr & Frings, 2008). For instance, a primingprocedure might reveal some knowledge of the unattended stim-ulus and would perhaps be more likely to do so in the early trialsof the initial session. Alternatively, it would be of interest to testwhether rapid serial visual presentation methods in which thestatistical properties of the stimuli, rather than a visual cue, sig-naled the target yielded results similar to those presented here orthose demonstrating parallel processing of more than one target
(e.g., Bay & Wyble, 2014), and whether differences, should theyexist, emerged as a function of practice.
A more general limitation is one that attends virtually all re-search on the matching law relations. In the present procedure, andin the more typical procedures in which the possibility of rein-forcement is continuous and not trial-by-trial, the moment tomoment probabilities of reward change dynamically as a functionof moment-to-moment choices. These dynamics are ignored byEquations 1 and 2 and are usually ignored in research reports. Insupport of this approach are studies that explicitly tracked themoment-to-moment response patterns (e.g., Heyman, 1979; Nevin,1969). There was little or no evidence of moment-to-momentreward probability tracking. Indeed, in one case a simple two-stateMarkov model fit the results (Heyman, 1979). Thus, it is notobvious that more molecular analyses would prove fruitful.
Concluding Remarks
The matching law was originally formulated as a quantitativesummary of the relations between voluntary behaviors and theirconsequences. In the original studies, the consequences wereevents that were established reinforcers, such as grain for hungrypigeons and chow for hungry rats. In this experiment, the conse-quences were the participants’ impressions that they had made acorrect response—there was no feedback. By the criteria used inbehavioral studies, such impressions functioned as reinforcers.This suggests that self-generated self-appraisal (“I found the sumof the three digits”) was functionally similar to environmentalgenerated, tangible rewards. In turn, this raises the possibility thatcovert positive self-regard and positive consummatory eventsshare some common, underlying factors.
The allocation of cognitive resources and the allocation of overtbehavior are similar in that both involve the problem of how tomanage limited resources. This point suggests that if the matchinglaw describes the allocation of choices, it should also describe howindividuals divide their attention between competing stimuli. Theresults summarized by Figures 2 and 3 support this line of reason-ing. The matching law described the allocation of covert cognitiveprocesses as well as it describes the allocation of key pecks, leverpresses, and the other behavioral indices experimenters have usedto investigate choice. What remains to be established is the natureof the cognitive constraints that limited correct responses to justone of the two stimuli on each trial. Did they take place in theinitial response to the stimulus display, did they take place later inthe course of adding together the three digits, or both? Similarly,at what stage or stages did the constraints operate as predicted bythe matching law? Answering these questions will likely prove nosmall task; however, prior to conducting our experiment, we didnot know that these questions needed to be asked.
Context
Heyman’s introductory psychology course motivated our exper-iment. The readings suggested parallels between attention alloca-tion and choice (e.g., Corbetta, Miezin, Dobmeyer, Shulman, &Petersen, 1990; Sperling, 1960). To test this idea, we developed amathematical model and experimental procedure for calculatingthe allocation of covert visual attention; eye movements played norole (Heyman et al., 2016, 2017). The results were systematic, but
Figure 4. The probabilities of a correct response on cued and uncuedtrials. The first bar is the expected percentage of correct responses for thecase that the participant attended the incorrect stimulus and had no usableknowledge of the contents of the correct stimulus (i.e., the expected correctguess rate). The second bar is the observed correct guess rate. The third baris the percentage of correct responses in cued trials. The fourth bar is thepercentage of correct responses on uncued trials in which the participantsreported attending the designated target (correct) stimulus. See the onlinearticle for the color version of this figure.
Thi
sdo
cum
ent
isco
pyri
ghte
dby
the
Am
eric
anPs
ycho
logi
cal
Ass
ocia
tion
oron
eof
itsal
lied
publ
ishe
rs.
Thi
sar
ticle
isin
tend
edso
lely
for
the
pers
onal
use
ofth
ein
divi
dual
user
and
isno
tto
bedi
ssem
inat
edbr
oadl
y.
9A MATCHING LAW ACCOUNT OF ATTENTION ALLOCATION
O CN OL LI ON RE
tapraid5/zfr-xge/zfr-xge/zfr99920/zfr3409d20z xppws S�1 7/23/20 15:36 Art: 2019-2274APA NLM

the procedure was limited in that the results that were compatiblewith any one of several quantitative choice theories. These ambi-guities motivated the present study. We modified the procedure sothat it would unambiguously test whether the matching law ap-plied. Although shifts in attention were covert, and the proceduredid not provide explicit reinforcers, the matching law equationdescribed the division of attention between two small, brieflypresented stimuli as accurately as it describes the allocation of keypecking between two illuminated disks in hungry pigeons.
References
Anderson, B. A., & Yantis, S. (2013). Persistence of value-driven atten-tional capture. Journal of Experimental Psychology: Human Perceptionand Performance, 39, 6–9. http://dx.doi.org/10.1037/a0030860
Arvanitogiannis, A., & Shizgal, P. (2008). The reinforcement mountain:Allocation of behavior as a function of the rate and intensity of reward-ing brain stimulation. Behavioral Neuroscience, 122, 1126–1138. http://dx.doi.org/10.1037/a0012679
Baum, W. M. (1974). On two types of deviation from the matching law:Bias and undermatching. Journal of the Experimental Analysis of Be-havior, 22, 231–242. http://dx.doi.org/10.1901/jeab.1974.22-231
Baum, W. M. (1979). Matching, undermatching, and overmatching instudies of choice. Journal of the Experimental Analysis of Behavior, 32,269–281. http://dx.doi.org/10.1901/jeab.1979.32-269
Bay, M., & Wyble, B. (2014). The benefit of attention is not diminishedwhen distributed over two simultaneous cues. Attention, Perception &Psychophysics, 76, 1287–1297. http://dx.doi.org/10.3758/s13414-014-0645-z
Borrero, J. C., & Vollmer, T. R. (2002). An application of the matching lawto severe problem behavior. Journal of Applied Behavior Analysis, 35,13–27. http://dx.doi.org/10.1901/jaba.2002.35-13
Bridwell, D. A., & Srinivasan, R. (2012). Distinct attention networks forfeature enhancement and suppression in vision. Psychological Science,23, 1151–1158. http://dx.doi.org/10.1177/0956797612440099
Cero, I., & Falligant, J. M. (2020). Application of the generalized matchinglaw to chess openings: A gambit analysis. Journal of Applied BehaviorAnalysis, 53, 835–845. http://dx.doi.org/10.1002/jaba.612
Chelazzi, L., Bisley, J. W., & Bartolomeo, P. (2018). The unconsciousguidance of attention. Cortex, 102, 1–5. http://dx.doi.org/10.1016/j.cortex.2018.02.002
Chelazzi, L., Perlato, A., Santandrea, E., & Della Libera, C. (2013).Rewards teach visual selective attention. Vision Research, 85, 58–72.http://dx.doi.org/10.1016/j.visres.2012.12.005
Conger, R., & Killeen, P. (1974). Use of concurrent operants in smallgroup research: A demonstration. Pacific Sociological Review, 17, 399–416. http://dx.doi.org/10.2307/1388548
Corbetta, M., Miezin, F. M., Dobmeyer, S., Shulman, G. L., & Petersen,S. E. (1990). Attentional modulation of neural processing of shape,color, and velocity in humans. Science, 248, 1556–1559. http://dx.doi.org/10.1126/science.2360050
Davison, M., & McCarthy, D. (1988). The matching law: A researchreview. Hillsdale, NJ: Lawrence Erlbaum.
De Carlo, L. T., & Abramson, C. I. (2012). “Time allocation in carpenterants (Camponotus herculeanus)”: Correction to De Carlo & Abramson(1989). Journal of Comparative Psychology, 126, 346. http://dx.doi.org/10.1037/a0030304
De Cesarei, A., & Codispoti, M. (2008). Fuzzy picture processing: Effectsof size reduction and blurring on emotional processing. Emotion, 8,352–363. http://dx.doi.org/10.1037/1528-3542.8.3.352
Duncan, J. (1980). The locus of interference in the perception of simulta-neous stimuli. Psychological Review, 87, 272–300. http://dx.doi.org/10.1037/0033-295X.87.3.272
Eriksen, C. W., & Hoffman, J. E. (1973). The extent of processing of noiseelements during selective encoding from visual displays. Perception &Psychophysics, 14, 155–160. http://dx.doi.org/10.3758/BF03198630
Falligant, J. M., Boomhower, S. R., & Pence, S. T. (2016). Application ofthe generalized matching law to point-after-touchdown conversions andkicker selection in college football. Psychology of Sport and Exercise,26, 149–153. http://dx.doi.org/10.1016/j.psychsport.2016.07.006
Foxall, G. R., James, V. K., Oliveira-Castro, J. M., & Ribier, S. (2010).Product substitutability and the matching law. The Psychological Re-cord, 60, 185–216. http://dx.doi.org/10.1007/BF03395703
Goolkasian, P. (1991). The effect of size on the perception of ambiguousfigures. Bulletin of the Psychonomic Society, 29, 161–164. http://dx.doi.org/10.3758/BF03335224
Grace, R. C., & Hucks, A. D. (2013). The allocation of operant behavior.In G. J. Madden, W. V. Dube, T. D. Hackenberg, G. P. Hanley, & K. A.Lattal (Eds.), APA handbook of behavior analysis, Vol. 1: Methods andprinciples (pp. 307–337). Washington, DC: American PsychologicalAssociation. http://dx.doi.org/10.1037/13937-014
Gray, L. N., Stafford, M. C., & Tallman, I. (1991). Rewards and punish-ments in complex human choices. Social Psychology Quarterly, 54,318–329. http://dx.doi.org/10.2307/2786844
Herrnstein, R. J. (1970). On the law of effect. Journal of the ExperimentalAnalysis of Behavior, 13, 243–266. http://dx.doi.org/10.1901/jeab.1970.13-243
Herrnstein, R. J., Rachlin, H., & Laibson, D. I. (Eds.). (1997). The match-ing law: Papers in psychology and economics. Cambridge, MA: HarvardUniversity Press.
Heyman, G. M. (1979). A Markov model description of changeoverprobabilities on concurrent schedules. Journal of the Experimental Anal-ysis of Behavior, 31, 41–51. http://dx.doi.org/10.1901/jeab.1979.31-41
Heyman, G. M. (1982). Is time allocation elicited behavior? In M. Com-mons, R. Herrnstein, & H. Rachlin (Eds.), Quantitative analyses ofbehavior: Vol. 2. Matching and maximizing accounts (pp. 459–490).Cambridge, MA: Ballinger Press.
Heyman, G. M., Grisanzio, K. A., & Liang, V. (2016). Introducing amethod for calculating the allocation of attention in a cognitive “two-armed bandit” procedure: Probability matching gives way to maximiz-ing. Frontiers in Psychology, 7, 223. http://dx.doi.org/10.3389/fpsyg.2016.00223
Heyman, G. M., & Luce, R. D. (1979). Operant matching is not a logicalconsequence of reinforcement rate maximization. Animal Learning &Behavior, 7, 133–140. http://dx.doi.org/10.3758/BF03209261
Heyman, G. M., Montemayor, J., & Grisanzio, K. A. (2017). Dissociatingattention and eye movements in a quantitative analysis of attentionallocation. Frontiers in Psychology, 8, 715. http://dx.doi.org/10.3389/fpsyg.2017.00715
Houston, A. (1986). The matching law applies to wagtails’ foraging in thewild. Journal of the Experimental Analysis of Behavior, 45, 15–18.http://dx.doi.org/10.1901/jeab.1986.45-15
Houston, A. I., McNamara, J. M., & Steer, M. D. (2012). Do we expectnatural selection to produce rational behaviour? In A. K. Seth, T. J.Prescott, & J. J. Bryson (Eds.), Modelling natural action selection (pp.12–36). New York, NY: Cambridge University Press.
Jiang, Y. V. (2018). Habitual versus goal-driven attention. Cortex, 102,107–120. http://dx.doi.org/10.1016/j.cortex.2017.06.018
Jonides, J. (1983). Further toward a model of the mind’s eye’s movement.Bulletin of the Psychonomic Society, 21, 247–250. http://dx.doi.org/10.3758/BF03334699
Kubanek, J. (2017). Optimal decision making and matching are tiedthrough diminishing returns. Proceedings of the National Academy ofSciences of the United States of America, 114, 8499–8504. http://dx.doi.org/10.1073/pnas.1703440114
Lass, U., Yan, S., Chen, G., Becker, D., & Lüer, G. (2008). Position effectsin encoding briefly exposed item matrices: Evidence for a reading bias
Thi
sdo
cum
ent
isco
pyri
ghte
dby
the
Am
eric
anPs
ycho
logi
cal
Ass
ocia
tion
oron
eof
itsal
lied
publ
ishe
rs.
Thi
sar
ticle
isin
tend
edso
lely
for
the
pers
onal
use
ofth
ein
divi
dual
user
and
isno
tto
bedi
ssem
inat
edbr
oadl
y.
10 HEYMAN AND MONCALEANO
AQ: 6
AQ: 7
tapraid5/zfr-xge/zfr-xge/zfr99920/zfr3409d20z xppws S�1 7/23/20 15:36 Art: 2019-2274APA NLM
HEYMANG
Cross-Out
HEYMANG
Sticky Note
omit "that". Line should read "results were compatible" thanks

or merely a matter of the selection criterion? Psychological Research,72, 641–647. http://dx.doi.org/10.1007/s00426-008-0169-z
Lavie, N., Hirst, A., de Fockert, J. W., & Viding, E. (2004). Load theoryof selective attention and cognitive control. Journal of ExperimentalPsychology: General, 133, 339–354. http://dx.doi.org/10.1037/0096-3445.133.3.339
Lee, J., & Shomstein, S. (2014). Reward-based transfer from bottom-up totop-down search tasks. Psychological Science, 25, 466–475. http://dx.doi.org/10.1177/0956797613509284
Le Pelley, M. E., Vadillo, M., & Luque, D. (2013). Learned predictivenessinfluences rapid attentional capture: Evidence from the dot probe task.Journal of Experimental Psychology: Learning, Memory, and Cogni-tion, 39, 1888–1900. http://dx.doi.org/10.1037/a0033700
Loewenstein, Y., Seung, H. S., & Newsome, W. T. (2006). Operantmatching is a generic outcome of synaptic plasticity based on thecovariance between reward and neural activity. Proceedings of theNational Academy of Sciences of the United States of America, 103,15224–15229. http://dx.doi.org/10.1073/pnas.0505220103
Nevin, J. A. (1969). Interval reinforcement of choice behavior in discretetrials. Journal of the Experimental Analysis of Behavior, 12, 875–885.http://dx.doi.org/10.1901/jeab.1969.12-875
Raymond, J. E., & O’Brien, J. L. (2009). Selective visual attention andmotivation: The consequences of value learning in an attentional blinktask. Psychological Science, 20, 981–988. http://dx.doi.org/10.1111/j.1467-9280.2009.02391.x
Rees, C., & Winfree, L. T., Jr. (2017). Social learner decision making:Matching theory as a unifying framework for recasting a general theory.In W. Bernasco, J.-L. Van Gelder, & H. Elffers (Eds.), The Oxfordhandbook of offender decision making (pp. 268–300). New York, NY:Oxford University Press.
Shahan, T. A., & Podlesnik, C. A. (2006). Divided attention performanceand the matching law. Learning & Behavior, 34, 255–261. http://dx.doi.org/10.3758/BF03192881
Shanks, D. R., Tunney, R. J., & McCarthy, J. D. (2002). A re-examinationof probability matching and rational choice. Journal of BehavioralDecision Making, 15, 233–250. http://dx.doi.org/10.1002/bdm.413
Shaw, M. L., & Shaw, P. (1977). Optimal allocation of cognitive resourcesto spatial locations. Journal of Experimental Psychology: Human Per-ception and Performance, 3, 201–211. https://doi-org.ezp-prod1.hul.harvard.edu/10.1037/0096-1523.3.2.201
Small, D. M., Gitelman, D., Simmons, K., Bloise, S. M., Parrish, T., &Mesulam, M. M. (2005). Monetary incentives enhance processing inbrain regions mediating top-down control of attention. Cerebral Cortex,15, 1855–1865. http://dx.doi.org/10.1093/cercor/bhi063
Soltani, A., & Wang, X. J. (2006). A biophysically based neural model ofmatching law behavior: Melioration by stochastic synapses. The Journalof Neuroscience: The Official Journal of the Society for Neuroscience,26, 3731–3744. http://dx.doi.org/10.1523/JNEUROSCI.5159-05.2006
Sperling, G. (1960). The information available in brief visual presentations.Psychological Monographs, 74, 1–29. http://dx.doi.org/10.1037/h0093759
Todd, R. M., & Manaligod, M. G. M. (2018). Implicit guidance ofattention: The priority state space framework. Cortex, 102, 121–138.http://dx.doi.org/10.1016/j.cortex.2017.08.001
Todorov, J. C., de Oliveira Castro, J. M., Hanna, E. S., Bittencourt de Sa,M. C., & Barreto, M. Q. (1983). Choice, experience, and the generalizedmatching law. Journal of the Experimental Analysis of Behavior, 40,99–111. http://dx.doi.org/10.1901/jeab.1983.40-99
Treisman, A. M. (1969). Strategies and models of selective attention.Psychological Review, 76, 282–299. http://dx.doi.org/10.1037/h0027242
Vollmer, T. R., & Bourret, J. (2000). An application of the matching lawto evaluate the allocation of two- and three-point shots by collegebasketball players. Journal of Applied Behavior Analysis, 33, 137–150.http://dx.doi.org/10.1901/jaba.2000.33-137
Wandell, B. A. (1995). Foundations of vision. Sunderland, MA: SinauerAssociates.
Wolfe, J. M. (1992). The parallel guidance of visual attention. CurrentDirections in Psychological Science, 1, 124–128. http://dx.doi.org/10.1111/1467-8721.ep10769733
Wühr, P., & Frings, C. (2008). A case for inhibition: Visual attentionsuppresses the processing of irrelevant objects. Journal of ExperimentalPsychology: General, 137, 116–130. http://dx.doi.org/10.1037/0096-3445.137.1.116
Zénon, A., Ben Hamed, S., Duhamel, J.-R., & Olivier, E. (2009). Atten-tional guidance relies on a winner-take-all mechanism. Vision Research,49, 1522–1531. http://dx.doi.org/10.1016/j.visres.2009.03.010
Received November 4, 2019Revision received February 24, 2020
Accepted May 18, 2020 �
Thi
sdo
cum
ent
isco
pyri
ghte
dby
the
Am
eric
anPs
ycho
logi
cal
Ass
ocia
tion
oron
eof
itsal
lied
publ
ishe
rs.
Thi
sar
ticle
isin
tend
edso
lely
for
the
pers
onal
use
ofth
ein
divi
dual
user
and
isno
tto
bedi
ssem
inat
edbr
oadl
y.
11A MATCHING LAW ACCOUNT OF ATTENTION ALLOCATION
tapraid5/zfr-xge/zfr-xge/zfr99920/zfr3409d20z xppws S�1 7/23/20 15:36 Art: 2019-2274APA NLM