This Supplement describes our approach to simulating the TB ...
55
Appendix A Strategic Planning for Tuberculosis Control in the Republic of Fiji General approach This Supplement describes our approach to simulating the TB epidemic in Fiji. As described in our previous publication [1], we have developed a flexible modelling platform that first divides the population into compartments related to their TB-related status, specifically: susceptible, early latent, active, detected, early treatment, late treatment, and recovered groups or compartments. The entire population is stratified according to risk groups, age groups, and treatment history groups (new and retreatment), with these stratifications applied to all the population groups and compartments, such that these stratifications are fully multiplicative. Stratification by strain and by access to care of variable quality (which is an available option in the AuTuMN platform) are not applicable to this application to Fiji. Stratification by organ manifestation (smear-positive, smear-negative, and extrapulmonary) is applied only to the compartments that represent active disease, and hence is not applied to susceptible, latently infected, and recovered groups. Model parameters may be time-variant and informed by reported data over multiple time points or constant throughout a model run. Of the constant parameters, some are varied from run to run during the calibration process, while the remainder remain fixed throughout. This is intended to capture a high degree of historical consistency with TB epidemiology in Fiji, incorporating both TB-related and demographic aspects. Last, our approach to calibration allows for variation in highly uncertain epidemiological quantities that are relevant to TB transmission, permitting both model calibration and quantification of the uncertainty around baseline extrapolations of the trajectory of TB burden markers. By contrast, to quantify uncertainty around the effects of interventions, we do not consider the uncertainty around disease-specific model parameters, aiming instead to isolate and quantify uncertainty relating to the evidence for the interventions alone.
-
Upload
khangminh22 -
Category
Documents
-
view
3 -
download
0
Transcript of This Supplement describes our approach to simulating the TB ...

Appendix A Strategic Planning for Tuberculosis Control in the Republic of Fiji
General approach
This Supplement describes our approach to simulating the TB epidemic in Fiji. As described
in our previous publication [1], we have developed a flexible modelling platform that first
divides the population into compartments related to their TB-related status, specifically:
susceptible, early latent, active, detected, early treatment, late treatment, and recovered
groups or compartments.
The entire population is stratified according to risk groups, age groups, and treatment history
groups (new and retreatment), with these stratifications applied to all the population groups
and compartments, such that these stratifications are fully multiplicative. Stratification by
strain and by access to care of variable quality (which is an available option in the AuTuMN
platform) are not applicable to this application to Fiji. Stratification by organ manifestation
(smear-positive, smear-negative, and extrapulmonary) is applied only to the compartments
that represent active disease, and hence is not applied to susceptible, latently infected, and
recovered groups.
Model parameters may be time-variant and informed by reported data over multiple time
points or constant throughout a model run. Of the constant parameters, some are varied from
run to run during the calibration process, while the remainder remain fixed throughout. This
is intended to capture a high degree of historical consistency with TB epidemiology in Fiji,
incorporating both TB-related and demographic aspects.
Last, our approach to calibration allows for variation in highly uncertain epidemiological
quantities that are relevant to TB transmission, permitting both model calibration and
quantification of the uncertainty around baseline extrapolations of the trajectory of TB burden
markers. By contrast, to quantify uncertainty around the effects of interventions, we do not
consider the uncertainty around disease-specific model parameters, aiming instead to isolate
and quantify uncertainty relating to the evidence for the interventions alone.
Parameter types
There are four broad types of parameters implemented: 1. Constant parameters
These parameters are set at a constant value throughout time during the course
of a model run and over sequential runs during an uncertainty simulation.
2. Calibration parameters
These parameters are a limited subset of the time-invariant parameters (five in
this application), which are varied between consecutive runs of the model
during the process of calibration and estimation of epidemiological
uncertainty.
3. Time-variant parameters
Functions mapping parameter values to time are created by fitting to multiple
data points provided for different times. This approach allows programmatic
parameters to vary in order to reflect the programmatic history of Fiji and so
enhance realism.
Polynomial spline fitting techniques are used to fit curves to available data.
4. Calculated parameters
Some parameters are calculated from simulated quantities at each time step of
model integration. In this application, this only applies to the forces of
infection for each group that is susceptible to infection. Frequency-dependent
transmission and homogeneous mixing is assumed, such that the force of
infection is proportional to a weighted proportion of all groups with active TB
in Fiji who have not yet entered the non-infectious phase of treatment. The
force of infection is modified for persons who are already infected and in late
latency, for BCG-vaccinated persons, and for persons completing treatment
for active disease (with the parameters reflecting partial immunity being fixed
for the first two of these groups and varied with calibration for the third).
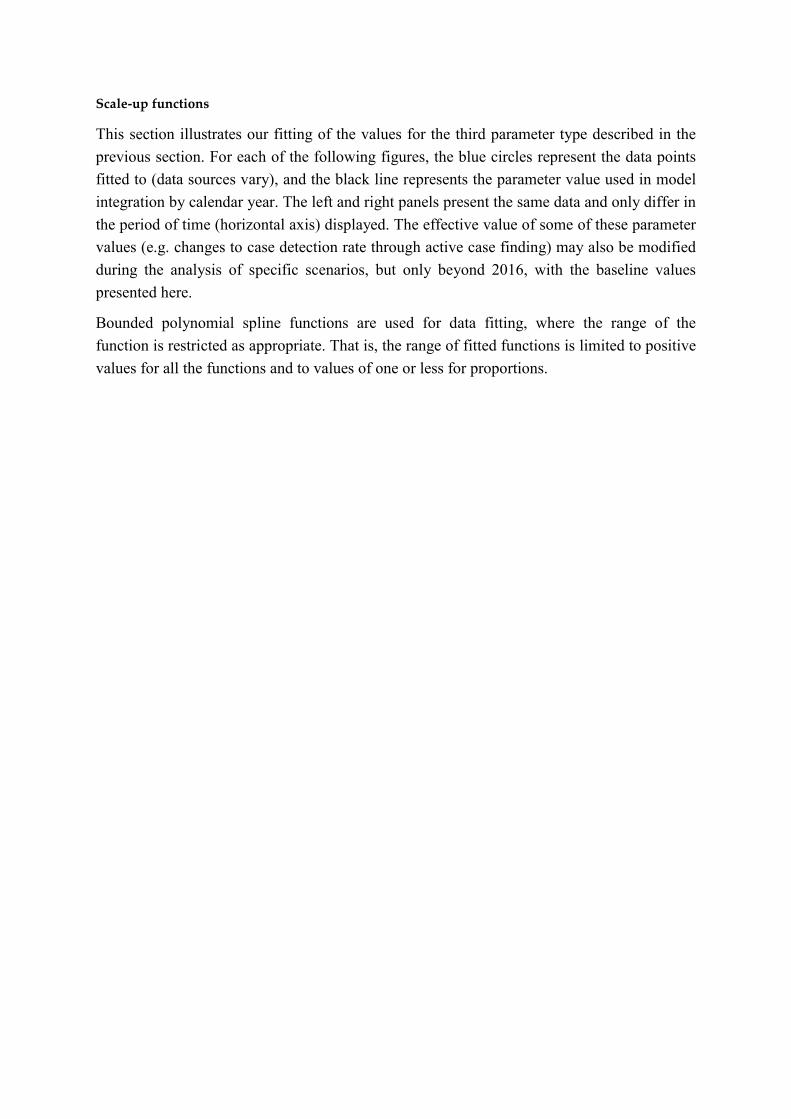
Scale-up functions
This section illustrates our fitting of the values for the third parameter type described in the
previous section. For each of the following figures, the blue circles represent the data points
fitted to (data sources vary), and the black line represents the parameter value used in model
integration by calendar year. The left and right panels present the same data and only differ in
the period of time (horizontal axis) displayed. The effective value of some of these parameter
values (e.g. changes to case detection rate through active case finding) may also be modified
during the analysis of specific scenarios, but only beyond 2016, with the baseline values
presented here.
Bounded polynomial spline functions are used for data fitting, where the range of the
function is restricted as appropriate. That is, the range of fitted functions is limited to positive
values for all the functions and to values of one or less for proportions.
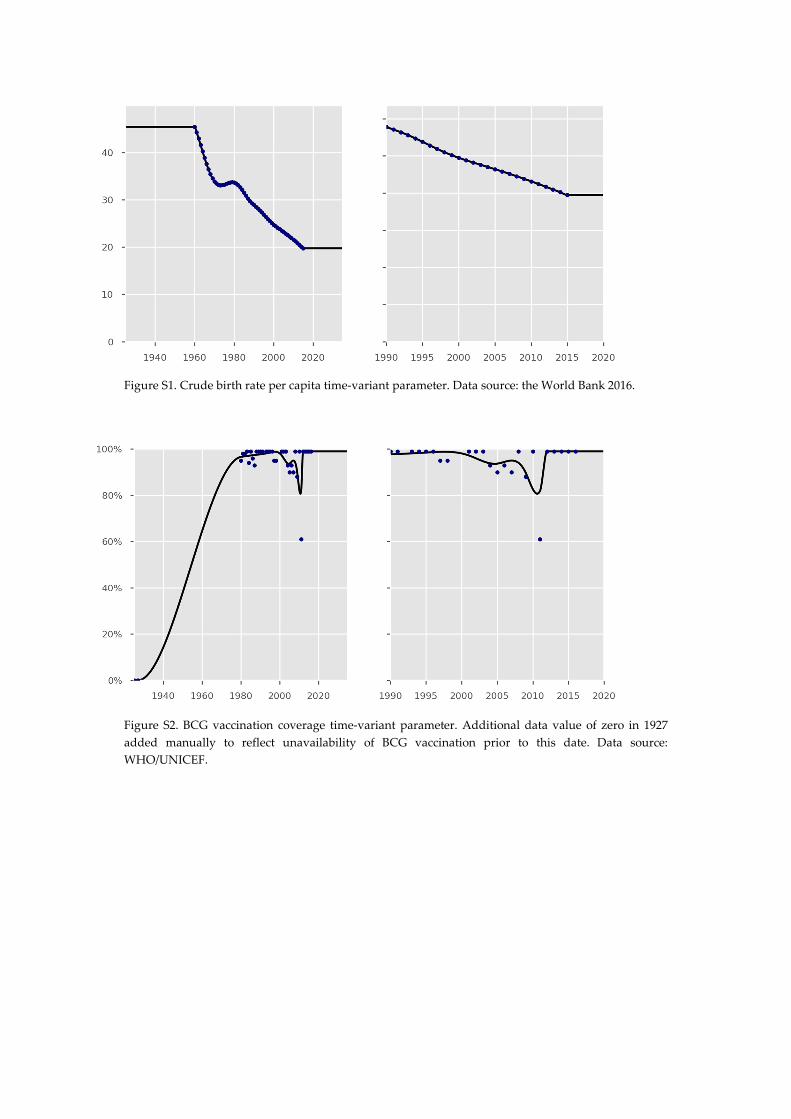
Figure S1. Crude birth rate per capita time-variant parameter. Data source: the World Bank 2016.
Figure S2. BCG vaccination coverage time-variant parameter. Additional data value of zero in 1927
added manually to reflect unavailability of BCG vaccination prior to this date. Data source:
WHO/UNICEF.
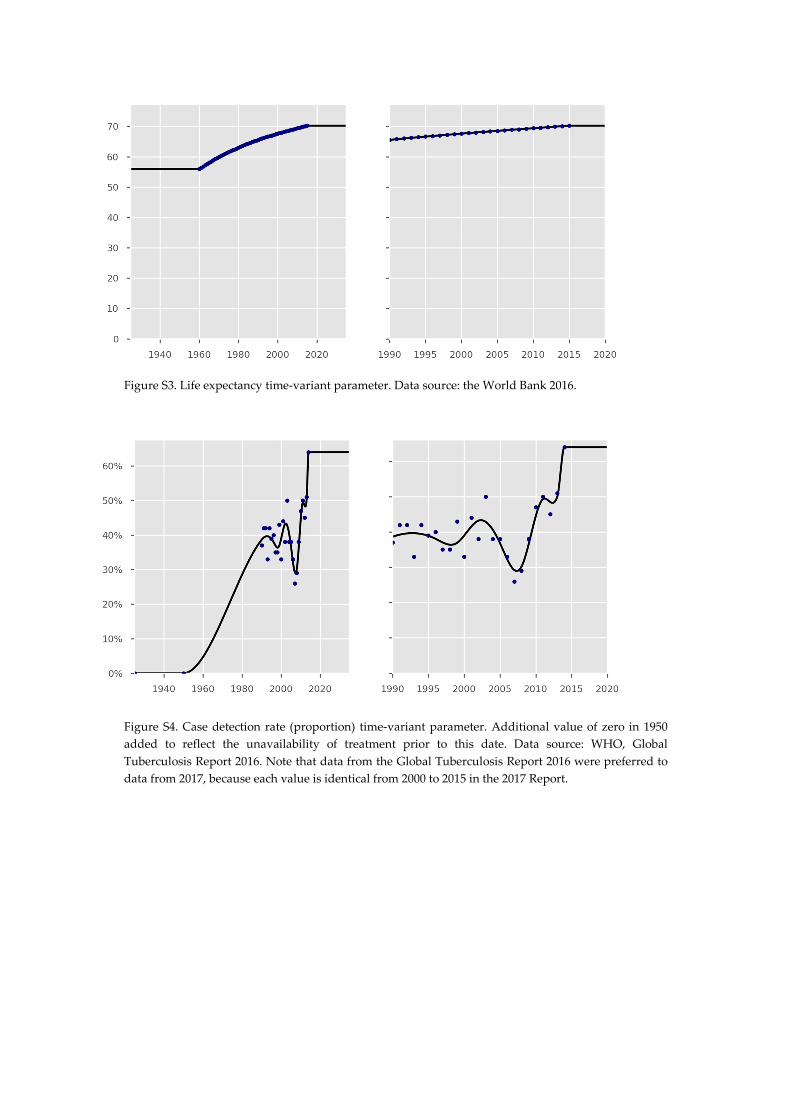
Figure S3. Life expectancy time-variant parameter. Data source: the World Bank 2016.
Figure S4. Case detection rate (proportion) time-variant parameter. Additional value of zero in 1950
added to reflect the unavailability of treatment prior to this date. Data source: WHO, Global
Tuberculosis Report 2016. Note that data from the Global Tuberculosis Report 2016 were preferred to
data from 2017, because each value is identical from 2000 to 2015 in the 2017 Report.

Figure S5. Time-variant parameter of the treatment success outcome for new patients. Data source:
WHO, Global Tuberculosis Report 2017. Note that value of the parameter is inconsequential until the
case detection rate exceeds zero in 1950 (Figure S4).
Figure S6. Time-variant parameter of the proportion of unsuccessful outcomes resulting in death for
new patients. Data source: WHO, Global Tuberculosis Report 2017. Note that the value of the
parameter is inconsequential until the case detection rate exceeds zero in 1950 (Figure S4). Further
clarification of the meaning of this parameter is presented in Section 13.

Figure S7. Time-variant parameter of treatment success outcome in previously treated patients. Data
source: WHO, Global Tuberculosis Report 2017. Note that the value of the parameter is
inconsequential until the case detection rate exceeds zero in 1950 (Figure S4).
Figure S8. Time-variant parameter of the proportion of unsuccessful outcomes resulting in death on
treatment for previously treated patients. Data source: WHO, Global Tuberculosis Report 2017. Note
that the value of the parameter is inconsequential until the case detection rate exceeds zero in 1950
(Figure S4).

Figure S9. Simulated proportion of adult population with diabetes mellitus.
Figure S10. Time-variant parameter of the coverage of isoniazid preventive therapy in under five-year-
old contacts. Data source: Fiji National Tuberculosis Program.

Constant parameters
The constant parameters (first group in Section 2) that do not vary with the calendar time
through model integration are presented in Table S1 below. The rationale and review of the
relevant evidence that were used to determine these parameter values are presented in the
following sections.
Table S1. Constant parameter values
Parameter Value Unit
Latency progression parameters
Duration in early latency (all age groups) 60 Days
Proportion of persons progressing to active TB from
early latency if aged under 5 years
56 %
Proportion of persons progressing to active TB from
early latency if aged 5 to 15 years
26 %
Proportion of persons progressing to active TB from
early latency if aged 15 and above (including 15 to
25 and 25 and up age groups, non-diabetics only)
3 %
Rate of progression from late latency to active
disease (all age groups)
0.245 % per year
Natural history of disease
Duration of active disease if untreated 2.82 (2 to 4)a Years
Case fatality of untreated smear-positive active TB 72.6 (35 to 85)a %
Relative case fatality for smear-negative and
extrapulmonary TB, by comparison to smear-positive
TB (i.e. 20% CFR if smear-negative, 73% CFR if
smear-positive)
20 ÷ 73 Multiplier
Other biological
Effective contact rate 10.0 (5 to 20)a Contacts
per year
Proportion of incident cases smear-positive 33.1 %
Proportion of incident cases smear-negative 39.4 %
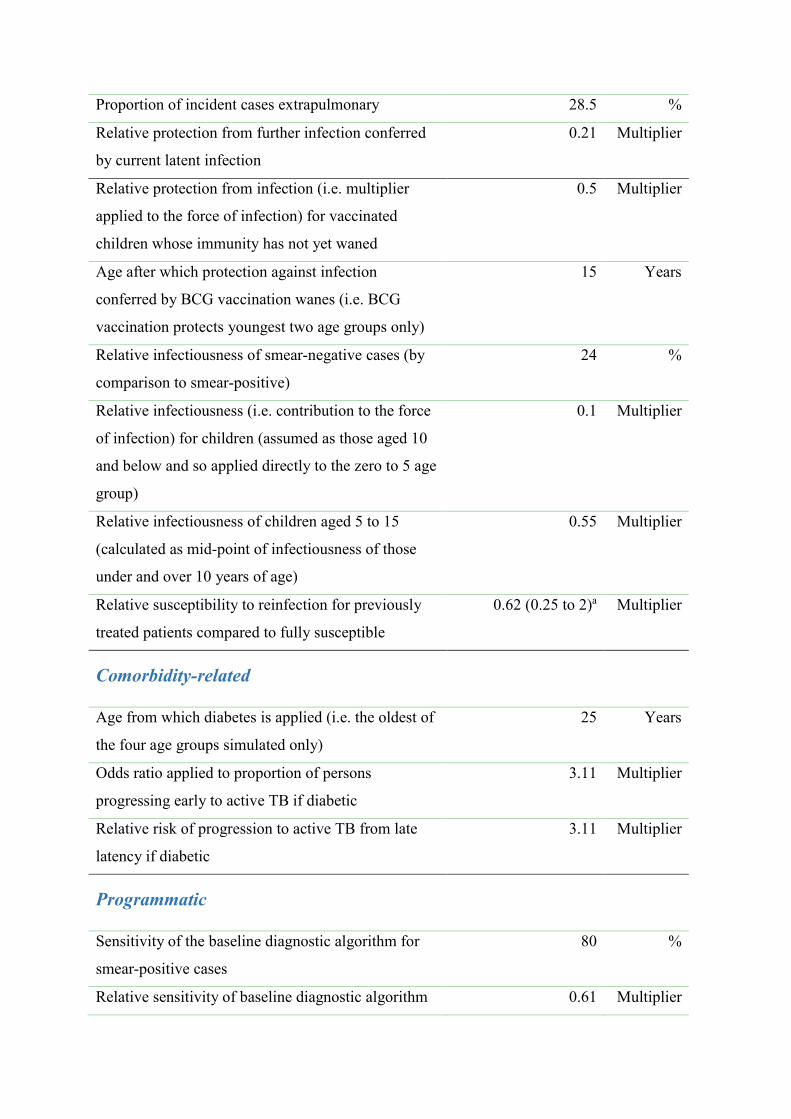
Proportion of incident cases extrapulmonary 28.5 %
Relative protection from further infection conferred
by current latent infection
0.21 Multiplier
Relative protection from infection (i.e. multiplier
applied to the force of infection) for vaccinated
children whose immunity has not yet waned
0.5 Multiplier
Age after which protection against infection
conferred by BCG vaccination wanes (i.e. BCG
vaccination protects youngest two age groups only)
15 Years
Relative infectiousness of smear-negative cases (by
comparison to smear-positive)
24 %
Relative infectiousness (i.e. contribution to the force
of infection) for children (assumed as those aged 10
and below and so applied directly to the zero to 5 age
group)
0.1 Multiplier
Relative infectiousness of children aged 5 to 15
(calculated as mid-point of infectiousness of those
under and over 10 years of age)
0.55 Multiplier
Relative susceptibility to reinfection for previously
treated patients compared to fully susceptible
0.62 (0.25 to 2)a Multiplier
Comorbidity-related
Age from which diabetes is applied (i.e. the oldest of
the four age groups simulated only)
25 Years
Odds ratio applied to proportion of persons
progressing early to active TB if diabetic
3.11 Multiplier
Relative risk of progression to active TB from late
latency if diabetic
3.11 Multiplier
Programmatic
Sensitivity of the baseline diagnostic algorithm for
smear-positive cases
80 %
Relative sensitivity of baseline diagnostic algorithm 0.61 Multiplier

for smear-negative and extrapulmonary cases
Treatment duration 6 Months
Duration infectious after commencing treatment 10 Days
Time period before patients re-start seeking care after
a false-negative diagnosis of TB
3 Months
Time from presentation to treatment commencement,
smear-positive and extrapulmonary cases
7 Days
Time from presentation to treatment commencement,
smear-negative cases
30 Days
Other miscellaneous
Model run start time 1845 (1830 to 1920)a
Modern population targeted in 2016 892,000 Persons
Infectious seed (i.e. first calibration run starts with
190,000 susceptible persons and three active patients,
with total starting population varied but proportion
infectious at commencement remains constant)
3 ÷ (3 + 190,000) Proportion
a Epidemiological uncertainty parameter varied during calibration, presented as: calibrated
value (lower limit of permitted range to upper limited of permitted range). Note that
references to the literature that are used to inform parameter values are not presented here,
as the rationale for the choice of values is presented in detail in the model description below.

Epidemiological uncertainty parameters
We restrict the parameters that can be varied during calibration to TB-specific parameters
that would otherwise remain constant throughout model runs. This behaviour is chosen so
that the uncertainty calculations capture the considerable epidemiological uncertainty in such
parameters, whereas the programmatic parameters are fitted to the best available data for each
time point available. Similarly, the intervention-related and economic parameters are held
constant throughout the epidemiological uncertainty simulations. The uncertainty parameters
are indicated by providing a lower and upper value of the uncertainty range that may be
explored. Each uncertainty parameter is varied between each simulation using a Metropolis–
Hastings algorithm. When running uncertainty, the base case (i.e. without interventions other
than vaccination and IPT in under five years of age applied) is run to completion, and
acceptance is determined based on this simulation only.
Prior distributions
Figure S11 presents the prior distributions used for the five calibrated parameters. The
parameters of the gamma and beta distributions were obtained by specifying the values of the
mean and standard deviation, and the shape and scale parameters were computed accordingly.
We used the following distributions:
Run start time: uniform (1830, 1920)
Relative susceptibility after treatment: gamma (2.8, 0.36). Mean = 1 and sd = 6
Effective contact rate: uniform (5, 40)
Case fatality of untreated smear-positive TB: beta (5.8, 2.5). Mean = 0.7 and sd =
0.15
Duration of untreated active disease: gamma (36, 0.083). Mean = 3 and sd = 0.5
Likelihood
The likelihood is obtained by assuming that the country TB incidence at a given time point is
normally distributed around the predicted TB incidence provided by the model for this same
time point. As the time period 2010–2016 is used for calibration and because the WHO
provides yearly estimates for TB incidence, this means that the likelihood is made of seven
components that are all multiplied together.
Posterior distributions of the parameters
Figure S12 presents the posterior distributions of the five calibrated parameters.
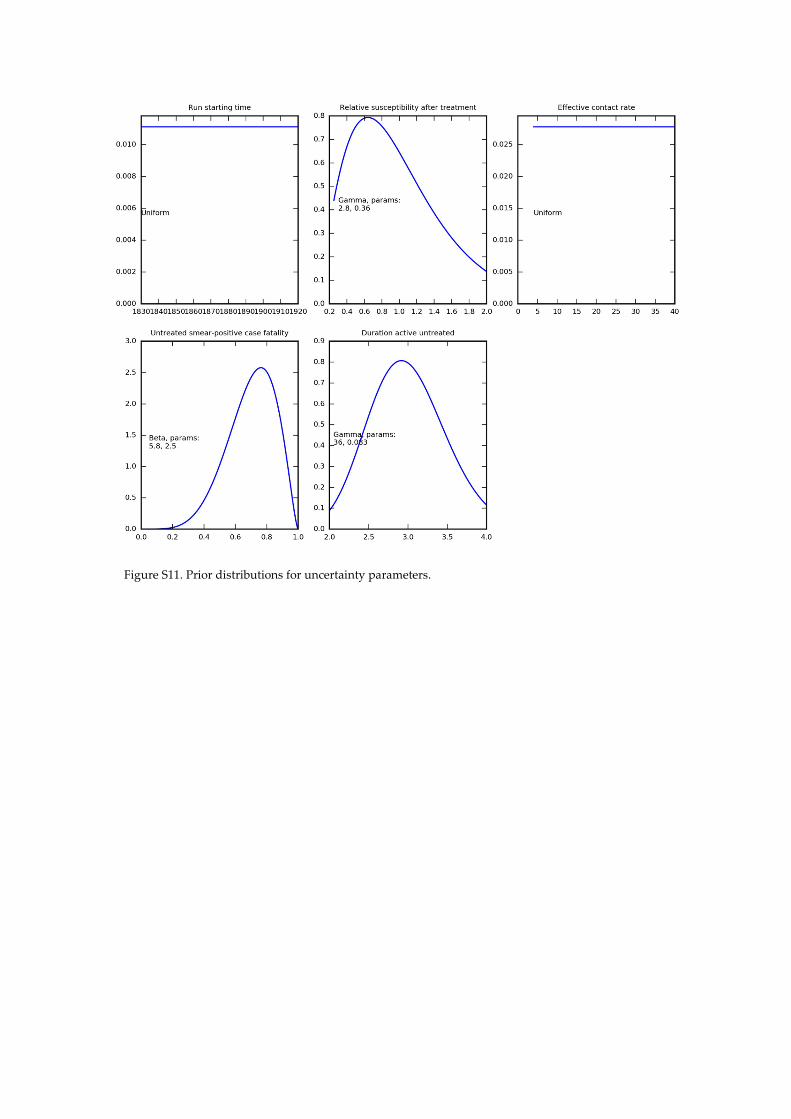
Figure S11. Prior distributions for uncertainty parameters.
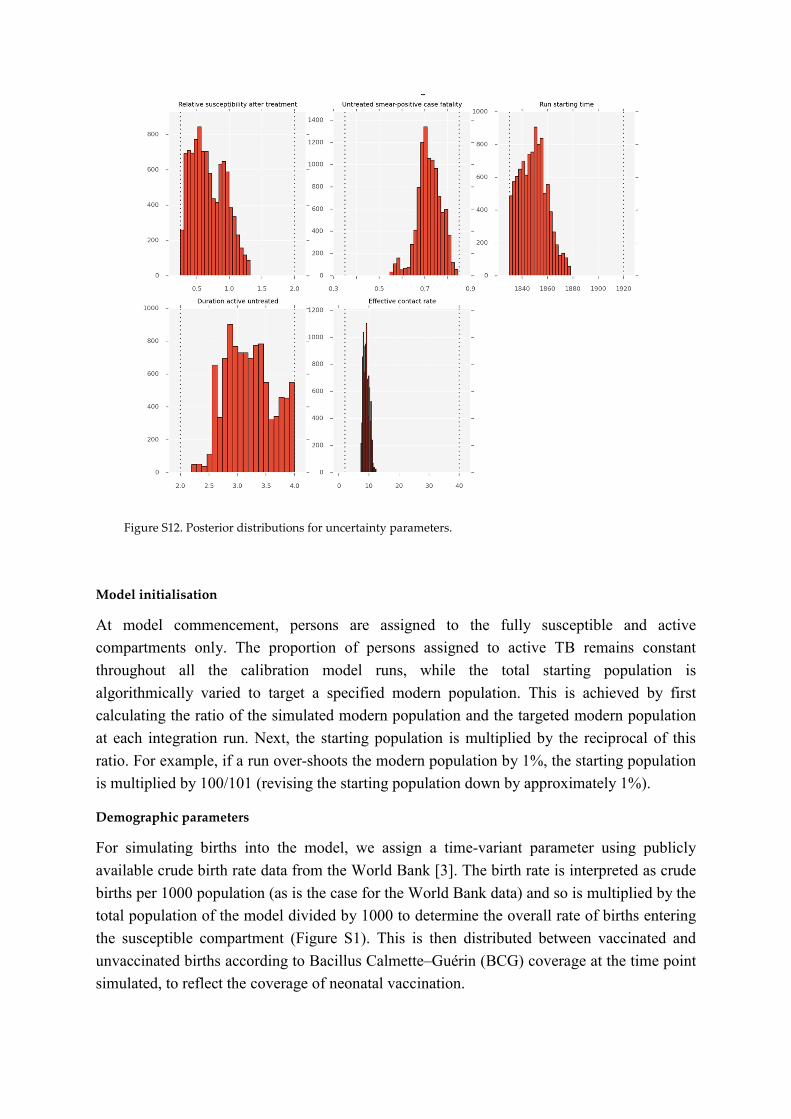
Figure S12. Posterior distributions for uncertainty parameters.
Model initialisation
At model commencement, persons are assigned to the fully susceptible and active
compartments only. The proportion of persons assigned to active TB remains constant
throughout all the calibration model runs, while the total starting population is
algorithmically varied to target a specified modern population. This is achieved by first
calculating the ratio of the simulated modern population and the targeted modern population
at each integration run. Next, the starting population is multiplied by the reciprocal of this
ratio. For example, if a run over-shoots the modern population by 1%, the starting population
is multiplied by 100/101 (revising the starting population down by approximately 1%).
Demographic parameters
For simulating births into the model, we assign a time-variant parameter using publicly
available crude birth rate data from the World Bank [3]. The birth rate is interpreted as crude
births per 1000 population (as is the case for the World Bank data) and so is multiplied by the
total population of the model divided by 1000 to determine the overall rate of births entering
the susceptible compartment (Figure S1). This is then distributed between vaccinated and
unvaccinated births according to Bacillus Calmette–Guérin (BCG) coverage at the time point
simulated, to reflect the coverage of neonatal vaccination.

Simulating non-TB-related deaths or the background death rate is achieved with an analogous
method. Life expectancy is obtained from publicly available data from the World Bank [3],
and a time-variant parameter is fitted to these data points (Figure S3). Then, population
deaths are calculated as the reciprocal of this value and applied equally to every model
compartment, including all the compartments for patients with active TB (in addition to TB-
specific mortality), all risk groups, and all age groups.
Susceptibility/immunity to infection
The degree of susceptibility or immunity to infection among different population groups
given their vaccination status, Mtb infection-related compartment, age, and treatment history
is one of the most uncertain yet important parameters in TB epidemiology. We consider
homogeneous susceptibility/immunity to Mtb across risk groups and age groups, assuming
that the differing rates of TB disease in these groups are related to the other factors described
below. By contrast, BCG vaccination and latent infection with Mtb are considered to
influence the likelihood of infection after exposure to an infectious individual. The effect of
BCG vaccination on immunity is described under the section on BCG vaccination below. The
effect of prior latent infection on reinfection is estimated from a review of cohort studies
comparing those with evidence of prior Mtb infection to those without such evidence among
persons exposed to infectious TB. This study found that the rate of new episodes of TB
disease in those with prior latent infection was 0.21-fold that in those without. Since the
reactivation of past infection would lead to even lower values, we use this estimate as our
parameter value for the relative rate of reinfection among currently latently infected persons
(by comparison to the rate of infection in fully susceptible persons) [4]. Note that this only
applies to the late latent compartment, as the reinfection of those in the early latent
compartment will not affect their risk of progression to active disease, as these persons are
already conferred the highest risk of progression to TB.
Subsequent episodes of TB disease after recovery from a prior episode are known to occur at
a higher rate than that in the background population [5]. However, whether this is due to an
increased host susceptibility to reinfection incurred by the previous episode or to underlying
heterogeneity in rates of reinfection is unclear. In the latter case, it is feasible that recovered
or treated individuals have equivalent or even decreased susceptibility to future infection than
those who have never been infected [6]. We use a multiplying parameter to allow for
individuals who have previously been treated for active TB to be assigned a different level of
susceptibility to subsequent infection from those who have not. This multiplier is applied in
addition to the parameters described above for latent infection and vaccination, such that the
total level of susceptibility is the product of these two parameters. This parameter is varied
during uncertainty, with its prior distribution presented in the second panel of Figure S11. For
example, previously treated and latently infected persons would both have a relative risk of
0.21 compared to fully susceptible persons where this parameter is set to one.
Model of M. tuberculosis infection and progression
General approach and compartmental structure
Our approach to quantifying rates of progression from latency to active disease is described
in detail in two published journal articles. The first uses TB surveillance data from a very low
transmission setting to estimate rates of active disease following a defined index exposure to
an infectious case and evidence of exposure [7]. The second article uses the reactivation
profiles from this study and from a similar epidemiological investigation [8] to determine the

ideal compartmental structure and progression parameters to accurately capture progression
to active TB following infection [9]. This second publication found that two latency
compartments placed in series are highly effective at reproducing epidemiological
observations when appropriately parameterised, and appropriate parameter values are
provided. Specifically, following infection, all the latently infected individuals first progress
to a high-risk “early latent” compartment, from which they may progress rapidly (within
months) to active TB. Alternatively, these individuals may “stabilise”, transitioning to a low-
risk “late latent” compartment, from which the progression to active TB occurs much more
slowly. This configuration is also consistent with that used or recommended in other
important TB modelling papers [10]. This approach requires the estimation of three
epidemiological parameters: the time period spent in the early latent compartment, the
proportion of individuals progressing to active disease from the early latent compartment, and
the rate of progression from the late latent compartment to active disease (values presented in
Table S1). Then, these are converted into three rates for early progression, stabilisation, and
late progression.
Organ manifestation
We distinguish three types of organ manifestation of active TB: smear-positive pulmonary,
smear-negative pulmonary cases, and extrapulmonary cases. We assume that the proportion
of notified TB cases that are pulmonary or extrapulmonary, along with the proportion of
pulmonary cases that are smear-positive, are constant over time. We calculate this value as
the total number of notifications reported by each organ manifestation, and use this constant
value for the proportion of incident cases by organ manifestation.
Natural history
Once TB disease has manifested, natural history parameters are first set to reflect outcomes in
the absence of detection by the health care system. The total rates of progression to either
death or spontaneous recovery are set to equal the reciprocal of the time period of untreated
active disease. Next, a proportion of this total rate is then allocated to each of the two
possible outcomes (death and spontaneous recovery) according to the case fatality rate (a
proportion) for smear-positive TB. The smear-negative and extrapulmonary case fatality rates
are then both set to be proportionately lower than the smear-positive case fatality rate by a
relative multiplier parameter that remains constant throughout model runs. That is, the rate of
untreated death is equal to the reciprocal of the time period untreated multiplied by the case
fatality rate, while the rate of spontaneous recovery is equal to the reciprocal of the time
period untreated multiplied by the complement of the case fatality rate. Parameter values and
uncertainty ranges are estimated from a detailed review of pre-chemotherapy era outcomes
[11].

Case detection
Obtaining the case detection ratio
The case detection rate is a time-variant parameter and is a fundamental parameter
determining the performance of TB programs at the country level. Estimates of the case
detection rate are provided by the World Health Organization in the Global TB Report [12]. It
is important to note that this “rate” is actually a ratio or proportion, and is referred to as the
case detection ratio hereafter. Specifically, the case detection ratio is the proportion of all the
active cases that are detected during their episode of disease, which is also expressed as the
ratio of notifications to incidence in the geographical region considered. Variations in its
magnitude have major impacts on disease burden that may only be realised decades later.
Effective medical treatments for active TB only became available from the 1950s onwards.
Since there was no effective treatment that improved on the natural history of the disease, we
apply an effective case detection ratio prior to that time of zero. As with other time-variant
parameters, case detection ratio data are loaded from the Global TB Report data. Adjustment to the case detection ratio for decentralisation
After the case detection ratio time-variant parameter has been defined as described above, it
is next adjusted for the decentralisation intervention. This is described in detail in Section 17,
and has the general effect of narrowing the gap between the actual, loaded case detection
ratio and an idealised perfect case detection ratio. Adjustment to the case detection ratio by organ status
We assign different values to the case detection ratio according to organ status, because it is
likely that smear-positive, smear-negative, and extrapulmonary cases are diagnosed by the
health care system at different rates. Smear-positive cases may be targeted by the health
system, and may be easier to diagnose with the tools locally available (smear microscopy in
particular). Moreover, several interventions may act to close this diagnostic gap between
smear-positive and smear-negative or extrapulmonary cases. For example, GeneXpert
improves the possibility of detection with smear-negative TB cases relative to smear
microscopy and clinical judgement, partially closing this detection gap, as described below.
In our model, the rate of detection for smear-positive cases is increased, while the rates of
detection for smear-negative and extrapulmonary cases are decreased. This is calculated such
that the smear-negative and extrapulmonary cases have a case detection ratio that is lower
than that of the smear-positive cases by a constant specified ratio, while the weighted average
case detection ratio for all the forms of TB remains equal to the unprocessed case detection
ratio originally estimated. Missed diagnosis and the accuracy of the diagnostic algorithm
In order to explicitly simulate patients who presented for care but whose diagnosis was
missed, a flow rate that transitions patients from the active untreated compartment to a
missed diagnosis compartments is simulated. Patients whose diagnosis has been missed suffer
outcomes applicable to those in the active treatment compartment in terms of death and
spontaneous recovery, but do not re-start seeking treatment for a limited period of time. To

achieve this, it is considered that case detection is linked to the diagnostic algorithm, as
missed cases are proportional to its complement. That is:
���� �� ���� ��������� × �������ℎ� ��������
= ���� �� ������ ��������� × (1 − �������ℎ� ��������)
The adjustment process for organ status described for the rate of case detection is applied in
the same way to the sensitivity of the baseline diagnostic algorithm parameter in order to
simulate a greater proportion of smear-positive persons being detected rather than missed
under baseline conditions through clinical assessment and smear microscopy (i.e. prior to
implementation of novel diagnostics, such as GeneXpert).

Treatment outcomes
Determining aggregate outcomes
Treatment outcomes are derived from the Global TB Report, which reports outcomes for
patients differently by strain, HIV status, sputum smear status, and treatment history, as well
as changing its reporting approach for some categories after 2011. All the reported treatment
outcomes are grouped into three broad categories for model interpretation: 1) treatment
success, 2) death during treatment, and 3) survival with unfavourable outcomes (i.e. any
outcome other than success or death, with the terminology for these pathways having
changed over time).
For patients up to and including 2011, patients achieving treatment completion or cure (the
latter for smear-positive patients only) are classified as treatment success, patients dying on
treatment are classified as such, and patients reported as default or failure are classified into
the third category. Up to 2011, relapse cases are included with retreatment cases in Global
TB Report data. After 2011 for non-MDR-TB patients, loss to follow-up and failure are
classified as unfavourable outcomes (as opposed to default and failure up to 2011). After
2011, relapse cases are included with new cases in official data, in contrast to the situation up
to 2011. As there is no reliable way to account for this change, it should be noted that
outcome parameters are fit to data that changes its characteristics after 2011, although this
change is very small in magnitude. Calculation of proportions
Once the total outcomes have been classified into the three categories described above, the
proportion of patients falling into each category is calculated. Then, two time-variant
proportion functions are defined. The first is the treatment success proportion, for which the
numerator is successful treatment outcomes (cure and completion), and the denominator is all
treatment outcomes (figures S5 and S7). The second is the proportion of unsuccessful
outcomes resulting in death, for which the numerator is death outcomes, and the denominator
is all the treatment outcomes other than success.
Then, time-variant functions representing proportions (limited to range zero to one) are
calculated for these quantities. Then, the proportion of defaults is calculated as the proportion
of non-success outcomes multiplied by the proportion of unsuccessful outcomes resulting in
death. Using this approach, all the treatment outcomes must consistently remain non-
negative, and the three possible outcomes always sum to one.

Treatment history
All the compartments are duplicated according to whether patients have been previously
treated or not. The only exception is for the fully susceptible unvaccinated compartment(s),
which is not duplicated, as there is no equivalent compartment representing fully susceptible
individuals in the previously treated stratum. This is because previously treated individuals
are assigned a modified level of immunity/susceptibility to future episodes of infection.
Age differences
Risk of progression to active disease
The natural history of childhood TB was described in detail by Marais et al. in their 2004
publication that considered historical publications on this topic in detail [13]. The period from
1920 to 1950 was particularly informative for the study of the natural history of TB, as chest
radiography had become available, but effective treatment to modify the natural history had
not. Although quantitative estimates of the risk of progression to active disease and subtypes
are presented, we prefer the publications by Sloot et al. and Trauer et al., as these two modern
estimates employ formal survival analysis techniques and are highly consistent with one
another [7,8]. Moreover, after modification of the progression rates for BCG-vaccination,
these estimates are likely to be consistent with those of Marais et al. Infectiousness
Although children are often considered non-infectious, some groups of children are likely to
have the potential to transmit infection, including adolescents who more often have adult-
type reactivation TB. Other potentially infectious paediatric groups include those with
pulmonary cavitation, positive smears for acid fast bacilli (AFBs), laryngeal involvement,
widespread pulmonary disease, and suspected congenital TB (which tends to be more
extensive). However, younger children, including those with primary pulmonary TB, are
unlikely to be infectious because of their low bacillary load [14] and inability to generate a
sufficiently forceful cough [15]. This is supported by the observation that an infectious adult
was consistently identifiable in outbreaks of TB in orphanages and children’s hospitals, while
such outbreaks did not occur when only a child was identified with active TB. Eight case
reports of transmission from children were identified in a 2001 review, which included four
children aged under one (including two with congenital TB), with the others aged three, five,
seven, and nine. However, the extent of transmission was either limited or incompletely
described in most of the six reports considering children aged five and below. Unpublished
data recording low rates of tuberculin skin test (TST) conversion in the staff of paediatric
hospitals also support this contention [16]. For these reasons, we reduce the infectiousness of
children by one order of magnitude (i.e. 0.1 times that of adults) and apply this to estimates of
the under-five age group. Although we maintain the division into smear-negative/smear
positive and extra-pulmonary in this age group to reflect the same qualitative status as in the
adult age group, we acknowledge that all of the members of this group are likely to be smear-
negative most of the time, and use the (0.1-fold) multiplier to reflect this. For the age group
aged 5 to 15, we assume that approximately half of these patients will have adult-type and
half child-type manifestations of disease, resulting in a weighted average of 0.55 times the
infectiousness of adults for this group. Case fatality
The case fatality rate (a proportion) for children with miliary TB was estimated at 14% in one
case series [17], which is considerably greater than the estimate of 3.5% for all cases from
one meta-analysis [18]. However, this is clearly not a direct comparison, as this higher rate
was observed only in a subgroup of paediatric cases, and may well be offset by lower case

fatality rates in the other subgroups, such as tuberculous lymphadenitis. Moreover, these
estimates primarily consider patients under treatment, and so cannot be used to estimate the
case fatality of untreated TB (which is of greater relevance to our model parameters). Conclusions and model implementation
We use the age-specific progression proportions reported by Trauer et al. and are currently
undertaking further work to refine these parameters. Although difficult to quantify, the
infectiousness of persons aged under 10 is lower than those of older ages, and we apply a 10-
fold reduction as described above. Case fatality rates are not currently modified for age,
although we continue to seek evidence to quantify this.

Diabetes
Implementation
We estimate the relative risk or odds ratio for developing TB in patients with diabetes by
comparing the risk of disease in affected patients to the risk for patients without diabetes.
Ideally, a relative risk or hazard would be applied to the rate of late progression from late
latency to active disease, while an odds ratio would be applied to the proportion of patients in
early latency who progress to active disease rather than stabilising to late latency. For
individuals in early latency, we do not adjust the duration of early latency for persons with
comorbidities. Instead, we only adjust the duration of early latency for the proportion of
patients undergoing early progression to active TB. We apply an estimate of the odds ratio for
progression to active disease associated with the comorbidity to the original estimate for the
proportion progressing, which is age-specific in the age-stratified models. We term the
proportion of persons in early latency progressing to active TB in the absence of
comorbidities “pn”, such that the odds of progressing is equal to pn / (1 – pn). Similarly, the
proportion progressing in the presence of the comorbidity is termed “pc”, with associated
odds pc / (1 – pc). Therefore, if the odds ratio associated with the comorbidity is termed
“OR”: ��
1 − ��= �� ×
��
1 − ��
Solving for pc gives:
�� =�� × ��
�� × (�� − 1) + 1
This formula is used to calculate the rate of progression in the presence of diabetes. It has the
advantages of producing a similar modification in pc to that achieved with a relative risk
calculation if the odds ratio (OR) is relatively small, but having a ceiling value at one for
large ORs. As this is a proportion that is used to determine the rates of flows from early
latency, the rate of progression from early latency to active disease and to late latency are:
����� ������� �� ������ ������� ����������� ���� =��
�������� ����� �������
����� �� ���� ������� ����������� ���� =1 − ��
�������� ����� �������
Quantification of effect
Several epidemiological studies have found a greater rate of incident TB in patients with
diabetes across a range of contexts [19,20]. Observations from such individual studies include
a generally similar or greater rate of bacteriologically-confirmed disease than for all forms
[21] and similar increases in risk associated with recent and reactivation disease [22]. One
study reported a slightly lower strength of association, but recruited controls with medical
conditions that are potentially weakly associated with TB [23]. A limitation of several of
these studies is that TB itself is known to be associated with transient impairment to glucose
metabolism [24,25], although the above studies varied as to whether they considered
previously diagnosed diabetes or performed glucose metabolism testing at the time of

diagnosis. Several of the above-mentioned studies were included in a meta-analysis of the
association of diabetes on TB published by Jeon et al. in 2008 [26]. This study found a
relative risk for diabetes of 3.11 (95% CI 2.27 to 4.26) from a random effects meta-analysis
of three cohort studies. To apply the modification in the rates of progression to active disease
due to diabetes, we adopt the approach outlined above, estimating both the odds ratio for
early progression and the relative risk for late progression at 3.11.
Impact of diabetes on TB epidemic
The following figure presents the scale-up functions that were used to simulate different
levels of diabetes prevalence in the future population of Fiji.
Figure S13. Scale-up curves used to vary future diabetes prevalence in Fiji.
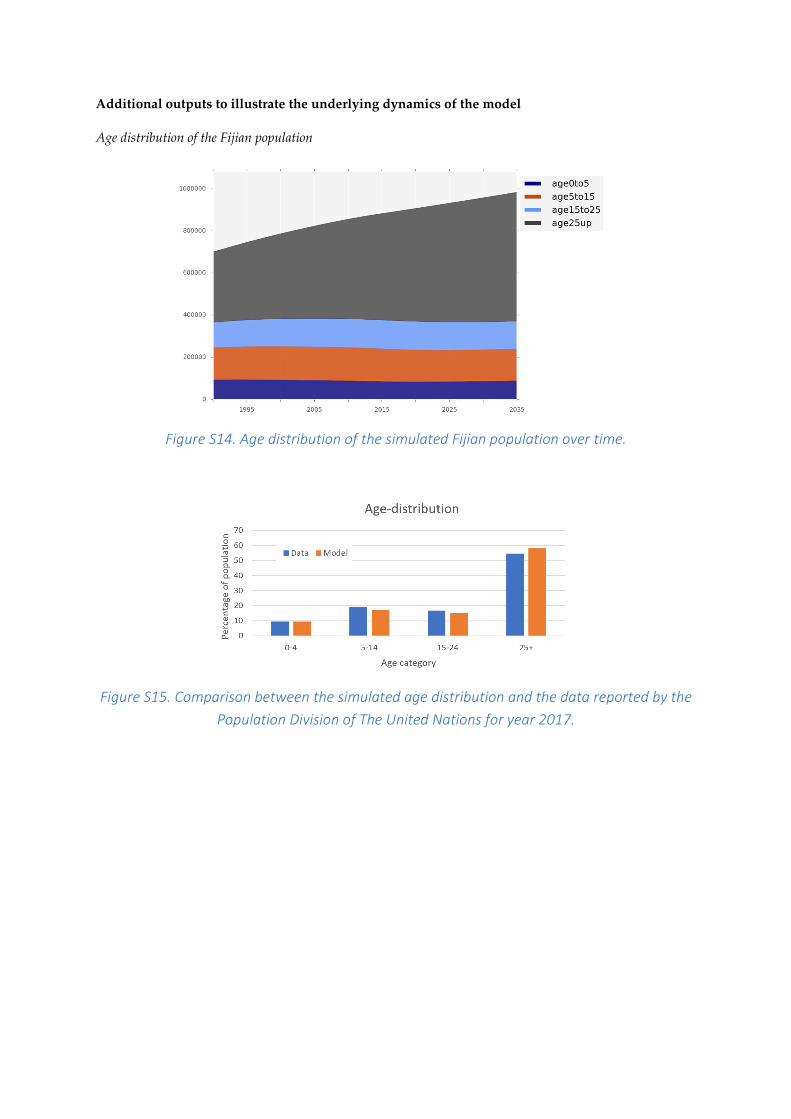
Additional outputs to illustrate the underlying dynamics of the model
Age distribution of the Fijian population
Figure S14. Age distribution of the simulated Fijian population over time.
Figure S15. Comparison between the simulated age distribution and the data reported by the
Population Division of The United Nations for year 2017.

Disease burden estimates by age groups
Figure S16. Estimated distribution of TB incidence by age group over time.
Figure S17. Estimated distribution of TB notifications by age group over time.

Figure S18. Estimated distribution of the number of TB deaths by age group over time.
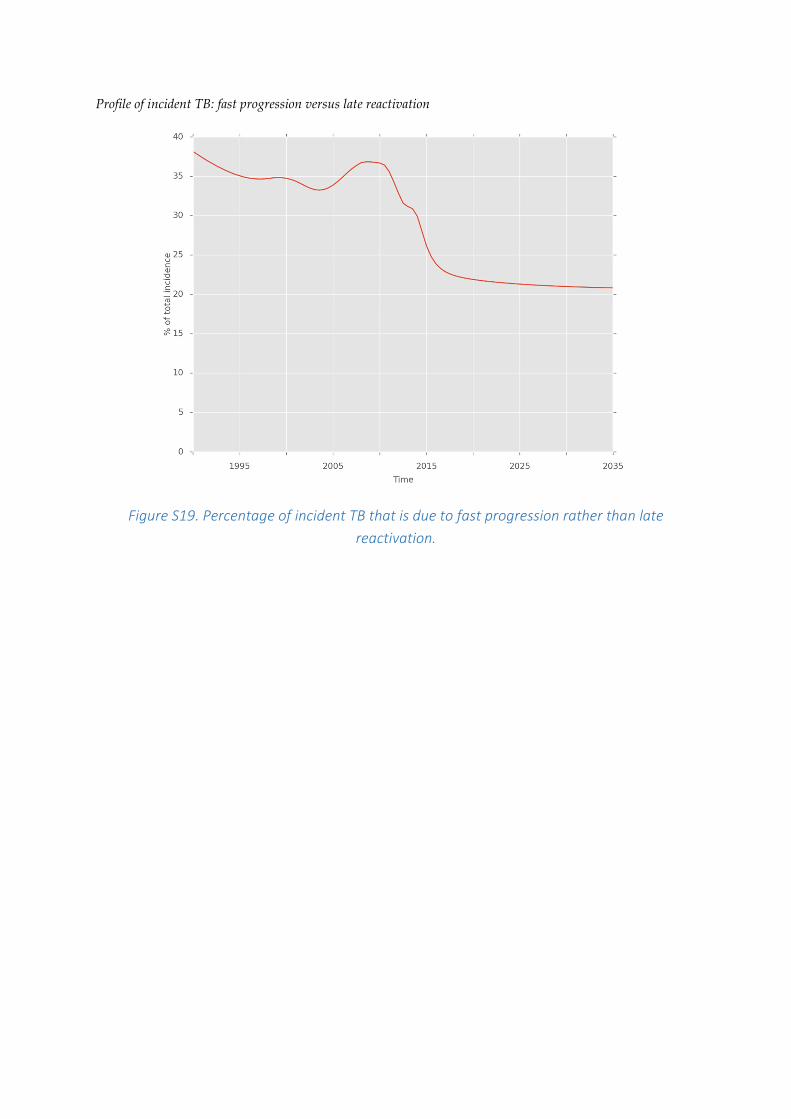
Profile of incident TB: fast progression versus late reactivation
Figure S19. Percentage of incident TB that is due to fast progression rather than late
reactivation.
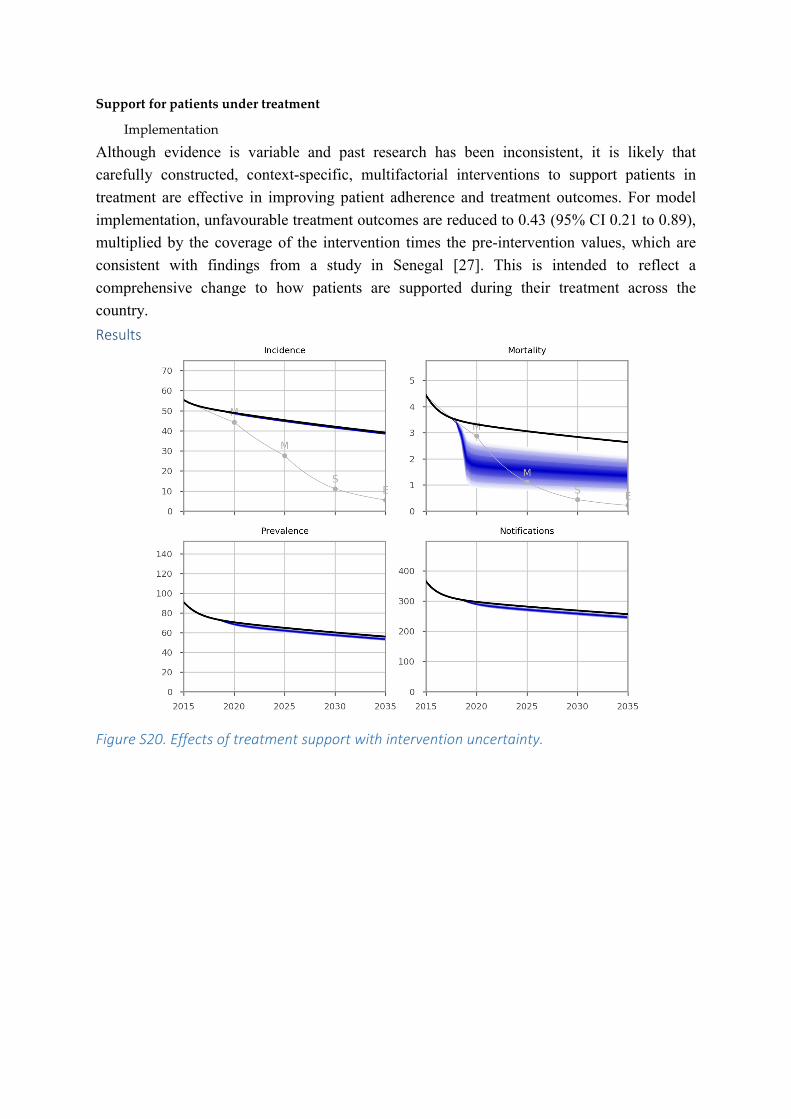
Support for patients under treatment
Implementation
Although evidence is variable and past research has been inconsistent, it is likely that
carefully constructed, context-specific, multifactorial interventions to support patients in
treatment are effective in improving patient adherence and treatment outcomes. For model
implementation, unfavourable treatment outcomes are reduced to 0.43 (95% CI 0.21 to 0.89),
multiplied by the coverage of the intervention times the pre-intervention values, which are
consistent with findings from a study in Senegal [27]. This is intended to reflect a
comprehensive change to how patients are supported during their treatment across the
country.
Results
Figure S20. Effects of treatment support with intervention uncertainty.

Decentralisation
Implementation
In the context of Fiji, the decentralisation of clinical care for patients with active TB
represents a comprehensive intervention to bring high-quality TB care to patients in their
local communities. The effect of this intervention, when fully implemented, is to entirely
eliminate all the geographical barriers to accessing curative care for any patient with TB in
any geographical location in the country. Conceptually, this means that patient-related delays
to starting treatment are considerably reduced, such that case detection is faster and more
consistent across the country.
Given the logistical difficulties, few or no studies have considered an intervention consisting
of the expansion of health facilities in the context of medical research or a randomised
controlled trial. Ecological studies give some sense that the decentralisation of TB treatment
facilities is likely to improve case detection rates. For example, observations from Armenia
indicate that TB clinics located near urban centres and examining more presumptive cases of
TB are likely to have greater TB notification rates [28]. Similarly, geospatial modelling from
a remote zone of Ethiopia indicates that notification rates are higher in areas with closer
proximity to TB health care [29]. Studies from various contexts have found that treatment
from decentralised, community-based, or patient-centred care centres, potentially involving
outreach visits by health extension workers, is as effective as clinic-based management
[30,31]. Together, this evidence implies that support for community-based TB treatment,
along with an increase in the number of health facilities available, could improve case
detection rates.
As passive case finding remains the basis for TB detection in most countries worldwide, we
consider an “idealised” case detection rate to be equal to that estimated by the best
performing TB programs reported in the WHO’s Global TB Report. Low-burden, high-
resource countries, along with the best-performing high-burden countries, are able to
consistently achieve case detection rates of 80% to 90% for periods of several years,
suggesting that this may be an upper limit for case detection through passive strategies alone.
Therefore, this intervention is implemented in the model by increasing the case detection
ratio from its baseline value towards an idealised case detection ratio, which by default is set
to 85%. To estimate the adjusted case detection rate, the gap between the current case
detection ratio and the ideal is decreased by the coverage of the intervention. That is:
��������� ���� ��������� �����
= �������� ���� ��������� �����
+ (����� ���� ��������� ����� − �������� ���� ��������� �����)
× �������� �� ������������
If the current case detection ratio is greater than the ideal case detection ratio at any time
point during integration, the intervention is applicable at that time and is not applied. Note
that this intervention is applied before adjustments are made for active case finding, which
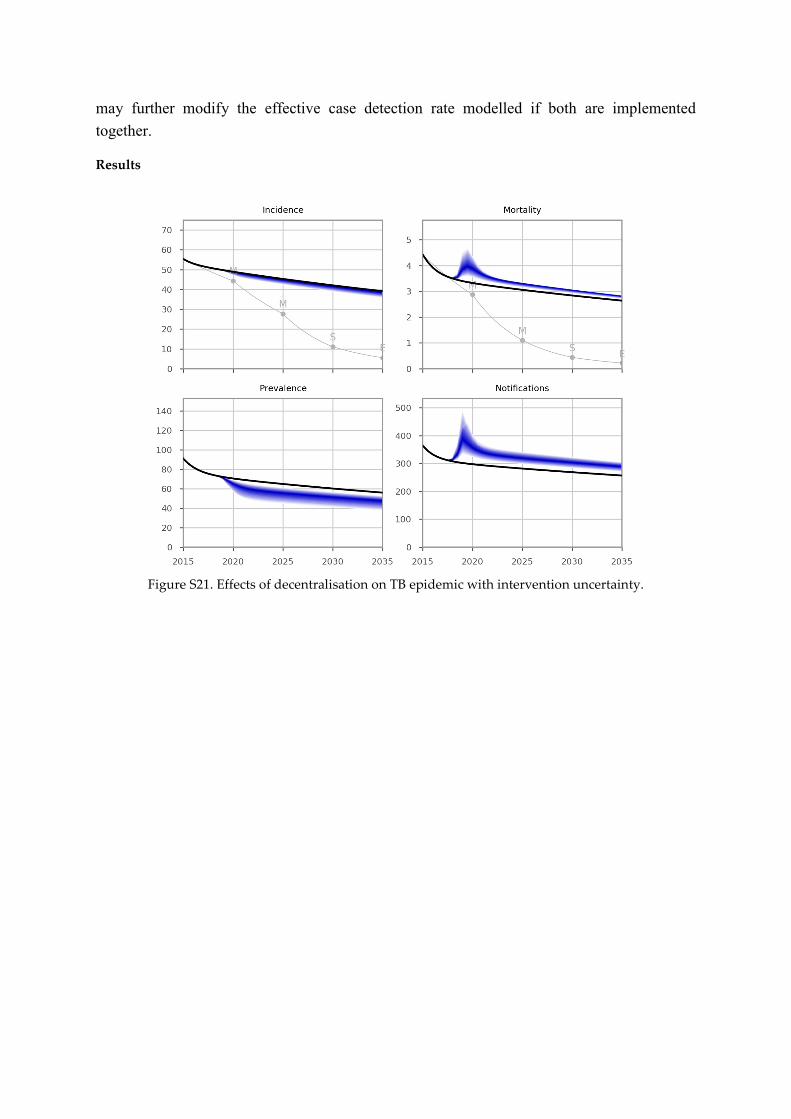
may further modify the effective case detection rate modelled if both are implemented
together.
Results
Figure S21. Effects of decentralisation on TB epidemic with intervention uncertainty.

GeneXpert replaces smear
Implementation
Background
Sputum smear microscopy has been the mainstay of TB diagnostics since the 1850s, although
the test is known to have sub-optimal sensitivity, particularly for paucibacillary cases (such as
HIV-associated TB, paediatric TB, and extrapulmonary TB). Meanwhile, mycobacterial
culture techniques have the disadvantage of a substantial delay in results that could influence
the availability of clinical decisions [32] and the technical complexity of maintaining a
functioning laboratory service.
GeneXpert (Cepheid Inc, Sunnyvale, California, USA) is the current leading technology in
the molecular diagnosis of TB. It was endorsed by the WHO with unprecedented speed in
December 2010 as the initial diagnostic for HIV-associated TB and where high rates of drug-
resistant TB are present [33]. Despite uncertainties as to the ideal approach to
implementation, South Africa has led the way in deploying GeneXpert devices from 2011 to
2013, deploying 314 such devices by 2017 and being responsible for over half the global
cartridge utilization [34].
Time to treatment initiation
Although GeneXpert has the potential to provide results within two hours of specimen
submission, it remains important to assess the real effect on accelerating patients’ progression
through the treatment cascade. Reasons for a longer actual time to diagnosis or change in
clinical decisions may include a preference for delaying specimen processing until a
sufficient number of samples are received at a clinic.
A 2013 Cochrane review found a significantly shorter time to detection for GeneXpert
compared to culture methods [35]. Moreover, there is evidence of decreased time to treatment
initiation for patients with drug-susceptible TB compared to other approaches. The large
multi-centre study considering the implementation of GeneXpert across six countries in three
continents found a median time to detection of Mtb of zero days for GeneXpert, one day for
smear microscopy, 16 days for liquid culture, and 30 days for solid culture [36]. However,
time to treatment commencement for smear-negative, culture-positive patients decreased
from a median 56 days to five days, while for smear-positive patients, a non-significant
reduction from four to two days occurred. A study in Johannesburg (641 presentations with
possible TB, 69% HIV-infected) found delays to treatment initiation of zero days for
GeneXpert, 14 days for clinical or radiological diagnoses, and 144 days for culture-based
diagnoses [37]. Similarly, a study from Saudi Arabia found results for both GeneXpert and
smear microscopy were available on the same day, while cultures took a median of 22 days
for results to be available [38].
The roll-out of GeneXpert technology has also been demonstrated to reduce the time taken
for patients to begin treatment for MDR-TB. For example, the time to commence treatment
decreased from a median of 40 days to seven days in Latvia [39]. Similarly, in Cape Town,
GeneXpert also decreased time to treatment commencement for MDR-TB by around a
month, with the median time to commencement falling from 42 to 17 days [40].
A 2017 systematic review of the programmatic effect of GeneXpert included 18 studies
finding a significant reduction in time to treatment, while only four did not [34].
Diagnostic accuracy for the presence of TB
In the large multi-centre study introduced above, pooled results across all the centres gave a
98.3% sensitivity for smear-positive TB, 76.9% for smear-negative (ranging from 56.3% to
100.0% by a study site) and culture-positive TB, and a specificity of 99.0% [36]. This was
associated with a reduction from 39.3% to 14.7% in the proportion of patients with smear-
negative, culture-positive disease who remained untreated. These estimates are close to those
derived from a 2014 Cochrane review of 27 studies (including the study described above),
which reported a pooled sensitivity of 98% for smear-positive TB, 67% for smear-negative,
culture-positive TB, and a specificity of 99% [35,41].
However, a critical consideration is the extent of empiric treatment undertaken prior to the
implementation of GeneXpert or the sensitivity of clinical assessments for TB. That is, in a
setting in which the threshold for initiating empiric treatment for TB is low, implementation
of a highly sensitive diagnostic may do little to increase the number of patients commenced
on treatment, and so have little programmatic effect [42]. Although this is an important
concern, estimating the underlying sensitivity of clinical diagnosis across a country is
challenging. Several factors may influence the threshold for clinical diagnosis, with one being
the underlying prevalence of TB in the population, such that rates of empiric diagnosis may
be higher in high-burden countries. A 2013 meta-analysis pooled five studies that estimated
the sensitivity and specificity of the clinical WHO algorithm for the diagnosis of smear-
negative TB found a pooled sensitivity of 0.61 (0.55 to 0.67), but with substantial
heterogeneity [43]. Clinicians in real-world settings may conceivably do better [44] or worse
than such standardised diagnostic algorithms. By default, this parameter is set to 0.61.
The sensitivity of GeneXpert-based platforms may improve in the near future through the
release of the GeneXpert MTB/RIF Ultra. This test is currently under evaluation [45], but is
anticipated to significantly improve the sensitivity of GeneXpert for paucibacillary forms of
TB (including children, HIV-positive, and smear-negative culture-positive cases) with the
manufacturer claiming levels of sensitivity that approach those for liquid culture [46].

Results
Figure S22. Effects of GeneXpert on TB epidemic.

Isoniazid preventive therapy (IPT)
Implementation
The WHO strongly recommends the systematic evaluation of contacts of potentially
infectious cases of active TB as a form of intensified case finding for further cases of active
disease. The investigation of close/household contacts of higher risk index cases (e.g. smear-
positive pulmonary TB) is strongly recommended, while the investigation of all
close/household contacts is conditionally recommended. Following such screening for active
TB, preventive therapy is then recommended for contacts at the highest risk of progression to
active disease following infection. However, the groups for which treatment is recommended
has been highly restricted, focusing on PLHIV and children aged under five years [47].
Moreover, screening policies vary substantially between countries, and recommendations are
inconsistently implemented [48]. At least seven meta-analyses have estimated the sensitivity
of TST in diagnosing LTBI, with results ranging from 0.70 to 0.82 [49]. Meanwhile, meta-
analytic estimates for the sensitivity of QuantiFERON range from 0.66 to 0.83, and of T-
SPOT range from 0.62 to 0.90. Therefore, there is no evidence that any one of these tests has
superior sensitivity to the others, and all the tests have a sensitivity of approximately 0.7 to
0.8.
A Cochrane review of IPT was undertaken in 1994, with the 2003 update to this review
finding no further citations, such that the authors do not plan any further updates. The review
was limited to randomised trials of appropriately dosed IPT provided for at least six months
with follow-up for at least two years. It found IPT to be associated with a risk ratio for active
TB of 0.40 (95% CI 0.31 to 0.52) [50]. This estimate is very similar to the results of a recent
meta-analysis, which found a risk ratio of 0.41 (95% CI 0.19 to 0.80) [51]. When six-month
and 12-month courses were considered separately, the respective risk ratios were 0.44 and
0.38, although this difference was not statistically significant. Rates of hepatotoxicity for
these two regimen durations were 0.36% and 0.52%, respectively. For model implementation,
it should be noted that all but one of the studies included in this review were analysed by
intention-to-treat. Therefore, this estimate does not need to be reduced to reflect patient
compliance.
Concerns regarding the relatively low efficacy of six-month isoniazid treatment and poor
completion of twelve-month isoniazid treatment have resulted in a re-analysis of data from
several clinical trials [52]. This re-analysis suggests that the optimal duration of isoniazid is
nine months, and that this is associated with a 90% reduction in the risk of progression to
active TB in fully compliant patients. Extending to 12 months is unlikely to improve efficacy
any further. The findings of this re-analysis have resulted in the recommendations for nine
months of INH by the American Thoracic Society in 2000, followed by health authorities of
other countries soon after.
Recently, a randomised control trial (RCT) compared treatment efficacy of three-month
weekly INH plus rifapentine and nine-month INH alone [53]. The combination therapy was
found to be as effective as INH alone, but associated with less hepatotoxicity.
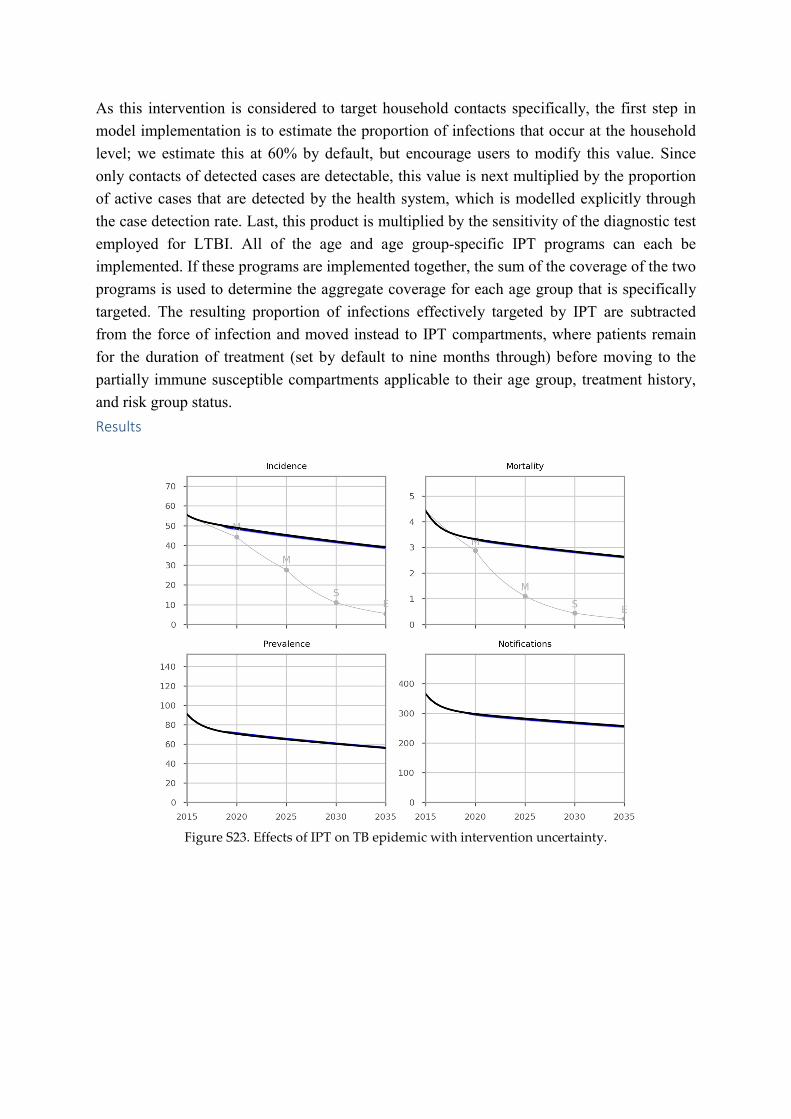
As this intervention is considered to target household contacts specifically, the first step in
model implementation is to estimate the proportion of infections that occur at the household
level; we estimate this at 60% by default, but encourage users to modify this value. Since
only contacts of detected cases are detectable, this value is next multiplied by the proportion
of active cases that are detected by the health system, which is modelled explicitly through
the case detection rate. Last, this product is multiplied by the sensitivity of the diagnostic test
employed for LTBI. All of the age and age group-specific IPT programs can each be
implemented. If these programs are implemented together, the sum of the coverage of the two
programs is used to determine the aggregate coverage for each age group that is specifically
targeted. The resulting proportion of infections effectively targeted by IPT are subtracted
from the force of infection and moved instead to IPT compartments, where patients remain
for the duration of treatment (set by default to nine months through) before moving to the
partially immune susceptible compartments applicable to their age group, treatment history,
and risk group status.
Results
Figure S23. Effects of IPT on TB epidemic with intervention uncertainty.

Active case finding
Implementation
Rationale
To effectively decrease the transmission of Mtb, the duration of infectiousness should be kept
to a minimum, although there are no specific targets for what an acceptable time to diagnosis
is, nor is this time period required reporting for national TB control programs (NTPs) [54].
The delay to treatment initiation has been found to be significantly associated with the
proportion of household contacts infected, with one study finding a delay of greater than 30
days to be an important threshold [55]. A systematic review found that a variety of features of
the disease, patient, health system, culture, and environment may be important in influencing
the time to presentation [56]. However, detecting patients early can be challenging, given that
a small but significant proportion of patients report no symptoms at all, while a sizeable
proportion (as many as half) do not report symptoms that are consistent with the commonly
utilised criteria [57]. A substantial proportion of all cases of TB are still missed entirely [58],
while both patient and health system-related delays to treatment initiation are substantial in a
range of settings [59].
Historical background
Active case finding (ACF) through the chest radiography of asymptomatic persons was
implemented extensively in developed country settings from the 1930s to the 1960s.
Although this strategy was successful in detecting a significant number of previously
undiagnosed cases, the financial expense and logistics were considerable. From the early
1960s, the paradigm began to change in the light of studies, finding that most patients with
undiagnosed TB had symptoms for some time, and had often sought care previously. These
studies suggested that few patients would be missed by restricting ACF to those with
symptoms, such as having a cough for two weeks or more. Therefore, the focus shifted to
health system strengthening with ACF considered unnecessary, particularly at a time when
TB was thought to be becoming a relatively minor problem in global health. Since then, a
range of ACF strategies have been studied, although few have been linked to prevalence
surveys that could shed light on the proportion of undiagnosed cases detected [60].
DETECTB
One of the most important studies in ACF was DECECTB, which was a cluster randomised
study of two alternative approaches to ACF undertaken in Harare from 2006 to 2008 [61].
This study compared six rounds of ACF at six-monthly intervals, either through the presence
of a mobile van in the community for five days (manned by three lay workers equipped with
a loudspeaker and leaflets) or through door-to-door enquiry at the household level (with each
household approached once per ACF round by two teams of three lay workers). Two sputum
specimens were collected from individuals with a history of cough for two weeks or longer
and analysed with smear microscopy (but not culture). The primary outcome was the relative
yield of smear-positive TB between the two screening methods, while the secondary outcome
was the change in culture-positive TB through prevalence surveys performed with the first
and last ACF round.
Consistent with evidence from elsewhere (Thailand), the door-to-door approach did not lead
to a marked increase in the number of cases diagnosed [62]. In fact, the mobile van
intervention detected considerably more cases (255) than did the door-to-door intervention
(137), for a cumulative yield of 4.27 and 2.38 smear-positive cases per 1000 population over
the six rounds of intervention (or 0.71 and 0.40 per round). Given that the prevalence was 4.0
smear-positive cases per 1000 population at the start of the intervention and 2.3 smear-
positive cases per 1000 per population before the fifth round and assuming a linear decrease
in burden over the study period (as the authors did), the average prevalence of smear-positive
disease over the course of the study would have been 3.1 per 1000. Therefore, the 0.71
smear-positive cases diagnosed in each round of van-based ACF and 0.40 cases in each round
of door-to-door based ACF represent 23.2% and 12.8% of all the undiagnosed cases
respectively.
Other recent studies
Sekandi et al. reported on a single round of ACF undertaken in a peri-urban setting of around
10,000 persons, finding 33 additional cases of smear-positive TB through an algorithm of
symptom screening for chronic cough and smear microscopy [63]. This study was limited by
comparison to DETECTB, in that no prevalence surveys were undertaken, such that the
proportion of all undiagnosed cases that this represents is difficult to estimate. Given
Uganda’s prevalence of TB of around 150 to 200 per 100,000 with around 60% of notified
cases smear-positive, the smear-positive prevalence may be around 100 per 100,000.
Therefore, it could be estimated that around 10 undiagnosed such cases should be present in a
population of 10,000. Clearly, the study results refute this estimate, and indicate that the true
prevalence was much higher in this slum setting, as the authors acknowledge.
A study of free workplace TB diagnostics included a prevalence survey at study completion,
but not at the outset, and did not constitute active case finding in the sense reviewed here
[64].
A comparison of cohorts of patients diagnosed by ACF and passive case finding in Cambodia
found that the patients diagnosed through ACF were generally older (55 versus 48 years) and
were considerably more likely to be smear-negative (71.4% versus 40.5%). Reassuringly for
this intervention, treatment outcomes were comparable between the two groups, with
treatment success rates of 96.4% and 95.2% for patients diagnosed through ACF and passive
case finding, respectively [65]. Another study in the same country found that 810 cases of
active TB were diagnosed through an ACF intervention, after the screening of 35,005 patients
with chest x-ray and symptoms and testing of 3649 of these with GeneXpert. The
intervention covered 30 operational districts with a population of approximately 100,000 to
200,000 each, and a TB incidence of around 176 cases per 100,000 per year [66,67]. The
authors estimated that an additional 9.8% of cases had been found compared to the baseline

case detection rate, but if the expected decline in burden is allowed for, an additional 18.5%
of cases were detected. As the total population in the intervention area was around 2.9
million, the proportion of the population screened was around 1.21%, and the proportion of
the population definitively tested was 0.126%.
Conclusions and model implementation
For smear-based ACF, we estimate that van-based ACF implemented with screening rounds
at six-monthly intervals can be expected to diagnose around 23.2% of smear-positive cases
not previously diagnosed at each round. For GeneXpert-based strategies, the intervention can
also be reasonably applied to the undiagnosed smear-negative population, but is multiplied by
the sensitivity of GeneXpert for smear-negative disease (i.e. 67%, to give an overall
proportion diagnosed of 15.6%). As these strategies generally commence with enquiry as to
the presence of cough, no effect on extrapulmonary disease is expected. In this analysis, we
consider the intervention to be directed at the general community.
Results
Figure S24. Effects of GeneXpert-based ACF on TB epidemic with intervention uncertainty.
Awareness raising
Implementation
Background
Cultural, environmental, and politico-economic factors are known to be important in driving
the TB epidemic, which is more often conceptualised from a biological perspective [68].
Therefore, communication interventions for TB control have the potential to markedly
improve rates of presentation for care through reduction in stigma, improved understanding
of the condition, and greater community awareness. Countries such as Peru and Vietnam
have used improved awareness as a cornerstone of their control efforts [69–71]. Although a
systematic review was registered in 2014 to consider the effect of mass media interventions
on TB knowledge, attitudes, awareness, health care seeking behaviour, and health service
utilisation, no results are yet available from this study. Moreover, there are a number of
critical considerations to bear in mind in estimating the likely effectiveness of such
interventions, including tailoring messages to the context and culture in which they are
provided, and ensuring that curative care of a sufficient standard is available to the additional
persons who may present for care as a result of the intervention.
TB-specific studies
Studies investigating the impact of awareness programs on TB have reported variable results,
but have consistently found increased rates of presentation for care, increased detection of
new active and latent cases, and reduced rates of treatment abandonment [72]. In a study
conducted in an indigenous community with high TB burden in Canada in the context of
passive case finding, Alvarez et al. found that the number of people presenting themselves to
clinics increased by 92% during the four-month community-wide awareness campaigns,
compared to the previous periods without the campaign (increased from an average of 26
people per month to 50 per month) [73]. This study also found that a door-to-door campaign
increased the number of new LTBI cases by 34%, and increased the number of newly
diagnosed active TB cases by 29.5%. In Columbia, Jaramillo reported that a six-week mass
media-based health education campaign (radio, television, and newspaper) increased the
number of smears processed by laboratories by 64%, and increased the number of smear-
positive pulmonary TB cases detected and notified by 52% [74]. However, this increase only
accrued in the study area and for the quarter during which the intervention was implemented,
with programmatic effects not sustained after the intervention for either study.
Awareness programs have also been found to enhance treatment retention. A report using
nationwide data in Peru found that health communication steadily reduced the rate of TB
treatment abandonment from 12.1% prior to the start of the program to 2.8% over a period of
10 years. A brief report of an intervention in Odisha (India) involving health worker
education, van-mounted loudspeakers, and community-based health camps found an increase
in the number of detections [75]. Although the increase in the total number of TB diagnoses
made was not reported, the number of persons screened increased by 87.8% and the number

of smear-positive diagnoses made increased by 10.8% (figures that seem consistent with
those reported by the studies discussed above). Conclusions and model implementation
Implementation of this intervention acts to accelerate the rate of case detection from baseline,
and similarly the rate at which missed cases accrue through incorrect diagnosis, reflecting a
decrease in pre-presentation delays to treatment. The applied value for the relative increase in
presentation rate is 1.52-fold the baseline rate, using the results of the study by Jaramillo et
al. above. This is intended to reflect intensive, periodic advertising and awareness raising
through the mass media, but without the extensive community mobilisation described in
Alvarez et al. above. An even more extensive intervention could be captured by
implementing a relative increase parameter of 1.92 or similar. However, we believe that the
value of 1.52 better reflects the interventions considered in Fiji.
An important caveat is that we aim to simulate repeated media-based interventions in order to
maintain the effectiveness of this intervention over time, assuming interventions of six weeks
in duration implemented quarterly or similar. We also assume that the effect of the
intervention is maintained over time, ignoring the potential for loss of effectiveness with
time, which is impossible to quantify.
Results
Figure S25. Effects of awareness raising on TB epidemic with intervention uncertainty.

Effect of interventions on actual mortality
Figure S26. Effects of interventions on true mortality. This includes all the modelled mortality
occurring outside of the health system.

Cost inputs for economic analysis
Support for patients under treatment
In Fiji, this intervention involves getting a person trained in directly observed therapy short
course (DOTS) to administer daily treatment and being given USD 10 per day while they are
a DOTS trained-treatment administering person. The Fiji NTP estimates that the total cost of
the program in 2015 is about USD 150,000 with a total annual number of patients to be
treated of 305, giving a unit program cost of USD 500 (USD 534 in 2017 values). The yearly
cost of treatment support is projected by the NTP to be USD 3469 for the next three years
(USD 10,407 for a total of three years) to scale up the program; however, cost components of
this amount are not available. Decentralisation
Fiji-specific cost data for the decentralisation of TB care are lacking, nor are such data
available in the literature. In consultation with the Fiji NTP, we assumed a unit cost of USD
1000 per patient for decentralization. An arbitrary value of USD 700,000 for start-up cost for
three years was used. GeneXpert
Using an ingredient costing approach of identifying all the inputs and quantities required to
perform the test such as cartridge, equipment, and salaries, Vassall et al. [81] estimated that
the cost for the GeneXpert test ranged from USD 23 in India to USD 39 in South Africa and
USD 47 in Uganda. These estimates are consistent with those from Dowdy et al. [82] and
Menzies et al. [83]. Although the WHO recommends the rapid implementation of GeneXpert
because of its proven benefits for the diagnosis of TB, implementation among resource-
constrained countries has been slow due to the substantial start-up costs of GeneXpert, which
is estimated to be $103,679.5 for Fiji per year for three years. This estimate includes the
following cost components: WHO to organise technical assistance (TA) to strengthen NTP to improve diagnosis
using new technology (GeneXpert), culture and DST–QMRL (USD 19,114.46)
NTP to organise a workshop on improving diagnosis using GeneXpert, culture, and DST by Technical Assistant (USD 85.28)
NTP to organise training on GeneXpert and a portable X-ray machine for staff with assistance of the WHO TB and Leprosy MO (USD 426.41)
GeneXpert kits: XpertᴿMTB/RIF, GXMTB/RIF-10 tests/kit, Cepheid; Gene Xpert Machine (USD 36,961)
Maintenance cost for equipment: GeneXpert calibration kits, GeneXpert replacement module, and GeneXpert warranty extension (USD 27,312)
Recruitment and appointment of TA to strengthen NTP to improve diagnosis using new technology (GeneXpert), culture, and DST–QMRL under WHO implementation for one visit per annum (USD 12,183.98)
TA to conduct workshop and training on improving diagnosis using new technology (GeneXpert), culture and DST–QMRL (USD 1745.53)
Conduct training and retraining on GeneXpert and intensified case finding (portable X-ray screening) for laboratory technicians and TB medical officers and TB nurse coordinators in collaboration with the WHO TB and Leprosy MO (USD 2230)
Procure and distribute consumables for GeneXpert (USD 3620)
Isoniazid preventive therapy
As with most TB programs in Fiji, country-specific cost data for IPT are not available. As
such, we performed a literature search to inform the cost inputs for the program. Although a
few studies that investigated the economics of six-month IPT exist, most of these studies
focused on IPT in HIV-infected adult patients [76–79]. To date, there is only one study that
investigated the cost and cost-effectiveness of IPT in children contacts (<5 years of age),
which are the target population group of the IPT program in Fiji [80]. Mandalakas et al. [80]
estimated that the unit costs of IPT in this setting were USD 179 for health providers. These
estimates included costs of screening using TST, medications, clinic visits, and liver function
tests. In Fiji, the current coverage of IPT in children under five years old is only 23.6%, and
the country aspires to scale up the program to achieve a high level of coverage of 80% in the
next few years. Sutton et al. [78] estimated the cost required for starting an IPT program to be
USD 105.35 per patient, which includes costs of personnel, laboratory use, supplies, capital,
and infrastructure. Under most simulations, our model projected that the total number of
children over the next three years who are eligible for the program is around 672, such that
the total start-up cost was estimated to be USD 70,800. Active case finding
Evidence on the cost of active case finding is limited. The total per patient cost is estimated to
be USD 74 in urban Africa from a health provider perspective [63]. These costs include
program costs (administration, transportation, communication, health personnel), direct
medical costs (smear tests, culture tests, chest X-ray, consumable supplies), and patient and
caregiver costs (for analysis from societal perspective). Of note, sputum smear microscopy is
used for TB screening and diagnosis in this study. Then, the unit cost of GeneXpert-based
ACF is calculated as follows: unit cost of GeneXpert-based ACF = unit cost of smear-based
ACF (USD 74.26) – unit cost of smear test (USD 1.16) + unit cost of GeneXpert test (USD
22.63) = USD 95.73
In Fiji, the activities and their estimated costs that are related to the implementation of active
case finding program are identified follows: Mobile caravan for active case finding in communities (USD 116,402.68)
Six-monthly supervisory visits to hard-to-reach populations (USD 1384.95)
Weekly and quarterly review of surveillance data to identify high-risk groups (USD
2544.23)
Active screening of TB symptoms among contacts in hard-to-reach areas (USD
11,811.78)

Six-monthly outreach clinics to 20 medical areas and hard-to-reach populations (USD
1491.85)
Monthly TB clinics in HIV hubs for active case finding and the provision of IPT for
PLHIV (USD 384.84)
Repairs and maintenance for mobile caravan (USD 9312.21)
Fuel and oil for mobile caravan (USD 9407.72)
Training and retraining on GeneXpert and intensified case finding (screening by
portable X-ray) for laboratory technicians and TB medical officers and TB nurse
coordinators in collaboration with the WHO TB and Leprosy MO (USD 2230.79)
Active screening of high-risk groups in the 20 medical areas and hard-to-reach
populations (USD 766)
Mobile caravan for active case finding outreach activities for a portable X-ray
machine and GeneXpert machine (USD 9465.46)
Technical assistance from WHO to strengthen the NTP to improve diagnosis using
new technology (GeneXpert), culture, and DST–QMRL (USD 19,114.46)
Workshop on improving diagnosis using GeneXpert, culture, and DST for technical
assistant (USD 85.28)
Training on GeneXpert and the portable X-ray machine for staff with assistance of the
WHO TB and Leprosy MO (USD 426.41)
GeneXpert kits, GeneXpert machine (USD 36,961)
Maintenance cost for equipment, GeneXpert calibration kits, GeneXpert replacement
module, GeneXpert warranty extension (USD 27,312)
Recruitment and appointment of technical assistants to strengthen the NTP to improve
diagnosis using new technology (GeneXpert), culture, and DST–QMRL under WHO
implementation for one visit per annum (USD 12,183.98)
Workshop and training on improving diagnosis using new technology (GeneXpert),
culture, and DST–QMRL (USD 1745.53)
Consumables for GeneXpert (USD 3620)
Based on the above activities and costs, the yearly start-up costs for GeneXpert-based active
case finding are estimated to be USD 266,651. We assume that the start-up cost is applied for
three years, with the cost of purchasing mobile caravans (USD 116,402.68) excluded from
year 2 and year 3. Awareness raising

No economic or other data were available to inform the estimated costs of this intervention,
and an arbitrary cost was arrived at in consultation with local programmatic staff. Therefore,
the economics of this intervention remain highly uncertain, and should be interpreted with
caution.
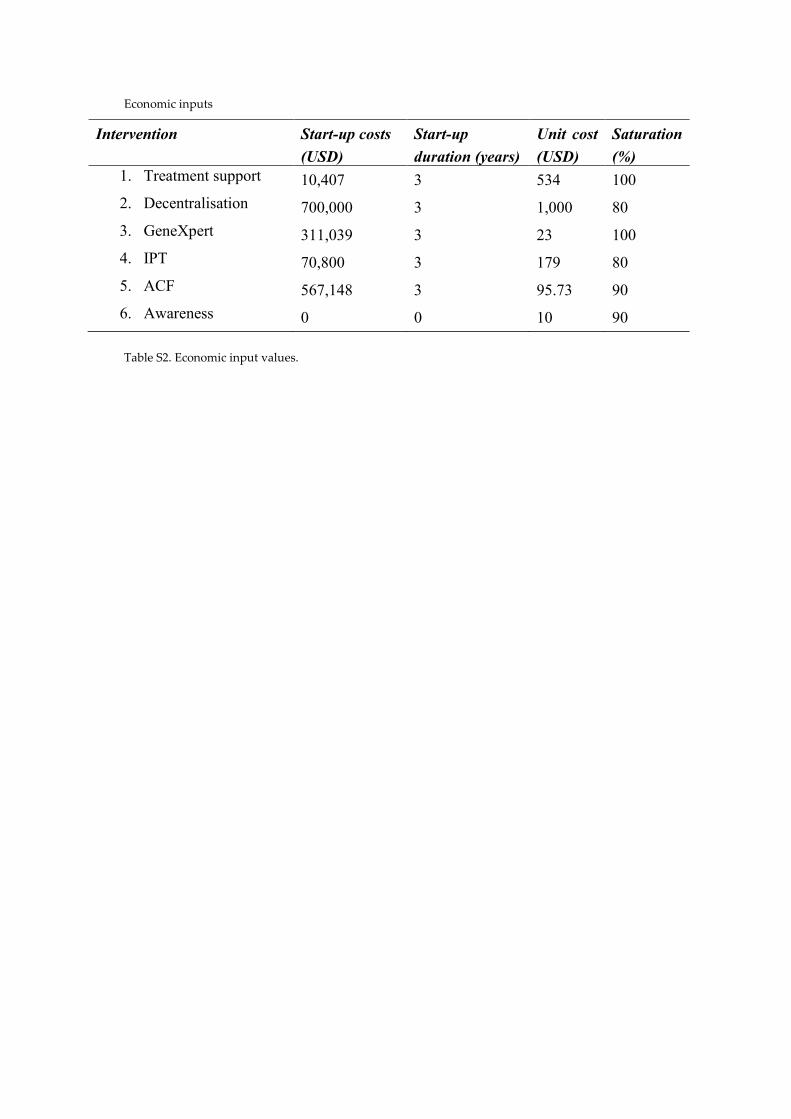
Economic inputs
Intervention Start-up costs
(USD)
Start-up
duration (years)
Unit cost
(USD)
Saturation
(%) 1. Treatment support 10,407 3 534 100
2. Decentralisation 700,000 3 1,000 80
3. GeneXpert 311,039 3 23 100
4. IPT 70,800 3 179 80
5. ACF 567,148 3 95.73 90
6. Awareness 0 0 10 90
Table S2. Economic input values.
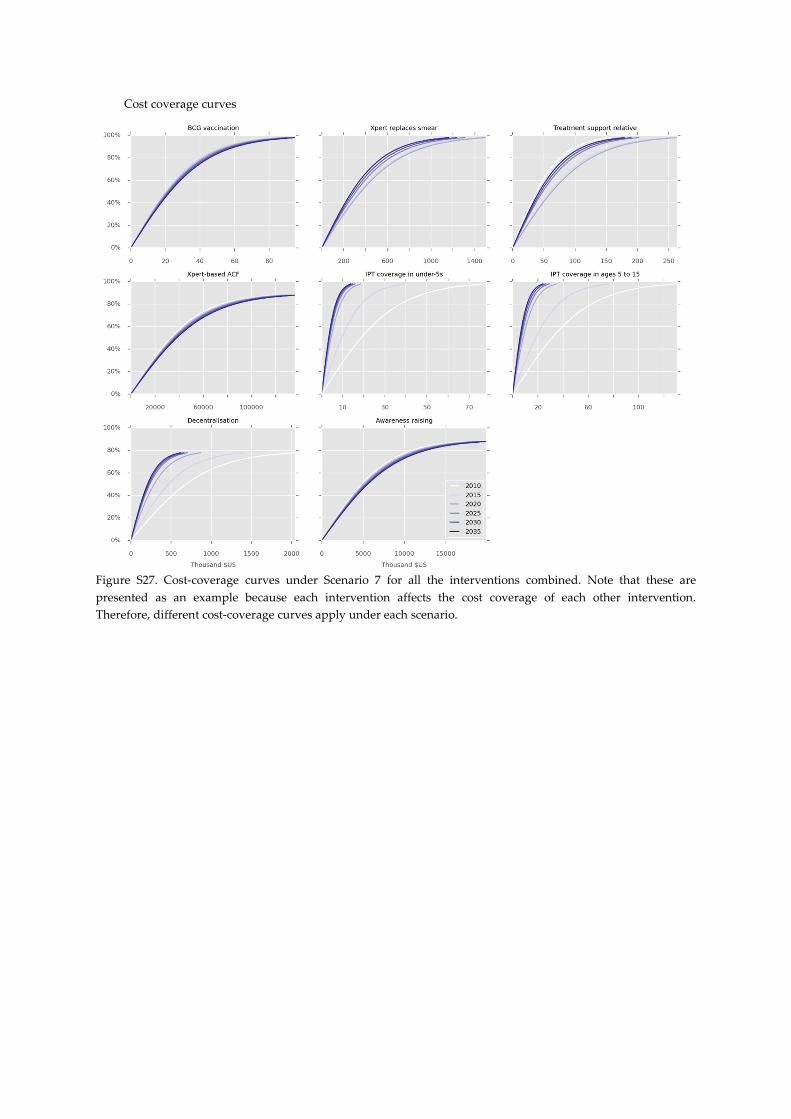
Cost coverage curves
Figure S27. Cost-coverage curves under Scenario 7 for all the interventions combined. Note that these are
presented as an example because each intervention affects the cost coverage of each other intervention.
Therefore, different cost-coverage curves apply under each scenario.
References
1. Trauer, J. M., Ragonnet, R., Doan, T. N. & McBryde, E. S. Modular programming for
tuberculosis control, the “AuTuMN” platform. BMC Infect. Dis. 17, 546 (2017).
2. The World Bank. World Development Indicators | DataBank.
3. World Bank. Life expectancy at birth, total (years) | Data. Available at:
http://data.worldbank.org/indicator/SP.DYN.LE00.IN. (Accessed: 19th June 2017)
4. Andrews, J. R. et al. Risk of progression to active tuberculosis following reinfection
with Mycobacterium tuberculosis. Clin Infect Dis 54, 784–791 (2012).
5. Verver, S. et al. Rate of reinfection tuberculosis after successful treatment is higher
than rate of new tuberculosis. Am J Respir Crit Care Med 171, 1430–1435 (2005).
6. Gomes, M. G. et al. How host heterogeneity governs tuberculosis reinfection? Proc
Biol Sci 279, 2473–2478 (2012).
7. Trauer, J. M. et al. Risk of active tuberculosis in the five years following infection ⋯
15%? Chest 149, (2016).
8. Sloot, R., Schim van der Loeff, M. F., Kouw, P. M. & Borgdorff, M. W. Risk of
Tuberculosis after Recent Exposure. A 10-Year Follow-up Study of Contacts in
Amsterdam. Am J Respir Crit Care Med 190, 1044–1052 (2014).
9. Ragonnet, R. et al. Optimally capturing latency dynamics in models of tuberculosis
transmission. Epidemics 21, 39–47 (2017).
10. Dowdy, D. W., Dye, C. & Cohen, T. Data Needs for Evidence-Based Decisions: a
Tuberculosis Modeler’s ‘Wish List’. Int J Tuberc Lung Dis 17, 866–877 (2013).
11. Tiemersma, E. W., van der Werf, M. J., Borgdorff, M. W., Williams, B. G. &
Nagelkerke, N. J. Natural history of tuberculosis: duration and fatality of untreated
pulmonary tuberculosis in HIV negative patients: a systematic review. PLoS One 6,
e17601 (2011).
12. World Health Organization. Global Tuberculosis Report 2016. 2016, (2016).
13. Marais, B. J. et al. The natural history of childhood intra-thoracic tuberculosis: a
critical review of literature from the pre-chemotherapy era. Int J Tuberc Lung Dis 8,
392–402 (2004).
14. Cruz, A. T. & Starke, J. R. Clinical manifestations of tuberculosis in children.
Paediatr. Respir. Rev. 8, 107–117 (2007).
15. Matlow, A., Robb, M. & Goldman, C. Infection control and paediatric tuberculosis: A
practical guide for the practicing paediatrician. Paediatr. Child Health 8, 624–6
(2003).
16. Starke, J. R. Transmission of mycobacterium tuberculosis to and from children and
adolescents. Semin. Pediatr. Infect. Dis. 12, 115–123 (2001).
17. Hussey, G., Chisholm, T. & Kibel, M. Miliary tuberculosis in children: a review of 94
cases. Pediatr. Infect. Dis. J. 10, 832–6 (1991).
18. Straetemans, M., Glaziou, P., Bierrenbach, A. L., Sismanidis, C. & van der Werf, M. J.
Assessing tuberculosis case fatality ratio: a meta-analysis. PLoS One 6, e20755 (2011).

19. Pablos-Méndez, A., Blustein, J. & Knirsch, C. A. The role of diabetes mellitus in the
higher prevalence of tuberculosis among Hispanics. Am. J. Public Health 87, 574–9
(1997).
20. Alisjahbana, B. et al. Diabetes mellitus is strongly associated with tuberculosis in
Indonesia. Int. J. Tuberc. Lung Dis. 10, 696–700 (2006).
21. Kim, S. J., Hong, Y. P., Lew, W. J., Yang, S. C. & Lee, E. G. Incidence of pulmonary
tuberculosis among diabetics. Tuber. Lung Dis. 76, 529–33 (1995).
22. Ponce-De-Leon, A. et al. Tuberculosis and diabetes in southern Mexico. Diabetes
Care 27, 1584–90 (2004).
23. Pérez, A., Brown, H. S., Restrepo, B. I. & RESTREPO, B. I. Association between
tuberculosis and diabetes in the Mexican border and non-border regions of Texas. Am.
J. Trop. Med. Hyg. 74, 604–11 (2006).
24. Oluboyo, P. O. & Erasmus, R. T. The significance of glucose intolerance in pulmonary
tuberculosis. Tubercle 71, 135–8 (1990).
25. Başoğlu, O. K., Bacakoğlu, F., Cok, G., Sayiner, A. & Ateş, M. The oral glucose
tolerance test in patients with respiratory infections. Monaldi Arch. chest Dis. = Arch.
Monaldi per le Mal. del torace 54, 307–10 (1999).
26. Jeon, C. Y. & Murray, M. B. Diabetes mellitus increases the risk of active
tuberculosis: a systematic review of 13 observational studies. PLoS Med 5, e152
(2008).
27. Thiam, S. et al. Effectiveness of a Strategy to Improve Adherence to Tuberculosis
Treatment in a Resource-Poor Setting. JAMA 297, 380 (2007).
28. Davtyan, K. et al. Performance of decentralised facilities in tuberculosis case
notification and treatment success in Armenia. Public Heal. action 4, S13-6 (2014).
29. Shaweno, D., Shaweno, T., Trauer, J. M., Denholm, J. T. & McBryde, E. S.
Heterogeneity of distribution of tuberculosis in Sheka Zone, Ethiopia: Drivers and
temporal trends. Int. J. Tuberc. Lung Dis. 21, (2017).
30. Ketema, K. H., Raya, J., Workineh, T., Klinkenberg, E. & Enquselassie, F. Does
decentralisation of tuberculosis care influence treatment outcomes? The case of
Oromia Region, Ethiopia. Public Heal. action 4, S13-7 (2014).
31. Egwaga, S. et al. Patient-centred tuberculosis treatment delivery under programmatic
conditions in Tanzania: a cohort study. BMC Med. 7, 80 (2009).
32. World Health Organization. Framework for Implementing New Tuberculosis
Diagnostics. (2010).
33. WHO endorses new rapid tuberculosis test, a major milestone for global TB diagnosis
and care. WHO (2010). Available at:
http://www.who.int/mediacentre/news/releases/2010/tb_test_20101208/en/. (Accessed:
21st August 2017)
34. Stevens, W. S., Scott, L., Noble, L., Gous, N. & Dheda, K. Impact of the GeneXpert
MTB/RIF Technology on Tuberculosis Control. Microbiol. Spectr. 5, (2017).
35. Steingart, K. R. et al. Xpert(R) MTB/RIF assay for pulmonary tuberculosis and

rifampicin resistance in adults. Cochrane Database Syst Rev 1, CD009593 (2013).
36. Boehme, C. C. et al. Feasibility, diagnostic accuracy, and effectiveness of
decentralised use of the Xpert MTB/RIF test for diagnosis of tuberculosis and
multidrug resistance: a multicentre implementation study. Lancet 377, 1495–1505
(2011).
37. Hanrahan, C. F. et al. Time to Treatment and Patient Outcomes among TB Suspects
Screened by a Single Point-of-Care Xpert MTB/RIF at a Primary Care Clinic in
Johannesburg, South Africa. PLoS One 8, e65421 (2013).
38. Omrani, A. S. et al. GeneXpert MTB/RIF Testing in the Management of Patients with
Active Tuberculosis; A Real Life Experience from Saudi Arabia. Infect. Chemother.
46, 30–4 (2014).
39. Stagg, H. R. et al. Decreased Time to Treatment Initiation for Multidrug-Resistant
Tuberculosis Patients after Use of Xpert MTB/RIF Test, Latvia. Emerg. Infect. Dis. 22,
482–90 (2016).
40. Naidoo, P. et al. A Comparison of Multidrug-Resistant Tuberculosis Treatment
Commencement Times in MDRTBPlus Line Probe Assay and Xpert® MTB/RIF-
Based Algorithms in a Routine Operational Setting in Cape Town. PLoS One 9,
e103328 (2014).
41. Steingart, K. R. et al. Fluorescence versus conventional sputum smear microscopy for
tuberculosis: a systematic review. Lancet Infect Dis 6, 570–581 (2006).
42. Theron, G. et al. Do high rates of empirical treatment undermine the potential effect of
new diagnostic tests for tuberculosis in high-burden settings? Lancet Infect Dis 14,
527–532 (2014).
43. Walusimbi, S. et al. Meta-analysis to compare the accuracy of GeneXpert, MODS and
the WHO 2007 algorithm for diagnosis of smear-negative pulmonary tuberculosis.
BMC Infect. Dis. 13, 507 (2013).
44. Chang, K. C., Leung, C. C., Yew, W. W. & Tam, C. M. Supervised and induced
sputum among patients with smear-negative pulmonary tuberculosis. Eur. Respir. J.
31, 1085–1090 (2008).
45. Accuracy and Feasibility of Xpert Ultra, ClinicalTrials.gov. Available at:
https://clinicaltrials.gov/ct2/show/NCT03072576. (Accessed: 21st August 2017)
46. Cepheid. 2017 launch of new TB test Ultra backed by WHO recommendation.
Available at: http://www.cepheid.com/us/about-us/news-events/press-releases/216-
2017-launch-of-new-tb-test-ultra-backed-by-who-recommendation. (Accessed: 21st
August 2017)
47. World Health Organization. Recommendations for investigating contacts of persons
with infectious tuberculosis in low- and middle-income countries. WHO (World Health
Organization, 2012).
48. Hwang, T. J., Ottmani, S. & Uplekar, M. A rapid assessment of prevailing policies on
tuberculosis contact investigation. Int. J. Tuberc. Lung Dis. 15, 1620–1623 (2011).
49. Sollai, S., Galli, L., de Martino, M. & Chiappini, E. Systematic review and meta-

analysis on the utility of Interferon-gamma release assays for the diagnosis of
Mycobacterium tuberculosis infection in children: a 2013 update. BMC Infect. Dis. 14,
S6 (2014).
50. Smieja, M. J., Marchetti, C. A., Cook, D. J. & Smaill, F. M. Isoniazid for preventing
tuberculosis in non-HIV infected persons. Cochrane Database Syst Rev CD001363
(2000). doi:10.1002/14651858.CD001363
51. Pease, C. et al. Efficacy and completion rates of rifapentine and isoniazid (3HP)
compared to other treatment regimens for latent tuberculosis infection: a systematic
review with network meta-analyses. BMC Infect. Dis. 17, 265 (2017).
52. Comstock, G. W. How much isoniazid is needed for prevention of tuberculosis among
immunocompetent adults? Int. J. Tuberc. Lung Dis. 3, 847–50 (1999).
53. Sterling, T. R. et al. Three months of rifapentine and isoniazid for latent tuberculosis
infection. N Engl J Med 365, 2155–2166 (2011).
54. Lonnroth, K. et al. Tuberculosis control and elimination 2010-50: cure, care, and
social development. Lancet 375, 1814–1829 (2010).
55. Lin, X., Chongsuvivatwong, V., Lin, L., Geater, A. & Lijuan, R. Dose–response
relationship between treatment delay of smear-positive tuberculosis patients and intra-
household transmission: a cross-sectional study. Trans. R. Soc. Trop. Med. Hyg. 102,
797–804 (2008).
56. Storla, D. G., Yimer, S. & Bjune, G. A. A systematic review of delay in the diagnosis
and treatment of tuberculosis. BMC Public Health 8, 15 (2008).
57. Ayles, H. et al. Prevalence of Tuberculosis, HIV and Respiratory Symptoms in Two
Zambian Communities: Implications for Tuberculosis Control in the Era of HIV. PLoS
One 4, e5602 (2009).
58. World Health Organization, W. H. Global tuberculosis report 2016. WHO (2016).
doi:ISBN 978 92 4 156539 4
59. Sreeramareddy, C. T., Panduru, K. V, Menten, J. & Van den Ende, J. Time delays in
diagnosis of pulmonary tuberculosis: a systematic review of literature. BMC Infect.
Dis. 9, 91 (2009).
60. Golub, J. E., Mohan, C. I., Comstock, G. W. & Chaisson, R. E. Active case finding of
tuberculosis: historical perspective and future prospects. Int J Tuberc Lung Dis 9,
1183–1203 (2005).
61. Corbett, E. L. et al. Comparison of two active case-finding strategies for community-
based diagnosis of symptomatic smear-positive tuberculosis and control of infectious
tuberculosis in Harare, Zimbabwe (DETECTB): a cluster-randomised trial. Lancet
376, 1244–1253 (2010).
62. Elink Schuurman, M. W. et al. The rapid village survey in tuberculosis control. Tuber.
Lung Dis. 77, 549–54 (1996).
63. Sekandi, J. N., Neuhauser, D., Smyth, K. & Whalen, C. C. Active case finding of
undetected tuberculosis among chronic coughers in a slum setting in Kampala,
Uganda. Int J Tuberc Lung Dis 13, 508–513 (2009).

64. Corbett, E. L. et al. Epidemiology of tuberculosis in a high HIV prevalence population
provided with enhanced diagnosis of symptomatic disease. PLoS Med 4, e22 (2007).
65. Eang, M. T. et al. Early detection of tuberculosis through community-based active case
finding in Cambodia. BMC Public Health 12, 469 (2012).
66. Yadav, R. P., Satha, P., Nishikiori, N., Eang, M. T. & Lubell, Y. Cost-Effectiveness of
a Tuberculosis Active Case Finding Program Targeting Household and Neighborhood
Contacts in Cambodia. Am. J. Trop. Med. Hyg. 90, 866–872 (2014).
67. Morishita, F. et al. Increased Case Notification through Active Case Finding of
Tuberculosis among Household and Neighbourhood Contacts in Cambodia. PLoS One
11, e0150405 (2016).
68. Ho, M.-J. Sociocultural aspects of tuberculosis: a literature review and a case study of
immigrant tuberculosis. Soc. Sci. Med. 59, 753–762 (2004).
69. Fernandez Llanos-Zavalaga, Patricia Poppe, Youssef Tawfik & Cathleen Church-
Balin. The Role of Communication in Peru’s Fight Against Tuberculosis. (2004).
70. Huu Thuy, D., Llanos-Zavalaga, F., Nguyen Thi Mai Huong, Poppe, P. & Youssef
Tawfik. The Role of Health Communication in Achieving Global TB Control Targets.
Marie Stopes International Vietnam (2004).
71. Thuy, D. H., Huong, N. T. M., Tawfik, Y. & Church-Balin, C. The Role of Health
Communication in Vietnam’s Fight Against Tuberculosis. (2004).
72. Nglazi, M. D. et al. The impact of mass media interventions on tuberculosis
awareness, health-seeking behaviour and health service utilisation: a systematic review
protocol. BMJ Open 4, e004302 (2014).
73. Alvarez, G. G. et al. Taima (stop) TB: the impact of a multifaceted TB awareness and
door-to-door campaign in residential areas of high risk for TB in Iqaluit, Nunavut.
PLoS One 9, e100975 (2014).
74. Jaramillo, E. The impact of media-based health education on tuberculosis diagnosis in
Cali, Colombia. Health Policy Plan. 16, 68–73 (2001).
75. Parija, D. et al. Impact of awareness drives and community-based active tuberculosis
case finding in Odisha, India. Int. J. Tuberc. Lung Dis. 18, 1105–1107 (2014).
76. Kapoor, S., Gupta, A. & Shah, M. Cost-effectiveness of isoniazid preventive therapy
for HIV-infected pregnant women in India. Int. J. Tuberc. Lung Dis. 20, 85–92 (2016).
77. Pho, M. T. et al. The cost-effectiveness of tuberculosis preventive therapy for HIV-
infected individuals in southern India: a trial-based analysis. PLoS One 7, e36001
(2012).
78. Sutton, B. S., Arias, M. S., Chheng, P., Eang, M. T. & Kimerling, M. E. The cost of
intensified case finding and isoniazid preventive therapy for HIV-infected patients in
Battambang, Cambodia. Int. J. Tuberc. Lung Dis. 13, 713–8 (2009).
79. Maheswaran, H. & Barton, P. Intensive case finding and isoniazid preventative therapy
in HIV infected individuals in Africa: economic model and value of information
analysis. PLoS One 7, e30457 (2012).
80. Mandalakas, A. M. et al. Modelling the cost-effectiveness of strategies to prevent

tuberculosis in child contacts in a high-burden setting. Thorax 68, 247–55 (2013).
81. Vassall, A. et al. Rapid Diagnosis of Tuberculosis with the Xpert MTB/RIF Assay in
High Burden Countries: A Cost-Effectiveness Analysis. PLoS Med. 8, e1001120
(2011).
82. Dowdy, D. W., van’t Hoog, A., Shah, M. & Cobelens, F. Cost-effectiveness of rapid
susceptibility testing against second-line drugs for tuberculosis. Int. J. Tuberc. Lung
Dis. 18, 647–54 (2014).
83. Menzies, N. A., Cohen, T., Lin, H.-H., Murray, M. & Salomon, J. A. Population health
impact and cost-effectiveness of tuberculosis diagnosis with Xpert MTB/RIF: a
dynamic simulation and economic evaluation. PLoS Med. 9, e1001347 (2012).