Bayesian assessment of favorability for oil and gas prospects over the Recôncavo basin, Brazil
20
AUTHORS Sidnei Pires Rostirolla Basin Analysis and Petrophysical Laboratory, Department of Geology, Federal University of Parana ´ (UFPR), Curitiba, Parana ´ , Brazil; present address: Universidade Federal do Parana ´ , Setor de Cie ˆ ncias da Terra, Departamento de Geologia, Centro Polite ´ cnico, Jardim das Ame ´ ricas, 81531-990, Curitiba, Parana ´ , Brazil; [email protected] Sidnei P. Rostirolla is a professor of geology at the Federal University of Parana ´. He received his M.Sc. (1991) degree from the Federal University of Ouro Preto (UFOP) and Ph.D. (1996) from the State University of Sa ˜ o Paulo (UNESP). He worked at the Petrobras Research Center as a structural geologist, where his research focused on balancing cross section, syntectonic sedimentation and field work. His current research interests are basin analysis, geomathematics, structural geology, and frac- tured reservoir characterization. Antonio Carlos Mattana A. C. Mattana Consultoria e Sistemas, Curitiba, Parana ´, Brazil; [email protected] Antonio C. Mattana received his M.Sc. degree (2000) in exploration geology from the Federal University of Parana ´ . His research interests are geographical information systems and object- oriented programming applied to geology and geophysics. Marcelo Kulevicz Bartoszeck Basin Analysis and Petrophysical Laboratory, Depart- ment of Geology, Federal University of Parana ´ (UFPR), Curitiba, Parana ´ , Brazil; [email protected] Marcelo K. Bartoszeck is a graduate student of geology in the Federal University of Parana ´. His research interests are reservoir modeling, seismic interpretation, and structural geology. ACKNOWLEDGEMENTS The authors thank John Lorenz, John Doveton, Robert Otis, Luciano Magnavita, and John Harbaugh for the profitable suggestions to improve the manuscript. Sidnei Pires Rostirolla thanks the Brazilian National Research Founda- tion CNPq, processes 520063/98-8 e 463002/ 00-8, for financial and scholarship support, and UFPR for institutional support. Bayesian assessment of favorability for oil and gas prospects over the Reco ˆncavo basin, Brazil Sidnei Pires Rostirolla, Antonio Carlos Mattana, and Marcelo Kulevicz Bartoszeck ABSTRACT This paper presents a Bayesian approach to evaluate remaining po- tential of oil and gas in the Reco ˆ ncavo basin, Brazil. The purpose is to test a new Bayesian weighting methodology and quantify the favorability for the existence of new fields in the basin. The meth- odology implies organization of petroleum system data in descrip- tive models with which results from drilling are manipulated sta- tistically, including analysis of geologic factors that are spatially correlated with both producing and dry areas. In the first stage of modeling, the essential elements (reservoir, seal, and overburden rocks) that control the fundamental processes of generation, ex- pulsion, migration, and entrapment of petroleum accumulation are defined throughout integration of previously published data. The petroleum accumulation models of Reco ˆ ncavo basin comprise gen- eration from Neocomian shale rocks of the Gomo Member (Can- deias Formation), vertical migration along extensional and transfer faults, and accumulation in tilted horsts with Upper Jurassic prerift reservoirs (Sergi Formation) or in Neocomian turbidite reservoirs in stratigraphic/combined traps (Candeias and Marfim formations). Probability distributions and weights are then calculated through Boolean operations among producing and dry areas and each diag- nostic criterion evaluated through descriptive models such as source bed thickness, onset of organic maturation, presence or absence of faults and structural blocks, reservoir thickness, and seal distribu- tion. The final stage of evaluation consists of spatial integration of raster maps that are weighted according to their necessity and suf- ficiency conditions, the results being presented as favorability maps. The characterization of favorable areas and their comparison with known fields suggest that such a Bayesian approach can contribute to the understanding of petroleum systems as a practical approach that considers the spatial nature of exploration variables. Copyright #2003. The American Association of Petroleum Geologists. All rights reserved. Manuscript received January 3, 2002; provisional acceptance June 20, 2002; revised manuscript received August 5, 2002; final acceptance October 7, 2002. AAPG Bulletin, v. 87, no. 4 (April 2003), pp. 647 – 666 647
-
Upload
independent -
Category
Documents
-
view
2 -
download
0
Transcript of Bayesian assessment of favorability for oil and gas prospects over the Recôncavo basin, Brazil
AUTHORS
Sidnei Pires Rostirolla � Basin Analysisand Petrophysical Laboratory, Department ofGeology, Federal University of Parana (UFPR),Curitiba, Parana, Brazil; present address:Universidade Federal do Parana, Setor deCiencias da Terra, Departamento de Geologia,Centro Politecnico, Jardim das Americas,81531-990, Curitiba, Parana, Brazil;[email protected]
Sidnei P. Rostirolla is a professor of geology atthe Federal University of Parana. He receivedhis M.Sc. (1991) degree from the FederalUniversity of Ouro Preto (UFOP) and Ph.D.(1996) from the State University of Sao Paulo(UNESP). He worked at the Petrobras ResearchCenter as a structural geologist, where hisresearch focused on balancing cross section,syntectonic sedimentation and field work. Hiscurrent research interests are basin analysis,geomathematics, structural geology, and frac-tured reservoir characterization.
Antonio Carlos Mattana � A. C. MattanaConsultoria e Sistemas, Curitiba, Parana,Brazil; [email protected]
Antonio C. Mattana received his M.Sc. degree(2000) in exploration geology from the FederalUniversity of Parana. His research interests aregeographical information systems and object-oriented programming applied to geology andgeophysics.
Marcelo Kulevicz Bartoszeck � BasinAnalysis and Petrophysical Laboratory, Depart-ment of Geology, Federal University of Parana(UFPR), Curitiba, Parana, Brazil;[email protected]
Marcelo K. Bartoszeck is a graduate student ofgeology in the Federal University of Parana.His research interests are reservoir modeling,seismic interpretation, and structural geology.
ACKNOWLEDGEMENTS
The authors thank John Lorenz, John Doveton,Robert Otis, Luciano Magnavita, and JohnHarbaugh for the profitable suggestions toimprove the manuscript. Sidnei Pires Rostirollathanks the Brazilian National Research Founda-tion CNPq, processes 520063/98-8 e 463002/00-8, for financial and scholarship support,and UFPR for institutional support.
Bayesian assessment offavorability for oil and gasprospects over the Reconcavobasin, BrazilSidnei Pires Rostirolla, Antonio Carlos Mattana, andMarcelo Kulevicz Bartoszeck
ABSTRACT
This paper presents a Bayesian approach to evaluate remaining po-
tential of oil and gas in the Reconcavo basin, Brazil. The purpose is
to test a new Bayesian weighting methodology and quantify the
favorability for the existence of new fields in the basin. The meth-
odology implies organization of petroleum system data in descrip-
tive models with which results from drilling are manipulated sta-
tistically, including analysis of geologic factors that are spatially
correlated with both producing and dry areas. In the first stage of
modeling, the essential elements (reservoir, seal, and overburden
rocks) that control the fundamental processes of generation, ex-
pulsion, migration, and entrapment of petroleum accumulation are
defined throughout integration of previously published data. The
petroleum accumulation models of Reconcavo basin comprise gen-
eration from Neocomian shale rocks of the Gomo Member (Can-
deias Formation), vertical migration along extensional and transfer
faults, and accumulation in tilted horsts with Upper Jurassic prerift
reservoirs (Sergi Formation) or in Neocomian turbidite reservoirs in
stratigraphic/combined traps (Candeias and Marfim formations).
Probability distributions and weights are then calculated through
Boolean operations among producing and dry areas and each diag-
nostic criterion evaluated through descriptive models such as source
bed thickness, onset of organic maturation, presence or absence of
faults and structural blocks, reservoir thickness, and seal distribu-
tion. The final stage of evaluation consists of spatial integration of
raster maps that are weighted according to their necessity and suf-
ficiency conditions, the results being presented as favorability maps.
The characterization of favorable areas and their comparison with
known fields suggest that such a Bayesian approach can contribute
to the understanding of petroleum systems as a practical approach
that considers the spatial nature of exploration variables.
Copyright #2003. The American Association of Petroleum Geologists. All rights reserved.
Manuscript received January 3, 2002; provisional acceptance June 20, 2002; revised manuscriptreceived August 5, 2002; final acceptance October 7, 2002.
AAPG Bulletin, v. 87, no. 4 (April 2003), pp. 647–666 647

INTRODUCTION
This paper integrates numerical basin modeling and
statistical procedures to the mapping of success prob-
ability for oil and gas prospects in the Reconcavo basin,
Brazil. The objective is to apply weighting procedures
and Bayesian updating of the hydrocarbon favorability
in the Reconcavo basin based on isopach, structural,
lithologic, and geochemical mapping. The procedures
attempt to seek out Bayesian relationships between
major geologic variables and the presence or absence
of oil and gas based on results of previous exploratory
drilling.
Most evaluation systems depend heavily on geo-
logic factors considered essential for an oil or gas pros-
pect, such as the presence of reservoir beds, traps, seals,
hydrocarbon source beds, and so forth. Although these
geologic features are of unquestionable importance,
they are commonly entered into decision systems as
poorly constrained assumptions. The goal here is to
outline some statistical procedures that can help to min-
imize uncertainty and to provide quantitative measure-
ments of uncertainty in the form of objectively derived
probability distributions.
Many different schemes for analyzing risk in oil ex-
ploration have been proposed. Most of them attempt to
provide a systematic approach in which geologic factors
are systematically weighted to yield numerical scores
(e.g., Sluijk and Nederlof, 1984; Harbaugh et al., 1995;
White, 1993; Otis and Schneiderman, 1997; Lerche,
1997). The procedures discussed here consider the same
modeling strategy and are similar to those of Agterberg
(1989) and Bonham-Carter (1994), involving sampling
over an entire region, followed by processing of the
sample data stored in raster or pixel form or, alternatively,
in vector form as points, lines, and polygons.
Because we are interested in forecasting the out-
comes of exploratory wells, it is important to categorize
these outcomes with respect to the geologic percep-
tions of prospects before they are drilled. Schemes can
be readily devised for systematic comparison of predrill
perceptions with postdrill outcomes or ‘‘postmortems,’’
yielding frequencies that can be manipulated with Bayes’
theorem to yield conditional probabilities based on joint
and marginal frequencies. The study has involved exten-
sive search in the Reconcavo basin for Bayesian relation-
ships that relate geologic factors to producible quantities
of oil and gas, for which a large amount of published in-
formation is available.
Such an approach contrasts with forecasting ap-
proaches that assign hydrocarbon volumes subjectively,
calculation involving the multiplication of separate
probabilities for key geologic properties. These prop-
erties include thickness of the reservoir rocks, area of
closure, proportion of fill, and so forth. If these properties
can be objectively estimated before drilling, multiplica-
tion procedures have great merit, but if the properties
cannot be estimated objectively, the procedures are
likely to be misleading, thus increasing the uncertainty
instead of decreasing it.
The Reconcavo basin provides a wealth of pub-
lished data for testing favorability evaluation procedures,
including migration pathways, reservoir properties,
trapping structures, seals, and hydrocarbon-generation
windows. Although the favorability evaluation present-
ed here has been specifically calibrated for the Recon-
cavo basin, it could be adapted for other sedimentary
basins.
METHODOLOGY FOR DELINEATINGFAVORABLE AREAS
Because most statistical and mapping tools are readily
available for uncertainty assessment, the time-consuming
tasks in basin assessment involve data-set organiza-
tion. Deterministic relationships among prospects, oil
fields, and rocks can contribute to petroleum system
approaches in which all major geologic factors are
incorporated into the definition of the system, as source,
carrier and reservoir beds, traps, seals, faults, temper-
ature gradients, burial history, and fluid flow. The ex-
tent to which petroleum systems can be incorporated
into statistically based assessment systems is current-
ly unresolved. The end product of petroleum systems
modeling, however, necessarily consists of quantita-
tive measurements of favorability expressed as prob-
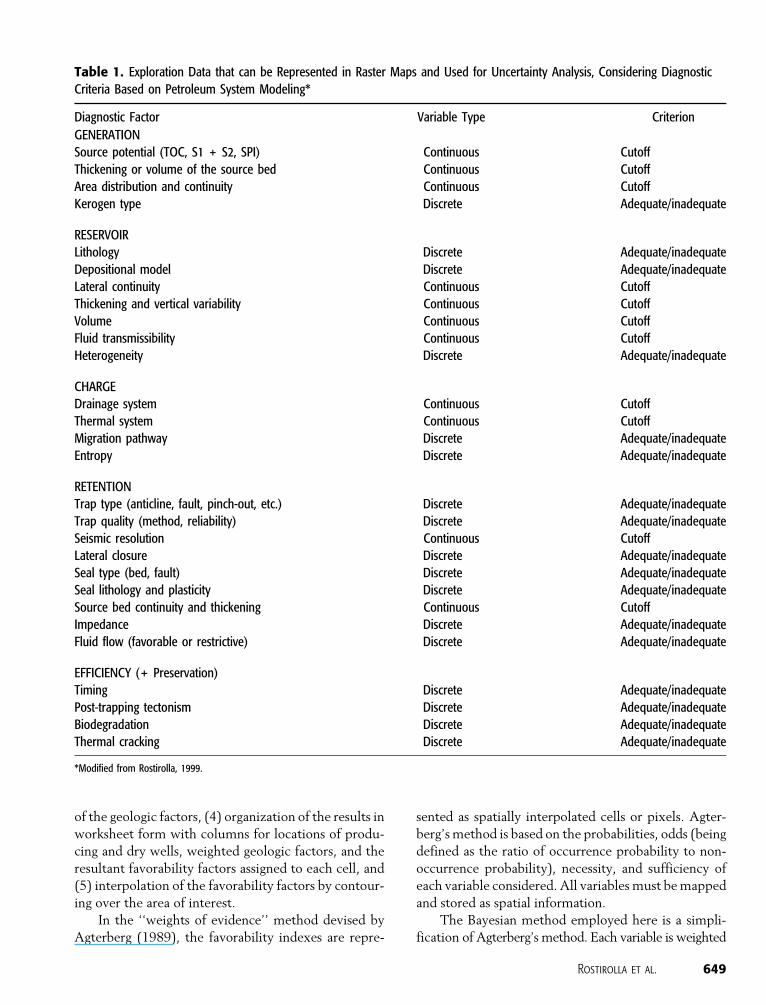
ability distributions. Table 1 lists the main geologic
factors and their forms.
The transformation of ‘‘point or cross section data’’
such as wells or local seismic into mapped probabili-
ties is made on a cell-by-cell basis, in which geologic
factors can be classified as present or absent, and then
weighted and probabilistically combined. The method
implies exploration modeling, statistical analysis of post-
mortems and manipulation of geographically refer-
enced variables, including the following tasks: (1) se-
lection of the geologic factors from Table 1 that are
deemed to be critical, (2) rasterization of the area into
cells for which the probabilities of new discoveries are
to be calculated, (3) calculation of the probability
distributions for well outcomes based on joint occurrences
648 Bayesian Assessment of Favorability for Oil and Gas Prospects
of the geologic factors, (4) organization of the results in
worksheet form with columns for locations of produ-
cing and dry wells, weighted geologic factors, and the
resultant favorability factors assigned to each cell, and
(5) interpolation of the favorability factors by contour-
ing over the area of interest.
In the ‘‘weights of evidence’’ method devised by
Agterberg (1989), the favorability indexes are repre-
sented as spatially interpolated cells or pixels. Agter-
berg’s method is based on the probabilities, odds (being
defined as the ratio of occurrence probability to non-
occurrence probability), necessity, and sufficiency of
each variable considered. All variables must be mapped
and stored as spatial information.
The Bayesian method employed here is a simpli-
fication of Agterberg’s method. Each variable is weighted
Rostirolla et al. 649
Table 1. Exploration Data that can be Represented in Raster Maps and Used for Uncertainty Analysis, Considering Diagnostic
Criteria Based on Petroleum System Modeling*
Diagnostic Factor Variable Type Criterion
GENERATION
Source potential (TOC, S1 + S2, SPI) Continuous Cutoff
Thickening or volume of the source bed Continuous Cutoff
Area distribution and continuity Continuous Cutoff
Kerogen type Discrete Adequate/inadequate
RESERVOIR
Lithology Discrete Adequate/inadequate
Depositional model Discrete Adequate/inadequate
Lateral continuity Continuous Cutoff
Thickening and vertical variability Continuous Cutoff
Volume Continuous Cutoff
Fluid transmissibility Continuous Cutoff
Heterogeneity Discrete Adequate/inadequate
CHARGE
Drainage system Continuous Cutoff
Thermal system Continuous Cutoff
Migration pathway Discrete Adequate/inadequate
Entropy Discrete Adequate/inadequate
RETENTION
Trap type (anticline, fault, pinch-out, etc.) Discrete Adequate/inadequate
Trap quality (method, reliability) Discrete Adequate/inadequate
Seismic resolution Continuous Cutoff
Lateral closure Discrete Adequate/inadequate
Seal type (bed, fault) Discrete Adequate/inadequate
Seal lithology and plasticity Discrete Adequate/inadequate
Source bed continuity and thickening Continuous Cutoff
Impedance Discrete Adequate/inadequate
Fluid flow (favorable or restrictive) Discrete Adequate/inadequate
EFFICIENCY (+ Preservation)
Timing Discrete Adequate/inadequate
Post-trapping tectonism Discrete Adequate/inadequate
Biodegradation Discrete Adequate/inadequate
Thermal cracking Discrete Adequate/inadequate
*Modified from Rostirolla, 1999.
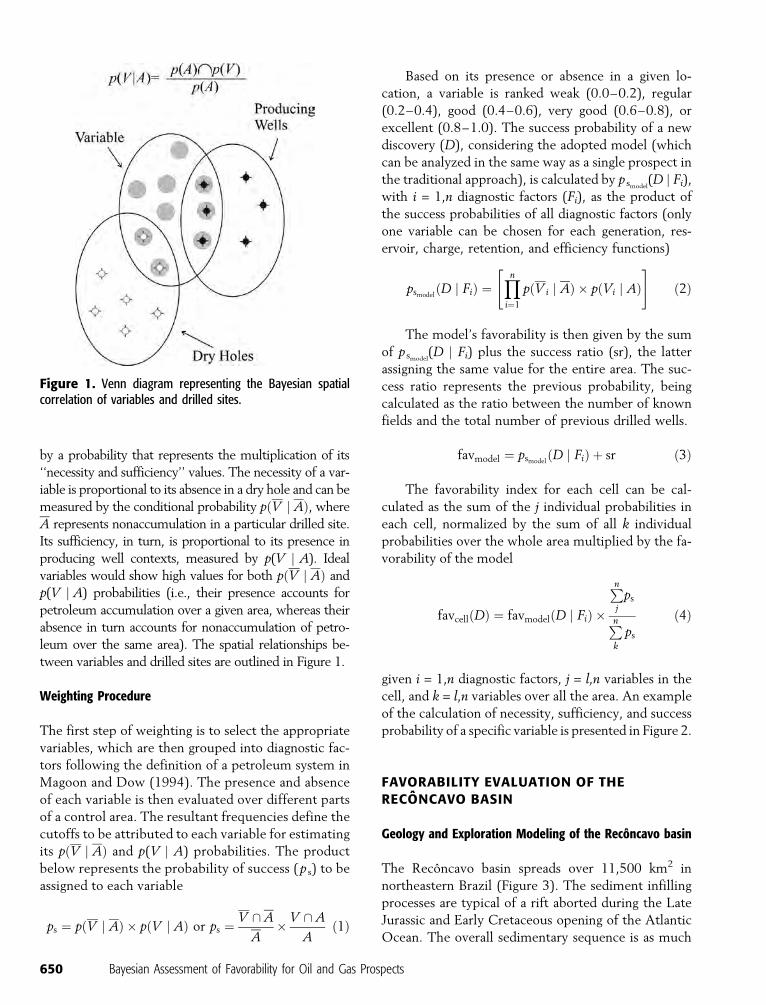
by a probability that represents the multiplication of its
‘‘necessity and sufficiency’’ values. The necessity of a var-
iable is proportional to its absence in a dry hole and can be
measured by the conditional probability pðV j AÞ, where
A represents nonaccumulation in a particular drilled site.
Its sufficiency, in turn, is proportional to its presence in
producing well contexts, measured by p(V j A). Ideal
variables would show high values for both pðV j AÞ and
p(V j A) probabilities (i.e., their presence accounts for
petroleum accumulation over a given area, whereas their
absence in turn accounts for nonaccumulation of petro-
leum over the same area). The spatial relationships be-
tween variables and drilled sites are outlined in Figure 1.
Weighting Procedure
The first step of weighting is to select the appropriate
variables, which are then grouped into diagnostic fac-
tors following the definition of a petroleum system in
Magoon and Dow (1994). The presence and absence
of each variable is then evaluated over different parts
of a control area. The resultant frequencies define the
cutoffs to be attributed to each variable for estimating
its pðV j AÞ and p(V j A) probabilities. The product
below represents the probability of success (p s) to be
assigned to each variable
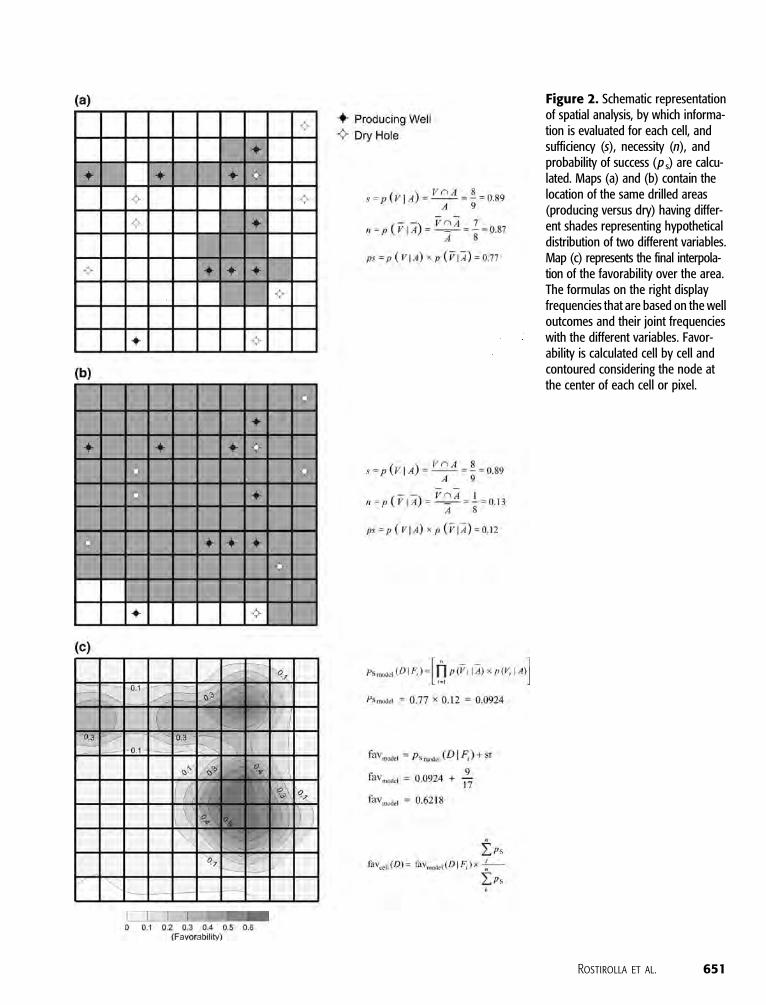
ps ¼ pðV j AÞ � pðV j AÞ or ps ¼V \ A
A� V \ A
Að1Þ
Based on its presence or absence in a given lo-
cation, a variable is ranked weak (0.0–0.2), regular
(0.2–0.4), good (0.4–0.6), very good (0.6–0.8), or
excellent (0.8–1.0). The success probability of a new
discovery (D), considering the adopted model (which
can be analyzed in the same way as a single prospect in
the traditional approach), is calculated by p smodel(D j Fi),
with i = 1,n diagnostic factors (Fi), as the product of
the success probabilities of all diagnostic factors (only
one variable can be chosen for each generation, res-
ervoir, charge, retention, and efficiency functions)
psmodelðD j FiÞ ¼
Yn
i¼1
pðVi j AÞ � pðVi j AÞ" #
ð2Þ
The model’s favorability is then given by the sum
of p smodel(D j Fi) plus the success ratio (sr), the latter
assigning the same value for the entire area. The suc-
cess ratio represents the previous probability, being
calculated as the ratio between the number of known
fields and the total number of previous drilled wells.
favmodel ¼ psmodelðD j FiÞ þ sr ð3Þ
The favorability index for each cell can be cal-
culated as the sum of the j individual probabilities in
each cell, normalized by the sum of all k individual
probabilities over the whole area multiplied by the fa-
vorability of the model
favcellðDÞ ¼ favmodelðD j FiÞ �
Pnj
ps
Pnk
ps
ð4Þ
given i = 1,n diagnostic factors, j = l,n variables in the
cell, and k = l,n variables over all the area. An example
of the calculation of necessity, sufficiency, and success
probability of a specific variable is presented in Figure 2.
FAVORABILITY EVALUATION OF THERECONCAVO BASIN
Geology and Exploration Modeling of the Reconcavo basin
The Reconcavo basin spreads over 11,500 km2 in
northeastern Brazil (Figure 3). The sediment infilling
processes are typical of a rift aborted during the Late
Jurassic and Early Cretaceous opening of the Atlantic
Ocean. The overall sedimentary sequence is as much
650 Bayesian Assessment of Favorability for Oil and Gas Prospects
Figure 1. Venn diagram representing the Bayesian spatialcorrelation of variables and drilled sites.
Rostirolla et al. 651
Figure 2. Schematic representationof spatial analysis, by which informa-tion is evaluated for each cell, andsufficiency (s), necessity (n), andprobability of success (p s) are calcu-lated. Maps (a) and (b) contain thelocation of the same drilled areas(producing versus dry) having differ-ent shades representing hypotheticaldistribution of two different variables.Map (c) represents the final interpola-tion of the favorability over the area.The formulas on the right displayfrequencies that are based on the welloutcomes and their joint frequencieswith the different variables. Favor-ability is calculated cell by cell andcontoured considering the node atthe center of each cell or pixel.
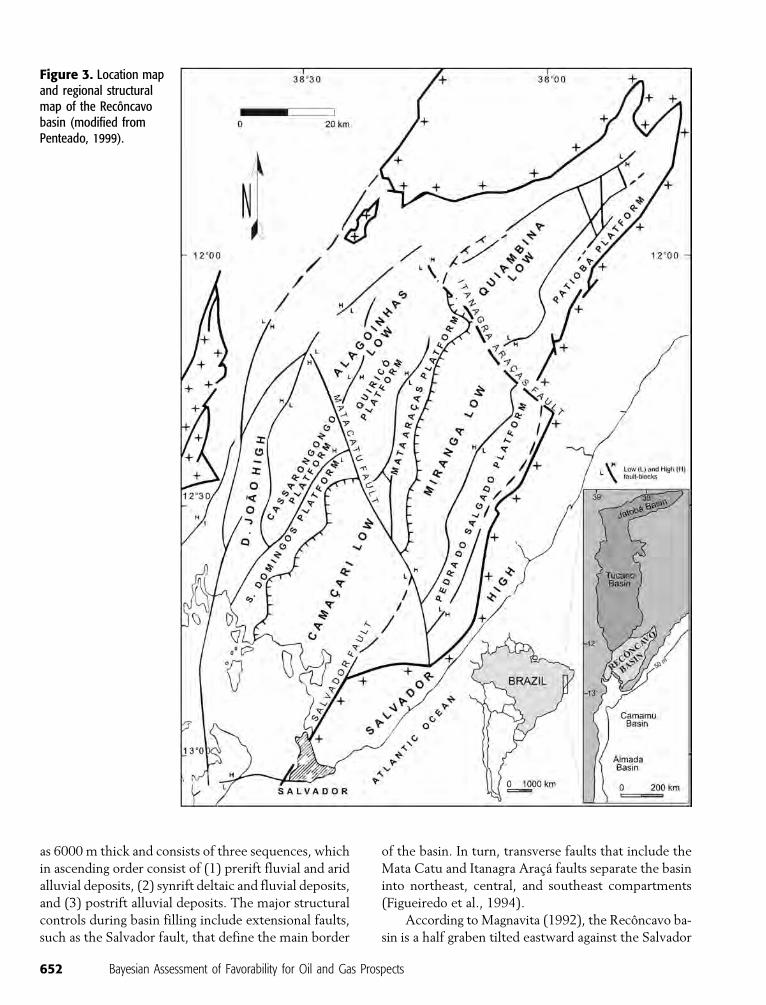
as 6000 m thick and consists of three sequences, which
in ascending order consist of (1) prerift fluvial and arid
alluvial deposits, (2) synrift deltaic and fluvial deposits,
and (3) postrift alluvial deposits. The major structural
controls during basin filling include extensional faults,
such as the Salvador fault, that define the main border
of the basin. In turn, transverse faults that include the
Mata Catu and Itanagra Araca faults separate the basin
into northeast, central, and southeast compartments
(Figueiredo et al., 1994).
According to Magnavita (1992), the Reconcavo ba-
sin is a half graben tilted eastward against the Salvador
652 Bayesian Assessment of Favorability for Oil and Gas Prospects
Figure 3. Location mapand regional structuralmap of the Reconcavobasin (modified fromPenteado, 1999).
fault, being structurally characterized by a 30jN–40jE-
trending system of extensional faults that define platforms
and structural lows (Camacari, Miranga, and Quiambina).
The northeast fault system is interrupted in places by
the northwest-trending transfer zones (Mata Catu and
Itanagra Araca faults) that divide the basin into three
compartments, each compartment exhibiting character-
istic stratigraphic and structural architectures.
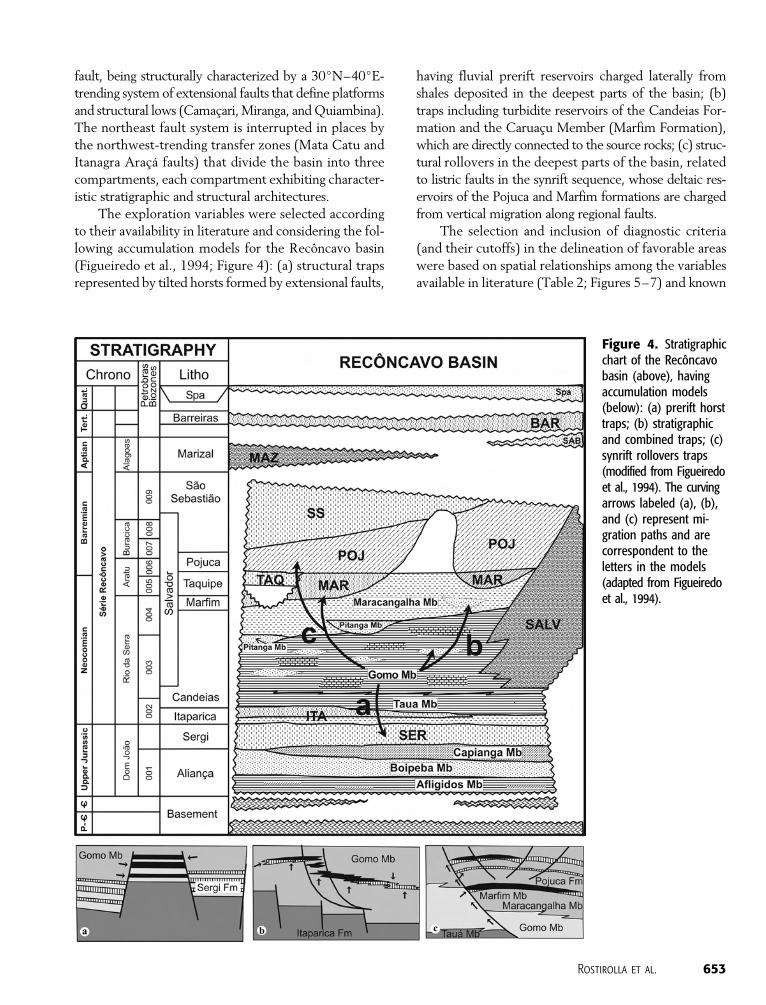
The exploration variables were selected according
to their availability in literature and considering the fol-
lowing accumulation models for the Reconcavo basin
(Figueiredo et al., 1994; Figure 4): (a) structural traps
represented by tilted horsts formed by extensional faults,
having fluvial prerift reservoirs charged laterally from
shales deposited in the deepest parts of the basin; (b)
traps including turbidite reservoirs of the Candeias For-
mation and the Caruacu Member (Marfim Formation),
which are directly connected to the source rocks; (c) struc-
tural rollovers in the deepest parts of the basin, related
to listric faults in the synrift sequence, whose deltaic res-
ervoirs of the Pojuca and Marfim formations are charged
from vertical migration along regional faults.
The selection and inclusion of diagnostic criteria
(and their cutoffs) in the delineation of favorable areas
were based on spatial relationships among the variables
available in literature (Table 2; Figures 5–7) and known
Rostirolla et al. 653
Figure 4. Stratigraphicchart of the Reconcavobasin (above), havingaccumulation models(below): (a) prerift horsttraps; (b) stratigraphicand combined traps; (c)synrift rollovers traps(modified from Figueiredoet al., 1994). The curvingarrows labeled (a), (b),and (c) represent mi-gration paths and arecorrespondent to theletters in the models(adapted from Figueiredoet al., 1994).
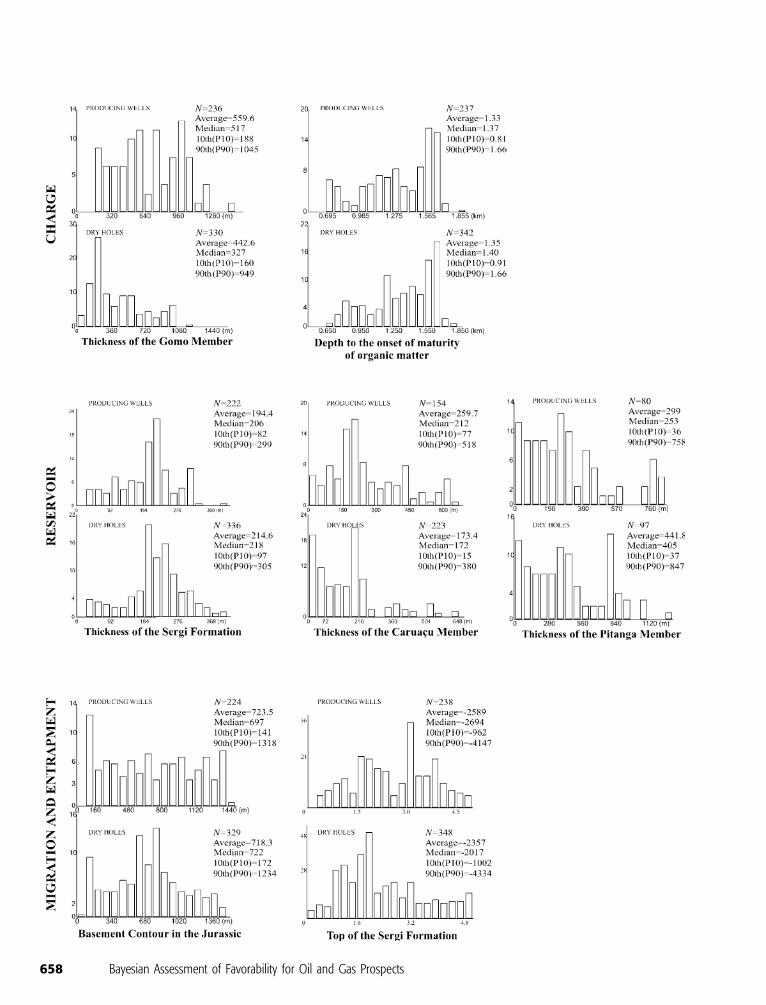
producing and dry wells (histograms in Figure 8).
Although the database is not representative, because the
known exploration variables of Reconcavo basin were
intentionally omitted in previous published papers, the
available data could validate a first test of the evaluation
system.
The Gomo and Taua members (Candeias Forma-
tion) represent the main source rock units of the Recon-
cavo basin, having an average total organic carbon (TOC)
of approximately 1% and a source potential of 5 kg HC
(hydrocarbons)/ton in the deepest parts of the basin,
reaching 10 kg HC/ton in certain places. The Pojuca
Formation also contains carbon-rich shales, but has not
fallen in the generation window in most of the basin.
Fluvial sandstones of the prerift sequence (Sergi Forma-
tion) are the main reservoir rocks, a coarsening-upward
sequence having porosity ranging from 10 to 25% and
permeability from 20 to 1200 md (Figueiredo et al.,
1994). The turbiditic reservoirs of the Taquipe For-
mation are components of the synrift Ilhas system, the
second most important one in the basin. Their porosities
range between 18 and 24% and permeability from 30
to 300 md. Turbidite sandstones of the Pitanga Mem-
ber, belonging to the Candeias Formation according
Figueiredo et al. (1994), are associated with fractured
shales and represent a third reservoir system, having po-
rosity ranging from 15 to 18% and permeability in the
best intervals around 30 md and reaching 200 md in
places. Intercalated and overlying pelites form the seals
to the reservoir sandstones.
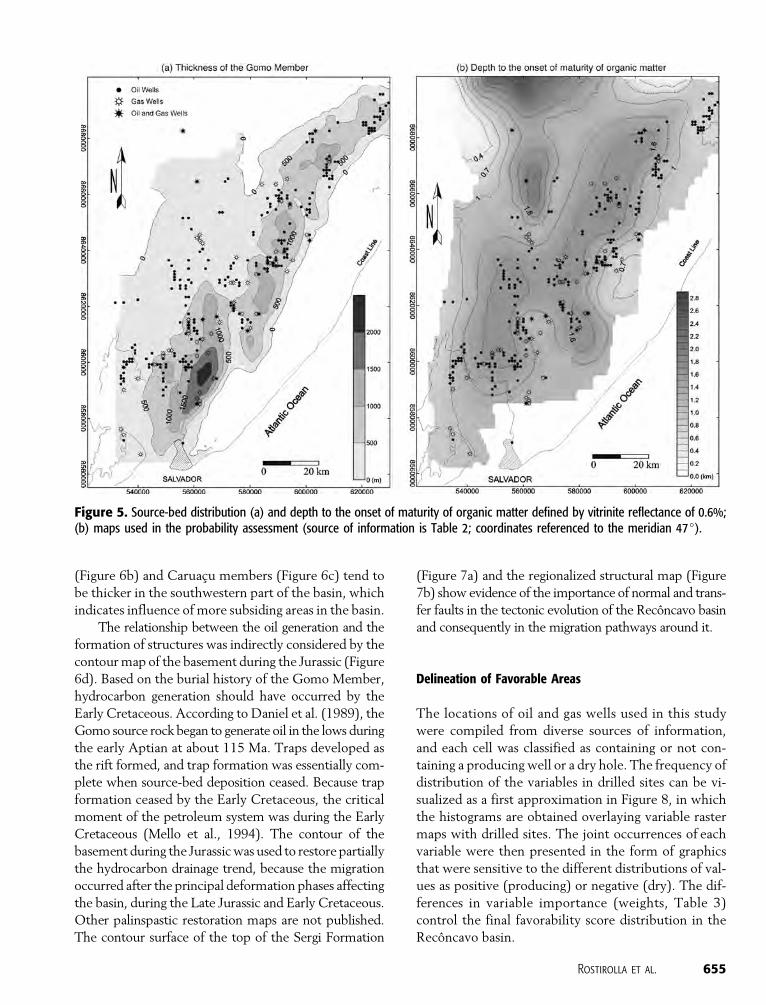
Figures 5–7 present generalized maps of the gen-
eration, migration, reservoir, and trap variables in the
Reconcavo basin. The Gomo Member (Figure 5a) has
a general hydrocarbon source potential trend that is
thicker in the southeastern part of the basin. Despite
this general trend, its distribution suggests that anoxic
environments are poorly correlated to depocenter areas
because there is no coincidence between the principal
depocenter and the hydrocarbon richer areas. A gen-
erative variable, defined by vitrinite reflectance (Figure
5b), is controlled by the thermal distribution in deeper
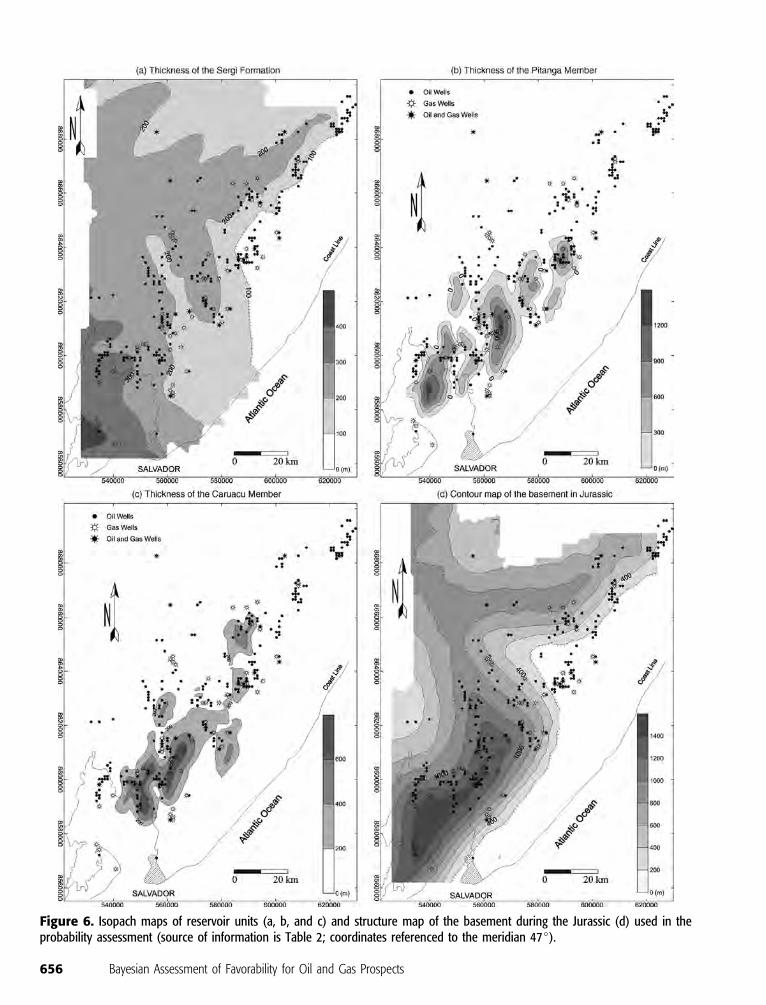
parts of the basin. The Sergi Formation (Figure 6a) has
a rather uniform thickness throughout the basin, but
thickens gradually to the southeast, whereas the Pitanga
654 Bayesian Assessment of Favorability for Oil and Gas Prospects
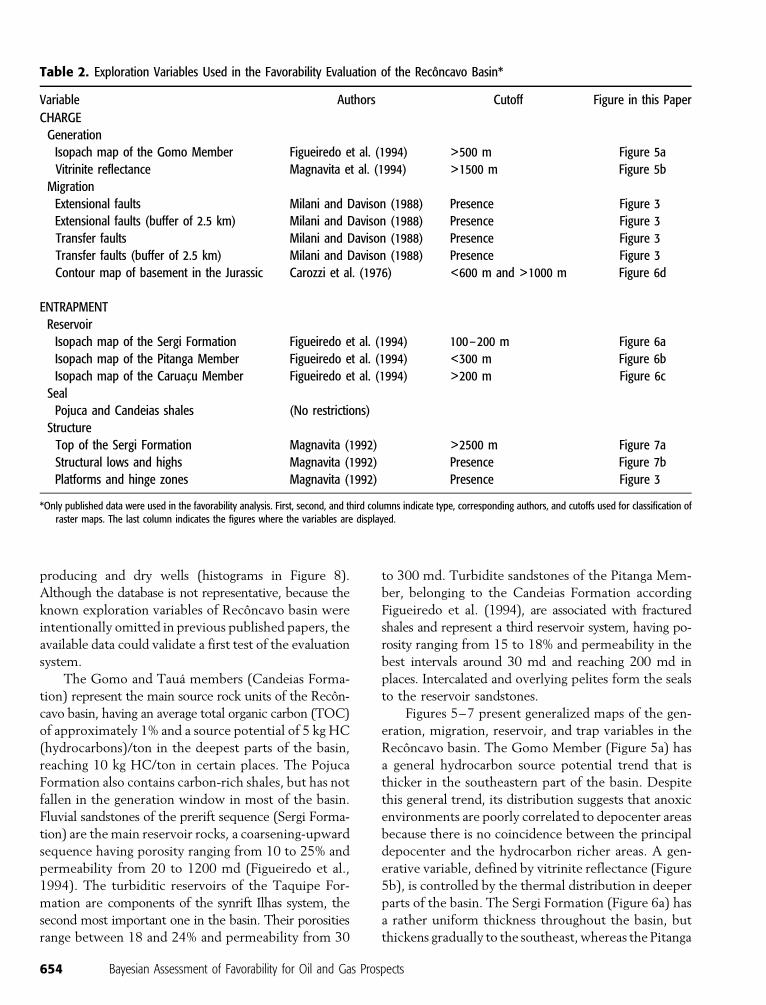
Table 2. Exploration Variables Used in the Favorability Evaluation of the Reconcavo Basin*
Variable Authors Cutoff Figure in this Paper
CHARGE
Generation
Isopach map of the Gomo Member Figueiredo et al. (1994) >500 m Figure 5a
Vitrinite reflectance Magnavita et al. (1994) >1500 m Figure 5b
Migration
Extensional faults Milani and Davison (1988) Presence Figure 3
Extensional faults (buffer of 2.5 km) Milani and Davison (1988) Presence Figure 3
Transfer faults Milani and Davison (1988) Presence Figure 3
Transfer faults (buffer of 2.5 km) Milani and Davison (1988) Presence Figure 3
Contour map of basement in the Jurassic Carozzi et al. (1976) <600 m and >1000 m Figure 6d
ENTRAPMENT
Reservoir
Isopach map of the Sergi Formation Figueiredo et al. (1994) 100–200 m Figure 6a
Isopach map of the Pitanga Member Figueiredo et al. (1994) <300 m Figure 6b
Isopach map of the Caruacu Member Figueiredo et al. (1994) >200 m Figure 6c
Seal
Pojuca and Candeias shales (No restrictions)
Structure
Top of the Sergi Formation Magnavita (1992) >2500 m Figure 7a
Structural lows and highs Magnavita (1992) Presence Figure 7b
Platforms and hinge zones Magnavita (1992) Presence Figure 3
*Only published data were used in the favorability analysis. First, second, and third columns indicate type, corresponding authors, and cutoffs used for classification ofraster maps. The last column indicates the figures where the variables are displayed.
(Figure 6b) and Caruacu members (Figure 6c) tend to
be thicker in the southwestern part of the basin, which
indicates influence of more subsiding areas in the basin.
The relationship between the oil generation and the
formation of structures was indirectly considered by the
contour map of the basement during the Jurassic (Figure
6d). Based on the burial history of the Gomo Member,
hydrocarbon generation should have occurred by the
Early Cretaceous. According to Daniel et al. (1989), the
Gomo source rock began to generate oil in the lows during
the early Aptian at about 115 Ma. Traps developed as
the rift formed, and trap formation was essentially com-
plete when source-bed deposition ceased. Because trap
formation ceased by the Early Cretaceous, the critical
moment of the petroleum system was during the Early
Cretaceous (Mello et al., 1994). The contour of the
basement during the Jurassic was used to restore partially
the hydrocarbon drainage trend, because the migration
occurred after the principal deformation phases affecting
the basin, during the Late Jurassic and Early Cretaceous.
Other palinspastic restoration maps are not published.
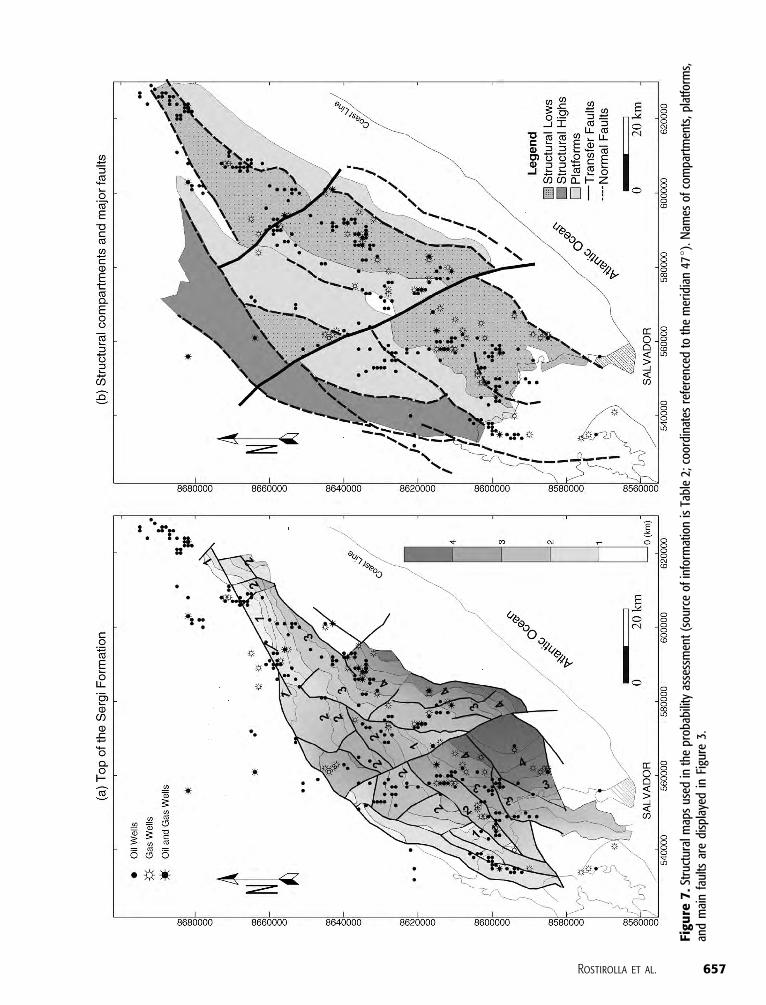
The contour surface of the top of the Sergi Formation
(Figure 7a) and the regionalized structural map (Figure
7b) show evidence of the importance of normal and trans-
fer faults in the tectonic evolution of the Reconcavo basin
and consequently in the migration pathways around it.
Delineation of Favorable Areas
The locations of oil and gas wells used in this study
were compiled from diverse sources of information,
and each cell was classified as containing or not con-
taining a producing well or a dry hole. The frequency of
distribution of the variables in drilled sites can be vi-
sualized as a first approximation in Figure 8, in which
the histograms are obtained overlaying variable raster
maps with drilled sites. The joint occurrences of each
variable were then presented in the form of graphics
that were sensitive to the different distributions of val-
ues as positive (producing) or negative (dry). The dif-
ferences in variable importance (weights, Table 3)
control the final favorability score distribution in the
Reconcavo basin.
Rostirolla et al. 655
Figure 5. Source-bed distribution (a) and depth to the onset of maturity of organic matter defined by vitrinite reflectance of 0.6%;(b) maps used in the probability assessment (source of information is Table 2; coordinates referenced to the meridian 47j).
656 Bayesian Assessment of Favorability for Oil and Gas Prospects
Figure 6. Isopach maps of reservoir units (a, b, and c) and structure map of the basement during the Jurassic (d) used in theprobability assessment (source of information is Table 2; coordinates referenced to the meridian 47j).
Rostirolla et al. 657
Figu
re7
.Str
uctu
ralm
aps
used
inth
epr
obab
ility
asse
ssm
ent(
sour
ceof
info
rmat
ion
isTa
ble
2;co
ordi
nate
sre
fere
nced
toth
em
erid
ian
47j)
.Nam
esof
com
part
men
ts,p
latfo
rms,
and
mai
nfa
ults
are
disp
laye
din
Figu
re3.
658 Bayesian Assessment of Favorability for Oil and Gas Prospects
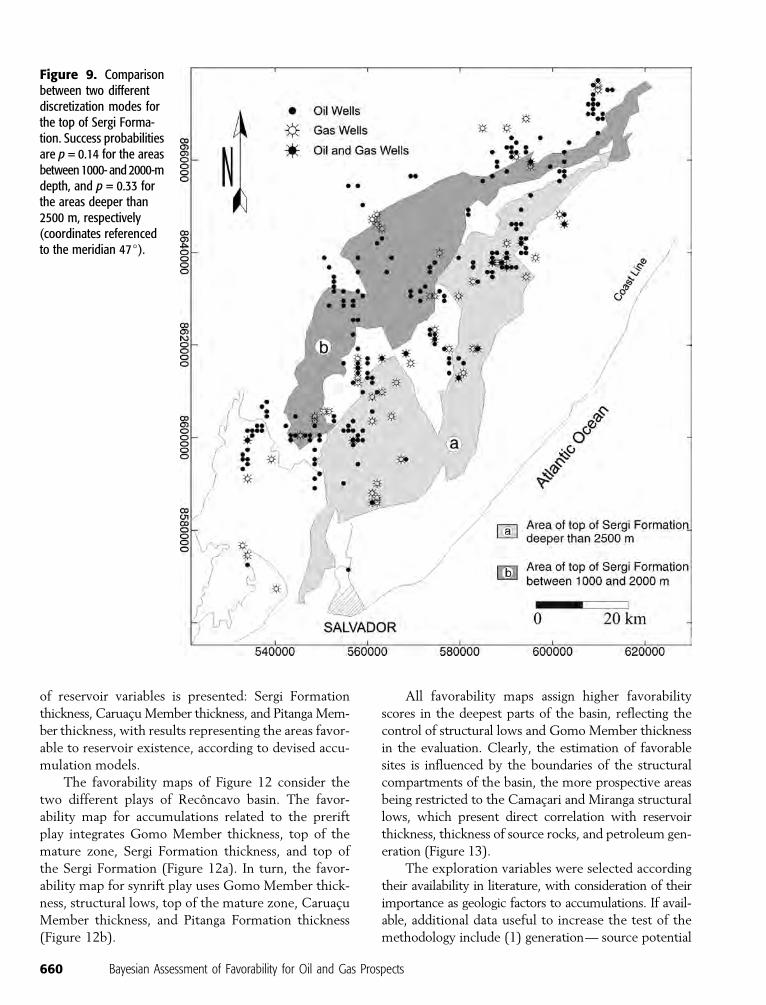
The structural map of the top of the Sergi Forma-
tion and its relationship with wells (Figures 7, 8) can
be used to exemplify the weighting definition. Consid-
ering only this variable, an area for prospecting could be
defined as the area of potential accumulation whose
values are satisfied by its presence or absence as a diag-
nostic criterion. For example, the same contour map of
the top of Sergi Formation (Figure 7a) could represent
two different exploratory variables depending on the
cutoff used. In Figure 9, the contour of the top of the
Sergi Formation was discretized in two ways: (1) be-
tween 1000 and 2000 m deep and (2) deeper than 2500
m. The success probabilities for those cases are 0.1383
and 0.3278, respectively (Table 3). These two different
scenarios for the same variable demonstrate the sen-
sitivity of the weighting method to the cutoffs and cor-
respondent frequency distributions.
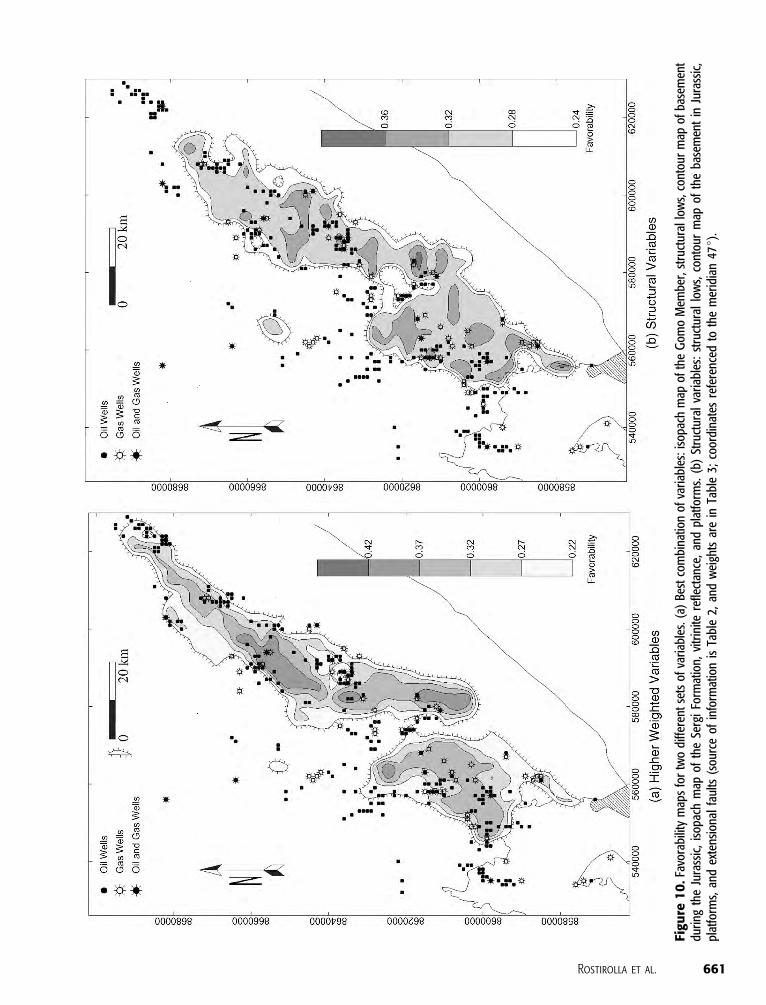
To investigate the variability of petroleum potential
in the basin, six favorability maps have been constructed
with different sets of variables (Figures 10–12). Much
of the remaining potential of the oil and gas can be
delineated, considering the combination of variables of
higher weights (Figure 10a): Gomo Member thickness,
structural lows, paleobasement contour map, top of the
mature zone, Sergi Formation thickness, and platforms.
Otherwise, a series of small leads can be delineated if we
consider only diagnostic criteria derived from the struc-
tural maps: structural lows, paleobasement contour
map, platforms, normal faults (having 2.5-km buffers
around them), and the top of the Sergi Formation
(Figure 10b).
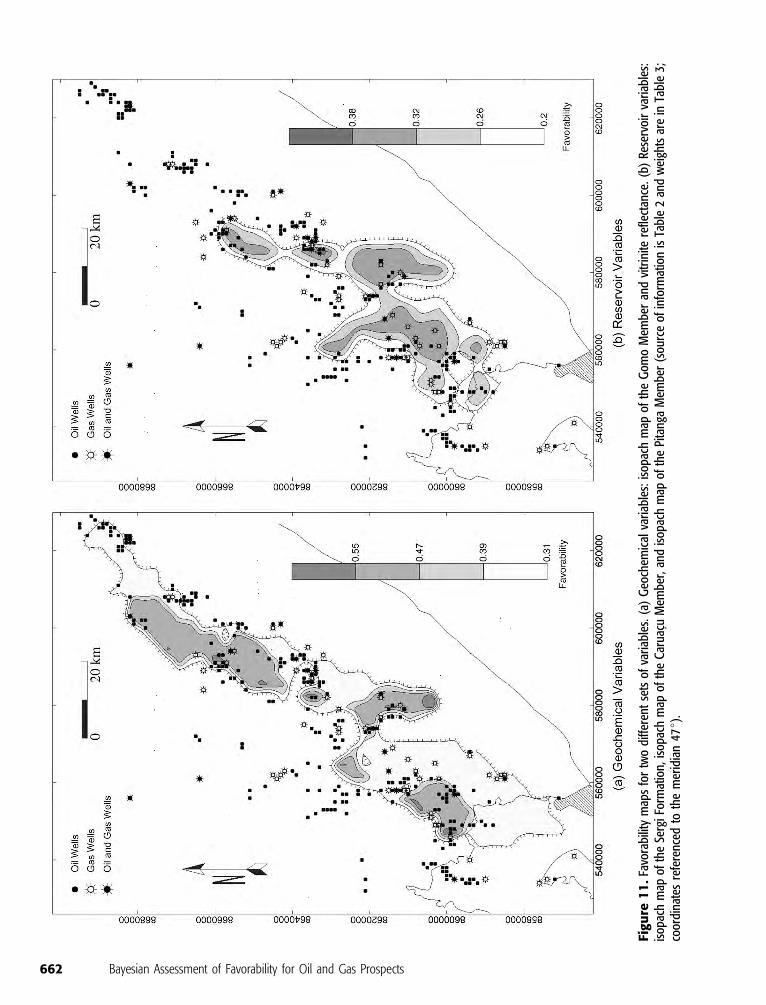
To achieve better constraints about generation
factors, Figure 11a presents a set of geochemical var-
iables, Gomo Formation thickness and vitrinite reflec-
tance. The results are also tendentious to structural
lows, confirming the idea of bulk petroleum expulsion
and hydrocarbon saturation controlled by hotter sites in
the basin. In the Figure 11b, the result of a combination
Rostirolla et al. 659
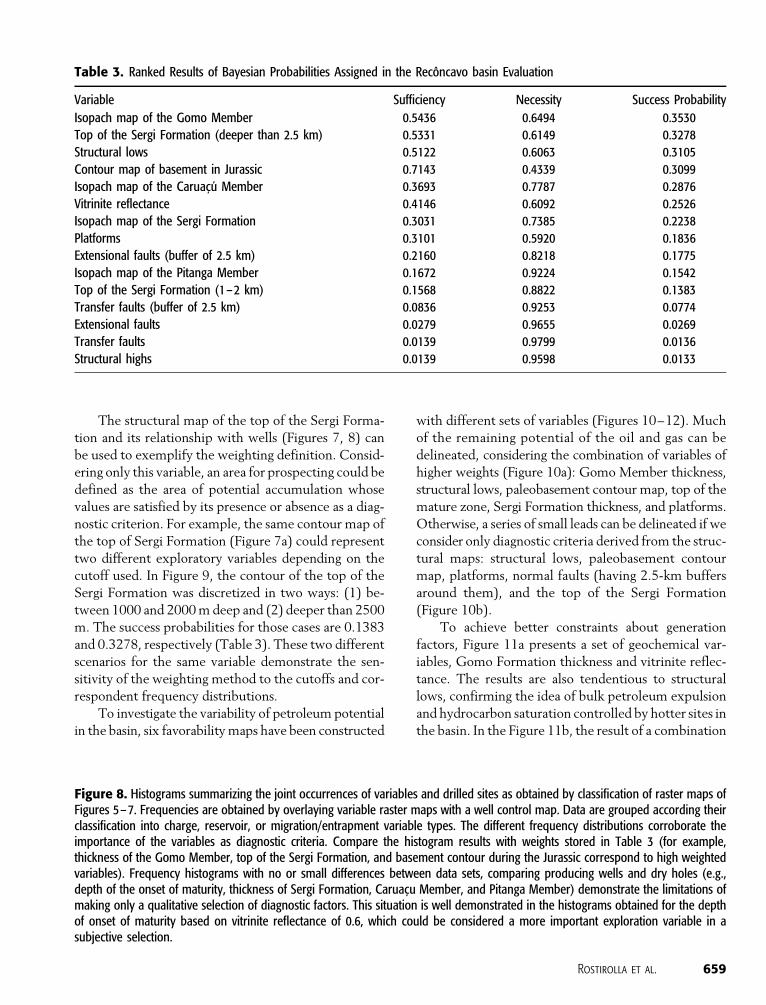
Table 3. Ranked Results of Bayesian Probabilities Assigned in the Reconcavo basin Evaluation
Variable Sufficiency Necessity Success Probability
Isopach map of the Gomo Member 0.5436 0.6494 0.3530
Top of the Sergi Formation (deeper than 2.5 km) 0.5331 0.6149 0.3278
Structural lows 0.5122 0.6063 0.3105
Contour map of basement in Jurassic 0.7143 0.4339 0.3099
Isopach map of the Caruacu Member 0.3693 0.7787 0.2876
Vitrinite reflectance 0.4146 0.6092 0.2526
Isopach map of the Sergi Formation 0.3031 0.7385 0.2238
Platforms 0.3101 0.5920 0.1836
Extensional faults (buffer of 2.5 km) 0.2160 0.8218 0.1775
Isopach map of the Pitanga Member 0.1672 0.9224 0.1542
Top of the Sergi Formation (1–2 km) 0.1568 0.8822 0.1383
Transfer faults (buffer of 2.5 km) 0.0836 0.9253 0.0774
Extensional faults 0.0279 0.9655 0.0269
Transfer faults 0.0139 0.9799 0.0136
Structural highs 0.0139 0.9598 0.0133
Figure 8. Histograms summarizing the joint occurrences of variables and drilled sites as obtained by classification of raster maps ofFigures 5–7. Frequencies are obtained by overlaying variable raster maps with a well control map. Data are grouped according theirclassification into charge, reservoir, or migration/entrapment variable types. The different frequency distributions corroborate theimportance of the variables as diagnostic criteria. Compare the histogram results with weights stored in Table 3 (for example,thickness of the Gomo Member, top of the Sergi Formation, and basement contour during the Jurassic correspond to high weightedvariables). Frequency histograms with no or small differences between data sets, comparing producing wells and dry holes (e.g.,depth of the onset of maturity, thickness of Sergi Formation, Caruacu Member, and Pitanga Member) demonstrate the limitations ofmaking only a qualitative selection of diagnostic factors. This situation is well demonstrated in the histograms obtained for the depthof onset of maturity based on vitrinite reflectance of 0.6, which could be considered a more important exploration variable in asubjective selection.
of reservoir variables is presented: Sergi Formation
thickness, Caruacu Member thickness, and Pitanga Mem-
ber thickness, with results representing the areas favor-
able to reservoir existence, according to devised accu-
mulation models.
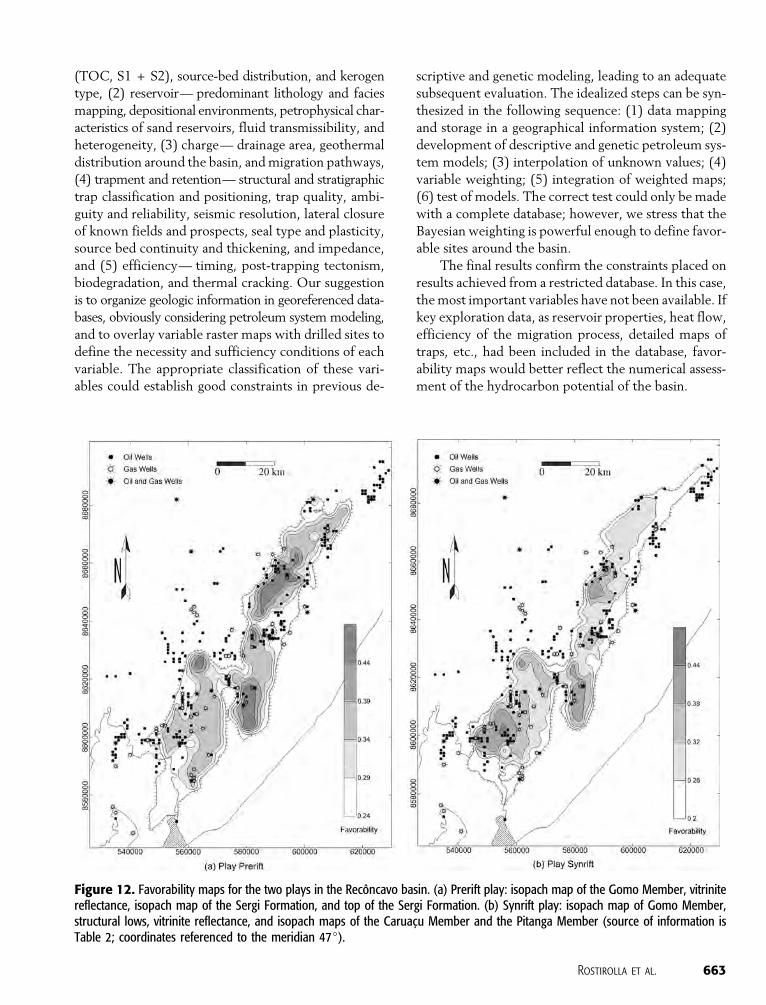
The favorability maps of Figure 12 consider the
two different plays of Reconcavo basin. The favor-
ability map for accumulations related to the prerift
play integrates Gomo Member thickness, top of the
mature zone, Sergi Formation thickness, and top of
the Sergi Formation (Figure 12a). In turn, the favor-
ability map for synrift play uses Gomo Member thick-
ness, structural lows, top of the mature zone, Caruacu
Member thickness, and Pitanga Formation thickness
(Figure 12b).
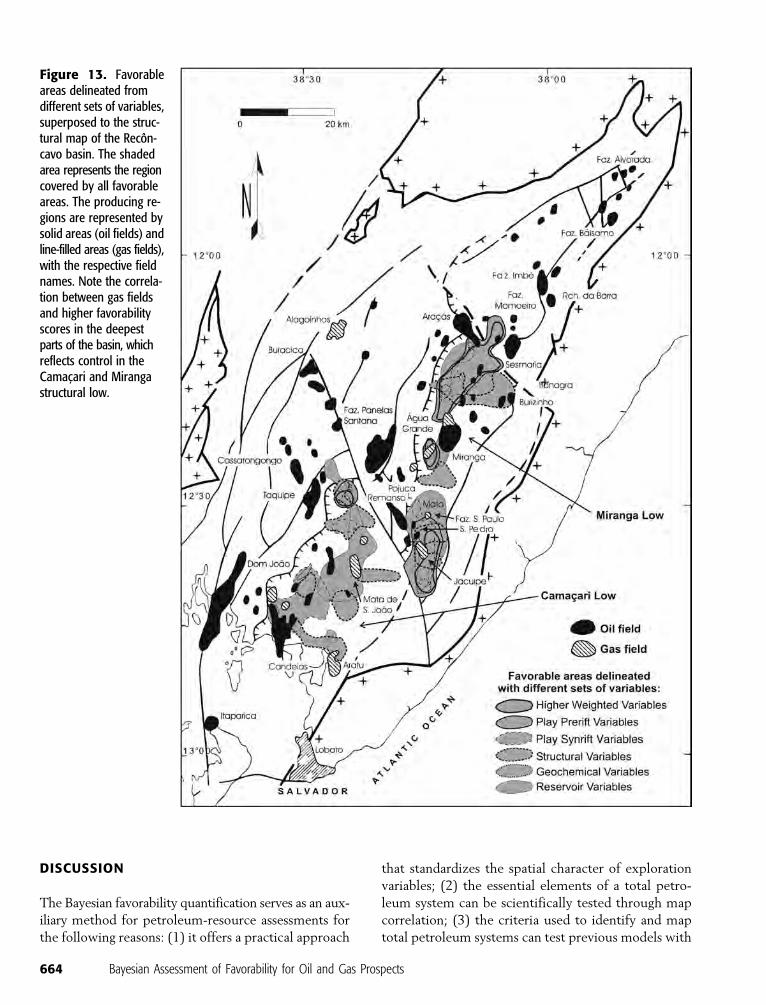
All favorability maps assign higher favorability
scores in the deepest parts of the basin, reflecting the
control of structural lows and Gomo Member thickness
in the evaluation. Clearly, the estimation of favorable
sites is influenced by the boundaries of the structural
compartments of the basin, the more prospective areas
being restricted to the Camacari and Miranga structural
lows, which present direct correlation with reservoir
thickness, thickness of source rocks, and petroleum gen-
eration (Figure 13).
The exploration variables were selected according
their availability in literature, with consideration of their
importance as geologic factors to accumulations. If avail-
able, additional data useful to increase the test of the
methodology include (1) generation— source potential
660 Bayesian Assessment of Favorability for Oil and Gas Prospects
Figure 9. Comparisonbetween two differentdiscretization modes forthe top of Sergi Forma-tion. Success probabilitiesare p = 0.14 for the areasbetween 1000- and 2000-mdepth, and p = 0.33 forthe areas deeper than2500 m, respectively(coordinates referencedto the meridian 47j).
Rostirolla et al. 661
Figu
re1
0.F
avor
abili
tym
aps
for
two
diffe
rent
sets
ofva
riab
les.
(a)
Best
com
bina
tion
ofva
riab
les:
isop
ach
map
ofth
eG
omo
Mem
ber,
stru
ctur
allo
ws,
cont
our
map
ofba
sem
ent
duri
ngth
eJu
rass
ic,
isop
ach
map
ofth
eSe
rgi
Form
atio
n,vi
trin
itere
flect
ance
,an
dpl
atfo
rms.
(b)
Stru
ctur
alva
riab
les:
stru
ctur
allo
ws,
cont
our
map
ofth
eba
sem
ent
inJu
rass
ic,
plat
form
s,an
dex
tens
iona
lfa
ults
(sou
rce
ofin
form
atio
nis
Tabl
e2,
and
wei
ghts
are
inTa
ble
3;co
ordi
nate
sre
fere
nced
toth
em
erid
ian
47j)
.
662 Bayesian Assessment of Favorability for Oil and Gas Prospects
Figu
re1
1.
Favo
rabi
lity
map
sfo
rtw
odi
ffere
ntse
tsof
vari
able
s.(a
)G
eoch
emic
alva
riab
les:
isop
ach
map
ofth
eG
omo
Mem
ber
and
vitr
inite
refle
ctan
ce.
(b)
Rese
rvoi
rva
riab
les:
isop
ach
map
ofth
eSe
rgiF
orm
atio
n,is
opac
hm
apof
the
Car
uacu
Mem
ber,
and
isop
ach
map
ofth
ePi
tang
aM
embe
r(s
ourc
eof
info
rmat
ion
isTa
ble
2an
dw
eigh
tsar
ein
Tabl
e3;
coor
dina
tes
refe
renc
edto
the
mer
idia
n47j)
.
(TOC, S1 + S2), source-bed distribution, and kerogen
type, (2) reservoir— predominant lithology and facies
mapping, depositional environments, petrophysical char-
acteristics of sand reservoirs, fluid transmissibility, and
heterogeneity, (3) charge— drainage area, geothermal
distribution around the basin, and migration pathways,
(4) trapment and retention— structural and stratigraphic
trap classification and positioning, trap quality, ambi-
guity and reliability, seismic resolution, lateral closure
of known fields and prospects, seal type and plasticity,
source bed continuity and thickening, and impedance,
and (5) efficiency— timing, post-trapping tectonism,
biodegradation, and thermal cracking. Our suggestion
is to organize geologic information in georeferenced data-
bases, obviously considering petroleum system modeling,
and to overlay variable raster maps with drilled sites to
define the necessity and sufficiency conditions of each
variable. The appropriate classification of these vari-
ables could establish good constraints in previous de-
scriptive and genetic modeling, leading to an adequate
subsequent evaluation. The idealized steps can be syn-
thesized in the following sequence: (1) data mapping
and storage in a geographical information system; (2)
development of descriptive and genetic petroleum sys-
tem models; (3) interpolation of unknown values; (4)
variable weighting; (5) integration of weighted maps;
(6) test of models. The correct test could only be made
with a complete database; however, we stress that the
Bayesian weighting is powerful enough to define favor-
able sites around the basin.
The final results confirm the constraints placed on
results achieved from a restricted database. In this case,
the most important variables have not been available. If
key exploration data, as reservoir properties, heat flow,
efficiency of the migration process, detailed maps of
traps, etc., had been included in the database, favor-
ability maps would better reflect the numerical assess-
ment of the hydrocarbon potential of the basin.
Rostirolla et al. 663
Figure 12. Favorability maps for the two plays in the Reconcavo basin. (a) Prerift play: isopach map of the Gomo Member, vitrinitereflectance, isopach map of the Sergi Formation, and top of the Sergi Formation. (b) Synrift play: isopach map of Gomo Member,structural lows, vitrinite reflectance, and isopach maps of the Caruacu Member and the Pitanga Member (source of information isTable 2; coordinates referenced to the meridian 47j).
DISCUSSION
The Bayesian favorability quantification serves as an aux-
iliary method for petroleum-resource assessments for
the following reasons: (1) it offers a practical approach
that standardizes the spatial character of exploration
variables; (2) the essential elements of a total petro-
leum system can be scientifically tested through map
correlation; (3) the criteria used to identify and map
total petroleum systems can test previous models with
664 Bayesian Assessment of Favorability for Oil and Gas Prospects
Figure 13. Favorableareas delineated fromdifferent sets of variables,superposed to the struc-tural map of the Recon-cavo basin. The shadedarea represents the regioncovered by all favorableareas. The producing re-gions are represented bysolid areas (oil fields) andline-filled areas (gas fields),with the respective fieldnames. Note the correla-tion between gas fieldsand higher favorabilityscores in the deepestparts of the basin, whichreflects control in theCamacari and Mirangastructural low.
extensive databases; (4) new information that im-
proves the understanding of the petroleum system can
be incorporated into the assessment.
Although not optimal, the resultant favorability
maps demonstrate the applicability of the Bayesian ap-
proach in the conceptual modeling of petroleum systems
and uncertainty assessment of the Reconcavo basin. One
important point is that the methodology reflects the
subjective reasoning in petroleum exploration, because
simple joint relationships between variables and pro-
ducing and dry areas are quantified and expressed as
weights. This situation equals that of the traditional
decision-making process, in which separate probability
distributions assigned to key geologic factors are mul-
tiplied. Besides, the proposed strategy is probabilistic
and based on a systematic approach that relies on sev-
eral calibration routines prior to drilling decisions.
The method implies possibility of updating when
new information is available, through Bayesian combi-
natorial procedures yielding conditional probabilities.
The final favorability scores are regarded as a function
of the behavior of variables, forecasts being represented
by a combination of subjective probability assessments
of these variables. Assessments are predictive appraisals
of diagnostic criteria filtered in the petroleum system
modeling of the basin, which depends strongly on ex-
ploration history data.
The Reconcavo basin has been developed over the
past three decades and has provided information rel-
atively relevant to the industry, including seismic sur-
veys, well logs, and geochemical and lithologic data.
Such a continuing succession of widespread reassess-
ments would only be feasible through the use of sys-
temic procedures consistently applied in the next stages
of Reconcavo’s industrial development.
Applying favorability evaluation, the late-stage ex-
ploration drilling of the Reconcavo basin can be op-
timized. These procedures should still be useful in
assessing the favorability of those parts of the basin that
remain unknown regarding production potential for
gas because most of the oil fields of the basin have
already been outlined. The more important aspect of
the method is its simplicity and its close relationship
with the traditional reasoning in exploration, in which
available prospective guides are also weighted in a sub-
jective way by cognitive associations among variables
and tested prospects. The approach is spatial in essence
because the Bayesian analysis is linked to geographic
information systems. The scores calculated can be con-
sidered as an indirect measure of posterior probabil-
ities, which are conditional probabilities representing
the sum of the probabilities derived from variable occur-
rence over the basin plus previous success ratios (i.e.,
the joint probability that both a producer and the geo-
logic factors will coexist at the drilling site).
Despite the fact that petroleum exploration in the
Reconcavo basin is in retrenchment, there are several
reasons to consider the favorability results, such as (1)
the Reconcavo basin is in an advanced stage of matu-
rity for oil prospects, but its favorability for gas-only
prospects is still underevaluated; (2) most of the tested
prospects are in shallow sections of the basin (i.e., con-
sidering that depths below the basin have not been ex-
plored, possibilities are good for new accumulations as
demonstrated by favorable area delineation); (3) the
Reconcavo basin is a training region, and any further
knowledge will be important in the delineation of pros-
pects in analog rift basins in Brazil.
REFERENCES CITED
Agterberg, F. P., 1989, Computer programs for mineral exploration:Science, v. 245, p. 76–81.
Bonham-Carter, G. F., 1994, Geographic information systems forgeoscientists— modeling with GIS: Computer Methods in theGeosciences, v. 13, Canada, Pergamon Press, 398 p.
Carozzi, A. V., M. B. Araujo, P. Cesero, J. R. Fonseca, and V. J. L.Silva, 1976, Formacao Salvador: um modelo de deposicaogravitacional subaquosa: Boletim Tecnico da Petrobras, Rio deJaneiro, v. 19, no. 2, p. 47–79.
Daniel, L. M. F., E. M. Souza, and L. F. Matos, 1989, Geochemicaland hydrocarbon migration models for the Rio do Bu: Inte-gration with the northeastern sector of the Reconcavo basin,state of Bahia: Boletim de Geociencias da Petrobras, v. 33,p. 201–214.
Figueiredo, A. M. F., J. A. E. Braga, J. C. Zabalaga, J. J. Oliveira,G. A. Aguiar, O. B. Silva, L. F. Mato, L. M. F. Daniel, L. P.Magnavita, and C. H. L. Bruhn, 1994, Reconcavo basin, Brazil:A prolific intracontinental rift basin: AAPG Memoir 59,p. 157–203.
Harbaugh, J. W., J. C. Davis, and J. Wendebourg, 1995, Computingrisk for oil prospects: Principles and programs: ComputerMethods in the Geosciences, v. 14, USA, Pergamon Press,452 p.
Lerche, I., 1997, Geological risk and uncertainty in oil exploration:San Diego, California, Academic Press, 658 p.
Magnavita, L. P., 1992, Geometry and kinematics of the Reconca-vo-Tucano-Jatoba rift, NE Brazil: Ph.D. Thesis, University ofOxford, 493 p.
Magnavita, L. P., I. Davison, and N. J. Kusznir, 1994, Rifting,erosion, and uplift history of the Reconcavo-Tucano-Jatobarift, northeast Brazil: Tectonics, v. 13, no. 2, p. 367–388.
Magoon, L. B., and W. G. Dow, 1994, The petroleum system:AAPG Memoir 60, p. 3–24.
Mello, M. R., E. A. M. Koutsoukos, W. U. Moriak, and G.Bacoccoli, 1994, Selected petroleum systems in Brazil, in L. B.Magoon and W. G. Dow, eds., The petroleum system— fromsource to trap: AAPG Memoir 60, p. 499–512.
Milani, E. J., and I. Davison, 1988, Basement control and transfer
Rostirolla et al. 665
tectonics in the Reconcavo-Tucano-Jatoba rift, northeastBrazil: Tectonophysics, v. 154, p. 41–70.
Otis, R. M., and N. Schneiderman, 1997, A process for evaluating ex-ploration prospects: AAPG Bulletin, v. 81, no. 7, p. 1087–1109.
Penteado, H. L. B., 1999, Modelisation compositionelle 2D de laGenese, expulsion et migration du petrole dans le comparti-ment Sud du Bassin de Reconcavo, Bresil: Ph.D. Thesis,Universite Pierre et Marie Curie (Paris VI), 233 p.
Rostirolla, S. P., 1999, Analise de Incertezas em Sistemas Petrolıferos:Revista Brasileira de Geociencias, v. 29, no. 2, p. 261–270.
Sluijk, D., and M. H. Nederlof, 1984, Worldwide geologicalexperience as a systematic basis for prospect appraisal, in G.Demaison and R. J. Murris, eds., Petroleum geochemistry andbasin evaluation: AAPG Memoir 35, p. 15–26.
White, D. A., 1993, Geologic risking guide for prospects and plays:AAPG Bulletin, v. 77, no. 12, p. 2048–2061.
666 Bayesian Assessment of Favorability for Oil and Gas Prospects