Availability of glucose and light modulates the structure and function of a microbial biofilm
16
RESEARCH ARTICLE Availability of glucose and light modulates the structure and function of a microbial bio¢lm Irene Ylla 1 , Carles Borrego 2 , Anna M. Roman´ ı 1 & Sergi Sabater 1,3 1 Institute of Aquatic Ecology, University of Girona, Girona, Spain; 2 Group of Molecular Microbial Ecology, Institute of Aquatic Ecology, University of Girona, Girona, Spain; and 3 Catalan Institute for Water Research (ICRA), Scientific and Technologic Park of the University of Girona, Girona, Spain Correspondence: Irene Ylla, Institute of Aquatic Ecology, University of Girona, Campus Montilivi, E-17071 Girona, Spain. Tel.: 134 972 418 177; fax: 134 972 418 150; e-mail: [email protected] Received 14 October 2008; revised 12 March 2009; accepted 7 April 2009. Final version published online 18 May 2009. DOI:10.1111/j.1574-6941.2009.00689.x Editor: Riks Laanbroek Keywords microbial biofilm; extracellular enzymes; glucose; light; algae–bacteria coupling; biofilm composition. Abstract We have studied the differences in the organic matter processing and biofilm composition and structure between autoheterotrophic and heterotrophic biofilm communities. Microbial communities grown on artificial biofilms were mon- itored, following incubation under light and dark conditions and with or without the addition of glucose as a labile organic compound. Glucose addition greatly affected the microbial biofilm composition as shown by differences in 16S rRNA gene fingerprints. A significant increase in b-glucosidase and peptidase enzyme activities were also observed in glucose-amended biofilms incubated in the dark, suggesting an active bacterial community. Light enhanced the algal and bacterial growth, as well as higher extracellular enzyme activity, thereby indicating a tight algal–bacterial coupling in biofilms incubated under illumination. In these biofilms, organic compounds excreted by photosynthetic microorganisms were readily available for bacterial heterotrophs. This algal–bacterial relationship weakened in glucose-amended biofilms grown in the light, probably because heterotrophic bacteria preferentially use external labile compounds. These results suggest that the availability of labile organic matter in the flowing water and the presence of light may alter the biofilm composition and function, therefore affecting the processing capacity of organic matter in the stream ecosystem. Introduction Biofilms are energy transducers in flowing waters (Battin et al., 2003) and they play a key role in the uptake or retention of inorganic and organic nutrients (Sabater et al., 2000). Biofilm microbial metabolism is responsible for the decomposition and uptake of organic matter. Organic matter available to microorganisms growing on biofilms comes from the water column and from material produced or entrapped within the biofilm matrix [including algal exudates and extracellular polymeric substances (EPS)](Sa- bater & Admiraal, 2005). The organic matter in freshwater ecosystems mainly comprises dissolved organic carbon (DOC), of which 70–90% is recalcitrant (M¨ unster, 1993). The remaining 10–30% is in a labile form that can be rapidly consumed by heterotrophs (Wetzel, 1992), which show a preferential use for the most labile molecules (Kaplan & Newbold, 2003). Although the availability of biodegradable labile organic compounds in the flowing water is usually low, biodegradable DOC can increase to about 40% of total DOC during flooding episodes in intermittent Mediterra- nean streams (Roman´ ı et al., 2006). Besides, an increase in the content of total polysaccharides (including monomers and polymers) can be also measured (I. Ylla, unpublished data). These flooding periods have a similar impact on streams as those derived from anthropogenic urban con- tamination. Biofilm microbial composition and their autotrophic and heterotrophic metabolism may change in relation to quan- tity and quality of the organic matter available in the flowing water, and this could affect the whole stream ecosystem organic matter processing capacity (Sabater et al., 2006). The heterotrophic use of organic matter by biofilm micro- biota has been detected by analyzing the extracellular enzyme activity (Sinsabaugh et al., 1994). In microbial heterotrophs, extracellular enzymes convert polymeric com- pounds to low-molecular-weight molecules that are readily assimilated (Chr ´ ost, 1990). In particular, the activity of leucine-aminopeptidase has been linked to the activity of photosynthetic primary producers (Espeland et al., 2001), FEMS Microbiol Ecol 69 (2009) 27–42 c 2009 Federation of European Microbiological Societies Published by Blackwell Publishing Ltd. All rights reserved
-
Upload
independent -
Category
Documents
-
view
1 -
download
0
Transcript of Availability of glucose and light modulates the structure and function of a microbial biofilm
R E S E A R C H A R T I C L E
Availabilityofglucoseand lightmodulates the structureandfunctionofamicrobial bio¢lmIrene Ylla1, Carles Borrego2, Anna M. Romanı1 & Sergi Sabater1,3
1Institute of Aquatic Ecology, University of Girona, Girona, Spain; 2Group of Molecular Microbial Ecology, Institute of Aquatic Ecology, University of
Girona, Girona, Spain; and 3Catalan Institute for Water Research (ICRA), Scientific and Technologic Park of the University of Girona, Girona, Spain
Correspondence: Irene Ylla, Institute of
Aquatic Ecology, University of Girona,
Campus Montilivi, E-17071 Girona, Spain.
Tel.: 134 972 418 177; fax: 134 972 418
150; e-mail: [email protected]
Received 14 October 2008; revised 12 March
2009; accepted 7 April 2009.
Final version published online 18 May 2009.
DOI:10.1111/j.1574-6941.2009.00689.x
Editor: Riks Laanbroek
Keywords
microbial biofilm; extracellular enzymes;
glucose; light; algae–bacteria coupling; biofilm
composition.
Abstract
We have studied the differences in the organic matter processing and biofilm
composition and structure between autoheterotrophic and heterotrophic biofilm
communities. Microbial communities grown on artificial biofilms were mon-
itored, following incubation under light and dark conditions and with or without
the addition of glucose as a labile organic compound. Glucose addition greatly
affected the microbial biofilm composition as shown by differences in 16S rRNA
gene fingerprints. A significant increase in b-glucosidase and peptidase enzyme
activities were also observed in glucose-amended biofilms incubated in the dark,
suggesting an active bacterial community. Light enhanced the algal and bacterial
growth, as well as higher extracellular enzyme activity, thereby indicating a tight
algal–bacterial coupling in biofilms incubated under illumination. In these
biofilms, organic compounds excreted by photosynthetic microorganisms were
readily available for bacterial heterotrophs. This algal–bacterial relationship
weakened in glucose-amended biofilms grown in the light, probably because
heterotrophic bacteria preferentially use external labile compounds. These results
suggest that the availability of labile organic matter in the flowing water and the
presence of light may alter the biofilm composition and function, therefore
affecting the processing capacity of organic matter in the stream ecosystem.
Introduction
Biofilms are energy transducers in flowing waters (Battin
et al., 2003) and they play a key role in the uptake or
retention of inorganic and organic nutrients (Sabater et al.,
2000). Biofilm microbial metabolism is responsible for the
decomposition and uptake of organic matter. Organic
matter available to microorganisms growing on biofilms
comes from the water column and from material produced
or entrapped within the biofilm matrix [including algal
exudates and extracellular polymeric substances (EPS)](Sa-
bater & Admiraal, 2005). The organic matter in freshwater
ecosystems mainly comprises dissolved organic carbon
(DOC), of which 70–90% is recalcitrant (Munster, 1993).
The remaining 10–30% is in a labile form that can be rapidly
consumed by heterotrophs (Wetzel, 1992), which show a
preferential use for the most labile molecules (Kaplan &
Newbold, 2003). Although the availability of biodegradable
labile organic compounds in the flowing water is usually
low, biodegradable DOC can increase to about 40% of total
DOC during flooding episodes in intermittent Mediterra-
nean streams (Romanı et al., 2006). Besides, an increase in
the content of total polysaccharides (including monomers
and polymers) can be also measured (I. Ylla, unpublished
data). These flooding periods have a similar impact on
streams as those derived from anthropogenic urban con-
tamination.
Biofilm microbial composition and their autotrophic and
heterotrophic metabolism may change in relation to quan-
tity and quality of the organic matter available in the flowing
water, and this could affect the whole stream ecosystem
organic matter processing capacity (Sabater et al., 2006).
The heterotrophic use of organic matter by biofilm micro-
biota has been detected by analyzing the extracellular
enzyme activity (Sinsabaugh et al., 1994). In microbial
heterotrophs, extracellular enzymes convert polymeric com-
pounds to low-molecular-weight molecules that are readily
assimilated (Chrost, 1990). In particular, the activity of
leucine-aminopeptidase has been linked to the activity of
photosynthetic primary producers (Espeland et al., 2001),
FEMS Microbiol Ecol 69 (2009) 27–42 c� 2009 Federation of European Microbiological SocietiesPublished by Blackwell Publishing Ltd. All rights reserved

and to the use of algal-released proteinaceous compounds
by microbial heterotrophs (Romanı et al., 2004a). In con-
trast, b-glucosidase activity is involved in polysaccharide
decomposition and is correlated with the degradation of
either organic compounds of algal origin (algal exudates and
EPS) or polysaccharidic organic compounds dissolved in
flowing water (Jones & Lock, 1993).
The capacity to use organic matter may further differ
between microbial biofilms, depending on the species com-
position of the community (Olapade & Leff, 2005). Given
that no single species expresses all extracellular enzyme
activities (Martinez et al., 1996), any variation in the
bacterial community will be reflected by enzymatic activ-
ities. Probably, bacterial communities have the capacity to
express only the enzymes necessary for hydrolyzing a certain
range of high-molecular-weight organic compounds (Kirch-
man et al., 2004). Judd et al. (2006) demonstrated that the
bacterial community composition is controlled by the
nature of the organic matter available.
The development of an autoheterotrophic biofilm in
contrast to a heterotrophic biofilm could further modulate
the biofilm response to changes in available DOC. Algae and
heterotrophs coexist and interact within autotrophic bio-
films (Stock & Ward, 1989). When an algal biomass is
developed, microorganisms preferentially use and take up
the fresh molecules released by algae, such as algal exudates
and lysis products (Wetzel, 1993; Romanı & Sabater, 2000).
Several studies of epilithic biofilms conclude that algal
exudates are a major carbon source for bacteria (Rier &
Stevenson, 2002). This algal–bacterial link reduces the
uptake of dissolved organic compounds from the flowing
water pool in biofilms growing in light in comparison with
those growing in the dark (Romanı et al., 2004a). However,
other studies report that this algal–bacterial coupling is
weak or undetectable (Findlay et al., 1991; Gao et al., 2004).
The degree of coupling between algae and bacteria may
depend on the trophic state of the system and dissolved
organic matter content (Findlay et al., 1993a; Scott et al.,
2008), light availability (Findlay et al., 1993b) or even
substratum type (Kaplan & Bott, 1989).
In this study, we aim to determine differences in organic
matter processing and biofilm composition and structure
between autoheterotrophic and heterotrophic biofilm com-
munities, when allochthonous labile organic matter is avail-
able (provided by addition of glucose). We used a factorial
experiment that included the presence and absence of light
and glucose to control single and interactive effects in the
biofilm. The analysis of biofilm composition (molecular
analysis and microscopic observations) and function
(photosynthetic efficiency, b-glucosidase and peptidase en-
zyme activities) under the laboratory-tested conditions
might add interesting knowledge to the potential expected
changes in organic matter processing in stream biofilms
when labile organic matter is available. A differential re-
sponse of light-grown vs. dark-grown biofilms is expected
due to the potential significant effect of autotrophic meta-
bolism on biofilm structure and function.
Materials and methods
Experimental procedure
Sand-blasted glass tiles (1 cm2) were used as substrata for
epilithic biofilm colonization and were incubated in
12 microcosms with algal inoculum from the oligotrophic
Fuirosos stream (Veraart et al., 2008). Each microcosm
consisted of a sterile glass jar (19 cm in diameter, 9 cm high)
with 70–90 autoclaved glass tiles attached to the bottom by a
plastic rod. The microcosms were filled with 1.5 L of
simulated river water, which was recirculated by means of a
submersible pump (Hydor, Pico 300, 230 V 50 Hz, 4.5 W).
Simulated river water was obtained by dissolving pure salts
(12 mg L�1 Na2SO4, 20 mg L�1 Na2SiO3, 30 mg L�1 CaCl2,
1 mg L�1 KCl, 2 mg L�1 MgSO4 and 20 mg L�1 NaHCO3) in
MilliQ water in order to reproduce the chemical composi-
tion of the Fuirosos stream (Bernal et al., 2002; Vazquez
et al., 2007). The simulated water was sterilized by filtration
through 0.22-mm pore-diameter sterile filters (Acrodisc,
PALL Life Sciencess) before its use. Every 3–4 days, all the
water from each microcosm was replaced by fresh sterile
simulated river water. All microcosms were maintained
under a controlled atmosphere at 18 1C in a constant day–
night light cycle (12 h/12 h) using an incubator (Radiber
AGP-570). The irradiance reaching the glass substrata ran-
ged between 160 and 180 mmol photons m�2 s�1.
The experiment comprised four treatments: light–no
glucose (LnG), light–glucose (LG), dark–no glucose (DnG)
and dark–glucose (DG). For each treatment, three replicate
microcosms were established. Dark conditions were
achieved by covering the corresponding six microcosms
with opaque black plastic. Glucose enrichment was achieved
by adding pure glucose to the corresponding microcosms at
a final concentration of 10 mg C L�1 at the beginning of the
experiment and when water was renewed. To prevent
phosphorus and nitrogen depletion, ammonium phosphate
(30 mg L�1) and ammonium nitrate (750mg L�1) were added
to all the treatments at the beginning of the experiment and
every time the water was replaced.
To stimulate biofilm colonization of the glass substrata, a
biofilm previously scraped under sterile conditions from
rocks collected from the Fuirosos stream (10 mL containing
60–70 mg of chlorophyll) was suspended in each microcosm.
This inoculum was added at the beginning of the experi-
ment to promote the colonization of the glass substrata, and
new biofilm suspensions were repeated after 4, 8 and 11
days, to improve and accelerate colonization. After the
FEMS Microbiol Ecol 69 (2009) 27–42c� 2009 Federation of European Microbiological SocietiesPublished by Blackwell Publishing Ltd. All rights reserved
28 I. Ylla et al.

colonization phase, biofilms in the microcosms were
sampled every week (days 15, 22 and 29).
Glass tiles were sampled at random from each micro-
cosm. Enzymatic activities, photon yield, and bacterial
density were measured immediately after collection. Sam-
ples for chlorophyll determination were frozen (� 20 1C)
until analysis.
Samples for extracellular polysaccharide content at the
EPS, algal observation and scanning electron microscope
(SEM) observations were collected from day 29. Samples for
molecular analyses, PCR and denaturing gradient gel elec-
trophoresis (DGGE), were also taken after 29 days of
incubation. The inoculum was also analyzed for bacterial
and algal community.
Chemical conditions in the microcosms
The water nutrient content and chemical parameters were
monitored every time water was renewed (every 3–4 days).
Water was replaced eight times during the experiment.
Oxygen concentration (Hach DO meter), pH (pH meter,
WTW) and conductivity (conductivity meter, WTW) were
measured. Triplicate water samples for each microcosm were
passed through a 0.2-mm pore-diameter nylon filter (What-
man) and used to analyze inorganic nutrients. Phosphate
was analyzed spectrophotometrically, as described by Mur-
phy & Riley (1962). DOC and dissolved organic nitrogen
(DON) were determined with a Shimadzu TOC 5050A.
Algal and bacterial biomass and communitycomposition
Chlorophyll concentration
Chlorophyll (Chl) a concentration on the glass tiles (two
replicates for each microcosm, for each sampling date) was
measured after extraction in 90% acetone for 12 h in the
dark at 4 1C. To ensure complete extraction of chlorophyll,
samples were further sonicated for 2 min in a Selecta
sonication bath operating at 40 W and 40 kHz and pre-
viously protected from light. Extracts were passed through
47-mm-diameter and 1.45-mm-mesh fiberglass filters (GF/C
Whatman), and Chl a concentration was further determined
spectrophotometrically using a Lambda UV/Vis spectro-
photometer (Hitachi), following Jeffrey & Humphrey
(1975). The ratio of carotenoids to Chlorophyll and/or
Chlorophyll degradation products (OD430 nm/OD665 nm ra-
tio, Margalef, 1983) was also calculated.
Algal composition
Glass substrata from day 29 (one tile for each microcosm)
were preserved and stored with 4% formalin until analysis.
Glass substrata were sonicated for 2 min using an ultrasoni-
cation bath (Selecta) to achieve complete detachment of the
microbial community. The inoculum samples and three
aliquots from each scraped biofilm sample were observed
under a light microscope (Nikon E600) at � 400 to identify
species/genus level. The algal community composition was
determined qualitatively.
Bacterial density
Live and dead bacteria were counted using the Live/Dead
Baclight bacterial viability kit (Invitrogens Molecular
probes Inc.) (Freese et al., 2006). The bacterial density was
estimated after ultrasonication of each glass tile (one per
microcosm on each sampling date) for 90 s using a sonica-
tion bath (Selecta) operating at 40 W and 40 kHz. After
appropriate dilution (10 times) with sterile water, a 1 : 1
mixture of SYTOs 9 and propidium iodide was added to
the sample under analysis and incubated for 15 min. Sam-
ples were then filtered (0.2-mm pore-diameter black poly-
carbonate filters, Nucleopore, Whatman) and at least 20
randomly chosen fields were counted for each slide (Nikon
E600 epifluorescence microscope). The fraction of live
bacteria was calculated as the abundance of live cells divided
by the total counts obtained with the live/dead method.
Molecular analyses
DNA extraction
DNA extraction was performed in the inoculum samples
(two replicates) and the biofilm samples collected after 29
days of incubation (one tile from each microcosm) to check
for differences in the bacterial community composition
caused by the treatments. Samples for DNA extraction
included 1 mL of the two inoculum samples (in duplicate)
and the biofilm samples (in triplicate). The latter were
obtained by scrapping the glass tiles under sterile condi-
tions. DNA was extracted from wet cell pellets obtained after
centrifugation of samples at 13 400 g for 30 min in a 5415D
centrifuge (Eppendorfs). Total nucleic acids were extracted
as described previously (Lliros et al., 2008). DNA extracts
were stored at � 80 1C until use. DNA concentration and
purity were determined spectrophotometrically from ex-
tracts using a Nanodrop ND-1000 UV-Vis spectrophot-
ometer (Nanodrop, DE).
PCR amplification
The bacterial richness of the biofilms was determined by PCR
using the universal primer pair 357F-907R, targeting the 16S
rRNA gene sequences for the Domain Bacteria (Lane, 1991).
Because PCR products were later used for DGGE analysis, a
GC-rich sequence was attached at the 50 end of the forward
FEMS Microbiol Ecol 69 (2009) 27–42 c� 2009 Federation of European Microbiological SocietiesPublished by Blackwell Publishing Ltd. All rights reserved
29Biofilm shifts caused by glucose and light
primer (Muyzer et al., 1993, 1998). Each PCR mixture (50mL)
had 5mL of 10�PCR buffer containing 15 mM MgCl2 (Qiagen
GmbH, Hilden, Germany), 4mL of premixed dNTPs (2.5 mM
each, GeneAmps, Applied Biosystemss, Warrington, UK),
0.5mL of MgCl2 (50 mM, Qiagen GmbH), 2mL of bovine
serum albumin (10 mg mL�1, Sigma-Aldrich, Steinhem, Ger-
many), 1mL of each primer (10mM), 0.25mL of Taq DNA
polymerase (5 UmL�1, Qiagen GmbH) and 1mL of the DNA
template (10–50 ng). All amplification reactions were run in a
GeneAmps 2700 thermocycler (Applied Biosystems, Perkin-
Elmers, CA), following a step-down PCR program as de-
scribed previously (Bruns et al., 2003). A positive amplification
was confirmed by analyzing 4mL of the resulting PCR products
in 1.5% (w/v) agarose gels stained with ethidium bromide.
DGGE fingerprinting
The community analysis by DGGE (Muyzer et al., 1993)
provided a high resolution and allowed easy comparison of
fingerprints to examine potential changes in the predomi-
nant bacterial composition of each biofilm between treat-
ments. DGGE was carried out in an Ingeny phorU-2 (Ingeny
International BV, the Netherlands) system. Between 800 and
1000 ng of PCR product was loaded onto 6% (w/v) poly-
acrylamide [acrylamide/N,N(-methylene bisacrylamide) ra-
tio, 37 : 1 (w/w)] gels prepared with a 30–70% linear
gradient of denaturant [100% denaturant agent contains
7M urea and 40% (v/v) deionized formamide (McCaig et al.,
2001)]. Electrophoresis was run at 60 1C and at a constant
voltage of 160 V for 12 h in 1�TAE (Tris-acetate EDTA).
After electrophoresis, gels were stained for 30 min with
1� SYBR Gold nucleic acid stain (Molecular Probes Inc.)
in 1�TAE buffer. They were then rinsed and viewed under
UV radiation using a GelPrinter system (TDI, Spain). The
digitalized gel images were analyzed with GEL COMPARE II
IMAGE ANALYSES software package (Applied Maths NV,
Belgium). Within each treatment, bands located at the same
position were considered to be the same phylotype. Accord-
ingly, only one representative band for each position and
treatment was excised and sequenced. A total of 55 clear and
discrete bands representative of each treatment were excised
from the gels using a sterile scalpel and rehydrated in 50mL
of Tris-HCl 10 mM buffer (pH = 7.4). DNA was eluted after
incubation of the excised bands at 65 1C for 3 h and forward
and reverse amplified using the same primers (without GC
clamp) and PCR conditions as cited above. Sequencing
reactions were carried out using external facilities (http://
www.macrogen.com).
Phylogenetic affiliation and analyses
All the sequences retrieved were compared for closest
relatives to partial 16S rRNA gene sequences in the NCBI
sequence database (http://www.ncbi.nlm.nih.gov/blast/)
using the BLASTN algorithm tool (Altschul et al., 1990).
Sequences were properly aligned using NAST (DeSantis et al.,
2006a) aligner web server. The presence of chimera was
checked using the BELLEROPHON (Huber et al., 2004) tool
implemented at the Greengenes website (http://greengenes.
lbl.gov/; DeSantis et al., 2006b). A phylogenetic backbone
tree for the Domain Bacteria was constructed with the
ARB software package (Ludwig et al., 2004) using the 16S
rRNA gene GreenGenes ARB-compatible database (May
2007). All partial sequences obtained from DGGE bands
(c. 400–600 bp), as well as other closely related sequences
(c. 500–1300 bp) from databases, were then added to the
backbone tree using the parsimony ‘quick add marked tool’
implemented in ARB, thereby maintaining the overall tree
topology. For better clarity, only selected subsets of the
sequences used for treeing are shown in the final tree
(Supporting Information, Fig. S1). All the sequences ob-
tained in this study have been deposited in GenBank under
accession numbers FJ183981–FJ184030.
Biofilm structure
SEM observations
Samples for SEM (one glass tile from each microcosm
collected after 29 days of incubation) were fixed immedi-
ately after sampling with 2.5% glutaraldehyde in 0.1M
cacodilate buffer, pH 7.2–7.4. Afterwards, a series of ethanol
baths (65–100%) were used to dehydrate the samples, which
were further dried by the critical point of CO2 (CPD).
Samples were finally coated with gold using a sputtering
diode. Samples were viewed under a Zeiss DSM 960 SEM.
Polysaccharide content of EPS
Glass samples for polysaccharide content in EPS were
collected from one glass tile per microcosm at the end of
the incubation period (day 29) and preserved frozen at
� 20 1C until analysis. EPS were extracted using cation-
exchange resin (Dowex Marathon C, Na1-form, strongly
acid, Sigma-Aldrich), following the procedure described in
Romanı et al. (2008). The polysaccharide content was
measured by the phenol–sulfuric acid assay (Dubois et al.,
1956) after the extraction of EPS. Standards of glucose
(0–200 mg mL�1) were also prepared. Results are given as
glucose equivalents per cm2 of biofilm surface area.
Biofilm function
Extracellular enzyme activity measurements
The extracellular enzyme activities of b-D-1,4-glucosidase (EC
3.2.1.21) and leucine-aminopeptidase (EC 3.4.11.1) were
FEMS Microbiol Ecol 69 (2009) 27–42c� 2009 Federation of European Microbiological SocietiesPublished by Blackwell Publishing Ltd. All rights reserved
30 I. Ylla et al.
measured spectrofluorometrically using 4-methylumbelliferyl-
b-D-glucopyranoside (Sigma-Aldrich) and 7-aminomethyl-
coumarin-leucine (Sigma-Aldrich) as the respective sub-
strate analogues. Glass substrata (18 tiles per microcosm
– nine for each enzyme and sampling date) were collected for
the measurement of extracellular kinetics of each enzyme.
Incubations were performed at increasing concentrations of
each substrate analogue (separately) as follows: 0, 0.01, 0.025,
0.05, 0.075, 0.1, 0.2, 0.3 and 0.5 mM. Blanks and standards of
methylumbelliferone and aminomethylcoumarin were also
included. Incubations for enzyme activity measurements
were performed in the dark under continuous shaking for
1 h at 18 1C immediately after sampling. At the end of the
incubation, glycine buffer (pH 10.4) was added (1 : 1 v/v) and
fluorescence was measured at 365/455 and 364/445 nm
excitation/emission for methylumbelliferone and amino-
methylcoumarin, respectively. The fluorescence intensity of
the blanks was subtracted from all the samples to correct for
hydrolysis of the substrate or fluorescent substances in the
water solution. Values are expressed as nmol methylumbelli-
ferone or aminomethylcoumarin cm�2 h�1. Results for each
enzyme were fitted into the Michaelis–Menten approach
(rectangular hyperbola). Vmax and Km values were obtained
by nonlinear regression using the SIGMAPLOT GRAPH software
(Systat Software Inc., San Jose, CA).
Photosynthetic efficiency
Two randomly selected colonized glass tiles per microcosm
were used to determine the photon yield of algae on each
sampling day. Photon yield is defined as a measure of the
photosynthetic efficiency of a community (Schreiber et al.,
2002). Samples were placed in a Petri dish with 10 mL of
water from the microcosm. Saturating light pulses simulta-
neously emitted at four wavelengths (470, 520, 645 and
665 nm) were provided by a phytoPAM (Pulse Amplitude
Modulated) fluorometer (Heinz Walz GmbH). The photon
yield of the main algal groups was measured by the
emitter–detector unit (PHYTO-EDF) at the sample surfaces.
The mean of the photon yield corresponding to each algal
group was used as the photon yield for each tile.
Statistical analyses
t-Test analyses of paired values were used to control the
stability of the physical–chemical parameters during the
experiment by comparing water samples for every 3–4-day
period (each water renewal) from each microcosm.
Variability in the descriptors of biofilm function and
structure (b-glucosidase, leucine-aminopeptidase, photon
yield, chlorophyll and bacterial density) was analyzed by
MANOVA. This analysis was used to test for the single-source
effects and the interactions between three factors: light–
dark, glucose–no glucose and sampling time. All variables
included in the analyses were log [log (x)] transformed,
except for chlorophyll and photon yield, which were
log (x11) transformed. Correlation analysis (Pearson’s coef-
ficient) was used to determine potential relationships be-
tween the analyzed variables. The relationships between
photosynthetic efficiency and enzymatic activities in light
treatments were analyzed by linear regression. Model II
linear regression (geometric mean regression) was applied
because the two variables used for the regression were
measurements (with errors; Sokal & Rohlf, 1995). All
statistical analyses were performed using the SPSS software
package for Windows (ver.14.0.1, SPSS Inc., 1989–2005).
DGGE fingerprints were analyzed using GELCOMPAR II
(Applied Maths NV). A DGGE marker comprising a mix-
ture of known 16S rRNA PCR amplified genes was loaded in
several gel lanes and used as an internal standard for the
comparison between fingerprints. For sample comparison, a
presence–absence matrix was used to calculate similarities
between patterns, and statistical analysis based on hierarch-
ical cluster analysis was performed with the Jaccard distance
and the unweighted pair group method with arithmetic
mean grouping algorithm.
Results
Physical and chemical conditions in themicrocosms
During the incubation, oxygen, pH and conductivity re-
mained steady at 9–9.8 mg L�1, 7.5–8.5, and 105–130mS cm�1,
respectively. Nutrient content, especially phosphate, decreased
in each 3–4-day period (from 35 to 4mg L�1), but the nutrient
depletion was prevented by periodical water replacement at
the same interval. The initial DOC concentration in the
‘renewed water’ decreased slightly after each 3–4-day period
in glucose-amended treatments (from 9.5 to 4 mg L�1), while
DOC clearly increased in treatments without glucose supple-
mentation (from 0.5 to 2 mg L�1). Thus, water replacement
every 3–4 days was considered necessary to maintain the
imposed treatment conditions throughout the study period.
Mean DON values were maintained at 12.3� 2.3 mg L�1 in all
treatments.
Algal and bacterial biomass and communitycomposition
Chl a density was higher in the LnG (up to 25.3 mg cm�2 on
day 29) than in the LG treatment (up to 11.6mg cm�2 on day
29, Table 1). The OD430/665 nm was positively affected by
glucose (ANOVA, Po 0.0005), thereby indicating an increase
in carotenoids and/or chlorophyll degradation products.
Chl a in the biofilms incubated in the dark was almost
undetectable. In addition, a negative correlation was found
between DOC and Chl a (r =� 0.792, P = 0.011).
FEMS Microbiol Ecol 69 (2009) 27–42 c� 2009 Federation of European Microbiological SocietiesPublished by Blackwell Publishing Ltd. All rights reserved
31Biofilm shifts caused by glucose and light
The concentration of live bacteria was significantly higher
in biofilms grown under light (1.24� 107 bacteria cm�2)
than in those grown in the dark (5.13� 106 bacteria cm�2),
although the differences between treatments receiving
no glucose or glucose amendments were not significant
(Table 1). However, in light treatments, live bacteria ratio
tended to increase in the absence of glucose, from 32% to
44%, while they decreased when this monosaccharide was
added, from 31% to 22% (Glucose�Time interaction, for
live bacteria cm�2 and ratio of live to total bacteria, Table 1).
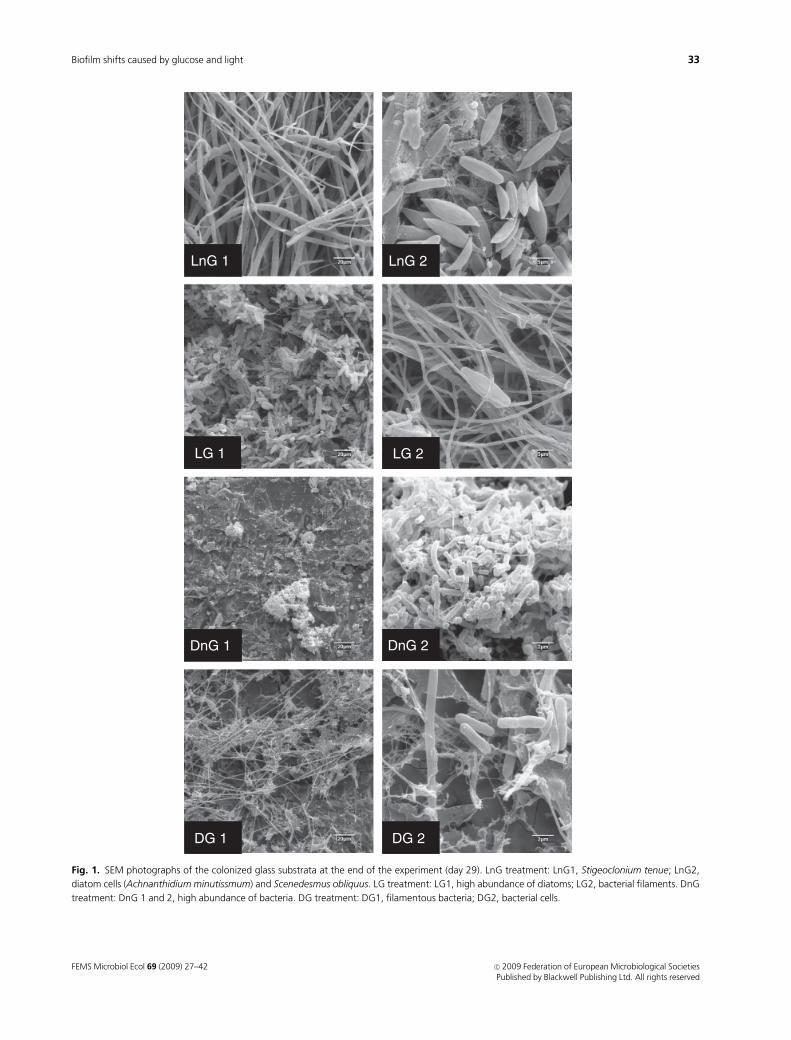
The algal community in the biofilms was qualitatively
described by optical microscopy and by SEM observations.
The bacterial community was studied both by SEM (Fig. 1)
and by molecular fingerprinting and sequencing of the
bacterial SSU rRNA genes. Nearly identical DGGE finger-
prints were obtained for the triplicate samples for each
treatment, and only fingerprints from the LG treatment
showed some discordance between replicas (Fig. 2a). De-
spite these differences, the results obtained from triplicate
treatment samples were consistent and allowed a reliable
comparison between fingerprints. In this regard, up to 82
distinct bands were observed in fingerprints from all treat-
ments (Fig. 2a). Of these, 55 representative bands were
excised and sequenced, resulting in 50 high-quality partial
16S rRNA gene sequences that were further used for
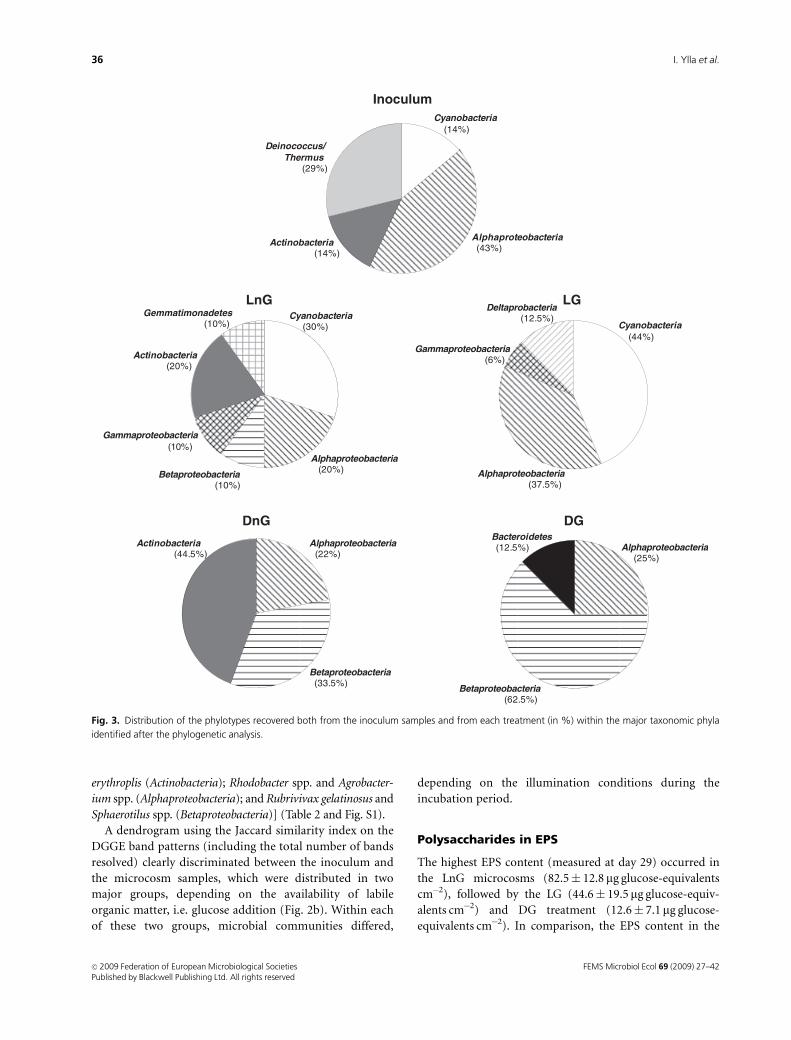
phylogenetic analyses. The total phylotypes retrieved (those
from the inoculum plus those from the treatments) grouped
in nine major phylogenetic phyla, namely Alphaproteobac-
teria, Cyanobacteria, Betaproteobacteria, Actinobacteria,
Gammaproteobacteria, Deinococcus-Thermus, Deltaproteo-
bacteria, Bacteroidetes and Gemmatimonadetes (Table 2 and
Fig. 3).
The initial biofilm suspension from the Fuirosos stream,
which was used as the inoculum, comprised mainly diatoms,
cyanobacteria and bacteria. Visual inspection of the optical
microscope images did not allow proper identification of the
main bacterial genera or species developed in the biofilms,
although some major algal groups were identified (Ach-
nanthidium minutissimum, Scenedesmus obliquus, Stigeoclo-
nium tenue). The molecular fingerprinting of the inoculum
sample gave a total of 12 bands, seven of which were selected
for sequencing because of their intensity and representative-
ness (Fig. 2a and Fig. S1). Phylotypes retrieved from the
inoculum affiliated with Alphaproteobacteria (3), Deinococ-
cus-Thermus (2), Cyanobacteria (1) and Actinobacteria (1)
(Fig. 3). Although other faint bands were observed in this
sample, it was not possible to excise them from the gel
because of their weak intensity under UV illumination. One
of these nonexcised bands was located at the same position
as band b9 (LnG and LG treatments, Fig. 2a). Although no
molecular data support this notion, it is plausible that the
sequence retrieved from b9 (a chloroplast signature from
S. obliquus, 98% similarity) was already present in the water
from the Fuirosos stream. After 29 days of incubation, the
algal and bacterial communities in the microcosms differed
clearly from that in the inoculum, and these differences were
related to the conditions under which the biofilm was
grown. In fact, most of the bands that were clearly visible in
fingerprints from the different treatments were not detected
in the inocula (Fig. 2a). These new bands were attributed to
phylotypes whose abundance in the inoculum was below the
detection limit of the technique (c. 1%, Muyzer et al., 1993),
but that they were enriched under the new conditions
imposed by the treatments. Interestingly, most of the intense
bands detected in samples from biofilms grown under light
(b9, b10, b13, b21, b22, b24, b25, b27, b28 and b56 in Fig.
2a) gave sequences affiliating with either cyanobacteria or
chloroplast from green algae (Table 2, Fig. 3 and Fig. S1),
thereby suggesting that photosynthetic microorganisms
were predominant in these samples. Optical microscopic
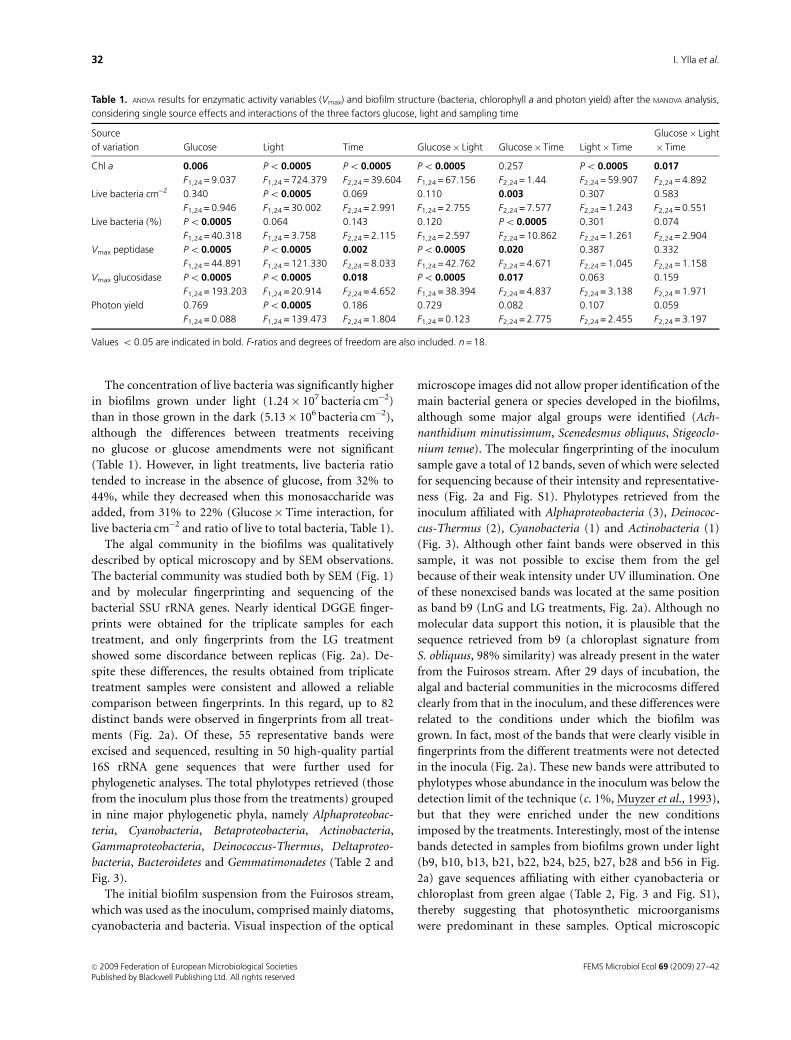
Table 1. ANOVA results for enzymatic activity variables (Vmax) and biofilm structure (bacteria, chlorophyll a and photon yield) after the MANOVA analysis,
considering single source effects and interactions of the three factors glucose, light and sampling time
Source
of variation Glucose Light Time Glucose� Light Glucose� Time Light� Time
Glucose� Light
� Time
Chl a 0.006 Po 0.0005 Po 0.0005 Po 0.0005 0.257 Po 0.0005 0.017
F1,24 = 9.037 F1,24 = 724.379 F2,24 = 39.604 F1,24 = 67.156 F2,24 = 1.44 F2,24 = 59.907 F2,24 = 4.892
Live bacteria cm�2 0.340 Po 0.0005 0.069 0.110 0.003 0.307 0.583
F1,24 = 0.946 F1,24 = 30.002 F2,24 = 2.991 F1,24 = 2.755 F2,24 = 7.577 F2,24 = 1.243 F2,24 = 0.551
Live bacteria (%) Po 0.0005 0.064 0.143 0.120 Po 0.0005 0.301 0.074
F1,24 = 40.318 F1,24 = 3.758 F2,24 = 2.115 F1,24 = 2.597 F2,24 = 10.862 F2,24 = 1.261 F2,24 = 2.904
Vmax peptidase Po 0.0005 Po 0.0005 0.002 Po 0.0005 0.020 0.387 0.332
F1,24 = 44.891 F1,24 = 121.330 F2,24 = 8.033 F1,24 = 42.762 F2,24 = 4.671 F2,24 = 1.045 F2,24 = 1.158
Vmax glucosidase Po 0.0005 Po 0.0005 0.018 Po 0.0005 0.017 0.063 0.159
F1,24 = 193.203 F1,24 = 20.914 F2,24 = 4.652 F1,24 = 38.394 F2,24 = 4.837 F2,24 = 3.138 F2,24 = 1.971
Photon yield 0.769 Po 0.0005 0.186 0.729 0.082 0.107 0.059
F1,24 = 0.088 F1,24 = 139.473 F2,24 = 1.804 F1,24 = 0.123 F2,24 = 2.775 F2,24 = 2.455 F2,24 = 3.197
Values o 0.05 are indicated in bold. F-ratios and degrees of freedom are also included. n = 18.
FEMS Microbiol Ecol 69 (2009) 27–42c� 2009 Federation of European Microbiological SocietiesPublished by Blackwell Publishing Ltd. All rights reserved
32 I. Ylla et al.
LG 2
DG 1 DG 2
DnG 1
LG 1
DnG 2
LnG 2LnG 1
Fig. 1. SEM photographs of the colonized glass substrata at the end of the experiment (day 29). LnG treatment: LnG1, Stigeoclonium tenue; LnG2,
diatom cells (Achnanthidium minutissmum) and Scenedesmus obliquus. LG treatment: LG1, high abundance of diatoms; LG2, bacterial filaments. DnG
treatment: DnG 1 and 2, high abundance of bacteria. DG treatment: DG1, filamentous bacteria; DG2, bacterial cells.
FEMS Microbiol Ecol 69 (2009) 27–42 c� 2009 Federation of European Microbiological SocietiesPublished by Blackwell Publishing Ltd. All rights reserved
33Biofilm shifts caused by glucose and light
observations and SEM images obtained from biofilms grown
under light showed the presence of abundant algal filaments,
resembling those of the freshwater algae S. tenue, and diatoms
such as A. minutissimum and Melosira varians. Minor densi-
ties of S. obliquus were also observed in these samples (Fig. 1,
LnG 2). In glucose-amended biofilms, most of the phylotypes
retrieved grouped in Alphaproteobacteria (Figs 2a and 3 and
Fig. S1) and, at the same time, the SEM observations revealed
a high abundance of bacterial filaments (LG and DG, Fig. 1).
Additionally, several representatives of protozoa, such as
Vorticella sp., were observed under the SEM in glucose-
amended treatments. Biofilms grown under dark conditions,
(a)
1 2 31 2 1 2 3 1 2 3 1 2 3
IN LnG LG DnG DG
L
LnG1LnG2LnG3DnG1DnG3DnG2LG1LG3LG2DG1DG2DG3IN1IN2Inoculum
Dark
Dark
Light
Light
+ Gluc
No Gluc
LnG1LnG2LnG3DnG1DnG3DnG2LG1LG3LG2DG1DG2DG3IN1IN2Inoculum
Dark
Dark
Light
Light
+ Gluc
No Gluc10
0
9590858075706560555045
LnG1LnG2LnG3DnG1DnG3DnG2LG1LG3LG2DG1DG2DG3IN1IN2Inoculum
Dark
Dark
Light
Light
+ Gluc
No Gluc
Averaged similarity (%)(b)
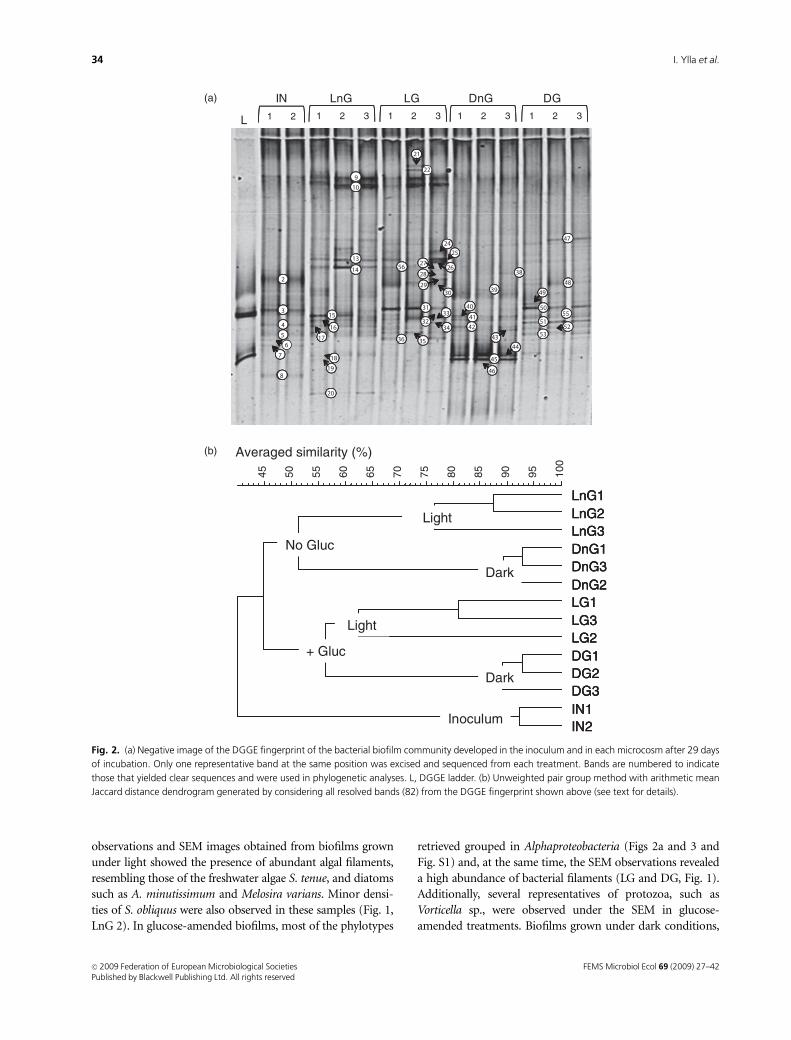
Fig. 2. (a) Negative image of the DGGE fingerprint of the bacterial biofilm community developed in the inoculum and in each microcosm after 29 days
of incubation. Only one representative band at the same position was excised and sequenced from each treatment. Bands are numbered to indicate
those that yielded clear sequences and were used in phylogenetic analyses. L, DGGE ladder. (b) Unweighted pair group method with arithmetic mean
Jaccard distance dendrogram generated by considering all resolved bands (82) from the DGGE fingerprint shown above (see text for details).
FEMS Microbiol Ecol 69 (2009) 27–42c� 2009 Federation of European Microbiological SocietiesPublished by Blackwell Publishing Ltd. All rights reserved
34 I. Ylla et al.

in turn, showed mixed bacterial communities comprising
mostly either Actinobacteria and Betaproteobacteria (DnG
treatment) or Alpha- and Betaproteobacteria (DG treatment)
(Figs 2a and 3). In both cases, the closest-cultivated repre-
sentatives of the phylotypes retrieved from these samples
were photo- or chemoheterotrophic bacteria [Rhodococcus
Table 2. Phylogenetic affiliation of the 16S rRNA partial gene sequences obtained from DGGE bands (Fig. 2a)
Band Nearest species and taxon Accession no. % Similarity
2 Uncult. cyanobacterium clone TAF-A34 AY038729 98
3 Uncult. Phyllobacteriaceae clone Amb_16S_1129 EF018496 80
4 Hyphomicrobium sp. LAT3 AY934489 91
5 Uncult. Deinococcus sp. clone CG1-25 EF438206 82
6 Uncult. bacterium clone BTX10 EF488244 76
7 Actinobacterium kmd_307 EU723162 79
8 Uncult. Deinococcus sp. clone CG1-3 EF438203 86
9 Scenedesmus obliquus strain UTEX 393 chloroplast DQ396875 98
10 Scenedesmus obliquus strain UTEX 393 chloroplast DQ396875 99
13 Uncult. cyanobacterium isolate DGGE band 5 AY942894 93
14 Uncult. bacterium clone 255b2 EF459912 97
15 Comamonas sp. strain P-120 AM412126 93
16 Uncult. alphaproteobacterium clone EV818FW062101BH4MD6 DQ079651 80
17 Alphaproteobacterium BAC247 EU180521 94
18 Uncult. actinobacterium clone TH1-77 AM690872 75
19 Rhodococcus erythropolis strain K22-22 EU326491 96
20 Uncult. Gemmatimonadetes bacterium clone MVS-78 DQ676418 84
21 Phaeodactylum tricornutum chloroplast EF067920 97
22 Phaeodactylum tricornutum chloroplast EF067920 97
24 Uncult. cyanobacterium isolate DGGE band 5 AY942894 93
25 Uncult. cyanobacterium clone LPR90 DQ130046 89
26 Legionella pneumophila ssp. pascullei AF122885 97
27 Uncult. cyanobacterium isolate DGGE band 5 AY942894 95
28 Uncult. cyanobacterium isolate DGGE band 5 AY942894 93
29 Agrobacterium sp. CBCEN3 EF427846 90
30 Agrobacterium sp. C13 EF189105 100
31 Uncult. Rhodospirillaceae clone HrhB62 AM159277 86
32 Uncult. bacterium clone BTX10 EF488244 77
33 Uncult. alphaproteobacterium clone JG35-K2-AG57 AM116746 82
34 Rhodobacter sp. DQ12-45T EF186075 95
35 Uncult. deltaproteobacterium clone AS105 EU283398 76
36 Uncult. bacterium clone 1548 AB286604 74
38 Rhizobiales bacterium isolate D11-29 AM403229 92
39 Rhizobiales bacterium isolate D11-29 AM403229 88
40 Uncult. bacterium clone M1-53 EU015116 96
41 Ideonella sp. 0-0013 AB211233 94
42 Betaproteobacterium A0640 AF236010 95
43 Actinobacterium KV-537 AB249842 90
44 Rhodococcus erythropolis strain K22-22 EU326491 99
45 Rhodococcus erythropolis strain K22-22 EU326491 100
46 Rhodococcus erythropolis strain K22-22 EU326491 99
47 Saprospiraceae bacterium clone MS-Wolf2-H AJ786323 99
48 Agrobacterium sp. C13 EF189105 99
49 Uncult. bacterium clone RVW-06 AB199573 97
50 Uncult. bacterium clone RVW-06 AB199573 95
51 Uncult. bacterium clone 29 DQ413088 99
52 Uncult. bacterium clone FW104-022 EF693423 74
53 Uncult. Aquabacterium sp. clone GASP-WA2W2_F08 EF072951 98
55 Uncult. bacterium isolate S01_H01 AB374505 78
56 Uncult. cyanobacterium isolate DGGE band 5 AY942894 97
Bands not appearing in the table correspond to bad sequences (see text for details).
FEMS Microbiol Ecol 69 (2009) 27–42 c� 2009 Federation of European Microbiological SocietiesPublished by Blackwell Publishing Ltd. All rights reserved
35Biofilm shifts caused by glucose and light
erythroplis (Actinobacteria); Rhodobacter spp. and Agrobacter-
ium spp. (Alphaproteobacteria); and Rubrivivax gelatinosus and
Sphaerotilus spp. (Betaproteobacteria)] (Table 2 and Fig. S1).
A dendrogram using the Jaccard similarity index on the
DGGE band patterns (including the total number of bands
resolved) clearly discriminated between the inoculum and
the microcosm samples, which were distributed in two
major groups, depending on the availability of labile
organic matter, i.e. glucose addition (Fig. 2b). Within each
of these two groups, microbial communities differed,
depending on the illumination conditions during the
incubation period.
Polysaccharides in EPS
The highest EPS content (measured at day 29) occurred in
the LnG microcosms (82.5� 12.8 mg glucose-equivalents
cm�2), followed by the LG (44.6� 19.5 mg glucose-equiv-
alents cm�2) and DG treatment (12.6� 7.1mg glucose-
equivalents cm�2). In comparison, the EPS content in the
Deinococcus/Thermus
(29%)
Alphaproteobacteria(43%)
Cyanobacteria(14%)
Actinobacteria(14%)
Inoculum
DG
Alphaproteobacteria(25%)
Bacteroidetes(12.5%)
Betaproteobacteria(62.5%)
Betaproteobacteria(10%)
LnGCyanobacteria
(30%)
Gemmatimonadetes(10%)
Gammaproteobacteria(10%)
Alphaproteobacteria(20%)
Actinobacteria(20%)
DnG
Alphaproteobacteria(22%)
Betaproteobacteria(33.5%)
Actinobacteria(44.5%)
Deltaprobacteria(12.5%)
LG
Cyanobacteria(44%)
Alphaproteobacteria(37.5%)
Gammaproteobacteria(6%)
Fig. 3. Distribution of the phylotypes recovered both from the inoculum samples and from each treatment (in %) within the major taxonomic phyla
identified after the phylogenetic analysis.
FEMS Microbiol Ecol 69 (2009) 27–42c� 2009 Federation of European Microbiological SocietiesPublished by Blackwell Publishing Ltd. All rights reserved
36 I. Ylla et al.
DnG microcosm was very low (0.6� 2.2 mg glucose-equiv-
alents cm�2).
Extracellular enzyme activities
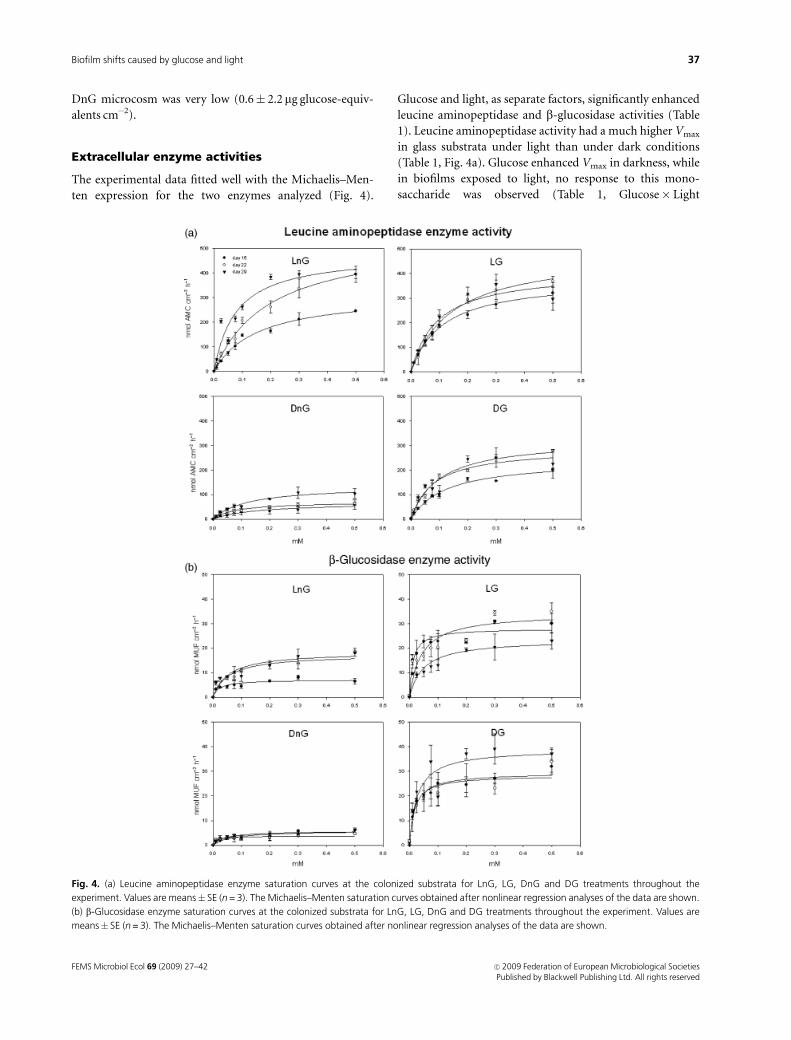
The experimental data fitted well with the Michaelis–Men-
ten expression for the two enzymes analyzed (Fig. 4).
Glucose and light, as separate factors, significantly enhanced
leucine aminopeptidase and b-glucosidase activities (Table
1). Leucine aminopeptidase activity had a much higher Vmax
in glass substrata under light than under dark conditions
(Table 1, Fig. 4a). Glucose enhanced Vmax in darkness, while
in biofilms exposed to light, no response to this mono-
saccharide was observed (Table 1, Glucose� Light
Fig. 4. (a) Leucine aminopeptidase enzyme saturation curves at the colonized substrata for LnG, LG, DnG and DG treatments throughout the
experiment. Values are means� SE (n = 3). The Michaelis–Menten saturation curves obtained after nonlinear regression analyses of the data are shown.
(b) b-Glucosidase enzyme saturation curves at the colonized substrata for LnG, LG, DnG and DG treatments throughout the experiment. Values are
means� SE (n = 3). The Michaelis–Menten saturation curves obtained after nonlinear regression analyses of the data are shown.
FEMS Microbiol Ecol 69 (2009) 27–42 c� 2009 Federation of European Microbiological SocietiesPublished by Blackwell Publishing Ltd. All rights reserved
37Biofilm shifts caused by glucose and light
interaction, Fig. 4a). A progressive increase in peptidase
activity was observed throughout the experiment (Table 1,
Time effect, Fig. 4a). Km values were similar among all
treatments, ranging between 0.08 and 0.20 mM. In turn,
b-glucosidase activity showed a higher Vmax in glucose-
enriched treatments both under light and dark conditions
(Table 1, Fig. 4b). However, under light conditions, the
glucose treatment caused a slight increase in the Vmax, while
in the dark, this increase was much higher (Table 1,
Glucose� Light interaction, Fig. 4b). No significant differ-
ences were obtained for the b-glucosidase Km values
(0.01–0.07 mM).
Photosynthetic efficiency
Photon yield in the treatments was affected by light avail-
ability (Table 1), with mean values under light of 0.43� 0.4,
in contrast to nonsignificant photosynthetic efficiency un-
der dark conditions. Although no significant effect of
glucose was detected (Table 1), in the LnG treatment, the
photosynthetic yield increased throughout the experiment,
while it decreased in LG treatments (Table 1, Glucose
� Light�Time interaction). At day 29, the photosynthetic
efficiency was higher for the LnG than for the LG treatment
(P = 0.002).
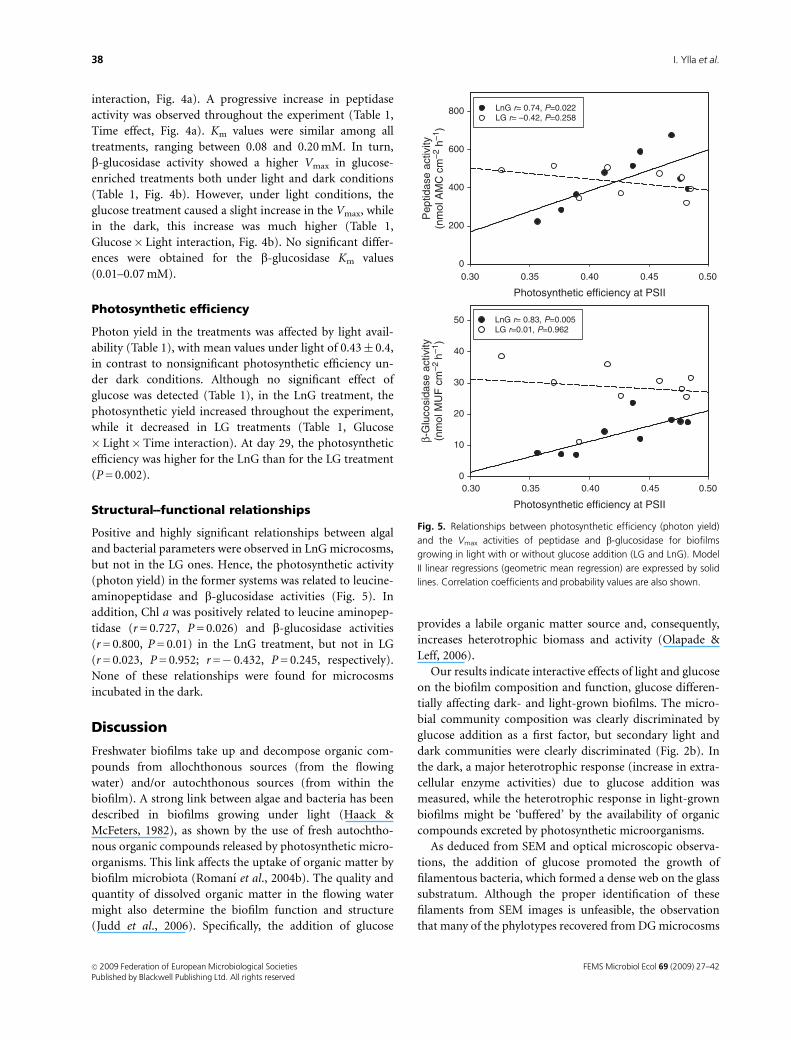
Structural--functional relationships
Positive and highly significant relationships between algal
and bacterial parameters were observed in LnG microcosms,
but not in the LG ones. Hence, the photosynthetic activity
(photon yield) in the former systems was related to leucine-
aminopeptidase and b-glucosidase activities (Fig. 5). In
addition, Chl a was positively related to leucine aminopep-
tidase (r = 0.727, P = 0.026) and b-glucosidase activities
(r = 0.800, P = 0.01) in the LnG treatment, but not in LG
(r = 0.023, P = 0.952; r =� 0.432, P = 0.245, respectively).
None of these relationships were found for microcosms
incubated in the dark.
Discussion
Freshwater biofilms take up and decompose organic com-
pounds from allochthonous sources (from the flowing
water) and/or autochthonous sources (from within the
biofilm). A strong link between algae and bacteria has been
described in biofilms growing under light (Haack &
McFeters, 1982), as shown by the use of fresh autochtho-
nous organic compounds released by photosynthetic micro-
organisms. This link affects the uptake of organic matter by
biofilm microbiota (Romanı et al., 2004b). The quality and
quantity of dissolved organic matter in the flowing water
might also determine the biofilm function and structure
(Judd et al., 2006). Specifically, the addition of glucose
provides a labile organic matter source and, consequently,
increases heterotrophic biomass and activity (Olapade &
Leff, 2006).
Our results indicate interactive effects of light and glucose
on the biofilm composition and function, glucose differen-
tially affecting dark- and light-grown biofilms. The micro-
bial community composition was clearly discriminated by
glucose addition as a first factor, but secondary light and
dark communities were clearly discriminated (Fig. 2b). In
the dark, a major heterotrophic response (increase in extra-
cellular enzyme activities) due to glucose addition was
measured, while the heterotrophic response in light-grown
biofilms might be ‘buffered’ by the availability of organic
compounds excreted by photosynthetic microorganisms.
As deduced from SEM and optical microscopic observa-
tions, the addition of glucose promoted the growth of
filamentous bacteria, which formed a dense web on the glass
substratum. Although the proper identification of these
filaments from SEM images is unfeasible, the observation
that many of the phylotypes recovered from DG microcosms
Photosynthetic efficiency at PSII
0.300
200
400
600
800 LnG r= 0.74, P=0.022LG r= –0.42, P=0.258
0
10
20
30
40
50 LnG r= 0.83, P=0.005LG r=0.01, P=0.962
Photosynthetic efficiency at PSII
0.35 0.40 0.45 0.50
0.30 0.35 0.40 0.45 0.50
β-G
luco
sida
se a
ctiv
ity(n
mol
MU
F c
m–2
h–1
)P
eptid
ase
activ
ity(n
mol
AM
C c
m–2
h–1
)
Fig. 5. Relationships between photosynthetic efficiency (photon yield)
and the Vmax activities of peptidase and b-glucosidase for biofilms
growing in light with or without glucose addition (LG and LnG). Model
II linear regressions (geometric mean regression) are expressed by solid
lines. Correlation coefficients and probability values are also shown.
FEMS Microbiol Ecol 69 (2009) 27–42c� 2009 Federation of European Microbiological SocietiesPublished by Blackwell Publishing Ltd. All rights reserved
38 I. Ylla et al.
were similar to filamentous members of Betaproteobacteria
(4 95% of sequence identity with Leptothrix spp. and
Sphaerotilus spp.) provides a plausible identification for the
dominant bacteria enriched under these conditions. The
preference for labile organic matter showed by species of the
Genus Sphaerotilus (Gao et al., 2005; Olapade & Leff, 2006)
also agree with the results obtained from these microcosms.
The prevalence of phylotypes affiliated within the Alpha-
subclass of Proteobacteria in LG microcosms does not
preclude the occurrence of filamentous forms, although the
closest relatives obtained by BLAST corresponded to nonfila-
mentous species (i.e. Rhodobacter sphaeroides, Rhizobium
spp. or Agrobacterium tumefaciens).
Glucose amendment, however, did not increase bacterial
cell density, but it decreased the proportion of living cells.
This lack of effect could be due to the effect of protozoa
grazing on bacterial density (Bott & Kaplan, 1990; Sobczak,
1996). In fact, Vorticella cells were easily identified in SEM
micrographs from glucose-amended microcosms. The het-
erotrophic bacterial community under these conditions
(glucose addition) showed strong activity in hydrolyzing
polysaccharides (high activity of b-glucosidase). The high
activity of b-glucosidase might be caused by the availability
of polysaccharides in the EPS. In this regard, the metabolic
response of the biofilm to glucose addition differed between
biofilms grown under light or dark conditions. The higher
enzymatic response on adding glucose in the latter biofilms
(Fig. 4a and b) might indicate stronger dependence of the
heterotrophic members of the biofilm community on avail-
able organic matter in the flowing water (Romanı et al.,
2004b).
In biofilms grown under light conditions, bacterial bio-
mass and heterotrophic extracellular enzyme activities are
favored by the presence and activity of photosynthetic
microorganisms, suggesting an algal–bacterial link. The high
extracellular enzyme activities (especially leucine aminopep-
tidase) and high bacterial density in biofilms grown under
light indicate that bacterial settlement and growth are
favored by the presence of algae, which probably increase
the amount of organic matter available to heterotrophs
(Romanı & Sabater, 1999; Espeland et al., 2001; Sekar et al.,
2002). Several authors have reported that proteinaceous
substances released by living or senescent algal cells enhance
leucine aminopeptidase activity (Middelboe et al., 1995;
Francoeur & Wetzel, 2003), while b-glucosidase activity is
enhanced mainly by polysaccharides released by algae (Jones
& Lock, 1993; Espeland et al., 2001). The large amount of
EPS detected in the biofilms grown under light could also
provide a major source of organic matter for bacteria
(Zhang & Bishop, 2003).
However, the influence of photosynthetic biomass on
bacterial biomass and extracellular enzyme activities de-
creased when glucose was available (Fig. 5). The obtained
results suggested that heterotrophic bacteria preferentially
use the most labile compounds such as glucose, which is
more easily and rapidly taken up than organic molecules
released by algae, which are usually of high molecular weight
(4 5000 Da; Sundh, 1989), therefore needing enzymatic
breakdown before uptake. However, changes in the trophic
relationships between algae and bacteria could be further
modulated by the effect of glucose on algal physiology and
on the structure of the microbial community (Kirchman
et al., 2004). The addition of glucose to the microcosms
lowered chlorophyll density and photosynthetic efficiency,
findings that are consistent with other observations (Sobc-
zak, 1996). The high OD ratio (OD430/665 nm) in glucose-
amended microcosms indicated a higher amount of de-
graded pigments in comparison with functional Chl a. This
observation suggests that under these conditions photosyn-
thetic microorganisms were not favored to compete with
microbial heterotrophs for space and nutrients. Therefore,
the possibility that some diatoms facultatively used organic
matter in the glucose treatment cannot be ruled out (Tuch-
man et al., 2006).
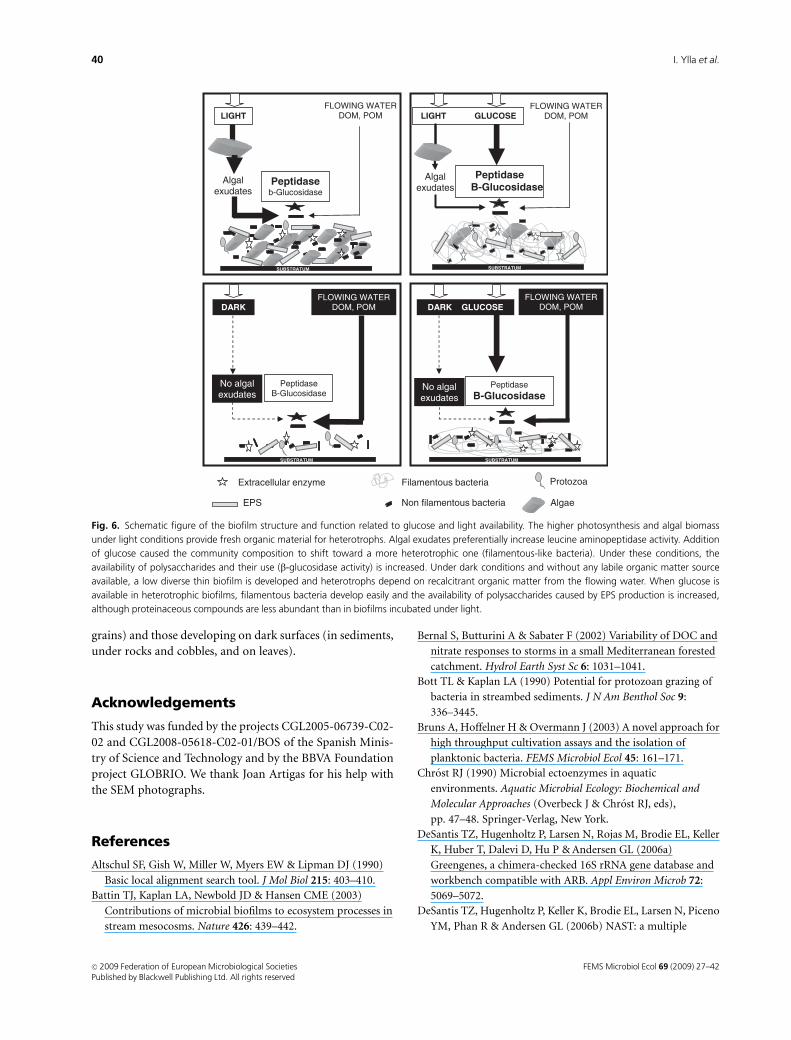
Our results indicate that the availability of glucose and
light modulates biofilm structure and function (Fig. 6).
Glucose availability affects the microbial community com-
position considerably and leads to a greater use of poly-
saccharides, whereas light availability allows the
development of a mixed, more diverse biofilm community
comprising auto- and heterotrophic members and favors the
heterotrophic use of peptides released by algae. Here, we
have confirmed that the effects of readily available organic
carbon are greater in biofilms grown in the dark than in
those grown under light. Under the latter conditions, the
release of organic molecules by phototrophs clearly benefits
the activity and growth of heterotrophic microbiota by
buffering their response to the artificial addition of organic
matter. Consequently, the autoheterotrophic biofilm
showed a tighter bacterial–algal link when it was not
supplemented with readily available organic carbon.
The extrapolation of the results to the ecosystem (stream)
scale can be performed in oligotrophic streams where
dissolved organic matter availability is usually low and of
low biodegradability. In these systems, there occur periods
of higher availability of dissolved organic matter, and these
might have a remarkable effect on the biofilm community
composition and function. Although in the present experi-
ment a very high input (designed to obtain clear effects) was
simulated, analogous increases in labile DOC might occur.
These have been described both in intermittent streams
during flood episodes after drought periods (Romanı et al.,
2006), as well as in streams suffering from anthropogenic
urban contamination. The potential effect would therefore
differ between those stream biofilms developing on illumi-
nated surfaces (upper surfaces of rocks, cobbles and sand
FEMS Microbiol Ecol 69 (2009) 27–42 c� 2009 Federation of European Microbiological SocietiesPublished by Blackwell Publishing Ltd. All rights reserved
39Biofilm shifts caused by glucose and light
grains) and those developing on dark surfaces (in sediments,
under rocks and cobbles, and on leaves).
Acknowledgements
This study was funded by the projects CGL2005-06739-C02-
02 and CGL2008-05618-C02-01/BOS of the Spanish Minis-
try of Science and Technology and by the BBVA Foundation
project GLOBRIO. We thank Joan Artigas for his help with
the SEM photographs.
References
Altschul SF, Gish W, Miller W, Myers EW & Lipman DJ (1990)
Basic local alignment search tool. J Mol Biol 215: 403–410.
Battin TJ, Kaplan LA, Newbold JD & Hansen CME (2003)
Contributions of microbial biofilms to ecosystem processes in
stream mesocosms. Nature 426: 439–442.
Bernal S, Butturini A & Sabater F (2002) Variability of DOC and
nitrate responses to storms in a small Mediterranean forested
catchment. Hydrol Earth Syst Sc 6: 1031–1041.
Bott TL & Kaplan LA (1990) Potential for protozoan grazing of
bacteria in streambed sediments. J N Am Benthol Soc 9:
336–3445.
Bruns A, Hoffelner H & Overmann J (2003) A novel approach for
high throughput cultivation assays and the isolation of
planktonic bacteria. FEMS Microbiol Ecol 45: 161–171.
Chrost RJ (1990) Microbial ectoenzymes in aquatic
environments. Aquatic Microbial Ecology: Biochemical and
Molecular Approaches (Overbeck J & Chrost RJ, eds),
pp. 47–48. Springer-Verlag, New York.
DeSantis TZ, Hugenholtz P, Larsen N, Rojas M, Brodie EL, Keller
K, Huber T, Dalevi D, Hu P & Andersen GL (2006a)
Greengenes, a chimera-checked 16S rRNA gene database and
workbench compatible with ARB. Appl Environ Microb 72:
5069–5072.
DeSantis TZ, Hugenholtz P, Keller K, Brodie EL, Larsen N, Piceno
YM, Phan R & Andersen GL (2006b) NAST: a multiple
FLOWING WATERDOM, POMDARK
No algal exudates
PeptidaseB-Glucosidase
DARK GLUCOSE
No algal exudates
PeptidaseB-Glucosidase
LIGHTFLOWING WATER
DOM, POM
Algalexudates
Peptidaseb-Glucosidase
FLOWING WATERDOM, POM
Algalexudates
PeptidaseB-Glucosidase
Extracellular enzyme
AlgaeNon filamentous bacteria
Filamentous bacteria Protozoa
EPS
FLOWING WATERDOM, POM
LIGHT GLUCOSE
Fig. 6. Schematic figure of the biofilm structure and function related to glucose and light availability. The higher photosynthesis and algal biomass
under light conditions provide fresh organic material for heterotrophs. Algal exudates preferentially increase leucine aminopeptidase activity. Addition
of glucose caused the community composition to shift toward a more heterotrophic one (filamentous-like bacteria). Under these conditions, the
availability of polysaccharides and their use (b-glucosidase activity) is increased. Under dark conditions and without any labile organic matter source
available, a low diverse thin biofilm is developed and heterotrophs depend on recalcitrant organic matter from the flowing water. When glucose is
available in heterotrophic biofilms, filamentous bacteria develop easily and the availability of polysaccharides caused by EPS production is increased,
although proteinaceous compounds are less abundant than in biofilms incubated under light.
FEMS Microbiol Ecol 69 (2009) 27–42c� 2009 Federation of European Microbiological SocietiesPublished by Blackwell Publishing Ltd. All rights reserved
40 I. Ylla et al.

sequence alignment server for comparative analysis of 16S
rRNA genes. Nucleic Acids Res 34: 394–399.
Dubois M, Giles KA, Hamilton JK, Rebers PA & Smith F (1956)
Colorimetric method for the determination of sugars and
related substances. Anal Chem 28: 350–356.
Espeland EM, Francoeur SN & Wetzel RG (2001) Influence of
algal photosynthesis on biofilm bacterial production and
associated glucosidase and xylosidase activities. Microb Ecol
42: 524–530.
Findlay S, Pace ML, Lints D & Cole JJ (1991) Weak coupling of
bacterial and algal production in a heterotrophic ecosystem:
the Hudson River estuary. Limnol Oceanogr 36: 268–278.
Findlay S, Howe K & Fontvieille D (1993a) Bacterial–algal
relationships in streams of the Hubbard Brook experimental
forest. Ecology 74: 2326–2336.
Findlay S, Strayer D, Goumbala C & Gould K (1993b)
Metabolism of streamwater dissolved organic carbon in the
shallow hyporheic zone. Limnol Oceanogr 38: 1493–1499.
Francoeur SN & Wetzel RG (2003) Regulation of periphytic
leucine-aminopeptidase activity. Aquat Microb Ecol 31:
249–258.
Freese HM, Karsten U & Schumannn R (2006) Bacterial
abundance, activity, and viability in the etutrophic river
Warnow, Northeast Germany. Microb Ecol 51: 117–127.
Gao X, Olapade OA, Kershner MW & Leff LG (2004)
Algal–bacterial co-variation in streams: a cross-stream
comparison. Arch Hydrobiol 159: 253–261.
Gao X, Olapade OA & Leff LG (2005) Comparison of benthic
bacterial community composition in nine streams. Aquat
Microb Ecol 40: 51–60.
Haack TK & McFeters GA (1982) Microbial dynamics of an
epilithic mat community in a high alpine stream. Appl Environ
Microb 42: 702–707.
Huber T, Faulkner G & Hugenholtz P (2004) Bellerophon: a
program to detect chimeric sequences in multiple sequence
alignments. Bioinformatics 20: 2317–2319.
Jeffrey SW & Humphrey GF (1975) New spectrophotometric
equations for determining chlorophylls a, b, and c in higher
plants, algae and natural phytoplankton. Biochem Physiol Pfl
167: 191–194.
Jones SE & Lock MA (1993) Seasonal determinations of
extracellular hydrolytic activities in heterotrophic and mixed
heterotrophic/autotrophic biofilms from two contrasting
rivers. Hydrobiologia 257: 1–16.
Judd KE, Crump BC & Kling GW (2006) Variation in dissolved
organic matter controls bacterial production and community
composition. Ecology 87: 2068–2079.
Kaplan LA & Bott TL (1989) Diel fluctuations in bacterial activity
on streambed substrata during vernal algal blooms: effects of
temperature, water chemistry and habitat. Limnol Oceanogr
34: 718–733.
Kaplan LA & Newbold JD (2003) The role of monomers in stream
ecosystem metabolism. Aquatic Ecosystems. Interactivity of
Dissolved Organic Matter (Findlay SEG & Sinsabaugh RL, eds),
pp. 99–119. Academic Press, San Diego, CA.
Kirchman DL, Dittel AI, Findlay SE & Fischer D (2004) Changes
in bacterial activity and community structure in response to
dissolved organic matter in the Hudson River, New York.
Aquat Microb Ecol 35: 243–257.
Lane DJ (1991) 16S/23S rRNA sequencing. Nucleic Acid
Techniques in Bacterial Systematics (Stackebrandt E &
Goodfellow M, eds), pp. 115–175. John Wiley & Sons, New
York.
Lliros M, Casamayor EO & Borrego CM (2008) High archaeal
richness in the water column of a freshwater sulphurous
karstic lake along an inter-annual study. FEMS Microbiol Ecol
66: 331–342.
Ludwig W, Strunk O, Westram R et al. (2004) ARB: a software
environment for sequence data. Nucleic Acids Res 32:
1363–1371.
Margalef R (1983) Limnologıa. Omega, Barcelona.
Martinez J, Smith DC, Steward GF & Azam F (1996) Variability in
ectohydrolytic enzyme activities of pelagic marine bacteria and
its significance for substrate processing in the sea. Aquat
Microb Ecol 10: 223–230.
McCaig AE, Glover LA & Prosser JI (2001) Numerical analysis of
grassland bacterial community structure under different land
management regimens by using 16S ribosomal DNA sequence
data and denaturing gradient gel electrophoresis banding
patterns. Appl Environ Microb 67: 4554–4559.
Middelboe M, Sondergaard M, Letarte Y & Borch NH (1995)
Attached and free-living bacteria: production and polymer
hydrolysis during a diatom bloom. Microb Ecol 29: 231–248.
Munster U (1993) Concentrations and fluxes of organic carbon
substrates in aquatic environment. Antonie van Leeuwenhoek
63: 243–274.
Murphy J & Riley JP (1962) A modified single solution for the
determination of phosphate in natural waters. Anal Chim Acta
27: 31–36.
Muyzer G, de Waal EC & Uitterlinden AG (1993) Profiling of
complex microbial populations by denaturing gradient gel
electrophoresis analysis of polymerase chain reaction
amplified genes coding for 16S rRNA. Appl Environ Microb 59:
695–700.
Muyzer G, Brinkhoff T, Nubel U, Santegoeds C, Schafer H &
Wawer C (1998) Denaturing gradient gel electrophoresis
(DGGE) in microbial ecology. Molecular Microbial Ecology
Manual (Akkermans ADL, van Elsas JD & de Bruijn FJ, eds),
pp. 1–27. Kluwer Academic Publishers, Dordrecht.
Olapade OA & Leff LG (2005) Seasonal response of stream
biofilm communities to dissolved organic matter and nutrient
enrichments. Appl Environ Microb 71: 2278–2287.
Olapade OA & Leff LG (2006) Influence of dissolved organic
matter and inorganic nutrients on the biofilm bacterial
community on artificial substrates in a northeastern Ohio,
USA, stream. Can J Microbiol 52: 540–549.
Rier ST & Stevenson RJ (2002) Effects of light, dissolved organic
carbon, and inorganic nutrients on the relationship between
algae and heterotrophic bacteria in stream periphyton.
Hydrobiologia 489: 179–184.
FEMS Microbiol Ecol 69 (2009) 27–42 c� 2009 Federation of European Microbiological SocietiesPublished by Blackwell Publishing Ltd. All rights reserved
41Biofilm shifts caused by glucose and light

Romanı AM & Sabater S (1999) Effect of primary producers on
the heterotrophic metabolism of a stream biofilm. Freshwater
Biol 41: 729–736.
Romanı AM & Sabater S (2000) Influence of algal biomass on
extracellular enzyme activity in river biofilms. Microb Ecol 40:
16–24.
Romanı AM, Giorgi A, Acuna V & Sabater S (2004a) The
influence of substratum type and nutrient supply on biofilm
organic matter utilization in streams. Limnol Oceanogr 49:
1713–1721.
Romanı AM, Guasch H, Munoz I, Ruana J, Vilalta E, Schwartz T,
Emtiazi F & Sabater S (2004b) Biofilm structure and function
and possible implications for riverine DOC dynamics. Microb
Ecol 47: 316–328.
Romanı AM, Vazquez E & Butturini A (2006) Microbial
availability and size fractionation of dissolved organic carbon
after drought in an intermittent stream: biogeochemical link
across the stream–riparian interface. Microb Ecol 52: 501–512.
Romanı AM, Fund K, Artigas J, Schwartz T, Sabater S & Obst U
(2008) Relevance of polymeric matrix enzymes during biofilm
formation. Microb Ecol 56: 427–436.
Sabater S & Admiraal W (2005) Biofilms as biological indicators
in managed aquatic ecosystems. Periphyton: Ecology,
Exploitation and Management (Azim ME, Verdegem MCJ, Van
Dam AA & Beveridge MCM, eds), pp. 159–177. CABI
Publishing, Cambridge, MA.
Sabater S, Guasch H, Romanı A & Munoz I (2000) The effect of
biological factors on the efficiency of river biofilms in
improving water quality. Hydrobiologia 469: 149–156.
Sabater S, Guasch H, Munoz I & Romanı AM (2006) Hydrology,
light and the use of organic and inorganic materials as
structuring factors of biological communities in
Mediterranean streams. Limnetica 25: 335–348.
Schreiber U, Gademann R, Bird P, Ralph PJ, Larkum AWD &
Kuhl M (2002) Apparent light requirement for activation of
photosynthesis upon rehydration of desiccated beachrock
microbial mats. J Phycol 38: 125–134.
Scott JT, Back JA, Taylor JM & King RS (2008) Does nutrient
enrichment decouple algal–bacterial production in
periphyton? J N Am Benthol Soc 27: 332–344.
Sekar R, Nair KVK, Rao VNR & Venugopalan VP (2002) Nutrient
dynamics and successional changes in a lentic freshwater
biofilm. Freshwater Biol 47: 1893–1907.
Sinsabaugh RL, Osgood MP & Findlay S (1994) Enzymatic
models for estimating decomposition rates of particulate
detritus. J N Am Benthol Soc 13: 160–169.
Sobczak WV (1996) Epilithic bacterial responses to variations in
algal biomass and labile dissolved organic carbon during
biofilm colonization. J N Am Benthol Soc 15: 143–154.
Sokal RR & Rohlf FJ (1995) Biometry: The Principles and Practice
of Statistics in Biological Research, 3rd edn. WH Freeman, New
York.
Stock MS & Ward AK (1989) Establishment of a bedrock epilithic
community in a small stream: microbial (algal and bacterial)
metabolism and physical structure. Can J Fish Aquat Sci 46:
1874–1883.
Sundh I (1989) Characterization of phytoplankton extracellular
products (PDOC) and their subsequent uptake by
heterotrophic organisms in a mesotrophic forest lake.
J Plankton Res 11: 463–486.
Tuchman NC, Schollet MA, Rier ST & Geddes P (2006)
Differential heterotrophic utilization of organic compounds
by diatoms and bacteria under light and dark conditions.
Hydrobiologia 561: 167–177.
Vazquez E, Romanı AM, Sabater F & Butturini A (2007) Effects of
the dry–wet hydrological shift on dissolved organic carbon
dynamics and fate across stream–riparian interface in a
mediterranean catchment. Ecosystems 10: 239–251.
Veraart A, Romanı A, Tornes E & Sabater S (2008) Algal response
to nutrient enrichment in a forested oligotrophic stream.
J Phycol 44: 564–572.
Wetzel RG (1992) Gradient-dominated ecosystems: sources and
regulatory functions of dissolved organic matter in freshwater
ecosystem. Hydrobiologia 229: 181–198.
Wetzel RG (1993) Microcommunities and microgradients:
linking nutrient regeneration, microbial mutualism, and high
sustained aquatic primary production. Neth J Aquat Ecol 27:
3–9.
Zhang X & Bishop PL (2003) Biodegradability of biofilm
extracellular polymeric substances. Chemosphere 50: 63–69.
Supporting Information
Additional Supporting Information may be found in the
online version of this article:
Fig. S1. Phylogenetic tree showing the affiliation of the
representative bacterial partial 16S rRNA gene sequences
obtained from the DGGE bands.
Please note: Wiley-Blackwell is not responsible for the
content or functionality of any supporting materials sup-
plied by the authors. Any queries (other than missing
material) should be directed to the corresponding author
for the article.
FEMS Microbiol Ecol 69 (2009) 27–42c� 2009 Federation of European Microbiological SocietiesPublished by Blackwell Publishing Ltd. All rights reserved
42 I. Ylla et al.