Service Availability and Readiness Assessment (SARA)
142
Service Availability and Readiness Assessment (SARA) An annual monitoring system for service delivery Implementation Guide
-
Upload
khangminh22 -
Category
Documents
-
view
0 -
download
0
Transcript of Service Availability and Readiness Assessment (SARA)

HEALTH FACILITY ASSESSMENT OF SERVICE AVAILABILITY AND READINESS
Service Availability and Readiness
Assessment (SARA)
An annual monitoring system for service delivery
Implementation Guide

WHO/HIS/HSI/RME/2013/2
© World Health Organization 2013
All rights reserved. Publications of the World Health Organization are available on the WHO web site (www.who.int) or can be purchased from WHO Press, World Health Organization, 20 Avenue Appia, 1211 Geneva 27, Switzerland (tel.: +41 22 791 3264; fax: +41 22 791 4857; e-mail: [email protected]).
Requests for permission to reproduce or translate WHO publications – whether for sale or for noncommercial distribution – should be addressed to WHO Press through the WHO web site (http://www.who.int/about/licensing/copyright_form/en/index.html).
The designations employed and the presentation of the material in this publication do not imply the expression of any opinion whatsoever on the part of the World Health Organization concerning the legal status of any country, territory, city or area or of its authorities, or concerning the delimitation of its frontiers or boundaries. Dotted lines on maps represent approximate border lines for which there may not yet be full agreement.
The mention of specific companies or of certain manufacturers’ products does not imply that they are endorsed or recommended by the World Health Organization in preference to others of a similar nature that are not mentioned. Errors and omissions excepted, the names of proprietary products are distinguished by initial capital letters.
All reasonable precautions have been taken by the World Health Organization to verify the information contained in this publication. However, the published material is being distributed without warranty of any kind, either expressed or implied. The responsibility for the interpretation and use of the material lies with the reader. In no event shall the World Health Organization be liable for damages arising from its use.
Cover photo credit: WHO/Evelyn Hockstein
Service Availability and Readiness
Assessment (SARA)
An annual monitoring system for service delivery
Implementation Guide
Version 2.1 September 2013

Acknowledgements
The service availability and readiness assessment (SARA) methodology was developed through a joint World Health Organization (WHO) – United States Agency for International Development (USAID) collaboration. The methodology builds upon previous and current approaches designed to assess service delivery including the service availability mapping (SAM) tool developed by WHO, and the service provision assessment (SPA) tool developed by ICF International under the USAID-funded MEASURE DHS project (monitoring and evaluation to assess and use results, demographic and health surveys) project, among others. It draws on best practices and lessons learned from the many countries that have implemented health facility assessments as well as guidelines and standards developed by WHO technical programmes and the work of the International Health Facility Assessment Network (IHFAN).
Particular thanks are extended to all those who contributed to the development of the service readiness indicators, indices, and questionnaires during the workshop on "Strengthening Monitoring of Health Services Readiness" held in Geneva, 22–23 September 2010.
Many thanks to The Norwegian Agency for Development Cooperation (Norad) whom has supported Statistics Norway to take part in the development of the SARA tools. The support has contributed to the development and implementation of a new electronic questionnaire in CSPro and data verification guidelines.
A special thanks to the Medicines Information and Evidence for Policy unit at WHO for their contribution to the SARA training materials and to the Unidad de Calidad y Seguridad de la Atención Médica-Hospital General de México for their contribution of photographs to the SARA data collectors' guide. Project Management Group The SARA methodology and tool were developed under the direction and management of Kathy O’Neill and Ashley Sheffel with valuable inputs from Ties Boerma and Marina Takane. Project Advisory Group Carla AbouZahr, Maru Aregawi Weldedawit, Sisay Betizazu, Paulus Bloem, Krishna Bose, Maurice Bucagu, Alexandra Cameron, Daniel Chemtob, Meena Cherian, Richard Cibulskis, Mario Dal Poz, Sergey Eremin, Jesus Maria Garcia Calleja, Sandra Gove, Neeru Gupta, Teena Kunjumen, Thierry Lambrechts, Richard Laing, Blerta Maliqi, Shanthi Mendis, Claire Preaud, Andrew Ramsay, Leanne Riley, Cathy Roth, Willy Urassa, Adriana Velasquez Berumen, Junping Yu, Nevio Zagaria, and Evgeny Zheleznyakov.

Service Availability and Readiness Assessment (SARA) | Implementation Guide
5
Table of contents
Acknowledgements ...........................................................................................................4
CHAPTER 1 | PLANNING AND METHODOLOGY ..................................................................7
1.1 Background .................................................................................................................................... 9 1.2 Objectives ....................................................................................................................................... 9 1.3 Key topics of the assessment .......................................................................................................10 1.4 Methodology ................................................................................................................................11 1.5 Survey steps .................................................................................................................................11 1.6 Requirements ...............................................................................................................................13 1.7 Budget ..........................................................................................................................................16 Annexes ..................................................................................................................................................17
CHAPTER 2 | SAMPLING ................................................................................................... 25
2.1 Sampling strategies ......................................................................................................................27 2.2 List sample methodology .............................................................................................................28 2.3 Probability sampling in Excel .......................................................................................................35 Annex .....................................................................................................................................................38
CHAPTER 3 | QUESTIONNAIRE ADAPTATION .................................................................... 39
3.1 Country adaptation ......................................................................................................................41 3.2 Editing the structure of the questionnaire ..................................................................................42 3.3 Important tips ..............................................................................................................................42 3.4 Questionnaire implementation ....................................................................................................43 3.5 Adding modules ...........................................................................................................................43
CHAPTER 4 | CSPRO FOR SARA ......................................................................................... 45
CHAPTER 5 | DATA COLLECTOR’S GUIDE........................................................................... 49
5.1 Overview of data collection procedures ......................................................................................51 5.2 Interviewer skills ..........................................................................................................................56 5.3 Completing the SARA questionnaire ............................................................................................60 5.4 Using CSPro for data entry ...........................................................................................................67 5.5 Using GPS for geographic coordinates collection ........................................................................73
CHAPTER 6 | SUPERVISOR’S GUIDE .................................................................................. 79
6.1 Roles and responsibilities .............................................................................................................81 6.2 Conducting field activities ............................................................................................................81 6.3 Using CSPro for data checking and validation .............................................................................87

Service Availability and Readiness Assessment (SARA) | Implementation Guide
6
CHAPTER 7 | DATA PROCESSING ...................................................................................... 91
7.1 Concatenation ..............................................................................................................................93 7.2 Data cleaning ................................................................................................................................94 7.3 Data verification for completeness ..............................................................................................98 7.4 Calculating sample weights ..........................................................................................................98 7.5 Calculating SARA indicators .......................................................................................................100 7.6 Exporting data from CSPro .........................................................................................................100
CHAPTER 8 | ANALYSIS AND OUTPUT ............................................................................. 101
Introduction ..........................................................................................................................................103 Introduction ..........................................................................................................................................103 8.1 Calculating SARA results .............................................................................................................104 8.2 Alternative method of calculations ............................................................................................118 8.3 Sample weights ..............................................................................................................................119 8.4 Importing data to the SARA analysis tool ..................................................................................126 8.5 Data visualization .......................................................................................................................128 8.6 Survey report .............................................................................................................................140 8.7 Results dissemination ................................................................................................................141

HEALTH FACILITY ASSESSMENT OF SERVICE AVAILABILITY AND READINESS

7
1. Planning and methodology


Service Availability and Readiness Assessment (SARA) | Implementation Guide
9
1.1 Background Ensuring access to quality health services is one of the main functions of a health system. Sound information on the supply and quality of health services is necessary for health systems management, monitoring and evaluation. Efforts to achieve the Millennium Development Goals (MDGs) and scale-up interventions for HIV/AIDS, tuberculosis, malaria, safe motherhood, child health and non-communicable diseases have drawn attention to the need for strong country monitoring of health services and their readiness to deliver key interventions.
The Service availability and readiness assessment (SARA) is designed to function as a systematic tool to support annual verification of data and service delivery at the facility level. It intends to cover public as well as private and faith-based health facilities. The goals of the survey is to provide evidence based data on health system progress to inform the annual health sector review, identify gaps and weaknesses responsible for sub-optimal service provision and intervention coverage that need to be addressed, provide a baseline for planning and monitoring scale-up intervention for service delivery improvement. From that perspective, SARA serves as an M&E tool of the national health strategy and provides key information on progresses of the health system strengthening over time.
SARA is jointly administered with a data verification module that allows record review in health facilities being surveyed. The goal of the data verification module is to provide key information on data quality of monthly reported data from health facilities to the superior/next level in the system (discrepancies between data in primary source and monthly report). This crucial information is complementary with the DQRC (Data Quality Report Card) that assesses data quality of the routine system, providing key information on the reliability of the data used for analysis of the progress and performance of the health system. It is recommended that the quality of the routine data be assessed on a yearly basis and results included on the annual progress report and statistical booklets.
1.2 Objectives The overall objective of the Service Availability and Readiness Assessment is to assess on a regular basis service delivery (availability and readiness) and conduct data verification in public and private facilities. This evidence based information collected as an independent verification aims to provide regular and reliable information on progress and performance of the health system. It is intended to be conducted according to the country planning cycle to provide a one-time key information on service delivery and data quality of the HMIS (data verification and DQRC) in order to inform the health sector review.
• The specific objectives of the SARA and data quality assessment are:
• detect change and measure progress in health system strengthening over time;
• plan and monitor the scale-up of (those) interventions that are key to achieving the MDGs, such as implementing interventions to reduce child and maternal mortality, HIV/AIDS, tuberculosis and malaria, and to respond to the increasing burden of non-communicable diseases;
• generate the evidence base to feed into country annual health sector reviews, to better inform the development of annual operational plans and to guide country and partners towards making more effective investments;
• support national planners in planning and managing health systems (e.g. assessing equitable and appropriate distribution of services, human resources and availability of medicines and supplies).
• ensure systematic assessment of completeness and consistency (both internal and external) of reported data and intervention coverage rates;
• identify data quality problems that are part of the routine monitoring system and need to be addressed.

1. Planning and methodology
10
1.3 Key topics of the assessment The service availability and readiness assessment tool is designed to generate a set of core indicators on key inputs and outputs of the health system, which can be used to measure progress in health system strengthening over time. Tracer indicators aim to provide objective information about whether or not a facility meets the required conditions to support provision of basic or specific services with a consistent level of quality and quantity. Summary or composite indicators, also called indices, can be used to summarize and communicate information about multiple indicators and domains of indicators. Indices can be used for general and service-specific availability and readiness.
There are three main focus areas of SARA-
I. Service availability refers to the physical presence of the delivery of services and encompasses health infrastructure, core health personnel and aspects of service utilization.
II. General service readiness refers to the overall capacity of health facilities to provide general health services. Readiness is defined as the availability of components required to provide services, such as basic amenities, basic equipment, standard precautions for infection prevention, diagnostic capacity and essential medicines.
III. Service-specific readiness refers to the ability of health facilities to offer a specific service, and the capacity to provide that service measured through consideration of tracer items that include trained staff, guidelines, equipment, diagnostic capacity, and medicines and commodities.
The key topic areas and core functional capacities assessed include:
• Identification, location and managing authority of health facility (public and private).
• General facility status (e. g. availability of water supply, telecommunications, electricity, beds, etc).
• Basic medical equipment, such as X-ray, oxygen, weighing machines, etc.
• Availability of health workforce (e.g. cadre of human resources, staff training and guidelines).
• Drugs and commodities - availability of general medicines.
• Diagnostic facilities - availability of lab tests (e.g. HIV, malaria, TB, others).
• Standard precautions - availability of injection, sterilization, disposal, and hygiene practices.
• Specialized services, such as for maternal and newborn child health, family planning, child and adolescent health, communicable diseases (e.g. HIV, TB, malaria), non-communicable diseases (diabetes, cardiovascular, etc…).
• Standard and specialized surgery services and blood transfusion
The SARA facility assessment is usually combined with a record review for verification of health facility reported data on diseases or interventions. The data verification module aims to verify the quality of routinely reported data by comparing facility data (from register, tally sheets, etc.) with monthly aggregated reports sent at district level. The information generated by the collected information will be included in the data quality record card (DQRC), assessing the data quality of the routine system at national and subnational levels.

Service Availability and Readiness Assessment (SARA) | Implementation Guide
11
1.4 Methodology The SARA survey requires visits to health facilities with data collection based on key informant interviews and observation of key items. The survey can either be carried out as a sample or a census; the choice between these methodologies will depend on a number of elements including the country's resources, the objectives of the survey and the availability of a master facility list (MFL). For example, if the objective of the survey is to have nationally representative estimates, a sample survey would be appropriate. However, if the objective is to have district estimates, the sampling methodology must be adjusted to either a larger sample or in some cases a full census.
The recommended data source for information on service availability is a national master facility list and database of all public and private facilities. A facility census is usually required to establish and maintain the master facility list (MFL) and database. Service availability data should be updated annually through routine facility based reporting and validated approximately every 5 years through a facility census.
Service readiness data can be generated through sample surveys. Sampling is done in a systematic way to ensure that the findings are representative of the country or state/province in which the survey is being conducted. Basic service readiness should be an important input into health sector reviews and sample surveys should be organized annually about 4-6 months in advance of the annual review. The national database of health facilities should be used to provide the sampling frame (MFL). In cases where a national database of facilities is not available or up-to-date, the service readiness survey can be carried out at the same time as the facility census for service availability.
FIGURE 1.4.1: TIMELINE OF IMPLEMENTATION
1.5 Survey steps A Service Availability and Readiness Assessment (SARA) should be planned to coincide with and generate data to feed into the national health planning cycle. The time needed to complete a SARA depends on the size of the country whether or not there is a need for a full facility census. From the initial country-adaptation of the assessment tool to the dissemination of data and production of country reports, the entire process generally takes from three to six months.

1. Planning and methodology
12
The table below provides an overview of the survey's steps and the activities to be undertaken at each step.
Steps Survey activities
1. Survey planning and preparation
• Establish a survey coordinating group of country stakeholders to oversee and facilitate the objectives, scope, design, implementation and analysis
• Obtain a list of all health facility sites (public, private, nongovernmental organizations (NGOs) and faith-based organizations (FBOs)), including country facility registry codes
• Determine appropriate design methodology (census or sample), develop an implementation plan and budget, and secure funding
• Review and adapt questionnaires to meet country-specific needs • Recruit survey personnel (survey manager, field supervisors, data collectors, data
entry/processing personnel, data analysts) • Prepare a survey schedule • Identify the survey sites (sampling frame). Select the sample size and sample of
health facilities (if sampling methodology is chosen) • Procure logistics including equipment and transport, taking into consideration the
number of sites to be visited, the number of data collection teams, drivers, vehicles, petrol, etc.
• Plan and conduct training courses for interviewers and field supervisors • Pilot test the survey in a selected number of health facilities, evaluate results and
make amendments if necessary
2. Data collection in the field
• Plan the data collection visits (prepare a letter of introduction, contact each site, prepare a schedule of visits)
• Prepare materials and tools for data collectors • Arrange for transport and regular communications during fieldwork • Assemble materials necessary for local data collection • Confirm appointments with health facilities • Visit health facilities and collect SARA data in teams (usually two interviewers and a
driver) • At the end of the interview, check questionnaire and resolve missing/unreliable
information • Return completed forms and/or transfer electronic files to field supervisor at the
conclusion of each day • Return forms (paper and/or electronic) to survey manager when data collection is
complete
3. Data entry, analysis and interpretation
• Enter data using the CSPro application1 • Edit, validate and clean data set, check for consistency and accuracy • Export the data set for analysis (SARA indicators) • Conduct analyses of SARA data using the standard core indicators (SARA automated
tool for results graphs and tables) as well as any country-specific indicators of interest
4. Results dissemination
• Meet with survey coordinating group to analyze and interpret survey results and to finalize recommendations
• Prepare the final report • Plan and implement dissemination activities. The results should be used to support
annual health reviews and feed into the M&E platform for the national health plan • Document and archive the survey using metadata standards
1 http://www.census.gov/population/international/software/cspro/csprodownload.html

Service Availability and Readiness Assessment (SARA) | Implementation Guide
13
1.6 Requirements The data collection planning phase requires consideration of the logistical needs for data collection teams as well as an assessment of the hardware and software needs for data collection.
1.6.1 Resources requirements for SARA and data quality assessment
I. Data resources
Master Facility List (MFL)
• List of all health facilities in country (including private sector)
National reference documents • Official health workforce classification • National drug policies (essential medicines, ARV treatment strategy,etc.) • Health services provision/basic package by facility types (reference list of
service provision) • Procurement
HMIS tools • Standard registers, tally sheet and reporting forms
Country adapted questionnaire
• The following areas of the SARA tool must always be adapted to the country context: − Types of facilities − National guidelines for services − Staffing categories − Tuberculosis medications − HIV & AIDS medications − Other country specific medicines
Country adapted data verification module
• Selection of 4 or 5 indicators from the module proposed indicators’ list
DQRC data requirements • In order to develop the data quality report card (DQRC) the following HMIS data should be made available: − ANC1, DTP1, DTP3, institutional deliveries and OPDs (district monthly
data for the year of the next Annual Health Sector Review (AHSR)) − Annual totals at district level for the above indicators for the preceding
3 years − Other country specific indicators (depending on the data verification
selection) − Estimated denominators for the above indicators (for the year of the
AHSR and preceding years if possible) − Data on # of facilities reporting and # of facilities in the district (for each
district) − Data on # of districts reporting every month/trimester − Latest household survey data
II. Human resources
Survey manager Field supervisors Data collectors Data entry personnel Data analysts • Key resource persons from the survey team, technical units and partners to
be involved

1. Planning and methodology
14
III. Logistics
Transport for data collection field work activities
• Vehicles and drivers
Field accommodation for data collectors
IV. Training resources
Training venue Daily accommodation for participants
Transport • Vehicles and drivers • Includes transport to/from the training venue and for the pilot test
V. Electronic equipment
Computer • Computer (PC): for data entry and processing • Charger • Extra battery
Mobile electronic data collection devices (EDC)
• Mobile data collection unit (such as PDA, tablet computer, laptop computer): for training purposes, one per participant; for survey purposes, one per data collection team plus two backup units
• Charger/battery: two chargers per unit, two sets of batteries per unit • Mobile unit carry case: one per unit • PC/mobile unit connector cable: one per unit • Memory card (if applicable): one per unit
GPS devices (if running adjunct to primary EDC)
• GPS device: for training purposes, one unit per participant; for survey purposes, one unit per data collection team plus two backup units
• Charger/battery: two chargers per unit, two sets of batteries per unit • GPS carry case: one per unit • PC/GPS connector cable: one per unit
Communication equipment • Cell phones: one per data collection team • Chargers: one per unit • Mobile phone credit
Software for data collection/entry • The Census and Survey Processing System (CSPro) is recommended unless the country already uses other software. CSPro is a public domain software package for entering, editing, tabulating, and disseminating data from censuses and surveys. It can be downloaded from www.census.gov/ipc/www/cspro/index.html. More information on hardware and software specifications can be found in Table 2.
• Software manual: one per data collection team Data analysis program
VI. Supplies
Printing • Printer/copier (two in one or as separate machines): • PC/Printer connector cable: one per pair • Ink cartridge: • Printing paper: standard size is A4
Pens, pencils Projector and projector screen Multi-port extension cable International power adapters USB keys (1GB)

Service Availability and Readiness Assessment (SARA) | Implementation Guide
15
1.6.2 Hardware and software specifications
Computer and software specifications PDA hardware and software specifications
• Desktop or laptop computer
• Pentium Processor
• 512 MB of Ram
• SVGA monitor
• Mouse
• 100MB of free hard drive space
• Microsoft Windows 98se, Me, NT, 4.0, 2000, XP, Vista or Windows 7.0
• CSPro Version 5.2 (or 4.1 if using PDAs)
• Pocket PC
• Windows Mobile 5.0 or 6.0
• USB cable or cradle to connect the Pocket PC to the desktop or laptop computer.
• Microsoft ActiveSync 4.2 or later. This should come with your Pocket PC and is also available for download at http://www.microsoft.com/windowsmobile/en-us/help/synchronize/device-synch.mspx
• CSProMobile. This is the installer for the Pocket PC. It is separate from the installer for the "standard version" of CSPro on a desktop computer. It can be found on the CSPro CD or downloaded from the CSPro website.

1. Planning and methodology
16
1.7 Budget Area of work Activities Unit Cost Activity Cost
1. Preparation and training of data collectors
Adaptation of the questionnaire(s) and data entry application
Translation of the questionnaire (if applicable)
Training workshop for field supervisors and data collectors (xx data collectors & xx supervisors):
- per diem xx USD * nbr persons * nbr days - travel cost of participants (if applicable) - venue, lunch
Pilot testing in 3 facilities
- USD xx per diem * nbr people * 1 day - USD xx transportation * 3 facilities * 1 day
Printing of documents for training
Technical assistance (travel, fee & per diem of 2 facilitators)
Subtotal
2. Field survey Data collector per diem (USD xx per diem * nbr people * nbr days) Field supervisors per diem (USD xx per diem * nbr people * nbr days)
Driver, vehicle and petrol@ USD xx * nbr days
Equipment ; Data collection devices * nbr needed
Supplies (e.g. paper forms, mobile phone + units, …)
Subtotal
3. Data processing, analysis and dissemination
Data processing and analysis
-manager/analyst * 6 weeks -statistician/analyst * 6 weeks
Production of analytical report
Analytical workshop
- per diem xx USD * nbr person * 1 day - travel cost of participants (if applicable) - venue, lunch
Validation workshop
- per diem xx USD *nbr persons * nbr days Dissemination of results (report printing, web posting,…)
Subtotal
Total activities
Contingency/unpredictable costs (around 10%)
GRAND TOTAL Nbr facilities

Service Availability and Readiness Assessment (SARA) | Implementation Guide
17
Annex 1 | Excel template: budget for SARA implementation
ACTIVITY 1. PREPARATORY ACTIVITIES No/quantity Frequency Cost/unit Total
Adaptation of technical documents and data entry application 1 1000
Translation of questionnaire (if applicable - 12$ per page)
Training of field supervisors, data collectors (4 days)
Data collector per diem (per pers.)
Supervisor per diem (per pers.) 23 5 20 2,300
Facilitator per diem (per pers.) -
Travel costs (if applicable) 25 5 45 5,625
Venue
Coffee break
Lunch
Vehicules (pilot test) 1 1 1 1
Fuel for the car
Supplies
Pinting documents
• SARA questionnaire
• Data verification module
• Data collector's kit
• Supervisor's kit
Subtotal 7,926
2. DATA COLLECTION IN THE FIELD No/quantity Frequency Cost/unit Total
Data collector per diem 12 10 50 6,000
Transportation
•Vehicule -
•Fuel -
•Driver -
Electronic equipment
•Laptops/Tablet/PDA -
•USB memory sticks (1 per supervisor) -
Printing of documents for data collection
•Questionnaire -
•Data collector's kit -
Subtotal 6,000
3. DATA PROCESSING, ANALYSIS & DISSEMINATION No/quantity Frequency Cost/unit Total
Data processing and analysis
Manager/analyst (for 6 weeks) -
Statistician/analyst (for 6 weeks) -

1. Planning and methodology | Annexes
18
ACTIVITY Analytical workshop
Paricipants per diem -
Travel cost for participants (if applicable) -
Venue -
Coffee break -
Lunch -
Validation workshop -
Paricipants per diem -
Travel cost for participants (if applicable) -
Venue -
Coffee break -
Lunch -
Dissemination of results
Report printing -
Subtotal -
Total activities 13,926
Contingency/unpredictable costs (around 10%) 1,393
GRAND TOTAL 15,319

Service Availability and Readiness Assessment (SARA) | Implementation Guide
19
Annex 2 | Template: agenda, data collectors and supervisors training
Objectives :
1. Common understanding of the Service Availability and Readiness Assessment (SARA) by all participants;
2. Train field supervisors in the SARA survey procedures and introduce their roles and responsibilities during the survey ;
3. Train data collectors in using the SARA questionnaire and data verification module (including electronic versions) and introduce their roles and responsibilities during data collection ;
4. Develop a detailed timeframe and plan for the field implementation ;
Training of SARA data collectors
Day 1: Date 8:30 – 9:00 Registration and opening
9:00 – 10:00 SARA introduction and overview Objectives and expected outputs
10:00 – 10:30 Break
10:30 – 13:00 Review of questions and response options
• SARA questionnaire
13:00 – 14:00 Lunch
14:00 – 18:00 Review of questions and response options
• SARA questionnaire
Day 2: Date 8:30 – 10:30 Review of questions and response options
• SARA questionnaire
10:30 – 11:00 Break
11:00 – 13:00 Review of questions and response options
• SARA questionnaire
13:00 – 14:00 Lunch
14:00 – 18:00 Understanding the questions and response options Data verification

1. Planning and methodology | Annexes
20
Day 3: Date 8:30 – 10:30 Roles and responsibilities of data collectors
Procedure – before, during, and after site visits
10:30 – 11:00 Break
11:00 – 12:30 Administering the SARA questionnaire
• Interviewer skills
12:30 – 1:30 Lunch
1:30 – 3:30 Data entry on PDAs
3:30 – 5:30 Practice administering SARA questionnaire
5:30 – 6:00 Review of procedures and materials for data collection
Day 4: Date 8:00 – 1:30 Pilot test
• Field test in at least 3 health facilities
1:30 – 2:30 Lunch
2:30 – 6:00 Debrief of pilot test and troubleshooting Conclusion of training of SARA data collectors
Training of SARA supervisors (SARA supervisors and technical committee)
Day 5: Date 8:30 – 9:30 Lessons learned from SARA
9:30 – 11:00 Responsibilities of field supervisors Procedures for field work supervision
11:00 – 11:30 Break
11:30 – 12:30 Transferring data from PDAs/tablets/laptops
12:30 – 1:30 Using CSPro (data checking and correcting answer)
1:30 – 2:30 Lunch
2:30 – 4:30 Planning of data collection logistics, teams and itineraries

Service Availability and Readiness Assessment (SARA) | Implementation Guide
21
Annex 3 | Template, SARA data analysis and HMIS data quality assessment workshop
SARA country, year data analysis and HMIS data quality assessment
-------- Place – Date
Objectives :
• Strengthen skills of the technical unit XXX from the Ministry of Health in charge of the SARA and of the data quality assessment, in the production and the analysis of the SARA data for year as well as in the development of the data quality record card based on the HMIS data.
• Support SARA institutionalization through dissemination and use of SARA results by stakeholders in the context of the annual health sector review.
Expected outputs :
• National technical team has been trained in the procedures for the calculation of SARA indicators and in the use of CSPro and the SARA Excel tool for the automated production of result tables and graphs as well as manual calculation for country specific needs;
• The national team has been trained on the use of the DQRC tool for an assessment of the HMIS data quality, as well as the procedures for the analysis of the data collected using the data verification module;
• « Standard » tables and graphs of SARA results are produced and a first analysis of the results is done;
• Drafts of the SARA year results overview and summary analysis by health services;
• A draft of the DQRC of the HMIS data is developed;
• Use of the SARA results in preparation of the annual health sector review for year is clearly defined;
• Senior staff in the Ministry of Health as well as the technical and financial partners of the health sector are informed on the potential use and interest of SARA in the monitoring and evaluation of the health sector reforms.
Pre-requisites:
• Collection of SARA data and data verification module completed;
• Data compiling, entry and cleaning completed;
• Availability of monthly routine data from the HMIS for the year of the annual health sector review (year) as well as population data and information on the completeness of reporting.

1. Planning and methodology | Annexes
22
Participants (maximum 15 participants):
• National team [Name from the department/unit at MoH] from the Ministry of Health in charge of the SARA and the HMIS.
• Key persons in the domains of the country health system organization, mother and child health, communicable diseases and medicines (from the 2nd day when data analysis starts).
AGENDA
Day 1 - Date
8:00 – 8:30 Workshop objectives and expected outputs WHO/Dpt in charge of SARA
8:30 – 10h30 Field survey and data collection
- Data collection, entry and cleaning - Response rate - Lessons learnt from the field experience : strengths and areas
for improvement
Dpt in charge of SARA
10:30 – 10:45 Break
10 :45 – 11 :15 Overview of SARA/DQA data processing and analysis
WHO
11 :15 – 13 :00 Other steps in data processing
- Validation by field supervisors - Calculating the weights
WHO/ Dpt in charge of SARA
13:00 – 14:00 Lunch
14:00 – 18:00 SARA indicator calculation
₋ Adaptation of the « batch edit » in CSPro (SARA specificities) ₋ SARA indicators calculation ₋ Use of the Excel tool for automated production of « standard » SARA
tables and graphs ₋ Manual calculation of results
WHO
Day 2 - Date
8:00 – 8:30 Expected outputs (overview and summary report)
8:30 – 13:00 Availability and readiness of general services – results and analysis
₋ Production of tables and graphs ₋ Analysis (break from 10:30 to 10:45)
WHO/ Dpt in charge of SARA
Entire groupe
13:00 – 14:00 Lunch
14:00 – 18:00 Development of SARA draft analysis documents (overview and summary report)
WHO/ Dpt in charge of SARA
Availability and readiness of specific services – results and analysis
₋ Working group I : Tables/ graphs production and analysis ₋ Working group II : Tables/ graphs production and analysis ₋ Working group III : Tables/ graphs production and analysis ₋ Working group IV : Tables/ graphs production and analysis
(break from 16:00 to 16h15)
Working groups I, II, III & IV

Service Availability and Readiness Assessment (SARA) | Implementation Guide
23
Day 3 - Date
8:00 – 10:00 Plenary session on group work : presentation of the SARA analytical results
₋ Discussion ₋ Identification of country specific results (tables and graphs)
Group rapporteurs
Entire group
10:00 – 10:15 Break
10:15 – 13:00 Manual production of tables and graphs
- Development and analysis of country specific tables and graphs - Interpretation
Entire group
13:00 – 14:00 Lunch
14:00 – 16:30 HMIS data quality assessment – data verification
₋ Introduction- HMIS data verification ₋ Processing of collected data (data verification module)
Parallel session I
14:00 – 16:30 Development of SARA draft analysis documents (overview and summary report) (cont’d)
Parallel session II
Availability and readiness of specific services – results and analysis
₋ Working group I : Tables/ graphs production and analysis ₋ Working group II : Tables/ graphs production and analysis ₋ Working group III : Tables/ graphs production and analysis ₋ Working group IV : Tables/ graphs production and analysis
16:30 – 18:00 Plenary session on group works : presentation of the results
₋ Discussion, results analysis
Entire group
Day 4 - Date
8:00 – 10:30 HMIS data quality assessment
₋ Introduction and presentation of the DQRC Excel tool for assessment of the HMIS data quality
WHO
10:30 – 10:45 Break
10:45 – 13:00 HMIS data quality assessment
₋ Development of the DQRC and analysis
Group work
13:00 – 14:00 Lunch
14:00 – 16:30 HMIS data quality assessment
- Development of the DQRC and analysis (cont’d)
Group work
16:30 – 16:45 Break
16:45 – 18:00 Plenary feedback on group works: presentation of the results
₋ Discussion, results analysis
Entire group

1. Planning and methodology | Annexes
24
Day 5 - Date
8:00 – 10h30 SARA report development and preparation for the annual health sector review
₋ SARA report template and other country best practices ₋ Use of SARA and DQA data in preparation for the annual health sector
review ₋ Discussions
WHO
Dpt in charge of the SARA
Entire group
10:30 – 11:00 Break
11:00 – 13:00 Presentation of the SARA and DQRC results to stakeholders from the Ministry of Health and Technical and Financial partners (objectives, methodology, preliminary results, next steps) and discussion.
Dpt in charge of the SARA
13:00 – 14:00 Lunch
14:00 – 16:15 Technical support requirements and specific questions WHO
Dpt in charge of the SARA
16:15 – 16:45 Next steps WHO/ Dpt in charge of the SARA
16:45 – 17:00 Wrap-up and close

25
2. Sampling


Service Availability and Readiness Assessment (SARA)
27
2.1 Sampling strategies Determining the sample size and selecting the sample for a facility survey is a complex subject, which will vary considerably from case to case depending on the desired precision and type of estimates, the number of facilities in the country as well as the specific objectives of the assessment. For example, a SARA conducted to produce national estimates will require a much smaller sample size than if district-level estimates are desired. Before concluding on a sampling strategy it should be decided if breakdowns by categories such as region, facility type, managing authority, urban/rural are desired. In order to ensure that the sample is representative, it is best to consult with a sampling expert or a statistician to select an appropriate sampling methodology. For the SARA, the most common sampling strategy is Option 1 in the table below—a nationally representative sample obtained by taking a simple random sample of facilities within each stratum (facility type and managing authority) at the national level. The table below presents different sampling options that could be used to conduct a SARA based on the desired level of estimates and available resources: Domains of estimation Sampling method Sample size
(estimate)1 Approximate cost
Option 1: National estimates only National estimates with disaggregation by facility type (3 levels) and managing authority (public/private)
Small country Stratification by facility type and managing authority, simple/systematic random sampling within each stratum with census or oversampling of hospitals (design effect = 1)
150 – 250 facilities
$60K-100K
Medium country Blend of list and area sampling: list sampling for large health facilities, and area sampling for small facilities (census of facilities in sampled area PSUs 2) (design effect = 1.2)
250 – 500 facilities
$100K-200K
Option 2: Subnational estimates Regional and national estimates with disaggregation by facility type (3 levels) and managing authority (public/private)
Small country Stratification by region, facility type and managing authority, simple/systematic random sampling within each stratum, with census or oversampling of hospitals (design effect = 1)
5 regions: 250 – 500 facilities 10 regions: 500 – 800 facilities
$100K-130K $130K-180K
Medium/large country Blend of list and area sampling: list sampling for large health facilities, and area sampling for small facilities (census of facilities in sampled area PSUs2) (design effect = 1.2)
Medium country 4 regions: 300 – 500 facilities Large country 4 regions: 400 – 800 facilities
$120K-200K $180K-360K
Option 3: Subnational estimates Regional estimates for a subset of regions, with disaggregation by facility type (3 levels) and managing authority (public/private) for selected regions; no national estimates
Large country Purposive sample of regions,; within regions, stratification by facility type and managing authority, simple/systematic random sampling within each stratum with oversampling of hospitals for each region (design effect = 1)
4 regions (150 facilities per region): 600 facilities
$60-100K per region
1 Sample size estimates assume a margin of error of 0.1 and 95% level of confidence 2 Administrative units that form the PSUs (Primary Sampling Units) for the area sample should contain approximately 1-5 health facilities each (communes, sub-counties, villages)
2. Sampling
28
Domains of estimation Sampling method Sample size (estimate)1
Approximate cost
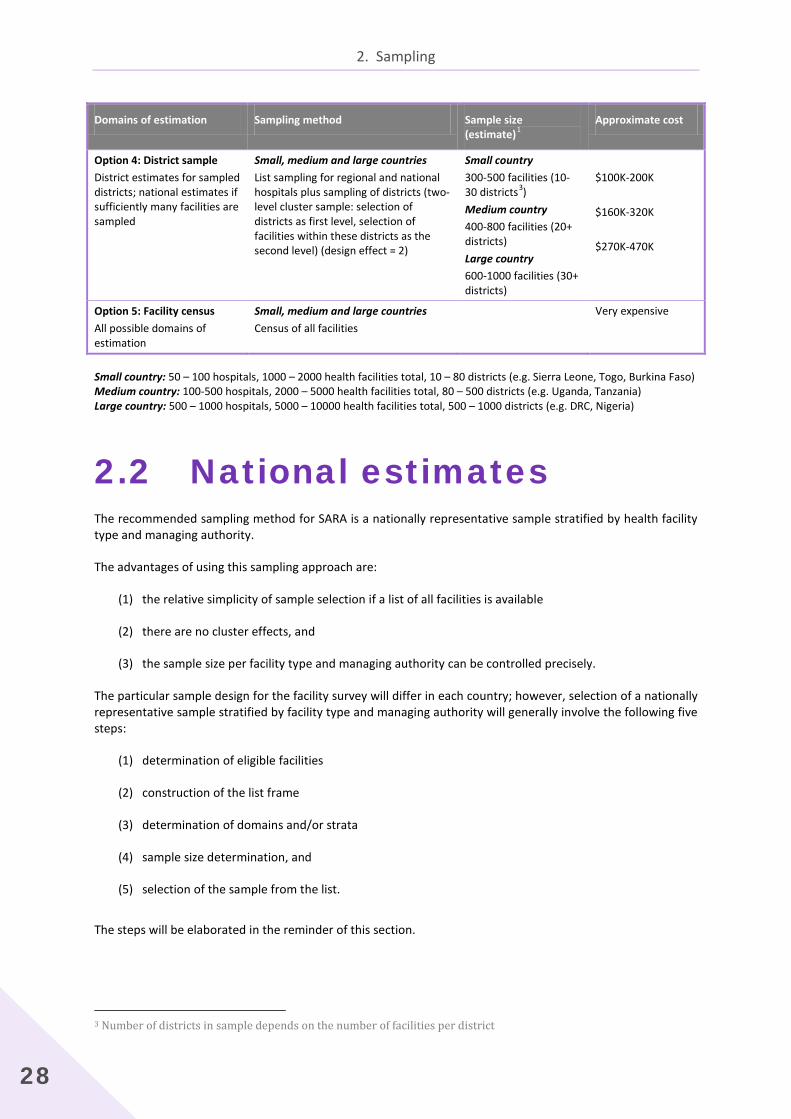
Option 4: District sample District estimates for sampled districts; national estimates if sufficiently many facilities are sampled
Small, medium and large countries List sampling for regional and national hospitals plus sampling of districts (two-level cluster sample: selection of districts as first level, selection of facilities within these districts as the second level) (design effect = 2)
Small country 300-500 facilities (10-30 districts3) Medium country 400-800 facilities (20+ districts) Large country 600-1000 facilities (30+ districts)
$100K-200K $160K-320K $270K-470K
Option 5: Facility census All possible domains of estimation
Small, medium and large countries Census of all facilities
Very expensive
Small country: 50 – 100 hospitals, 1000 – 2000 health facilities total, 10 – 80 districts (e.g. Sierra Leone, Togo, Burkina Faso) Medium country: 100-500 hospitals, 2000 – 5000 health facilities total, 80 – 500 districts (e.g. Uganda, Tanzania) Large country: 500 – 1000 hospitals, 5000 – 10000 health facilities total, 500 – 1000 districts (e.g. DRC, Nigeria)
2.2 National estimates The recommended sampling method for SARA is a nationally representative sample stratified by health facility type and managing authority.
The advantages of using this sampling approach are:
(1) the relative simplicity of sample selection if a list of all facilities is available
(2) there are no cluster effects, and
(3) the sample size per facility type and managing authority can be controlled precisely.
The particular sample design for the facility survey will differ in each country; however, selection of a nationally representative sample stratified by facility type and managing authority will generally involve the following five steps:
(1) determination of eligible facilities
(2) construction of the list frame
(3) determination of domains and/or strata
(4) sample size determination, and
(5) selection of the sample from the list. The steps will be elaborated in the reminder of this section.
3 Number of districts in sample depends on the number of facilities per district

Service Availability and Readiness Assessment (SARA)
29
Step 1. Determination of eligible facilities
The first step is to determine the characteristics of the facilities that form the study population. The sampling frame will be all health facilities that meet defined eligibility criteria in a country. Examples of eligibility criteria include:
(1) the managing authority;
(2) the type of facility (from primary health-care centres to tertiary-level hospitals); or
(3) facilities within a certain geographical area.
Often, a combination of several such criteria is used. For SARA, it is recommended to include in the sampling frame health facilities of all types and all managing authorities (public, private-for-profit, NGO, FBO, etc.). Specialized health facilities such as eye hospitals, dental clinics, etc. may be excluded.
Step 2. Construction of the sampling frame
Whenever a list frame for any survey, including facility survey sampling, is constructed, three principles must be kept in mind. The frame must be, in so far as is practicable:
(1) complete,
(2) accurate, and
(3) up to date.
A complete list consists of a list of all facilities in a country (both public and private) and contains a unique identifier along with information on region/district, facility type, managing authority, and urban/rural designation for each facility. If a Master Facility List (MFL) exists for a country, this can serve as the sampling frame.
Often a list frame that is complete, accurate and up-to-date, covering both public and private sectors does not exist. Then it will need to be constructed before a sample can be selected. Unless the country maintains a comprehensive master facility list, authorities do not always have up-to-date records of health facilities functioning in the country. Coverage of private facilities is often spotty and outdated; they may have closed or moved, and there is generally no standard definition for facility type in the private sector.
An initial list obtained from the MoH will usually need to be complemented with information from multiple other sources, such as private sector coordinating bodies, social ministries where NGOs register their activities, or directly from faith-based, private and parastatal organizations. In situations where it is not possible to obtain a reliable sampling frame list of facilities a dual-frame sampling methodology4 may be used. This method combines a simple random sample of hospitals and large facilities, with a sample of geographically-defined areas in the country.
Accuracy of the list can pose a problem on important details such as location, type and managing authority of a given facility. Finally, any list may suffer from outdated information such as inclusion of facilities that may not be operational at the time of the survey. Compilation of the facility list will likely involve coordinating and
4 Sampling manual for facility surveys for population, maternal health, child health and STD programs in developing countries. North Carolina, MEASURE Evaluation, 2001 (MEASURE Evaluation Manual Series, No.3) http://www.cpc.unc.edu/measure/publications/pdf/ms-01-03.pdf, accessed 17 December 2011).

2. Sampling
30
verifying information gathered from a number of sources. It is recommended that the government’s MoH be contacted first, to obtain a comprehensive list of government facilities. However, the MoH list itself may be incomplete or out of date, in which case it will be necessary to supplement it with information from other sources such as private foundations, NGOs and religious organizations. These secondary sources should be used to correct and update information from the MoH. It is expected, for example, that private hospitals and other specialized clinics would more likely be identified through the secondary sources than through the MoH.
Depending upon time constraints and budgetary resources, additional sources may also be tapped to refine the frame. These would include local NGOs and the local offices of external donors who may be able to supplement and update the MoH list in regions of the country where each is active. Preliminary lists may also be verified with district or regional health officials. Finally, community informants may also be valuable resources in some instances, especially to verify whether facilities from central institutional lists are currently operational. See Creating a master facility list5 for a more comprehensive methodology for constructing a list of all facilities in a country.
Step 3. Determination of domains and/or strata
Once the sampling frame has been established, probability sampling principles are used to draw a selection of facilities for inclusion in the assessment. Usually, a multistage or stratified sampling plan is followed to ensure representation across various domains of the eligible facilities. In stratified random sampling, the sampling frame (or the population) is partitioned into strata (or subpopulations), which are then independently sampled (usually a simple or systematic random sample within each stratum). The results from the different strata are then combined to form estimates for the entire population.
There are a number of reasons why it is better to use a stratified sample for SARA rather than a simple random sample of all facilities. First, a stratified sample guarantees that a prescribed number of facilities from each strata (or subpopulation) will be assessed, whereas taking a simple random sample of all facilities might result in under-representation of certain types of facilities. Also, the number of hospitals in a country is generally small compared with the number of primary care facilities, and thus a simple random sample of all facilities in a country is likely to include only a very small number of hospitals or might miss them altogether. By stratifying the sample by facility type, the number of hospitals and primary care facilities can be controlled to ensure that a sufficient number of hospitals are included in the sample. Secondly, more precise estimates can be obtained in cases where facilities within each stratum are relatively homogeneous and the variation between strata is relatively large. The recommended sampling methodology for SARA is to select all tertiary-level facilities or hospitals in a country plus a simple random sample of the lower-level facilities stratified by a combination of region, facility type, managing authority and urban-rural distribution. If disproportionate allocation is used, sample weights need to be applied when analyzing the data to calibrate for national representation. Please refer to SARA implementation guide chapter 8: Analysis and Outputs for more information on calculating weights.
Often, it is desirable to have separate estimates by region, facility type or other groupings of facilities called domains. Domains are the analytical groupings, whether geographical or categorical, for which separate estimates are wanted when analysing the results (for example, primary care facilities versus hospitals; urban areas versus rural areas; public sector facilities versus private sector facilities; different regions). Domains and strata are often synonymous, but this is not always the case, as the former is determined by analytical considerations, while the latter serves to improve sampling efficiency. For SARA, the domains of interest are usually the same as the strata, and are generally a subset of the following: region, facility type, managing authority and urban-rural location. The greater the number of domains, the larger the sample size is required to obtain good estimates.
5 Creating a master facility list. Draft document. Geneva, World Health Organization, 2013

Service Availability and Readiness Assessment (SARA)
31
Step 4. Determination of sample size
Determining sample size is a complex subject for any survey. The overall sample size for a facility survey will vary from country to country, depending upon conditions, precision requirements, and need for domain estimates. The larger the sample size, the greater the precision of the estimates; however, the total size of the sample will generally also depend on budget, time, and other constraints6.
Given a desired level of precision (or margin of error) and confidence level, it is fairly easy to determine the necessary sample size using well-known mathematical formulas, assuming that some reasonable assumptions about the unknown parameters can be made. The SARA survey produces hundreds of estimates, each of which would require a different sample size according to the sample size formulas. It is customary in these cases to choose a small number of the most important estimates, then calculate the sample size requirements for each of these and to choose the largest. A formula commonly used for calculating the sample size for SARA is given in Annex 1.
Adjusting sample size for the number of domains
The survey design will most likely require that the estimates be disaggregated for important estimation domains –regions, facility types, urban-rural. If there is particular interest in obtaining very reliable data for a given domain, it may be necessary to increase the sample size in that domain. For example, if equally reliable data were desired for urban and rural areas separately it would be necessary to sample the two areas disproportionately to assure the same sample size. By way of illustration, use of a proportionate sampling scheme when the urban-rural distribution is 65 and 35 percent respectively would give a sample size for the urban part that is about twice as big as the rural part, in which case the reliability of the urban sample would be much better than the rural. The desire for equal reliability in this case would demand that the rural sample size be increased commensurately. The most efficient sample we will get when the two groups have equal size.
In general, the sample size for domains when equal reliability is wanted for each necessitates multiplying the calculated sample size needed for a domain by the number of categories in the domain. Thus, if equally reliable estimates were wanted for, say, five regions, the sample size would be about five times the value calculated using the equation above. The survey budget would likely preclude such a large sample, so certain compromises would have to be made. One such compromise is to relax the confidence interval criterion for the domain estimates. Another possibility is to select the most important domains for the stricter reliability and allow the others to be measured with whatever reliability a proportionately allocated sample would yield.
An alternative approach for determining domain and overall sample sizes is to carry out the calculations from the formula in Annex 1 separately for each domain of interest. The total sample size would then be the sum of the domain samples.
Sampling to estimate change
Often facility surveys aim to monitor change over time. The need to estimate change has implications for survey operations and sample design of a facility survey. When making considerations for selecting the sample for a repeat SARA in a country, three methodologies may be considered:
(a) use of the same sample of facilities on each occasion, (b) use of rotating or replacement panels of facilities, or (c) use of new, different samples each time.
Proceeding from (a) to (c), sampling error on estimates of change increases. Sampling error is least when the same sample facilities are used on each occasion, because the correlation between observations is highest.
6 The following is adapted from MEASURE Evaluation (2001). Sampling Manual for Facility Surveys for population, maternal health, child health and STD programs in developing countries, MEASURE Evaluation Manual Series, No.3, July 2001. http://www.cpc.unc.edu/measure/publications/pdf/ms-01-03.pdf

2. Sampling
32
Adjusting for non-response
The sample size calculation assumes that all facilities in the sample will be covered in the assessment. However, complete response is rarely attainable in the field, so the calculated sample size should be increased by a factor to reflect the anticipated non-response rate. Absent any other prior information, it is recommended that the sample size be increased by at least 10% to take into account non-response.
Adjusting the sample size for finite population size
When there are few facilities in the universe to be assessed, the sample size becomes a significant proportion (e.g. 5 percent or more) of that total. Then the calculated sample size (n) should be reduced by the factor, 1-n/N, where N is the total number of facilities in a country.
Summary of sample size calculation methodology
1. Ascertain main estimates of interest. 2. Identify those closest to zero or 100 percent: The ones with small or large value of p. 3. Use formula in Annex 1 to calculate the sample size (n). 4. Choose the largest n. 5. Adjust n upward to account for non-response. 6. Adjust n upwards to account for estimation domains. 7. Evaluate inclusion of previously sampled facilities for a repeat SARA 8. Evaluate n in relation to budget and field constraints; revise if necessary.
Step 5. Sample selection
Stratified sampling
Once the stratification and the sample size have been selected, the final step is to select the sample of facilities to be assessed from the list frame. The simplest sampling strategy is to use proportional allocation, in which the same sampling fraction is used for each stratum. For example, if there are 1000 health facilities in a country, and the sample size is 150, then 150/1000= 15% of facilities that need to be selected from each stratum.
Sometimes it is desirable to use a different sampling fraction for each stratum. For example, hospitals tend to make up a small percentage of the total number of facilities in a country, but it is often desirable to report results for this subgroup. If the same sampling fraction is used for hospitals as for other facility types, the number of hospitals included in the sample would be small, and any estimates based on such a small sample would be too unreliable to report. The problem can be solved by oversampling the hospitals in order to reduce the associated error. This is called disproportionate sampling, as different sampling fractions are used for different strata, and requires the application of sampling weights in the analysis of data to account for unbalanced sampling.
It is recommended that all hospitals in the list frame be included in the sample if possible. If it is not possible to cover all hospitals due to budget or other constraints, then all tertiary hospitals should be included in the sample, and a sample of the other hospitals should be taken. The proportion of hospitals to be included in the sample depends highly on the available resources, and should be oversampled relative to the other health facility types.

Service Availability and Readiness Assessment (SARA)
33
Cluster sampling
Cluster sampling means sampling in two stages. First a geographical area is sampled. Then facilities are sampled from within that area. The primary reason to use this kind of sampling is to reduce the distance between the sampled facilities, and hence reduce costs. The approach can be used in very large countries or countries were traveling for other reasons is time-consuming. In general, using a one-stage sample of facilities would be the recommended procedure in most countries.
If the approximate number of facilities in a primary sampling area (like province, district or local government area) is known, sampling areas proportional to the number of facilities in each area is recommended. This means that areas with many facilities will have a higher probability of being sampled. An equal number of facilities from each area should then be sampled. Information on which area a facility belongs to, will generally be available through a master facility list. To sample the areas, use the same approach as for sampling facilities, except the names of the sampled areas are selected, instead of the facility name. Then the sampling procedure will have to be repeated for selecting facilities within the selected geographical areas. How to do random sampling in excel is described in section 1.4.
Using the described approach for cluster sampling will not influence the chance of a given facility to be sampled. Hence, the weights used for the facilities will remain unchanged.
Using cluster sampling makes it necessary to increase the sample size. The design of a cluster sample makes it less representative because facilities located close to each other tend to be relatively equal, compared to other facilities. This is described as the design effect, and can be adjusted for by inflating the sample by the design effect factor. The design effect is described in more detail in Annex 1.
Blend of list and area sampling
More details on the blend of the list and area sampling methodology can be derived from the Sampling Manual for Facility Surveys for Population, Maternal Health, Child Health and STD Programs in Developing Countries7.
Replacement facilities
Replacement facilities should be selected in the event that a facility in the sample cannot be surveyed (i.e. facility is closed, facility has relocated, etc.).
The replacement facilities should be selected In the Excel worksheet used to identify the sampled facilities. As a rule of thumb, identify the next 10 facilities listed after the facilities in the sample for each strata. These will serve as the replacement facilities in case of need.
7 Sampling manual for facility surveys for population, maternal health, child health and STD programs in developing countries. North Carolina, MEASURE Evaluation, 2001 (MEASURE Evaluation Manual Series, No.3) http://www.cpc.unc.edu/measure/publications/pdf/ms-01-03.pdf, accessed 17 December 2011).

2. Sampling
34
Example 1: Determining sample size
The following example will describe the steps for calculating the sample size for a nationally representative sample stratified by facility type and managing authority. Note: this is a simple example for calculating sample size in order to demonstrate the basic steps. 1. Determine how many facilities are in the sampling frame categorized by facility type/managing authority.
Facility type/ managing authority
Total number of facilities
Hospital- public 27 Hospital- private 19 Health centre- public 51 Health centre- private 235 Health post- public 713 Health post- private 152 Total 1197
2. Determine the sample size for primary level facilities based on the total number of facilities in the sampling
frame and the strata of interest. For the SARA, hospitals are typically oversampled to ensure there is a sufficient number of them in the sample for the hospital specific indicators. Hence, it is suggested to include all hospitals in the sample.
Using the following formula: n = [[ ( z2 * p * q ) + ME2 ] / [ ME2 + z2 * p * q / N ]]*d where: n = sample size z = confidence level at 95% (1.96) ME = margin of error (15%) p = the anticipated proportion of facilities with the attribute of interest (.5) q = 1-p d = design effect (1) add footnote on design effect
All facilities Hospitals Primary z p q ME
Primary sample
size Hospitals
Total sample
size
Hospital- public 27 27 0 1.96 0.5 0.5 0.15 0 27 27
Hospital- private 19 19 0 1.96 0.5 0.5 0.15 0 19 19
Health centre- public 51 0 51 1.96 0.5 0.5 0.15 24 0 24
Health centre- private 235 0 235 1.96 0.5 0.5 0.15 37 0 37
Health post- public 713 0 713 1.96 0.5 0.5 0.15 41 0 41
Health post- private 152 0 152 1.96 0.5 0.5 0.15 34 0 34
Total 1197 46 1151
136 46 182

Service Availability and Readiness Assessment (SARA)
35
3. Oversampling of strata where there is most likely to be variations (strata with less than 30 facilities) should
be done. This will give the final sample size and sampling proportions for the sample.
All facilities Hospitals Primary z p q ME
Primary sample
size Hospitals
Total sample
size Oversampling
of strata
Hospital- public 27 27 0 1.96 0.5 0.5 0.15 0 27 27 27
Hospital- private 19 19 0 1.96 0.5 0.5 0.15 0 19 19 19
Health centre- public 51 0 51 1.96 0.5 0.5 0.15 24 0 24 30
Health centre- private 235 0 235 1.96 0.5 0.5 0.15 37 0 37 37
Health post- public 713 0 713 1.96 0.5 0.5 0.15 41 0 41 41
Health post- private 152 0 152 1.96 0.5 0.5 0.15 34 0 34 34
Total 1197 46 1151
136 46 182 188
2.3 Probability sampling in Excel
Once the sampling fractions for each stratum have been determined, the facilities from each stratum should be selected using a probability sampling method. The list frame should be partitioned according to the chosen stratification, and within each stratum (e.g. a list of hospitals in Region 1), the facilities to be included in the sample should be selected by simple random sampling or systematic sampling. Replacement facilities for those facilities that are closed or otherwise cannot be accessed can be selected using the same method. Alternatively, to facilitate logistics, the closest facility of the same type in the same geographical area can be selected.
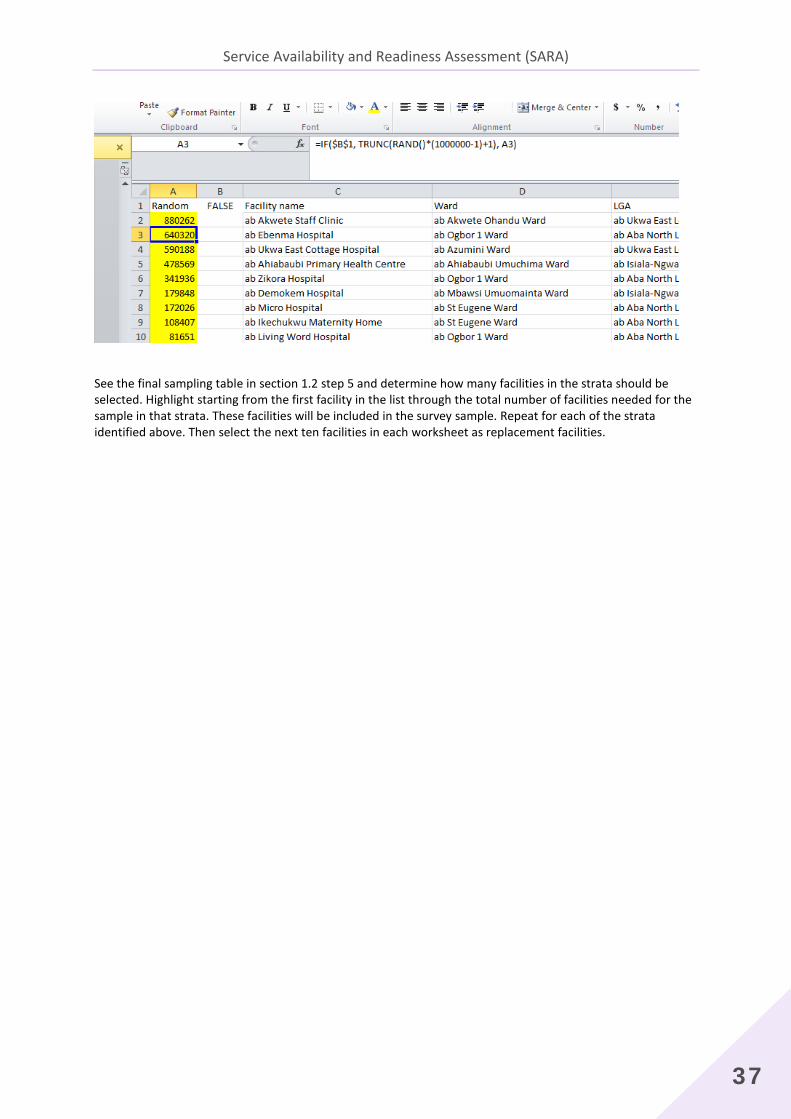
First select the facilities to be included in the sample from the MFL. The MFL should be divided up according to the categories selected to determine the sample (e.g. the ones mentioned in step 5 in section 1.3). If the MFL is in a Microsoft excel workbook, copy and paste each strata of facilities into a new worksheet within the workbook. On each sheet add a column called Random. Type “Random” into the first cell. In the column to the right of the column called Random, type the word “TRUE” in the first cell, as illustrated by the yellow fields in the figure below.

2. Sampling
36
Use the following formula to assign a random unique number to each facility.
=IF($B$1, TRUNC(RAND()*(1000000-1)+1), A2) Copy and paste the formula into the first cell of the column called Random. Place the cursor at the lower right corner of the cell with the formula and pull it downwards. If the columns named “Random” and “TRUE” is not in the first two columns (A and B), please change A to the letter of the “Random” column and B to the letter of the “TRUE” column in the formula. A random number will be assigned to each of the facilities. Then change the word TRUE to FALSE. This will freeze the random numbers so that they don’t regenerate new random numbers.
A warning box may appear similar to the following:
Click on OK. Then filter the data so that the column Random is in descending order, from the largest to the smallest.
Service Availability and Readiness Assessment (SARA)
37
See the final sampling table in section 1.2 step 5 and determine how many facilities in the strata should be selected. Highlight starting from the first facility in the list through the total number of facilities needed for the sample in that strata. These facilities will be included in the survey sample. Repeat for each of the strata identified above. Then select the next ten facilities in each worksheet as replacement facilities.
2. Sampling | Annex
38
Annex 1 | Calculating the sample size for SARA
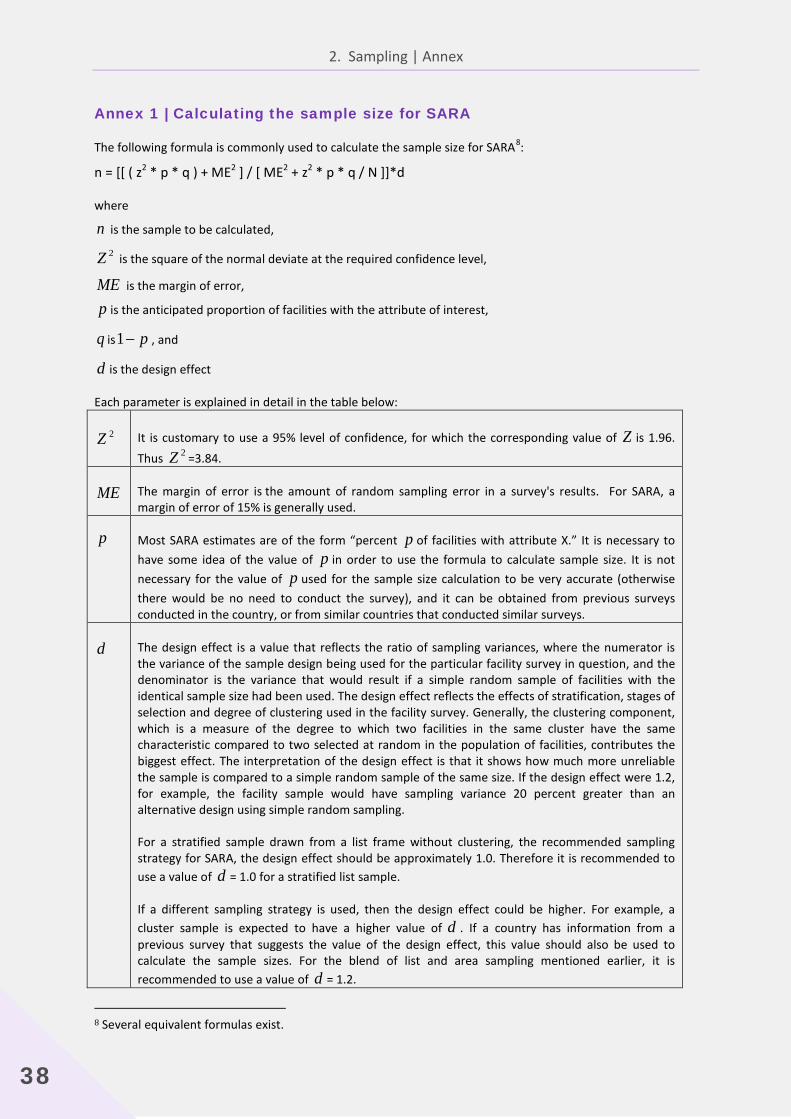
The following formula is commonly used to calculate the sample size for SARA8:
n = [[ ( z2 * p * q ) + ME2 ] / [ ME2 + z2 * p * q / N ]]*d
where
n is the sample to be calculated,
2Z is the square of the normal deviate at the required confidence level,
ME is the margin of error,
p is the anticipated proportion of facilities with the attribute of interest,
q is p−1 , and
d is the design effect
Each parameter is explained in detail in the table below:
2Z It is customary to use a 95% level of confidence, for which the corresponding value of Z is 1.96. Thus 2Z =3.84.
ME The margin of error is the amount of random sampling error in a survey's results. For SARA, a margin of error of 15% is generally used.
p Most SARA estimates are of the form “percent p of facilities with attribute X.” It is necessary to have some idea of the value of p in order to use the formula to calculate sample size. It is not necessary for the value of p used for the sample size calculation to be very accurate (otherwise there would be no need to conduct the survey), and it can be obtained from previous surveys conducted in the country, or from similar countries that conducted similar surveys.
d The design effect is a value that reflects the ratio of sampling variances, where the numerator is the variance of the sample design being used for the particular facility survey in question, and the denominator is the variance that would result if a simple random sample of facilities with the identical sample size had been used. The design effect reflects the effects of stratification, stages of selection and degree of clustering used in the facility survey. Generally, the clustering component, which is a measure of the degree to which two facilities in the same cluster have the same characteristic compared to two selected at random in the population of facilities, contributes the biggest effect. The interpretation of the design effect is that it shows how much more unreliable the sample is compared to a simple random sample of the same size. If the design effect were 1.2, for example, the facility sample would have sampling variance 20 percent greater than an alternative design using simple random sampling.
For a stratified sample drawn from a list frame without clustering, the recommended sampling strategy for SARA, the design effect should be approximately 1.0. Therefore it is recommended to use a value of d = 1.0 for a stratified list sample.
If a different sampling strategy is used, then the design effect could be higher. For example, a cluster sample is expected to have a higher value of d . If a country has information from a previous survey that suggests the value of the design effect, this value should also be used to calculate the sample sizes. For the blend of list and area sampling mentioned earlier, it is recommended to use a value of d = 1.2.
8 Several equivalent formulas exist.

39
3. Questionnaire adaptation

3. Questionnaire adaptation
40
The standard SARA questionnaire for measuring service availability and readiness should be adapted for country use to reflect the needs and specificities of each health-care system. When adapting the health facility questionnaire, consideration should be given to how changes will affect data collection, and adjustments should be made to ascertain that definitions are specific enough to assure comparability across the country and within districts.
It is important to remember that the SARA methodology is not intended to provide comprehensive data on all aspects of health system functioning. Rather, it focuses on key "tracer" elements that are critical to programmes that are scaling up or that are indicative of the essential health system underpinnings or "readiness" to do so. This should be kept in mind while adapting the questionnaire and adding additional questions or modules.

Service Availability and Readiness Assessment (SARA) | Implementation Guide
41
3.1 Country adaptation The adaptation of the SARA questionnaire should take place in the planning and preparation phase. It should be conducted by the SARA survey technical team in close collaboration with national stakeholders and the key resource persons from the appropriate technical units.
The following areas of the SARA tool should always be adapted to the country context:
Areas References Comments
Health facility types
National classification of health infrastructures
The facility types classification should reflect the national classification, including both public and private structures. It should be in conformity with the service package offered by each facility profile (based on the national Basic Package of Essential Services, if available).
Health facility managing authority National classification of health infrastructures
The managing authority types should reflect the national classification of authorities potentially in charge of a facility.
Staffing categories Official categorization of human resources for health
The proposed human resources list available in the questionnaire should be mapped to the official classification of certified health personnel and appropriate cadres added.
Guidelines for services National guidelines for health services
List of guidelines in the questionnaire should reflect official guidelines.
Country specific medicines policy National drug policy and any other specific drug policies (essential medicines, TB, …)
Standard lists of tracer items for medicines are proposed in the questionnaire according to international standards*. If there is a country specific regimen for certain treatments it should be edited accordingly (tracer items).
ARV national protocol The ARV section of the questionnaire lists all ARV drugs. The ARV section should be customized based on the official recommended first line treatment and medicines recommended for PMTCT.
Trained staff Official training cycle for health workers
A standard of 2 years interval in training cycle updates for staff is used in the questionnaire. If the timeframe for staff training updates is different according to the official policy it should be reflected in the questionnaire.
* Details references for medicines are available in the SARA Indicators Index.

3. Questionnaire adaptation
42
3.2 Editing the structure of the questionnaire
The SARA questionnaire is also available in electronic format along with automated tools for data processing and production of results. If these automated tools are to be used, editing the structure of the questionnaire should be done as follows:
• Adding a question: -Country-specific questions that are key in measuring tracer elements for service delivery can be added to the questionnaire. A practical and recommended way to number these specific country questions is to use the country ISO.2 code*. For example:
− SL_01 : where SL corresponds to the ISO.2 code for Sierra Leone + numbering (sequential according to the number of questions added)
*For detail list of country ISO codes please refer to: http://www.iso.org/iso/country_codes/iso_3166_code_lists/country_names_and_code_elements.htm
• Deleting a question: It is possible that certain questions might not be relevant and applicable to a country. In this case a question can be deleted. It should be removed from the questionnaire and the question number should be deleted as well and not re-used. This should remain occasional- the SARA aims to measure a minimum of tracer elements that are defined for service delivery. Deleting too many questions will change the measurement’s parameters.
• Changing a question’s text: Question text should not be replaced by another question text. Clarification can be added in parenthesis to help the respondent understand the question if needed. It is very important to keep each question with its original numbering, therefore we ask that you add or delete questions but DO NOT change the content of existing questions.
• Skip patterns: Any addition or deletion affecting a skip pattern in the questionnaire should be updated accordingly.
3.3 Important tips • Do not change numbering: the original numbering structure of the standard questionnaire should be
kept. Changing the numbering will affect links to the existing tools for automated data processing and results production.
• The goal of the SARA is to measure based on key tracer items the minimum package of services that should be available in the health facilities. It is important not to stray from the SARA concept by adding a long list of additional items (SARA doesn’t aim to be a census of all items that should be present in a facility).
• It is also important to remember that adding more to the tool will impact the training, the data collection and the data analysis. Any question addition should also be consider in term of the analysis outputs. Before a question is added, it should first be added to the analysis plan so that it is clear how it will be used in the analysis.

Service Availability and Readiness Assessment (SARA) | Implementation Guide
43
3.4 Questionnaire implementation The SARA questionnaire is available in paper and electronic format.
Paper questionnaire: Any changes should be made according to the country adaptation.
Electronic questionnaire: For the SARA survey, the recommended software for electronic questionnaires is CSPro. A standard version of the questionnaire is available in that format and all changes should be made according to the country adaptation. Further information on CSPro can be found at:
http://who.int/healthinfo/systems/sara_introduction/en/index.html
http://www.census.gov/population/international/software/cspro/csprodownload.html
3.5 Adding modules Commonly, the SARA questionnaire is jointly administered with a data verification module that allows for a record review in health facilities being surveyed.
The Data Verification module will also need to be adapted based on country requirements. Adaptation consists of the selection of 4 or 5 core indicators from the proposed module list. The selection should be reflected in the paper version as well as the electronic format of the DV section (also available in CSPro format).
The SARA questionnaire can also be used in conjunction with additional modules such as management assessment or quality of care. These specific modules are not part of the standard package and will need to be designed accordingly.


45
4. CSPro for SARA
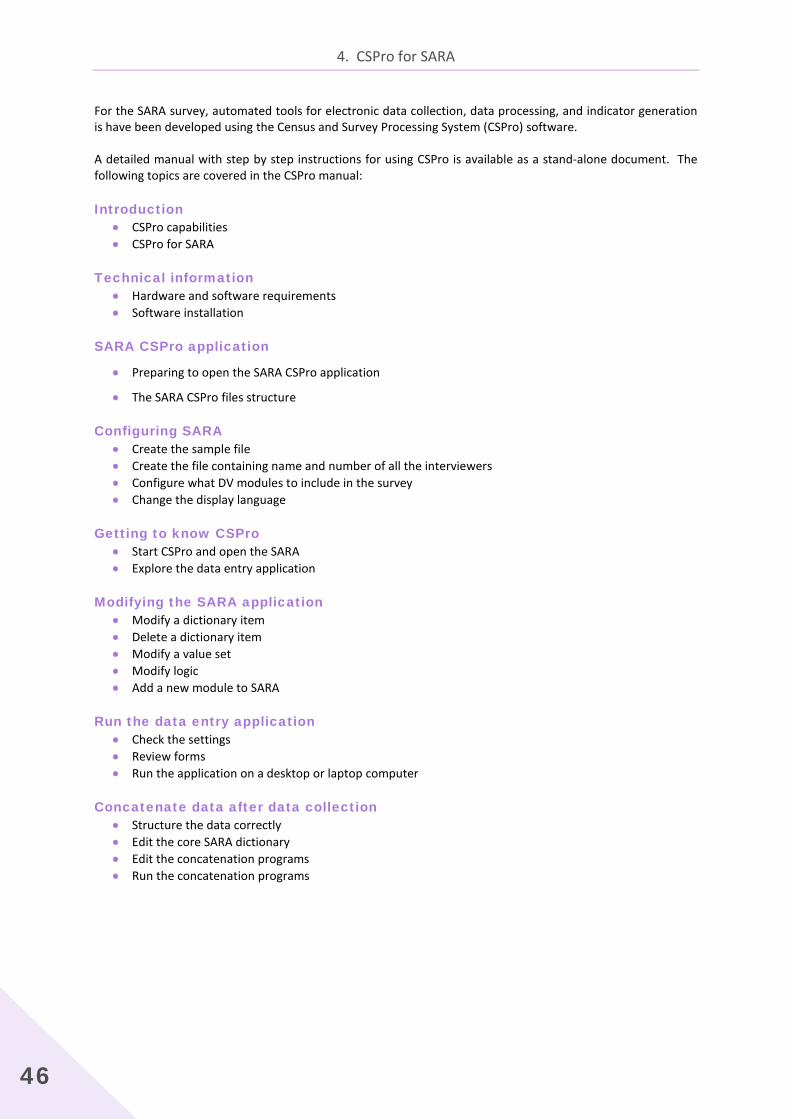
4. CSPro for SARA
46
For the SARA survey, automated tools for electronic data collection, data processing, and indicator generation is have been developed using the Census and Survey Processing System (CSPro) software.
A detailed manual with step by step instructions for using CSPro is available as a stand-alone document. The following topics are covered in the CSPro manual:
Introduction • CSPro capabilities • CSPro for SARA
Technical information • Hardware and software requirements • Software installation
SARA CSPro application
• Preparing to open the SARA CSPro application
• The SARA CSPro files structure
Configuring SARA • Create the sample file • Create the file containing name and number of all the interviewers • Configure what DV modules to include in the survey • Change the display language
Getting to know CSPro • Start CSPro and open the SARA • Explore the data entry application
Modifying the SARA application • Modify a dictionary item • Delete a dictionary item • Modify a value set • Modify logic • Add a new module to SARA
Run the data entry application • Check the settings • Review forms • Run the application on a desktop or laptop computer
Concatenate data after data collection • Structure the data correctly • Edit the core SARA dictionary • Edit the concatenation programs • Run the concatenation programs

Service Availability and Readiness Assessment (SARA) | Implementation Guide
47
Review and edit data in CSPro • Step 1: Run edit_data application • Step 2: Open merged data file and check key items • Step 3: Delete empty records • Step 4: Check for duplicate facility IDs • Step 5: Recode “other” responses • Step 6: Check validity of GPS coordinates • Step 7: Supervisor validation cases • Step 8: Batch application for completeness • Step 9: Dependent verification (if applicable)
Batch edit application for indicator generation • Step 1: Open and explore the batch application • Step 2: Assign strata for analysis • Step 3: Apply weights • Step 4: Edit country specific items • Step 5: Run the batch application
Export indicators • Step 1: Open the CSPro Export Data application • Step 2: Select items for export • Step 3: Export data


49
5. Data collector’s guide

Service Availability and Readiness Assessment (SARA) | Implementation Guide
51
5.1 Overview of data collection procedures
The Service availability and readiness assessment (SARA) is designed to function as a systematic tool to support annual verification of data and service delivery at the facility level. It intends to cover public as well as private and faith-based health facilities. The goals of the survey is to provide evidence based data on health system progress to inform the annual health sector review, identify gaps and weaknesses responsible for sub-optimal service provision and intervention coverage that need to be addressed. It also provides a baseline for planning and monitoring scale-up intervention for service delivery improvement for maternal and child health, HIV, TB,malaria and NDCs among others .
The Data Collector's Guide is designed to provide interviewers with the knowledge and skills necessary to effectively conduct a health facility assessment. It is intended to support and guide staff members who have been identified as interviewers for conducting health facility assessments. The guide provides general instructions on the interviewing skills required to gather information; detailed explanations and definitions of specific questions to ensure a uniform understanding of the content and a consistent approach to recording results by different data collectors across different facilities; and instructions on how to collect data at a facility.
The primary objectives of the Data Collector's Guide are to:
• Introduce participants to the Service Availability and Readiness Assessment tool (SARA) as well as the Facility Reporting Data Verification Tool (record review).
• Gain an understanding of the rationale for conducting a health facility assessment
• Instruct participants on how to conduct an interview and complete the questionnaires
• Familiarize participants with paper-based and CSPro data collection methodologies
5.1.1 Survey approach
Objectives of the Service Availability and Readiness Assessment tool
The Service Availability and Readiness Assessment tool has been developed for interviewers to collect information on core functional capacities and availability of services in health facilities. The assessment tool is designed to rapidly assess and monitor service availability and readiness with a focus on a number of core health interventions. It does not attempt to measure the quality of services or resources, nor is it disease specific.
The SARA methodology has been developed by USAID and WHO in close collaboration with Ministries of Health and global partners to:
• Assist countries in assessing and monitoring service availability at district and health facility levels;
• Monitor scale up programs;
• Assess equitable and appropriate distribution of services and resources; and
• Support decision making by providing national and district planners with the skills and tools required to map and monitor service and resource availability on a regular basis.
This approach aims to fill critical data gaps required for monitoring health systems strengthening and is designed to be implemented as a routine monitoring system of services at district and national levels.

5. Data collector’s guide
52
Objectives of the facility reporting data verification tool
The Facility Reporting Data Verification Tool is jointly administered with the SARA and allows record review in health facilities being surveyed. The goal of the data verification module is to provides key information on data quality of monthly reported data from health facilities to the superior level by comparing discrepancies between data in primary source and monthly report). This crucial information is integrated in the data quality report card (DQRC).
Data collection instruments
A standard core questionnaire has been developed for the SARA. This questionnaire is typically adopted in its entirety and then adapted at country level with adaptations to certain elements such as names and types of facilities, personnel, first line drugs, etc. It is usually tested during an in-country pilot visit for final adjustments and validation.
The tool is usually used in conjunction with supplemental modules such as the Facility Reporting Data Verification tool (enclosed at the end of the SARA questionnaire).
The collection instruments are paper based or used in conjunction with electronic collection devices (tablets, laptops, etc.).
Role of the interviewer
The interviewer's main responsibility is to use the questionnaire appropriately to collect information that is as accurate as possible by asking questions of the appropriate respondents and accurately recording responses.
The health facility assessment will be completed in teams. Typically, each team will include 2 persons responsible for data collection who work closely with a field supervisor.
The data collectors main tasks include:
• Visit health facilities and collect information.
• Verify geographic coordinates (if relevant).
• Complete a SARA data collection paper form and/or an electronic form, as well as the facility reporting data verification and other modules if relevant.
• Back up electronic data on a memory card/USB key.
• Report back to the field supervisor at the end of each day.
Survey regulations
The following survey regulations have been established to ensure the success of the Service Availability and Readiness Assessment tool and will be closely adhered to by all interviewers.
• The interviewer's attendance during each day of the fieldwork is required. Any person who is tardy or absent during any part of the fieldwork (whether it is a whole day or part of a day) without prior approval may be dismissed from the survey.
• Throughout the fieldwork period, interviewers are representing the implementing agency. Your conduct must be professional and your behaviour must be congenial when dealing with the public. You must always be aware of the fact that we are only able to do our work with the good will and cooperation of the people we interview. Therefore, any team member who is consistently overly aggressive, abrupt, or disrespectful to others may be dismissed from the survey team.
• For the survey to succeed, each team must work closely together. Any team member who, in the judgment of the survey manager, is a disruptive influence on the team may be asked to transfer to another team or dismissed.
Service Availability and Readiness Assessment (SARA) | Implementation Guide
53
• It is critical that the data gathered during the fieldwork be both consistent and accurate. Field staff may be dismissed at any time during the fieldwork if the quality of their work is inadequate.
• Vehicles and gasoline are provided for the survey for official use only. Any person using a vehicle for an unauthorized personal reason will be dismissed.
• Data are confidential. Under no circumstances should confidential information be passed on to third parties. Persons breaking these rules, and therefore the confidence placed in them by respondents, will be dismissed.
5.1.2 Planning the SARA fieldwork
The following describes the activities that concern data collectors in the planning the SARA fieldwork.
Fieldwork schedule
The field supervisor will assign each team a list of facilities to be visited for data collection. The list will include the name and location of the facility as well as the facility identification information required in the SARA questionnaire.
If the information is available, the list may include the name of the person in-charge at the facility, telephone numbers or other information on how to contact the facility, and the hours during which the facility is open and/or various services offered. The field supervisor will also provide the team with a map showing the location (or approximate location) of all of the facilities on their list.
The team generally will need to arrive at a facility on or before the official opening hours; therefore, the lodgings that the team will use each night must be within a reasonable distance of the facility that is to be visited on the next day.
Advance contact with authorities/facilities
Generally, the survey manager or another senior member of the team will have notified appropriate authorities of the nature and purpose of the health facility assessment in advance of the fieldwork. An official letter from the managing authority for the facilities being surveyed should have been sent to the regional or district offices for that organization. Each team should also have a copy of the letter to show at facilities if necessary
Logistical arrangements
Prior to departure for fieldwork, the field supervisor must ensure that the team has the questionnaires and other materials necessary to complete the assignment.
Each morning before leaving for field visits, the team should check that they have all necessary materials.

5. Data collector’s guide
54
Checklist of materials for data collectors:
A list of data collection teams and contact information.
The contact details of the field supervisor, including a mobile phone number to call in case of difficulty in the field (with sufficient credit) .
A schedule of visits to survey sites.
The contact details of the sites to be visited.
Details of backup facilities to be visited if scheduled visits are not possible.
Copies of letter of introduction.
The SARA data collectors' guide (part1 and part2).
A SARA data collection form for each health facility to be visited that day (with cover page pre-filled by field supervisor).
A SARA data collection form for each backup site that may need to be visited that day.
An EDC/tablet/laptop (fully charged with CSPro installed and loaded with the SARA questionnaire) a charger and battery.
A memory card/USB stick for data backup.
A fully charged and accurately configured GPS unit (if relevant).
A fully charged cell phone with credit
Pens (pencils should not be used to record data), a clipboard and other supplies.
A notebook to record any significant events or findings.
A field allowance for local expenses.
An identity document with a photograph for each data collector.
5.1.3 Activities during facility visit
There are a number of general procedures to be followed by a survey team during a visit to a survey facility. These procedures are outlined in the following sections.
Locating and verifying the survey facility
The field supervisor has provided you with a list of the facilities you are responsible for surveying. Every attempt should be made to conduct the survey at each facility on your list. If after contacting local authorities, you cannot locate a health facility on your list, or are not sure about whether a facility that you have found is actually the one identified on the facility list, contact your field supervisor. If a facility included in the assignment has closed, no interview will be necessary, just note that fact on the cover sheet of the assigned questionnaire. Finally, no facility not listed in the sample should be visited and interviewed unless specifically approved by the survey manager.
Validating the cover page of the questionnaire
Before starting the data collection, the data collectors should check that the information on the first page of the data collection form (cover page) is complete and correct (pre-filled by the field supervisor). If there is any mistakes, inform the field supervisor at the end of the day. If applicable, enter this information on the electronic form on the electronic data collection device/tablet or laptop.

Service Availability and Readiness Assessment (SARA) | Implementation Guide
55
The following information should be completed by the data collectors on the first page of the data collection form prior to starting the survey:
• Date
• Name of the data collectors (interviewer)
• Number/code of the interviewers’ team (given by the field supervisor prior to the fieldwork)
Geographic Positioning System data collection
Upon arrival at the health facility to be surveyed, fill out the geographic coordinates section of the questionnaire included in the cover page. The global positioning system (GPS) which is a space-based satellite system will be used to precisely locate the geographic position of the site. Step-by-steps instruction on using a GPS device is available on Section V.
Gaining permission to survey the health facility
Data collection teams will be visiting facilities operated by the government, others operated by non-governmental organizations, and perhaps other private health facilities. All facilities must give permission for the survey to be conducted on their premises. The day of the survey data collectors may provide reassurance to facility staff that results will only be provided so that no individual respondent can be identified.
The first contact at the site should be made by asking to speak with the person in charge. If the official “in-charge” is not present the day of the survey, the data collection team should ask to see the person acting “in-charge” for the day. The data collectors will then:
• introduce themselves
• explain the purpose of the visit and the activities that are a part of the survey
• give the person in-charge the introductory letters from the relevant organization and the letters explaining the survey and giving the authorization to visit the facility.
• when consent obtain, sign the inform consent section in the cover page of the questionnaire to indicate the consent from the person in-charge has been obtained.
If you are refused an interview in the facility and nothing you say can make the in-charge reconsider, contact the field supervisor, and provide the name of the facility, its managing authority, and location. The field supervisor will make every attempt to contact appropriate persons who can help to convince the health facility staff to allow the interview.
Meeting with the person in-charge of the facility
An important objective of the survey is to obtain correct and consistent answers to the questions. As the questions relate to a facility and not to a specific person, the information can be obtained from a variety of respondents as long as they are knowledgeable about the topic. During the interview, interviewers may need to speak with various respondents in order to obtain complete and correct information.
The data collectors are responsible for working out a plan for completing all components of the questionnaire at each facility. They should discuss the plan with the in-charge. It may be helpful to meet with relevant supervisors (at large facilities) and other staff who may be requested to allow interviews and observations during the team’s visit. For a small facility this may be relatively easy since most services are in the same general area. For larger facilities, this may involve different departments.

5. Data collector’s guide
56
Duration of the survey
Duration of the interview will depend on the size of the facility and the availability of suitable staff to provide the answers to the questions, but generally should be 3 – 5 hours for a small health post or health centre and up to a day for a hospital*. * For conducting both the SARA and the Facility Reporting Data Verification Tool
5.2 Interviewer skills Collecting data that accurately reflect health services available at a facility, whether it is a small health post or an urban hospital, requires skill and practice. This section provides general instructions on the skills required for gathering this information. The data collectors should remember that the survey findings are only as good as the data from which they are calculated. The quality of that data depends to a large extent on the interviewer.
Below are some basic instructions on the practices that should be used when interviewing respondents and tips for how to handle difficult situations that you might encounter while conducting an interview.
5.2.1 General interviewing practices and techniques
In order to obtain accurate information from a health provider at work in a health service setting, it is very important that they be engaged in the data collection process. There are several basic ways to gain the provider’s cooperation while collecting accurate and specific information.
Showing respect for the respondent
The interaction between the interviewer and all respondents is very important. All respondents should be treated respectfully and politely. The respondents should know that their cooperation and the time they are taking to help make the survey successful is very much appreciated.
A respondent's first impression of the interviewer will strongly affect his/her willingness to fully participate in the interview. Therefore, it is important that the interviewer approach each person to be interviewed and his/her colleagues at work in a friendly, respectful, and professional manner.
One basic way to show respect for a health worker at work is to be considerate of what they need to accomplish during their workday and to let them know that there will be no interference with their client-related tasks. Two ways to accomplish this are: 1) If the health worker to interviewed is busy with a client, the interviewer should wait until that visit is completed before approaching him/her; and 2) the interviewer should wait until there are no clients around or until there is a qualified person available to complete the questionnaire. The interviewer will discover other ways to fit smoothly into the health worker's busy schedule while gaining more experience gathering data in a variety of health service settings during the survey implementation.
If it appears that there will never be a convenient time for collecting the data, the interviewer should discuss with the health worker or the staff member in charge to determine the best approach for collecting the required data with the least interference possible.

Service Availability and Readiness Assessment (SARA) | Implementation Guide
57
Listening carefully to the respondent
Listening carefully to what the respondents say is as important as asking the questions on the questionnaire, and demonstrates respect. Some questions in the questionnaire require the interviewer to listen to what the respondent says and record it by simply circling a printed response category. Sometimes, the interviewer must write down exactly the answer given by the respondent if the answer does not fit in any of the listed categories. In either case, the interviewer should listen well. He/she should not rush into circling the code category before he/she has really listened to the respondent. This may be taken as a sign of disrespect or not paying attention. More importantly, people who rush into coding a response are often in danger of attributing their own biases, preferences, and favourite response categories to their respondents.
Requesting consent from the respondent prior to asking questions
There is a consent form and some background information that should be read to the respondent prior to beginning the interview. This is located at the start of each questionnaire. The interviewer is required to read the information in its entirety to the respondent and then request his/her consent before starting to ask questions. Without the respondent's consent the interview cannot proceed beyond the cover section.
Answering the respondent's questions without pressuring them
Some respondents may question the interviewer about the purpose of the survey before agreeing to participate. In this situation, the interviewer should answer the respondent's questions as directly as possible. If the respondents feel that the information is important and that the interviewer is sympathetic to their situation, they will be more straightforward with responses and will be more likely to answer questions to the best of their ability. If they feel pressured to respond, or feel that the interview is a burden, they may not carefully think about responses.
Offering no opinions or advice on specific health facility practices or patient care issues
If a respondent has specific questions that require the interviewer’s medical opinion or advice, he/she should politely respond by saying that he/she is here to collect information to provide an overview of the services, and that he/she is interested in the systems and practices at this facility. Explaining this and then simply stating, “I am not in a position to provide any advice or opinions” may be sufficient. It is important to remember that the job is not to educate respondents, but only to collect information from them.
Reading every question exactly as written and in sequence
The wording of each question has been carefully chosen and for that reason it is essential that the interviewer read each question to the respondent exactly as it is written. It is very important for this survey that each question is asked to each respondent in exactly the same manner. Each section of the questionnaire also has an introductory paragraph that must be read to the respondent (when applicable) in its entirety.
The interviewer should speak slowly and clearly so that the people who are interviewed will have no difficulty in hearing or understanding the question. At times, the interviewer may need to repeat a question in order to be sure the respondent understands it. In these cases, the interviewer should not paraphrase the question but repeat it exactly as it is written. If, after the question has been repeated the respondent still does not understand it, the question may have to be restated. The interviewer should be very careful when changing the wording not to alter the meaning of the original question. During the practice sessions conducted at a facility not included in the survey sample, if the interviewer find that they have to repeat the same question to several respondents, a note of this should be made and reported to the field supervisor so that if necessary, the wording can be changed on the questionnaire.
5. Data collector’s guide
58
Being straightforward
There are some questions in the survey where the interviewer is asking about the availability of items, and then asking to see them. Providers will be more cooperative if they know beforehand what to expect. If the interviewer ask questions and then later ask to see items, people may think you are trying to trick them, or “checking up” on their answer. In order to have the greatest amount of cooperation, the interviewer should always tell the respondent what is coming. For example:
“I am interested in knowing if the following basic equipments and supplies used in the provision of client services are available in the general outpatient area of this facility. For each item, please tell me if it is available today and functioning. I will need to see the item so that I can completely fill in this questionnaire.”
Probing for a response
Occasionally, a respondent may answer a question incompletely, or seems to have misunderstood the question. The first thing to do is simply to repeat the question as written a second time. If this does not help, the interviewer will have to probe to obtain the response. Probing is a way of asking for further information without influencing the response. For example, “Could you explain that a little more?” or “Could you be more specific about that?” The interviewer must never interpret a respondent's answer and then ask the respondent if the interpretation is correct.
There is not a uniform understanding, even between health service providers within the same health facility, on some of the issues for which we are collecting data or on terms used to describe items or practices. If it appears that the respondent is not understanding what the interviewer is asking, or the response does not seem consistent with other information the interviewer has collected, he/she may rephrase or describe in more detail the item or practice that he/she is asking about, using examples, to ensure that the respondent completely understands the question to which he/she is responding.
In cases where it may be necessary to provide additional clarification, the interviewer should provide only the minimum information required for an appropriate response.
If, however, the respondent appears to understand the question and the response still is not consistent, the interviewer must record the response as given by the respondent.
Never suggesting answers to the respondents
If the respondent's answer is not relevant to a question, the interviewer should not prompt them by saying something like “I suppose you mean that…Is that right?”. In many cases, the informants will agree with the interviewer’s interpretation of their answer, even when that is not what they meant. Rather, in most cases, the interviewer should probe in such a manner that the informants themselves come up with the relevant answer, e.g.
“Can you explain a little more?” “There is no hurry. Take a moment to think about it”.
Specific questions for which it may be necessary to provide additional clarification will be discussed in the detailed instructions for completing the SARA questionnaires. Even in these cases, the interviewer should provide only the minimum information required for an appropriate response. Except when specifically instructed, the interviewer should never read out the list of coded answers to the respondents, even if they have trouble in answering the question.
Remaining neutral
The job as an interviewer is to obtain the facts. An interviewer should be friendly, but firm; neutral, but interested. The tone of voice, facial expressions, and even bodily postures all combine to establish the rapport you create with your respondent. The interviewer should not express surprise, pleasure, or disapproval at any response or comment made by the respondent.

Service Availability and Readiness Assessment (SARA) | Implementation Guide
59
Asking all applicable questions
In most cases, the interviewer will ask questions in the sequence in which they appear in the questionnaire. However, because the organization of facilities often differs, the interviewer may find that to complete one section he/she has to talk to more than one respondent, or go to different areas of the facility. It is up to the interviewer to ensure that when sections of the questionnaire are skipped because the information must be collected from a different respondent or location, that those sections are completed before departure from the facility.
Not raising expectations of immediate changes in the situation of the staff or facility
The interviewer should not raise expectations that he/she can immediately assist with solving problems that the staff or clients raise as problems. He/she is going to provide information to decision makers and health planners and administrators, but any changes as a result of the survey will most likely occur over an extended period of time, and be gradual in implementation. If clients or staffs complain about the poor state of repair of the facility, equipment, or supplies or other problems, the interviewer should provide a neutral or non-judgmental response (e.g., “I know these things are difficult”).
Not separating questionnaires
The interviewer should never separate stapled or bound questionnaire forms to speed up the process of data collection. Experience has shown that this strategy may result in lost pages.
Thank the respondent at the end of the interview
At the end of every interview, the interviewer should thank the respondent for taking time out of his/her busy schedule, telling him/her it was very much appreciated. They should be asked if he/she can direct the interviewer to the next appropriate clinic/unit and/or person.
5.2.2 Tips on handling difficult interview situations
The respondent is reluctant to participate
Occasionally, a potential respondent will refuse to participate in the survey. The interviewer should not take the initial unwillingness of a respondent to cooperate to mean a final refusal. He/she should try to put himself/herself in the position of the respondent and think of factors that might have brought about this reaction. The respondent may not be in the right mood at that particular time or he/she may have misunderstood the purpose of the visit. The interviewer should try to find out why the respondent is unwilling to participate, and respond accordingly. Some points can be used to persuade a respondent to participate:
• The information he/she provides will help the Ministry of Health and the government to better understand the effectiveness of programs and make improvements to the program that will ultimately help the clients.
• If confidentiality is an issue, the interviewer should reassure the respondent that everyone working on the survey has pledged to maintain confidentiality and that the respondent's name will not be shared with others, including his/her supervisors or colleagues.
• The respondent cannot be replaced by anyone else.
However, in some circumstances a respondent may continue to refuse. In this situation, the interviewer should respect the respondent's right to refuse, and thank the respondent for his/her time. The interviewer should not take these refusals personally.

5. Data collector’s guide
60
The respondent seems bored
There may be other situations where the respondent simply says, “I don’t know”, gives an irrelevant answer, acts bored or detached, contradicts something they have already said, or refuses to answer the question. This happens most when the respondent is concerned about their other clinic/unit responsibilities and wants to get back to them. In these cases the interviewer must try to re-interest the respondent in the conversation. For example, if the interviewer sense that the respondent is growing restless, he/she should be reassured that there are not many more questions and that his/her responses are very valuable.
The respondent is very talkative
If an informant is giving irrelevant or elaborate answers or complaining about something, the interviewer should not stop him/her abruptly or rudely, but listen to what they have to say. Then the interviewer should try to steer him/her gently back to the original question. The interviewer can also write down what he/she says and tell him/her that it is duly noted. A good atmosphere must be maintained throughout the interview. The best atmosphere for an interview is one in which the respondent see the interviewer as a friendly, sympathetic, and responsive person who cares about him/her.
5.3 Completing the SARA questionnaire
The interviewer's main responsibility is to use the questionnaire to appropriately collect information that is as accurate as possible by asking questions to the appropriate respondents and accurately record the responses.
The instructions and examples below explain the questionnaire form, the various types of questions and instructions, and procedures for correctly recording information.
5.3.1 Recording the responses
When completing a paper version of the questionnaire, all responses are to be recorded using pens with blue ink. Blue ink is used because it can be distinguished from the black ink in which the questionnaires are printed. Red or green ink should never be used in recording responses since these colours are reserved for the survey manager and field supervisor to use in correcting the questionnaires in the office.
The information recorded in the fields of the questionnaire form will eventually be entered into an electronic database. At that point, it is very difficult to correct for errors or omissions in the questionnaires. Consequently, it is very important that all answers be correctly recorded and special instructions in the questionnaire be followed.
The procedures for recording responses will vary according to the type of question being asked. There are some basic types of questions in the questionnaire such as pre-coded questions and questions requiring a numeric response. Samples of all types of questions, and combinations of them, are reviewed below giving examples.
NEVER LEAVE A RESPONSE BLANK! A blank is recorded as “missing information” because it is not known if the question was asked or not. If a response is negative, the negative response must be circled. Likewise, if a response is “don’t know”, the number corresponding to the “don’t know” response must be circled.

Service Availability and Readiness Assessment (SARA) | Implementation Guide
61
This questionnaire is typically divided into four columns, as shown below. The first column contains the question number with each question numbered separately within each section. The second column contains the questions and instructions to the interviewer for posing questions, the third column contains the response categories, and the fourth column contains skip and other instructions, if necessary.
5.3.2 Instructions
Instructions for the interviewer
It is important to ask the questions exactly as they are written in the questionnaire and in the order in which they appear. Questions are often accompanied by a set of instructions for the interviewer. Instructions are usually located in the question column and appear as bold faced CAPITAL LETTERS. Instructions will help you to remember important directions for asking questions, making correct observations, and recording information. These instructions should not be read to respondents.
Example:
It is important to pay attention and follow consistently the instructions because they will help the interviewer complete the questionnaire as accurately and completely as possible.

5. Data collector’s guide
62
Introducing a set of questions
There are sentences throughout the questionnaire that provide information to the respondent about the next set of questions to be asked. These sentences must be read to the respondent, so that they know what to expect from the next set of questions. Respondents who are provided information up front are less likely to be surprised or uncomfortable about certain questions and much more likely to respond sincerely. Below is an example of a set of sentences found in the questionnaire that are to be read to the respondent so that they will know what to expect.
Example:
If, during the training or the pretest, the interviewer finds that information such as this would be useful prior to a set of questions where there is no narrative, it should be reported to the field supervisor so that the questionnaire can be modified if necessary.
Skip Instructions
The questionnaire is set up to avoid as much redundancy as possible and to ask only appropriate questions given a situation. This is accomplished through the use of skip patterns. It is very important to follow these skips for they will make the questionnaire more concise and relevant and thus increase the cooperation of the respondent. In the sample question below, if the answer to question 301 is “No”, the providers in the health facility do not have to answer the following question about overnight observations. The interviewer will skip the following questions (302-304) and go to question 305. If the answer is “Yes” the interviewer will ask question 302.
Example:

Service Availability and Readiness Assessment (SARA) | Implementation Guide
63
Available and functional Instructions
Throughout the questionnaire many questions ask if equipment and supplies used in different services are available and if so if there functional. The following pattern should be followed to fully answer the question:
Section A: “Availaible”
The respondent is asked if a specific item is available. It the answer is NO, the response “2” should be circled. As indicated by skip on the questionnaire, the interviewer will go directly to the next item. If the answer is YES, the answer “1” should be circled. The interviewer should now skip to the section B “functional”
Section B: “Functioning”
The interviewer will need to determine if the item available is functioning at the time of the visit. For these cases the following criteria will be used:
• “1” for “YES”: Staff reports that the item is in working order thus functional.
• “2” for “NO”: The item does not function if the staff member indicates that it is not in working order.
• “8” for “DON’T KNOW”: The respondent is not certain if the item is in working condition or not, and you cannot verify the functioning condition (e.g. the place where the item might be is locked and cannot be accessed at the time of the survey and the respondent does not know about the item).

5. Data collector’s guide
64
Observation Instructions
Throughout the questionnaire many questions ask if drugs and commodities are present. The following criteria are to be used for classifying the presence of the item (observed and with valid expiration date on the day of the assessment):
• "1" for "OBSERVED AND VALID": The item was seen in the service provision area or in an adjacent room where it can easily be used. The expiration date of the drug or commodities (at least one of them) has been checked and confirmed valid.
• “2” for “OBSERVED BUT NOT VALID”: The item was seen in the service provision area or in an adjacent room where it can easily be used. The expiration date of the drugs or commodities has been checked and confirmed not valid.
• "3" for "REPORTED AVAILABLE BUT NOT SEEN": Staff reports that the item is located in the facility or immediately adjacent, where it can easily be used, but for some reason (e.g., key to cabinet is missing or room is locked), the interviewer cannot observe the item. This answer should also be selected when staff indicates that the item is brought to the service delivery area only at the time services are provided (thus not being observed by the interviewer).
• “4” for “NOT AVAILABLE TODAY”: Staff reports that the item is usually available in the facility but not on the day of the assessment.
• “5” for “NEVER AVAILABLE”: Staff reports that the item is never available in the facility.
5.3.3 Question types
Pre-coded questions
For some questions, we can predict the types of responses a respondent will give. The responses to pre-coded questions are listed in the questionnaire. To record a respondent’s answer, the number (code) that corresponds to the response should be circled. When numbers indicate coding categories, the interviewer records only one response for each question. The interviewer should make sure that each circle surrounds only a single number.
Example:
In some cases, a pre-coded question will include an “other” category. The “other” code should be circled when the answer provided is different from any of the pre-coded responses. The “other” response should be specified and written in the space provided. If more room is needed, the margins can be used. The interviewer should also pay attention to any skip linked to a pre-coded answer.

Service Availability and Readiness Assessment (SARA) | Implementation Guide
65
Example:
Sometimes responses to particular questions must be entered in response grid (table). When recording a response in one of these grids, the interviewer has to be sure that the answer is entered in the proper row and column.
Example:
Numeric responses
Several questions require a numeric response. These should be recorded in the appropriate available boxes in the right column of the table.
Example:
Whenever respondents do not know the answer to a numeric question, the interviewer must circle the “Don't know” response option. If “Don't know” is not one of the responses then you must probe to get a numeric response to fill in the boxes. All boxes should have a number recorded in them. Anytime a respondent's answer requires fewer digits than provided for in the response column, the interviewer must record zeros (0) in the left-hand box and the respondent's answer in the right hand box.

5. Data collector’s guide
66
5.3.4 Ensuring quality
All members of the survey team are responsible for ensuring that the data that is collected at each facility is as accurate and comprehensive as possible. Each interviewer is responsible for:
• Checking that questionnaires filled are complete at the end of each interview, ensuring that all answers are clear and reasonable, and that your handwriting is legible.
• Returning to the original respondent(s) if questions are omitted or there appears to be errors, in order to complete the questionnaire. In this situation, the interviewer should apologize, explain that a mistake was made, and then ask the question again.
• Notifying the field supervisor whenever there are problems in completing the daily assignment.
• Taking into account the field supervisor’s feedback and recommendation on the field work/interview procedures based on the on-going assessment work.
Correcting mistakes
If a mistake was made while recording an answer or the respondent changes his/her reply, two diagonal lines through the incorrect response should be used. The interviewer should not try to erase an answer, use white-out, or write over an answer. It is particularly hard for data entry staff to understand which of two numbers is correct, if the interviewer has tried to write over a response.
Example:
The interviewer should remember that if there are two responses for a particular question that requires only one response, it may be impossible later, when the data are being entered, to determine which the correct answer is. Also, if he/she writes over an answer, the data input staff frequently cannot determine which of the two responses you meant as the correct response.
Questionnaire editing
Interviewers are required to edit their questionnaires before considering an interview complete. If questions are omitted or there appear to be errors, he/she must returns to the original respondent(s) if possible. He/she should apologize, explain that an error was made, and ask the question again.
Editing should be done on the spot in order to avoid the need for re-contacting respondents, which is impractical given the time frame for fieldwork completion, as well as inconvenient for both the interview teams and the respondents.

Service Availability and Readiness Assessment (SARA) | Implementation Guide
67
Check list
All questionnaires should be reviewed from beginning to end for the following:
Verify that the interviewer has signed the verbal consent.
Verify that all skip and filter instructions have been respected.
Verify that the responses are legible.
Verify that only one response code is ticked for each question.
Verify that any corrections made by the interviewer are done legibly
according to the instructions above.
Check that all questionnaires contain the correct number of pages.
Check that there are no missing responses.
5.4 Using CSPro for data entry Electronic data collection facilitates collection of more accurate and reliable data in a more efficient, timely manner. For the SARA survey, electronic data collection is carried out through the use of the Census and Survey Processing System (CSPro) software. CSPro was developed jointly by the U.S. Census Bureau, Macro International, and Serpro, SA, with major funding from the U.S. Agency for International Development. CSPro is in the public domain. It is available at no cost and may be freely distributed.
For information about the Census and Survey Processing System (CSPro), including free download, visit: http://www.census.gov/population/international/software/cspro/
5.4.1 Installing CSPro
1. Download the CSPro application from http://www.census.gov/ipc/www/cspro/index.html
2. Install CSPro 5.0.3 to your computer by double-clicking on cspro50.exe. This will start the installation wizard.
3. The setup process takes you through a series of dialog boxes that prompt you for setup information.
Selecting components for installation
CSPro allows you to select which components of the system you want to install. During the installation you will see the following component screen:
You have the following choices:
• CSPro (all components): Select this if you plan to develop applications.
• Data Entry Operator (only): Select this if you are installing a data entry application on a production machine. The operator will be able to run an already-created data entry application, but will not be able to make any changes to it. The Data Entry, Compare Data, Text Viewer, and Table Viewer components are installed.
At any later time, you can change the components installed by rerunning the installation.

5. Data collector’s guide
68
5.4.2 SARA data entry application
Open the SARA data entry application in CSPro
• To open the SARA data entry application, click on the “SARA_2_0_Menu.pff” shortcut available on the desktop.
• A new form (Case) opens. You can now start filling the Cover page information:
• The question text is located on the yellow top window. For each question a pop-up window will appear. Select your answer and validate your choice by clicking on the green check mark (or press the ENTER button).
Filling in the SARA data entry forms
• Fill in all the responses for the cover page. When the consent is received from the respondent select “1” for the answer Q015; the main Menu will automatically open.
• From the main Menu select the form you want to fill-in. Click on the green check mark to validate your choice.
Please note that it is required to fill-in form 8 on “Obstetric and newborn care” prior to being able to fill in form 19 on “Surgery” and form 18 on “Tuberculosis” prior to being able to fill in form 23 on “Diagnostics” .
• The selected form opens and can be filled. The text question appears on the yellow top window. The green check mark in the pop-up window is used to validate the answers.
•
• To save the file go to: File/Save partial case
• The following pop-up window appears. Click “Ok” to continue the data entry.
Remember to save regularly while filling in the case to avoid any data lost .
• At the end of the form the following pop-up window will appear:
Text of the question
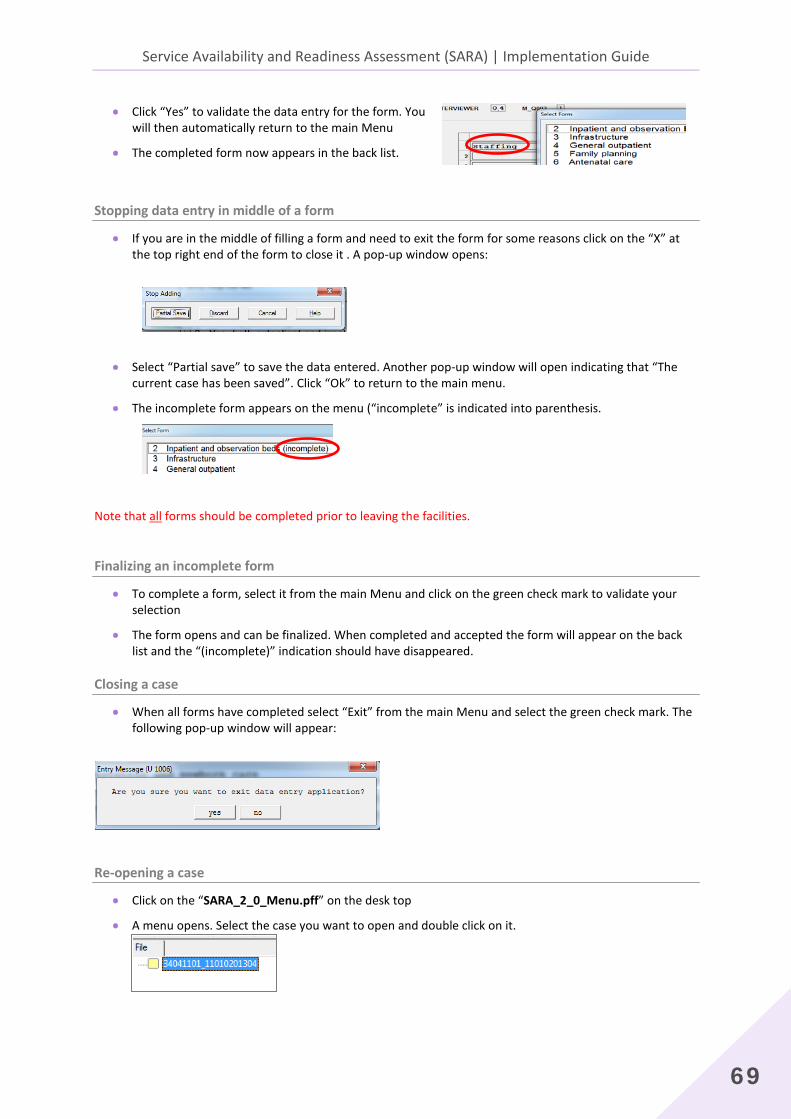
Service Availability and Readiness Assessment (SARA) | Implementation Guide
69
• Click “Yes” to validate the data entry for the form. You will then automatically return to the main Menu
• The completed form now appears in the back list.
Stopping data entry in middle of a form
• If you are in the middle of filling a form and need to exit the form for some reasons click on the “X” at the top right end of the form to close it . A pop-up window opens:
• Select “Partial save” to save the data entered. Another pop-up window will open indicating that “The current case has been saved”. Click “Ok” to return to the main menu.
• The incomplete form appears on the menu (“incomplete” is indicated into parenthesis.
Note that all forms should be completed prior to leaving the facilities.
Finalizing an incomplete form
• To complete a form, select it from the main Menu and click on the green check mark to validate your selection
• The form opens and can be finalized. When completed and accepted the form will appear on the back list and the “(incomplete)” indication should have disappeared.
Closing a case
• When all forms have completed select “Exit” from the main Menu and select the green check mark. The following pop-up window will appear:
Re-opening a case
• Click on the “SARA_2_0_Menu.pff” on the desk top
• A menu opens. Select the case you want to open and double click on it.

5. Data collector’s guide
70
• The Cover page of the form (case) opens.
• If no edits have to be done to the Cover page, select 1 from the Consent pop-up window and click on the
green check mark to validate your selection.
• The main Menu opens.
Viewing and editing a module
• If you want to view/edit a module that has already been fully completed, select the option 98 at the bottom (View/change module already finished) and click on the green check mark. You can now choose from the list the form that need to be revised.
• Indicate the number of the form you want to review at the right bottom of the window and click ENTER to validate your choice
• Review the form answers as needed.
• To exit the form click on the last question and press ENTER. The following pop-up window will appear. Click “Yes” to validate your review and go back to the main Menu
Open the SARA data entry application in CSPro
• To open the SARA data entry application, click on the “SARA_2_0_Menu.pff” shortcut available on the desktop.
• A new form (Case) opens. You can now start filling the Cover page information:
Text of the question

Service Availability and Readiness Assessment (SARA) | Implementation Guide
71
• The question text is located on the yellow top window. For each question a pop-up window will appear. Select your answer and validate your choice by clicking on the green check mark (or press the ENTER button).
Filling in the SARA data entry forms
• Fill in all the responses for the cover page. When the consent is received from the respondent select “1” for the answer Q015; the main Menu will automatically open.
• From the main Menu select the form you want to fill-in. Click on the green check mark to validate your choice.
Please note that it is required to fill-in form 8 on “Obstetric and newborn care” prior to being able to fill in form 19 on “Surgery” and form 18 on “Tuberculosis” prior to being able to fill in form 23 on “Diagnostics” .
• The selected form opens and can be filled. The text
question appears on the yellow top window. The green check mark in the pop-up window is used to validate the answers.
• To save the file go to: File/Save partial case
• The following pop-up window appears. Click “Ok” to continue the data entry.
Remember to save regularly while filling in the case to avoid any data lost .
• At the end of the form the following pop-up window will appear:
• Click “Yes” to validate the data entry for the form. You will then automatically return to the main Menu
• The completed form now appears in the back list.
Stopping data entry in middle of a form
• If you are in the middle of filling a form and need to exit the form for some reasons click on the “X” at the top right end of the form to close it . A pop-up window opens:
• Select “Partial save” to save the data entered. Another pop-up window will open indicating that “The current case has been saved”. Click “Ok” to return to the main menu.

5. Data collector’s guide
72
• The incomplete form appears on the menu (“incomplete” is indicated into parenthesis.
Note that all forms should be completed prior to leaving the facilities.
Finalizing an incomplete form
• To complete a form, select it from the main Menu and click on the green check mark to validate your selection
• The form opens and can be finalized. When completed and accepted the form will appear on the back list and the “(incomplete)” indication should have disappeared.
Closing a case
• When all forms have completed select “Exit” from the main Menu and select the green check mark. The following pop-up window will appear:
Re-opening a case
• Click on the “SARA_2_0_Menu.pff” on the desk top
A menu opens. Select the case you want to open and double click on it.
• The Cover page of the form (case) opens.
• If no edits have to be done to the Cover page, select 1 from the Consent pop-up window and click on the green check mark to validate your selection.
• The main Menu opens.

Service Availability and Readiness Assessment (SARA) | Implementation Guide
73
Viewing and editing a module
• If you want to view/edit a module that has already been fully completed, select the option 98 at the bottom (View/change module already finished) and click on the green check mark. You can now choose from the list the form that need to be revised.
• Indicate the number of the form you want to review at the right bottom of the window and click ENTER to validate your choice
• Review the form answers as needed.
• To exit the form click on the last question and press ENTER. The following pop-up window will appear. Click “Yes” to validate your review and go back to the main Menu
Viewing and editing a module
• Start the application by double clicking on the icon on the desktop
• In the menu, go to Mode, select “Add case”
• A new form opens.
5.5 Using GPS for geographic coordinates collection
This section introduces required steps for geographic data collection using GPS devices. For the purpose of the description the Garmin eTrex device has been used. Complete functionality of the device are described in the user manual provided with the Garmin eTrex.
The functions described on this section only focus on the essential steps to collect health facilities geographical coordinates to complete the national Master Facility List.

5. Data collector’s guide
74
5.5.1 Features of the Garmin eTrex GPS unit
The eTrex GPS device comprises 5 main buttons as described below:
It requires two AA batteries that should be place on the back of the device (take off back cover).
5.5.2 Overview of the GPS functions
All of the information needed to operate the GPS is found on 4 main “pages” (or display screens).
These pages are:
4. Satellite 5. Map 6. Navigation 7. Menu
Simply press the PAGE button to switch between pages.
Use the ENTER, UP, and DOWN buttons to access the different functions of a page.
Satellite
The satellite page shows the eTrex gathering all the necessary satellite information in order to work. There are two display options on the Satellite page: Normal Skyview and Advanced Skyview. Normal Skyview shows you the satellites, satellite signal strength, and the eTrex's estimated location accuracy. Advanced Skyview shows the numbered satellites the eTrex is using, their proximity to your current position, and their individual signal strengths. To navigate from one to the other, select the ENTER button and choose the preferred skyview.
Map
The Map Page shows where you are (the animated figure) and provides a real picture of where you are going. As you travel (the animated figure "walks") and leaves a "trail" (track log). Waypoint names and symbols are also shown on the map.
LCD Display (with backlight)
POWER button
PAGE button
Internal GPS Antenna
UP button
DOWN button
ENTER button

Service Availability and Readiness Assessment (SARA) | Implementation Guide
75
Navigation
The Navigation Page helps guide you to a destination. When you are moving with no particular destination in mind, the navigation page shows you your moving direction and speed. When you are moving towards a specific destination, the navigation page shows you the name of the location, the distance and time to go, and displays a direction arrow in the compass ring. To navigate, simply follow the arrow.
Menu The Main Menu gives you access to the eTrex's more advanced features. With the main menu, you can create and view waypoints, create a route, save and track logs, or access the system setup features.
5.5.3 Setup for map units
From the MENU page, select SETUP, then select the category UNITS in order to specify units of measure.
5.5.4 Where to collect GPS coordinates
The rules for GPS data collection are as follows:
1. Single facility in a building
• The geographic coordinates should be recorded in front of the main sign attached to the building of the facility.
• If there is no sign attached to the building then the geographic coordinates should be recorded in front of the main door or reception area of the facility.
2. Multiple facilities in a single building
• The geographic coordinates should be recorded in front of the sign(s) that lists what facilities are located in that building (if the sign is outdoors and attached to the building).
POSITION FRMT hddd.ddddd
MAP DATUM WGS 84
UNITS metric
NORTH REF magnetic
ANGLE degree

5. Data collector’s guide
76
• If there is no sign listing what is in the building (or if the sign is indoors), the geographic coordinates should be recorded in front of the main entrance door or reception area of the building.
3. Single facility in multiple buildings
• The geographic coordinates should be recorded in front of the door or main entrance to the reception area of the facility (preferably where the main sign for the facility is). If there is no reception area, the geographic coordinates should be recorded in front of the door to the administrative offices of the facility.
5.5.5 Using the GPS for collecting geographic data
Once you have configured the settings on the GPS receiver, you can use it to record the geographic coordinates of a facility. Make sure that if the receiver had been previously used to collect data, the internal memory has been cleared.
1. Move to main entrance of the building and stand within 30 meters of the main door. It is necessary to be placed in an open area that has a clear view of the sky and hold the GPS receiver parallel to the ground so that its antenna is able to receive signals.
2. Collect coordinate only when the receiver indicates that is has acquired signal from enough satellites to produce and accurate reading. The message "Ready to navigate" should appear on the GPS receiver (SATELLITE page) and the accuracy should be lower than 20 meters. In case you do not get the message "Ready to navigate", wait at the same place for 5 minutes.
3. When the signal is sufficient and the accuracy is at the recommended level, the geographic coordinates can be recorded:
• Go to the MENU page and select MARK
• Highlight the WAYPOINT number and press ENTER. You can now enter the facility code (maximum 6 digits or letters)
• Press ENTER and scoll down to OK
• Press ENTER to go back to the MARK page
• Highlight OK using the UP and DOWN button and press ENTER
• The WAYPOINT is now registered
5.5.6 Retrieving waypoints list from the GPS receiver
To retrieve the waypoints from the list of GPS coordinates collected:
• Go to the MENU page and select WAYPOINTS
• Using the UP and DOWN button you can now look for a waypoint just or previously entered
You can now report the geographic coordinates on the SARA paper questionnaire as well as electronic form (if applicable).

Service Availability and Readiness Assessment (SARA) | Implementation Guide
77
Latitude and longitude
Latitude is the north/south value measured from the equator. Longitude is the east/west value measured from the Prime Meridian that runs through West Africa and Western Europe. A latitude and longitude identifies an exact location on the earth’s surface. Thus, based on the location of the health facility positive (+) (North/East) or negative (-) (South/West) coordinates should be properly reported.
In order to conserve battery life, switch off the GPS receiver once the geographic coordinates are recorded.
5.5.7 Checklist for GPS units
Each morning before you leave for visits, check that you have all the necessary materials with you and remember the following when collecting GPS coordinates.
Check battery level and verify that the device is properly working.
Check the settings of your GPS receiver.
Have questionnaire for data collection ready to be used.
Make sure to be properly placed for reliability of data collection.
Report coordinates taking into account location to the Equator and Greenwich meridian.
Make sure that all information relative to the collected point has been reported
(in the paper SARA form as well as electronic form if applicable).


79
6. Supervisor’s guide

6. Supervisor’s guide
80
The Service availability and readiness assessment (SARA) is designed to function as a systematic tool to support annual verification of data and service delivery at the facility level. It intends to cover public as well as private and faith-based health facilities. The goals of the survey is to provide evidence based data on health system progress to inform the annual health sector review, identify gaps and weaknesses responsible for sub-optimal service provision and intervention coverage that need to be addressed. It also provides a baseline for planning and monitoring scale-up intervention for service delivery improvement for maternal and child health, HIV, TB,malaria and NDCs among others .
The SARA survey requires visits to health facilities with data collection based on key informant interviews and observation of key items. Supervisors have a key role to ensure that the field data is properly conducted.
The Supervisor’s Guide is designed to provide supervisors with:
• Clear understanding of their roles and responsibilities in managing the field data collection and supervising the data collectors’ teams
• Details of the field data collection procedures and protocols required steps to ensure quality data collection work
• Steps in using CSPro for electronic data verification and validation

Service Availability and Readiness Assessment (SARA) | Implementation Guide
81
6.1 Roles and responsibilities Field supervisors are responsible for overseeing all aspects of data collection in the survey area(s) for which they are responsible. This includes:
• Organizing data collection visits in facilities (making initial contact, preparing a schedule of data collection visits, etc).
• Preparing the necessary materials for data collection.
• Supervising data collection activities:
− Make sure data collection protocols are followed − Arrange for regular communication with data collection teams − Check data collection forms at the end of each day for completeness and legibility − Ensure data are transferred to computer at the end of each day and at national level by the end of
the assessment
• Validating data collection by re-conducting the survey at 10% of facilities comparing results to those of data collectors.
• Collecting and storing data collection forms, and sending them to the survey manager.
• Transferring electronic data from electronic data collection devices to survey area computer/laptop.
Field supervisors have a crucial role to play in ensuring data quality and consistency.
6.2 Conducting field activities 6.2.1 Preparing for data collection
1. Schedule survey visits and identify replacement facilities
The survey manager will provide you with a list health facilities and replacement facilities for your survey area.
1. Contact (in person or by phone) each health facility and replacement facility to introduce the survey and seek permission for data collection:
• Introduce the survey and its objectives
• Use the letter of endorsement and introduction provided by the survey manager
• Stress that individual facilities will not be identified in the results
2. Make an appointment for data collection at a date and time which is convenient for the facility, avoiding peak hours.
• Plan for approximately 3-4 hours for each data collection visit, plus travel time
• More time should be allotted for large facilities/hospitals (1 day for hospital)
3. Note the name and telephone number of the contact person at each health facility.

6. Supervisor’s guide
82
4. Explain about the possibility of a second visit for 'validation,' which may take place in 10% of the surveyed health facilities.
5- If a facility refuses to participate, alert the survey manager who will contact the health facility directly, and if necessary, provide you with an alternative site. Luckily, this rarely happens.
2. Prepare a schedule of data collection visits for each pair of data collectors
1. Prepare a schedule for each pair of data collectors, including:
• Date and time of each visit
• Name, number, sector and contact person for each health facility
• Address and location of each health facility
• Contact information for replacement facility to be visited if necessary
Example: Date and time of appointment
Name of facility
Contact person
Location Managing authority
ID Number replacement facility- name and contact details
April 20 10h00
ABC Health center
Mrs Nguyen
45 Main Street Eastern City Tel: +22 414 00
Govt 01234 XYZ Health Center- 59 main street Eastern City
2. Call each facility and confirm appointment the day before the data collection
3. Arrange for regular communications and transport
Once all of the survey sites are known, transportation should be arranged according to the number of sites to be visited, the number of teams going into the field, and the number of people per team.
6.2.2 Preparing the necessary materials for data collection
1. Prepare data collection form for each facility to be visited
1. The survey manager will provide you with a separate data collection form for:
• Each sample health facility in your survey area;
• Each replacement facility; and
• Each validation visit.
Make sure that there are enough forms according to the list of facilities in the survey area prior to starting the field data collection.
2. Complete the front page of the SARA questionnaire data collection form with the identifying information of each sample facility.

Service Availability and Readiness Assessment (SARA) | Implementation Guide
83
Complete the following fields in the cover page of the form:
• Name of health facility
• Health facility unique ID
• Name of town/village
• Region and district
• Type of facility
• Managing authority
Do not complete these fields, as these will be completed by data collectors during facility visits:
• Date
• Name of person(s) who provided information
• Name of data collectors
2. Material checklist
To be completed by field supervisors before data collection visit

6. Supervisor’s guide
84
2. Material check-list
The supervisor will need to make sure that the following material is available each day for the field data collectors to properly conduct the survey:
Checklist of materials for data collectors
Contact details of the field supervisor, including a mobile phone number to call in case of difficulty in the field
Data collector’s guide and relevant handouts
A schedule of visits to survey sites and contact details of the sites
List of data collection teams and contact information when in the field
Copies of letter(s) of endorsement and letter of introduction
A data collection form for each facility that may need to be visited that day
Extra copies of the SARA data collection form
Electronic data collection devices (fully charged with CSPro application installed and loaded with the SARA questionnaire) batteries and power cables
Memory cards or USB keys for data backup
GPS units (fully charged and accurately configured, if relevant )
Pens (pencils should not be used to record data), a clipboard and other supplies.
A notebook to record any significant events or findings
Field allowance for local expenses
An identity document with a photograph
A mobile phone for each team and credit
Checklist of materials needed by supervisors for daily meeting with the data collectors
Detailed planning of site visits for each data collection team
Electronic data collection software installed on the laptop (CSPro 5.3) (See instructions in Section 4)
A fully charged laptop computer with appropriate software for copying data from electronic data collection device to laptop computer (using memory cards or USB keys)
6.2.3 Supervising data collection activities
Your main responsibilities during data collection are to supervise data collectors and make sure data collection forms are complete and accurate. Go out into the field regularly with your data collectors to make sure that the survey protocols are being followed. Identify any problems regarding the data collection process and resolve them. If you encounter problems that you cannot resolve, report them to the survey manager as soon as possible.
You are responsible for the accuracy of the data collected by data collectors.
1. Make sure data collection protocols are followed
• Ensure that data collection teams are conducting interviews at the facility
• Keep track of facilities that have been covered from the sample

Service Availability and Readiness Assessment (SARA) | Implementation Guide
85
2. Arrange for regular communication with data collection teams
• Provide data collectors with a mobile phone and phone number where they can contact you during data collection
• Arrange to meet with data collectors at the end of each day of data collection
• Ensure data are transferred to computer at the end of each day
6.2.4 Tracking facilities
The field supervisors should keep a running tally of facilities that have been assessed from the list of facilities in the sample assigned to them, for example using a table such as the one below:
GREEN = facility has been assessed, data collectors have entered data into CSPro, data has been checked RED = facility could not be assessed BLUE = replacement facility WHITE = not yet covered
• Include information on which facilities were selected for supervisor validations
• Any issues encountered with the data should also be documented in the tally
• This table should be submitted to the survey manager with the electronic data files at the end of the field work
6.2.5 Daily meeting with data collectors
At the end of each day, supervisors have the responsibility to:
• Meet with data collectors to collect completed forms and resolve any problems encountered
• Review each data collection form completed that day:
− making sure they are complete and legible − verifying missing or suspicious information
• Uncertain or illegible data should be checked with data collectors, may need to re-contact facility to clarify
• Sign the last page of each questionnaire to record that it has been checked, but only once you are sure that data is complete, legible, and there are no obvious mistakes

6. Supervisor’s guide
86
6.2.6 Storing completed data collection forms
• Completed paper forms should be stored in waterproof plastic bags in the field until completion of field work, at which time they will be send to the survey manager
• All original data collection forms, including those for validation visits (label clearly!), should be transferred to the survey manager upon completion of fieldwork
• Field supervisors should retain the copies for use in the event that the originals become lost or damaged
6.2.7 Transferring electronic data collected (using USB flash)
Electronic data should be backed up on a memory card/USB key and transferred to computer of field supervisor at the end of each day to prevent data loss
Transferring final data files from laptops/netbooks/etc. with a USB flash drive
1. A USB flash drive should be inserted into the laptop/netbook computer that was used for data collection. The file explorer can be used to navigate to where the SARA data files are stored. This location was selected at the beginning of data collection.
2. The SARA data file should be copied from the laptop/netbook computer to the USB flash drive. The USB flash drive can now be ejected from the laptop/notebook.
3. The USB flash drive can be inserted into the desktop/laptop computer that will be used for data processing. The SARA data files can now be copied and pasted to a folder on the desktop/laptop.
4. This should be repeated for all laptop/netbook computers used for data collection.
Organizing data files from the field collection The back-up procedure (steps-as described above) should be done every time supervisors meet their teams. It is important to save the data files in an organized manner to make sure that the latest files enclose data for all surveyed facilities by each team. A saving procedure as below could be used to save in an organized manner data in specific folder for each team: SARA_TEAM1_DATE1 SARA_TEAM1_DATE2 SARA_TEAM1 SARA_TEAM1_DATE3
The latest file for each team should correspond to the final file. This will be validated by the supervisor. A copy of the final file should be created and renamed:
SARA_TEAM1_FINAL
THE FINAL DATA SET WILL CONTAIN THE FINAL FILES FROM EACH TEAM: SARA_TEAM1_FINAL SARA_TEAM2_FINAL SARA_DATA_COLLECTION_FINAL (REGION X) SARA_TEAM3_FINAL

Service Availability and Readiness Assessment (SARA) | Implementation Guide
87
This final data set should be sent/shared with the identified data manager at central level in charge of the compilation of the data from field collection. A back-up of all data files (final and stamped with dates) should preciously be saved as back-up and remain accessible during the cleaning and data processing phase.
6.2.8 Validation of data collection
The supervisor will do a validation visit in 10% of health facilities. They will return to some of the sample facilities (10% randomly selected within the list) and collect data again, to make sure that the data obtained by the data collectors is accurate and reliable. To do so, the supervisors will:
• Select facilities for validation at random (randomly select 1 public facility and 1 private facility).
• Conduct the validation visits on the same day as the visits to these facilities by data collector (or as soon after as possible).
• Compare the data obtained with that collected by the data collectors.
• Identify and resolve any issues/mistakes and discussed with data collectors.
• Data collected for validation should also be entered electronically in CSPro. The consistency of responses (exact matching) will be analyzed as a measure of quality control.
6.3 Using CSPro for data checking and validation
6.3.1 Installing CSPro
5. Download the CSPro application from http://www.census.gov/ipc/www/cspro/index.html
6. Install CSPro 5.0.3 to your computer by double-clicking on cspro50.exe. This will start the installation wizard.
7. The setup process takes you through a series of dialog boxes that prompt you for setup information.

6. Supervisor’s guide
88
Selecting components for installation
CSPro allows you to select which components of the system you want to install. During the installation you will see the following component screen:
You have the following choices:
• CSPro (all components): Select this if you plan to develop applications.
• Data Entry Operator (only): Select this if you are installing a data entry application on a production machine. The operator will be able to run an already-created data entry application, but will not be able to make any changes to it. The Data Entry, Compare Data, Text Viewer, and Table Viewer components are installed.
At any later time, you can change the components installed by rerunning the installation.
6.3.2 Reviewing data in CSPro
Supervisors should review data transferred to the laptop for completeness and consistency. The following steps for reviewing the data should be done:
• Data files in CSPro should be checked for each facility
• At a minimum, the following items should be verified:
− The facility code and the facility name match − The level and type of facility are correct (based on the facility inventory) − The data collector ID/team name is correct − Location of facility is correct − The data file does not have any missing values
1. Open SARA CSPro application − Click on the .pff extension file named SARA_2.0_MENU

Service Availability and Readiness Assessment (SARA) | Implementation Guide
89
2. Select the data file to open
• Select the case containing the data for the facility you would like to review, and double-click to open it
3. The case opens on the Cover page form.
• Review the information as per indication at the beginning of this section.
• If no edits have to be done to the Cover page, select 1 from the Consent pop-up window and click on the green check mark to validate your selection.
• The main Menu opens.
• If changes have been done, click on Q015, select “1” and press ENTER to go to the main Menu
4. Forms completion:
• The main Menu should indicate that all the forms have been filled in. If this is the case, only option 98 (View/change module already finished) and 99 (exit) should be displayed on the menu.
• The rest of the forms should appear on the background menu (grey), indicating that they all have been filled:

6. Supervisor’s guide
90
5. Form content:
• To check the content of a form, select the option 98 and click on the green check mark:
• Indicate the number of the form you want to review at the right bottom of the window and click ENTER to validate your choice
• Review the form answers as needed.
• If any edit are done, make sure to save them: go to “File/Save partial case”
• To exit the form click on the last question and press ENTER. The following pop-up window will appear. Click “Yes” to validate your review and go back to the main Menu
6. When you have completed all necessary modifications to the data, select “Exit” from the main Menu and select the green check mark
• The following pop-up window will appear:
• Select “Yes” to exit the application. The following confirmation will appear:
• Select “Yes” to accept the revised case.

91
7. Data processing


Service Availability and Readiness Assessment (SARA) | Implementation Guide
93
After data entry, data should be processed in order to compile all data into a single file as well as to check for inconsistencies and possible errors. Any inconsistencies or errors should be addressed and reconciled in order to create a final, clean data set that is ready for analysis.
The following are the major steps that must be taken when processing and cleaning the SARA dataset:
1. Concatenation
2. Data cleaning
3. Data verification for completeness
4. Calculating sample weights
5. Calculating the SARA indicators
6. Exporting data
The following sections provides details on the SARA data cleaning and processing. These steps are based on the use of CSPro for data collection and data processing but they also provide some generic steps and principles.
7.1 Concatenation 7.1.1 Gathering data files into a single folder on a desktop/laptop computer
After the data has been captured electronically, the data files have to be moved to a single desktop or laptop computer for further processing. Copying data files from the data collectors’ computers to a back-up computer/laptop is usually done by the field supervisors (cf. Chapter 6 – Supervisor’s guide). It is also their responsibility to transfer data collected in the field to the central level.
At the end of the data collection, supervisors should have a folder for each team with the backup files: SARA_TEAM1_DATE1 SARA_TEAM1_DATE2 SARA_TEAM1 SARA_TEAM1_DATE3
The latest file for each team should correspond to the final file. After validation by the supervisor, a copy of the final file should be created and renamed:
SARA_TEAM1_FINAL
The final data set should gather the final files from each team: SARA_TEAM1_FINAL SARA_TEAM2_FINAL SARA_DATA_COLLECTION_FINAL (REGION X) SARA_TEAM3_FINAL
Note: If the standardized SARA analysis tools are to be used, all data processing must be done in CSPro and the final, cleaned data file must be in CSPro format.

7. Data processing
94
This final data set should be transfer to the data manager/focal point at central level in charge of the compilation of the data from field collection. A back-up of all data files (final and stamped with dates) should preciously be saved as back-up and remain accessible during the cleaning and data processing phase.
A USB flash can be used to transfer data from the supervisors’ computers to the data manager/focal point at the central level.
When all data have been transferred, there should be only one final data folder enclosing all data files from all the field teams: SARA_TEAM1_FINAL SARA_TEAM2_FINAL SARA_DATA_COLLECTION_FINAL (…) SARA_TEAM25_FINAL
7.1.2 Data concatenation
If the CSPro data entry application has been used, the data will need to be concatenated into a single data file before any further processing can be done. Concatenation consists of two steps:
1. Combining all the data files by module
2. Consolidating all the modules
If CSPro has been used, the “Concatenate Data” tools in CSPro can be used for these purposes. Before consolidating the data files, any duplicate facility ID’s should be identified. If there are two or more data files containing the same exact facility ID’s, CSPro will not be able to consolidate the files since no two cases are allowed to have identical ID items. If there are duplicates one copy should be deleted prior to consolidating the data files. For step-by-step instructions on Concatenation in CSPro, please refer to Chapter 4 – CSPro.
7.2 Data cleaning 7.2.1 Tracking facilities
Once all the data has been concatenated, the first step in the review process is to take stock of the data and determine what has been collected. It is important to check that all facilities in the sample have been covered, and if not, to keep track of those that are missing. An excel sheet such as the following should be kept by the supervisors during the field data collection to help for this process:

Service Availability and Readiness Assessment (SARA) | Implementation Guide
95
In this example, green is highlighting facilities that were in the original data set and have been assessed. It also indicates that data collectors have entered data in CSPro and data has been validated (as per the steps described in the following section). The facilities highlighted in blue are replacement facilities. It is important to indicate which of the facilities from the original sample have been replaced. Finally the facilities in red are those which could not be assessed- information on why the facility could not be assessed should be enclosed in the tracking table.
This information is extremely useful in understanding what happened during the field data collection as per the original plan. This information will also be very helpful later when calculating sample weights.
7.2.2 Reviewing data files
Each data files should be opened and the following key items checked:
• Facility name and ID number correspond to each other • Facility ID information is correct (facility type, managing authority, as per the master
facility list) • The data collector ID is correct • All forms have been fully completed • Empty cases have been deleted • Duplicate cases have been identified and reconciled • “Other” responses have been recorded as applicable • Geographic coordinates checked (if applicable) • Supervisor validations compared with originals and reconciled
If errors are found in the facility name, facility ID number, facility type, or managing authority, etc. these should be corrected. Key items should be reviewed as follow (based on electronic data collection using CSPro):
Reviewing facility identification
Reviewing facility identification is the first step in data cleaning. It consists on validating the name of the facility and its corresponding identification code, type, managing authority and location as defined in the country master facility list. If any updates have been made to the facility identification during the field data collection all these changes should be captured in the log of the facilities surveyed (as described in the previous section). This will assist the supervisor and other people in charge of the data handling to understand the facility identification and why it differs from the initial master facility list.
It is also important to make sure that the Data collector ID is properly entered in case information. In some cases, the data processors will find discrepancies that need to be reconciled and will need to contact the team responsible or the original data collection. Having the Data collector ID greatly facilitates this process.
Reviewing completeness of a case
It is important to verify that all forms of a case (CSPro electronic version of the paper questionnaire) have been filled properly. The completeness of a case should be verified prior to leaving the facility and double-checked by the supervisor when backing-up the data so that any gaps can be identified and completed if necessary.
Recode “other” responses as applicable
All responses that have “other, please specify” as an answer option should be reviewed to make sure that the response written in the “other” category does not fall into one of the pre-coded categories. If the “other” response does fall into one of the pre-coded categories, it should be recoded as such.

7. Data processing
96
For example: Section 4 - Infrastructure / question Q418: “What is the most commonly used source of water for the facility at this time?”
• The response have been recorded as “Other” and Q418_A has been recorder as “Piped into facility” which is an option in the answer options for Q418.
• The response for Q418 should be updated to “1- Piped into facility”
Delete any empty cases
Occasionally a case will be stored by accident that contains no data. These cases should be removed from the data set.
Final check for any duplicate cases
Duplicate cases are cases with the same facility code. If two cases appear to be duplicates according to facility name, but do not contain the same data, a list of criteria must be used to determine if it is a true duplicate. The following data elements could be used as the criteria for determining duplicates:
• district
• facility code/name
• GPS coordinates (if collected)
• facility type
• managing authority
• interviewer's code.
If these are all the same it is safe to consider the cases as duplicates. At this point, the most complete case should stay in the data set. If both cases are complete, the case with latest time stamp should be kept.
Check the validity of GPS coordinates if applicable
GPS coordinates should be checked to ensure that they fall within the boundaries for the country. Sometimes latitude and longitude coordinates can be entered incorrectly. All GPS coordinates should be double-checked to ensure they are valid for the area being surveyed.
For example, all facilities in Kenya should fall within the following ranges: Latitude: 5°N and 5°S (-5.0000 to 5.0000 in decimal degrees) Longitude: 34° and 42°E (34.0000 to 42.0000 in decimal degrees)
One common mistake is to not record properly the positive (+) and negative (-) values for coordinates. North and East coordinates should be positive (+). South and West coordinates should be (-). Another common mistake is to reverse the recording of longitude and latitude coordinates. Review and edit the GPS coordinates using the same method used above for reviewing and editing the key items for each facility.
If CSPro has been used for the data collection, steps for reviewing/editing data are available in Chapter 4 – CSPro.

Service Availability and Readiness Assessment (SARA) | Implementation Guide
97
7.2.3 Identify supervisor validation records and reconcile with original record
If supervisor validations have been conducted, it is important to identify them in the data set and make sure they have been labelled correctly (Q002 and Interviewer Number). A comparison between the supervisor validation record and the original record should be done and any differences reconciled so that there is ONE record per facility in the final data set. Step-by-steps instructions on using the CSPro Compare Data Tool to compare two data files and identify the differences is available in Chapter 4 – CSPro.
7.2.4 Dependent verification if survey was conducted on paper and entered into CSPro at a later time (if applicable)
Dependent verification is used to check that the electronic data are consistent with the responses in the paper version of the questionnaire. When you verify a case, you key the case a second time as if you were in Add mode. Even though there is already data in the data file, CSEntry does not show this to you. All fields on the current form start out blank. Each time you key a field, the system compares the value you keyed with the value in the data file. If these two values match, you move to the next field. If the values do not match, you get a message telling you so. When this happens, simply rekey the field. One of the following situations will occur:
• The second value you key matches the value in the data file. The system assumes your first value is in error and moves to the next field. There will be no change to the data file for this field.
• The second value you key matches the first value you keyed. The system assumes the value in the data file is in error and moves to the next field. The new value, which you keyed twice, will replace the original value in the data file.
• The second value you key matches neither the value in the data file nor the first value you keyed. The system will throw away the first value you keyed, show you the mismatch message and wait for you to rekey the field again.
For details on verifying cases, see Chapter 4 – CSPro.
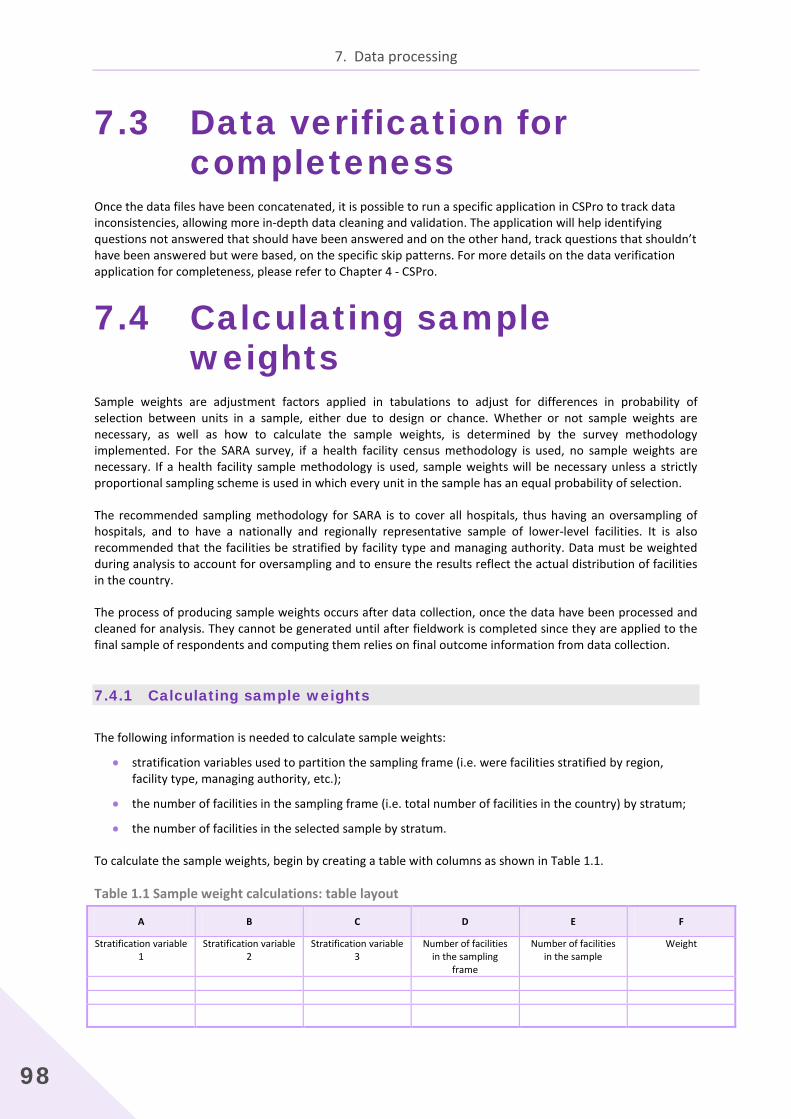
7. Data processing
98
7.3 Data verification for completeness
Once the data files have been concatenated, it is possible to run a specific application in CSPro to track data inconsistencies, allowing more in-depth data cleaning and validation. The application will help identifying questions not answered that should have been answered and on the other hand, track questions that shouldn’t have been answered but were based, on the specific skip patterns. For more details on the data verification application for completeness, please refer to Chapter 4 - CSPro.
7.4 Calculating sample weights
Sample weights are adjustment factors applied in tabulations to adjust for differences in probability of selection between units in a sample, either due to design or chance. Whether or not sample weights are necessary, as well as how to calculate the sample weights, is determined by the survey methodology implemented. For the SARA survey, if a health facility census methodology is used, no sample weights are necessary. If a health facility sample methodology is used, sample weights will be necessary unless a strictly proportional sampling scheme is used in which every unit in the sample has an equal probability of selection.
The recommended sampling methodology for SARA is to cover all hospitals, thus having an oversampling of hospitals, and to have a nationally and regionally representative sample of lower-level facilities. It is also recommended that the facilities be stratified by facility type and managing authority. Data must be weighted during analysis to account for oversampling and to ensure the results reflect the actual distribution of facilities in the country.
The process of producing sample weights occurs after data collection, once the data have been processed and cleaned for analysis. They cannot be generated until after fieldwork is completed since they are applied to the final sample of respondents and computing them relies on final outcome information from data collection.
7.4.1 Calculating sample weights
The following information is needed to calculate sample weights:
• stratification variables used to partition the sampling frame (i.e. were facilities stratified by region, facility type, managing authority, etc.);
• the number of facilities in the sampling frame (i.e. total number of facilities in the country) by stratum;
• the number of facilities in the selected sample by stratum.
To calculate the sample weights, begin by creating a table with columns as shown in Table 1.1.
Table 1.1 Sample weight calculations: table layout
A B C D E F
Stratification variable 1
Stratification variable 2
Stratification variable 3
Number of facilities in the sampling
frame
Number of facilities in the sample
Weight

Service Availability and Readiness Assessment (SARA) | Implementation Guide
99
Fill in Columns A–E with the information from the survey methodology. For example, if the sampling methodology was to stratify by region and facility type, the regions would be displayed in Column A and the facility types would be displayed in Column B. The number of facilities in the sampling frame that correspond to the specified strata would be given in Column D, and the number of facilities in the sample that correspond to the specified strata in Column E. Column F, the sampling weight, is the inverse of the probability of selection of the sample units by stratum, and is calculated as Column D / Column E, or the number of facilities in the sampling frame divided by the number of facilities in the sample.
Table 1.2 provides example data for a SARA survey implemented in country X. Facilities in the sampling frame are stratified by region and facility type. There are four regions (coded 1–4) in the country and five facility types (coded 1–5). Column C is empty because there are only two stratification variables, and therefore can be deleted. If there are four or more stratification variables, additional columns would need to be added after Column C.
Table 1.2 Sample weight calculations: example data
A B C D E F
Stratification variable 1
Stratification variable 2 Stratification variable 3
Number of facilities in the sampling frame
Number of facilities in the
sample
Weight (Column D / Column E)
Northern (1) Hospital (1) 3 3 1.000
Health centre (2) 45 7 6.429
Health post (3) 87 11 7.909
Maternal child health post (4) 132 16 8.250
Clinic (5) 5 3 1.667
Southern (2) Hospital (1) 6 7 0.857
Health centre (2) 60 9 6.667
Health post (3) 68 9 7.556
Maternal child health post (4) 283 35 8.086
Clinic (5) 6 4 1.500
Eastern (3) Hospital (1) 4 4 1.000
Health centre (2) 61 9 6.778
Health post (3) 66 8 8.250
Maternal child health post (4) 179 23 7.782
Clinic (5) 7 5 1.400
Western (4) Hospital (1) 7 5 1.400
Health centre (2) 29 3 9.667
Health post (3) 15 3 5.000
Maternal child health post (4) 29 4 7.250
Clinic (5)
3 1 3.000
Once the weights have been calculated, they need to be added to the final data set. Determine the stratum that each facility belongs to and then assign the appropriate weight. For example, using the weights calculated in Table 1.2, if a facility is a health centre in the Northern region, it would be assigned a weight of 6.429.

7. Data processing
100
7.5 Calculating SARA indicators
SARA indicators can be calculated manually or using other software. Step-by-step approach on calculation of SARA indicators is available on the Chapter 8 – Data analysis. If CSPro has been used for the data collection, a Batch Edit application for generating the SARA indicators is available. It contains logic that you can apply against one set of files to produce another set of files and reports. For the SARA we will use a batch edit application to create additional variables, specifically the SARA indicators.
For the SARA questionnaire, all the SARA indicators have been placed in the data dictionary and a batch edit application has been created to assign the values to each indicator based on the responses to the questions in the questionnaire. If changes have been made to the SARA core questionnaire, these changes will need to be reflected in the batch edit application. Defined stratum and calculated weights (if applicable) will also need to be added to the batch to reflect country specificities.
For detailed step-by-step on calculating SARA indicators using the CSPro batch edit application, please refer to the Chapter 4 – CSPro.
7.6 Exporting data from CSPro Once the indicators have been generated in CSpro, they should be exported for analysis. CSPro has a built-in Export Data application that allows you to quickly and easily export data in a variety of formats. For the SARA data, the CSProExport data application will be used to export the SARA indicators to a txt file. It can then be opened, viewed and saved in Microsoft Excel (XLS). For more details on exporting data from CSPro please refer to Chapter 4 - CSPro.

101
8. Analysis and output


Service Availability and Readiness Assessment (SARA) | Implementation Guide
103
Introduction Once data have been verified, data analysis can begin. There are many different types of results that can be obtained from surveys. The types of analysis used depend to a large extent on the design determined in the planning phase of the SARA survey. Some data analyses are standard and are included in most survey reports. However, not all of the analyses of the survey data need to be included in the final report, as the focus should be on the most important and relevant results. Therefore, survey managers should generate the full range of survey results, and together with the survey coordinating group, select the most significant findings for inclusion in the final report. It is only by conducting a complete analysis of the survey data that it can be assured that important findings have not been overlooked. Based on the initial set of results from the standard analyses, there is often further analysis in areas of interest. Following data analysis, a meeting with the survey coordinating group should be held to assist in interpreting the results and developing recommendations.
Survey indicators are important in providing crucial information for informed policy choices, especially to decision-makers, programme planners and policy-makers. Serving as baselines, indicators are important for setting goals and targets for the future and allow for a certain level of comparability between surveys of different location and time period. Moreover, indicators help place focus on predetermined areas of a survey that are deemed to be most useful, relevant and important to the current health system. Having a consistent indicator set also contributes to standardized analytical reporting.
SARA uses both tracer indicators and composite indicators in data analysis. Tracer indicators aim to provide objective information about whether or not a facility meets the required conditions to support provision of basic or specific services with a consistent level of quality and quantity. Summary or composite indicators, also called indices, are a useful means to summarize and communicate information about multiple indicators and domains of indicators. Composite indices are useful to help get an overall view of the situation and to summarize multiple pieces of information. For SARA, composite indices are useful to compare districts or regions or to look at change over time. However, composite indices also have limitations. It can be difficult to understand the individual factors contributing to an index score, and thus it is important to have information on individual indicator items in addition to composite index scores.
The following sections provide an overview of how to calculate SARA indicators and indices. A detailed tabulation plan is available as Annex and can serve as a guidance document for creating SARA output tables and tabulations. Additionally, the Chapter 4 in the SARA Reference Manual provides a complete listing of the SARA indicators and their detailed definitions.

8. Analysis and output
104
8.1 Calculating SARA results This section will go through the steps by steps explanation of the manual calculation of the SARA indicators and index. The starting point will be the availability of the SARA indicators in XLS format.
The first sub- section will look into calculating the five domains defining the General service readiness. The second sub-section will go through the steps for calculating the Service specific indicators and index.
8.1.1 General service readiness and indicators
General service readiness is described by the following five domains of tracer indicators: • Basic amenities • Basic equipment
• Standard precautions for infection prevention • Diagnostic capacity • Essential medicines.
Each domain consists of a set of tracer items. Table 8.1 lists the tracer indicators for each domain.
Table 8.1 General service readiness items and index
General service domains Tracer items Domain score (mean availability of items)
(a) Basic amenities • Power (a grid or functional generator with fuel) n / 7 × 100, where n is the total number of items available in the domain • Improved water source within 500 m of facility
• Room with auditory and visual privacy for patient consultations
• Access to adequate sanitation facilities
• Communication equipment (phone or short-wave radio)
• Access to computer with e-mail and Internet
• Emergency transportation (b) Basic equipment • Adult scale n / 6 × 100 where n is the total
number of items available in the domain • Child scale
• Thermometer
• Stethoscope
• Blood pressure apparatus
• Light source
(c) Standard precautions for infection prevention
• Safe final disposal of sharps n / 9 × 100 where n is the total number of items available in the domain • Safe final disposal of infectious wastes
• Appropriate storage of sharps waste
• Appropriate storage of infectious waste
• Disinfectant
• Single-use, standard disposable or auto-disable syringes
• Soap and running water or alcohol-based hand rub
• Latex gloves
• Guidelines for standard precautions

Service Availability and Readiness Assessment (SARA) | Implementation Guide
105
General service domains Tracer items Domain score (mean availability of items)
(d) Diagnostic capacity • Haemoglobin n / 8× 100 where n is the total number of items available in the domain • Blood glucose
• Malaria diagnostic capacity (RDT or smear)
• Urine dipstick - protein
• Urine dipstick - glucose
• HIV diagnostic capacity (RDT or ELISA)
• Syphilis RDT
• Urine pregnancy test (e) Essential medicines • Amitriptyline tablet n / 20 × 100 where n is the total
number of items available in the domain • Amlodipine tablet or alternative calcium channel blocker
• Amoxicillin syrup/suspension or dispersible tablet
• Amoxicillin tablet
• Ampicillin powder for injection
• Beclometasone inhaler
• Ceftriaxone injection
• Enalapril tablet or alternative ACE inhibitor
• Fluoxetine tablet
• Gentamicin injection
• Glibenclamide tablet
• Ibuprofen tablet
• Insulin regular injection
• Metformin tablet
• Omeprazole tablet or alternative
• Oral rehydration solution
• Paracetamol tablet
• Salbutamol inhaler
• Simvastatin tablet or other statin
• Zinc sulphate tablet or syrup
General service readiness index (Mean score of the five domains)
(a + b + c + d + e ) / 5
In order to calculate the five domain scores and the general service readiness index, there are four main steps.

8. Analysis and output
106
Step 1. Create variables for the tracer items
Use the definition of each tracer item to create these variables. All variables created for tracer items should have two possible values: 1 if the criteria are met and 0 if the criteria are not met. This calculation is done for each facility.
This example is based on a sample set of data in which the variables have already been recoded to equal "1" if certain criteria are met (for example, the facility has a particular piece of equipment), and "0" if the criteria are not met. Please refer to the detailed definitions of the indicators in the SARA Reference Manual – Chapter 4 - Indicators for indicator criteria.
Table 1.2 provides a sample set of data that shows basic amenities tracer item values for 25 facilities. For each tracer item, the value is "1" if the item is available in a particular facility, and "0" if it is not.
Step 2. Calculate the mean availability of each tracer item
The mean availability of each tracer item is equal to the total number of facilities that have the tracer item available (i.e. value = 1) divided by the total number of facilities, multiplied by 100 to get a percentage value.
Table 8.2 shows how the mean availability of items in the basic amenities domain is calculated. This calculation should be repeated for the tracer items in each of the five general service readiness domains.
Table 8.2 Basic amenities domain: mean availability of items
Facility code
Basic amenities tracer items Power Improved
water source Room with privacy
Adequate sanitation facilities
Communication equipment
Access to computer with Internet
Emergency transportation
1 1 1 1 1 1 1 1 2 1 1 1 1 0 1 0 3 1 1 1 1 1 1 0 4 1 1 1 1 1 0 0 5 0 1 1 1 0 0 1 6 0 0 1 1 0 0 1 7 0 0 0 0 0 0 0 8 0 1 1 1 1 0 1 9 0 0 1 1 1 0 1
10 0 1 1 0 0 0 1 11 0 0 1 1 1 0 1 12 0 0 1 1 0 0 1 13 0 0 0 0 1 0 0 14 0 1 1 1 1 0 1 15 0 1 1 1 1 0 1 16 0 0 0 1 1 0 1 17 0 1 1 0 0 0 1 18 0 1 1 1 1 0 1 19 1 1 1 1 1 0 0 20 0 0 1 0 1 0 0 21 0 1 1 1 0 0 1 22 1 1 1 1 0 0 1 23 1 1 1 1 1 0 0 24 1 0 1 1 0 0 1 25 0 1 1 1 1 0 1
Sum 8 16 22 20 15 3 17 Total number
of facilities 25 25 25 25 25 25 25 Mean (sum /
total 0.32 0.64 0.88 0.80 0.60 0.12 0.68 % (mean ×
100) 32 64 88 80 60 12 68

Service Availability and Readiness Assessment (SARA) | Implementation Guide
107
1. Sum the total number of facilities that have the tracer item available (i.e. value =1) in each column. Power = 1 + 1 + 1 + 1 + 1 + 1 + 1 + 1 = 8 Improved water source = 1 + 1 + 1 + 1 + 1 + 1 + 1 + 1 + 1 + 1 + 1 + 1 + 1 + 1 + 1 + 1 = 16 …
2. Since the total number of facilities in this example is 25, divide each sum by 25 to obtain a mean availability for each item.
Power = 8 / 25 = 0.32 Improved water source = 16 / 25 = 0.64 …
3. Multiply the mean availability of each item by 100 in order to produce a percentage value. Power = 0.32 × 100 = 32% Improved water source = 0.64 × 100 = 64% … The mean availability of tracer items can be displayed in a graph such as the one in Figure 8.1.
Figure 8.1 Percentage of health facilities with basic amenities items
Step 3. Calculate the percentage of facilities that have all the tracer items
The percentage of health facilities that have all the tracer items for a service is equal the sum of facilities that have all the items (if all items, health facility score =1) divided by the total number of facilities, and then multiplied by 100.
Table 8.3 shows how the percentage of health facilities having all the tracer items for the basic amenities is calculated. This calculation should be repeated for each of the five general service readiness domains.
88
88
68
64
60
32
12
0 20 40 60 80 100
Room with privacy
Adequate sanitation facil ities
Emergency transportation
Improved water source
Communication equipment
Power
Access to computer with internet andemail
Trac
er it
ems
Percentage availability (%)

8. Analysis and output
108
Table 8.3 Basic amenities – health facilities that have all the tracer items
Facility code
Basic amenities tracer items Power Improve
d water source
Room with privacy
Adequate sanitation facilities
Communication equipment
Access to computer with Internet
Emergency transportation
HF with all tracer items
1 1 1 1 1 1 1 1 1 2 1 1 1 1 0 1 0 0 3 1 1 1 1 1 1 0 0 4 1 1 1 1 1 0 0 0 5 0 1 1 1 0 0 1 0 6 0 0 1 1 0 0 1 0 7 0 0 0 0 0 0 0 0 8 0 1 1 1 1 0 1 0 9 0 0 1 1 1 0 1 0
10 0 1 1 0 0 0 1 0 11 0 0 1 1 1 0 1 0 12 0 0 1 1 0 0 1 0 13 0 0 0 0 1 0 0 0 14 0 1 1 1 1 0 1 0 15 0 1 1 1 1 0 1 0 16 0 0 0 1 1 0 1 0 17 0 1 1 0 0 0 1 0 18 0 1 1 1 1 0 1 0 19 1 1 1 1 1 0 0 0 20 0 0 1 0 1 0 0 0 21 0 1 1 1 0 0 1 0 22 1 1 1 1 0 0 1 0 23 1 1 1 1 1 0 0 0 24 1 0 1 1 0 0 1 0 25 0 1 1 1 1 0 1 0
Sum
1
Total number of facilities
25 Mean (sum /
total 0.04
% HF with all items (mean
× 100)
4% 1. Score each facility according to the availability of tracer items. The facilities with all tracer items (each item =1) will get the score =1. The facilities that don’t have the entire 7 tracer item will score =0. Power =1, Improved water source =1, Room with privacy =1, Adequate sanitation facilities =1, Communication equipment =1, Access to computer with Internet =1, Emergency transportation=1 Total = 7 score for facility#1=1 2. Sum the number of facilities that have all items and divide it by the total number of facilities. 1 / 25 = 0.04 3. Multiply by 100 to obtain the percentage of health facilities with all tracer items. 0.04 × 100 = 4% This means that 4% of the health facilities have all the seven tracers available. The percentage of facilities having all the tracer items can be displayed with the information generated from step1 and step2 for a comprehensive view on the basic amenities availability and readiness.

Service Availability and Readiness Assessment (SARA) | Implementation Guide
109
Figure 8.2 Basic amenities – facilities with all tracer items
Step 4. Calculate the general service readiness domain scores
The general service readiness domain scores are equal to the sum of the means that were obtained for each tracer item in a domain, divided by the total number of items in the domain, and then multiplied by 100.
Table 8.4 shows how the basic amenities domain score is calculated. This calculation should be repeated for each of the five general service readiness domains.
Table 8.4 Basic amenities domain score
Basic amenities tracer items A
Number of facilities that have the item available
B Total number of
facilities A / B
Power 8 25 0.32 Improved water source 16 25 0.64 Room with privacy 22 25 0.88 Access to adequate sanitation facilities 20 25 0.80 Communication equipment 15 25 0.60 Access to computer with Internet 3 25 0.12 Emergency transportation 17 25 0.68 Sum of values 4.04 Total number of items 7 Mean (sum / total) 0.58 Basic amenities domain score (mean × 100) 58
1. Sum the means obtained for each item (e.g. sum the means of all the items in the basic amenities domain). 0.32 + 0.64 + 0.88 + 0.80 + 0.60 + 0.12 + 0.68 = 4.04 2. Divide by the total number of items. For basic amenities, there are 7 tracer items. 4.04 / 7 = 0.58 3. Multiply by 100 to obtain the domain score. 0.58 × 100 = 58 This means that on average, just over half of the tracer items required for basic amenities are available. The basic amenities domain score can be displayed in a graph such as the one in Figure 8.3. It is presented along with the results from the previous steps for a comprehensive view of the domain.

8. Analysis and output
110
Figure 8.3 Basic amenities domain score
Step 5. Calculate the general service readiness index
The general service readiness index is equal to the sum of the domain scores divided by the number of domains.
The example in Table 8.5 shows how the general service readiness index is calculated. Once the general service readiness domain scores have been calculated for all five domains, they can be aggregated to produce a general service readiness index.
Table 8.5 General service readiness index
General service domains Domain scores
Basic amenities 58
Basic equipment 77
Standard precautions for infection prevention 58
Diagnostic capacity 18
Essential medicines 44
Sum of domain scores 255
Total number of domains 5
General service readiness index (sum of domain scores / total number of domains) 51 1. Sum the five general service readiness domain scores
58 + 77 + 58 + 18 + 44 = 255
2. Divide the sum by the total number of domains to get the general service readiness index 255 / 5 = 51 This means that the general service readiness index, or the mean of the domains scores, is 51. The general service readiness index as well as the five individual domain scores can be displayed in a graph such as the one in Figure 8.4

Service Availability and Readiness Assessment (SARA) | Implementation Guide
111
Figure 8.4 General service readiness index
8.1.2 Specific service availability and readiness indicators
Service-specific availability refers to whether or not a specific service is offered in a facility. Service-specific availability is calculated as the proportion of facilities offering specific services. The number of facilities that offer a service become the denominator for the service-specific readiness calculations.
Service-specific readiness refers to the capacity facility has to provide a service that it offers (measured through consideration of tracer items that include trained staff, guidelines, equipment, diagnostic capacity, medicines and commodities). For service-specific readiness calculations, facilities that do not offer the specific service are NOT included in the readiness calculations as these facilities would not expected to be "ready" to provide a service which they do not offer.
Each service has a readiness indicator that consists of a set of domains, and each domain consists of a set of tracer items. The following four domains are used for service-specific readiness: staff and training, equipment, diagnostics, and medicines and commodities. Not all service readiness indicators include all four domains.
Service-specific readiness indicators are available for the following services (cf. SARA Reference Manual, Chapter 4 – Indicators):
• Family planning • Antenatal care • Basic obstetric care • Comprehensive obstetric care • Child health immunization • Child health preventative and curative care • Adolescent health services • Lifesaving commodities for women and children • Malaria diagnosis or treatment • Tuberculosis diagnosis services • HIV counselling and testing • HIV/AIDS care and support services • Antiretroviral prescription and client management • Prevention of mother-to-child transmission (PMTCT) of HIV • Sexually transmitted infections diagnosis or treatment • Noncommunicable diseases diagnosis or management: diabetes, cardiovascular disease, chronic
respiratory disease and cervical cancer screening • Basic and comprehensive surgical care • Blood transfusion • Laboratory capacity
5158
77
58
18
44
0
20
40
60
80
100
Generalservice
readiness
Basicamenities
Basicequipment
Standardprecautionsfor infectionprevention
Diagnosticcapacity
Essentialmedicines
Domain
Scor
e
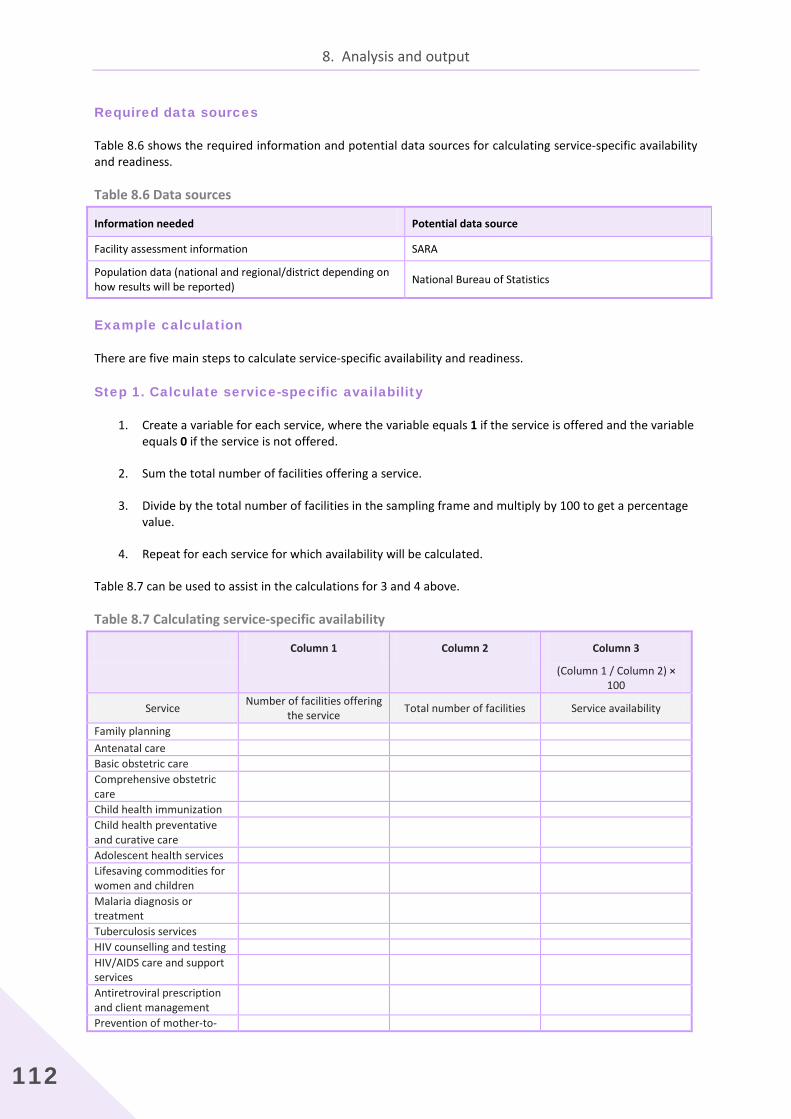
8. Analysis and output
112
Required data sources
Table 8.6 shows the required information and potential data sources for calculating service-specific availability and readiness.
Table 8.6 Data sources
Information needed Potential data source
Facility assessment information SARA
Population data (national and regional/district depending on how results will be reported) National Bureau of Statistics
Example calculation
There are five main steps to calculate service-specific availability and readiness.
Step 1. Calculate service-specific availability
1. Create a variable for each service, where the variable equals 1 if the service is offered and the variable equals 0 if the service is not offered.
2. Sum the total number of facilities offering a service.
3. Divide by the total number of facilities in the sampling frame and multiply by 100 to get a percentage value.
4. Repeat for each service for which availability will be calculated.
Table 8.7 can be used to assist in the calculations for 3 and 4 above.
Table 8.7 Calculating service-specific availability
Column 1 Column 2 Column 3
(Column 1 / Column 2) × 100
Service Number of facilities offering the service Total number of facilities Service availability
Family planning Antenatal care Basic obstetric care Comprehensive obstetric care
Child health immunization Child health preventative and curative care
Adolescent health services Lifesaving commodities for women and children
Malaria diagnosis or treatment
Tuberculosis services HIV counselling and testing HIV/AIDS care and support services
Antiretroviral prescription and client management
Prevention of mother-to-
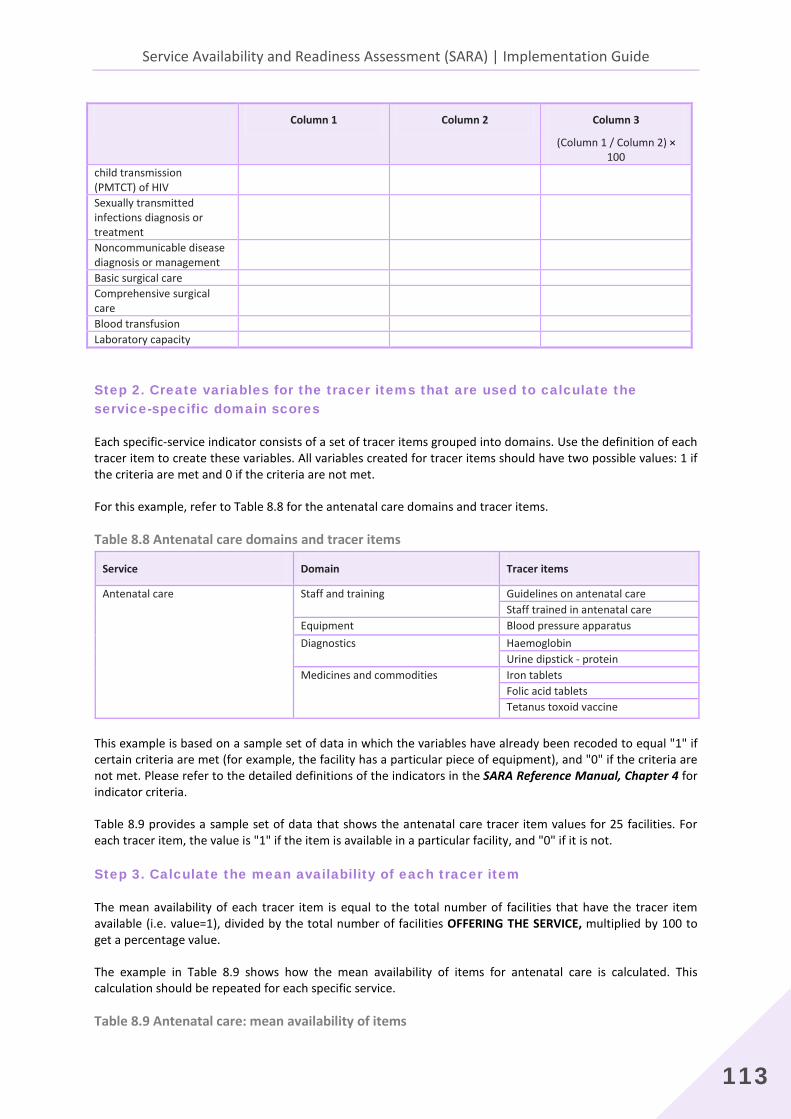
Service Availability and Readiness Assessment (SARA) | Implementation Guide
113
Column 1 Column 2 Column 3
(Column 1 / Column 2) × 100
child transmission (PMTCT) of HIV Sexually transmitted infections diagnosis or treatment
Noncommunicable disease diagnosis or management
Basic surgical care Comprehensive surgical care
Blood transfusion Laboratory capacity
Step 2. Create variables for the tracer items that are used to calculate the service-specific domain scores
Each specific-service indicator consists of a set of tracer items grouped into domains. Use the definition of each tracer item to create these variables. All variables created for tracer items should have two possible values: 1 if the criteria are met and 0 if the criteria are not met.
For this example, refer to Table 8.8 for the antenatal care domains and tracer items.
Table 8.8 Antenatal care domains and tracer items
Service Domain Tracer items
Antenatal care Staff and training Guidelines on antenatal care Staff trained in antenatal care
Equipment Blood pressure apparatus Diagnostics Haemoglobin
Urine dipstick - protein Medicines and commodities Iron tablets
Folic acid tablets Tetanus toxoid vaccine
This example is based on a sample set of data in which the variables have already been recoded to equal "1" if certain criteria are met (for example, the facility has a particular piece of equipment), and "0" if the criteria are not met. Please refer to the detailed definitions of the indicators in the SARA Reference Manual, Chapter 4 for indicator criteria.
Table 8.9 provides a sample set of data that shows the antenatal care tracer item values for 25 facilities. For each tracer item, the value is "1" if the item is available in a particular facility, and "0" if it is not.
Step 3. Calculate the mean availability of each tracer item
The mean availability of each tracer item is equal to the total number of facilities that have the tracer item available (i.e. value=1), divided by the total number of facilities OFFERING THE SERVICE, multiplied by 100 to get a percentage value.
The example in Table 8.9 shows how the mean availability of items for antenatal care is calculated. This calculation should be repeated for each specific service.
Table 8.9 Antenatal care: mean availability of items

8. Analysis and output
114
Facility code
Antenatal care tracer items
Guidelines Trained staff
Blood pressure apparatus Haemoglobin
Urine dipstick - protein
Iron tablets
Folic acid tablets
Tetanus toxoid vaccine
1 1 1 1 0 0 1 1 1 2 1 1 1 0 0 0 0 0 3 1 1 1 1 1 1 0 0 4 0 1 0 0 0 0 0 1 5 0 1 1 0 0 0 1 1 6 1 1 0 0 0 1 1 0 7 1 1 1 0 0 1 0 0 8 0 1 0 0 0 1 1 1 9 1 0 1 0 0 1 1 1
10 0 1 0 0 0 1 1 1 11 0 0 0 0 0 1 0 1 12 0 1 1 0 0 1 1 1 13 1 1 1 0 0 1 1 1 14 0 1 1 0 0 1 1 1 15 1 1 1 0 0 1 1 1 16 1 1 1 0 0 1 1 0 17 1 1 1 0 0 1 1 0 18 1 1 1 0 0 1 1 1 19 0 1 1 0 0 1 1 1 20 0 1 1 0 0 1 0 0 21 0 1 1 0 0 1 1 1 22 0 1 1 1 1 1 1 1 23 0 1 1 0 0 1 1 0 24 0 1 1 1 1 1 1 1 25 0 0 1 0 0 1 1 0
Sum 11 22 20 3 3 22 19 16 Total
number of
facilities 25 25 25 25 25 25 25 25 Mean
(sum / total) 0.44 0.88 0.80 0.12 0.12 0.88 0.76 0.64
% (mean ×
100) 44 88 80 12 12 88 76 64 1. Sum the total amount of available items (i.e. value = 1) in each column.
Guidelines = 1 + 1 + 1 + 1 + 1 + 1 + 1 + 1 + 1 + 1 + 1= 11 Trained staff = 1 + 1 + 1 + 1 + 1 + 1 + 1 + 1 + 1 + 1 + 1 + 1 + 1 + 1 + 1 + 1 + 1 + 1 + 1 + 1 + 1 + 1 = 22
… 2. Divide each sum by the total number of facilities to obtain a mean availability for each item. Guidelines = 11 / 25 = 0.44 Trained staff = 22 / 25 = 0.88 … 3. Multiply by 100 in order to produce a percentage value. Guidelines = 0.44 × 100 = 44% Trained staff = 0.88 × 100 = 88% … The mean availability of tracer items can be displayed in a graph such as the one in Figure 8.5.
Figure 8.5 Percentage availability of antenatal care tracer items

Service Availability and Readiness Assessment (SARA) | Implementation Guide
115
Step 4. Calculate the service-specific domain scores
Once the mean availability of each tracer item has been obtained, they can be aggregated to produce service-specific domain scores. There are four domains for each specific service: staff and training, equipment, diagnostics, and medicines and commodities. For each domain, sum the means for the items contained in the domain, then divide the domain sums by the total number of items in the domain, and multiply by 100.
Table 8.10 shows how the antenatal care domain scores are calculated. This calculation should be repeated for each of the specific services.
Table 8.10 Antenatal care domain scores Antenatal care tracer items Antenatal care domains
Staff and training Equipment Diagnostics Medicines and commodities Guidelines 0.44 Trained staff 0.88 Blood pressure apparatus 0.80 Haemoglobin test 0.12 Urine protein test 0.12 Iron tablets 0.88 Folic acid tablets 0.76 Tetanus toxoid vaccine 0.64 Sum of values 1.32 0.80 0.24 2.28 Total number of items 2 1 2 3 Mean (sum / total) 0.66 0.80 0.12 0.76 Domain score (mean *100) 66 80 12 76
1. Sum the means for the items contained in each domain. Staff and training: 0.44 + 0.88 = 1.32 Equipment: 0.80 = 0.80 Diagnostics: 0.12 + 0.12 = 0.24
Medicines and commodities: 0.88 + 0.76 + 0.64 = 2.28 2. Divide the domain sums by the total number of items in each domain. Staff and training: 1.32 / 2 = 0.66 Equipment: 0.80 / 1 = 0.80 Diagnostics: 0.24 / 2 = 0.12
Medicines and commodities: 2.28 / 3 = 0.76
88
44
80
12
12
88
76
64
0 20 40 60 80 100
Staff trained ANC
Guidelines ANC
BP apparatus
Urine dipstick protein
Haemoglobin test
Iron tablets
Folic acid tablets
Tetanus toxoid vaccine
Trac
er it
ems
Percentage availability (%)
Staff and guidelines Equipment Diagnostics Medicines and commodities
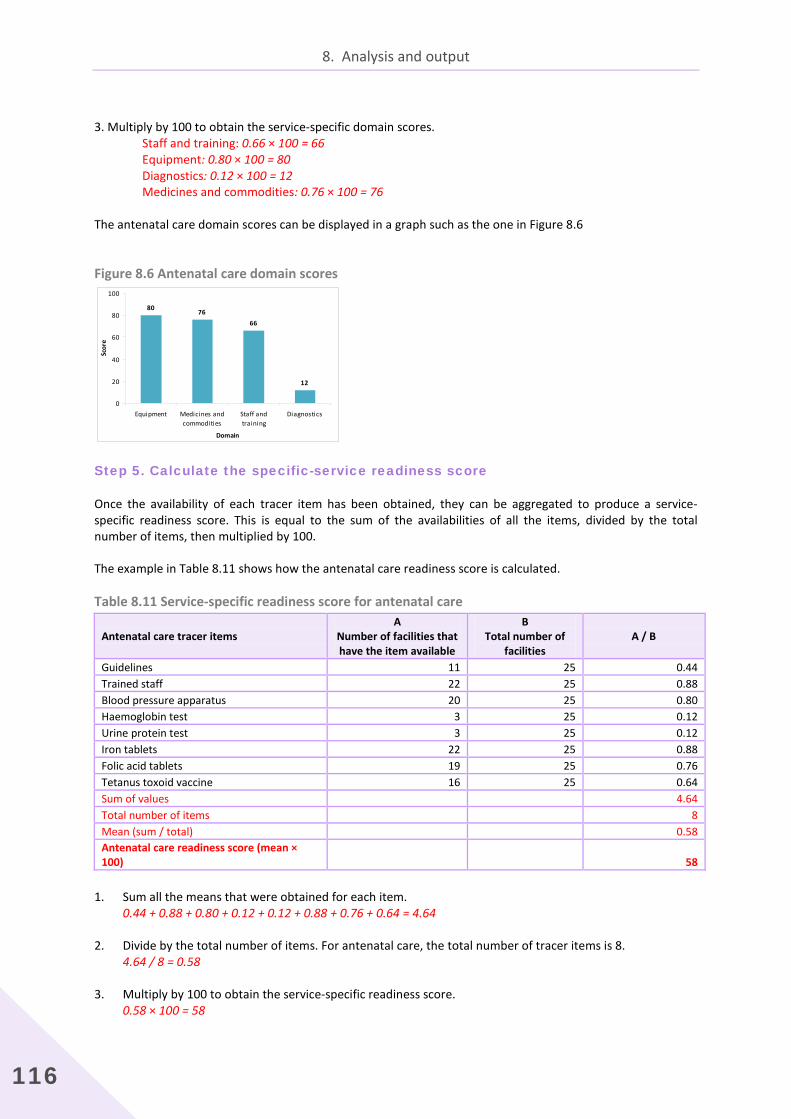
8. Analysis and output
116
3. Multiply by 100 to obtain the service-specific domain scores.
Staff and training: 0.66 × 100 = 66 Equipment: 0.80 × 100 = 80 Diagnostics: 0.12 × 100 = 12
Medicines and commodities: 0.76 × 100 = 76 The antenatal care domain scores can be displayed in a graph such as the one in Figure 8.6
Figure 8.6 Antenatal care domain scores
Step 5. Calculate the specific-service readiness score
Once the availability of each tracer item has been obtained, they can be aggregated to produce a service-specific readiness score. This is equal to the sum of the availabilities of all the items, divided by the total number of items, then multiplied by 100.
The example in Table 8.11 shows how the antenatal care readiness score is calculated.
Table 8.11 Service-specific readiness score for antenatal care
Antenatal care tracer items A
Number of facilities that have the item available
B Total number of
facilities A / B
Guidelines 11 25 0.44 Trained staff 22 25 0.88 Blood pressure apparatus 20 25 0.80 Haemoglobin test 3 25 0.12 Urine protein test 3 25 0.12 Iron tablets 22 25 0.88 Folic acid tablets 19 25 0.76 Tetanus toxoid vaccine 16 25 0.64 Sum of values 4.64 Total number of items 8 Mean (sum / total) 0.58 Antenatal care readiness score (mean × 100) 58
1. Sum all the means that were obtained for each item. 0.44 + 0.88 + 0.80 + 0.12 + 0.12 + 0.88 + 0.76 + 0.64 = 4.64 2. Divide by the total number of items. For antenatal care, the total number of tracer items is 8.
4.64 / 8 = 0.58 3. Multiply by 100 to obtain the service-specific readiness score.
0.58 × 100 = 58
80 7666
12
0
20
40
60
80
100
Equipment Medicines andcommodities
Staff andtraining
Diagnostics
Domain
Scor
e
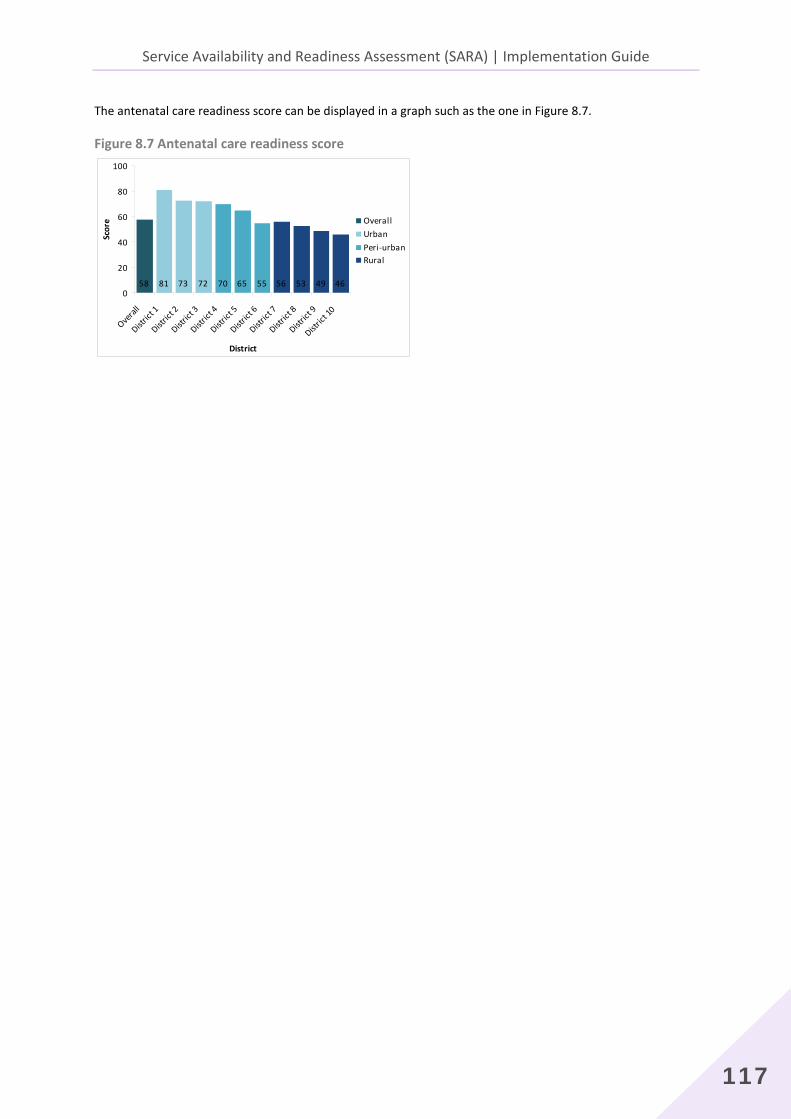
Service Availability and Readiness Assessment (SARA) | Implementation Guide
117
The antenatal care readiness score can be displayed in a graph such as the one in Figure 8.7.
Figure 8.7 Antenatal care readiness score
58 81 73 72 70 65 55 56 53 49 460
20
40
60
80
100
Overal
l
Distric
t 1
Distric
t 2
Distric
t 3
Distric
t 4
Distric
t 5
Distric
t 6
Distric
t 7
Distric
t 8
Distric
t 9
Distric
t 10
District
Scor
e OverallUrbanPeri-urbanRural

8. Analysis and output
118
8.2 Alternative method of calculations
The examples above have taken sums and means by tracer item (i.e. columns), to arrive at the readiness scores. It is also possible to compute the readiness scores by taking sums and means by facility (i.e. rows). The resulting readiness score should be the same as can be seen in Table 8.12.
Table 8.12 Basic amenities domain: mean availability of tracer items by facility
Facility code
Basic amenities tracer items Mean availability of tracer items
Power Improved water source
Room with privacy
Adequate sanitation facilities
Communication equipment
Access to computer with Internet
Emergency transportation
1 1 1 1 1 1 1 1 1.00
2 1 1 1 1 0 1 0 0.71
3 1 1 1 1 1 1 0 0.86
4 1 1 1 1 1 0 0 0.71
5 0 1 1 1 0 0 1 0.57
6 0 0 1 1 0 0 1 0.43
7 0 0 0 0 0 0 0 0.00
8 0 1 1 1 1 0 1 0.71
9 0 0 1 1 1 0 1 0.57
10 0 1 1 0 0 0 1 0.43
11 0 0 1 1 1 0 1 0.57
12 0 0 1 1 0 0 1 0.43
13 0 0 0 0 1 0 0 0.14
14 0 1 1 1 1 0 1 0.71
15 0 1 1 1 1 0 1 0.71
16 0 0 0 1 1 0 1 0.43
17 0 1 1 0 0 0 1 0.43
18 0 1 1 1 1 0 1 0.71
19 1 1 1 1 1 0 0 0.71
20 0 0 1 0 1 0 0 0.29
21 0 1 1 1 0 0 1 0.57
22 1 1 1 1 0 0 1 0.71
23 1 1 1 1 1 0 0 0.71
24 1 0 1 1 0 0 1 0.57
25 0 1 1 1 1 0 1 0.71
Sum of values 14.43
Total number of facilities 25
Mean (sum / total) 0.58
Basic amenities domain
score (mean × 100) 58
The advantage of computing means by facility (row) is that it is easier to compute readiness scores by different units of aggregation (e.g. region, facility type, managing authority, urban/rural) if the mean scores have already been computed by facility. For example, to compute the readiness scores by region, one simply takes the mean of the facility scores for all facilities by region. If mean scores are computed by tracer item (column) instead of by facility, the process is more cumbersome: availabilities for each tracer item would need to be computed for each region, and then the mean computed to obtain the readiness scores by region.

Service Availability and Readiness Assessment (SARA) | Implementation Guide
119
8.3 Sample weights
Sample weights are adjustment factors applied in tabulations to adjust for differences in probability of selection between units in a sample, either due to design or chance. Whether or not sample weights are necessary, as well as how to calculate the sample weights, is determined by the survey methodology implemented. For the SARA survey, if a health facility census methodology is used, no sample weights are necessary. If a health facility sample methodology is used, sample weights will be necessary unless a strictly proportional sampling scheme is used in which every unit in the sample has an equal probability of selection.
The recommended sampling methodology for SARA is to cover all hospitals, thus having an oversampling of hospitals, and to have a nationally and regionally representative sample of lower-level facilities. It is also recommended that the facilities be stratified by facility type and managing authority. Data must be weighted during analysis to account for oversampling and to ensure the results reflect the actual distribution of facilities in the country.
The process of producing sample weights occurs after data collection, once the data have been processed and cleaned for analysis. They cannot be generated until after fieldwork is completed since they are applied to the final sample of respondents and computing them relies on final outcome information from data collection.
8.3.1 Calculating sample weights
The following information is needed to calculate sample weights:
stratification variables used to partition the sampling frame (i.e. were facilities stratified by region, facility type, managing authority, etc.);
the number of facilities in the sampling frame (i.e. total number of facilities in the country) by stratum;
the number of facilities in the selected sample by stratum.
To calculate the sample weights, begin by creating a table with columns as shown in Table 8.13.
Table 8.13 Sample weight calculations: table layout
A B C D E F
Stratification variable 1
Stratification variable 2
Stratification variable 3
Number of facilities in the sampling frame
Number of facilities in the
sample
Weight
Fill in Columns A–E with the information from the survey methodology. For example, if the sampling methodology was to stratify by region and facility type, the regions would be displayed in Column A and the facility types would be displayed in Column B. The number of facilities in the sampling frame that correspond to the specified strata would be given in Column D, and the number of facilities in the sample that correspond to the specified strata in Column E. Column F, the sampling weight, is the inverse of the probability of selection of the sample units by stratum, and is calculated as Column D / Column E, or the number of facilities in the sampling frame divided by the number of facilities in the sample.
Table 8.14 provides example data for a SARA survey implemented in country X. Facilities in the sampling frame are stratified by region and facility type. There are four regions (coded 1–4) in the country and five facility types

8. Analysis and output
120
(coded 1–5). Column C is empty because there are only two stratification variables, and therefore can be deleted. If there are four or more stratification variables, additional columns would need to be added after Column C.
Table 8.14 Sample weight calculations: example data
A B C D E F
Stratification variable 1
Stratification variable 2 Stratification variable 3
Number of facilities in the sampling
frame
Number of facilities in the sample
Weight (Column D / Column E)
Northern (1) Hospital (1) 3 3 1.000 Health centre (2) 45 7 6.429 Health post (3) 87 11 7.909 Maternal child health post (4) 132 16 8.250 Clinic (5) 5 3 1.667 Southern (2) Hospital (1) 6 7 0.857 Health centre (2) 60 9 6.667 Health post (3) 68 9 7.556 Maternal child health post (4) 283 35 8.086 Clinic (5) 6 4 1.500 Eastern (3) Hospital (1) 4 4 1.000 Health centre (2) 61 9 6.778 Health post (3) 66 8 8.250 Maternal child health post (4) 179 23 7.782 Clinic (5) 7 5 1.400 Western (4) Hospital (1) 7 5 1.400 Health centre (2) 29 3 9.667 Health post (3) 15 3 5.000 Maternal child health post (4) 29 4 7.250
Clinic (5)
3 1 3.000
Once the weights have been calculated, they need to be added to the final data set. Determine the stratum that each facility belongs to and then assign the appropriate weight. For example, using the weights calculated in Table 8.14, if a facility is a health centre in the Northern region, it would be assigned a weight of 6.429.
The process for adding weights to the data set will depend on the software chosen. Instructions for adding weights to the data set using CSPro can be found in the SARA Implementation Guide – Chapter 4 - CSPro.
8.3.2 Applying sample weights
This section provides an example of applying weights to the general service readiness indicators. The same process is applied for applying weights to both general service readiness indicators and service-specific indicators. For service-specific indicators however, the denominator is number of facilities offering the service, not the total number of facilities.
Using the same data set as used in Section 8.1 for basic amenities, this example shows how facility weights can be applied to the indicator calculations. Having calculated the sample weights, the main difference between calculating general service availability with and without weights comes in Step 3 with creating WEIGHTED tracer item scores and in Step 4 where the denominator changes to the number of facilities in the SAMPLE FRAME. Other than these, the calculations proceed as in Section 8.1.
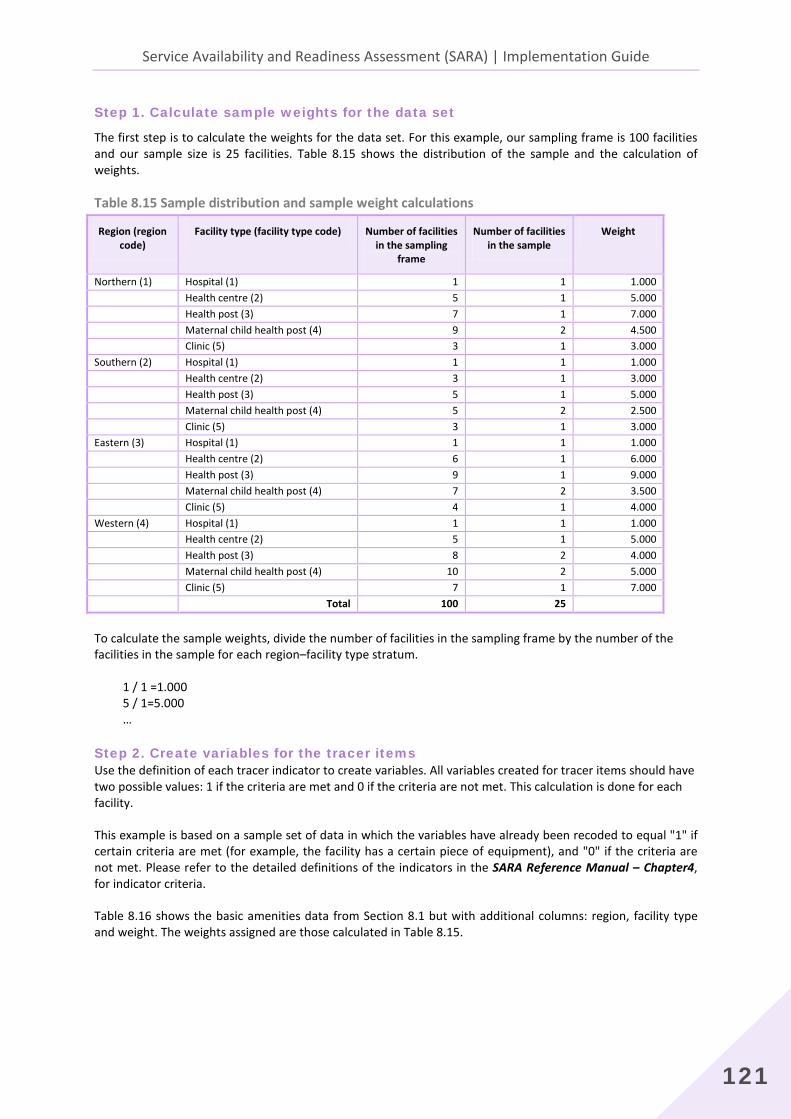
Service Availability and Readiness Assessment (SARA) | Implementation Guide
121
Step 1. Calculate sample weights for the data set
The first step is to calculate the weights for the data set. For this example, our sampling frame is 100 facilities and our sample size is 25 facilities. Table 8.15 shows the distribution of the sample and the calculation of weights.
Table 8.15 Sample distribution and sample weight calculations
Region (region code)
Facility type (facility type code) Number of facilities in the sampling
frame
Number of facilities in the sample
Weight
Northern (1) Hospital (1) 1 1 1.000 Health centre (2) 5 1 5.000 Health post (3) 7 1 7.000 Maternal child health post (4) 9 2 4.500 Clinic (5) 3 1 3.000 Southern (2) Hospital (1) 1 1 1.000 Health centre (2) 3 1 3.000 Health post (3) 5 1 5.000 Maternal child health post (4) 5 2 2.500 Clinic (5) 3 1 3.000 Eastern (3) Hospital (1) 1 1 1.000 Health centre (2) 6 1 6.000 Health post (3) 9 1 9.000 Maternal child health post (4) 7 2 3.500 Clinic (5) 4 1 4.000 Western (4) Hospital (1) 1 1 1.000 Health centre (2) 5 1 5.000 Health post (3) 8 2 4.000 Maternal child health post (4) 10 2 5.000 Clinic (5) 7 1 7.000 Total 100 25
To calculate the sample weights, divide the number of facilities in the sampling frame by the number of the facilities in the sample for each region–facility type stratum. 1 / 1 =1.000 5 / 1=5.000 …
Step 2. Create variables for the tracer items Use the definition of each tracer indicator to create variables. All variables created for tracer items should have two possible values: 1 if the criteria are met and 0 if the criteria are not met. This calculation is done for each facility.
This example is based on a sample set of data in which the variables have already been recoded to equal "1" if certain criteria are met (for example, the facility has a certain piece of equipment), and "0" if the criteria are not met. Please refer to the detailed definitions of the indicators in the SARA Reference Manual – Chapter4, for indicator criteria.
Table 8.16 shows the basic amenities data from Section 8.1 but with additional columns: region, facility type and weight. The weights assigned are those calculated in Table 8.15.

8. Analysis and output
122
Table 8.16 Basic amenities domain: sample data set with weights
Facility code
Region code
Facility type code
Weight
Basic amenities tracer items Power Improv
ed water source
Room with privacy
Adequate sanitation facilities
Communication equipment
Access to computer with Internet
Emergency transportation
1 1 1 1.000 1 1 1 1 1 1 1 2 2 1 1.000 1 1 1 1 0 1 0 3 3 1 1.000 1 1 1 1 1 1 0 4 4 1 1.000 1 1 1 1 1 0 0 5 1 2 5.000 0 1 1 1 0 0 1 6 2 2 3.000 0 0 1 1 0 0 1 7 3 2 6.000 0 0 0 0 0 0 0 8 4 2 5.000 0 1 1 1 1 0 1 9 1 3 7.000 0 0 1 1 1 0 1
10 2 3 5.000 0 1 1 0 0 0 1 11 3 3 9.000 0 0 1 1 1 0 1 12 4 3 4.000 0 0 1 1 0 0 1 13 4 3 4.000 0 0 0 0 1 0 0 14 1 4 4.500 0 1 1 1 1 0 1 15 1 4 4.500 0 1 1 1 1 0 1 16 2 4 2.500 0 0 0 1 1 0 1 17 2 4 2.500 0 1 1 0 0 0 1 18 3 4 3.500 0 1 1 1 1 0 1 19 3 4 3.500 1 1 1 1 1 0 0 20 4 4 5.000 0 0 1 0 1 0 0 21 4 4 5.000 0 1 1 1 0 0 1 22 1 5 3.000 1 1 1 1 0 0 1 23 2 5 3.000 1 1 1 1 1 0 0 24 3 5 4.000 1 0 1 1 0 0 1 25 4 3 7.000 0 1 1 1 1 0 1
Step 3. Calculate the WEIGHTED tracer item score
Table 8.17 shows the WEIGHTED tracer item scores for the basic amenities tracer items, which is equal to the weight (Column 4) multiplied by the item value (either 1 or 0) from Table 8.16.
Table 8.17 Basic amenities domain tracer items weighted
Facility code
Region code
Facility type code
Weight
Basic amenities tracer items: WEIGHTED values
Power_W Improved water source_W
Room with privacy_W
Adequate sanitation facilities_W
Communication equipment_W
Access to computer with Internet_W
Emergency transportation_W
1 1 1 1.000 1 1 1 1 1 1 1 2 2 1 1.000 1 1 1 1 0 1 0 3 3 1 1.000 1 1 1 1 1 1 0 4 4 1 1.000 1 1 1 1 1 0 0 5 1 2 5.000 0 5 5 5 0 0 5 6 2 2 3.000 0 0 3 3 0 0 3 7 3 2 6.000 0 0 0 0 0 0 0 8 4 2 5.000 0 5 5 5 5 0 5 9 1 3 7.000 0 0 7 7 7 0 7
10 2 3 5.000 0 5 5 0 0 0 5 11 3 3 9.000 0 0 9 9 9 0 9 12 4 3 4.000 0 0 4 4 0 0 4 13 4 3 4.000 0 0 0 0 4 0 0 14 1 4 4.500 0 4.5 4.5 4.5 4.5 0 4.5

Service Availability and Readiness Assessment (SARA) | Implementation Guide
123
15 1 4 4.500 0 4.5 4.5 4.5 4.5 0 4.5 16 2 4 2.500 0 0 0 2.5 2.5 0 2.5 17 2 4 2.500 0 2.5 2.5 0 0 0 2.5 18 3 4 3.500 0 3.5 3.5 3.5 3.5 0 3.5 19 3 4 3.500 3.5 3.5 3.5 3.5 3.5 0 0 20 4 4 5.000 0 0 5 0 5 0 0 21 4 4 5.000 0 5 5 5 0 0 5 22 1 5 3.000 3 3 3 3 0 0 3 23 2 5 3.000 3 3 3 3 3 0 0 24 3 5 4.000 4 0 4 4 0 0 4 25 4 3 7.000 0 7 7 7 7 0 7
Step 4. Calculate the WEIGHTED mean availability of each tracer item
The mean availability of each tracer item is equal to the sum of the WEIGHTED tracer item scores divided by the total number of facilities in the sample frame, multiplied by 100 to get a percentage value.
Table 8.18 shows how the WEIGHTED mean availability of tracer items for basic amenities is calculated.
Table 8.18 Basic amenities domain: weighted mean availability of tracer items
Facility code
Region code
Facility type code
Weight
Basic amenities tracer items: WEIGHTED values
Power_W
Improved water source_W
Room with privacy_W
Adequate sanitation facilities_W
Communication equipment_W
Access to computer with Internet _W
Emergency transportation_W
1 1 1 1.000 1 1 1 1 1 1 1 2 2 1 1.000 1 1 1 1 0 1 0 3 3 1 1.000 1 1 1 1 1 1 0 4 4 1 1.000 1 1 1 1 1 0 0 5 1 2 5.000 0 5 5 5 0 0 5 6 2 2 3.000 0 0 3 3 0 0 3 7 3 2 6.000 0 0 0 0 0 0 0 8 4 2 5.000 0 5 5 5 5 0 5 9 1 3 7.000 0 0 7 7 7 0 7
10 2 3 5.000 0 5 5 0 0 0 5 11 3 3 9.000 0 0 9 9 9 0 9 12 4 3 4.000 0 0 4 4 0 0 4 13 4 3 4.000 0 0 0 0 4 0 0 14 1 4 4.500 0 4.5 4.5 4.5 4.5 0 4.5 15 1 4 4.500 0 4.5 4.5 4.5 4.5 0 4.5 16 2 4 2.500 0 0 0 2.5 2.5 0 2.5 17 2 4 2.500 0 2.5 2.5 0 0 0 2.5 18 3 4 3.500 0 3.5 3.5 3.5 3.5 0 3.5 19 3 4 3.500 3.5 3.5 3.5 3.5 3.5 0 0 20 4 4 5.000 0 0 5 0 5 0 0 21 4 4 5.000 0 5 5 5 0 0 5 22 1 5 3.000 3 3 3 3 0 0 3 23 2 5 3.000 3 3 3 3 3 0 0 24 3 5 4.000 4 0 4 4 0 0 4 25 4 3 7.000 0 7 7 7 7 0 7
Sum 17.5 55.5 87.5 77.5 61.5 3 75.5 Total
number of
facilities 100 100 100 100 100 100 100

8. Analysis and output
124
Facility code
Region code
Facility type code
Weight
Basic amenities tracer items: WEIGHTED values
Power_W
Improved water source_W
Room with privacy_W
Adequate sanitation facilities_W
Communication equipment_W
Access to computer with Internet _W
Emergency transportation_W
Mean (sum
/ total) 0.175 0.555 0.875 0.775 0.615 0.030 0.775
% (mea
n × 100) 17.5 55.5 87.5 77.5 61.5 3.0 75.5
1. Sum the total amount of available items in each column.
Power = 1 + 1 + 1 + 1 + 3.5 + 3 + 3 + 4 = 17.5 Improved water source = 1 + 1 + 1 + 1 + 5 + 5 + 5 + 4.5 + 4.5 + 2.5 + 3.5 + 3.5 + 5 + 3 + 3 + 7 =55.5 …
2. Since the total number of facilities in the sampling frame is 100, divide each sum by 100 to obtain a
WEIGHTED mean availability for each item. Power = 17.5 / 100 = 0.175 Improved water source = 55.5 / 100 =0.555 … 3. Multiply the WEIGHTED mean availability of each item by 100 in order to produce a percentage value. Power = 0.175 × 100 = 17.5% Improved water source = 0.555 × 100 = 55.5% …
Step 5. Calculate the WEIGHTED general service readiness domain scores
The weighted general service readiness domain scores are equal to the sum of the WEIGHTED means that were obtained for each tracer item in a domain divided by the total number of items in the domain, then multiplied by 100.
Table 8.19 shows how the basic amenities WEIGHTED domain score is calculated. This calculation should be repeated for each of the five general service readiness domains.
Table 8.19 Basic amenities domain score (weighted) Basic amenities tracer items Sum Total Sum / Total) Power 17.5 100 0.175 Improved water source 55.5 100 0.555 Room with privacy 87.5 100 0.875 Access to adequate sanitation facilities 77.5 100 0.775 Communication equipment 61.5 100 0.615 Access to computer with Internet 3.0 100 0.030 Emergency transportation 75.5 100 0.755 Sum of values 3.780 Total number of items 7 Mean (sum / total) 0.54 Weighted basic amenities domain score (mean × 100) 54
1. Sum the WEIGHTED means that were obtained for each item (e.g. sum the WEIGHTED means of all the
items in the basic amenities domain). 0.175 + 0.555 + 0.875 + 0.775 + 0.615 + 0.030 + 0.755 = 3.78

Service Availability and Readiness Assessment (SARA) | Implementation Guide
125
2. Divide by the total number of items. For basic amenities, there are 7 tracer items. 3.78 / 7 = 0.54 3. Multiply by 100 to obtain the domain score.
0.54 × 100 = 54
Step 6. Calculate the WEIGHTED general service readiness index
The weighted general service readiness index is equal to the sum of the weighted domain scores divided by the number of domains.
The example in Table 8.20 shows how the WEIGHTED general service readiness index is calculated. Once the WEIGHTED general service readiness domain scores have been calculated for all five domains, they can be aggregated to produce a general service readiness index.
Table 8.20 General service readiness index (weighted)
General service domains (weighted) Domain scores
Basic amenities 54
Basic equipment 75
Standard precautions for infection prevention 53
Diagnostic capacity 12
Essential medicines 38
Sum of domain scores 232
Total number of domains 5
General service readiness index (sum of domain scores / total number of domains) 46
1. Sum the five WEIGHTED general service readiness domain scores 54 + 75 + 53 + 12 + 38 = 232
2. Divide the sum by the total number of domains to get the WEIGHTED general service readiness index 232 / 5 = 46

8. Analysis and output
126
8.4 Importing data to the SARA analysis tool
The SARA analysis tool has been developed to quickly produced, in an automated manner, SARA standard results including tables and graphs on the indicators.
Prior to using the tool, the SARA indicators should have been generated using the Batch edit application and Data export function from the CSPro (Chapter 7 – Data cleaning and processing).
Step 1: Opening the exported data file into Excel
To open this file using Microsoft Excel, start Microsoft Excel and open a blank workbook. Then click on File -> Open -> and browse to where the SARA_Indicators_Export.txt file is saved. Make sure that all files is selected so that the txt file will show in the browse window. Select the SARA_Indicators_Export.txt file and click on Open.
The text import window will open. Make the following selections:
• Step 1: File type- select Delimited; check box- My data has headers;
• Step 2: Delimiters- make sure only Tab box is checked;
• Step 3: Column data format- select General. Then click on Finish.
The txt file is now open in Microsoft Excel. Click on File -> Save as and change the save as type to Excel Workbook. The file is now saved as an XLS file.
When you open the XLS file, the following column headers should be present in the order specified in the table below (from left to right in the XLS file). If this is not the case, please edit the XLS file until it matches this structure.
*Please read this table starting at the top of column one, read down column one and when you reach the end, please go to the top of column two. Continue in this fashion for the eight columns. You can also open the SARA excel generic tool to see the column headings in the appropriate order.
Column 1 Column 2 Column 3 Column 4 Column 5 Column 6 Column 7 Column 8 Column 9 Q001 Q002 QDAY QMONTH QYEAR QINTERVIEWER Q003 Q004 Q005 Q006 Q007 Q007_A Q008 Q008_A Q009 Q010 Q011 Q012 Q013_A Q013_B Q013_C Q014_A Q014_B Q014_C INS_Q015
DO4 DO4_ALL M1 M56 M33 M2 M71 M59 M5 M53 M94 M72 M10 M95 M51 M50 M11 M32 M38 M13 M14 M36 DO5 DO5_ALL IN5
M20 M39 M40 DO9 DO10 DO11 DO12 IN7 IN7_ALL S9 S9_01 S9_02 S9_03 S9_04 S9_05 S9_06 S9_07 S9_08 T6 T7 I8 E7 E8 E9 E10
S10_02 S10_03 S10_04 S10_05 S10_06 T8 T9 E14 E15 I21 I22 E39 E40 E41 E42 M28 M29 M30 M31 M93 M92 DO16 DO17 DO18 IN9
T16 T17 DO23 DO77 DO24 IN11 IN11_ALL M69 M70 M73 M74 M75 M76 M77 M78 M79 M106 M107 DO70 M141 M80 M81 M82 M83 DO71
T59 D35 D34 D36 D36_A D36_B M37_A M37_B M136 M138 M139 M140 S16 S16_01 S16_02 S16_03 S16_04 S16_05 S16_06 S16_07 S16_08 S16_09 S16_10 T22 T23
M44 DO36 DO37 DO38 IN15 IN15_ALL S19 S19_01 S19_02 T35 T36 D15 D16 D17 D16_D17 D18 D19 M45 DO39 DO40 DO41 IN16 IN16_ALL S20 S20_01
IN19 IN19_ALL S23 T45 T46 E45 M54 M55 M57 DO53 DO54 DO55 IN20 IN20_ALL S24 T47 T48 E19 E20 M60 M61 DO56 DO57 DO58 IN21
DO68 DO69 IN24 IN24_ALL M135 M114 M116 M118 M119 M120 M121 M122 M123 M124 M125 M126 M127 M128 M129 M130 M131 M132 M133 M134 S28

Service Availability and Readiness Assessment (SARA) | Implementation Guide
127
Q015 Q016_A Q016_B STRATUM_1 STRATUM_2 STRATUM_3 STRATUM_4 WEIGHT I1 I2 I3 I4 I5 I6 I7 DO1 DO1_ALL E1 E2 E3 E4 E5 E6 DO2 DO2_ALL I9 I10 I11 I12 I13 I14 I15 I16 T1 DO3 DO3_ALL D1 D2 D3 D4 D5 D6 D9 D11
S7 S7_01 S7_02 S7_03 S7_04 S7_05 S7_06 S7_07 S7_08 S7_09 S7_10 S7_11 S7_12 T2 T3 M15 M16 M17 DO6 DO7 DO8 IN6 IN6_ALL M96 M97 M98 M99 M100 M101 M102 M103 M104 M105 S8 S8_01 S8_02 S8_03 S8_04 S8_05 S8_06 T4 T5 M18 M19
E11 E12 E37 E13 I20 M21 M22 M23 M24 M26 M27 DO13 DO14 DO15 IN8 IN8_ALL S26_01 S26_02 S26_03 T51 T52 T53 T54 E29 E30 D21 D22 M66 M67 M89 M62 M87 M86 M84 M85 M64 DO62 DO63 DO64 DO65 IN23 IN23_ALL S10 S10_01
IN9_ALL M28_A M29_A M30_A M31_A M93_A M92_A S11 S11_01 S11_02 S11_03 S11_04 S11_05 S11_06 S11_07 S11_08 T10 T11 T12 T13 E38 E16 E17 D10 M7 M12 M34 M35 DO19 DO20 DO21 DO22 IN10 IN10_ALL S12 S12_01 S12_02 S12_03 S12_04 S12_06 S12_07 S12_09 T14 T15
M108 M109 M110 M111 E43 M99_A M100_A M101_A M102_A M103_A M104_A M22_A M74_A M24_A M72_A M72_B M72_C M80_A M5_A M78_A M78_B M111_A M33_A M32_A M36_A M36_B S15 S15_01 S15_02 S15_05 S15_06 S15_07 S15_03 S15_04 T18 T19 T20 T21 M37 DO26 DO27 DO28 IN12 IN12_ALL
T24 T25 T26 T27 T28 T29 D8 D13 M41 DO29 DO30 DO31 IN13 IN13_ALL S17 T30 T31 I23 M91 DO32 DO33 DO34 DO35 IN14 IN14_ALL S18 S18_01 S18_02 S18_03 S18_04 S18_05 S18_06 S18_07 S18_08 S18_09 S18_10 S18_11 S18_12 T32 T33 T34 D14 M42 M43
S20_02 S20_03 S20_04 S20_05 S20_06 S20_07 T37 T38 T39 T40 I24 D7 M46 M47 M48 DO42 DO43 DO44 DO45 IN17 IN17_ALL S21 S21_01 S21_02 T41 T42 M49 M6 DO46 DO47 DO48 IN18 IN18_ALL S22 T43 T44 E18 D20 M52 M115 DO49 DO50 DO51 DO52
IN21_ALL S29 T60 T61 E44 D37 DO78 DO79 DO80 IN26 IN26_ALL S25 S25_01 S25_02 S25_03 S25_04 S25_05 S25_06 S25_07 S25_08 S25_09 T49 T50 E21 E22 E23 E24 E25 E26 E27 E28 M63 M65 DO59 DO60 DO61 IN22 IN22_ALL S27 T55 T56 E31 DO66 DO67
S28_01 S28_02 S28_03 S28_04 S28_05 S28_06 S28_07 S28_08 S28_09 S28_10 S28_11 S28_12 S28_13 S28_14 S28_15 S28_16 S28_17 S28_18 S28_19 T57 T58 E32 M25 M88 M90 DO72 DO73 DO74 IN25 IN25_ALL D24 D25 D21_D22 D23 D29 D30 D31 D32 D33 DO75 E33 E34 E35 E36 DO76
Step 2: Copy/paste data into the excel tool
1. Once the data is in the proper order, select all the rows that have data in your exported XLS data file (do not include the header row), copy the rows, open the SARA generic analysis tool, and paste the rows into the sheet called indicators starting in row 2 (beneath the headers).
2. Once the data has been pasted, the remaining worksheets will be automatically updated with the new data. From there, adjustments will need to be made only on the graphs in order to put the items in descending order.

8. Analysis and output
128
8.5 Data visualization The visual display of quantitative information in the form of charts, graphs and maps is referred to as the analytical output. In contrast to tables, which are an excellent tool for looking up and comparing individual values, but by themselves do not do a good job of summarizing large amounts of data; charts, graphs and maps display the relationships among multiple quantitative values by giving them shape. They present data in visual form, and often make data easier to understand since readers can visualize overall trends or patterns that might otherwise be difficult to identify.
This section discusses the fundamental concepts of charts and graphs, and survey reports, as well as methods for disseminating analytical outputs.
8.5.1 Creating graphs
Graphs display relative sizes of numerical quantities, and present a straightforward way of comparing numbers. They can be used to clearly illustrate many different types of data. Graphs can display nominal comparisons, changes over time, categorical rankings, percentages and ratios, deviations, distributions or correlations. The output from the SARA questionnaire is primarily used for nominal comparison, ranking, and percentages or ratios. Nominal comparison and ranking refer to the subdivision and organization of data so that categories can be easily seen and compared with each other. For example, nominal comparison and ranking makes it easy to identify that a particular type of health facility has more equipment in one district than in another. The SARA output is also used to communicate percentages. For example, a graph can visually display that a certain percentage of facilities have a particular type of equipment available. Regardless of the type of data being displayed, there are several characteristics that every graph should include.
Title
A descriptive title should explain what kind of data is being displayed. A proper title communicates the theme, location and time period. The title should be concise, but should leave the reader knowing exactly what is being shown.
Labels
Both x- and y-axes should be labelled and a legend should be included when applicable. If including a legend, it should usually be placed outside of the plot area. Placing it inside the plot area may save space, but will often clutter the chart, detract from its purpose and may cross or interrupt the data being presented.
Scales
Every chart or graph should have clearly labelled x- and y-axis unit values. The values should reflect the data accurately. In most cases, it is appropriate for the scale to begin at zero. If a scale does not begin at zero, this fact should be clearly highlighted and explained.
Simplicity
Each chart or graph should be designed to clearly communicate its purpose while avoiding unnecessary flourishes. For example, flat, two dimensional charts are typically better than three dimensional charts. Three dimensional charts are often difficult to interpret because readers must study the various dimensions in relation to the axes. In a three dimensional bar or column chart, it is often unclear which plane or line of the bar relates to the scale. Similarly, gridlines are optional, but when they are used they should be displayed with a light, non-distracting colour and line weight. Sufficient blank space should be given to enable the reader to quickly focus on the intended information.

Service Availability and Readiness Assessment (SARA) | Implementation Guide
129
Bars, columns, lines, symbols, etc. Bars, columns, lines and symbols represent the data derived from the data table or directly from the data set. Bars and columns should not be touching unless the chart is a histogram, which is intended to convey the continuous nature of the data. If the data are discrete (i.e. represent separate groups or attributes, such as data organized by district or by facility type), the bars should not touch each other. If symbols are used, such as in a scatter plot, they should be of sufficient size to be clearly distinguishable from each other. Value can also be added to a graph by re-ordering the bars to display data by different variables (e.g. region, managing authority, type of facility). This can be done by clustering bars that are similar (e.g. region) and then further categorizing the bars within each region by another variable (e.g. rural versus urban). For example, a graph with bars representing the different regions in a country could be reordered in ascending or descending order by the type of managing authority. Within the different types of managing authorities the bars could be further ordered by the type of facility.
Number of observations It is usually helpful to include the total number of observations being displayed. If a sample is being represented, the chart should clearly state that somewhere. This will give the reader a better idea of what the chart represents, and will help establish trust between the reader and the creator. Building trust is essential if the chart is to effectively convey a message, idea or concept.
8.5.2 Graphs for SARA indicators
The Section 8.1 provided examples for generating SARA indicators and their associated tables. From these tables, graphs can be generated to help visualize the data and give a visual indication of what the data tells us. This section provides example graphs for SARA indicators that can be used as a template when creating graphs from SARA data.
The types of graphs produced will largely depend on the methodology used to collect the data as well as the objectives of the assessment. For example, if a census is undertaken, disaggregation can be by district, managing authority, facility type or any other variable of interest. However, if a sample survey is undertaken, there are limitations to the variables by which data can be disaggregated depending on the sampling design.
Each graph should convey a message on a key result in the data. In order to identify the key results and efficiently display them, several graphs may need to be made, each one more refined than the last until the message is clear and all relevant information is displayed. First identify the key results by looking at a table or initial graph of the basic indicator data. Then, determine the best way to display the result so that the key message is easily communicated. Finally, decide what additional information would be valuable for highlighting this key result. For the final report, only the most relevant and informative graphs should be included. Some suggestions for creating graphs that highlight the key message are as follows (note that not all suggestions will be relevant for all graphs).
• Include a bar for the overall results in addition to any disaggregation of data.
• Disaggregate data by different variables, such as district, facility type or managing authority as applicable. Disaggregating the data will help to see if there are differences in the indicator according to variables of interest. For example, health workforce density may differ between districts, with urban districts having a higher density than rural districts; this important result would only be seen if the data for health workforce density are disaggregated.
• Whenever possible, order bar graphs in ascending or descending order. This allows for easy visualization of trends.
• Order bars by any applicable organizational unit. For example, if each bar represents a district, group the districts by urban, peri-urban and rural districts, then arrange in ascending or descending order within these groupings. This type of grouping can also apply to indicators such as essential medicines and the domains for the service-specific indicators.

8. Analysis and output
130
• Where applicable, add a benchmark or target line. This provides a reference point to facilitate interpretation of the data.
• For graphs where the bars represent an index (a composite of several indicators), the components of the index can be displayed with symbols superimposed on the bar. This provides additional information on how the individual components are affecting the overall index score.
• When possible, add information on trends over time (if data are available). Looking at trends allows for analysis and comparison of progress over time.
Service availability indicators This section provides examples of graphs used for SARA service availability indicators. These graphs are specific to the data set from which they were created and should not be replicated identically. For additional examples, please refer to the Sierra Leone services availability and readiness 2011 summary report or the Zambia services availability and readiness 2010 summary report, which are available at: http://apps.who.int/healthinfo/systems/datacatalog/index.php/catalog.
Health facility density
INDICATOR Health facility density (number of health facilities per 10 000 population) is primarily an indicator of outpatient access. This measure provides a good understanding of the health system resources available in a country. While there is no gold standard on assessing the sufficiency of health facilities in a country, a low density usually suggests inadequate capacity to meet a minimum coverage of essential services. Figure 10.1 shows an example of a graph displaying health facility density by district, type of district and managing authority.
KEY PARAMETERS 1. Facility density by geographical distribution.
- Plot facility density overall for all districts and separately for each district.
2. Facility density relative to a benchmark or target.
- Plot the benchmark value. In Figure 8.8, this is the horizontal line at two health facilities per 10 000 population.
3. Facility density in urban, peri-urban and rural districts.
- Group the districts by milieu, then order by descending facility density.
4. Composition of facilities by managing authority.
- Disaggregate each bar by public/private/other.

Service Availability and Readiness Assessment (SARA) | Implementation Guide
131
Figure 8.8 Density of health facilities per 10 000 population, by district
Inpatient bed density
INDICATOR The number of inpatient beds per 10 000 population is an indicator that provides information on the number of inpatient beds available relative to the total population for a defined geographical area. This indicator is useful for measuring the supply of health services available. In this measure, paediatric beds (cots) are included, but maternity beds are excluded. Figure 8.9 shows an example of a graph displaying the density of inpatient beds by district and type of district.
KEY PARAMETERS 1. Inpatient bed density by geographical distribution.
- Plot inpatient bed density overall for all districts and separately for each district.
2. Inpatient bed density relative to a benchmark or target.
- Plot the benchmark value. In Figure 8.9, this is the horizontal line at 25 inpatient beds per 10 000.
3. Inpatient bed density in urban, peri-urban and rural districts.
- Group the districts by milieu, then order by descending inpatient bed density.
Figure 8.9 Density of inpatient beds per 10 000 population, by district
1.5
2.3
1.5
1.1
2.2
1.2 1.1
2
1.61.4
0.9
Target
0
0.5
1
1.5
2
2.5
Overal
l
Distric
t 1
Distric
t 2
Distric
t 3
Distric
t 4
Distric
t 5
Distric
t 6
Distric
t 7
Distric
t 8
Distric
t 9
Distric
t 10
District
Heal
th fa
ciliti
es p
er 1
0 00
0 po
p
Overall
Urban
Peri-urbanRural
16
24
20
16
2119
14 1513 12
10
Target
0
5
10
15
20
25
30
Overal
l
Distric
t 1
Distric
t 2
Distric
t 3
Distric
t 4
Distric
t 5
Distric
t 6
Distric
t 7
Distric
t 8
Distric
t 9
Distric
t 10
District
Inpa
tient
bed
s per
10
000
pop
Overall
Urban
Peri-urbanRural

8. Analysis and output
132
Maternity bed density
INDICATOR The number of maternity beds per 1000 pregnant women informs stakeholders about the availability of beds specifically for pregnant woman seeking care during pregnancy. Note that maternity beds differ from delivery beds and are not used for childbirth, but are used before and after delivery. This indicator also provides information on access to delivery services because often the accessibility of delivery care services increases where there are more maternity beds available. Figure 10.3 shows an example of a graph displaying the density of maternity beds by district.
KEY PARAMETERS 1. Maternity bed density by geographical distribution.
- Plot maternity bed density overall for all districts and separately for each district. 2. Maternity bed density relative to a benchmark or target.
- Plot the benchmark value. In Figure 8.10, this is the horizontal line at 10 maternity beds per 1000 pregnant women.
Figure 8.10 Density of maternity beds per 1000 pregnant women, by district
Health services infrastructure index
INDEX The health services infrastructure index consists of the average score of the three indicators: facility density, inpatient bed density and maternity bed density. Figure 8.11 shows an example of a graph displaying the health services infrastructure index by district.
KEY PARAMETERS 1. Health services infrastructure index by geographical distribution.
- Plot health services infrastructure index overall for all districts and separately for each district represented as a solid bar.
2. Breakdown of index elements.
- Plot the individual indicator elements of the index as symbols in order to see how the elements contribute to the overall index score.
5
76 6
8
6
4
6
43
2
Target
0
2
4
6
8
10
12
Overal
l
Distric
t 1
Distric
t 2
Distric
t 3
Distric
t 4
Distric
t 5
Distric
t 6
Distric
t 7
Distric
t 8
Distric
t 9
Distric
t 10
District
Mat
erni
ty b
eds p
er 1
000
pre
gnan
t w
omen Overall
Urban
Peri-urbanRural

Service Availability and Readiness Assessment (SARA) | Implementation Guide
133
Figure 8.11 Health services infrastructure index score and component scores, overall and by district
Service availability index
INDEX The service availability index is the unweighted average of the three indices: health infrastructure, health workforce and service utilization. The service availability index serves as an overall composite index to summarize all of the service availability indicators. Figure 10.5 shows an example of a graph displaying the service availability index by district and type of district.
KEY PARAMETERS 1. Service availability index by geographical distribution.
- Plot service availability index overall for all districts and separately for each district represented as a solid bar.
2. Breakdown of index elements.
- Plot the individual indicator elements of the index as symbols in order to see how the elements contribute to the overall index score.
Figure 8.12 General service availability index score and component scores, overall and by district
65 89 72 60 88 65 50 73 57 49 350
20
40
60
80
100
Overal
l
Distric
t 1
Distric
t 2
Distric
t 3
Distric
t 4
Distric
t 5
Distric
t 6
Distric
t 7
Distric
t 8
Distric
t 9
Distric
t 10
District
Scor
e
HealthinfrastructureindexFacil ity density
Inpatient beds
Maternity beds
52 88 71 62 60 55 34 56 43 34 260
20
40
60
80
100
Overal
l
Distric
t 1
Distric
t 2
Distric
t 3
Distric
t 4
Distric
t 5
Distric
t 6
Distric
t 7
Distric
t 8
Distric
t 9
Distric
t 10
District
Scor
e
Overall
Urban
Peri-urban
Rural
Health infrastructure
Health workforce
Service util ization

8. Analysis and output
134
General service readiness indicators This section provides examples of graphs used for two of the five SARA general service readiness indicators. These graphs are specific to the data set from which they were created and should not be replicated identically. For additional examples please refer to the Sierra Leone services availability and readiness 2011 summary report or the Zambia services availability and readiness 2010 summary report, which are available at: http://apps.who.int/healthinfo/systems/datacatalog/index.php/catalog.
Diagnostic capacity
The diagnostic capacity domain consists of a set of eight tracer items, and the domain score is the mean percentage of items available for each facility. Elements include facilities with capacity to conduct tests on-site and with appropriate equipment for: haemoglobin, blood glucose, malaria diagnostic capacity, urine dipstick- protein, urine dipstick- glucose, HIV diagnostic capacity, syphilis RDT and urine pregnancy test.
Figure 8.13 shows the percentage of facilities that have all eight tracer items present, by district and type of district.
Figure 8.13 Percentage of facilities with all 8 diagnostic tests, overall and by district
Figure 8.14 shows the mean availability of the diagnostic tests by district and type of district.
Figure 8.14 Diagnostic capacity domain score: Mean availability of diagnostic tests, overall and by district
Figure 8.15 shows the diagnostic capacity domain readiness score as solid bars and the indicator elements that make up the domain score as symbols.
The general service readiness graphs should be created in a way that clearly shows the capacity in a country. For diagnostics, ideally all facilities would be able to offer the 8 tracer diagnostic tests (i.e. all the bars in Figure
819
127
146 4 8 4 4 3
0
20
40
60
80
100
Overal
l
Distric
t 1
Distric
t 2
Distric
t 3
Distric
t 4
Distric
t 5
Distric
t 6
Distric
t 7
Distric
t 8
Distric
t 9
Distric
t 10
District
Perc
enta
ge o
f fac
ilitie
s
Overall
Urban
Peri-urban
Rural

Service Availability and Readiness Assessment (SARA) | Implementation Guide
135
8.13 would be 100). However, when this is not the actual situation, Figures 8.14 and 8.15 help to illustrate the current state of diagnostic capacity.
Figure 8.15 Diagnostic capacity domain score and tracer items, overall and by district
Essential medicines
The essential medicines domain consists of 20 essential medicines, and the domain score is the mean percentage of essential medicines available for each facility. The standard 20 essential medicines are: amitriptyline tablet, amlodipine tablet or alternative calcium channel blocker, amoxicillin (syrup/suspension or dispersible tablets AND tablet), ampicillin powder for injection, beclometasone inhaler, ceftriaxone injection, enalapril tablet or alternative ACE inhibitor, fluoxetine tablet, gentamicin injection, glibenclamide tablet, ibuprofen tablet, insulin regular injection, metformin tablet, omeprazole tablet or alternative, oral rehydration solution, paracetamol tablet, salbutamol inhaler, simvastatin tablet or other statin and zinc sulphate (tablet or syrup).
Figure 8.16 shows the percentage of facilities that have all 20 essential medicines present by district and type of district.
Figure 8.16 Percentage of facilities with all 20 essential medicines, overall and by district
27 5 3 0 0
70 0 0 0
0
20
40
60
80
100
Overal
l
Distric
t 1
Distric
t 2
Distric
t 3
Distric
t 4
Distric
t 5
Distric
t 6
Distric
t 7
Distric
t 8
Distric
t 9
Distric
t 10
District
Perc
enta
ge o
f fac
ilitie
s
Overall
Urban
Peri-urban
Rural

8. Analysis and output
136
Figure 8.17 shows the mean availability of the essential medicines by district and type of district.
Figure 8.17 Essential medicines domain score: Mean availability of 20 essential medicines, overall and by district
Figure 8.18 shows the essential medicines domain readiness score as solid bars and the indicator elements that make up the domain score as symbols.
Figure 8.18 Essential domain score and tracer items, overall and by district
The general service readiness graphs should be created in a way that clearly shows the capacity in a country. For essential medicines, ideally all facilities would have the 20 tracer medicines (i.e. all the bars in Figure 8.16 would be 100. However, when this is not the actual situation, Figures 8.17 and 8.18 help to illustrate the current state of essential medicines availability.

Service Availability and Readiness Assessment (SARA) | Implementation Guide
137
Service-specific availability and readiness indicators This section provides examples of graphs used for SARA service-specific readiness indicators. These graphs are specific to the data set from which they were created and should not be replicated identically. For additional examples please refer to the Sierra Leone services availability and readiness 2011 summary report or the Zambia services availability and readiness 2010 summary report, which are available at: http://apps.who.int/healthinfo/systems/datacatalog/index.php/catalog.
Service-specific availability
Service-specific availability measures what proportion of facilities are offering services. As an example, Figure 8.19 shows the proportion of facilities offering different maternal, newborn and child health (MNCH) services.
Figure 8.19 Availability of maternal, newborn and child health services
Service-specific readiness: comprehensive obstetric care The SARA indicator for comprehensive obstetric care has four domains and a total of 17 tracer items. These tracer items include: guidelines on CEmOC, staff trained in CEmOC, staff trained in surgery, staff trained in anaesthesia, anaesthesia equipment, incubator, blood typing, cross match testing, blood supply sufficiency, blood supply safety, Lidocaine 5%, Epinephrine (injectable), Halothane (inhalation), Atropine (injectable), Thiopental (powder), Suxamethonium bromide (powder) and Ketamine (injectable). For the facilities that offer comprehensive obstetric care, the percentage of facilities with these tracer items available are shown in Figure 8.20. Readiness to provide comprehensive obstetric care is calculated as the mean of the domain scores and is shown in the last (light grey) bar of the graph. This type of detailed graph is useful to see the details of each service-specific indicator.
96%
93%
92%
91%
89%
10%
0% 20% 40% 60% 80% 100%
Child health preventative…
Antenatal care
Child immunization
Basic obstetric care
Family planning
Comprehensive obstetric care
Percentage of facilities
Serv
ices

8. Analysis and output
138
Figure 8.20 Availability of tracer items for comprehensive obstetric care at facilities providing the service
Maternal, newborn and child health (MNCH) service readiness can be summarized by showing each service readiness score as a solid bar and the service-specific domain scores as symbols in order to visualize how the domain scores contribute to the readiness score (Figure 8.21).
Figure 8.21 Readiness to provide maternal, newborn and child health services
Service-specific readiness: communicable diseases The SARA indicator for HIV counselling and testing has four domains and a total of five tracer items. These tracer items include: staff trained in HIV counselling and testing, guidelines on HIV counselling and testing, room with auditory and visual privacy, HIV diagnostic capacity and male condoms. For facilities that offer HIV counselling and testing, the percentage of facilities with these tracer items available is displayed in Figure 8.22. Readiness to provide HIV counselling and testing is calculated as the mean of the domain scores and is shown in the last (light blue) bar of the graph. This type of detailed graph is useful to see the details of each service-specific indicator.

Service Availability and Readiness Assessment (SARA) | Implementation Guide
139
Figure 8.22 Availability of tracer items for HIV counselling and testing at facilities providing the service
HIV/AIDS, tuberculosis and malaria service readiness can be summarized by showing each service readiness score as a solid bar and the service-specific domain scores as symbols in order to visualize how the domain scores contribute to the readiness score (Figure 8.23).
Figure 8.23 Readiness to provide HIV/AIDS, tuberculosis and malaria services
91
65
88
48
86
64
0 20 40 60 80 100
Staff trained HIV counseling and testing
Guidelines HIV counseling and testing
Room with auditory/visual privary
HIV diagnostic capacity
Male condoms
Readiness to provide HIV counseling and testingservices
Trac
er it
ems
Percentage availability (%)
Staff and training Equipment Diagnostics Medicines and commodities Readiness score
75
60
3851 48
67 62
0
20
40
60
80
100
HIV counselling and testing
HIV care and support
Antiretroviral therapy
PMTCTSexually transmitted infections
MalariaTuberculosis
Services
Scor
e
Readiness score Staff and training Equipment Diagnostics Medicines and commodities

8. Analysis and output
140
8.6 Survey report Findings from the SARA survey can be used for different purposes by different stakeholders. The way in which the survey results are reported depends on the target audience and the survey's objectives. However, information on many aspects of the survey needs to be included in all reports. All reports should include the following core information.
• Cover page including the name of the organization that undertook the survey
• Table of contents
• Background and/or Foreword
• Acknowledgements
• Abbreviations and acronyms
• Executive summary
• Introduction
− Survey's objective(s) − When and where survey was conducted
• Methodology and data collection
− Selection of survey areas and sectors surveyed − Planning process − Sampling methodology − Data collection, data entry and quality-assurance procedures
• Ethical issues
− Confidentiality − Potential conflicts of interest
• Results, with national and subnational comparisons
− Service availability − Service readiness − Service-specific availability and readiness (e.g. HIV/AIDS; MNCH; noncommunicable diseases)
• Discussion
• Recommendations
• Conclusion
• Annexes (if needed).
In general, reports are written collaboratively and include all the stakeholders who had an active role in administering the survey, such as programme officers from the MoH, external development partners and nongovernmental organizations. There are a number of helpful tips for developing a survey report.
• Policy-makers and key stakeholders may not devote enough time to reading the full report and may only read the executive summary. More people will read beyond the executive summary if sufficient interest is created.
• The report should be presented in a straightforward and precise fashion that is understandable to a moderately-informed reader.
Service Availability and Readiness Assessment (SARA) | Implementation Guide
141
• Avoid presenting too many numbers and avoid crowding tables or charts, or presenting data too scientifically. This may make the report unintelligible to the reader; the details can be provided in an annex, where necessary.
• Avoid overusing abbreviations.
• Table and graphs should be employed to avoid long, overcomplicated narrative descriptions of results.
• The findings must be presented clearly and important results highlighted, with the conclusions and recommendations clearly presented and logically derived from these findings.
• Make logical inferences based on the results of the survey and take into account the limitations of the survey methodology. Refer to data from other sources, if available.
• Recommendations should reflect consultation with the survey coordinating group. They should be realistic, limited and focused on those areas where the greatest impact can be achieved. They should identify the problem to be addressed and the proposed solution.
• Conclusions and recommendations that do not originate from the findings should not be included.
When a draft report is written, a meeting of the survey coordinating group and key stakeholders (technical programmes, M&E units, statistical office, policy-makers, partners, etc.) should be held to present the survey results, discuss their interpretation and develop policy recommendations. The report should be finalized as soon as possible after this meeting.
8.7 Results dissemination Dissemination of results is key to the successful implementation of a survey. Development of new data sources is only useful if data are received in a timely manner by their intended recipients and their strengths, potential uses and limitations are well understood by the target audience. The purpose of dissemination is to ensure that the right people receive survey results in a format that is targeted specifically to their needs. Target audiences for SARA are usually decision-makers at national, district and facility levels. Conducting the survey, along with analysing and interpreting the data, are important, but the final use of the results will depend on the effectiveness of final reporting and dissemination. Without these steps, the survey would fall short of achieving its objectives. Any of the following activities may be undertaken in order to disseminate SARA results:
• national and/or regional dissemination workshops;
• an annual health sector review;
• web dissemination e.g. MoH web site, country observatory, etc.
• publication of reports, presentations and brochures.