Cap 13 Nutrient Availability in Soils
25
13 Nutrient Availability in Soils 13.1 Chemical Soil Analysis The most direct way of determining nutrient availability in soils is to measure the growth responses of plants by means of field plot fertiUzer trials. This is a time- consuming procedure, however, and the results are not easily extrapolated from one location to another. In contrast, chemical soil analysis - soil testing - is a comparatively rapid and inexpensive procedure for obtaining information on nutrient availabiUty in soils as a basis for recommending fertilizer appUcation. Soil testing has been practised in agriculture and horticulture for many years with relative success. The effectiveness of the procedure is closely related both to the extent to which the data can be calibrated withfieldfertilizer trials, and to the interpretation of the analysis. For a comprehensive recent review on soil testing methods for micronutrients see Sims and Johnson (1991). Quite often much more is expected from soil testing than the method allows. The reasons for this discrepancy are discussed in detail in this chapter, with special reference to phosphorus and potassium. Soil testing makes use of a whole range of conventional extraction methods involving different forms of dilute acids, salts, or complexing agents, as well as water. Depending on the method used, quite different amounts of plant nutrients are extracted, as shown for phosphorus in Table 13.1. As a guide, 1 mg phosphorus per 100 g soil may be taken to represent —30 kg phosphorus per hectare at a 20-cm profile depth (soil bulk density 1.5 kg r^ leads to 3 x 10^ kg soil ha~^). Weak extractants such as water or sodium •bicarbonate (Table 13.1) reflect mainly the intensity of supply (concentration in soil solution), whereas strong extractants primarily indicate the capacity of the soil to supply nutrients to the soil solution (buffer capacity). All methods used to characterize the availability of a given mineral nutrient for the plants, and thus to predict fertilizer response, must be evaluated by means of growth experiments (see Section 12.5). Quite often a number of methods are equally suitable for soil testing for a particular mineral nutrient (Vetter et aL, 1978; BoUand and Gilkes, 1992). For phosphorus for example, water extraction (Van Noordwijk et al., 1990) can be as satisfactory as extractant for determining availability as dilute acids, despite the difference in amounts of phosphorus extracted by these methods (Schachtschabel and Beyme, 1980). Typi- cally, as is the case for phosphorus, soil testing methods provide a good indication of nutrient status of the soil, and the likehhood of fertilizer response, when the soil is
-
Upload
independent -
Category
Documents
-
view
4 -
download
0
Transcript of Cap 13 Nutrient Availability in Soils

13
Nutrient Availability in Soils
13.1 Chemical Soil Analysis
The most direct way of determining nutrient availability in soils is to measure the growth responses of plants by means of field plot fertiUzer trials. This is a time-consuming procedure, however, and the results are not easily extrapolated from one location to another. In contrast, chemical soil analysis - soil testing - is a comparatively rapid and inexpensive procedure for obtaining information on nutrient availabiUty in soils as a basis for recommending fertilizer appUcation. Soil testing has been practised in agriculture and horticulture for many years with relative success. The effectiveness of the procedure is closely related both to the extent to which the data can be calibrated with field fertilizer trials, and to the interpretation of the analysis. For a comprehensive recent review on soil testing methods for micronutrients see Sims and Johnson (1991). Quite often much more is expected from soil testing than the method allows. The reasons for this discrepancy are discussed in detail in this chapter, with special reference to phosphorus and potassium.
Soil testing makes use of a whole range of conventional extraction methods involving different forms of dilute acids, salts, or complexing agents, as well as water. Depending on the method used, quite different amounts of plant nutrients are extracted, as shown for phosphorus in Table 13.1. As a guide, 1 mg phosphorus per 100 g soil may be taken to represent —30 kg phosphorus per hectare at a 20-cm profile depth (soil bulk density 1.5 kg r ^ leads to 3 x 10 kg soil ha~^). Weak extractants such as water or sodium •bicarbonate (Table 13.1) reflect mainly the intensity of supply (concentration in soil solution), whereas strong extractants primarily indicate the capacity of the soil to supply nutrients to the soil solution (buffer capacity). All methods used to characterize the availability of a given mineral nutrient for the plants, and thus to predict fertilizer response, must be evaluated by means of growth experiments (see Section 12.5).
Quite often a number of methods are equally suitable for soil testing for a particular mineral nutrient (Vetter et aL, 1978; BoUand and Gilkes, 1992). For phosphorus for example, water extraction (Van Noordwijk et al., 1990) can be as satisfactory as extractant for determining availability as dilute acids, despite the difference in amounts of phosphorus extracted by these methods (Schachtschabel and Beyme, 1980). Typically, as is the case for phosphorus, soil testing methods provide a good indication of nutrient status of the soil, and the likehhood of fertilizer response, when the soil is

484 Mineral Nutrition of Higher Plants
Table 13.1 Mean Content of Readily Soluble Phosphorus in 40 Soils
Extracted with Various Solutions"
Extraction solution
Neutral NH4F (pH 7.0) Acidic NH4F (pH < 2) Truog, H2SO4 + (NH4)2S04 (pH 3.0) Acetic acid (pH 2.6) Bicarbonate, NaHCOa (pH 8 Calcium lactate (pH 3.8)
.5)
Readily soluble phosphorus
(mg(lOOg)-iof air dried soil)
14.8 7.4 3.6 2.5 2.4 1.2
''Based on Williams and Knight (1963).
either acutely deficient or abundantly supplied (Bolland and Gilkes, 1992). Particularly in the upper part of the response curve relating nutrient supply to plant growth (Fig. 12.1), soil chemical analysis alone is unsatisfactory for predicting the effects of fertilizer application. Soil analysis mainly provides an indication of the capacity of a soil to supply nutrients to the plants, but does not adequately and in some cases does not at all, characterize the mobility of the nutrients in the soil. Additionally it fails to provide information about soil structure, or microbial activity, and plant factors, such as root growth and root-induced changes in the rhizosphere, which are of decisive importance for nutrient uptake under field conditions. In the following three chapters these factors are discussed, beginning with nutrient availability in relation to mobility in soils and root growth. For comprehensive treatments of this topic the reader is referred to Barber (1984), Jungk and Claassen (1989); Claassen (1990) and Jungk (1991).
13.2 Movement of Nutrients to the Root Surface
13.2.1 Principles of Calculations
The importance of the mobility of nutrients in soils in relation to availability to plants was emphasized by Barber (1962) and these ideas which were refined and further developed were summarized in a concept of 'bioavailability of nutrients' (Barber, 1984; Section 13.6). Although this concept is focused on aerated soils, its principles may also be applied to submerged soils and plant species such as lowland rice. In principle this concept may also be applied to forest trees. In mature forest stands, however, the application of this concept for the development of simulation models on nutrient delivery and uptake is considerably restricted by the high spatial heterogenity of soil and soil solution chemistry in relation to the stem distance (Koch and Matzner, 1993) and the ill-defined absorbing area of ectomycorrhizal root systems (Section 15.7).
Three components are considered in the concept: root interception, mass flow, and diffusion (Fig. 13.1). As roots proliferate through the soil they also move into spaces
Nutrient Availability in Soils 485
Soil • • •
Shoot
• • ( ^
• • • "— • • Fig. 13.1 Schematic presentation of the movement of mineral elements to the root surface of soil-grown plants. (1) Root interception: soil volume displaced by root volume. (2) Mass flow: transport of bulk soil solution along the water potential gradient (driven by transpiration). (3) Diffusion: nutrient transport along the concentration gradient. • = Available nutrients (as
determined, e.g., by soil testing).
previously occupied by soil and containing available nutrients, as, for example, adsorbed to clay surfaces. Root surfaces may thus intercept nutrients during this displacement process (Barber, 1984). Calculations of root interception are based on (a) the amounts of available nutrients in the soil volume occupied by the roots; (b) root volume as a percentage of the total soil volume - on average 1% of the topsoil volume; and (c) the proportion of the total soil volume occupied by pores, on average 50%, but very much dependent on the soil bulk density (Section 13.5). In general, only a small part of the total nutrient requirement can be met by root interception (Table 13.2).
The second component is the mass flow of water and dissolved nutrients to the root surface, which is driven by transpiration. Estimates of the quantity of nutrients supplied to plants by mass flow are based on the nutrient concentration in the soil solution and the amount of water transpired either per unit weight of shoot tissue (transpiration coefficient, e.g., 300-600 1 H2O kg"^ shoot dry wt) or per hectare of a crop. The contribution of diffusion, the third component relating to the supply of nutrients to the
Table 13.2 Nutrient Demand of a Maize Crop and Estimates on Nutrient Supply from the
Soil by Root Interception, Mass Flow, and Diffusion''
Nutrient
Potassium Nitrogen Phosphorus Magnesium
"From Barber (1984)
Demand (kgha- i )
195 190 40 45
.
Estimates on
Interception
4 2 1
15
amounts (kg ha
Mass flow
35 150
2 100
^) supplied by
Diffusion
156 38 37 0

486 Mineral Nutrition of Higher Plants
root surface can be calculated on the basis of the effective diffusion coefficients (Section 13.2.4). Such data are more difficult to obtain than those on mass flow. Estimates of the contribution of diffusion can also be based on differences between total uptake by plants and the sum of the amounts suppUed by root interception together with mass flow. An example of such a calculation is given in Table 13.2 showing the importance of the three components for different nutrients. It is apparent that, in this soil, nitrogen and magnesium are suppUed mainly by mass flow whereas the supply of potassium and phosphorus depends mainly on diffusion. Furthermore, for magnesium, supply by mass flow is greater than uptake, so that accumulation of this nutrient would be expected at the root surface as indeed is also often found. Accumulation at the root surface is particularly true for calcium (Section 15.2).
The term root interception has been criticized by Brewster and Tinker (1970) as it contains a diffusion component. Current concepts of solute movement in the soil-root system consider only mass flow and diffusion, and include root interception in the diffusion component (Barber, 1984; Claassen, 1990; Jungk, 1991). As will be shown in Chapter 15, however, conditions at the soil-root interface are sometimes considerably different in a number of aspects from those at a distance from the roots. These conditions are insufficiently described by a mechanistic model treating roots primarily as a sink for mineral nutrients supplied by mass flow or diffusion or both these processes. Also in view of the role of soil structure for nutrient uptake the root-soil contact zone requires separate treatment, particularly in soils of low nutrient avail-abiUty and in ectomycorrhizal plants (Chapter 15).
13.2.2 Concentration of Nutrients in the Soil Solution
To meet the nutrient demand of soil-grown plants, nutrients must reach the root surface, and this is mainly mediated by movement in or transport with the soil solution, interrelated with root growth which decreases the length of transport pathways. The concentration of nutrients in the soil solution is therefore of primary importance for nutrient supply to roots. Soil solution mineral nutrient concentration varies widely, depending on such factors as soil moisture, soil depth, pH, cation-exchange capacity, redox potential, quantity of soil organic matter and microbial activity, season of the year, and fertilizer application (Asher, 1978). The concentrations of mineral nutrients in the soil solution, particularly nitrogen, are usually very low in many natural ecosystems, for example, of the tundra (Chapin, 1988) as compared with arable soils. An example of annual average concentrations of mineral nutrients in the soil solution of an arable soil is shown in Table 13.3. As a rule in aerobic soils of neutral pH the concentrations of calcium, magnesium and sulfate are fairly high, as are the concentrations of nitrate, whereas those of ammonium and particularly phosphate are very low. The potassium concentrations are mainly a function of clay content and clay mineral composition.
The concentration of mineral nutrients in the soil solution is an indicator of the mobility of nutrients both toward the root surface and in the vertical direction (i.e., in humid climates it indicates the potential for leaching). Compared with the concentration of other nutrients, that of phosphorus is extremely low (Table 13.3), leaching or transport by mass flow to root surfaces thus being generally of minor importance in

Nutrient Availability in Soils 487
Table 13.3 Annual Average Concentrations of Mineral Nutrients in the Soil Solution
(Topsoil, 0-20 cm) of an Arable Soil (Luvisol, pH 7.7)«
Concentration in JJM
K
510
Ca
1650
Mg
490
NH4-N NO3-N SO4-S
48 3100 590
PO4-P
1.5
Zn
0.48
Mn
0.002
''Recalculated from Peters (1990).
mineral soils. In contrast to other anions such as nitrate and sulfate, phosphate strongly interacts with surface-active sesquioxides and oxidhydrates of clay minerals. In mineral soils, concentration and mobility of phosphate is enhanced by complexation of sesquioxides with organic Ugands. Soil organic matter and microbial activity therefore increase concentration and mobihty of phosphate (Seeling and Zasoski, 1993) and also lead to a higher percentage of organically bound forms (Porg) in the soil solution, of which in soils at higher pH (>6.0) more than 50% may exist as humic~-Fe(Al)-P complexes (Gerke, 1992b). The percentage of Porg in the soil solution may vary between 20 and 70% (Welp et al., 1983; Ron Vaz et al, 1993) and reach 80-90% in the rhizosphere soil solution (Helal and Dressier, 1989).
In fertile, arable soils supporting high yielding crops the concentrations of mineral nutrients, particularly nitrogen, but also phosphorus, are usually far above average and fluctuate according to the time of fertilizer supply (Table 13.4). In such highly fertile, or fertilized soils, nutrient transport to the root surface does not limit uptake by the crop, even a concentration in the soil solution of 10//M phosphorus and 87/^M nitrogen being adequate for the rape crop to ensure supply by diffusion (Barraclough, 1989).
The concentration of the micronutrients manganese, iron, zinc and copper in the soil solution mainly depends on the soil pH, redox potential, and soil organic matter
Table 13.4 Time Course of Nutrient Concentrations in the Soil Solution of the Topsoil (0-20 cm) of a High-Yielding Winter Rape (Brassica napus)
Crop^
Nutrients
NO3-N NH4-N PO4-P K Ca Mg
22 February
620 29 14 91
1106 34
Concentration (MM) at
28 March^
11300 1100
14 202
5258 84
15 May
1843 <1 10
133 1558
52
"Barraclough (1989). Reprinted by permission of Kluwer Academic Publishers. ^Split application of 265 kg N ha~^ as calcium ammonium nitrate on 25 February and 25 March.

488 Mineral Nutrition of Higher Plants
content, and in a temperate climate may fluctuate very much throughout the season, with a maximum in early summer (Sinclair etal., 1990). With a fall in the pH, or in redox potential, the concentration of the micronutrients manganese, iron, zinc and copper increase to various degrees (Sims and Patrick, 1978; Herms and Briimmer, 1980; Sanders, 1983; B. Marschner er a/., 1992).
Chelation by low-molecular-weight organic substances is another factor which exerts a dominant influence on the concentration of micronutrient cations in the soil solution and their transport to root surfaces by means of mass flow and diffusion. In soil solutions of calcareous soils, 40-75% of the zinc and 98-99% of the copper have been found in organic complexes (Hodgson etal., 1966; Sanders, 1983). As a rule, dependent on soil organic matter content, the proportion of complexed manganese, zinc, and copper increases in the order manganese < zinc < copper, for example from 55%; 75%; 80% when organic matter was present in low amounts, and to 50%; 85% and >98% respectively, at high amounts of organic matter (McGrath et al. 1988). For the plants, the importance of complexed micronutrients in the soil solution is particularly evident in calcareous soils (Section 16.5). This is also indicated by the fact that soil extractions with synthetic chelators provide suitable soil tests for the estimation of available micronutrients (Sims and Johnson, 1991).
There is often a poor correlation, however, between the concentration of chelated micronutrients in the soil solution, on the one hand, and the availability of these micronutrients as indicated by plant uptake, on the other (Gilmour, 1977). This is because the metal-organic complexes in the soil solution differ both in electrical charge [they are negatively charged, uncharged, or positively charged (Sims and Patrick, 1978)] and in size. In general, the rate of uptake of metal cations from metal-organic complexes is lower than that of free cations (Section 2.5) and decreases with the size of the organic ligand, as has been demonstrated for copper (Jarvis, 1987). In contrast to such findings from experiments in nutrient solutions, however, chelation of micronutrient cations such as copper and nickel in soil does not give rise to a decrease but usually to an increase in their contents in plants. This results from an increase in concentration of these nutrients in soil solution and thus also in mobility and transport to the root surface (Table 13.5).
Table 13.5 Effect of a Metal Chelator Added to the Nutrient Solution or Soil on the Trace Element Content of Bean Leaves'"'*
Nutrient solution Control + 1 0 - ^ M D T P A
Soil culture Control + 1 0 ~ ^ M D T P A
Content in leaves (ag
Zn
34.0 19.2
23.4 26.8
Cu
37.3 3.8
7.6 18.6
Fe
125 149
124 230
g Mrywt)
Mn Ni
132 32.7 118 0.0
108 2.0 136 12.8
"Based on Wallace (1980a,b). ^Chelator: diethylethylenetriamine pentaacetate (DTPA).

Nutrient Availability in Soils 489
In view of the importance of concentration and binding forms of mineral nutrients in the soil solution for both transport of nutrients to the roots as well as for leaching of nutrients from the rooting zone, various new techniques have been developed and older methods modified in order to obtain representative samples of soil solution. Many of these methods are based on soil preparations such as drying, grinding, etc., prior to rewetting and collection of soil solution by displacement or centrifugation. However, to characterize soil solutions of relevance for field-grown plants collection by suction cups or from undisturbed soil cores by centrifugation or percolation is more appropriate (Section 13.5).
Not only the concentration of nutrients in the soil solution (the so-called intensity), but also the buffer power (the so-called capacity) of a soil is highly important for mineral nutrient supply to the plants (Section 13.2.4). Minor fluctuations in the concentrations of a given mineral nutrient in the soil solution throughout the season (e.g., phosphorus in Table 13.4) reflect on a macroscale the buffer power of the soil.
13.2.3 Role of Mass Flow
Mass flow is the convective transport of nutrients dissolved in the soil solution from the bulk of the soil to the root surface. Calculations of the contribution of mass flow to the nutrient supply of field-grown plants therefore rely on detailed data both on the concentration of nutrients in the soil solution throughout the season and on the water consumption of the plants in question. The results of such experiments are shown in Table 13.6. Expressed as average values for the whole growing season, the contribution made by mass flow to total supply differs not only between mineral nutrients but also between plant species (owing to differences in transpiration rate or uptake rate of a particular mineral nutrient or to both these factors). Mass flow is more than sufficient to supply calcium in both plant species and for supply of magnesium in spring wheat, but not in sugar beet. In contrast, mass flow is unimportant for potassium supply, and the potassium uptake was mainly achieved from supply via diffusion. It can therefore be concluded that the soil around the roots was depleted of potassium, whereas substantial accumulation of calcium and magnesium took place at the root surface which can indeed be demonstrated (Barber, 1984; Section 15.2).
Table 13.6 Plant Uptake and Estimates on Supply to the Roots by Mass Flow of Potassium, Magnesium, and Calcium in Spring Wheat and Sugar Beet
Grown in a Silty Loam Soil (Luvisol Derived from Loess)""
Amount (kgha~^) Spring wheat Sugar beet
K Mg Ca K Mg Ca
Plant uptake 215 13 35 326 44 104 Mass flow 5 17 272 3 10 236 (% of total uptake) (2) (131) (777) (1) (23) (227)
"From Strebel and Duynisveld (1989).

490 Mineral Nutrition of Higher Plants
From a four-year field study growing different cereal crops and sugar beet at the same location (Table 13.6), the average contribution of nitrogen supply by mass flow was between 15 and 33% of the total nitrogen supply mainly being confined to the topsoil (Strebel and Duynisveld, 1989). No data are given in Table 13.6 for phosphorus, but a rough calculation can be made. The amount of water transpired by a crop varies in the range 2-4 million 1 ha~^ (Strebel et al., 1983; Barber, 1984). Assuming a phosphorus concentration in the soil solution of 5 //M (0.15 mg 1" ) and a total water consumption of the crop by transpiration of 3 million liters, the amount of phosphorus supplied by mass flow, the product of the two values, can be calculated at about 0.45 kg. This value corresponds to about 2-3% of the total demand of a crop and agrees well with the 1-4% found in field experiments with winter wheat and sugar beet (Claassen, 1990).
The contribution of mass flow depends on the plant species (Table 13.6) and might, for example, be higher in onion than in maize since onion roots have a higher water uptake per unit length (BaUgar and Barber, 1978). The relative contribution of mass flow also varies with the age of plants (Brewster and Tinker, 1970), and time of the day.
When the soil water content is high (e.g., at field capacity), mass flow is unrestricted and maintains a similar water content (potential) at the root surface. As the soil water content falls, the rate of water uptake by the roots may exceed the supply by mass flow and the soil may then dry out at the soil-root interface. This is observed around the roots, particularly when the transpiration rate is high (Nye and Tinker, 1977), and often occurs in the topsoil during the growing season. Under field conditions the rainfall pattern (or irrigation cycle) therefore has an important influence on the contribution of mass flow to the total nutrient supply as well as on the proportion of nutrients taken up from the subsoil (Section 13.4).
Since mass flow and diffusion to the root surface usually occur simultaneously, it is not possible strictly to separate these processes. The term 'apparent mass flow' has therefore been recommended to define the amount of solutes transported to the root by mass flow (Nye and Tinker, 1977). A principal limitation of these calculations by mechanistic models is the assumption that uptake rates of nutrients and water are uniform along the axis of individual roots, which is not the case for various reasons, particularly in plant species showing 'root dimorphism' (Section 2.6 and 2.7).
13.2.4 Role of Diffusion
Diffusion is the main mechanism for the movement of at least phosphorus and potassium to the root surface. The driving force of diffusion is a concentration gradient. In soil-grown plants a concentration gradient between the adjacent soil and the root surface is formed when uptake rate of ions exceeds the supply by mass flow. Depletion profiles develop with time and their shape depends mainly on the balance between uptake by roots, replenishment from soil, and mobility of ions by diffusion.
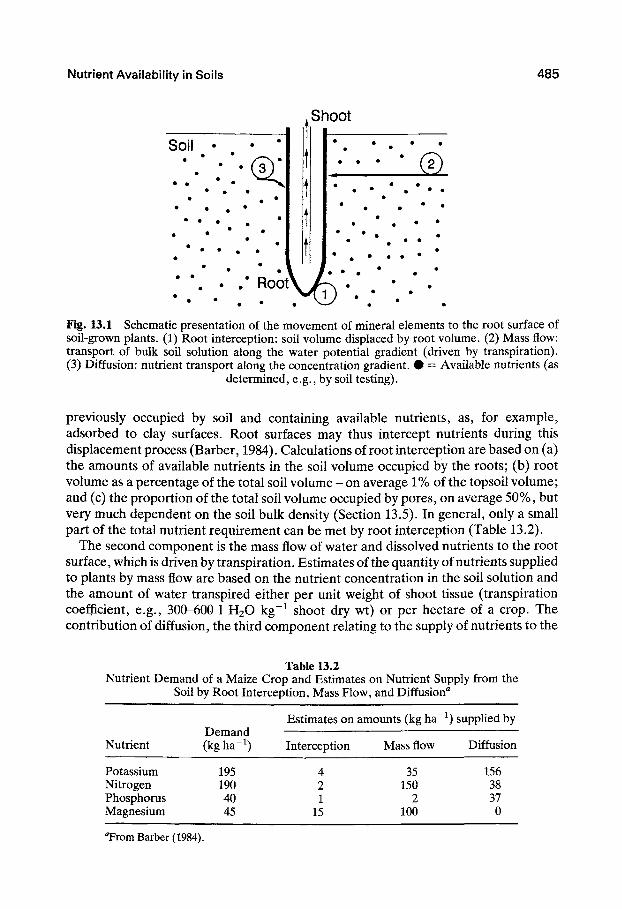
The mobility of ions is defined in terms of the diffusion coefficient. Diffusion coefficients in homogeneous media such as water (Dj) are fairly uniform for different ions and orders of magnitude higher than in nonhomogeneous porous media such as aerated soils (Table 13.7). This is true in particular for phosphate. In aerated soils ions diffuse only in pore spaces that are filled with water, and additionally ions in the soil solution interact with the soHd phase of the soil. For describing the diffusion of ions in
Nutrient Availability in Soils 491
Table 13.7 Estimates of Diffusion Coefficients (m^ s~ ) of Ions in Water (Di) and in
Soils (Z)e), and of Movement per Day at Average Values of D^^
Diffusion coefficient Average Movement in
Ion Water (Di) soil (Dg) D^ in soils soils (mm per day)
N03~ 1.9 X 10-^ 10-^0-10-11 5 X 10"ii 3.0 K+ 2.0 X 10-^ 10-11-10-12 5 X 10-12 0.9 H2P04~ 0.9 X 10"^ 10-12-10-1^ 1 X 10⁻¹^ 0.13
"From Jungk (1991). Reprinted by courtesy of Marcel Dekker Inc.
soils the term effective diffusion coefficient D^ has been introduced by Nye and Tinker (1977):
/)e = D i 0 / d C i / d C s
where D^ is the effective diffusion coefficient in the soil (m^ s~^); Di is the diffusion coefficient in water (m^ s~^); 0 is the volumetric water content of the soil (m^ m~^); / i s the impedance (or tortuosity) factor which takes into account the tortuous pathway of ions and other solutes through water-filled soil pores, increasing the path length and thus decreasing the concentration gradient. It is defined as the reciprocal of the impedance, i.e., becomes smaller when the soil water content falls; and dCi/dCs is the reciprocal of the soil buffer power for the ion concerned; Ci is the concentration of the ion in the soil solution, and C^ the sum of both ions in the soil solution and those which can be released from the solid phase (e.g., exchangeable potassium). Soils with high adsorption capacity (e.g., clay soils for K^) have therefore a high buffer power, and thus a low dCi/dCs value.
73.2.4.1 Soil Factors
As a rule, the concentration of potassium and phosphorus is much lower at the root surface than in the bulk soil, creating a typical depletion zone around the roots. As shown in Fig. 13.2 with increasing potassium content in the soil D^ increases. The nutrient-depleted area surrounding the plant roots also increases from --4 mm in depleted soil (by previous intensive cropping) to 5.3 mm in unfertilized and 6.3 mm in fertilized soil. Hence, raising the content of exchangeable potassium by fertilizer application increases the amount of potassium suppUed via diffusion by a factor of more than 20, i.e. much more than would be expected from the increase in the amount of exchangeable potassium per unit soil weight only. AppUcation of NaCl or MgCl2 also increased the extension of the depletion zone and thus the delivery of potassium to the root surface (Kuchenbuch and Jungk, 1984).
For potassium, shape and extension of the depletion zone in different soils strongly depend on their clay content (cation exchange capacity) which is an important parameter of the buffer power for potassium (Fig. 13.3). In soil A, with 21% clay and a

492 Mineral Nutrition of Higher Plants
E 3
12+
10
If ^ 4 |
Available K (jL/mol [cm root length]" )
Fertilized soil De=27cm^s"M0"^
Unfertilized soil De=5.3cm^ s^ 10"
Depleted soil De= 1.2 cm^ s' 10"
9.1
1.32
0.42
— I — I — I — I — I — I — I — 1 — \ — I — I _ _
0 2 4 6 8 10 12 Distance from
root surface (mm) Fig. 13.2 Concentration gradient around roots of 7-day-old rape (Brassica napus) seedlings grown in a silt loam soil with different contents of exchangeable potassium. (Modified from
Kuchenbuch and Jungk, 1984.)
correspondingly higher cation-exchange capacity, the equilibrium concentration of potassium in the soil solution was much lower than in soil B, with only 4% clay. In both soils, roots depleted the soil solution to about 2-3 //M K ^ . The depletion zone in soil B was much wider than that in soil A, however, reflecting the much lower capacity of soil B to replenish the potassium in the soil solution.
Particularly in soils low in exchangeable potassium the plant demand might by far exceed the amount of potassium supply from this fraction, and a large proportion of the potassium taken up derives from the non-exchangeable fraction. In the experiment shown in Fig. 13.4 the proportion of potassium from the nonexchangeable fraction
Soil A, 21% clay .T T • • • ^ '^
Distance from root surface (mm)
Fig. 13.3 Concentration gradient of potassium in the soil solution around maize roots growing in soils with different clay contents. Potassium concentration at the root surface, 2-3 jum. (Modified
from Claassen and Jungk, 1982.)

Nutrient Availability in Soils 493
41-
Decrease of K fractions: • • • NH4-extractable oo°HCI-extractable
Non-exchangeable K depleted by plants
0 2 4 6 8 10 Distance from root surface (mnn)
Fig. 13.4 Depletion of potassium in the rhizosphere of rape (Brassica napus) seedlings grown for 7 days in a silt loam soil. (From Jungk and Claassen, 1986.)
increased from 20% in the fertilized soil to 71% in the unfertilized and 83% in the depleted soil (Kuchenbuch and Jungk, 1984), i.e., in the latter two cases the rape seedlings received most of their potassium from a fraction which is either not, or only to a minor extent, characterized as plant available by soil testing methods. Similarly high proportions of potassium delivery in the rhizosphere from the nonexchangeable fraction have been found in ryegrass, and part of this potassium originated from the interlayer of clay minerals (Kong and Steffens, 1989; Hinsinger et al., 1992).
Soil water content is another important factor affecting D^. As shown for potassium in Table 13.8, for a given soil increasing the volumetric soil water content increases the cross-sectional area available for diffusion of ions and correspondingly raises the value of the impedance factor / (Section 13.2.4) and the buffer power of the soil. As a consequence D^ for potassium more than doubles. For phosphorus this effect of soil water content on D^ is even more pronounced. Increasing the volumetric soil water content in a Luvisol from 0.12 to 0.33 g cm~^ increased D^ from 0.10 x 10~^^ to 4,45 x 10" " m^ s~\ whereas changes in the bulk density of the soil had only a relatively small effect on D^ (Bhadoria et al., 1991).
This pronounced effect of water content on D^ is also of importance in comparisons of water relations in soils of different textures (sandy soil, clay soil). Soils of different texture can have quite different water contents 0 at the same soil water potential (pF). As a rule, at the same pF the 0 increases with the clay content as shown by Cox and Barber (1992) by using four different soils in which at the same soil water potential (-33 kPa) the water content © varied between 0.13 and 0.40 g cm~^. In order to achieve the same phosphorus uptake by maize plants, in the soil with the highest volumetric water content (0 = 0.4 g cm~^) a concentration in the soil solution of only 10 juu P was necessary as compared with 200 juu in the soil with the lowest 0 = 0.13 g cm~^ (Cox and Barber, 1992). These examples on the role of soil water content on ion supply to roots indicate the advantages particularly for phosphorus and potassium nutrition in plants adapted to submerged soils (e.g., lowland rice).
It is well known from field and greenhouse experiments that at low soil water contents

494 Mineral Nutrition of Higher Plants
Table 13.8 Influence of Soil Volumetric Water Content (0) on Impedance Factor (/), Buffer Power (b) and Effective Diffusion Coefficient (D^) of
Potassium^
Impedance Effective diffusion Water content factor Buffer power coefficient (e,cm^cm-^) (/) (b) (De,cm^s-^)
0.19 0.20 2.68 2.55 x lO"" 0.26 0.30 3.09 4.91 X 10"^ 0.34 0.45 4.42 6.40 x 10 -7
''Based on Kuchenbuch et al. (1986). Reprinted by permission of Kluwer Academic Publishers.
- or in dry years - the uptake of potassium and phosphorus are more impaired than that of calcium and magnesium which may even be increased (Talha et al,, 1979). As has been demonstrated by Zur et al, (1982) at low soil water contents, the water content at the root surface is much lower than that of the bulk soil. Contact between root surface and soil via the soil solution can thus be lost. Under these conditions it has been postulated that long root hairs are of particular importance in preventing this loss of contact (Nye and Tinker, 1977).
When soil water content is low, mechanical impedance of the soil increases and root elongation growth is inhibited, which further Umits nutrient supply to the root surface by diffusion. However, root hair growth is strongly enhanced at low soil water content (Mackay and Barber, 1985,1987) and thus might in part compensate for any decrease in surface area from impeded elongation growth of the root axis. At least for phosphorus uptake, a similar compensatory effect, particularly for the decrease in D^ can be expected, as a result of mycorrhizal infection by roots. At low soil water contents the supply of boron to roots is depressed to a greater degree than that of any other micronutrient (Kluge, 1971). As reUable data on boron concentrations in soil solutions are lacking, it is not known whether it is mass flow or diffusion that is mainly responsible for boron supply to roots.
13.2.4.2 Plant Factors
As a rule, in nonmycorrhizal plants the extension of the depletion zones of phosphorus is closely related to root hair length. An example is given in Fig. 13.5 for maize. For potassium this close relation between root hair length and depletion zone also holds true for depleted soils (Fig. 13.2) or soils with a high buffer power for potassium (Fig. 13.3).
Root hair formation is modified by environmental factors (Chapter 14) and also differs typically between plant species. Genotypical differences in root hair length are particularly important for the concentration gradients of phosphorus and potassium around roots. For example, in maize and rape the distance of the extent of maximum phosphorus depletion in the rhizosphere is somewhat similar to the average root hair length, which is 0.7 mm in maize and 1.3 mm in rape. The extension of the depletion

Nutrient Availability in Soils 495
Fig. 13.5 Autoradiograph of maize roots in a soil labeled with ^ P showing zones of phosphorus depletion around the roots (removal of ^ P indicated by black zones).
zone is nearly identical with the maximal root hair length, namely 1.8 mm in maize and 2.6 mm in rape (Hendriks et al., 1981).
When the uptake rates of phosphorus or potassium per unit root length of different plant species are compared, a close positive correlation can be demonstrated between the uptake rate per unit root length and volume of the root hair cyUnder. This is shown for potassium in Fig. 13.6. In onion, root hairs were virtually absent, whereas of the plant species tested rape had the longest root hairs. Per unit length of onion root, the potassium of only 2-3 mm^ soil was available, as compared with -60 mm^ for rape. Results similar to those shown in Fig. 13.6 were obtained for phosporus in comparative studies with plant species of different root hair lengths (Itoh and Barber, 1983a). In agreement with this, even within a given plant species (white clover) selection of genotypes results in more-efficient phosphorus uptake in genotypes with long root hairs than in those with short root hairs (Caradus, 1982).
The importance of root hairs for phosphorus uptake from soils is also reflected in simulation models for predicting phosphorus uptake by different plant species (Fohse et al., 1988,1991). In models in which root hairs are not taken into account uptake is only predicted well in species which are without root hairs or in which root hair formation is minimal. The inclusion of root hairs leads to a much better agreement with determined values. In soils low in extractable phosphorus the contribution of root hairs can account for up to 90% of the total uptake (Fohse et al., 1991). Root hairs are more effective in absorbing phosphorus than the root cylinder when the influx pet unit area of each are

496 Mineral Nutrition of Higher Plants
0.5
0.4 n
0.3
0.2
0.1
n
^ •Rape Tomato
• Lolium
• Maize
• Onion 1 1 1 1—1
a>
Sf (0 t CO Q . CO — "
a.
0 20 40 60 80 Volume of the root hair cylinder
(mm^cm' ) Fig. 13.6 Rate of potassium uptake per unit length of root in relation to the volume of the root hair cylinder. The plant species were grown in a silt loam with 21% clay. (Modified from Jungk et
fl/.,1982.)
compared because of the smaller diameter and geometric arrangement of the root hairs which maintain higher diffusion rates of phosphorus (Jungk and Claassen, 1989; Claassen, 1990). This advantage of root hairs is likely of particular importance for phosphorus nutrition not only at low soil water content (see above) but also in macrostructured soils with large proportions of voids (Misra et al., 1988).
However, close relationships between root hair length and extension of the depletion zone of phosphorus and potassium are not always found. For example, in a given soil, extension of the phosphorus depletion zone was confined mainly to the root hair cylinder in rape which possesses long root hairs (>0.5 mm), but considerably exceeded the root hair cylinder in species with short root hairs (—0.2 mm), for example cotton (Misra et al., 1988). The extension of the depletion zone distinctly beyond the root hair cylinder in nonmycorrhizal plants can also indicate root-induced changes in the rhizosphere (e.g., release of root exudates, pH changes; Chapter 15) or higher efficiency in uptake parameters {K^, /^ax; Section 2.4.1) set by the plant demand per unit root length. In mycorrhizal plants the depletion zone of phosphorus by far exceeds the root hair cylinder (Jungk and Claassen, 1989) and in white clover, for example, can reach a value up to 11 cm (Li et al., 1991a).
Both the degree of depletion within the root hair cylinder and the extension of the depletion zone can also be affected by Cmin values, i.e., the minimum concentration of nutrients to which the roots can deplete the external concentration. These differ between plant species and even genotypes within a given species (Section 2.4.1). In general compared with solution cultures C^in values are usually much higher in soil-grown plants, indicating the buffer power of the soil to replenish the removal of nutrients in the rhizosphere soil solution. Average Cmin values for soil-grown plants are 2-3 juM potassium (Claassen and Jungk, 1982) and 1 juu for phosphorus (Hendriks et al., 1981). For the rate of replenishment of phosphorus in the soil solution of the root hair cylinder the following calculation can be made: concentration in the soil solution, 5 juu = 0.15 mg phosphorus per liter; amount of soil solution in the topsoil (0-30 cm).

Nutrient Availability in Soils 497
Table 13.9 Estimates of Proportions of Soil (Sandy Loam) Contribution to the Phosphorus and Potassium Nutrition of Field Grown Maize''
Proportion of soil contributing (%)
Root length density
» 2 cm cm~^ <2 cm cm~^
P K
20 50 5 12
"Fusseder and Krauss (1986).
~500000 liters = 75 g phosphorus per hectare; requirement during phase of rapid growth (e.g. in cereals between tillering and heading), —300-500 g phosphorus per hectare and day. Since only —25% of the topsoil is explored by roots during one growing season (Jungk, 1984) the rate of replenishment within the root hair cylinder has to be at least 10-20 times per day in order to meet the requirement of plants. For potassium, too, the rate of replenishment in the root hair cylinder has to be high. Within 2.5 days more than half of the potassium taken up by maize is derived from the so-called nonexchangeable fraction of the soil in the root hair cylinder (Claassen and Jungk, 1982), and in rape, within 7 days the contribution by the nonexchangeable fraction in an unfertilized and fertilized soil was 71% and 20%, respectively, of the total uptake (Section 13.2.4.1). From these data it can be concluded that field-grown plants do not uniformly deplete even the densely rooted topsoil; near the root surface a high proportion of the nonexchangeable potassium contributes to the total uptake, whereas at a distance from the root (that is, in the bulk soil) even the readily exchangeable potassium is not utilized. An example giving estimates of the proportion of soil delivering phosphorus and potassium to maize roots is shown in Table 13.9. Because of the typical differences in D^ values between potassium and phosphorus, the proportion of soil supplying nutrients is lower for phosphorus than for potassium.
Table 13.9 also clearly demonstrates the importance of the other main morphological component of nutrient acquisition of nonmycorrhizal roots from soils, the root length. This is expressed either as total root length per plant or total root length per unit soil volume as given in Table 13.9. Although the volume of the root hair cylinder of different plant species is often closely related to the uptake per unit root length of potassium (Claassen and Jungk, 1984) and phosphorus (Fohse etaL, 1991), this is not necessarily true for the content of the two mineral nutrients in the shoots, or the demand of supply of nutrients required for shoot growth as shown for phosphorus in Table 13.10. If a plant species is highly efficient in phosphorus acquisition from soils this results either from high influx rates per unit root length (particularly root hair length), as well as from total root length, or root length-shoot dry weight ratio (Fohse etal. 1988; 1991), i.e., the ratio of 'source' size (root surface area) to 'sink' size (shoot weight). The relative importance of total root length versus uptake efficiency per unit root length also depends on the phosphorus level in the soil; for example, in wheat roots length becomes more important in low phosphorus soils and uptake efficiency in high phosphorus soils (Romer et ai,, 1988). In studies with young plants on phosphorus efficiency of different

498 Mineral Nutrition of Higher Plants
Table 13.10 Relationship between Surface Area of Root Hairs (SAH) per Surface Area of Root Cylinder (SAC), and Demand of Phosphorus Supply in Soils for Obtaining 80% of
Maximum Growth in Different Plant Species^
Phosphorus demand SAH/SAC
Plant species (cm^ cm ^) mg P (100 g) ^ soil //M P in soil solution
Wheat (Tr. aestivum) Rape {Br. napus) Spinach {Sp. oleracea) Bean (P. vulgaris) Tomato (L. esculentum) Onion {A. cepa)
1.2 1.3 1.9 0.4 0.6
<0.001
4 5 9 9
11 17
1.2 1.4 4.6 4.6 5.7 6.9
''Based on Fohse et al. (1988, 1991).
species which differ much in seed size, and thus in phosphorus reserves (e.g. rape and bean), some problems in interpretation can arise, as large-seeded plants can develop a larger root system from seed reserves only (Narayanan etal., 1981).
Compared with red clover, ryegrass has a 2-4 times larger total root surface area and has a distinctly higher capacity for acquiring phosphorus (Steffens, 1984) and potassium (Mengel and Steffens, 1985) particularly when grown in soils low in phosphorus or potassium. As both plant species have a similar demand, for example of potassium, rates of potassium uptake per unit root length have to be at least three times higher in red clover compared with ryegrass (Mengel and Steffens, 1985). In mixed stands of both species, ryegrass is therefore a strong competitor for potassium and as a consequence the growth of red clover can rapidly be depressed in soils low in potassium (Steffens and Mengel, 1980).
13.3 Role of Root Density
Although a high root density and long root hairs are important factors in the uptake of nutrients supplied by diffusion, the relationship between root density and uptake rate is not linear, as shown in Fig. 13.7. When the root density is high, the uptake rate levels off. This is caused by overlapping of the depletion zones of individual roots and reflects interroot competition for nutrients (Fig. 13.8). For a given interroot distance the degree of competition mainly depends on Dg and is therefore usually much higher for nitrate than for potassium and is of minor importance for phosphorus, at least under field conditions for maize (Fusseder et al,, 1988). However, in poorly structured soils root aggregations are abundant and in those zones interroot competition for mineral nutrients can become important even for phosphorus at root length densities which on average are still relatively low (Fusseder and Kraus, 1986). This also holds true for root aggregations induced by localized fertilizer placement. In principle the same curvilinear relationship as shown in Fig. 13.7 can be expected between the rate of phosphorus uptake and root hair density, because of competition between individual root hairs

Nutrient Availability in Soils 499
^calculated
measured
Rooting density (root surface area [unit soil volume]")
Fig. 13.7 Relationship between root density and uptake rate of nutrients supplied by diffusion.
(Itch and Barber, 1983b). This competition has to be kept in mind when attempts are made to correlate root density, for example, to different soil layers or horizons, in relation to their contribution to nutrient supply.
In field-grown plants typical root density gradients occur between topsoil and subsoil (Table 13.11). The high rooting density in the topsoil is mainly caused by the usually more favorable physical, chemical and biological conditions in the topsoil as compared with the subsoil. As a first approximation and as an average of annual agricultural and horticultural crops, the logarithm of root density declines linearly with increasing depth (Greenwood et al., 1982). However, at least in cereal species and maize this gradient becomes less steep during the growing season, and root density in the subsoil increases (Barber and Mackay, 1986; Vincent and Gregory, 1989). A representative example giving average root densities of cereal crops at heading is shown in Fig. 13.9.
Despite the lower root density in the subsoil, nutrient uptake from the subsoil can be considerable. The importance of subsoil nitrate for nitrogen nutrition of crop plants is
'^j 'K' ^'^' Fig. 13.8 Profile of extractable phosphorus around two individual maize roots with overlapping depletion zones. (Fusseder and Kraus, 1986). A = root cylinder; B = root hair cylinder;
C = maximal depletion zone.

500 Mineral Nutrition of Higher Plants
Table 13.11 Root Length Distribution of Maize at Flowering in a Luvisol^
Soil depth (cm)
0-15 15-30 30-45 45-60 60-75 75-90 90-135
Density (cm cm"
6.19 3.07 1.12 0.48 0.41 0.26 0.17
Root
-')
length
Total (km m~^)
9.3 4.6 1.7 0.7 0.6 0.4 0.3
' Horlacher (1991).
widely established {Nj^ml Section 13.6). For cereal crops such as winter wheat growing in deep loess soils, on average, 30% of the total nitrogen uptake by the crop can derive from the subsoil (Kuhlmann et al., 1989). Uptake from the subsoil is important also for other mineral nutrients such as magnesium, potas*sium, and phosphorus. The relative importance of subsoil supply depends not only on root density in the subsoil (Fig. 13.9) but also on root density and nutrient availabiHty in the topsoil (Barber and Mackay, 1986; Kuhlmann and Baumgartel, 1991). Accessibility of mineral nutrients in the subsoil can also depend on the activity of the soil fauna, earthworms in particular; in barley and sugar beet between 20 and 40% of the roots in the subsoil (<65 cm) were found to follow earthworm channels (Meuser, 1991).
13.4 Nutrient Availability and Distribution of Water in Soils
Under many climatic conditions nutrient availability in the topsoil declines more or less steeply during the growing season because low soil water content becomes a limiting
^ (0
c
r t += o g'F 0) O +-•
o o LL.
9 8 7 | 6 5 4
3 21 1 1 0^
• Loamy and silty soils o Sandy soils
20 30 40 50 60
Soil depth (cm)
Fig. 13.9 Root length densities at heading of cereal crops in different soils as a function of soil depth. (G^thetaL, 1989.)

Nutrient Availability in Soils 501
E CO O (0 (0 CO n
CO SZ
60
o c
Q.
o 2 CO c o •E c
o ^ Q.
50
iS £ 40 4
- 30
20
^ Dry year
Wet year .. Average year
2 4 6 8 10 12 Topsoil root length density
(cm cm' ) Fig. 13.10 Estimated potassium uptake of spring wheat from a Luvisol (derived from loess) at different rooting densities in the topsoil at flowering, and in years with different soil moisture
contents. (Wessolek and Gath, 1989.)
factor for nutrient delivery to the root surface. It has been shov^n by Fox and Lipps (1961) that under these conditions —3% of the total root mass of alfalfa takes up from the subsoil more than 60% of the total nutrient uptake. Low^ soil w^ater content in the top soil also impairs root elongation and, thus, additionally decreases nutrient uptake, although part of these negative effects on Dg and root elongation can be compensated for by enhancement of root hair development in dry soils (Mackay and Barber, 1985, Section 14.6). The effect of v^ater supply on the root distribution, for example, of spring barley has been demonstrated in two successive years (Scott-Russell, 1977). In the first year, with high rainfall (82 mm) occurring a month after planting, more than 70% of the total root mass was found in the topsoil (2.5-12.5 cm) 2 months after planting and only ---10% of the roots had penetrated deeper than 22.5 cm; in contrast, in the following year, with inadequate rainfall (24 mm) during the first month after planting, the corresponding values for the distribution of the root mass were about 40% and 30%, respectively. This type of shift in root distribution has important consequences for nutrient uptake from various soil horizons. In spring wheat growing on Luvisols, on average ---50% of the total potassium taken up later in the growing season is derived from the subsoil (Grimme etal., 1981), but depending on the rainfall during the growing season the percentage may vary between ~60% in a dry year and —30% in a wet year (Fleige et al., 1983). Within a given year (wet or dry) the relative importance of potassium uptake from the subsoil also depends very much on the root length density in the topsoil (Fig. 13.10). From large-scale field tests on root length distribution in various cereal crops (Fig. 13.9), combined with measurements of exchangeable potassium and consideration of the climatic water balance at a given location, models have been established which properly predict potassium delivery to roots of cereal crops (Gath era/., 1989).
In principle, the uptake of phosphorus from different soil horizons should also

502 Mineral Nutrition of Higher Plants
Table 13.12 Phosphorus Uptake by Spring Wheat and Phosphorus DeUvery as a Function of
Soil Depth and Time''
Available P^ (mg(lOOg)-i
soil)
11.5 4.5 2.5 2.0
Soil depth (cm)
0-30 30-50 50-75 75-90
Phosphorus uptake (kg ha M )
Booting stage Anthesis Milky stage 0.345 0.265 0.145
Delivery of P from different soil depths (%)
83.3 58.8 67.4 8.1 17.8 15.5 5.9 16.3 12.0 2.7 7.1 5.1
' Luvisol derived from loess. Based on data from Fleige et al. (1981). ^Determined by extraction with calcium ammonium lactate.
respond similarly, or even more distinctly, to differences in soil moisture distribution within the soil profile. As shown in Table 13.12, despite the much higher level of extractable ('available') phosphorus in the topsoil, under low or erratic rainfall conditions during the growing season, in the later stages of growth between 30 and 40% of the total phosphorus taken up by the spring wheat crop comes from the subsoil.
For prediction of the nitrogen supply in the form of nitrate from the topsoil and subsoil the situation is somewhat different from potassium and phosphorus. Transport of nitrate by massflow can considerably contribute to the total delivery to the root surface (Strebel et a/., 1983; Strebel and Duynisveld, 1989). However, unless a high nitrate concentration is maintained in the soil solution by fertilizer application during the growing season, the relative proportions of nitrate supplied by mass flow and by diffusion shift most noticeably, as the buffer power for nitrate is usually low in soils, except in soils with high potential of readily mineralizable organic nitrogen. The concentration of nitrate is usually high in the topsoil early in the growing season but rapidly declines thereafter as a result of plant uptake. In spring wheat the change in nitrate concentration in the soil solution is correlated with a decline in the amount of nitrate supplied by mass flow and an increase in supply via diffusion, which then supplies more than 50% of the total nitrate (Strebel etal., 1980).
c o
g w 100 B ^ Q.T3
(D "D
50
August Sept.
Fig. 13.11 Nitrate uptake rate and delivery by diffusion to sugar beet plants as a function of soil depth (cm) and time. Soil: Luvisol derived from loess. (Based on Strebel etaL, 1983.)

Nutrient Availability in Soils 503
For sugar beet the supply by mass flow during the entire growing season is even less, on average 32 kg nitrate nitrogen, compared with 181 kg suppUed by diffusion (Strebel er«/., 1983). A time course study (Fig. 13.11) demonstrates that the supply by mass flow is restricted to the early growing period; during this time, nitrate is taken up from the topsoil, which has a large nitrate concentration in the soil solution. Thereafter, the nitrate in the topsoil is depleted, and upon root proliferation into the subsoil nitrate is supplied exclusively by diffusion. This example illustrates that average data on the contribution of mass flow and diffusion (as well as of different soil horizons) to the total supply do not reflect reality. Simulation models for predicting nutrient uptake in field-grown plants have therefore to take into account nutrient dynamics in space and time as well as plant species and genotype within a species. In maize, for example, considerable genotypical differences exist in the extent of nitrate depletion in the subsoil; depletion was positively correlated with the root length densities in the subsoil at silking (Wiesler and Horst, 1993).
13.5 Role of Soil Structure
For various reasons, soil structure plays an important role in determining the amounts of mineral nutrients that are available for uptake by the roots. In structured soils not all roots have complete contact with the soil matrix, and in nonmycorrhizal plants the degree of root-soil contact varies between root segments (i.e., along the root axis) from 0 to 100% (Van Noordwijk et al., 1992). In soils with higher bulk density contact is greater but root elongation growth is simultaneously impaired (Table 13.13). This impairment is in part compensated for by higher uptake rates per unit root length, at least of nitrate and water (Table 13.13), as well as of phosphate, particularly in soils high in available phosphorus (Cornish et al., 1984). However, in experiments in which soil bulk density was increased and soil-root contact raised from 25 to 75%, root aggre-
Table 13.13 Relationship between Bulk Density of the Soil, Soil Porosity (Macro-pores > 30 jum), Root Length, Estimated Root-Soil Contact, and
Uptake Rate of Nitrate and Water per Unit Root Length of Maize""
Bulk density (g cm~^)
Parameter
Soil porosity (%) Root length (m per pot) Root surface with soil contact (%) Uptake (mmol m~^ root length)
Nitrate Water
1.08
60 114 60
14 18
1.32
51 83 72
15 21
1.50
44 50 87
19 24
''Compiled data from Van Noordwijk et al. (1992); Kooistra et al. (1992) and Veen era/. (1992)

504 Mineral Nutrition of Higher Plants
gation was observed in certain zones and so too increased local O2 demand (Asady and Smucker, 1989). For maintenance of root respiration at such sites of aggregation required external O2 concentrations are more than triple. The optimal degree of soil-root contact and soil bulk density for nutrient uptake and plant growth thus depends on aeration and soil fertility (Van Noordwijk et aL, 1992).
In structured soils nutrient availability, particularly to perennial species, is also affected by other means. In arable soils at least in the plow layer established macro-structures are rare, these structures occur in the subsoil. However, in soils in which perennial species (pastures, forests) are growing established macrostructures are also present in the topsoil. The conventional soil testing methods for determination of available nutrients use soil samples which are homogenized prior to extraction. These methods have thus two major Umitations. They not only ignore the importance of spatial availability of nutrients (as discussed above) but also destroy the soil structure and thereby, for example, gradients which occur in the cation exchange capacity and the base saturation between the external and internal surfaces of aggregates (Horn, 1987; Kaupenjohann and Hantschel, 1989). Whereas external surfaces of aggregates are usually in equihbrium with the soil solution in the macropores, this is not the case with the internal surfaces, as ion exchange processes between both surfaces are obviously Umited and quite slow (Horn, 1989). These aspects are particularly important in acid forest soils where the structurally related gradients in microvariabihty of soil solution chemistry are very distinct, in addition to the spatial heterogenity related to the stem distance (Section 13.2.1).
Most of these limitations concerning soil structural aspects can be avoided by using soil solution collected from lysimeter or suction cups in the field, or from small soil cores. Soil solution can be obtained from these cores either by circulation of a percolating solution (Hildebrand, 1986) or by centrifuging after adjustment to field capacity. An example of the differences in cation concentration between so-called equilibrium soil solutipn from homogenized soil and of percolation solution of the same, but still structured acid soil, is shown in Table 13.14. As a rule, the concentrations of cations (except protons) are much higher in the homogenized samples as a result of the destruction of the aggregates and exposure of internal surfaces to the extract ant. Accordingly, correlations were poor or absent between the contents of potassium and magnesium in the needles of Norway spruce, and the respective concentrations of the two nutrients in the extraction solution. For the same sites, however, correlations were
Table 13.14 Cation Concentrations in Soil Equilibrium Solutions (Homogenized Soil) and in Soil Percolation Solution (Structured Soil) of a Brown-
Earth, pH (CaCl2) 3.06"
Method employed
Equilibr. sin. Percolat. sin.
K
55 13
Concentration in soil solution (juu)
Ca Mg Al
41 39 104 15 17 52
Fe
39 17
''Based on Hantschel et al. (1988) and Kaupenjohann and Hantschel (1989).
Nutrient Availability in Soils 505
highly significant for both nutrients in the solutions of structured samples (Kaupenjo-hann and Hantschel, 1989).
13.6 Intensity/Quantity Ratio, Plant Factors, and Consequences for Soil Testing
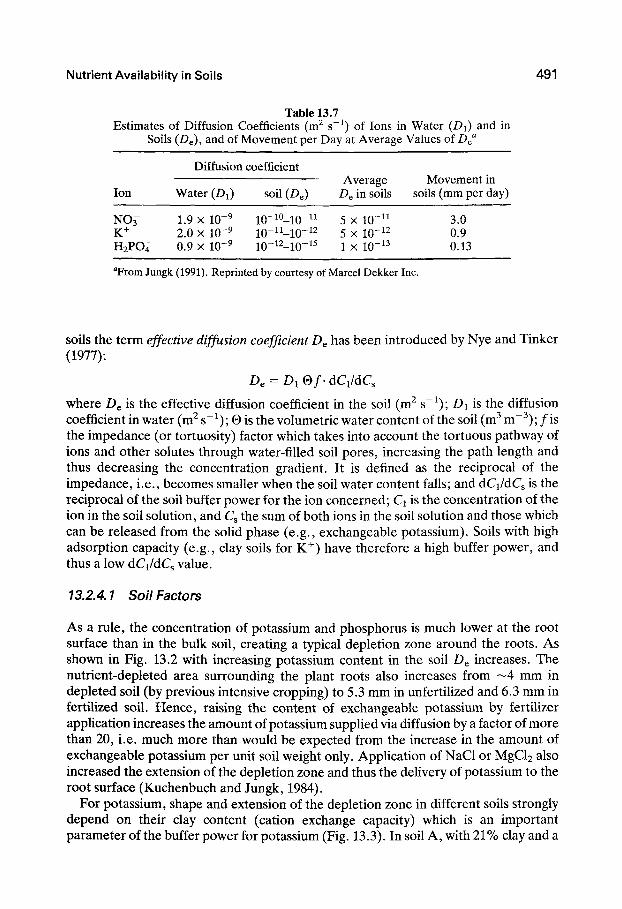
In principle routine soil testing methods (Section 13.1, Table 13.1) determine the fraction of 'chemically available' nutrients. In terms of an intensity/quantity concept, depending on the extraction method, this mainly characterizes the intensity (e.g,. water extraction) or a variable amount of the quantity, represented by the labile pool (Fig. 13.12). Soil testing for phosphorus in water extracts (1 cm^ soil (60 ml)~^ H2O (22 h)~^) is considered a reasonable compromise between a measurement of intensity and capacity of phosphorus supply of the soil (Van Noordwijk et al., 1990). Mild extractants such as sodium bicarbonate (Olsen-method) primarily characterize the phosphate fraction adsorbed to aluminum at clay surfaces (Kuo, 1990). More detailed information concerning binding strengths, rate of replenishment, and the intensity/quantity ratios for different mineral nutrients can be obtained with the electro-ultrafiltration method (EUF), which involves the use of different electrical field strengths and temperatures in an aqueous soil suspension (Nemeth, 1982; Nemeth et al, 1987). However, it is not possible to characterize adequately the buffer power of the soil for phosphate in terms of predicting plant uptake of phosphate (Nair and Mengel, 1984). Also, for routine soil testing the EUF method is not necessarily superior or technically simpler than conventional extraction methods (e.g. with CaCl2) in the prediction of fertilizer requirement (Houba et al., 1986).
%
Soil solution concentration,
"intensity" (chelators,
soil pH, clay content...)
Rate (reaction kinetics, tempe
rature, microorganisms ...)
Quantity, capacity
"labile" ' "extractable"
"Nutrient availability" ("bioavailability")
-quantity (e.g., extractability) -mobility, spatial availability
• mass flow, diffusion • root growth, surface area, mycorrhizae
-root-induced changes in rhizosphere
Fig. 13.12 Intensity/quantity ratio of nutrient availability, and factors determining the 'bioavailability' of mineral nutrients. (Marschner, 1993.) Reprinted by permission of Kluwer
Academic Publishers.
506 Mineral Nutrition of Higher Plants
A large number of extraction methods are used in routine soil testing for micronu-trients which, as a rule, mainly characterize the quantity component (Fig. 13.12) and predict fertilizer requirement reasonably well when the extracted amounts are considerably different from those considered as adequate (Sims and Johnson, 1991). Predictions can sometimes be improved by consideration of other soil properties such as pH, redox potential, clay and organic matter content (Moraghan and Mascogni, 1991; Brennan, 1992c). In terms of 'bioavailabihty' (Fig. 13.12) no systematic studies have been carried out on the relative importance of mass flow and diffusion for delivery of micronutrients to plant roots, nor on the subsoil as a potential contributor to micronu-trient supply to roots. Only for zinc is there direct and indirect evidence to support the view that in aerated soils of high pH at least is diffusion the main component of delivery to the roots (Marschner, 1993).
Because of the importance of both ion concentrations in the soil solution and the rates of replenishment of these ions, the use of ion-exchange resins has attracted new interest as a possible means of characterizing the buffer power of soils, as for example for potassium (Gath et al., 1989) or simultaneously for various cations and anions (Yang et al., 1991). In experiments with bean and maize under field conditions prediction of zinc uptake was more precise with ion exchange resins than with the routine DTPA extraction (Hamilton and Westermann, 1991).
Soil testing as the basis for recommendation of nitrogen fertilizer appUcation for various agricultural and horticultural field crops has been very much improved by the ^min method. With this method the amount of mineralized nitrogen, mainly nitrate, in the soil profile is measured at the beginning of the growing season, thus taking into account components of'bioavailability' (Fig. 13.12), namely the high mobility of nitrate in the soil profile (mass flow) and nitrogen uptake from the subsoil (root growth). Depending on plant species and rooting depth, A in is determined up to a soil depth of 90 cm (Wehrmann and Scharpf, 1986; Schenk etal, 1991). The Nmin method can also improve fertilizer recommendations in rainfed agriculture under dryland conditions (Soltanpour et al., 1989). Since in humid and semihumid climates most of the nitrate in the subsoil originates from mineralization of organically bound nitrogen (A org) and nitrification of ammonium nitrogen in the topsoil, various attempts have been made to characterize this particular N^^^ fraction in the topsoil prior to nitrate leaching into the subsoil, as for example, by use of the EUF method (Nemeth, 1985; Mengel, 1991) or of CaCl2 as an extractant (Appel and Steffens, 1988). For cereals, both EUF N^^g and CaCl2 extraction seem to be a suitable alternative to the Nmin method (Appel and Mengel, 1992).
The principal limitation of soil testing methods is that they only characterize some of the factors which determine nutrient supply to the roots of field-grown plants. Improving the reliability of fertilizer recommendations based on chemical soil analysis does not depend primarily on extraction method used, but rather on the systematic consideration of the roots and environmental factors such as soil water content. Current models for predicting nutrient availability and nutrient uptake under field conditions are therefore based on both soil and plant factors (Fig. 13.12) in which root parameters are the key element (Greenwood, 1983; Barber, 1984; Van Noordwijk et al, 1990; Claassen, 1990). These models have been very much refined in recent years and predictions on mineral nutrient uptake, and actual uptake by crops, for example of

Nutrient Availability in Soils 507
Extractable P (0-30 cm depth)
20 mg [100 g soil]"
4mg [tOOgsoil]'^
May June
Fig. 13.13 Phosphorus uptake of winter wheat in a field experiment after long-term application of either 100 kg P ha~^ per year (high P soil) or without P fertilizer application (low P soil). Comparison of measured P uptake with P uptake predicted by the Claassen-Barber model.
(Jungk and Claassen, 1989.)
phosphorus (Fig. 13.13) or potassium (Seward etal., 1990) are often, but not always, in good agreement. As shown in Fig. 13.13 the predicted and measured uptake of phosphorus were closely related in the soil with high phosphorus content. However, in the soil with low phosphorus content predicted uptake was much lower than the measured uptake, indicating that the wheat plants in the low phosphorus soil had access to soil phosphorus sources which were not considered in the model. The acquisition of relatively large amounts of phosphorus by VA mycorrhiza to the wheat plants offers one possible explanation (Jungk and Claassen, 1989), and root-induced changes in the rhizosphere another (Silberbush and Barber, 1984). The role of mycorrhizae and of root-induced changes in the rhizosphere for the 'bioavailability' of nutrients (Fig. 13.12) is discussed in detail in Chapter 15.
In contrast to phosphorus, in the case of potassium the predictions were in close agreement with the measured uptake of the wheat crop only in potassium-deficient soils whereas in the potassium-sufficient soil the models overpredicted the potassium uptake by as much as four times (Seward et al., 1990). This overprediction was obviously the result of poor characterization of the plant demand and thus an underestimation of the role of negative feedback regulation of potassium uptake by the roots at high internal content (Section 2.5.6).
In conclusion, at present, but presumably also at least in the near future, mechanistic simulation models cannot replace soil testing but can refine recommendations for different yield levels, and can make more accurate predictions for new crops or on the effects of changing soil water balance (Van Noordwijk et al., 1990).