Advances in utilization of renewable substrates for biosurfactant production
Upload
independentCategory
view
4download
0
Autoregulation allows Escherichia coli RNase E to adjustcontinuously its synthesis to thatof its substrates
Sandra Sousa,† Isabelle Marchand and Marc Dreyfus*
Laboratoire de Genetique Moleculaire, CNRS UMR 8541,
Ecole Normale Superieure, 46 rue d’Ulm, 75230 Paris,
France.
Summary
The Escherichia coli endonuclease RNase E plays a
key role in rRNA maturation and mRNA decay. In
particular, it controls the decay of its own mRNA by
cleaving it within the 50-untranslated region (UTR),
thereby autoregulating its synthesis. Here, we report
that, when the synthesis of an RNase E substrate is
artificially induced to high levels in vivo, both the rne
mRNA concentration and RNase E synthesis increase
abruptly and then decrease to a steady-state level that
remains higher than in the absence of induction.
Using rne–lacZ fusions that retain or lack the rne
50UTR, we show that these variations reflect a
transient mRNA stabilization mediated by the rne
50UTR. Finally, by putting RNase E synthesis under
the control of an IPTG-controlled promoter, we show
that a similar, rne 50UTR-mediated mRNA stabilization
can result from a shortage of RNase E. We conclude
that the burst in substrate synthesis has titrated
RNase E, stabilizing the rne mRNA by protecting its
50UTR. However, this stabilization is self-correcting,
because it allows the RNase E pool to expand until its
mRNA is destabilized again. Thus, autoregulation
allows RNase E to adjust its synthesis to that of its
substrates, a behaviour that may be common among
autoregulated proteins. Incidentally, this adjustment
cannot occur when translation is blocked, and we
argue that the global mRNA stabilization observed
under these conditions originates in part from this
defect.
Introduction
In Escherichia coli, proteins that play a general role in gene
expression, e.g. in the synthesis or translation of mRNAs
or in the folding, maturation or degradation of either RNAs
or proteins, often exploit their activity for autoregulating
their own expression. For instance, protein CRP, which
activates many promoters by binding upstream of them,
can also bind downstream of its own promoter, repressing
its activity (Hanamura and Aiba, 1991). Likewise, many
proteins that bind to specific sites on rRNA or tRNA, such
as ribosomal proteins (r-proteins) and certain aminoacyl
tRNA synthetases, can also bind to similar sites on their
own mRNAs, inhibiting their translation (Nomura et al.,
1980; Draper, 1987; Springer, 1996). Similarly, the heat
shock proteins specifically downregulate the activity of s32,
a factor required for the transcription of their genes; in
particular, the DnaK–DnaJ–GrpE chaperone team, which
normally associates with denatured proteins, can also
associate with s32, inactivating this factor and perhaps
promoting its degradation (Gross, 1996; Arsene et al.,
2000). Finally, RNase III and RNase E, two endonu-
cleases involved in rRNA maturation and mRNA decay,
also repress their own synthesis by initiating the decay of
their mRNAs (Bardwell et al., 1989; Jain and Belasco,
1995).
What is the benefit for the bacterial cell of these
autoregulation loops? It is generally believed that they act
as sensors of the metabolic demand for the corresponding
proteins. Thus, the overproduction of rRNA or tRNAThr
results in an increased synthesis of r-proteins or threonyl-
tRNA synthetase respectively. Presumably, these proteins
are titrated by the burst of their substrates so that the
autoregulation loop is derepressed and their synthesis
increases (Yamagishi and Nomura, 1988; Comer et al.,
1996). Similarly, the misfolded or denatured polypeptides
that accumulate during heat shock are thought to titrate
the DnaK–DnaJ–GrpE team, thereby releasing free s32
and contributing to the induction of heat shock protein
synthesis (Craig and Gross, 1991). Following workers in
the heat shock field, we use the term ‘homeostasy’ to
designate this adjustment between the synthesis of a
protein and that of its substrates.
RNase E is a key E. coli endonuclease that controls the
production of p5S and 16.3S rRNAs, the immediate
precursors of 5S and 16S rRNAs, as well as the decay of
many or most mRNAs in the cell (Ghora and Apirion, 1978;
Ono and Kuwano, 1979; Cohen and McDowall, 1997;
Coburn and Mackie, 1999; Li et al., 1999). In particular, it
Accepted 31 August, 2001. *For correspondence. E-mail [email protected]; Tel. (133) 1 44 32 35 26; Fax (133) 1 44 32 39 41.†Present address: Unite des Interactions Bacteries-Cellules, InstitutPasteur, 28 rue du Dr Roux, 75724 Paris Cedex 15, France.
Molecular Microbiology (2001) 42(3), 867–878
Q 2001 Blackwell Science Ltd

initiates the decay of its own mRNA by cleaving it in the 50
untranslated region (UTR), thereby autoregulating its own
synthesis (Mudd and Higgins, 1993; Jain and Belasco,
1995; Diwa et al., 2000). Recently, we have observed that
situations that result in a translational block also cause an
apparent inhibition of RNase E; presumably, this inhibition
contributes to the well-known stabilization of bulk mRNA
observed under these conditions (Lopez et al., 1998). As
an explanation, we noted that the pool of free RNase E in
growing cells may be limited because of autoregulation
and that, once translation is blocked, it cannot expand
further. Under these conditions, the synthesis of rRNA is
boosted, and this newly synthesized rRNA is unstable,
presumably because it cannot assemble with r-proteins
(Shen and Bremer, 1977). We therefore proposed that
RNase E is then permanently titrated by excess substrates
(Lopez et al., 1998). This model yields the simple
prediction that, by inducing the synthesis of a highly
expressed RNase E substrate in normally growing cells, it
should be possible to titrate RNase E independently of any
translation block. However, titration should be transient
because the pool of RNase E is free to expand in response
to the stabilization of its cognate mRNA. Accordingly,
autoregulation would allow homeostasy of RNase E
expression as for heat shock or ribosomal proteins. It is
this critical point of the model that is tested here.
Results
A truncated rrnB transcript lacking most of the 16S and
23S sequence is a substrate for RNase E
Our first aim was to design a system that allows massive
and inducible synthesis of a well-defined RNase E
substrate in the cell. Ideally, this substrate should be
devoid of biological activity in order to avoid perturbing
growth; in particular, it should remain untranslated. On this
basis, we chose plasmid pNO2681 (Gourse et al., 1985)
as a source of substrate RNA. This pBR322 derivative
carries a defective version of the rrnB operon lacking most
of the 16S and 23S rRNA genes, but retaining the 50 and 30
ends of the operon, including the two RNase E cleavage
sites flanking the 5S rRNA and the RNase E site located
upstream of the 16S rRNA (Ghora and Apirion, 1978; Li
et al., 1999; Fig. 1A and B). Its putative 1.8 kb transcript
carries no known ribosome binding site, nor is it functional
in ribosome biosynthesis (Gourse et al., 1985). In
pNO2681, the defective rrnB operon lacks its own
promoter but is fused downstream of the strong PL
promoter from bacteriophage lambda. Whereas at 308C,
this promoter is tightly repressed in cells synthesizing the
thermolabile c I857 lambda repressor, it can be switched
on by shifting the cultures to 428C, which inactivates the
repressor (Gourse et al., 1985). Since the effect of
blocking translation upon RNase E activity (Lopez et al.,
1998) and upon rRNA synthesis and stability (Shen and
Bremer, 1977), as well as most information on E. coli
physiology (Bremer and Dennis, 1996), have been studied
in the E. coli B (or B/r ) background, the E. coli B strain
BL21(DE3) (Studier et al., 1990) was chosen as a host for
this study. In the derivatives used, the genuine lacZ gene
has been inactivated in order to allow the use of various
rne–lacZ fusions for testing RNase E activity (see below).
Plasmids pNO2681 or pBR322 were introduced into
cells carrying pc I857, a pBR322-compatible plasmid
encoding the repressor (Remaut et al., 1983; Fig. 1A).
The doubly transformed cells were grown at 308C and then
shifted to 428C to induce the PL promoter. Cells carrying
either pNO2681 or pBR322 grew at the same rate both
before and after the temperature shift, indicating that this
induction is not toxic. Total RNA was extracted from the
doubly transformed cells before or after the shift and
analysed on Northern blots, using oligonucleotide probes
complementary to the 5S rRNA or the immediately
Fig. 1. A. Outline of an experimental system designed for the inducibleexpression of a RNase E substrate in E. coli. Plasmid pNO2681(Gourse et al., 1985) carries a truncated version of the rrnB operon(grey box) under the control of the PL promoter (thick arrow), insertedbetween the HindIII (H) and Bam HI (B) sites of pBR322. At 308C (butnot at 428C), the PL promoter is repressed (curved line) by thethermolabile c I857 repressor encoded by the plasmid pc I857 (circle).B. Detail of the truncated rrnB operon. The corresponding transcript,which extends down to the natural rrnB terminators (rrnT), differs fromthe genuine rrnB transcript by a large internal deletion (symbolized bydotted lines), which removes most of the 16S and 23S sequences(open boxes). Note that, because of the deletion, the duplex regionsthat are cleaved by RNase III during rRNA maturation, (cleavage sitesnoted ‘III’) are no longer present so that the transcript is presumablynot a substrate for RNase III. The RNase E sites flanking the 5S rRNAand the RNase E site located upstream of the 16S rRNA are arrowed(‘E’). Starred bars noted ‘5S’ and ‘9S’ show the positions of theoligonucleotides used in Figs 2 and 7 to probe 5S rRNA or itsprecursors, respectively.
868 S. Sousa, I. Marchand and M. Dreyfus
Q 2001 Blackwell Science Ltd, Molecular Microbiology, 42, 867–878
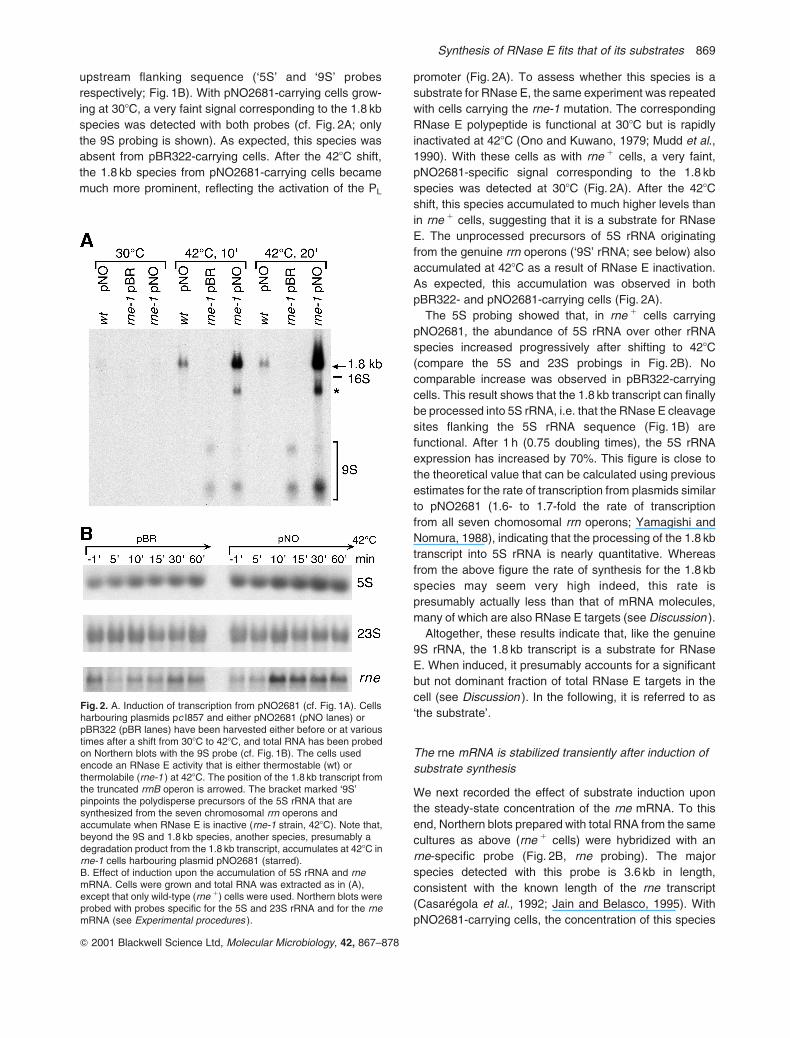
upstream flanking sequence (‘5S’ and ‘9S’ probes
respectively; Fig. 1B). With pNO2681-carrying cells grow-
ing at 308C, a very faint signal corresponding to the 1.8 kb
species was detected with both probes (cf. Fig. 2A; only
the 9S probing is shown). As expected, this species was
absent from pBR322-carrying cells. After the 428C shift,
the 1.8 kb species from pNO2681-carrying cells became
much more prominent, reflecting the activation of the PL
promoter (Fig. 2A). To assess whether this species is a
substrate for RNase E, the same experiment was repeated
with cells carrying the rne-1 mutation. The corresponding
RNase E polypeptide is functional at 308C but is rapidly
inactivated at 428C (Ono and Kuwano, 1979; Mudd et al.,
1990). With these cells as with rne 1 cells, a very faint,
pNO2681-specific signal corresponding to the 1.8 kb
species was detected at 308C (Fig. 2A). After the 428C
shift, this species accumulated to much higher levels than
in rne 1 cells, suggesting that it is a substrate for RNase
E. The unprocessed precursors of 5S rRNA originating
from the genuine rrn operons (‘9S’ rRNA; see below) also
accumulated at 428C as a result of RNase E inactivation.
As expected, this accumulation was observed in both
pBR322- and pNO2681-carrying cells (Fig. 2A).
The 5S probing showed that, in rne 1 cells carrying
pNO2681, the abundance of 5S rRNA over other rRNA
species increased progressively after shifting to 428C
(compare the 5S and 23S probings in Fig. 2B). No
comparable increase was observed in pBR322-carrying
cells. This result shows that the 1.8 kb transcript can finally
be processed into 5S rRNA, i.e. that the RNase E cleavage
sites flanking the 5S rRNA sequence (Fig. 1B) are
functional. After 1 h (0.75 doubling times), the 5S rRNA
expression has increased by 70%. This figure is close to
the theoretical value that can be calculated using previous
estimates for the rate of transcription from plasmids similar
to pNO2681 (1.6- to 1.7-fold the rate of transcription
from all seven chomosomal rrn operons; Yamagishi and
Nomura, 1988), indicating that the processing of the 1.8 kb
transcript into 5S rRNA is nearly quantitative. Whereas
from the above figure the rate of synthesis for the 1.8 kb
species may seem very high indeed, this rate is
presumably actually less than that of mRNA molecules,
many of which are also RNase E targets (see Discussion ).
Altogether, these results indicate that, like the genuine
9S rRNA, the 1.8 kb transcript is a substrate for RNase
E. When induced, it presumably accounts for a significant
but not dominant fraction of total RNase E targets in the
cell (see Discussion ). In the following, it is referred to as
‘the substrate’.
The rne mRNA is stabilized transiently after induction of
substrate synthesis
We next recorded the effect of substrate induction upon
the steady-state concentration of the rne mRNA. To this
end, Northern blots prepared with total RNA from the same
cultures as above (rne 1 cells) were hybridized with an
rne-specific probe (Fig. 2B, rne probing). The major
species detected with this probe is 3.6 kb in length,
consistent with the known length of the rne transcript
(Casaregola et al., 1992; Jain and Belasco, 1995). With
pNO2681-carrying cells, the concentration of this species
Fig. 2. A. Induction of transcription from pNO2681 (cf. Fig. 1A). Cellsharbouring plasmids pc I857 and either pNO2681 (pNO lanes) orpBR322 (pBR lanes) have been harvested either before or at varioustimes after a shift from 308C to 428C, and total RNA has been probedon Northern blots with the 9S probe (cf. Fig. 1B). The cells usedencode an RNase E activity that is either thermostable (wt) orthermolabile (rne-1 ) at 428C. The position of the 1.8 kb transcript fromthe truncated rrnB operon is arrowed. The bracket marked ‘9S’pinpoints the polydisperse precursors of the 5S rRNA that aresynthesized from the seven chromosomal rrn operons andaccumulate when RNase E is inactive (rne-1 strain, 428C). Note that,beyond the 9S and 1.8 kb species, another species, presumably adegradation product from the 1.8 kb transcript, accumulates at 428C inrne-1 cells harbouring plasmid pNO2681 (starred).B. Effect of induction upon the accumulation of 5S rRNA and rnemRNA. Cells were grown and total RNA was extracted as in (A),except that only wild-type (rne 1) cells were used. Northern blots wereprobed with probes specific for the 5S and 23S rRNA and for the rnemRNA (see Experimental procedures ).
Synthesis of RNase E fits that of its substrates 869
Q 2001 Blackwell Science Ltd, Molecular Microbiology, 42, 867–878
increased abruptly (by < sixfold) after 10 min at 428C, and
decreased progressively thereafter; however, even after
60 min at 428C, it remained < twofold higher than before
the temperature shift. In contrast, with cells carrying the
control plasmid pBR322, the concentration of the rne
mRNA changed more smoothly and over a more limited
range (Fig. 2B).
The transient accumulation of the rne mRNA after
substrate induction might reflect either an increased
promoter activity or a stabilization of the rne mRNA. In the
latter event, it would presumably reflect a transient
shortage in RNase E activity, because the stability of
the rne mRNA is controlled by the rate of cleavage of
its 50UTR, which itself responds to RNase E activity (Jain
and Belasco, 1995). To test this issue, we used two in-
phase rne– lacZ fusions designed by Jain and Belasco
(1995). These fusions consist of the rne promoter followed
by the same rne– lacZ hybrid coding sequences, but they
differ in the presence or absence of most of the 361-nt-
long rne 50UTR in between. Only with the former fusion
was mRNA stability and protein yield affected by RNase E
activity as for the rne gene (Jain and Belasco, 1995).
These fusions were then introduced onto the chromosome
of BL21(DE3). For simplicity, the corresponding deriva-
tives are qualified here as ‘150UTR’ and ‘250UTR’
respectively (Fig. 3A); by extension, the same qualifiers
are used to designate the rne–lacZ fusions themselves or
the mRNAs originating from them. The 150UTR and
250UTR cells carrying plasmids pc I857 and either
pNO2681 or pBR322 were then grown as before. Total
RNA was extracted before or after the 428C shift and
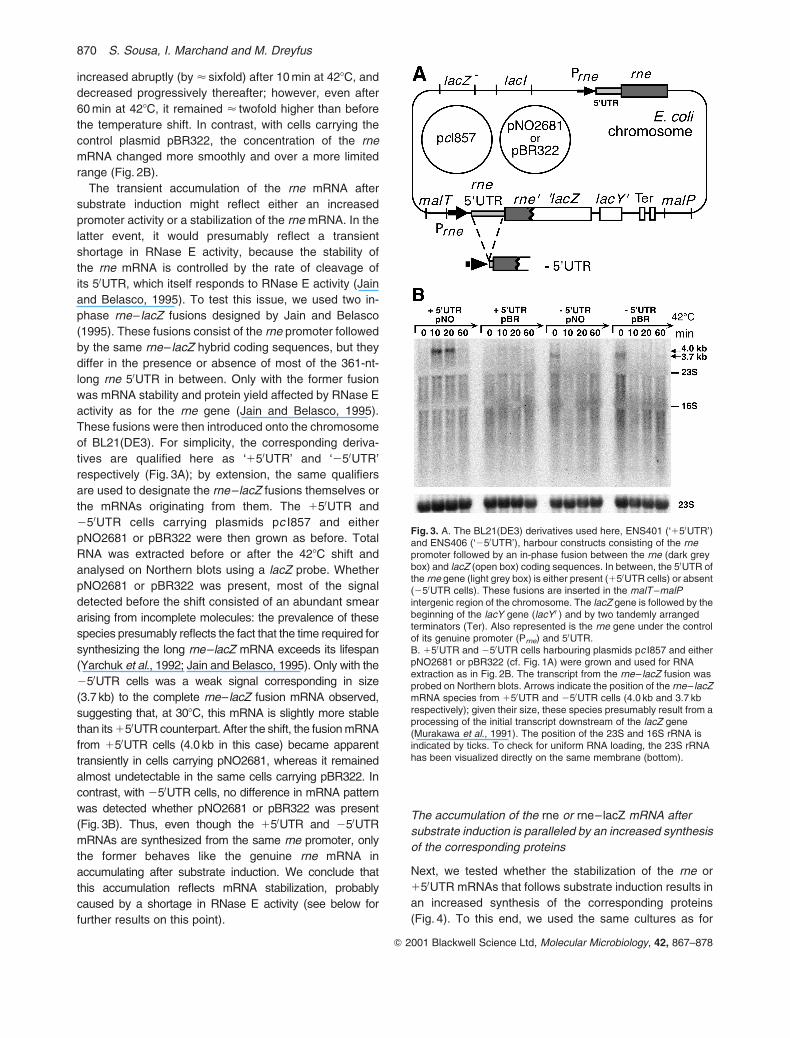
analysed on Northern blots using a lacZ probe. Whether
pNO2681 or pBR322 was present, most of the signal
detected before the shift consisted of an abundant smear
arising from incomplete molecules: the prevalence of these
species presumably reflects the fact that the time required for
synthesizing the long rne–lacZ mRNA exceeds its lifespan
(Yarchuk et al., 1992; Jain and Belasco, 1995). Only with the
250UTR cells was a weak signal corresponding in size
(3.7 kb) to the complete rne– lacZ fusion mRNA observed,
suggesting that, at 308C, this mRNA is slightly more stable
than its 150UTR counterpart. After the shift, the fusion mRNA
from 150UTR cells (4.0 kb in this case) became apparent
transiently in cells carrying pNO2681, whereas it remained
almost undetectable in the same cells carrying pBR322. In
contrast, with 250UTR cells, no difference in mRNA pattern
was detected whether pNO2681 or pBR322 was present
(Fig. 3B). Thus, even though the 150UTR and 250UTR
mRNAs are synthesized from the same rne promoter, only
the former behaves like the genuine rne mRNA in
accumulating after substrate induction. We conclude that
this accumulation reflects mRNA stabilization, probably
caused by a shortage in RNase E activity (see below for
further results on this point).
The accumulation of the rne or rne–lacZ mRNA after
substrate induction is paralleled by an increased synthesis
of the corresponding proteins
Next, we tested whether the stabilization of the rne or
150UTR mRNAs that follows substrate induction results in
an increased synthesis of the corresponding proteins
(Fig. 4). To this end, we used the same cultures as for
Fig. 3. A. The BL21(DE3) derivatives used here, ENS401 (‘150UTR’)and ENS406 (‘250UTR’), harbour constructs consisting of the rnepromoter followed by an in-phase fusion between the rne (dark greybox) and lacZ (open box) coding sequences. In between, the 50UTR ofthe rne gene (light grey box) is either present (150UTR cells) or absent(250UTR cells). These fusions are inserted in the malT–malPintergenic region of the chromosome. The lacZ gene is followed by thebeginning of the lacY gene (lacY 0 ) and by two tandemly arrangedterminators (Ter). Also represented is the rne gene under the controlof its genuine promoter (Prne) and 50UTR.B. 150UTR and 250UTR cells harbouring plasmids pc I857 and eitherpNO2681 or pBR322 (cf. Fig. 1A) were grown and used for RNAextraction as in Fig. 2B. The transcript from the rne– lacZ fusion wasprobed on Northern blots. Arrows indicate the position of the rne– lacZmRNA species from 150UTR and 250UTR cells (4.0 kb and 3.7 kbrespectively); given their size, these species presumably result from aprocessing of the initial transcript downstream of the lacZ gene(Murakawa et al., 1991). The position of the 23S and 16S rRNA isindicated by ticks. To check for uniform RNA loading, the 23S rRNAhas been visualized directly on the same membrane (bottom).
870 S. Sousa, I. Marchand and M. Dreyfus
Q 2001 Blackwell Science Ltd, Molecular Microbiology, 42, 867–878
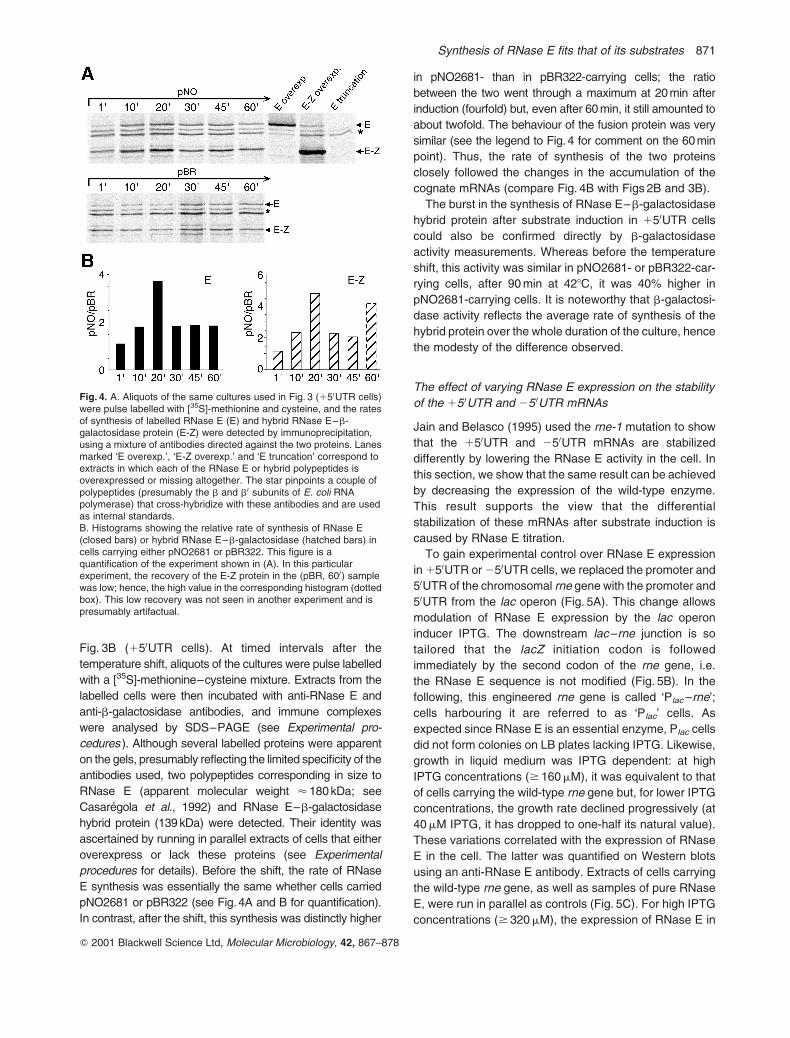
Fig. 3B (150UTR cells). At timed intervals after the
temperature shift, aliquots of the cultures were pulse labelled
with a [35S]-methionine–cysteine mixture. Extracts from the
labelled cells were then incubated with anti-RNase E and
anti-b-galactosidase antibodies, and immune complexes
were analysed by SDS–PAGE (see Experimental pro-
cedures ). Although several labelled proteins were apparent
on the gels, presumably reflecting the limited specificity of the
antibodies used, two polypeptides corresponding in size to
RNase E (apparent molecular weight < 180 kDa; see
Casaregola et al., 1992) and RNase E–b-galactosidase
hybrid protein (139 kDa) were detected. Their identity was
ascertained by running in parallel extracts of cells that either
overexpress or lack these proteins (see Experimental
procedures for details). Before the shift, the rate of RNase
E synthesis was essentially the same whether cells carried
pNO2681 or pBR322 (see Fig. 4A and B for quantification).
In contrast, after the shift, this synthesis was distinctly higher
in pNO2681- than in pBR322-carrying cells; the ratio
between the two went through a maximum at 20 min after
induction (fourfold) but, even after 60 min, it still amounted to
about twofold. The behaviour of the fusion protein was very
similar (see the legend to Fig. 4 for comment on the 60 min
point). Thus, the rate of synthesis of the two proteins
closely followed the changes in the accumulation of the
cognate mRNAs (compare Fig. 4B with Figs 2B and 3B).
The burst in the synthesis of RNase E–b-galactosidase
hybrid protein after substrate induction in 150UTR cells
could also be confirmed directly by b-galactosidase
activity measurements. Whereas before the temperature
shift, this activity was similar in pNO2681- or pBR322-car-
rying cells, after 90 min at 428C, it was 40% higher in
pNO2681-carrying cells. It is noteworthy that b-galactosi-
dase activity reflects the average rate of synthesis of the
hybrid protein over the whole duration of the culture, hence
the modesty of the difference observed.
The effect of varying RNase E expression on the stability
of the 15 0UTR and 25 0UTR mRNAs
Jain and Belasco (1995) used the rne-1 mutation to show
that the 150UTR and 250UTR mRNAs are stabilized
differently by lowering the RNase E activity in the cell. In
this section, we show that the same result can be achieved
by decreasing the expression of the wild-type enzyme.
This result supports the view that the differential
stabilization of these mRNAs after substrate induction is
caused by RNase E titration.
To gain experimental control over RNase E expression
in 150UTR or 250UTR cells, we replaced the promoter and
50UTR of the chromosomal rne gene with the promoter and
50UTR from the lac operon (Fig. 5A). This change allows
modulation of RNase E expression by the lac operon
inducer IPTG. The downstream lac–rne junction is so
tailored that the lacZ initiation codon is followed
immediately by the second codon of the rne gene, i.e.
the RNase E sequence is not modified (Fig. 5B). In the
following, this engineered rne gene is called ‘Plac–rne’;
cells harbouring it are referred to as ‘Plac’ cells. As
expected since RNase E is an essential enzyme, Plac cells
did not form colonies on LB plates lacking IPTG. Likewise,
growth in liquid medium was IPTG dependent: at high
IPTG concentrations ($ 160mM), it was equivalent to that
of cells carrying the wild-type rne gene but, for lower IPTG
concentrations, the growth rate declined progressively (at
40mM IPTG, it has dropped to one-half its natural value).
These variations correlated with the expression of RNase
E in the cell. The latter was quantified on Western blots
using an anti-RNase E antibody. Extracts of cells carrying
the wild-type rne gene, as well as samples of pure RNase
E, were run in parallel as controls (Fig. 5C). For high IPTG
concentrations ($ 320mM), the expression of RNase E in
Fig. 4. A. Aliquots of the same cultures used in Fig. 3 (150UTR cells)were pulse labelled with [35S]-methionine and cysteine, and the ratesof synthesis of labelled RNase E (E) and hybrid RNase E–b-galactosidase protein (E-Z) were detected by immunoprecipitation,using a mixture of antibodies directed against the two proteins. Lanesmarked ‘E overexp.’, ‘E-Z overexp.’ and ‘E truncation’ correspond toextracts in which each of the RNase E or hybrid polypeptides isoverexpressed or missing altogether. The star pinpoints a couple ofpolypeptides (presumably the b and b0 subunits of E. coli RNApolymerase) that cross-hybridize with these antibodies and are usedas internal standards.B. Histograms showing the relative rate of synthesis of RNase E(closed bars) or hybrid RNase E–b-galactosidase (hatched bars) incells carrying either pNO2681 or pBR322. This figure is aquantification of the experiment shown in (A). In this particularexperiment, the recovery of the E-Z protein in the (pBR, 600) samplewas low; hence, the high value in the corresponding histogram (dottedbox). This low recovery was not seen in another experiment and ispresumably artifactual.
Synthesis of RNase E fits that of its substrates 871
Q 2001 Blackwell Science Ltd, Molecular Microbiology, 42, 867–878
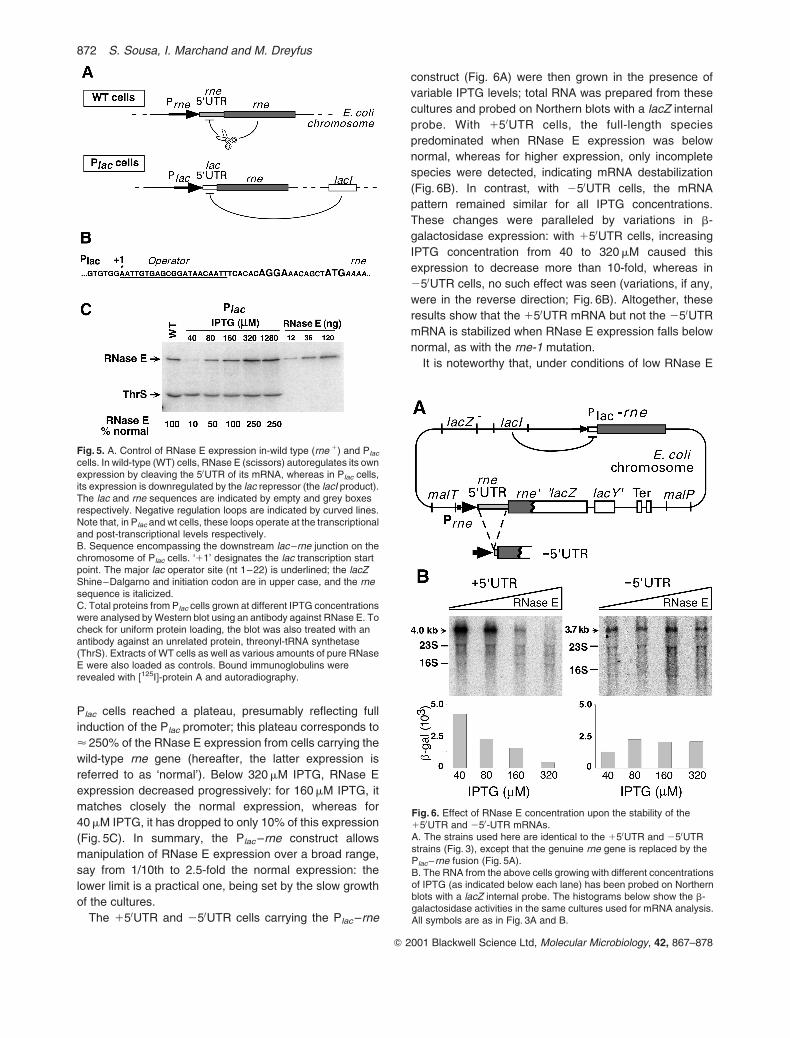
Plac cells reached a plateau, presumably reflecting full
induction of the Plac promoter; this plateau corresponds to
< 250% of the RNase E expression from cells carrying the
wild-type rne gene (hereafter, the latter expression is
referred to as ‘normal’). Below 320mM IPTG, RNase E
expression decreased progressively: for 160mM IPTG, it
matches closely the normal expression, whereas for
40mM IPTG, it has dropped to only 10% of this expression
(Fig. 5C). In summary, the Plac–rne construct allows
manipulation of RNase E expression over a broad range,
say from 1/10th to 2.5-fold the normal expression: the
lower limit is a practical one, being set by the slow growth
of the cultures.
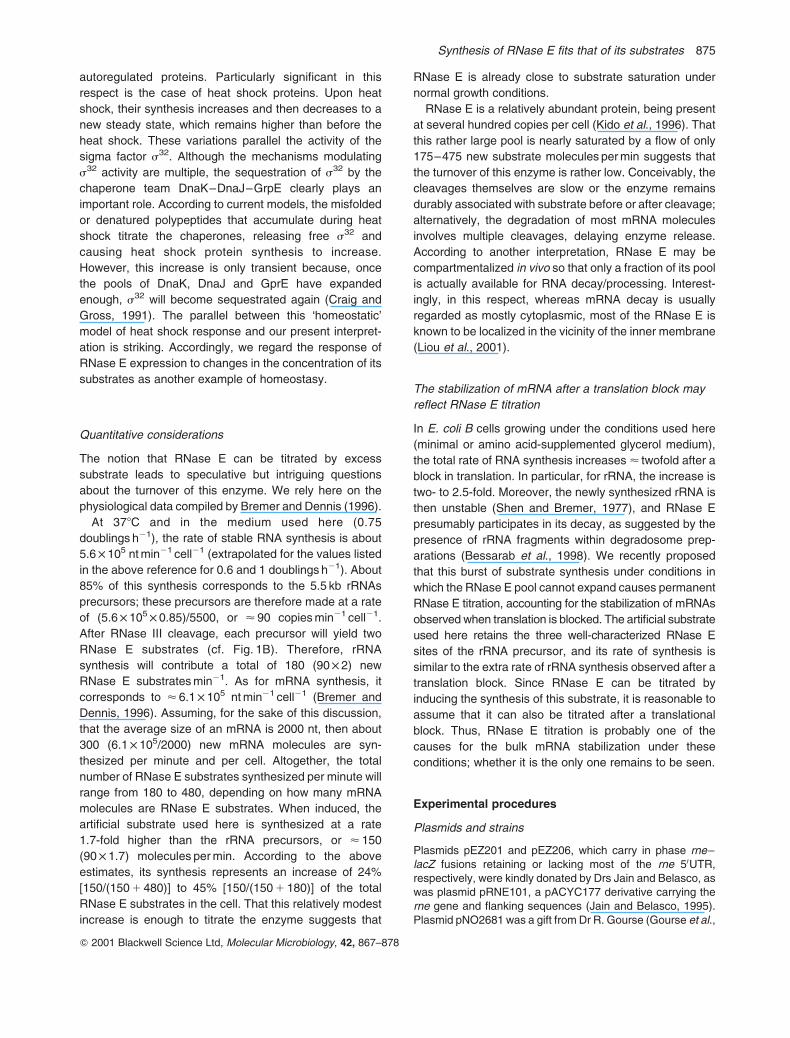
The 150UTR and 250UTR cells carrying the Plac–rne
construct (Fig. 6A) were then grown in the presence of
variable IPTG levels; total RNA was prepared from these
cultures and probed on Northern blots with a lacZ internal
probe. With 150UTR cells, the full-length species
predominated when RNase E expression was below
normal, whereas for higher expression, only incomplete
species were detected, indicating mRNA destabilization
(Fig. 6B). In contrast, with 250UTR cells, the mRNA
pattern remained similar for all IPTG concentrations.
These changes were paralleled by variations in b-
galactosidase expression: with 150UTR cells, increasing
IPTG concentration from 40 to 320mM caused this
expression to decrease more than 10-fold, whereas in
250UTR cells, no such effect was seen (variations, if any,
were in the reverse direction; Fig. 6B). Altogether, these
results show that the 150UTR mRNA but not the 250UTR
mRNA is stabilized when RNase E expression falls below
normal, as with the rne-1 mutation.
It is noteworthy that, under conditions of low RNase E
Fig. 6. Effect of RNase E concentration upon the stability of the150UTR and 250-UTR mRNAs.A. The strains used here are identical to the 150UTR and 250UTRstrains (Fig. 3), except that the genuine rne gene is replaced by thePlac– rne fusion (Fig. 5A).B. The RNA from the above cells growing with different concentrationsof IPTG (as indicated below each lane) has been probed on Northernblots with a lacZ internal probe. The histograms below show the b-galactosidase activities in the same cultures used for mRNA analysis.All symbols are as in Fig. 3A and B.
Fig. 5. A. Control of RNase E expression in-wild type (rne 1) and Plac
cells. In wild-type (WT) cells, RNase E (scissors) autoregulates its ownexpression by cleaving the 50UTR of its mRNA, whereas in Plac cells,its expression is downregulated by the lac repressor (the lacI product).The lac and rne sequences are indicated by empty and grey boxesrespectively. Negative regulation loops are indicated by curved lines.Note that, in Plac and wt cells, these loops operate at the transcriptionaland post-transcriptional levels respectively.B. Sequence encompassing the downstream lac–rne junction on thechromosome of Plac cells. ‘11’ designates the lac transcription startpoint. The major lac operator site (nt 1–22) is underlined; the lacZShine–Dalgarno and initiation codon are in upper case, and the rnesequence is italicized.C. Total proteins from Plac cells grown at different IPTG concentrationswere analysed by Western blot using an antibody against RNase E. Tocheck for uniform protein loading, the blot was also treated with anantibody against an unrelated protein, threonyl-tRNA synthetase(ThrS). Extracts of WT cells as well as various amounts of pure RNaseE were also loaded as controls. Bound immunoglobulins wererevealed with [125I]-protein A and autoradiography.
872 S. Sousa, I. Marchand and M. Dreyfus
Q 2001 Blackwell Science Ltd, Molecular Microbiology, 42, 867–878

expression, the b-galactosidase level is higher in 150UTR
than in 250UTR cells. This difference, which has also been
observed in the presence of the rne-1 mutation (Jain and
Belasco, 1995), indicates that the 150UTR mRNA is
intrinsically more translatable and/or less susceptible to
RNase E-independent decay than the 250UTR mRNA.
Other effects of varying RNase E expression
We also assayed the effect of varying RNase E expression
upon the maturation or decay of other RNase E
substrates. A classical substrate is the so-called ‘9S’
rRNA. This RNase III-generated fragment encompasses
the 30 end of the rRNA precursor; it is further processed by
RNase E into p5S, the immediate precursor of the 5S
rRNA (Ghora and Apirion, 1978). 9S rRNA is in fact
polydisperse, owing to heterogeneities at the 30 end of the
seven rRNA operons (Condon et al., 1995; Fig. 7A). To
test the effect of RNase E expression upon 9S rRNA
processing, total RNA from Plac cells growing with various
concentrations of IPTG was probed on Northern blots with
the 5S and 9S probes. To achieve a better resolution,
acrylamide–urea electrophoresis was used here instead
of agarose electrophoresis (Fig. 7B). For RNase E
expression equal to or larger than normal, the signals
originating from 9S rRNA were quite faint compared with
that originating from the 5S rRNA, consistent with a rapid
processing of the 9S rRNA. Quantitatively, raising RNase
E expression from 100% to 250% of normal caused an
< twofold decrease in the 9S compared with the 5S rRNA
signals. Conversely, for lower RNase E expressions, the
9S rRNA signals rose progressively until, together, they
eventually became nearly as intense as the 5S rRNA
signal (Fig. 7B). Thus, lowering the RNase E concentration
below normal slows down 9S rRNA processing markedly.
Finally, we assessed the effect of varying RNase E
concentration upon the functional stability of bulk mRNA.
Plac cells growing exponentially in the presence of various
concentrations of IPTG were treated with the transcription
inhibitor rifampicin, and the residual protein-synthesizing
capacity of the cultures was subsequently recorded as a
function of time by following the ability of aliquots to
incorporate [35S]-methionine in proteins (Fig. 8A). This
capacity decayed nearly exponentially with time, allowing
the functional half-life of bulk mRNA to be determined
(Fig. 8B). For RNase E expressions equal to or higher than
normal (IPTG $ 160mM), this half-life was nearly constant
(1.7–1.9 min) and similar to that observed with cells
carrying the wild-type rne gene. However, for lower RNase
E expressions, the half-life increased significantly: when
RNase E expression dropped to 1/10th of the normal
value, the increase was twofold (Fig. 8A and B).
Discussion
Here, we have examined the effect of overexpressing an
RNase E substrate upon the decay of mRNAs that carry
the rne 50UTR, the target for RNase E autoregulation. To
facilitate the interpretation of results, we have also studied
the effect of varying RNase E expression upon the stability
of the same mRNAs and, more generally, of other RNase
E substrates. For clarity, the latter results are discussed
first.
Experimental control of RNase E expression
To gain experimental control over RNase E expression,
we have replaced the promoter and 50UTR from the rne
gene with the promoter and 50UTR from the lac operon. As
the lac fragment used in this replacement encompasses
not only the main operator site (cf. Fig. 5B), but also a
minor one (OIII) located upstream of the promoter, the
transcription of the engineered rne gene is expected to be
very tightly repressed by the lac repressor in the absence
of IPTG (by < 440-fold; Oehler et al., 1990). Under
conditions of maximal IPTG induction, RNase E
expression was 2.5-fold the normal level. Interestingly,
this modest overexpression has no effect on growth,
Fig. 7. The rate of 9S rRNA processing varies with RNase Eexpression.A. Schematic representation of the most promoter-distal RNase IIIfragment from the E. coli rrn transcript (‘9S rRNA’; cf. Fig. 1B). Thesequence heterogeneity among the seven rrn operons downstream ofthe 5S sequence is symbolized by the hatched box. All other symbolsare as in Fig. 1B.B. Total RNA from Plac cells growing with different IPTGconcentrations (as indicated below each lane) was separated byurea–PAGE, blotted and probed with the 5S (left) or 9S (right) probes.The arrow points to 5S rRNA. Stars or ticks on the left indicate speciesthat are detected with both probes. The starred species match in sizethe classical ‘9S’ RNA from the rrnB operon (243 nt; see Cormack andMackie, 1992).
Synthesis of RNase E fits that of its substrates 873
Q 2001 Blackwell Science Ltd, Molecular Microbiology, 42, 867–878

whereas overexpression of RNase E from high-copy-
number plasmids bearing the rne gene has been found to
be toxic (Claverie-Martin et al., 1991). In contrast, growth
was impaired when the RNase E expression fell below
normal and was completely abolished in the absence of
IPTG, confirming the essential nature of RNase
E. However, surprisingly, as little as 1/10th of the normal
expression is enough to sustain growth, albeit at a twofold
reduced rate. The same observation has been made by
Belasco and colleagues (cited in Jiang et al., 2000).
Besides these effects on growth, variations in RNase E
expression also affected the stability of RNase E
substrates. In particular, the functional decay of bulk
mRNA, the processing of 9S rRNA and the cleavage of
the rne 50UTR (as judged by the compared stabilities and
b-galactosidase yields of the ‘150UTR’ and ‘250UTR’
mRNAs; see Fig. 6) were all slowed when RNase E
expression dropped below normal. These effects mimic
those observed with the rne-1 mutation (Mudd et al., 1990;
Jain and Belasco, 1995), confirming that the phenotype
associated with this mutation results from a shortage of
RNase E activity and not from a property of the mutated
polypeptide per se. Conversely, increasing RNase E
expression from 100% to 250% of normal appears to affect
individual substrates differently. Thus, bulk mRNA is not
destabilized further, and the processing of 9S rRNA is only
modestly accelerated, as judged by the magnitude of the
9S signal on Northern blots (Fig. 7B). In contrast, the rne
50UTR is destabilized more significantly, as seen by the
fact that the b-galactosidase yield from the 150UTR mRNA
decreases fourfold in this range of RNase E expression
(Fig. 6B). Whereas the molecular basis for this differential
behaviour is unknown, the particular sensitivity of the rne
50UTR to changes in RNase E expression seems
reasonable given its role as a ‘sensor’ of RNase E
demand (see below).
Homeostasy of RNase E expression in wild-type cells
Turning back to cells carrying the wild-type rne gene, we
have observed that, when the synthesis of an artificial
RNase E substrate is induced to relatively high levels (see
below), the concentration of the rne mRNA and the
synthesis of the RNase E polypeptide first increase rapidly
and then decrease to a new steady-state level, which
nevertheless remains higher than in the absence of
induction. These changes are not the result of changes in
the activity of the rne promoter, but rather of variations in
the rate of cleavage of the rne 50UTR. Thus, whereas the
150UTR fusion mRNA accumulates after substrate
induction much as the rne mRNA itself, no accumulation
was seen with the 250UTR mRNA (Fig. 3B). Given the
inverse correlation between the stability of the 150UTR
mRNA and the availability of RNase E (Fig. 6B), these
observations suggest that RNase E is transiently titrated
after substrate induction. A straightforward interpretation
is that, because of autoregulation, the pool of free RNase
E in the cell is limited: a burst in substrate synthesis
causes its titration, stabilizing RNase E substrates
including the rne mRNA. However, this stabilization is
transient, because it allows the RNase E pool to expand
and correct the titration. Thereby, autoregulation allows
RNase E to adjust its expression to that of its substrates.
As noted in the Introduction, this behaviour is not unique
to RNase E, but is also observed with several other
Fig. 8. The functional stability of bulk mRNA varies with RNase Econcentration.A. Plac cells growing with 40 (top) or 160 (bottom) mM IPTG weretreated with rifampicin (zero time) and, at the indicated times, theresidual protein-synthesizing capacity of the culture was measured byincubating an aliquot with [35S]-methionine until incorporation hadceased. Labelled proteins were separated by SDS–PAGE andvisualized by autoradiography.B. Total radioactivity incorporated into proteins is plotted versus time,assuming exponential decay kinetics; bulk mRNA half-lives areestimated from the slopes. Open circles, 40mM IPTG (10% normalRNase E expression; cf. Fig. 5C). Closed diamonds, 80mM IPTG(50% normal). Open triangles, 320mM IPTG (250% normal).
874 S. Sousa, I. Marchand and M. Dreyfus
Q 2001 Blackwell Science Ltd, Molecular Microbiology, 42, 867–878
autoregulated proteins. Particularly significant in this
respect is the case of heat shock proteins. Upon heat
shock, their synthesis increases and then decreases to a
new steady state, which remains higher than before the
heat shock. These variations parallel the activity of the
sigma factor s32. Although the mechanisms modulating
s32 activity are multiple, the sequestration of s32 by the
chaperone team DnaK–DnaJ–GrpE clearly plays an
important role. According to current models, the misfolded
or denatured polypeptides that accumulate during heat
shock titrate the chaperones, releasing free s32 and
causing heat shock protein synthesis to increase.
However, this increase is only transient because, once
the pools of DnaK, DnaJ and GprE have expanded
enough, s32 will become sequestrated again (Craig and
Gross, 1991). The parallel between this ‘homeostatic’
model of heat shock response and our present interpret-
ation is striking. Accordingly, we regard the response of
RNase E expression to changes in the concentration of its
substrates as another example of homeostasy.
Quantitative considerations
The notion that RNase E can be titrated by excess
substrate leads to speculative but intriguing questions
about the turnover of this enzyme. We rely here on the
physiological data compiled by Bremer and Dennis (1996).
At 378C and in the medium used here (0.75
doublings h21), the rate of stable RNA synthesis is about
5.6� 105 nt min21 cell21 (extrapolated for the values listed
in the above reference for 0.6 and 1 doublings h21). About
85% of this synthesis corresponds to the 5.5 kb rRNAs
precursors; these precursors are therefore made at a rate
of (5.6� 105� 0.85)/5500, or < 90 copies min21 cell21.
After RNase III cleavage, each precursor will yield two
RNase E substrates (cf. Fig. 1B). Therefore, rRNA
synthesis will contribute a total of 180 (90� 2) new
RNase E substrates min21. As for mRNA synthesis, it
corresponds to < 6.1� 105 nt min21 cell21 (Bremer and
Dennis, 1996). Assuming, for the sake of this discussion,
that the average size of an mRNA is 2000 nt, then about
300 (6.1� 105/2000) new mRNA molecules are syn-
thesized per minute and per cell. Altogether, the total
number of RNase E substrates synthesized per minute will
range from 180 to 480, depending on how many mRNA
molecules are RNase E substrates. When induced, the
artificial substrate used here is synthesized at a rate
1.7-fold higher than the rRNA precursors, or < 150
(90� 1.7) molecules per min. According to the above
estimates, its synthesis represents an increase of 24%
[150/(150 1 480)] to 45% [150/(150 1 180)] of the total
RNase E substrates in the cell. That this relatively modest
increase is enough to titrate the enzyme suggests that
RNase E is already close to substrate saturation under
normal growth conditions.
RNase E is a relatively abundant protein, being present
at several hundred copies per cell (Kido et al., 1996). That
this rather large pool is nearly saturated by a flow of only
175–475 new substrate molecules per min suggests that
the turnover of this enzyme is rather low. Conceivably, the
cleavages themselves are slow or the enzyme remains
durably associated with substrate before or after cleavage;
alternatively, the degradation of most mRNA molecules
involves multiple cleavages, delaying enzyme release.
According to another interpretation, RNase E may be
compartmentalized in vivo so that only a fraction of its pool
is actually available for RNA decay/processing. Interest-
ingly, in this respect, whereas mRNA decay is usually
regarded as mostly cytoplasmic, most of the RNase E is
known to be localized in the vicinity of the inner membrane
(Liou et al., 2001).
The stabilization of mRNA after a translation block may
reflect RNase E titration
In E. coli B cells growing under the conditions used here
(minimal or amino acid-supplemented glycerol medium),
the total rate of RNA synthesis increases < twofold after a
block in translation. In particular, for rRNA, the increase is
two- to 2.5-fold. Moreover, the newly synthesized rRNA is
then unstable (Shen and Bremer, 1977), and RNase E
presumably participates in its decay, as suggested by the
presence of rRNA fragments within degradosome prep-
arations (Bessarab et al., 1998). We recently proposed
that this burst of substrate synthesis under conditions in
which the RNase E pool cannot expand causes permanent
RNase E titration, accounting for the stabilization of mRNAs
observed when translation is blocked. The artificial substrate
used here retains the three well-characterized RNase E
sites of the rRNA precursor, and its rate of synthesis is
similar to the extra rate of rRNA synthesis observed after a
translation block. Since RNase E can be titrated by
inducing the synthesis of this substrate, it is reasonable to
assume that it can also be titrated after a translational
block. Thus, RNase E titration is probably one of the
causes for the bulk mRNA stabilization under these
conditions; whether it is the only one remains to be seen.
Experimental procedures
Plasmids and strains
Plasmids pEZ201 and pEZ206, which carry in phase rne–lacZ fusions retaining or lacking most of the rne 50UTR,
respectively, were kindly donated by Drs Jain and Belasco, aswas plasmid pRNE101, a pACYC177 derivative carrying the
rne gene and flanking sequences (Jain and Belasco, 1995).
Plasmid pNO2681 was a gift from Dr R. Gourse (Gourse et al.,
Synthesis of RNase E fits that of its substrates 875
Q 2001 Blackwell Science Ltd, Molecular Microbiology, 42, 867–878

1985). Plasmid pc I857 (Remaut et al., 1983) was obtainedfrom Dr M. Springer.
Construction of strains carrying the 15 0UTR and
25 0UTR fusions
We started from plasmid pTlacZ-Arg5 (Lopez et al., 1994).Within its polylinker, this pUC18 derivative carries sequen-
tially: (i) a truncated lac operon encompassing the lacZ geneand the beginning of lacY; and (ii) two tandemly arranged
transcriptional terminators. The Kpn I –Dra III fragmentextending from the polylinker sequence down to within the
lacZ coding sequence was then replaced by the Kpn I–Dra IIIfragments from pEZ201 and pEZ206, which extend from
upstream of the rne promoter down to the same Dra III site
within lacZ. The whole Kpn I–Xba I inserts extending fromupstream of the rne promoter to downstream of the
terminators were then subcloned from the resulting plasmidsinto the shuttle plasmid pOM43 (Chevrier-Miller et al., 1990),
yielding plasmids pSS201 and pSS206 respectively. Theinserts were then transferred into the malT–malP intergenic
region of the chromosome of MO20 [a Lac– derivative ofBL21(DE3)] as described by Lopez et al. (1994), yielding
strains ENS401 and ENS406.
Construction of the Plac strains
Using the fusion polymerase chain reaction (PCR) technique
(Ho et al., 1989), we constructed a 1.8 kb chimeric Bam HI–Sal I fragment carrying sequentially: (i) the region extending
from nt 2853 to 239 with respect to the rne transcription start;(ii) the region extending from nt 2126 to 141 with respect to
the lac transcription start; and (iii) the region extending from nt1365 to 11194 with respect to the rne transcription start. The
resulting fragment carries the lac promoter and 50UTR,flanked by rne homology regions. The rne and lac fragments
were amplified from plasmids pRNE101 and pUC19
respectively. The chimeric fragment was then cloned betweenthe Bam HI and Sal I sites of the shuttle plasmid pKO3 (Link
et al., 1997). After sequencing, the fragment was transferredinto the rne region of the E. coli chromosome using
homologous recombination between the plasmid- andchromosome-borne rne sequences (Link et al., 1997), yielding
the Plac–rne construct (Fig. 5A and B). As a recipient strain,we used a derivative of MG1655 carrying a Tn10 transposon
near the rne gene. The latter was transferred from CH1828[ams (ts), zce-726::Tn10; Mudd et al., 1990] by transduction,
selecting for TetR and ability to grow at 428C. The Plac–rneconstruct was then transduced from the MG1655 background
into strains ENS401 and ENS406, selecting for TetR andIPTG-dependent growth. The presence of the Plac– rne
construct in the final strains was checked by PCR.
Growth of cells
Cells were grown in MOPS medium (Neidhardt et al., 1974)
containing glycerol (0.2% w/v) as the carbon source. Forsubstrate induction studies, the above medium was sup-
plemented with kanamycin (50mg ml21) and ampicillin
(100mg ml21). Cells were grown to an OD600 of 0.4 at 308C,
then shifted to 428C for the time indicated. For experimentswith Plac cells, this medium was supplemented with all amino
acids, nucleic acid bases and vitamins, together with variableconcentrations of IPTG, as indicated. Growth temperature
was 378C in this case. With Plac cells, the use of startercultures yielded inconsistent results: we suspect that the
expression of RNase E differs widely in exponential andsaturated cultures, generating ‘memory’ effects when the
latter are diluted. Therefore, cells were routinely reisolated onM63B1 plates (Miller, 1972) containing 0.5% casamino acids
and a low concentration (32mM) of IPTG. After 20 h at 378C,the very small colonies that appeared were used directly to
inoculate liquid cultures (one colony per 5 ml). Cells wereharvested at an OD600 of 0.3–0.4.
RNA analysis
RNA was extracted as described by Yarchuk et al. (1992).
Conditions for agarose or acrylamide–urea electrophoresis,RNA blotting and membrane hybridization with randomly32P-labelled DNA fragments or 50 32P-labelled oligonucleo-tides have been described before, as have the 1.8 kb lac
fragment used to probe the rne–lacZ mRNA and the ‘5S’ and‘9S’ oligonucleotides used to probe the 5S and 9S rRNA
(Yarchuk et al., 1992; Lopez et al., 1994; 1999). The
oligonucleotide probe used to detect 23S rRNA was 50-AAGGTTAAGCCTCACGGTTC-30; the probe used to detect
the rne mRNA was an 816 bp Bam HI fragment from plasmidpGM102 (Cormack et al., 1993), which encompasses the 30
region of the rne gene. Radioactive signals were quantifiedwith a BAS1000 imager (Fuji).
Protein analysis
Purification of RNase E. RNase E was overexpressedfrom BL21(DE3) cells harbouring plasmid pGM102 (Cormack
et al., 1993). The overexpressed protein was eluted from apreparative 7.5% SDS–polyacrylamide gel. Its concentration
was estimated by running aliquots on an analytical gel inparallel with known amounts of bovine serum albumin (BSA),
staining with Coomassie blue and comparing the intensities ofthe stained bands by densitometry.
Quantification of RNase E in Plac cells. Pellets of
exponentially growing cells (equivalent to 0.1 OD600) wereresuspended directly in Laemmli sample buffer and separated
by SDS–PAGE (7.5% acrylamide). The proteins were
transferred to a nitrocellulose membrane (Amersham),which was incubated for 1 h at 378C in buffer A (20 mM Tris-
HCl, pH 7.5, 0.9% NaCl, 0.1% Triton X-100) containing 5%BSA. The membrane was incubated overnight with anti-
RNase E and anti-ThrS antibodies [gifts from Dr A. J.Carpousis (Toulouse) and Drs H. Putzer and C. Condon
(Paris); antibodies were used at 1:5000 in buffer A with 0.5%(BSA)], then washed (3� 15 min) with buffer A and, finally,
incubated for 2 h with buffer A containing 0.1mCi ml21 [125I]-protein A (Amersham). After washing again, the membrane
was exposed to a Fuji imager screen.
Functional half-life of bulk mRNA (Plac cells). Rifampicin
(500mg ml21 final) was added to exponentially growing
876 S. Sousa, I. Marchand and M. Dreyfus
Q 2001 Blackwell Science Ltd, Molecular Microbiology, 42, 867–878
cultures (OD600 < 0.4) of Plac cells (or control wild-type cells).Aliquots (500ml) were subsequently collected at timed
intervals and incubated with 10mCi of [35S]-methionine–[35S]-cysteine mix (Amersham) until 30 min after rifampicin
addition. As methionine and cysteine are present in excess inthe growth medium (see above), only a small fraction of the
label is incorporated in these experiments, so that theincorporated radioactivity reflects the protein-synthesizing
activity of the culture. The labelled samples were thenseparated by SDS–PAGE (12% acrylamide); after drying the
gels, the total incorporated radioactivity was quantified withthe Fuji imager.
Rate of synthesis of RNase E and hybrid RNase E–b-
galactosidase polypeptides after substrate induction. Cells
growing exponentially at 308C were shifted to 428C asdescribed above. At timed intervals after the shift, aliquots of
the cultures (0.5 ml) were removed, incubated for 1 min at428C with 10mCi of [35S]-methionine–cysteine mix and then
for 5 min with 10 mM cold methionine20.5 mM cold cysteine(final concentration). Cells were collected by centrifugation,
resuspended in SDS–PAGE loading buffer without thiols andheated (1008C for 4 min). Samples were diluted 20-fold in the
immunoprecipitation buffer described by Carpousis et al.(1994), except that Triton X-100 was used in place of Genapol
and BSA (0.2 mg ml21) was added. Extracts were incubatedwith anti-RNase E and anti-b-galactosidase antibodies (2.5ml
each for 0.5 ml of culture) for 1 h at 48C and treated with 100mlof a 20% (v/v) suspension of protein A–sepharose beads
(Pharmacia). After centrifugation, the immune complexeswere washed with the immunoprecipitation buffer (without
BSA), analysed by SDS–PAGE (7.5% acrylamide) and,finally, quantified with the Fuji imager. The anti-b-galactosi-
dase antibody was from Rockland. As controls, cultures
overexpressing RNase E or RNase E–b-galactosidase fusionpolypeptides or lacking them altogether were grown and
processed as above. For this purpose, we used BL21(DE3)rne-1 cells that had been incubated at 428C (at this
temperature, the inactive RNase E polypeptide encoded bythe rne-1 allele accumulates), BL21(DE3) cells carrying
pSS206, a multicopy plasmid encoding the fusion protein (seeabove) and BL21(DE3)rne131 cells, which synthesize a
truncated RNase E (Lopez et al., 1999).
Acknowledgements
We are much indebted to Drs C. Jain, J. G. Belasco andR. Gourse for plasmids, and to Dr A. J. Carpousis for
antibodies. We thank Dr P. J. Lopez for his participation inearly experiments, and Drs I. Iost and M. Springer for fruitful
discussions. This work was supported by CNRS, ENS and bygrants from ARC (no. 5474) and MENRT (programme
‘Microbiologie’) to M.D. S.S. was supported by the Fundacaopara a Ciencia e Tecnologia (fellowship PRAXIS
XXI/BM/19113/99), and I.M. by the Fondation pour laRecherche Medicale.
References
Arsene, F., Tomoyasu, T., and Bukau, B. (2000) The heat
shock response of Escherichia coli. Int J Food Microbiol 55:
3–9.
Bardwell, J.C., Regnier, P., Chen, S.M., Nakamura, Y.,
Grunberg-Manago, M., and Court, D.L. (1989) Autoregula-
tion of RNase III operon by mRNA processing. EMBO J 8:
3401–3407.
Bessarab, D.A., Kaberdin, V.R., Wei, C.-L., Liou, G.-G., and
Lin-Chao, S. (1998) RNA component of Escherichia coli
degradosome: evidence for rRNA decay. Proc Natl Acad
Sci USA 95: 3157–3161.
Bremer, H., and Dennis, P.P. (1996) Modulation of chemical
composition and other parameters of the cell by growth
rate. In Escherichia coli and Salmonella: Cellular and
Molecular Biology. Neidhardt, F.C. (ed.). Washington, DC:
American Society for Microbiology Press, pp. 1553–1569.
Carpousis, A.J., Van Houwe, G., Ehretsmann, C., and Krisch,
H.M. (1994) Copurification of E. coli RNase E and PNPase:
evidence for a specific association between two enzymes
important in RNA processing and degradation. Cell 76:
889–900.
Casaregola, S., Jacq, A., Laoudj, D., McGurk, G., Margarson,
S., Tempete, M., et al. (1992) Cloning and analysis of the
entire Escherichia coli ams gene. ams is identical to hmp1
and encodes a 114 kDa protein that migrates as a 180 kDa
protein. J Mol Biol 228: 30–40.
Chevrier-Miller, M., Jacques, N., Raibaud, O., and Dreyfus,
M. (1990) Transcription of single-copy hybrid lacZ genes by
T7 RNA polymerase in Escherichia coli: mRNA synthesis
and degradation can be uncoupled from translation. Nucleic
Acids Res 18: 5787–5792.
Claverie-Martin, F., Diaz-Torres, M.R., Yancey, S.D., and
Kushner, S.R. (1991) Analysis of the altered mRNA stability
(ams ) gene from Escherichia coli. Nucleotide sequence,
transcriptional analysis, and homology of its product to
MRP3, a mitochondrial ribosomal protein from Neurospora
crassa. J Biol Chem 266: 2843–2851.
Coburn, G.A., and Mackie, G.A. (1999) Degradation of mRNA
in Escherichia coli: an old problem with some new twists.
Prog Nucleic Acid Res Mol Biol 62: 55–108.
Cohen, S.N., and McDowall, K.J. (1997) RNase E: still a
wonderfully mysterious enzyme. Mol Microbiol 23:
1099–1106.
Comer, M.M., Dondon, J., Graffe, M., Yarchuk, O., and
Springer. M. (1996) Growth rate-dependent control, feed-
back regulation and steady-state mRNA levels of the
threonyl-tRNA synthetase gene of Escherichia coli. J Mol
Biol 261: 108–124.
Condon, C., Squires, C., and Squires, C.L. (1995) Control of
rRNA transcription in Escherichia coli. Microbiol Rev 59:
623–645.
Cormack, R.S., and Mackie, G.A. (1992) Structural require-
ments for the processing of Escherichia coli 5S ribosomal
RNA by RNase E in vitro. J Mol Biol 228: 1078–1090.
Cormack, R.S., Genereaux, J.L., and Mackie, G.A. (1993)
RNase E activity is conferred by a single polypeptide:
overexpression, purification, and properties of the ams/r-
ne/hmp1 gene product. Proc Natl Acad Sci USA 90:
9006–9010.
Craig, E.A., and Gross, C.A. (1991) Is hsp70 the cellular
thermometer? Trends Biochem Sci 16: 135–140.
Diwa, A., Bricker, A.L., Jain, C., and Belasco, J.G. (2000) An
Synthesis of RNase E fits that of its substrates 877
Q 2001 Blackwell Science Ltd, Molecular Microbiology, 42, 867–878

evolutionary conserved RNA stem–loop functions as asensor that directs feedback regulation of RNase E gene
expression. Genes Dev 14: 1249–1260.Draper, D.E. (1987) Translational regulation of ribosomal
proteins in E. coli: molecular mechanisms. In TranslationalRegulation of Gene Expression. Ilan, J. (ed.). New York:
Plenum Press, pp. 1–26.Ghora, B.K., and Apirion, D. (1978) Structural analysis and in
vitro processing to p5 rRNA of a 9S RNA molecule isolatedfrom an rne mutant of E. coli. Cell 15: 1055–1066.
Gourse, R.L., Takebe, Y., Sharrock, R.A., and Nomura, M.(1985) Feedback regulation of rRNA and tRNA synthesis
and accumulation of free ribosomes after conditionalexpression of rRNA genes. Proc Natl Acad Sci USA 82:
1069–1073.Gross, C. (1996) Function and regulation of the heat-shock
proteins. In Escherichia coli and Salmonella: Cellular andMolecular Biology. Neidhardt, F.C. (ed.). Washington, DC:
American Society for Microbiology press, pp. 1382–1399.
Hanamura, A., and Aiba, H. (1991) Molecular mechanism ofnegative autoregulation of Escherichia coli crp gene.
Nucleic Acids Res 19: 4413–4419.Ho, S.N., Hunt, H.D., Horton, R.M., Pullen, J.K., and Pease,
L.R. (1989) Site-directed mutagenesis by overlap extensionusing the polymerase chain reaction. Gene 77: 51–59.
Jain, C., and Belasco, J.G. (1995) RNase E autoregulates itssynthesis by controlling the degradation rate of its own
mRNA in E. coli: unusual sensitivity of the rne transcript toRNase E activity. Genes Dev 9: 84–96.
Jiang, X., Diwa, A., and Belasco, J.G. (2000) Regions ofRNase E important for 50-end dependent RNA cleavage
and autoregulated synthesis. J Bacteriol 182: 2468–2475.Kido, M., Yamanaka, K., Mitani, T., Niki, H., Ogura, T., and
Hiraga, S. (1996) RNase E polypeptides lacking a carboxyl-terminal half suppress a mukB mutation in Escherichia coli.
J Bacteriol 178: 3917–3925.Li, Z., Pandit, S., and Deutscher, M.P. (1999) RNase G (CafA
protein) and RNase E are both required for the 50 maturationof 16S ribosomal RNA. EMBO J 18: 2878–2885.
Link, A.J., Phillips, D., and Church, G.M. (1997) Methods forgenerating precise deletions and insertions in the genome
of wild-type Escherichia coli: application to open readingframe characterization. J Bacteriol 179: 6228–6237.
Liou, G.G., Jane, W.N., Cohen, S.N., Lin, N.S., and Lin-Chao,S. (2001) RNA degradosomes exist in vivo in Escherichia
coli as multicomponent complexes associated with thecytoplasmic membrane via the N-terminal region of
ribonuclease E. Proc Natl Acad Sci USA 98: 63–68.Lopez, P.J., Iost, I., and Dreyfus, M. (1994) The use of a tRNA
as a transcriptional reporter: the T7 late promoter isextremely efficient in Escherichia coli but its transcripts are
poorly expressed. Nucleic Acids Res 22: 1186–1193.
Lopez, P.J., Marchand, I., Yarchuk, O., and Dreyfus, M.(1998) Translation inhibitors stabilize Escherichia coli
mRNAs independently of ribosome protection. Proc NatlAcad Sci USA 95: 6067–6072.
Lopez, P.J., Marchand, I., Joyce, S.A., and Dreyfus, M. (1999)
The C-terminal half of RNase E, which organizes the
Escherichia coli degradosome, participates in mRNA
degradation but not rRNA processing in vivo. Mol Microbiol
33: 188–199.
Miller, J.H. (1972) Experiments in Molecular Genetics. Cold
Spring Harbor, NY: Cold Spring Harbor Laboratory Press,
pp. 431–435.
Mudd, E.A., and Higgins, C.F. (1993) Escherichia coli
endoribonuclease RNase E: autoregulation of expression
and site-specific cleavage of mRNA. Mol Microbiol 9:
557–568.
Mudd, E.A., Krisch, H.M., and Higgins, C.F. (1990) RNase E,
an endoribonuclease, has a general role in the chemical
decay of Escherichia coli mRNA: evidence that rne and ams
are the same genetic locus. Mol Microbiol 4: 2127–2135.
Murakawa, G.J., Kwan, C., Yamashita, J., and Nierlich, D.P.
(1991) Transcription and decay of the lac messenger: role
of an intergenic terminator. J Bacteriol 173: 28–36.
Neidhardt, F.C., Bloch, P.L., and Smith, D.F. (1974) Culture
medium for Enterobacteria. J Bacteriol 119: 736–747.
Nomura, M., Yates, J.L., Dean, D., and Post, L.E. (1980)
Feedback regulation of ribosomal protein gene expression
in Escherichia coli: structural homology of ribosomal RNA
and ribosomal protein mRNA. Proc Natl Acad Sci USA 77:
7084–7088.
Oehler, S., Eismann, E.R., Kramer, H., and Muller-Hill, B.
(1990) The three operators of the lac operon cooperate in
repression. EMBO J 9: 973–979.
Ono, M., and Kuwano, M. (1979) A conditional lethal mutation
in an E. coli strain with a longer chemical lifetime of
messenger RNA. J Mol Biol 129: 343–357.
Remaut, E., Tsao, H., and Fiers, W. (1983) Improved plasmid
vector with a thermoinducible expression and temperature-
regulated runaway replication. Gene 22: 103–113.
Shen, V., and Bremer, H. (1977) Chloramphenicol-induced
changes in the synthesis of ribosomal, transfer, and
messenger RNA in Escherichia coli B/r. J Bacteriol 130:
1098–1108.
Springer, M. (1996) Translational control of gene expression
in Escherichia coli and bacteriophages. In Regulation of
Gene Expression in E. coli. Lin, E.C.C., and Lynch, A.S.
(eds). Austin, TX: R.G. Landes Company, pp. 85–126.
Studier, F.W., Rosenberg, A.H., Dunn, J.J., and Dubendorff,
J.W. (1990) Use of T7 RNA polymerase to direct expression
of cloned genes. Methods Enzymol 185: 60–89.
Yamagishi, M., and Nomura, M. (1988) Effects of induction of
rRNA overproduction on ribosomal protein synthesis and
ribosome subunit assembly in Escherichia coli. J Bacteriol
170: 5042–5050.
Yarchuk, O., Jacques, N., Guillerez, J., and Dreyfus, M.
(1992) Interdependence of translation, transcription and
mRNA degradation in the lacZ gene. J Mol Biol 226:
581–596.
878 S. Sousa, I. Marchand and M. Dreyfus
Q 2001 Blackwell Science Ltd, Molecular Microbiology, 42, 867–878
Copyright © 2022 FDOKUMEN