AUTOMATIC SEGMENTATION OF 3D HUMAN BODY SCANS
13
IEEE TRANSACTIONS ON SYSTEMS, MAN, AND CYBERNETICS—PART B: CYBERNETICS, VOL. 36, NO. 1, FEBRUARY 2006 153 A Functional-Based Segmentation of Human Body Scans in Arbitrary Postures Naoufel Werghi, Member, IEEE, Yijun Xiao, and Jan Paul Siebert, Member, IEEE Abstract—This paper presents a general framework that aims to address the task of segmenting three-dimensional (3-D) scan data representing the human form into subsets which correspond to functional human body parts. Such a task is challenging due to the articulated and deformable nature of the human body. A salient feature of this framework is that it is able to cope with various body postures and is in addition robust to noise, holes, irregular sampling and rigid transformations. Although whole human body scanners are now capable of routinely capturing the shape of the whole body in machine readable format, they have not yet realized their potential to provide automatic extraction of key body mea- surements. Automated production of anthropometric databases is a prerequisite to satisfying the needs of certain industrial sectors (e.g., the clothing industry). This implies that in order to extract specific measurements of interest, whole body 3-D scan data must be segmented by machine into subsets corresponding to functional human body parts. However, previously reported attempts at au- tomating the segmentation process suffer from various limitations, such as being restricted to a standard specific posture and being vulnerable to scan data artifacts. Our human body segmentation algorithm advances the state of the art to overcome the above lim- itations and we present experimental results obtained using both real and synthetic data that confirm the validity, effectiveness, and robustness of our approach. Index Terms—Human body shape analysis, Reeb graph, scat- tered 3-D range data segmentation, 3-D surface topology, 3-D whole-body scanners. I. INTRODUCTION T HE PAST FEW years have witnessed the emergence of three-dimensional (3-D) imaging technology that enables full scanning of the human body (HB) surface with reasonable measurement accuracy as well as at an acceptable computa- tional cost. This advance facilitates the exploitation of the HB form in various areas such as anthropometrical research [1]–[3], clothing design [4]–[6], and virtual human animation [7], [8]. Although the raw data generated by the HB scanner requires substantial main memory and storage resources, it contains little semantic information. To achieve effective and efficient use of body scan data, it is often necessary to partition the whole scan data set into subsets corresponding to the principal body parts. Manuscript received June 21, 2004; revised February 9, 2005. This work was supported by the U.K. EPSRC under Grant RG 533801 and by the U.K. Imaging Faraday Partnership. This paper was recommended by Associate Ed- itor D Goldgof. N. Werghi is with the College of Information Technology, Dubai University College, United Arab Emirates (e-mail: [email protected]). Y. Xiao and J. P. Siebert are with the Department of Computing Sci- ences, University of Glasgow, Glasgow, U.K. (e-mail: [email protected]; [email protected]). Digital Object Identifier 10.1109/TSMCB.2005.854503 This segmentation provides the basis for a high-level represen- tation of the scan data and is a prerequisite for further semantic analysis. For example, in medical applications, the segmenta- tion process provides an Atlas for extracting data belonging to limbs that can then be used to support further analysis such as fitting generic limb models. These models can then be used to automate specific clinical protocols, such as spinal curvature as- sessment. Applications dealing with the estimation of HB mo- tion from range image sequences [9], can exploit scan data seg- mentation when initializing the parameters of a HB tracking al- gorithm. HB scan segmentation is also useful for online garment shopping applications [5], [6] as it can contribute toward pro- viding accurate body measurements and sizing. Many attempts to devise a framework for the segmentation of objects that are human-like in shape have been reported in the literature [10]–[13]. Most of this previous work is based on contour-based segmentation techniques whereby points of discontinuity in the range data are first detected and then dynamically grouped into contours using various techniques, such as energy-minimization, when processing deformable curves [14]. However, automatic segmentation of real HB data is a more challenging problem, firstly because the body shape is both articulated and deformable and secondly because the scan data is by nature nonuniformly sampled and may exhibit gaps and may be corrupted by noise. It was therefore necessary to explore new techniques in order to formulate approaches that would be better able to cope with these challenges. In his pioneering work, Nurre [15] approximated the body structure by a stick-template representing the head, the two arms, the two legs and the torso. His goal was to segment the body into six segments corresponding to these parts. This approach combines a global shape description, namely moments analysis, and local criteria of proximity which are derived from a priori knowledge of the relative positions of the body parts in the standard posture (standing body with arms held at the sides). The range data is organized into slices of data points. The horizontal slices are stacked vertically and the data points are assigned to the different body parts according to the slice’s topology and its position in the body. While this work achieved considerable progress toward the automatic decomposition of HB scan data, it has been criticized for imposing the requirement to limit body poses to a strict standard posture and for its lack of robustness against noise, gaps in the data, and variations in shape and posture of the HB. There have been many subsequent attempts to improve Nurre’s approach. For example, Decker et al. [16] improved the localization of the key landmarks of the HB by applying differential operations on slice shape attributes. Although a degree of improvement resulted, this 1083-4419/$20.00 © 2005 IEEE
Transcript of AUTOMATIC SEGMENTATION OF 3D HUMAN BODY SCANS

IEEE TRANSACTIONS ON SYSTEMS, MAN, AND CYBERNETICS—PART B: CYBERNETICS, VOL. 36, NO. 1, FEBRUARY 2006 153
A Functional-Based Segmentation of Human BodyScans in Arbitrary Postures
Naoufel Werghi, Member, IEEE, Yijun Xiao, and Jan Paul Siebert, Member, IEEE
Abstract—This paper presents a general framework that aims toaddress the task of segmenting three-dimensional (3-D) scan datarepresenting the human form into subsets which correspond tofunctional human body parts. Such a task is challenging due to thearticulated and deformable nature of the human body. A salientfeature of this framework is that it is able to cope with variousbody postures and is in addition robust to noise, holes, irregularsampling and rigid transformations. Although whole human bodyscanners are now capable of routinely capturing the shape of thewhole body in machine readable format, they have not yet realizedtheir potential to provide automatic extraction of key body mea-surements. Automated production of anthropometric databases isa prerequisite to satisfying the needs of certain industrial sectors(e.g., the clothing industry). This implies that in order to extractspecific measurements of interest, whole body 3-D scan data mustbe segmented by machine into subsets corresponding to functionalhuman body parts. However, previously reported attempts at au-tomating the segmentation process suffer from various limitations,such as being restricted to a standard specific posture and beingvulnerable to scan data artifacts. Our human body segmentationalgorithm advances the state of the art to overcome the above lim-itations and we present experimental results obtained using bothreal and synthetic data that confirm the validity, effectiveness, androbustness of our approach.
Index Terms—Human body shape analysis, Reeb graph, scat-tered 3-D range data segmentation, 3-D surface topology, 3-Dwhole-body scanners.
I. INTRODUCTION
THE PAST FEW years have witnessed the emergence ofthree-dimensional (3-D) imaging technology that enables
full scanning of the human body (HB) surface with reasonablemeasurement accuracy as well as at an acceptable computa-tional cost. This advance facilitates the exploitation of the HBform in various areas such as anthropometrical research [1]–[3],clothing design [4]–[6], and virtual human animation [7], [8].Although the raw data generated by the HB scanner requiressubstantial main memory and storage resources, it contains littlesemantic information. To achieve effective and efficient use ofbody scan data, it is often necessary to partition the whole scandata set into subsets corresponding to the principal body parts.
Manuscript received June 21, 2004; revised February 9, 2005. This workwas supported by the U.K. EPSRC under Grant RG 533801 and by the U.K.Imaging Faraday Partnership. This paper was recommended by Associate Ed-itor D Goldgof.
N. Werghi is with the College of Information Technology, Dubai UniversityCollege, United Arab Emirates (e-mail: [email protected]).
Y. Xiao and J. P. Siebert are with the Department of Computing Sci-ences, University of Glasgow, Glasgow, U.K. (e-mail: [email protected];[email protected]).
Digital Object Identifier 10.1109/TSMCB.2005.854503
This segmentation provides the basis for a high-level represen-tation of the scan data and is a prerequisite for further semanticanalysis. For example, in medical applications, the segmenta-tion process provides an Atlas for extracting data belonging tolimbs that can then be used to support further analysis such asfitting generic limb models. These models can then be used toautomate specific clinical protocols, such as spinal curvature as-sessment. Applications dealing with the estimation of HB mo-tion from range image sequences [9], can exploit scan data seg-mentation when initializing the parameters of a HB tracking al-gorithm. HB scan segmentation is also useful for online garmentshopping applications [5], [6] as it can contribute toward pro-viding accurate body measurements and sizing.
Many attempts to devise a framework for the segmentationof objects that are human-like in shape have been reported inthe literature [10]–[13]. Most of this previous work is basedon contour-based segmentation techniques whereby pointsof discontinuity in the range data are first detected and thendynamically grouped into contours using various techniques,such as energy-minimization, when processing deformablecurves [14]. However, automatic segmentation of real HB datais a more challenging problem, firstly because the body shapeis both articulated and deformable and secondly because thescan data is by nature nonuniformly sampled and may exhibitgaps and may be corrupted by noise. It was therefore necessaryto explore new techniques in order to formulate approachesthat would be better able to cope with these challenges. In hispioneering work, Nurre [15] approximated the body structureby a stick-template representing the head, the two arms, the twolegs and the torso. His goal was to segment the body into sixsegments corresponding to these parts. This approach combinesa global shape description, namely moments analysis, and localcriteria of proximity which are derived from a priori knowledgeof the relative positions of the body parts in the standard posture(standing body with arms held at the sides). The range datais organized into slices of data points. The horizontal slicesare stacked vertically and the data points are assigned to thedifferent body parts according to the slice’s topology and itsposition in the body. While this work achieved considerableprogress toward the automatic decomposition of HB scandata, it has been criticized for imposing the requirement tolimit body poses to a strict standard posture and for its lackof robustness against noise, gaps in the data, and variations inshape and posture of the HB. There have been many subsequentattempts to improve Nurre’s approach. For example, Deckeret al. [16] improved the localization of the key landmarksof the HB by applying differential operations on slice shapeattributes. Although a degree of improvement resulted, this
1083-4419/$20.00 © 2005 IEEE

154 IEEE TRANSACTIONS ON SYSTEMS, MAN, AND CYBERNETICS—PART B: CYBERNETICS, VOL. 36, NO. 1, FEBRUARY 2006
approach could not remedy the limitations of Nurre’s approach.Recently, Wang et al. [17] proposed a new approach based ona Fuzzy logic framework, however, this again was restrictedto standing postures. Their segmentation technique involvedlocal curvature analysis of the slices and operates on mesh datathat has undergone several preprocessing stages. The overallperformance of this approach remains identical to that of Nurre.
From the above it is evident that the approaches developed sofar are restricted by their underlying assumptions, and none ofthese has been able to overcome the standard posture restriction.Furthermore, most of these approaches suffer from instabilitywhen applied within real applications that must cope with noisyand corrupted 3-D HB scan data. In addition, to date no evi-dence citing the repeatability of these previous algorithms hasbeen reported in the literature. By definition, HB scan data seg-mentation must be of practical utility, it must be robust to vari-ation in the body surface shape stemming from biological fac-tors such as age, genetics, etc. It must also cope with changesof body posture as well as with the diversity of the scan datasources. While ad hoc techniques might work for special cases,they cannot address the above stringent requirements. In a re-cent publication [18], the authors presented an approach thatsuccessfully addressed some of the previously discussed issues.However this approach can only deal with moderate variationsaround the standard posture.
In this paper we propose a general topological analysis frame-work that offers a systematic way to segment HB body data. Thesalient feature of this framework is that it can cope with bodyshape variations, posture changes, rigid transformations and di-verse sources of scan data. Furthermore, our approach does notrequire any pre-processing stages, operates on 3-D point-clouddata, and does not rely on local feature analysis, which wouldbe vulnerable to deficiencies in the scan data.
The novel aspects of this paper are 1) the extension of theReeb graph concept to sets of scattered data points, which rep-resents an extension to the work of Biasotti et al. [19] whichexplores the use of Reeb graph applied to polygonal meshes;2) a simple and efficient technique for computing the geodesicdistance map of HB shape (and generally of a three-dimensionalshape) with respect to a source point; 3) a robust technique, forconstructing the discrete Reeb graph (DRG), which can cope ef-fectively with data deficiencies; and 4) a new functional surfacesegmentation method based on the concept of the DRG appliedto the HB surface.
The remainder of this paper is organized as follows. Section IIdescribes the theoretical foundations of our approach, namelyMorse theory, the Reeb graph and geodesic distance. Section IIIdescribes the implementation of the segmentation approach andthe mechanisms involved. Section IV validates our proposedframework via experimental results. Finally, in Section V, weprovide a summary of the main findings of this paper and makesuggestions for future research.
II. MORSE THEORY AND THE REEB GRAPH
Morse theory can be thought of as generating the classicaltheory of critical points (maxima, minima and saddle points)of smooth functions on a smooth manifold. Specifically Morse
theory states that for a generic function defined on a closed com-pact manifold, the nature of its critical points determines thetopology of the manifold. Morse functions are generic functionswhose critical points are nondegenerate (Hessian matrix of thefunction at the critical point is nonsingular). For a Morse func-tion, the critical points determine the homology groups of themanifold, which in turn fully describe its topology. Moreoverthe way the manifold is embedded can be coded using a Reebgraph, as proposed by Reeb [20] to represent the evolution andarrangement of level-set curves on a manifold. A Reeb graphdescribes the configuration of and relationship between criticalpoints and provides a way to understand the intrinsic topolog-ical structure of a shape. Morse theory and the Reeb graph havebeen used in many applications such as shape matching [21],shape coding [22]–[24], surface compression [25], volume vi-sualization [26], terrain analysis [27] and 3-D skeletonization[28], [29]. The last publication cited is particularly close to ourwork. We will describe and compare in detail the related ap-proaches in Section III-F.
A Reeb graph can be defined as follows.Definition 1: Let be a real-valued function on a compact
manifold . The Reeb graph of is the quotient space of thegraph of in by the equivalence relation “ ” defined by
if and andare in the same connected component of .
Roughly speaking, the two pairs andare represented as the same element in the
Reeb graph if the values of are the same and if they belongto the same connected component of the inverse image of
or . Actually one element in the Reeb graph of acompact manifold represents all points having the same valueunder a real function. The Reeb graph is a representation ofthe evolution and arrangement of these groups of points, alsocalled level-sets. Fig. 1(a) illustrates an example of a Reebgraph for a torus. The function is the “height” function whichhere simply returns the value of the coordinate of a point .In the corresponding Reeb graph, a point in a branch representsisovalued and connected points on the manifold. From bottomto top, the level-sets on the torus expand, split, merge and thenbecome smaller. The Reeb graph gives an intuitive descriptionof the evolution of level-sets, where diamond points denote thelevel-sets passing through saddle points on the torus. By ap-plying the Reeb graph to a HB, we get a tree-like representationas illustrated in Fig. 1(b). Extremal points lie on the head top,hand tips and the bottom of the feet. Saddle points are locatedat the armpits and groin. Moreover, the branches in the Reebgraph reflect the body parts of the human figure, i.e., arms,legs, torso, and head. Therefore, if we succeed in retrievingthe level-sets in these branches, we can partition the inputpoint-cloud data into sub-sets approximately corresponding tothe body parts of the human shape.
A. The Morse Function
For standard postures such the one shown in Fig. 1(b), wherethe human figure stands in the measuring platform with armsheld at the sides and legs separated, the simple height function
that returns the z coordinate of a point , is an op-timal choice because the orientations of the body parts in such

WERGHI et al.: FUNCTIONAL-BASED SEGMENTATION OF HUMAN BODY SCANS 155
Fig. 1. (a) Reeb graph of a torus. (b) Reeb graph of a HB shape. (c) Discrete Reeb graph.
postures are orthogonal to the cross-sectional planes inferred bythe height function. For nonstandard postures where the humanfigure is not constrained to be in a standing position, both thearms and legs as well as the whole body can have arbitrary orien-tations. The only constraint is that the body limbs must be sepa-rated from each other everywhere except at their joints. For suchpostures, the simple height function cannot guarantee a Reebgraph faithful to the HB anatomy. This limitation emanates fromthe fact that the height function is not invariant under rigid trans-formation or under deformation inferred by whole body trans-formation or body part movement. Therefore, to be capable ofhandling nonstandard postures, it is imperative that the Morsefunction be invariant under these transformations, i.e., a func-tion that keeps the same value as long as the topology of the sur-face is preserved. The curvature function could be a candidateas it is invariant under rotation and only very slightly affectedby body movements. However, it is very sensitive to noise anddata deficiencies that would lead to highly unstable Reeb graphstructures. Therefore, it is not appropriate for our applicationwhich must handle scattered noisy scan data that might be cor-rupted by many deficiencies such as holes, gaps and nonuniformsampling. To find a function that overcomes these problems, weemployed the geodesic distance [31] defined as the length of theshortest path connecting two points. The geodesic distance isinvariant to the rotations and transformations produced by bodymovements and is resistant to data corruption and perturbation.Thus the geodesic distance metric underpins a stable Reeb graphwith respect to these aspects. The function defined as
(1)
where returns the geodesic distance from a pointto a source point , is a reasonable candidate for a Morse func-tion. However the location of the source point might affect, to acertain extent, the structure of the Reeb graph as will be shownlater.
Another candidate for a Morse function is the function de-fined as
(2)
This function represents the sum of the geodesic distances be-tween the point X and all the points on the body surface. In ad-
dition to being resistant to geometric transformations and de-formations produced by body movements, this function is notrelated to any source point and therefore guarantees a stableReeb graph. Intuitively, the function presents low values forpoints located at the center of the body (torso area), for whichthe distance to other points is relatively small, and high valuesfor points located at the body extremities. On the other hand,this function is computationally expensive when compared to
as it will be described in Section III-A.
B. The DRG
Classical Morse theory is concerned with only nondegeneratecritical points of smooth functions (Morse functions) on smoothmanifolds. The notion of the Reeb graph in its standard form isdefined with respect to smooth and continuous surfaces. Therehave been several successful attempts to extend the Reeb graphto discrete surfaces e.g., [19], but the surface data is requiredto be organized into polygonal meshes. In practice, our dataformat does not comply with this requirement, as it consistsof an unorganized cloud of 3-D data points which have beencorrupted by noise, gaps and nonuniform sampling. We presenta Reeb-graph extraction technique that is compatible with thistype of data. For clarification of terminology, hereafter we referto Reeb graph extracted from such data as the DRG to distin-guish it from the classical Reeb graph. The concept of the DRGis described in the following definitions.:
Definition 2 (Connectivity of Point Sets): Two point setsand are defined as
connected if and such that .denotes the distance between points and and
is a given threshold. The above definition also holds for theconnectedness between two points for the particular case wherethe sets P and Q contain a single point each.
Definition 3 (Connective Point Set): A point set is con-nective if subset and and are connected.Here denotes the complement of in C. Definition 3 definesa “tight” point set in which all the points are connected.
Definition 4 (Level-Set Curve): A level-set curve is an iso-valued connective point set, that is a group of points, that sharethe same Morse function value, and which forms a connectivepoint set.
Dentition 5: A Discrete Reeb graph is a non-oriented two-dimensional (2-D) graph, where a node represents a level-set

156 IEEE TRANSACTIONS ON SYSTEMS, MAN, AND CYBERNETICS—PART B: CYBERNETICS, VOL. 36, NO. 1, FEBRUARY 2006
curve and where an edge represents a connection (in the senseof Definition 2) between two adjacent level-set curves.
Based on the above definitions, the construction of the DRGinvolves the following tasks.
Step 1: Establishing Level-Sets: Level-sets are groupsof iso-valued data points defined as
, where is the Morse functionand is a set of discrete equidistant values.
Step 2: Establishing Level-Set Curves: Each level-set is de-composed into a group of level-set curves, using the criteria out-lined in Definition 3, and where the threshold is set to whichstands for the minimum distance between a pair of points.
Step 3: Building the Connectivity Between Nodes: Twonodes in two adjacent level sets ( and ) are linked if theircorresponding level-set curves are connected, according to Def-inition 2. However, the related threshold is set to , where
is a parameter used to tune the precision of the connection.By following the above steps, we can construct progressively
a graph containing all the nodes and their associated links.Fig. 1(c) depicts a DRG of the HB shape. This graph has theappearance of a discrete version of the graph in Fig. 1(b), wherethe continuous branches are replaced with successively linkednodes. The DRG extends the concept of Reeb graph to discretesurfaces, and thus permits topological analysis of scan data.
III. THE SEGMENTATION
The segmentation process involves three tasks, namely: 1)computing the Morse function; 2) extracting the level-sets; 3)decomposing these level-sets into connected level-set curves;and 4) extracting the different branches. Task 3 in essencecomprises DRG construction. The implementation of thesetasks within the segmentation process and the complexity ofthe overall algorithm depend on the adopted Morse function.When the simple height function is used (i.e., when dealingwith standard postures), the four tasks are carried out withina single stage in one pass algorithm. When the function isused, tasks 1 and 2 are performed simultaneously. Alternatively,when the function is employed the four tasks are executedconsecutively. The following sections will shed light on theseaspects.
A. Computation of the Morse Function and
Both Morse functions and involve the computation ofgeodesic distances. In the literature, Dijkstra’s algorithm [30]has been the most popular tool for computing geodesic distancesbetween a group of points and a source point. In addition, it pro-vides the path from any point to the source point. However, thisalgorithm implies a significant computational cost. Indeed, it re-quires that the group of points be organized in a graph, wherea node is associated to each point and edge represents a con-nection between pair of points, according to a proximity cri-terion. The construction of such graph infers a computationalcomplexity that can go up , where is the number ofpoints. Dijkstra’s algorithm itself, in its optimal implementa-tion, infers a complexity of , where is thenumber of edges in the graph. For these reasons and because
finding the paths to a source point is not required in our applica-tion, we preferred not to use this algorithm. Instead, we devel-oped an efficient algorithm based on a wavefront propagationtechnique. It is based on the following principle: Given a wavecentered on a manifold, then all the points on the wavefront havethe same geodesic distance to the wave center and thus form alevel-set. Our wavefront propagation algorithm operates on abinary voxel grid since it is easy to define a neighborhood invoxel space and to then traverse connected voxels. Due to thesewell-behaved properties, wavefront-propagation on a voxel gridcan have a very simple mathematical form as follows:
where is the wavefront generated on the th iteration of thealgorithm; is the source voxel; . is thecomplement set of . denotes the morphological dilation op-erator and is a 3 3 3 structuring element composed of 271-valued voxels. The wavefront starting position is located atthe source voxel associated with the source point and the wave-front then iteratively spreads on the voxelised surface from thislocation. In each iteration, the wavefront is the level-set con-taining voxels of the same geodesic distance to the source point.The attractive aspect of this technique is that it simultaneouslyextracts the level-sets while it computes the function. It iseasy to prove that the computational complexity in each itera-tion is , where is the number of voxels in . There-fore, the complexity of the whole algorithm is , whereis the number of all 1-valued voxels. This linear complexity al-lows efficient calculation of geodesic distances and level-sets.Therefore the computation of the function is carried out bysimply applying the above algorithm after selecting a sourcepoint. Fig. 2(a) illustrates wavefront-propagation applied on asimple ellipsoid surface. Row 1 in Fig. 2 depicts grey level map-ping of the function, related to a posture instance, and cor-responding to different locations of the source point, namelythe head (column f), the torso(columns g, h, i, and j), the knee(column k), and the hand (column l). The grey level varies fromwhite (which corresponds to the minimum value, at the sourcepoint) to the black (largest value). Row 2 depicts the corre-sponding level-sets. We can observe that while the level-set ori-entations follow the body limbs in all cases, they do presentsome dissimilarities, particularly at the junction areas.
The computation of the function is more complex as it in-volves for each data point the sum of geodesic distances fromthat point to all the points in the body surface. The discrete ap-proximation of in (2) is
(3)
Using (1), the above equation can be rewritten as. This indicates that the computation of at
a given point requires computing the function for all the1-valued voxels. Making thus the complexity of the wholealgorithm that calculates the function for all the points to be
.

WERGHI et al.: FUNCTIONAL-BASED SEGMENTATION OF HUMAN BODY SCANS 157
Fig. 2. (a): Wavefront propagation on a simple elliptic surface. (b), (c), (d) Level-sets of � function, related to an L-Shaped object, and corresponding to sourcepoints located at the junction, the middle and the extremity of a branch respectively. (e) Level-sets of � function. Row 1: grey level mapping of the � function fordifferent source point locations (indicated by the arrows). Rows 2 and 3: corresponding level-sets’ patterns and DRGs, respectively. Row 4: grey level mappingsof the � function, the corresponding levels-sets’ patterns and DRGs related to two different postures.
B. Source Point Location and Its Effect on the Level-Sets andthe DRG
While the exhibits nice properties in terms of efficiencyand ease of implementation, an effective deployment of thisfunction for constructing the DRG, and for performing the sepa-ration between branches, depends to some extent on the locationof the source point however. Ideally, the use of geodesic distancewould permits us to extract level-sets that maintain a consistentorientation relative to the HB pose. Locally, this would result inthe recovery of “slices” parallel to the principal axes of humanlimbs. Unfortunately, this desirable behavior is compromised atareas comprising junctions (and also within the neighborhoodof the source point) and the patterns resulting from such cor-ruption are dependent on the location of the source point it-self. Fig. 2(b), (c), and (d) illustrates this effect on a simpleL-shaped object, showing the different level-sets that are pro-duced by the function corresponding to three different sourcepoints located at respectively: the junction area, the middle, andthe extremity of one branch. By observing their correspondingpatterns at junction areas clear dissimilarities become apparent.
The disparity between the level-set’s behaviors in the three casesmakes their decomposition into subsets, and the correspondenceof these subsets to the their associated branches, unlikely to re-sult in an identical separation between these branches. For thepurpose of comparison, we show in Fig. 2(e) level-sets of thefunction for the same object. We notice that the level-sets, seem-ingly behave like those related to the junction-located sourcepoint case. Indeed, both of them exhibit a degree of symmetryat the junction area.
Regarding the reconstruction of the DRG, ideally, we wouldlike to have a DRG structure that is similar to the “standard” HBDRG depicted in Fig. 1(c). This structure reflects the anatomyof the HB shape, and thereby facilitates the identification of thebranches. However, the stability of this structure is guaranteedonly for source points selected at the central area of the body,that is the torso-head area. Fig. 2 (row 3) illustrates this aspect.It shows a group of DRGs obtained for different source pointlocations. We can observe that for cases where the source pointis located within the torso-head area a DRG structure is gener-ated which is close to the standard form displayed in Fig. 1(c).On the other hand, in those cases where the source point is lo-
158 IEEE TRANSACTIONS ON SYSTEMS, MAN, AND CYBERNETICS—PART B: CYBERNETICS, VOL. 36, NO. 1, FEBRUARY 2006
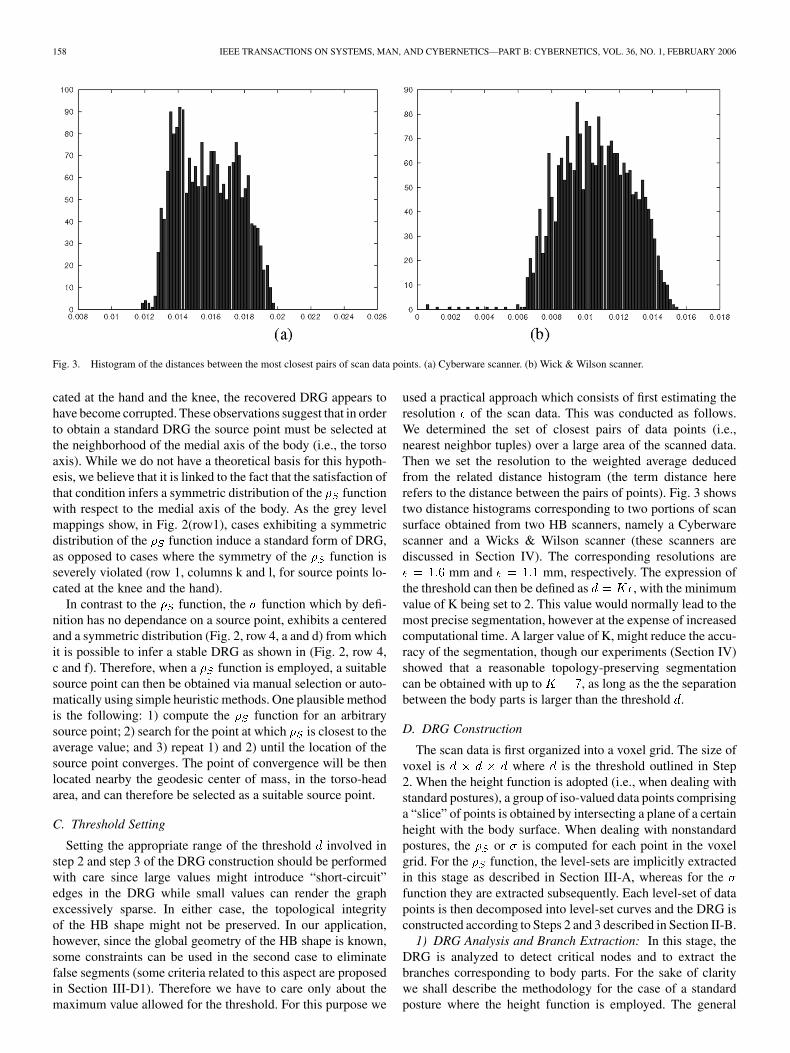
Fig. 3. Histogram of the distances between the most closest pairs of scan data points. (a) Cyberware scanner. (b) Wick & Wilson scanner.
cated at the hand and the knee, the recovered DRG appears tohave become corrupted. These observations suggest that in orderto obtain a standard DRG the source point must be selected atthe neighborhood of the medial axis of the body (i.e., the torsoaxis). While we do not have a theoretical basis for this hypoth-esis, we believe that it is linked to the fact that the satisfaction ofthat condition infers a symmetric distribution of the functionwith respect to the medial axis of the body. As the grey levelmappings show, in Fig. 2(row1), cases exhibiting a symmetricdistribution of the function induce a standard form of DRG,as opposed to cases where the symmetry of the function isseverely violated (row 1, columns k and l, for source points lo-cated at the knee and the hand).
In contrast to the function, the function which by defi-nition has no dependance on a source point, exhibits a centeredand a symmetric distribution (Fig. 2, row 4, a and d) from whichit is possible to infer a stable DRG as shown in (Fig. 2, row 4,c and f). Therefore, when a function is employed, a suitablesource point can then be obtained via manual selection or auto-matically using simple heuristic methods. One plausible methodis the following: 1) compute the function for an arbitrarysource point; 2) search for the point at which is closest to theaverage value; and 3) repeat 1) and 2) until the location of thesource point converges. The point of convergence will be thenlocated nearby the geodesic center of mass, in the torso-headarea, and can therefore be selected as a suitable source point.
C. Threshold Setting
Setting the appropriate range of the threshold involved instep 2 and step 3 of the DRG construction should be performedwith care since large values might introduce “short-circuit”edges in the DRG while small values can render the graphexcessively sparse. In either case, the topological integrityof the HB shape might not be preserved. In our application,however, since the global geometry of the HB shape is known,some constraints can be used in the second case to eliminatefalse segments (some criteria related to this aspect are proposedin Section III-D1). Therefore we have to care only about themaximum value allowed for the threshold. For this purpose we
used a practical approach which consists of first estimating theresolution of the scan data. This was conducted as follows.We determined the set of closest pairs of data points (i.e.,nearest neighbor tuples) over a large area of the scanned data.Then we set the resolution to the weighted average deducedfrom the related distance histogram (the term distance hererefers to the distance between the pairs of points). Fig. 3 showstwo distance histograms corresponding to two portions of scansurface obtained from two HB scanners, namely a Cyberwarescanner and a Wicks & Wilson scanner (these scanners arediscussed in Section IV). The corresponding resolutions are
mm and mm, respectively. The expression ofthe threshold can then be defined as , with the minimumvalue of K being set to 2. This value would normally lead to themost precise segmentation, however at the expense of increasedcomputational time. A larger value of K, might reduce the accu-racy of the segmentation, though our experiments (Section IV)showed that a reasonable topology-preserving segmentationcan be obtained with up to , as long as the the separationbetween the body parts is larger than the threshold .
D. DRG Construction
The scan data is first organized into a voxel grid. The size ofvoxel is where is the threshold outlined in Step2. When the height function is adopted (i.e., when dealing withstandard postures), a group of iso-valued data points comprisinga “slice” of points is obtained by intersecting a plane of a certainheight with the body surface. When dealing with nonstandardpostures, the or is computed for each point in the voxelgrid. For the function, the level-sets are implicitly extractedin this stage as described in Section III-A, whereas for thefunction they are extracted subsequently. Each level-set of datapoints is then decomposed into level-set curves and the DRG isconstructed according to Steps 2 and 3 described in Section II-B.
1) DRG Analysis and Branch Extraction: In this stage, theDRG is analyzed to detect critical nodes and to extract thebranches corresponding to body parts. For the sake of claritywe shall describe the methodology for the case of a standardposture where the height function is employed. The general
WERGHI et al.: FUNCTIONAL-BASED SEGMENTATION OF HUMAN BODY SCANS 159
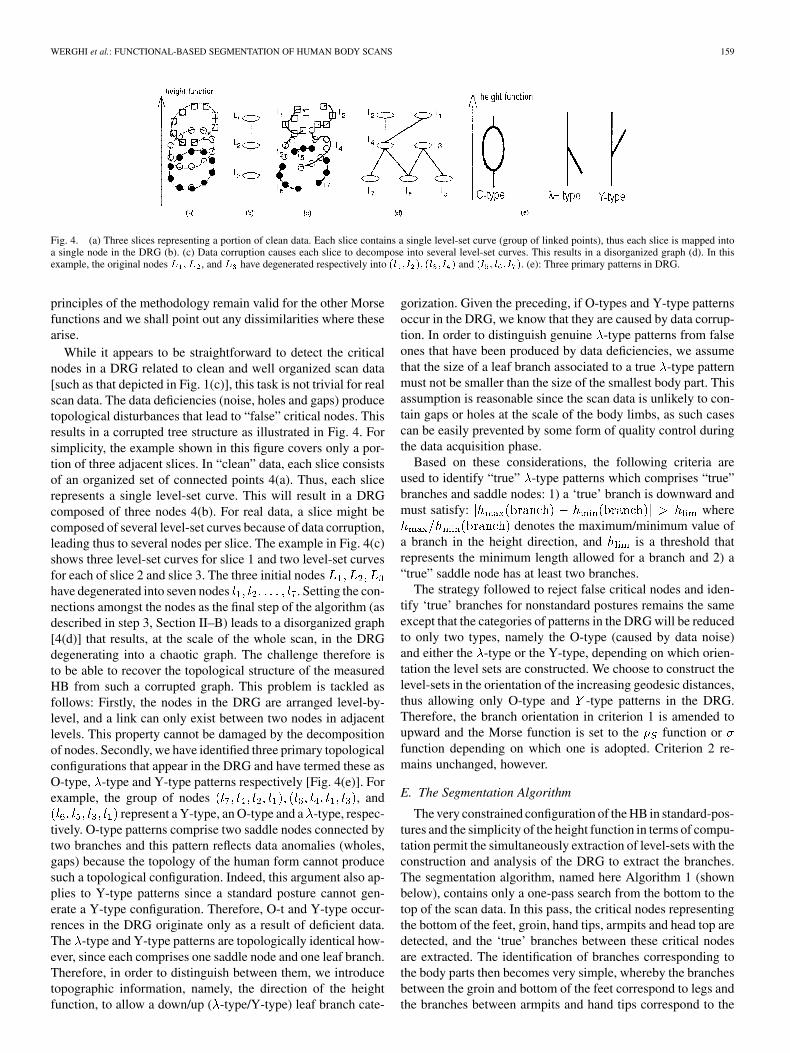
Fig. 4. (a) Three slices representing a portion of clean data. Each slice contains a single level-set curve (group of linked points), thus each slice is mapped intoa single node in the DRG (b). (c) Data corruption causes each slice to decompose into several level-set curves. This results in a disorganized graph (d). In thisexample, the original nodes L ;L , and L have degenerated respectively into (l ; l ); (l ; l ) and (l ; l ; l ). (e): Three primary patterns in DRG.
principles of the methodology remain valid for the other Morsefunctions and we shall point out any dissimilarities where thesearise.
While it appears to be straightforward to detect the criticalnodes in a DRG related to clean and well organized scan data[such as that depicted in Fig. 1(c)], this task is not trivial for realscan data. The data deficiencies (noise, holes and gaps) producetopological disturbances that lead to “false” critical nodes. Thisresults in a corrupted tree structure as illustrated in Fig. 4. Forsimplicity, the example shown in this figure covers only a por-tion of three adjacent slices. In “clean” data, each slice consistsof an organized set of connected points 4(a). Thus, each slicerepresents a single level-set curve. This will result in a DRGcomposed of three nodes 4(b). For real data, a slice might becomposed of several level-set curves because of data corruption,leading thus to several nodes per slice. The example in Fig. 4(c)shows three level-set curves for slice 1 and two level-set curvesfor each of slice 2 and slice 3. The three initial nodeshave degenerated into seven nodes . Setting the con-nections amongst the nodes as the final step of the algorithm (asdescribed in step 3, Section II–B) leads to a disorganized graph[4(d)] that results, at the scale of the whole scan, in the DRGdegenerating into a chaotic graph. The challenge therefore isto be able to recover the topological structure of the measuredHB from such a corrupted graph. This problem is tackled asfollows: Firstly, the nodes in the DRG are arranged level-by-level, and a link can only exist between two nodes in adjacentlevels. This property cannot be damaged by the decompositionof nodes. Secondly, we have identified three primary topologicalconfigurations that appear in the DRG and have termed these asO-type, -type and Y-type patterns respectively [Fig. 4(e)]. Forexample, the group of nodes , and
represent a Y-type, an O-type and a -type, respec-tively. O-type patterns comprise two saddle nodes connected bytwo branches and this pattern reflects data anomalies (wholes,gaps) because the topology of the human form cannot producesuch a topological configuration. Indeed, this argument also ap-plies to Y-type patterns since a standard posture cannot gen-erate a Y-type configuration. Therefore, O-t and Y-type occur-rences in the DRG originate only as a result of deficient data.The -type and Y-type patterns are topologically identical how-ever, since each comprises one saddle node and one leaf branch.Therefore, in order to distinguish between them, we introducetopographic information, namely, the direction of the heightfunction, to allow a down/up ( -type/Y-type) leaf branch cate-
gorization. Given the preceding, if O-types and Y-type patternsoccur in the DRG, we know that they are caused by data corrup-tion. In order to distinguish genuine -type patterns from falseones that have been produced by data deficiencies, we assumethat the size of a leaf branch associated to a true -type patternmust not be smaller than the size of the smallest body part. Thisassumption is reasonable since the scan data is unlikely to con-tain gaps or holes at the scale of the body limbs, as such casescan be easily prevented by some form of quality control duringthe data acquisition phase.
Based on these considerations, the following criteria areused to identify “true” -type patterns which comprises “true”branches and saddle nodes: 1) a ‘true’ branch is downward andmust satisfy: where
denotes the maximum/minimum value ofa branch in the height direction, and is a threshold thatrepresents the minimum length allowed for a branch and 2) a“true” saddle node has at least two branches.
The strategy followed to reject false critical nodes and iden-tify ‘true’ branches for nonstandard postures remains the sameexcept that the categories of patterns in the DRG will be reducedto only two types, namely the O-type (caused by data noise)and either the -type or the Y-type, depending on which orien-tation the level sets are constructed. We choose to construct thelevel-sets in the orientation of the increasing geodesic distances,thus allowing only O-type and -type patterns in the DRG.Therefore, the branch orientation in criterion 1 is amended toupward and the Morse function is set to the function orfunction depending on which one is adopted. Criterion 2 re-mains unchanged, however.
E. The Segmentation Algorithm
The very constrained configuration of the HB in standard-pos-tures and the simplicity of the height function in terms of compu-tation permit the simultaneously extraction of level-sets with theconstruction and analysis of the DRG to extract the branches.The segmentation algorithm, named here Algorithm 1 (shownbelow), contains only a one-pass search from the bottom to thetop of the scan data. In this pass, the critical nodes representingthe bottom of the feet, groin, hand tips, armpits and head top aredetected, and the ‘true’ branches between these critical nodesare extracted. The identification of branches corresponding tothe body parts then becomes very simple, whereby the branchesbetween the groin and bottom of the feet correspond to legs andthe branches between armpits and hand tips correspond to the

160 IEEE TRANSACTIONS ON SYSTEMS, MAN, AND CYBERNETICS—PART B: CYBERNETICS, VOL. 36, NO. 1, FEBRUARY 2006
arms. The reminder of the data corresponds to torso and head.For nonstandard postures, the Morse function and the level-setsare first computed (in one stage for the function and in twostages for the function) and thereafter, Algorithm 1 is applied(after setting the ‘true’ orientation of the branches to up) to ex-tract the critical nodes and the true branches.
Algorithm 1: NotationSlice: A level-setNode: A level-set curve in a slice.Class: A group of connected nodes.Class(Node): The Class containing the Node.Branch: A ‘true’ branch connected to a ‘true’ saddle node.f : The Morse function (height function for standard postures) and �S
function or � function for nonstandard posturesCode:
For each sliceGroup data points into level-set curves
For each level-set curveAssign a node to this level-set curveIf it is the 1-st slice
Class(node) := fthis nodeg
ElseExtract the group of nodes (l1; l2; . . . ; lm), connectedto node, from the previous sliceIf m = 0
Class(node) := fthis nodeg
ElseFrom fClass(li); i = 1; 2; . . . ; mg select the
classes verifying:
fCj : jfmax(Cj)� fmin(Cj)j > hlim; j = 1; 2; . . . ; n; (n � m)g
If n � 2
For each Cj
Branchk = Cj ; k := k + 1
End ForEnd If
Class(node) = fClass(node)g fClass(l1)g � � � fClass(lm)gg
End IfEnd If
End forEnd for
F. Summary of the Approach and Comparison With 3-DSkeletonization
The HB scan segmentation approach involves four tasks andthe implementation depends on the adopted Morse function.Table I summarizes the different versions. Of the different tasks,
TABLE ISTAGES AND TASKS INVOLVED IN THE DIFFERENT VERSIONS OF THE
SEGMENTATION PROCESS. THE FIRST COLUMN INDICATES THE EMPLOYED
MORSE FUNCTION. THE SECOND COLUMN LISTS THE NUMBER OF INFERRED
STAGES. THE THIRD COLUMN INDICATES THE TASKS INVOLVED IN EACH STAGE
the computation of the Morse function is the most time con-suming. The height function implies the simplest implementa-tion, because it does not infer any computation. This permitsus to perform all of the tasks in a single stage. Conversely, the
function requires the sequential execution of the four tasks,and represents the most costly implementation . Thecomputational time related to this function is of the order ofseveral hours on a Pentium IV, 1.7 Ghz computer. Thefunction, exhibits a reasonably tolerable computational cost.It exhibits an overall complexity of O(N). Despite the fact thatthe infers a stable DRG, we prefer the function, becauseof the considerable disparity in terms of computational cost.Furthermore, our experiments showed that the two versions aresimilar in performance. The presented algorithm operates ona voxel grid and the number of voxels containing data pointsis small compared with the number of raw data points in thescan. However, it is straightforward to recover segmented rawHB scan data points from the segmented voxel data structure.
The approach of Verroust and Lazarus [29], mentionedpreviouslyinthispaper, is theclosest tooursintermsoftheoreticalbackground.Althoughboth approaches involvesimilar concepts,namely, geodesic distance and level-sets, there are severalfundamental differences, namely the objective of our task andthecomplexityandrobustnessofourrespective implementations.In the following section, we shall detail these aspects, whileemphasizing the characteristics of our approach.
Firstly, regarding the task undertaken, the two approachestarget different objectives, namely skeleton construction andfunctional-based segmentation. Regarding implementation,the skeletonization process in [29] involves five stages: 1)establishing a neighborhood graph, where nodes representdata points, and an edge between a pair of nodes represents aconnection between the corresponding pair of points, accordingto the m-nearest points rule; 2) computing a geodesic graphout of the neighborhood graph—this graph is actually a treecomposed of geodesic paths joining the data points to a sourcepoint. The Dijkstra algorithm is used to compute the geodesicpaths as well as the geodesic distances between the data pointsand the source point; 3) extracting level-sets of isovaluedpoints using the geodesic graph; 4) Partitioning each level-setinto subsets corresponding to the different branches of thesurface; and 5) computing the centroids of connected subsetsin each level-set and joining them, via the geodesic graph, toconstruct the skeletal curves. The approach was implemented

WERGHI et al.: FUNCTIONAL-BASED SEGMENTATION OF HUMAN BODY SCANS 161
on powerful Indy machines. In this process the extraction ofthe level-sets goes through the construction of a neighborhoodgraph and the use of Dijkstra’s algorithm. This results in a highcomputational complexity. Indeed, although the neighborhoodgraph algorithm is optimized, its complexity is estimated tobe , where is the number of data points and is theaverage of the number of points contained in the neighborhoodof each point. The value of is not small given the potentiallyvery large number of points in the raw scan data. Dijkstra’salgorithm has a complexity of where is thenumber of edges in the neighborhood graph. Proceeding as in[29], to determine the level-sets in our application, will inducean intolerable computational cost. Based on the precedingimplementation, we estimate that to process one HB containing13 000 points would require approximately 20 h to execute on aPentium IV, 1.7-GHz computer. In the contrary, the versionof our approach where the extraction of the level-sets infers acomplexity of , N being the number of 1-valued voxels,takes around 70 s to achieve the segmentation of the wholescan. Yet the most important feature of our work with respectto [29] is its robustness. Indeed, it is not clear how the approachin [29] can cope with an irregular sampling distribution ofdata points, data corruption and deficiencies. Since in order toobtain a valid skeleton, faithful to the body anatomy, each ob-tained subset (stage 4 of the skeletonization process, mentionedabove) must correspond to a branch and thereby: 1) contain asingle connected component and 2) form a closed curve. Thenon satisfaction of condition 1, results in false branches in theskeleton. The authors in [29] showed an instance of this caserelated to a body scan, presenting false branches, at the level ofthe feet, caused by the irregular distribution of the data pointsand the presence of gaps. The violation of condition 2, causesthe centroid to be shifted (stage 5) from its actual location atthe branch axis implying thus a distorted curve. The resultingskeleton will not then reflect correctly the actual body template.Cases such as those depicted in Fig. 9(b) and (c) for instance,cannot be accommodated by the approach in [29]. Actually, theauthors in [29] recognized that the validity of their approachis conditional upon having data points that are regularly dis-tributed on the object surface. Our approach, on the contrary,copes rather effectively with different types of data corruptiondue to the mechanisms implemented in the DRG analysis thateliminate false branches while preserving correct connectivity.Regarding segmentation accuracy, it appears that operating onraw data points and the use of Dijkstra’s algorithm as in [29]improves segmentation accuracy because this approach is ableto extend the computation of the to the interior of the edgesof the geodesic graph by interpolating the endpoint valuesof the edge. This in turn permits a finer mapping of thefunction. While this result appears to be attractive, as it allowsthe possibility of further refining the level-sets and improvingthe accuracy of the segmentation, it is also very likely that thisbenefit will be cancelled by the corruption of the level-sets atthe junction areas of the body (see Section III-B). It must alsobe noted that this limitation applies equally to our approach.Nevertheless the established thresholds, namely , and
, involved respectively in setting connections between pair
of points and level-set curves, permit us to control to a limitedextent the accuracy of the segmentation in our approach.
IV. EXPERIMENTS
A series of experiments were conducted using real and syn-thetic data to test the validity of our approach. The performanceand the robustness of the corresponding algorithms were as-sessed with respect to: 1) variation of the HB shape; 2) varia-tion of scan source; 3) severe corruption of the scan data; and 4)variation of the HB posture.
Real-world HB scan data was collected from differentsources, namely the Cyberware website [32], the CAESARproject website [3] and the HB scanner located within EdVEC,Edinburgh Virtual Reality Centre [34]. The scans of the firsttwo sources were acquired by Cyberware whole body scannersWB4 [32]. This scanner, uses laser-based technology in whicha laser beam is projected on the body. The beam profile iscaptured by different cameras around the body and 3-D pointsare then extracted from each camera view to be combined intoa single 3-D point cloud representing the body surface. Theacquisition time of this scanner is approximately 17 s. The setof collected scans contains 25 scans of different individualsincluding males and females (only 4 are shown in this paper).Each scan contains of the order of 13 000 data points. Thethird source is a Wicks & Wilson HB scanner [33], which isbased on a Moire fringing technology where fringe patterns,projected onto the body surface, are captured by four cameras,with a moving mirror system providing another four viewingpositions. The sets of 3-D points extracted from each camera(triangulating with the fringe projector) are combined togetherto form the whole scan. The scanning time of this device isaround 8 s, yet the person is required to stand very still duringthe scanning. Furthermore, the space inside the scanner isvery limited and allows little freedom of body movement. Forthese reasons, it was difficult to perform scans for nonstandardpostures. However, we did manage to obtain a few nonstandardpostures and collected a set of ten scans (seven are shownin the paper) related to three different male individuals. Thenumber of points in each scan is approximately 11 000 points.Synthetic HB scans were obtained using POSER software[35]. The data sets were generated by randomly sampling thesurface of four different models (two men and two women, twowith clothes and two without). 16 simulated scans were thenextracted representing human figures in different non standardpostures. First, we conducted preliminary tests in order to: 1)compare the performance of the algorithm versions related tothe and Morse functions and 2) assess the appropriatenessof the threshold selection with respect to (describedin Section III-C) and used to establish connections betweenadjacent level-set curves. Fig. 5 shows trials made with twopostures, using the version (a) and the version (b) and wecan observe that the segmentation results are not significantlydifferent. Threshold setting was investigated out asfollows: We segmented a HB scan (in standard posture) severaltimes, each with a different threshold , with K varyingfrom 2 to 7. These tests were carried out with the algorithmversion that utilizes a height function. Fig. 6 (Rows and 1 and

162 IEEE TRANSACTIONS ON SYSTEMS, MAN, AND CYBERNETICS—PART B: CYBERNETICS, VOL. 36, NO. 1, FEBRUARY 2006
Fig. 5. Cyberware scan and a Wick & Wilson scan segmented usingrespectively a � -based version (a) and a �-based version (b) of the approach.
Fig. 6. Rows 1 and 2: A Wick & Wilson HB scan and Cyberware scansegmented using a sequence of six thresholds ranging from d = 2� to d = 7�,where � is the scanner resolution estimated in Section III-C. Row 3: A Wick& Wilson HB scan segmentation results corresponding to six thresholds�d; � = 1; . . . ; 6; d = 2�.
2) shows that the overall segmentation appears to be similarthroughout the trial. However, by examining the zoomed areasaround the armpit we can observe a decrease in the segmen-tation accuracy as the threshold becomes larger (a decreasein segmentation accuracy is clearly visible for ). Thisbehavior is caused by “short-circuit” edges between nodes ofthe arm and nodes of the torso. These short-cuts occur when thedistance separating the arm and the torso becomes relativelysmall compared to the threshold . Threshold setting wasinvestigated as follows. We set the threshold to the bestprecision and we segmented a nonstandard posture sixtimes, each with a different value of varying from 1 to 6.The segmentation was carried out with the -based version ofthe approach. The results are depicted in Fig. 6 (row 3). Theobservation of the zoomed area around the right armpit, acrossthe different trials reveals a slight improvement in the accuracy,as increases until it reaches . Beyond that value itappears to stabilize.
Next, we applied the segmentation algorithm to a collectionof scans obtained from different sources, including real and syn-thetic data. Because of space constraints we show principally theresults related to nonstandard postures. Exhaustive results cor-responding to standard postures have been published in [18].
Fig. 7. Segmentation of HB scans acquired with the Cyberware scanner (1, 2,3) and Wicks & Wilson scanner (4, 5, 6).
Fig. 7 depicts images of the scanned persons, in a standard pos-ture taken during the scanning process and the correspondingsegmented scans. These scans were acquired with the Cybewarescanner (1, 2, 3) and the Wicks & Wilson scanner (4, 5, 6). Wecan observe that the scans are segmented with reasonable accu-racy. The scan 3 in Fig. 7 corresponds to that of a fully dressedperson. The corresponding surface presents many irregularitiescaused by wrinkles, in comparison to other scans which presentsmooth surfaces. Despite the surface irregularity, the segmen-tation result is reasonable and confirms that the algorithm cancope with ill-conditioned (non smooth) surfaces.
For nonstandard postures, validation experiments were per-formed using the second version of the algorithm, that involvesthe Morse function . A first series of tests were performedon HB scans, related to people in a seated posture, and col-lected from the CAESAR website [3]. The Results are depictedin Fig. 8(a). We can see that all the data sets are clearly seg-mented into five subsets corresponding to the arms, legs and thetorso, despite the sitting posture of the subjects and the varietyof body shapes. A second series of tests was conducted overseveral scans acquired from Wick & Wilson scanner [33], theresults are depicted in Fig. 8(b), which also shows images ofthe scanned persons. The results reveal reasonable segmenta-tions that produce correctly separated body parts.
Because of the current shortage of real scans of nonstandardpostures we had to resort to computer-simulated data sets in orderto examine additional postures. A first set of artificial postureswas obtainedas follows: We conformed a parameterizedHBtem-plate to a Cyberware HB scan and then animated the conformedmodel by varying the template parameters. Some instances fromthis set are shown after segmentation in Fig. 8(c). The results il-lustrate correct segmentation for all the samples. The second setwas obtained by generating 16 synthetic scan models in differentpostures using Poser software [35]. These data were obtained byrandomly sampling the animated mesh models, thus generatingscattered data point sets of similar properties to real scan data.The scans were extracted from four different models comprisinga man and a woman, in both dressed and undressed states. Thedressed models included the hair. Fig. 8(d) and (e) shows the 16scans and the segmentation results. We can see that all the datasets are clearly decomposed into the five principal parts for allthe different postures, illustrating the robustness of the algorithmwith respect to rigid transformation and deformation. Fig. 8(e)

WERGHI et al.: FUNCTIONAL-BASED SEGMENTATION OF HUMAN BODY SCANS 163
Fig. 8. (a) Segmented real scans corresponding to setting postures acquired withe the Cyberware scanner. (b) Segmented Wick & Wilson scans related tononstandard postures. (c) Segmentation results of an animated Cyberware scan. (d) and (e) Segmentation results of simulated scans corresponding respectively toscans of naked and dressed characters.
in particular, illustrates the robustness of the algorithm to falsebranches. Indeed, if we examine for instance, the head of thedressed woman, we can observe wrinkles and waves character-izing the hair surface. These features are likely to cause falsecritical nodes that consequently generate false branches. How-ever, our algorithm did not fail when applied to this data set. Alsowe can observe that fingers are not segmented separately, eventhough some of them appear to be partially detached from thehandandthereforedisposedtogenerate truebranches in theDRG.This is explained by the fact that the first criterion established inSection III-D1 states that a true branch must have a length abovea given threshold, which is set here to the size of smallest bodypart, namely the arm. Therefore branches inferred by body partssmaller than the arm, such as the fingers and the head will bediscarded by the algorithm.
A. Robustness With Respect to Data Deficiencies
It is also worth mentioning that these results were obtainedwith poorly scanned data as illustrated in Fig. 9(a), which shows
a zoomed area around the groin. The nonregular sampling ofthe data and the presence of gaps and holes are clearly visible.To further test the robustness of the segmentation algorithm, wecorrupted the data by creating large holes in a group of scans rep-resenting a variety of postures. The results presented in Fig. 9(b)and (c) reveal a consistent segmentation over all of the corruptedscans: all of these scans are properly decomposed into the fivebody parts, despite the presence of large gaps. These results con-firm that the algorithm is capable of discarding effectively theO-type critical nodes described in Section III-D1. In another ex-periment we corrupted the scan data by adding Gaussian noiseof different amplitudes to the data points. A representative setof the associated segmented scans are depicted in Fig. 10. Thesevalidation trials illustrate, therefore, the robustness of our ap-proach against noise disturbance and severe data deficiencies.
V. CONCLUSIONS
This paper presents a topological framework for the segmen-tation of HB scans. The framework extends the Reeb graph con-

164 IEEE TRANSACTIONS ON SYSTEMS, MAN, AND CYBERNETICS—PART B: CYBERNETICS, VOL. 36, NO. 1, FEBRUARY 2006
Fig. 9. (a) Zoomed image illustrating the distribution of the scan data. (b), (c)Segmented HB scans corrupted by large holes.
Fig. 10. Segmented HB scans corrupted with a Gaussian noise of differentamplitudes.
cept to unorganized clouds of data points by defining connec-tivity notions. Compared to work previously reported in th elit-erature describing on HB segmentation, our framework is dif-ferentiated by the following features: 1) it handles directly theraw scan data without the need of any preprocessing or pre-for-matting stages; 2) it involves only topology-based techniques;3) it can cope with arbitrary postures; 4) it offers different con-figurations in order to accommodate different categories of HBposture; and 5) no post-processing stage is required. With re-spect to other 3-D skeletonization frameworks, our approach isdistinguished by the following aspects: 1) intrinsic robustness,that allows it to cope with data deficiencies and severe corrup-tions; 2) an efficient implementation; and 3) it provides a so-lution to the problem of locating the source point, by using asource-point independent Morse function, although at the ex-pense of additional computational cost.
The scan sets used in the experiments were collected from dif-ferent sources and cover a rich variety of HB shapes and profilesincluding some severely damaged scans. The results confirm therobustness of the approach with respect to the diversity of scansources, diversity of the body shapes, rigid transformations, ir-regular distribution, and corruption of the scan data.
From a quantitative point of view, the experiments confirmthe reliability and the repeatability of the two algorithms. In the152 segmentation trials (58 are shown in this paper), the algo-
rithms always segment the scan into five connected and com-pact parts that respect the topology of the HB. Cases of severeunder-segmentation, over-segmentation, or cases where a seg-mented part contains disjoint subparts (e.g., from the arm andthe leg), never occurred.
While the results show overall reasonable segmentations, itwould appear to be difficult to achieve what would be considereda “perfect” segmentation to a human observer because of theill conditioned behavior of the level-sets at the junctions areas.In fact, we believe that to achieve human segmentation perfor-mance would require techniques that go beyond our middle-level processing approach. Nevertheless, the segmentation pro-vided by our approach could be used as a starting point for finerprocessing and analysis. One might also ask to what extent thejoint areas detected by our approach can be used to locate actualuseful body landmarks, which are used for instance in garmentsizing. While our approach is suitable for delimiting the localeof such landmarks, detecting their precise location may be lit-erally beyond the grasp of purely scan-based approaches, sincethese landmarks often correspond to bony points below the skin,which are usually detected and located by palpation. There issome hope that a 2-D/3-D approach to landmark detection basedon combining both 2-D image features and 3-D surface featuresused in conjunction with explicit statistical knowledge, as en-capsulated in an active appearance model, may provide a routeto a more complete analysis of the human form. To this end,we propose that the techniques presented here could provide auseful means of constraining the search space by providing aninitial annotation of the body.
Being based on topological analysis, our framework is intrin-sically not qualified to handle postures where limbs are joinedtogether, for example closed legs, or arms touching the torso.Dealing with such cases requires that the contours of discon-tinuities between joined parts of the body be detected and la-beled, using local surface analysis and differential geometrytechniques or explicit model fitting. The work developed in [12],for example, could perhaps afford an appropriate framework forhandling the above cases.
It is quite plausible that our framework can be extended todeal with other variety of 3-D shapes. The approach should in-tegrate mechanisms to accommodate with change of scale andshape. Some directions that can be explored are: 1) using mul-tiple source points for the Morse function , analyzing the re-sulting DRGs, and establishing criteria to reject those degen-erate graphs; and 2) a fast implementation of the function asit infers a stable DRG; in addition it can be adapted for a multi-scale segmentation approach, in the absence of any prior knowl-edge about the object size.
ACKNOWLEDGMENT
The authors would like to thank Cyberware and the Caeserproject, from which we obtained HB scans, and the EdinburghVirtual Environment Centre for providing access to their HBscanning facilities. Finally, they would like to thank the UKEngineering and Physical Sciences Research Council who sup-ported this work and also the reviewers for their constructivefeedback.

WERGHI et al.: FUNCTIONAL-BASED SEGMENTATION OF HUMAN BODY SCANS 165
REFERENCES
[1] P. R. M. Jones and M. Rioux, “Three dimensional surface anthropom-etry: Applications to human body,” Opt. Lasers Eng., vol. 28, no. 2, pp.89–17, 1997.
[2] E. Paquet, K. M. Robinette, and M. Rioux, “Management of three-di-mensional and anthropometric databases: Alexandria and Cleopatra,” J.Electron. Imag., vol. 9, pp. 421–431, 2000.
[3] The Civilian American and European Surface Anthropometry ResourceProject Website (2005). [Online]. Available: http://www.sae.org/techni-calcommittees/caesar.htm
[4] R. P. Pargas, N. J. Staples, and J. S. Davis, “Automatic measurementextraction for apparel from a three-dimensional body scan,” Opt. LasersEng., vol. 28, no. 2, pp. 157–172, 1997.
[5] D. Protopsaltou et al., “A body and garment creation method for aninternet-based virtual fitting room,” in Advances in Modeling, Anima-tion, and Rendering, J. Vince and R. Earnshaw, Eds. Berlin, Germany:Springer-Verlag., 2003, pp. 105–122.
[6] F. Cordier, H. Seo, and N. Magnenat-Thalmann, “Made-to-measuretechnologies for an online clothing store,” Comput. Graph. Applicat.,pp. 38–48, Jan.–Feb. 2003.
[7] J. Starck and A. Hilton, “Human shape estimation in a multi-camerastudio,” in Proc. British Machine Vision Conf., Manchester, U.K., 2001,pp. 573–583.
[8] J. Starck, G. Collins, R. Smith, A. Hilton, and J. Illingworth, “Animatedstatues,” J. Mach. Vis. Applicat., pp. 248–259, 2003.
[9] M. Lin, “Tracking articulated objects in real-time image sequence,” inProc. Int. Conf. Computer Vision, Corfu, Greece, 1999, pp. 648–653.
[10] D. L. Borges and R. B. Fisher, “Segmentation of 3-D articulated objectsby dynamic grouping of discontinuities,” in Proc. British Machine VisionConf., Surrey, U.K., 1993, pp. 279–287.
[11] D. Dion Jr., D. Laurendeau, and R. Bergevin, “Generalized cylindersextraction in a range image,” in Proc. IEEE. Int. Conf. Recent Advancesin 3-D Digital Imaging and Modeling, Ottawa, ON, Canada, 1997, pp.296–299.
[12] F. Ferrie, J. Lagarde, and P. Whaite, “Darboux frames, snakes and super-quadrics: Geometry from the bottom up,” IEEE Trans. Pattern Anal.Mach. Intell., vol. 15, no. 8, pp. 771–784, 1993.
[13] E. Trucco, “Inferring convex subparts from slice data,” Patt. Recognit.Lett., vol. 1, no. 12, pp. 707–715, 1991.
[14] M. Kass and D. Terzopoulos, “SNAKES: Active contour models,” Int.J. Comput. Vis., vol. 1, no. 4, pp. 321–332, 1988.
[15] J. H. Nurre, “Locating landmarks on human body scan data,” in Proc.IEEE Int. Conf. 3-D Digital Imaging and Modeling, Ottawa, ON,Canada, 1997, pp. 289–295.
[16] L. Dekker, I. Douros, B. F. Buxton, and P. Treleaven, “Building sym-bolic information for 3-D human body modeling from range data,” inProc. IEEE Int. Conf. 3-D Digital Imaging and Modeling, Ottawa, ON,Canada, 1999, pp. 388–397.
[17] C. L. Wang, T. K. Chang, and M. Yuen, “From laser-scanned to featurehuman model: A system based on fuzzy logic concepet,” Comput.-AidedDes., vol. 35, no. 3, pp. 241–253, 2003.
[18] Y. Xiao, P. Siebert, and N. Werghi, “A discrete reeb graph for the seg-memtation of human body scans,” in Proc. IEEE Int. Conf. 3-D DigitalImaging and Modeling, Alberta, Canada, 2003, pp. 378–385.
[19] S. Biasotti, B. Falcidieno, and M. Spagnuolo, “Extended reeb graphsfor surface understanding and classification,” in Proc. Int. Conf. Dis-crete Geometry for Computer Imagery, Uppsala, Sweden, Dec. 2000,pp. 185–197.
[20] G. Reeb, “Sur les points singuliers d’une forme de Pfaff completementintegrable ou d’une fonction numrique,” Comptes Rendus Acad. Sci-ences Paris, vol. 222, pp. 847–849, 1946.
[21] M. Hilaga, Y. Shinagawa, T. Kohmura, and T. Kunii, “Topologymatching for fully automatic similarity estimation of 3-D shape,” inProc. SIGGRAPH 2001, New York, 2001, pp. 203–212.
[22] C. Tai, Y. Shinagawa, and T. Kunii, “A Reeb graph-based representationfor nonsequential construction of topologically valid shapes,” Comput.& Graph., vol. 22, no. 2, pp. 255–268, 1998.
[23] J. C. Hart, “Morse theory for implicit surface modeling,” in Mathemat-ical Visulaization, H. C. Edge and K. Plothier, Eds. Heidelberg, Ger-many: Springer-Verlag, 1998, pp. 257–268.
[24] Y. Shinagawa, T. L. Kunii, and Y. L. Kergosien, “Surface coding basedon morse theory,” IEEE Trans. Comput. Graph. Applicat., vol. 11, no. 5,pp. 66–78, 1991.
[25] S. Biasotti, M. Mortara, and M. Spagnuolo, “Surface compression andreconstruction using Reeb graphs and shape analysis,” in Proc. SpringConf. Computer Graphics, Bratislava, Slovakia, 2000, pp. 175–184.
[26] I. Fujishiro, T. Azuma, and Y. Takeshima, “Automating transfer func-tion design for comprehensible volume rendering based on 3-D fieldtopology analysis,” in Proc. IEEE Conf. Visualization, San Francisco,CA, 1999, pp. 467–470.
[27] M. van Kreveld, R. van Oostrum, C. Bajaj, V. Pascucci, and D. Schikore,“Contour trees and small seed sets for isosurface traversal,” in Proc.Symp. Computational Geometry, Nice, France, 1997, pp. 212–220.
[28] M. Mortara and G. Patané, “Affine-invariant skeleton of 3-D-shapes,” inProc. Int. Conf. Shape Modeling and Applications, Banff, AB, Canada,2002, pp. 245–252.
[29] A. Verroust and F. Lazarus, “Extracting skeletal curves from 3-D scat-tered data,” Vis. Comput., vol. 16, no. 1, pp. 15–25, 2000.
[30] T. H. Cormen, C. E. Leiserson, and R. L. Rivest, Introduction to Algo-rithms. New York: McGraw-Hill, 1990.
[31] J. S. B. Mitchell, D. M. Mount, and C. H. Paradimitriou, “The discretegeodesic problem,” SIAM J. Comput., vol. 16, no. 4, pp. 647–668, 1987.
[32] Cyberware Website (2005). [Online]. Available: http:www.cyber-ware.com
[33] Wicks and Wilson Website (2005). [Online]. Available:http://www.wwl.co.uk/wwl2/index.html
[34] Edinburgh Virtual Reality Center Website (2005). [Online]. Available:http://www.edvec.ed.ac.uk
[35] Poser Website (2005). [Online]. Available: http://www.curiouslabs.com
Naoufel Werghi (M’97) received the Ph.D. degree incomputer vision from the University of Strasbourg,Strasbourg, France, in 1996, and the M.Sc. degree ininstrumentation and control for computer vision fromthe University of Rouen, Rouen, France, in 1993.
He has been a Research Fellow at the Divisionof Informatics, University of Edinburgh, Edinburgh,U.K., and a Lecturer at the Department of ComputerSciences, University of Glasgow, Glasgow, U.K. Hehas also been a Visiting Professor at the Departmentof Computer and Electrical Engineering, University
of Louisville, Louisville, KY. Currently, he is an Assistant Professor at theCollege of Information Technology, Dubai University College, UAE. Hisresearch interests are in the areas of computer vision and computer graphics, inparticular 2-D/3-D image processing, 3-D shape analysis and modeling.
Yijun Xiao is currently a Research Assistant inthe Department of Computing Science, Universityof Glasgow, Glasgow, U.K. His research interestsare in the areas of computer vision, graphics,and image analysis, with particular focus on 3-D.He has authored or co-authored 14 internationaljournal/conference papers.
Dr. Xiao is a member of the British ComputingSociety.
Jan Paul Siebert (M’01) received the B.Sc. andPh.D. degrees from the Department of Electronicsand Electrical Engineering, University of Glasgow,Glasgow, U.K., in 1979 and 1985, respectively.
He is currently a Senior Research Fellow in theDepartment of Computing Science, University ofGlasgow, and the Group Leader for the ComputerVision and Graphics Laboratory. From 1991 to1997, he was with the Turing Institute, Glasgow,developing photogrammetry-based 3-D imagingsystems for clinical applications, and served as Chief
Executive since 1994. Prior to this, he was a Scientist at BBN Laboratories,Edinburgh, U.K., from 1988 to 1991. His research interests include 3-Dimaging systems and tools for human and animal surface anatomy assessment,and also robot vision systems based on biologically motivated principles. Hehas co-authored more than 60 international journal and conference papers inthese areas.