An Entropy Based Multi-Thresholding Method for Semi-Automatic Segmentation of Liver Tumors
12
An Entropy Based Multi-Thresholding Method for Semi-Automatic Segmentation of Liver Tumors Anirudh Choudhary 1 , Nicola Moretto 2 , Francesca Pizzorni Ferrarese 2 , and Giulia A. Zamboni 3 1 Department of Electrical Engineering, Indian Institute of Technology Kharagpur, India 2 Altair Lab, Department of Computer Science, University of Verona, Italy [email protected] 3 Department of Radiology, University of Verona, Italy Abstract. Liver cancer is the fifth most commonly diagnosed cancer and the third most common cause of death from cancer worldwide; more- over the liver is the second most commonly involved organ by metastatic disease. A precise analysis of the lesions would help in the staging of the tumor and in the evaluation of the possible applicable therapies. In this paper we present the workflow developed for the semi-automatic segmentation of liver tumors in the data sets provided for the MICCAI Liver Tumor Segmentation contest. Since we wanted to develop a system that could be as automatic as possible and to follow the segmentation process in every single step starting from the image loading to the lesion extraction, we decided to subdivide the workflow in two main steps: first we focus on the liver segmentation and once we have extracted the organ structure we segment the lesions applying an adaptive multi-thresholding system. 1 Introduction In 2008, an estimated 21,370 adults (15,190 men and 6,180 women) in the United States will be diagnosed with primary liver cancer, with 18,410 estimated deaths (12,570 men and 5,840 women) from the disease. Liver cancer is the fifth most common cause of cancer death among men, and ninth most common cause of cancer death among women [1]. The five-year relative survival rate of patients with liver cancer is 11%. Unlike many other forms of cancer, incidence and mor- tality for liver cancer are increasing. Liver cancer is more common in developing countries within Africa and East Asia: in some countries, it is the most common cancer type and it is predicted that for 2030 it will enter the top 20 causes of death [2]. Moreover, the liver is the second most commonly involved organ by metastatic disease, after the lymph nodes: in Europe and the United States, a focal liver lesion is more likely to represent a metastatic deposit than a primary malignancy. The true prevalence of metastatic liver disease is unknown because most figures are based on autopsy series that reflect the end stage of a disease
-
Upload
royalholloway -
Category
Documents
-
view
4 -
download
0
Transcript of An Entropy Based Multi-Thresholding Method for Semi-Automatic Segmentation of Liver Tumors

An Entropy Based Multi-Thresholding Method
for Semi-Automatic Segmentation of Liver
Tumors
Anirudh Choudhary1, Nicola Moretto2, Francesca Pizzorni Ferrarese2, andGiulia A. Zamboni3
1 Department of Electrical Engineering,Indian Institute of Technology Kharagpur, India
2 Altair Lab, Department of Computer Science, University of Verona, [email protected]
3 Department of Radiology, University of Verona, Italy
Abstract. Liver cancer is the fifth most commonly diagnosed cancerand the third most common cause of death from cancer worldwide; more-over the liver is the second most commonly involved organ by metastaticdisease. A precise analysis of the lesions would help in the staging ofthe tumor and in the evaluation of the possible applicable therapies. Inthis paper we present the workflow developed for the semi-automaticsegmentation of liver tumors in the data sets provided for the MICCAILiver Tumor Segmentation contest. Since we wanted to develop a systemthat could be as automatic as possible and to follow the segmentationprocess in every single step starting from the image loading to the lesionextraction, we decided to subdivide the workflow in two main steps: firstwe focus on the liver segmentation and once we have extracted the organstructure we segment the lesions applying an adaptive multi-thresholdingsystem.
1 Introduction
In 2008, an estimated 21,370 adults (15,190 men and 6,180 women) in the UnitedStates will be diagnosed with primary liver cancer, with 18,410 estimated deaths(12,570 men and 5,840 women) from the disease. Liver cancer is the fifth mostcommon cause of cancer death among men, and ninth most common cause ofcancer death among women [1]. The five-year relative survival rate of patientswith liver cancer is 11%. Unlike many other forms of cancer, incidence and mor-tality for liver cancer are increasing. Liver cancer is more common in developingcountries within Africa and East Asia: in some countries, it is the most commoncancer type and it is predicted that for 2030 it will enter the top 20 causes ofdeath [2]. Moreover, the liver is the second most commonly involved organ bymetastatic disease, after the lymph nodes: in Europe and the United States, afocal liver lesion is more likely to represent a metastatic deposit than a primarymalignancy. The true prevalence of metastatic liver disease is unknown becausemost figures are based on autopsy series that reflect the end stage of a disease

2 An Entropy Based Multi-Thresholding Method for Tumor Segmentation
process. However, depending on the site of the primary tumor 30-70% of patientsdying of cancer have liver metastases.
Prognosis for liver cancer is poor, and incidence and mortality patterns arevery similar. In order to improve the curability of liver cancer, early detectionand accurate staging are critical. Staging, commonly performed with CT, meansdescribing the tumor features, such as site, local and distant spread, and involve-ment of other organs in the body. Knowing the stage helps the physician decidewhat type of treatment is best suited and can help predict a patient’s prognosis.Moreover a proper estimation of the tumor size is useful for several applicationssuch as evaluating the effect of therapies on tumor and changing the treatmentplans. Although the largest tumor diameter is widely used as an indication ofthe lesion size, because of 3D shape of the tumor it may not reflect a properassessment of this tumor attributes [3]. The tumor volume, on the other hand,suggests an appropriate representation of the tumor size.
One method for estimating the tumor volume is to use segmentation algo-rithms. Although many research groups have developed different approaches forliver segmentation and volume construction in the last few years, only few haveproposed systems for the segmentation of the hepatic lesions. Seo and Chung[4] have developed a method that involves the segmentation and binarizationof the liver, the creation of the image based bounding box and the segmenta-tion of the convex deficiencies. Large convex deficiencies are selected by pixelarea estimation, they are then transformed to gray-level deficiencies and finallythe boundary tumor is selected by evaluating their variance. As stated by theauthors, this approach is only applicable to homogeneous boundary tumors. Be-sides Seo in [5] worked up the previous approach to segment all the hepaticlesions: after the segmentation of the liver, the optimal threshold is calculatedby composite hypotheses and minimum total probability error. Finally, hepatictumors are segmented using the optimal threshold value. Promising results areshown, even if the approach produce diverse false positives, especially for smalltumors. Massoptier and Casciaro [6] first segment the liver by adopting a statis-tical model-based approach and then apply a wavelet analysis for classifying thetumors. The method proposed reaches good results in terms of sensitivity andspecificity, even if it does not take into account lesions that show pixel intensityvalues similar to the vessels. In fact primary and secondary liver tumors showdifferent attenuation values in the different contrast-enhancement phases, there-fore their conspicuousness to the normal liver will change according to the phasethat is analyzed. Most primary liver tumors and many secondary tumors arehyperdense to the normal liver parenchyma (i.e. hypervascular) in the arterialphase, whereas nearly all malignant lesions (both primary and secondary) arehypodense in the portal and in the delayed phase.
In this work we present an innovative semi-automatic liver tumor segmenta-tion technique. In our method, the liver contours are first extracted using thewatershed algorithm, tumors are then segmented using a minimum cross-entropymulti-thresholding algorithm. The tumor segmentation is further refined with re-gion growing and level-set based surface smoothing methods.

An Entropy Based Multi-Thresholding Method for Tumor Segmentation 3
Fig. 1. Segmentation of the ribs
2 Materials and Methods
To develop a system that could be as automatic as possible, we decided toproceed sequentially starting from the liver segmentation followed by the lesionsdetection. Our workflow is mainly divided into 2 steps:
– Segmentation of the liver using ribs and diaphragm constraints.– Segmentation of the tumors from the segmented liver using multi-thresholding
approach.
2.1 Segmentation of the Liver
Segmentation of the ribs With a simple thresholding method we extractthe bones, then we subdivide the skeleton in three parts from the axial viewand take into account only the first third on the left side, in order to consideronly those parts of the ribs that surround the liver. In Fig. 1 the extractionand volumetric reconstruction of the ribs are shown. After obtaining the ribsdata from different slices we interpolate them slice by slice using Cubic-Hermiteshape preserving interpolation and we use the obtained curves as constrains forthe liver segmentation.
Segmentation of the diaphragm One of the main problems in liver seg-mentation consists in the liver’s close proximity to the heart: these two tissuesshow almost the same density values and using region based methods usuallyresults in the heart being classified as part of the liver. To try to automate ouralgorithm as much as possible, we implemented a procedure to identify the di-aphragm so that it could be used to constrain the region where the algorithmlooks for the liver. This idea has already been used in [7], but our approach iscomputationally more efficient. We have defined this approach since our focusis not in segmenting the liver accurately but in finding the region where it islocated, which will then be used as starting point for our tumor segmentationmodule. After the automatic segmentation of the lungs using a region growing

4 An Entropy Based Multi-Thresholding Method for Tumor Segmentation
approach, we can then construct a map of the diaphragm considering the lowersurfaces of the lungs. To refine the results, we interpolate the lungs lower sur-faces to make them closed together by simply connecting them slice-by-slice inthe coronal plane (see Fig. 2 ).
Fig. 2. Representation of a section of the lungs surface seen in the coronal plane
At the end we obtain a good approximation of the entire diaphragm domethat is used as a constrain in the next processing step, since all the voxels abovethe obtained surface are set to 0 (in Fig. 3 these parts are highlighted in blue).
Fig. 3. Diaphragm dome approximation

An Entropy Based Multi-Thresholding Method for Tumor Segmentation 5
Extraction of liver contours Since the focus of our work consists in theextraction of hepatic lesions, we only need to consider approximate liver bound-aries. In our approach, first of all, we require that the user identify a slice wherethe liver appears as the biggest organ or, in cases where it is not possible (i.e.when there are very large tumors), he/she selects a point inside the organ, butnot on the tumor. With this initialization, the algorithm, as described in Fig. 4,starts. The algorithm computes the gradient magnitude of the image and thenit processes the results to highlight boundaries and normalize image intensities.
Fig. 4. Flowchart of liver segmentation technique
We apply the watershed segmentation algorithm, introduced by Vincent andSoille in [8], and, if the user has previously identified a point inside the liver,we consider the class containing that point as the one representing the liver.Otherwise, classes are ordered by their area and we consider the first one havingmean and variance values (computed using original image values) compatiblewith that of the liver.
Given this first slice of the liver, we estimate its mean (µ̄) and variance(σ̄), so as to calibrate our system on the specific dataset being studied, and thesystem starts a sequence of post-processing tasks in order to obtain a mask to beused in subsequent steps. This post-processing includes level-set smoothing anddilation of the region. The resulting region of interest (ROI) is then used in thecontiguous slices as a binary mask such that, after the magnitude gradient andthe watershed have been computed, only classes inside that mask are considered.For each class i, mean (µi) and variance (σi) are estimated and if the conditionsin (1) are satisfied, the class is considered as part of the liver.
‖µi − µ̄‖ <3
2µ̄ and |σi − σ̄| ≤ σ̄/2 (1)

6 An Entropy Based Multi-Thresholding Method for Tumor Segmentation
In (1) we compare both the mean value and the variance, since in the prox-imity of the liver there could be many structures whose mean values are closeto the one of the liver, but the texture may differ. Hence, comparing the σ givesus a hint to distinguish them. This process is repeated for each slice in bothdirections and ends when the area of the liver becomes too small (i.e. below 25pixels for standard images with resolution 512x512). At the end, using all theslices a 3D model of the liver is obtained. In Fig. 5 all the aforementioned stepsare shown for the liver in dataset 5.
(a) (b)
(c) (d)
Fig. 5. Watershed segmentation steps on dataset 5: (a) original image (slice 140), (b)gradient image, (c) result of the watershed segmentation and (d) computed liver mask
2.2 Segmentation of the Tumors
Using the liver data obtained, a Haar Wavelet based de-noising algorithm is usedfor removing the noise from the liver images. Then a minimum cross-entropymulti-thresholding algorithm segments out the tumors. In order to smoothenthe final results the system applies morphological closing and 3D level sets to
An Entropy Based Multi-Thresholding Method for Tumor Segmentation 7
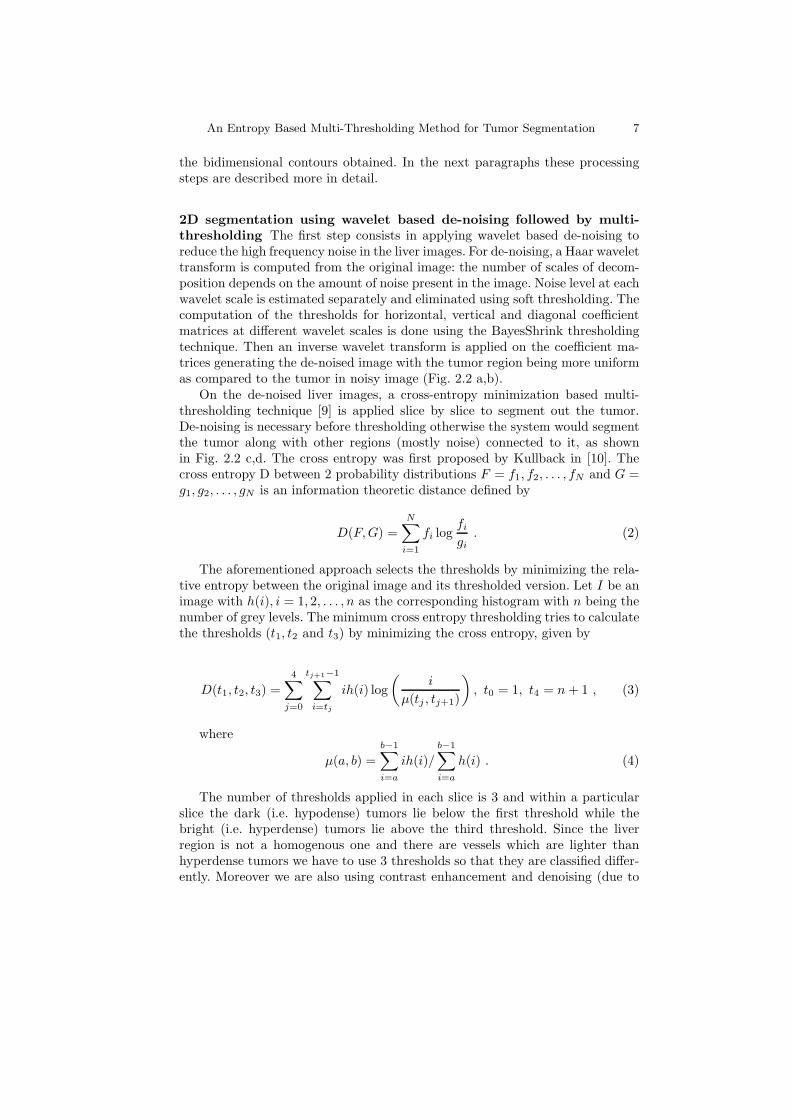
the bidimensional contours obtained. In the next paragraphs these processingsteps are described more in detail.
2D segmentation using wavelet based de-noising followed by multi-
thresholding The first step consists in applying wavelet based de-noising toreduce the high frequency noise in the liver images. For de-noising, a Haar wavelettransform is computed from the original image: the number of scales of decom-position depends on the amount of noise present in the image. Noise level at eachwavelet scale is estimated separately and eliminated using soft thresholding. Thecomputation of the thresholds for horizontal, vertical and diagonal coefficientmatrices at different wavelet scales is done using the BayesShrink thresholdingtechnique. Then an inverse wavelet transform is applied on the coefficient ma-trices generating the de-noised image with the tumor region being more uniformas compared to the tumor in noisy image (Fig. 2.2 a,b).
On the de-noised liver images, a cross-entropy minimization based multi-thresholding technique [9] is applied slice by slice to segment out the tumor.De-noising is necessary before thresholding otherwise the system would segmentthe tumor along with other regions (mostly noise) connected to it, as shownin Fig. 2.2 c,d. The cross entropy was first proposed by Kullback in [10]. Thecross entropy D between 2 probability distributions F = f1, f2, . . . , fN and G =g1, g2, . . . , gN is an information theoretic distance defined by
D(F, G) =N
∑
i=1
fi logfi
gi
. (2)
The aforementioned approach selects the thresholds by minimizing the rela-tive entropy between the original image and its thresholded version. Let I be animage with h(i), i = 1, 2, . . . , n as the corresponding histogram with n being thenumber of grey levels. The minimum cross entropy thresholding tries to calculatethe thresholds (t1, t2 and t3) by minimizing the cross entropy, given by
D(t1, t2, t3) =
4∑
j=0
tj+1−1∑
i=tj
ih(i) log
(
i
µ(tj , tj+1)
)
, t0 = 1, t4 = n + 1 , (3)
where
µ(a, b) =
b−1∑
i=a
ih(i)/
b−1∑
i=a
h(i) . (4)
The number of thresholds applied in each slice is 3 and within a particularslice the dark (i.e. hypodense) tumors lie below the first threshold while thebright (i.e. hyperdense) tumors lie above the third threshold. Since the liverregion is not a homogenous one and there are vessels which are lighter thanhyperdense tumors we have to use 3 thresholds so that they are classified differ-ently. Moreover we are also using contrast enhancement and denoising (due to

8 An Entropy Based Multi-Thresholding Method for Tumor Segmentation
which the gray levels of the pixels at the boundary of the liver change) and hencethe histogram is spread over larger gray levels and we require 3 thresholds forfinding the exact tumors. While moving from a normal liver slice to a slice thatcontains the tumor, there is a sufficient amount of shift in the first threshold butwhile moving among slices containing the tumor, the first threshold value almostremains the same. This criterion is used for differentiating the pathological slicesfrom the normal ones and estimating a global threshold below which the tumorsin these slices lie. The bright tumors are always segmented as white regions lyingabove the third threshold. The 3D regions obtained after thresholding consti-tute the dark and the bright tumors as well as other tissues having the intensitysimilar to the tumors.
(a) (b)
(c) (d)
Fig. 6. (a) Original image, (b) de-noised image, (c) thresholding applied on the originalimage and (d) thresholding applied on the de-noised image
Segmentation refinement of the thresholded tumors For each segmented3D region, mean (µ) and variance (σ) are computed. A 3D neighbourhood con-nected region growing is then initiated from the centre of that region taking thelower threshold limit as (µ−6σ) and upper threshold limit as (µ+2σ). Since thetumor regions are not homogenous and there are some darker regions somewherewithin the tumors (whose volume is very little and hence the mean of the tumorintensity lies a bit higher than these values) so we take the lower threshold limit

An Entropy Based Multi-Thresholding Method for Tumor Segmentation 9
as µ− 6σ so that we can include those darker regions as well. There is no harmin extending the lower limit because the liver is normally lighter than the hy-podense tumors. It would only help in including darker regions within tumors,which would otherwise be classified as holes. Note that for region growing weare not using the denoised image but the original one. This method refines theboundary of all the regions segmented and also segments the complete tumor inthose datasets in which the liver region excludes the lesion. The next step is toeliminate the noise attached to the segmented regions using slice connectivitycriteria. Starting from the first slice of each region, we correct the segmentationerror by eliminating the artefacts attached to the regions using the fact thatthe contours in adjacent slices must be similar. While moving among slices weexpand and smoothen the boundary of the region in the current slice using 2Dlevel sets and considering only that part of the region in the next slice whichlies within this boundary. The bi-dimensional region contours obtained are sub-jected to morphological dilation and closing to fill the holes and obtain smoother2D contours. After this step we obtain different 3D structures that have to beclassified in order to distinguish between tumors and other elements, e.g. ves-sels or non-filtered noise. Therefore the system applies shape constraints. Foreach structure, a singular value decomposition is estimated and the eigenvalues{λi}i=1..3 obtained are analyzed applying the following rules:
– if the λs have almost the same values, the structure is spherical. Evaluateits mean intensity value: if it is lower than the average pixel intensity of theliver, classify it as a tumor;
– if two λs are very big with respect to the third one, then let it unclassified;– if one λ has a very large value compared to the other two and the intensity
value is higher than the average pixel intensity of the liver, classify it as avessel;
– leave all the other regions as unclassified.
To further improve on smoothness, 3D Min/Max flow is applied to the segmentedtumor [11]. Examples of the smooth surface of the tumor after applying Min/Maxflow are demonstrated in Fig. 7.
Fig. 7. Results of the 3D level set smoothening step on tumor L2 of dataset 7

10 An Entropy Based Multi-Thresholding Method for Tumor Segmentation
3 Results
Table 1. Results of the comparison metrics and scores for all ten tumors
Overlap Error Volume Diff. Avg. Surf. Dist. RMS Surf. Dist. Max. Surf. Dist.Tumor (%) Score (%) Score (mm) Score (mm) Score (mm) Score Tot.IMG05 L1 35.10 73 19.69 80 2.74 31 3.79 47 12.87 68 60IMG05 L2 29.68 77 25.65 73 1.00 75 1.41 80 6.03 85 78IMG05 L3 43.66 66 35.66 63 1.86 53 2.63 63 7.68 81 65IMG06 L1 30.34 77 9.52 90 0.77 81 1.03 86 4.23 89 84IMG06 L2 35.27 73 28.10 71 0.77 80 1.09 85 5.21 87 79IMG07 L1 23.88 82 2.87 97 3.07 23 4.27 40 18.69 53 59IMG07 L2 30.47 76 5.88 94 1.56 60 2.10 71 9.10 77 76IMG08 L1 17.85 86 11.61 88 1.99 50 2.76 61 11.72 71 71IMG09 L1 45.65 65 78.18 19 2.11 47 2.60 64 9.74 76 54IMG10 L1 29.53 77 8.61 91 1.78 55 2.27 68 7.64 81 75Average 32.14 75 22.58 77 1.77 56 2.40 67 9.29 77 70
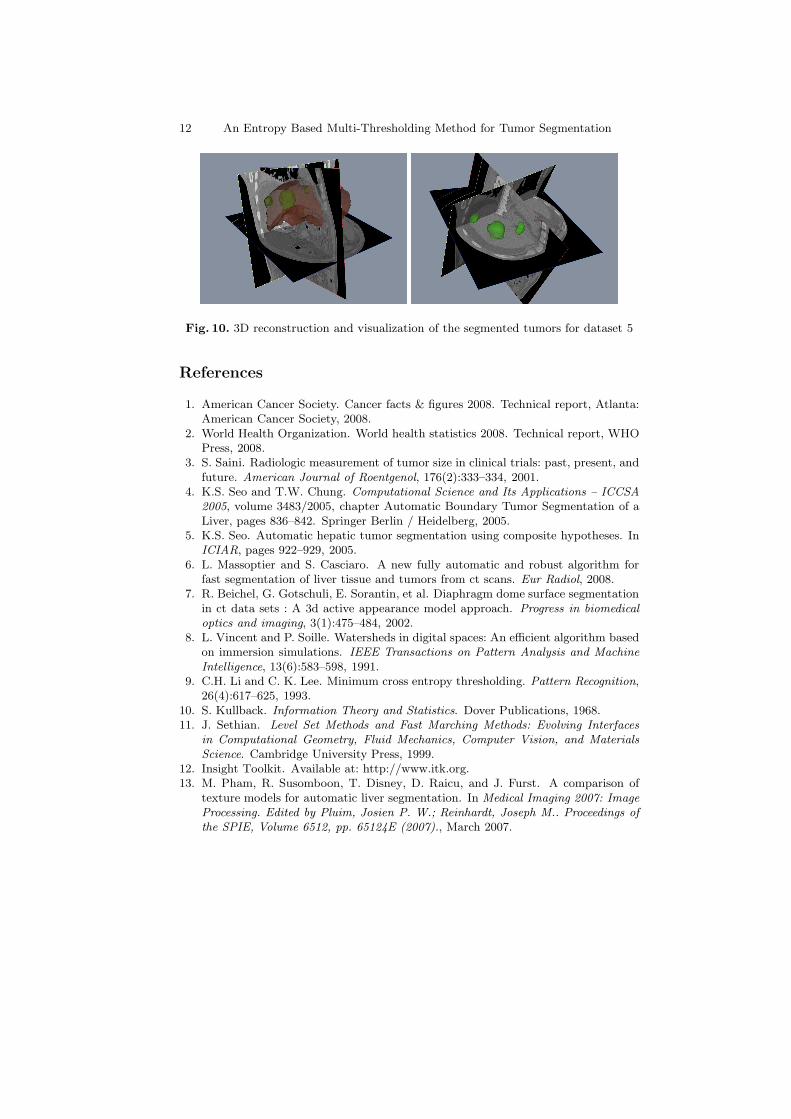
Our method has been applied to 10 CT datasets of oncological patients.Some functions are implemented using the Insight Toolkit [12]. For the gradientmagnitude filter, σ value of 1.7 was found to work perfectly for all the cases.For the watershed segmentation, the level and threshold parameters dependedon the protocol used to acquire the data. A higher threshold value resulted ina smooth liver boundary but it also led to the disappearance of weaker edgesbetween the liver and the nearby organs in images with poor resolution. A lowerlevel value resulted in oversegmentation of the liver because of the high amountof noise present inside the organ. However, for most of the cases the optimalthreshold value for watershed segmentation was determined to be 0.1 after con-trast enhancement of the gradient magnitude image. For de-noising the numberof decomposition levels was either 2 or 3 depending on the extent of noise presentin the image and the non-homogeneity of the tumor regions (e.g. for dataset 5this value was set to 3 and for dataset 6 it was set to 2). The system evalu-ates the segmentation accuracy by comparing the segmentation results with themanual segmentation done by experienced radiologists. This system has beensuccessfully applied to the data sets provided for the contest, with a final scoreof 70. As evident from the Table 1, the accuracy was greater in case of uniformand smaller tumors while for bigger one the accuracy was lower mainly due togreater non-uniformity in their intensities. There were some problems with thewatershed segmentation of the liver in datasets in which the tumor occupied amajor part of the organ, like dataset 10 (Fig. 8) and hence the tumor was left out.But since we have some slices of the liver containing the lesion, so by initiating3D region growing from any of these tumor slices obtained after thresholding,we can segment out the complete tumor from the dataset. Therefore, we decidedto apply 3D region growing as a post processing step to refine the segmentationof the tumor in all datasets. In Fig. 9 the final results of the complete workflowis shown and in Fig. 10 the 3D models obtained are visualized.

An Entropy Based Multi-Thresholding Method for Tumor Segmentation 11
Fig. 8. Results of the watershed segmentation in dataset 10
Fig. 9. Final results of the complete workflow for dataset 7: the liver is segmented(blue line) and the lesions are highlighted (blue regions)
4 Discussion and Future Work
In this work we have developed a complete workflow aimed at the semi-automaticsegmentation of hepatic lesions. After the extraction of the organ boundariesby applying watershed segmentation, the system extracts both the dark andbright tumors using minimum cross entropy multi-thresholding. Since traditionalmulti-thresholding techniques could be computationally expensive, we want tooptimize our system using genetic algorithms. A more precise method that weare also studying consists in using textures modeling to better discriminate liverfrom other organs, as in [13]. Furthermore, we are currently investigating thepossible application of our approach to other abdominal structures, such as thepancreas.
5 Acknowledgments
The work described in this paper has been funded by the European Commission’sSixth Framework Programme under contract no. 045201 as part of the SpecificTargeted Research Project AccuRobAs (Accurate Robotic Assistant).
12 An Entropy Based Multi-Thresholding Method for Tumor Segmentation
Fig. 10. 3D reconstruction and visualization of the segmented tumors for dataset 5
References
1. American Cancer Society. Cancer facts & figures 2008. Technical report, Atlanta:American Cancer Society, 2008.
2. World Health Organization. World health statistics 2008. Technical report, WHOPress, 2008.
3. S. Saini. Radiologic measurement of tumor size in clinical trials: past, present, andfuture. American Journal of Roentgenol, 176(2):333–334, 2001.
4. K.S. Seo and T.W. Chung. Computational Science and Its Applications – ICCSA2005, volume 3483/2005, chapter Automatic Boundary Tumor Segmentation of aLiver, pages 836–842. Springer Berlin / Heidelberg, 2005.
5. K.S. Seo. Automatic hepatic tumor segmentation using composite hypotheses. InICIAR, pages 922–929, 2005.
6. L. Massoptier and S. Casciaro. A new fully automatic and robust algorithm forfast segmentation of liver tissue and tumors from ct scans. Eur Radiol, 2008.
7. R. Beichel, G. Gotschuli, E. Sorantin, et al. Diaphragm dome surface segmentationin ct data sets : A 3d active appearance model approach. Progress in biomedicaloptics and imaging, 3(1):475–484, 2002.
8. L. Vincent and P. Soille. Watersheds in digital spaces: An efficient algorithm basedon immersion simulations. IEEE Transactions on Pattern Analysis and MachineIntelligence, 13(6):583–598, 1991.
9. C.H. Li and C. K. Lee. Minimum cross entropy thresholding. Pattern Recognition,26(4):617–625, 1993.
10. S. Kullback. Information Theory and Statistics. Dover Publications, 1968.11. J. Sethian. Level Set Methods and Fast Marching Methods: Evolving Interfaces
in Computational Geometry, Fluid Mechanics, Computer Vision, and MaterialsScience. Cambridge University Press, 1999.
12. Insight Toolkit. Available at: http://www.itk.org.13. M. Pham, R. Susomboon, T. Disney, D. Raicu, and J. Furst. A comparison of
texture models for automatic liver segmentation. In Medical Imaging 2007: ImageProcessing. Edited by Pluim, Josien P. W.; Reinhardt, Joseph M.. Proceedings ofthe SPIE, Volume 6512, pp. 65124E (2007)., March 2007.