A Concentrated Course in - Traditional Harmony - Petrucci ...
Upload
guadalajaraCategory
view
1download
0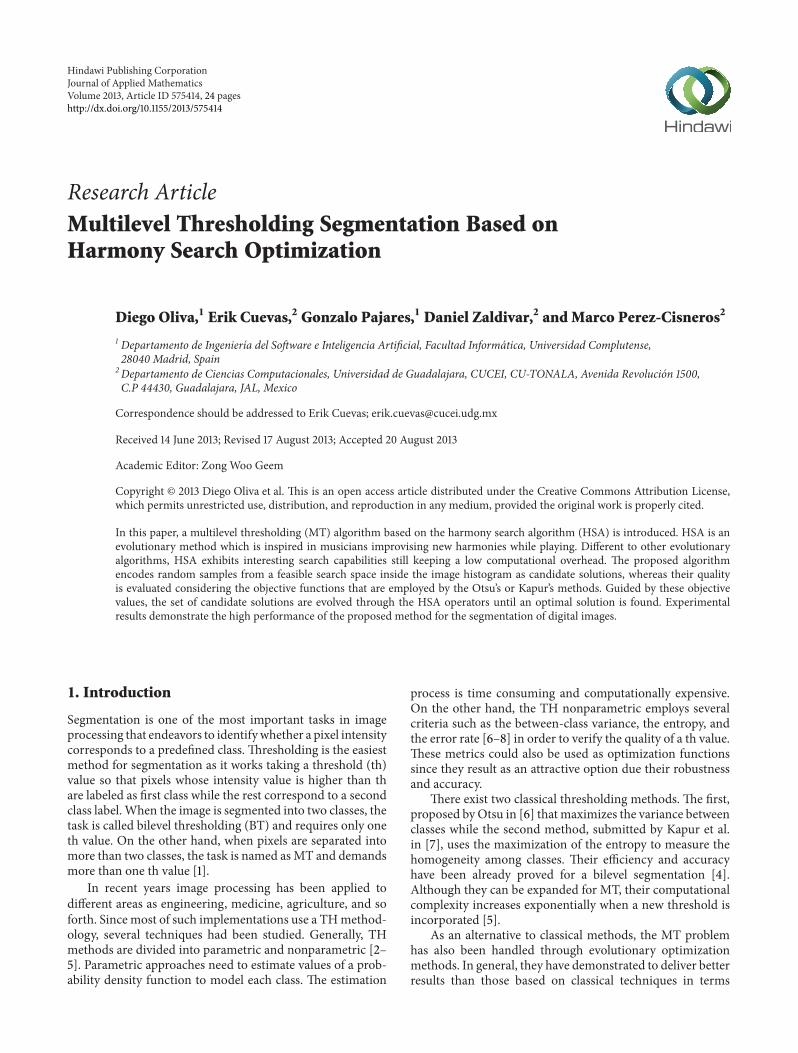
Hindawi Publishing CorporationJournal of Applied MathematicsVolume 2013 Article ID 575414 24 pageshttpdxdoiorg1011552013575414
Research ArticleMultilevel Thresholding Segmentation Based onHarmony Search Optimization
Diego Oliva1 Erik Cuevas2 Gonzalo Pajares1 Daniel Zaldivar2 and Marco Perez-Cisneros2
1 Departamento de Ingenierıa del Software e Inteligencia Artificial Facultad Informatica Universidad Complutense28040 Madrid Spain
2Departamento de Ciencias Computacionales Universidad de Guadalajara CUCEI CU-TONALA Avenida Revolucion 1500CP 44430 Guadalajara JAL Mexico
Correspondence should be addressed to Erik Cuevas erikcuevascuceiudgmx
Received 14 June 2013 Revised 17 August 2013 Accepted 20 August 2013
Academic Editor Zong Woo Geem
Copyright copy 2013 Diego Oliva et al This is an open access article distributed under the Creative Commons Attribution Licensewhich permits unrestricted use distribution and reproduction in any medium provided the original work is properly cited
In this paper a multilevel thresholding (MT) algorithm based on the harmony search algorithm (HSA) is introduced HSA is anevolutionary method which is inspired in musicians improvising new harmonies while playing Different to other evolutionaryalgorithms HSA exhibits interesting search capabilities still keeping a low computational overhead The proposed algorithmencodes random samples from a feasible search space inside the image histogram as candidate solutions whereas their qualityis evaluated considering the objective functions that are employed by the Otsursquos or Kapurrsquos methods Guided by these objectivevalues the set of candidate solutions are evolved through the HSA operators until an optimal solution is found Experimentalresults demonstrate the high performance of the proposed method for the segmentation of digital images
1 Introduction
Segmentation is one of the most important tasks in imageprocessing that endeavors to identifywhether a pixel intensitycorresponds to a predefined class Thresholding is the easiestmethod for segmentation as it works taking a threshold (th)value so that pixels whose intensity value is higher than thare labeled as first class while the rest correspond to a secondclass labelWhen the image is segmented into two classes thetask is called bilevel thresholding (BT) and requires only oneth value On the other hand when pixels are separated intomore than two classes the task is named asMT and demandsmore than one th value [1]
In recent years image processing has been applied todifferent areas as engineering medicine agriculture and soforth Since most of such implementations use a THmethod-ology several techniques had been studied Generally THmethods are divided into parametric and nonparametric [2ndash5] Parametric approaches need to estimate values of a prob-ability density function to model each class The estimation
process is time consuming and computationally expensiveOn the other hand the TH nonparametric employs severalcriteria such as the between-class variance the entropy andthe error rate [6ndash8] in order to verify the quality of a th valueThese metrics could also be used as optimization functionssince they result as an attractive option due their robustnessand accuracy
There exist two classical thresholding methods The firstproposed byOtsu in [6] that maximizes the variance betweenclasses while the second method submitted by Kapur et alin [7] uses the maximization of the entropy to measure thehomogeneity among classes Their efficiency and accuracyhave been already proved for a bilevel segmentation [4]Although they can be expanded for MT their computationalcomplexity increases exponentially when a new threshold isincorporated [5]
As an alternative to classical methods the MT problemhas also been handled through evolutionary optimizationmethods In general they have demonstrated to deliver betterresults than those based on classical techniques in terms
2 Journal of Applied Mathematics
of accuracy speed and robustness Numerous evolutionaryapproaches have been reported in the literature
Hammouche et al in [9] provides an interesting survey ofhow different evolutionary algorithms are used to solve theKapturrsquos and Otsursquos problems The study uses four classicalevolutionary algorithms to test their efficiency in MT Suchmethods include differential evolution (DE) [10] simulatedannealing (SA) [11] and tabu search (TS) [12]
Genetic algorithms (GA) [13] inspired on the biologicalevolution have been also used for solving segmentationtasks One interesting example is presented in [14] where aGA-based algorithm is combined with Gaussian models formultilevel thresholding Other similar works such as that ofYin [15] proposes an improved GA for optimal thresholdingIn the approach it is used as a learning strategy to increasethe speed of convergence
Evolutionary approaches inspired on swarm behaviorsuch as particle swarm optimization (PSO) [16] and artificialbee colony (ABC) [17] have been employed to face thesegmentation problem In [18] bothmethods are used to findthe optimal multilevel threshold points by using the Kapurrsquosentropy as fitness function
Finally in [19] the optimal segmentation threshold valuesare determined by using the bacterial foraging algorithm(BFA) Suchmethod aims tomaximize the Kapurrsquos andOtsursquosobjective functions by considering a set of operators thatare based on the social foraging behavior of the bacteriaEschericha Colli
On the other hand the harmony search algorithm (HSA)introduced by Geem et al [20] is an evolutionary opti-mization algorithm which is based on the metaphor of theimprovisation process that occurs when a musician searchesfor a better state of harmony The HSA generates a newcandidate solution from all existing solutions The solutionvector is analogous to the harmony in music while thelocal and global search schemes are analogous to musi-cianrsquos improvisations In comparison to other metaheuristicsmethods in the literature HSA imposes fewer mathematicalrequirements as it can be easily adapted for solving severalsorts of engineering optimization challenges [21] Further-more numerical comparisons have demonstrated that theconvergence for theHSA is faster thanGA [22] which attractsfurther attention It has been successfully applied to solve awide range of practical optimization problems such as dis-crete and continuous structural optimization [23] parameterestimation of the nonlinear Muskingum model [24] designoptimization of water distribution networks [25] vehiclerouting [26] combined heat and power economic dispatch[27] design of steel frames [28] and image processing [29]Although the standard HSA presents good search character-istics several modifications to the original HSA have beenproposed in the literature in order to enhance its own features[30]
In this paper a novel multithresholding segmentationalgorithm is introduced The proposed approach calledthe harmony search multithresholding algorithm (HSMA)combines the original harmony search algorithm (HSA) andthe Otsursquos and Kapurrsquos methodologies The proposed algo-rithm takes random samples from a feasible search space
inside the image histogram Such samples build each har-mony (candidate solution) in the HSA context whereas itsquality is evaluated considering the objective function thatis employed by the Otsursquos or the Kapurrsquos method Guidedby these objective values the set of candidate solutions areevolved using the HSA operators until the optimal solutionis found The approach generates a multilevel segmentationalgorithm which can effectively identify the threshold valuesof a digital image within a reduced number of iterationsExperimental results over several complex images have val-idated the efficiency of the proposed technique regardingaccuracy speed and robustness
The paper is organized as follows In Section 2 the HSAis introduced Section 3 gives a brief description of the Otsursquosand Kapurrsquos methods Section 4 explains the implementationof the proposed algorithm Section 5 discusses experimentalresults after testing the proposed method over a set bench-mark images Finally some conclusions are discussed inSection 6
2 Harmony Search Algorithm
21 The Harmony Search Algorithm In the basic HSA eachsolution is called a ldquoharmonyrdquo and is represented by an n-dimension real vector An initial population of harmonyvectors are randomly generated and stored within a har-mony memory (HM) A new candidate harmony is thusgenerated from the elements in the HM by using a memoryconsideration operation either by a random reinitializationor a pitch adjustment operation Finally the HM is updatedby comparing the new candidate harmony and the worstharmony vector in the HM The worst harmony vector isreplaced by the new candidate vector when the latter deliversa better solution in the HM The above process is repeateduntil a certain termination criterion is met The basic HSalgorithm consists of three main phases HM initializationimprovisation of new harmony vectors and updating theHM The following discussion addresses details about eachstage
211 Initializing the Problem and the Algorithm ParametersIn general the global optimization problem can be summa-rized as followsminimize 119891 (x) x = (119909 (1) 119909 (2) 119909 (119899)) isin R119899
subject to 119909 (119895) isin [119897 (119895) 119906 (119895)] 119895 = 1 2 119899(1)
where 119891(x) is the objective function x = (119909(1) 119909(2) 119909(119899)) is the set of design variables 119899 is the number of designvariables and 119897(119895) and 119906(119895) are the lower and upper boundsfor the design variable 119909(119895) respectively The parameters forHSA are the harmony memory size that is the numberof solution vectors lying on the harmony memory (HM)the harmony-memory consideration rate (HMCR) the pitchadjusting rate (PAR) the distance bandwidth (BW) and thenumber of improvisations (NI) which represents the totalnumber of iterations The performance of HSA is stronglyinfluenced by values assigned to such parameters which inturn depend on the application domain [31]
Journal of Applied Mathematics 3
212 Harmony Memory Initialization In this stage initialvector components at HM that is HMS vectors are con-figured Let x
119894= 119909119894(1) 119909119894(2) 119909
119894(119899) represent the 119894th
randomly-generated harmony vector 119909119894(119895) = 119897(119895) + (119906(119895) minus
119897(119895)) sdot rand(0 1) for 119895 = 1 2 119899 and 119894 = 1 2 HMSwhere rand(01) is a uniform random number between 0 and1 the upper and lower bounds of the search space are definedby 119897(119895) and 119906(119895) respectively Then the HM matrix is filledwith the HMS harmony vectors as follows
HM =[[[[
[
x1
x2
xHMS
]]]]
]
(2)
213 Improvisation of New Harmony Vectors In this phasea new harmony vector xnew is built by applying the followingthree operators memory consideration random reinitializa-tion and pitch adjustment Generating a new harmony isknown as ldquoimprovisationrdquo In thememory consideration stepthe value of the first decision variable 119909new(1) for the newvector is chosen randomly from any of the values alreadyexisting in the current HM that is from the set 119909
1(1)
1199092(1) 119909HMS(1) For this operation a uniform random
number 1199031is generated within the range [0 1] If 119903
1is
less than HMCR the decision variable 119909new(1) is gener-ated through memory considerations otherwise 119909new(1) isobtained from a random reinitialization between the searchbounds [119897(1) 119906(1)] Values of the other decision variables119909new(2) 119909new(3) 119909new(119899) are also chosen accordinglyTherefore both operations memory consideration and ran-dom reinitialization can be modeled as follows
119909new (119895)
=
119909119894(119895) isin 119909
1(119895) 119909
2(119895) 119909HMS (119895)
with probability HMCR119897 (119895) + (119906 (119895) minus 119897 (119895)) sdot rand (0 1)
with probability 1 minusHMCR
(3)
Every component obtained by memory consideration isfurther examined to determine whether it should be pitch-adjusted For this operation the pitch-adjusting rate (PAR)is defined as to assign the frequency of the adjustment andthe bandwidth factor (BW) to control the local search aroundthe selected elements of the HM Hence the pitch-adjustingdecision is calculated as follows
119909new (119895)
=
119909new (119895) = 119909new (119895) plusmn rand (0 1) sdot BW
with probability PAR119909new (119895) with probability (1 minus PAR)
(4)
Pitch adjusting is responsible for generating new potentialharmonies by slightly modifying original variable positionsSuch operation can be considered similar to the mutationprocess in evolutionary algorithms Therefore the decision
variable is either perturbed by a random number between 0and BW or left unaltered In order to protect the pitch adjust-ing operation it is important to assure that points lyingoutside the feasible range [119897 119906] must be reassigned that istruncated to the maximum or minimum values of the inter-val
214 Updating the Harmony Memory After a new harmonyvector 119909new is generated the harmony memory is updated bythe survival of the fit competition between 119909new and the worstharmony vector 119909
119908in the HMTherefore 119909new will replace 119909
119908
and become a newmember of theHM in case the fitness valueof 119909new is better than the fitness value of 119909
119908
215 Computational Procedure The computational proce-dure of the basic HSA can be summarized as in Algorithm 1[20]
This procedure is implemented for minimization If theintention is to maximize the objective function a signmodification of step 4 (x
119908= xnew if 119891(xnew) gt 119891(x
119908)) is
required In this paper the HSA is used for maximizationproposes
3 Image Multilevel Thresholding (MT)
Thresholding is a process in which the pixels of a gray scaleimage are divided in sets or classes depending on their inten-sity level (119871) For this classification it is necessary to select athreshold value (th) and follow the simple rule of
1198621larr997888 119901 if 0 le 119901 lt th
1198622larr997888 119901 if th le 119901 lt 119871 minus 1
(5)
where119901 is one of the119898times119899 pixels of the gray scale image 119868119892that
can be represented in 119871 gray scale levels 119871 = 0 1 2 119871minus11198621and 119862
2are the classes in which the pixel 119901 can be located
while th is the threshold The rule in (5) corresponds to abilevel thresholding and can be easily extended for multiplesets
1198621larr997888 119901 if 0 le 119901 lt th
1
1198622larr997888 119901 if th
1le 119901 lt th
2
119862119894larr997888 119901 if th
119894le 119901 lt th
119894+1
119862119899larr997888 119901 if th
119899le 119901 lt 119871 minus 1
(6)
where th1 th2 th
119894 th119894+1 th119896 represent different thresh-
olds The problem for both bilevel and MT is to selectthe th values that correctly identify the classes AlthoughOtsursquos and Kapurrsquos methods are well-known approaches fordetermining such values both propose a different objectivefunction which must be maximized in order to find optimalthreshold values just as it is discussed below
31 Between-Class Variance (Otsursquos Method) This is a non-parametric technique for thresholding proposed by Otsu [6]that employs the maximum variance value of the different
4 Journal of Applied Mathematics
119878119905119890119901 1 Set the parameters HMS HMCR PAR BW and NI119878119905119890119901 2 Initialize the HM and calculate the objective function value of
each harmony vector119878119905119890119901 3 Improvise a new harmony xnew as follows
for (119895 = 1 to 119899) doif (1199031ltHMCR) then
119909new(119895) = 119909119886(119895) where 119886 isin (1 2 HMS)if (1199032lt PAR) then
119909new(119895) = 119909new(119895) plusmn 1199033 sdot BW where 1199031 1199032 1199033isin rand (0 1)
end ifif 119909new(119895) lt 119897(119895)119909new(119895) = 119897(119895)end ifif 119909new(119895) gt 119906(119895)119909new(119895) = 119906(119895)end if
else119909new(119895) = 119897(119895) + 119903sdot (119906(119895) minus 119897(119895)) where 119903 isin rand (0 1)
end ifend for
119878119905119890119901 4 Update the HM as x119908= xnew if 119891(xnew) lt 119891(x119908)
119878119905119890119901 5 If NI is completed the best harmony vector x119887in the HM is returned
otherwise go back to Step3
Algorithm 1
119878119905119890119901 1 Read the image 119868 and if it is RGB separate it into 119868119877 119868119866and 119868119861 If 119868 is gray scale store it into
119868Gr 119888 = 1 2 3 for RGB images or 119888 = 1 for gray scale images119878119905119890119901 2 Obtain histograms for RGB images ℎ119877 ℎ119866 ℎ119861 and for gray scale images ℎGr119878119905119890119901 3 Calculate the probability distribution using (7) and obtain the histograms119878119905119890119901 4 Initialize the HSA parameters HMS 119896 HMCR PAR BW NI and the limits 119897 and 119906119878119905119890119901 5 Initialize a HM x119888
119894of HMS random particles with 119896 dimensions
119878119905119890119901 6 Compute the values 120596119888119894and 120583119888
119894 Evaluate each element ofHM in the objective function 119869(HM) (14)
or (20) depending on the thresholding method (Otsu or Kapur respectively)119878119905119890119901 7 Improvise a new harmony x119888new as follows
for (119895 = 1 to 119899) doif (1199031lt HCMR) then
119909119888new (119895) = 119909119888
119886(119895) where 119886 isin (1 2 HMS)
if (1199032lt PAR) then
119909119888new (119895) = 119909119888
119886(119895) plusmn 119903
3sdot BW where 119903
1 1199032 1199033isin rand (0 1)
end ifif 119909119888new (119895) lt 119897 (119895)119909119888new (119895) = 119897 (119895)
end ifif 119909119888new (119895) gt 119906 (119895)119909119888new (119895) = 119906 (119895)
end ifelse
119909119888new (119895) = 119897 (119895) + 119903 sdot (119906 (119895) minus 119897 (119895)) whew 119903 isin rand (0 1)end if
end for119878119905119890119901 8 Update the HM as x119888worst = x119888new if 119891 (x119888new) gt 119891 (x
cworst)
119878119905119890119901 9 If NI is completed or the stop criteria is satisfied then jump to Step 10 otherwise go back to Step 6119878119905119890119901 10 Select the harmony that has the best 119909119888bestobjective function value119878119905119890119901 11 Apply the thresholds values contained in 119909119888best to the image 119868 (6)
Algorithm 2
Journal of Applied Mathematics 5
(a)
0025
002
0015
001
0005
050 100 150 200 250
Gray level
Freq
uenc
y
(b)
(c)
0012
001
0008
0006
0004
0002
050 100 150 250
Gray level200
Freq
uenc
y
(d)
(e)
0012
001
0008
0006
0004
0002
050 100 150 250
Gray level200
Freq
uenc
y
(f)
(g)
0045004
0035003
0025002
0015001
00050
50 100 150 250Gray level
200
Freq
uenc
y
(h)
Figure 1 Continued
6 Journal of Applied Mathematics
(i)
003
0025
002
0015
001
0005
050 100 150 250
Gray level200
Freq
uenc
y
(j)
Figure 1 (a) Camera man (c) Lena (e) Baboon (g) Hunter and (i) Butterfly the selected benchmark images (b) (d) (f) (h) and (j)histograms of the images
classes as a criterion to segment the image Taking the119871 inten-sity levels from a gray scale image or from each component ofa RGB (red green and blue) image the probability distribu-tion of the intensity values is computed as follows
Ph119888119894=
ℎ119888119894
NP
NPsum119894=1
Ph119888119894= 1
119888 = 1 2 3 if RGB Image1 if Gray scale Image
(7)
where 119894 is a specific intensity level (0 le 119894 le 119871 minus 1) 119888 is thecomponent of the image which depends if the image is grayscale or RGB whereas NP is the total number of pixels inthe image ℎ119888
119894(histogram) is the number of pixels that cor-
responds to the 119894 intensity level in 119888 The histogram is norm-alized within a probability distribution Ph119888
119894 For the simplest
segmentation (bilevel) two classes are defined as
1198621=
Ph1198881
1205961198880(th)
Ph119888th1205961198880(th)
1198622=
Ph119888th+11205961198881(th)
Ph119888119871
1205961198881(th)
(8)
where 1205960(th) and 120596
1(th) are probabilities distributions for119862
1
and 1198622 as it is shown by
1205961198880(th) =
thsum119894=1
Ph119888119894 120596119888
1(th) =
119871
sum119894=th+1
Ph119888119894 (9)
It is necessary to compute mean levels 1205831198880and 120583119888
1that define
the classes using (10) Once those values are calculated theOtsu variance between classes 1205902
119888
is calculated using (11) asfollows
1205831198880=
thsum119894=1
119894Ph119888119894
1205961198880(th)
1205831198881=119871
sum119894=th+1
119894Ph119888119894
1205961198881(th)
(10)
1205902119888
= 1205901198881+ 1205901198882 (11)
Notice that for both equations (10) and (11) 119888 depends on thetype of image In (11) the number two is part of the Otsursquosvariance operator and does not represent an exponent inthe mathematical sense Moreover 120590119888
1and 120590119888
2in (11) are the
variances of 1198621and 119862
2which are defined as
1205901198881= 1205961198880(1205831198880+ 120583119888119879)2
1205901198882= 1205961198881(1205831198881+ 120583119888119879)2
(12)
where 120583119888119879= 12059611988801205831198880+12059611988811205831198881and 120596119888
0+1205961198881= 1 Based on the values
1205901198881and 120590119888
2 (13) presents the objective function
119869 (th) = max (1205902119888
(th)) 0 le th le 119871 minus 1 (13)
where 1205902119888
(th) is the Otsursquos variance for a given th valueTherefore the optimization problem is reduced to find theintensity level (th) that maximizes (13)
Otsursquos method is applied for a single component of animage In case of RGB images it is necessary to apply separa-tion into single component images The previous descriptionof such bilevel method can be extended for the identificationofmultiple thresholds Considering 119896 thresholds it is possibleseparate the original image into 119896 classes using (6) then itis necessary to compute the 119896 variances and their respectiveelements The objective function 119869(th) in (13) can thus berewritten for multiple thresholds as follows
119869 (TH) = max (1205902119888
(TH)) 0 le th119894le 119871 minus 1 119894 = 1 2 119896
(14)
where TH = [th1 th2 th
119896minus1] is a vector containing mult-
iple thresholds and the variances are computed through
1205902119888
=119896
sum119894=1
120590119888119894=119896
sum119894=1
120596119888119894(120583119888119894minus 120583119888119879)2
(15)
Journal of Applied Mathematics 7
Here 119894 represents the 119894 class 120596119888119894and 120583119888
119895are respectively the
probability of occurrence and themean of a class InMT suchvalues are obtained as
1205961198880(th) =
th1
sum119894=1
Ph119888119894
1205961198881(th) =
th2
sum119894=th1+1
Ph119888119894
120596119888119896minus1
(th) =119871
sum119894=th119896+1
Ph119888119894
(16)
And for the mean values
1205831198880=
th1
sum119894=1
119894Ph119888119894
1205961198880(th1)
1205831198881=
th2
sum119894=th1+1
119894Ph119888119894
1205961198880(th2)
120583119888119896minus1
=119871
sum119894=th119896+1
119894Ph119888119894
1205961198881(th119896)
(17)
Similar to the bilevel case for the MT using the Otsursquosmethod 119888 corresponds to the image components RGB 119888 =1 2 3 and gray scale 119888 = 1
32 Entropy Criterion Method (Kapurrsquos Method) Anothernonparametric method that is used to determine the optimalthreshold values has been proposed by Kapur et al [7] It isbased on the entropy and the probability distribution of theimage histogram The method aims to find the optimal ththat maximizes the overall entropy The entropy of an imagemeasures the compactness and separability among classes Inthis sense when the optimal th value appropriately separatesthe classes the entropy has the maximum value For thebilevel example the objective function of theKapurrsquos problemcan be defined as
119869 (th) = 1198671198881+ 1198671198882
119888 = 1 2 3 if RGB Image1 if Gray scale Image
(18)
where the entropies1198671and119867
2are computed by the following
model
1198671198881=
thsum119894=1
Ph119888119894
1205961198880
ln(Ph119888119894
1205961198880
)
1198671198882=119871
sum119894=th+1
Ph119888119894
1205961198881
ln(Ph119888119894
1205961198881
)
(19)
Ph119888119894is the probability distribution of the intensity levels which
is obtained using (7) 1205960(th) and 120596
1(th) are probabilities
distributions for 1198621and 119862
2 ln(sdot) stands for the natural
logarithm Similar to the Otsursquos method the entropy-basedapproach can be extended for multiple threshold values forsuch a case it is necessary to divide the image into 119896 classesusing the similar number of thresholds Under such condi-tions the new objective function is defined as
119869 (TH) = max(119896
sum119894=1
119867119888119894)
119888 = 1 2 3 if RGB Image1 if Gray scale Image
(20)
where TH = [th1 th2 th
119896minus1] is a vector that contains
the multiple thresholds Each entropy is computed separatelywith its respective th value so (21) is expanded for 119896 entropies
1198671198881=
th1
sum119894=1
Ph119888119894
1205961198880
ln(Ph119888119894
1205961198880
)
1198671198882=
th2
sum119894=th1+1
Ph119888119894
1205961198881
ln(Ph119888119894
1205961198881
)
119867119888119896=119871
sum119894=th119896+1
Ph119888119894
120596119888119896minus1
ln(Ph119888119894
120596119888119896minus1
)
(21)
The values of the probability occurrence (1205961198880 1205961198881 120596119888
119896minus1)
of the 119896 classes are obtained using (16) and the probabilitydistribution Ph119888
119894with (10) Finally it is necessary to use (6) to
separate the pixels into the corresponding classes
4 Multilevel Thresholding Using HarmonySearch Algorithm (HSMA)
41 Harmony Representation Each harmony (candidate sol-ution) uses 119896 different elements as decision variables withinthe optimization algorithm Such decision variables representa different threshold point th that is used for the segmenta-tion Therefore the complete population is represented as
HM = [x1198881 x1198882 x119888HMS]
119879
x119888119894= [th1198881 th1198882 th119888
119896]
(22)
where 119879 refers to the transpose operator HMS is the size ofthe harmony memory x
119894is the 119894th element of HM and 119888 =
1 2 3 is set for RGB images while 119888 = 1 is chosen for grayscale images For this problem the boundaries of the searchspace are set to 119897 = 0 and 119906 = 255 which correspond to imageintensity levels
42 HMA Implementation Theproposed segmentation algo-rithmhas been implemented considering two different objec-tive functions Otsu and Kapur Therefore the HSA has been
8 Journal of Applied Mathematics
coupled with the Otsu and Kapur functions producing twodifferent segmentation algorithms The implementation ofboth algorithms can be summarized as in Algorithm 2
43 Parameter Setting The performance of HSA is stronglyinfluenced by values assigned to parameters HM HMCRPAR BW and NI Determining the most appropriate param-eter values for an arbitrary problem is a complex issue sincesuch parameters interact to each other in a highly nonlinearmanner and no mathematical models of such interactioncurrently exist The common method to find the best setof parameter values is to fix each parameter value to arandom number within the parameter limits and then HSAis executed If the final result is not satisfactory then anew set of parameter values is defined and the evolutionaryalgorithm is executed again Evidently this process can bevery expensive (in terms of computational time) since manydifferent trials may be required before reaching a set ofsatisfactory parameter values Additionally the set of valueschosen by the user are not necessarily the best possible butonly the best from the arbitrary number of trials performedby the user In order to reduce the number of experiments inthis paper it has used the factorial design method proposedin [32 33] to systematically identify the best parameters ofHSA
The factorial design method [34] is a statistical techniquethat evaluates at the same time all process variables in orderto determine which ones really exert significant influence onthe final response All variables are called factors and thedifferent values chosen to study the factors are called levelsThe factors to be considered in the factorial design are theHSA parameters the harmonymemory (HM) the harmony-memory consideration rate (HMCR) the pitch adjusting rate(PAR) the distance bandwidth (BW) and the number ofimprovisations (NI) whereas the response is the best fitnessvalue obtained as a consequence of the HSA executionTable 1 show the levels of the quantitative factors used in thefactorial design The values of zero level (central point) arebased on the suggestions of the literature [33]
Each experiment is conducted combining the two differ-ent levels that define each parameter considering as a probleman image histogram example Since the factors are five a25minus1 fractional factorial design is chosen requiring sixteenoptimization experiments plus one optimization trial for thecentral point The results obtained from seventeen runs wereanalyzed according to [32 33] using a general linear formof analysis of variance (ANOVA) [34] considering a 95 ofconfidence After such analysis it was found that the bestpossible configuration of HSA is shown in Table 2 Theseresults were consistent considering six replications usingdifferent image histograms and the Otsu (14) or Kapur (20)functions indistinctly Formore information on how to buildfractional factorial designs the reader is referred to [32 33]
5 Experimental Results
The HSMA has been tested under a set of 11 benchmarkimages Some of these images are widely used in the image
Table 1 Levels of the factors used for the factorial design method
HSA parameters (Factors) (minus) Level Central point (+) LevelHM 50 100 200HMCR 05 075 09PAR 01 05 09BW 01 03 05NI 200 250 300
Table 2 HSMA parameter values obtained by the factorial designmethod
HM HMCR PAR BW NI100 075 05 05 300
processing literature to test different methods (Lena Cam-eraman Hunter Baboon etc) [3 9] All the images havethe same size (512 times 512 pixels) and they are in JPGEformat For the sake of representation only five imageswhich are presented in Figure 1 have been used to show thevisual results however the numerical outcomes are analyzedconsidering the complete set
Since HSMA is stochastic it is necessary to employan appropriate statistical metrics to measure its efficiencyHence the results have been reported executing the algo-rithm 35 times for each image In order to maintain com-patibility with similar works reported in the literature [14 1518 19] the number of thresholds points used in the test areth = 2 3 4 5 In the experiments the stop criterion is thenumber of times in which the best fitness values remain withno changeTherefore if the fitness value for the best harmonyremains unspoiled in 10 of the total number of iterations(NI) then the HSA is stopped
To evaluate the stability and consistency it has beencomputed the standard deviation (STD) from the resultsobtained in the 35 executions Since the STD represents ameasure about how the data are dispersed the algorithmbecomes more instable as the STD value increases [19]Equation (23) shows the model used to calculate the STDvalue
STD = radicNIsum119894=1
(bf119894minus av)Ru
(23)
where bf119894is the best fitness of the 119894th iteration av is the average
value of bf and Ru is the number of total executions (Ru =35)
On the other hand as an index of quality the peak-to-signal ratio (PSNR) is used to assess the similarity of thesegmented image against a reference image (original image)based on the produced mean square error (MSE) [18 35]Both PSNR and MSE are defined as
PSNR = 20 log10(
255
RMSE) (dB)
RMSE = radicsum
ro119894=1sum
co119895=1
(119868119888119900(119894 119895) minus 119868119888th (119894 119895))
ro times co
(24)
Journal of Applied Mathematics 9
Table 3 Result after appling the HSMA using Otsursquos function to theset of benchmark images
Image 119896 Thresholds 119909119888best PSNR STC
Camera man
2 70 144 17247 230119864 minus 12
3 59 119 156 20211 155119864 minus 02
4 42 95 140 170 21533 276119864 minus 12
5 36 82 122 149 173 23282 530119864 minus 03
Lena
2 91 150 15401 922119864 minus 13
3 79 125 170 17427 299119864 minus 02
4 73 112 144 179 18763 277119864 minus 01
5 71 107 134 158 186 19443 304119864 minus 01
Baboon
2 97 149 15422 692119864 minus 13
3 85 125 161 17709 192119864 minus 02
4 71 105 136 167 20289 582119864 minus 02
5 66 97 123 147 173 21713 440119864 minus 01
Hunter
2 51 116 17875 230119864 minus 12
3 36 86 135 20350 230119864 minus 12
4 27 65 104 143 22203 122119864 minus 02
5 22 53 88 112 152 23703 184119864 minus 12
Airplane
2 113 173 15029 922119864 minus 13
3 92 144 190 18854 483119864 minus 01
4 84 129 172 203 20735 724119864 minus 01
5 68 106 143 180 205 23126 838119864 minus 01
Peppers
2 72 138 16299 138119864 minus 12
3 65 122 169 18359 461119864 minus 13
4 50 88 128 171 20737 461119864 minus 13
5 48 85 118 150 179 22310 184119864 minus 012
Living room
2 87 145 15999 115119864 minus 12
3 76 123 163 18197 692119864 minus 12
4 56 97 132 168 20673 922119864 minus 12
5 49 88 120 146 178 22225 286119864 minus 02
Blonde
2 106 155 14609 692119864 minus 13
3 53 112 158 19157 923119864 minus 13
4 50 103 139 168 20964 548119864 minus 01
5 49 92 121 152 172 22409 650119864 minus 01
Bridge
2 91 56 13943 461119864 minus 13
3 72 120 177 17019 710119864 minus 01
4 63 103 145 193 18872 291119864 minus 01
5 56 91 124 159 201 20539 357119864 minus 01
Butterfly
2 99 151 13934 730119864 minus 02
3 82 119 160 16932 617119864 minus 01
4 71 102 130 163 19259 307119864 + 00
5 62 77 109 137 167 21450 387119864 + 00
Lake
2 85 154 14638 461119864 minus 13
3 78 140 194 15860 184119864 minus 12
4 67 110 158 198 17629 268119864 minus 01
5 57 88 127 166 200 19416 112119864 minus 01
where 119868119888119900is the original image 119868119888th is the segmented image
119888 = 1 for gray scale and 119888 = 3 for RGB images whereas ro
co are the total number of rows and columns of the imagerespectively
51 Otsursquos Results This section analyzes the results of HSMAafter considering the variance among classes (14) as theobjective function just as it has been proposed by Otsu [6]The approach is applied over the complete set of benchmarkimages whereas the results are registered in Table 3 Suchresults present the best threshold values after testing theproposed method with four different threshold points th =2 3 4 5The table also features the PSNR and the STD valuesIt is evident that the PSNR and STD values increase theirmagnitude as the number of threshold points also increases
For the sake of representation it has been selected onlyfive images of the set to show (graphically) the segmenta-tion results Figure 1 presents the images selected from thebenchmark set and their respective histograms which possessirregular distributions (see Figure 1(j) in particular) Undersuch circumstances classical methods face great difficultiesto find the best threshold values
The processing results for the selected original imagesare presented in five tables Tables 4 5 6 7 and 8 Suchresults show the segmented images considering four differentthreshold points th = 2 3 4 5 The tables also show theevolution of the objective function during one execution
52 Kapurrsquos Results This section analyzes the performance ofHSMA after considering the entropy function (20) as objec-tive function as it has been proposed by Kapur et al in [7]Table 9 presents the experimental results after the applicationof HSMAover the entire set of benchmark imagesThe valueslisted are PSNR STD and the best threshold values of the lastpopulation (119909119861
119905)The same test procedure that was previously
applied to the Otsursquos method (Section 51) is used with theKapurrsquos method also considering the same stop criterion anda similar HSA parameter configuration
The results after appling the HSMA to the selectedbenchmark images are presented in Tables 10 11 12 13and 14 Four different threshold points have been employedth = 2 3 4 5 All tables exhibit the segmented image theapproximated histogram and the evolution of the fitnessvalue during the execution of the HSA method
From the results of both Otsursquos and Kapurrsquos methods it ispossible to appreciate that the HSMA converges (stabilizes)after a determined number of iterations depending on the thvalue For experimental purposes HSMA continues runningstill further even though the stop criterion is achieved In thisway the graphics show that convergence is often reached inthe first iterations of the optimization processThe segmentedimages provide evidence that the outcome is better with th =4 and th = 5 however if the segmentation task does notrequire to be extremely accurate then it is possible to selectth = 3
53 Comparisons In order to analyze the results of HSMAtwo different comparisons are executedThe first one involvesthe comparison between the two versions of the proposedapproach one with the Otsu function and the other with
10 Journal of Applied Mathematics
Table 4 Results after appling the HSMA using Otsursquos over the Camera man image
HistogramThreshold 1
Threshold 2
HistogramThreshold 1
HistogramThreshold 1
Threshold 2
Threshold 2
Threshold 3Threshold 4
HistogramThreshold 1Threshold 2
Threshold 3Threshold 4Threshold 5
Threshold 3
0025
002
0015
001
0005
0 50 100 150 250Gray level
200Fr
eque
ncy
0025
002
0015
001
0005
0 50 100 150 250Gray level
200
Freq
uenc
y
0025
002
0015
001
0005
050 100 150 250
Gray level200
Freq
uenc
y
0025
002
0015
001
0005
0 50 100 150 250Gray level
200
Freq
uenc
y
365236515
365136505
365036495
364936485
0 500 1000 1500 2000 2500 3000Iterations
0 500 1000 1500 2000 2500 3000
0 500 1000 1500 2000 2500 3000
0 500 1000 1500 2000 2500 3000
Obj
ectiv
e fun
ctio
n va
lues
Obj
ectiv
e fun
ctio
n va
lues
Obj
ectiv
e fun
ctio
n va
lues
Obj
ectiv
e fun
ctio
n va
lues
th=2
th=3
th=4
th=5
3730
37253720
3715
37103705
37003695
3785
3780
3775
3770
3765
3760
3755
3750
3815
3810
3805
3800
3795
3790
3785
3780
Iterations
Iterations
Iterations
Journal of Applied Mathematics 11
Table 5 Results after appling the HSMA using Otsursquos over Lena image
0012
001
0008
0006
0004
0002
0
50 100 150 250Gray level
200Fr
eque
ncy
0012
001
0008
0006
0004
0002
0
50 100 150 250Gray level
200
Freq
uenc
y
HistogramThreshold 1
Threshold 2
HistogramThreshold 1
Threshold 2Threshold 3
0012
001
0008
0006
0004
0002
0
50 100 150 250Gray level
200
Freq
uenc
y
0012
001
0008
0006
0004
0002
0
50 100 150 250Gray level
200
Freq
uenc
y
HistogramThreshold 1Threshold 2
Threshold 3Threshold 4
HistogramThreshold 1Threshold 2
Threshold 3Threshold 4Threshold 5
196445
19644
196435
19643
196425
19642
196415
19641
0 500 1000 1500 2000 2500 3000
0 1000 2000 3000O
bjec
tive f
unct
ion
valu
esO
bjec
tive f
unct
ion
valu
esO
bjec
tive f
unct
ion
valu
esO
bjec
tive f
unct
ion
valu
es
2140
2120
2100
2080
2060
2040
2020
2000
2195
2190
2185
2180
2175
2170
2165
2160
0 2000 4000 6000
0 1000 2000 3000 4000 5000 6000
2225
2220
2215
2210
2205
2200
2195
2190
th=2
th=3
th=4
th=5
Iterations
Iterations
Iterations
Iterations
12 Journal of Applied Mathematics
Table 6 Results after appling the HSMA using Otsursquos over the Baboon image
0012
001
0008
0006
0004
0002
0
50 100 150 250Gray level
200Fr
eque
ncy
HistogramThreshold 1
Threshold 2
0012
001
0008
0006
0004
0002
0
50 100 150 250Gray level
200
Freq
uenc
y
HistogramThreshold 1
Threshold 2Threshold 3
0012
001
0008
0006
0004
0002
0
50 100 150 250Gray level
200
Freq
uenc
y
HistogramThreshold 1Threshold 2
Threshold 3Threshold 4
0012
001
0008
0006
0004
0002
0
50 100 150 250Gray level
200
Freq
uenc
y
HistogramThreshold 1Threshold 2
Threshold 3Threshold 4Threshold 5
th=2
th=3
th=4
th=5
1550
1548
1546
1544
1542
1540
1538
1536
0 500 1000 1500 2000 2500 3000
0 1000 2000 3000O
bjec
tive f
unct
ion
valu
esO
bjec
tive f
unct
ion
valu
esO
bjec
tive f
unct
ion
valu
esO
bjec
tive f
unct
ion
valu
es
1638
1640
1636
1634
1632
1630
1628
1695
1690
1685
1680
1675
1670
1665
1660
0 2000 4000 6000
1720
1715
1710
1705
1700
1695
1690
1685
1680
1675
0 2000 4000 6000 8000 10000
Iterations
Iterations
Iterations
Iterations
Journal of Applied Mathematics 13
Table 7 Results after appling the HSMA using Otsursquos over the Hunter image
0045
004
0035
003
0025
002
0015
001
0005
0
50 100 150 250Gray level
200
50 100 150 250Gray level
200
Freq
uenc
y
0045
004
0035
003
0025
002
0015
001
0005
0
Freq
uenc
y
50 100 150 250Gray level
200
0045
004
0035
003
0025
002
0015
001
0005
0
Freq
uenc
y
50 100 150 250Gray level
200
0045
004
0035
003
0025
002
0015
001
0005
0
Freq
uenc
y
HistogramThreshold 1
Threshold 2
HistogramThreshold 1
Threshold 2Threshold 3
HistogramThreshold 1Threshold 2
Threshold 3Threshold 4Threshold 5
HistogramThreshold 1Threshold 2
Threshold 3Threshold 4
th=2
th=3
th=4
th=5
3065
3060
3055
3050
Obj
ectiv
e fun
ctio
n va
lues
Obj
ectiv
e fun
ctio
n va
lues
Obj
ectiv
e fun
ctio
n va
lues
Obj
ectiv
e fun
ctio
n va
lues
0 1000 2000 3000Iterations
0 1000 2000 3000 4000 5000 6000
Iterations
0 2000 4000 6000
Iterations
0 1000 2000 3000 4000 5000
Iterations
3220
3210
3200
3190
3180
3170
3160
3150
3270
3268
3266
3264
3262
3260
3258
3256
3254
3252
3250
3310
3305
3300
3295
3290
3285
3280
3275
14 Journal of Applied Mathematics
Table 8 Results after appling the HSMA using Otsursquos over the Butterfly image
HistogramThreshold 1
Threshold 2
0025
003
002
0015
001
0005
050 100 150 250
Gray level200
Freq
uenc
y
0025
003
002
0015
001
0005
050 100 150 250
Gray level200
Freq
uenc
y
0025
003
002
0015
001
0005
050 100 150 250
Gray level200
Freq
uenc
y
0025
003
002
0015
001
0005
050 100 150 250
Gray level200
Freq
uenc
y
HistogramThreshold 1
Threshold 2Threshold 3
HistogramThreshold 1Threshold 2
Threshold 3Threshold 4
HistogramThreshold 1Threshold 2
Threshold 3Threshold 4Threshold 5
1555
1550
1545
I 540
1535
1530
0 1000 2000 3000 4000
Obj
ectiv
e fun
ctio
n va
lues
Obj
ectiv
e fun
ctio
n va
lues
Obj
ectiv
e fun
ctio
n va
lues
Obj
ectiv
e fun
ctio
n va
lues
Iterations
Iterations
1670
1660
1650
1640
1630
1620
1610
0 2000 4000 6000 8000
Iterations0 2000 4000 6000 8000
10000
1710
1700
1690
1680
1670
1660
1650
0 1000 2000 3000 4000
Iterations
1740
1735
1730
1725
1720
1715
1710
1705
1700
th=2
th=3
th=4
th=5
Journal of Applied Mathematics 15
Table 9 Results after appling the HSMA using Kapurrsquos function to the set of benchmark images
Image 119896 Thresholds 119909119888best PSNR STD
Camera man
2 128 196 13626 360119864 minus 15
3 44 103 196 14460 140119864 minus 03
4 44 96 146 196 20153 120119864 minus 03
5 24 60 98 146 196 20661 275119864 minus 02
Lena
2 96 163 14638 360119864 minus 15
3 23 96 163 16218 766119864 minus 02
4 23 80 125 173 19287 144119864 minus 14
5 23 71 109 144 180 21047 122119864 minus 02
Baboon
2 79 143 16016 108119864 minus 14
3 79 143 231 16016 719119864 minus 02
4 44 98 152 231 18485 847119864 minus 02
5 33 74 114 159 231 20507 108119864 minus 14
Hunter
2 92 179 15206 144119864 minus 14
3 59 117 179 18500 416119864 minus 04
4 44 89 133 179 21065 431119864 minus 04
5 44 89 133 179 222 21086 343119864 minus 02
Airplane
2 70 171 15758 330119864 minus 03
3 68 126 182 18810 108119864 minus 14
4 68 126 182 232 18810 182119864 minus 01
5 64 104 143 184 232 20321 180119864 minus 01
Peppers
2 66 143 16265 721119864 minus 15
3 62 112 162 18367 180119864 minus 14
4 62 112 162 227 18376 239119864 minus 02
5 48 86 127 171 227 18827 417119864 minus 04
Living room
2 89 170 14631 140119864 minus 03
3 47 103 175 17146 270119864 minus 03
4 47 98 149 197 19144 134119864 minus 02
5 42 85 125 162 197 21160 189119864 minus 02
Blonde
2 125 203 12244 144119864 minus 14
3 65 134 203 16878 100119864 minus 03
4 65 113 155 203 20107 550119864 minus 03
5 65 113 155 203 229 20107 448119864 minus 02
Bridge
2 94 171 13529 740119864 minus 03
3 65 131 195 16806 144119864 minus 02
4 53 102 151 199 18902 247119864 minus 02
5 40 85 131 171 211 20268 212119864 minus 02
Butterfly
2 27 213 81930 225119864 minus 02
3 27 120 213 13415 860119864 minus 04
4 27 96 144 213 16725 380119864 minus 03
5 27 83 118 152 213 19413 390119864 minus 03
Lake
2 91 163 14713 144119864 minus 14
3 73 120 170 16441 305119864 minus 04
4 69 112 156 195 17455 453119864 minus 02
5 62 96 131 166 198 18774 366119864 minus 02
16 Journal of Applied Mathematics
Table 10 Results after appling the HSMA using Kapurrsquos over the Camera man image
HistogramThreshold 1
Threshold 2
0025
002
0015
001
0005
0500 100 150 250
Gray level200
Freq
uenc
y
0025
002
0015
001
0005
0500
0
0
100 150 300250Gray level
200
Freq
uenc
y
0025
002
0015
001
0005
050 100 150 300250
Gray level200
Freq
uenc
y
0025
002
0015
001
0005
050 100 150 300250
Gray level200
Freq
uenc
y
HistogramThreshold 1
Threshold 2Threshold 3
HistogramThreshold 1Threshold 2
Threshold 3Threshold 4
HistogramThreshold 1Threshold 2
Threshold 3Threshold 4Threshold 5
th=2
th=3
th=4
th=5
176
1755
175
1745
174
1735
173
1725
172
1715
Obj
ectiv
e fun
ctio
n va
lues
Obj
ectiv
e fun
ctio
n va
lues
Obj
ectiv
e fun
ctio
n va
lues
Obj
ectiv
e fun
ctio
n va
lues
0 1000 2000 3000 4000
Iterations
0 1000 2000 3000 4000
Iterations
0 1000 2000 3000 4000
Iterations
0 1000 2000 3000 4000
Iterations
222
22
218
216
214
212
21
268
266
264
262
26
258
256
254
252
25
306
304
302
30
298
296
294
Journal of Applied Mathematics 17
Table 11 Results after appling the HSMA using Kapurrsquos over Lenarsquos image
0012
001
0008
0006
0004
0002
0
50
0
0
0
0
100 150 250Gray level
200Fr
eque
ncy
0012
001
0008
0006
0004
0002
0
Freq
uenc
y
HistogramThreshold 1
Threshold 2
50 100 150 300250Gray level
200
HistogramThreshold 1
Threshold 2Threshold 3
0012
001
0008
0006
0004
0002
0
Freq
uenc
y
50 100 150 300250Gray level
200
0012
001
0008
0006
0004
0002
0
Freq
uenc
y
50 100 150 300250Gray level
200
HistogramThreshold 1Threshold 2
Threshold 3Threshold 4
HistogramThreshold 1Threshold 2
Threshold 3Threshold 4Threshold 5
1781
178
1779
1778
1777
1776
1775
1774
1773
1772
1771
Obj
ectiv
e fun
ctio
n va
lues
Obj
ectiv
e fun
ctio
n va
lues
Obj
ectiv
e fun
ctio
n va
lues
Obj
ectiv
e fun
ctio
n va
lues
0 1000 2000 3000 4000 5000
Iterations
224
223
222
221
22
219
218
0 1000 2000 3000 4000
Iterations
0 1000 2000 3000 4000 60005000
Iterations
2665
266
2655
265
2645
264
2635
263
2625
262
2615
0 1000 2000 3000 4000
Iterations
308
306
304
302
30
298
296
294
292
29
288
th=2
th=3
th=4
th=5
18 Journal of Applied Mathematics
Table 12 Results after appling the HSMA using Kapurrsquos over the Baboon image
0012
001
0008
0006
0004
0002
0 50 100 150 250Gray level
200Fr
eque
ncy
0012
001
0008
0006
0004
0002
0 50 100 150 250Gray level
200
Freq
uenc
y
0012
001
0008
0006
0004
0002
0 50 100 150 250Gray level
200
Freq
uenc
y
0012
001
0008
0006
0004
0002
0 50 100 150 250Gray level
200
Freq
uenc
y
HistogramThreshold 1
Threshold 2
HistogramThreshold 1Threshold 2
Threshold 3Threshold 4
HistogramThreshold 1Threshold 2
Threshold 3Threshold 4Threshold 5
17635
1763
17625
1762
17615
1761
17605
176
Obj
ectiv
e fun
ctio
n va
lues
Obj
ectiv
e fun
ctio
n va
lues
Obj
ectiv
e fun
ctio
n va
lues
Obj
ectiv
e fun
ctio
n va
lues
0 1000 2000 3000 4000
Iterations
2206
2204
2202
22
2198
2196
2194
2192
219
2188
0 1000 2000 3000 4000 60005000
Iterations
0 2000 4000 80006000
Iterations
Iterations0 2000 4000 6000 8000 10000 12000
268
266
264
262
26
258
256
254
31
308
306
304
302
30
298
296
294
292
29
th=2
th=3
th=4
th=5
HistogramThreshold 1
Threshold 2Threshold 3
Journal of Applied Mathematics 19
Table 13 Results after appling the HSMA using Kapurrsquos over the Hunter image
0045
004
0035
003
0025
002
0015
001
0005
0 50 100 150 250Gray level
200Fr
eque
ncy
0045
004
0035
003
0025
002
0015
001
0005
0
50 100 150 250Gray level
200
Freq
uenc
y
0045
004
0035
003
0025
002
0015
001
0005
0
50 100 150 250Gray level
200
Freq
uenc
y
0045
004
0035
003
0025
002
0015
001
0005
0
50 100 150 250Gray level
200
Freq
uenc
y
HistogramThreshold 1
Threshold 2
HistogramThreshold 1
Threshold 2Threshold 3
HistogramThreshold 1Threshold 2
Threshold 3Threshold 4
HistogramThreshold 1Threshold 2
Threshold 3Threshold 4Threshold 5
17865
1786
17855
1785
17845
1784
17835
Obj
ectiv
e fun
ctio
n va
lues
Obj
ectiv
e fun
ctio
n va
lues
Obj
ectiv
e fun
ctio
n va
lues
Obj
ectiv
e fun
ctio
n va
lues
0 1000 2000 3000 4000
Iterations
0 1000 2000 3000 4000
Iterations
226
225
224
223
222
221
22
219
218
0 1000 2000 3000 4000 5000
Iterations
269
268
267
266
265
264
263
262
0 2000 4000 80006000
Iterations
306
3055
305
3045
304
3035
303
3025
302
th=2
th=3
th=4
th=5
20 Journal of Applied Mathematics
Table 14 Results after appling the HSMA using Kapurrsquos over the Butterfly image
th=2
th=3
th=4
th=5
50 100 150 300250Gray level
200
HistogramThreshold 1
Threshold 2
0025
003
002
0015
001
0005
0Fr
eque
ncy
50 100 150 300250Gray level
200
0025
003
002
0015
001
0005
0
Freq
uenc
y
500
0
0
0
100 150 300250Gray level
200
0025
003
002
0015
001
0005
0
Freq
uenc
y
50 100 150 250Gray level
200
0025
003
002
0015
001
0005
0
Freq
uenc
y
HistogramThreshold 1
Threshold 2Threshold 3
HistogramThreshold 1Threshold 2
Threshold 3Threshold 4
HistogramThreshold 1Threshold 2
Threshold 3Threshold 4Threshold 5
168
166
164
162
16
158
156
154
152
0 1000 2000 3000 4000
Iterations
Obj
ectiv
e fun
ctio
n va
lues
Obj
ectiv
e fun
ctio
n va
lues
Obj
ectiv
e fun
ctio
n va
lues
Obj
ectiv
e fun
ctio
n va
lues
215
205
20
19
21
195
0 1000 2000 3000 4000
Iterations
0 1000 2000 3000 4000 5000
Iterations
255
25
245
24
235
23
225
0 2000 4000 80006000
Iterations
29
285
28
275
27
265
26
255
25
Journal of Applied Mathematics 21
Table 15 119875 values produced by Wilcoxonrsquos test comparing Otsuversus Kapur over the averaged PSNR from Tables 3 and 9
Image 119896 P-value Otsu versus Kapur
Camera man
2 10425119864 minus 16
3 21435119864 minus 15
4 26067119864 minus 16
5 62260119864 minus 16
Lena
2 10425119864 minus 16
3 94577119864 minus 15
4 97127119864 minus 15
5 12356119864 minus 12
Baboon
2 10425119864 minus 16
3 17500119864 minus 02
4 53417119864 minus 14
5 14013119864 minus 14
Hunter
2 10425119864 minus 16
3 26067119864 minus 16
4 66386119864 minus 14
5 64677119864 minus 15
Airplane
2 10425119864 minus 16
3 46500119864 minus 02
4 17438119864 minus 13
5 62475119864 minus 13
Peppers
2 10425119864 minus 16
3 10425119864 minus 16
4 60498119864 minus 15
5 53194119864 minus 15
Living room
2 32405119864 minus 15
3 14223119864 minus 15
4 13175119864 minus 14
5 62220119864 minus 14
Blonde
2 10425119864 minus 16
3 26067119864 minus 16
4 40480119864 minus 13
5 78167119864 minus 04
Bridge
2 73588119864 minus 06
3 11300119864 minus 04
4 19400119864 minus 02
5 21900119864 minus 02
Butterfly
2 11615119864 minus 14
3 25697119864 minus 14
4 37190119864 minus 13
5 17941119864 minus 06
Lake
2 10425119864 minus 16
3 56120119864 minus 16
4 98174119864 minus 14
5 22292119864 minus 14
the Kapur criterion The second analyses the comparisonbetween the HSMA and other state-of-the-art approaches
531 Comparison between Otsu and Kapur HSMA In orderto statistically compare the results fromTables 3 and 9 a non-parametric significance proof known as the Wilcoxonrsquos ranktest [36 37] for 35 independent samples has been conductedSuch proof allows assessing result differences among tworelated methods The analysis is performed considering a 5significance level over the peak-to-signal ratio (PSNR) datacorresponding to the five threshold points Table 15 reportsthe 119875 values produced by Wilcoxonrsquos test for a pairwisecomparison of the PSNR values between the Otsu and Kapurobjective functions As a null hypothesis it is assumed thatthere is no difference between the values of the two objectivefunctions The alternative hypothesis considers an existentdifference between the values of both approaches All119875 valuesreported in Table 15 are less than 005 (5 significance level)which is a strong evidence against the null hypothesis indi-cating that the Otsu PSNR mean values for the performanceare statistically better and it has not occurred by chance
532 Comparison among HSMA and Other MT ApproachesThe results produced by HSMA have been compared withthose generated by state-of-the-art thresholding methodssuch genetic algorithms (GA) [15] particle swarm optimiza-tion (PSO) [18] and bacterial foraging (BF) [19]
All the algorithms run 35 times over each selected imageThe images at this test are the same as in Sections 52 and51 (Camera man Lena Baboon Hunter and Butterfly) Foreach image the PSNR the STD and themean of the objectivefunction values are calculated Moreover the entire test isperformed using both Otsursquos and Kapurrsquos objective functions
Table 16 presents the computed values for a reducedbenchmark test (five images) It is clear that the HSMAdelivers better performance than the others Such values arecomputed using the Otsursquos method as the objective functionOn the other hand the same experiment has been performedusing the Kapurrsquos method Using the same criteria (as thosedescribed for the Otsursquos method) the algorithm runs over35 times at each image The results of this experiment arepresented in Table 17 and show that the proposed HSMAalgorithm is better in comparison with the GA PSO and BF
6 Conclusions
In this paper a MT-based method on the original harmonysearch algorithm (HSA) is presentedThe approach combinesthe good search capabilities of HSA algorithm and the useof some objective functions that have been proposed by thepopularMTmethods of Otsu and Kapur In order tomeasurethe performance of the proposed approach the peak signal-to-noise ratio (PSNR) is used to assess the segmentationquality by considering the coincidences between the seg-mented and the original images In this work a simple HSAimplementation without any modification is considered inorder to demonstrate that it can be applied to image process-ing tasks
The study explores the comparison between two versionsof HSMA one employs the Otsu objective function whilethe other uses the Kapur criterion Results show that the
22 Journal of Applied Mathematics
Table 16 Comparisons between HSMA GA PSO and BF applied over the selected test images using Otsursquos method
Image 119896HSMA GA PSO BF
PSNR STD Mean PSNR STD Mean PSNR STD Mean PSNR STD Mean
Camera man
2 17247 230119864 minus 12 36519 17048 00232 36045 17033 00341 35983 17058 00345 359093 20211 155119864 minus 02 37274 17573 01455 36783 19219 02345 36627 20035 02459 365754 21533 276119864 minus 12 37824 20523 02232 37815 21254 03142 37774 21209 04560 376145 23282 530119864 minus 03 38137 21369 04589 37664 22095 05089 37416 22237 05089 37898
Lena
2 15401 922119864 minus 13 19644 15040 00049 19609 15077 00033 19614 15031 299119864 minus 04 196153 17427 299119864 minus 02 21314 17304 01100 21264 17276 00390 21277 17401 00061 212804 18763 277119864 minus 01 21949 17920 02594 21737 18305 01810 21806 18507 00081 218905 19443 304119864 minus 01 22187 18402 03048 21962 18770 02181 22125 19001 00502 22156
Baboon
2 15422 692119864 minus 13 15481 15304 00031 15476 15088 00077 15479 15353 888119864 minus 04 154803 17709 192119864 minus 02 16383 17505 01750 16335 17603 00816 16353 17074 00287 163704 20289 582119864 minus 02 16921 18708 02707 16777 19233 00853 16843 19654 00336 169075 21713 440119864 minus 01 17175 20203 03048 17129 20526 01899 17129 21160 01065 17167
Hunter
2 17875 230119864 minus 12 30542 17088 00470 30641 17932 02534 30641 17508 00322 306413 20350 230119864 minus 12 32134 20045 01930 32129 19940 09727 32124 20350 09627 321344 22203 122119864 minus 02 32695 20836 06478 32684 21128 22936 32663 21089 22936 326635 23703 184119864 minus 12 33081 21284 16202 33056 22026 41811 32763 22804 36102 32911
Butterfly
2 13934 730119864 minus 02 15530 13007 00426 15530 13092 00846 15530 13890 00643 155303 16932 617119864 minus 01 16692 15811 03586 16690 17261 26268 16657 17285 12113 166724 19259 307119864 + 00 17083 17104 06253 17099 17005 37976 17029 17128 22120 170705 21450 387119864 + 00 17280 18593 05968 17344 18099 60747 17307 189061 35217 17330
Table 17 Comparison between HSMA GA PSO and BF applied over selected test images using Kapurrsquos method
Image 119896HSMA GA PSO BF
PSNR STD Mean PSNR STD Mean PSNR STD Mean PSNR STD Mean
Camera man
2 13626 360119864 minus 15 17584 11941 01270 15341 12259 01001 16071 12264 00041 167683 14460 140119864 minus 03 22007 14827 02136 20600 15211 01107 21125 15250 00075 214984 20153 120119864 minus 03 26586 17166 02857 24267 18000 02005 25050 18406 00081 250935 20661 275119864 minus 02 30553 19795 03528 28326 20963 02734 28365 21211 00741 30026
Lena
2 14638 360119864 minus 15 17809 12334 00049 16122 12345 00033 16916 12345 299119864 minus 4 166053 16218 766119864 minus 02 22306 14995 01100 20920 15133 00390 20468 15133 00061 208124 19287 144119864 minus 14 26619 17089 02594 23569 17838 01810 24449 17089 00081 262145 21047 122119864 minus 02 30485 19549 03043 27213 20442 02181 27526 19549 00502 28046
Baboon
2 16016 108119864 minus 14 17625 12184 00567 16425 12213 00077 16811 12216 888119864 minus 4 168893 16016 719119864 minus 02 22117 14745 01580 21069 15008 00816 21088 15211 00287 216304 18485 847119864 minus 02 26671 16935 01765 25489 17574 00853 24375 17999 00336 254465 20507 108119864 minus 14 30800 19662 02775 29601 20224 01899 30994 20720 01065 30887
Hunter
2 15206 144119864 minus 14 17856 12349 00148 16150 12370 00068 15580 12373 00033 167953 18500 416119864 minus 04 22525 14838 01741 21026 15128 00936 20639 15553 01155 218604 21065 431119864 minus 04 26728 17218 02192 25509 18040 01560 27085 18381 00055 262305 21086 343119864 minus 02 30612 19563 03466 29042 20533 02720 29013 21256 00028 28856
Butterfly
2 81930 225119864 minus 02 16791 10470 00872 15481 10474 00025 14098 10474 00014 157843 13415 860119864 minus 04 21417 11628 02021 20042 12313 01880 19340 12754 00118 213084 16725 380119864 minus 03 25292 13314 02596 23980 14231 02473 25190 14877 00166 259635 19413 390119864 minus 03 28664 15756 03977 27411 16337 02821 27004 16828 00877 27980
Journal of Applied Mathematics 23
Otsu function delivers better results than the Kapur criterionSuch conclusion has been statistically proved considering theWilcoxon test
The proposed approach has been compared to othertechniques that implement different optimization algorithmslikeGA PSO andBFThe efficiency of the algorithmhas beenevaluated in terms of the PSNR index and the STD valueExperimental results provide evidence on the outstandingperformance accuracy and convergence of the proposedalgorithm in comparison to other methods Although theresults offer evidence to demonstrate that the standard HSAmethod can yield good results on complicated images theaim of our paper is not to devise an MT algorithm thatcould beat all currently available methods but to show thatharmony search algorithms can be effectively considered asan attractive alternative for this purpose
Acknowledgment
The proposed algorithm is part of the vision system usedby a biped robot supported under the Grant CONACYT CB181053 The first author acknowledges The National Councilof Science and Technology of Mexico (CONACyT) for thedoctoral Grant number 215517 and The Youth Institute ofJalisco (IJJ) for partially support this research
References
[1] R C Gonzalez and R E Woods Digital Image ProcessingAddison Wesley Reading Mass USA 1992
[2] R Guo and S M Pandit ldquoAutomatic threshold selection basedon histogram modes and a discriminant criterionrdquo MachineVision and Applications vol 10 no 5-6 pp 331ndash338 1998
[3] N R Pal and S K Pal ldquoA review on image segmentationtechniquesrdquo Pattern Recognition vol 26 no 9 pp 1277ndash12941993
[4] P K Sahoo S Soltani and A K C Wong ldquoA survey ofthresholding techniquesrdquoComputer Vision Graphics and ImageProcessing vol 41 no 2 pp 233ndash260 1988
[5] W Snyder G Bilbro A Logenthiran and S Rajala ldquoOptimalthresholding a new approachrdquo Pattern Recognition Letters vol11 no 12 pp 803ndash809 1990
[6] N Otsu ldquoA threshold selection method from gray-level his-togramsrdquo IEEE Transactions on Systems Man Cybernetics vol9 no 1 pp 62ndash66 1979
[7] J N Kapur P K Sahoo and A K C Wong ldquoA new methodfor gray-level picture thresholding using the entropy of thehistogramrdquo Computer Vision Graphics amp Image Processing vol29 no 3 pp 273ndash285 1985
[8] J Kittler and J Illingworth ldquoMinimum error thresholdingrdquoPattern Recognition vol 19 no 1 pp 41ndash47 1986
[9] K Hammouche M Diaf and P Siarry ldquoA comparative studyof various meta-heuristic techniques applied to the multilevelthresholding problemrdquo Engineering Applications of ArtificialIntelligence vol 23 no 5 pp 676ndash688 2010
[10] R Storn and K Price ldquoDifferential evolutionmdasha simple andefficient heuristic for global optimization over continuousspacesrdquo Journal of Global Optimization vol 11 no 4 pp 341ndash359 1997
[11] S Kirkpatrick C D Gelatt Jr andM P Vecchi ldquoOptimizationby simulated annealingrdquo Science vol 220 no 4598 pp 671ndash6801983
[12] F Glover ldquoTabu Searchmdashpart Irdquo ORSA Journal on Computingvol 1 article 3 pp 190ndash206 1989
[13] J H Holland Adaptation in Natural and Artificial SystemsUniversity of Michigan Press Ann Arbor Mich USA 1975
[14] C Lai and D Tseng ldquoA hybrid approach using Gaussiansmoothing and genetic algorithm for multilevel thresholdingrdquoInternational Journal of Hybrid Intelligent Systems vol 1 pp143ndash152 2004
[15] P-Y Yin ldquoA fast scheme for optimal thresholding using geneticalgorithmsrdquo Signal Processing vol 72 no 2 pp 85ndash95 1999
[16] J Kennedy and R Eberhart ldquoParticle swarm optimizationrdquoin Proceedings of the IEEE International Conference on NeuralNetworks vol 4 pp 1942ndash1948 December 1995
[17] D Karaboga ldquoAn idea based on honey bee swarm for numer-ical optimizationrdquo Tech Rep TR06 Computer EngineeringDepartment Engineering Faculty Erciyes University 2005
[18] B Akay ldquoA study on particle swarm optimization and artificialbee colony algorithms for multilevel thresholdingrdquo Applied SoftComputing vol 13 no 6 pp 3066ndash3091 2012
[19] PD Sathya andRKayalvizhi ldquoOptimalmultilevel thresholdingusing bacterial foraging algorithmrdquo Expert Systems with Appli-cations vol 38 no 12 pp 15549ndash15564 2011
[20] Z W Geem J H Kim and G V Loganathan ldquoA new heuristicoptimization algorithm harmony searchrdquo Simulation vol 76no 2 pp 60ndash68 2001
[21] M Mahdavi M Fesanghary and E Damangir ldquoAn improvedharmony search algorithm for solving optimization problemsrdquoAppliedMathematics and Computation vol 188 no 2 pp 1567ndash1579 2007
[22] K S Lee and Z W Geem ldquoA new meta-heuristic algorithm forcontinuous engineering optimization harmony search theoryand practicerdquo Computer Methods in Applied Mechanics andEngineering vol 194 no 36-38 pp 3902ndash3933 2005
[23] K S Lee Z W Geem S-H Lee and K-W Bae ldquoThe harmonysearch heuristic algorithm for discrete structural optimizationrdquoEngineering Optimization vol 37 no 7 pp 663ndash684 2005
[24] J H Kim Z W Geem and E S Kim ldquoParameter estimationof the nonlinear Muskingum model using harmony searchrdquoJournal of the AmericanWater Resources Association vol 37 no5 pp 1131ndash1138 2001
[25] Z W Geem ldquoOptimal cost design of water distribution net-works using harmony searchrdquo Engineering Optimization vol38 no 3 pp 259ndash280 2006
[26] Z W Geem K S Lee and Y J Park ldquoApplication of harmonysearch to vehicle routingrdquoAmerican Journal of Applied Sciencesvol 2 pp 1552ndash1557 2005
[27] A VasebiM Fesanghary and SM T Bathaee ldquoCombined heatand power economic dispatch by harmony search algorithmrdquoInternational Journal of Electrical Power andEnergy Systems vol29 no 10 pp 713ndash719 2007
[28] S O Degertekin ldquoOptimum design of steel frames using har-mony search algorithmrdquo Structural and Multidisciplinary Opti-mization vol 36 no 4 pp 393ndash401 2008
[29] E Cuevas N Ortega-Sanchez D Zaldivar and M Perez-Cisneros ldquoCircle detection by harmony search optimizationrdquoJournal of Intelligent and Robotic Systems pp 1ndash18 2011
[30] OMAlia andRMandava ldquoThevariants of the harmony searchalgorithm an overviewrdquo Artificial Intelligence Review vol 36no 1 pp 49ndash68 2011
24 Journal of Applied Mathematics
[31] F G Lobo C F Lima and Z Michalewicz Eds ParameterSetting in Evolutionary Algorithms vol 54 of Studies in Com-putational Intelligence Springer Berlin Germany 2007
[32] C B B Costa M R W MacIel and R M Filho ldquoFactorialdesign technique applied to genetic algorithm parameters ina batch cooling crystallization optimisationrdquo Computers andChemical Engineering vol 29 no 10 pp 2229ndash2241 2005
[33] A Khadwilard P Luangpaiboon and P Pongcharoen ldquoFull fac-torial experimental design for parameters selection of harmonysearch Algorithmrdquo The Journal of Industrial Technology vol 8no 2 pp 1ndash10 2012
[34] G E P Box W G Hunter and J S Hunter Statistic for Experi-mentersmdashAn Introduction to Design Data Analysis and ModelBuilding John Wiley amp Sons New York NY USA 1978
[35] S K Pal D Bhandari and M K Kundu ldquoGenetic algorithmsfor optimal image enhancementrdquo Pattern Recognition Lettersvol 15 no 3 pp 261ndash271 1994
[36] F Wilcoxon ldquoIndividual comparisons by ranking methodsrdquoBiometrics vol 1 pp 80ndash83 1945
[37] S Garcia D Molina M Lozano and F Herrera ldquoAstudy onthe use of non-parametric tests for analyzing the evolutionaryalgorithmsrsquo behaviour a case study on the CECrsquo2005 Specialsession on real parameter optimizationrdquo Journal of Heuristicsvol 15 no 6 pp 617ndash644 2008
Submit your manuscripts athttpwwwhindawicom
OperationsResearch
Advances in
Hindawi Publishing Corporationhttpwwwhindawicom Volume 2013
Hindawi Publishing Corporationhttpwwwhindawicom Volume 2013
Mathematical Problems in Engineering
Abstract and Applied AnalysisHindawi Publishing Corporationhttpwwwhindawicom Volume 2013
ISRN Applied Mathematics
Hindawi Publishing Corporationhttpwwwhindawicom Volume 2013
Hindawi Publishing Corporationhttpwwwhindawicom
Volume 2013
International Journal of
Combinatorics
Hindawi Publishing Corporationhttpwwwhindawicom Volume 2013
Journal of Function Spaces and Applications
International Journal of Mathematics and Mathematical Sciences
Hindawi Publishing Corporationhttpwwwhindawicom Volume 2013
ISRN Geometry
Hindawi Publishing Corporationhttpwwwhindawicom Volume 2013
Discrete Dynamics in Nature and Society
Hindawi Publishing Corporationhttpwwwhindawicom Volume 2013
Hindawi Publishing Corporationhttpwwwhindawicom
Volume 2013
Advances in
Mathematical Physics
ISRN Algebra
Hindawi Publishing Corporationhttpwwwhindawicom Volume 2013
ProbabilityandStatistics
Journal of
Hindawi Publishing Corporationhttpwwwhindawicom Volume 2013
ISRN Mathematical Analysis
Hindawi Publishing Corporationhttpwwwhindawicom Volume 2013
Journal ofApplied Mathematics
Hindawi Publishing Corporationhttpwwwhindawicom Volume 2013
Advances in
DecisionSciences
Hindawi Publishing Corporationhttpwwwhindawicom Volume 2013
Hindawi Publishing Corporationhttpwwwhindawicom Volume 2013
Stochastic AnalysisInternational Journal of
Hindawi Publishing Corporation httpwwwhindawicom Volume 2013Hindawi Publishing Corporation httpwwwhindawicom Volume 2013
The Scientific World Journal
Hindawi Publishing Corporationhttpwwwhindawicom Volume 2013
ISRN Discrete Mathematics
Hindawi Publishing Corporationhttpwwwhindawicom
Differential EquationsInternational Journal of
Volume 2013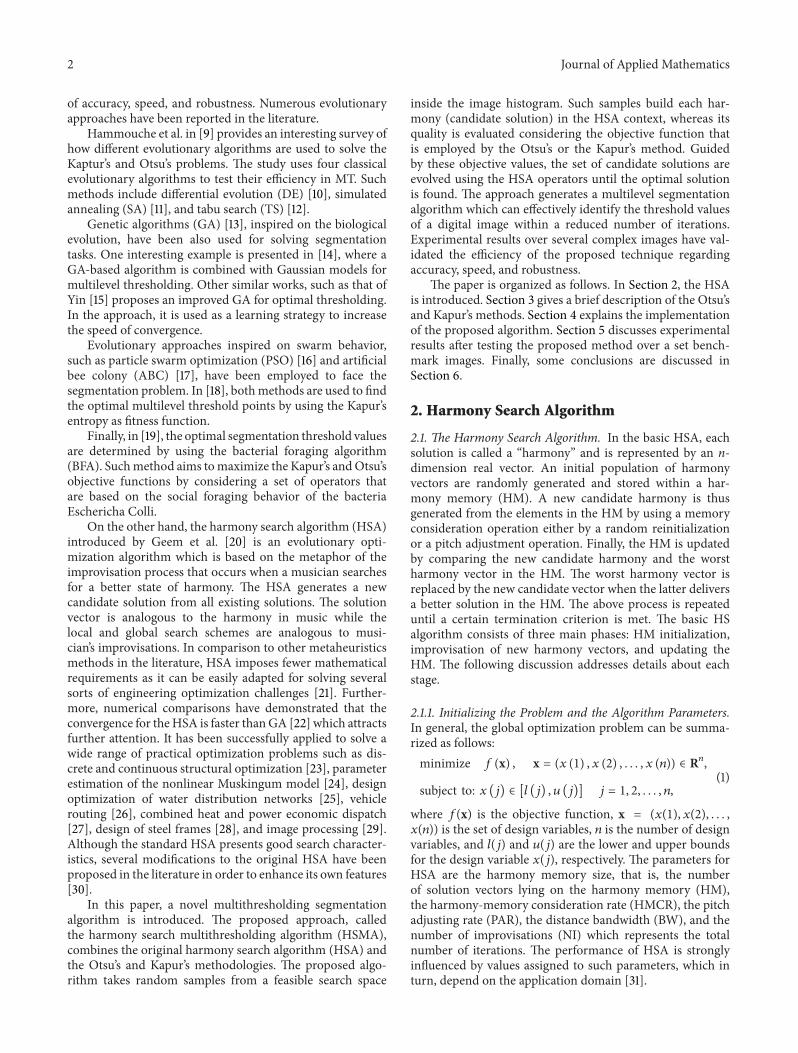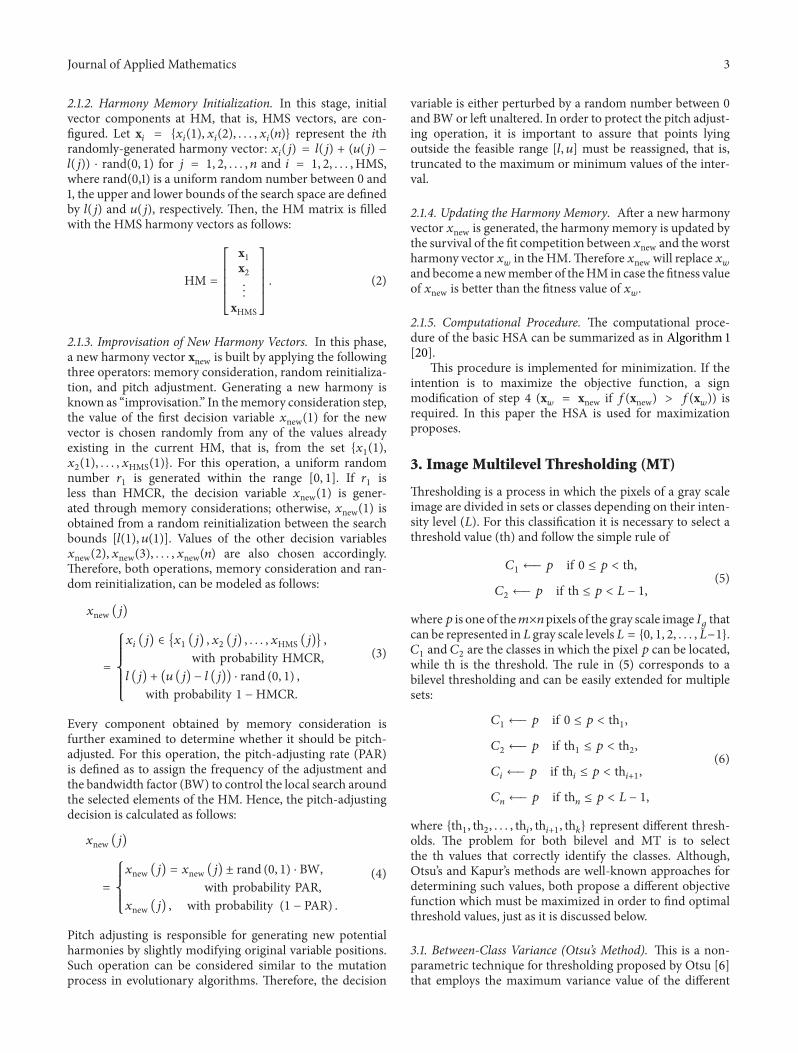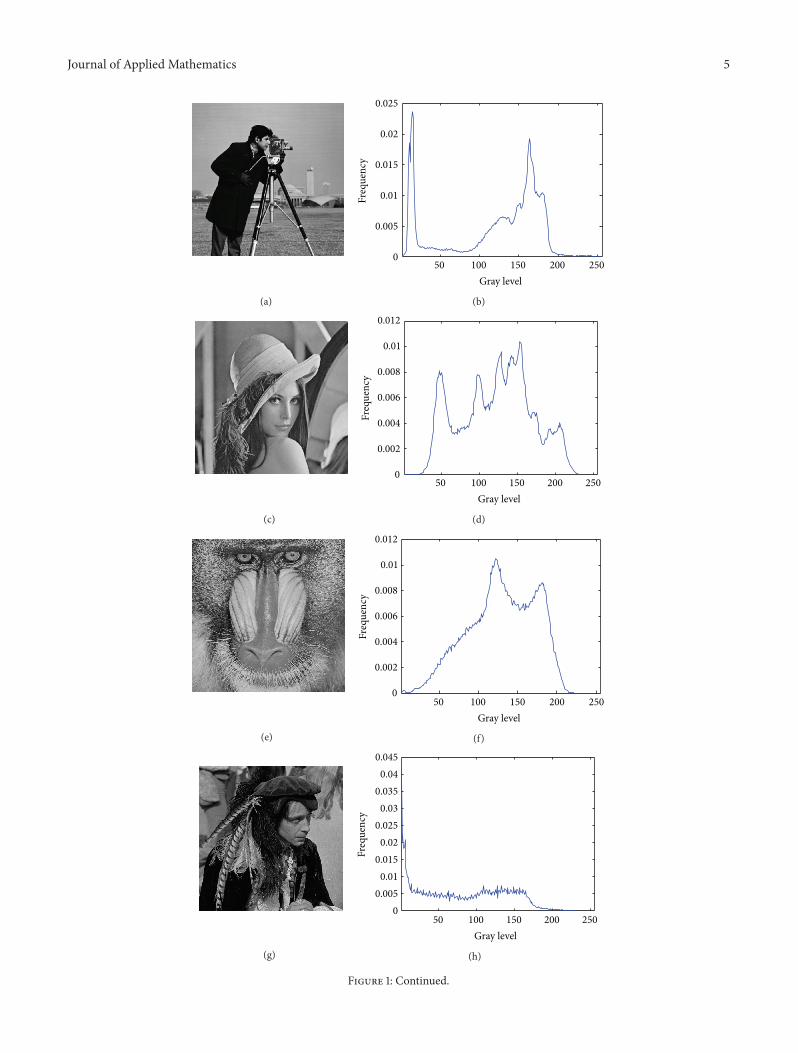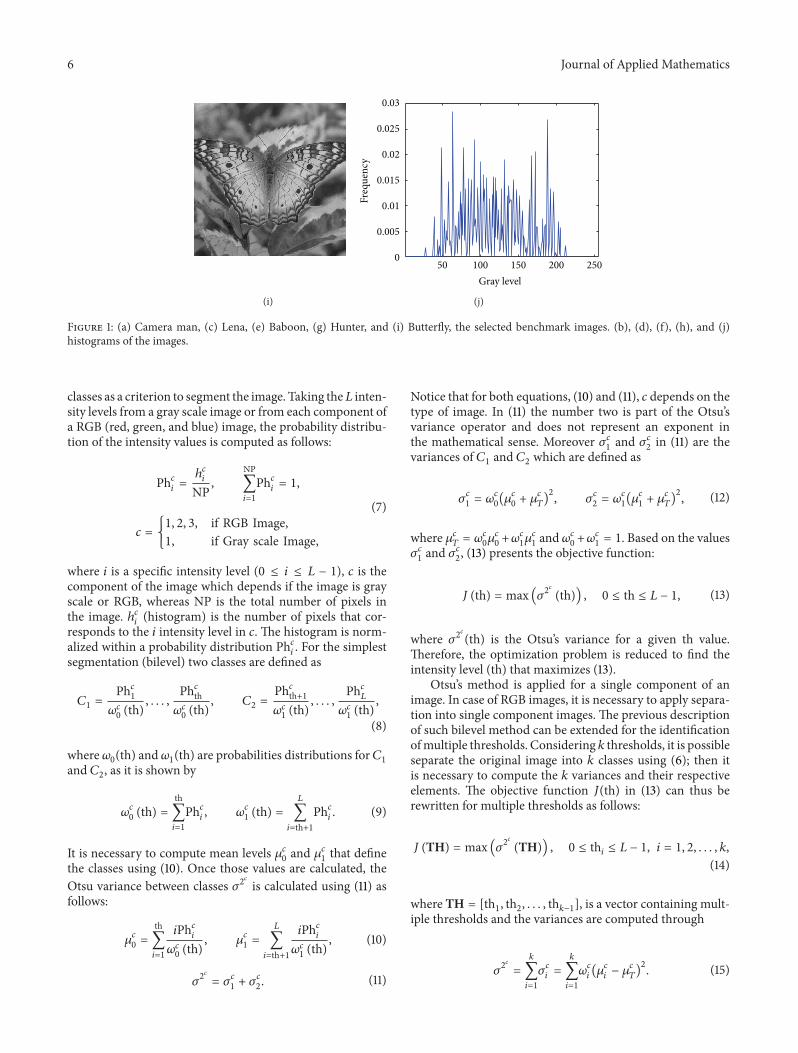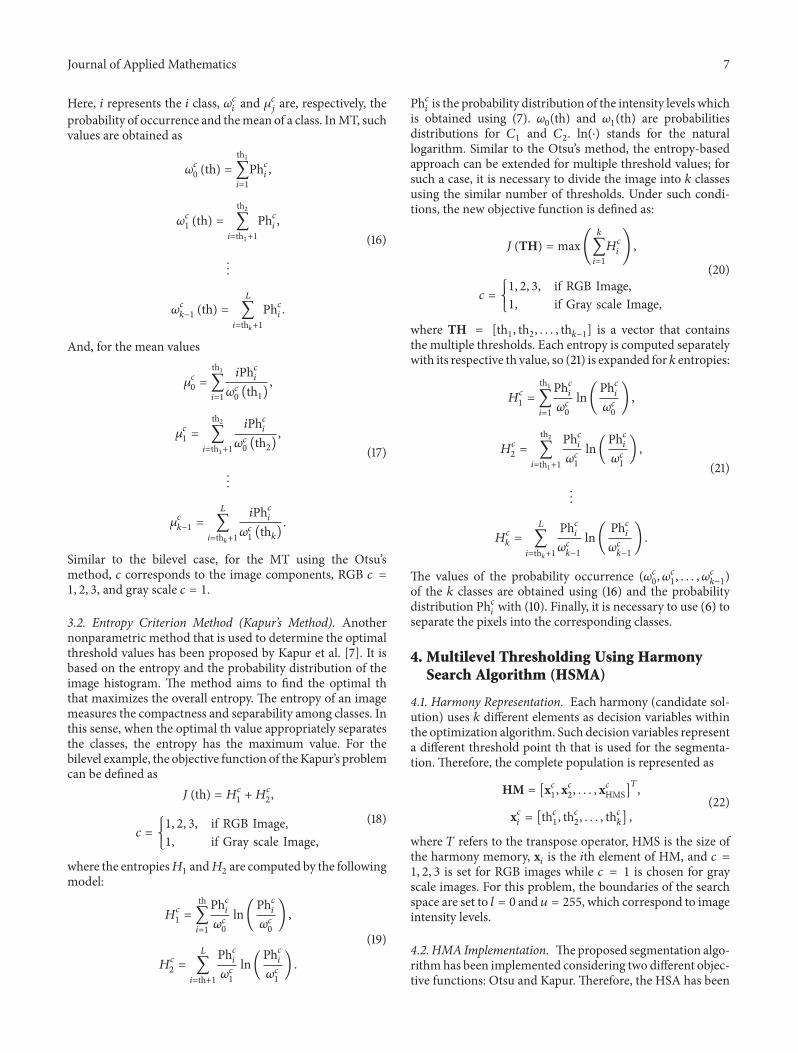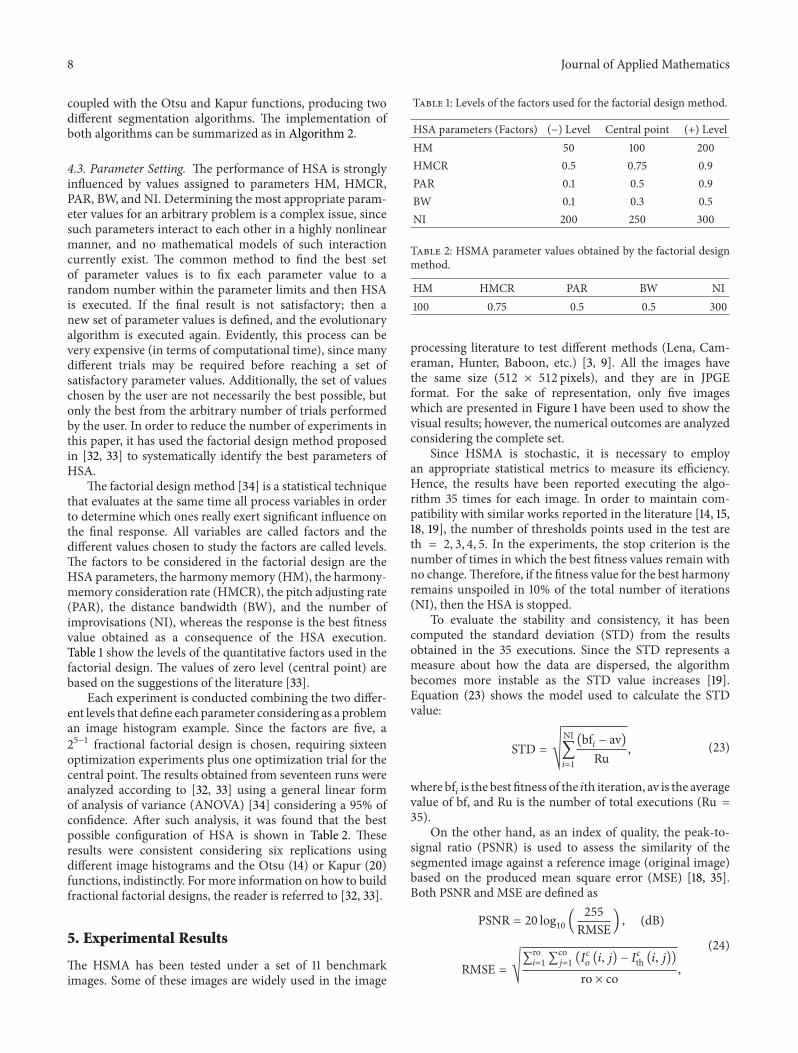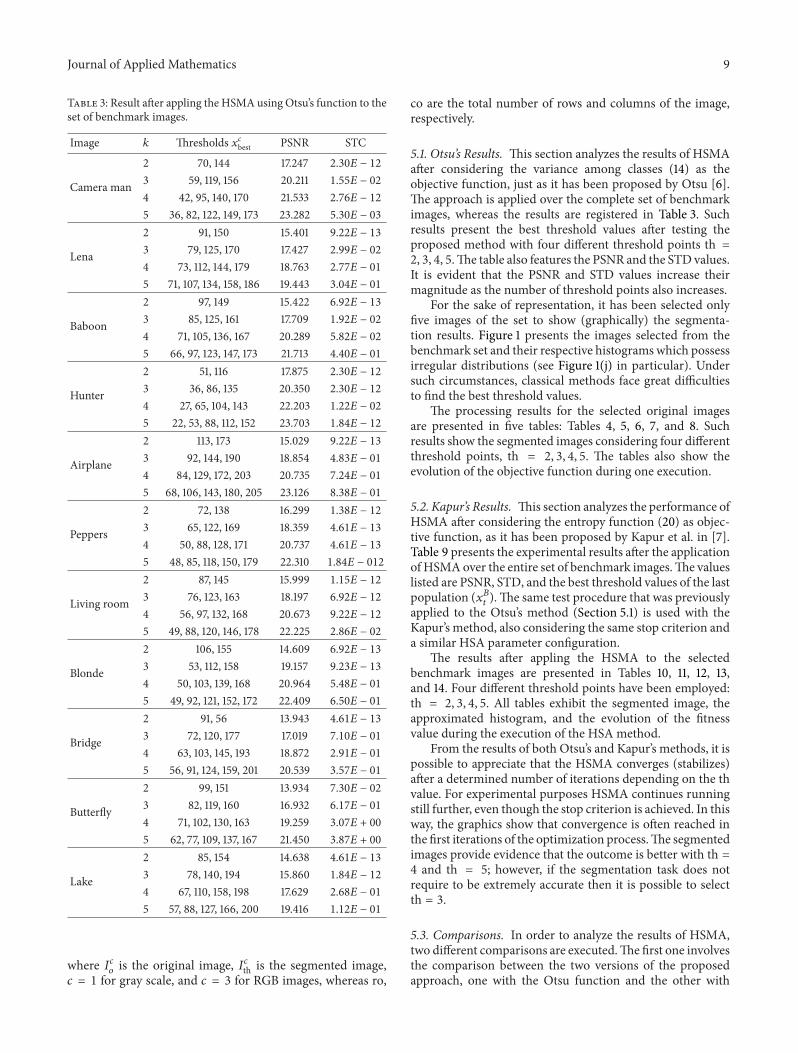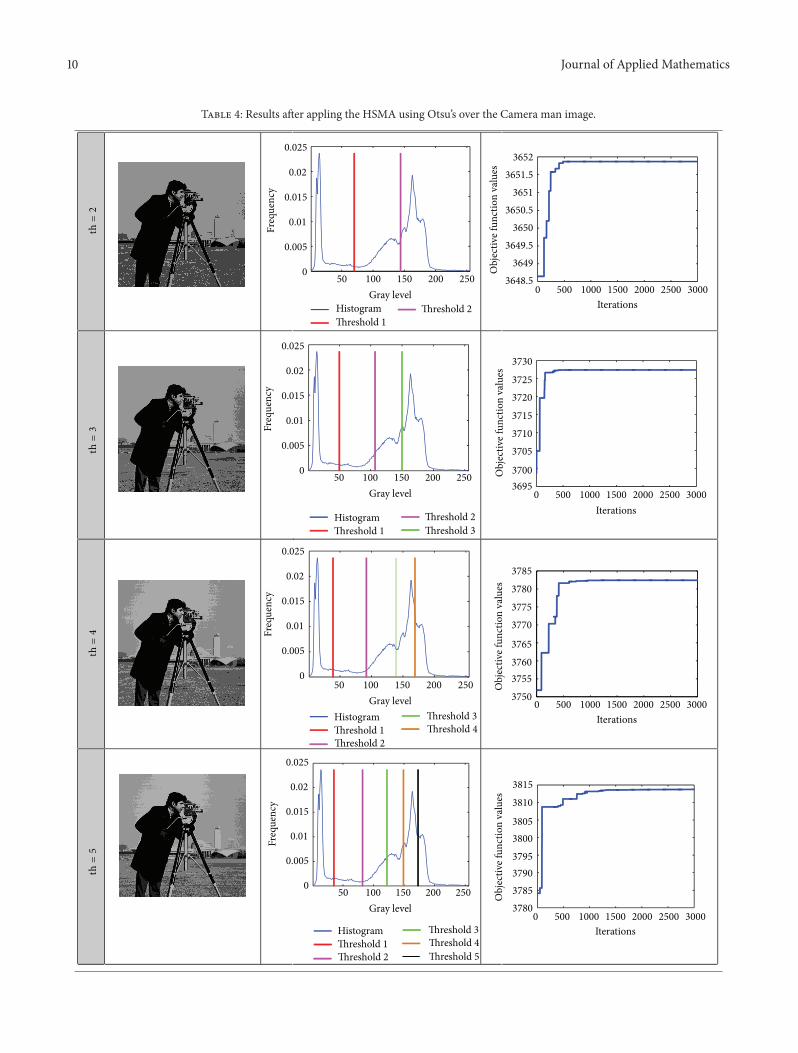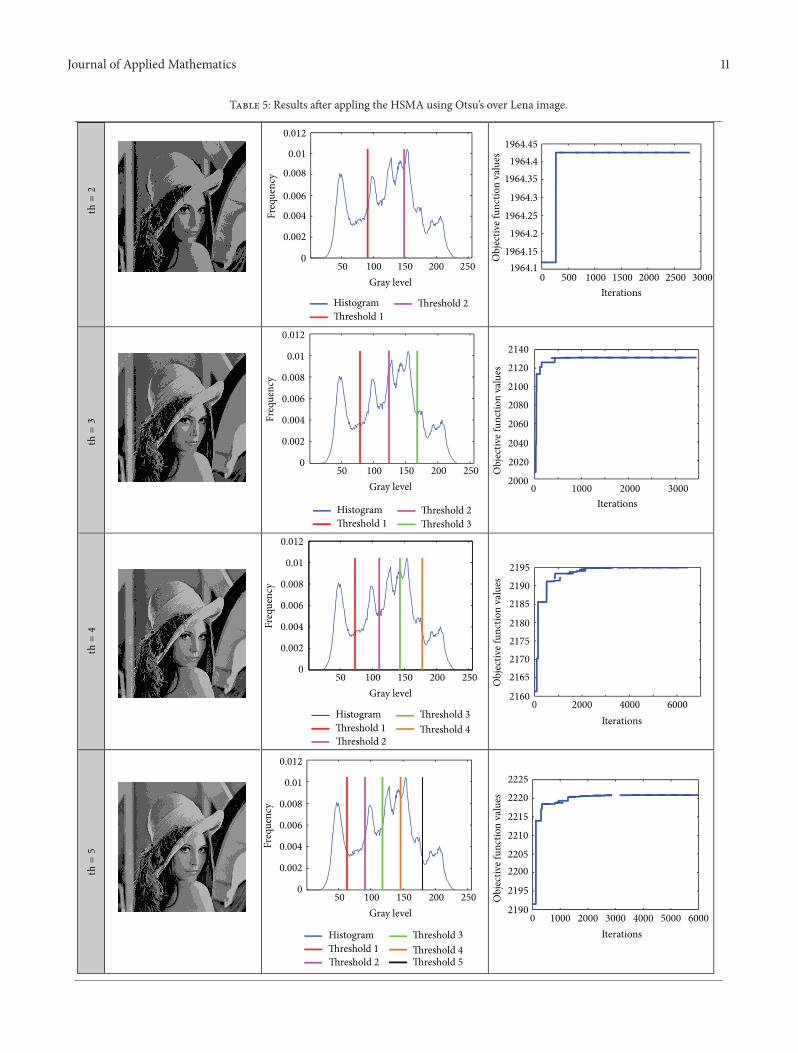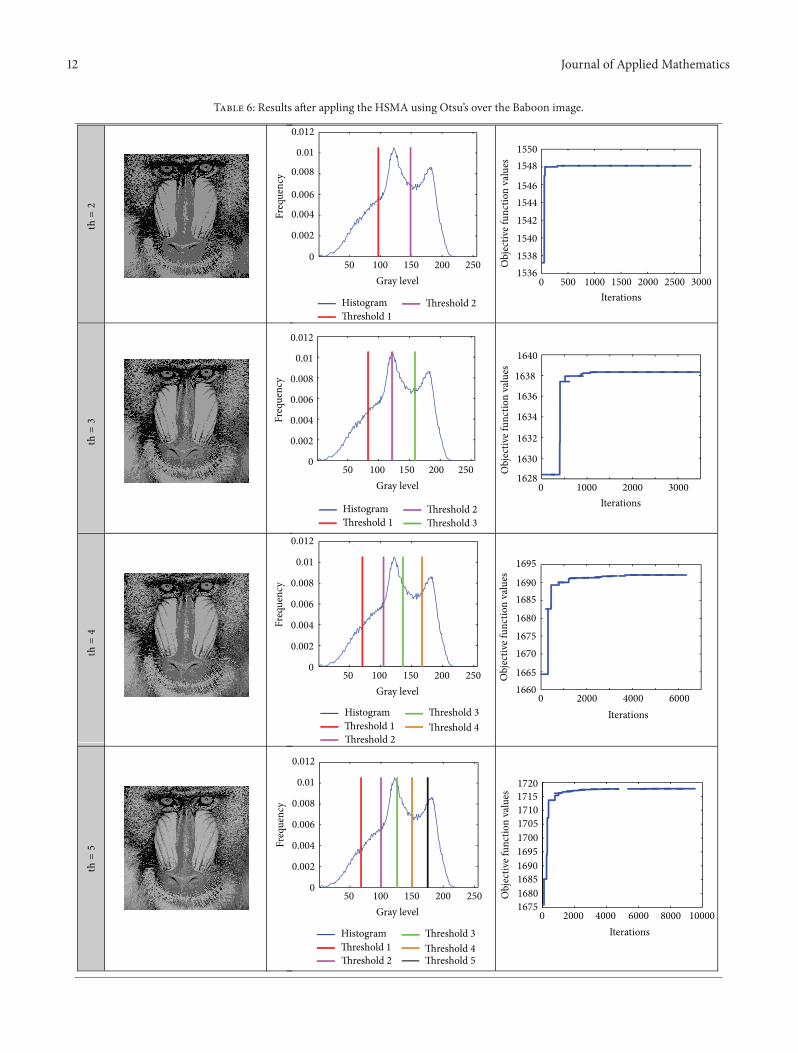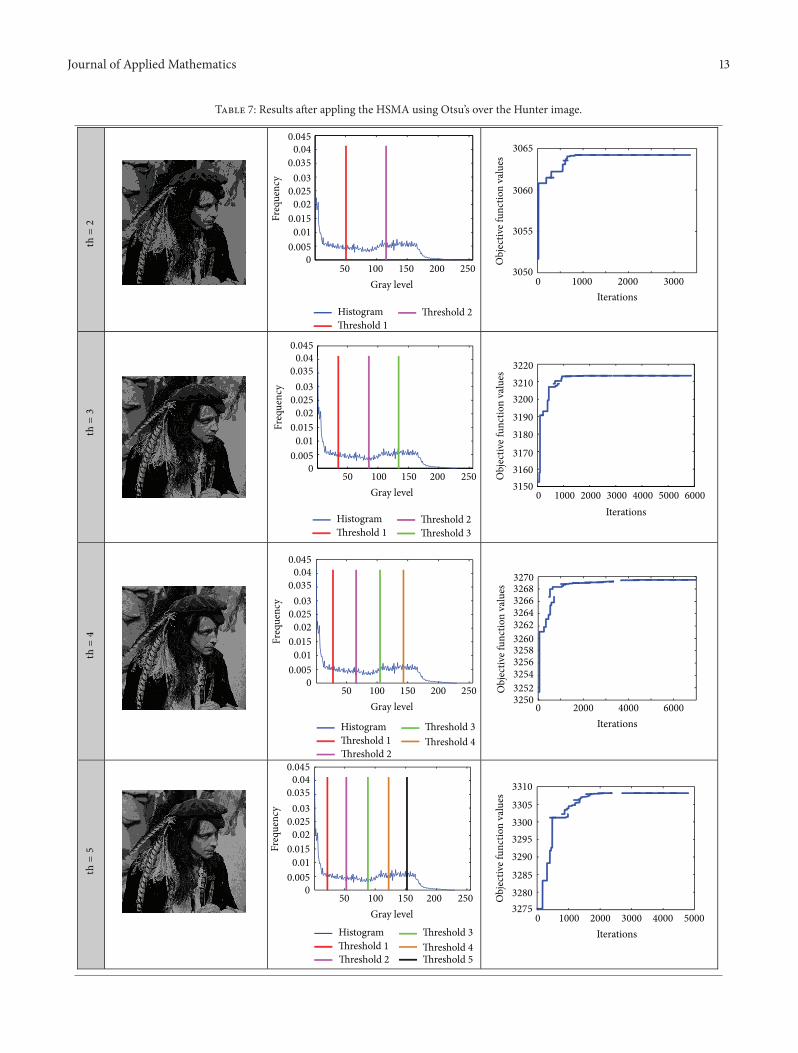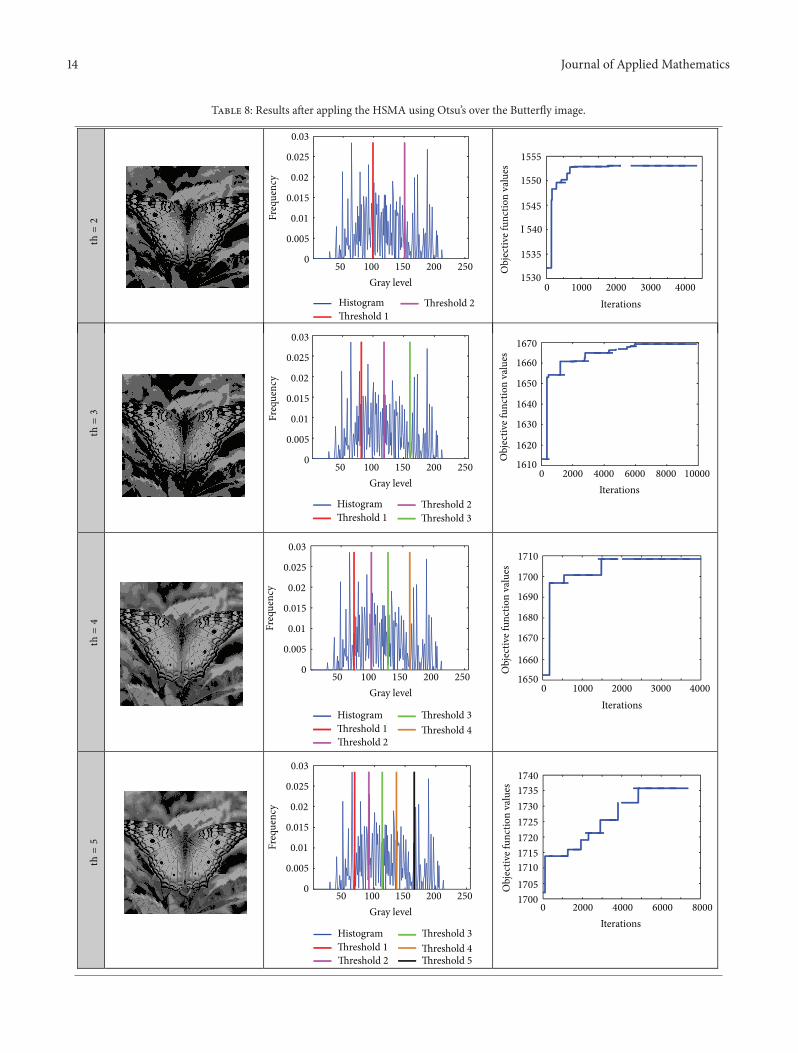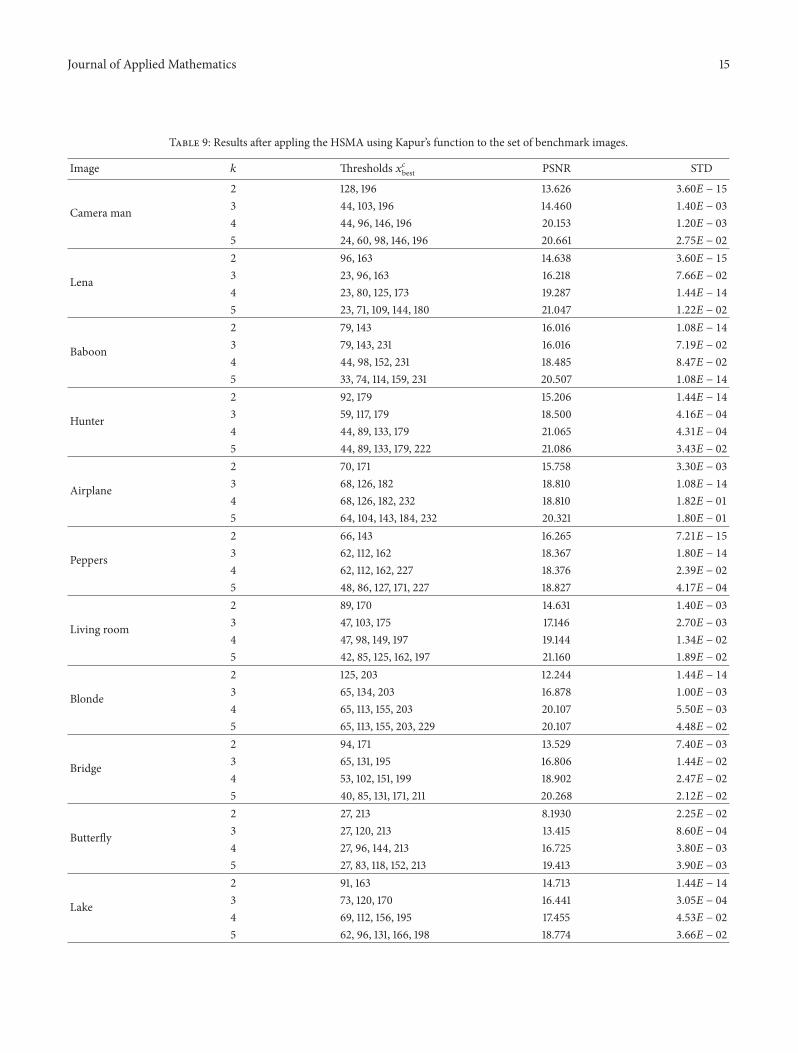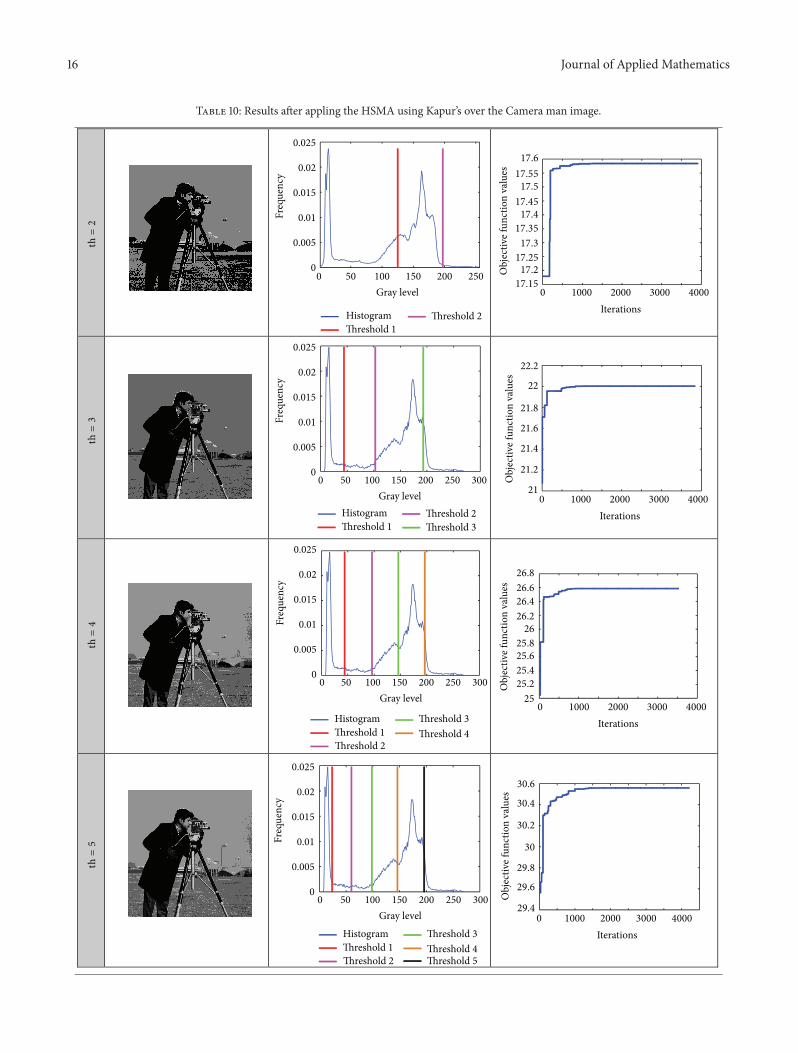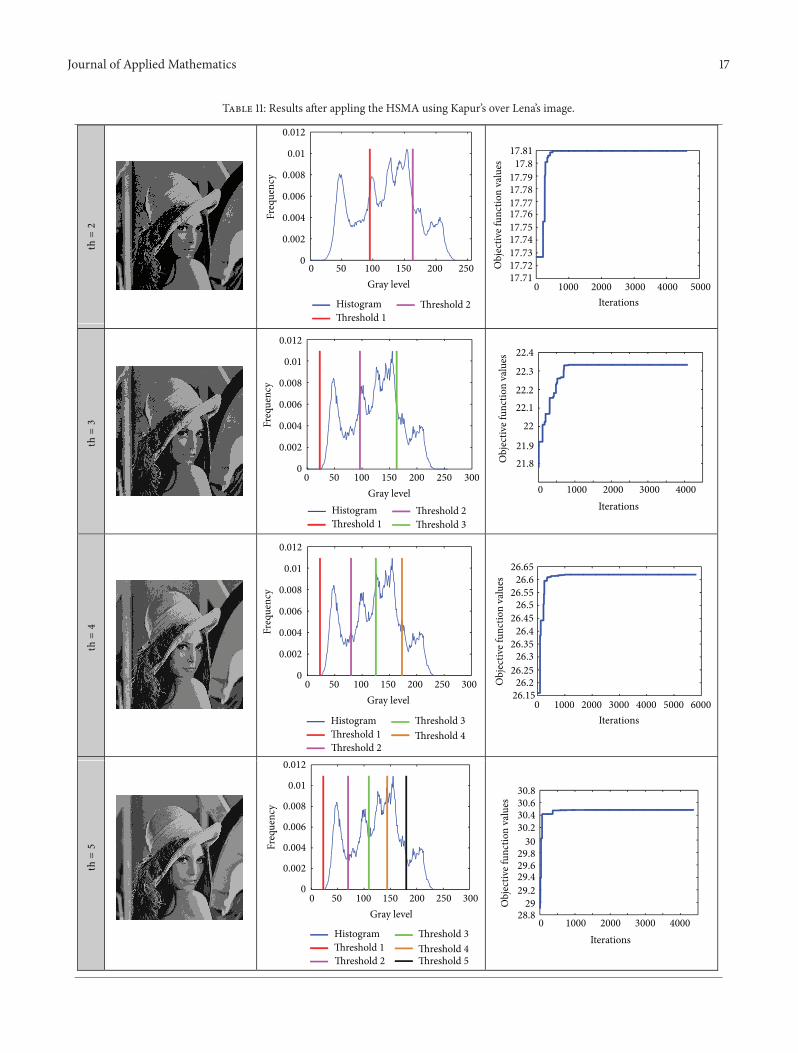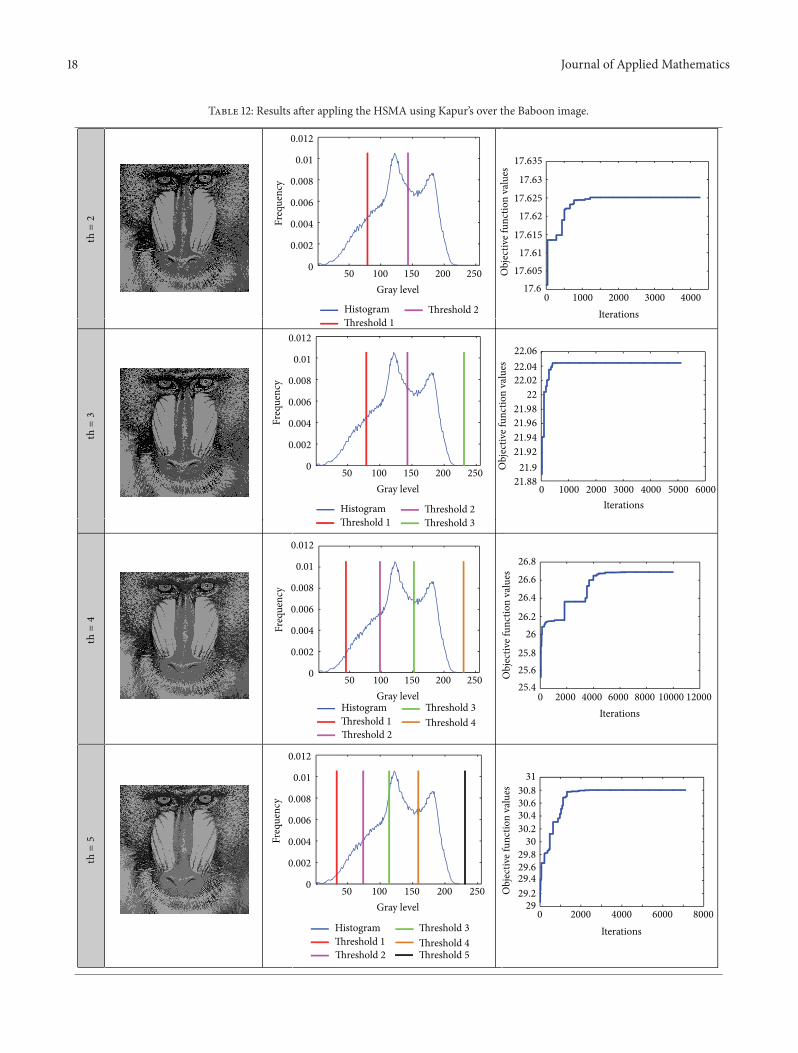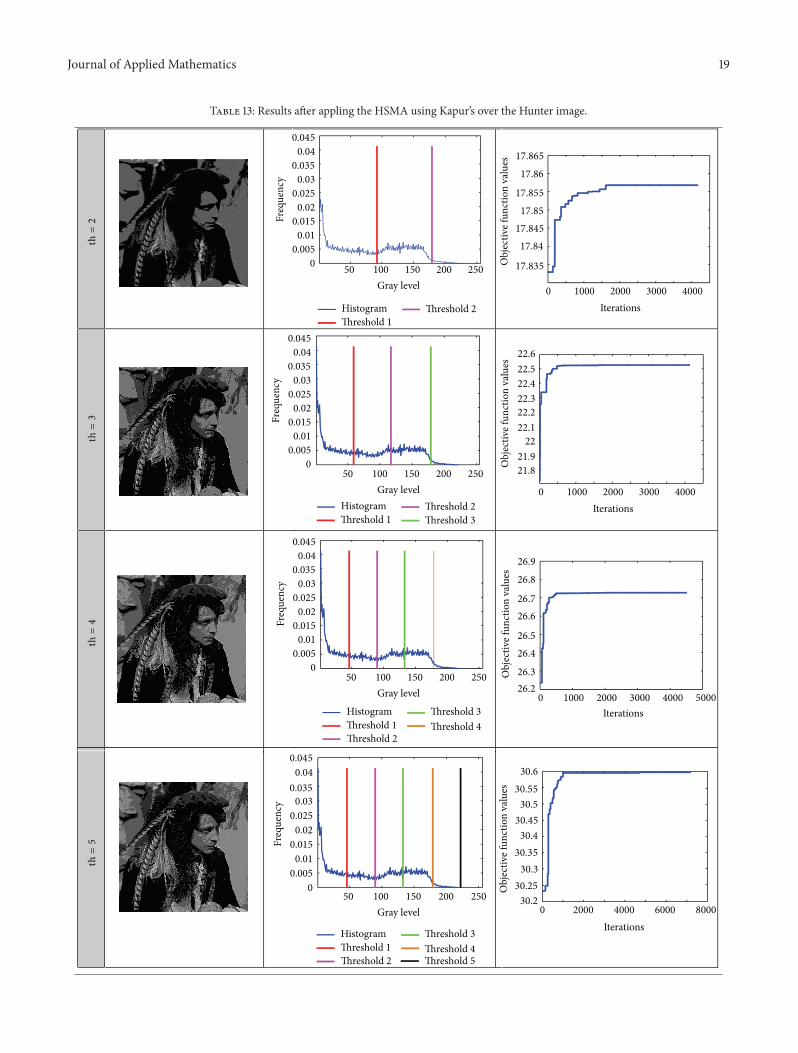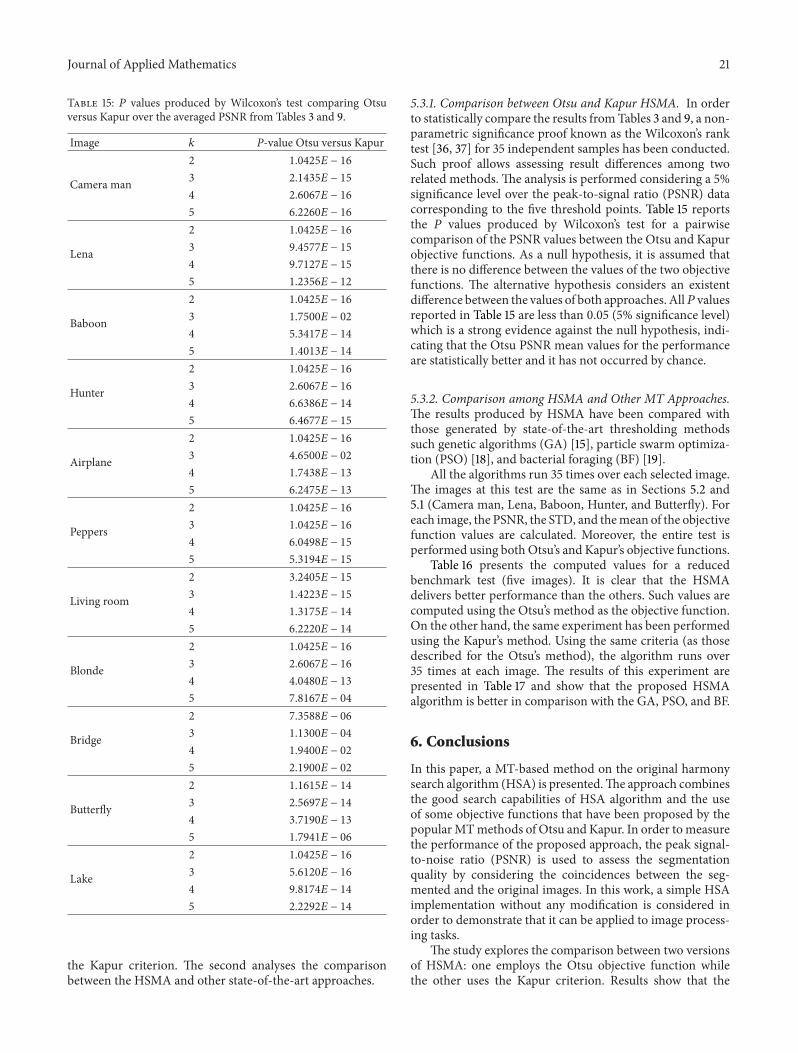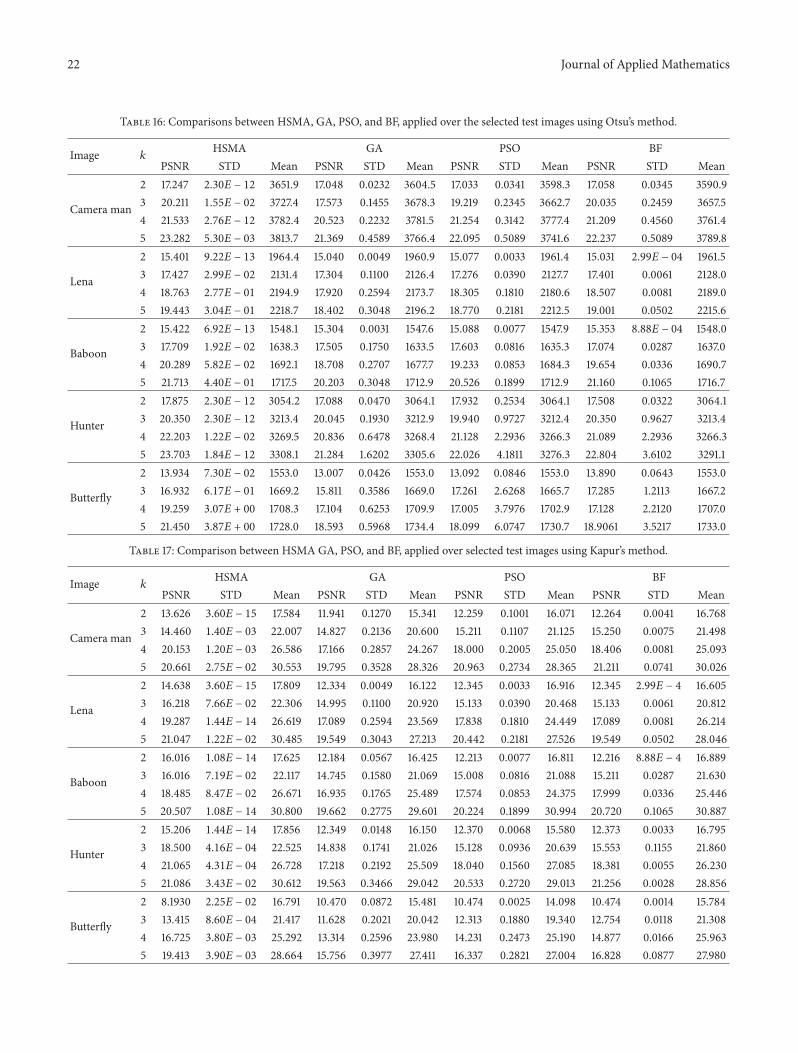
Copyright © 2022 FDOKUMEN