Resilience of human brain functional networks under thresholding
8
Resilience of human brain functional coactivation networks under thresholding Somwrita Sarkar Design Lab University of Sydney NSW 2006, Australia [email protected] Sanjay Chawla School of Information Technologies University of Sydney NSW 2006, Australia [email protected] Hanley Weng Design Lab University of Sydney NSW 2006, Australia [email protected] ABSTRACT Recent studies have demonstrated the existence of commu- nity structure and rich club nodes, (i.e., highly intercon- nected, high degree hub nodes), in human brain functional networks. The cognitive relevance of the detected modules and hubs has also been demonstrated, for both task based and default mode networks, suggesting that the brain self- organizes into patterns of co-activated sets of regions for performing specific tasks or in resting state. In this paper, we report studies on the resilience or robustness of this mod- ular structure: under systematic erosion of connectivity in the network under thresholding, how resilient is the modu- larity and hub structure? The results show that the network shows show strong resilience properties, with the modular- ity and hub structure maintaining itself over a large range of connection strengths. Then, at a certain critical threshold that falls very close to 0, the connectivity, the modularity, and hub structure suddenly break down, showing a phase transition like property. Additionally, the spatial and topo- logical organization of erosion of connectivity at all levels was found to be homogenous rather than heterogenous; i.e., no “structural holes” of any significant sizes were found, and no gradual increases in numbers of components were de- tected. Any loss of connectivity is homogenously spread out across the network. The results suggest that human task- based functional brain networks are very resilient, where the whole network structure fails only when connectivity is al- most fully removed from the network. The findings may help further the understanding of dynamics of and relationships between structural and functional brain networks. Categories and Subject Descriptors H.4 [Information Systems Applications]: Miscellaneous; G.2.2 [Graph Theory]: Metrics General Terms Networks, modularity, community structure, hubs, resilience, Permission to make digital or hard copies of all or part of this work for personal or classroom use is granted without fee provided that copies are not made or distributed for profit or commercial advantage and that copies bear this notice and the full citation on the first page. To copy otherwise, to republish, to post on servers or to redistribute to lists, requires prior specific permission and/or a fee. WOODSTOCK ’97 El Paso, Texas USA Copyright 20XX ACM X-XXXXX-XX-X/XX/XX ...$15.00. human brain, functional coactivation Keywords ACM proceedings, Networks, modularity, community struc- ture, hubs, resilience, human brain, functional coactivation 1. INTRODUCTION With graph theory, network science, and computational neuroscience joining forces, significant advances have been made in furthering the understanding of human brain net- work organization [6, 3, 8, 7, 13, 12]. Recent studies have demonstrated the existence of small-worldness, community structure and a set of rich club nodes, (i.e., highly inter- connected, high degree hub nodes, with large periphery), in human brain structural and functional networks [4, 8, 7, 6]. The cognitive relevance of the detected modules and hubs has also been demonstrated, for both task based and de- fault mode or resting state networks, suggesting that the brain self-organizes into co-activated sets of regions for per- forming specific tasks or in resting state [4]. Most of these studies on the functional structure of brain networks, that is, patterns of measured co-activation of brain regions as the brain is in a resting state or performing a specific task, is based on the experimental basis provided by fMRI or functional magnetic resonance imaging stud- ies [5, 13]. After considerable pre- and post-processing of such data, fMRI based brain networks are produced, on which established graph theoretic algorithms are applied, to deduce information about the topology and spatial or- ganization of brain networks, and the relationship of graph theoretic properties to brain function and dynamics. How- ever, mining and detection of these patterns is dependent on the data, and it is known that in the brain domain, ex- perimentally measured data is subject to innumerable vari- ations on experimental conditions, pre- and post-processing steps, and human subjects, along with combinatorial expla- nations of these variations [5]. Therefore, to base the results of analysis on a simple application of algorithms to numeri- cal data can be problematic in terms of interpretation of the data [5]. Further, while small-worldness, modularity struc- ture, and hub structure has essentially been demonstrated by multiple studies, the resilience of their topological and spatial organization and their relationship to the numerical data provided by the experiments is still an open question. In this paper, we report studies on the resilience or ro- bustness of this modular structure: under systematic ero- sion of connectivity in the network under thresholding, how arXiv:1407.1549v1 [cs.SI] 6 Jul 2014
Transcript of Resilience of human brain functional networks under thresholding
Resilience of human brain functional coactivationnetworks under thresholding
Somwrita SarkarDesign Lab
University of SydneyNSW 2006, Australia
Sanjay ChawlaSchool of Information
TechnologiesUniversity of SydneyNSW 2006, Australia
Hanley WengDesign Lab
University of SydneyNSW 2006, Australia
ABSTRACTRecent studies have demonstrated the existence of commu-nity structure and rich club nodes, (i.e., highly intercon-nected, high degree hub nodes), in human brain functionalnetworks. The cognitive relevance of the detected modulesand hubs has also been demonstrated, for both task basedand default mode networks, suggesting that the brain self-organizes into patterns of co-activated sets of regions forperforming specific tasks or in resting state. In this paper,we report studies on the resilience or robustness of this mod-ular structure: under systematic erosion of connectivity inthe network under thresholding, how resilient is the modu-larity and hub structure? The results show that the networkshows show strong resilience properties, with the modular-ity and hub structure maintaining itself over a large range ofconnection strengths. Then, at a certain critical thresholdthat falls very close to 0, the connectivity, the modularity,and hub structure suddenly break down, showing a phasetransition like property. Additionally, the spatial and topo-logical organization of erosion of connectivity at all levelswas found to be homogenous rather than heterogenous; i.e.,no “structural holes” of any significant sizes were found, andno gradual increases in numbers of components were de-tected. Any loss of connectivity is homogenously spread outacross the network. The results suggest that human task-based functional brain networks are very resilient, where thewhole network structure fails only when connectivity is al-most fully removed from the network. The findings may helpfurther the understanding of dynamics of and relationshipsbetween structural and functional brain networks.
Categories and Subject DescriptorsH.4 [Information Systems Applications]: Miscellaneous;G.2.2 [Graph Theory]: Metrics
General TermsNetworks, modularity, community structure, hubs, resilience,
Permission to make digital or hard copies of all or part of this work forpersonal or classroom use is granted without fee provided that copies arenot made or distributed for profit or commercial advantage and that copiesbear this notice and the full citation on the first page. To copy otherwise, torepublish, to post on servers or to redistribute to lists, requires prior specificpermission and/or a fee.WOODSTOCK ’97 El Paso, Texas USACopyright 20XX ACM X-XXXXX-XX-X/XX/XX ...$15.00.
human brain, functional coactivation
KeywordsACM proceedings, Networks, modularity, community struc-ture, hubs, resilience, human brain, functional coactivation
1. INTRODUCTIONWith graph theory, network science, and computational
neuroscience joining forces, significant advances have beenmade in furthering the understanding of human brain net-work organization [6, 3, 8, 7, 13, 12]. Recent studies havedemonstrated the existence of small-worldness, communitystructure and a set of rich club nodes, (i.e., highly inter-connected, high degree hub nodes, with large periphery), inhuman brain structural and functional networks [4, 8, 7, 6].The cognitive relevance of the detected modules and hubshas also been demonstrated, for both task based and de-fault mode or resting state networks, suggesting that thebrain self-organizes into co-activated sets of regions for per-forming specific tasks or in resting state [4].
Most of these studies on the functional structure of brainnetworks, that is, patterns of measured co-activation of brainregions as the brain is in a resting state or performing aspecific task, is based on the experimental basis providedby fMRI or functional magnetic resonance imaging stud-ies [5, 13]. After considerable pre- and post-processing ofsuch data, fMRI based brain networks are produced, onwhich established graph theoretic algorithms are applied,to deduce information about the topology and spatial or-ganization of brain networks, and the relationship of graphtheoretic properties to brain function and dynamics. How-ever, mining and detection of these patterns is dependenton the data, and it is known that in the brain domain, ex-perimentally measured data is subject to innumerable vari-ations on experimental conditions, pre- and post-processingsteps, and human subjects, along with combinatorial expla-nations of these variations [5]. Therefore, to base the resultsof analysis on a simple application of algorithms to numeri-cal data can be problematic in terms of interpretation of thedata [5]. Further, while small-worldness, modularity struc-ture, and hub structure has essentially been demonstratedby multiple studies, the resilience of their topological andspatial organization and their relationship to the numericaldata provided by the experiments is still an open question.
In this paper, we report studies on the resilience or ro-bustness of this modular structure: under systematic ero-sion of connectivity in the network under thresholding, how
arX
iv:1
407.
1549
v1 [
cs.S
I] 6
Jul
201
4
resilient is the modularity and hub structure? The resultsshow that the functional co-activation network shows strongresilience properties, with the modularity and hub structuremaintaining itself over a large range of connection strengths.Then, at a certain critical threshold that falls very close to0, the connectivity, the modularity, and hub structure sud-denly breaks down, showing a phase transition like prop-erty. Additionally, the spatial and topological organizationof erosion of connectivity at all levels was found to be ho-mogenous rather than heterogenous; no “structural holes” ofany significant sizes appeared, and no gradual increases innumbers of components were detected. Loss of connectiv-ity was homogenously spread out across the network. Theresults suggest that human task-based functional brain net-works are very resilient, where the whole network structurefails only when connectivity is almost fully removed from thenetwork. The findings may help further the understandingof dynamics of functional brain networks, such as their crit-icality and stability, ad the relationships between structureand function.
1.1 Paper summaryWe first present a static modularity analysis and rich club
or hub analysis as presented in previous work [4]. Our re-sults match with the previously reported results in the lit-erature [4]. Then, in Section 2 we present our thresholdingmethod, and its application on the data to produce graphsat various levels of decreasing connectivity. In Section 3 weanalyze the dynamics of how the community structure or-ganization and rich club structure changes dynamically asthe connectivity in the graph is systematically eroded. Weshow the existence of a sudden phase transition like behav-ior, where the community structure organization suddenlybreaks down, and we show that this is in the region thatrepresents the bulk of connectivity in the network. We alsoanalyze how the rich club structure changes. Finally, in Sec-tion 4 we summarize our findings, discuss our results, andpresent ideas for future work.
2. DATA AND THRESHOLDINGFrom [4], we have obtained data on functional coactiva-
tion brain networks. In the original paper, the authors havecollected 1641 instances of task-related fMRI or PET studiespublished between 1985 and 2010, available in the BrainMapdatabase. The human brain has been then parcellated into638 regions covering the whole brain, and for every pair ofthese regions, a Jaccard Index similarity was defined, thatwas computed using the 1641 instances of task related datamentioned above. That is, for every individual task, pat-terns of co-activation between pairs of brain regions wereavailable, and the Jaccard Index was then used as meta-analysis, to provide a measure of ”co-activation” associationbetween every two pairs of 638 brain regions over the entireset of tasks. This provides the functional co-activation ma-trix, where a high value of co-activation between two brainregions indicates the high measure of similarity between thepatterns of activations of two regions reported across a rangeof task-based experiments. For more information, please seethe original source [4].
Using the functional co-activation matrix, a network Gcan be defined with V vertices, and E edges, where twovertices vi and vj are connected by an edge with a weightwij equal to the functional co-activation measure described
above. If two nodes do not have an edge between them,this means that the corresponding brain regions have no co-activation. From the data available, the numerical rangeis particularly small, varying from 0 (no co-activation) to0.3355 (highest co-activation). The adjacency matrix is rep-resented by A, where Aij = wij if the nodes are connected,and Aij = 0 otherwise.
The original source [4] reports that this graph has a strongmodular structure with four principal modules detected (oc-cipital, central, frontoparietal, and default mode), that notonly correspond to the known large scale structural organi-zation of the brain, but also correspond to the known spe-cific behavioral, and cognitive functions supported by theseregions in the brain, thereby showing the relationship be-tween structural and functional structure. We reproducedthese results, by applying the same algorithm to the dataas the authors, and confirmed the existence of these mod-ules. Additionally, a rich-club structure was also reportedin the study, showing the existence of a set of highly con-nected, highly interrelated, high degree hub nodes, There-fore, it was interesting to ask the following question: how re-silient is this network to systematic erosion of connectivity?The answer to this question would not only help to deepenour understanding of the topological and spatial organiza-tion of the modularity and hub structure of the functionalnetwork, it would also help us to understand the patterns ofco-activation as they are spread across the brain, both topo-logically and spatially. More specifically, we ask the classicintegration versus segregation question: under systematicerosion of connectivity, does the co-activation network frac-ture into separate components gradually with modularitystructure rapidly changing, or does the modularity struc-ture hold as network connectivity erodes, pointing to a moreglobally integrated structure of co-activation.
We did the following. Looking at the data range and dis-tribution, we identified a set of relevant numerical thresholdst. Then, at every step, a new network was produced fromthe original network, with all edges above the value of tbeing removed from the network. Repeated application ofthis process produced a set of networks with the same set ofnodes, but decreasing in connectivity. This process was per-formed till there were no edges left in the network. Thesenew sparse networks were then examined for connectivity,modularity and hub (degree centrality) structure. For mod-ularity, we used the Louvain algorithm that the authors ofthe original paper used. The Louvain algorithm is a wellknown fast algorithm for Newman’s modularity maximiza-tion [2].
3. RESULTS
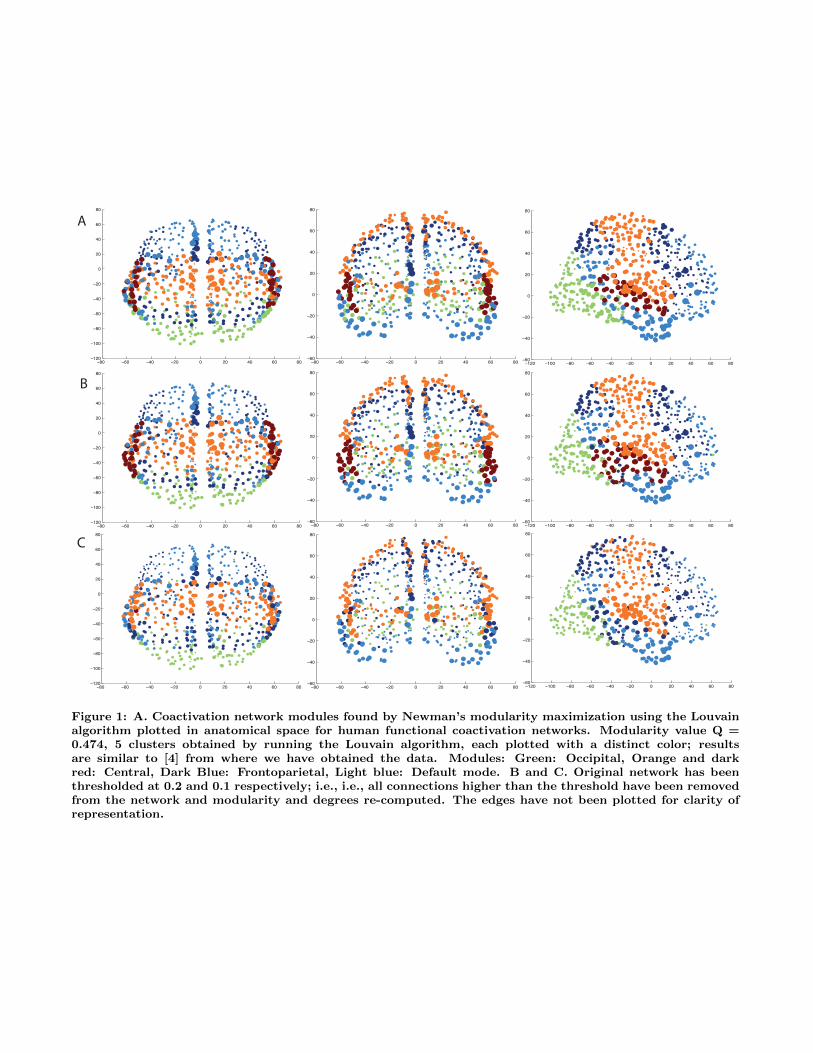
3.1 Modularity and hubs analysisFigure 1A shows the results of the modularity analysis for
the original functional coactivation network. We detected 5large clusters, corresponding exactly with the 4 large clustersreported in the original source [4]. The 4 detected moduleswere largely identified to be the occipital, central, fronto-parietal, and default mode. In our case, two clusters weredetected for the fronto-pareital, making the total number ofmodules 5.
We then performed an analysis of the distribution of edgestrengths in the network 2. The data range is small, andvaries from 0 to a maximum of 0.3355, but most of the con-
−120 −100 −80 −60 −40 −20 0 20 40 60 80−60
−40
−20
0
20
40
60
80
−80 −60 −40 −20 0 20 40 60 80−60
−40
−20
0
20
40
60
80
−80 −60 −40 −20 0 20 40 60 80−120
−100
−80
−60
−40
−20
0
20
40
60
80
−120 −100 −80 −60 −40 −20 0 20 40 60 80−60
−40
−20
0
20
40
60
80
−80 −60 −40 −20 0 20 40 60 80−60
−40
−20
0
20
40
60
80
−80 −60 −40 −20 0 20 40 60 80−120
−100
−80
−60
−40
−20
0
20
40
60
80
−120 −100 −80 −60 −40 −20 0 20 40 60 80−60
−40
−20
0
20
40
60
80
−80 −60 −40 −20 0 20 40 60 80−60
−40
−20
0
20
40
60
80
−80 −60 −40 −20 0 20 40 60 80−120
−100
−80
−60
−40
−20
0
20
40
60
80
A
B
C
Figure 1: A. Coactivation network modules found by Newman’s modularity maximization using the Louvainalgorithm plotted in anatomical space for human functional coactivation networks. Modularity value Q =0.474, 5 clusters obtained by running the Louvain algorithm, each plotted with a distinct color; resultsare similar to [4] from where we have obtained the data. Modules: Green: Occipital, Orange and darkred: Central, Dark Blue: Frontoparietal, Light blue: Default mode. B and C. Original network has beenthresholded at 0.2 and 0.1 respectively; i.e., i.e., all connections higher than the threshold have been removedfrom the network and modularity and degrees re-computed. The edges have not been plotted for clarity ofrepresentation.
0 0.1 0.2 0.3 0.40
1
2
3
4x 10⁵
0 0.1 0.2 0.3 0.40
200
400
600
800
1000
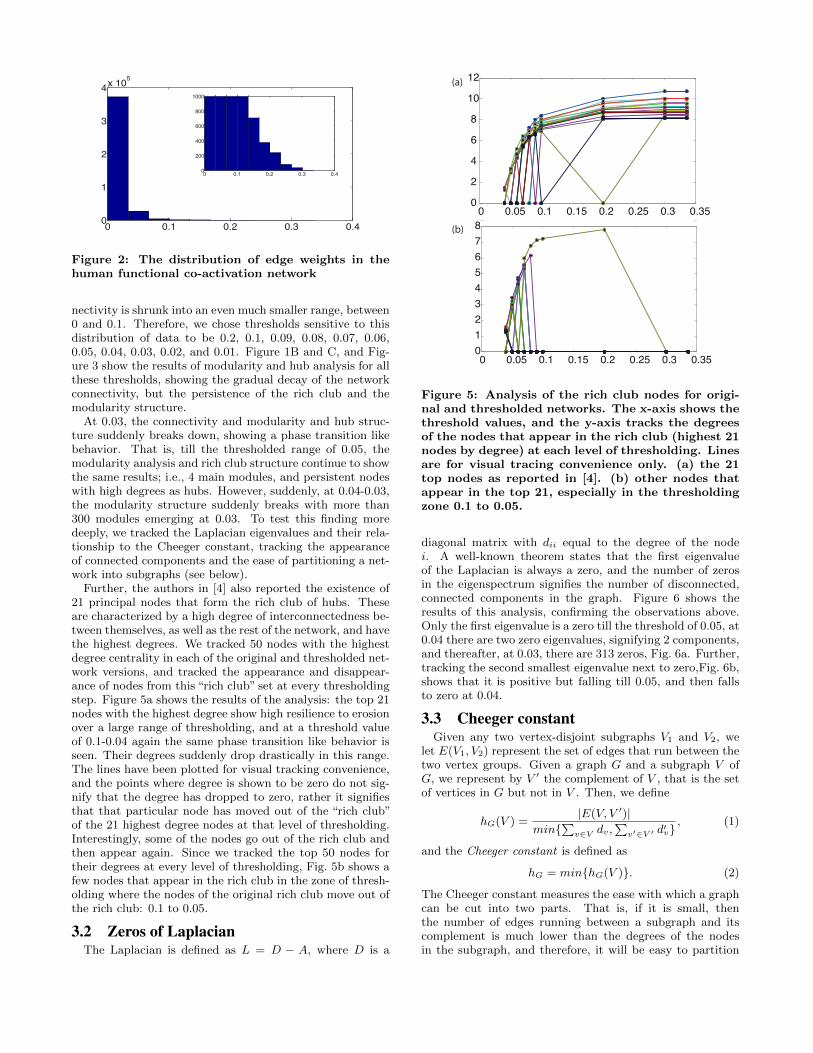
Figure 2: The distribution of edge weights in thehuman functional co-activation network
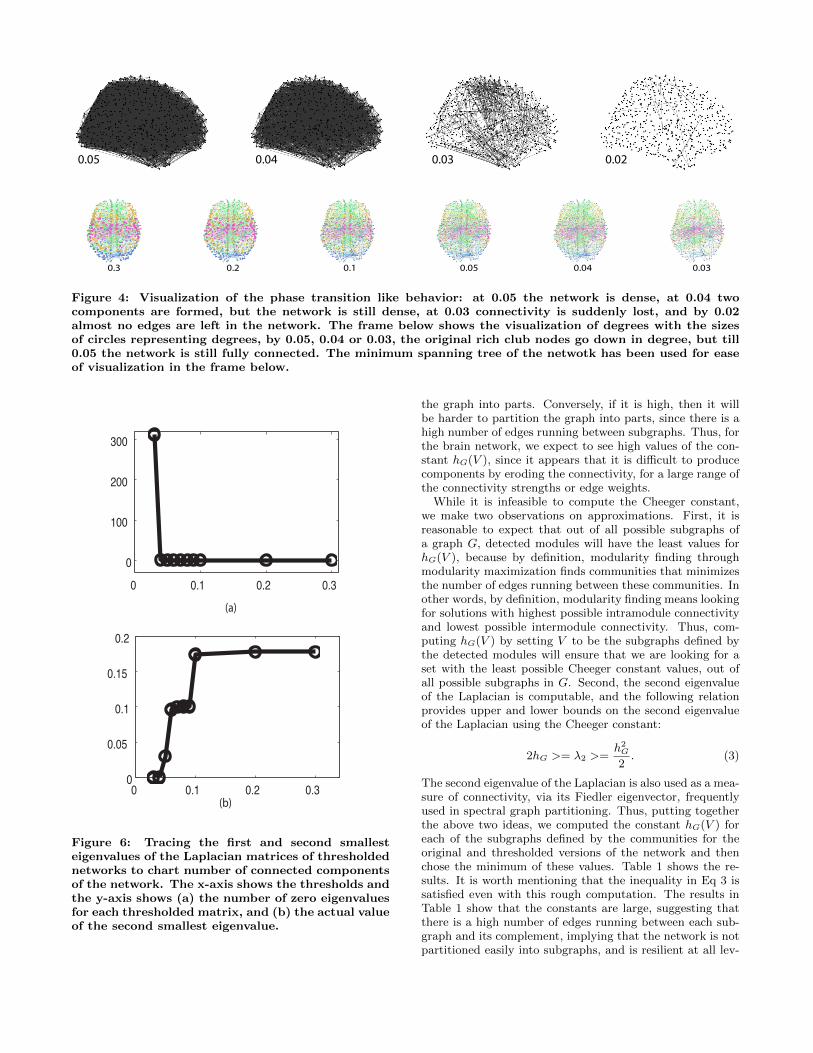
nectivity is shrunk into an even much smaller range, between0 and 0.1. Therefore, we chose thresholds sensitive to thisdistribution of data to be 0.2, 0.1, 0.09, 0.08, 0.07, 0.06,0.05, 0.04, 0.03, 0.02, and 0.01. Figure 1B and C, and Fig-ure 3 show the results of modularity and hub analysis for allthese thresholds, showing the gradual decay of the networkconnectivity, but the persistence of the rich club and themodularity structure.
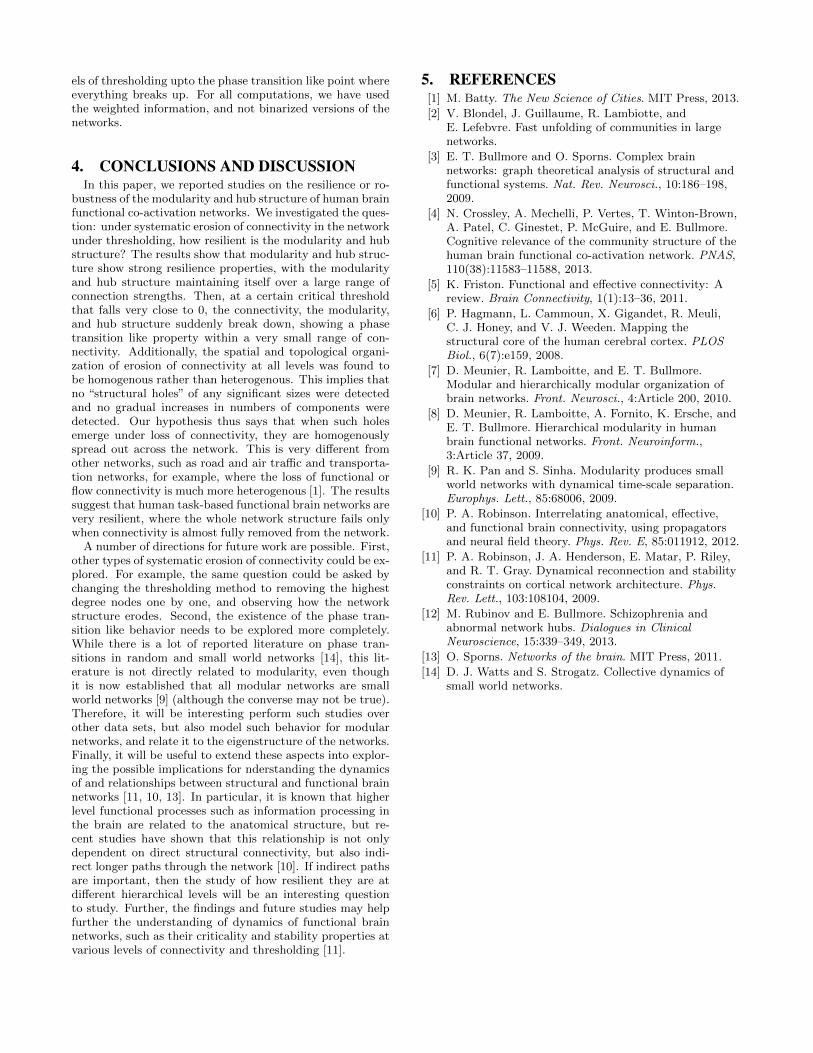
At 0.03, the connectivity and modularity and hub struc-ture suddenly breaks down, showing a phase transition likebehavior. That is, till the thresholded range of 0.05, themodularity analysis and rich club structure continue to showthe same results; i.e., 4 main modules, and persistent nodeswith high degrees as hubs. However, suddenly, at 0.04-0.03,the modularity structure suddenly breaks with more than300 modules emerging at 0.03. To test this finding moredeeply, we tracked the Laplacian eigenvalues and their rela-tionship to the Cheeger constant, tracking the appearanceof connected components and the ease of partitioning a net-work into subgraphs (see below).
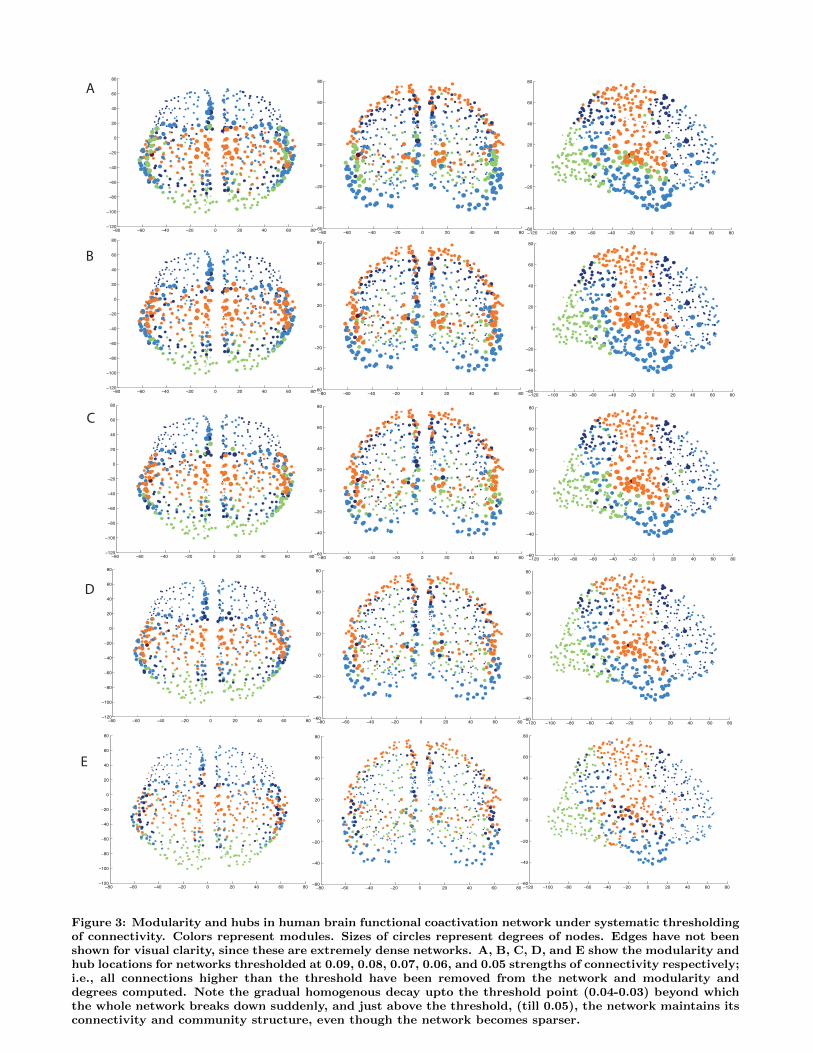
Further, the authors in [4] also reported the existence of21 principal nodes that form the rich club of hubs. Theseare characterized by a high degree of interconnectedness be-tween themselves, as well as the rest of the network, and havethe highest degrees. We tracked 50 nodes with the highestdegree centrality in each of the original and thresholded net-work versions, and tracked the appearance and disappear-ance of nodes from this “rich club” set at every thresholdingstep. Figure 5a shows the results of the analysis: the top 21nodes with the highest degree show high resilience to erosionover a large range of thresholding, and at a threshold valueof 0.1-0.04 again the same phase transition like behavior isseen. Their degrees suddenly drop drastically in this range.The lines have been plotted for visual tracking convenience,and the points where degree is shown to be zero do not sig-nify that the degree has dropped to zero, rather it signifiesthat that particular node has moved out of the “rich club”of the 21 highest degree nodes at that level of thresholding.Interestingly, some of the nodes go out of the rich club andthen appear again. Since we tracked the top 50 nodes fortheir degrees at every level of thresholding, Fig. 5b shows afew nodes that appear in the rich club in the zone of thresh-olding where the nodes of the original rich club move out ofthe rich club: 0.1 to 0.05.
3.2 Zeros of LaplacianThe Laplacian is defined as L = D − A, where D is a
0 0.05 0.1 0.15 0.2 0.25 0.3 0.350
2
4
6
8
10
12
0 0.05 0.1 0.15 0.2 0.25 0.3 0.35012345678
(a)
(b)
Figure 5: Analysis of the rich club nodes for origi-nal and thresholded networks. The x-axis shows thethreshold values, and the y-axis tracks the degreesof the nodes that appear in the rich club (highest 21nodes by degree) at each level of thresholding. Linesare for visual tracing convenience only. (a) the 21top nodes as reported in [4]. (b) other nodes thatappear in the top 21, especially in the thresholdingzone 0.1 to 0.05.
diagonal matrix with dii equal to the degree of the nodei. A well-known theorem states that the first eigenvalueof the Laplacian is always a zero, and the number of zerosin the eigenspectrum signifies the number of disconnected,connected components in the graph. Figure 6 shows theresults of this analysis, confirming the observations above.Only the first eigenvalue is a zero till the threshold of 0.05, at0.04 there are two zero eigenvalues, signifying 2 components,and thereafter, at 0.03, there are 313 zeros, Fig. 6a. Further,tracking the second smallest eigenvalue next to zero,Fig. 6b,shows that it is positive but falling till 0.05, and then fallsto zero at 0.04.
3.3 Cheeger constantGiven any two vertex-disjoint subgraphs V1 and V2, we
let E(V1, V2) represent the set of edges that run between thetwo vertex groups. Given a graph G and a subgraph V ofG, we represent by V ′ the complement of V , that is the setof vertices in G but not in V . Then, we define
hG(V ) =|E(V, V ′)|
min{∑
v∈V dv,∑
v′∈V ′ d′v}, (1)
and the Cheeger constant is defined as
hG = min{hG(V )}. (2)
The Cheeger constant measures the ease with which a graphcan be cut into two parts. That is, if it is small, thenthe number of edges running between a subgraph and itscomplement is much lower than the degrees of the nodesin the subgraph, and therefore, it will be easy to partition
−120 −100 −80 −60 −40 −20 0 20 40 60 80−60
−40
−20
0
20
40
60
80
−80 −60 −40 −20 0 20 40 60 80−60
−40
−20
0
20
40
60
80
−80 −60 −40 −20 0 20 40 60 80−120
−100
−80
−60
−40
−20
0
20
40
60
80
−120 −100 −80 −60 −40 −20 0 20 40 60 80−60
−40
−20
0
20
40
60
80
−80 −60 −40 −20 0 20 40 60 80−60
−40
−20
0
20
40
60
80
−80 −60 −40 −20 0 20 40 60 80−120
−100
−80
−60
−40
−20
0
20
40
60
80
−120 −100 −80 −60 −40 −20 0 20 40 60 80−60
−40
−20
0
20
40
60
80
−80 −60 −40 −20 0 20 40 60 80−60
−40
−20
0
20
40
60
80
−80 −60 −40 −20 0 20 40 60 80−120
−100
−80
−60
−40
−20
0
20
40
60
80
C
D
E
−120 −100 −80 −60 −40 −20 0 20 40 60 80−60
−40
−20
0
20
40
60
80
−80 −60 −40 −20 0 20 40 60 80−60
−40
−20
0
20
40
60
80
−80 −60 −40 −20 0 20 40 60 80−120
−100
−80
−60
−40
−20
0
20
40
60
80−120 −100 −80 −60 −40 −20 0 20 40 60 80−60
−40
−20
0
20
40
60
80
−80 −60 −40 −20 0 20 40 60 80−60
−40
−20
0
20
40
60
80
−80 −60 −40 −20 0 20 40 60 80−120
−100
−80
−60
−40
−20
0
20
40
60
80
B
A
Figure 3: Modularity and hubs in human brain functional coactivation network under systematic thresholdingof connectivity. Colors represent modules. Sizes of circles represent degrees of nodes. Edges have not beenshown for visual clarity, since these are extremely dense networks. A, B, C, D, and E show the modularity andhub locations for networks thresholded at 0.09, 0.08, 0.07, 0.06, and 0.05 strengths of connectivity respectively;i.e., all connections higher than the threshold have been removed from the network and modularity anddegrees computed. Note the gradual homogenous decay upto the threshold point (0.04-0.03) beyond whichthe whole network breaks down suddenly, and just above the threshold, (till 0.05), the network maintains itsconnectivity and community structure, even though the network becomes sparser.
0.05 0.04 0.03 0.02
0.3 0.2 0.1 0.05 0.04 0.03
Figure 4: Visualization of the phase transition like behavior: at 0.05 the network is dense, at 0.04 twocomponents are formed, but the network is still dense, at 0.03 connectivity is suddenly lost, and by 0.02almost no edges are left in the network. The frame below shows the visualization of degrees with the sizesof circles representing degrees, by 0.05, 0.04 or 0.03, the original rich club nodes go down in degree, but till0.05 the network is still fully connected. The minimum spanning tree of the netwotk has been used for easeof visualization in the frame below.
0 0.1 0.2 0.3
0
100
200
300
0 0.1 0.2 0.30
0.05
0.1
0.15
0.2
(a)
(b)
Figure 6: Tracing the first and second smallesteigenvalues of the Laplacian matrices of thresholdednetworks to chart number of connected componentsof the network. The x-axis shows the thresholds andthe y-axis shows (a) the number of zero eigenvaluesfor each thresholded matrix, and (b) the actual valueof the second smallest eigenvalue.
the graph into parts. Conversely, if it is high, then it willbe harder to partition the graph into parts, since there is ahigh number of edges running between subgraphs. Thus, forthe brain network, we expect to see high values of the con-stant hG(V ), since it appears that it is difficult to producecomponents by eroding the connectivity, for a large range ofthe connectivity strengths or edge weights.
While it is infeasible to compute the Cheeger constant,we make two observations on approximations. First, it isreasonable to expect that out of all possible subgraphs ofa graph G, detected modules will have the least values forhG(V ), because by definition, modularity finding throughmodularity maximization finds communities that minimizesthe number of edges running between these communities. Inother words, by definition, modularity finding means lookingfor solutions with highest possible intramodule connectivityand lowest possible intermodule connectivity. Thus, com-puting hG(V ) by setting V to be the subgraphs defined bythe detected modules will ensure that we are looking for aset with the least possible Cheeger constant values, out ofall possible subgraphs in G. Second, the second eigenvalueof the Laplacian is computable, and the following relationprovides upper and lower bounds on the second eigenvalueof the Laplacian using the Cheeger constant:
2hG >= λ2 >=h2G
2. (3)
The second eigenvalue of the Laplacian is also used as a mea-sure of connectivity, via its Fiedler eigenvector, frequentlyused in spectral graph partitioning. Thus, putting togetherthe above two ideas, we computed the constant hG(V ) foreach of the subgraphs defined by the communities for theoriginal and thresholded versions of the network and thenchose the minimum of these values. Table 1 shows the re-sults. It is worth mentioning that the inequality in Eq 3 issatisfied even with this rough computation. The results inTable 1 show that the constants are large, suggesting thatthere is a high number of edges running between each sub-graph and its complement, implying that the network is notpartitioned easily into subgraphs, and is resilient at all lev-
els of thresholding upto the phase transition like point whereeverything breaks up. For all computations, we have usedthe weighted information, and not binarized versions of thenetworks.
4. CONCLUSIONS AND DISCUSSIONIn this paper, we reported studies on the resilience or ro-
bustness of the modularity and hub structure of human brainfunctional co-activation networks. We investigated the ques-tion: under systematic erosion of connectivity in the networkunder thresholding, how resilient is the modularity and hubstructure? The results show that modularity and hub struc-ture show strong resilience properties, with the modularityand hub structure maintaining itself over a large range ofconnection strengths. Then, at a certain critical thresholdthat falls very close to 0, the connectivity, the modularity,and hub structure suddenly break down, showing a phasetransition like property within a very small range of con-nectivity. Additionally, the spatial and topological organi-zation of erosion of connectivity at all levels was found tobe homogenous rather than heterogenous. This implies thatno “structural holes” of any significant sizes were detectedand no gradual increases in numbers of components weredetected. Our hypothesis thus says that when such holesemerge under loss of connectivity, they are homogenouslyspread out across the network. This is very different fromother networks, such as road and air traffic and transporta-tion networks, for example, where the loss of functional orflow connectivity is much more heterogenous [1]. The resultssuggest that human task-based functional brain networks arevery resilient, where the whole network structure fails onlywhen connectivity is almost fully removed from the network.
A number of directions for future work are possible. First,other types of systematic erosion of connectivity could be ex-plored. For example, the same question could be asked bychanging the thresholding method to removing the highestdegree nodes one by one, and observing how the networkstructure erodes. Second, the existence of the phase tran-sition like behavior needs to be explored more completely.While there is a lot of reported literature on phase tran-sitions in random and small world networks [14], this lit-erature is not directly related to modularity, even thoughit is now established that all modular networks are smallworld networks [9] (although the converse may not be true).Therefore, it will be interesting perform such studies overother data sets, but also model such behavior for modularnetworks, and relate it to the eigenstructure of the networks.Finally, it will be useful to extend these aspects into explor-ing the possible implications for nderstanding the dynamicsof and relationships between structural and functional brainnetworks [11, 10, 13]. In particular, it is known that higherlevel functional processes such as information processing inthe brain are related to the anatomical structure, but re-cent studies have shown that this relationship is not onlydependent on direct structural connectivity, but also indi-rect longer paths through the network [10]. If indirect pathsare important, then the study of how resilient they are atdifferent hierarchical levels will be an interesting questionto study. Further, the findings and future studies may helpfurther the understanding of dynamics of functional brainnetworks, such as their criticality and stability properties atvarious levels of connectivity and thresholding [11].
5. REFERENCES[1] M. Batty. The New Science of Cities. MIT Press, 2013.
[2] V. Blondel, J. Guillaume, R. Lambiotte, andE. Lefebvre. Fast unfolding of communities in largenetworks.
[3] E. T. Bullmore and O. Sporns. Complex brainnetworks: graph theoretical analysis of structural andfunctional systems. Nat. Rev. Neurosci., 10:186–198,2009.
[4] N. Crossley, A. Mechelli, P. Vertes, T. Winton-Brown,A. Patel, C. Ginestet, P. McGuire, and E. Bullmore.Cognitive relevance of the community structure of thehuman brain functional co-activation network. PNAS,110(38):11583–11588, 2013.
[5] K. Friston. Functional and effective connectivity: Areview. Brain Connectivity, 1(1):13–36, 2011.
[6] P. Hagmann, L. Cammoun, X. Gigandet, R. Meuli,C. J. Honey, and V. J. Weeden. Mapping thestructural core of the human cerebral cortex. PLOSBiol., 6(7):e159, 2008.
[7] D. Meunier, R. Lamboitte, and E. T. Bullmore.Modular and hierarchically modular organization ofbrain networks. Front. Neurosci., 4:Article 200, 2010.
[8] D. Meunier, R. Lamboitte, A. Fornito, K. Ersche, andE. T. Bullmore. Hierarchical modularity in humanbrain functional networks. Front. Neuroinform.,3:Article 37, 2009.
[9] R. K. Pan and S. Sinha. Modularity produces smallworld networks with dynamical time-scale separation.Europhys. Lett., 85:68006, 2009.
[10] P. A. Robinson. Interrelating anatomical, effective,and functional brain connectivity, using propagatorsand neural field theory. Phys. Rev. E, 85:011912, 2012.
[11] P. A. Robinson, J. A. Henderson, E. Matar, P. Riley,and R. T. Gray. Dynamical reconnection and stabilityconstraints on cortical network architecture. Phys.Rev. Lett., 103:108104, 2009.
[12] M. Rubinov and E. Bullmore. Schizophrenia andabnormal network hubs. Dialogues in ClinicalNeuroscience, 15:339–349, 2013.
[13] O. Sporns. Networks of the brain. MIT Press, 2011.
[14] D. J. Watts and S. Strogatz. Collective dynamics ofsmall world networks.
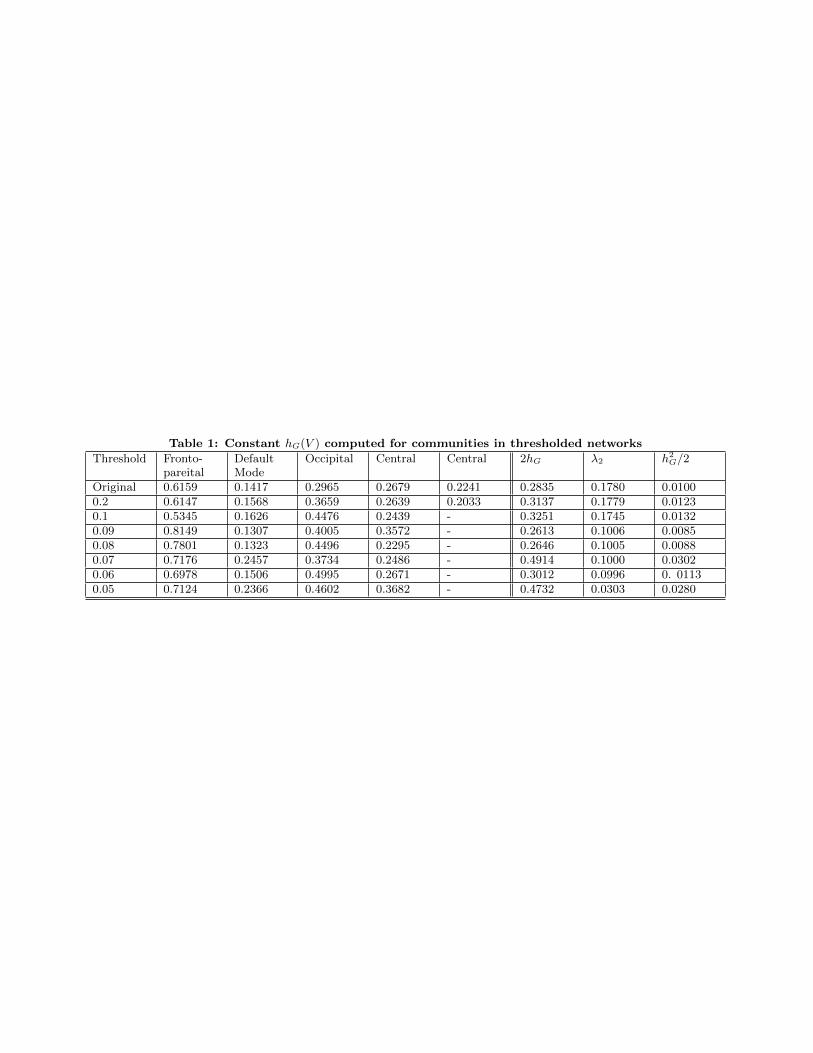
Table 1: Constant hG(V ) computed for communities in thresholded networks
Threshold Fronto-pareital
DefaultMode
Occipital Central Central 2hG λ2 h2G/2
Original 0.6159 0.1417 0.2965 0.2679 0.2241 0.2835 0.1780 0.01000.2 0.6147 0.1568 0.3659 0.2639 0.2033 0.3137 0.1779 0.01230.1 0.5345 0.1626 0.4476 0.2439 - 0.3251 0.1745 0.01320.09 0.8149 0.1307 0.4005 0.3572 - 0.2613 0.1006 0.00850.08 0.7801 0.1323 0.4496 0.2295 - 0.2646 0.1005 0.00880.07 0.7176 0.2457 0.3734 0.2486 - 0.4914 0.1000 0.03020.06 0.6978 0.1506 0.4995 0.2671 - 0.3012 0.0996 0. 01130.05 0.7124 0.2366 0.4602 0.3682 - 0.4732 0.0303 0.0280