Association of coronary artery disease with Lewis and ABO ...

A Semi-Automatic Method for Segmentation of theCoronary Artery Tree from Angiography
Daniel S.D. Lara and Alexandre W.C. Faria and Arnaldo A. de AlbuquerqueComputer Science Departament
UFMG - Belo Horizonte (MG) - BrazilEmail: {daniels,awcfaria,arnaldo}@dcc.ufmg.br
David MenottiComputer Science Department
UFOP - Ouro Preto (MG) - BrazilEmail: [email protected]
Abstract—Nowadays, medical diagnostics using images hasa considerable importance in many areas of medicine. Itpromotes and makes easier the acquisition, transmission andanalysis of medical images. The use of digital images fordiseases evaluations or diagnostics is still growing up andnew application modalities are always appearing. This paperpresents a methodology for a semi-automatic segmentation ofthe coronary artery tree in 2D X-Ray angiographies. It com-bines a region growing algorithm and a differential geometryapproach. The proposed segmentation method identifies about90% of the main coronary artery tree.
Keywords-Image Segmentation; Coronary Artery Tree; An-giography;
I. INTRODUCTION
Blood vessels detection is an important step in manymedical application tasks, such as automatic detection ofvessel malformations, quantitative coronary analysis (QCA),vessel centerline extractions, etc. Vessel detection is arecognition problem that is challenging due to the complexnature of vascular trees and to imaging imperfections [1].Blood vessel segmentation algorithms are the key com-ponents of automated radiological diagnostic systems [2].A wide variety of automatic blood vessel segmentationmethods have been proposed in the last two decades.These methods used approaches that varied from PatternRecognition techniques [3]–[11], Model-based Approaches[12]–[18], Tracking-Based Approaches [19]–[22], ArtificialIntelligence Approaches [23]–[26] until Neural Network-based approaches [27]–[29]. In [2], Kirbas and Queek pre-sented a well referenced survey of some of those vesselsegmentations methods.
Even with all these efforts, only few of these methodsachieved enough results to be applied in a system allowingthe user to give a minimum input. The major part of themhas too many parameters to be adjusted depending on theimage quality. Once these parameters are all set, the userdoes not need to change anything for similar quality images.However, the nature of X-Ray angiograms leads to a pos-sible low or high contrast images depending on the patientweight. It means that even if all the segmentation algorithmparameters, X-Ray Generator dose, Camera adjustments and
image intensifier fields are the same, the image quality canvary depending on the patient weight.
O’Brien and N. Ezquerra [30] proposed a region growingmethod for coronary (cardiac arteries) segmentation that didnot need successive user refinements. This method took arectangular local region around the coronary intending torealize local searches in order to detect the vessel. Theprocess was performed in many temporal acquired frames(Cine frames) to avoid problems caused by intodisjointsegments. Intodisjoint segments could be caused by noise,image artifacts, structural defects (e.g., a stenosis), etc. Themain disadvantage of this approach resides on the factthat it needs to search vessels in other sequential framesto eliminate any other user-supplied seed points. It makesthe final result dependent on the possibility of next framesappearing without the same discontinuities identified before.Supposing, for example, the discontinuity is a stenosis, itwill be present in many sequential frames stopping theregion to grow anyways.
Schrijver [7] proposed a multi-scale coronary tree seg-mentation based on a differential geometry approach. Basi-cally, it processes the angiogram with a multi-scale vesseldetector, applies a vessel resemblance function, allows theuser to change some parameters to reach the best results andtraces the arteries. As explained before, this method alsorequires a lot of parameters to automatically obtain greatresults for each angiogram. However the vessel resemblancefunction proposed by [7] could be an excellent seed gener-ator for a region growing method.
In this paper, we present a hybrid region growing methodwith a differential geometry vessel detector for coronarysegmentation. It intends to reach the advantages from bothand tries to avoid at most the user parameter adjustments.Figure 1 shows an overview of the method.
This paper is organized as follows. Section II describes thesegmentation method, where Section II-A explains in detailsthe region growing step, Sections II-B and II-C explain theHessian and vessel resemblance function, and Section II-Dpresents the algorithm for the whole segmentation process.Analysis of results of our method is presented in Section III,whilst conclusions and future works are pointed out in
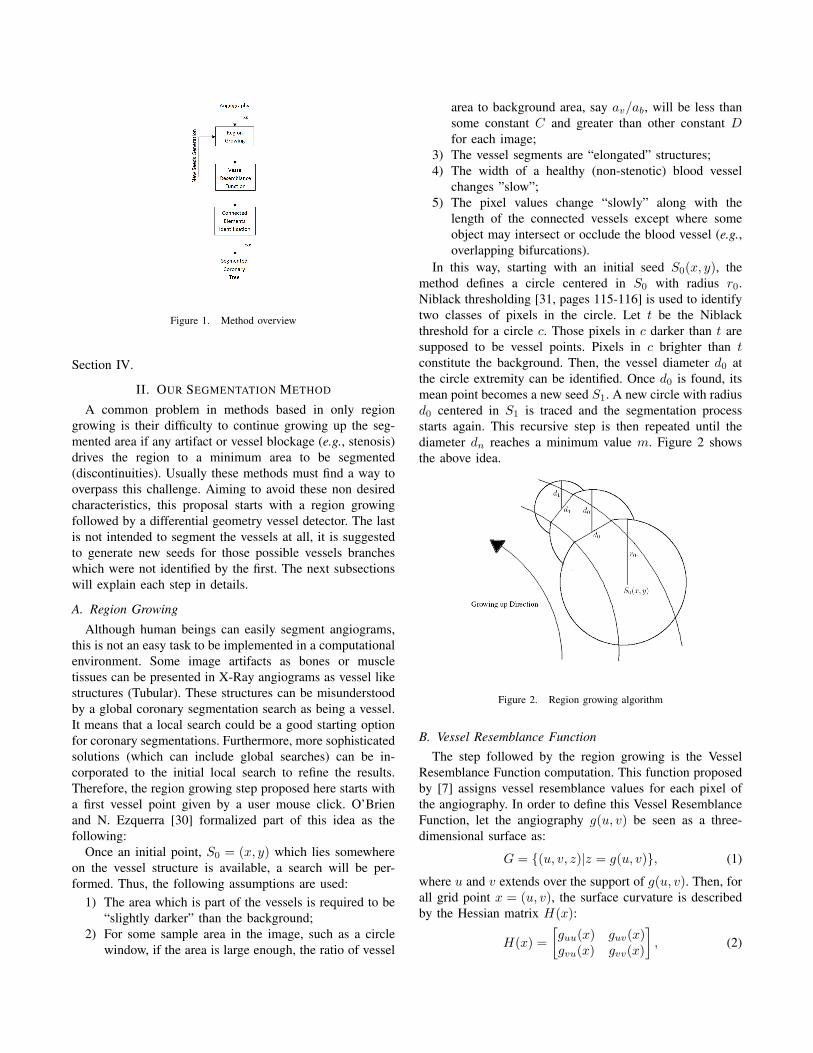
Figure 1. Method overview
Section IV.
II. OUR SEGMENTATION METHOD
A common problem in methods based in only regiongrowing is their difficulty to continue growing up the seg-mented area if any artifact or vessel blockage (e.g., stenosis)drives the region to a minimum area to be segmented(discontinuities). Usually these methods must find a way tooverpass this challenge. Aiming to avoid these non desiredcharacteristics, this proposal starts with a region growingfollowed by a differential geometry vessel detector. The lastis not intended to segment the vessels at all, it is suggestedto generate new seeds for those possible vessels brancheswhich were not identified by the first. The next subsectionswill explain each step in details.
A. Region Growing
Although human beings can easily segment angiograms,this is not an easy task to be implemented in a computationalenvironment. Some image artifacts as bones or muscletissues can be presented in X-Ray angiograms as vessel likestructures (Tubular). These structures can be misunderstoodby a global coronary segmentation search as being a vessel.It means that a local search could be a good starting optionfor coronary segmentations. Furthermore, more sophisticatedsolutions (which can include global searches) can be in-corporated to the initial local search to refine the results.Therefore, the region growing step proposed here starts witha first vessel point given by a user mouse click. O’Brienand N. Ezquerra [30] formalized part of this idea as thefollowing:
Once an initial point, S0 = (x, y) which lies somewhereon the vessel structure is available, a search will be per-formed. Thus, the following assumptions are used:
1) The area which is part of the vessels is required to be“slightly darker” than the background;
2) For some sample area in the image, such as a circlewindow, if the area is large enough, the ratio of vessel
area to background area, say av/ab, will be less thansome constant C and greater than other constant Dfor each image;
3) The vessel segments are “elongated” structures;4) The width of a healthy (non-stenotic) blood vessel
changes ”slow”;5) The pixel values change “slowly” along with the
length of the connected vessels except where someobject may intersect or occlude the blood vessel (e.g.,overlapping bifurcations).
In this way, starting with an initial seed S0(x, y), themethod defines a circle centered in S0 with radius r0.Niblack thresholding [31, pages 115-116] is used to identifytwo classes of pixels in the circle. Let t be the Niblackthreshold for a circle c. Those pixels in c darker than t aresupposed to be vessel points. Pixels in c brighter than tconstitute the background. Then, the vessel diameter d0 atthe circle extremity can be identified. Once d0 is found, itsmean point becomes a new seed S1. A new circle with radiusd0 centered in S1 is traced and the segmentation processstarts again. This recursive step is then repeated until thediameter dn reaches a minimum value m. Figure 2 showsthe above idea.
Figure 2. Region growing algorithm
B. Vessel Resemblance FunctionThe step followed by the region growing is the Vessel
Resemblance Function computation. This function proposedby [7] assigns vessel resemblance values for each pixel ofthe angiography. In order to define this Vessel ResemblanceFunction, let the angiography g(u, v) be seen as a three-dimensional surface as:
G = {(u, v, z)|z = g(u, v)}, (1)
where u and v extends over the support of g(u, v). Then, forall grid point x = (u, v), the surface curvature is describedby the Hessian matrix H(x):
H(x) =[guu(x) guv(x)gvu(x) gvv(x)
], (2)

Figure 3. Vessel resemblance function results
where guu(x), guv(x) = gvu(x), and gvv(x) are the second-order spatial derivatives of g(x). These derivatives canbe calculated by a convolution of a second order spatialderivatives of a Gaussian filter at a scale σ with g(x) ( [7],[32], [33] and [34]):
gab(x;σ) = σ2hab(x;σ) ∗ g(x). (3)
From an analysis of the eigenvalues and eigenvectors ofthe Hessian matrix, it is noticeable that the Hessian matrixstrongest eigenvalue and its corresponding eigenvector ina point (u, v) give the 3D-surface strongest curvature andits direction. The eigenvector corresponding to the weakereigenvalue represents the surface direction perpendicular tothe strongest curvature.
As the Hessian matrix is a function of scale σ then theeigenvalues are also. Furthermore λi could be written asλi(x;σ). However, supposing we are working with onlyone scale, and for simplicity, it will be abbreviated by λiand its corresponding eigenvector by vi. For the subsequentanalysis, it is supposed the eigenvalues are ordered accordingto:
|λ1| ≥ |λ2|. (4)
In this way, assuming an angiography point x = (u, v)
being part of a vessel, the eigenvector v1 is perpendicular tothe vessel in x. It happens because the vessels are consideredto be a darker region against a brighter background. It meansthe strongest Hessian eigenvalue is positive in x and thestrongest surface curvature is perpendicular to the vessel inx. Furthermore, v2 will be parallel to the vessel in x. Also,the assumption 3 proposed by [30] allows us to concludethat the weaker Hessian eigenvalue should be small in x. Inother words, the surface G has a little curvature on the vesseldirection. The following summarizes these characteristics forthe vessel point x = (u, v):
λ1 > 0 and λ2 ≈ 0. (5)
Based on all these considerations, the following vesselresemblance function V (x;σ), is defined ( [32]):
V (x;σ) =
{0 if λ1 < 0 ,
exp(R2
B
2β21
) [1− exp
(−S2
2β22
)]otherwise ,
(6)where RB is a measure of how |λ1| is bigger than |λ2|, i.e.,
RB =|λ2||λ1|
, (7)

and S is a measure of the strength of the overall curvature:
S =√λ2
1 + λ22. (8)
The parameters β1 > 0 and β2 > 0 are scaling factorsinfluencing the sensitivity to RB and S respectively.
Images in Figure 3 shows an angiography processed byapplying the vessel resemblance function. The ones in thefirst column have resolution of 512× 512, whilst the othershave 1024×1024 pixels. The parameters used for the imagein both rows are the same: σ = 2, 2β2
1 = 16 and 2β22 =
128, and they were chosen based on upper and lower bounddeterminations from [33] apud [35].
Next subsection explains how to use these results to obtainregion growing seeds automatically.
C. Identifying the Seeds
The Vessel Resemblance Function returns a value foreach pixel in the angiography. It determines if this pixelconstitutes part of the vessel or not. In images in Figure 3,most part of the non zero pixels belongs to the vessels. Allthose ones greater than zero are new possible growing seeds.However, some noise or image artifacts can contribute for asmall part of background being misunderstood as vessels. Inorder to eliminate these cases, some statistics are used. Letn and sd be the mean and standard deviation pixel intensityin the area of the circle defined in Section 2.1, respectively.Then defining t as
t =n− sdn
, (9)
allows us to distinguish homogeneous from heterogeneousregions. From the assumption 2 [30] proposed in Section 2.1,it is supposed that the circle centered in any artery regionwill have part of its area being background and anotherpart being vessel. Also, from the assumption 1 proposed in2.1, the set of pixels intensities in that circle will be moreheterogeneous than if it was centered in a background regiononly. In other words, for circles centered in backgroundregions only the standard deviation sd will be smallerthan for circles centered in arteries. It happens becausebackground regions only will not have the “slightly darker”presence of any blood vessel. Therefore t will be closer tothe value 1 when the circle area is more homogeneous andfurther from 1 otherwise.
After the Vessel Detector Phase, a filtering on the possibleseed candidates is done to identify points in the backgroundarea. This filtering scans all the pixels greater than zero,traces a circle with radius r0 centered in each candidate andcomputes t. Those cases where t is greater than a thresholdmean the region is homogeneous (background) and theseseeds are discarded.
This process results in a final image with all pixels greaterthan zero in vessels region. This enhanced image with somevessels points detected will be used for a new region growingstep explained in the next subsection.
D. The Segmentation Process
The method was implemented in MatLab and the segmen-tation process is explained by the following algorithm.
1) The user gives the first vessel point s0.2) The step described in Section II-A starts.3) The step described in Section II-B starts.4) The filtering stage described in Section II-C is per-
formed.5) For each seed not discarded in Section II-C, perform
the region growing described in Section II-A again.Since it is a recursive algorithm, its complexity will
depend on the coronary diameter as well the the numberof coronary branches segmented. For instance, taking anangiography A with dimensions N = m×n, it is possible tosay that this algortithm execution time will be O(N) for A.It is understood this way because once a pixel is determinedto be part of a vessel or not, it will not be processed again.
E. Connected Elements Identification
By supposing that the segmented coronary will representthe major area of the segmented portion, connected com-ponents theory is used to identify the component with thegreatest area.
In some exceptional cases, it is possible that in II-C somepixels that do not belong to the artery area become a seed.For those cases, small isolated segmented parts can appear.However it will generate portions of segmented regionsdisconnected from the main coronary artery tree. Aimingto elimminate these small possible segmented blobs, allconnected components are identified, labeled and the onepresenting the greatest area is showed as the final coronaryartery tree segmented.
III. EXPERIMENTAL RESULTS
In order to evaluate the proposed method, we sampled fiveLeft Coronary Artery (LCA) angiographies and five RightCoronary Artery (RCA) angiographies. Images in Figure 5are three experimental results. All images are 1024× 1024pixels, 8 bits gray-scale, and they were recorded using aSISMED Digitstar 600N system.
The evaluation of our method is performed as follows. Foreach image, we manually produce two reference images.The first one with primary arteries (which includes maincoronary and first order derivations), and the second withsecondary arteries (second order derivations). These arteriesare represented by their center lines. Figure 4 illustratesa typical image of a coronary and a representation of itsreference images joined. Note that the artery center linesare surrounded by green and purple contours, primary andsecondary arteries, respectively. These representations areused for illustrations reasons. From these reference images,it is possible to compute the method accuracy by intersectingthe portions between the artery center lines and the resultantsegmented arteries.

(a) Original Image
(b) Reference Image
Figure 4. A typical angiography and a union of its reference images
This evaluation in two artery classes is motivated by thenature of the coronary analysis. For instance, in applicationswhere the artery segmentation tree is used, such as quanti-tative coronary analysis, the task is basically done in mainand first order coronaries.
Table I presents the evaluation results for all 10 processedimages.
Our method segments the primary coronaries with ac-curacy of 88.79% ± 10, 42% (µ ± σ), where the accu-racy is defined as described above (the intersection por-tions between the artery center lines and the resultantsegmented arteries). It also segments secondary coronarieswith 22.04%± 10.18%.
Figure 5 illustrates three samples of our database, where
Table IIDENTIFICATION OF THE CORONARY ARTERY TREE
Image Type Primary Secondary01 RCA 96.46% 16.67%02 RCA 100.00% 35.14%03 LCA 98.75% 34.01%04 LCA 63.28% 0.00%05 RCA 89.60% 24.04%06 RCA 89.17% 20.97%07 RCA 83.74% 18.97%08 LCA 92.01% 28.86%09 LCA 88.60% 16.40%10 LCA 86.28% 25.39%
Mean 88.79% 22.04%Std 10.42% 10.18%
angiographies in the first row are the original images, andits respective segmented coronary artery tree in the secondrow. Also, for each image in the second row, the arteries areidentified by a set of colors. The colors are used to enhancethe different regions of the segmented images. The greenand red portions represent the non- and segmented primaryarteries by the method, respectively. In contrast, the non-and segmented secondary arteries are represented by thepurple and blue parts, respectively. It is important to noticethat the colored regions only highlight the artery center lineidentification. In fact, the real thickness (or diameter) of thearteries is unknown.
By observing the images in Figure 5, we can also state thatthe primary arteries are well segmented, while the secondaryartery segmentations still need improvements. This statementagrees with the data presented in Table I.
In spite of the resulting images were not evaluated regard-ing the segmentation, by observing the images in Figure 5one can note that, in average, the segmentation is wellperformed.
IV. CONCLUSION AND FUTURE WORK
A new method for coronary segmentation was presented.Differently from the major part of the methods proposed inliterature, this does not need lots of parameter adjustmentsby the user. Simple ideas were used to contemplate theregion growing stage. The results showed that it can be usedon a system where the user will have a minimum a prioriknowledge about the algorithm.
For future works we propose to apply this method in orderto automatically detect stenosis by using a hundred moreextended database. Also, it was verified that areas of theangiography with a poor contrast make the region difficultto grow. Therefore an interesting characteristic to be addedin a pre-processing step is a local vessel contrast enhance-ment. Furthermore, we propose to evaluate the segmentationaccuracy of the proposed method in terms of artery treearea percentage by using reference image, i.e., ground truthimage.

Figure 5. Segmentation results and coronary artery tree identification
ACKNOWLEDGMENT
The authors are thankfull to CNPq, CAPES, andFAPEMIG, Brazilian agencies, also SISMED, private com-pany, for the financial support to this work.
REFERENCES
[1] J. Peter, K. Mark, S. Miller, W. Libutti, and P. Choyke,“Automated detection of blood vessels using dynamic pro-gramming,” Pattern Recognition Letters, vol. 24, no. 14, pp.2471–2478, 2003.
[2] C. Kirbas and F. Quek, “A review of vessel extractiontechniques and algorithms,” ACM Computing Surveys, vol. 36,no. 2, pp. 81–121, 2004.
[3] A. Sarwal and A. Dhawan, “3-d reconstruction of coronaryarteries,” in IEEE Conference on Engineering in Medicineand Biology, vol. 1, 1994, pp. 504–505.
[4] M. Chwialkowski, Y. Ibrahim, F. Hong, and R. Peshock, “Amethod for fully automated quantitative analysis of arterialflow using flow-sensitized mr images,” Computerized MedicalImaging and Graphics, vol. 20, no. 5, pp. 365–378, 1996.
[5] E. Sorantin, C. Halmai, B. Erdohelyi, K. Palagyi, L. Nyul,K. Olle, B. Geiger, F. Lindbichler, G. Friedrich, andK. Kiesler, “Spiral-ctbased assessment of tracheal stenosesusing 3-d skeletonization,” IEEE Transactions on MedicalImaging, vol. 21, no. 3, pp. 263–273, 2002.
[6] H. Schmitt, M. Grass, V. Rasche, O. Schramm, S. Haehnel,and K. Sartor, “An x-raybased method for the determinationof the contrast agent propagation in 3-d vessel structures,”IEEE Transactions on Medical Imaging, vol. 21, no. 3, pp.251–262, 2002.
[7] M. Schrijver, “Angiographic assessment of coronary stenoses:A review of the techniques,” Archives Of Physiology AndBiochemistry, vol. 111, no. 2, pp. 77–158, 2003.
[8] B. J., G. M., and T. C., “Coronary extraction and stenosisquantification in x-ray angiographic imaging,” in IEEE En-gineering in Medicine and Biology Society, vol. 3, 2004, pp.1714–1717.
[9] Q. Li, J. You, and L. Zhang, “Automated retinal vesselsegmentation using multiscale analysis and adaptive thresh-olding,” in IEEE Southwest Symposium on Image Analysisand Interpretation, 2006, pp. 139–143.
[10] X. Y., H. Zhang, H. Li, and G. Hu, “An improved algorithmfor vessel centerline tracking in coronary angiograms,” Com-

puter Methods and Programs in Biomedicine, vol. 88, no. 2,pp. 131–143, 2007.
[11] S. Zhou, J. Yang, W. Chen, and Y. Wang, “New approachto the automatic segmentation of coronary artery in x-rayangiograms,” Sci China Ser F-Inf Sci, vol. 51, no. 1, pp. 25–39, 2008.
[12] J. Molina, S. G. Ellis, and T. et al, “Percutaneous treatment ofleft main coronary stenosis,” Circulation, vol. 98, pp. 1587–1590, 1998.
[13] S. Kozerke, R. Botnar, S. Oyre, M. Scheidegger, E. Pedersen,and P. Boesiger, “Automatic vessel segmentation using activecontours in cine phase contrast flow measurements,” Journalof Magnetic Resonance Imaging (JMRI), vol. 10, no. 1, pp.41–51, 1999.
[14] H. Luo, L. Qiang, R. Acharya, and R. Gaborski, “Robustsnake model,” in IEEE International Conference on ComputerVision and Pattern Recognition, vol. 1, 2000, pp. 452–457.
[15] L. Sarry and J. Boire, “Three-dimensional tracking of coro-nary arteries from biplane angiographic sequences usingparametrically deformable models,” IEEE Transactions onMedical Imaging, vol. 20, no. 12, pp. 1341–1351, 2001.
[16] F. Quek and C. Kirbas, “Vessel extraction in medical imagesby wave propagation and traceback,” IEEE Transactions onMedical Imaging, vol. 20, no. 2, pp. 117–131, 2001.
[17] W. Law and A. Chung, “Segmentation of vessels usingweighted local variances and an active contour model,” inIEEE Conference on Computer Vision and Pattern Recogni-tion Workshop (CVPRW’06), 2006, pp. 83–83.
[18] F. G. Lacoste, C. and I. Magnin, “Coronary tree extrac-tion from x-ray angiograms using marked point processes,”in IEEE International Symposium on Biomedical Imaging(ISBI), 2006, pp. 157–160.
[19] S. Aylward, S. Pizer, E. Bullitt, and D. Eberl, “Intensity ridgeand widths for tubular object segmentation and description,”in Workshop on Math. Methods in Biomed. Image Analysis,1996, pp. 131–138.
[20] Y. Tolias and S. Panas, “A fuzzy vessel tracking algorithm forretinal images based on fuzzy clustering,” IEEE Transactionson Medical Imaging, vol. 17, pp. 263–273, 1998.
[21] F. Quek, C. Kirbas, and F. Charbel, “Aim: attentionally-based interaction model for the interpretation of vascularangiograph,” IEEE Transactions on Information Technologyin Biomedicine, vol. 3, no. 2, pp. 139–150, 1999.
[22] ——, “Aim: An attentionally-based system for the inter-pretation of angiography,” in IEEE Medical Imaging andAugmented Reality Conference, 2001, pp. 168–173.
[23] M. Goldbaum, S. Moezzi, A. Taylor, S. Chatterjee, J. Boyd,E. Hunter, and R. Jain, “Automated diagnosis and imageunderstanding with object extraction, object classification,and inferencing in retinal images,” in IEEE InternationalConference on Image Processing, vol. 3, 1996, pp. 695–698.
[24] V. Bombardier, M. Jaluent, A. Bubel, and B. J., “Cooperationof two fuzzy segmentation operators for digital subtractedangiograms analysis,” in IEEE Conference on Fuzzy Systems,1997, pp. 1057–1062.
[25] U. Rost, H. Munkel, and C. Liedtke, “A knowledge basedsystem for the configuration of image processing algorithms,”in Fachtagung Informations und Mikrosystem Technik, 1998,pp. 25–27.
[26] R. Socher, A. Barbu, and D. Comaniciu, “A learning basedhierarchical model for vessel segmentation,” in IEEE Inter-national Symposium on Biomedical Imaging: From Nano toMacro (ISBI’08), Paris, France, May 2008, pp. 1055–1058.
[27] R. Nekovei and Y. Sun, “Back-propagation network and itsconfiguration for blood vessel detection in angiograms,” IEEETransaction on Neural Networks, vol. 6, pp. 64–72, 1995.
[28] I. Hunter, J. Soraghan, and T. McDonagh, “Fully automaticleft ventricular boundary extraction in echocardiographic im-ages,” in IEEE Computers in Cardiology, 1995, pp. 741–744.
[29] S. Shiffman, G. D. Rubin, and S. Napel, “Semiautomatedediting of computed tomography sections for visualization ofvasculature,” in SPIE Medical Imaging Conference, vol. 2707,1996, pp. 140–151.
[30] J. O’Brien and N. Ezquerra, “Automated segmentation ofcoronary vessels in angiographic image sequences utilizingtemporal, spatial structural constraints,” in SPIE Conferenceon Visualization in Biomedical Computing, 1994, pp. 25–37.
[31] W. Niblack, An Introduction to Digital Image Processing.NJ, USA: Prentice Hall,, 1986.
[32] A. F. Frangi, W. J. Niessen, R. M. Hoogeveen, T. vanWalsum, and M. A. Viergever, “Model-based quantitationof 3-d magnetic resonance angiographic images,” MedicalImaging, IEEE Transactions on, vol. 18, no. 10, pp. 946–956,1999.
[33] Y. Sato, S. Nakajima, N. Shiraga, H. Atsumi, S. Yoshida,T. Koller, G. Gerig, and R. Kikinis, “Three-dimensionalmulti-scale line filter for segmentation and visualization ofcurvilinear structures in medical images,” Medical ImageAnalysis, vol. 2, no. 2, pp. 143–168, 1998.
[34] F.-v.-d. Heijden, Image based measurement systems: objectrecognitionand parameter estimation. John Wiley & Sons,Ltd., 1994.
[35] M. Schrijver and C. H. Slump, “Automatic segmentationof the coronary artery tree in angiographic projections,” inProRISC, Nov. 2002, pp. 449–464.
Copyright © 2022 FDOKUMEN