Automatic volumetric liver segmentation using texture based region growing
7
Automatic Volumetric Liver Segmentation Using Texture Based Region Growing O. Gambino 1 , S. Vitabile 2 , G. Lo Re 2 , G. La Tona 1 , S. Librizzi 1 , R.Pirrone 1 , E. Ardizzone 1 , M. Midiri 2 1 Universita’ degli Studi di Palermo-Dipartimento di Ingegneria Informatica viale delle Scienze-Edificio 6-Terzo Piano- 90128 Palermo(Italy) 2 Universita’ degli Studi di Palermo-Dipartimento di Biotecnologie Mediche e Medicina Legale via del Vespro 129 - 90128 Palermo (Italy) Abstract— In this paper an automatic texture based volumetric region growing method for liver segmentation is proposed. 3D seeded region growing is based on texture features with the automatic selection of the seed voxel inside the liver organ and the automatic threshold value computation for the region growing stop condition. Co-occurrence 3D texture features are extracted from CT abdominal volumes and the seeded region growing algorithm is based on statistics in the features space. Each CT volume is composed by 230 slices, having 512 x 512 pixels as spatial resolution, and 12-bit gray level resolution. In this initial feasible study, 5 healthy volunteer acquisitions has been used. Tests have been performed on both basal phase and arterial phase images. Segmentation result shows the effectiveness of the proposed method: liver organ is correctly recognized and segmented, leaving out liver vessels form the segmented area and overcoming the “organ-splitting” problem. The goodness of the proposed method has been confirmed by manual liver segmentation results, having analogous and super- imposable behavior. Keywords-components: Liver segmentation, Texture based Region Growing, CT images. I. INTRODUCTION In the context of medical imaging, the problem of tissue segmentation is to delimit the image areas representing different anatomies. It is an essential step for automatic analysis of medical images because it increases the radiologists’ productivity and permits a more accurate diagnosis and quantitative analysis. There are many approaches for image segmentation based on the irregularity or similarity of some pixel properties such as their gray levels. Nevertheless, intensity-based methods are not successful for abdominal segmentation because gray levels of the adjacent issues are very similar. In particular the liver segmentation is a very difficult task due to the considerable overlap of soft tissues and lately it has received much attention from researchers. The methods that uses low-level features based on texture information are more interesting, because they can extract from the images those features that are relevant and they also allow a more accurate analysis of the similarities between regions. In a generic texture feature based region growing approach, given a seed point, the algorithm merges individual pixels that satisfy the homogeneity criterion resulting from the study of some local descriptors of the texture. There are several main aspects that affect system performance such as the seed point selection that can be manual or automatic and the stopping criterion that determine if a new pixel can be added to the region. The goal of the approach presented in this paper is to achieve automatic texture based volumetric segmentation of the liver in Computed Tomography (CT) images of the abdomen acquired on different modalities. The first step is the pre-processing of the whole volume in order to correct the contrast, segment the abdomen area and reduce the number of gray levels of the images. The next step is the reconstruction of the liver volume in which we first extract a region of interest (ROI) that contains the liver region than from that the seed point is determined by the minimization of a cost function with three factors. The local texture features are extracted from Co- occurrence matrices computed given 13 directions in 3D. In particular from every Co-occurrence matrix, 7 of the features proposed by Haralick [1] are computed. Then the automatic seeded region growing is executed on the features space. The threshold is obtained with a new method in which several points around the seed point are chosen sampling from a normal distribution. For every one of these points it is calculated the distance in the features space from the seed point. The statistical parameters of the distribution of these distances is used to select the threshold for the region growing. The paper is organized as follow. In section II we present an overview of the state of the art in the field of liver segmentation in CT images and texture based analysis for organ segmentation. In section III we describe our proposed system. In section IV we discuss the experimental results obtained. The last section is a conclusion with some ideas for improvements and further work. II. BACKGROUND A. Liver segmentation from CT Scans In this section we describe some semi-automatic and automatic techniques for liver volume extraction from abdominal CT that was presented in the last years [27]. Barret et al.[11] proposed a Live Wire liver segmentation approach. This algorithm interprets a two-dimensional image as an undirected and weighted graph and compute minimal costs paths between seed points manually selected by the user. The vertex of the graph represents the image pixels, the graph edges connect neighboring pixels and their weights represent the cost of connections computed from different image features 2010 International Conference on Complex, Intelligent and Software Intensive Systems 978-0-7695-3967-6/10 $26.00 © 2010 IEEE DOI 10.1109/CISIS.2010.118 146
-
Upload
independent -
Category
Documents
-
view
1 -
download
0
Transcript of Automatic volumetric liver segmentation using texture based region growing

Automatic Volumetric Liver Segmentation Using Texture Based Region Growing
O. Gambino1, S. Vitabile2, G. Lo Re2, G. La Tona1, S. Librizzi1, R.Pirrone1, E. Ardizzone1, M. Midiri2 1Universita’ degli Studi di Palermo-Dipartimento di Ingegneria Informatica
viale delle Scienze-Edificio 6-Terzo Piano- 90128 Palermo(Italy) 2Universita’ degli Studi di Palermo-Dipartimento di Biotecnologie
Mediche e Medicina Legale via del Vespro 129 - 90128 Palermo (Italy)
Abstract— In this paper an automatic texture based volumetric region growing method for liver segmentation is proposed. 3D seeded region growing is based on texture features with the automatic selection of the seed voxel inside the liver organ and the automatic threshold value computation for the region growing stop condition. Co-occurrence 3D texture features are extracted from CT abdominal volumes and the seeded region growing algorithm is based on statistics in the features space. Each CT volume is composed by 230 slices, having 512 x 512 pixels as spatial resolution, and 12-bit gray level resolution. In this initial feasible study, 5 healthy volunteer acquisitions has been used. Tests have been performed on both basal phase and arterial phase images. Segmentation result shows the effectiveness of the proposed method: liver organ is correctly recognized and segmented, leaving out liver vessels form the segmented area and overcoming the “organ-splitting” problem. The goodness of the proposed method has been confirmed by manual liver segmentation results, having analogous and super-imposable behavior.
Keywords-components: Liver segmentation, Texture based Region Growing, CT images.
I. INTRODUCTION In the context of medical imaging, the problem of tissue
segmentation is to delimit the image areas representing different anatomies. It is an essential step for automatic analysis of medical images because it increases the radiologists’ productivity and permits a more accurate diagnosis and quantitative analysis.
There are many approaches for image segmentation based on the irregularity or similarity of some pixel properties such as their gray levels. Nevertheless, intensity-based methods are not successful for abdominal segmentation because gray levels of the adjacent issues are very similar. In particular the liver segmentation is a very difficult task due to the considerable overlap of soft tissues and lately it has received much attention from researchers.
The methods that uses low-level features based on texture information are more interesting, because they can extract from the images those features that are relevant and they also allow a more accurate analysis of the similarities between regions.
In a generic texture feature based region growing approach, given a seed point, the algorithm merges individual pixels that satisfy the homogeneity criterion resulting from the study of some local descriptors of the texture. There are several main
aspects that affect system performance such as the seed point selection that can be manual or automatic and the stopping criterion that determine if a new pixel can be added to the region.
The goal of the approach presented in this paper is to achieve automatic texture based volumetric segmentation of the liver in Computed Tomography (CT) images of the abdomen acquired on different modalities. The first step is the pre-processing of the whole volume in order to correct the contrast, segment the abdomen area and reduce the number of gray levels of the images. The next step is the reconstruction of the liver volume in which we first extract a region of interest (ROI) that contains the liver region than from that the seed point is determined by the minimization of a cost function with three factors. The local texture features are extracted from Co-occurrence matrices computed given 13 directions in 3D. In particular from every Co-occurrence matrix, 7 of the features proposed by Haralick [1] are computed. Then the automatic seeded region growing is executed on the features space. The threshold is obtained with a new method in which several points around the seed point are chosen sampling from a normal distribution. For every one of these points it is calculated the distance in the features space from the seed point. The statistical parameters of the distribution of these distances is used to select the threshold for the region growing.
The paper is organized as follow. In section II we present an overview of the state of the art in the field of liver segmentation in CT images and texture based analysis for organ segmentation. In section III we describe our proposed system. In section IV we discuss the experimental results obtained. The last section is a conclusion with some ideas for improvements and further work.
II. BACKGROUND
A. Liver segmentation from CT Scans In this section we describe some semi-automatic and
automatic techniques for liver volume extraction from abdominal CT that was presented in the last years [27].
Barret et al.[11] proposed a Live Wire liver segmentation approach. This algorithm interprets a two-dimensional image as an undirected and weighted graph and compute minimal costs paths between seed points manually selected by the user. The vertex of the graph represents the image pixels, the graph edges connect neighboring pixels and their weights represent the cost of connections computed from different image features
2010 International Conference on Complex, Intelligent and Software Intensive Systems
978-0-7695-3967-6/10 $26.00 © 2010 IEEE
DOI 10.1109/CISIS.2010.118
146

like gray level and gradient value. When the user initially clicks to set a starting point on the boundary, all the possible minimum-cost paths from this point to all other point in the image are computed by a graph search algorithm and the desired boundary segment can be chosen as the minimum cost path from the seed point and a free point specified by the mouse position. If the user is satisfied by the boundary segment obtained he can click and reiterate the process using as seed point the last free point until the entire boundary is traced. The disadvantage of this approach is that it requires a full control of the operator and the quality of segmentation result is heavily dependent on the skills of the user.
In the gray level based liver segmentation approaches [12][13][14], at first, a statistical analysis of a subset of manually segmented slices is performed and the gray levels of the liver are estimated, or alternatively the gray levels of the liver are extracted by means of an histogram analysis based on an a priori knowledge about the liver density [15]. Successively, simple or iterative thresholding is used to create binary images that are further processed by 2D or 3D [16] morphological operators to separate attached organs like spleen or stomach that have similar tissue appearance. In order to repair and recognize segmentation errors in the current slice, prior information and the information retrieved from the previous segmented slices is used and in the last step the boundaries are smoothed in each slice by means of active contours or B-splines. The problem of this method relies in the liver gray level estimation step that depends strongly from the gray level characteristics variability of different patients. To overcome it, [17][18][19] have proposed methods based on learning the gray level features corresponding to the liver by means of feed forward neural network trained with back propagation on liver and unsupervised procedures based on pixel gray levels and spatial information.
Gao et al.[20] have developed a method to describe and capture a priori information about the shape, position and size of the liver by means of its parameterized 3D surface model. It is defined an energy function to minimize, this function measures the match between the gradient of the image and the unit surface normal of the deformable model. The limit of deformable models is that they often fail to capture the natural liver shape variability because they must be bounded by global constraints to make them robust to noise and outliers. To overcome this limitation Montagnat et al. [21][22] proposes an hybrid approach that combines the classical deformable model technique with an elastic registration technique.
Other works regards the construction of probabilistic atlases for the abdomen organs [23][24][25]. Here, the first phase is the registration of each training CT data into a standard space defined by a small set of landmarks. The probabilistic atlas is then created by a spatial averaging of the registered organ surfaces, and is incorporated into a Bayesian framework to compute, for each voxel, the probability of belonging to a certain organ, finally, the region that maximizes the posterior probability of being the desired organ is extracted with the iterative conditional mode algorithm or by simple thresholding.
The seeded region growing algorithm was first proposed by Adams and Bischof [3], the method requires the input of a number of seeds, either individual pixels or regions, which will control the formation of regions into which the image will be
segmented. Starting from a set of seed points, it considers as homogeneity criterion the absolute value of the difference between the gray level of the pixel to be added to the region and the mean of those already belonging to the region itself. The efficiency of this method strongly depends on the choice of the seed point.
B. Texture feature analysis for organ segmentation There has been considerable research in the field of texture
analysis in medical imaging. Backman et al. [6] proposed a prioritized and adaptive volumetric region growing algorithm which automatically segments a region of interest simultaneously developing a stopping criterion. The algorithm uses volumetric texture extraction using Haralick co-occurrence matrix derived from a 3-dimensional neighborhood around a voxel using the all-pairs approach [4]. The extracted texture features are then used to establish the homogeneity criterion needed to test whether a voxel can be added to the region or not by means of the Mahalanobis distance in the features space. The benefit is the little need of user intervention because the user should only identify the seed point.
Kalinin et al. [4] presented a supervised pixel-based classifier approach for segmenting different anatomical regions in Computed Tomography (CT) images of the abdomen. At first, a set of local texture descriptors are calculated for each pixel from the image data sample, then a decision tree is built using texture descriptors and the names of tissues to label each pixel as belonging to an organ.
Susomboon et al.[26] proposed an automatic liver segmentation method that utilizes low-level features based on texture information (Co-occurrence matrices, Gabor filters, Markov Random Fields), then liver probability images are generated using a binary classification approach and a split and merge algorithm is applied to detect the seed set with the highest probability area. Finally it is iteratively applied to the seed set a region growing algorithm to refine the liver boundary and get the final segmentation results.
Our approach is based principally on the work of Wu et al.[2] which proposed a new texture feature based seeded region growing algorithm for the automatic segmentation of organs in Abdominal MR images. In their work, once the gray level co-occurrence matrices for 4 directions in a plane are created, 14 descriptors as proposed by Haralick are extracted and represent the texture feature space for each pixel. With a given Region of Interest (ROI) chosen by the user, a seed point is automatically picked up based on three homogeneity criteria with a cost minimization approach. Then the seeded region growing algorithm is run on this feature space and it considers the neighbors of the seed point to determine whether they belong to the same region using the Euclidean distance in feature space until no more new pixel can be added to the region. The threshold value is the value that can stop the region growing. Depending on the selected value the extracted region may grow over the actual region boundary and grow to a much larger region, this phenomenon is called ‘explosion’. Their idea is to take a lower value for the threshold just before the one causing the ‘explosion’. So the algorithm starts from a low threshold value and increases it by 1. When it comes to a value causing explosion it retrieves the last value not causing it and reiterate the process with increasing steps of 0.1 instead of 1 until another explosion is caused, in this way the value just
147

before explosion is retrieved. This method has the problem of under-segmentation because soft tissues close to the organ can be selected without causing explosion. This algorithm executes the region growing only for a single slice and therefore it fail to recognize not connected regions in the image belonging to the same organ, a phenomenon called ‘organ splitting’.
Among all, Co-occurrence matrices are the most widely used texture features.
III. THE PROPOSED SYSTEM Our system uses Computed Tomography (CT) DICOM
slices of the abdomen acquired on different modalities. The algorithm consists of two stages:
i). The volume of CT images is loaded and pre-processed performing the follows steps:
• contrast enhancement
• abdomen segmentation
• gray level requantization
ii). The seed point is selected, the automatic seeded region growing runs on texture feature space and the threshold value is automatically selected.
A. Preprocessing Step The preprocessing step considers the whole volume and for
every slice performs contrast enhancement, abdomen segmentation, and gray level requantization.
The contrast enhancement step improves image quality through the following two operations:
i). the linear transformation y=mx+q is applied in order to correct the intensity range (see Figure 1). In this way, the dynamic is mapped on a standard scale (Hounsfield units) [9].
Figure 1. Linear transformation
ii). Following the previous step, a contrast stretching transformation as linear intensity re-mapping is applied. However, contrast stretching is applied to a defined intensity range rather than the entire dynamics (see Figure 2).
The second phase of pre-processing step is related to the abdomen segmentation. A global intensity thresholding of the processed image is performed. Threshold value is selected by analyzing the image histogram in order to split the foreground objects from the background. Foreground objects are the abdomen and the examination couch, so that the abdomen region is selected as the largest object of the image.
The last step is related to the gray level requantization. This step is aimed to decrease image gray levels in order to reduce the computational load for texture feature extraction. Two different methods were compared:
i) uniform gray level quantization where gray levels are scaled by a uniform subdivision of the dynamic range.
ii) clustering based gray level quantization where gray levels are grouped using the k-means algorithm [7] and a resulting gray level is assigned to each cluster.
Figure 1. Mapping used for the contrast stretching.
Uniform gray level quantization is very fast but the subdivision does not take into account gray levels distribution. Conversely, clustering gray level quantization can discriminate better the gray levels of interest by an adaptive subdivision of the dynamic range. However, it has higher computational complexity.
B. Automatic Seeded Region Growing Step 1) Selection of a Seed Point
The seed point is selected using a cost-minimization approach based on the algorithm proposed in [2]. The algorithm chooses a seed point in the central slice of the CT volume. Firstly, a Region of Interest (ROI) including the liver is extracted. This operation is automatically performed by extracting the region including abdomen pixels whose orientation ranges from 90° to 210° with respect to the coordinates of the abdomen center of mass in the anatomical coordinate system (see Figure 3).
Figure 2. Selected region of interest (ROI).
148
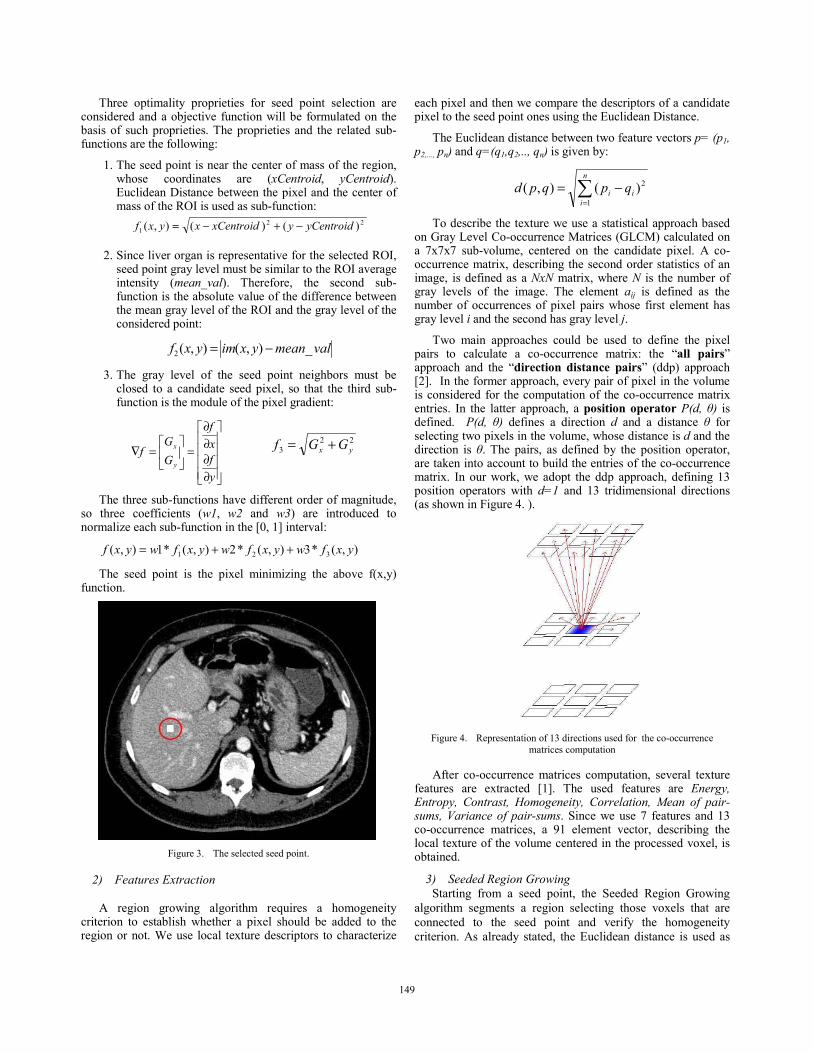
Three optimality proprieties for seed point selection are considered and a objective function will be formulated on the basis of such proprieties. The proprieties and the related sub-functions are the following:
1. The seed point is near the center of mass of the region, whose coordinates are (xCentroid, yCentroid). Euclidean Distance between the pixel and the center of mass of the ROI is used as sub-function:
221 )()(),( yCentroidyxCentroidxyxf −+−=
2. Since liver organ is representative for the selected ROI, seed point gray level must be similar to the ROI average intensity (mean_val). Therefore, the second sub-function is the absolute value of the difference between the mean gray level of the ROI and the gray level of the considered point:
valmeanyximyxf _),(),(2 −=
3. The gray level of the seed point neighbors must be closed to a candidate seed pixel, so that the third sub-function is the module of the pixel gradient:
⎥⎥⎥⎥
⎦
⎤
⎢⎢⎢⎢
⎣
⎡
∂∂∂∂
=⎥⎦
⎤⎢⎣
⎡=∇
yfxf
GG
fy
x
223 yx GGf +=
The three sub-functions have different order of magnitude, so three coefficients (w1, w2 and w3) are introduced to normalize each sub-function in the [0, 1] interval:
),(*3),(*2),(*1),( 321 yxfwyxfwyxfwyxf ++=
The seed point is the pixel minimizing the above f(x,y) function.
Figure 3. The selected seed point.
2) Features Extraction
A region growing algorithm requires a homogeneity criterion to establish whether a pixel should be added to the region or not. We use local texture descriptors to characterize
each pixel and then we compare the descriptors of a candidate pixel to the seed point ones using the Euclidean Distance.
The Euclidean distance between two feature vectors p= (p1, p2,..., pn) and q=(q1,q2,.., qn) is given by:
∑=
−=n
iii qpqpd
1
2)(),(
To describe the texture we use a statistical approach based on Gray Level Co-occurrence Matrices (GLCM) calculated on a 7x7x7 sub-volume, centered on the candidate pixel. A co-occurrence matrix, describing the second order statistics of an image, is defined as a NxN matrix, where N is the number of gray levels of the image. The element aij is defined as the number of occurrences of pixel pairs whose first element has gray level i and the second has gray level j.
Two main approaches could be used to define the pixel pairs to calculate a co-occurrence matrix: the “all pairs” approach and the “direction distance pairs” (ddp) approach [2]. In the former approach, every pair of pixel in the volume is considered for the computation of the co-occurrence matrix entries. In the latter approach, a position operator P(d, θ) is defined. P(d, θ) defines a direction d and a distance θ for selecting two pixels in the volume, whose distance is d and the direction is θ. The pairs, as defined by the position operator, are taken into account to build the entries of the co-occurrence matrix. In our work, we adopt the ddp approach, defining 13 position operators with d=1 and 13 tridimensional directions (as shown in Figure 4. ).
Figure 4. Representation of 13 directions used for the co-occurrence
matrices computation
After co-occurrence matrices computation, several texture features are extracted [1]. The used features are Energy, Entropy, Contrast, Homogeneity, Correlation, Mean of pair-sums, Variance of pair-sums. Since we use 7 features and 13 co-occurrence matrices, a 91 element vector, describing the local texture of the volume centered in the processed voxel, is obtained.
3) Seeded Region Growing Starting from a seed point, the Seeded Region Growing
algorithm segments a region selecting those voxels that are connected to the seed point and verify the homogeneity criterion. As already stated, the Euclidean distance is used as
149

criterion of homogeneity, while the 6-connectivity is used to establish if two voxels are neighbors (see Figure 5. ).
Figure 5. Representation of the 6 neighbours used for the connectivity.
Starting from the seed voxel, each 6-neighbor voxel is iteratively included in the volume, if the Euclidean Distance between their texture features is below a predefined threshold. The process is repeated until no more new pixels can be added to the volume or the maximum number of iterations is reached.
4) Automatic Threshold Value Selection Threshold value selection is a critical issue for voxel
growing procedure, since high threshold value is too selective, while low threshold value is too sensitive.
The threshold value has been selected analyzing the statistical distribution of the texture features of the seed point neighbors. A 20000 points ellipsoidal sampling region, having the seed point as center, has been considered. Region size comes from a trivariate Gaussian model whose covariance matrix is:
⎥⎥⎥
⎦
⎤
⎢⎢⎢
⎣
⎡=Σ
30000100000100
The above covariance values assure that the sampled region will be inside the liver organ (see Figure 6. ). Successively, the histogram of the Euclidean distances between the sampled voxels and the seed point is created. We assume that the sampled voxels belong to two classes, which are the class of liver voxels and the class of non-liver voxels, respectively. We also assume that the distances from the seed point to the voxels in a class are normally distributed; therefore the previous distances can be modeled by a Gaussian mixture distribution. A Gaussian mixture distribution can be written as a linear superposition of Gaussian variables in the form:
∑=
Σ=K
kkkk xNxp
1),|()( μπ
Each Gaussian density N(x|μk,Σk) is a component of the mixture and has its own mean μk and covariance Σk, the parameters πk are called mixing coefficients [7].
We use the Expectation Maximization (EM) algorithm [28][29] to estimate the mixture parameters. Successively, the algorithm pick the component with the smallest mean value and the threshold value T is calculated as:
11 *σαμ +=T
where μ1 and σ1 are the parameters of the Gaussian with the lowest mean value, and α is a tuning parameter, defined as:
otherwiseif 1
12 2
1 <
⎩⎨⎧
=σα
Figure 6. Sampled region (100 samples) for the texture feature statistical
distribution analysis
Figure 7. Euclidean distances histogram in the feature space.
IV. EXPERIMENTAL STUDIES AND DISCUSSIONS The proposed automatic liver segmentation system has
been prototyped using the Matlab environment, embedding C functions and procedures for co-occurrence matrices computation.
A. Material The system is tested on 3D CT abdominal images acquired
with two different modalities: baseline and after intravenous administration of contrast medium (arterial phase) [8]. Each volume is composed by 230 slices, having 512 x 512 pixels as spatial resolution, and 12-bit gray level resolution. Tests have been executed on both basal phase and arterial phase images. In this initial feasible study, we used 5 healthy volunteer acquisitions.
150
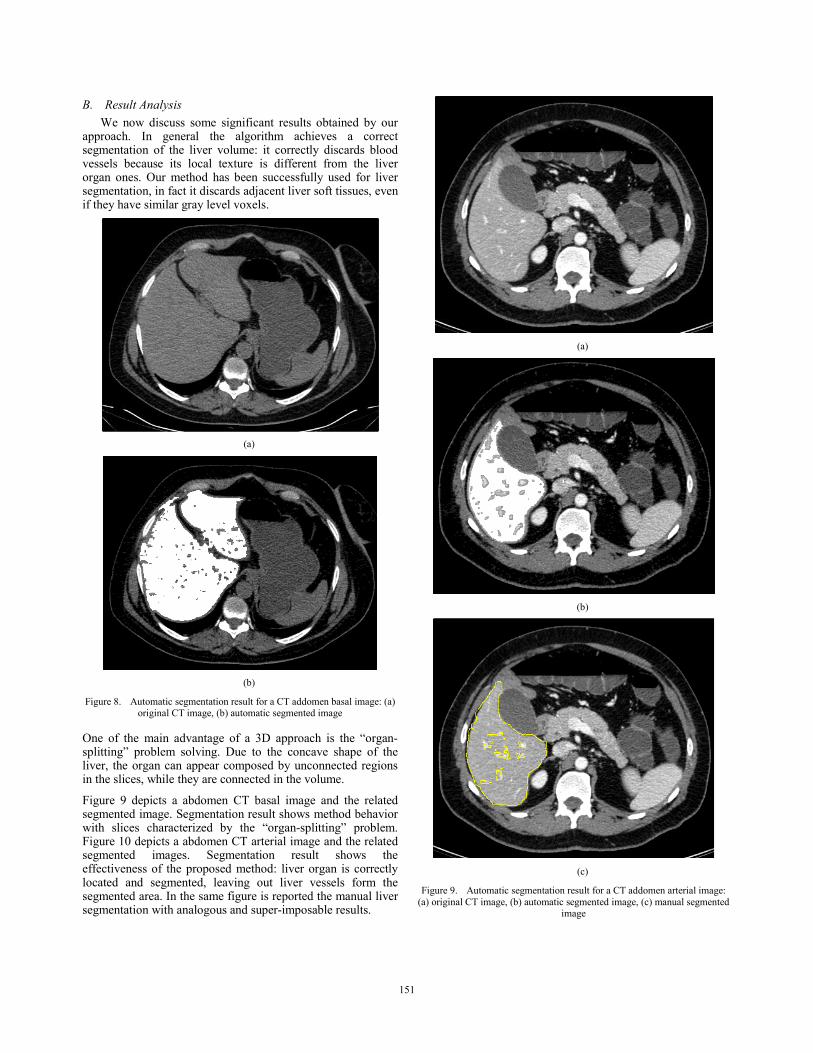
B. Result Analysis We now discuss some significant results obtained by our
approach. In general the algorithm achieves a correct segmentation of the liver volume: it correctly discards blood vessels because its local texture is different from the liver organ ones. Our method has been successfully used for liver segmentation, in fact it discards adjacent liver soft tissues, even if they have similar gray level voxels.
(a)
(b)
Figure 8. Automatic segmentation result for a CT addomen basal image: (a) original CT image, (b) automatic segmented image
One of the main advantage of a 3D approach is the “organ-splitting” problem solving. Due to the concave shape of the liver, the organ can appear composed by unconnected regions in the slices, while they are connected in the volume.
Figure 9 depicts a abdomen CT basal image and the related segmented image. Segmentation result shows method behavior with slices characterized by the “organ-splitting” problem. Figure 10 depicts a abdomen CT arterial image and the related segmented images. Segmentation result shows the effectiveness of the proposed method: liver organ is correctly located and segmented, leaving out liver vessels form the segmented area. In the same figure is reported the manual liver segmentation with analogous and super-imposable results.
(a)
(b)
(c)
Figure 9. Automatic segmentation result for a CT addomen arterial image: (a) original CT image, (b) automatic segmented image, (c) manual segmented
image
151

V. CONCLUSION AND FUTURE WORK In this paper an automatic texture based volumetric region
growing method for liver segmentation has been proposed. The algorithm provides a parameter-free environment that need no user intervention. This can be really useful for batch work to process huge amount of data. In addition, an automatic method for threshold value computation during the region growing process is proposed.
The main drawback of our method is the under-segmentation near the liver boundary. As shown in Figure 9 and 10, the boundary of the segmented region is internal to the liver organ. Under-segmentation is due to the 7x7x7 sub-volume used for co-occurrence matrices computation: the sub-volume centered on a boundary voxel will contain external liver voxels, thus the local feature descriptors are different and the voxel will be discarded. On the other hand, smaller sub-volumes are unable to generate significant data for useful statistics.
Future works will be aimed to improve segmentation results through the application of other texture feature descriptors, the use of a neural network for texture feature selection, and different similarity criteria in the region growing procedure. In addition, future experimentation will be planned involving more volunteers, and several parameters, such as sensitivity and specificity, for result evaluation.
REFERENCES [1] Robert M. Haralick, K.Shanmugam and Its’Hak Dinstein. “Textural
Features for Image Classification”. IEEE Transactions On Systems, Man and Cybernetics, vol. Smc-3, no.6 November 1973.
[2] Jie Wu, Skip Poehlman, Michael D.Noseworthy, Markad V.Kamath. “Texture Feature based Automated Seeded Region Growing in Adominal MRI Segmentation”. International Conference on BioMedical Engineering and Informatics 2008.
[3] R. Adams, L Bischof, “Seeded region growing”. IEEE Transactions On. Pattern Analysis and. Machine Intelligence, vol 16, pp.641-647, 1994.
[4] M. Kalinin, D.S. Raicu, J. Furst, and D.S. Channin, “A classification Approach for anatomical regions segmentation”, IEEE Int. Conf. on Image Processing, 2005.
[5] Matjaz Bevk, Igor Kononenko. “A Statistical Approach to Texture Description of Medical Images: A Preliminary Study”.
[6] Nathan J. Backman, Brian W. Whitney, Jacob D.Furst, Daniela S. Raicu “A prioritized and adaptive approach to volumetric seeded region growing using texture descriptors”.
[7] C.M. Bishop, Springer “Pattern Reognition and Machine Learning”, 2006.
[8] G.Marchal, T.J.Vogl, J.P.Heiken, G.D.Rubin (Eds) “Multidetector-Row Computed Tomography. Scanning and Contrast Protocols”, Springer 2006.
[9] Digital Imaging and Communications in Medicine(DICOM) Part 3, 2008.
[10] R. Susomboon, D.S. Raicu, and J.D. Furst, "Pixel-Based Texture Classification of Tissues in Computed Tomography", CTI Research Symposium, Chicago, April 2006.
[11] Barrett, W. and Mortensen, E.N., Interactive live-wire boundary extraction. Medical Image Analysis. 1(4), 331-341(1997).
[12] Bae, K.T., Giger, M.L., Chen, C.T. and Kahn, C.E., Automatic segmentation of liver structure in CT images. Medical Physics 20 (1993).
[13] Gao, L., Heath, D., Kuszyk, B. and Fishman, E., Automatic liver segmentation technique for three-dimensional visualization of CT data. Radiology 201, 359-364 (1996).
[14] Kobashi, M. and Shapiro, L.G., Knowledge-based organ identification from CT images. Pattern Recognition. 28 (4), 475-491 (1995).
[15] Woodhouse, C., Ney, D., Sitzmann, J. and Fishman, E., Spiral computed tomography arterial portography with three-dimensional volumetric rendering for oncologic planning: a retrospective analysis. Investigative Radiology. 29, 1031-1037 (1994).
[16] Kaneko, T., Gu, L. and Fujimoto, H., Recognition of abdominal organs using 3D mathematical morphology. Systems and Computers in Japan. 33 (8), 75-83 (2002).
[17] Tsai, D. and Tanahashi, N., Neural-network-based boundary detection of liver structure in CT images for 3D visualization. In: Proceedings of IEEE international conference on neural networks, IEEE Catalog Number: 04CH37541, vol. 6 (1), pp. 3484-3489 (1994).
[18] Koss, J.E., Newman, F.D., Johnson, T.K. and Kirch, D.L., Abdominal organ segmentation using texture transforms and a hopfield neural network. Correspondences of IEEE Transaction on Medical Imaging. v18 i7. 640-648 (1999).
[19] Lee, C-C., Chung, P-C. and Tsai, H-M., Identifying multiple abdominal organs from CT image series using a multimodule contextual neural network and spatial fuzzy rules. IEEE Transaction on Information Technology in Biomedicine. v7. 208-217 (2003).
[20] Gao, L., Heath, D. and Fishman, E., Abdominal image segmentation using three-dimensional deformable models. Investigative Radiology. 33 (6). 348-355 (1998).
[21] Montagnat,J., Delingette, H.: Volumetric medical images segmentation using shape constrained deformable models. In: CVRMed-MRCAS, pp. 13-22 Springer Verlang, Heidelberg (!996).
[22] Soler, L., Delingette, H., Malandain, G., Montagnat, J., Ayache, N. and Koehl, C., Fully automatic anatomical, pathological, and functional segmentation from CT scans for hepatic surgery. Computed Aided Surgery. 6 (3), 131-142 (2001).
[23] Park, H., Bland, P. and Meyer, C., Construction of an abdominal probabilistic atlas and its application in segmentation. IEEE Transactions on Medical Imaging. 22 (4), 483-492 (2003).
[24] Shimizu, A., Ohno, R., Ikegami, T., Kobatake, H., Nawano, S. and Smutek, D., Multi-organ segmentation in three dimensional abdominal CT images. International Journal of Computer Assisted Radiology and Surgery (CARS 2006). vol.1 (7), pp 76-78.
[25] Zhou, X., Kitagawaa, T., Okuo, K., Hara, T., Fujita, H. and Yokoyama, R., Construction of a probabilistic atlas for automated liver segmentation in non-contrast torso CT images. International Journal of Computed Assisted Radiology and Surgery (CARS 2005). v1281. 1169-1174.
[26] M. Pham, R. Susomboon, T. Disney, D. Raicu and J. Furst, A comparison of texture models for automatic liver segmentation, Proceedings of the SPIE 6512 (2007), p.
[27] Campadelli P., Casiraghi E., Liver Segmentation from CT Scans: A Survey. Proceedings of Fourth International Meeting on Computational Intelligence Methods for Bioinformatics and Biostatistics (CIBB 2007), Portofino, 7-10 July 2007.
[28] Dempster, A. P., N. M. Laird, and D. B. Rubin (1977). Maximum likelihood from incomplete data via the EM algorithm. Journal of the Royal Statistical Society, B 39(1), 1–38.
[29] McLachlan, G. J. and T. Krishnan (1997). The EM Algorithm and its Extensions. Wiley.
152