Automatic real-time analysis and interpretation of arterial ...
17
RESEARCH ARTICLE Automatic real-time analysis and interpretation of arterial blood gas sample for Point-of-care testing: Clinical validation Sancho Rodrı ´guez-Villar ID 1 *, Paloma Poza-Herna ´ ndez 2☯ , Sascha Freigang 3☯ , Idoia Zubizarreta-Ormazabal 4☯ , Daniel Paz-Martı ´n 2‡ , Etienne Holl 3‡ , Osvaldo Ceferino Pe ´ rez-Pardo 4‡ , Marı ´a Sherezade Tovar-Doncel 2‡ , Sonja Maria Wissa 3‡ , Bonifacio Cimadevilla-Calvo 4‡ , Guillermo Tejo ´ n-Pe ´ rez 4‡ , Ismael Moreno-Ferna ´ ndez 5‡ , Alejandro Escario-Me ´ ndez 5‡ , Juan Are ´ valo-Serrano 6‡ , Antonio Valentı ´n 7‡ , Bruno Manuel Do-Vale ID 8‡ , Helen Marie Fletcher 9‡ , Jesu ´ s Medardo Lorenzo- Ferna ´ ndez 10‡ 1 Critical Care Department, King´s College Hospital, London, United Kingdom, 2 Hospital Virgen de la Salud, Servicio de Anestesia y Reanimacio ´ n, Surgical Intensive Care Unit, Complejo Hospitalario de Toledo, Toledo, Spain, 3 Department of Neurosurgery, Neurosurgical Intensive Care Unit, Medical University of Graz, Graz, Austria, 4 Marque ´ s de Valdecilla University Hospital (HUMV), Servicio de Anestesia y Reanimacio ´n, Santander, Cantabria, Spain, 5 Medical Software Specialist at Madrija Company, Toledo, Spain, 6 Internal Medicine Department, Prı ´ncipe de Asturias Hospital, Alcala ´ de Henares, Madrid, Spain, 7 Department of Basic and Clinical Neuroscience, Institute of Psychiatry, Psychology & Neuroscience (IoPPN) Academic Neuroscience Centre, London, United Kingdom, 8 Critical Care Department, Centro Hospitalar Universita ´ rio do Porto (CHUP), Porto, Portugal, 9 Executive Nursing Department, King´s College Hospital, London, United Kingdom, 10 External Consultant, Ingeniero de Caminos, Canales y Puertos e Ingeniero Te ´ cnico de Obras Pu ´ blicas ☯ These authors contributed equally to this work. ‡ These authors also contributed equally to this work. * [email protected] Abstract Background Point-of-care arterial blood gas (ABG) is a blood measurement test and a useful diagnostic tool that assists with treatment and therefore improves clinical outcomes. However, numeri- cally reported test results make rapid interpretation difficult or open to interpretation. The arterial blood gas algorithm (ABG-a) is a new digital diagnostics solution that can provide cli- nicians with real-time interpretation of preliminary data on safety features, oxygenation, acid-base disturbances and renal profile. The main aim of this study was to clinically validate the algorithm against senior experienced clinicians, for acid-base interpretation, in a clinical context. Methods We conducted a prospective international multicentre observational cross-sectional study. 346 sample sets and 64 inpatients eligible for ABG met strict sampling criteria. Agreement was evaluated using Cohen’s kappa index, diagnostic accuracy was evaluated with sensitiv- ity, specificity, efficiency or global accuracy and positive predictive values (PPV) and nega- tive predictive values (NPV) for the prevalence in the study population. PLOS ONE PLOS ONE | https://doi.org/10.1371/journal.pone.0248264 March 10, 2021 1 / 17 a1111111111 a1111111111 a1111111111 a1111111111 a1111111111 OPEN ACCESS Citation: Rodrı ´guez-Villar S, Poza-Herna ´ndez P, Freigang S, Zubizarreta-Ormazabal I, Paz-Martı ´n D, Holl E, et al. (2021) Automatic real-time analysis and interpretation of arterial blood gas sample for Point-of-care testing: Clinical validation. PLoS ONE 16(3): e0248264. https://doi.org/10.1371/journal. pone.0248264 Editor: Tai-Heng Chen, Kaohsuing Medical University Hospital, TAIWAN Received: October 29, 2020 Accepted: February 24, 2021 Published: March 10, 2021 Peer Review History: PLOS recognizes the benefits of transparency in the peer review process; therefore, we enable the publication of all of the content of peer review and author responses alongside final, published articles. The editorial history of this article is available here: https://doi.org/10.1371/journal.pone.0248264 Copyright: © 2021 Rodrı ´guez-Villar et al. This is an open access article distributed under the terms of the Creative Commons Attribution License, which permits unrestricted use, distribution, and reproduction in any medium, provided the original author and source are credited. Data Availability Statement: In accordance with the Declaration of Helsinki regarding the confidentiality of the patient’s information, The
-
Upload
khangminh22 -
Category
Documents
-
view
3 -
download
0
Transcript of Automatic real-time analysis and interpretation of arterial ...

RESEARCH ARTICLE
Automatic real-time analysis and
interpretation of arterial blood gas sample for
Point-of-care testing: Clinical validation
Sancho Rodrıguez-VillarID1*, Paloma Poza-Hernandez2☯, Sascha Freigang3☯,
Idoia Zubizarreta-Ormazabal4☯, Daniel Paz-Martın2‡, Etienne Holl3‡, Osvaldo
Ceferino Perez-Pardo4‡, Marıa Sherezade Tovar-Doncel2‡, Sonja Maria Wissa3‡,
Bonifacio Cimadevilla-Calvo4‡, Guillermo Tejon-Perez4‡, Ismael Moreno-Fernandez5‡,
Alejandro Escario-Mendez5‡, Juan Arevalo-Serrano6‡, Antonio Valentın7‡, Bruno
Manuel Do-ValeID8‡, Helen Marie Fletcher9‡, Jesus Medardo Lorenzo- Fernandez10‡
1 Critical Care Department, King´s College Hospital, London, United Kingdom, 2 Hospital Virgen de la Salud,
Servicio de Anestesia y Reanimacion, Surgical Intensive Care Unit, Complejo Hospitalario de Toledo, Toledo,
Spain, 3 Department of Neurosurgery, Neurosurgical Intensive Care Unit, Medical University of Graz, Graz,
Austria, 4 Marques de Valdecilla University Hospital (HUMV), Servicio de Anestesia y Reanimacion,
Santander, Cantabria, Spain, 5 Medical Software Specialist at Madrija Company, Toledo, Spain, 6 Internal
Medicine Department, Prıncipe de Asturias Hospital, Alcala de Henares, Madrid, Spain, 7 Department of
Basic and Clinical Neuroscience, Institute of Psychiatry, Psychology & Neuroscience (IoPPN) Academic
Neuroscience Centre, London, United Kingdom, 8 Critical Care Department, Centro Hospitalar Universitario
do Porto (CHUP), Porto, Portugal, 9 Executive Nursing Department, King´s College Hospital, London, United
Kingdom, 10 External Consultant, Ingeniero de Caminos, Canales y Puertos e Ingeniero Tecnico de Obras
Publicas
☯ These authors contributed equally to this work.
‡ These authors also contributed equally to this work.
Abstract
Background
Point-of-care arterial blood gas (ABG) is a blood measurement test and a useful diagnostic
tool that assists with treatment and therefore improves clinical outcomes. However, numeri-
cally reported test results make rapid interpretation difficult or open to interpretation. The
arterial blood gas algorithm (ABG-a) is a new digital diagnostics solution that can provide cli-
nicians with real-time interpretation of preliminary data on safety features, oxygenation,
acid-base disturbances and renal profile. The main aim of this study was to clinically validate
the algorithm against senior experienced clinicians, for acid-base interpretation, in a clinical
context.
Methods
We conducted a prospective international multicentre observational cross-sectional study.
346 sample sets and 64 inpatients eligible for ABG met strict sampling criteria. Agreement
was evaluated using Cohen’s kappa index, diagnostic accuracy was evaluated with sensitiv-
ity, specificity, efficiency or global accuracy and positive predictive values (PPV) and nega-
tive predictive values (NPV) for the prevalence in the study population.
PLOS ONE
PLOS ONE | https://doi.org/10.1371/journal.pone.0248264 March 10, 2021 1 / 17
a1111111111
a1111111111
a1111111111
a1111111111
a1111111111
OPEN ACCESS
Citation: Rodrıguez-Villar S, Poza-Hernandez P,
Freigang S, Zubizarreta-Ormazabal I, Paz-Martın D,
Holl E, et al. (2021) Automatic real-time analysis
and interpretation of arterial blood gas sample for
Point-of-care testing: Clinical validation. PLoS ONE
16(3): e0248264. https://doi.org/10.1371/journal.
pone.0248264
Editor: Tai-Heng Chen, Kaohsuing Medical
University Hospital, TAIWAN
Received: October 29, 2020
Accepted: February 24, 2021
Published: March 10, 2021
Peer Review History: PLOS recognizes the
benefits of transparency in the peer review
process; therefore, we enable the publication of
all of the content of peer review and author
responses alongside final, published articles. The
editorial history of this article is available here:
https://doi.org/10.1371/journal.pone.0248264
Copyright: © 2021 Rodrıguez-Villar et al. This is an
open access article distributed under the terms of
the Creative Commons Attribution License, which
permits unrestricted use, distribution, and
reproduction in any medium, provided the original
author and source are credited.
Data Availability Statement: In accordance with
the Declaration of Helsinki regarding the
confidentiality of the patient’s information, The

Results
The concordance rates between the interpretations of the clinicians and the ABG-a for acid-
base disorders were an observed global agreement of 84,3% with a Cohen’s kappa coeffi-
cient 0.81; 95% CI 0.77 to 0.86; p < 0.001. For detecting accuracy normal acid-base status
the algorithm has a sensitivity of 90.0% (95% CI 79.9 to 95.3), a specificity 97.2% (95% CI
94.5 to 98.6) and a global accuracy of 95.9% (95% CI 93.3 to 97.6). For the four simple acid-
base disorders, respiratory alkalosis: sensitivity of 91.2 (77.0 to 97.0), a specificity 100.0
(98.8 to 100.0) and global accuracy of 99.1 (97.5 to 99.7); respiratory acidosis: sensitivity of
61.1 (38.6 to 79.7), a specificity of 100.0 (98.8 to 100.0) and global accuracy of 98.0 (95.9 to
99.0); metabolic acidosis: sensitivity of 75.8 (59.0 to 87.2), a specificity of 99.7 (98.2 to 99.9)
and a global accuracy of 97.4 (95.1 to 98.6); metabolic alkalosis sensitivity of 72.2 (56.0 to
84.2), a specificity of 95.5 (92.5 to 97.3) and a global accuracy of 93.0 (88.8 to 95.3); the
four complex acid-base disorders, respiratory and metabolic alkalosis, respiratory and meta-
bolic acidosis, respiratory alkalosis and metabolic acidosis, respiratory acidosis and meta-
bolic alkalosis, the sensitivity, specificity and global accuracy was also high. For normal
acid-base status the algorithm has PPV 87.1 (95% CI 76.6 to 93.3) %, and NPV 97.9 (95%
CI 95.4 to 99.0) for a prevalence of 17.4 (95% CI 13.8 to 21.8). For the four-simple acid-
base disorders and the four complex acid-base disorders the PPV and NPV were also statis-
tically significant.
Conclusions
The ABG-a showed very high agreement and diagnostic accuracy with experienced senior
clinicians in the acid-base disorders in a clinical context. The method also provides refine-
ment and deep complex analysis at the point-of-care that a clinician could have at the bed-
side on a day-to-day basis. The ABG-a method could also have the potential to reduce
human errors by checking for imminent life-threatening situations, analysing the internal
consistency of the results, the oxygenation and renal status of the patient.
Introduction
The most imperative aspect of patients in emergency and critical care settings is their dynamic
physiological status and potential for rapid deterioration that may require early diagnosis and
clinical decisions for better patient outcome including pre-hospital medicine, using portable
systems for the correct diagnosis of the patient’s condition. Along with various “vital signs”
such as, blood pressure, heart rate and rhythm, temperature, and respiratory rate, some bio-
chemical markers reflect these rapid changes resulting in patient’s unstable physiology [1].
Rapid provision of blood measurements, particularly blood gases and electrolytes, may trans-
late into improved clinical outcomes. These situations require prompt lab results, most of
which are done serially, ideally a point-of-care test (POCT), to meet the urgency of clinical
decision and avoid subsequent damage to vital organs and systems [2]. Studies show that
POCT carries advantages of providing reduced therapeutic turnaround time (TTAT), shorter
door-to-clinical-decision time, rapid data availability, reduced pre-analytic and post-analytic
testing errors, self-contained user-friendly instruments, small sample volume requirements,
and frequent serial whole-blood testing [3,4]. This information provides vital in acute settings
PLOS ONE Arterial blood gas algorithm (ABG-a): Clinical validation
PLOS ONE | https://doi.org/10.1371/journal.pone.0248264 March 10, 2021 2 / 17
General Data Protection Regulation (25 May 2018),
local applicable regulatory requirements and the
ethical approvals for the study, the deidentified
study data can be made available to researchers
upon request and after approval by the local Ethics
Committee (Comite de Etica de la Investigacion con
Medicamentos (CEIm) de Toledo, Spain; Comite de
Etica de la Investigacion con Medicamentos (CEIm)
de Cantabria, Spain and Vice-Rector for Research
and International Affairs, Mag. a Caroline Schober-
Trummler on behalf of the Med Uni Graz.) for
researchers who meet the criteria for access to
confidential data by contacting Comite de Etica de
la Investigacion con Medicamentos (CEIm) de
Toledo, Spain (ref: 05/12/19. Number 461):
Funding: Financial support, including any
institutional departmental funds, was not sought
for the study. The authors received no specific
funding for this work Medical Software Madrija
Company provided financial support in the form of
a salary to Moreno-Fernandez I and Escario-
Mendez A, but did not have any additional role in
the study design, data collection and analysis,
decision to publish, or preparation of the
manuscript. The specific roles of these authors are
articulated in the ‘author contributions’ section.
Competing interests: The validation study is a
collaboration among healthcare professionals:
Rodrıguez-Villar S, Do-Vale BM and Fletcher HM
who hold currently the ABG-a patent and original
design; the medical team who run the study in the
different centres in Europe: Poza- Hernandez P,
Freigang S, Zubizarreta-Ormazabal I, Paz-Martın D,
&Holl E, Perez-Pardo OC,Tovar-Doncel MS,Wissa
S, Cimadevilla-Calvo B, Tejon-Perez G an IT
company: Medical Software Madrija Company
which provided financial support in the form of a
salary to Moreno-Fernandez I and Escario-Mendez
A; a statistician: Arevalo-Serrano J; an academic
who help with the design:Valentın A and an external
consultant who does not received any salary or
fees: Lorenzo- Fernandez JM. There are not
currently competing financial interests or
institutional conflicts among the authors of the
study. The study is not linked to any company and
there is not currently any competing interest
associated such products in development, or
marketed products. This does not alter our
adherence to PLOS ONE policies on sharing data
and materials. The rest of faculty and staff in a
position to control or affect the content of this
paper have declared that they have no competing
financial interests or institutional conflicts. The rest
of authors have declared that no competing
interests exist.

and patients on any type of extracorporeal support including extracorporeal membrane oxy-
genation (ECMO) especially on the initial set up until the patient is physiologically stable. This
POCT is relevant also in chronic patients who attend on a regular basis to dialysis units or to
respiratory outpatient clinics. In addition, the implementation and increased use of telemedi-
cine in most countries is significant and thus the need for strong reliable software to support
this new technology (e.g. supporting patients on home dialysis, clinics, small district/satellite
hospitals, out-of-hours consultations, remote medicine, and district nurses) is essential.
A number of arterial blood gas (ABG) analysers from different manufactures exist which
are commercially available. All such analysers, with more or less the same parameters, provide
an output in the form of an on-screen or printed analysis which contains raw data, possibly
with some standard reference values and indications as to whether the measured values fall
inside or outside those reference values (Fig 1).
However, there is significant potential for human error when interpreting the blood mea-
surements, which can be very complex on occasions. This, together with other stressors facing
healthcare professionals today may affect the best possible clinical treatment of patients in a
critical condition. Such stressors include: inexperienced non-laboratorians, reduced in hospital
presence particularly out of hours of senior clinicians, ever increasing workloads of clinical
staff, extreme working conditions as a result of the Covid-19 pandemic, financial burdens of
tests, operator-dependent processes, reduced medical workforce, pre-hospital medicine and
difficulty in integrating test results with hospital information systems (HIS) [3].
In order to reduce the impact of these stressors and improve patient safety the ABG-a is a
recent technique designed for the automatic real-time analysis and interpretation of the arte-
rial blood gases in a form of a written report, using only data from the arterial blood gases or
when available results from the laboratory biochemistry department. ABG-a can also be con-
nected to an interface to help with the communication and integration of the results with HIS
and other devices (Figs 2 and 3).
The method was evaluated initially by the developers in Emergency Departments, Theatres
and Critical Care settings in different hospitals with subpopulations of patients across all ages.
Fig 1. Standard arterial blood gas results from a commercially available analyser. All current analysers, with more
or less the same parameters, provide an output in the form of an on-screen or printed analysis which contains raw
data, possibly with some standard reference values and indications as to whether the measured values fall inside or
outside those reference values.
https://doi.org/10.1371/journal.pone.0248264.g001
PLOS ONE Arterial blood gas algorithm (ABG-a): Clinical validation
PLOS ONE | https://doi.org/10.1371/journal.pone.0248264 March 10, 2021 3 / 17

The main aim of the present study is to evaluate the agreement and clinical usefulness of the
ABG-a comparing the final software conclusion with the independent and unbiased diagnostic
decision of senior clinicians among hospitalized patients, eligible for arterial blood assessment
with acid-base disturbances interpretation. The second aim is to explore if the ABG-a could be
considered a safety tool integrated into regular clinical practice by providing default calcula-
tions with the results.
Materials and methods
Study design and eligibility
This is a prospective multicentre, international, observational, cross sectional validation study:
Complejo Hospitalario de Toledo (Spain), Marques de Valdecilla University Hospital in San-
tander (Spain) and Medical University of Graz (Austria). The study conformed to the Declara-
tion of Helsinki (a set of ethical principles regarding human experimentation developed for
the medical community by the World Medical Association) and to local applicable regulatory
requirements. The study was approved by each of the local Regional Research Ethics Commit-
tees [Comite de Etica de la Investigacion con Medicamentos (CEIm) de Toledo, Spain; Comite
Fig 2. Connectivity. Data can be fed into the ABG-a manually for example, into small devices or used in countries
where the digital hospital data has not yet been fully developed. It can also be embedded directly into medical devices,
such as an arterial blood gas machine (including portable blood gas analysers), extracorporeal support machines, a
monitor, database or any other biochemistry/haematology programs available through an interface for the
communication and integration of the results with HIS and other devices.
https://doi.org/10.1371/journal.pone.0248264.g002
PLOS ONE Arterial blood gas algorithm (ABG-a): Clinical validation
PLOS ONE | https://doi.org/10.1371/journal.pone.0248264 March 10, 2021 4 / 17

de Etica de la Investigacion con Medicamentos (CEIm) de Cantabria, Spain and Vice-Rector for
Research and International Affairs, Mag. a Caroline Schober-Trummler on behalf of the Med
Uni Graz. (References 461, 2020.008 and 32-104ex19/20 respectively)]. All participants (or the
next of kin/legally authorized representative in minors) in accordance with applicable law.
The article is reported in accordance with recommendations for non-randomized trials [5]
and comparing diagnostic tests [6].
For accuracy, reproducibility and consistency, we standardized the inclusion and exclusion
criteria used for patient recruitment. Subjects aged over two days old (full-term pregnancy)
that for clinical reasons required invasive arterial monitoring during their stay in the Emer-
gency Department, Theatres, Recovery or Critical Care Units between January 2020 and Sep-
tember 2020 were included in the study. The exclusion criteria included patients without
inserted arterial lines or lines that were not functioning properly, samples with time between
taking and analysing of more than 5 minutes; and evidence of errors in sampling, processing
and analysis such as visible gas bubbles and/or blood clots. All participants (or the next of kin)
provided written informed consent.
Procedures and assessments
For the main study, patients admitted through the Emergency Department, Theatres, Recov-
ery, interhospital transfers or any of the Critical Care Units were screened for eligibility by the
responsible physician.
Fig 3. Connectivity. The communication and integration of the results with the hospital information system and other
devices, can also be through the cloud and interface.
https://doi.org/10.1371/journal.pone.0248264.g003
PLOS ONE Arterial blood gas algorithm (ABG-a): Clinical validation
PLOS ONE | https://doi.org/10.1371/journal.pone.0248264 March 10, 2021 5 / 17

ABG samples were taken by qualified nurses directly from the arterial catheter (ensuring
the monitor displayed arterial waveforms properly) according to standard criteria. They were
analysed straight away using the closest certified routine diagnostic methods on the instru-
ments ABL800 FLEX (Radiometer Medical ApS, Brønshøj, Denmark) in Marques de Valde-
cilla University Hospital; ABL-90 FLEX analyzer (Radiometer Medical ApS, Brønshøj,
Denmark) in Medical University of Graz, and the GEM Premier 3000 system and GEM Pre-
mier 5000 system (Instrumentation Laboratory) in Hospital Virgen de la Salud.
Data including IDs of the patient and temperature corrected arterial blood gas samples and
the date and times of each sample was recorded on a standardized study sheet. Acid-base dis-
orders have been grouped into a total of nine categories (Table 1) from a total of 36 subcatego-
ries that the ABG-a can reproduce (Table in S1 Table).
In order to reduce internal variability three senior Consultant level clinicians, with more than
ten years of postgraduate experience, were assigned in each centre for the assessment. Initially,
each ABG was individually interpreted, initially by two different senior clinicians (A and B). A
research ABG-a demo was downloaded as an application on the principal investigator device
from each centre, for the software to interpret the results. The clinicians in charge of the patient
did not have access to the software results and they were not able to use it in their clinical practice
or decisions. Concordance was reached if the interpretations by the ABG-a coincided with the
two clinicians (A and B); partial concordance was reached if the interpretations by the ABG-a
coincided with one of the two clinicians’ interpretations (A or B), in this case the two clinicians’
interpretations and the interpretation by the ABG-a were compared separately against a third
independent as external opinion (C). Final discordance was reached if the interpretations of the
ABG-a did not agree with at least two of the three clinicians (A, B, C) (Table 2).
Table 1. Classification of acid-base disturbances.
0 ’Normal acid-base status’
1 ’Respiratory alkalosis’
2 ’Respiratory acidosis’
3 ’Metabolic acidosis’
4 ’Metabolic alkalosis’
5 ’Respiratory alkalosis and metabolic alkalosis’
6 ’Respiratory acidosis and metabolic acidosis’
7 ’Respiratory alkalosis and metabolic acidosis’
8 ’Respiratory acidosis and metabolic alkalosis’
9 ’I am not sure’
Normal arterial blood gas values: pH 7,35–7,45; pCO2 4,7–6,0 KPa or pCO2 35-45mmHg; HCO3 22–30 (mean 26)
mmol/L (= 26 mEq/L); SBE-2 to +2 mmol/L (-2 to +2 mEq/L); lactate 0,5–2,0 mmol/L (0,5–2,0 mEq/L). To convert
from KPa to mmHg multiply by 7,5 (mmHg = KPa x 7,5).
https://doi.org/10.1371/journal.pone.0248264.t001
Table 2. Questionnaire CI = when software agrees with one clinician (A or B) but disagree with other (A or B).
Clinician A Clinician B Software Clinician indept. (CI) S congruence
1 1 1 no Yes
1 1 2 no No
1 2 1 yes 1 Yes
1 2 1 yes 2 no
Then a third and independent clinician (CI) answered the questionnaire. Questionnaire AR and BR = When software disagrees with any of the two clinicians or with
both. The outcome of the software will not be used to suggest any treatment or any diagnosis in this study because it will not be available for the clinician. It is a blind
study to the clinicians. The main objective is to compare the clinician’s interpretation with the software interpretation.
https://doi.org/10.1371/journal.pone.0248264.t002
PLOS ONE Arterial blood gas algorithm (ABG-a): Clinical validation
PLOS ONE | https://doi.org/10.1371/journal.pone.0248264 March 10, 2021 6 / 17

ABG-a
The ABG-a software by principle is an integrated mathematical algorithm, with foundations
based on the current medical evidence for the analysis of oxygenation, acid-base and renal pro-
files. Some of the basis of this medical evidence have been previously published extensively
elsewhere [7–11]. ABG-a has exclusive safety features such as an analysis of the internal consis-
tency of the results with an identification of imminent life-threatening situations. Its prelimi-
nary diagnosis includes analysis of oxygenation, acid-base disturbances, blood urea nitrogen
BUN (blood urea nitrogen)/creatinine ratio, and the URR (urea reduction ratio) as optional.
The URR has been considered as useful in patients with presence of renal injury or renal
replacement therapy [12]. Finally, ABG-a provides the clinician a differential physiological
diagnosis and a potential list of causes of the identified disorder/s.
Data can be fed into the ABG-a manually for example, into small devices or used in coun-
tries where the digital hospital data has not yet been fully developed. It can also be embedded
directly into medical devices, such as an arterial blood gas machine (including portable blood
gas analysers), extracorporeal support machines, a monitor, database or any other biochemis-
try/haematology programs available through an interface for communication (Figs 2 and 3).
The ABG-a software has been developed on a three-layer architecture to ensure that it can run
under as many platforms as possible. The bottom layer of the software is the core algorithm,
which is implemented in C++ and exchanges information in XML-format (Extensible Markup
Language) with any other layer or piece of software.
The core algorithm can run on almost any device on the market, no matter whether it is
Desktop, Mobile, Unix, Windows, cloud-based, on -premise or, even an embedded device.
Furthermore, two different bridges, one for iOS devices to provide a software for testing, and a
JNI (Java Native Interface) bridge has been developed, so it can interact with any piece of soft-
ware written in Java. The described algorithm can also interact in seven different scenarios,
with and without direct EHR/PDMS (Electronic Health Record)/(Patient Data Management
System) integrations (Figs 2 and 3).
Statistical analysis
Characteristics of patients and samples were tabulated as medians with range or interquartile
range (IQR) for continuous variables. Categorical variables were expressed as frequencies and
percentages.
The reliability also called agreement, reproducibility or consistency is the degree of coinci-
dence of two or more measurements made on the same sample by one or more observers. The
statistical tests used is the unweighted Cohen Kappa index with 95% asymptotic confidence
interval for nominal measurements (also used was the observed agreement).
The diagnostic accuracy was evaluated with the index of sensitivity, specificity and effi-
ciency of global accuracy. The clinical performance of the ABG-a was evaluated with the posi-
tive and negative predictive values for the prevalence of study population. The 95% confidence
intervals of this diagnostic accuracy index were computed by de Wilson method. The analyses
were performed using IBM SPSS Statistics 25.00 (IBM Corp., Armonk, NY, USA) and the
Macro ’kappa for SPSS Statistics [13].
Results
A preliminary version of ABG-a was tested initially with a total of 2348 calculations. A final
ABG-a version of ABG-a was used for this validation study.
Between January and September 2020, 346 complete sample sets of consecutive ABG and
biochemistry data (when available) was collected. The final analysis included 346 sample sets
PLOS ONE Arterial blood gas algorithm (ABG-a): Clinical validation
PLOS ONE | https://doi.org/10.1371/journal.pone.0248264 March 10, 2021 7 / 17
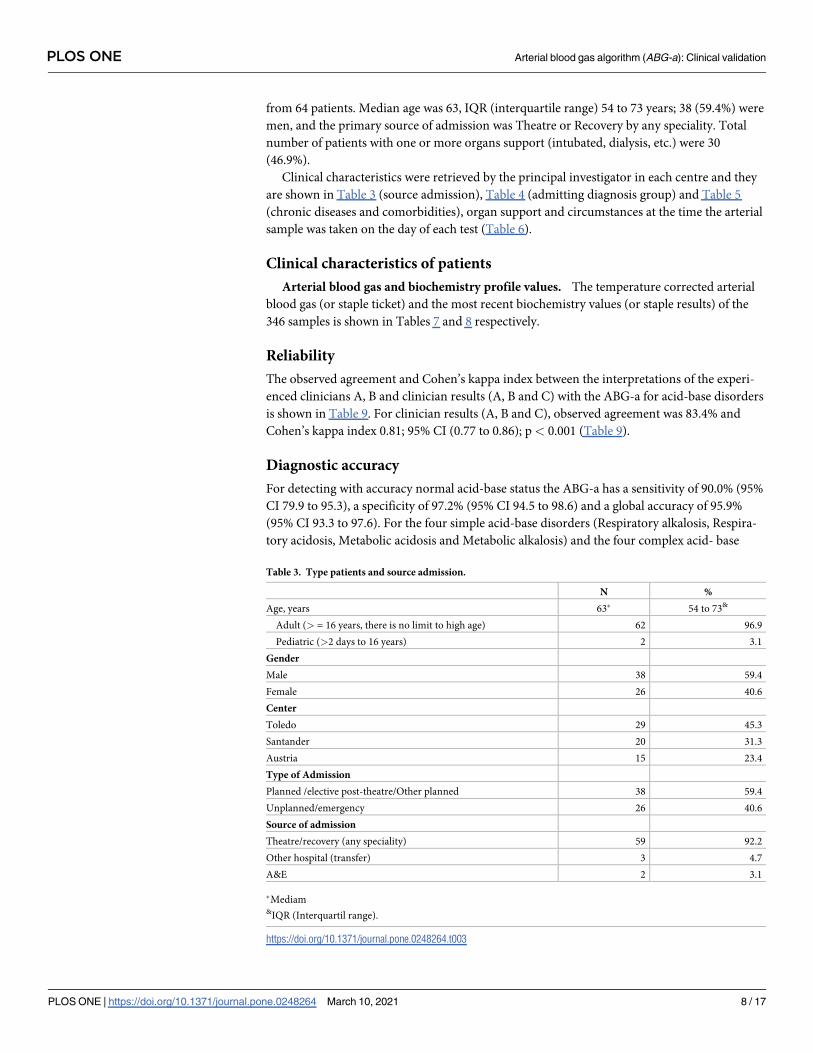
from 64 patients. Median age was 63, IQR (interquartile range) 54 to 73 years; 38 (59.4%) were
men, and the primary source of admission was Theatre or Recovery by any speciality. Total
number of patients with one or more organs support (intubated, dialysis, etc.) were 30
(46.9%).
Clinical characteristics were retrieved by the principal investigator in each centre and they
are shown in Table 3 (source admission), Table 4 (admitting diagnosis group) and Table 5
(chronic diseases and comorbidities), organ support and circumstances at the time the arterial
sample was taken on the day of each test (Table 6).
Clinical characteristics of patients
Arterial blood gas and biochemistry profile values. The temperature corrected arterial
blood gas (or staple ticket) and the most recent biochemistry values (or staple results) of the
346 samples is shown in Tables 7 and 8 respectively.
Reliability
The observed agreement and Cohen’s kappa index between the interpretations of the experi-
enced clinicians A, B and clinician results (A, B and C) with the ABG-a for acid-base disorders
is shown in Table 9. For clinician results (A, B and C), observed agreement was 83.4% and
Cohen’s kappa index 0.81; 95% CI (0.77 to 0.86); p< 0.001 (Table 9).
Diagnostic accuracy
For detecting with accuracy normal acid-base status the ABG-a has a sensitivity of 90.0% (95%
CI 79.9 to 95.3), a specificity of 97.2% (95% CI 94.5 to 98.6) and a global accuracy of 95.9%
(95% CI 93.3 to 97.6). For the four simple acid-base disorders (Respiratory alkalosis, Respira-
tory acidosis, Metabolic acidosis and Metabolic alkalosis) and the four complex acid- base
Table 3. Type patients and source admission.
N %
Age, years 63� 54 to 73&
Adult (> = 16 years, there is no limit to high age) 62 96.9
Pediatric (>2 days to 16 years) 2 3.1
Gender
Male 38 59.4
Female 26 40.6
Center
Toledo 29 45.3
Santander 20 31.3
Austria 15 23.4
Type of Admission
Planned /elective post-theatre/Other planned 38 59.4
Unplanned/emergency 26 40.6
Source of admission
Theatre/recovery (any speciality) 59 92.2
Other hospital (transfer) 3 4.7
A&E 2 3.1
�Mediam&IQR (Interquartil range).
https://doi.org/10.1371/journal.pone.0248264.t003
PLOS ONE Arterial blood gas algorithm (ABG-a): Clinical validation
PLOS ONE | https://doi.org/10.1371/journal.pone.0248264 March 10, 2021 8 / 17

Table 4. Admitting diagnosis group.
N %
Cardiac arrest/other causes of cardiogenic shock 1 1.6
Cardiothoracic surgery 9 14.1
Septic shock 29 45.3
Surgical 21 32.8
Neutropenic sepsis/other hematology & oncology sepsis 2 3.1
Medical 1 1.6
Other 5 7.8
Post-operative management: any specialty (recovery anaesthesia) 53 82.8
Haemorrhagic shock 8 12.5
Gastrointestinal/other medical 4 6.3
Post-surgical 4 6.3
Acute respiratory failure 7 10.9
Pneumonia 3 4.7
Other causes� 4 6.3
Acute kidney injury or acute on chronic kidney disease 7 10.9
Trauma/neuro-surgical 17 26.6
Decompensated liver disease/acute liver failure 3 4.7
Diabetic ketoacidosis/hyperosmotic sındrome 0 0.0
Acute Intoxication of any type including medication, illegal drugs or herbs 0 0.0
Ulcerative colitis 1 1.6
� No COPD /asthma exacerbation.
https://doi.org/10.1371/journal.pone.0248264.t004
Table 5. Chronic diseases and comorbidities.
N %
Ischaemic heart disease 6 9.4
Congestive heart failure 4 6.3
Atrial fibrillation/Atrial flutter 11 17.2
Arterial hypertension 8 12.5
Pacemaker (PM) +/- Implantable cardioverter-defibrillator (ICD) 3 4.7
Cardiac resynchronization therapy (CRT) +/- (ICD) 0 0.0
Pulmonary hypertension 0 0.0
Pulmonary embolus/deep vein thrombosis 0 0.0
COPD/Asthma 12 18.8
Oxygen and/or non-invasive ventilation at home on regular bases 3 4.7
Pulmonary Fibrosis 1 1.6
Diabetes mellitus 8 12.5
Chronic kidney disease or pre-dialysis (Not on dialysis) 4 6.3
End-stage kidney disease (on regular dialysis) 4 6.3
Morbid obesity 4 6.3
Recent quimiotherapy /radiotherapy (last 30 days) 2 3.1
Acute myeloid leukemia (AML) 1 1.6
Other hemato-onco malignancies 0 0.0
Use of diuretics and/or bicarbonate on regular bases 7 10.9
Any type of organ support 30 46.9
https://doi.org/10.1371/journal.pone.0248264.t005
PLOS ONE Arterial blood gas algorithm (ABG-a): Clinical validation
PLOS ONE | https://doi.org/10.1371/journal.pone.0248264 March 10, 2021 9 / 17

disorders (Respiratory and metabolic alkalosis, Respiratory and metabolic acidosis, Respira-
tory alkalosis and metabolic acidosis, Respiratory acidosis and metabolic alkalosis) the sensitiv-
ity, specificity and global accuracy were also high (Table 10). The table also includes a column
with the number of cases for each acid-base disorder in order to help with the interpretation.
Since there are less positive cases than negative the sensitivity values are less than the specificity
and the 95% CI are wider in the sensitivity and narrower in the specificity.
Likelihood ratios
Likelihood ratios of the ABG-a analysis and interpretation of the ABG was shown in Table 12.
For normal acid-base status the Positive Likelihood Ratio is 32.0, the Inverse Negative Likeli-
hood Ratio is 9.7 (Negative Likelihood Ratio 0.1). Al the Positive and Inverse Negative Likeli-
hood Ratios for the 4 simple and the 4 complex acid-base disorders are high and very high
(Table 11).
Clinical performance
For normal acid-base status the algorithm has Positive Predictive Value 87.1 (95% CI 76.6 to
93.3) %, and Negative Predictive Value 97.9 (95% CI 95.4 to 99.0) % for a prevalence of 17.4
(95% CI 13.8 to 21.8) %. For the four simple acid-base disorders (Respiratory alkalosis,
Table 6. Organ support/circumstances at the time the ABG was taken.
N %
Intravascular volume of the patient depleted 49 14.2
The pO2 or the saturation increase with 100% O2 346 100.0
Hemofiltration, haemodialysis, MARS, PROMETHEUS, other 1 0.3
Intubated and on mechanical ventilation 159 46.0
Spontaneous ventilation on non-invasive ventilation 7 2.0
Spontaneous ventilation on high flow nasal cannula (Opti-flow) 74 21.4
Spontaneous (with oxygen) 164 47.4
Spontaneous (without oxygen) 18 5.2
ECMO, LVECD, full extracorporeal, other cardiac support devices 3 0.9
CO2 removal device 0 0.0
Bicarbonate infusion or boluses given 31 9.0
Cardiovascular monitoring such as PiCCO, PAC (Pulmonar Artery Catheter, other.) 27 7.8
Other mechanical devices such as IABP, other. 0 0.0
During a cardiac arrest resuscitation 0 0.0
https://doi.org/10.1371/journal.pone.0248264.t006
Table 7. Corrected arterial blood gas (or staple ticket).
Median IQR
FiO2% 40 28 to 40
pH 7.41 7.34 to 7.46
pCO2 mmHg� 39 35 to 43
PO2 mmHg� 106 83 to 138
HCO3- mmol/L 24.9 21.2 to 27.9
SBE mmol/L 0.05 -3.70 to 3.60
Lactate mmol/L 1.16 0.78 to 2.00
�Coversion to kPa (mmHg/7.5).
https://doi.org/10.1371/journal.pone.0248264.t007
PLOS ONE Arterial blood gas algorithm (ABG-a): Clinical validation
PLOS ONE | https://doi.org/10.1371/journal.pone.0248264 March 10, 2021 10 / 17

Respiratory acidosis, Metabolic acidosis and Metabolic alkalosis) and the four complex acid-
base disorders (Respiratory and metabolic alkalosis, Respiratory and metabolic acidosis, respi-
ratory alkalosis and metabolic acidosis, Respiratory acidosis and metabolic alkalosis the Posi-
tive and Negative Predictive Values were also high (Table 12).
Discussion
As reported by the National Committee for Clinical Laboratory Standards, ABG analysis has a
prospective influence on patient care over any other laboratory determinants [14]. The sudden
changes in these parameters may result in life-threatening situations hence; rapid results are
frequently required for effective management. POCT is of enormous help in pre-hospital
emergency settings and have been employed for many years with immense success [15]. The
management strategies in these life-threatening conditions immensely rely on rapid blood gas
analysis [16]. Early detection of rapid clinical deterioration and associated changes in treat-
ment is recommended by the World Health Organisation (WHO) and Surviving Sepsis Cam-
paign guidelines [17,18]. POCT devices with rapid blood gas analysis are essentially required
in these situations. Accurate and timely interpretation of an ABG can be lifesaving but estab-
lishing a correct interpretation and therefore to conclude with a diagnosis may be challenging
as well as time consuming, with a risk of error in the calculations without an automated
process.
Currently, most clinical laboratories and ABG machine manufacturers report only numeric
values for the ABG results (Fig 1), and clinicians who are not specialists have difficulty inter-
preting the results and appropriately assessing a patient’s status for pertinent therapeutic
action.
Thus, interpretation of the ABG results depends on the judgement of experienced clinicians
for a precise interpretation. However, whilst clinicians who request and receive raw data from
patients’ blood samples have considerable experience in this interpretation, they will not
always be checking every aspect of the results and/or may overlook a particular aspect of the
results if it was not part of the original reason for requesting ABG analysis. A thorough analysis
Table 8. Most recent biochemistry values (or staple results).
Median IQR
Na mmol/L 139 136 to 142
K mmol/L 4.1 3.7 to 4.5
Cl mmol/L 107 103 to 109
Glucose mg/dL 142 120 to 174
Ca ionized mmol/L 1.15 1.11 to 1.20
Albumin g/dL 2.2 3.1 to 3.6
Urea� mg/dL 49 36 to 77
Creatinine mg/dL 0.82 0.62 to 1.26
�Pre if dialysis or hemofiltration.
https://doi.org/10.1371/journal.pone.0248264.t008
Table 9. Fiability of the ABG-a for the analysis and interpretation of acid-base.
N Observed agreement (%) Kappa (95% CI) p value
Clinician A 344 81.7 0.79 (0.74 to 0.84) < 0.001
Clinician B 342 74.6 0.71 (0.66 to 0.76) < 0.001
Clinicians Result (A, B and C) 344 83.4 0.81 (0.77 to 0.86) < 0.001
https://doi.org/10.1371/journal.pone.0248264.t009
PLOS ONE Arterial blood gas algorithm (ABG-a): Clinical validation
PLOS ONE | https://doi.org/10.1371/journal.pone.0248264 March 10, 2021 11 / 17

can also be time consuming with a risk of error in the calculations without an automated
process.
The ABG-a was designed to allow a detailed interpretation by the introduction of categories
that reflect the extent of complexity for the four existing categories up to 36 categories. Given
this, an algorithm for the automatic interpretation of ABG results would be useful for manag-
ing patients because it allows for the prompt and accurate interpretation of test results. We
have assessed the validity of the algorithm by applying it to the interpretation of test results
from clinical specimens. The main findings of our study are that ABG-a has very high agree-
ment with the judgment of the senior clinician in all patients for the interpretation of acid-
base status. This is the first published evaluation of ABG-a performed in independent centres
from the developers. Strengths of the present study are that it includes a good sample size and
a relevant target population on inpatients (emergency and elective) with a range of cardiopul-
monary conditions and other pathologies eligible for blood gas measurement. Sampling was
standardized and conducted by a dedicated specially trained nurse. The main analysis included
only samples that met strict quality criteria. There were no signs of selection bias due to eligi-
bility criteria as findings were robust when analysing all available samples. The analysis aligned
to recent recommendations on the comparison of diagnostic tests [5,6].
At their broadest, aspects of the present method provide means of analysing an arterial
blood sample, potentially at the point-of-care, which includes the following stages: safety anal-
ysis, oxygenation analysis, renal analysis and acid-base analysis. If any of the above sections are
interpreted as abnormal or potential conditions identified, the software can then provide, for
example, on screen or in printed form, a list of potential or likely causes and/or processes that
explain the analytical findings.
Table 10. Diagnostic accuracy of automatic real-time analysis and interpretation of arterial blood sample.
N (%) Sensitivity (95% CI) % Specificity (95% CI) % Global accuracy (95% CI) %
Normal acid-base status 60 (17,4) 90.0 (79.9 to 95.3) 97.2 (94.5 to 98.6) 95.9 (93.3 to 97.6)
Respiratory alkalosis 34 (9,9) 91.2 (77.0 to 97.0) 100.0 (98.8 to 100.0) 99.1 (97.5 to 99.7)
Respiratory acidosis 18 (5,2) 61.1 (38.6 to 79.7) 100.0 (98.8 to 100.0) 98.0 (95.9 to 99.0)
Metabolic acidosis 33 (9,6) 75.8 (59.0 to 87.2) 99.7 (98.2 to 99.9) 97.4 (95.1 to 98.6)
Metabolic alkalosis 36 (10,5) 72.2 (56.0 to 84.2) 95.5 (92.5 to 97.3) 93.0 (88.8 to 95.3)
Respiratory and metabolic alkalosis 48 (14,0) 79.2 (65.7 to 88.3) 95.6 (92.6 to 97.4) 93.3 (90.2 to 95.5)
Respiratory and metabolic acidosis 51 (14,8) 90.2 (79.0 to 95.7) 97.3 (94.7 to 98.6) 96.2 (93.6 to 97.8)
Respiratory alkalosis and metabolic acidosis 31 (9,0) 96.8 (83.8 to 99.4) 98.1 (95.9 to 99.1) 98.0 (95.8 to 99.0)
Respiratory acidosis and metabolic alkalosis 31 (9,0) 96.8 (83.8 to 99.4) 98.1 (95.9 to 99.1) 98.0 (95.9 to 99.0)
https://doi.org/10.1371/journal.pone.0248264.t010
Table 11. Likelihood ratios of the ABG-a analysis and interpretation of acid-base.
Positive Negative Inverse Negative
Normal acid-base status 32.0 0.1 9.7
Respiratory alkalosis � 0.1 11.3
Respiratory acidosis � 0.4 2.6
Metabolic acidosis 235.6 0.2 4.1
Metabolic alkalosis 15.9 0.3 3.4
Respiratory and metabolic alkalosis 18.0 0.2 4.6
Respiratory and metabolic acidosis 33.0 0.1 9.9
Respiratory alkalosis and metabolic acidosis 50.5 0.0 30.4
Respiratory acidosis and metabolic alkalosis 50.5 0.0 30.4
�No calculable, false positive is 0.0%.
https://doi.org/10.1371/journal.pone.0248264.t011
PLOS ONE Arterial blood gas algorithm (ABG-a): Clinical validation
PLOS ONE | https://doi.org/10.1371/journal.pone.0248264 March 10, 2021 12 / 17

Safety
As an initial step, the ABG-a carries out a number of safety checks by default to alert the clinician
to potential problems with the analysis. Included within these checks is an analysis of the internal
consistency of the results. Errors in the measurement of plasma pH, pCO2 or serum (total CO2/
HCO3-) are not uncommon [7]. If the values do not fit, this could suggest an error in one or
more of the parameters and the measurements should be taken with caution. The alert includes
advice to check on one or more of the following (non-exhaustive) sources of inconsistency such
as: machine calibration; sample taken with a tourniquet; sample taken from a patient on dialysis
with an A-V fistula with a tourniquet in place. The data collected from the study also showed cli-
nicians do not routinely complete checks on numeric results for internal consistency. The alert
may advise repeating the sample as a first check. A second safety check is for imminent life-
threatening situations. This may include the checking of one or more of the K+, Na+, Ca2+, lac-
tate and/or glucose concentrations and/or the pH against thresholds [7].
Oxygenation
If the patient is on mechanical ventilation, the ABG-a checks for hypoxemia by calculating the
PaO2/FiO2 ratio on (PEEP 5cmH2O+) and if abnormal it will suggest or advise the clinician to
rule out acute respiratory distress syndrome (ARDS) based on the Berlin definition [10]. If the
patient is not on mechanical ventilation, the pO2 is checked against normal values for group
age and if abnormal, the A-a gradient is calculated and appropriate steps taken. From the ques-
tionnaire completed during the study, the Clinicians would welcome the routine automatic
mathematical calculations of PaO2/FiO2 ratio and A-a gradient.
Acid-base
The main limitation in order to be completely precise with the interpretation of the results
from the ABG-a is the need of a clinical framework. The clinician should be aware that the
assessment of an acid–base disorder is based on an accurate clinical evaluation and history.
First, various signs and symptoms often provide clues regarding the underlying acid–base dis-
order; these include the patient’s vital signs (which may indicate shock or sepsis), neurologic
state (consciousness vs. unconsciousness), signs of infection (e.g., fever), pulmonary status
(respiratory rate and presence or absence of Kussmaul respiration, cyanosis, and clubbing of
the fingers), and gastrointestinal symptoms (vomiting and diarrhoea). Secondly, it is the time
and conditions at which the sample was taken and thus subsequent pathological processed. E.
g. the result at the onset of septic shock will differ from that at the end when the patient may be
hyperventilating or receiving mechanical ventilator/dialysis support respectively. Thirdly,
Table 12. Clinical performance of the ABG-a on the analysis and interpretation of acid-base.
Positive Predictive Value (95% CI) % Negative Predictive Value (95% CI) % Prevalence (95% CI) %
Normal acid-base status 87.1 (76.6 to 93.3) 97.9 (95.4 to 99.0) 17.4 (13.8 to 21.8)
Respiratory alkalosis 100.0 (89.0 to 100.0) 99.0 (97.2 to 99.7) 9.9 (7.2 to 13.5)
Respiratory acidosis 100.0 (74.1 to 100.0) 97.9 (95.7 to 99.0) 5.2 (3.3 to 8.1)
Metabolic acidosis 96.2 (81.1 to 99.3) 97.5 (95.1 to 98.7) 9.6 (6.9 to 13.1)
Metabolic alkalosis 65.0 (49.5 to 77.9) 96.7 (94.1 to 98.2) 10.5 (7.7 to 14.1)
Respiratory and metabolic alkalosis 74.5 (61.1 to 84.5) 96.6 (93.8 to 98.1) 14.0 (10.7 to 18.0)
Respiratory and metabolic acidosis 85.2 (73.4 to 92.3) 98.3 (96.0 to 99.3) 14.8 (11.5 to 19.0)
Respiratory alkalosis and metabolic acidosis 83.3 (68.1 to 92.1) 99.7 (98.2 to 99.9) 9.0 (6.4 to 12.5)
Respiratory acidosis and metabolic alkalosis 83.3 (68.1 to 92.1) 99.7 (98.2 to 99.9) 9.0 (6.4 to 12.5)
https://doi.org/10.1371/journal.pone.0248264.t012
PLOS ONE Arterial blood gas algorithm (ABG-a): Clinical validation
PLOS ONE | https://doi.org/10.1371/journal.pone.0248264 March 10, 2021 13 / 17

certain underlying medical conditions such as liver, pregnancy, diabetes, and heart, lung, and
kidney diseases may also affect the result. Finally, the clinician should determine whether the
patient has taken any regular or new medications that affect acid–base balance (e.g. laxatives)
and should consider signs of intoxication that may be associated with acid–base disturbances
(e.g. acetone fetor as a sign of diabetic ketoacidosis).
In the physiological approach used by the ABG-a, a patient’s acid–base status (meaning the
physiologic derangement occurring at “a point in time”) is classified according to one of the
following four major acid-base disturbances defined as primary acid-base disorders: metabolic
acidosis, metabolic alkalosis, respiratory acidosis and respiratory alkalosis. In many cases,
however, a patient’s acid–base status cannot be precisely classified into only one of the afore-
mentioned four categories. Instead, test results may fall into a combination of two or more
types of acid–base conditions and even one acid–base disturbance can present a broad range
of test results, depending on the extent of the secondary response, compensatory respiratory
or metabolic [7,19]. In many patients, we are unable to identify the order of presentation of
clinical events or physiological derangement thus making it problematic to assign a label to the
primary disorder and subsequent secondary response. These explanations may partially
explain the relatively low sensitivities in respiratory acidosis (61.1%), metabolic acidosis
(75.8%), and metabolic alkalosis (72.2%) results in our study (Table 10), all of which were iden-
tified by the clinician as a “simple” acid-base disorder. Furthermore, in our opinion, the soft-
ware begins to calculate as soon as values are identified outside the normal range, and
therefore, obtaining more refined conclusions than that of the clinicians. The clinicians how-
ever only considered the presence of “complex” acid-base disturbances when the results were
obviously clearly deranged. This is likely due to multiple reasons including time pressures
meaning not all ABG results can be rigorously examined with this approach.
Deviations from the prevailing normal value of the serum anion gap can reflect either errors
in the measurements of its constituents or changes in the concentrations of unmeasured cat-
ions and/or anions. Given this wide inter-individual variability, it is important, where possible,
to know the prevailing baseline value of the serum anion gap for a particular individual [20]. If
the baseline serum anion gap of an individual is not known and the range of normal values of
a particular laboratory is used to assess the anion gap, then it is possible that disorders that
cause deviations in the serum anion gap might not be recognized since they are insufficient to
shift the serum anion gap outside the normal range [20].
The advantage of the ABG-a is that it can successfully provide the identification and
description of the acid-base disturbances and secondary responses associated from each sam-
ple and has the additional benefit of taking into account the basal anion gap and bicarbonate
values to overcome the problems explained. Nevertheless, the clinician must review all results
taking into account the clinical context of the situation they are presented with.
The concept of the automatic interpretation of acid-base using a computer program is not
new. Since the first publications in the 1980’s [21–23], several web-based programs have been
developed and are available online. However, the lack of a description of material and methods
in most cases and a standard validation methodology make the comparison among studies
and web-based programs impossible.
Renal analysis
The ABG-a analyses the BCR (BUN Creatinine ratio) automatically when the electrolytes,
from either from ABG or/and HIS, are available. If it is not within the normal range, depend-
ing on what side of the range it lies, a selection of possible causes are identified. If the patient is
on dialysis or CRRT (continuous renal replacement therapy), the algorithm can calculate the
PLOS ONE Arterial blood gas algorithm (ABG-a): Clinical validation
PLOS ONE | https://doi.org/10.1371/journal.pone.0248264 March 10, 2021 14 / 17

urea reduction ratio (URR) and determine if the dialysis is grossly performing adequately. The
Kt/V is mathematically related to the URR (on average, a Kt/V of 1.2 is roughly equivalent to a
URR of about 63 percent). The ABG-a can provide an initial estimation of the renal support
treatment at POC. It was not the aim of this study to validate these features since they are
mathematical calculations. The Clinicians reported via the study’s questionnaire that routine
automatic calculation of BCR would be welcomed in order to obtain more initial information
at Point-of-Care (POC).
The further benefit is the possibility of the ABG-a to be used outside of acute settings partic-
ularly for patients with chronic conditions such as long term respiratory pathologies e.g.
chronic obstructed pulmonary disease (COPD) or renal patients on dialysis. This may provide
reliable clinical interpretation with the option of taking into account known basal values of the
anion gap and bicarbonate at the time of the analysis. Many of these patients are well known to
the respiratory outpatients clinics or satellite dialysis units. The ABG-a could be a potential
tool in the screening for an acute on chronic decompensation secondary to any other patho-
logical process, to follow up clinical progression, monitoring during dialysis sessions or even
telemedicine through application of the software to portable devices [21,24].
Conclusions
The ABG-a showed very high agreement and diagnostic accuracy with experienced senior cli-
nicians in the acid-base disorders in a clinical context. The method also provides refinement
and deep complex analysis for the point-of-care that a clinician could have at the bedside on a
day-to-day basis. The ABG-a method could also have the potential to reduce human errors by
checking for imminent life-threatening situations, analysing the internal consistency of the
results and the oxygenation and renal statuses of the patient.
Supporting information
S1 Table. ABG-a diagnosis with 36 categories.
(DOCX)
S1 Text. Three clinical cases to ilustrate the ABG-a use.
(DOCX)
S1 Raw data Raw blood gas data 06_02_21.
(XLSX)
Acknowledgments
The authors thank the patients and, in some cases, the next of kin who made this research
possible.
Author Contributions
Conceptualization: Sancho Rodrıguez-Villar, Bruno Manuel Do-Vale, Helen Marie Fletcher.
Data curation: Sancho Rodrıguez-Villar, Paloma Poza-Hernandez, Sascha Freigang, Idoia
Zubizarreta-Ormazabal, Daniel Paz-Martın, Etienne Holl, Osvaldo Ceferino Perez-Pardo,
Marıa Sherezade Tovar-Doncel, Sonja Maria Wissa, Bonifacio Cimadevilla-Calvo, Guil-
lermo Tejon-Perez.
Formal analysis: Sancho Rodrıguez-Villar, Juan Arevalo-Serrano.
Funding acquisition: Sancho Rodrıguez-Villar.
PLOS ONE Arterial blood gas algorithm (ABG-a): Clinical validation
PLOS ONE | https://doi.org/10.1371/journal.pone.0248264 March 10, 2021 15 / 17

Investigation: Sancho Rodrıguez-Villar, Paloma Poza-Hernandez, Sascha Freigang, Idoia
Zubizarreta-Ormazabal, Daniel Paz-Martın, Etienne Holl, Osvaldo Ceferino Perez-Pardo,
Marıa Sherezade Tovar-Doncel, Sonja Maria Wissa, Bonifacio Cimadevilla-Calvo, Guil-
lermo Tejon-Perez.
Methodology: Sancho Rodrıguez-Villar, Juan Arevalo-Serrano, Antonio Valentın.
Project administration: Sancho Rodrıguez-Villar, Paloma Poza-Hernandez, Sascha Freigang,
Idoia Zubizarreta-Ormazabal.
Resources: Sancho Rodrıguez-Villar, Paloma Poza-Hernandez, Sascha Freigang, Idoia Zubi-
zarreta-Ormazabal.
Software: Sancho Rodrıguez-Villar, Ismael Moreno-Fernandez, Alejandro Escario-Mendez.
Supervision: Sancho Rodrıguez-Villar, Juan Arevalo-Serrano, Antonio Valentın.
Validation: Juan Arevalo-Serrano, Antonio Valentın.
Visualization: Sancho Rodrıguez-Villar.
Writing – original draft: Sancho Rodrıguez-Villar, Bruno Manuel Do-Vale, Helen Marie
Fletcher, Jesus Medardo Lorenzo- Fernandez.
Writing – review & editing: Sancho Rodrıguez-Villar, Paloma Poza-Hernandez, Sascha Frei-
gang, Idoia Zubizarreta-Ormazabal, Daniel Paz-Martın, Etienne Holl, Osvaldo Ceferino
Perez-Pardo, Marıa Sherezade Tovar-Doncel, Sonja Maria Wissa, Bonifacio Cimadevilla-
Calvo, Guillermo Tejon-Perez, Ismael Moreno-Fernandez, Alejandro Escario-Mendez,
Juan Arevalo-Serrano, Antonio Valentın, Bruno Manuel Do-Vale, Helen Marie Fletcher,
Jesus Medardo Lorenzo- Fernandez.
References1. D’Orazio P, Fogh-Andersen N, Okorodudu A, Shipp G, Shirley T, Toffaletti J. Critical Care Chapter 5.
In: Nichols JH, editor. Evidence Based Practice for Point-of-Care Testing: A National Academy of Clini-
cal Biochemistry Laboratory Medicine Practice Guideline. Washington DC: AACC Press; 2006. pp.
30–43.
2. Adekola OO, Soriyan OO, Meka I, Akanmu ON, Olanipekun S, Oshodi TA. The incidence of electrolyte
and acid-base abnormalities in critically ill patients using point of care testing (i-STAT portable analy-
ser). Nig Q J Hosp Med. 2012; 22:103–8. PMID: 23175907
3. Louie RF, Tang Z, Shelby DG, Kost GJ. Point-of-care testing: Millennium technology for critical care.
Lab Med. 2000; 31:402–8.
4. Jose RJ, Preller J. Near-patient testing of potassium levels using arterial blood gas analysers: Can we
trust these results? Emerg Med J. 2008; 25:510–3. https://doi.org/10.1136/emj.2007.053322 PMID:
18660404
5. Lederer DJ, Bell SC, Branson RD, Chalmers JD, Marshall R, Maslove DM, et al. Control of Confounding
and Reporting of Results in Causal Inference Studies: Guidance for Authors from Editors of Respiratory,
Sleep, and Critical Care Journals. Ann Am Thorac Soc. 2018. Epub 2018/09/20. https://doi.org/10.
1513/AnnalsATS.201808-564PS PMID: 30230362.
6. Mallett S, Halligan S, Thompson M, Collins GS, Altman DG. Interpreting diagnostic accuracy studies for
patient care. BMJ: British Medical Journal. 2012; 345. https://doi.org/10.1136/bmj.e3999 PMID:
22750423
7. Rodrıguez-Villar S, Do Vale BM, Fletcher HM. The arterial blood gas algorithm: proposal of a systematic
approach to analysis of acid-base disorders. Revista Española de Anestesiologıa y Reanimacion. Rev
Esp Anestesiol Reanim. 2020 Jan; 67(1):20–34. https://doi.org/10.1016/j.redar.2019.04.001 PMID:
31826801
8. Higgins C. Urea and the clinical value measuring blood urea concentration. www.acutecaretesting.org
July 2016.
PLOS ONE Arterial blood gas algorithm (ABG-a): Clinical validation
PLOS ONE | https://doi.org/10.1371/journal.pone.0248264 March 10, 2021 16 / 17

9. Desmond Burke M. (1978) Blood gas measurements, Postgraduate Medicine, 64:6, 163–167, https://
doi.org/10.1080/00325481.1978.11715008 PMID: 33371
10. Ferguson ND, Fan E, Camporota L, et al. The Berlin definition of ARDS: an expanded rationale, justifi-
cation, and supplementary material [published correction appears in Intensive Care Med. 2012 Oct; 38
(10):1731–2]. Intensive Care Med. 2012; 38(10):1573–1582. https://doi.org/10.1007/s00134-012-2682-
1 PMID: 22926653
11. Liang KV, Zhang JH, Palevsky PM. Urea reduction ratio may be a simpler approach for measurement of
adequacy of intermittent hemodialysis in acute kidney injury. BMC Nephrol. 2019; 20(1):82. Published
2019 Mar 6. https://doi.org/10.1186/s12882-019-1272-7 PMID: 30841863
12. National Kidney Foundation: K/DOQI clinical practice guidelines for hemodialysis adequacy, 2000.
American Journal of Kidney Disease. 2001;37(suppl 1): S7-S64.
13. Domenech JM. Macro! DT for SPSS Statistics. Diagnostic Tests [computer program]. V Last revised.
Bellaterra: Universitat Autonoma de Barcelona; 2007. Available from: http://www.metodo.uab.cat/
macros.htm.
14. 3rd ed. Villanova, PA: National Committee for Clinical Laboratory Standards; 1991. NCCLS. Approved
standard H4-A3. Procedures for the collection of diagnostic blood specimens by skin puncture; pp. 1–
17.
15. Prause G, Ratzenhofer-Komenda B, Offner A, Lauda P, Voit H, Pojer H. Prehospital point of care testing
of blood gases and electrolytes -an evaluation of IRMA. Crit Care. 1997; 1:79–83. https://doi.org/10.
1186/cc108 PMID: 11056700
16. Jousi M, Reitala J, Lund V, Katila A, Leppaniemi A. The role of pre-hospital blood gas analysis in trauma
resuscitation. World J Emerg Surg. 2010; 5:10. https://doi.org/10.1186/1749-7922-5-10 PMID:
20412593
17. World Health Organisation. (2020). Article available from https://www.who.int/publications-detail/
clinical-management-of-severe-acute-respiratory-infection-when-novel-coronavirus-(ncov)-infection-is-
suspected [Accessed May 2020].
18. Alhazzaniet al. Surviving Sepsis Campaign: guidelines on the management of critically ill adults with
Coronavirus Disease 2019 (COVID-19). Intensive Care Med. 2020 May; 46(5):854–887. https://doi.org/
10.1007/s00134-020-06022-5 Epub 2020 Mar 28. PMID: 32222812; PMCID: PMC7101866.
19. Adrogue HJ, Madias NE. Secondary responses to altered acid-base status: the rules of engagement. J
Am Soc Nephrol. 2010 Jun; 21(6):920–3. https://doi.org/10.1681/ASN.2009121211 Epub 2010 Apr 29.
PMID: 20431042.
20. Kraut JA, Madias NE. Serum anion gap: its uses and limitations in clinical medicine. Clin J Am Soc
Nephrol. 2007 Jan; 2(1):162–74. https://doi.org/10.2215/CJN.03020906 Epub 2006 Dec 6. PMID:
17699401.
21. Hess D, Silage DA, Maxwell C. An arterial blood gas interpretation program for hand-held computers.
Respir Care. 1984 Jul; 29(7):756–9. PMID: 10315595.
22. Hess D, Eitel D. A portable and inexpensive computer system to interpret arterial blood gases. Respir
Care. 1986 Sep; 31(9):792–5. PMID: 10315707.
23. Park SH, An D, Chang YJ, Kim HJ, Kim KM, Koo TY, Kim S, Lee W, Yang WS, Hong SB, Chun S, Min
WK. Development and validation of an arterial blood gas analysis interpretation algorithm for application
in clinical laboratory services. Ann Clin Biochem. 2011 Mar; 48(Pt 2):130–5. https://doi.org/10.1258/
acb.2010.010180 Epub 2011 Feb 21. PMID: 21339233.
24. Nielsen AL, Thunedborg P, Brinkenfeldt H, Hegbrant J, Jensen HA, Wandrup JH. Assessment of pH
and oxygen status during hemodialysis using the arterial blood line in patients with an arteriovenous fis-
tula. Blood Purif. 1999; 17(4):206–12. https://doi.org/10.1159/000014397 PMID: 10494023.
PLOS ONE Arterial blood gas algorithm (ABG-a): Clinical validation
PLOS ONE | https://doi.org/10.1371/journal.pone.0248264 March 10, 2021 17 / 17