Automatic Detection of Vena Contracta Width for the Mitral Regurgitation Assessment
6
Automatic Detectio R Ka * Dept of Electrical Engineer # Department of Cardiolog Abstract: The aim of this paper is to derive regurgitation (MR). Vena contracta width i this narrowest part exactly in transthoracic there is a need to develop such method wh between the results obtained from the comp Keywords: Echocardiography; Transthoraci 1. Introduction Mitral regurgitation is the most co of heart. Perfect assessment is required and correct therapy of the mitral valv many noninvasive techniques based echocardiography [1–9] have been disc At present interest in color Dopple vena contracta for the assessmen regurgitation is increasing progressively vena contracta is the narrowest part of jet can also be called as ‘neck’ of th having location just downstream from before the jet area [13] as in fig.1. Ven slightly smaller than the mitral o boundary effects, so the effective regu area (EROA) can be measured by the [14]. If the orifice is fixed then the siz contracta is independent of driving pre rate [15]. But for dynamic regugitan contracta may change with hemodyna the cardiac cycle [16]. Research [17 –2 the regurgitant orifice size can be pre vena contracta width obtained from the imaging. Hence in recent studies me vena contracta is the mostly used meth assessment [10, 1, 21 –23]. In [1, 22, 24, 10] vena contracta is as the accurate method for finding out MR, using TTE or TEE method. Lite [22] shows that vena contracta diamet measured by TTE with a good feasib 95% and 97%). But recent study sh determination of vena contracta is mo TEE [26]. In case of mitral regurgita on of Vena Contracta Width for th Regurgitation Assessment alpana Saini * , M.L.Dewal * , Manojkumar Rohit # ring, Indian institute of Technology Roorkee, Uttarakhand gy, Advanced Cardiac Centre, Post Graduate Institute of & Research, Chandigarh, India, 160012 e an automatic method for vena contracta width detection for th is the efficient method to grading the severity of MR, but it is c echocardiography (TTE) as well as in transesophageal echoca hich is able to find out the vena contracta width. A compariso puting method and results obtained by the clinicians. ic; Transesophageal; Mitral; Regurgitation; Vena contracta. ommon disease d for the quick ve. In literature d on Doppler cussed. er imaging for nt of mitral y [10–11]. The f the regugitant he jet [12] and the orifice and na contracta is orifice due to urgitant orifice vena contracta ize of the vena essure and flow nt orifice vena amic or during 20] shows that esented by the e color Doppler easurement of hod for the MR to be assumed the severity of erature [1] and ter can also be bility (between hows that the ore feasible by ation, the vena contracta diameter can vary over the case of mitral regurgitati literature [28-30] it is suggested diameter should be measured maximal width for mitral regurgit The aim of this paper to processing based technique by w width can be find out automati regurgitation. Color Doppler e used for collecting the images. T RGB color space. First step in pr to separate the color jet which ventricle. Then covert this RGB scale. After this preprocessing s width had been detected. This paper describes a method is able to find out vena contracta during MR. Accurate assessmen replace or maintain the valve. he Mitral d, India, 247667 Medical Education he severity of the mitral very difficult to locate ardiography (TEE). So on also has been made time, particularly in ion [28]. In some d that vena contracta at the time of its tation. develop an image which vena contracta ically during mitral echocardiography is These images are in reprocessing stage is h is formed in left color space to gray stage vena contracta by which a clinician width automatically nt is helpful to cure, International Journal of Computer Science and Management Research Vol 2 Issue 5 May 2013 ISSN 2278-733X Kalpana Saini et.al. www.ijcsmr.org 2455
Transcript of Automatic Detection of Vena Contracta Width for the Mitral Regurgitation Assessment
Automatic Detection of Vena Contracta Width for the Mitral
Regurgitation Assessment
Kalpana Saini
*Dept of Electrical Engineering, Indian institute of Technology Roorkee, Uttarakhand, India, 247667
# Department of Cardiology, Advanced Cardiac Centre, Post Graduate Institute of Medical Education
Abstract: The aim of this paper is to derive an automatic method for vena contracta width detection for the severity of
regurgitation (MR). Vena contracta width is the efficient method to grading the severity of MR, but it is very difficult to locate
this narrowest part exactly in transthoracic echocardiography
there is a need to develop such method which is able to find out the vena contracta width. A
between the results obtained from the computing method and results obtained by the clinicians.
Keywords: Echocardiography; Transthoracic;
1. Introduction
Mitral regurgitation is the most common disease
of heart. Perfect assessment is required for the quick
and correct therapy of the mitral valve. In literature
many noninvasive techniques based on Doppler
echocardiography [1–9] have been discussed.
At present interest in color Doppler imaging for
vena contracta for the assessment of mitral
regurgitation is increasing progressively [10
vena contracta is the narrowest part of the regugitant
jet can also be called as ‘neck’ of the jet [12] and
having location just downstream from the orifice and
before the jet area [13] as in fig.1. Vena contracta is
slightly smaller than the mitral orifice due to
boundary effects, so the effective regurgitant orifice
area (EROA) can be measured by the vena contracta
[14]. If the orifice is fixed then the size of the vena
contracta is independent of driving pressure and flow
rate [15]. But for dynamic regugitant orifice vena
contracta may change with hemodynamic or during
the cardiac cycle [16]. Research [17 –20] shows that
the regurgitant orifice size can be presented by the
vena contracta width obtained from the color Doppler
imaging. Hence in recent studies measurement of
vena contracta is the mostly used method for the MR
assessment [10, 1, 21 –23].
In [1, 22, 24, 10] vena contracta is to be assumed
as the accurate method for finding out the severity of
MR, using TTE or TEE method. Literature [
[22] shows that vena contracta diameter can also be
measured by TTE with a good feasibility (between
95% and 97%). But recent study shows that the
determination of vena contracta is more feasible by
TEE [26]. In case of mitral regurgitation, the ven
Automatic Detection of Vena Contracta Width for the Mitral
Regurgitation Assessment
Kalpana Saini*, M.L.Dewal
*, Manojkumar Rohit
#
Dept of Electrical Engineering, Indian institute of Technology Roorkee, Uttarakhand, India, 247667
Department of Cardiology, Advanced Cardiac Centre, Post Graduate Institute of Medical Education
& Research, Chandigarh, India, 160012
The aim of this paper is to derive an automatic method for vena contracta width detection for the severity of
Vena contracta width is the efficient method to grading the severity of MR, but it is very difficult to locate
transthoracic echocardiography (TTE) as well as in transesophageal echocardiography
there is a need to develop such method which is able to find out the vena contracta width. A comparison also has been made
between the results obtained from the computing method and results obtained by the clinicians.
Transthoracic; Transesophageal; Mitral; Regurgitation; Vena contracta.
Mitral regurgitation is the most common disease
of heart. Perfect assessment is required for the quick
valve. In literature
many noninvasive techniques based on Doppler
9] have been discussed.
At present interest in color Doppler imaging for
vena contracta for the assessment of mitral
regurgitation is increasing progressively [10–11]. The
vena contracta is the narrowest part of the regugitant
jet can also be called as ‘neck’ of the jet [12] and
having location just downstream from the orifice and
before the jet area [13] as in fig.1. Vena contracta is
orifice due to
boundary effects, so the effective regurgitant orifice
area (EROA) can be measured by the vena contracta
[14]. If the orifice is fixed then the size of the vena
contracta is independent of driving pressure and flow
c regugitant orifice vena
contracta may change with hemodynamic or during
20] shows that
the regurgitant orifice size can be presented by the
vena contracta width obtained from the color Doppler
t studies measurement of
vena contracta is the mostly used method for the MR
In [1, 22, 24, 10] vena contracta is to be assumed
as the accurate method for finding out the severity of
MR, using TTE or TEE method. Literature [1] and
vena contracta diameter can also be
measured by TTE with a good feasibility (between
95% and 97%). But recent study shows that the
determination of vena contracta is more feasible by
TEE [26]. In case of mitral regurgitation, the vena
contracta diameter can vary over time, particularly in
the case of mitral regurgitation [28]. In some
literature [28-30] it is suggested that vena contracta
diameter should be measured at the time of its
maximal width for mitral regurgitation.
The aim of this paper to develop an image
processing based technique by which vena contracta
width can be find out automatically during mitral
regurgitation. Color Doppler echocardiography is
used for collecting the images. These images are in
RGB color space. First step in preprocessing stage is
to separate the color jet which is formed in left
ventricle. Then covert this RGB color space to gray
scale. After this preprocessing stage vena contracta
width had been detected.
This paper describes a method by which a clinician
is able to find out vena contracta width automatically
during MR. Accurate assessment is helpful to cure,
replace or maintain the valve.
Automatic Detection of Vena Contracta Width for the Mitral
Dept of Electrical Engineering, Indian institute of Technology Roorkee, Uttarakhand, India, 247667
Department of Cardiology, Advanced Cardiac Centre, Post Graduate Institute of Medical Education
The aim of this paper is to derive an automatic method for vena contracta width detection for the severity of the mitral
Vena contracta width is the efficient method to grading the severity of MR, but it is very difficult to locate
echocardiography (TEE). So
comparison also has been made
contracta diameter can vary over time, particularly in
the case of mitral regurgitation [28]. In some
30] it is suggested that vena contracta
diameter should be measured at the time of its
maximal width for mitral regurgitation.
The aim of this paper to develop an image
processing based technique by which vena contracta
width can be find out automatically during mitral
regurgitation. Color Doppler echocardiography is
used for collecting the images. These images are in
or space. First step in preprocessing stage is
to separate the color jet which is formed in left
ventricle. Then covert this RGB color space to gray
scale. After this preprocessing stage vena contracta
thod by which a clinician
is able to find out vena contracta width automatically
Accurate assessment is helpful to cure,
International Journal of Computer Science and Management Research Vol 2 Issue 5 May 2013 ISSN 2278-733X
Kalpana Saini et.al. www.ijcsmr.org 2455
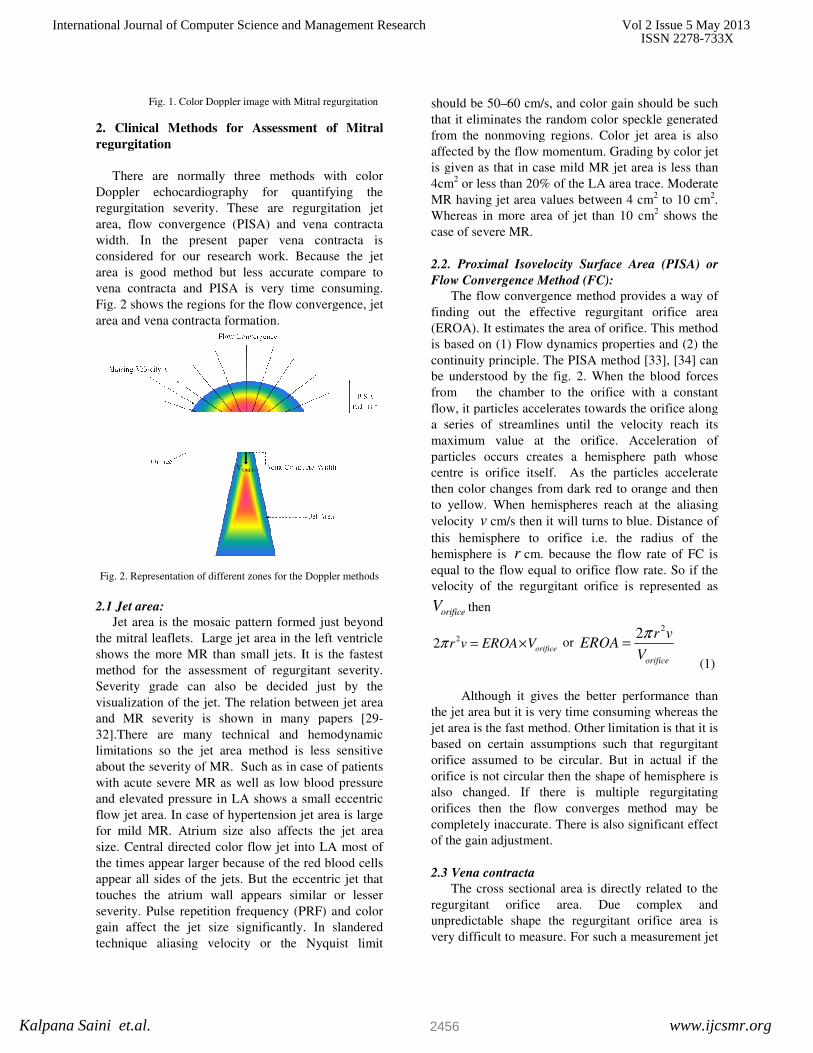
Fig. 1. Color Doppler image with Mitral regurgitation
2. Clinical Methods for Assessmen
regurgitation
There are normally three methods with color
Doppler echocardiography for quantifying the
regurgitation severity. These are regurgitation jet
area, flow convergence (PISA) and vena contracta
width. In the present paper vena
considered for our research work. Because the jet
area is good method but less accurate compare to
vena contracta and PISA is very time consuming.
Fig. 2 shows the regions for the flow convergence, jet
area and vena contracta formation.
Fig. 2. Representation of different zones for the Doppler methods
2.1 Jet area:
Jet area is the mosaic pattern formed just beyond
the mitral leaflets. Large jet area in the left ventricle
shows the more MR than small jets. It is the fastest
method for the assessment of regurgitant severity.
Severity grade can also be decided just by
visualization of the jet. The relation between jet area
and MR severity is shown in many papers [29
32].There are many technical and hemodynamic
limitations so the jet area method is less sensitive
about the severity of MR. Such as in case of patients
with acute severe MR as well as low blood pressure
and elevated pressure in LA shows a small eccentric
flow jet area. In case of hypertension jet area is large
for mild MR. Atrium size also affects the jet area
size. Central directed color flow jet into L
the times appear larger because of the red blood cells
appear all sides of the jets. But the eccentric jet that
touches the atrium wall appears similar or lesser
severity. Pulse repetition frequency (PRF) and color
gain affect the jet size significantly. In slandered
technique aliasing velocity or the Nyquist limit
Fig. 1. Color Doppler image with Mitral regurgitation
2. Clinical Methods for Assessment of Mitral
There are normally three methods with color
Doppler echocardiography for quantifying the
regurgitation severity. These are regurgitation jet
area, flow convergence (PISA) and vena contracta
width. In the present paper vena contracta is
considered for our research work. Because the jet
area is good method but less accurate compare to
vena contracta and PISA is very time consuming.
Fig. 2 shows the regions for the flow convergence, jet
g. 2. Representation of different zones for the Doppler methods
Jet area is the mosaic pattern formed just beyond
the mitral leaflets. Large jet area in the left ventricle
shows the more MR than small jets. It is the fastest
method for the assessment of regurgitant severity.
Severity grade can also be decided just by the
visualization of the jet. The relation between jet area
and MR severity is shown in many papers [29-
32].There are many technical and hemodynamic
limitations so the jet area method is less sensitive
about the severity of MR. Such as in case of patients
with acute severe MR as well as low blood pressure
and elevated pressure in LA shows a small eccentric
flow jet area. In case of hypertension jet area is large
for mild MR. Atrium size also affects the jet area
size. Central directed color flow jet into LA most of
the times appear larger because of the red blood cells
appear all sides of the jets. But the eccentric jet that
touches the atrium wall appears similar or lesser
Pulse repetition frequency (PRF) and color
icantly. In slandered
technique aliasing velocity or the Nyquist limit
should be 50–60 cm/s, and color gain should be such
that it eliminates the random color speckle generated
from the nonmoving regions. Color jet area is also
affected by the flow momentum. Grading by color jet
is given as that in case mild MR jet area is less than
4cm2 or less than 20% of the LA area trace. Moderate
MR having jet area values between 4 cm
Whereas in more area of jet than 10 cm
case of severe MR.
2.2. Proximal Isovelocity Surface Area (PISA) or
Flow Convergence Method (FC):
The flow convergence method provides a way of
finding out the effective regurgitant orifice area
(EROA). It estimates the area of orifice. This method
is based on (1) Flow dynamics properties a
continuity principle. The PISA method [33], [34] can
be understood by the fig. 2. When the blood forces
from the chamber to the orifice with a constant
flow, it particles accelerates towards the orifice along
a series of streamlines until the velocity reach its
maximum value at the orifice. Acceleration of
particles occurs creates a hemisphere path whose
centre is orifice itself. As the particles accelerate
then color changes from dark red to orange and then
to yellow. When hemispheres reach at the aliasing
velocity v cm/s then it will turns to blue. Distance of
this hemisphere to orifice i.e. the radius of the
hemisphere is r cm. because the flow rate of FC is
equal to the flow equal to orifice flow rate. So if the
velocity of the regurgitant orifice is represented as
orificeV then
22 orificer v EROA Vπ = ×
or EROA
Although it gives the better performance than
the jet area but it is very time consuming whereas the
jet area is the fast method. Other limitation is that it is
based on certain assumptions such that regurgitant
orifice assumed to be circular. But
orifice is not circular then the shape of hemisphere is
also changed. If there is multiple regurgitating
orifices then the flow converges method may be
completely inaccurate. There is also significant effect
of the gain adjustment.
2.3 Vena contracta
The cross sectional area is directly related to the
regurgitant orifice area. Due complex and
unpredictable shape the regurgitant orifice area is
very difficult to measure. For such a measurement jet
60 cm/s, and color gain should be such
that it eliminates the random color speckle generated
from the nonmoving regions. Color jet area is also
m. Grading by color jet
is given as that in case mild MR jet area is less than
or less than 20% of the LA area trace. Moderate
MR having jet area values between 4 cm2 to 10 cm
2.
Whereas in more area of jet than 10 cm2 shows the
. Proximal Isovelocity Surface Area (PISA) or
Flow Convergence Method (FC):
The flow convergence method provides a way of
finding out the effective regurgitant orifice area
(EROA). It estimates the area of orifice. This method
cs properties and (2) the
continuity principle. The PISA method [33], [34] can
be understood by the fig. 2. When the blood forces
from the chamber to the orifice with a constant
flow, it particles accelerates towards the orifice along
eamlines until the velocity reach its
maximum value at the orifice. Acceleration of
particles occurs creates a hemisphere path whose
centre is orifice itself. As the particles accelerate
then color changes from dark red to orange and then
hemispheres reach at the aliasing
cm/s then it will turns to blue. Distance of
this hemisphere to orifice i.e. the radius of the
cm. because the flow rate of FC is
equal to the flow equal to orifice flow rate. So if the
velocity of the regurgitant orifice is represented as
22
orifice
r vEROA
V
π=
(1)
Although it gives the better performance than
the jet area but it is very time consuming whereas the
jet area is the fast method. Other limitation is that it is
based on certain assumptions such that regurgitant
orifice assumed to be circular. But in actual if the
orifice is not circular then the shape of hemisphere is
also changed. If there is multiple regurgitating
orifices then the flow converges method may be
completely inaccurate. There is also significant effect
The cross sectional area is directly related to the
regurgitant orifice area. Due complex and
unpredictable shape the regurgitant orifice area is
very difficult to measure. For such a measurement jet
International Journal of Computer Science and Management Research Vol 2 Issue 5 May 2013 ISSN 2278-733X
Kalpana Saini et.al. www.ijcsmr.org 2456

is to be image in short axis plane. In clinical settings,
it is very difficult to localize the narrowest area from
the jet. So a correlation is measured between the VC
width which is measured from the zoomed view of
the parasternal long axis and apical views, and the
EROA by quantitative Doppler [1]. Relation between
EROA and VC width is also being given in other
literatures [29, 26, 24]. This relation shows good
results even in eccentric MR [23]. The VC width is
the one dimensional measurement whereas EROA is
the two dimensional so there are some limitations
also. But in [1] it is shown that VC width is the much
better tool for measurement of severity of MR. Such
as VC width less than 0.3cm indicates the mild MR.
If this value is in between 0.3 and 0.5 then it is the
case of moderate MR. But if the VC width is more
than 0.5cm than it indicates the severe MR.
In any view the localization of the VC width is
very difficult. So an experienced clinician is required
for the measurement of such narrowest portion. This
is very time consuming also to locate the exact VC.
So this paper is introducing a technique to locate the
VC and find out the VC width automatically.
3. Automatic detection of VC width: The
Proposed Method
Block diagram in fig. 3 shows the steps of the
proposed method for automatic detection of vena
contracta width.
Fig. 3. Algorithm for vena contracta width detection
At the preprocessing stage the ROI ie. the color
area has been detected. After that the image has been
converted to gray scale from color image,
processing. Next step is to detect the jet area in which
vena contracta exists. For this region growing
proceeding by morphological operation have been
done. There may be some spurious areas also
generated so need to remove these areas so that able
to concentrate on the main area.
In clinical settings,
it is very difficult to localize the narrowest area from
the jet. So a correlation is measured between the VC
width which is measured from the zoomed view of
the parasternal long axis and apical views, and the
ppler [1]. Relation between
EROA and VC width is also being given in other
literatures [29, 26, 24]. This relation shows good
results even in eccentric MR [23]. The VC width is
the one dimensional measurement whereas EROA is
e some limitations
shown that VC width is the much
better tool for measurement of severity of MR. Such
as VC width less than 0.3cm indicates the mild MR.
If this value is in between 0.3 and 0.5 then it is the
t if the VC width is more
than 0.5cm than it indicates the severe MR.
In any view the localization of the VC width is
very difficult. So an experienced clinician is required
for the measurement of such narrowest portion. This
also to locate the exact VC.
So this paper is introducing a technique to locate the
VC and find out the VC width automatically.
Automatic detection of VC width: The
Block diagram in fig. 3 shows the steps of the
proposed method for automatic detection of vena
Fig. 3. Algorithm for vena contracta width detection
preprocessing stage the ROI ie. the color
the image has been
from color image, for further
processing. Next step is to detect the jet area in which
vena contracta exists. For this region growing
proceeding by morphological operation have been
urious areas also
generated so need to remove these areas so that able
Now aim is to find out the vena contracta width
from this area. We need to count the elements in each
row in this area. As shown in fig. 4 the row
the minimum pixels inside the jet area is the region
where vena contracta exist. The total number of
pixels in this region is the vena contracta width in
pixels.
Fig. 4. Counting for elements inside the object
Total number of nonzero elements
object is given as in equation (2)
j n
ij
i m
E e=
=
=∑
Where ij
e is the th
ij element inside the object i.e.
itthe element at the th
i row and
contracta width can be find out as in
min( )widthVC E=
This value is in pixels. To compare with clinical data
it is good to convert this value to centimeters.
4. Experiments and discussion
Figure 5 shows the original images with mitral
regurgitation taken from PGIMER Chandigarh.
cases have been taken in this research work.
parasternal and long axis views are taken to the
detection of regurgitation jet.
Figure 6 shows the images with region of interest
from where vena contracta width can be find out.
This is the color area in which VC exist.
Figure 7 shows the images after segmentation
process. From this figure we can see that there is
pixel value is 1 inside the ROI and zero outside the
ROI.
Now aim is to find out the vena contracta width
from this area. We need to count the elements in each
row in this area. As shown in fig. 4 the row showing
the minimum pixels inside the jet area is the region
where vena contracta exist. The total number of
pixels in this region is the vena contracta width in
Fig. 4. Counting for elements inside the object
Total number of nonzero elements in arrow inside the
(2)
inside the object i.e.
row and th
j column. Vena
contracta width can be find out as in equation (3)
(3)
This value is in pixels. To compare with clinical data
it is good to convert this value to centimeters.
Figure 5 shows the original images with mitral
regurgitation taken from PGIMER Chandigarh. Nine
cases have been taken in this research work.
parasternal and long axis views are taken to the
Figure 6 shows the images with region of interest
from where vena contracta width can be find out.
This is the color area in which VC exist.
Figure 7 shows the images after segmentation
process. From this figure we can see that there is
1 inside the ROI and zero outside the
International Journal of Computer Science and Management Research Vol 2 Issue 5 May 2013 ISSN 2278-733X
Kalpana Saini et.al. www.ijcsmr.org 2457

Fig.5. Color Doppler images with mitral regurgitation
Fig. 6. Object extracted Images
Fig.5. Color Doppler images with mitral regurgitation
Fig. 6. Object extracted Images
Fig. 7. Final segmented images for vena contracta width
It can be analyzed from table 1 that the automatic
vena contracta width detection method proposed here
satisfies the severity grade given by the clinician.
Table 1. MR severity grade checking
5. Conclusion
Here TTE images have been taken for the
experiment in the case of valvular regurgitations.
Vena contracta diameter is directly related to the
effective regurgitant orifice area (EROA). Automatic
Images Vena
Contracta
width in
(pixels)
Vena
Contracta
width
(Cm)
1 13 0.58
2 14 0.61
3 8 0.46
4 12 0.56
5 8 0.46
6 12 0.56
7 11 0.54
8 11 0.54
9 9 0.39
Fig. 7. Final segmented images for vena contracta width
It can be analyzed from table 1 that the automatic
vena contracta width detection method proposed here
satisfies the severity grade given by the clinician.
Table 1. MR severity grade checking
Here TTE images have been taken for the
experiment in the case of valvular regurgitations.
Vena contracta diameter is directly related to the
orifice area (EROA). Automatic
MR
Severity
(by
Proposed
method)
MR
Severity
(by
Clinician)
severe severe
severe severe
moderate moderate
severe severe
moderate moderate
severe severe
severe severe
severe severe
moderate moderate
International Journal of Computer Science and Management Research Vol 2 Issue 5 May 2013 ISSN 2278-733X
Kalpana Saini et.al. www.ijcsmr.org 2458
detection of vena contracta width presented in this
paper gives a time saving method for finding out the
severity of MR. there is no need to zoom out the vana
contracta width portion in this method. Zooming the
view increase the burring in the image. VCW is not
load independent in MR because short-term changes
in loading conditions produce dynamic changes in the
regurgitant orifice. Cause of MR does not always
predict accurately whether the regurgitant orifice is
fixed or dynamic.
References
[1] S. A. Hall, M. E. Brickner, D. L. Willett, W. N.
Irani, I. Afridi, P. A. Grayburn. “Assessment of
mitral regurgitation severity by Doppler color
flow mapping of the vena contracta”, Circulation
vol.95, pp. 636-642, 1997.
[2] T. Ammar , S. Konstadt, “Intraoperative
transesophageal echocardiographic evaluation of
mitral regurgitation [review]”, J Cardiothorac
Vasc Anesth vol., 10, pp. 397– 405, 1996.
[3] H. Aotsuka, K. Tobita, H. Hamada, et al.,
“Validation of the proximal isovelocity surface
area method for assessing mitral regurgitation in
children”. Pediatr Cardiol, vol.17, pp. 351–359,
1996.
[4] A. G. Burleson, R. A. Levine, A. P. Yoganathan,
“A model based on dimensional analysis for non-
invasive quantification of valvular regurgitation
under confined and impinging conditions”. J
Biomech. Vol. 29, pp. 99 –102, 1996.
[5] E. P. Pieper, H.P. Hamer, R. A. Sluijs, C. J. Anita
Ravelli, G. P. Jan Tijssen, J. G. M. Harry. Crijns,
I. Kong Lie, A. Cees Visse, “Usefulness of
multiplane transesophageal echocardiography to
improve the assessment of severity of mitral
regurgitation”, Am J Cardiol, vol.78, pp.1132–
1139, 1996.
[6] E. P. Pieper EP, I. M. Hellemans, H. P. Hamer,
A. C. Ravelli, E. C. Cheriex, J. G. Tijssen, K. I.
Lie, C. A. Visser, “Value of systolic pulmonary
venous flow reversal and color Doppler jet
measurements assessed with transesophageal
echocardiography in recognizing severe pure
mitral regurgitation”, Am J Cardiol, vol. 78, pp.
444 –450, 1996.
[7] E. Schwammenthal, C. Chen, F. Benning, M.
Block, G. Breithardt, R. A.Levine, “Dynamics of
mitral regurgitant flow and orifice area.
Physiologic application of the proximal flow
convergence method: clinical data and
experimental testing”, Circulation, vol. 90, pp.
307–322, 1994.
[8] M. Pu, P. M. Vandervoort, N. L. Greenberg, K.
A. Powell, B. P. Griffin, J. D. Thomas, “Impact
of wall constraint on velocity distribution in
proximal flow convergence zone. Implications
for color Doppler quantification of mitral
regurgitation” J Am Coll Cardiol , vol. 27, pp.
706 –713, 1996.
[9] M. Pu, P. M. Vandervoort, B. P. Griffin BP, et
al., “Quantification of mitral regurgitation by the
proximal convergence method using
transesophageal echocardiography Clinical
validation of a geometric correction for proximal
flow constraint”, Circulation , vol. 92, pp. 2169 –
77, 1995.
[10] C. Tribouilloy, W.F. Shen, J. P. Quere, J. L. Rey,
D. Choquet, H. Dufosse, J.P Lesbre, “Assessment
of severity of mitral regurgitation by measuring
regurgitant jet width at its origin with
transesophageal Doppler color flow imaging”
Circulation, vol. 8, pp. 1248 –1253, 1992.
[11] M. Ishii, M. Jones, T. Shiota, I. Yamada, R. S.
Heinrich, S. R. Holcomb, A. P. Yoganathan, D. J.
Sahn, “Quantifying aortic regurgitation by using
the color Doppler-imaged vena contracta: a
chronic animal model study” Circulation, vol. 96,
pp. 2009 –2015, 1997.
[12] T. Irvine, X. K. Li, D. J. Sahn, A. Kenny,
“Assessment of mitral regurgitation”, Heart vol
88(Suppl IV) , pp. iv11–iv19, 2002.
[13] M. Ishii, M. Jones, T. Shiota, I. Yamada, R. S.
Heinrich, S. R. Holcomb, A. P. Yoganathan, D. J.
Sahn, “Evaluation of eccentric aortic
regurgitation by color Doppler jet and color
Doppler-imaged vena contracta measurements:
an animal study of quantified aortic
regurgitation”, Am Heart J , vol. 132, pp. 796–
804, 1996.
[14] A. P. Yoganathan, E. G. Cape, H. W. Sung, F. P.
Williams, A. Jimoh, “Review of hydrodynamic
principles for the cardiologist: applications to the
study of blood flow and jets by imaging
techniques”, J Am Coll Cardiol, vol. 12, pp.
1344 –53, 1988.
[15] H. Baumgartner, H. Schima, P. Kuhn. “Value and
limitations of proximal jet dimensions for the
quantitation of valvular regurgitation: an in vitro
study using Doppler flow imaging”, J Am Soc
Echocardiography, vol. 4, pp. 57-66, 1991.
[16] A. M. Kizilbash, D. L.Willett, M. E. Brickner, S.
K. Heinle, P. A. Grayburn, “Effects of afterload
reduction on vena contracta width in mitral
regurgitation”, J Am Coll Cardiol , vol. 32, pp.
427-431, 1998.
[17] A. F. Bolger, N. L. Eigler, J. M. Pfaff, K. J.
Resser, G. Maurer, “Computer analysis of
Doppler color flow mapping images for
quantitative assessment of in vitro fluid jets”, J
Am Coll Cardiol, vol. 12, pp. 450 –457, 1988.
[18] D. F. Switzer, A. P. Yoganathan, N. C. Nanda, Y.
R. Woo, A. J. Ridgway, “Calibration of color
Doppler flow mapping during extreme
hemodynamic conditions in vitro: a foundation
for a reliable quantitative grading system for
aortic incompetence” Circulation , vol. 75, pp.
837– 846, 1987.
[19] A. L. Taylor, E. J. Eichhorn, M. E. Brickner, R.
C. Eberhart, P. A. Grayburn, “Aortic valve
International Journal of Computer Science and Management Research Vol 2 Issue 5 May 2013 ISSN 2278-733X
Kalpana Saini et.al. www.ijcsmr.org 2459
morphology: an important in vitro determinant of
proximal regurgitant jet width by Doppler color
flow mapping”, J Am Coll Cardiol, vol. 16, pp.
405–412, 1990.
[20] H. Baumgartner, H. Kratzer, G. Helmreich, P.
Kuhn, “Quantitation of aortic regurgitation by
color coded cross-sectional Doppler
echocardiography” Eur Heart J 9, pp. 380 –387,
1988.
[21] P. A. Grayburn, W. Fehske, H. Omran, M. E.
Brickner, B. Luderitz, “Multiplane
transesophageal echocardiographic assessment of
mitral regurgitation by Doppler color flow
mapping of the vena contracta”, Am J Cardiol ,
vol. 74, pp. 912–917, 1994.
[22] W. Fehske, H. Omran, M. Manz, J. Kohler, A.
Hagendorff, B. Luderitz, “Color-coded Doppler
imaging of the vena contracta as a basis for
quantification of pure mitral regurgitation”, Am
J Cardiol, vol. 73, pp. 268–274, 1994.
[23] X. Zhou, M. Jones, T. Shiota, I. Yamada, D.
Teien, D. J. Sahn, “Vena contracta imaged by
Doppler color flow mapping predicts the severity
of eccentric mitral regurgitation better than color
jet area: a chronic animal study”, J Am Coll
Cardiol, vol. 30, pp. 1393– 1398, 1997.
[24] S. K. Heinle, S. A. Hall, M. E. Brickner, D.
L.Willett, P. A. Grayburn, “Comparison of vena
contracta width by multiplane transesophageal
echocardiography with quantitative Doppler
assessment of mitral regurgitation”, Am J Cardiol
vol.81, pp. 175-179, 1998.
[25] J.P. Quere, C. Tribouilloy, M. Enriquez-Sarano,
“Vena contracta width measurement: theoretic
basis and usefulness in the assessment of valvular
regurgitation severity”, Curr Cardiol Rep, vol.5,
pp. 1101–1115, 2003.
[26] M. Enriquez-Sarano, L. Sinak, A. Tajik, R. Kent,
Bailey, B. James, M. D. Seward, “Changes in
effective regurgitant orifice throughout systole in
patients with mitral valve prolapse. A clinical
study using the proximal isovelocity surface area
method”, Circulation, vol. 92, pp.2951–2958,
1995.
[27] P. Grayburn, W. Fehske, H. Omran, M.
E.Brickner, B. Lüderitz, “Multiplane
transesophageal echocardiographic assessment of
mitral regurgitation by Doppler color flow
mapping of the vena contracta”, Am J Cardiol,
vol. 74, pp. 912–917, 1994.
International Journal of Computer Science and Management Research Vol 2 Issue 5 May 2013 ISSN 2278-733X
Kalpana Saini et.al. www.ijcsmr.org 2460