Evidence of Cardiovascular Calcification and Fibrosis ... - Nature
Upload
khangminh22Category
view
1download
0
STUDY OF MITRAL ANNULAR CALCIFICATION
IN CHRONIC KIDNEY DISEASE
Dissertation Submitted for
MD Degree (Branch I) General Medicine March- 2010
The Tamilnadu Dr.M.G.R.Medical University Chennai – 600 032.
MADURAI MEDICAL COLLEGE, MADURAI.
CERTIFICATE
This is to certify that this dissertation titled ‘MITRAL
ANNULAR CALCIFICATION IN CHRONIC KIDNEY DISEASE’
submitted by Dr. BINJO . J. VAZHAPPILLY to the faculty of General
Medicine, The Tamilnadu Dr. M.G.R. Medical University, Chennai in
partial fulfillment of the requirement for the award of MD degree branch I
General Medicine, is a bonafide research work carried out by him under our
direct supervision and guidance.
DR.S.VADIVELMURUGAN, MD DR.A.AYYAPPAN, MD. Professor of Medicine, Professor and Head,
Chief, III Medical Unit, Department of Medicine,
Department of Medicine, Madurai Medical College,
Madurai Medical College, Madurai.
Madurai.
DECLARATION
I, Dr. BINJO. J. VAZHAPPILLY, solemnly declare that the dissertation
titled “MITRAL ANNULAR CALCIFICATION IN CHRONIC
KIDNEY DISEASE’” has been prepared by me.
This is submitted to The Tamilnadu Dr. M.G.R. Medical
University, Chennai, in partial fulfillment of the rules and regulations for
the award of MD degree (branch I) General Medicine.
Place: Madurai
Date: Dr. BINJO. J . VAZHAPPILLY

ACKNOWLEDGEMENT
At the outset, I wish to thank our Dean Dr. S.M.SIVAKUMAR,
MS., for permitting me to use the facilities of Madurai Medical College
and Government Rajaji Hospital to conduct this study.
My beloved Head of the Department of Medicine, PROF. A
AYYAPPAN, MD has always guided me, by example and valuable
words of advice and has always given me his moral support and
encouragement throughout the conduct of the study and also during
my post graduate course. I owe my sincere thanks to him.
I also owe my sincere thanks to my unit chief and my guide
PROF. S. VADIVELMURUGAN MD, for his guidance and advice
throughout the study.
I wish to extend my gratitude to DR.S. PALANICHAMY, MD DM,
HOD, Department of Cardiology, DR. S. MURUGAN, MD DM and
other faculties in the department of cardiology for their valuable
guidance and support throughout the study.
Knowledge and kindness abounds my beloved teachers, Dr.
Moses.K.Daniel MD, Dr.D.D.Venketraman MD, Dr.M.Muthiah MD

Dr.V.T.Premkumar MD, Dr. M.Natarajan MD, I owe them a lot and
sincerely thank them.
My special thanks to Dr. Shanmugaperumal MD DM , and Dr.
Sampath MD DM for there helping hands without hesitation in
completing this study.
I offer my heartfelt thanks to my Assistant Professors
Dr.C.Dharmaraj MD, Dr.A.Senthamarai MD, Dr. R. Sundaram MD
for their constant encouragement, timely help and critical suggestions
throughout the study and also for making my stay in the unit both
informative and pleasurable.
My patients, who form the most integral part of the work, were
always kind and cooperative. I cannot but pray for their speedy
recovery and place this study as a tribute to them and to the
numerous others likely affected.
Above all I thank the Lord Almighty for His kindness and
benevolence.

CONTENTS
1. INTRODUCTION 1
2. REVIEW OF LITERATURE 3
3. AIMS AND OBJECTIVES 29
4. MATERIALS AND METHODS 30
5. RESULTS AND ANALYSIS 35
6. DISCUSSION 48
7. CONCLUSION 53
8. SUMMARY 54
9. APPENDIX
BIBLIOGRAPHY
PROFORMA
GLOSSARY
MASTER CHART
ETHICAL COMMITTEE APPROVAL FORM
1
INTRODUCTION
Chronic kidney disease (CKD) is becoming
a major public health problem worldwide. The median prevalence of
CKD was 7.2% in persons aged 30 years or older. In persons aged
64 years or older prevalence of CKD varied from 23.4% to
35.8%1.The prevalence of CKD in India is 0.8%, and diabetes has
emerged as the most frequent cause (30–40%)2 .It is estimated that
1,00,000 new patients of end stage renal disease (ESRD) enter renal
replacement programs annually in India3 .
Chronic kidney disease (CKD) is
associated with a high incidence of cardiovascular events.4
Cardiovascular calcium deposition has been recognized as a
common finding in patients with renal failure.5 .
Mitral annular calcification is a chronic,
degenerative process of the mitral valve fibrous ring, involving the
posterior annulus. It is a common disorder in the elderly, above all in
women. It may also occur in younger patients with advanced renal
disease or other metabolic disorders that result in abnormal calcium
metabolism. CKD patients are exposed to a much greater risk for the
calcification of cardiac valves and coronary arteries than the general
2
population.6 ,7MAC occurs earlier in patients with chronic renal failure
than those without renal dysfunction Mitral annulus calcification in
the elderly is associated with a doubled risk of stroke, independent of
the traditional risk factors. Each 1 mm increase in mitral annular
calcification was associated with an increase in all-cause mortality of
about 10 percent.

3
REVIEW OF LITERATURE
CHRONIC KIDNEY DISEASE
CKD is defined as kidney damage with or without
decreased GFR, manifested as either pathologic abnormalities or
markers of kidney damage, including abnormalities in composition of
blood or urine, abnormality in renal imaging findings and a GFR less
than 60 mL/min 1.73 m2 (8). The prevalence and the incidence of CKD
are increasing. The most common causes of CKD leading to ESRD
are diabetes mellitus, hypertension, glomerulonephritis, and cystic
kidney disease, which together account for 90% of all new cases of
CKD. Hypertensive nephropathy is a common cause of CKD in the
elderly. Progressive nephrosclerosis from vascular disease is the
renal correlate of the same processes that lead to coronary heart
disease and cerebrovascular disease.
The increasing incidence of CKD in the
elderly has been ascribed, to decreased mortality from the cardiac
and cerebral complications of atherosclerotic vascular disease in
them, enabling a greater segment of the population to manifest the
renal component of generalized vascular disease. Majority of those
4
with early stages of renal disease, especially of vascular origin, will
succumb to the cardiovascular and cerebrovascular consequences of
the vascular disease before they can progress to the most advanced
stages of CKD. Inter-individual variability in the rate of progression to
CKD has an important heritable component, and a number of genetic
loci that contribute to the progression of CKD have been identified.
Similarly, it has been noted that women of reproductive age are
relatively protected against progression of many renal diseases, and
sex-specific responses to angiotensin II and its blockade have been
identified.
Pathophysiology of CKD
It involves two broad sets of mechanisms of damage:
(1) initiating mechanisms specific to underlying etiology like immune
complexes and mediators of inflammation in glomerulonephritis, or
toxins in certain diseases of the renal tubules and interstitium; and
(2) a set of progressive mechanisms, involving hyperfiltration and
hypertrophy of the remaining viable nephrons, that are a common
consequence following long-term reduction of renal mass. Increased
intrarenal activity of the renin-angiotensin axis appears to contribute
5
both to the initial adaptive hyperfiltration and to the subsequent
maladaptive hypertrophy and sclerosis.
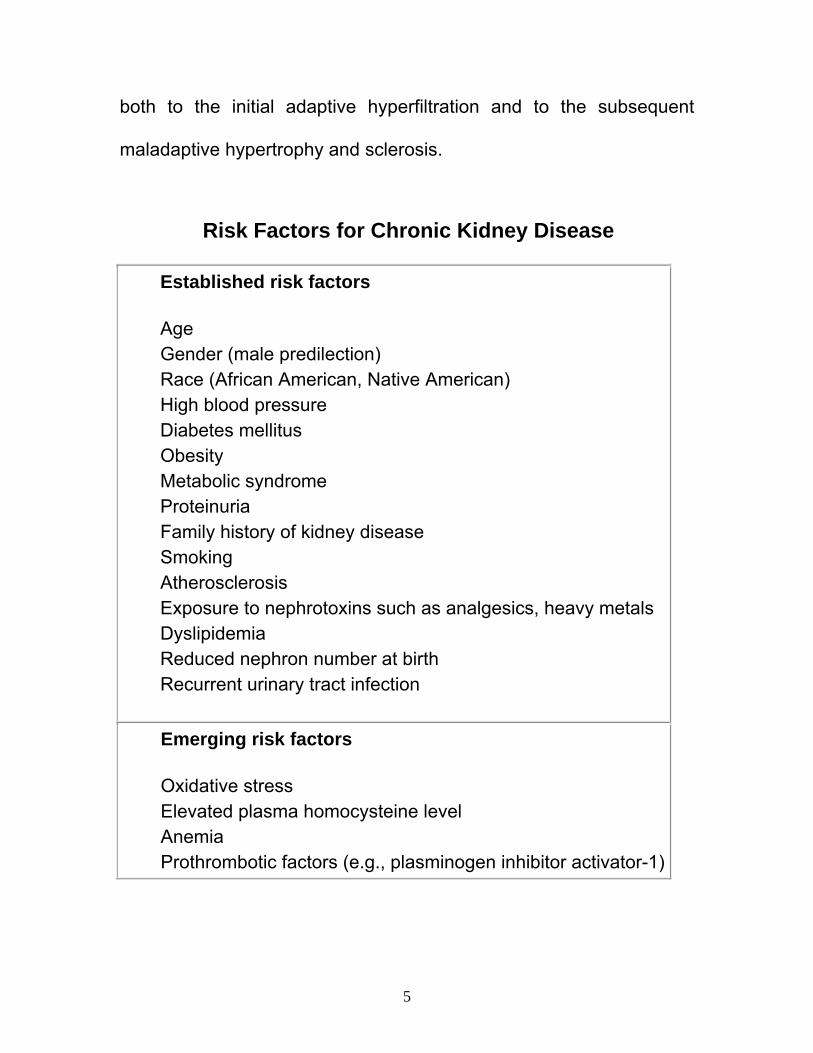
Risk Factors for Chronic Kidney Disease
Established risk factors
Age Gender (male predilection) Race (African American, Native American) High blood pressure Diabetes mellitus Obesity Metabolic syndrome Proteinuria Family history of kidney disease Smoking Atherosclerosis Exposure to nephrotoxins such as analgesics, heavy metals Dyslipidemia Reduced nephron number at birth
Recurrent urinary tract infection
Emerging risk factors
Oxidative stress Elevated plasma homocysteine level Anemia Prothrombotic factors (e.g., plasminogen inhibitor activator-1)
6
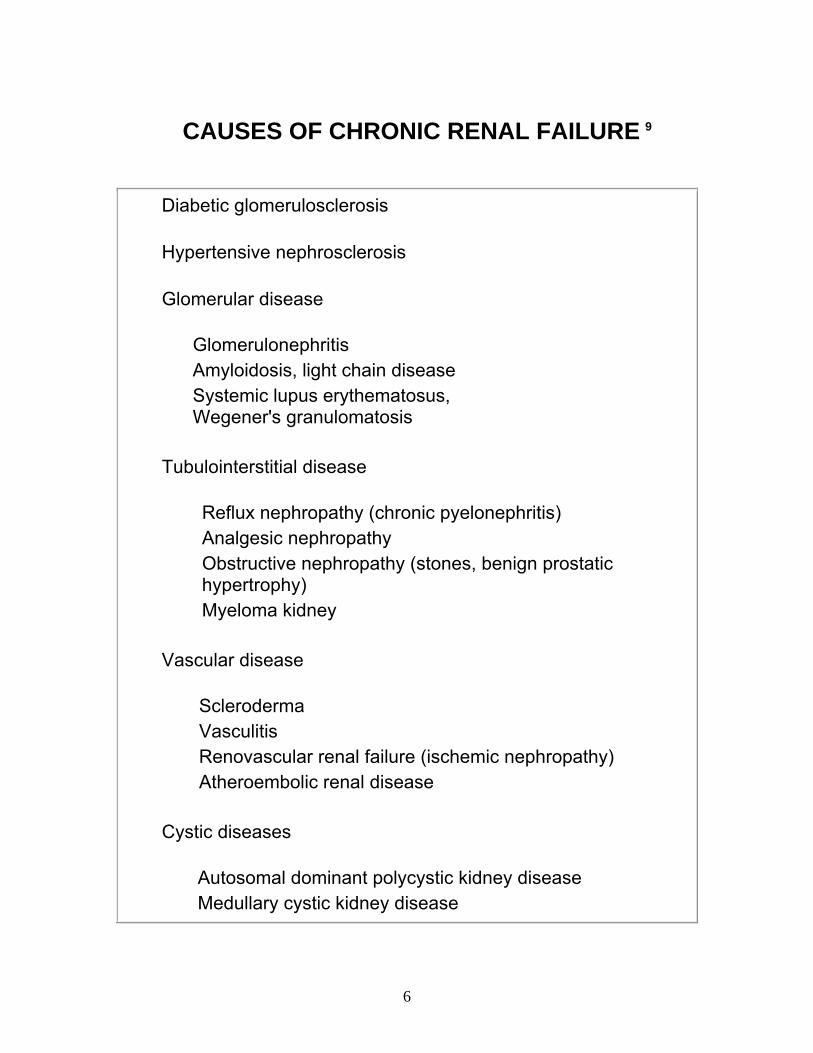
CAUSES OF CHRONIC RENAL FAILURE 9
Diabetic glomerulosclerosis
Hypertensive nephrosclerosis
Glomerular disease Glomerulonephritis Amyloidosis, light chain disease
Systemic lupus erythematosus,
Wegener's granulomatosis
Tubulointerstitial disease Reflux nephropathy (chronic pyelonephritis) Analgesic nephropathy
Obstructive nephropathy (stones, benign prostatic hypertrophy)
Myeloma kidney
Vascular disease Scleroderma Vasculitis Renovascular renal failure (ischemic nephropathy)
Atheroembolic renal disease
Cystic diseases Autosomal dominant polycystic kidney disease Medullary cystic kidney disease
7
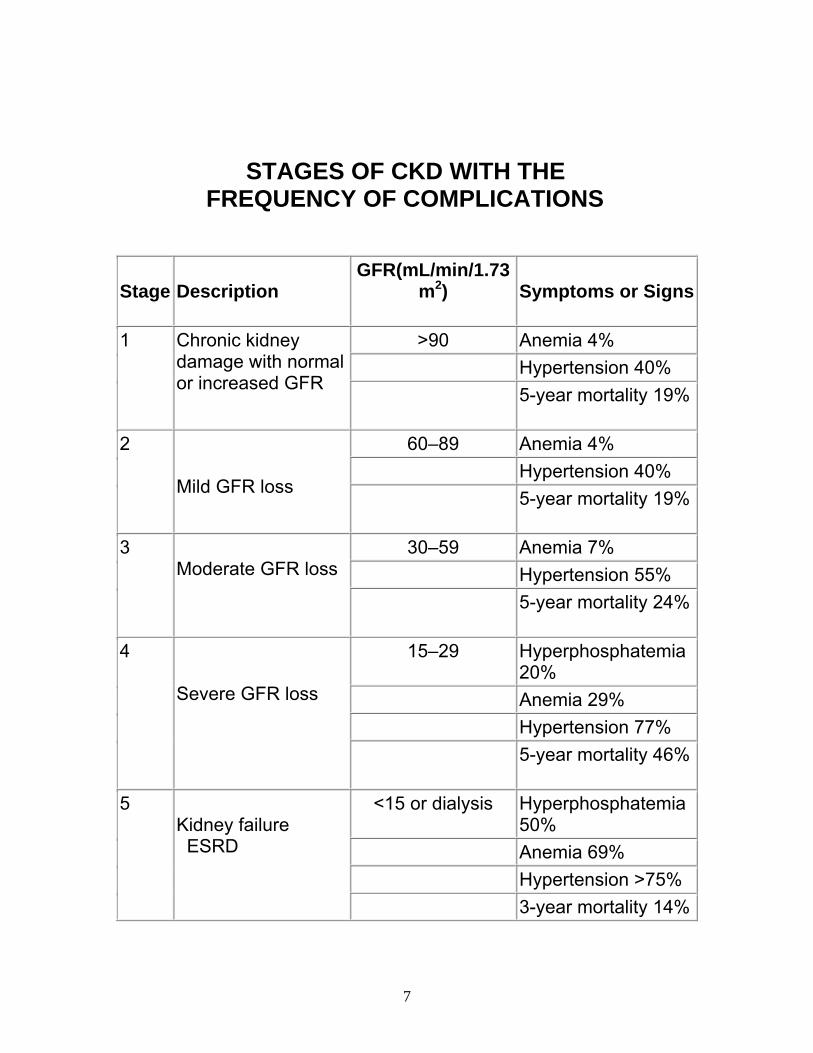
STAGES OF CKD WITH THE FREQUENCY OF COMPLICATIONS
Stage
Description
GFR(mL/min/1.73 m2)
Symptoms or Signs
>90 Anemia 4% Hypertension 40%
1 Chronic kidney damage with normal or increased GFR 5-year mortality 19%
60–89 Anemia 4%
Hypertension 40% 2
Mild GFR loss 5-year mortality 19%
30–59 Anemia 7%
Hypertension 55% 3
Moderate GFR loss
5-year mortality 24%
15–29 Hyperphosphatemia 20%
Anemia 29% Hypertension 77%
4 Severe GFR loss
5-year mortality 46%
<15 or dialysis Hyperphosphatemia 50%
Anemia 69% Hypertension >75%
5 Kidney failure ESRD
3-year mortality 14%
8
CLINICAL PRESENTATION
Patients are asymptomatic in the early stages of
CKD, most patients do not come to medical attention until most of
their kidney function has been lost. Features of advanced CKD
disease include fatigue, anorexia, nausea, morning vomiting,
malnutrition, pruritus, bone pain, impotence, amenorrhea, epistaxis,
easy bruising, myopathy, muscle twitching and cramps, nail changes,
uremic frost on skin surfaces, pleurisy, pericarditis, edema, volume
overload, lethargy, confusion, asterixis, peripheral neuropathy,
seizures, and coma. Hypertension and proteinuria are the most
common features of CKD and are present at all stages of the disease.
Progressive metabolic acidosis develops
when renal ammoniagenesis fails and impairs tubular acid excretion.
If untreated, metabolic acidosis leads to osteodystrophy (through
bone buffering), skeletal muscle breakdown, and diminished albumin
synthesis. Gastrointestinal bleeding may occur secondary to platelet
dysfunction and diffuse mucosal erosions through the gut. Uremia
leads to impaired capillary permeability, fluid accumulation, and

9
uremic serositis, a syndrome characterized by pericarditis, pleural
effusions, and ascites.
Renal osteodystrophy results from secondary
hyperparathyroidism (caused by hyperphosphatemia and
hypocalcemia, marked parathyroid hypertrophy, and bony resistance
to the action of parathyroid hormone) and metabolic acidosis. The
principal types of bone disease in CKD are osteitis fibrosis (resulting
mainly from secondary hyperparathyroidism) and adynamic bone
disease (resulting from oversuppression of parathyroid hormone).
In CKD all organ systems are affected, but the most
evident complications include anemia and associated easy fatigability;
decreasing appetite with progressive malnutrition, abnormalities in
calcium, phosphorus, and mineral-regulating hormones, such as
1,25(OH)2D3 (calcitriol) and parathyroid hormone (PTH); and
abnormalities in sodium, potassium, water, and acid-base
homeostasis.
The cause of anemia in patients with CKD can be
multifactorial with a central component being a relative deficiency of
erythropoietin an erythrocyte-stimulating protein that is normally
produced by renal parenchymal cells in response to blood partial
10
pressure of oxygen. Anemia caused by CKD is present in 20 percent
of patients with stable coronary disease and 30 to 60 percent of
patients with HF. Hence anemia is a common and easily identifiable
potential diagnostic and therapeutic target 10,11 .
Hypertension, like anemia, is almost universal in
CKD patients and often is the first sign of CKD. Hypertension
contributes to the development of cardiovascular disease, the leading
cause of morbidity and mortality in CKD patients. Hypertension in
CKD patients is mainly the result of an expanded extracellular volume
from a salt-rich diet and a decreased capacity for excretion of sodium.
Another mechanism for hypertension in CKD patients is activation of
the renin-angiotensin-aldosterone (RAA) system and the sympathetic
nervous system. Evidence for activation of the RAA system in CKD
patients includes circulating levels of renin and aldosterone that are
too high for individuals who are hypertensive, suggesting that the
vasoconstrictive action of angiotensin II and the salt retention induced
by aldosterone contribute to hypertension. Patients with hypertension
frequently have serum uric acid values in the upper range of normal
or at supranormal levels and this can cause vascular damage,
11
suggesting that uric acid could play a role in the genesis of
hypertension in CKD.
Evaluation
Evaluation of CKD should include measurements of GFR
and the degree of albuminuria. Most studies of cardiovascular
outcomes have found that a critical cut point for the development of
various adverse effects , is an eGFR of 60 ml/min/1.73 m2, which
roughly corresponds to a serum creatinine greater than 1.5 mg/dl in
the general population12, 13 Because Cr is a crude indicator of renal
function and often underestimates renal dysfunction in women and
the elderly, calculated measures of eGFR or Cr clearance using the
Cockcroft-Gault equation or the Modification of Diet in Renal Disease
equation are superior methods for the assessment of renal function.
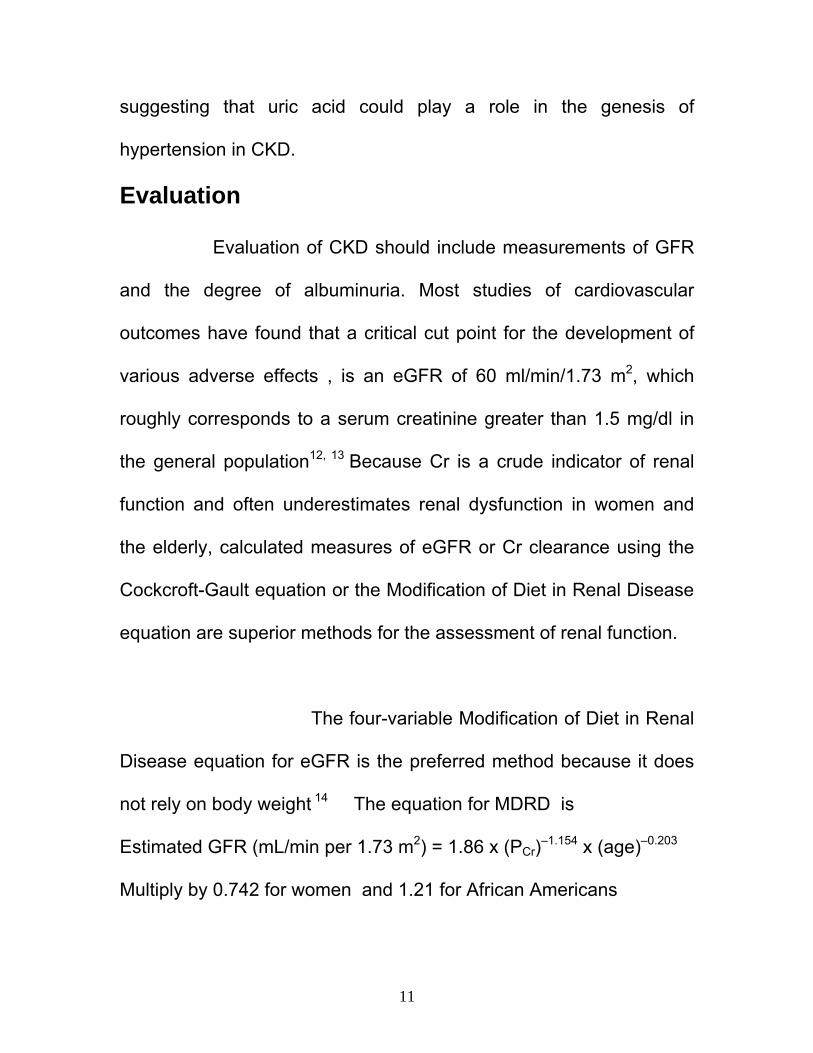
The four-variable Modification of Diet in Renal
Disease equation for eGFR is the preferred method because it does
not rely on body weight 14 The equation for MDRD is
Estimated GFR (mL/min per 1.73 m2) = 1.86 x (PCr)–1.154 x (age)–0.203
Multiply by 0.742 for women and 1.21 for African Americans
12
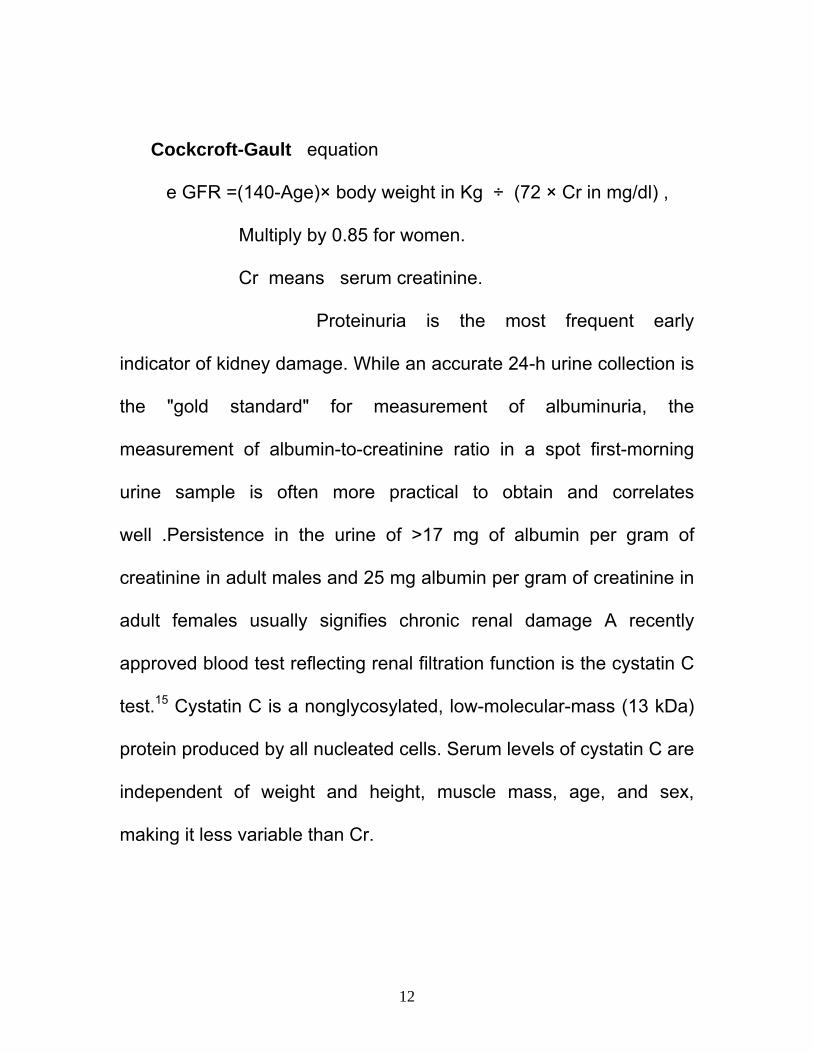
Cockcroft-Gault equation
e GFR =(140-Age)× body weight in Kg ÷ (72 × Cr in mg/dl) ,
Multiply by 0.85 for women.
Cr means serum creatinine.
Proteinuria is the most frequent early
indicator of kidney damage. While an accurate 24-h urine collection is
the "gold standard" for measurement of albuminuria, the
measurement of albumin-to-creatinine ratio in a spot first-morning
urine sample is often more practical to obtain and correlates
well .Persistence in the urine of >17 mg of albumin per gram of
creatinine in adult males and 25 mg albumin per gram of creatinine in
adult females usually signifies chronic renal damage A recently
approved blood test reflecting renal filtration function is the cystatin C
test.15 Cystatin C is a nonglycosylated, low-molecular-mass (13 kDa)
protein produced by all nucleated cells. Serum levels of cystatin C are
independent of weight and height, muscle mass, age, and sex,
making it less variable than Cr.
13
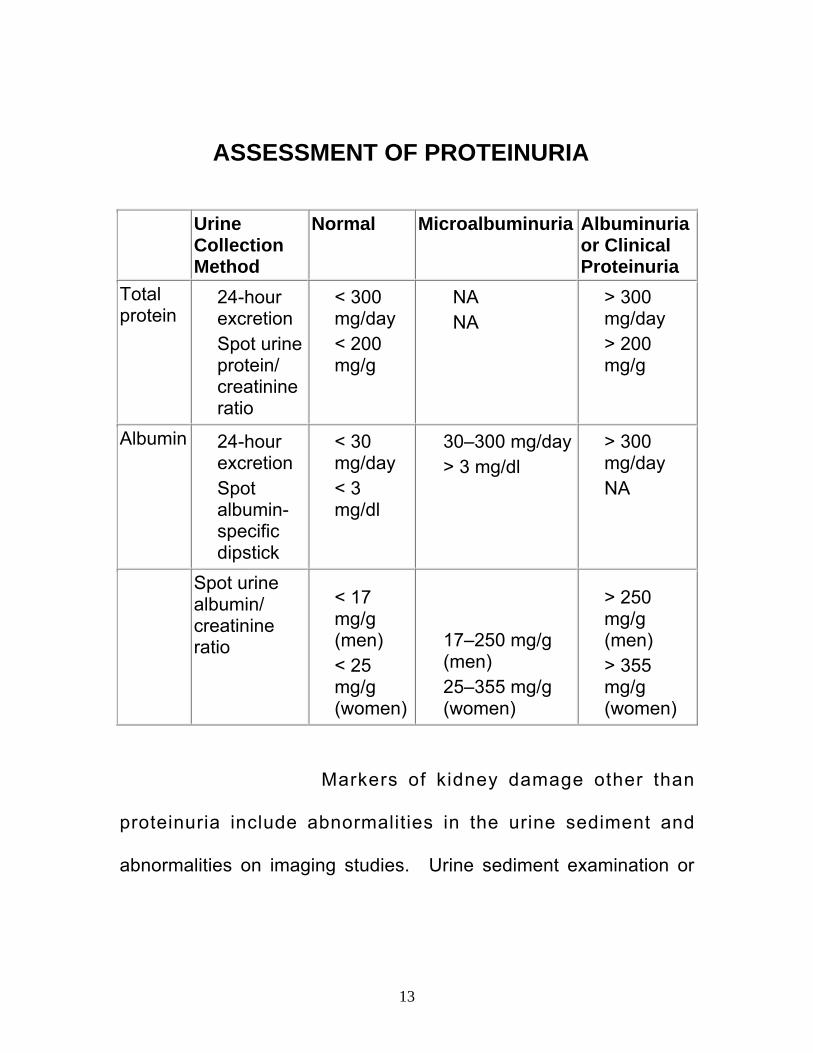
ASSESSMENT OF PROTEINURIA
Urine Collection Method
Normal Microalbuminuria Albuminuria or Clinical Proteinuria
Total protein 24-hour
excretion
Spot urine protein/ creatinine ratio
< 300 mg/day
< 200 mg/g
NA NA
> 300 mg/day
> 200 mg/g
Albumin 24-hour
excretion
Spot albumin- specific dipstick
< 30 mg/day
< 3 mg/dl
30–300 mg/day > 3 mg/dl
> 300 mg/day
NA
Spot urine albumin/ creatinine ratio
< 17 mg/g (men)
< 25 mg/g (women)
17–250 mg/g (men)
25–355 mg/g (women)
> 250 mg/g (men)
> 355 mg/g (women)
Markers of kidney damage other than
proteinuria include abnormalities in the urine sediment and
abnormalities on imaging studies. Urine sediment examination or
14
dipstick for red blood cells and white blood cells should be performed
in all patients with CKD. Imaging of the kidneys should be
performed in all patients with CKD to evaluate for structural
abnormalities, impaired renal blood flow, and urinary obstruction.
Imaging should begin with renal ultrasonography but may also
include computed tomography or magnetic resonance imaging.
Calcium and Phosphate metabolism in CKD Normal serum levels of phosphorus and
calcium are maintained through the interaction of two hormones:
parathyroid hormone (PTH) and 1,25(OH)2D (calcitriol). These
hormones act on three primary target organs: bone, kidney, and
intestine. The kidneys play a critical role in the regulation of normal
serum calcium and phosphorus concentrations, thus derangements
are common in patients with chronic kidney disease (CKD).
Abnormalities are initially observed in patients with glomerular
filtration rate (GFR) levels less than 60 mL/min and are nearly
uniform at a GFR less than 30 mL/min.
Chronic kidney disease (CKD) is associated
with a number of important disturbances in mineral metabolism,
15
which include hypocalcemia, hyperphosphatemia, and abnormalities
in vitamin D metabolism that result in functional calcitriol
deficiency.16Elevated plasma levels of parathyroid hormone (PTH), a
key calcium-regulating hormone that also affects renal phosphorus
excretion, and fibroblast growth factor 23, a recently identified
phosphorus-regulating hormone, occur often.17,18 The major
consequences of disordered mineral metabolism in CKD are
secondary hyperparathyroidism, metabolic bone disease, and extra
skeletal calcification.19,20
Studies have demonstrated that the serum
phosphorus and the calcium × phosphorus product are associated
with poor outcomes in CKD. The association of elevated serum
phosphorus and mortality has been confirmed in several studies.
Block and colleagues used a large dialysis data base of more than
40,000 patients undergoing hemodialysis in the United States and
found an association with increased mortality for phosphorus levels
greater than 5.0 mg/dL, with a progressive increase in mortality with
increasing levels.21 In this same study, the relative risk of death
correlated directly to serum calcium levels, increasing 47% as the
calcium level increased from 9 to 9.5 mg/dL to more than 11 mg/dL..
16
Epidemiologic studies have revealed the major cause of
death in the presence of hyperphosphatemia and hypercalcemia to
be cardiovascular events.22 Studies have demonstrated an
association of hyperphosphatemia with increased vascular stiffening,
arterial calcification and calciphylaxis and valvular calcification.23
VASCULAR CALCIFICATION IN CKD
There is high prevalence of vascular calcification in
patients with CKD. Calcium can be deposited into either the medial or
intimal layers of the vasculature. Calcium deposition in the medial
layer, a common finding in dialysis patients, is associated with
stiffening of the vasculature, resulting in significantly adverse
cardiovascular outcomes. Intimal calcium deposition is principally
associated with atherosclerotic plaques; in patients with normal renal
function, such "complex" plaques are more often associated with
myocardial infarction and thrombotic events. Compared to those with
intimal calcification, patients with medial disease had a longer
survival. However, survival was less than that observed in those
without calcification
There is evidence for increased arterial calcification
in coronary, renal, and iliac arteries from patients on dialysis
17
compared with nondialysis patients. Braun and associates24
demonstrated that coronary artery calcification is increased with
advancing age in patients on dialysis and that the calcification scores
were two to five fold greater in dialysis patients than age-matched
individuals with normal kidney function and angiographically proven
coronary artery disease. More recent data in patients not yet on
dialysis also demonstrates an increased risk of coronary artery
calcification, especially in diabetic patients25. Nearly 50% to 60% of
patients starting hemodialysis have evidence of coronary artery
calcification26. The only risk factors for coronary artery calcification
that are uniform across studies are advancing age and duration of
dialysis. Several "modifiable and nonmodifiable" factors that are able
to promote vascular calcification are extremely frequent in patients
with CKD. Most of the present strategies to decrease vascular
calcifications are based in the control of the more prevalent
modifiable risk factors. Unfortunately, the extremely important
nonmodifiable risk factors, which are highly prevalent, such as older
age, time on dialysis, and diabetes, are not under one's control. 27
18
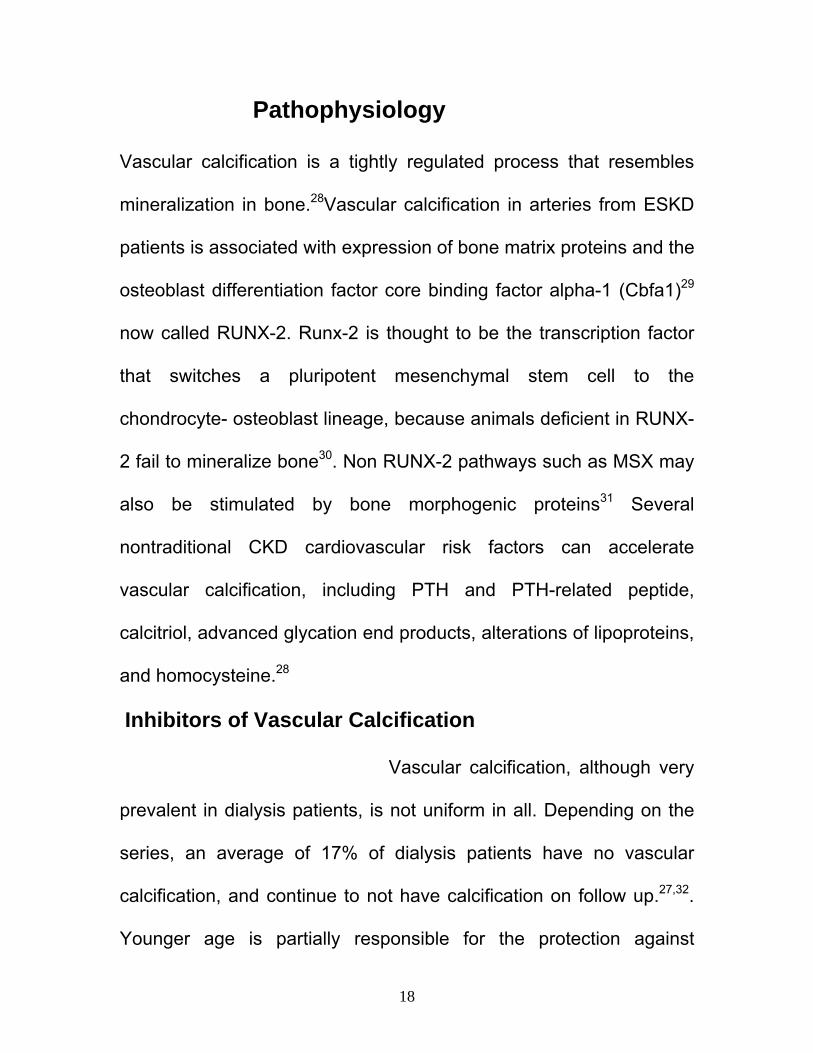
Pathophysiology
Vascular calcification is a tightly regulated process that resembles
mineralization in bone.28Vascular calcification in arteries from ESKD
patients is associated with expression of bone matrix proteins and the
osteoblast differentiation factor core binding factor alpha-1 (Cbfa1)29
now called RUNX-2. Runx-2 is thought to be the transcription factor
that switches a pluripotent mesenchymal stem cell to the
chondrocyte- osteoblast lineage, because animals deficient in RUNX-
2 fail to mineralize bone30. Non RUNX-2 pathways such as MSX may
also be stimulated by bone morphogenic proteins31 Several
nontraditional CKD cardiovascular risk factors can accelerate
vascular calcification, including PTH and PTH-related peptide,
calcitriol, advanced glycation end products, alterations of lipoproteins,
and homocysteine.28
Inhibitors of Vascular Calcification
Vascular calcification, although very
prevalent in dialysis patients, is not uniform in all. Depending on the
series, an average of 17% of dialysis patients have no vascular
calcification, and continue to not have calcification on follow up.27,32.
Younger age is partially responsible for the protection against
19
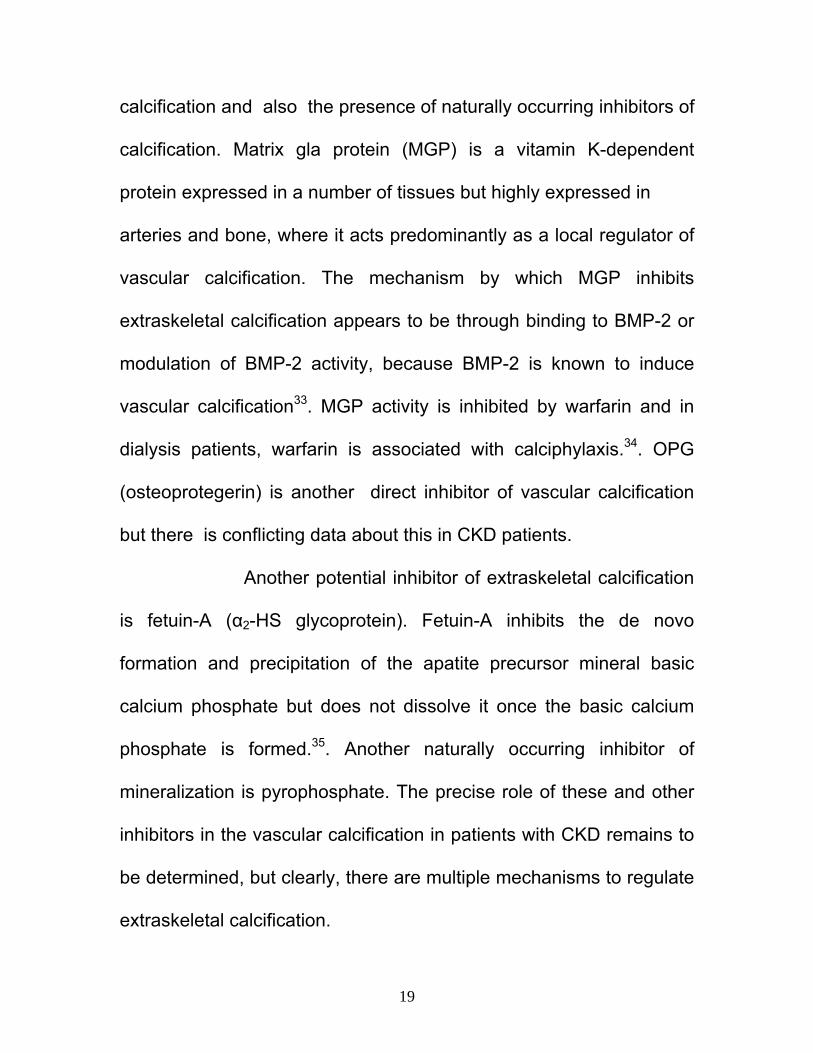
calcification and also the presence of naturally occurring inhibitors of
calcification. Matrix gla protein (MGP) is a vitamin K-dependent
protein expressed in a number of tissues but highly expressed in
arteries and bone, where it acts predominantly as a local regulator of
vascular calcification. The mechanism by which MGP inhibits
extraskeletal calcification appears to be through binding to BMP-2 or
modulation of BMP-2 activity, because BMP-2 is known to induce
vascular calcification33. MGP activity is inhibited by warfarin and in
dialysis patients, warfarin is associated with calciphylaxis.34. OPG
(osteoprotegerin) is another direct inhibitor of vascular calcification
but there is conflicting data about this in CKD patients.
Another potential inhibitor of extraskeletal calcification
is fetuin-A (α2-HS glycoprotein). Fetuin-A inhibits the de novo
formation and precipitation of the apatite precursor mineral basic
calcium phosphate but does not dissolve it once the basic calcium
phosphate is formed.35. Another naturally occurring inhibitor of
mineralization is pyrophosphate. The precise role of these and other
inhibitors in the vascular calcification in patients with CKD remains to
be determined, but clearly, there are multiple mechanisms to regulate
extraskeletal calcification.
20
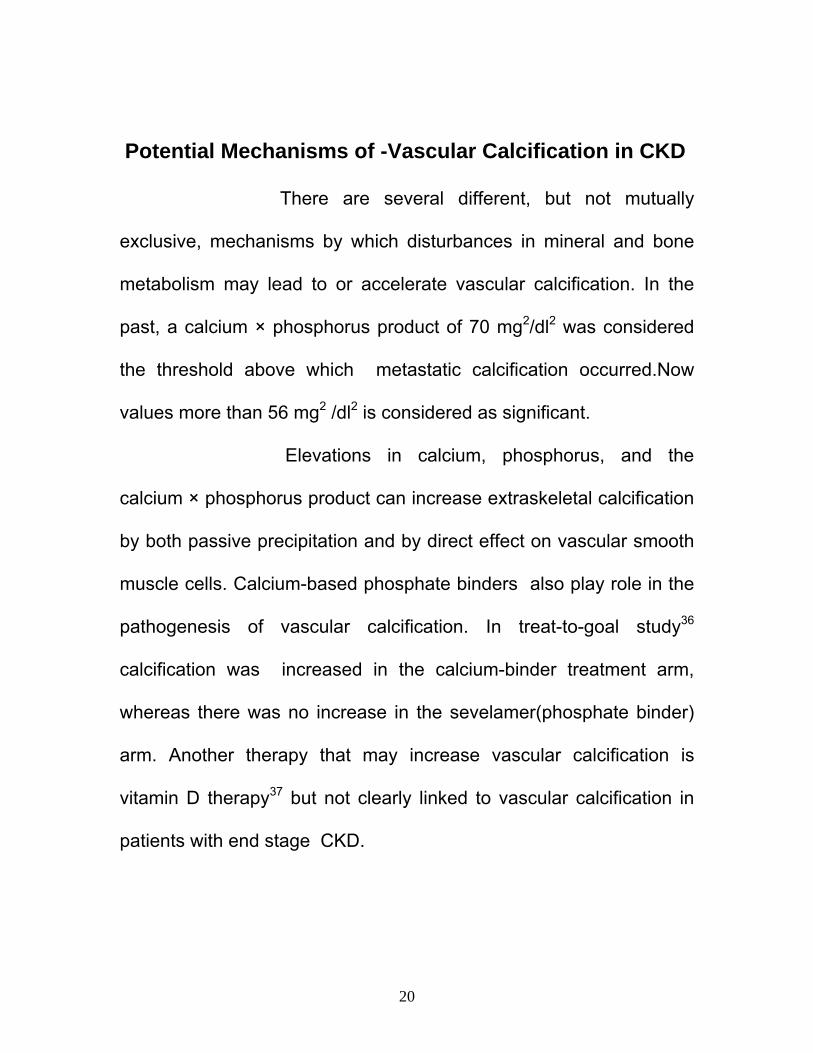
Potential Mechanisms of -Vascular Calcification in CKD
There are several different, but not mutually
exclusive, mechanisms by which disturbances in mineral and bone
metabolism may lead to or accelerate vascular calcification. In the
past, a calcium × phosphorus product of 70 mg2/dl2 was considered
the threshold above which metastatic calcification occurred.Now
values more than 56 mg2 /dl2 is considered as significant.
Elevations in calcium, phosphorus, and the
calcium × phosphorus product can increase extraskeletal calcification
by both passive precipitation and by direct effect on vascular smooth
muscle cells. Calcium-based phosphate binders also play role in the
pathogenesis of vascular calcification. In treat-to-goal study36
calcification was increased in the calcium-binder treatment arm,
whereas there was no increase in the sevelamer(phosphate binder)
arm. Another therapy that may increase vascular calcification is
vitamin D therapy37 but not clearly linked to vascular calcification in
patients with end stage CKD.
21
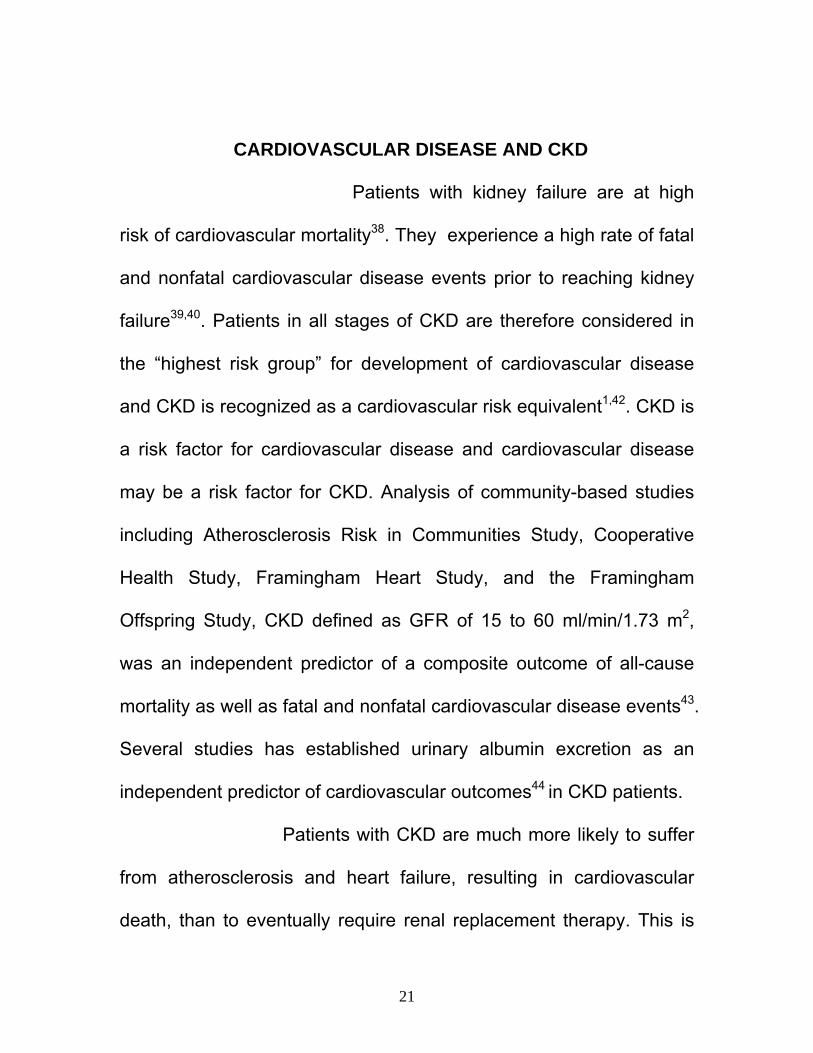
CARDIOVASCULAR DISEASE AND CKD
Patients with kidney failure are at high
risk of cardiovascular mortality38. They experience a high rate of fatal
and nonfatal cardiovascular disease events prior to reaching kidney
failure39,40. Patients in all stages of CKD are therefore considered in
the “highest risk group” for development of cardiovascular disease
and CKD is recognized as a cardiovascular risk equivalent1,42. CKD is
a risk factor for cardiovascular disease and cardiovascular disease
may be a risk factor for CKD. Analysis of community-based studies
including Atherosclerosis Risk in Communities Study, Cooperative
Health Study, Framingham Heart Study, and the Framingham
Offspring Study, CKD defined as GFR of 15 to 60 ml/min/1.73 m2,
was an independent predictor of a composite outcome of all-cause
mortality as well as fatal and nonfatal cardiovascular disease events43.
Several studies has established urinary albumin excretion as an
independent predictor of cardiovascular outcomes44 in CKD patients.
Patients with CKD are much more likely to suffer
from atherosclerosis and heart failure, resulting in cardiovascular
death, than to eventually require renal replacement therapy. This is
22
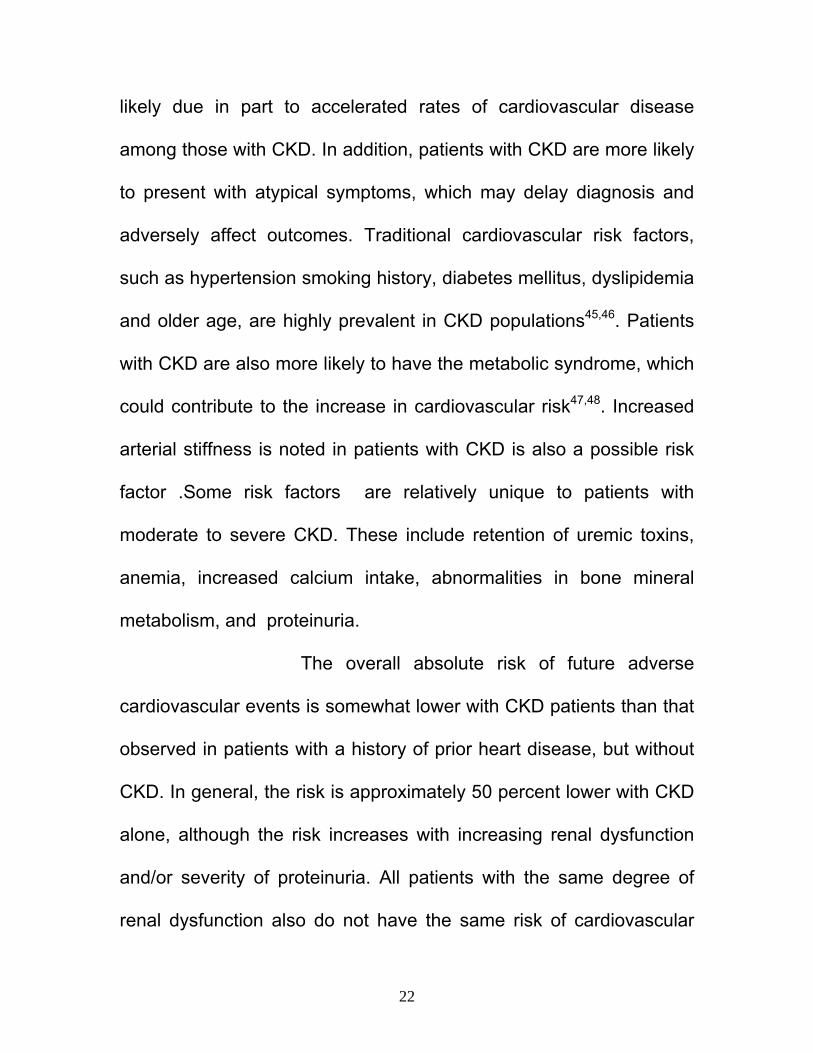
likely due in part to accelerated rates of cardiovascular disease
among those with CKD. In addition, patients with CKD are more likely
to present with atypical symptoms, which may delay diagnosis and
adversely affect outcomes. Traditional cardiovascular risk factors,
such as hypertension smoking history, diabetes mellitus, dyslipidemia
and older age, are highly prevalent in CKD populations45,46. Patients
with CKD are also more likely to have the metabolic syndrome, which
could contribute to the increase in cardiovascular risk47,48. Increased
arterial stiffness is noted in patients with CKD is also a possible risk
factor .Some risk factors are relatively unique to patients with
moderate to severe CKD. These include retention of uremic toxins,
anemia, increased calcium intake, abnormalities in bone mineral
metabolism, and proteinuria.
The overall absolute risk of future adverse
cardiovascular events is somewhat lower with CKD patients than that
observed in patients with a history of prior heart disease, but without
CKD. In general, the risk is approximately 50 percent lower with CKD
alone, although the risk increases with increasing renal dysfunction
and/or severity of proteinuria. All patients with the same degree of
renal dysfunction also do not have the same risk of cardiovascular

23
disease. Thus, in addition to the evaluation for the presence of CKD,
the proper assessment of overall cardiovascular risk requires an
adequate assessment for the presence and severity of the other
major risk factors for cardiovascular disease
Most common causes of death among patients with CKD49
ISCHEMIC HEART DISEASE
Ischemic heart disease most commonly
results from atherosclerosis of the coronary arteries. The processes
that contribute to accelerate atherosclerosis include a dyslipidemia
characterized by decreased function of lipoprotein lipase, reduced
HDL-C, elevated TG, and elevated LDL-C. Both uremia and dialysis
therapy markedly enhance oxidant stress through the production of
proinflammatory complement fragments, cytokines, and increased
Heart failure 31.2% Myocardial infarction 15.6%
Sepsis 11.3% Withdrawal from dialysis 5.2%
Strokes 6.4% Malignant neoplasm 3.8%
Other 26.5%
24
adhesion molecules in endothelial cells50. Endothelial dysfunction
begets cardiac and arterial remodeling with resultant cardiovascular
events. Potentially important in the inflammatory cascade and
ensuing cardiovascular mortality among kidney patients are C-
reactive protein (CRP) and asymmetric dimethyl-arginine.
HEART FAILURE
About 40% of people starting dialysis therapy
have a history of heart failure symptoms, which is a risk factor for
significant morbidity and mortality in this group51. For those without
heart failure symptoms at the commencement of dialysis, 25% will
develop it within 3½ years (7% per year)52. Age (risk increased by
30% for every 10 years), female sex, hypertension, diabetes,
conditions of atherosclerosis (CAD, cerebrovascular or peripheral
vascular disease), pericarditis, and structural cardiac abnormalities
(left ventricular hypertrophy, clinical cardiomegaly) were all
associated with heart failure. Multiple studies of patients with class II
and III HF, in whom a low cardiac output state is not present, have
shown decreased survival in a graded fashion related to renal
impairment.
25
VALVULAR HEART DISEASE
Impaired renal function has been linked to
valvular calcification and aortic sclerosis. Advanced thickening of the
cardiac valves and calcification have been observed in patients with
ESRD53. Bacterial endocarditis may develop in patients with ESRD
who have temporary dialysis access catheters. Most valvular lesions
observed in patients with CKD are acquired and develop from
dystrophic calcifications of the valvular annulus and leaflets,
particularly the aortic and mitral valves. Such calcification is now
known to be present far more frequently than previously recognized
with a prevalence of up to 55% and 39% for the aortic and mitral
valves respectively54,55. Once considered benign, aortic valve
sclerosis is now also associated with an increased cardiovascular
mortality in the general community.
MITRAL ANNULAR CALCIFICATION
Mitral annular calcification is commonly seen
in association with aging and in patients with renal failure. Incidence
is more common in females. The calcium begins to form in or below
the mitral annulus at the junction between the ventricular myocardium
26
and the posterior mitral leaflet. More severe degrees of calcification
will form a pattern resembling the letter J, the letter O, or a reversed
letter C . In most instances, mitral annulus calcification has little
clinical significance and is a noninflammatory chronic degenerative
process. In extreme cases, the mass of calcification can grow
posteriorly into the ventricular myocardium to produce heart block. It
can also grow anteriorly into the leaflets of the mitral valve to cause
mitral regurgitation and stenosis. Rarely, the calcification can erode
through the endocardium and cause small systemic emboli. Mitral
annulus calcification in the elderly is associated with a doubled risk of
stroke, independent of the traditional risk factors.
Two large observational series showed that MAC
was present in 8 percent of subjects with a mean age of 5756 and 48
percent of subjects with a mean age of 81 57. MAC is associated with
atherosclerosis, thromboembolic events (including stroke) and, in
some series, atrioventricular conduction defects 58,59. Patients with
MAC may also have calcification of the aortic annulus, aortic valve,
aortic root, sinotubular junction, papillary muscle tips, and systemic
calcified atherosclerosis. In an electron beam CT study, MAC was
significantly associated with calcific atherosclerosis in the ascending
27
and thoracic aorta and the carotid arteries, but not the coronary or
iliac arteries 58. Mitral annular calcification is infrequently associated
with hemodynamically important mitral insufficiency, mitral stenosis,
or endocarditis 60,61.
MAC, like calcific aortic valve disease, is
associated with standard cardiovascular risk factors. However, Kizer
et al62 recently showed that the presence of MAC but not of aortic
valve sclerosis was a strong risk factor for incident stroke in a cohort
of American Indians without clinical cardiovascular disease after
extensive adjustment for other predictors.
A lesser known variant of MAC, is caseous
calcification of the mitral annulus. It is described as “a round mass
with a central echolucent area composed of a puttylike admixture of
fatty acids, cholesterol, and calcium”63 . This variant of MAC carries a
benign prognosis; however, it is important that it not be mistaken for a
cardiac tumor 64,65.
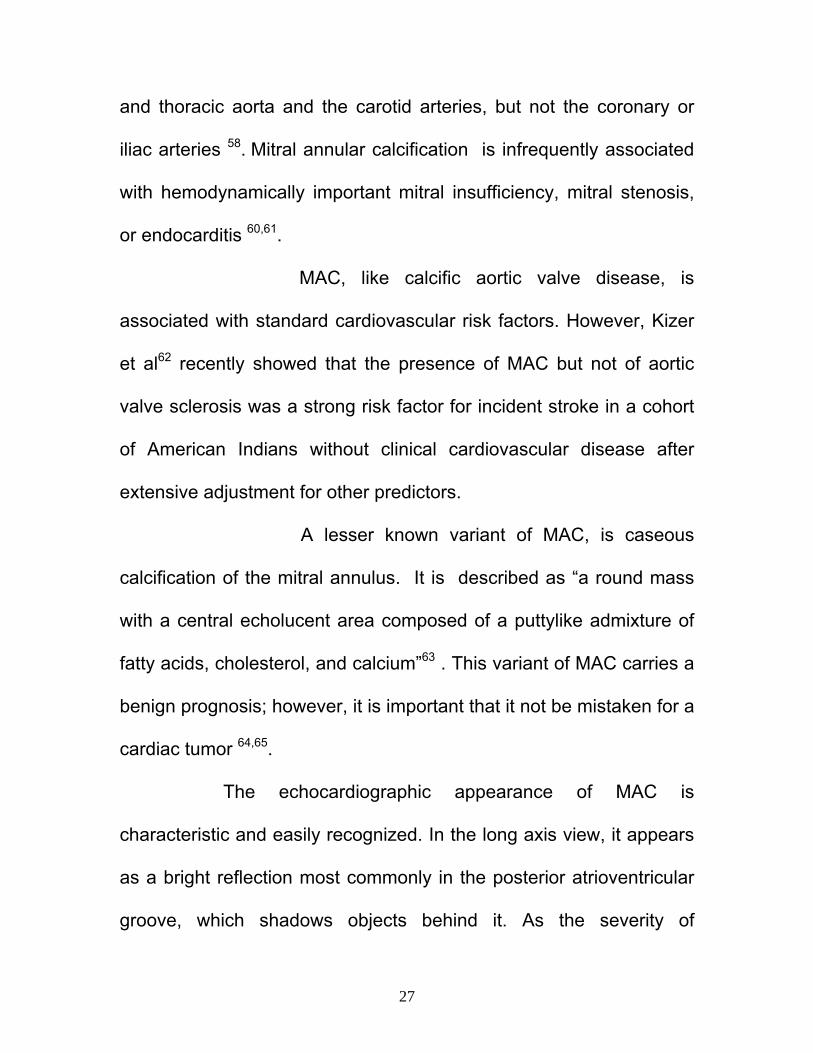
The echocardiographic appearance of MAC is
characteristic and easily recognized. In the long axis view, it appears
as a bright reflection most commonly in the posterior atrioventricular
groove, which shadows objects behind it. As the severity of

28
calcification increases, the mass appears to grow into the
myocardium of the left ventricular base and its inflow tract. Unless
care is exercised, the process may be mistaken for posterior leaflet
calcification because the mass and its ultrasonic side lobe artifacts
obscure that relatively short structure. In the short axis view, careful
angulation will reveal its typical C-shaped morphology and its location
between the papillary muscles, from four to eight o'clock.
Mitral annular calcification in CKD
Mitral annular calcification (MAC) occurs in 10
to 50 percent of patients with end-stage renal disease 66,67.It is
associated with an elevated calcium-phosphorus product, vascular
calcification, hypercalcemia, and hyperphosphatemia. MAC occurs
earlier in patients with chronic renal failure than those without renal
dysfunction. In one study, MAC was more common in younger (less
than 60 years of age) than older dialysis patients 67. Since older
dialysis patients are commonly dialyzed for fewer years because of a
marked increase in mortality, MAC appears to occur more frequently
in those dialyzed for a longer period of time.
29
AIMS AND OBJECTIVE
1 To study the prevalence of mitral annular calcification in chronic
kidney disease patients compared to people with normal kidney
function
2. To find out various parameters that shows significant association
with mitral annular calcification in chronic kidney disease patients
30
MATERIALS AND METHODS
Setting : Department of Medicine ,
Govt Rajaji hospital Madurai
Design : case control study Period of study : six months study Ethical approval : Obtained from ethical committee approval
headed by Dean, Govt. Rajaji hospital
Consent : Informed consent obtained from
all patients
Study population : Patients attending outpatient
department or wards with
chronic kidney disease
Control group :Persons comparable in age and sex
with study group without kidney disease
Collaborating : Department of Cardiology
Departments Department of Nephrology
Financial support : Nil
Conflict of interest : Nil
31
SELECTION AND DETAILS OF STUDY SUBJECTS
In the study group ,102 chronic kidney disease
patients who attended the outpatient department or wards of
Government Rajaji Hospital Madurai, fulfilling the inclusion criteria
were selected randomly. Informed consent was obtained from all.
Inclusion criteria
eGFR< 60 ml/min/1.73m2.
Documented elevated renal parameters for > 3 months.
… Ultrasonography suggestive of chronic kidney disease.
Exclusion criteria
eGFR > 60 ml /min/1.73m2.
Patients who underwent renal transplant.
Patients with valvular heart disease of other causes.
Duration of disease less than 3 months.
Patients with obstructive uropathy.
Patients not given consent.
32
The control group of 100 persons comparable to
study group in age and sex distribution and not having kidney
disease ,were selected and evaluated.
Data collection
Profoma containing details regarding age, sex, history of
diabetes mellitus, hypertension, coronary artery
disease ,cerebrovascular disease ,vital data and blood investigation
and imaging studies were filled up for all participants.
Participants who were receiving oral
hypoglycemic drugs or insulin and those who had fasting glucose
level >126mg/dl or postprandial glucose level > 200mg/dl were
defined as diabetic.
Hypertension was defined as participants having
systolic blood pressure > 140 mm of Hg or
diastolic bloodpressure > 90 mm of Hg or
those receiving medication for hypertension
An average of at least two readings of blood pressure were
taken in all participants.
33
Kidney function assessment
kidney function assessment was estimated by GFR using
Cockcroft-Gault equation
e GFR =(140-Age) × body weight in Kg ÷ (72 × Cr in mg/dl).
, Multiply by 0.85 for women.
Cr means serum creatinine.
In this study definition of CKD was based on the
National Kidney Foundation Kidney Disease Outcomes Quality
Initiative working group definition of CKD as a GFR < 60 ml/min per
1.73 m2 .
Echocardiographic Evaluation
All the participants in study were subjected to
echocardiographic evaluation (using Philips IE 33). Mitral annular
calcification was considered present when an echo-dense band was
visualized in the region of the mitral annulus that was >0.3 cm thick
on the M-mode or when the two -dimensional study demonstrated
calcification of more than one third of the circumference of the

34
annulus in the parasternal short-axis view .For all determinations of
valvular calcification, interpreters confirmed visualization in more than
one view.
ULTRASONOGRAPHY
Ultrasonographic evaluation of all participants in the study
were done to assess the presence of chronic kidney disease based
on following parameters (1) increase in cortical eccogenicity (2) loss
of corticomedullary differentiation ( 3) and contracted kidney .
BIOCHEMICAL EVALUATION
All the participants were evaluated for
haemoglobin ,blood urea, serum creatinine , calcium, phosphorus,
and potassium based on standard tests available in our hospital.
Presence of albuminuria was also done in all participants.
35
RESULTS AND OBSERVATIONS
CHARACTERISTICS OF CASES AND CONTROL GROUPS
SEX DISTRIBUTION
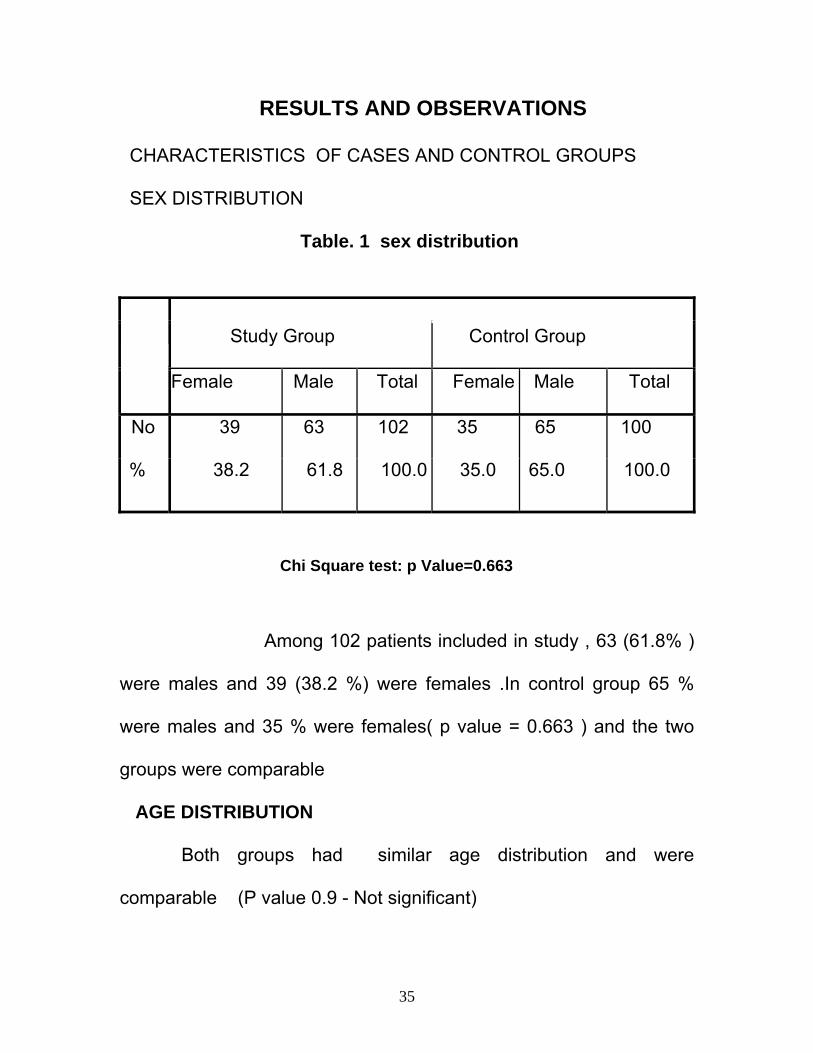
Table. 1 sex distribution
Chi Square test: p Value=0.663
Among 102 patients included in study , 63 (61.8% )
were males and 39 (38.2 %) were females .In control group 65 %
were males and 35 % were females( p value = 0.663 ) and the two
groups were comparable
AGE DISTRIBUTION
Both groups had similar age distribution and were
comparable (P value 0.9 - Not significant)
Study Group
Control Group
Female
Male Total Female Male
Total
No 39 63 102 35 65 100
% 38.2 61.8 100.0 35.0 65.0 100.0
36
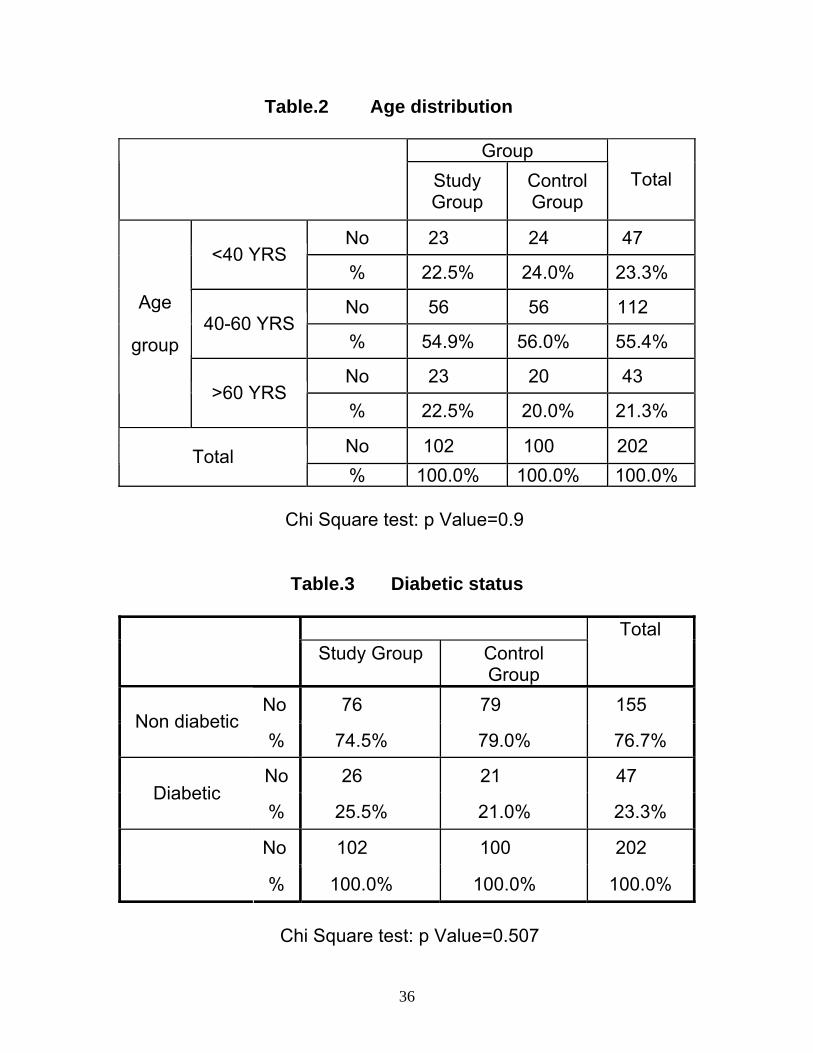
Table.2 Age distribution
Group Study
Group Control Group
Total
No 23 24 47 <40 YRS
% 22.5% 24.0% 23.3%
No 56 56 112 40-60 YRS
% 54.9% 56.0% 55.4%
No 23 20 43
Age
group
>60 YRS % 22.5% 20.0% 21.3%
No 102 100 202 Total % 100.0% 100.0% 100.0%
Chi Square test: p Value=0.9
Table.3 Diabetic status
Study Group
Control Group
Total
No 76 79 155 Non diabetic
% 74.5% 79.0% 76.7%
No 26 21 47 Diabetic
% 25.5% 21.0% 23.3%
No 102 100 202
% 100.0% 100.0% 100.0% Chi Square test: p Value=0.507
37
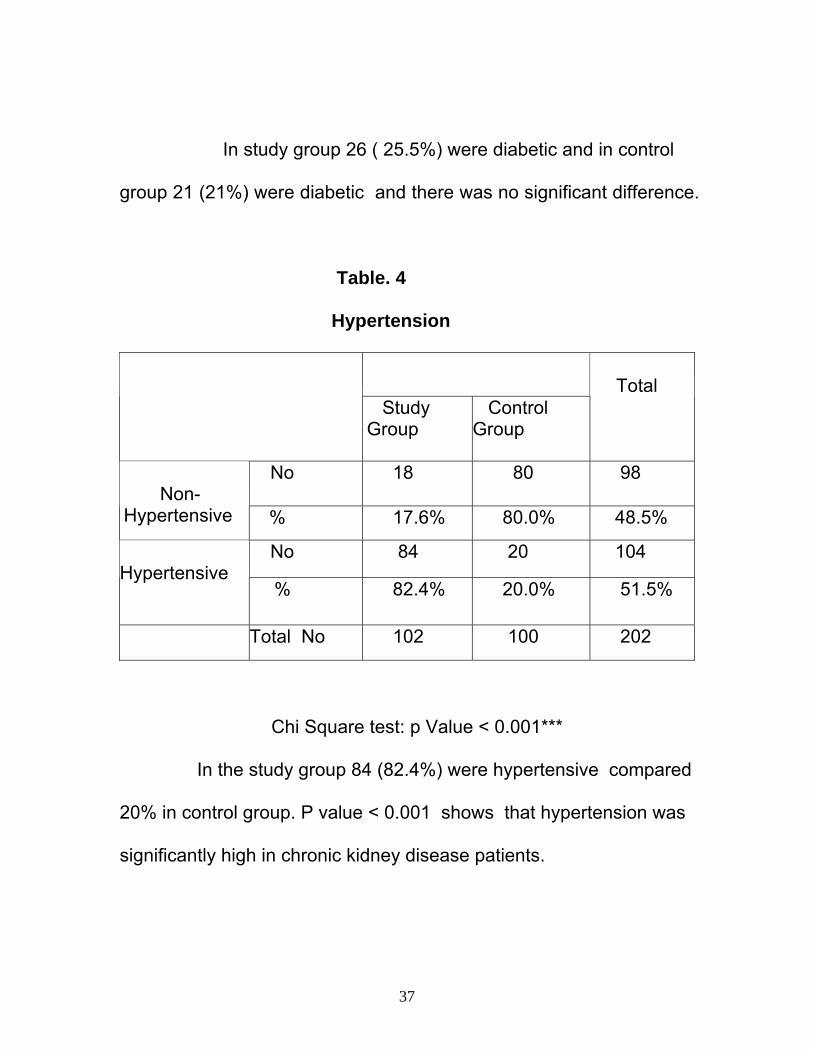
In study group 26 ( 25.5%) were diabetic and in control
group 21 (21%) were diabetic and there was no significant difference.
Table. 4
Hypertension
Study Group
Control Group
Total
No 18 80 98 Non-Hypertensive % 17.6% 80.0% 48.5%
No 84 20 104 Hypertensive
% 82.4% 20.0% 51.5%
Total No 102 100 202
Chi Square test: p Value < 0.001***
In the study group 84 (82.4%) were hypertensive compared
20% in control group. P value < 0.001 shows that hypertension was
significantly high in chronic kidney disease patients.
38
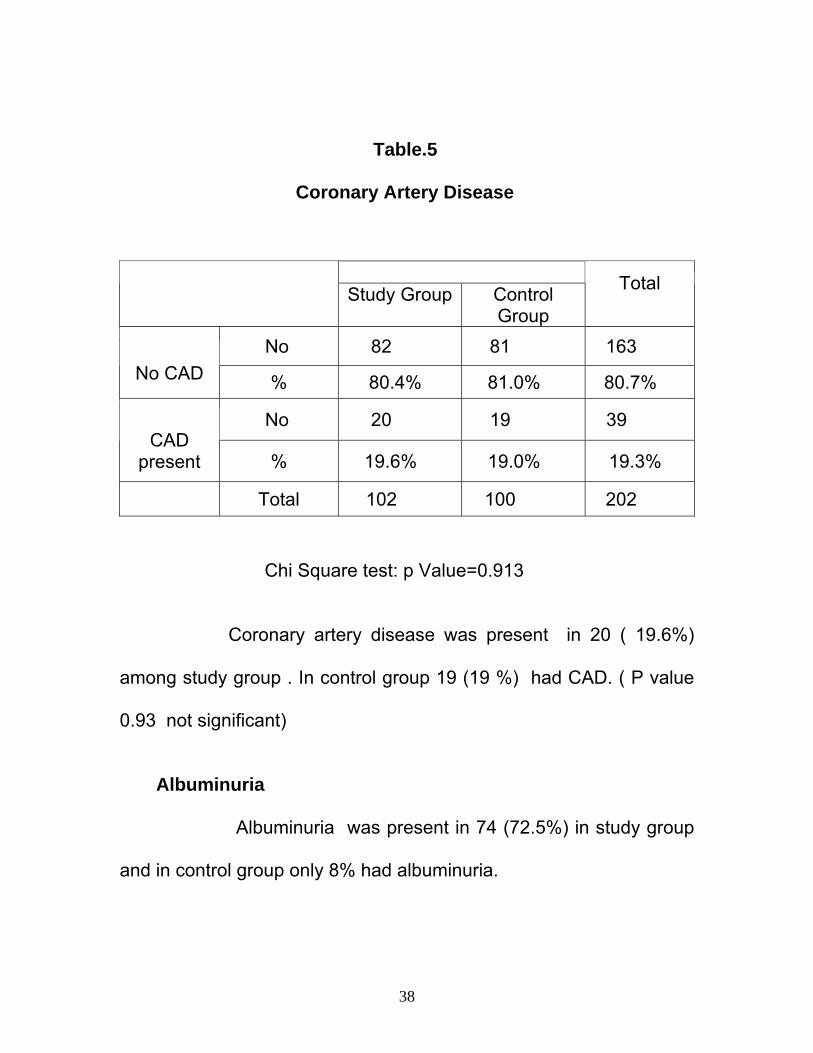
Table.5
Coronary Artery Disease
Chi Square test: p Value=0.913
Coronary artery disease was present in 20 ( 19.6%)
among study group . In control group 19 (19 %) had CAD. ( P value
0.93 not significant)
Albuminuria Albuminuria was present in 74 (72.5%) in study group
and in control group only 8% had albuminuria.
Study Group
Control Group
Total
No 82 81 163 No CAD % 80.4% 81.0% 80.7%
No 20 19 39 CAD
present % 19.6% 19.0% 19.3%
Total 102 100 202
39
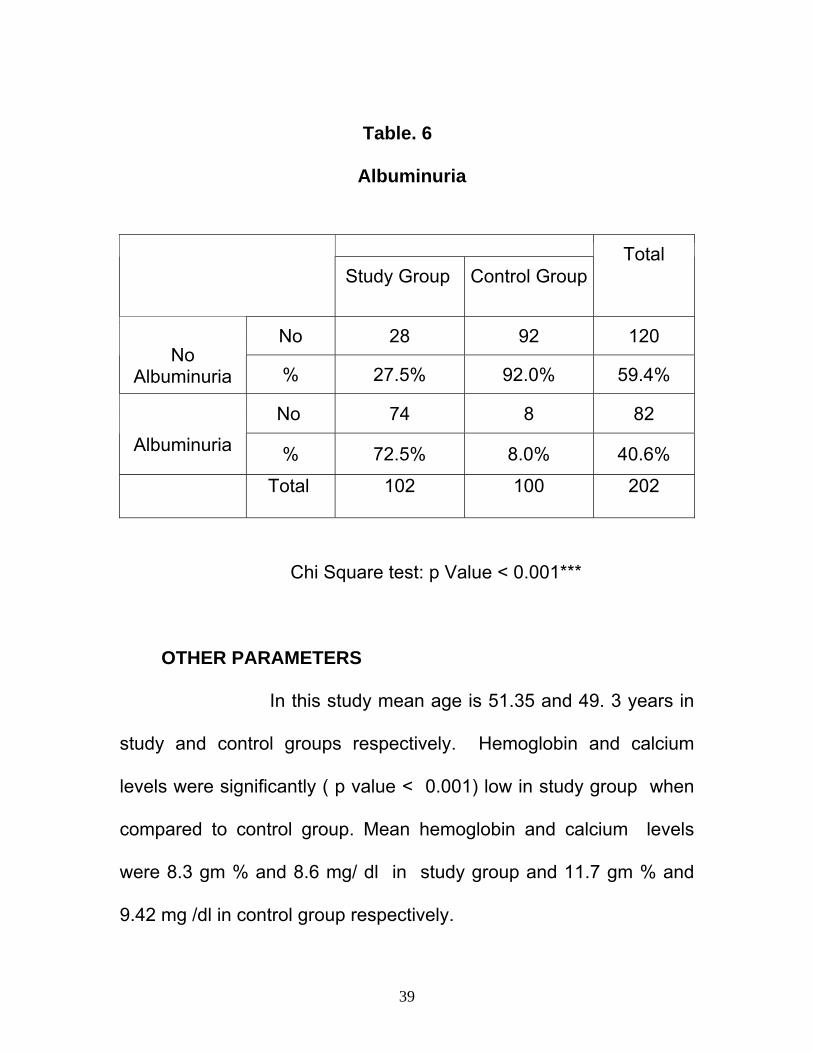
Table. 6
Albuminuria
Study Group
Control Group
Total
No 28 92 120 No
Albuminuria % 27.5% 92.0% 59.4%
No 74 8 82 Albuminuria % 72.5% 8.0% 40.6%
Total 102 100 202
Chi Square test: p Value < 0.001***
OTHER PARAMETERS
In this study mean age is 51.35 and 49. 3 years in
study and control groups respectively. Hemoglobin and calcium
levels were significantly ( p value < 0.001) low in study group when
compared to control group. Mean hemoglobin and calcium levels
were 8.3 gm % and 8.6 mg/ dl in study group and 11.7 gm % and
9.42 mg /dl in control group respectively.
40
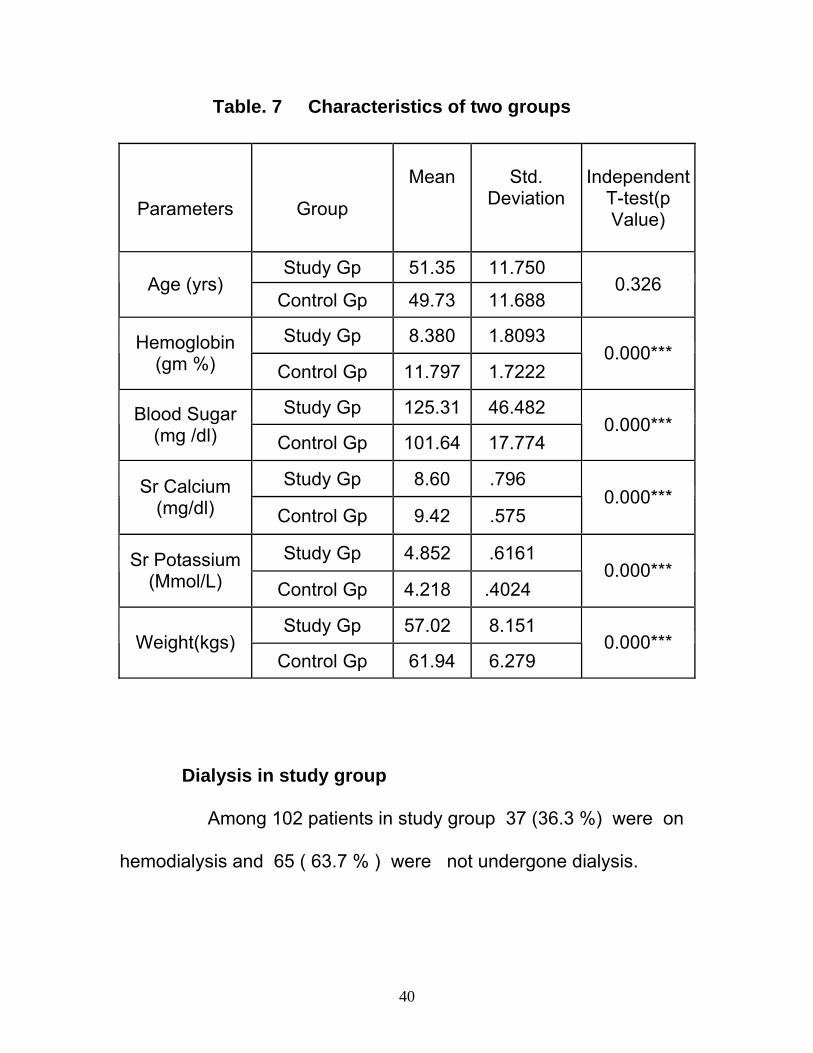
Table. 7 Characteristics of two groups
Dialysis in study group
Among 102 patients in study group 37 (36.3 %) were on
hemodialysis and 65 ( 63.7 % ) were not undergone dialysis.
Parameters
Group
Mean
Std.
Deviation
Independent T-test(p Value)
Study Gp 51.35 11.750 Age (yrs)
Control Gp 49.73 11.688 0.326
Study Gp 8.380 1.8093 Hemoglobin (gm %) Control Gp 11.797 1.7222
0.000***
Study Gp 125.31 46.482 Blood Sugar (mg /dl) Control Gp 101.64 17.774
0.000***
Study Gp 8.60 .796 Sr Calcium (mg/dl) Control Gp 9.42 .575
0.000***
Study Gp 4.852 .6161 Sr Potassium (Mmol/L) Control Gp 4.218 .4024
0.000***
Study Gp 57.02 8.151 Weight(kgs)
Control Gp 61.94 6.279 0.000***
41
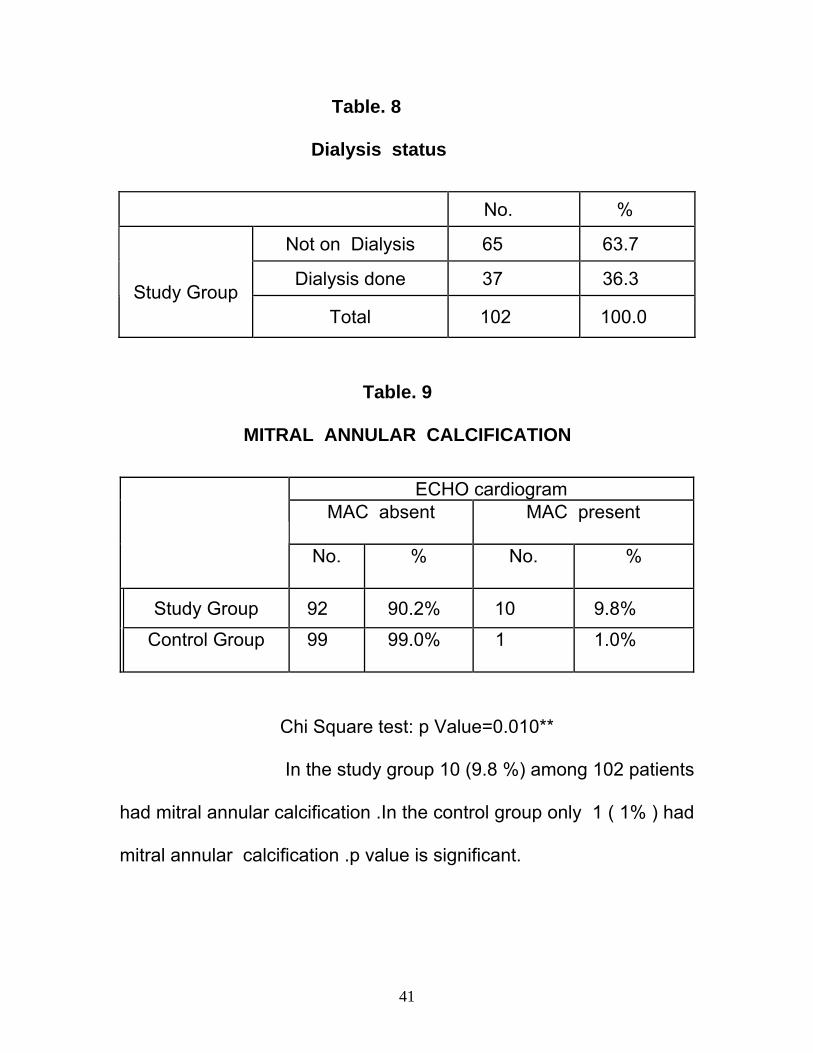
Table. 8
Dialysis status
Table. 9
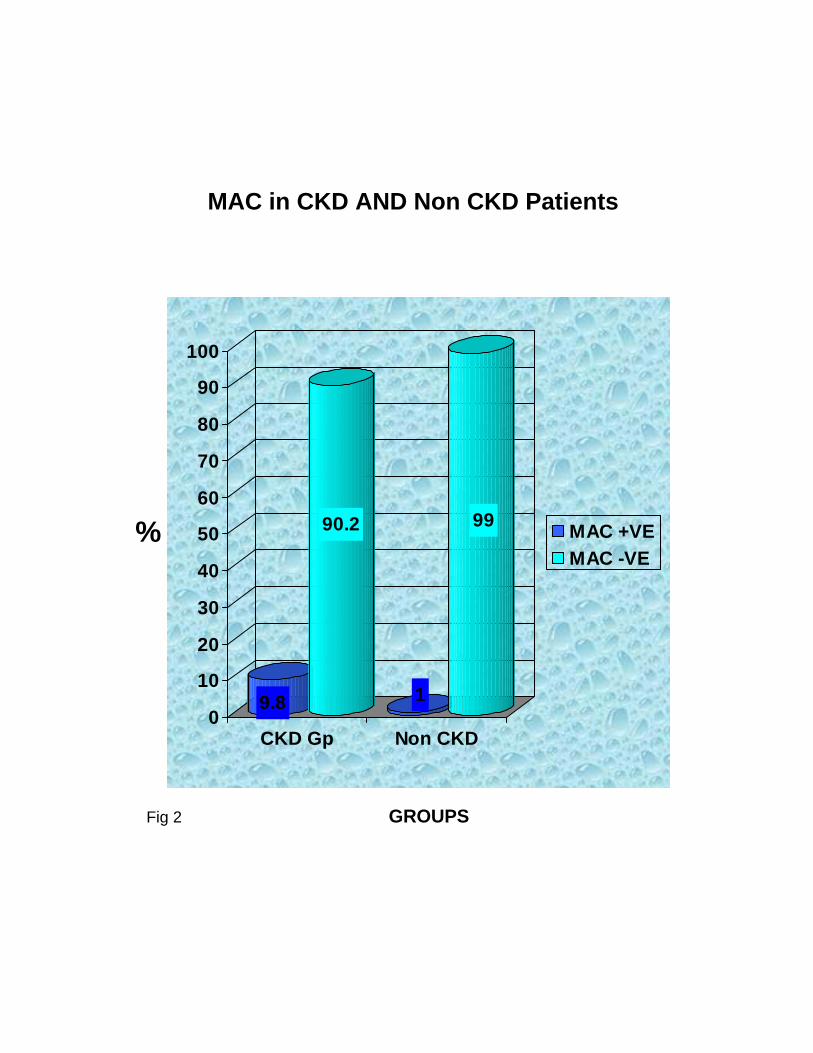
MITRAL ANNULAR CALCIFICATION
Chi Square test: p Value=0.010**
In the study group 10 (9.8 %) among 102 patients
had mitral annular calcification .In the control group only 1 ( 1% ) had
mitral annular calcification .p value is significant.
No. %
Not on Dialysis 65 63.7
Dialysis done 37 36.3 Study Group
Total 102 100.0
ECHO cardiogram MAC absent
MAC present
No.
%
No.
%
Study Group 92 90.2% 10 9.8%
Control Group 99 99.0% 1 1.0%
42
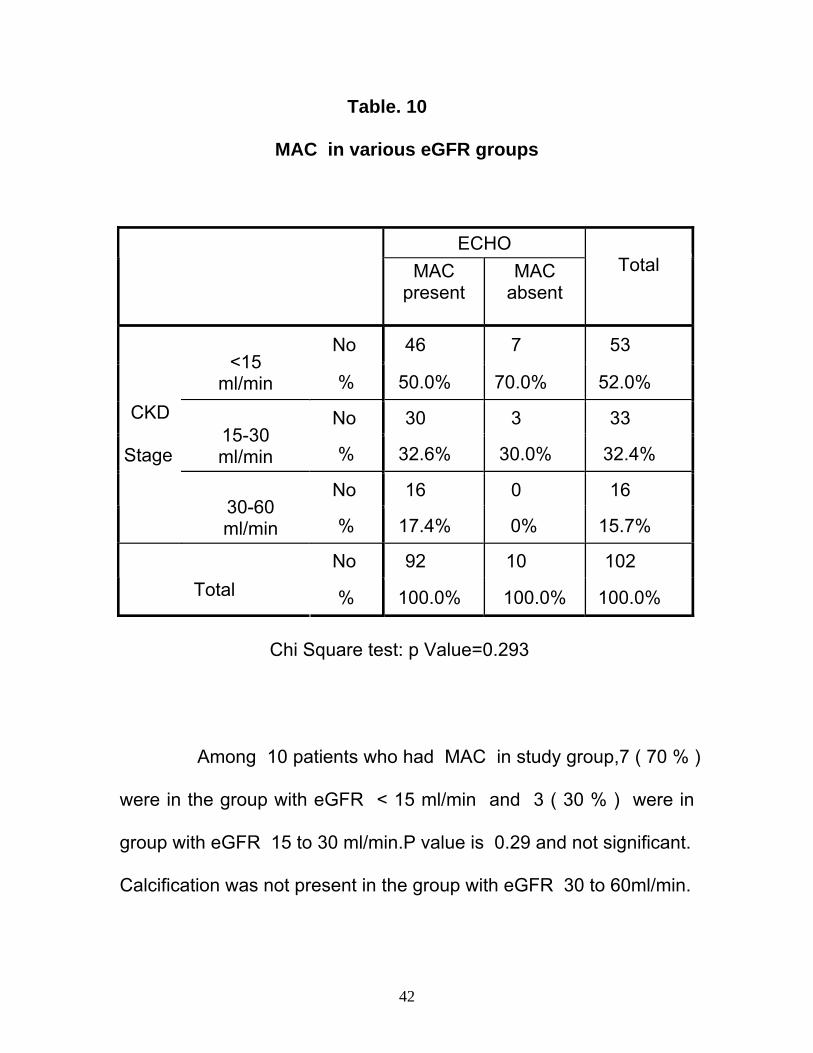
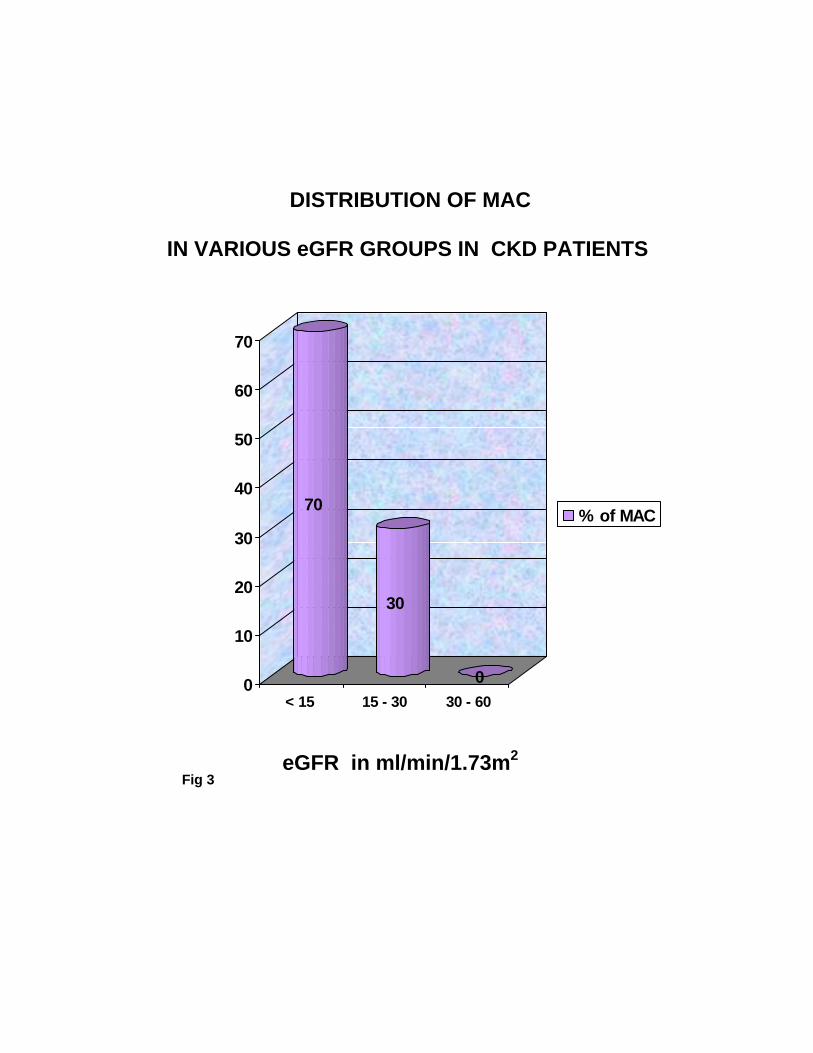
Table. 10
MAC in various eGFR groups
Chi Square test: p Value=0.293
Among 10 patients who had MAC in study group,7 ( 70 % )
were in the group with eGFR < 15 ml/min and 3 ( 30 % ) were in
group with eGFR 15 to 30 ml/min.P value is 0.29 and not significant.
Calcification was not present in the group with eGFR 30 to 60ml/min.
ECHO
MAC present
MAC absent
Total
No 46 7 53 <15
ml/min % 50.0% 70.0% 52.0%
No 30 3 33 15-30 ml/min % 32.6% 30.0% 32.4%
No 16 0 16
CKD
Stage
30-60 ml/min % 17.4% 0% 15.7%
No 92 10 102 Total % 100.0% 100.0% 100.0%
43
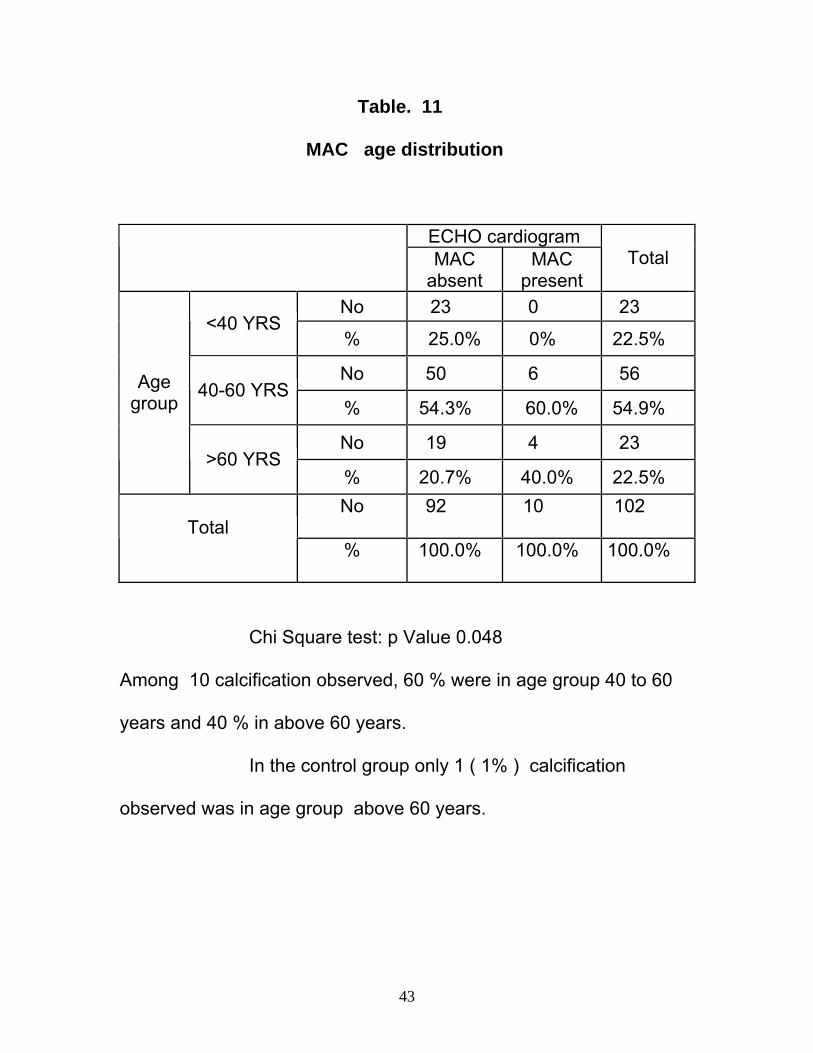
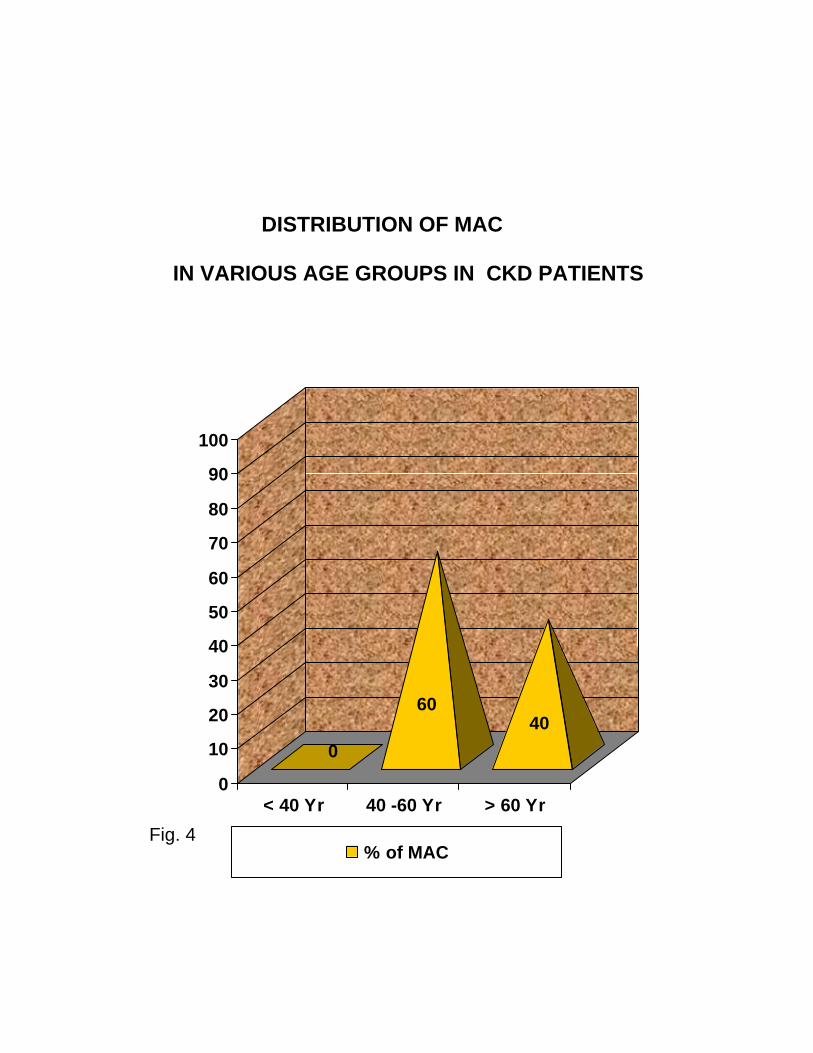
Table. 11
MAC age distribution
ECHO cardiogram MAC
absent MAC
present Total
No 23 0 23 <40 YRS
% 25.0% 0% 22.5%
No 50 6 56 40-60 YRS
% 54.3% 60.0% 54.9%
No 19 4 23
Age group
>60 YRS % 20.7% 40.0% 22.5% No 92 10 102
Total % 100.0% 100.0% 100.0%
Chi Square test: p Value 0.048
Among 10 calcification observed, 60 % were in age group 40 to 60
years and 40 % in above 60 years.
In the control group only 1 ( 1% ) calcification
observed was in age group above 60 years.
44
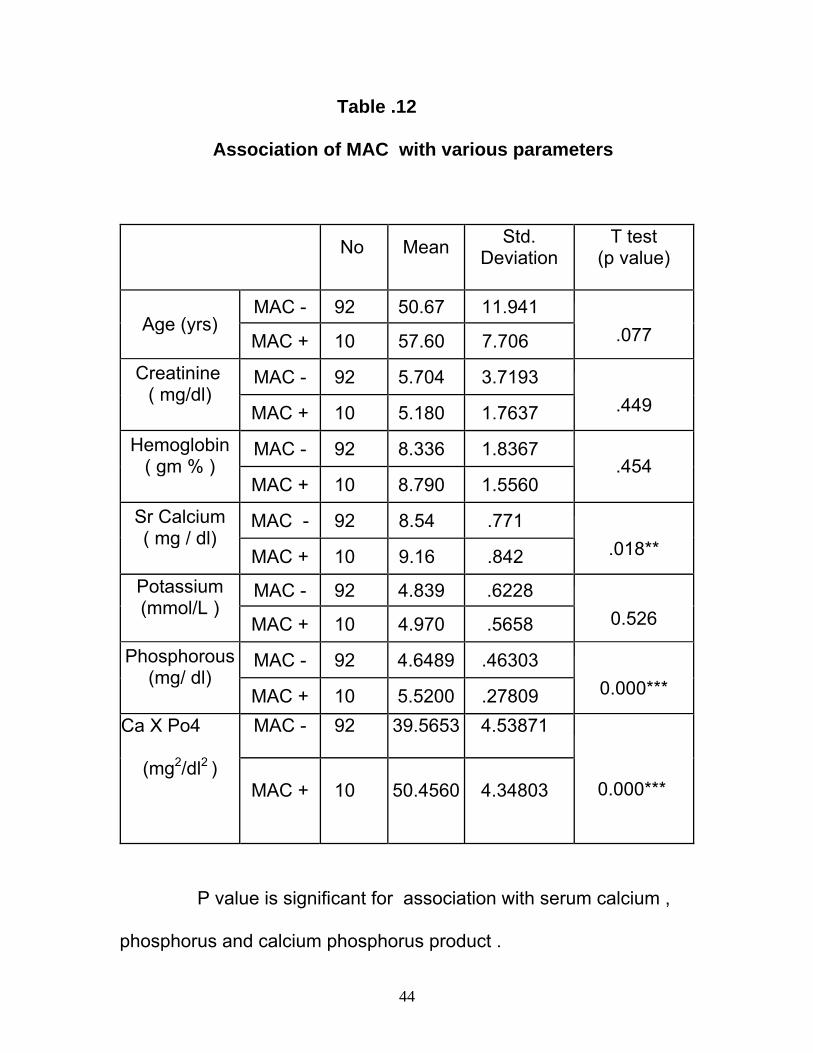
Table .12
Association of MAC with various parameters
No
Mean
Std. Deviation
T test (p value)
MAC - 92 50.67 11.941
Age (yrs) MAC + 10 57.60 7.706
.077
MAC - 92 5.704 3.7193 Creatinine ( mg/dl)
MAC + 10 5.180 1.7637
.449
MAC - 92 8.336 1.8367 Hemoglobin ( gm % )
MAC + 10 8.790 1.5560
.454
MAC - 92 8.54 .771 Sr Calcium ( mg / dl)
MAC + 10 9.16 .842
.018**
MAC - 92 4.839 .6228 Potassium (mmol/L )
MAC + 10 4.970 .5658
0.526
MAC - 92 4.6489 .46303 Phosphorous (mg/ dl)
MAC + 10 5.5200 .27809
0.000***
MAC - 92 39.5653 4.53871 Ca X Po4
(mg2/dl2 )
MAC + 10 50.4560 4.34803
0.000***
P value is significant for association with serum calcium ,
phosphorus and calcium phosphorus product .
45
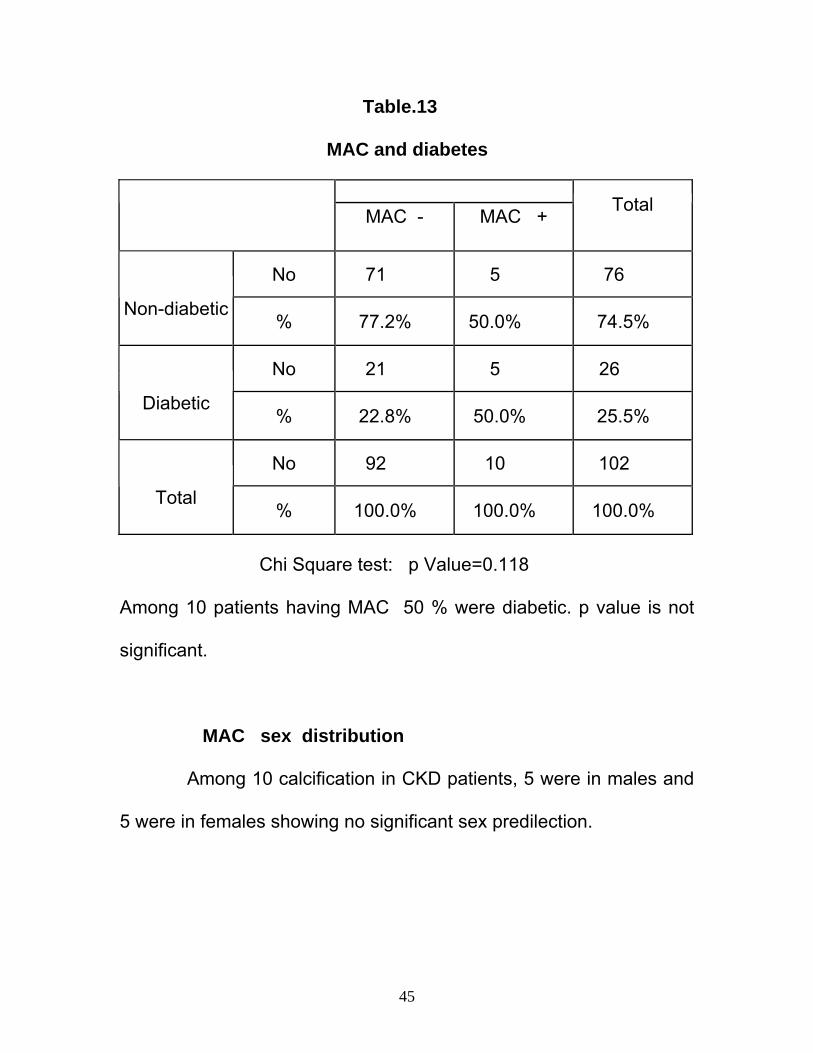
Table.13 MAC and diabetes
Chi Square test: p Value=0.118
Among 10 patients having MAC 50 % were diabetic. p value is not
significant.
MAC sex distribution
Among 10 calcification in CKD patients, 5 were in males and
5 were in females showing no significant sex predilection.
MAC -
MAC +
Total
No 71 5 76
Non-diabetic % 77.2% 50.0% 74.5%
No 21 5 26
Diabetic % 22.8% 50.0% 25.5%
No 92 10 102
Total % 100.0% 100.0% 100.0%
46
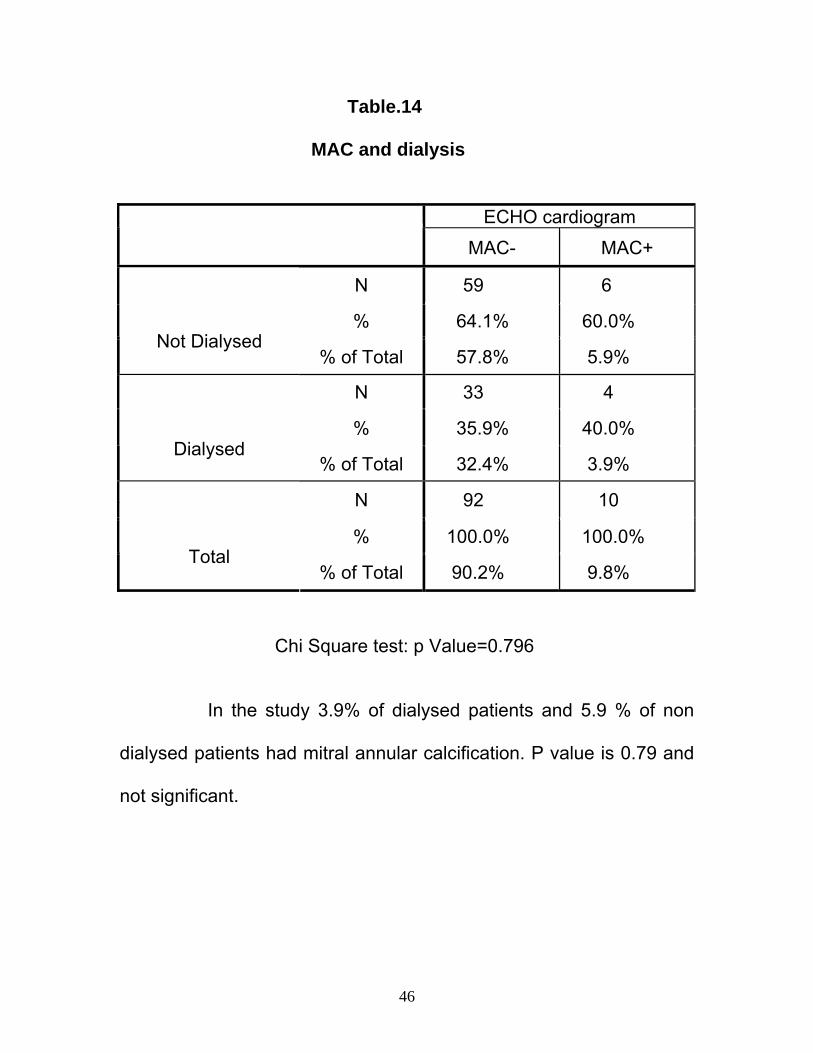
Table.14
MAC and dialysis
Chi Square test: p Value=0.796
In the study 3.9% of dialysed patients and 5.9 % of non
dialysed patients had mitral annular calcification. P value is 0.79 and
not significant.
ECHO cardiogram
MAC- MAC+
N 59 6
% 64.1% 60.0%
Not Dialysed % of Total 57.8% 5.9%
N 33 4
% 35.9% 40.0%
Dialysed % of Total 32.4% 3.9%
N 92 10
% 100.0% 100.0%
Total % of Total 90.2% 9.8%
47
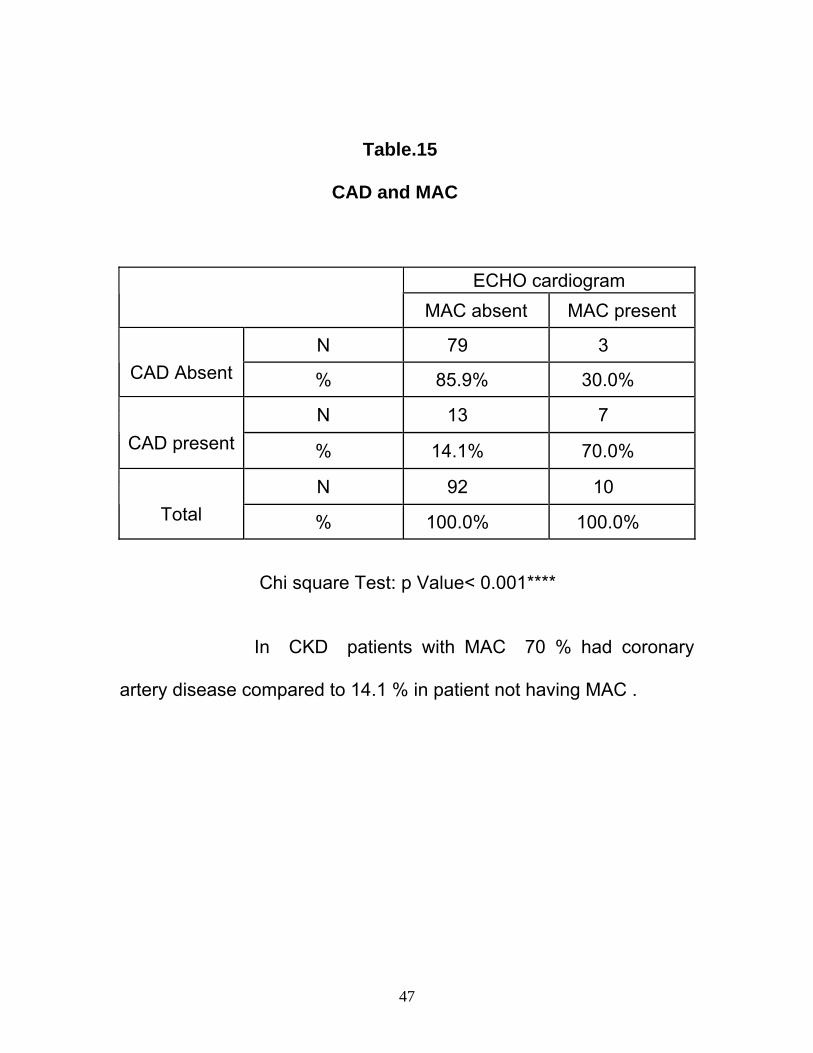
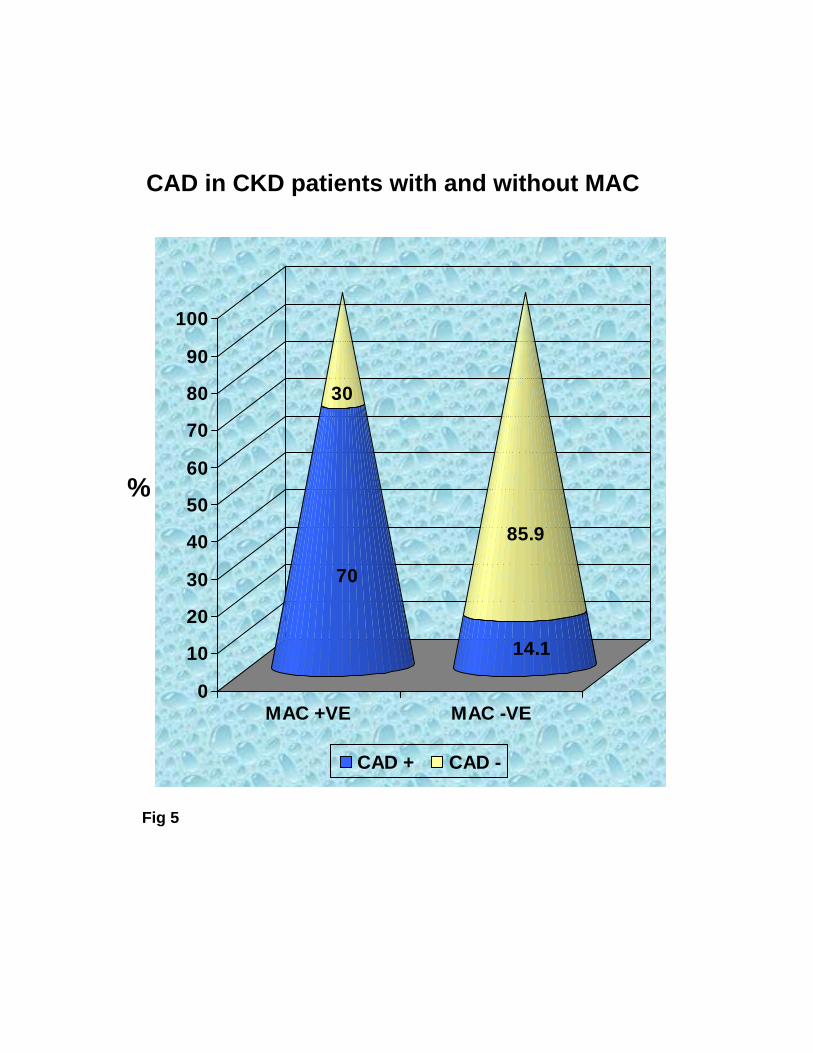
Table.15
CAD and MAC
ECHO cardiogram
MAC absent MAC present
N 79 3 CAD Absent % 85.9% 30.0%
N 13 7 CAD present % 14.1% 70.0%
N 92 10 Total % 100.0% 100.0%
Chi square Test: p Value< 0.001****
In CKD patients with MAC 70 % had coronary
artery disease compared to 14.1 % in patient not having MAC .
48
DISCUSSION
In India the approximate prevalence of CKD is
800 per million population (pmp) and the incidence of end-stage renal
disease (ESRD) is 150-200 pmp68.MAC occurs earlier in patients with
chronic kidney disease than those without renal dysfunction and is
associated with atherosclerosis and thromboembolic events
(including stroke).
In this study , the main aim was to find out the
prevalence of mitral annular calcification in patients with chronic
kidney disease as compared to those with out chronic kidney
disease. Beyond that association of mitral annular calcification with
various parameters like age , sex , diabetic status ,serum calcium ,
serum phosphorus , calcium x phosphorus product , estimated GFR
and dialysis were also observed .
Among 102 patients who were allotted to study group
63 (61.8 %) were males and 39 (38. 2 %) were females. In the control
group 65 % were males and 35 % were females.
In the study group 26 % were diabetic while 21 % in
control group. Prevalence of hypertension and coronary artery
disease were 82.4 % and 19.6 % in study group and 20 % and

49
19 % in control group respectively. Albuminuria was present in 72.5
% of patients with CKD.
The two groups were comparable in age and sex
distribution .CKD group had significant anemia ( mean Hb 8.3 gm%)
compared to control group( mean Hb 11.7 gm %) P value < 0. 001.
Calcium level was also significantly low in CKD group ( mean 8.6
mg/dl) than control group (mean 9.42). Potassium level was high in
CKD patients (4.85 mmol/L) compared to non CKD group(4.2 mmol/L)
p value< 0.001. Anemia , hypocalcemia and hyperkalemia are well
documented features of chronic kidney disease .
Mitral annular calcification was present in 9.8 % of
patients with chronic kidney disease while only 1% had calcification
in non CKD group; which shows that there is significantly high
prevalence of MAC in CKD patients ( p valve 0.010) . In Framingham
heart study69 on “Association of kidney function with valvular and
annular calcification”, prevalence of mitral annular calcification were
12 % and 3 % in CKD and non CKD groups respectively. In
“Atherosclerotic Risk in Communities study”, the overall prevalence of
MAC was 4.6% for women and 5.6% for men.70 In participants aged
50
70 years and older, the prevalence of MAC was 10% in women and
15.2% in men.70
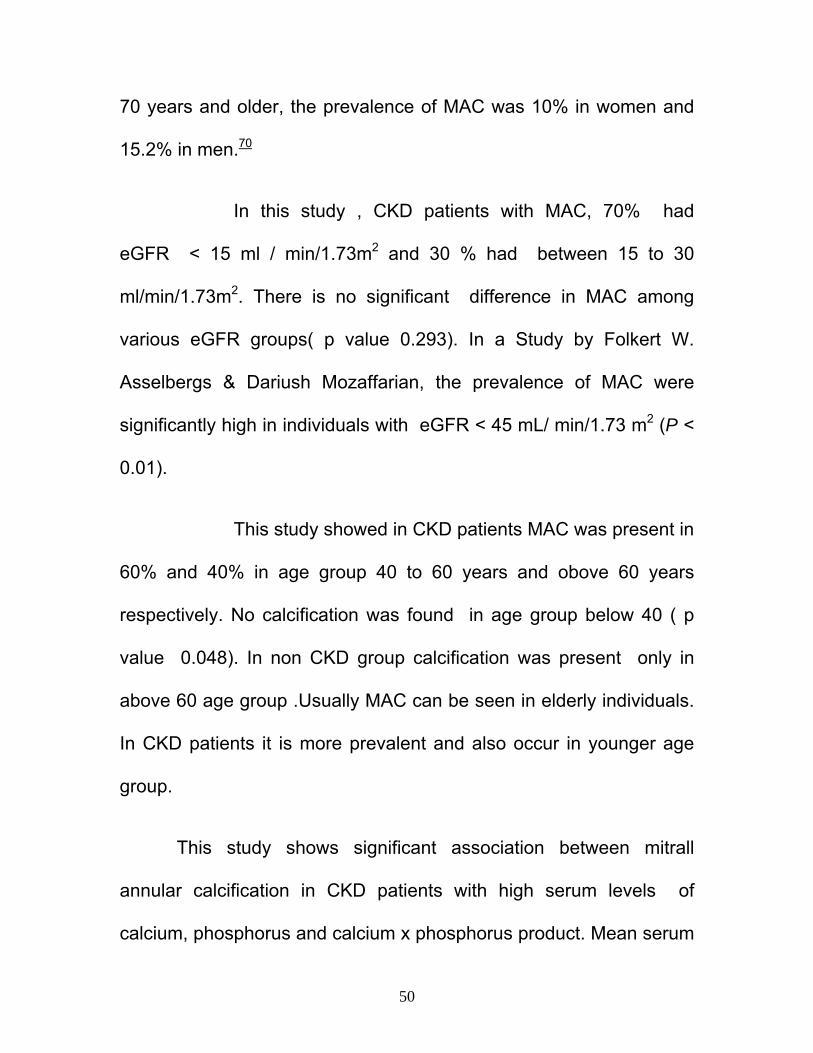
In this study , CKD patients with MAC, 70% had
eGFR < 15 ml / min/1.73m2 and 30 % had between 15 to 30
ml/min/1.73m2. There is no significant difference in MAC among
various eGFR groups( p value 0.293). In a Study by Folkert W.
Asselbergs & Dariush Mozaffarian, the prevalence of MAC were
significantly high in individuals with eGFR < 45 mL/ min/1.73 m2 (P <
0.01).
This study showed in CKD patients MAC was present in
60% and 40% in age group 40 to 60 years and obove 60 years
respectively. No calcification was found in age group below 40 ( p
value 0.048). In non CKD group calcification was present only in
above 60 age group .Usually MAC can be seen in elderly individuals.
In CKD patients it is more prevalent and also occur in younger age
group.
This study shows significant association between mitrall
annular calcification in CKD patients with high serum levels of
calcium, phosphorus and calcium x phosphorus product. Mean serum
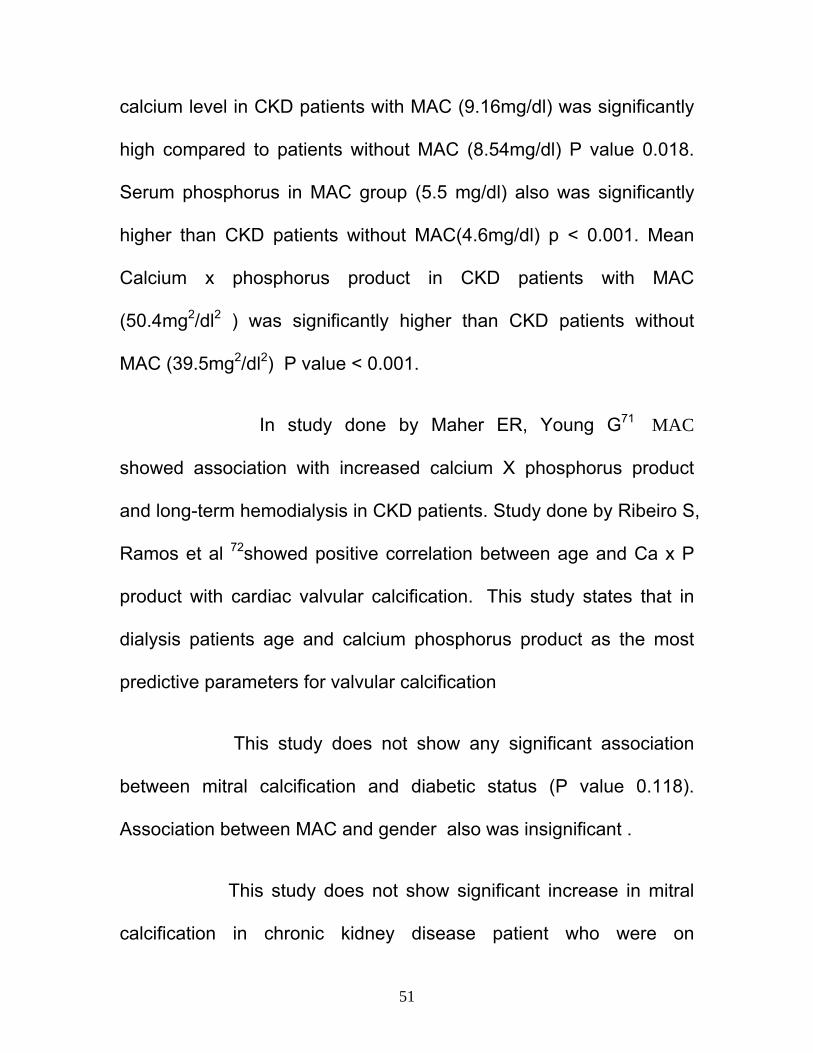
51
calcium level in CKD patients with MAC (9.16mg/dl) was significantly
high compared to patients without MAC (8.54mg/dl) P value 0.018.
Serum phosphorus in MAC group (5.5 mg/dl) also was significantly
higher than CKD patients without MAC(4.6mg/dl) p < 0.001. Mean
Calcium x phosphorus product in CKD patients with MAC
(50.4mg2/dl2 ) was significantly higher than CKD patients without
MAC (39.5mg2/dl2) P value < 0.001.
In study done by Maher ER, Young G71 MAC
showed association with increased calcium X phosphorus product
and long-term hemodialysis in CKD patients. Study done by Ribeiro S,
Ramos et al 72showed positive correlation between age and Ca x P
product with cardiac valvular calcification. This study states that in
dialysis patients age and calcium phosphorus product as the most
predictive parameters for valvular calcification
This study does not show any significant association
between mitral calcification and diabetic status (P value 0.118).
Association between MAC and gender also was insignificant .
This study does not show significant increase in mitral
calcification in chronic kidney disease patient who were on

52
dialysis .Various studies have shown that presence of MAC
increases with duration of dialysis. Disparity may be due to that,
many of the dialysis group patients in this study, were not on regular
dialysis and duration of dialysis was not taken into account. In Study
by Yusuf and Selcoki Faruk, longer duration of dialysis was
associated with mitral valve calcification.
This study showed significantly high
association of coronary artery disease in CKD patients with mitral
calcification than those with out calcification. 70 % of those with MAC
had CAD compared to 14.1% in CKD patients without MAC ( P <
0.001).The study by Fox CS, Vasan RS et al 73 showed
independent association of MAC with incident CAD and CAD death
and suggest cardiac calcification as a marker of increased CAD risk.
The association between MAC, and increased cardiovascular risk
may also be due to the burden of shared risk factors, including age,
hypertension, hyperlipidemia, diabetes, and obesity.
53
CONCLUSION
1 The prevalence of mitral annular calcification in chronic kidney
disease patients was 9.8% compared to 1% in people with normal
kidney function.
2 Mitral annular calcification showed significant association with high
serum calcium , phosphorus and calcium x phosphorus product in
CKD patients.
3 No significant association was noticed between diabetes , dialysis
status and gender with mitral annular calcification.
4.Mitral annular calcification occurs at an earlier age in CKD patients.
5 Coronary artery disease was significantly high in patients with mitral
annular calcification.
54
SUMMARY
A case control study was conducted on prevalence of
MAC in chronic kidney disease patients compared to subjects with
normal kidney function. After obtaining ethical committee clearance ,
102 CKD patients and 100 non CKD subjects comparable in age
and sex distribution were selected randomly. After recording clinical
data, blood investigations and ultrasonographic study,
echocardiogram was done in all to look for MAC
Results on analysis showed significantly high MAC in CKD
patients. Among 102 CKD patients 10(9.8%) had MAC while only
one(1%) had MAC in non CKD group. Among 10 who had MAC in
CKD group, 6 (60%) were in 40 to 60 age group and 4 (40%) were in
above 60 age group. In non CKD group MAC was present only in an
elderly female. In CKD patients MAC occurs even in younger age
group. Significant association of high levels of calcium, phosphorus
and calcium x phosphorus product with MAC was also noticed in the
study. Increased MAC in CKD patients may be due to altered calcium
and phosphorus metabolism in them. CAD was significantly high in
those with MAC which may be due to the burden of shared risk
factors for atherosclerosis in both groups.

BIBLIOGRAPHY 1: Zhang QL, Rothenbacher D. Prevalence of chronic kidney disease in population-based studies: systematic review. BMC Public Health. 2008 Apr 11;8:117. 2 Agarwal SK, Dash SC, Irshad M et al. Prevalence of Chronic Renal Failure in adults in Delhi, India. Nephrol Dial Transplant 2005; 20: 1638–1642 3 Kher V. End stage renal disease in developing countries. Kidney Int 2002; 62: 350-62. 4 Manjunath G., Tighiouart H., Ibrahim H., MacLeod B., Salem D.N., Griffith J.L., Coresh J., Levey A.S., Sarnak M.J.: Level of kidney function as a risk factor for atherosclerotic cardiovascular outcomes in the community. 5 Floege J., Ketteler M.: Vascular calcification in patients with end-stage renal disease. Nephrol Dial Transplant 19. (suppl 5): V59-V66.2004;
6 Dellegrottaglie S., Saran R., Gillespie B., Zhang X., Chung S., Finkelstein F., Kiser M., Sanz J., Eisele G., Hinderliter A.L., Kuhlmann M., Levin
7 N.W., Rajagopalan S.: Prevalence and predictors of cardiovascular calcium in chronic kidney disease (from the prospective longitudinal RRI-CKD study). Am J Cardiol 98. 571-576.2006
8 K/DOQI Clinical Practice Guidelines for Chronic Kidney Disease: Evaluation, classification, and stratification. Kidney Disease Outcome Quality Initiative. Am J Kidney Dis 2002 2002; 39:S1-S246. 9 Goldman: Cecil Medicine, 23rd ed
10 NKF-DOQI clinical practice guidelines for the treatment of anemia of chronic renal failure. National Kidney Foundation-Dialysis Outcomes Quality Initiative. Am J Kidney Dis 1997; 30 (Suppl 3):S192-S240 . 11. McCullough PA, Lepor NE: The deadly triangle of anemia, renal insufficiency, and cardiovascular disease: Implications for prognosis and treatment. Rev Cardiovasc Med 2005; 6:1-10. 12. McCullough PA, Soman SS, Shah SS, et al: Risks associated with renal dysfunction in patients in the coronary care unit. J Am Coll Cardiol 2000; 36:679.
13 Beattie JN, Soman SS, Sandberg KR, et al: Determinants of mortality after myocardial infarction in patients with advanced renal dysfunction. Am J Kidney Dis 2001; 37:1191
14 National Kidney Foundation : Clinical practice guidelines for chronic kidney disease: Evaluation, classification, and stratification. Am J Kidney Dis 2002; 2(Suppl 1):S46
15 Filler G, Bokenkamp A, Hofmann W, et al: Cystatin C as a marker of GFR—history, indications, and future research. Clin Biochem 2005; 38:1-8 16 Goodman WG, Coburn JW, Slatopolsky E, et al: Renal osteodystrophy in adult and pediatric patients. In: Favus M, ed. Primer on the Metabolic Bone Diseases and Disorders of Mineral Metabolism, Washington, D.C.: American Society of Bone and Mineral Research; 2003:430-447. 17. Larsson T, Nisbeth U, Ljunggren O, et al: Circulating concentration of FGF-23 increases as renal function declines in patients with chronic kidney disease, but does not change in response to variation in phosphate intake in healthy volunteers. Kidney Int 2003; 64:2272-2279 .

18 Imanishi Y, Inaba M, Nakatsuka K, et al: FGF-23 in patients with end-stage renal disease on hemodialysis. Kidney Int 2004; 65:1943-1946. 19 Goodman WG: The consequences of uncontrolled secondary hyperparathyroidism and its treatment in chronic kidney disease. Semin Dial 2004; 17:209-216. 20. Goodman WG, London GM, Amann K, et al: Vascular calcification in chronic kidney disease. Am J Kidney Dis 2004; 43:572-579.
21 Block GA, Klassen PS, Lazarus JM, et al: Mineral metabolism, mortality, and morbidity in maintenance hemodialysis. J Am Soc Nephrol 2004; 15:2208-2218.
22 Slinin Y, Foley RN, Collins AJ: Calcium, phosphorus, parathyroid hormone, and cardiovascular disease in hemodialysis patients: the USRDS waves 1, 3, and 4 study. J Am Soc Nephrol 2005; 16:1788-1793
23 Merjanian R, Budoff M, Adler S, et al: Coronary artery, aortic wall, and valvular calcification in nondialyzed individuals with type 2 diabetes and renal disease. Kidney Int 2003; 64:263-271.
24 Braun J, Oldendorf M, Moshage W, et al: Electron beam computed tomography in the evaluation of cardiac calcification in chronic dialysis patients. Am J Kidney Dis 1996; 27:394-401.
25 Mehrotra R, Budoff M, Christenson P, et al: Determinants of coronary artery calcification in diabetics with and without nephropathy. Kidney Int 2004; 66:2022-2031. 26. Block GA, Spiegel DM, Ehrlich J, et al: Effects of sevelamer and calcium on coronary artery calcification in patients new to hemodialysis. Kidney Int 2005; 68:1815-1824. 27 Cannata-Andia JB, Rodrigues-Garcia M, Carrillo-Lopez N, et al: Vascular calcification: pathogenesis, management, and impact on clinical outcomes. J Am Soc Nephrol 2006; 17(Suppl 3):S267-S273.
28 Moe SM, Chen NX: Pathophysiology of vascular calcification in
chronic kidney disease. Circ Res 2004; 95:560-567 29 Chen NX, Duan D, O'Neill KD, Moe SM: High glucose increases
the expression of Cbfa1 and BMP-2 and enhances the calcification of vascular smooth muscle cells. Nephrol Dial Transplant 2006; 21:3435-3442.
30 Ducy P, Zhang R, Geoffroy V, et al: Osf2/Cbfa1: a transcriptional
activator of osteoblast differentiation [see comments]. Cell 1997; 89:747-754.
31 Tower DA, Shao JS, Cheng SL, et al: Osteogenic regulation of
vascular calcification. Ann N Y Acad Sci 2006; 1068:327-333. 32 Block GA, Raggi P, Bellasi A, et al: Mortality effect of coronary
calcification and phosphate binder choice in hemodialysis patients. Kidney Int 2007; 71:438-441.
33 Bostrom K, Tsao D, Shen S, et al: Matrix gla protein modulates
differentiation induced by bone morphogenetic protein-2 in c3h10t1/2 cells. J Biol Chem 2001; 276:14044-14052.
34 Ahmed S, O'Neill KD, Hood AF, et al: Calciphylaxis is associated
with hyperphosphatemia and increased osteopontin expression by vascular smooth muscle cells. Am J Kidney Dis 2001; 37:1267-1276.
35 Schinke T, Amendt C, Trindl A, et al: The serum protein alpha2-
HS glycoprotein/fetuin inhibits apatite formation in vitro and in mineralizing calvaria cells. A possible role in mineralization and calcium homeostasis. J Biol Chem 1996; 271:20789-20796.
36 Chertow GM, Burke SK, Raggi P: Sevelamer attenuates the progression of coronary and aortic calcification in hemodialysis patients. Kidney Int 2002; 62:245-252.
37. Wolisi GO, Moe SM: The role of vitamin D in vascular calcification in chronic kidney disease. Semin Dial 2005; 18:307-314.
38Coresh J, Astor B, Sarnak MJ: Evidence for increased cardiovascular disease risk in patients with chronic kidney disease. Curr Opin Nephrol Hypertens 2004; 13(1):73-81
39. Fried LF, Shlipak MG, Crump C, et al: Renal insufficiency as a predictor of cardiovascular outcomes and mortality in elderly individuals. J Am Coll Cardiol 2003; 41(8):1364-1372.
40. Jungers P, Massy ZA, Khoa TN, et al: Incidence and risk factors of atherosclerotic cardiovascular accidents in predialysis chronic renal failure patients: A prospective study. Nephrol Dial Transplant 1997; 12(12):2597-2602.
41. Chobanian AV, Bakris GL, Black HR, et al: The Seventh Report of the Joint National Committee on Prevention, Detection, Evaluation, and Treatment of High Blood Pressure: The JNC 7 report. JAMA 2003; 289(19):2560-2572.
42. Mosca L, Appel LJ, Benjamin EJ, et al: Evidence-based guidelines for cardiovascular disease prevention in women. Circulation 2004; 109(5):672-693
43. Weiner DE, Tighiouart H, Amin MG, et al: Chronic kidney disease as a risk factor for cardiovascular disease and all-cause mortality: A pooled analysis of community-based studies. J Am Soc Nephrol 2004; 15(5):1307-1315.
44. Sarnak MJ, Levey AS, Schoolwerth AC, et al: Kidney disease as a risk factor for development of cardiovascular disease: A statement from the American Heart Association Councils on Kidney in Cardiovascular Disease, High Blood Pressure Research, Clinical Cardiology, and Epidemiology and Prevention. Circulation 2003; 108(17):2154-2169.
45. Sarnak, MJ, Levey, AS, Schoolwerth, AC, Coresh, J. Kidney disease as a risk factor for development of cardiovascular disease: a statement from the American Heart Association Councils on Kidney in Cardiovascular Disease, High Blood Pressure Research, Clinical
Cardiology, and Epidemiology and Prevention. Circulation 2003; 108:2154.
46. Sosnov, J, Lessard, D, Goldberg, RJ, et al. Differential symptoms of acute myocardial infarction in patients with kidney disease: a community-wide perspective. Am J Kidney Dis 2006; 47:378.
47. Chen, J, Muntner, P, Hamm, LL, Jones, DW. The metabolic syndrome and chronic kidney disease in U.S. adults. Ann Intern Med 2004; 140:167.
48. Kobayashi, S, Maesato, K, Moriya, H, et al. Insulin resistance in patients with chronic kidney disease. Am J Kidney Dis 2005; 45:275.
49. Crawford: Cardiology, 3rd ed.
50.Hörl W.H., Cohen J.J., Harrington J.T., Madias N.E., Zusman C.J.: Atherosclerosis and uremic retention solutes. Kidney Int 2004; 66:1719.
51Brown J.H., Hunt L.P., Vites N.P., Short C.D., Gokal R., Mallick N.P: Comparative mortality from cardiovascular disease in patients with chronic kidney failure. Nephrol Dial Transplant 1994; 9:1136.
52.Harnett J.D., Foley R.N., Kent G.M., Barre P.E., Murray D., Parfrey P.S.: Congestive heart failure in dialysis patients: prevalence, incidence, prognosis and risk factors. Kidney Int 1995; 47:884.
53. Umana E, Ahmed W, Alpert MA: Valvular and perivalvular abnormalities in end-stage renal disease. Am J Med Sci 2003; 325:23720 54. Mazzaferro S, Coen G, Bandini S, et al: Role of ageing, chronic renal failure and dialysis in the calcification of the mitral annulus (abstract). Nephrol Dial Transplant 1993; 8:335-340. 55. London GM, Pannier B, Marchais SJ, Guerin AP: Calcification of the aortic valve in the dialyzed patient. J Am Soc Nephrol 2000; 11(4):778-783.

56.Allison, MA. Cheung, P, Criqui, MH, et al. Mitral and aortic annular calcification are highly associated with systemic calcified atherosclerosis. Circulation 2006; 113:861. 57. Aronow, WS, Ahn, C, Kronzon, I, et al. Association of mitral annular calcium with new thromboembolic stroke at 44-month follow-up of 2,148 persons, mean age 81 years. Am J Cardiol 1998; 81:105. 58. Jeon, DS, Atar, S, Brasch, AV, et al. Association of mitral annulus calcification, aortic valve sclerosis and aortic root calcification with abnormal myocardial perfusion single photon emission tomography in subjects age ≤ 65 years old. J Am Coll Cardiol 2001; 38:1988. 59. Aronow, WS, Koenigsberg, M, Kronzon, I, Gustein, H. Association of mitral annular calcium with new thromboembolic stroke and cardiac events at 39-month follow-up in elderly patients. Am J Cardiol 1990; 65:1511. 60. Labovitz, AJ, Nelson, JG, Windhorst, DM, et al. Frequency of mitral valve dysfunction from mitral anular calcium as detected by Doppler echocardiography. Am J Cardiol 1985; 55:133. 61. Nair, CK, Thomson, W, Ryschon, K, et al. Long-term follow-up of patients with echocardiographically detected mitral anular calcium and comparison with age- and sex-matched control subjects. Am J Cardiol 1989; 63:465. 62. Kizer J.R., Wiebers D.O., Whisnant J.P., et al: Mitral annular calcification, aortic valve sclerosis, and incident stroke in adults free of clinical cardiovascular disease: The Strong Heart Study. Stroke 2005; 36:2533-2537. 63. Deluca G., Correale M., Ieva R., et al: The incidence and clinical course of caseous calcification of the mitral annulus: A prospective echocardiographic study. J Am Soc Echocardiogr 2008; 21:828-833. 64. Fernandes R.M., Branco L.M., Galrinho A., et al: Caseous calcification of the mitral annulus: A review of six cases. Rev Port Cardiol 2007; 26:1059-1070.
65. Marcu C.B., Ghantous A.E., Prokop E.K.: Caseous calcification of the mitral valve ring. Heart Lung Circ 2006; 153:187-188.
66. Forman, MB, Virmani, R, Robertson, RM, Stone, WJ. Mitral anular calcification in chronic renal failure. Chest 1984; 85:367.
67. Stinebaugh, J, Lavie, CJ, Milani, RV, et al. Doppler echocardiographic assessment of valvular heart disease in patients requiring hemodialysis for end-stage renal disease. South Med J 1995; 88:65.
68. Chronic Kidney Disease in India: Challenges and Solutions S.K. Agarwal , R.K. Srivastava Nephron Clin Pract 2009;111:c197-c203
69. Fox CS, Larson MG, Vasan RS, Guo CY, Parise H, Levy D, Leip EP, O'donnell CJ, D'Agostino RB Sr, Benjamin EJ. Cross-sectional association of kidney function with valvular and annular calcification: the Framingham heart study. J Am Soc Nephrol. 2006 Feb;17(2):521 70. Fox E., Harkins D., Taylor H., et al: Epidemiology of mitral annular calcification and its predictive value for coronary events in African Americans: The Jackson Cohort of the Atherosclerotic Risk in Communities Study. Am Heart J 2004; 148:979-984.
71. Aortic and mitral valve calcification in patients with end-stage renal disease.Maher ER, Young G, Smyth-Walsh B, Pugh S, Curtis JR. Lancet. 1987 Oct 17;2(8564):875-7
72. Cardiac valve calcification in haemodialysis patients: role of calcium-phosphate metabolism.Ribeiro S, Ramos A, Brandão A, Rebelo JR, Guerra A, Resina C, Vila-Lobos A, Carvalho F, Remédio F, Ribeiro F. 73. Mitral annular calcification predicts cardiovascular morbidity and mortality: the Framingham Heart Study.Fox CS, Vasan RS, Parise H, Levy D, O'Donnell CJ, D'Agostino RB, Benjamin EJ; Framingham Heart Study.
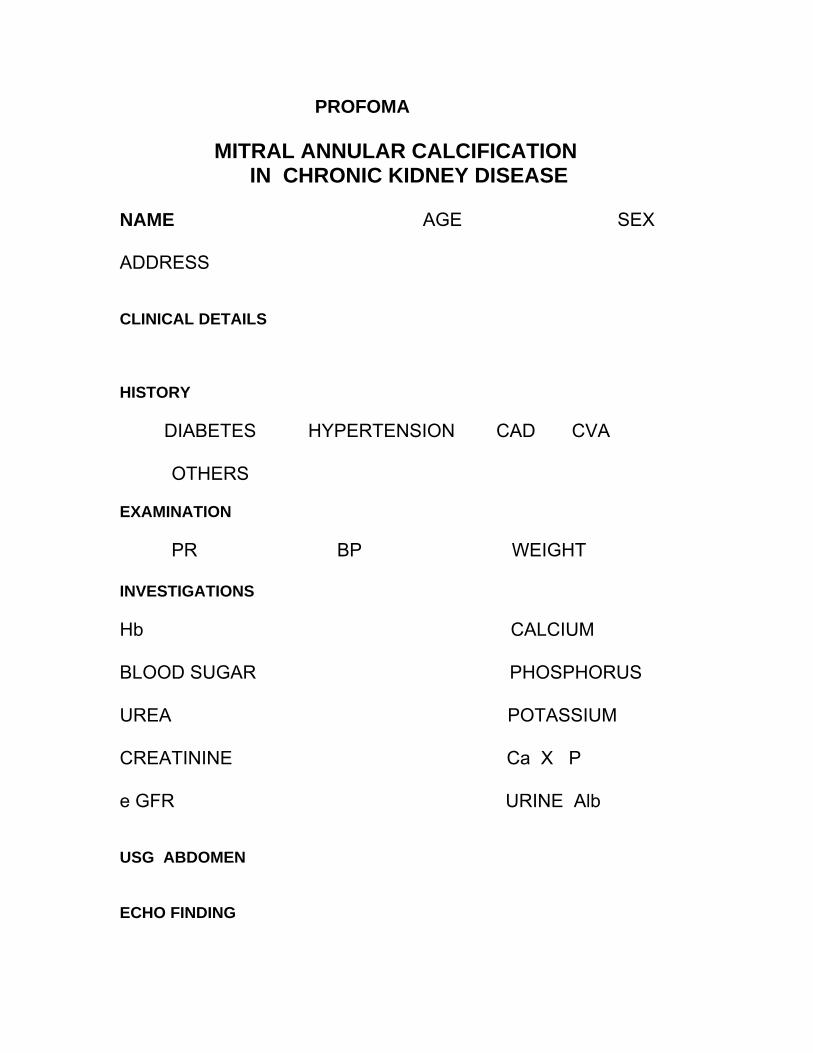
PROFOMA MITRAL ANNULAR CALCIFICATION IN CHRONIC KIDNEY DISEASE NAME AGE SEX ADDRESS CLINICAL DETAILS HISTORY DIABETES HYPERTENSION CAD CVA OTHERS EXAMINATION PR BP WEIGHT INVESTIGATIONS Hb CALCIUM BLOOD SUGAR PHOSPHORUS UREA POTASSIUM CREATININE Ca X P e GFR URINE Alb
USG ABDOMEN
ECHO FINDING
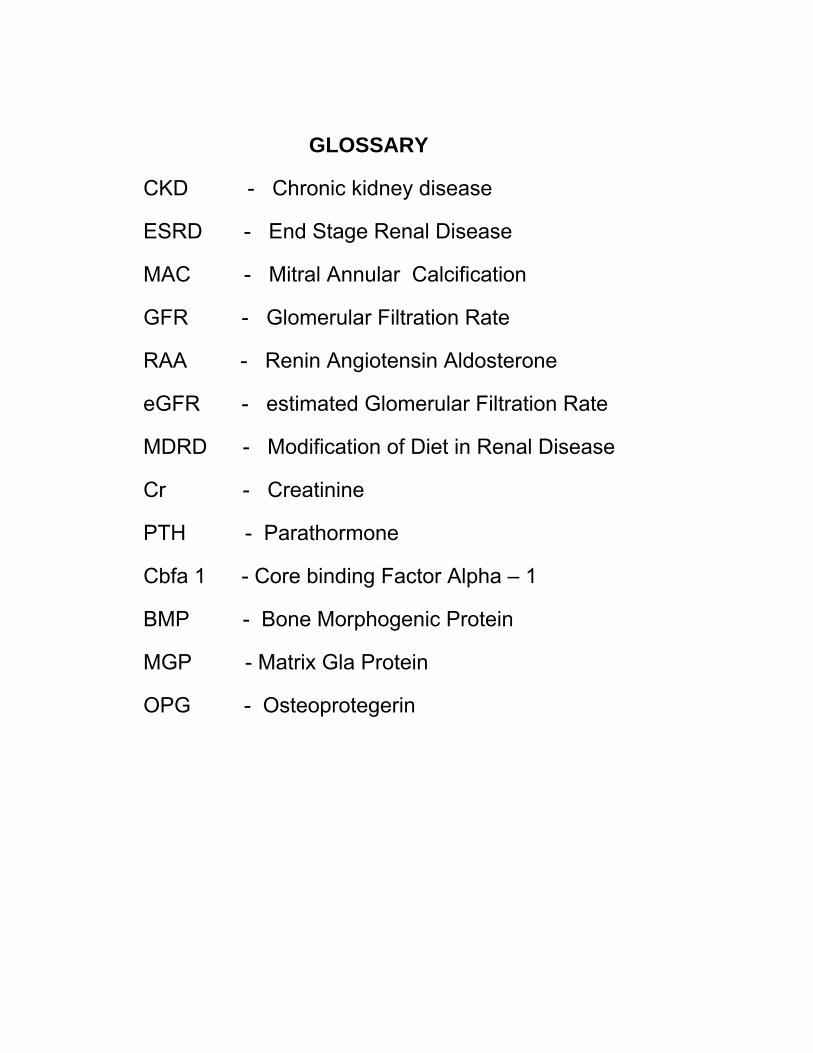
GLOSSARY
CKD - Chronic kidney disease
ESRD - End Stage Renal Disease
MAC - Mitral Annular Calcification
GFR - Glomerular Filtration Rate
RAA - Renin Angiotensin Aldosterone
eGFR - estimated Glomerular Filtration Rate
MDRD - Modification of Diet in Renal Disease
Cr - Creatinine
PTH - Parathormone
Cbfa 1 - Core binding Factor Alpha – 1
BMP - Bone Morphogenic Protein
MGP - Matrix Gla Protein
OPG - Osteoprotegerin
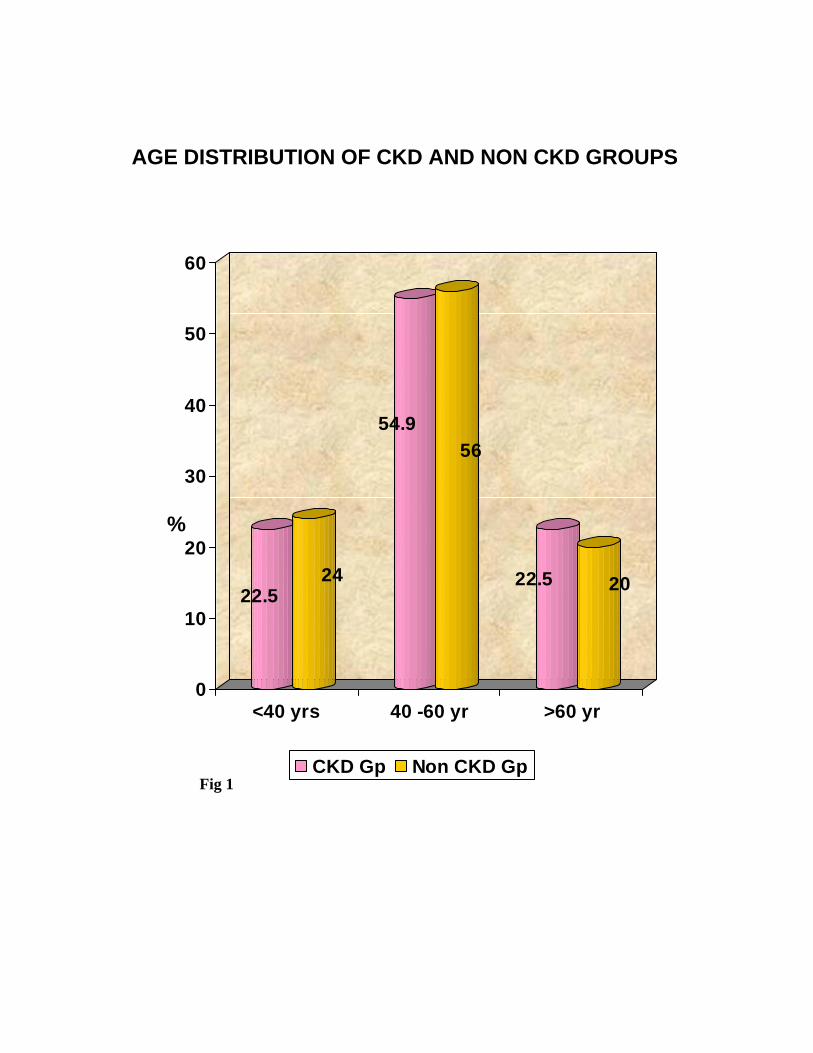
AGE DISTRIBUTION OF CKD AND NON CKD GROUPS
% Fig 1
22.524
54.956
22.5 20
0
10
20
30
40
50
60
<40 yrs 40 -60 yr >60 yr
CKD Gp Non CKD Gp
MAC in CKD AND Non CKD Patients
% Fig 2 GROUPS
9.8
90.2
1
99
0
10
20
30
40
50
60
70
80
90
100
CKD Gp Non CKD
MAC +VEMAC -VE
DISTRIBUTION OF MAC IN VARIOUS eGFR GROUPS IN CKD PATIENTS eGFR in ml/min/1.73m2
Fig 3
70
30
00
10
20
30
40
50
60
70
< 15 15 - 30 30 - 60
% of MAC
DISTRIBUTION OF MAC IN VARIOUS AGE GROUPS IN CKD PATIENTS
Fig. 4
0
6040
0
10
20
30
40
50
60
70
80
90
100
< 40 Yr 40 -60 Yr > 60 Yr
% of MAC
CAD in CKD patients with and without MAC % Fig 5
70
30
14.1
85.9
0
10
20
30
40
50
60
70
80
90
100
MAC +VE MAC -VE
CAD + CAD -
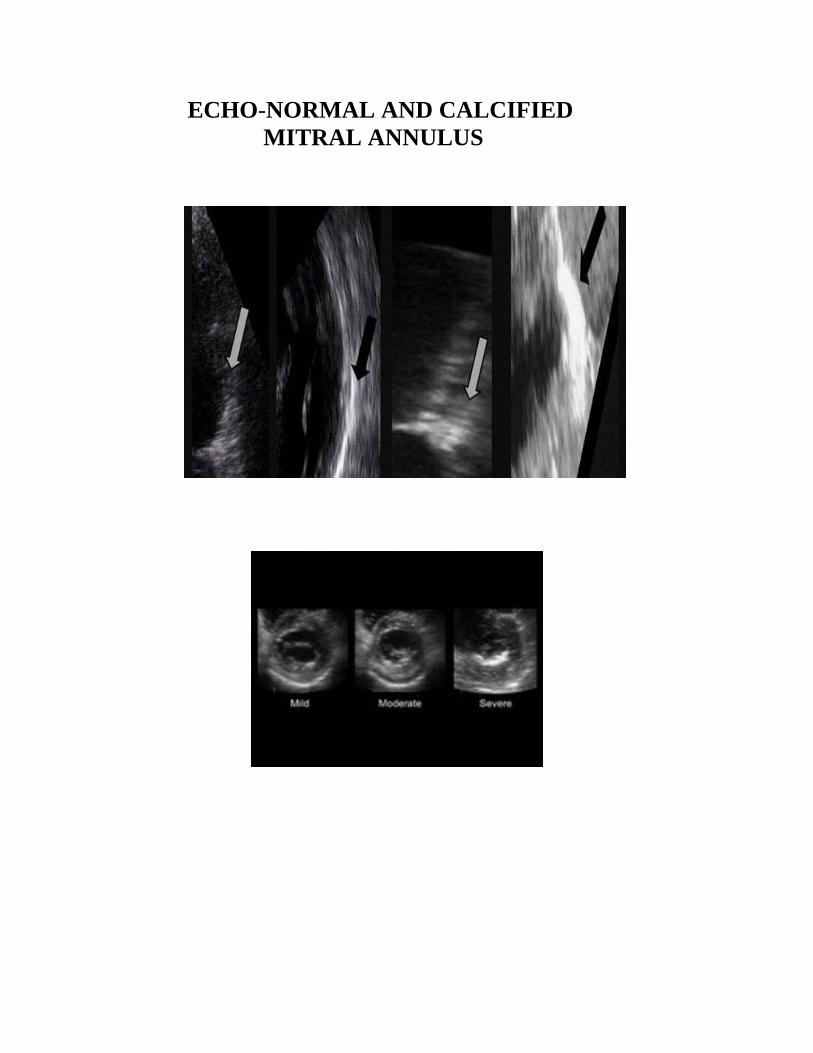
ECHO-NORMAL AND CALCIFIED MITRAL ANNULUS
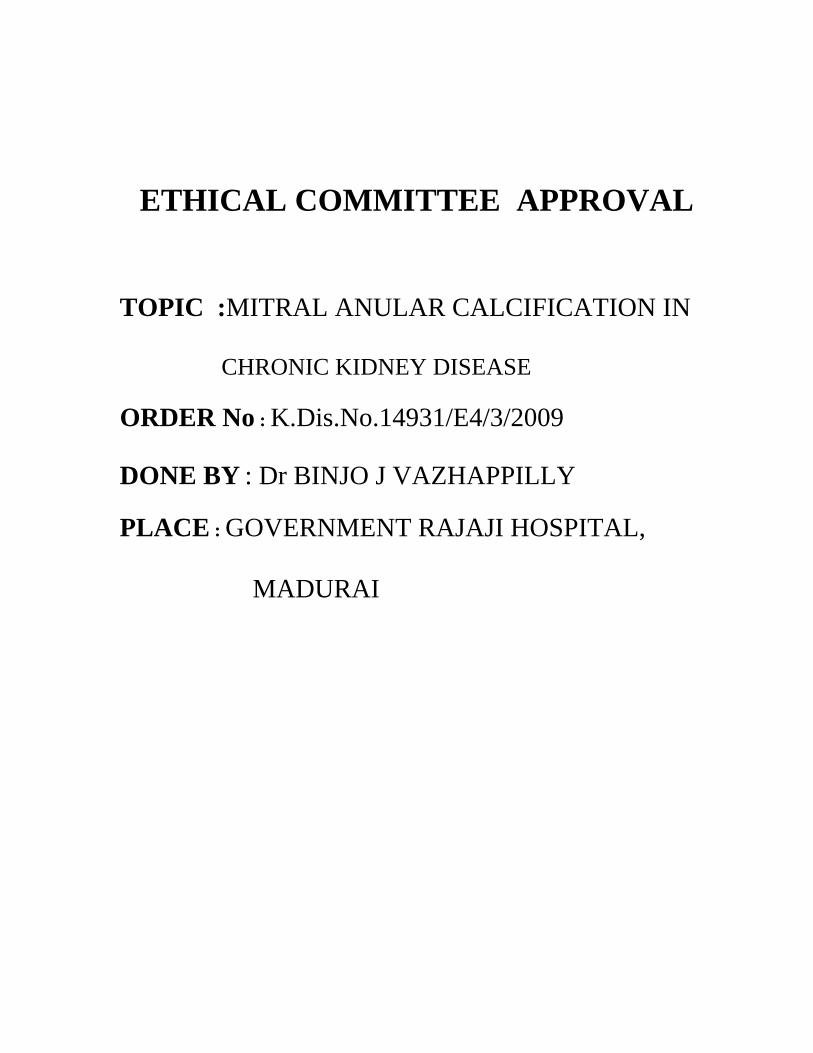
ETHICAL COMMITTEE APPROVAL
TOPIC :MITRAL ANULAR CALCIFICATION IN CHRONIC KIDNEY DISEASE ORDER No : K.Dis.No.14931/E4/3/2009 DONE BY : Dr BINJO J VAZHAPPILLY PLACE : GOVERNMENT RAJAJI HOSPITAL, MADURAI

NO AGE SEX DM HTN CAD CVA Hb RBS UREA Cr Ca K P Ca x P Ur. Alb Weight eGFR Echo USG DIALYSIS
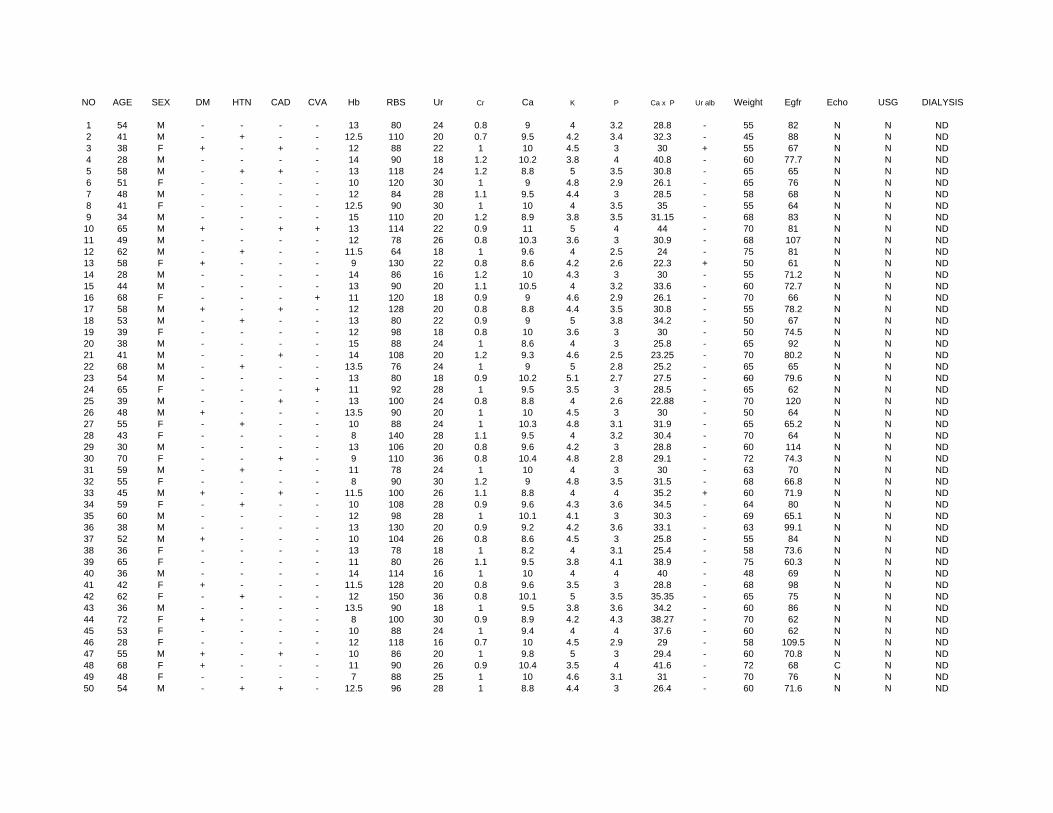
1 75 F - + + - 6.1 138 94 4.3 8 4.5 5 40 + 52 9.56 N CKD ND2 42 M - + - 9 86 46 1.4 9 4.2 4 36 - 60 58 N CKD ND3 44 M - + - - 6.4 125 179 16.5 7.8 6 5.2 40.56 + 62 5 N CKD D4 33 M - - - - 5.9 120 40 1.8 8.4 3.2 3.9 32.76 - 64 52.8 N CKD ND5 20 M - + - - 10 80 109 9.6 7.5 4.4 4 30 + 58 10 N CKD D6 31 M - + - - 5.7 74 74 7.2 8 6 4.5 36 + 52 10.9 N CKD ND7 63 M - + + - 9.3 184 40 6 9.9 4.8 5.8 57.4 + 48 8.5 C CKD D8 28 F - + - - 4.3 100 30 8.5 9.1 5.2 4.4 40.04 + 55 16 N CKD ND9 61 F - + + - 5 240 150 9 8.1 6.4 5 40.5 + 61 7.4 N CKD ND
10 33 F - + - - 7.1 120 130 7.8 8.8 6 5.1 44.88 + 48 7.7 N CKD D11 50 M - + - - 7.3 170 60 7 8.6 4.9 4.5 38.7 + 62 11 N CKD ND12 51 F - + - - 5.6 90 70 6.5 9 5.3 4.2 37.8 + 70 13.3 N CKD D13 61 M + + + - 10 99 70 7.4 10 5.4 5 50 + 65 9.6 C CKD ND14 30 M + + - - 10 120 100 14 9.2 5.5 5 46 + 60 6.5 N CKD ND15 55 F - + - - 11 90 40 1.8 8.7 5 4.1 35.67 + 50 27.8 N CKD ND16 45 F - + - - 8 110 113 11.1 7.9 4.8 4.6 36.3 + 74 8.79 N CKD ND17 54 M - + - - 12 120 30 4.2 8.2 4.1 4 32.8 + 66 17 N CKD ND18 40 M - + - - 7 71 83 9 8.8 5.6 5 44 + 57 8.8 N CKD D19 55 F + + - - 6.4 142 42 4.2 8 5.7 4.3 34.4 + 60 16.8 N CKD ND20 29 F - + - - 8.5 125 100 7.7 7.5 4.1 4.6 34.5 + 64 12.8 N CKD ND21 45 M - + + - 10 300 79 6 9.5 4.6 5.4 51.3 + 85 18.6 C CKD D22 64 M - - + - 9.4 140 60 2.7 9.2 5 4.8 44.16 + 60 23.4 N CKD ND23 59 M - + - - 9 110 110 9 9 3.5 5 45 + 55 6.9 N CKD ND24 30 M - + - - 6 120 140 15 8.6 4.2 5.1 43.86 + 60 6.1 N CKD D25 53 M - + - - 7 200 79 3.8 9 5 4.5 40.5 + 58 18.44 N CKD ND26 49 M - + - - 8.4 64 61 7.4 8.7 5.2 4 34.8 + 68 11.6 N CKD ND27 59 M + + - + 8 169 64 8 8.5 5.6 4.8 40.8 + 48 6.75 N CKD ND28 48 F + + + - 7.8 90 40 4.3 8.8 4.2 5.3 46.64 + 50 12.6 C CKD D29 68 F - + - - 7 130 89 5 8.5 5.3 4.2 35.7 + 54 9.1 N CKD ND30 58 M - + - + 5.4 80 170 17 7 4.8 4.1 28.7 + 60 4 N CKD D31 45 M - - - - 6 90 120 10 7.4 5.4 5.2 38.4 + 50 6.5 N CKD ND32 45 F - + - - 11 110 38 2 8.3 4 4.6 38.18 - 54 30.2 N CKD ND33 54 F + + 7.7 160 66 10 8 5.4 5 40 + 60 7.1 N CKD D34 48 M - - - - 8.7 90 80 11 8.2 5.4 4.8 39.3 + 74 8.5 N CKD D35 54 M + + - + 7 104 74 8 9.5 4.8 4.6 43.7 + 60 8.9 N CKD ND36 65 F - + - - 9 110 140 7 7.2 5.5 4.5 32.4 + 58 8.6 N CKD D37 64 M - + - - 6 92 64 6 8.5 5 4.3 36.55 - 60 10.5 N CKD ND38 57 F + + - - 7.5 98 80 4.2 7.4 5.2 6 44.4 + 45 12.3 C CKD ND39 28 F - - - - 5 90 30 4.5 8.1 5 4.6 37.2 - 56 16.45 N CKD ND40 64 M - + + - 7.2 200 60 4 7.8 5.2 4 31.2 - 50 15.8 N CKD ND41 65 F + + - - 6 133 120 8 6.1 5 5.3 32.33 + 55 6.08 N CKD D42 45 F + + - - 8 110 90 8.6 7.5 4.5 5 37.5 + 68 10.4 N CKD ND43 60 F - - - - 10 100 116 10 7 4 5.1 35.7 + 60 5.66 N CKD ND44 63 M - + - - 10 100 200 9.8 7.5 3.5 5.5 41.25 + 54 5.8 N CKD D45 27 M - + - - 9 95 180 18 7 6 5 35 + 60 5.2 N CKD ND46 47 M + - - + 8 260 78 2.3 8.5 5 4.8 40.8 - 55 30.88 N CKD ND47 59 M - + - - 9 220 100 4 8 4.8 4.5 36 - 68 19.1 N CKD D48 60 F + - - - 8 170 80 3.4 8.5 4 4.2 35.7 + 70 19.44 N CKD ND49 52 F + + + - 8.6 90 67 2.7 9 4.2 4.8 43.2 - 65 25.1 N CKD ND50 52 M - + - - 8 110 80 4 7.8 5 4.8 37.44 + 70 21.3 N CKD D
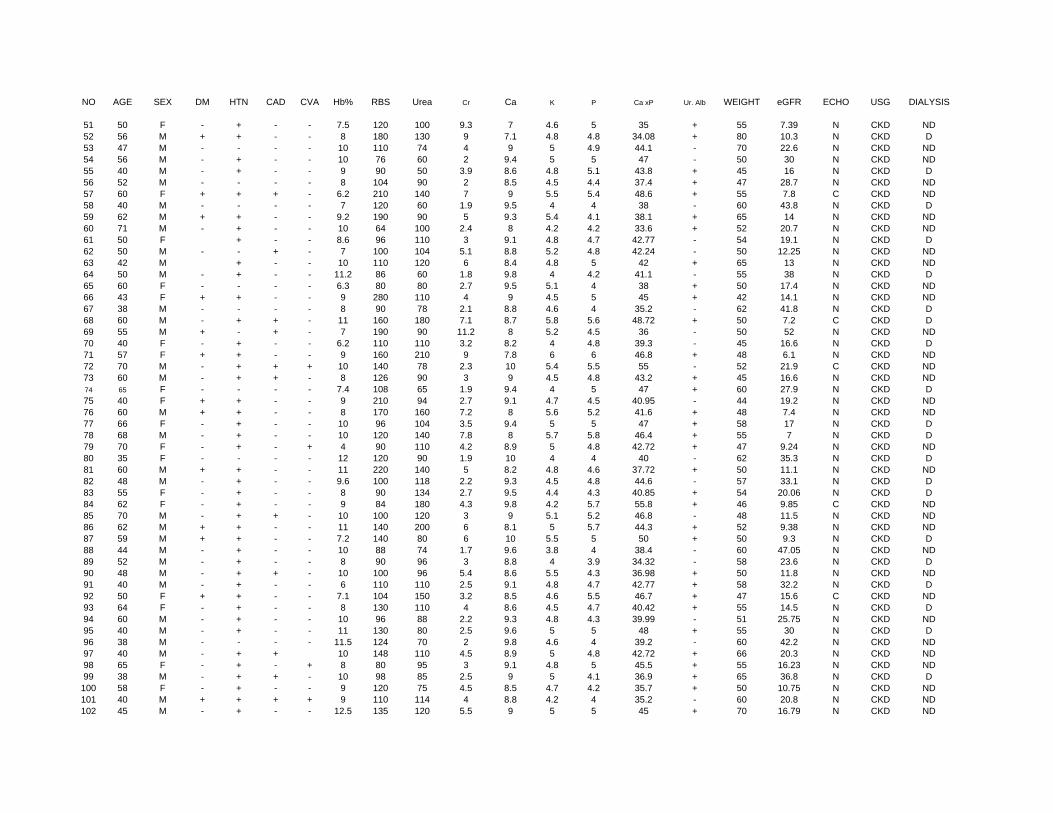
NO AGE SEX DM HTN CAD CVA Hb% RBS Urea Cr Ca K P Ca xP Ur. Alb WEIGHT eGFR ECHO USG DIALYSIS
51 50 F - + - - 7.5 120 100 9.3 7 4.6 5 35 + 55 7.39 N CKD ND52 56 M + + - - 8 180 130 9 7.1 4.8 4.8 34.08 + 80 10.3 N CKD D53 47 M - - - - 10 110 74 4 9 5 4.9 44.1 - 70 22.6 N CKD ND54 56 M - + - - 10 76 60 2 9.4 5 5 47 - 50 30 N CKD ND55 40 M - + - - 9 90 50 3.9 8.6 4.8 5.1 43.8 + 45 16 N CKD D56 52 M - - - - 8 104 90 2 8.5 4.5 4.4 37.4 + 47 28.7 N CKD ND57 60 F + + + - 6.2 210 140 7 9 5.5 5.4 48.6 + 55 7.8 C CKD ND58 40 M - - - - 7 120 60 1.9 9.5 4 4 38 - 60 43.8 N CKD D59 62 M + + - - 9.2 190 90 5 9.3 5.4 4.1 38.1 + 65 14 N CKD ND60 71 M - + - - 10 64 100 2.4 8 4.2 4.2 33.6 + 52 20.7 N CKD ND61 50 F + - - 8.6 96 110 3 9.1 4.8 4.7 42.77 - 54 19.1 N CKD D62 50 M - - + - 7 100 104 5.1 8.8 5.2 4.8 42.24 - 50 12.25 N CKD ND63 42 M + - - 10 110 120 6 8.4 4.8 5 42 + 65 13 N CKD ND64 50 M - + - - 11.2 86 60 1.8 9.8 4 4.2 41.1 - 55 38 N CKD D65 60 F - - - - 6.3 80 80 2.7 9.5 5.1 4 38 + 50 17.4 N CKD ND66 43 F + + - - 9 280 110 4 9 4.5 5 45 + 42 14.1 N CKD ND67 38 M - - - - 8 90 78 2.1 8.8 4.6 4 35.2 - 62 41.8 N CKD D68 60 M - + + - 11 160 180 7.1 8.7 5.8 5.6 48.72 + 50 7.2 C CKD D69 55 M + - + - 7 190 90 11.2 8 5.2 4.5 36 - 50 52 N CKD ND70 40 F - + - - 6.2 110 110 3.2 8.2 4 4.8 39.3 - 45 16.6 N CKD D71 57 F + + - - 9 160 210 9 7.8 6 6 46.8 + 48 6.1 N CKD ND72 70 M - + + + 10 140 78 2.3 10 5.4 5.5 55 - 52 21.9 C CKD ND73 60 M - + + - 8 126 90 3 9 4.5 4.8 43.2 + 45 16.6 N CKD ND74 65 F - - - - 7.4 108 65 1.9 9.4 4 5 47 + 60 27.9 N CKD D75 40 F + + - - 9 210 94 2.7 9.1 4.7 4.5 40.95 - 44 19.2 N CKD ND76 60 M + + - - 8 170 160 7.2 8 5.6 5.2 41.6 + 48 7.4 N CKD ND77 66 F - + - - 10 96 104 3.5 9.4 5 5 47 + 58 17 N CKD D78 68 M - + - - 10 120 140 7.8 8 5.7 5.8 46.4 + 55 7 N CKD D79 70 F - + - + 4 90 110 4.2 8.9 5 4.8 42.72 + 47 9.24 N CKD ND80 35 F - - - - 12 120 90 1.9 10 4 4 40 - 62 35.3 N CKD D81 60 M + + - - 11 220 140 5 8.2 4.8 4.6 37.72 + 50 11.1 N CKD ND82 48 M - + - - 9.6 100 118 2.2 9.3 4.5 4.8 44.6 - 57 33.1 N CKD D83 55 F - + - - 8 90 134 2.7 9.5 4.4 4.3 40.85 + 54 20.06 N CKD D84 62 F - + - - 9 84 180 4.3 9.8 4.2 5.7 55.8 + 46 9.85 C CKD ND85 70 M - + + - 10 100 120 3 9 5.1 5.2 46.8 - 48 11.5 N CKD ND86 62 M + + - - 11 140 200 6 8.1 5 5.7 44.3 + 52 9.38 N CKD ND87 59 M + + - - 7.2 140 80 6 10 5.5 5 50 + 50 9.3 N CKD D88 44 M - + - - 10 88 74 1.7 9.6 3.8 4 38.4 - 60 47.05 N CKD ND89 52 M - + - - 8 90 96 3 8.8 4 3.9 34.32 - 58 23.6 N CKD D90 48 M - + + - 10 100 96 5.4 8.6 5.5 4.3 36.98 + 50 11.8 N CKD ND91 40 M - + - - 6 110 110 2.5 9.1 4.8 4.7 42.77 + 58 32.2 N CKD D92 50 F + + - - 7.1 104 150 3.2 8.5 4.6 5.5 46.7 + 47 15.6 C CKD ND93 64 F - + - - 8 130 110 4 8.6 4.5 4.7 40.42 + 55 14.5 N CKD D94 60 M - + - - 10 96 88 2.2 9.3 4.8 4.3 39.99 - 51 25.75 N CKD ND95 40 M - + - - 11 130 80 2.5 9.6 5 5 48 + 55 30 N CKD D96 38 M - - - - 11.5 124 70 2 9.8 4.6 4 39.2 - 60 42.2 N CKD ND97 40 M - + + 10 148 110 4.5 8.9 5 4.8 42.72 + 66 20.3 N CKD ND98 65 F - + - + 8 80 95 3 9.1 4.8 5 45.5 + 55 16.23 N CKD ND99 38 M - + + - 10 98 85 2.5 9 5 4.1 36.9 + 65 36.8 N CKD D
100 58 F - + - - 9 120 75 4.5 8.5 4.7 4.2 35.7 + 50 10.75 N CKD ND101 40 M + + + + 9 110 114 4 8.8 4.2 4 35.2 - 60 20.8 N CKD ND102 45 M - + - - 12.5 135 120 5.5 9 5 5 45 + 70 16.79 N CKD ND
NO AGE SEX DM HTN CAD CVA Hb RBS Ur Cr Ca K P Ca x P Ur alb Weight Egfr Echo USG DIALYSIS
1 54 M - - - - 13 80 24 0.8 9 4 3.2 28.8 - 55 82 N N ND2 41 M - + - - 12.5 110 20 0.7 9.5 4.2 3.4 32.3 - 45 88 N N ND3 38 F + - + - 12 88 22 1 10 4.5 3 30 + 55 67 N N ND4 28 M - - - - 14 90 18 1.2 10.2 3.8 4 40.8 - 60 77.7 N N ND5 58 M - + + - 13 118 24 1.2 8.8 5 3.5 30.8 - 65 65 N N ND6 51 F - - - - 10 120 30 1 9 4.8 2.9 26.1 - 65 76 N N ND7 48 M - - - - 12 84 28 1.1 9.5 4.4 3 28.5 - 58 68 N N ND8 41 F - - - - 12.5 90 30 1 10 4 3.5 35 - 55 64 N N ND9 34 M - - - - 15 110 20 1.2 8.9 3.8 3.5 31.15 - 68 83 N N ND10 65 M + - + + 13 114 22 0.9 11 5 4 44 - 70 81 N N ND11 49 M - - - - 12 78 26 0.8 10.3 3.6 3 30.9 - 68 107 N N ND12 62 M - + - - 11.5 64 18 1 9.6 4 2.5 24 - 75 81 N N ND13 58 F + - - - 9 130 22 0.8 8.6 4.2 2.6 22.3 + 50 61 N N ND14 28 M - - - - 14 86 16 1.2 10 4.3 3 30 - 55 71.2 N N ND15 44 M - - - - 13 90 20 1.1 10.5 4 3.2 33.6 - 60 72.7 N N ND16 68 F - - - + 11 120 18 0.9 9 4.6 2.9 26.1 - 70 66 N N ND17 58 M + - + - 12 128 20 0.8 8.8 4.4 3.5 30.8 - 55 78.2 N N ND18 53 M - + - - 13 80 22 0.9 9 5 3.8 34.2 - 50 67 N N ND19 39 F - - - - 12 98 18 0.8 10 3.6 3 30 - 50 74.5 N N ND20 38 M - - - - 15 88 24 1 8.6 4 3 25.8 - 65 92 N N ND21 41 M - - + - 14 108 20 1.2 9.3 4.6 2.5 23.25 - 70 80.2 N N ND22 68 M - + - - 13.5 76 24 1 9 5 2.8 25.2 - 65 65 N N ND23 54 M - - - - 13 80 18 0.9 10.2 5.1 2.7 27.5 - 60 79.6 N N ND24 65 F - - - + 11 92 28 1 9.5 3.5 3 28.5 - 65 62 N N ND25 39 M - - + - 13 100 24 0.8 8.8 4 2.6 22.88 - 70 120 N N ND26 48 M + - - - 13.5 90 20 1 10 4.5 3 30 - 50 64 N N ND27 55 F - + - - 10 88 24 1 10.3 4.8 3.1 31.9 - 65 65.2 N N ND28 43 F - - - - 8 140 28 1.1 9.5 4 3.2 30.4 - 70 64 N N ND29 30 M - - - - 13 106 20 0.8 9.6 4.2 3 28.8 - 60 114 N N ND30 70 F - - + - 9 110 36 0.8 10.4 4.8 2.8 29.1 - 72 74.3 N N ND31 59 M - + - - 11 78 24 1 10 4 3 30 - 63 70 N N ND32 55 F - - - - 8 90 30 1.2 9 4.8 3.5 31.5 - 68 66.8 N N ND33 45 M + - + - 11.5 100 26 1.1 8.8 4 4 35.2 + 60 71.9 N N ND34 59 F - + - - 10 108 28 0.9 9.6 4.3 3.6 34.5 - 64 80 N N ND35 60 M - - - - 12 98 28 1 10.1 4.1 3 30.3 - 69 65.1 N N ND36 38 M - - - - 13 130 20 0.9 9.2 4.2 3.6 33.1 - 63 99.1 N N ND37 52 M + - - - 10 104 26 0.8 8.6 4.5 3 25.8 - 55 84 N N ND38 36 F - - - - 13 78 18 1 8.2 4 3.1 25.4 - 58 73.6 N N ND39 65 F - - - - 11 80 26 1.1 9.5 3.8 4.1 38.9 - 75 60.3 N N ND40 36 M - - - - 14 114 16 1 10 4 4 40 - 48 69 N N ND41 42 F + - - - 11.5 128 20 0.8 9.6 3.5 3 28.8 - 68 98 N N ND42 62 F - + - - 12 150 36 0.8 10.1 5 3.5 35.35 - 65 75 N N ND43 36 M - - - - 13.5 90 18 1 9.5 3.8 3.6 34.2 - 60 86 N N ND44 72 F + - - - 8 100 30 0.9 8.9 4.2 4.3 38.27 - 70 62 N N ND45 53 F - - - - 10 88 24 1 9.4 4 4 37.6 - 60 62 N N ND46 28 F - - - - 12 118 16 0.7 10 4.5 2.9 29 - 58 109.5 N N ND47 55 M + - + - 10 86 20 1 9.8 5 3 29.4 - 60 70.8 N N ND48 68 F + - - - 11 90 26 0.9 10.4 3.5 4 41.6 - 72 68 C N ND49 48 F - - - - 7 88 25 1 10 4.6 3.1 31 - 70 76 N N ND50 54 M - + + - 12.5 96 28 1 8.8 4.4 3 26.4 - 60 71.6 N N ND
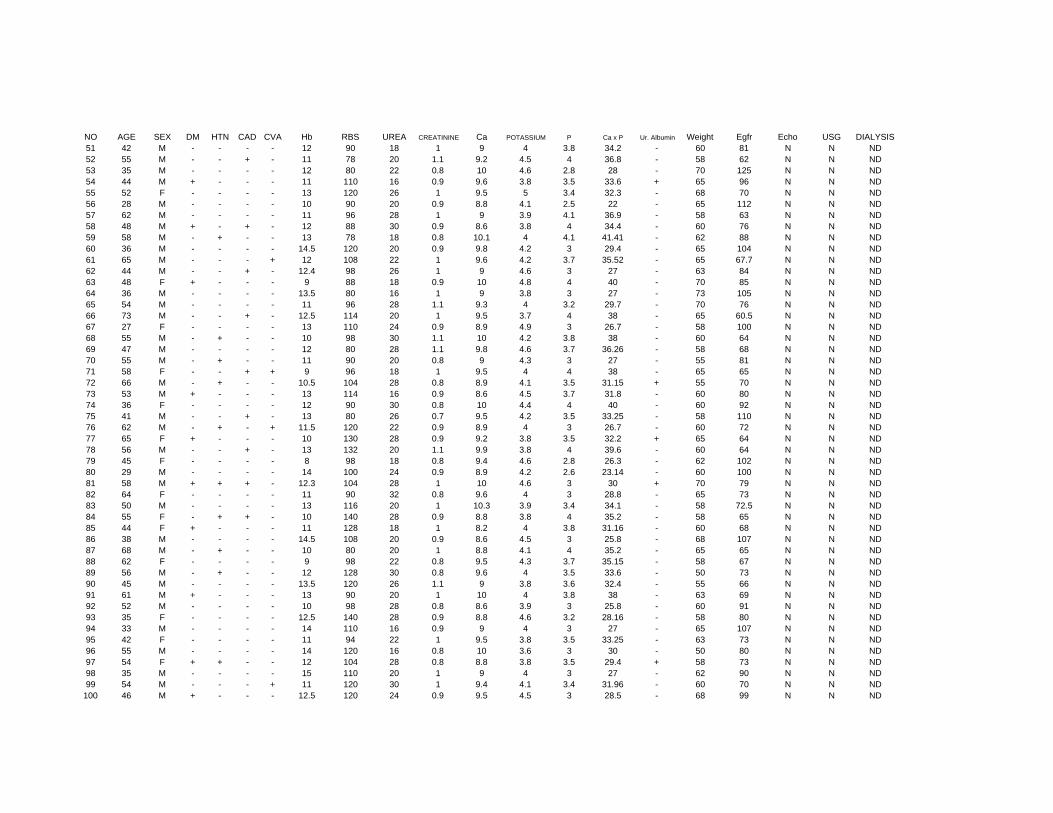
NO AGE SEX DM HTN CAD CVA Hb RBS UREA CREATININE Ca POTASSIUM P Ca x P Ur. Albumin Weight Egfr Echo USG DIALYSIS51 42 M - - - - 12 90 18 1 9 4 3.8 34.2 - 60 81 N N ND52 55 M - - + - 11 78 20 1.1 9.2 4.5 4 36.8 - 58 62 N N ND53 35 M - - - - 12 80 22 0.8 10 4.6 2.8 28 - 70 125 N N ND54 44 M + - - - 11 110 16 0.9 9.6 3.8 3.5 33.6 + 65 96 N N ND55 52 F - - - - 13 120 26 1 9.5 5 3.4 32.3 - 68 70 N N ND56 28 M - - - - 10 90 20 0.9 8.8 4.1 2.5 22 - 65 112 N N ND57 62 M - - - - 11 96 28 1 9 3.9 4.1 36.9 - 58 63 N N ND58 48 M + - + - 12 88 30 0.9 8.6 3.8 4 34.4 - 60 76 N N ND59 58 M - + - - 13 78 18 0.8 10.1 4 4.1 41.41 - 62 88 N N ND60 36 M - - - - 14.5 120 20 0.9 9.8 4.2 3 29.4 - 65 104 N N ND61 65 M - - - + 12 108 22 1 9.6 4.2 3.7 35.52 - 65 67.7 N N ND62 44 M - - + - 12.4 98 26 1 9 4.6 3 27 - 63 84 N N ND63 48 F + - - - 9 88 18 0.9 10 4.8 4 40 - 70 85 N N ND64 36 M - - - - 13.5 80 16 1 9 3.8 3 27 - 73 105 N N ND65 54 M - - - - 11 96 28 1.1 9.3 4 3.2 29.7 - 70 76 N N ND66 73 M - - + - 12.5 114 20 1 9.5 3.7 4 38 - 65 60.5 N N ND67 27 F - - - - 13 110 24 0.9 8.9 4.9 3 26.7 - 58 100 N N ND68 55 M - + - - 10 98 30 1.1 10 4.2 3.8 38 - 60 64 N N ND69 47 M - - - - 12 80 28 1.1 9.8 4.6 3.7 36.26 - 58 68 N N ND70 55 M - + - - 11 90 20 0.8 9 4.3 3 27 - 55 81 N N ND71 58 F - - + + 9 96 18 1 9.5 4 4 38 - 65 65 N N ND72 66 M - + - - 10.5 104 28 0.8 8.9 4.1 3.5 31.15 + 55 70 N N ND73 53 M + - - - 13 114 16 0.9 8.6 4.5 3.7 31.8 - 60 80 N N ND74 36 F - - - - 12 90 30 0.8 10 4.4 4 40 - 60 92 N N ND75 41 M - - + - 13 80 26 0.7 9.5 4.2 3.5 33.25 - 58 110 N N ND76 62 M - + - + 11.5 120 22 0.9 8.9 4 3 26.7 - 60 72 N N ND77 65 F + - - - 10 130 28 0.9 9.2 3.8 3.5 32.2 + 65 64 N N ND78 56 M - - + - 13 132 20 1.1 9.9 3.8 4 39.6 - 60 64 N N ND79 45 F - - - - 8 98 18 0.8 9.4 4.6 2.8 26.3 - 62 102 N N ND80 29 M - - - - 14 100 24 0.9 8.9 4.2 2.6 23.14 - 60 100 N N ND81 58 M + + + - 12.3 104 28 1 10 4.6 3 30 + 70 79 N N ND82 64 F - - - - 11 90 32 0.8 9.6 4 3 28.8 - 65 73 N N ND83 50 M - - - - 13 116 20 1 10.3 3.9 3.4 34.1 - 58 72.5 N N ND84 55 F - + + - 10 140 28 0.9 8.8 3.8 4 35.2 - 58 65 N N ND85 44 F + - - - 11 128 18 1 8.2 4 3.8 31.16 - 60 68 N N ND86 38 M - - - - 14.5 108 20 0.9 8.6 4.5 3 25.8 - 68 107 N N ND87 68 M - + - - 10 80 20 1 8.8 4.1 4 35.2 - 65 65 N N ND88 62 F - - - - 9 98 22 0.8 9.5 4.3 3.7 35.15 - 58 67 N N ND89 56 M - + - - 12 128 30 0.8 9.6 4 3.5 33.6 - 50 73 N N ND90 45 M - - - - 13.5 120 26 1.1 9 3.8 3.6 32.4 - 55 66 N N ND91 61 M + - - - 13 90 20 1 10 4 3.8 38 - 63 69 N N ND92 52 M - - - - 10 98 28 0.8 8.6 3.9 3 25.8 - 60 91 N N ND93 35 F - - - - 12.5 140 28 0.9 8.8 4.6 3.2 28.16 - 58 80 N N ND94 33 M - - - - 14 110 16 0.9 9 4 3 27 - 65 107 N N ND95 42 F - - - - 11 94 22 1 9.5 3.8 3.5 33.25 - 63 73 N N ND96 55 M - - - - 14 120 16 0.8 10 3.6 3 30 - 50 80 N N ND97 54 F + + - - 12 104 28 0.8 8.8 3.8 3.5 29.4 + 58 73 N N ND98 35 M - - - - 15 110 20 1 9 4 3 27 - 62 90 N N ND99 54 M - - - + 11 120 30 1 9.4 4.1 3.4 31.96 - 60 70 N N ND
100 46 M + - - - 12.5 120 24 0.9 9.5 4.5 3 28.5 - 68 99 N N ND
Copyright © 2022 FDOKUMEN