Cross sectional early mitral flow velocity profiles from colour Doppler
9
SO Samstad, O Rossvoll, HG Torp, T Skjaerpe and L Hatle with mitral valve disease Cross-sectional early mitral flow-velocity profiles from color Doppler in patients ISSN: 1524-4539 Copyright © 1992 American Heart Association. All rights reserved. Print ISSN: 0009-7322. Online 72514 Circulation is published by the American Heart Association. 7272 Greenville Avenue, Dallas, TX 1992, 86:748-755 Circulation http://circ.ahajournals.org/content/86/3/748 located on the World Wide Web at: The online version of this article, along with updated information and services, is http://www.lww.com/reprints Reprints: Information about reprints can be found online at [email protected] Fax: 410-528-8550. E-mail: Kluwer Health, 351 West Camden Street, Baltimore, MD 21202-2436. Phone: 410-528-4050. Permissions: Permissions & Rights Desk, Lippincott Williams & Wilkins, a division of Wolters http://circ.ahajournals.org//subscriptions/ Subscriptions: Information about subscribing to Circulation is online at by guest on July 10, 2011 http://circ.ahajournals.org/ Downloaded from
-
Upload
independent -
Category
Documents
-
view
0 -
download
0
Transcript of Cross sectional early mitral flow velocity profiles from colour Doppler

SO Samstad, O Rossvoll, HG Torp, T Skjaerpe and L Hatlewith mitral valve disease
Cross-sectional early mitral flow-velocity profiles from color Doppler in patients
ISSN: 1524-4539 Copyright © 1992 American Heart Association. All rights reserved. Print ISSN: 0009-7322. Online
72514Circulation is published by the American Heart Association. 7272 Greenville Avenue, Dallas, TX
1992, 86:748-755Circulation
http://circ.ahajournals.org/content/86/3/748located on the World Wide Web at:
The online version of this article, along with updated information and services, is
http://www.lww.com/reprintsReprints: Information about reprints can be found online at [email protected]: 410-528-8550. E-mail: Kluwer Health, 351 West Camden Street, Baltimore, MD 21202-2436. Phone: 410-528-4050. Permissions: Permissions & Rights Desk, Lippincott Williams & Wilkins, a division of Wolters http://circ.ahajournals.org//subscriptions/Subscriptions: Information about subscribing to Circulation is online at
by guest on July 10, 2011http://circ.ahajournals.org/Downloaded from

748
Cross-sectional Early Mitral Flow-VelocityProfiles From Color Doppler in Patients
With Mitral Valve DiseaseStein 0. Samstad, MD; Ole Rossvoll, MD; Hans G. Torp;
Terje Skjaerpe, MD, PhD; and Liv Hatle, MD
Background. Cross-sectional flow-velocity profiles from early mitral flow in 20 patients (10 with mitralregurgitation and 10 with mitral stenosis) were constructed from the velocity data from each point insequentially delayed two-dimensional digital Doppler ultrasound maps.Methods and Results. The data suggested that the early mitral flow studied in an apical four-chamber
view was variably skewed in both patient groups. The maximum flow velocity overestimated thecross-sectional mean velocity at the same time by a factor of 1.12-1.86. The maximum time-velocityintegral was 1.13-1.77-fold greater than the cross-sectional mean time-velocity integral. In patients withmitral regurgitation, the cross-sectional flow-velocity profile appeared to be most skewed at the level of themitral leaflet tips. The level of the mitral annulus appeared to give the most homogenous flow-velocitydistribution in both patient groups.
Conclusions. When calculations of volume flow are based on pulsed Doppler ultrasound recordings witha single sample volume, the possibility of a skewed flow-velocity profile must be taken into account.(Circulation 1992;86:748-755)KEY WoRDs * echocardiography, Doppler * mitral regurgitation * stenoses
T he recording of mitral blood flow velocities hasbeen used for cardiac stroke volume calcula-tion'-5 and for estimation of regurgitant frac-
tion in patients with mitral regurgitation.6 Variousmethods have been based on different ways of estimat-ing flow area combined with pulsed wave Dopplerultrasound recordings. In some of the methods, a flatflow-velocity distribution across the mitral orifice hasbeen assumed.1'24 This assumption was made by Lewiset all based on lateral movement of the pulsed waveDoppler sample volume at the depth of area measure-ment; others24 have based their assumption on a studyby Taylor and Whamond7 in anesthetized dogs. Re-cently, a variably skewed flow-velocity distribution ofthe early mitral blood flow has been suggested fromrecordings obtained in normal subjects.8The purpose of the present study was to obtain cross-
sectional flow-velocity profiles from the early mitralblood flow in patients with mitral valve disease usingtwo-dimensional color Doppler ultrasound. Second, wewanted to study the individual variability in the obtainedflow-velocity profiles both among patients with mitral
From the Section of Cardiology (S.O.S., O.R., T.S., L.H.),Department of Medicine, and the Institute of Biomedical Engi-neering (H.G.T.), Regional Hospital of Trondheim and Universityof Trondheim, Norway.
Supported by grants from the Norwegian Council on Cardiovas-cular Diseases and the Cardiac Research Fund of the RegionalHospital of Trondheim, Norway.Address for reprints: Dr. S.O. Samstad, Section of Cardiology,
Department of Medicine, Regional Hospital of Trondheim,N-7006 Trondheim, Norway.
Received February 14, 1992; revision accepted May 18, 1992.
regurgitation and among patients with mitral stenosisand to compare the findings from the two patient groups.
MethodsPatients
Twenty patients -10 with moderate or severe mitralregurgitation (Table 1) and 10 with mitral stenosis (Table2) -were included in the study after informed consenthad been received. All patients were in sinus rhythm.Patient age ranged from 31 to 80 years, and mean patientage was 63+10 years for patients with pure mitral regur-gitation and 57±15 years for patients with mitral stenosis.
Five of the patients with pure mitral regurgitation hadprolapse of one mitral leaflet (anterior leaflet in patients 2,3, and 9 and posterior leaflet in patients 4 and 8 [Table 1]).The other five patients in this group had dilation of the leftventricle with dilation of the mitral annulus as the mostplausible reason for the mitral regurgitation. A mild butclinically insignificant aortic regurgitation was present infour patients, whereas none had aortic stenosis.
Five of the patients with mitral stenosis also had mild(n=3) or moderate (n=2) mitral regurgitation (Table2). One of these patients had prolapse of the anteriormitral leaflet (patient 1 [Table 2]). Three patients hadmild aortic regurgitation (patients 1, 9, and 10 [Table2]), and one patient had mild aortic stenosis andmoderate aortic regurgitation (patient 7 [Table 2]).Patients 2 and 5 (Table 2) had had mitral valve com-missurotomy 7 and 19 years previously, respectively.
Doppler EchocardiographyThe patients were positioned in a left semirecumbent
position, and an apical four-chamber view to the mitral by guest on July 10, 2011http://circ.ahajournals.org/Downloaded from
Samstad et al Early Mitral Flow-Velocity Profiles 749
TABLE 1. Maximum Flow Velocity and Time-Velocity Integral of Early Mitral Inflow Compared With the Simultaneous Mean Velocityand Mean Time-Velocity Integral Across the Mitral Orifice at the Level of the Leaflet Tips and the Annulus in Patients With MitralRegurgitation
Velocity (cm/sec) Time-velocity integral (cm)Heart Leaflet tips Annulus Leaflet tips Annulusrate
Patient (bpm) MR Max* Mean* Max* Mean* Maxt Meant Maxt Meant
1 69 3 89 59 56 44 12.1 7.9 7.8 5.52 62 3 98 58 68 55 8.9 6.1 7.8 5.53 73 2 117 71 46 31 23.2 13.1 12.0 8.34 77 3 131 79 106 57 17.9 10.9 10.1 6.25 76 3 129 76 73 45 17.2 11.1 8.5 6.46 83 2 101 67 88 61 12.0 8.6 9.4 6.17 64 2 92 67 44 30 14.5 10.3 7.1 6.38 81 3 114 83 69 50 16.9 11.9 11.1 8.69 77 2 131 85 61 51 21.5 16.4 14.3 11.210 73 2 121 69 72 55 12.0 7.8 9.3 6.5Mean 73.5 112.3 71.4 68.3 47.9 15.6 10.4 9.7 7.1SD 6.8 16.2 9.3 18.7 10.5 4.6 3.0 2.2 1.8
bpm, Beats per minute; MR, severity of mitral regurgitation: 1, mild; 2, moderate; 3, severe; *max and mean, maximum velocity of theearly mitral flow and cross-sectional mean velocity at the time of maximum velocity, respectively; tmax and mean, time-velocity integralfrom the point in the flow sector giving the maximum value of early mitral flow and mean cross-sectional time-velocity integral of early mitralflow, respectively.
valve was used. The patients were asked to stop respi-ration in passive end expiration.The recordings were made with a combined two-
dimensional echocardiographic and color Doppler ul-trasonograph (VingMed CFM 700, VingMed Sound,Oslo, Norway). A combined imaging (3.0 MHz) andDoppler (2.5 MHz) transducer was used. The high-passfilter limit was set at 0.19 m/sec; the reject was set to theminimum value; and the gain settings were adjusted toprovide optimal recording quality. The highest velocitythat could be recorded with the two-dimensional Dopp-ler technique was 180 cm/sec, i.e., twice the Nyquistfrequency minus the high-pass filter limit. The radialresolution was 1.6 mm, defined as the depth range of the
flow sector divided by the number of samples in radialdirection. Velocity data were resampled from two sam-
ples in the radial direction, giving a resolution of 3.2 mmin radial direction from the transducer. The lateralresolution was 2.4-2.9 mm, defined as a 50% decreasein the backscatter signal from the central maximum at a
depth of 8-10 cm from the transducer.A routine echocardiographic and conventional Dopp-
ler ultrasound examination with grading of mitral regur-gitation and stenosis was done. Mitral regurgitation wasgraded in a semiquantitative way from the impressionsof the extent of the regurgitant flow in the left atriumcombined with the intensity of the jet signal comparedwith that of forward flow and the width of the regur-
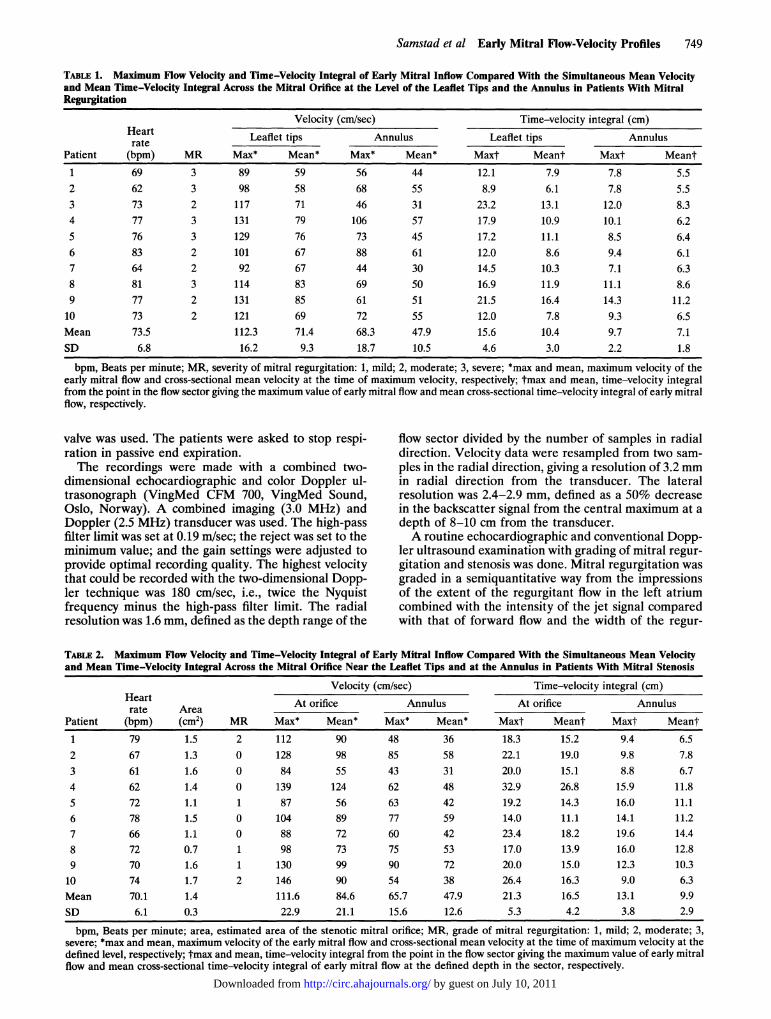
TABLE 2. Maximum Flow Velocity and Time-Velocity Integral of Early Mitral Inflow Compared With the Simultaneous Mean Velocityand Mean Time-Velocity Integral Across the Mitral Orifice Near the Leaflet Tips and at the Annulus in Patients With Mitral Stenosis
Velocity (cm/sec) Time-velocity integral (cm)Heart At orifice Annulus At orifice Annulusrate Area
Patient (bpm) (cm2) MR Max* Mean* Max* Mean* Maxt Meant Maxt Meant1 79 1.5 2 112 90 48 36 18.3 15.2 9.4 6.52 67 1.3 0 128 98 85 58 22.1 19.0 9.8 7.83 61 1.6 0 84 55 43 31 20.0 15.1 8.8 6.74 62 1.4 0 139 124 62 48 32.9 26.8 15.9 11.85 72 1.1 1 87 56 63 42 19.2 14.3 16.0 11.16 78 1.5 0 104 89 77 59 14.0 11.1 14.1 11.27 66 1.1 0 88 72 60 42 23.4 18.2 19.6 14.48 72 0.7 1 98 73 75 53 17.0 13.9 16.0 12.89 70 1.6 1 130 99 90 72 20.0 15.0 12.3 10.310 74 1.7 2 146 90 54 38 26.4 16.3 9.0 6.3Mean 70.1 1.4 111.6 84.6 65.7 47.9 21.3 16.5 13.1 9.9SD 6.1 0.3 22.9 21.1 15.6 12.6 5.3 4.2 3.8 2.9
bpm, Beats per minute; area, estimated area of the stenotic mitral orifice; MR, grade of mitral regurgitation: 1, mild; 2, moderate; 3,severe; *max and mean, maximum velocity of the early mitral flow and cross-sectional mean velocity at the time of maximum velocity at thedefined level, respectively; tmax and mean, time-velocity integral from the point in the flow sector giving the maximum value of early mitralflow and mean cross-sectional time-velocity integral of early mitral flow at the defined depth in the sector, respectively.
by guest on July 10, 2011http://circ.ahajournals.org/Downloaded from

750 Circulation Vol 86, No 3 September 1992
gitant jet at the orifice.9 Mitral stenosis was gradedaccording to the mean gradient and the pressure half-time obtained from maximum jet velocities.'0
In the color flow mode, a series of two-dimensionalflow maps was recorded from the early mitral inflow.Each flow map was time-gated by the preceding R waveof the simultaneously recorded ECG, and the time delayfrom the R wave to the start of the flow map wasincreased by 20 msec from one heartbeat to the next.The sweep time, i.e., the time required by the ultrasono-graph to record each flow map, was set to 65 msec in allpatients. Before each flow map was recorded, a two-dimensional tissue image of the same plane was re-corded. Therefore, one tissue map and one flow mapwere recorded from each heartbeat. The first tissue andflow maps were recorded at the start of the early mitralblood flow, and the recording period was terminatedafter onset of the atrial contraction with its increase inmitral flow velocity.The combined tissue and two-dimensional flow-veloc-
ity recordings from each series of the sequentiallydelayed maps were transferred from the digital replaymemory of the ultrasonograph to an external computer(Macintosh II, Apple Computer, Inc., Cupertino, Calif.)immediately after the recording period using a commer-cial data program (TRANSDISP, VingMed Sound, Oslo)and a commercial data port (NBDIO 24, NationalInstruments, Austin, Tex.).11 In addition, each of therecording series was recorded on videotape for latermeasurement of time intervals.The digital flow-velocity data from the early mitral
flow period were postprocessed with the TRANSDISPprogram on the Macintosh computer. The duration ofeach flow map was known, as were the time delaysfrom one flow map to the next relative to the precedingR wave of the ECG. Therefore, the skew of therecorded flow profiles caused by the sweep timenecessary to record each flow map could be correctedfor by time interpolation between the serially obtainedflow maps. This procedure has been described in detailelsewhere.8,'2From the recorded flow maps, time-corrected cross-
sectional flow-velocity profiles could be constructed atany level of the mitral inflow with the computer soft-ware. In this study, profiles were constructed at 20-msecintervals throughout the early mitral flow period, andthe velocities were calculated for each 2 mm across theflow channel. In each patient group, two levels werechosen for further analysis. In the patients with mitralregurgitation, the levels at the mitral annulus and at theleaflet tips were analyzed. In the patients with mitralstenosis, the velocity profiles at the mitral annulus andat a level near the stenotic orifice were analyzed. Theposition near the orifice was chosen 3-5 mm upstreamfrom where the flow velocity reached a velocity twicethe Nyquist frequency. All cross-sectional flow-velocityprofiles were traced perpendicular to the assumed di-rection of blood flow. The levels of flow-velocity profilecalculation were selected at the time of peak flow.The time-corrected cross-sectional flow-velocity pro-
files from each patient were displayed as either three-dimensional plots (Figures 1 and 2) or data arrayssuitable for further analysis. At each level in the mitralflow channel, the ratio of the maximum flow velocity to
flow was calculated, as was the relative position withinthe orifice of the maximum flow velocity in each patient(Figures 3 and 4). In addition, the time-velocity integralfrom each position across the flow channel was calcu-lated to obtain the ratio of the maximum to the cross-sectional mean time-velocity integral and the relativeposition of the maximum value within the orifice (Fig-ures 5 and 6).
Statistical AnalysisResults are given as ranges and sample mean values
(SD) from each of the two patient groups, and wheresuitable, results from the two groups were comparedusing the Bonferroni t test.13
ResultsThe results were plotted as cross-sectional flow-
velocity profiles versus time to provide a three-dimen-sional impression of the flow-velocity distribution withtime. The largest variability in the flow-velocity distri-bution was found at the level of the mitral leaflet tips inthe patients with mitral regurgitation. In these patients,the flow-velocity profile at the leaflet tips ranged fromclearly skewed with the highest velocities located closeto either the anterior or the posterior mitral leaflet to a
nearly parabolic shape with the highest velocities almostcentral in the orifice (Figures 1A and 1C). At the levelof the mitral annulus (Figures 1B and 1D), the flow-velocity distribution appeared to be flatter, but somevariation between the patients remained. In patientswith mitral stenosis (Figure 2), the cross-sectional flow-velocity distribution appeared to be more homogenousthan in the patients with mitral regurgitation, except inpatient 10, who had combined moderate mitral regur-gitation and stenosis (Table 2).
Cross-sectional Flow-Velocity Profiles at Peak FlowThe difference between the maximum and the cross-
sectional mean velocities ranged from 10 cm/sec at thelevel of the mitral annulus in patient 9 (Table 1) to 56cm/sec at the level near the stenotic orifice in patient 10(Table 2). Mean differences were 20±11.7 cm/sec and41± 10.3 cm/sec at the level of the annulus and at themitral leaflet tips in the patients with mitral regurgita-tion, respectively. In patients with mitral stenosis, meandifferences were 18±4.7 cm/sec and 27±12.1 cm/sec atthe annulus and at the level near the stenotic orifice,respectively.At the time of peak mitral flow, the ratios of the
maximum to the cross-sectional mean flow velocity inpatients with mitral regurgitation ranged from 1.2 to1.86 with a mean value of 1.43±0.2 at the annulus andfrom 1.37 to 1.75 with a mean of 1.58±0.13 at the leaflettips (Figure 3A). In the patients with mitral stenosis,this ratio ranged from 1.25 to 1.5 with a mean of1.38±0.08 at the annulus and from 1.12 to 1.62 with a
mean of 1.34+0.17 at the level near the stenotic orifice(Figure 4A).
Figures 3 and 4 show the ratios of the maximum to thecross-sectional mean velocity and the relative locationsof the maximum velocity within the mitral orifice at thetwo levels of measurement in both the patients with
the cross-sectional mean velocity at the time of peak mitral regurgitation and those with mitral stenosis. by guest on July 10, 2011http://circ.ahajournals.org/Downloaded from

b)
d)
Samstad et al Early Mitral Flow-Velocity Profiles 751
Velocity
position
a)
c)
Cross-sectional Distribution of theTime-Velocity IntegralsThe difference between the maximum time-velocity
integral and the cross-sectional mean time-velocity inte-gral from the same time period ranged from 1 cm at thelevel of the mitral annulus in patient 7 (Table 1) to 10 cmat the level near the stenotic orifice in patient 10 (Table 2).The mean differences between the maximum and thecross-sectional mean time-velocity integrals were 2.7+0.9cm and 5.2±2.1 cm at the annulus and at the level of theleaflet tips in the patients with mitral regurgitation, re-spectively. The respective differences in the patients withmitral stenosis were 3.2±1.2 cm at the annulus and4.8±2.2 cm at the level near the stenotic orifice.The maximum time-velocity integrals overestimated
the cross-sectional mean time-velocity integral at allsites of recording in both patient groups. In the patientswith mitral regurgitation, the maximum overestimatedthe mean cross-sectional time-velocity integral with aratio ranging from 1.13 to 1.63 and a mean of 1.39±0.14at the annulus and a ratio ranging from 1.31 to 1.77 anda mean of 1.5±0.13 at the level of the leaflet tips. Inpatients with mitral stenosis, the same ratio ranged from1.19 to 1.45 with a mean of 1.33±0.09 at the mitralannulus and from 1.16 to 1.62 with a mean of 1.3±0.13at the level near the stenotic orifice.The ratios of the maximum to the mean cross-
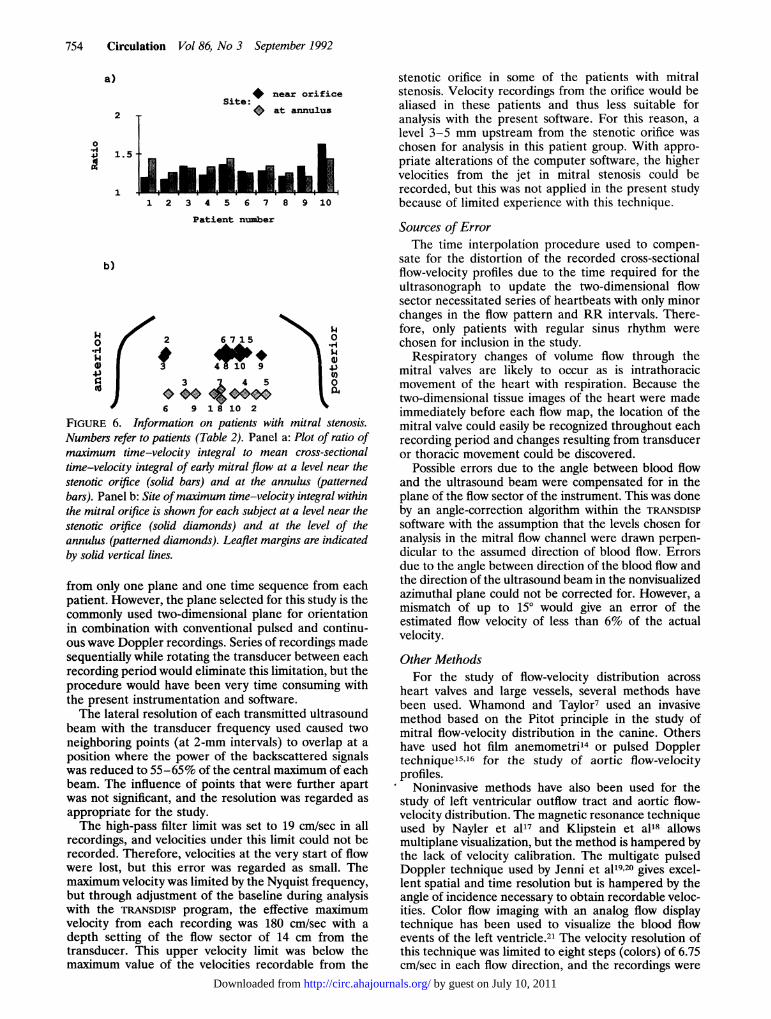
sectional time-velocity integrals and the relative loca-tion of the maximum time-velocity integrals at the twolevels of recording are shown for each patient in Figures5 (mitral regurgitation) and 6 (mitral stenosis).
100
FIGURE 1. Plots of instanta-neous early mitral flow-velocityprofiles against time in two pa-tients with mitral regurgitation.Axis scaling and orientation areshown at top. Plots a and b arefrom patient 4 (Table 1), andplots c and d are from patient 9.Left panels: Plots a and c arerecorded at the level ofthe mitralleaflet tips. Right panels: Plots band d are recorded at the level ofthe annulus.
Heart rate ranged from 62 to 83 beats per minute(mean, 73.5±6.8 beats per minute) in the patients withmitral regurgitation (Table 1) and from 61 to 79 beatsper minute (mean, 70.1±6.1 beats per minute) in thepatients with mitral stenosis.
DiscussionThe data indicate that the flow-velocity distribution
across the mitral orifice varies among patients withmitral regurgitation as well as patients with mitralstenosis. In patients with mitral regurgitation, the mostuniform flow-velocity distribution was seen at the levelof the mitral annulus. At the orifice, the profile wasmore skewed, as indicated in Figure 1. In patients withmitral stenosis, the velocity distributions were moresimilar both at the annulus and at a level near thestenotic orifice and the velocity profile did not appear tobecome more skewed closer to the orifice (Figure 2).
Cross-sectional Flow- VelocityDistribution at Peak FlowThe maximum velocity versus the simultaneous mean
cross-sectional flow velocity gives an indication of theskewness of the flow-velocity profile at the time of peakflow. The maximum velocity overestimated the cross-sectional mean flow velocity by a factor of 1.12-1.86 atpeak flow, indicating a considerable variation among the20 patients examined. No significant differences betweenthe level of the annulus and the level at or near the mitralleaflet tips were found within any of the patient groups.However, in patients with mitral regurgitation, the mean
by guest on July 10, 2011http://circ.ahajournals.org/Downloaded from

752 Circulation Vol 86, No 3 September 1992
Velocity
Position
a) t
100
b)FIGURE 2. Plots of instantaneous early mitralflow-velocity profiles against time in two patientswith mitral stenosis. Axis scaling and orientationare shown at top. Plots a and b are from patient7, and plots c and d arefrom patient 4 (Table 2).Left panels: Plots a and c are recorded at a levelnear the stenotic orifice ofthe mitral valve. Rightpanels: Plots b and d are recorded at the level ofthe annulus.
d)
ratio obtained at the level of the mitral leaflet tips wassignificantly different from the ratios obtained both at thelevel of the mitral annulus and at the level near the mitralorifice in patients with mitral stenosis (p<0.05).
Cross-sectional Distribution ofthe Time-Velocity Integral
In volume-flow calculations, the time-velocity inte-gral obtained from pulsed Doppler recordings is multi-plied with the flow area. In the present study, thetime-velocity integrals were calculated at each pointacross the mitral orifice. The maximum versus the meancross-sectional time-velocity integral gives an impres-sion of the possible errors in volume-flow calculationdepending on the sample volume position during thevelocity recording. The maximum overestimated thecross-sectional mean time-velocity integral by a factorof 1.19-1.77 in the 20 patients studied. Within each ofthe patient groups, there were no significant differencesbetween the obtained ratios at the two levels of record-ing. The mean ratio obtained at the level of the mitralleaflet tips in the patients with mitral regurgitation wassignificantly larger than the ratios obtained both nearthe stenotic orifice and at the annulus in patients withmitral stenosis (p<0.05).
Location ofMaximum Velocity and MaximumTime-Velocity IntegralAs expected from the variability among patients in
the cross-sectional flow-velocity distribution with time(Figures 1 and 2), a wide variation in the relativelocations of the maximum velocities and the maximumtime-velocity integrals was found (Figures 3-6). In the
a) Site:* Leaflet tipAnulus
1 2 3 4 5 6 7 8 9 10
Patient number
b)
o 7 4 1 10
O 2 a 6 S 3 9 Ol
0
J 5l 6 10 8 toi7 2 4 9 1 3
FIGURE 3. Information on patients with mitral regurgita-tion. Numbers refer topatients (Table 1). Panel a: Plot ofratioofmaximum velocity to mean cross-sectional flow velocity atthe time ofmaximum velocity ofearly mitralflow at the leaflettips (solid bars) and at the annulus (patterned bars). Panel b:Site ofmaximum velocity within the mitral orifice is shown foreach patient at the level of the mitral leaflet tips (soliddiamonds) and at the annulus (patterned diamonds). Leafletmargins are indicated as solid vertical lines.
by guest on July 10, 2011http://circ.ahajournals.org/Downloaded from

Samstad et al Early Mitral Flow-Velocity Profiles 753
Site:near orifice
0 at annulus
2
0
4 1 .
1 2 3 4 5 6 7 8 9 10
Patient number
0.,A
a)Site:
2
1.5 -0
1
* Leaflet tip
* Annulus
1 2 3 4 5 6 7 8 9 10
Patient number
b)
H40
.84
H40
43
c:(U
3 8 7 5 4 0o~~~~~~~~~~
at** w-a lr2 10 6 9
0° P 44m0$* 04
V3 6 4
FIGURE 4. Information on patients with mitral stenosis.Numbers refer to patients (Table 2). Panel a: Plot of ratio ofmaximum velocity to mean cross-sectionalflow velocity at thetime ofmaximum velocity ofearly mitralflow at the level nearthe stenotic orifice (solid bars) and at the annulus (patternedbars). Panel b: Site of maximum velocity within the mitralorifice is shown for each patient at the level near the stenoticorifice (solid diamonds) and at the annulus (patterned dia-monds). Leaflet margins are indicated as solid vertical lines.
H40
H4(043)c: J
4 7 65 3
2 1 8 10 9
4 7 18
5 6 2
3
10 9
.,,
to(004
1%4i4FIGURE 5. Information on patients with mitral regurgitation.Numbers refer to patients (Table 1). Panel a: Plot of ratio ofmaximum time-velocity integral to mean cross-sectional time-velocity integral ofearly mitralflow at the level ofthe leaflet tips(solid bars) and at the annulus (patterned bars). Panel b: Siteofmaximum time-velocity integral within the mitral orifice isshown for each subject at the level of the leaflet tips (soliddiamonds) and at the level of the annulus (patterned dia-monds). Leaflet margins are indicated by solid vertical lines.
five patients with mitral regurgitation due to mitral valveprolapse, the highest velocities as well as the maximumtime-velocity integrals at the orifice were found on thecontralateral side of the prolapsing valve (n=4) or onthe ipsilateral side (n= 1). This might be due to thedirection of the regurgitant jet following the atrial wallaround the cavity of the left atrium during systole andpossibly contributing to an increased velocity on eitherof the two sides of the mitral flow channel duringdiastole. In the other patients, the regurgitant jets werenot directed to either of the sides of the left atrium.These patients showed no definite pattern regardingwhere the maximum values were recorded -not at thelevels of the mitral annulus or close to the orifice ofmitral valve. This finding was in contrast to a similarstudy on normal subjects in which the highest velocitiesusually were found closer to the anterior than to theposterior leaflet.8 The maximum time-velocity integralsappeared to be located slightly more centrally than therespective maximum velocities in both the patients withmitral regurgitation and those with mitral stenosis.
Clinical ImplicationsThe finding of a variably skewed velocity distribution
of mitral blood flow may have clinical implications.Volume flow calculations from pulsed wave Dopplerrecordings may be critically hampered by the lack ofinformation about velocities outside the Doppler sam-
ple area when the cross-sectional flow-velocity distribu-tion is highly skewed or parabolic. In addition, the
relative location of the maximum time-velocity integralshad variable locations within the mitral orifice in pa-
tients with mitral regurgitation. For the purpose ofvolume flow calculations, the level of the mitral annulusappears to be more suitable since the flow-velocitydistribution was more homogenous at this location.
In patients with mitral stenosis, the flow-velocitydistribution appeared to be more uniform than that inthose with mitral regurgitation except for patient 10,who had combined mild mitral stenosis and moderatemitral regurgitation (Table 2). However, variations inthe relative location of the maximum velocity as well asin the maximum time-velocity integral within the orificewere also found in this patient group. The finding of a
relatively flat flow-velocity profile at the level of themitral annulus makes thLs location more suitable forvolume flow calculations and thus for calculations of thestenotic flow area based on the continuity equation.
In the present study, no correction for the diastolicmovement of the mitral annulus in the longitudinal direc-tion of the heart was made because this usually cannot bedone when recordings are made with regular pulsedDoppler ultrasound. Thus, the effective flow area at thetwo levels of recording was subjected to changes due notonly to the blood flow but also to relative movement of theanatomic structures during the recording period.
Study LimitationsThe main limitation of the present study was that the
cross-sectional flow-velocity profiles were obtained
a)
1
b)
by guest on July 10, 2011http://circ.ahajournals.org/Downloaded from
754 Circulation Vol 86, No 3 September 1992
a)
Site:* near orifice
A +. st,. W-.2 * az ann- s
0
*144) 1.5
11 2 3 4 5 6 7 8 9 10
Patient number
b)
$42
.14o
$4
4J3
6 9
6 7 15
4110 9
4 5
1 8 10 2
$4
0
$4
43)(I)
0
FIGURE 6. Information on patients with mitral stenosis.Numbers refer to patients (Table 2). Panel a: Plot of ratio ofmaximum time-velocity integral to mean cross-sectionaltime-velocity integral of early mitral flow at a level near thestenotic orifice (solid bars) and at the annulus (patternedbars). Panel b: Site ofmaximum time-velocity integral withinthe mitral orifice is shown for each subject at a level near thestenotic orifice (solid diamonds) and at the level of theannulus (patterned diamonds). Leaflet margins are indicatedby solid vertical lines.
from only one plane and one time sequence from eachpatient. However, the plane selected for this study is thecommonly used two-dimensional plane for orientationin combination with conventional pulsed and continu-ous wave Doppler recordings. Series of recordings madesequentially while rotating the transducer between eachrecording period would eliminate this limitation, but theprocedure would have been very time consuming withthe present instrumentation and software.The lateral resolution of each transmitted ultrasound
beam with the transducer frequency used caused twoneighboring points (at 2-mm intervals) to overlap at a
position where the power of the backscattered signalswas reduced to 55-65% of the central maximum of eachbeam. The influence of points that were further apartwas not significant, and the resolution was regarded as
appropriate for the study.The high-pass filter limit was set to 19 cm/sec in all
recordings, and velocities under this limit could not berecorded. Therefore, velocities at the very start of flowwere lost, but this error was regarded as small. Themaximum velocity was limited by the Nyquist frequency,but through adjustment of the baseline during analysiswith the TRANSDISP program, the effective maximumvelocity from each recording was 180 cm/sec with a
depth setting of the flow sector of 14 cm from thetransducer. This upper velocity limit was below themaximum value of the velocities recordable from the
stenotic orifice in some of the patients with mitralstenosis. Velocity recordings from the orifice would bealiased in these patients and thus less suitable foranalysis with the present software. For this reason, alevel 3-5 mm upstream from the stenotic orifice waschosen for analysis in this patient group. With appro-priate alterations of the computer software, the highervelocities from the jet in mitral stenosis could berecorded, but this was not applied in the present studybecause of limited experience with this technique.
Sources of ErrorThe time interpolation procedure used to compen-
sate for the distortion of the recorded cross-sectionalflow-velocity profiles due to the time required for theultrasonograph to update the two-dimensional flowsector necessitated series of heartbeats with only minorchanges in the flow pattern and RR intervals. There-fore, only patients with regular sinus rhythm werechosen for inclusion in the study.
Respiratory changes of volume flow through themitral valves are likely to occur as is intrathoracicmovement of the heart with respiration. Because thetwo-dimensional tissue images of the heart were madeimmediately before each flow map, the location of themitral valve could easily be recognized throughout eachrecording period and changes resulting from transduceror thoracic movement could be discovered.
Possible errors due to the angle between blood flowand the ultrasound beam were compensated for in theplane of the flow sector of the instrument. This was doneby an angle-correction algorithm within the TRANSDISPsoftware with the assumption that the levels chosen foranalysis in the mitral flow channel were drawn perpen-dicular to the assumed direction of blood flow. Errorsdue to the angle between direction of the blood flow andthe direction of the ultrasound beam in the nonvisualizedazimuthal plane could not be corrected for. However, amismatch of up to 150 would give an error of theestimated flow velocity of less than 6% of the actualvelocity.
Other MethodsFor the study of flow-velocity distribution across
heart valves and large vessels, several methods havebeen used. Whamond and Taylor7 used an invasivemethod based on the Pitot principle in the study ofmitral flow-velocity distribution in the canine. Othershave used hot film anemometri'4 or pulsed Dopplertechnique15'16 for the study of aortic flow-velocityprofiles.
Noninvasive methods have also been used for thestudy of left ventricular outflow tract and aortic flow-velocity distribution. The magnetic resonance techniqueused by Nayler et al17 and Klipstein et al18 allowsmultiplane visualization, but the method is hampered bythe lack of velocity calibration. The multigate pulsedDoppler technique used by Jenni et al1920 gives excel-lent spatial and time resolution but is hampered by theangle of incidence necessary to obtain recordable veloc-ities. Color flow imaging with an analog flow displaytechnique has been used to visualize the blood flowevents of the left ventricle.2' The velocity resolution ofthis technique was limited to eight steps (colors) of 6.75cm/sec in each flow direction, and the recordings were
by guest on July 10, 2011http://circ.ahajournals.org/Downloaded from

Samstad et al Early Mitral Flow-Velocity Profiles 755
done during several heartbeats. No correction for thedistortion of the flow-velocity profiles introduced by thesweep time was done.
ConclusionsThe results of the present study provide new infor-
mation on the distribution of early mitral flow velocityacross the mitral valve at a level close to or at the orificeand at the annulus in patients with mitral valve disease.The instantaneous flow-velocity profiles obtained froman apical four-chamber view were variably skewed atboth levels in both the patients with mitral regurgitationand those with mitral stenosis. The possibility of askewed flow-velocity distribution should be borne inmind when recordings from a small area in the valveorifice are used for volume flow calculations.
References1. Lewis JF, Kuo LC, Nelson JG, Limacher MC, Quinones MA:
Pulsed Doppler echocardiographic determination of stroke volumeand cardiac output: Clinical validation of two new methods usingthe apical window. Circulation 1984;70:425-431
2. Zhang Y, Nitter-Hauge S, Ihlen H, Myhre E: Doppler echocardio-graphic measurement of cardiac output using the mitral orificemethod. Br Heart J 1985;53:130-136
3. Goldberg SJ, Dickinson DF, Wilson N: Evaluation of an ellipticalarea technique for calculating mitral blood flow by Doppler echo-cardiography. Br Heart J 1985;54:68-75
4. de Zuttere D, Touche T, Saumon G, Nitenberg A, Prasquier R:Doppler echocardiographic measurement of mitral flow volume:Validation of a new method in adult patients. JAm Coll Cardiol1988;11:343-350
5. Hoit BD, Rashwan M, Watt C, Sahn DJ, Bhargava V: Calculatingcardiac output from transmitral volume flow using Doppler andM-mode echocardiography. Am J Cardiol 1988;62:131-135
6. Zhang Y, Ihlen H, Myhre E, Levorstad K, Nitter-Hauge S: Mea-surement of mitral regurgitation by Doppler echocardiography. BrHeart J 1985;54:384-391
7. Taylor DEM, Whamond JS: Velocity profile and impedance of thehealthy mitral valve, in Kalmanson D (ed): The Mitral Valve: A
Pluridisciplinary Approach. Acton, Mass, Publishing SciencesGroup Inc, 1976, p 127
8. Samstad SO, Torp HG, Linker DT, Rossvoll 0, Skjaerpe T,Johansen E, Kristoffersen K, Angelsen BAJ, Hatle L: Cross sec-tional early mitral flow velocity profiles from colour Doppler. BrHeart J 1989;62:177-184
9. Samstad SO, Skjaerpe T, Hegrenaes L, Haugland T, Nordby A:Evaluation of mitral regurgitation with Doppler ultrasound andcineangiography: A comparative study of two semiquantitativetechniques. J Cardiovasc Technol 1989;8:203-209
10. Hatle L, Angelsen BA, Tromsdal A: Noninvasive assessment ofatrioventricular pressure half-time by Doppler ultrasound. Circu-lation 1979;60:1096-1104
11. Linker DT, Johansen E, Torp H, Angelsen BAJ: Practical consid-erations and design of a digital system for acquisition of two-dimensional ultrasonic tissue and flow data. Echocardiography1988;5:485-494
12. Samstad SO, Torp HG, Matre K, Rossvoll 0, Segadal L, Piene H:Instantaneous cross-sectional flow velocity profiles: A comparativestudy of two ultrasound Doppler methods applied to an in vitropulsatile flow model. JAm Soc Echo 1990;3:451-464
13. Glantz SA: Primer of Biostatistics, ed 2. New York, McGraw-HillBook Co, 1987
14. Paulsen PK, Hasenkam JM: Three-dimensional visualization ofvelocity profiles in the ascending aorta in dogs, measured with ahot-film anemometer. J Biomech 1983;16:201-210
15. Seed WA, Wood NB: Velocity patterns in the aorta. CardiovascRes 1971;5:319-330
16. Segadal L, Matre K: Blood velocity distribution in the humanascending aorta. Circulation 1987;76:90-100
17. Nayler GL, Firmin DN, Longmore DB: Blood flow imaging by cinemagnetic resonance. J Comput Assist Tomogr 1986;10:715-722
18. Klipstein RH, Firmin DN, Underwood SR, Rees RSO, LongmoreDB: Blood flow patterns in the human aorta studied by magneticresonance. Br Heart J 1987;58:316-323
19. Jenni R, Vieli A, Ruffmann K, Krayenbuehl HP, Anliker M: Acomparison between single gate and multigate ultrasonic Dopplermeasurements for the assessment of the velocity pattern in thehuman ascending aorta. Eur Heart J 1984;5:948-953
20. Jenni R, Ruffmann K, Vieli A, Anliker M, Krayenbuehl HP:Dynamics of aortic flow in hypertrophic cardiomyopathy. EurHeartJ 1985;6:391-398
21. Takabatake H, Sasayama S, Asanoi H, Tanaka I, Ando M, KiharaY, Fujita M: A new two-dimensional color flow mapping system forthe visualization of flow velocity profile. J Cardiovasc Technol 1990;9:173-180
by guest on July 10, 2011http://circ.ahajournals.org/Downloaded from