Privacy Implications of Automated GPS Tracking and Profiling
Automated Real-Time Search and Analysis Algorithms for a Non-Contact 3D Profiling System
37
Transcript of Automated Real-Time Search and Analysis Algorithms for a Non-Contact 3D Profiling System

Automated Real-Time Search and Analysis Algorithms for a Non-
Contact 3D Profiling System
Mark Haynes, [email protected], IE Department, Kansas State University
Chih-Hang John Wu, [email protected], IMSE Department, Kansas State University
B. Terry Beck, [email protected], MNE Department, Kansas State University
Robert J. Peterman, [email protected], CE Department, Kansas State University
ABSRACT
The purpose of this research is to develop a new means of identifying and extracting geometrical feature statistics from a
non-contact precision-measurement 3D profilometer. Autonomous algorithms have been developed to search through
large-scale Cartesian point clouds to identify and extract geometrical features. These algorithms are developed with the
intent of providing real-time production quality control of cold-rolled steel wires. The steel wires in question are pre-
stressing steel reinforcement wires for concrete members. The geometry of the wire is critical in the performance of the
overall concrete structure.
For this research a custom 3D non-contact profilometry system has been developed that utilizes laser displacement
sensors for submicron resolution surface profiling. Optimizations in the control and sensory system allow for data points
to be collected at up to an approximate 400,000 points per second. In order to achieve geometrical feature extraction and
tolerancing with this large volume of data, the algorithms employed are optimized for parsing large data quantities. The
methods used provide a unique means of maintaining high resolution data of the surface profiles while keeping algorithm
running times within practical bounds for industrial application.
By a combination of regional sampling, iterative search, spatial filtering, frequency filtering, spatial clustering, and
template matching a robust feature identification method has been developed. These algorithms provide an autonomous
means of verifying tolerances in geometrical features. The key method of identifying the features is through a
combination of downhill simplex and geometrical feature templates. By performing downhill simplex through several
procedural programming layers of different search and filtering techniques, very specific geometrical features can be
identified within the point cloud and analyzed for proper tolerancing. Being able to perform this quality control in real
time provides significant opportunities in cost savings in both equipment protection and waste minimization.
KEYWORD LIST
Geometrical, Dimensioning, Tolerancing, Automated, Measurement, Search, Algorithms, Surface, Profiling

Page | 13
FIGURE 4.1: FREQUENCY PLOT FOR VARIOUS PARAMETERS FOR ACQUIRING COMPANIES
From the above graph we can see that PBDITA and PAT have shown improvement in maximum number of cases whereas Current Ratio seems to have deteriorated post merger for the acquiring companies. Cost Efficiency has improved in nearly half the cases and deteriorated in the remaining half. 4.2. Model I
The following are the results for various parameters �–
TABLE 4.2: RESULTS FOR PRE-POST MERGER COMPARISON
Parameter Pre/Post Series JB Statistic Wilcoxon/Mann Whitney Pre-Merger 5982.70 1.8765 Post-Merger 5082.70 Pre-Merger 6002.56 2.0123* Post-Merger 5681.45 Pre-Merger 1796.68 0.6247 Post-Merger 9.27 Pre-Merger 1130.91 0.1722 Post-Merger 7361.45 Pre-Merger 18.86 0.3922 Post-Merger 19.17
ADV/TA Pre-Merger 0.765 1.0061 Post-Merger 2.19
CR Pre-Merger 609.11 4.5899* Post-Merger 8131.51 * Significant at 95% level of confidence
Note: For Profit Margin (PM) the numbers of data points were insufficient to give any conclusive results.
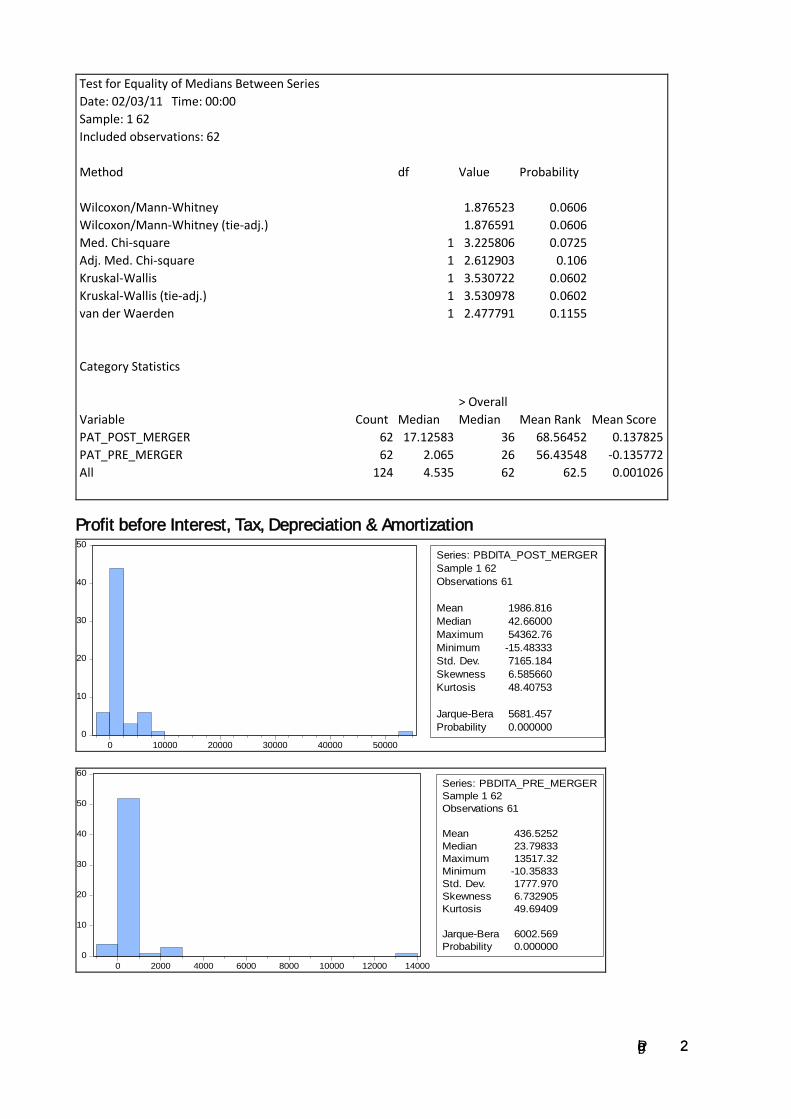
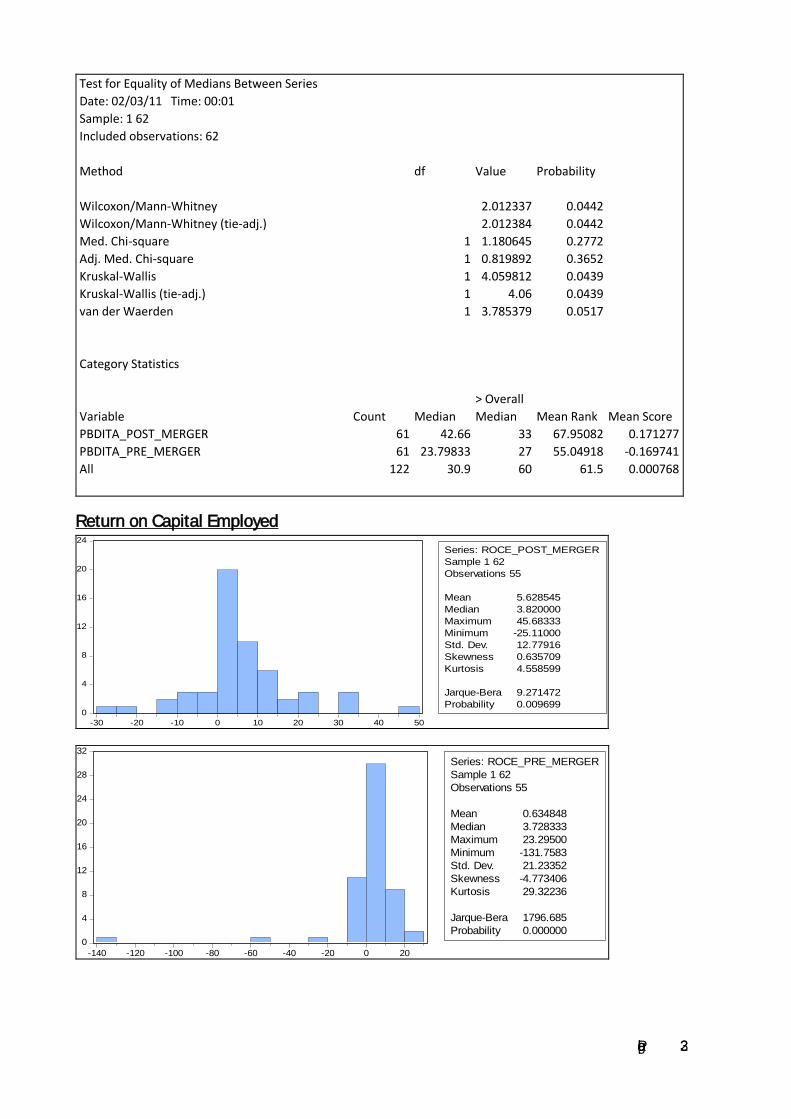
From the results above, we can conclude that only Current Ratio (CR) and Profit before Interest, Tax, Depreciation& Amortization (PBDITA) have had a significant change from their pre-merger values while remaining parameters have not shown a significant change for the acquiring company.A comparison of

Page | 14
means indicates that on one side where PBDITA has improved post merger, Current Ratio on the other hand has deteriorated. (Refer Appendix Model I Results) 4.3. Model II
4.3.1. Pre-Merger
All the dependent variables and the independent variable series were found to be stationary at Level using the ADF test.
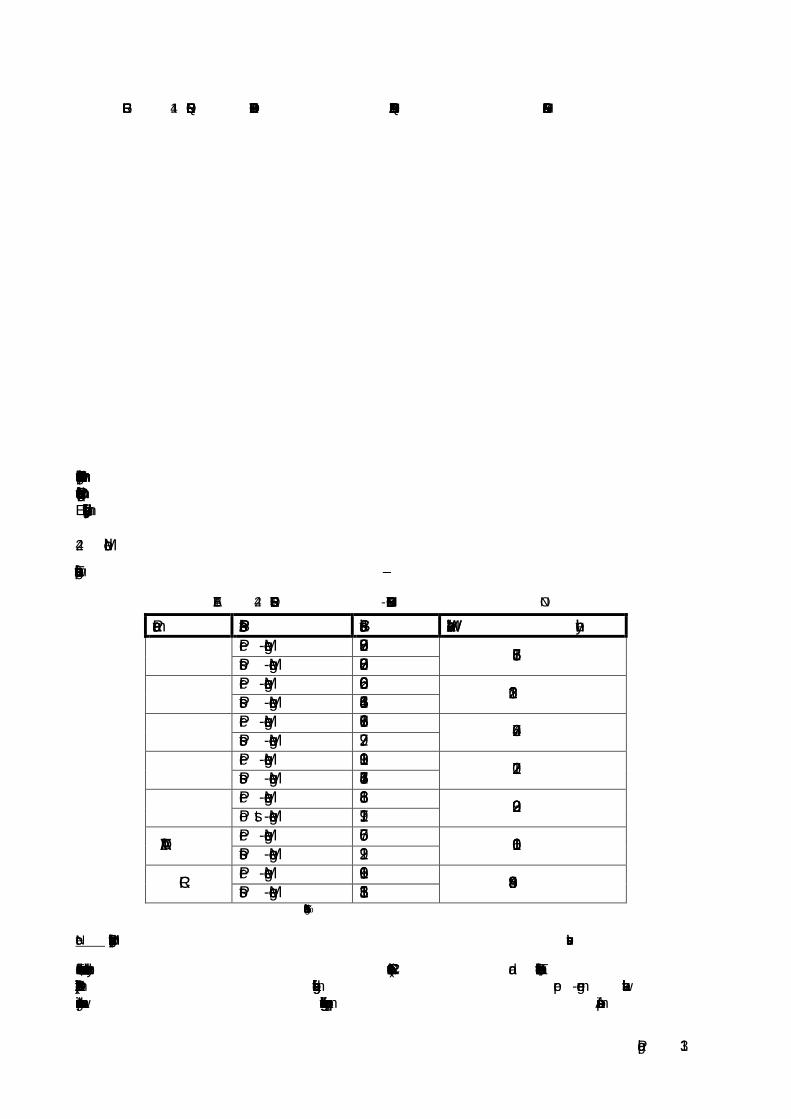
TABLE 4.3: PRE MERGER MODEL
Explanatory Variables Coefficient t-statistic p-value
-0.182358 -0.048757 0.9613 0.156388 1.893913 0.0427* -0.025916 -0.274015 0.785
-2.137706 -0.232981 0.8165 * Significant at 95% level of confidence
Note: For Profit Margin (PM) the numbers of data points were insufficient to be used in this regression model. Therefo�U�H�� �Z�H�� �V�H�H�� �W�K�D�W�� �,�Q�W�H�U�H�V�W�� �&�R�Y�H�U�D�J�H�� �L�V�� �D�� �V�L�J�Q�L�I�L�F�D�Q�W�� �Y�D�U�L�D�E�O�H�� �D�I�I�H�F�W�L�Q�J�� �W�K�H�� �U�H�W�X�U�Q�� �R�Q�� �V�K�D�U�H�K�R�O�G�H�U�V�¶��funds (ROSF) before the merger and is positively associated to the same indicating that an increase in interest coverage will allow for an increase in Return e�D�U�Q�H�G���R�Q���V�K�D�U�H�K�R�O�G�H�U�V�¶���I�X�Q�G�V�� 4.3.2. Post-Merger
All the dependent variables and the independent variable series were found to be stationary at Level using the ADF test.
TABLE 4.4: POST MERGER MODEL
Explanatory Variables Coefficient t-statistic p-value
-0.982382 -0.263645 0.7936 0.022824 2.546185 0.0136* 0.040164 2.340353 0.0253* 0.326509 0.260242 0.7962
4.669587 1.272021 0.212 * Significant at 95% level of confidence
Hence we see that Interest Coverage continues to be a significant variable affecting the return on �V�K�D�U�H�K�R�O�G�H�U�V�¶���I�X�Q�G�V�����5�2�6�)�����H�Y�H�Q���D�I�W�H�U���W�K�H���P�H�U�J�H�U���D�Q�G���L�V���S�R�V�L�W�L�Y�H�O�\���D�V�V�R�F�L�D�W�H�G���W�R���W�K�H���V�D�P�H���L�Q�G�L�F�D�W�L�Q�J���W�K�D�W��there is no change in the relationship between ROSF and IC even after the merger. But we see that Profit Margin is also significant post the merger. 4.4. Model III
4.4.1. State Bank of India
The date of merger of SBI with SBS is taken as the reference point. 90 days pre and post merger announcement data is taken to estimate the change in systematic risk. The results for the pre and post-merger �H�V�W�L�P�D�W�L�R�Q���R�I�������D�U�H���–

Page | 15
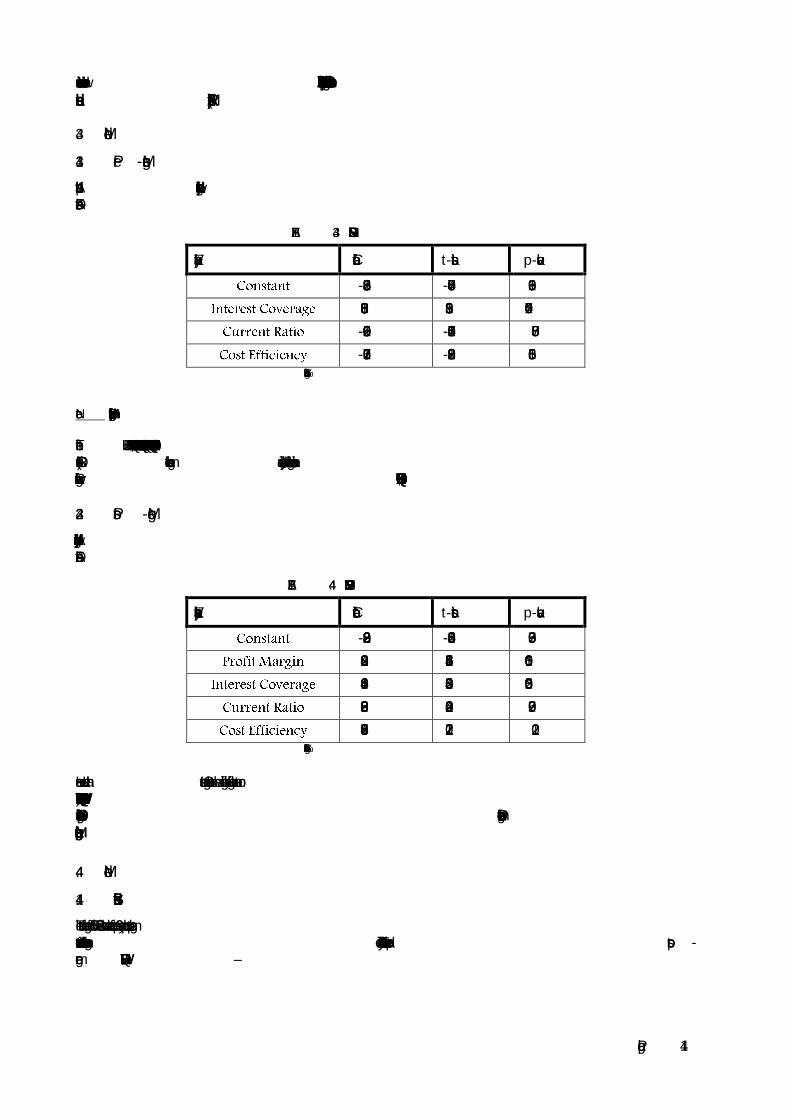
TABLE 4.5: SBI PRE-POST MERGER BETA ESTIMATION
Explanatory Variables Coefficient t-statistic p-value
0.000792 0.556514 0.5793 0.972368 6.789262 0*
0.99355Systematic Risk (BM) = 0.9394
0.002219 1.836094 0.0697
1.217363 11.5422 0*
1.3272Systematic Risk (AM) = 1.9670
* Significant at 95% level of confidence
From above table it can be seen that there has been an increase in the systematic risk for State Bank of India post its merger with State Bank of Saurashtra. Now we evaluate whether this increase is significant or not.
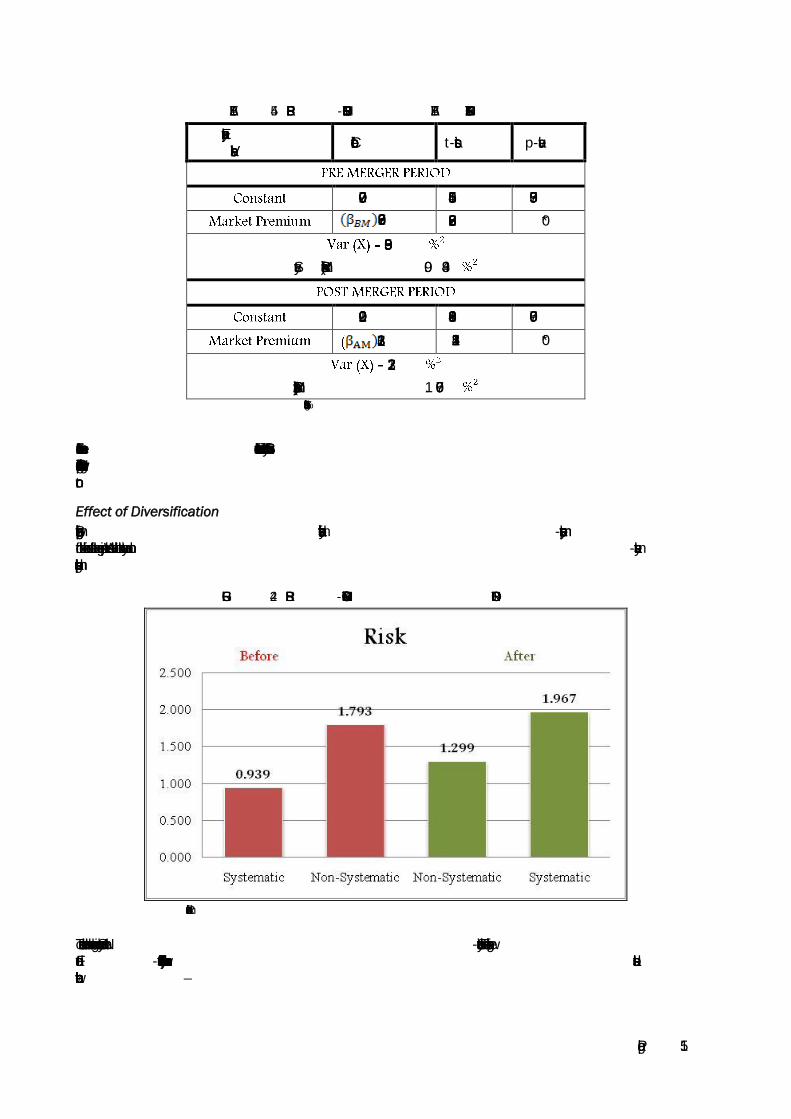
Effect of Diversification
Below is a figure representing the composition of total risk as systematic and non-systematic components for both before and after the merger periods. We see that both the systematic and non-systematic components have increased post the merger.
FIGURE 4.2: SBI PRE-POST MERGER RISK COMPOSITION
* Risk is measured as variance of returns
To measure whether the above changes in Systematic and Non-Systematic Risk are significant, we conduct an F-test for total risk and the systematic risk components, the results for which are as tabulated in the table below �–

Page | 16
TABLE 4.6: EFFECT OF DIVERSIFICATION ON RISK
Explanatory Variables Value p-value
1.19517 0.402
1.335867 0.1739 * Significant at 95% level of confidence
Thereby we see that the change in neither the Total Risk nor the Systematic Risk component is significant for State Bank of India. Hence this case of merger did not reap any benefits for State Bank of India which could be attributable to diversification effects of merger. 4.4.2. ICIC I Bank
The date of merger of ICICI Bank Ltd with Bank of Madura is taken as the reference point. 90 days pre and post-merger announcement data is taken to estimate the change in systematic risk. The results for the pre and post-�P�H�U�J�H�U���H�V�W�L�P�D�W�L�R�Q���R�I�������D�U�H���–
TABLE 4.7:ICICI PRE-POST MERGER BETA ESTIMATION
Explanatory Variables Coefficient t-statistic p-value
1.007208 1.619621 0.1123 1.816053 4.628941 0*
2.5263Systematic Risk (BM) = 8.3321
-0.1591 -0.42526 0.6719
0.730419 3.837213 0.0003*
3.7608Systematic Risk (AM) = 2.0065
* Significant at 95% level of confidence
From above table it can be seen that there has been a decrease in the systematic risk for ICICI Bank post its merger with Bank of Madura. Now we evaluate whether this decrease is significant or not.
Effect of Diversification
Below is a figure representing the composition of total risk as systematic and non-systematic components for both before and after the merger periods. We see that both the systematic and non-systematic components have decreased post the merger.

Page | 17
FIGURE 2.3: ICICI PRE-POST MERGER RISK COMPOSITION
* Risk is measured as variance of returns
To measure whether the above changes in Systematic and Non-Systematic Risk are significant, we conduct an F-test for total risk and the systematic risk components, the results for which are as tabulated in the table below �–
TABLE 4.8: EFFECT OF DIVERSIFICATION ON RISK
Explanatory Variables Value p-value
1.432692 0.2265
2.091126 0.0139* * Significant at 95% level of confidence
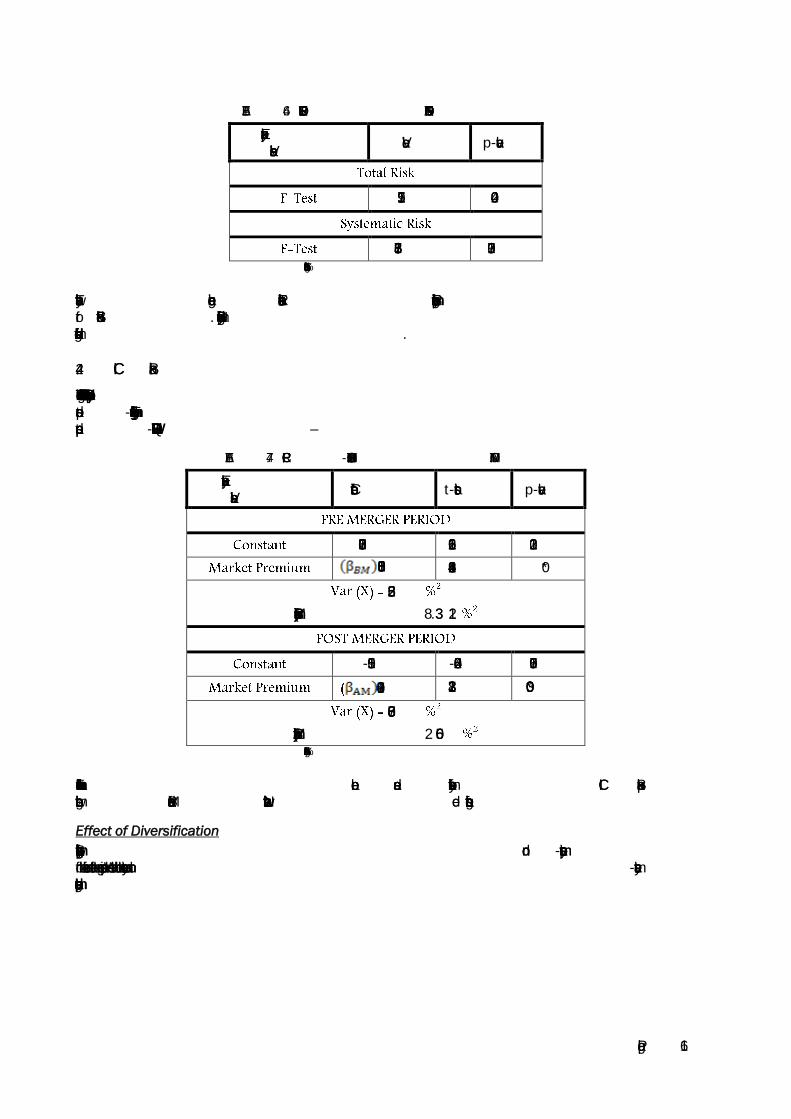
Thereby we see that the change in only the Systematic Risk component is significant for ICICI Bank whereas though there is a change in absolute value of Total Risk also, but the change is not significant. Also a comparison of variances shows that the Systematic Risk component has actually decreased after the merger, supporting the evidence for diversification effects of merger. 4.4.3. Athena Financial Services
The date of merger of Athena Financial Services with Kinetic Capital Finance Ltd is taken as the reference point. 90 days pre and post-merger announcement data is taken to estimate the change in systematic risk. The results for the pre and post-�P�H�U�J�H�U���H�V�W�L�P�D�W�L�R�Q���R�I�������D�U�H���–

Page | 18
TABLE 4.9: ATHENA FINANCIAL SERVICES PRE-POST MERGER BETA ESTIMATION
Explanatory Variables Coefficient t-statistic p-value
-0.238214 -0.085449 0.9325 1.847578 2.248608295 0.0272*
2.9172Systematic Risk (BM) = 9.9580
POST MERGER PERIOD 1.209026 0.81325 0.4186
( 1.217896 2.5902375 0.0205*
4.4820Systematic Risk (AM) = 6.6482
* Significant at 95% level of confidence
From above table it can be seen that there has been a decrease in the systematic risk for Athena Financial Services post its merger with Kinetic Capital Finance Ltd. Now we evaluate whether this decrease is significant or not.
Effect of Diversification
Below is a figure representing the composition of total risk as systematic and non-systematic components for both before and after the merger periods. We see that both the systematic and non-systematic components have decreased post the merger.
FIGURE 4.4: ATHENA PRE-POST MERGER RISK COMPOSITION
* Risk is measured as variance of returns
To measure whether the above changes in Systematic and Non-Systematic Risk are significant, we conduct an F-test for total risk and the systematic risk components, the results for which are as tabulated in the table below �–

Page | 19
TABLE 4.10: EFFECT OF DIVERSIFICATION ON RISK
Explanatory Variables Value p-value
2.027728 0.0495*
2.638788 0.0075* * Significant at 95% level of confidence
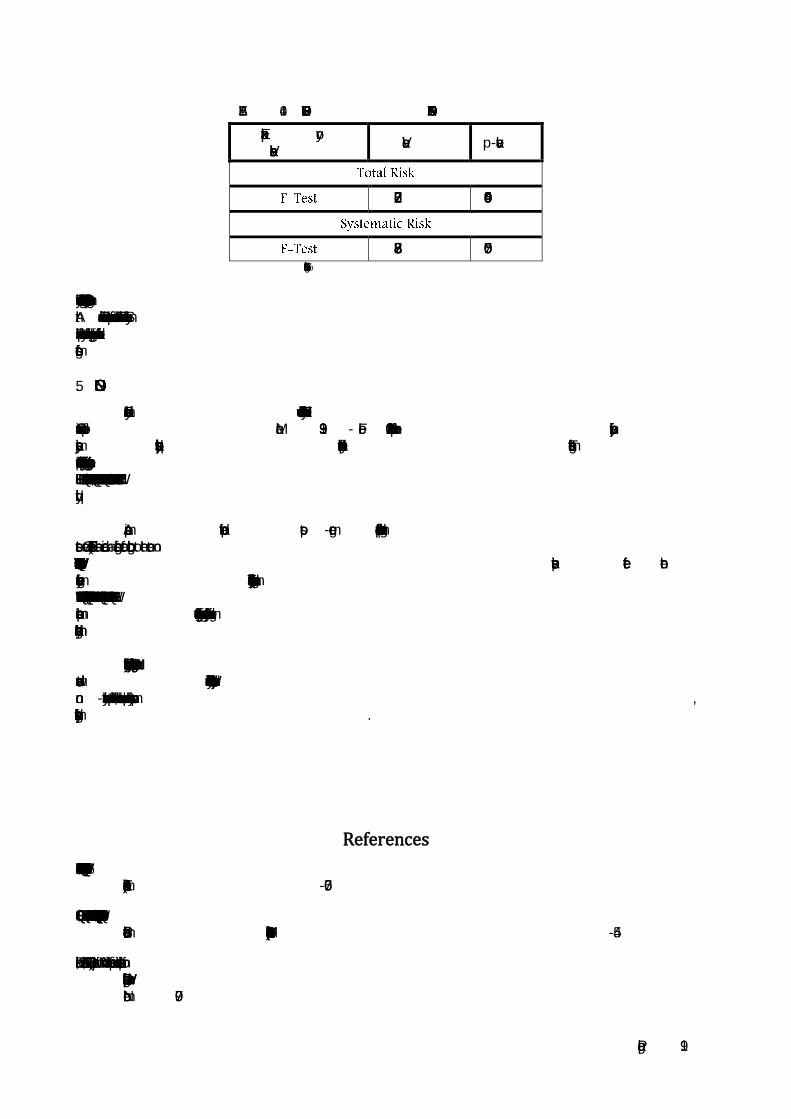
Thereby we see that the change in both Total Risk and the Systematic Risk component is significant for Athena Financial Services. Also a comparison of variances shows that Total Risk and the Systematic Risk components have actually decreased after the merger, supporting the evidence for diversification effects of merger. 5. CONCLUSION
From the study conducted above we can conclude that the M&A activity in the Indian Financial Services Sector over a period of March 1993- Feb 2010 has had positive effects on the profitability in majority cases but the liquidity position has deteriorated in a period of three years after the merger. This points to the fact that though companies may have been able to leverage the synergies arising out of the �P�H�U�J�H�U�� �R�U�� �D�F�T�X�L�V�L�W�L�R�Q���� �E�X�W�� �W�K�H�\�� �K�D�Y�H�Q�¶�W�� �E�H�H�Q�� �D�E�O�H�� �W�R�� �P�D�Q�D�J�H�� �W�K�H�L�U�� �F�D�S�L�W�D�O�� �V�W�U�X�F�W�X�U�H�� �W�R�� �L�P�S�U�R�Y�H�� �W�K�H�L�U��liquidity.
A comparison of the pre and post-merger performance of these companies indicates that though
Interest Cover (EBIT/Interest) has remained a significant factor contributing to the return on �V�K�D�U�H�K�R�O�G�H�U�¶�V���I�X�Q�G�V���E�R�W�K���E�H�I�R�U�H���D�Q�G���D�I�W�H�U���W�K�H���P�H�U�J�H�U�����3�U�R�I�L�W���0�D�U�J�L�Q���K�D�V���D���V�L�J�Q�L�I�L�Fant positive effect on the return only after the merger. Thus the ability of a company to service its debt obligations is an important �I�D�F�W�R�U�� �D�I�I�H�F�W�L�Q�J�� �W�K�H�� �F�R�P�S�D�Q�L�H�V�¶�� �U�H�W�X�U�Q�� �L�U�U�H�V�S�H�F�W�L�Y�H�� �R�I�� �Z�K�H�W�K�H�U�� �L�W�� �L�V�� �L�Q�Y�R�O�Y�H�G�� �L�Q�� �D�� �P�H�U�J�H�U�� �R�U�� �Q�R�W�� �E�X�W�� �L�W��becomes important to generate higher profits after the merger in order to justify the decision of merger undertaken by the management to the shareholders.
Finally looking at the three specific cases, we are able to highlight the importance of M&A as a
means towards reduction of risk by diversification. We see that diversification not only helps reduce the non-systematic risk as part of the total risk, but also has an impact on the systematic risk component, thereby helping reduce the overall risk of the firm.
References
�$�P�L�K�X�G�����<���D�Q�G���/�H�Y�����%�����������������‡�5�L�V�N���5�H�G�X�F�W�L�R�Q���D�V���D���0�D�Q�D�J�H�U�L�D�O���0�R�W�L�Y�H���I�R�U���&�R�Q�J�O�R�P�H�U�D�W�H���0�H�U�J�H�U���·���%�H�O�O��Journal of Economics, 12(2), 605-607.
�$�Q�D�Q�G���� �0���� ��� �6�L�Q�J�K���� �-���� ���������������� �,�P�S�D�F�W�� �R�I�� �0�H�U�J�H�U�� �$�Q�Q�R�X�Q�F�H�P�H�Q�W�V�� �R�Q�� �6�K�D�U�H�K�R�O�G�H�U�V�¶�� �:�H�D�O�W�K���� �(�Y�L�G�H�Q�F�H��from Indian Private Sector Banks. Vikalpa: Journal for Decision Makers, 33(1), 35-54.
Bhaumik, S. &Selarka, E. (2008). Impact of M&A on firm performance in India: Implications for concentration of ownership and insider entrenchment. William Davidson Institute Working Paper Number 907.

Page | 20
Cornett, M. M., McNutt, J. J., &Tehranian, H. (2006). Performance Changes around Bank Mergers: Revenue Enhancements versus Cost Reductions. Journal of Money, Credit and Banking, Volume 38Issue(4), 1013-1050.
Cummins, J. D. & Weiss, M. A. (2004). Consolidation in the European Insurance Industry: Do Mergers and Acquisitions Create Value for Shareholders?.Temple University - Risk Management & Insurance & Actuarial Science.
Eckbo, B. E. (1983). Horizontal Mergers, Collusion, and Stockholder Wealth. Journal of Financial Economics (JFE), 11, 241-273.
Estanol, A. B. & Ottaviani, M. (2007). Bank Mergers and Diversification: Implications for Competition Policy. European Financial Management, Volume 13 Issue (2), 578-590.
Kalimeris, D. (2010). An Event Analysis of Asymmetric Information on Merger and Acquisition Announcements in the SE European Region: The Case of Greek Early Mover Companies. International Research Journal of Finance and Economics, Issue (39). ISSN 1450-2887
Kar, R. N. & Soni, A. (2008). Mergers & Acquisitions in India: A Strategic Impact Analysis for the Corporate Enterprises in the Post Liberalisation Period. IGIDR Working Paper Series, WP -2008-31.
Kumar, S. &Bansal, L. K. (2008). The impact of mergers and acquisitions on corporate performance in India. Management Decision, 46(10), 1531-1543.
Kwan, S. H. & Eisenbeis, R. A. (1999). Mergers of publicly traded banking organizations revisited. Economic Review, Issue q4, p. 26-37
Mandelkar, G. (1972). The Microeconomic Consequences of Corporate Mergers.. Journal of Business, 45(1), 85-104.
Mantravadi, P. & Reddy, A. (2008). Post-Merger Performance of Acquiring Firms from Different Industries in India. International Research Journal of Finance and Economics, Issue (22).
�0�\�O�R�Q�D�N�L�V���� �-���� ���������������� �7�K�H�� �,�P�S�D�F�W�� �R�I�� �%�D�Q�N�V�¶�� �0�H�U�J�H�U�V�� ��� �$�F�T�X�L�V�L�W�L�R�Q�V�� �R�Q�� �W�K�H�L�U�� �6�W�D�I�I�� �(�P�S�O�R�\�P�H�Q�W�� ���Effectiveness. International Research Journal of Finance and Economics, Issue(3). ISSN 1450-2887.
Rani, N., Surendra, S., & Jain, P. K. (2008). Flexible Enterprise for Global Business. In Impact of Mergers and Acquisitions on Shareholders Wealth in Short-Run: An Empirical Study of Indian Pharmaceutical Industry, Vol. IX: Sectoral Applications.
Tambi, M. K. (2005). Impact Of Mergers And Amalgamation On The Performance Of Indian Companies. Econ WPA Finance, (0506007).
Web References
"Mergers and Acquisitions: Introduction." Investopedia.com - Your Source For Investing Education. Web. 10 Feb. 2011. <http://www.investopedia.com/university/mergers/>.
"Financial Services."IBEF. Jan. 2011. Web. 12 Feb. 2011. <http://www.ibef.org/industry/financialservices.aspx>.

Page | 21
APPENDIX
Model I Results
Profit afterTax
0
5
10
15
20
25
30
35
40
0 1000 2000 3000 4000 5000 6000 7000 8000
Series: PAT_POST_MERGER
Sample 1 62
Observations 62
Mean 347.4491
Median 17.12583
Maximum 8338.800
Minimum -20.09667
Std. Dev. 1107.215
Skewness 6.248286
Kurtosis 45.26561
Jarque-Bera 5018.244
Probability 0.000000
0
10
20
30
40
50
0 400 800 1200 1600 2000
Series: PAT_PRE_MERGER
Sample 1 62
Observations 62
Mean 69.58272
Median 2.065000
Maximum 2111.810
Minimum -10.69667
Std. Dev. 277.0936
Skewness 6.668373
Kurtosis 49.23688
Jarque-Bera 5982.270
Probability 0.000000

Page | 22
Test for Equality of Medians Between Series
Date: 02/03/11 Time: 00:00
Sample: 1 62
Included observations: 62
Method df Value Probability
Wilcoxon/Mann-Whitney 1.876523 0.0606
Wilcoxon/Mann-Whitney (tie-adj.) 1.876591 0.0606
Med. Chi-square 1 3.225806 0.0725
Adj. Med. Chi-square 1 2.612903 0.106
Kruskal-Wallis 1 3.530722 0.0602
Kruskal-Wallis (tie-adj.) 1 3.530978 0.0602
van der Waerden 1 2.477791 0.1155
Category Statistics
> Overall
Variable Count Median Median Mean Rank Mean Score
PAT_POST_MERGER 62 17.12583 36 68.56452 0.137825
PAT_PRE_MERGER 62 2.065 26 56.43548 -0.135772
All 124 4.535 62 62.5 0.001026
Profit before Interest, Tax, Depreciation & Amortization
0
10
20
30
40
50
0 10000 20000 30000 40000 50000
Series: PBDITA_POST_MERGER
Sample 1 62
Observations 61
Mean 1986.816
Median 42.66000
Maximum 54362.76
Minimum -15.48333
Std. Dev. 7165.184
Skewness 6.585660
Kurtosis 48.40753
Jarque-Bera 5681.457
Probability 0.000000
0
10
20
30
40
50
60
0 2000 4000 6000 8000 10000 12000 14000
Series: PBDITA_PRE_MERGER
Sample 1 62
Observations 61
Mean 436.5252
Median 23.79833
Maximum 13517.32
Minimum -10.35833
Std. Dev. 1777.970
Skewness 6.732905
Kurtosis 49.69409
Jarque-Bera 6002.569
Probability 0.000000

Page | 23
Test for Equality of Medians Between Series
Date: 02/03/11 Time: 00:01
Sample: 1 62
Included observations: 62
Method df Value Probability
Wilcoxon/Mann-Whitney 2.012337 0.0442
Wilcoxon/Mann-Whitney (tie-adj.) 2.012384 0.0442
Med. Chi-square 1 1.180645 0.2772
Adj. Med. Chi-square 1 0.819892 0.3652
Kruskal-Wallis 1 4.059812 0.0439
Kruskal-Wallis (tie-adj.) 1 4.06 0.0439
van der Waerden 1 3.785379 0.0517
Category Statistics
> Overall
Variable Count Median Median Mean Rank Mean Score
PBDITA_POST_MERGER 61 42.66 33 67.95082 0.171277
PBDITA_PRE_MERGER 61 23.79833 27 55.04918 -0.169741
All 122 30.9 60 61.5 0.000768
Return on Capital Employed
0
4
8
12
16
20
24
-30 -20 -10 0 10 20 30 40 50
Series: ROCE_POST_MERGER
Sample 1 62
Observations 55
Mean 5.628545
Median 3.820000
Maximum 45.68333
Minimum -25.11000
Std. Dev. 12.77916
Skewness 0.635709
Kurtosis 4.558599
Jarque-Bera 9.271472
Probability 0.009699
0
4
8
12
16
20
24
28
32
-140 -120 -100 -80 -60 -40 -20 0 20
Series: ROCE_PRE_MERGER
Sample 1 62
Observations 55
Mean 0.634848
Median 3.728333
Maximum 23.29500
Minimum -131.7583
Std. Dev. 21.23352
Skewness -4.773406
Kurtosis 29.32236
Jarque-Bera 1796.685
Probability 0.000000

Page | 24
Test for Equality of Medians Between Series
Date: 02/03/11 Time: 00:02
Sample: 1 62
Included observations: 62
Method df Value Probability
Wilcoxon/Mann-Whitney 0.624716 0.5322
Wilcoxon/Mann-Whitney (tie-adj.) 0.62475 0.5321
Med. Chi-square 1 0.036364 0.8488
Adj. Med. Chi-square 1 0 1
Kruskal-Wallis 1 0.394014 0.5302
Kruskal-Wallis (tie-adj.) 1 0.394056 0.5302
van der Waerden 1 0.8223 0.3645
Category Statistics
> Overall
Variable Count Median Median Mean Rank Mean Score
ROCE_POST_MERGER 55 3.82 28 57.40909 0.083745
ROCE_PRE_MERGER 55 3.728333 27 53.59091 -0.083583
All 110 3.7425 55 55.5 8.11E-05
Interest Coverage
0
10
20
30
40
50
60
-100 0 100 200 300 400 500 600 700 800
Series: INTERESTCOVER_POSTMERGER
Sample 1 62
Observations 59
Mean 16.55446
Median 1.316667
Maximum 800.7300
Minimum -61.72000
Std. Dev. 104.4569
Skewness 7.347516
Kurtosis 55.71190
Jarque-Bera 7361.451
Probability 0.000000
0
10
20
30
40
50
-120 -100 -80 -60 -40 -20 0 20 40 60
Series: INTERESTCOVER_PREMERGER
Sample 1 62
Observations 59
Mean 1.240424
Median 1.440000
Maximum 64.78500
Minimum -125.0000
Std. Dev. 21.35529
Skewness -3.182438
Kurtosis 23.48226
Jarque-Bera 1130.918
Probability 0.000000
Page | 25
Test for Equality of Medians Between Series
Date: 02/28/11 Time: 23:21
Sample: 1 62
Included observations: 62
Method df Value Probability
Wilcoxon/Mann-Whitney 0.172233 0.8633
Wilcoxon/Mann-Whitney (tie-adj.) 0.172248 0.8632
Med. Chi-square 1 0.033898 0.8539
Adj. Med. Chi-square 1 0 1
Kruskal-Wallis 1 0.030598 0.8611
Kruskal-Wallis (tie-adj.) 1 0.030604 0.8611
van der Waerden 1 0.108419 0.742
Category Statistics
> Overall
Variable Count Median Median Mean Rank Mean Score
INTERESTCOVER_POSTMERGER 59 1.316667 29 60.05085 0.029454
INTERESTCOVER_PREMERGER 59 1.44 30 58.94915 -0.029302
All 118 1.33 59 59.5 7.59E-05
Cost Efficiency
0
4
8
12
16
20
24
0.0 0.2 0.4 0.6 0.8 1.0 1.2 1.4 1.6 1.8 2.0 2.2
Series: COST_TA_POSTSample 1 62Observations 62
Mean 0.446062Median 0.156788Maximum 2.220044Minimum 0.005201Std. Dev. 0.538671Skewness 1.313317Kurtosis 3.723176
Jarque-Bera 19.17400Probability 0.000069
0
2
4
6
8
10
12
0.0 0.2 0.4 0.6 0.8 1.0 1.2
Series: COST_TA_PRESample 1 62Observations 62
Mean 0.294454Median 0.161277Maximum 1.292872Minimum 0.003723Std. Dev. 0.291968Skewness 1.259124Kurtosis 3.979590
Jarque-Bera 18.86136Probability 0.000080
Page | 26
Test for Equality of Medians Between Series
Date: 02/28/11 Time: 23:28
Sample: 1 62
Included observations: 62
Method df Value Probability
Wilcoxon/Mann-Whitney 0.392296 0.6948
Wilcoxon/Mann-Whitney (tie-adj.) 0.392309 0.6948
Med. Chi-square 1 0.129032 0.7194
Adj. Med. Chi-square 1 0.032258 0.8575
Kruskal-Wallis 1 0.155863 0.693
Kruskal-Wallis (tie-adj.) 1 0.155873 0.693
van der Waerden 1 0.513438 0.4737
Category Statistics
> Overall
Variable Count Median Median Mean Rank Mean Score
COST_TA_POST 62 0.156788 30 63.77419 0.062279
COST_TA_PRE 62 0.161277 32 61.22581 -0.062565
All 124 0.158297 62 62.5 -0.000143
Advances/Total Assets
0
1
2
3
4
5
6
7
8
0.0 0.1 0.2 0.3 0.4 0.5 0.6 0.7
Series: ADV_TA_POSTSample 1 62Observations 21
Mean 0.343865Median 0.427930Maximum 0.670108Minimum 0.000134Std. Dev. 0.251508Skewness -0.279555Kurtosis 1.518505
Jarque-Bera 2.194001Probability 0.333871
0
1
2
3
4
5
6
0.0 0.1 0.2 0.3 0.4 0.5 0.6 0.7 0.8
Series: ADV_TA_PRESample 1 62Observations 21
Mean 0.263960Median 0.224856Maximum 0.703088Minimum 0.001013Std. Dev. 0.181320Skewness 0.461858Kurtosis 2.854076
Jarque-Bera 0.765228Probability 0.682076
Page | 27
Test for Equality of Medians Between Series
Date: 02/28/11 Time: 23:30
Sample: 1 62
Included observations: 62
Method df Value Probability
Wilcoxon/Mann-Whitney 1.00623 0.3143
Wilcoxon/Mann-Whitney (tie-adj.) 1.00623 0.3143
Med. Chi-square 1 0.857143 0.3545
Adj. Med. Chi-square 1 0.380952 0.5371
Kruskal-Wallis 1 1.037969 0.3083
Kruskal-Wallis (tie-adj.) 1 1.037969 0.3083
van der Waerden 1 0.555807 0.456
Category Statistics
> Overall
Variable Count Median Median Mean Rank Mean Score
ADV_TA_POST 21 0.42793 12 23.42857 0.107524
ADV_TA_PRE 21 0.224856 9 19.57143 -0.107524
All 42 0.323804 21 21.5 -6.34E-17
Current Ratio
0
10
20
30
40
50
60
0 100 200 300 400 500 600 700 800 900 1000
Series: CURRENTRATIO_POST
Sample 1 62
Observations 60
Mean 18.48919
Median 1.318333
Maximum 1006.790
Minimum 0.096667
Std. Dev. 129.7628
Skewness 7.548939
Kurtosis 57.99690
Jarque-Bera 8131.512
Probability 0.000000
0
10
20
30
40
50
60
0 20 40 60 80 100 120 140 160
Series: CURRENTRATIO_PRE
Sample 1 62
Observations 60
Mean 11.20700
Median 2.453333
Maximum 150.9308
Minimum 0.050000
Std. Dev. 28.09357
Skewness 3.773636
Kurtosis 16.66320
Jarque-Bera 609.1110
Probability 0.000000
Page | 28
Test for Equality of Medians Between Series
Date: 02/28/11 Time: 23:35
Sample: 1 62
Included observations: 62
Method df Value Probability
Wilcoxon/Mann-Whitney 4.589935 0
Wilcoxon/Mann-Whitney (tie-adj.) 4.590118 0
Med. Chi-square 1 26.13333 0
Adj. Med. Chi-square 1 24.3 0
Kruskal-Wallis 1 21.0916 0
Kruskal-Wallis (tie-adj.) 1 21.09328 0
van der Waerden 1 17.03157 0
Category Statistics
> Overall
Variable Count Median Median Mean Rank Mean Score
CURRENTRATIO_PRE 60 2.453333 44 75.08333 0.365413
CURRENTRATIO_POST 60 1.318333 16 45.91667 -0.365275
All 120 1.711667 60 60.5 6.94E-05
Model II Results
Pre Merger
Dependent Variable: PRE_ROCE
Method: Least Squares
Date: 03/01/11 Time: 00:43
Sample: 1 66
Included observations: 66
Variable Coefficient Std. Error t-Statistic Prob.
C -0.182358 3.740139 -0.048757 0.9613
PRE_INTERESTCOVER 0.156388 0.082574 1.893913 0.0427
PRE_CURRENTRATIO -0.025916 0.09458 -0.274015 0.785
PRE_COSTTA -2.137706 9.17544 -0.232981 0.8165
R-squared 0.027065 Mean dependent var -0.550694
Adjusted R-squared -0.020012 S.D. dependent var 20.29206
S.E. of regression 20.4941 Akaike info criterion 8.936843
Sum squared resid 26040.51 Schwarz criterion 9.069549
Log likelihood -290.9158 Hannan-Quinn criter. 8.989282
F-statistic 0.574911 Durbin-Watson stat 1.486111
Prob(F-statistic) 0.633654

Page | 29
Post Merger
Dependent Variable: POST_ROCE
Method: Least Squares
Date: 03/01/11 Time: 00:15
Sample: 1 39
Included observations: 39
Variable Coefficient Std. Error t-Statistic Prob.
C -0.982382 3.726149 -0.263645 0.7936
POST_PROFITMARGIN 0.022824 0.008964 2.546185 0.01365
POST_INTERESTCOVER 0.040164 0.017162 2.340353 0.0253
POST_CURRENTRATIO 0.326509 1.254638 0.260242 0.7962
POST_COSTTA 4.669587 3.670999 1.272021 0.212
R-squared 0.252214 Mean dependent var 3.387179
Adjusted R-squared 0.164239 S.D. dependent var 14.61419
S.E. of regression 13.36028 Akaike info criterion 8.141659
Sum squared resid 6068.905 Schwarz criterion 8.354936
Log likelihood -153.7624 Hannan-Quinn criter. 8.218181
F-statistic 2.86689 Durbin-Watson stat 1.945843
Prob(F-statistic) 0.037799
Model III Results
State Bank of India
StationarityNull Hypothesis: SBI_PRE has a unit root
Exogenous: Constant
Lag Length: 0 (Automatic - based on SIC, maxlag=11)
t-Statistic Prob.*
Augmented Dickey-Fuller test statistic -9.14041 0
Test critical values: 1% level -3.5056
5% level -2.89433
10% level -2.58433
*MacKinnon (1996) one-sided p-values.

Page | 30
Null Hypothesis: SBI_POST has a unit root
Exogenous: Constant
Lag Length: 0 (Automatic - based on SIC, maxlag=11)
t-Statistic Prob.*
Augmented Dickey-Fuller test statistic -8.28424 0
Test critical values: 1% level -3.5056
5% level -2.89433
10% level -2.58433
*MacKinnon (1996) one-sided p-values.
Pre merger
Dependent Variable: SBI_PRE
Method: Least Squares
Date: 03/10/11 Time: 22:03
Sample: 1 90
Included observations: 90
Variable Coefficient Std. Error t-Statistic Prob.
C 0.000792 0.001424 0.556514 0.5793
MKT_PRE 0.972368 0.143221 6.789262 0
R-squared 0.343744 Mean dependent var 5.31E-05
Adjusted R-squared 0.336287 S.D. dependent var 0.016531
S.E. of regression 0.013468 Akaike info criterion -5.755048
Sum squared resid 0.015962 Schwarz criterion -5.699497
Log likelihood 260.9772 Hannan-Quinn criter. -5.732647
F-statistic 46.09409 Durbin-Watson stat 2.145322
Prob(F-statistic) 0
Post merger
Dependent Variable: SBI_POST
Method: Least Squares
Date: 03/10/11 Time: 22:04
Sample: 1 90
Included observations: 90
Variable Coefficient Std. Error t-Statistic Prob.
C 0.002219 0.001208 1.836094 0.0697
MKT_POST 1.217363 0.105471 11.5422 0
R-squared 0.60221 Mean dependent var 0.002042
Adjusted R-squared 0.59769 S.D. dependent var 0.018073
S.E. of regression 0.011463 Akaike info criterion -6.077386
Sum squared resid 0.011564 Schwarz criterion -6.021835
Log likelihood 275.4824 Hannan-Quinn criter. -6.054985
F-statistic 133.2224 Durbin-Watson stat 1.926282
Prob(F-statistic) 0
Page | 31
Diversification Effect of Merger
Test for Equality of Variances Between Series
Date: 03/13/11 Time: 12:23
Sample: 1 90
Included observations: 90
Method df Value Probability
F-test (89, 89) 1.19517 0.402
Siegel-Tukey 1.414735 0.1571
Bartlett 1 0.702377 0.402
Levene (1, 178) 1.076282 0.3009
Brown-Forsythe (1, 178) 1.13919 0.2873
Category Statistics
Mean Abs. Mean Abs. Mean Tukey-
Variable Count Std. Dev. Mean Diff. Median Diff. Siegel Rank
SBI_POST 90 0.018073 0.014439 0.014418 85
SBI_PRE 90 0.016531 0.012805 0.012707 96
All 180 0.0173 0.013622 0.013563 90.5
Bartlett weighted standard deviation: 0.017319
Test for Equality of Variances Between Series
Date: 03/13/11 Time: 12:24
Sample: 1 90
Included observations: 90
Method df Value Probability
F-test (89, 89) 1.335867 0.1739
Siegel-Tukey 0.962706 0.3357
Bartlett 1 1.848944 0.1739
Levene (1, 178) 1.191603 0.2765
Brown-Forsythe (1, 178) 1.071878 0.3019
Category Statistics
Mean Abs. Mean Abs. Mean Tukey-
Variable Count Std. Dev. Mean Diff. Median Diff. Siegel Rank
MKT_POST 90 0.011521 0.008942 0.008861 86.75556
MKT_PRE 90 0.009968 0.007858 0.007804 94.24444
All 180 0.010747 0.0084 0.008332 90.5
Bartlett weighted standard deviation: 0.010772

Page | 32
ICICI Bank Ltd.
Stationarity
Null Hypothesis: ICICI_PRE has a unit root
Exogenous: Constant
Lag Length: 0 (Automatic - based on SIC, maxlag=9)
t-Statistic Prob.*
Augmented Dickey-Fuller test statistic -6.12641 0
Test critical values: 1% level -3.58115
5% level -2.92662
10% level -2.60142
*MacKinnon (1996) one-sided p-values.
Null Hypothesis: ICICI_POST has a unit root
Exogenous: Constant
Lag Length: 0 (Automatic - based on SIC, maxlag=11)
t-Statistic Prob.*
Augmented Dickey-Fuller test statistic -9.11595 0
Test critical values: 1% level -3.51905
5% level -2.90014
10% level -2.58741
*MacKinnon (1996) one-sided p-values.
Pre merger
Dependent Variable: ICICI_PRE
Method: Least Squares
Date: 03/11/11 Time: 13:39
Sample: 1 47
Included observations: 47
Variable CoefficientStd. Error t-Statistic Prob.
C 1.007208 0.621879 1.619621 0.1123
MKT_PRE 1.816053 0.392326 4.628941 0
R-squared 0.322566 Mean dependent var 0.644255
Adjusted R-squared 0.307511 S.D. dependent var 5.082399
S.E. of regression 4.229364 Akaike info criterion 5.763601
Sum squared resid 804.9382 Schwarz criterion 5.842331
Log likelihood -133.445 Hannan-Quinn criter. 5.793228
F-statistic 21.4271 Durbin-Watson stat 1.85726
Prob(F-statistic) 0.000031

Page | 33
Post merger
Dependent Variable: ICICI_POST
Method: Least Squares
Date: 03/11/11 Time: 13:40
Sample: 1 77
Included observations: 77
Variable CoefficientStd. Error t-Statistic Prob.
C -0.1591 0.374125 -0.42526 0.6719
MKT_POST 0.730419 0.190352 3.837213 0.0003
R-squared 0.164105 Mean dependent var -0.442857
Adjusted R-squared 0.15296 S.D. dependent var 3.496683
S.E. of regression 3.218165 Akaike info criterion 5.20113
Sum squared resid 776.7438 Schwarz criterion 5.262008
Log likelihood -198.244 Hannan-Quinn criter. 5.225481
F-statistic 14.7242 Durbin-Watson stat 2.100719
Prob(F-statistic) 0.000258
Diversification Effect of Merger
Test for Equality of Variances Between Series
Date: 03/13/11 Time: 11:11
Sample (adjusted): 1 47
Included observations: 47 after adjustments
Method df Value Probability
F-test (46, 46) 1.432692 0.2265
Siegel-Tukey 0.737296 0.4609
Bartlett 1 1.462879 0.2265
Levene (1, 92) 0.658652 0.4191
Brown-Forsythe (1, 92) 0.56191 0.4554
Category Statistics
Mean Abs. Mean Abs. Mean Tukey-
Variable Count Std. Dev. Mean Diff. Median Diff.Siegel Rank
ICICI_POST 47 4.24612 3.046908 3.044681 49.58511
ICICI_PRE 47 5.082399 3.591879 3.555319 45.41489
All 94 4.691558 3.319393 3.3 47.5
Bartlett weighted standard deviation: 4.682965
Page | 34
Test for Equality of Variances Between Series
Date: 03/13/11 Time: 11:12
Sample (adjusted): 1 47
Included observations: 47 after adjustments
Method df Value Probability
F-test (46, 46) 2.091126 0.0139
Siegel-Tukey 1.491014 0.136
Bartlett 1 6.055571 0.0139
Levene (1, 92) 4.355918 0.0396
Brown-Forsythe (1, 92) 4.183113 0.0437
Category Statistics
Mean Abs. Mean Abs. Mean Tukey-
Variable Count Std. Dev. Mean Diff. Median Diff.Siegel Rank
MKT_POST 47 2.298472 1.732947 1.715106 43.29433
MKT_PRE 47 1.589459 1.177981 1.155745 51.70567
All 94 1.966988 1.455464 1.435426 47.5
Bartlett weighted standard deviation: 1.976026
Athena Financial Services
Stationarity
Null Hypothesis: ATHENA_PRE has a unit root
Exogenous: Constant
Lag Length: 0 (Automatic - based on SIC, maxlag=8)
t-Statistic Prob.*
Augmented Dickey-Fuller test statistic -7.91103 0
Test critical values: 1% level -3.65373
5% level -2.95711
10% level -2.61743
*MacKinnon (1996) one-sided p-values.
Page | 35
Null Hypothesis: ATHENA_POST has a unit root
Exogenous: Constant
Lag Length: 0 (Automatic - based on SIC, maxlag=11)
t-Statistic Prob.*
Augmented Dickey-Fuller test statistic -13.9008 0.0001
Test critical values: 1% level -3.5056
5% level -2.89433
10% level -2.58433
*MacKinnon (1996) one-sided p-values.
Pre merger
Dependent Variable: ATHENA_PRE
Method: Least Squares
Date: 03/11/11 Time: 14:11
Sample: 1 33
Included observations: 33
Variable Coefficient Std. Error t-Statistic Prob.
C -0.238214 2.787788 -0.085449 0.9325
MKT_PRE 1.847578 0.821654 2.2486083 0.0272
R-squared 0.038781 Mean dependent var 0.014848
Adjusted R-squared 0.007774 S.D. dependent var 16.02419
S.E. of regression 15.96178 Akaike info criterion 8.436963
Sum squared resid 7898.129 Schwarz criterion 8.52766
Log likelihood -137.2099 Hannan-Quinn criter. 8.46748
F-statistic 1.250719 Durbin-Watson stat 2.524884
Prob(F-statistic) 0.272007

Page | 36
Post merger
Dependent Variable: ATHENA_POST
Method: Least Squares
Date: 03/11/11 Time: 14:11
Sample: 1 77
Included observations: 77
Variable Coefficient Std. Error t-Statistic Prob.
C 1.209026 1.48666 0.81325 0.4186
MKT_POST 1.217896 0.470187 2.5902375 0.0205
R-squared 0.005157 Mean dependent var 1.250779
Adjusted R-squared -0.008107 S.D. dependent var 12.97964
S.E. of regression 13.03215 Akaike info criterion 7.998346
Sum squared resid 12737.77 Schwarz criterion 8.059224
Log likelihood -305.9363 Hannan-Quinn criter. 8.022697
F-statistic 0.388817 Durbin-Watson stat 2.774491
Prob(F-statistic) 0.534814
Diversification Effect of Merger
Test for Equality of Variances Between Series
Date: 03/12/11 Time: 22:49
Sample (adjusted): 1 33
Included observations: 33 after adjustments
Method df Value Probability
F-test (32, 32) 2.027728 0.0495
Siegel-Tukey 1.617261 0.1058
Bartlett 1 3.857006 0.0495
Levene (1, 64) 3.659378 0.0602
Brown-Forsythe (1, 64) 3.376688 0.0708
Category Statistics
Mean Abs. Mean Abs. Mean Tukey-
Variable Count Std. Dev. Mean Diff. Median Diff. Siegel Rank
ATHENA_POST 33 11.25307 8.335813 8.322121 37.33535
ATHENA_PRE 33 16.02419 12.44259 12.33182 29.66465
All 66 13.74053 10.3892 10.32697 33.5
Bartlett weighted standard deviation: 13.84569