Autocratization Changing Nature ? - V-Dem
60
DEMOCRACY REPORT 2022 Autocratization Changing Nature ?
-
Upload
khangminh22 -
Category
Documents
-
view
4 -
download
0
Transcript of Autocratization Changing Nature ? - V-Dem

DEMOCRACY REPORT 2022
Autocratization Changing Nature ?

Produced by the V-Dem Institute at the University of Gothenburg
Democracy Report Team: Nazifa Alizada, Vanessa A. Boese, Martin Lundstedt, Kelly Morrison, Natalia Natsika, Yuko Sato, Hugo Tai, and Staffan I. Lindberg.
V-Dem Data and Management Team: Nazifa Alizada, Lisa Gastaldi, Sandra Grahn, Garry Hindle, Nina Ilchenko, Natalia Natsika, Josefine Pernes, and Johannes von Römer.
Editors: Vanessa A. Boese and Staffan I. Lindberg.
Design and Final Art: Harald Schörnig, Frank & Earnest.
Printing: Stema Specialtryck AB.
Cover photo: Rally at Sophia Square in Kyiv, Ukraine, January 22, 2022, as Russian military invasion seems possible. Photo by Sean Gallup, Getty Images.
Suggested citation: Vanessa A. Boese, Nazifa Alizada, Martin Lundstedt, Kelly Morrison, Natalia Natsika, Yuko Sato, Hugo Tai, and Staffan I. Lindberg. 2022. Autocratization Changing Nature? Democracy Report 2022. Varieties of Democracy Institute (V-Dem).
March 2022 Copyright ©2022 by V-Dem Institute. All rights reserved.
V-Dem Institute: Department of Political Science University of Gothenburg Sprängkullsgatan 19, P.O. box 711 SE-405 30 Gothenburg Sweden [email protected] +46 (0)31 786 30 43 www.v-dem.net
https://github.com/vdeminstitute
facebook.com/vdeminstitutetwitter.com/vdeminstitute youtube.com/user/vdemproject linkedin.com/vdeminstitute
Follow us on social media
V-Dem is a unique approach to measuring democracy – historical, multidimensional, nuanced, and disaggregated – employing state-of-the-art methodology.
We are very grateful for our funders’ support over the years, which has made this venture possible. To learn more about our funders, please visit: https://v-dem.net/funders.html.
The views and opinions expressed in this report are those of the authors and do not necessarily reflect an official position of the V-Dem Project or the V-Dem Steering Committee.
Varieties of Democracy (V-Dem) produces the largest global dataset on democracy with over 30 million data points for 202 countries from 1789 to 2021. Involving over 3,700 scholars and other country experts, V-Dem measures hundreds of different attributes of democracy. V-Dem enables new ways to study the nature, causes, and consequences of democracy embracing its multiple meanings.

Table of ContentsWord from the Team 5
Executive Summary 6
State of the World: Autocratization Changing Nature? 9
Democracy Worldwide in 2021 12
Democratizers and Autocratizers 18
Autocratization Changing Nature? 30
The Case for Democracy 38
V-Dem in Numbers 44
V-Dem Methodology 48
V-Dem Indices 50
Publications from the V-Dem Team 57
3DEMOCRACY REPORT 2022

İstanbul Turkey, March 27, 2021. LGBTİ+ and women protested the withdrawal of Turkey's Istanbul Convention. Photo: Shutterstock.
4 DEMOCRACY REPORT 2022

Word from the Team
W E ARE PLEASED TO PRESENT the Democracy Report 2022 from the V-Dem Institute. Our report comes
during challenging times as the world is facing a war in Europe, rising tensions in the East Asia-Pacific region, a return of military and other coups, and new heights of polarization across many societies. It is our hope that the Democracy Report 2022 will con-tribute to a greater understanding of the global challenges to democracy.
Like many other observers around the world, we are deeply concerned with the decline of democracy over the past decade. This year’s Democracy Report documents a continuation of that trend during 2021. This intensifying wave of autocratization around the world highlights the need for new initiatives to defend democracy. In 2021, a series of such engagements originated from the highest levels as well as a by a multitude of important grass roots actions around the world.
But engagement to protect and promote democracy must build on science to be effective. Facts must meet misconceptions and lies about the virtues and limitations of democratic and autocratic governance.
That is why we started the Case for Democracy with financial support from the European Union. It collates state-of-the-art research on the dividends of democracy for economic and human development, health and socio-economic protections, environmental protection and climate change mitigation, as well as for international and domestic security. You will find a special box with summary of findings in this year’s Democracy Report. We look forward to carrying on and expanding these efforts in the coming years.
The Democracy Report 2022 presents findings based on the newest edition of the V-Dem dataset (version 12). The data is the result of a vast international collaboration. We are immensely grateful to the 3,700 country experts without whose contribution V-Dem would not be possible, and to the Country Coordinators, Regional Managers, Project Managers, and Steering Committee Members for their principal roles.
Finally, this is the first Democracy Report produced without Anna Lührmann. She joined the Institute as a postdoc in 2015, then became Assistant Professor and Deputy Director. Anna founded the Democracy Report and led the work during her tenure. We miss her presence deeply, but we congratulate Germany to have Anna as Minister of State for Europe. Anna, we hope you read this report and feel proud of your legacy.
The V-Dem Institute Team
Hugo Tai
Natalia Natsika
Aaron Mannis
Sebastian Hellmeier
Adea Gafuri
Amanda Edgell
Berker Kavasoglu
Garry Hindle
Johannes von Römer
Juraj Medzihorsky
Kelly MorrisonMartin Lundstedt
Matthew Wilson
Melina Liethmann
Jean Lachapelle
Nazifa Alizada
Nina Ilchenko
Oskar Rydén
Sandra Grahn
Staffan I. Lindberg
Taiwo Ayodeji Ahmed
Valeriya Mechkova
Vanessa A. Boese
Yuko Sato
Josefine Pernes
Lisa Gastaldi
5DEMOCRACY REPORT 2022

Executive Summary
DEMOCRACY WORLDWIDE IN 2021• The level of democracy enjoyed by the average global
citizen in 2021 is down to 1989 levels. The last 30 years of democratic advances are now eradicated.
• Dictatorships are on the rise and harbor 70% of the world population – 5.4 billion people.
• There are signals that the nature of autocratization is changing.
Back to 1989 Levels• Liberal democracies peaked in 2012 with 42 countries
and are now down to the lowest levels in over 25 years – 34 nations home to only 13% of the world population.
• The democratic decline is especially evident in Asia-Pacific, Eastern Europe and Central Asia, as well as in parts of Latin America and the Caribbean.
Dictatorships on the Rise• The increasing number of closed autocracies – up from
25 to 30 countries with 26% of the world population – contributes to the changing nature of autocratization.
• Electoral autocracy remains the most common regime type and harbors 44% of the world’s population, or 3.4 billion people.
Ten Years Ago – A Different World• A record of 35 countries suffered significant
deteriorations in freedom of expression at the hands of governments – an increase from only 5 countries 10 years ago.
• A signal of toxic polarization, respect for counter-arguments and associated aspects of the deliberative component of democracy got worse in more than 32 countries – another increase from only 5 nations in 2011.
TOXIC POLARIZATION WORSENING
5 countries
2011
2021
32 countries
SHARE OF WORLD POPULATION LIVING IN AUTOCRACIES
49%
2011
2021
70%
5
201135
NUMBER OF COUNTRIES THREATENING FREEDOM OF EXPRESSION
2021
6 DEMOCRACY REPORT 2022

DEMOCRATIZERS AND AUTOCRATIZERS• 2021 comes with a record number of nations autoc ratiz-
ing in the last 50 years – 33 countries home to 36% of the world population – 2.8 billion people.
• The EU may be facing its own wave of autocratization – 20% of members are autocratizing.
A Record 33 Countries are Autocratizing• Democracy broke down in 7 of the top 10
autocratizing countries over the last decade. • The world has not recorded so few democratizers
since 1978 – 15 countries in 2021, with 3% of the world population.
Democratization Across Regions• Across regions, elections are the aspect of democracy
with the highest average improvement among democratizers.
• In Latin America and the Caribbean, democratizing countries made the greatest improvements in judicial constraints on the executive – making leaders more accountable than a decade ago.
Autocratization Across Regions• Repression of civil society worsened in 22 and
censorship of media in 21 of the 33 autocratizing countries.
• Leaders in autocratizing countries diminished respect for counterarguments in 19 countries – a signal of the changing nature of autocratization.
The Major Democratizers• Among the top 10 democratizing countries, 6 transi-
tioned from autocracy and are democracies in 2021. • But few of the democratizers continue to improve
further.
The Major Autocratizers• Anti-pluralist parties drive autocratization in at least
6 of the top 10 autocratizers – Brazil, Hungary, India, Poland, Serbia, and Turkey
• 6 out of 27 EU member states are now autocratizing. Three EU neighbors to the east are also autocratizing.
Popular Mobilization in (Another) Year ofAutocratization
• Popular mobilization continues to stay at low levels. This lack of a pro-democratic mobilization risks allowing autocratization to deepen unchallenged.
• Rising levels of pro-autocracy mobilization may signal that autocratizing leaders are taking bolder actions to demonstrate legitimacy.
AUTOCRATIZATION CHANGING NATURE ?• The “epidemic of coup d’états” in 2021 suggests that
bolder actions of autocratization are becoming more common.
• Polarization escalates towards toxic levels in 40 countries.
• Autocratic governments increasingly use misinformation to shape domestic and international opinion in their favor.
A Year of Coups• The 5 military and 1 self-coup in 2021 set a record
for the 21st century in a sharp break from the average of 1.2 coups per year.
• The coups resulted in 4 new closed autocracies – Chad, Guinea, Mali, and Myanmar.
A Wave of Polarization• Signaling a changing nature of autocratization,
polarization is increasing to toxic levels in 40 countries.• Toxic levels of polarization contribute to electoral
victories of anti-pluralist leaders and the empowerment of their autocratic agendas.
Misinformation Multiplying• Governments increasingly use misinformation to
shape domestic and international opinion.• MENA is the region with the highest – and most
increasing – levels of government misinformation.
2011
SHARE OF WORLD POPULATION LIVING IN AUTOCRATIZING COUNTRIES
5%
2021
36%
7DEMOCRACY REPORT 2022

Stop Killing Afghan Protest in London, August 2021. Photo: Ehimetalor Akhere Unuabona, Unsplash
8 DEMOCRACY REPORT 2022

State of the World: Autocratization Changing Nature?
A
WAR BEGAN IN EUROPE. This war is the doing of the same leader who triggered the third
wave of autocratization1 when he began to derail democracy in Russia 20 years ago. The invasion
seems like a definite confirmation of the dangers the world faces as a consequence of autocratization
around the world.
On the day we finalize this year’s Democracy Report, President Putin ordered a full-scale invasion of Ukraine,
an independent country led by an elected government. For years, scholars warned that the global wave
of autocratization would lead to more wars, both inter-state and civil (see also box on the Case for
Democracy at the end of this report). The Democracy Report 2022 also points to this shift in the nature of
autocratization. Various pieces of evidence point to leaders becoming bolder and taking more drastic
actions, leading to further autocratization.
This Democracy Report documents several signs that autocratization is changing nature. With five military
coups and one self-coup, 2021 featured an increase in coups unprecedented over the past two decades.
These coups contributed to driving the uptick in the number of closed autocracies. They also seem to
signal a shift toward emboldened actors, given the previous decline in coups during the 21st century.
Polarization and government misinformation are also increasing. These trends are interconnected.
Polarized publics are more likely to demonize political opponents and distrust information from diverse
sources, and mobilization shifts as a result. The increase in misinformation and polarization further signals
what may prove to be a changing nature of autocratization in the world today. We discuss this shift in
detail in the third part of the report: “Autocratization Changing Nature?”.
Another sign of emboldened political leaders is the increasing number of countries where critical, formal
aspects of democracy are eroding. The autonomy of institutions such as Election Management Bodies
(EMBs) are now attacked and undermined in many autocratzing countries alongside the judiciary and the
legislature. This year’s Democracy Report documents such changes.
The Democracy Report 2022 is published along with version 12 of the V-Dem dataset.2 The dataset is pro-
duced by the worldwide V-Dem collaboration and is based on assessments by over 3,700 experts from
more than 180 countries, resulting in over 30 million data points. The Democracy Report 2022 is authored
by a team at the V-Dem Institute, and we alone are accountable for its contents.
The Democracy Report 2022 analyzes the evidence from three perspectives. The first part examines
the state of the world in 2021 based on the Liberal Democracy Index (LDI) and the Regimes of the
World (RoW) Index. The second part of the report focuses on countries that are in a process of changing.
The third part presents data on coups, polarization, and disinformation, all of which signal that the
fundamental dynamics of the current wave of autocratization may be changing.
In summary: The worldwide wave of autocratization is deepening, engulfing more countries, and seems
to be changing nature.
1 Lührmann A. and Lindberg S.I. 2019. A Third Wave of Autocratization Is Here. Democratization 26(7).
2 The V-Dem Project improves the quality of the released data every year by engaging additional, specialized country experts and further refining the methodology. This process of constant improvement may lead to a correction of scores reported in earlier versions of the dataset and the Democracy Report.
9DEMOCRACY REPORT 2022

Top 50% of countries
Score Confidence interval
Autocratizing countries Democratizing countries
2011 2021
FIGURE 1: COUNTRIES BY SCORE ON V-DEM’S LIBERAL DEMOCRACY INDEX (LDI), 2011 COMPARED TO 2021
SpainSouth Korea
FranceLuxembourg
AustraliaNetherlands
PortugalBelgium
IrelandGermany
FinlandSwitzerland
EstoniaNew Zealand
Costa RicaNorway
DenmarkSweden
Top
10%
Score and Con�dence Intervals
GreeceBarbados
CyprusJamaica
TaiwanCzech Republic
LatviaUnited States of America
JapanLithuania
AustriaIcelandCanada
UruguaySlovakia
ChileItaly
United Kingdom
Top
10−2
0%
ArmeniaPanama
GhanaSeychelles
Sao Tome and PrincipeSouth Africa
SloveniaMoldova
CroatiaMalta
RomaniaSuriname
Cape VerdeIsraelPeru
Trinidad and TobagoArgentina
Vanuatu
Top
20−3
0%
MauritiusNepal
EcuadorColombia
Dominican RepublicSolomon Islands
Burkina FasoBhutan
BotswanaTimor−Leste
GeorgiaMongolia
LesothoBrazil
NamibiaMalawi
BulgariaSenegal
Top
30−4
0%
GuyanaBolivia
Sri LankaMexico
MontenegroNorth Macedonia
NigerKenya
AlbaniaThe Gambia
PolandKosovo
Sierra LeoneParaguay
IndonesiaMaldives
TunisiaLiberia
0.00 0.25 0.50 0.75 1.00Liberal Democracy Index
Top
40−5
0%
2021 2011 Democratizing Autocratizing
Figure 1 shows every country’s rating on the LDI in 2021 in rank order, as well as the change over the last 10 years. Country names highlighted in blue highlight the 15 countries with significant democratization and red country names reveal which 33 countries have undergone substantial autocratization. Countries are also divided into groups from the top 10 to 50% to the bottom 50 to 10%.
10 DEMOCRACY REPORT 2022

Score Confidence interval
Autocratizing countries Democratizing countries
2011 2021
FijiKuwait
BeninPhilippines
LebanonMalaysiaZambia
TanzaniaUkraine
GuatemalaSingapore
Papua New GuineaNigeria
Bosnia and HerzegovinaIndia
Guinea−BissauHungary
Bott
om 4
0−50
%
Score and Con�dence Intervals
TogoZanzibar
Hong KongGabon
HaitiUganda
El SalvadorIraq
PakistanHondurasMorocco
Ivory CoastMozambique
MadagascarSerbia
JordanSomalilandKyrgyzstan
Bott
om 3
0−40
%
DjiboutiIran
VietnamCameroon
ComorosKazakhstan
OmanPalestine/West Bank
AlgeriaLibya
EthiopiaDemocratic Republic of Congo
Central African RepublicMauritania
ThailandMali
ZimbabweAngola
Bott
om 2
0−30
%
VenezuelaBurundi
CubaUnited Arab Emirates
SudanMyanmar
QatarUzbekistan
SomaliaLaos
RussiaRepublic of the Congo
EswatiniGuineaTurkey
BangladeshRwanda
Egypt
Bott
om 1
0−20
%
EritreaNorth KoreaAfghanistan
YemenBelarus
SyriaTurkmenistan
ChinaSaudi Arabia
TajikistanBahrain
Equatorial GuineaNicaragua
South SudanPalestine/Gaza
CambodiaChad
Azerbaijan
0.00 0.25 0.50 0.75 1.00Liberal Democracy Index
Bott
om 1
0%
2021 2011 Democratizing Autocratizing
Bottom 50% of countries
11STATE OF THE WORLD

Democracy Worldwide in 2021
3 V-Dem’s Liberal Democracy Index (LDI) captures both electoral and liberal aspects of democracy and goes from the lowest (0) to the highest (1) levels of democracy. The electoral component is measured by the Electoral Democracy Index (EDI) that captures the extent to which all elements of Robert Dahl’s (1971) famous articulation of “polyarchy” are present, including the quality of elections, individual rights, as well as the media and freedoms of association. The Liberal Component Index (LCI) captures the liberal aspects including checks and balances on the executive arm of government, respect for civil liberties, the rule of law, and the independence of the legislature and the judiciary. Dahl, R.A. 1971. Polyarchy: participation and opposition. New Haven: Yale University Press.
• The level of democracy enjoyed by the average global citizen in 2021 is down to 1989 levels – the last 30 years of democratic advances are now eradicated.
• The number of liberal democracies is down to 34 in 2021. There have not been so few since 1995 – over 26 years ago.
• Closed autocracies are up from 25 to 30 between 2020–2021. Electoral autocracy remains the most common regime type in the world – 60 countries. Together, autocracies now harbor 70% of the world population – 5.4 billion people.
• A record 35 states suffer from significant deteriorations in freedom of expression at the hands of governments – ten years ago it was only 5.
• Signaling “toxic polarization”, the deliberative aspects worsened substantially in 32 countries – another massive increase from the count of 5 ten years ago.
• Autonomy of electoral management bodies (EMB) was blatantly undermined by governments in 25 countries over the past ten years.
Western Europe, North America, and parts of Latin America, Oceania, and East Asia remain among the most democratic regions of the world. The least democratic areas in the world include the Middle East and North Africa (MENA) region, Central Asia, and parts of Sub-Saharan Africa. Countries such as Afghanistan, Belarus, China, Russia, Saudi Arabia, Sudan, and Venezuela are among the most autocratic in the world. The map in Figure 2 shows this state of democracy in 2021 based on the Liberal Democracy Index (LDI).3
Back to 1989 Levels• The level of democracy enjoyed by the average global
citizen in 2021 is down to levels last registered in 1989. The last 30 years of democratic advances following the end of the Cold War have been eradicated.
• The decline is especially evident in Asia-Pacific, Eastern Europe and Central Asia, as well as in Latin America and the Caribbean.
The level of democracy enjoyed by the average global citizen in 2021 is down to a low point not registered since 1989 (Figure 3, red line). From this perspective, the last ten years set the world back 32 years. The far-reaching expansion of rights and freedoms around the world over that period has been eradicated.
Since democracy is rule by the people it matters how many people are enjoying democratic rights and freedoms around the world.
FIGURE 2: STATE OF LIBERAL DEMOCRACY IN 2021
0 0.1 0.2 0.3 0.4 0.5 0.6 0.7 0.8 0.9 1
12 DEMOCRACY REPORT 2022

The population-weighted measure is arguably therefore a more meaningful measure of the state of democracy worldwide.
Figure 3 captures the rise in democracy around the world, showing the “third wave of democratization” starting in 1974 and peaking after the end of the Cold War. A worldwide steep decline in liberal democracy started around 2011 (right-hand panel). The dramatic decline for people over the past decade is masked when only country-averages are counted, as in the left-hand panel. The red line in that panel shows that by straight country-averages, democracy has reverted only to the 2000-level.
The decline by population-weighted measures is especially evident in Asia-Pacific, Eastern Europe and Central Asia, as well as in Latin America and the Caribbean, even if the latter remains one of the more democratic regions. In Asia-Pacific, the degree of liberal democracy enjoyed by citizens is down to levels last seen in 1986, some 35 years ago. Average democracy in Eastern Europe and Central Asia has gradually regressed down to a level found in 1991 at the end of the Cold War. Similarly, democracy in Latin America and the Caribbean has now fallen to an average level last seen in the region around 1990.
FIGURE 3: LIBERAL DEMOCRACY INDEX, GLOBAL AND REGIONAL AVERAGES 1971–2021
0.0
0.1
0.2
0.3
0.4
0.5
0.6
0.7
0.8
0.9
1971 1981 1991 2001 2011 2021
Aver
age
Valu
e
0.0
0.1
0.2
0.3
0.4
0.5
0.6
0.7
0.8
0.9
1971 1981 1991 2001 2011 2021
Aver
age
Wei
ghte
d Va
lue
World
Asia and the Paci�c
Eastern Europe and Central Asia
Latin America and the Caribbean
Sub−Saharan Africa
The Middle East and North Africa
Western Europe and North America
Figure 3 compares the state of the world in 2021 to global and regional trends since 1971. The black lines represent global averages on the LDI with the grey area marking the confidence intervals. The left panel is based on conventional country averages. The right-hand panel instead shows average levels of democracy weighted by population.
DemocracySince the ancient Greeks first gave us the term δημοκρατία, the meaning of “democracy” has evolved considerably. V-Dem seeks to reflect the contemporary varieties of democracy, each encompassing many different attributes. We measure over 450 aspects in the main V-Dem Dataset, and several more in additional datasets associated with V-Dem such as the V-Party and the Episodes of Regime Trans-formation Dataset. They jointly inform us about the state of political institutions and rights worldwide.
The V-Dem Institute’s Democracy Report sheds light on the state of democracy worldwide without losing the eye for key details. Without intent to underrate other varieties of democracy, the report focuses on the Liberal Democracy Index (LDI) that combines the electoral “core” institutions with the liberal aspects – executive constraint by the legislature and high courts, and rule of law and individual rights. This measure is among the most sophisticated measures that V-Dem offers.
The Regimes of the World measure is a categorical measure classify-ing countries into four distinct regimes: the two forms of democracy
(electoral and liberal) and two types of autocracies (electoral and closed). To be considered minimally democratic, i.e. an electoral democracy, a country has to meet sufficiently high levels of free and fair elections as well as universal suffrage, freedom of expression and association. Hence, solely holding elections does not suffice for a country to be considered democratic. Countries in which liberal aspects (executive constraint by the legislature and high courts, rule of law and individual rights) are respected on top of the requirements for electoral democracy, are considered liberal democracies. In electoral autocracies, there are institutions emulating democracy but falling substantially below the threshold for democracy in terms of authentic-ity or quality. In closed autocracies, an individual or group of people exercise power largely unconstrained by the people.
The Democracy Report should serve as an entryway to examine the numerous varieties of democratic attributes available in the V-Dem dataset. Categorizing regimes with the Regimes of the World index inherently reduces the nuance available in the universe of V-Dem indicators. Visit the website and explore the data, for example using online graphing tools: https://v-dem.net.
13STATE OF THE WORLD

Dictatorships on the Rise• Liberal democracies peaked in 2012 with 42 countries.
There are only 34 in 2021. There have not been so few liberal democracies in the world since 1995 – over 25 years ago. Only 13% of the world's population live in this least populous regime type.
• Dictatorships are on the rise – up from 25 to 30 closed autocracies between 2020 and 2021. This development adds to the picture of a change in the nature of autocratization.
• Electoral autocracies is the most common regime type and harbor the largest share of the world population – 44% or 3.4 billion people.
Most of the analyses in Democracy Report 2022 focus on gradual changes in the LDI, which is an original index from V-Dem and one of its most nuanced products. This section uses the Regimes of the World (RoW) categorization of four distinct regime types (closed autocracies, electoral autocracies, electoral democracies, and liberal democracies,4 see Figure 4). This categorization allows for a more compact analysis capturing some additional aspects of the broad global trends.
By the Regimes of the World classification, there were 89 democra-cies and 90 autocracies in the world in 2021.5 However, autocratic countries are far more populous. In 2021, 70% of the world popula-tion – 5.4 billion people – live in closed or electoral autocracies. A mere 13% of the world’s population reside in liberal democra-cies, and 16% in electoral democracies.
4 The typology and indicator are published in Lührmann et al. 2018. Regimes of the World (RoW). Politics and Governance 6(1). It builds on V-Dem data as well as the liberal and electoral democracy indices but is not officially endorsed by the V-Dem Steering Committee and international team.
5 Naturally, uncertainty remains about regimes that exhibit similar degrees of authoritarian and democratic traits and thus are close to the threshold between democracy and autocracy. In 2021, such uncertainty applied to 20 countries. Thus, the number of autocracies in the world might range from 80 to 100 countries, with 90 being our best estimate. For more details, refer to the variable v2x_regime_amb in the V-Dem dataset, v12.
The number of liberal democracies continues to dwindle from the peak at 42 in 2012 down to 34 countries now. Not since 1995 has the world harbored so few liberal democracies. The share of the world population living in liberal democracies also declined in the last decade. Only 13% lived in the least populous regime type at present: liberal democracies.
In Sub-Saharan Africa, there are only two liberal democracies: Botswana and Seychelles. Likewise, there are only two liberal democracies in Eastern Europe and Central Asia: Estonia and Latvia. Because of their small populations, these countries barely register in Figure 5, which tracks the population share living in each regime type across regions.
Electoral democracies have increased substantially in number since the end of the 1980s. It remains the second common regime type, amounting to 55 countries in 2021. However, the share of the world’s population living in electoral democracies decreased markedly in recent years. A mere 16% of the world’s population live in these 55 countries by 2021.
Two countries – Armenia and Bolivia – made democratic transi-tions from electoral autocracy to electoral democracy in 2021. But four countries were also downgraded over the last year from liberal democracy to electoral democracy: Austria, Ghana, Portugal, and Trinidad and Tobago. For Austria, a significant decline on the indicator for transparent laws and predictable enforcement is a decisive change that contributed to Austria falling below the criteria for liberal democracy. The reclassification of Ghana is a largely consequence of falling below the RoW threshold for liberal democracy on the level of access to justice for both men and women. Similarly, Trinidad and Tobago’s transparent laws and
FIGURE 4: NUMBER OF COUNTRIES AND SHARE OF POPULATION, BY REGIME TYPE 1971-2021
87
30
35
66
60
16
6055
20
42
34
0
10
20
30
40
50
60
70
80
90
100
1971 1981 1991 2001 2011 2021
Num
ber o
f Cou
ntrie
s
51
52
26
12
44
19
39
1618
18
13
0
5
10
15
20
25
30
35
40
45
50
55
1971 1981 1991 2001 2011 2021
Shar
e of
Wor
ld P
opul
atio
n (%
)
Closed Autocracy
Electoral Autocracy
Electoral Democracy
Liberal Democracy
Figure 4 plots the number of countries (left-hand panel) and the share of the world’s population (right-hand panel), by regime type.
14 DEMOCRACY REPORT 2022

predictable enforcement, as well as access to justice for women, have declined and fallen below the RoW thresholds for qualifying as a liberal democracy. Portugal’s score on access to justice for women declined but is only just below the threshold that the RoW methodology stipulates. Ghana, Portugal, and Trinidad and Tobago are all classified in the electoral democracy “upper bound”, indicating that their classification by the RoW methodol-ogy is somewhat uncertain with Portugal sitting on the fence. The downgrading of these countries, in particular Portugal, should therefore be interpreted with caution.
Electoral autocracies6 are home to the largest share of the world population following India’s downgrade to electoral democ-racy in 2020. In 2021, 44% of the world’s population – 3.4 billion people – live in electoral autocracies. Very large proportions of the world population live in electoral autocracies in Eastern Europe and Central Asia, Africa, and Middle East and North Africa (Figure 5). In 2021, countries such as El Salvador, Nigeria, and Tunisia turned into electoral autocracies and there are now 60 electoral autocracies, making it the most common regime type.
6 Electoral autocratic regimes hold de jure multiparty elections but nevertheless tilt the playing field in the incumbent’s favor to the extent that it is no longer a democracy, typically through restricting media freedom and the space for civil society, and by repressing the opposition, see Lührmann et al. 2018. Regimes of the World (RoW).
Notably, closed autocracies are on the rise. This is a new devel-opment in the “third wave of autocratization” that is more pro-nounced in 2021 than in previous years. The number of dictator-ships has been dwindling since the 1970s. From a record low of 20 closed autocracies in 2012, there were 30 in 2021. In the last year alone, five countries reverted to closed autocracy.
This increase is one of the signals of the changing nature of auto-cratization that we discuss further below. It reflects a growing number of coups, including Chad, Guinea, Mali, Myanmar, and the Taliban takeover in Afghanistan. All of these countries ended the year as closed autocracies. What seems to be emerging is a class of emboldened autocrats that are making the world more autocratic.
Now 26% of the world population – 2 billion people – live in closed autocracies. Asia-Pacific is the region with the largest share of its population living in closed autocracies, largely because of China. The MENA region has the second largest share of its population in dictatorships (Figure 5). Table 2 at the end of the report shows current regime types and changes in regime type since last year for all countries.
FIGURE 5: SHARE OF POPULATION IN TYPE OF REGIME, BY REGION
Western Europe, North America
98/100 LD 2/100 ED
Eastern Europe and Central Asia
1/100 LD 37/100 ED 54/100 EA 8/100 CA
Latin America, Caribbean
4/100 LD 84/100 ED 10/100 EA 2/100 CA
Asia, Paci�c
4/100 LD 8/100 ED 47/100 EA 41/100 CA
Middle East, North Africa
70/100 EA 30/100 CA
Sub−Saharan Africa
0/100 LD 17/100 ED 72/100 EA 11/100 CA
Each “person” represents 1% of population in the region. The colors represent the 4 regime types (Liberal Democracy, Electoral Democracy, Electoral Autocracy, and Closed Autocracy).
15STATE OF THE WORLD

Ten Years Ago – A Different World• A record of 35 countries suffered significant
deteriorations in freedom of expression at the hands of governments – an increase from only 5 countries ten years ago.
• A signal of toxic polarization, respect for counter-arguments and associated aspects of the deliberative component of democracy got worse in more than 32 countries – another increase from only 5 nations in 2011.
• Autonomy for the electoral management body (EMB) – a critical precondition for democratic elections – has been severely undermined by governments in 25 countries.
Just ten years ago the world looked very different from today. In 2011, there were more countries improving than declining on every aspect of democracy. By 2021 the world has been turned on its head: there are more countries declining than advancing on nearly all democratic aspects captured by V-Dem measures.
Figure 6 demonstrates these patterns. By 2011, elections, rule of law, freedom of expression, and freedom of association were declining in six or fewer countries but advancing in 10 to 30 countries. That is, they were advancing by two to five times the number of countries that were in decline.
The situation is completely turned around now. There is sub-stantial deterioration in freedom of expression in a record 35 countries this year, while only 10 countries are making advances. That means there are three times more countries declining than advancing. For rule of law, quality of elections, and freedom of
7 The deliberative principle of democracy focuses on the process by which decisions are reached in a polity. A deliberative process is one in which public reasoning focused on the common good motivates political decisions—as contrasted with emotional appeals, solidary attachments, parochial interests, or coercion. According to this principle, there should be respectful dialogue among informed and competent participants who are open to persuasion. V-Dem measures this feature with the extent to which political elites give public justifications for their positions on matters of public policy, justify their positions in terms of the public good, acknowledge and respect counterarguments; and how wide the range of consultation is at elite levels.
association, the number of countries in decline by 2021 also far outweigh the number making progress.
The picture is similar for the increase in “toxic polarization”, which is discussed more under “Autocratization Changing Nature?” below. Toxic polarization captures declining respect for legitimate opposition, pluralism, and counterarguments measured by the deliberative component.7 It is now getting worse in 32 countries. This constitutes a vast change from the count of 5 countries with deteriorating deliberative aspects in 2011. Declines over the last ten years include the United States of America dropping from 0.91 in 2016 to 0.60 in 2020 during the Trump administration. With the succession of the Biden administration, the score improved to 0.78 in 2021.
THE DEVIL IS IN THE DETAILS
Which aspects of democracy are affected most by the ongoing autocratization trends? Zooming in on the specific indicators of the components of democracy analyzed above, we find the devil is in the details. Increasingly authoritarian moves are visible on a series of critical indicators.
The count of countries with declines is also higher for many individual indicators than for the overall components discussed in the section above. In other words, there are many countries that have begun encroaching on specific aspects of freedoms and rights that are not captured by the analysis at aggregate levels.
For example, Figure 7 shows that repression of civil society organizations (CSOs) has worsened substantially in 44 countries over the past ten years, putting it at the very top of the indicators most affected by autocratization. Further, in 37 countries direct
FIGURE 6: DEMOCRATIC ASPECTS IMPROVING AND DECLINING, 2011 VS. 2021.
Elected O�cials
Freedom of Association
Freedom of Expression
Judical Constraints
Su�rage
Rule of LawDeliberation
Clean Elections
Legislative Constraints
0
4
8
12
16
20
24
28
32
36
0 4 8 12 16 20 24 28 32 36Number of Countries Declining
Num
ber o
f Cou
ntrie
s Im
prov
ing
2011
Elected O�cials
Freedom of Association
Freedom of Expression
Judical Constraints
Su�rage
Rule of Law
Deliberation
Clean Elections
Legislative Constraints
0
4
8
12
16
20
24
28
32
36
0 4 8 12 16 20 24 28 32 36Number of Countries Declining
Num
ber o
f Cou
ntrie
s Im
prov
ing
2021
Deliberative Component Electoral Democracy Liberal Component
This figure shows the number of countries improving and declining significantly and substantially for different components of democracy. The left panel compares changes between 2011 and 2001 and the right panel compares changes between 2021 and 2011.
16 DEMOCRACY REPORT 2022 STATE OF THE WORLD

government control over CSO’s existence (“entry and exit”) moved in an authoritarian direction. These data are evidence of the far-ranging weakening of civil society around the world. Autocrats seem to understand that one of the greatest defenses for democ-racy is a strong and independent civil society that can mobilize people against the autocratic government (see “Mobilization in Democratizing vs. Autocratizing Countries” below).
Figure 7 details for how many countries the top 20 indicators declined (substantively and significantly) between 2011 and 2021. The findings echo last year’s Democracy Report that there are intensifying threats to freedom of expression and the media. All those indicators are found on the top 20 on the list with signifi-cant deterioration in 25 to 44 countries, and governments’ efforts to censor the media is the second from the top.
The presence of six critical indicators of liberal democracy among the top 20 declining indicators is noteworthy – including high court independence and executive oversight. These six have moved in an authoritarian direction in 25 to 32 countries.
Indicators constituting the Clean Elections Index decline in relatively fewer countries. But one should note that the decisive autonomy for the electoral management body (EMB) deteriorates in 25 countries.
8 The Pandemic Backsliding project collected detailed, factual data on violations of international norms in response to the pandemic from March 2020 to June 2021. https://www.v-dem.net/pandem.html
9 https://www.v-dem.net/media/publications/pb_32.pdf
PANDEMIC BACKSLIDING?
How much are these trends an effect of the Covid-19 pandemic? Along the lines of the more detailed analysis in last year’s Democ-racy Report, we find that the pandemic has had limited direct effects on the global downward trend in democracy. While leaders of some countries take advantage of the pandemic to further consolidate power, autocratization was typically happen-ing already.
However, there have been significant violations of international standards for what governments are allowed to do in response to a pandemic. The final policy brief from the Pandemic Backsliding project8 shows that 57 countries recorded moderate violations and 44 countries had major violations of international norms. Most of these violations occurred in autocratic countries. For details, see the policy brief.9
FIGURE 7: TOP-20 DECLINING INDICATORS, 2011–2021
EMB autonomy
Freedom from torture
Executive oversight
High court independence
Print/broadcast media critical
Rigorous and impartial public administration
Transparent laws with predictable enforcement
Media bias
Freedom of discussion for men
Media self−censorship
Freedom of foreign movement
Reasoned justi�cation
Freedom of discussion for women
CSO entry and exit
Freedom of academic and cultural expression
Harassment of journalists
Engaged society
Range of consultation
Respect counterarguments
Government censorship e�ort −−− Media
CSO repression
051015202530354045Number of Countries Declining
Freedom of Expression Index
Freedom of Association Index
Clean Elections Index
Liberal Component Index
Deliberative Component Index
17STATE OF THE WORLD

Democratizers and Autocratizers
10 The Democracy Report uses a simplified metric to capture which countries are autocratizing or democratizing. It measures the difference between the country score on the liberal democracy index (LDI) in 2021 and 2011. A country is autocratizing or democratizing if the difference is statistically significant (the confidence intervals do not overlap) and substantial (the difference is greater than 0.05). The metric builds on the ideas in Lührmann, A. and S.I. Lindberg. 2019. A Third Wave of Democratization Is Here. Democratization 26(7), but is simplified and uses the LDI. For a more recent extension, see the “Episodes of Regime Transformation” project: on Github (https://github.com/vdeminstitute/ert); and Maerz, S.F., et al. 2021. A Framework for Understanding Regime Transformation: Introducing the ERT Dataset. V-Dem Working Paper No 113.
• The largest number of nations in 50 years are now autocratizing – 33 countries harboring 2.8 billion people.
• Democracy broke down in 7 of the top 10 auto c ratiz-ing states over the past decade.
• Anti-pluralist parties drive the autocratization in at least 6 of the top 10 autocratizers – Brazil, Hungary, India, Poland, Serbia, and Turkey.
• The EU may be facing its own wave of autocratization. 6 out of 27 EU members states – more than 20% of the union – are now autocratizing.
• The lack of a pro-democratic mobilization – still at low levels – risks allowing autocratization to deepen unchallenged.
In this part of the Democracy Report 2022, we leave the focus on the situation in 2021 and on the state (level of democracy, type of regime, level of mobilization) countries are in. The analyses below instead look at the world from the perspective of the direction in which countries are moving. Are they democratizing or autocratizing, and what aspects of democracy are affected when they change?
A Record 33 Countries are Autocratizing• There have not been so few democratizers since 1978 –
15 countries in 2021, with 3% of the world population.
• 33 states are autocratizing by 2021. Economically strong and populous, they harbor 36% of the world population.
• Both democratizing and autocratizing nations are found across all regions of the world.
The number of democratizing countries – 15 – is now down to levels last seen in 1978 at the very beginning of the third wave of democratization. These democratizing nations have relatively small populations and host a tiny 3% of the world population.
Figure 8 details the striking patterns of autocratization and democratization.10 In the left-hand panel, the dashed blue line displays how the number of democratizing countries increased until the peak of 72 in 1999. The dramatic decline started shortly after and continues into 2021.
The red line in Figure 8 illustrates how the number of autocratizing countries declined until the late 1990s and has been increasing since. More countries are autocratizing by 2021 than at any time in the last 50 years – 33 countries.
Autocratizing countries are often economically strong but also populous. They hold 36% of the world population – 2.8 billion people.
FIGURE 8: AUTOCRATIZING VS. DEMOCRATIZING COUNTRIES, 1971–2021
19
72
15
26
33
0
10
20
30
40
50
60
70
1971 1981 1991 2001 2011 2021
Num
ber o
f Cou
ntrie
s
4
30
3
10
36
0
10
20
30
1971 1981 1991 2001 2011 2021
Shar
e of
Wor
ld P
opul
atio
n (%
)
Autocratizing Countries Democratizing Countries
Figure 8 shows patterns of democratization and autocratization over the last 50 years. The left-hand panel displays the number of countries in each category and the right-hand panel shows the share of the world population living in autocratizing or democratizing countries.
18 DEMOCRACY REPORT 2022

The autocratizing countries tend to be influential regional and global powers. The group includes major G20 countries such as Brazil, India, Turkey, and the United States of America, as well as countries such as Bangladesh, Tanzania, Thailand, and The Philippines. Except for South Korea, the countries improv-ing on the LDI were typically less populous and not as influential internationally.
COUNTRY OVERVIEW, BY REGION
The 15 countries democratizing as well as the 32 autocratizing are found across all regions of the world (Figure 9 and 10).
Four countries in Sub-Saharan Africa have made democratic progress: Madagascar, Malawi, Seychelles, and The Gambia. But more than twice as many – eleven countries in in the region – declined compared to 2011: Benin, Botswana, Burundi, Comoros, Ghana, Ivory Coast, Mali, Mauritius, Mozambique, Tanzania, and Zambia.
Four of the advancing countries are in the Asia-Pacific region: Fiji, Malaysia, South Korea, and Sri Lanka. South Korea is a rare example of a country that halted and turned around a period of autocratization. Almost twice as many – seven countries – worsened in Asia-Pacific in the last decade – Afghanistan, Bangladesh, Cambodia, Hong Kong, India, Thailand, and The Philippines.
Three advancing countries are found in Eastern Europe and Central Asia: Armenia, Georgia, and Uzbekistan. Democratic qualities decayed substantially in more than twice as many – seven – over the last ten years: Belarus, Croatia, Czech Republic, Hungary, Poland, Serbia, and Slovenia.
In Latin America, two countries have improved: Dominican Republic and Ecuador. Ecuador is another example of a country that managed to turn a process of autocratization around. Again,
major regressions have struck twice as many countries: Brazil, El Salvador, Nicaragua, and Venezuela.
In the MENA region, Libya and Tunisia have advanced on the LDI compared to 2011 even if Libya is still at an extremely low level and Tunisia faced a self-coup in 2021. There are two autocratiz-ers – Turkey and Yemen – in the region. In Turkey the process started in 2006 and is still developing for the worse.
No single country across North America and Western Europe made improvements over the last decade. Meanwhile, two coun-tries in Western Europe and North America that autocratized over the last ten years: Greece and the United States of America.
Democratization Across Regions• Across regions, elections are the aspect of democracy
with the highest average improvement among democratizers.
• In Latin America and the Caribbean, democratizing countries made the greatest improvements in judicial constraints on the executive. Leaders in these countries are in effect now much more accountable to the judiciary than they were a decade ago.
What are the regional patterns that emerge from changes in the countries discussed above? Among the 15 democratizing coun-tries (Figure 11), the quality of elections is the aspect of democracy improving the most across regions except in Latin America and the Caribbean and the MENA region.
In Armenia, Malaysia, and Seychelles for instance, there was significant improvement in autonomy of electoral management bodies in the last 10 years. In The Gambia, there was great improvement across many election indicators, including quality of voter registries, vote buying, and election violence.
FIGURE 9: COUNTRIES DEMOCRATIZING VS. AUTOCRATIZING, 2011–2021
−0.5 −0.4 −0.3 −0.2 −0.1 0 0.1 0.2 0.3 0.4 0.5
Figure 9 shows where the LDI has improved (blue) or declined (red) substantially and significantly over the past decade. Countries in gray had no substantial and significant change on the LDI during this period.
19STATE OF THE WORLD

In Latin America and the Caribbean democratizing countries made the greatest strides in improving judicial constraints. In Dominican Republic and Ecuador, for instance, there was significant and substantial improvement in government compli-ance with the high court over the last ten years.
Leaders in the countries making improvements on democracy are in effect now much more accountable to the judiciary than they were a decade ago. The long history of elections with already decent quality in many countries may explain why there is little improvement in the clean elections index, even among countries making improvements on the LDI.
Notably, there was an average decline in legislative constraints on the executive even across the democratizing countries in the MENA region: Libya and Tunisia.
Autocratization Across Regions• Freedom of expression is the aspect of democracy
undermined the most in autocratizing countries. Authoritarian-minded leaders are especially prone to harassing and censoring the media – this got worse in 21 of the 33 autocratizing countries.
• Repression of civil society increased substantially in 22 autocratizing nations.
• Autonomy of electoral management bodies has been undermined by governments in 20 autocratizing states.
• Leaders in autocratizing countries also diminished respect for counterarguments in 21 countries – a signal of the changing nature of autocratization.
A regional breakdown demonstrate that leaders often attack the same aspects of democracy in autocratizing countries: freedom of expression and especially the media (Figure 12).
Across four regions (Asia-Pacific, Eastern Europe and Central Asia, Latin America and the Caribbean, and MENA), freedom of expression and the media was the most common aspect of democracy to decline. While not the most commonly affected aspect in the remaining two regions, free expression was also severely derailed there.
There is also some regional variation in the aspects of democracy most often attacked in autocratizing countries. Freedom of asso-ciation and attacks on civil society are prominent aspect of auto-cratization in Asia-Pacific, Latin America, and MENA. For instance, there were significant and substantial increases in government censorship of the media in Afghanistan, Brazil, and Hong Kong.
The critical legislative constraints on the executive were most frequently undermined in two regions: Sub-Saharan Africa, and Western Europe and North America. Two countries in Sub-Saharan Africa – Benin and Comoros -- ranked highest in terms of decline in legislative constraints over the last ten years. In Europe, Greece and Poland registered substantial and significant decline in the legislature’s propensity to investigate the executive over the last decade.
ZOOMING IN: WHAT AUTOCRATS ATTACK
As discussed above, zooming in on individual indicators reveals important additional details about the process of autocratization. The specific aspect of democracy that political leaders in autoc-ratizing countries most commonly attack is civil society organi-zations (CSOs). CSO repression is closely followed by increasing censorship of media and harassment of journalists (Figure 13).
FIGURE 10: ADVANCES VS. DECLINES ON THE LIBERAL DEMOCRACY INDEX (LDI), 2011–2021
Afghanistan
Armenia
Bangladesh
Belarus
Benin
Botswana Brazil
Burundi
Cambodia
Comoros
Croatia
Czech Republic
Dominican Republic
Ecuador
El Salvador
Fiji
Georgia
Ghana
Greece
Hong Kong
Hungary
India
Ivory Coast
Libya
Madagascar
Malawi
Malaysia
Mali
Mauritius
Mozambique
Nicaragua
Philippines
Poland
Serbia
SeychellesSlovenia
South Korea
Sri LankaTanzania
Thailand
Gambia
Tunisia
Turkey
USA
UzbekistanVenezuela
Yemen
Zambia
0.0
0.1
0.2
0.3
0.4
0.5
0.6
0.7
0.8
0.9
0.0 0.1 0.2 0.3 0.4 0.5 0.6 0.7 0.8 0.9Liberal Democracy Index 2011
Libe
ral D
emoc
racy
Inde
x 20
21
Eastern Europe and Central Asia
Latin America and the Caribbean
The Middle East and North Africa
Sub-Saharan Africa
Western Europe and North America
Asia and the Paci�c
Figure 10 displays country scores on the liberal democracy index (LDI) in 2011 (x-axis) and 2021 (y-axis). Countries above the diagonal line have become more democratic whereas countries below the diagonal line have become more autocratic. Country names are highlighted if the difference between 2011 to 2021 is significant and substantial.
20 DEMOCRACY REPORT 2022

FIGURE 11: CHANGES IN DEMOCRATIZING COUNTRIES, BY REGION
Sub−Saharan Africa The Middle East and North Africa
Asia and the Paci�c Eastern Europe and Central Asia Latin America and the Caribbean
0.0 0.1 0.2 0.3 0.0 0.1 0.2 0.3
0.0 0.1 0.2 0.3
Freedom of Expression
Freedom of Association
Clean Elections
Legislative Constraints
Judicial Constraints
Rule of Law
Freedom of Expression
Freedom of Association
Clean Elections
Legislative Constraints
Judicial Constraints
Rule of Law
Mean Change
Figure 11 plots average change in democracy components in countries that were democratizing between 2011 and 2021. Democratizing countries are those with significant and substantial improvement on V-Dem’s liberal democracy index (LDI) during this 10-year period.
FIGURE 12: DECLINES IN AUTOCRATIZING COUNTRIES, BY REGION,
Sub−Saharan Africa The Middle East and North Africa Western Europe and North America
Asia and the Paci�c Eastern Europe and Central Asia Latin America and the Caribbean
−0.3 −0.2 −0.1 0.0 −0.3 −0.2 −0.1 0.0 −0.3 −0.2 −0.1 0.0
Freedom of Expression
Freedom of Association
Clean Elections
Legislative Constraints
Judicial Constraints
Rule of Law
Freedom of Expression
Freedom of Association
Clean Elections
Legislative Constraints
Judicial Constraints
Rule of Law
Mean Change
Figure 12 plots average change in democracy components in countries that were autocratizing between 2011 and 2021. Autocratizing countries are those with significant and substantial decline on V-Dem’s liberal democracy index (LDI) during this 10-year period.
21STATE OF THE WORLD

The countries with the highest increases in repression of civil society (on a 0 to 4 scale) are Afghanistan (–2.6), Hong Kong (–2.2), and Nicaragua (–2.1). Governments in all three countries evidently engage in extensive subjugation of civil society.
Freedom of expression is another area that leaders in autocratizing countries frequently batter. The data show substantial deteriora-tions in government censorship of the media and harassment of journalists in 21 autocratizing countries. For instance, increased media censorship took place in Mauritius, Poland, and Slovenia.
Leaders in autocratizing countries also severely undercut delib-erative aspects of democracy. In 19 or more countries, leaders diminished respect for counterarguments, range of consultation, and engagement within society. In Burundi, El Salvador, and Serbia, for instance, the range of consultation has significantly declined in the last ten years.
Notably, some formal democratic institutions are relatively free from attacks in autocratizing countries, such as many indicators measuring quality of elections. However, governments dimin-ished the critical autonomy of electoral management bodies in no less than 20 of the 33 autocratizing countries. In Benin, Ivory Coast, and Nicaragua governments are responsible for substan-tial and significant deteriorations in the overall quality of elections.
11 https://www.nytimes.com/2021/07/10/world/asia/sri-lanka-basil-rajapaksa.html
12 https://www.bbc.com/news/world-latin-america-57228324
The Major Democratizers• Among the top 10 democratizing countries, 6 transitioned
from autocracy and are democracies in 2021.
• But few of the democratizers continue to improve further.
Among the top 10 democratizing countries in the last 10 years, seven out of ten were autocracies in 2011. Six out of these ten are democra-cies in 2021. Seychelles transitioned from an electoral democracy to a liberal democracy over the last decade and continues its upward trajectory. Armenia and Sri Lanka have moved from being elec-toral autocracies in 2011 to electoral democracies in 2021.
Fiji and Madagascar remain autocratic but have improved on the LDI and moved out of the group of closed autocracies. The right-hand panel of Figure 14 displays the trajectories for all top democratizers over the last 10 years.
Notably, few of the top democratizers continue to improve in 2021. Only Dominican Republic and Seychelles display a sub-stantial upward trajectory in 2021. Sri Lanka is on a downward trend. Changes in Sri Lanka reflect a move to centralize power under President Rajapaksa and his family members through con-stitutional amendments removing checks on executive power.11 Ecuador held presidential elections in 2021 leading to a transfer of power to the new President Guillermo Lasso. However, the country is still plagued by an economic and public health crisis.12 Georgia is
FIGURE 13: TOP-20 DECLINING INDICATORS, AUTOCRATIZING COUNTRIES
Executive respects constitution
Freedom of foreign movement
Legislature investigates in practice
Print/broadcast media perspectives
Reasoned justi�cation
Executive oversight
Freedom from torture
Print/broadcast media critical
CSO entry and exit
Media bias
Freedom of discussion for men
Media self−censorship
Freedom of discussion for women
Range of consultation
Transparent laws with predictable enforcement
EMB autonomy
Engaged society
Freedom of academic and cultural expression
Government censorship e�ort −−− Media
Harassment of journalists
Respect counterarguments
CSO repression
05101520Number of Autocratizing Countries Declining
Freedom of Expression Index
Freedom of Association Index
Clean Elections Index
Liberal Component Index
Deliberative Component Index
Figure13 plots the number of autocratizing countries declining significantly and substantially on each democracy indicator. An indicator is declining substantially and significantly if its 2021 value is at least 0.5 points lower than its 2011 value on a scale ranging from 0 to 4 (for most variables) or 0 to 5 (for some variables) and the confidence intervals do not overlap.
22 DEMOCRACY REPORT 2022

suffering from increased levels of political polarization, especially after the heavily contested 2020 elections.13 Tunisia had a demo-cratic breakdown after the self-coup in 2021 (see box on Tunisia).
Fiji, Madagascar, and The Gambia remained constant on recent LDI scores. Madagascar failed to continue its improvement under controversial President Andry Rajolina.14 Fiji is facing a political crisis after several opposition figures were arrested in relation to the passing of a controversial new land bill.15 The Gambia held its first democratic election in 2021 after the ousting of the autocratic President Yahya Jammeh in 2016.16
The Major Autocratizers• Democracy broke down in 7 of the top 10 autoc ratiz ing
countries over the past decade.
• Anti-pluralist parties drive autocratization in at least 6 of the top 10 autocratizers – Brazil, Hungary, India, Poland, Serbia, and Turkey.
• 6 out of 27 EU members states – more than 20% of the Union – are now autocratizing. Three of EU’s neighbors to the east are also autocratizing.
• Afghanistan, Ivory Coast, Myanmar, Slovenia, and Tunisia are new top autocratizers emerging in the last three years.
13 https://www.bbc.com/news/world-europe-54868053
14 https://www.bbc.com/news/world-africa-53756752
15 https://www.theguardian.com/world/2021/aug/04/fijis-political-turmoil-everything-you-need-to-know
16 https://www.bbc.com/news/world-africa-59542813
17 Boese, V. A., et al. 2021. How Democracies Prevail: Democratic Resilience as a Two-Stage Process. Democratization 28(5).
18 Lührmann, A., et al. 2021. Walking the Talk: How to Identify Anti-Pluralist Parties. V-Dem Working Paper No.116.
19 https://apnews.com/article/europe-poland-courts-1fc3c963fa5b62a8f36e4bd7fabb01fa
20 https://www.theguardian.com/world/2021/aug/11/polish-government-media-bill-latest-move-silence-critics
21 https://www.politico.eu/article/hungary-election-campaign-hit-spying-allegations/
In 2021, two new countries entered the list of top autocratizers compared to the list in last year’s Democracy Report: El Salvador and Mali.
Of the top autocratizing countries over the past decade, all countries were democracies ten years ago but only three remain by 2021. The other seven reversed to autocracy (Figure 14). This pattern closely mirrors a recent analysis of all episodes of autocratization starting in democracies over the past century, which found that almost 80% of autocratization episodes lead to breakdown of democracy.17 Autocratization very rarely stops short of autocracy.
Anti-pluralist parties are driving the autocratization in at least six of the top autocratizers – Brazil, Hungary, India, Poland, Serbia, and Turkey.18 Anti-pluralist parties and their leaders lack commitment to the democratic process, disrespect fundamental minority rights, encourage demonization of political opponents, and accept political violence. These ruling parties tend to be nationalist-reactionary and have used government power to push forward autocratic agendas. In Poland, for example, the ruling party has ramped up government control over the judiciary19 and the media.20 In Hungary, Prime Minister Orbán used his control over the media to slander civil society figures and independent media ahead of the 2022 general elections.21 These tendencies often coincide with increasing polarization, as the Democracy Report discusses in the next section.
FIGURE 14: TOP 10 DEMOCRATIZING VS. AUTOCRATIZING COUNTRIES (10-YEAR)
Armenia
DominicanRepublicEcuador
Fiji
Georgia
Madagascar
Seychelles
Sri LankaGambiaTunisia
0.0
0.1
0.2
0.3
0.4
0.5
0.6
0.7
0.8
0.9
2011 2016 2021
Libe
ral D
emoc
racy
Inde
x
Benin
Brazil
El Salvador
HungaryIndia
Mali
MauritiusPoland
Serbia
Turkey
0.0
0.1
0.2
0.3
0.4
0.5
0.6
0.7
0.8
0.9
2011 2016 2021
Libe
ral D
emoc
racy
Inde
x
Closed Autocracy
Electoral Autocracy
Electoral Democracy
Liberal Democracy
Figure 14 plots values of the liberal democracy index (LDI) for the 10 countries with the highest amount of LDI increase (left panel) and decrease (right panel) in the last 10 years.
23STATE OF THE WORLD

El Salvador, Mali, Poland, and Serbia continue their steep down-ward trend in 2021. Mali had its second coup in less than a year in May 2021.22 In El Salvador, President Nayib Bukele and his party have removed constraints on the executive and undermined the judiciary, for example by removing five supreme court judges.23
Benin, Hungary, and Turkey are not autocratizing at the same pace as in previous years but remain electoral autocracies. Benin held presidential elections in 2021 where key opposition figures were either arrested or in exile, leading to re-election of sitting President Patrice Talon.24
Brazil, India, and Mauritius’ trajectories have stabilized in recent years, enough to remain electoral democracies or, in India’s case, an electoral autocracy. In Brazil, President Bolsonaro faced push-back from the supreme court on his attempts to discredit the electoral system.25
ZOOMING IN: LAST THREE YEARS
Zooming in on the last three years makes it possible to identify the countries that started to change only recently.
Only three out of the top ten democratizers since 2011 are among the top democratizers in the past three years – Armenia, Dominican Republic, and Seychelles. The new, more recent democratizers are Malawi, Maldives, Malta, Moldova, Romania, Slovakia, and Ukraine (Figure 15). In the best-case scenario, this could be the first sign of a reversal of the downward trend for democratization around the world, but this remains to be seen.
22 https://www.bbc.com/news/world-africa-57239805
23 https://www.hrw.org/news/2021/11/01/el-salvador-legislature-deepens-democratic-backsliding
24 https://www.bbc.com/news/world-africa-56690689
25 https://www.dw.com/en/brazils-bolsonaro-asks-senate-to-impeach-supreme-court-judge/a-58938384
26 https://www.bbc.com/news/world-africa-54778200
27 https://www.politico.eu/article/european-parliament-slovenia-janez-jansa/
In comparison, five of the top 10 autocratizers since 2011 have also been top autocratizers in the last three years. Benin, El Salvador, Mali, Mauritius, and Poland qualify as top autocratizers in both the long-term and short-term windows. These are countries where the process of autocratization has both been ongoing for a long while and continues into the present.
Afghanistan, Ivory Coast, Myanmar, Slovenia, and Tunisia are countries that appear only on the list of top autocratizers over the past three years. Conditions in Ivory Coast deteriorated after the controversial 2020 presidential election that was characterized by violence, malpractice, and opposition boycotts.26 In Slovenia, President Jansa led attacks on the independence of the judiciary and media freedom since his installment in 2018,27 resulting in a downgrading from liberal to electoral democracy in 2020. In this case, the recent developments serve as a warning of possible future declines.
The remaining three are cases of dramatic autocratizing events in 2021. Myanmar fell victim to the well-known coup at the start of 2021. Tunisia was subject to a self-coup by President Said Kaied in 2021. Democracy in Afghanistan plummeted after 2020 due to the Taliban takeover in mid-2021 (see box on Afghanistan for further details).
IN FOCUS: EU AND ITS EASTERN FLANK
The EU harbors a few recent democratizers. While not on the list in the ten-year perspective discussed above, Malta, Romania, and Slovakia registered significant improvements in the last three
Yangon, Myanmar. Demonstrators gather during a protest against the military coup in Yangon, Myanmar on March 3, 2021. Photo: Getty Images.
24 DEMOCRACY REPORT 2022

years since 2018. Another two neighbors to the east – Moldova and Ukraine – are also included among the list of top democ-ratizers from the last three years (Figure 15).
Yet, six of the EU’s 27 member states are autocratizing. With more than 20% of EU members autocratizing, the union is starting to face its own wave of autocratization (Figure 16).
Among the union members, Hungary and Poland are among the top autocratizers in the world over the last decade. Hungary turned into an electoral autocracy in 2018. Autocratization is now also affecting Slovenia, which is one of the top autocratizers in
the world over the last three years (Figure 15). Croatia, Czech Republic, and Greece are also newly autocratizing countries.
In addition, the EU’s neighbors on the eastern flank are becoming increasingly autocratic. Three of them have been autocratizing in the last decade. Turkey is still one of the top autocratizers, although it was already classified as an electoral autocracy by 2013. Serbia is a top autocratizer. It was downgraded to electoral autocracy in 2014. Already an electoral autocracy, conditions recently worsened further in Belarus with the regime ramping up repression after the contested 2020 elections. Figure 16 illustrates these troubling trends in Europe.
Cracow, Poland, October 10, 2021. We stay – the government leaves! People protest against the verdict of the Constitutional Tribunal. Many citizens believe that the verdict is a step towards Polexit. Photo: Shutterstock
FIGURE 15: TOP 10 DEMOCRATIZING VS. AUTOCRATIZING COUNTRIES (3-YEAR)
Armenia
DominicanRepublic
Malawi
Maldives
MaltaMoldova
Romania
Seychelles
Slovakia
Ukraine
0.0
0.1
0.2
0.3
0.4
0.5
0.6
0.7
0.8
0.9
2018 2019 2020 2021
Libe
ral D
emoc
racy
Inde
x
Afghanistan
Benin
Myanmar
El SalvadorIvory Coast
Mali
Mauritius
Poland
Slovenia
Tunisia
0.0
0.1
0.2
0.3
0.4
0.5
0.6
0.7
0.8
0.9
2018 2019 2020 2021
Libe
ral D
emoc
racy
Inde
x
Closed Autocracy
Electoral Autocracy
Electoral Democracy
Liberal Democracy
Figure 15 plots values of the liberal democracy index (LDI) for the 10 countries with the highest amount of LDI increase (left panel) and decrease (right panel) in the last 3 years. Markers and color indicate each country’s regime type on the Regimes of the World index.
FIGURE 16: AUTOCRATIZATION IN THE EU AND ITS EASTERN NEIGHBORS
−0.5 −0.4 −0.3 −0.2 −0.1 0 0.1 0.2 0.3 0.4 0.5
Figure 16 shows where the liberal democracy index (LDI) substantially and significantly improved (blue) or declined (red) over the past decade. Countries in gray had no substantial and significant change on the LDI during this period.
25STATE OF THE WORLD

Popular Mobilization in (Another) Year of Autocratization• Mobilization continues to stay at low levels. This lack
of a pro-democratic mobilization risks allowing autocra-tization to deepen unchallenged.
• Popular mobilization is highest in countries undergoing autocratization, such as El Salvador, Mali, Myanmar, and Serbia.
• Rising pro-autocracy mobilization in autocratizing countries may signal that autocratizing leaders are taking bolder actions to demonstrate legitimacy.
The Democracy Report 2020 reported that pro-democratic mobi-lization in reaction to autocratization worldwide reached the highest level in 2019. The Covid-19 pandemic with restrictions on freedom of assembly pushed levels of mass mobilization down in 2020 and 2021 (see Figure 17). Restrictions continue to prevent mobilization as there remained limitations of freedom of assembly and movement in several countries during 2021.
Meanwhile the number of autocratizing countries increased signifi cantly during these last two years. The lack of a correspond-ing increase in pro-democratic mobilization confronting such a trend risks allowing autocratization to accelerate unchallenged.
28 Gerbaudo, P. 2020. The Pandemic Crowd: Protests in the time of COVID-19. Journal of International Affairs 73(2).
29 https://www.aljazeera.com/news/2021/10/18/thousands-protest-in-el-salvador-against-bukele-government
30 https://balkaninsight.com/2021/04/27/slovenian-protesters-rally-against-degradation-of-democracy/
31 https://www.bbc.com/news/world-asia-55902070
32 https://www.bbc.com/news/world-us-canada-55640437
33 https://theintercept.com/2021/09/05/bolsonaro-september-7-brazil-trump-january-6/
34 https://www.africanews.com/2021/09/23/mali-thousands-denounce-france-at-pro-army-rally/
35 Hellmeier, S., & Weidmann, N. B. 2020. Pulling the Strings? The Strategic Use of Pro-Government Mobilization in Authoritarian Regimes. Comparative Political Studies 53(1).
MOBILIZATION IN DEMOCRATIZING VS. AUTOCRATIZING COUNTRIES
Despite a significant increase in state-imposed restrictions under the pandemic over the past two years, a number of protests took place. The Covid-19 pandemic led to the emergence of new griev-ances with accompanying “pandemic protests,” socially distanced protests by health care personnel, anti-lockdown protests, and even riots.28
While pro-democracy mass mobilization in general is low, it is occurring in particular in those countries subject to autocratiza-tion and, in those countries typically in favor of democracy (see Figure 18). In El Salvador, for example, thousands of demonstra-tors took the street in San Salvador on October 18, 2021 against President Nayib Bukele’s government. They protested legalization of Bitcoin as well as the government’s attack on judicial independ-ence referring to the legislative vote to remove certain judges.29
In Slovenia, several thousand people gathered to demonstrate against the right-wing Prime Minister Janez Jansa on April 27, 2021. The protesters accused Jansa of using the pandemic as a pretext to restrict freedoms, increase police powers, incite hostility to activists and NGOs, and attack journalists.30
Countries with recent military coups have some of the highest levels of pro-democracy mobilization. The military coup in Myanmar on February 1, 2021 for example, provoked peaceful pro-democracy mobilization coordinated the Campaign for Civil Disobedience (CDM). The government responded by repressing pro-democratic protesters, and the military and police killed at least 1503 protesters.31
Yet, mobilization for autocracy also happens more often in coun-tries undergoing autocratization (see Figure 19). Anti-pluralist and authoritarian leaders seem to be using mass mobilization to promote their anti-democratic agendas. For example, pro-Trump protesters stormed the Capitol, encouraged by the former presi-dent of the United States of America on the spurious grounds of mass electoral fraud.32 In Brazil, President Jair Bolsonaro asked sup-porters to coordinate rallies on September 7th, 2021 in support of anti-democratic calls, including the removal of all supreme court judges and the specter of a military coup.33 In Mali, thousands of people marched in Bamako in support of the military-dominated transitional government on September 22, 2021.34
These examples suggest that authoritarian-minded leaders are actively mobilizing people to obtain popular support for their anti-democratic agendas and to shore up the legitimacy of their regimes.35
FIGURE 17: MOBILIZATION AND AUTOCRATIZATION, 1971–2021
0.0
0.5
1.0
1.5
2.0
2.5
0
10
20
30
2001 2006 2011 2016 2021
Glo
bal M
ean
Num
ber of Countries
Autocratizing CountriesMobilization for AutocracyMobilization for Democracy
Figure 17 displays the level of mobilization for democracy and autocracy against the backdrop of the number of autocratizing countries in that year.
26 DEMOCRACY REPORT 2022

FIGURE 19: MOBILIZATION FOR AUTOCRACY IN 2021
Afghanistan
Armenia
Bangladesh
Belarus
Benin
Botswana
Brazil
Burundi Cambodia
Chad
Comoros
Croatia
Cuba
Czech Republic
Ecuador
El Salvador
Ethiopia
Fiji
Georgia
GhanaGreece
Hong Kong
Hungary
India
Iran
Ivory Coast
Libya
Malawi
Malaysia
Mali
Mauritius
Mozambique
Nicaragua
North Korea
Philippines
Poland
Congo
Senegal
Serbia
Slovenia
South Korea
Sri LankaTanzania
Thailand
Gambia
Tunisia
Turkey
Turkmenistan
USA
Uzbekistan
Venezuela
Yemen
Zambia
No Events
Several SmallEvents
Many SmallEvents
Several LargeEvents
Many LargeEvents
Democratized No Change Autocratized
Mob
iliza
tion
for A
utoc
racy
in 2
021
Figure 19 shows the countries in which large-scale pro-autocracy protests took place in 2021 and relates that level to whether the country was democratizing, autocratizing, or stable compared to ten years ago based on the LDI. The indicator of mass mobilization for autocracy captures the extent to which events with pro-autocratic aims have been frequent and large. Gray lines stand for the mean of the level of mobilization in each category.
FIGURE 18: MOBILIZATION FOR DEMOCRACY IN 2021
Afghanistan
Armenia
Bangladesh
Belarus
Benin
Botswana
Brazil
Myanmar
Burundi
Cambodia
Chad
Colombia
Comoros
Croatia
Cuba
Czech Republic
Dominican RepublicEcuador
El Salvador
Eswatini
Ethiopia
Fiji
Georgia Ghana
Greece
Haiti
Honduras
Hong Kong
Hungary
India
Iraq
Ivory Coast
LebanonLibya
Madagascar
Malawi
Malaysia
Mali
Mauritius
Mozambique
Nicaragua
Philippines
Poland
Serbia
Seychelles
Slovenia
South Korea
Sri Lanka
Sudan
Taiwan
Tanzania
Thailand
Gambia
Tunisia
Turkey
USA
Uzbekistan
Venezuela
Yemen
Zambia
No Events
Several SmallEvents
Many SmallEvents
Several LargeEvents
Many LargeEvents
Democratized No Change Autocratized
Mob
iliza
tion
for D
emoc
racy
in 2
021
Figure 18 shows the countries in which large-scale pro-democracy protests took place in 2021 and relates that level to whether the country was democratizing, autocratizing, or stable compared to ten years ago based on the LDI. The indicator of mass mobilization for democracy captures the extent to which events with pro-democratic aims have been frequent and large. Gray lines stand for the mean of the level of mobilization in each category.
27STATE OF THE WORLD

Taliban Take-Over in Afghanistan
1 Murtazashvili, JB. 2022. The Collapse of Afghanistan. Journal of Democracy 33(1).
2 https://rsf.org/en/news/afghanistan-11-journalism-rules-imposed-taliban-open-way-censorship-and-arbitrary-decisions-rsf
3 https://www.hrw.org/news/2021/10/01/afghanistan-taliban-severely-restrict-media
4 https://www.aljazeera.com/news/2021/12/24/afghanistan-media-rsf-survey-taliban-takeover-journalists
5 https://www.fidh.org/en/region/asia/afghanistan/broken-promises-civil-society-under-siege-after-100-days-of-taliban
6 https://www.hrw.org/report/2020/06/30/you-have-no-right-complain/education-social-restrictions-and-justice-taliban-held
7 https://www.nytimes.com/2021/09/20/world/asia/afghan-girls-schools-taliban.html
8 https://www.bbc.co.uk/worldservice/people/features/ihavearightto/four_b/casestudy_art26.shtml
9 https://www.bbc.com/news/world-asia-57046527
10 https://president.jhu.edu/meet-president-daniels/speeches-articles-and-media/washington-post-op-ed-why-authoritarian-regimes-attack-independent-universities/
11 https://www.npr.org/2018/08/15/638953303/bombing-in-kabul-targets-educational-center-kills-dozens-of-young-people?t=1644831949528
12 https://www.hrw.org/report/2020/06/30/you-have-no-right-complain/education-social-restrictions-and-justice-taliban-held
13 https://www.aljazeera.com/news/2022/1/17/taliban-says-will-open-all-schools-for-girls-across-country
14 https://www.bbc.com/news/world-asia-58709353
15 https://www.bbc.com/news/world-asia-57767067
16 https://edition.cnn.com/2021/08/25/asia/taliban-women-workplaces-afghanistan-intl/index.html
17 https://www.bbc.com/news/world-asia-58437713
18 https://www.theguardian.com/world/2021/sep/08/afghan-women-to-be-banned-from-playing-sport-taliban-say
Following the US-Taliban Doha Agreement on February 2020, the Taliban takeover on 15th August 2021 meant a rapid transition to closed autocracy.1
The media and free press are among the worst affected by new media regulations,2 with arbitrary detainment, harassment and torture of journalists.3 Since the takeover, 40% of the Afghan media have shut down and 60% of journalists are unemployed.4 Self-censorship, as well as Taliban censorship efforts, are rigid.
Freedom of association is close to eradicated and civil society repres-sion has intensified. Pro-democracy movements are suppressed by kidnapping, beating, threatening, and attacks on protesters.5 Criti-cism of the Taliban or just expression of alternative socio-political and religious views, is strongly prohibited.6 All aspects of deliberation have been undermined.
Figure 1 evidences the changes showing the top 20 changing indica-tors on the LDI and the Deliberative Component Index (DCI) over the past year.
Cutbacks on freedoms and liberties are particularly grave for women. In six months, the Taliban regime dismantled close to all rights Afghan women gained over the past 20 years. For example, the Taliban banned education for girls beyond class 6.7 During their rule from 1996 to 2001 they entirely banned women’s education.8 Over the past twenty years, they attacked girls’ schools,9 universities,10 and educa-tional centers11 across the country. In Taliban-controlled areas, girls were barely allowed to attend secondary school “beyond puberty”.12 Promises to re-open girls’ schools13 now are thus open to doubt.
Figure 2 exposes the massive declines in rights of Afghan women since the Taliban takeover. While rights are in decline for everyone, women’s liberties are close to nil. Access to justice for women dropped to the absolute zero point on the V-Dem measure. Afghan female judges, lawyers, and those previously employed in the justice sector are forced into hiding by those they convicted during the former government.14
In the Republic of Afghanistan, women held 27% of seats in parlia-ment, occupied 20% of the civil servants’ positions, ran their own businesses,15 and many had paid employment. Women are now denied entry to both public and private workplaces,16 and their prop-erty rights are on a new low. Freedom of movement for women is close to the absolute zero-point following mobility restrictions enforced by the Taliban. Unaccompanied Afghan women are harassed on streets or denied public transport,17 and sports for women is banned.18
FIGURE 1: DEGREE OF CHANGE ON INDICATORS OF LDI & DCI, AFGHANISTAN, 2020–2021
Opposition Parties Autonomy
Government CensorshipE�ort – Media
Range of Consultation
CSO Repression
Party Ban
Engaged Society
Common Good
Respect Counterarguments
Property Rights for Women
Media Bias
Freedom of Discussion forWomen
EMB Capacity
CSO Entry and Exit
Barriers to Parties
Freedom from Political Killings
Compliance with High Court
Compliance with Judiciary
Media Self-Censorship
Freedom of Discussion for Men
Freedom from Torture
Freedom of Expression Index
Freedom of Association Index
Clean Elections Index
Liberal Component Index
Deliberative Component Index
Change, 2020 to 2021–3 –2 –1 0
FIGURE 2: INDICATORS BY GENDER, AFGHANISTAN, 2011/2020/2021
Access to justice women
Freedom from forcedlabor women
Property rightswomen
Freedom ofmovement women
Access to justice men
Freedom ofmovement men
Property rightsmen
Freedom from forcedlabor men
1
2
3
4
5
2011 2020 2021
28 DEMOCRACY REPORT 2022

Kabul, Afghanistan. Thousands of Afghans rush to the Hamid Karzai International Airport as they try to flee the Afghan capital of Kabul, Afghanistan, on August 16, 2021. Photo: Getty Images.
29STATE OF THE WORLD

Autocratization Changing Nature?
36 Somer, M. & McCoy, J. 2019. Transformations through Polarizations and Global Threats to Democracy. The ANNALS of the American Academy of Political and Social Science 681(1).
37 https://www.arresteddictatorship.com/global-instances-of-coups.html
38 https://www.reuters.com/world/an-epidemic-coups-un-chief-laments-urging-security-council-act-2021-10-26/
39 https://www.bbc.com/news/world-asia-55902070
• The nature of autocratization appears to be changing.
• The “epidemic” of 6 coups in 2021 is a sharp break from the average of 1.2 coups per year since 2000 – suggesting that rash actions are becoming more common in a less democratic world.
• Polarization escalates towards toxic levels in 40 countries – contributing to the changing nature of autocratization.
• Autocratic governments increasingly use mis infor ma-tion to shape domestic and international opinion in their favor – a signal of emboldened autocrats.
• MENA is the region with the highest – and most increasing – levels of government misinformation.
This Democracy Report 2022 provides several indications that auto-cratization processes are departing from incremental changes to more forceful developments. Leaders seems to be taking bolder actions now than in the past.
Beyond the signs discussed in the previous sections, at least three areas signal this changing nature of autocratization. First, five military and one self-coup in 2021 show that autocratization no longer necessarily proceeds at a slow, incremental pace. These coups also illustrate that autocratization is not limited to democra-cies. Consolidation of power in the hands of a few is also occurring in autocratic countries.
Second, polarization reached unprecedented global levels in 2021. Leaders of 40 countries contributed to sizeable increases in toxic polarization over the past decade. In contrast, polarization declined in only 6 countries. At current levels, polarization and autocratization form a mutually reinforcing, vicious cycle.
Polarization becomes toxic when it reaches extreme levels. Camps of “Us vs. Them” start questioning the moral legitimacy of each other and start treating opposition as an existential threat to a way of life or a nation (also see box on polarization).36 Once political elites and their followers no longer believe that political opponents are legiti-mate and deserve equal respect, democratic norms and rules can be set aside to “save the nation”. This is a dangerous development.
Third and relatedly, governments are increasingly using misinfor-ma tion as a tool to manipulate public opinion and their inter-national reputations. Government manipulation of statistics and surging misinformation in digital media also show how political leaders are becoming bolder in furthering autocratization.
A Year of Coups • The 5 military and 1 self-coup in 2021 set a record for
the 21st century in a sharp break from the average of 1.2 coups per year since 2000.
• The coups resulted in 4 new closed autocracies – Chad, Guinea, Mali, and Myanmar.
Coups play a significant role in advancing autocratization in 2021. They represent a break with the established pattern of the third wave of autocratization. The coups thus contribute to what seems to be a change in the nature of autocratization.
The five military and one self-coup in 2021 set a record for the 21st century in a sharp break from the average of 1.2 coups per year since 2000.37 The coups resulted in four new closed autocracies (Chad, Guinea, Mali, and Myanmar). They also destroyed all immediate prospects for Sudan to move out of closed autocracy. A self-coup led to the breakdown of democracy in Tunisia (see box). UN Secretary General Antonio Guterres called this rise an “epidemic of coup d’états”.38
Myanmar was one of the top democratizers in last year’s Democ-racy Report. However, the military seized control on the day the new parliament should have convened after the 2020 elections.39
A Self-Coup in Tunisia
1 https://www.aljazeera.com/news/2021/7/25/tunisias-president-dismisses-prime-minister-after-protests
2 https://www.reuters.com/world/africa/tunisias-president-extends-suspension-parliament-2021-08-23/
3 https://www.journalofdemocracy.org/articles/coup-in-tunisia-is-democracy-lost/
4 https://www.loc.gov/item/global-legal-monitor/2021-12-22/tunisia-president-calls-for-abolishing-current-constitution-and-holding-referendum-on-new-constitution-in-2022/
Ten years after a democratic breakthrough, President Said Kaied staged a self-coup in Tunisia. The only country to democratize after the Arab Spring and the top democratizer in the world in last year’s Democracy Report is now an electoral autocracy.
Large-scale protests erupted in Tunisia on July 25th, 2021 in response to Covid-19-induced economic and public health problems.1 President Saied responded by suspending the govern-ment and parliament in violation of the constitutional provisions. The measures were supposed to be temporary but have been extended indefinitely2 in a move that observers agree is a coup.3 President Saied is ruling Tunisia by decree and its score on the LDI plummeted from 0.644 in 2020 to 0.459 in 2021.
There is a plan for a new constitution to be drafted ahead of a ref-erendum to be held in July 2022. President Saied has also declared that parliamentary elections are scheduled for December 17th, 2022.4 It remains to be seen whether these plans will be imple-mented and return Tunisia to parliamentary and constitutional rule.
30 DEMOCRACY REPORT 2022

The coup brought the democratization process to an abrupt end. Myanmar is now classified as a closed autocracy.
Chadian president Idriss Déby was killed by rebels on April 20, 2021. The military suspended parliament and installed Déby’s son, Mahamat Déby, as new president. This action violated constitu-tional provisions.40 While Chad was never a democracy, the coup resulted in Chad’s downgrade from electoral to closed autocracy.
Mali suffered from two military coups in less than a year. In the second, Vice President Assimi Goïta led the military to oust the sitting president and prime minister on May 24th, 2021 and installed himself as acting president.41 The two coups marked a fast downfall to closed autocracy given Mali’s recent democratic experience.
The military ousted Guinea’s president, Alpha Condé, on Septem-ber 5th, 2021. Special Forces Commander Mamady Doumbouya is now acting president.42 The coup changed the regime from an electoral to a closed autocracy.
A military coup on October 25th, 2021 removed a short-lived civilian regime in Sudan. General Abdel Fattah al-Burhan became the de facto leader of the country.43 Sudan continues as a closed autocracy. All prospects for democracy are suspended for the time being.
The trend of increasing coups continues in the first months of 2022. The military unseated President Roch Kaboré in Burkina Faso on January 23rd, derailing its electoral democracy.44 We do not know where these developments will lead. However, it is certain that the coup ended democratic rule in Burkina Faso.
40 https://www.bbc.com/news/world-africa-56830510
41 https://www.bbc.com/news/world-africa-57239805
42 https://www.bbc.com/news/world-africa-58453778
43 https://www.bbc.com/news/world-africa-59045020
44 https://www.bbc.com/news/world-africa-60112043
A Wave of Polarization • Signaling a changing nature of autocratization,
polarization is increasing to toxic levels in 40 countries.
• Toxic polarization affects all regions and varying countries regardless of size, economic performance, and levels of democracy.
• Toxic polarization and Autocratization mutually reinforce each other.
• Toxic levels of polarization contribute to electoral victories of anti-pluralist leaders and the empowerment of their agendas.
Polarization is a major global trend. It escalated towards toxic levels in 40 countries over the last decade while decreasing in only six. All regions are negatively affected as the world map in Figure 20 demonstrates.
Polarization also affects countries of all regime types, established democracies and autocratizing countries alike. In North America and Western Europe, polarization increased in countries such as Germany, Portugal, Spain, and the United States of America. There was also rising polarization in autocratizing countries like Brazil, India, and Serbia. In addition, countries that recently experienced political crises, such as Hong Kong, Myanmar, Tunisia, and Ukraine, stand out with high levels of polarization.
Figure 21 illustrates the striking escalation and worldwide spread of polarization over the past decade. Most countries are located
FIGURE 20: COUNTRIES WITH CHANGES ON POLITICAL POLARIZATION, 2011–2021
−2.5 −2 −1.5 −1 −0.5 0 0.5 1 1.5 2 2.5
Red marks countries where political polarization increased substantially and significantly over the past ten years. Blue marks countries where the level of polarization decreased. Countries in grey are unchanged.
31STATE OF THE WORLD

A Sudanese demonstrator carrying a national flag walks by roadblocks set up by protesters on a street in the capital Khartoum, on October 26, 2021, to denounce a military coup that overthrew the transition to civilian rule. Photo: Getty Images.
DEMOCRACY REPORT 202232

45 https://www.foreignaffairs.com/articles/brazil/2021-11-01/democracy-dying-brazil
46 Vegetti, F. 2019. The Political Nature of Ideological Polarization: The Case of Hungary. The ANNALS of the American Academy of Political and Social Science 681(1).
above the diagonal, indicating increasing polarization between 2011 and 2021. Polarization increased across all world regions. It affected countries regardless of their size, economic perfor-mance, and levels of democracy.
POLARIZATION AND AUTOCRATIZATION ARE MUTUALLY REINFORCING
When polarization develops to toxic levels, democracy is typi-cally dismantled, as illustrated in Figure 22. A rise in polarization is followed by a decrease on the LDI in all the top 5 autocratizing countries Brazil, Hungary, Poland, Serbia, and Turkey.
The measures of polarization of society, political polarization, and political parties’ use of hate speech tend to systematically rise together to extreme levels. That escalation into toxic polarization is followed by a downturn on the LDI in all cases.
For example, polarization in Brazil started rising in 2013 and reached toxic levels with the electoral victory of far-right President Jair Bolsonaro in 2018. Since taking office, Bolsonaro has joined demonstrators calling for military intervention in Brazil’s politics and the closure of Congress and the Supreme Court. Moreover, he has promoted a large-scale militarization of his government and public distrust in the voting system.45
In Hungary, polarization escalated before 2010 when Prime Min-ister Viktor Orbán came to power but reached toxic levels after. This polarization paved the way for Fidesz to consolidate its hold on power and to expand its anti-pluralism by derailing checks and balances and press freedom, and by changing electoral rules to their advantage.46
Polarization
1 McCoy, J. & Somer, M. 2019. Toward a Theory of Pernicious Polarization and How It Harms Democracies: Comparative Evidence and Possible Remedies. The ANNALS of the AAPSS 681(1); Somer, M., McCoy, J. L., and Luke, R. E. 2021. Pernicious Polarization, Autocratization and Opposition Strategies. Democratization 28(5).
2 Baldassarri, D., & Gelman, A. 2008. Partisans without Constraint: Political Polarization and Trends in American Public Opinion. American Journal of Sociology 114(2); McCoy, J., et al. 2018. Polarization and the Global Crisis of Democracy: Common Patterns, Dynamics, and Pernicious Consequences for Democratic Polities. American Behavioral Scientist 62(1).
3 Somer, M., McCoy, J. L., & Luke, R. E. 2021. Pernicious Polarization, Autocratization and Opposition Strategies. Democratization 28(5).
Political polarization is a division of society into Us versus Them camps whose members hold negative views of and distrust the other group.1 When such camps align with mutually exclusive identities and interests, it undermines social cohesion and political stability.2 We speak of toxic polarization when levels of polariza-tion are high and widely permeate and shape society.3
We use two measures of polarization: “Polarization of Society” measures the extent to which the differences in opinions result in major clashes of views and polarization and comes from the Digital Society Project. “Political Polarization” measures the extent to which society is polarized into antagonistic, political camps where political differences affect social relationships beyond political discussions. This measure comes from the V-Dem project. In addi-tion, we use “Political Parties Hate Speech” to measure how often major political parties use hate speech as part of their rhetoric. This indicator captures the extent to which political parties’ use of this rhetoric directly affects level of polarization.
FIGURE 21: INCREASING VS. DECREASING POLITICAL POLARIZATION, 2011-2021
Albania
Azerbaijan
Belarus
Belgium
Benin
Bolivia
Brazil
Bulgaria
Myanmar
Chile
Czech Republic
Denmark
Egypt
Estonia
Ethiopia
Germany
Guinea−Bissau
Hong Kong
Iceland
India
Jamaica
Latvia
Libya
Lithuania
Mexico
Montenegro
New Zealand
Nicaragua
Oman
Peru
Portugal
Russia
Serbia
Sierra Leone
Slovakia
Slovenia
Solomon Islands
SomaliaSpain
Sweden
Taiwan
Tunisia
Ukraine
USA
Uzbekistan
Vanuatu
0.0
0.5
1.0
1.5
2.0
2.5
3.0
3.5
4.0
0.0 0.5 1.0 1.5 2.0 2.5 3.0 3.5 4.0Political Polarization in 2011
Polit
ical
Pol
ariz
atio
n in
202
1
Eastern Europe and Central Asia
Latin America and the Caribbean
The Middle East and North Africa
Sub-Saharan Africa
Western Europe and North America
Asia and the Paci�c
Polarization increased in countries above the diagonal line and decreased in countries below it. Countries are labeled if the difference between 2011 and 2021 was statistically significant and substantially meaningful.
33STATE OF THE WORLD

47 Somer, M. 2019. Turkey: The Slippery Slope from Reformist to Revolutionary Polarization and Democratic Breakdown. The ANNALS of the American Academy of Political and Social Science 681(1).
48 Svolik, M. W. 2019. Polarization versus Democracy. Journal of Democracy 30(3); Graham, M. H. & Svolik, M. W. 2020. Democracy in America? Partisanship, Polarization, and the Robustness of Support for Democracy in the United States. American Political Science Review 114(2).
49 Somer, M., et al. 2021. Pernicious Polarization, Autocratization and Opposition Strategies. Democratization 28(5).
Toxic levels of political polarization developed in Turkey after President Recep Tayyip Erdoğan and the AKP came to power in 2002, arguably following the government’s will. It can be argued that toxic polarization functioned as a strategic tool to enable reforms and actions to break down democracy.47
Toxic polarization and autocratization tend to be mutually rein-forcing. Extreme levels of polarization have detrimental effects on the democratic foundations of society. When polarization becomes toxic, different camps typically start questioning the moral legitimacy of other groups, viewing opposition as existen-tial threats to a way of life or a nation.
Research demonstrates that citizens in highly polarized contexts are often willing to abandon democratic principles if it means that one’s own party people is elected and that “the right” deci-sions are made.48 Thus, toxic levels of polarization contribute to electoral victories of anti-pluralist leaders and to empowering their agendas.49
When anti-pluralist leaders assume office, their parties are likely to use rhetoric that is intended to insult, offend, or intimidate members of specific groups – usually minorities or political
FIGURE 22: POLARIZATION IN TOP-5 AUTOCRATIZING CASES, 2001–2021
Serbia Turkey
Brazil Hungary Poland
20012006
20112016
20212001
20062011
20162021
20012006
20112016
2021
0
1
2
3
4
0
1
2
3
4
0.00
0.25
0.50
0.75
1.00
0.00
0.25
0.50
0.75
1.00Indi
cato
r Sco
re
Liberal D
emocracy Index
Liberal Democracy Index Polarization of Society Political Parties Hate Speech Political Polarization
The left y-axis indicates the score for the polarization indicators (Polarization of Society, Political Parties Hate Speech, and Political Polarization). High scores for polarization indicators indicate high levels of polarization. The highest score for Political Parties Hate Speech Indicator represents that the political parties often use hate speech as a part of their rhetoric. Both the scores for the Polarization of Society and the Political Parties Hate Speech Indicators are reversed for the presentation purpose. The right y-axis represents the scale for the LDI (0-1).
Salvador, Bahia, Brazil, June 11, 2021. Protesters protest against the government of President Jair Bolsonaro in the city of Salvador. Photo: Shutterstock.
34 DEMOCRACY REPORT 2022

opponents. This increase in hate speech, in turn, can worsen toxic polarization and thereby create room for further autocratization.
Misinformation Multiplying• Governments increasingly use misinformation to
shape domestic and international opinion.
• There is evidence of government misinformation in the form of manipulation of official statistics.
• Governments multiply their spread of false information to undermine opposition and to feed polarization.
• MENA is the region with the highest – and most increasing – levels of government misinformation.
Evidence shows that autocratic governments spread dis infor-ma tion to improve their reputation both domestically and internationally.
The amount of data available as well as its transparency and reli-ability are much lower for autocracies than democracies.50 Data related to policy, fiscal decisions, and implementation are sub-stantially more transparent in democracies than in autocracies.51 Autocracies habitually manipulate data, such as the Covid-19 death statistics and economic growth.52 Citizens in autocracies are also forced to rely more on government-controlled informa-tion since internet access is also substantially lower in autocracies compared to democracies.53
50 Hollyer, J. R., et al. 2011. Democracy and Transparency. Journal of Politics 73(4).
51 Rosendorff, B. P. & J. Doces. 2006. Transparency and Unfair Eviction in Democracies and Autocracies. Swiss Political Science Review 12(3).
52 Annaka, S. 2021. Political Regime, Data Transparency, and COVID-19 Death Cases. Population Health 15; Kapoor, M., A. et al. 2020. Authoritarian Governments Appear to Manipulate COVID Data. ArXiv; Magee, C. S. P. & J. A. Doces. 2015. “Reconsidering Regime Type and Growth: Lies, Dictatorships, and Statistics.” International Studies Quarterly 59.
53 Weidmann, N. B., et al. 2016. Digital Discrimination: Political Bias in Internet Service Provision Across Ethnic Groups. Science 353(6304).
54 World Bank. 2021. World Development Report 2021: Data for Better Lives. Washington, DC: World Bank.
Access to high-quality transparent data is a global common good. The World Development Report 2021 demonstrates the extent to which data is used to spread misinformation and information today.54 It details why reliable data lead to better lives for citizens through better government programs and policies, as well as business decisions.
But it is not only through the spread of false or misleading official statistics that governments spread misinformation domestically as well as abroad. Misinformation is on the rise worldwide (Figure 23).
Governments have continuously expanded their use of digital and social media to spread false information at home since 2000. Recently the uptake is especially pronounced in the Global South, across Asia-Pacific, Latin America and the Caribbean, sub-Saharan
The Digital Society Project
1 http://digitalsocietyproject.org, see also Mechkova, V., et al. 2019. Measuring Internet Politics: Introducing the Digital Society Project (DSP). Working Paper (1).
The Digital Society Project (DSP) addresses questions surrounding interactions between the internet and politics.1 Created using the V-Dem infrastructure, the DSP dataset covers virtually all countries in the world from 2000 to 2020. It provides a set of 35 indicators covering such topics as online censorship, polarization and politi-cization of social media, misinformation campaigns, coordinated information operations, and foreign influence in and monitoring of domestic politics.
FIGURE 23: GOVERNMENT DISSEMINATION OF FALSE INFORMATION
Never,Almost Never
Rarely
About Halfthe Time
Often
ExtremelyOften
2001 2006 2011 2016 2021
Dom
estic
Never,Almost Never
Rarely
About Halfthe Time
Often
ExtremelyOften
2001 2006 2011 2016 2021
Abr
oad
World
Asia and the Paci�c
Eastern Europe and Central Asia
Latin America and the Caribbean
Sub-Saharan Africa
The Middle East and North Africa
Western Europe and North America
Figure 23 shows two variables from the Digital Society Project that measure how often governments and their agents use social media to disseminate misleading viewpoints or false information to influence their own population (left) as well as citizens of other countries (right). The value shown is the average values of the regions.
35STATE OF THE WORLD

Africa, and MENA. The latter is the region with the highest levels of government-spread false information.
Even in Western Europe and North America there is a slight increase in domestic government misinformation. These gov-ernments almost never used to spread misinformation through digital and social media. The use of misinformation for both domestic and international audiences is most frequent in Malta, the United Kingdom, and the United States of America in 2021.
Around the world, governments also increasingly rely on mis infor-ma tion to influence citizens of other countries.
Government disinformation through the internet can be used strategically to influence citizens in two ways. Misinformation and fake news regarding political opponents can inflate negative feelings and distrust, or even instigate violence, which in turn aggravates levels of polarization.55 This pattern played out during the “Brexit” vote in Great Britain and the 2016 US presidential elec-tion, for example.56
55 Osmundsen, M., et al. 2021. Partisan Polarization is the Primary Psychological Motivation Behind Political Fake News Sharing on Twitter. American Political Science Review 115(3).
56 Rose, J. 2017. Brexit, Trump, and Post-Truth Politics. Public Integrity 19(6).
57 Hartley, K., & Vu, M. K. 2020. Fighting Fake News in the COVID-19 Era: Policy Insights from an Equilibrium Model. Policy Sciences 53(4) .
Second, government misinformation can be used to garner support for politically convenient policy decisions. In the Covid-19 context, fake news was used to justify governments’ Covid responses (or lack thereof) and to muzzle media and political opposition.57
In short, government misinformation is multiplying. Access to information and reliable data is a public good. Recent trends endanger democracy by serving anti-pluralist purposes.
Bardo Protest, Tunis Tunisia, 26 July 2021. Photo: Shutterstock.
36 DEMOCRACY REPORT 2022

United States of America: January 6 and Its Aftermath
1 Grinberg, N., et al. 2019. Fake News on Twitter During the 2016 US Presidential Election.”Science 363(6425).
2 By the end of 2021, two-thirds of Republicans believe the lie that voter fraud helped President Biden win the 2020 election.https://apnews.com/article/voter-fraud-election-2020-joe-biden-donald-trump-7fcb6f134e528fee8237c7601db3328f and https://www.npr.org/2022/01/03/1069764164/american-democracy-poll-jan-6?t=1645113214224
3 https://www.theguardian.com/us-news/2021/nov/02/trump-georgia-elections-official-brad-raffensperger
While the United States remains a liberal democracy, V-Dem data shows that it is only a fraction away from losing this status after sub-stantial autocratization. The U.S. LDI score dropped from 0.85 in 2015 to 0.72 in 2020, driven by weakening constraints on the executive under the Trump administration.
Simultaneously, polarization and government misinformation esca-lated and remain high in 2021 (Figure 1). Political use of social media exacerbates the polarization. Fake news, hate speech, conspiracy theories, and distrust have intensified negative feelings, prejudice, and violence between Republicans and Democrats since the run-up to the 2016 election.1 Polarization and misinformation culminated in a violent test for U.S. democracy: the storming of the Capitol on January 6th, 2021. President Trump’s false claim that he won the 2020 presidential election (the so-called “Big Lie”) also helped to instigate the riots.2
Though ultimately unsuccessful, the storming of the Capitol tested the foundations of U.S. democracy after an unprecedented post-election period of lawsuits and pressure from Trump to have the election outcome overturned.3
The events on January 6th did not affect the U.S. LDI score (Figure 1). However, liberal democracy remains significantly lower than before Trump came to power. Government misinformation declined last year but did not return to previous levels. Toxic levels of polarization continue to increase. Democracy survives in the United States, but it remains under threat.
FIGURE 1: POLARIZATION AND AUTOCRATIZATION IN THE U.S.
Polarization of SocietyPolitical Polarization
Government Dissemination of False InformationLiberal Democracy Index (LDI)
Liberal Dem
ocracy Index
Pola
rizat
ion
/ Mis
info
rmat
ion
2011 2012 2013 2014 2015 2016 2017 2018 2019 2020 2021
0.00
0.25
0.50
0.75
1.00
0
1
2
3
4
The left y-axis indicates the score for the indicators (Polarization of Society, Government Misinformation, and Political Polarization). The right y-axis represents the scale for the LDI (0-1). The large scores for polarization indicators indicate the highest levels of polarization. The highest score for “Government Dissemination of False Information Domestic” indicator represents that the political parties often use hate speech as a part of their rhetoric. Both the scores for the Polarization of Society and the Government Misinformation Indicators are reversed for presentation purposes.
Photo: Shutterstock.
37STATE OF THE WORLD

Case for Democracy
With support from the European Union, the V-Dem Institute initiated the “Case for Democracy”. The goals are to:
• Collate the latest, most rigorous scientific evidence on the dividends of democracy in key areas of development;
• Bring together leading scholars with policymakers and practitioners to share and discuss the evidence and facilitate a coherent narrative on why democracy support and protection is important;
• Distribute the evidence on the dividends of democracy widely among democracy support and protection stakeholders around the world.
Below, we highlight key findings compiled over the last year.
Economic DevelopmentDemocracy is important for reducing poverty (SDG #1), achieving economic growth (SDG #8), and reducing inequality (SDG #10). Evidence shows that democratization produces 20% higher increase in GDP per capita over 25 years than compared to staying autocratic (Acemoglu et al. 2019). Democracies provide stable and predictable growth, as shown by only 7% of democra-cies between 1900 and 2009 experiencing negative growth as compared to almost 30% of autocracies (Knutsen 2020). These effects of democracy primarily stem from the vertical account-ability mechanisms issued by clean elections and freedom of expression (Boese & Eberhardt 2022).
EducationDemocracies are critical for providing education (SDG #4). A recent, encompassing assessment found democracy to increase secondary education enrollment by almost 70% (Acemoglu et al. 2015). Another important study found that democratization leads to increasing education spending with up to 30% (Ansell 2008). Furthermore, the effect of democracy on school attendance has been found to be particularly pronounced in lower-income and rural populations (Harding 2020).
Peace and Human SecurityDemocracy is crucial for people enjoying good health and well-being (SDG #3) and peace, justice, and strong institutions (SDG #16). Democracies are much less likely to engage in war and civil war than autocracies, as shown by the fact that after India turned into an electoral autocracy, the statistical odds of a militarized dispute with Pakistan are 3 times higher than 10 years ago (Hegre et al. 2020). Two states located in a region with low levels of democracy are 70% more likely to have a fatal armed conflict than a pair of
states placed in a region with high levels (Altman et al. 2021). However, new and weakly institutionalized democracies are also at high risk of civil war, with high-quality liberal democracies the by far the most peaceful (Gates et al. 2006).
Sustainable Environment and Climate Change MitigationDemocracy provides the arena for reaching sustainable com-munities (SDG #11) and climate action (SDG #13). High-quality democracies have almost 20% higher policy commitment to climate change mitigation than closed autocracies like China (Bättig & Bernauer 2009). The difference between high-quality democracy and closed autocracy also equals a difference in the Paris Agreement reduction policy targets of 1.6C (Törstad et al 2020). Democracies also provide the arena for civil society to effectively advocate climate change issues. A 1% increase in civil liberties generates a 0.05% reduction in national CO2 emissions (Pacheco-Vega & Murdie 2020).
Global HealthDemocracies provide superior access to and quality of health care, making it essential for global health and well-being (SDG #3). Transitions to democracy increase life expectancy by 3% within 10 years (Bollyky et al. 2019). High-quality democracy leads to 94% lower infant mortality compared to closed autocracies (Wang et
Photo: Mithell Luo, Unsplash
38 DEMOCRACY REPORT 2022

al. 2019). Increased global levels of democracy averted 16 million cardiovascular deaths between 1995 and 2015 (Bollyky et al. 2019). Autocratization directly leads to a decline in life expectancy by 1.3 percentage points and a decrease in health care protection by 9 percentage points (Wigley et al. 2020).
Gender Equality and Empowering WomenGender equality (SDG #5) is both a dividend of and fundamental aspect to democracy. Democracy leads to higher levels of female political participation and representation (Fallon et al. 2012). Democracy also produces substantial improvements in women’s civil liberties (Sundström et al. 2017). Civil liberties, in turn, provide the opportunity for women’s movements to effectively promote gender equality (Paxton et al. 2006).
Public Goods and CorruptionDemocracy increases public goods provision and can diminish corruption, contributing to achieving affordable and clean energy (SDG #7), reduced inequality (SDG #10), and peace, justice, and strong institutions (SDG #16). High-quality democracies spend 100% more than closed autocracies on social protection policies benefitting the poor (Murshed et al. 2020). Democracy provides an average citizen with an internet connection rate more than 300% higher than autocracies (Weidmann et al. 2016). While low-performing democracies are often plagued by corruption, democracies that develop strong vertical accountability mecha-nisms diminish corruption (McMann 2020). Finally, democracies produce more transparent and higher-quality data (Annaka 2021).
1 At https://www.v-dem.net/casefordemocracy.html
The program has so far provided output in terms of one con-ference, a webinar series, eight policy briefing papers, and one conference report. We encourage readers to visit the V-Dem Insti-tute webpage1 for more in-depth information on the dividends of democracy and the Case for Democracy.
REFERENCESAcemoglu, D., Naidu, S., Restrepo, P., & Robinson, J. 2019. Democracy Does Cause Growth. Journal of Political Economy 127(1).
Acemoglu, D., Naidu, S., Restrepo, P., & Robinson, J. A. 2015. Democracy, Redistribution, and Inequality. In Handbook of Income Distribution 2. Elsevier.
Altman, D., Rojas-de-Galarreta, F., & Urdinez, F. 2021. An Interactive Model of Democratic Peace. Journal of Peace Research 58(3).
Annaka, S. 2021. Political Regime, Data Transparency, and COVID-19 Death Cases. Population Health 15.
Ansell, B. W. 2008. Traders, Teachers, and Tyrants: Democracy, Globalization, and Public Investment in Education. International Organization 62(2).
Vanessa A. Boese and Markus Eberhardt. 2022. Which Institutions Rule? Unbundling the Democracy-Growth Nexus. V-Dem Working Paper 131.
Bollyky, T. J., Templin, T., Cohen, M., Schoder, D., Dieleman, J. L., & Wigley, S. 2019. The Relationships between Democratic Experience, Adult Health, and Cause-Specific Mortality in 170 Countries between 1980 and 2016: An Observational Analysis. The Lancet 393(10181).
Bättig, M. & Bernauer, T. 2009. National Institutions and Global Public Goods: Are Democracies More Cooperative in Climate Change Policy? International Organization 63(2).
Fallon, K. M., Swiss, L., & Viterna, J. 2012. Resolving the Democracy Paradox: Democratization and Women’s Legislative Representation in Developing Nations, 1975 to 2009. American Sociological Review 77(3).
Harding, R. 2020. Who is Democracy Good for? Elections, Rural Bias, and Health and Education Outcomes in Sub-Saharan Africa. Journal of Politics 82(1).
Hegre, H. 2014. Democracy and Armed Conflict. Journal of Peace Research 51(2).
Hegre, H., Bernhard, M., & Teorell, J. 2020. Civil Society and the Democratic Peace. Journal of Conflict Resolution 64(1).
Hoeffler, A. 2018. Security and Development: Shifting the Focus to Interpersonal Violence. The Economics of Peace and Security Journal 13.
Knutsen, C. H. 2020. The Business Case for Democracy. V-Dem Working Paper 111.
McMann, K. M., Seim, B., Teorell, J., & Lindberg, S.I. 2020. Why Low Levels of Democracy Promote Corruption and High Levels Diminish It. Political Research Quarterly 73(4).
Murshed, S. M., Bergougui, B., Badiuzzaman, M., & Pulok, M. H. 2020. Fiscal Capacity, Democratic Institutions and Social Welfare Outcomes in Developing Countries. Defence and Peace Economics.
Pacheco-Vega, R. & Murdie, A. 2020. When Do Environmental NGOs Work? A Test of the Conditional Effectiveness of Environmental Advocacy. Environmental Politics.
Paxton, P., Hughes, M. M., & Green, J. L. 2006. The International Women's Movement and Women's Political Representation, 1893–2003. American Sociological Review 71(6).
Sundström, A., Paxton, P., Wang, Y. T., & Lindberg, S. I. 2017. ”Women’s Political Empowerment: A New Global Index, 1900–2012.” World Development 94.
Tørstad, V., Sælen, H., & Bøyum, L. 2020. The Domestic Politics of International Climate Commitments: Which Factors Explain Cross-Country Variation in NDC Ambition? Environmental Research Letters 15(2).
Wang, Y. T., Mechkova, V., & Andersson, F. 2019. Does Democracy Enhance Health? New Empirical Evidence 1900–2012. Political Research Quarterly 72(3).
Weidmann, N. B., Benitez-Baleato, S., Hunziker, P., Glatz, E., & Dimitropoulos, X. 2016. Digital Discrimination: Political Bias in Internet Service Provision Across Ethnic Groups. Science 353(6304).
Wigley, S., Dieleman, J. L., Templin, T., Mumford, J. E., & Bollyky, T. J. 2020. Autocratisation and Universal Health Coverage: Synthetic Control Study. BMJ.
39CASE FOR DEMOCRACY

Concept Note
International Scientific Panel on Democracy (ISPD)Confronted with increasingly overt attacks on democracy, world leaders are aware of the need for a united effort in democracy promotion and protection. For instance, US President Joseph Biden convened a leader’s Democracy Summit in December 2021 to be followed up in Summer 2022, and Boris Johnson has proposed a D10 group bringing together the G7 with Australia, India and South Korea. German foreign minister Heiko Maas recently suggested a Marshall Plan for Democracy, and Sweden launched the ‘Drive for Democracy’ as a foreign policy prior-ity. While these efforts are relevant political reactions to current global autocratization trends, they also need to build on scientific evidence to make a substantial and credible case for democracy.
Therefore, this is the time to build an equivalent of the Intergov-ernmental Panel on Climate Change (IPCC) and the Intergovern-mental Science-Policy Platform on Biodiversity and Ecosystem Services (IPBES) for democracy: the International Scientific Panel on Democracy (ISPD).
The ISPD will provide policy makers with regular scientific assess-ments on democratic developments, their implications for fact-based dividends (and limitations) of democracy, as well as to put forward scientific guidance on democratic resilience and protection.
RationaleThe world is facing a wave of autocratization. Powerful autocratic states, former democracies, and political movements within democracies increasingly present ideological challenges to the principles of democratic governance. There is an urgent need for a global coalition to demonstrate and protect the dividends of democracy. At this historical moment, the European Union has a unique position to take the lead, to gather its partners around the globe, and based on hard scientific evidence shape the future of democracy in the world.
A range of academic and think-tank organizations provide assess-ments of democracy including various aspects such as media and academic freedom, and human rights on a regular basis. There is much consensus between these assessments. Yet, the world lacks a single, coherent, and scientific account of both supply (democratic institutions) and demand (popular support) that the major academic data sources stand behind. This is a source of disunion standing in the way of decisive action on the protection of democracy in the international community. The independent, science-based ISPD Expert Report on Democracy will provide key input for international negotiations as well as work on democracy protection and promotion.
In addition, there is an urgent need to gather the best available science on democracy’s dividends across a range of fields related to the Sustainable Development Goals and human development
including human rights, and to conduct additional studies where there are gaps. Finally, the evidence must be brought to bear on policy and programs through guidance from academic on how to interpret and use/not interpret or use, the scientific findings.
GoalsSimilar to the IPCC and IPBES, in order to serve the needs of the international community of policy makers, practitioners, and the public, the ISPD will provide the best possible scientific evidence. Therefore, the goals of the ISPD are:
1) Provide a scientific consensus on the state of democratic institutions: The ISPD will build a scientific consensus to provide an authoritative account of the status and trends in the world for democracy, autocracy, and human rights. For example, details on which countries are worsening or improving on democracy and human rights, and how popular support for democracy and human rights are developing or diminishing. Not all sources will agree on every country’s status as a democracy or autocracy but with world-leading academics on the ISPD, the various sources can be used to authoritatively classify the vast majority of coun-tries where sources are close to in the agreement, and then also to identify the countries in the “grey-zone/mixed-status” while taking sources of uncertainty into account. This scientific assess-ment will come in the form of an annual ISPD Expert Report on Democracy communicating the global expert consensus.
2) Build an evidence base on the dividends (and limita-tions) of democracy: The ISPD will build an evidence base to provide the most reliable science on democracy’s dividends for outcomes across the sciences, medicine, technology, as well as the social sciences. This will incorporate issues such as human health, economic development, education, empowerment of women and children, climate change, peace and human security, public goods and corruption, information technology and digital communication, and crisis management, including handling of pandemics. An additional, and critical component of the evidence base will be focusing on what one could refer to as the “intrinsic” case for democracy’s dividends in terms of ensuring citizens’ freedoms and rights, especially human rights. The output will be a series of subcommittee thematic reports and studies that distill and communicate the scientific evidence of the benefits, as well as the limitations of, democratic governance and associated human rights on a range of human and developmental outcomes. Assessing limitations is important also critical for understanding how democracy may need to be strengthened and supported in order for any dividends to be maximized. Following a review of existing evidence, gaps will be filled by original research con-ducted or commissioned by ISPD subcommittees.
40 DEMOCRACY REPORT 2022

3) Provide global, regional, and country-specific guid-ance: The ISPD will organize a science-policy interface through consultative meetings policy- and practitioner stakeholders can meet the scientific expertise the ISPD gathers on a thematic or geographic basis to get guidance on how the findings can but also should not be interpreted and used.
Value AddedThe ISPD will bring together the leading actors who make assess-ments of democratic institutions across the world and build one evidence-based consensus based on these multiple sources.
The first value added is that the ISPD will bring about the sort of consensus on the state and trends for democracy and autocracy in the world, that the IPCC did for climate change. The full range of evidence that members offer will be brought to bear on estab-lishing which countries are democracies and autocracies or an uncertain status in between; which countries are in decline or in an episode of democratization; as well as on the state of various democratic rights and institutions in each country of the world.
Second, the ISPD will couple this evidence-base with the demand-side of how people across the world assess democracy, what they want, how support for democracy is changing, and what the relationship is between the developments of institutions, rights, and preferences.
Third, the ISPD will put these findings on trends for supply and demand in light of what the evidence shows on the dividends and limitations of democracy in terms of Agenda 2030 and issues such as human health, economic development, education, empower-ment of women and children, climate change, peace and human security, public goods and corruption, crisis management includ-ing handling of pandemics, as well as human rights and freedoms. While identifying direct causality is not always possible with 100 percent certainty, the leading expertise from among the best scientists in the world that the ISPD will cast, can identify the most plausible positions and conclusions on both consequences and limitations of democratic governance. Thus, the ISPD can provide evidence on what the trends for democracy and autocracy will mean in terms of achieving the Sustainable Development Goals and meeting related global challenges.
Set-upGiven the potential implications of assessing the political institu-tions of states, it is critical that the ISPD can claim independence from governments and other political actors. Different from the IPCC and the IPBES, therefore, the ISPD should not be organized within the confines of the UN or any other type of intergovern-mental body. While it is anticipated that the funding must come
from a global coalition of democratic states, the consortium constituting and organizing the ISPD should accordingly consist of highly reputable academic and policy institutions that can provide and safeguard the legitimacy of the ISPD and its reports. The institutional arrangement can be organized through a trust fund, or similar.
To accomplish its goals, the ISPD will gather the leading expert academic communities, think-tanks, and institutes that take stock of democracy. While, for example, the V-Dem Institute’s Democ-racy Report and Freedom House’s Freedom in the World are by some considered leading sources of factual assessment on democracy there are many specialized sources. These include Susan Hyde and Nikolay Marinov’s National Elections across Democracy and Autocracy (NELDA); Article 19’s data and report on freedom of expression/media; Bertelsmann Foundation’s Transformation Index; the Democracy Barometer by the Center for Democracy Aarau (ZDA) and the Department of Political Science at the Uni-versity of Zurich; the Polity project at Center for Systemic Peace; Reporters without Borders’ World Press Freedom Index; CIVICUS Civil Society Index Project; and the Human Rights Measurement Initiative founded by economists Ann-Marie Brook and Susan Randolph. On the demand-side measuring popular opinions the ISPD will involve the World Values Survey as well as the Global Barometers (Arab-, Afro-, Asia-, Latino-, and Euro-barometers). In addition, the ISPD will draw on prominent scholars of democracy at universities across the world, not the least in the Global South for regional and country-specific expertise.
As members in its subcommittees, the ISPD will also include leading research institutions, centers, and groups across differ-ent fields such as political science, sociology, economics, law and human rights, conflict and security, development, global health, medicine, biology/biodiversity, and climate change/climatology to collate, assess, and when necessary, conduct additional studies of democracy’s dividends across outcomes critical for the inter-national community.
Supported by the EU (EC/INTPA) as well as by, for example, the Swedish Ministry of Foreign Affairs, and with its extensive global network and international standing, the V-Dem Institute is able to bring the leading academic and other authorities on democracy together for this joint mission.
The V-Dem Institute has also (with support from the EC/INTPA) taken the first steps towards gathering the leading scholars providing evidence on democracy’s dividends across a range of outcomes. This is done under a program of work titled “The Case for Democracy”, which could serve as a model for the second leg of the ISPD and its subcommittees.
41CASE FOR DEMOCRACY

OrganizationThe ISPD will have a slim and decentralized organization to ensure unconstrained output of the highest scientific quality with the minimum bureaucracy. Figure 1 provides a suggested organiza-tional structure.
The coalition of democratic states provides the core funding to a trust fund (or similar) that is owned by a consortium of academic and other reputable institutions. These institutions are repre-sented in the Steering Committee which appoints members of the ISPD but beyond that has oversight functions only.
The ISPD meets twice a year and is tasked with 1) providing a scientific consensus on the state of democratic institutions worldwide in the Expert Report on Democracy, and 2) bringing the findings from topic-specific sub-committees together to provide the overall evidence base on the dividends of democracy at a global scale. The members of the ISPD are expected to conduct the equivalent of about three months of fulltime work per year.
The secretariat supports the work of both the ISPD and its sub-committees and organizes the interface for science-policy/practitioners. The secretariat is estimated to need at least three to five fulltime officers.
The sub-committees meet quarterly and are tasked with identify-ing and collating the best available, robust scientific evidence on the relationship between democracy/autocracy as well as democratization/autocratization, and the area of its concern (e.g. economic development, human and global health, climate change mitigation, ICT, human rights and freedoms, etc). The recruitment of scholars is critical to the success of the ISPD and its sub-committees. The primary criterion for invitations will be based on publishing robust findings in the most highly regarded international, peer-reviewed scientific journals and publishing houses in respective field. In addition, the ISPD and its sub-committees must reflect a wide variety of expertise from both the North and the Global South, and be well-balanced with regard to gender, race, and ethnicity.
Concept Note
FIGURE 1. ISPD ORGANIZATIONAL STRUCTURE
Coalition of Democratic States
(funding & support)
Trust Fund
Consortium of Academic Institutions• Steering Committee
• Expert Report on Democracy• Overarching perspectives, global assessments
Sub-Committee
1
Sub-Committee
1
Sub-Committee
1
Sub-Committee
1
Sub-Committee
1
Topic Topic Topic Topic Topic
• Leading scholars/centers
• Topic speci�c global/regional/country analyses
• Reports
... ... ... ...
Science – Policy/Practitioners Interface• Stakeholder meetings
• Policy Briefs, Outreach, Guidance
Secretariat
INTERNATIONAL SCIENTIFIC PANEL ON DEMOCRACY
42 DEMOCRACY REPORT 2022

Based on the collation of evidence, the sub-committees will identify gaps in the existing evidence-base, and conduct its own, cross-disciplinary studies to fill those gaps with essential knowledge. The work for each individual who are members of a sub-committee is estimated to between one and two months of fulltime work per year, and each sub-committee needs at least one full-time officer coordinating and supporting the work.
Examples of possible topics for such interdisciplinary sub-committees:
1. Supply side: Global/regional institutional trends (democratiza-tion / autocratization);
2. Demand side: regional surveys including cross-cutting and selected country analysis, which represent trends on popular supports for democracy;
3. Outcome: Human development (health, life expectancy, infant mortality, disease control, etc);
4. Outcome: Social development (education, cooperation, social protection schemes, empowerment of women and children);
5. Outcome: Economic development (income, employment, public goods, corruption);
6. Outcome: Climate change mitigation and environment;
7. Outcome: Peace and human security;
8. Outcome: Innovation, technology, and digital communication.
In the interface for science-policy/practitioners, stakeholders are invited to provide feedback on findings and, in particular, to discuss of provide guidance on how the findings can be trans-lated and communicated to policy-makers and practitioners. The interface’s core activities consist of policy briefs summariz-ing findings from the sub-committees, and direct workshops/conferences with policy-makers and practitioners.
SIGNATORIES TO THE ISDP CONCEPT NOTEAssistant Professor Vanessa Boese, V-Dem Institute, University of Gothenburg, Sweden
Professor Staffan I. Lindberg, V-Dem Institute, University of Gothenburg, Sweden
Professor David Altman, Pontificia Universidad Católica de Chile, Chile
Assistant Professor Susumu Annaka, Waseda University, Japan
Dr. Hind Arroub, Hypatia of Alexandria Institute for Reflexion & Studies, Morocco
Dr. Joseph Asunka, CEO, Afrobarometer, Ghana
Professor Thomas Bernauer, ETH Zürich, Germany
Professor Michael Bernhard, University of Florida, United States of America
Professor Thomas J. Bollyky, Council on Foreign Relations, United States of America
Professor Michael Coppedge, University of Notre Dame, United States of America
Assistant Professor Charles Crabtree, Dartmouth College, United States of America
Assistant Professor Sirianne Dahlum, Peace Research Institute Oslo, Norway
Professor Larry Diamond, Hoover Institute, Stanford University, United States of America
Professor John Doces, Bucknell University, United States of America
Associate Professor Markus Eberhardt, University of Nottingham, United Kingdom
Associate Professor Tiago Fernandes, University Institute of Lisbon, Portugal
Professor M. Steven Fish, University of California, Berkeley, United States of America
Professor Scott Gates, Peace Research Institute Oslo, Norway
Professor John Gerring, University of Texas at Austin, United States of America
Associate Professor Carlos Gervasoni, Universidad Torcuato Di Tella, Argentina
Associate Professor Robin Harding, University of Oxford, United Kingdom
Professor Håvard Hegre, Uppsala University, Sweden
Professor Allen Hicken, University of Michigan, United States of America
Associate Professor Masaaki Higashijima, Tohoku University, Japan
Professor Anke Hoeffler, University of Konstanz, Germany
Professor Sverker Jagers, University of Gothenburg, Sweden
Professor Amaney A. Jamal, Dean, Princeton School for Public and International Affairs, Edwards S. Sanford Professor of Politics, United States of America
Professor Morten Jerven, Norwegian University of Life Sciences, Norway
Professor Yuko Kasuya, Keio University, Japan
Associate Professor Marisa Kellam, School of Political Science & Economics, Waseda University, Japan
Associate Professor Asma Shakir Khawaja, National Defence University, Pakistan
Professor Carl-Henrik Knutsen, University of Oslo, Norway
Professor Liisa Laakso, Nordic Africa Institute, Sweden
Dr. Julia Leininger, Head of Program, German Development Institute, Germany
Professor Mario A. Maggioni, DISEIS & CSCC Catholic University of Milan, Italy
Assistant Professor Kyle L Marquardt, HSE University, Russia
Professor Kelly M. McMann, Case Western Reserve University, United States of America
Professor Amanda Murdie, University of Georgia, United States of America
Professor Mansoob Murshed, Erasmus University & Coventry University, United Kingdom
Professor Pamela Paxton, University of Texas-Austin, United States of America
Associate Professor Daniel Pemstein, North Dakota State University, United States of America
Professor James A. Robinson, University of Chicago, United States of America
Associate Professor Brigitte Seim, University of North Carolina-Chapel Hill, United States of America
Assistant Professor Carlos Shenga, Centre for Research on Governance and Development, University Joaquim Chissano, Mozambique
Professor Julio C. Teehankee, De La Salle University, Philippines
Dr. Kharis Templeman, Hoover Institution, Stanford University, United States of America
Professor Jan Teorell, Stockholm University, Sweden
Assistant Professor Medet Tiulegenov, American University of Central Asia, Kyrgyzstan
Professor Ann Towns, University of Gothenburg, Sweden
Associate Professor Yi-ting Wang, National Cheng Kung University, Taiwan
Professor Nils Weidmann, University of Konstanz, Germany
Assistant Professor Steven Lloyd Wilson, Brandeis University, United States of America
43CASE FOR DEMOCRACY

V-Dem in Numbers
WHERE IS V-DEM DATA USED ?
The V-Dem dataset has been downloaded by users 234,000 times in 186 countries since 2016.
12 million graphs created using the online tools by users in 182 countries since 2016.
V-DEM PUBLICATIONS AND PRESENTATIONS TO ACADEMIC AND POLICY COMMUNITIES
850+ presentations across the world by V-Dem scholars since 2007.
100+ visiting scholars presented at the V-Dem Institute since 2014.
While the majority of the dataset downloads in 2020 come from Europe and Americas, users
from all regions of the world have accessed the data and used the online tools since 2016.
DATASET DOWNLOADS (2016–2021)
Europe 45%
North America 31%
Asia 13%
Latin America 8%
Africa 2%
Oceania 1%
234,000
130WORKING PAPERS 27
COUNTRY REPORTS
122JOURNAL ARTICLES
35POLICY BRIEFS
V-Dem is an international effort comprised of:
5Principal
Investigators
33Regional
Managers
18Personnel at the V-Dem Institute
134Country
Coordinators
22Project
Managers
3,700Country Experts
ALL WORKING TOGETHER TO PRODUCE
over 30,000,000 data points
IN THE V12 DATASET
44 DEMOCRACY REPORT 2022
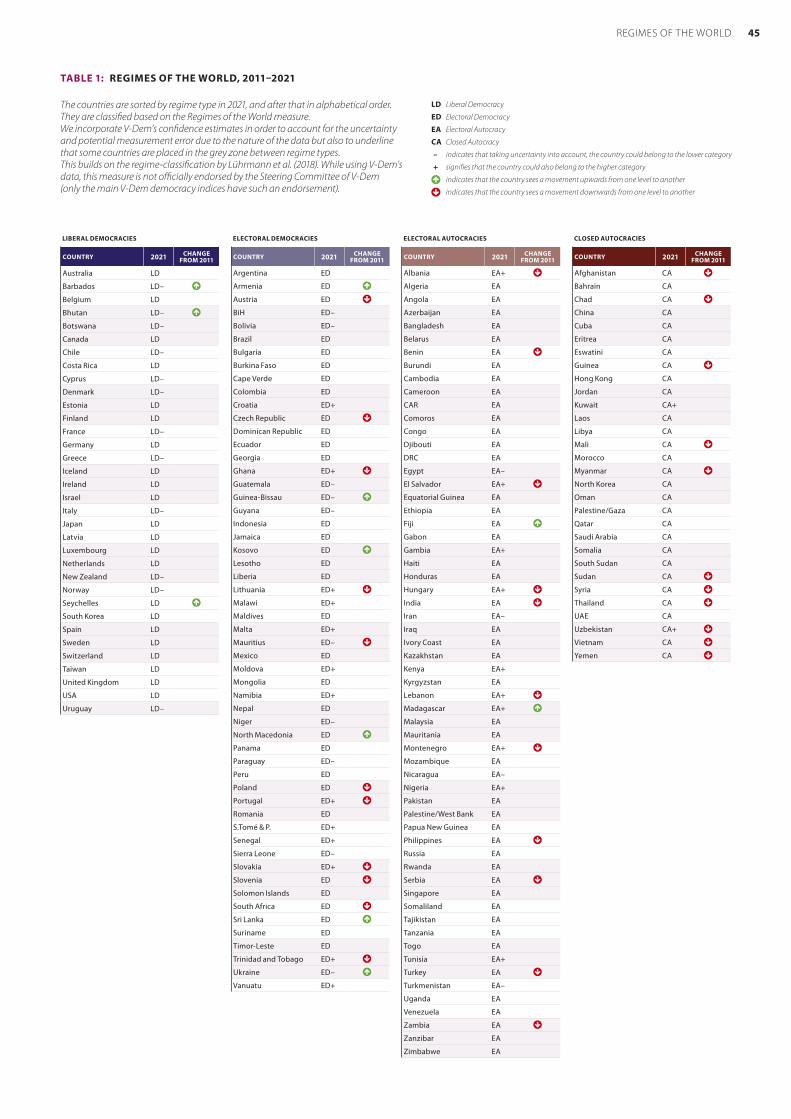
The countries are sorted by regime type in 2021, and after that in alphabetical order. They are classified based on the Regimes of the World measure. We incorporate V-Dem’s confidence estimates in order to account for the uncertainty and potential measurement error due to the nature of the data but also to underline that some countries are placed in the grey zone between regime types. This builds on the regime-classification by Lührmann et al. (2018). While using V-Dem’s data, this measure is not officially endorsed by the Steering Committee of V-Dem (only the main V-Dem democracy indices have such an endorsement).
TABLE 1: REGIMES OF THE WORLD, 2011–2021
COUNTRY 2021 CHANGE FROM 2011
Australia LD
Barbados LD–
Belgium LD
Bhutan LD–
Botswana LD–
Canada LD
Chile LD–
Costa Rica LD
Cyprus LD–
Denmark LD–
Estonia LD
Finland LD
France LD–
Germany LD
Greece LD–
Iceland LD
Ireland LD
Israel LD
Italy LD–
Japan LD
Latvia LD
Luxembourg LD
Netherlands LD
New Zealand LD–
Norway LD–
Seychelles LD
South Korea LD
Spain LD
Sweden LD
Switzerland LD
Taiwan LD
United Kingdom LD
USA LD
Uruguay LD–
COUNTRY 2021 CHANGE FROM 2011
Argentina ED
Armenia ED
Austria ED
BiH ED–
Bolivia ED–
Brazil ED
Bulgaria ED
Burkina Faso ED
Cape Verde ED
Colombia ED
Croatia ED+
Czech Republic ED
Dominican Republic ED
Ecuador ED
Georgia ED
Ghana ED+
Guatemala ED–
Guinea-Bissau ED–
Guyana ED–
Indonesia ED
Jamaica ED
Kosovo ED
Lesotho ED
Liberia ED
Lithuania ED+
Malawi ED+
Maldives ED
Malta ED+
Mauritius ED–
Mexico ED
Moldova ED+
Mongolia ED
Namibia ED+
Nepal ED
Niger ED–
North Macedonia ED
Panama ED
Paraguay ED–
Peru ED
Poland ED
Portugal ED+
Romania ED
S.Tomé & P. ED+
Senegal ED+
Sierra Leone ED–
Slovakia ED+
Slovenia ED
Solomon Islands ED
South Africa ED
Sri Lanka ED
Suriname ED
Timor-Leste ED
Trinidad and Tobago ED+
Ukraine ED–
Vanuatu ED+
COUNTRY 2021 CHANGE FROM 2011
Albania EA+
Algeria EA
Angola EA
Azerbaijan EA
Bangladesh EA
Belarus EA
Benin EA
Burundi EA
Cambodia EA
Cameroon EA
CAR EA
Comoros EA
Congo EA
Djibouti EA
DRC EA
Egypt EA–
El Salvador EA+
Equatorial Guinea EA
Ethiopia EA
Fiji EA
Gabon EA
Gambia EA+
Haiti EA
Honduras EA
Hungary EA+
India EA
Iran EA–
Iraq EA
Ivory Coast EA
Kazakhstan EA
Kenya EA+
Kyrgyzstan EA
Lebanon EA+
Madagascar EA+
Malaysia EA
Mauritania EA
Montenegro EA+
Mozambique EA
Nicaragua EA–
Nigeria EA+
Pakistan EA
Palestine/West Bank EA
Papua New Guinea EA
Philippines EA
Russia EA
Rwanda EA
Serbia EA
Singapore EA
Somaliland EA
Tajikistan EA
Tanzania EA
Togo EA
Tunisia EA+
Turkey EA
Turkmenistan EA–
Uganda EA
Venezuela EA
Zambia EA
Zanzibar EA
Zimbabwe EA
COUNTRY 2021 CHANGE FROM 2011
Afghanistan CA
Bahrain CA
Chad CA
China CA
Cuba CA
Eritrea CA
Eswatini CA
Guinea CA
Hong Kong CA
Jordan CA
Kuwait CA+
Laos CA
Libya CA
Mali CA
Morocco CA
Myanmar CA
North Korea CA
Oman CA
Palestine/Gaza CA
Qatar CA
Saudi Arabia CA
Somalia CA
South Sudan CA
Sudan CA
Syria CA
Thailand CA
UAE CA
Uzbekistan CA+
Vietnam CA
Yemen CA
LD Liberal Democracy
ED Electoral Democracy
EA Electoral Autocracy
CA Closed Autocracy
– indicates that taking uncertainty into account, the country could belong to the lower category
+ signifies that the country could also belong to the higher category
indicates that the country sees a movement upwards from one level to another
indicates that the country sees a movement downwards from one level to another
LIBERAL DEMOCRACIES ELECTORAL DEMOCRACIES ELECTORAL AUTOCRACIES CLOSED AUTOCRACIES
45REGIMES OF THE WORLD
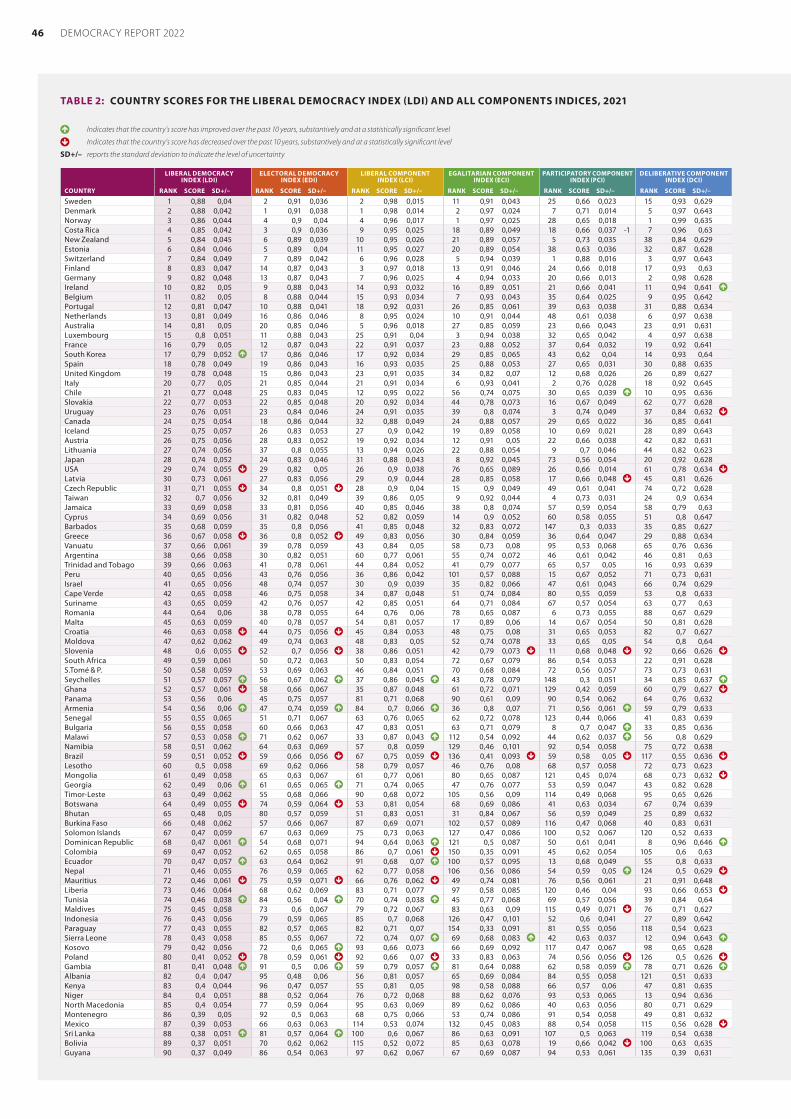
LIBERAL DEMOCRACY INDEX (LDI)
ELECTORAL DEMOCRACY INDEX (EDI)
LIBERAL COMPONENT INDEX (LCI)
EGALITARIAN COMPONENT INDEX (ECI)
PARTICIPATORY COMPONENT INDEX (PCI)
DELIBERATIVE COMPONENT INDEX (DCI)
COUNTRY RANK SCORE SD+/– RANK SCORE SD+/– RANK SCORE SD+/– RANK SCORE SD+/– RANK SCORE SD+/– RANK SCORE SD+/–
Sweden 1 0,88 0,04 2 0,91 0,036 2 0,98 0,015 11 0,91 0,043 25 0,66 0,023 15 0,93 0,629Denmark 2 0,88 0,042 1 0,91 0,038 1 0,98 0,014 2 0,97 0,024 7 0,71 0,014 5 0,97 0,643Norway 3 0,86 0,044 4 0,9 0,04 4 0,96 0,017 1 0,97 0,025 28 0,65 0,018 1 0,99 0,635Costa Rica 4 0,85 0,042 3 0,9 0,036 9 0,95 0,025 18 0,89 0,049 18 0,66 0,037 -1 7 0,96 0,63New Zealand 5 0,84 0,045 6 0,89 0,039 10 0,95 0,026 21 0,89 0,057 5 0,73 0,035 38 0,84 0,629Estonia 6 0,84 0,046 5 0,89 0,04 11 0,95 0,027 20 0,89 0,054 38 0,63 0,036 32 0,87 0,628Switzerland 7 0,84 0,049 7 0,89 0,042 6 0,96 0,028 5 0,94 0,039 1 0,88 0,016 3 0,97 0,643Finland 8 0,83 0,047 14 0,87 0,043 3 0,97 0,018 13 0,91 0,046 24 0,66 0,018 17 0,93 0,63Germany 9 0,82 0,048 13 0,87 0,043 7 0,96 0,025 4 0,94 0,033 20 0,66 0,013 2 0,98 0,628Ireland 10 0,82 0,05 9 0,88 0,043 14 0,93 0,032 16 0,89 0,051 21 0,66 0,041 11 0,94 0,641 Belgium 11 0,82 0,05 8 0,88 0,044 15 0,93 0,034 7 0,93 0,043 35 0,64 0,025 9 0,95 0,642Portugal 12 0,81 0,047 10 0,88 0,041 18 0,92 0,031 26 0,85 0,061 39 0,63 0,038 31 0,88 0,634Netherlands 13 0,81 0,049 16 0,86 0,046 8 0,95 0,024 10 0,91 0,044 48 0,61 0,038 6 0,97 0,638Australia 14 0,81 0,05 20 0,85 0,046 5 0,96 0,018 27 0,85 0,059 23 0,66 0,043 23 0,91 0,631Luxembourg 15 0,8 0,051 11 0,88 0,043 25 0,91 0,04 3 0,94 0,038 32 0,65 0,042 4 0,97 0,638France 16 0,79 0,05 12 0,87 0,043 22 0,91 0,037 23 0,88 0,052 37 0,64 0,032 19 0,92 0,641South Korea 17 0,79 0,052 17 0,86 0,046 17 0,92 0,034 29 0,85 0,065 43 0,62 0,04 14 0,93 0,64Spain 18 0,78 0,049 19 0,86 0,043 16 0,93 0,035 25 0,88 0,053 27 0,65 0,031 30 0,88 0,635United Kingdom 19 0,78 0,048 15 0,86 0,043 23 0,91 0,035 34 0,82 0,07 12 0,68 0,026 26 0,89 0,627Italy 20 0,77 0,05 21 0,85 0,044 21 0,91 0,034 6 0,93 0,041 2 0,76 0,028 18 0,92 0,645Chile 21 0,77 0,048 25 0,83 0,045 12 0,95 0,022 56 0,74 0,075 30 0,65 0,039 10 0,95 0,636Slovakia 22 0,77 0,053 22 0,85 0,048 20 0,92 0,034 44 0,78 0,073 16 0,67 0,049 62 0,77 0,628Uruguay 23 0,76 0,051 23 0,84 0,046 24 0,91 0,035 39 0,8 0,074 3 0,74 0,049 37 0,84 0,632 Canada 24 0,75 0,054 18 0,86 0,044 32 0,88 0,049 24 0,88 0,057 29 0,65 0,022 36 0,85 0,641Iceland 25 0,75 0,057 26 0,83 0,053 27 0,9 0,042 19 0,89 0,058 10 0,69 0,021 28 0,89 0,643Austria 26 0,75 0,056 28 0,83 0,052 19 0,92 0,034 12 0,91 0,05 22 0,66 0,038 42 0,82 0,631Lithuania 27 0,74 0,056 37 0,8 0,055 13 0,94 0,026 22 0,88 0,054 9 0,7 0,046 44 0,82 0,623Japan 28 0,74 0,052 24 0,83 0,046 31 0,88 0,043 8 0,92 0,045 73 0,56 0,054 20 0,92 0,628USA 29 0,74 0,055 29 0,82 0,05 26 0,9 0,038 76 0,65 0,089 26 0,66 0,014 61 0,78 0,634 Latvia 30 0,73 0,061 27 0,83 0,056 29 0,9 0,044 28 0,85 0,058 17 0,66 0,048 45 0,81 0,626Czech Republic 31 0,71 0,055 34 0,8 0,051 28 0,9 0,04 15 0,9 0,049 49 0,61 0,041 74 0,72 0,628Taiwan 32 0,7 0,056 32 0,81 0,049 39 0,86 0,05 9 0,92 0,044 4 0,73 0,031 24 0,9 0,634Jamaica 33 0,69 0,058 33 0,81 0,056 40 0,85 0,046 38 0,8 0,074 57 0,59 0,054 58 0,79 0,63Cyprus 34 0,69 0,056 31 0,82 0,048 52 0,82 0,059 14 0,9 0,052 60 0,58 0,055 51 0,8 0,647Barbados 35 0,68 0,059 35 0,8 0,056 41 0,85 0,048 32 0,83 0,072 147 0,3 0,033 35 0,85 0,627Greece 36 0,67 0,058 36 0,8 0,052 49 0,83 0,056 30 0,84 0,059 36 0,64 0,047 29 0,88 0,634Vanuatu 37 0,66 0,061 39 0,78 0,059 43 0,84 0,05 58 0,73 0,08 95 0,53 0,068 65 0,76 0,636Argentina 38 0,66 0,058 30 0,82 0,051 60 0,77 0,061 55 0,74 0,072 46 0,61 0,042 46 0,81 0,63Trinidad and Tobago 39 0,66 0,063 41 0,78 0,061 44 0,84 0,052 41 0,79 0,077 65 0,57 0,05 16 0,93 0,639Peru 40 0,65 0,056 43 0,76 0,056 36 0,86 0,042 101 0,57 0,088 15 0,67 0,052 71 0,73 0,631Israel 41 0,65 0,056 48 0,74 0,057 30 0,9 0,039 35 0,82 0,066 47 0,61 0,043 66 0,74 0,629Cape Verde 42 0,65 0,058 46 0,75 0,058 34 0,87 0,048 51 0,74 0,084 80 0,55 0,059 53 0,8 0,633Suriname 43 0,65 0,059 42 0,76 0,057 42 0,85 0,051 64 0,71 0,084 67 0,57 0,054 63 0,77 0,63Romania 44 0,64 0,06 38 0,78 0,055 64 0,76 0,06 78 0,65 0,087 6 0,73 0,055 88 0,67 0,629Malta 45 0,63 0,059 40 0,78 0,057 54 0,81 0,057 17 0,89 0,06 14 0,67 0,054 50 0,81 0,628Croatia 46 0,63 0,058 44 0,75 0,056 45 0,84 0,053 48 0,75 0,08 31 0,65 0,053 82 0,7 0,627Moldova 47 0,62 0,062 49 0,74 0,063 48 0,83 0,05 52 0,74 0,078 33 0,65 0,05 54 0,8 0,64Slovenia 48 0,6 0,055 52 0,7 0,056 38 0,86 0,051 42 0,79 0,073 11 0,68 0,048 92 0,66 0,626 South Africa 49 0,59 0,061 50 0,72 0,063 50 0,83 0,054 72 0,67 0,079 86 0,54 0,053 22 0,91 0,628S.Tomé & P. 50 0,58 0,059 53 0,69 0,063 46 0,84 0,051 70 0,68 0,084 72 0,56 0,057 73 0,73 0,631Seychelles 51 0,57 0,057 56 0,67 0,062 37 0,86 0,045 43 0,78 0,079 148 0,3 0,051 34 0,85 0,637 Ghana 52 0,57 0,061 58 0,66 0,067 35 0,87 0,048 61 0,72 0,071 129 0,42 0,059 60 0,79 0,627 Panama 53 0,56 0,06 45 0,75 0,057 81 0,71 0,068 90 0,61 0,09 90 0,54 0,062 64 0,76 0,632Armenia 54 0,56 0,06 47 0,74 0,059 84 0,7 0,066 36 0,8 0,07 71 0,56 0,061 59 0,79 0,633Senegal 55 0,55 0,065 51 0,71 0,067 63 0,76 0,065 62 0,72 0,078 123 0,44 0,066 41 0,83 0,639Bulgaria 56 0,55 0,058 60 0,66 0,063 47 0,83 0,051 63 0,71 0,079 8 0,7 0,047 33 0,85 0,636Malawi 57 0,53 0,058 71 0,62 0,067 33 0,87 0,043 112 0,54 0,092 44 0,62 0,037 56 0,8 0,629Namibia 58 0,51 0,062 64 0,63 0,069 57 0,8 0,059 129 0,46 0,101 92 0,54 0,058 75 0,72 0,638Brazil 59 0,51 0,052 59 0,66 0,056 67 0,75 0,059 136 0,41 0,093 59 0,58 0,05 117 0,55 0,636 Lesotho 60 0,5 0,058 69 0,62 0,066 58 0,79 0,057 46 0,76 0,08 68 0,57 0,058 72 0,73 0,623Mongolia 61 0,49 0,058 65 0,63 0,067 61 0,77 0,061 80 0,65 0,087 121 0,45 0,074 68 0,73 0,632 Georgia 62 0,49 0,06 61 0,65 0,065 71 0,74 0,065 47 0,76 0,077 53 0,59 0,047 43 0,82 0,628Timor-Leste 63 0,49 0,062 55 0,68 0,066 90 0,68 0,072 105 0,56 0,09 114 0,49 0,068 95 0,65 0,626Botswana 64 0,49 0,055 74 0,59 0,064 53 0,81 0,054 68 0,69 0,086 41 0,63 0,034 67 0,74 0,639Bhutan 65 0,48 0,05 80 0,57 0,059 51 0,83 0,051 31 0,84 0,067 56 0,59 0,049 25 0,89 0,632Burkina Faso 66 0,48 0,062 57 0,66 0,067 87 0,69 0,071 102 0,57 0,089 116 0,47 0,068 40 0,83 0,631Solomon Islands 67 0,47 0,059 67 0,63 0,069 75 0,73 0,063 127 0,47 0,086 100 0,52 0,067 120 0,52 0,633Dominican Republic 68 0,47 0,061 54 0,68 0,071 94 0,64 0,063 121 0,5 0,087 50 0,61 0,041 8 0,96 0,646 Colombia 69 0,47 0,052 62 0,65 0,058 86 0,7 0,061 150 0,35 0,091 45 0,62 0,054 105 0,6 0,63Ecuador 70 0,47 0,057 63 0,64 0,062 91 0,68 0,07 100 0,57 0,095 13 0,68 0,049 55 0,8 0,633Nepal 71 0,46 0,055 76 0,59 0,065 62 0,77 0,058 106 0,56 0,086 54 0,59 0,05 124 0,5 0,629 Mauritius 72 0,46 0,061 75 0,59 0,071 66 0,76 0,062 49 0,74 0,081 76 0,56 0,061 21 0,91 0,648Liberia 73 0,46 0,064 68 0,62 0,069 83 0,71 0,077 97 0,58 0,085 120 0,46 0,04 93 0,66 0,653 Tunisia 74 0,46 0,038 84 0,56 0,04 70 0,74 0,038 45 0,77 0,068 69 0,57 0,056 39 0,84 0,64Maldives 75 0,45 0,058 73 0,6 0,067 79 0,72 0,067 83 0,63 0,09 115 0,49 0,071 76 0,71 0,627Indonesia 76 0,43 0,056 79 0,59 0,065 85 0,7 0,068 126 0,47 0,101 52 0,6 0,041 27 0,89 0,642Paraguay 77 0,43 0,055 82 0,57 0,065 82 0,71 0,07 154 0,33 0,091 81 0,55 0,056 118 0,54 0,623Sierra Leone 78 0,43 0,058 85 0,55 0,067 72 0,74 0,07 69 0,68 0,083 42 0,63 0,037 12 0,94 0,643 Kosovo 79 0,42 0,056 72 0,6 0,065 93 0,66 0,073 66 0,69 0,092 117 0,47 0,067 98 0,65 0,628Poland 80 0,41 0,052 78 0,59 0,061 92 0,66 0,07 33 0,83 0,063 74 0,56 0,056 126 0,5 0,626 Gambia 81 0,41 0,048 91 0,5 0,06 59 0,79 0,057 81 0,64 0,088 62 0,58 0,059 78 0,71 0,626 Albania 82 0,4 0,047 95 0,48 0,06 56 0,81 0,057 65 0,69 0,084 84 0,55 0,058 121 0,51 0,633Kenya 83 0,4 0,044 96 0,47 0,057 55 0,81 0,05 98 0,58 0,088 66 0,57 0,06 47 0,81 0,635Niger 84 0,4 0,051 88 0,52 0,064 76 0,72 0,068 88 0,62 0,076 93 0,53 0,065 13 0,94 0,636North Macedonia 85 0,4 0,054 77 0,59 0,064 95 0,63 0,069 89 0,62 0,086 40 0,63 0,056 80 0,71 0,629Montenegro 86 0,39 0,05 92 0,5 0,063 68 0,75 0,066 53 0,74 0,086 91 0,54 0,058 49 0,81 0,632Mexico 87 0,39 0,053 66 0,63 0,063 114 0,53 0,074 132 0,45 0,083 88 0,54 0,058 115 0,56 0,628 Sri Lanka 88 0,38 0,051 81 0,57 0,064 100 0,6 0,067 86 0,63 0,091 107 0,5 0,063 119 0,54 0,638Bolivia 89 0,37 0,051 70 0,62 0,062 115 0,52 0,072 85 0,63 0,078 19 0,66 0,042 100 0,63 0,635Guyana 90 0,37 0,049 86 0,54 0,063 97 0,62 0,067 67 0,69 0,087 94 0,53 0,061 135 0,39 0,631
TABLE 2: COUNTRY SCORES FOR THE LIBERAL DEMOCRACY INDEX (LDI) AND ALL COMPONENTS INDICES, 2021
Indicates that the country’s score has improved over the past 10 years, substantively and at a statistically significant level
Indicates that the country’s score has decreased over the past 10 years, substantively and at a statistically significant level
SD+/– reports the standard deviation to indicate the level of uncertainty
46 DEMOCRACY REPORT 2022

LIBERAL DEMOCRACY INDEX (LDI)
ELECTORAL DEMOCRACY INDEX (EDI)
LIBERAL COMPONENT INDEX (LCI)
EGALITARIAN COMPONENT INDEX (ECI)
PARTICIPATORY COMPONENT INDEX (PCI)
DELIBERATIVE COMPONENT INDEX (DCI)
COUNTRY RANK SCORE SD+/– RANK SCORE SD+/– RANK SCORE SD+/– RANK SCORE SD+/– RANK SCORE SD+/– RANK SCORE SD+/–
Hungary 91 0,36 0,043 98 0,46 0,055 74 0,73 0,062 75 0,66 0,084 58 0,59 0,063 138 0,38 0,626Guinea-Bissau 92 0,36 0,055 83 0,56 0,066 102 0,58 0,079 122 0,5 0,092 146 0,31 0,059 147 0,33 0,639India 93 0,36 0,042 100 0,44 0,055 69 0,74 0,063 114 0,53 0,088 85 0,55 0,053 102 0,61 0,626 BiH 94 0,35 0,049 87 0,53 0,06 98 0,61 0,074 77 0,65 0,084 82 0,55 0,052 114 0,56 0,632Nigeria 95 0,34 0,046 93 0,49 0,06 96 0,62 0,073 128 0,46 0,086 51 0,6 0,044 112 0,58 0,62Papua New Guinea 96 0,34 0,038 103 0,42 0,049 78 0,72 0,067 135 0,42 0,093 104 0,5 0,063 128 0,5 0,629Singapore 97 0,33 0,037 108 0,4 0,047 73 0,74 0,067 40 0,79 0,072 167 0,14 0,061 57 0,8 0,628Guatemala 98 0,32 0,049 90 0,5 0,062 103 0,58 0,078 162 0,29 0,083 78 0,55 0,063 131 0,45 0,627Ukraine 99 0,32 0,047 89 0,52 0,062 110 0,54 0,074 73 0,67 0,09 70 0,57 0,057 48 0,81 0,63Tanzania 100 0,31 0,032 117 0,36 0,043 65 0,76 0,061 60 0,73 0,088 79 0,55 0,056 77 0,71 0,634Zambia 101 0,3 0,036 112 0,38 0,047 89 0,68 0,07 107 0,55 0,089 63 0,58 0,055 142 0,36 0,635 Malaysia 102 0,29 0,039 106 0,41 0,054 99 0,61 0,073 74 0,67 0,09 101 0,51 0,058 85 0,69 0,63Lebanon 103 0,28 0,041 99 0,45 0,057 113 0,53 0,073 116 0,51 0,091 118 0,47 0,072 81 0,7 0,633Philippines 104 0,28 0,042 102 0,43 0,054 106 0,57 0,079 149 0,36 0,097 55 0,59 0,052 52 0,8 0,637Benin 105 0,28 0,038 104 0,42 0,055 104 0,57 0,068 50 0,74 0,076 112 0,49 0,064 103 0,6 0,628 Kuwait 106 0,27 0,025 127 0,3 0,026 77 0,72 0,064 93 0,6 0,08 163 0,15 0,06 122 0,51 0,642 Fiji 107 0,27 0,038 109 0,4 0,05 105 0,57 0,073 96 0,59 0,097 140 0,35 0,061 83 0,7 0,634 Kyrgyzstan 108 0,27 0,038 105 0,42 0,051 109 0,54 0,074 125 0,48 0,096 127 0,42 0,078 108 0,59 0,633 Somaliland 109 0,26 0,037 107 0,41 0,05 111 0,54 0,073 160 0,31 0,09 103 0,51 0,067 125 0,5 0,624Jordan 110 0,25 0,023 138 0,26 0,025 80 0,72 0,067 95 0,59 0,094 150 0,28 0,071 106 0,6 0,631Serbia 111 0,24 0,032 122 0,34 0,041 101 0,58 0,074 57 0,74 0,079 97 0,53 0,061 130 0,45 0,632 Madagascar 112 0,24 0,042 94 0,48 0,061 129 0,39 0,07 156 0,32 0,091 109 0,5 0,069 129 0,48 0,634Mozambique 113 0,24 0,032 119 0,36 0,039 108 0,55 0,074 115 0,52 0,086 87 0,54 0,059 109 0,58 0,619Ivory Coast 114 0,24 0,037 101 0,43 0,054 123 0,45 0,073 119 0,51 0,093 34 0,65 0,051 91 0,66 0,645Morocco 115 0,24 0,024 137 0,26 0,024 88 0,68 0,071 99 0,58 0,093 126 0,43 0,073 70 0,73 0,627Honduras 116 0,24 0,034 110 0,39 0,044 117 0,51 0,074 165 0,28 0,083 89 0,54 0,055 111 0,58 0,633Pakistan 117 0,23 0,033 116 0,36 0,045 118 0,5 0,072 163 0,29 0,085 98 0,53 0,062 79 0,71 0,639Iraq 118 0,22 0,033 114 0,37 0,047 120 0,48 0,078 138 0,4 0,095 128 0,42 0,072 107 0,6 0,639El Salvador 119 0,21 0,036 97 0,47 0,057 146 0,3 0,065 141 0,39 0,082 108 0,5 0,063 134 0,39 0,645 Uganda 120 0,21 0,028 128 0,28 0,031 107 0,55 0,077 142 0,39 0,093 113 0,49 0,066 99 0,65 0,63Haiti 121 0,21 0,029 120 0,35 0,042 121 0,47 0,064 177 0,15 0,065 124 0,44 0,067 104 0,6 0,643Gabon 122 0,21 0,029 113 0,38 0,046 126 0,43 0,059 71 0,68 0,091 61 0,58 0,053 87 0,67 0,634 Hong Kong 123 0,2 0,022 134 0,27 0,023 124 0,45 0,065 84 0,63 0,084 159 0,18 0,057 164 0,14 0,63 Zanzibar 124 0,2 0,026 136 0,26 0,028 112 0,54 0,077 79 0,65 0,091 142 0,35 0,085 86 0,69 0,646Togo 125 0,2 0,03 115 0,37 0,048 128 0,41 0,065 82 0,64 0,099 96 0,53 0,065 69 0,73 0,632Angola 126 0,19 0,031 121 0,35 0,044 127 0,41 0,074 164 0,28 0,08 169 0,14 0,058 145 0,35 0,627Zimbabwe 127 0,19 0,025 130 0,28 0,031 119 0,49 0,07 145 0,38 0,095 102 0,51 0,064 116 0,55 0,622Mali 128 0,18 0,025 141 0,25 0,015 122 0,46 0,081 120 0,51 0,094 110 0,5 0,057 84 0,69 0,636Thailand 129 0,17 0,023 151 0,2 0,021 116 0,52 0,075 118 0,51 0,093 145 0,32 0,068 167 0,14 0,64 Mauritania 130 0,17 0,033 111 0,38 0,054 143 0,31 0,071 175 0,19 0,074 75 0,56 0,079 89 0,67 0,649CAR 131 0,16 0,029 123 0,33 0,036 135 0,33 0,079 161 0,29 0,091 151 0,28 0,06 139 0,37 0,641DRC 132 0,16 0,029 118 0,36 0,043 142 0,32 0,069 143 0,38 0,094 111 0,49 0,065 94 0,65 0,649Ethiopia 133 0,15 0,026 125 0,31 0,037 141 0,32 0,067 111 0,54 0,094 136 0,37 0,065 96 0,65 0,635Libya 134 0,15 0,022 133 0,27 0,018 131 0,38 0,068 134 0,42 0,094 141 0,35 0,061 90 0,67 0,633Algeria 135 0,15 0,023 129 0,28 0,033 137 0,33 0,065 59 0,73 0,085 153 0,24 0,059 132 0,44 0,621Palestine/West Bank 136 0,14 0,021 142 0,25 0,02 130 0,38 0,065 104 0,56 0,098 119 0,47 0,073 141 0,37 0,662 Oman 137 0,14 0,021 161 0,18 0,016 125 0,44 0,073 94 0,6 0,082 135 0,37 0,071 161 0,17 0,632Kazakhstan 138 0,13 0,02 140 0,26 0,03 139 0,32 0,059 103 0,57 0,094 157 0,21 0,062 146 0,34 0,635Comoros 139 0,13 0,021 124 0,32 0,031 153 0,25 0,056 92 0,6 0,093 64 0,57 0,061 110 0,58 0,63Cameroon 140 0,13 0,021 126 0,3 0,031 150 0,27 0,059 113 0,53 0,091 152 0,25 0,069 140 0,37 0,636Vietnam 141 0,13 0,022 147 0,22 0,021 133 0,36 0,073 87 0,62 0,1 77 0,56 0,058 97 0,65 0,63Iran 142 0,12 0,02 159 0,18 0,021 136 0,33 0,068 108 0,55 0,095 170 0,13 0,063 127 0,5 0,649Djibouti 143 0,12 0,021 143 0,25 0,028 144 0,31 0,062 117 0,51 0,092 139 0,36 0,071 137 0,39 0,625Egypt 144 0,12 0,02 157 0,18 0,016 132 0,37 0,068 166 0,26 0,079 155 0,22 0,051 143 0,36 0,622 Rwanda 145 0,12 0,022 145 0,24 0,027 140 0,32 0,07 91 0,61 0,099 105 0,5 0,072 101 0,61 0,62Bangladesh 146 0,12 0,022 135 0,27 0,028 148 0,28 0,065 172 0,22 0,075 144 0,32 0,072 152 0,27 0,63Turkey 147 0,11 0,021 131 0,28 0,031 152 0,26 0,061 123 0,5 0,092 131 0,4 0,06 168 0,13 0,63 Guinea 148 0,11 0,022 132 0,28 0,03 154 0,25 0,066 140 0,39 0,09 99 0,52 0,068 155 0,24 0,636Eswatini 149 0,11 0,022 170 0,13 0,016 134 0,34 0,077 169 0,24 0,08 132 0,39 0,077 162 0,16 0,639Congo 150 0,11 0,023 144 0,24 0,023 151 0,27 0,071 147 0,36 0,094 83 0,55 0,062 113 0,57 0,636Russia 151 0,1 0,017 139 0,26 0,028 155 0,24 0,049 110 0,54 0,092 125 0,43 0,065 151 0,3 0,631 Laos 152 0,1 0,02 169 0,13 0,014 138 0,33 0,073 133 0,44 0,098 130 0,41 0,056 159 0,2 0,642Somalia 153 0,09 0,019 163 0,16 0,019 149 0,28 0,066 168 0,24 0,081 149 0,29 0,066 158 0,21 0,649Uzbekistan 154 0,09 0,016 149 0,22 0,021 157 0,22 0,048 131 0,45 0,092 165 0,15 0,062 123 0,5 0,627 Qatar 155 0,09 0,017 178 0,06 0,006 145 0,3 0,063 144 0,38 0,06 178 0,07 0,046 136 0,39 0,626Myanmar 156 0,08 0,018 171 0,13 0,015 156 0,22 0,058 173 0,22 0,079 158 0,19 0,061 160 0,19 0,642 Sudan 157 0,08 0,017 154 0,18 0,019 163 0,17 0,053 148 0,36 0,095 154 0,23 0,074 166 0,14 0,646UAE 158 0,08 0,016 174 0,1 0,018 147 0,28 0,06 124 0,49 0,082 174 0,09 0,058 150 0,3 0,631Cuba 159 0,08 0,017 160 0,18 0,015 158 0,21 0,058 37 0,8 0,073 138 0,36 0,045 149 0,32 0,629Burundi 160 0,08 0,017 155 0,18 0,017 159 0,2 0,059 153 0,34 0,091 122 0,44 0,077 153 0,26 0,639 Venezuela 161 0,07 0,014 148 0,22 0,021 165 0,17 0,045 137 0,4 0,093 106 0,5 0,064 178 0,04 0,636 Azerbaijan 162 0,07 0,012 153 0,19 0,017 164 0,17 0,041 155 0,33 0,074 161 0,16 0,053 173 0,1 0,634Chad 163 0,07 0,014 150 0,21 0,02 169 0,15 0,045 171 0,23 0,081 143 0,34 0,067 148 0,33 0,621Cambodia 164 0,06 0,014 152 0,2 0,019 166 0,16 0,046 170 0,24 0,081 134 0,38 0,068 163 0,16 0,633 Palestine/Gaza 165 0,06 0,014 168 0,13 0,017 160 0,18 0,05 109 0,54 0,095 133 0,39 0,084 156 0,22 0,639South Sudan 166 0,06 0,015 167 0,14 0,014 161 0,18 0,053 179 0,06 0,043 171 0,13 0,06 133 0,42 0,631Nicaragua 167 0,06 0,012 146 0,23 0,027 176 0,07 0,029 158 0,31 0,093 137 0,36 0,067 175 0,06 0,645 Equatorial Guinea 168 0,05 0,013 162 0,17 0,014 170 0,13 0,046 152 0,34 0,087 172 0,12 0,046 170 0,11 0,634Bahrain 169 0,05 0,012 172 0,12 0,016 167 0,16 0,045 146 0,37 0,068 175 0,09 0,053 157 0,22 0,629Tajikistan 170 0,05 0,011 156 0,18 0,015 173 0,1 0,037 174 0,2 0,069 166 0,15 0,055 165 0,14 0,629Saudi Arabia 171 0,04 0,013 179 0,02 0,006 162 0,17 0,05 130 0,46 0,074 177 0,07 0,048 154 0,25 0,643China 172 0,04 0,012 176 0,08 0,006 168 0,15 0,047 151 0,34 0,086 168 0,14 0,057 144 0,36 0,646 Turkmenistan 173 0,04 0,011 165 0,15 0,009 172 0,11 0,039 157 0,32 0,085 176 0,08 0,038 174 0,06 0,644Syria 174 0,04 0,012 166 0,14 0,006 171 0,11 0,044 176 0,19 0,067 162 0,16 0,059 176 0,05 0,637Belarus 175 0,04 0,009 158 0,18 0,017 175 0,08 0,028 54 0,74 0,078 160 0,16 0,059 169 0,12 0,636Yemen 176 0,03 0,011 173 0,11 0,013 174 0,09 0,04 178 0,09 0,051 156 0,22 0,055 177 0,05 0,641 Afghanistan 177 0,02 0,007 164 0,16 0,015 177 0,06 0,028 167 0,25 0,077 173 0,1 0,054 172 0,1 0,647 North Korea 178 0,01 0,007 175 0,09 0,011 178 0,03 0,027 159 0,31 0,08 164 0,15 0,036 179 0,03 0,641Eritrea 179 0,01 0,004 177 0,07 0,003 179 0,02 0,017 139 0,39 0,098 179 0,03 0,028 171 0,1 0,629
47COUNTRY SCORES

V-Dem Methodology: Aggregating Expert AssessmentsAuthor: Kyle L. Marquardt
V -DEM USES INNOVATIVE METHODS TO aggregate expert judgments and thereby produce estimates of important
concepts. We use experts because many key features of democ-racy are not directly observable. For example, it is easy to observe whether or not a legislature has the legal right to investigate an executive. However, assessing the extent to which the legislature actually does so requires evaluation by experts with extensive conceptual and case knowledge.
V-Dem typically gathers data from five experts per country-year observation, using a pool of over 3,700 country experts who provide judgment on different concepts and cases. Experts hail from almost every country in the world, allowing us to leverage diverse opinions.
Despite their clear value, expert-coded data pose multiple prob-lems. Rating concepts requires judgment, which varies across experts and cases; it may also vary systematically across groups of experts. We address these concerns by aggregating expert-coded data with a measurement model, allowing us to account for uncertainty about estimates and potential biases.
The logic of the V-Dem measurement model is that an unob-served concept exists (e.g. a certain level of academic freedom and freedom of cultural expression) but we only see imperfect manifestations of this concept in the form of the ordinal categories which experts use to code their judgments. Our model converts these manifest items (expert ratings) to a single continuous latent scale and thereby estimates values of the concept.
In the process, the model algorithmically estimates both the degree to which an expert is reliable relative to other experts, as well as the degree to which their perception of the response scale differs from other experts. Similarly, we use patterns of overlap-ping coding – both in the form of experts who code multiple countries and experts who code hypothetical cases (anchoring vignettes) – to estimate the degree to which differences in scale perception are systematic across experts who code different sets of cases. Given the iterative nature of the estimation process, these estimates of reliability and scale perception weight an expert's contribution to the estimation of the unobserved concept.
In the resulting V-Dem dataset, we present users with a best estimate of the value for an observation (the point estimate), as well as an uncertainty estimate (the credible regions, a Bayesian corollary of confidence intervals). More precisely, the output of the measurement model is an interval-level point estimate of the latent trait that typically varies from –5 to 5, and its associ-ated measurement error. These estimates are the best for use in statistical analysis.
However, the interval-level estimates are difficult for some users to interpret substantively. We therefore also provide interval-level point estimates that we have linearly transformed back to the coding scale that experts originally used to code each case. These estimates typically run from 0 to 4; users can refer to the V-Dem codebook to substantively interpret them. Finally, we provide ordinal versions of each variable for applications in which users require ordered categorical values. Each of the latter two data versions are also accompanied by credible regions.
VERSIONS OF THE V-DEM INDICATORS
Suffix Scale Description Recommended useNone Interval V-Dem measurement model
estimatesRegression analysis
_osp Interval Linearized transformation of the model estimates on the original scale
Substantive interpretation of graphs and data
_ord Ordinal Most likely ordinal value of model estimates on the original scale
Substantive interpretation of graphs and data
_codelow / _codehigh
Interval One standard deviation above (_codehigh) and below (_codelow) a point estimate
Evaluating differences over time within units
_sd Interval Standard deviation of the interval estimate
Creating confidence intervals based on user needs
The result of this process is a set of versions of indicators of democratic institutions and concepts, which allow academics and policymakers alike to understand the different features of a polity. The box summarizes the output with which we provide users.
KEY TERMS
Point Estimate: A best estimate of a concept’s value.
Confidence Intervals: Credible regions for which the upper and lower bounds represent a range of probable values for a point estimate. These bounds are based on the interval in which the measurement model places 68 percent of the probability mass for each score, which is generally approximately equivalent to the upper and lower bounds of one standard deviation from the median.
Significant Differences or Changes: When the upper and lower bounds of the confidence intervals for two point estimates do not overlap, we are confident that the difference between them is not a result of measure-ment error.
References
Marquardt, Kyle L. and Daniel Pemstein. 2018. IRT Models for Expert-Coded Panel Data. Political Analysis 26(4).
Pemstein, Daniel, et al. 2022. The V-Dem Measurement Model: Latent Variable Analysis for Cross-National and Cross-Temporal Expert-Coded Data. Varieties of Democracy Institute: Working Paper No. 21, 7th edition.
Pemstein, Daniel, Eitan Tzelgov and Yi-ting Wang. 2015. Evaluating and Improving Item Response Theory Models for Cross-National Expert Surveys. Varieties of Democracy Institute: Working Paper No. 1.
48 DEMOCRACY REPORT 2022

Nagaon, India, March 27, 2021. Security personnel stand guard as voters queue to cast their votes during Assam Assembly election, at a polling station in Batadrawa Constituency, Nagaon. Photo: Shutterstock.
49DEMOCRACY REPORT 2022

The Liberal Democracy Index The V-Dem Liberal Democracy Index (LDI) captures both liberal and electoral aspects of democracy based on the 71 indicators included in the Liberal Component Index (LCI) and the Electoral Democracy Index (EDI). The EDI reflects a relatively ambitious idea of electoral democracy where a number of institutional features
guarantee free and fair elections such as freedom of associa-tion and freedom of expression. The LCI goes even further and captures the limits placed on governments in terms of two key aspects: The protection of individual liberties, and the checks and balances between institutions.
FIGURE A1.2: EXPLANATION OF THE V-DEM LIBERAL DEMOCRACY INDEX
V-Dem Liberal Democracy Index
Liberal Component Index
Equality before the law and individual liberty index
20 indicators
Judicial constraints on the
executive index
5 indicators
Legislative constraints on the
executive index
4 indicators
Electoral Democracy Index
Suffrage
1 indicator
Elected officials
16 indicators
Clean elections
8 indicators
Freedom of association
6 indicators
Freedom of expression and
alternative sources of information
9 indicators
FIGURE A1.1: THE V-DEM LIBERAL DEMOCRACY INDEX: WORLD AND REGIONAL AVERAGES, 1901/1961–2021
V-Dem Indices
0.0
0.1
0.2
0.3
0.4
0.5
0.6
0.7 0.7
0.8
0.9
1.0
1901 1921 1941 1961 1981 2001 2021
Average Value
1961 1971 1981 1991 2001 2011 2021
Average Value, Population Weighted
WorldAsia and the Paci�cEastern Europe and Central AsiaLatin America and the CaribbeanSub-Saharan AfricaThe Middle East and North AfricaWestern Europe and North America
0.0
0.1
0.2
0.3
0.4
0.5
0.6
0.8
0.9
1.0
50 DEMOCRACY REPORT 2022

The Electoral Democracy Index For several decades, scholars and practitioners alike depicted democracy in the world as though the extant measures really captured what is meant by the concept “electoral democracy”. Yet, we have all known that they did not. V-Dem is the first system-atic effort to measure the de facto existence of all the institutions in Robert Dahl’s famous articulation of “polyarchy” as electoral
democracy. The V-Dem Electoral Democracy Index (EDI) captures not only the extent to which regimes hold clean, free and fair elections, but also their actual freedom of expression, alternative sources of information and association, as well as male and female suffrage and the degree to which government policy is vested in elected political officials.
Freedom of association index
Party ban
Barriers to parties
Opposition parties autonomy
Elections multiparty
CSO entry and exit
CSO repression
Share of population with suffrage
Percent of population with suffrage
Elected officials index
Clean elections index
EMB autonomy
EMB capacity
Election voter registry
Election vote buying
Election other voting irregularities
Election government intimidation
Election other electoral violence
Election free and fair
Expanded freedom of expression index
Government censorship effort – Media
Government censorship effort – Internet
Harassment of journalists
Media self-censorship
Media bias
Print/broadcast media critical
Print/broadcast media perspectives
Freedom of discussion for men
Freedom of discussion for women
Freedom of academic and cultural expression
FIGURE A2.2: THE V-DEM ELECTORAL DEMOCRACY INDEX (EDI)
FIGURE A2.1: THE V-DEM ELECTORAL DEMOCRACY INDEX: WORLD AND REGIONAL AVERAGES, 1901/1961–2021
Average Value Average Value, Population Weighted
WorldAsia and the Paci�cEastern Europe and Central AsiaLatin America and the CaribbeanSub-Saharan AfricaThe Middle East and North AfricaWestern Europe and North America
0.0
0.1
0.2
0.3
0.4
0.5
0.6
0.7 0.7
0.8
0.9
1.0
1901 1921 1941 1961 1981 2001 2021 1961 1971 1981 1991 2001 2011 2021
0.0
0.1
0.2
0.3
0.4
0.5
0.6
0.8
0.9
1.0
51V-DEM INDICES
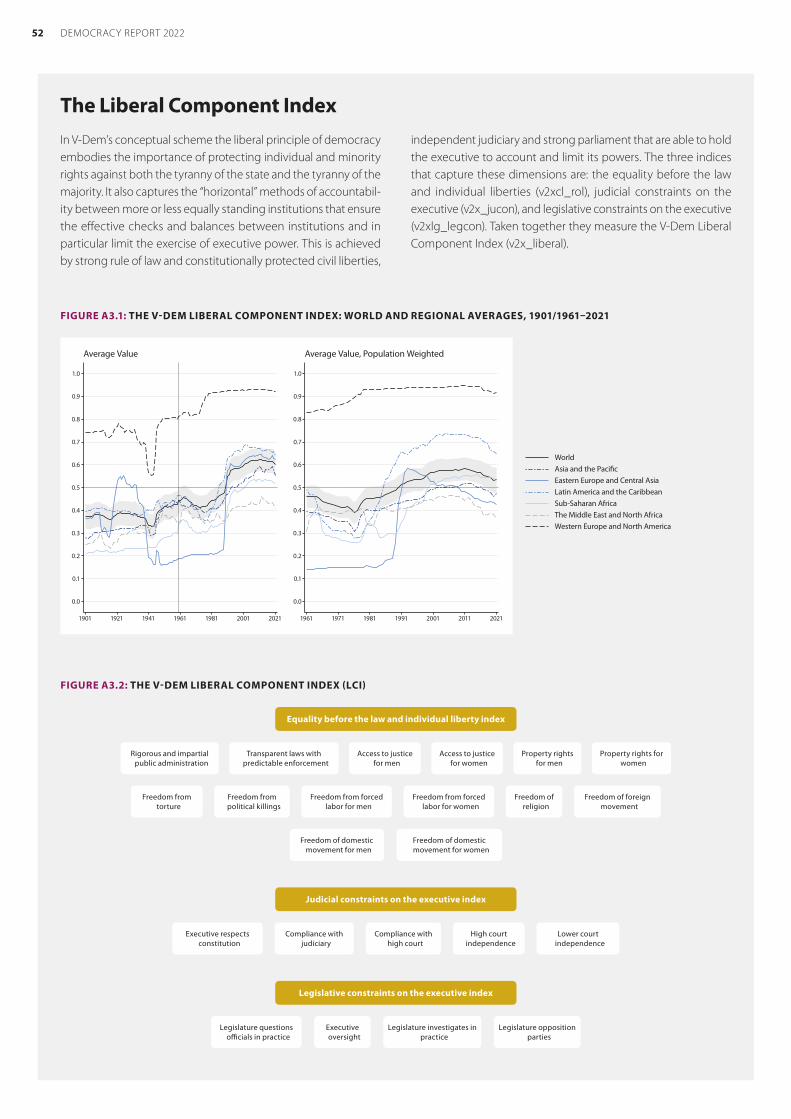
The Liberal Component Index
FIGURE A3.2: THE V-DEM LIBERAL COMPONENT INDEX (LCI)
Equality before the law and individual liberty index
Rigorous and impartial public administration
Transparent laws with predictable enforcement
Access to justice for men
Access to justice for women
Property rights for men
Property rights for women
Freedom from torture
Freedom from political killings
Freedom from forced labor for men
Freedom from forced labor for women
Freedom of religion
Freedom of foreign movement
Freedom of domestic movement for men
Freedom of domestic movement for women
Judicial constraints on the executive index
Executive respects constitution
Compliance with judiciary
Compliance with high court
High court independence
Lower court independence
Legislative constraints on the executive index
Legislature questions officials in practice
Executive oversight
Legislature investigates in practice
Legislature opposition parties
In V-Dem’s conceptual scheme the liberal principle of democracy embodies the importance of protecting individual and minority rights against both the tyranny of the state and the tyranny of the majority. It also captures the “horizontal” methods of accountabil-ity between more or less equally standing institutions that ensure the effective checks and balances between institutions and in particular limit the exercise of executive power. This is achieved by strong rule of law and constitutionally protected civil liberties,
independent judiciary and strong parliament that are able to hold the executive to account and limit its powers. The three indices that capture these dimensions are: the equality before the law and individual liberties (v2xcl_rol), judicial constraints on the executive (v2x_jucon), and legislative constraints on the executive (v2xlg_legcon). Taken together they measure the V-Dem Liberal Component Index (v2x_liberal).
FIGURE A3.1: THE V-DEM LIBERAL COMPONENT INDEX: WORLD AND REGIONAL AVERAGES, 1901/1961–2021
0.0
0.1
0.2
0.3
0.4
0.5
0.6
0.7 0.7
0.8
0.9
1.0
1901 1921 1941 1961 1981 2001 2021 1961 1971 1981 1991 2001 2011 2021
0.0
0.1
0.2
0.3
0.4
0.5
0.6
0.8
0.9
1.0
Average Value Average Value, Population Weighted
WorldAsia and the Paci�cEastern Europe and Central AsiaLatin America and the CaribbeanSub-Saharan AfricaThe Middle East and North AfricaWestern Europe and North America
52 DEMOCRACY REPORT 2022

The Egalitarian Component Index
FIGURE A4.2: THE V-DEM EGALITARIAN COMPONENT INDEX (ECI)
Equal protection index
Social class equality in respect for civil liberties
Social group equality in respect for civil liberties
Weaker civil liberties population
Equal distribution of resources index
Encompassingness Means-tested vs. universalistic welfare Health equalityEducational equality
Equal access index
Power distributed by gender
Power distributed by social group
Power distributed by socioeconomic position
The egalitarian principle of democracy measures to what extent all social groups enjoy equal capabilities to participate in the political arena. It relies on the idea that democracy is a system of rule “by the people” where citizens participate in various ways, such as making informed voting decisions, expressing opinions, demonstrating, running for office or influencing policy-making in
other ways. The egalitarian principle of democracy is fundamen-tally related to political participation, as systematic inequalities in the rights and resources of citizens of specific social groups limit capabilities to participate in the political and governing processes. Therefore, a more equal distribution of resources across groups results in political equality and hence democracy.
FIGURE A4.1: THE V-DEM EGALITARIAN COMPONENT INDEX: WORLD AND REGIONAL AVERAGES, 1901/1961–2021
0.0
0.1
0.2
0.3
0.4
0.5
0.6
0.7 0.7
0.8
0.9
1.0
1901 1921 1941 1961 1981 2001 2021 1961 1971 1981 1991 2001 2011 2021
0.0
0.1
0.2
0.3
0.4
0.5
0.6
0.8
0.9
1.0
Average Value Average Value, Population Weighted
WorldAsia and the Paci�cEastern Europe and Central AsiaLatin America and the CaribbeanSub-Saharan AfricaThe Middle East and North AfricaWestern Europe and North America
53V-DEM INDICES

The Participatory Component Index
FIGURE A5.2: THE V-DEM PARTICIPATORY COMPONENT INDEX (PCI)
Candidate selection – National / Local CSO consultation CSO participatory
environment CSO womens participation
Civil society participation index
Direct popular vote index Local government index
Local government elected
Local offices relative power
Local government exists
Regional government index
Regional government elected
Regional offices relative power
Regional government exists
The participatory principle of democracy emphasizes active partici pation by citizens in all political processes, electoral and non-electoral. This principle prefers direct rule by citizens as practicable. The V-Dem Participatory Component Index (PCI) takes into account four important aspects of citizen participation:
civil society organizations, mechanisms of direct democracy, and partici pation and representation through local and regional govern ments. Four different V-Dem indices capture these aspects and are the basis for the PCI.
FIGURE A5.1: THE V-DEM PARTICIPATORY COMPONENT INDEX: WORLD AND REGIONAL AVERAGES, 1901/1961–2021
0.0
0.1
0.2
0.3
0.4
0.5
0.6
0.7 0.7
0.8
0.9
1.0
1901 1921 1941 1961 1981 2001 2021 1961 1971 1981 1991 2001 2011 2021
0.0
0.1
0.2
0.3
0.4
0.5
0.6
0.8
0.9
1.0
Average Value Average Value, Population Weighted
WorldAsia and the Paci�cEastern Europe and Central AsiaLatin America and the CaribbeanSub-Saharan AfricaThe Middle East and North AfricaWestern Europe and North America
54 DEMOCRACY REPORT 2022

The Deliberative Component Index
FIGURE A6.2: THE V-DEM DELIBERATIVE COMPONENT INDEX (DCI)
Reasoned justification Common good Respect counterarguments Range of consultation Engaged society
Deliberative Component index
The V-Dem Deliberative Component Index (DCI) captures to what extent the deliberative principle of democracy is achieved. It assesses the process by which decisions are reached in a polity. A deliberative process is one in which public reasoning, focused on the common good, motivates political decisions – as contrasted with emotional appeals, solidary attachments, parochial interests
or coercion. According to this principle, democracy requires more than an aggregation of existing preferences. There should also be respectful dialogue at all levels – from preference formation to final decision – among informed and competent participants who are open to persuasion.
FIGURE A6.1: THE V-DEM DELIBERATIVE COMPONENT INDEX: WORLD AND REGIONAL AVERAGES, 1901/1961–2021
0.0
0.1
0.2
0.3
0.4
0.5
0.6
0.7 0.7
0.8
0.9
1.0
1901 1921 1941 1961 1981 2001 2021 1961 1971 1981 1991 2001 2011 2021
0.0
0.1
0.2
0.3
0.4
0.5
0.6
0.8
0.9
1.0
Average Value Average Value, Population Weighted
WorldAsia and the Paci�cEastern Europe and Central AsiaLatin America and the CaribbeanSub-Saharan AfricaThe Middle East and North AfricaWestern Europe and North America
55V-DEM INDICES

Publications from the V-Dem Team
Featured Publications2022Patterns of Democracy over Space and TimeVanessa A. Boese, Scott Gates, Carl Henrik Knutsen, Håvard Mokleiv Nygård, and Håvard Strand.2022 | Forthcoming at International Studies Quarterly.The authors disaggregate the concept of democracy and propose a multidimensional conceptualization of democracy. Three theoretically informed dimensions are featured: participation, electoral contestation, and constraints on the executive. The three dimensions constitute a cube covering all regime types, and the article places all countries since 1789 along these dimensions. The evolution of countries in this three-dimensional cube can be traced over time.
Episodes of Liberalization in Autocracies: A New Approach to Quantitatively Studying DemocratizationMatthew C. Wilson, Juraj Medzihorsky, Seraphine F. Maerz, Patrik Lindenfors, Amanda B. Edgell, Vanessa A. Boese, and Staffan I. Lindberg.2022 | Forthcoming in Political Science Research and MethodsIntroduces a new approach to the quantitative study of democratization, empirically identifies episodes of liberalization in autocracies since 1900, and offers a new classification of successful and different types of failed liberalization episodes.
Not All Elections Are Created Equal: Election Quality and Civil ConflictDaniela Donno, Kelly Morrison, and Burcu Savun. 2022 | Journal of Politics 84(1)This article shows how variation in electoral integrity shapes the opportunities and incentives for civil conflict. In an analysis of 134 non-OECD countries from 1950 to 2012, the results show that flawed presidential elections increase the risk of civil conflict onset.
Resistance to PopulismSato, Yuko, and Moisés Arce 2022 | Democratization #OpenAccessPopulist leaders in office often attempt to erode democracy to concentrate their power. However, using the V-Party dataset, the authors show that popular mobilization in defense of democracy increases in response to such anti-pluralistic attempts.
Why Democracies Develop and Decline
Edited by Michael Coppedge, Amanda B. Edgell,
Carl Henrik Knutsen and Staffan I. Lindberg
LongbottomT
homas Paine and the Idea of H
uman R
ights
Text
“Quote”Endorser, Affiliation
Cover image:
Why Democracies Develop and Decline. Michael Coppedge, Amanda B. Edgell, Carl Henrik Knutsen, and Staffan I. Lindberg (Eds.)2022 | Forthcoming Cambridge University PressWhy do some countries manage to escape autocratic rule and become democratic, whereas others remain trapped? And why do some democracies remain stable or improve their level of democracy while others “backslide” or even die? These are the big questions this book seeks to answer.
2021 Populism and COVID-19: How Populist Governments (Mis)Handle the PandemicMichael Bayerlein, Vanessa A. Boese, Scott Gates, Katrin Kamin, and Syed Mansoob Murshed. 2021 | Journal of Political Institutions and Political Economy 2(3) #OpenAccessThe article assesses how populist governments have handled the pandemic, theorizing that such governments introduce less far-reaching policy measures and lower the effort of citizens to counter the pandemic. Evidence is found that countries with populist governments had 8 percentage points higher excess mortality than countries with non-populist governments.
How Democracies Prevail: Democratic Resilience as a Two-Stage Process Vanessa A. Boese, Amanda B. Edgell, Sebastian Hellmeier, Seraphine F. Maerz, and Staffan I. Lindberg. 2021 | Democratization 28(5) #OpenAccessIntroduces a new conceptualization of democratic resilience as a two-stage process in which democracies can avoid decline altogether or avert democratic breakdown once autocratization has already begun. The authors find that democratic resilience has become weaker since the end of the cold war, and that once autocratization sets in, only one in five democracies manages to avert breakdown.
Waves of Autocratization and Democratization: A RejoinderVanessa A. Boese, Staffan I. Lindberg, and Anna Lührmann.2021 | Democratization 28(6) #OpenAccessAdding to the debate on what a wave of democratization and autocratization is, the authors argue that is urgent to understand how the current wave of autocratization shapes autocratization processes, and that waves need to be clearly defined and measured, for example with the Episodes of Regime Transformation dataset.
The Institutional Order of LiberalizationAmanda B. Edgell, Vanessa A. Boese, Seraphine F. Maerz, Patrik Lindenfors, and Staffan I. Lindberg.2021 | British Journal of Political Science #OpenAccessExamines the institutional order of democratic reforms among 371 episodes of liberalization in autocracies between 1900 and 2019, finding that the patterns of liberalization are similar across failed and successful cases of democratization. However, successful democratization is characterized by reforms to electoral administration occurring earlier in the liberalization process.
State of the World 2020: Autocratization Turns ViralSebastian Hellmeier, Rowan Cole, Sandra Grahn, Palina Kolvani, Jean Lachapelle, Anna Lührmann, Seraphine F. Maerz, Shreeya Pillai, and Staffan I. Lindberg. 2021 | Democratization 28(6) #OpenAccessAnalyses the state of democracy in the world in 2020, demonstrating that the third wave of autocratization is accelerating and deepening. It also examines the effects of the Covid-19 pandemic on democracy worldwide.
A Framework for Understanding Regime Transformation: Introducing the ERT DatasetSeraphine F. Maerz, Amanda B. Edgell, Matthew C. Wilson, Sebastian Hellmeier, and Staffan I. Lindberg. 2021 | V-Dem Working Paper 113Introduces a new dataset on all democratic and autocratic episodes of regime transformation (ERT) from 1900 to 2019, allowing for comprehensive analysis and comparison of regime transformation and regime transition.
56 DEMOCRACY REPORT 2022

Publications from the V-Dem Team
Additional publications2022
John Gerring, Haakon Gjerlow, and Carl Henrik Knutsen. 2022. Regimes and Industrialization. World Development 152.
2021David Altman and Clemente T. Sanchez. 2021. Citizens at the Polls Direct Democracy in the World, 2020. Taiwan Journal of Democracy 17(2).
Nancy Arrington, Lean Bass, Brian Delgado, Adam Glynn, Jeffrey Staton, and Staffan I. Lindberg. 2021. Constitutional Reform and the Gender Diversification of Peak Courts. American Political Science Review 115(3).
Nils Dupont, Berker Kavasoglu, Anna Lührmann, and Ora John Reuter. 2021. A Global Perspective on Party Organizations. Validating the Varieties of Party Identity and Organization Dataset (V-Party). Electoral Studies 75.
Adea Gafuri. 2021. Can Democracy Aid Improve Democracy? The European Union’s Democracy Assistance 2002–2018. Democratization.
Sandra Grahn and Anna Lührmann. 2021. Good Seed Makes a Good Crop? The Relationship between Civil Society and Post-Independence Democracy Levels. Journal of Civil Society 17(3-4).
Sebastian Hellmeier, Rowan Cole, Sandra Grahn, Palina Kolvani, Jean Lachapelle, Anna Lührmann, Seraphine F. Maerz, Shreeya Pillai, and Staffan I. Lindberg. 2021. State of the World 2020: Autocratization Turns Viral. Democratization 28(6).
Yuko Kasuya and Kota Mori. 2021. Re-examining Thresholds of Continuous Democracy Measures. Contemporary Politics.
Berker Kavasoglu. 2021. Opposition Party Organizational Features, Ideological Orientations, and Elite Co-optation in Electoral Autocracies. Democratization.
Eda Keremoglu, Sebastian Hellmeier, and Nils B. Weidmann. 2021. Thin-Skinned Leaders: Regime Legitimation, Protest Issues, and Repression in Autocracies. Political Science Research and Methods 10(1).
Carl Henrik Knutsen. 2021. A Business Case for Democracy: Regime Type, Growth, and Growth Volatility. Democratization 28(8).
Melis G. Laebens and Anna Lührmann. 2021. What Halts Democratic Erosion? The Changing Role of Accountability. Democratization 28(5).
Anna Lührmann. 2021. Disrupting the Autocratization Sequence: Towards Democratic Resilience. Democratization 28(5).
Kyle L. Marquardt. 2021. Language, Ethnicity, and Separatism: Survey Results from Two Post-Soviet Regions. British Journal of Political Science.
Kyle L. Marquardt and Daniel Pemstein. 2021. Estimating Latent Traits from Expert Surveys: An Analysis of Sensitivity to Data-Generating Process. Political Science Research and Methods.
Kelly McMann, Daniel Pemstein, Brigitte Seim, Jan Teorell, and Staffan Lindberg. 2021. Assessing Data Quality: An Approach and an Application. Political Analysis.
Wolfgang Merkel and Anna Lührmann. 2021. Resilience of Democracies: Responses to Illiberal and Authoritarian Challenges. Democratization 28(5).
Marcus Tannenberg. 2021. The Autocratic Bias: Self-Censorship of Regime Support. Democratization.
Johannes Vuellers and Sebastian Hellmeier. 2021. Does Counter-Mobilization Contain Right-Wing Populist Movements? Evidence from Germany. European Journal of Political Research.
V-Dem Working Papers and Reports FEATURED PUBLICATIONS
Case for Democracy: Conference ReportNazifa Alizada, Martin Lundstedt, Kelly Morrison, Yuko Sato, Vanessa A. Boese, and Staffan I. Lindberg. 2022 | University of Gothenburg: V-Dem Institute From November 30th to December 1st, 2021, 26 scholars and over 400 policymakers and practitioners participated in a hybrid onsite/virtual conference held in Brussels on the Case for Democracy. Scholars presented scientific evidence on the dividends of democracy across six broad areas. This report summarizes these findings and discussions.
V-DEM WORKING PAPERS
2022Vanessa A. Boese and Markus Eberhardt. 2022. Which Institutions Rule? Unbundling the Democracy-Growth Nexus. V-Dem Working Paper 131.
Vanessa A. Boese and Matthew Wilson. 2022. A Short History of Contestation and Participation. V-Dem Working Paper 130.
Sebastian Hellmeier and Michael Bernhard. 2022. Mass Mobilization and Regime Change. Evidence From a New Measure of Mobilization for Democracy and Autocracy From 1900 to 2020. V-Dem Working Paper 128.
Carl Henrik Knutsen and Palina Kolvani. 2022. Fighting the Disease or Manipulating the Data? Democracy, State Capacity, and the COVID-19 Pandemic. V-Dem Working Paper,127.
2021Kelly M. McMann and Daniel Tisch. 2021. Democratic Regimes and Epidemic Deaths. V-Dem Working Paper 126.
Maria C. Lo Bue, Kunal Sen, and Staffan I. Lindberg. 2021. Clientelism, Public Goods Provision, and Governance. V-Dem Working Paper 125.
Jørgen Møller and Svend-Erik Skaaning. 2021. Varieties of Measurement: A Comparative Assessment of Relatively New Democracy Ratings based on Original Data. V-Dem Working Paper 123.
Jean Lachapelle, Sebastian Hellmeier, and Anna Lührmann. 2021. How to Build Democracy after Authoritarian Breakdown: Insights from a Mixed Methods Approach. V-Dem Working Paper 122.
Michael Coppedge, Benjamin Denison, Paul Friesen, Lucia Tiscornia, and Yang Xu. 2021. International Influence: The Hidden Dimension. V-Dem Working Paper 119.
Ora John Reuter. 2021. Why Do Ruling Parties Extend Authoritarian Rule? Examining the Role of Elite Institutions and Mass Organization. V-Dem Working Paper 118.
Marina Povitkina and Sverker C. Jagers. 2021. Environmental Commitments in Different Types of Democracies: The Role of Liberal, Social-liberal, and Deliberative Politics. V-Dem Working Paper 117.
Anna Lührmann, Juraj Medzihorsky, and Staffan I. Lindberg. 2021. Walking the Talk: How to Identify Anti-Pluralist Parties. V-Dem Working Paper 116.
Kyle M. Marquardt. 2021. Measuring Politically-Relevant Identity, with and without Groups. V-Dem Working Paper 115 .
Vanessa A. Boese and Marcus Eberhardt. 2021. Democracy Doesn’t Always Happen Over Night: Regime Change in Stages and Economic Growth. V-Dem Working Paper 114.
Seraphine F. Maerz, Carsten Schneider. 2021. Public Discourse and Autocratization: Infringing on Autonomy, Sabotaging Accountability. V-Dem Working Paper 112.
57DEMOCRACY REPORT 2022

V-DEM POLICY BRIEFS
2022Varieties of Democracy Institute. 2022. Case for Democracy: Does Democracy Have Dividends for Education? University of Gothenburg: V-Dem Policy Brief 35.
Varieties of Democracy Institute. 2022. Case for Democracy: Democracies Produce More Transparent and Higher-Quality Data. University of Gothenburg: V-Dem Policy Brief 34.
Varieties of Democracy Institute. 2022. Case for Democracy: Does Democracy Improve Public Goods Provision? University of Gothenburg: V-Dem Policy Brief 33.
2021Palina Kolvani, Martin Lundstedt, Amanda B. Edgell, Jean Lachapelle. 2021. Pandemic Backsliding: A Year of Violations and Advances in Response to Covid-19. University of Gothenburg: V-Dem Policy Brief 32.
Varieties of Democracy Institute. 2021. Case for Democracy: Do Democracies Perform Better Combatting Climate Change? University of Gothenburg: V-Dem Policy Brief 31.
Varieties of Democracy Institute. 2021. Case for Democracy: Does Democracy Bring International and Domestic Peace and Security? University of Gothenburg: V-Dem Policy Brief 30.
Varieties of Democracy Institute. 2021. Case for Democracy: Does Democracy Increase Global Health? University of Gothenburg: V-Dem Policy Brief 29.
Varieties of Democracy Institute. 2021. Case for Democracy: Are Democracies Better for Social Protection of the Poor, Gender Equality, and Social Cohesion? University of Gothenburg: V-Dem Policy Brief 28.
Varieties of Democracy Institute. 2021. Case for Democracy: Does Democracy Cause Economic Growth, Stability, and Work for the Poor? University of Gothenburg: V-Dem Policy Brief 27.
V-DEM COUNTRY BRIEFS
2022Varieties of Democracy Institute. 2022. Country Brief: Uganda. University of Gothenburg: V-Dem Country Brief 11.
V-DEM POLICY BRIEF | 1
No. #28, 11 May 2021
1 1% increase in fiscal capacity increases social protection spending by 0.387%, both as share of GDP.
Democratization Increases Social ProtectionsA large body of rigorous scientific studies demonstrate that democratic
institutions have a positive effect on increasing public expenditures
on social protection policies, in favor of poor and vulnerable groups in
society.
Strong, robust evidence demonstrates that democratization, along-
side fiscal capacity, leads to a substantial increase in spending on social
protection. Fiscal capacity1 alone has only minor positive effects on the
expansion of social protection policies and increased spending that
protect the poor and vulnerable. Yet, transitioning from a closed
dictatorship to a full democracy leads on average to more than a
100% increase in spending on social protection policies.
FIG 1. POSITIVE EFFEC T OF DEMOCR AC Y ON SPENDING ON SOCIAL PRO -TEC TION (COURTESY OF M. MURSHED AND B. BERGOUIGI, BASED ON RE-SULTS FROM MURSHED et al).
This dividend of democracy is of great policy significance since the
positive impact of social welfare programs in areas such as poverty and
inequality reduction, human development, and economic growth is
evidenced by a large body of scientific literature (Murshed et al. 2020).
Evidence also shows that the strong relationship between democratiza-
tion and increasing social protection is due to the vertical accountability
mechanisms inherent in well-developed democracies. “Pressure from
below” in strong democracies creates strong incentives for elected-
politicians to deliver public services (Acemoglu & Robinson 2006; Sen
2001). The democracy-support community should be aware that
mediocre levels of democracy are not enough.
Evidence demonstrates that democracy also helps to improve the provi-
sion of public goods such as electricity. For such goods, democracy
only delivers when corruption in the government is not widespread.
A country needs to be below 0.7 on V-Dem’s 0-1 corruption scale in
order for democracy to deliver. (Boräng et al. 2021) For illustration, 124
countries in the world were below that threshold in 2022. Countries like
Bolivia, Kenya, Philippines, and Ukraine are just around the threshold
while Ghana, Mexico, Sri Lanka, and Romania are clearly below.
Gender Equality and Social CohesionEvidence from recent empirical studies demonstrates that gender
equality is much more likely to be the norm in democratic countries.
Flawed democracy leads to almost 33% lower levels of egalitarian
gender attitudes compared to fully democratic countries, and
hybrid as well as authoritarian regimes to over 60% lower levels
(Zagrebina 2020).
The driving factor for egalitarian gender attitudes seems to be higher
levels of high-quality education. Importantly, the positive effect of
education is conditional on the strength of the democracy. Education
is much less likely to improve gender-equality attitudes in non-demo-
cratic countries (Zagrebina 2020, Shu & Meagher 2018), with obvious
policy implications.
More broadly, democracy facilitates social cohesion, which holds socie-
ties together. This is because democratization also changes the social
organization of a society and its relationship with the state (Zagrebina
The Case for Democracy:The Case for Democracy:Are Democracies Better for Social Protection of the Poor, Are Democracies Better for Social Protection of the Poor,
Gender Equality, and Social Cohesion?Gender Equality, and Social Cohesion?
Scientific Evidence Shows:
• Full democracies spend 100% more than closed dictatorships on social protection policies benefitting the poor and vulnerable.
• The degree of democracy is more important than governance (fiscal capacity) for increasing spending on social protection policies.
• Democracy is a significant factor in achieving higher levels of egalitarian gender attitudes.
• Democracy facilitates social cohesion and makes cooperation for the common good more likely.
I N S T I T U T E
POLICY BRIEF
V-DEM POLICY BRIEF | 1
No. #27, 11 May 2021
Democracy Causes GrowthRecent, state-of-the-art scientific studies provide clear evidence:
democracy causes growth (Acemoglu et al. 2019). Knutsen (2020)
also (2020) presents evidence that average GDP/c growth has been
higher in democracies than in autocracies since 1800 until today,
with the exception of the turbulent period of 1900-1939. For instance,
mean GDP/c growth was twice as high in democracies compared to
autocracies between 1970 and 1989.
FIG. 1. MEAN GROW TH R ATES FOR DEMOCR ACIES AND AUTOCR ACIES 1800S-2000S, DEMOCR ACIES IN RED (KNUTSEN 2020).
An influential “study-of-many-studies” demonstrates that democracy
also has a clear and robust indirect positive effect on growth through
increasing human capital, regime stability, and economic freedom
(Doucouliagos & Ulubaşoğlu 2008).
Democratization Causes Higher GrowthDemocratization is also evidently good for economic growth. Coun-
tries that democratized increased their GDP/c by about 20% in
the 25 years following democratization – compared to countries
that remained autocracies (Acemoglu et al. 2019). For instance, Lithuania
democratized after gaining independence in 1990 and nearly doubled
its GDP/c by 2018. Neighboring Belarus on the other hand,
which remained an autocracy, only increased its GDP/c by 63% in the
same period.
FIG. 2. EFFEC T OF DEMOCR ATIZATION ON GDP/C[LOG] (ACEMOGLU et al 2019).
Yet, the immediate effect of democratization might be less noticeable
due to the turbulence of introducing new institutions. One should,
therefore, expect it to take a few years before the dividends of democ-
racy kick in.
Finally, the positive effect on growth increases over time. For
example, having a democratic system in place for seven years or more
increases GDP/c growth by about one extra percentage point per year
compared to the early years after democratization, and to countries that
did not democratize (Papaioannou & Siourounis 2008).
The argument – using a few cases such as China, Rwanda, and Singa-
pore – that autocracies are better at development, is incorrect. The
most rigorous available scientific evidence demonstrates that autocra-
cies does not perform better than democracies in terms of economic
growth. For the vast majority of countries, democracy leads to greater
economic growth.
The Case for Democracy:The Case for Democracy:Does Democracy Cause Economic Growth, Does Democracy Cause Economic Growth,
Stability, and Work for the Poor?Stability, and Work for the Poor?
Scientific Evidence Shows:
• Economic growth is higher in democracies than in autocracies.
• Democratization leads to better economic development.
• Democracy acts as a safety net for the economy – Democracies have fewer and less severe financial crises.
• Democracy provides mechanisms for more equitable growth that reduces poverty and empowers marginalized individuals.
I N S T I T U T E
POLICY BRIEF
Publications, cont.
V-DEM POLICY BRIEF | 1
No. #31, 11 May 2021
Democracy is Good for Climate Ambitions Robust empirical evidence shows that democracy is critical to combating
climate change. Democracies consistently perform better than autocra-
cies when it comes to committing to policy on climate change mitiga-
tion. Moving from the lowest levels of democracy (e.g., China) to
the highest (e.g., Canada) equals an increase in policy commit-
ments to climate change mitigation by 19% (Bättig & Bernauer 2009).
The effect is similar regarding signing of multilateral climate agreements
(Neumayer 2002).
FIG 1. EMISSIONS DEMOCR ACIES AND AUTOCR ACIES (V-DEM DATA AND OUR WORLD IN DATA)
A 10% increase on the V-Dem democracy index equals a 3% increase in
the level of ambition of the degree target under the Paris Agreement.
Moving from a fully authoritarian regime to a full democracy there-
fore generates a large increase in ambition, equal to almost -1.6°C
(Tørstad et al. 2020). This has major consequences for global climate
change (see Fig 1.). Annual risk of civil conflict reduces substantially as
female political empowerment increases.
In addition, evidence demonstrates that more egalitarian democracies
have higher commitments toward combatting climate change than
other democratic types (Povitkina & Jagers 2021).
Democracies Are Better at Taking ActionAmbitions produce outcomes. Ample evidence shows that each new
climate policy enacted by governments on average reduces CO2 emis-
sions by 0.79% over the first three years and 1.79% after that. In 2016, the
reduction in global CO2 emissions due to additional climate policies was
larger than the total US yearly emissions. The cumulative CO2 emission
reductions related to climate policies between 1999 and 2016 amount to
one year’s worth of global CO2 emissions (Eskander & Fankhauser 2020).
Evidence also demonstrates that democracies clearly perform better
than autocracies in terms of domestic environment. Air quality in cities
is found to improve by 0.14% with each 1% increase on a democ-
racy index (Bernauer & Koubi 2009). Data shows that democracy also
led to the improvement of the marine environment in coastal countries
in Sub-Saharan Africa (Sjöstedt & Jagers 2014).
Civil Society Freedom Is KeyDemocracies provide more freedom for non-governmental organiza-
tions (NGOs) that can educate citizens about climate problems, and
exert pressure on governments to take action.
FIG 2. CO2 EMISSIONS/C, COUNTRIES ON THE LOWER AND UPPER HALF OF THREE INDICES ENABLING NGOS (V-DEM, OUR WORLD IN DATA).
The Case for Democracy:The Case for Democracy:Do Democracies Perform Better Combatting Do Democracies Perform Better Combatting
Climate Change?Climate Change?
Scientific Evidence Shows:
• Democracy is critical for achieving SDG 13 “Climate Action”.
• Democracies produce more ambitious climate policies – the difference between closed autocracies and democratic equals a difference in the Paris Agreement reduction policy targets of 1.6°C.
• Each new climate policy reduces CO2 emissions by 1.79% within three years .
• Civil liberties empower environmental NGOs. A 1% increase in civil liberties generates a 0.05% reduction in national CO2 emissions.
I N S T I T U T E
POLICY BRIEF
V-DEM POLICY BRIEF | 1
No. #33, January 2022
More Safe Water, Immunization, Electricity, and Social Protection for the PoorA large body of scientific research demonstrates that democratic elec-
tions induce governments to provide public goods. Already 20 years
ago, Lake and Baum (2001) established that moving from the lowest to
highest levels of democracy is associated with 23% more of the popu-
lation having access to safe water and 35% more of the population
younger than age 1 being immunized against DPT (Diphtheria, Pertussis,
and Tetanus) . A recent set of studies such as Boräng et al. (2016), have
produced evidence that when corruption is low to moderate, moving
from the lowest to the highest levels of democracy results in a 20-40%
increase in electricity access/ consumption.
Democratization is also innstrumental in bringing acces to public goods
for the poor and marginalized. Solid evidence now demonstrates that
transitioning from a closed dictatorship to a full democracy leads, on
average, to more than a 100% increase in social protection spending
(Murshed et al. 2020). Thus, democracies also provide public goods to
more people by reducing inequality.
Hard scientific evidence supports the basic idea of why democracy is
better for the people than autocracy: in order to secure support from
the majority, governments are forced to fulfill policies that increase the
provision of public goods (Bueno de Mesquita et al. 2001). Therefore,
well-functioning vertical accountability mechanisms induce politicians
to provide public goods.
More and Free Digital Communication A growing number of scientific studies demonstrates that democra-
cies also provide much greater internet access for their citizens as well
as a freer environment for digital communication. These public goods
are increasingly critical to citizens' communication, access to informa-
tion, as well as to use government services. A study published by Science
Weidmann et al.(2016) for example, demonstrate that Internet penetra-
tion increases at a much higher rates in democracies than autocracies
(Figure 1). Already in 2012 democracies afforded their citizens on average
a 300% higher rates in democracies.
FIGURE 1: INTERNET ACCESS R ATES IN DEMOCR ACIES AND NON - DEMOC-
R ACIES (WEIDMANN ET AL . 2016)
Autocratic governments have good reasons to limit access to this public
goods. As King et al. (2013) show, autocrats censor content. Keremoglu
and Weidmann (2020) bring evidence on how autocrats use thech-
nology to contain those challenging their rule. With their rigorous
analysis, Lutscher et al. (2020) also demonstrate how frequently authori-
tarian government uses interference in online traffic, such as cyberat-
tacks and temporary shutdowns.
Democracy Mitigates CorruptionA growing body of scientific studies now demonstrates that democrati-
zation mitigates corruption. For example, both Kolstad and Wiig (2016)
and Pellegata (2013) show that being a democracy is robustly linked to
lower rates of corruption.
In a rigorous study using the most comprehend-sive empirical data
to-date, McMann et al. (2020) provide unanimous evidence of a solid
curvilinear relationship between corruption and democracy (Figure 2).
The Case for Democracy:The Case for Democracy:
Does Democracy Improve Public Goods Provision?
Scientific evidence shows that:
• Democracies with vibrant vertical accountability provide 23% more safe water access, 35% more immunization to young children, and up to 40% more electricity access, than autocracies.
• Democracy provides on average citizens with an internet connection rate more than 300% compared to autocracies.
• Democracy with strong vertical accountability mechanisms diminishes corruption.
POLICY BRIEF
V-DEM POLICY BRIEF | 1
No. #35, January 2022
1 Calculated using education spending data from the OECD: https://data.oecd.org/eduresource/education-spending.htm
Democracy Increases Education A recent body of scientific studies provides robust evidence that democ-
racy leads to higher enrollment in education. For example, Acemoglu et
al. (2015) demonstrate in an comprehensive empirical study that democ-
racy increases secondary school enrollment by almost 70% over autoc-
racies in the long run. Increasing enrollement in education is integral to
achieving SDG#4.
Dahlum & Knutsen (2017) comprehensive analyses across a global sample
of countries demonstrates that a country moving from the least to most
democratic on average increases education by 1.3 years of schooling
(Dahlum & Knutsen 2017). Harding & Stavasage (2014) present strong
evidence of the same pattern in Africa’s low- and lower-middle income
countries. They also show becoming a democracy means a country is
likely to abolish primary education school fees which reduces inequali-
ties in acces to education, another critical target outlined in SDG#4.
Recent studies such as the ones mentioned above, as well as Lake &
Baum's (2001) analysis shows that when a country democratizes from a
full autocracy to a full democracy, the ratio of enrolled students within
a cohort increases by five, as compared to the average annual increase
of under 1 student.
Democracies Spend More on Education Another large body of evidence from scientific research shows tangible
benefits of democracy on education spending. For example, Ansell’s
(2008) rigorous global analysis shows that moving from an autocracy to
a democracy corresponds to an increase of up to 30% in total education
expenditure as share of GDP (Ansell 2008). The study also demonstrates
that democracies redistribute to less educated children by shifting
spending from tertiary to primary education.
Similarly, Brown and Hunter (2004) demonstrate that the difference in
spending on primary education between the least and most democratic
countries in Latin America is six percentage points, or a sizeable 18
dollars per capita.
Stasavage (2005) provides evidence of an equally consequential effect
observed in Africa on the the critical role vertical accountability plays
on education. In this case, the introduction of real multiparty elections
leads to a large increase in education spending, equivalent to adding
resources corresponding to 1.1% GDP (Stasavage 2005)
This positive effect of vertical accountability is even more amplified
when electoral competition is high. Hecock's study (2006) attests that
higher electoral competition consistently increases spending on educa-
tion. For instance, adding one more party to the legislature equals an
increase of between 126 and 173 Mexican pesos per student in primary
education, or about 1 % of total expenditure per student1, between
1999 and 2004.
Competitiveness is thus beneficial, and even in less competitive settings
elections have been found to positively impact enrollment and literacy
(Harding & Stasavage 2014, Miller 2015; Harding 2020).
FIGURE 1. AVER AGE YEARS OF EDUCATION IN AUTOCR ACIES AND DE-MOCR ACIES
Note: Education estimates as average years of education among citizens older than 15 (Clio Infra 2018). Democracy and autocracy estimated using V-Dem’s Regimes of the World measure (Coppedge et al. 2021).
The Case for Democracy:The Case for Democracy:
Does Democracy Have Dividends for Education?
Scientific evidence shows:
• Democracy leads to more education and is thus critical to achieving SDG#4 as it can increase secondary education enrollment by almost 70%.
• Democratization leads to countries spending up to 30% more on education. These dividends primarily benefit low- and middle-income households and rural residents.
• Effect of democracy on education quality is less consistent.
POLICY BRIEF
V-DEM POLICY BRIEF | 1
No. #33, January 2022
More Safe Water, Immunization, Electricity, and Social Protection for the PoorA large body of scientific research demonstrates that democratic elec-
tions induce governments to provide public goods. Already 20 years
ago, Lake and Baum (2001) established that moving from the lowest to
highest levels of democracy is associated with 23% more of the popu-
lation having access to safe water and 35% more of the population
younger than age 1 being immunized against DPT (Diphtheria, Pertussis,
and Tetanus) . A recent set of studies such as Boräng et al. (2016), have
produced evidence that when corruption is low to moderate, moving
from the lowest to the highest levels of democracy results in a 20-40%
increase in electricity access/ consumption.
Democratization is also innstrumental in bringing acces to public goods
for the poor and marginalized. Solid evidence now demonstrates that
transitioning from a closed dictatorship to a full democracy leads, on
average, to more than a 100% increase in social protection spending
(Murshed et al. 2020). Thus, democracies also provide public goods to
more people by reducing inequality.
Hard scientific evidence supports the basic idea of why democracy is
better for the people than autocracy: in order to secure support from
the majority, governments are forced to fulfill policies that increase the
provision of public goods (Bueno de Mesquita et al. 2001). Therefore,
well-functioning vertical accountability mechanisms induce politicians
to provide public goods.
More and Free Digital Communication A growing number of scientific studies demonstrates that democra-
cies also provide much greater internet access for their citizens as well
as a freer environment for digital communication. These public goods
are increasingly critical to citizens' communication, access to informa-
tion, as well as to use government services. A study published by Science
Weidmann et al.(2016) for example, demonstrate that Internet penetra-
tion increases at a much higher rates in democracies than autocracies
(Figure 1). Already in 2012 democracies afforded their citizens on average
a 300% higher rates in democracies.
FIGURE 1: INTERNET ACCESS R ATES IN DEMOCR ACIES AND NON - DEMOC-
R ACIES (WEIDMANN ET AL . 2016)
Autocratic governments have good reasons to limit access to this public
goods. As King et al. (2013) show, autocrats censor content. Keremoglu
and Weidmann (2020) bring evidence on how autocrats use thech-
nology to contain those challenging their rule. With their rigorous
analysis, Lutscher et al. (2020) also demonstrate how frequently authori-
tarian government uses interference in online traffic, such as cyberat-
tacks and temporary shutdowns.
Democracy Mitigates CorruptionA growing body of scientific studies now demonstrates that democrati-
zation mitigates corruption. For example, both Kolstad and Wiig (2016)
and Pellegata (2013) show that being a democracy is robustly linked to
lower rates of corruption.
In a rigorous study using the most comprehend-sive empirical data
to-date, McMann et al. (2020) provide unanimous evidence of a solid
curvilinear relationship between corruption and democracy (Figure 2).
The Case for Democracy:The Case for Democracy:
Does Democracy Improve Public Goods Provision?
Scientific evidence shows that:
• Democracies with vibrant vertical accountability provide 23% more safe water access, 35% more immunization to young children, and up to 40% more electricity access, than autocracies.
• Democracy provides on average citizens with an internet connection rate more than 300% compared to autocracies.
• Democracy with strong vertical accountability mechanisms diminishes corruption.
POLICY BRIEF
V-DEM POLICY BRIEF | 1
No. #30, 11 May 2021
Democracy is Beneficial for Human Security, International and Domestic PeaceA large body of scientific evidence demonstrates that human security,
as well as international and domestic peace are strongly and positively
related to democracy. The democratic peace axiom – that democ-
racies do not fight wars against each other, and that the spread
of democracy reduces armed disputes and wars – is soundly
confirmed by a wealth of rigorous studies (e.g., Altman et al., 2020; Hegre
et al., 2020; Hegre, 2014; Hegre, 2008). A recent study using the V-Dem
democracy indices shows that there is no case of a war in any pair of
states whose democratic level was above 0.61 on the V-Dem electoral
democracy index (Altman et al., 2020).
Being part of a region with high levels of democracy also matters. Two
states located in a region with low levels of democracy are 70% more
likely to have a fatal armed conflict than a pair of states placed in a region
with high levels (Altman et al., 2020). Consequently, the current wave of
autocratization should be expected to lead to a world with more
international conflicts, with devastating consequences for human
security.
Hegre et al. (2020) demonstrate that vertical (free and fair multiparty elec-
tions), horizontal (institutional constraints on the executive), and diagonal
(civil society) accountability mechanisms all contribute to lowering the
risk of interstate war. For example, this means that after India turned into
an electoral autocracy (Alizada et al., 2021), the statistical odds of a milita-
rized dispute with at least one death between India and Pakistan is now
3 times higher than 10 years ago.
A series of scientific studies demonstrate that democracies are also less
prone to civil war and domestic volatility compared to autocra-
cies, especially long-term, institutionalized democracies. The key is that
democracies are better at absorbing and channeling discontent through
legal institutional means and accountability mechanisms that in turn
lower the risk of domestic conflict (Fjelde et al., 2021; Hegre et al., 2001;
Hegre, 2014).
Yet, it is vital to recognize that semi-democracies and countries with
recent transitions tend to be more volatile with a higher risk of civil and
international conflict. Such a regime is around four times more likely to
experience domestic unrest compared to a well-established democracy.
In addition, the risk of civil war in a regime transitioning from an autoc-
racy to a semi-democracy is nine times higher compared to before the
transition (Hegre et al., 2001). That is why long-term strategies toward
stabilizing and improving the quality of newly established democracies
are critical.
Democracies Enable Female Empowerment that Leads to Civil PeaceScience can now confirm a robust connection between women’s polit-
ical empowerment and peace. Recent research drawing on V-Dem data
over a 200-year period shows that the annual risk of civil conflict drops
from roughly 30% in the least gender equal country to around 5% in
countries where women are fully empowered (Dahlum & Wig, 2020).
FIG 1. ANNUAL RISK OF CIVIL CONFLIC T REDUCES SUBSTANTIALLY AS FEMALE POLITICAL EMPOWERMENT INCREASES (DAHLUM & WIG, 2020).
The Case for Democracy:The Case for Democracy:Does Democracy Bring International and Domestic Does Democracy Bring International and Domestic
Peace and Security?Peace and Security?
Scientific Evidence Shows:• Democracies do not fight wars with each other. Fewer democracies in the world will lead to more wars. After India turned into
an electoral autocracy, the statistical odds of a militarized dispute with Pakistan are now 3 times higher than 10 years ago.• Democracies are also much less prone to civil war and domestic volatility compared to autocracies. • But transitions are risky: The odds of civil war in a regime transitioning from autocracy to semi-democracy is nine times
higher compared to before the change.• Gender equality is good for peace: The annual risk of civil conflict drops from roughly 30% in the least gender equal country
to around 5% in countries where women are fully empowered.
I N S T I T U T E
POLICY BRIEF
V-DEM POLICY BRIEF | 1
No. #29, 11 May 2021
1 Access to quality essential health services, without incurring undue financial hardship (Wigley et al. 2020).
Democracy Improves Health and Life ExpectancyDemocracy and the health of people are increasingly and unavoidably
inseparable. A comprehensive study by Bolyky et al. (2019) in The Lancet
spanning over 170 countries between 1980-2016 shows unequivocally
that transitions to democracy increase life expectancy, reduce
child mortality, and that democratic experience significantly
lowers deaths from non-communicable diseases. For example,
there is now evidence that on average and within 10 years after tran-
sition from autocracy, democracy leads to a 3% increase in life expec-
tancy (Bollyky et al., 2019).
FIG 1. ADULT LIFE EXPEC TANC Y, 1970 -2015 (BOLLYK Y et al 2019).
Evidence also demonstrates that democratic transitions significantly
reduce mortality from non-communicable diseases. For example,
scientists calculate that increased levels of democracy in the world
between 1995 and 2015 prevented 16.2 million cardiovascular
deaths (Bollyky et al., 2019).
Democracy’s effect on health is not driven by income (GDP). The
changes in health indicators depend on two key factors: free and fair
elections and how long a country has been democratic, since long-
standing democracies invest in healthcare to a higher degree. These
findings demonstrate that democracy improves human development
and that democratic experience matters for global health.
Democracy Reduces Infant MortalityThere is hard evidence showing democracy has both instant and lasting
effects on the lowering of infant and child mortality (e.g., Gerring et al.,
2012; Pieters et al., 2016; Wigley & Akkoyunlu-Wigley, 2017).
FIG 2. LOWER INFANT MORTALIT Y IN DEMOCR ACIES (WANG et al 2019).
Electoral democracy reduces infant mortality even when controlling for
other relevant factors, such as effectiveness of governance. The substan-
tive effects are quite striking: Full-fledged democracies have (on
average) 94% lower infant mortality than closed dictatorships.
(Wang et al., 2019).
The results also show that the quality of democracy matters for the
positive effects to become evident. Democracy reduces infant mortality
rates first when above 0.4 on a 0-1 scale of democracy. Yet, the really
pronounced positive effects show only after reaching 0.7 or higher, and
the full effect requires more than a decade to materialize. This is impor-
tant for policy-makers and donors to keep in mind.
Autocratization Decreases Health Care Coverage Rigorous scientific evidence shows that autocratization leads to substan-
tial deterioration of both health care coverage1 for individuals, and of
population health. Autocratizing countries have lower estimated
life expectancy, less effective health service coverage, and higher
levels of out-of-pocket health spending than they would have had
The Case for Democracy:The Case for Democracy:Does Democracy Increase Global Health?Does Democracy Increase Global Health?
Scientific Evidence Shows:
• Transition to democracy increases life expectancy by 3% within 10 years of regime change.
• Increased global levels of democracy averted 16.2 million cardiovascular deaths between 1995 and 2015.
• A high level of democracy leads to 94% lower infant mortality compared to dictatorships.
• Autocratization directly leads to a decline in life expectancy by 1.3 percentage points, health care protection decrease by 8.7 percentage points, and out-of-pocket spending/capita increase by 5.6 percentage points.
I N S T I T U T E
POLICY BRIEF
Policy Briefs 2022
Policy Briefs 2021
58 DEMOCRACY REPORT 2022

Kolkata, India, May 02, 2021. Trinamool Congress party member and activist gathered after Mamata Banerjee win in 2021 West Bengal election. Photo: Shutterstock.

Global Standards, Local Knowledge
Department of Political Science University of GothenburgSprängkullsgatan 19, PO 711SE 405 30 Gothenburg [email protected] +46 (0) 31 786 30 43 www.v-dem.netwww.facebook.com/vdeminstitutewww.twitter.com/vdeminstitute