THE CHANGING NATURE OF WORK - ILO
144
World Development Report 2019 THE CHANGING NATURE OF WORK Working Draft July 6, 2018
-
Upload
khangminh22 -
Category
Documents
-
view
1 -
download
0
Transcript of THE CHANGING NATURE OF WORK - ILO

World Development Report 2019
THE CHANGING NATURE OF
WORK
Working Draft
July 6, 2018
Table of Contents Overview ......................................................................................................................................... 1
What is Changing in the World of Work .................................................................................... 5
What Can Governments Do?....................................................................................................... 9
This Study’s Running Order ..................................................................................................... 12
Chapter 1: The Changing Nature of Work .................................................................................... 16
Technology Generates Jobs ....................................................................................................... 18
How Work is Changing ............................................................................................................. 20
A Simple Model of Changing Work ......................................................................................... 24
Chapter 2: Building Human Capital ............................................................................................. 30
Why Government is Needed ..................................................................................................... 32
Why Governments Often Fail and Why Measurement Helps ................................................... 34
The Human Capital Project ....................................................................................................... 35
What Comes Next ..................................................................................................................... 41
Chapter 3: Lifelong Learning........................................................................................................ 44
Learning in Early Childhood ..................................................................................................... 48
Tertiary Education ..................................................................................................................... 51
Adult Learning Outside Jobs ..................................................................................................... 56
Chapter 4: Returns to Work .......................................................................................................... 62
Informality ................................................................................................................................. 64
Working Women ....................................................................................................................... 66
Working in Agriculture ............................................................................................................. 69
Chapter 5: Strengthening Social Protection and Labor Policies ................................................... 72
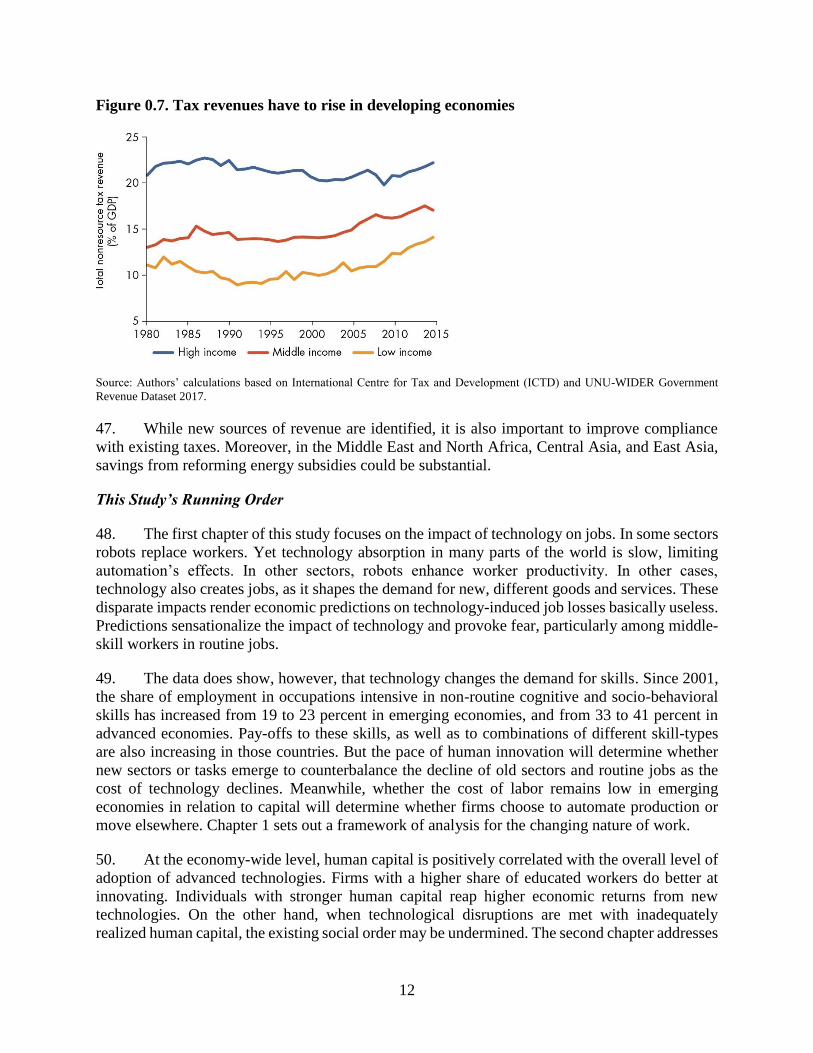
Social Assistance ....................................................................................................................... 73
Social Insurance ........................................................................................................................ 80
Labor Regulation ....................................................................................................................... 82
Chapter 6: The Changing Nature of Firms ................................................................................... 88
Superstar Firms ......................................................................................................................... 89
Competitive Markets ................................................................................................................. 93
Tax Avoidance .......................................................................................................................... 96
Chapter 7: Ideas for Social Inclusion .......................................................................................... 100
A New “New Deal”? ............................................................................................................... 101

Possible Elements of a New Social Contract .......................................................................... 103
Financing Social Inclusion ...................................................................................................... 106
Bibliography ............................................................................................................................... 120
1
Overview
1. There has never been a time when Mankind was not afraid of the consequences of its talent
for innovation. This is especially the case for economists with a professional interest in the future
of work. Karl Marx worried that “machinery does not just act as a superior competitor to the
worker, always on the point of making him superfluous. It is the most powerful weapon for
suppressing strikes.” 1 Economist John Maynard Keynes warned in 1931 of widespread
unemployment due to technology.2 Yet innovation has transformed our living standards. Life
expectancy has increased, basic healthcare and education are widespread, average incomes have
gone up for most people. The world is better connected, aspirations have risen and citizens’ voices
are more likely to be heard.
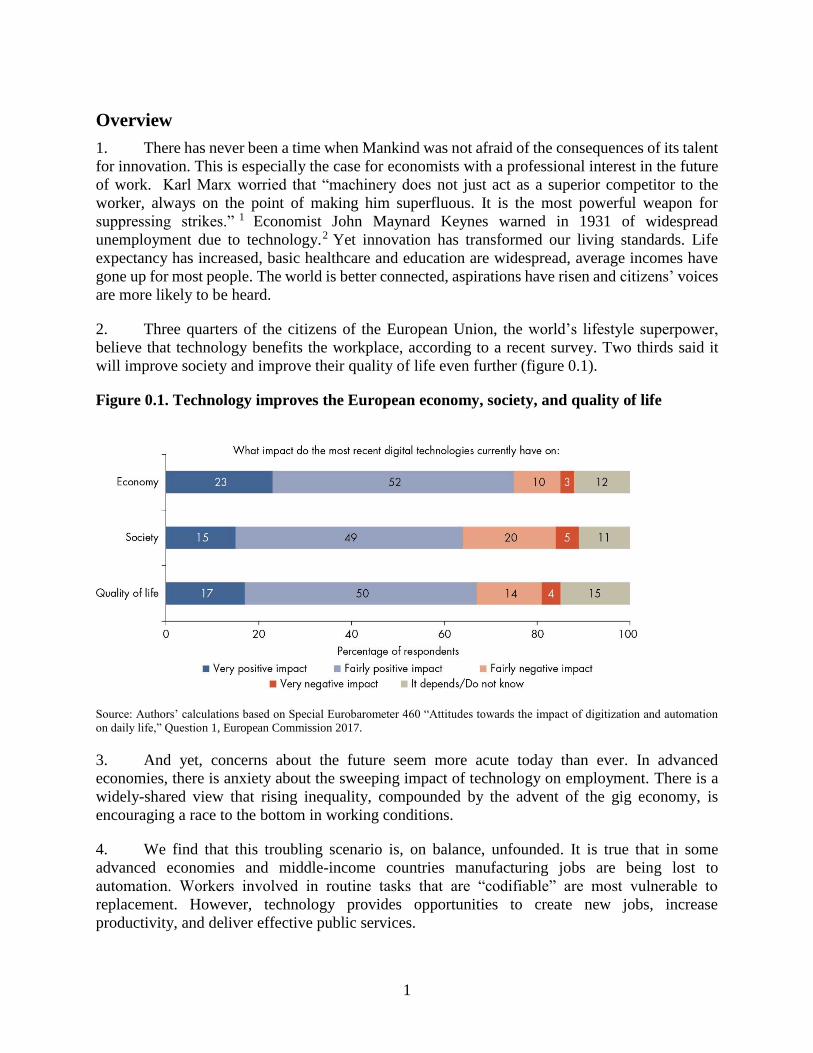
2. Three quarters of the citizens of the European Union, the world’s lifestyle superpower,
believe that technology benefits the workplace, according to a recent survey. Two thirds said it
will improve society and improve their quality of life even further (figure 0.1).
Figure 0.1. Technology improves the European economy, society, and quality of life
Source: Authors’ calculations based on Special Eurobarometer 460 “Attitudes towards the impact of digitization and automation
on daily life,” Question 1, European Commission 2017.
3. And yet, concerns about the future seem more acute today than ever. In advanced
economies, there is anxiety about the sweeping impact of technology on employment. There is a
widely-shared view that rising inequality, compounded by the advent of the gig economy, is
encouraging a race to the bottom in working conditions.
4. We find that this troubling scenario is, on balance, unfounded. It is true that in some
advanced economies and middle-income countries manufacturing jobs are being lost to
automation. Workers involved in routine tasks that are “codifiable” are most vulnerable to
replacement. However, technology provides opportunities to create new jobs, increase
productivity, and deliver effective public services.
2
5. Is this time any different? Technological progress always impacts factors of production,
production processes, as well as the demand and supply for goods or services. Nevertheless,
compared to previous major technological innovations such as electricity or the assembly line,
some peculiarities of the current wave of technological progress are notable.
6. For one, technology is shifting the mix of skills required to succeed in the labor market.
The demand for advanced, problem-solving and interpersonal skills increases – and, conversely,
decreases for less advanced skills - as routine jobs become automated. This pattern is evident in
developed countries, and it is beginning to emerge in developing countries.
7. Today’s digital transformation allows platforms to scale very quickly, blurring the
boundaries of firms and challenging traditional production patterns. Platforms evolve fast from
start-up to global force, often with few employees and tangible assets. This new industrial
organization poses policy questions in the fields of privacy, competition and taxation.
Governments’ ability to raise revenues is curtailed by the virtual nature of productive assets.
8. The rise of platform marketplaces allows the impacts of technology to reach more people
quickly than ever before. Individuals and firms need little more than a broadband connection in
order to trade goods and services on online platforms. This brings economic opportunity to
millions of people who do not live in industrialized countries or even industrial areas. At the same,
however, this means that the changing demand for skills also reaches those people. As automation
raises the premium on high order cognitive skills in advanced economies, it does the same in
emerging economies.
9. Investing in human capital is the priority in order to secure opportunity worldwide. Three
types of skills are increasingly important in labor markets: advanced cognitive skills (such as
complex problem-solving), socio-behavioral skills (like team work), and skill-combinations that
are predictive of adaptability (e.g., reasoning, self-efficacy). Building these skills requires strong
human capital foundations and lifelong learning.
10. Human capital foundations, created in early childhood, become more important. Yet,
governments in developing countries do not prioritize early childhood development. Human
capital outcomes in basic schooling are also sub-optimal. The human capital index highlights the
link between health and education investments with the productivity of future workers. Climbing
from the 25th to the 75th percentile on the index brings an additional 1.4 percentage annual growth
rate for 50 years.
11. Creating more quality jobs is also important to take advantage of the human capital
accumulated and seize the benefits of technological change. In many developing countries large
shares of workers remain in low-productivity employment, often in the informal sector with little
access to technology. What’s more, lack of quality private sector jobs leaves young talents few
pathways. For example, high-skilled university graduates are making up almost 30 percent of the
total unemployed pool in the Middle East and North Africa.
12. Investments in infrastructure are also needed. Most obvious is the need to provide
universal, affordable access to the internet to the population in developing countries that remains
unconnected. Equally important is to increase investments in the road, port and municipal
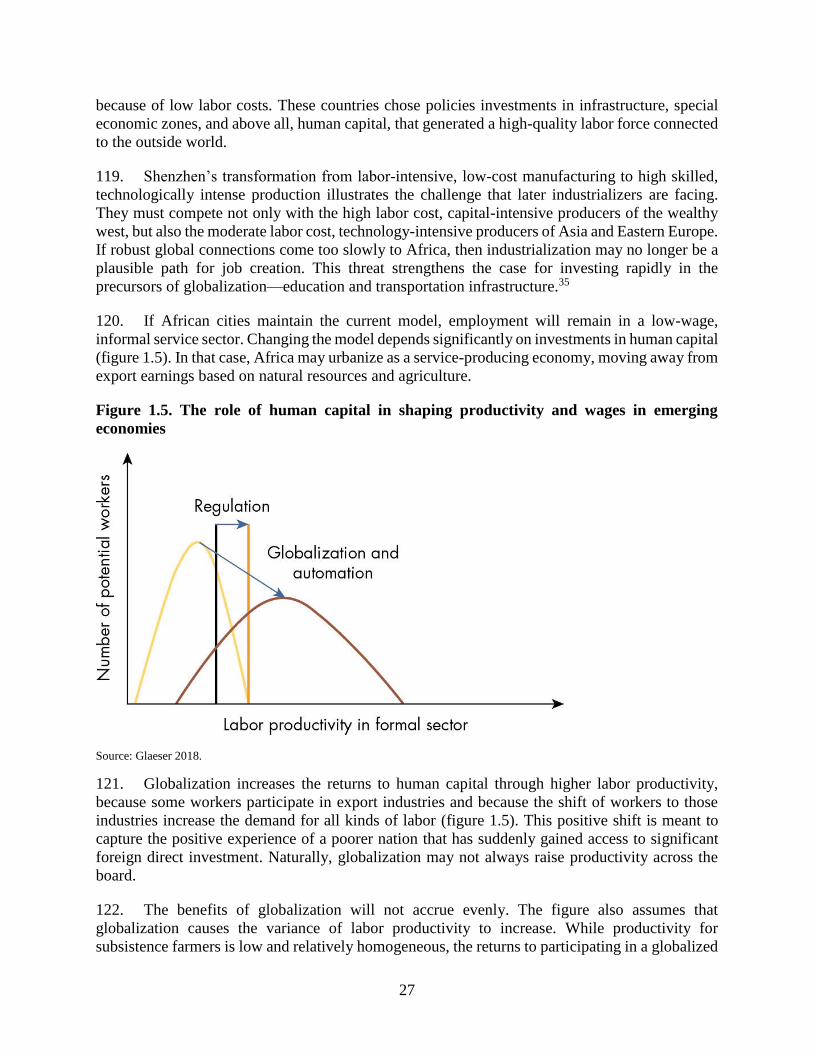
3
infrastructure needed for firms, governments and individuals to be able to exploit technologies to
their full potential.
13. Adjusting to the next wave of jobs requires more universal social protection. Eight out of
ten people in developing countries have no social assistance, while six out of ten work informally
and consequently do not benefit from insurance.
14. Even in advanced economies, the payroll-based insurance model is increasingly challenged
by working arrangements outside standard employment contracts. New ways of protecting people
are needed. A societal minimum that provides support independent of employment is one such
option. This model, which would include mandated and voluntary social insurance, could reach
substantially larger swaths of the population.
15. Strengthening social protection is possible through ‘progressive universalism’,
emphasizing an expansion in overall coverage that prioritizes those most in need. Community
health workers on the government’s payroll is a step in the right direction. This study investigates
universal basic income as a policy, but recognizes that it is untested and fiscally prohibitive for
developing economies.
16. To benefit from the potential that technology offers, societies need a new social contract
centered around larger human capital investments and progressively universal social protection.
For this contract to work, social inclusion needs fiscal space (figure 0.2). Many developing
countries lack finances because of inadequate tax bases, large informal sectors, and inefficient
administration.
4
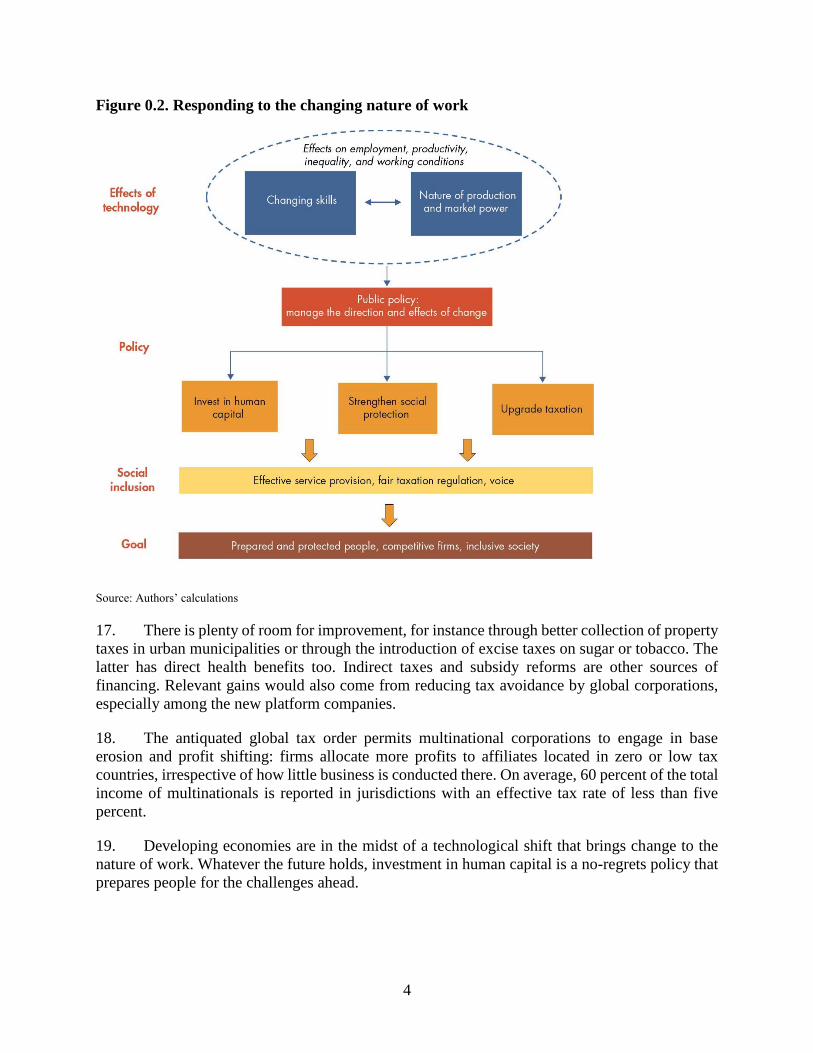
Figure 0.2. Responding to the changing nature of work
Source: Authors’ calculations
17. There is plenty of room for improvement, for instance through better collection of property
taxes in urban municipalities or through the introduction of excise taxes on sugar or tobacco. The
latter has direct health benefits too. Indirect taxes and subsidy reforms are other sources of
financing. Relevant gains would also come from reducing tax avoidance by global corporations,
especially among the new platform companies.
18. The antiquated global tax order permits multinational corporations to engage in base
erosion and profit shifting: firms allocate more profits to affiliates located in zero or low tax
countries, irrespective of how little business is conducted there. On average, 60 percent of the total
income of multinationals is reported in jurisdictions with an effective tax rate of less than five
percent.
19. Developing economies are in the midst of a technological shift that brings change to the
nature of work. Whatever the future holds, investment in human capital is a no-regrets policy that
prepares people for the challenges ahead.
5
What is Changing in the World of Work
20. Several stylized facts have dominated the discussion on the changing nature of work. This
study finds that only some of them are accurate in the context of developing economies.
21. First, technology is reshaping the skills needed for work. Demand for less advanced skills
that are substitutable by technology decreases. Demand for advanced cognitive skills, socio-
behavioral skills, and skill-combinations associated with greater adaptability is increasing. This
pattern is evident in developed countries. It is starting to be seen in some developing countries as
well. In Bolivia, the share of employment in high-skilled occupations increased by eight
percentage points during 2000 -2014. In Ethiopia, this increase was 13 percentage points. These
changes show up not just through new jobs replacing old jobs, but also through the changing skills
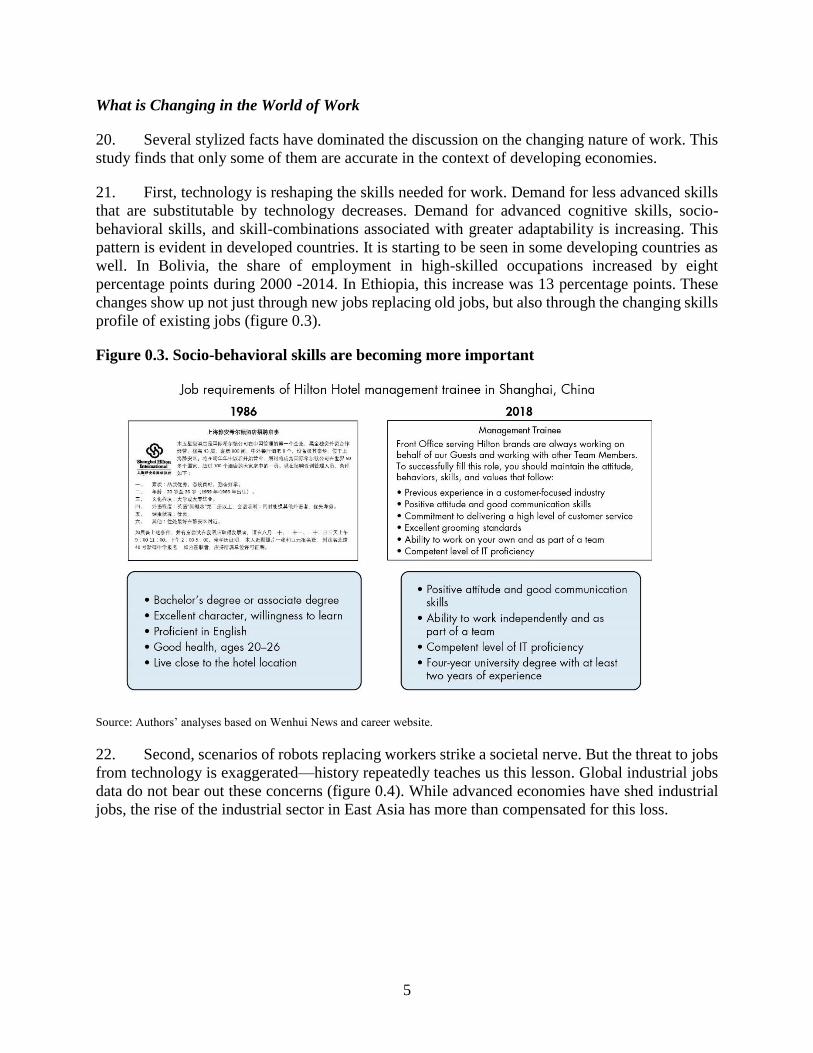
profile of existing jobs (figure 0.3).
Figure 0.3. Socio-behavioral skills are becoming more important
Source: Authors’ analyses based on Wenhui News and career website.
22. Second, scenarios of robots replacing workers strike a societal nerve. But the threat to jobs
from technology is exaggerated—history repeatedly teaches us this lesson. Global industrial jobs
data do not bear out these concerns (figure 0.4). While advanced economies have shed industrial
jobs, the rise of the industrial sector in East Asia has more than compensated for this loss.
6
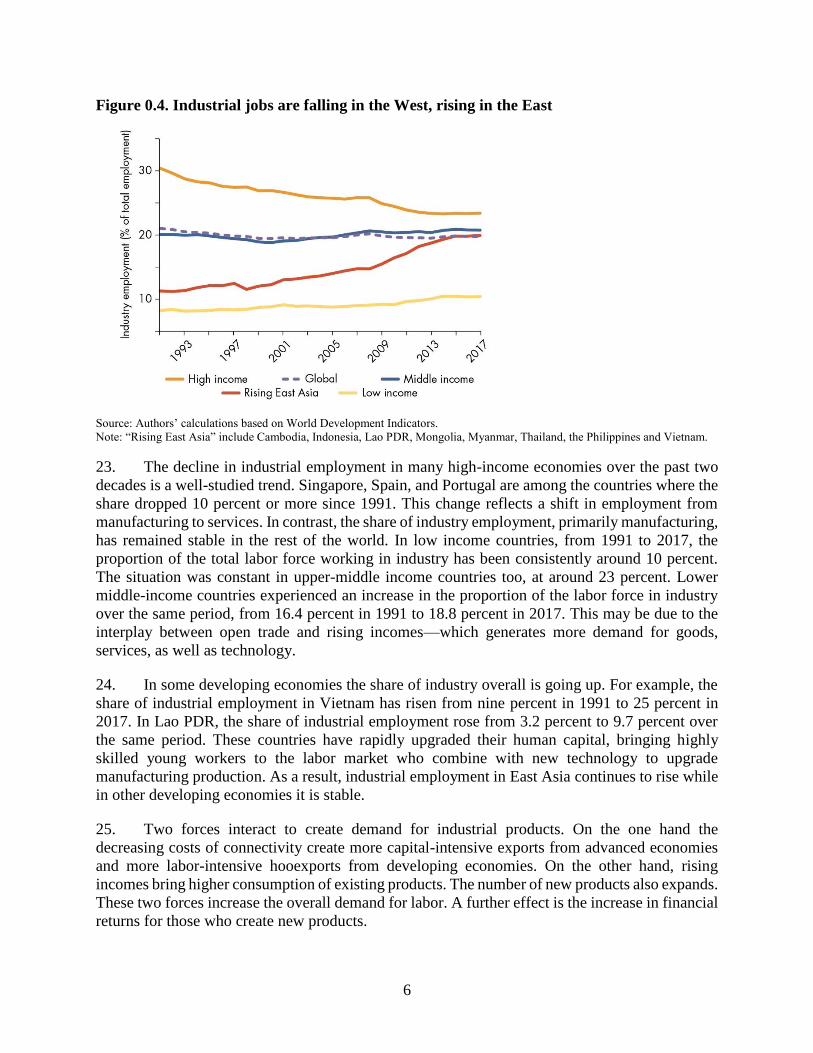
Figure 0.4. Industrial jobs are falling in the West, rising in the East
Source: Authors’ calculations based on World Development Indicators.
Note: “Rising East Asia” include Cambodia, Indonesia, Lao PDR, Mongolia, Myanmar, Thailand, the Philippines and Vietnam.
23. The decline in industrial employment in many high-income economies over the past two
decades is a well-studied trend. Singapore, Spain, and Portugal are among the countries where the
share dropped 10 percent or more since 1991. This change reflects a shift in employment from
manufacturing to services. In contrast, the share of industry employment, primarily manufacturing,
has remained stable in the rest of the world. In low income countries, from 1991 to 2017, the
proportion of the total labor force working in industry has been consistently around 10 percent.
The situation was constant in upper-middle income countries too, at around 23 percent. Lower
middle-income countries experienced an increase in the proportion of the labor force in industry
over the same period, from 16.4 percent in 1991 to 18.8 percent in 2017. This may be due to the
interplay between open trade and rising incomes—which generates more demand for goods,
services, as well as technology.
24. In some developing economies the share of industry overall is going up. For example, the
share of industrial employment in Vietnam has risen from nine percent in 1991 to 25 percent in
2017. In Lao PDR, the share of industrial employment rose from 3.2 percent to 9.7 percent over
the same period. These countries have rapidly upgraded their human capital, bringing highly
skilled young workers to the labor market who combine with new technology to upgrade
manufacturing production. As a result, industrial employment in East Asia continues to rise while
in other developing economies it is stable.
25. Two forces interact to create demand for industrial products. On the one hand the
decreasing costs of connectivity create more capital-intensive exports from advanced economies
and more labor-intensive hooexports from developing economies. On the other hand, rising
incomes bring higher consumption of existing products. The number of new products also expands.
These two forces increase the overall demand for labor. A further effect is the increase in financial
returns for those who create new products.
7
26. Third, technology blurs the boundaries of the firm, as seen in the rise of platform
marketplaces. Digital technologies create global platform-based businesses that differ from the
traditional production process with inputs provided from one end and output delivered on the other
end. Platform companies generate value by creating a network effect, connecting customers,
producers and providers, and facilitating interactions and transactions in a multi-sided model.
27. Compared to traditional companies, digital platforms scale up faster and at lower cost.
IKEA, founded in 1943, took almost 30 years before it began expanding within Europe. After
endeavors of more than seven decades, it achieved a global annual sales revenue of €36.3 billion
($42.1 billion). Through digital technology, it took Alibaba 2 years to reach 1 million users and
less than two decades to accumulate more than 8 million online merchants and achieved an annual
gross merchandise value of $550 billion.
28. Platform-based businesses are on the rise in every country—such as Flipkart in India or
Jumia in Nigeria, allowing technology to reach more people more quickly than ever before.
Globally integrated virtual marketplaces also pose new policy challenges in the fields of privacy,
competition and taxation.
29. Fourth, there are concerns about the rise of the gig economy, where organizations contract
with independent workers for short-term engagements tha typically lack social protections. It is
difficult to estimate the size of the gig economy, but where data exist, the numbers are small. Data
from Germany and the Netherlands indicate that only 0.4 percent of the labor force is active in the
gig economy. Worldwide, the total freelancer population is estimated at around 84 million—less
than three percent of the global labor force (3.5 billion).3 Someone who is counted as a freelancer
may also engage in traditional employment. In the United States, for example, more than two thirds
of 57.3 million freelancers are also in traditional employment, using freelancing to supplement
income.4 The best estimate is that less than 0.5 percent of the active labor force is in the gig
economy globally, with less than 0.25 percent in developing countries.
30. Fifth, in many developing countries, large shares of workers remain in low-productivity
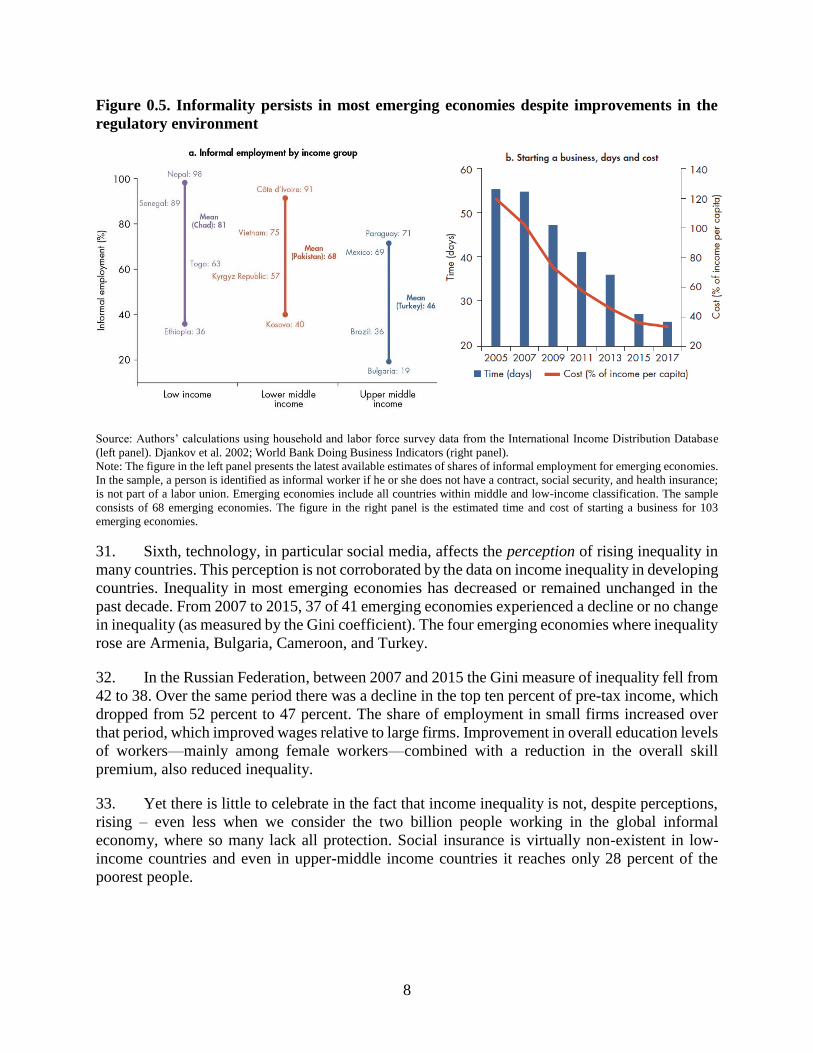
employment, often in informal sector firms with little access to technology. Informality has
remained high across regions over the past two decades despite improvements in the business
regulatory environment (figure 0.5). The share of informal workers is as high as 90 percent in some
developing economies. For countries such as Zambia or Madagascar informality is 80 percent.
Around two thirds of the labor force in emerging economies is informal. Informality has remained
remarkably stable notwithstanding the changing nature of work: in Peru, for all the attention
focused on the issue, informality has remained constant around 75 percent in the last 30 years. In
Sub-Saharan Africa informality has on average remained around 75 percent of total employment
from 2000-2016. In South Asia, it has increased from an average of 50 percent in the 2000s to 60
percent in the period 2010-2016. Addressing informality and the absence of social protections for
many workers across the globe continues to be the most pressing concern for emerging economies.
8
Figure 0.5. Informality persists in most emerging economies despite improvements in the
regulatory environment
Source: Authors’ calculations using household and labor force survey data from the International Income Distribution Database
(left panel). Djankov et al. 2002; World Bank Doing Business Indicators (right panel).
Note: The figure in the left panel presents the latest available estimates of shares of informal employment for emerging economies.
In the sample, a person is identified as informal worker if he or she does not have a contract, social security, and health insurance;
is not part of a labor union. Emerging economies include all countries within middle and low-income classification. The sample
consists of 68 emerging economies. The figure in the right panel is the estimated time and cost of starting a business for 103
emerging economies.
31. Sixth, technology, in particular social media, affects the perception of rising inequality in
many countries. This perception is not corroborated by the data on income inequality in developing
countries. Inequality in most emerging economies has decreased or remained unchanged in the
past decade. From 2007 to 2015, 37 of 41 emerging economies experienced a decline or no change
in inequality (as measured by the Gini coefficient). The four emerging economies where inequality
rose are Armenia, Bulgaria, Cameroon, and Turkey.
32. In the Russian Federation, between 2007 and 2015 the Gini measure of inequality fell from
42 to 38. Over the same period there was a decline in the top ten percent of pre-tax income, which
dropped from 52 percent to 47 percent. The share of employment in small firms increased over
that period, which improved wages relative to large firms. Improvement in overall education levels
of workers—mainly among female workers—combined with a reduction in the overall skill
premium, also reduced inequality.
33. Yet there is little to celebrate in the fact that income inequality is not, despite perceptions,
rising – even less when we consider the two billion people working in the global informal
economy, where so many lack all protection. Social insurance is virtually non-existent in low-
income countries and even in upper-middle income countries it reaches only 28 percent of the
poorest people.
9
What Can Governments Do?
34. The analysis suggests three takeaways for governments. Actions include:
• Governments need to focus more on disadvantaged groups and early childhood education,
and developing skills needed in the modern economy, such as high order cognitive and
socio-behavioral skills in addition to foundational skills.
• Governments need to enhance social protection. A solid societal guaranteed minimum and
strengthened social insurance, subsequently complemented by reforms in labor market
rules in some developing economies would achieve this goal.
• Taxation is in dire need of upgrading in some developing economies to provide fiscal space
for public financing of human capital and social protection. Property taxes in large cities,
excise taxes on sugar and tobacco, automatic links between customs and VAT databases
to identify tax evasion, levying carbon taxes are among the ways to increase government
revenue. Many global corporations use tax avoidance techniques to increase their profits.
Governments can optimize their taxation policy without resorting to tax rate increases.
35. The most significant investments that people, firms and governments make in the changing
nature of work is in enhancing human capital. A basic level of human capital, such as literacy and
numeracy, is needed for economic survival. The increased role of technology means that all types
of jobs (including low-skilled jobs), demand more advanced cognitive skills. The role of human
capital is also enhanced because of increasing demand for socio-behavioral skills. Jobs that rely
on inter-personal interaction are not readily replaced by machines. However, to succeed at these
jobs, socio-behavioral skills—established in early years and shaped throughout our lifetimes—
need to be strong. Human capital is important because of the increased premium on adaptability.
This ability is shaped through human capital investments, especially in early years.
36. Lacking human capital puts new generations at a severe disadvantage, especially among
the poorest. This individual disadvantage aggregates to low economic competitiveness globally.
Low investments in human capital are also likely to exacerbate existing inequalities. This
inequality puts security at risk, as unmet aspirations lead to unrest.
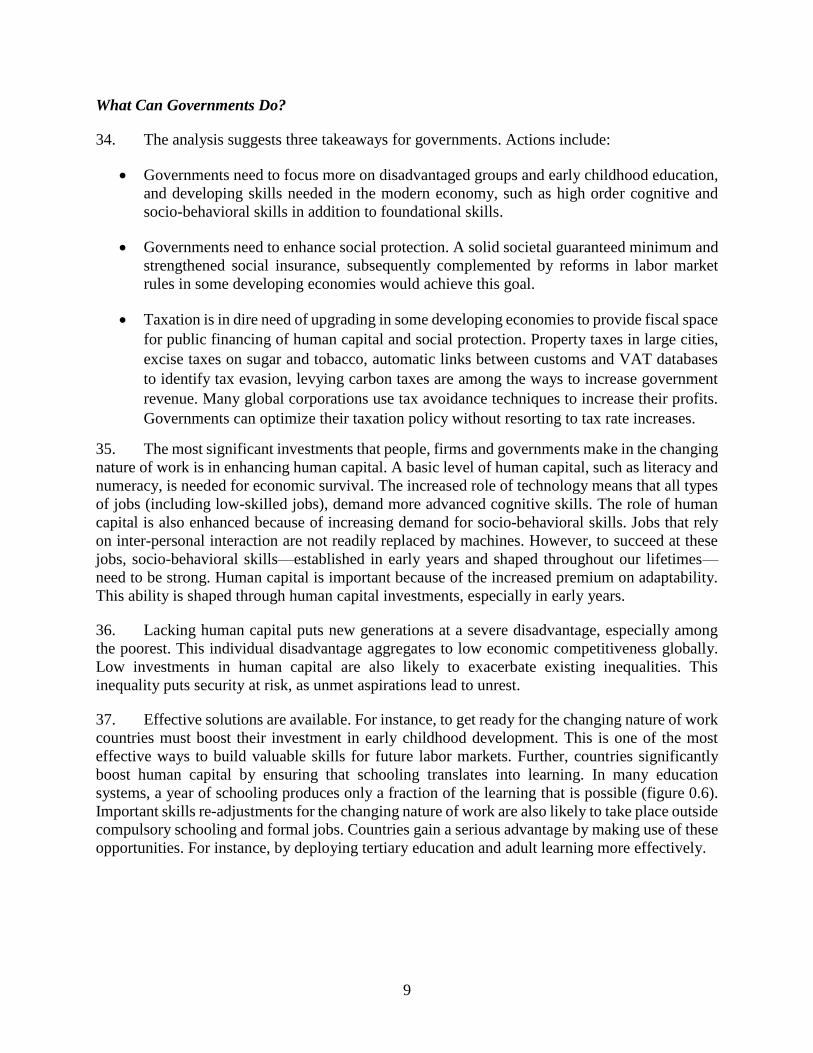
37. Effective solutions are available. For instance, to get ready for the changing nature of work
countries must boost their investment in early childhood development. This is one of the most
effective ways to build valuable skills for future labor markets. Further, countries significantly
boost human capital by ensuring that schooling translates into learning. In many education
systems, a year of schooling produces only a fraction of the learning that is possible (figure 0.6).
Important skills re-adjustments for the changing nature of work are also likely to take place outside
compulsory schooling and formal jobs. Countries gain a serious advantage by making use of these
opportunities. For instance, by deploying tertiary education and adult learning more effectively.
10
Figure 0.6. Learning varies across emerging economies, 2018
Source: Authors’ calculations based on Kim 2018 and Filmer et al. 2018.
Note: The estimates are provisional, and are subject to further changes.
38. One reason why governments do not invest in human capital is because they lack the
political incentives to do so. There is little publicly available data on whether health and education
systems are generating human capital. This gap hinders the design of effective solutions, the
pursuit of improvement, and the ability of citizens to hold their governments accountable. The
World Bank’s human capital project is designed to address the issue of low political incentives.
By doing so it aims to provide the impetus for investing in human capital.
39. People in developing countries should be protected through social assistance and insurance
systems that fit with the changing nature of work. The concept of “progressive universalism” could
be a guiding principle in covering more people, especially in the informal economy. Once such
protections are in place, flexible labor regulation facilitates work transitions.
40. The current social contract is broken in most developing economies. It looks increasingly
out of date for some advanced economies too. A new social contract is needed. Investing in human
capital increases the opportunities for workers to find better jobs. Such investment improves the
job prospects for newborns or kids in school.
41. Governments need to raise additional resources in order to invest in human capital and
advance social inclusion. The share of tax revenue in developing economies is half of the share in
advanced economies (figure 0.7). Investments in human capital, basic social protection, including
community health workers in some developing countries, and productive opportunities for youth
11
are likely to have fiscal costs in the order of 6-8 percent of GDP. This is an ambitious, but attainable
goal. Increasing tax revenue, however, should go hand in hand with improving public service
delivery. If that is not the case, increasing tax rates will only spur further public discontent.
42. Most of the required fiscal resources are likely to come from value-added taxes,
specifically through expansion of the tax base. Sub-Saharan African countries, on average, could
raise around 3 to 5 percent of GDP in additional revenues through reforms that improve the
efficiency of current tax systems.5 Closing tax exemptions and converging toward a uniform tax
rate in VAT, could raise further revenues. In Costa Rica or Uruguay such revenues could amount
to more than 3 percent of GDP.
43. Other taxes and savings would contribute to the financing of human capital. Saudi Arabia
adopted excise tax regulations in 2017: 50 percent on soft drinks, and 100 percent on energy drinks,
tobacco, and tobacco products. It is estimated that nationally efficient carbon pricing policies
would raise above 6 percent in China, Iran, Russia, and Saudi Arabia.6 Taxes on immovable
property could raise an additional 2.9 and 0.9 percent of GDP in middle-income and poor countries,
respectively.7
44. Age-old tax avoidance schemes could be addressed, too. On average, almost 60 percent of
the total income of multinationals is reported in jurisdictions with an effective tax rate of less than
five percent. The structure of the global tax system permits multinational corporations to engage
in base erosion and profit shifting: firms allocate more profits to affiliates located in zero or low
tax to countries, irrespective of how little business is conducted there. Four out of five Fortune 500
companies operate one or more subsidiaries in so-called “tax haven” countries—those perceived
to have preferential corporate tax regimes. Governments worldwide miss out US$100–$240 billion
in lost annual revenues.
45. The increasingly digital nature of business makes tax avoidance worse. Corporate income
tax rules, including in bilateral income tax treaties, are founded on the principle of physical
presence. This means that digital platform companies located in one (low tax) country which
supply services online to a consumer in another (higher tax) country have an unfair advantage over
local companies or other foreign companies headquartered in higher tax jurisdictions. Digital
companies also generate revenue from new kinds of assets, such as user data or online
advertisements, but it is not clear how or where value is created for tax purposes (even in those
countries that have a right to tax in the first place). As a result, digital companies carry a smaller
tax burden than traditional brick and mortar companies.
46. Governments have to put a stop to tax avoidance. The way to do so is to put an end to the
divorce between the location of profits and the location of real activities. If firms are digital, the
location is most justifiably where goods or services are consumed. Profit-shifting practices that
involve syphoning revenues off to affiliates in low tax jurisdictions—ostensibly as payment for
using a brand’s intellectual property, for example, should be curbed. Tax breaks for profits
generated through intellectual property should also be revisited. Amending international tax rules,
shutting down tax havens, as well as developing new ways to tax the digital economy, should all
be on the table.
12
Figure 0.7. Tax revenues have to rise in developing economies
Source: Authors’ calculations based on International Centre for Tax and Development (ICTD) and UNU-WIDER Government
Revenue Dataset 2017.
47. While new sources of revenue are identified, it is also important to improve compliance
with existing taxes. Moreover, in the Middle East and North Africa, Central Asia, and East Asia,
savings from reforming energy subsidies could be substantial.
This Study’s Running Order
48. The first chapter of this study focuses on the impact of technology on jobs. In some sectors
robots replace workers. Yet technology absorption in many parts of the world is slow, limiting
automation’s effects. In other sectors, robots enhance worker productivity. In other cases,
technology also creates jobs, as it shapes the demand for new, different goods and services. These
disparate impacts render economic predictions on technology-induced job losses basically useless.
Predictions sensationalize the impact of technology and provoke fear, particularly among middle-
skill workers in routine jobs.
49. The data does show, however, that technology changes the demand for skills. Since 2001,
the share of employment in occupations intensive in non-routine cognitive and socio-behavioral
skills has increased from 19 to 23 percent in emerging economies, and from 33 to 41 percent in
advanced economies. Pay-offs to these skills, as well as to combinations of different skill-types
are also increasing in those countries. But the pace of human innovation will determine whether
new sectors or tasks emerge to counterbalance the decline of old sectors and routine jobs as the
cost of technology declines. Meanwhile, whether the cost of labor remains low in emerging
economies in relation to capital will determine whether firms choose to automate production or
move elsewhere. Chapter 1 sets out a framework of analysis for the changing nature of work.
50. At the economy-wide level, human capital is positively correlated with the overall level of
adoption of advanced technologies. Firms with a higher share of educated workers do better at
innovating. Individuals with stronger human capital reap higher economic returns from new
technologies. On the other hand, when technological disruptions are met with inadequately
realized human capital, the existing social order may be undermined. The second chapter addresses
13
the link between human capital accumulation and the future of work, discussing why governments
need to invest and why they often fail to do so.
51. To ensure effective policy design and delivery, more information and better measurement
are needed, even when there is full willingness to invest in human capital. To achieve this goal,
the World Bank has launched the human capital project, which is composed of three pillars: a
global benchmark—the human capital index, a program of measurement and research to inform
policy action, and a program of support for country strategies to accelerate investment in human
capital.
52. The index is measured in terms of the amount of human capital that a child born today can
expect to attain by the end of secondary school, given the risks of poor health and poor education
that prevail in the country where she was born. In other words, it measures the productivity of the
next generation of workers, relative to the benchmark of complete education and full health.
Chapter 2 also presents index cross-country comparisons for up to 150 economies globally.
53. Part of the ongoing skills re-adjustment is happening outside of compulsory education and
formal jobs. Where? Chapter 3 answers this question by exploring three domains—early
childhood, tertiary education, and adult learning outside jobs—where people acquire specific skills
that are demanded by the changing nature of work.
54. Investments in early childhood, including in nutrition, health, protection, and education lay
strong foundations for the future acquisition of higher-order cognitive and socio-behavioral skills.
From the prenatal period to the age of five, the brain’s ability to learn from experience is at its
highest. Individuals who acquire such skills in early childhood are more resilient to uncertainty
later in life. Tertiary education provides another opportunity for individuals to acquire the higher-
order general cognitive skills—like complex problem solving, critical thinking, or advanced
communication—that are demanded by the changing nature of work but that cannot be acquired
through schooling alone.
55. Something has to be done with the current stock of workers, too, particularly those that
cannot go back to school or university to learn. Reskilling and upskilling workers who are not in
school or in formal jobs must be part of the response to technology-induced labor market
disruption. But only rarely do adult learning programs get it right. Adults face various binding
constraints that limit the effectiveness of traditional approaches to learning. Better diagnosis and
evaluation of adult learning programs, better design, and better delivery are needed. Chapter 3
explores these issues in greater detail.
56. Work is the next venue for human capital accumulation after school. Chapter 4 evaluates
how successful economies are in generating human capital at work. Advanced economies have
higher returns to work than emerging economies. A worker in an emerging economy is more likely
to find herself in a manual occupation that is intensive in physical tasks than a worker in an
advanced economy. An additional year of work in cognitive professions increases wages by 2.9
percent, while for manual occupations the figure is 1.9 percent. Work provides a venue for a
prolonged acquisition of skills after school—but such opportunities are relatively rare in emerging
economies.
14
57. Governments raise the returns to work by increasing formal jobs for the poor; they do this
by creating an enabling environment for business, investing in entrepreneurship training for adults,
and increasing access to technology. The payoff to women’s participation in the workforce is
significantly lower than for men—in other words, women aquire significantly less human capital
in work than men do. Bridging that gap requires governments to remove limitations on the type or
nature of work available to women, and eliminate rules that would limit womens’ property rights.
Workers in rural areas face similar challenges when it comes to accumulating human capital after
school. There is little scope to improve the returns to work by reallocating labor from villages to
cities. However, technology can be harnessed to increase payoffs to work, by increasing
agricultural productivity.
58. Uncertain labor markets call for strengthening social protection. What are the implications
for social assistance, social insurance and labor market institutions? This question is explored in
chapter 5 of the study. Traditional provisions of social protection based on steady wage
employment, clear definitions of employers and employees, as well as a fixed point of retirement
become increasingly obsolete. In developing countries, where informality is the norm, this model
has been largely aspirational.
59. Spending on social assistance should be increased and complemented with insurance that
does not fully depend on having formal wage employment. Expansions in social assistance should
be guided by the principle of “progressive universalism”. As people become better protected
through enhanced social assistance and insurance, labor regulation could, where appropriate, be
made more balanced to facilitate work transitions.
60. Chapter 6 examines how technological change affects the nature of the firm. Technological
progress has made firm boundaries more permeable. New digital technologies accelerate the trend
toward superstar firms. Superstar firms have a beneficial effect on labor demand by boosting
production, and therefore employment. These firms are also large integrators of young, innovative
firms, often benefiting small businesses by connecting them with larger markets. But large firms,
particularly firms in the digital economy, also pose policy challenges. Regulations often fail to
address the challenges created by new types of business in the digital economy. Antitrust
frameworks are also challenged by multi-sided markets and the impact of network effects on
competition. Tax systems are also in many ways no longer fit for purpose.
61. Changes in the nature of work, compounded by rising aspirations, make it essential to
increase social inclusion. Hence, social contracts need to place equality of opportunity at their
center. Chapter 7 considers potential elements of the contract, which include – but are not limited
to – investing early in human capital; taxing firms; expanding social protection; and increasing
productive opportunities for youth.
62. Social inclusion is costly. A new social contract would require significant additional
government revenues in the order of 6-8 percentage points of GDP. The chapter discusses how
governments can create fiscal space through a mix of additional revenues from existing and new
funding sources. Potential sources of revenue include value-added taxes, excise taxes, carbon tax,
charging platform companies taxes equal to what other companies are paying, and the revisit of
energy subsidies.
15
63. Simeon Djankov and Federica Saliola lead the 2019 WDR team. The core team comprises
Ciro Avitabile, Rong Chen, Davida Connon, Ana Paula Cusolito, Roberta Gatti, Ugo Gentilini,
Asif Mohammed Islam, Aart Kraay, Shwetlena Sabarwal, Indhira Vanessa Santos, David
Sharrock, Consuelo Jurado Tan, and Yucheng Zheng. Michal Rutkowski, Senior Director for the
Social Protection and Jobs Global Practice, provides overall guidance.

16
Chapter 1: The Changing Nature of Work
65. From the beginning, robots were construed as worker-replacing machines. Karel Čapek,
the Czech writer who invented the word robot in 1920, used the Slavic language for work “robota”
to connote what these machines are used for. In the past century, machines have replaced workers
in many tasks. On balance, however, technology has created more jobs than it has displaced.
Technology has brought higher labor productivity to many sectors by reducing the need for
workers in routine tasks. It has opened new sectors, previously only imagined in the field of science
fiction.
66. As technology advances, new ways of production are adopted, markets expand, societies
evolve. Technology enhances worker productivity. Firms use new technologies to improve capital
utilization, overcome information barriers, outsource, and innovate. New technologies allow for
more efficient management of firm operations: firms hire workers in one location to produce parts,
in another location to assemble, and in a third location to sell. Consumers enjoy more product
choice at lower prices.
67. In the digital economy, market opportunities expand for all participants. In some cases,
platform firms create new market places to trade goods or services. Even small firms are global in
the digital economy. Firms grow faster. The firms selling on eBay in Chile, Jordan, Peru and South
Africa are younger than firms in offline markets.8 Start-ups in China are dominant on the Alibaba
platform.9 Societies benefit as technology expands options for service delivery and for citizens to
exercise their voice to hold governments accountable.
68. In short, workers, firms and governments build new comparative advantages as conditions
change. For example, by adopting 3D technologies first, Danish firms strengthened their hold on
the global market for hearing aid products in the 2000s.10 The Indian government invested in
numerous technical universities across the country, and subsequently became a world leader in
high-tech sectors. By integrating into global value chains, Vietnamese workers developed their
foreign language abilities, building additional human capital that allows them to expand into other
markets.
69. Notwithstanding the opportunities, however, there is still disruption. The declining cost of
machines puts particularly at risk those low-skill jobs that are intensive in routine tasks. These are
the occupations that are most susceptible to automation. Displaced workers are likely to compete
with (other) low-skilled workers for jobs with low wages. Even when new jobs arise retooling is
costly and, in many cases, not possible.
70. As a result, the displacement of workers generates anxiety, just as in the past. In 1589,
Queen Elizabeth I was alarmed when clergyman William Lee applied for a royal patent for a
knitting machine. “Consider thou what the invention would do to my poor subjects,” she replied.
“It would assuredly bring them to ruin by depriving them of employment.”11 The Qing dynasty
fiercely opposed constructing railways in China during the 1880s, arguing that the loss of luggage
carrying jobs might lead to social turmoil.12
The Luddites sabotaged machines to defend their jobs
in Britain during the early 19th century, despite the overall economic growth fueled by steam
power.
17
71. Fears about robot-induced unemployment have dominated the discussion over the future
of work. Nowhere are these fears more pronounced than in the context of the industrial sector. The
decline in industrial employment in some high-income economies over the past two decades is an
established trend. Singapore, Spain, United Kingdom and Korea are among the countries where
the share dropped more than ten percentage points. But this trend mainly reflects a shift in
employment from manufacturing to services as those countries develop. In contrast, millions of
industrial jobs have been created in developing countries since the late 1980s: the share of industry
employment has increased significantly in a few emerging markets such as Vietnam and
Cambodia. On average the share of industry employment has remained stable in developing
countries, against the numerous predictions of job losses resulting from technology.
72. Nevertheless, technology is disrupting demand for three types of skills. These are general
cognitive skills, job-specific skills, and socio-behavioral skills. Globally, private returns to
education, at about nine percent a year, remain high despite the significant expansion in the supply
of skilled labor. Returns to tertiary education are at almost 15 percent a year. Individuals with more
advanced skills take better advantage of new technologies, to adapt to the changing nature of work.
For example, returns to primary schooling in India increased during the Green Revolution, with
more educated farmers adopting new technologies.
73. Technology has the potential to improve living standards, but these effects are not
manifesting equally across the globe. The process of job creation works society-wide—and not
just for the few—only when the rules of the game are fair. Workers in some sectors or countries
benefit handsomely from technological progress. Workers are displaced in other sectors, having
to retool to survive. Platform technologies create huge wealth, but place it in the hands of the few.
74. Irrespective of technological progress, persistent informality continues to pose the greatest
challenge for emerging economies. Informal employment remains at more than 70 percent in Sub-
Saharan Africa and South Asia; it is more than 50 percent in Latin America. In India, the informal
sector has remained around 90 percent notwithstanding rapid economic growth or technology
adoption. Both wages and productivity are significantly lower in the informal sector. Informal
workers live without health insurance or social protection. Many fear that technology will prevent
Africa and South Asia from industrializing in a manner that moves workers to the formal sector.
75. What constitutes progress in the context of the formal/informal worker divide must be re-
evaluated given the changing nature of work. Future economic growth depends on human capital
accumulation, infrastructure that serves education, health, and business needs. Enhanced social
protection that applies irrespective of the form of labor contract is also ripe for consideration.
18
Technology Generates Jobs
76. “They’re always polite, they always upsell, they never take a vacation, they never show up
late, there’s never a slip-and-fall, or an age, sex or race discrimination case,” Andrew Puzder, chief
executive of Hardee’s restaurant chain with headquarters in Tennessee, says of swapping
employees for machines.13 Such statements give workers reason to worry.
77. People fear the advent of a jobless economy because tasks traditionally performed by
humans are being—or are at risk of being—taken over by robots, especially those enabled with
artificial intelligence. Indeed, the number of robots operating worldwide is rising rapidly. By 2019,
there will be 1.4 million new industrial robots in operation, taking the total to 2.6 million
worldwide.14 Robot density per worker in 2018 is highest in the Republic of Korea, Singapore and
Germany. In all these countries the employment rate remains high despite the high prevalence of
robots.
78. Young workers can be more affected by automation than older workers. Although robot
adoption did not have any substantial net effect on employment in Germany, it reduced hiring for
young entrants.15 For this reason, the effect of automation can be very different on countries which
are ageing and on those which have young populations and expect large numbers of new labour
market entrants.
79. Robots replace workers; but it is far from clear to what extent. Overall, technological
change that replaces routine work is estimated to have created more than 23 million jobs across
Europe from 1999 to 2016—almost half of the total employment increase in the same period.
Recent evidence for European countries suggests that while technology may be substituting
workers in some jobs, overall it is raising labor demand.16 Instead of hiring traditional loan officers
JD Finance, a leading fintech platform in China, created more than 3,000 risk management or data
analysis jobs to sharpen algorithms for digitized lending.
80. Technological progress directly creates jobs in the technology sector. The internet of things
means that people are relying on portable devices to work, organize their finances and have fun.
Humans create the online interfaces that drive this growth. With consumer interests changing fast,
there are more opportunities for individuals to pursue careers in mobile app development or virtual
reality design.
81. Technology has also facilitated the creation of jobs through online work or in the gig
economy. Andela has built its business model on the digitization of Africa. It has trained 20,000
software programmers across Africa using free online learning tools. Once qualified, programmers
work with Andela directly or join other Andela clients across the world. It aims to train 100,000
African software developers by 2024. Ninety percent of its workers are in Lagos, Nigeria, with
other sites in Nairobi, Kenya, as well as Kampala, Uganda.
82. Technology increases proximity to markets, facilitating the creation of new, efficient value
chains. Farmerline in Ghana is an online platform that communicates with a network of over
200,000 farmers in their native languages via mobile phone on the weather and market prices while
collecting data for buyers, governments and development partners. The company is expanding to
include credit services.
19
83. As part of this process of technology adoption, however, some workers will be replaced by
technology. Workers involved in routine tasks that are “codifiable” are most vulnerable. The
examples are numerous. More than two thirds of robots are employed in the automotive,
electrical/electronics, as well as metal and machinery industry. Foxconn Technology Group, the
world’s largest electronics assembler based in Taiwan, China, cut its workforce by 30 percent
when it adopted robots into the production process (from 1.3 million in 2012 to 873,467 by the
end of 2016).17 If robots are cheaper than existing manufacturing processes, relocating production
closer to consumer markets becomes more appealing to firms. In 2017, 3D printing technologies
enabled the German company Adidas to establish two “speed factories” for shoe production in
Ansbach, Germany, and Atlanta, United States. The move eliminated more than 1,000 jobs in
Vietnam. In 2012, the Dutch multinational technology company Philips Electronics shifted
production from China back to the Netherlands.
84. Some service jobs are also susceptible to automation. Mobileye of Israel is developing
driverless vehicle navigation units. Baidu, the Chinese technological giant, is working with King
Long Motor Group, China, to introduce autonomous buses in industrial parks. Financial analysts,
who spend much of their time conducting formula-based research, are also experiencing job cuts:
Sberbank, the largest bank in the Russian Federation, relies on artificial intelligence to make loan
decisions in 35 percent of cases, anticipating this to increase to 70 percent in less than five years.18
“Robot lawyers” have already substituted for 3,000 jobs in Sberbank’s legal department. The
number of back office employees overall has shrunk to 1,000 by 2021, down from 59,000 in 2011.
Ant Financial, a fintech firm in China, uses big data to assess loan agreements instead of hiring
thousands of loan officers or lawyers.19
85. Nevertheless, it is impossible to put a figure on the level of job displacement that will take
place overall. Even the best economists have experienced little success with this exercise. In 1930,
John Maynard Keynes declared that technology would usher in an age of leisure and abundance
within a hundred years. “Everyone would need to do some work if he is to be contented,” he wrote,
“but three hours a day is quite enough.”20 The world in 2018 is far from this kind of reality.
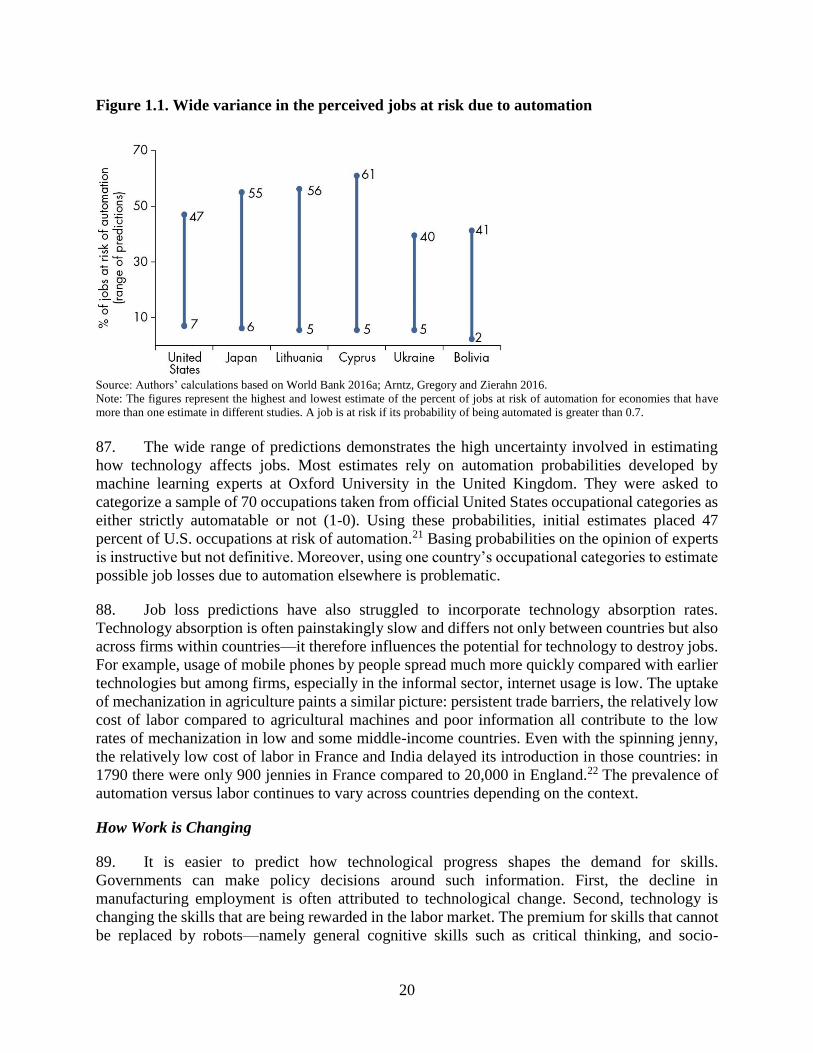
86. Although quantifying the impact of technological progress on job losses continues to
challenge economists, estimates abound. There are wide differences in the job loss predictions that
have been released (figure 1.1). For Bolivia, job automation estimates range from two percent to
41 percent. In other words, anything from 100,000 to two million Bolivian jobs in 2018 may be
automated. The range is even wider for advanced economies. In Lithuania, five to 56 percent of
jobs are at risk of being automated. In Japan, six to 55 percent of jobs are alleged to be at risk.
20
Figure 1.1. Wide variance in the perceived jobs at risk due to automation
Source: Authors’ calculations based on World Bank 2016a; Arntz, Gregory and Zierahn 2016.
Note: The figures represent the highest and lowest estimate of the percent of jobs at risk of automation for economies that have
more than one estimate in different studies. A job is at risk if its probability of being automated is greater than 0.7.
87. The wide range of predictions demonstrates the high uncertainty involved in estimating
how technology affects jobs. Most estimates rely on automation probabilities developed by
machine learning experts at Oxford University in the United Kingdom. They were asked to
categorize a sample of 70 occupations taken from official United States occupational categories as
either strictly automatable or not (1-0). Using these probabilities, initial estimates placed 47
percent of U.S. occupations at risk of automation.21 Basing probabilities on the opinion of experts
is instructive but not definitive. Moreover, using one country’s occupational categories to estimate
possible job losses due to automation elsewhere is problematic.
88. Job loss predictions have also struggled to incorporate technology absorption rates.
Technology absorption is often painstakingly slow and differs not only between countries but also
across firms within countries—it therefore influences the potential for technology to destroy jobs.
For example, usage of mobile phones by people spread much more quickly compared with earlier
technologies but among firms, especially in the informal sector, internet usage is low. The uptake
of mechanization in agriculture paints a similar picture: persistent trade barriers, the relatively low
cost of labor compared to agricultural machines and poor information all contribute to the low
rates of mechanization in low and some middle-income countries. Even with the spinning jenny,
the relatively low cost of labor in France and India delayed its introduction in those countries: in
1790 there were only 900 jennies in France compared to 20,000 in England.22 The prevalence of
automation versus labor continues to vary across countries depending on the context.
How Work is Changing
89. It is easier to predict how technological progress shapes the demand for skills.
Governments can make policy decisions around such information. First, the decline in
manufacturing employment is often attributed to technological change. Second, technology is
changing the skills that are being rewarded in the labor market. The premium for skills that cannot
be replaced by robots—namely general cognitive skills such as critical thinking, and socio-
21
behavioral skills such as managing and recognizing emotions that enhance teamwork—is rising.
These skills make workers more adaptable in labor markets. Third, technology is disrupting the
production process by challenging the traditional boundaries of firms, expanding global value
chains and changing the geography of jobs. Fourth, technology is changing how people work,
giving rise to the gig economy where organizations contract with independent workers for short-
term engagements.
90. These changes are more noticeable in advanced economies where technology is widespread
and labor markets start from higher levels of formalization. But emerging economies have been
grappling with many of the same issues for decades, even if not related to technological change.
Informality persists on a vast scale in emerging economies—as high as 90 percent in some low
and middle-income countries—notwithstanding technological progress. With some notable
exceptions in Eastern Europe, informality has been hard to tackle (figure 1.2). In countries such as
El Salvador, Morocco or Tanzania only one out of 5 workers is part of the formal sector. On
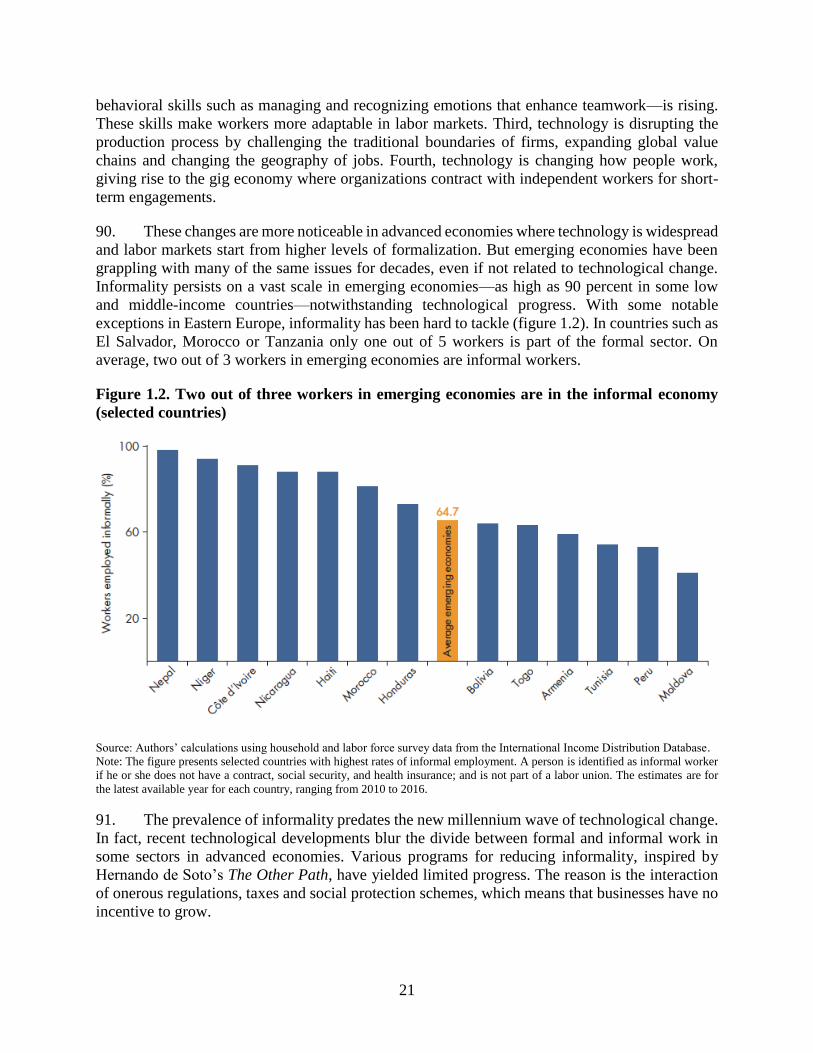
average, two out of 3 workers in emerging economies are informal workers.
Figure 1.2. Two out of three workers in emerging economies are in the informal economy
(selected countries)
Source: Authors’ calculations using household and labor force survey data from the International Income Distribution Database.
Note: The figure presents selected countries with highest rates of informal employment. A person is identified as informal worker
if he or she does not have a contract, social security, and health insurance; and is not part of a labor union. The estimates are for
the latest available year for each country, ranging from 2010 to 2016.
91. The prevalence of informality predates the new millennium wave of technological change.
In fact, recent technological developments blur the divide between formal and informal work in
some sectors in advanced economies. Various programs for reducing informality, inspired by
Hernando de Soto’s The Other Path, have yielded limited progress. The reason is the interaction
of onerous regulations, taxes and social protection schemes, which means that businesses have no
incentive to grow.
22
92. Technology is disrupting demand for three types of skills at work. First, returns to non-
routine cognitive and socio-behavioral skills appear to be rising, in both advanced and emerging
economies.23 Second, returns to job-specific skills that are routine are declining. Third, pay-offs to
combinations of different skill-types appear to be increasing.
93. Since 2001, the share of employment in occupations intensive in non-routine cognitive and
socio-behavioral skills has increased from 19 to 23 percent in emerging economies, and from 33
to 41 percent in advanced economies. In Vietnam, within a given industry, workers performing
non-routine analytical tasks earn 23 percent more; those on interpersonal tasks 13 percent more.
In Georgia and Armenia, the earnings premium for problem solving and learning new things at
work is close to 20 percent.24
94. Robots complement workers that engage in non-routine tasks that require advanced
analytical, interpersonal or manual skills that require significant dexterity. For example, teamwork,
relationship management, people management, care: these activities require people to react to one
another based on tacit knowledge. Designing, producing art, conducting research, managing teams,
nursing, cleaning have proven hard to automate. Robots have, for the most part, struggled to
replicate these skills to compete with workers.
95. Machines, including robots, replace workers most easily when it comes to routine tasks
that are “codifiable”. Some of these tasks are cognitive, such as processing payrolls, book-keeping,
or arithmetic. Others are manual or physical, such as operating welding machines, assembling
goods, operating forklifts. These tasks are easily automated. In Norway, broadband adoption by
firms improved employment among skilled workers but worsened it among unskilled workers. The
new technology complemented skilled workers in executing non-routine abstract tasks while
substituting for unskilled workers.25
96. Pay-offs to combinations of different skill-types are also increasing. The evolving world
of work demands skills-sets that improve the adaptability of workers, allowing them to transfer
easily from one job to another. Across countries, both higher-order cognitive (technical) skills and
socio-behavioral skills are consistently ranked among the skills most valued by employers.
Employers in Benin, Liberia, Malawi and Zambia rank teamwork, communication, and problem-
solving skills as the most important set of skills after technical skills.26
97. Even within a given occupation, the nature of the skills needed to perform a job is changing.
While the job of a personal assistant in 2018, for example, is quite different from what it was 15
years ago, the impact of technology on skills demand within occupations is not always in the
direction one may expect. In Chile, the adoption of complex software used for client, production,
and business management between 2007 and 2013 reallocated employment from skilled workers
to administrative, unskilled production workers. This shift led to an increase in the use of routine
manual tasks and a reduction in the use of abstract tasks within firms.27
98. In advanced economies employment has been growing fastest in high-skilled cognitive
occupations and low-skilled occupations that require dexterity. In contrast, employment has shifted
away from middle-skilled occupations like machine operators. This is one of the factors that may
translate into rising inequality in advanced economies. Both middle- and low-skilled workers could
see falling wages: the former because of automation; the latter because of increased competition.
23
99. Few studies have taken place in emerging economies, but some show that similar changes
in employment are taking place. In middle-income countries in Europe, for example Bulgaria and
Romania, the demand for non-routine cognitive and interpersonal work is rising but there is no
increase in low-skilled non-routine manual work.28 Routine cognitive work has increased in other
countries such as Botswana, Ethiopia, Mongolia, the Philippines and Vietnam.29 Studies observe,
in most cases, that the demand for non-routine cognitive and interpersonal skills is rising much
faster than for other skills. High-skilled workers are gaining with technological change while low-
skilled workers—especially those in manual jobs—seem to be losing out.
100. Other studies show that changes in employment have been positive. In Argentina the
adoption of information and communications technology in manufacturing increased employment
turnover through the replacement of workers, elimination of occupations, creation of new
occupations and a decrease in the share of unskilled workers. However, employment levels
increased across all skill categories.30
101. Technology is changing the geography of jobs by disrupting production processes,
challenging the traditional boundaries of firms and expanding global value chains. Other waves of
technological change have done the same. The industrial revolution, which mechanized
agricultural production, automated manufacturing and expanded exports led to mass migration of
labor from farms to cities. The advent of commercial passenger planes expanded tourism from
local holiday destinations in Northern Europe to new, foreign resorts on the Mediterranean Sea.
Thousands of new jobs were created in new locations.
102. Improvements in transcontinental communication technologies, along with the fall in
transportation costs, have expanded global value chains toward East Asia. Beyond technology, of
course, many other factors matter for outsourcing. The Philippines overtook India in 2017 in terms
of market share in the call center business at least partly due to lower taxes.
103. Technology enables clusters of business to form in under-developed rural areas. In China
rural micro e-tailers began to emerge in 2009 on Taobao.com Marketplace, which is owned by
Alibaba and is one of the largest online retail platforms in China . These clusters—referred to as
“Taobao Villages”—spread rapidly, from just 3 in 2009 to 2118 across 28 provinces in 2017. In
2017, there were 490,000 online shops. While sales have been strongest in traditional goods such
as apparel, furniture, shoes, luggage, leather goods, or auto accessories, sellers are diversifying
their offerings to include high-tech goods such as drones.31
104. Online work platforms eliminate many of the geographical barriers previously associated
with certain tasks. Bangladesh contributes 15 percent to the global labor pool online with 650,000
freelance workers.32
Indiez, founded in 2016 in India, takes a team-based approach to online
freelancing. The platform provides a remotely distributed community of talent—mainly from
India, Southeast Asia, and Eastern Europe—that works together on tech projects for clients
anywhere in the world. Clients include the pizza restaurant, Dominos India, as well as the Indian
multinational conglomerate, Aditya Birla Group. Wonderlabs in Indonesia follows a similar
model.
105. Finally, technology is changing how people work and the terms on which they work. Rather
than “standard” long-term contracts, digital technologies are giving rise to more short-term work,
24
often via online work platforms. These so-called “gigs” make certain kinds of work more
accessible to every individual on a more flexible basis. Increased access to digital infrastructure—
via laptops, tablets, and smartphones—provides an enabling environment for on-demand services
to boom. Examples range from grocery delivery, driving services to sophisticated tasks like
accounting, editing, or music production. ASUQU in Nigeria connects creatives and other experts
with businesses across Africa. CrewPencil works in the South African movie industry. Tutorama,
based in Egypt, connects students with local private tutors. In the Russian Federation, students
work as Yandex drivers whenever is most convenient with their university schedules. They
identify peak hours in different locations to achieve the highest level of passenger turnover.
106. Many of these changes amount to a convergence in the nature of work between advanced
and developing economies. Labor markets are becoming more fluid in advanced economies while
informality persists in emerging economies. Most challenges faced by short-term or temporary
workers, even in advanced economies, are the same as those faced by workers in the informal
sector. Self-employment, informal wage work with no written contracts or protections and low-
productivity jobs more generally are the norm in most of the developing world. Workers operate
in a regulatory grey area, with most labor laws unclear on roles and responsibilities of the employer
versus the employee. This group of workers often lacks access to benefits. There are no pensions,
no health or unemployment insurance schemes, or other workers’ protections.
107. This type of convergence is not what was expected in the 21st century. Traditionally,
economic development is synonymous with formalization. This is reflected in the design of social
protection systems and labor regulations. A formal wage employment contract is still the most
common basis for the protections afforded by social insurance programs and by regulations such
as minimum wages or severance pay. Changes in the nature of work caused by technology shifts
the pattern of demanding workers’ benefits from employers to directly demanding welfare benefits
from the state. These changes raise questions about the continuing relevance of current labor laws.
A Simple Model of Changing Work
108. Will robots turn the old Luddite fears of machine-replacing-man into reality? Will massive
automation mean that the old path of prosperity-through-industrialization, once taken by England,
Japan and China, is closing? How would public policy ensure that the evolution of work produces
a world that is both more prosperous and more equitable?33
109. Keynes correctly understood that employment in traditional sectors, especially in
agriculture, would decline enormously in the 20th century, but he failed to anticipate the explosion
of new products that 21st century workers would produce and consume. Most importantly, he failed
to foresee the vast service economy that would employ workers in most wealthy countries.
110. Breakthroughs, like digital technologies, enable firms to automate, replacing labor with
machines in production, and to innovate, expanding the number of tasks and products. The future
of work is determined by the battle between automation and innovation (figure 1.3). Automation
causes the employment in old sectors to decline; innovation causes new sectors or tasks to emerge.
The overall future of employment depends on both of them. It also depends on the labor and skills
intensity of the new sectors or tasks that emerge. These forces, in turn, affect wages.
25
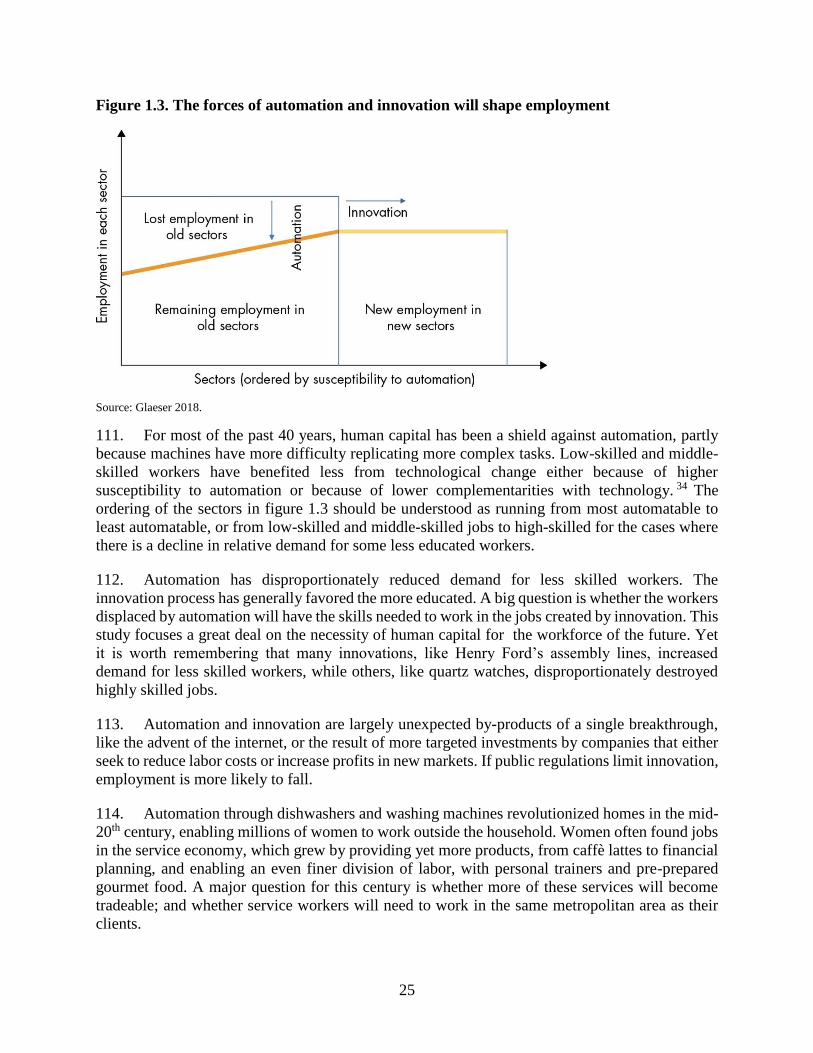
Figure 1.3. The forces of automation and innovation will shape employment
Source: Glaeser 2018.
111. For most of the past 40 years, human capital has been a shield against automation, partly
because machines have more difficulty replicating more complex tasks. Low-skilled and middle-
skilled workers have benefited less from technological change either because of higher
susceptibility to automation or because of lower complementarities with technology. 34 The
ordering of the sectors in figure 1.3 should be understood as running from most automatable to
least automatable, or from low-skilled and middle-skilled jobs to high-skilled for the cases where
there is a decline in relative demand for some less educated workers.
112. Automation has disproportionately reduced demand for less skilled workers. The
innovation process has generally favored the more educated. A big question is whether the workers
displaced by automation will have the skills needed to work in the jobs created by innovation. This
study focuses a great deal on the necessity of human capital for the workforce of the future. Yet
it is worth remembering that many innovations, like Henry Ford’s assembly lines, increased
demand for less skilled workers, while others, like quartz watches, disproportionately destroyed
highly skilled jobs.
113. Automation and innovation are largely unexpected by-products of a single breakthrough,
like the advent of the internet, or the result of more targeted investments by companies that either
seek to reduce labor costs or increase profits in new markets. If public regulations limit innovation,
employment is more likely to fall.
114. Automation through dishwashers and washing machines revolutionized homes in the mid-
20th century, enabling millions of women to work outside the household. Women often found jobs
in the service economy, which grew by providing yet more products, from caffè lattes to financial
planning, and enabling an even finer division of labor, with personal trainers and pre-prepared
gourmet food. A major question for this century is whether more of these services will become
tradeable; and whether service workers will need to work in the same metropolitan area as their
clients.
26
115. The battle between innovation and automation rages not only in the American and
European rustbelts. Even though low wage countries may not invest in the development of labor-
saving innovations, they import labor-saving ideas from advanced economies. In fact, the
mechanization of agriculture in emerging economies represents the largest global shift in work.
Cities in emerging countries must generate abundant new jobs to employ the farmers displaced by
the industrialization of agriculture. Declining costs of transportation and connectivity, which we
call globalization, enables these urban job markets to expand, as long as increased connectivity
moves more quickly than the automation of tradable good production. So, while the growth of
employment in emerging economies is supported by global value chains, automation may mean
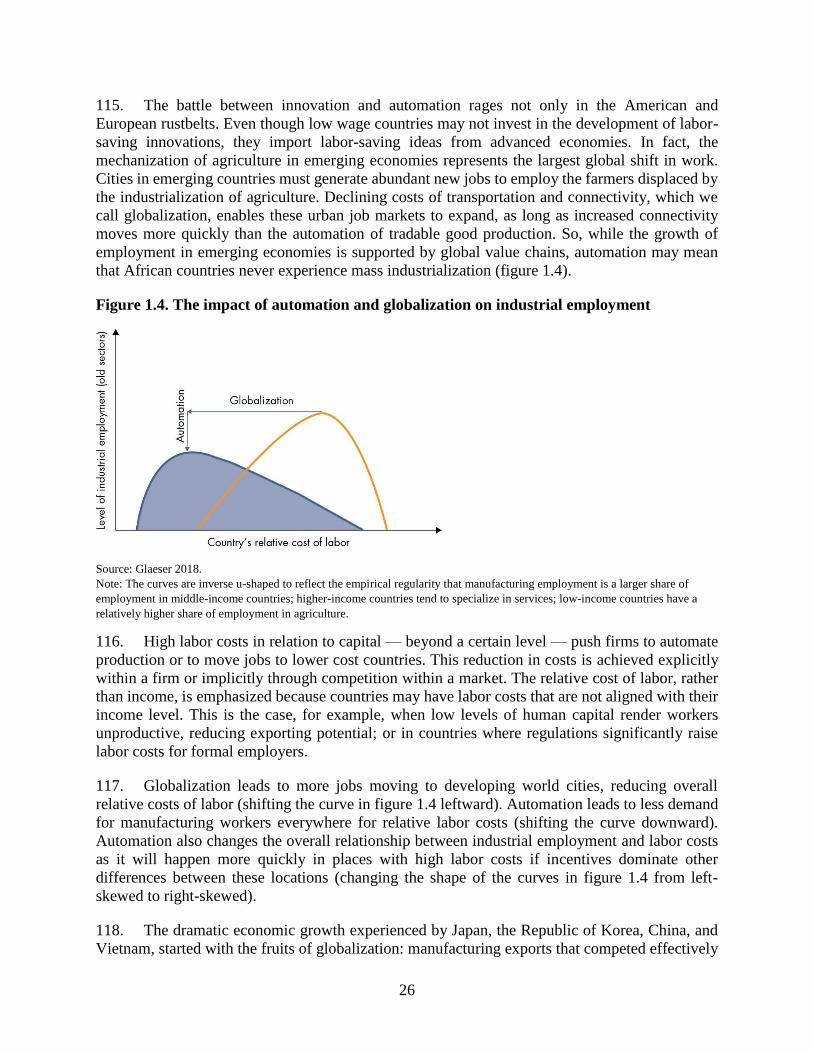
that African countries never experience mass industrialization (figure 1.4).
Figure 1.4. The impact of automation and globalization on industrial employment
Source: Glaeser 2018.
Note: The curves are inverse u-shaped to reflect the empirical regularity that manufacturing employment is a larger share of
employment in middle-income countries; higher-income countries tend to specialize in services; low-income countries have a
relatively higher share of employment in agriculture.
116. High labor costs in relation to capital — beyond a certain level — push firms to automate
production or to move jobs to lower cost countries. This reduction in costs is achieved explicitly
within a firm or implicitly through competition within a market. The relative cost of labor, rather
than income, is emphasized because countries may have labor costs that are not aligned with their
income level. This is the case, for example, when low levels of human capital render workers
unproductive, reducing exporting potential; or in countries where regulations significantly raise
labor costs for formal employers.
117. Globalization leads to more jobs moving to developing world cities, reducing overall
relative costs of labor (shifting the curve in figure 1.4 leftward). Automation leads to less demand
for manufacturing workers everywhere for relative labor costs (shifting the curve downward).
Automation also changes the overall relationship between industrial employment and labor costs
as it will happen more quickly in places with high labor costs if incentives dominate other
differences between these locations (changing the shape of the curves in figure 1.4 from left-
skewed to right-skewed).
118. The dramatic economic growth experienced by Japan, the Republic of Korea, China, and
Vietnam, started with the fruits of globalization: manufacturing exports that competed effectively
27
because of low labor costs. These countries chose policies investments in infrastructure, special
economic zones, and above all, human capital, that generated a high-quality labor force connected
to the outside world.
119. Shenzhen’s transformation from labor-intensive, low-cost manufacturing to high skilled,
technologically intense production illustrates the challenge that later industrializers are facing.
They must compete not only with the high labor cost, capital-intensive producers of the wealthy
west, but also the moderate labor cost, technology-intensive producers of Asia and Eastern Europe.
If robust global connections come too slowly to Africa, then industrialization may no longer be a
plausible path for job creation. This threat strengthens the case for investing rapidly in the
precursors of globalization—education and transportation infrastructure.35
120. If African cities maintain the current model, employment will remain in a low-wage,
informal service sector. Changing the model depends significantly on investments in human capital
(figure 1.5). In that case, Africa may urbanize as a service-producing economy, moving away from
export earnings based on natural resources and agriculture.
Figure 1.5. The role of human capital in shaping productivity and wages in emerging
economies
Source: Glaeser 2018.
121. Globalization increases the returns to human capital through higher labor productivity,
because some workers participate in export industries and because the shift of workers to those
industries increase the demand for all kinds of labor (figure 1.5). This positive shift is meant to
capture the positive experience of a poorer nation that has suddenly gained access to significant
foreign direct investment. Naturally, globalization may not always raise productivity across the
board.
122. The benefits of globalization will not accrue evenly. The figure also assumes that
globalization causes the variance of labor productivity to increase. While productivity for
subsistence farmers is low and relatively homogeneous, the returns to participating in a globalized
28
economy are far more mixed. By investing strongly in raising the human capital of their citizens,
governments increase their citizens’ chances of success in global markets.
123. The vertical lines in figure 1.5 denote the minimum productivity level at which firms find
it optimal to employ workers formally, before the move towards globalization. Minimum wages,
required benefits, along with other taxes and regulations ensure that informality is appealing for
all but the most productive workers before the economy grows. Figure 1.5 illustrates that, if
regulations stayed constant, globalization and automation would in many cases pull more workers
into the formal sector by increasing their productivity. Yet this formal employment effect may be
reduced if development leads countries to impose more requirements on firms. Globalization raises
incomes, but it may not do much to reduce informality if regulatory aspirations increase along with
global connections. Indeed, informality could even rise if globalization sufficiently increases
regulation.
124. Finally, policymakers need to think about risk management because of the predominance
of informality in developing countries and the higher uncertainty associated with the changing
nature of work. The large continuing presence of a vast informal service sector challenges risk
management systems that function through employers. Financing pensions and other forms of
insurance through payroll taxes that are levied on formal workers does little good if these workers
represent only a small share of the workforce. Strong requirements also deter formalization.
125. This study emphasizes the need for social inclusion for all workers regardless of how or
where they work. Governments try to strengthen social protection and reduce inequality through
requirements or subsidies for employer-provided support, such as minimum wages, employer-
provided health care or protection against dismissal. Alternatively, governments could pursue the
same goals through direct, state-provided support in the form of social assistance programs and
subsidized universal social insurance or public jobs, for example, for community health workers.
126. Both types of social policy promote equity. Both have costs. From the state’s perspective
there are different combinations of regulations and public aid that generate the same level of equity.
Direct public aid generates implementation costs through waste and higher tax rates (figure 1.6).
Employer requirements deter hiring and could, when too stringent, raise inequity by increasing the
share of workers who are either unemployed or in the informal sector.
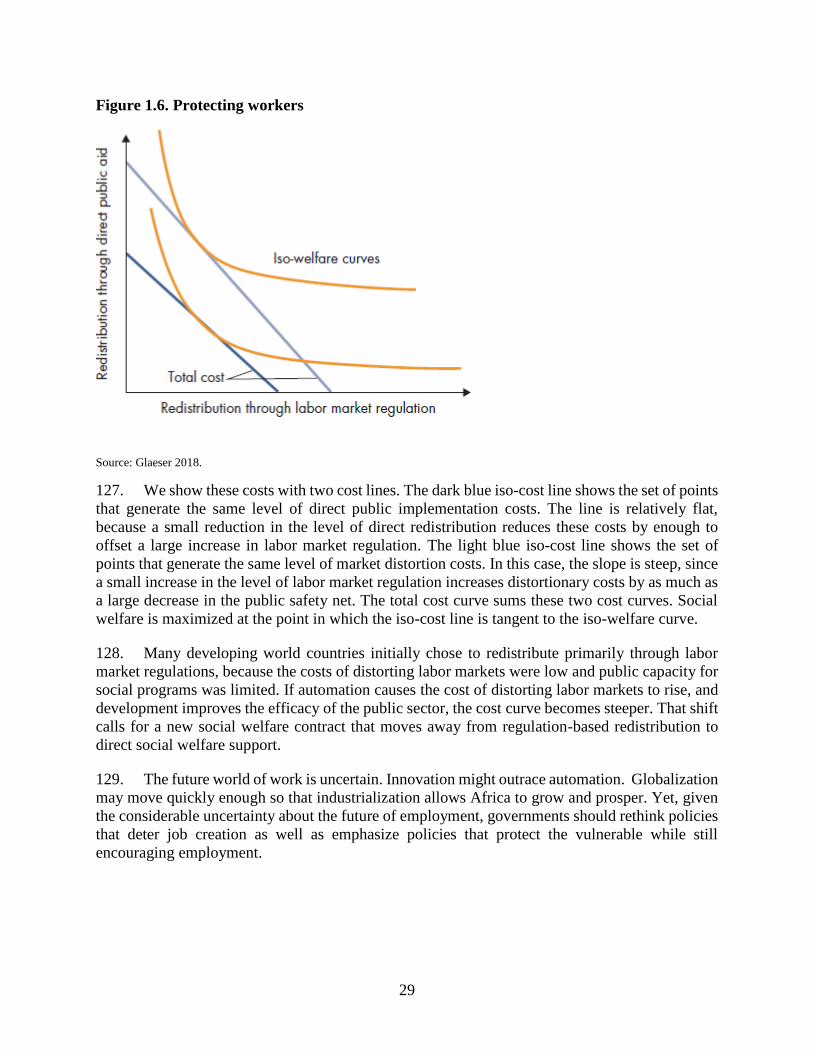
29
Figure 1.6. Protecting workers
Source: Glaeser 2018.
127. We show these costs with two cost lines. The dark blue iso-cost line shows the set of points
that generate the same level of direct public implementation costs. The line is relatively flat,
because a small reduction in the level of direct redistribution reduces these costs by enough to
offset a large increase in labor market regulation. The light blue iso-cost line shows the set of
points that generate the same level of market distortion costs. In this case, the slope is steep, since
a small increase in the level of labor market regulation increases distortionary costs by as much as
a large decrease in the public safety net. The total cost curve sums these two cost curves. Social
welfare is maximized at the point in which the iso-cost line is tangent to the iso-welfare curve.
128. Many developing world countries initially chose to redistribute primarily through labor
market regulations, because the costs of distorting labor markets were low and public capacity for
social programs was limited. If automation causes the cost of distorting labor markets to rise, and
development improves the efficacy of the public sector, the cost curve becomes steeper. That shift
calls for a new social welfare contract that moves away from regulation-based redistribution to
direct social welfare support.
129. The future world of work is uncertain. Innovation might outrace automation. Globalization
may move quickly enough so that industrialization allows Africa to grow and prosper. Yet, given
the considerable uncertainty about the future of employment, governments should rethink policies
that deter job creation as well as emphasize policies that protect the vulnerable while still
encouraging employment.

30
Chapter 2: Building Human Capital
130. The world is healthier and more educated than ever. In 1980, only five in ten primary-
school-aged children in low-income countries were enrolled in school. By 2015 this number had
increased to 8 in 10.36 In 1980 only 84 out of 100 children reached their fifth birthday, compared
with 94 out of 100 in 2018. A child born in the developing world in 1980 could expect to live for
52 years. In 2018 this number is 65 years.
131. However, a large unfinished agenda remains. Life expectancy in the developing world still
lags far behind rich countries like South Korea, where a girl born in 2018 can expect to live more
than 85 years. Nearly a quarter of children under five are malnourished. In many places, the
working memory and executive functions such as sustained attention of poor children start to lag
as early as at six months of age.37 Globally, more than 260 million children and youth are not in
school. Nearly 60 percent of primary school children in developing countries fail to achieve
minimum proficiency in learning.
132. Human capital consists of the knowledge, skills and health that people accumulate over
their lives, enabling them to realize their potential as productive members of society. Human
capital has large payoffs for individuals, societies and countries. This was true in the 1700s when
Adam Smith wrote, “The acquisition of…talents during…education, study or apprenticeship, costs
a real expense, which [is] capital in [a] person. Those talents [are] part of his fortune [and] likewise
that of society.”38 This is still true in 2018.
133. For individuals, an additional year of school generates eight to ten percent higher earnings
on average. These returns are large in low- and middle-income countries, especially for women.
However, what children learn matters more than how long they stay in school. In the United States
replacing a low-quality teacher in an elementary school classroom with an average-quality teacher
raises the combined lifetime income of that classroom’s students by US$250,000.39
134. Returns to education are high when technology is changing. During the Green Revolution
in India in the 1970s-80s better educated farmers adopted new technologies.40 In Mexico the
benefits of increased labor productivity resulting from the North American Free Trade Agreement
were concentrated among more skilled workers.41 In the current era of technological change
human capital is more important than ever. Despite the higher supply of educated workers, returns
to investments in education have increased since 2000.42 People with higher human capital adapt
faster to technological change. Future success depends on working with machines, not fearing
them.
135. Developing socio-behavioral skills such as aptitude for teamwork, empathy, conflict
resolution and relationship management enlarges a person’s human capital. Globalized and
automated economies put a higher premium on human capabilities that cannot be fully mimicked
by machines. Abilities such as grit have economic returns that are often as large as those associated
with cognitive skills.43
136. Health is an important component of human capital. People are more productive when they
are healthier. In Nigeria a program providing malaria testing and treatment increased workers’
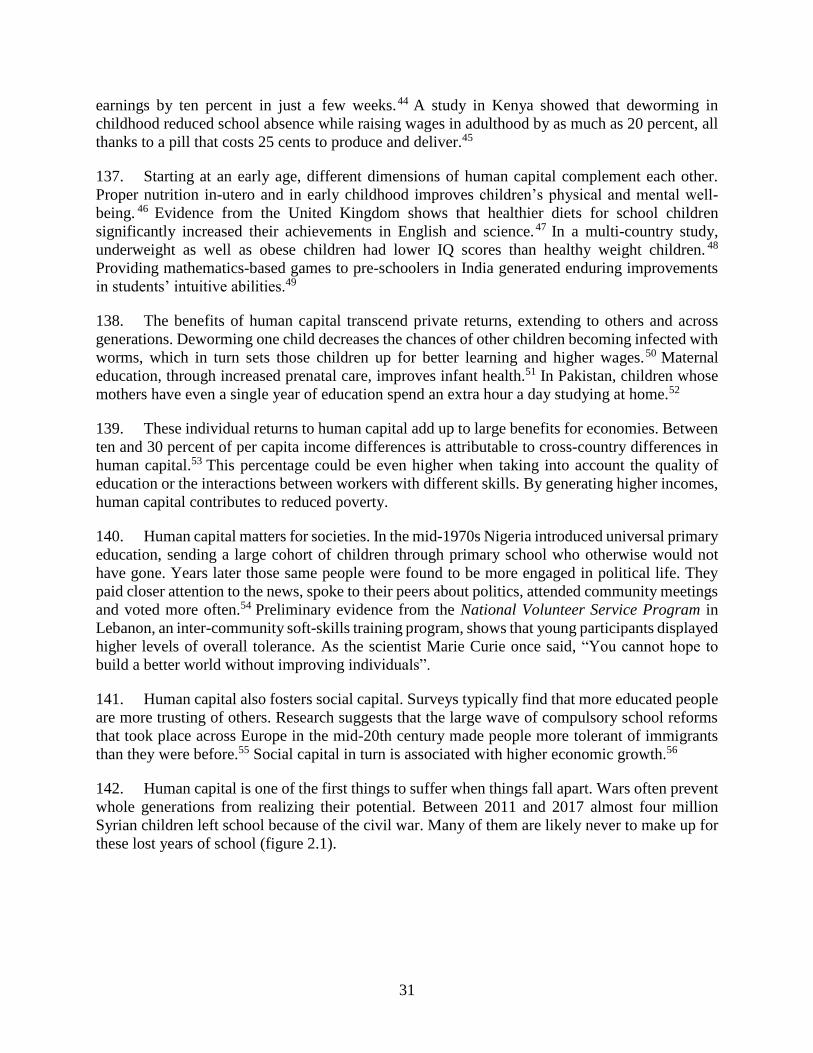
31
earnings by ten percent in just a few weeks.44 A study in Kenya showed that deworming in
childhood reduced school absence while raising wages in adulthood by as much as 20 percent, all
thanks to a pill that costs 25 cents to produce and deliver.45
137. Starting at an early age, different dimensions of human capital complement each other.
Proper nutrition in-utero and in early childhood improves children’s physical and mental well-
being. 46 Evidence from the United Kingdom shows that healthier diets for school children
significantly increased their achievements in English and science.47 In a multi-country study,
underweight as well as obese children had lower IQ scores than healthy weight children. 48
Providing mathematics-based games to pre-schoolers in India generated enduring improvements
in students’ intuitive abilities.49
138. The benefits of human capital transcend private returns, extending to others and across
generations. Deworming one child decreases the chances of other children becoming infected with
worms, which in turn sets those children up for better learning and higher wages.50 Maternal
education, through increased prenatal care, improves infant health.51 In Pakistan, children whose
mothers have even a single year of education spend an extra hour a day studying at home.52
139. These individual returns to human capital add up to large benefits for economies. Between
ten and 30 percent of per capita income differences is attributable to cross-country differences in
human capital.53 This percentage could be even higher when taking into account the quality of
education or the interactions between workers with different skills. By generating higher incomes,
human capital contributes to reduced poverty.
140. Human capital matters for societies. In the mid-1970s Nigeria introduced universal primary
education, sending a large cohort of children through primary school who otherwise would not
have gone. Years later those same people were found to be more engaged in political life. They
paid closer attention to the news, spoke to their peers about politics, attended community meetings
and voted more often.54 Preliminary evidence from the National Volunteer Service Program in
Lebanon, an inter-community soft-skills training program, shows that young participants displayed
higher levels of overall tolerance. As the scientist Marie Curie once said, “You cannot hope to
build a better world without improving individuals”.
141. Human capital also fosters social capital. Surveys typically find that more educated people
are more trusting of others. Research suggests that the large wave of compulsory school reforms
that took place across Europe in the mid-20th century made people more tolerant of immigrants
than they were before.55 Social capital in turn is associated with higher economic growth.56
142. Human capital is one of the first things to suffer when things fall apart. Wars often prevent
whole generations from realizing their potential. Between 2011 and 2017 almost four million
Syrian children left school because of the civil war. Many of them are likely never to make up for
these lost years of school (figure 2.1).
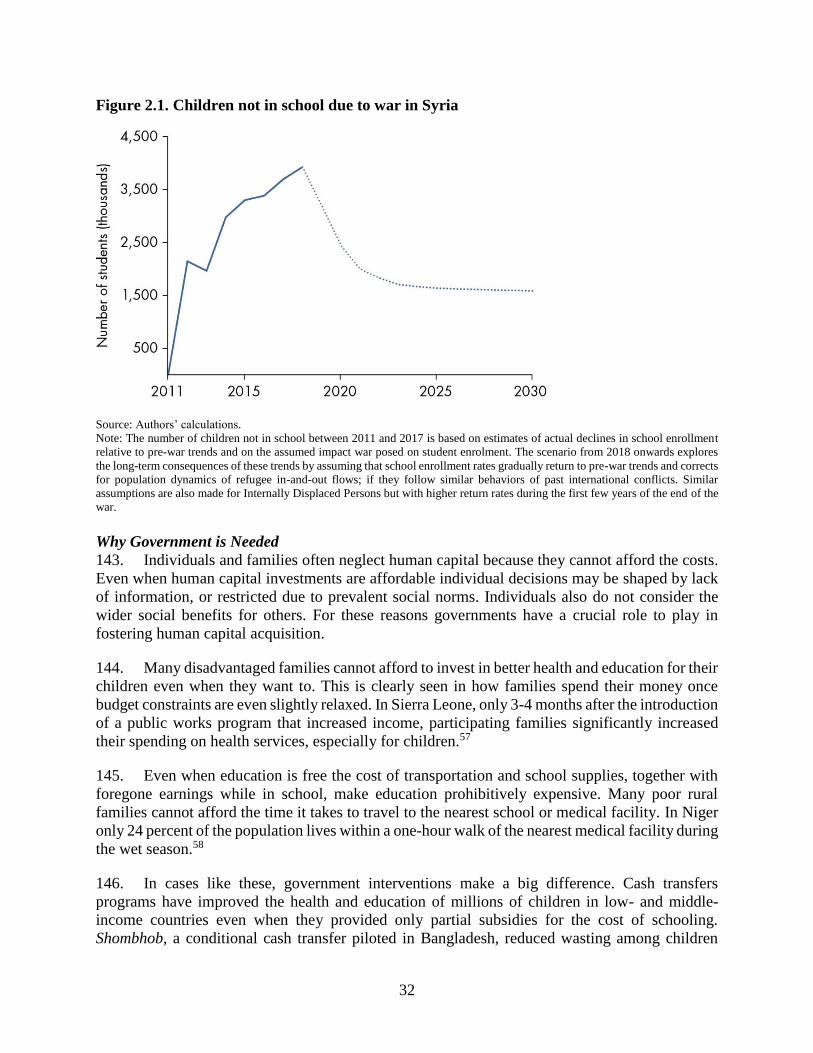
32
Figure 2.1. Children not in school due to war in Syria
Source: Authors’ calculations.
Note: The number of children not in school between 2011 and 2017 is based on estimates of actual declines in school enrollment
relative to pre-war trends and on the assumed impact war posed on student enrolment. The scenario from 2018 onwards explores
the long-term consequences of these trends by assuming that school enrollment rates gradually return to pre-war trends and corrects
for population dynamics of refugee in-and-out flows; if they follow similar behaviors of past international conflicts. Similar
assumptions are also made for Internally Displaced Persons but with higher return rates during the first few years of the end of the
war.
Why Government is Needed
143. Individuals and families often neglect human capital because they cannot afford the costs.
Even when human capital investments are affordable individual decisions may be shaped by lack
of information, or restricted due to prevalent social norms. Individuals also do not consider the
wider social benefits for others. For these reasons governments have a crucial role to play in
fostering human capital acquisition.
144. Many disadvantaged families cannot afford to invest in better health and education for their
children even when they want to. This is clearly seen in how families spend their money once
budget constraints are even slightly relaxed. In Sierra Leone, only 3-4 months after the introduction
of a public works program that increased income, participating families significantly increased
their spending on health services, especially for children.57
145. Even when education is free the cost of transportation and school supplies, together with
foregone earnings while in school, make education prohibitively expensive. Many poor rural
families cannot afford the time it takes to travel to the nearest school or medical facility. In Niger
only 24 percent of the population lives within a one-hour walk of the nearest medical facility during
the wet season.58
146. In cases like these, government interventions make a big difference. Cash transfers
programs have improved the health and education of millions of children in low- and middle-
income countries even when they provided only partial subsidies for the cost of schooling.
Shombhob, a conditional cash transfer piloted in Bangladesh, reduced wasting among children
33
aged 10-22 months and improved mothers’ knowledge about the benefits of breastfeeding.59 The
effects of these programs last over time. A two-year conditional cash transfer program in Malawi
targeting adolescent girls and young women produced a large increase in educational attainment
and a sustained reduction in the total number of births in girls who were out of school at the start
of the program. This persisted after the program ended.60
147. Some parents neglect their children’s human capital because of social norms. This is
particularly evident for girls. Infant mortality among girls increases more than it does for boys
during economic downturns.61 Lower investment in girls’ health has effects that last a lifetime. A
study in Indonesia found that girls—but not boys—whose families experienced adverse income
shocks completed less school and ended up poorer as adults.62
148. People also neglect investment in human capital because they do not always know what is
in their long-term interest. Young people might not want to stay in school or take care of their
health because they lack self-control or do not fully appreciate the benefits. Providing information
about human capital has had large effects on behavior. In the Philippines young people were
offered a voluntary commitment program in which their savings were returned only if the person
passed a smoking cessation test. The program resulted in a significant reduction in smoking.63
149. Human capital investment generates significant social returns but these are often hard for
parents to quantify, let alone factor into their decisions. When deciding to deworm their children,
parents may not consider the fact that other children will also be less likely to be infected. Parents
deciding to send their children to pre-school may not consider wider future societal benefits such
as lower crime and incarceration rates that have been associated with early childhood development
programs. A 2010 study of Perry Pre-school, a high-quality program for three- to five-year-olds
developed in Michigan, United States, in the 1960s, estimated a return to society over and above
the private return of about US$7-12 for each dollar invested.64 Without government interventions
families might not choose to invest enough in these types of programs.
150. Ensuring access to those services closes early gaps in cognitive and socio-behavioral
skills.65 By the age of three, children from low-income families have heard 30 million fewer words
than their more affluent peers. As children turn into teenagers, interventions to close these gaps
become more expensive.66
151. Evidence suggests that, for governments looking to make effective investments in human
capital, there is no better proposition than investing in the “first thousand days” of a child’s life.
Without these interventions early in life, it is more likely that a de-equalizing spiral will ensue: the
benefits of subsequent public investments in education and health are more likely to benefit people
who start out better off. In Mexico, 45 percent of public spending on tertiary education accrues to
students from the top income quintile.67
152. Government actions to support investment in human capital go well beyond spending on
health, education and social protection programs. Other public investments play an important
complementary role in levelling the field. Evidence from Nepal shows that sanitation significantly
contributes to preventing anemia.68 Housing programs improve the education and labor market
outcomes of the most disadvantaged by changing the quality of the peers with whom they interact.
The effects tend to be stronger the earlier children are exposed to the better off neighbors.69
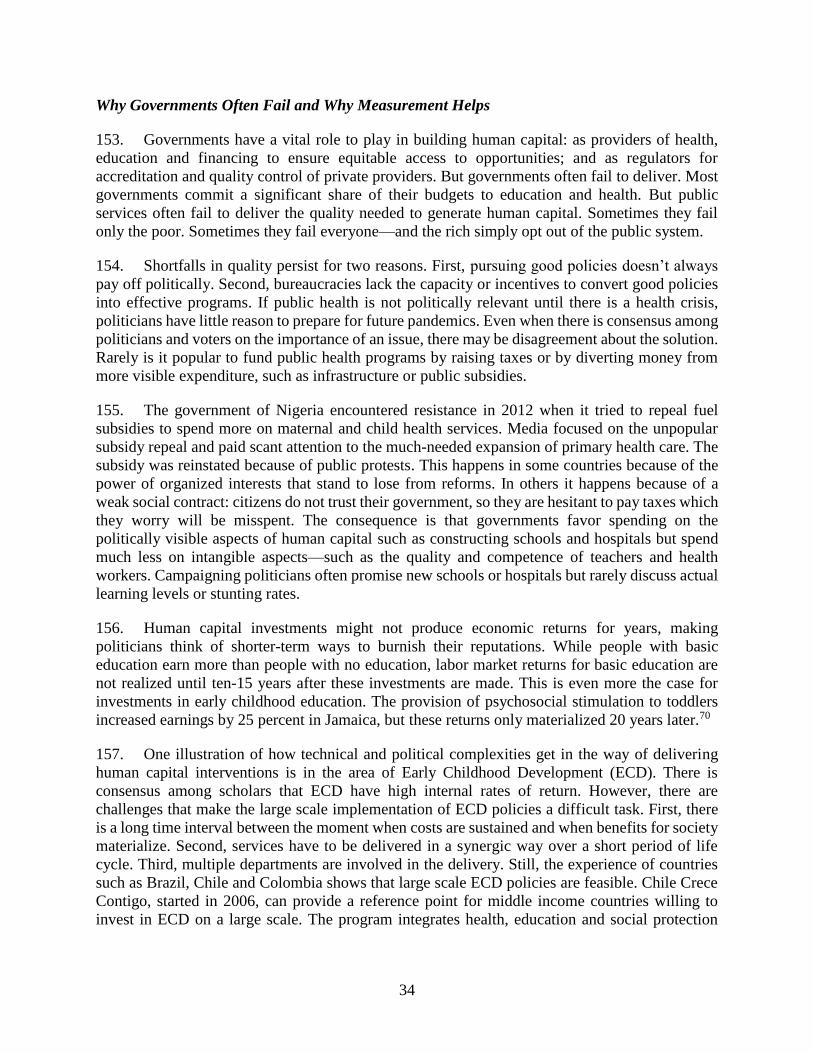
34
Why Governments Often Fail and Why Measurement Helps
153. Governments have a vital role to play in building human capital: as providers of health,
education and financing to ensure equitable access to opportunities; and as regulators for
accreditation and quality control of private providers. But governments often fail to deliver. Most
governments commit a significant share of their budgets to education and health. But public
services often fail to deliver the quality needed to generate human capital. Sometimes they fail
only the poor. Sometimes they fail everyone—and the rich simply opt out of the public system.
154. Shortfalls in quality persist for two reasons. First, pursuing good policies doesn’t always
pay off politically. Second, bureaucracies lack the capacity or incentives to convert good policies
into effective programs. If public health is not politically relevant until there is a health crisis,
politicians have little reason to prepare for future pandemics. Even when there is consensus among
politicians and voters on the importance of an issue, there may be disagreement about the solution.
Rarely is it popular to fund public health programs by raising taxes or by diverting money from
more visible expenditure, such as infrastructure or public subsidies.
155. The government of Nigeria encountered resistance in 2012 when it tried to repeal fuel
subsidies to spend more on maternal and child health services. Media focused on the unpopular
subsidy repeal and paid scant attention to the much-needed expansion of primary health care. The
subsidy was reinstated because of public protests. This happens in some countries because of the
power of organized interests that stand to lose from reforms. In others it happens because of a
weak social contract: citizens do not trust their government, so they are hesitant to pay taxes which
they worry will be misspent. The consequence is that governments favor spending on the
politically visible aspects of human capital such as constructing schools and hospitals but spend
much less on intangible aspects—such as the quality and competence of teachers and health
workers. Campaigning politicians often promise new schools or hospitals but rarely discuss actual
learning levels or stunting rates.
156. Human capital investments might not produce economic returns for years, making
politicians think of shorter-term ways to burnish their reputations. While people with basic
education earn more than people with no education, labor market returns for basic education are
not realized until ten-15 years after these investments are made. This is even more the case for
investments in early childhood education. The provision of psychosocial stimulation to toddlers
increased earnings by 25 percent in Jamaica, but these returns only materialized 20 years later.70
157. One illustration of how technical and political complexities get in the way of delivering
human capital interventions is in the area of Early Childhood Development (ECD). There is
consensus among scholars that ECD have high internal rates of return. However, there are
challenges that make the large scale implementation of ECD policies a difficult task. First, there
is a long time interval between the moment when costs are sustained and when benefits for society
materialize. Second, services have to be delivered in a synergic way over a short period of life
cycle. Third, multiple departments are involved in the delivery. Still, the experience of countries
such as Brazil, Chile and Colombia shows that large scale ECD policies are feasible. Chile Crece
Contigo, started in 2006, can provide a reference point for middle income countries willing to
invest in ECD on a large scale. The program integrates health, education and social protection
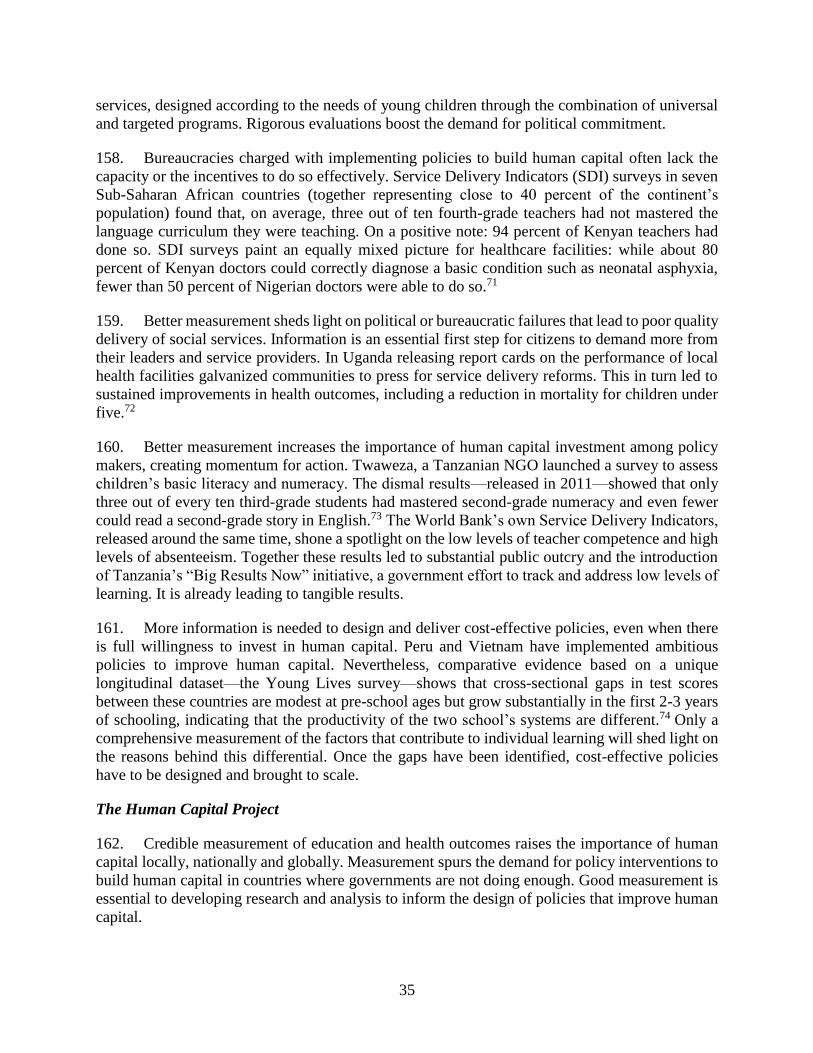
35
services, designed according to the needs of young children through the combination of universal
and targeted programs. Rigorous evaluations boost the demand for political commitment.
158. Bureaucracies charged with implementing policies to build human capital often lack the
capacity or the incentives to do so effectively. Service Delivery Indicators (SDI) surveys in seven
Sub-Saharan African countries (together representing close to 40 percent of the continent’s
population) found that, on average, three out of ten fourth-grade teachers had not mastered the
language curriculum they were teaching. On a positive note: 94 percent of Kenyan teachers had
done so. SDI surveys paint an equally mixed picture for healthcare facilities: while about 80
percent of Kenyan doctors could correctly diagnose a basic condition such as neonatal asphyxia,
fewer than 50 percent of Nigerian doctors were able to do so.71
159. Better measurement sheds light on political or bureaucratic failures that lead to poor quality
delivery of social services. Information is an essential first step for citizens to demand more from
their leaders and service providers. In Uganda releasing report cards on the performance of local
health facilities galvanized communities to press for service delivery reforms. This in turn led to
sustained improvements in health outcomes, including a reduction in mortality for children under
five.72
160. Better measurement increases the importance of human capital investment among policy
makers, creating momentum for action. Twaweza, a Tanzanian NGO launched a survey to assess
children’s basic literacy and numeracy. The dismal results—released in 2011—showed that only
three out of every ten third-grade students had mastered second-grade numeracy and even fewer
could read a second-grade story in English.73 The World Bank’s own Service Delivery Indicators,
released around the same time, shone a spotlight on the low levels of teacher competence and high
levels of absenteeism. Together these results led to substantial public outcry and the introduction
of Tanzania’s “Big Results Now” initiative, a government effort to track and address low levels of
learning. It is already leading to tangible results.
161. More information is needed to design and deliver cost-effective policies, even when there
is full willingness to invest in human capital. Peru and Vietnam have implemented ambitious
policies to improve human capital. Nevertheless, comparative evidence based on a unique
longitudinal dataset—the Young Lives survey—shows that cross-sectional gaps in test scores
between these countries are modest at pre-school ages but grow substantially in the first 2-3 years
of schooling, indicating that the productivity of the two school’s systems are different.74 Only a
comprehensive measurement of the factors that contribute to individual learning will shed light on
the reasons behind this differential. Once the gaps have been identified, cost-effective policies
have to be designed and brought to scale.
The Human Capital Project
162. Credible measurement of education and health outcomes raises the importance of human
capital locally, nationally and globally. Measurement spurs the demand for policy interventions to
build human capital in countries where governments are not doing enough. Good measurement is
essential to developing research and analysis to inform the design of policies that improve human
capital.
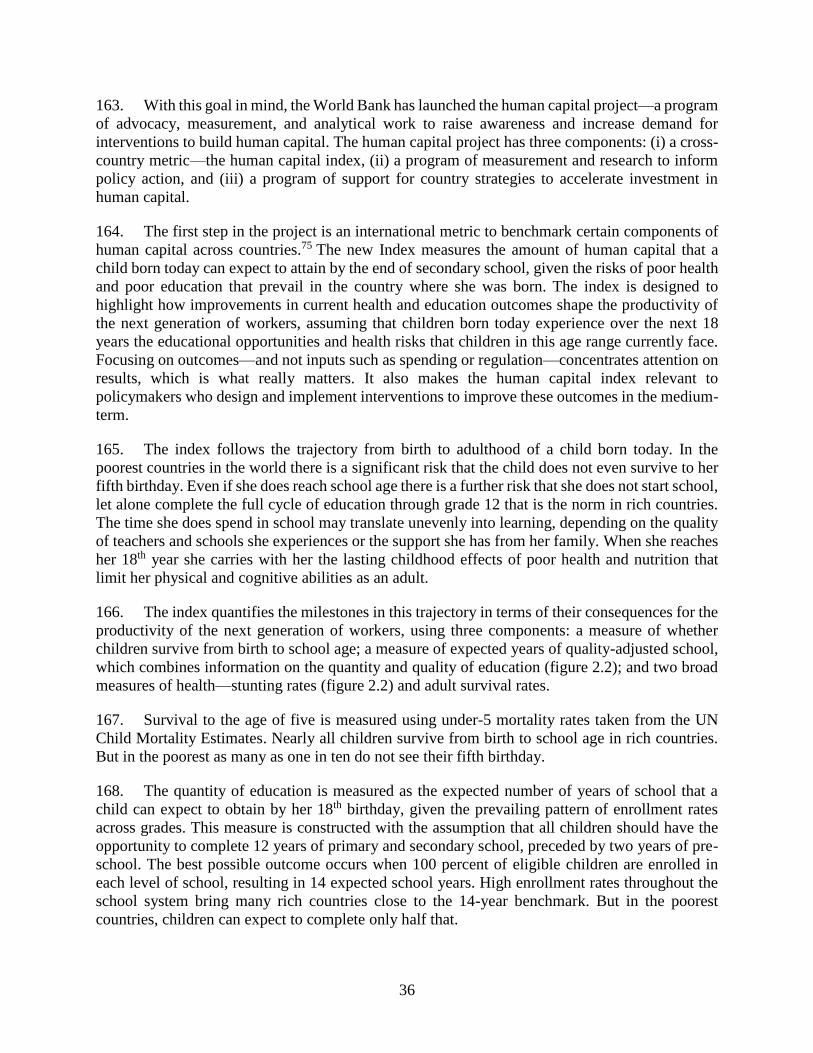
36
163. With this goal in mind, the World Bank has launched the human capital project—a program
of advocacy, measurement, and analytical work to raise awareness and increase demand for
interventions to build human capital. The human capital project has three components: (i) a cross-
country metric—the human capital index, (ii) a program of measurement and research to inform
policy action, and (iii) a program of support for country strategies to accelerate investment in
human capital.
164. The first step in the project is an international metric to benchmark certain components of
human capital across countries.75 The new Index measures the amount of human capital that a
child born today can expect to attain by the end of secondary school, given the risks of poor health
and poor education that prevail in the country where she was born. The index is designed to
highlight how improvements in current health and education outcomes shape the productivity of
the next generation of workers, assuming that children born today experience over the next 18
years the educational opportunities and health risks that children in this age range currently face.
Focusing on outcomes—and not inputs such as spending or regulation—concentrates attention on
results, which is what really matters. It also makes the human capital index relevant to
policymakers who design and implement interventions to improve these outcomes in the medium-
term.
165. The index follows the trajectory from birth to adulthood of a child born today. In the
poorest countries in the world there is a significant risk that the child does not even survive to her
fifth birthday. Even if she does reach school age there is a further risk that she does not start school,
let alone complete the full cycle of education through grade 12 that is the norm in rich countries.
The time she does spend in school may translate unevenly into learning, depending on the quality
of teachers and schools she experiences or the support she has from her family. When she reaches
her 18th year she carries with her the lasting childhood effects of poor health and nutrition that
limit her physical and cognitive abilities as an adult.
166. The index quantifies the milestones in this trajectory in terms of their consequences for the
productivity of the next generation of workers, using three components: a measure of whether
children survive from birth to school age; a measure of expected years of quality-adjusted school,
which combines information on the quantity and quality of education (figure 2.2); and two broad
measures of health—stunting rates (figure 2.2) and adult survival rates.
167. Survival to the age of five is measured using under-5 mortality rates taken from the UN
Child Mortality Estimates. Nearly all children survive from birth to school age in rich countries.
But in the poorest as many as one in ten do not see their fifth birthday.
168. The quantity of education is measured as the expected number of years of school that a
child can expect to obtain by her 18th birthday, given the prevailing pattern of enrollment rates
across grades. This measure is constructed with the assumption that all children should have the
opportunity to complete 12 years of primary and secondary school, preceded by two years of pre-
school. The best possible outcome occurs when 100 percent of eligible children are enrolled in
each level of school, resulting in 14 expected school years. High enrollment rates throughout the
school system bring many rich countries close to the 14-year benchmark. But in the poorest
countries, children can expect to complete only half that.
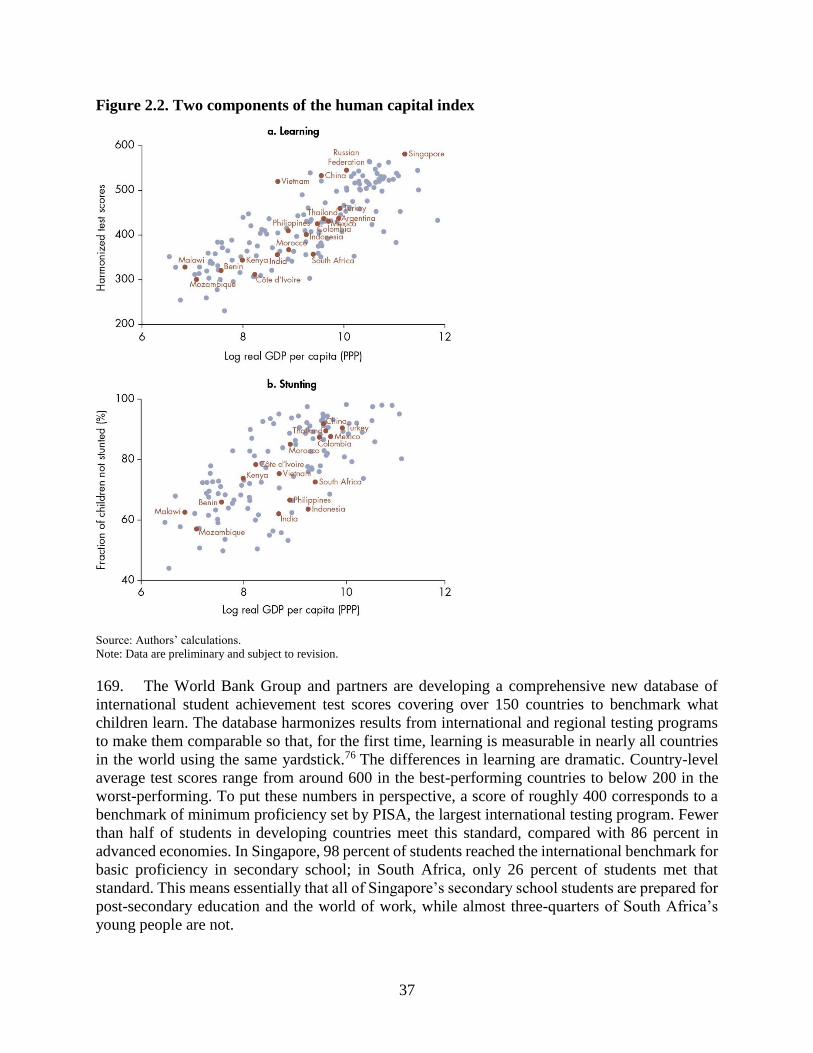
37
Figure 2.2. Two components of the human capital index
Source: Authors’ calculations.
Note: Data are preliminary and subject to revision.
169. The World Bank Group and partners are developing a comprehensive new database of
international student achievement test scores covering over 150 countries to benchmark what
children learn. The database harmonizes results from international and regional testing programs
to make them comparable so that, for the first time, learning is measurable in nearly all countries
in the world using the same yardstick.76 The differences in learning are dramatic. Country-level
average test scores range from around 600 in the best-performing countries to below 200 in the
worst-performing. To put these numbers in perspective, a score of roughly 400 corresponds to a
benchmark of minimum proficiency set by PISA, the largest international testing program. Fewer
than half of students in developing countries meet this standard, compared with 86 percent in
advanced economies. In Singapore, 98 percent of students reached the international benchmark for
basic proficiency in secondary school; in South Africa, only 26 percent of students met that
standard. This means essentially that all of Singapore’s secondary school students are prepared for
post-secondary education and the world of work, while almost three-quarters of South Africa’s
young people are not.
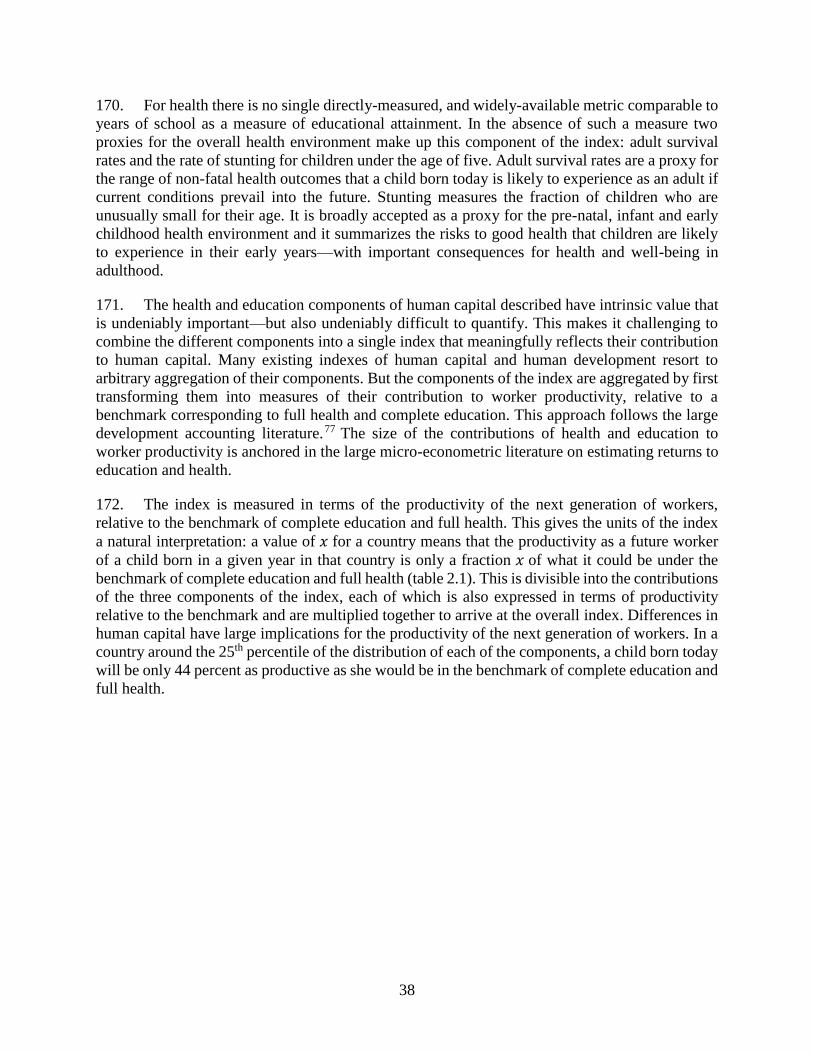
38
170. For health there is no single directly-measured, and widely-available metric comparable to
years of school as a measure of educational attainment. In the absence of such a measure two
proxies for the overall health environment make up this component of the index: adult survival
rates and the rate of stunting for children under the age of five. Adult survival rates are a proxy for
the range of non-fatal health outcomes that a child born today is likely to experience as an adult if
current conditions prevail into the future. Stunting measures the fraction of children who are
unusually small for their age. It is broadly accepted as a proxy for the pre-natal, infant and early
childhood health environment and it summarizes the risks to good health that children are likely
to experience in their early years—with important consequences for health and well-being in
adulthood.
171. The health and education components of human capital described have intrinsic value that
is undeniably important—but also undeniably difficult to quantify. This makes it challenging to
combine the different components into a single index that meaningfully reflects their contribution
to human capital. Many existing indexes of human capital and human development resort to
arbitrary aggregation of their components. But the components of the index are aggregated by first
transforming them into measures of their contribution to worker productivity, relative to a
benchmark corresponding to full health and complete education. This approach follows the large
development accounting literature.77 The size of the contributions of health and education to
worker productivity is anchored in the large micro-econometric literature on estimating returns to
education and health.
172. The index is measured in terms of the productivity of the next generation of workers,
relative to the benchmark of complete education and full health. This gives the units of the index
a natural interpretation: a value of 𝑥 for a country means that the productivity as a future worker
of a child born in a given year in that country is only a fraction 𝑥 of what it could be under the
benchmark of complete education and full health (table 2.1). This is divisible into the contributions
of the three components of the index, each of which is also expressed in terms of productivity
relative to the benchmark and are multiplied together to arrive at the overall index. Differences in
human capital have large implications for the productivity of the next generation of workers. In a
country around the 25th percentile of the distribution of each of the components, a child born today
will be only 44 percent as productive as she would be in the benchmark of complete education and
full health.
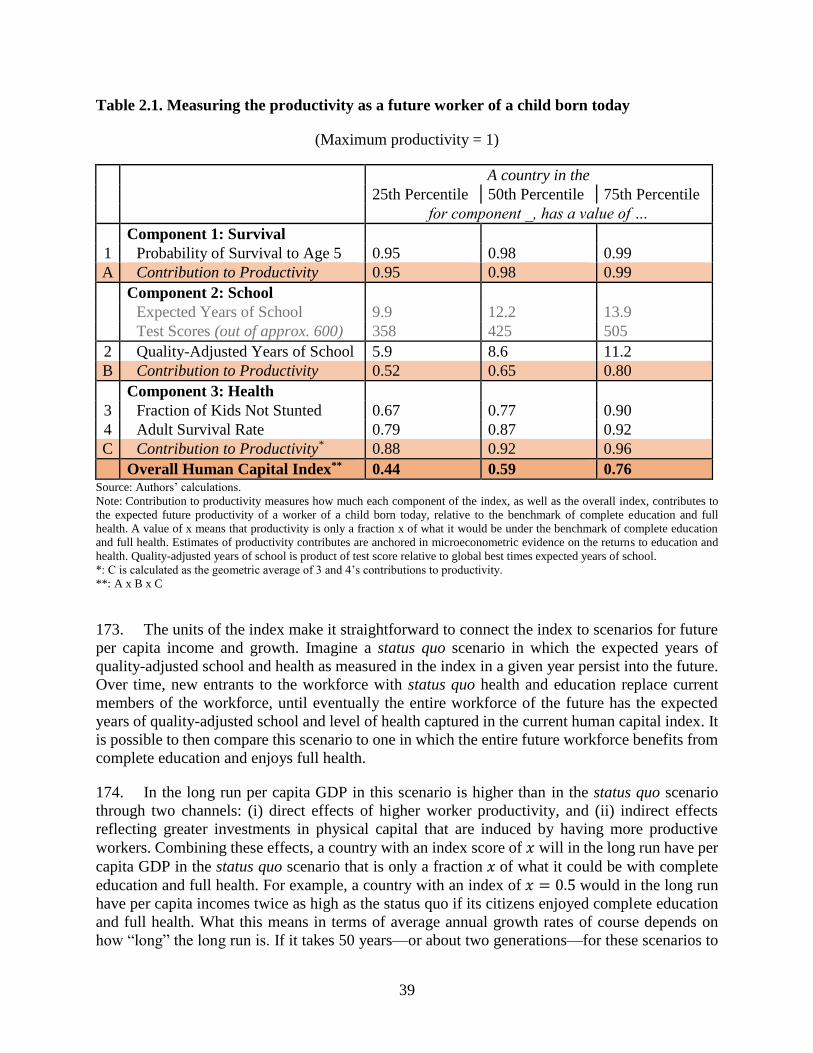
39
Table 2.1. Measuring the productivity as a future worker of a child born today
(Maximum productivity = 1)
A country in the 25th Percentile 50th Percentile 75th Percentile
for component _, has a value of …
Component 1: Survival
1 Probability of Survival to Age 5 0.95 0.98 0.99
A Contribution to Productivity 0.95 0.98 0.99
Component 2: School
Expected Years of School 9.9 12.2 13.9
Test Scores (out of approx. 600) 358 425 505
2 Quality-Adjusted Years of School 5.9 8.6 11.2
B Contribution to Productivity 0.52 0.65 0.80
Component 3: Health
3 Fraction of Kids Not Stunted 0.67 0.77 0.90
4 Adult Survival Rate 0.79 0.87 0.92
C Contribution to Productivity* 0.88 0.92 0.96
Overall Human Capital Index** 0.44 0.59 0.76 Source: Authors’ calculations.
Note: Contribution to productivity measures how much each component of the index, as well as the overall index, contributes to
the expected future productivity of a worker of a child born today, relative to the benchmark of complete education and full
health. A value of x means that productivity is only a fraction x of what it would be under the benchmark of complete education
and full health. Estimates of productivity contributes are anchored in microeconometric evidence on the returns to education and
health. Quality-adjusted years of school is product of test score relative to global best times expected years of school.
*: C is calculated as the geometric average of 3 and 4’s contributions to productivity.
**: A x B x C
173. The units of the index make it straightforward to connect the index to scenarios for future
per capita income and growth. Imagine a status quo scenario in which the expected years of
quality-adjusted school and health as measured in the index in a given year persist into the future.
Over time, new entrants to the workforce with status quo health and education replace current
members of the workforce, until eventually the entire workforce of the future has the expected
years of quality-adjusted school and level of health captured in the current human capital index. It
is possible to then compare this scenario to one in which the entire future workforce benefits from
complete education and enjoys full health.
174. In the long run per capita GDP in this scenario is higher than in the status quo scenario
through two channels: (i) direct effects of higher worker productivity, and (ii) indirect effects
reflecting greater investments in physical capital that are induced by having more productive
workers. Combining these effects, a country with an index score of 𝑥 will in the long run have per
capita GDP in the status quo scenario that is only a fraction 𝑥 of what it could be with complete
education and full health. For example, a country with an index of 𝑥 = 0.5 would in the long run
have per capita incomes twice as high as the status quo if its citizens enjoyed complete education
and full health. What this means in terms of average annual growth rates of course depends on
how “long” the long run is. If it takes 50 years—or about two generations—for these scenarios to
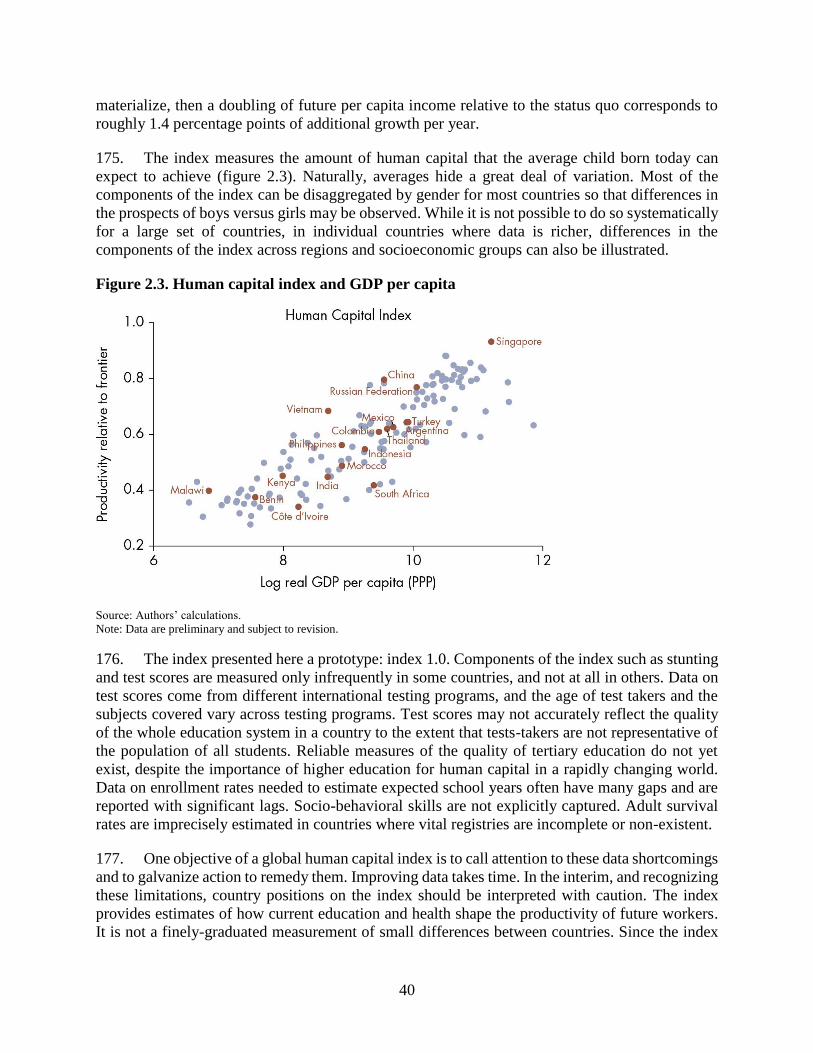
40
materialize, then a doubling of future per capita income relative to the status quo corresponds to
roughly 1.4 percentage points of additional growth per year.
175. The index measures the amount of human capital that the average child born today can
expect to achieve (figure 2.3). Naturally, averages hide a great deal of variation. Most of the
components of the index can be disaggregated by gender for most countries so that differences in
the prospects of boys versus girls may be observed. While it is not possible to do so systematically
for a large set of countries, in individual countries where data is richer, differences in the
components of the index across regions and socioeconomic groups can also be illustrated.
Figure 2.3. Human capital index and GDP per capita
Source: Authors’ calculations.
Note: Data are preliminary and subject to revision.
176. The index presented here a prototype: index 1.0. Components of the index such as stunting
and test scores are measured only infrequently in some countries, and not at all in others. Data on
test scores come from different international testing programs, and the age of test takers and the
subjects covered vary across testing programs. Test scores may not accurately reflect the quality
of the whole education system in a country to the extent that tests-takers are not representative of
the population of all students. Reliable measures of the quality of tertiary education do not yet
exist, despite the importance of higher education for human capital in a rapidly changing world.
Data on enrollment rates needed to estimate expected school years often have many gaps and are
reported with significant lags. Socio-behavioral skills are not explicitly captured. Adult survival
rates are imprecisely estimated in countries where vital registries are incomplete or non-existent.
177. One objective of a global human capital index is to call attention to these data shortcomings
and to galvanize action to remedy them. Improving data takes time. In the interim, and recognizing
these limitations, country positions on the index should be interpreted with caution. The index
provides estimates of how current education and health shape the productivity of future workers.
It is not a finely-graduated measurement of small differences between countries. Since the index
41
captures outcomes it is not a checklist of policy actions. The right type and scale of interventions
to build human capital are not the same in different countries. Although the index combines
education and health into a single measure it is too blunt a tool to inform the cost-effectiveness of
policy interventions in these areas—which should instead be assessed based on cost-benefit
analysis of specific programs.
What Comes Next
178. The goal of the index is to increase the importance of human capital for politicians,
policymakers and citizens. Although there has been significant progress in the availability of data
on health and education outcomes there is still a long way to go. Even more work needs to be done
to measure the intermediating factors that affect these outcomes. While individuals in low- and
middle-income countries face similar constraints in the accumulation of human capital, their
relevance is often context-specific. Understanding which constraints matter the most is essential
to setting priorities across different policy areas.
179. A first step is improving the quality of basic administrative data in education and health.
In education, only one in six governments publish annual education monitoring reports. Only about
a hundred countries report reasonably-complete and up-to-date data on net enrollment rates at
different levels of education to the UNESCO Institute of Statistics—the body that is tasked with
compiling this data internationally. Monitoring of even the most basic health information—births
and deaths—is inadequate in low- and middle-income countries (figure 2.4). The pace of
improvement in these systems has been slow. Worldwide between 2000 and 2012 the percentage
of registered deaths changed from only 36 percent to 38 percent. The percentage of children under
five whose births were registered only increased from 58 percent to 65 percent.78 High quality
basic administrative data is essential for governments to understand their needs and to plan the
allocation of public services.
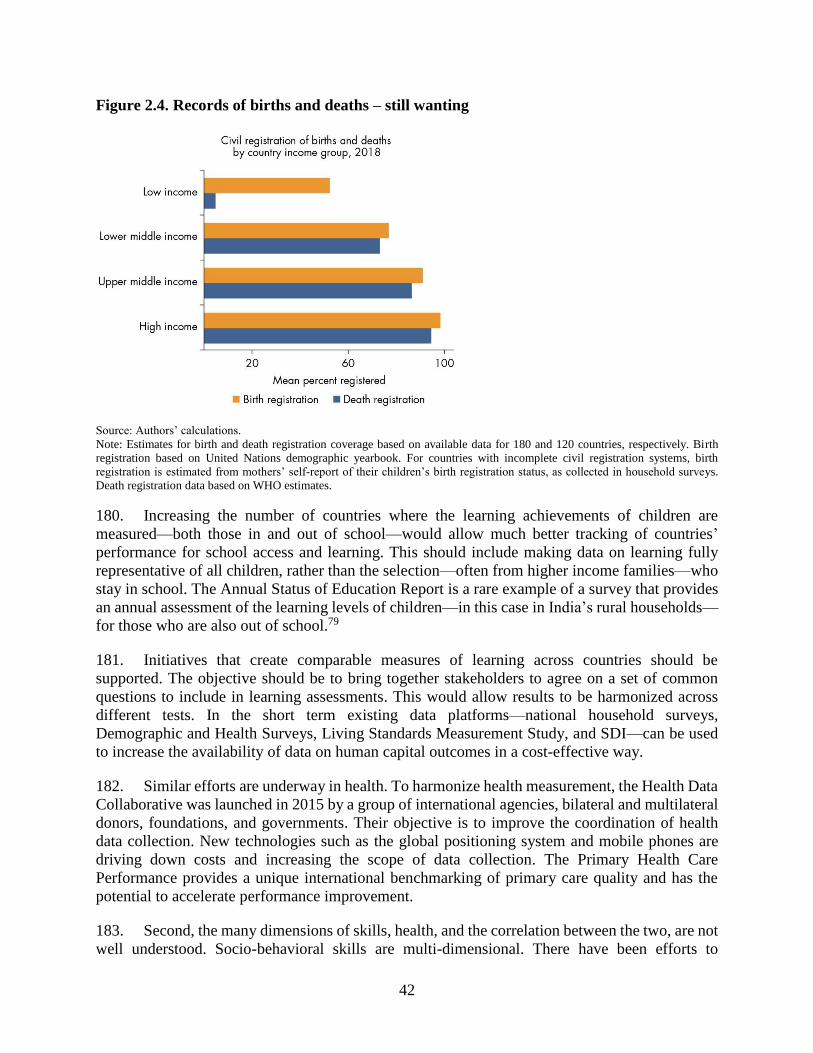
42
Figure 2.4. Records of births and deaths – still wanting
Source: Authors’ calculations.
Note: Estimates for birth and death registration coverage based on available data for 180 and 120 countries, respectively. Birth
registration based on United Nations demographic yearbook. For countries with incomplete civil registration systems, birth
registration is estimated from mothers’ self-report of their children’s birth registration status, as collected in household surveys.
Death registration data based on WHO estimates.
180. Increasing the number of countries where the learning achievements of children are
measured—both those in and out of school—would allow much better tracking of countries’
performance for school access and learning. This should include making data on learning fully
representative of all children, rather than the selection—often from higher income families—who
stay in school. The Annual Status of Education Report is a rare example of a survey that provides
an annual assessment of the learning levels of children—in this case in India’s rural households—
for those who are also out of school.79
181. Initiatives that create comparable measures of learning across countries should be
supported. The objective should be to bring together stakeholders to agree on a set of common
questions to include in learning assessments. This would allow results to be harmonized across
different tests. In the short term existing data platforms—national household surveys,
Demographic and Health Surveys, Living Standards Measurement Study, and SDI—can be used
to increase the availability of data on human capital outcomes in a cost-effective way.
182. Similar efforts are underway in health. To harmonize health measurement, the Health Data
Collaborative was launched in 2015 by a group of international agencies, bilateral and multilateral
donors, foundations, and governments. Their objective is to improve the coordination of health
data collection. New technologies such as the global positioning system and mobile phones are
driving down costs and increasing the scope of data collection. The Primary Health Care
Performance provides a unique international benchmarking of primary care quality and has the
potential to accelerate performance improvement.
183. Second, the many dimensions of skills, health, and the correlation between the two, are not
well understood. Socio-behavioral skills are multi-dimensional. There have been efforts to
43
measure these skills on a large scale among working age individuals through initiatives such as
the Skills Towards Employability and Productivity surveys and the Programme for International
Assessment of Adult Competencies surveys. There has not been a similar attempt among school
age children—even though there is evidence that skills such as grit and self-regulation matter for
learning. Interventions that have reduced iron deficiency anemia have been found to improve
student learning outcomes80 but the correlation between health status and student test scores has
not yet been quantified. The introduction of health modules in school surveys would represent an
important first step. Relatively low cost assessments, such as those of student vision acuity and
anthropometric status, can go a long way in improving our understanding of the relationship
between learning and health.
184. Vietnam’s experience illustrates the potential benefits of mapping pathways of change.
Vietnam’s schoolchildren scored in the top quarter of the mostly high- and middle-income
countries that participate in 2012 and 2015 PISA. This performance is remarkable, given
Vietnam’s level of per capita income. A study of the PISA results found that observable student-
and school-level characteristics could not account for the high test-score performance, suggesting
that other more intangible factors were at play in delivering these results.81 Understanding these
factors could provide important lessons for how to ensure that schooling achieves learning.
44
Chapter 3: Lifelong Learning
186. Nelson Mandela, the first president of post-apartheid South Africa, said this: “Education is
the great engine of personal development. It is through education that the daughter of a peasant
can become a doctor, that the son of a mineworker can become the head of the mine, that the child
of a farmworker can become the president of a great nation. It is what we make out of what we
have, not what we are given, that separates one person from another.”
187. Automation is reshaping work and the skills needed for work. Demand for advanced
cognitive skills82 and socio-behavioral skills83 are increasing. Demand for narrow job-specific
skills is waning.84 There is increasing demand for skills associated with ‘adaptability’. These are
a combination of specific cognitive skills (critical thinking and problem solving) and socio-
behavioral skills (creativity and curiosity) that are transferable across jobs.
188. How well countries cope with the demand for changing skills depends on how quickly and
pertinently the supply of skills shifts. Education systems tend to be resistant to change. A
significant part of the supply re-adjustment is happening outside compulsory education or formal
jobs. Early childhood, tertiary education and adult learning outside jobs are increasingly important
in meeting the skill demands of future labor markets. This chapter shows how.
189. Automation—and technology adoption more generally—makes some jobs obsolete.
Demand for skills linked to home-appliance repair is decreasing quickly because technology drives
down equipment prices and improves reliability. Innovation creates new types of jobs. A large
share of children entering primary school in 2018 will work in occupations that do not yet exist.
Even in low- and middle-income countries many people are employed in jobs that did not exist
three decades ago. India has nearly four million app developers; Uganda has over 400,000 internationally certified organic farmers; China has 100,000 data labelers.
190. But many current jobs are being retooled into new forms, resulting in new and sometimes
unexpected skills combinations. In 2018 a marketing professional might well be called upon to
write algorithms. A physics graduate may land a job as a quantitative trader in the finance industry.
Workers who bring emerging skills into relevant technical fields of expertise—teachers who are
good at web design, actuaries proficient in big data analytics—are likely to be in high demand.
191. Which skills are now less in demand? Evidence from developed countries points to job
polarization—the expansion of high- and low-skill jobs coupled with the decline of middle-skill
jobs. Demand for non-routine cognitive tasks, such as high-skilled research, is increasing. So is
the relative demand for non-routine tasks which cannot be automated easily, such as food
preparation. Conversely demand for procedural routine tasks, which are often performed in
middle-skill jobs such as data entry, is decreasing due to automation.
192. Is the same pattern starting to emerge in low- and middle-income countries? Not quite. In
many developing countries, demand for high-skilled workers is increasing (figure 3.1). The share
of workers in high-skill occupations increased by eight percent or more in Ethiopia, Bolivia and
South Africa from 2000 to 2014. But the change in demand for middle- and low-skill jobs is more
heterogenous across countries. In Jordan the share of employment in middle-skill jobs increased
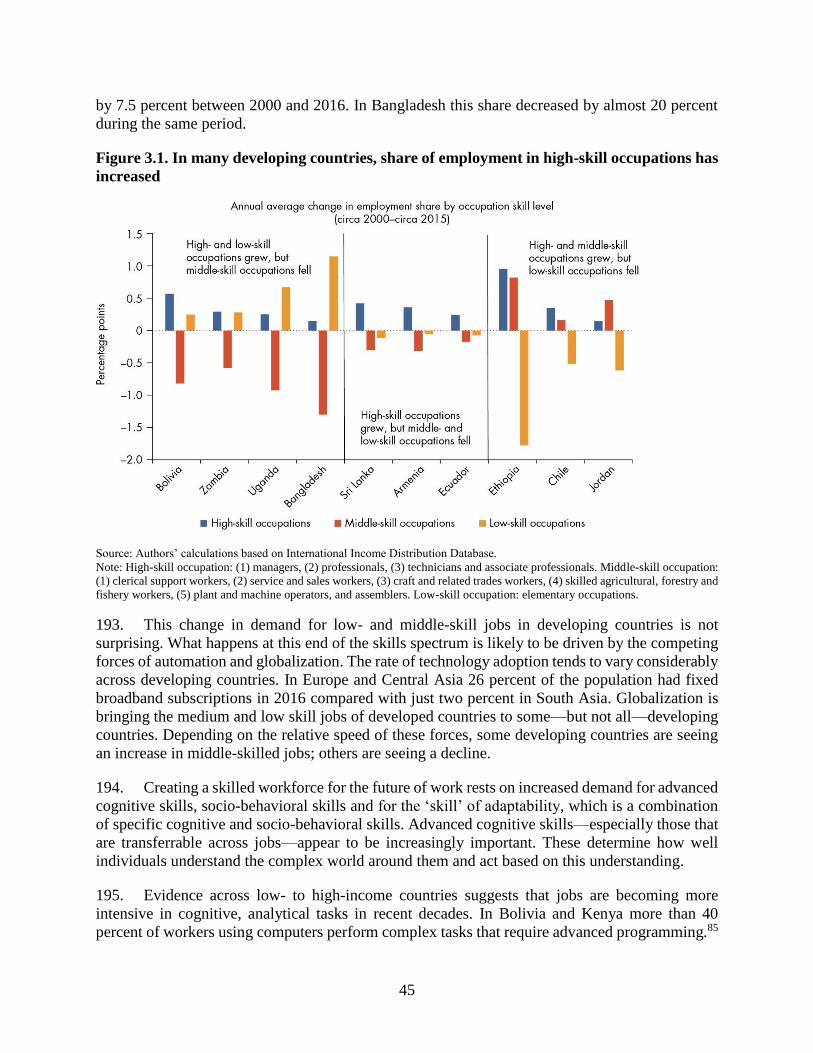
45
by 7.5 percent between 2000 and 2016. In Bangladesh this share decreased by almost 20 percent
during the same period.
Figure 3.1. In many developing countries, share of employment in high-skill occupations has
increased
Source: Authors’ calculations based on International Income Distribution Database.
Note: High-skill occupation: (1) managers, (2) professionals, (3) technicians and associate professionals. Middle-skill occupation:
(1) clerical support workers, (2) service and sales workers, (3) craft and related trades workers, (4) skilled agricultural, forestry and
fishery workers, (5) plant and machine operators, and assemblers. Low-skill occupation: elementary occupations.
193. This change in demand for low- and middle-skill jobs in developing countries is not
surprising. What happens at this end of the skills spectrum is likely to be driven by the competing
forces of automation and globalization. The rate of technology adoption tends to vary considerably
across developing countries. In Europe and Central Asia 26 percent of the population had fixed
broadband subscriptions in 2016 compared with just two percent in South Asia. Globalization is
bringing the medium and low skill jobs of developed countries to some—but not all—developing
countries. Depending on the relative speed of these forces, some developing countries are seeing
an increase in middle-skilled jobs; others are seeing a decline.
194. Creating a skilled workforce for the future of work rests on increased demand for advanced
cognitive skills, socio-behavioral skills and for the ‘skill’ of adaptability, which is a combination
of specific cognitive and socio-behavioral skills. Advanced cognitive skills—especially those that
are transferrable across jobs—appear to be increasingly important. These determine how well
individuals understand the complex world around them and act based on this understanding.
195. Evidence across low- to high-income countries suggests that jobs are becoming more
intensive in cognitive, analytical tasks in recent decades. In Bolivia and Kenya more than 40
percent of workers using computers perform complex tasks that require advanced programming.85
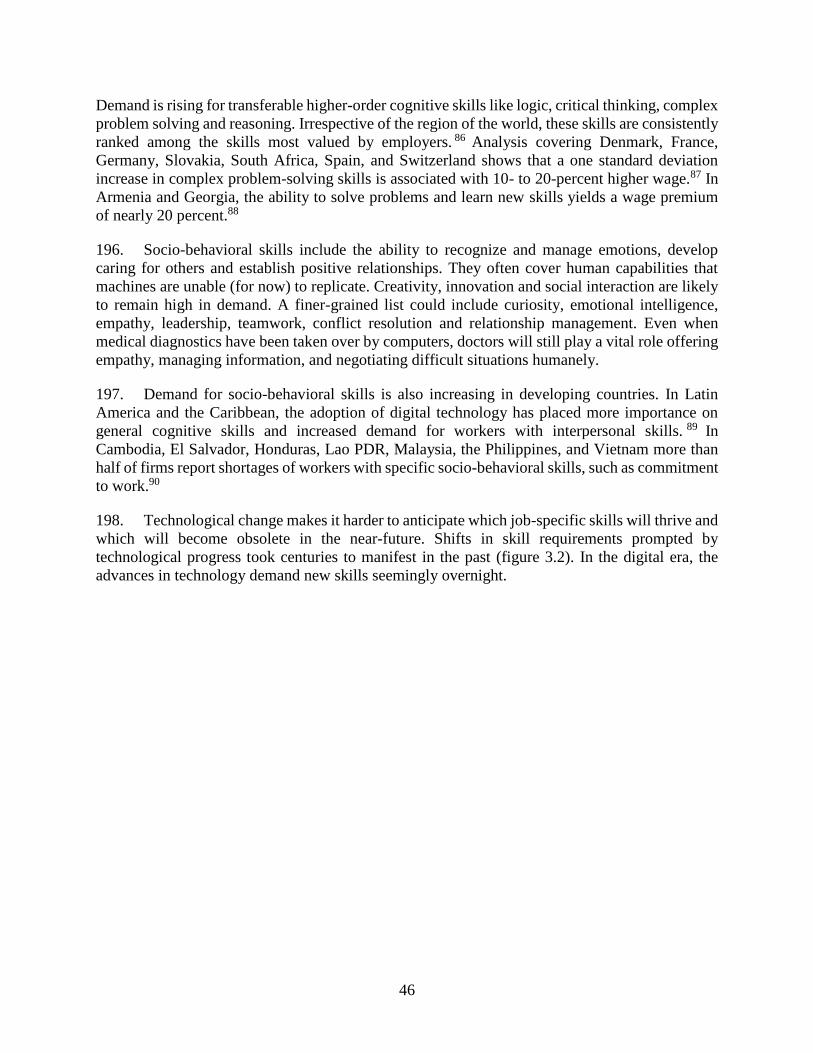
46
Demand is rising for transferable higher-order cognitive skills like logic, critical thinking, complex
problem solving and reasoning. Irrespective of the region of the world, these skills are consistently
ranked among the skills most valued by employers. 86 Analysis covering Denmark, France,
Germany, Slovakia, South Africa, Spain, and Switzerland shows that a one standard deviation
increase in complex problem-solving skills is associated with 10- to 20-percent higher wage.87 In
Armenia and Georgia, the ability to solve problems and learn new skills yields a wage premium
of nearly 20 percent.88
196. Socio-behavioral skills include the ability to recognize and manage emotions, develop
caring for others and establish positive relationships. They often cover human capabilities that
machines are unable (for now) to replicate. Creativity, innovation and social interaction are likely
to remain high in demand. A finer-grained list could include curiosity, emotional intelligence,
empathy, leadership, teamwork, conflict resolution and relationship management. Even when
medical diagnostics have been taken over by computers, doctors will still play a vital role offering
empathy, managing information, and negotiating difficult situations humanely.
197. Demand for socio-behavioral skills is also increasing in developing countries. In Latin
America and the Caribbean, the adoption of digital technology has placed more importance on
general cognitive skills and increased demand for workers with interpersonal skills. 89 In
Cambodia, El Salvador, Honduras, Lao PDR, Malaysia, the Philippines, and Vietnam more than
half of firms report shortages of workers with specific socio-behavioral skills, such as commitment
to work.90
198. Technological change makes it harder to anticipate which job-specific skills will thrive and
which will become obsolete in the near-future. Shifts in skill requirements prompted by
technological progress took centuries to manifest in the past (figure 3.2). In the digital era, the
advances in technology demand new skills seemingly overnight.
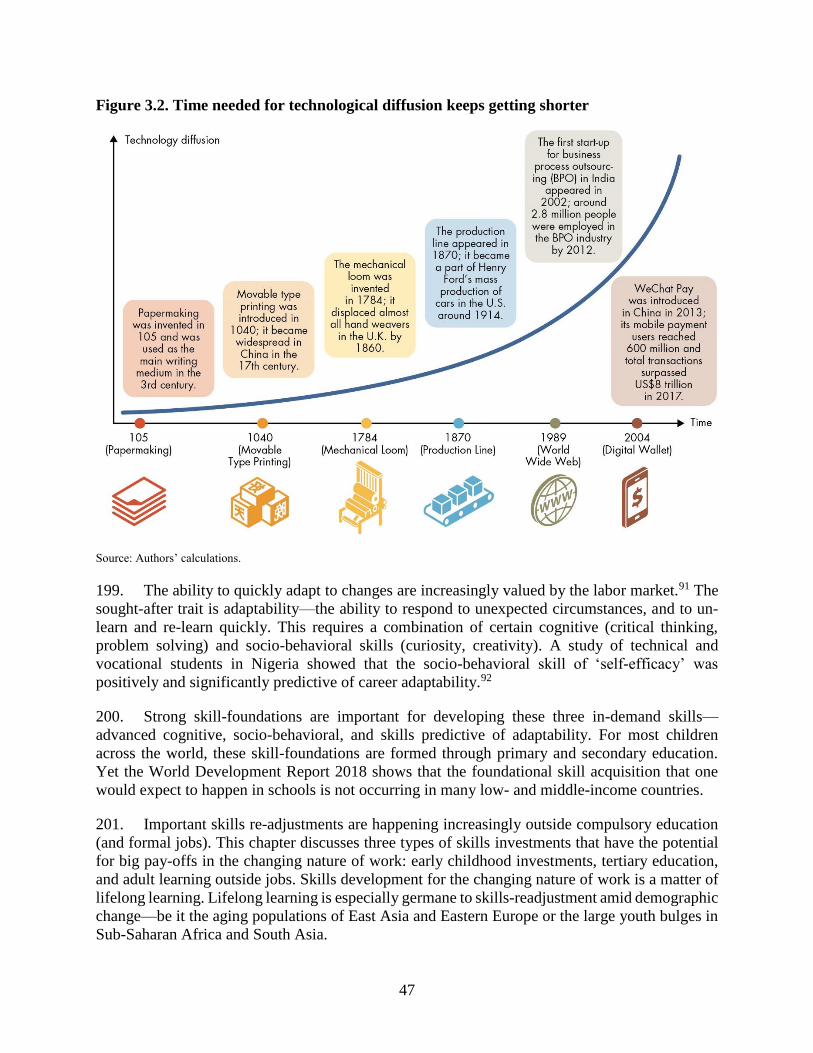
47
Figure 3.2. Time needed for technological diffusion keeps getting shorter
Source: Authors’ calculations.
199. The ability to quickly adapt to changes are increasingly valued by the labor market.91 The
sought-after trait is adaptability—the ability to respond to unexpected circumstances, and to un-
learn and re-learn quickly. This requires a combination of certain cognitive (critical thinking,
problem solving) and socio-behavioral skills (curiosity, creativity). A study of technical and
vocational students in Nigeria showed that the socio-behavioral skill of ‘self-efficacy’ was
positively and significantly predictive of career adaptability.92
200. Strong skill-foundations are important for developing these three in-demand skills—
advanced cognitive, socio-behavioral, and skills predictive of adaptability. For most children
across the world, these skill-foundations are formed through primary and secondary education.
Yet the World Development Report 2018 shows that the foundational skill acquisition that one
would expect to happen in schools is not occurring in many low- and middle-income countries.
201. Important skills re-adjustments are happening increasingly outside compulsory education
(and formal jobs). This chapter discusses three types of skills investments that have the potential
for big pay-offs in the changing nature of work: early childhood investments, tertiary education,
and adult learning outside jobs. Skills development for the changing nature of work is a matter of
lifelong learning. Lifelong learning is especially germane to skills-readjustment amid demographic
change—be it the aging populations of East Asia and Eastern Europe or the large youth bulges in
Sub-Saharan Africa and South Asia.
48
Learning in Early Childhood
202. In France the mandatory school starting age is soon to be reduced from six to three years.
According to President Emmanuel Macron this reform is intended to boost equality, improving the
ability of children from disadvantaged backgrounds to remain competitive in the education system.
203. The most effective way to acquire the skills demanded by the changing nature of work is
to start early. Early investments in nutrition, health, protection, and education lay strong
foundations for future acquisition of cognitive and socio-behavioral skills. They also make future
skill acquisition more resilient to uncertainty. Early childhood investments are an important
channel to improve equality of opportunity. Currently, these investments are underprovided,
especially for poor, disadvantaged children who would benefit the most from them. Prioritizing
these investments has the potential for significant pay-offs for economies, as long as both access
and quality are highlighted.
204. The foundations of brain architecture are set from the prenatal period to the age of five—
making this an important stage to develop cognitive and socio-behavioral skills. During this period
the brain’s ability to learn from experience is at its highest (figure 3.3). As a result, experiences
and learning during this period directly affect achievement in adulthood. If this window is missed,
skill-building becomes harder.
Figure 3.3. Brain’s ability to learn from experience decreases with age
Source: Authors’ calculations.
205. Quality early childhood development programs enable children to learn. Investments in
nutrition, health, and stimulation in the first thousand days of life build stronger brains. The
engagement of parents and caregivers during this phase also matters for the development of
children’s language skills, motor and self-regulation skills, as well as social behavior. In Colombia
exposure to psychological stimulations through home visits with play demonstrations significantly
improved cognitive development of children aged 12-24 months.93 In Pakistan, the Lady Health
Workers program, which provided health services in rural areas, led to a decline in infant mortality
49
from 250 to 79 for every 100,000 live births.94 The program generated sustained positive effects
on children’s cognitive abilities and pro-social behaviors when it provided nutrition
supplementation and encouraged mothers to engage in responsive play with children aged up to
the age of two.95
206. From the age of three socialization and more formal early learning become important to
prepare children to succeed in primary school. Quality pre-school strengthens children’s executive
functions (e.g., working memory, flexible thinking, self-control), launching them on higher
learning trajectories. In Bangladesh rural children who attended pre-school performed better in
early grade speaking, writing and mathematics compared with those who did not.96 A pre-school
reform in rural Mozambique had positive effects on socio-behavioral development—participating
children were better at interacting with others, following directions and regulating their emotions
under stress.97 But, to achieve these results, the quality of pre-schools needs to meet thresholds. In
some cases, low quality pre-school is worse for child development than no pre-school at all.98
207. Early childhood investments efficiently produce skills that are relevant to a child’s future.
Learning is cumulative—skills acquired at an earlier stage facilitate skill formation in subsequent
stages. The returns for early investments are the highest and the advantages conferred by these
investments grow overtime. An additional dollar invested in quality early childhood programs
yields a return of six to 17 dollars.99
208. Early childhood development programs improve parents’ labor force participation. Many
women do not work due to time-consuming childrearing responsibilities. In the United Kingdom,
half of the stay-at-home mothers would prefer going back to work if they could get high-quality,
affordable childcare services. 100 Early childhood development investments alleviate this
constraint. In Argentina a large-scale construction program of pre-primary school facilities in the
1990s positively affected maternal employment.101 In Spain during the same period maternal
employment increased by 10 percent because of the availability of full-time public care for three-
year-old children.102
209. Early childhood investments are also effective in increasing equity. For children exposed
to poverty and other adverse conditions quality early childhood programs increase adult
competence, reduce violent behavior and social inhibition, as well as foster growth in the
subsequent generation. In Guatemala an early childhood development nutrition program for poor
families significantly increased wages for these children in adulthood. 103 In Jamaica early
stimulation for infants and toddlers increased their future earnings by 25 percent—equivalent to
adults who grew up in wealthier households.104
210. Early childhood investments are underprovided despite their efficiency in producing
important skills. Around 250 million children under the age of five are at risk of not reaching their
developmental potential in low and middle-income countries because of stunting or extreme
poverty. Worldwide more than 87 million children under the age of seven have spent their entire
lives in conflict-affected areas. They suffer from extreme trauma and toxic stress, which impair
their brain development and skill enhancement. Only half of all three- to six-year-olds have access
to pre-primary education globally—in low income countries this share is one in five.105 In 2012,
North America and Western Europe countries spent 8.8 percent of their education budgets on pre-
primary education; in Sub-Saharan Africa the share allocated was a paltry 0.3 percent.106
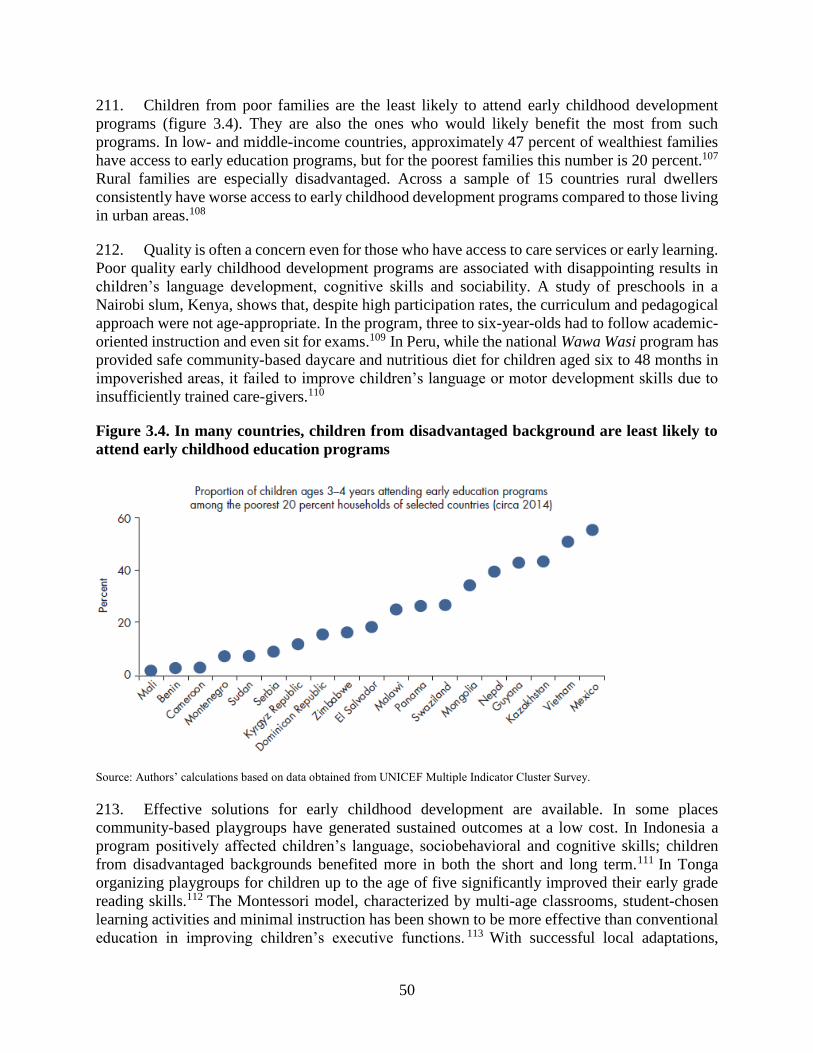
50
211. Children from poor families are the least likely to attend early childhood development
programs (figure 3.4). They are also the ones who would likely benefit the most from such
programs. In low- and middle-income countries, approximately 47 percent of wealthiest families
have access to early education programs, but for the poorest families this number is 20 percent.107
Rural families are especially disadvantaged. Across a sample of 15 countries rural dwellers
consistently have worse access to early childhood development programs compared to those living
in urban areas.108
212. Quality is often a concern even for those who have access to care services or early learning.
Poor quality early childhood development programs are associated with disappointing results in
children’s language development, cognitive skills and sociability. A study of preschools in a
Nairobi slum, Kenya, shows that, despite high participation rates, the curriculum and pedagogical
approach were not age-appropriate. In the program, three to six-year-olds had to follow academic-
oriented instruction and even sit for exams.109 In Peru, while the national Wawa Wasi program has
provided safe community-based daycare and nutritious diet for children aged six to 48 months in
impoverished areas, it failed to improve children’s language or motor development skills due to
insufficiently trained care-givers.110
Figure 3.4. In many countries, children from disadvantaged background are least likely to
attend early childhood education programs
Source: Authors’ calculations based on data obtained from UNICEF Multiple Indicator Cluster Survey.
213. Effective solutions for early childhood development are available. In some places
community-based playgroups have generated sustained outcomes at a low cost. In Indonesia a
program positively affected children’s language, sociobehavioral and cognitive skills; children
from disadvantaged backgrounds benefited more in both the short and long term.111 In Tonga
organizing playgroups for children up to the age of five significantly improved their early grade
reading skills.112 The Montessori model, characterized by multi-age classrooms, student-chosen
learning activities and minimal instruction has been shown to be more effective than conventional
education in improving children’s executive functions. 113 With successful local adaptations,
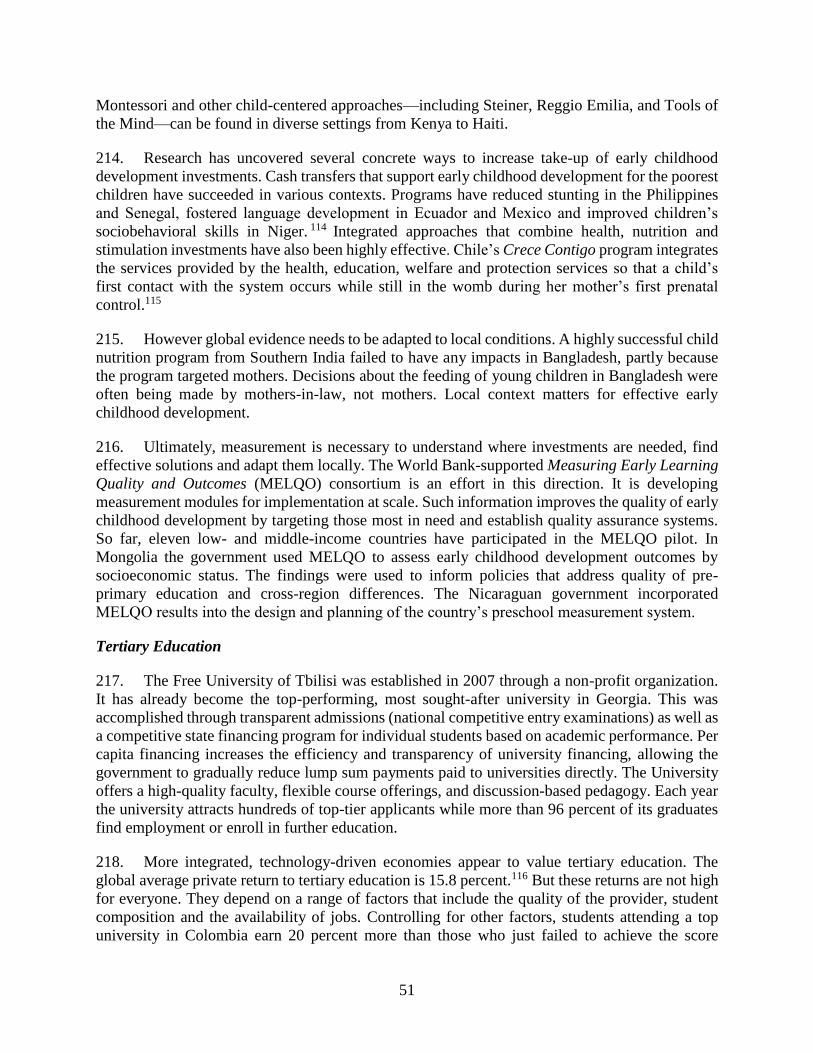
51
Montessori and other child-centered approaches—including Steiner, Reggio Emilia, and Tools of
the Mind—can be found in diverse settings from Kenya to Haiti.
214. Research has uncovered several concrete ways to increase take-up of early childhood
development investments. Cash transfers that support early childhood development for the poorest
children have succeeded in various contexts. Programs have reduced stunting in the Philippines
and Senegal, fostered language development in Ecuador and Mexico and improved children’s
sociobehavioral skills in Niger. 114 Integrated approaches that combine health, nutrition and
stimulation investments have also been highly effective. Chile’s Crece Contigo program integrates
the services provided by the health, education, welfare and protection services so that a child’s
first contact with the system occurs while still in the womb during her mother’s first prenatal
control.115
215. However global evidence needs to be adapted to local conditions. A highly successful child
nutrition program from Southern India failed to have any impacts in Bangladesh, partly because
the program targeted mothers. Decisions about the feeding of young children in Bangladesh were
often being made by mothers-in-law, not mothers. Local context matters for effective early
childhood development.
216. Ultimately, measurement is necessary to understand where investments are needed, find
effective solutions and adapt them locally. The World Bank-supported Measuring Early Learning
Quality and Outcomes (MELQO) consortium is an effort in this direction. It is developing
measurement modules for implementation at scale. Such information improves the quality of early
childhood development by targeting those most in need and establish quality assurance systems.
So far, eleven low- and middle-income countries have participated in the MELQO pilot. In
Mongolia the government used MELQO to assess early childhood development outcomes by
socioeconomic status. The findings were used to inform policies that address quality of pre-
primary education and cross-region differences. The Nicaraguan government incorporated
MELQO results into the design and planning of the country’s preschool measurement system.
Tertiary Education
217. The Free University of Tbilisi was established in 2007 through a non-profit organization.
It has already become the top-performing, most sought-after university in Georgia. This was
accomplished through transparent admissions (national competitive entry examinations) as well as
a competitive state financing program for individual students based on academic performance. Per
capita financing increases the efficiency and transparency of university financing, allowing the
government to gradually reduce lump sum payments paid to universities directly. The University
offers a high-quality faculty, flexible course offerings, and discussion-based pedagogy. Each year
the university attracts hundreds of top-tier applicants while more than 96 percent of its graduates
find employment or enroll in further education.
218. More integrated, technology-driven economies appear to value tertiary education. The
global average private return to tertiary education is 15.8 percent.116 But these returns are not high
for everyone. They depend on a range of factors that include the quality of the provider, student
composition and the availability of jobs. Controlling for other factors, students attending a top
university in Colombia earn 20 percent more than those who just failed to achieve the score

52
required for university admission. 117 Returns also vary dramatically depending on the
specialization. In Chile the return to tertiary education ranges from 4.1 percent for humanities to
125.8 percent for engineering and technology.118 Tertiary enrollment and expenditure also vary
considerably by region (figure 3.5).
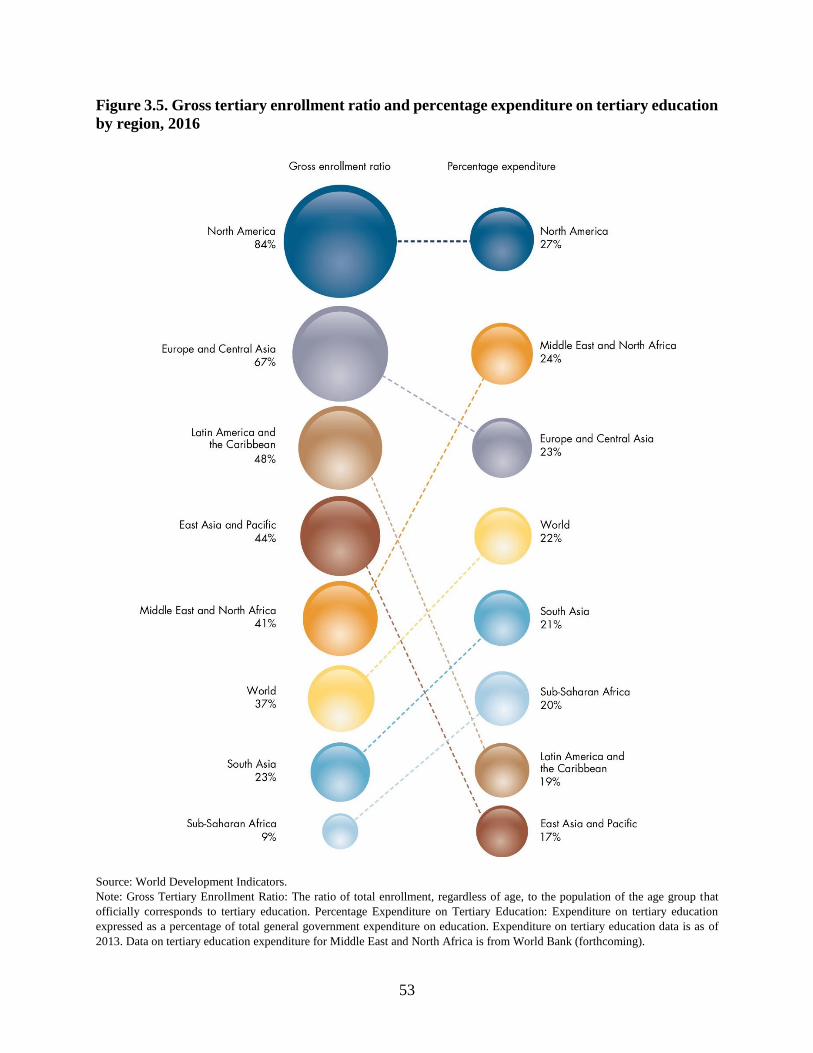
53
Figure 3.5. Gross tertiary enrollment ratio and percentage expenditure on tertiary education
by region, 2016
Source: World Development Indicators.
Note: Gross Tertiary Enrollment Ratio: The ratio of total enrollment, regardless of age, to the population of the age group that
officially corresponds to tertiary education. Percentage Expenditure on Tertiary Education: Expenditure on tertiary education
expressed as a percentage of total general government expenditure on education. Expenditure on tertiary education data is as of
2013. Data on tertiary education expenditure for Middle East and North Africa is from World Bank (forthcoming).
54
219. The changing nature of work makes tertiary education more attractive in three ways. First,
technology and integration have increased the demand for higher-order general cognitive skills—
like complex problem solving, critical thinking, or advanced communication that are transferable
across jobs but cannot be acquired through schooling alone. Rising demand for these skills has
enhanced the wage premiums of tertiary graduates,119 while reducing the demand for less educated
workers.120 Second, by increasing the demand for lifelong learning. Workers are expected to have
multiple careers, not just multiple jobs over their life-time. Tertiary education—with a wide-array
of course offerings and flexible delivery models like online learning and open universities—meets
this growing demand. Third, tertiary education—especially universities—becomes more attractive
in the changing world of work by serving as a platform for innovation.
220. The relevance of tertiary education systems for the future of work depends on how well
they deliver on these three fronts. Increasingly, skills acquisition is a continuum, not a finite
unchangeable path. Flexibility is increased by ensuring that when students open the door to one
pathway, the door to other pathways does not close irrevocably. For instance, at the start of tertiary
education most students must choose between general education or vocational training. General
education such as programs on engineering or economics prepare students in transferable higher-
order skills that determine their overall learning-readiness or trainability. On the other hand,
vocational training, such as programs on nursing or airport operations, is directly related to specific
occupations. Once this choice is made—especially if it is for vocational training—it is typically
difficult and expensive to reverse.
221. The relative returns to general and vocational education are changing in unpredictable ways
and most economies continue to need both. Technological progress tends to lower the demand for
certain occupation-specific skills, making certain vocational degrees obsolete. It also leads to a
higher depreciation of narrow job-specific skills compared to general skills. Yet vocational training
continues to be pursued by many. In 2012, 63 percent of Dutch higher education students were
attending vocational training.121 This share was more than 50 percent in Malaysia, and 31 percent
in Kenya in 2013.122 Vocational training meets immediate demand for technical skills, enables
faster education-to-work transitions for some, and alleviates pressures on the university system.
222. Three factors make flexibility between general and technical tracks imperative for the
changing nature of work. First, the combination of general and technical skills is becoming highly
valued. Second, even technical jobs seem to be getting more intensive in higher-order general
skills, implying that this type of skills acquisition needs to be accessible before and during working
life. Third, people trained in narrow vocational skills need viable options for an unpredictable
future. For instance, Congo, Dem. Rep. and Tanzania offer “bridging” arrangements for vocational
graduates to continue to university.
223. Close collaboration between industry and vocational education also plays a role. In China,
Lenovo is working with tertiary institutes to train vocational students in high-tech areas such as
cloud computing, which features practice-based curricula, practitioner-led instruction, along with
professional certification. Filling in information gaps enables students to make choices between
and within different paths. Chile is establishing online platforms where students can access
information on the employability of individuals with various degrees, wage profiles, courses to
take for certain occupations.123
55
224. Tertiary systems have not remained impervious to these changing demands. General and
vocational tracks often intersect. There is a wide range of programs offered by universities which
have a vocational dimension or orientation—including many in science, engineering and
technology. Technology-enabled platforms are making tertiary education more available,
especially to those with historically low access. The five largest distance-learning programs are
based in lower or middle-income countries. India is the second largest consumer of Massive Open
Online Courses (MOOCs).124 XuetangX, China’s biggest MOOCs and blended learning portal,
crossed ten million students in 2018. Veduca from Brazil launched the world’s first open online
MBA program in 2013 and offers over 5,000 courses in 2018. MOOCs represent a promising way
of delivering flexible, personalized education to a large population. But ensuring quality is a
serious challenge. A recent study shows that students who took a course online performed worse
than those who followed in-person instructions.125 Besides content, many MOOCs fail on student
engagement or instructor quality.
225. Tertiary education systems need to guarantee a minimum threshold of transferable
cognitive skills—which are the best inoculation against job uncertainty. But not all are effective
at producing these skills. In Colombia there is significant variation across universities in their
ability to impart foundational higher order skills such as critical thinking, problem-solving and
communications.126A study among Chinese undergraduates in engineering and computer science
suggests that their cognitive skills did not improve much during the first two years of college.127
226. Incorporating more general education in tertiary programs is one way to increase the
acquisition of transferable higher-order cognitive skills. An additional year of general education
was added in 2012 to undergraduate programs in Hong Kong SAR, China—focusing on problem
solving, critical thinking, communication, leadership, and lifelong learning skills. A large majority
of students perceive this change as effective in promoting desirable graduate attributes. Another
way is through innovative pedagogy. The Faculty of Architecture and Environmental Design at
College of Science and Technology-University of Rwanda promoted learning strategies that
include open-ended assessment, feedback opportunities, and a progressive curriculum that
balances academic challenge with student support. These approaches improved the critical
thinking skills of students.128
227. Tertiary education also builds transferable socio-behavioral skills such as teamwork,
resilience, self-confidence, negotiation and self-expression. In a survey of employers of engineers
in India, socio-behavioral skills were ranked at or above technical qualifications and credentials in
terms of their significance for the employability of recent graduates.129 Employer surveys in
Bulgaria, Georgia, Kazakhstan, Poland, Macedonia FYR, the Russian Federation and Ukraine
indicate that employers see the lack of socio-behavioral skills at least as problematic as lack of
technical skills.130
228. Forward-looking universities are finding ways for adult students to acquire socio-
behavioral skills. Dutch Vocational Colleges provide entrepreneurial courses with the objective of
improving non-cognitive skills such as teamwork and self-confidence.131 In Tunisia, introducing
an entrepreneurship track that combines business training with personal coaching reshaped
behavioral skills of university students.132 In Spain, cooperative learning strategies (learning in
small teams with peers of different ability levels) improved empathy, assertiveness, cohesion and
the ability to accept different views and reach agreements among university students.133 In China
56
a combination of cooperative learning and role play enhanced self-educational abilities and
communication skills among undergraduate students in pharmacology classes.134 However, to
better teach socio-behavioral skills more efforts are necessary to design appropriate curricula and
accurate measurement, especially in the contexts of low income countries and rural areas.
229. The role of tertiary education systems as centers of innovation is highly valued too. There
are well-known examples of successful university innovation clusters in the developed world—
Stanford University, UC Berkley (Silicon Valley) and Harvard-MIT (Boston’s Route 128) in the
United States, Cambridge-Oxford-University College London (part of the “golden triangle”) in the
United Kingdom. Clusters are also emerging in middle income countries. The University of
Malaya has established eight interdisciplinary research clusters during the past decade, covering
sustainability science and biotechnology.135 Peking University is building Clinical Medicine Plus
X, a research cluster for precision medicine, health big data, and intelligence medicine.136 As part
of the Startup India initiative, seven new research parks located in different Indian Institute of
Technology campuses are established to promote innovation through incubation and collaboration
between universities and private sector firms. 137 In Mexico, the Research and Technology
Innovation Park currently houses more than 30 research centers covering R&D in biotechnology,
nanotechnology, robotics, seven of which are led by universities.138
230. Two main factors matter for a healthy innovation ecosystem. First, prioritize the right
university for the right sector. The agglomeration effects of universities vary by sector. University
R&D has been shown to be irrelevant for sectors such as furniture.139 Second, a healthy innovation
ecosystem requires an enabling environment. Just because successful innovation clusters exist
does not mean that there is a guaranteed formula for their creation. However, governments are
often responsible for creating the enabling environment in which innovation clusters flourish—by
providing necessary local infrastructure, increasing expenditure on R&D, assisting universities to
attract high-quality researchers and connect with private sector innovation, easing rigid labor
market regulations.140
Adult Learning Outside Jobs
231. As the nature of work changes, some workers are caught in the cross-hairs of ongoing skills
disruptions. As economies adjust skills provision for the human capital of the next generation, the
current working-age population becomes anxious over job prospects.
232. One step towards lessening this anxiety is adult learning for reskilling and upskilling
workers who are not in school or in jobs. This approach has shown more promise in theory than in
practice. Bad design too often gets in the way. There are three ways to improve adult learning:
more systematic diagnoses of the specific constraints that adults are facing; pedagogies that are
customized to the adult brain; and flexible delivery models that fit well with adult lifestyles. Adult
learning is an important channel for skills readjustment in the future of work but it needs a serious
design rethink.
233. Adult learning programs come in many different forms. This section mainly focuses on
three types that are particularly relevant in preparing adults for the changing labor markets:
programs on adult literacy; skills training for wage employment; and entrepreneurship programs.
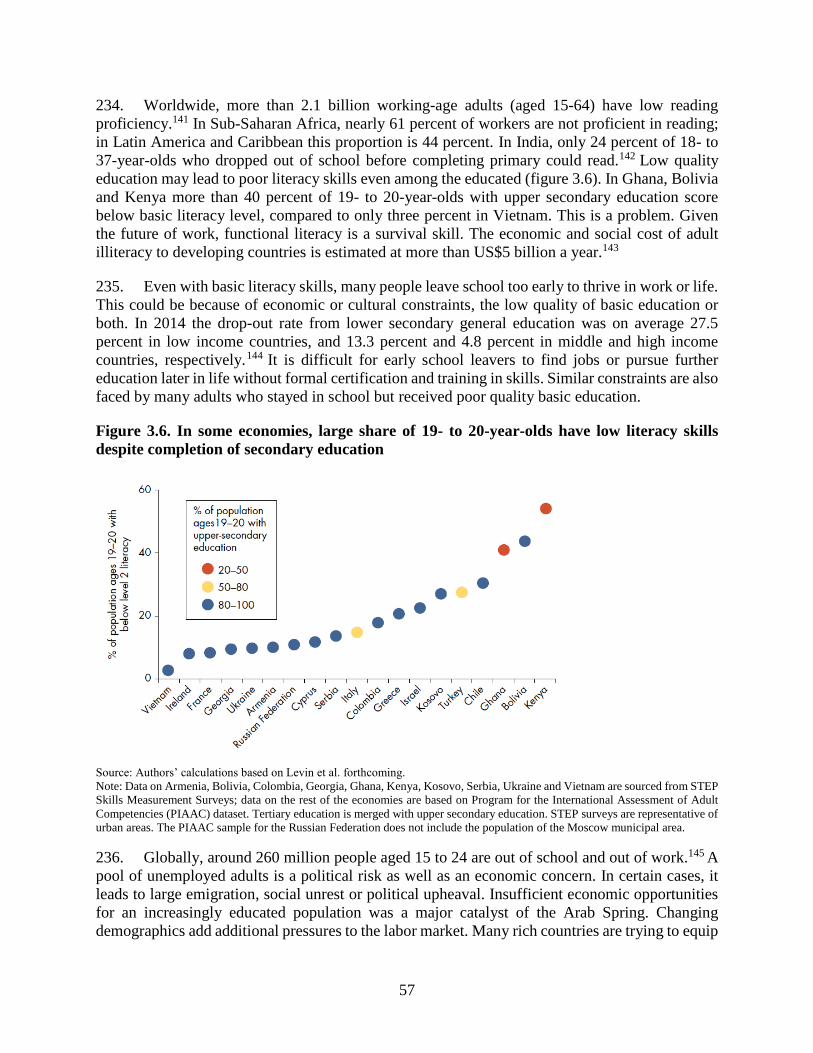
57
234. Worldwide, more than 2.1 billion working-age adults (aged 15-64) have low reading
proficiency.141 In Sub-Saharan Africa, nearly 61 percent of workers are not proficient in reading;
in Latin America and Caribbean this proportion is 44 percent. In India, only 24 percent of 18- to
37-year-olds who dropped out of school before completing primary could read.142 Low quality
education may lead to poor literacy skills even among the educated (figure 3.6). In Ghana, Bolivia
and Kenya more than 40 percent of 19- to 20-year-olds with upper secondary education score
below basic literacy level, compared to only three percent in Vietnam. This is a problem. Given
the future of work, functional literacy is a survival skill. The economic and social cost of adult
illiteracy to developing countries is estimated at more than US$5 billion a year.143
235. Even with basic literacy skills, many people leave school too early to thrive in work or life.
This could be because of economic or cultural constraints, the low quality of basic education or
both. In 2014 the drop-out rate from lower secondary general education was on average 27.5
percent in low income countries, and 13.3 percent and 4.8 percent in middle and high income
countries, respectively.144 It is difficult for early school leavers to find jobs or pursue further
education later in life without formal certification and training in skills. Similar constraints are also
faced by many adults who stayed in school but received poor quality basic education.
Figure 3.6. In some economies, large share of 19- to 20-year-olds have low literacy skills
despite completion of secondary education
Source: Authors’ calculations based on Levin et al. forthcoming.
Note: Data on Armenia, Bolivia, Colombia, Georgia, Ghana, Kenya, Kosovo, Serbia, Ukraine and Vietnam are sourced from STEP
Skills Measurement Surveys; data on the rest of the economies are based on Program for the International Assessment of Adult
Competencies (PIAAC) dataset. Tertiary education is merged with upper secondary education. STEP surveys are representative of
urban areas. The PIAAC sample for the Russian Federation does not include the population of the Moscow municipal area.
236. Globally, around 260 million people aged 15 to 24 are out of school and out of work.145 A
pool of unemployed adults is a political risk as well as an economic concern. In certain cases, it
leads to large emigration, social unrest or political upheaval. Insufficient economic opportunities
for an increasingly educated population was a major catalyst of the Arab Spring. Changing
demographics add additional pressures to the labor market. Many rich countries are trying to equip
58
a smaller, older workforce with skills to sustain economic growth. Other countries with big youth
cohorts struggle with a low-skilled labor force trapped in low-productivity jobs.
237. Adult learning programs upskill, retool and improve the adaptability of older workers.
India’s Saakshar Bharat initiative from 2009 aimed to provide adult literacy to 70 million adults.
In Ghana adult literacy programs yielded labor market returns of more than 66 percent.146 The
Mexican National Institute for Adult Education has developed flexible modules to deliver
education programs that are equivalent to primary or secondary education for giving a second
chance to out-of-school individuals. Under the World Bank’s Nepal Adolescent Girls Initiative,
vocational training for women increased employment outside of agriculture by 174 percent.147
Argentina’s Entra21 program provided adult skills training and internships, creating 40 percent
higher earnings for its participants.148 Kenya’s Ninaweza program offered skills training to young
women living in informal settlements in Nairobi, leading to a 14 percent increase in the likelihood
of obtaining a job, increased earnings and improved self-confidence for participants.149
238. But many adult learning programs fail to generate meaningful impact. Adult literacy
programs often improve word recognition but fail to improve actual reading comprehension.150 In
Niger, although an adult education program increased reading speed but not to the level required
for reading comprehension (the minimum reading speed for reading comprehension is to one word
every 1.5 second).151 Entrepreneurship programs often improve business knowledge but do not
create employment. In Peru training for female entrepreneurs improved business but did not
generate a significant increase in employment.152 Vocational training for the unemployed often
improves short-run earnings but not always long-run employment. The Dominican Republic’s
Juventud y Empleo program improved non-cognitive skills and job formality but did not increase
employment.153 Turkey’s vocational training had no significant impacts on overall employment,
while the positive effects on employment quality faded in the long term.154
239. Even among successful adult learning programs, costs are high. In Liberia even though
young women with access to job skills training enjoy higher monthly earnings—US$11 more than
the comparison group—the program cost is US$1650 per person.155 It would take 12 years of
stable effects for the training program to recoup its costs. It takes a long time for some programs
in Latin America to attain positive net present values if the program benefits are sustained: for
examples, seven years for ProJoven of Peru and 12 years for Proyecto Joven of Argentina.156
Adult learning is frequently just one expensive component in a comprehensive package, making it
difficult to understand its cost-effectiveness. The Chilean Micro Entrepreneurship Support
Program boosted self-employment by 15 percentage points in the short run but it is not clear how
much of this is due to the 60-hour business training or the US$600 capital injection. 157
240. There are two main reasons for low effectiveness: suboptimal design and incorrect
diagnose. Adult brains learn differently—this is not always factored into program design. The
brain’s ability to learn decreases with age, so adult learning programs face a built-in challenge:
acquiring knowledge when the brain is less efficient at learning. Advances in neuroscience suggest
how to tackle this. An adult brain’s ability to learn is significantly dependent upon how much it is
used. Practice is essential to adult learning. Adult learning programs have a better chance of
success if lessons are integrated into everyday life. In Niger people who were taught basic
operations on their mobile phones as part of an adult education program achieved reading and
math scores that were significantly higher than those who were not.158
59
241. Adults face significant stress which compromises their mental capacity—this is not always
factored into program design. For adults, emotions are constantly mediated by the demands of
family, childcare, and work. These demands compete for cognitive capacity required for learning.
Sugar farmers in India were found to have markedly diminished cognitive capacity when they were
poorer (during pre-harvest) than when richer (during post-harvest).159 Creating emotional cues
linked to learning content—such as goal-setting—can be an effective strategy to increase adult
learning. But behavioral tools are only rarely integrated into adult learning programs.
242. Adults face specific socio-economic constraints—these are not always factored into
program design. Adult learners have high opportunity costs in terms of lost income and lost time
with their children, but programs often have inflexible and intensive schedules. In Malawi
participation in training resulted in a decline in personal savings for women at a rate nearly double
that of men.160 Distance to training locations and lack of childcare were significant barriers for
women to complete vocational training programs in India.161 Dropout rates are often high for adult
literacy programs, ranging from 17 percent in Niger to 58 percent in India.162
243. Low participation in adult learning programs is a sign that they are not always the answer.
In Pakistan’s Skills for Employability program, even among poor households who expressed
interest in vocational skills, more than 95 percent did not enroll when given a voucher. Even when
government increased daily stipends and moved the training centers to the village, enrollment did
not cross 25 percent.163 In Ghana, demand for training by informal businesses is low as most
managers do not see lack of skills as a constraint.164
244. The potential binding constraints that inhibit participation in adult learning programs often
relate to lack of information or lack of credit. Information is an important constraint, especially for
young adults, whose decisions about the right skills to acquire may be based on outdated
stereotypes or misguided perceptions.165 In other cases, cash (or capital) transfers may have a
stronger impact on self-employment and long-term earning potential than adult learning
programs.166 Even when skills are inadequate training alone may not achieve the desirable results
unless complemented by cash or capital support. For a group of businesswomen in Sri Lanka a
training-only approach did not influence business profits, sales or capital stock. However, the
grant-plus-training approach enhanced business profitability.167 Similar results have been found in
programs for high-risk ex-fighters in Liberia.168
245. There are three promising routes to more effective adult learning programs: better
diagnosis and evaluation, better design, and better delivery.
246. Systematic data collection before program design identifies the most important constraints
for the target population. This information is also useful for purposes of customizing skills training.
Administrative data under India’s massive National Rural Employment Guarantee Act program
has offered powerful insights about local labor markets.
247. Another useful approach is small-scale piloting combined with rigorous evaluation before
scale-up. This was undertaken by the Youth Opportunities Project in Uganda. In evaluating early
pilots, it is important to test the relative impact of different training components separately.
Policymakers then have greater insight into the most cost-effective bundle of inputs. Evaluations
also need to have sufficiently large sample sizes and sufficiently long timeframes. Larger study
60
samples are needed if we want to look at how training impacts different recipients differently. For
instance, to test if a training impacts men and women differently a study needs four times the
sample size than if it simply wants to test how training affects the overall population.169
248. There is tremendous scope to improve adult learning programs through insights from
neuroscience and behavioral economics. Both practical exercises and visual aids are effective in
adult learning because they assist memory. Including motivational tools such as financial reward,
work experience or frequent feedback have all been shown to boost adult learning. An experiment
among young adults shows that offering rewards increases post-training long-term performance
gains.170
249. Adult learning programs need to be flexible so that adults can learn at their convenience.
In a voucher program for vocational training in Kenya nearly 50 percent of women cited proximity
to a training center as a determining factor in choosing a course.171 Given competing demands on
adults’ time, training programs with short-modules delivered through mobile applications are
particularly promising. Delivering training programs via mobile phones better shields adult
learners from potential stigma.
250. Adult learning programs are more successful when they are explicitly linked to
employment opportunities. One popular way to do this is through apprenticeships or internships
that link training to day-to-day experience and provide motivation through the promise of future
economic returns. Skills training programs are more successful when the private sector is involved
in developing the curriculum or training methods or in providing on-the-job training via internships
or apprenticeships. Colombia’s Jóvenes en Acción program combined classroom instruction with
on-the-job training at private companies. The probability of formal employment and earnings rose
in the short term and was sustained in the long run.172 The program has also demonstrated strong
education effects, with participants more likely to complete secondary school and to pursue higher
education eight years after the training. The likelihood of their family members enrolling in tertiary
education also increased.173
251. Success might also depend on addressing multiple constraints at the same time. Combining
training with cash or capital in some cases is a direct way to boost effectiveness. In Cameroon
54,000 people who participated in a program that coupled training with financial assistance found
employment. 174 Combining skills training with skills certificates, referral letters and better
information about job opportunities may enhance effectiveness, especially for women. In Uganda,
workers with more certifiable, transferrable skills have higher employment rates, more earnings
and greater labor market mobility.175 A World Bank program in South Africa is attempting to
improve job search through peer support, SMS reminders, and action planning.
252. Incorporating soft-skills or socio-behavioral skills in training design has shown promise.
In Togo teaching informal business owners “personal initiative”—a mindset of self-starting
behavior, innovation and goal-setting—boosted the profits of firms by 30 percent two years after
the program. This approach was much more effective than traditional business training.176 For
factory workers in India, acquiring skills such as time management, effective communication and
financial management increased their productivity.177
61
253. The need for better targeting comes out clearly in the highly variable returns to training.
The World Bank’s Youth Employment and Opportunities project in Kenya is tailoring the design
of a youth-friendly entrepreneurship aptitude test. India’s Vikalp Voucher program incentivizes
students to choose between multiple private training providers and courses.
62
Chapter 4: Returns to Work
254. Learning does not end in school. Work presents an opportunity to accumulate human
capital, but there are obstacles in the way. The first of these is the exclusion of women from work.
Next, the poor in emerging economies are concentrated in rural areas in the agriculture sector.
Raising their productivity is crucial to making human capital gains. Third is the large informal
sector that is such a feature of emerging economies. The informal sector provides unstable sources
of income and excludes the poor from social protection. Governments need to create the conditions
for formal sector jobs as viable alternatives for the poor. The lack of social protection for informal
workers means the social contract between the state and its citizens needs to be revisited.
255. To quantify the payoffs to work and school, let’s turn to one of the fathers of labor
economics. Before Jacob Mincer’s work the common belief among his contemporaries was that
luck determined one’s ability, which in turn determined payoffs. Mincer proved that earnings
differentials are influenced by human capital investments that grow over the life cycle, initially in
school and later at work. The payoff of such investments may be measured in terms of increased
earnings or “returns” as a result of an additional year spent in school or work.178 For example,
Mincer found that, for white males in non-farm wage jobs, an additional year of education
increases earnings by 10.7 percent.
256. Workers in emerging economies face lower payoffs to work than their counterparts in
advanced economies (figure 4.1). In the Netherlands and Sweden one additional year of work
raises wages by 5.5 percent. In Afghanistan the corresponding figure is 0.3. A worker in an
emerging economy is more likely to find herself in a manual occupation that is intensive in physical
tasks than a worker in an advanced economy. There is less scope for learning, as well as risk of
automation, in manual jobs. Moreover, compared to advanced economies, emerging economies
have a poorly educated workforce. Advanced economies, meanwhile, are often at the cutting edge
of technology. Their workers tend to be highly educated, formally employed, and have access to a
wide range of jobs intensive in non-routine, cognitive tasks. This may explain the higher returns
to work in advanced economies than emerging economies.
257. Data shows a positive relationship between self-reported levels of learning at work and the
degree of development of an economy. 179 Comparing returns to work between manual and
cognitive occupations shows that an additional year of work in cognitive professions increases
wages by 2.9 percent, while for manual occupations the figure is 1.9 percent. Elementary
occupations and skilled agriculture have the lowest returns. Professionals, managers and
technicians have the highest returns.
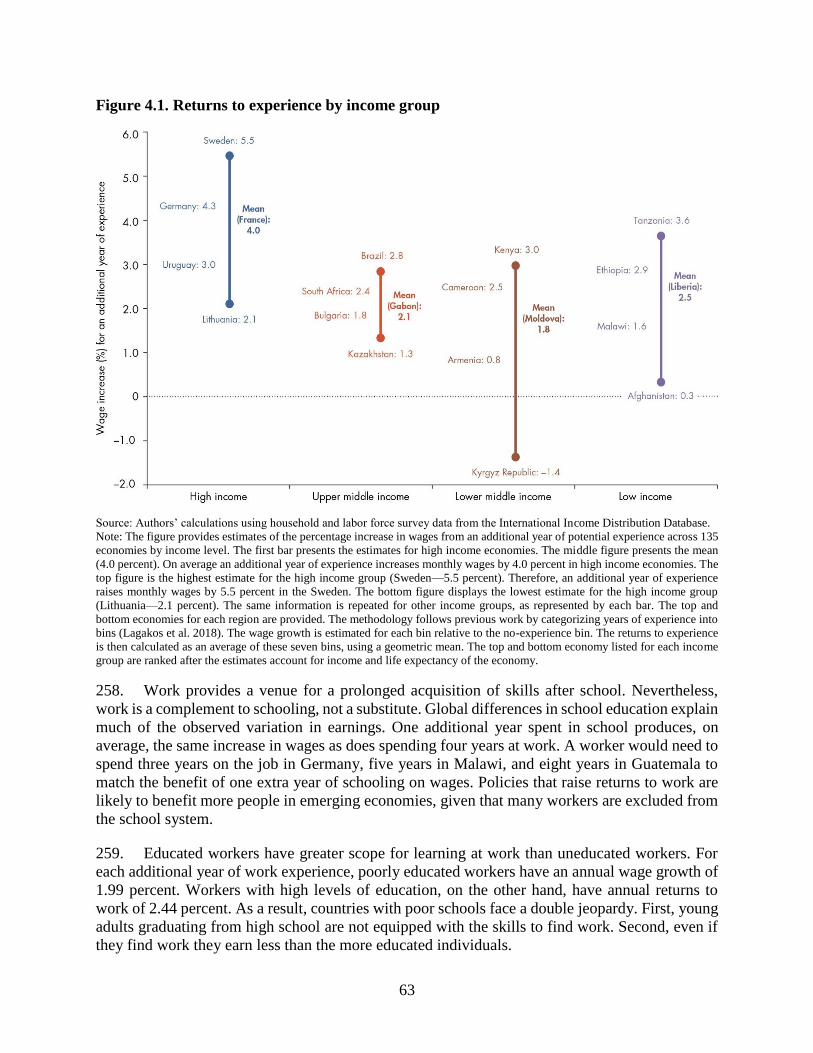
63
Figure 4.1. Returns to experience by income group
Source: Authors’ calculations using household and labor force survey data from the International Income Distribution Database.
Note: The figure provides estimates of the percentage increase in wages from an additional year of potential experience across 135
economies by income level. The first bar presents the estimates for high income economies. The middle figure presents the mean
(4.0 percent). On average an additional year of experience increases monthly wages by 4.0 percent in high income economies. The
top figure is the highest estimate for the high income group (Sweden—5.5 percent). Therefore, an additional year of experience
raises monthly wages by 5.5 percent in the Sweden. The bottom figure displays the lowest estimate for the high income group
(Lithuania—2.1 percent). The same information is repeated for other income groups, as represented by each bar. The top and
bottom economies for each region are provided. The methodology follows previous work by categorizing years of experience into
bins (Lagakos et al. 2018). The wage growth is estimated for each bin relative to the no-experience bin. The returns to experience
is then calculated as an average of these seven bins, using a geometric mean. The top and bottom economy listed for each income
group are ranked after the estimates account for income and life expectancy of the economy.
258. Work provides a venue for a prolonged acquisition of skills after school. Nevertheless,
work is a complement to schooling, not a substitute. Global differences in school education explain
much of the observed variation in earnings. One additional year spent in school produces, on
average, the same increase in wages as does spending four years at work. A worker would need to
spend three years on the job in Germany, five years in Malawi, and eight years in Guatemala to
match the benefit of one extra year of schooling on wages. Policies that raise returns to work are
likely to benefit more people in emerging economies, given that many workers are excluded from
the school system.
259. Educated workers have greater scope for learning at work than uneducated workers. For
each additional year of work experience, poorly educated workers have an annual wage growth of
1.99 percent. Workers with high levels of education, on the other hand, have annual returns to
work of 2.44 percent. As a result, countries with poor schools face a double jeopardy. First, young
adults graduating from high school are not equipped with the skills to find work. Second, even if
they find work they earn less than the more educated individuals.
64
260. Consider Jordan, a country with low returns both on education (5.85 percent) and
experience (1.24 percent), together with below average PISA (Programme for International
Student Assessment) scores in math, science and reading. A worker who completes secondary
education in Jordan and one year at work would earn less than half of her counterpart in Germany.
What is more, by the time she accumulates 30 years of experience, the German worker’s wage
would already be at least five times higher than for the worker in Jordan.
Informality
261. The informal economy is omnipresent in most emerging economies. Informal employment
is more than 70 percent in Sub-Saharan Africa and South Asia and more than 50 percent in Latin
America. In Kenya, for example, informal employment stands at a staggering 77.9 percent of total
employment. Juma, a bicycle repairman, works in one of the thousand stalls in the open-air space
which Kenyans call Jua Kali – Swahili for “fierce sun”. Juma’s is one of the 5.8 million unlicensed
businesses in Kenya’s informal sector.180 Three out of four workers are informal, one of the highest
rates in the continent.
262. Although informal workers outnumber formal ones, their overall productivity is
significantly lower for the typical developing economy. In fact, informal workers are only 15
percent as productive as formal workers.181
263. The informal sector is slow to change. Since 1999, India has seen its IT sector boom,
become a nuclear power, broken the world record in terms of the number of satellites launched
into outer space using a single rocket, and achieved an annual growth rate of 5.6 percent. Yet the
size of its informal sector has remained around 90 percent. These patterns are not idiosyncratic to
India. Informal sectors in emerging economies are a fixture. In Madagascar the percentage of non-
agricultural informal employment workers increased from 74 percent in 2005 to 89 percent in
2012. In Nicaragua the size of informality rose from 72.4 percent in 2005 to 75 percent in 2010.
264. The returns to experience for a worker in the formal sector are higher than the informal
sector. For instance, a year spent in the informal sector in Kenya raises incomes by only 2.65
percent a year. In contrast, a worker in the formal sector in Kenya raises her income 4.13 percent
every year, which is 1.6 times higher than the informal sector. The difference is potent.
265. The disparity in the payoffs to work between formal and informal jobs is a global
phenomenon. In Nepal returns to experience are 1.4 times higher for formal wage workers than
informal wage workers. In South Africa they are 1.6 times higher in the formal than the informal
sector; in India they are over twice as high as the informal sector. In emerging economies, on
average, the earnings increase for an additional year of work for informal wage workers is 1.42
percent. The figure is 1.84 percent for formal wage workers.
266. Millions of informal businesses run by the poor are unlikely to make their owners rich.
Typically, they have no paid staff and tend to be barely profitable. In Dakar, Senegal, 87 percent
of firms with labor productivity below US$10,000 per worker are in the informal sector. 182
Informal firms are run by uneducated owners, serve low-income consumers, and use little capital—
informal firms add only 15 percent of the value per employee of formal firms.183 They also rarely
move to the formal sector.
65
267. The poor manage to make a lot out of little, but the businesses they run are too small to
raise the livelihoods of their owners. These enterprises do not provide a stable income stream,
leaving the poor vulnerable to unexpected events. Yet they have no other option. The enterprises
of the poor are a way to work when formal employment is unavailable.
268. Creating stable formal private jobs for the poor is an important policy goal. Stable jobs
allow poor workers to make commitments to expenditures. Factory jobs dramatically improve the
lives of the poor.184 Improvements in infrastructure in towns and villages could encourage formal
firms to establish themselves near poor workers. While small-scale informal enterprises are
unlikely to formalize and grow, the owners of informal firms may obtain formal jobs.
269. Countries with heavier regulation have larger unofficial economies.185 Mexico provides a
good illustration of what happens when a country streamlines its business regulation.186 Starting
in May 2002, Mexico implemented the Rapid Business Opening System. The program simplified
local business registration procedures. It reduced the average number of days needed to register a
business from 30.1 to 1.4. The number of required procedures was reduced from 7.9 to 2.7. The
number of office visits required to register a business fell from 4.2 to one. The Federal Commission
for Improving Regulation (COFEMER) organized the reform, coordinating with municipal
governments since many business registration procedures are set locally in Mexico. Business
reforms resulted in informal business owners, who were similar in profile to formal wage workers,
to be 22.3 percent more likely to join them in formal employment. The evidence suggests that
easing regulation encourages the transition from informal firm ownership to formal wage jobs.
270. In some cases, streamlining business is not enough but has to be carried out in tandem with
other policies. In Brazil the Individual Micro-Entrepreneur Program, introduced in 2009, targeted
entrepreneurs with at most one employee, and was designed to reduce dimensions of formality
costs: (i) registration (entry) costs; and (ii) the costs of remaining formal, by reducing monthly
taxes and red tape. The combination of reducing business registration costs in combination with
reducing taxes resulted in the formalization of existing informal firms.187 Industries eligible for tax
reduction experienced an increase of 4.8 percent in the number of formal firms. Halving monthly
taxes led to a 1.9 percent increase in the registration rate for entrepreneurs, from a baseline rate of
20 percent.
271. Governments can use technology to reduce informality. The introduction of e-payroll was
an important factor in the reduction of non-agricultural informal employment in Peru from 75
percent in 2004 to 68 percent in 2012.188 Employers use e-payroll to send monthly reports to the
National Tax Authority regarding their workers, pensioners, service providers, personnel in
training, outsourced workers and claimants. E-payroll resulted in the registration of 276,000 new
formal jobs, after accounting for economic growth.
272. Investments in human capital reduce informal employment. When young people are
equipped with the right skills they are more likely to obtain a formal job. A youth training program
in Santo Domingo, the capital of the Dominical Republic, targeted youths between 16 and 29 years
old who did not attend school and were living in poor neighborhoods.189 The program offered
skills training courses that lasted 225 hours: 150 hours devoted to teaching a wide range of low-
skill qualifications such as administrative assistant, hair stylist, and mechanic; and 75 hours
devoted to improving the soft skills of participants (mainly, work habits and self-esteem). Courses
66
were followed by a three-month internship in a private firm. The program’s evaluation shows that
skills investment in youth training has a significant impact on the probability of securing a formal
job and on earnings in an urban labor market. And these gains last over time.
Working Women
273. The mural “Making of a Fresco” by Mexican painter Diego Rivera is chosen as the cover
of this study. A communist, Rivera painted a gigantic worker towering over bankers, architects,
and artists. But there is only one woman among the 19 people in the painting. Although the status
of women in the economy has improved since Rivera’s times, a considerable gulf remains in
economic opportunity between them and men.
274. Some societies exclude women from work. Across the world, 49 percent of women above
the age of 15 are employed, compared with 75 percent of men. Gender imbalances persist in
positions of power. Less than a fifth of firms have a woman as the top manager.190 These numbers
mask wide differences among countries. In Sweden 61 percent of women are formally employed.
In Italy, the figure is 40 percent. In India and Pakistan, only 25 to 27 percent of women are in the
labor force. Generally, women work in less economically productive sectors, in occupations with
potentially lower on-the-job learning opportunities.
275. The inclusion of women in formal economic activity depends on equal property rights. In
ancient Greece women could not inherit property rights, while in ancient Rome they had no
political rights. In 1804 the Napoleonic Code stated that wives were under the purview of their
fathers and husbands. Before 1870 married women in England had no right to claim property and
full ownership rights belonged to the husband. Although gender parity has improved around the
world, major differences persist.
276. Women face legal restrictions in obtaining jobs across many countries. The restrictions are
sector-specific. 65 economies around the world restrict women from mining jobs. Women in 47
economies face restrictions in manufacturing while 37 economies restrict women from
construction jobs. Furthermore, in 29 out of 189 economies explored, women cannot work the
same hours as men.
277. Men outnumber women in every occupation (figure 4.2). Only a quarter of managers are
women. About 39 percent of professionals are women. Across occupations, women have a
relatively higher presence in clerical support worker occupations (44 percent) and services and
sales workers (44 percent). The lowest is in plant and machinery operators and assemblers, where
women constitute just 16 percent. Most female managers of formal firms in emerging economies
are in the retail sector.
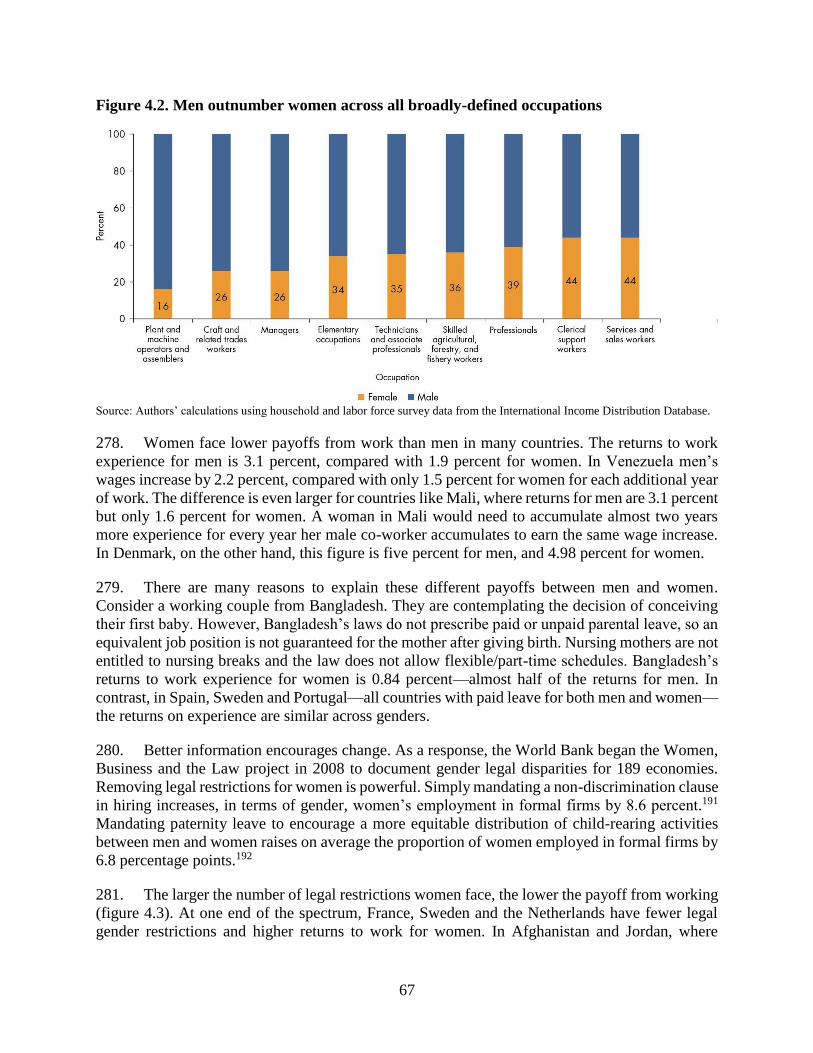
67
Figure 4.2. Men outnumber women across all broadly-defined occupations
Source: Authors’ calculations using household and labor force survey data from the International Income Distribution Database.
278. Women face lower payoffs from work than men in many countries. The returns to work
experience for men is 3.1 percent, compared with 1.9 percent for women. In Venezuela men’s
wages increase by 2.2 percent, compared with only 1.5 percent for women for each additional year
of work. The difference is even larger for countries like Mali, where returns for men are 3.1 percent
but only 1.6 percent for women. A woman in Mali would need to accumulate almost two years
more experience for every year her male co-worker accumulates to earn the same wage increase.
In Denmark, on the other hand, this figure is five percent for men, and 4.98 percent for women.
279. There are many reasons to explain these different payoffs between men and women.
Consider a working couple from Bangladesh. They are contemplating the decision of conceiving
their first baby. However, Bangladesh’s laws do not prescribe paid or unpaid parental leave, so an
equivalent job position is not guaranteed for the mother after giving birth. Nursing mothers are not
entitled to nursing breaks and the law does not allow flexible/part-time schedules. Bangladesh’s
returns to work experience for women is 0.84 percent—almost half of the returns for men. In
contrast, in Spain, Sweden and Portugal—all countries with paid leave for both men and women—
the returns on experience are similar across genders.
280. Better information encourages change. As a response, the World Bank began the Women,
Business and the Law project in 2008 to document gender legal disparities for 189 economies.
Removing legal restrictions for women is powerful. Simply mandating a non-discrimination clause
in hiring increases, in terms of gender, women’s employment in formal firms by 8.6 percent.191
Mandating paternity leave to encourage a more equitable distribution of child-rearing activities
between men and women raises on average the proportion of women employed in formal firms by
6.8 percentage points.192
281. The larger the number of legal restrictions women face, the lower the payoff from working
(figure 4.3). At one end of the spectrum, France, Sweden and the Netherlands have fewer legal
gender restrictions and higher returns to work for women. In Afghanistan and Jordan, where
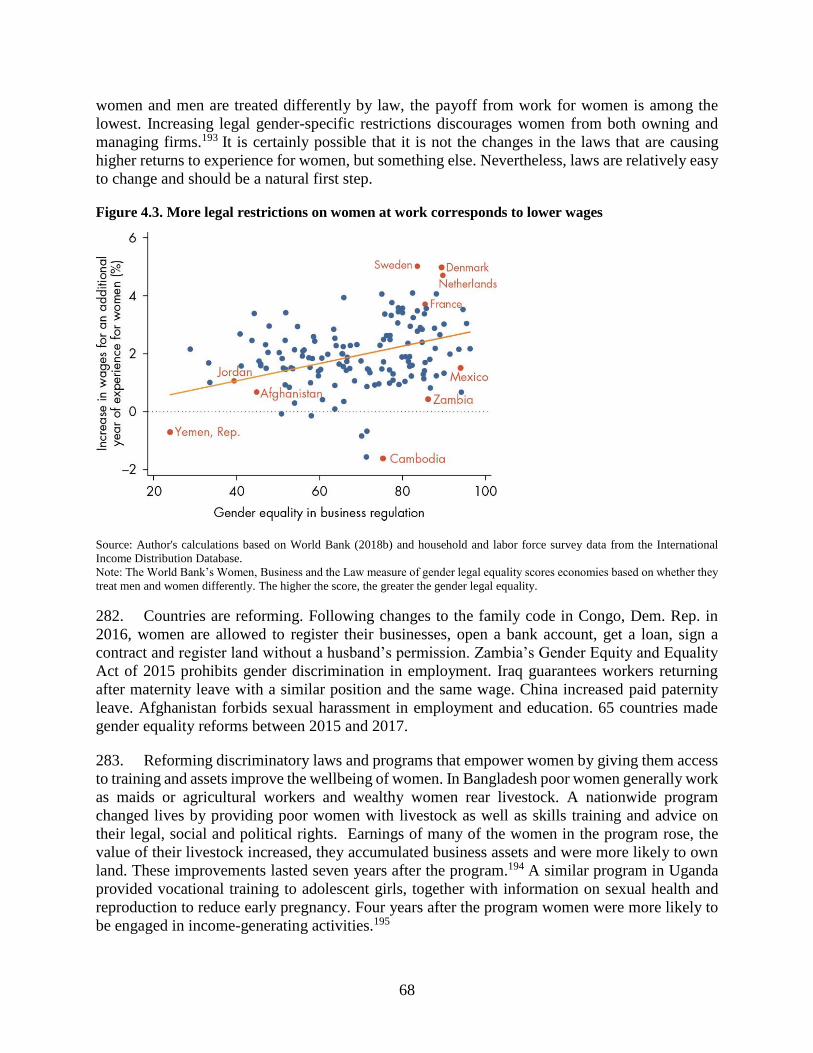
68
women and men are treated differently by law, the payoff from work for women is among the
lowest. Increasing legal gender-specific restrictions discourages women from both owning and
managing firms.193 It is certainly possible that it is not the changes in the laws that are causing
higher returns to experience for women, but something else. Nevertheless, laws are relatively easy
to change and should be a natural first step.
Figure 4.3. More legal restrictions on women at work corresponds to lower wages
Source: Author's calculations based on World Bank (2018b) and household and labor force survey data from the International
Income Distribution Database.
Note: The World Bank’s Women, Business and the Law measure of gender legal equality scores economies based on whether they
treat men and women differently. The higher the score, the greater the gender legal equality.
282. Countries are reforming. Following changes to the family code in Congo, Dem. Rep. in
2016, women are allowed to register their businesses, open a bank account, get a loan, sign a
contract and register land without a husband’s permission. Zambia’s Gender Equity and Equality
Act of 2015 prohibits gender discrimination in employment. Iraq guarantees workers returning
after maternity leave with a similar position and the same wage. China increased paid paternity
leave. Afghanistan forbids sexual harassment in employment and education. 65 countries made
gender equality reforms between 2015 and 2017.
283. Reforming discriminatory laws and programs that empower women by giving them access
to training and assets improve the wellbeing of women. In Bangladesh poor women generally work
as maids or agricultural workers and wealthy women rear livestock. A nationwide program
changed lives by providing poor women with livestock as well as skills training and advice on
their legal, social and political rights. Earnings of many of the women in the program rose, the
value of their livestock increased, they accumulated business assets and were more likely to own
land. These improvements lasted seven years after the program.194 A similar program in Uganda
provided vocational training to adolescent girls, together with information on sexual health and
reproduction to reduce early pregnancy. Four years after the program women were more likely to
be engaged in income-generating activities.195
69
284. Liberia launched the Economic Empowerment of Adolescent Girls and Young Women
project in 2009. It seeks to provide young girls with both in-classroom training—focused on life
and technical skills highly demanded in the market—and follow-up job placement support (to
either enter a paying job or start a new business). The program significantly improved participants’
lives: employment and earnings increased by 47 and 80 percent respectively; participating women
saved US$35 more; their self-confidence, life satisfaction and social abilities improved.
Households with participating women improved their food security by increasing the consumption
of high-value proteins while decreasing the likelihood of food shortages.196
Working in Agriculture
285. Agriculture remains the main economic sector in low income countries, even as the number
of jobs it supports decreases as economies develop. In 2017 agriculture accounted for 68 percent
of employment in low income economies. Improving agricultural incomes is therefore an effective
way of reducing poverty.197 However, the combined forces of automation and open trade work
against agricultural employment in developing countries. Capital-intensive agriculture in advanced
economies may be reducing import demand.
286. The result is faster urbanization in Africa and South Asia, where the challenges of moving
to cities proliferate. On the one hand, earnings could rise: in emerging economies an additional
year of city work experience is worth 2.2 percent increase in pay. The returns to work in urban
areas are 1.7 more than rural areas, or a premium of 69 percent. This reflects a global pattern. In
Indonesia and Mexico, the returns to work are 50 percent higher in urban than rural areas. For
India, China and Vietnam payoffs to work in urban areas are double those of rural areas.
287. On the other hand, opportunities in the city can be limited. Workers need to have a level of
education to access most of the better jobs in the cities. In several developing economies stringent
workplace regulation deters firms from employing less productive workers, pushing them into the
informal economy.
288. The constraints faced by the poor in moving to cities have been well illustrated. In India,
for instance, workers in Orissa provided several reasons for not staying in the city.198 First, there
is no housing—the extreme poor squeeze themselves often into swamps or slums right next to
refuse dumps. In contrast, villages offer more open, greener and quieter spaces. There are
considerable risks in moving one’s family to a city. If your children fall sick, healthcare is better
but will anyone lend you money if it is needed? The connections developed in villages serve as
crude safety nets for the vulnerable lives of the poor.
289. Workers in emerging economies experience half of the payoffs to work (about 2 percent)
than workers in advanced economies (4 percent). To reduce poverty, governments may be tempted
to move poor workers from villages to cities to raise the overall payoffs in the economy. However,
this movement is unlikely to considerably narrow the payoff gap between emerging and advanced
economies. Improvements in rural areas are necessary to narrow the payoffs gap between emerging
and advanced economies. This has been found by studies conducted in Kenya and Indonesia.199
290. Between the bustling cities and the subsistence-oriented villages lie secondary towns. They
serve a special role in facilitating the transition of rural workers to off-farm employment, much of
70
it related to agriculture. Secondary towns inhabit an important space between villages and cities,
enabling movement up and down the value chain. The experiences of Tanzanian migrants confirm
this, highlighting the role that secondary towns play in facilitating the transition out of
agriculture.200 In the early stages of development, growing secondary towns may do more for rural
poverty alleviation than cities. But in later stages of development, the cities take over.201
291. As economies develop, agricultural productivity rises, unlike productivity in the informal
sector. But the challenges facing farmers in emerging economies are numerous and governments
play an important part in raising agricultural productivity. Smallholders have limited access to
agricultural inputs, such as fertilizers and machinery, as well as services that increase their
productivity. They are not integrated into value chains. Entrepreneurs face numerous obstacles to
their operations. Value chain development allows farmers to capture the urban demand for higher
value agricultural products such as dairy, meat, fruit and vegetables. Poverty reduction is faster
when agriculture transforms from staple to non-staple crops. This requires raising staple crop
productivity well beyond the levels currently achieved in Sub-Saharan Africa. This section
explores three areas where policymakers have made progress: programs that transfer knowledge,
initiatives that exploit digital technologies to increase access to input, output and capital markets,
and improvement in regulatory systems.
292. Training farmers on the best farming techniques has been shown to raise productivity.
Some projects expand training programs or collaborations to improve the exchange of information.
Sometimes this has been combined with increasing access to finance or provisions of agricultural
as an impetus for improving agricultural productivity. Providing resources to cooperatives
improves linkages between agri-businesses along the value chain. JD Finance, the fintech arm of
JD.com, a leading Chinese e-commerce platform, has been collaborating with cooperatives to
provide farmers with microcredits.
293. For example, the Integrated Growth Poles Project in Madagascar, which provided training
on improved cocoa processing practices and business management skills to farmers, resulted in
beneficiaries experiencing an average increase in net revenues of 47 percent. Farmer field schools
in Afghanistan, which are part of the National Horticulture and Livestock Project, tripled the
income of some participants. Farmer field schools have also been successful in East Africa.202
Government initiatives to link farmers with producer organizations, agribusiness purchasers and
financial institutions in the sorghum sector in Northern Cameroon had similar effects.
294. The effectiveness of agricultural training can be improved. One way is by activating social
ties in villages to encourage peer learning. A recent study with rural female farmers in Uganda
concluded that encouraging them to compete resulted in greater learning in training sessions.203
Agricultural extension services can be improved through low cost videos that leverage the
knowledge and participation of local communities.
295. Mechanization has in the past failed to take a foothold in Sub-Saharan Africa, creating
skepticism about ambitious predictions of technological transformations in agriculture. Yet, thanks
to new technologies focused on information and communication, there are signs that
mechanization is happening. Instantaneous measurements allow farmers to make better decisions.
Aerial images from satellites, drones and soil sensors improve measurements and crop monitoring.
Detailed information informs farmers’ decisions on how much fertilizer and irrigation is needed.
71
296. Many farmers in emerging economies do not know if they are getting the best price for
their crops. TruTrade in Uganda is an example of digital technology bridging this information gap.
It uses online applications to allow price-setting, to track the movements of produce and payments.
TruTrade connects smallholders to buyers while raising quality and transparency. This creates an
atmosphere of trust. Farmers receive good prices and reliable access to markets. Traders build
relationships as trusted providers, thereby growing their businesses.
297. Mobile technology in Kenya is reducing administrative and assessment costs for insurance
schemes. A good illustration of this is the app Kilimo Salama (Swahili for “Safe Farming”). When
insurance products are sold, the seller activates the insurance policy using the Kilimo Salama
application by scanning a product-specific bar code with the camera phone, entering the farmer’s
mobile number, and connecting the farmer to the local weather station. Thirty solar-powered
weather stations automatically monitor the weather. An SMS is received to confirm the insurance
policy. The indemnity payments are made through the M-Pesa platform. The Kilimo Salama
project has evolved into ACRE Africa. By 2017 over a million farmers in Kenya, Tanzania, and
Rwanda have been insured.204
298. Orchard farmers in the Kastamonu Province in Turkey face challenges from pests and frost.
The government, in collaboration with international donors, established five mini- meteorological
stations in rural areas throughout the province along with 14 reference farms to measure rain,
temperature and pest cycles. Producers are regularly updated by SMS, allowing them to react to
prevailing local conditions. Costs fell dramatically for producers in the first two years of the
scheme. Pesticide applications dropped by 50 percent.205
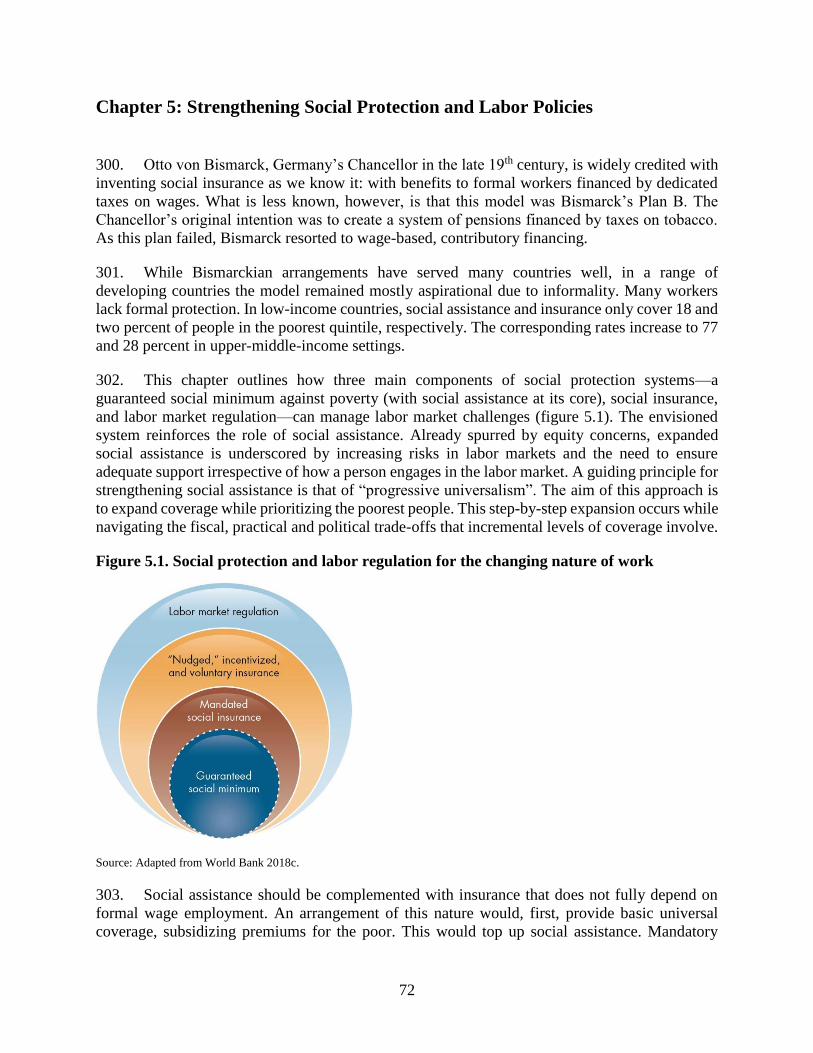
72
Chapter 5: Strengthening Social Protection and Labor Policies
300. Otto von Bismarck, Germany’s Chancellor in the late 19th century, is widely credited with
inventing social insurance as we know it: with benefits to formal workers financed by dedicated
taxes on wages. What is less known, however, is that this model was Bismarck’s Plan B. The
Chancellor’s original intention was to create a system of pensions financed by taxes on tobacco.
As this plan failed, Bismarck resorted to wage-based, contributory financing.
301. While Bismarckian arrangements have served many countries well, in a range of
developing countries the model remained mostly aspirational due to informality. Many workers
lack formal protection. In low-income countries, social assistance and insurance only cover 18 and
two percent of people in the poorest quintile, respectively. The corresponding rates increase to 77
and 28 percent in upper-middle-income settings.
302. This chapter outlines how three main components of social protection systems—a
guaranteed social minimum against poverty (with social assistance at its core), social insurance,
and labor market regulation—can manage labor market challenges (figure 5.1). The envisioned
system reinforces the role of social assistance. Already spurred by equity concerns, expanded
social assistance is underscored by increasing risks in labor markets and the need to ensure
adequate support irrespective of how a person engages in the labor market. A guiding principle for
strengthening social assistance is that of “progressive universalism”. The aim of this approach is
to expand coverage while prioritizing the poorest people. This step-by-step expansion occurs while
navigating the fiscal, practical and political trade-offs that incremental levels of coverage involve.
Figure 5.1. Social protection and labor regulation for the changing nature of work
Source: Adapted from World Bank 2018c.
303. Social assistance should be complemented with insurance that does not fully depend on
formal wage employment. An arrangement of this nature would, first, provide basic universal
coverage, subsidizing premiums for the poor. This would top up social assistance. Mandatory
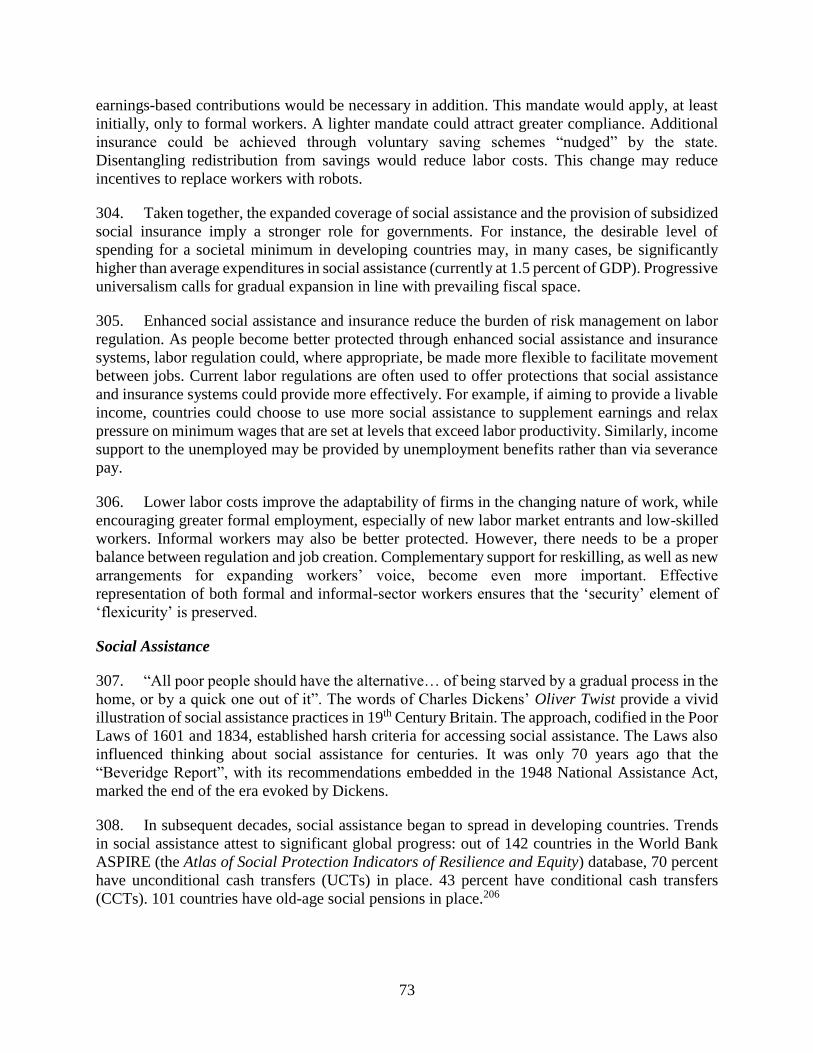
73
earnings-based contributions would be necessary in addition. This mandate would apply, at least
initially, only to formal workers. A lighter mandate could attract greater compliance. Additional
insurance could be achieved through voluntary saving schemes “nudged” by the state.
Disentangling redistribution from savings would reduce labor costs. This change may reduce
incentives to replace workers with robots.
304. Taken together, the expanded coverage of social assistance and the provision of subsidized
social insurance imply a stronger role for governments. For instance, the desirable level of
spending for a societal minimum in developing countries may, in many cases, be significantly
higher than average expenditures in social assistance (currently at 1.5 percent of GDP). Progressive
universalism calls for gradual expansion in line with prevailing fiscal space.
305. Enhanced social assistance and insurance reduce the burden of risk management on labor
regulation. As people become better protected through enhanced social assistance and insurance
systems, labor regulation could, where appropriate, be made more flexible to facilitate movement
between jobs. Current labor regulations are often used to offer protections that social assistance
and insurance systems could provide more effectively. For example, if aiming to provide a livable
income, countries could choose to use more social assistance to supplement earnings and relax
pressure on minimum wages that are set at levels that exceed labor productivity. Similarly, income
support to the unemployed may be provided by unemployment benefits rather than via severance
pay.
306. Lower labor costs improve the adaptability of firms in the changing nature of work, while
encouraging greater formal employment, especially of new labor market entrants and low-skilled
workers. Informal workers may also be better protected. However, there needs to be a proper
balance between regulation and job creation. Complementary support for reskilling, as well as new
arrangements for expanding workers’ voice, become even more important. Effective
representation of both formal and informal-sector workers ensures that the ‘security’ element of
‘flexicurity’ is preserved.
Social Assistance
307. “All poor people should have the alternative… of being starved by a gradual process in the
home, or by a quick one out of it”. The words of Charles Dickens’ Oliver Twist provide a vivid
illustration of social assistance practices in 19th Century Britain. The approach, codified in the Poor
Laws of 1601 and 1834, established harsh criteria for accessing social assistance. The Laws also
influenced thinking about social assistance for centuries. It was only 70 years ago that the
“Beveridge Report”, with its recommendations embedded in the 1948 National Assistance Act,
marked the end of the era evoked by Dickens.
308. In subsequent decades, social assistance began to spread in developing countries. Trends
in social assistance attest to significant global progress: out of 142 countries in the World Bank
ASPIRE (the Atlas of Social Protection Indicators of Resilience and Equity) database, 70 percent
have unconditional cash transfers (UCTs) in place. 43 percent have conditional cash transfers
(CCTs). 101 countries have old-age social pensions in place.206
74
309. Developing countries are continuously expanding social assistance programs: the coverage
of the national CCT scheme in Tanzania increased twentyfold from 0.4 percent of the population
in 2013 to ten percent in 2016. An equal level of coverage is achieved by the Productive Safety
Net Program in Ethiopia. About 20 percent of the population is served by the Pantawid program
in the Philippines and the Child Support Grant in South Africa. Overall, the cumulative coverage
of social assistance is 40.1 percent of the 5.1 billion people represented in surveys included in
ASPIRE; however, the largest among single programs reaches about ten percent of the population
(figure 5.2).
Figure 5.2. Global coverage of social assistance by programs and cumulatively (% of
population)
Source: Authors’ calculations based on ASPIRE database - www.worldbank.org/aspire.
Note: Number of countries: Sub-Saharan Africa (31); East Asia and Pacific (10); Europe and Central Asia (20); Latin America and
Caribbean (20); Middle East and North Africa (7); South Asia (8). This figure underestimates total coverage because household
surveys do not include all programs existing in each country. The figure does not account for possible overlap among programs
(individual receiving more than one program). The number of individuals is estimated by multiplying the percentage coverage rate
by the expanded population of the household survey, using household weights. Coverage indicator includes direct and indirect
beneficiaries (individuals who belong to the same household where at least one person receives a benefit). Unconditional cash
transfers also include social pensions.
310. Social assistance helps on many levels. Empirical studies demonstrate that cash transfers
are spent on food, health care, education and other desirable goods.207 Transfers are associated
with enhanced human capital of current and future generations. A systematic review of 56 cash
transfer programs found significant improvements in school enrolment, test scores, cognitive
development, food security and usage of health facilities. 208 In Mexico, the Prospera CCT
program improved motor skills, cognitive development and receptive language of children 24-68
months old. In Kenya, secondary school enrollment increases by seven percent for children in the
Orphans and Vulnerable Children program. These gains are usually largest for the poorest, rural
dwellers, girls and ethnic minorities. Transfers reduce stress and depression, increase mental
bandwidth and foster more involved parenting.209
75
311. Social assistance programs also affect household assets and livelihoods. In a meta-analysis
of evaluations from Africa, livestock ownership increased on average by 34 percent and ownership
of durable goods by ten percent.210 Programs increasingly reinforce livelihood effects by adding
elements of awareness-raising on nutritional risks, financial inclusion, entrepreneurship training
and asset transfers. 211 In other words, social assistance, especially “income support plus”
interventions, has raised productivity and resilience among poor informal sector workers in many
cases.
312. In advanced economies social assistance faces the challenge of low uptake amongst eligible
beneficiaries. In the European Union only about 60 percent of social benefits are claimed.212 This
challenge stems from a lack of awareness of benefits, misunderstanding eligibility rules, perceived
stigma associated with assistance, bureaucratic obstacles and the opportunity costs of accessing
benefits.
313. In some middle-income countries with high levels of coverage, policymakers have weighed
the possibility of targeting by “excluding the rich” instead of selecting beneficiaries from the
bottom. This approach is often considered in the context of large-scale energy and food subsidy
reforms. While it does not eliminate exclusion errors, these tend to occur higher up the income
distribution. “Targeting from the top” may have less problematic social consequences. The
political viability of such a proposition may then depend on how the middle-class and various
interest groups are set to benefit (and in part pay for) the program as part of a wider social
contract.213
314. Where deprivation is more widespread, households across the income distribution face
similar levels of need. Continuity in welfare distribution may contrast with sharp, somewhat
arbitrary measures of poverty or eligibility criteria.214 Even where poverty is less prevalent,
similarly-vulnerable people may concentrate around poverty lines. For instance, in some middle-
income countries people living on US$6 a day, or just above the poverty line, face a 40 percent
probability of falling back into poverty.215 In fact, poverty is often dynamic: in Africa, a third of
the population is persistently poor, while another third moves in and out of poverty.216
315. In low-income countries, only 18 percent of the poorest quintile receives some form of
transfer. In those contexts, the combined effects of fiscal, administrative and informational
constraints mean that the poorest households are hardest hit.217 Overall, social assistance is mildly
progressive: out of the benefits provided in developing countries, about a third accrues to the
poorest quintile while two-thirds are spread across the income distribution.218
316. These facts suggest the need for broader and more permanent coverage than most programs
currently provide. While the direction of travel towards more universal approaches is desirable—
including a high-coverage “guaranteed societal minimum”—the specific shape of this minimum
carries different technical, budgetary and political challenges. Universal approaches typically
reduce or eliminate hurdles around program fragmentation, eligibility determination and social
tensions, but they require significant additional resources. Expanding social assistance should
proceed at the same pace as the capacity of a country’s ability to mobilize the required resources.
The choice of larger or smaller tax-transfer policies has different distributional effects as well as
diverse roots of political support.
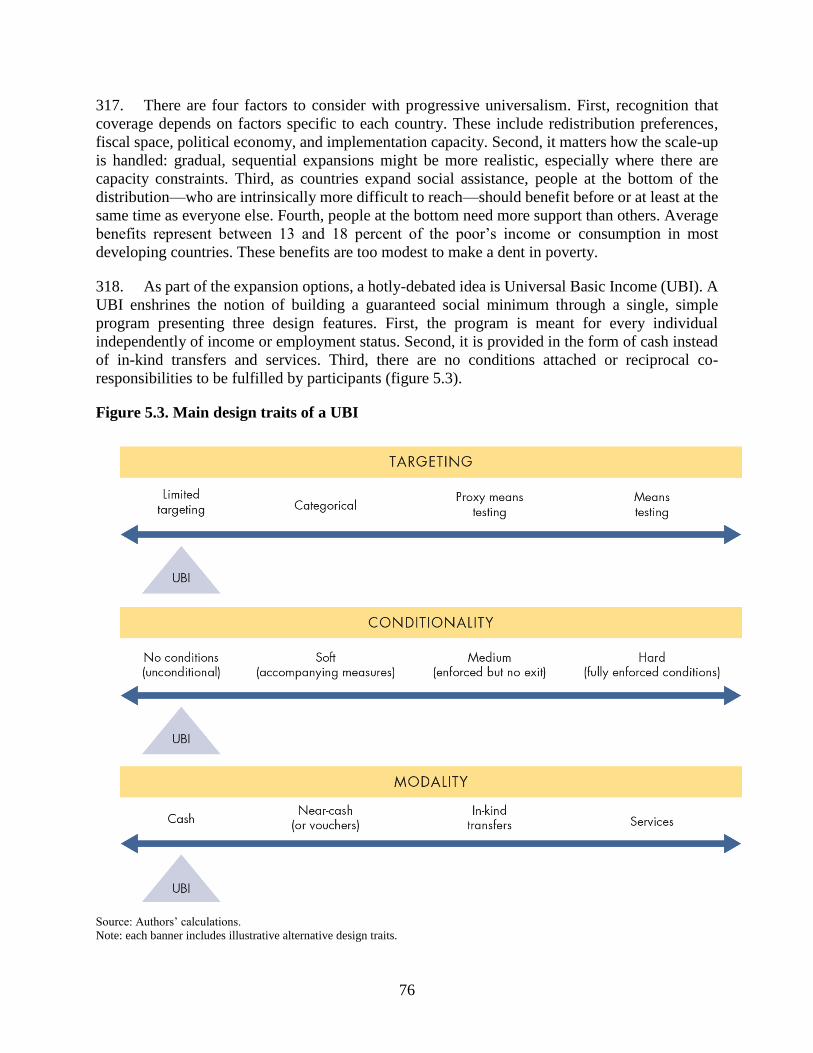
76
317. There are four factors to consider with progressive universalism. First, recognition that
coverage depends on factors specific to each country. These include redistribution preferences,
fiscal space, political economy, and implementation capacity. Second, it matters how the scale-up
is handled: gradual, sequential expansions might be more realistic, especially where there are
capacity constraints. Third, as countries expand social assistance, people at the bottom of the
distribution—who are intrinsically more difficult to reach—should benefit before or at least at the
same time as everyone else. Fourth, people at the bottom need more support than others. Average
benefits represent between 13 and 18 percent of the poor’s income or consumption in most
developing countries. These benefits are too modest to make a dent in poverty.
318. As part of the expansion options, a hotly-debated idea is Universal Basic Income (UBI). A
UBI enshrines the notion of building a guaranteed social minimum through a single, simple
program presenting three design features. First, the program is meant for every individual
independently of income or employment status. Second, it is provided in the form of cash instead
of in-kind transfers and services. Third, there are no conditions attached or reciprocal co-
responsibilities to be fulfilled by participants (figure 5.3).
Figure 5.3. Main design traits of a UBI
Source: Authors’ calculations.
Note: each banner includes illustrative alternative design traits.
77
319. A UBI is not an alternative to health, education or other social services. The program may
be additional to current social assistance programs and more likely to replace some of the programs
pursuing income support functions. A UBI may be designed with different objectives in mind,
from poverty reduction to ensuring a liveable income. The discussion here focuses on the former.
While UBI provides the same level of benefits to the entire population, the money may be
recovered from the rich, for example through progressive income tax.
320. India’s Chief Economic Adviser, Arvind Subramanian, predicted enthusiastically in 2017
that “… I can bet, within the next two years, at least one or two [Indian] states will implement
universal basic income”.219 But we know very little about how UBI works in practice. Only one
country, Mongolia, had a short-lived UBI covering the entire population. The program lasted two
years (2010-2012) before being dismantled due to fiscal constraints. When mineral prices
collapsed, so too did the scheme.220 Iran also had a program resembling a UBI for one year: in
2011, energy subsidies were replaced by cash transfers to 96 percent of the population.
321. Local variants of a UBI are in place in a range of resource-dividend schemes. The Alaska
Permanent Fund, for example, is designed to redistribute oil revenues to all residents. In 2016, the
Fund distributed about US$2,000 each to 660,000 individuals. There are several small-scale
schemes and experiments ongoing in Canada, China, Kenya, the Netherlands, and the United
States.221 While labelled UBI, they are often versions of targeted programs.
322. The fiscal implications of a UBI could be significant. New analysis estimates the costs of
providing a UBI in four European countries. UBI transfers were set equal to those of existing cash
transfer programs.222 Results show that the additional cost of a UBI varies significantly, i.e., 13.8
percent of GDP in Finland, 10.1 percent in France, 8.9 percent in the UK, and 3.3 percent in Italy.
To cover the additional costs, two funding sources were identified: taxing UBI transfers alongside
other incomes and abolishing existing tax allowances. In Finland and Italy, these measures were
more than adequate to cover the extra costs of a UBI. In France, those revenues almost offset the
cost of a UBI. In the United Kingdom, taxing cash benefits and eliminating tax allowances is not
enough to cover for the UBI.
323. Simulations from developing countries also point to significant additional spending for a
UBI. In a handful of emerging economies, a UBI set at 25 percent of median income would cost
about 3.75 percent of GDP.223 In comparison, low and middle-income countries spend on average
1.5 percent of GDP on social assistance. In India the government’s estimates show that a quasi-
UBI excluding the top 25 percent could be largely paid for by replacing existing schemes.224 While
the latter accounts for about 5 percent of GDP, results have been contested.225 Other simulations
are providing further evidence. The cost of a UBI for adults set at the average poverty gap level
ranges from 9.6 percent of GDP in low-income countries to 3.5 percent of GDP in upper-middle
income countries. If transfer amounts are lower—for example, set at the average level of current
benefits—costs would shrink considerably (but would have less impact). Whether a UBI provides
sufficient money to close the poverty gap or equates to current transfer levels, the cost of the
scheme would nearly double if intended for the entire population instead of for adults only (figure
5.4).
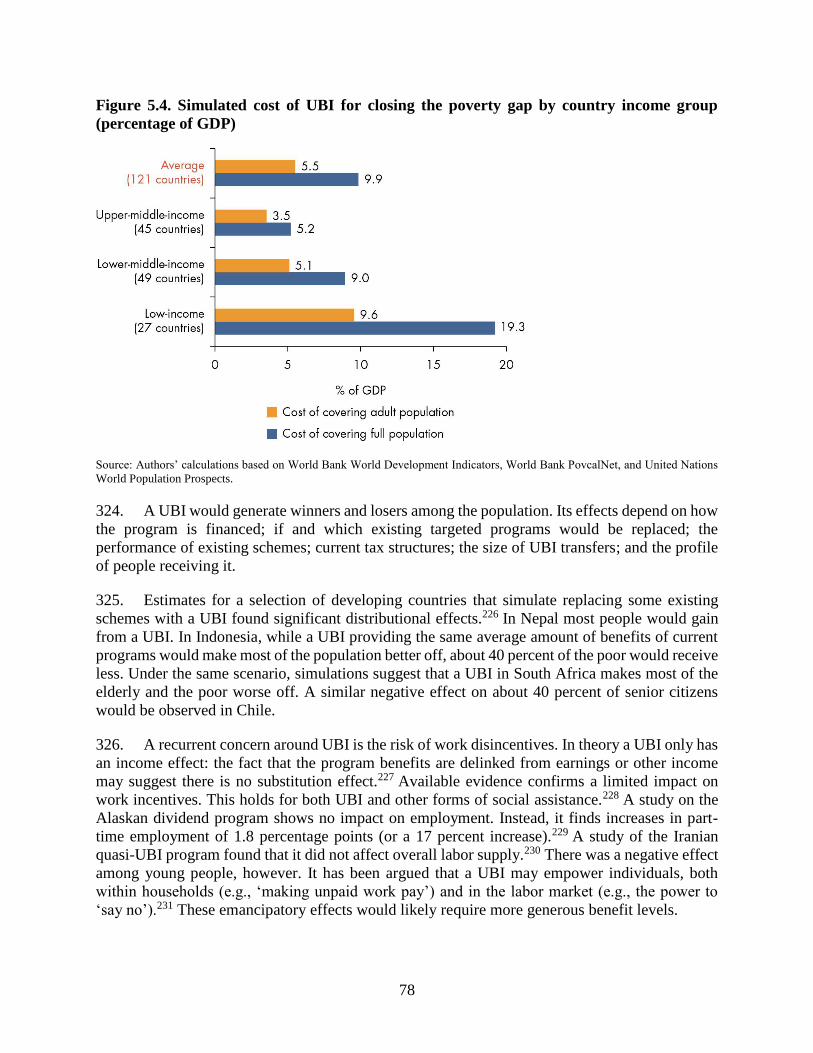
78
Figure 5.4. Simulated cost of UBI for closing the poverty gap by country income group
(percentage of GDP)
Source: Authors’ calculations based on World Bank World Development Indicators, World Bank PovcalNet, and United Nations
World Population Prospects.
324. A UBI would generate winners and losers among the population. Its effects depend on how
the program is financed; if and which existing targeted programs would be replaced; the
performance of existing schemes; current tax structures; the size of UBI transfers; and the profile
of people receiving it.
325. Estimates for a selection of developing countries that simulate replacing some existing
schemes with a UBI found significant distributional effects.226 In Nepal most people would gain
from a UBI. In Indonesia, while a UBI providing the same average amount of benefits of current
programs would make most of the population better off, about 40 percent of the poor would receive
less. Under the same scenario, simulations suggest that a UBI in South Africa makes most of the
elderly and the poor worse off. A similar negative effect on about 40 percent of senior citizens
would be observed in Chile.
326. A recurrent concern around UBI is the risk of work disincentives. In theory a UBI only has
an income effect: the fact that the program benefits are delinked from earnings or other income
may suggest there is no substitution effect.227 Available evidence confirms a limited impact on
work incentives. This holds for both UBI and other forms of social assistance.228 A study on the
Alaskan dividend program shows no impact on employment. Instead, it finds increases in part-
time employment of 1.8 percentage points (or a 17 percent increase).229 A study of the Iranian
quasi-UBI program found that it did not affect overall labor supply.230 There was a negative effect
among young people, however. It has been argued that a UBI may empower individuals, both
within households (e.g., ‘making unpaid work pay’) and in the labor market (e.g., the power to
‘say no’).231 These emancipatory effects would likely require more generous benefit levels.
79
327. An important debate is whether a jobs-guarantee program would offer a better alternative
to UBI. India’s National Rural Employment Guarantee Act offers 100 days of work every year at
the minimum wage. UBI proponents contest public works on the basis that a “right to income”
should precede that of work. Conversely, it is contended that the right to work rests on the premise
that anyone who wants work could be offered a job, hence conferring on work societal value.
Those favoring jobs schemes also point to the range of productive and socially valuable activities
implementable beyond labor-intensive tasks (e.g., social care services). A UBI may be an
alternative to public works when their overwhelming function is mere income support. However,
when more meaningful activity is envisioned, public works emerge as a complementary instrument
for those who are fit and able to work. The concept of ‘participation income’ is a hybrid between
a UBI and public works. It envisions providing universal cash transfers tied to some form of civil
engagement.232
328. A UBI could generate efficiency gains by reducing program fragmentation. Most countries
operate a complex mosaic of social assistance progras: Bangladesh has more than a hundred
programs; India has nearly 950 centrally sponsored schemes, with many more provided at the state
level. This plethora of programs usually has more historical or institutional roots than solid
technical justification. Some degree of consolidation may be appropriate, but the optimal number
of programs is certainly more than one.
329. The program composition of social assistance should allow for differentiated support to
different vulnerabilities; instead, as illustrated, a UBI offers flat benefits. Some groups at the
bottom of the distribution may not be better off with a UBI instead of targeted programs. The net
impact would depend on how progressive are existing tax-benefit systems: where they are
regressive, a flat benefit may yield distributional gains.
330. Whichever form of social assistance is selected, technology can be harnessed to improve
delivery of social protection programs. In Mexico geospatial mapping tools are used to identify
the most vulnerable areas in cities, down to the block-level. Mobile phone data was leveraged to
construct poverty maps in Côte d’Ivoire. In Benin, GPS-based data collection located households
lacking addresses in urban settlements. Digital technologies also deliver assistance in fragile
places. In Lebanon electronic smartcards provide food vouchers to nearly 124,000 Syrian refugee
households.
331. Technology improves the credibility of personal identification (ID) systems, which are the
first step in the delivery of social protection. In Sub-Saharan Africa the share of the population
with national IDs ranges from nearly 90 percent in Rwanda to less than ten percent in Nigeria.
Technology improves access to social registries, which in turn improves coordination among
different programs. Better coordination generates cost savings by reducing inclusion errors. In
Pakistan, the social registry, which includes 85 percent of the population and serves 70 different
programs, contributed to savings of US$248 million. In South Africa and Guinea, a similar process
saved US$157 million and US$13 million, respectively. Technology reduces costs. In Argentina,
linking 34 social program databases to the unique ID number of beneficiaries revealed inclusion
errors in eligibility for various social programs. This led to US$143 million in savings over an
eight-year period. In 2016, Thailand eliminated 660,000 applicants out of 8.4 million, based on
cross-checking databases using unique national ID numbers.
80
332. Payment technologies make a difference. A UBI, in particular, requires robust payment
mechanisms that meet additional demand for cash transfers. In Ghana’s Labor Intensive Public
Works scheme, the digitalization of paper-based transactions and a wider use of biometric
machines reduced overall wage payment time from four months to a week. In the Indian state of
Chattisgarh, electronic devices for the Public Distribution System of food assistance contributed
to a reduction in ‘leakages’ from 52 percent in 2005 to nine percent in 2012.233
Social Insurance
333. In June 2011, after six years of double-digit growth, Ethiopia introduced a landmark social
insurance law. For the first time, the mandate to provide pension and disability benefits was
extended to private-sector firms. Firms operating beyond the reach of enforcement could evade
and keep their workers uncovered. The policy aimed to expand social protection and reduce
poverty. However, the consequent rise in labor costs, together with other factors, induced firms to
adopt more technology. As a result, employment among lower-skilled workers dropped,
exacerbating the formal-informal divide in the labor market.234
334. The Bismarckian social insurance model of earning-based contributions is premised on
steady wage employment, clear definitions of employers and employees and a fixed point of
retirement. It relies on levying a dedicated tax on wages. In rich countries this scheme was effective
in increasing coverage as workers were steadily absorbed into factories, then into jobs in formal
services firms. But this contributory approach is not a good fit for developing countries where
formal and stable employment is uncommon. Indeed, because eligibility is based on making
mandatory contributions, this form of social insurance excludes informal workers who account for
more than two-thirds of the workforce in developing countries and one in ten in India and many
countries in Sub-Saharan Africa (figure 5.5). This model is also increasingly unsuitable for a
changing world of work where the prevalence of traditional employer-employee relationships is
no longer the norm. The traditional financing model of social insurance often makes employing
workers more expensive, as illustrated by the case of Ethiopia. Rethinking this model is a priority.
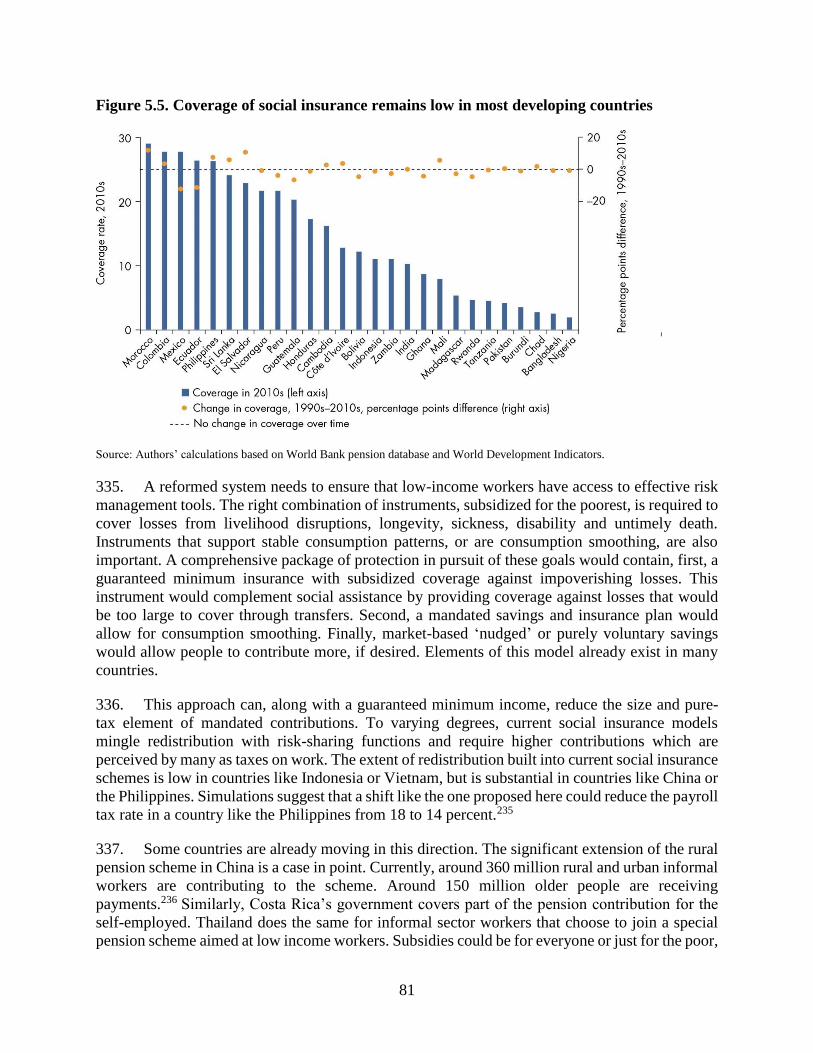
81
Figure 5.5. Coverage of social insurance remains low in most developing countries
Source: Authors’ calculations based on World Bank pension database and World Development Indicators.
335. A reformed system needs to ensure that low-income workers have access to effective risk
management tools. The right combination of instruments, subsidized for the poorest, is required to
cover losses from livelihood disruptions, longevity, sickness, disability and untimely death.
Instruments that support stable consumption patterns, or are consumption smoothing, are also
important. A comprehensive package of protection in pursuit of these goals would contain, first, a
guaranteed minimum insurance with subsidized coverage against impoverishing losses. This
instrument would complement social assistance by providing coverage against losses that would
be too large to cover through transfers. Second, a mandated savings and insurance plan would
allow for consumption smoothing. Finally, market-based ‘nudged’ or purely voluntary savings
would allow people to contribute more, if desired. Elements of this model already exist in many
countries.
336. This approach can, along with a guaranteed minimum income, reduce the size and pure-
tax element of mandated contributions. To varying degrees, current social insurance models
mingle redistribution with risk-sharing functions and require higher contributions which are
perceived by many as taxes on work. The extent of redistribution built into current social insurance
schemes is low in countries like Indonesia or Vietnam, but is substantial in countries like China or
the Philippines. Simulations suggest that a shift like the one proposed here could reduce the payroll
tax rate in a country like the Philippines from 18 to 14 percent.235
337. Some countries are already moving in this direction. The significant extension of the rural
pension scheme in China is a case in point. Currently, around 360 million rural and urban informal
workers are contributing to the scheme. Around 150 million older people are receiving
payments.236 Similarly, Costa Rica’s government covers part of the pension contribution for the
self-employed. Thailand does the same for informal sector workers that choose to join a special
pension scheme aimed at low income workers. Subsidies could be for everyone or just for the poor,
82
or they could be gradually reduced as income grows. The latter is the case in Turkey’s health
insurance system. In addition to an almost universal old age pension, Thailand pays part of the
social insurance premium for working-age people in the informal sector. The cost of the subsidy
depends, of course, on the subsidy level as well as the size of the population to be subsidized.
338. In many emerging economies, social insurance liabilities are limited, since coverage is low.
In countries like Bangladesh, Namibia, Lao PDR, Somalia, and South Africa, pensions are not
financed through labor taxes but from general revenues. In these cases, decoupling from payroll
taxes may be feasible. A significant portion could be replaced with other taxes while broadening
the coverage beyond those in contracted and regulated standard employment relationships. These
are also countries that could use technology to leapfrog institutional developments through, for
example, the use of mobile transactions as a base for consumption taxation.
339. Beyond the basic insurance level, additional policy support is likely to be required to
achieve adequate protection. Additional mandated contributions would allow consumption
smoothing, for which instruments are often missing in countries with underdeveloped capital and
insurance markets. This layer would cover formal workers, but setting the level of insurance is not
trivial since a higher mandate leads to higher labor taxes. In some countries these taxes are already
high, which affects formal employment. The average payroll tax rate used to finance contributions
is almost 23 percent in advanced economies.237 It is also more than 20 percent in countries like
China, Egypt and Peru. The mandate could be relaxed by reducing the tax rate or lowering the
ceiling on earnings subject to mandatory savings.
340. To complement mandatory contributions, participation in savings or insurance schemes
could be the lowest effort, default option. Some measures include adding an “opt-in” default on
business registration and income tax returns. These measures would potentially lower transaction
costs. Other approaches that rely on behavioural insights are also instructive in some cases. In
Kenya, giving people a golden-colored coin with numbers for each week to keep track of their
weekly deposits doubled their savings rate.238 Another form of nudging may include “commitment
devices” through which, for example, people agree to incur a loss if they do not reach a savings
goal. Technology vastly increases possible nudges. For example, it facilitates the defaulting of
rounding from mobile money or credit card transactions into savings.
341. There are also larger, national efforts to nudge people—regardless of the way they work—
to augment savings and insurance efforts. The “KiwiSaver” program in New Zealand relies on
automatic enrolment and offers a limited set of investment choices. The United Kingdom’s
National Employment Savings Trust operates similarly. In both programs, although people are
allowed to withdraw, incentives dissuade people from doing so.
Labor Regulation
342. In many developing countries, labor regulations were adopted at the time of colonialism.
Through conquest, labor law was transplanted throughout Western Europe and the colonies in
North and West Africa, Latin America, and parts of Asia. Repercussions are still felt in the 21st
Century: civil law countries have significantly more stringent labor regulations than do common
law countries, placing more restrictions on how employers and workers interact.239
83
343. The more restrictive approach to regulation is ill-fitting to many developing countries’
labor markets as it assumes greater administrative capacity than most governments have. Designed
with industrial-era economies in mind and at a time of weak social protection systems, regulations
often fail to protect most workers when informality is the norm and work is often out of reach of
the authorities. Within formal work, regulation in most countries was written assuming that most
working people are in stable, full-time wage employment. In many developing countries these
types of jobs are an exception, mostly found in the public sector or among high-skilled workers.
344. Governments seek to ensure the labor market is safe, fair, and a place where people’s skills
and enterprise are rewarded. In pursuit of these objectives, labor policies –workplace safety
requirements, statutory minimum wages, employment protection and the institutions for dialogue
and negotiations between market actors- are important instruments in the policy makers’ toolkit.
Their successful application requires balance, agility and close attention to their impact on market
actors. Balance is sought, for example, in the “flexicurity” model, with its roots in Denmark in the
late nineteenth century, combining flexibility in the labor market with strong social protections
and active labor market programs. In this view, labor market flexibility and social protection are
strong complements. For developing countries, it is not about copying Denmark or other countries’
institutions but translating the principles underpinning flexicurity models into their own labor
market realities.
345. Reforms need to address three main challenges of labor market regulations. First, these
regulations cover few and only formal workers whose labor is observed by the state. Yet more than
half of the global labor force is informal. Especially in non-agricultural activities, close to seven
in ten workers are informal or work in the informal sector in countries like Guatemala, India,
Liberia and Pakistan.240 Second, governments are trying to do too much with labor regulations,
expecting these to substitute for a social protection system, including ensuring a minimum income
or substituting for unemployment benefits.
346. Third, and as argued in the World Development Report 2013, while regulations address
labor market imperfections, they often reduce dynamism in the economy by affecting labor market
flows and increasing the length of time spent in both employment and unemployment.241 At this
time of change, stringent regulations make it more expensive for firms to adjust the composition
of their workforce, an important condition for adopting new technologies and increasing
productivity.242 This happens when regulations are too strict and exclude many, especially young
and low-skilled people.
347. However, when too restrictive, regulations impose costs on firms that hamper
dynamism.243 In a sample of 60 countries, moving from the 20th to the 80th percentile in job
security, in countries with strong rule of law, cuts the speed of adjustment to shocks in terms of
employment by a third and reduces annual productivity growth by one percentage point.244
Productivity-enhancing technology adoption is negatively associated with the strictness of some
labor regulations, specifically with burdensome dismissal procedures.245 Technology-intensive
sectors are smaller in countries with stricter employment protection regulations.246 More stringent
regulations are also associated with lower entry and exit of firms—especially small ones—in
industries with higher worker reallocation.247 Within countries, similar evidence is also emerging
in some cases.248
84
348. To address this challenge, policymakers need to rethink labor regulations. Some countries
are reforming theirs in ways that support firms and workers in adapting to the changing world of
work. Italy’s recent reforms have been associated with the creation of more permanent jobs.249
Aiming for a balance of security and flexibility is vital. Many governments have made their labor
markets more flexible. However, only a few are making corresponding investments in income
support and reemployment assistance to get workers back into work. Increasing flexibility for
firms goes hand in hand with strengthened social protection, intermediation and job-search
assistance programs and arrangements for expanding workers’ voice. Beyond basic regulations,
protections would be provided to all working people irrespective of how they engage in the labor
market as part of a comprehensive approach to social protection and labor institutions. This
approach adds protection to the many workers—often the most vulnerable—who are effectively
excluded. This would be a shift away from protecting some jobs to protecting all people.
349. One of the policies that needs careful attention is the statutory minimum wage. Only a
minority of workers benefit from the minimum wage; most informal workers do not.250 Even in
correcting imbalances in market power, a legislated minimum wage is blunt, as it assumes that
these imbalances are the same across the board and it is not responsive to changes in market power.
In most cases the minimum wage applies uniformly to firms irrespective of productivity across
regions and sectors. As a result, many firms—65 percent of formal firms and 82 percent of informal
ones in Paraguay, for example—have labor productivity levels that are below the minimum
wage.251 For this reason it is important to tighten the link between changes in minimum wages to
changes in labor productivity.252
350. The bargaining power of workers needs to be strengthened. Labor unions—particularly
those making efforts to broaden their constituencies and membership to include traditionally
underrepresented segments of the labor force—play an important role. So does collective
bargaining. Technology, including social media, has the potential to make this task for workers
associations more effective. For larger firms, for whom there is evidence in advanced economies
of increased labor market power, increased scrutiny could be applied to competition policies and
assessments of the potential adverse labor market effects of mergers.253
351. A more ambitious set of instruments would target, explicitly, the distribution of value
added within the firm. Many workers, such as sole traders, self-employed or workers in family
businesses, share in the profits of firms. Profit sharing—monitored by social partners and firm-
level collective bargaining arrangements—potentially complements the minimum wage. The
experience of the more than 50 countries that have mechanisms for profit sharing is illustrative.
The proceeds from profit sharing could be deposited into individual savings accounts.
352. Reasonable notice periods and protections against discriminatory dismissals are important
to counter employer market power. However, when rules on firms’ hiring and dismissal decisions
are too onerous they also create structural rigidities that carry higher social costs in the face of
disruption. Bolivia, Oman and Venezuela do not allow contract termination for economic reasons,
limiting grounds for dismissal to disciplinary and personal matters. In 32 countries an employer
needs the approval of a third party even in cases of individual redundancies. In Indonesia an
approval from the Industrial Relations Dispute Settlement Board is required. In Mexico an
employer obtains approval from the Conciliation and Arbitration Labor Board. In Sri Lanka an
employer must obtain consent of the employee or approval of the Commissioner of Labor.
85
353. Firms could be accorded more flexibility in managing their human resources contingent on
the law mandating proper notice, the presence of an adequate system of income protection and
efficient mechanisms to punish discrimination. However, more flexible dismissal procedures
ought to be balanced with increased protections outside of the work contract and active re-
employment support measures to protect people who lose their jobs. Otherwise, reducing
restrictions on hiring and dismissal decisions would shift an unmanageable risk-burden onto
workers. The current approach in many countries, however, places too much of this burden on
firms and not enough on the state directly. Audits based on the risk of violating the law and
applying penalties on employers found at fault may reduce abuse.
354. The provision of financial protection to workers in the case of livelihood disruption is also
ripe for reconsideration. Severance pay is the most prevalent form of this protection in most low
and middle-income economies. However, it is left over from a time when governments were
unable to offer unemployment income support schemes. Some countries have, on paper, extremely
generous severance pay. In Sierra Leone the statutory severance pay after ten years of continuous
employment equals 132 weeks of salary, 130 weeks of salary in Mauritius and 120 weeks of salary
in Bahrain.
355. Yet, severance pay is an ineffective instrument for income protection since it pools risk at
the firm or industry level where shocks and losses are correlated.254 Employees also face a high
risk of not receiving payments if their employers have liquidity constraints or go out of business.
Placing greater reliance on unemployment benefits organized nationally would give workers more
reliable options. National, rather than firm-based arrangements also open this form of protection
to all, no matter where or how they work. To ensure sufficient protection while preserving work
incentives, unemployment benefit systems would rely both on individual savings and
redistribution.255
356. Savings could be drawn upon in case of unemployment or for retraining. If people do not
draw on all their savings the remainder would be available upon retirement. Workers without
enough savings would be able to rely on the minimum income guarantee financed through general
revenues. Chile and Jordan have individual savings accounts for unemployment. Singapore has
individual accounts for housing or education.
357. Governments would need to ensure that worker protections in the labor code are neutral
with respect to types of work. Brazil’s 2017 labor code reform moved in this direction. Any
benefits that are part of the base contract would also be pro-rated depending on hours worked. A
starting point is to do away with regulations that severely constrain flexible work arrangements.
In Montenegro contracts for part-time employment cannot be less than ten hours each week. In
Serbia, the “reference” wage (determining a minimum social contribution) is not adjusted for hours
worked.256 Reforms are also necessary in terms of working time arrangements. The traditional
five-day, eight hours a day week is no longer desirable for some workers.
358. As industrial-era employment protections are scrutinized, so too should rigid, possibly
outdated laws regarding work arrangements. Some new forms of work blur the distinction between
being an employee and being a “dependent” self-employed: is a Yandex driver a Yandex
employee? Labor codes need to define more clearly what it means to be an employee in current
labor markets to ensure the basic set of protections discussed above. This definition would be
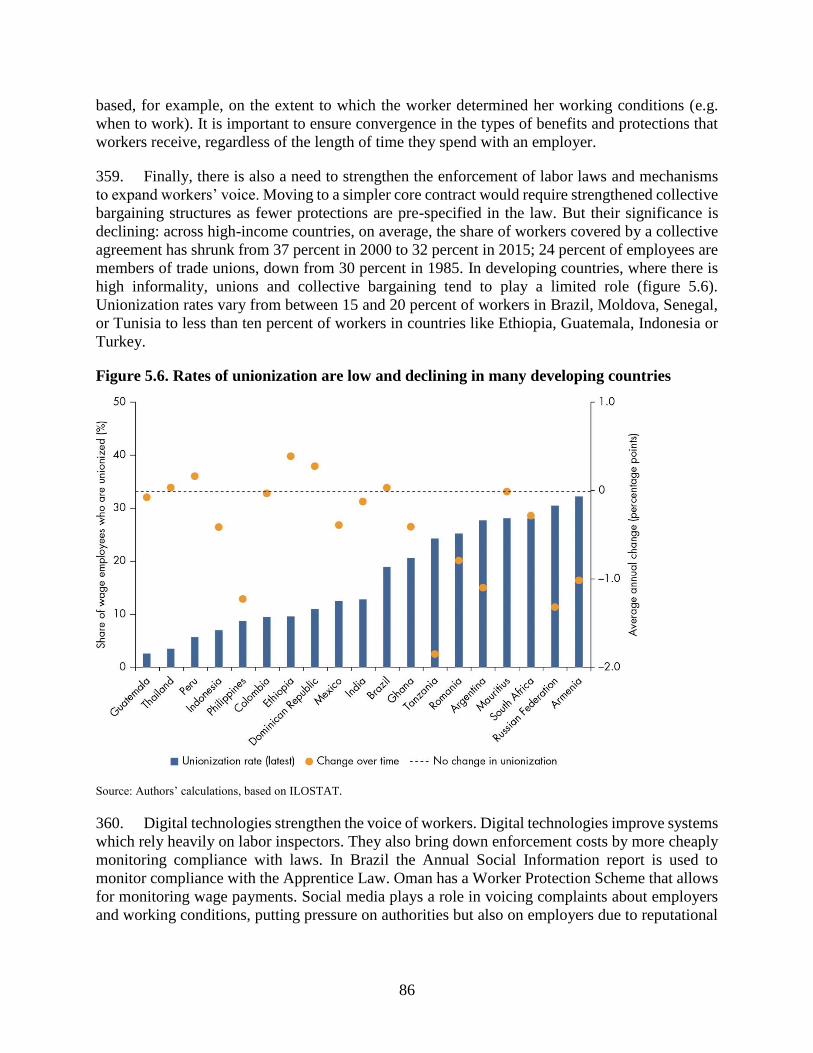
86
based, for example, on the extent to which the worker determined her working conditions (e.g.
when to work). It is important to ensure convergence in the types of benefits and protections that
workers receive, regardless of the length of time they spend with an employer.
359. Finally, there is also a need to strengthen the enforcement of labor laws and mechanisms
to expand workers’ voice. Moving to a simpler core contract would require strengthened collective
bargaining structures as fewer protections are pre-specified in the law. But their significance is
declining: across high-income countries, on average, the share of workers covered by a collective
agreement has shrunk from 37 percent in 2000 to 32 percent in 2015; 24 percent of employees are
members of trade unions, down from 30 percent in 1985. In developing countries, where there is
high informality, unions and collective bargaining tend to play a limited role (figure 5.6).
Unionization rates vary from between 15 and 20 percent of workers in Brazil, Moldova, Senegal,
or Tunisia to less than ten percent of workers in countries like Ethiopia, Guatemala, Indonesia or
Turkey.
Figure 5.6. Rates of unionization are low and declining in many developing countries
Source: Authors’ calculations, based on ILOSTAT.
360. Digital technologies strengthen the voice of workers. Digital technologies improve systems
which rely heavily on labor inspectors. They also bring down enforcement costs by more cheaply
monitoring compliance with laws. In Brazil the Annual Social Information report is used to
monitor compliance with the Apprentice Law. Oman has a Worker Protection Scheme that allows
for monitoring wage payments. Social media plays a role in voicing complaints about employers
and working conditions, putting pressure on authorities but also on employers due to reputational

87
risks. Governments could, through results-based contracts, outsource to third parties the
development of online platforms for submitting, managing and resolving labor complaints.
88
Chapter 6: The Changing Nature of Firms
362. Firms have, historically, operated within boundaries. The British economist Ronald Coase
explained this phenomenon in The Nature of the Firm.257 He observed that firms in Detroit, USA,
grow only so long as it is cheaper for them to take on additional transactions rather than it is to
complete those transactions on the open market.
363. Firms in 2018 operate within wider boundaries. Free trade agreements and improved
infrastructure reduce the cost of cross-border trade. This allows transactions to take place wherever
costs are minimized.258 New technologies have lowered communication costs. As a result, firms
are also less vertically-integrated: managers outsource more tasks to the market. Some platform
companies create new markets, for example JD.com in China has nearly 300 million active users,
many in rural areas.
364. The wider boundaries of the firm evolved gradually. Compare the Ford Motor Company
(Ford) of the 1930s with Inter IKEA Group (IKEA) of 2018. Henry Ford owned the sheep farms
that supplied the wool for automobile seat covers. He also owned the iron ore and coal freighters
that fed Ford’s sprawling River Rouge manufacturing complex. Ford kept most of the transactions
needed to manufacture a car in-house because the transaction costs were higher for finding an
outside supplier able to customize auto parts.
365. Vertical integration within one country gave ground to globalization in the 1980s and
1990s. The international expansion of IKEA, founded in Sweden in 1943, began with the
establishment of small stores in Norway in 1963, then in Denmark in 1969.259 The reduction in
tariff or non-tariff barriers allowed IKEA to set up global value chains. The advent of internet
technology transformed these chains into global networks: IKEA procures many of its products
through online bidding. Firms from around the world become part of IKEA’s network of suppliers.
366. The rise of “superstar” firms like IKEA would have made Joseph Schumpeter proud.
“Capitalism requires the perennial gale of Creative Destruction,” Schumpeter wrote.260 He did not
worry about whether jobs might be lost in the process. Politicians do.
367. Thanks to digital technologies, which allow for rapid scaling, platform-based businesses
are on the rise across the globe. Jamalon, an eight-year-old online books retailer in Amman, Jordan,
was able, with less than 100 staff, to establish partnerships with over 3,000 Arabic-language and
27,000 English-language publishers, delivering 10 million titles to the Middle East region.261
368. As the boundaries of firms expanded, the corporate labor share declined between 1975 and
2012 in 75 percent of advanced countries and 59 percent of emerging economies.262 World Bank
evidence based on the use of total labor shares, including the self-employed and government
sectors, shows a decline in two-thirds of the 76 developing countries.
369. Governments struggle to respond to this decline and often blame the rise of superstar firms
to explain this trend. Politicians try to create jobs by financing programs for the development of
small and medium enterprises (SMEs). These programs are rarely cost-effective. They are based
89
on the belief that SMEs create stable jobs. Yet the evidence shows that large firms account for the
largest proportion of stable jobs in many economies.263
370. A better solution is to ease the barriers for start-ups to encourage competitive markets.
Start-ups require a business-friendly environment which does not favor large private firms that
have been already in a market for some time (incumbents), state-owned enterprises or firms run
by government officials, their associates or relatives. A small number of start-ups will grow to
become the next superstar firms. Technological change favors the most productive firms in each
industry, incentivizing the reallocation of resources towards them.
371. There is much to celebrate when it comes to the rise of superstar firms. The digital economy
allows firms to grow faster as compared with firms of 20 years ago. But there is also much to
beware. Negative externalities arise faster in two ways. First, digital markets provide new, different
opportunities for firms to stifle competition. Sherwin Rosen, who introduced the concept of
superstar firms in 1981, predicted that technology would allow firms to expand markets or crowd
out the competition more easily. In many markets, this prediction has proven to be true.
Technology has allowed some companies to rise quickly to the top—but prevent others from rising.
372. Second, globally integrated firms, which have “scale without mass”, create new challenges
for taxation. It is increasingly difficult to determine where value is created when businesses create
value by combining networks of users, ideas and production across borders. International value
creation, in turn, gives increased opportunities for firms to divert profits to low-tax jurisdictions.
Solutions require coordination at the global level. In the meantime, countries take unilateral steps
by extending VAT regimes or creating new taxes for the digital economy. But these taxes still do
not tax profits generated through intangible assets, such as user data or advertising space. More
traditional tax avoidance schemes, through transfer pricing, are also easier in the digital economy.
373. Regulations, particularly in relation to competition and taxation, must be updated if they
are to keep up with technological innovation in business.
Superstar Firms
374. Large, innovative (superstar) firms dominate the global economy: 10 percent of the
world’s public companies are estimated to generate 80 percent of all profits. Emerging markets
account for a growing proportion of these profits. Superstar firms shape a country’s exports. One
study across 32 developing countries found that, on average, the five largest exporters in a country
account for one third of exports, nearly half of export growth and a third of growth due to export
diversification.264
375. Superstar growth is particularly strong in markets undergoing rapid technological
advances.265 Reduced trade barriers also encourage firm growth by increasing access to new
imported inputs.266 The top one percent of exporters account for a larger share of exports—on
average, 55 percent (figure 6.1). Reduced informational costs related to price search, free trade
agreements, as well as improved infrastructure have reduced the cost of cross-border trade,
allowing more transactions to take place.267 The effect of trade on work is the subject of the next
World Development Report.
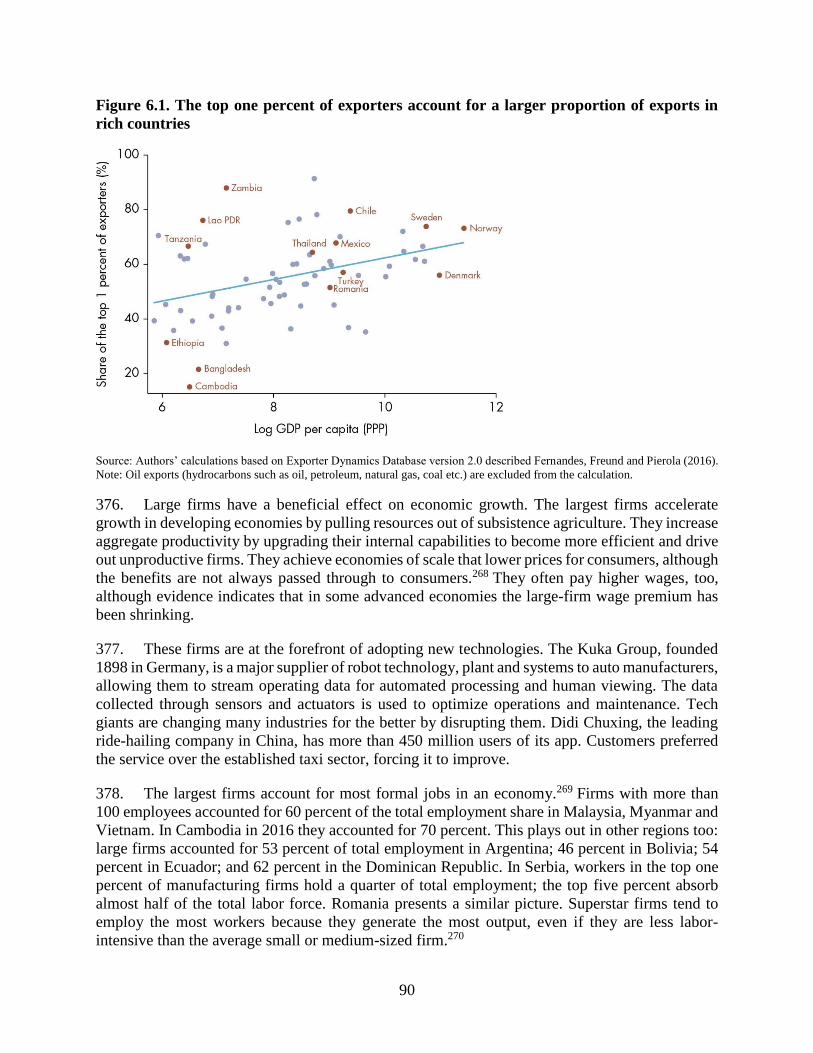
90
Figure 6.1. The top one percent of exporters account for a larger proportion of exports in
rich countries
Source: Authors’ calculations based on Exporter Dynamics Database version 2.0 described Fernandes, Freund and Pierola (2016).
Note: Oil exports (hydrocarbons such as oil, petroleum, natural gas, coal etc.) are excluded from the calculation.
376. Large firms have a beneficial effect on economic growth. The largest firms accelerate
growth in developing economies by pulling resources out of subsistence agriculture. They increase
aggregate productivity by upgrading their internal capabilities to become more efficient and drive
out unproductive firms. They achieve economies of scale that lower prices for consumers, although
the benefits are not always passed through to consumers.268 They often pay higher wages, too,
although evidence indicates that in some advanced economies the large-firm wage premium has
been shrinking.
377. These firms are at the forefront of adopting new technologies. The Kuka Group, founded
1898 in Germany, is a major supplier of robot technology, plant and systems to auto manufacturers,
allowing them to stream operating data for automated processing and human viewing. The data
collected through sensors and actuators is used to optimize operations and maintenance. Tech
giants are changing many industries for the better by disrupting them. Didi Chuxing, the leading
ride-hailing company in China, has more than 450 million users of its app. Customers preferred
the service over the established taxi sector, forcing it to improve.
378. The largest firms account for most formal jobs in an economy.269 Firms with more than
100 employees accounted for 60 percent of the total employment share in Malaysia, Myanmar and
Vietnam. In Cambodia in 2016 they accounted for 70 percent. This plays out in other regions too:
large firms accounted for 53 percent of total employment in Argentina; 46 percent in Bolivia; 54
percent in Ecuador; and 62 percent in the Dominican Republic. In Serbia, workers in the top one
percent of manufacturing firms hold a quarter of total employment; the top five percent absorb
almost half of the total labor force. Romania presents a similar picture. Superstar firms tend to
employ the most workers because they generate the most output, even if they are less labor-
intensive than the average small or medium-sized firm.270
91
379. They are also large integrators of young, innovative, dynamic firms. Superstars assist small
businesses by connecting them with new markets to source inputs, offering convenient payment
solutions, and reaching a wider, targeted consumer base. In India, numerous technological startups
act as digital partners for global technological companies, providing payment solutions and app
development services at a lower cost compared with large firms’ in-house capacity. These startups
are the largest employers of India’s contract workforce.
380. The importance of large firms in driving economic growth is not new. However, the advent
of digital platforms changes how this phenomenon unfolds. Digital platforms are the new bricks-
and-mortar malls, connecting shoppers with different brand stores, creating efficiencies for brands,
and generating revenue for mall owners. But data gathered through platforms is also utilized to
improve firm efficiency, at times in different markets to where the data was collected in the first
place. JD Financial, a financial company which is part of the Chinese JD.com Group, incorporates
transaction data into its loan assessment model that it gains through its marketplace.271
381. Platform-based businesses are on the rise in every country. Consider VIPKID, a leading
Chinese online education firm, founded in 2013, that matches children in China with North
American teachers for virtual, one-to-one English learning classes. It links 200,000 students with
30,000 teachers in North America. Jumia is a six-years-old Nigerian e-commerce company that is
already present across 23 African countries, bringing electronics, groceries, and fashion to
customers. Flipkart in India facilitates sales of consumer electronics between suppliers and
customers. Flipkart operates like a market, defying the boundaries of firms as originally described
by Ronald Coase.
382. Digital platforms allow for rapid scaling. There are many examples of billion-dollar
startups built around platforms. JD.com, China’s second-largest e-commerce company, started as
a retail business in a tiny booth in Zhongguancun Electronic Shopping Market, Beijing. In July
2018 the JD platform had 320 million active users. Ant Financial, part of the Alibaba Group, is the
most valuable fintech firm in the world. It took off within just a few years due to advances in
artificial intelligence. It uses big data to disburse loans in less than 1 second from the moment of
application. Its famous “3-1-0” online lending model involves a 3-minute application process, 1-
second processing time, with zero manual intervention. Since 2014 more than four million small
Chinese businesses received loans.
383. Digital platforms create instant business opportunities for entrepreneurs, thereby creating
jobs. Since 2009 many clusters of rural micro e-tailers have opened shops on Taobao.com
Marketplace, fostering “Taobao Villages” in China. 272 Taobao Village merchants produce
consumer goods, agricultural products and handicraft works based on their niche competencies.
Taobao Villages has created more than 1.3 million jobs, drawing young people who migrated to
cities back to their hometowns to start their own enterprises. Reliable internet connectivity and
high smartphone penetration must exist for this kind of e-commerce to grow.273
384. Platforms expand the business opportunities for service providers, which consolidate
services sectors and create more jobs. In 2018, the services sector accounts for most jobs in several
countries: its share in total employment is more than 70 percent in Argentina, Saudi Arabia,
Uruguay and above 80 percent in Jordan, Israel and Hong Kong SAR, China. There has been a
proliferation of platforms that allow freelancers to have simultaneous access to multiple platforms
92
at low entry costs. Consumers are also more willing to use online services because they trust them
as a result of brand certification, digitalized social capital and third-party validations. Consumer
trust enables platforms to expand rapidly into other business lines. Grab, a Singapore-based ride-
hailing platform, grew to hold 95 percent of the Southeast Asian market before expanding to offer
additional services ranging from ordering food to payment systems at the touch of the app.
GrabPay extends e-payment opportunities to an estimated two-thirds of people in the region who
do not have bank accounts.
385. Some platforms expand the supply of labor by increasing opportunities for new, flexible
types of work that complement traditional forms of employment in the gig economy. Data from
Germany and the Netherlands indicates that only 0.4 percent of the labor force is active in the gig
economy. The global freelancer population is estimated at around 84 million—less than three
percent of the labor force (3.5 billion).274 Workers set their own hours for most platforms. The
additional source of income may alleviate reduce income fluctuations for secondary earners. The
flexibility inherent in platform work also enables more women to participate in the labor force.
But these features blur the line between formal and casual employment. While flexibility is a
benefit in some cases, it also raises concerns around stagnant wages, income instability, and
protections connected with standard employer-employee relationships, including pension plans,
health insurance and paid leave.
386. Finally, digital platforms enable firms to exploit under-used physical and human
capacity—transforming dead capital into active. Hernando de Soto in The Mystery of Capital
explained that capital is created when an asset’s economic potential is fixed into a form that
initiates production. Assets that are not fixed in a formal property system are difficult to mobilize
in markets: “[t]he formal property system […] is the place where capital is born.” Property records
capture and organize the necessary information required to conceptualize the potential value of an
asset, identifying, exploring and combining those assets. Digital platforms do the same. Ride-
hailing platforms provide a way for individuals to advertise their free time and spare vehicle
capacity—be it a luxury vehicle, a moped, or a tuk-tuk—to generate income. Freelancing websites
enable unemployed computer programmers located in remote parts of the world to document their
expertise to find remote work with companies abroad.
387. The rise of the digital platform firm—operating globally, existing principally in the cloud
and often generating income from the capital of others—marks a shift in the nature of firms more
generally. Most regulations are not yet adapted to these changes. Platform firms often operate in
regulatory grey areas, but minimum standards of quality, prudence and safety, among other policy
goals, must still be upheld by digital business. Data privacy and protection is at the center of the
regulatory discussion considering the large amount of data accumulated, employed, and monetized
by platform businesses. Zoning or other laws affecting business activity may also be implicated.
For example, although Airbnb in many cases shifts tourism away from urban centers and have a
positive impact on local businesses, Airbnb locations are often not subject to the same zoning or
licensing requirements as other commercial accommodation. Nevertheless, Airbnb might affect
neighbors who do not share the benefit of local rental income.
388. Regulation may also be needed if platforms provoke a race to the bottom in working
conditions. In Indonesia, drivers with Go-Jek and Grab held large demonstrations in early 2018
demanding an increase in their tariffs. Instead of banning the platforms, the Indonesian government
93
is amending its laws to require such firms to register as transport companies, comply with safety
requirements, and impose a minimum floor price. In early 2018, Egyptian courts suspended the
licenses of ride-hailing companies Uber and Careem, in response to a challenge by taxi drivers.
Shortly thereafter, in May 2018, the Egyptian government passed a law to regulate ride-hailing
companies, allowing Uber and Careem to get back on the road and compete alongside traditional
taxis. The short and medium impacts for consumers are yet to be seen.
Competitive Markets
389. The importance to doing business of a physical presence in a market is declining,
particularly in the digital economy where intangible products are replicable at little or no cost.
Expanded boundaries create opportunities for firms to grow, but in many cases the risk of market
concentration increases. Anti-competitive behavior is harder to identify in the digital economy.
Network effects often benefit early adopters of technology, facilitating the emergence of
monopolies.
390. Governments have an important role to play in ensuring that markets remain competitive—
to promote the efficient use of resources while protecting the economic freedom of market
participants. Competitive markets require government policies that strike the right balance
between ensuring a level playing field in which firms are able to flourish while also patrolling anti-
competitive behavior.
391. More start-ups mean more competition.275 If the business conditions are right, it is more
likely that some start-ups will grow strongly, creating jobs. Faced with new competition, less
productive firms—so long as they are not state-owned or politically connected—exit the market.276
392. Creating a better business environment allows more successful firms to rise naturally.277
The World Bank’s Doing Business project lays out the basic regulatory requirements for private
initiatives to grow. These data have been used by researchers to study the deleterious effects of
burdensome regulation. Poverty is lower in countries that have business-friendly regulations.278
393. A country with a business-friendly environment has more start-up activity and job
creation.279 When Mexico simplified business registration the number of new businesses increased
by five percent and wage employment went up by 2.2 percent.280 The failure of small firms to
become larger lowered productivity growth in manufacturing by 25 percent in Mexico and India,
compared with the United States. 281 Higher start-up costs may also lead to lower overall
productivity: in the absence of competition, firms that are already in a market will continue to
operate regardless of productivity levels.282
394. Competitive markets require basic infrastructure. Roads, bridges, ports, and airports are
required to trade goods efficiently. Lower transport costs, as well as streamlined, cheaper border
compliance processes, increase exports.283 Logistics infrastructure facilitates the online trade of
non-digital products. The Chinese government invested $300 million in 200 counties to establish
local logistics centers to encourage rural e-commerce.
395. Broadband access is a prerequisite for business in the digital era given that many firms
exist in part or even exclusively on the internet. Cell phone access alone is not enough. Broadband
technologies push down transaction costs even further in remotely located markets that lack
94
transport infrastructure. Citizens in the Middle East and North Africa region are some of the most
underserved: although there are there are over 120 mobile subscriptions for every 100 inhabitants
(one of the highest levels in the world), there are less than 10 broadband subscriptions per 100
inhabitants, and bandwidth per subscriber is limited.284 In the end, this means that while citizens
in these countries are active on social media, digital finance has barely any presence.
396. Technology allows firms to sharpen their competitive edge by making their operations
more efficient and enabling them to create new ways of doing business. Teleroute is a Belgian
platform that uses an algorithm to match freight-forwarders and carriers in Europe, reducing empty
runs by up to 25 percent. Improved connectivity also enables start-ups to source essential technical
expertise through online freelancing platforms. Upwork, a US platform, has, since 2015, connected
five million businesses with more than 12 million freelancers. Its fourth largest community of task
providers is in Ukraine. Start-ups used to need data centers, IT systems, custom software and a
user support infrastructure to take on large conglomerates. In the digital age, entrepreneurs
worldwide source these services via the internet.
397. While governments foster competitive markets by creating the right conditions for
business, they must monitor markets for anti-competitive behavior. The largest, most productive
firms in an economy may ultimately dominate domestic, regional, or global markets, in one or
many sectors. New problems arise over time as they become entrenched themselves.
398. The digital economy poses new challenges for competition law, mergers and acquisitions
and consumer welfare. The rapid ascent of platform firms raises issues related to market power
(figure 6.2). The network effects associated with some online products often lead to significant
benefits for early adopters, resulting in market concentration and facilitating the emergence of
monopolies. In 2017 Safaricom, Kenya’s largest mobile phone operator with 80 percent of the
market, launched M-Pesa, the country’s first mobile money system. A year later M-Pesa
commanded the same market share in mobile money.285
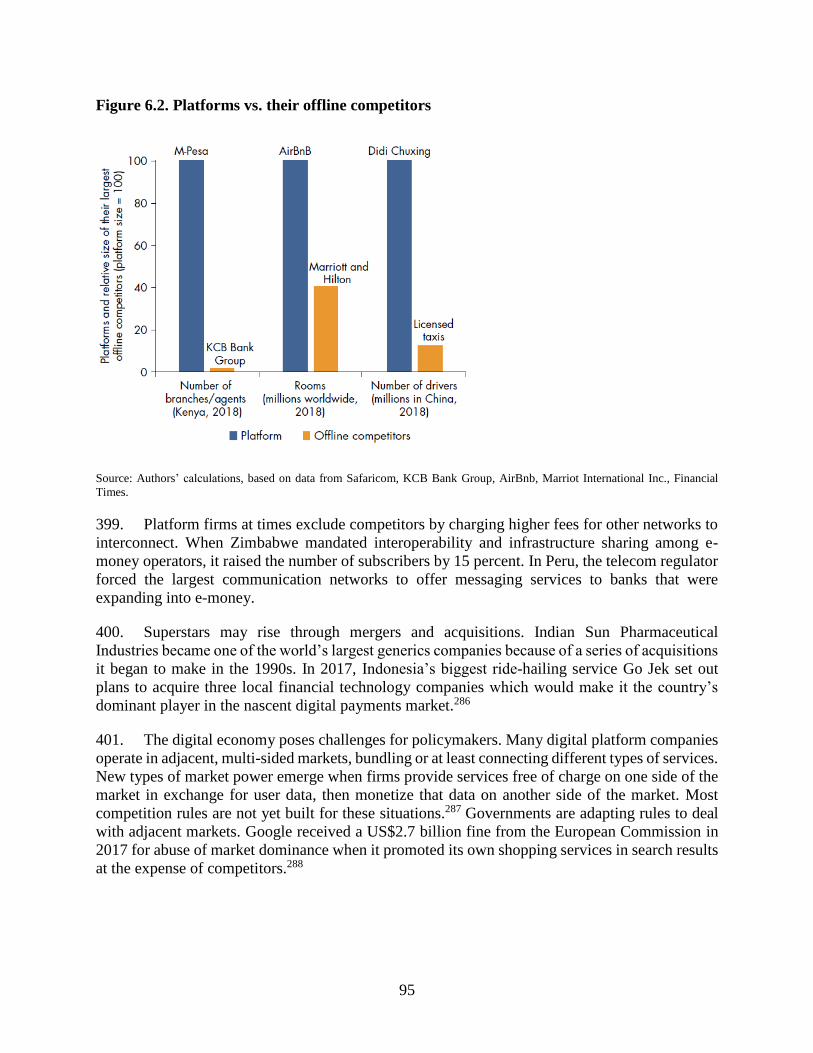
95
Figure 6.2. Platforms vs. their offline competitors
Source: Authors’ calculations, based on data from Safaricom, KCB Bank Group, AirBnb, Marriot International Inc., Financial
Times.
399. Platform firms at times exclude competitors by charging higher fees for other networks to
interconnect. When Zimbabwe mandated interoperability and infrastructure sharing among e-
money operators, it raised the number of subscribers by 15 percent. In Peru, the telecom regulator
forced the largest communication networks to offer messaging services to banks that were
expanding into e-money.
400. Superstars may rise through mergers and acquisitions. Indian Sun Pharmaceutical
Industries became one of the world’s largest generics companies because of a series of acquisitions
it began to make in the 1990s. In 2017, Indonesia’s biggest ride-hailing service Go Jek set out
plans to acquire three local financial technology companies which would make it the country’s
dominant player in the nascent digital payments market.286
401. The digital economy poses challenges for policymakers. Many digital platform companies
operate in adjacent, multi-sided markets, bundling or at least connecting different types of services.
New types of market power emerge when firms provide services free of charge on one side of the
market in exchange for user data, then monetize that data on another side of the market. Most
competition rules are not yet built for these situations.287 Governments are adapting rules to deal
with adjacent markets. Google received a US$2.7 billion fine from the European Commission in
2017 for abuse of market dominance when it promoted its own shopping services in search results
at the expense of competitors.288
96
Tax Avoidance
402. With firm boundaries transcending borders and physical assets, it has become easier to shift
profits to low tax jurisdictions (tax planning and tax avoidance) and harder for governments to
identify illicit financial flows. As a result, billions of dollars of corporate profits go untaxed every
year. The international tax system is in need of an update—how to tax businesses in the globalised
digital economy and how to distribute value are questions at the debate.
403. The OECD estimates that US$100-240 billion is lost in revenue annually due to base
erosion and profit shifting by multinational companies. This is equivalent to 4-10 percent of global
corporate income tax revenue. Another estimate suggests that the level of assets sheltered in tax
havens is around 8 percent of global GDP.289 Yet another suggests that multinationals shift around
45 percent of their profits to tax havens, causing a loss of 12 percent of global corporate tax
revenues.290 These losses are not symmetric across countries, however. The United States, Brazil,
France, Japan, Australia, India and Mexico, as well as much of Africa, are among the countries
estimated to be most hurt due to profit shifting.291
404. A multitude of loopholes exist in tax laws, many created through shrewd corporate
lobbying, that allows corporations to increase their tax deductions and move profits to jurisdictions
with low or zero corporate income tax—often called “tax havens” or “investment hubs”. In doing
so, firms reduce their tax burden. This phenomenon is not new, nor is it illegal, but it is easier in
the digital economy. Some companies maintain hundreds of affiliates in low or zero tax economies
to take advantage of the fact that taxation of a multinational group is done at the level of individual
subsidiaries that operate in different countries. Almost 60 percent of Fortune 500 companies in
2016 have at least one affiliate established in Bermuda or the Cayman Islands, both of which have
a zero percent corporate income tax rate.292 The same group of companies is reportedly holding
more than US$2.6 trillion in accumulated profits offshore.293 The Paradise Papers, leaked in late
2017, expose many examples.294
405. The problem is that current rules are based on both source and residence. Source relates to
a justification based on the geographic location of the income generating activities (the idea of
‘where value is created’ and linked to the physical presence of labor or capital). Residence refers
to the place where the company receiving the income is considered to have its primary location,
usually based on where the company is incorporated or effectively managed as per the owner’s
linkage to the state (residence, domicile or citizenship—physical presence). Source countries have
primary taxing rights over the income from sales. Residence countries tax multinationals’ income
from cash investments.
406. In practice, prevailing rules mean that multinational enterprises pay taxes in economies
where they locate their affiliates and activities. Firms organize their own internal cross-border
production structures between affiliates, declaring different profits for different affiliates,
irrespective of direct value generation by each affiliate. It is often difficult to identify when these
structures are legitimate and when they are established principally to avoid paying taxes in higher-
tax jurisdictions.
407. Given the many opportunities that exist to avoid taxes, it is not surprising that firms do so.
In fact, profits have become more sensitive to international tax differentials over time, which
97
means firms are getting better at avoiding taxes.295 Transfer mispricing allows firms to charge
lower prices for exports sold from high-tax to low-tax countries, or a higher price for inputs coming
from low-tax countries. The strategic location of intellectual property ownership, international debt
shifting through intracompany loans, treaty shopping, and tax deferrals are other mechanisms used
to avoid taxes. Effective corporate taxation rates have a decisive impact on where affiliates
locate.296 A one percentage point larger tax rate differential between two jurisdictions reduces
reported pre-tax profits of an affiliate by one percent.297 Treaty-shopping is estimated to have
reduced revenues in Africa by about 8.5 percent among countries having signed a treaty with an
“investment hub”.298
408. The digital economy poses new challenges: the European Commission estimates that
digital businesses in Europe face an effective tax rate of only 9.5 percent, compared with 23.2
percent for traditional business models.299 The virtual nature of digital businesses makes it even
easier to locate activities in low tax jurisdictions. The provision of goods and services from abroad,
without physical presence in countries where consumers are located, escapes traditional corporate
tax. Digital firms generate profit out of intangible assets, such as (foreign) user data or advertising.
Identifying where value is created is difficult. Governments where consumers are located have no
legal basis on which to collect taxes from companies outside the jurisdiction.
409. In 2016 the OECD released a template for collecting value added tax (VAT) from foreign
suppliers of digital goods and services. More than 50 countries have adopted the Guidelines’
recommendations for imposing VAT on the direct supply to consumers of services and intangibles
by foreign suppliers.
410. The European Union has levied VAT on nonresident suppliers of telecommunications,
broadcasting, and electronic services, regardless of scale, since January 2015. Nonresident
businesses are required to charge the customer VAT at the rate applying in the customer’s country,
removing the competitive advantage held by digital companies located in countries with low VAT
rates. This new VAT has raised more than €3 billion in taxes for the EU. Australia adopted a
similar approach in July 2017. Singapore announced in its February 2018 budget that goods and
services tax will be imposed on imported services, including digital services like music and movie
streaming, starting from January 2020. Other advanced economies with indirect taxes on the digital
economy include Japan, Korea, New Zealand, Norway, the Russian Federation, as well as South
Africa.
411. Less has been done in emerging economies, where additional tax revenues are most needed.
In 2017, Serbia and Taiwan, China, adopted models, extending their VAT regimes to cover digital
suppliers. In 2018, Argentina and Turkey did the same. China, Malaysia, and Thailand are among
the countries reviewing their tax laws to extend collection to digital profits.
412. As an alternative, a country could introduce a new, free-standing tax on foreign suppliers
of digital services. A free-standing tax would do a better job of targeting foreign suppliers directly
rather than domestic consumers. It would avoid conflict with existing double taxation agreements
by separation from the mainstream income tax system. Arguably a freestanding tax would level
the playing field between domestic and foreign suppliers of digital services. As with VAT,
collecting this kind of tax is enhanced through a registry of non-resident suppliers of digital
services.
98
413. The Indian Government in 2016 introduced a six percent equalization levy on online
advertising revenue paid by Indian companies to nonresident e-commerce companies. The
European Commission in March 2018 proposed a tax on the gross revenues from digital activities
in which users have a major role in value creation. The tax would apply to revenues from selling
online advertising space, intermediary activities that allow users to interact and sell goods and
services, and the sale of data.300 The Commission has estimated that a 3 percent tax could raise €5
billion a year.
414. Alongside the adoption of new measures to tax digital business, governments are taking
steps to address base erosion and profit shifting, as well as other tax avoidance or evasion schemes,
by both digital and traditional business.301 The Base Erosion and Profit Shifting (BEPS) initiative
launched by the OECD and G20 countries in 2013 brings together more than 100 countries,
regional tax organizations, and international organizations to develop new tax standards to reduce
tax avoidance. The measures to be adopted by signatories to strengthen both source and residence
taxation, but group negotiated a comprehensive package of putting more emphasis on the source
principle. Emphasizing the source principle better aligns the location of taxable profits with the
location of economic activity and value creation and improves the information available to tax
authorities.
415. Further incremental steps to strengthen tax administration include widening the definition
of a “permanent establishment” to recognize that companies may conduct considerable business
in a country without having much of a physical presence; strengthening transfer pricing and anti-
avoidance rules and audit capacity by emerging economies (including in areas such as thin
capitalization); adopting some aspects of formulary apportionment when implementing the arm’s
length principle; adjusting tax incentives, potentially through regional cooperation agreements;
and targeted anti-tax-avoidance measures such as stronger controlled foreign corporation rules.
416. Countries take some steps unilaterally. New anti-diversion rules entered into force in the
United Kingdom in 2015, allowing firms to pay taxes up front. The rules were designed to
incentivize greater compliance with the mainstream corporate income tax regime. Australia
adopted similar rules in 2016. These countries already have a developed transfer pricing capacity,
however, and a sophisticated suite of anti-avoidance measures. The context for emerging
economies is rather different—their capacity to address transfer pricing risks is low, so anti-
avoidance legislation may not be effective. A more mechanical and targeted anti-diversion rule
that is integrated into the corporate tax system could better tackle tax avoidance. Certain minimum
criteria as set out in the law could trigger the application of such a rule.
417. Growing public discontent with tax avoidance practices by multinational firms has revived
discussions around more significant overhauls to the international tax system. One option is to
reform the residence principle in corporate taxation to restore the link between the place of
residence or domicile of shareholders and the taxation of corporations.302 Such an approach is
unlikely, however, since BEPS moves strongly towards a source taxation concept, collecting taxes
where value is created.
418. Global formulary apportionment is one option that has garnered much interest amongst
policymakers, although practically the obstacles to implementation make it unlikely to be adopted.
Such a system would divide the tax base between jurisdictions according to the location where
99
“source” activities take place. Countries would have to agree upon a formula to allocate profits
based on “allocation keys”, usually tangible assets such as volume of sales to third parties, assets,
payroll, and/or headcount of staff in each jurisdiction.303 This system is used domestically in
countries such as Canada and Switzerland to apportion income amongst states and cantons. It was
proposed for the European Union in 2016.
419. Although global formulary apportionment would remove existing incentives for profit
shifting to low tax jurisdictions via transfer pricing, it would create others incentives, depending
on the allocation formular adopted.304 The introduction of formulary apportionment would require
an agreement among major economies on the rules used to allocate corporate income, but the
divergent interests of countries would make such an agreement difficult to achieve. Emerging
economies with less bargaining power may suffer in any such negotiation. Efforts to model the
distributional impacts of adopting a formulary system indicate that emerging economies
(specifically, Brazil, Chile, China, Colombia, Egypt, India, Malaysia, Mexico, Peru, the
Philippines, South Africa and Thailand) only gain when the allocation formula places a heavy
weight on employment headcount. They lose if the apportionment factor is based on assets or
payroll and come out slightly ahead if the apportionment is by sales. Any unilateral moves to
formulary apportionment risk double taxation of some income and non-taxation of other income.
420. Another option is a destination-based cash flow tax (or “border adjusted tax”), which is
similar to formulary apportionment based exclusively on volume of sales, but the tax base is not
consolidated. Instead, countries tax net income from sales in the purchaser’s place of residence.
Expenses incurred in the same country may be deducted, but not foreign expenses. A key challenge
that the destination-based cash flow tax is the need to give tax refunds (or credits) to net exporters
whose local expenses will always exceed local revenues. This can be an opportunity for fraud, as
well as being politically unpalatable.
421. The international community continues to take steps to mitigate weaknesses in global
corporate tax. But much more remains to be done. In its current form, the international tax system
disproportionately benefits sophisticated multinational firms. Tax regulation that collects too little
tax from the wealthiest in society only contributes to global inequality.
100
Chapter 7: Ideas for Social Inclusion
423. New ideas are demanded by old and new pressures on social contracts. Cracks in current
social contracts are evident in the lack of protections or efficient public services for most of the
poor. On the other hand, the changing nature of work is generating fears about mass
unemployment, a race to the bottom in social protection. These factors, among others, are straining
the relationship between citizens, firms, and governments across the globe.
424. While some of these fears appear to be exaggerated, there are indeed reasons to be
concerned. Technological developments in the digital era merit the injection of new ideas into
public debates about social inclusion. Two elements require particular attention.
425. First, technology opens new avenues to reach society. Governments have new ways to
reach the poor as well as many others who lack access to quality services or tools to manage risks.
Many work informally without access to protections in low-productivity jobs, making it difficult
to escape or remain out of poverty. Informality limits the reach of social insurance systems that
are based on formal earnings contributions declared to the state.
426. Second, the adjustment costs that are related to the changing nature of work. Technology
has varying impacts on different skills and their demand in the labor market. Depending on the
technology, some skills (and their workers) are becoming more relevant than others in the world
of work. Advanced skills—like complex problem solving or critical thinking—are becoming more
valued in labor markets. With these skills, individuals work more effectively with new, changing
technologies. Socio-behavioral skills—like empathy, teamwork, conflict-resolution—are also
becoming more valuable in labor markets because they cannot easily be replicated by machines.
427. This is the right time to think about how to improve social inclusion. The changes outlined
above require time to take hold. The politics of some of the reforms needed are complex, given
the potential trade-offs involved between, for example, investments in the current generation of
workers versus future generations. Public spending would need to become more efficient.
Additional sources of revenue need to be identified. This is urgent given rising aspirations,
especially among the youth. Social media and urbanization contribute to these rising aspirations.
When aspirations are met they foster opportunity and prosperity. But when aspirations are
unfulfilled they can lead to frustration, or even fragility in some countries. The sustainability of a
social contract therefore hinges on a sense of fairness.
428. A social contract envisions the state’s obligations to citizens and what the state expects in
return. This basic conception has evolved over time. For much of history social contracts have
been imposed by force or the threat of it. Rulers governed by “divine law”, wherein protection was
provided in return for obedience. This idea was challenged in the 1600s by Thomas Hobbes and
John Locke, who embedded the relationship between state and citizens in rational thought rather
than religion. A social contract imposes an obligation on citizens to respect and obey the state in
exchange for security. In most societies the obligation of the state extends beyond simply providing
safety. It includes broad provisions around services, jobs and public goods.
429. Arguably, the sustainability of social contracts hinges, at least partly, on how fair it is
perceived to be. This echoes John Rawls’ need for a veil of ignorance regarding one’s place in
society, traits, or skills when thinking about the social contract. Similarly, in his 1762 book “On
101
the Social Contract; or, Principles of Political Rights”, Jean-Jacques Rousseau posits that everyone
will be free because all forfeit the same number of rights and are imposed the same duties. This is
the view this chapter takes of the social contract: a policy package that aims to contribute to a fairer
society.
430. This chapter addresses three questions: how can society frame a new social contract in the
context of informality and the changing nature of work? If the government is given a mandate to
prepare a social contract aimed at improving fairness in society, what could its basic ingredients
be? Related to this is how can the State finance these proposed reforms? This exercise sets out a
scenario for politicians to consider as part of legislative processes and national consultations. The
package described here is not meant to be exhaustive. Instead, the discussion lays out a menu of
policies that could ignite a renewed societal dialogue.
A New “New Deal”?
431. “The social contract is broken... there is a culture of not participating, of not caring, of
silence”, was one of the comments received from areas affected by insecurity in Mexico.305 Cracks
in current social contracts are already evident in, for example, the events surrounding the ‘Arab
Spring’ and a backlash against globalization that is reflected in rising protectionism. In many
developing countries a dysfunctional social contract may lead to less demand being exerted on the
state to improve public service provision. As a result, evidence from developing countries suggests
that the middle class may sometimes “send their children to private schools, use private healthcare,
dig their own boreholes for water and buy their own generators”.306
432. One possible explanation for pervasive dissatisfaction with existing social contracts is the
sense that these contracts are unfair. Societies offer limited opportunities to the poor or
marginalized for upward mobility. The more limited these opportunities the more unfair a social
contract becomes. This perceived unfairness is only heightened in the current era because the risk
of income instability is higher.
433. Mechanisms to ensure equal opportunity, which ensure social inclusion, often fall short
and especially in developing countries. Countries are neglecting investment in the early years of
children’s lives, particularly among disadvantaged groups. In Latin America per capita
government spending on children under five is one-third that for children aged between six and
eleven. In Sub-Saharan Africa, only two percent of the education budget goes to pre-primary
education.307 Tax and social protection systems in developing countries redistribute income to a
limited extent. This is because revenue collection and social protection spending are both too low.
434. Persistently high levels of informality are both symptom and cause in the erosion of social
contracts. Informal employment is more than 70 percent in Sub-Saharan Africa and South Asia. In
Latin America it is more than 50 percent. Informal workers are beyond the reach of the state with
respect to provision, protection, and redistribution. People operating in the informal economy
evade their obligations to the state by not paying taxes. Informality is an opt-out option when social
contracts are considered unfair. Informality reflects a lack of trust in the State.308
435. Recent examples of substantially new social contracts and their elements include
“flexicurity” in Denmark, which has its roots in the nineteenth century. These new social contracts
102
combine labor market flexibility with strong social security and active labor market programs.
Other examples include the economic reforms introducing market principles that began in 1978
China; the Balcerowicz Plan in Poland in 1989; and the Hartz reforms in Germany in 2003.
Arguably, however, when people think about social contracts that involve significant reforms
associated with the world of work, the New Deal under Franklin Roosevelt’s presidency of the
United States is a common yardstick for ambition and approach. The reference evokes the need to
substantially subsidize employment (or tax robots) in response to technological progress. The
allusion, however, is disingenuous.
436. Between 1929 and 1933, with the Great Depression the unemployment rate rocketed from
three percent to 25 percent. Industrial output halved. Given the dismal state of the economy, in
1932 Franklin Roosevelt pledged “a new deal for the American people” as he accepted his party’s
presidential nomination. The “New Deal” came to encompass the various programs and reforms
his administration put in place from 1933 to 1938 to lift the country out of the Great Depression.309
437. The New Deal, albeit bold and comprehensive, was a response to a problem that is different
to that faced in 2018 in the context of informality in developing countries or the changing nature
of work everywhere. Most notably, while the Great Depression was largely a transitory shock to
the American economy, changes to the nature of work and persistent informality are anything but
transitory. Some of the measures included in the New Deal—such as the Federal Deposit Insurance
Corporation or the Supplemental Nutrition Assistance Program—addressed not only the temporary
shock of the Depression but also a permanent need for protections beyond the crisis. However, the
largest programs, especially those subsidizing employment or earnings were temporary—as was
appropriate to the circumstances.
438. Yet public works activities may go beyond infrastructure. Currently a number of essential
social activities are provided voluntarily by individuals. Informal care, or caregiving provided for
a household member with severe disabilities or long-term illness, is widespread. Recent estimates
show that more than two million people in the UK are in receipt of informal care. This tends to
have a gender dimension. Evidence shows that women may be more likely than men to experience
an unexpected move into providing it. As a result, they face difficulties in balancing care provision
with labor market engagement and other responsibilities. As well as lost income, this can generate
negative socio-behavioral impacts on the wellbeing of informal providers.310
439. Effective social care may entail reimagining a role for the state in reducing involuntary
unemployment by providing services in several areas. These may include childcare, disability and
old-age care, psychological support to the long-term unemployed, supporting social kitchens and
rehabilitation from drugs and violence. Interventions like Kinofelis in Greece and the Expanded
Public Works Program in South Africa provide examples of activities of this nature.
440. An area for enhanced public service provision is community-based primary health care.
This extends preventive and curative health services beyond health facilities into communities and
households. A review of over 700 empirical studies show that this approach is effective in
enhancing nutrition, immunization, controlling pneumonia and various diseases like malaria, as
well as preventing and treating HIV. 311 Equipped with less comprehensive training than
professional health workers, community health workers provide basic hospital care, have solid
referral capabilities and develop trust and strong collaboration with the communities that they
103
serve. In some countries, they are equipped with iPads to be able to cosult the internet on disease
symptoms.
441. The changing nature of work requires a reconsideration of social contracts that puts
equality of opportunity at their center. Equality of opportunity requires creating jobs and making
early childhood investments. One estimate suggests that expansion of early childhood
development in the United States could reduce inequality by seven percent and increase
intergenerational income mobility by 30 percent. 312 In addition it means boosting social
protections, including social assistance and insurance, in ways that are compatible with all forms
of work.
442. A new social contract should also foster open social dialogue with a wide range of people.
From informal self-employed workers to wage employers and from small informal enterprises to
superstar firms — different voices are emerging in the world of work. An effective social dialogue
promotes this diversity. Social media tools open the door to engagement. These elements of the
social contract echo the three freedoms discussed by the Nobel Prize winner Amartya Sen in
“Development as Freedom”: political freedoms and transparency in relations between people;
freedom of opportunity; and economic protection from abject poverty.
443. Beyond some core elements, aspects of a new social contract would need to be tailored.
One clear area of customization relates to demographic trends. By 2050 more than half of global
population growth will occur in Sub-Saharan Africa, where annual growth rates of the working-
age population are projected to be over 2.7 percent.313 In contrast, the populations of East Asia and
the Pacific are rapidly aging: more than 211 million people over the age of 65 live in this region,
accounting for 36 percent of the global population in this age group. By 2040, the working-age
population will shrink by 10-15 percent in Korea, China, and Thailand.314 Countries in Sub-
Saharan Africa and South Asia would therefore have to be particularly responsive to the needs of
large youth cohorts entering the labor market to ensure the sustainability of the social contract.
Social contracts in Eastern Europe or in East Asia would also need to create mechanisms to ensure
the sustainable financing of elderly protection and care.
Possible Elements of a New Social Contract
444. Possible elements of a social contract could include: investing early in human capital;
taxing firms adequately; and expanding social protection to provide a socially acceptable minimum
income and insurance. The overall goal of these elements is to achieve equality of opportunity.
445. A society with equality of opportunity is often defined as a society that manages to give all
its members an equal chance to attain economic and social well-being. This only happens if
everyone has access to some minimum level of health, education and social protection. This basic
human capital puts everyone on an equal footing to pursue their goals.
446. In most countries existing social contracts guarantee access to basic education. The
changing nature of work requires a reexamination of this basic contract. The labor market
increasingly values advanced cognitive and socio-behavioral skills, which complement technology
and make workers more adaptable. This means that inequality will increase unless everyone has a
fair shot at acquiring these skills. In fact, given the changing nature of work, education is likely to
104
be one of the strongest mechanisms for transmitting inequalities from one generation to the next.
A new social contract would level the playing field for skills acquisition. The most direct way to
provide fairness is to support early childhood development. Guaranteeing that every child has
access to adequate nutrition, health, education and protection in her early years ensures a solid
foundation for skills development in the future. As skills acquisition is cumulative, returns to early
investments is the highest.
447. The changing nature of work turns basic literacy and numeracy into survival skills. They
are required for simply navigating life—for buying medication, applying to jobs and interpreting
campaign promises. The ability to read and manipulate numbers also serves as a prerequisite for
acquiring advanced skills. But, for too many children, schooling does not translate into learning.
Millions of children in low- and middle-income countries attend school for four to five years
without acquiring basic literacy and numeracy. Consequently, guaranteeing access to basic
education is not enough. A new social contract needs to guarantee actual learning, ensuring that
schooling leads to literacy and numeracy for all.
448. A social contract for early childhood development would ideally have three components.
The first component ensures that children have the essential inputs so they are healthy, well-
nourished and stimulated during their first thousand days (from conception to 24 months of age).
This means access to prenatal healthcare, immunizations, micronutrients and information for
parents on the importance of breastfeeding and early stimulation. The second component ensures
access to quality early learning during their “next thousand days” (25 months to 60 months). This
means at least one year of quality preschool so that they are ready for primary school. These pre-
primary programs need to be designed for young children with age-appropriate curricula and
capable and qualified teachers. The third component is birth registration, whereby children are
recognized by the State and equipped with the ability to access essential services throughout their
lives. The elements outlined above—prenatal healthcare, birth assistance, immunizations,
micronutrients, information for parents, quality pre-school and birth registration—present a basic
package to address children’s early development and learning needs. A more comprehensive
package would include investments in safe water and adequate sanitation. Investments to improve
air quality are increasingly also important and research into cost-effective programs is ongoing.
449. Some countries are already trying to deliver this type of social contract. In Cuba’s early
childhood development program, children’s growth and development are regularly monitored. At
the beginning of each school year the education sector identifies families who need specific
attention. Chile’s Crece Contigo includes a programa de acompañamiento familiar, which works
with families, pregnant women and children under grade four who are at social and health risk.
Peru has simplified the birth registration process for easier access to early childhood development
services. It supports parents in monitoring children’s growth and health and engaging in early
stimulation activities. France passed a law in 2018 to ensure that all children have access to pre-
school starting at the age of three.
450. A social contract on literacy and numeracy would ensure that students master these skills
by grade three (approximately age ten). By this stage students need to be able to read to access the
school curriculum. Children who cannot read by grade three struggle to catch up, eventually falling
so far behind that no learning takes place at all. The core ingredients of this element would include:
learning assessments at the end of grade three to identify children at risk, and early grade reading
105
and math assistance for students in grades one to three who need additional support. A more
comprehensive package would add items including ensuring a pupil-teacher ratio of no more than
40:1 in primary grades and providing adequate learning materials with a target of one pupil with
one textbook in primary grades.
451. There are good models for supporting literacy and numeracy by grade three. Research has
shown that early grade reading and teaching at the right level interventions are both cost-effective
and scalable, even where resources are limited. In Liberia and Malawi, training teachers to better
evaluate their students combined with additional materials significantly improved learning in early
grades. In Singapore, all students are screened at the start of grade one. Children who do not attain
appropriate early literacy skills will be supported through the Learning Support Programme. These
are straightforward approaches. They train teachers to assess their students through ongoing,
simple measurements of their abilities to read, write, comprehend and do basic arithmetic. Children
who need additional support are provided with support through targeted activities and materials.
These models have been tested with success in India, Ghana, Kenya and Jordan. They form a basis
of precise design and budget estimates.
452. A social contract also requires all economic participants to pay taxes. This is currently not
the case. In the European Union it is estimated that traditional companies have paid an effective
corporate tax rate of 23.2 percent while digital companies pay on average only 9.5 percent.315
453. The new social contract would also include elements of social protection. Increased risks
in the world of work make it imperative to adapt how societies protect workers. A new social
contract could provide a minimum income, combined with basic universal social insurance, that is
decoupled from how or where people work. A minimum could take many forms. It could be
achieved through a series of programs or by expanding individual interventions. Each of these
modalities present different comparative advantages, fiscal, political, and administrative
implications.
454. Low and middle-income countries have made significant headway in social assistance. In
Tanzania, spending on conditional cash transfers increased ten-fold between 2013 and 2016. The
program currently reaches 16 percent of the population and claims 0.3 percent of GDP. Spending
on conditional cash transfers in the Philippines grew five-fold over 2009-2015: the Pantawid
program covers 20 percent of the population at a cost of 0.5 percent of GDP. These trends mirror
the growth in categorical or age-based programs like the Child Support Grant in South Africa. The
scheme’s coverage increased from a million beneficiaries in 2001 to 11 million in 2014, absorbing
from 0.2 to 1.2 percent of GDP respectively.
455. Current experiences offer a wide range of tested programs that could be considered for
expanding. Whether they are new or old, programs should share the notion of ‘progressive
universalism’. This principle deliberately aims at higher levels of coverage while ensuring that the
poor would benefit more and before others. Where exactly in the income distribution one becomes
a net beneficiary instead of a net payer is a choice that countries and governments should make for
themselves.
456. Social insurance systems that cover old age and disability pensions are based on a standard
employer-employee relationship with limited suitability for developing countries. New forms of
106
work increasingly challenge this model in advanced economies as well and, as a result, informal
workers often lack access to this kind of support. The system is financed by labor taxes that raise
the costs of hiring workers. As social contracts are reimagined, subsidizing a basic level of social
insurance—especially for the poor—can be considered. Such a reform could also reduce labor
costs, as the financing of the system is at least partly shifted away from labor taxes towards general
taxation.
457. Providing economic opportunities for young adults is a critical element of social contracts.
But the pace of jobs creation for new labor market entrants has often been slow. For many young
people persistent gaps in access to productive assets (adequate skills) are barriers to employment.
International experiences of ‘productive inclusion’ of poor and vulnerable young people show that
a wide array of programs is available for connecting them to waged and self-employment.
Interventions may include wage subsidies, public works schemes, entrepreneurship grants and
asset transfers (often part of ‘graduation’ models), coaching, apprenticeships, internships and
various forms of training. Empirical evidence shows that these programs have mixed effects, with
profiling, design and their particular contexts shaping their cost-effectiveness. For instance, wage
subsidies may be appropriate in peri-urban contexts with large industrial parks, while graduation
schemes are largely devised for rural populations (including the transfer of assets like livestock,
etc.).
Financing Social Inclusion
458. Social inclusion is costly (figure 7.1). Simulations suggest that the component of building
human capital, including early childhood development and support for literacy and numeracy by
grade three, would cost around 2.7 percent of GDP in low income countries. In lower middle
income countries that figure is 1.2 percent of GDP. Costs for a more comprehensive human capital
package are estimated at 11.5 and 2.3 percent of GDP in low income and lower middle income
countries respectively. These estimates are based on unit costs of fully-costed models in
developing countries, combined with data-driven assumptions. These are the costs of delivering
the human capital package, irrespective of income level or coverage of existing programs. The
actual costs could be lower for countries that choose to adopt more targeted interventions that build
on existing programs. Given that costs are likely to differ by country, estimates are provided for
three scenarios, one low income country (Mali), one lower middle income country (Indonesia),
and one upper middle income country (Colombia).
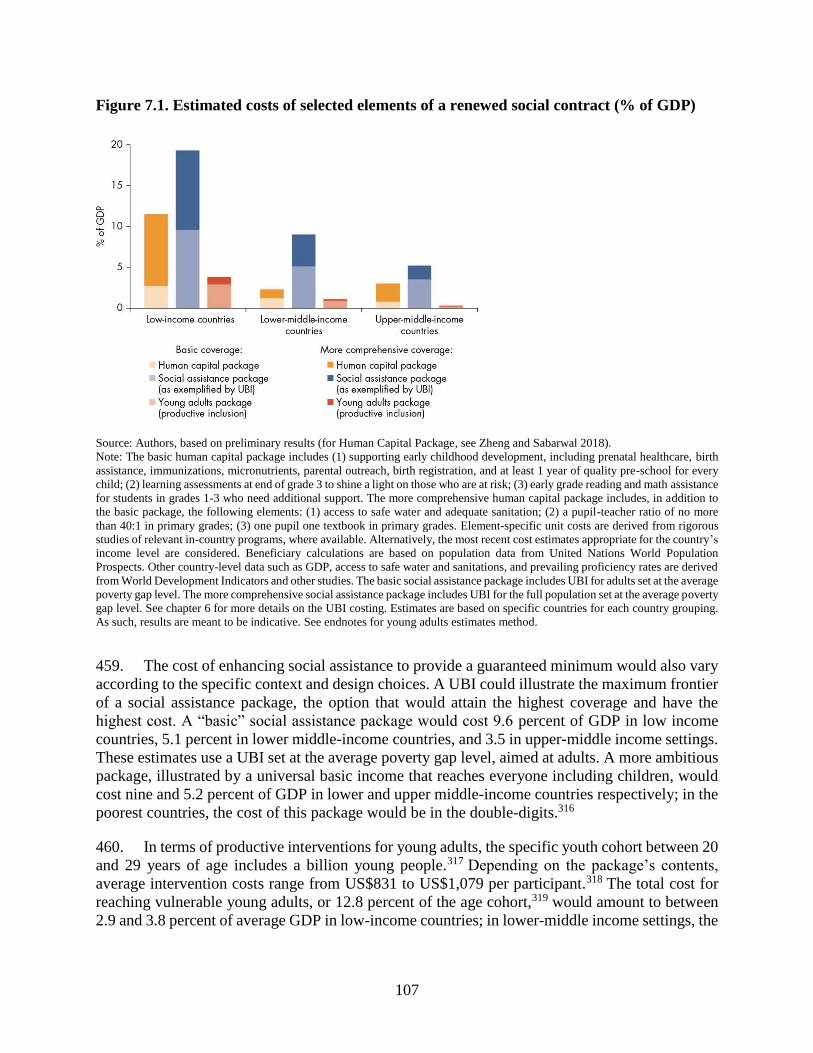
107
Figure 7.1. Estimated costs of selected elements of a renewed social contract (% of GDP)
Source: Authors, based on preliminary results (for Human Capital Package, see Zheng and Sabarwal 2018).
Note: The basic human capital package includes (1) supporting early childhood development, including prenatal healthcare, birth
assistance, immunizations, micronutrients, parental outreach, birth registration, and at least 1 year of quality pre-school for every
child; (2) learning assessments at end of grade 3 to shine a light on those who are at risk; (3) early grade reading and math assistance
for students in grades 1-3 who need additional support. The more comprehensive human capital package includes, in addition to
the basic package, the following elements: (1) access to safe water and adequate sanitation; (2) a pupil-teacher ratio of no more
than 40:1 in primary grades; (3) one pupil one textbook in primary grades. Element-specific unit costs are derived from rigorous
studies of relevant in-country programs, where available. Alternatively, the most recent cost estimates appropriate for the country’s
income level are considered. Beneficiary calculations are based on population data from United Nations World Population
Prospects. Other country-level data such as GDP, access to safe water and sanitations, and prevailing proficiency rates are derived
from World Development Indicators and other studies. The basic social assistance package includes UBI for adults set at the average
poverty gap level. The more comprehensive social assistance package includes UBI for the full population set at the average poverty
gap level. See chapter 6 for more details on the UBI costing. Estimates are based on specific countries for each country grouping.
As such, results are meant to be indicative. See endnotes for young adults estimates method.
459. The cost of enhancing social assistance to provide a guaranteed minimum would also vary
according to the specific context and design choices. A UBI could illustrate the maximum frontier
of a social assistance package, the option that would attain the highest coverage and have the
highest cost. A “basic” social assistance package would cost 9.6 percent of GDP in low income
countries, 5.1 percent in lower middle-income countries, and 3.5 in upper-middle income settings.
These estimates use a UBI set at the average poverty gap level, aimed at adults. A more ambitious
package, illustrated by a universal basic income that reaches everyone including children, would
cost nine and 5.2 percent of GDP in lower and upper middle-income countries respectively; in the
poorest countries, the cost of this package would be in the double-digits.316
460. In terms of productive interventions for young adults, the specific youth cohort between 20
and 29 years of age includes a billion young people.317 Depending on the package’s contents,
average intervention costs range from US$831 to US$1,079 per participant.318 The total cost for
reaching vulnerable young adults, or 12.8 percent of the age cohort,319 would amount to between
2.9 and 3.8 percent of average GDP in low-income countries; in lower-middle income settings, the
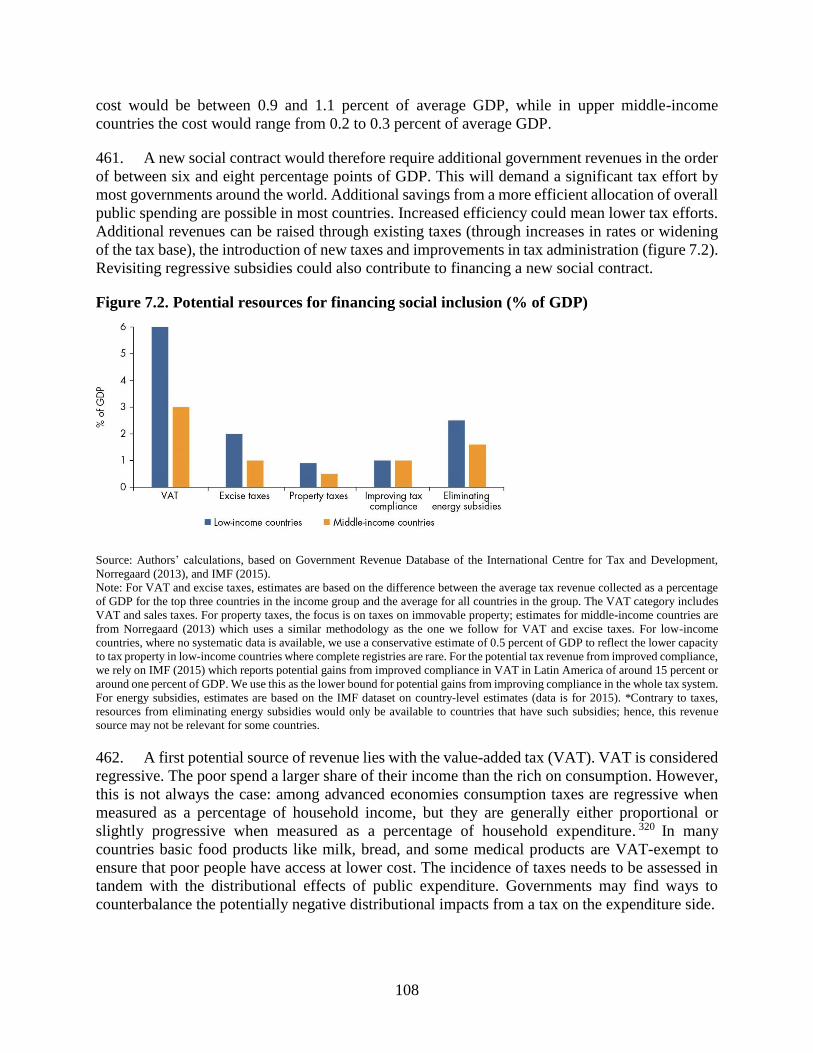
108
cost would be between 0.9 and 1.1 percent of average GDP, while in upper middle-income
countries the cost would range from 0.2 to 0.3 percent of average GDP.
461. A new social contract would therefore require additional government revenues in the order
of between six and eight percentage points of GDP. This will demand a significant tax effort by
most governments around the world. Additional savings from a more efficient allocation of overall
public spending are possible in most countries. Increased efficiency could mean lower tax efforts.
Additional revenues can be raised through existing taxes (through increases in rates or widening
of the tax base), the introduction of new taxes and improvements in tax administration (figure 7.2).
Revisiting regressive subsidies could also contribute to financing a new social contract.
Figure 7.2. Potential resources for financing social inclusion (% of GDP)
Source: Authors’ calculations, based on Government Revenue Database of the International Centre for Tax and Development,
Norregaard (2013), and IMF (2015).
Note: For VAT and excise taxes, estimates are based on the difference between the average tax revenue collected as a percentage
of GDP for the top three countries in the income group and the average for all countries in the group. The VAT category includes
VAT and sales taxes. For property taxes, the focus is on taxes on immovable property; estimates for middle-income countries are
from Norregaard (2013) which uses a similar methodology as the one we follow for VAT and excise taxes. For low-income
countries, where no systematic data is available, we use a conservative estimate of 0.5 percent of GDP to reflect the lower capacity
to tax property in low-income countries where complete registries are rare. For the potential tax revenue from improved compliance,
we rely on IMF (2015) which reports potential gains from improved compliance in VAT in Latin America of around 15 percent or
around one percent of GDP. We use this as the lower bound for potential gains from improving compliance in the whole tax system.
For energy subsidies, estimates are based on the IMF dataset on country-level estimates (data is for 2015). *Contrary to taxes,
resources from eliminating energy subsidies would only be available to countries that have such subsidies; hence, this revenue
source may not be relevant for some countries.
462. A first potential source of revenue lies with the value-added tax (VAT). VAT is considered
regressive. The poor spend a larger share of their income than the rich on consumption. However,
this is not always the case: among advanced economies consumption taxes are regressive when
measured as a percentage of household income, but they are generally either proportional or
slightly progressive when measured as a percentage of household expenditure. 320 In many
countries basic food products like milk, bread, and some medical products are VAT-exempt to
ensure that poor people have access at lower cost. The incidence of taxes needs to be assessed in
tandem with the distributional effects of public expenditure. Governments may find ways to
counterbalance the potentially negative distributional impacts from a tax on the expenditure side.
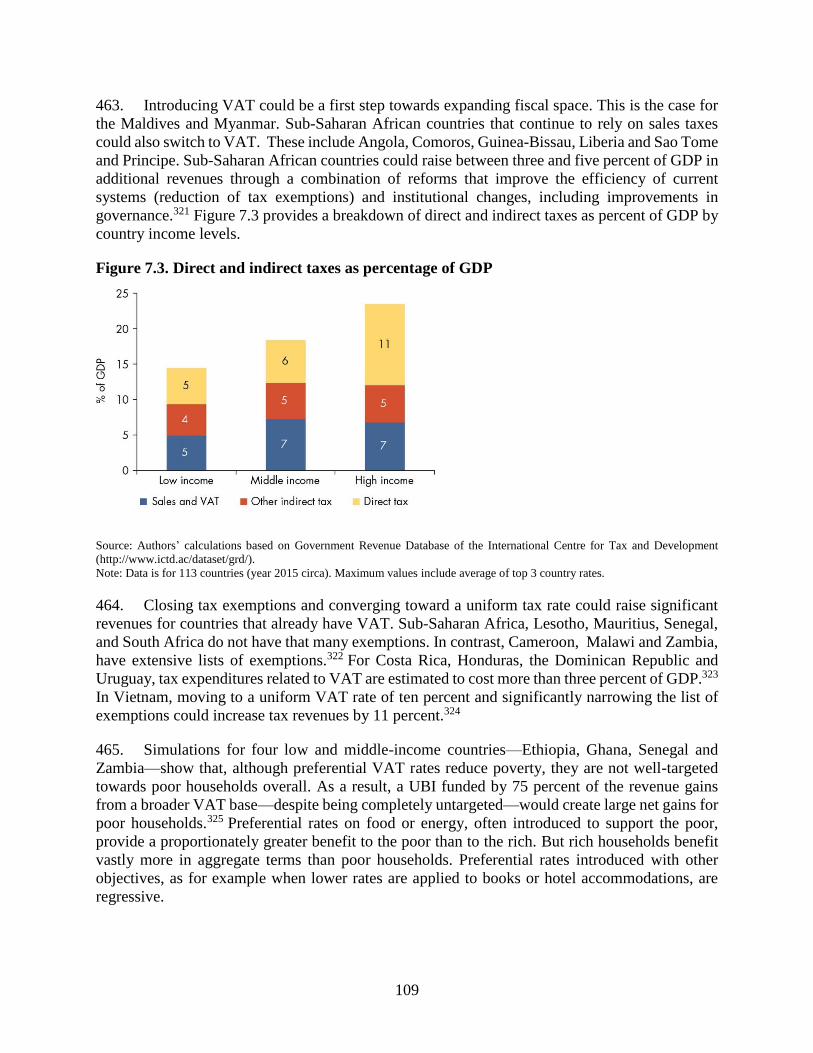
109
463. Introducing VAT could be a first step towards expanding fiscal space. This is the case for
the Maldives and Myanmar. Sub-Saharan African countries that continue to rely on sales taxes
could also switch to VAT. These include Angola, Comoros, Guinea-Bissau, Liberia and Sao Tome
and Principe. Sub-Saharan African countries could raise between three and five percent of GDP in
additional revenues through a combination of reforms that improve the efficiency of current
systems (reduction of tax exemptions) and institutional changes, including improvements in
governance.321 Figure 7.3 provides a breakdown of direct and indirect taxes as percent of GDP by
country income levels.
Figure 7.3. Direct and indirect taxes as percentage of GDP
Source: Authors’ calculations based on Government Revenue Database of the International Centre for Tax and Development
(http://www.ictd.ac/dataset/grd/).
Note: Data is for 113 countries (year 2015 circa). Maximum values include average of top 3 country rates.
464. Closing tax exemptions and converging toward a uniform tax rate could raise significant
revenues for countries that already have VAT. Sub-Saharan Africa, Lesotho, Mauritius, Senegal,
and South Africa do not have that many exemptions. In contrast, Cameroon, Malawi and Zambia,
have extensive lists of exemptions.322 For Costa Rica, Honduras, the Dominican Republic and
Uruguay, tax expenditures related to VAT are estimated to cost more than three percent of GDP.323
In Vietnam, moving to a uniform VAT rate of ten percent and significantly narrowing the list of
exemptions could increase tax revenues by 11 percent.324
465. Simulations for four low and middle-income countries—Ethiopia, Ghana, Senegal and
Zambia—show that, although preferential VAT rates reduce poverty, they are not well-targeted
towards poor households overall. As a result, a UBI funded by 75 percent of the revenue gains
from a broader VAT base—despite being completely untargeted—would create large net gains for
poor households.325 Preferential rates on food or energy, often introduced to support the poor,
provide a proportionately greater benefit to the poor than to the rich. But rich households benefit
vastly more in aggregate terms than poor households. Preferential rates introduced with other
objectives, as for example when lower rates are applied to books or hotel accommodations, are
regressive.
110
466. A second potential source of additional revenues are excise taxes. The average revenue
from excise taxes in the European Union on alcohol and tobacco is 0.3 percent of GDP. But several
countries are more dependent than others on these taxes: Estonia at 4.8 percent in 2016;
Luxembourg at 2.5 percent; the Czech Republic, Ireland and the Netherlands at about 1.5 percent.
Saudi Arabia adopted excise tax regulations in 2017: 50 percent on soft drinks, and 100 percent
on energy drinks, tobacco, and tobacco products. The “sugar” tax is a relatively new phenomenon.
Hungary imposed a tax in 2011 on unhealthy products (including sugar products like sugar-
sweetened beverages, pre-packaged sweetened products, chocolate, jam, but also on energy drinks,
salty snacks, seasonings). Croatia in 2014 imposed a similar tax on all sugar and coffee-based
products. Ireland approved a “soda tax” set to start in mid-2018, which is around the same time a
similar tax takes effect in the UK. Some of these taxes—such as tobacco taxes—are deemed
regressive as the poorest families tend to allocate larger shares of their budget to them. But when
looked at comprehensively, including benefits from lower medical expenses and longer, healthier
working lives, the benefits far exceed the increase in taxes.
467. Another excise tax gaining momentum is the carbon tax. It is estimated that nationally
efficient carbon pricing policies raise substantial amounts of revenue—above six percent in China,
Russia, Iran, and Saudi Arabia.326
468. Carbon taxes are in place in nearly every large economy apart from Brazil and the United
States.327 The median carbon tax in 2016 was US$8 per ton of CO2 emissions, with wide variance
across countries. Sweden charges US$130 per ton, while Poland charges US$1 per ton. In the
European Union the ratio of environmental tax revenues to total revenue varies from over ten
percent in Croatia, Slovenia, and Greece, to five percent in Belgium and France.328
469. China and Korea have gone a different way: instead of imposing a carbon tax they
experimented with emissions trading systems in 2013 and 2015 respectively. China’s emissions
trading system covers traditionally high-emission sectors such as iron and steel, power generation,
chemicals, building materials, papermaking, and non-ferrous metals. Korea imposed caps on
emissions from 525 of the country’s biggest companies, creating the second-largest market
globally. The World Bank estimates that China’s emissions trading systems are equivalent to
charging between US$7 (Beijing) and US$2 (Shanghai) per ton, while the Korean emissions
trading system is equivalent to charging US$9 per ton.329
470. A third source of revenue is applying the corporate tax to platform companies or more
generally to multinational firms. This would mean charging platform companies taxes equal to
what other companies pay. This is rarely the case. Evidence has surfaced for several cases where
companies use tax havens or direct negotiations with governments to avoid taxation. Regulators
are investigating whether certain companies are getting unfair support in some cases. Amazon
attributed more than US$7 billion worth of sales to the United Kingdom in 2013 but paid only
US$6.5 million in tax. Apple has much of its intellectual property located in low or zero income
tax jurisdictions. More generally, the U.S. Government Accountability Office estimates that the
tax code allows corporate deductions, credits, and deferrals to the tune of US$180 billion a year,
or about 40 percent of the actual corporate income tax revenue. More than half of U.S. business
activity, measured by sales, is conducted by ‘pass-through entities’, which do not pay taxes. It is
estimated that almost half of multinationals’ profits are shifted to tax havens, causing a loss of 12
percent of global corporate tax revenues.330
111
471. A fourth direction to raise government revenue is taxing immovable property. These types
of taxes are relatively efficient since they do not distort labor markets, human capital accumulation,
or innovation decisions. On average, high-income countries raise 1.1 percent of GDP from
immovable property taxes. France, Japan and the United Kingdom rely heavily on them, with
revenues higher than two percent of GDP. In middle income countries, these taxes yield about 0.4
percent of GDP.331 Countries like Georgia and Russia leverage them substantially.
472. Property taxes represent untapped revenue potential. This gap is estimated at an additional
2.9 – 0.9 percent of GDP in high and middle-income countries respectively. 332 China and Vietnam
have moved in this direction. In 2010 Vietnam adopted a tax on non-agricultural land and is
considering additional reforms. China may introduce a residential property tax in 2019.
473. Implementing property taxes is challenging in countries without clear property regulation
and land cadasters. In Cameroon and Rwanda formally registered land constitutes less than
one percent of total land parcels. But limited registration capabilities have not prevented the use
of specific property taxes in most of Sub-Saharan Africa. For instance, property taxes may be
levied on leasehold rights, as in the case of Zambia, or other types of limited property rights, such
as concessions in Cameroon and the Democratic Republic of the Congo.333
474. Digital technologies improve the implementation of these measures by digitalizing
property registration systems in big cities. Taking such a step, when accompanied by rigorous
enforcement of municipal tax collection, usually leads to a significant boost in revenues. In 2010
the rate of collection of tax on urban immovable property in Lahore, the second largest city in
Pakistan, was one of the lowest in the world—at 0.03 percent of the state’s GDP. The average for
large cities in developing countries stands at 0.6 percent. The digitization of Lahore’s property
records in 2012-13 led to the addition of 1.7 million previously unregistered properties. Municipal
property tax receipts increased by 102 percent by 2018.
475. Finally, energy subsidies reform represents a significant source of financing. Globally,
according to the latest estimates, government spending on these subsidies amounts to $333
billion.334 Fiscal gains from reforming energy subsidies could be substantial: in many countries,
their overall level is higher than public spending on social assistance (countries on the right side
of the 45 degree line in figure 7.4). In the MENA region average spending on energy subsidies is
three times higher than on social assistance.
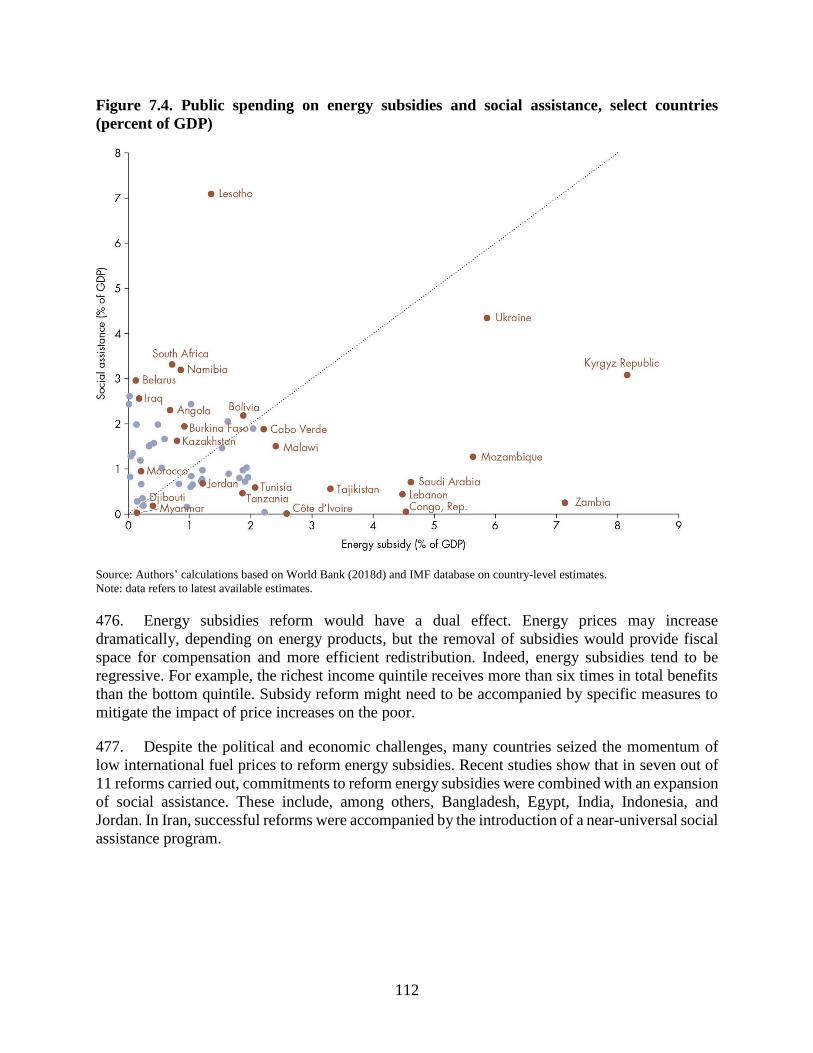
112
Figure 7.4. Public spending on energy subsidies and social assistance, select countries
(percent of GDP)
Source: Authors’ calculations based on World Bank (2018d) and IMF database on country-level estimates.
Note: data refers to latest available estimates.
476. Energy subsidies reform would have a dual effect. Energy prices may increase
dramatically, depending on energy products, but the removal of subsidies would provide fiscal
space for compensation and more efficient redistribution. Indeed, energy subsidies tend to be
regressive. For example, the richest income quintile receives more than six times in total benefits
than the bottom quintile. Subsidy reform might need to be accompanied by specific measures to
mitigate the impact of price increases on the poor.
477. Despite the political and economic challenges, many countries seized the momentum of
low international fuel prices to reform energy subsidies. Recent studies show that in seven out of
11 reforms carried out, commitments to reform energy subsidies were combined with an expansion
of social assistance. These include, among others, Bangladesh, Egypt, India, Indonesia, and
Jordan. In Iran, successful reforms were accompanied by the introduction of a near-universal social
assistance program.
113
Notes
1 Marx 1867. 2 Keynes 1931. 3 This is a sum of various available statistics: 57.3 million in the United States, 1.4 million in the United Kingdom, 10 million in
European Union, 15 million in India. These countries or regions are where freelancing is booming. The aggregated number
reflects a sizable portion of the global freelancer workforce. 4 Edelman Intelligence 2017. 5 IMF 2018. 6 Parry et al. 2014. 7 Norregaard 2013. 8 eBay 2013. 9 Chen and Xu 2015. 10 Freund, Mulabdic and Ruta 2018. 11 McKinley 1958. 12 Kunhua Zeng, The History of Chinese Railway, 1923, p.31. 13 Kate Taylor. 2016. “Fast-food CEO says he's investing in machines because the government is making it difficult to afford
employees,” Business Insider, March 16. 14 International Federation of Robotics. 15 Dauth et al. 2017 16 Gregory et al. 2016. 17 Chan, Jennifer. 2017. “Robots, not humans: official policy in China.” New Internationalist, November 1.
https://newint.org/features/2017/11/01/industrial-robots-china. 18 Gref, Herman. 2017, September 25. Speaking at the Council on Legislative Support for the Development of the Digital
Economy under the Chairman of the State Duma. http://special.tass.ru/ekonomika/4590924. 19 孙宏超. 2017. “蚂蚁金服彭蕾联合国演讲:倡议建数字金融创新小组.” 腾讯科技.
http://tech.qq.com/a/20170919/031275.htm?pc 20 Keynes 1931. 21 An algorithm was then used to extend that sample to categorize the remainder of the 632 US occupational categories based on
their task make-up. Where the probability of automation was greater than 0.7, that occupation was considered at risk. Frey and
Osborne 2017. 22 Aspin and Chapman 1964. 23 Ajwad et al. 2014a and 2014b; Bodewig et al. 2014. 24 Valerio et al. 2015a and 2015b. 25 Akerman, Gaarder and Mogstad 2015. 26 Arias et al. forthcoming. 27 Almeida et al. 2017. 28 Hardy et al. 2018. 29 For East Asian countries, see Mason et al. 2018. For others, see World Bank 2016a. 30 Brambrilla and Tortarolo 2018. 31 阿里研究院, 阿里新乡村研究中心. 2016. “中国淘宝村研究报告: 淘宝村新突破.” 北京:阿里研究院. 32 SM Abrar Aowsaf. 2018. “The cost of getting paid.” Dhaka Tribune, March 01.
http://www.dhakatribune.com/business/2018/03/01/cost-getting-paid/. 33 This section is based on Edward Glaeser 2018. 34 Acemoglu and Autor 2011. In advanced economies, labor replacement due to automation appears concentrated in middle-
skilled jobs, leading to the polarization of labor markets. We show in this report that in developing countries, at least so far, there
is significant variation across countries in terms of the relative employment growth of different occupations; in many countries,
middle-skilled jobs continue to grow in importance. 35 Education improves the ability of countries to take advantage of globalization. For example, successful exporters in developing
countries tend to export higher quality products, and high quality requires skills (Verhoogen 2008; Brambrilla et al 2012). 36 World Development Indicators. Figures refer to Adjusted Net Enrollment Rate for primary school. 37 Fernald et al. 2012. 38 Smith 1776 as reported in Goldin 2016. 39 Chetty, Friedman, and Rockoff 2014. 40 Foster and Rosenzweig 1996. 41 Hanson 2007. 42 Psacharopoulos and Patrinos 2018. 43 Heckman, Stixrud, and Urzua 2006, for developed countries; Acosta, Muller, and Sarzosa 2015, for Colombia.
114
44 Dillon et al. 2014. 45 Ahuja, Baird, Hicks et al. 2015. 46 Heckman 2008. 47 Belot and James 2011. 48 Sandjaja et al. 2013. 49 Dillon et al. 2017. 50 Ahuja, Baird, Hicks et al. 2015. 51 Currie and Moretti 2003. 52 Andrabi et al. 2012. 53 Hsieh and Klenow 2010. 54 Larreguy and Marshall 2017. 55 Cavaillé and Marshall 2017. 56 Knack and Keefer 1997. 57 Rosas and Sabarwal 2016. 58 Blanford et al. 2012. 59 Ferre and Sharif 2014. 60 Baird, Mcintosh, and Ozler 2016. 61 Baird, Friedman and Schady 2011. 62 Maccini and Yang 2009. 63 Gine, Karlan, and Zinman 2010. 64 Heckman et al. 2010. 65 Paes De Barros et al. 2009. 66 Cook, Dodge, Farkas et al. 2014. 67 World Bank 2016b. 68 Coffey, Geruso and Spears 2018. 69 Chetty and Hendren 2018. 70 Gertler et al. 2014. 71 Service Delivery Indicators 2015. 72 Björkman Nyqvist, de Walque, and Svensson 2017. 73 Joshi and Gaddis (Eds.) 2015. 74 Singh 2015. 75 A description of the methodology, data, and interpretation of the index is provided in a background paper to the WDR, see
Kraay 2018. 76 Analyses based on ongoing research by the World Bank and partners. 77 Caselli 2005; Weil 2007. 78 Mikkelsen et al. 2015. 79 ASER Centre 2018. 80 Chong, Cohen, Field, Nakasone, Torero 2016. 81 Glewwe, Dang, Lee and Vu 2017. 82 Krueger and Kumar 2004. 83 Deming 2017; Cunningham and Villasenor 2016. 84 Hanushek et al. 2017. 85 Valerio et al. 2016. 86 Cunningham and Villasenor 2016. 87 Ederer et al. 2015. 88 Valerio et al. 2015a and 2015b. 89 Dutz et al. 2018. 90 Authors’ calculations based on World Bank Enterprise Surveys 2015-2016 data. 91 Handel 2012; MacCrory et al. 2014. 92 Ebenehi et al. 2016. 93 Attanasio et al. 2014. 94 Global Health Workforce Alliance 2008. 95 Yousafzai et al. 2014; Yousafzai et al. 2016. 96 Aboud and Hossain 2011. 97 Martinez et al. 2012. 98 Garcia et al. 2017.
99 Engle et al. 2011.
115
100 Save the Children. 2017. “870,000 Stay-At-Home Mums in England Want to Work but Can’t Get the Childcare They Need.”
https://www.savethechildren.org.uk/news/media-centre/press-releases/870-000-stay-at-home-mums-in-england-want-to-work-
but-cant-get-t. 101 Berlinski and Galiani 2007. 102 Nollenberger and Rodríguez-Planas 2015. 103 Hoddinott et al. 2008. 104 Gertler et al. 2014. 105 UNESCO Institute for Statistics 2014. 106 UNESCO 2015. 107 Black et al. 2017a.
108 UNESCO 2015. 109 Bidwell and Watine 2014. 110 Cueto et al. 2009. 111 Brinkman et al. 2017. 112 Macdonald et al. 2017. 113 Lillard and Else-Quest 2006. 114 Asian Development Bank 2015; Independent Evaluation Group 2016; Fernald and Hidrobo 2011; Fernald et al. 2008;
Premand et al. 2016. 115 Araujo et al. 2015. 116 Psacharopoulos and Patrinos 2018. 117 Saavedra 2009. 118 Ferreyra et al. 2017. 119 Psacharopoulos and Patrinos 2018. 120 Autor et al. 2008. 121 Hasanefendic et al. 2016. 122 StudyMalaysia. 2016. “Technical and Vocational Education and Training (TVET) in Malaysia.” October 12.
https://www.studymalaysia.com/education/top-stories/technical-and-vocational-education-and-training-in-malaysia; Blom et al.
2016. 123 Almeida et al. 2016. 124 OECD 2014. 125 Bettinger et al. 2017. 126 Saavedra and Saavedra 2011. 127 Loyalka et al. 2016. 128 Schendel 2013. 129 Blom and Saeki 2011. 130 Arias et al. 2014. 131 Brunello and Schlotter 2011. 132 Premand et al. 2012. 133 López-Mondéjar and Tomás Pastor 2017. 134 Wang et al. 2012. 135 Altbach and Salmi (eds.) 2011. 136 Peking University. 2018. “Peking University holds a Plenary Meeting on Clinical Medicine +X Committee.” January 17.
http://english.pku.edu.cn/news_events/news/focus/6749.htm. 137 TNM Staff. 2017. “Indian Government to Set Up Seven New Research Parks across India to Boost Innovation.” The News
Minute, May 10. https://www.thenewsminute.com/article/indian-government-set-seven-new-research-parks-across-india-boost-
innovation-61795. 138 Parque de Investigación e Innovación Tecnológica (PIIT). http://piit.com.mx/index.php 139 Ordóñez de Pablos et al. 2011. 140 Åslund and Djankov 2017. 141 World Bank 2018a. 142 Kaffenberger and Pritchett 2017. 143 Cree et al. 2012. 144 Based on the “cumulative drop-out rate to the last grade of lower secondary general education” indicator published by
UNESCO Institute for Statistics. The data is available for 112 economies. 145 De Hoyos et al. 2016. 146 Blunch et al. 2018. 147 Chakravarty, Lundberg, Nikolov, and Zenker. 2017. 148 J-PAL 2017. 149 Alvarez de Azevedo et al. 2013.
116
150 Aker and Sawyer 2016. 151 Aker and Ksoll 2017. 152 Valdivia 2011. 153 Ibarrarán et al. 2012; Ibarrarán et al. 2018. 154 Hirshleifer et al. 2016. 155 Adoho et al. 2014. 156 Kluve 2016. 157 Martínez A. et al. 2018. 158 Aker et al. 2012. 159 Mani et al. 2013. 160 Cho et al. 2013. 161 Maitra and Mani 2014. 162 Aker and Sawyer 2016. 163 Cheema et al. 2015. 164 Darvas and Palmer 2014. 165 Sabarwal 2013. 166 Blattman and Ralston 2015. 167 De Mel et al. 2014. 168 Blattman and Annan 2016. 169 Goldstein, Markus and Alaka Holla. 2011. “Gender Power Doesn't Come Cheap.” Development Impact Blog, July 26.
http://blogs.worldbank.org/impactevaluations/gender-power-doesnt-come-cheap. 170 Abe et al. 2011. 171 Hicks et al. 2011. 172 Attanasio et al. 2017. 173 Kugler et al. 2015. 174 Haan and Serriere 2002. 175 Alfonsi et al. 2017. 176 Campos et al. 2017. 177 Adhvaryu et al. 2017. 178 Mincer 1974. 179 Levin et al. forthcoming. 180 Omondi, Dominic. 2016. “Why Informal Sector is the theatre of Survival” The Standard, November 1
https://www.standardmedia.co.ke/business/article/2000221705/why-informal-sector-is-theatre-of-survival 181 La Porta and Shleifer 2014. 182 Benjamin and Mbaye 2012. 183 La Porta and Shleifer 2014. 184 Foster and Rosenzweig 2007. 185 Djankov et al. 2002. 186 Bruhn 2013. 187 Rocha et al. 2017a. 188 FORLAC (2014) 189 Ibarraran et al.2018. 190 Islam et al. 2018b. 191 Amin and Islam 2015. 192 Amin, et al. 2016. 193 Islam et al. 2018a 194 Bandiera et al. 2017a. 195 Bandiera et al. 2017b. 196 Adoho et al. 2014. 197 Christiaensen, Demery and Kuhl 2011. 198 Banerjee and Duflo 2011. 199 Hicks et al. 2017. 200 Ingelaere et al. 2018. 201 Gibson et al. 2017. 202 Davis et al. 2012; Larsen et al. 2014. 203 Vasilaky and Islam 2018. 204 Acre Africa. http://acreafrica.com/services/. 205 World Bank 2017b. 206 World Bank 2018c.
117
207 Evans and Popova 2017. 208 Bastagli et al. 2016 209 Akee et al. 2018. 210 Ralston et al. 2017. 211 Banerjee et al. 2018. 212 European Union 2015. 213 Desai and Kharas 2017. 214 Brown et al. 2017. 215 Lopez-Calva and Ortiz-Juarez 2011. 216 Dang and Dalaban 2018. 217 Brown et al. 2016. 218 World Bank 2018a. 219 The Economic Times. 2018. “1 or 2 states may roll out universal income in two yrs: CEA Arvind Subramanian.” January 29.
https://economictimes.indiatimes.com/news/economy/policy/1-or-2-states-may-roll-out-universal-income-in-two-yrs-cea-arvind-
subramanian/articleshow/62696689.cms. 220 Yeung and Howes 2015. 221 A pilot in Finland was discontinued for various reasons before the publishing of the evaluation. See:
https://www.nytimes.com/2018/04/24/business/finland-universal-basic-income.html 222 Browne and Immervoll 2017. 223 IMF 2017. See Harris et al. 2018 for a discussion on financing a UBI via VAT. 224 Government of India 2017. 225 Khosla 2018. 226 Gentilini et al. forthcoming. 227 However, substitution could occur through an increase in taxes. 228 Baird et al. 2018. 229 Marinescu 2018. 230 Salehi-Isfahani and Mostafavi-Dehzooei 2017. 231 Birnbaum and De Wispelaere 2016. 232 Atkinson 2015. 233 Alderman et al. 2017. 234 Shiferaw et al. 2017. 235 World Bank 2018d. 236 Dorfman et al. 2013. 237 OECD Taxing Wages 2017. 238 Akbas et al. 2016.
239 Botero et al, 2004. 240 ILOSTAT, accessed 02/27/2018. 241 Betcherman 2012. 242 Adhvaryu et al. 2013. 243 Acharya, Baghai and Subramanian 2013; Almeida and Aterido 2008. 244 Caballero et al. 2013. 245 Packard and Montenegro 2017. 246 Bartelsman, Gautier and De Wind 2016. 247 Bottasso et al. 2017. 248 Brambilla and Tortarolo 2018. 249 Sestito and Viviano 2016. 250 The empirical literature, particularly on Latin America, suggests that wages often increase in the informal sector after a minimum
wage hike. This has been explained as a “lighthouse effect” whereby the minimum wage is a signal for wage bargaining, including
in the informal sector, or as a compositional effect as an increase in the minimum wage leads firms to substitute formal workers
for informal ones (Boeri et al. 2011). 251 Palacios and Robalino forthcoming. 252 Kuddo et al. 2015. 253 Krueger and Posner 2018. 254 Holzmann et al. 2012. 255 Robalino and Weber 2014. 256 Krstic and Schneider 2015. 257 Coase 1937. 258 Freund, Djankov, Pham 2010. 259 http://inter.ikea.com/en/about-us/milestones/.
118
260 Schumpeter 1942. 261 https://www.entrepreneur.com/article/286368 262 Karabarbounis and Neiman 2014. 263 Freund 2016. 264 Freund and Pierola 2015. 265 Autor et al. 2017b. 266 Goldberg et al. 2010. 267 Cirera et al. 2018. 268 Goldberg et al. 2016. 269 Enterprise Survey, Employment Indicators Database. 270 Freund 2016. 271 Sundararajan 2016. 272 The cluster of rural e-tailers is referred as a “Taobao Village” where 1) those e-tailers operate businesses within an
administrative village; 2) annual village e-commerce transaction volume exceeds 10 million yuan (around $US1.6million); and 3)
at least 10% of village households actively engage in e-commerce or there are 100 or more active online-shops, primarily with
the use of Taobao.com Marketplace. 273 梁周倩, 姜雪芬. 2017. “淘宝村超 2100 个!农村电商已不是你想象的样子.” 搜狐.
http://www.sohu.com/a/209234546_114930 274 This is a sum of various available statistics: 57.3 million in the United States, 1.4 million in the United Kingdom, 10 million in
European Union, 15 million in India. These countries or regions are where freelancing is booming. The aggregated number
reflects a sizable portion of the global freelancer workforce. 275 Bento and Restuccia 2017. 276 World Bank research finds that in Ben Ali’s Tunisia, new firms were prevented from competing with companies connected to
the President’s family through restrictions on investment in certain sectors. Rijkers, Freund, and Nucifora 2017. 277 Nightingale and Coad 2014. 278 Djankov, Georgieva and Ramalho 2018. 279 Haltiwanger, Jarmin and Miranda 2013. 280 Bruhn 2011. 281 Hsieh and Klenow 2014. 282 Moscoso Boedo and Mukoyama 2012. 283 Martincus, Carballo, and Graziano 2015; Carballo et al. 2016. 284 The Economist Intelligence Unit, Inclusive Internet Index 2018. 285 Kenya Communications Authority 2017. Second Quarter Sector Statistics Report for the Financial Year 2017/2018 (1 October
– 31 December 2017) 286 Bloomberg Technology, Go-Jek acquires three companies to dominate payment in Indonesia, December 17th, 2017 287 Filistrucchi et al. 2014. 288 For details, please see https://www.w3counter.com/globalstats.php. 289 Zucman 2015. 290 Tørsløv, Wier and Zucman 2018. 291 Beer et al. 2018. 292 Institute on Taxation and Economic Policy 2017. 293 Institute on Taxation and Economic Policy 2017. 294 Obermaier, Frederik and Bastian Obermayer. 2017. “How We Reported the Paradise Papers.” Süddeutsche Zeitung,
November 5. https://projekte.sueddeutsche.de/paradisepapers/wirtschaft/answers-to-pressing-questions-about-the-leak-e574659/.
See also: International Consortium of Investigative Journalists. 2017. Offshore Leaks Database.
https://www.icij.org/investigations/paradise-papers/icij-releases-paradise-papers-data-appleby/ 295 Beer et al. 2018. 296 Hebous et al. 2011; Griffith, Miller and O’Connell 2018. 297 Beer et al. 2018. 298 Beer and Loeprick 2018. 299 European Commission - Fact Sheet. 2018. “Questions and Answers on a Fair and Efficient Tax System in the EU for the
Digital Single Market.” March 21. http://europa.eu/rapid/press-release_MEMO-18-2141_en.htm 300 European Commission, “Digital taxation: Commission proposes new measures to ensure that all companies pay fair tax in the
EU,” March 21, 2018, http://europa.eu/rapid/press-release_IP-18-2041_en.htm. 301 According to the OECD base erosion and profit shifting (BEPS) refers to tax planning strategies that exploit gaps in the
architecture of the international tax system to artificially shift profits to places where there is little or no economic activity or
taxation. 302 Fleming et al. 2016. 303 Picciotto 2012 and Piciotto et al. 2017.
119
304 Altshuler and Grubert 2008. 305 Fisher, Max and Amanda Taub. 2017. “The Social Contract is Broken: Inequality Becomes Deadly in Mexico.” New York
Times. https://www.nytimes.com/2017/09/30/world/americas/mexico-inequality-violence-security.html?_r=0. 306 Desai and Kharas 2017. 307 World Bank 2018a. 308 Saavedra and Tommasi 2007. 309 For more details on the job-creation programs, see: Harvey 2007. 310 McDonald and Powdthavee 2018. 311 Black et al. 2017b. 312 Daruich 2018. 313 Africa’s Population Boom: Will It Mean Disaster or Economic and Human Development Gains? World Bank 2016 314 Trotsenburg 2015. “How can rapidly aging East Asia sustain its economic dynamism?”
http://blogs.worldbank.org/eastasiapacific/how-can-rapidly-aging-east-asia-sustain-its-economic-dynamism 315 European Commission 2018. 316 The level of international poverty lines used in the simulations vary by country income categories. 317 Estimates for 2015 from the UN World Population Prospects 2017. 318 The maximum frontier cost would include a typical multi-program graduation package, the cost of which (i.e., $1,079) is
calculated as the average from 6 developing country interventions (Banerjee et al. 2015); the lower-cost package is based on
vocational training programs, the average cost of which (i.e., $831) is calculated from 8 developing country experiences with
such schemes (McKenzie 2017). 319 Given the lack of youth poverty data, the figure refers to the estimated global unemployment rate among youth in 2016, or
12.8 percent, which equals 135 million young adults in low and middle-income countries (O’Higgins 2016). 320 OECD/Korea Institute of Public Finance 2014. 321 IMF 2018. 322 IMF 2018. 323 World Bank 2017c. 324 World Bank 2017d. 325 Harris et al. 2018. 326 Parry et al. 2014. 327 Djankov 2017. 328 Djankov 2017. 329 Kossoy et al. 2015. 330 Tørsløv, Wier and Zucman 2018. 331 Norregaard 2013. 332 Norregaard 2013. 333 Franzsen and McCluskey 2017. 334 IMF database on energy subsidies (country-level estimates) available at
http://www.imf.org/external/np/fad/subsidies/index.htm. Estimates for post-tax subsidies, which include a range of environmental
and other costs, were at $5.3 trillion in 2015, equivalent to 6.5 percent of global GDP (Coady et al. 2017).
120
Bibliography
Abe, M., H. Schambra, E.M. Wassermann, D. Luckenbaugh, N. Schweighofer, and L.G. Cohen.
2011. “Reward Improves Long-Term Retention of A Motor Memory Through Induction of
Offline Memory Gains.” Current Biology 21(7): 557–62.
Aboud, Frances E., and Kamal Hossain. 2011. “The Impact of Preprimary School on Primary
School Achievement in Bangladesh.” Early Childhood Research Quarterly 26: 237–46.
Acemoglu, Daron, and David H. Autor. 2011. “Skills, Task and Technologies: Implications for
Employment and Earnings.” Handbook of Labor Economics 4: 1043–1171.
Acharya, Viral, Ramin Baghai and Krishnamurthy Subramanian. 2013. “Labor Laws and
Innovation”. Journal of Law and Economics 56 (4): 997-1037.
Acosta, Pablo, Noel Muller, and Miguel Alonso Sarzosa. 2015. “Beyond qualifications: returns to
cognitive and socio-behavioral skills in Colombia,” IZA Discussion Paper No. 9403.
Adhvaryu, Achyuta, Namrata Kala, and Anant Nyshadham. 2017. “The Skills to Pay the Bills:
Returns to On-the-job Soft Skills Training.” Working Paper.
Adhvaryu, A., AV Chari, S. Sharma. 2013. “Firing Costs and Flexibility: Evidence from Firms’
Employment Responses to Shocks in India.” The Review of Economics and Statistics 95(3):
725-740.
Adoho, Franck, Shubha Chakravarty, Jr, Dala T. Korkoyah, Mattias, Lundberg, and Afia Tasneem.
2014. “The Impact of An Adolescent Girls Employment Program: The EPAG Project in
Liberia.” Policy Research Working Paper No. 6832. Washington, DC: World Bank.
Ahuja, Amrita, Sarah Baird, Joan Hamory Hicks, Michael Kremer, Edward Miguel, and Shawn
Powers. 2015. “When should governments subsidize health? The case of mass deworming,”
The World Bank Economic Review 29(1): S9-S24.
Ajwad, Mohamed Ihsan; Stefan Hut, Ilhom Abdulloev, Robin Audy, Joost de Laat, Sachiko
Kataoka, Jennica Larrison, Zlatko Nikoloski,and Federico Torracchi. 2014a. “The Skills Road:
Skills for Employability in Tajikistan.” World Bank, Washington, DC.
Ajwad, Mohamed Ihsan, Joost de Laat, Stefan Hut, Jennica Larrison, Ilhom Abdulloev, Robin
Audy, Zlatko Nikoloski, and Federico Torracchi. 2014b. “The Skills Road: Skills for
Employability in the Kyrgyz Republic.” World Bank, Washington, DC.
Akbas, Merve, Dan Ariely, David Robalino, and Michael Weber. 2016. “How to Help Poor
Informal Workers to Save a Bit: Evidence from a Field Experiment in Kenya.” IZA Working
Paper 1024. Bonn.
Akee, W., Costello, E. and Simeonova, E. 2018. “How Does Household Income Affect Child
Personality Traits and Behaviors?” American Economic Review 108(3): 775–827.
Aker, Jenny C., Christopher Ksoll, and Travis J. Lybbert. 2012. “Can Mobile Phones Improve
Learning? Evidence from a Field Experiment in Niger.” American Economic Journal: Applied
Economics 4(4): 94-120.
121
Aker, Jenny C., and Christopher Ksoll. 2017. “Call Me Educated: Evidence from a Mobile
Monitoring Experiment in Niger.” Center for Global Development Working Paper No. 406.
Aker, Jenny, and Melita Sawyer. 2016. “Adult Learning in Sub-Saharan Africa: What Do and
Don’t We Know?” Background Paper for Arias et al. forthcoming. “The Skills Balancing Act
in Sub-Saharan Africa: Investing in Skills for Productivity, Inclusion and Adaptability.”
Akerman, A., I. Gaarder, and M. Mogstad. 2015. “The Skill Complementarity of Broadband
Internet.” Quarterly Journal of Economics 130 (4): 1781-824.
Alderman, H., Gentilini, U., and Yemtsov, R. (Eds) 2017. The 1.5 Billion People Question: Food,
Vouchers, or Cash Transfers? World Bank, Washington, DC.
Alfonsi, Livia, Oriana Bandiera, Vittorio Bassi, Robin Burgess, Imran Rasul, Munshi Sulaiman,
and Anna Vitali. 2017. “Tackling Youth Unemployment: Evidence from a Labour Market
Experiment in Uganda.” STICERD - Development Economics Papers.
Almeida, Rita K., Ana M. Fernandes, and Mariana Viollaz. 2017. “Does the Adoption of Complex
Software Impact Employment Composition and the Skill Content of Occupations? Evidence
from Chilean Firms.” Policy Research Working Paper 8110, World Bank, Washington, DC,
and CEDLAS-FCE-UNLP Working Paper No. 214, Argentina.
Almeida, Rita, Nicole Amaral, and Fabiana de Felicio. 2016. Assessing Advances and Challenges
in Technical Education in Brazil. World Bank Studies. Washington, DC: World Bank.
Almeida, Rita, and Reyes Aterido. 2008. “The Incentives to Invest in Job Training: Do Strict Labor
Codes Influence this Decision?” Social Protection and Labor working paper No. 0832, World
Bank, Washington, DC.
Andrabi, T., J. Das, and A. Khwaja. 2012. “What Did You Do All Day? Maternal Education and
Child Outcomes.” Journal of Human Resources 47(4): 873-912.
Altbach, Philip G. and Jamil Salmi (eds.). 2011. The Road to Academic Excellence: The Making
of World-Class Research Universities. World Bank: Washington DC.
Altshuler, Rosanne and Harry Grubert. 2008. "Formula Apportionment: Is It Better Than The
Current System And Are Their Better Alternatives?" U.S. Treasury Department Office of Tax
Analysis.
Alvarez de Azevedo, Thomaz, Jeff Davis, and Munene Charles. 2013. “Testing What Works in
Youth Employment: Evaluating Kenya’s Ninaweza Program.” Global Partnership for Youth
Employment, Washington, DC.
Amin, Mohammad and Asif Islam. 2015. “Does Mandating Nondiscrimination in Hiring Practices
Influence Women’s Employment? Evidence Using Firm-Level Data.” Feminist Economics
21(4): 28-60.
Amin, Mohammad, Asif Islam and Alena Sakhonchik. 2016. “Does Paternity Leave Matter for
Female Employment in Developing Economies? Evidence from Firm-level Data” Applied
Economics Letters 23(16): 1145-11
122
Araujo, María Caridadac, Martín Ardanaz, Edna Armendáriz, Jere R. Behrman, Samuel Berlinski,
Julian P. Cristia, Yyannu Cruz-Aguayo, Luca Flabbi, Diana Hincapie, Analía Jalmovich,
Sharon Lynn Kagan, Florencia López Bóo, Ana Pérez Expósito, and Norbert Schady. 2015.
The Early Years: Child Well-being and the Role of Public Policy. Inter-American Development
Bank: Washington, DC.
Arias, Omar, David Evans and Indhira Santos. Forthcoming. “The Skills Balancing Act in Sub-
Saharan Africa: Investing in Skills for Productivity, Inclusion and Adaptability.” World Bank:
Washington, DC.
Arias, Omar S., Carolina Sánchez-Páramo, María E. Dávalos, Indhira Santos, Erwin R. Tiongson,
Carola Gruen, Natasha de Andrade Falcão, Gady Saiovici, and Cesar A. Cancho. 2014. Back
to Work: Growing with Jobs in Europe and Central Asia. World Bank, Washington, DC.
Arntz, M., T. Gregory and U. Zierahn. 2016. “The Risk of Automation for Jobs in OECD
Countries: A Comparative Analysis.” OECD Social, Employment and Migration Working
Papers, No. 189, OECD Publishing, Paris.
Arntz, M., T. Gregory and U. Zierahn. 2017. “Revisiting the Risk of Automation.” Economics
Letters, 159 (2017) 157–160.
ASER Centre. 2018. Overview. New Delhi.
http://www.asercentre.org/Survey/Basic/Pack/Sampling/History/p/54.html.
Asian Development Bank. 2015. The Design, Expansion, and Impact of Pantawid. Manila.
Åslund, Anders, and Simeon Djankov. 2017. Europe’s Growth Challenge. Oxford University
Press.
Aspin, C., and Chapman, S.D. 1964. James Hargreaves and the Spinning Jenny, Preston,
Helmshore Local History Society, p.49; Robert C. Allen. 2006. The British Industrial
Revolution in Global Perspective, Oxford University Press.
Atkinson, Anthony B. 2015. Inequality: What can Be Done? Harvard University Press.
Attanasio, Orazio P., Camila Fernández, Emla O A Fitzsimons, Sally M. Grantham-McGregor,
Costas Meghir, and Marta Rubio-Codina. 2014. “Using the Infrastructure of a Conditional
Cash Transfer Program to Deliver a Scalable Integrated Early Child Development Program in
Colombia: Cluster Randomized Controlled Trial.” BMJ 349, Article g5785.
Attanasio, Orazio, Arlen Guarin, Carlos Medina and Costas Meghir. 2017. “Vocational Training
for Disadvantaged Youth in Colombia: A Long-Term Follow-Up.” American Economic
Journal: Applied Economics 9(2): 131–43.
Autor, David H., Lawrence F. Katz, and Melissa S. Kearney. 2008. “Trends in U.S. Wage
Inequality: Revising the Revisionists.” Review of Economics and Statistics 90(2): 300-23.
Autor, David H., David Dorn, Lawrence F. Katz, Christina Patterson, and John Van Reenen.
2017b. “The Fall of the Labor Share and the Rise of Superstar Firms.” NBER Working Paper
No. 23396. National Bureau of Economic Research, Cambridge, MA.
123
Baird, Sarah Jane, Jed Friedman and Norbert Schady. 2011. “Aggregate Income Shocks and Infant
Mortality in the Developing World.” Review of Economics and Statistics 93(3):847-856.
Baird, Sarah Jane, Craig Mcintosh, and Berk Ozler. 2016. “When the money runs out: do cash
transfers have sustained effects on human capital accumulation ?,” Policy Research Working
Paper Series 7901, The World Bank.
Baird, S., Ozler, B. and McKenzie, D. 2018. “The Effects of Cash Transfers on Adult Labor Market
Outcomes.” World Bank World Bank Policy Research Working Paper No. 8404. Washington
DC.
Bandiera, Oriana, Robin Burgess, Narayan Das, Selim Gulesci, Imran Rasul and Munshi
Sulaiman. 2017a. “Labor Markets and Poverty in Village Economies.” The Quarterly Journal
of Economics 132(2): 811-870
Bandiera, Oriana; Niklas Buehren, Robin Burgess, Markus P Goldstein, Selim Gulesci, Imran
Rasul, Munshi Sulaiman. 2017b. “Women’s empowerment in action : evidence from a
randomized control trial in Africa.” Washington, D.C. : World Bank Group
Banerjee, Abhijit V., & Duflo, Esther, 2011. Poor economics: A radical rethinking of the way to
fight global poverty. New York: Public Affairs.
Banerjee, A., Duflo E., Goldberg, N, Karlan, D., Osei, R, Parienté W, Shapiro J, Thuysbaert B,
Udry C. 2015 “A multifaceted program causes lasting progress for the very poor: Evidence
from six countries.” Science Vol. 348, Issue 6236.
Banerjee, A., Karlan, D., Osei, R., Trachtman, H., and Udry, C. 2018. “Unpacking a Multi-Faceted
Program to Build Sustainable Income for the Very Poor.” NBER Working Paper 24271.
Cambridge.
Bartelsman, Eric, Pieter Gautier and Joris De Wind. 2016. “Employment Protection, Technology
Choice, and Worker Allocation.” International Economic Review, Vol. 57, Issue 3, pp. 787-
826, 2016.
Bastagli, F., Hagen-Zanker, J., Harman, L., Sturge, G., Barca, V., Schmidt, T., and Pellerano, L.
2016. “Cash Transfers: What Does the Evidence Say? A Rigorous Review of Impacts and the
Role of Design and Implementation Features.” ODI. London.
Beer, Sebastian, Ruud de Mooij, and Li Lui. 2018. “International Corporate Tax Avoidance: A
Review of the Channels, Effect Sizes, and Blind Spots.” International Monetary Fund Working
Paper, Washington, DC.
Beer, Sebastian, and Jan Loeprick. 2018. “The Costs and Benefits of Tax Treaties with Investment
Hubs: Findings from Sub-Saharan Africa. Forthcoming International Monetary Fund Working
Paper. Washington, DC.
Belot, Michèle, and Jonathan James. 2011. “Healthy School Meals and Educational Outcomes.”
Journal of Health Economics 30: 489–504.
Benjamin, Nancy and Ahmadou Aly Mbaye. 2012. The Informal Sector in Francophone Africa:
Firm Size, Productivity and Institutions. Washington, DC: World Bank
124
Bento, Pedro and Diego Restuccia. 2017. "Misallocation, Establishment Size, and Productivity."
American Economic Journal: Macroeconomics, 9(3): 267-303.
Berlinski, S., and S. Galiani. 2007. “The Effect of A Large Expansion of Pre-Primary School
Facilities on Preschool Attendance and Maternal Employment.” Labour Economics 14(3):
665−80.
Betcherman, Gordon. 2012. “Labor Market Institutions: A Review of the Literature.” World Bank
Policy Research Working Paper 6276. World Bank, Washington, DC.
Bettinger, Eric, Lindsay Fox, Susanna Loeb, and Eric Taylor. 2017. “Virtual Classrooms: How
Online College Courses Affect Student Success.” American Economic Review 107(9): 2855-
2875.
Bidwell, Kelly, and Loïc Watine. 2014. Exploring Early Education Programs in Peri-urban
Settings in Africa. New Haven, CT, Innovations for Poverty Action.
Birnbaum, S. and De Wispelaere, J. 2016. “Basic Income in the Capitalist Economy: The Mirage
of “Exit” from Employment.” Basic Income Studies 11(1): 61-74.
Björkman Nyqvist, Martina, Damien de Walque, and Jakob Svensson. 2017. “Experimental
evidence on the long-run impact of community-based monitoring,” American Economic
Journal: Applied Economics 9(1): 33-69.
Black, Maureen M, Susan P Walker, Lia C H Fernald, Christopher T Andersen, Ann M
DiGirolamo, Chunling Lu, Dana C McCoy, Günther Fink, Yusra R Shawar, Jeremy Shiffman,
Amanda E Devercelli, Quentin T Wodon, Emily Vargas-BarÓn, and Sally Grantham-
McGregor. 2017a. “Early Childhood Development Coming of Age: Science Through the Life
Course.” The Lancet 389: 77–90.
Black, Robert, Carl Taylor, Shobha Arole, Abhay Bang, Zulfiqar Bhutta, Mushtaque Chowdhury,
Betty Kirkwood, Nazo Kureshy, Claudio Lanata, James Phillips, Mary Taylor, Cesar Victora,
Zonghan Zhu, and Henry Perry. 2017b. “Comprehensive Review of the Evidence regarding
the Effectiveness of Community-Based Primary Health Care in Improving Maternal, Neonatal
and Child Health: 8. Summary and Recommendations of the Expert Panel.” Journal of Global
Health 7(1): 010908.
Blanford, Justine I, Supriya Kumar, Wei Luo, and Alan M MacEachren. 2012. “It’s a Long, Long
Walk: Accessibility to Hospitals, Maternity and Integrated Health Centers in Niger.”
International Journal of Health Geographics 11:24.
Blattman, Christopher, and Laura Ralston. 2015. “Generating Employment in Poor and Fragile
States: Evidence from Labor Market and Entrepreneurship Programs.”
Blattman, Christopher, and Jeannie Annan. 2016. “Can Employment Reduce Lawlessness and
Rebellion? A Field Experiment with High-Risk Men in a Fragile State.” American Political
Science Review 110(1): 1-17.
Blom, Andreas, and Hiroshi Saeki. 2011. “Employability and Skill Set of Newly Graduated
Engineers in India.” Policy Research Working Paper No.5640. World Bank, Washington, DC.
125
Blunch, Niels-Hugo, Peter Darvas, and Marta Favara. 2018. “Unpacking the Returns to Education
and skills in Urban Ghana: The Remediation Role of Second Chance Learning Programs.”
Working paper.
Bodewig, Christian, Reena Badiani-Magnusson, Kevin Macdonald, David Newhouse, Jan
Rutkowski. 2014. Skilling Up Vietnam: Preparing the Workforce for a Modern Market
Economy. Washington, DC: World Bank.
Boeri, Tito, Pietro Garibaldi and Marta Ribeiro. 2011. “The Lighthouse Effect and Beyond.”
Review of Income and Wealth, 2011, 57 (s1), 54-78
Botero, Juan, Simeon Djankov, Rafael Porta and Florencio C. Lopez-De-Silanes. 2004. "The
Regulation of Labor," The Quarterly Journal of Economics, MIT Press, vol. 119(4): 1339-
1382.
Bottasso, A. M. Contib, and G. Sulis. 2017. “Firm Dynamics and Employment Protection:
Evidence from Sectoral Data.” Labour Economics 48: 35-53.
Brambrilla, Irene, and Dario Tortarolo. 2018. “Investment in ICT, Productivity and Labor
Demand: The Case of Argentina.” Policy Research Working Paper 8325, World Bank,
Washington, DC.
Brambrilla, Irene, Daniel Lederman, and Guido Porto. 2012. "Exports, Export Destinations, and
Skills." American Economic Review, 102 (7): 3406-38.
Brinkman, Sally Anne, Amer Hasan, Haeil Jung, Angela Kinnell, and Menno Pradhan. 2017. “The
Impact of Expanding Access to Early Childhood Education Services in Rural Indonesia.”
Journal of Labor Economics 35(S1): 305-35.
Brown, C., Martin Ravallion, D. van de Walle. 2017 “Are Poor Individuals Mainly Found in Poor
Households? Evidence using Nutrition Data for Africa.” NBER Working Paper 24047.
Cambridge.
Brown, C., Ravallion, M., van de Walle, D. 2016 “Poor Means Test? Econometric Targeting in
Africa.” NBER Working Paper 22919. Cambridge.
Browne, James, and Herwig Immervoll. 2017. “Mechanics of Replacing Benefit Systems with a
Basic Income: Comparative Results from a Microsimulation Approach.” Journal of Economic
Inequality 15(4): 325–44.
Bruhn, Miriam. 2011. “License to Sell: The Effect of Business Registration Reform on
Entrepreneurial Activity in Mexico.” Review of Economics and Statistics 93 (1): 382–86.
Bruhn, Miriam (2013). “A Tale of Two Species: Revisiting the Effect of Registration Reform on
Informal Business Owners in Mexico.” Journal of Development Economics 103: 275-283
Brunello, Giorgio, and Martin Schlotter. 2011. “Non Cognitive Skills and Personality Traits:
Labour Market Relevance and their Development in Education & Training Systems.” IZA DP
No. 5743. Bonn.
Caballero, R. K. Cowanc, E. Engel, and A. Micco. 2013. “Effective Labor Regulation and
Microeconomic Flexibility.” Journal of Development Economics 101: 92-104.
126
Caliendo, Marco, Deborah A. Cobb-Clark, Helke Seitz, and Arne Uhlendorff. 2016. “Locus of
Control and Investment in Training.” IZA Discussion Paper No. 10406.
Campos, Francisco, Michael Frese, Markus Goldstein, Leonardo Iacovone, Hillary C. Johnson,
and David McKenzie. 2017. “Teaching Personal Initiative Beats Traditional Training in
Boosting Small Business in West Africa.” Science 357(6357): 1287-90.
Carballo, Jerónimo, et al. 2016. “The border labyrinth: Information technologies and trade in the
presence of multiple agencies.” Inter-American Development Bank, Washington, DC.
Caselli, F. 2005. “Accounting for cross-Country Income Differences.” In Philippe Aghion and
Stephen Durlauf (eds.) Handbook of Economic Growth Volume 1A: 679-741, Elsevier.
Cavaillé, Charlotte, and John Marshall. 2017. “Education and Anti-Immigration Attitudes:
Evidence from Compulsory Schooling Reforms across Western Europe,” Working
Paper.Center on the Developing Child at Harvard University. 2016. From Best Practices to
Breakthrough Impacts: A Science-Based Approach to Building a More Promising Future for
Young Children and Families. Cambridge, MA.
Center on the Developing Child at Harvard University. 2016. From Best Practices to Breakthrough
Impacts: A Science-Based Approach to Building a More Promising Future for Young Children
and Families. Cambridge, MA.
Chakravarty, S., M. Lundberg, P. Nikolov, and J. Zenker. 2017. “Vocational Training Programs
and Youth Labor Market Outcomes: Evidence from Nepal.” Human Capital and Economic
Opportunity Working Group Working Papers.
Cheema, A., A. I. Khwaja, M. F. Naseer, and J. N. Shapiro. 2015. “Skills Intervention Report:
Results of first round of voucher disbursement and strategies for improving uptake.” Technical
Report. Pakistan: Punjab Economic Opportunities Program.
Chen, Maggie, and Min Xu. 2015. “Online International Trade in China.” Background paper for
the World Development Report 2016, World Bank: Washington, DC.
Chetty, Raj, John N. Friedman, and Jonah E. Rockoff. 2014. “Measuring the impacts of teachers
II: Teacher value-added and student outcomes in adulthood,” American Economic Review
104(9): 2633-79.
Chetty, Raj, and Nathaniel Hendren. 2018. “The Impact of Neighborhoods on Intergenerational
Mobility I: County-Level Estimates.” Quarterly Journal of Economics qjy007.
Cho, Yoonyoung, Davie Kalmoba, Ahmed Mushfiq Mobarak, and Victor Orozco. 2013. “Gender
Differences in the Effects of Vocational Training: Constraints on Women and Drop-out
Behavior.” Policy Research Working Paper No. 6545. Washington, DC: World Bank Group.
Chong, A., Cohen, I., Field, E., Nakasone, E. and Torero, M., 2016. “Iron Deficiency and
Schooling Attainment in Peru.” American Economic Journal: Applied Economics 8(4): 222-
55.
127
Christiaensen, Luc, Lionel Demery and Jesper Kuhl. 2011. “The (Evolving) Role of Agriculture
in Poverty Reduction: An Empirical Perspective.” Journal of Development Economics, 96(2):
239-254.
Clifton Fleming Jr., Robert J. Peroni, & Stephen E. Shay. 2016. "Defending Worldwide Taxation
with A Shareholder-Based Definition of Corporate Residence." 2016 BYU Law Review 1681.
Available at: https://digitalcommons.law.byu.edu/lawreview/vol2016/iss6/6
Cirera, Xavier, Ana Cusolito, Caroline Freund, Roberto Fattal, Nicolas Gonne, Leonardo
Iacovone. 2018. “Superstar Firms and the Decline in Labor Shares. What is the Evidence for
Developing Countries?”. World Bank, World Development Report. Background Note for
Chapter 6.
Coady, David, Parry, Ian, Sears, Louis, and Shang, Baoping. 2017. “How Large Are Global Fossil
Fuel Subsidies?” World Development 91: 11-27.
Coase, Ronald. 1937. “The Nature of the Firm.” Economica 4: 386–405.
Coffey, D., Geruso, M., and Spears, D. 2018. “Sanitation, Disease Externalities and Anaemia:
Evidence From Nepal.” The Economic Journal 128:1395-1432.
Cook, Philip J., Kenneth Dodge, George Farkas, Roland G. Fryer Jr, Jonathan Guryan, Jens
Ludwig, Susan Mayer, Harold Pollack, and Laurence Steinberg. 2014. “The (surprising)
efficacy of academic and behavioral intervention with disadvantaged youth: results from a
randomized experiment in Chicago,” Working Paper No. 19862, National Bureau of Economic
Research.
Cree A., Kay A., Steward J. 2012. The Economic & Social Cost of Illiteracy: A Snapshot of
Illiteracy in a Global Context. Melbourne: The World Literacy Foundation.
Cueto, S., Guerrero, G., Leon, J., Zevallos, A. and Sugimaru, C. 2009. “Promoting Early
Childhood Development Through a Public Programme: Wawa Wasi in Peru.” Oxford, UK,
Young Lives, Department of International Development, University of Oxford. (Working
Paper, 51.)
Cunningham, Wendy, and Paula Villaseñor. 2016. “Employer Voices, Employer Demands, and
Implications for Public Skills Development Policy Connecting the Labor and Education
Sectors.” World Bank Research Observer 31(1): 102–34.
Currie, Janet, and Enrico Moretti. 2003. “Mother's education and the intergenerational
transmission of human capital: Evidence from college openings.” The Quarterly Journal of
Economics118(4): 1495-1532.
Dalberg (Dalberg Development Advisors). 2016. “Inflection Point: Unlocking Growth in the Era
of Farmer Finance.” New York.
Dang, H.A. and Dalaban, A. 2018 “Is Poverty in Africa Mostly Chronic or Transient? Evidence
from Synthetic Panel Data.” Journal of Development Studies. In press.
Daruich, Diego. 2018. “The Macroeconomic Consequences of Early Childhood Development
Policies.” HCEO Working Paper Series.
128
Darvas, Peter, and Robert Palmer. 2014. Demand and Supply of Skills in Ghana: How can Training
Programs Improve Employment? World Bank Study. Washington, DC: World Bank.
Dauth, Wolfgang, Sebastian Findeisen, Jens Südekum and Nicole Wößner. 2017. “German Robots
– The Impact of Industrial Robots on Workers.” IAB Discussion Paper 30/2017
Davis K., E. Nkonya, E. Kato, D. A. Mekonnen, M. Odendo, R. Miiro, and K. Nkuba. 2012.
“Impact of Farmer Field Schools on Agricultural Productivity and Poverty in East Africa.”
World Development 40 (2): 402-413
De Hoyos, Rafael, Halsey Rogers, and Anna Popova. 2016. “Out of School and Out of Work: A
Diagnostic of Ninis in Latin America.” Washington, DC: World Bank. Background paper for
the “Out of School, Out of Work” study.
De Mel, Suresh, David McKenzie, and Christopher Woodruff. 2014. “Business Training and
Female Enterprise Start-up, Growth, and Dynamics: Experimental Evidence from Sri Lanka.”
Journal of Development Economics 106: 199-210.
Deming, David J. 2017. “The Growing Importance of Social Skills in the Labor Market.”
Quarterly Journal of Economics. 132(4): 1593–640.
Desai, Raj M, and Homi Kharas. 2017. “Is a Growing Middle-Class Good for the Poor? Social
Policy in a Time of Globalization” Brookings Institution, Working Paper 105. Washington,
DC.
Dillon, Andrew, Jed Friedman, and Pieter Serneels. 2014. “Health Information, Treatment, and
Worker Productivity: Experimental Evidence from Malaria Testing and Treatment among
Nigerian Sugarcane Cutters.” Policy Research Working Paper No.7120. World Bank,
Washington, DC.
Dillon, Moira R., Harini Kannan, Joshua T. Dean, Elizabeth S. Spelke, and Esther Duflo. 2017.
“Cognitive Science in the Field: A Preschool Intervention Durably Enhances Intuitive but Not
Formal Mathematics.” Science 357(6346): 47-55.
Djankov, Simeon. 2017. “United States Is Outlier in Tax Trends in Advanced and Large Emerging
Economies.” PIIE Policy Brief 17-29 (November). Washington: Peterson Institute for
International Economics.
Djankov, Simeon, Dorina Georgieva, Rita Ramalho. 2018. “Business Regulations and Poverty,”
Economics Letters, 165: 82-87, April.
Djankov, Simeon, Caroline Freund and Cong Pham. 2010. “Trading on Time,” The Review of
Economics and Statistics, 92, issue 1: 166-173.
Djankov, Simeon; Rafael la Porta ; Florencio Lopez-de-Silanes; Andrei Shleifer. 2002. “The
Regulation of Entry.” Quarterly Journal of Economics 118(1): 1-37.
Dorfman, M., D. Wang, P. O’Keefe and J. Cheng. 2013. “China’s Pension Schemes for Rural and
Urban Residents.” In R. Hinz, R. Holzmann, D. Tuesta and N. Takayama (eds) Matching
Contributions for Pensions. Washington DC.
129
Dutz, Mark A., Rita K. Almeida, and Truman G. Packard. 2018. The Jobs of Tomorrow:
Technology, Productivity, and Prosperity in Latin America and the Caribbean. Directions in
Development. Washington, DC: World Bank.
eBay. 2013. “Commerce 3.0 for Development: The Promise of the Global Empowerment
Network.”
Ebenehi, Amos Shaibu; Rashid, Abdullah Mat; Bakar, Ab Rahim. 2016. “Predictors Of Career
Adaptability Skill among Higher Education Students in Nigeria.” International Journal for
Research in Vocational Education and Training 3(3): 212-229.
Ederer, Peer, Ljubica Nedelkoska, Alexander Patt, and Silvia Castellazzi. 2015. “What Do
Employers Pay for Employees’ Complex Problem Solving Skills?” International Journal of
Lifelong Education 34(4): 430-447.
Edelman Intelligence. 2017. Freelancing in America: 2017. Washington, DC.
Engle, Patrice, Lia Fernald, Harold Alderman, Jere Behrman, Chloe O’Gara, Aisha Yousafzai,
Meena Cabral de Mello, Melissa Hidrobo, Nurper Ulkuer, Ilgi Ertem, and Selim Iltus. 2011.
“Strategies for Reducing Inequalities and Improving Developmental Outcomes for Young
Children in Low-Income and Middle-Income Countries.” The Lancet 378(9799): 1339-53.
European Union 2015. European Union. 2015. Access to Social Benefits: Reducing Non-Take-Up.
Eurofound. Luxembourg.
Evans, David and Anna Popova. 2017. “Cash Transfers and Temptation Goods”. Economic
Development and Cultural Change 65(2): 189-221.
Fernald, Lia C. H. and Melissa Hidrobo. 2011. “Effect of Ecuador’s cash transfer program (Bono
de Desarrollo Humano) on child development in infants and toddlers: A randomized
effectiveness trial.” Social Science & Medicine 72(9): 1437-1446.
Fernald, Lia C. H., Paul J. Gertler, and Lynnette M. Neufeld. 2008. “Role of cash in conditional
cash transfer programmes for child health, growth, and development: an analysis of Mexico’s
Oportunidades.” Lancet 371(9615): 828-837.
Fernandes, Ana M., Caroline Freund, and Martha Denisse Pierola. 2016. “Exporter behavior,
country size and stage of development: Evidence from the exporter dynamics database.”
Journal of Development Economics 119(C): 121-137.
Ferre, Celine, and Iffath Sharif. 2014. “Can Conditional Cash Transfers Improve Education and
Nutrition Outcomes for Poor Children in Bangladesh? Evidence from a Pilot Project.” World
Bank: Washington, DC.
Ferreyra, María Marta, Ciro Avitabile, Javier Botero Álvarez, Francisco Haimovich Paz, and
Sergio Urzúa. 2017. At a Crossroads: Higher Education in Latin America and the Caribbean.
Directions in Development. Washington, DC: World Bank.
Filistrucchi, Lapo, Damien Geradin, Eric van Damme, and Pauline Affeldt. 2014. “Market
Definition in Two-Sided Markets: Theory and Practice.” Journal of Competition Law &
Economics, 10(2): 293–339.
130
Filmer, Deon, Halsey Rogers, Noam Angrist, Roberta Gatti, and Shwetlena Sabarwal. 2018.
“Learning-Adjusted Years of Schooling (LAYS): Defining A New Macro Measure of
Education.” World Bank. Mimeo.
FORLAC. 2014. “Trends in informal employment in Peru: 2004 – 2012.” Programme for the
promotion of formalization in Latin America and the Caribbean. International Labour
Organization.
Foster, Andrew and Mark Rosenzweig. 2007. “Economic Development and the Decline of
Agricultural Employment,” Handbook of Development Economics 4:3051-3083
Foster, A. D., and M. R. Rosenzweig. 1996. “Technical Change and Human-Capital Returns and
Investments: Evidence from the Green Revolution.” American Economic Review: 86 (4): 931–
53.
Franzsen, Riel and William McCluskey. 2017. “Property Tax in Africa: Status, Challenges and
Prospects”. Lincoln Institute of Land Policy. Cambridge, MA.
Freund, Caroline. 2016. Rich People Poor Countries: The Rise of Emerging-Market Tycoons and
Their Mega Firms. Peterson Institute for International Economics: Washington, DC.
Freund, Caroline, Alen Mulabdic, and Michele Ruta. 2018. “Is 3D Printing a Threat to Global
Trade.” (forthcoming).
Freund, Caroline, and Martha Denisse Pierola. 2015. “Export Superstars,” Review of Economics
and Statistics 97(5): 1023-1032.
Frey, Carl Benedikt, and Michael A. Osborne. 2017. “The Future of Employment: How
Susceptible Are Jobs to Computerisation?” Technological Forecasting & Social Change
114(c): 254–80.
Garcia, Jorge Luis, James J. Heckman, Anna L. Ziff. 2017. “Gender Differences in the Benefits of
an Influential Early Childhood Program.” NBER Working paper 23412.
Gentilini, Ugo, Margaret Grosh, Jamele Rigolini, and Ruslan Yemtsov. Forthcoming.
“Understanding Universal Basic Income: Concepts, Evidence, and Practices.” (Preliminary
title). World Bank. Washington DC.
Gertler, Paul, James Heckman, Rodrigo Pinto, Arianna Zanolini, Christel Vermeersch, Susan
Walker, Susan M. Chang, and Sally Grantham-McGregor. 2014. “Labor Market Returns to An
Early Childhood Stimulation Intervention in Jamaica.” Science 344: 998–1001.
Gibson, John, Gaurav Datt, Rinku Murgai, and Martin Ravallion. 2017. “For India’s Rural Poor,
Growing Towns Matter More Than Growing Cities.” World Development 98: 413-429
Giné, Xavier, Dean Karlan, and Jonathan Zinman. 2010. “Put Your Money Where Your Butt Is:
A Commitment Contract for Smoking Cessation.” American Economic Journal: Applied
Economics 2(4): 213-35.
Glaeser, Edward. 2018. “Framework for the Changing Nature of Work.” Mimeo. Harvard
University.
131
Glewwe, P., Dang, H.A., Lee, J. and Vu, K., 2017. What Explains Vietnam’s Exceptional
Performance in Education Relative to Other Countries? Analysis of the 2012 and 2015 PISA
Data.
Global Health Workforce Alliance. 2008. Country Case Study: Pakistan’s Lady Health Worker
Program. Global Health Workforce Alliance and WHO.
Goldberg, Pinelopi Koujianou; Amit Kumar Khandelwal; Nina Pavcnik; Petia Topalova. 2010.
“Imported Intermediate Inputs and Domestic Product Growth: Evidence from India.”
Quarterly Journal of Economics 125(4): 1727-1767.
Goldberg, Pinelopi, Jan De Loecker, Amit Khandelwal and Nina Pavcnik. 2016. “Prices, Markups
and Trade Reform.” Econometrica, 84(2): 445-510.
Goldin, Claudia. 2016. “Human Capital.” in: C. Diebolt, and M. Haupert (eds.) Handbook of
Cliometrics, Berlin: Springer-Verlag, pp.55-86.
Hardy, W. , Keister, R. and Lewandowski, P. 2018. “Educational upgrading, structural change and
the task composition of jobs in Europe”. Econ Transit, 26: 201-231. doi:10.1111/ecot.12145
Government of India. 2017. Economic Survey 2016-17. New Delhi.
Gregory, Terry and Salomons, Anna and Zierahn, Ulrich. 2016. “Racing with or Against the
Machine? Evidence from Europe.” ZEW - Centre for European Economic Research
Discussion Paper No. 16-053.
Griffith, Rachel, Helen Miller and Martin O'Connell. 2018. “Ownership of intellectual property
and corporate taxation.” Journal of Public Economics 112: 2014, 12–2.
Grubert, Harry and Rosanne Altshuler. 2013. "Fixing The System: An Analysis Of Alternative
Proposals For The Reform Of International Tax." National Tax Journal, 66 (3): 671-712.
Haan, Hans Christian, and Nicolas Serrière. 2002. “Training for Work in the Informal Sector:
Fresh Evidence from West and Central Africa.” Turin, Italy: International Training Centre of
the International Labour Organization.
Haltiwanger, John, Ron Jarmin and Javier Miranda. 2013. “Who Creates Jobs? Small versus Large
versus Young,” The Review of Economics and Statistics. 95, 2: 347-361, May.
Handel, M. 2012. “Trends in Job Skill Demands in OECD Countries.” OECD Social, Employment
and Migration Working Papers, No. 143, OECD Publishing, Paris.
Hanson, Gordon H. 2007. “Globalization, Labor Income, and Poverty in Mexico.” NBER Chapters
in Globalization and Poverty 417-56. National Bureau of Economic Research, Inc.
Hanushek, Eric A., Guido Schwerdt, Simon Wiederhold, and Ludger Woessmannh. 2017. “Coping
with Change: International Differences in the Returns to Skills.” Economics Letters 153: 15–
19.
Hanushek, E. A., Schwerdt, G., Woessmann, L., and Zhang, L. 2017. “General Education,
Vocational Education, and Labor-Market Outcomes over the Lifecycle.” Journal of Human
Resources 52(1): 48-87.
132
Harris, T., Phillips, D., Warwick, R., Goldman, M., Jellema, J., Goraus, K., Inchauste, G. 2018.
“Redistribution via VAT and Cash Transfers: An Assessment in Four Low and Middle Income
Countries.” IFS, Working Paper 18/11. London.
Harvey, P. 2007. “U.S. Job Creation Programs in the 1930s.” Background Paper for the HSRC
Mid-Term Review of South Africa’s Expanded Public Works Program. Pretoria.
Hasanefendic, Sandra, Manuel Heitor, and Hugo Horta. 2016. “Training Students for New Jobs:
The Role of Technical and Vocational Higher Education and Implications for Science Policy
in Portugal.” Technological Forecasting & Social Change 113 (Part B): 328-40.
Hebous Shafi K., Martin Ruf, and Alfons J. Weichenrieder. 2011. “The effects of taxation on the
location decision of multinational firms.” National Tax Journal, 64 (3), 817–838.
Heckman, James J. 2008. “Schools, Skills, and Synapses.” Economic Inquiry 46(3): 289-324.
Heckman, James. 2011. “The Economics of Inequality: The Value of Early Childhood Education.”
American Educator Spring: 31–47.
Heckman, James J., Jora Stixrud, and Sergio Urzua. 2006. “The Effects of Cognitive and
Noncognitive Abilities on Labor Market Outcomes and Social Behavior.” Journal of Labor
Economics 24(3): 411-82.
Heckman, James J., Seong Hyeok Moon, Rodrigo Pinto, Peter A. Savelyev, and Adam Yavitz.
2010. “The Rate of Return to the Highscope Perry Preschool Program.” Journal of Public
Economics 94(1-2): 114-28.
Hicks, J. H., M. Kremer, I. Mbiti, and E. Miguel. 2011. Vocational Education Voucher Delivery
and Labor Market Returns: A Randomized Evaluation Among Kenyan Youth. enGender
Impact: World Bank's Gender Impact Evaluation Database. Washington DC: World Bank.
Hicks, Joan Hamory, Marieke Kleemans, Nicholas Y. Li, Edward Miguel. 2017. “Reevaluating
Agricultural Productivity Gaps with Longitudinal Microdata” NBER Working Paper No.
23253
Hirshleifer, Sarojini, David McKenzie, Rita Almeida, and Cristobal Ridao-Cano. 2016. “The
Impact of Vocational Training for the Unemployed: Experimental Evidence from Turkey.”
The Economic Journal 126(597): 2115–46.
Hoddinott J, Maluccio JA, Behrman JR, Flores R, Martorell R. 2008. “Effect of A Nutrition
Intervention During Early Childhood on Economic Productivity in Guatemalan Adults.” The
Lancet 371: 411–16.
Holzmann, Robert, Yann Pouget, Milan Vodopivec, and Michael Weber. 2012. “Severance Pay
Programs Around the World: History, Rationale, Status, and Reforms.” In Robert Holzmann
and Milan Vodopivec (eds), Reforming Severance Pay: An International Perspective,
Washington, D.C.: The World Bank., 2012.
Hsieh, Chang-Tai and Peter Klenow. 2014. “The Life Cycle of Plants in India and Mexico,” The
Quarterly Journal of Economics, 129(3): 1035-1084.
133
Hsieh, Chang-Tai, and Peter J. Klenow. 2010. “Development Accounting.” American Economic
Journal: Macroeconomics 2(1): 207-23.
Ibarrarán, P., L. Ripani, B. Taboada and J.M. Villa. 2012. “Life Skills, Employability and Training
for Disadvantaged Youth: Evidence from a Randomized Evaluation Design.” IDB Working
Paper Series No. IDB-WP-342. Inter-American Development Bank, Washington, DC.
Ibarraran, Pablo, Jochen Kluve, Laura Ripani and David Rosas Shady. 2018. “Experimental
evidence on the long-term impacts of a youth training program.” ILR Review forthcoming
ILOSTAT. 2018. Key Indicators of the Labor Market (KILM). Available at:
http://www.ilo.org/ilostat/. Accessed 02/27/2018.
Independent Evaluation Group. 2016. A decade of World Bank Support to Senegal’s Nutrition
Program. Project Performance Assessment Report.
Ingelaere, Bert, Luc Christiaensen, Joachm De Weerdt, and Ravi Kanbur. 2018. “Why secondary
towns can be important for poverty reduction - A migrant perspective.” World Development
105: 273-282.
International Monetary Fund. 2017. Fiscal Monitor October 2017: Tackling Inequality.
Washington, DC.
International Monetary Fund. 2018. Sub-Saharan Africa Regional Economic Outlook: Domestic
Revenue Mobilization and Private Investment. Washington, DC.
Islam, Asif, Silvia Muzi, and Mohammad Amin. 2018a. “Unequal Laws and the Disempowerment
of Women in the Labor Market: Evidence from Firm-Level Data.” Journal of Development
Studies. Forthcoming.
Islam, Asif, Isis Gaddis, Amparo Palacios-Lopez, Mohammad Amin. 2018b. “The labor
productivity gap between female and male-managed firms in the formal private sector.” Policy
Research working paper no. 8445. Washington, D.C. : World Bank Group
J-PAL. 2017. “J-PAL Skills for Youth Program Review Paper.” Cambridge, MA: Abdul Latif
Jameel Poverty Action Lab.
Jensen, Robert. 2012. “Do Labor Market Opportunities Affect Young Women’s Work and Family
Decisions? Experimental Evidence from India.” Quarterly Journal of Economics 127: 753–
92.
Joshi, A. R., and I. Gaddis, (eds.). 2015. Preparing the Next Generation in Tanzania: Challenges
and Opportunities in Education. World Bank Group.
Kaffenberger, Michelle, and Lant Pritchett. 2017. “More School or More Learning? Evidence from
Learning Profiles from the Financial Inclusion Insights Data.” World Development Report
Background Paper. Washington, DC: World Bank.
Karabarbounis, Loukas, and Brent Neiman. 2014. “The Global Decline of the Labor Share.”
Quarterly Journal of Economics 129(1): 61–103.
134
Keynes, John Maynard. 1931. “Economic Possibilities for our Grandchildren,” in Essays in
Persuasion (New York: W.W.Norton & Co., 1963), 358-373,
http://www.econ.yale.edu/smith/econ116a/keynes1.pdf.
Khosla, Saksham. 2018. India’s Universal Basic Income: Bedeviled by the Details. Carnegie
India. New Delhi.
Kim, Jim Yong. 2018. “Learning: A High-Return Investment for Rising Economies.” Financial
Times.
Kluve, Jochen. 2016. A Review of the Effectiveness of Active Labour Market Programmes with a
Focus on Latin America and the Caribbean.” ILO Working Paper No. 9.
Knack, Stephen, and Philip Keefer. 1997. “Does Social Capital Have An Economic Payoff? A
Cross-Country Investigation.” The Quarterly Journal of Economics 112(4): 1251-88.
Kraay, Aart. 2018. “Proposed Methodology for a World Bank Human Capital Index”. Manuscript,
The World Bank
Krstic, Gorana, and Friedrich Schneider. 2015. Formalizing the Shadow Economy in Serbia:
Policy Measures and Growth Effects. Springer.
Krueger, Alan, and Eric Posner. 2018. “A Proposal for Protecting Low‑Income Workers from
Monopsony and Collusion.” The Hamilton Project Policy Proposal 2018-05. Washington, DC.
Krueger, Dirk, and Krishna Kumar. 2004. “Skill-Specific rather than General Education: A Reason
for US-Europe Growth Differences?” Journal of Economic Growth 9: 167-207.
Kuddo, Arvo. Forthcoming. “Labor regulations around the World: An Overview”. Washington,
DC.
Kugler, Adriana, Maurice Kugler, Juan Saavedra, and Luis Omar Herrera Prada. 2015. “Long-
Term Direct and Spillover Effects of Job Training: Experimental Evidence from Colombia.”
NBER Working Paper, No. 21607. National Bureau of Economic Research, Cambridge, MA.
La Porta, Rafael, and Andrei Shleifer. 2014. “Informality and Development.” Journal of Economic
Perspectives 28(3): 109–26.
Lagakos, David, Benjamin Moll, Tommaso Porzio, Nancy Qian and Todd Schoellman. 2018.
“Life-Cycle Wage Growth Across Countries.” Journal of Political Economy.
Larreguy, Horacio, and John Marshall. 2017. “The Effect of Education on Civic and Political
Engagement in Nonconsolidated Democracies: Evidence from Nigeria.” Review of Economics
and Statistics 99(3): 387-401.
Larsen, Anna Folke and Helene Bie Lilleor. 2014. “Beyond the Field: The Impact of Farmer Field
Schools on Food Security and Poverty Alleviation” World Development 64: 843-859
Levin, Victoria, Carla Solis Uehara, Marcela Gutierrez Bernal, Alexandria Valerio, and
Magdalena Bendini. Forthcoming. “The adult literacy crisis: Lessons from Adult Skills
Surveys.” background paper prepared for the WDR.
135
Lillard, Angeline, and Nicole Else-Quest. 2006. “The Early Years: Evaluating Montessori
Education.” Science 313(5795): 1893–94.
Lopez-Calva, Luis F. and Eduardo Ortiz-Juarez. 2011. “A Vulnerability Approach to the
Definition of the Middle Class.” World Bank, Policy Research Working Paper 5902.
Washington, DC.
López-Mondéjar, Loida M., and Lina M. Tomás Pastor. 2017. “Development of Socio-emotional
Skills through Cooperative Learning in a University Environment.” Procedia - Social and
Behavioral Sciences 21: 432-37.
Loyalka, Prashant, Elena Kardonova, Lydia Liu, Guirong Li, Huan Wang, Natalie Johnson, and
Henry Shi. 2016. “Assessing Skill Levels and Gains in Engineering Programs across the US,
China, and Russia.” Unpublished paper.
Maccini, Sharon, and Dean Yang. 2009. “Under the Weather: Health, Schooling, and Economic
Consequences of Early-Life Rainfall.” American Economic Review 99 (3): 1006-26.
MacCrory, Frank, George Westerman, Yousef AlHammadi, and Erik Brynjolfsson. 2014. “Racing
With and Against the Machine: Changes in Occupational Skill Composition in an Era of Rapid
Technological Advance.” Thirty Fifth International Conference on Information Systems,
Auckland 2014.
Macdonald, Kevin Alan David, Sally Ann Brinkman, Wendy Jarvie, Myrna Machuca-Sierra,
Kristen Andrew Mcdonall, Souhila Messaoud-Galusi, Siosiana Tapueluelu, and Binh Thanh
Vu. 2017. “Pedagogy Versus School Readiness: The Impact of a Randomized Reading
Instruction Intervention and Community-Based Playgroup Intervention on Early Grade
Reading Outcomes in Tonga.” Policy Research Working Paper No. 7944. Washington, D.C.:
World Bank.
Maitra, Pushkar, and Subha Mani. 2014. “Learning and Earning: Evidence from a Randomized
Evaluation in India.” IZA Discussion Paper No. 8552. Bonn.
Mani, Anandi, Sendhil Mullainathan, Eldar Shafir, and Jiaying Zhao. 2013. “Poverty Impedes
Cognitive Function.” Science 341(6149): 976-80.
Marinescu, Ioana. 2018. “No Strings Attached: The Behavioral Effects of U.S. Unconditional Cash
Transfer Programs.” Roosevelt Institute. Washington, DC.
Martincus, Christian Volpe, Jerónimo Carballo, and Alejandro Graziano. 2015.
“Customs.” Journal of International Economics 96(1):119-137.
Martínez A., Claudia, Esteban Puentes, and Jaime Ruiz-Tagle. 2018. “The Effects of Micro-
Entrepreneurship Programs on Labor Market Performance: Experimental Evidence from
Chile.” American Economic Journal: Applied Economics 10 (2): 101-24.
Martinez, Sebastian, Sophie Naudeau, and Vitor Pereira. 2012. “The Promise of Preschool in
Africa: A Randomized Impact Evaluation of Early Childhood Development in Rural
Mozambique.” World Bank, Washington, DC.
136
Marx, Karl. 1867. Das Kapital: Kritik der politischen Oekonomie. Verlag Otto Meissner,
Hamburg.
Mason, Andrew, Vera Kehayova, and Judy Yang. 2018. “Trade, Technology, Skills and Jobs:
Exploring the Road Ahead for Developing East Asia.” Background Paper for Sustaining the
Revival of Middle-Income East Asia, forthcoming. World Bank, Washington, DC.
McDonald, Rebecca and Nattavudh Powdthavee. 2018. “The Shadow Prices of Voluntary
Caregiving: Using Panel Data of Well-Being to Estimate the Cost of Informal Care.” IZA,
Discussion Paper No.11545. Bonn.
McKenzie, David. 2017. “How Effective Are Active Labor Market Policies in Developing
Countries? : A Critical Review of Recent Evidence.” Policy Research Working Paper No.
8011. World Bank, Washington, DC.
McKinley, R.A. 1958. The City of Leicester: Social and administrative history, 1660–1835, A
History of the County of Leicester: volume 4: The City of Leicester (1958), pp. 153.
Mikkelsen, Lene, David E Phillips, Carla AbouZahr, Philip W Setel, Don de Savigny, Rafael
Lozano and Alan D Lopez. 2015. “A global assessment of civil registration and vital statistics
systems: monitoring data quality and progress.” Lancet 386(10001): 1395-1406.
Mincer, Jacob 1974. Schooling, Experience, and Earnings. New York: Columbia University Press.
Moscoso Boedo, Hernan J., and Toshihiko Mukoyama. 2012. “Evaluating the Effects of Entry
Regulations and Firing Costs on International Income Differences.” Journal of Economic
Growth 17(2): 143–70.
Nightingale, Paul and Alex Coad. 2014. “Muppets and gazelles: political and methodological
biases in entrepreneurship research.” Industrial and Corporate Change 23(1): 113-143.
Nollenberger, Natalia, and Núria Rodríguez-Planas. 2015. “Full-Time Universal Child Care in a
Context of Low Maternal Employment: Quasi-Experimental Evidence from Spain.” Labour
Economics 36: 124−36.
Norregaard, John. 2013. “Taxing Immovable Property: Revenue Potential and Implementation
Challenges.” IMF Working Paper WP/13/129. Washington, DC.
OECD. 2017. Taxing Wages 2017. OECD, Paris.
OECD. 2014. India Policy Brief: Education and Skills-Improving the Quality of Education and
Skills Development. Paris.
OECD/Korea Institute of Public Finance. 2014. “The Distributional Effects of Consumption Taxes
in OECD Countries.” OECD Tax Policy Studies, No. 22, OECD Publishing.
O’Higgins N. 2016. “Rising to the Youth Employment challenge: the evidence on key policy
issues.” ILO, Geneva.
Ordóñez de Pablos, Patricia, W.B. Lee, and Jingyuan Zhao. 2011. Regional Innovation Systems
and Sustainable Development: Emerging Technologies. Hershey: New York.
137
Paes de Barros, Ricardo; Ferreira, Francisco H.G.; Molinas Vega, Jose R.; Saavedra Chanduvi,
Jaime. 2009. Measuring Inequality of Opportunities in Latin America and the Caribbean.
Washington, DC: World Bank; New York: Palgrave Macmillan, World Bank.
Parry, Ian Chandara Veung, and Dirk Heine. 2014. “How Much Carbon Pricing is in Countries’
Own Interests? The Critical Role of Co-Benefits.” IMF Working Paper WP/14/174.
Washington, DC.
Picciotto, Sol (Ed.) 2017. Taxing Multinational Enterprises as Unitary Firms. IDS
Picciotto, Sol. 2012. Towards Unitary Taxation of Transnational Corporations. Tax Justice
Network.
Premand, Patrick, Rebekka Grun, Stefanie Brodmann, Mahdi Barouni, and Rita Almeida. 2012.
“Entrepreneurship Training and Self-Employment among University Graduates: Evidence
from a Randomized Trial in Tunisia.” IZA DP No. 7079.
Premand, Patrick, Oumar Barry, and Marc-Francois Smitz. 2016. Transferts monétaires, valeur
ajoutée de mesures d'accompagnement comportemental, et développement de la petite enfance
au Niger: Rapport de l'évaluation d'impact à court terme du Projet Filets Sociaux: Transferts
monétaires, valeur ajoutée de mesures d'accompagnement comportemental, et développement
de la petite enfance au Niger : Rapport de l'évaluation d'impact à court terme du Projet Filets.
Washington, D.C.: World Bank Group.
Psacharopoulos, George, and Harry Anthony Patrinos. 2018. “Returns to investment in education:
a decennial review of the global literature.” Policy Research working paper; no. WPS 8402.
Washington, DC, World Bank.
Ralston, L., Andrews, Co., and Hsiao, R. 2017. “The Impacts of Safety Nets in Africa: What Are
We Learning?” World Bank, Policy Research Working Paper 8255. Washington, DC.
Rijkers, Bob, Caroline Freund, and Antonio Nucifora. 2017. “All in the family: State capture in
Tunisia,” Journal of Development Economics, 124(C): 41-59.
Robalino, David, and Michael Weber. 2014. “Designing and Implementing Unemployment
Benefit Systems in Middle and Low Income Countries: Key Choices between Insurance and
Savings Accounts.” Social Protection & Labor Discussion Paper No. 1303. World Bank:
Washington, DC.
Rocha, Rudi, Gabriel Ulyssea and Laísa Rachter. 2017a. “Do Lower Taxes Reduce Informality?
Evidence from Brazil.” Journal of Development Economics 134: 28-49.
Rosas, Nina, and Shwetlena Sabarwal. 2016. “Public Works as a Productive Safety Net in a Post-
Conflict Setting: Evidence from a Randomized Evaluation in Sierra Leone.” Policy Research
Working Paper No. 7580. World Bank, Washington, DC.
Saavedra, J. 2009. “The Learning and Early Labor Market Effects of College Quality: A
Regression Discontinuity Analysis.” Mimeo, Harvard University.
138
Saavedra, Anna Rosefsky, and Juan Esteban Saavedra. 2011. “Do Colleges Cultivate Critical
Thinking, Problem Solving, Writing and Interpersonal Skills?” Economics of Education
Review 30(6): 1516-26.
Saavedra, Jaime, and Mariano Tommasi. 2007. “Informality, the State and the social contract in
Latin America: A preliminary exploration.” International Labour Review, 146(3‐4), 279-309.
Sabarwal, Shwetlena. 2013. “Tanzania: Skills for Competitiveness in the Small and Medium
Enterprise Sector.” Background paper for the Tanzania Country Economic Memorandum 2014
Jobs Wanted. World Bank.
Salehi-Isfahani, D. and M. Mostafavi-Dehzooei. 2017. “Cash Transfers and Labor Supply:
Evidence from A Large-Scale Program in Iran”. ERF, Working Paper 1090. Giza.
Sandjaja, Bee Koon Poh, Nipa Rojroonwasinkul, Bao Khanh Le Nyugen, Basuki Budiman, Lai
Oon Ng, Kusol Soonthorndhada, Hoang Thi Xuyen, Paul Deurenberg and Panam Parikh. 2013.
“Relationship between Anthropometric Indicators and Cognitive Performance in Southeast
Asian School-Aged Children.” British Journal of Nutrition 110: S57–S64.
Schendel, Rebecca. 2013. A Critical Missing Element: Critical Thinking at Rwanda’s Public
Universities and the Implications for Higher Education Reform (PhD thesis). London: Institute
of Education.
Schumpeter, Joseph. 1942. Capitalism, Socialism and Democracy. London: Routledge. pp. 82–83.
Sestito, Paolo, and Eliana Viviano. 2016. “Hiring Incentives and/or Firing Cost Reduction?
Evaluating the Impact of the 2015 Policies on the Italian Labour Market”. Banca D’Italia
Occasional Papers No. 325.
Shiferaw, Admasu, Arjun S. Bedi, Måns Söderbom, Getnet Alemu Zewdu. 2017. “Social
Insurance Reform and Labor Market Outcomes in Sub-Saharan Africa: Evidence from
Ethiopia”, IZA Discussion Papers 10903. Bonn.
Singh, A. 2015. “Learning more with every year: School year productivity and international
learning divergence.” In CESifo Area Conference on the Economics of Education, CESifo
Group, Munich, September (pp. 11-12).
Smith, Adam. 1776. An Inquiry into the Nature and Causes of the Wealth of Nations, Book 2.
Reprint. New York: Random House, 1937.
Sundararajan, Arun. 2016. The Sharing Economy. The End of Employment and the Rise of Crowd-
Based Capitalism. The MIT Press. Cambridge, Massachusetts, London, England.
Tørsløv, Thomas, Ludvig Wier, and Gabriel Zucman. 2018. Global Profit Sharing: A Tale of Three
Incentives. Slides, available at: http://gabriel-zucman.eu/files/TWZ2018Slides.pdf, accessed
04/09/2018
UNESCO. 2015. Education for All Global Monitoring Report. Paris.
139
Valerio, Alexandria, Katia Herrera-Sosa, Sebastian Monroy-Taborda, and Dandan Chen. 2015a.
“Armenia Skills toward Employment and Productivity (STEP) Survey Findings (Urban
areas).” World Bank. Washington, DC.
Valerio, Alexandria, Katia Herrera-Sosa, Sebastian Monroy-Taborda, and Dandan Chen. 2015b.
“Georgia Skills toward Employment and Productivity (STEP) Survey Findings (Urban areas).”
World Bank. Washington, DC.
Valerio, Alexandria, Maria Laura Sanchez Puerta, Namrata Raman Tognatta, and Sebastian
Monroy Taborda. 2016. “Are There Skills Payoffs in Low- and Middle-Income Countries?
Empirical Evidence Using STEP Data.” Policy Research Working Paper No. 7879; WDR 2018
background paper. Washington, D.C.: World Bank Group.
Vasilaky, Kathryn N., and Asif Islam. 2018. “Competition or Cooperation? Using Team and
Tournament Incentives for Learning among Female Famers in Rural Uganda.” World
Development 103: 216-225.
Valdivia, Martin. 2011. “Training or Technical Assistance? A Field Experiment to Learn What
Works to Increase Managerial Capital for Female Microentrepreneurs.” CAF Working Papers,
No. 02/2011. CAF — Banco de Desarrollo de América Latina, Venezuela.
Verhoogen, Eric. 2008. “Trade, Quality Upgrading, and Wage Inequality in the Mexican
Manufacturing Sector.”. The Quarterly Journal of Economics 123 (2): 489-530.
Von Der Goltz, Jan; Hallward-Driemeier, Mary C.; Piffaretti, Nadia Fernanda; Rutkowski, Michal
J.; Jha, Saroj Kumar. 2016. An integrated framework for jobs in fragile and conflict situations
(English). Washington, D.C. : World Bank Group.
Wang, Jun, Xiamin Hu, and Jinglei Xi. 2012. “Cooperative Learning With Role Play In Chinese
Pharmacology Education.” Indian Journal Pharmacol 44(2): 253–56.
Weil, David, 2007. “Accounting for the Effect of Health on Economic Growth.” Quarterly Journal
of Economics 122: 1265-1306.
World Bank. 2013. World Development Report 2013: Jobs. Washington, DC.
World Bank. 2016a. World Development Report 2016: Digital Dividends. Washington, DC.
World Bank. 2016b. Mexico - Public Expenditure Review. Washington, DC.
World Bank. 2017a. The Toll of War: The Economic and Social Consequences of the Conflict in
Syria, World Bank Group.
World Bank. 2017b. ICT IN AGRICULTURE: Connecting Smallholders to Knowledge, Networks,
and Institutions (Updated Edition). Washington, DC: The International Bank for
Reconstruction and Development.
World Bank. 2017c. “Ecuador Development Discussion Notes”, The World Bank, Washington,
DC.
World Bank. 2017d. Vietnam Public Expenditure Review: Fiscal Policies towards Sustainability,
Efficiency, and Equity. World Bank, Washington, DC.
140
World Bank. 2018a. World Development Report 2018: Learning to Realize Education’s Promise.
Washington, DC.
World Bank. 2018b. Women, Business and the Law 2018. Washington, DC.
World Bank. 2018c. “On Risk Sharing in the Diverse and Diversifying World of Work”. Social
Protection and Jobs White Paper. Washington, DC.
World Bank 2018d. The State of Social Safety Nets 2018. Washington, DC.
World Bank. Forthcoming. “Unleashing the Potential of Education in the Middle East and North
Africa.” Washington, DC.
Yeung, Y. and S. Howes. 2015. “Resources-to-Cash: A Cautionary Tale from Mongolia”. ANU,
Development Policy Centre Discussion Paper 42. Canberra.
Yousafzai, Aisha K., Muneera A Rasheed, Arjumand Rizvi, Robert Armstrong, Zulfiqar A Bhutta.
2014. “Effect of Integrated Responsive Stimulation and Nutrition Interventions in the Lady
Health Worker Programme in Pakistan on Child Development, Growth, And Health Outcomes:
A Cluster-Randomised Factorial Effectiveness Trial.” The Lancet 384(9950): 1282–93.
Yousafzai, Aisha K, Jelena Obradović, Muneera A Rasheed, Arjumand Rizvi, Ximena A Portilla,
Nicole Tirado-Strayer, Saima Siyal, and Uzma Memon. 2016. “Effects of responsive
stimulation and nutrition interventions on children’s development and growth at age 4 years in
a disadvantaged population in Pakistan: a longitudinal follow-up of a cluster-randomised
factorial effectiveness trial.” Lancet Global Health 4: e548–58.
Zheng, Yucheng, and Shwetlena Sabarwal. 2018. “How Much Would Expanding Early Childhood
Investments Cost?” mimeo. World Bank.
Zucman, Gabriel. 2015. The Hidden Wealth of Nations: The Scourge of Tax Heavens. The
University of Chicago Press.