Author's personal copy The possibilities and pitfalls presented by a pragmatic approach to ecosystem...
12
The possibilities and pitfalls presented by a pragmatic approach to ecosystem service valuation in an arid biodiversity hotspot P.J. O’Farrell a, * , W.J. De Lange a , D.C. Le Maitre a , B. Reyers a , J.N. Blignaut b , S.J. Milton c , D. Atkinson d , B. Egoh e , A. Maherry a , C. Colvin a , R.M. Cowling f a Natural Resources and the Environment, CSIR, P.O. Box 320, Stellenbosch 7599, South Africa b Department of Economics, University of Pretoria, ASSET Research, and Jabenzi, Pretoria 0001, South Africa c School of Natural Resource Management, Nelson Mandela Metropolitan University Saasveld Campus, Saasveld street, George 6529, South Africa d Research Cluster on Sustainable Development and Poverty Reduction, University of the Free State, PO Box 139, Philippolis 9970, South Africa e Department of Plant Science, University of Pretoria, Botany Building, room 1-6, Lynwood Road, Pretoria 0002, South Africa f Department of Botany, Nelson Mandela Metropolitan University, P.O. Box 77000, Port Elizabeth 6031, South Africa article info Article history: Received 15 June 2010 Received in revised form 21 October 2010 Accepted 11 January 2011 Available online xxx Keywords: Conservation Human wellbeing Resource limited Scarcity of services Sustainable land-use abstract Arid regions are home to unique fauna, flora, and vulnerable human populations, and present a challenge for sustainable land-use management. We undertook an assessment and valuation of three key services, grazing, tourism and water supply in the arid Succulent Karoo biome in western South Africa - a globally recognised biodiversity hotspot. We were looking for ways and values that could be used to promote conservation in this region through the adoption of sustainable land-use practices which have human welfare benefits. Our study adopted a variety of methods in valuing these services in developing ranges of values for these services. At the biome level, total annual values ranged from $ 19e114 million for grazing, $ 2e$ 20 million for tourism, and $ 300e3120 million for water. These values are generally low compared with values derived for other biomes and regions and do not adequately reflect known dependence and the importance of ecosystem services to the residents of this biome. The ecosystems here provide small but critical benefits enabling communities to sustain themselves and small changes in service levels can have major welfare effects. Highlighting these sensitivities will require finding more appropriate ways to link ecological and social factors. Ó 2011 Elsevier Ltd. All rights reserved. 1. Introduction Ecosystem service assessment has become an important tool in the development of sustainable land-use practices and natural resource management with an increasing number of decision makers requesting such assessments. Valuation has developed as one of the cornerstones of this rapidly growing research area. The ability to summarise and express complex ecological interactions in a single common currency is very appealing. This enables the explicit evaluation of tradeoffs between different services and between services and other forms of capital (e.g. manufactured capital), and greater ease in communicating the importance of ecosystem services to policy makers (Heal, 2000; Ludwig, 2000; Farley and Brown Gaddis, 2007; TEEB, 2008; Ash et al., 2009; Tallis and Polasky, 2009). Economic valuation has been used to add to conservation efforts, to reinforce scientific and ethical reasoning (Balmford et al., 2002; Turner et al., 2010), to make explicit the link with human wellbeing and development and to explore the potential for incentives like payments for ecosystem services (PES) (Wunder, 2005; Cowling et al., 2008; Ash et al., 2009; Daily et al., 2009; Wendland et al., 2009). The valuation of ecosystems and their services is supported by a growing body of literature on conceptual approaches, technical valuation methods and operational issues (Simpson, 1998; Turner et al., 1998, 2010; Costanza, 2003). Despite these advances ecosys- tems remain difficult to value given their complex behaviour, non- linear responses and their potential to undergo irreversible change (Chavas, 2000; Ludwig, 2000; Norgaard et al., 2007). The services they produce are also multiple and interdependent, and differ in terms of their ease of valuation (Turner et al., 2003), leading to a risk of excluding or undervaluing key ecosystem services (Redford and Adams, 2009). Added to these concerns, and of central interest here, is the influence that the type and location of beneficiaries will have on the value calculated. The values people place on ecosystem services are considered to be highly dependent on social and * Corresponding author. Tel.: þ27 21 888 2476; fax: þ21 86 619 6737. E-mail address: [email protected] (P.J. O’Farrell). Contents lists available at ScienceDirect Journal of Arid Environments journal homepage: www.elsevier.com/locate/jaridenv 0140-1963/$ e see front matter Ó 2011 Elsevier Ltd. All rights reserved. doi:10.1016/j.jaridenv.2011.01.005 Journal of Arid Environments xxx (2011) 1e12 Please cite this article in press as: O’Farrell, P.J., et al., The possibilities and pitfalls presented by a pragmatic approach to ecosystem service valuation in an arid biodiversity hotspot, Journal of Arid Environments (2011), doi:10.1016/j.jaridenv.2011.01.005
Transcript of Author's personal copy The possibilities and pitfalls presented by a pragmatic approach to ecosystem...
The possibilities and pitfalls presented by a pragmatic approach to ecosystem
service valuation in an arid biodiversity hotspot
P.J. O’Farrell a,*, W.J. De Lange a, D.C. Le Maitre a, B. Reyers a, J.N. Blignaut b, S.J. Milton c, D. Atkinson d,B. Egoh e, A. Maherry a, C. Colvin a, R.M. Cowling f
aNatural Resources and the Environment, CSIR, P.O. Box 320, Stellenbosch 7599, South AfricabDepartment of Economics, University of Pretoria, ASSET Research, and Jabenzi, Pretoria 0001, South Africac School of Natural Resource Management, Nelson Mandela Metropolitan University Saasveld Campus, Saasveld street, George 6529, South AfricadResearch Cluster on Sustainable Development and Poverty Reduction, University of the Free State, PO Box 139, Philippolis 9970, South AfricaeDepartment of Plant Science, University of Pretoria, Botany Building, room 1-6, Lynwood Road, Pretoria 0002, South AfricafDepartment of Botany, Nelson Mandela Metropolitan University, P.O. Box 77000, Port Elizabeth 6031, South Africa
a r t i c l e i n f o
Article history:
Received 15 June 2010
Received in revised form
21 October 2010
Accepted 11 January 2011
Available online xxx
Keywords:
Conservation
Human wellbeing
Resource limited
Scarcity of services
Sustainable land-use
a b s t r a c t
Arid regions are home to unique fauna, flora, and vulnerable human populations, and present a challenge
for sustainable land-use management. We undertook an assessment and valuation of three key services,
grazing, tourism and water supply in the arid Succulent Karoo biome in western South Africa - a globally
recognised biodiversity hotspot. We were looking for ways and values that could be used to promote
conservation in this region through the adoption of sustainable land-use practices which have human
welfare benefits. Our study adopted a variety of methods in valuing these services in developing ranges
of values for these services. At the biome level, total annual values ranged from $ 19e114 million for
grazing, $ 2e$ 20 million for tourism, and $ 300e3120 million for water. These values are generally low
compared with values derived for other biomes and regions and do not adequately reflect known
dependence and the importance of ecosystem services to the residents of this biome. The ecosystems
here provide small but critical benefits enabling communities to sustain themselves and small changes in
service levels can have major welfare effects. Highlighting these sensitivities will require finding more
appropriate ways to link ecological and social factors.
� 2011 Elsevier Ltd. All rights reserved.
1. Introduction
Ecosystem service assessment has become an important tool in
the development of sustainable land-use practices and natural
resource management with an increasing number of decision
makers requesting such assessments. Valuation has developed as
one of the cornerstones of this rapidly growing research area. The
ability to summarise and express complex ecological interactions in
a single common currency is very appealing. This enables the
explicit evaluation of tradeoffs between different services and
between services and other forms of capital (e.g. manufactured
capital), and greater ease in communicating the importance of
ecosystem services to policy makers (Heal, 2000; Ludwig, 2000;
Farley and Brown Gaddis, 2007; TEEB, 2008; Ash et al., 2009;
Tallis and Polasky, 2009). Economic valuation has been used to
add to conservation efforts, to reinforce scientific and ethical
reasoning (Balmford et al., 2002; Turner et al., 2010), to make
explicit the link with human wellbeing and development and to
explore the potential for incentives like payments for ecosystem
services (PES) (Wunder, 2005; Cowling et al., 2008; Ash et al., 2009;
Daily et al., 2009; Wendland et al., 2009).
The valuation of ecosystems and their services is supported by
a growing body of literature on conceptual approaches, technical
valuation methods and operational issues (Simpson, 1998; Turner
et al., 1998, 2010; Costanza, 2003). Despite these advances ecosys-
tems remain difficult to value given their complex behaviour, non-
linear responses and their potential to undergo irreversible change
(Chavas, 2000; Ludwig, 2000; Norgaard et al., 2007). The services
they produce are also multiple and interdependent, and differ in
terms of their ease of valuation (Turner et al., 2003), leading to a risk
of excluding or undervaluing key ecosystem services (Redford and
Adams, 2009). Added to these concerns, and of central interest
here, is the influence that the type and location of beneficiaries will
have on the value calculated. The values people place on ecosystem
services are considered to be highly dependent on social and* Corresponding author. Tel.: þ27 21 888 2476; fax: þ21 86 619 6737.
E-mail address: [email protected] (P.J. O’Farrell).
Contents lists available at ScienceDirect
Journal of Arid Environments
journal homepage: www.elsevier .com/locate/ jar idenv
0140-1963/$ e see front matter � 2011 Elsevier Ltd. All rights reserved.
doi:10.1016/j.jaridenv.2011.01.005
Journal of Arid Environments xxx (2011) 1e12
Please cite this article in press as: O’Farrell, P.J., et al., The possibilities and pitfalls presented by a pragmatic approach to ecosystem servicevaluation in an arid biodiversity hotspot, Journal of Arid Environments (2011), doi:10.1016/j.jaridenv.2011.01.005

environmental factors (Carpenter and Folke, 2006). Valuation
therefore requires an understanding of the spatial scales at which
services are generated and flow, where benefits are realised and to
which beneficiaries, to which components of their wellbeing, and
taking into account the beliefs and value systems of the owners,
managers and beneficiaries of ecosystem services (Turner et al.,
2003; Hein et al., 2006; Wilson et al., 2006; Brauman et al., 2007;
Chan et al., 2007; Norgaard et al., 2007; Tallis and Polasky, 2009).
Whilst research and development in the field of ecosystem
services has increased dramatically (Egoh et al., 2007; Daily and
Matson, 2008; Fisher and Turner, 2008; Daily et al., 2009), the
focus of these studies has not been evenly distributed across the
world’s different habitats and regions. Mesic biomes such as trop-
ical forests and estuaries, and tropical biodiversity hotspots have
received a disproportionally large amount of attention (Fisher et al.,
2008). Arid and semi-arid regions, typically those areas viewed as
marginal in terms of biological productivity and ecosystem service
values (Costanza et al., 2007; Naidoo and Iwamura, 2007), with low
human population levels, have received less. This is unsurprising
given that ecosystem service research has emerged partly in
response to the conservation crisis (Balmford and Cowling, 2006),
with a focus on tropical hotspots and areas of large biodiversity
losses which are seldom congruent with arid environments
(Mittermeier et al., 2005). The focus has also been on areas with
existing data and knowledge (e.g. Wisconsin (e.g. Nelson et al.,
2009) or California (e.g. Chan et al., 2006)) which have rarely
included arid regions. Furthermore, global studies which have
incorporated arid regions into their analysis (Costanza et al., 1997;
Sutton and Costanza, 2002), have found these to be areas with
a scarcity of services with some of the lowest associated ecosystem
service values (Turner et al., 2007).
However, some arid areas are home to unique fauna and flora, as
well as vulnerable human populations, which may benefit from an
ecosystem services approach to sustainable land-use management
(Safriel et al., 2005; Reyers et al., 2009; O’Farrell et al., 2010).This is
the case in the arid Succulent Karoo biome in South Africa. The
Succulent Karoo biome is a globally recognised biodiversity hotspot
with highly endemic and threatened biodiversity facing increasing
land-use pressures and climate change. The biodiversity of this
region has received considerable research attention (Cowling et al.,
1999a, 1999b; Cowling and Pierce, 1999). The area is also home to
some of the most vulnerable people in South Africa with high
unemployment and poverty levels (22e75%) (CSIR 2007). Consid-
ering the significance and vulnerability of this area and the detailed
level of biodiversity research already undertaken, the conservation
community thought it worthwhile to explore the potential that
ecosystem service assessment and valuation could provide in
making a case for conservation, thereby complementing prior
research activities. This could facilitate securing regional and
national political support and resources for conservation,
promoting sustainable land-use practices, possibly developing PES
schemes, and raising awareness of the importance of ecosystem
service and their linkages to human wellbeing in arid areas.
Furthermore, as one of only two arid biodiversity hotspots in the
world (Mittermeier et al., 2005) the Succulent Karoo also repre-
sents an extreme case of ecological and social vulnerability (Safriel
et al., 2005; Fisher and Christopher, 2007; Hoffman and Rohde,
2007) and a unique opportunity to test some of the learning and
approaches to assessing and valuing ecosystem services outside of
temperate and tropical biomes. Finally it also provides an oppor-
tunity to test and possibly challenge Turner et al.’s (2007) claim that
specialised conservation approaches beyond those offered by
ecosystem services, are required for this arid region.
This study follows on from a biophysical assessment of the
ecosystem services of the Succulent Karoo biome (see O’Farrell
et al., 2010) and has as its objectives: the production of spatially
explicit economic valuations of the biome; an improved under-
standing of the links between ecosystems, value, service scarcity,
and human wellbeing in an arid context; an investigation of the
potential of these valuations to promote conservation actions; and
finally, to highlight some of the learning generated in undertaking
this conservation sector requested assessment and to provide
suggestions and direction for enhancing economic valuationwithin
the context of ecosystem service assessment.
As is typical with many user demanded assessments of this
nature, we were forced due to a lack of time, adequate data and
funding to adopt a highly pragmatic approach to valuing ecosystem
services. We blended economic valuation techniques with financial
analysis techniques, used financial values as proxy values for
ecosystem service values where applicable, and undertookmultiple
valuation approaches for single services. Using these approaches
we generated potential ranges of ecosystem services values for
selected services instead of trying to provide single best estimates.
State of the art economic approaches focussed on generating
consumer surplus-based marginal values, ecological production
functions, models of future supply and demand and consumers
willingness-to-pay, would take years and incredible funding to
deliver narrower ranges and possibly more theoretically valid
figures. Our aim therefore was not to come up with a single “right”
value, but rather to foster understanding and awareness of arid
systems and their ecosystem services.
2. The Succulent Karoo biome
The Succulent Karoo is an arid biome is situated in western
Southern Africa, and covers 111,000 km2, and is the forth largest
biome in Southern Africa (Mucina et al., 2006). It is themost diverse
arid environment in the world having exceptionally high levels of
biodiversity among plants, reptiles and invertebrates, birds and
mammals (Cowling et al., 1999a; CEPF, 2003; Desmet, 2007; SKEP,
2008). The topography is flat and gently undulating, disrupted by
hills in places. The biome can be divided into five broad physio-
graphic regionswith the northern region divided into coastal plains
and mountains, the south central region divided into mountains
and plains, hills and lowlands, and the easternmost region all being
distinctly separate (Mucina and Rutherford, 2006). The altitude
varies from sea level to 1500m, but most lies below 800m (Mucina
et al., 2006). Rainfall is regarded and highly predictable and mostly
cyclonic falling during the winter months between April and
September and varies between 100 and 300 mm per year, with and
average of 170 mm (Mucina and Rutherford, 2006). This rainfall
gradient increases from west to east and from north to south.
Despite being one of the least economically developed and popu-
lated regions in South Africa with only 312,000 people (mean
population density of 3.76 people/km2), it is under pressure due to
mining, irrigated cultivation in some areas, overstocking of live-
stock. Furthermore, projected climate change is arguably the
greatest threat to this region (Hoffman and Ashwell, 2001;
Hewitson and Crane, 2006; Keay-Bright and Boardman, 2006;
Rouget et al., 2006; MacKellar et al., 2007; Thompson et al.,
2009).Under conditions of climate change, rainfall in the western
and northern regions are expected to experience the largest
decreases in the biome (MacKellar et al., 2007). Extensive livestock
farming is the primary land-use activity as irrigated agriculture is
limited and confined to those regions with suitable soils and rela-
tively reliable water supplies.
The above mentioned threats affect not only the ecological
systems but also the social and economic systems of the region. It is
home to some of the most vulnerable people in South Africa who
depend directly on a variety of natural resources for much of their
P.J. O’Farrell et al. / Journal of Arid Environments xxx (2011) 1e122
Please cite this article in press as: O’Farrell, P.J., et al., The possibilities and pitfalls presented by a pragmatic approach to ecosystem servicevaluation in an arid biodiversity hotspot, Journal of Arid Environments (2011), doi:10.1016/j.jaridenv.2011.01.005

livelihoods and ultimate survival (James et al., 2005). The people of
Nama originwho live on communal lands here are at the extreme of
this dependency and are, therefore, very vulnerable to fluctuations
in services. The percentage of the population below themean living
level, the minimum household income required to meet basic
needs (Statistics South Africa, 2007), is about 27%. The situation
appears to be worsening as the labour dependent agricultural
industry transitions to a more tertiary sector focus and the mining
industry adopts labour reducing practices to remain globally
competitive. As a result out-migration as well as social grant
dependency is increasing in some parts of the region (CSIR 2007).
This creates a unique suite of developmental challenges, requiring
the adoption of more appropriate land-use strategies and alterna-
tive ways of living and sources of fulfilling livelihoods. One of these
options in the region is tourism which is seen as a significant
economic growth opportunity because it creates employment at
a variety of skills levels as well as creating many business devel-
opment opportunities such as accommodation, tour guiding,
transport, marketing and crafts. Tourism in the biome has become
a more dominant economic activity in recent times (Hoffman and
Rohde, 2007) associated with spring flower displays, undeveloped
landscapes and conservation areas (including transfrontier parks).
3. Ecosystem service assessment
As is often the case in conservation and ecosystem service
assessments, ecological boundaries seldom overlap with adminis-
trative boundaries. In attempting to circumvent this issue which has
becomeknownas themodifiableareal unit problem(Jelinski andWu,
1996), we used the Succulent Karoo biome as defined byMucina and
Rutherford (2006), to identify the municipal districts within the
Succulent Karoo, as well as the proportional contribution this biome
makes to the area of each municipal district (Fig. 1). All socio-
economic data relevant to this study have been collected at the
municipal district level. This aggregated data is fairly coarse and
introduces issues of scale which are irresolvable in a study of this
nature. A total of 21districts containingvaryingareas of the Succulent
Karoo biome formed the basis of this study, 10 of which include high
priority conservation areas identified by SKEP (2003) (see Table 1).
Based on literature, stakeholder interviews and expert work-
shops we identified multiple beneficiary groups associated with
a variety of services from the Succulent Karoo (see O’Farrell et al.,
2010). These beneficiaries varied from local communities using
natural vegetation for grazing and medicines, to researchers at
Universities outside of the biome who study the unique flora of the
region. Using a prioritisation system of importance to the vulner-
able beneficiary groups, relevance to the region’s socio-economic
development and links to ecosystem integrity and therefore
conservation, we focussed our ecosystem services valuation on the
services associated with water, grazing and tourism (O’Farrell et al.,
2010). The primary beneficiaries of these services were identified as
farmers and farm workers for the grazing service; local town and
settlement residents, their municipalities and industries for the
water service; and both tourists (predominately urban dwellers
outside of the region) and tourism operators and employees for the
tourism service. A detailed biophysical analysis of these services is
provided by O’Farrell et al. (2010).
In order to explore the links between ecosystems services,
human wellbeing and the potential for using economic valuations
to promote conservation actions we adopted a variety of practical
approaches to the valuation of each service. We present a range of
values (possible upper and lower values), and display the results in
four different ways.
1. A total $ value estimate for the Succulent Karoo according to
each district
2. A $ per km2 value for each district
3. A per capita $ value for each district
4. A $ value of the service proportional to the per capita gross
value added (GVA). Per capita gross value added is equal to total
Fig. 1. Succulent Karoo biome with overlapping magisterial districts, and its location within southern Africa.
P.J. O’Farrell et al. / Journal of Arid Environments xxx (2011) 1e12 3
Please cite this article in press as: O’Farrell, P.J., et al., The possibilities and pitfalls presented by a pragmatic approach to ecosystem servicevaluation in an arid biodiversity hotspot, Journal of Arid Environments (2011), doi:10.1016/j.jaridenv.2011.01.005

gross economic value summed for a district divided by the
population for that district (based on the proportional area of
the Succulent Karoo biome in each district). This measure
represents the value of the ecosystem service relative to the
total value being generated by an individual in the economy.
3.1. Value of the grazing service
The natural vegetation of the Succulent Karoo region has been
used for its grazing services for the last 2000 years (Deacon et al.,
1978; Smith, 1983). Whilst the indigenous pastoralists employed
strongly seasonal practices, moving livestock between biomes,
colonisation and changes in land tenure practices constrained
livestock movements in the last 2 centuries leading to sedentary
grazing and degradation of this service (Archer, 2000; Beinart,
2003; Hoffman and Rohde, 2007). Overstocking with a variety of
livestock types has further compounded this degradation leading to
changes in vegetation community composition (Todd and Hoffman,
1999; Anderson and Hoffman, 2007; Thompson et al., 2009).
Grazing services are now more tightly coupled to rainfall, predis-
posing farmers to greater risk, decreased production and higher
mortality rates under drought conditions (Anderson and Hoffman,
2007; Richardson et al., 2007). Determining grazing services values
allows for more informed decision making, and potential leverage
in steering grazing practices towards sustainability.
We valued grazing, the largest and single most important input
required for the extensive livestock industry in the Succulent Karoo,
as equivalent to the gross production value of livestock. We decided
to adopt this approach rather than a marginal approach to the
valuation which we considered to be equally flawed as it assumes
a given profit level for a farmer, with the magnitude of this
assumption having direct impact on the final value of the service.
We converted the 2002 National Agricultural Census count data
(Statistics South Africa, 2002) for all livestock - beef cattle, sheep,
goats and ostriches - to numbers of large stock units (LSU) by
means of the daily metabolic energy demand for a homogenised or
‘typical animal’ based on the following formula 293 kJ/kg 0.75 (Van
der Merwe and Smith, 1991) where an LSU is taken as a 450 kg
heifer. All animal numbers were converted to the number of LSUs
per magisterial district. A representative price for LSUs was calcu-
lated for each magisterial district by means of proportional abun-
dance across the different animal types.
In developing a practical broad understanding of the value of
this service we adopted three different approaches in estimating
the value per unit of the grazing service, contrasting non-sustain-
able with sustainable grazing practices. The first approach drew on
the 2002 Agricultural census stock counts as a basis from which to
multiply the proportional price per LSU with the real or actual
number of LSUs per district to obtain a derived value for the district.
This scenario reflects the prevailing non-sustainable situation
highlighted above (we call this the REAL scenario). The second
approach took recommended long term sustainable stock rates
from Scholes (1998) in km2/LSU, and multiplied these with the
representative LSU price to derive the recommended value for each
district assuming that grazing was the only land-use practice (we
call this the SUSTAINABLE scenario). Our third approach estimated
the substitution or replacement value of grazing via a drought
relief-support scenario of the current or real situation (we call this
the SUBSTITUTION scenario). We estimated this by adopting the
South African Department of Agriculture’s recommended drought
relief diet of 0.25 kg of maize and 1.75 kg of lucern per small stock
unit per day (Van derMerwe and Smith,1991). This third scenario is
equivalent to measures undertaken during emergency drought
conditions in this area and represents the substitution value of
natural vegetation as fodder, but also presents a value estimate of
expected losses if overstocking continues and eventually requires
farmers to provide livestock with an alternative food source to
natural vegetation. This scenario is not feasible over the long term,
but it provides a necessary possible upper level value for the
grazing service here. At current market prices, which have histor-
ically been stable for maize ($ 275/t) and lucern ($ 175/t), an LSU
Table 1
Value estimates for grazing as an ecosystem service in the Succulent Karoo according to Magisterial Districts. Total annual value, value per unit area, per capita values and flow
values estimated as a % of GVA (Gross Value Added) per capita are presented. Highlighted districts are conservation priority areas.
Magisterial
District
Total annual value ($) Total annual Value per unit area
($/km2)
Per capita values ($/capita) Flow value estimate (as % of
GVA/cap)
Real Sustainable Substitution Real Sustainable Substitution Real Sustainable Substitution Real Sustainable Substitution
Calitzdorp $365 349 $256 250 $722 753 $1 247 $875 $2 467 $41 $29 $81 1.3% 0.9% 2.6%
Calvinia $5 319 617 $3 870 461 $46 044 921 $331 $241 $2 867 $250 $182 $2 161 7.4% 5.4% 64.2%
Ceres $708 605 $4 110 279 $2 219 781 $175 $1 016 $549 $13 $73 $40 0.4% 2.0% 1.1%
Clanwilliam $735 278 $1 041 805 $2 410 512 $506 $717 $1 659 $23 $32 $75 0.5% 0.7% 1.7%
George $737 363 $706 744 $1 585 248 $2 404 $2 304 $5 169 $6 $5 $12 0.1% 0.1% 0.3%
Ladismith $760 912 $1 594 978 $4 002 367 $333 $699 $1 754 $55 $115 $287 1.9% 4.0% 10.1%
Laingsburg $320 279 $1 123 718 $2 657 307 $94 $328 $776 $51 $178 $422 2.2% 7.9% 18.6%
Montagu $152 215 $1 083 384 $438 919 $222 $1 577 $639 $5 $35 $14 0.2% 1.4% 0.6%
Namakwaland $1 471 425 $2 769 724 $10 664 028 $50 $94 $363 $19 $35 $135 0.6% 1.2% 4.5%
Oudtshoorn $2 376 910 $898 330 $7 392 735 $2 905 $1 098 $9 035 $27 $10 $85 0.8% 0.3% 2.5%
Prince Albert $300 572 $359 254 $1 815 741 $178 $213 $1 074 $30 $36 $180 2.1% 2.5% 12.8%
Riversdal $610 033 $785 463 $2 092 916 $1 304 $1 679 $4 474 $21 $27 $73 0.6% 0.8% 2.2%
Robertson $113 301 $808 559 $234 249 $333 $2 373 $687 $3 $23 $7 0.1% 0.6% 0.2%
Steytlerville $560 281 $501 372 $4 198 752 $370 $331 $2 772 $98 $88 $736 4.7% 4.2% 35.3%
Sutherland $745 144 $1 620 973 $6 382 525 $157 $341 $1 344 $179 $390 $1 534 4.2% 9.2% 36.2%
Swellendam $669 559 $694 355 $2 966 474 $1 234 $1 279 $5 466 $17 $17 $74 0.4% 0.4% 1.7%
Uniondale $260 278 $467 839 $1 149 103 $437 $785 $1 929 $24 $43 $106 1.1% 1.9% 4.7%
Vanrhynsdorp $1 327 392 $1 691 785 $8 743 730 $152 $194 $1 000 $86 $110 $568 2.6% 3.3% 16.9%
Vredendal $810 349 $657 839 $3 864 620 $359 $291 $1 712 $24 $20 $114 0.5% 0.4% 2.4%
Willowmore $588 792 $569 359 $4 737 193 $285 $276 $2 295 $48 $46 $386 3.3% 3.2% 26.9%
Worcester $187 793 $1 672 276 $406 791 $263 $2 339 $569 $1 $11 $3 0.0% 0.2% 0.1%
Total $19 121 448 $27 284 746 $114 730 665
Mean $635 $907 $2 314 $49 $72 $338 1.7% 2.4% 11.7%
P.J. O’Farrell et al. / Journal of Arid Environments xxx (2011) 1e124
Please cite this article in press as: O’Farrell, P.J., et al., The possibilities and pitfalls presented by a pragmatic approach to ecosystem servicevaluation in an arid biodiversity hotspot, Journal of Arid Environments (2011), doi:10.1016/j.jaridenv.2011.01.005

maintenance diet would cost approximately $ 1.95 per day for
a 100% grazing substitution scenario. If we assume a permanent
substitution (365 days per year) then the annual substitution value
is $ 711 per LSU. From these three approaches we calculated a
$/km2 value for each district as well as a proportional value that
relates to the area of the district that falls within the Succulent
Karoo biome, and a per capita grazing value for each district.
The real and the sustainable scenarios produced similar absolute
values of $ 19million and $ 27million respectively for the Succulent
Karoo biome (Table 1), which can be interpreted as minimum
values for this service. Here the value from the hypothetical
sustainable grazing scenario is higher that the real scenario as it
considered the entire biome as having grazing potential. In reality
areas may not be used for livestock production. The value estimate
derived from the grazing substitution scenario, was significantly
larger at $ 115 million for the biome e the maximum value. This
scenario produced the highest values for all of the districts assessed
in the Succulent Karoo (Table 1). We have a high degree of confi-
dence in this figure since it is based on a legitimate fodder
replacement value but recognise that is could not be realised in
practice.
Comparing proportional annual values at a district level with $
per km2 estimates, those districts with the highest values (Calvinia,
Namaqualand) fall to middle and lower order estimated respec-
tively. The difference in grazing values per district is the outcome of
significant variation in both the absolute value estimates (i.e. inter-
method comparisons) and the relative values (i.e. inter district
comparisons). The values per unit surface area provide low esti-
mates for grazing services; however, these services are vital for
those individuals whose livelihoods depend primarily on their
livestock. The potentially misleading nature of these values
becomes apparent on examination of the per capita values for the
grazing service (Table 1) which implying almost no value at the
individual level. All three methods show that the grazing service is
an important economic component in the Succulent Karoo, espe-
cially for districts with low potential for intensive agriculture (e.g.
Calvinia, Sutherland and Steytlerville).
Whilstweacknowledge that degradation is a highly complex and
contested issue (Gillson and Hoffman, 2007), there is sufficient
evidence that excessive demand and sustained heavy grazing has
damaged the natural capital of the area and the services that flow
from it (Reyers et al., 2009). REAL grazing scenario values can be
expected to fall over time as degradation continues, resulting in
lower stocking rates or higher input costs. The high values of the
SUBSTITUTION scenario may resonate with beneficiaries of this
service, given that they follow such a strategy under conditions of
drought. Without any changes to land-use practices and under
continuing conditions of climate change degraded areas are likely to
become less productive, with the plants experiencing greater stress
due to increased air and soil temperatures, decreased soil moisture
availability and the continued loss of moisture, organic matter and
nutrients from the system. Reversing these effects is extremely
difficult, and requires returning nutrients and organic matter to the
system and re-capturing the rainwater and reducing stocking rates.
High restoration input costs relative to livestock profits are also
likely to make large scale restoration activities difficult and unfea-
sible (Herling et al., 2009). Considering the relative importance of
this service to many beneficiary groups (many of whom are very
vulnerable) this is an enormous concern for the region’s future.
3.2. Value of the tourism service
Understanding tourism as an ecosystem service requires the
identification of the biodiversity, ecosystem and landscape features
or assets that drive tourism (tourism value attributes) as well as the
socio-economic features that drive its promotion and development.
This has been both locally and internationally recognised as
extremely difficult to achieve (Balmford et al., 2008; Shackleton
et al., 2008). This is particularly the case when the tourism service
is multidimensional and not one-dimensional like bird watching or
scuba diving (Balmford et al., 2008). Placing monetary values on
these assets in a valuation exercise provides a further challenge.
Our objective was to assess the relative value of ecosystem
service delivery to the tourism industry. In doing so we estimated
the financial value of key tourism service features as a proxy value
for the ecosystem service. Tourism services in the Succulent Karoo
biome are characterised by ‘flower viewing’, ‘scenery’ and the
‘remoteness’ of the region. This division was largely based on
climate conditions across the study area (see O’Farrell et al., 2010).
None of these services are directly captured by formal markets, and
hence there are no market prices for these features. We were
therefore unable to use the same approach we adopted in assessing
grazing services for the extensive livestock industry. Instead, we
used tourist expenditure, measured as the total daily expenditure
(TDE), as the basis for estimating the value of tourism as an
ecosystem service in the biome. We applied the TDE profile as
developed by Thornton and Feinstein (Thornton and Feinstein,
2003) for the adjacent Western Cape region of South Africa. This
profile breaks TDE down to five different categories: transport 42%,
accommodation 22%, food and drink 24%, entertainment 8%, other
4%. We used an average TDE of $ 80.25, from four tourism valuation
studies that had been conducted in the broader Succulent Karoo
biome (Thornton and Feinstein, 2003; Turpie and Joubert, 2004;
Blignaut et al., 2006; James et al., 2007). These values reflect
actual expenditure of tourists in the Western Cape. The average
value obtained may be seen as maximum estimate for TDE. These
values were multiplied with the average number of bed nights (5.2
bed-nights based on Thornton and Feinstein, 2003; Turpie and
Joubert, 2004; Blignaut et al., 2006; James et al., 2007), to obtain
an estimate of the total expenditure per tourist per year.
Given the heterogeneity of the Succulent Karoo, a variety of
features attract different types, and varying numbers of tourists at
different times of the year. We could not assume (as in the case of
TDE) that all districts were equally important in terms of relative
attractiveness for tourists. We divided the Succulent Karoo into two
attraction categories, ‘flower viewing’ and ‘scenery’. Five of the
21 districts were categorised as ‘flower viewing’ districts while 13
districts were categorised as ‘scenic’ areas (see Table 2). Three
districts (Laingsberg, Sutherland, Steytlerville) were excluded from
the analysis as they did not lie along any major scenic tourism
route; nor could they be classified as flower viewing areas.
Visitor numbers for the ‘flower tourism’ region were estimated
at 21000 pa, based on two regional studies (Turpie and Joubert,
2004; James et al., 2007), and data provided by a regional
tourism office. Visitor numbers for the ‘scenic tourism’ regionwere
based on the number of visitors to a popular scenic attraction (the
CangoCaves in the Oudtshoorn area) which receives 400,000 visi-
tors per year. This attraction was used as a proxy given the central
location of this feature in relation to the main tourism route, the
nature of this route and the local fame of the attraction. The total
annual tourism value for each tourism category was obtained by
multiplying the TDE, bed-nights and number of tourists per year.
We obtained an annual value of $ 8.9 million for the ‘flower
viewing’ region, and $ 167 million for the ‘scenic’ tourism region.
Large areaswithin the Succulent Karoo receive very few tourists,
and a great deal of this region is not visible from favoured tourism
routes. In translating tourism values into spatial units only areas
visible from roads, or viewsheds, can be used to calculate the total
tourism value for a particular district (Reyers et al., 2009; O’Farrell
et al., 2010). Based on the approach adopted by Reyers et al. (2009),
P.J. O’Farrell et al. / Journal of Arid Environments xxx (2011) 1e12 5
Please cite this article in press as: O’Farrell, P.J., et al., The possibilities and pitfalls presented by a pragmatic approach to ecosystem servicevaluation in an arid biodiversity hotspot, Journal of Arid Environments (2011), doi:10.1016/j.jaridenv.2011.01.005

we restricted viewing distances to a 10 km zone along the primary
and secondary road networks for areas within the Succulent Karoo
biome (see O’Farrell et al., 2010). Viewshed areas were used to
convert TDE values to $/km2 values. Estimates of $ 166/km2 for the
‘flower tourism’ category and $ 6799/km2 for the scenic tourism’
category were generated using this methodology. These values
were multiplied with the viewshed areas of the districts within
each category to obtain the districts’ total annual value of the
tourism ecosystem service value (Table 2). Values were also
calculated on a per capita basis ($ per capita) (Table 2).
The results for viewsheds alone indicate significant differences
between the value of flower viewing and scenic tourism with total
values of $ 2.2 million and $ 19.5 million respectively (Table 2).
However these are not necessarily comparable as they cater to
different categories of tourists.
Substantial variation in the estimates for flower tourism and
scenic tourismwas also evident when examined using a $ per capita
approach (Table 2). Themeanper capita value for flower tourismwas
$ 1.6,while for the scenic tourism the equivalentwas $ 10.7 per capita
per year. These figures give an indication of the potential of this
service to alleviate poverty and diversify livelihoods. The potential is
explained when compared to the gross value added (GVA) per
district. The values as a percentage of the GVA showmuch the same
patterns. The scenic tourism service hasmuch higher values both per
capita and as a percentage of the district GVA. Districts with lower
thananticipatedpercentageofGVApercapitavalues,were attributed
to both larger relative population sizes and a greater diversity of
economic activity. The per capita values presented provide an inac-
curate picture as only a portion of the population is involved in
tourism.Per capitavalueswouldbemuchhigher for those engaged in
this industry but these numbers are not known.
Our approach and analysis demonstrates both the critical need
for better tourism service related data, and the possible or future
potential of the tourism industry in improving human wellbeing,
diversifying available livelihood options and reducing vulnerability.
The number of tourists to a region, and to what degree they engage
with ecosystem system service assets, strongly influences the value
of the tourism service. Conservative visitor estimates indicate that
tourism is not as important as grazing in the Succulent Karoo in
terms of value created. Studies in similar environments in Namibia
have found that the broader social value of tourism-related
ecosystem services is typically underestimated because the valua-
tions do not (a) take into account the fact that employment in the
tourism industry often benefits the poorest people most directly
(through employment as guides or in accommodation) and (b) that
wildlife farming benefits can exceed those from conventional
livestock farming (Barnes and Humavindu, 2003). These beneficiary
groups can however, be vulnerable to changes in the supply and
demand for the tourism ecosystem service.
Our approach was not geared towards capturing the effects that
a change in the amount of tourism service features (changes in the
number of flowers and change in scenic landscapes) would have on
the value of this service. Whilst we have little understanding of this
relationship we do know that the supply of annual flower displays
which drives demand in parts of our study area is directly coupled to
the rainfall in these regions. Annual plant species displays which are
the key biodiversity feature, are directly cued by rainfall (Van Rooyen
et al., 1990) and decreases in the size of and probability of flower
displays are highly likely to result in a decrease in flower tourism to
the region (James et al., 2007).Dryyears result inpoorflowerdisplays
and low numbers of tourists. In these years the more vulnerable
beneficiaries of this service, those involved in the tourism industry,
are severely affected. Furthermore, climate change predictions for
this region anticipate decreased rainfall threatening the long term
supply of this service (MacKellar et al., 2007). Further constraints to
tourism development such as escalating transport costs (Succulent
Karoodestinations are remote frommajorpopulation centres) and, in
particular, water demand and supply, also closely coupled to climate
change, are discussed in the following section.
3.3. Value of the water service
Water is the limiting resource for semi-arid and arid systems
like the Succulent Karoo biome. It controls and constrains all
Table 2
Value estimates for tourism as an ecosystem service in the Succulent Karoo as defined by the flower viewing region and the scenic region, and based on the area of the
viewsheds. Total annual value, Per capita value estimates and ecosystem service flow values expressed as a percentage of GVA (Gross Value Added) per capita are presented.
Highlighted districts are conservation priority areas.
Total annual value for the SK per district ($) Values of tourism in the SK portion
of the district ($ per capita)
Ecosystem service flow estimates
(value as % of GVA per capita)
Magisterial District Flower tourism ($166/km2) Scenic tourism ($6799/km2) Flower tourism Scenic tourism Flower tourism Scenic tourism
Calitzdorp $1 686 113 $23.7 6.1%
Calvinia $433 594 $2.5 0.6%
Ceres $210 764 $0.5 0.1%
Clanwilliam $85 626 $0.3 0.1%
George $890 648 $0.8 0.1%
Ladismith $3 596 588 $32.3 9.0%
Laingsburg
Montagu $659 488 $2.7 0.8%
Namakwaland $1 414 230 $2.2 0.6%
Oudtshoorn $3 297 439 $4.8 1.1%
Prince Albert $1 890 078 $23.4 13.3%
Riversdal $20 397 $0.1 0.0%
Robertson $1 216 993 $4.4 0.9%
Steytlerville
Sutherland
Swellendam $1 393 763 $4.4 0.8%
Uniondale $3 045 882 $35.2 12.5%
Vanrhynsdorp $321 137 $2.6 0.6%
Vredendal $17 887 $0.1 0.0%
Willowmore $645 890 $6.6 3.7%
Worcester $965 436 $0.8 0.1%
Total $2 272 474 $19 519 478
Mean $1.6 $10.7 0.4% 3.7%
P.J. O’Farrell et al. / Journal of Arid Environments xxx (2011) 1e126
Please cite this article in press as: O’Farrell, P.J., et al., The possibilities and pitfalls presented by a pragmatic approach to ecosystem servicevaluation in an arid biodiversity hotspot, Journal of Arid Environments (2011), doi:10.1016/j.jaridenv.2011.01.005
aspects of life in the region from primary production in ecosystems
through to the future economic development potential of the area.
Despite its importance there have been few detailed studies of the
hydrology of this region. The natural flows in the river systems of
the Succulent Karoo are highly erratic with marked temporal and
spatial variability even in the larger rivers (Görgens and Hughes,
1982).
The valuation of water is complicated by its fundamental role in
sustaining all life. The upper level value of water is, therefore, the
value of life which is generally viewed as having cultural and moral
dimensions which make reducing it to a monetary value, or price,
highly controversial. The valuation of water is further complicated
by the fact that little consensus exists on the appropriatemethod for
estimating thevalueof thewater service and thepublic goodsnature
of many benefits derived fromwater (Blignaut & DeWit, 2004; Birol
et al., 2006; United Nations, 2006). One approach in determining
price is to usemarket prices or, preferably,marginal values todeduce
a price; however the inelastic demand for this resource makes this
type of approach invalid (Nieuwoudt et al., 2004). A further sug-
gested approach to deriving an economic value is to estimate how
much value is added per unit of water. This can be relatively easily
estimated for agricultural products where there is a market and the
water inputs are reasonably well understood so the returns per unit
of water can be calculated (e.g. Hassan and Okbrich, 1999; Lange
et al., 2007). But measuring water’s contribution to all sectors, to
the total value chain of a goodor service, or its total economic benefit
is farmore complex (Hassan andOkbrich,1999; Crafford et al., 2004;
Nieuwoudtet al., 2004;Moolmanet al., 2006;UnitedNations, 2006).
Furthermore suchanalysis should also include thedemand forwater
from the ecosystems themselves. An analysis of this kind for the
Succulent Karoo is potentially feasible but was beyond the possible
bounds of this study.
We calculated an upper and lower estimate for the value of
water in the study area based on two approaches. We adopted
a cost recovery approach (Lange and Hassan, 2006) in determining
a minimum estimate for the value of the water services of the
Succulent Karoo which excludes any benefits or value derived from
that water, and ignores the role that ecosystems play in the supply
of water. In addition to this method we estimated the total value of
the economy (GVA) as an indication of the upper value of the water
services, and therefore includes those benefits and the ecological
role that it plays excluded by the cost recovery approach. We
acknowledge that attributing GVA to water when water is only one
of several inputs is incorrect; the GVA is derived from several inputs
and will, therefore, overestimate the value of water. Using the GVA
also involves double counting where for example water is valued
for the grazing it provides to livestock and the livestock sales are
reflected in the total GVA. However, water is arguably the one input
without which there would be no economic activity so the GVA per
unit of water is arguably closer to the upper bound of water’s
economic value to society than the cost of water provision.
The cost recovery approach value estimate was based on a unit
reference value (URV) for water provisioning multiplied by the
volume of water (annual yield) of the supply infrastructure. Infra-
structure includes formal infrastructure used by water user asso-
ciations and municipalities, and informal infrastructure like private
boreholes or even communal water supply mechanisms. We
defined the URV as the present value of all costs (PVC), divided by
the present value of all of yields or savings and benefits (PVB)
incurred over the economic life span of the water supply infra-
structure. Total yield is estimated by multiplying the expected
annual yield with the supply scheme/infrastructure life span. This
value is presented in a volumetric unit ($/m3) and is considered to
be a minimum estimate of the relative value of water. URV is
therefore a reversed benefit cost ratio (BCR), (BCR ¼ 1/URV). This
value should only be used for comparing the different water supply
alternatives in the same region, since the actual values of a unit of
water vary widely in the different areas and the accepted cost per
m3 will differ as well. In addition the URV is heavily dependant on
the consistency of counting all the different cost and benefits that
occur over the set life span of the supply scheme, which is debat-
able too.
We extracted data from a provincial survey (De Lange, 2006) on
water user associations in the Western Cape to obtain estimates
regarding tariffs and volumes relevant to our study area. The survey
excluded the City of Cape Town metropolis, but still represented
53.1% of all municipal and agricultural water use in the Western
Cape (De Lange and Kleynhans, 2007, 2008). Cost data relating to
the type of bulk supply infrastructure, source of supply, number of
members, enlistment, types of user and annual tariffs were
obtained from water user associations relevant to our study area
(De Lange, 2006). A distinction was made between serviced and
raw water, with the former being significantly more expensive
because of additional built in services (filtration, chlorination, sta-
bilisation and pressurisation). Borehole water was handled sepa-
rately. Cost estimates for each source were based on survey data
and reconciled with unpublished estimates from the Western Cape
provincial department of Agriculture’s engineering services unit
(De Lange, 2006).
We calculated from the survey data (De Lange, 2006) that 85.3%
of the surface water consumed in the study area is sold as raw
surface water at $ 0.018/m3 while the remaining 14.7% is supplied
as serviced water at $ 0.674/m3. Ground water was supplied at $
0.106/m3 as raw water. The weighted average (volumetric
weighted) cost recovery value of surface water was $ 0.115/m3 for
the survey. These estimates were multiplied with annual surface
and ground water yield estimates obtained at quaternary catch-
ment level. Values are also expressed on a per capita basis.
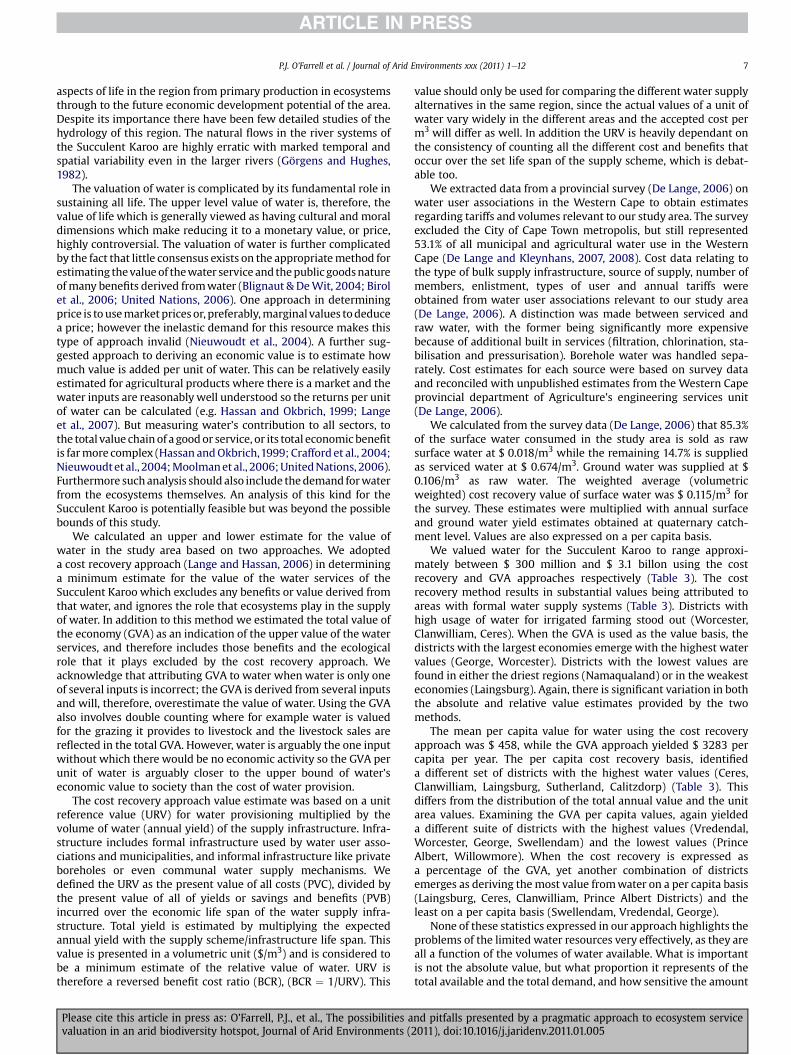
We valued water for the Succulent Karoo to range approxi-
mately between $ 300 million and $ 3.1 billon using the cost
recovery and GVA approaches respectively (Table 3). The cost
recovery method results in substantial values being attributed to
areas with formal water supply systems (Table 3). Districts with
high usage of water for irrigated farming stood out (Worcester,
Clanwilliam, Ceres). When the GVA is used as the value basis, the
districts with the largest economies emerge with the highest water
values (George, Worcester). Districts with the lowest values are
found in either the driest regions (Namaqualand) or in the weakest
economies (Laingsburg). Again, there is significant variation in both
the absolute and relative value estimates provided by the two
methods.
The mean per capita value for water using the cost recovery
approach was $ 458, while the GVA approach yielded $ 3283 per
capita per year. The per capita cost recovery basis, identified
a different set of districts with the highest water values (Ceres,
Clanwilliam, Laingsburg, Sutherland, Calitzdorp) (Table 3). This
differs from the distribution of the total annual value and the unit
area values. Examining the GVA per capita values, again yielded
a different suite of districts with the highest values (Vredendal,
Worcester, George, Swellendam) and the lowest values (Prince
Albert, Willowmore). When the cost recovery is expressed as
a percentage of the GVA, yet another combination of districts
emerges as deriving themost value fromwater on a per capita basis
(Laingsburg, Ceres, Clanwilliam, Prince Albert Districts) and the
least on a per capita basis (Swellendam, Vredendal, George).
None of these statistics expressed in our approach highlights the
problems of the limited water resources very effectively, as they are
all a function of the volumes of water available. What is important
is not the absolute value, but what proportion it represents of the
total available and the total demand, and how sensitive the amount
P.J. O’Farrell et al. / Journal of Arid Environments xxx (2011) 1e12 7
Please cite this article in press as: O’Farrell, P.J., et al., The possibilities and pitfalls presented by a pragmatic approach to ecosystem servicevaluation in an arid biodiversity hotspot, Journal of Arid Environments (2011), doi:10.1016/j.jaridenv.2011.01.005
available is to variability in rainfall and the state of the land and
ecosystems (Le Maitre et al., 2007a). In the Succulent Karoo the
demand exceeds the amount available and the amount is very
dependent on rainfall, especially during extended droughts (Le
Maitre & O’Farrell, 2008). Despite the discrepancies between
valuation methods and approaches it is clear that even if we are
considering only minimum values, the water services make
a substantial contribution to this region, especially in contrast to
the values estimated for tourism and grazing.
Water service values generated in this study have potential to
advance sustainable land management agendas in the districts for
which high values exist. Water services also play an overarching
role in determining many other services related to the agricultural
economy of an arid system including soil conservation and nutrient
cycling, and in turn, the services of primary production and water
provision (Safriel et al., 2005). Therefore promoting catchment
integrity to maximise water flows would see the sustainable
management of grazing, and in turn the preservation of key
ecological elements such as vegetation and soil crusts integrity
(Belnap and Lange, 2003), and these in turn are likely to also tie in
closely to other regulating and provisioning services (Le Maitre
et al., 2007a; Reyers et al., 2009). Increasing population and
economic growth will increase demand for this service, however
supply, already constrained is most likely to decrease, and inno-
vative approaches to demand side management of this services will
become vital in the future.
4. Valuation for conservation and sustainable management
As Redford and Adams (2009) point out the conservation
community is increasingly reliant on the concept of ecosystem
services as they try to make a case for the importance of nature and
its conservation to a sceptical audience of decision and policy
makers. This study represents an attempt to enhance the conser-
vation program in the Succulent Karoo biome with more informa-
tion on the value of the biome to humanwellbeing and economies.
In these cases one’s hope to end up at the upper end of the valu-
ation scale, where services have high value and can potentially
compete with opportunity costs and other costs often associated
with conservation. In these instances, and where spatial and
institutional arrangements align, there would be potential for
establishing PES and other incentive schemes to direct certain
conservation land-use behaviours and practices. However, while
the study area is certainly rich in unique fauna and flora, the same
cannot be said for its ecosystem services. The Succulent Karoo
biome ecosystem services values are at the lower end of the scale
when compared with global studies such as Costanza et al. (1997)
and Turner et al. (2007), studies in other more mesic biodiversity
hotspots (Wendland et al., 2009), and even other studies in South
Africa (see Le Maitre et al., 2007b; Blignaut et al., 2008). It is
important to note that comparisons are constrained by the diverse
range of valuation methods used in the literature as well as the lack
of studies carried out in other arid and semi-arid regions. These
lower end values, which compare less favourably with the costs of
conservation than in other parts of the country or world, make it
more challenging to gain international and national support for
conservation or to set up incentive schemes.
Despite their poor appeal at national and international scales,
these regional assessments and valuations in arid areas are useful
in that they allow for comparisons within a region, highlight the
spectrum of services values and when communicated correctly can
emphasise the need for careful management of these services. We
discuss three ways below in which lower values in arid systems
can still be useful in promoting conservation and sustainable
management.
First, where there is congruence with conservation priority
areas ecosystem services (even at the lower end of values) can add
weight to the conservation case. In this study for example, the 10
priority conservation districts all stand out as having some of the
highest values for one or more services. Whilst there is some
variation dependent on valuation approach and the way the value
is expressed, priority districts consistently appear in the top third of
Table 3
Estimates of the value of water as an ecosystem service in the portions of the Magisterial Districts which are found in the Succulent Karoo. Total annual value, value per unit
area, per capita values and flow values estimated as a % of GVA (Gross Value Added) per capita are presented. Highlighted districts are conservation priority areas.
Total annual value ($) Unit area values ($/km2) Value of the service ($ per
capita)
Ecosystem service flow
values (% of GVA per
capita)
Magisterial District Cost Recovery GVA Cost Recovery GVA Cost Recovery GVA Cost Recovery GVA
Calitzdorp $5 612 250 $27 523 250 $4 983.50 $24 440 $630.3 $3 090.8 20% 100%
Calvinia $12 076 523 $71 673 500 $463.38 $1 929 $566.9 $3 364.0 17% 100%
Ceres $83 540 720 $200 762 500 $8 500.25 $20 420 $1 485.1 $3 568.9 42% 100%
Clanwilliam $50 380 392 $140 033 000 $8 783.88 $18 947 $1 567.6 $4 357.3 36% 100%
George $4 287 075 $620 915 500 $3 296.13 $253 262 $31.9 $4 621.9 1% 100%
Ladismith $5 565 789 $39 761 750 $1 520.38 $10 861 $399.5 $2 854.4 14% 100%
Laingsburg $6 246 089 $14 271 375 $830.38 $1 632 $991.5 $2 265.3 44% 100%
Montagu $7 965 000 $79 422 250 $3 302.00 $32 203 $260.1 $2 593.8 10% 100%
Namakwaland $2 960 550 $234 976 750 $61.50 $4 861 $37.5 $2 978.8 1% 100%
Oudtshoorn $18 699 549 $294 724 875 $5 558.75 $87 531 $215.6 $3 398.5 6% 100%
Prince Albert $4 741 620 $14 166 500 $995.75 $1 741 $470.3 $1 404.9 34% 100%
Riversdal $1 795 931 $97 240 250 $2 159.63 $24 779 $62.4 $3 377.9 2% 100%
Robertson $7 314 760 $135 070 875 $4 764.75 $84 383 $211.4 $3 903.6 5% 100%
Steytlerville $2 220 850 $11 884 625 $639.25 $3 317 $389.1 $2 082.1 19% 100%
Sutherland $3 767 254 $17 652 750 $438.25 $1 954 $905.6 $4 243.5 21% 100%
Swellendam $1 008 984 $176 838 625 $913.25 $43 661 $25.3 $4 436.0 1% 100%
Uniondale $5 379 191 $24 337 250 $2 319.50 $7 893 $497.6 $2 251.6 22% 100%
Vanrhynsdorp $2 804 241 $51 792 875 $293.88 $5 428 $182.3 $3 365.1 5% 100%
Vredendal $1 036 662 $160 16 625 $284.75 $43 629 $30.6 $4 739.0 1% 100%
Willowmore $2 457 929 $17 607 875 $631.25 $2 290 $200.3 $1 434.3 14% 100%
Worcester $69 504 398 $690 040 750 $17 194.13 $170 047 $464.8 $4 613.5 10% 100%
Total $299 365 755 $3 120 861 750
Mean $3 234.98 $40 248 $458.4 $3 283.1 16% 100%
P.J. O’Farrell et al. / Journal of Arid Environments xxx (2011) 1e128
Please cite this article in press as: O’Farrell, P.J., et al., The possibilities and pitfalls presented by a pragmatic approach to ecosystem servicevaluation in an arid biodiversity hotspot, Journal of Arid Environments (2011), doi:10.1016/j.jaridenv.2011.01.005

valuations. Of these conservation priority districts three
(Worcester, Robertson, Oudtshoorn) are important in terms of their
water service values (Table 3), while seven (Calvinia, Ladismith,
Oudtshoorn, Sutherland, Namaqualand, Vanrynsdorp, Vredendal)
are important for their grazing service values (Table 1), one
(Namaqualand) for its flower-related tourism values and three
(Ladismith, Calitzdorp, Oudtshoorn) for their scenic tourism values
(Table 2). There is potential for conservation efforts in these
districts to use particular ecosystem services to make their case
(with the right communication tools) for more carefulmanagement
and decision making.
Second, as ecosystem services seldom respect administrative
boundaries and ecosystem services in arid regions require careful
management, regional level analyses can enable the development
of agreements between administrative units regarding ecosystem
service supply. This could lead to a district-level policy for the
adoption of a PES scheme, where payments are made via a district
or promoted by a district and paid by a third party like a conser-
vation organisation to landowners for adopting sustainable land-
use practices. For example land-use practices in districts in upper
river catchments affect down stream users in other districts (Le
Maitre & O’Farrell, 2008). Inter-district level agreements are
required to ensure understanding between service suppliers and
beneficiaries in these cases.
Third, being able to depict where ecosystem services are
provided, who benefits and by how much, can be quite powerful
informers of land and resource use decision making. While the
economic values of ecosystem services in arid areas may not be
comparable to the value of other industries, decision makers
especially in arid areas, are concerned about water, social devel-
opment targets and vulnerable populations. By conducting an
assessment of ecosystem service values in such a spatially explicit
manner at the local land-use decision making scale, studies such as
these have tremendous potential to inform decisions. In this case
the water and grazing services, their value in the regional economy,
and their declining state would be useful information for decision
makers. The challenge now remains to find ways of mainstreaming
this information into the tools and approaches used by decision
makers (Cowling et al., 2008; Reyers et al., 2010). In South Africa
this would include the Spatial Development Framework e a spatial
depiction of the future development trajectory of the region.
Currently these instruments are constrained by inadequate data,
lack of consultation and capacity challenges, but much of the work
done in this pragmatic study would be possible in most parts of the
country and would strengthen these planning tools significantly.
In conclusion, it would appear that the scale of approach is
important. While a regional scale demonstrates significant use in
land-use decision making as highlighted above, the national or
international scale is less useful in land-use decisions, but poten-
tially powerful in directing resources and political will. This is also
evident when reflecting on the ‘value’ of a service where percep-
tions and values are likely to differ between, for example, national
politicians and local farmers. Here the idea of how and where one
chooses to ‘bound’ a study, and in turnwhat and whose perspective
is being valued is evidently significant. Furthermore, such valua-
tions should engage the audience that one is trying to influence
(Cowling et al., 2008).
5. Valuation implications for wellbeing
People living the Succulent Karoo, particularly those in
communal areas and rangelands who have historically been mar-
ginalised, have low income levels (Berzborn, 2007; Hoffman et al.,
2007).While ecosystem service valuesmay be low, there is a tightly
coupled dependence between the people living in this region and
the services provided by the region (James et al., 2005; Allsopp
et al., 2007; Richardson et al., 2007). For example, although
grazing service values may be far lower than those in higher rainfall
regions, the importance of this service to the lifestyle of people of
the Succulent Karoo region goes beyond its economic value
(Berzborn, 2007).
In previous studies the link between human wellbeing and
ecosystem services has been tied to areas with high levels and
values of ecosystem services (e.g. Costanza et al., 1997; Ash et al.,
2009). Marginal environments, critical thresholds of service
supply and the livelihood and cultural values of ecosystem services
are not frequently included in many economic valuation studies. If
we adopt the notion that people, wellbeing and ecosystem services
are integrally linked, and our goal is to improve human wellbeing,
then efforts should also be focussed on these topics and areas with
high dependence on even the most marginal of services. Small
changes to these landscapes and ecosystems, and the subsequent
delivery of services, could have massive positive or negative
implications for those dependent on these services.
This vulnerability to small changes in service supply, as well as
the consideration of livelihood options in arid regions, provides two
helpful avenues for further exploration. The first is the argument in
favour of wellbeing or welfare payments linked to threshold levels
of supply. Where sustainable management is critical for human
wellbeing it raises the possibility for private and public funded PES
scheme establishment, particularly those schemes linked to
ecosystem restoration and even job creation (Wendland et al.,
2009). The case of the Working for Water scheme in South Africa
is an example (van Wilgen et al., 1998). When research demon-
strated the water use of alien woody plants, particularly in areas of
already constrained water availability, this public funded job
creation program to remove alien plants was set up and has
continued to grow in scope and investment (Turpie et al., 2008).
PES schemes can focus on any range of ecosystem service delivery
or value and therefore have the potential to contribute to improved
wellbeing. A limiting factor is the administrative costs associated
with these schemes, which cannot but often does exceed service
values, often necessitating public investment. Within the Succulent
Karoo the supply of the water and tourism services is to a large
degree controlled by the land-use practices of the farmers of this
region. Approaches which reward farmers for adopting sustainable
land-use practices and new practices which diversify away from
a reliance on intensive grazing can increase the potential income
achievable under such management regimes and are likely to have
positive wellbeing and service spinoffs for this region (Le Maitre
et al., 2007a; Le Maitre & O’Farrell, 2008).
The second argument relates to valuing limited yet strategically
important services. The valuation approach that we adopted,
particularly the value per unit surface area, indicated that services
such as the grazing service in the Succulent Karoo had little value.
However, it may have very high value to the beneficiary whose
livelihood, for example, depends primarily on their livestock
particularly in times of hardship and limited options. Whilst we
attempted to overcome these issues by considering per capita
values, district level statistics are indiscriminate and service bene-
ficiaries (especially small vulnerable populations) cannot be
extracted for the total district population. An identified problem
with using mean annual values is that in some cases areas of low
ecosystem service supply have a critical role to play at certain times
of ayear for certain communities. Theseare typically inmarginal and
resource impoverished environments, where annual and mean
value assessments fail to capture the strategic importance of
a marginal resource. Key resource areas are areas which form
a critical component of a resource use or landmanagement strategy
during a year (Illius and O’Connor, 1999). Farmers have developed
P.J. O’Farrell et al. / Journal of Arid Environments xxx (2011) 1e12 9
Please cite this article in press as: O’Farrell, P.J., et al., The possibilities and pitfalls presented by a pragmatic approach to ecosystem servicevaluation in an arid biodiversity hotspot, Journal of Arid Environments (2011), doi:10.1016/j.jaridenv.2011.01.005
strategies to exploit specific resources at certain times of the year
(O’Farrell et al., 2007). Key resource areas are generally limited in
extent and of value at specific times, given their ecology. Once
incorporated into annual district level valuations, their critical role
inmaintaining lifestyles and land-use strategies is lost. Furthermore
some areas of low ecosystem service values still provide a diversity
of services, enabling communities to diversify their livelihood
strategies and reducing vulnerability in hard times (e.g. engaging in
tourism activities and livestock production) e here it is diversity
rather than amount per service that matters (Berzborn, 2007;
O’Farrell et al., 2007). This is significant because it reduces vulner-
ability in an area of low economic activity and low per capita
incomes. Evidently our adopted approach fell well short in recog-
nising important services, valuable service areas, and broader soci-
etal ‘value’. Approaches such as those focussed on inclusive wealth
and the use of resilience measures show promise in filling this gap
(Walker et al., 2009). Returning back to the points made about the
scale of assessment and valuation, the findings of this study make
a strong case for detailed household-level, service-dependence
assessments and valuation (Shackleton and Shackleton, 2006).
Generating an understanding of demand and supply of a service, as
well as understanding the implication of changing services, at a local
level, would be highly informative.
6. Need for improved tools
This study points to the need for better links between ecological
knowledge and social science tools where understanding is inte-
grated. Indicators which measure both ecological function and
human wellbeing need to be developed so as to allow for more
accurate assessment and in turn monitoring into the future, espe-
cially within the context of potential PES schemes. If we are to
proceed towards sustainable land-use practices with ecosystem
services integrated into land-use and development plans, then
socio-economic data collection needs to be informed by ecosystem
service assessment requirements. This will also allow for marginal
analyses approaches in the future. We need to improve our data
capture, valuation and reporting tools, so that the nuances and the
detail of service supply and benefit are not lost.We also need robust
ways of capturing the non-monetary values that are critical to the
sense of identity and belonging that underpin the social structures
and cohesion that are needed for individual and communal human
wellbeing. Finally, we need some consensus on data, methods and
approaches for pragmatic valuation approaches which do not
requiremassive amounts of funding nor take years to be completed,
if valuation exercises are to feed into formal PES schemes and other
conservation and wellbeing tools where such huge ranges in
numbers would be problematic.
References
Allsopp, N., Laurent, C., Debeaudoin, L.M.C., Samuels, M.I., 2007. Environmentalperceptions and practices of livestock keepers on the Namaqualand Commonschallenge conventional rangeland management. Journal of Arid Environments70 (4), 740e754.
Anderson, P.M.L., Hoffman, M.T., 2007. The impacts of sustained heavy grazing onplant diversity and composition in lowland and upland habitats across theKamiesberg mountain range in the Succulent Karoo, South Africa. Journal ofArid Environments 70 (4), 686e700.
Archer, S., 2000. Technology and ecology in the Karoo: a century of windmills, wireand changing farming practice. Journal of Southern African Studies 26 (4),675e696.
Ash, N., Blanco, H., Brown, C., Garcia, K., Hendrichs, T., Lucas, N., Ruadsepp-Hearne, C., Simpson, R.D., Scholes, R., Tomich, T., Vira, B., Zurek, M., 2009.Ecosystems and Human Well-Being: A Manual for Assessment Practitioners.World Resources Institute, Washington, D.C., USA.
Balmford, A., Cowling, R.M., 2006. Fusion or failure? The future of conservationbiology. Conservation Biology 20 (3), 692e695.
Balmford, A., Bruner, A., Cooper, P., Costanza, R., Farber, S., Green, R.E., Jenkins, M.,Jefferiss, P., Jessamy, V., Madden, J., Munro, K., Myers, N., Naeem, S., Paavola, J.,Rayment, M., Rosendo, S., Roughgarden, J., Trumper, K., Turner, R.K., 2002.Economic reasons for conserving wild nature. Science 297 (5583), 950e953.
Balmford, A., Rodrigues, A.S.L., Walpole, M., ten Brink, P., Kettunen, M., Braat, L., deGroot, R., 2008. The Economics of Ecosystems and Biodiversity: Scoping theScience. European Commission, Cambridge, UK.
Barnes, J.I., Humavindu, M.N., 2003. Economic Returns to Land-Use Options inGondwana Canyon Park, Karas, Namibia. Environmental Economics Unit,Ministry of Environment and Tourism, Namibia, for Nature Investments (Pty) Ltd.Sourced. http://www.span.org.na/Reports%20%20and%20Publications/Conservation%20Needs%20Assessment.pdf.
Beinart, W., 2003. The Rise of Conservation in South Africa. Settlers, Livestock andthe Environment 1770e1950. Oxford University press, Cape Town.
Belnap, J., Lange, O.L., 2003. Biological Soil Crusts: Structure, Function, andManagement. Springer-Verlag, Berlin.
Berzborn, S., 2007. The household economy of pastoralists and wage-labourers inthe Richtersveld, South Africa. Journal of Arid Environments 70 (4), 672e685.
Birol, E., Karousakis, K., Koundouri, P., 2006. Using economic valuation techniques toinformwater resources management: a survey and critical appraisal of availabletechniques and an application. Science of the Total Environment 365, 105e122.
Blignaut, J.N., De Wit, M., 2004. Sustainable Options: Development Lessons fromApplied Environmental Economics. UCT Press, Cape Town.
Blignaut, J.N., Milton, S., Cupido, C.F., 2006. The Economic Value of ControllingInvasive Alien Plant Species in the Succulent and Nama Karoo Biomes of SouthAfrica. Working for Water Programme, Department of Water Affairs andForestry, Pretoria.
Blignaut, J., Marais, C., Rouget, M., Mander, M., Turpie, J., Klassen, T., Preston, G.,2008. Making Markets Work for People and the Environment: EmploymentCreation from Payment for Eco-Systems Services Combating EnvironmentalDegradation and Poverty on a Single Budget while Delivering Real Services toReal People. South African Government, Pretoria.
Brauman, K.A., Daily, G.C., Duarte, T.K., Mooney, H.A., 2007. The nature value ofecosystem services: an overview highlighting hydrological services. AnnualReview of Environment and Resources 32, 67e98.
CEPF, 2003. The Succulent Karoo hotspots. Namibia and South Africa. Ecosystemprofile. Critical Ecosystem Partnership Fund. Conservation International,Washington.
CSIR, 2007. Geospatial Analysis Platform and NSDP Spatial Profiles. Incorporating SAMesoframe Version 2. The Presidency, dti, GTZ, EDAP. Built Environment CSIR,Pretoria.
Carpenter, S.R., Folke, C., 2006. Ecology for transformation. Trends in Ecology andEvolution 21, 309e315.
Chan, K.M.A., Shaw, M.R., Cameron, D.R., Underwood, E.C., Daily, G.C., 2006.Conservation planning for ecosystem services. Plos Biology 4 (11), 2138e2152.
Chan,K.M.A., Pringle, R.M., Ranganathan, J., Boggs, C.L., Chan, Y.L., Ehrlich, P.R., Haff, P.K.,Heller, N.E., Al-Krafaji, K.,Macmynowski, D.P., 2007.When agendas collide: humanwelfare and biological conservation. Conservation Biology 21 (1), 59e68.
Chavas, J.-P., 2000. Ecosystem valuation under uncertainty and irreversibility.Ecosystems (3), 11e15.
Costanza, R., 2003. Social goals and the valuation of natural capital. EnvironmentalMonitoring and Assessment 86 (1e2), 19e28.
Costanza, R., dArge, R., deGroot, R., Farber, S., Grasso, M., Hannon, B., Limburg, K.,Naeem, S., ONeill, R.V., Paruelo, J., Raskin, R.G., Sutton, P., vandenBelt, M., 1997.The value of the world’s ecosystem services and natural capital. Nature 387(6630), 253e260.
Costanza, R., Fisher, B., Mulder, K., Liu, S., Christopher, T., 2007. Biodiversity andecosystem services: a multi-scale empirical study of the relationship betweenspecies richness and net primary production. Ecological Economics 61 (2e3),478e491.
Cowling, R.M., Pierce, S.M., 1999. Namaqualand: A Succulent Desert. FernwoodPress, Cape Town.
Cowling, R.M., Esler, K.J., Rundel, P.W., 1999a. Namaqualand, South Africa - anoverview of a unique winter-rainfall desert ecosystem. Plant Ecology 142 (1e2),3e21.
Cowling, R.M., Esler, K.J., Rundel, P.W., 1999b. Special issue editorial: the plantecology of Namaqualand, South Africa. Plant Ecology 142 (1e2), 1e2.
Cowling, R.M., Egoh, B., Knight, A.T., O’Farrell, P.J., Reyers, B., Rouget’ll, M., Roux, D.J.,Welz, A., Wilhelm-Rechman, A., 2008. An operational model for mainstreamingecosystem services for implementation. Proceedings of the National Academyof Sciences of the United States of America 105 (28), 9483e9488.
Crafford, J.G., Hassan, R.M., King, N.A., Damon, M.C., de Wit, M.P., Bekker, S.,Rapholo, B.M., Olbrich, B.W., 2004. An Analysis of the Social, Economic, andEnvironmental Direct and Indirect Costs and Benefits of Water Use in IrrigatedAgriculture and Forestry. Report No. 1048/1/04. Water Research Commission,Pretoria.
Daily, G.C., Matson, P.A., 2008. Ecosystem services: from theory to implementation.Proceedings of the National Academy of Sciences of the United States ofAmerica 105 (28), 9455e9456.
Daily, G.C., Polasky, S., Goldstein, J., Kareiva, P.M., Mooney, H.A., Pejchar, L.,Ricketts, T., Salzman, J., Shallenberger, R., 2009. Ecosystem services in decisionmaking: time to deliver. Frontiers in Ecology and Environment 7, 21e28.
De Lange, W.J., 2006. Multi-criteria Decision-Making for Water Resource Manage-ment in the Berg Water Management Area. Stellenbosch University,Stellenbosch.
P.J. O’Farrell et al. / Journal of Arid Environments xxx (2011) 1e1210
Please cite this article in press as: O’Farrell, P.J., et al., The possibilities and pitfalls presented by a pragmatic approach to ecosystem servicevaluation in an arid biodiversity hotspot, Journal of Arid Environments (2011), doi:10.1016/j.jaridenv.2011.01.005

De Lange, W., Kleynhans, T.E., 2007. Towards more inclusive long term bulk waterresource management. Agrekon 46, 371e397.
De Lange, W., Kleynhans, T.E., 2008. Long-term water resource management insemi-arid areas: a South African case study. International Journal of SustainableDevelopment and Planning 3, 1e19.
Deacon, H.J., Deacon, J., Brooker, M., Wilson, M., 1978. The evidence for herding atBoomplaas Cave in the southern Cape, South Africa. South African Archaeo-logical Bulletin 33, 39e65.
Desmet, P.G., 2007. Namaqualand - a brief overview of the physical and floristicenvironment. Journal of Arid Environments 70 (4), 570e587.
Egoh, B., Rouget, M., Reyers, B., Knight, A.T., Cowling, R.M., van Jaarsveld, A.S.,Welz, A., 2007. Integrating ecosystem services into conservation assessments:a review. Ecological Economics 63 (4), 714e721.
Farley, J., Brown Gaddis, E.J., 2007. Restoring natural capital: an ecologicaleconomics assessment. In: Aronson, J., Milton, S.J., Blignaut, J.N. (Eds.), RestoringNatural Capital: Science, Business and Practice. Island Press, Washington DC,USA, pp. 17e27.
Fisher, B., Christopher, T., 2007. Poverty cand biodiversity: measuring the overlap ofhuman poverty and the biodiversity hotspots. Ecological Economics 62 (1),93e101.
Fisher, B., Turner, R.K., 2008. Ecosystem services: classification for valuation. Bio-logical Conservation 141 (5), 1167e1169.
Fisher, B., Turner, K., Zylstra, M., Brouwer, R., de Groot, R., Farber, S., Ferraro, P.,Green, R., Hadley, D., Harlow, J., Jefferiss, P., Kirkby, C., Morling, P., Mowatt, S.,Naidoo, R., Paavola, J., Strassburg, B., Yu, D., Balmford, A., 2008. EcosystemServices and economic theory: integration for policy-relevant research.Ecological Applications 18 (8), 2050e2067.
Görgens, A.H.M., Hughes, D.A., 1982. Synthesis of streamflow information relatingto the semi-arid Karoo biome of South Africa. South African Journal of Science78, 58e68.
Gillson, L., Hoffman, M.T., 2007. Rangeland ecology in a changing world. Science315, 53e54.
Hassan, R.M., Okbrich, B., 1999. Comparative analysis of the economic efficiency ofwater use by plantation forestry and irrigation agriculture in the Crocodilecatchment. Agrekon 38, 566e575.
Heal, G., 2000. Valuing ecosystem services. Ecosystems 3 (1), 24e30.Hein, L., van Koppen, K., de Groot, R.S., van Ierland, E.C., 2006. Spatial scales,
stakeholders and the valuation of ecosystem services. Ecological Economics 57(2), 209e228.
Herling, M.C., Cupido, C.F., O’Farrelldu, P.J., du Plessis, A., 2009. The financial costs ofecologically non-sustainable farming practices in a semi-arid system. Restora-tion Ecology 17 (6), 827e836.
Hewitson, B.C., Crane, R.G., 2006. Consensus between GCM climate changeprojections with empirical downscaling: precipitation downscaling over SouthAfrica. International Journal of Climatology 26 (10), 1315e1337.
Hoffman, T., Ashwell, A., 2001. Nature Divided. Land Degredation in South Africa.University of Cape Town Press, Cape Town.
Hoffman, M.T., Rohde, R.F., 2007. From pastoralism to tourism: the historical impactof changing land use practices in Namaqualand. Journal of Arid Environments70 (4), 641e658.
Hoffman, M.T., Allsopp, N., Rohde, R.F., 2007. Sustainable land use in Namaqualand,South Africa: key issues in an interdisciplinary debate. Journal of Arid Envi-ronments 70 (4), 561e569.
Illius, A.W., O’Connor, T.G., 1999. When is grazing a major determinant of rangelandcondition and productivity?. In: People and Rangelands: Building the Future,pp. 419e424. Proceedings of the 6th International Rangeland Congress.
James, I., Hoffman, M.T., Cowling, R.M., Roberts, R., Campbell, B.M., Boumans, R.,Allsopp, N., 2005. Valuing Namaqualand’s Natural Resources: The Costs andBenefits of Communal, Commercial and Conservation Land Use Practices inNamaqualand Incorporating Ecological, Economic and Social Values. Leslie HillInstitute for Plant Conservation and Terrestrial Ecology Research Unit, Univer-sity of Cape Town, Cape Town.
James, I., Hoffman, T., Munro, A., O’Farrell, P., Smart, R., 2007. The value of flowertourism at the Namaqua National Park. South African Journal of Economic andManagement Sciences 10 (4), 442e456.
Jelinski, D.E., Wu, J.G., 1996. The modifiable areal unit problem and implications forlandscape ecology. Landscape Ecology 11 (3), 129e140.
Keay-Bright, J., Boardman, J., 2006. Changes in the distribution of degraded landover time in the central Karoo, South Africa. Catena 67 (1), 1e14.
Lange, G., Hassan, R., 2006. The Economics of Water Management in SouthernAfrica: An Environmental Accounting Approach. Edward Elgar, Cheltenham, UK.
Lange, G.-M., Mungatana, E., Hassan, R.M., 2007. Water accounting for the OrangeRiver Basin: an economic perspective on managing a transboundary resource.Ecological Economics 61, 660e670.
Le Maitre, D., O’Farrell, P., 2008. Social-ecological resilience in a dry environment:people and water resources in the Little Karoo. In: Burns, M., Weaver, A. (Eds.),Advancing Sustainability Science in South Africa. Sun Press, Stellenbosch, SouthAfrica.
Le Maitre, D.C., Milton, S.J., Jarmain, C., Colvin, C.A., Saayman, I., Vlok, J.H.J., 2007a.Linking ecosystem services and water resources: landscape-scale hydrology ofthe Little Karoo. Frontiers in Ecology and the Environment 5 (5), 261e270.
Le Maitre, D.C., O’Farrell, P.J., Reyers, B., 2007b. Ecosystems services in South Africa:a research theme that can engage environmental, economic and social scien-tists in the development of sustainability science? South African Journal ofScience 103 (9e10), 367e376.
Ludwig, D., 2000. Limitations of economic valuation of ecosystems. Ecosystems 3,31e35.
MacKellar, N.C., Hewitson, B.C., Tadross, M.A., 2007. Namaqualand’s climate: recenthistorical changes and future scenarios. Journal of Arid Environments 70 (4),604e614.
Mittermeier, R.A., Gil, P.R., Pilgrim, J., 2005. Hotspots Revisited: Earth’s BiologicallyRichest and Most Endangered Terrestrial Ecoregions. Conservation Interna-tional, Washington D.C.
Moolman, C.E., Blignaut, J.N., Van Eyden, R., 2006. Modelling the marginal revenueof water in selected agricultural commodities: a panel data approach. Agrekon45, 78e88.
Mucina, L., Rutherford, M.C., 2006. The Vegetation of South Africa, Lesotho andSwaziland. Strelitzia 19. South African National Biodiversity Institute, Pretoria.
Mucina, L., Jurgensle Roux, N., le Roux, A., Rutherford, M.C., 2006. Succulent Karoobiome. In: Mucina, L., Rutherford, M.C. (Eds.), The Vegetation of South Africa,Lesotho, and Swaziland. Strelitzia, Pretoria.
Naidoo, R., Iwamura, T., 2007. Global-scale mapping of economic benefits fromagricultural lands: implications for conservation priorities. Biological Conser-vation 140, 40e49.
Nelson, E., Mendoza, G., Regetz, J., Polasky, S., Tallis, H., Cameron, D.R., Chan, K.M.A.,Daily, G.C., Goldstein, J., Kareiva, P.M., Lonsdorf, E., Naidoo, R., Ricketts, T.H.,Shaw, M.R., 2009. Modeling multiple ecosystem services, biodiversity conser-vation, commodity production, and tradeoffs at landscape scales. Frontiers inEcology and the Environment 7 (1), 4e11.
Nieuwoudt, W.L., Backeberg, G.R., Du Plessis, H.M., 2004. The value of water in theSouth African economy: some implications. Agrekon 43, 162e183.
Norgaard, R.B., Barnard, P., Lavelle, P., 2007. Assessing and restoring natural capitalacross scales: lessons from the millennium ecosystem assessment. In:Aronson, J., Milton, S.J., Blignaut, J.N. (Eds.), Restoring Natural Capital: Science,Business and Practice. Island Press, Washington DC, USA, pp. 36e43.
O’Farrell, P.J., Donaldson, J.S., Hoffman, M.T., 2007. The influence of ecosystem goodsand services on livestock management practices on the Bokkeveld plateau,South Africa. Agriculture Ecosystems & Environment 122 (3), 312e324.
O’Farrell, P.J., Reyers, B., Le Maitre, D.C., Milton, S.J., Egoh, B., Maherry, A., Colvin, C.,Atkinson, D., De Lange, W., Blignaut, J., Cowling, R.M., 2010. Multi-functionallandscapes in semi arid environments: implications for biodiversity andecosystem services. Landscape Ecology 25 (8), 1231e1246.
Redford, K.H., Adams, W.M., 2009. Payment for ecosystem services and the chal-lenge of saving nature. Conservation Biology 23 (4), 785e787.
Reyers, B., O’Farrell, P.J., Cowling, R.M., Egoh, B.N., Le Maitre, D.C., Vlok, J.H.J., 2009.Ecosystem services, land-cover change, and stakeholders: finding a sustainablefoothold for a semiarid biodiversity hotspot. Ecology and Society 14 (1).
Reyers, B., Roux, D.J., Cowling, R.M., Ginsburg, A.E., Nel, J.L., O’ Farrell, P., 2010. Puttingconservation plans to work: conservation planning as a transdisciplinary process.Conservation Biology. doi:10.1111/j.1523e1739.2010.01497.x.
Richardson, F.D., Hahn, B.D., Hoffman, M.T., 2007. Modelling the sustainability andproductivity of pastoral systems in the communal areas of Namaqualand.Journal of Arid Environments 70 (4), 701e717.
Rouget, M., Cowling, R.M., Vlok, J., Thompson, M., Balmford, A., 2006. Getting thebiodiversity intactness index right: the importance of habitat degradation data.Global Change Biology 12 (11), 2032e2036.
SKEP, 2003. SKEP: A 20 Year Strategy. The Botanical Society of South Africa, CapeTown.
SKEP, 2008. Succulent Karoo Ecosystem Programme Rapid Appraisal Report.A discussion paper in preparation for strategic planning 2009e2014. SANBI,Cape Town.
Safriel, U., Adeel, Z., Niemeijer, D., Puigdefabregas, J., White, R., Lal, R., Winslow, M.,Ziedler, J., Prince, S., Archer, E., King, C., 2005. Dryland systems. In: Hassan, R.,Scholes, R.J., Ash, N. (Eds.), Findings of the Conditions and Trends WorkingGroup of the Millennium Ecosystem Assessment. Ecosystems and Human Well-being, Vol. 1. Island Press, Washington, D.C., USA, pp. 623e662.
Scholes, R.J., 1998. The South African 1:250 000 Maps of Areas of HomogeneousGrazing Potential. Division of Water, Environment and Forestry Technology,CSIR, Pretoria.
Shackleton, C.M., Shackleton, S.E., 2006. Household wealth status and naturalresource use in the Kat River valley, South Africa. Ecological Economics 57,306e317.
Shackleton, C., Shackleton, S., Gambiza, J., Nel, E., Rowntree, K., Urquhart, P., 2008.Links between Ecosystem Services and Poverty Alleviation: Situation Analysisfor Arid and Semi-arid Lands in Southern Africa. Ecosystem Services andPoverty Reduction Research Programme. DFID, NERC, ESRC, DFID, UK.
Simpson, R.D., 1998. Economic analysis and ecosystems: some concepts and issues.Ecological Applications 8, 342e349.
Smith, A.B., 1983. Prehistoric pastoralism in the Southwestern Cape, South-Africa.World Archaeology 15 (1), 79e89.
Statistics South Africa, 2002. Census of Agriculture Provincial Statistics 2002:Western, Northern and Eastern Cape Financial and Production Statistics.Statistics South Africa, Pretoria.
Statistics South Africa, 2007. A National Poverty Line for South Africa. DiscussionPaper. Statistics South Africa, National Treasury, Pretoria. http://www.treasury.gov.za/publications/other/povertyline/TreasuryStatsSApovertylinediscussionpaper.pdf.
Sutton, P.C., Costanza, R., 2002. Global estimates of market and non-market valuesderived from nighttime satellite imagery, land cover, and ecosystem servicevaluation. Ecological Economics 41 (3), 509e527.
P.J. O’Farrell et al. / Journal of Arid Environments xxx (2011) 1e12 11
Please cite this article in press as: O’Farrell, P.J., et al., The possibilities and pitfalls presented by a pragmatic approach to ecosystem servicevaluation in an arid biodiversity hotspot, Journal of Arid Environments (2011), doi:10.1016/j.jaridenv.2011.01.005

TEEB, 2008. The Economics of Ecosystems and Biodiversity: An Interim Report.European Commission, Brussels. www.teebweb.org (accessed 01.09.09.).
Tallis, H., Polasky, S., 2009. Mapping and valuing ecosystem services as an approachfor conservation and natural-resource management. Year in Ecology andConservation Biology 1162, 265e283.
Thompson, M., Vlok, J.H.J., Rouget, M., Hoffman, M.T., Balmford, A., Cowling, R.M.,2009. Mapping grazing-induced degradation in a semi-arid environment:a rapid and cost effective approach for assessment and monitoring. Environ-mental Management 43 (4), 585e596.
Thornton, G., Feinstein, K., 2003. The Tourism Industry in the Western Cape isGrowing. Get All the Statistics and Figures in our Western Cape Trends Card.Tourism, Hospitality & Leisure Specialists South African member of GrantThornton International. Sourced from. http://www.wesgro.co.za/February2008.
Todd, S.W., Hoffman, M.T., 1999. A fence-line contrast reveals effects of heavygrazing on plant diversity and community composition in Namaqualand, SouthAfrica. Plant Ecology 142 (1e2), 169e178.
Turner, R.K., Adger,W.N., Brouwer, R.,1998. Ecosystem services value, research needs,and policy relevance: a commentary. Ecological Economics 25 (1), 61e65.
Turner, R.K., Paavola, J., Cooper, P., Farber, S., Jessamy, V., Georgiou, S., 2003. Valuingnature: lessons learned and future research directions. Ecological Economics 46(3), 493e510.
Turner, W.R., Brandon, K., Brooks, T.M., Costanza, R., da Fonseca, G.A.B., Portela, R.,2007. Global conservation of biodiversity and ecosystem services. Bioscience 57(10), 868e873.
Turner, R.K., Morse-Jones, S., Fisher, B., 2010. 2010. Ecosystem valuation. Asequential decision support system and quality assessment issues. Annals of theNew York Academy of Sciences 1185, 79e101.
Turpie, J.K., Joubert, A.R., 2004. The value of flower tourism on the BokkeveldPlateau, a botanical hotspot. Development Southern Africa 21 (4), 645e662.
Turpie, J.K., Marais, C., Blignaut, J.N., 2008. The working for water programme:evolution of a payments for ecosystem services mechanism that addresses bothpoverty and ecosystem service delivery in South Africa. Ecological Economics65 (4), 788e798.
United Nations, 2006. System of Environmental Economic Accounting for WaterSourced from. http://unstats.un.org/unsd/envaccounting/ceea/PImeetings/Handbook_Voorburg.pdf February 2009.
Van Rooyen, M.W., Grobbelaar, N., Theron, G.K., van Rooyen, N., 1990. Theephemerals of Namaqualand: effects of photoperiod, temperature and moisturestress on development and flowering of three species. Journal of Arid Envi-ronments 19, 15e29.
van Wilgen, B.W., Le Maitre, D.C., Cowling, R.M., 1998. Ecosystem services, effi-ciency, sustainability and equity: South Africa’s working for water programme.Trends in Ecology & Evolution 13 (9), 378.
Van der Merwe, F.J., Smith, W.A., 1991. Dierevoeding. Animal Science Uitgewers(Pty) Ltd, Cape Town.
Walker, B., Pearson1, L., Harris, M., Maler, K.-G., Li, C.-Z., Biggs, R., Baynes, T., 2009.Incorporating resilience in the assessment of inclusive wealth: an example fromSouth East Australia. Environmental and Resource Economics. doi:10.1007/s10640-009-9311-7.
Wendland, K.J., Honzak, M., Portela, R., Vitale, B., Rubinoff, S., Randrianarisoa, J.,2009. Targeting and implementing payments for ecosystem services:opportunities for bundling biodiversity conservation with carbon and waterservices in Madagascar. Ecological Economics. doi:10.1016/j.ecolecon.2009.01.002.
Wilson, K.A., McBride, M.F., Bode, M., Possingham, H.P., 2006. Prioritizing globalconservation efforts. Nature 440, 337e340.
Wunder, S., 2005. Payments for Environmental Services: Some Nuts and Bolts.CIFOR. Occasional Paper No. 42.
P.J. O’Farrell et al. / Journal of Arid Environments xxx (2011) 1e1212
Please cite this article in press as: O’Farrell, P.J., et al., The possibilities and pitfalls presented by a pragmatic approach to ecosystem servicevaluation in an arid biodiversity hotspot, Journal of Arid Environments (2011), doi:10.1016/j.jaridenv.2011.01.005