LABORATORY - International Nuclear Information System (INIS)
Upload
khangminh22Category
view
2download
0
NO. TATÜA-R-9QA7-F
TITLE
Development of improved procedures for evaluationof neutron cross sections for reactor neutron dosimetry
FINAL PKPORT FOR THE PERIOD
1977-10-O1 - 1980-02-29
AUTHOR(S)
Herbert Vonach
INSTITUTE
Institute für Radiumforschung und KernphysikViennaAustria
INTERKATIONAL ATOMIC ENERGY AGENCY
DATE June 1980

/7
Final Report on Research Contract 2047/R1XRB
Evaluation of the Cross-Sections for the Reactions19F(n,2n)18F, 31P-(H",P)31Sl', 93Mb(n,n')33mNb and103Rh(n,n')103mRh.
Institut für Radiumforschung und Kernphysik der
Universität Wien
Chief Scientific Investigator Prof. Dr. H. Vonach
March 1979 - May 1980
Table of Contents
AbstractI. IntroductionII. Use of theoretically calculated cross-sections in the
evaluations11.1. General Procedure11.2. Details on the model calculationIII.The 19F(n,2n) reaction1I1.1. Experimental data base111.2. Evaluation and results thereof
31IV. The P(n,p) reactionIV.1. Experimental data baseIV. 2. Statistical model calculationsIV.3. Evaluation and results thereofV. The 93Nb (n,n')93mNb reactionV.1. Experimental data baseV. 2. Statistical model calculationsV.3. Evaluation and results thereofVI. The 103Hh (m1 )103mBh reactionVI.1. Experimental data baseVI.2. Statistical model calculationsVI.3. Evaluation and results thereofVII. Derivation of the relative correlation matrices
- 13 -and relative excitation functions or measurement« relative to
abstract
The cross-sections for the four important neutron dosimetry
reactions 19F(n,2n)18F, 31P(n,p)31Si, 93Nb(n,n»)93mNb and103Rh(n,n*)1O3mRh were evaluated in the neutron energy range
from threshold to 20 MeV.
For the F(n,2n) reaction the evaluation could be based entirely
on experimental data; for the reactions P(n,p) Si and103Rh (n,n')103inRh large gaps in the experimental excitation
functions and large discrepancies between the existing data
made it necessary to supplement the experimental data by cross-
section calculations and to give about equal weight to the ex-
perimental and calculated cross-sections. For the Nb(n,n') "1Nb
reaction the evaluation had to be based entirely on
the theoretically calculated cross-sections.
All data sets were critically reviewed and obviously erroneous
data sets were disregarded. If- necessary, the data were re-
normalized in order to take into account adjustments in
corresponding standard cross-sections and decay schemes.
The cross-section calculations were performed using the statisti-
cal model of nuclear reactions allowing for precompound
processes in the first reaction step and errors of the cal-
culated cross-sections were estimated from their sensitivity
to the various input parameters'.
Cross-section values were evaluated for energy groups between
0.1 MeV and 1 MeV wide, the width depending on both the slope

of the excitation functions and the density of the available
data.
For each evaluated cross-section also an uncertainty (on a
1a confidence level) was derived taking into account
the errors given by the experimentalists, the general con-
sistency of the experimental data and the estimated errors
of the theoretically calculated cross-sections. In addition
relative correlation matrices were derived for each evaluated
excitation function describing the correlations between the
uncertainties of the cross-sections at different energies .
The correlations between the cross-section uncertainties
for different reactions were found to be negligible.
The results of this evaluation as well as those of Ref. 1/
will be combined with the ENDF/B-V doslmetry file into an
international neutron dosimetry file by the nuclear data section
of the IAEA.
J

nI« Introduction
In order to satisfy the increasing demand for neutron
cross-section evaluations providing also information on the
uncertainties of the evaluated data and their correlations,
the authors recently developed procedures for deriving values
of the diagonal and, at least approximately, also of the non-
diagonal elements of the covariance matrices of the evaluated
cross-sections and applied these procedures to four neutron
threshold reactions chosen for their importance in fast
neutron dosimetry /1/.
In continuation of this work four more threshold reactions,
the 19P(n,2n)18F, 31P(n,p)31Si, 93Nb(n,n')93mNb and
Rh(n,n') Rh reactions,were evaluated using the general
procedures outlined in Reference 1 •
The reactionswere chosen in close cooperation with the
nuclear data section of the IAEA. Just as in the case of the
reactions.evaluated in Ref. 1 reactions not yet contained in
the ENDF/B dosimetry file, but also requested as important
for dosimetry purposes especially by European users, were
selected. ,,••'• - • • ' ' ' 19 18,For the reaction F(n,2n) F the experimental data were
sufficient for an evaluation based exclusively on measured
cross-sections, for the other three reactions, however,
the situation was much worse and it became necessary to give
considerably more weight to theoretical cross-section
calculations than in the evaluations of Ref. 1.19Thus for th« reaction F(n,2n) th« «valuation was per-

1 - 2 -
formed exactly according to the rules described in R ef. 1,
chapter II, for the other three reactions the experimental
data were processed also as outlined in Ref. 1., however,
in addition theoretical cross-section curves were calculated
and included into the evaluation.
The uncertainties of the calculated cross-sections as
well as estimates of their correlation coefficients were
derived from calculated sensitivities of the cross-sections
to changes of the various input parameters within their admissible
limits. This whole procedure which has not yet been used in
Ref. 1 is described in detail in chapter II.

- 3 -
II. Use of theoretically calculated cross-sections in evaluations
II.1. General procedure
II.1.1. Use of statistical model calculations as independent
source of information in addition to the experimental
data base.
Already in the evaluations of Ref. 1 statistical model cal-
culations were used to fill smaller gaps in the measured
excitation function (e.g. the region of O - 2 MeV above
threshold in the Cu(n,2n) and Zr(n,2n) reactions).
In these cases, however, rather accurate cross-section measure-
ments existed over most of the energy range and therefore
the parameters used in the calculations were adjusted to fit
the known part of the excitation function and by these con-
straints a rather accurate estimate of the cross-sections
in the unmeasured region became possible. Of course in this
procedure the theoretical values are not independent of the
measured values but highly correlated with them.
This procedure is appropriate if at least a considerable part
of the excitation function is known more accurately than it
can be calculated at present considering the uncertainties of
the input parameters of nuclear reaction model calculations.
If, however, the quality of the experimental data is com-
parable or worse than that of cross-section model calculations
the quality of the evaluation will be improved considerably
if theoretically calculated cross-sections are used as a second
independent source of information. The set of calculated cross-
section values with estimated 1o uncertainties and correlation
- 4 -
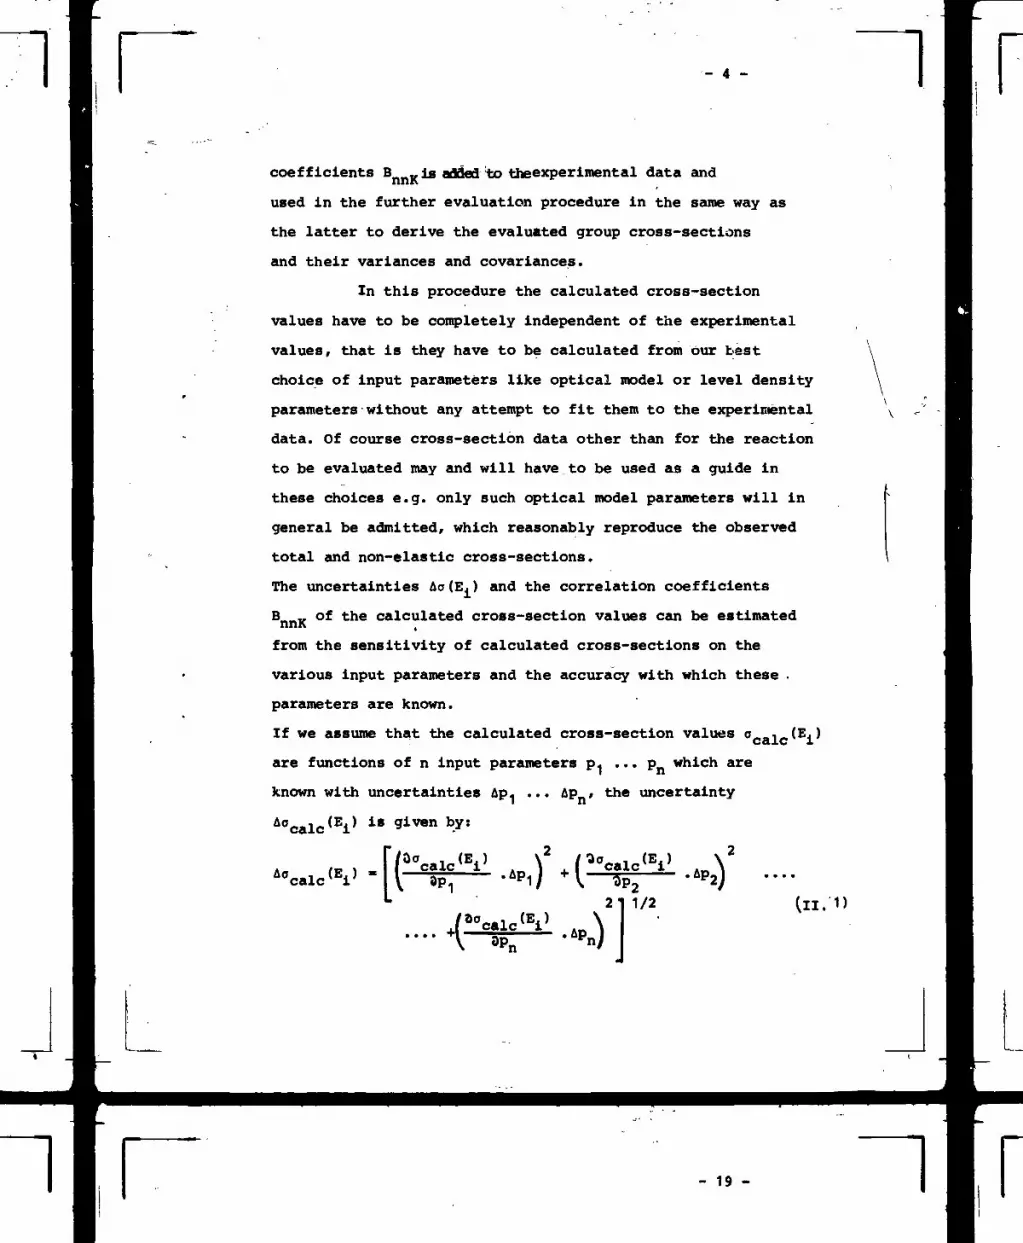
coefficients B Kis added to theexperimental data and
used in the further evaluation procedure in the same way as
the latter to derive the evaluated group cross-sections
and their variances and covariances.
In this procedure the calculated cross-section
values have to be completely independent of the experimental
values, that is they have to be calculated from our best
choice of input parameters like optical model or level density
parameters without any attempt to fit them to the experimental
data. Of course cross-section data other than for the reaction
to be evaluated may and will have to be used as a guide in
these choices e.g. only such optical model parameters will in
general be admitted, which reasonably reproduce the observed
total and non-elastic cross-sections.
The uncertainties Ao(E.) and the correlation coefficients
B „ of the calculated cross-section values can be estimatednnK ,from the sensitivity of calculated cross-sections on the
various input parameters and the accuracy with which these .
parameters are known.
If we assume that the calculated cross-section values °caic(Ej)
are functions of n input parameters p^ • • • Pn which are
known with uncertainties Ap1 ... Apn, the uncertainty
i8
'calc1 iI ..P1) t(Üf
i (E ) \ca^-c * .Ap lOpn
Fn/
1/2

- 5 -
whereby the quantities 5 - A p will in general be derived from"m
the changes in cross-sections if all parameters except p are
kept fixed and only the parameter p in question is changed
by the estimated amount Apm from its most probable value.
Likewise the covariances <Ao , (S.).Aa , (E.,)> of the cal-
culated values have to be estimated. The uncertainties of the
calculated cross-section values for different energies
are certainly correlated to a rather high degree due to the
very fact that most parameter changes result in an increase
or decrease of,the whole excitation function.
For any two energies E. and E., this covariance can be estimated
as: - - '--•
<&'calc(Ei)A<Icalc<Ei'»=
'calc'V
With the results of equation(H.'l)and(lL.Z)the relative correlation
coefficient B.
as
(II.3)
.UIl
, .., (see Ref. 1, p. 10) can be calculated
Bnn' • ;kk '
<Agoalc(Ei}'
k - k' « index characterizing the particular set of cal-
culated cross-sections.
By averaging over all pairs of energies E. and E.,, one
finally gets the quantity B ^ characterizing the average
degree of correlation between the cross-section values at

- 6 -
different energies.
Of course a considerable amount of information is lost
in this averaging procedure, but if the calculated cross-
sections are evaluated together with the experimental ones foe which
only such average correlation coefficients B . can be esti-
mated the more detailed information available on the covariance
matrix of the calculated cross-sections can not yet be utilized
at present.
In cases where the theoretical cross-sections are the only
available source of information of course the values S- ,calcare identical with the evaluated group cross-sections and the
covariance matrix is given by equ II.2).
Correlations between the calculated cross-sections for different
reactions and between the calculated cross-sections and the
measured cross-sections will in most cases be very small and
will be neglected in all cases.
The described method of evaluation using calculated cross-
sections as a completely independent additional source of
information will be used whenever the experimental data base
is insufficient especially in the following cases.
a) If no reliable experimental data exist.
b) if only one data set is available; as discussed in Ref.1
(p. 133) especially for the case of the Zn(n,p) reaction
taking just one data.set may lead to a dangerous underesti-
mation of the uncertainties of the evaluated group cross-
sections .
c) if the uncertainties of all experimental values are about
equal or larger than the uncertainties achievable in cross-
section calculations (20 - 30%).

- 7 -
In the present work the above procedure was used for the93Nb(n,n')93inNb evaluation (case a).
II. 1.2. Use'of statistical model calculations in conjunction
with an accurate cross-section value at one energy
In many cases there are no experimental data in a
large energy region (e.g. 1O - 2O MeV) except for
one small energy range usually 14 - 15 MeV where rather
good cross-section measurements are available, which are far more
accurate than the theoretical values computed according to Il.1.1.
In such cases thei ciost accurate information on the excitation
function can be obtained by jointly exploiting the theoretical
and experimental information in the following way:
1) An evaluated cross-section and its uncertainty are calculated
according to the standard procedures for the one accurately
measured energy group.
2) A tL- *;. tical excitation function is calculated using cur best
a priorichoice of input parameters as described in the pre-
ceding section.
3) Due to its rather large uncertainties this excitation
function will in general not exactly agree with the experimen-
tal group cross section derived in step 1. Thus the input
parameters will be slightly modified (within their known un-
certainties) in 'order to fit the theoretical curve to the one
measured group cross-section and that excitation function is
used as evaluated cross-section. Of course this procedure is
not unique as in general the necessary adjustment can be
achieved by variation:, of a number of different parameters
- 22 -

- 8 -
resulting in a number of slightly different excitation
functions .
However, as yet we found that in all cases investigated
up to now, these adjustments were very small and con-
sequently the choice which parameter to adjust was not
critical.
4) For calculation of the variances and covariances of the
evaluated group cross-sections, however, we must not
use equation (II.1 ) -(H. 3) , but have to take into
account the constraints on the parameter space imposed
by the condition that we do know an accurate cross-section
value at one energy. This is dene approximately in the
following way:
Input data to the calculation are the one known group
cross-section °exD(E.«)
the matrix of uncertainties
its uncertainty Aaexp(E4) and
'-
according to IZ. 1.1.
Within the limits of - Ap1 any linear combination of
variations of the parameters is permissible, provided the
resulting uncertainty A°caic(E.j) does not exceed Aoexp (*••})•
A band representing the permissible uncertainty range for
the excitation function is therefore generated by displacing
the excitation function by applying parameter variation Apnj) at E. byand replacing it to within the limits of
simultaneously applying a fraction of a second parameter
variation

- 9 -
(II.4) °optimum calc*Ei
ApP
Ap
condition: £ < 1 and
(II.5) - °calc
This can be done to a sufficient precision by some 1O
suitably chosen combinations n;m. As "calculated excitation
function" the center value of the generated band is given,
the uncertainty is taken equal to the width of the band.
Covariances are calculated as given by formula (II.2 ),
but taking now the combined variation of each pair n;m
as one parameter variation in the sense of formula (II.2 ):
(Apn + f*Apm) 4 Apn,

- 10 -
II.2. Details of the model calculations
All calculations were performed using the computer code STAPRE
/2/. This code serves for the computation of energy-averaged
cross-sections for particle induced nuclear reactions with <several
emitted particles and gamma-rays under the assumption of sequential
evaporation. For the first evaporation step preequilibrium particle
emission is included and treated on the basis of the exciton
model; for the equilibrium part the width fluctuation corrected
flauser-Feshbach formula is applied. For the further evaporation
steps only the usual Hauser-Feshbach formula is used. Y-competition
was accounted for from the second compound nucleus on , for the
Tfc(n,n') Tto calculations at low energies even- fro» the first compound nucleus en
Jh general, the following input parameter« are used as our best a priori choice:
a) Optical Model Parameters:
Neutrons: As all cross-sections are rather sensitive to the
choice of the neutron potential, for each case all available
potentials are investigated for their fit to total and especial-
ly non-elastic cross-section, and strength function and a choice
is then made as discussed with the individual reactions.
Protons: Becchetti-Greenlees /3/ for A>4O
a-particles: Huizenga-Igo /4/
b) Level densities: The back-shifted Fermi gas model is used,
with the parameters- of DiIg et al. /5/ assuming values of
the spin cutoff parameters corresponding to the full<
rigid body moment of inertia. In the «xciton »odel part,
the particle-hoi« stat« densities ar« calculated with a single
particle stat« density g obtained fro« th« F«rmi gas
«-parameter as g- A a. However, no pairing correction«
were used for the particle-hole state densities.
- 11 -
c) Precompound matrix element: Energy and mass dependence Is
taken according to ref. 6, the value of the constant FM is21 —1adjusted so as to give a value of approximately 5.1O s
for the transition rate from 3 to 5 exciton states at 21 MeV
according toGadioli et al. /7/.
d) Particle emission rates in preequilibrium stage /7/
e) Y-competition: For E1 radiation the energy dependence of
the y-decay width according to the giant dipole resonance
model of Axel /8/ was used. For the other multipolarities
(M1, E2, M2, E3, M3) energy independent y-strengthUfunctions
were used. An overall normalization of the y~ray trans-
mission coefficients was obtained by adjustment of the
total s-wave neutron radiation width at the neutron binding
energy to an experimental value r~.
f) Discrete levels in all residual nuclei were used up to the
highest excitation energies for which reliable spin and parity
assignments exist. Unless otherwise indicated this in -
formation wat. taken from Nuclear Data Sheets.
This general choice of parameters was used for the cases of93Nb(n, n')93mNb and 103Rh(n, n')1O3*Rh. For the 31P(n, p)
reaction, however, use was made of the extensive evaluation work
of B. Strohmaler /10/ and the parameters found to give a best
fit to all neutron induced reaction on phosphorus were used.
F - 13 -and relative excitation functions or measurements relative to
different standards were reported in one paper, the paper was
split into its two parts for further processing and correspon-
dingly there appear two entries in Tab.HI.I.for such papers
(Bormann 67, Bormann 65, Nagel 66).
Detailed examination of the above measurements resulted in
rejection of 7 measurements for the following reasons:
Picard 61 and Picard 63: identical with Picard 65
Picard 65: Relative excitation function did not allow ad-
equate renormalization due to strongly deviating
shape«.
Strohal 64: Shape of excitation function disagrees strongly
with all other data.
Nagel 65: superseded by Nagel 66
Shiokawa 68: deviates by more than 6 standard deviations from
average
Rayburn 61: deviates by ybout 8 standard deviations from
average
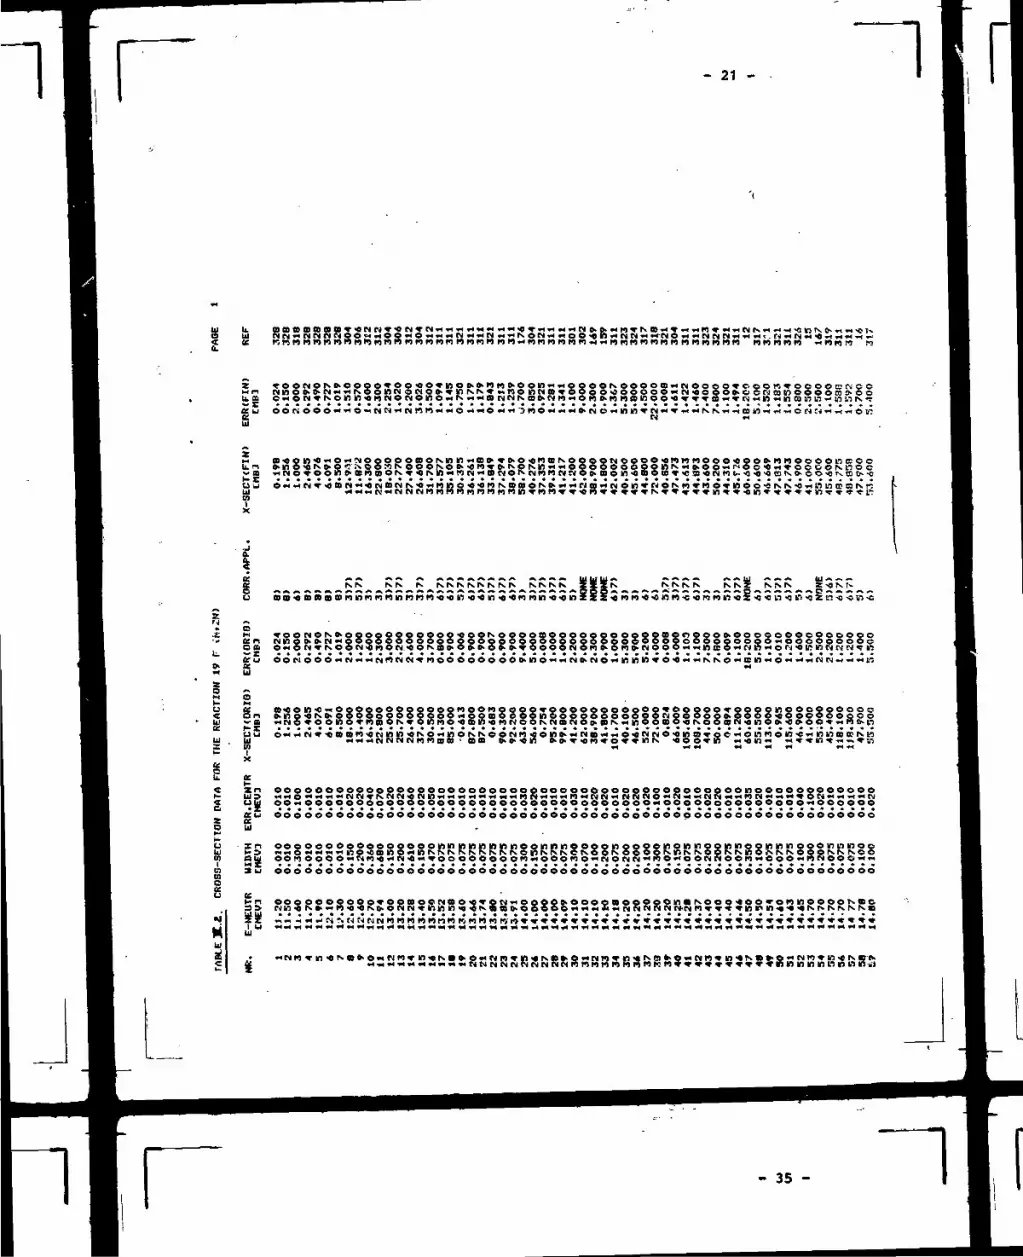
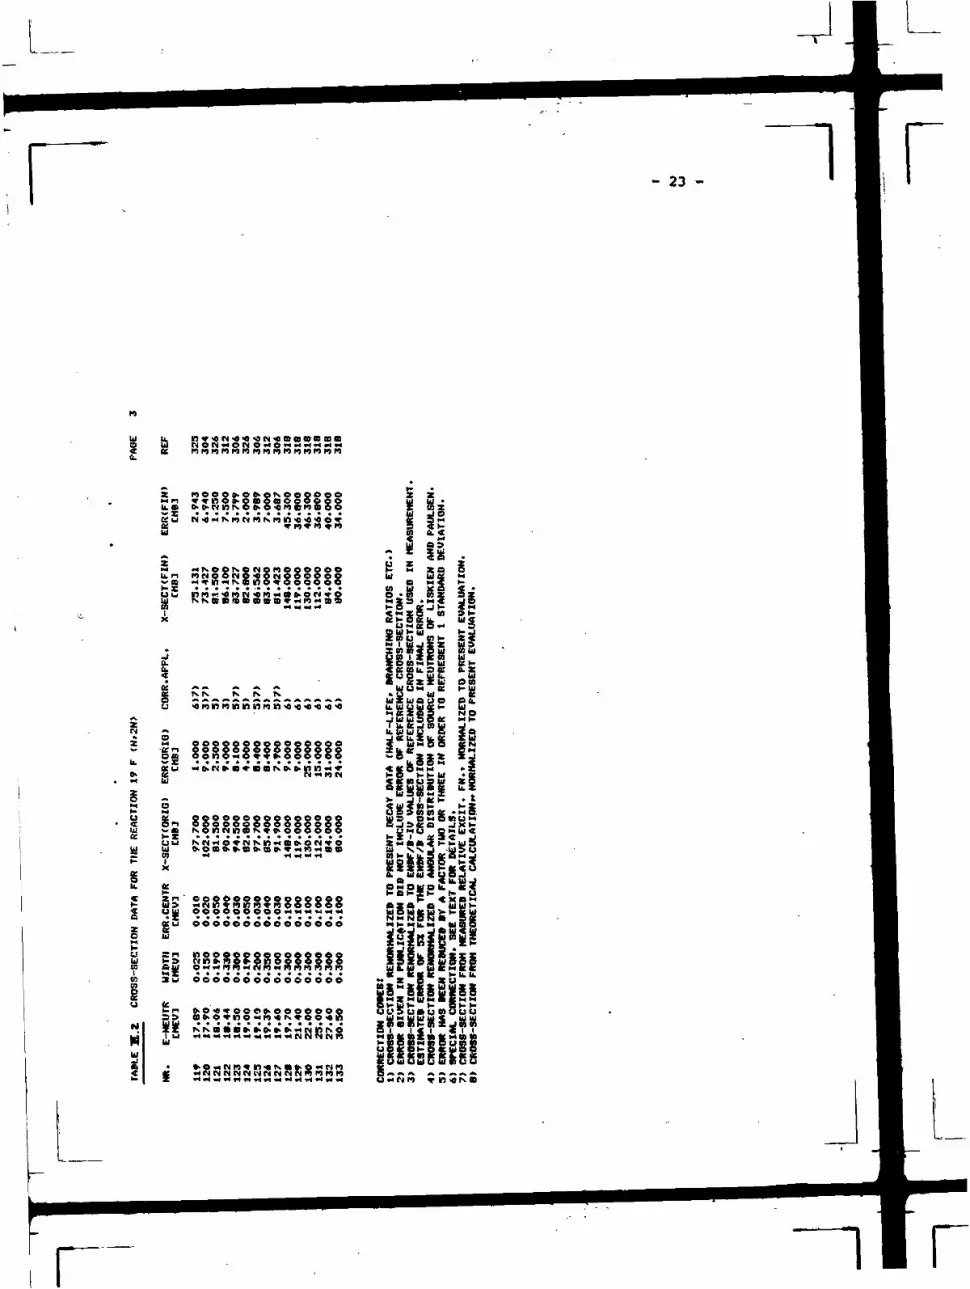
The cross section data from all accepted measurements are
summarized in Table XZI.2. The table lists all cross section
measurements in order of increasing neutron energy. For
each data point the following quantities are listed:
the average neutron energy and the energy spread (half-width
at half maximum) of the neutrons used for the measurement, the
uncertainty of the average neutron energy, the cross section
values and errors as given by the authors, an indication
which renormalization procedures have been applied to both
cross sections and errors according to general'rules of R«f. 1,
section II and finally the renormalized cross section values
and errors. The renormaiized cross section values are also
shown in Fig. IIX.1. The uncertainties in the average neutron

- 14 -
energy E centr. not given in most papers were either estimated
from the experimental conditions as described in the papers
or in a few cases obtained by communicating with the authors.
As indicated in Table III.2. cross sections and errors were
partly renonnalized according to the general procedures out-
lined in Ref.1. section XI. If not specially indicated in
Tab. III.2., the following standards were taken:
a) Decay scheme as given in Table of Isotopes. As there have
been no significant improvements to these data for many
years, no corrections had to be applied for such changes.
b) Reference cross sections for the reactions Fe(n,p),
^5Cu(n,2n) and 235U(n,f) from the ENDP/B-IV file.
An estimated error of 5% has been assigned to such reference
values and included in the final error of the renormalized
cross section.
In the following cases special corrections had to be
applied instead of or in addition to the procedures specified
above:
Pasquarelli 67: The systematic errors in absolute beta-counting
using fixed solid angle and rather thick samples
due to self-absorption and scattering are probably
at least 5%, therefore the total error given
in the paper seems unrealistic and was increased
to 6%.
Vonach 68: cross-section was renormalized to Al (n,o) re-
ference cross-section of 112.0-1.4 mb according
to the precision measurement of Vonach et al./28/,
which

- 15 -
appears at present more accurate than the. ENDF/B
values
Chatterjee 69 and Csikai 67: cross-section was renormalized to
Cu(n,2n) reference cross-sections from the
evaluation of Tagesen et al. /1/.
Bormann 67: Bormann gives mutually inconsistent results for
measurements with two teflon sample thicknesses.
Only the results of the measurements with the thin
sample which suffers less from scattering effects
were used. In addition his errors (only statistical)
were increased by quadratic addition of an assumed
3% error for scattering effects from the rather bulky
target construction.
5 relative excitation functions have been renormalized to the
"preliminary evaluated excitation function" (absolute data points
only, see /1/, p. 4).
The «normalization factors R and errors/4R are:
Ref.Rayburn 62
Bormann 65 A
Bormann 67 A
Vonach 68
Bormann 67 B
R.727
.886
.413
49.34
.769
(%)3.15
3.02
0.79
2.42
2.31

- 16 -
In the energy region from threshold to 12.6 MeV there is only
1 data point available, however from theoretical considerations
the general shape of the excitation function near threshold should
follow to a good approximation!
O1 (E) « const, «r (E -
6 additional points, referenced Vonach 79, have been added, by
extrapolating the low energy end of the evaluated excitation
function according to formula (III.1) , including a smooth
continuation of the errors.

- 17 -
»H O IM PJ 1-* "O 8 8 m n n n n « n S S 2 * K "*M PJ n *-i T*
t M
£ s!
S m- S•o T
§ iI P
g §
L. SSo
N M K ID w O «
i §
S iff C
. i l•; - f -
*4 «» *4
i i
- ; c ü =• 3 3 0 =
5 g
-^
I S S
S u ~ ~ =IH 5 -I U Ul
n n n n
- 31 -

- 18 -
CROSS SECTION ( 10 flBl
ro
i en
9 Q 4
(n2'"" 2m22oig OT 2 moo t. 01 oi 3Ji-ItD mm — \J0120) l" m BB 01 M OB ff) Ol 01 01 U)
PO
t i i
- 19 -
References to Table III.1. and Fig. III.1.
Paul 53: E.B. Paul and R.L. Clark, Can J. Phya. 31 (1953) 267
Ashby 58: V.J. Ashby et al., Phys. Rev. 111 (1958) 616
Brill 61: U.D. Brill et al., Soviet. Phys. Doklady 6 (1961) 24
Rayburn 61: L.A. Rayburn, Phys. Rev. 122 (1961) 168
Picard 61: J. Picard et al., J. Phys. Rad. 24 (1963) 813
Cevolani 62: M. Cevolani and S. Petralia, Nuov. Cim. 26 (1962) 1328
Rayburn 62: L.A. Rayburn, Proc. Conf. on Direct Interactions and
Nuclear Reaction Mechanisms, Padua 1962
Strohal 64: P. Strohal et al., Phys. Lett. 1O (1964) 104
Bormann 65: N. Bormann et al., Nucl. Phys. 63 (1965) 438
Nagel 65: W. Nagel and A.H.W. Aten jr., Physica 31 (1965) 1O91
Picard 65: J. Picard and C.F. Williamson, Nucl. Phys. 63(1965)673
Nagel 66: W. Nagel, Thesis, Univ. Amsterdam 1966
Bonaann 67: M. Bormann and I. Riehle, Z.f.Physik 2O7 (1967) 64
Csikai 67: J. Csikai and G. Peto, Acta Physica Hungarica 23 (1967)87
Menlove 67: H.O. Nenlove et al., Phys. Rev. 163 (1967) 13O8
Pasquarelli 67: A. Pasquarelli, Nucl. Phys. A93 (1967) 218
Shiokawa 68: T. Shiokawa et al.,.-J. Inorg. and Nucl. Che» 30(1968)1
Vonach 68: H.K. Vonach et al., Proc. Conf. Neutron Cross-Sections
and Technology, Hahington 1968, p. 885
Chatterjee 69: A. Chatterjee, Nucl. Phys. and Solid State Phys.
Symp., Roorke (India) 1969, Vol. 2, p. 117
Crumpton 69: D. Crumpton et al., J. Inorg. and Nucl. Che».31(1969)1

- 20 -
Mogharrab 72: R. Mogharrab and H. Heuert, Atomkemenergie 19
(1972) 107
Robertson 73: J.C. Robertson et al., J. Nucl. En. 27 (1973) 531
Ryves 78: T.B. Ryves, P. Kolkowski and K.J. Zieba, J. Phys. G. 4
(1978) 1783
- 21 -
S u.Ill »« N t» •< «*
u. a o«
Z
L."
£«NN N N N N N N N N N N N N N ZXZK KNTvN NNZ N N N
gn NnS o> n«a oxonvNO
> o o B o o o O Q O o o o o o B o r > Q o o o > o o 9 Q o o o e o e o o o e
C- ^« U
C Su et wco n« M O o o o o o o tC On 0*10 P *C N »> O O O OO OO <UI — B «NO » O O I O O T M B O N «K Uu OMill . UX 10
§ n^
Nn«»o><en
<o ine«oc«nnn < o« in in iBaN««oovn — -« « « « T ^- in * . — - w,
IL «
£ S5ooSooooooooooooooooooSoooooooooooooooMOOoeooooooooooxoooooo
1 =*"g C6
ooonnnnnn
NOOo«oovonnooooNBC«»»»»«!««! •« • • • •NNNNNNB
< N r « f J N fj M M M M M M n M I») W M W W»<tW»«»»»T»»»»*»»»»««»**«««»**»»»»»*»
- 35 -

- 22 -
NMs N N NNNNNNIVKNISNNNNNNKtrkNrtNNNNK f». NK K N K Isivlv MV KN r<. N N
- r •i s "i is giii§iigii§ii§iiiiim!Hiii§ii§i§i§iiii§§miiii§imii?:SU W M N N « * NI • M M M M M
! i...H W> **•*
2 ?* 0^
i§000000» * o o o o o o o o o o o * o o o e » e « * e * * « * * * o * e o * « * o o o
u o o o e o e o o e e e o o * * * o * * o « o * * * * « o * 4OAO
ClJ
- 23 -
« ce nnnnnnnn nnnnnn
Ii
te. ~~
NOM *-
M oocoooooee«Sn öoeoooeeoo<K öonoxo T » o> o <
"• Za5 Si -U K OOOOQ
K £rUu N N ft O »
U U CKOO
UU OOOOOOOÖO*
>-o i*z xjUi O O M «gKJSHM^ >2
> W ' K >• * »gu fin i- t-zE 5 n <« tf .MO
Ss eSSiBuW-l »SO -JXh-U t-*U O M U <t-* F «s« j
zfi*«?'KUSJ -U 5 u
Cu OOOOOOOOOOOOOOO
3u 0000OOOOO0OOOOO
Ie
"'BIM
- 24 -
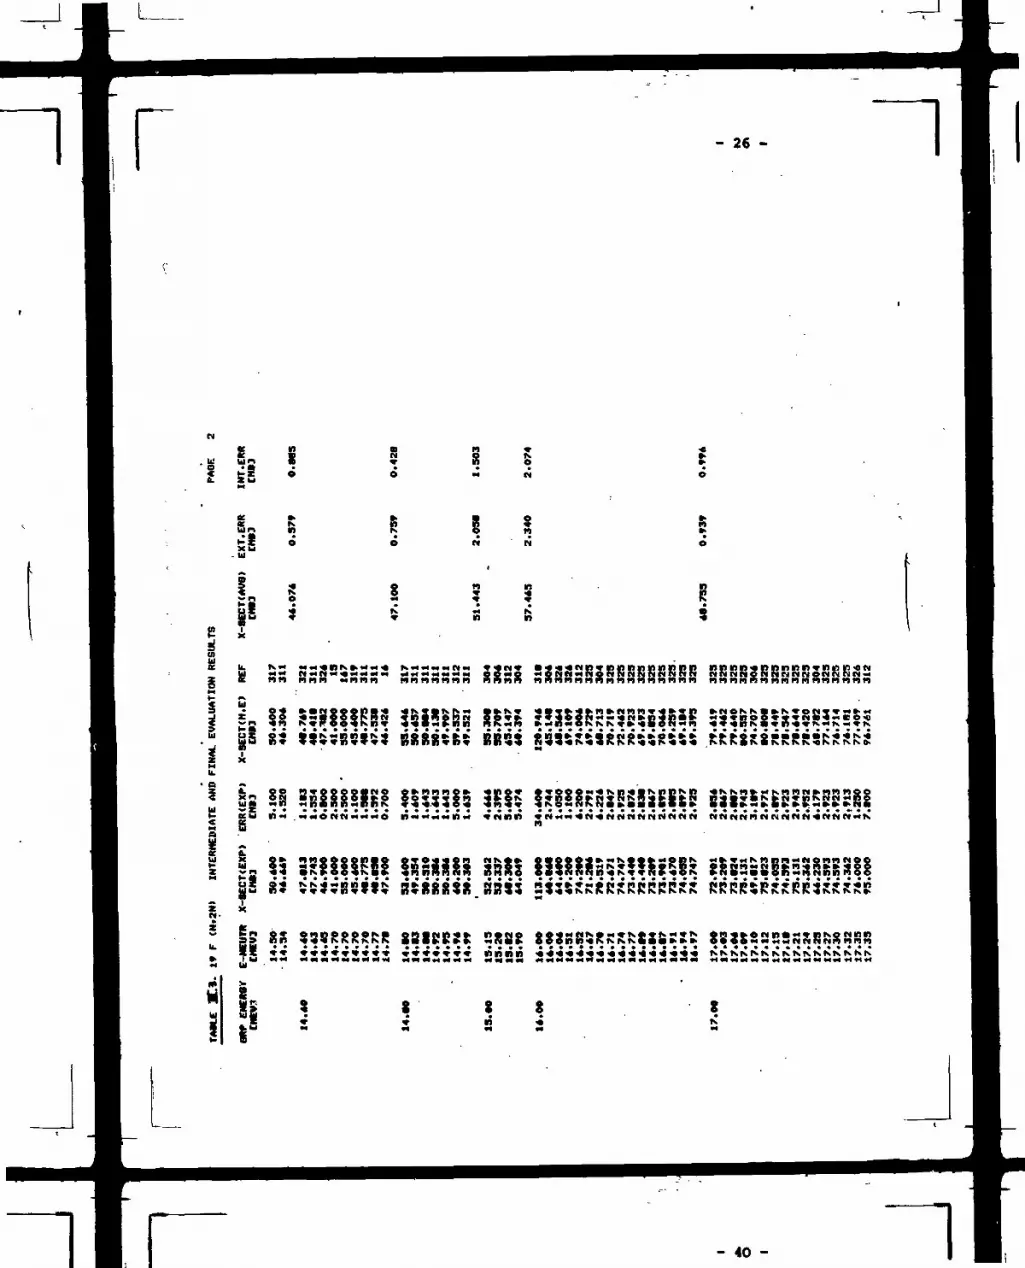
III»2. Evaluation and results thereof
The intermediate (column 5) and final result« (colunn 7, 8
and 9) of the evaluation procedure according to Ref. 1. ,
chapter II,step« 4 and 5 are listed in Table III.3. The final
results are sunmariied again in Table III.4.
As there is no evidence'for strong cross section fluctuations
for this reaction« the energy group size has been chosen mainly
governed by the availability of data points, up to 12.4 HeV it is
the identical repetition of the extrapolated data points, to
14 MeV the group width of .4 MeV has been chosen to ensure at
least 2 independent data sources per group, to 15 MeV there are
sufficient data to allow the reasonable minimum (due to neutron
energy spread) of .2 MeV, and finally up to 2O MeV a group width
of 1 MeV is sufficient and adequate in view of the few data and
the smooth course of the excitation function.
Fig. III.2. shows the final results and the previous
evaluation of Lapenas /9/. Above 14 MeV our values are
15% lower than Lapenas1 predictions. This is Mainly due
to the Inclusion of some recent precision measurement»
(Robertson 73, Ryves 78) not yet contained in Lapenas'
evaluation.

B B
O o 0 o n
u5 tO ^ *4 «0 *4
Sn - 8 v S SO M N v « a N2 8
i i
- 25 -
Lu UJ f"io -a
•r *Q o o r») w v CD0 * 4 n n N O n KOO Ö O O « Ö «4
nö
gO
U. B • • • p • • w« «M M v •• M * N M M M M M M M M <««MMMM(M*.*>M n»rv«o^r - — —u N ft *«(* n n M 00*4 *<Q e*«p«««(«< N«<««N«4*« ptoK«*««oo4in*« r i C M M x r ^ o ^ xK n n nn n n n nnn nrt Ani^nnn n n n n n n « f tnnnnn««» n n r a n n n r a n
* • * w ID * *« Q »«w » »»p P» <• • «4 •*• n n n •»<*«• «•«••»is.'ioooons« - 8 s? s s i :.: ES «hsR SKBSBS $..!»1(111«K& • • • • • • * « * « • « • * • » • • • « • • « • • « • « • • • • • • »•« o r. »• ax »«too-o
M x M M M N M *' » fc ü 5 S C M n » M M M N ( M < * «n nnnnnn «vnvwcn«« *
? & » o ON o ^ *• ooo ov o o-• o v n ofe^nn*» O O R M M O O O O N O O O O B M N O ooovcxn N « £»- i- N M Mixe on N O N o r v n N S V M n onrinvoSSo-« oööoo-irj-c ococ-cu u* o M SN V N O " "•» nN O N O A O M N M M J I N N isfc». Sn-ön ».n n*nod-«vv V Q M V T Ji- KW ö ö N O o o M MOM NN M N n n M . OM. O M M i i n O M M M ^ N O M n n v N M V M M t C N Ü M B11 Ul **
X -n M i§O M MN V <0 • N M «N M « ttm N K « M n nM M M N M i M N N n n n n w N O
W » N » »W» »in«»-o
a» R R *K * M n 4*K
x W
*• 9
J *5 t ? S 8 8 8 ?^ Z M M M M N N N? r
»-O
Nn
8N
rinvninn •«•«N*«»»-nnnnnn nnnnnn
N S
n n
O O O O O M• v v v v v v
SV
MMMM NNNNNNNn V V V v n
V V V V V V V V V V V V V V V V V
N VV V
L
r - 26 -
~n e
M M « n N » M M < « N X M M M f <• <• N p • M n n n n n n n nSSSSSSSSSSSSSSS
nnift vn nin -OM
S0 11
i Sen
IU HM MM »••••«•<»•< «Nnn *NMM«N«NNnriNMNiMn MN nnnn r4nnn-*Mn NM
5 Sn
M U
nnnnnn - N N K N N N N N N N N K T V NMv4 *«*4*4*«*4*4*«««*f*«**««**«*««4 «4«<*«««««««««*l«4«4«4M*4v4
S S
- 40 -

L__
i2S *
I ,I 8
i s.I &i
i Iini S
IL*
r
s a
s .K9 . N
•fc • '«
^2 I
SsS828 3J2S*
m-Kn nnp>n jo
523 8<88f
- 27 - \
- 41 -
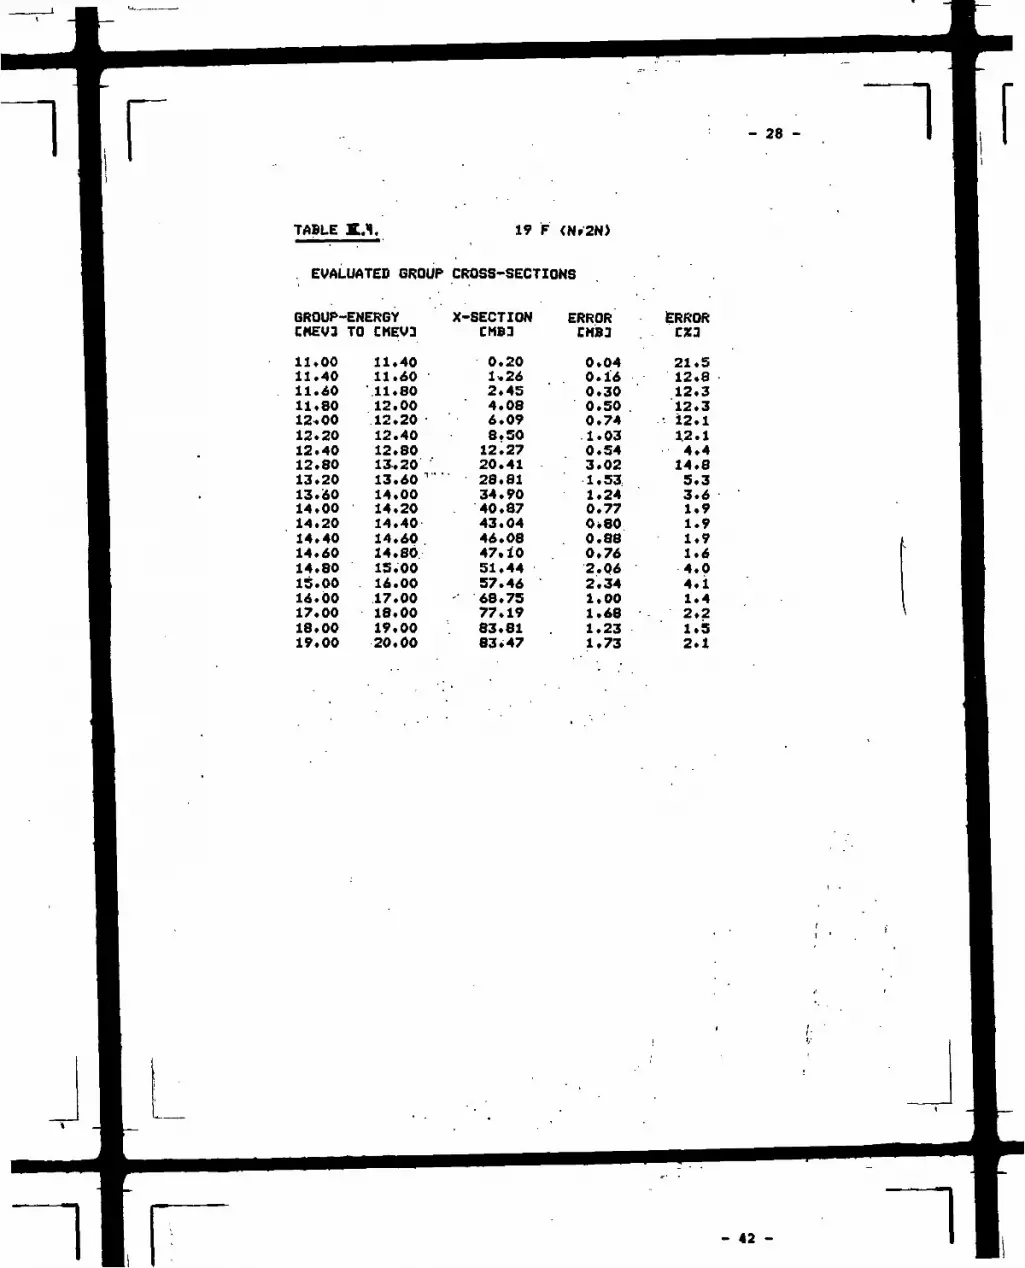
r - 28 -
TABLE ».M, 19 F <N»2N>
EVALUATED GROUP CROSS-SECTIONS
GROUP-ENERGY X-SECTIONCMEV3 TO
11.0011.4011.6011.8012.0012.2012.4012.8013.2013.6014.0014.2014.4014.6014.8015.0016*0017.0018.0019.00
CMEV3
11.4011.6011.8012.0012.2012.4012.8013.2013.60 1 - -
14.0014.2014*4014.6014.8015.0016.0017.0018.0019.0020.00
CMB3
0.201.262.454*086*098.5012.2720.4128.8134.9040.8743.0446.0847.1051.4457.4668.7577.1983.8183.47
ERRORCMBa
0.040.160.300.50 .0.741.030.543.021*531.240.770.800.880,762.062.341.001.681.231.73
ERRORCX3
21.512*812.312.3
• 12.112.14.414.85.33.61.91.91.91.64.04.11.42.21.52.1

- 29 -
CVI- .
C
OO
LOj
CVJ
ID LA «• K» ' OJ
IfU Ol ] NOU33S SS(KP
- 43 -

r - 30 -
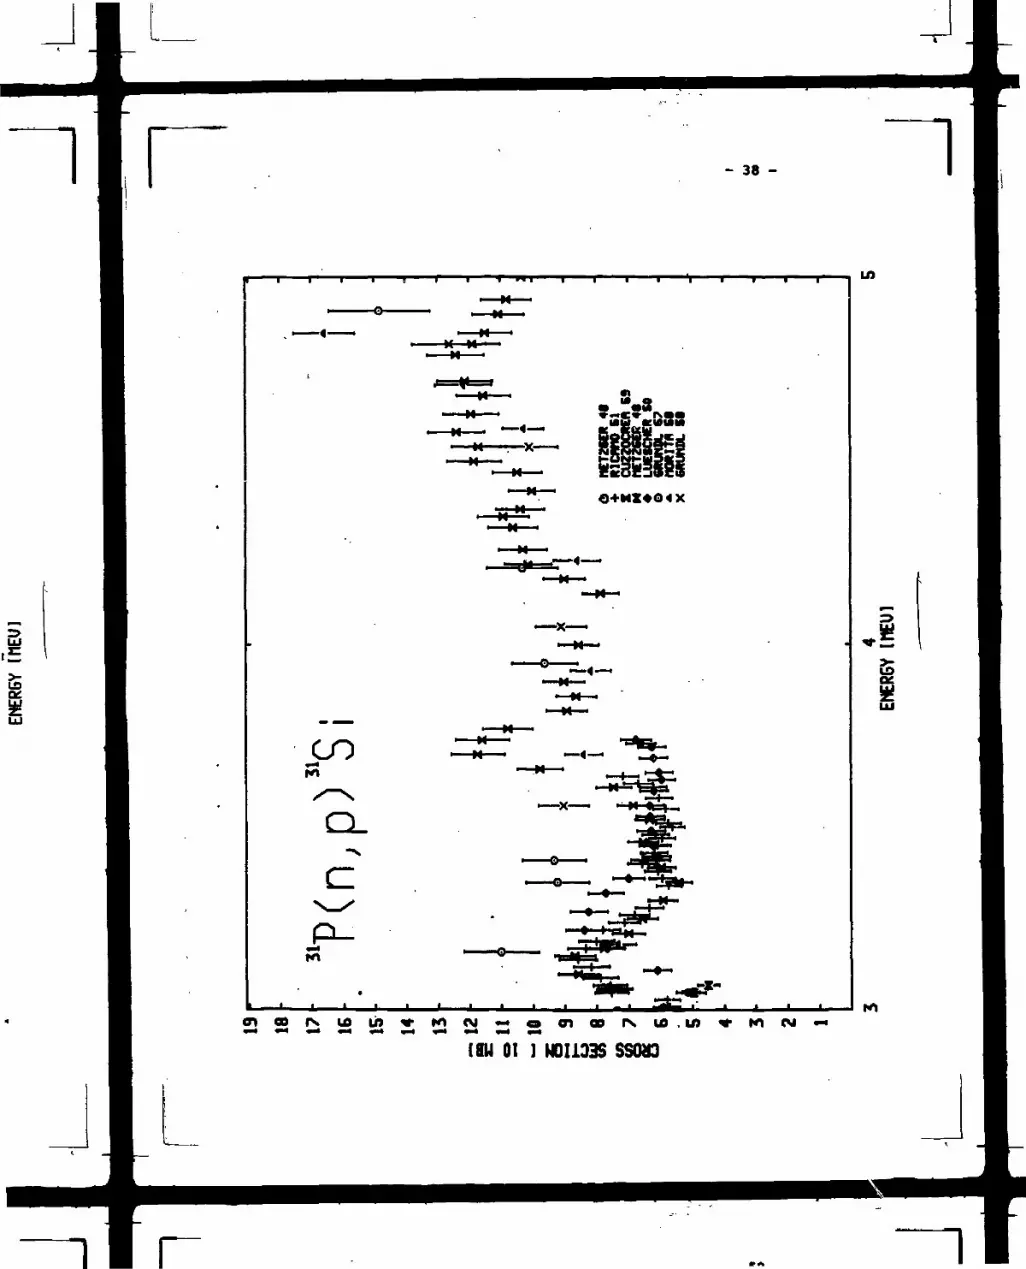
IV. Tho 31P(n,p)31Si reaction
IV. 1. Experimental data base
To establish the data base, a literature search has been per-
formed in two steps.
a) Two very comprehensive compilations, namely CINDA
up'to Supplement 79 (1 Oct. 1979) and the threshold reaction
compilation EANDC 95 "U" (Feb. 1974) have been used as
index to existing literature.
b) The most recent editions of some journals most likely to
contain relevant publications have also been semrhal up to March 1980.
The original papers have1 been looked up, whenever available
checking simultaneously that references cited therein were
already contained in the literature list. The most important
information on the 16 experiments found in this way is
briefly summarized in Table IV.1. Columns 1 to 7 give the
energy range of the experiment, the number of cross-section
measurements within this range, the method used to detect
either the induced activity or the particles produced in the
considered reaction, the method used to determine the neutron
flux, the first author and date of the respective paper and
the reference number used furtheron In the compilation.
In case the cross-section was measured relative to some other
cross-sections it is indicated whether this reference cross-
section had been taken from an earlier own absolute measure-
ment of the authors, in which case the measurements were also
considered as absolute measurements, as discussed in Ref.1,
II.1., Step 1.
- 31 -
Detailed examination of the above measurements resulted in
rejection of 4 measurements for the following reasons:
Allan 61: The measured proton spectra even if corrected
for (n,np) processes give only the sum of (n,p )
and (n,pn) cross-sections
Hassler 62, Prasad 71 and Pasquarelli 67:
Cross-sections deviate by 4, 14 and 1O standard
deviations (as given by the respective authors)
from the main body of the data
The cross-section data from all accepted measurements are
summarized in Table IV. 2. The table lists all cross-section
measurements in order of increasing neutron energy. For each
data point the following quantities are listed: The average
neutron energy and the energy spread (half width at half
maximum) of the neutrons used for the measurement, the un-
certainty of the average neutron energy, the cross-section
values and errors as given by the authors, an indication
which renoxmalization procedures have been applied to both
cross-sections and errors according to the general rules of f,ef. 1
section IZ and finally the »normalized cross-section values
and errors. The renormalized cross-section values are also
shown in Fig. IV. 1. In on* case (Metzger 48) where both
absolute cross-section measurements and the determination of
a relative excitation function is reported in one paper, the
paper was split into its two components for further processing
and correspondingly there appear two entries in Table iv.1. for
this paper.
- 32 -
The uncertainties in the, average neutron energy ER centr.
not given in most paper« were either estimated from the
experimental conditions.as described in the papers or in a
few cases obtained by communicating with the authors.
As indicated in Table IV.2. cross-sections and errors were
partly renormalized according to the general procedures out-
lined in Ref.1., Section II.
If not specially indicated in Tab. IV.2. the following
standards were taken:
a) Decay scheme as given in Table of Isotopes. As there have
been no changes to these data for many years no correction
had to be applied for such changes.i
b) Reference cross-sections for the reactions Fe(n,p) and2 •to"°U(n,f) from the ENDF/B-IV file. An estimated error of
5% reap. 3% has been assigned to such reference values and
included in the final error of the renormalized cross-
section.
In the following cases special corrections had to be applied
instead of or in addition to the procedures specified above:
Kantele 62: Cross-section was renormalized to Cu(n,2n)
reference cross-section from the evaluation of
Tagesen et al. /1/
Metzger 48: (absolute cross-section measurement at 30 NeV)
Cross-section is normalized to sum of H(n,ao)
and N(n,p0) cross-section. These cross-sections
do show a strong resonance structure just around
3 MeV. This fact together with the rather ill-
defined neutron energy distribution used in the

- 33 -
measurement necessitates an increase of the
assumed error of this measurement to 27%.
Morita 58, Ricamo 51, Cuzzocrea 59 and Lüscher SO:
Errors were increased by quadratically adding 5% for
systematic errors to the purely statistical errors
given by the authors.
Metzger 48: (measurement of relativ« excitation function)
Errors were increased adding 7% quadratically
to the purely statistical errors given by the
authors.
Renormalization of the relative excitation functions Metzger 48,
Lüscher 50, Ricamo 51, Morita 58, Cuzzocrea 59 and Grundl 67 hasi
been executed following the general procedure outlined in
Ref. 1 , p. 4. However one faces the special situation, that
only one absolute excitation function is available, complemented
by 6 single point measurements, mainly around 14 MeV.
Most of the relative excitation functions however cover only a
small energy range, but exhibit strong structure. By adjusting
the relative excitation functions to follow the absolute measure-
ments over the widest possible energy range, an acceptable agree-
ment can be achieved in the ranges 1.5 to 3 MeV, 3.9 to 4.9 MeV
and 5.2 to 10 MeV. Onresolvable discrepancies, leading to enlarged
uncertainties of the evaluated excitation function, remain in
the ranges 3 to 3.9 and 4.9 to 5.2 MeV.
The following renormalizatlon factors R and respective
uncertainties R have been applied:

- 34 -
Ref.
Metzger 48
Luescher 50
Rlcano 51
Morita 58
Cuzzocrea 59
Grundl 67
R
.78
.89
.31
1.05
.90
.98
AR (%)
2.0
5.0
5.0
3.0
2.0
10.0
The large uncertainty assigned to the last renormalization is due
to a slight deviation in the general shape.

- 35 -
U 8 §K . N N
M N m" » " • « "n » R v
H O Z WM N * B
I 3 < i
U
IX £ * a i •^ .t " * _
* <w • * * * * *
i l g I l i a l s
4.hz
tL
n
x
Ui UlM M «
s i :
i s
UiT
B)H
i S E
0 o n o e1 "3 * . .* B B » «
8 0. M
* *
3i
Mu g R S
- 49 -

- 36 -
COS
O.•x
C
P-
CVI
CM
tnVlH
OO
U)
CSI .
<n
OO
rs.
10
LO
CM
18U OI J MOI103S SS(KO
- 50 -

r - 37 - r
COs
CL
PL.
• • I. K-"
«D
"*".+,**•
ft*
X
}+ rvj tz
l SU Ol l HOI133S SS(KiO
- 38 -
LO
CL-N
C
-
M M-M-
-M--M-
M ". X-M • • SiIiSiSi
O+MX4O4X
*• m CM —
(flU 01 I HOI133S SS02I3

Kt
CL-X
C
- 39 -
->-
-**.*
CM
01
U)
LO
H 6'
^BlSUKM IOC«»»•u) . B
Bl! )MU.i
M 4 X e » B » « Q «
l l
IiU Ol J HOIiOBS SSO»
Ol
l l
U)
U)

- 40 -
References to table 3Y.1. and fig. IV. 1.
Metzger 48: F. Metzger, F. Alder and P. Huba, HeIv. Phys.
Acta 21 (1948) 278
Luescher 50: E. LOscher et al., HeIv. Phys. Acta 23
(1950) 561
Ricamo 51: R. Ricawo, Nuov. Cl*. 8 (1951) 383
Forbes 52: S.G. Forbe«, Phys. Rev. 88 (1952) 1309
Paul 53: E.B. Paul, R.L. Clark, Can.J. Phy». 31 (1953)267
Grundl 58: J.A. Grundl, R.L. Henkel and B.L. Perkins,
Phys. Rev. 109 (1958) 425 •
Morita 58: S. Merita, J. of Phys. Soc. Jap. 13 (1958)431
Cuzzocrea 59: P. Cuzzocrea, 6. Pappalardo and R. Ricano,
Nuov. Ci». 16 (196O) 450
Allan 61: D.L. Allan, Nucl. Phys. 24 (1961) 274
Hassler 62: F. Hassler and R.A. Peck jr., Phys. Rev. 125
(1962) 1011
Kantele 62: J. Kantele and D.G. Gardner , Nucl. Phys. 35
(1962) 353
Grl*aland 65: B. Gr!»eland, E. Kjellsby and J. Vines,
Phys. Rev. 137 (1965) 878
Grundl 67: J.A. Grundl, Nucl Sei. and Eng. 30(1967)39
Pasquarelli 67: A. Pasquarelli, Nucl. Phys. A93 (1967)218
Prasad 71: R. Prasad and D.C. Sarkar, Nuov. CM. 3A
(1971) 467
Robertson 73: J.C. Robertson et a., J. Nucl. Bn. 27(1973)531

- 41 -
N N N N N N N N N N N ( V N N h - N N N N N N N N N N N N N N N N N N N N N N N N N N N N N N N N N N N N N
!HUHiHHH*Hi3ttiHKHH***$
« znzn <«as o *enoee
8"
u e e o e e e e o o e f t » « e e » e « < > « e o * e e e o e o « * * * o e « « » * » 0 « o * e * * * e e e o e e
N N N f « C i n N N N f t N c t ( ( l w ( c * ( t w N N N N N N I M N N IN N N N N N N n M M Nt N M

L_
- 42 - f
"
i K NNN IS.NN K NtS, h. rofoN N N N N N N N N N N N N N N N N N N N N
; ri -.
ciX
t
EW eooo«*oooooeoooooeo*o*oooo«*oo?>oooooooooooooooooo«ooooooooo
i9 u o e o o o o o o o « o o e e o o o o e ö o e « o o o o e o o * o o o o e e o e o o o o 0 o o e o < > o
SS«
r - 56 -

L__
- 43 -
N N N N N N N N N N N N N N N N N N N N N N N N NNNNNNNNNNNNN NNNNNNNNIxN
•; r o -< n IH « « n » « •- •• •<» « N « » •< n •< n •«« »» M « x •• « M « « •« n n •<« M » MMMM«n«<H»*«»-<v«M«M
» s§I ¥
eeeee4»o*e* **««o****«o»«eee
S«
r - 57 -

- 44 -
Is
N
I V N N N I V N K N N NN N N N N N N N N NN NN NN NN N NNN
* s
.; ri 2
rnnnnnnnn-««««N-*«n«<«n-««>«
SHSS85SSSsS!HHjcu oeo«oooooooo*«o*»*oo*ooooooooo*ooo
i iiO ••••••••••« oe*
n 3ü eoeoooooooooooooooooooooooooooooooooooooooooooooooooooooooo
IgIZ"

r - 45 -
E u
•
; ri -
Ii
5
Ii!
J I I -S«« A B * ««•«««»«««« U^ A Wl»•N Z •««« mm.mm+m Ci
sstge ü
iiiii
I w N H
- 59 - l

- 46 -
IV. 2. Statistical Modal Calculation«
A* apparent fro« !able IV.2. and Ug. IV. 1. there are no
experimental data in the energy rang«« 10-14 and 15 - 2O
MeV, whereas «OM rather accurate measurements do exi«t
in the 14 - 15 NeV range.
Therefore the evaluation in the 10 - 2O MeV neutron energy
range was done by means of statistical Model calculation«
with parameter« adjusted to reproduce the weighted average
of the experimental cro««-«ection« from 14.5 to 15.5 NeV.
Table IV. 3. li«t« the input parameters»chosen. These para-
meter« are al»o«t identical with the par • chosen by
Strohmaier /10/ in the simultaneous evaluation of all
neutron-induced reactions on P and therefore well
established. The information in the discrete levels was
taken from Bndt et al. /11/ as was done in Mf. 10.
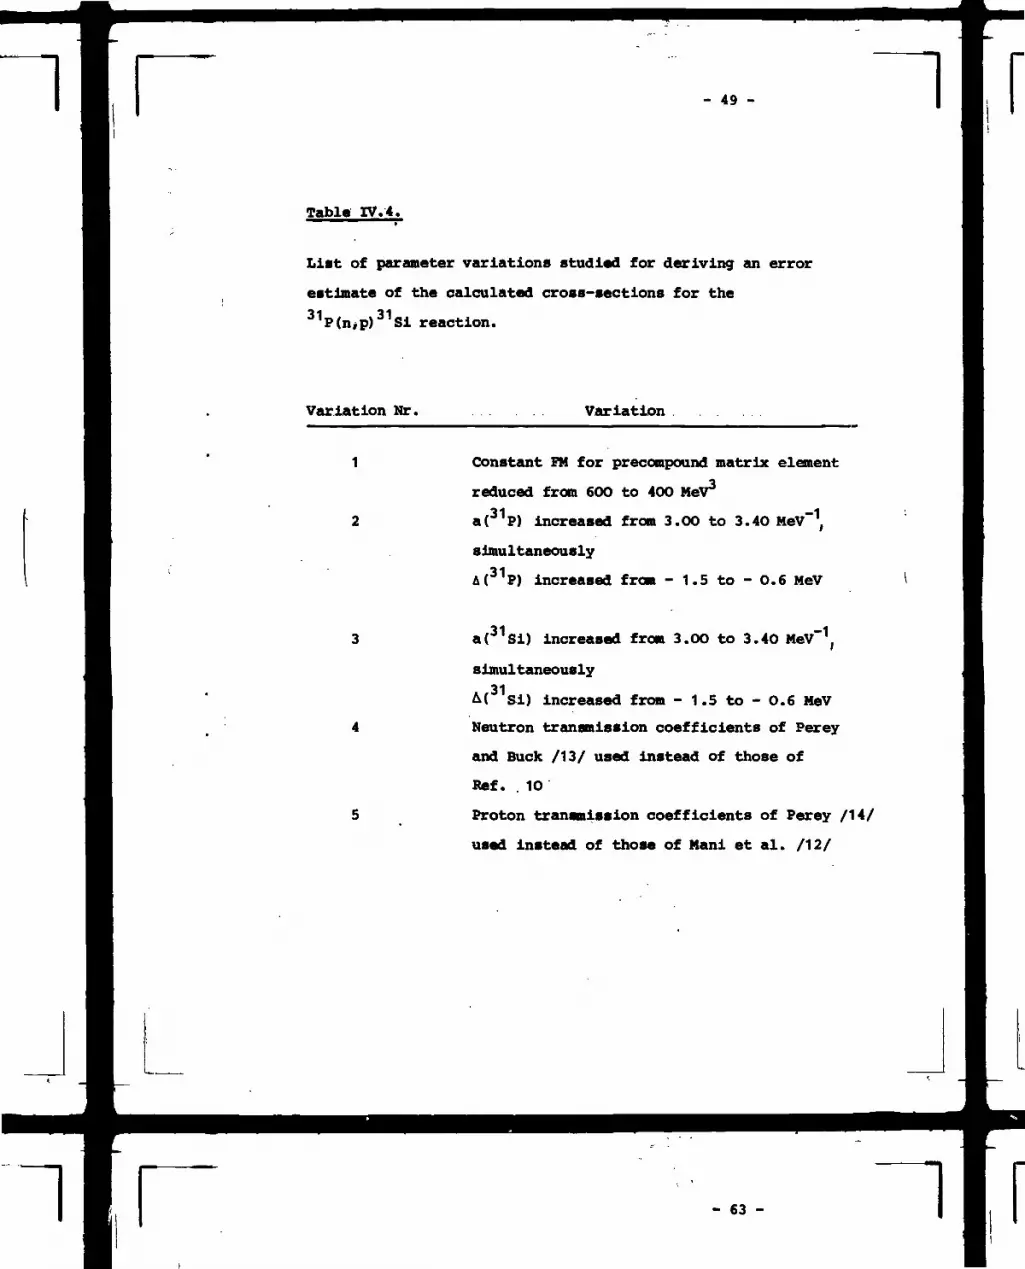
Table IV. 4. lists the admitted variations of the various in-
put parameters used for the error estimate and Table IV.5.
lists the cross-sections calculated with these perimeter
change«.
Therefrom the uncertainties of the calculated values were ob-
tained according to the procedure! described in section II.1.2,
The calculated cross-section values and their uncertainties
are given in Table IV.«.; they are also included in Table 3V.2.

- 47 -
Tabla IV.3.
!•!•t of input paraMatara uaad for tha calculation of
tha 31P(n,P)31Si racitation function.
Paranatar value
FM
DD
6OO MaV3
2OOO MV
0.50 NaV
0.75
Laval dancity paraMtar« for
"P a
A31P a
4
31Si.
A
28Al.
A
30Si.
A30AIa
A27Mg a
A
3.20 NaV '
- 2.50 NaV
3.00 NaV"1
• 1.5O NaV
3.00 NaV"1
- 1.50 NaV
2.95 NaV'1
• 4.50 NaV
3.00 NaV'1
- 3.00 NaV
2.75 NaV'1
- 4.50 NaV
2.25 NaV'1
- 4.50 MaV

- 48 -
Transmission coefficient«
n Potential obtained by coupled channel« optical Model
fit to n scattering data on 31P /1O/
p Hani Melkanoff /12/
a Ruizenga et al. /4/
- 49 -
Table IV.4.
List of parameter variations studied for deriving an error
estimate of the calculated cross-sections for the31P(n*p)31Si reaction.
Variation Mr. Variation
Constant FM for precompound matrix element
reduced from 6OO to 400 MeV3
a(31P) increased from 3.OO to 3.40 MeV-1,
simultaneously
A(31P) increased from - 1.5 to - O.6 MeV
a(31Si) increased from 3.OO to 3.40 MeV~1,
simultaneously. .31A( Si) increased from - 1.5 to - 0.6 MeV
Neutron transmission coefficients of Percy
and Buck /13/ used instead of those of
Ref. . 1O
Proton transmission coefficients of Percy /14/
used instead of those of Hani et al. /12/

- 50 -
5
IIfl1
II
in T-
T- IHm o
n «N <OO>O
W OB •» »* X» OK M * IS. i-i N. IS. OB *-• n Otnnninnto ~i
z NO ONOu nn<rn«r.««Tio<h<0N-anin<r
rt CKON-OO»NO QK NN
N •«• < n »> ID »> N o « » o» at » <o on »KJ NWi-IfJION
T^ Z WK ODNrt
NO«r N ow NO wooM Z NN NCBOB »O-CS «K OOOfli-l i-i N
-ONOB CK Ort N <tn-ON«9 OKO- - - - - - -
- 64 -

- 51 -
Table IV.6.
Final remit« of the model calculation« fitted to the
14 MeV experimental data for the 31P(n,p)31Si reaction.
ENEROY .
8.849,87
10,9011,9412,9714.0015.0316.0717.1018.1319.1620.20
X-SECTIONCMBJ
142.81148.57139.58123.01107.4093.9482.9173.6965.9959.3353.6648.81
ERRORCMBJ
17.9116.0212.6010.778.164.792.143.214.906*126.787.07

r - 52 -
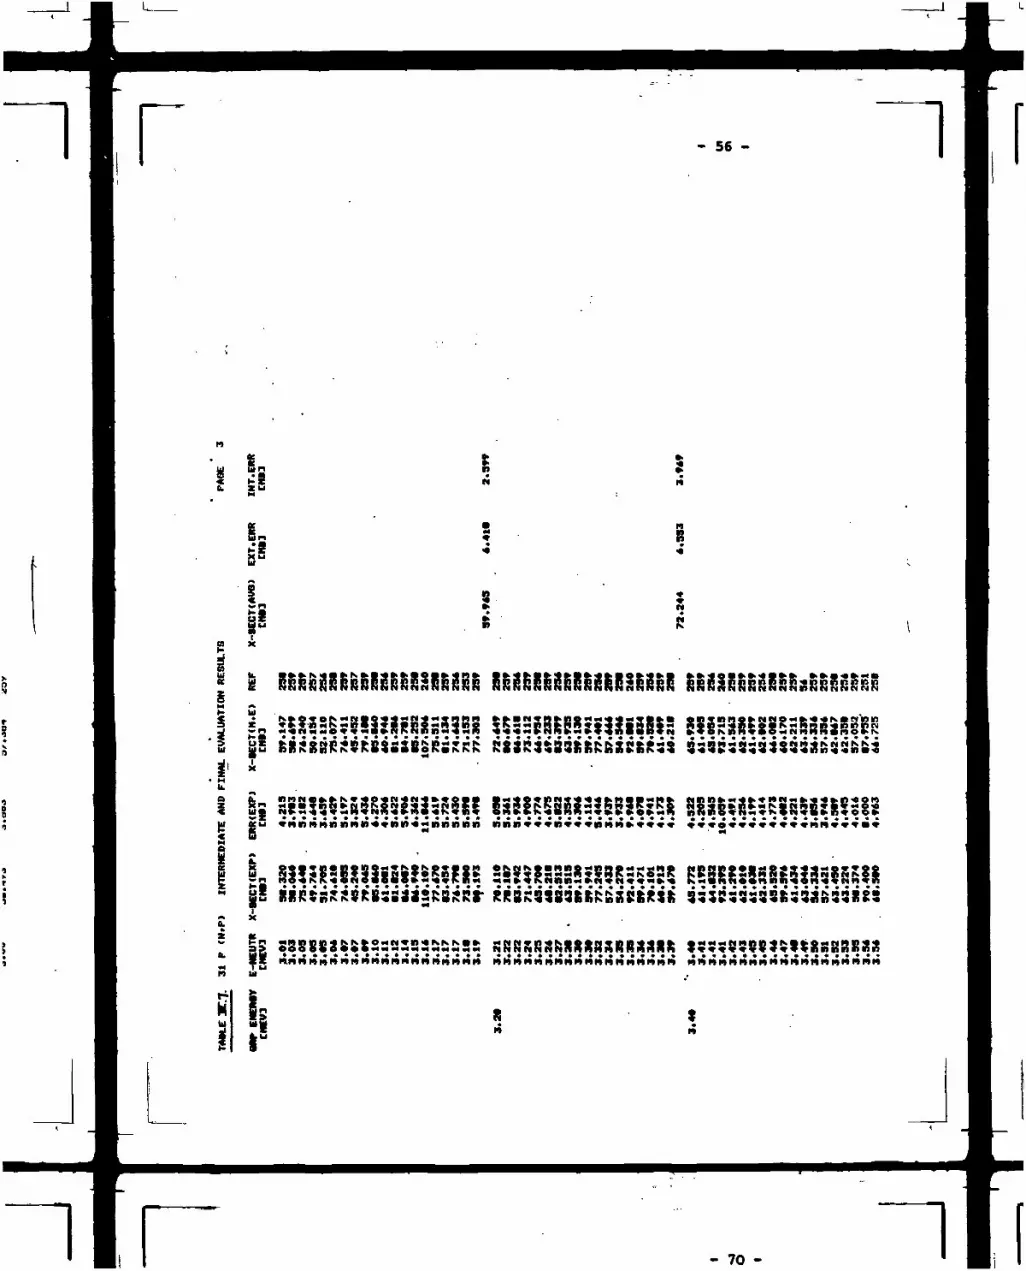
IV. 3. Evaluation and results thereof
For the energy region from threshold to 1O MeV the evaluation
was based entirely on the experimental data and carried out
according to the procedures described in Ref. 1 , for the
10 - 20 MeV range the calculated values according to sections
IV.2. were used. The intermediate (Column 5) and final results
(column 7, 8 and 9)of the evaluation procedure according to chapter
II, step 4 and 5 of Ref. 1 are listed in Table IV.7.for the
experimentally covered energy range. The final results for the
whole energy range are summarized in Table IV. 8. The energy
group size was chosen as 0.2 MeV in the steeply rising part
of the excitation function from threshold to 4.8 MeV and around
1 MeV for the flatter part above that energy.
It has to be emphasised that the given group cross-sections
are only meant to be cross-section! averages over the respective
energy groups. At any particular energy the actual cross-section
may deviate significantly due to crocs-section fluctuations.
Fluctuations of the Bricson type with "periods" of about SOkeV
and considerable amplitude are to be expected especially in the
energy region below 1O MeV due to the relatively small number of
effective reaction channels contributing to the (n,p) crocs-
sections.
In Vlg.3V.2a and 2b our results are compared with the earlier
evaluations dn SAMDII-CCC1128 /15/, OKDL-DFM226 /15/ and
BMDL-78 Mat. 7821 /16/. As apparent all previous evaluations
exhibit rather strong structure in the cross-sections below
6 MeV which obviously corresponds to the structure found by

- 53 -
Cuxzocrea 59. However, if on« also .includes th* results of
other author« which did not find thi» resonance structure
(see Fig. ZV. 1.) th« discussed structure disappears to larg«
«xt«nt. Essentially th« «valuation in th« 3 - 6 H«V rang«
is largely a question of judgement between some rather dis-
crepant and old data set«. Mew measurements are therefore
urgently needed in this energy rang«. In th« r«gion froa
6 - 14 MeV we are in reasonable agreement with all peerions
evaluations. In the 14-20 HeV range our evaluation lies about
in the Middle between the older evaluations /15/ which see«
to have neglected precoBpcnnd effects and th« recent Liver-
more evaluation /16/ which apparently somewhat overestimates
these effects.

L
- 54 -
i
S 8
1g*
fi
»-
s- ee eoeeeoeooooo
N N N N N
* s

- 55 -
ZU
rS wF
fcl
Z «
Zi88
N N N N N N N N N N N N N N N N N N N N N N N N N N N N N N N N N N N N N N N N N N N N N N N N N N N N N N nn
L_
r - 56 -
E > x
£ H
: u« TU
n n n n n n n n n n n n n n n n n n i « M n n n n n n n n i n n n n n n
- 70 -

- 57 -
S„ a• K *i- r n
i i
• • .t-fö"
I. xI )
8 .i slZ xn xt)
s•n
g S s I i
M TU
iS tt 533335315SRRRS^P: SJtCC ^SSS SRRSSRR«n nnnnnnnnnnnnnnnn nnnnn
*
|§ ^ ipsspppisHi tmt im %$un mmi #m minJ5SSSJ
SSEEJ^

- 58 -
!lZu R•
N
g S S S 8 S 2 S 2 £ £ g* • • » • • • » * o N •> N • n• n » * - r
* n oi § § i• * • •n o « o
v o o o o o» 5 o 5 o ov o o o o o•4 O O O O O
nH
i
U.
Q
iCCg
§ g* •K 8
r» x n2 « 3 B N * !fn n ix x nS 8 J ? S S
S 5 § I 2 5* * * * * *S S ? R S 8
O X H x MNQ N N N NnxO N N « n N n N (M M NSRSR R U i U U U SSRS -R-ES S S S S S
uc *njP9S ^fiäß1^ *"S SSS SB"» ^i* ^ N « M N « N xonnn » •• o » »uu SoVnn nnnnx wn Ann nv«n n* v n t« o ••»••»• ••••••• K •* <• n »i
x • •
w^ «W N N V ) **•• «f4NN W «• N CV^ O » «ONO »N»« m M n •« •* N
iig m m nn m ^ s iSSS SRR ftm ftf5 R 8 i S8888 R S 8
ü.
«4n
p SSSSS 8R8$g =5t =I u
SlSS fctg ? J t SSSS 55JRIS fc S 2 S 8••••*! +*•% o « n **** 2S5Z5 3 ^ 5 £ £
8n
S S K S K• * • * n « N • IK

- 59 -
TABLE JP*. 31 P (NfP)
EVALUATED GROUP CROSS-SECTIONS
GROUP-ENERGYCMEV]
1.401.802.002.202.402.602.803.003.203.403.603.804*004.204.404.604.805.206.007.008.OO9.5010.5011.5012.5013.5014.5015.5016.5017.5018.5019.50
TO CMEV3
1.802.002.202.402.602.80 •-3.003.203.403.603.804.004.204.404.604.805,206.007.008.009.5010.5011.5012.5013.5014.5015.5016.5017.5018.5019.5020*50
X-SECTIONCMBJ
1.5227.48010.21327.50341.04962.70561.98659.96572.24466.28471,53687.34285.941
••: 98.466101.887121.157125.035126.971141.649
; 132.566138.908143.502137.987122.101106.95991.85483.34974.36366.73860.17154.54149.743
ERRORCMB3
0.5320.8962.5213.3602.1052.7453.8336.4186,5535.0205.3444.1754.8845.9824.305 .6.3589.5567.2789.9189.0378*4948.61312.457
. 10.6918.1283*4841.4943.2404.9566.2076.8917.205
ERRORCX]
34.912.024.712.25.14.46.210.79.17.67.54.85.76.14.25.27.65.77.06.86.16.09.08.87*63.81.84.47.410.312. 614*5

- 60 -
tau oi i Holloas ssoao
- 74 -

- 61 -
(Vl
CD(Vl
(n
oo
rs
i i •__
LO
Kl
tn
co
rx
u>
LO
(Vl
J j
IffU Ol I MOI103S SSOU
- 75 -

- 62 -
V. The 93Nb(n,n')9311Nb reaction
V.1. Experimental data base
To establish the data base, a literature search has been
performed in two steps.
a) Two very comprehensive compilations, namely CINOA
up to Supplement 79 (1 Oct. 1979) and the threshold reaction
compilation EANDC 95 "U" (Feb. 1974) have been used as
index to existing literature.
b) The most recent editions of some journals most likely to
contain relevant publications have also been acarchefl up to March 1980.
The original papers have been looked up, whenever available
checking simultaneously that references cited therein were
already contained in the literature list. The most important
information on the 7 experiments found in this way is brief-
ly summarized in Table V.1. Columns 1 to 7 give the energy
range of the experiment, the number of cross-section measure-
ments within this range, the method used to detect the con-
sidered reaction, the method used to determine the neutron
flux, the first author and date of the respective paper
and the reference number used furtheron in the compilation.
Detailed examination of the above measurements resulted in
rejection of 4 measurements for the following reasons:
Morgan 67, Williams 69 and Buchanan 71:
preliminary reports on the experiments described
in full detail in Williams 75 •
- 76 -

- 63 -
Roger« 71: reported relative gamma-ray production cross-
sections differ strongly from all other measure-
ments r probably because of the much poorer
quality of the gamma spectra which are apparent
from the figure in the paper.
As indicated in Tab.V.1. the data given in all the papers93m
are not the cross-sections for formation of the Nb
isomer itself but partial y-production cross-section« from
which the isomer production cross-sections can be derived.
This was done in the following way:
Following the decay scheme of van Heerden and Mc Murray /17/
whose (n,n'Y) data have both the best energy resolution and
the highest sensitivity for detecting weak -»—transitions,
the Y-transitions with energies 656.4, 779.4 and 2123 were
assumed to be the only transitions feeding the isomeric level
from the excitation energy range below 2.5 MeV. Therefore
the sum of these 3 gamma production cross-sections plus a
(relatively small) contribution due to the direct population
of the isomeric level by inelastic neutron scattering is given
as the formation cross-section for "üb in Table V.2.
The latter contribution had been taken from the cross-section
calculation described in the next subsection. In case of
the production cross-sections for the 656.4 keV y-transition
there exists the additional difficulty that in the measure-
ments of Gtfbel et al. /18/ and Williams /19/ this gamma-
ray was not resolved from a noch more intense 653.4 keV
- 64 -
gamma transition. In these cases the observed 653.4 + 656.4
peaks were divided approximately into their two components
using the intensity ratios of van Heerden /17/ who had been
able to experimentally separate the two peaks.
The cross-sections for formation of ^Jb derived in this
way are given in Fig. V. 1. The errors given in the figure
are those calculated fron the errors given by the authors
for the corresponding ganma transitions and an assumed 25%
uncertainty for the calculated cross sections for direct popu-
lation of the isomeric level by inelastic neutron scattering.
As apparent fcom the figure there is a large discrepancy bet-
ween the data of van Heerden and Williams on the one hand
and the data point of Göbel which is about SO % higher than a
reasonable extrapolation of van Heerden's excitation curve.
This would at first sight indicate that the measurement of
Göbel et al. /18/ should be rejected. Comparison of the
spectra of Göbel with the spectra of van Heerden for
En • 2.53 MeV, however, shows that the relative Intensities
of the various gamma peaks agree rather well and that the
difference is due to a difference in the absolute
cross-section scale. In order to decide which of these scales
is most probably correct we have calculated in all three
experiments the total inelastic cross-sections .
by adding up the production cross-sections for all
gamma transitions feeding either the grotand or the isomeric
state, in Fig. V.2. these total inelastic cross-sections are
compared with those derived from direct detection of the
n- 78 -
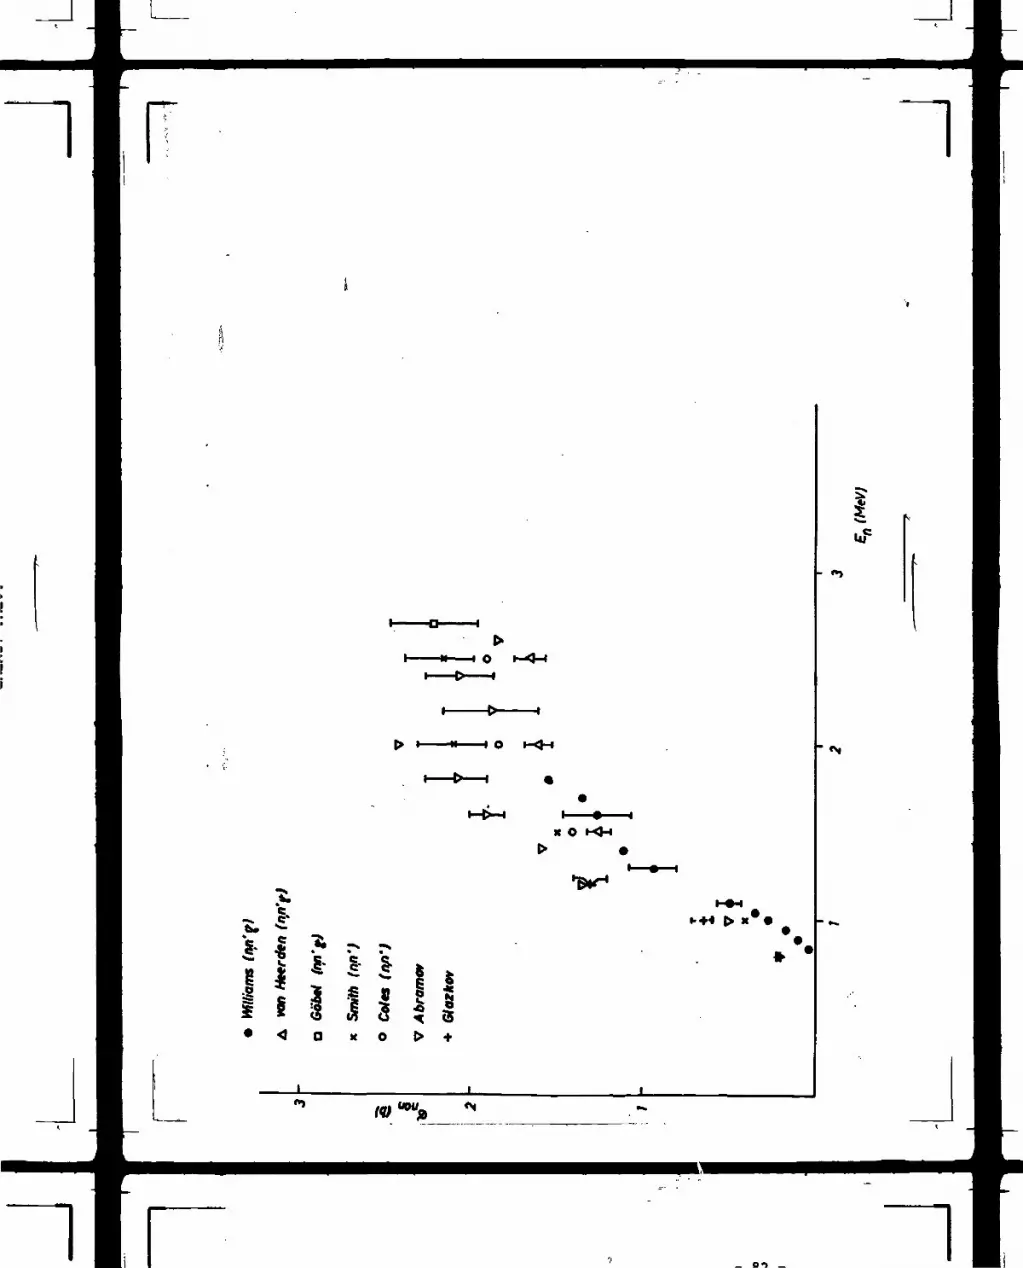
- 65 -
inelastically scattered neutrons /20, 21/ and from sphere
transmission measurements /22, 23/. As apparent front the
figure the inelastic cross-sections derived fron GObel's data
agree well both with the results of the inelastic neutron
scattering and of the sphere transmission Measurement*,
whereas the cross-sections derived from the other (n,n'-r)
experiments are considerably lower. Thus at present the data
are extremely inclusive as which of the data sets should be
renormalized and therefore no renormalisatious could be
performed. Summarizing the experimental situation it can be
said that only in the energy range of about O.9 - 2.7 MeV
there are experimental data at all and that these data have
large errors of about - 3O% which is about as large
as the uncertainty of model calculations. Thus we decided not
to use the experimental data at all but to base the evaluation
on the cross-section calculations described in the next sub-
section only.

- 66 -
i B B B I S
FV O
i I
s § s iS Ä Ä t
U
g O g
g g i i Iz t * *
i i i i i i il i S S I S i
X X X X X X X K
H H ife fe b * feH i il» M N M N N
g ? R fe S *M M M N M O
l

L
- 67 -
—X-
-X-
-X-
.— K W IN
3Sxo+»
-Q
•X«
IO
LO
law ooi i MOU33S ssoao
l - O - 1
Cl - H - 1 O
I - >-— »
I - G>
I - M - 1 O
I - fr - 1
X O
t 4
I * * *i i 11• < O X O f r +
•••M
IW
L
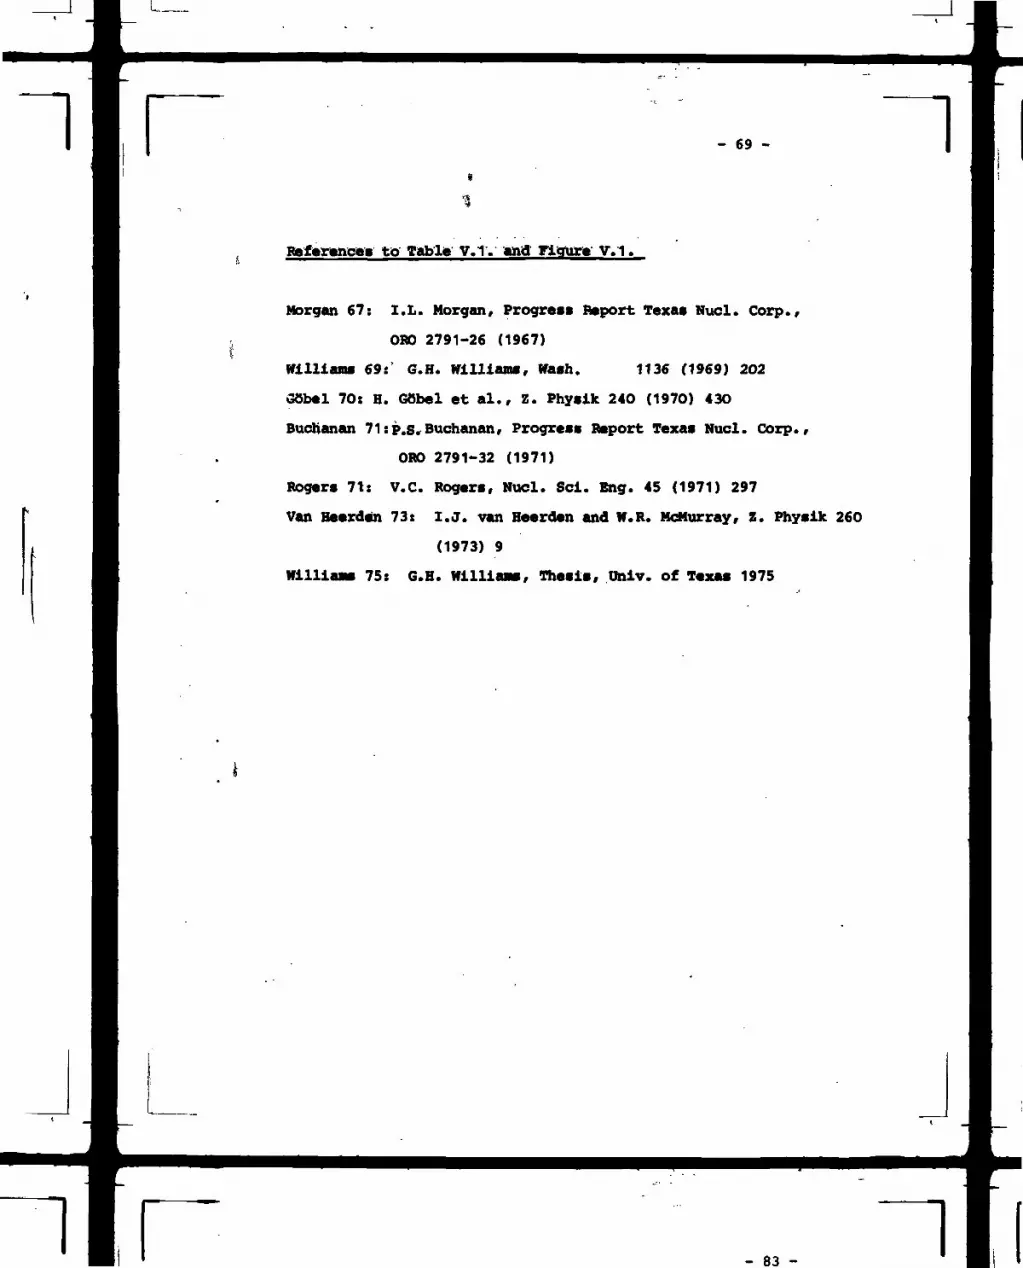
- 69 -
Reference» to Tabue V.l. and Figure v.l.
Morgan 67: I.L. Morgan, Progress Report Texas Nucl. Corp.,
OBO 2791-26 (1967)
William« 69:' G.H. Williams, Wash. 1136 (1969) 2O2
Göbel 70: H. Göbel et al., Z. Physik 24O (197O) 43O
Buchanan 71:P.S. Buchanan, Progress Report Texas Nucl. Corp.,
ORO 2791-32 (1971)
Rogers 71: V.C. Rogers, Nucl. Sei. Eng. 45 (1971) 297
Van Heerden 73: I.J. van Heerden and W.R. McMurray, Z. Physik 26O
(1973) 9
William 75: G.H. William, Thesis, Univ. of Texas 1975
- 70 -
Mn ID WO M g O S <>N P Q Op n
CD NOtn >mn NIK »NM « B NM M VMM MVMMMMMMM
- 84 -

- 71 -
(D u n nnnninnininininnnnnin n2 K nnnnnnmnnnnmnnnnn
i- in in n n in » n CN w <\.
M O O O O O O O O O O O O O O O O
ULJ oo>o>o-^o-Hcv i in -Hvo-m(Nooo-cu ro IM r. r.itMo«oin*-n!NrMN(M»<-iIK r» PJ r» PI r» N •< Ci3K=I ii« MZ O Ui Z>h-
tC
x
a,*H C O O O O Q O O O O O O O O O O Cg ^ P J ^ C O ^ H J f c ^ O O O V C M ' C f J w f r ' Ca o o* r^ w »H HI •* o w to * n •« o in *-t oneu ^ o O w C M O ' - t W N f O T H f r N X J ^ w r gAC tnL-minin^TMf-jfjf-j-f'H-H-H'M^Ul
,KUJ U
H;i;i2^ p;*oii£ !i. g K K U • K: KO! U3U ZO
u£u.
Sa: o o o o o o o o o o o cO^ o o o o o o o o o o o c"a S mrv o r>to« KTCBMI
> OOO O§ 000in» N
u ki
s: LJ o o o o o o o o o o o o o o o o o
. uu«uo JB <Ü- UI J
«
3 kj ö CO Ö O O O O O O O O O O O O O
£io o S e w E S oO K U K K OKKu t; 5o a UU) u cj u
UKUUU4E UUzu) esB KmI J uiüi»•ngS^gÜSg!uSü m""° ""^S u ui ü u ü ü
<n a « t «c «uu
- 72 -
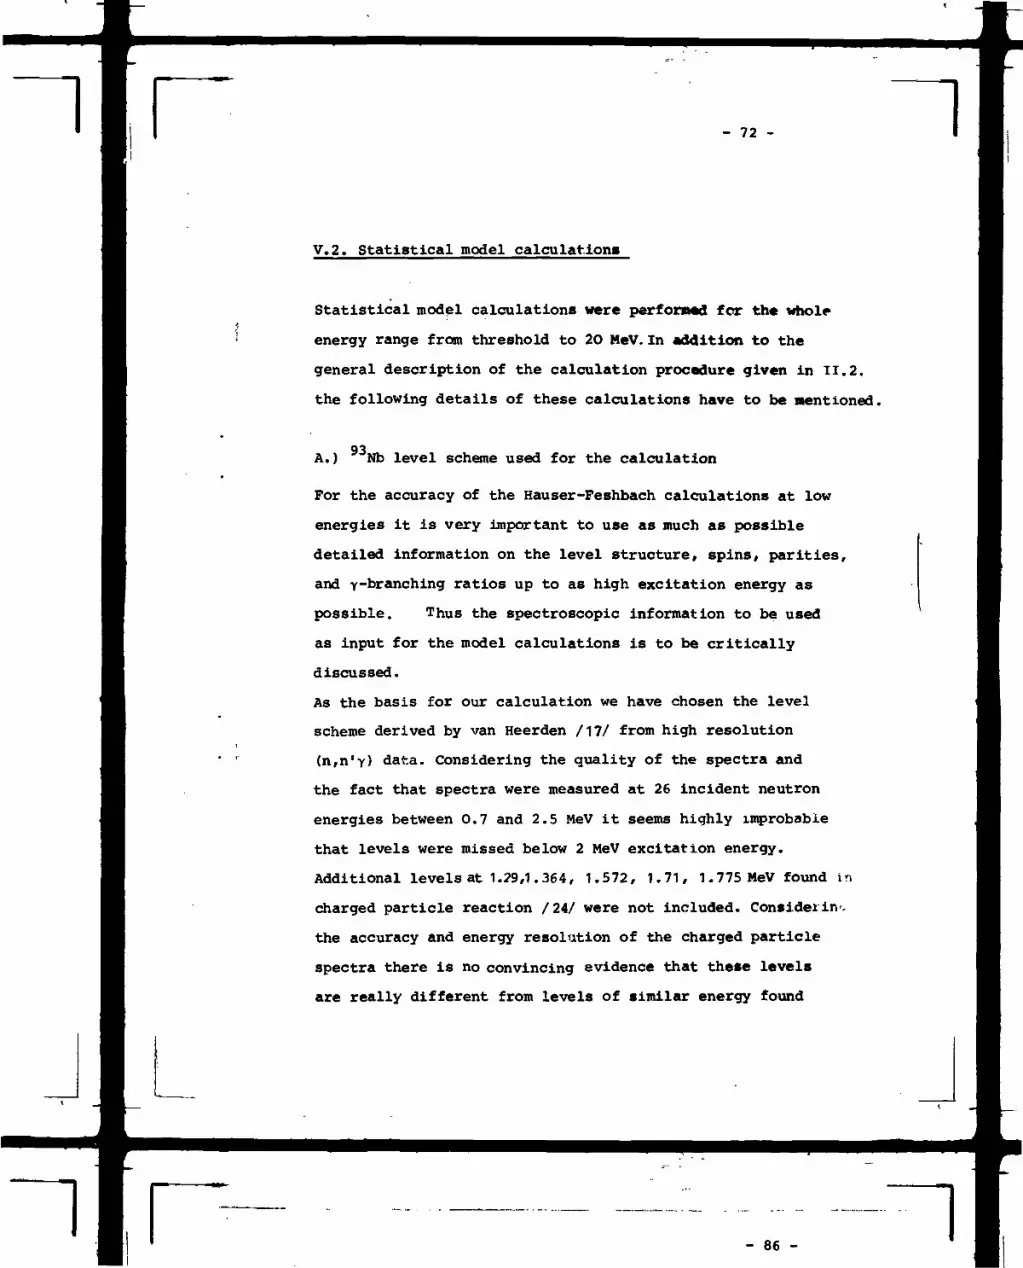
V. 2. Statistical model calculation»
Statistical model calculations were perform«} for the whole
energy range from threshold to 2O HeV. In addition to the
general description of the calculation procedure given in II. 2.
the following details of these calculations have to be mentioned.
93A. ) Nb level scheme used for the calculation
For the accuracy of the Hauser-Feshbach calculations at low
energies it is very important to use as much as possible
detailed information on the level structure, spins/ parities,
and v-branching ratios up to as high excitation energy as
possible. Thus the spectroscopic information to be used
as input for the model calculations is to be critically
discussed.
As the basis for our calculation we have chosen the level
scheme derived by van Heerden /17/ from high resolution
(n,n'Y) data. Considering the quality of the spectra and
the fact that spectra were measured at 26 incident neutron
energies between 0.7 and 2.5 MeV it seems highly improbable
that levels were missed below 2 MeV excitation energy.
Additional levels at 1.29,1.364, 1.572, 1.71, 1.775MeV found in
charged particle reaction /24/ were not included. Considering
the accuracy and energy resolution of the charged particle
spectra there is no convincing evidence that these levels
are really different from levels of similar energy found

- 73 -
in fef. 17 and there is strong evidence against the existence
of such additional levels from the fact that no corresponding
Y-transitions were found in the (n,n'y) reaction.
Thus level-energies up to an excitation energy of 2.2 MeV
and branching ratios were taken without changes from Table 2
resp. Fig. 2 of Ref.17 . Concerning the spins and parities
some of the assignments of Ref. 17 had to be changed for the
following reasons. The spin assignments of Ref.M are primari-
ly based on the comparison of the measured excitation functions
with Hauser-Feshbach calculations and do not take care of the
restrictions imposed on the spin assignments by the y-decay
characteristics of the levels. As it can safely be assumed
that all observed y-transitions are of either E1, Ml or E2 type
the maximum spin difference between any two levels connected by
y-transitions is two units for levels of equal and.one unit
for levels of opposite parity. Application of this rule to the9 3level and decay scheme of Nb leads to the following
consequences:
a) A unique spin assignment 5/2~ results for the 8O9.8 keV
level from observed decay of the 1947.4 keV level to
both the 11/2+ 978.6 keV and the 8O9.8 keV level, for the
spin of the 1947.4 keV level the assignment has to be changed
from 5/2 to 7/2+.
b) As the levels at 16O2.8, 1686.1 and 2171.1 (all
assigned as 15/2+ in ref. 17) all exhibit y-transition
to the 9/2+ ground-state their spin values have to be re-
duced to 13/2+.
- 74 -
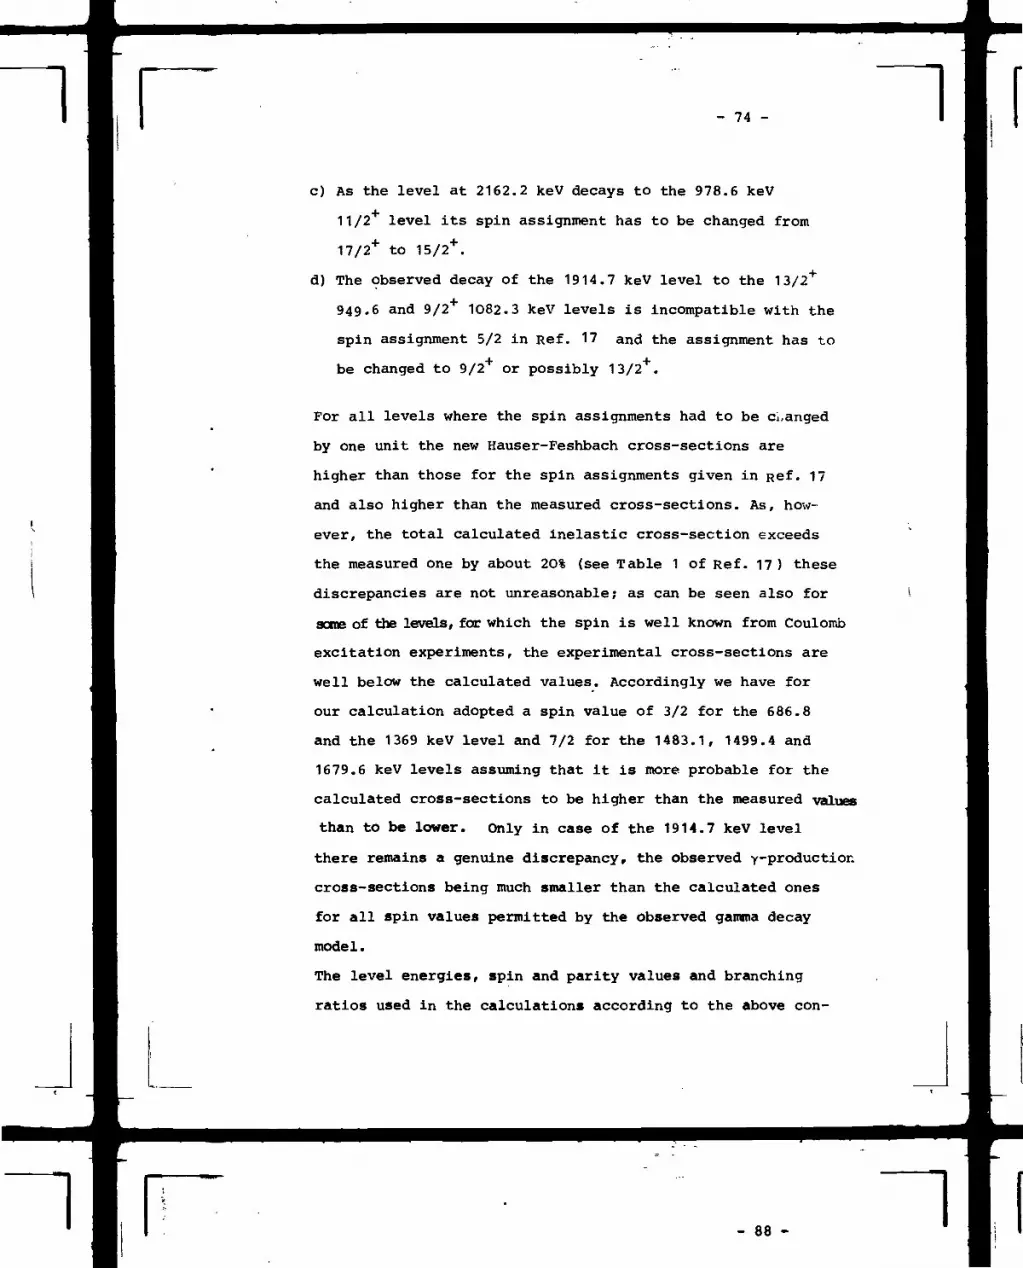
c) As the level at 2162.2 keV decays to the 978.6 keV
11/2 level its spin assignment has to be changed from
17/2+ to
d) The observed decay of the 1914.7 keV level to the 13/2+
949.6 and 9/2+ 1O82.3 keV levels is incompatible with the
spin assignment 5/2 in Ref. 17 and the assignment has to
be changed to 9/2 or possibly 13/2 .
For all levels where the spin assignments had to be changed
by one unit the new Hauser-Peshbach cross-sections are
higher than those for the spin assignments given in Ref. 17
and also higher than the measured cross-sections. As, how-
ever, the total calculated inelastic cross-section exceeds
the measured one by about 2O% (see Table 1 of Ref. 17 ) these
discrepancies are not unreasonable; as can be seen also for
sane of the levels, for which the spin is well known from Coulomb
excitation experiments, the experimental cross-sections are
well below the calculated values. Accordingly we have for
our calculation adopted a spin value of 3/2 for the 686.8
and the 1369 keV level and 7/2 for the 1483.1, 1499.4 and
1679.6 keV levels assuming that it is more probable for the
calculated cross-sections to be higher than the measured values
than to be lower. Only in case of the 1914.7 keV level
there remains a genuine discrepancy, the observed y-production
cross-sections being much smaller than the calculated ones
for all spin values permitted by the observed gamma decay
model.
The level energies, spin and parity values and branching
ratios used in the calculations according to the above con-

- 75 -
siderations are summarized in Table V. 3. Up to the 1296.8
keV level the spin and parity values are certain. For the
higher levels it cannot be excluded that for a small fraction
of the levels the right spin values have been missed by - 1
unit and the sensitivity of the calculated cross-section to
such uncertainties is investigated in the calculations
and included in the error estimates of the calculated
values. The parities of some of the higher levels are com-
pletely unknown (see Table V.3.) and arbitrarily one value
had to be selected for the calculations which, however, are
rather insensitive to these parity choices.
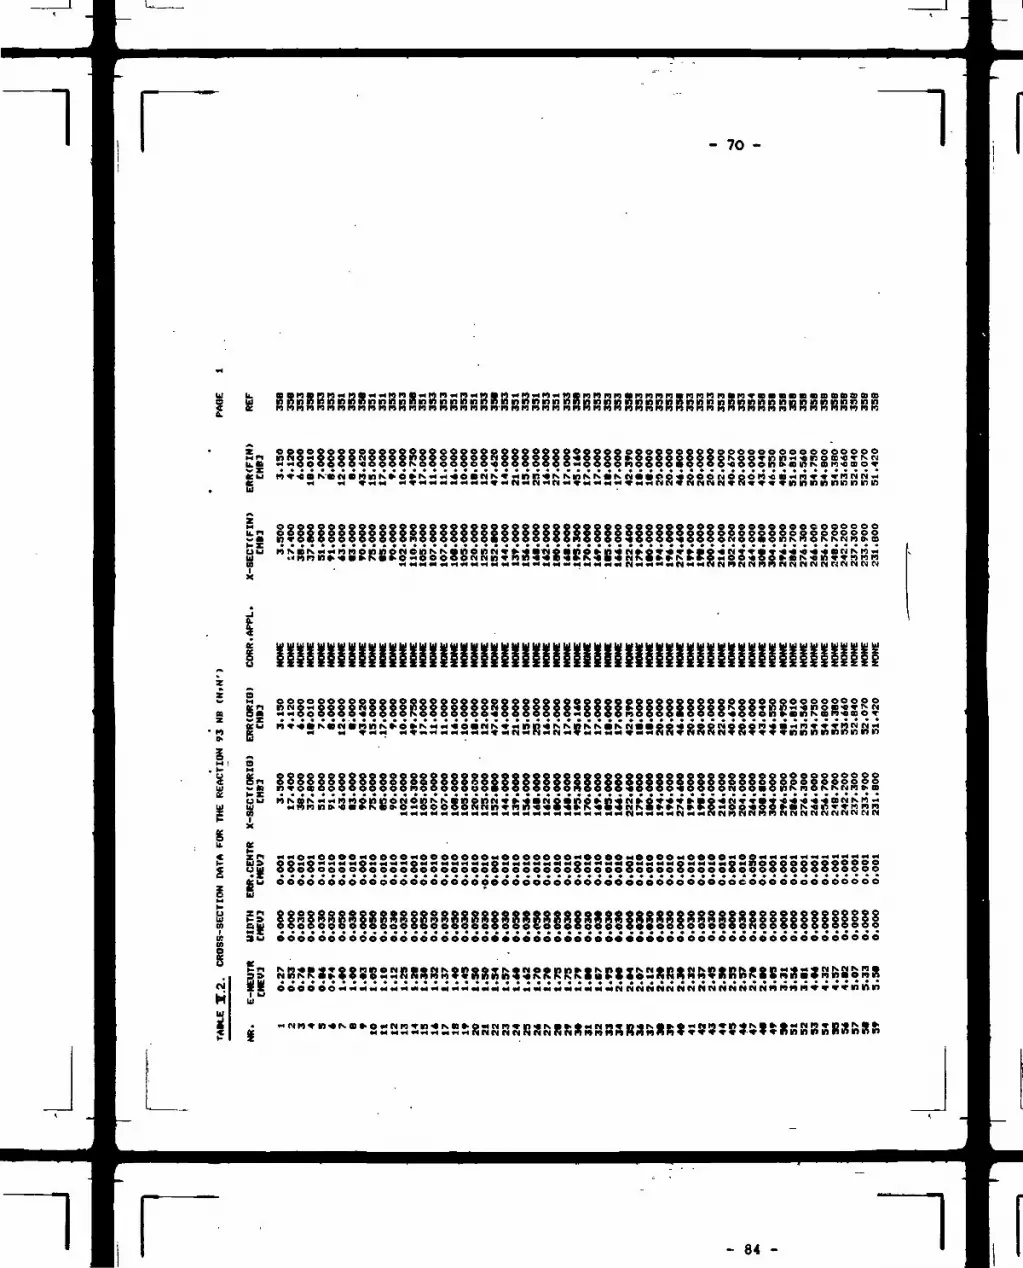
- 89 -The cross-section data from all accepted measurements are
- 76 -
B.) Neutron optical potential
In order to choose optimum transmission coefficients, a series
of the usual global neutron potentials as well as several
optical potentials fitted individually to neutron scattering
data on Nb were investigated for their fit to nonelastic /17,
18, 19, 20, 21, 22, 23/ and total /25/ cross-sections up to
3 and 15 MeV, respectively. The potential given by Delaroche
et al. /26/ turned out to reproduce the experimental values
for these cross-sections best. Moreover, due to the procedure
of determining the optical potentials parameters used by the
authors of Ref. 26 good fits to the s- and p-wave neutron
strength functions and the potential scattering radius are
also warranted. A comparison of the calculated (n,2n) excitation
function and the neutron production spectrum at 14 MeV bom-
barding energy to experimental data compiled in Ref. 27
confirmed our decision.
The parameters used for the final calculations, the con-
sidered parameter variations, the results of these parameter
variations and the final model calculation result, that is
calculated cross-sections and their errors according to the
results of the parameter variations (section II.1.2.) are
listed in Tables V. 4. - 7.

- 77 -
Table V.3 . Level scheme for Nb used in the statistical
model calculations.
Level Nr. Energy Spin Parity Branching ratios
g.s.12
34
56
7
8
9
1O
11
12
1314
1516
1718
1920
O
30.4
686.1
743.7
808.4
809.8
949.6
978.6
1082.3
1296.8
1315.3
1334.3
1369
1395
1483
149O.7
1499.4
1546.0
1602.8
1665.2
1679.6
9/2
1/23/27/25/25/2
13/2
11/2
9/2
9/2
5/2
17/2
3/2
5/2
7/2
17/2
7/23/213/2
3/2
7/2
+
1OO%
1OO%
+ 1OO%
+ 1OO%
1OO%
+ 1OO%
+ 1OO%
+ 34%
66%
+ 49%
25%26%
81%
19%
+ 100%
+ * 1OO%
+ * 1OO%
- * :81%
19%
+ 100%
- * 1OO%
+ 1OO%
+ 17%
57%
19%
7%
+ 100%
+ * 19%50%31%
—•*• g.S.* 30.4
•»• g.S.•* g.S.-»• 3O.4
-»• g.S.->• g.S.
•*• g.s.•»• 743.7
•»• g.S.+ 743.7
+ 978.6
+ 743.7
-»• 808.4
+ 949.6
-f 8O9.8
-* 809.8
•*• g.S.* 8O8.4
* 949.6
-»• g.S.+ 686.8
-»• g.S.-»• 949.6
+ 978.6
-*• 1082.3
f 743.7
+• g.S.* 743.7
* 1315.3

Level Nr. Energy Spin
- 78 -
Parity Branching ratios
21
22
23
24
25
26
27
28
29
30
31
32
3334
1682.6
1686.1
1728.1191O.41914.7
1947.4
1949.6
1963. 3
20O1.92018.82117.4
2153.4
2162.2
2171.1
7/2 . +
13/2 +
3/2 +
7/2 - *
9/2 +
7/2 +
5/2 +
13/2 +
17/2 +
3/2 + *17/2 +5/215/2 +
13/2 +
28%
48%
24%
26%
41%
33%
1OO%
100%
38%
62%
44%
56%
37%
34%
29%
32%
9%
11%
48%
1OO%
1OO%
100%
100%
1OO%
7%
42%
51%
* g.S.
•*• 743.7
-y 978.6
* g.S."*" 949.6~* 978.6
-»- 1O82.3
-> g.S.
•* 949.6
-* 1082.3
* 809.8
+ 978.6
* g.S.
* 808.4* 743.7-»• g.S.-* 949.6-»• 978.6
-> 149O.7
-»• 949.6
-*• 809.8* 1490.7* 30.4
^ 978.6
-*• g.S.* 949.6
* 978. f
*)No information exist« on parity of level. Arbitrary one
half of theie level« was given positive and negative
parity, respectively.
- 79 -
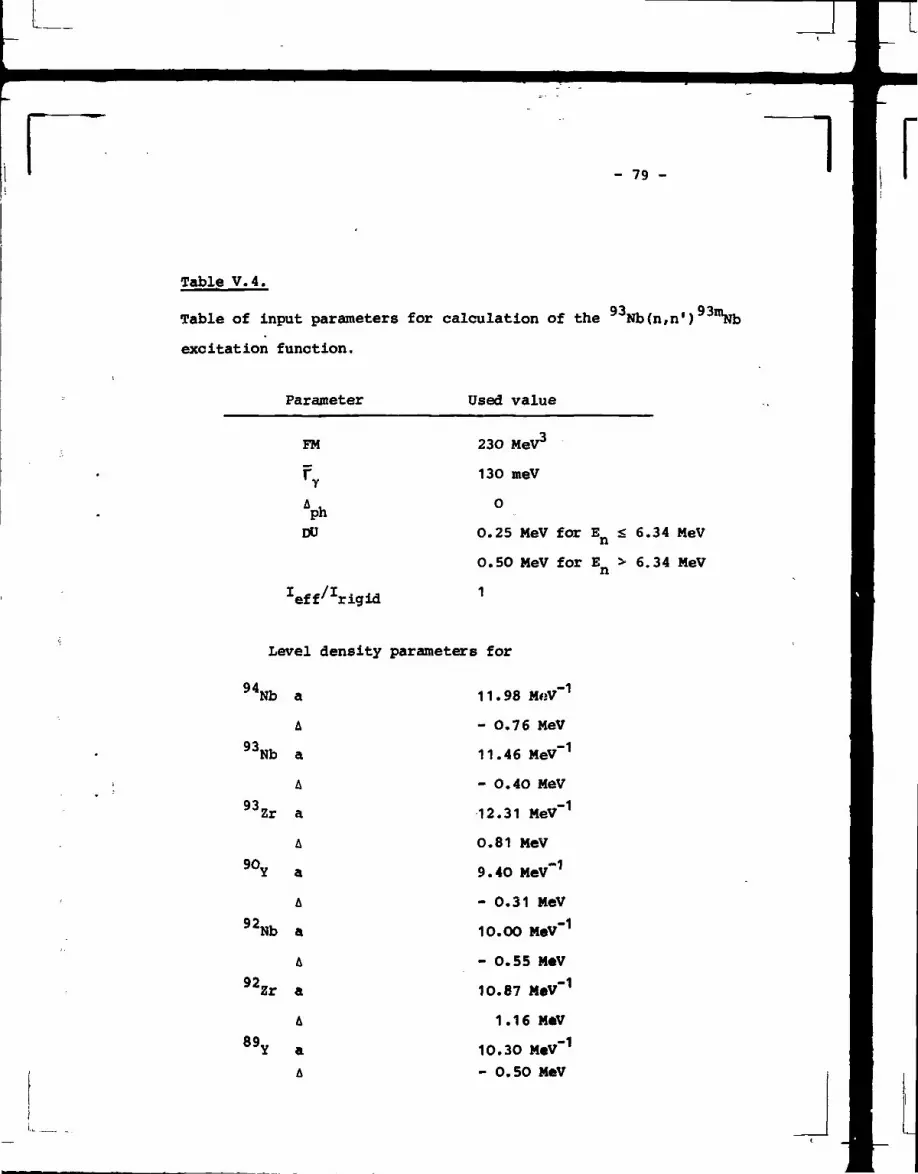
Table V.4.
Table of input parameters for calculation of the Nb(n,n') 10Nb
excitation function.
Parameter
FM
DU
Used value
23O MeV3
130 meV
O
0.25 MeV for
0.5O MeV for
1
6.34 MeV
6.34 MeV
Level density parameters for
"Nb
93Nb
93Zr
90Y
92Nb
92Zr
89Y
a
A
a
A
a
A
a
A
a
A
a
A
aA
11.98
- O.76 MeV
11.46 MeV"1
- O.4O MeV
12.31 MeV"1
0.81 MeV
9.40 MeV"1
- 0.31 MeV
10.OO MsV"1
- 0.55 M*V
10.87 MeV"1
1.16 M*V
10.30 M«V"1
- O.5O MeV
- 80 -
Transmission coefficients
n Delardche et al. /26/
p Becchatti et al. /3/
a Huizenga et al. /4/

L
- 81 -
Table V.5.
List of parameter variations studied for deriving an error
estimate of the calculated cross-sections for the93Nb (n,nf) 9310Nb reaction.
Variation Nr. Variation
3
4
5
6
7
8
10 *
Total s-wave neutron radiation width at
neutron binding energy increased from
13O to 3OO meV.
Constant FM for precompound matrix ele-
ment increased from 23O to 4OO MeV .
a(94Nb) increased by 1 MeV~1
a (93Nb) increased by 1 MeV~1
A(93Nb) reduced by O.5 MeV
a (92Nb) increased by 1 MeV*1
QOA (Nb) reduced by 0.5 MeV
Neutron transmission coefficients of Wilmore
Hodgson used instead of those of DeIa-
roche
Reduction of nuclear moment of inertia
from 1OO to 5O% of rigid body value
(r0 - 1.25 fro)
Spin of levels at 1.369, 1.395, 1.483,
1.499, 1.680, 1.910, 2.019 increased by
one unit,parity changed.

- 82 -
11* Spin of levels at 1.369, 1.395, 1.483,
1.499, 1.68O, 1.91O, 2.O19 reduced by one
unit,parity changed
Only one half of the resulting change was considered as 1 a
error and has been catalogued in Table V.6.
i &

- 83 -
VOt
OlH
3
m
•s
O•H4^id•Hh(O>hO)-P$
IIS1!
l(O
AtU
caO
•H-PUO)nUn2U
0t
C*C
I
n w v c o x w n i n o D - i i ' } ' C W O - ' C N r o c j x x - e - ' C O - x o « v n v D - o - - c v r > j u : o ' c * o : p 5 xX CCi • • • * • • • • • • • • • • • • « • . • . • • • . . . » , » . • . . . . , . ,"* o x n a x K « o «<o o- o- a O N « in » n w r» n N Cj r-; u x 5 S ;-. i.-,v «•' * " S — x 2
-» x x C ) C-i CV <M ri N CJ N M N PJ C-J P-J CJ N N CJ T-.' CJ CJ X —
v i ^ ccnocp ioo i^ßconccc i f t i f tO jn in inL^L^n inc inn in iß i . ' co^ - . ' i t oC OI"" u 1 ' « H ö ~ n £ N N b c i n r i « « ö " ö ^ m N * < ö « R i r i « » K » £ « V M ' ' ; K c j c : i - x— —! w « ro n w m n cj rj cj CJ cj cj N CM cj c; cj -<
> c o o o p o o o <
c, IU
C C O O C C O O O O C O O C O C O C C O O O O O C C C O C O C C C C O p O O C
tt • • •
u ' - t M x N c j n n n w w n n N C j c j n n r M C J N n c j r Ü M C . ^'
oococoococoooocoocooooooecccccccccoooooflj « * . . . . . . . . « « • • » • • » • • • • . . . . . . . . . . . ^'. * . . ,u "«wos^ino-c jNOOOO-ceiN-onT^ronwncjc jn iSotocc inJw.CvTifJc jxxx « x cj cj n n n n cj N cj cj N cj n cj N cj cj cj N cj cj«
O C O O O O O O O O O O O O C O O O O O O O O O C O C C O C O C O O O O O O C
• C r w N N S * *
X X - I N cj n n r o n n N c j c
oooooooooocoooocooooooooooooocooeoooooc^ I a V O S W M C O W - O 1 C P - W r ) X X V V N O - C o W O J W - O V C N ^ - N - C n CJ x r— ~ —
" *"" x x x C J N N W n C M n N C J C J C J N N N n N C J C J H C J x x '
n oeoopooqoeooooopoooooopooooooopoeooopqoa
8 ocooooooocoococcooooooeeoeecooococcccoO - O - W — i m O x - O - O N O O - V x C N N C I W O C O m O - N N N O - ^ - O V N - C V - O W C O V N
n p p o e p o o o o o p o o o o o o o o e o o o c o o p p o o o o e e o o p o oOJ
CJ *Ul
ttU
It-
COe>

- 84 -
Table V. 7.
93Final results of the model calculations for the Nb (n, S
reaction « final evaluated group cross-sections.
EVALUATED GROUP CROSS SECTIONS
GROUP-CMEV3
0.140,400.660.911.161.411.671,922.172.432.682.933.183.44.3.693.944.194. 454.704.955.205.465.715.966.226.857.868.879.8810.8911.9012.9113.9214.9315.9516.9617.9718.9819.99
•ENERGY X-SECTIONTO CMEVD
0.400.660.911.161.411.671.922.172.432.682.933.183.443.693.944.19
. 4.454.704. 955.20 •5.465.71 .5.966.226.857.868.879.8810.8911.9012.9113.9214.9315.9516.96 .17.9718.9819.9921.00
CMEU
3.1517.4037.8090.00110.30152.80195.30222.60274,60302.20308.80304.00296.50286.70276.30266.00256.70248.70242.20237.30233.90231.80230.50229.80229.70229.00224.90200.80131.1082.5055.4041.8034,3029.5025.9022,9020,5018.4016.70
ERRORCMBII
2.. W4.1218.0143,6249.7547.6245.1642.3946.8040.6743.0446.5548.9551.81o3» *JQ54.7554.8054.3853.6652.8452.0751.4251.0350.9750.7851.3152.1350.6941.6933.0027.3023.8021.4419.5217.6616.0314.5113.1912.06
ERKORC%3
90. 023.747.648.545.131.223.3.19.017.013.513.915.316.518.119.420.621.321.922.222.322.322.222.122.222.122.423.225,231.840,049.356.962.566,260. 270,070.871.772.2
L.

- 85 -
V.3. Evaluation and results thereof
As already discussed the calculated values are adopted as
evaluated group cross-sections in the Nb(n,n') 111Nb case
for the whole excitation function. Thus the final evaluation
result is already given in T able V.7. In addition these values
are shown in Fig. V.3.

- 86 -
1
§
-Q . If O/ B!
E <->Kl ,
x—v I— s 10
f~""~ °- "u
" CC
•— tu
_Q x
~^~en
•
•
1 '— X —
B
— X —
• XI
.
_
' x
x
x •
X •
"
'
xv X
„
''•kj
"
,
«f Kl
KX
"
V J
CVI
C3OJ
en«F-4
CD
CiUO*"*
LO*•*
.
W^
t— »
^ * ' '
2LDfyUBB
LU
OO
rs
i n\,O
LO
^." *
_-».
C^J
. XX V _-
I I ^^
C V ) - O
18U 001 ] MOI133S SSOaO

- 87 -
VI. The 103Rh(n,n' Y)103mRh reaction
VI.1. Experimental data base
To establish the data base, a literature search has been per-
formed in two steps.
a) Two very comprehensive compilations, namely CINDA
up to Supplement 79 (1 Oct. 1979) and the threshold reaction
compilation EANDC 95 "U" (Feb. 1974) have been used as
index to existing literature.
b) The most recent editions of some journals most likely to
contain relevant publications have also been searched up to March 1980.
The original papers have been looked up, whenever available
checking simultaneously that references cited therein were
already contained in the literature list. The most important
information on the 6 experiments found in this way is
briefly summarized in Table VI.1. Columns 1 to 7 give the
energy range of the experiment, the number of cross-section
measurements within this range, the method used to detect
either the induced activity or the particles produced in the
considered reaction, the method used to determine neutron
flux, the first author and date of the respective paper and
the reference number used furtheron in the compilation.
In two cases (Santry 74 and Barnard 78) the papers report
essentially on two different experiments for determination
of the 103Rh(n,n')103mRh cross-section using either different
techniques for detecting the reaction or for determining
the neutron flux. In these cases (as indicated by two entries

- 88 -
in !'able Vl.1. the papers were split into their two parts, which
were treated as independent data sets in the further evaluationI
procedure.
Detailed examination of the above measurements resulted in
rejection of 2 measurements and partial rejection of a third
measurement for the following reasons:
Kimura 69: reported excitation curve deviates strongly from
mutually agreeing excitation functions of Santry 74
and Barnard 78 and Paulsen 78
Nagel 66: value deviates by 4 standard deviations from
average of the other values.\
Santry 74: At energies above 6 MeV thefre exist serious dis-
crepancies within the results of this work, cross-
sections determined using the DD-source reactions are
about 25% higher than those measured using the TP-
reaction, the lower results being in agreement with the
recent work at Geel (Liskien 80). Moreover the very high
cross-section values found in Santry 74 in the neutron
energy range 7 - 10 MeV could not be reproduced with any
calculation using reasonable input parameters. Thus it
seems that that part of the measurements of Santry 74,
which used the OD-reaction in the neutron energy range
6 - 1 2 MeV is systematically in error probably due to
the influence of parasitic low energy neutrons. There-
fore all cross-section measurements of Santry 74 based
on the DD-reaction were rejected for neutron energies
above 5.5 MeV.

- 89 -The cross-section data from all accepted measurements are
summarized in Table VI.2. The table lists all cross-section
measurements in order of increasing neutron energy. For each
data point the following quantities are listed: the average
neutron energy and the energy spread (half width at half
maximum) of the neutrons used for the measurement, the un-
certainty of the average neutron energy, the cross-section
values and errors as given by the authors, an indication
which renorns<?.lization procedures have been applied to both
cross-sections and errors according to the general rules
of Ref. 1, section II and finally the renormalized cross-section
values and errors. The renormalized cross-section values are
also shown in pig. VI.1. The uncertainties in the average
neutron energy E centr. not given in most papers were either
estimated from the experimental conditions as described in the
papers or in a few cases obtained by communicating with the
authors.
As indicated in Table VI.2. cross-sections and errors were
partly renormalized according to the general procedures out-
lined in Ref. 1 , section II.
If not specially indicated in Tab. VI.2. the following
standards were taken:
a) Decay scheme as given in Table of Isotopes
b) Reference cross-sections for the reaction 32S(n,p) from
the ENDP/B-IV fi .e. An estimated error of 5% has been
assigned to such reference values and included in the
final error of the renormalized cross-tection.
In the energy range 13.4 - 15 MeV the mor« accurate results
from the precision measurement of Vonach /28/ for the27 24Al(n,a) Mg reaction were used for renormalization j
of the ENDF/B-IV values. This applies to Pazsit 72.

- 90 -
-w-
-M-
-M-
"M-
-M—
-G-
_,e-
QZ flIÄ CQCQ O CO QO QlO(ETT OO r\l\ Ul Lu QD «T OJrx. N "-• f\ r\"«« er
-K3- .X
i * _i i
CVJ
oCVJ
en»— *
OO«— «
r\
LO
U)
CVJ
"5Qi
OO
rx
uo
Kl
(M
CVJ - OO U)
I9U 001 l NOI103S SSOdO

- 91 -
UD
LC
*_0S^TO _.
—X—O—s-e
—o—i
CZ—s
d
—O—,—o—
•'• i oo -
mCC 103
O)OOOOD K* to rx rx Ln LUr\
KO)(E (T-I
CC(E(E(E(Ll-LO O- CQCQP- CO
X O + O S N
-x- -x»* ,x,
t I I I I |_
LDOZ.
>£LU
CVJ —< QO r\ LD LO •«• CVJ —•
ISU 001 ] WO1133S
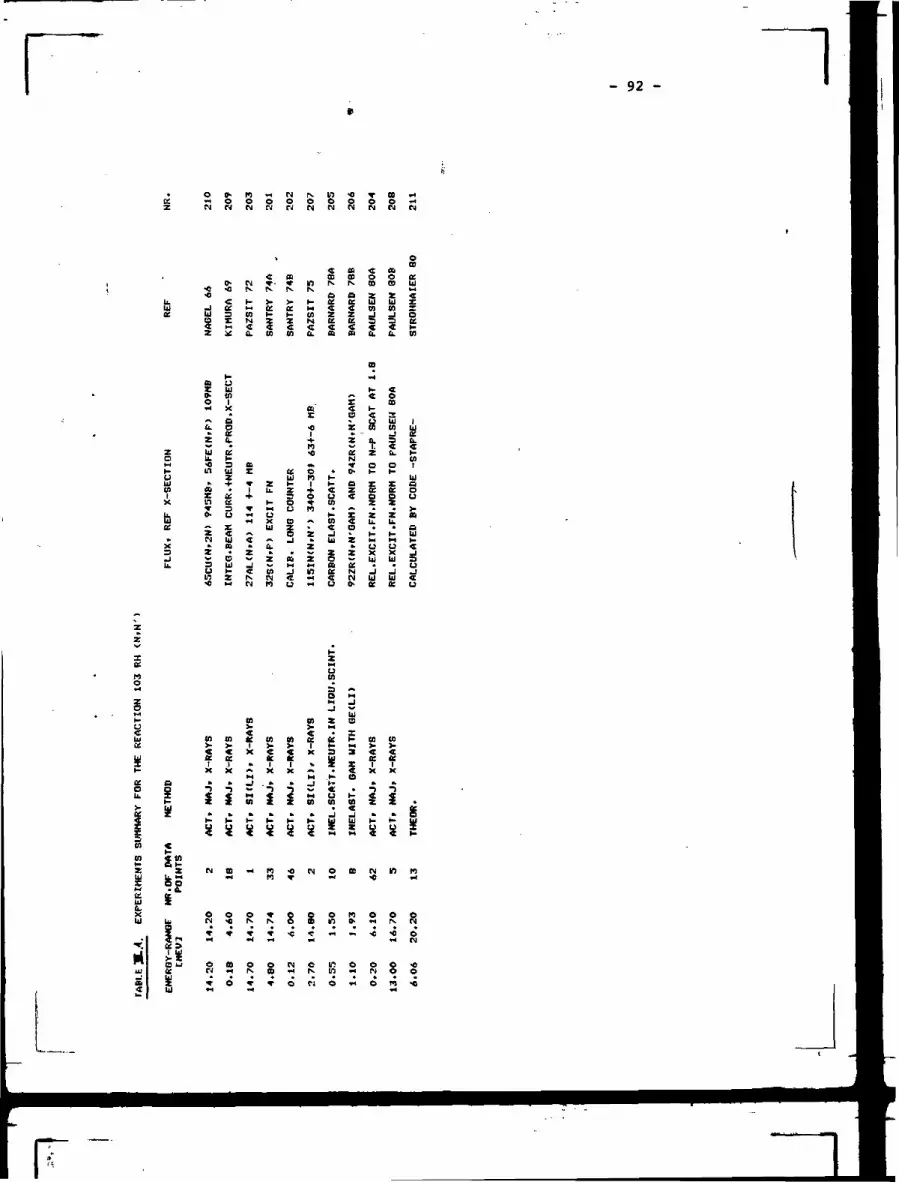
- 92 -
^Z
isse
zO
UUliniX
u.Ula.
X
u.
O
M
•O
-JUl
§Z
a5OH
azUlU.SmEnJ
zrjz3Uin<o
SM
o-
giHlj:
t-U
¥X
gZtt^IgS£
Snou;K-Z
SN
M
h-M
S3C(L
ffiE
I
*
CkZ
Ej
« N
-C »
> VK CC
I Iin in
Ul
r- O
u uX C?U Z
tz äW Min ^S S
ISOCM
n
K
inK<I(L
£
•0I-*•W»0MlO
IO
P)
ZhZ
znTH
8N
N
B
<ra
h-
^cn
d
CC
2
•oOIM
aCO
B
g
S
r«oz»Z
£N
O-
1£
zzSN
g
T
isV)
ü.
OD
«H
gr-C
.8
ei§zu.
IHUXU_J
O
aOOD
i5|*"
«g2iüdCCL.
S
1zU,
K
4JXU_J
g
*H
M
§
S1O
O)
I£ein
UI
gL)
«äBUlK
U
U
Z
Z
« e xIf XX X *> X X ~
M M
« « »H « « M* * in J z cn
z r f f4 I x x
§ ^ i Itn tn aE z ** SS
2£
o eo
» ö
§ S

- 93 -
References to Table VI.1. and Figure VI.1.
Nagel 66: 'W. Nagel and A.H.W. Aten jr., J. Nucl. En. A/B 2O
(1966) 475
Kimura 69: I. Kimura et al., J. Nucl. Sei. Technol. 6 (1969) 1
Pazsit 72: A. Pazsit and J. Csikai, Sov. J. of Nucl. Phys. 35
(1972) 232.K
Santry 74: D.C. Santry and J.P. Butler, can J. Phys. 52 (1974)1421
Barnard 78: E. Barnard and D. Reitmann, Nucl. Phys. A3O3 (1978)27
Paulsen 8O: A. Paulsen, H. Liskien, Nucl. Sei. En. (in press)
Pazsit 75: A. Pazsit et al., J. Applied Rad. Isotopes 26 (1975)621

- 94 -
U. Pv PJ PJ * Ct PJ PJ V PJ PJ * PJ P- * CM * M CJ PJ P4 CM CM P4 ^1 IO CM « IO * (M PJ * PJ PJ V P, * K W CJ - K in VJ V M LO ** PJ lfl - L". «C <f <O P, Il V TJUi O O O O O O O O C O O O Q O O Q O O O O O O O O O O O O O O O O O O O O O O O O O O O O C O C C C C O C O C C C O O Cü: P-,- (V P* P1. PJ PV « ni w PV P* PV w « PJ « PJ PJ PJ PJ CM M ry N PJ PJ TJ tv n PJ n rv P. p. PJ pg « M P-J PJ PJ r-j n P-: PJ PJ PJ PJ PJ P* r; PJ PJ M P-J PJ PJ PJ TJ
M - C O O C O C C O C O O O C - O O C O C C O O O C O O O O O O O C O C C C C C O O O O C O Ou.CiCN. _ _ . . - - - - . . - - - . . _ _ - -OOOOC(C O C C C C C C C C C C C C O
•C C C C Oc o c «• c
^mCM *-•
M O C C C O O O C O O O O O O O C C O O O _ _ _ _ _ _ _u. .— O C C C O C C C C O O O O O C O O O O O C O O O C O O
_ _ _ ^ _O O O C O
!CCCOCCCCCCCCC
'
Z
Z
o-
Z'
i£ U J L U U J U t l ^ L U U J L J U J L J L U U J U j U J l ^ L l J U J L L i L J U J L U U L u U J UJUJ L U U J U J k J U J U J U i U J U j Ui i tJUi iU UJ Uj L.' UJ u3 U^ Ii* •*!. * L,C C Z Z Z Z Z Z Z Z Z Z Z Z Z Z Z I Z Z Z Z Z Z Z Z Z Z Z Z Z Z Z Z Z Z Z Z Z Z Z Z Z Z Z2 Z Z Z Z Z Z ZO O O O O G C 3 O Q O O O O G O O C O O O O O C O O ^ C O ' ^ C O O O O C O O O ' * - O C C - - ^ ' « - C - C C - ' C C ^ C - - O 3 C C ' ^ C cw zzzzzzzzzzzzzzzzzzzzzzzz w ZZNZZZZZZZZZ r.' zzz w N zzz n zz r-.- 3: r.zzszr, za
— , C O O O C O O C C O O O O O C O C t O O O O C O O O O O O C O O C C C C O O O O O C O O O O O C O C O C O O C C O C C CC O O O C O O O O O O O O O O O O O O O O O O O C O O O O O O O O O O O O O O O C O C O C O O O C O C C C C C C C C O
O T H ^ - W I O M ^ O W C C i l C ' O O O O O O » H O O O C ' H O « 'O O O O OCt«30OC
CCC*-
Ä 0 0 0 0 0 O C C C O C O O O O C O O O O O O O C O O O O e 1 O O C C C C O O C C O O C O C C C C C C C O O C C C C C C CS-- C O O O O O O O O O O O O O O O Q C C O O O O C G C O O O O O O O O O O C C C C C C O O O C O O O C C C O O C C O C C— Ä 0 . ^ " C O n - . ^ O 0 3 N O « O C O O O O O O O O O C C C O C O O O C C O O C C O O O O C O C O O C C O O O C C O C C C C C
-Uj r> CCCCOOCOOOOCCCOOOOOOOOOO P O-H W QOOO^COOO W OCC TJ W OiHO PJ OC fJ r>O*HOOr^
oco.oo.oooocooco.occ.ooooooooooooo
-ii'M 5E
* n r; L^ L- O O rN in LT CD C C O L^ Ll LT O O O LT « S3 C O LT LTt N C Ci IT5 O O K fr C C C TJ O- C -• f 4 C- O C t"; n CD l> O C O C C --, «0 C O O~> — ^ ^ r j p . p i P i P i N r ^ n n ^ ^ ^ V ^ ^ ^ ^ ^ ^ W i T n i n i n y i ^ M a N K r V r V C D ^ c s o ^ ^ o o o ^ ^ W ^ ^ ^ ^ P V r ^ W M t ^ W r o V ^ i n- - - -

- 95 -
CD u o o o o o o o o o o o o o o o o o o o o o o o o o o o o o o o o o o o o o o o o o o o o o c e o o o o o o o oo c c oC S N S M N N S N S r I N r J W W M W M r J N N M N N W M r J N W M N N W M r ( W M P J W M N M N r J W H S S W n K S S N S M S S r J S r J
Z C O O O O O O O O O O O O O O O O O O O O*O O O O O <Sri ooocooo oopppppopoppoopr oooooocoooooooococcccccoooocc
oooooooooococoooeocccccoocccc
o«n «k
L*ri O p O O O O p O O <•» B C O O O O
U uLJ
> OO f- OO <
§ o o o o <o o o o < S C O 3? O O , C O C C C O C O C
Z
Z
ü:nC
g -.L.u IM z;
g** r- O <A O <
O O O O O O O « O P Q O O O O O O O O O O O O O O O O O O O O O O O O P O O C O O C O O Cooooooopoooeooooooooocooooccocoocoocc
u. inw*onNNO>BNrao>tKOvNN«n"«-n«NN*oo-ivo«'««o.o«oon*4CsmoNN»<s)!<:(DO(BNriii>.o.Ncrjcc n».nononNi<>MO-«n«»»«»*'<^»»»io^ift»n<rft»io»»iB«io*>»n'OivN'«v<ixi'O»i')-c-ONTinn-c-o
O O O fr*ooeeoooo
- N- (— {• {-cooccoco
-O < O I V « NND O BO SUBf »0-OaO- »0>
onoraonooNonooooonooooonor-jo*Q*4O*4*4Q'-«Q*H«-t*mMQ«M*4M«4*«Q*|4CoooooSooooöooooooooooooo
nononoooooNOttnnnnooooooo
oo^-iMoooooeoc)'*)p)cp'*}nro«4mT*)***r']ococ
a: uItU
S!Uooooooo'

- 96 -
ooe^o«-iiH«-i«-iW (N W W W N W CSI N
Z Q O O O O O C O O O O O O O O O O O O O O OMI-I O O O O O O O O O O O O O O O Q O O O O O Ci*, ft ^ f f i O V H n o o t s o n t o o o c M N r ^ N V T H O o n o
O O O O O O O C OO O O O O O O O O^n^ntnno^is
w fH o M o ^j i o w i n r o n N N-o rs r j •« -c -o n -c O^ ^c i-i cj CM CD n ro M w fj rj w »4 -H N w w rj M re to
H f- <•<••• t- <- C- C- f- C ! !>• P- !•• O O O O O p O p O O O C O O O O O O O O Ou. n e ooooooooooooooooooooooooooooeoooo
u <-miinrs«Hton-«ov~iin ••(CMO-iO'H'HfM^Mv'v
H O O O O O O O O <CC n OOO O OOO O <OCd »BOH WOO 0> <
cc" Six
§ 000«OOO«
Jts»»iO <
> O OO Op) O O O O Oi otM^nn
_ > O Ö O O O O O p O O O O OO C~ CCi O O O O O O O O O O O O O «T N H O (M. O~C
CC
Z n oU U O Ö Ö Ö Ö O Ö O Ö O Ö 6 Ö Ö Ö Ö Ö O O O Ö O O O O O O O Ö O Ö Ö Ö «
ecu ööööoööööööooodöoöoöooööoööoöööoöo
* t * * < * ^ * *
3S onoo o o3u ooooooooooooooooooooeooooooooooooo
Cf 00-ooc.oo^oMDD.OHrgonmo.o^,
2 :"o
=!S
ZUi1
CCZ
ZCi OU K >HHC H-^a «w z 3
-HC J
C H Z O O)CCH- O CCU.
U H CC S H
§ U H- UlO) U CO H-
H I U - J Z ZI (A O) C O UiUO) I ZCC O)Z O O) H H- UiCCC O) It = CC
m cc zzuUJ U H CC
»U UiUZUBUOu.ui;*
HtZtHUJMwCCIHIHl-fil- t- Bt-H-uSueuinuuu
ce -tiMi
ucccccc0 )Acccb . ccccICUU UUUU O)UU
uCinn » J) 5^ co
- 97 -
VI.2. Statistical Model Calculations
As apparent fron Table VI.2. and Fig. VI.1. there are no
accepted experimental data in the energy range 7 - 1 4 and
above 17 MeV, whereas there are three independent mutually
consistent measurements resulting in a rather accurate average
of 304.3 i 16.8mb for the group cross-section for the 13.5 - 14.5
interval. Therefore the evaluation in the 6 - 13.5 and 15 - 2O
MeV neutron energy ranges was done by means of statistical
model calculations with parameters adjusted to reproduce the
experimental value in the 14-15 MeV range.
Table VI.3. lists the input parameters chosen for this purpose.
The neutron optical potentials of Igarasi et al. /29/ was used
for generating transmission coefficients because compared to
various global potentials this one is superior in reproducing
the total cross-section between 2 and 15 MeV /25/
simultaneously with the 103Rh(n,n1)1O3mRh cross-section in the
low energy «6 MeV) and 14 MeV range. The decay scheme of Ref.
3O was used to describe the discrete levels of Rh up to
an excitation energy of 1.293 MeV and the remaining parameters
were given standard values as described in section II.2.
Table VI.4. lists the admitted variations of the various input
parameters used for the error estimate and Table VI.5. gives the
cross-sections obtained with the varied parameters.
Therefrom the uncertainties of the calculated values were derived
according to the procedure described in section II.1.2. The
calculated cross-section values and their uncertainties are given
in Table VI.6.; they are also included in Table VI.2.

- 98 -
Table VI.3.
Table of input parameters for calculation of the103Rh(n,n')103mRh excitation function.
Parameter Used value
FH
DO
Ieff/Irigid
195 MeV3
165 meV
O
0.5 MeV
1
Level density parameters for
104
103
103
1OO,
102
102
99
Rh a
A1Rh a
A
Ru a
A
'Tc a
A
Rh a
A
'Ru a
A
'Tc a
A
14.00 MeV"1
- O.75 MeV
14.4O MeV"1
- 0.23 MeV
12.69 MeV~1
- 1.08 MeV
13.5O MeV"1
- 1.00 MeV
14.00 MeV"1
- O.75 MeV
13.01 M«V"1
0.48 MeV
12.64 M«V"1
- 0.36 MeV

- 99 -
Transmission coefficients
n Igarasi et al. /29/
p Becchetti et al. /3/
a Huizenga et al. /4/
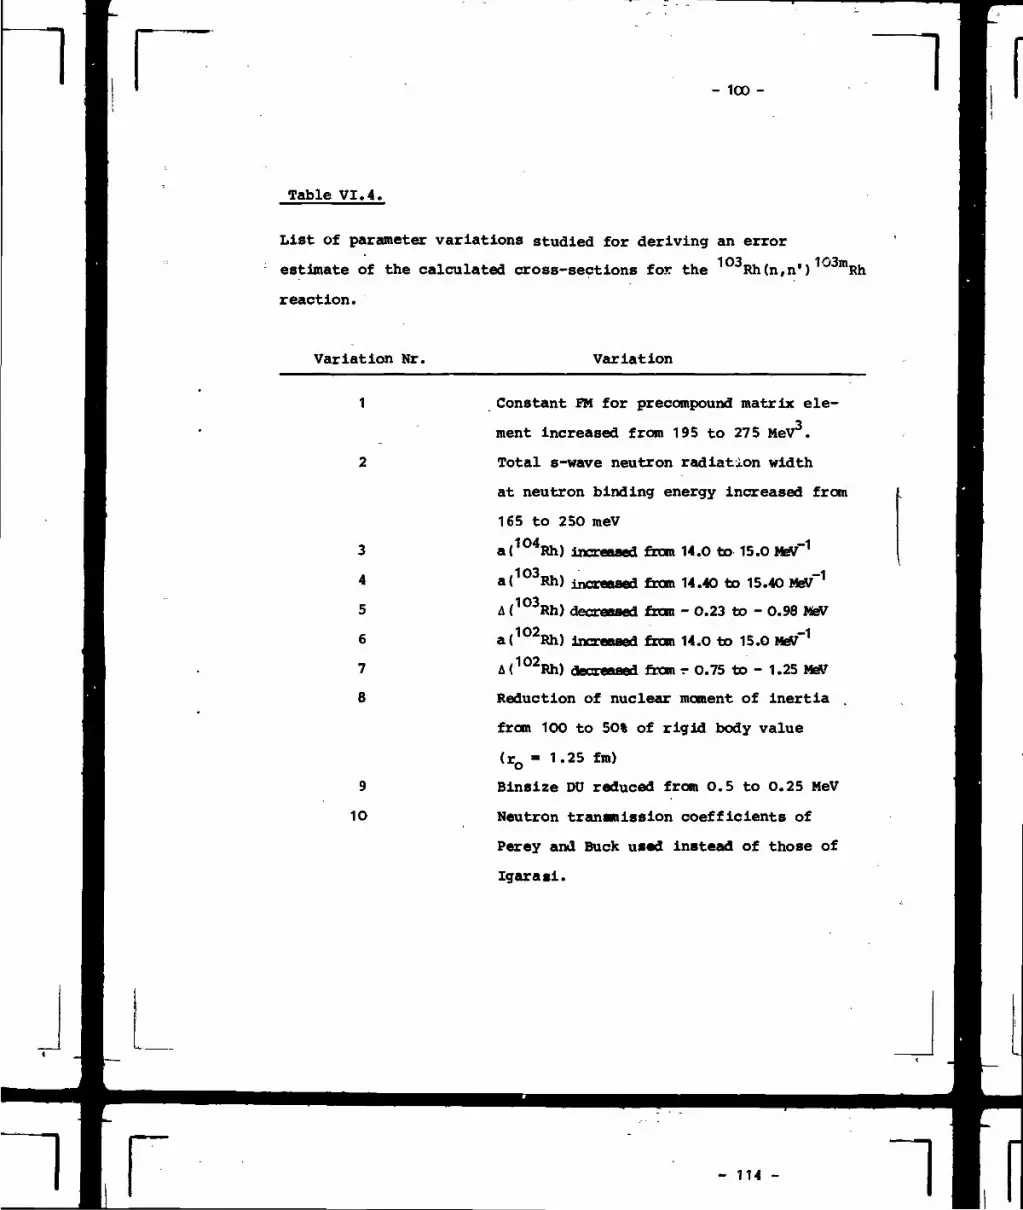
- 103 -
Table VI.4.
List of parameter variations studied for deriving an error
estimate of the calculated cross-sections for the 103Rh(n,n1)1O3mRh
reaction.
Variation Nr. Variation
3
4
5
6
7
8
9
10
Constant FK for precompound matrix ele-
ment increased from 195 to 275 Me\r.
Total s-wave neutron radiation width
at neutron binding energy increased from
165 to 250 meV
a (104Rh) increased from 14.0 to 15.O MeV"1
a (103Rh) increased from 14.4O to 15.40 MeV~1
A (103Rh) decreased fron - O.23 to - O.98 MeV
a (102Rh) Increased from 14.O to 15.0 MeW~1
A(102Rh) decreased from r O.75 to - 1.25 MeV
Reduction of nuclear moment of inertia .
from 1OO to 5O% of rigid body value
(X0 - 1.25 fm)
Binsize DU reduced from O.5 to O.25 MeV
Neutron transmission coefficients of
Perey and Buck u*«d instead of those of
Igarasi.

~1 - 101 -
O O O OC O O O O
OC C O O O O O O O O O O O-
* s -5 -i fi f-i n M " o N » "s n t< n — -< — •*
§
u ^ D r o o n < c m M O * i C M * « iin o « -< -i ~ i — •< o N n r. n .* .< -. -
a5•p«l
gUl O> -O »H O W
'O- N IS M D^ N IO -
§on
e O O O O O O O O * | - « r < B I B ~ l O - r s l f i e < Wn o-o o o o o oc C IVf^ wo-o «r *•-r nno>
u & o n o ro <o «r •* o>-*o N r*> n B ro D>N n «r mV ) O t V H v H M V H V H v H O O I t O * - ! * ) CM C S i v 4 V H 4 H V 4 V H
•P
O)K C
§OGOOOOC OOOoooooooox; —O O O O O O O O O O O
i A M N O N T nnto CB v * N n < x I\<OIRw ^ v - t n ^ ^ - f ^ o N m ^ - n M i M ^ M M M
R)U
ooooooo§£§;
u ö ^ ö r ö ö w * o V - ü ( K - f l b - * - N » * ) N ^ r * ^ c > 6 -mts-«TH^T-i^-(ccKsc*MC--j -*-f^*- ' - t
nnmoVlo
Im•Ht»
- 115 - l
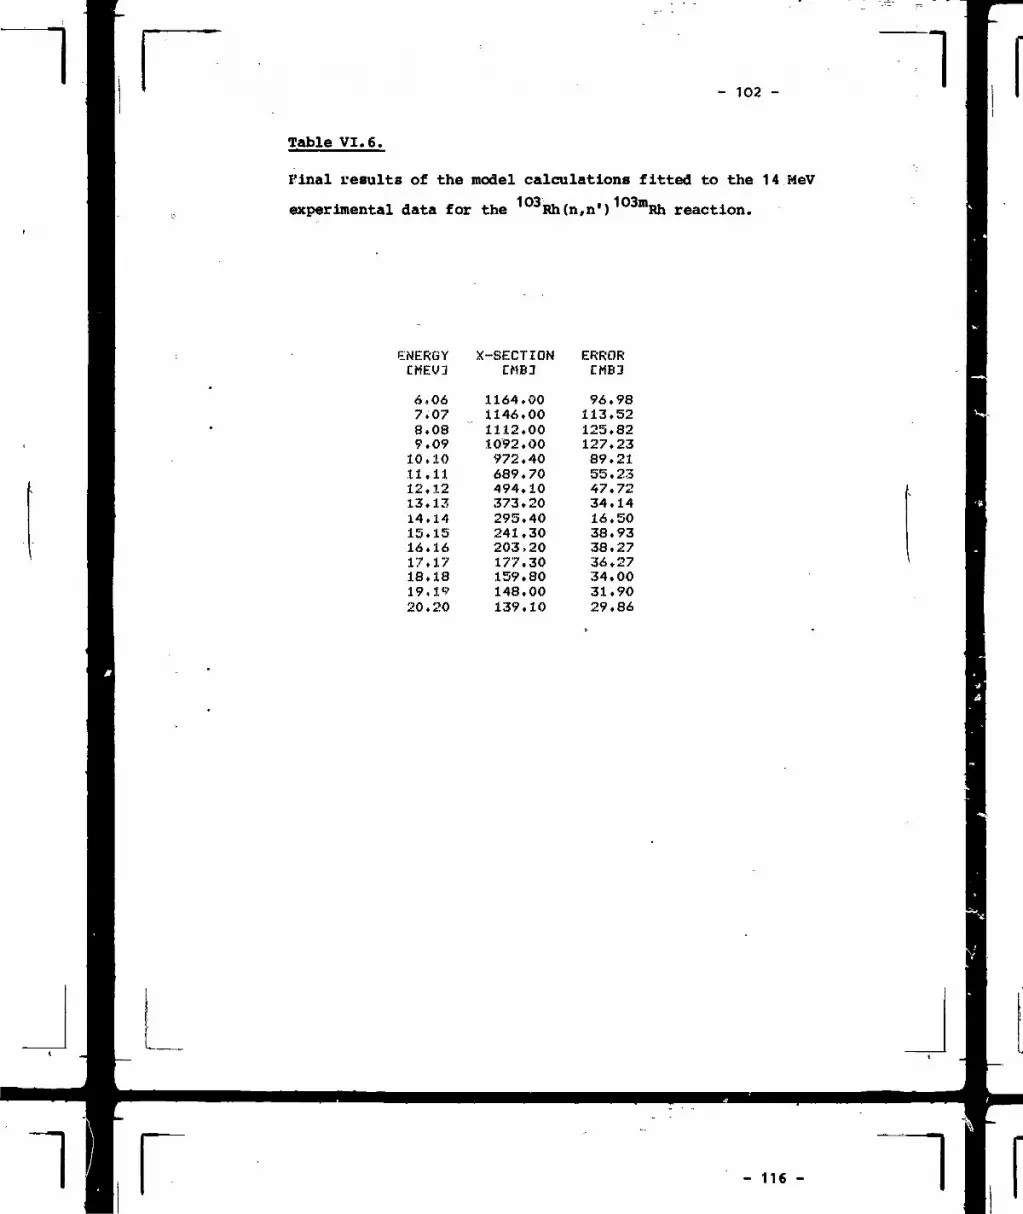
- 102 -
Table VI.6.
Tina! results of the model calculations fitted to the 14 MeV
experimental data for the Bh(n,n') Rh reaction.
ENERGYCMEVD
6,067.078.089.0910.10.11.1112,1213.1314,1415.1516.1617,1718,1819.1920.20
X-SECTIONC MB 3
1164,001146.001112.001092.00972.40689.70494.10373.20295.40241,30203,20177.30159,80148.00139.10
ERROR
96.98113.52125.82127.2389,2155.2347.7234,1416,5038.9338.2736.2734.0031.9029.86

l- 103 -
VI.3. Evaluation and results thereof
For the energy region threshold - 7 NeV the evaluation was based
entirely'on experimental data and carried omt according to the
procedures described in Ref. 1 }for E * 7 - 2O MeV the calculated
values of the preceding section were used. The intermediate steps
(column 7, 8 and 9) flat the experimentally covered energy range
threshold - 7 NeV are given in Table VT.7. The final results for
the whole energy range are summarized in table VI.8.
In figure VI.2. our results are compared to the previous eva-
luations of Lapenas /9/ and Butler and Santry /31/. As apparent
our evaluation is in good agreement with the previous ones below
about 6 MeV whereas there is a discrepancy of about 2O% in the
6 - 1 2 MeV range. This is due to the fact that the older
evaluations are essentially reproductions of the cross-section
data of Santry 74, whereas we decided to reject these data
for the reasons discussed in section VI.1. and decided to
rely on our statistical model calculation described in
section VI.2.
- 117 -

- 1O4 -
uSn
ICUL
HiS(- ZX UU
•0«o.•e
09
CK
8ovvin•on
rsl\i•o
2 U. CüpJCJTt tCJCJ^CM (M » CM M * CJ T N N CJ M N M N V 1ft fM fM n * N CJ ^ W CM * ft * IS H f J « U) L1S -C V C-i in >C rj JS L~ -«CO . UI O O C O O O O O O C O O O O O O O O O O O O p O O O O O O O O O O O O O C O O O O O O C C C O C O O O COH* £C N N PJ N N CJ PJ TJ CM PJ PJ CJ PJ PJ CJ CJ N tM CJ PJ fM n N M PJ CM N W PJ CJ PJ N N TJ ft M Cj TJ di W W W H N N r* ft Tw T-: p; TK Tv Ti
». » » N N C o T C O O n w f f l O T M C M - O C O T O O ^ r v O «|s«CM O) Ol M TJ O TC (S r^« inoNrjnononnO'O-N -ortonoin«-^ » — o o S- rv — .- c -e rj —
C D N V C M O I B X V o>-<vo osvine-ow». in-to-Mfl-o-ncoW^-OXi -^- -rtco( K N N N ^ O r ^ C C
w n < H f r i B C K r « - < i n r \ n M I B « K C M N « f r - wCDTCMvrocMrvr i i rQ*«r jN« C D N O - ^ O X J W W W ONIO^,«««rt rt_ — rt-lrH«« « r M x N C M C M M C V IT V IO
n N v n n n o « r c v t - c ' c ' "Nvc5«w^o» t t« -&.cer i j !« :vo* !^
IO in «ITC« R -O R Ll «0 n « 11 -C
L. O O O O O C O O O O O O O O O O O O O O O O O O O O O O O O O OOOO OOOCCOO O O O O O O O C C OOxr< oocoooooo ooooocopoooooo oooooooo oooo ooooooo coooooocc ccUJGQ O N r J C F - O O T H ^ - M IDn^ 1 OWO W O O O O O O O M O O O O ^ H O O CK O O CJ onoOOCiO C O C J O O C C O a - CC
i CM O CJ T OD S) CJ N * N N. * QD ffi tt OD O < f O O O O C C C O f J CD•*N»H^*H VH cj CM n cj cj - cj cj N - wrvCi.WL'jttw^-r': L cc
% x ooooooooo $$$SO$O$$SSSS° SO22SS00 S ° ° S ooooooo ooooooooo co
I— £Ci * * • • • • • • • • • * • • * • • • • * • • • • • • • • » • • • * • • . * . * • • • • • • • • • • • < • • •*4CK*p*no tMc jn<H*o*K) *^mo «oo-oin nnnnnnn •««««»."»no»' re n< O » V C M MO>incjn«o> oo r -N«mtxc rm va
nviin -o n ii< < -o r- «nin-eoin-oii'e < f-Z
Z^Iit
8«4
rf-
WUi
—
VlIX
gC n
I UUl
>
IsUl Uf
a"(9
fttninpocMinftCD•H*"***CMP!PJCVrMtto o o o o o o o o
O«H
O
oooinnnooo>«inii<«o oininr-ooino
OOO O O O O O O O OO OO O O O O O O O O
n RO O
P7vt?n VL^bI-C1O1Vm -QInIi-O1QIn1VL^1C -IL.
NN£B S S S ^ o o o SSS""S«88 r?
r? § S S* • • *O O « -"

- 105 -
g(L
g
UJ
•oS n
MnCM
O)
U XU un
o»nICN•C
0-»n«n a n
8
CMNnn
O
VH*cC
L- <O OS r;
«r <••C C-e -e
II
u
Ul
?X
* «C M VJ T NB11
oo ooe o o<N W CM (M W N IM ( M CM CM CM N fi Hl lilsiiss illslsis MHH HHH
n« -< (n -o o nno» »oo n o o ».rMVCD^*4Q IsnÖ« OMO CDinON0-CMM-O(MO I - )OOO « O- O n CM O •
fr- N «- *• N oo i- *- »- fr- (••»~ in *•»~ +• r- t-«-1- t- ^ t- »• i-, t-1- t-NnCMWtVCBvHN N » O W N W C M T CO^fMHrWN TO VH N K &• O*
(X rs m - r « e o « » c r f r N N »»T *-o« » v « r > * n t y < » r n < K n n m v n n r< IK i m t»i*><-4t&o-rä tf»»N>*H »*o**n **WT n*««4O »-»^ONTNift »»^-ino-wr«« ISNMWN^ o-inoc«-o-« s -o s; r. rx«-cN<or<. N O O O a<oo o- e- »- «K oo>oo*-9>oo ooooo-ooo e o o c o o o o -* « r. -<
I O O O O O O O O OOO»OOpO O Q O p OOO> O M 6 0 O P T O < C O N
£u »*o*^«on no~4*on NN»CD Nno>>«oninn n\nn-nom omnn ne-n
> O O O O O O O OPOOOC O O O O O O
§ 000000 OPOOPO occoooCMflOOCKO VOvHl f i ^CM M)PVInCO"^
n* K»* n n n i n « r w -
o oO OO C
n äf a•C L"
§ 00 r-<Op p<85 Si SSS SSSSSSSS SSSSSS
n » I O N » - o M »v H O N D - C M 4 T O O C M M > v 4 vHpvHv / OCM*•ONV5-ON N-O-ON-OK NBBO S -C»
Is
O O O O O O

- 106 -
CD
O
t»
N
N
n o o o o0 0 0 0 0 g
OO O
Ö O Ö Ö Ö
n•e
K auz
P. t- .4 o- o n0> B T 09 T »•0 N M T D H»
T n T Ö N M-H O- O) IM -H O-
ag
O-n
Ö m*W
IK»
S
TNTT «r MCM * P-I * * Ca
NNNNNNMN NNNMMtMIM MNNtNMMMMNN N N N M M N NN MMNN NNMNN NN NT.
U
£fr- fr- fr' fr- fr- fr> fr- fr- fr- fr* fr- fr- fr- fr- fr-T O - N O - ^ J N O N T O T T M M ON H H O - N N 1 O O - W ) T N N O n T O - .
fr- fr- fr- HH O- O
l? 5 N S ? 15OK «t •* O * in v CD V? O O *-" O-- IT-o» 2« 5< *n02C 05 -e-*
•*-i tfl CO <• LI *• -i K C K N C K N O C M N OC K V N * N * C K D > <r n in »* o <o CMO * 4 O * 4 O * * * 4 M W v H v H O O O * 1
)N*< tD^tPFO*OO T «•* 0» CD tM ** CKtD »* O SB W IT5 SP «O O " WO rj N-j o « o ** -M N »4 CM «H *4 o O1* N n n K n n r-j « n r-j rj w TJ WM r-j —•
ü.X nLJ Oi
o o o o o o o o o o o o o o o $.$$$$90000 $ ° $OOOOOOOO OOOOOOO OOOOOOOOOO O O O{KON«-(Noo*< n c M O O C M o m ^ c D O " H W o o o * o f j n es Mr jN^-önoocc N M C K C K N O C M ^vHOtMOOO 1 ONn n in N'OT^'O-o^-n-o -o N T n n -o -o ^ONM^^o^onooo*^ ^ n CM
IC OOCO COOOO OC «CO OOOC OOOOC OC OC-< O O D o o o o T IM "K r. !r:
S *N NT TtMNO B - W e D O ) W «05 — tT K K MNMtM «M««tM NW W K
(t. (b. . «k. (k. (.. fk. fk. i>. e- e» . »v t», fr* fr- fr- fr- fr' fr- fr- fr. fr. fr. fr. fr. fr. fr. o o O oo o o o o o O o Cgggggggg gggggss gggggggggg g g g l I s Il il§l iiiPH O T T O - Q O - n T nTTNnN<0 Nfr - -eQNHHMO-TN *0 M M M C*> T Bn «00-<ON OlftnDT N*<) -CN•4N<ono)TO-o> -o -o -o -H p -o ro -Hntj^N-xon-oo T M o- N B o- ON LI«HBO BNNOT NO NNOHHOHHOMMHH M M M O O O M M M O M O M M M H H M M M O *• 5 T nn nnMn MNMNN NN N-H
OCn
Nn -u N
=-min n ninin <«o<c <« N B O - n n n « T T T T T T B
14Ll
I^" Sli! Ut A
n n n n n n ß n•ö N cö o- ö M N n

L
- 107 -
S S
8 ?
S 5,
n § §
s § sO O «H
fi ? S
O (S OS « rS• * .CD (h O*4 ^ W
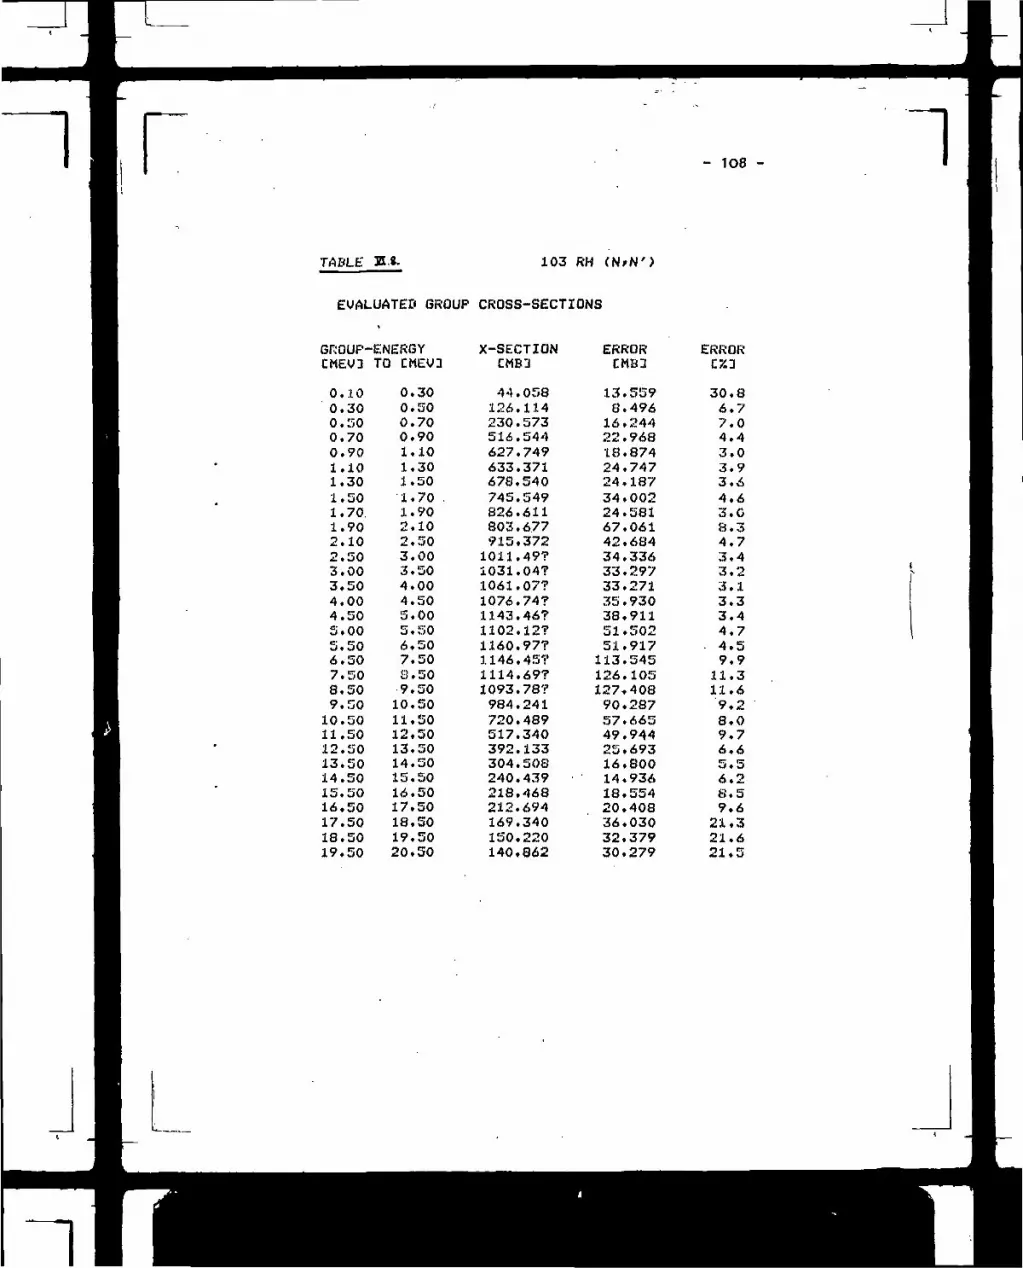
- 108 -
TABLE H.«. 103 RH
EVALUATED GROUP CROSS-SECTIONS
GROUP-ENERGYCMEV3
0.100.300.500.700.901.101,301.501.70.1.902,102.503.003.504.004.505.005,506.507.508.509.5010.5011.5012.5013.5014.5015.5016.5017.5018.5019.50
TO CMEV3
0.300.500.700.901.101.301.501.70 .1,902.102.503.003.504.004,505.005.506,507.500. 509.5010.5011.5012.5013.5014.5015.5016.5017.5018,5019.5020.50
X-SECTJONCMB3
44.058126.114230.573516,544627.749633.371678.540745.549826.611803.677915.3721011.49?1031.04?1061.07?1076.74?1143.46?1102.12?1160.97?1146.45?1114.69?1093.78?984,241720.489517,340392,133304.508240,439218,468212.694169.340150.220140.862
ERRORCMB3
13.5598.49616.24422.96818.87424.74724.18734.00224.58167.06142.68434.33633.29733.27135.93038.91151.50251.917113.545126.105127.40890.28757.66549,94425.69316.80014.93618.55420.40836.03032.37930.279
ERRORr/.330.86.77,04.43,03.93.64.63.08.34.73.43 . 23.13.33.44.74.59.911.311.69.28.09.76.6Kr KT-J* U
6.2e.59.621.321,621.5

L
- 109 -
CSJ
CO«-H
rv-*
ID»— «
LO
V
ro«— •
rvi
Sg
3SQi
GO
rx
1C
LO
M
LO «• IO U)
(8U 001 l NOI133S SSO»
L
- 110 -
VII. Derivation of the relative correlation matrices and
covariances
Relative correlation coefficients and covariances between all
uncertainties of the evaluated cross-sections were calculated
according to the general procedure described in Reference 1 ,
section II.2. for those parts of the evaluation based on ex-
perimental data and according to section II.1. of this report for
the parts derived from model calculations. Only correlations between
the cross-sections within each excitation function are given
in the following as no correlations between the excitation19functions are present except for the two reactions F(n,2n) and
P(n,p) at one energy (14 MeV,see Table VII.1.) and this one
point correlation can certainly be neglected for all practical
cases .
In detail the correlation matrices were derived for the 4 reactions
in the following way:19F(n,2n); For the whole energy range the correlation matrix was
derived from the estimated correlation coefficients of
the experimental values (see Table VII.1.)93Nb(n.n')93inNbt
For this case, where the evaluation was done by model
calculations only the covariances were calculated from
the results of the parameter variation according to
equation (ll.2).

31P(n,p) and 1O3Rh(n.n')103mBh:
In these two cases the correlation matrices consist
of two independent submatrices, one for the low
energy part of the excitation function derived
from the experimental data and one for the high
energy parts derived from calculations adjusted
to the 14 MeV data with no correlations between
the two parts. Thus in these cases the submatrices
of the low energy parts were calculated according
to the standard procedure from the experimental
B K values and the matrices for the high energy
parts were calculated from the results of the
cross-section variations according to the procedure
described in section II.1.2.
The relative covariance matrices, that is, the quantities
<a(Ei)xa(Ei')>
are given in Tables VI I. 2. to 5.
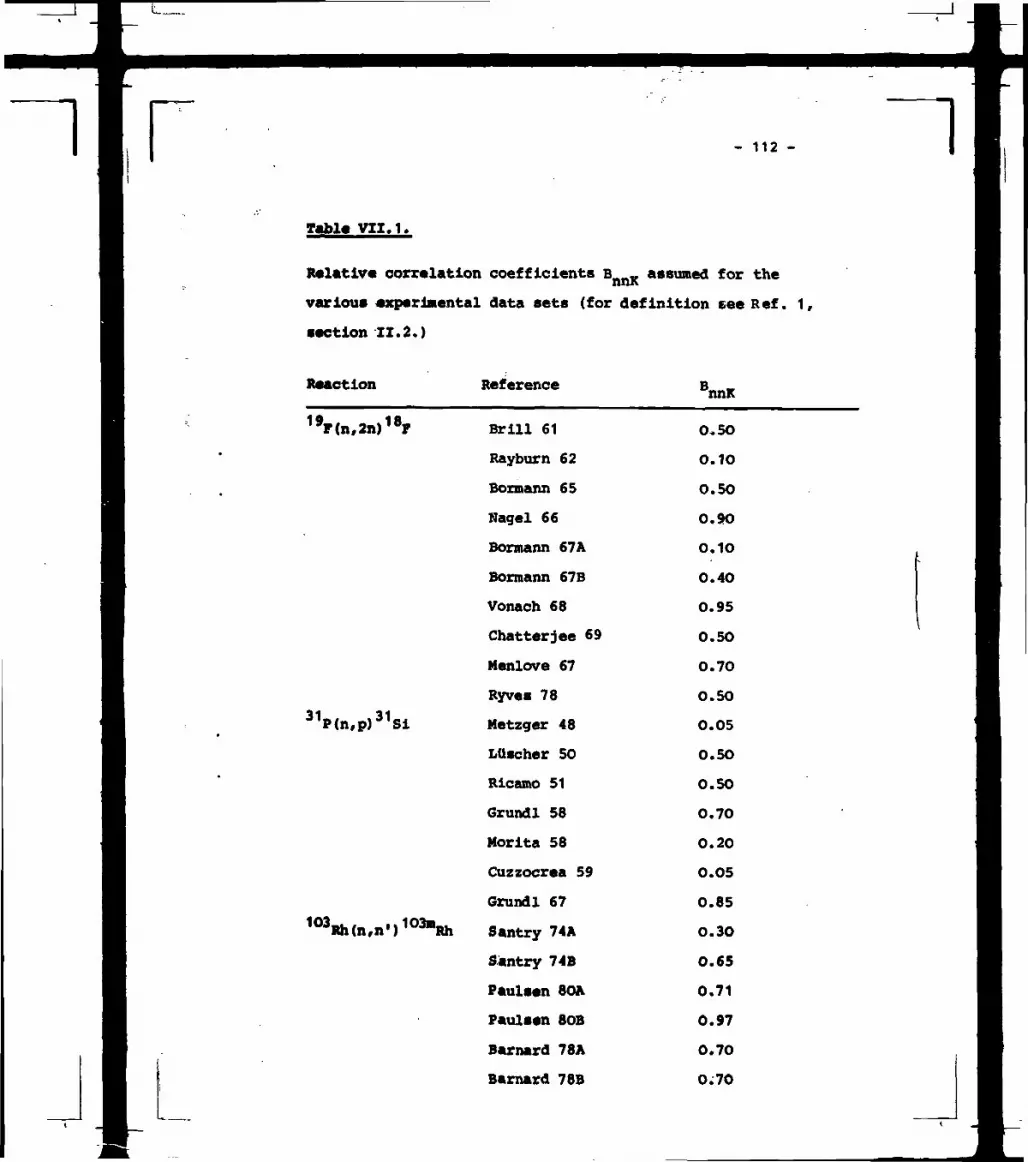
- 112 -
Table vii.1.
Relativ« correlation coefficients B _-. assumed for thennKvarious experimental data sets (for definition eee Ref. 1,
section II.2.)
Reaction
19FCn, 2H)1 8F
31P(n,p)31Si
103Rh(n,n')103*Rh
Reference
Brill 61
Rayburn 62
Bormann 65
Nagel 66
Bormann 67A
Bormann 67B
Vonach 68
Chatterjee 69
Menlove 67
Ryves 78
Metzger 48
LUscher SO
Ricamo 51
Grundl 58
Morita 58
Cuzzocrea 59
Grundl 67
Santry 74A
Santry 74B
Paulsen 8OA
Paulsen 8OB
Barnard 78A
Barnard 78B
BnnK
0,50
0. 1O
0.5O
0.9O
0.10
0.40
0.95
0.5O
0.70
O. SO
0.05
O.5O
O. SO
0.70
0.20
0.05
0.85
0.30
0.65
0.71
0.97
0.70
0.70

- 113 -
o o o o o o o o o o o o o o o o o o o o oOO^'OOOOCM^-CO. tM 'OOnvOf lDOOOOO
X
U.
CK
§H
CJ
CM
O(M
OO
iH
•0
in
«riH
w
oooooooi r>THCooooo»H««<oinoo
»H «H (M *H •» <T O
O O O O O O O O C O T O O O O O n C K C O O
O O O O O O O C K C O ^ - O O O O O W C K O * *-< "I CM rt O
oooooooNorooiHiHoocoo. v Cii n o
U!
UI
CL
OSC.O
O O O O O O O O O C M f H C O N O O On IH CM w oooooooooo tooo^ -o^<o r >oo
XU,
X
SiUI
$
M
Z
zUl
(D
CO
§U
O
CK
CO
•o
V)
ntl
o o o o o o o o o r a oO
ooooooowwo^*W -* O
o o o o o o o c o o ^— O
oooooooo" 1
O
O CK O O OO CK O O O
O CKO OO CK O OIH IH IHO CK OO CK OIH IHCK OCKO
OOO
OOOiH
O OOIH
O CKCK
OOOIH •
OOO
OO
** O
IH(M ro <r n <o r». OD CK o <H (M ro« n-ON co CK o *4 ^TH iH IH 1* 1-1 IH 1« *H •* «H CM N X
(9
g

- 114 -
S S
i
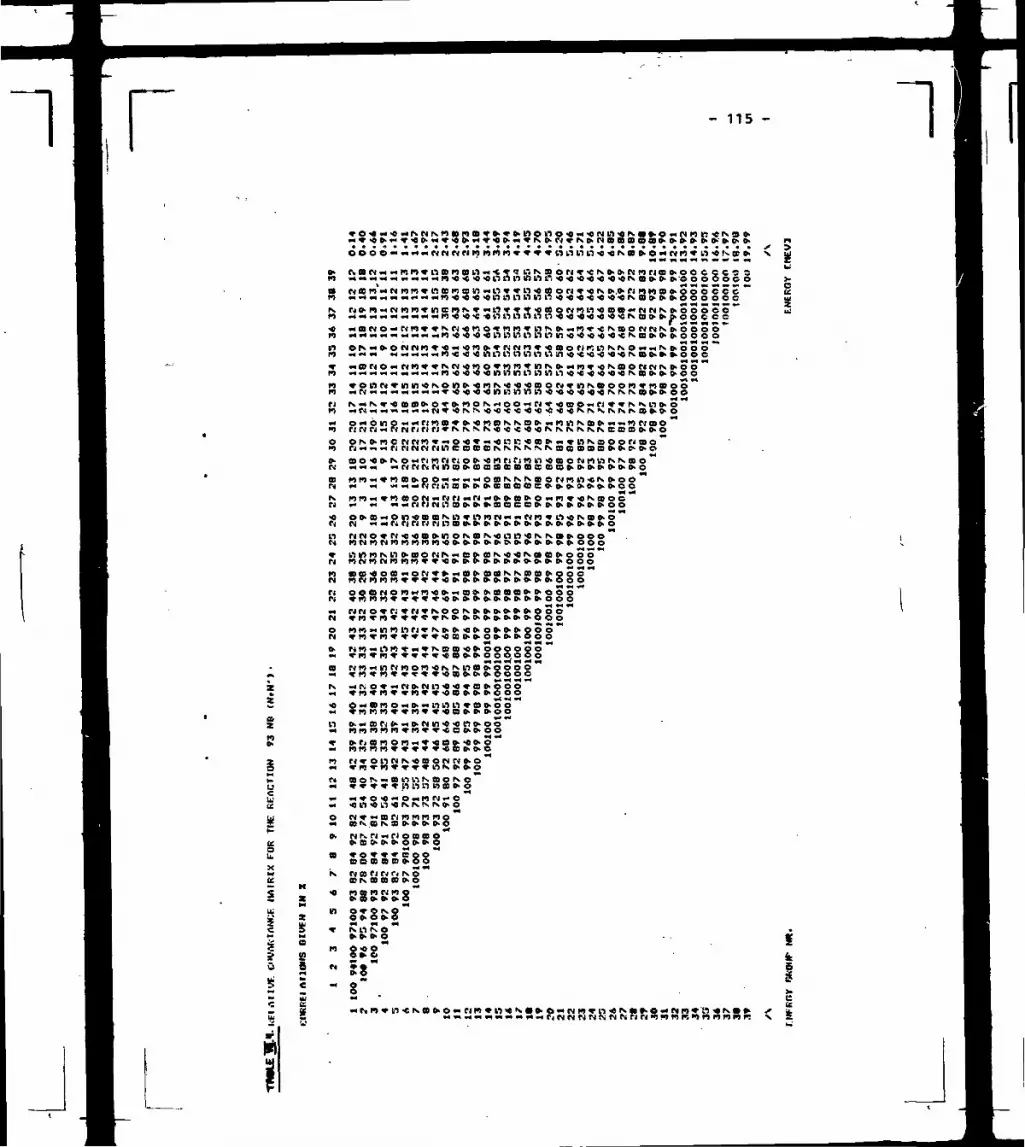
Z
Z
- 115 -
c\c f tN^*4mr '3T i '3 f f in (a . '>« '<Y<TL < jNaor i *<CNo>o-NnnBo>ooccc <33»4 « « M x « •« •* « m « 3 « « nv> nn in in « « <o « « « 4 N a o» o> o>'O o o Oo c o
. — .«wro-e-e-o-onLi i . innninJ-c-o-C'O-er^mo-o-o-ooooV4 v* *4 •»
ix.<«n««<oini.ii.ioiniii.i»««!o!e-e-orvS(7»>»ooS
jnnnoS-e-o-o-o-crxeoo-o-o-oo
• / - O N ^ - O ^ - C - O V O ^ - O - e S l s N ' - . ^ N I V O s S o - O
nn»*ncD»>oex~«-<oaNKKmorjnin«i^»oo« n xxoir j r j i . io«>v-e>CDgooofDe»»o-»(KO-o-oo
4 o^onOMO-x mi LI V B O - O O
I
U
SM
C9
n r j *r o n n rv « o o rj r i o- o
N ooP.-.Bp«N«ogr-.o""«4 •? *• » » n W Ll Ll GO O- O
O CMTwBMI - )MDCX
o > o o o > o - f f - o c i > o >» O » » « f C B O S( O B C D C O C D O - O Or-i CO f ft r« ix oDfS COCO(D CKO
•0
n o
» N
n S
N 5
- s

- 116 - f
'2JfS
in ooo ooo oooooooooooo OSSi1^PSC4 W T T T Ix O
m oooooooooooooooooooggggO O O O O O O O O O O O O O O O O O O g g g
Z
Z
O
Z
gU.
•u•C L1) -O « O
a " °585 N oo"
5 - •(CE -^«TB-orsiiO^o« <«"»» X
»«!•>*> V

- 117 -
The authors gratefully acknowledge the assistance of
Dr. W.G. Vonach and J. Kramer in the literature search
and data renormalization procedure. They are also glad to
acknowledge financial support from the Osterr. Bundesministerium
für Wissenschaft.unä Forschung.

Literature
/1/ S. Tagesen, H. Vonach and B. Strohmaier, Physics Data
Nr. 13-1, 1979, ISSNo.344-9401
/2/ M. UhI and B. Strohmaier, Proc. Winter Course on Nuclear
Physics and Reactors, Trieste, 16 Jan - 1O Feb 1978,
IAEA (in press)
/3/ F.D. Becchetti Jr. and G.W. Greenlees, Phys. Rev. 182,
1190 (1969)
/4/ J.R. Huizenga and G. Igo, Nucl. Phys. 29, 462 (1962) and
ANL-6373 (1961)
/5/ W. DiIg et al., Nucl. Phys. A217, 269 (1973)
/6/ C. Kalbach-Cline, Nucl. Phys. A21O, 590 (1973)
/7/ E. Gadioli, E. Gadioli-Erba and P.G. Sona, Nucl. Phys.
A214, 589 (1973) and L. Milazzo-Colli, G.M. Braga-
Marcazzan, Nucl. Phys. A21O, 297 (1973)
/8/ P. Axel, Phys, Rev. 126, 671 (1962)
/9/ A.A. Lapenas, Kh.Ja. Bondars, Ja.K. Vejnbergs, Izmerenie
Spektrov Nejtronov Aktivycionnym Hetodom, zinatne,
Riga, USSR, 1975 and EXFOR VOO02.O2O
/10/ B. Strohmaier and M. UhI, Proc. Int. Conf. on Neutr. Phys.
and Nucl. Data for Reactors and Other Applied Purpose*,
Harwell, 25-29 Sept. 1978, p. 1184
/11/ P.M. Endt and C. van der Leun, Nucl. Phys. A214,1 (1973)
/12/ G.S. Mani, H.A. Melkanoff and I. lori, Rpt. C.E.A. 2379,
1963
/13/ P.G. Perey and B. Buck, Nucl. Phys. 32, 35O (1962)
/14/ P.G. Perey, Phys. Rev. 1O9, 1295 (1958)
/15/ W.L. %Zijp et al., RCN 196 (1973)
/16/ Ü.C.R.L. 5O4OO, Vol. 15 (1978)!
/17/ I.J. van Heerden and W.R. HcMurray, .Z. Physik 26O,i
9(1973)
/18/ H. Göbel, E. Feicht and H. Vonach, Z. Physik 240,
430 (1970)
/19/ G.H. Williams, Thesis Univ. of Texas (1975)
/20/ A.B. Smith, P.T. Guenther and J.F. Whalen, Z. Physik 264,
379 (1973)
/21/ R.E. Coles, AWRE-RPT, No. O66/71 (1971)
/22/ A.I. Abramov, Sov. Journ. Atom. En. 12, 65 (1962)
/23/ N.P. Glazkov, Sov. Journ. Atom. En. 14, 1173 (1963)
/24/ D.C. Kocher, Nucl. Data Sheets B8, 527 (1972)
/25/ D.G. Foster and D.W. Glasgow, Phys. Rev. C3, 576 (1971)
/26/ J.P. Delaroche, Ch. Lagrange and J. Saivy, IAEA Con-
sultants Meeting on the Use of Nuclear Theory in
Neutron Nuclear Data Evaluation, Trieste, 8-15 Dec. 1975,
IAEA-190, Vol. 1, p. 251
/27/ D. Hermsdorf, G. Kiefiig, J. Seeliger, Kernenergie 20,
166 (1977)
/28/ H. Vonach «t al., Z. Physik 237, 155 (1970)
/29/ S. Igarasi «t al., Proc. Conf. Nucl. Cross Sections and
Technology, Washington DC, March 1975, Vol.1,p.320
/30/ E. Barnard, D. Reitmann, Nucl. Phys. A303, 27 (1978)
/31/ J.P. Butler, D.C. Santry, AECL-3043 and UKDL-DFN 94 A

Figur» Caption»
Fig. IV.2.
19Fig. III.t. Experimental data base for the F(n,2n) reaction
in the neutron energy range threshold - 2O MeV.
The figure displays the renormalized cross-section«
and their effective 1a errors (according to Table
III.2., column 8+9) for all measurements reported
in Table III.1.
Fig. III.2. Comparison of the present evaluation with the pre-
vious evaluations of Lapenas
Fig. IV.1. Experimental data base for the reaction P(n,p)
in the neutron energy range threshold - 2O MeV.
The figure displays the renormalized cross-sections
and their effective 1o errors (according to Table
IV.2., column 8+9) for all measurements in Table
IV.1. Also shown are the results of the model
calculations of section IV.2. (Strohmaier 8O).
a) whole energy range
b) E- 1 - 3 MeVnc) E "3-5 MeVnd) E. 5 - 2O MeV
Comparison of the present evaluation with previous
evaluations
a) Comparison with SANDIT and UKDL.
b) Comparison with ENDL-78.

93Fig. V.1. Experimental values of Nb(n,n')
Fig. VI.1.
!93mNbcross-
sections derived from y-production cross-section93measurements in the Nb(n,n'Y) reaction (values
of Table V.2.) and effective 1a errors. Also
shown are the results of the statistical model
calculations of section V.2. (Strohmaier 8O).93Fig. V.2. Nonelastic cross-sections for the Nb+n system derived
from sphere-transmission, (n,n') and (n,n'-y) ex-
periments.
Fig. V.3. Results of the present evaluation
l103mRh1O3Experimental data base for the Rh(n,n')
reaction in the neutron energy range threshold -
20 MeV. The figure displays the renormalized cross-
sections and their effective 10 errors (according
to Table VI.2., column 8+9) for all measurements
reported in Table VI.1. and the cross-sections cal-
culated as described in the next section (Strohmaier 80).
a) full energy range
b) E.n O - 6 MeV
Fig. VI.2. Comparison of the present evaluation with previous
evaluations.
Copyright © 2022 FDOKUMEN