Authigenic 10Be/9Be signature of the Laschamp excursion: A tool for global synchronisation of...
10
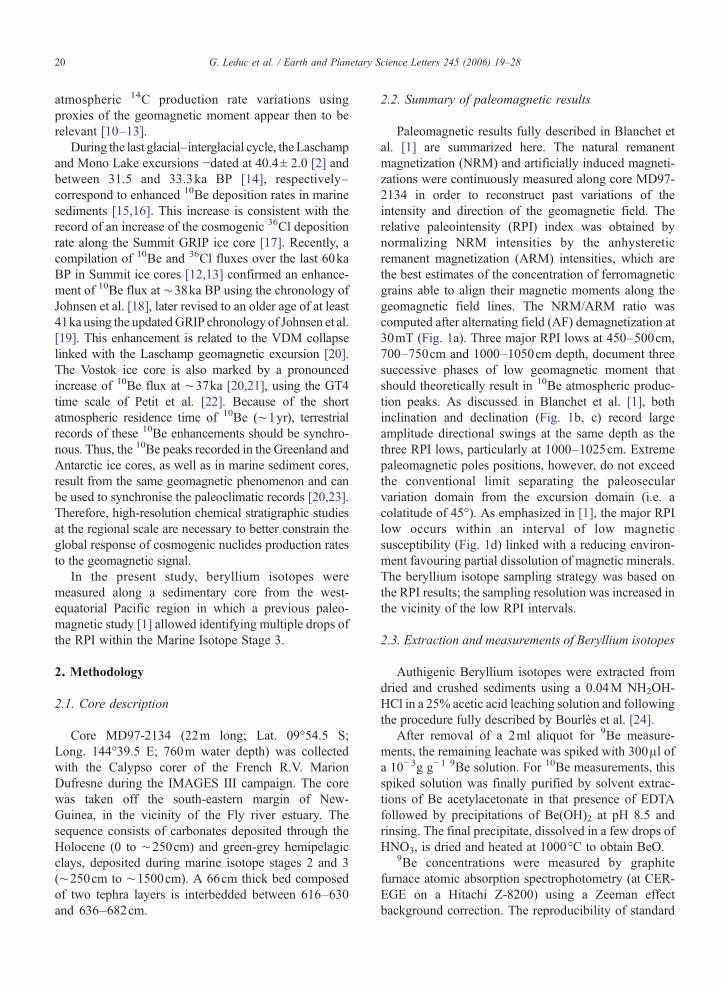
Authigenic 10 Be/ 9 Be signature of the Laschamp excursion: A tool for global synchronisation of paleoclimatic archives G. Leduc ⁎ , N. Thouveny, D.L. Bourlès, C.L. Blanchet, J.T. Carcaillet Centre Européen de Recherche et d'Enseignement des Géosciences de l'Environnement (CEREGE), Europôle Méditerranéen de l'Arbois, BP 80, 13545 Aix en Provence Cedex 04, France Received 11 July 2005; received in revised form 9 February 2006; accepted 3 March 2006 Available online 19 April 2006 Editor: V. Courtillot Abstract Authigenic 10 Be and 9 Be isotope concentrations have been measured in marine sediments deposited between 10 and 60 ka BP in the western equatorial Pacific and their ratio compared to the geomagnetic relative paleointensity (RPI) record obtained from the same core [C.L. Blanchet, N. Thouveny, T. de Garidel-Thoron, New evidences of geomagnetic moment lows between 30 and 45ka BP from a sedimentary sequence of the west equatorial Pacific, Quat. Sci Rev. (in press)]. Over the studied time interval, dated by radiocarbon and oxygen isotope stratigraphy, three periods of reduced RPI occurring at ∼ 32, 37 and 45ka, according to the constructed age model, are concomitant with three significant increases in atmospheric 10 Be production. Since the most pro- minent 10 Be/ 9 Be peak necessarily results from the weakest geomagnetic moment event, i.e. that associated with the Laschamp excursion, we assign to this cosmogenic nuclide event the age of the Laschamp excursion (i.e. 40.4 ± 2.0 ka BP) [H. Guillou, B.S. Singer, C. Laj, C. Kissel, S. Scaillet, B.R. Jicha, On the age of the Laschamp geomagnetic excursion, Earth Planet. Sci. Lett. 227 (2004) 331–343]. Cosmogenic nuclide production peaks provide critical complementary evidence for the identification of geomagnetic dipole lows linked to excursions and constitute accurate markers for global intercorrelation of paleoclimatic archives. © 2006 Elsevier B.V. All rights reserved. Keywords: cosmogenic nuclides; geomagnetic field intensity; Laschamp excursion; correlation of geological records 1. Introduction The geomagnetic field modulation of the production rate of cosmogenic nuclides ( 10 Be, 14 C, 26 Al, 36 Cl…) in the atmosphere theoretically follows a negative power law relation [3,4,5]. This has been experimentally supported by authigenic 10 Be/ 9 Be measurements per- formed on Portuguese margin sedimentary sequences covering the last 300ka [6], as well as by authigenic 10 Be/ 230 Th xs measured on sedimentary cores that cover the last 200 ka and that are globally distributed [7]. This relationship has been further strengthened by compar- isons of paleointensity or VDM variations with cosmogenic nuclide variations over the last 1.3Ma [8,9]. These comparisons showed that significant cosmogenic nuclide enhancements systematically oc- curred at the time of excursions or reversals, indepen- dently of paleoclimatic conditions (see Fig. 3 in [9]). Thus, whilst it cannot be excluded, environmental and/ or climatic influences on the 10 Be/ 9 Be authigenic ratio appear to be negligible. The attempts to model Earth and Planetary Science Letters 245 (2006) 19 – 28 www.elsevier.com/locate/epsl ⁎ Corresponding author. Tel.: +33 4 42 97 15 98. E-mail address: [email protected] (G. Leduc). 0012-821X/$ - see front matter © 2006 Elsevier B.V. All rights reserved. doi:10.1016/j.epsl.2006.03.006
Transcript of Authigenic 10Be/9Be signature of the Laschamp excursion: A tool for global synchronisation of...
etters 245 (2006) 19–28www.elsevier.com/locate/epsl
Earth and Planetary Science L
Authigenic 10Be/9Be signature of the Laschamp excursion:A tool for global synchronisation of paleoclimatic archives
G. Leduc ⁎, N. Thouveny, D.L. Bourlès, C.L. Blanchet, J.T. Carcaillet
Centre Européen de Recherche et d'Enseignement des Géosciences de l'Environnement (CEREGE), Europôle Méditerranéen de l'Arbois,BP 80, 13545 Aix en Provence Cedex 04, France
Received 11 July 2005; received in revised form 9 February 2006; accepted 3 March 2006Available online 19 April 2006
Editor: V. Courtillot
Abstract
Authigenic 10Be and 9Be isotope concentrations have been measured in marine sediments deposited between 10 and 60ka BP inthe western equatorial Pacific and their ratio compared to the geomagnetic relative paleointensity (RPI) record obtained from thesame core [C.L. Blanchet, N. Thouveny, T. de Garidel-Thoron, New evidences of geomagnetic moment lows between 30 and 45kaBP from a sedimentary sequence of the west equatorial Pacific, Quat. Sci Rev. (in press)]. Over the studied time interval, dated byradiocarbon and oxygen isotope stratigraphy, three periods of reduced RPI occurring at ∼32, 37 and 45ka, according to theconstructed age model, are concomitant with three significant increases in atmospheric 10Be production. Since the most pro-minent 10Be/9Be peak necessarily results from the weakest geomagnetic moment event, i.e. that associated with the Laschampexcursion, we assign to this cosmogenic nuclide event the age of the Laschamp excursion (i.e. 40.4±2.0ka BP) [H. Guillou, B.S.Singer, C. Laj, C. Kissel, S. Scaillet, B.R. Jicha, On the age of the Laschamp geomagnetic excursion, Earth Planet. Sci. Lett. 227(2004) 331–343].
Cosmogenic nuclide production peaks provide critical complementary evidence for the identification of geomagnetic dipolelows linked to excursions and constitute accurate markers for global intercorrelation of paleoclimatic archives.© 2006 Elsevier B.V. All rights reserved.
Keywords: cosmogenic nuclides; geomagnetic field intensity; Laschamp excursion; correlation of geological records
1. Introduction
The geomagnetic field modulation of the productionrate of cosmogenic nuclides (10Be, 14C, 26Al, 36Cl…) inthe atmosphere theoretically follows a negative powerlaw relation [3,4,5]. This has been experimentallysupported by authigenic 10Be/9Be measurements per-formed on Portuguese margin sedimentary sequencescovering the last 300ka [6], as well as by authigenic
⁎ Corresponding author. Tel.: +33 4 42 97 15 98.E-mail address: [email protected] (G. Leduc).
0012-821X/$ - see front matter © 2006 Elsevier B.V. All rights reserved.doi:10.1016/j.epsl.2006.03.006
10Be/230Thxs measured on sedimentary cores that coverthe last 200ka and that are globally distributed [7]. Thisrelationship has been further strengthened by compar-isons of paleointensity or VDM variations withcosmogenic nuclide variations over the last 1.3Ma[8,9]. These comparisons showed that significantcosmogenic nuclide enhancements systematically oc-curred at the time of excursions or reversals, indepen-dently of paleoclimatic conditions (see Fig. 3 in [9]).Thus, whilst it cannot be excluded, environmental and/or climatic influences on the 10Be/9Be authigenic ratioappear to be negligible. The attempts to model
20 G. Leduc et al. / Earth and Planetary Science Letters 245 (2006) 19–28
atmospheric 14C production rate variations usingproxies of the geomagnetic moment appear then to berelevant [10–13].
During the last glacial–interglacial cycle, the Laschampand Mono Lake excursions −dated at 40.4± 2.0 [2] andbetween 31.5 and 33.3ka BP [14], respectively–correspond to enhanced 10Be deposition rates in marinesediments [15,16]. This increase is consistent with therecord of an increase of the cosmogenic 36Cl depositionrate along the Summit GRIP ice core [17]. Recently, acompilation of 10Be and 36Cl fluxes over the last 60kaBP in Summit ice cores [12,13] confirmed an enhance-ment of 10Be flux at ∼38ka BP using the chronology ofJohnsen et al. [18], later revised to an older age of at least41ka using the updatedGRIP chronology of Johnsen et al.[19]. This enhancement is related to the VDM collapselinked with the Laschamp geomagnetic excursion [20].The Vostok ice core is also marked by a pronouncedincrease of 10Be flux at ∼37ka [20,21], using the GT4time scale of Petit et al. [22]. Because of the shortatmospheric residence time of 10Be (∼1yr), terrestrialrecords of these 10Be enhancements should be synchro-nous. Thus, the 10Be peaks recorded in the Greenland andAntarctic ice cores, as well as in marine sediment cores,result from the same geomagnetic phenomenon and canbe used to synchronise the paleoclimatic records [20,23].Therefore, high-resolution chemical stratigraphic studiesat the regional scale are necessary to better constrain theglobal response of cosmogenic nuclides production ratesto the geomagnetic signal.
In the present study, beryllium isotopes weremeasured along a sedimentary core from the west-equatorial Pacific region in which a previous paleo-magnetic study [1] allowed identifying multiple drops ofthe RPI within the Marine Isotope Stage 3.
2. Methodology
2.1. Core description
Core MD97-2134 (22m long; Lat. 09°54.5 S;Long. 144°39.5 E; 760m water depth) was collectedwith the Calypso corer of the French R.V. MarionDufresne during the IMAGES III campaign. The corewas taken off the south-eastern margin of New-Guinea, in the vicinity of the Fly river estuary. Thesequence consists of carbonates deposited through theHolocene (0 to ∼250cm) and green-grey hemipelagicclays, deposited during marine isotope stages 2 and 3(∼250cm to ∼1500cm). A 66cm thick bed composedof two tephra layers is interbedded between 616–630and 636–682cm.
2.2. Summary of paleomagnetic results
Paleomagnetic results fully described in Blanchet etal. [1] are summarized here. The natural remanentmagnetization (NRM) and artificially induced magneti-zations were continuously measured along core MD97-2134 in order to reconstruct past variations of theintensity and direction of the geomagnetic field. Therelative paleointensity (RPI) index was obtained bynormalizing NRM intensities by the anhystereticremanent magnetization (ARM) intensities, which arethe best estimates of the concentration of ferromagneticgrains able to align their magnetic moments along thegeomagnetic field lines. The NRM/ARM ratio wascomputed after alternating field (AF) demagnetization at30mT (Fig. 1a). Three major RPI lows at 450–500cm,700–750cm and 1000–1050cm depth, document threesuccessive phases of low geomagnetic moment thatshould theoretically result in 10Be atmospheric produc-tion peaks. As discussed in Blanchet et al. [1], bothinclination and declination (Fig. 1b, c) record largeamplitude directional swings at the same depth as thethree RPI lows, particularly at 1000–1025cm. Extremepaleomagnetic poles positions, however, do not exceedthe conventional limit separating the paleosecularvariation domain from the excursion domain (i.e. acolatitude of 45°). As emphasized in [1], the major RPIlow occurs within an interval of low magneticsusceptibility (Fig. 1d) linked with a reducing environ-ment favouring partial dissolution of magnetic minerals.The beryllium isotope sampling strategy was based onthe RPI results; the sampling resolution was increased inthe vicinity of the low RPI intervals.
2.3. Extraction and measurements of Beryllium isotopes
Authigenic Beryllium isotopes were extracted fromdried and crushed sediments using a 0.04M NH2OH-HCl in a 25% acetic acid leaching solution and followingthe procedure fully described by Bourlès et al. [24].
After removal of a 2ml aliquot for 9Be measure-ments, the remaining leachate was spiked with 300μl ofa 10−3g g−1 9Be solution. For 10Be measurements, thisspiked solution was finally purified by solvent extrac-tions of Be acetylacetonate in that presence of EDTAfollowed by precipitations of Be(OH)2 at pH 8.5 andrinsing. The final precipitate, dissolved in a few drops ofHNO3, is dried and heated at 1000°C to obtain BeO.
9Be concentrations were measured by graphitefurnace atomic absorption spectrophotometry (at CER-EGE on a Hitachi Z-8200) using a Zeeman effectbackground correction. The reproducibility of standard

21G. Leduc et al. / Earth and Planetary Science Letters 245 (2006) 19–28
addition absorptions and the fit of standard additionlines were then used to determine 9Be uncertainties. 10Beconcentration is deduced from the spiked 10Be/9Be ratiosmeasured by AMS at the Tandetron facility in Gif-sur-Yvette. The presented data were calibrated directlyagainst the 10Be/9Be standard of the National Institute ofStandards and Technology (NIST) standard reference
Fig. 1. Paleomagnetic and rock magnetic parameters as a function of depth aseveral voids due to gas expansion during core extraction (a) NRM/ARM ratindicator, (b) inclination (°) at 30mTAF, (c) declination (°) at 30mTAF andshow the three main decreases of the RPI. Light grey area corresponds to thethe position of the tephra layer (T).
material (SRM) 4325 (10Be/9Be=2.68 10−11). 10Beuncertainties result from statistical uncertainties linkedto the number of 10Be events detected coupled to a 5%analytical uncertainty deduced from the reproducibilityof the standard through the measurement sequences.Propagation of the 10Be and 9Be uncertainties ultimatelydetermines the uncertainty linked to the 10Be/9Be ratio.
long core MD97-2134 [1]. The core depth scale has been corrected forio at 30mTAF demagnetization used as a relative paleointensity (RPI)(d) magnetic susceptibility measured on Uchannel series. Black arrowsdepth interval affected by low susceptibilities. Dark grey area indicates

Table 1Be isotope concentrations and 10Be/9Be ratio along core MD97-2134(see text for details)
Correcteddepth (cm)
10Be(.10−15g g−1)
9Be(.10−9g g−1)
10Be/9Be(.10−6)
300 6.82±0.40 6.25±0.24 1.09±0.08306 7.20±0.45 4.87±0.18 1.48±0.11320 7.77±0.85 5.93±0.20 1.31±0.15354 8.69±0.69 5.70±0.21 1.52±0.13374 8.86±1.09 4.66±0.20 1.90±0.25396 8.60±0.50 7.56±0.26 1.14±0.08420 9.29±0.58 4.56±0.17 2.03±0.15460 9.03±0.51 5.60±0.30 1.61±0.12476 11.14±0.72 4.28±0.12 2.61±0.19482 9.54±0.51 4.85±0.25 1.97±0.15484 10.69±0.72 4.02±0.18 2.66±0.21488 9.43±0.54 7.70±0.11 1.23±0.07492 9.15±0.52 3.80±0.45 2.41±0.32506 7.47±0.53 5.85±0.26 1.28±0.11522 6.54±0.38 8.67±0.34 0.75±0.05548 6.88±0.38 7.01±0.22 0.98±0.06608 5.55±0.32 8.82±0.39 0.63±0.05694 6.25±0.34 9.78±0.05 0.64±0.04712 10.51±0.60 7.62±0.27 1.38±0.09722 12.31±0.65 6.86±0.36 1.79±0.13732 14.70±0.87 4.37±0.17 3.36±0.24736 11.54±0.64 5.87±0.28 1.97±0.14738 12.36±0.86 5.05±0.06 2.45±0.17742 11.15±0.59 6.25±0.38 1.79±0.14748 8.83±0.57 8.32±0.31 1.06±0.08770 5.03±0.31 13.89±0.12 0.36±0.02802 3.99±0.23 7.94±0.24 0.50±0.03862 3.71±0.22 4.96±0.27 0.75±0.06886 3.08±0.19 7.72±0.37 0.40±0.03900 2.03±0.13 11.46±0.34 0.18±0.01934 2.04±0.13 9.88±0.19 0.21±0.01964 3.40±0.23 13.03±0.07 0.26±0.02976 5.56±0.42 11.57±0.85 0.48±0.05986 6.51±0.38 6.52±0.23 1.00±0.07990 7.53±0.57 6.07±0.23 1.24±0.10994 6.19±0.39 6.90±0.31 0.90±0.071000 7.19±0.61 6.60±0.48 1.09±0.121008 6.56±0.38 9.04±0.49 0.73±0.061016 7.13±0.63 6.73±0.34 1.06±0.111026 5.46±0.37 6.30±0.26 0.87±0.071032 5.51±0.33 10.46±0.17 0.53±0.031036 5.44±0.48 4.85±0.32 1.12±0.121040 4.42±0.29 7.71±0.19 0.57±0.041056 3.88±0.26 9.18±0.29 0.42±0.031090 4.11±0.28 6.95±0.27 0.59±0.051122 4.18±0.28 8.17±0.36 0.51±0.041128 4.74±0.33 6.73±0.28 0.70±0.061154 4.33±0.30 9.17±0.43 0.47±0.041176 3.95±0.28 8.00±0.42 0.49±0.041254 3.15±0.19 10.12±0.28 0.31±0.021286 4.65±0.34 7.09±0.20 0.66±0.05
22 G. Leduc et al. / Earth and Planetary Science Letters 245 (2006) 19–28
2.4. Normalization procedure
10Be concentrations measured in marine sedimentsnot only depend on 10Be production rates but also onenvironmental conditions affecting the chemical andgranulometric composition of the sediments [24–26].Notably, the absolute 10Be concentration of marinesediments is inversely proportional to their carbonatecontents [27–29], and proportional to the specificsurface of the settling particles, which implies that thetotal 10Be absolute concentration is meaningless. Inorder to account for these environmental effects,normalization procedures are required. Both cosmo-genic 10Be and stable 9Be isotopes have the samechemistry but different sources [30]. 10Be is produced inthe atmosphere and transferred to the ocean in solubleform [31], while 9Be is introduced by the detrital inputsof which a small fraction is solubilized. Only the solubleform of both beryllium isotopes can thus be homoge-nized in the water column before deposition. It haseffectively been demonstrated that the 10Be/9Be ratio ofthe authigenic phase from marine sediments – i.e. thefraction due to adsorption from the water column ontoparticles – represents the 10Be/9Be ratio of soluble Be inthe deep ocean at the time of deposition [24]. Since thepublication of [24], authigenic 9Be has commonly beenused to normalize the authigenic 10Be concentrationsin deep-sea sediments [6,15,16,24] and the authigenic10Be/9Be ratio considered as the most appropriateproxy of the atmospheric 10Be production rate. Theauthigenic 9Be concentration is most likely moreappropriate than the mass of the authigenic fraction(proposed by McHargue and Donahue [32]) tonormalize authigenic 10Be concentration. Althoughboth isotope concentrations similarly depend on theparticle specific surface, this may not be the case forthe total authigenic mass that might also depend on thenature of the settling particles. In addition it remains tobe explained why and demonstrated how normalizationto the total authigenic mass might be representative ofthe conditions at the time of deposition.
3. Results
The beryllium isotope concentrations and their ratiosare presented in Table 1 and compared to the RPI curvein Fig. 2.
3.1. Authigenic 10Be and 9Be concentrations
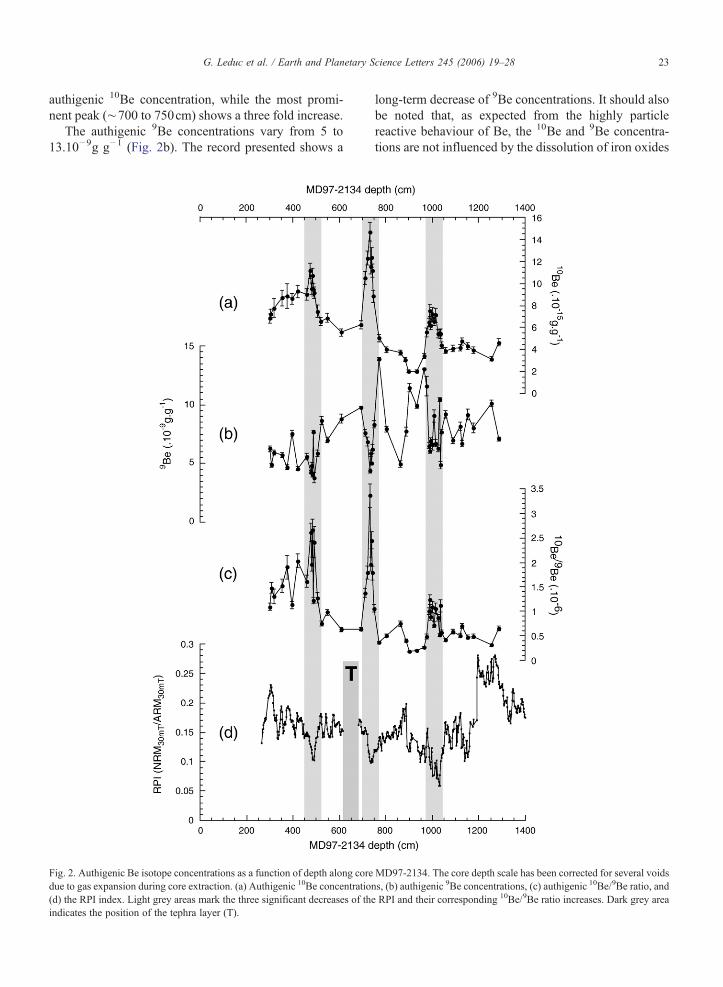
10Be concentrations in the studied sediments varyfrom 2 to 13.10−15g g−1 (Fig. 2a). Three maxima of
authigenic 10Be are recorded at ∼480, ∼730 and∼1020cm; two of them show a doubling of the
23G. Leduc et al. / Earth and Planetary Science Letters 245 (2006) 19–28
authigenic 10Be concentration, while the most promi-nent peak (∼700 to 750cm) shows a three fold increase.
The authigenic 9Be concentrations vary from 5 to13.10−9g g−1 (Fig. 2b). The record presented shows a
Fig. 2. Authigenic Be isotope concentrations as a function of depth along coredue to gas expansion during core extraction. (a) Authigenic 10Be concentration(d) the RPI index. Light grey areas mark the three significant decreases of theindicates the position of the tephra layer (T).
long-term decrease of 9Be concentrations. It should alsobe noted that, as expected from the highly particlereactive behaviour of Be, the 10Be and 9Be concentra-tions are not influenced by the dissolution of iron oxides
MD97-2134. The core depth scale has been corrected for several voidss, (b) authigenic 9Be concentrations, (c) authigenic 10Be/9Be ratio, andRPI and their corresponding 10Be/9Be ratio increases. Dark grey area
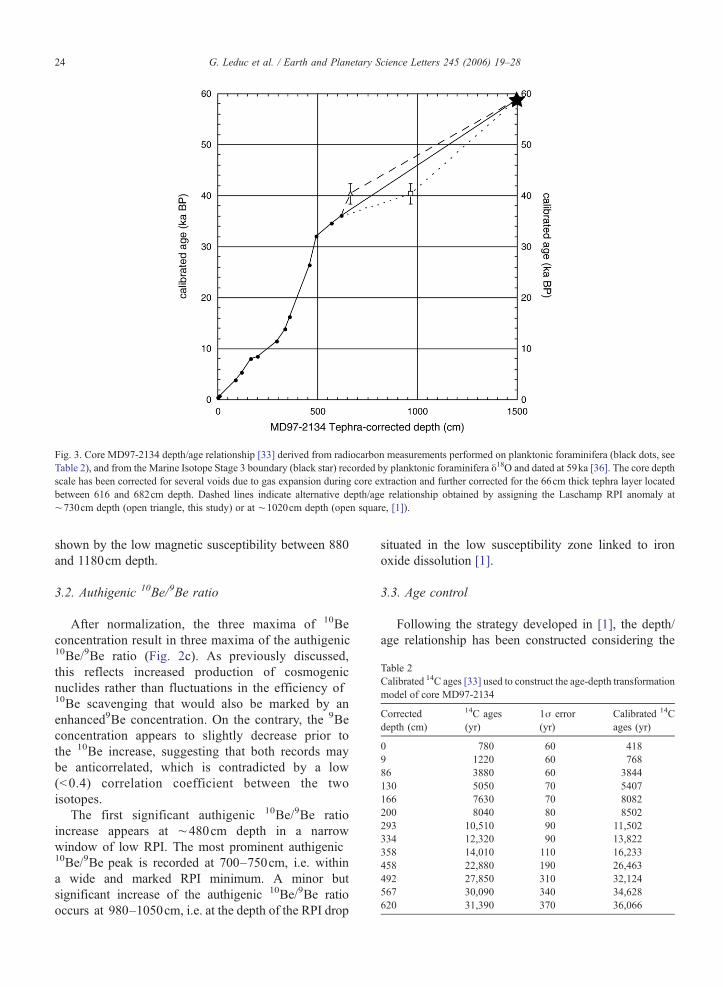
Fig. 3. Core MD97-2134 depth/age relationship [33] derived from radiocarbon measurements performed on planktonic foraminifera (black dots, seeTable 2), and from the Marine Isotope Stage 3 boundary (black star) recorded by planktonic foraminifera δ18O and dated at 59ka [36]. The core depthscale has been corrected for several voids due to gas expansion during core extraction and further corrected for the 66cm thick tephra layer locatedbetween 616 and 682cm depth. Dashed lines indicate alternative depth/age relationship obtained by assigning the Laschamp RPI anomaly at∼730cm depth (open triangle, this study) or at ∼1020cm depth (open square, [1]).
Table 2Calibrated 14C ages [33] used to construct the age-depth transformationmodel of core MD97-2134
Correcteddepth (cm)
14C ages(yr)
1σ error(yr)
Calibrated 14Cages (yr)
0 780 60 4189 1220 60 76886 3880 60 3844130 5050 70 5407166 7630 70 8082200 8040 80 8502293 10,510 90 11,502334 12,320 90 13,822358 14,010 110 16,233458 22,880 190 26,463492 27,850 310 32,124567 30,090 340 34,628620 31,390 370 36,066
24 G. Leduc et al. / Earth and Planetary Science Letters 245 (2006) 19–28
shown by the low magnetic susceptibility between 880and 1180cm depth.
3.2. Authigenic 10Be/9Be ratio
After normalization, the three maxima of 10Beconcentration result in three maxima of the authigenic10Be/9Be ratio (Fig. 2c). As previously discussed,this reflects increased production of cosmogenicnuclides rather than fluctuations in the efficiency of10Be scavenging that would also be marked by anenhanced9Be concentration. On the contrary, the 9Beconcentration appears to slightly decrease prior tothe 10Be increase, suggesting that both records maybe anticorrelated, which is contradicted by a low(<0.4) correlation coefficient between the twoisotopes.
The first significant authigenic 10Be/9Be ratioincrease appears at ∼480cm depth in a narrowwindow of low RPI. The most prominent authigenic10Be/9Be peak is recorded at 700–750cm, i.e. withina wide and marked RPI minimum. A minor butsignificant increase of the authigenic 10Be/9Be ratiooccurs at 980–1050cm, i.e. at the depth of the RPI drop
situated in the low susceptibility zone linked to ironoxide dissolution [1].
3.3. Age control
Following the strategy developed in [1], the depth/age relationship has been constructed considering the

25G. Leduc et al. / Earth and Planetary Science Letters 245 (2006) 19–28
tephra between 616 and 682cm depth as instantaneousdeposits at the millennial scale; thus the depth scale hasbeen corrected for this thickness before its transforma-tion to a time scale.
The chronology of the sequence is mainly based on13 radiocarbon ages obtained on the planktonicforaminifera Globigerinoides ruber ([33], Fig. 3, Table2). After correction of a 400yr reservoir age, the radio-carbon ages were converted to calendar ages using theINTCAL98 calibration curve [34] back to 24ka BP, andusing the coral-based calibration of Bard et al. [35]beyond 24ka BP (Table 2). The oldest age control pointat ∼59ka BP [36] is the Marine Isotope Stage 4/3boundary at ∼1500cm (tephra-corrected depth) in theδ18O record of G. ruber [33]. The time scale wasconstructed by linear interpolation between the agecontrol points.
Fig. 4. Comparison of the expected variations of the 10Be production (upper pafunction of time. The expected 10Be production is calculated from the relatio(thick line) RPI data [1] (see text for details). Grey areas show the three signifiproduction. A grey dashed line has been drawn at the age of the Laschamcalibrated 14C AMS dates.
4. Discussion and conclusion
The authigenic 10Be/9Be presents its most significantvariations at (1) 30–32ka BP, (2) 36–38ka BP and (3)44–45ka BP (Fig. 4). This record is compared to theexpected fluctuations of cosmonuclide production rateusing both the original and the corrected NRM/ARMratio. Indeed, the RPI record published in [1] is affectedby abrupt step-like drops at the limits of a marked lowsusceptibility zone (Fig. 1a), attributed to partial andselective dissolution of the magnetic carriers (seeSection 5.2 in [1]). Therefore, the NRM/ARM ratiocurve within this zone appears to be shifted downwardsby at least a value of 0.055 that corresponds to the stepvalue at the upper end of the low susceptibility zone, andwas thus corrected for such a value before computingthe expected 10Be production rate (Fig. 4).
nel) and of the measured authigenic 10Be/9Be ratio (bottom panel), as anship described in [4] using the uncorrected (thin line) and correctedcant decreases of the RPI and their corresponding enhancement of 10Bep excursion [2]. Black triangles along the age axis correspond to the
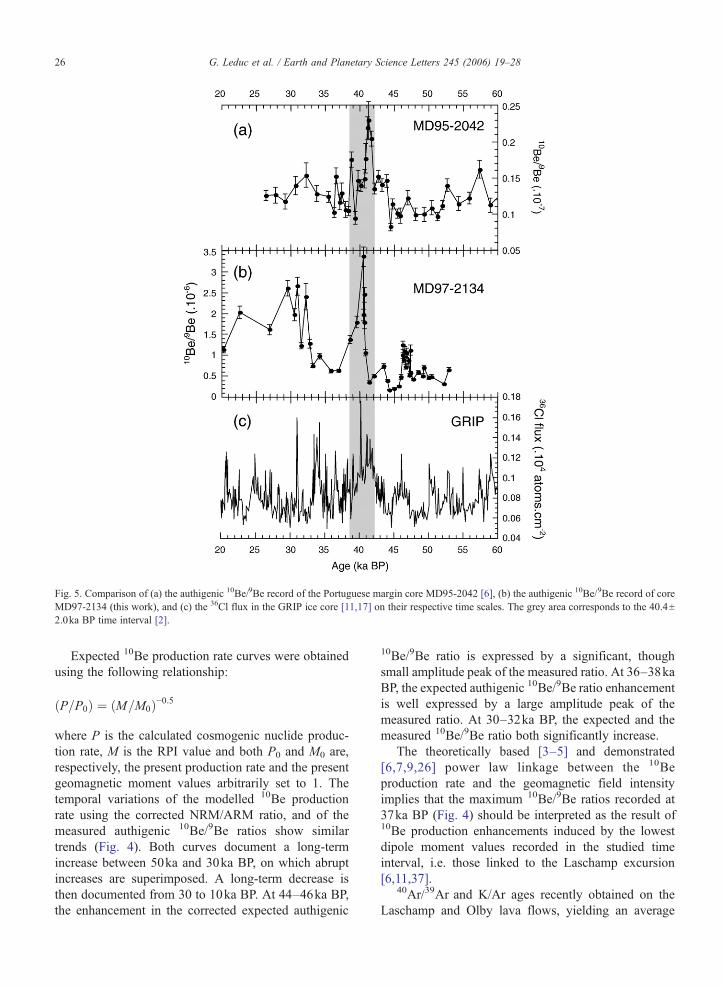
Fig. 5. Comparison of (a) the authigenic 10Be/9Be record of the Portuguese margin core MD95-2042 [6], (b) the authigenic 10Be/9Be record of coreMD97-2134 (this work), and (c) the 36Cl flux in the GRIP ice core [11,17] on their respective time scales. The grey area corresponds to the 40.4±2.0ka BP time interval [2].
26 G. Leduc et al. / Earth and Planetary Science Letters 245 (2006) 19–28
Expected 10Be production rate curves were obtainedusing the following relationship:
ðP=P0Þ ¼ ðM=M0Þ−0:5
where P is the calculated cosmogenic nuclide produc-tion rate, M is the RPI value and both P0 and M0 are,respectively, the present production rate and the presentgeomagnetic moment values arbitrarily set to 1. Thetemporal variations of the modelled 10Be productionrate using the corrected NRM/ARM ratio, and of themeasured authigenic 10Be/9Be ratios show similartrends (Fig. 4). Both curves document a long-termincrease between 50ka and 30ka BP, on which abruptincreases are superimposed. A long-term decrease isthen documented from 30 to 10ka BP. At 44–46ka BP,the enhancement in the corrected expected authigenic
10Be/9Be ratio is expressed by a significant, thoughsmall amplitude peak of the measured ratio. At 36–38kaBP, the expected authigenic 10Be/9Be ratio enhancementis well expressed by a large amplitude peak of themeasured ratio. At 30–32ka BP, the expected and themeasured 10Be/9Be ratio both significantly increase.
The theoretically based [3–5] and demonstrated[6,7,9,26] power law linkage between the 10Beproduction rate and the geomagnetic field intensityimplies that the maximum 10Be/9Be ratios recorded at37ka BP (Fig. 4) should be interpreted as the result of10Be production enhancements induced by the lowestdipole moment values recorded in the studied timeinterval, i.e. those linked to the Laschamp excursion[6,11,37].
40Ar/39Ar and K/Ar ages recently obtained on theLaschamp and Olby lava flows, yielding an average

27G. Leduc et al. / Earth and Planetary Science Letters 245 (2006) 19–28
age of 40.4±2.0ka BP [2], are in perfect agreementwith the occurrence of 10Be and 36Cl flux maxima inthe Summit ice cores during interstadial 10 dated at∼41ka BP in the GISP2 chronology [38] and in therecently revised ss09sea GRIP chronology [19].Therefore, in contrast with the correlation establishedin [1], we assign the age of 40.4±2.0ka BP to themaximum 10Be/9Be ratio located at ∼664cm (tephracorrected depth) (Fig. 3).
The authigenic 10Be/9Be record of core MD97-2134on its corrected time scale is compared to twocosmogenic nuclide reference records on their ownchronologies (Fig. 5): (1) the authigenic 10Be/9Be recordof coreMD95-2042 [6] and (2) the 36Cl flux record of theGRIP ice core [13,17]. In core MD95-2042, themaximum authigenic 10Be/9Be peak linked to theLaschamp occurs at 41.2ka BP (Fig. 5a). In the GRIPcore, the revised chronology (ss09sea, [19]) sets themaximum 36Cl flux peak between 40 and 42ka BP (Fig.5c). The assignment of the maximum 10Be/9Be peak toan age of 40.4±2.0ka BP (Fig. 5b) allows a comparisonto be made between the three records and identificationof the two secondary authigenic 10Be/9Be peaksoccurring between 30 and 32ka BP and at 46–47kaBP, respectively.
The calibrated radiocarbon age obtained just beneaththe youngest cosmogenic nuclide production peakconstrains its maximum age to 32.12±0.31ka, whichpermits a correlation with the low geomagnetic momentevent linked to the Mono lake excursion dated at∼32kaBP in theMono lake sediments [14], and expressed in theGRIP ice core by a 36Cl flux peak centred at ∼34ka BP.The oldest and weaker cosmogenic nuclide productionpeak at ∼46–47ka BP in the MD97-2134 core has itscounterpart at ∼46ka BP in the GRIP 36Cl flux record.
The comparison of the three records thus shows thattheir only common feature is the significant cosmogenicnuclide production rate enhancement due to the dipolemoment low linked to the Laschamp excursion.
The global synchronicity of the dipole moment lowsrecorded by cosmogenic nuclide and paleomagneticsignals, allows interhemispheric correlations to beestablished. In the Vostok ice core, the 10Be flux peak[20,21] centred at ∼37ka BP according to the GT4chronology of Petit et al. [22] should be assigned to theLaschamp dipole low centred at 40.4±2ka BP, allowingcorrection of the Vostok chronology as suggested byParrenin et al. [23]. This strategy can be applied tointercorrelate high-resolution marine and continentalpaleoclimate records.
Despite the increase in available data, the atmosphericradiocarbon content remains controversial beyond 26ka
BP [39]. The short atmospheric residence time and thelong half-life (1500ka) of 10Be make it a particularlywell-suited tool to constrain the origin and the timing oflarge amplitude Δ14C variations during the highlyvariable dipole moment epoch ranging from 30 to50ka BP.
Acknowledgements
We thank Luc Beaufort, Chief of the IMAGE III“IPHIS” coring campaign, Yvon Balut, Chief of theoperation on board of the R.V. Marion Dufresne and theI.P.E.V. (Institut Paul Emile Victor). Thanks are due to R.Braucher for his help with 10Be measurements. 36Cl dataof the GRIP ice core were kindly provided by Jürg Beer.Three anonymous reviewers helped to improve themanuscript. The help of Christine Paillès and SimonBrewer improved the English expression.
References
[1] C.L. Blanchet, N. Thouveny, T. deGaridel-Thoron, New evidencesof geomagnetic moment lows between 30 and 45ka BP from asedimentary sequence of the west equatorial Pacific, Quat. SciRev. (in press) (Available on the web at sciencedirect.com).
[2] H. Guillou, B.S. Singer, C. Laj, C. Kissel, S. Scaillet, B.R. Jicha,On the age of the Laschamp geomagnetic excursion, EarthPlanet. Sci. Lett. 227 (2004) 331–343.
[3] W. Elsasser, E.P. Ney, J.R. Winckler, Cosmic-ray intensity andgeomagnetism, Nature 178 (1956) 1226–1227.
[4] D. Lal, Expected secular variations in the global terrestrialproduction rate of radiocarbon, in: E. Bard, W.S. Broecker(Eds.), The Last Deglaciation: Absolute and RadiocarbonChronologies, Series I: Global Environmental Change, vol. 2,1992, pp. 114–126.
[5] J. Masarik, J. Beer, Simulation of particle fluxes and cosmogenicnuclide production in the Earth's atmosphere, J. Geophys. Res.104 (1999) 12099–12111.
[6] J.T. Carcaillet, D.L. Bourlès, N. Thouveny, M. Arnold, A highresolution authigenic 10Be/9Be record of geomagnetic momentvariations over the last 300ka from sedimentary cores of thePortuguese margin, Earth Planet. Sci. Lett. 219 (2004) 397–412.
[7] M. Frank, B. Schwarz, S. Baumann, P.W. Kubik, M. Suter, A.Mangini,A200kyr record of cosmogenic radionuclide productionrate and geomagnetic field intensity from 10Be in globally stackeddeep-sea sediments, Earth Planet. Sci. Lett. 149 (1997) 121–129.
[8] J.T. Carcaillet, N. Thouveny, D.L. Bourlès, Geomagneticmoment instability between 0.6 and 1.3Ma from cosmonuclideevidence, Geophys. Res. Lett. 30 (15) (2003) 1792, doi:10.1029/2003GL017550.
[9] J.T. Carcaillet, D.L. Bourlès, N. Thouveny, Geomagnetic dipolemoment and 10Be production rate intercalibration from authi-genic 10Be/9Be for the last 1.3Ma, Geochem. Geophys. Geosyst.5 (2004) Q05006, doi:10.1029/2003GC000641.
[10] C. Laj, C. Kissel, A. Mazaud, E. Michel, R. Muscheler, J. Beer,Geomagnetic field intensity, North Atlantic Deep Watercirculation and atmospheric Δ14C during the last 50kyr, EarthPlanet. Sci. Lett. 200 (2002) 177–190.

28 G. Leduc et al. / Earth and Planetary Science Letters 245 (2006) 19–28
[11] K. Huguen, S. Lehman, J. Southon, J. Overpeck, O. Marchal, C.Herring, J. Turnbull, 14C activity and global carbon cycle changesover the past 50,000 years, Science 304 (2004) 202–207.
[12] R. Muscheler, J. Beer, G. Wagner, C. Laj, C. Kissel, G.M.Raisbeck, F. Yiou, P.W. Kubik, Changes in the carbon cycleduring the last deglaciation as indicated by the comparison of 10Beand 14C records, Earth Planet. Sci. Lett. 219 (2004) 325–340.
[13] R. Muscheler, J. Beer, P.W. Kubik, H.A. Synal, Geomagneticfield intensity during the last 60,000 years based on 10Be and 36Clfrom the Summit cores and 14C, Quat. Sci. Rev. 24 (2005)1849–1860.
[14] L. Benson, J. Liddicoat, J. Smoot, A. Sarna-Wojcicki, R. Negrini,S. Lund, Age of Mono Lake excursion and associated tephra,Quat. Sci. Rev. 22 (2003) 135–140.
[15] L.M. McHargue, P.E. Damon, D.J. Donahue, Enhanced cosmic-ray production of 10Be coincident with the Mono Lake andLaschamp geomagnetic excursions, Geophys. Res. Lett. 22 (5)(1995) 659–662.
[16] G. Cini Castagnoli, A. Albrecht, J. Beer, G. Bonino, C. Shen,E. Callegari, C. Taricco, B. Dittrich-Hannen, P. Kubik, M.Suter, G.M. Zhu, Evidence for enhanced 10Be deposition inMediterranean sediments 35ka BP, Geophys. Res. Lett. 22 (6)(1995) 707–710.
[17] G. Wagner, J. Beer, C. Laj, C. Kissel, J. Masarik, R. Muscheler,H.A. Synal, Chlorine-36 evidence for the Mono Lake event in theSummit GRIP ice core, Earth Planet. Sci. Lett. 181 (2000) 1–6.
[18] S.J. Johnsen, H.B. Clausen, W. Dansgaard, N.S. Gundestrup, C.U. Hammer, U. Andersen, K.K. Andersen, C.S. Hvidberg, D.Dahl-Jensen, J.P. Steffensen, H. Shoji, A.E. Sveinbjörnsdóttir, J.White, J. Jouzel, D. Fisher, The δ18O record along the GreenlandIce Core Project deep ice core and the problem of possible Eemianclimatic instability, J. Geophys. Res. 102 (1997) 26397–26410.
[19] S.J. Johnsen, D. Dahl-Jensen, N. Gunderstrup, J.P. Steffensen, H.B. Clausen, H. Miller, V. Masson-Delmotte, A.E. Sveinbjorns-dottir, J. White, Oxygen isotopes an paleotemperature recordsfrom six Greenland ice-core stations: camp century, dye-3, GRIP,GISP2, Renland and NorthGRIP, J. Quat. Sci. 16 (2001)299–307.
[20] F. Yiou, G.M. Raisbeck, S. Baumgartner, J. Beer, C. Hammer, S.Johnsen, J. Jouzel, P.W. Kubik, J. Lestringuez, M. Stiénenard, M.Suter, P. Yiou, Beryllium 10 in the Greenland ice core project icecore at summit, Greenland, J. Geophys. Res. 102 (C112) (1997)26783–26794.
[21] G.M. Raisbeck, F. Yiou, D. Bourlès, C. Lorius, J. Jouzel, N.I.Barkov, Evidence for two intervals of enhanced 10Be depositionin Antarctic ice during the last glacial period, Nature 326 (1987)273–277.
[22] J.R. Petit, J. Jouzel, D. Raynaud, N.I. Barkov, J.M. Barnola, I.Basile, M. Bender, J. Chappellaz, M. Davis, G. Delaygue, M.Delmotte, V.M. Kotlyakov, M. Legrand, V.Y. Lipenkov, C.Lorius, L. Pépin, C. Ritz, E. Saltzmann, M. Stievenard, Climateand atmospheric history of the past 420,000 years from theVostok ice core, Antarctica, Nature 399 (1999) 429–436.
[23] F. Parrenin, F. Rémy, C. Ritz, M.J. Siegert, J. Jouzel, Newmodeling of the Vostok ice flow line and implication for theglaciological chronology of the Vostok ice core, J. Geophys. Res.109 (2004) D20102, doi:10.1029/2004JD004561.
[24] D.L. Bourlès, G.M. Raisbeck, F. Yiou, 10Be and 9Be in marinesediments and their potential for dating, Geochim. Cosmochim.Acta 53 (1989) 443–452.
[25] R.F. Anderson, Y. Lao, W.S. Broecker, S.E. Trumbore, H.J.Hofmann, W.Wolfi, Boundary scavenging in the Pacific Ocean: acomparison of 10Be and 231Pa, Earth Planet. Sci. Lett. 96 (1990)287–304.
[26] C. Robinson, G.M. Raisbeck, F. Yiou, B. Lehman, C. Laj, Therelationship between 10Be and geomagnetic field strength recordsin central North Atlantic sediments during the last 80ka, EarthPlanet. Sci. Lett. 136 (1995) 551–557.
[27] J.R. Southon, T.L. Ku, D.E. Nelson, J.L. Reyss, J.C. Duplessy, J.S. Vogel, 10Be in a deep-sea core: implications regarding 10Beproduction changes over the past 420ka, Earth Planet. Sci. Lett.85 (1987) 356–364.
[28] W.U. Henken-Mellies, J. Beer, F. Heller, K.J. Hsü, C. Shen, G.Bonani, H.J. Hofmann, M. Suter, W. Wölfi, 10Be and 9Be inSouth Atlantic DSDP Site 519: relation to the geomagneticreversals and to sediment composition, Earth Planet. Sci. Lett. 98(1990) 267–276.
[29] Z. Chase, R.F. Anderson, M.Q. Fleisher, P.W. Kubik, Theinfluence of particle composition and particle flux on scavengingof Th, Pa and Be in the ocean, Earth Planet. Sci. Lett. 204 (2002)215–229.
[30] E.T. Brown, C.I. Measures, J.M. Edmond, D.L. Bourlès, G.M.Raisbeck, F. Yiou, Continental input of beryllium to the oceans,Earth Planet. Sci. Lett. 114 (1992) 101–111.
[31] R. Rama, P.K. Zutschi, Annual deposition of cosmic rayproduced 7Be at equatorial latitudes, Tellus 10 (1958) 99–103.
[32] L.R. McHargue, D.J. Donahue, Effects of climate and thecosmic-ray flux on the 10Be content of marine sediments, EarthPlanet. Sci. Lett. 232 (2005) 193–207.
[33] T. de Garidel-Thoron, L. Beaufort, F. Bassinot, P. Henry,Evidence for large methane releases to the atmosphere fromdeep-sea gas-hydrate dissociation during the last glacial episode,Proc. Natl. Acad. Sci. 101 (25) (2004) 9187–9192.
[34] M. Stuiver, P.J. Reimer, E. Bard, W. Beck, G. Burr, K. Hughen,B. Kromer, G. McCormac, J. van der Plicht, M. Spurk,INTCAL98 radiocarbon age calibration, 24,000-0 cal BP,Radicarbon 40 (1998) 1041–1083.
[35] E. Bard, M. Arnold, B. Hamelin, N. Tisnerat-Laborde, G.Cabioch, Radiocarbon calibration by means of mass spectromet-ric 230Th/234U and 14C ages of corals. An updated databaseincluding samples from Barbados, Mururoa and Tahiti, Radio-carbon 40 (1998) 1085–1092.
[36] D.G. Martinson, N.G. Pisias, J.D. Hays, J. Imbrie, T.C. Moore,N.J. Shackleton, Age dating and the orbital forcing theory of theice ages: development of a high-resolution 0 to 300,000 yearchronostratigraphy, Quat. Res. 27 (1987) 1–29.
[37] N. Thouveny, J. Carcaillet, E. Moreno, G. Leduc, D. Nérini,Geomagnetic moment variation and paleomagnetic excursionssince 400ka BP: a stacked record of sedimentary sequences of thePortuguese margin, Earth Planet. Sci. Lett. 219 (2004) 377–396.
[38] M. Stuiver, P.M. Grootes, GISP2 oxygen isotope ratios, Quat.Res. 53 (2000) 277–284.
[39] E. Bard, F. Rostek, G. Ménot-Combes, A better radiocabonclock, Science 303 (2004) 178–179.