AUDIT & ASSESSMENT OF QOS FOR QE-JUNE-2015 ...
114
Audit & Assessment of Quality of Service Of Cellular Mobile Telephone Service Basic Telephone (Wire line) Service & Broadband Service For Telecom Regulatory Authority Of India North Zone – Punjab Service Area (April 2015 – June 2015) Prepared by:- TÜV SÜD SOUTH ASIA PVT. LTD, C-153/1, Okhla Industrial Estate, Phase-1, New Delhi – 110020 Telephone 011- 30889611 Fax: 011-30889595
-
Upload
khangminh22 -
Category
Documents
-
view
3 -
download
0
Transcript of AUDIT & ASSESSMENT OF QOS FOR QE-JUNE-2015 ...

AUDIT & ASSESSMENT OF QOS FOR QE-JUNE-2015-PUNJAB CIRCLE
TUV-SUD SOUTH ASIA PRIVATE LIMITED Page 1
Audit & Assessment of Quality of Service
Of
Cellular Mobile Telephone Service
Basic Telephone (Wire line) Service
&
Broadband Service
For
Telecom Regulatory Authority Of India
North Zone – Punjab Service Area
(April 2015 – June 2015)
UNICEF Lucknow Office
Prepared by:-
TÜV SÜD SOUTH ASIA PVT. LTD,
C-153/1, Okhla Industrial Estate,
Phase-1, New Delhi – 110020
Telephone 011- 30889611
Fax: 011-30889595

AUDIT & ASSESSMENT OF QOS FOR QE-JUNE-2015-PUNJAB CIRCLE
TUV-SUD SOUTH ASIA PRIVATE LIMITED Page 2
PREFACE
The Telecom Regulatory Authority of India (TRAI) was established in 1997 by an Act of Parliament, called the
Telecom Regulatory Authority of India Act, 1997, to regulate telecom services. The Authority’s mission is to ensure
that the interest of consumers are protected and at the same time to nurture conditions for growth of
telecommunications, broadcasting and cable services in a manner and at a pace which will enable India to play a
leading role in emerging global information society.
The Authority, in exercise of its functions as per the provisions in the TRAI Act, has been entrusted to measure the
Quality of Service provided by the Service Providers from time to time and to compare them with the benchmarks so
as to assess the level of performance. In pursuance of this, TRAI has appointed M/s TUV-SUD South Asia Pvt. Ltd.
to carry out “Audit and Assessment of Quality of Service” provided by Basic (Wire line), Cellular Mobile and
Broadband service providers in terms of the benchmarks specified in the respective regulations, in North and West
Zones.
TUV-SUD South Asia carried out QoS audit as per the norms of TRAI in all the eight circles / services areas of the
North Zone and four circles of the West Zone. This report details the performance of the various service providers in
Punjab circle against the QoS bench marks laid down by TRAI in the respective regulations.

AUDIT & ASSESSMENT OF QOS FOR QE-JUNE-2015-PUNJAB CIRCLE
TUV-SUD SOUTH ASIA PRIVATE LIMITED Page 3
Table of Contents 1. BACKGROUND ................................................................................................................................................. 6
2. OBJECTIVES AND METHODOLOGY ............................................................................................................. 9
3. SAMPLE SIZE .................................................................................................................................................. 11
3.1 SAMPLING FOR CELLULAR MOBILE (WIRELESS) SERVICE PROVIDERS ........................................ 11
3.2 SAMPLING FOR BASIC (WIRE LINE) SERVICES ..................................................................................... 12
3.3 SAMPLING FOR BROADBAND SERVICE PROVIDERS........................................................................... 12
4. EXECUTIVE SUMMARY ................................................................................................................................ 14
5. PMR AUDIT REPORTS: .................................................................................................................................. 18
5.1 MONTHLY PMR: ............................................................................................................................................ 18
5.1.1 BUSY HOUR OF VARIOUS SERVICE PROVIDERS: ......................................................................... 18
5.1.2 SWITCHES/BSC/BTS DETAILS OF SERVICE PROVIDERS: ............................................................ 18
5.1.3 QOS PERFORMANCE OF MONTHLY PMR – APRIL-15 MONTH: ................................................... 19
5.1.4 QOS PERFORMANCE OF MONTHLY PMR MAY-- 15 MONTH: ..................................................... 20
5.1.5 QOS PERFORMANCE OF MONTHLY PMR – JUNE- 15 MONTH: ................................................... 21
5.1.6 QOS PERFORMANCE OF QUARTERLY PMR –AVERAGE OF QE- JUNE 15 (APRIL – MAY –
JUNE MONTHS AUDITED DATA) ................................................................................................................ 22
5.1.7 KEY FINDINGS ON MONTHLY PMR AUDIT REPORTS: ................................................................. 23
5.2 LIVE MEASUREMENT DATA (3-DAYS) FOR CELLULAR MOBILE SERVICE PROVIDERS
(NETWORK SERVICE QUALITY PARAMETER): ........................................................................................... 26
5.2.1 LIVE MEASURMENT DATA (3-DAYS) – APRIL- 15 MONTH: ......................................................... 26
5.2.2 LIVE MEASURMENT DATA (3-DAYS) – MAY- 15 MONTH: ........................................................... 27
5.2.3 LIVE MEASURMENT DATA (3-DAYS) – JUNE- 15 MONTH: .......................................................... 28
5.2.4 QUARTERLY QOS PERFORMANCE OF 3-DAYS LIVE MEASUREMENT AUDITED DATA
(AVERAGE OF APRIL – MAY– JUNE- 2015 MONTHS AUDITED DATA) ............................................... 29
5.2.5 KEY FINDING ON 3 DAYS LIVE MEASUREMENTS: ....................................................................... 29
5.2.6 DETAILED NETWORK DATA ASSESSMENT OF CELLULAR MOBILE TELEPHONE
SERVICES: ........................................................................................................................................................ 30
5.3 CUSTOMER SERVICE QUALITY PARAMETERS MEASUREMENT FOR CMTS-QE JUNE- 15: ......... 42
5.3.1 QUARTERLY CUSTOMER SERVICE DELIVERY (CSD) AUDITED DATA FOR CELLULAR
MOBILE SERVICES (APRIL – MAY- JUNE- 2015 MONTHS AUDITED DATA): .................................... 42
5.3.2 3 DAYS LIVE CSD AUDITED DATA FOR CELLULAR MOBILE SERVICES (QE - JUNE 2015): . 44
KEY FINDINGS: CUSTOMER SERVICE DELIVERY PARAMETERS ....................................................... 45
6. LIVE CALLING ASSESSMENT:..................................................................................................................... 47
6.1 INTER OPERATOR CALLS ASSESSMENT: ................................................................................................ 47
6.2 CUSTOMER CARE / HELPLINE ASSESSMENT:........................................................................................ 48
6.3 LIVE CALLING ASSESSMENT FOR BILLING COMPLIANTS: ............................................................... 48
6.4 LEVEL -1 CALLING ASSESSMENT:............................................................................................................ 49
7. OPERATOR ASSESTID DRIVE TEST ........................................................................................................... 51
7.1 DETAIL OF THE ROUTES COVERED DURING THE DRIVE TESTS: ..................................................... 61

AUDIT & ASSESSMENT OF QOS FOR QE-JUNE-2015-PUNJAB CIRCLE
TUV-SUD SOUTH ASIA PRIVATE LIMITED Page 4
7.2 SSA WISE DRIVE TEST OBSERVATION: ................................................................................................... 63
7.3 KEY FINDINGS ON DRIVE TEST: ............................................................................................................... 69
8. GRAPHICAL REPRESENTATION (CMTS): .................................................................................................. 71
9. QOS AUDIT OF BASIC TELEPHONE SERVICE (WIRELINE) ................................................................... 76
9.1 SERVICE PROVIDER PERFORMANCE REPORT BASED ON QUARTERLY MEASUREMENT DATA
VERIFICATION FOR BASIC TELEPHONE SERVICE (WIRELINE) PROVIDERS: ....................................... 77
9.2 SERVICE PROVIDER PERFORMANCE REPORT BASED ON 3 DAYS LIVE MEASUREMENT DATA
VERIFICATION FOR BASIC TELEPHONE SERVICE (WIRELINE) PROVIDERS: ....................................... 78
9.3 KEY FINDINGS: BASIC TELEPHONE SERVICES (WIRELINE) .............................................................. 79
9.4 INTER OPERATOR CALL ASSESSMENT (WIRELINE SERVICES) ........................................................ 80
9.5 LEVEL-1 LIVE CALLING (WIRELINE SERVICES) ................................................................................... 80
9.6 CUSTOMER CARE / HELPLINE ASSESSMENT (WIRELINE SERVICES) .............................................. 81
9.7 GRAPHICAL REPRESENTATION OF QUARTERLY PERFORMANCE OF THE BASIC TELEPHONE
SERVICE (WIRELINE) PROVIDERS: ................................................................................................................. 83
9.8 GRAPHICAL REPRESENTATION OF PERFORMANCE OF THE BASIC TELEPHONE SERVICE
(WIRELINE) PROVIDERS V/S 3-DAYS LIVE MEASUREMENT: ................................................................... 87
10. QUALITY OF SERVICE AUDIT OF BROADBAND SERVICE PROVIDERS......................................... 89
10.1 SERVICE PROVIDER PERFORMANCE REPORT BASED ON QUARTERLY MEASUREMENT DATA
VERIFICATION FOR BROADBAND SERVICE PROVIDERS: ........................................................................ 90
10.2 SERVICE PROVIDER PERFORMANCE REPORT BASED ON 3 DAYS MEASUREMENT DATA
VERIFICATION FOR BROADBAND SERVICE PROVIDERS: ........................................................................ 96
10.3 KEY FINDINGS: BROADBAND SERVICES .............................................................................................. 99
10.4 CUSTOMER CARE / HELPLINE ASSESSMENT ..................................................................................... 100
10.5 LIVE CALLING FOR BILLING COMPLIANTS ....................................................................................... 100
10.6 GRAPHICAL REPRESENTATION OF QUARTERLY PERFORMANCE OF BROADBAND SERVICE
PROVIDERS: ....................................................................................................................................................... 102
10.7 GRAPHICAL REPRESENTATION OF PERFORMANCE OF THE BROADBAND SERVICE
PROVIDERS V/S 3-DAYS LIVE MEASUREMENT:........................................................................................ 105

AUDIT & ASSESSMENT OF QOS FOR QE-JUNE-2015-PUNJAB CIRCLE
TUV-SUD SOUTH ASIA PRIVATE LIMITED Page 5
1. BACKGROUND

AUDIT & ASSESSMENT OF QOS FOR QE-JUNE-2015-PUNJAB CIRCLE
TUV-SUD SOUTH ASIA PRIVATE LIMITED Page 6
1. BACKGROUND
Telecom Regulatory Authority of India has been entrusted to “lay down the standards of quality of service to
be provided by the service providers and ensure the quality of service and conduct the periodical survey of
such service provided by the service providers so as to protect interest of the consumers
of telecommunication services” vide sub-clause (v) of clause (b) of sub-section (1) of section 11 of the
Telecom Regulatory Authority of India Act, 1997 (24 of 1997).
The purpose of laying down Quality of Service Parameters is to:
i) Create conditions for consumer satisfaction by making known the quality of service, which the Service
provider is required to provide, and the user has a right to expect.
ii) Measure the Quality of Service provided by the Service Providers from time to time and to compare them
with the norms so as to assess the level of performance.
iii) Generally protect the interests of consumers of telecommunication services.
TRAI, the regulatory watch dog for the Quality of Service for the telecom services – Basic (Wire line),
Cellular Mobile (Wireless) and Broadband has commissioned M/s TUV-SUD South Asia Pvt. Ltd. for
conducting audit and assessment of quality of service of service providers, in terms of the benchmarks
specified in the “The Standards of Quality of Service of Basic Telephone Service (Wire line) and Cellular
Mobile Telephone Service Regulations, 2009 (7 of 2009) dated 20th March, 2009 and the Quality of Service
of Broadband Service Regulations, 2006 (11 of 2006) dated 6thOctober, 2006 on zonal basis for North
Zone and West Zone comprising of the following Telecom Circles/Metro Service Areas:
North Zone: Delhi, Jammu & Kashmir, Himachal Pradesh, Punjab, Haryana, Rajasthan, Uttar Pradesh-
East and Uttar Pradesh-West (including Uttarakhand). For the cellular mobile telephone service the service
area of Delhi includes Ghaziabad, Faridabad, Noida and Gurgaon.
West Zone: Mumbai, Maharashtra (including Goa and excluding Mumbai), Gujarat and Madhya Pradesh
(including Chhattisgarh).

AUDIT & ASSESSMENT OF QOS FOR QE-JUNE-2015-PUNJAB CIRCLE
TUV-SUD SOUTH ASIA PRIVATE LIMITED Page 7
The Audit exercise would assess the Quality of Service of telecom operators providing Basic (Wire line),
Cellular Mobile (Wireless) and Broadband services by auditing the relevant QoS records maintained by the
operators, conducting drive tests as well as live measurements and comparing them with quality of service
benchmarks stipulated by TRAI. The audit would be carried out by TUV-SUD South Asia every quarter
across all the Circles/Service areas of North and West Zones for Cellular Mobile Service. However, in
respect of Basic telephone service (wireline) and Broadband service, a circle would be audited once in a
year.

AUDIT & ASSESSMENT OF QOS FOR QE-JUNE-2015-PUNJAB CIRCLE
TUV-SUD SOUTH ASIA PRIVATE LIMITED Page 8
2. OBJECTIVES AND METHODOLOGY

AUDIT & ASSESSMENT OF QOS FOR QE-JUNE-2015-PUNJAB CIRCLE
TUV-SUD SOUTH ASIA PRIVATE LIMITED Page 9
2. OBJECTIVES AND METHODOLOGY
The primary objective is to audit and assess the Quality of Service being rendered by Basic, Cellular Mobile
& Broadband service providers against the parameters notified by TRAI. The audit and assessment of Quality of Service was carried out by TUV SUD South Asia across all the
Circles/Service areas of North and West Zones for Cellular Mobile Service. Apart from this, QoS
audit for Basic (Wire line) and Broadband Services was also undertaken for Punjab, Rajasthan and
Gujarat circles during the quarter April 2015 – June 2015.
The Scope of work as per the Terms of Reference (TOR) includes the following:
i) Preparation of Performance Monitoring reports (PMRs) and uploading in the system.
ii) Live measurements of the performance of Service Providers (SPs) against the benchmarks for
three days during each audit.
iii) Monthly audit based on one month data of the SPs.
iv) Drive test of the RF networks.
v) Audit of the performance of call centers with respect to their accessibility and percentage of
calls answered by the operators and random customer feedback by calling the customers to
get feedback of the services provided by the service providers.
vi) Transfer of data generated by the RF drive test/Live measurements / PMR/ monthly audit to
the server located at TRAI premises on real time basis.

AUDIT & ASSESSMENT OF QOS FOR QE-JUNE-2015-PUNJAB CIRCLE
TUV-SUD SOUTH ASIA PRIVATE LIMITED Page 10
3. SAMPLE SIZE

AUDIT & ASSESSMENT OF QOS FOR QE-JUNE-2015-PUNJAB CIRCLE
TUV-SUD SOUTH ASIA PRIVATE LIMITED Page 11
3. SAMPLE SIZE
3.1 SAMPLING FOR CELLULAR MOBILE (WIRELESS) SERVICE PROVIDERS
100% of the Gateway MSC’s (GMSC’s) and Mobile Switching Centers (MSC’s) of all the Cellular Mobile
Service Providers or Unified Access Service Providers (UASP) were covered for audit in specified
circles/service areas. Following are the various operators covered in Punjab circle
Sl. No. Name of Service Provider
Dates of live measurement Audit Audit Location
GSM Operators April-15 May-15 June-15 Address
1 AIRCEL 13, 15 & 16 Apr-15 12 to 14 May-15 11, 12 & 15 Jun-15 Dishnet Wireless Ltd Office ,Phase -7
Industrial Area, Mohali
2 AIRTEL 16, 17 & 20 Apr-15 11 to 13 May-15 9 to 11 Jun-15 Bharti Airtel Campus, Plot No 21, Rajiv
Gandhi Information and Technilogy Park, Chandigarh, 160101
3 TATA GSM 15 to 17 Apr-15 21, 22 & 25 May-15 4, 5 & 8 Jun-15 TTSL Office Phase-8,Industrial area Mohali
4 BSNL 9, 10 & 13 Apr-15 12 to 14 May-15 8 to 10 Jun-15 BSNL Exchange Sector-49 Chandigarh
5 VIDEOCON 13, 15 & 16 Apr-15 12 to 14 May-15 3 to 5 Jun-15 QTL Office Phase -7 Industrial Area, Mohali
6 RCOM GSM 3, 6 & 7 Apr-15 13 to 15 May-15 10 to 12 Jun-15 Reliance Communications Ltd. Phase-8,Industrial area Mohali
7 IDEA 13 to 15 Apr-15 11 to 13 May-15 3 to 5 Jun-15 Idea Office Phase -7 Industrial Area,Mohali
8 VODAFONE 3, 6 & 7 Apr-15 21, 22 & 25 May-15 5, 8 & 9 Jun-15 Vodafone Office Phase-8,Industrial area
Mohali
CDMA Operators
9 TATA CDMA 15 to 17 Apr-15 13 to 15 May-15 4, 5 & 8 Jun-15 TTSL Office Phase-8,Industrial area Mohali
10 RCOM CDMA 3, 6 & 7 Apr-15 19, 21 & 22 May-15 10 to 12 Jun-15 Reliance Communications Ltd. Phase-8, Industrial area Mohali
For all the above operators, audit was conducted in all the three months of the Quarter ended June 2015. The data generated by monthly PMR and 3-days live measurements audit for the period April 2015 to June 2015 has been successfully uploaded to the server located at TRAI premises.

AUDIT & ASSESSMENT OF QOS FOR QE-JUNE-2015-PUNJAB CIRCLE
TUV-SUD SOUTH ASIA PRIVATE LIMITED Page 12
3.2 SAMPLING FOR BASIC (WIRE LINE) SERVICES The QoS audit for basic (wire line) service is to be done for the number of exchanges spread over in about
10% of SDCAs with each service providers in specified circles once in a year. As per the current list of the
exchanges provided by BSNL, there are total 1508 exchanges in Punjab Circle. Out of 1508, audit was done
for sampled 15 (Urban) and 61 (Rural) exchanges of BSNL (List of BSNL exchanges undertaken for QoS
audit attached as Annex-1), 1 exchange each of Bharti-Airtel, RCL, TTL, Vodafone and 2 exchange of HFCL.
3.3 SAMPLING FOR BROADBAND SERVICE PROVIDERS TUV–SUD South Asia has to conduct the audit and assessment of Quality of Service of Broadband Service
only in respect of the service providers who are having broadband subscriber base of more than 10,000
subscribers in their licensed service area, for 5% of Point of Presence (PoPs) spread over in 10% SDCAs in
specified Telecom Circle. Location of PoPs, covered for QoS audit is attached as Annex-2.
Discussion with the private broadband service providers reveled that there is no concept of their PoPs on
SDCA basis; they are maintaining their entire data on centralized basis so audit has been done for the
centralized data

AUDIT & ASSESSMENT OF QOS FOR QE-JUNE-2015-PUNJAB CIRCLE
TUV-SUD SOUTH ASIA PRIVATE LIMITED Page 13
4. EXECUTIVE SUMMARY

AUDIT & ASSESSMENT OF QOS FOR QE-JUNE-2015-PUNJAB CIRCLE
TUV-SUD SOUTH ASIA PRIVATE LIMITED Page 14
4. EXECUTIVE SUMMARY The executive summary put in a nutshell the key findings of the Audit by providing: -
“Service provider performance report” for Cellular mobile, Basic (wire line) and Broadband services , which gives a
foretaste of the performance of various operators against the benchmark specified by TRAI, during the months in which the
Audit was carried out by TUV-SUD Auditors.
“Parameter wise critical findings” for Cellular mobile, Basic (wire line) and Broadband services: This indicates key
observations and findings from different activities carried out during the Audit process.
TUV-SUD conducted audit involved a 3 stage verification process which consisted of auditing the records of the service
providers and verifying the data submitted to TRAI. The second step involved a three day live measurement of all the
network parameters. On the basis of the three days live measurement, the auditors checked the busy hour of the day for the
service provider and collected the data for this busy hour for the month in which the audit was conducted Finally, the
performance of the service providers was also gauged by conducting drive tests in three select SSAs per service provider
per quarter.
The three stage audit / verification viz audit of the records, live measurements and drive tests of all the cellular mobile
operators was repeated every month. In case of Basic (Wire line) and Broadband, this exercise is required to be carried out
on quarterly basis.
Essence of compliance report of service providers with respect to the QoS:
1) Cellular Mobile Service:
(i) From the audit of monthly PMR and Live measurements of the network parameter, it was revealed that performance of
all the operators in Punjab Service Area was satisfactory except for one parameter namely ‘Worst affected cells having >
3% TCH drop’ which could not be met by BSNL, Tata (GSM) and Tata (CDMA). The quarterly averaged performance of
BSNL, Tata (GSM) and Tata (CDMA for this parameter was 17.91%, 4.10% and 5.93% respectively. The performance of
BSNL was way beyond the benchmark. Further, BSNL and QTL were showing congestion on 1 and 2 POIs respectively
on quarterly basis
(ii) Similar non-compliance was observed for BSNL, Tata (GSM) and Tata (CDMA) during the live measurements in all three
months of the Quarter with their quarterly average performance as 17.82%, 3.98% and 5.77% respectively. BSNL and QTL
were showing congestion on 1 and 2 POIs respectively on quarterly basis.
From the above analysis, it is concluded that the performance of BSNL, Tata (GSM) and Tata (CDMA) is not satisfactory in
respect of the parameter “Worst affected cells> 3 % TCH drops”. Further, the performance of BSNL was very poor in
respect of this parameter.

AUDIT & ASSESSMENT OF QOS FOR QE-JUNE-2015-PUNJAB CIRCLE
TUV-SUD SOUTH ASIA PRIVATE LIMITED Page 15
(iii) With regard to the Customer Service Quality Parameters, it is revealed that most of the operators are in well compliance
of the parameters on Metering and Billing Credibility, Termination of Service and Time taken for refunds. Only, Vodafone
could not meet the benchmark for billing complaints for both post-paid and pre-paid with its performance as 0.19% and 0.17%
respectively.
Regarding the parameters related to ‘Response time to customers for assistance’, all service providers are in compliance with
respect to the parameter accessibility of call center. However, Airtel, BSNL and RCOM (GSM) have not met the benchmark
of ‘calls answered by Operators (voice to voice) within 90 seconds’ with their performance as 91.34%, 50.90% and
94.91%, against the benchmark of >=95%.
In case of the parameter ‘Termination/Closure within the benchmark of 7 days’, the performance of Idea was very marginally
below the benchmark (99.99%). Regarding the parameter Time taken for refund of deposits, all operators (except
Vodafone) were found to have complied with the benchmark of 100% refund of deposits within 60 days of closure. Vodafone
remained under performed with its performance as 88.04%.
The results of live measurements revealed that all operators (except Airtel and BSNL) have met the benchmarks for the
parameters ‘Accessibility to call center’ and ‘Call connection to operators (Voice to voice) within 90 seconds’. The
performance of Airtel and BSNL for parameter ‘calls answered by Operators (voice to voice) within 90 seconds’ was
86.30% and 43.50% respectively.
(iv) The analysis of drive test results revealed that the performance of the services providers namely BSNL and Aircel failed
to meet the benchmarks of the parameters Call drop rate, Voice quality, CSSR and Blocked call rate in Ludhiana and
Chandigarh SSAs respectively. Whereas, Idea, Tata (GSM), Videocon and RCOM (GSM) also remained underperformed for
parameter Voice Quality in one or the other SSAs (Ludhiana, Ropar and Chandigarh) where the drive tests were conducted.
2) Basic (Wireline) Service:
With regard to the audit of Basic (wire line), it was concluded that the performance of BSNL was not satisfactory in
respect of the parameters Fault incidences, Fault Repairs/Restoration Time, MTTR, Response time to customer
for assistance and Termination/ Closure . Hence, BSNL need to improve their services in respect of these
parameters. Apart from this, TTL failed to meet the benchmark of MTTR. Bharti and BSNL remained under
performed for parameter Call answered by operator (Voice to voice) during 3 days live measurement.
3) Broadband Service:
The QoS audit of the Broadband service reveals that the majority of the operators are largely meeting the
benchmarks. However, some of the service providers have not met the benchmark as detailed below:

AUDIT & ASSESSMENT OF QOS FOR QE-JUNE-2015-PUNJAB CIRCLE
TUV-SUD SOUTH ASIA PRIVATE LIMITED Page 16
BSNL: Could not meet the benchmark of “% age Faults repaired by next working day” “% age Faults repaired
within three days”; with its achievement level as 48.25% and 81.13% respectively. BSNL also failed to meet the
benchmark of “%age of calls answered by Operator (voice to voice) within 90 seconds” with its achievement
level as 76.33% during 3 days live measurement audit.
TCL: failed to meet the benchmark of “% age Faults repaired by next working day” , “% age Faults repaired
within three days” and %age of calls answered by Operator (voice to voice) within 90 seconds’; with its
achievement level as 74.39%, 87.80% and 65.38% respectively.
TTSL: Could not meet the benchmark of “% age Faults repaired by next working day” with its achievement level
as 89.46%. TTSL also could not meet the benchmark of “%age international Bandwidth utilization during peak
hours” and “Packet Loss” with its achievement level as 80.18% and 7.50% respectively during 3 days live audit.
Hathway: Could not meet the benchmark of “Service Availability / Uptime” with its achievement level as 88.80%
& 82.11 % (during 3 days live measurement). Hathway also failed to meet the benchmark ““%age Bandwidth
utilization during peak hours for POP to ISP gateway node {Intra network}” and “Packet Loss” with its
achievement level as 92.72% and 1.26% during 3 days live audit.
HFCL: Could not meet the benchmark of “%age international Bandwidth utilization during peak hours” with its
achievement level as 85.02%. HFCL also could not meet the benchmark of “%age international Bandwidth
utilization during peak hours” with its achievement level as 88.57% during 3 days live audit.
NSTPL: Could not meet the benchmark of “%age Bandwidth utilization during peak hours for POP to ISP
gateway node {Intra network}” with its achievement level as 80%. NSTPL also failed to meet the benchmark
“%age Bandwidth utilization during peak hours for POP to ISP gateway node {Intra network}” and “Service
Availability / Uptime” with its achievement level as 85.80% and 97.22% respectively during 3 days live audit.
D-Vois and Pacenet also failed to meet the benchmark “%age Bandwidth utilization during peak hours for POP
to ISP gateway node {Intra network}” with their achievement level as 87.85% and 81.51% respectively during 3
days live audit.

AUDIT & ASSESSMENT OF QOS FOR QE-JUNE-2015-PUNJAB CIRCLE
TUV-SUD SOUTH ASIA PRIVATE LIMITED Page 17
5. PMR AUDIT REPORT

AUDIT & ASSESSMENT OF QOS FOR QE-JUNE-2015-PUNJAB CIRCLE
TUV-SUD SOUTH ASIA PRIVATE LIMITED Page 18
5. PMR AUDIT REPORTS:
5.1 MONTHLY PMR:
5.1.1 BUSY HOUR OF VARIOUS SERVICE PROVIDERS:
Sl. No. Name of Service Provider Month of Audit Network TCBH Hour
GSM Operators
1 AIRCEL June -15 20:00 - 21:00
2 AIRTEL June -15 19:00 - 20:00
3 BSNL June -15 19:00 - 20:00
4 IDEA June -15 20:00 - 21:00
5 RCOM GSM June -15 19:00 - 20:00
6 TATA GSM June -15 20:00 - 21:00
7 QUADRANT TELEVENTURES LTD June -15 20:00 - 21:00
8 VODAFONE June -15 20:00 - 21:00
CDMA Operators
9 RCOM CDMA June -15 19:00 - 20:00
10 TATA CDMA June -15 12:00 - 13:00
The TCBH reported by all the service providers matched the network busy hour calculated by TUV auditors for the Punjab circle.
5.1.2 SWITCHES/BSC/BTS DETAILS OF SERVICE PROVIDERS:
Sl. No.
Name of Service Provider
No. of MSC + GMSC
No. of BSC No. of BTS NSS make BSS make
GSM Operators
1 AIRCEL 1 5 609 NSN NSN
2 AIRTEL 23 56 5548 Ericsson Ericsson
3 BSNL 12 47 3338 Ericsson & ZTE Ericsson, ZTE & NSN
4 IDEA 9 49 5128 ZTE ZTE & Huawei
5 RCOM GSM 3 8 1535 Huawei & Ericsson ZTE
6 TATA GSM 2 12 1631 NSN NSN
7 QTL 1 14 2235 Huawei & NSN Huawei
8 VODAFONE 9 51 4904 Ericsson Ericsson
CDMA Operators
9 RCOM CDMA 4 3 622 Lucent, ZTE & Ericsson Lucent & ZTE
10 TATA CDMA 3 4 404 Ericsson Huawei & Motorola

AUDIT & ASSESSMENT OF QOS FOR QE-JUNE-2015-PUNJAB CIRCLE
TUV-SUD SOUTH ASIA PRIVATE LIMITED Page 19
5.1.3 QOS PERFORMANCE OF MONTHLY PMR – APRIL-15 MONTH:
CELLULAR MOBILE TELEPHONE SERVICES PUNJAB CIRCLE - APRIL 15 MONTH
PMR Generation Data B
ench
- m
ark
Au
dit
Per
iod
AIR
CE
L
AIR
TE
L
BS
NL
IDE
A
RC
OM
GS
M
TA
TA
GS
M
QT
L
VO
DA
FO
NE
RC
OM
CD
MA
TA
TA
CD
MA
S/N Name of Parameter GSM Operators CDMA
Operators
Network Service Quality Parameter
1
Network Availability
a) BTS Accumulated Downtime
<=2% Apr-15 0.13% 0.05% 0.55% 0.04% 0.18% 0.03% 0.11% 0.03% 0.16% 0.03%
b) Worst affected BTSs due to downtime
<=2% Apr-15 0.33% 0.04% 1.90% 0.02% 0.59% 0.00% 0.31% 0.00% 0.16% 0.25%
2
Connection Establishment (Accessibility)
a) CSSR (Call Setup Success Rate)
>=95% Apr-15 98.10% 99.50% 97.01% 98.90% 99.63% 99.02% 98.34% 99.85% 98.62% 99.02%
b) SDCCH/PAGING Channel congestion
<=1% Apr-15 0.10% 0.07% 0.98% 0.05% 0.02% 0.02% 0.04% 0.02% 0.00% 0.00%
c) TCH congestion <=2% Apr-15 0.89% 0.06% 1.18% 0.20% 0.04% 0.14% 0.32% 0.15% 0.00% 0.08%
3
Connection maintenance (Retainability)
a) CDR (Call Drop Rate)
<=2% Apr-15 0.63% 0.30% 1.65% 0.48% 0.21% 0.62% 0.88% 0.54% 0.06% 0.39%
b) Worst affected cells>3% TCH drop (Call drop) rate
<=3% Apr-15 3.19% 0.60% 17.91% 0.40% 0.05% 3.92% 1.08% 1.81% 0.26% 6.17%
c) Connections with good voice quality
>=95% Apr-15 97.07% 98.73% 95.56% 98.10% 98.92% 97.37% 96.69% 98.08% 99.71% 99.08%
4
No. of POI’s having >=0.5% POI congestion
Apr-15 0 0 2 0 0 0 2 0 0 0

AUDIT & ASSESSMENT OF QOS FOR QE-JUNE-2015-PUNJAB CIRCLE
TUV-SUD SOUTH ASIA PRIVATE LIMITED Page 20
5.1.4 QOS PERFORMANCE OF MONTHLY PMR MAY-- 15 MONTH:
CELLULAR MOBILE TELEPHONE SERVICES PUNJAB CIRCLE - MAY 15 MONTH
PMR Generation Data
Ben
ch-
mar
k
Au
dit
Per
iod
AIR
CE
L
AIR
TE
L
BS
NL
IDE
A
RC
OM
GS
M
TA
TA
GS
M
QT
L
VO
DA
FO
NE
RC
OM
CD
MA
TA
TA
CD
MA
S/N Name of Parameter GSM Operators CDMA Operators
Network Service Quality Parameter
1
Network Availability
a) BTS Accumulated Downtime
<=2% May-15 0.15% 0.07% 0.62% 0.04% 0.15% 0.08% 0.10% 0.04% 0.14% 0.08%
b) Worst affected BTSs due to downtime
<=2% May-15 0.17% 0.04% 1.95% 0.06% 0.13% 0.06% 0.27% 0.02% 0.00% 0.25%
2
Connection Establishment (Accessibility)
a) CSSR (Call Setup Success Rate)
>=95% May-15 98.34% 99.48% 97.32% 98.91% 99.66% 99.06% 98.47% 99.86% 98.75% 98.76%
b) SDCCH/PAGING Channel congestion
<=1% May-15 0.08% 0.09% 0.95% 0.07% 0.01% 0.03% 0.05% 0.02% 0.00% 0.00%
c) TCH congestion <=2% May-15 0.74% 0.08% 0.97% 0.15% 0.03% 0.12% 0.24% 0.14% 0.00% 0.09%
3
Connection maintenance (Retainability)
a) CDR (Call Drop Rate)
<=2% May-15 0.54% 0.28% 1.60% 0.44% 0.19% 0.66% 0.64% 0.49% 0.07% 0.40%
b) Worst affected cells>3% TCH drop (Call drop) rate
<=3% May-15 2.59% 0.62% 17.46% 0.37% 0.08% 4.41% 0.65% 1.64% 0.34% 5.79%
c) Connections with good voice quality
>=95% May-15 97.57% 98.76% 95.73% 98.20% 99.05% 97.43% 96.80% 98.15% 99.71% 99.07%
4
No. of POI’s having >=0.5% POI congestion
May-15 0 0 1 0 0 0 2 0 0 0

AUDIT & ASSESSMENT OF QOS FOR QE-JUNE-2015-PUNJAB CIRCLE
TUV-SUD SOUTH ASIA PRIVATE LIMITED Page 21
5.1.5 QOS PERFORMANCE OF MONTHLY PMR – JUNE- 15 MONTH:
CELLULAR MOBILE TELEPHONE SERVICES PUNJAB CIRCLE - JUNE 15 MONTH
PMR Generation Data B
ench
- m
ark
Au
dit
Per
iod
AIR
CE
L
AIR
TE
L
BS
NL
IDE
A
RC
OM
GS
M
TA
TA
GS
M
QT
L
VO
DA
FO
NE
RC
OM
CD
MA
TA
TA
CD
MA
S/N Name of Parameter GSM Operators CDMA
Operators Network Service Quality Parameter
1
Network Availability
a) BTS Accumulated Downtime
<=2% Jun-15 0.13% 0.05% 0.75% 0.06% 0.16% 0.08% 0.13% 0.06% 0.19% 0.04%
b) Worst affected BTSs due to downtime
<=2% Jun-15 0.16% 0.00% 1.95% 0.06% 0.07% 0.25% 0.22% 0.02% 0.16% 0.25%
2
Connection Establishment (Accessibility)
a) CSSR (Call Setup Success Rate)
>=95% Jun-15 98.00% 99.49% 97.37% 98.71% 99.65% 98.96% 98.23% 99.86% 98.67% 98.46%
b) SDCCH/PAGING Channel congestion
<=1% Jun-15 0.34% 0.12% 0.70% 0.08% 0.01% 0.02% 0.11% 0.02% 0.00% 0.00%
c) TCH congestion <=2% Jun-15 1.42% 0.08% 0.80% 0.12% 0.03% 0.15% 0.30% 0.14% 0.00% 0.06%
3
Connection maintenance (Retainability)
a) CDR (Call Drop Rate) <=2% Jun-15 0.64% 0.32% 1.59% 0.49% 0.19% 0.60% 0.72% 0.50% 0.04% 0.41%
b) Worst affected cells>3% TCH drop (Call drop) rate
<=3% Jun-15 2.70% 0.70% 18.37% 0.40% 0.06% 3.98% 0.86% 2.80% 0.21% 5.82%
c) Connections with good voice quality
>=95% Jun-15 97.17% 98.65% 95.73% 98.16% 99.16% 97.32% 96.32% 97.97% 99.71% 99.07%
4 No. of POI’s having >=0.5% POI congestion
Jun-15 0 0 0 0 0 0 0 0 0 0

AUDIT & ASSESSMENT OF QOS FOR QE-JUNE-2015-PUNJAB CIRCLE
TUV-SUD SOUTH ASIA PRIVATE LIMITED Page 22
5.1.6 QOS PERFORMANCE OF QUARTERLY PMR –AVERAGE OF QE- JUNE 15 (APRIL – MAY – JUNE MONTHS AUDITED DATA)
QUARTERLY QOS PERFORMANCE (AVERAGE OF QE – JUNE 15) – PUNJAB CIRCLE
PMR Generation Data
Ben
ch-
mar
k
Au
dit
Per
iod
AIR
CE
L
AIR
TE
L
BS
NL
IDE
A
RC
OM
GS
M
TA
TA
GS
M
QT
L
VO
DA
FO
NE
RC
OM
CD
MA
TA
TA
CD
MA
S/N Name of Parameter GSM Operators CDMA
Operators Network Service Quality Parameter
1
Network Availability
a) BTS Accumulated Downtime
<=2% Quarterly 0.14% 0.06% 0.64% 0.05% 0.16% 0.06% 0.11% 0.04% 0.16% 0.05%
b) Worst affected BTSs due to downtime
<=2% Quarterly 0.22% 0.03% 1.93% 0.05% 0.26% 0.10% 0.27% 0.01% 0.11% 0.25%
2
Connection Establishment (Accessibility)
a) CSSR (Call Setup Success Rate)
>=95% Quarterly 98.15% 99.49% 97.23% 98.84% 99.65% 99.01% 98.35% 99.86% 98.68% 98.75%
b) SDCCH/PAGING Channel congestion
<=1% Quarterly 0.17% 0.09% 0.88% 0.07% 0.01% 0.02% 0.07% 0.02% 0.00% 0.00%
c) TCH congestion <=2% Quarterly 1.02% 0.07% 0.98% 0.16% 0.03% 0.14% 0.29% 0.14% 0.00% 0.08%
3
Connection maintenance (Retainability)
a) CDR (Call Drop Rate)
<=2% Quarterly 0.60% 0.30% 1.61% 0.47% 0.20% 0.63% 0.75% 0.51% 0.06% 0.40%
b) Worst affected cells>3% TCH drop (Call drop) rate
<=3% Quarterly 2.83% 0.64% 17.91% 0.39% 0.06% 4.10% 0.86% 2.08% 0.27% 5.93%
c) Connections with good voice quality
>=95% Quarterly 97.27% 98.71% 95.67% 98.15% 99.04% 97.37% 96.60% 98.07% 99.71% 99.07%
4
No. of POI’s having >=0.5% POI congestion
Quarterly 0 0 1 0 0 0 2 0 0 0

AUDIT & ASSESSMENT OF QOS FOR QE-JUNE-2015-PUNJAB CIRCLE
TUV-SUD SOUTH ASIA PRIVATE LIMITED Page 23
5.1.7 KEY FINDINGS ON MONTHLY PMR AUDIT REPORTS: The audit of network related parameters for cellular mobile service providers was conducted at their respective MSCs
in the circles.
TUV conducted audit for cellular mobile operators based on three stage audit / verification viz audit of the records, live measurements and drive tests. This exercise has been repeated every month for CMSPs.
Network Service Quality Parameters:
Network Availability
i. BTS Accumulated Downtime (Not Available for Service): ii. Worst affected BTSs due to downtime
For measuring the performance against the benchmark for this parameter, down time of each BTS lasting for more than 1 hour at a time in a day during the period of a month has been taken for computation. In Punjab circle, all the operators were found meeting benchmark on the above parameters ‘BTS accumulated downtime’ and ‘worst affected BTSs due to down time’ in all the three months of the quarter.
Connection Establishment (Accessibility)
i. Call Set-up Success Rate(CSSR) CSSR includes complete signaling in the call set up process and does not aim to measure the performance of the called exchange or that of the Point of Interconnection (POI). CSSR was established as the ratio of total number of successful call attempts (establishment) to the total number of call attempts made. All the operators were meeting the benchmark on this parameter. Parameters related to Network Congestion: The parameters namely SDCCH / Paging Channel Congestion, TCH and POI are prescribed with the aim of measuring the congestion in the network. In CDMA system, there is no direct counter defined for reporting Paging Channel Congestion as reported by Tata Teleservices. However, they have a defined counter for Paging Channel Occupancy Ratio (PCH Average Using Ratio) which is used to determine the Paging Channel Occupancy which on an average is < 50% on all sites in the network. When the value of this parameter is less than 100%, it is counted as 0% congestion. Thus, there is no congestion on the pegging channel in CDMA system. With respect to this parameter, the performance of the operators is quite satisfactory as all operators met the TRAI specified benchmarks on the congestion parameters.

AUDIT & ASSESSMENT OF QOS FOR QE-JUNE-2015-PUNJAB CIRCLE
TUV-SUD SOUTH ASIA PRIVATE LIMITED Page 24
Connection Maintenance (Retainability)
i. Call Drop Rate: This parameter gives a reliable measurement of the mobile network used by the service provider for maintaining a call once it has been correctly established. Failures in coverage, network congestion and network failures have important impact on this parameter. The audit of this parameter revealed that all the service providers were measuring this parameter as per the TRAI guidelines. Also, all the service providers were found to be meeting the TRAI specified benchmark. The lowest call drop rate (0.20 %) was for RCOM GSM during the quarter.
ii. Worst affected cells having more than 3% TCH drops Worst affected cells are defined as cells in which the call drop rate exceeds 3% during cell Bouncing Busy Hour (CBBH) or at any other hour of a day. The audit with respect to this parameter revealed that all the operators met the benchmark for this parameter except BSNL, Tata (GSM) and Tata (CDMA). The quarterly averaged performance of BSNL, Tata (GSM) and Tata (CDMA) for this parameter was 17.91%, 4.10% and 5.93% respectively. The performance of BSNL was way beyond the benchmark.
iii. Connections with good voice quality:
The audit results for this parameter indicates that all operators have met the bench mark during the quarter.
iv. No. of POI’s having >=0.5% POI congestion:
The audit with respect to this parameter revealed that only BSNL and QTL were having congestion > 0.5% on one and two POIs respectively.

AUDIT & ASSESSMENT OF QOS FOR QE-JUNE-2015-PUNJAB CIRCLE
TUV-SUD SOUTH ASIA PRIVATE LIMITED Page 25
3-DAYS LIVE MEASUREMENT DATA VERIFICATION FOR
CELLULAR MOBILE SERVICE PROVIDERS
(NETWORK SERVICE QUALITY PARAMETER)

AUDIT & ASSESSMENT OF QOS FOR QE-JUNE-2015-PUNJAB CIRCLE
TUV-SUD SOUTH ASIA PRIVATE LIMITED Page 26
5.2 LIVE MEASUREMENT DATA (3-DAYS) FOR CELLULAR MOBILE SERVICE PROVIDERS (NETWORK SERVICE QUALITY PARAMETER):
5.2.1 LIVE MEASURMENT DATA (3-DAYS) – APRIL- 15 MONTH:
CELLULAR MOBILE TELEPHONE SERVICES PUNJAB CIRCLE - APRIL 15 MONTH
Live measurement Data
Ben
ch-
mar
k
Ave
rag
e o
f 3
Day
s
AIR
CE
L
AIR
TE
L
BS
NL
IDE
A
RC
OM
GS
M
TA
TA
GS
M
QT
L
VO
DA
FO
NE
RC
OM
CD
MA
TA
TA
CD
MA
S/N Name of Parameter GSM Operators CDMA Operators
Network Service Quality Parameter
1
Network Availability
a) BTS Accumulated Downtime
<=2% Live data 0.16% 0.03% 0.55% 0.03% 0.13% 0.02% 0.09% 0.01% 0.15% 0.01%
b) Worst affected BTSs due to downtime
<=2% Live data 0.00% 0.00% 0.48% 0.00% 0.00% 0.00% 0.00% 0.00% 0.00% 0.00%
2
Connection Establishment (Accessibility)
a) CSSR (Call Setup Success Rate)
>=95% Live data 98.14% 99.54% 97.50% 98.83% 99.60% 99.01% 98.35% 99.84% 98.94% 98.96%
b) SDCCH/PAGING Channel congestion
<=1% Live data 0.04% 0.06% 0.93% 0.04% 0.02% 0.01% 0.05% 0.02% 0.00% 0.00%
c) TCH congestion <=2% Live data 0.57% 0.04% 0.92% 0.34% 0.04% 0.13% 0.29% 0.16% 0.00% 0.10%
3
Connection maintenance (Retainability)
a) CDR (Call Drop Rate) <=2% Live data 0.60% 0.30% 1.46% 0.45% 0.21% 0.62% 0.90% 0.58% 0.02% 0.39%
b) Worst affected cells>3% TCH drop (Call drop) rate
<=3% Live data 2.80% 0.53% 18.75% 0.34% 0.00% 3.98% 1.14% 1.79% 0.14% 5.49%
c) Connections with good voice quality
>=95% Live data 97.10% 98.74% 95.73% 98.11% 98.86% 97.32% 96.70% 98.06% 99.72% 99.08%
4 No. of POI having >=0.5% congestion
Live data 0 0 2 0 0 0 3 0 0 0

AUDIT & ASSESSMENT OF QOS FOR QE-JUNE-2015-PUNJAB CIRCLE
TUV-SUD SOUTH ASIA PRIVATE LIMITED Page 27
5.2.2 LIVE MEASURMENT DATA (3-DAYS) – MAY- 15 MONTH:
CELLULAR MOBILE TELEPHONE SERVICES PUNJAB CIRCLE – MAY 15 MONTH
Live measurement Data B
ench
- m
ark
Ave
rag
e o
f 3
Day
s
AIR
CE
L
AIR
TE
L
BS
NL
IDE
A
RC
OM
GS
M
TA
TA
GS
M
QT
L
VO
DA
FO
NE
RC
OM
CD
MA
TA
TA
CD
MA
S/N Name of Parameter GSM Operators CDMA Operators
Network Service Quality Parameter
1
Network Availability
a) BTS Accumulated Downtime
<=2% Live data 0.15% 0.02% 0.81% 0.07% 0.23% 0.22% 0.25% 0.03% 0.15% 0.21%
b) Worst affected BTSs due to downtime
<=2% Live data 0.00% 0.00% 0.48% 0.00% 0.00% 0.00% 0.00% 0.00% 0.00% 0.00%
2
Connection Establishment (Accessibility)
a) CSSR (Call Setup Success Rate)
>=95% Live data 98.23% 99.44% 97.07% 99.02% 99.66% 99.19% 98.55% 99.86% 98.83% 98.58%
b) SDCCH/PAGING Channel congestion
<=1% Live data 0.11% 0.13% 0.84% 0.13% 0.02% 0.01% 0.03% 0.01% 0.00% 0.00%
c) TCH congestion <=2% Live data 0.87% 0.08% 0.99% 0.15% 0.03% 0.06% 0.20% 0.14% 0.00% 0.01%
3
Connection maintenance (Retainability)
a) CDR (Call Drop Rate) <=2% Live data 0.62% 0.29% 1.71% 0.48% 0.20% 0.57% 0.63% 0.49% 0.04% 0.42%
b) Worst affected cells>3% TCH drop (Call drop) rate
<=3% Live data 3.01% 0.64% 18.51% 0.48% 0.00% 4.13% 0.67% 1.74% 0.16% 6.53%
c) Connections with good voice quality
>=95% Live data 97.58% 98.75% 95.95% 98.26% 98.95% 97.44% 96.96% 98.14% 99.72% 99.07%
4 No. of POI having >=0.5% congestion
Live data 0 0 1 0 0 0 2 0 0 0

AUDIT & ASSESSMENT OF QOS FOR QE-JUNE-2015-PUNJAB CIRCLE
TUV-SUD SOUTH ASIA PRIVATE LIMITED Page 28
5.2.3 LIVE MEASURMENT DATA (3-DAYS) – JUNE- 15 MONTH:
CELLULAR MOBILE TELEPHONE SERVICES PUNJAB CIRCLE – JUNE 15 MONTH
Live measurement Data B
ench
- m
ark
Ave
rag
e o
f 3
Day
s
AIR
CE
L
AIR
TE
L
BS
NL
IDE
A
RC
OM
GS
M
TA
TA
GS
M
QT
L
VO
DA
FO
NE
RC
OM
CD
MA
TA
TA
CD
MA
S/N Name of Parameter GSM Operators CDMA Operators
Network Service Quality Parameter
1
Network Availability
a) BTS Accumulated Downtime
<=2% Live data 0.21% 0.02% 1.30% 0.05% 0.20% 0.17% 0.04% 0.03% 0.31% 0.03%
b) Worst affected BTSs due to downtime
<=2% Live data 0.00% 0.00% 0.66% 0.00% 0.00% 0.12% 0.00% 0.00% 0.00% 0.00%
2
Connection Establishment (Accessibility)
a) CSSR (Call Setup Success Rate)
>=95% Live data 98.11% 99.42% 97.05% 98.89% 99.67% 99.03% 98.54% 99.85% 98.58% 98.96%
b) SDCCH/PAGING Channel congestion
<=1% Live data 0.20% 0.17% 0.60% 0.07% 0.02% 0.01% 0.03% 0.02% 0.00% 0.00%
c) TCH congestion <=2% Live data 1.36% 0.12% 1.24% 0.10% 0.03% 0.17% 0.18% 0.15% 0.01% 0.03%
3
Connection maintenance (Retainability)
a) CDR (Call Drop Rate) <=2% Live data 0.61% 0.31% 1.54% 0.51% 0.19% 0.58% 0.64% 0.48% 0.06% 0.39%
b) Worst affected cells>3% TCH drop (Call drop) rate
<=3% Live data 2.62% 0.66% 16.19% 0.44% 0.00% 3.82% 0.59% 2.67% 0.20% 5.29%
c) Connections with good voice quality
>=95% Live data 97.36% 98.67% 95.72% 98.01% 99.20% 97.43% 96.73% 98.01% 99.72% 99.06%
4 No. of POI having >=0.5% congestion
Live data 0 0 0 0 0 0 0 0 0 0

AUDIT & ASSESSMENT OF QOS FOR QE-JUNE-2015-PUNJAB CIRCLE
TUV-SUD SOUTH ASIA PRIVATE LIMITED Page 29
5.2.4 QUARTERLY QOS PERFORMANCE OF 3-DAYS LIVE MEASUREMENT AUDITED DATA (AVERAGE OF APRIL – MAY– JUNE- 2015 MONTHS AUDITED DATA)
QUARTERLY QOS PERFORMANCE OF 3-DAYS LIVE MEASUREMENT (AVERAGE OF QE- JUNE 15) – PUNJAB CIRCLE
Live measurement Data
Ben
ch-
mar
k
Ave
rag
e o
f 3
Day
s
AIR
CE
L
AIR
TE
L
BS
NL
IDE
A
RC
OM
GS
M
TA
TA
GS
M
QT
L
VO
DA
FO
NE
RC
OM
CD
MA
TA
TA
CD
MA
S/N Name of Parameter GSM Operators CDMA
Operators
Network Service Quality Parameter
1
Network Availability
a) BTS Accumulated Downtime <=2% Quarterly 0.17% 0.02% 0.89% 0.05% 0.19% 0.14% 0.13% 0.02% 0.20% 0.08%
b) Worst affected BTSs due to downtime
<=2% Quarterly 0.00% 0.00% 0.54% 0.00% 0.00% 0.04% 0.00% 0.00% 0.00% 0.00%
2
Connection Establishment (Accessibility)
a) CSSR (Call Setup Success Rate) >=95% Quarterly 98.16% 99.47% 97.21% 98.91% 99.64% 99.08% 98.48% 99.85% 98.78% 98.83%
b) SDCCH/PAGING Channel congestion
<=1% Quarterly 0.12% 0.12% 0.79% 0.08% 0.02% 0.01% 0.04% 0.02% 0.00% 0.00%
c) TCH congestion <=2% Quarterly 0.93% 0.08% 1.05% 0.20% 0.03% 0.12% 0.22% 0.15% 0.00% 0.05%
3
Connection maintenance (Retainability)
a) CDR (Call Drop Rate) <=2% Quarterly 0.61% 0.30% 1.57% 0.48% 0.20% 0.59% 0.72% 0.52% 0.04% 0.40%
b) Worst affected cells>3% TCH drop (Call drop) rate
<=3% Quarterly 2.81% 0.61% 17.82% 0.42% 0.00% 3.98% 0.80% 2.07% 0.17% 5.77%
c) Connections with good voice quality
>=95% Quarterly 97.35% 98.72% 95.80% 98.13% 99.00% 97.40% 96.80% 98.07% 99.72% 99.07%
4 No. of POI having >=0.5% congestion
Quarterly 0 0 1 0 0 0 2 0 0 0
5.2.5 KEY FINDING ON 3 DAYS LIVE MEASUREMENTS:
From three days live measurement assessment, it was found that the performance of all operators was satisfactory as they were largely meeting the benchmarks except for the parameter ‘Worst affected cells> 3 % TCH drops”. The benchmark for this parameter was not met by BSNL, Tata (GSM) and Tata (CDMA) during the live measurements in all three months of the Quarter ended June-2015. The quarterly average performance of BSNL, Tata (GSM) and Tata (CDMA) was 17.82%, 3.98% and 5.77% respectively, during the live measurements in three months of the quarter. The similar non-compliance of BSNL, Tata (GSM) and Tata (CDMA) was observed in monthly audit also. BSNL and QTL were showing congestion on 1 and 2 POIs respectively on quarterly basis. From the above analysis, it is concluded that the performance of BSNL, Tata (GSM) and Tata (CDMA) is not satisfactory in respect of the parameter “Worst affected cells> 3 % TCH drops”. Further, the performance of BSNL is very poor in respect of this parameter.

AUDIT & ASSESSMENT OF QOS FOR QE-JUNE-2015-PUNJAB CIRCLE
TUV-SUD SOUTH ASIA PRIVATE LIMITED Page 30
5.2.6 DETAILED NETWORK DATA ASSESSMENT OF CELLULAR MOBILE TELEPHONE SERVICES:
TABLE: 1
Detailed Network Data Assessment of Cellular Mobile Telephone Services- Punjab Circle - April 15 month
S/N Name of
Parameter Bench- mark
Audit Period
AIRCEL AIRTEL BSNL IDEA RCOM GSM
TATA GSM
QTL VODAFONE RCOM CDMA
TATA CDMA
GSM Operators CDMA
Operators
Network Service Quality Parameter
1
Network Availability
a) Total no. of BTSs in the licensed service area
Apr-15 599 5480 3315 4964 1533 1632 2223 4864 622 405
b) Sum of downtime of BTSs in a month in hours i.e. total outage time of all BTSs in hours during a month
Apr-15 580.08 1790.68 13211.40 1489.95 1975.38 376.57 1803.54 932.61 694.18 86.98
c) BTS Accumulated Downtime
<=2% Apr-15 0.13% 0.05% 0.55% 0.04% 0.18% 0.03% 0.11% 0.03% 0.16% 0.03%
d) No. of BTSs having accumulated downtime of >24 hours in a month
Apr-15 2 2 63 1 9 0 7 0 1 1
e) Worst affected BTSs due to downtime
<=2% Apr-15 0.33% 0.04% 1.90% 0.02% 0.59% 0.00% 0.31% 0.00% 0.16% 0.25%
2
Connection Establishment (Accessibility)
a) CSSR (Call Setup Success Rate)
>=95% Apr-15 98.10% 99.50% 97.01% 98.90% 99.63% 99.02% 98.34% 99.85% 98.62% 99.02%
b) SDCCH/PAGING Congestion
<=1% Apr-15 0.10% 0.07% 0.98% 0.05% 0.02% 0.02% 0.04% 0.02% 0.00% 0.00%
c) TCH congestion
<=2% Apr-15 0.89% 0.06% 1.18% 0.20% 0.04% 0.14% 0.32% 0.15% 0.00% 0.08%
3
Connection Maintenance (Retainability)
a) Call Drop Rate (CDR)
<=2% Apr-15 0.63% 0.30% 1.65% 0.48% 0.21% 0.62% 0.88% 0.54% 0.06% 0.39%
b) Worst affected cells>3% TCH drop
<=3% Apr-15 3.19% 0.60% 17.91% 0.40% 0.05% 3.92% 1.08% 1.81% 0.26% 6.17%
c) % of connections with good voice quality
>=95% Apr-15 97.07% 98.73% 95.56% 98.10% 98.92% 97.37% 96.69% 98.08% 99.71% 99.08%
d) Total No. of cells exceeding 3% TCH drop (call drop)
Apr-15 57 99 1781 59 2 195 76 271 5 80
e) Total no. of cells (Sector) in the licensed service area
Apr-15 1797 16525 9945 14954 4559 4979 7041 14978 1865 1294

AUDIT & ASSESSMENT OF QOS FOR QE-JUNE-2015-PUNJAB CIRCLE
TUV-SUD SOUTH ASIA PRIVATE LIMITED Page 31
Detailed Network Data Assessment of Cellular Mobile Telephone Services- Punjab Circle - April 15 month
S/N Name of
Parameter Bench- mark
Audit Period
AIRCEL AIRTEL BSNL IDEA RCOM GSM
TATA GSM
QTL VODAFONE RCOM CDMA
TATA CDMA
GSM Operators CDMA
Operators
4
No. of POI’s having >=0.5% POI congestion No. of POI’s having >=0.5% POI congestion
Apr-15 0 0 2 0 0 0 2 0 0 0
Name of POI not meeting the benchmark
Apr-15 0 0
JALGMSS1 HFCLGS, 1151
(HF_GSM_9645) 0 0 0
PB01BSLB01 -cellone -1 ,
PB01BSLB11 -cellone-2
0 0 0
5
Network Data
a) Equipped Capacity of Network in Erlang
Apr-15 23258 264545 282000 216873 72000 107591 102494 169212 53000 75604
b) Total traffic in TCBH in erlang (Avg.)
Apr-15 13231 222389 106233 157870 54383 36878 50101 127803 10917 12482
c) Total no. of customers served (as per VLR) on last day of the month
Apr-15 505467 7382248 2349614 6393513 2062318 1290482 1582123 4480786 230314 131828

AUDIT & ASSESSMENT OF QOS FOR QE-JUNE-2015-PUNJAB CIRCLE
TUV-SUD SOUTH ASIA PRIVATE LIMITED Page 32
TABLE: 2
Detailed Network Data Assessment of Cellular Mobile Telephone Services -3 days live - Punjab Circle – April 15 month
S/N Name of
Parameter Bench- mark
Average of 3
Days
AIRCEL AIRTEL BSNL IDEA RCOM GSM
TATA GSM
QTL VODAFONE RCOM CDMA
TATA CDMA
GSM Operators CDMA
Operators
Network Service Quality Parameter
1
Network Availability
a) Total no. of BTSs in the licensed service area
Live data 599 5486 3301 4961 1533 1632 2221 4864 622 405
b) Sum of downtime of BTSs in a month in hours i.e. total outage time of all BTSs in hours during a month
Live data 68.77 101.13 1300.47 100.80 138.13 22.38 138.77 47.97 65.18 2.73
c) BTS Accumulated Downtime
<=2% Live data 0.16% 0.03% 0.55% 0.03% 0.13% 0.02% 0.09% 0.01% 0.15% 0.01%
d) No. of BTSs having accumulated downtime of >24 hours in a month
Live data 0 0 16 0 0 0 0 0 0 0
e) Worst affected BTSs due to downtime
<=2% Live data 0.00% 0.00% 0.48% 0.00% 0.00% 0.00% 0.00% 0.00% 0.00% 0.00%
2
Connection Establishment (Accessibility)
a) CSSR (Call Setup Success Rate)
>=95% Live data 98.14% 99.54% 97.50% 98.83% 99.60% 99.01% 98.35% 99.84% 98.94% 98.96%
b) SDCCH/PAGING Congestion
<=1% Live data 0.04% 0.06% 0.93% 0.04% 0.02% 0.01% 0.05% 0.02% 0.00% 0.00%
c) TCH congestion
<=2% Live data 0.57% 0.04% 0.92% 0.34% 0.04% 0.13% 0.29% 0.16% 0.00% 0.10%
3
Connection Maintenance (Retainability)
a) Call Drop Rate (CDR)
<=2% Live data 0.60% 0.30% 1.46% 0.45% 0.21% 0.62% 0.90% 0.58% 0.02% 0.39%
b) Worst affected cells>3% TCH drop
<=3% Live data 2.80% 0.53% 18.75% 0.34% 0.00% 3.98% 1.14% 1.79% 0.14% 5.49%
c) % of connections with good voice quality
>=95% Live data 97.10% 98.74% 95.73% 98.11% 98.86% 97.32% 96.70% 98.06% 99.72% 99.08%
d) Total No. of cells exceeding 3% TCH drop (call drop)
Live data 50 89 1857 50 0 198 80 267 3 71
e) Total no. of cells (Sector) in the licensed service area
Live data 1797 16644 9903 14954 4559 4980 7043 14976 1865 1294

AUDIT & ASSESSMENT OF QOS FOR QE-JUNE-2015-PUNJAB CIRCLE
TUV-SUD SOUTH ASIA PRIVATE LIMITED Page 33
Detailed Network Data Assessment of Cellular Mobile Telephone Services -3 days live - Punjab Circle – April 15 month
S/N Name of
Parameter Bench- mark
Average of 3
Days
AIRCEL AIRTEL BSNL IDEA RCOM GSM
TATA GSM
QTL VODAFONE RCOM CDMA
TATA CDMA
GSM Operators CDMA
Operators
4
No. of POI’s having >=0.5% POI congestion
No. of POI’s having >=0.5% POI congestion
Live data 0 0 2 0 0 0 3 0 0 0
Name of POI not meeting the benchmark
Live data 0 0
JALGMSS1 HFCLGS, 1151
(HF_GSM_9645) 0 0 0
PB01BSLB01 -cellone -1,
PB01BSLB11 -cellone-2,
PB01BSNB01(L1 TAX -Jal)
0 0 0

AUDIT & ASSESSMENT OF QOS FOR QE-JUNE-2015-PUNJAB CIRCLE
TUV-SUD SOUTH ASIA PRIVATE LIMITED Page 34
TABLE: 3
Detailed Network Data Assessment of Cellular Mobile Telephone Services - Punjab Circle - May 15 month
S/N Name of
Parameter Bench- mark
Audit Period
AIRCEL AIRTEL BSNL IDEA RCOM GSM
TATA GSM
QTL VODAFONE RCOM CDMA
TATA CDMA
GSM Operators CDMA
Operators
Network Service Quality Parameter
1
Network Availability
a) Total no. of BTSs in the licensed service area
May-15 602 5515 3330 5075 1534 1631 2227 4889 622 404
b) Sum of downtime of BTSs in a month in hours i.e. total outage time of all BTSs in hours during a month
May-15 674.85 2754.42 15257.13 1351.68 1695.08 922.29 1595.38 1311.20 635.15 247.09
c) BTS Accumulated Downtime
<=2% May-15 0.15% 0.07% 0.62% 0.04% 0.15% 0.08% 0.10% 0.04% 0.14% 0.08%
d) No. of BTSs having accumulated downtime of >24 hours in a month
May-15 1 2 65 3 2 1 6 1 0 1
e) Worst affected BTSs due to downtime
<=2% May-15 0.17% 0.04% 1.95% 0.06% 0.13% 0.06% 0.27% 0.02% 0.00% 0.25%
2
Connection Establishment (Accessibility)
a) CSSR (Call Setup Success Rate)
>=95% May-15 98.34% 99.48% 97.32% 98.91% 99.66% 99.06% 98.47% 99.86% 98.75% 98.76%
b) SDCCH/PAGING Congestion
<=1% May-15 0.08% 0.09% 0.95% 0.07% 0.01% 0.03% 0.05% 0.02% 0.00% 0.00%
c) TCH congestion
<=2% May-15 0.74% 0.08% 0.97% 0.15% 0.03% 0.12% 0.24% 0.14% 0.00% 0.09%
3
Connection Maintenance (Retainability)
a) Call Drop Rate (CDR)
<=2% May-15 0.54% 0.28% 1.60% 0.44% 0.19% 0.66% 0.64% 0.49% 0.07% 0.40%
b) Worst affected cells>3% TCH drop
<=3% May-15 2.59% 0.62% 17.46% 0.37% 0.08% 4.41% 0.65% 1.64% 0.34% 5.79%
c) % of connections with good voice quality
>=95% May-15 97.57% 98.76% 95.73% 98.20% 99.05% 97.43% 96.80% 98.15% 99.71% 99.07%
d) Total No. of cells exceeding 3% TCH drop (call drop)
May-15 46 103 1745 55 4 220 46 246 6 75
e) Total no. of cells (Sector) in the licensed service area
May-15 1795 16664 9990 15014 4560 4979 7051 14984 1865 1291

AUDIT & ASSESSMENT OF QOS FOR QE-JUNE-2015-PUNJAB CIRCLE
TUV-SUD SOUTH ASIA PRIVATE LIMITED Page 35
Detailed Network Data Assessment of Cellular Mobile Telephone Services - Punjab Circle - May 15 month
S/N Name of
Parameter Bench- mark
Audit Period
AIRCEL AIRTEL BSNL IDEA RCOM GSM
TATA GSM
QTL VODAFONE RCOM CDMA
TATA CDMA
GSM Operators CDMA
Operators
4
No. of POI’s having >=0.5% POI congestion
No. of POI’s having >=0.5% POI congestion
May-15 0 0 1 0 0 0 2 0 0 0
Name of POI not meeting the benchmark
May-15 0 0
JALGMSS1 HFCLGS
0 0 0
PB01BSLB01 -cellone -1 ,
PB01BSLB11 -cellone-2
0 0 0
5
Network Data
a) Equipped Capacity of Network in Erlang
May-15 23913 266274 282000 222520 72000 107540 103364 169874 53000 75358
b) Total traffic in TCBH in erlang (Avg.)
May-15 13739 222937 99953 158868 53605 35730 47794 125705 8851 10742
c) Total no. of customers served (as per VLR) on last day of the month
May-15 515211 7341101 2335586 6473502 2030190 1379575 1493979 4444303 227784 128870

AUDIT & ASSESSMENT OF QOS FOR QE-JUNE-2015-PUNJAB CIRCLE
TUV-SUD SOUTH ASIA PRIVATE LIMITED Page 36
TABLE: 4
Detailed Network Data Assessment of Cellular Mobile Telephone Services-3 days live- Punjab Circle- May 15 month
S/N Name of
Parameter Bench- mark
Average of 3
Days
AIRCEL AIRTEL BSNL IDEA RCOM GSM
TATA GSM
QTL VODAFONE RCOM CDMA
TATA CDMA
GSM Operators CDMA
Operators
Network Service Quality Parameter
1
Network Availability
a) Total no. of BTSs in the licensed service area
Live data 599 5497 3315 4966 1533 1631 2224 4864 622 404
b) Sum of downtime of BTSs in a month in hours i.e. total outage time of all BTSs in hours during a month
Live data 62.81 63.95 1934.75 240.21 249.45 263.09 405.02 121.73 65.43 62.20
c) BTS Accumulated Downtime
<=2% Live data 0.15% 0.02% 0.81% 0.07% 0.23% 0.22% 0.25% 0.03% 0.15% 0.21%
d) No. of BTSs having accumulated downtime of >24 hours in a month
Live data 0 0 16 0 0 0 0 0 0 0
e) Worst affected BTSs due to downtime
<=2% Live data 0.00% 0.00% 0.48% 0.00% 0.00% 0.00% 0.00% 0.00% 0.00% 0.00%
2
Connection Establishment (Accessibility)
a) CSSR (Call Setup Success Rate)
>=95% Live data 98.23% 99.44% 97.07% 99.02% 99.66% 99.19% 98.55% 99.86% 98.83% 98.58%
b) SDCCH/PAGING Congestion
<=1% Live data 0.11% 0.13% 0.84% 0.13% 0.02% 0.01% 0.03% 0.01% 0.00% 0.00%
c) TCH congestion
<=2% Live data 0.87% 0.08% 0.99% 0.15% 0.03% 0.06% 0.20% 0.14% 0.00% 0.01%
3
Connection Maintenance (Retainability)
a) Call Drop Rate (CDR)
<=2% Live data 0.62% 0.29% 1.71% 0.48% 0.20% 0.57% 0.63% 0.49% 0.04% 0.42%
b) Worst affected cells>3% TCH drop
<=3% Live data 3.01% 0.64% 18.51% 0.48% 0.00% 4.13% 0.67% 1.74% 0.16% 6.53%
c) % of connections with good voice quality
>=95% Live data 97.58% 98.75% 95.95% 98.26% 98.95% 97.44% 96.96% 98.14% 99.72% 99.07%
d) Total No. of cells exceeding 3% TCH drop (call drop)
Live data 54 107 1840 71 0 206 47 261 3 84
e) Total no. of cells (Sector) in the licensed service area
Live data 1797 16698 9945 14969 4559 4977 7051 14979 1865 1291

AUDIT & ASSESSMENT OF QOS FOR QE-JUNE-2015-PUNJAB CIRCLE
TUV-SUD SOUTH ASIA PRIVATE LIMITED Page 37
Detailed Network Data Assessment of Cellular Mobile Telephone Services-3 days live- Punjab Circle- May 15 month
S/N Name of
Parameter Bench- mark
Average of 3
Days
AIRCEL AIRTEL BSNL IDEA RCOM GSM
TATA GSM
QTL VODAFONE RCOM CDMA
TATA CDMA
GSM Operators CDMA
Operators
4
No. of POI’s having >=0.5% POI congestion
No. of POI’s having >=0.5% POI congestion
Live data 0 0 1 0 0 0 2 0 0 0
Name of POI not meeting the benchmark
Live data 0 0
JALGMSS1 HFCLGS
0 0 0
PB01BSLB01 -cellone -1
PB01BSLB11 -cellone-2
0 0 0
AUDIT & ASSESSMENT OF QOS FOR QE-JUNE-2015-PUNJAB CIRCLE
TUV-SUD SOUTH ASIA PRIVATE LIMITED Page 38
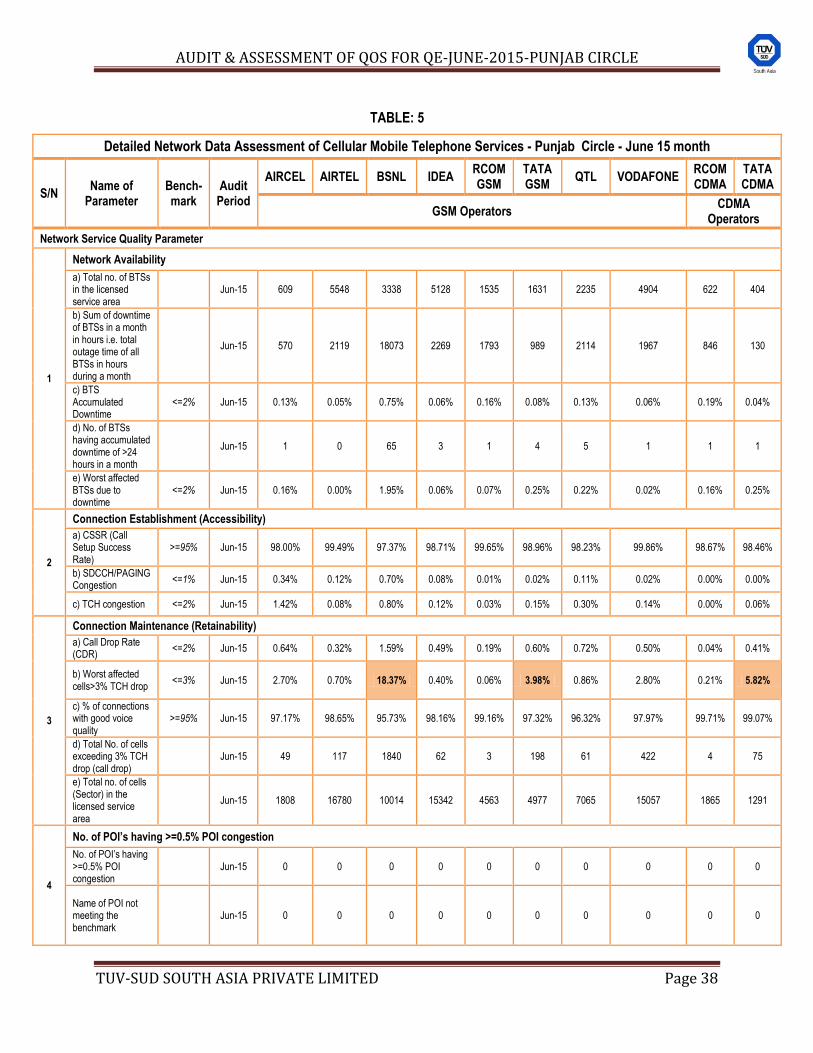
TABLE: 5
Detailed Network Data Assessment of Cellular Mobile Telephone Services - Punjab Circle - June 15 month
S/N Name of
Parameter Bench- mark
Audit Period
AIRCEL AIRTEL BSNL IDEA RCOM GSM
TATA GSM
QTL VODAFONE RCOM CDMA
TATA CDMA
GSM Operators CDMA
Operators
Network Service Quality Parameter
1
Network Availability
a) Total no. of BTSs in the licensed service area
Jun-15 609 5548 3338 5128 1535 1631 2235 4904 622 404
b) Sum of downtime of BTSs in a month in hours i.e. total outage time of all BTSs in hours during a month
Jun-15 570 2119 18073 2269 1793 989 2114 1967 846 130
c) BTS Accumulated Downtime
<=2% Jun-15 0.13% 0.05% 0.75% 0.06% 0.16% 0.08% 0.13% 0.06% 0.19% 0.04%
d) No. of BTSs having accumulated downtime of >24 hours in a month
Jun-15 1 0 65 3 1 4 5 1 1 1
e) Worst affected BTSs due to downtime
<=2% Jun-15 0.16% 0.00% 1.95% 0.06% 0.07% 0.25% 0.22% 0.02% 0.16% 0.25%
2
Connection Establishment (Accessibility)
a) CSSR (Call Setup Success Rate)
>=95% Jun-15 98.00% 99.49% 97.37% 98.71% 99.65% 98.96% 98.23% 99.86% 98.67% 98.46%
b) SDCCH/PAGING Congestion
<=1% Jun-15 0.34% 0.12% 0.70% 0.08% 0.01% 0.02% 0.11% 0.02% 0.00% 0.00%
c) TCH congestion <=2% Jun-15 1.42% 0.08% 0.80% 0.12% 0.03% 0.15% 0.30% 0.14% 0.00% 0.06%
3
Connection Maintenance (Retainability)
a) Call Drop Rate (CDR)
<=2% Jun-15 0.64% 0.32% 1.59% 0.49% 0.19% 0.60% 0.72% 0.50% 0.04% 0.41%
b) Worst affected cells>3% TCH drop
<=3% Jun-15 2.70% 0.70% 18.37% 0.40% 0.06% 3.98% 0.86% 2.80% 0.21% 5.82%
c) % of connections with good voice quality
>=95% Jun-15 97.17% 98.65% 95.73% 98.16% 99.16% 97.32% 96.32% 97.97% 99.71% 99.07%
d) Total No. of cells exceeding 3% TCH drop (call drop)
Jun-15 49 117 1840 62 3 198 61 422 4 75
e) Total no. of cells (Sector) in the licensed service area
Jun-15 1808 16780 10014 15342 4563 4977 7065 15057 1865 1291
4
No. of POI’s having >=0.5% POI congestion
No. of POI’s having >=0.5% POI congestion
Jun-15 0 0 0 0 0 0 0 0 0 0
Name of POI not meeting the benchmark
Jun-15 0 0 0 0 0 0 0 0 0 0

AUDIT & ASSESSMENT OF QOS FOR QE-JUNE-2015-PUNJAB CIRCLE
TUV-SUD SOUTH ASIA PRIVATE LIMITED Page 39
Detailed Network Data Assessment of Cellular Mobile Telephone Services - Punjab Circle - June 15 month
S/N Name of
Parameter Bench- mark
Audit Period
AIRCEL AIRTEL BSNL IDEA RCOM GSM
TATA GSM
QTL VODAFONE RCOM CDMA
TATA CDMA
GSM Operators CDMA
Operators
5
Network Data
a) Equipped Capacity of Network in Erlang
Jun-15 24318 266879 282000 223302 NP 107558 104062 168841 NP 70356
b) Total traffic in TCBH in erlang (Avg.)
Jun-15 14731 215924 95961 159524 NP 34777 47749 120454 NP 10672
c) Total no. of customers served (as per VLR) on last day of the month
Jun-15 522762 7559812 2346086 6563123 NP 1363592 1568781 4491541 NP 122444

AUDIT & ASSESSMENT OF QOS FOR QE-JUNE-2015-PUNJAB CIRCLE
TUV-SUD SOUTH ASIA PRIVATE LIMITED Page 40
TABLE: 6
Detailed Network Data Assessment of Cellular Mobile Telephone Services -3 days live - Punjab Circle – June 15 month
S/N Name of Parameter Bench- mark
Average of 3
Days
AIRCEL AIRTEL BSNL IDEA RCOM GSM
TATA GSM
QTL VODAFONE RCOM CDMA
TATA CDMA
GSM Operators CDMA
Operators
Network Service Quality Parameter
1
Network Availability
a) Total no. of BTSs in the licensed service area
Live data 602 5534 3330 5077 1534 1631 2227 4889 622 404
b) Sum of downtime of BTSs in a month in hours i.e. total outage time of all BTSs in hours during a month
Live data 92.67 76.92 3128.37 190.24 219.82 196.05 66.18 99.43 139.48 8.37
c) BTS Accumulated Downtime
<=2% Live data 0.21% 0.02% 1.30% 0.05% 0.20% 0.17% 0.04% 0.03% 0.31% 0.03%
d) No. of BTSs having accumulated downtime of >24 hours in a month
Live data 0 0 22 0 0 2 0 0 0 0
e) Worst affected BTSs due to downtime
<=2% Live data 0.00% 0.00% 0.66% 0.00% 0.00% 0.12% 0.00% 0.00% 0.00% 0.00%
2
Connection Establishment (Accessibility)
a) CSSR (Call Setup Success Rate)
>=95% Live data 98.11% 99.42% 97.05% 98.89% 99.67% 99.03% 98.54% 99.85% 98.58% 98.96%
b) SDCCH/PAGING Congestion
<=1% Live data 0.20% 0.17% 0.60% 0.07% 0.02% 0.01% 0.03% 0.02% 0.00% 0.00%
c) TCH congestion <=2% Live data 1.36% 0.12% 1.24% 0.10% 0.03% 0.17% 0.18% 0.15% 0.01% 0.03%
3
Connection Maintenance (Retainability)
a) Call Drop Rate (CDR) <=2% Live data 0.61% 0.31% 1.54% 0.51% 0.19% 0.58% 0.64% 0.48% 0.06% 0.39%
b) Worst affected cells>3% TCH drop
<=3% Live data 2.62% 0.66% 16.19% 0.44% 0.00% 3.82% 0.59% 2.67% 0.20% 5.29%
c) % of connections with good voice quality
>=95% Live data 97.36% 98.67% 95.72% 98.01% 99.20% 97.43% 96.73% 98.01% 99.72% 99.06%
d) Total No. of cells exceeding 3% TCH drop (call drop)
Live data 48 111 1618 68 0 190 42 402 4 68
e) Total no. of cells (Sector) in the licensed service area
Live data 1818 16810 9990 15303 4562 4977 7060 15052 1865 1291
4
No. of POI’s having >=0.5% POI congestion
No. of POI’s having >=0.5% POI congestion
Live data 0 0 0 0 0 0 0 0 0 0
Name of POI not meeting the benchmark
Live data 0 0 0 0 0 0 0 0 0 0

AUDIT & ASSESSMENT OF QOS FOR QE-JUNE-2015-PUNJAB CIRCLE
TUV-SUD SOUTH ASIA PRIVATE LIMITED Page 41
CUSTOMER SERVICE QUALITY (CSD) PARAMETERS

AUDIT & ASSESSMENT OF QOS FOR QE-JUNE-2015-PUNJAB CIRCLE
TUV-SUD SOUTH ASIA PRIVATE LIMITED Page 42
5.3 CUSTOMER SERVICE QUALITY PARAMETERS MEASUREMENT FOR CMTS-QE JUNE- 15:
5.3.1 QUARTERLY CUSTOMER SERVICE DELIVERY (CSD) AUDITED DATA FOR CELLULAR MOBILE SERVICES (APRIL – MAY- JUNE- 2015 MONTHS AUDITED DATA):
QUARTERLY CSD DATA FOR CELLULAR MOBILE TELEPHONE SERVICES - QE JUNE 15
Quarterly CSD Audit Data
Ben
ch-
mar
k
Cir
cle
Nam
e
AIR
CE
L
AIR
TE
L
BS
NL
IDE
A
RC
OM
(GS
M)
TA
TA
(GS
M)
QT
L
VO
DA
FO
NE
RC
OM
(CD
MA
)
TA
TA
(CD
MA
)
S/ N
Name of Parameter GSM Operators CDMA Operators
Customer Service Quality Parameters
1
Metering & Billing Credibility -Post Paid
A) No. of bills issued during the quarter
Punjab 28055 1516898 101251 2197959 144467 228026 69862 1341408 136324 70571
B) No. of bills disputed including billing complaints during the quarter
Punjab 0 310 48 1327 124 2 0 2562 110 4
C)% of billing complaints during the quarter
<= 0.1% Punjab 0.00% 0.02% 0.05% 0.06% 0.09% 0.001% 0.00% 0.19% 0.08% 0.01%
2
Metering & Billing Credibility -Pre Paid
A) Total No. of Pre-paid customers at the end of the quarter
Punjab 976211 7139214 3045157 5601263 2058853 2533075 2778830 4471727 178452 282522
B) Total No. of complaints relating to charging, Credit and Validity during the quarter
Punjab 0 141 383 1781 1850 2 29 7816 158 0
C) % of Pre-paid Charging Complaints
<= 0.1% Punjab 0.00% 0.002% 0.01% 0.03% 0.09% 0.00% 0.001% 0.17% 0.09% 0.00%
3
Resolution of Billing/Charging Complaints and Period of applying credit/Waiver/Adjustment to customers account from the date of resolution of complaints
A) No. of Billing/Charging/Credit/Validity Complaints received during the quarter
Punjab 0 451 431 10994 1974 4 29 10378 268 4
B) No. of billing complaints for Post paid customers/Charging/Credit/Validity complaints for pre-paid customers resolved within 4 weeks during the quarter
Punjab 0 451 431 10994 1974 4 29 10378 268 4
C) No. of billing complaints for Post paid customers/Charging/Credit/Validity complaints for pre-paid customers resolved within 6 weeks during the quarter
Punjab 0 451 431 10994 1974 4 29 10378 268 4
D) % of billing complaints (for post paid customer) / Charging /Credit /Validity (for Pre paid customer) resolved within 4 weeks
>=98% within 4 weeks
Punjab 100% 100% 100% 100% 100% 100% 100% 100% 100% 100%
E) % of billing complaints (for post paid customer) / Charging/Credit/Validity (for Pre paid customer) resolved within 6 weeks
100% within 6 weeks
Punjab 100% 100% 100% 100% 100% 100% 100% 100% 100% 100%

AUDIT & ASSESSMENT OF QOS FOR QE-JUNE-2015-PUNJAB CIRCLE
TUV-SUD SOUTH ASIA PRIVATE LIMITED Page 43
QUARTERLY CSD DATA FOR CELLULAR MOBILE TELEPHONE SERVICES - QE JUNE 15
Quarterly CSD Audit Data
Ben
ch-
mar
k
Cir
cle
Nam
e
AIR
CE
L
AIR
TE
L
BS
NL
IDE
A
RC
OM
(GS
M)
TA
TA
(GS
M)
QT
L
VO
DA
FO
NE
RC
OM
(CD
MA
)
TA
TA
(CD
MA
)
S/ N
Name of Parameter GSM Operators CDMA Operators
F) % of Period of applying credit/Waiver/Adjustment to customers account from the date of resolution of complaints
<=1 week
Punjab 100% 100% 100% 100% 100% 100% 100% 100% 100% 100%
4
Response time to customers for assistance
A) Total no of calls attempted to customer care/Call center
Punjab 2958906 2653453 162622 16040342 2522058 487845 574579 1381057 161715 39670
B) Total no. of calls successfully established to customer care/Call center.
Punjab 2900686 2652636 162622 16022627 2484992 484060 574579 1381057 160044 39466
C) % Accessibility of Call centre /customer Care (Total calls successfully established *100/ Total call attempts)
>=95% Punjab 98.03% 99.97% 100% 99.89% 98.53% 99.22% 100% 100% 98.97% 99.49%
D) Total Calls reached to operator for Voice to Voice (Total call attempts)
Punjab 404719 3398212 1211725 3173121 646488 880702 1468427 365226 51265 39757
E) Total number of calls answered by the operator (Voice to voice) within 90 seconds
Punjab 391634 3103933 616785 3155620 613588 868063 1407420 364389 49186 39355
F) % age of calls answered by operator (voice to voice) (Total calls successfully established within 90 Sec.*100 / Total call attempts )
>=95% Punjab 96.77% 91.34% 50.90% 99.45% 94.91% 98.56% 95.85% 99.77% 95.94% 98.99%
5
Termination/closure of service
A) Total No. of requests for Termination / Closure of service received during the quarter
Punjab 171 6667 510 27030 1518 4073 3147 5296 457 1521
B) No. of requests for Termination / Closure of service complied within 7 days during the quarter
Punjab 171 6667 510 27028 1518 4073 3147 5296 457 1521
C) % of Termination/ Closure of service within 7 days
<=7days Punjab 100% 100% 100% 99.99% 100% 100% 100% 100% 100% 100%
6
Time taken for refunds of deposits after closures.
A) No. of Payments/ Refunds due during the quarter
Punjab 166 870 698 5799 390 968 78 12789 584 568
B) No. of Payments/ Refunds Cleared during the quarter
Punjab 166 870 698 5799 390 968 78 11260 584 568
C) Time taken for refunds of deposits after closures.
100% within
60 days Punjab 100% 100% 100% 100% 100% 100% 100% 88.04% 100% 100%
NB: Accessibility of call center / Customer care data of RCOM (GSM & CDMA) are based on average of two months’ data i.e. April & May 15 as June-15
month data was not provided by RCOM (GSM & CDMA) due to TTI server issue.

AUDIT & ASSESSMENT OF QOS FOR QE-JUNE-2015-PUNJAB CIRCLE
TUV-SUD SOUTH ASIA PRIVATE LIMITED Page 44
5.3.2 3 DAYS LIVE CSD AUDITED DATA FOR CELLULAR MOBILE SERVICES (QE - JUNE 2015):
CSD 3 DAYS LIVE DATA FOR CELLULAR MOBILE TELEPHONE SERVICES - QE- JUNE 15
3 days live CSD Audit Data Bench-
mark Circle Name
AIRCEL AIRTEL BSNL IDEA RCOM (GSM)
TATA (GSM)
QTL VODAFONE RCOM
(CDMA) TATA
(CDMA)
S/ N
Name of Parameter
GSM Operators
RESPONSE TIME TO CUSTOMERS FOR ASSISTANCE
1
A) Total no of calls attempted to customer care/Call center
Punjab 143605 56105 5657 597537 NP 15486 20043 362523 NP 1203
B) Total no. of calls successfully established to customer care/Call center.
Punjab 139932 56105 5657 590913 NP 15376 20043 362523 NP 1198
C) % Accessibility of Call centre /customer Care (Total calls successfully established *100/ Total call attempts)
>=95% Punjab 97.44% 100% 100% 98.89% NP 99.29% 100% 100% NP 99.58%
D) Total Calls reached to operator for Voice to Voice (Total call attempts)
Punjab 15079 118540 42559 109606 25521 32717 54290 95131 1934 1252
E) Total number of calls answered by the operator (Voice to voice) within 90 seconds
Punjab 14432 102302 18512 108947 25174 31109 52091 94678 1865 1215
F) % age of calls answered by operator (voice to voice) (Total calls successfully established within 90 Sec.*100 / Total call attempts )
>=95% Punjab 95.71% 86.30% 43.50% 99.40% 98.64% 95.09% 95.95% 99.52% 96.43% 97.04%
NP: RCOM (GSM & CDMA) has not provided data for the parameter “Accessibility of call center / Customer care” due to TTI server issue

AUDIT & ASSESSMENT OF QOS FOR QE-JUNE-2015-PUNJAB CIRCLE
TUV-SUD SOUTH ASIA PRIVATE LIMITED Page 45
KEY FINDINGS: CUSTOMER SERVICE DELIVERY PARAMETERS
1. Metering and billing credibility-(Post paid & Pre-paid) The performance of the service providers with respect to the parameter metering and billing credibility for both post-paid and pre-paid was majorly within the prescribed bench mark of <=0.1 % . Only, Vodafone could not meet the benchmark for billing complaints for both post-paid and pre-paid with its performance as 0.19% and 0.17% respectively.
2. Resolution of Billing complaints and applying credits -
i. Resolution of billing /charging complaints
ii. Period of applying credit/waiver/adjustment to customer’s account from the date of resolution of complaints
All operators were found meeting the benchmarks of the above parameters
3. Response Time to the Customer for assistance
i. Accessibility of call centre/customer care ii. Percentage of calls answered by Operators (Voice to Voice)
All service providers are in compliance with respect to the parameter accessibility of call center. However, Airtel, BSNL and RCOM (GSM) have not met the benchmark of ‘calls answered by Operators (voice to voice) within 90 seconds’ with their performance as 91.34%, 50.90% and 94.91%, against the benchmark of >=95%.
4. Termination/Closure of Service
In case of this parameters also, all service providers (except Idea) have settled the Termination/Closure within the benchmark of 7 days. The performance of Idea was very marginally below the benchmark (99.99%).
5. Time Taken for Refund of deposits after closures Regarding this parameter, all operators (except Vodafone) were found to have complied with the benchmark of 100% refund of deposits within 60 days of closure. Vodafone remained under performed with its performance as 88.04%.
Live Measurements: The results of live measurements revealed that all operators (except Airtel and BSNL) have met the benchmarks for the parameters ‘Accessibility to call center’ and ‘Call connection to operators (Voice to voice) within 90 seconds’. The performance of Airtel and BSNL for parameter ‘calls answered by Operators (voice to voice) within 90 seconds’ was 86.30% and 43.50% respectively.

AUDIT & ASSESSMENT OF QOS FOR QE-JUNE-2015-PUNJAB CIRCLE
TUV-SUD SOUTH ASIA PRIVATE LIMITED Page 46
6. LIVE CALLING ASSESSMENT

AUDIT & ASSESSMENT OF QOS FOR QE-JUNE-2015-PUNJAB CIRCLE
TUV-SUD SOUTH ASIA PRIVATE LIMITED Page 47
6. LIVE CALLING ASSESSMENT:
6.1 INTER OPERATOR CALLS ASSESSMENT: Inter operator call assessment with a sample of 2x50 test calls for each Service provider operating in Punjab service area during the time 1100 to 1400 Hrs and 1600 to 1900 was carried out by TUV auditors. The test calls were made from one operator to another within the same licensed area to judge the ease of connectivity amongst the operators. While doing this exercise, the radio part, the switch part and POI in between the two operators are involved. Congestion in any of these network elements could result in congestion in the network.
INTER OPERATOR CALL ASSESSMENT BASED ON LIVE MEASUREMENT
Cal
ling
Op
erat
ors
Cir
cle
Nam
e
AIR
CE
L
AIR
TE
L
BS
NL
IDE
A
RC
OM
(G
SM
)
TA
TA
(G
SM
)
QT
L
VO
DA
FO
NE
RC
OM
(C
DM
A)
TA
TA
(C
DM
A)
AIRCEL Punjab -- 100% 100% 100% 100% 100% 100% 100% 100% 100%
AIRTEL Punjab 100% -- 100% 100% 100% 100% 100% 100% 100% 100%
BSNL Punjab 100% 100% -- 100% 100% 100% 100% 100% 100% 100%
IDEA Punjab 100% 100% 100% -- 100% 100% 100% 100% 100% 100%
RCOM (GSM) Punjab 100% 100% 100% 100% -- 100% 100% 100% 100% 100%
TATA (GSM) Punjab 100% 100% 100% 100% 100% -- 100% 100% 100% 100%
QTL Punjab 100% 100% 100% 100% 100% 100% -- 100% 100% 100%
VODAFONE Punjab 100% 100% 100% 100% 100% 100% 100% -- 100% 100%
RCOM (CDMA) Punjab 100% 100% 100% 100% 100% 100% 100% 100% -- 100%
TATA (CDMA) Punjab 100% 100% 100% 100% 100% 100% 100% 100% 100% --
The result of the testing revealed that the inter connection performance among the operators was quite satisfactory
as no problem was observed in interconnection from one operator to other operators.

AUDIT & ASSESSMENT OF QOS FOR QE-JUNE-2015-PUNJAB CIRCLE
TUV-SUD SOUTH ASIA PRIVATE LIMITED Page 48
6.2 CUSTOMER CARE / HELPLINE ASSESSMENT:
LIVE CALLING TO CALL CENTRE
Parameter Circle Name
AIRCEL AIRTEL BSNL IDEA RCOM (GSM)
TATA (GSM)
QTL VODAFONE RCOM
(CDMA) TATA
(CDMA)
Total No. of calls Attempted Punjab 100 100 100 100 100 100 100 100 100 100
Total no of calls attempted to customer care/Call center
Punjab 100 100 100 100 100 100 100 100 100 100
Total no. of calls successfully established to customer care/Call center
Punjab 100 100 100 100 100 100 100 100 100 100
% Accessibility of Call centre / customer Care (Total call successfully established *100 / Total call attempt)
Punjab 100% 100% 100% 100% 100% 100% 100% 100% 100% 100%
Total Calls reached to agent desk for Voice to Voice (Total call attempt)
Punjab 100 100 100 100 100 100 100 100 100 100
Total number of calls answered by the operator (Voice to voice) within 90 seconds
Punjab 100 100 96 100 96 100 96 100 98 100
% age of calls answered by operator(voice to voice) (Total call successfully established within 90 Sec.*100 / Total call attempt)
Punjab 100% 100% 96% 100% 96% 100% 96% 100% 98% 100%
In case of calls answered by operators (voice to voice) within 90 seconds when test calls were made to the call centers, BSNL, RCOM (GSM), QTL and RCOM CDMA could achieve their performance as 96%, 96%, 96% and 98% respectively.
6.3 LIVE CALLING ASSESSMENT FOR BILLING COMPLIANTS:
TELEPHONIC INTERVIEW FOR BILLING COMPLAINTS
Parameter Circle Name
AIRCEL AIRTEL BSNL IDEA RCOM (GSM)
TATA (GSM)
QTL VODAFONE RCOM
(CDMA) TATA
(CDMA)
Total No. of calls Attempted
Punjab 0 150 148 151 150 4 29 125 120 4
Total No. of calls Answered
Punjab NA 130 100 100 120 2 10 100 100 1
Resolution of billing Complaints
Punjab NA 130 100 100 120 2 10 100 100 1
% age of cases resolved Punjab NA 100% 100% 100% 100% 100% 100% 100% 100% 100%
NA: Not Applicable
To test the Service Providers performance on billing related complaints and their resolutions, TUV-SUD auditors conducted a customer feedback calling for about random 100 nos. of customers. However, in some cases, the number of customers contacted for verification was very less due to less number of billing complaints. During live calling, some of the customers did not attend the calls, so shortfall was made good by taking other complaints to make verification of 100 Complaints. However, most of the customers reported their satisfaction on resolution of the billing complaints.

AUDIT & ASSESSMENT OF QOS FOR QE-JUNE-2015-PUNJAB CIRCLE
TUV-SUD SOUTH ASIA PRIVATE LIMITED Page 49
6.4 LEVEL -1 CALLING ASSESSMENT:
LEVEL 1 LIVE CALLING
Mo
nth
SS
A N
ame
Nam
e o
f S
DC
A
Em
erg
ency
No
.
No
. of
calls
mad
e
per
op
erat
or
AIR
CE
L
AIR
TE
L
BS
NL
IDE
A
RC
OM
GS
M
RC
OM
CD
MA
TA
TA
CD
MA
TA
TA
GS
M
VID
EO
CO
N
VO
DA
FO
NE
April'15 LUDHIANA
LUDHIANA
100,101,108,102 4,5,4,4 √ √ √ √ √ √ √ √ √ √
1091 4 √ √ √ √ √ √ √ √ √ √
1073 4 √ √ √ √ √ √ √ √ √ √
JAGRAON
100,101,108,102 4,5,4,4 √ √ √ √ √ √ √ √ √ √
1091 4 √ √ √ √ √ √ √ √ √ √
1073 4 √ √ √ √ √ √ √ √ √ √
SAMRALA
100,101,108,102 4,5,4,4 √ √ √ √ √ √ √ √ √ √
1091 4 √ √ √ √ √ √ √ √ √ √
1073 4 √ √ √ √ √ √ √ √ √ √
May'15 ROPAR
ROPAR
100,101,108,102 4,5,4,4 √ √ √ √ √ √ √ √ √ √
1091 4 √ √ √ √ √ √ √ √ √ √
1073 4 √ √ √ √ √ √ √ √ √ √
NANGAL
100,101,108,102 4,5,4,4 √ √ √ √ √ √ √ √ √ √
1091 4 √ √ √ √ √ √ √ √ √ √
1073 4 √ √ √ √ √ √ √ √ √ √
KHARAR
100,101,108,102 4,5,4,4 √ √ √ √ √ √ √ √ √ √
1091 4 √ √ √ √ √ √ √ √ √ √
1073 4 √ √ √ √ √ √ √ √ √ √
√ √ √ √ √ √ √ √ √ √
June'15 CHANDIGARH
MOHALI
100,101,108,102 4,5,4,4 √ √ √ √ √ √ √ √ √ √
1091 4 √ √ √ √ √ √ √ √ √ √
1073 4 √ √ √ √ √ √ √ √ √ √
CHANDIGARH
100,101,108,102 4,5,4,4 √ √ √ √ √ √ √ √ √ √
1091 4 √ √ √ √ √ √ √ √ √ √
1073 4 √ √ √ √ √ √ √ √ √ √
PANCHKULA
100,101,108,102 4,5,4,4 √ √ √ √ √ √ √ √ √ √
1091 4 √ √ √ √ √ √ √ √ √ √
1073 4 √ √ √ √ √ √ √ √ √ √
To assess the availability and efficiency of level 1 services such as police, fire, ambulance (emergency services) offered by various mobile service providers in the SDCAs of three select SSAs, the calls were made from mobile phones provided by the service providers during the drive tests. In these SSA of Punjab service areas, the emergency services as mentioned in the above table were found functional in the networks of all the service providers.

AUDIT & ASSESSMENT OF QOS FOR QE-JUNE-2015-PUNJAB CIRCLE
TUV-SUD SOUTH ASIA PRIVATE LIMITED Page 50
7. DRIVE TEST

AUDIT & ASSESSMENT OF QOS FOR QE-JUNE-2015-PUNJAB CIRCLE
TUV-SUD SOUTH ASIA PRIVATE LIMITED Page 51
7. OPERATOR ASSESTID DRIVE TEST In terms of TRAI’s letter dated 21st January, 2014, the drive tests were conducted for three consecutive days in one
select SSA each month in each service area. Thus, the drive tests were carried out in three SSA’s namely Ludihana,
Ropar and Chandigarh in the months of April, May and June 2015 respectively .The total route Kms covered during
the drive tests in the respective SSAs was 365Kms, 418Kms and 388Kms. The performance of the operators has
been highlighted below in the tables. The drive test was conducted simultaneously for all the operators following the
same route of drive tests. The holding period for all test calls was 120 seconds. The drive test vehicle across all
routes plied at a speed of about 30-50 km per hour.
For measuring voice quality, Rx Qual samples on a scale from 0 to 7 for GSM operators and Frame Error Rate
(FERs) for CDMA service providers were measured. As per the QoS norms, Rx Qual between 0- 5 for GSM
operators and between 0-4% FER value for CDMA operators FERs is considered to be good, where as Rx Qual
beyond this benchmark is considered to be bad. Call drops were measured by the number of calls that were dropped
to the total number of calls established during the drive test. Similarly CSSR was measured as the ratio of total calls
established to the total call attempts made. Signal strength was measured in dBm at street level with strength ≥ -75
dBm for in-door coverage and ≥ -85 dBm for in-vehicle.

AUDIT & ASSESSMENT OF QOS FOR QE-JUNE-2015-PUNJAB CIRCLE
TUV-SUD SOUTH ASIA PRIVATE LIMITED Page 52
DRIVE TEST TABLE – 1
OPERATOR ASSISTED DRIVE TEST AT LUDHIANA SSA IN APRIL 15 MONTH - PUNJAB CIRCLE
S/N
Par
amet
er
Cla
ssif
icat
ion
of
rou
te
cove
red
AIR
CE
L
AIR
TE
L
BS
NL
IDE
A
TA
TA
GS
M
RC
OM
GS
M
VID
EO
CO
N
VO
DA
FO
NE
RC
OM
CD
MA
TA
TA
CD
MA
OU
TD
OO
R
IND
OO
R
OU
TD
OO
R
IND
OO
R
OU
TD
OO
R
IND
OO
R
OU
TD
OO
R
IND
OO
R
OU
TD
OO
R
IND
OO
R
OU
TD
OO
R
IND
OO
R
OU
TD
OO
R
IND
OO
R
OU
TD
OO
R
IND
OO
R
OU
TD
OO
R
IND
OO
R
OU
TD
OO
R
IND
OO
R
1 Call
Attempts
Major Road
152 28 132 26 156 25 141 26 150 27 144 27 107 25 158 25 113 26 100 25
Highway 76 25 84 25 89 25 85 27 96 26 92 26 87 26 77 25 102 25 63 26
Within City
306 25 287 25 380 25 258 26 252 25 292 26 275 27 268 25 308 25 273 25
Overall SSA
534 78 503 76 625 75 484 79 498 78 528 79 469 78 503 75 523 76 436 76
2 Blocked Call Rate
Major Road
0.66% 0.00% 0.00% 0.00% 10.26% 0.00% 2.13% 0.00% 1.33% 0.00% 0.69% 0.00% 0.00% 0.00% 0.00% 0.00% 0.00% 0.00% 0.00% 0.00%
Highway 1.32% 0.00% 0.00% 0.00% 3.37% 0.00% 2.35% 0.00% 2.08% 0.00% 1.09% 0.00% 3.45% 0.00% 0.00% 0.00% 0.00% 0.00% 0.00% 0.00%
Within City
0.33% 0.00% 0.00% 0.00% 8.68% 0.00% 0.39% 0.00% 0.40% 0.00% 0.00% 0.00% 0.36% 0.00% 0.00% 0.00% 0.32% 0.00% 0.00% 0.00%
Overall SSA
0.56% 0.00% 0.00% 0.00% 8.32% 0.00% 1.24% 0.00% 1.00% 0.00% 0.38% 0.00% 0.85% 0.00% 0.00% 0.00% 0.19% 0.00% 0.00% 0.00%
3 Dropped Call Rate (<=2%)
Major Road
0.00% 0.00% 0.00% 0.00% 8.96% 0.00% 0.00% 0.00% 0.00% 0.00% 0.70% 0.00% 0.00% 0.00% 0.00% 0.00% 0.88% 0.00% 0.00% 0.00%
Highway 0.00% 0.00% 0.00% 0.00% 3.66% 0.00% 1.20% 0.00% 0.00% 0.00% 1.10% 0.00% 2.38% 0.00% 0.00% 0.00% 1.96% 0.00% 3.28% 0.00%
Within City
0.33% 0.00% 0.00% 0.00% 2.19% 0.00% 0.00% 0.00% 0.00% 0.00% 0.00% 0.00% 0.00% 0.00% 0.00% 0.00% 0.00% 0.00% 0.00% 0.00%
Overall SSA
0.19% 0.00% 0.00% 0.00% 4.29% 0.00% 0.21% 0.00% 0.00% 0.00% 0.38% 0.00% 0.43% 0.00% 0.00% 0.00% 0.57% 0.00% 0.46% 0.00%
4 Percentage connections with good voice quality (=>95%)

AUDIT & ASSESSMENT OF QOS FOR QE-JUNE-2015-PUNJAB CIRCLE
TUV-SUD SOUTH ASIA PRIVATE LIMITED Page 53
S/N
Par
amet
er
Cla
ssif
icat
ion
of
rou
te
cove
red
AIR
CE
L
AIR
TE
L
BS
NL
IDE
A
TA
TA
GS
M
RC
OM
GS
M
VID
EO
CO
N
VO
DA
FO
NE
RC
OM
CD
MA
TA
TA
CD
MA
OU
TD
OO
R
IND
OO
R
OU
TD
OO
R
IND
OO
R
OU
TD
OO
R
IND
OO
R
OU
TD
OO
R
IND
OO
R
OU
TD
OO
R
IND
OO
R
OU
TD
OO
R
IND
OO
R
OU
TD
OO
R
IND
OO
R
OU
TD
OO
R
IND
OO
R
OU
TD
OO
R
IND
OO
R
OU
TD
OO
R
IND
OO
R
(a) 0-4 (w/o
frequency hopping
for CDMA Operators)
Major Road
NA NA NA NA NA NA NA NA NA NA NA NA NA NA NA NA 97.80% 99.52% 98.36% 99.98%
Highway NA NA NA NA NA NA NA NA NA NA NA NA NA NA NA NA 99.26% 99.97% 97.00% 99.67%
Within City
NA NA NA NA NA NA NA NA NA NA NA NA NA NA NA NA 99.69% 99.97% 98.41% 100%
Overall SSA
NA NA NA NA NA NA NA NA NA NA NA NA NA NA NA NA 99.15% 99.82% 98.21% 99.86%
(b) 0-5 ( with
frequency hopping for GSM
Operators)
Major Road
95.42% 94.28% 97.75% 96.76% 89.96% 99.37% 95.49% 98.39% 92.35% 91.87% 96.92% 99.13% 94.89% 96.28% 97.06% 99.49% NA NA NA NA
Highway 94.02% 98.98% 97.24% 98.46% 86.59% 90.06% 93.77% 97.32% 91.99% 92.82% 95.96% 97.78% 90.35% 95.31% 97.34% 86.83% NA NA NA NA
Within City
94.02% 98.96% 96.34% 99.20% 90.11% 90.13% 96.20% 90.12% 93.65% 92.47% 96.76% 99.97% 94.71% 99.58% 97.38% 98.38% NA NA NA NA
Overall SSA
94.43% 97.45% 96.96% 97.24% 89.50% 92.96% 95.47% 95.48% 92.96% 92.30% 96.67% 98.97% 93.98% 97.12% 97.28% 95.39% NA NA NA NA
5
Service Coverage
In door (>= -
75dBm)
Major Road
47.88% 46.10% 91.89% 99.18% 100% 87.80% 86.69% 99.95% 74.86% 94.45% 65.75% 97.84% 64.53% 89.13% 88.23% 98.45% 62.01% 18.80% 22.10% 46.78%
Highway 53.62% 89.50% 94.14% 100% 100% 100% 79.84% 100% 92.63% 99.09% 69.65% 100% 72.44% 65.09% 90.65% 55.22% 72.41% 25.26% 46.68% 34.40%
Within City
67.11% 80.50% 95.89% 100% 99.87% 100% 95.24% 99.57% 96.13% 99.93% 86.50% 100% 77.81% 99.01% 97.77% 62.12% 85.17% 64.31% 46.14% 17.36%
Overall SSA
59.49% 70.83% 94.27% 99.37% 99.93% 96.31% 89.06% 99.86% 88.94% 97.44% 78.09% 99.25% 73.76% 84.73% 93.80% 73.19% 77.39% 36.19% 39.95% 35.53%
In-vehicle (>= -
85dBm)
Major Road
89.00% 99.50% 99.17% 99.97% 100% 100% 99.61% 100% 94.39% 99.72% 91.06% 100% 94.90% 98.89% 98.33% 100% 82.07% 95.24% 52.17% 94.93%
Highway 92.94% 100% 99.64% 100% 100% 100% 99.45% 100% 99.22% 100% 95.10% 100% 96.25% 98.43% 99.60% 98.57% 93.63% 98.75% 79.65% 99.98%
Within City
96.69% 100% 99.73% 100% 100% 100% 99.80% 100% 99.73% 100% 99.38% 100% 97.89% 100% 99.96% 96.31% 96.35% 98.64% 83.02% 97.43%
Overall SSA
93.89% 99.83% 99.53% 99.97% 100% 100% 99.66% 100% 97.99% 99.88% 96.42% 100% 96.91% 99.13% 99.42% 98.31% 92.38% 97.55% 74.43% 97.62%

AUDIT & ASSESSMENT OF QOS FOR QE-JUNE-2015-PUNJAB CIRCLE
TUV-SUD SOUTH ASIA PRIVATE LIMITED Page 54
S/N
Par
amet
er
Cla
ssif
icat
ion
of
rou
te
cove
red
AIR
CE
L
AIR
TE
L
BS
NL
IDE
A
TA
TA
GS
M
RC
OM
GS
M
VID
EO
CO
N
VO
DA
FO
NE
RC
OM
CD
MA
TA
TA
CD
MA
OU
TD
OO
R
IND
OO
R
OU
TD
OO
R
IND
OO
R
OU
TD
OO
R
IND
OO
R
OU
TD
OO
R
IND
OO
R
OU
TD
OO
R
IND
OO
R
OU
TD
OO
R
IND
OO
R
OU
TD
OO
R
IND
OO
R
OU
TD
OO
R
IND
OO
R
OU
TD
OO
R
IND
OO
R
OU
TD
OO
R
IND
OO
R
Outdoor- in city (>=
- 95dBm)
Major Road
98.30% 99.90% 99.93% 99.99% 100% 100% 99.91% 100% 99.41% 99.96% 99.30% 100% 99.74% 99.65% 100% 100% 99.83% 100% 87.84% 100%
Highway 99.40% 100% 99.97% 100% 100% 100% 99.91% 100% 99.90% 100% 99.47% 100% 99.66% 99.81% 100% 100% 98.28% 100% 97.08% 100%
Within City
99.60% 100% 99.96% 100% 100% 100% 99.93% 100% 99.94% 100% 100% 100% 99.85% 100% 100% 99.99% 99.72% 100% 98.24% 100%
Overall SSA
99.19% 99.97% 99.95% 99.99% 100% 100% 99.92% 100% 99.77% 99.98% 99.72% 100% 99.79% 99.83% 100% 100% 99.52% 100% 95.34% 100%
6
Call Setup Success
Rate (>=95%)
Major Road
99.34% 100% 100% 100% 85.90% 100% 97.87% 100% 98.67% 100% 99.31% 100% 100% 100% 99.37% 100% 100% 100% 100% 100%
Highway 98.68% 100% 100% 100% 92.13% 100% 97.65% 100% 97.92% 100% 98.91% 100% 96.55% 100% 100% 100% 100% 100% 100% 100%
Within City
99.67% 100% 100% 100% 72.11% 100% 99.61% 100% 99.60% 100% 100% 100% 99.64% 100% 99.63% 100% 99.68% 100% 100% 100%
Overall SSA
99.44% 100% 100% 100% 78.40% 100% 98.76% 100% 99.00% 100% 99.62% 100% 99.15% 100% 99.60% 100% 99.81% 100% 100% 100%
7
Hand Over Success
Rate (HOSR)
Major Road
100% 100% 99.41% 100% 97.31% 100% 99.38% 100% 99.57% 100% 99.12% 100% 98.74% 100% 99.19% 100% 100% 100% 100% 100%
Highway 100% 100% 99.26% 100% 94.48% 100% 98.89% 95.24% 95.98% 100% 97.65% 100% 92.75% 100% 99.59% 93.50% 100% 100% 100% 100%
Within City
99.60% 100% 99.03% 100% 98.45% 96.72% 99.60% 100% 95.91% 97.96% 99.44% 100% 97.05% 100% 98.75% 100% 100% 100% 100% 100%
Overall SSA
99.76% 100% 99.15% 100% 97.21% 97.73% 99.41% 98.78% 96.78% 98.99% 99.04% 100% 96.37% 100% 99.03% 95.21% 100% 100% 100% 100%
NA: Not Applicable
The service providers having block call rate more than 3% have been shaded in yellow colour.

AUDIT & ASSESSMENT OF QOS FOR QE-JUNE-2015-PUNJAB CIRCLE
TUV-SUD SOUTH ASIA PRIVATE LIMITED Page 55
DRIVE TEST TABLE – 2
OPERATOR ASSISTED DRIVE TEST AT ROPAR SSA IN MAY 15 MONTH - PUNJAB CIRCLE
S/N
Par
amet
er
Cla
ssif
icat
ion
of
rou
te
cove
red
AIR
CE
L
AIR
TE
L
BS
NL
IDE
A
TA
TA
GS
M
RC
OM
GS
M
VID
EO
CO
N
VO
DA
FO
NE
RC
OM
CD
MA
TA
TA
CD
MA
OU
TD
OO
R
IND
OO
R
OU
TD
OO
R
IND
OO
R
OU
TD
OO
R
IND
OO
R
OU
TD
OO
R
IND
OO
R
OU
TD
OO
R
IND
OO
R
OU
TD
OO
R
IND
OO
R
OU
TD
OO
R
IND
OO
R
OU
TD
OO
R
IND
OO
R
OU
TD
OO
R
IND
OO
R
OU
TD
OO
R
IND
OO
R
1 Call
Attempts
Major Road
145 26 186 25 209 25 214 26 130 25 165 26 73 27 187 26 141 25 34 25
Highway 146 25 119 25 158 26 141 26 140 26 140 26 140 25 151 26 158 26 67 25
Within City
192 25 222 25 198 27 175 27 205 26 218 28 203 25 188 25 219 27 234 25
Overall SSA
483 76 527 75 565 78 530 79 475 77 523 80 416 77 526 77 518 78 335 75
2 Blocked Call Rate
Major Road
1.38% 0.00% 0.00% 0.00% 4.31% 0.00% 1.87% 0.00% 0.77% 0.00% 1.21% 0.00% 0.00% 0.00% 0.00% 0.00% 0.71% 0.00% 0.00% 0.00%
Highway 1.37% 0.00% 0.00% 0.00% 1.90% 3.85% 1.42% 0.00% 0.00% 0.00% 1.43% 0.00% 0.71% 0.00% 0.00% 0.00% 0.00% 0.00% 1.49% 0.00%
Within City
2.60% 0.00% 0.00% 0.00% 1.01% 0.00% 1.14% 0.00% 0.49% 0.00% 0.00% 0.00% 0.49% 0.00% 0.00% 0.00% 0.00% 0.00% 0.43% 0.00%
Overall SSA
1.86% 0.00% 0.00% 0.00% 2.48% 1.28% 1.51% 0.00% 0.42% 0.00% 0.76% 0.00% 0.48% 0.00% 0.00% 0.00% 0.19% 0.00% 0.60% 0.00%
3 Dropped Call Rate (<=2%)
Major Road
0.70% 0.00% 0.00% 0.00% 1.00% 0.00% 0.00% 0.00% 0.00% 0.00% 1.23% 0.00% 0.00% 0.00% 0.00% 0.00% 2.86% 0.00% 0.00% 0.00%
Highway 0.69% 0.00% 0.00% 0.00% 0.65% 0.00% 0.00% 0.00% 0.71% 0.00% 0.00% 0.00% 0.00% 0.00% 0.00% 0.00% 0.00% 0.00% 0.00% 0.00%
Within City
1.60% 0.00% 0.00% 0.00% 0.51% 3.70% 1.73% 0.00% 0.49% 0.00% 0.46% 0.00% 0.00% 0.00% 0.00% 0.00% 0.00% 0.00% 0.43% 0.00%
Overall SSA
1.05% 0.00% 0.00% 0.00% 0.73% 1.30% 0.57% 0.00% 0.42% 0.00% 0.58% 0.00% 0.00% 0.00% 0.00% 0.00% 0.77% 0.00% 0.30% 0.00%
4 Percentage connections with good voice quality (=>95%)

AUDIT & ASSESSMENT OF QOS FOR QE-JUNE-2015-PUNJAB CIRCLE
TUV-SUD SOUTH ASIA PRIVATE LIMITED Page 56
S/N
Par
amet
er
Cla
ssif
icat
ion
of
rou
te
cove
red
AIR
CE
L
AIR
TE
L
BS
NL
IDE
A
TA
TA
GS
M
RC
OM
GS
M
VID
EO
CO
N
VO
DA
FO
NE
RC
OM
CD
MA
TA
TA
CD
MA
OU
TD
OO
R
IND
OO
R
OU
TD
OO
R
IND
OO
R
OU
TD
OO
R
IND
OO
R
OU
TD
OO
R
IND
OO
R
OU
TD
OO
R
IND
OO
R
OU
TD
OO
R
IND
OO
R
OU
TD
OO
R
IND
OO
R
OU
TD
OO
R
IND
OO
R
OU
TD
OO
R
IND
OO
R
OU
TD
OO
R
IND
OO
R
(a) 0-4 (w/o
frequency hopping
for CDMA Operators)
Major Road
NA NA NA NA NA NA NA NA NA NA NA NA NA NA NA NA 94.72% 99.82% 99.64% 100%
Highway NA NA NA NA NA NA NA NA NA NA NA NA NA NA NA NA 98.31% 99.97% 98.98% 100%
Within City
NA NA NA NA NA NA NA NA NA NA NA NA NA NA NA NA 98.85% 98.80% 97.66% 95.28%
Overall SSA
NA NA NA NA NA NA NA NA NA NA NA NA NA NA NA NA 97.63% 99.53% 98.11% 98.43%
(b) 0-5 ( with
frequency hopping for GSM
Operators)
Major Road
95.24% 97.82% 97.42% 99.67% 95.51% 94.58% 93.43% 94.07% 96.50% 86.17% 93.51% 91.23% 97.33% 100% 95.79% 99.55% NA NA NA NA
Highway 94.88% 94.79% 98.16% 99.65% 93.80% 96.41% 96.96% 99.30% 97.19% 98.33% 94.74% 99.02% 96.67% 98.37% 97.58% 99.62% NA NA NA NA
Within City
96.83% 99.01% 97.26% 97.98% 94.92% 80.53% 96.48% 87.19% 97.35% 98.81% 96.43% 89.00% 95.16% 96.80% 98.36% 97.75% NA NA NA NA
Overall SSA
95.80% 97.18% 97.55% 99.24% 94.83% 90.54% 95.42% 92.20% 97.07% 94.16% 95.08% 93.00% 96.05% 98.40% 97.18% 98.96% NA NA NA NA
5
Service Coverage
In door (>= -
75dBm)
Major Road
40.15% 54.20% 65.14% 99.51% 65.94% 93.00% 89.13% 98.70% 26.38% 67.49% 45.69% 54.86% 21.63% 99.99% 68.06% 95.80% 34.11% 4.35% 10.40% 6.57%
Highway 52.85% 4.77% 77.52% 100% 62.49% 97.70% 93.09% 99.95% 40.76% 37.79% 64.40% 98.84% 32.08% 2.81% 83.00% 97.70% 48.68% 80.19% 14.54% 15.70%
Within City
64.62% 87.29% 84.35% 80.06% 69.82% 50.60% 93.94% 93.20% 48.46% 99.45% 75.68% 4.64% 38.47% 4.95% 83.56% 100% 61.82% 0.00% 18.71% 13.83%
Overall SSA
54.07% 48.38% 76.56% 95.50% 66.37% 80.21% 91.80% 96.42% 39.93% 69.60% 63.46% 52.07% 33.36% 36.13% 77.62% 97.84% 50.69% 28.22% 17.08% 11.96%
In-vehicle (>= -
85dBm)
Major Road
74.04% 96.80% 91.05% 100% 94.08% 99.30% 98.40% 99.89% 61.37% 99.18% 75.01% 99.45% 61.06% 100% 88.32% 99.60% 71.99% 63.04% 40.97% 41.15%
Highway 84.85% 98.07% 97.04% 100% 88.00% 100% 98.84% 100% 78.35% 76.21% 87.61% 100% 73.16% 72.93% 98.23% 100% 85.63% 100% 48.30% 63.98%
Within City
94.94% 97.08% 97.59% 99.52% 88.96% 95.90% 99.43% 98.55% 77.74% 100% 95.30% 97.96% 75.77% 73.59% 98.19% 100% 91.86% 21.81% 48.47% 52.81%
Overall SSA
85.92% 97.33% 95.39% 99.90% 90.53% 98.38% 98.85% 99.28% 73.28% 92.21% 87.02% 99.12% 72.31% 82.24% 94.52% 99.87% 84.88% 61.62% 47.67% 52.46%

AUDIT & ASSESSMENT OF QOS FOR QE-JUNE-2015-PUNJAB CIRCLE
TUV-SUD SOUTH ASIA PRIVATE LIMITED Page 57
S/N
Par
amet
er
Cla
ssif
icat
ion
of
rou
te
cove
red
AIR
CE
L
AIR
TE
L
BS
NL
IDE
A
TA
TA
GS
M
RC
OM
GS
M
VID
EO
CO
N
VO
DA
FO
NE
RC
OM
CD
MA
TA
TA
CD
MA
OU
TD
OO
R
IND
OO
R
OU
TD
OO
R
IND
OO
R
OU
TD
OO
R
IND
OO
R
OU
TD
OO
R
IND
OO
R
OU
TD
OO
R
IND
OO
R
OU
TD
OO
R
IND
OO
R
OU
TD
OO
R
IND
OO
R
OU
TD
OO
R
IND
OO
R
OU
TD
OO
R
IND
OO
R
OU
TD
OO
R
IND
OO
R
Outdoor- in city (>=
- 95dBm)
Major Road
96.36% 99.00% 99.19% 100% 99.62% 100% 99.80% 100% 90.23% 99.99% 94.95% 100% 94.49% 100% 98.93% 100% 97.84% 100% 93.82% 97.01%
Highway 97.83% 99.97% 99.80% 100% 97.11% 100% 99.82% 100% 97.51% 99.97% 98.07% 100% 95.80% 99.82% 99.96% 100% 99.83% 100% 92.45% 100%
Within City
99.72% 100% 99.89% 99.96% 98.06% 99.90% 99.88% 99.52% 98.06% 100% 99.72% 100% 95.63% 99.31% 99.97% 100% 99.96% 100% 85.85% 99.71%
Overall SSA
98.19% 99.67% 99.65% 99.99% 98.35% 99.97% 99.83% 99.77% 95.68% 99.99% 97.81% 100% 95.49% 99.71% 99.58% 100% 99.38% 100% 87.91% 98.89%
6
Call Setup Success
Rate (>=95%)
Major Road
98.62% 100% 100% 100% 95.69% 100% 98.13% 100% 99.23% 100% 98.79% 100% 100% 100% 100% 100% 99.29% 100% 100% 100%
Highway 98.63% 100% 100% 100% 97.47% 96.15% 98.58% 100% 100% 100% 98.57% 100% 99.29% 100% 100% 100% 100% 100% 98.51% 100%
Within City
97.40% 100% 100% 100% 98.48% 96.30% 98.86% 100% 99.51% 100% 100% 100% 99.51% 100% 100% 100% 100% 100% 99.57% 100%
Overall SSA
98.14% 100% 100% 100% 97.17% 97.44% 98.49% 100% 99.58% 100% 99.24% 100% 99.52% 100% 100% 100% 99.81% 100% 99.40% 100%
7
Hand Over Success
Rate (HOSR)
Major Road
95.92% 100% 100% 100% 96.21% 100% 100% 100% 96.39% 100% 99.23% 100% 100% 100% 98.74% 100% 100% 100% 100% 100%
Highway 100% 100% 98.96% 100% 99.14% 100% 100% 100% 97.65% 100% 100% 100% 100% 100% 99.30% 100% 100% 100% 100% 100%
Within City
97.81% 100% 99.37% 100% 100% 86.59% 100% 60.00% 99.27% 100% 98.96% 100% 98.80% 100% 100% 100% 100% 100% 100% 100%
Overall SSA
97.90% 100% 99.38% 100% 98.30% 89.00% 100% 90.48% 98.03% 100% 99.34% 100% 99.27% 100% 99.34% 100% 100% 100% 100% 100%
NA: Not Applicable
The service providers having block call rate more than 3% have been shaded in yellow colour.

AUDIT & ASSESSMENT OF QOS FOR QE-JUNE-2015-PUNJAB CIRCLE
TUV-SUD SOUTH ASIA PRIVATE LIMITED Page 58
DRIVE TEST TABLE – 3
OPERATOR ASSISTED DRIVE TEST AT CANDIGARH SSA IN JUNE 15 MONTH - PUNJAB CIRCLE
S/N
Par
amet
er
Cla
ssif
icat
ion
of
rou
te
cove
red
AIR
CE
L
AIR
TE
L
BS
NL
IDE
A
TA
TA
GS
M
RC
OM
GS
M
VID
EO
CO
N
VO
DA
FO
NE
RC
OM
CD
MA
TA
TA
CD
MA
OU
TD
OO
R
IND
OO
R
OU
TD
OO
R
IND
OO
R
OU
TD
OO
R
IND
OO
R
OU
TD
OO
R
IND
OO
R
OU
TD
OO
R
IND
OO
R
OU
TD
OO
R
IND
OO
R
OU
TD
OO
R
IND
OO
R
OU
TD
OO
R
IND
OO
R
OU
TD
OO
R
IND
OO
R
OU
TD
OO
R
IND
OO
R
1 Call
Attempts
Major Road
260 25 256 25 266 26 255 25 259 31 271 27 275 25 271 24 273 25 274 27
Highway 80 31 78 25 82 27 88 26 84 25 93 28 82 25 93 26 92 25 70 25
Within City
213 27 205 25 203 27 209 25 205 25 221 27 214 25 192 25 215 25 198 25
Overall SSA
553 83 539 75 551 80 552 76 548 81 585 82 571 75 556 75 580 75 542 77
2 Blocked Call Rate
Major Road
8.08% 8.00% 0.00% 0.00% 1.50% 0.00% 1.96% 0.00% 0.39% 0.00% 1.85% 0.00% 0.36% 0.00% 0.00% 0.00% 0.00% 0.00% 1.09% 0.00%
Highway 6.25% 16.13% 1.28% 0.00% 0.00% 0.00% 0.00% 0.00% 1.19% 0.00% 1.08% 0.00% 1.22% 0.00% 0.00% 0.00% 1.09% 0.00% 0.00% 0.00%
Within City
6.10% 0.00% 0.00% 0.00% 0.49% 0.00% 1.91% 0.00% 0.49% 0.00% 0.90% 0.00% 0.00% 0.00% 0.00% 0.00% 0.93% 0.00% 0.00% 0.00%
Overall SSA
7.05% 8.43% 0.19% 0.00% 0.91% 0.00% 1.63% 0.00% 0.55% 0.00% 1.37% 0.00% 0.35% 0.00% 0.00% 0.00% 0.52% 0.00% 0.55% 0.00%
3 Dropped Call Rate (<=2%)
Major Road
4.18% 0.00% 0.00% 0.00% 0.39% 0.00% 0.40% 0.00% 0.00% 0.00% 0.00% 0.00% 0.36% 0.00% 0.00% 0.00% 0.37% 0.00% 0.00% 0.00%
Highway 1.33% 0.00% 0.00% 0.00% 0.00% 0.00% 0.00% 0.00% 0.00% 0.00% 0.00% 0.00% 0.00% 0.00% 0.00% 0.00% 1.10% 0.00% 0.00% 0.00%
Within City
1.50% 0.00% 0.00% 0.00% 0.00% 0.00% 0.00% 0.00% 0.49% 0.00% 0.46% 0.00% 0.00% 0.00% 0.00% 0.00% 0.47% 0.00% 0.51% 0.00%
Overall SSA
2.72% 0.00% 0.00% 0.00% 0.19% 0.00% 0.18% 0.00% 0.18% 0.00% 0.17% 0.00% 0.18% 0.00% 0.00% 0.00% 0.52% 0.00% 0.19% 0.00%
4 Percentage connections with good voice quality (=>95%)

AUDIT & ASSESSMENT OF QOS FOR QE-JUNE-2015-PUNJAB CIRCLE
TUV-SUD SOUTH ASIA PRIVATE LIMITED Page 59
S/N
Par
amet
er
Cla
ssif
icat
ion
of
rou
te
cove
red
AIR
CE
L
AIR
TE
L
BS
NL
IDE
A
TA
TA
GS
M
RC
OM
GS
M
VID
EO
CO
N
VO
DA
FO
NE
RC
OM
CD
MA
TA
TA
CD
MA
OU
TD
OO
R
IND
OO
R
OU
TD
OO
R
IND
OO
R
OU
TD
OO
R
IND
OO
R
OU
TD
OO
R
IND
OO
R
OU
TD
OO
R
IND
OO
R
OU
TD
OO
R
IND
OO
R
OU
TD
OO
R
IND
OO
R
OU
TD
OO
R
IND
OO
R
OU
TD
OO
R
IND
OO
R
OU
TD
OO
R
IND
OO
R
(a) 0-4 (w/o
frequency hopping
for CDMA Operators)
Major Road
NA NA NA NA NA NA NA NA NA NA NA NA NA NA NA NA 99.35% 99.94% 99.87% 99.98%
Highway NA NA NA NA NA NA NA NA NA NA NA NA NA NA NA NA 98.02% 99.94% 98.33% 100%
Within City
NA NA NA NA NA NA NA NA NA NA NA NA NA NA NA NA 99.26% 99.91% 99.88% 100%
Overall SSA
NA NA NA NA NA NA NA NA NA NA NA NA NA NA NA NA 99.11% 99.93% 99.67% 99.99%
(b) 0-5 ( with
frequency hopping for GSM
Operators)
Major Road
90.52% 99.77% 95.41% 99.66% 89.02% 99.81% 92.36% 98.93% 91.64% 99.18% 96.45% 99.91% 93.49% 99.80% 94.93% 99.49% NA NA NA NA
Highway 90.79% 97.86% 96.35% 99.64% 89.59% 93.07% 91.19% 96.38% 92.96% 98.56% 95.19% 99.63% 92.83% 96.68% 95.03% 98.75% NA NA NA NA
Within City
92.45% 98.15% 97.65% 99.72% 92.56% 96.49% 94.74% 99.66% 93.77% 98.51% 96.84% 99.71% 95.67% 99.79% 97.13% 99.69% NA NA NA NA
Overall SSA
91.32% 98.53% 96.35% 99.67% 90.43% 96.45% 93.12% 98.29% 92.64% 98.75% 96.41% 99.75% 94.22% 98.76% 95.75% 99.31% NA NA NA NA
5
Service Coverage
In door (>= -
75dBm)
Major Road
72.75% 100% 95.80% 99.84% 79.56% 99.96% 89.67% 91.70% 92.38% 100% 86.88% 100% 53.36% 68.23% 87.24% 100% 80.76% 99.54% 56.00% 73.98%
Highway 77.47% 95.44% 94.43% 99.17% 78.12% 97.47% 78.93% 100% 92.18% 99.70% 81.48% 100% 60.54% 37.99% 91.61% 100% 83.34% 94.14% 45.79% 70.57%
Within City
80.79% 82.23% 97.95% 99.70% 80.82% 100% 86.06% 93.65% 96.34% 99.58% 86.43% 100% 63.74% 95.97% 94.95% 100% 69.41% 100% 55.31% 95.46%
Overall SSA
76.57% 92.25% 96.23% 99.56% 79.76% 99.01% 86.44% 95.19% 93.82% 99.77% 85.89% 100% 58.28% 67.31% 90.68% 100% 76.95% 97.93% 54.38% 79.58%
In-vehicle (>= -
85dBm)
Major Road
94.75% 100% 99.62% 100% 97.76% 100% 98.53% 99.98% 98.66% 100% 99.44% 100% 90.66% 99.77% 98.99% 100% 96.85% 100% 87.83% 82.09%
Highway 96.03% 99.48% 99.51% 99.99% 98.57% 99.73% 97.78% 100% 98.28% 99.93% 99.13% 100% 92.24% 96.13% 99.83% 100% 97.12% 100% 65.36% 97.93%
Within City
96.53% 98.63% 99.86% 99.99% 97.95% 100% 98.19% 100% 99.32% 99.76% 98.82% 100% 93.32% 99.95% 99.94% 100% 95.76% 100% 86.51% 98.72%
Overall SSA
95.63% 99.34% 99.68% 99.99% 97.96% 99.90% 98.27% 99.99% 98.85% 99.91% 99.16% 100% 91.89% 98.62% 99.46% 100% 96.49% 100% 84.35% 92.01%

AUDIT & ASSESSMENT OF QOS FOR QE-JUNE-2015-PUNJAB CIRCLE
TUV-SUD SOUTH ASIA PRIVATE LIMITED Page 60
S/N
Par
amet
er
Cla
ssif
icat
ion
of
rou
te
cove
red
AIR
CE
L
AIR
TE
L
BS
NL
IDE
A
TA
TA
GS
M
RC
OM
GS
M
VID
EO
CO
N
VO
DA
FO
NE
RC
OM
CD
MA
TA
TA
CD
MA
OU
TD
OO
R
IND
OO
R
OU
TD
OO
R
IND
OO
R
OU
TD
OO
R
IND
OO
R
OU
TD
OO
R
IND
OO
R
OU
TD
OO
R
IND
OO
R
OU
TD
OO
R
IND
OO
R
OU
TD
OO
R
IND
OO
R
OU
TD
OO
R
IND
OO
R
OU
TD
OO
R
IND
OO
R
OU
TD
OO
R
IND
OO
R
Outdoor- in city (>=
- 95dBm)
Major Road
99.45% 100% 99.91% 100% 99.98% 100% 99.51% 100% 99.53% 100% 100% 100% 99.45% 100% 100% 100% 100% 100% 97.70% 83.62%
Highway 99.54% 99.97% 99.95% 100% 100% 100% 99.68% 100% 99.60% 99.96% 100% 100% 99.62% 99.99% 100% 100% 100% 100% 95.56% 98.45%
Within City
99.87% 99.99% 99.96% 100% 99.99% 100% 99.53% 100% 99.81% 99.84% 100% 100% 99.50% 100% 100% 100% 100% 100% 98.27% 99.57%
Overall SSA
99.63% 99.99% 99.94% 100% 99.99% 100% 99.55% 100% 99.64% 99.94% 100% 100% 99.49% 100% 100% 100% 100% 100% 97.62% 93.02%
6
Call Setup Success
Rate (>=95%)
Major Road
91.92% 92.00% 100% 100% 96.24% 100% 98.04% 100% 99.61% 100% 98.15% 100% 99.64% 100% 100% 100% 100% 100% 98.91% 100%
Highway 93.75% 83.87% 98.72% 100% 100% 100% 100% 100% 98.81% 100% 98.92% 100% 98.78% 100% 100% 100% 98.91% 100% 100% 100%
Within City
93.90% 100% 100% 100% 99.51% 100% 98.09% 100% 99.51% 100% 99.10% 100% 100% 100% 100% 100% 99.07% 100% 100% 100%
Overall SSA
92.95% 91.57% 99.81% 100% 98.00% 100% 98.37% 100% 99.45% 100% 98.63% 100% 99.65% 100% 100% 100% 99.48% 100% 99.45% 100%
7
Hand Over Success
Rate (HOSR)
Major Road
89.43% 100% 98.15% 100% 95.34% 100% 98.89% 100% 97.08% 100% 99.54% 100% 99.37% 100% 98.64% 100% 100% 100% 100% 100%
Highway 94.34% 100% 97.64% 100% 97.06% 92.31% 100% 100% 88.31% 100% 100% 100% 100% 100% 98.06% 100% 100% 100% 100% 100%
Within City
95.97% 100% 99.56% 100% 95.15% 100% 99.80% 100% 98.91% 100% 99.15% 100% 98.86% 100% 99.22% 100% 100% 100% 100% 100%
Overall SSA
92.32% 100% 98.50% 100% 95.55% 98.67% 99.40% 100% 96.49% 100% 99.44% 100% 99.28% 100% 98.76% 100% 100% 100% 100% 100%
NA: Not Applicable
The service providers having block call rate more than 3% have been shaded in yellow colour.

AUDIT & ASSESSMENT OF QOS FOR QE-JUNE-2015-PUNJAB CIRCLE
TUV-SUD SOUTH ASIA PRIVATE LIMITED Page 61
7.1 DETAIL OF THE ROUTES COVERED DURING THE DRIVE TESTS:
DRIVE TEST TABLE: 4
Name of SSA
Month of
Drive Test
Day 1 Day 2 Day 3
Name of SDCA Covered/Route
KMs Route Covered
Name of SDCA Covered/Route
KMs Route Covered
Name of SDCA
Covered/Route Kms
Route Covered
LUDHIANA Apr-15 LUDHIANA
/130 KMs
Highway- Jawahar Nagar, ITI, Gill road, Industrial area B, Pratap chowk, Industrial estate, Apollo hospital, H.C., Dhandri Kalan, Sahnewal. Major Road- Bharat nagar, Bus stand, Modal town extension, Vishal nagar, Jawadi, SBS nagar, Phullowal, Daad, Baba nand singh nagar, Janda enclave, Dugri, GK vihar, Dhandra, Jameri, Kheri, Hajipur, Jasowal, Alamgir. Within City- Rajiv gandhi colony, Jamalpur, Urban estate-2, Urban estate road, Vardhman, NTS nagar, Transport nagar, Link road, Pratap plaza, Pratap chowk, Nand pur, Gill road, Upkar nagar, Field ganj, Brown road, CMC road, CMC hospital, Dharmpura, Kashmir nagar, Kripal nagar, Sunder nagar, Gandhi nagar, Kailash chowk, Civil lines, Tagore nagar, Habowal kalan, Kirchu nagar, Focal point, Metro road. Indoor: Kalra Hospital Ludhiana
JAGRAON /130 KMs
Highway- Ranjit nagar, Ferozpur road towards Jagroan, Dakha, Mullanpur, Chaukiman. Major Road- Baddowal, Surya enclave, Ramgarh Bhullar, Leela, Bangripura, Sidhwal, Kiri bhumal, Palmgiri bundri, Bharowal kalan, Jwaddi kalan, majeri, Talwandi khurd, Nehru market, Khanjarwal, Sherpur road, Mullanpur, Singla enclave, Platinum city, Pakhowal road. Within City- Ghumar Mandir, Gurudev nagar, Sarafa bazar, Inder nagar, Sunet, BRS nagar, Punjabi bagh, Dasmesh nagar, Golden bagh, Chungi chowk, Main bazar jagraon, Geeta colony, New kartar nagar, Lajpatrai road, Link road, Old & new grain market, College road, Dakha, Grain market, Keshar ganj, Raipur road, Mandi mullanpur, Singla enclave. Indoor: Raja Dhaba Jagraon
SAMRALA /105 KMs
Highway- Samrala chowk, Mundian Hkurd, Jhabowal, Unccnanagli, Kohra, Mangarh, Chotti katni kalan, Neelo, Gulal, Cheetah, Court Complex. Major Road- Khanna road, Katla, Maria nagar, Kullawal, Dhilwan, Bhartala, Swaddi, Kalal majra, Malerkotla road, Deep nagar, Gill chowk, Baba jeet singh nagar, Basant nagar, Cheema chowk, Ramdas nagar, Rassolwan. Within City- Bhrat nagar, Industria area, Machiwada road, Ambedkar colony, Dana mandi, Kang mohalla, Jama road, Modal town, Poorewal tower, New abadi, Nand colony, Azad nagar, Kalia estate, Ram nagar, Narottam nagar, Court complex, Bus stand(khanna), GTB nagar, Book market, Sabji mandi, Gul mohar, Mata rani mohalla, Bank colony, Rupnagar, Purana Bazar, Dev nagar, Krishna nagar, Saheed bhagat singh colony, Basant nagar, Sunder nagar. Indoor: City Tower Mall Khanna

AUDIT & ASSESSMENT OF QOS FOR QE-JUNE-2015-PUNJAB CIRCLE
TUV-SUD SOUTH ASIA PRIVATE LIMITED Page 62
Name of SSA
Month of
Drive Test
Day 1 Day 2 Day 3
Name of SDCA Covered/Route
KMs Route Covered
Name of SDCA Covered/Route
KMs Route Covered
Name of SDCA
Covered/Route Kms
Route Covered
ROPAR May-15 ROPAR/136
KMs
Highway- ITI Ropar, Khwaspura, Malikpur, Ghanauli, Roapr, Asron, Railmajra, Banah Tonsa, Kurali, Charheri, Bannmajra, Solakhian. Major Road- Bela chowk, Shampura, Kherabad, Chaunta, Bela, Chamkor, Pipal majra, Lutheri, Morinda, Dongrali, Chatmali, Kurali. Within City- Gyani Jail singh nagar, Haveli kalan, Dashmesh nagar, Malhotra colony, Ranjeet avenue, Adarsh nagar, Ropar thermal plant, Ghanauli, Nehon, Sun city. Indoor: Sangha Hospital Ropar
NANGAL /152KMs
Highway- Nangal railway road, Bhanupali, Brahmpur, Dher, Ganguwal mour, Anandpur sahib, Kotla, Kiratpur, gardley, Bharatgarh, Sirsa nangal, Ghanauli. Major Road- Swarajmajda ropar, Gadh bagha, Tibba tipparian, Abiana kalan, Sarthali, takhatgarh, Bajrur, Nurpur bedi, Singhpur, Khera, Bhanupali, Sukhsal, Majowal, Naya nangal Within City- Bharbour sahib, Ajouli, Nangal bus stand, Old nangal, Main market, Anandpur sahib, Dashmesh academy, ward no-7, Holicity. Indoor: Tehsil Nangal
KHARAR/152KMs
Highway- Morinda-Kharar highway, Kharar-Kurali highway, Kurali-Kharar-Landran highway. Major Road- Rangeelpur, Mianpur, Bhaddal, Parkhali, Bindrakh, Khizrabad, Sialba, Barandi, Nangal Gharian, Chintgarh, Kurali, Paprali, kainour, Morinda. Within City- Main market Kurali, Modal town, Morinda sugar mill, Morinda main market, Morinda bus stand, Churi road morinda, Kharar bus stand, Sunny enclave, Gilco valley, Badala road, Randhawa road, Shivjot enclave Indoor: Chandigarh Resturant
CHANDIGARH Jun-15 MOHALI / 130
KMs
Highway- Ph 6 to Furniture chowk to Verka chowk to Balongi to North country mall to Ph 7 to Landren to Saneta to Mauli Baidwan. Major Road- Sec-71 to PCL chowk, Bassi theatre, Ph 2, Patiala chowk, Ph 81 , Spice chowk, Mohali village, Ph 6, Ph 2, Kunbra chowk, Ph 11, Mohali club, Sec 68, PCA, Sohna, Dolphin chowk, Ph 4. Within City- Ph 3B1, Ph 4, Ph 2, Ph 5, Ph 3B1, Ph 3B2 to Ph 7, Ph 9, Ph 10, Ph 11, Ph 91A, Sec 68, Sec 69. Indoor: Sindhi Sweet 3b2 Mohali
CHANDIGARH /130 KMs
Highway- Sec 39, Tribune via NH-21, Tribune to ITBT campus, Tribune to Transport chowk, Housing board, MHC Manimajra, Sec-26, Sec-48. Major Road- Sec 49, Sec 7, Sec 52, Punjab Raj Bhawan, Sec 17, Sec 42, PGI, Khudda Lahora, Dhanas, Daddu majra, Sec 38, Sec 67, Sec36. Within City- Sec 35, Sec 34, I/A Ph 2, I/A Ph 1, Sec 28, Sec 27, Sec 22, Sec 16, Sec 15, Sec 11, Sec 10, Sec 9, Sec 8. Indoor: GPO SEC. 17 CHD
PANCHKULA /128 KMs
Highway- Saket to Sec 2, Sec 3, Sec 20. Major Road- Ph 6, Sec 39, Sec 37, Sec 24, Madhya marg, Transport chowk, IT park, sec 4, MMJ, Saket, Sec 20, Sec 14, Sec 16, Sec 5, Sec 2, Sec 4, Secretriate. Within City- Sec 1, Sec 2, Sec 4, Sec 11, Sec 10, Sec 9, Sec 8, Sec 7, Sec 18, Sec 16, Sec 15, Sec 14, I/A Ph 1, Sec 12. Indoor: FCI Sec. 4 Panchkula

AUDIT & ASSESSMENT OF QOS FOR QE-JUNE-2015-PUNJAB CIRCLE
TUV-SUD SOUTH ASIA PRIVATE LIMITED Page 63
7.2 SSA WISE DRIVE TEST OBSERVATION:
DRIVE TEST TABLE: 5
DRIVE TEST OBSERVATION OF LUDHIANA SSA – APRIL 15
S NO Name of SP SDCA
Covered in Day 1
Day 1 Observation SDCA
Covered in Day 2
Day 2 Observation SDCA
Covered in Day 3
Day 3 Observation
1 AIRCEL
Ludhiana
Poor Rx Level and Rx Quality Near Gausala
Road, Alamgir.
Jagraon
Overall Good coverage in Covered SDCA on Day2.
Samrala
Poor Quality Patch Near Samrala Chowk Flyover.
2 AIRTEL
Poor Rx Level and Rx Quality Near Alamgir,Near Civil Line Road,Near Gill
Bulara.
Poor Rx Level and Rx Quality Near Swadi
Kalan,Near Bhunadri,Near Dhotar,Near Dhaka.
Poor Rx Level and Rx Quality Near Near Majri
,Near Latton Joga.
3 BSNL
Poor Rx Level and Rx Quality Near Sanjay Ghandhi Colony,Obc
Dhanchari Kalan,Inbetween Jassowal And Dungra.
Poor Rx Level and Rx Quality Near Village
Mullanpur.
Poor Rx Level and Rx Quality Near Lalkhan,Sec
32,Sanjay Gandhi,Kalaurhkalan,Utal
an.
4 TATA GSM
Poor Rx Level and Rx Quality Near Gill Village
Road,Near Mercedes Benz Showroom,
Poor Rx Level and Rx Quality Near Swadi Kalan
Road
Poor Rx Level and Rx Quality Near Mudian
Kalan Chandigarh Road
5 TATA CDMA Overall Good coverage in Covered SDCA on Day1.
Poor Rx Level and Rx Quality Sidhwan Bet
Bundri Road,Hambran Bhundri Road,Agwar Pona
Link Road.
Poor Rx Level and Rx Quality Malerkotla Road.
6 IDEA
Poor Rx Level and Rx Quality Near Gill
Village,Alamgir To Kheri Chameri,Malerkotla Road.
Poor Rx Level and Rx Quality Near Pakhowal
Road, Near Mansuran.
Poor Rx Level and Rx Quality Near Jarg Road,
Khanna.
7 RCOM GSM
Poor Rx Level and Rx Quality Near Ardhman ,
Chd Road,Textile Colony.
Poor Rx Level and Rx Quality Near Sidhwan To Bhunri Road,Jagraon To Mullanpur Road,Mohi To
Jodhan Road.
Poor Rx Level and Rx Quality Near Khanna To Samrala Road,Industrial
Area Khanna.
8 RCOM CDMA Overall Good coverage in Covered SDCA on Day1.
Poor Rx Level and Rx Quality Near Jagraon
Bypass,Jodhan Village.
Poor Rx Level and Rx Quality Near Katani
Kalan.
9 QTL
Poor Rx Level and Rx Quality Near Akalgarh
Away From Site,Manakwal,Ranian,Him
ayunpura,Alamgir .
Poor Rx Level and Rx Quality Near
Bangsipura,Raqba.
Poor Rx Level and Rx Quality Near Chak Sarwan Nath,Utala.
10 VODAFONE
Poor Rx Level and Rx Quality Near Alamgir To
Kheri
Poor Rx Quality in Jagraon SDCA.
Poor Rx Quality in Samrala SDCA.

AUDIT & ASSESSMENT OF QOS FOR QE-JUNE-2015-PUNJAB CIRCLE
TUV-SUD SOUTH ASIA PRIVATE LIMITED Page 64
DRIVE TEST TABLE: 6
DRIVE TEST OBSERVATION OF ROPAR SSA – MAY 15
S NO Name of SP SDCA
Covered in Day 1
Day 1 Observation SDCA
Covered in Day 2
Day 2 Observation SDCA
Covered in Day 3
Day 3 Observation
1 AIRCEL
Ropar
Poor Rx Level And Rx Quality Near Bela Road,Poor Rx
Quality Near Vill Behdala On Ropar Kurali Road,Poor Rx Quality At Morinda To Kurali
Road.
Nangal
Poor Rx Level And Rx Quality Near Vill Abiana
Kalan
Kharar
Poor Rx Level And Rx Quality Near Vill Purkhali,Poor
Coverage Near Iet Bhaddal College
2 AIRTEL
Poor Rx Level And Rx Quality Near
Asron,Ghanauli,Lutheri,Kurali& Marinda
Poor Rx Level And Rx Quality Near
Kiratpur,Bajrur.
Poor Rx Level And Rx Quality Near Kotla,Gharuan.
3 BSNL Poor Rx Level And Rx Quality
Near Morinda Donghrali.
Poor Rx Level And Rx Quality Near
Takhatgarh,Near Kiratpur.
Poor Rx Level And Rx Quality Near Kurali And Kharar
Road,Kurali Ludhiana Road.
4 TATA GSM Poor Rx Level and Rx Quality Near Kurali To Singh Road.
They have coverage Only In SDCA's & Major Towns with Poor Level and Quality at Outers.
They have coverage Only In SDCA's & Major Towns with
Poor Level and Quality at Outers.
5 TATA CDMA Poor Rx Level And Rx Quality
Near Side Foot Bridge Ropar,Near Govt. College
Poor Rx Level And Rx Quality Near Adda
Market Nangal,Bharthla Road,Phagwara-Nangal
Express Highway,Gharuan Road
Poor Rx Level And Rx Quality Near Inbetween Kurali And
Kharar.
6 IDEA Poor Rx Level And Rx Quality
Near Bela-Chamkaur Sahib,Ropar-Bela Road.
Poor Rx Level And Rx Quality Near Naya
Nangal
Poor Rx Level and Rx Quality Near Kurali anf Baraudi.
7 RCOM GSM Poor Rx Level and Rx Quality
Near Ropar to Kiratpur Highway.
Poor Rx Level And Rx Quality Near Ropar -
Anandpur Sahib Road,Nurpur Bedi -
Takhtgarh Road.
Overall Good Rx Quality in Covered SDCA.
8 RCOM CDMA
They have coverage Only In SDCA's & Major Towns with
Poor Level and Quality at Outers.
They have coverage Only In SDCA's & Major Towns with Poor Level and Quality at Outers.
They have coverage Only In SDCA's & Major Towns with
Poor Level and Quality at Outers.
9 QTL Poor Rx Level And Rx Quality
Near Jamiatgarh,Rail ,Jatana,Neho,Ahemdpur.
Poor Rx Level And Rx Quality Near
Bhabhaur,Behlu,Lang Majri,Mataur,Chotti
Jhakhian.
Poor Rx Level And Rx Quality Near
Bheora,Mianpur,Harnampur ,Mundhon Bagh Singh Away From Site,Padiala,Railway
Colony, Morinda,Dau Majra.
10 VODAFONE Poor Rx Level And Rx Quality
Near Bella Road.
Poor Rx Level and Rx Quality Near Nurpur
Bedi.
Overall Good Rx Quality and Rx Level in Covered SDCA on
Day3.

AUDIT & ASSESSMENT OF QOS FOR QE-JUNE-2015-PUNJAB CIRCLE
TUV-SUD SOUTH ASIA PRIVATE LIMITED Page 65
DRIVE TEST TABLE: 7
DRIVE TEST OBSERVATION OF CHANDIGARH SSA – JUNE 15
S. NO Name of SP SDCA
Covered in Day 1
Day 1 Observation SDCA
Covered in Day 2
Day 2 Observation SDCA
Covered in Day 3
Day 3 Observation
1 AIRCEL
Mohali
Poor Rx Level and Rx Quality Near Mohali-Landra
Road,Poor Rx Qualitynear Imperial Hotel,Poor Quality Near Sector 57 Chowk,Poor
Quality Near Vill Baidwan,Poor Quality Patch At Sector 68 Chowk On Sukhna
Path Road.
Chandigarh
Poor Rx Level and Rx Quality Near Road Kissan
Bhawan To Isbt-17,Poor Rx Quality Near Hotel City
Edgesec 32 , Poor Quality Near Sector 11/15 Chownk/
Panchkula
Poor Rx Level and Rx Quality Near Baltana Village And Baltana- Industrial Area Road,Poor Quality At
Madhya Marg Near Sector9 Panchkula.
2 AIRTEL Poor Rx Level and Rx Quality
Near Ph. 8 Mohali,Landren,Kambali
Poor Rx Level and Rx Quality Near Ph.6
Mohali,Sec. 45,Sec 46.
Poor Rx Level and Rx Quality Near Sec 38 Chd,Sec 12
Pkl,Sec 6 Pkl.
3 BSNL
Poor Rx Level and Rx Quality Near Near Saneta,Near Pca
Stadium,Near Dolphin Chowk,Near Sec 66 Mohali.
Poor Rx Level and Rx Quality Near Punjab Raj
Bhawan,Near Sec 50,51,45,46.
Poor Rx Level and Rx Quality Near Surajpur,Near Sec 5 And
Sec6 Dividing Road.
4 TATA GSM
Poor Rx Level and Rx Quality Near Furniture Mkt,Ind Area
Phase-8,Puncom Chowk,Niper.
Poor Rx Level and Rx Quality Near Manimajra, Near Sec-6,Near Sec-
15,Near Sec-21.
Poor Rx Level and Rx Quality Near Panchkula Lights,Near
Sec-44,Near Sec-20.
5 TATA CDMA Poor Rx Level and Rx Quality
Near Pearl City,Electricity Board Colony Mohali.
Poor Rx Level and Rx Quality Near Chandigarh
Travel View, Dakshin Marg.
Poor Rx Level and Rx Quality Near Sector-9 Panchkula,Rally
Village Panchkula.
6 IDEA
Poor Rx Level and Rx Quality Near Vill Sohana Outer Road,
Vill Mauli_Baidwan To Vill Saneta,Yps Chownk To Phase 7,Mohali,Ptl Chownk To Phase
2,Mohali.
Poor Rx Level and Rx Quality Near Sec 45 To Sec
32,Chandigarh,Sec 51,Chandigarh,Hallo Majra
To Vill Raipur Khurd,Punjab University To Sec 11,Chandigarh.
Poor Rx Level and Rx Quality Near Sector 17 To Urja
Bhawan,Panchkula,Sec 10 To Sec 21,Panchkula.
7 RCOM GSM
Poor Rx Level and Rx Quality Near Mcn Chd,Quark City
Mohali,22Bs Mohali,Sec 67 Mkt,Sec71,Sec 69.
Poor Rx Level and Rx Quality Near Sector 27,
Hallomajra. No Quality Patch
8 RCOM CDMA Poor Rx Level and Rx Quality
Near Shahimajra, Sector 69,Raipur Kalan.
Poor Rx Level and Rx Quality Near Sector 35, Ramdarvar,Hallomajra.
Poor Rx Level and Rx Quality Near Setor 39,40,24,Sector 7 Pkl,Sec 2 Pkl, 17-B,Ind. Area
Ph 2Pkl.
9 QTL
Poor Rx Level and Rx Quality Near Sec-70 :- Near Ivy
Hospital, Phase 6 -Sec-39 In-Between Road ,Kumbra Rd,Raipur Khurd Outer.
Poor Rx Level and Rx Quality Near Sec-25,Sec-4
,Sec-8C,Near Sec-26.
Poor Rx Level and Rx Quality Near Sec-39;Chd,Sec-15, Pkl.
10 VODAFONE Poor Rx Level and Rx Quality Near Phase 9, Near Sec 70
Overall Good coverage in Covered SDCA on Day2.
Overall Good coverage in Covered SDCA on Day3.

AUDIT & ASSESSMENT OF QOS FOR QE-JUNE-2015-PUNJAB CIRCLE
TUV-SUD SOUTH ASIA PRIVATE LIMITED Page 66
DRIVE TEST TABLE: 8
NO NETWORK COVERAGE STATUS OF DRIVE TEST – APRIL TO JUNE 15
S. No Month
of Drive Test
Name of Operators SSA SDCA No Coverage Area ICR Status
1 APRIL'15
AIRTEL
LUDHIANA LUDHIANA, JAGARON, SAMRALA
No Coverage Issue No
VODAFONE No Coverage Issue No
IDEA No Coverage Issue No
AIRCEL No Coverage Issue No
RELIANCE GSM
Near Village Dad, Katani kalan, Mohanpur, Ramgarh Leelan to Outter
Sidhwan Khas , Bharowal kalan to Khanjarwal village
ICR on Tata GSM
RELIANCE CDMA
Kheri Bila to Pippanwala, Pandori Mullanpur to Outer Jagraon, Ramgarh
to Outer Mullanpur, Outer Mohin to Outer Jodhan, Dhilawan to Kalal Majra, Khanna to Samrala road,
Samrala to Machiwada road.
No
BSNL No Coverage Issue No
TATA GSM Samrala to Kalal Majra/Ikolaha to Isru ICR on Aircel (Whole Ludhiana)
TATA CDMA
G.K Vihar, Kheri, Jhemari, Himanyupura, Jasowal, Dhandra,
R.K Resort near Ludhiana, Shubam Resort near Ludhiana, Drea villee, Bhanupur, Haveli, Dakha, Rajat
Resort, Gurra, Chakumaan, Sidhwan Khurd, Sohian, Pona, Ramgarh Bhullar, Sherpur Kalan, Leela,
Bhainirayia, Bhundri, Bharowal Kalan, Swaddi Kalan, Majri, Khanjarwal,
Mullanpur, Hissowal, Mohi, Kandur, Ratan, Jodhan, Lattan Kalan, Ucha Mangli, Jhandli, Kohara, Mongarh,
Heera, Chti Katani Kalan, Katani Kalan, Gulal, Rohla, Madpur,
Chahlal, Court Complex Samrala, Samarpur, Maria Ngr, Dhilwa, Bharthala, Salaudi, Kalal Majri
Khanna, Lalheri, Majri, Rasoolra, Ikolaha
No
VIDEOCON
Sidwah bet Outer to Bhundri, Sidhwan bet outer to bangsipura, Ldh Outer to Baddowal, Jagroan Outer to Ramgarh Bhullar, Mullanpur Outer to Hisowal,
Vill Rattan to Khandoor, Utalan to Bhardala vill.
No

AUDIT & ASSESSMENT OF QOS FOR QE-JUNE-2015-PUNJAB CIRCLE
TUV-SUD SOUTH ASIA PRIVATE LIMITED Page 67
S. No Month
of Drive Test
Name of Operators SSA SDCA No Coverage Area ICR Status
2 MAY'15
AIRTEL
ROPAR ROPAR,
NANGAL, KHARAR
No Coverage Issue No
VODAFONE No Coverage Issue No
IDEA No Coverage Issue No
AIRCEL
No Coverage at Bela Road Ropar and from Outer Chamkaur to Morinda
Road, No network between Nurpur Bedi - Nangran Kamlot , , No
Network between Rangilpur to vill Bhaddal.
ICR with Tata GSM
RELIANCE GSM
Bela road, Budha Bhoera to Chaunta Kalan, Binder to Abiana, Singhpur to Alar village, Naya Nangal, Outskirts Anandpur Sahib, Outskirts Nehon,
Before kalgarh Village, Puprali Village, Morinda to Ghroaon, Nurpur bedi -
Ropar road, Nurpur bedi road, Gosian Village, Manakpura - Kurali highway,
Morinda to Gharona road.
No
RELIANCE CDMA
Budha Bhoera to outer Chamkor Sahib, Slaimpur to outer Morinda, Village
Bhinder to Takhatgarh, Pachranda to Alar, Near Petrol pump to wards
Rampur to Fatehgarh, Manakpur.
No
BSNL No Coverage Issue No
TATA GSM
Therabad, Jhullain Khurd, Kamalpur, Ujjafat, Khalla, Pipal Majra, Kukri Khera, Lutheri, Chaklan, Chotti
Ronni, Garh Dollian, Hathala, Khudh, Buthler, Tibra tapdiya, Khatana,
Haripur, Abiana Kalan, GopalNagar, Majra Pandtian, Bahana, Basti Kamal,
Mianpur, Balamgarh, Panjola, Pukhrali
No
TATA CDMA
Therabad, Jhullin Khurd, Kamalpur, Sulaman Sukan, Khalla, Pipal Majra, Lutheri, Chaklan, Cheema Boilers, Chatmali, Singh, Sarahnan, Asron,
Railmajra, Tonsa, Banna Tonsa, Majra Jattan, Bela, Banah, Kathgarh,
Raipur, Bhanopal, Nangli Upper, Dhane, Dher, Surewal, Mangewal,
Ganguwal, Lang Majri, Jhingri, Baddal, Mithagar, Kotla Salman, Gajjpur, Gardal, Upparla Banga, Gazipur, Bhaowal, Bharatgarh,
Abiana, Binder Nagar, Garh Dollina, Khud Buthlar, Khatana, Haripur,
Takhat Garh, Gopalpur, Singhpur, Manku Majra, Jhajj, Dumewal,
Nangran, Passiwal, Bhallari, Kulgarh, Gohlari, Bela Dhiani, Mojowa, Naya
No

AUDIT & ASSESSMENT OF QOS FOR QE-JUNE-2015-PUNJAB CIRCLE
TUV-SUD SOUTH ASIA PRIVATE LIMITED Page 68
S. No Month
of Drive Test
Name of Operators SSA SDCA No Coverage Area ICR Status
Nangal, Rangeelpur, Mianpur, Balmgarh, Panjoli, Bhaddal, Rampur, Pukhroli, Hirdapur Kheri, Bindhrakh,
Khera, Baraudi, Padiala, Doaba College, Saharaun, Pavrali, Kainor,
Chatmala, Gharaun, Radiala
VIDEOCON
Khairabad to bela outer, Malikpur to Ahmedpur, Pipal Majra to Kanjla,
Kishanpur to Dhianpur, Nurpur kalan outer to Nangal outer, Mataur to
Kiratpur Sahib outer, Himatpur to inderpura, Mianpur to Harnampur,
Khera to sialba, Kakrali to Saheri.
No
3 June'15
AIRTEL
CHANDIGARH CHANDIGARH
No Coverage Issue No
VODAFONE No Coverage Issue No
IDEA No Coverage Issue No
AIRCEL No Coverage Issue ICR on Tata GSM
RELIANCE GSM Sector 80, Sector 9. ICR on Tata GSM
RELIANCE CDMA No Coverage Issue No
BSNL No Coverage Issue No
TATA GSM Landra towards Banur No
TATA CDMA Maujpur, EMAAR MGF, Pearl
City(Landra to banur Road)
ICR on RCOM CDMA {Whole Chandigarh SSA (Chandigarh /
Panchkula /Mohali)}
VIDEOCON
From vill Raipur kalan to Vill Saneta to Vill Dhurali, Sec 51 housing board, Sec
50, Near Burail Jail.
No
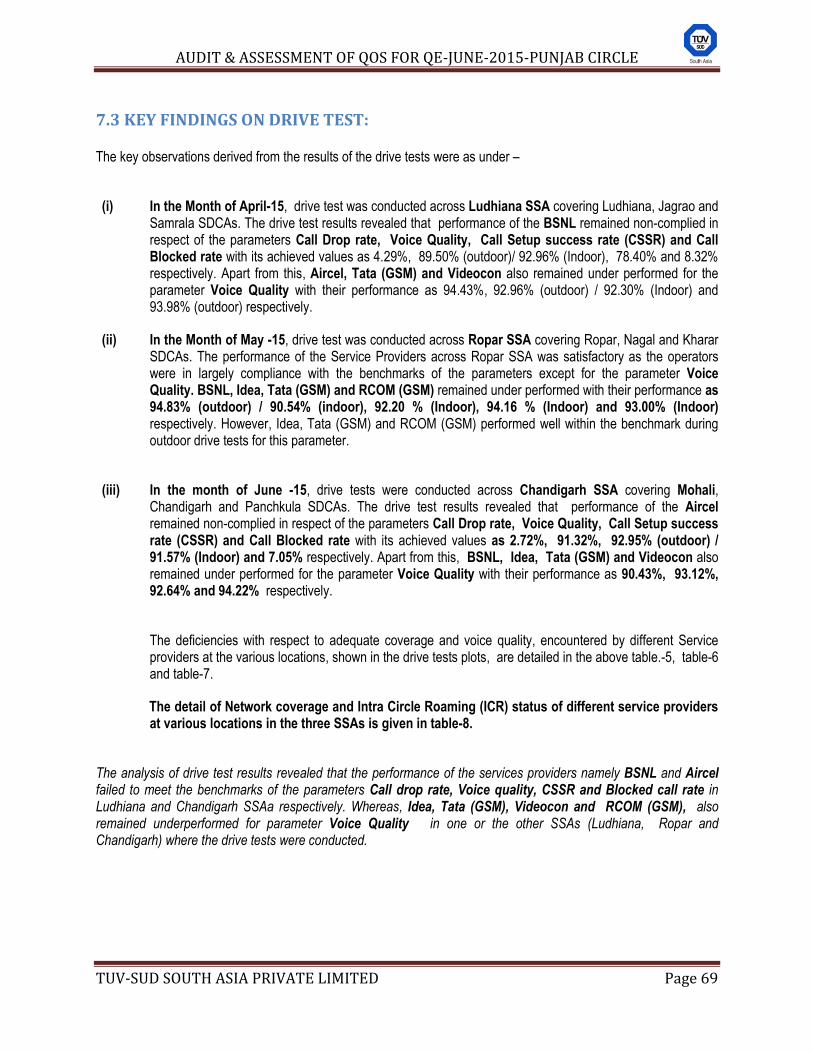
AUDIT & ASSESSMENT OF QOS FOR QE-JUNE-2015-PUNJAB CIRCLE
TUV-SUD SOUTH ASIA PRIVATE LIMITED Page 69
7.3 KEY FINDINGS ON DRIVE TEST: The key observations derived from the results of the drive tests were as under –
(i) In the Month of April-15, drive test was conducted across Ludhiana SSA covering Ludhiana, Jagrao and Samrala SDCAs. The drive test results revealed that performance of the BSNL remained non-complied in respect of the parameters Call Drop rate, Voice Quality, Call Setup success rate (CSSR) and Call Blocked rate with its achieved values as 4.29%, 89.50% (outdoor)/ 92.96% (Indoor), 78.40% and 8.32% respectively. Apart from this, Aircel, Tata (GSM) and Videocon also remained under performed for the parameter Voice Quality with their performance as 94.43%, 92.96% (outdoor) / 92.30% (Indoor) and 93.98% (outdoor) respectively.
(ii) In the Month of May -15, drive test was conducted across Ropar SSA covering Ropar, Nagal and Kharar SDCAs. The performance of the Service Providers across Ropar SSA was satisfactory as the operators were in largely compliance with the benchmarks of the parameters except for the parameter Voice Quality. BSNL, Idea, Tata (GSM) and RCOM (GSM) remained under performed with their performance as 94.83% (outdoor) / 90.54% (indoor), 92.20 % (Indoor), 94.16 % (Indoor) and 93.00% (Indoor) respectively. However, Idea, Tata (GSM) and RCOM (GSM) performed well within the benchmark during outdoor drive tests for this parameter.
(iii) In the month of June -15, drive tests were conducted across Chandigarh SSA covering Mohali, Chandigarh and Panchkula SDCAs. The drive test results revealed that performance of the Aircel remained non-complied in respect of the parameters Call Drop rate, Voice Quality, Call Setup success rate (CSSR) and Call Blocked rate with its achieved values as 2.72%, 91.32%, 92.95% (outdoor) / 91.57% (Indoor) and 7.05% respectively. Apart from this, BSNL, Idea, Tata (GSM) and Videocon also remained under performed for the parameter Voice Quality with their performance as 90.43%, 93.12%, 92.64% and 94.22% respectively.
The deficiencies with respect to adequate coverage and voice quality, encountered by different Service providers at the various locations, shown in the drive tests plots, are detailed in the above table.-5, table-6 and table-7.
The detail of Network coverage and Intra Circle Roaming (ICR) status of different service providers at various locations in the three SSAs is given in table-8.
The analysis of drive test results revealed that the performance of the services providers namely BSNL and Aircel failed to meet the benchmarks of the parameters Call drop rate, Voice quality, CSSR and Blocked call rate in Ludhiana and Chandigarh SSAa respectively. Whereas, Idea, Tata (GSM), Videocon and RCOM (GSM), also remained underperformed for parameter Voice Quality in one or the other SSAs (Ludhiana, Ropar and Chandigarh) where the drive tests were conducted.

AUDIT & ASSESSMENT OF QOS FOR QE-JUNE-2015-PUNJAB CIRCLE
TUV-SUD SOUTH ASIA PRIVATE LIMITED Page 70
8. GRAPHICAL REPRESENTATION (CELLULAR MOBILE SERVICE PROVIDERS)
AVERAGED QUARTERLY PMR
V/S
AVERAGED QUARTERLY 3-DAYs LIVE MEASURMENT

AUDIT & ASSESSMENT OF QOS FOR QE-JUNE-2015-PUNJAB CIRCLE
TUV-SUD SOUTH ASIA PRIVATE LIMITED Page 71
8. GRAPHICAL REPRESENTATION (CMTS):
Graphical Representation of Performance of the Cellular Mobile Service Providers (PMR) V/S 3-Days Live Measurement (Quarterly Average Data):
I. BTS ACCUMULATED DOWNTIME:
All operators are meeting the benchmarks.
II. WORST AFFECTED BTSS DUE TO DOWNTIME :
All operators are meeting the benchmarks.
AIRCEL AIRTEL BSNL IDEA RCOM GSM
TATA GSM
QTL VODAF
ONE RCOM CDMA
TATA CDMA
Quarterly PMR 0.14% 0.06% 0.64% 0.05% 0.16% 0.06% 0.11% 0.04% 0.16% 0.05%
Quarterly Live 0.17% 0.02% 0.89% 0.05% 0.19% 0.14% 0.13% 0.02% 0.20% 0.08%
Benchmark 2% 2% 2% 2% 2% 2% 2% 2% 2% 2%
0.00%
0.50%
1.00%
1.50%
2.00%
2.50%
BTS Accumulated Downtime
AIRCEL AIRTEL BSNL IDEA RCOM GSM
TATA GSM
QTL VODAF
ONE RCOM CDMA
TATA CDMA
Quarterly PMR 0.22% 0.03% 1.93% 0.05% 0.26% 0.10% 0.27% 0.01% 0.11% 0.25%
Quarterly Live 0.00% 0.00% 0.54% 0.00% 0.00% 0.04% 0.00% 0.00% 0.00% 0.00%
Benchmark 2% 2% 2% 2% 2% 2% 2% 2% 2% 2%
0.00%
0.50%
1.00%
1.50%
2.00%
2.50%
Worst affected BTSs due to downtime

AUDIT & ASSESSMENT OF QOS FOR QE-JUNE-2015-PUNJAB CIRCLE
TUV-SUD SOUTH ASIA PRIVATE LIMITED Page 72
III. CALL SETUP SUCCESS RATE :
All operators are meeting the benchmarks.
IV. SDCCH/PAGING CHANNEL CONGESTION
All operators are meeting the benchmarks.
AIRCEL AIRTEL BSNL IDEA RCOM GSM
TATA GSM
QTL VODAF
ONE RCOM CDMA
TATA CDMA
Quarterly PMR 98.15% 99.49% 97.23% 98.84% 99.65% 99.01% 98.35% 99.86% 98.68% 98.75%
Quarterly Live 98.16% 99.47% 97.21% 98.91% 99.64% 99.08% 98.48% 99.85% 98.78% 98.83%
Benchmark 95% 95% 95% 95% 95% 95% 95% 95% 95% 95%
92.00%
93.00%
94.00%
95.00%
96.00%
97.00%
98.00%
99.00%
100.00%
101.00%
Call Setup Success Rate
AIRCEL AIRTEL BSNL IDEA RCOM GSM
TATA GSM
QTL VODAF
ONE RCOM CDMA
TATA CDMA
Quarterly PMR 0.17% 0.09% 0.88% 0.07% 0.01% 0.02% 0.07% 0.02% 0.00% 0.00%
Quarterly Live 0.12% 0.12% 0.79% 0.08% 0.02% 0.01% 0.04% 0.02% 0.00% 0.00%
Benchmark 1% 1% 1% 1% 1% 1% 1% 1% 1% 1%
0.00%
0.20%
0.40%
0.60%
0.80%
1.00%
1.20%
SDCCH/PAGING Channel Congestion

AUDIT & ASSESSMENT OF QOS FOR QE-JUNE-2015-PUNJAB CIRCLE
TUV-SUD SOUTH ASIA PRIVATE LIMITED Page 73
V. TCH CONGESTION :
All operators are meeting the benchmarks.
VI. CALL DROP RATE :
All operators are meeting the benchmarks.
AIRCEL AIRTEL BSNL IDEA RCOM GSM
TATA GSM
QTL VODAF
ONE RCOM CDMA
TATA CDMA
Quarterly PMR 1.02% 0.07% 0.98% 0.16% 0.03% 0.14% 0.29% 0.14% 0.00% 0.08%
Quarterly Live 0.93% 0.08% 1.05% 0.20% 0.03% 0.12% 0.22% 0.15% 0.00% 0.05%
Benchmark 2% 2% 2% 2% 2% 2% 2% 2% 2% 2%
0.00%
0.50%
1.00%
1.50%
2.00%
2.50%
TCH Congestion
AIRCEL AIRTEL BSNL IDEA RCOM GSM
TATA GSM
QTL VODAF
ONE RCOM CDMA
TATA CDMA
Quarterly PMR 0.60% 0.30% 1.61% 0.47% 0.20% 0.63% 0.75% 0.51% 0.06% 0.40%
Quarterly Live 0.61% 0.30% 1.57% 0.48% 0.20% 0.59% 0.72% 0.52% 0.04% 0.40%
Benchmark 2% 2% 2% 2% 2% 2% 2% 2% 2% 2%
0.00%
0.50%
1.00%
1.50%
2.00%
2.50%
Call Drop Rate

AUDIT & ASSESSMENT OF QOS FOR QE-JUNE-2015-PUNJAB CIRCLE
TUV-SUD SOUTH ASIA PRIVATE LIMITED Page 74
VII. WORST AFFECTED CELLS>3% TCH DROP:
BSNL, Tata (GSM) and Tata (CDMA) could not meet the benchmark.
VIII. PERCENTAGE OF CONNECTIONS WITH GOOD VOICE QUALITY:
All operators are meeting the benchmarks.
AIRCEL AIRTEL BSNL IDEA RCOM GSM
TATA GSM
QTL VODAF
ONE RCOM CDMA
TATA CDMA
Quarterly PMR 2.83% 0.64% 17.91% 0.39% 0.06% 4.10% 0.86% 2.08% 0.27% 5.93%
Quarterly Live 2.81% 0.61% 17.82% 0.42% 0.00% 3.98% 0.80% 2.07% 0.17% 5.77%
Benchmark 3% 3% 3% 3% 3% 3% 3% 3% 3% 3%
0.00%
2.00%
4.00%
6.00%
8.00%
10.00%
12.00%
14.00%
16.00%
18.00%
20.00%
Worst affected cells>3% TCH drop
AIRCEL AIRTEL BSNL IDEA RCOM GSM
TATA GSM
QTL VODAF
ONE RCOM CDMA
TATA CDMA
Quarterly PMR 97.27% 98.71% 95.67% 98.15% 99.04% 97.37% 96.60% 98.07% 99.71% 99.07%
Quarterly Live 97.35% 98.72% 95.80% 98.13% 99.00% 97.40% 96.80% 98.07% 99.72% 99.07%
Benchmark 95% 95% 95% 95% 95% 95% 95% 95% 95% 95%
92.00% 93.00% 94.00% 95.00% 96.00% 97.00% 98.00% 99.00%
100.00% 101.00%
% Connections with good voice quality

AUDIT & ASSESSMENT OF QOS FOR QE-JUNE-2015-PUNJAB CIRCLE
TUV-SUD SOUTH ASIA PRIVATE LIMITED Page 75
IX. POI CONGESTION:
All operators are meeting the benchmark except BSNL & QTL.
AIRCEL AIRTEL BSNL IDEA RCOM GSM
TATA GSM
QTL VODAF
ONE RCOM CDMA
TATA CDMA
Quarterly PMR 0 0 1 0 0 0 2 0 0 0
Quarterly Live 0 0 1 0 0 0 2 0 0 0
Benchmark
0
0.5
1
1.5
2
2.5
No. of POI’s having >=0.5% POI congestion

AUDIT & ASSESSMENT OF QOS FOR QE-JUNE-2015-PUNJAB CIRCLE
TUV-SUD SOUTH ASIA PRIVATE LIMITED Page 76
9. QOS AUDIT OF BASIC TELEPHONE SERVICE (WIRELINE) The QoS audit for basic (wire line) service was undertaken for assessment of quarterly performance of the service
providers for quarter ended June-2015. As per the current list of the exchanges provided by BSNL, there are total
1508 exchanges in Punjab Circle. Out of 1508, audit was done for sampled 15 (Urban) and 61 (Rural)
exchanges of BSNL (List of BSNL exchanges undertaken for QoS audit attached as Annex-1 in the end of the
report),1 exchange of Bharti-Airtel, RCL, TTL, Vodafone and 2 exchange of HFCL. Punjab Circle is having 56
SDCAs, so 76 BSNL exchanges spread over 6 SDCAs (10% of total 56 SDCAs) have been taken for audit. The
performance of the Service providers against each parameter has been evaluated by taking average of
performance value of each parameter for all the exchanges of the respective service providers. The averaged value
of each parameter has been tabulated as follows:
Sr. No Service Provider Circle Urban Exchange
in Punjab
Rural Exchange in
Punjab
Total Exchange in
Punjab
No. of Urban Exchanges
Covered for Audit
No. of Rural Exchanges Covered for
Audit
1 BSNL Punjab 295 1213 1508 15 61
2 BHARTI-AIRTEL Punjab 2 0 2 1 0
3 RCL Punjab 2 0 2 1 0
4 HFCL Punjab 5 0 5 2 0
5 TTL Punjab 1 0 1 1 0
6 VODAFONE Punjab 1 0 1 1 0
Total Exchanges 306 1213 1519 21 61

AUDIT & ASSESSMENT OF QOS FOR QE-JUNE-2015-PUNJAB CIRCLE
TUV-SUD SOUTH ASIA PRIVATE LIMITED Page 77
9.1 SERVICE PROVIDER PERFORMANCE REPORT BASED ON QUARTERLY MEASUREMENT DATA VERIFICATION FOR BASIC TELEPHONE SERVICE (WIRELINE) PROVIDERS:
AVERAGED AUDITED DATA FOR WIRELINE (BASIC) SERVICES – PUNJAB CIRCLE
Sl. No.
Parameters Benchmark Period BHARTI AIRTEL
BSNL HFCL RCL TTL VODAFONE
1 Fault incidences
(No. of faults/100 subscribers /month) < 7% Quarterly 3.17% 9.30% 2.56% 0.06% 0.91% 0.39%
2
Faults Repair/Restoration Time
Fault repair by next working day(Urban Area) >85% Quarterly 94.69% 62.61% 95.64% 100.00% 87.00% 100.00%
% of fault repair within 5 days (Urban Area) 100% Quarterly 100.00% 93.69% 100.00% 100.00% 100.00% 100.00%
Fault repair by next working day(Rural & hilly Area)
>75% Quarterly NA 68.51% NA NA NA NA
% of fault repair within 7 days(Rural & hilly Area)
100% Quarterly NA 93.33% NA NA NA NA
Mean time to Repair(MTTR) ≤10 Hrs Quarterly 3.52 15.51 7.00 4.50 10.69 1.34
3
Rent Rebate
Fault pending > 3 days & <7 days Rebate for 7 days Quarterly 0 0 15 0 0 0
Fault Pending > 7 days & < 15 days Rebate for 15 days Quarterly 0 0 0 0 0 0
Fault pending > 15 days Rebate for 1 month Quarterly 0 1 0 0 0 0
4
Metering & Billing Performance
% of disputed Bills over bills issued (Post Paid )
< 0.1% Quarterly 0.01% 0.04% 0.00% 0.01% 0.00% 0.00%
% of Pre-paid Charging Complaints < 0.1% Quarterly NA NA NA NA NA NA
% of billing complaints resolved within 4 weeks
98% within 4 weeks Quarterly 100.00% 100.00% 100.00% 100.00% 100.00% 100.00%
% of billing complaints resolved within 6 weeks
100% within 6 weeks
Quarterly 100.00% 100.00% 100.00% 100.00% 100.00% 100.00%
Period of all refunds/payments from the date of resolution of complaints within 1weeks
<=1 week Quarterly 100.00% 100.00% 100.00% 100.00% 100.00% 100.00%
5 POI Congestion
No. of POI’s having congestion >0.5%
Quarterly 0 0 0 0 NA 0
6
Response Time to customer for assistance
Accessibility of Call centre/customer Care >=95% Quarterly 99.47% 96.23% 95.06% 96.40% 98.87% 99.60%
% age of calls answered by operator(voice to voice) within 90 seconds
>=95% Quarterly 95.01% 84.01% 96.09% 98.37% 97.88% 100.00%
7
Customer care(promptness in attending to customers request)
Termination / Closures 100% Quarterly 100.00% 76.80% 100.00% 100.00% 100.00% 100.00%
Time taken for refunds of deposit after closures
100% Quarterly 100.00% NP 100.00% 100.00% 100.00% 100.00%
NA-Not Applicable
NP-Not Provided, BSNL has not provided data for the parameter “Time taken for refunds of deposit after closures” despite our best
efforts.

AUDIT & ASSESSMENT OF QOS FOR QE-JUNE-2015-PUNJAB CIRCLE
TUV-SUD SOUTH ASIA PRIVATE LIMITED Page 78
9.2 SERVICE PROVIDER PERFORMANCE REPORT BASED ON 3 DAYS LIVE MEASUREMENT DATA VERIFICATION FOR BASIC TELEPHONE SERVICE (WIRELINE) PROVIDERS:
3 DAYS LIVE MEASUREMENT DATA FOR WIRELINE (BASIC) SERVICES – PUNJAB CIRCLE
Sl No. Parameters Benchmark Period BHARTI AIRTEL
BSNL HFCL RCL TTL VODAFONE
1
POI Congestion
No. of POI’s having congestion >0.5%
≤0.5% Quarterly 0 0 0 0 NA 0
2
Response Time to customer for assistance
Accessibility of Call centre/customer Care
≥95% Quarterly 100.00% 96.37% 95.54% 99.11% 100.00% 99.56%
% age of calls answered by operator(voice to voice) within 90 seconds
≥95% Quarterly 94.23% 82.51% 98.27% 99.83% 100.00% 100.00%

AUDIT & ASSESSMENT OF QOS FOR QE-JUNE-2015-PUNJAB CIRCLE
TUV-SUD SOUTH ASIA PRIVATE LIMITED Page 79
9.3 KEY FINDINGS: BASIC TELEPHONE SERVICES (WIRELINE)
Fault Incidences: The audit of the service providers revealed that the performance of all service providers was well
within the benchmark except BSNL. The performance of BSNL was 9.30% for the parameter ‘No. of faults/100 subscribers /month’.
Fault Repair/Restoration Time: For this parameter, Only BSNL failed to meet the benchmark of fault repair by
next working day (Urban Area) with their performance as 62.61%. Apart from this, BSNL also remained under performed for parameters Fault repair within 5 days (urban area), within next working day (rural and hilly areas) and within 7 days (rural & hilly areas) with its performance as 93.69%, 68.51% and 93.33% respectively.
Mean Time to Repair: Only BSNL and TTL could not achieve the benchmark with their achieved level as 15.51% and 10.69% respectively. Metering and Billing performance: For this parameter, all operators were meeting the benchmark.
POI Congestion: All operators were found meeting the benchmark for this parameter. Response Time to Customer for assistance: For percentage of calls getting connected to call center and
answered, all operators (except BSNL) managed to meet the TRAI benchmark. With respect to the parameter of calls answered by operator (voice to voice within 90 sec), BSNL could not meet the benchmark with its performance as 84.01% against the benchmark of >= 95%. BSNL and Bharti Airtel also failed to meet the benchmark for the same parameter during 3 days live measurement with their performance as 82.51% and 94.23% respectively.
Termination/Closures: All operators were found meeting the benchmark for this parameter except BSNL. BSNL
could not meet the benchmark for the parameter with its performance as 76.80% against the benchmark of 100%. BSNL has not provided data for the parameter “Time taken for refunds of deposit after closures” despite our best efforts. Thus, from the above findings that, it was concluded that the performance of BSNL was not satisfactory in respect of the parameters Fault incidences, Fault Repairs/Restoration Time, MTTR, Response time to customer for assistance and Termination/ Closure . Hence, BSNL need to improve their services in respect of these parameters. Apart from this TTL failed to meet the benchmark of MTTR. BSNL and Bharti Airtel remained under performed for parameter call answered by operator (Voice to voice) during 3 days live measurement.

AUDIT & ASSESSMENT OF QOS FOR QE-JUNE-2015-PUNJAB CIRCLE
TUV-SUD SOUTH ASIA PRIVATE LIMITED Page 80
9.4 INTER OPERATOR CALL ASSESSMENT (WIRELINE SERVICES) Inter operator call assessment with a sample of 2x50 test calls for each Service provider operating in HP Circle service area during the time 1000 to 1300 Hrs and 1500 to 1700 was carried out by TUV auditors. The test calls were made from one operator to another within the same licensed area to judge the ease of connectivity amongst the operators
INTER OPERATOR CALL ASSESSMENT BASED ON LIVE MEASUREMENT
Cal
ling
Op
erat
ors
Cir
cle
Nam
e
To
tal N
o. o
f
calls
Mad
e
BH
AR
TI -
AIR
TE
L
BS
NL
HF
CL
RC
L
TT
L
VO
DA
FO
NE
BHARTI - AIRETL Punjab 100 -- 100.00% 100.00% 100.00% 100.00% 100.00%
BSNL Punjab 100 100.00% -- 100.00% 100.00% 100.00% 100.00%
HFCL Punjab 100 100.00% 100.00% -- 100.00% 100.00% 100.00%
RCL Punjab 100 100.00% 100.00% 100.00% -- 100.00% 100.00%
TTL Punjab 100 100.00% 100.00% 100.00% 100.00% -- 100.00%
VODAFONE Punjab 100 100.00% 100.00% 100.00% 100.00% 100.00% --
The result of the testing revealed that the inter connection performance among the operators was quite satisfactory. Thus there was no remarkable problem in interconnection from one operator to other operators.
9.5 LEVEL-1 LIVE CALLING (WIRELINE SERVICES)
LEVEL 1 LIVE CALLING
Emergency no.
Circle Name
No. of calls made
AIRTEL-BHARTI
BSNL HFCL RCL TTL VODAFONE
100 Punjab 10 √ √ √ √ √ √
101 Punjab 10 √ √ √ √ √ √
108 Punjab 10 √ √ √ √ √ √
1073 Punjab 10 √ √ √ √ √ √
1098 Punjab 10 √ √ √ √ √ √
To assess the availability and efficiency of level 1 service such as police, fire, ambulance (emergency services) offered by BSNL, Bharti Airtel, HFCL, Reliance, TTL and Vodafone, the calls were made from telephone provided by service providers , these services were found functional in the networks of all the service providers.

AUDIT & ASSESSMENT OF QOS FOR QE-JUNE-2015-PUNJAB CIRCLE
TUV-SUD SOUTH ASIA PRIVATE LIMITED Page 81
9.6 CUSTOMER CARE / HELPLINE ASSESSMENT (WIRELINE SERVICES)
LIVE CALLING TO CALL CENTRE
Benchmark Circle
AIRTEL-BHARTI
BSNL HFCL RCL TTL VODAFONE
Total No. of calls Attempted
Punjab 100 100 100 100 100 100
A) Total no of calls attempted to customer care/Call center
Punjab 100 100 100 100 100 100
B) Total no. of calls successfully established to customer care/Call center
Punjab 100 100 100 100 100 100
C) % Accessibility of Call centre /customer Care (Total call attempt*100/ Total call successfully established)
>=95% Punjab 100.00% 100.00% 100.00% 100.00% 100.00% 100.00%
D) Total Calls reached to agent desk for Voice to Voice (Total call attempt)
Punjab 100 100 100 100 100 100
E) Total number of calls answered by the operator (Voice to voice) within 90 seconds
Punjab 100 95 100 100 100 100
F) % age of calls answered by the operators (voice to voice) within 90 seconds (E *100/ D)
>=95% Punjab 100.00% 95.00% 100.00% 100.00% 100.00% 100.00%
In case of calls answered by operators (voice to voice), when test calls were made to the call centers, BSNL could connect 95% calls within 90 seconds. In case of other service providers, 100% calls were connected to the call center within 90 seconds.

AUDIT & ASSESSMENT OF QOS FOR QE-JUNE-2015-PUNJAB CIRCLE
TUV-SUD SOUTH ASIA PRIVATE LIMITED Page 82
GRAPHICAL REPRESENTATION OF BASIC (WIRELINE) SERVICES

AUDIT & ASSESSMENT OF QOS FOR QE-JUNE-2015-PUNJAB CIRCLE
TUV-SUD SOUTH ASIA PRIVATE LIMITED Page 83
9.7 GRAPHICAL REPRESENTATION OF QUARTERLY PERFORMANCE OF THE BASIC TELEPHONE SERVICE (WIRELINE) PROVIDERS:
1) FAULT INCIDENCE:
BSNL is not meeting the benchmark.
2) FAULTS REPAIR/RESTORATION TIME:
BSNL is not meeting the benchmark.
BHARTI AIRTEL
BSNL HFCL RCL TTL VODAFONE
(No. of faults/100 subscribers /month)
3.17% 9.30% 2.56% 0.06% 0.91% 0.39%
Benchmark < 7% 7% 7% 7% 7% 7% 7%
0.00% 1.00% 2.00% 3.00% 4.00% 5.00% 6.00% 7.00% 8.00% 9.00%
10.00%
Fault Incidence (No. of faults/100 subscribers /month)
BHARTI AIRTEL
BSNL HFCL RCL TTL VODAFONE
Fault repair by next working day(Urban Area)
94.69% 62.61% 95.64% 100.00% 87.00% 100.00%
Benchmark >85% 85% 85% 85% 85% 85% 85%
0.00%
20.00%
40.00%
60.00%
80.00%
100.00%
120.00%
Faults Repair/Restoration Time Fault repair by next working day(Urban Area)

AUDIT & ASSESSMENT OF QOS FOR QE-JUNE-2015-PUNJAB CIRCLE
TUV-SUD SOUTH ASIA PRIVATE LIMITED Page 84
3) FAULTS REPAIR/RESTORATION TIME WITHIN 5 DAYS:
BSNL is not meeting the benchmark.
4) MEAN TIME TO REPAIR (MTTR):
BSNL and TTL are not meeting the benchmark.
BHARTI AIRTEL
BSNL HFCL RCL TTL VODAFONE
Within 5 days 100.00% 93.69% 100.00% 100.00% 100.00% 100.00%
Benchmark-100% 100% 100% 100% 100% 100% 100%
90.00% 91.00% 92.00% 93.00% 94.00% 95.00% 96.00% 97.00% 98.00% 99.00%
100.00% 101.00%
Faults Repair/Restoration Time Within 5 day
BHARTI AIRTEL
BSNL HFCL RCL TTL VODAFONE
Mean time to Repair(MTTR) 3.52 15.51 7 4.5 10.69 1.34
Benchmark ≤10 Hrs 10 10 10 10 10 10
0
2
4
6
8
10
12
14
16
18
Faults Repair/Restoration Time Mean time to Repair(MTTR)

AUDIT & ASSESSMENT OF QOS FOR QE-JUNE-2015-PUNJAB CIRCLE
TUV-SUD SOUTH ASIA PRIVATE LIMITED Page 85
5) METERING & BILLING PERFORMANCE:
a) DISPUTED BILLS OVER BILL ISSUED :
All operators are meeting the benchmark.
b) BILLING COMPLAINT RESOLUTION WITHIN 4 WEEKS:
All operators are meeting the benchmark.
BHARTI AIRTEL
BSNL HFCL RCL TTL VODAFONE
Disputed Bills over bills issued 0.01% 0.04% 0.00% 0.01% 0.00% 0.00%
Benchmark < 0.1% 0.1% 0.1% 0.1% 0.1% 0.1% 0.1%
0.00%
0.02%
0.04%
0.06%
0.08%
0.10%
0.12%
Metering & Billing Performance Disputed Bills over bills issued
BHARTI AIRTEL
BSNL HFCL RCL TTL VODAFONE
% of billing complaints resolved within 4 weeks
100.00% 100.00% 100.00% 100.00% 100.00% 100.00%
Benchmark-98% within 4 weeks 98% 98% 98% 98% 98% 98%
97.00%
97.50%
98.00%
98.50%
99.00%
99.50%
100.00%
100.50%
% of billing complaints resolved within 4 weeks

AUDIT & ASSESSMENT OF QOS FOR QE-JUNE-2015-PUNJAB CIRCLE
TUV-SUD SOUTH ASIA PRIVATE LIMITED Page 86
c) BILLING COMPLAINT RESOLUTION WITHIN 6 WEEKS:
All operators are meeting the benchmark.
6) TERMINATION & CLOSURES:
BSNL is not meeting the benchmark for the parameter “Termination/Closure” and BSNL has not provided data for the parameter “Refund of deposit after closure”.
BHARTI AIRTEL
BSNL HFCL RCL TTL VODAFON
E
% of billing complaints resolved within 6 weeks
100.00% 100.00% 100.00% 100.00% 100.00% 100.00%
Benchmark 100% within 6 weeks 100% 100% 100% 100% 100% 100%
0.00%
20.00%
40.00%
60.00%
80.00%
100.00%
120.00%
% of billing complaints resolved within 6 weeks
BHARTI AIRTEL
BSNL HFCL RCL TTL VODAFON
E
Termination / Closures 100.00% 76.80% 100.00% 100.00% 100.00% 100.00%
Time taken for refunds of deposit after closures
100.00% 100.00% 100.00% 100.00% 100.00%
Benchmark 100% 100% 100% 100% 100% 100% 100%
98.00%
98.50%
99.00%
99.50%
100.00%
100.50%
101.00%
Customer care(promptness in attending to customers request)

AUDIT & ASSESSMENT OF QOS FOR QE-JUNE-2015-PUNJAB CIRCLE
TUV-SUD SOUTH ASIA PRIVATE LIMITED Page 87
9.8 GRAPHICAL REPRESENTATION OF PERFORMANCE OF THE BASIC TELEPHONE SERVICE (WIRELINE) PROVIDERS V/S 3-DAYS LIVE MEASUREMENT:
1) RESPONSE TIME TO CUSTOMER FOR ASSISTANCE ACCESSIBILITY OF CALL
CENTRE/CUSTOMER CARE:
All operators are meeting the benchmark.
2) RESPONSE TIME TO CUSTOMER FOR ASSISTANCE CALL ANSWERED BY
OPERATORS :
Bharti-Airtel (during 3 day live) and BSNL is not meeting the benchmark.
BHARTI AIRTEL
BSNL HFCL RCL TTL VODAFONE
Quarterly 99.47% 96.23% 95.06% 96.40% 98.87% 99.60%
Live 100.00% 96.37% 95.54% 99.11% 100.00% 99.56%
Benchmark ≥95% 95% 95% 95% 95% 95% 95%
92.00% 93.00% 94.00% 95.00% 96.00% 97.00% 98.00% 99.00%
100.00% 101.00%
Response Time to customer for assistance Accessibility of Call centre/customer
BHARTI AIRTEL
BSNL HFCL RCL TTL VODAFONE
Quarterly 95.01% 84.01% 96.09% 98.37% 97.88% 100.00%
Live 94.23% 82.51% 98.27% 99.83% 100.00% 100.00%
Benchmark ≥95% 95% 95% 95% 95% 95% 95%
80.00%
85.00%
90.00%
95.00%
100.00%
105.00%
Response Time to customer for assistance % age of calls answered by operator(voice to voice) within 90 seconds

AUDIT & ASSESSMENT OF QOS FOR QE-JUNE-2015-PUNJAB CIRCLE
TUV-SUD SOUTH ASIA PRIVATE LIMITED Page 88
10. QOS AUDIT OF BROADBAND SERVICE PROVIDERS

AUDIT & ASSESSMENT OF QOS FOR QE-JUNE-2015-PUNJAB CIRCLE
TUV-SUD SOUTH ASIA PRIVATE LIMITED Page 89
10. QUALITY OF SERVICE AUDIT OF BROADBAND SERVICE PROVIDERS
TUV–SUD South Asia has to conduct the audit and assessment of Quality of Service of Broadband Service only
in respect of the service providers who are having broadband subscriber base of more than 10,000 subscribers in
their licensed service area, for 5% of Point of Presence (PoPs) spread over in 10% SDCAs in specified Telecom
Circle. Location of PoPs, covered for QoS audit is attached as Annex-2.
Discussion with the private broadband service providers reveled that there is no concept of their PoPs on SDCA
basis; they are maintaining their entire data on centralized basis so audit has been done for the centralized data.
Audit was done for the following Broadband four service Providers.
Sl. No. Name of Broadband Service Providers Location of Audit
1 BHARTI AIRTEL LIMITED Plot No-21, Rajiv Gandhi Technology Park, Chandigarh
2 BSNL BSNL Office Chandigarh, Ludhiana, Ferozpur
3 D-VOIS BROADBAND D-VOIS BROADBAND, Chandigarh
4 FIVE-NETWORKS Five Network Solution (India ) Limited, Bhatinda, Punjab
5 NSTPL NSTPL, Nangal, Punjab
6 BROADBAND PACENET INDIA PVT. LTD BROADBAND PACENET INDIA PRIVATE LIMITED,
Jalandhar, Punjab
7 RELIANCE COMMUNICATION LIMITED (RCL) RELIANCE COMMUNICATION LIMITED, DAKC, Mumbai
8 TATA COMMUNICATION LIMITED (TCL) C-125 , Industrial Area Ph-8 , Mohali - 160071
9 TATA TELESERVICES LIMITED (TTL) C-125 , Industrial Area Ph-8 , Mohali - 160071
10 HFCL HFCL, Mohali
11 HATHWAY Hathway Cable and Datacom Pvt. Ltd., Chandigarh

AUDIT & ASSESSMENT OF QOS FOR QE-JUNE-2015-PUNJAB CIRCLE
TUV-SUD SOUTH ASIA PRIVATE LIMITED Page 90
10.1 SERVICE PROVIDER PERFORMANCE REPORT BASED ON QUARTERLY MEASUREMENT DATA VERIFICATION FOR BROADBAND SERVICE PROVIDERS:
AVERAGED QUARTERLY (APR TO JUN-15) AUDIT DATA FOR BROADBAND SERVICES
Broadband Audit Data Bench- mark
Circle Name
BHARTI-AIRTEL
BSNL D-Vois RCL TCL TTSL HATHWAY Five
Network HFCL NSTPL Pacenet
S/ N Name of Parameter BROADBAND SERVICE PROVIDERS
1
Service Provisioning/Activation Time
A) No of connections registered during the period
Punjab 4361 1199 27 664 0 301 43 51 16206 22 117
B) Total number of connections provided within 15 days of registration on demand during the period
Punjab 4361 1199 27 664 0 301 43 51 16206 22 117
C) % age of connections provided within 15 days of registration on demand (subject to technical feasibility)
<15 days Punjab 100% 100% 100% 100% 100% 100% 100% 100% 100% 100% 100%
D)Total number of connections provided after 15 days of registration on demand
Punjab 0 0 0 0 0 0 0 0 0 0 0
E) %age of connections provided after 15 days of registration on demand
Punjab 0.00% 0.00% 0.00% 0.00% 0.00% 0.00% 0.00% 0.00% 0.00% 0.00% 0.00%
F) In all cases where payment towards installation charge & SD is taken and the Broadband connection is not provided within 15 working days
credit @ Rs.10/
per day. Punjab 0 0 0 0 0 0 0 0 0 0 0
2
Fault Repair/Restoration Time
A) Total number of faults registered during the period
Punjab 5152 8671 31 985 164 607 814 40 3601 71 136

AUDIT & ASSESSMENT OF QOS FOR QE-JUNE-2015-PUNJAB CIRCLE
TUV-SUD SOUTH ASIA PRIVATE LIMITED Page 91
AVERAGED QUARTERLY (APR TO JUN-15) AUDIT DATA FOR BROADBAND SERVICES
Broadband Audit Data Bench- mark
Circle Name
BHARTI-AIRTEL
BSNL D-Vois RCL TCL TTSL HATHWAY Five
Network HFCL NSTPL Pacenet
S/ N Name of Parameter BROADBAND SERVICE PROVIDERS
B) Total number of faults repaired by next working day
Punjab 4886 4184 31 985 122 543 780 40 3571 71 126
C) % age of faults repaired by next working day
>90% Punjab 94.84% 48.25% 100% 100% 74.39% 89.46% 95.82% 100% 99.17% 100% 92.65%
D) Total number of faults repaired within three working days
Punjab 5118 7035 31 985 144 592 814 40 3599 71 136
E)% age of faults repaired within three working days
≥99% Punjab 99.34% 81.13% 100% 100% 87.80% 97.53% 100% 100% 99.94% 100% 100%
3
Rent Rebate
A) Faults Pending for > 3 working days and < 7 working days: (Rebate equivalent to 7 days of minimum monthly charge or equivalent usage allowance)
Punjab 0 0 0 0 0 0 0 0 2 0 0
B) Faults Pending for > 7 working days and < 15 working days: (Rebate equivalent to 15 days of minimum monthly charge or equivalent usage allowance)
Punjab 0 0 0 0 0 0 0 0 0 0 0
C) Faults Pending for > 15 working days:(Rebate equivalent to one month of minimum monthly charge or equivalent usage allowance)
Punjab 0 18 0 0 0 0 0 0 0 0 0
4
Billing Performance
A) Total bills generated during period
Punjab 169663 66124 NA 34952 284 4266 NA NA 490409 NA 1908
B) Total complaints received from customers/ Bills disputed
Punjab 16 19 NA 79 0 3 NA NA 32 NA 10
C) Billing complaints per 100 bills issued
<2% Punjab 0.01% 0.03% NA 0.23% 0.00% 0.07% NA NA 0.01% NA 0.52%

AUDIT & ASSESSMENT OF QOS FOR QE-JUNE-2015-PUNJAB CIRCLE
TUV-SUD SOUTH ASIA PRIVATE LIMITED Page 92
AVERAGED QUARTERLY (APR TO JUN-15) AUDIT DATA FOR BROADBAND SERVICES
Broadband Audit Data Bench- mark
Circle Name
BHARTI-AIRTEL
BSNL D-Vois RCL TCL TTSL HATHWAY Five
Network HFCL NSTPL Pacenet
S/ N Name of Parameter BROADBAND SERVICE PROVIDERS
D) Total number of complaints resolved in 4 weeks from date of receipt
Punjab 16 19 NA 79 0 3 NA NA 32 NA 10
E) %age billing complaints resolved in 4 weeks
100% Punjab 100% 100% NA 100% 100% 100% NA NA 100% NA 100%
F) Total number of cases requiring refund of deposits after closure
Punjab 4 NP NA 4 0 0 NA NA 38 NA NP
G) Total number of cases where refund was made in <60 days
Punjab 4 NP NA 4 0 0 NA NA 38 NA NP
H) Percentage cases in which refund received within 60 days
100% Punjab 100% NP NA 100% 100% 100% NA NA 100% NA NP
5
Response time to the customer for assistance % age of calls answered by operator (Voice to Voice)
A) Total number of calls received by the operator
Punjab 45898 109213 31 101370 155290 799 808 40 225742 No
Customer Care
136
B) Total number of calls answered by the operator within 60 seconds
Punjab 39374 88905 28 95238 96545 780 684 40 165949
No Customer
Care 100
C) % age calls answered by the operator in 60 seconds
>60% Punjab 85.79% 81.41% 90.32% 93.95% 62.17% 97.62% 84.65% 100% 73.51% No
Customer Care
73.53%
D) Total number of calls answered by the operator within 90 seconds
Punjab 41587 97511 31 96125 101533 784 808 404 186066
No Customer
Care 126
E) % age calls answered by the operator within 90 seconds
>80% Punjab 90.61% 89.29% 100% 94.83% 65.38% 98.12% 100% 100% 82.42% No
Customer Care
92.65%

AUDIT & ASSESSMENT OF QOS FOR QE-JUNE-2015-PUNJAB CIRCLE
TUV-SUD SOUTH ASIA PRIVATE LIMITED Page 93
AVERAGED QUARTERLY (APR TO JUN-15) AUDIT DATA FOR BROADBAND SERVICES
Broadband Audit Data Bench- mark
Circle Name
BHARTI-AIRTEL
BSNL D-Vois RCL TCL TTSL HATHWAY Five
Network HFCL NSTPL Pacenet
S/ N Name of Parameter BROADBAND SERVICE PROVIDERS
6 Bandwidth Utilization/ Throughput: (If on any link(s) / route bandwidth utilization exceeds 90%, then network is considered to have congestion. For this additional provisioning of Bandwidth on immediate basis, but not later than one month, is mandated.) < 80% link(s) / route bandwidth utilization during peak hours (TCBH).
6.1
POP to ISP Gateway Node [Intra-network] Link(s)
A) Total Bandwidth Available at the link for the period days
Punjab 116563.67 36576 20 9000 40960 2048 NP 40 21000 60 110
B) Total Bandwidth utilized during the period during TCBH (In Mpbs)
Punjab 7757.58 17146.28 10.52 1833.67 8168 1413.12 NP 24.74 15953.33 48 87.67
C) % age Bandwidth utilized during the period
<80% Punjab 6.66% 46.87% 52.60% 20.37% 19.94% 69.00% NP 61.85% 75.97% 80.00% 79.70%
6.2
A) ISP Gateway Node to IGSP / NIXI Node upstream Link(s) for International connectivity
A) Total number of upstream links for International connectivity
Punjab 1 NP NA 11 35 1 NP NA 3 NA NA
B) Number of Links having Bandwidth utilization > 90% during TCBH
Punjab 0 NP NA 0 0 0 NP NA 0 NA NA
C) Total international bandwidth available from ISP Node to IGSP/NIXI/NAP
Punjab 10000 NP NA 106000 2048 18391.04 NP NA 14116 NA NA
D) Total international bandwidth utilization during peak hours (TCBH) in Mpbs
Punjab 7127 NP NA 54325.55 1228.8 14028.8 NP NA 12001 NA NA
E) %age International Bandwidth utilization during peak hours (TCBH)
<80% Punjab 71.27% NP NA 51.25% 60.00% 76.28% NP NA 85.02% NA NA
6.3
Broadband Connection Speed (download) - from ISP Node to User
A) Total committed download speed to the sample subscribers (In mpbs)
Punjab 2 NA NP 2 1.5 5.22 2.67 4 520.5 NP 1.33
B) Total average download speed observed for the sample subscribers during TCBH (In Mpbs)
Punjab 2 NA NP 1.90 1.4 4.67 2.48 3.62 517.1 NP 1.25
C) % age subscribed speed available to the subscriber during TCBH
>80% Punjab 100% NA NP 95.00% 93.33% 89.46% 92.88% 90.50% 99.35% NP 93.98%

AUDIT & ASSESSMENT OF QOS FOR QE-JUNE-2015-PUNJAB CIRCLE
TUV-SUD SOUTH ASIA PRIVATE LIMITED Page 94
AVERAGED QUARTERLY (APR TO JUN-15) AUDIT DATA FOR BROADBAND SERVICES
Broadband Audit Data Bench- mark
Circle Name
BHARTI-AIRTEL
BSNL D-Vois RCL TCL TTSL HATHWAY Five
Network HFCL NSTPL Pacenet
S/ N Name of Parameter BROADBAND SERVICE PROVIDERS
7
Service Availability/Uptime
A) Total operational Hours
Punjab 41114920 2184 2184 2184 2184 74232 2184 2184 2184 2184 2184
B) Total downtime (In hours)
Punjab 1922.18 0 13.12 10.45 2.78 327 244.69 0 1.21 1.5 14.2
C) Total time when the service was available (In Hrs)
Punjab 41112997.82 2184 2170.88 2173.55 2181.22 73905 1939.31 2184 2182.80 2182.5 2169.8
D) % age of Service availability uptime
>98% Punjab 100% 100% 99.40% 99.52% 99.87% 99.56% 88.80% 100% 99.94% 99.93% 99.35%
8
Packet Loss
A) Total number of ping packets transmitted
Punjab 1000 NP NP 91000 91000 3000 3000 91000 3000 NP 3000
B) Total number of ping packets lost
Punjab 0 NP NP 325 0 18 0 0 0 NP 2
C) % age packet loss <1% Punjab 0.00% NP NP 0.36% 0.00% 0.60% 0.00% 0.00% 0.00% NP 0.07%
9 Network latency (for wired broadband access)
9.1
Network Latency from User reference point at POP/ISP Node to IGSP/NIXI gateway
A) Total number of ping packets transmitted
Punjab 3000 NP NP 3000 91000 9000 3000 91000 3000 NP 3000
B) Total round trip time for all the ping packets transmitted during the period
Punjab 100 NP NP 21 70 540130 192 5278000 15 NP 283
C) Average round trip tip time for all the ping transmitted
<120 ms Punjab 33 NP NP 21 23 60 64 58 15 NP 94
9.2
Network Latency from User reference point at ISP Node to nearest NAP Port abroad (Terrestrial)
A) Total number of ping packets transmitted
Punjab 1000 NP NP 3000 91000 3400 3000 91000 3000 NP 3000
B) Total round trip time for all the ping packets transmitted during the period
Punjab 84 NP NP 25 833 208520 293 9266530 841 NP 1063
C) Average round trip tip time for all the ping transmitted
<350 ms Punjab 84 NP NP 25 278 61 98 102 280 NP 354

AUDIT & ASSESSMENT OF QOS FOR QE-JUNE-2015-PUNJAB CIRCLE
TUV-SUD SOUTH ASIA PRIVATE LIMITED Page 95
AVERAGED QUARTERLY (APR TO JUN-15) AUDIT DATA FOR BROADBAND SERVICES
Broadband Audit Data Bench- mark
Circle Name
BHARTI-AIRTEL
BSNL D-Vois RCL TCL TTSL HATHWAY Five
Network HFCL NSTPL Pacenet
S/ N Name of Parameter BROADBAND SERVICE PROVIDERS
9.3
Network Latency from User reference point at ISP Node to nearest NAP Port abroad (Satellite)
A) Total number of ping packets transmitted
Punjab NA NA NA NA NA NA NA NA NA NA NA
B) Total round trip time for all the ping packets transmitted during the period
Punjab NA NA NA NA NA NA NA NA NA NA NA
C) Average round trip tip time for all the ping transmitted
<800 ms Punjab NA NA NA NA NA NA NA NA NA NA NA
NA- Not Applicable
NP-Not Provided- Monthly Data Not Monitored by ISPs

AUDIT & ASSESSMENT OF QOS FOR QE-JUNE-2015-PUNJAB CIRCLE
TUV-SUD SOUTH ASIA PRIVATE LIMITED Page 96
10.2 SERVICE PROVIDER PERFORMANCE REPORT BASED ON 3 DAYS MEASUREMENT DATA VERIFICATION FOR BROADBAND SERVICE PROVIDERS:
3 DAYS LIVE DATA FOR BROADBAND SERVICES
3 days live Broadband Audit Data Bench- mark
Circle Name
BHARTI-AIRTEL
BSNL D-Vois RCL TCL TTSL HATHWAY Five
Network HFCL NSTPL Pacenet
S/ N Name of Parameter BROADBAND SERVICE PROVIDERS
1
Response time to the customer for assistance % age of calls answered by operator (Voice to Voice)
A) Total number of calls received by the operator
Punjab 1628 8442 5 101370 4459 54 84 5 10613 No Customer Care 17
B) Total number of calls answered by the operator within 60 seconds
Punjab 1259 5766 4 95238 3583 54 59 5 7851 No Customer Care 13
C) % age calls answered by the operator in 60 seconds
>60% Punjab 77.33% 68.30% 80.00% 93.95% 80.35% 100% 70.23% 100% 73.97% No Customer Care 76.47%
D) Total number of calls answered by the operator within 90 seconds
Punjab 1341 6444 5 96125 3706 54 75 5 8523 No Customer Care 16
E) % age calls answered by the operator within 90 seconds
>80% Punjab 82.37% 76.33% 100% 94.82% 83.11% 100% 89.29% 100% 80.31% No Customer Care 94.12%
2 Bandwidth Utilization/ Throughput: (If on any link(s) / route bandwidth utilization exceeds 90%, then network is considered to have congestion. For this additional provisioning of Bandwidth on immediate basis, but not later than one month, is mandated.) < 80% link(s) / route bandwidth utilization during peak hours (TCBH).
2.1
POP to ISP Gateway Node [Intra-network] Link(s)
A) Total Bandwidth Available at the link for the period days
Punjab 119647 19824 20 9000 40960 2048 165 40 1000 20 110
B) Total Bandwidth utilized during the period during TCBH (In Mpbs)
Punjab 7608.64 13150.92 17.57 1417.57 1071.33 1385.81 153 27.73 745.33 17.16 89.66
C) % age Bandwidth utilized during the period
<80% Punjab 6.36% 66.34% 87.85% 15.75% 2.61% 67.66% 92.72% 69.33% 74.53% 85.80% 81.51%
2.2
A) ISP Gateway Node to IGSP / NIXI Node upstream Link(s) for International connectivity
A) Total number of upstream links for International connectivity
Punjab 1 NA NA 11 35 1 1 NA 3 NA NA
B) Number of Links having Bandwidth utilization > 90% during TCBH
Punjab 0 NA NA 0 0 0 0 NA 0 NA NA
C) Total international bandwidth available from ISP Node to IGSP/NIXI/NAP
Punjab 10000 NA NA 106000 2048 18391.04 150 NA 14426 NA NA

AUDIT & ASSESSMENT OF QOS FOR QE-JUNE-2015-PUNJAB CIRCLE
TUV-SUD SOUTH ASIA PRIVATE LIMITED Page 97
3 DAYS LIVE DATA FOR BROADBAND SERVICES
3 days live Broadband Audit Data Bench- mark
Circle Name
BHARTI-AIRTEL
BSNL D-Vois RCL TCL TTSL HATHWAY Five
Network HFCL NSTPL Pacenet
S/ N Name of Parameter BROADBAND SERVICE PROVIDERS
D) Total international bandwidth utilization during peak hours (TCBH) in Mpbs
Punjab 761.25 NA NA 78150.57 1030 14745.6 108.42 NA 12776.67 NA NA
E) %age International Bandwidth utilization during peak hours (TCBH)
<80% Punjab 7.61% NA NA 73.73% 50.29% 80.18% 72.28% NA 88.57% NA NA
2.3
Broadband Connection Speed (download) - from ISP Node to User
A) Total committed download speed to the sample subscribers (In mpbs)
Punjab 2 11.01 6 1 1.5 5 2.66 4 4 1.41 1.33
B) Total average download speed observed for the sample subscribers during TCBH (In Mpbs)
Punjab 2.16 9.15 6.08 0.95 1.45 5.06 2.54 3.93 4 1.34 1.18
C) % age subscribed speed available to the subscriber during TCBH
>80% Punjab 108.00% 83.11% 101.33% 95.00% 96.66% 101.20% 95.49% 98.25% 100% 95.04% 88.72%
3
Packet Loss
A) Total number of ping packets transmitted
Punjab 3000 48000 3000 3000 3000 3000 2933 3000 3000 3000 3000
B) Total number of ping packets lost
Punjab 0 209 1 0 0 225 37 0 4 3 13
C) % age packet loss <1% Punjab 0.00% 0.44% 0.03% 0.00% 0.00% 7.50% 1.26% 0.00% 0.13% 0.10% 0.43%
4 Network latency (for wired broadband access)
4.1
Network Latency from User reference point at POP/ISP Node to IGSP/NIXI gateway
A) Total number of ping packets transmitted
Punjab 3000 2818 3000 3000 NP 3000 2933 3000 3000 3000 3000
B) Total round trip time for all the ping packets transmitted during the period
Punjab 90 153 48 4 NP 162 255 197 5 163 44
C) Average round trip tip time for all the ping transmitted
<120 ms Punjab 30 51 16 1 NP 54 85 66 2 54 15
4.2
Network Latency from User reference point at ISP Node to nearest NAP Port abroad (Terrestrial)
A) Total number of ping packets transmitted
Punjab 3000 9000 3000 9000 NP 6000 9000 3000 9000 9000 9000
B) Total round trip time for all the ping packets transmitted during the period
Punjab 226 2585 483 15 NP 446 604 312 1635 906 822
C) Average round trip tip time for all the ping transmitted
<350 ms Punjab 25 287 54 2 NP 50 67 35 182 101 91

AUDIT & ASSESSMENT OF QOS FOR QE-JUNE-2015-PUNJAB CIRCLE
TUV-SUD SOUTH ASIA PRIVATE LIMITED Page 98
3 DAYS LIVE DATA FOR BROADBAND SERVICES
3 days live Broadband Audit Data Bench- mark
Circle Name
BHARTI-AIRTEL
BSNL D-Vois RCL TCL TTSL HATHWAY Five
Network HFCL NSTPL Pacenet
S/ N Name of Parameter BROADBAND SERVICE PROVIDERS
4.3
Network Latency from User reference point at ISP Node to nearest NAP Port abroad (Satellite)
A) Total number of ping packets transmitted
Punjab NA NA NA NA NA NA NA NA NA NA NA
B) Total round trip time for all the ping packets transmitted during the period
Punjab NA NA NA NA NA NA NA NA NA NA NA
C) Average round trip tip time for all the ping transmitted
<800 ms Punjab NA NA NA NA NA NA NA NA NA NA NA
5
Service Availability/Uptime
A) Total operational Hours
Punjab NP 72 72 72 2664 2664 72 72 72 72 72
B) Total downtime (In hours)
Punjab NP 0 0 0 9 9 12.88 0 0 2 0
C) Total time when the service was available (In Hrs)
Punjab NP 72 72 72 2655 2655 59.12 72 72 70 72
D) % age of Service availability uptime
>98% Punjab NP 100% 100% 100% 99.66% 99.66% 82.11% 100% 100% 97.22% 100%
NA: Not Applicable NP: Data not provided

AUDIT & ASSESSMENT OF QOS FOR QE-JUNE-2015-PUNJAB CIRCLE
TUV-SUD SOUTH ASIA PRIVATE LIMITED Page 99
10.3 KEY FINDINGS: BROADBAND SERVICES
Service Provisioning / Activation Time: The audit of the service providers revealed that all Broadband service
providers were well within the benchmark against the benchmark of 100%.
Fault Repair/Restoration Time: With regards to this parameter the performance of the service providers was
within TRAI norms except BSNL, TCL & TTSL, their achievement level was 48.25%, 74.39% and 89.46% for the parameter “Fault Repair by next working day”. Further, BSNL & TCL remained under performed for parameter “Faults repaired within three working days” with their performance as 81.13% and 87.80%.
Billing Performance: For this parameter also the performance of the service providers was found well within the
compliance benchmarks.
Response Time to Customer for assistance by operator (Voice to Voice): For percentage of calls getting
connected to call center and answered, all service providers were found meeting the benchmark for this parameter. However, for parameter “% age calls answered by the operator within 90 seconds”; only TCL failed to meet the benchmark with its achieved level as 65.38%. During 3 days lives measurement, only BSNL failed to meet the benchmark with its achieved level as 76.33% for parameter “% age calls answered by the operator within 90 seconds”.
Bandwidth Utilization/ Throughput: All the service providers were found using Multiple Router Traffic Grapher
(MRTG) and also it was observed that all service providers were reporting combined bandwidth utilization for corporate customers and household customers. The performance of service providers with respect of these parameters was found satisfactory i.e. within benchmark except NSTPL and HFCL. The performance of NSTPL and HFCL for the parameter “%age Bandwidth utilized during the period” and “%age International Bandwidth utilization during peak hour” was 80% and 85.02% respectively against the benchmark of <80%. Live measurement: The performance of D-Vois, Hathway, NSTPL and Pacenet for the parameter “%age Bandwidth utilized during the period” was 87.85%, 92.72%, 85.80% and 81.51% respectively against the benchmark of <80% and TTSL & HFCL for the parameter “%age International Bandwidth utilization during peak hour” was 80.18% and 88.57% respectively.
Service Availability/Uptime: All service providers were found meeting the benchmark for this parameter except
Hathway. Only Hathway failed to meet the benchmark with its achieved level as 88.80%. During 3 days live measurement, Hathway and NSTPL failed to meet the benchmark for the parameter “Service Availability/Uptime” with their achieved level as 82.11% and 97.22% respectively.
Packet Loss and Network Latency: It was observed that almost all operators were measuring packet loss and
latency by conducting ping test on random basis for their internal assessment. However, the ping test conducted during live measurement revealed that all service providers were meeting the benchmark prescribed by TRAI. During 3 days lives measurement, TTSL and Hathway failed to meet the benchmark with their achieved level as 7.50% & 1.26% for parameter “Packet Loss”.

AUDIT & ASSESSMENT OF QOS FOR QE-JUNE-2015-PUNJAB CIRCLE
TUV-SUD SOUTH ASIA PRIVATE LIMITED Page 100
10.4 CUSTOMER CARE / HELPLINE ASSESSMENT
LIVE CALLING TO CALL CENTRE FOR BROADBAND SERVICES
Parameter C
ircl
e N
ame
BH
AR
TI-
AIR
TE
L
BS
NL
D-V
OIS
RC
L
TC
L
TT
SL
HA
TH
WA
Y
FIV
E
NE
TW
OR
K
HF
CL
NS
TP
L
PA
CE
NE
T
Total No. of calls Attempted Punjab 100 100 100 100 100 100 100 100 100 No Customer
Care 100
Total number of calls answered by the operator within 60 seconds
Punjab 100 100 88 100 92 100 96 100 100 No Customer
Care 100
% age calls answered by the operator in 60 seconds
Punjab 100% 100% 88% 100% 92% 100% 96% 100% 100% No Customer
Care 100%
Total number of calls answered by the operator within 90 seconds
Punjab 100 100 100 100 100 100 100 100 100 No Customer
Care 100
% age calls answered by the operator within 90 seconds
Punjab 100% 100% 100% 100% 100% 100% 100% 100% 100% No Customer
Care 100%
In case of calls answered by operators (voice to voice) within 60 seconds and 90 seconds, when test calls were made to the call centers, all broadband service providers were found meeting the TRAI prescribed benchmark. D-Vois, TCL and Hathway could connect 88%, 92% and 96% calls respectively within 60 seconds.
10.5 LIVE CALLING FOR BILLING COMPLIANTS
TELEPHONIC INTERVIEW FOR BILLING COMPLAINTS
Parameter
Cir
cle
Nam
e
BH
AR
TI-
AIR
TE
L
BS
NL
D-V
OIS
RC
L
TC
L
TT
SL
HA
TH
WA
Y
FIV
E
NE
TW
OR
K
HF
CL
NS
TP
L
PA
CE
NE
T
Total No. of calls Attempted Punjab 16 19 NA 79 0 3 NA NA 32 NA 10
Total No. of calls Answered Punjab 16 17 NA 79 0 3 NA NA 32 NA 10
Cases resolved within 4 weeks Punjab 16 17 NA 79 0 3 NA NA 32 NA 10
%age of cases resolved Punjab 100% 100% NA 100% 100% 100% NA NA 100% NA 100%
NA: Not Applicable, In case of D-Vois, Hathway, Five Network and NSTPL, they do not have postpaid services.
To test the Service Providers performance on billing related complaints and their resolutions, TUV-SUD auditors had
to conduct a customer feedback calling for about random 100 nos. of customers. However, the number of customers
contacted for verification was less due to less number of billing complaints. During live calling, some of the customers
reported that there complaints have been resolved but did not remember about the duration of their resolution.
However, most of the customers reported their satisfaction on resolution of the billing complaints.

AUDIT & ASSESSMENT OF QOS FOR QE-JUNE-2015-PUNJAB CIRCLE
TUV-SUD SOUTH ASIA PRIVATE LIMITED Page 101
GRAPHICAL REPRESENTATION OF BROADBAND SERVICES

AUDIT & ASSESSMENT OF QOS FOR QE-JUNE-2015-PUNJAB CIRCLE
TUV-SUD SOUTH ASIA PRIVATE LIMITED Page 102
10.6 GRAPHICAL REPRESENTATION OF QUARTERLY PERFORMANCE OF BROADBAND SERVICE PROVIDERS:
1. SERVICE PROVISIONING/ACTIVATION TIME:
All Operators are meeting the benchmark.
2. BILLING PERFORMANCE:
All Operators are meeting the benchmarks.
BHARTI-AIRTEL
BSNL D-Vois RCL TCL TTSL HATHW
AY Five
Network HFCL NSTPL Pacenet
100% cases in 15 days (subject to technical feasibility)
100% 100% 100% 100% 100% 100% 100% 100% 100% 100% 100%
Benchmark <15 days 100% 100% 100% 100% 100% 100% 100% 100% 100% 100% 100%
0%
20%
40%
60%
80%
100%
Service Provisioning/Activation Time
BHARTI-AIRTEL
BSNL D-Vois RCL TCL TTSL HATHWA
Y Five
Network HFCL NSTPL Pacenet
Billing complaints per 100 bills issued 0.01% 0.03% 0.23% 0.00% 0.07% 0.01% 0.52%
Benchmark <2% 2% 2% 2% 2% 2% 2% 2% 2% 2% 2% 2%
0.00%
0.50%
1.00%
1.50%
2.00%
2.50%
Billing Performance
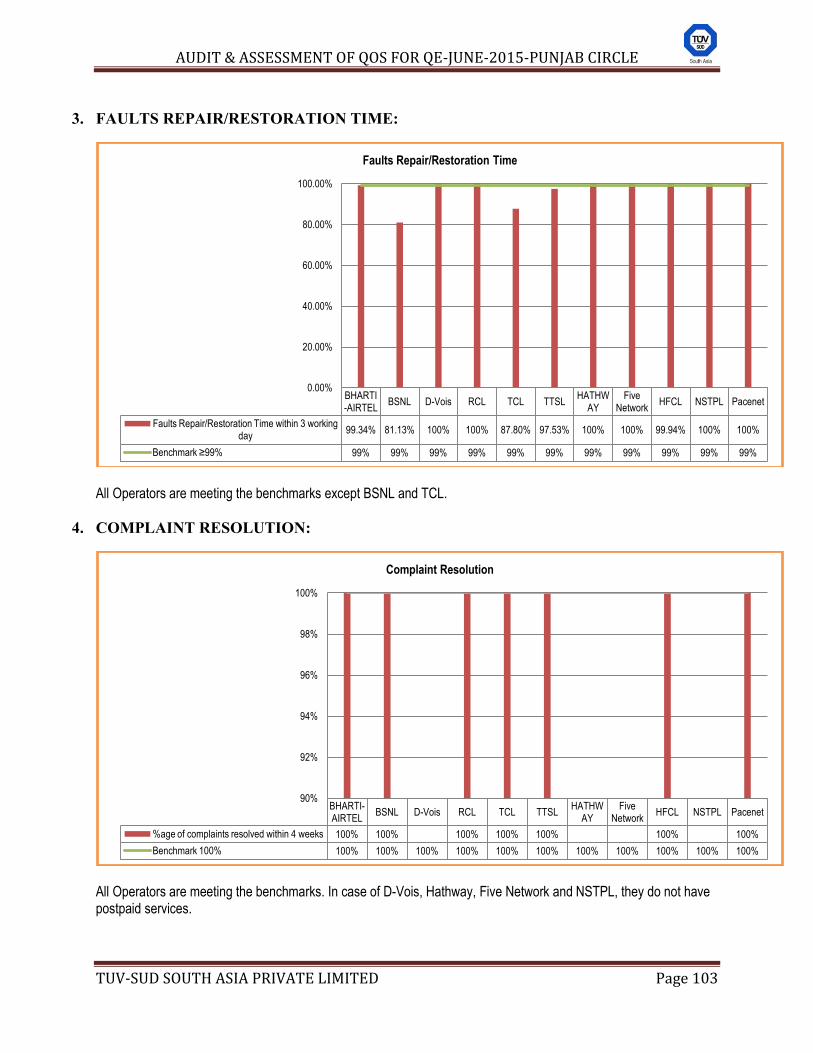
AUDIT & ASSESSMENT OF QOS FOR QE-JUNE-2015-PUNJAB CIRCLE
TUV-SUD SOUTH ASIA PRIVATE LIMITED Page 103
3. FAULTS REPAIR/RESTORATION TIME:
All Operators are meeting the benchmarks except BSNL and TCL.
4. COMPLAINT RESOLUTION:
All Operators are meeting the benchmarks. In case of D-Vois, Hathway, Five Network and NSTPL, they do not have postpaid services.
BHARTI-AIRTEL
BSNL D-Vois RCL TCL TTSL HATHW
AY Five
Network HFCL NSTPL Pacenet
Faults Repair/Restoration Time within 3 working day
99.34% 81.13% 100% 100% 87.80% 97.53% 100% 100% 99.94% 100% 100%
Benchmark ≥99% 99% 99% 99% 99% 99% 99% 99% 99% 99% 99% 99%
0.00%
20.00%
40.00%
60.00%
80.00%
100.00%
Faults Repair/Restoration Time
BHARTI-AIRTEL
BSNL D-Vois RCL TCL TTSL HATHW
AY Five
Network HFCL NSTPL Pacenet
%age of complaints resolved within 4 weeks 100% 100% 100% 100% 100% 100% 100%
Benchmark 100% 100% 100% 100% 100% 100% 100% 100% 100% 100% 100% 100%
90%
92%
94%
96%
98%
100%
Complaint Resolution

AUDIT & ASSESSMENT OF QOS FOR QE-JUNE-2015-PUNJAB CIRCLE
TUV-SUD SOUTH ASIA PRIVATE LIMITED Page 104
5. REFUND:
All Operators are meeting the benchmarks. In case of D-Vois, Hathway, Five Network and NSTPL, they do not have postpaid services.
6. SERVICE AVAILABILITY/UPTIME:
All Operators are meeting the benchmarks.
BHARTI-AIRTEL
BSNL D-Vois RCL TCL TTSL HATHW
AY Five
Network HFCL NSTPL Pacenet
Time taken for refund of deposits after closure (within 60 days)
100% 100% 100% 100% 100%
Benchmark 100% (within 60 days) 100% 100% 100% 100% 100% 100% 100% 100% 100% 100% 100%
90%
92%
94%
96%
98%
100%
102%
Time taken for refund of deposits after closure (within 60 days)
BHARTI-AIRTEL
BSNL D-Vois RCL TCL TTSL HATHW
AY Five
Network HFCL NSTPL Pacenet
Service Availability/Uptime (for all users) in %age 100% 100% 99.40% 99.52% 99.87% 99.56% 88.80% 100% 99.94% 99.93% 99.35%
Benchmark >98% 98% 98% 98% 98% 98% 98% 98% 98% 98% 98% 98%
90%
92%
94%
96%
98%
100%
Service Availability/Uptime (for all users) in %age

AUDIT & ASSESSMENT OF QOS FOR QE-JUNE-2015-PUNJAB CIRCLE
TUV-SUD SOUTH ASIA PRIVATE LIMITED Page 105
10.7 GRAPHICAL REPRESENTATION OF PERFORMANCE OF THE BROADBAND SERVICE PROVIDERS V/S 3-DAYS LIVE MEASUREMENT:
1. BROADBAND UTILIZATION/THROUGHPUT POP TO ISP GATEWAY NODE:
All Operators are meeting the benchmarks except D-Vois, Hathway, NSTPL and Pacenet during the 3 day live measurement.
2. BROADBAND UTILIZATION/THROUGHPUT ISP GATEWAY NODE TO IGSP/NIXI
NODE:
All Operators are meeting the benchmarks except TTSL (3 day live) and HFCL.
BHARTI-AIRTEL
BSNL D-Vois RCL TCL TTSL HATHWAY Five
Network HFCL NSTPL Pacenet
Quarterly 6.66% 46.87% 52.60% 20.37% 19.94% 69.00% 61.85% 75.97% 80.00% 79.70%
Live 6.36% 66.34% 87.85% 15.75% 2.61% 67.66% 92.72% 69.33% 74.53% 85.80% 81.51%
Benchmark <80% 80% 80% 80% 80% 80% 80% 80% 80% 80% 80% 80%
0.00%
20.00%
40.00%
60.00%
80.00%
100.00%
Bandwidth Utilization/ Throughput POP to ISP Gateway Node [Intra-network] Link(s)
BHARTI-AIRTEL
BSNL D-Vois RCL TCL TTSL HATHWAY Five
Network HFCL NSTPL Pacenet
Quarterly 71.27% 51.25% 60.00% 76.28% 85.02%
Live 7.61% 73.73% 50.29% 80.18% 72.28% 88.57%
Benchmark <80% 80% 80% 80% 80% 80% 80% 80% 80% 80% 80% 80%
0%
10%
20%
30%
40%
50%
60%
70%
80%
90%
100%
Bandwidth Utilization/ Throughput ISP Gateway Node to IGSP / NIXI Node upstream Link(s) for International connectivity

AUDIT & ASSESSMENT OF QOS FOR QE-JUNE-2015-PUNJAB CIRCLE
TUV-SUD SOUTH ASIA PRIVATE LIMITED Page 106
3. BROADBAND CONNECTION SPEED (DOWNLOAD) FROM ISP NODE TO USER:
All Operators are meeting the benchmark.
4. PACKET LOSS:
All Operators are meeting the benchmark except TTSL & Hathway during 3 day live measurement.
BHARTI-AIRTEL
BSNL D-Vois RCL TCL TTSL HATHWAY Five
Network HFCL NSTPL Pacenet
Quarterly 100% 95.00% 93.33% 89.46% 92.88% 90.50% 99.35% 93.98%
Live 108.00% 83.11% 101.33% 95.00% 96.66% 101.20% 95.49% 98.25% 100% 95.04% 88.72%
Benchmark >80% 80% 80% 80% 80% 80% 80% 80% 80% 80% 80% 80%
0%
20%
40%
60%
80%
100%
Broadband Connection Speed (download) from ISP Node to User
BHARTI-AIRTEL
BSNL D-Vois RCL TCL TTSL HATHWAY Five
Network HFCL NSTPL Pacenet
Quarterly 0.00% 0.36% 0.00% 0.60% 0.00% 0.00% 0.00% 0.07%
Live 0.00% 0.44% 0.03% 0.00% 0.00% 7.50% 1.26% 0.00% 0.13% 0.10% 0.43%
Benchmark <1% 1% 1% 1% 1% 1% 1% 1% 1% 1% 1% 1%
0.00%
1.00%
2.00%
3.00%
4.00%
5.00%
6.00%
7.00%
8.00%
% of Packet Loss

AUDIT & ASSESSMENT OF QOS FOR QE-JUNE-2015-PUNJAB CIRCLE
TUV-SUD SOUTH ASIA PRIVATE LIMITED Page 107
5. NETWORK LATENCY USER REFERENCE POINT AT POP/ISP GATEWAY NODE
TO IGSP/NIXI:
All Operators are meeting the benchmarks.
6. NETWORK LATENCY USER REFERENCE POINT AT ISP GATEWAY NODE TO
INTERNATIONAL NEAREST NAP PORT ABROAD (TERRESTRIAL):
All Operators are meeting the benchmark except Pacenet.
BHARTI-AIRTEL
BSNL D-Vois RCL TCL TTSL HATHWAY Five
Network HFCL NSTPL Pacenet
Quarterly 33 21 23 60 64 58 15 94
Live 30 51 16 1 54 85 66 2 54 15
Benchmark <120 ms 120 120 120 120 120 120 120 120 120 120 120
0
20
40
60
80
100
120
Network latency User reference point at POP/ISP Gateway node to IGSP/NIXI
BHARTI-AIRTEL
BSNL D-Vois RCL TCL TTSL HATHWAY Five
Network HFCL NSTPL Pacenet
Quarterly 84 25 278 61 98 102 280 354
Live 25 287 54 2 50 67 35 182 101 91
Benchmark <350 ms 350 350 350 350 350 350 350 350 350 350 350
0
50
100
150
200
250
300
350
Network latency User reference point at ISP Gateway Node to International nearest NAP port abroad (terrestrial)

AUDIT & ASSESSMENT OF QOS FOR QE-JUNE-2015-PUNJAB CIRCLE
TUV-SUD SOUTH ASIA PRIVATE LIMITED Page 108
7. RESPONSE TIME TO THE CUSTOMER FOR ASSISTANCE ACCESSIBILITY BY
OPERATOR WITHIN 60 SECONDS:
All Operators are meeting the benchmarks. In case of NSTPL, There is no Customer Care Number. Customers reported to them on their local mobile numbers.
8. RESPONSE TIME TO THE CUSTOMER FOR ASSISTANCE ACCESSIBILITY BY
OPERATOR WITHIN 90 SECONDS:
All Operators are meeting the benchmarks except BSNL (3 days live) and TCL. In case of NSTPL, There is no Customer Care Number. Customers reported to them on their local mobile number.
BHARTI-AIRTEL
BSNL D-Vois RCL TCL TTSL HATHWA
Y Five
Network HFCL NSTPL Pacenet
Quarterly 85.79% 81.41% 90.32% 93.95% 62.17% 97.62% 84.65% 100% 73.51% 73.53%
Live 77.33% 68.30% 80.00% 93.95% 80.35% 100% 70.23% 100% 73.97% 76.47%
Benchmark >60% (within 60 sec) 60% 60% 60% 60% 60% 60% 60% 60% 60% 60% 60%
0.00%
20.00%
40.00%
60.00%
80.00%
100.00%
120.00%
Response time to the customer for assistance % age of calls answered by operator (Voice to Voice)
BHARTI-AIRTEL
BSNL D-Vois RCL TCL TTSL HATHWA
Y Five
Network HFCL NSTPL Pacenet
Quarterly 90.61% 89.29% 100% 94.83% 65.38% 98.12% 100% 100% 82.42% 92.65%
Live 82.37% 76.33% 100% 94.82% 83.11% 100% 89.29% 100% 80.31% 94.12%
Benchmark >80% (within 90 sec) 80% 80% 80% 80% 80% 80% 80% 80% 80% 80% 80%
0%
20%
40%
60%
80%
100%
Response time to the customer for assistance % age of calls answered by operator (Voice to Voice) 90 Sec.

AUDIT & ASSESSMENT OF QOS FOR QE-JUNE-2015-PUNJAB CIRCLE
TUV-SUD SOUTH ASIA PRIVATE LIMITED Page 109
Exchanges covered for QoS audit in Punjab Circle - Annex-1
S.NO Service provider SSA Name SDCA EXCHANGE NAME Exchange Type
1 BSNL Amritsar Amritsar AR AL RD OCB URBAN
2 BSNL Amritsar Amritsar AR AL RD RSU URBAN
3 BSNL Amritsar Amritsar AR BATALA RD(ksq) URBAN
4 BSNL Amritsar Amritsar AR BHAGTANWALA URBAN
5 BSNL Amritsar Amritsar AR CHH(RSU) URBAN
6 BSNL Amritsar Amritsar AR FTC RD URBAN
7 BSNL Amritsar Rayya RAYYA U URBAN
8 BSNL Amritsar TarnTaran TARN TARAN U URBAN
9 BSNL Amritsar Amritsar AKALGARH RURAL
10 BSNL Amritsar Amritsar ATTARI RURAL
11 BSNL Amritsar Amritsar BAL KHURD RURAL
12 BSNL Amritsar Amritsar BHANGALI KALAN RURAL
13 BSNL Amritsar Amritsar BUNDALA RURAL
14 BSNL Amritsar Amritsar CHAUHAN RURAL
15 BSNL Amritsar Amritsar CHAWINDA DEVI RURAL
16 BSNL Amritsar Amritsar FATEH SUKAR CHAK RURAL
17 BSNL Amritsar Amritsar GEHRI MANDI RURAL
18 BSNL Amritsar Amritsar GHARINDA RURAL
19 BSNL Amritsar Amritsar HOSHIAR NAGAR RURAL
20 BSNL Amritsar Amritsar IBBAN KALAN RURAL
21 BSNL Amritsar Amritsar JAINTIPUR RURAL
22 BSNL Amritsar Amritsar JAJJEANI RURAL
23 BSNL Amritsar Amritsar JETHUWAL RURAL
24 BSNL Amritsar Amritsar KATHUNANGAL RURAL
25 BSNL Amritsar Rayya BABA BAKALA RURAL
26 BSNL Amritsar Rayya BAGGA RURAL
27 BSNL Amritsar Rayya BAL SARAI (WARAICH) RURAL
28 BSNL Amritsar Rayya BHOEWAL RURAL
29 BSNL Amritsar Rayya BHORSI RAJPUTAN RURAL

AUDIT & ASSESSMENT OF QOS FOR QE-JUNE-2015-PUNJAB CIRCLE
TUV-SUD SOUTH ASIA PRIVATE LIMITED Page 110
S.NO Service provider SSA Name SDCA EXCHANGE NAME Exchange Type
30 BSNL Amritsar Rayya BUTALA RURAL
31 BSNL Amritsar Rayya BUTTER KALAN RURAL
32 BSNL Amritsar Rayya DASHMESH NAGAR RURAL
33 BSNL Amritsar Rayya DEHRIWAL RURAL
34 BSNL Amritsar Rayya DERA BABA JAIMAL SINGH RURAL
35 BSNL Amritsar TarnTaran BATH RURAL
36 BSNL Amritsar TarnTaran CHABAL RURAL
37 BSNL Amritsar TarnTaran CHEEMA KHURD RURAL
38 BSNL Amritsar TarnTaran DABURJI RURAL
39 BSNL Amritsar TarnTaran DHAND KASEL RURAL
40 BSNL Amritsar TarnTaran DHOTIAN RURAL
41 BSNL Amritsar TarnTaran GAGO BUA RURAL
42 BSNL Amritsar TarnTaran GANDIWIND RURAL
43 BSNL Amritsar TarnTaran GOHALWAR RURAL
44 BSNL Amritsar TarnTaran JAHANGIR RURAL
45 BSNL Jalandhar Jalandhar GPO URBAN
46 BSNL Jalandhar Jalandhar I/Area URBAN
47 BSNL Jalandhar Jalandhar MTS Nagar URBAN
48 BSNL Jalandhar Jalandhar Rama Mandi URBAN
49 BSNL Jalandhar Jalandhar Adampur URBAN
50 BSNL Jalandhar Kapurthala Kapurthala URBAN
51 BSNL Jalandhar Fagwara Phagwara URBAN
52 BSNL Jalandhar Jalandhar Alampur Bakka RURAL
53 BSNL Jalandhar Jalandhar Ali Pur RURAL
54 BSNL Jalandhar Jalandhar Chitti RURAL
55 BSNL Jalandhar Jalandhar Dhogri RURAL
56 BSNL Jalandhar Jalandhar Dingrian RURAL
57 BSNL Jalandhar Jalandhar Ghurial RURAL
58 BSNL Jalandhar Jalandhar Jandeer RURAL
59 BSNL Jalandhar Jalandhar Jandu singha RURAL
60 BSNL Jalandhar Jalandhar Kala bakra RURAL
61 BSNL Jalandhar Jalandhar Kalra RURAL

AUDIT & ASSESSMENT OF QOS FOR QE-JUNE-2015-PUNJAB CIRCLE
TUV-SUD SOUTH ASIA PRIVATE LIMITED Page 111
S.NO Service provider SSA Name SDCA EXCHANGE NAME Exchange Type
62 BSNL Jalandhar Kapurthala Aujla RURAL
63 BSNL Jalandhar Kapurthala Balerkhan pur RURAL
64 BSNL Jalandhar Kapurthala Bhandal Bet RURAL
65 BSNL Jalandhar Kapurthala Fattu dhinga RURAL
66 BSNL Jalandhar Kapurthala Gopi pur RURAL
67 BSNL Jalandhar Kapurthala Hamira RURAL
68 BSNL Jalandhar Kapurthala Kala sanghian RURAL
69 BSNL Jalandhar Kapurthala Khera dona RURAL
70 BSNL Jalandhar Fagwara Bhanoki RURAL
71 BSNL Jalandhar Fagwara Chaheru RURAL
72 BSNL Jalandhar Fagwara Khuram pur RURAL
73 BSNL Jalandhar Fagwara Panchat RURAL
74 BSNL Jalandhar Fagwara Ram pur sunra RURAL
75 BSNL Jalandhar Fagwara Rani pur RURAL
76 BSNL Jalandhar Fagwara Rehana jattan RURAL
77 Bharti-Airtel --- --- Chandigarh URBAN
78 HFCL --- --- Mohali URBAN
79 RCL --- --- DAKC, Mumbai URBAN
80 TTL --- --- Chandigarh URBAN
81 Vodafone --- --- Mohali URBAN

AUDIT & ASSESSMENT OF QOS FOR QE-JUNE-2015-PUNJAB CIRCLE
TUV-SUD SOUTH ASIA PRIVATE LIMITED Page 112
PoPs covered for Broadband QoS audit in Punjab Circle - Annex-2
S.NO Service provider SSA Name SDCA PoPs Name Activity
1 BSNL Amritsar Amritsar AR AL RD OCB BB Audit
2 BSNL Amritsar Amritsar AR AL RD RSU BB Audit
3 BSNL Amritsar Amritsar AR BATALA RD(ksq) BB Audit
4 BSNL Amritsar Amritsar AR BHAGTANWALA BB Audit
5 BSNL Amritsar Amritsar AR CHH(RSU) BB Audit
6 BSNL Amritsar Amritsar AR FTC RD BB Audit
7 BSNL Amritsar Rayya RAYYA U BB Audit
8 BSNL Amritsar TarnTaran TARN TARAN U BB Audit
9 BSNL Amritsar Amritsar AKALGARH BB Audit
10 BSNL Amritsar Amritsar ATTARI BB Audit
11 BSNL Amritsar Amritsar BAL KHURD BB Audit
12 BSNL Amritsar Amritsar BHANGALI KALAN BB Audit
13 BSNL Amritsar Amritsar BUNDALA BB Audit
14 BSNL Amritsar Amritsar CHAUHAN BB Audit
15 BSNL Amritsar Amritsar CHAWINDA DEVI BB Audit
16 BSNL Amritsar Amritsar FATEH SUKAR CHAK BB Audit
17 BSNL Amritsar Amritsar GEHRI MANDI BB Audit
18 BSNL Amritsar Amritsar GHARINDA BB Audit
19 BSNL Amritsar Amritsar HOSHIAR NAGAR BB Audit
20 BSNL Amritsar Amritsar IBBAN KALAN BB Audit
21 BSNL Amritsar Amritsar JAINTIPUR BB Audit
22 BSNL Amritsar Amritsar JAJJEANI BB Audit
23 BSNL Amritsar Amritsar JETHUWAL BB Audit
24 BSNL Amritsar Amritsar KATHUNANGAL BB Audit
25 BSNL Amritsar Rayya BABA BAKALA BB Audit
26 BSNL Amritsar Rayya BAGGA BB Audit
27 BSNL Amritsar Rayya BAL SARAI (WARAICH) BB Audit
28 BSNL Amritsar Rayya BHOEWAL BB Audit
29 BSNL Amritsar Rayya BHORSI RAJPUTAN BB Audit
30 BSNL Amritsar Rayya BUTALA BB Audit
31 BSNL Amritsar Rayya BUTTER KALAN BB Audit
32 BSNL Amritsar Rayya DASHMESH NAGAR BB Audit
33 BSNL Amritsar Rayya DEHRIWAL BB Audit
34 BSNL Amritsar Rayya DERA BABA JAIMAL SINGH BB Audit
35 BSNL Amritsar TarnTaran BATH BB Audit
36 BSNL Amritsar TarnTaran CHABAL BB Audit
37 BSNL Amritsar TarnTaran CHEEMA KHURD BB Audit

AUDIT & ASSESSMENT OF QOS FOR QE-JUNE-2015-PUNJAB CIRCLE
TUV-SUD SOUTH ASIA PRIVATE LIMITED Page 113
S.NO Service provider SSA Name SDCA PoPs Name Activity
38 BSNL Amritsar TarnTaran DABURJI BB Audit
39 BSNL Amritsar TarnTaran DHAND KASEL BB Audit
40 BSNL Amritsar TarnTaran DHOTIAN BB Audit
41 BSNL Amritsar TarnTaran GAGO BUA BB Audit
42 BSNL Amritsar TarnTaran GANDIWIND BB Audit
43 BSNL Amritsar TarnTaran GOHALWAR BB Audit
44 BSNL Amritsar TarnTaran JAHANGIR BB Audit
45 BSNL Jalandhar Jalandhar GPO BB Audit
46 BSNL Jalandhar Jalandhar I/Area BB Audit
47 BSNL Jalandhar Jalandhar MTS Nagar BB Audit
48 BSNL Jalandhar Jalandhar Rama Mandi BB Audit
49 BSNL Jalandhar Jalandhar Adampur BB Audit
50 BSNL Jalandhar Kapurthala Kapurthala BB Audit
51 BSNL Jalandhar Fagwara Phagwara BB Audit
52 BSNL Jalandhar Jalandhar Alampur Bakka BB Audit
53 BSNL Jalandhar Jalandhar Ali Pur BB Audit
54 BSNL Jalandhar Jalandhar Chitti BB Audit
55 BSNL Jalandhar Jalandhar Dhogri BB Audit
56 BSNL Jalandhar Jalandhar Dingrian BB Audit
57 BSNL Jalandhar Jalandhar Ghurial BB Audit
58 BSNL Jalandhar Jalandhar Jandeer BB Audit
59 BSNL Jalandhar Jalandhar Jandu singha BB Audit
60 BSNL Jalandhar Jalandhar Kala bakra BB Audit
61 BSNL Jalandhar Jalandhar Kalra BB Audit
62 BSNL Jalandhar Kapurthala Aujla BB Audit
63 BSNL Jalandhar Kapurthala Balerkhan pur BB Audit
64 BSNL Jalandhar Kapurthala Bhandal Bet BB Audit
65 BSNL Jalandhar Kapurthala Fattu dhinga BB Audit
66 BSNL Jalandhar Kapurthala Gopi pur BB Audit
67 BSNL Jalandhar Kapurthala Hamira BB Audit
68 BSNL Jalandhar Kapurthala Kala sanghian BB Audit
69 BSNL Jalandhar Kapurthala Khera dona BB Audit
70 BSNL Jalandhar Fagwara Bhanoki BB Audit
71 BSNL Jalandhar Fagwara Chaheru BB Audit
72 BSNL Jalandhar Fagwara Khuram pur BB Audit
73 BSNL Jalandhar Fagwara Panchat BB Audit
74 BSNL Jalandhar Fagwara Ram pur sunra BB Audit
75 BSNL Jalandhar Fagwara Rani pur BB Audit

AUDIT & ASSESSMENT OF QOS FOR QE-JUNE-2015-PUNJAB CIRCLE
TUV-SUD SOUTH ASIA PRIVATE LIMITED Page 114
S.NO Service provider SSA Name SDCA PoPs Name Activity
76 BSNL Jalandhar Fagwara Rehana jattan BB Audit
77 BHARTI AIRTEL LIMITED --- --- Chandigarh BB Audit
78 D-VOIS BROADBAND --- --- Chandigarh BB Audit
79 FIVE-NETWORKS --- --- Bhatinda BB Audit
80 NSTPL --- --- Chandigarh BB Audit
81 BROADBAND PACENET INDIA PVT. LTD --- --- Subhash Nagar BB Audit
82 RELIANCE COMMUNICATION LIMITED (RCL) --- --- DAKC, Mumbai BB Audit
83 TATA COMMUNICATION LIMITED (TCL) --- --- Chandigarh BB Audit
84 TATA TELESERVICES LIMITED (TTL) --- --- Chandigarh BB Audit
85 HFCL --- --- Mohali BB Audit
86 HATHWAY --- --- Mohali BB Audit