audit & assessment of qos for qe- september - Telecom ...
68
Audit & Assessment of Quality of Service Of Cellular Mobile Telephone Service For Telecom Regulatory Authority of India North Zone – Haryana Service Area (July 2015 – September 2015) Prepared by:- TÜV SÜD SOUTH ASIA PVT. LTD, C-153/1, Okhla Industrial Estate, Phase-1, New Delhi – 110020 Telephone 011- 30889611 Fax: 011-30889595
-
Upload
khangminh22 -
Category
Documents
-
view
1 -
download
0
Transcript of audit & assessment of qos for qe- september - Telecom ...
AUDIT & ASSESSMENT OF QOS FOR QE- SEPTEMBER-2015 - HARYANA CIRCLE
TUV-SUD SOUTH ASIA PRIVATE LIMITED Page 1
AUDIT & ASSESSMENT OF QOS FOR QE- SEPTEMBER-2015 - HARYANA CIRCLE
[Type the document
subtitle]
Audit & Assessment of Quality of Service
Of
Cellular Mobile Telephone Service
For
Telecom Regulatory Authority of India
North Zone – Haryana Service Area
(July 2015 – September 2015)
North Zone – Haryana Service Area
(October 2014 – December 2014)
Prepared by:-
TÜV SÜD SOUTH ASIA PVT. LTD, C-153/1, Okhla Industrial Estate,
Phase-1, New Delhi – 110020 Telephone 011- 30889611
Fax: 011-30889595

AUDIT & ASSESSMENT OF QOS FOR QE- SEPTEMBER-2015 - HARYANA CIRCLE
TUV-SUD SOUTH ASIA PRIVATE LIMITED Page 2
PREFACE
The Telecom Regulatory Authority of India (TRAI) was established in 1997 by an Act of Parliament, called the
Telecom Regulatory Authority of India Act, 1997, to regulate telecom services. The Authority’s mission is to ensure
that the interest of consumers are protected and at the same time to nurture conditions for growth of
telecommunications, broadcasting and cable services in a manner and at a pace which will enable India to play a
leading role in emerging global information society.
The Authority, in exercise of its functions as per the provisions in the TRAI Act, has been entrusted to measure the
Quality of Service provided by the Service Providers from time to time and to compare them with the benchmarks so
as to assess the level of performance. In pursuance of this, TRAI has appointed M/s TUV-SUD South Asia Pvt. Ltd.
to carry out “Audit and Assessment of Quality of Service” provided by Basic (Wire line), Cellular Mobile and
Broadband service providers in terms of the benchmarks specified in the respective regulations, in North and West
Zones.
TUV-SUD South Asia carried out QoS audit as per the norms of TRAI in all the eight circles / services areas of the
North Zone and four circles of the West Zone. This report details the performance of the various service providers in
Haryana circle against the QoS bench marks laid down by TRAI in the respective regulations.

AUDIT & ASSESSMENT OF QOS FOR QE- SEPTEMBER-2015 - HARYANA CIRCLE
TUV-SUD SOUTH ASIA PRIVATE LIMITED Page 3
Table of Contents 1. BACKGROUND .................................................................................................................................. 6
2. OBJECTIVES AND METHODOLOGY ........................................................................................... 9
3. SAMPLE SIZE .................................................................................................................................. 11
3.1 SAMPLING FOR CELLULAR MOBILE (WIRELESS) SERVICE PROVIDERS ................... 11
3.2 SAMPLING FOR BASIC (WIRE LINE) SERVICES ................................................................ 12
3.3 SAMPLING FOR BROADBAND SERVICE PROVIDERS ...................................................... 12
4. EXECUTIVE SUMMARY ................................................................................................................ 14
5. PMR AUDIT REPORTS: ................................................................................................................. 17
5.1 MONTHLY PMR: ................................................................................................................................ 17
5.1.1 BUSY HOUR OF VARIOUS SERVICE PROVIDERS: ......................................................... 17
5.1.2 SWITCHES/BSC/BTS DETAILS OF SERVICE PROVIDERS: ............................................ 17
5.1.3 QOS PERFORMANCE OF MONTHLY PMR – JULY 15 MONTH: .................................... 18
5.1.4 QOS PERFORMANCE OF MONTHLY PMR – AUGUST 15 MONTH: .............................. 19
5.1.5 QOS PERFORMANCE OF MONTHLY PMR – SEPTEMBER 15 MONTH: ....................... 20
5.1.6 QOS PERFORMANCE OF QUARTERLY PMR –AVERAGE OF QE- SEPTEMBER 15
(JULY– AUGUST– SEPTEMBER 2015 MONTHS AUDITED DATA) ......................................... 21
5.1.7 KEY FINDINGS ON MONTHLY PMR AUDIT REPORTS: ................................................. 22
5.2 LIVE MEASUREMENT DATA (3-DAYS) FOR CELLULAR MOBILE SERVICE PROVIDERS
(NETWORK SERVICE QUALITY PARAMETER): ............................................................................... 25
5.2.1 LIVE MEASURMENT DATA (3-DAYS) – JULY 15 MONTH:............................................ 25
5.2.2 LIVE MEASURMENT DATA (3-DAYS) – AUGUST 15 MONTH: ..................................... 26
5.2.3 LIVE MEASURMENT DATA (3-DAYS) – SEPTEMBER 15 MONTH: .............................. 27
5.2.4 QUARTERLY QOS PERFORMANCE OF 3-DAYS LIVE MEASUREMENT AUDITED
DATA (AVERAGE OF JULY – AUGUST – SEPTEMBER 2015 MONTHS AUDITED DATA) 28
5.2.5 KEY FINDING ON 3 DAYS LIVE MEASUREMENTS: ....................................................... 28
5.2.6 DETAILED NETWORK DATA ASSESSMENT OF CELLULAR MOBILE TELEPHONE
SERVICES: ........................................................................................................................................ 29
5.3 CUSTOMER SERVICE QUALITY PARAMETERS MEASUREMENT FOR CMTS–QE SEPT-15:
36
5.3.1 QUARTERLY CUSTOMER SERVICE DELIVERY (CSD) AUDITED DATA FOR
CELLULAR MOBILE SERVICES (JULY TO SEPT 2015 MONTHS AUDITED DATA): .......... 36
5.3.2 3 DAYS LIVE CSD AUDITED DATA FOR CELLULAR MOBILE SERVICES (QE-SEPT
2015): ................................................................................................................................................. 38
5.3.3 KEY FINDINGS ON CUSTOMER SERVICE DELIVERY (CSD) PARAMETERS ............ 39
6. LIVE CALLING ASSESSMENT: .................................................................................................... 41
6.1 INTER OPERATOR CALLS ASSESSMENT:.................................................................................... 41
6.2 CUSTOMER CARE / HELPLINE ASSESSMENT: ........................................................................... 42

AUDIT & ASSESSMENT OF QOS FOR QE- SEPTEMBER-2015 - HARYANA CIRCLE
TUV-SUD SOUTH ASIA PRIVATE LIMITED Page 4
6.3 LIVE CALLING ASSESSMENT FOR BILLING COMPLAINTS: ................................................... 43
6.4 LEVEL -1 CALLING ASSESSMENT: ............................................................................................... 44
7. OPERATOR ASSESTID DRIVE TEST ........................................................................................ 46
7.1 DETAIL OF THE ROUTES COVERED DURING THE DRIVE TESTS: ......................................... 54
7.2 SSA WISE DRIVE TEST OBSERVATION: ...................................................................................... 55
7.3 KEY FINDINGS ON DRIVE TEST: ................................................................................................... 61
8. GRAPHICAL REPRESENTATION (CMTS): ............................................................................... 63
9. PMR VERIFICATION TABLE:........................................................................................................ 67

AUDIT & ASSESSMENT OF QOS FOR QE- SEPTEMBER-2015 - HARYANA CIRCLE
TUV-SUD SOUTH ASIA PRIVATE LIMITED Page 5
1. BACKGROUND

AUDIT & ASSESSMENT OF QOS FOR QE- SEPTEMBER-2015 - HARYANA CIRCLE
TUV-SUD SOUTH ASIA PRIVATE LIMITED Page 6
1. BACKGROUND
Telecom Regulatory Authority of India has been entrusted to “lay down the standards of quality of service to
be provided by the service providers and ensure the quality of service and conduct the periodical survey of
such service provided by the service providers so as to protect interest of the consumers
of telecommunication services” vide sub-clause (v) of clause (b) of sub-section (1) of section 11 of the
Telecom Regulatory Authority of India Act, 1997 (24 of 1997).
The purpose of laying down Quality of Service Parameters is to:
i) Create conditions for consumer satisfaction by making known the quality of service, which the Service
provider is required to provide, and the user has a right to expect.
ii) Measure the Quality of Service provided by the Service Providers from time to time and to compare them
with the norms so as to assess the level of performance.
iii) Generally protect the interests of consumers of telecommunication services.
TRAI, the regulatory watch dog for the Quality of Service for the telecom services – Basic (Wire line),
Cellular Mobile (Wireless) and Broadband has commissioned M/s TUV-SUD South Asia Pvt. Ltd. for
conducting audit and assessment of quality of service of service providers, in terms of the benchmarks
specified in the “The Standards of Quality of Service of Basic Telephone Service (Wire line) and Cellular
Mobile Telephone Service Regulations, 2009 (7 of 2009) dated 20th March, 2009 and the Quality of Service
of Broadband Service Regulations, 2006 (11 of 2006) dated 6thOctober, 2006 on zonal basis for North
Zone and West Zone comprising of the following Telecom Circles/Metro Service Areas:
North Zone: Delhi, Jammu & Kashmir, Himachal Pradesh, Punjab, Haryana, Rajasthan, Uttar Pradesh-
East and Uttar Pradesh-West (including Uttarakhand). For the cellular mobile telephone service the service
area of Delhi includes Ghaziabad, Faridabad, Noida and Gurgaon.
West Zone: Mumbai, Maharashtra (including Goa and excluding Mumbai), Gujarat and Madhya Pradesh
(including Chhattisgarh).

AUDIT & ASSESSMENT OF QOS FOR QE- SEPTEMBER-2015 - HARYANA CIRCLE
TUV-SUD SOUTH ASIA PRIVATE LIMITED Page 7
The Audit exercise would assess the Quality of Service of telecom operators providing Basic (Wire line),
Cellular Mobile (Wireless) and Broadband services by auditing the relevant QoS records maintained by the
operators, conducting drive tests as well as live measurements and comparing them with quality of service
benchmarks stipulated by TRAI. The audit would be carried out by TUV-SUD South Asia every quarter
across all the Circles/Service areas of North and West Zones for Cellular Mobile Service. However, in
respect of Basic telephone service (wireline) and Broadband service, a circle would be audited once in a
year.

AUDIT & ASSESSMENT OF QOS FOR QE- SEPTEMBER-2015 - HARYANA CIRCLE
TUV-SUD SOUTH ASIA PRIVATE LIMITED Page 8
2. OBJECTIVES AND METHODOLOGY

AUDIT & ASSESSMENT OF QOS FOR QE- SEPTEMBER-2015 - HARYANA CIRCLE
TUV-SUD SOUTH ASIA PRIVATE LIMITED Page 9
2. OBJECTIVES AND METHODOLOGY
The primary objective is to audit and assess the Quality of Service being rendered by Basic, Cellular Mobile
& Broadband service providers against the parameters notified by TRAI. The audit and assessment of Quality of Service was carried out by TUV SUD South Asia across all the
Circles/Service areas of North and West Zones for Cellular Mobile Service. Apart from this, QoS
audit for Basic (Wire line) and Broadband Services was also undertaken for UP (E), UP (W), and
MP&CG circles during the quarter July 2015 – September 2015.
The Scope of work as per the Terms of Reference (TOR) includes the following:
i) Preparation of Performance Monitoring reports (PMRs) and uploading in the system.
ii) Live measurements of the performance of Service Providers (SPs) against the benchmarks for
three days during each audit.
iii) Monthly audit based on one month data of the SPs.
iv) Drive test of the RF networks.
v) Audit of the performance of call centers with respect to their accessibility and percentage of
calls answered by the operators and random customer feedback by calling the customers to
get feedback of the services provided by the service providers.
vi) Transfer of data generated by the RF drive test/Live measurements / PMR/ monthly audit to
the server located at TRAI premises on real time basis.

AUDIT & ASSESSMENT OF QOS FOR QE- SEPTEMBER-2015 - HARYANA CIRCLE
TUV-SUD SOUTH ASIA PRIVATE LIMITED Page 10
3. SAMPLE SIZE

AUDIT & ASSESSMENT OF QOS FOR QE- SEPTEMBER-2015 - HARYANA CIRCLE
TUV-SUD SOUTH ASIA PRIVATE LIMITED Page 11
3. SAMPLE SIZE
3.1 SAMPLING FOR CELLULAR MOBILE (WIRELESS) SERVICE PROVIDERS
100% of the Gateway MSC’s (GMSC’s) and Mobile Switching Centers (MSC’s) of all the Cellular Mobile
Service Providers or Unified Access Service Providers (UASP) were covered for audit in specified
circles/service areas. Following were the various operators covered in Haryana circle
Sl. No. Name of Service
Provider Dates of live measurement Audit Audit Location
GSM Operators July-15 August-15 September -15
1 AIRCEL 20 to 22 Jul-15 12 to 14 Aug-15 7 to 9 Sep-15 Green Buleward Building, NSN office, Sector-62, Noida (UP)
2 AIRTEL 22 to 24 Jul-15 21, 24 & 25 Aug-15 8 to 10 Sep-15 Bharti Airtel Ltd, Plot No. 21, Rajiv Gandhi Chandigarh Technology Park, Chandigarh.
3 BSNL 17, 21 & 22 Jul-15 19 to 21 Aug-15 16 to 18 Sep-15 AGM (PG) Cum Nodal Officer (TRAI) O/o CGMT Haryana, Ambala (HR)
4 VIDEOCON 8 to 10 Jul-15 12 to 14 Aug-15 9 to 11 Sep-15 Videocon Telecommunication Ltd,Golden Palace,Near Vita Milk Plant,Jasmeet Nagar,Ambala City-134007
5 TATA GSM 21 to 23 Jul-15 19 to 21 Aug-15 17, 18 & 21 Sep-15 Tata Teleservices Limited, 5 - Jasmeet Nagar,Near Vita Milk Plant Gt Road,Ambala, Ambala-134001, India
6 IDEA 20 to 22 Jul-15 24 to 26 Aug-15 22 to 24 Sep-15 Idea Cellular Limited, E-5, Sector-63, Noida (UP)
7 RCOM GSM 15 to 17 Jul-15 24 to 26 Aug-15 10, 11 & 14 Sep-15 Reliance Communication Limited, NH-1, VPO-Mohari, Kuruskhetra, Near Hasari Pouthry Farm, Milestone 188.
8 VODAFONE 16, 17 & 20 Jul-15 19 to 21 Aug-15 17, 18 & 21 Sep-15 Vodafone Digilink Limited, 173 HSIDC Industrial Area, Sector-3, Karnal (Har.)
CDMA Operators
9 RCOM CDMA 15 to 17 Jul-15 24 to 26 Aug-15 10, 11 & 14 Sep-15 Reliance Communication Limited, NH-1, VPO-Mohari, Kuruskhetra, Near Hasari Pouthry Farm, Milestone 188.
10 TATA CDMA 21 to 23 Jul-15 19 to 21 Aug-15 17, 18 & 21 Sep-15 Tata Teleservices Limited, 5, Jasmeet Nagar,Near Vita Milk Plant Gt Road,Ambala, Ambala-134001, India
For all the above operators, audit was conducted in all the three months of the Quarter ended Sept. 2015. The data generated by monthly PMR and 3-days live measurements audit for the period July 2015 to September 2015 has been successfully uploaded to the server located at TRAI premises.

AUDIT & ASSESSMENT OF QOS FOR QE- SEPTEMBER-2015 - HARYANA CIRCLE
TUV-SUD SOUTH ASIA PRIVATE LIMITED Page 12
3.2 SAMPLING FOR BASIC (WIRE LINE) SERVICES The QoS audit for basic (wire line) service is to be done for the number of exchanges spread over in about
10% of SDCAs with each service providers in specified circles only once in a year. Based on this criterion,
QoS audit for basic (wire line) service was not required to be done for Haryana circle in the quarter
ended September - 2015, as the same has already been done during QE December 2014.
3.3 SAMPLING FOR BROADBAND SERVICE PROVIDERS TUV–SUD South Asia has to conduct the audit and assessment of Quality of Service of Broadband Service
only in respect of the service providers who are having broadband subscriber base of more than 10,000
subscribers in their licensed service area, for 5% of Point of Presence (PoPs) spread over in 10% SDCAs in
specified Telecom Circle only once in a year. Based on this criterion, the QoS audit for Broadband
service was not required to be done for Haryana circle in the quarter ended September - 2015, as the
same has already been done during QE December 2014.

AUDIT & ASSESSMENT OF QOS FOR QE- SEPTEMBER-2015 - HARYANA CIRCLE
TUV-SUD SOUTH ASIA PRIVATE LIMITED Page 13
4. EXECUTIVE SUMMARY

AUDIT & ASSESSMENT OF QOS FOR QE- SEPTEMBER-2015 - HARYANA CIRCLE
TUV-SUD SOUTH ASIA PRIVATE LIMITED Page 14
4. EXECUTIVE SUMMARY
The executive summary put in a nutshell the key findings of the Audit by providing: -
“Service provider performance report” for Cellular mobile, Basic (wire line) and Broadband services , which gives a foretaste of
the performance of various operators against the benchmark specified by TRAI, during the months in which the Audit was
carried out by TUV-SUD Auditors.
“Parameter wise critical findings” for Cellular mobile, Basic (wire line) and Broadband services: This indicates key observations
and findings from different activities carried out during the Audit process.
TUV-SUD conducted audit involved a 3 stage verification process which consisted of auditing the records of the service
providers and verifying the data submitted to TRAI. The second step involved a three day live measurement of all the network
parameters. On the basis of the three days live measurement, the auditors checked the busy hour of the day for the service
provider and collected the data for this busy hour for the month in which the audit was conducted Finally, the performance of
the service providers was also gauged by conducting drive tests in three select SSAs per service provider per quarter.
The three stage audit / verification viz audit of the records, live measurements and drive tests of all the cellular mobile operators
was repeated every month. In case of Basic (Wire line) and Broadband, this exercise is required to be carried out on quarterly
basis.
Essence of compliance report of service providers with respect to the QoS:
Cellular Mobile:
(i) Based on monthly audit, it was concluded that the performance of the service providers was fairly satisfactory for Network
Parameters in Haryana service area as they were found to have largely met the benchmarks of the parameters during the
quarter. However, Aircel, Tata (GSM) and Tata (CDMA) remained non-complied for the parameter Worst affected Cells > 3%
TCH drops’ with their average performance as 3.89%, 4.05% and 7.61% respectively. Further, Aircel also failed to meet the
benchmark of the parameters Call Drop Rate (CDR) with its achieved levels as 2.53%.
(ii) From three days assessment, the performance of all operators was found satisfactory as they were largely meeting the
benchmarks except the parameters CDR and ‘Worst affected cells> 3 % TCH drops”, which could not be complied with by
Aircel and Tata (GSM) / Tata (CDMA) respectively. The average performance of Aircel for parameter CDR was 2.19% and
that of Tata (GSM) and Tata (CDMA) for parameter ‘Worst affected cells> 3 % TCH drops” was 3.88% and 6.96%
respectively.
The similar non-compliance of Aircel, Tata (GSM) and Tata (CDMA) was also observed for monthly audit of the quarter.

AUDIT & ASSESSMENT OF QOS FOR QE- SEPTEMBER-2015 - HARYANA CIRCLE
TUV-SUD SOUTH ASIA PRIVATE LIMITED Page 15
(iii) With regard to the Customer Service Quality Parameters, the service providers were found in well compliance of most of
the parameters on Metering and Billing Credibility, Response Time to Customers, Termination of Service and Time taken for
refunds.
All service providers were in compliance with respect to the parameter ‘Accessibility of call center’ and ‘% Calls answered by
operator (voice to voice)’ except BSNL , RCOM GSM and Tata (GSM) have not met the benchmark of parameter calls
answered by Operators (voice to voice) within 90 seconds with their performance as 79.17% , 82.57% and 94.98%
against the benchmark of >=95%. The performance of BSNL and RCOM (GSM) was way below the benchmark.
In case of the parameters Termination and Time taken for refund, only Idea failed to meet the benchmark with its performed
vales as 97.19% and 98.46% respectively.
The results for three days live measurements reveal that all operators have met the benchmarks for the parameters
‘Accessibility to call center’ and call connection to operators (Voice to voice) within 90 seconds. Only BSNL remained short of
benchmark of ‘Call answered by operator (Voice to Voice) within 90 seconds’ with its performance of 52.85 % , way below
the benchmark.
(iv) With regard to Drive Tests, the overall performance of the service providers was satisfactory as they were largely meeting the
benchmarks. However, BSNL remained non-compliant with respect to the parameters Voice Quality and CDR in the respective
SSAs where drive tests were conducted.

AUDIT & ASSESSMENT OF QOS FOR QE- SEPTEMBER-2015 - HARYANA CIRCLE
TUV-SUD SOUTH ASIA PRIVATE LIMITED Page 16
5. PMR AUDIT REPORT

AUDIT & ASSESSMENT OF QOS FOR QE- SEPTEMBER-2015 - HARYANA CIRCLE
TUV-SUD SOUTH ASIA PRIVATE LIMITED Page 17
5. PMR AUDIT REPORTS:
5.1 MONTHLY PMR:
5.1.1 BUSY HOUR OF VARIOUS SERVICE PROVIDERS:
Sl. No. Name of Service Provider Month of Audit Network TCBH Hour
GSM Operators
1 AIRCEL September -15 20:00 - 21:00
2 AIRTEL September -15 19:00 - 20:00
3 BSNL September -15 20:00 - 21:00
4 VIDEOCON September -15 20:00 - 21:00
5 TATA GSM September -15 20:00 - 21:00
6 IDEA September -15 20:00 - 21:00
7 RCOM GSM September -15 20:00 - 21:00
8 VODAFONE September -15 20:00 - 21:00
CDMA Operators
9 RCOM CDMA September -15 20:00 - 21:00
10 TATA CDMA September -15 19:00 - 20:00
The TCBH reported by all the service providers matched the network busy hour calculated by TUV auditors for the Haryana circle.
5.1.2 SWITCHES/BSC/BTS DETAILS OF SERVICE PROVIDERS:
Sl. No. Name of Service
Provider No. of MSC +
GMSC No. of BSC No. of BTS NSS make BSS make
GSM Operators
1 AIRCEL NA* 1 28 NSN NSN
2 AIRTEL 4 25 2883 Ericsson Ericsson
3 BSNL 9 29 2085 Ericsson & ZTE Ericsson, NSN &
ZTE
4 IDEA 6 31 3282 NSN NSN
5 RCOM GSM 1 8 901 Huawei Huawei
6 TATA GSM 2 12 1641 NSN NSN
7 VIDEOCON 1 8 1426 Huawei Huawei
8 VODAFONE 7 46 3090 NSN NSN
CDMA Operators
9 RCOM CDMA 3 NA 551 Lucent & ZTE Lucent
10 TATA CDMA 4 6 388 Ericsson & Huawei ZTE & Motorola
NA*: Aircel is having one MSC at Gurgaon (NCR)

AUDIT & ASSESSMENT OF QOS FOR QE- SEPTEMBER-2015 - HARYANA CIRCLE
TUV-SUD SOUTH ASIA PRIVATE LIMITED Page 18
5.1.3 QOS PERFORMANCE OF MONTHLY PMR – JULY 15 MONTH:
CELLULAR MOBILE TELEPHONE SERVICES HARYANA CIRCLE - JULY 15 MONTH
PMR Generation Data B
ench
- m
ark
Au
dit
Per
iod
AIR
CE
L
AIR
TE
L
BS
NL
VID
EC
ON
TA
TA
GS
M
IDE
A
RC
OM
GS
M
VO
DA
FO
NE
RC
OM
CD
MA
TA
TA
CD
MA
S/N Name of Parameter GSM Operators CDMA Operators
Network Service Quality Parameter
1
Network Availability
a) BTS Accumulated Downtime <=2% July-15 0.22% 0.11% 1.35% 0.18% 0.14% 0.00% 0.62% 0.03% 0.18% 0.05%
b) Worst affected BTSs due to downtime <=2% July-15 0.00% 0.07% 1.35% 0.56% 0.31% 0.00% 1.66% 0.10% 0.00% 0.25%
2
Connection Establishment (Accessibility)
a) CSSR (Call Setup Success Rate)
>=95% July-15 99.87% 98.67% 97.56% 98.78% 97.43% 99.97% 99.71% 99.57% 98.41% 97.34%
b) SDCCH/PAGING Channel congestion
<=1% July-15 0.00% 0.18% 0.37% 0.09% 0.16% 0.50% 0.02% 0.13% 0.00% 0.00%
c) TCH congestion <=2% July-15 0.00% 0.37% 0.99% 0.06% 1.24% 0.29% 0.04% 0.43% 0.13% 0.66%
3
Connection maintenance (Retainability)
a) CDR (Call Drop Rate) <=2% July-15 3.30% 0.49% 1.39% 0.50% 0.85% 0.64% 0.18% 0.69% 0.06% 0.61%
b) Worst affected cells>3% TCH drop (Call drop) rate
<=3% July-15 3.92% 0.82% 1.98% 0.59% 4.55% 1.91% 0.01% 1.65% 0.21% 7.03%
c) Connections with good voice quality
>=95% July-15 99.23% 98.36% NP 97.04% 96.80% 98.03% 99.30% 97.66% 99.73% NP
4 No. of POI’s having >=0.5% POI congestion
<=0.5% July-15 0 0 0 0 0 0 0 0 0 0
* NP-Not Provided: BSNL and Tata CDMA having no direct counter to provide the data for the parameter “Connections with good voice quality”, hence they have not provided data for this parameter.

AUDIT & ASSESSMENT OF QOS FOR QE- SEPTEMBER-2015 - HARYANA CIRCLE
TUV-SUD SOUTH ASIA PRIVATE LIMITED Page 19
5.1.4 QOS PERFORMANCE OF MONTHLY PMR – AUGUST 15 MONTH:
CELLULAR MOBILE TELEPHONE SERVICES HARYANA CIRCLE - AUGUST 15 MONTH
PMR Generation Data
Ben
ch-
mar
k
Au
dit
Per
iod
AIR
CE
L
AIR
TE
L
BS
NL
VID
EC
ON
TA
TA
GS
M
IDE
A
RC
OM
GS
M
VO
DA
FO
NE
RC
OM
CD
MA
TA
TA
CD
MA
S/N Name of Parameter GSM Operators CDMA Operators
Network Service Quality Parameter
1
Network Availability
a) BTS Accumulated Downtime <=2% Aug-15 0.09% 0.07% 0.91% 0.05% 0.05% 0.00% 0.40% 0.01% 0.38% 0.05%
b) Worst affected BTSs due to downtime <=2% Aug-15 0.00% 0.03% 1.16% 0.00% 0.12% 0.00% 0.56% 0.03% 0.54% 0.25%
2
Connection Establishment (Accessibility)
a) CSSR (Call Setup Success Rate)
>=95% Aug-15 99.39% 98.81% 97.45% 98.77% 97.50% 98.56% 99.70% 99.71% 98.45% 96.22%
b) SDCCH/PAGING Channel congestion
<=1% Aug-15 0.00% 0.18% 0.22% 0.08% 0.14% 0.27% 0.02% 0.10% 0.00% 0.00%
c) TCH congestion <=2% Aug-15 0.00% 0.30% 1.04% 0.08% 1.26% 0.42% 0.04% 0.29% 0.11% 1.20%
3
Connection maintenance (Retainability)
a) CDR (Call Drop Rate) <=2% Aug-15 2.85% 0.32% 1.51% 0.55% 0.85% 0.69% 0.13% 0.78% 0.05% 0.68%
b) Worst affected cells>3% TCH drop (Call drop) rate
<=3% Aug-15 4.26% 0.88% 2.20% 0.75% 4.12% 2.45% 0.04% 2.32% 0.11% 8.24%
c) Connections with good voice quality
>=95% Aug-15 99.19% 98.68% NP 97.16% 96.89% 97.82% 99.30% 97.61% 99.72% NP
4 No. of POI’s having >=0.5% POI congestion
<=0.5% Aug-15 0 0 1 0 0 0 0 0 0 0
* NP-Not Provided: BSNL and Tata CDMA having no direct counter to provide the data for the parameter “Connections with good voice quality”, hence they have not provided data for this parameter.

AUDIT & ASSESSMENT OF QOS FOR QE- SEPTEMBER-2015 - HARYANA CIRCLE
TUV-SUD SOUTH ASIA PRIVATE LIMITED Page 20
5.1.5 QOS PERFORMANCE OF MONTHLY PMR – SEPTEMBER 15 MONTH:
CELLULAR MOBILE TELEPHONE SERVICES HARYANA CIRCLE - SEPTEMBER 15 MONTH
PMR Generation Data
Ben
ch-
mar
k
Au
dit
Per
iod
AIR
CE
L
AIR
TE
L
BS
NL
VID
EC
ON
TA
TA
GS
M
IDE
A
RC
OM
GS
M
VO
DA
FO
NE
RC
OM
CD
MA
TA
TA
CD
MA
S/N Name of Parameter GSM Operators CDMA Operators
Network Service Quality Parameter
1
Network Availability
a) BTS Accumulated Downtime <=2% Sep-15 0.12% 0.07% 1.09% 0.08% 0.09% 0.01% 0.38% 0.02% 0.38% 0.11%
b) Worst affected BTSs due to downtime <=2% Sep-15 0.00% 0.00% 1.34% 0.00% 0.06% 0.00% 0.54% 0.00% 0.54% 0.00%
2
Connection Establishment (Accessibility)
a) CSSR (Call Setup Success Rate)
>=95% Sep-15 98.95% 98.87% 97.68% 98.70% 97.21% 98.49% 98.52% 99.69% 98.52% 96.60%
b) SDCCH/PAGING Channel congestion
<=1% Sep-15 0.01% 0.22% 0.30% 0.18% 0.24% 0.37% 0.00% 0.12% 0.00% 0.00%
c) TCH congestion <=2% Sep-15 0.00% 0.37% 1.01% 0.10% 1.47% 0.73% 0.10% 0.31% 0.10% 0.97%
3
Connection maintenance (Retainability)
a) CDR (Call Drop Rate) <=2% Sep-15 1.45% 0.26% 1.57% 0.56% 0.79% 0.69% 0.04% 0.74% 0.04% 0.63%
b) Worst affected cells>3% TCH drop (Call drop) rate
<=3% Sep-15 3.49% 0.80% 2.40% 0.73% 3.48% 2.32% 0.13% 2.14% 0.13% 7.56%
c) Connections with good voice quality
>=95% Sep-15 99.12% 98.82% NP 97.20% 96.85% 97.79% 99.74% 97.63% 99.74% NP
4 No. of POI’s having >=0.5% POI congestion
<=0.5% Sep-15 0 0 0 0 0 0 0 0 0 0
* NP-Not Provided: BSNL and Tata CDMA having no direct counter to provide the data for the parameter “Connections with good voice quality”, hence they have not provided data for this parameter.

AUDIT & ASSESSMENT OF QOS FOR QE- SEPTEMBER-2015 - HARYANA CIRCLE
TUV-SUD SOUTH ASIA PRIVATE LIMITED Page 21
5.1.6 QOS PERFORMANCE OF QUARTERLY PMR –AVERAGE OF QE- SEPTEMBER 15 (JULY– AUGUST– SEPTEMBER 2015 MONTHS AUDITED DATA)
QUARTERLY QOS PERFORMANCE (AVERAGE OF QE - SEPTEMBER 15) OF HARYANA CIRCLE
PMR Generation Data
Ben
ch-
mar
k
Au
dit
Per
iod
AIR
CE
L
AIR
TE
L
BS
NL
VID
EC
ON
TA
TA
GS
M
IDE
A
RC
OM
GS
M
VO
DA
FO
NE
RC
OM
CD
MA
TA
TA
CD
MA
S/N Name of Parameter GSM Operators CDMA Operators
Network Service Quality Parameter
1
Network Availability
a) BTS Accumulated Downtime <=2% Quarterly 0.14% 0.08% 1.12% 0.10% 0.09% 0.00% 0.47% 0.02% 0.31% 0.07%
b) Worst affected BTSs due to downtime <=2% Quarterly 0.00% 0.03% 1.28% 0.19% 0.16% 0.00% 0.92% 0.04% 0.36% 0.17%
2
Connection Establishment (Accessibility)
a) CSSR (Call Setup Success Rate)
>=95% Quarterly 99.40% 98.78% 97.56% 98.75% 97.38% 99.01% 99.31% 99.66% 98.46% 96.72%
b) SDCCH/PAGING Channel congestion
<=1% Quarterly 0.00% 0.19% 0.30% 0.12% 0.18% 0.38% 0.01% 0.12% 0.00% 0.00%
c) TCH congestion <=2% Quarterly 0.00% 0.35% 1.01% 0.08% 1.32% 0.48% 0.06% 0.34% 0.11% 0.94%
3
Connection maintenance (Retainability)
a) CDR (Call Drop Rate) <=2% Quarterly 2.53% 0.36% 1.49% 0.54% 0.83% 0.67% 0.12% 0.74% 0.05% 0.64%
b) Worst affected cells>3% TCH drop (Call drop) rate
<=3% Quarterly 3.89% 0.83% 2.19% 0.69% 4.05% 2.23% 0.06% 2.04% 0.15% 7.61%
c) Connections with good voice quality
>=95% Quarterly 99.18% 98.62% NP 97.13% 96.85% 97.88% 99.45% 97.63% 99.73% NP
4 No. of POI’s having >=0.5% POI congestion
<=0.5% Quarterly 0 0 0 0 0 0 0 0 0 0
* NP-Not Provided: BSNL and Tata CDMA having no direct counter to provide the data for the parameter “Connections with good voice quality”, hence they have not provided data for this parameter.

AUDIT & ASSESSMENT OF QOS FOR QE- SEPTEMBER-2015 - HARYANA CIRCLE
TUV-SUD SOUTH ASIA PRIVATE LIMITED Page 22
5.1.7 KEY FINDINGS ON MONTHLY PMR AUDIT REPORTS: The audit for cellular mobile service providers was conducted at their respective MSCs in the circle.
TUV conducted audit for cellular mobile operators based on three stage audit / verification viz audit of the records, live measurements and drive tests. This exercise has been repeated every month for CMSPs.
Network Service Quality Parameters:
Network Availability
i. BTS Accumulated Downtime (Not Available for Service): ii. Worst affected BTSs due to downtime
For measuring the performance against the benchmark for this parameter, down time of each BTS lasting for more than 1 hour at a time in a day during the period of a month has been taken for computation. In Haryana circle, all the operators found meeting benchmark on the parameters ‘BTS accumulated downtime’ and ‘worst affected BTSs due to down time’. Connection Establishment (Accessibility)
i. Call Set-up Success Rate(CSSR) CSSR includes complete signaling in the call set up process and does not aim to measure the performance of the called exchange or that of the Point of Interconnection (POI). CSSR was established as the ratio of total number of successful call attempts (establishment) to the total number of call attempts made. All the operators were well performed on this parameter. Parameters related to Network Congestion: The parameters namely SDCCH / Paging Channel Congestion, TCH and POI are prescribed with the aim of measuring the congestion in the network.
In CDMA system, there is no direct counter defined for reporting Paging Channel Congestion as reported by Tata Teleservices. However, they have a defined counter for Paging Channel Occupancy Ratio (PCH Average Using Ratio) which is used to determine the Paging Channel Occupancy which on an average is < 50% on all sites in the network. When the value of this parameter is less than 100%, it is counted as 0% congestion. Thus, there is no congestion on the pegging channel in CDMA system.
With respect to this parameter, the performance of the operators is quite satisfactory as all operators have met the TRAI specified benchmarks on TCH congestion parameters.

AUDIT & ASSESSMENT OF QOS FOR QE- SEPTEMBER-2015 - HARYANA CIRCLE
TUV-SUD SOUTH ASIA PRIVATE LIMITED Page 23
Connection Maintenance (Retain ability)
i. Call Drop Rate: This parameter gives a reliable measurement of the mobile network used by the service provider for maintaining a call once it has been correctly established. Failures in coverage, network congestion and network failures have important impact on this parameter. The audit with respect to this parameter revealed that all the operators (except Aircel) met the benchmark for this parameter. Aircel failed to meet the benchmark with its quarterly average performance as 3.89%.
ii. Worst affected cells having more than 3% TCH drops Worst affected cells are defined as cells in which the call drop rate exceeds 3% during Cell Bouncing Busy Hour (CBBH) or at any other hour of a day. The audit with respect to this parameter revealed that all the operators met the benchmark for this parameter except Aircel and Tata Tele Services (TTSL). Aircel, Tata GSM and Tata CDMA failed to meet the benchmark in all the three months of the quarter with their quarterly average performance as 3.89%, 4.05% and 7.61% respectively.
iii. Connections with good voice quality:
Most of the Operators were measuring this parameter through the system generated data at their switches. BSNL & Tata CDMA have not provided the data for this parameter. The audit results for this parameter indicate that all operators have met the bench mark during the quarter.
iv. POI’s having >=0.5% POI congestion All operators were having congestion less than 0.5% on individual POI, thus met the benchmark.

AUDIT & ASSESSMENT OF QOS FOR QE- SEPTEMBER-2015 - HARYANA CIRCLE
TUV-SUD SOUTH ASIA PRIVATE LIMITED Page 24
3-DAYS LIVE MEASUREMENT DATA VERIFICATION FOR
CELLULAR MOBILE SERVICE PROVIDERS
(NETWORK SERVICE QUALITY PARAMETER)

AUDIT & ASSESSMENT OF QOS FOR QE- SEPTEMBER-2015 - HARYANA CIRCLE
TUV-SUD SOUTH ASIA PRIVATE LIMITED Page 25
5.2 LIVE MEASUREMENT DATA (3-DAYS) FOR CELLULAR MOBILE SERVICE PROVIDERS (NETWORK SERVICE QUALITY PARAMETER):
5.2.1 LIVE MEASURMENT DATA (3-DAYS) – JULY 15 MONTH:
CELLULAR MOBILE TELEPHONE SERVICES - HARYANA CIRCLE - JULY 15 MONTH
Live measurement Data
Ben
ch-
mar
k
Ave
rag
e o
f 3
Day
s
AIR
CE
L
AIR
TE
L
BS
NL
VID
EO
CO
N
TA
TA
GS
M
IDE
A
RC
OM
GS
M
VO
DA
FO
NE
RC
OM
CD
MA
TA
TA
CD
MA
S/N Name of
Parameter GSM Operators CDMA Operators
Network Service Quality Parameter
1
Network Availability
a) BTS Accumulated Downtime
<=2% Live data 2.26% 0.03% 1.63% 0.16% 0.16% 0.01% 0.72% 0.03% 0.12% 0.15%
b) Worst affected BTSs due to downtime
<=2% Live data 0.00% 0.00% 0.19% 0.00% 0.00% 0.00% 0.00% 0.00% 0.00% 0.00%
2
Connection Establishment (Accessibility)
a) CSSR (Call Setup Success Rate)
>=95% Live data 100% 98.89% 97.40% 98.79% 97.64% 99.97% 99.61% 98.82% 98.59% 96.79%
b) SDCCH/PAGING Channel congestion
<=1% Live data 0.00% 0.10% 0.32% 0.20% 0.13% 0.19% 0.03% 0.12% 0.00% 0.00%
c) TCH congestion <=2% Live data 0.00% 0.23% 1.07% 0.04% 1.05% 0.27% 0.04% 1.18% 0.08% 0.56%
3
Connection maintenance (Retainability)
a) CDR (Call Drop Rate)
<=2% Live data 1.65% 0.49% 1.42% 0.51% 0.89% 0.61% 0.19% 0.76% 0.06% 0.85%
b) Worst affected cells>3% TCH drop (Call drop) rate
<=3% Live data 3.57% 0.68% 1.93% 0.62% 4.69% 1.72% 0.00% 1.69% 0.22% 7.41%
c) Connections with good voice quality
>=95% Live data 99.12% 98.33% NP 96.98% 96.84% 97.99% 99.25% 97.50% 99.71% NP
4 No. of POI having >=0.5% congestion
<0.5% Live data 0 0 0 0 0 0 0 0 0 0
* NP-Not Provided: BSNL and Tata CDMA having no direct counter to provide the data for the parameter “Connections with good voice quality”, hence they have not provided data
for this parameter.

AUDIT & ASSESSMENT OF QOS FOR QE- SEPTEMBER-2015 - HARYANA CIRCLE
TUV-SUD SOUTH ASIA PRIVATE LIMITED Page 26
5.2.2 LIVE MEASURMENT DATA (3-DAYS) – AUGUST 15 MONTH:
CELLULAR MOBILE TELEPHONE SERVICES HARYANA CIRCLE - AUGUST 15 MONTH
Live measurement Data
Ben
ch-
mar
k
Ave
rag
e o
f 3
Day
s
AIR
CE
L
AIR
TE
L
BS
NL
VID
EO
CO
N
TA
TA
GS
M
IDE
A
RC
OM
GS
M
VO
DA
FO
NE
RC
OM
CD
MA
TA
TA
CD
MA
S/N Name of
Parameter GSM Operators
CDMA Operators
Network Service Quality Parameter
1
Network Availability
a) BTS Accumulated Downtime
<=2% Live data 0.00% 0.03% 1.90% 0.04% 0.06% 0.00% 0.13% 0.01% 0.40% 0.02%
b) Worst affected BTSs due to downtime
<=2% Live data 0.00% 0.00% 0.19% 0.00% 0.00% 0.00% 0.00% 0.00% 0.00% 0.00%
2
Connection Establishment (Accessibility)
a) CSSR (Call Setup Success Rate)
>=95% Live data 100% 98.45% 97.31% 98.80% 97.61% 98.58% 99.76% 99.70% 97.81% 95.18%
b) SDCCH/PAGING Channel congestion
<=1% Live data 0.00% 0.56% 0.12% 0.04% 0.09% 0.21% 0.02% 0.11% 0.00% 0.00%
c) TCH congestion <=2% Live data 0.00% 0.30% 1.04% 0.06% 1.15% 0.42% 0.03% 0.30% 0.22% 0.18%
3
Connection maintenance (Retainability)
a) CDR (Call Drop Rate)
<=2% Live data 3.55% 0.32% 1.77% 0.55% 0.84% 0.70% 0.16% 0.86% 0.07% 0.65%
b) Worst affected cells>3% TCH drop (Call drop) rate
<=3% Live data 3.17% 0.87% 2.68% 0.74% 3.60% 2.65% 0.02% 2.50% 0.16% 7.51%
c) Connections with good voice quality
>=95% Live data 99.19% 98.65% NP 97.15% 96.87% 97.81% 99.32% 97.59% 99.73% NP
4 No. of POI having >=0.5% congestion
<0.5% Live data 0 0 0 0 0 0 0 0 0 0
* NP-Not Provided: BSNL and Tata CDMA having no direct counter to provide the data for the parameter “Connections with good voice quality”, hence they have not provided the data for this parameter.

AUDIT & ASSESSMENT OF QOS FOR QE- SEPTEMBER-2015 - HARYANA CIRCLE
TUV-SUD SOUTH ASIA PRIVATE LIMITED Page 27
5.2.3 LIVE MEASURMENT DATA (3-DAYS) – SEPTEMBER 15 MONTH:
CELLULAR MOBILE TELEPHONE SERVICES HARYANA CIRCLE- SEPTEMBER 15 MONTH
Live measurement Data
Ben
ch-
mar
k
Ave
rag
e o
f 3
Day
s
AIR
CE
L
AIR
TE
L
BS
NL
VID
EO
CO
N
TA
TA
GS
M
IDE
A
RC
OM
GS
M
VO
DA
FO
NE
RC
OM
CD
MA
TA
TA
CD
MA
S/N Name of
Parameter GSM Operators
CDMA Operators
Network Service Quality Parameter
1
Network Availability
a) BTS Accumulated Downtime
<=2% Live data 0.00% 0.05% 1.69% 0.13% 0.12% 0.00% 0.22% 0.02% 0.51% 0.07%
b) Worst affected BTSs due to downtime
<=2% Live data 0.00% 0.00% 0.24% 0.00% 0.00% 0.00% 0.00% 0.00% 0.00% 0.00%
2
Connection Establishment (Accessibility)
a) CSSR (Call Setup Success Rate)
>=95% Live data 100% 99.19% 97.79% 98.73% 96.35% 98.51% 99.76% 99.65% 98.80% 95.65%
b) SDCCH/PAGING Channel congestion
<=1% Live data 0.00% 0.17% 0.22% 0.17% 0.60% 0.21% 0.01% 0.09% 0.00% 0.00%
c) TCH congestion <=2% Live data 0.00% 0.25% 1.03% 0.10% 1.90% 0.69% 0.03% 0.35% 0.04% 0.49%
3
Connection maintenance (Retainability)
a) CDR (Call Drop Rate)
<=2% Live data 1.38% 0.23% 1.60% 0.53% 0.80% 0.69% 0.16% 0.76% 0.05% 0.62%
b) Worst affected cells>3% TCH drop (Call drop) rate
<=3% Live data 1.98% 0.74% 2.39% 0.68% 3.34% 2.40% 0.03% 2.19% 0.24% 5.97%
c) Connections with good voice quality
>=95% Live data 99.59% 98.86% NP 97.27% 96.70% 97.92% 99.36% 97.55% 99.74% NP
4 No. of POI having >=0.5% congestion
<0.5% Live data 0 0 0 0 0 0 0 0 0 0
* NP-Not Provided: BSNL and Tata CDMA having no direct counter to provide the data for the parameter “Connections with good voice quality”, hence they have not provided by
data for this parameter.

AUDIT & ASSESSMENT OF QOS FOR QE- SEPTEMBER-2015 - HARYANA CIRCLE
TUV-SUD SOUTH ASIA PRIVATE LIMITED Page 28
5.2.4 QUARTERLY QOS PERFORMANCE OF 3-DAYS LIVE MEASUREMENT AUDITED DATA (AVERAGE OF JULY – AUGUST – SEPTEMBER 2015 MONTHS AUDITED DATA)
QUARTERLY QOS PERFORMANCE OF 3-DAYS LIVE MEASUREMENT (AVERAGE OF THREE MONTHS ) – HARYANA CIRCLE
Live measurement Data
Ben
ch-
mar
k
Ave
rag
e o
f 3
Day
s
AIR
CE
L
AIR
TE
L
BS
NL
VID
EO
CO
N
TA
TA
GS
M
IDE
A
RC
OM
GS
M
VO
DA
FO
NE
RC
OM
CD
MA
TA
TA
CD
MA
S/N Name of Parameter GSM Operators CDMA
Operators
Network Service Quality Parameter
1
Network Availability
a) BTS Accumulated Downtime
<=2% Quarterly 0.75% 0.04% 1.74% 0.11% 0.11% 0.00% 0.36% 0.02% 0.34% 0.08%
b) Worst affected BTSs due to downtime
<=2% Quarterly 0.00% 0.00% 0.21% 0.00% 0.00% 0.00% 0.00% 0.00% 0.00% 0.00%
2
Connection Establishment (Accessibility)
a) CSSR (Call Setup Success Rate)
>=95% Quarterly 100% 98.84% 97.50% 98.77% 97.20% 99.02% 99.71% 99.39% 98.40% 95.87%
b) SDCCH/PAGING Channel congestion
<=1% Quarterly 0.00% 0.28% 0.22% 0.14% 0.27% 0.20% 0.02% 0.11% 0.00% 0.00%
c) TCH congestion <=2% Quarterly 0.00% 0.26% 1.05% 0.07% 1.37% 0.46% 0.03% 0.61% 0.11% 0.41%
3
Connection maintenance (Retainability)
a) CDR (Call Drop Rate) <=2% Quarterly 2.19% 0.35% 1.60% 0.53% 0.84% 0.67% 0.17% 0.79% 0.06% 0.71%
b) Worst affected cells>3% TCH drop (Call drop) rate
<=3% Quarterly 2.91% 0.76% 2.33% 0.68% 3.88% 2.26% 0.02% 2.13% 0.21% 6.96%
c) Connections with good voice quality
>=95% Quarterly 99.30% 98.61% NP 97.13% 96.80% 97.91% 99.31% 97.55% 99.73% NP
4 No. of POI having >=0.5% congestion
<0.5% Quarterly 0 0 0 0 0 0 0 0 0 0
5.2.5 KEY FINDING ON 3 DAYS LIVE MEASUREMENTS: From three days assessment, the performance of all operators was found satisfactory as they were largely meeting
the benchmarks except the parameters CDR and ‘Worst affected cells> 3 % TCH drops”, which could not be
complied with by Aircel and Tata (GSM) / Tata (CDMA) respectively. The average performance of Aircel for
parameter CDR was 2.19% and that of Tata (GSM) and Tata (CDMA) for parameter ‘Worst affected cells> 3 %
TCH drops” was 3.88% and 6.96% respectively.
The similar non-compliance of Aircel, Tata (GSM) and Tata (CDMA) was also observed during monthly audit of the quarter.

AUDIT & ASSESSMENT OF QOS FOR QE- SEPTEMBER-2015 - HARYANA CIRCLE
TUV-SUD SOUTH ASIA PRIVATE LIMITED Page 29
5.2.6 DETAILED NETWORK DATA ASSESSMENT OF CELLULAR MOBILE TELEPHONE SERVICES:
TABLE: 1
Detailed Network Data Assessment of Cellular Mobile Telephone Services- Haryana Circle - July 15 month
S/N Name of
Parameter Bench- mark
Audit Period
AIRCEL AIRTEL BSNL VIDEOCON TATA GSM
IDEA RCOM GSM
VODAFONE RCOM CDMA
TATA CDMA
GSM Operators CDMA
Operators
Network Service Quality Parameter
1
Network Availability
a) Total no. of BTSs in the licensed service area
July-15 28 2841 2069 1416 1618 3201 901 3061 551 397
b) Sum of downtime of BTSs in a month in hours i.e. total outage time of all BTSs in hours during a month
July-15 46.65 2386.06 20786.71 1874.95 1634.12 99.03 4122.77 626.67 723.10 149.30
c) BTS Accumulated Downtime
<=2% July-15 0.22% 0.11% 1.35% 0.18% 0.14% 0.00% 0.62% 0.03% 0.18% 0.05%
d) No. of BTSs having accumulated downtime of >24 hours in a month
July-15 0 2 28 8 5 0 15 2 0 1
e) Worst affected BTSs due to downtime
<=2% July-15 0.00% 0.07% 1.35% 0.56% 0.31% 0.00% 1.66% 0.10% 0.00% 0.25%
2
Connection Establishment (Accessibility)
a) CSSR (Call Setup Success Rate)
>=95% July-15 99.87% 98.67% 97.56% 98.78% 97.43% 99.97% 99.71% 99.57% 98.41% 97.34%
b) SDCCH/PAGING Congestion
<=1% July-15 0.00% 0.18% 0.37% 0.09% 0.16% 0.50% 0.02% 0.13% 0.00% 0.00%
c) TCH congestion <=2% July-15 0.00% 0.37% 0.99% 0.06% 1.24% 0.29% 0.04% 0.43% 0.13% 0.66%
3
Connection Maintenance (Retainability)
a) Call Drop Rate (CDR) <=2% July-15 3.30% 0.49% 1.39% 0.50% 0.85% 0.64% 0.18% 0.69% 0.06% 0.61%
b) Worst affected cells>3% TCH drop
<=3% July-15 3.92% 0.82% 1.98% 0.59% 4.55% 1.91% 0.01% 1.65% 0.21% 7.03%
c) % of connections with good voice quality
>=95% July-15 99.23% 98.36% NP 97.04% 96.80% 98.03% 99.30% 97.66% 99.73% NP
d) Total No. of cells exceeding 3% TCH drop (call drop)
July-15 3 71 121 25 221 186 0 153 4 35
e) Total no. of cells (Sector) in the licensed service area
July-15 84 8575 6096 4336 4867 9701 2697 9275 1653 498
4
No. of POI’s having >=0.5% POI congestion
No. of POI’s having >=0.5% POI congestion
July-15 0 0 0 0 0 0 0 0 0 0
Name of POI not meeting the benchmark
July-15 0 0 0 0 0 0 0 0 0 0
5
Network Data
a) Equipped Capacity of Network in Erlang
July-15 212 79797 240000 64419 101730 107431 50000 143573 56000 22018
b) Total traffic in TCBH in erlang (Avg.)
July-15 2 63286 85026 27265 43358 110338 35344 122346 8326 4230
c) Total no. of customers served (as per VLR) on last day of the month
July-15 190 2346900 1528368 1064770 1656007 4514831 1526055 4952983 299140 118780

AUDIT & ASSESSMENT OF QOS FOR QE- SEPTEMBER-2015 - HARYANA CIRCLE
TUV-SUD SOUTH ASIA PRIVATE LIMITED Page 30
TABLE: 2
Detailed Network Data Assessment of Cellular Mobile Telephone Services-3 days live measurements-Haryana Circle- July 15 month
S/N Name of
Parameter Bench- mark
Average of 3
Days
AIRCEL AIRTEL BSNL VIDEOCON TATA GSM
IDEA RCOM GSM
VODAFONE RCOM CDMA
TATA CDMA
GSM Operators CDMA
Operators
Network Service Quality Parameter
1
Network Availability
a) Total no. of BTSs in the licensed service area
Live data 28 2842 2069 1414 1613 3191 901 3051 551 397
b) Sum of downtime of BTSs in a month in hours i.e. total outage time of all BTSs in hours during a month
Live data 45.55 54.45 2432.55 161.81 186.68 16.70 466.85 61.76 47.83 41.47
c) BTS Accumulated Downtime
<=2% Live data 2.26% 0.03% 1.63% 0.16% 0.16% 0.01% 0.72% 0.03% 0.12% 0.15%
d) No. of BTSs having accumulated downtime of >24 hours in a month
Live data 0 0 4 0 0 0 0 0 0 0
e) Worst affected BTSs due to downtime
<=2% Live data 0.00% 0.00% 0.19% 0.00% 0.00% 0.00% 0.00% 0.00% 0.00% 0.00%
2
Connection Establishment (Accessibility)
a) CSSR (Call Setup Success Rate)
>=95% Live data 100.00% 98.89% 97.40% 98.79% 97.64% 99.97% 99.61% 98.82% 98.59% 96.79%
b) SDCCH/PAGING Congestion
<=1% Live data 0.00% 0.10% 0.32% 0.20% 0.13% 0.19% 0.03% 0.12% 0.00% 0.00%
c) TCH congestion <=2% Live data 0.00% 0.23% 1.07% 0.04% 1.05% 0.27% 0.04% 1.18% 0.08% 0.56%
3
Connection Maintenance (Retainability)
a) Call Drop Rate (CDR) <=2% Live data 1.65% 0.49% 1.42% 0.51% 0.89% 0.61% 0.19% 0.76% 0.06% 0.85%
b) Worst affected cells>3% TCH drop
<=3% Live data 3.57% 0.68% 1.93% 0.62% 4.69% 1.72% 0.00% 1.69% 0.22% 7.41%
c) % of connections with good voice quality
>=95% Live data 99.12% 98.33% NP 96.98% 96.84% 97.99% 99.25% 97.50% 99.71% NP
d) Total No. of cells exceeding 3% TCH drop (call drop)
Live data 3 59 119 27 229 167 0 157 4 37
e) Total no. of cells (Sector) in the licensed service area
Live data 84 8588 6192 4335 4873 9699 2697 9243 1653 495
4
No. of POI’s having >=0.5% POI congestion
No. of POI’s having >=0.5% POI congestion
Live data 0 0 0 0 0 0 0 0 0 0
Name of POI not meeting the benchmark
Live data 0 0 0 0 0 0 0 0 0 0
AUDIT & ASSESSMENT OF QOS FOR QE- SEPTEMBER-2015 - HARYANA CIRCLE
TUV-SUD SOUTH ASIA PRIVATE LIMITED Page 31
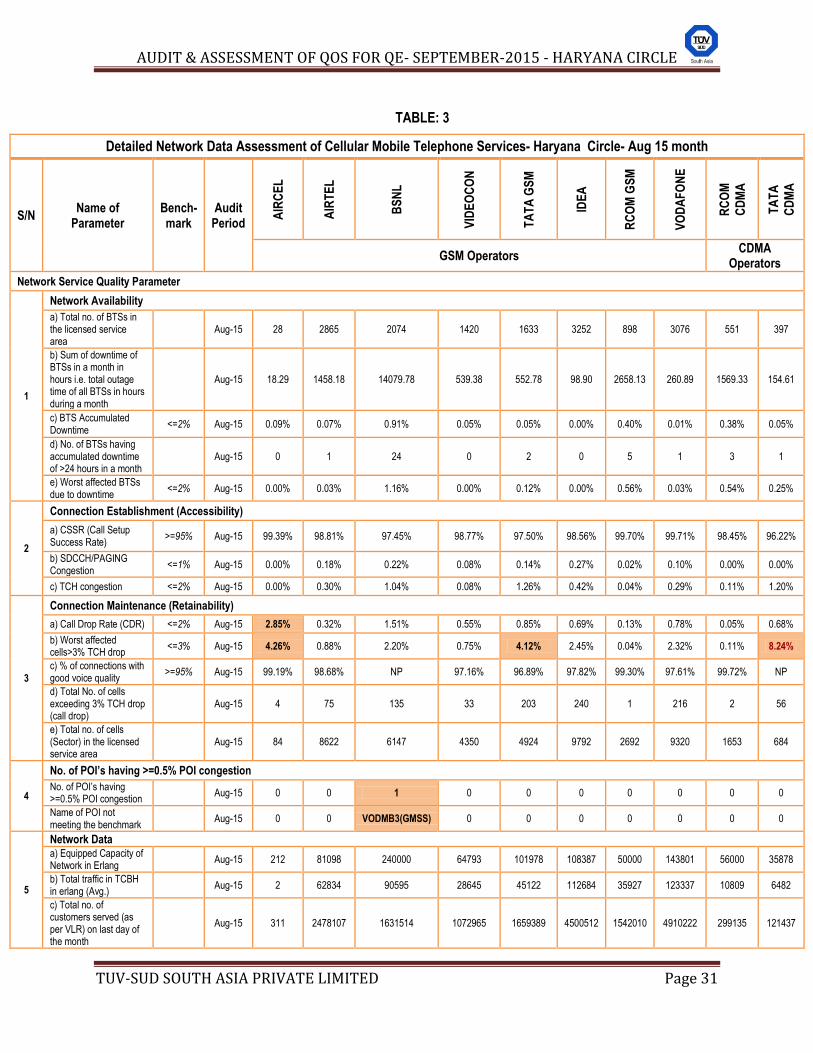
TABLE: 3
Detailed Network Data Assessment of Cellular Mobile Telephone Services- Haryana Circle- Aug 15 month
S/N Name of
Parameter Bench- mark
Audit Period
AIR
CE
L
AIR
TE
L
BS
NL
VID
EO
CO
N
TA
TA
GS
M
IDE
A
RC
OM
GS
M
VO
DA
FO
NE
RC
OM
CD
MA
TA
TA
CD
MA
GSM Operators CDMA
Operators
Network Service Quality Parameter
1
Network Availability
a) Total no. of BTSs in the licensed service area
Aug-15 28 2865 2074 1420 1633 3252 898 3076 551 397
b) Sum of downtime of BTSs in a month in hours i.e. total outage time of all BTSs in hours during a month
Aug-15 18.29 1458.18 14079.78 539.38 552.78 98.90 2658.13 260.89 1569.33 154.61
c) BTS Accumulated Downtime
<=2% Aug-15 0.09% 0.07% 0.91% 0.05% 0.05% 0.00% 0.40% 0.01% 0.38% 0.05%
d) No. of BTSs having accumulated downtime of >24 hours in a month
Aug-15 0 1 24 0 2 0 5 1 3 1
e) Worst affected BTSs due to downtime
<=2% Aug-15 0.00% 0.03% 1.16% 0.00% 0.12% 0.00% 0.56% 0.03% 0.54% 0.25%
2
Connection Establishment (Accessibility)
a) CSSR (Call Setup Success Rate)
>=95% Aug-15 99.39% 98.81% 97.45% 98.77% 97.50% 98.56% 99.70% 99.71% 98.45% 96.22%
b) SDCCH/PAGING Congestion
<=1% Aug-15 0.00% 0.18% 0.22% 0.08% 0.14% 0.27% 0.02% 0.10% 0.00% 0.00%
c) TCH congestion <=2% Aug-15 0.00% 0.30% 1.04% 0.08% 1.26% 0.42% 0.04% 0.29% 0.11% 1.20%
3
Connection Maintenance (Retainability)
a) Call Drop Rate (CDR) <=2% Aug-15 2.85% 0.32% 1.51% 0.55% 0.85% 0.69% 0.13% 0.78% 0.05% 0.68%
b) Worst affected cells>3% TCH drop
<=3% Aug-15 4.26% 0.88% 2.20% 0.75% 4.12% 2.45% 0.04% 2.32% 0.11% 8.24%
c) % of connections with good voice quality
>=95% Aug-15 99.19% 98.68% NP 97.16% 96.89% 97.82% 99.30% 97.61% 99.72% NP
d) Total No. of cells exceeding 3% TCH drop (call drop)
Aug-15 4 75 135 33 203 240 1 216 2 56
e) Total no. of cells (Sector) in the licensed service area
Aug-15 84 8622 6147 4350 4924 9792 2692 9320 1653 684
4
No. of POI’s having >=0.5% POI congestion
No. of POI’s having >=0.5% POI congestion
Aug-15 0 0 1 0 0 0 0 0 0 0
Name of POI not meeting the benchmark
Aug-15 0 0 VODMB3(GMSS) 0 0 0 0 0 0 0
5
Network Data a) Equipped Capacity of Network in Erlang
Aug-15 212 81098 240000 64793 101978 108387 50000 143801 56000 35878
b) Total traffic in TCBH in erlang (Avg.)
Aug-15 2 62834 90595 28645 45122 112684 35927 123337 10809 6482
c) Total no. of customers served (as per VLR) on last day of the month
Aug-15 311 2478107 1631514 1072965 1659389 4500512 1542010 4910222 299135 121437
AUDIT & ASSESSMENT OF QOS FOR QE- SEPTEMBER-2015 - HARYANA CIRCLE
TUV-SUD SOUTH ASIA PRIVATE LIMITED Page 32
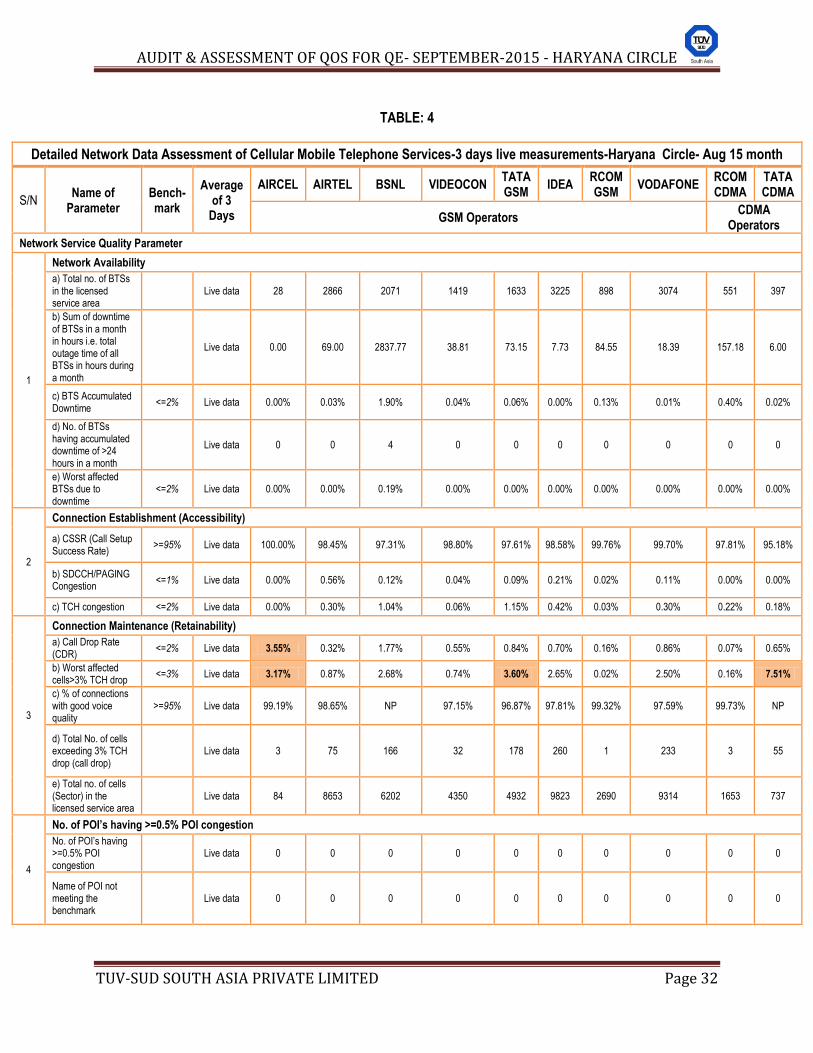
TABLE: 4
Detailed Network Data Assessment of Cellular Mobile Telephone Services-3 days live measurements-Haryana Circle- Aug 15 month
S/N Name of
Parameter Bench- mark
Average of 3
Days
AIRCEL AIRTEL BSNL VIDEOCON TATA GSM
IDEA RCOM GSM
VODAFONE RCOM CDMA
TATA CDMA
GSM Operators CDMA
Operators
Network Service Quality Parameter
1
Network Availability
a) Total no. of BTSs in the licensed service area
Live data 28 2866 2071 1419 1633 3225 898 3074 551 397
b) Sum of downtime of BTSs in a month in hours i.e. total outage time of all BTSs in hours during a month
Live data 0.00 69.00 2837.77 38.81 73.15 7.73 84.55 18.39 157.18 6.00
c) BTS Accumulated Downtime
<=2% Live data 0.00% 0.03% 1.90% 0.04% 0.06% 0.00% 0.13% 0.01% 0.40% 0.02%
d) No. of BTSs having accumulated downtime of >24 hours in a month
Live data 0 0 4 0 0 0 0 0 0 0
e) Worst affected BTSs due to downtime
<=2% Live data 0.00% 0.00% 0.19% 0.00% 0.00% 0.00% 0.00% 0.00% 0.00% 0.00%
2
Connection Establishment (Accessibility)
a) CSSR (Call Setup Success Rate)
>=95% Live data 100.00% 98.45% 97.31% 98.80% 97.61% 98.58% 99.76% 99.70% 97.81% 95.18%
b) SDCCH/PAGING Congestion
<=1% Live data 0.00% 0.56% 0.12% 0.04% 0.09% 0.21% 0.02% 0.11% 0.00% 0.00%
c) TCH congestion <=2% Live data 0.00% 0.30% 1.04% 0.06% 1.15% 0.42% 0.03% 0.30% 0.22% 0.18%
3
Connection Maintenance (Retainability)
a) Call Drop Rate (CDR)
<=2% Live data 3.55% 0.32% 1.77% 0.55% 0.84% 0.70% 0.16% 0.86% 0.07% 0.65%
b) Worst affected cells>3% TCH drop
<=3% Live data 3.17% 0.87% 2.68% 0.74% 3.60% 2.65% 0.02% 2.50% 0.16% 7.51%
c) % of connections with good voice quality
>=95% Live data 99.19% 98.65% NP 97.15% 96.87% 97.81% 99.32% 97.59% 99.73% NP
d) Total No. of cells exceeding 3% TCH drop (call drop)
Live data 3 75 166 32 178 260 1 233 3 55
e) Total no. of cells (Sector) in the licensed service area
Live data 84 8653 6202 4350 4932 9823 2690 9314 1653 737
4
No. of POI’s having >=0.5% POI congestion
No. of POI’s having >=0.5% POI congestion
Live data 0 0 0 0 0 0 0 0 0 0
Name of POI not meeting the benchmark
Live data 0 0 0 0 0 0 0 0 0 0

AUDIT & ASSESSMENT OF QOS FOR QE- SEPTEMBER-2015 - HARYANA CIRCLE
TUV-SUD SOUTH ASIA PRIVATE LIMITED Page 33
TABLE: 5
Detailed Network Data Assessment of Cellular Mobile Telephone Services- Haryana Circle - September 15 month
S/N Name of
Parameter Bench- mark
Audit Period
AIRCEL AIRTEL BSNL VIDEOCON TATA GSM
IDEA RCOM GSM
VODAFONE RCOM CDMA
TATA CDMA
GSM Operators CDMA
Operators
Network Service Quality Parameter
1
Network Availability
a) Total no. of BTSs in the licensed service area
Sep-15 28 2883 2085 1426 1641 3282 551 3090 551 388
b) Sum of downtime of BTSs in a month in hours i.e. total outage time of all BTSs in hours during a month
Sep-15 24.36 1354.24 16367.72 838.93 1053.43 148.45 1511.82 431.79 1511.82 310.12
c) BTS Accumulated Downtime
<=2% Sep-15 0.12% 0.07% 1.09% 0.08% 0.09% 0.01% 0.38% 0.02% 0.38% 0.11%
d) No. of BTSs having accumulated downtime of >24 hours in a month
Sep-15 0 0 28 0 1 0 3 0 3 0
e) Worst affected BTSs due to downtime
<=2% Sep-15 0.00% 0.00% 1.34% 0.00% 0.06% 0.00% 0.54% 0.00% 0.54% 0.00%
2
Connection Establishment (Accessibility)
a) CSSR (Call Setup Success Rate)
>=95% Sep-15 98.95% 98.87% 97.68% 98.70% 97.21% 98.49% 98.52% 99.69% 98.52% 96.60%
b) SDCCH/PAGING Congestion
<=1% Sep-15 0.01% 0.22% 0.30% 0.18% 0.24% 0.37% 0.00% 0.12% 0.00% 0.00%
c) TCH congestion <=2% Sep-15 0.00% 0.37% 1.01% 0.10% 1.47% 0.73% 0.10% 0.31% 0.10% 0.97%
3
Connection Maintenance (Retainability)
a) Call Drop Rate (CDR) <=2% Sep-15 1.45% 0.26% 1.57% 0.56% 0.79% 0.69% 0.04% 0.74% 0.04% 0.63%
b) Worst affected cells>3% TCH drop
<=3% Sep-15 3.49% 0.80% 2.40% 0.73% 3.48% 2.32% 0.13% 2.14% 0.13% 7.56%
c) % of connections with good voice quality
>=95% Sep-15 99.12% 98.82% NP 97.20% 96.85% 97.79% 99.74% 97.63% 99.74% NP
d) Total No. of cells exceeding 3% TCH drop (call drop)
Sep-15 3 70 149 32 172 230 2 200 2 55
e) Total no. of cells (Sector) in the licensed service area
Sep-15 84 8677 6205 4363 4956 9907 1653 9362 1653 729
4
No. of POI’s having >=0.5% POI congestion
No. of POI’s having >=0.5% POI congestion
Sep-15 0 0 0 0 0 0 0 0 0 0
Name of POI not meeting the benchmark
Sep-15 0 0 0 0 0 0 0 0 0 0
5
Network Data
a) Equipped Capacity of Network in Erlang
Sep-15 212 80586 240000 65148 103293 110945 50000 143550 56000 38016
b) Total traffic in TCBH in erlang (Avg.)
Sep-15 2 63921 94777 31770 47522 116292 35524 125321 10655 8094
c) Total no. of customers served (as per VLR) on last day of the month
Sep-15 205 2582272 1596587 1109576 1693917 4606806 1549111 4947879 294132 131795

AUDIT & ASSESSMENT OF QOS FOR QE- SEPTEMBER-2015 - HARYANA CIRCLE
TUV-SUD SOUTH ASIA PRIVATE LIMITED Page 34
TABLE: 6
Detailed Network Data Assessment of Cellular Mobile Telephone Services-3 days live measurements-Haryana Circle- Sept. 15 month
S/N Name of
Parameter Bench- mark
Average of 3
Days
AIRCEL AIRTEL BSNL VIDEOCON TATA GSM
IDEA RCOM GSM
VODAFONE RCOM CDMA
TATA CDMA
GSM Operators CDMA Operators
Network Service Quality Parameter
1
Network Availability
a) Total no. of BTSs in the licensed service area
Live data 28 2873 2084 1423 1641 3252 898 3088 551 388
b) Sum of downtime of BTSs in a month in hours i.e. total outage time of all BTSs in hours during a month
Live data 0.00 99.34 2540.92 128.85 139.63 8.22 142.13 46.94 203.23 18.59
c) BTS Accumulated Downtime
<=2% Live data 0.00% 0.05% 1.69% 0.13% 0.12% 0.00% 0.22% 0.02% 0.51% 0.07%
d) No. of BTSs having accumulated downtime of >24 hours in a month
Live data 0 0 5 0 0 0 0 0 0 0
e) Worst affected BTSs due to downtime
<=2% Live data 0.00% 0.00% 0.24% 0.00% 0.00% 0.00% 0.00% 0.00% 0.00% 0.00%
2
Connection Establishment (Accessibility)
a) CSSR (Call Setup Success Rate)
>=95% Live data 100.00% 99.19% 97.79% 98.73% 96.35% 98.51% 99.76% 99.65% 98.80% 95.65%
b) SDCCH/PAGING Congestion
<=1% Live data 0.00% 0.17% 0.22% 0.17% 0.60% 0.21% 0.01% 0.09% 0.00% 0.00%
c) TCH congestion <=2% Live data 0.00% 0.25% 1.03% 0.10% 1.90% 0.69% 0.03% 0.35% 0.04% 0.49%
3
Connection Maintenance (Retainability)
a) Call Drop Rate (CDR)
<=2% Live data 1.38% 0.23% 1.60% 0.53% 0.80% 0.69% 0.16% 0.76% 0.05% 0.62%
b) Worst affected cells>3% TCH drop
<=3% Live data 1.98% 0.74% 2.39% 0.68% 3.34% 2.40% 0.03% 2.19% 0.24% 5.97%
c) % of connections with good voice quality
>=95% Live data 99.59% 98.86% NP 97.27% 96.70% 97.92% 99.36% 97.55% 99.74% NP
d) Total No. of cells exceeding 3% TCH drop (call drop)
Live data 2 64 149 30 166 238 1 205 4 46
e) Total no. of cells (Sector) in the licensed service area
Live data 84 8676 6235 4358 4967 9898 2590 9356 1653 765
4
No. of POI’s having >=0.5% POI congestion
No. of POI’s having >=0.5% POI congestion
Live data 0 0 0 0 0 0 0 0 0 0
Name of POI not meeting the benchmark
Live data 0 0 0 0 0 0 0 0 0 0
AUDIT & ASSESSMENT OF QOS FOR QE- SEPTEMBER-2015 - HARYANA CIRCLE
TUV-SUD SOUTH ASIA PRIVATE LIMITED Page 35
CUSTOMER SERVICE QUALITY (CSD) PARAMETERS

AUDIT & ASSESSMENT OF QOS FOR QE- SEPTEMBER-2015 - HARYANA CIRCLE
TUV-SUD SOUTH ASIA PRIVATE LIMITED Page 36
5.3 CUSTOMER SERVICE QUALITY PARAMETERS MEASUREMENT FOR CMTS–QE SEPT-15:
5.3.1 QUARTERLY CUSTOMER SERVICE DELIVERY (CSD) AUDITED DATA FOR CELLULAR MOBILE SERVICES (JULY TO SEPT 2015 MONTHS AUDITED DATA):
QUARTERLY CSD DATA FOR CELLULAR MOBILE TELEPHONE SERVICES - QE SEPTEMBER 15
Quarterly Averaged CSD Audit Data
Ben
ch-
mar
k
Cir
cle
Nam
e
AIR
CE
L
AIR
TE
L
BS
NL
IDE
A
RC
OM
GS
M
TA
TA
GS
M
VID
EO
CO
N
VO
DA
FO
NE
RC
OM
CD
MA
TA
TA
CD
MA
S/ N
Name of Parameter GSM Operators CDMA Operators
Customer Service Quality Parameters
1
Metering & Billing Credibility -Post Paid
A) No. of bills issued during the quarter
Haryana 22 268953 57422 809786 39603 180738 NA 584431 86527 57885
B) No. of bills disputed including billing complaints during the quarter
Haryana 0 41 78 380 32 8 NA 529 78 0
C)% of billing complaints during the quarter
<= 0.1% Haryana 0.00% 0.02% 0.14% 0.05% 0.08% 0.004% NA 0.09% 0.09% 0.00%
2
Metering & Billing Credibility -Pre Paid
A) Total No. of Pre-paid customers at the end of the quarter
Haryana 3046 2650445 2875031 4351696 1611638 3000160 2090268 5025191 350829 341672
B) Total No. of complaints relating to charging, Credit and Validity during the quarter
Haryana 0 36 424 3723 1469 0 19 4920 313 0
C) % of Pre-paid Charging Complaints
<= 0.1% Haryana 0.00% 0.001% 0.01% 0.09% 0.09% 0.00% 0.001% 0.10% 0.09% 0.00%
3
Resolution of Billing/Charging Complaints and Period of applying credit/Waiver/Adjustment to customers account from the date of resolution of complaints
A) No. of Billing/Charging/Credit/Validity Complaints received during the quarter
Haryana 0 77 502 16484 1501 8 19 5449 391 0
B) No. of billing complaints for Post paid customers/Charging/Credit/Validity complaints for pre-paid customers resolved within 4 weeks during the quarter
Haryana 0 77 502 16484 1501 8 19 5449 391 0
C) No. of billing complaints for Post paid customers/Charging/Credit/Validity complaints for pre-paid customers resolved within 6 weeks during the quarter
Haryana 0 77 502 16484 1501 8 19 5449 391 0
D) % of billing complaints (for post paid customer) / Charging/Credit/Validity (for Pre paid customer) resolved within 4 weeks
>=98% within 4 weeks
Haryana 100.00% 100.00% 100.00% 100.00% 100.00% 100.00% 100.00% 100.00% 100.00% 100.00%
E) % of billing complaints (for post paid customer) / Charging/Credit/Validity (for Pre paid customer) resolved within 6 weeks
100% within 6 weeks
Haryana
100.00% 100.00% 100.00% 100.00% 100.00% 100.00% 100.00% 100.00% 100.00% 100.00%

AUDIT & ASSESSMENT OF QOS FOR QE- SEPTEMBER-2015 - HARYANA CIRCLE
TUV-SUD SOUTH ASIA PRIVATE LIMITED Page 37
QUARTERLY CSD DATA FOR CELLULAR MOBILE TELEPHONE SERVICES - QE SEPTEMBER 15
Quarterly Averaged CSD Audit Data
Ben
ch-
mar
k
Cir
cle
Nam
e
AIR
CE
L
AIR
TE
L
BS
NL
IDE
A
RC
OM
GS
M
TA
TA
GS
M
VID
EO
CO
N
VO
DA
FO
NE
RC
OM
CD
MA
TA
TA
CD
MA
S/ N
Name of Parameter GSM Operators CDMA Operators
F) % of Period of applying credit/Waiver/Adjustment to customers account from the date of resolution of complaints
<=1 week Haryana 100.00% 100.00% 100.00% 100.00% 100.00% 100.00% 100.00% 100.00% 100.00% 100.00%
4
Response time to customers for assistance
A) Total no of calls attempted to customer care/Call center
Haryana 2191 1570297 236277 12704475 548294 597470 487753 10673574 NP 35361
B) Total no. of calls successfully established to customer care/Call center.
Haryana 2121 1570193 236277 12623013 543292 592177 487753 10673537 NP 34313
C) % Accessibility of Call centre /customer Care (Total calls successfully established *100/ Total call attempts)
>=95% Haryana 96.81% 99.99% 100.00% 99.36% 99.09% 99.11% 100.00% 100.00% NP 97.04%
D) Total Calls reached to operator for Voice to Voice (Total call attempts)
Haryana 880 1467763 1118526 3328482 233584 1144690 1423731 3554842 47804 46337
E) Total number of calls answered by the operator (Voice to voice) within 90 seconds
Haryana 879 1397553 885484 3312068 192876 1087218 1361253 3525437 46936 45870
F) % age of calls answered by operator (voice to voice) (Total calls successfully established within 90 Sec.*100 / Total call attempts )
>=95% Haryana 99.89% 95.22% 79.17% 99.51% 82.57% 94.98% 95.61% 99.17% 98.18% 98.99%
5
Termination/closure of service
A) Total No. of requests for Termination / Closure of service received during the quarter
Haryana 0 1074 235 8364 188 1716 NA 1811 804 829
B) No. of requests for Termination /Closure of service complied within 7 days during the quarter
Haryana 0 1074 235 8129 188 1716 NA 1811 804 829
C) % of Termination/ Closure of service within 7 days
<=7days Haryana 100.00% 100.00% 100.00% 97.19% 100.00% 100.00% NA 100.00% 100.00% 100.00%
6
Time taken for refunds of deposits after closures.
A) No. of Payments/ Refunds due during the quarter
Haryana 0 195 242 2345 218 440 NA 10886 260 441
B) No. of Payments/ Refunds Cleared during the quarter
Haryana 0 195 242 2309 218 440 NA 10886 260 441
C)Time taken for refunds of deposits after closures.
100% within 60 days
Haryana 100.00% 100.00% 100.00% 98.46% 100.00% 100.00% NA 100.00% 100.00% 100.00%
NA* Videocon has no post paid subscribers, so no billing complaints. NP: Data not provided by RCOM CDMA.
NB: Accessibility of call center / Customer care data of RCOM GSM are based on one month data i.e. August 15 as July-15 & September-15 month’s data were not provided by
RCOM GSM due to TTI server issue.

AUDIT & ASSESSMENT OF QOS FOR QE- SEPTEMBER-2015 - HARYANA CIRCLE
TUV-SUD SOUTH ASIA PRIVATE LIMITED Page 38
5.3.2 3 DAYS LIVE CSD AUDITED DATA FOR CELLULAR MOBILE SERVICES (QE-SEPT 2015):
CSD 3 DAYS LIVE DATA FOR CELLULAR MOBILE TELEPHONE SERVICES – QE - SEPT 15
3 days live CSD Audit Data Bench- mark
Circle Name
AIR
CE
L
AIR
TE
L
BS
NL
IDE
A
RC
OM
(G
SM
)
TA
TA
(G
SM
)
VID
EO
CO
N
VO
DA
FO
NE
RC
OM
(C
DM
A)
TA
TA
(C
DM
A)
S/ N
Name of Parameter GSM Operators CDMA
Operators
Response time to customers for assistance
1
A) Total no of calls attempted to customer care/Call center
Haryana 27 20047 8835 382409 NP 10482 15416 320336 NP 1073
B) Total no. of calls successfully established to customer care/Call center.
Haryana 27 20047 8835 380151 NP 10385 15416 320332 NP 1049
C) % Accessibility of Call centre /customer Care (Total calls successfully established *100/ Total call attempts)
>=95% Haryana 100.00% 100.00% 100.00% 99.41% NP 99.07% 100.00% 100.00% NP 97.76%
2
D) Total Calls reached to operator for Voice to Voice (Total call attempts)
Haryana 416 47329 36479 104902 15870 33755 45138 126415 2195 1171
E) Total number of calls answered by the operator (Voice to voice) within 90 seconds
Haryana 413 46889 19280 104560 15202 33566 44059 125373 2144 1170
F) % age of calls answered by operator (voice to voice) (Total calls successfully established within 90 Sec.*100 / Total call attempts )
>=95% Haryana 99.28% 99.07% 52.85% 99.67% 95.79% 99.44% 97.61% 99.18% 97.68% 99.91%
NP: RCOM (GSM & CDMA) has not provided data for the parameter “Accessibility of call center / Customer care” due to TTI server issue.

AUDIT & ASSESSMENT OF QOS FOR QE- SEPTEMBER-2015 - HARYANA CIRCLE
TUV-SUD SOUTH ASIA PRIVATE LIMITED Page 39
5.3.3 KEY FINDINGS ON CUSTOMER SERVICE DELIVERY (CSD) PARAMETERS
1. Metering and billing credibility-(Post paid & Pre-paid) The performance of the service providers with respect to the parameter metering and billing credibility for both post-paid and pre-paid is well within the prescribed bench mark of <=0.1%. Only BSNL failed to meet the benchmark of Billing complaints (post-paid) with its performance level of 0.14%.
2. Resolution of Billing complaints and applying credits -
i. Resolution of billing /charging complaints
ii. Period of applying credit/waiver/adjustment to customer’s account from the date of resolution of complaints
All operators have 100% resolved the billing complaints within stipulated period of 4 weeks and 6 weeks. In all cases where customers were due for credit / adjustment, all the service providers have met the benchmark of 100 % adjustments in one week.
3. Response Time to the Customer for assistance
i. Accessibility of call centre/customer care ii. Percentage of calls answered by Operators (Voice to Voice)
All service providers were in compliance with respect to the parameter ‘Accessibility of call center’ and ‘% Calls answered by operator (voice to voice)’ except BSNL , RCOM GSM and Tata (GSM) have not met the benchmark of parameter calls answered by Operators (voice to voice) within 90 seconds with their performance as 79.17% , 82.57% and 94.98% against the benchmark of >=95%. The performance of BSNL and RCOM(GSM) was way below the benchmark.
4. Termination/Closure of Service
In case of this parameters , all service providers except Idea have settled the closure/termination within the benchmark of 7 days. The performance of Idea was 97.19%.
5. Time Taken for Refund of deposits after closures All operators except Idea were found to have complied with the benchmark of 100% refund of deposits within 60 days of closure. Only Idea failed to meet the benchmark with achieved level as 98.46%.
Live Measurements The results for three days live measurements reveal that all operators have met the benchmarks for the parameters ‘Accessibility to call center’ and call connection to operators (Voice to voice) within 90 seconds. Only BSNL remained short of benchmark of ‘Call answered by operator (Voice to Voice) within 90 seconds’ with their performance of 52.85% , way below the benchmark.

AUDIT & ASSESSMENT OF QOS FOR QE- SEPTEMBER-2015 - HARYANA CIRCLE
TUV-SUD SOUTH ASIA PRIVATE LIMITED Page 40
6. LIVE CALLING ASSESSMENT

AUDIT & ASSESSMENT OF QOS FOR QE- SEPTEMBER-2015 - HARYANA CIRCLE
TUV-SUD SOUTH ASIA PRIVATE LIMITED Page 41
6. LIVE CALLING ASSESSMENT:
6.1 INTER OPERATOR CALLS ASSESSMENT: Inter operator call assessment with a sample of 2x50 test calls for each Service provider operating in Haryana service area during the time 1100 to 1400 Hrs and 1600 to 1900 was carried out by TUV auditors. The test calls were made from one operator to another within the same licensed area to judge the ease of connectivity amongst the operators. While doing this exercise, the radio part, the switch part and POI in between the two operators are involved. Congestion in any of these network elements could result in congestion in the network.
INTER OPERATOR CALL ASSESSMENT BASED ON LIVE MEASUREMENT
Cal
ling
Op
erat
ors
Cir
cle
Nam
e
AIR
TE
L
BS
NL
IDE
A
RC
OM
GS
M
RC
OM
CD
MA
TA
TA
GS
M
TA
TA
CD
MA
VID
EO
CO
N
VO
DA
FO
NE
AIRTEL Haryana ---- 100.00% 100.00% 100.00% 100.00% 100.00% 100.00% 100.00% 100.00%
BSNL Haryana 100.00% ---- 100.00% 100.00% 100.00% 100.00% 100.00% 100.00% 100.00%
IDEA Haryana 100.00% 100.00% ---- 100.00% 100.00% 100.00% 100.00% 100.00% 100.00%
RCOM GSM Haryana 100.00% 100.00% 100.00% ---- 100.00% 100.00% 100.00% 100.00% 100.00%
RCOM CDMA Haryana 100.00% 100.00% 100.00% 100.00% ---- 100.00% 100.00% 100.00% 100.00%
TATA GSM Haryana 100.00% 100.00% 100.00% 100.00% 100.00% ---- 100.00% 100.00% 100.00%
TATA CDMA Haryana 100.00% 100.00% 100.00% 100.00% 100.00% 100.00% ---- 100.00% 100.00%
VIDEOCON Haryana 100.00% 100.00% 100.00% 100.00% 100.00% 100.00% 100.00% ---- 100.00%
VODAFONE Haryana 100.00% 100.00% 100.00% 100.00% 100.00% 100.00% 100.00% 100.00% ----
The result of the testing revealed that the inter connection performance among the operators was quite satisfactory. Thus there was no problem in interconnection from one operator to other operators.

AUDIT & ASSESSMENT OF QOS FOR QE- SEPTEMBER-2015 - HARYANA CIRCLE
TUV-SUD SOUTH ASIA PRIVATE LIMITED Page 42
6.2 CUSTOMER CARE / HELPLINE ASSESSMENT:
LIVE CALLING TO CALL CENTRE
Parameter Circle Name A
IRC
EL
AIR
TE
L
BS
NL
IDE
A
RC
OM
(GS
M)
TA
TA
(GS
M)
VID
EO
CO
N
VO
DA
FO
NE
RC
OM
(CD
MA
)
TA
TA
(CD
MA
)
Total No. of calls Attempted Haryana 100 100 100 100 100 100 100 100 100 100
Total no of calls attempted to customer care/Call center
Haryana 100 100 100 100 100 100 100 100 100 100
Total no. of calls successfully established to customer care/Call center
Haryana 100 100 100 100 100 100 100 100 100 100
% Accessibility of Call centre /customer Care (Total calls successfully established * 100 / Total call attempts)
Haryana 100% 100% 100% 100% 100% 100% 100% 100% 100% 100%
Total Calls reached to agent desk for Voice to Voice (Total call attempt)
Haryana 100 100 100 100 100 100 100 100 100 100
Total number of calls answered by the operator (Voice to voice) within 90 seconds
Haryana 100 100 96 100 98 100 100 98 100 100
% age of calls answered by operator(voice to voice) (Total call successfully established within 90 Sec.*100 / Total calls attempts)
Haryana 100% 100% 96% 100% 98% 100% 100% 98% 100% 100%
In case of calls answered by operators (voice to voice) within 90 seconds when test calls were made to the call centers BSNL, RCOM GSM and Vodafone could connect 96%, 98% and 98% of calls to the operator.

AUDIT & ASSESSMENT OF QOS FOR QE- SEPTEMBER-2015 - HARYANA CIRCLE
TUV-SUD SOUTH ASIA PRIVATE LIMITED Page 43
6.3 LIVE CALLING ASSESSMENT FOR BILLING COMPLAINTS:
Performance (live calling for billing complaints)
Circle Name
AIRCEL AIRTEL BSNL IDEA RCOM (GSM)
TATA (GSM)
VIDEOCON VODAFONE RCOM
(CDMA) TATA (CDMA)
Total No. of calls Attempted
Haryana 0 77 150 150 150 8 19 150 120 0
Total No. of calls Answered
Haryana 0 68 120 132 122 6 16 135 102 0
Cases resolved within 4 weeks
Haryana 0 68 120 132 122 6 16 135 102 0
%age of cases resolved
Haryana 100.00% 100.00% 100.00% 100.00% 100.00% 100.00% 100.00% 100.00% 100.00% 100.00%
To test the Service Providers performance on billing related complaints and their resolutions, TUV-SUD auditors conducted a customer feedback calling for about random 100 nos. of customers. However, in some cases, the number of customers contacted for verification was very less due to less number of billing complaints. During live calling, some of the customers did not attend the calls, so shortfall was made good by taking other complaints to make verification of 100 Complaints where the complaints were more than 100. Some of the complainants reported that they didn’t exactly remember about the duration of resolution of complaints. However, the customers reported that the billing complaints were resolved to their satisfaction.

AUDIT & ASSESSMENT OF QOS FOR QE- SEPTEMBER-2015 - HARYANA CIRCLE
TUV-SUD SOUTH ASIA PRIVATE LIMITED Page 44
6.4 LEVEL -1 CALLING ASSESSMENT:
LEVEL 1 LIVE CALLING
Mo
nth
Cir
cle
Nam
e
SS
A N
ame
SD
CA
Nam
e
Em
erg
ency
No
.
No
. of
calls
mad
e
AIR
TE
L
BS
NL
IDE
A
RC
OM
(G
SM
)
TA
TA
(G
SM
)
VID
EO
CO
N
VO
DA
FO
NE
RC
OM
(C
DM
A)
TA
TA
(C
DM
A)
July'15 Haryana Rohtak
Rohtak 100, 101, 108
,1091,1073,1098 4,5,5,4,4,
4 √ √ √ √ √ √ √ √ √
Bhiwani 100, 101, 108
,1091,1073,1098 4,5,5,4,4,
4 √ √ √ √ √ √ √ √ √
Bhiwanikhera 100, 101, 108
,1091,1073,1098 4,5,5,4,4,
4 √ √ √ √ √ √ √ √ √
Tosam 100, 101, 108
,1091,1073,1098 4,5,5,4,4,
4 √ √ √ √ √ √ √ √ √
Jhajjar 100, 101, 108
,1091,1073,1098 4,5,5,4,4,
4 √ √ √ √ √ √ √ √ √
Bahdurgarh 100, 101, 108
,1091,1073,1098 4,5,5,4,4,
4 √ √ √ √ √ √ √ √ √
Aug'15 Haryana Ambala
Ambala 100, 101, 108
,1091,1073,1098 4,5,5,4,4,
4 √ √ √ √ √ √ √ √ √
Chachruli 100, 101, 108
,1091,1073,1098 4,5,5,4,4,
4 √ √ √ √ √ √ √ √ √
Barara 100, 101, 108
,1091,1073,1098 4,5,5,4,4,
4 √ √ √ √ √ √ √ √ √
Jagahdari 100, 101, 108
,1091,1073,1098 4,5,5,4,4,
4 √ √ √ √ √ √ √ √ √
Kalka 100, 101, 108
,1091,1073,1098 4,5,5,4,4,
4 √ √ √ √ √ √ √ √ √
Narayangarh 100, 101, 108
,1091,1073,1098 4,5,5,4,4,
4 √ √ √ √ √ √ √ √ √
Sep'15 Haryana Sonipat
Sonipat 100, 101, 108
,1091,1073,1098 4,5,5,4,4,
4 √ √ √ √ √ √ √ √ √
Gohana 100, 101, 108
,1091,1073,1098 4,5,5,4,4,
4 √ √ √ √ √ √ √ √ √
To assess the availability and efficiency of level 1 services such as police, fire, ambulance (emergency services) offered by various mobile service providers, the calls were made from mobile phones provided by the service providers. In Haryana service area, these services were found functional in the networks of all the service providers.

AUDIT & ASSESSMENT OF QOS FOR QE- SEPTEMBER-2015 - HARYANA CIRCLE
TUV-SUD SOUTH ASIA PRIVATE LIMITED Page 45
7. DRIVE TEST

AUDIT & ASSESSMENT OF QOS FOR QE- SEPTEMBER-2015 - HARYANA CIRCLE
TUV-SUD SOUTH ASIA PRIVATE LIMITED Page 46
7. OPERATOR ASSESTID DRIVE TEST In terms of TRAI’s letter dated 21st January, 2014, the drive tests were conducted for three consecutive days in one select SSA each month in each service area. Thus, the drive tests were carried out in three SSA’s namely Rohtak, Ambala and Sonipat in the months of July, August and September 2015 respectively. The total route Kms covered during the drive tests in respective SSAs was 476 Kms, 460 Kms and 489 Kms. The performance of the operators has been highlighted below in the tables. The drive test was conducted simultaneously for all the operators following the same route of drive tests. The holding period for all test calls was 120 seconds. The drive test vehicle across all routes plied at a speed of about 30-50 km per hour. For measuring voice quality, Rx Qual samples on a scale from 0 to 7 for GSM operators and Frame Error Rate (FERs) for CDMA service providers were measured. As per the QoS norms, Rx Qual between 0- 5 for GSM operators and between 0-4% FER value for CDMA operators is considered to be good, where as Rx Qual beyond this benchmark is considered to be bad. Call drops were measured by the number of calls that were dropped to the total number of calls established during the drive test. Similarly CSSR was measured as the ratio of total calls
established to the total call attempts made. Signal strength was measured in dBm at street level with strength ≥ -75
dBm for in-door coverage and ≥ -85 dBm for in-vehicle.

AUDIT & ASSESSMENT OF QOS FOR QE- SEPTEMBER-2015 - HARYANA CIRCLE
TUV-SUD SOUTH ASIA PRIVATE LIMITED Page 47
DRIVE TEST TABLE – 1
OPERATOR ASSISTED DRIVE TEST AT ROHTAK SSA IN JULY 15 MONTH- HARYANA CIRCLE
S/N
Par
amet
er
Cla
ssif
icat
ion
of
rou
tes
cove
red
AIR
CE
L
AIR
TE
L
BS
NL
TA
TA
GS
M
IDE
A
RC
OM
GS
M
VID
EO
CO
N
VO
DA
FO
NE
TA
TA
CD
MA
RC
OM
CD
MA
OU
TD
OO
R
IND
OO
R
OU
TD
OO
R
IND
OO
R
OU
TD
OO
R
IND
OO
R
OU
TD
OO
R
IND
OO
R
OU
TD
OO
R
IND
OO
R
OU
TD
OO
R
IND
OO
R
OU
TD
OO
R
IND
OO
R
OU
TD
OO
R
IND
OO
R
OU
TD
OO
R
IND
OO
R
OU
TD
OO
R
IND
OO
R
1 Call
Attempts
Major Roads NC NC 149 25 122 25 94 25 146 25 83 24 84 25 128 25 28 25 95 25
Highways NC NC 116 26 139 25 85 25 113 25 64 23 87 25 115 25 68 25 94 25
Within City NC NC 123 26 125 25 112 25 111 25 118 25 107 25 152 25 162 25 208 26
Overall SSA NC NC 388 77 386 75 291 75 370 75 265 72 278 75 395 75 258 75 397 76
2 Blocked Call Rate
Major Roads NC NC 0.00% 0.00% 0.00% 0.00% 0.00% 0.00% 0.00% 0.00% 0.00% 0.00% 1.19% 0.00% 0.00% 0.00% 3.57% 0.00% 0.00% 0.00%
Highways NC NC 0.00% 0.00% 1.44% 0.00% 0.00% 0.00% 0.00% 0.00% 3.13% 0.00% 0.00% 0.00% 0.00% 0.00% 0.00% 0.00% 0.00% 0.00%
Within City NC NC 0.00% 0.00% 0.00% 0.00% 1.79% 0.00% 0.00% 0.00% 0.00% 0.00% 0.93% 0.00% 0.00% 0.00% 0.00% 0.00% 0.48% 0.00%
Overall SSA NC NC 0.00% 0.00% 0.52% 0.00% 0.69% 0.00% 0.00% 0.00% 0.75% 0.00% 0.72% 0.00% 0.00% 0.00% 0.39% 0.00% 0.25% 0.00%
3 Dropped Call Rate (<=2%)
Major Roads NC NC 0.00% 0.00% 1.64% 0.00% 0.00% 0.00% 0.00% 0.00% 0.00% 0.00% 0.00% 0.00% 0.00% 0.00% 0.00% 0.00% 0.00% 0.00%
Highways NC NC 0.00% 0.00% 0.00% 0.00% 0.00% 0.00% 0.00% 0.00% 0.00% 0.00% 0.00% 0.00% 0.00% 0.00% 1.47% 0.00% 2.13% 0.00%
Within City NC NC 0.00% 0.00% 0.00% 0.00% 0.00% 0.00% 0.00% 0.00% 0.00% 0.00% 0.00% 0.00% 0.00% 0.00% 1.23% 0.00% 0.97% 0.00%
Overall SSA NC NC 0.00% 0.00% 0.52% 0.00% 0.00% 0.00% 0.00% 0.00% 0.00% 0.00% 0.00% 0.00% 0.00% 0.00% 1.17% 0.00% 1.01% 0.00%
4
Percentage connections with good voice quality (=>95%)
(a) 0-4 (w/o
frequency hopping
for CDMA Operators)
Major Roads NC NC NA NA NA NA NA NA NA NA NA NA NA NA NA NA 95.48% 95.99% 99.74% 100%
Highways NC NC NA NA NA NA NA NA NA NA NA NA NA NA NA NA 94.88% 95.37% 99.85% 100%
Within City NC NC NA NA NA NA NA NA NA NA NA NA NA NA NA NA 96.02% 99.67% 99.99% 100%
Overall SSA NC NC NA NA NA NA NA NA NA NA NA NA NA NA NA NA 95.71% 97.05% 99.90% 100%
(b) 0-5 ( with
frequency hopping for GSM
Operators)
Major Roads NC NC 97.78% 99.58% 86.39% 100% 95.68% 94.49% 96.58% 96.42% 98.50% 98.73% 96.46% 95.08% 97.26% 99.79% NA NA NA NA
Highways NC NC 97.20% 99.17% 86.74% 99.60% 95.62% 99.39% 96.98% 98.90% 98.38% 99.80% 96.45% 99.96% 97.77% 99.55% NA NA NA NA
Within City NC NC 96.47% 96.99% 91.81% 97.10% 95.44% 97.39% 95.94% 99.90% 98.48% 99.35% 95.35% 99.24% 97.36% 99.92% NA NA NA NA
Overall SSA NC NC 97.17% 98.71% 88.33% 97.90% 95.56% 96.99% 96.51% 98.42% 98.46% 99.40% 95.90% 97.12% 97.44% 99.75% NA NA NA NA

AUDIT & ASSESSMENT OF QOS FOR QE- SEPTEMBER-2015 - HARYANA CIRCLE
TUV-SUD SOUTH ASIA PRIVATE LIMITED Page 48
DRIVE TEST TABLE – 1
OPERATOR ASSISTED DRIVE TEST AT ROHTAK SSA IN JULY 15 MONTH- HARYANA CIRCLE
S/N
Par
amet
er
Cla
ssif
icat
ion
of
rou
tes
cove
red
AIR
CE
L
AIR
TE
L
BS
NL
TA
TA
GS
M
IDE
A
RC
OM
GS
M
VID
EO
CO
N
VO
DA
FO
NE
TA
TA
CD
MA
RC
OM
CD
MA
OU
TD
OO
R
IND
OO
R
OU
TD
OO
R
IND
OO
R
OU
TD
OO
R
IND
OO
R
OU
TD
OO
R
IND
OO
R
OU
TD
OO
R
IND
OO
R
OU
TD
OO
R
IND
OO
R
OU
TD
OO
R
IND
OO
R
OU
TD
OO
R
IND
OO
R
OU
TD
OO
R
IND
OO
R
OU
TD
OO
R
IND
OO
R
5
Service Coverage
In door (>= -
75dBm)
Major Roads NC NC 64.26% 99.46% 56.05% 100% 72.77% 99.94% 94.81% 99.95% 34.09% 73.83% 64.21% 94.37% 97.44% 100% 47.68% 11.87% 94.55% 100%
Highways NC NC 65.98% 56.63% 54.87% 80.34% 63.91% 91.32% 96.00% 97.02% 38.14% 2.49% 68.41% 72.92% 97.91% 100% 46.95% 6.55% 95.08% 100%
Within City NC NC 88.06% 99.82% 86.21% 100% 87.40% 100% 98.61% 100% 59.44% 100% 83.77% 96.61% 98.98% 99.83% 31.23% 93.93% 98.63% 99.77%
Overall SSA NC NC 72.64% 82.68% 65.14% 93.88% 76.87% 97.34% 96.36% 99.27% 46.59% 63.87% 75.17% 89.69% 98.04% 99.94% 36.70% 37.18% 96.88% 99.94%
In-vehicle (>= -
85dBm)
Major Roads NC NC 84.44% 100% 81.04% 100% 97.40% 100% 99.05% 100% 68.64% 100% 91.13% 99.91% 98.42% 100% 81.72% 99.73% 96.08% 100%
Highways NC NC 86.62% 58.55% 85.22% 97.39% 94.59% 98.62% 99.60% 99.91% 73.81% 98.38% 93.71% 99.97% 98.75% 100% 87.66% 84.54% 97.63% 100%
Within City NC NC 97.50% 99.98% 96.44% 100% 97.20% 100% 99.81% 100% 88.08% 100% 97.05% 98.79% 99.06% 100% 90.97% 100% 99.84% 100%
Overall SSA NC NC 89.40% 83.66% 87.58% 99.19% 96.58% 99.58% 99.46% 99.98% 78.72% 99.47% 94.83% 99.66% 98.71% 100% 89.11% 94.74% 98.47% 100%
Outdoor- in city (>=
- 95dBm)
Major Roads NC NC 97.28% 100% 97.57% 100% 99.71% 100% 99.81% 100% 97.02% 100% 99.29% 99.95% 99.83% 100% 97.75% 99.97% 99.16% 100%
Highways NC NC 97.32% 94.38% 98.84% 100% 99.03% 99.66% 99.97% 100% 96.87% 100% 99.24% 100% 99.93% 100% 97.44% 98.43% 99.82% 100%
Within City NC NC 99.84% 100% 100% 100% 99.74% 100% 99.99% 100% 98.40% 100% 99.58% 99.82% 99.89% 100% 98.16% 100% 100% 100%
Overall SSA NC NC 98.14% 97.78% 98.84% 100% 99.55% 99.90% 99.91% 100% 97.61% 100% 99.42% 99.93% 99.87% 100% 97.95% 99.47% 99.77% 100%
6
Call Setup Success
Rate (>=95%)
Major Roads NC NC 100% 100% 100% 100% 100% 100% 100% 100% 100% 100% 98.81% 100% 100% 100% 96.43% 100% 100% 100%
Highways NC NC 100% 100% 98.56% 100% 100% 100% 100% 100% 96.88% 100% 100% 100% 100% 100% 100% 100% 100% 100%
Within City NC NC 100% 100% 100% 100% 98.21% 100% 100% 100% 100% 100% 99.07% 100% 100% 100% 100% 100% 99.52% 100%
Overall SSA NC NC 100% 100% 99.48% 100% 99.31% 100% 100% 100% 99.25% 100% 99.28% 100% 100% 100% 99.61% 100% 99.75% 100%
7
Hand Over Success
Rate (HOSR)
Major Roads NC NC 99.08% 100% 98.99% 100% 100% 100% 99.30% 100% 100% 100% 100% 100% 100% 100% 100% 100% 100% 100%
Highways NC NC 100% 100% 99.41% 100% 97.78% 100% 100% 100% 100% 100% 99.08% 100% 100% 100% 100% 100% 100% 100%
Within City NC NC 99.67% 100% 98.72% 100% 98.04% 100% 99.38% 100% 99.48% 100% 99.61% 100% 100% 100% 100% 100% 100% 100%
Overall SSA NC NC 99.61% 100% 99.01% 100% 98.43% 100% 99.55% 100% 99.66% 100% 99.57% 100% 100% 100% 100% 100% 100% 100%
NC-No Coverage; NA-Not Applicable
The service providers having block call rate more than 3% have been shaded in yellow colour.

AUDIT & ASSESSMENT OF QOS FOR QE- SEPTEMBER-2015 - HARYANA CIRCLE
TUV-SUD SOUTH ASIA PRIVATE LIMITED Page 49
DRIVE TEST TABLE – 2
OPERATOR ASSISTED DRIVE TEST AT AMBALA SSA IN AUGUST 15 MONTH- HARYANA CIRCLE
S/N
Par
amet
er
Cla
ssif
icat
ion
of
rou
tes
cove
red
AIR
CE
L
AIR
TE
L
BS
NL
TA
TA
GS
M
IDE
A
RC
OM
GS
M
VID
EO
CO
N
VO
DA
FO
NE
TA
TA
CD
MA
RC
OM
CD
MA
OU
TD
OO
R
IND
OO
R
OU
TD
OO
R
IND
OO
R
OU
TD
OO
R
IND
OO
R
OU
TD
OO
R
IND
OO
R
OU
TD
OO
R
IND
OO
R
OU
TD
OO
R
IND
OO
R
OU
TD
OO
R
IND
OO
R
OU
TD
OO
R
IND
OO
R
OU
TD
OO
R
IND
OO
R
OU
TD
OO
R
IND
OO
R
1 Call
Attempts
Major Roads NC NC 74 26 148 25 94 25 101 26 49 25 49 25 94 25 65 25 49 25
Highways NC NC 123 27 90 25 85 25 101 25 61 24 92 25 106 25 62 25 63 24
Within City NC NC 162 26 132 25 112 25 150 25 165 25 160 25 125 25 135 25 168 25
Overall SSA NC NC 359 79 370 75 291 75 352 76 275 74 301 75 325 75 262 75 280 74
2 Blocked Call Rate
Major Roads NC NC 0.00% 0.00% 2.70% 0.00% 0.00% 0.00% 2.97% 0.00% 0.00% 0.00% 0.00% 0.00% 0.00% 0.00% 0.00% 0.00% 0.00% 0.00%
Highways NC NC 0.00% 0.00% 1.11% 0.00% 0.00% 0.00% 1.98% 0.00% 0.00% 0.00% 0.00% 0.00% 0.00% 0.00% 0.00% 0.00% 0.00% 0.00%
Within City NC NC 0.00% 0.00% 2.27% 0.00% 1.79% 0.00% 0.00% 0.00% 0.00% 0.00% 0.63% 4.00% 0.00% 0.00% 0.00% 0.00% 0.00% 0.00%
Overall SSA NC NC 0.00% 0.00% 2.16% 0.00% 0.69% 0.00% 1.42% 0.00% 0.00% 0.00% 0.33% 1.33% 0.00% 0.00% 0.00% 0.00% 0.00% 0.00%
3 Dropped Call Rate (<=2%)
Major Roads NC NC 0.00% 0.00% 2.07% 0.00% 0.00% 0.00% 0.00% 0.00% 0.00% 0.00% 0.00% 0.00% 0.00% 0.00% 0.00% 0.00% 0.00% 0.00%
Highways NC NC 0.00% 0.00% 2.27% 0.00% 0.00% 0.00% 0.00% 0.00% 1.64% 4.17% 0.00% 0.00% 0.00% 0.00% 0.00% 0.00% 0.00% 0.00%
Within City NC NC 0.00% 0.00% 2.33% 0.00% 0.00% 0.00% 0.00% 0.00% 0.00% 0.00% 0.00% 0.00% 0.00% 0.00% 0.00% 0.00% 1.79% 0.00%
Overall SSA NC NC 0.00% 0.00% 2.21% 0.00% 0.00% 0.00% 0.00% 0.00% 0.36% 1.35% 0.00% 0.00% 0.00% 0.00% 0.00% 0.00% 1.07% 0.00%
4
Percentage connections with good voice quality (=>95%)
(a) 0-4 (w/o
frequency hopping
for CDMA Operators)
Major Roads NC NC NA NA NA NA NA NA NA NA NA NA NA NA NA NA 97.68% 99.07% 99.96% 100%
Highways NC NC NA NA NA NA NA NA NA NA NA NA NA NA NA NA 97.37% 98.38% 99.93% 100%
Within City NC NC NA NA NA NA NA NA NA NA NA NA NA NA NA NA 98.03% 97.49% 99.95% 100%
Overall SSA NC NC NA NA NA NA NA NA NA NA NA NA NA NA NA NA 97.74% 98.30% 99.95% 100%
(b) 0-5 ( with
frequency hopping for GSM
Operators)
Major Roads NC NC 96.02% 95.20% 94.59% 98.96% 95.68% 94.49% 95.22% 98.83% 97.83% 100% 98.18% 95.11% 96.70% 99.59% NA NA NA NA
Highways NC NC 96.30% 95.10% 94.28% 99.28% 95.62% 99.39% 95.27% 98.80% 98.31% 99.64% 95.90% 99.19% 97.35% 97.84% NA NA NA NA
Within City NC NC 96.11% 98.67% 96.16% 98.12% 95.44% 97.39% 96.27% 99.46% 98.00% 99.63% 95.23% 99.28% 96.79% 99.96% NA NA NA NA
Overall SSA NC NC 96.14% 96.27% 95.28% 98.79% 95.56% 96.99% 95.70% 99.03% 98.04% 99.81% 95.81% 97.55% 96.96% 98.98% NA NA NA NA

AUDIT & ASSESSMENT OF QOS FOR QE- SEPTEMBER-2015 - HARYANA CIRCLE
TUV-SUD SOUTH ASIA PRIVATE LIMITED Page 50
DRIVE TEST TABLE – 2
OPERATOR ASSISTED DRIVE TEST AT AMBALA SSA IN AUGUST 15 MONTH- HARYANA CIRCLE
S/N
Par
amet
er
Cla
ssif
icat
ion
of
rou
tes
cove
red
AIR
CE
L
AIR
TE
L
BS
NL
TA
TA
GS
M
IDE
A
RC
OM
GS
M
VID
EO
CO
N
VO
DA
FO
NE
TA
TA
CD
MA
RC
OM
CD
MA
OU
TD
OO
R
IND
OO
R
OU
TD
OO
R
IND
OO
R
OU
TD
OO
R
IND
OO
R
OU
TD
OO
R
IND
OO
R
OU
TD
OO
R
IND
OO
R
OU
TD
OO
R
IND
OO
R
OU
TD
OO
R
IND
OO
R
OU
TD
OO
R
IND
OO
R
OU
TD
OO
R
IND
OO
R
OU
TD
OO
R
IND
OO
R
5
Service Coverage
In door (>= -
75dBm)
Major Roads NC NC 78.41% 100% 73.63% 9.94% 72.77% 99.94% 63.76% 26.77% 51.51% 100% 57.91% 99.75% 95.32% 100% 24.59% 58.14% 97.08% 99.77%
Highways NC NC 82.71% 88.60% 80.13% 18.82% 63.91% 91.32% 78.50% 96.79% 43.03% 100% 54.61% 93.66% 98.25% 100% 17.19% 68.17% 96.45% 93.88%
Within City NC NC 94.39% 99.91% 97.89% 88.43% 87.40% 100% 97.33% 99.74% 57.19% 80.48% 84.97% 99.78% 99.52% 100% 59.89% 69.15% 99.35% 100%
Overall SSA NC NC 86.68% 96.14% 83.77% 32.84% 76.87% 97.34% 85.80% 52.15% 53.29% 90.60% 73.17% 98.09% 97.88% 100% 42.16% 65.80% 98.50% 99.57%
In-vehicle (>= -
85dBm)
Major Roads NC NC 96.05% 100% 95.55% 88.40% 97.40% 100% 90.83% 26.82% 80.15% 100% 85.69% 100% 98.14% 100% 77.69% 85.52% 99.21% 99.77%
Highways NC NC 97.81% 99.82% 97.90% 88.12% 94.59% 98.62% 97.54% 100% 68.96% 100% 83.18% 99.90% 99.01% 100% 74.41% 88.99% 98.61% 96.89%
Within City NC NC 99.80% 100% 99.68% 99.94% 97.20% 100% 99.83% 100% 89.41% 99.81% 98.25% 100% 99.70% 100% 87.90% 89.30% 99.76% 100%
Overall SSA NC NC 98.23% 99.94% 97.59% 91.25% 96.58% 99.58% 97.33% 52.81% 83.59% 99.91% 92.52% 99.97% 99.02% 100% 82.49% 88.16% 99.47% 99.73%
Outdoor- in city (>=
- 95dBm)
Major Roads NC NC 99.82% 100% 99.29% 99.86% 99.71% 100% 97.33% 26.82% 98.73% 100% 97.96% 100% 99.77% 100% 99.17% 99.20% 100% 100%
Highways NC NC 99.93% 99.99% 99.71% 99.85% 99.03% 99.66% 99.58% 100% 95.77% 100% 97.13% 100% 99.73% 100% 99.38% 98.54% 99.99% 100%
Within City NC NC 100% 100% 99.89% 100% 99.74% 100% 99.98% 100% 99.04% 100% 99.83% 100% 99.87% 100% 99.42% 98.55% 100% 100%
Overall SSA NC NC 99.93% 100% 99.61% 99.89% 99.55% 99.90% 99.30% 52.81% 98.32% 100% 98.86% 100% 99.80% 100% 99.36% 98.72% 100% 100%
6
Call Setup Success
Rate (>=95%)
Major Roads NC NC 100% 100% 97.97% 100% 100% 100% 96.04% 100% 100% 100% 100% 100% 100% 100% 100% 100% 100% 100%
Highways NC NC 100% 100% 97.78% 100% 100% 100% 96.04% 100% 100% 100% 100% 100% 100% 100% 100% 100% 100% 100%
Within City NC NC 100% 100% 97.73% 100% 98.21% 100% 98.67% 100% 100% 100% 99.38% 96.00% 100% 100% 100% 100% 100% 100%
Overall SSA NC NC 100% 100% 97.84% 100% 99.31% 100% 97.16% 100% 100% 100% 99.67% 98.67% 100% 100% 100% 100% 100% 100%
7
Hand Over Success
Rate (HOSR)
Major Roads NC NC 99.55% 100% 98.55% 100% 100% 100% 98.06% 100% 96.88% 100% 100% 100% 100% 100% 100% 100% 100% 100%
Highways NC NC 99.40% 100% 98.32% 100% 97.78% 100% 98.40% 100% 100% 100% 100% 100% 100% 100% 100% 100% 100% 100%
Within City NC NC 99.56% 100% 98.77% 100% 98.04% 100% 98.70% 100% 100% 100% 99.41% 100% 100% 100% 100% 100% 100% 100%
Overall SSA NC NC 99.52% 100% 98.67% 100% 98.43% 100% 98.43% 100% 99.73% 100% 99.61% 100% 100% 100% 100% 100% 100% 100%
NC-No Coverage; NA-Not Applicable
The service providers having block call rate more than 3% have been shaded in yellow colour.

AUDIT & ASSESSMENT OF QOS FOR QE- SEPTEMBER-2015 - HARYANA CIRCLE
TUV-SUD SOUTH ASIA PRIVATE LIMITED Page 51
DRIVE TEST TABLE – 3
OPERATOR ASSISTED DRIVE TEST AT SONIPAT SSA IN SEPTEMBER 15 MONTH- HARYANA CIRCLE
S/N
Par
amet
er
Cla
ssif
icat
ion
of
rou
tes
cove
red
AIR
CE
L
AIR
TE
L
BS
NL
TA
TA
GS
M
IDE
A
RC
OM
GS
M
VID
EO
CO
N
VO
DA
FO
NE
TA
TA
CD
MA
RC
OM
CD
MA
OU
TD
OO
R
IND
OO
R
OU
TD
OO
R
IND
OO
R
OU
TD
OO
R
IND
OO
R
OU
TD
OO
R
IND
OO
R
OU
TD
OO
R
IND
OO
R
OU
TD
OO
R
IND
OO
R
OU
TD
OO
R
IND
OO
R
OU
TD
OO
R
IND
OO
R
OU
TD
OO
R
IND
OO
R
OU
TD
OO
R
IND
OO
R
1 Call
Attempts
Major Roads
NC NC 75 30 67 31 63 25 76 30 45 31 50 30 149 25 35 30 47 31
Highways NC NC 55 30 60 31 68 25 60 30 57 30 57 30 151 25 52 30 57 31
Within City NC NC 344 30 363 32 268 25 353 30 239 30 246 30 203 25 227 30 242 30
Overall SSA
NC NC 474 90 490 94 399 75 489 90 341 91 353 90 503 75 314 90 346 92
2 Blocked Call Rate
Major Roads
NC NC 0.00% 0.00% 0.00% 0.00% 0.00% 0.00% 0.00% 0.00% 0.00% 0.00% 2.00% 0.00% 0.00% 0.00% 0.00% 0.00% 0.00% 0.00%
Highways NC NC 1.82% 0.00% 0.00% 0.00% 0.00% 0.00% 0.00% 0.00% 0.00% 0.00% 1.75% 0.00% 0.00% 0.00% 0.00% 0.00% 0.00% 0.00%
Within City NC NC 0.29% 0.00% 0.00% 0.00% 0.00% 0.00% 0.00% 0.00% 0.00% 0.00% 0.00% 0.00% 0.49% 0.00% 0.00% 0.00% 0.00% 0.00%
Overall SSA
NC NC 0.42% 0.00% 0.00% 0.00% 0.00% 0.00% 0.00% 0.00% 0.00% 0.00% 0.57% 0.00% 0.20% 0.00% 0.00% 0.00% 0.00% 0.00%
3 Dropped Call Rate (<=2%)
Major Roads
NC NC 0.00% 0.00% 0.00% 0.00% 0.00% 0.00% 0.00% 0.00% 0.00% 0.00% 0.00% 0.00% 0.00% 0.00% 0.00% 0.00% 0.00% 0.00%
Highways NC NC 0.00% 0.00% 0.00% 0.00% 0.00% 0.00% 0.00% 0.00% 0.00% 0.00% 0.00% 0.00% 0.00% 0.00% 0.00% 0.00% 0.00% 0.00%
Within City NC NC 0.00% 0.00% 0.00% 0.00% 0.75% 0.00% 0.00% 0.00% 0.00% 0.00% 0.00% 0.00% 0.00% 0.00% 0.44% 0.00% 0.41% 0.00%
Overall SSA
NC NC 0.00% 0.00% 0.00% 0.00% 0.50% 0.00% 0.00% 0.00% 0.00% 0.00% 0.00% 0.00% 0.00% 0.00% 0.32% 0.00% 0.29% 0.00%
4
Percentage connections with good voice quality (=>95%)
(a) 0-4 (w/o
frequency hopping
for CDMA Operators)
Major Roads
NC NC NA NA NA NA NA NA NA NA NA NA NA NA NA NA 98.69% 99.20% 99.95% 100%
Highways NC NC NA NA NA NA NA NA NA NA NA NA NA NA NA NA 97.64% 98.76% 99.88% 100%
Within City NC NC NA NA NA NA NA NA NA NA NA NA NA NA NA NA 98.44% 98.18% 99.92% 100%
Overall SSA
NC NC NA NA NA NA NA NA NA NA NA NA NA NA NA NA 98.39% 98.71% 99.92% 100%
(b) 0-5 ( with
Major Roads
NC NC 97.00% 96.83% 84.79% 94.45% 95.95% 98.96% 95.17% 99.33% 98.24% 100% 96.53% 95.71% 96.62% 99.37% NA NA NA NA

AUDIT & ASSESSMENT OF QOS FOR QE- SEPTEMBER-2015 - HARYANA CIRCLE
TUV-SUD SOUTH ASIA PRIVATE LIMITED Page 52
DRIVE TEST TABLE – 3
OPERATOR ASSISTED DRIVE TEST AT SONIPAT SSA IN SEPTEMBER 15 MONTH- HARYANA CIRCLE
S/N
Par
amet
er
Cla
ssif
icat
ion
of
rou
tes
cove
red
AIR
CE
L
AIR
TE
L
BS
NL
TA
TA
GS
M
IDE
A
RC
OM
GS
M
VID
EO
CO
N
VO
DA
FO
NE
TA
TA
CD
MA
RC
OM
CD
MA
OU
TD
OO
R
IND
OO
R
OU
TD
OO
R
IND
OO
R
OU
TD
OO
R
IND
OO
R
OU
TD
OO
R
IND
OO
R
OU
TD
OO
R
IND
OO
R
OU
TD
OO
R
IND
OO
R
OU
TD
OO
R
IND
OO
R
OU
TD
OO
R
IND
OO
R
OU
TD
OO
R
IND
OO
R
OU
TD
OO
R
IND
OO
R
frequency hopping for GSM
Operators)
Highways NC NC 96.70% 97.22% 87.85% 99.51% 96.37% 99.56% 93.97% 99.56% 97.44% 99.69% 95.54% 99.82% 96.64% 99.55% NA NA NA NA
Within City NC NC 96.42% 99.49% 88.37% 98.39% 95.33% 97.13% 95.52% 99.57% 97.39% 100% 95.27% 98.05% 96.61% 99.39% NA NA NA NA
Overall SSA
NC NC 96.57% 97.89% 87.78% 95.64% 95.56% 98.55% 95.29% 99.49% 97.51% 99.91% 95.51% 97.79% 96.62% 99.44% NA NA NA NA
5
Service Coverage
In door (>= -
75dBm)
Major Roads
NC NC 82.62% 78.16% 43.07% 52.74% 52.38% 100% 89.42% 99.91% 46.25% 99.24% 65.90% 60.60% 98.40% 100% 73.20% 70.82% 95.88% 100%
Highways NC NC 89.25% 99.99% 39.68% 44.42% 48.49% 99.39% 90.76% 100% 45.27% 100% 70.76% 100% 99.44% 100% 53.04% 77.93% 96.10% 97.92%
Within City NC NC 88.08% 65.14% 55.44% 69.83% 64.64% 74.13% 92.24% 100% 62.26% 100% 70.38% 79.13% 98.14% 100% 54.72% 69.15% 96.97% 100%
Overall SSA
NC NC 87.32% 81.48% 51.84% 55.75% 60.52% 90.43% 91.61% 99.97% 57.37% 99.55% 69.79% 81.64% 98.37% 100% 60.05% 73.21% 96.65% 99.48%
In-vehicle (>= -
85dBm)
Major Roads
NC NC 97.42% 99.15% 85.79% 98.78% 89.14% 100% 98.47% 100% 73.06% 100% 91.14% 99.23% 99.23% 100% 93.03% 89.90% 98.35% 100%
Highways NC NC 99.14% 100% 83.92% 99.63% 85.23% 100% 98.78% 100% 79.06% 100% 95.48% 100% 99.87% 100% 87.26% 92.36% 98.15% 100%
Within City NC NC 98.55% 78.09% 89.38% 99.81% 90.12% 99.98% 99.24% 100% 86.17% 100% 92.13% 99.78% 99.15% 100% 87.68% 95.47% 99.07% 100%
Overall SSA
NC NC 98.44% 92.15% 88.23% 99.41% 89.21% 99.99% 99.06% 100% 83.28% 100% 92.57% 99.70% 99.27% 100% 89.24% 92.51% 98.79% 100%
Outdoor- in city (>=
- 95dBm)
Major Roads
NC NC 99.99% 100% 98.96% 100% 99.28% 100% 99.53% 100% 98.60% 100% 98.57% 100% 99.70% 100% 99.46% 99.45% 100% 100%
Highways NC NC 99.98% 100% 98.71% 99.98% 98.74% 100% 99.73% 100% 98.05% 100% 99.57% 100% 99.95% 100% 99.13% 99.49% 99.91% 100%
Within City NC NC 99.94% 99.90% 99.32% 99.99% 98.87% 100% 99.82% 100% 99.00% 100% 98.66% 100% 99.85% 100% 99.15% 99.14% 100% 100%
Overall SSA
NC NC 99.95% 99.97% 99.20% 99.99% 98.90% 100% 99.76% 100% 98.79% 100% 98.81% 100% 99.84% 100% 99.24% 99.38% 99.98% 100%
6
Call Setup Success
Rate (>=95%)
Major Roads
NC NC 100% 100% 100% 100% 100% 100% 100% 100% 100% 100% 98.00% 100% 100% 100% 100% 100% 100% 100%
Highways NC NC 98.18% 100% 100% 100% 100% 100% 100% 100% 100% 100% 98.25% 100% 100% 100% 100% 100% 100% 100%
Within City NC NC 99.71% 100% 100% 100% 100% 100% 100% 100% 100% 100% 100% 100% 99.51% 100% 100% 100% 100% 100%

AUDIT & ASSESSMENT OF QOS FOR QE- SEPTEMBER-2015 - HARYANA CIRCLE
TUV-SUD SOUTH ASIA PRIVATE LIMITED Page 53
DRIVE TEST TABLE – 3
OPERATOR ASSISTED DRIVE TEST AT SONIPAT SSA IN SEPTEMBER 15 MONTH- HARYANA CIRCLE
S/N
Par
amet
er
Cla
ssif
icat
ion
of
rou
tes
cove
red
AIR
CE
L
AIR
TE
L
BS
NL
TA
TA
GS
M
IDE
A
RC
OM
GS
M
VID
EO
CO
N
VO
DA
FO
NE
TA
TA
CD
MA
RC
OM
CD
MA
OU
TD
OO
R
IND
OO
R
OU
TD
OO
R
IND
OO
R
OU
TD
OO
R
IND
OO
R
OU
TD
OO
R
IND
OO
R
OU
TD
OO
R
IND
OO
R
OU
TD
OO
R
IND
OO
R
OU
TD
OO
R
IND
OO
R
OU
TD
OO
R
IND
OO
R
OU
TD
OO
R
IND
OO
R
OU
TD
OO
R
IND
OO
R
Overall SSA
NC NC 99.58% 100% 100% 100% 100% 100% 100% 100% 100% 100% 99.43% 100% 99.80% 100% 100% 100% 100% 100%
7
Hand Over Success
Rate (HOSR)
Major Roads
NC NC 100% 100% 100% 100% 100% 100% 100% 100% 100% 100% 100% 100% 99.37% 100% 100% 100% 100% 100%
Highways NC NC 100% 100% 100% 100% 100% 100% 100% 100% 100% 100% 100% 100% 98.77% 100% 100% 100% 100% 100%
Within City NC NC 99.47% 100% 100% 100% 99.58% 100% 99.75% 100% 99.70% 100% 100% 100% 99.54% 100% 100% 100% 100% 100%
Overall SSA
NC NC 99.61% 100% 100% 100% 99.70% 100% 99.83% 100% 99.77% 100% 100% 100% 99.26% 100% 100% 100% 100% 100%
NC-No Coverage; NA-Not Applicable
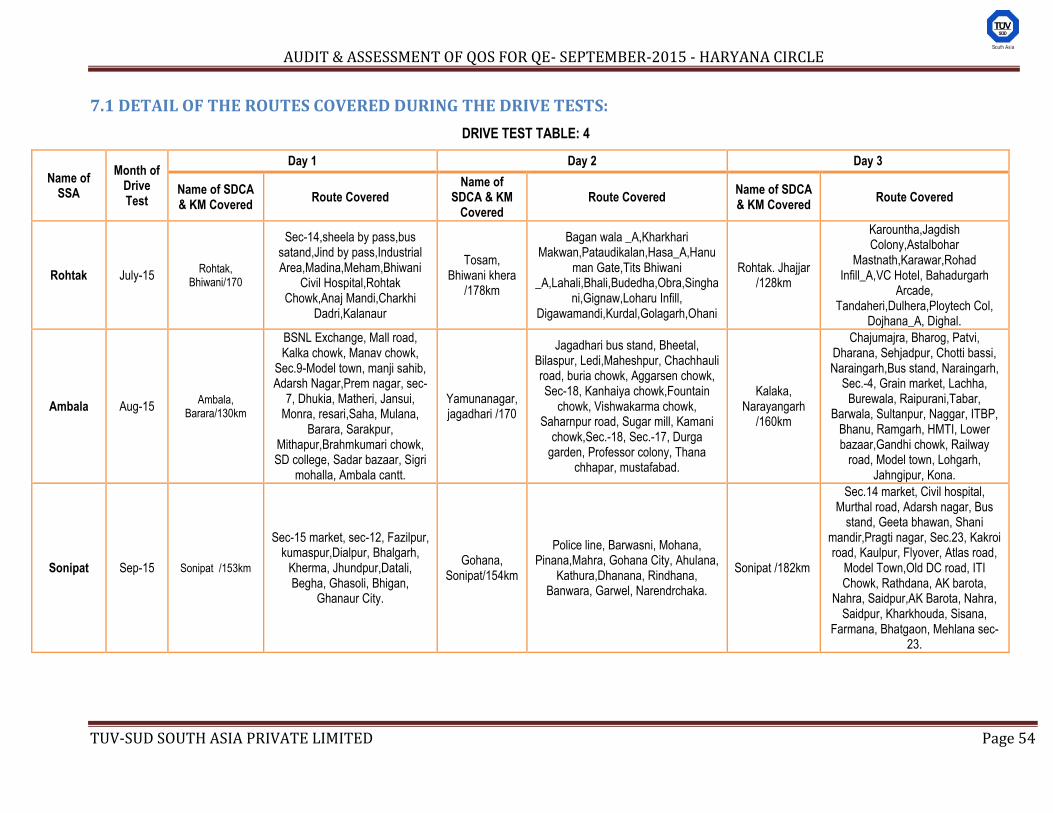
AUDIT & ASSESSMENT OF QOS FOR QE- SEPTEMBER-2015 - HARYANA CIRCLE
TUV-SUD SOUTH ASIA PRIVATE LIMITED Page 54
7.1 DETAIL OF THE ROUTES COVERED DURING THE DRIVE TESTS:
DRIVE TEST TABLE: 4
Name of SSA
Month of Drive Test
Day 1 Day 2 Day 3
Name of SDCA & KM Covered
Route Covered Name of
SDCA & KM Covered
Route Covered Name of SDCA & KM Covered
Route Covered
Rohtak July-15 Rohtak,
Bhiwani/170
Sec-14,sheela by pass,bus satand,Jind by pass,Industrial Area,Madina,Meham,Bhiwani
Civil Hospital,Rohtak Chowk,Anaj Mandi,Charkhi
Dadri,Kalanaur
Tosam, Bhiwani khera
/178km
Bagan wala _A,Kharkhari Makwan,Pataudikalan,Hasa_A,Hanu
man Gate,Tits Bhiwani _A,Lahali,Bhali,Budedha,Obra,Singha
ni,Gignaw,Loharu Infill, Digawamandi,Kurdal,Golagarh,Ohani
Rohtak. Jhajjar /128km
Karountha,Jagdish Colony,Astalbohar
Mastnath,Karawar,Rohad Infill_A,VC Hotel, Bahadurgarh
Arcade, Tandaheri,Dulhera,Ploytech Col,
Dojhana_A, Dighal.
Ambala Aug-15 Ambala,
Barara/130km
BSNL Exchange, Mall road, Kalka chowk, Manav chowk,
Sec.9-Model town, manji sahib, Adarsh Nagar,Prem nagar, sec-
7, Dhukia, Matheri, Jansui, Monra, resari,Saha, Mulana,
Barara, Sarakpur, Mithapur,Brahmkumari chowk, SD college, Sadar bazaar, Sigri
mohalla, Ambala cantt.
Yamunanagar, jagadhari /170
Jagadhari bus stand, Bheetal, Bilaspur, Ledi,Maheshpur, Chachhauli road, buria chowk, Aggarsen chowk, Sec-18, Kanhaiya chowk,Fountain
chowk, Vishwakarma chowk, Saharnpur road, Sugar mill, Kamani
chowk,Sec.-18, Sec.-17, Durga garden, Professor colony, Thana
chhapar, mustafabad.
Kalaka, Narayangarh
/160km
Chajumajra, Bharog, Patvi, Dharana, Sehjadpur, Chotti bassi, Naraingarh,Bus stand, Naraingarh,
Sec.-4, Grain market, Lachha, Burewala, Raipurani,Tabar,
Barwala, Sultanpur, Naggar, ITBP, Bhanu, Ramgarh, HMTI, Lower bazaar,Gandhi chowk, Railway
road, Model town, Lohgarh, Jahngipur, Kona.
Sonipat Sep-15 Sonipat /153km
Sec-15 market, sec-12, Fazilpur, kumaspur,Dialpur, Bhalgarh,
Kherma, Jhundpur,Datali, Begha, Ghasoli, Bhigan,
Ghanaur City.
Gohana, Sonipat/154km
Police line, Barwasni, Mohana, Pinana,Mahra, Gohana City, Ahulana,
Kathura,Dhanana, Rindhana, Banwara, Garwel, Narendrchaka.
Sonipat /182km
Sec.14 market, Civil hospital, Murthal road, Adarsh nagar, Bus
stand, Geeta bhawan, Shani mandir,Pragti nagar, Sec.23, Kakroi road, Kaulpur, Flyover, Atlas road,
Model Town,Old DC road, ITI Chowk, Rathdana, AK barota,
Nahra, Saidpur,AK Barota, Nahra, Saidpur, Kharkhouda, Sisana,
Farmana, Bhatgaon, Mehlana sec-23.

AUDIT & ASSESSMENT OF QOS FOR QE- SEPTEMBER-2015 - HARYANA CIRCLE
TUV-SUD SOUTH ASIA PRIVATE LIMITED Page 55
7.2 SSA WISE DRIVE TEST OBSERVATION:
DRIVE TEST TABLE: 5
DRIVE TEST OBSERVATION OF ROHTAK SSA (JULY-15)
S. No Name of SP SDCA
Covered in Day 1
Day 1 Observation SDCA
Covered in Day 2
Day 2 Observation SDCA
Covered in Day 3
Day 3 Observation
1 AIRTEL
Rohtak, Bhiwani,
Charkhidari.
Poor Rx Level and Rx Quality Near Bhiwani
Khera.
Bhiwani khera, Jhajjar,
Bhadurgarh
Poor Rx Level and Rx Quality Chang Village,Near Khark.
Rohtak, Tosam, Meham
Overall Good Coverage and Quality in Covered SDCA's.
2 BSNL
Overall Good Coverage
and Quality in Covered
SDCA's.
Overall Good Coverage and
Quality in Covered SDCA's.
Poor Rx Level and Rx Quality
Bondkalan Village,Near
Siwana,Mishri.
3 TATA GSM
Poor Rx Level and Rx
Quality Madina,Industrial
Area,Near Charki Dadri.
Poor Rx Level and Rx Quality
Lohni & Kalanaur,Isarwal,Obra,
milan,Lohni,Wlindenpur Village.
Poor Rx Level and Rx Quality
Industrial Area
Sampla,Bhadurgarh Major
road,Digal,sanwar,Kaurianta.
4 TATA CDMA
Poor Rx Level and Rx
Quality Madina,Industrial
Area,Near Charki Dadri.
Poor Rx Level and Rx Quality
Lohni & Kalanaur,Isarwal,Obra,
milan,Lohni,Wlindenpur Village.
Poor Rx Level and Rx Quality
Industrial Area
Sampla,Bhadurgarh Major
road,Digal,sanwar,Kaurianta.
5 IDEA
Poor Rx Level and Rx
Quality Near Paintawas
Kalan,Nirmiwalan to
kitlana,Chang to
khulawas.
Poor Rx Level and Rx Quality
Near Rawladhi to
snawar,Sangerwas to bond
kalan.
Poor Rx Level and Rx Quality
Near Jamalpur to
akabarpur,nirmiwalan to
kitlana,tosam to obra,Digwa
mandi.
6 RCOM GSM
Poor Rx Level and Rx
Quality Near
Madina,Prem
Nagar,Jhakoda,Rohatk-
jhajjar road.
Poor Rx Level and Rx Quality
Near Rwaldhri nd
sanwar,Kaurianta,Jhajjar
Road,Bhadurgarh.
Poor Rx Level and Rx Quality
Near Lohni,Wlindenpur
Village,Loharu,Dhulera.
7 RCOM CDMA
Poor Rx Level and Rx
Quality Near
Madina,Prem
Nagar,Jhakoda,Rohatk-
jhajjar road.
Poor Rx Level and Rx Quality
Near Rwaldhri nd
sanwar,Kaurianta,Jhajjar
Road,Bhadurgarh.
Poor Rx Level and Rx Quality
Near Lohni,Wlindenpur
Village,Loharu,Dhulera
8 VIDEOCON
Poor Rx Level and Rx
Quality Near Paintawas
Kalan,Nirmiwalan to
kitlana,Chang to
khulawas.
Poor Rx Level and Rx Quality
Near Rawladhi to
snawar,Sangerwas to bond
kalan.
Poor Rx Level and Rx Quality
Near Jamalpur to
Akabarpur,Nirmiwalan to
Kitlana,Tosam to Obra,Digwa
Mandi.
9 VODAFONE
Overall Good Coverage
and Quality in Covered
SDCA's.
Poor Rx Level and Rx Quality
Near Gujrani to Chang,Missri to
Indutrial Area.
Overall Good Coverage and
Quality in Covered SDCA's.
10 AIRCEL NC NC NC
NC: No coverage
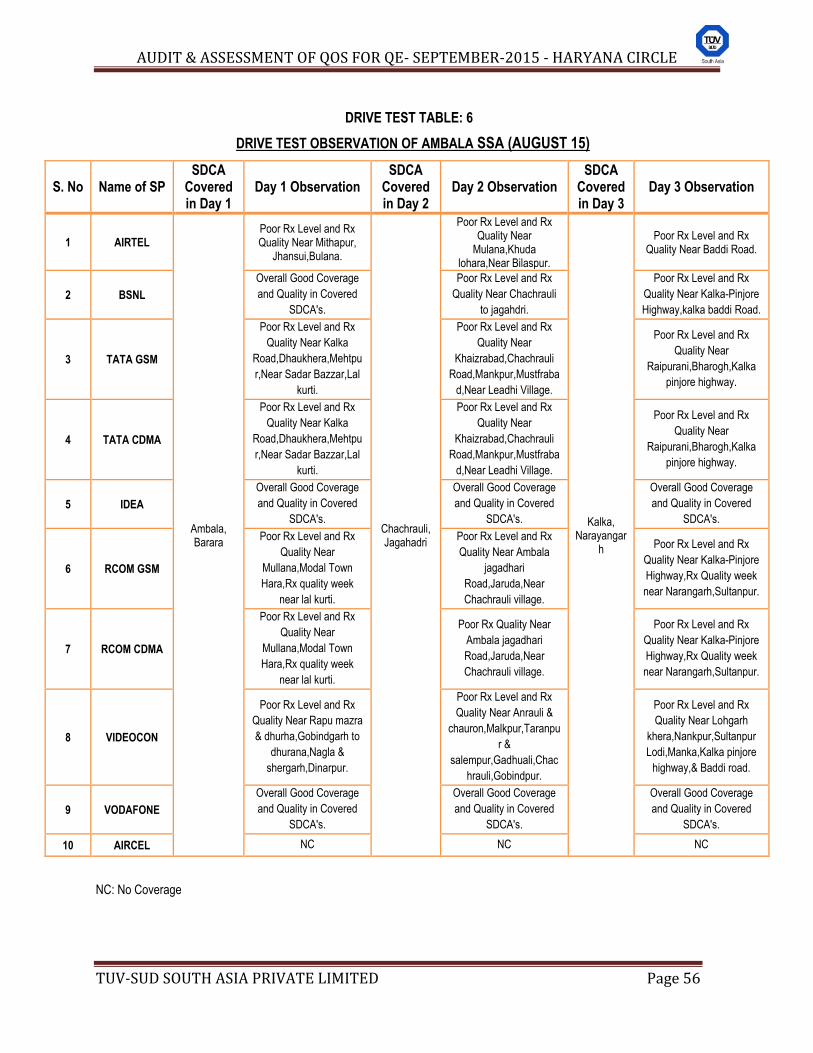
AUDIT & ASSESSMENT OF QOS FOR QE- SEPTEMBER-2015 - HARYANA CIRCLE
TUV-SUD SOUTH ASIA PRIVATE LIMITED Page 56
DRIVE TEST TABLE: 6
DRIVE TEST OBSERVATION OF AMBALA SSA (AUGUST 15)
S. No Name of SP SDCA
Covered in Day 1
Day 1 Observation SDCA
Covered in Day 2
Day 2 Observation SDCA
Covered in Day 3
Day 3 Observation
1 AIRTEL
Ambala, Barara
Poor Rx Level and Rx Quality Near Mithapur,
Jhansui,Bulana.
Chachrauli, Jagahadri
Poor Rx Level and Rx Quality Near
Mulana,Khuda lohara,Near Bilaspur.
Kalka, Narayangar
h
Poor Rx Level and Rx Quality Near Baddi Road.
2 BSNL
Overall Good Coverage
and Quality in Covered
SDCA's.
Poor Rx Level and Rx
Quality Near Chachrauli
to jagahdri.
Poor Rx Level and Rx
Quality Near Kalka-Pinjore
Highway,kalka baddi Road.
3 TATA GSM
Poor Rx Level and Rx
Quality Near Kalka
Road,Dhaukhera,Mehtpu
r,Near Sadar Bazzar,Lal
kurti.
Poor Rx Level and Rx
Quality Near
Khaizrabad,Chachrauli
Road,Mankpur,Mustfraba
d,Near Leadhi Village.
Poor Rx Level and Rx
Quality Near
Raipurani,Bharogh,Kalka
pinjore highway.
4 TATA CDMA
Poor Rx Level and Rx
Quality Near Kalka
Road,Dhaukhera,Mehtpu
r,Near Sadar Bazzar,Lal
kurti.
Poor Rx Level and Rx
Quality Near
Khaizrabad,Chachrauli
Road,Mankpur,Mustfraba
d,Near Leadhi Village.
Poor Rx Level and Rx
Quality Near
Raipurani,Bharogh,Kalka
pinjore highway.
5 IDEA
Overall Good Coverage
and Quality in Covered
SDCA's.
Overall Good Coverage
and Quality in Covered
SDCA's.
Overall Good Coverage
and Quality in Covered
SDCA's.
6 RCOM GSM
Poor Rx Level and Rx
Quality Near
Mullana,Modal Town
Hara,Rx quality week
near lal kurti.
Poor Rx Level and Rx
Quality Near Ambala
jagadhari
Road,Jaruda,Near
Chachrauli village.
Poor Rx Level and Rx
Quality Near Kalka-Pinjore
Highway,Rx Quality week
near Narangarh,Sultanpur.
7 RCOM CDMA
Poor Rx Level and Rx
Quality Near
Mullana,Modal Town
Hara,Rx quality week
near lal kurti.
Poor Rx Quality Near
Ambala jagadhari
Road,Jaruda,Near
Chachrauli village.
Poor Rx Level and Rx
Quality Near Kalka-Pinjore
Highway,Rx Quality week
near Narangarh,Sultanpur.
8 VIDEOCON
Poor Rx Level and Rx
Quality Near Rapu mazra
& dhurha,Gobindgarh to
dhurana,Nagla &
shergarh,Dinarpur.
Poor Rx Level and Rx
Quality Near Anrauli &
chauron,Malkpur,Taranpu
r &
salempur,Gadhuali,Chac
hrauli,Gobindpur.
Poor Rx Level and Rx
Quality Near Lohgarh
khera,Nankpur,Sultanpur
Lodi,Manka,Kalka pinjore
highway,& Baddi road.
9 VODAFONE
Overall Good Coverage
and Quality in Covered
SDCA's.
Overall Good Coverage
and Quality in Covered
SDCA's.
Overall Good Coverage
and Quality in Covered
SDCA's.
10 AIRCEL NC NC NC
NC: No Coverage

AUDIT & ASSESSMENT OF QOS FOR QE- SEPTEMBER-2015 - HARYANA CIRCLE
TUV-SUD SOUTH ASIA PRIVATE LIMITED Page 57
DRIVE TEST TABLE: 7
DRIVE TEST OBSERVATION OF SONIPAT SSA (SEPTEMBER) 15)
S. No Name of SP SDCA
Covered in Day 1
Day 1 Observation SDCA
Covered in Day 2
Day 2 Observation SDCA
Covered in Day 3
Day 3 Observation
1 AIRTEL
Sonipat, Gohana
Poor Rx Level and Rx Quality Near Rai Industrial Area.
Sonipat, Gohana
Poor Rx Level and Rx Quality Near Kundli
Industrial Area.
Sonipat, Gohana
Overall Good Coverage and Quality in Covered SDCA's.
2 BSNL Poor Rx Level and Rx Quality
Near saidpur,kharkhoda Village.
Poor Rx Level and Rx Quality Near Kundli Industrial Area,Gsoli
Village,Fazilpur,kewda.
Poor Rx Level and Rx Quality Near
Jhundpur,Murthal,Dipalpur,Mohana,Pinana.
3 TATA GSM Poor Rx Level and Rx Quality
Near Rai Indutrial area,Kewara.
Poor Rx Level and Rx Quality Near Kundli
Industrial Area,Gsoli.
Poor Quality Near Dipalpur & mohana.
4 TATA CDMA Poor Quality & Level Near Rai
Indutrial area,Kewara. Poor Quality near Kundli
Industrial Area,Gsoli. Poor Quality Near Dipalpur
& mohana.
5 IDEA Overall Good Coverage and Quality in Covered SDCA's.
Overall Good Coverage and Quality in Covered
SDCA's.
Overall Good Coverage and Quality in Covered SDCA's.
6 RCOM GSM
Poor Rx Level and Rx Quality Near Datoli,Begha,Week Rx
level near Gannur & Datuli,Pnipat Gohana Road,Biansawad Khurd.
Poor Rx Level and Rx Quality Near Jhakuli & Rai,Rohtak Gohana
Road.
Poor Rx Level and Rx Quality Near NH-1 &
Murthal.
7 RCOM CDMA
Poor Rx Level and Rx Quality Near Datoli,Begha,Week Rx
level near Gannur & Datuli,Pnipat Gohana Road,Biansawad Khurd.
Poor Rx Level and Rx Quality Near Jhakuli & Rai,Rohtak Gohana
Road.
Poor Rx Level and Rx Quality Near NH-1 &
Murthal.
8 VIDEOCON
Poor Rx Level and Rx Quality Near Kmaspur &
Dipalpur,Kewara & bhalgarh,Jhunpur.
Poor Rx Level and Rx Quality Near Seoli,Badh
Khalsa,Larsoli.
Poor Rx Level and Rx Quality Near
Umeadgarh,Ramnagar,anwali,Dhanana.
9 VODAFONE Overall Good Coverage and Quality in Covered SDCA's.
Overall Good Coverage and Quality in Covered
SDCA's.
Overall Good Coverage and Quality in Covered SDCA's.
10 AIRCEL NC NC NC
NC: No Coverage

AUDIT & ASSESSMENT OF QOS FOR QE- SEPTEMBER-2015 - HARYANA CIRCLE
TUV-SUD SOUTH ASIA PRIVATE LIMITED Page 58
DRIVE TEST TABLE: 8
NO NETWORK COVERAGE STATUS OF DRIVE TEST – JULY TO SEPTEMBER 15
S. No Month of
Drive Test Name of
Operators SSA
Covered SDCAs Covered
Status of no network coverage area
ICR Status
1 July-15
Airtel
Rohtak
No Coverage Issue No
BSNL No Coverage Issue No
Vodafone No Coverage Issue No
Tata GSM
Bahadurgarh-Jhajjar Highway ,Khardwad Highway ,Miran ,Sisar Khas Road ,Gadhi Khere Village ,Bichri Road ,Dhani Sankar Road ,Pokar Vas , Khuda Road , Gignau ,
Singani Road
No
Tata CDMA
Bahadurgarh-Jhajjar Highway ,Khardwad Highway ,Miran ,Sisar Khas Road ,Gadhi Khere Village ,Bichri Road ,Dhani Sankar Road ,Pokar Vas , Khuda Road , Gignau ,
Singani Road
No
Reliance GSM
No Coverage Areas On Bahadurgarh - Charra Road Near To Tanda Heri , No
Coverage Areas On Bahadurgarh - Rohtak Road ,Bhiwanikhera - Bhiwani Road ,Bhiwani - Loharu Road ,Bhiwani -
Charkhidadri Road ,Jhajjar - Rohtak Road ,Kalanaur Road , Rohtak - Kalanaur Road ,Bhiwani - Loharu Road , Loharu - Tosham Road ,Kherisaad , Bahu Jamalput To Bahu
Akbarpur ,
ICR Coverage with Tata is Available On Bahadurgarh
- Rohtak Road ,Bhiwanikhera - Bhiwani
Road ,Chang , Aluwa ,Bhiwani - Charkhidadri Road ,Charkhidadri -
Kalanaur Road , Rohtak - Kalanaur Road ,Karauntha
, Kherisaad , Bahu Akbarpur ,Kharkhari
Makhanwala.
Reliance CDMA
No Coverage Areas On Bahadurgarh - Charra Road Near To Tanda Heri , No
Coverage Areas On Bahadurgarh - Rohtak Road ,Bhiwanikhera - Bhiwani Road ,Bhiwani - Loharu Road ,Bhiwani -
Charkhidadri Road ,Jhajjar - Rohtak Road ,Kalanaur Road , Rohtak - Kalanaur Road ,Bhiwani - Loharu Road , Loharu - Tosham Road ,Kherisaad , Bahu Jamalput To Bahu
Akbarpur ,
No
Videocon Pahladgarh Road ,Saral Road ,Paintawas Nakipur To Obra With

AUDIT & ASSESSMENT OF QOS FOR QE- SEPTEMBER-2015 - HARYANA CIRCLE
TUV-SUD SOUTH ASIA PRIVATE LIMITED Page 59
S. No Month of
Drive Test Name of
Operators SSA
Covered SDCAs Covered
Status of no network coverage area
ICR Status
Kalan ,Charkhi Village ,No Service Between Khakara To Meham , Jhanjara Sheoran To
Pahari Road ,Salempur To Mansarwas Road ,Khaparbas ,Ladianwali ,Indiwali
,Saral ,Lohani To Dhani
Tata Docomo ,Isharwal With Tata Docomo
,Kharkhri Makhwa With Tata Docomo
Idea No Coverage Issue No
2 Aug-15
Airtel
Ambala
No Coverage Issue No
BSNL No Coverage Issue No
Vodafone No Coverage Issue No
Tata GSM
Jansuya To Dorana ,Baroli Majra To Lahsabad ,Kishanpura To Bhelpura ,Dhamla
To Nanakpura No
Tata CDMA
Jansuya To Dorana ,Baroli Majra To Lahsabad ,Kishanpura To Bhelpura ,Dhamla
To Nanakpura No
Reliance GSM
Segta To Sahibapura , Landha To Harra , Segta , Bishangarh , Kaleran , Barola
,Chuharpur Kalan To Chachrauli , Chachrauli To Yamunagar , Malakpur , Dadupr Jattan , Leda Khedar , Kotra
Kahansingh , Mahab Aliwala , Gurdhanpur , Pipli Majra , Malikpur , Gulabgarh , Piruwala
,Pinjokra To Chajjumajra (Punjab Area) , Dhanana To Shezadpur , Baragarh To
Ahemdpur , Husaini To Burewala , Barruna Chotta To Tabar
ICR Coverage With Tata Is Available Between
Kudhakalan To Jawahargarh , Mohri , Kesri , Tepla , Khudi ,
Mitthapur , Mathedi ,Kalpi
Reliance CDMA
Segta To Sahibapura , Landha To Harra , Segta , Bishangarh , Kaleran , Barola
,Chuharpur Kalan To Chachrauli , Chachrauli To Yamunagar , Malakpur , Dadupr Jattan , Leda Khedar , Kotra
Kahansingh , Mahab Aliwala , Gurdhanpur , Pipli Majra , Malikpur , Gulabgarh , Piruwala
,Pinjokra To Chajjumajra (Punjab Area) , Dhanana To Shezadpur , Baragarh To
Ahemdpur , Husaini To Burewala , Barruna Chotta To Tabar
No
Videocon
Mohra To Kesari ,Mithapur ,Jaroda ,Jalalui ,Ghaseetpur ,Lohgarh To Koona , Jansui Head To Durana ,Pipali Majra To Urjani ,Kheri To Barwala ,Bilaspur To Khijrabad
No
Idea No Coverage Issue No

AUDIT & ASSESSMENT OF QOS FOR QE- SEPTEMBER-2015 - HARYANA CIRCLE
TUV-SUD SOUTH ASIA PRIVATE LIMITED Page 60
S. No Month of
Drive Test Name of
Operators SSA
Covered SDCAs Covered
Status of no network coverage area
ICR Status
3 Sep-15
Airtel
Sonipat
No Coverage Issue No
BSNL No Coverage Issue No
Vodafone No Coverage Issue No
Tata GSM Pinana to Farmana , Jhundpur to Bahalgarh No
Tata CDMA Sonipat to Rurki Highway. No
Reliance GSM
No Coverage Between Muthal To Bighan , Khazirpur Ahir , Gannaur To Datauli , Gorar
To Muzamnagar , Mahipr To Mahlana , Barwasi To Mohana ,Tihat Ot Latth , Katwal To Kalhani , Gohana To Garhi Ujale Khan
,Gannaur To Datauli , Gorar To Muzamnagar , Mahipr To Mahlana , Barwasi
To Mohana , Certain Area Jhundpur To Bahalgarh
ICR With Tata Is Available Between Jhundpur &
Bahalgarh , Bahalgarh & Murthal , Ahmedpur , Bighan; Kheri Gujjar ,
Sisana , Bhatgaon Dogran , Khizarpur Jat ,Tihar ,
Rukhi , Bhainswankhurd
Reliance CDMA
No Coverage Between Muthal To Bighan , Khazirpur Ahir , Gannaur To Datauli , Gorar
To Muzamnagar , Mahipr To Mahlana , Barwasi To Mohana ,Tihat Ot Latth , Katwal To Kalhani , Gohana To Garhi Ujale Khan
,Gannaur To Datauli , Gorar To Muzamnagar , Mahipr To Mahlana , Barwasi
To Mohana , Certain Area Jhundpur To Bahalgarh
No
Videocon
Kheri Gujjar ,Umedhgarh To Bhigaan ,Badkhalsa ,Khewra To Jakholi ,Kathura To
Dhanana ,Katwal To Rukhi ,Chhtera To Nahara ,Rampur To Pai ,Polangi To
Muzzam Nagar ,Mahipur To Salimsar Majra ,Hasyanpur Tihara Kalan ,Mehlana To Snp
Road
ICR With Tata Is Available Between Begh ,Rajlu ,Larsauli ,Msit Engg
Collage ,Nilothi ,Bhatgaon ,Khizarpur Jat ,Lath ,Ahulana ,Kathura
Idea No Coverage Issue No

AUDIT & ASSESSMENT OF QOS FOR QE- SEPTEMBER-2015 - HARYANA CIRCLE
TUV-SUD SOUTH ASIA PRIVATE LIMITED Page 61
7.3 KEY FINDINGS ON DRIVE TEST: The key observations, derived from the results of the drive tests are as under –
Aircel has no coverage in all the SSAs where drive tests were conducted during the quarter. In fact, Aircel is having its very limited presence in Haryana circle with only 28 BTSs in entire Haryana service area.
(i) In the Month of July -15 drive tests were conducted across Rohtak SSA covering Rohtak, Bhiwani, Tosam, Bhiwani Khera and Jhajjar SDCAs during three consecutive days (476 Kms.). The overall performance of the service providers was satisfactory as they were largely meeting the benchmarks. Only BSNL failed to meet the benchmark of Voice Quality with its performance as 88.33%
(ii) In the Month of August -15, drive tests were conducted across Ambala SSA covering Ambala, Barara, Yamunanagar, Jagadhari, Kalka and Narayangarh SDCAs during three consecutive days (460 Kms.). In this SSA also, the overall performance of the service providers was satisfactory as they were largely meeting the benchmarks. Only BSNL remained non-complied for parameters Call Drop Rate with its performance 2.21%.
(iii) In the month of September -15, drive tests were conducted across Sonipat SSA covering Sonipat and Gohana SDCAs during three consecutive days (489 Kms.). In Sonipat SSA also, BSNL failed to meet the benchmarks for parameters Voice Quality (97.78). The overall performance on SSA level for other service providers was well within the compliance range of the benchmarks.
The deficiencies with respect to adequate coverage and voice quality, observed on the drive tests plots, at the various places are summarized in the table-5, table-6 and table -7 (above) respectively for three SSAs.
The detail of Network coverage and Intra Circle Roaming (ICR) status of different service providers at various locations in the three SSAs is given in table-8.
Thus overall performance of the service providers was satisfactory as they were largely meeting the benchmarks. However, BSNL remained non-compliant with respect to the parameters Voice Quality and CDR in the respective SSAs.

AUDIT & ASSESSMENT OF QOS FOR QE- SEPTEMBER-2015 - HARYANA CIRCLE
TUV-SUD SOUTH ASIA PRIVATE LIMITED Page 62
8. GRAPHICAL REPRESENTATION (CELLULAR MOBILE SERVICE PROVIDERS)
AVERAGED QUARTERLY PMR
V/S
AVERAGED QUARTERLY 3-DAYs LIVE MEASURMENT

AUDIT & ASSESSMENT OF QOS FOR QE- SEPTEMBER-2015 - HARYANA CIRCLE
TUV-SUD SOUTH ASIA PRIVATE LIMITED Page 63
8. GRAPHICAL REPRESENTATION (CMTS):
Graphical Representation of Performance of the Cellular Mobile Service Providers (PMR) V/S 3-Days Live Measurement (Quarterly Average Data):
1) BTS ACCUMULATED DOWNTIME:
All operators are meeting the benchmarks.
2) WORST AFFECTED BTSS DUE TO DOWNTIME:
All operators are meeting the benchmarks except Tata CDMA during monthly audit.
AIRCEL AIRTEL BSNL VIDEOCON TATA GSM IDEA RCOM GSM VODAFONE RCOM CDMA
TATA CDMA
Quarterly PMR 0.14% 0.08% 1.12% 0.10% 0.09% 0.00% 0.47% 0.02% 0.31% 0.07%
Quarterly Live 0.75% 0.04% 1.74% 0.11% 0.11% 0.00% 0.36% 0.02% 0.34% 0.08%
Benchmark 2% 2% 2% 2% 2% 2% 2% 2% 2% 2%
0.00%
0.50%
1.00%
1.50%
2.00%
2.50%
BTS Accumulated Downtime
AIRCEL AIRTEL BSNL VIDEOCON TATA GSM IDEA RCOM GSM VODAFONE RCOM CDMA
TATA CDMA
Quarterly PMR 0.00% 0.03% 1.28% 0.19% 0.16% 0.00% 0.92% 0.04% 0.36% 0.17%
Quarterly Live 0.00% 0.00% 0.21% 0.00% 0.00% 0.00% 0.00% 0.00% 0.00% 0.00%
Benchmark 2% 2% 2% 2% 2% 2% 2% 2% 2% 2%
0.00%
0.50%
1.00%
1.50%
2.00%
2.50%
Worst affected BTSs due to downtime

AUDIT & ASSESSMENT OF QOS FOR QE- SEPTEMBER-2015 - HARYANA CIRCLE
TUV-SUD SOUTH ASIA PRIVATE LIMITED Page 64
3) CALL SETUP SUCCESS RATE:
All operators are meeting the benchmarks.
4) SDCCH/PAGING CHANNEL CONGESTION:
All operators are meeting the benchmarks.
AIRCEL AIRTEL BSNL VIDEOCON TATA GSM IDEA RCOM GSM VODAFONE RCOM CDMA
TATA CDMA
Quarterly PMR 99.40% 98.78% 97.56% 98.75% 97.38% 99.01% 99.31% 99.66% 98.46% 96.72%
Quarterly Live 100.00% 98.84% 97.50% 98.77% 97.20% 99.02% 99.71% 99.39% 98.40% 95.87%
Benchmark 95% 95% 95% 95% 95% 95% 95% 95% 95% 95%
92.00%
93.00%
94.00%
95.00%
96.00%
97.00%
98.00%
99.00%
100.00%
101.00%
Call Setup Success Rate
AIRCEL AIRTEL BSNL VIDEOCON TATA GSM IDEA RCOM GSM VODAFONE RCOM CDMA
TATA CDMA
Quarterly PMR 0.00% 0.19% 0.30% 0.12% 0.18% 0.38% 0.01% 0.12% 0.00% 0.00%
Quarterly Live 0.00% 0.28% 0.22% 0.14% 0.27% 0.20% 0.02% 0.11% 0.00% 0.00%
Benchmark 1% 1% 1% 1% 1% 1% 1% 1% 1% 1%
0.00%
0.20%
0.40%
0.60%
0.80%
1.00%
1.20%
SDCCH/PAGING Channel Congestion

AUDIT & ASSESSMENT OF QOS FOR QE- SEPTEMBER-2015 - HARYANA CIRCLE
TUV-SUD SOUTH ASIA PRIVATE LIMITED Page 65
5) TCH CONGESTION:
All operators are meeting the benchmarks.
6) CALL DROP RATE:
All operators are meeting the benchmarks except Aircel.
AIRCEL AIRTEL BSNL VIDEOCON TATA GSM IDEA RCOM GSM VODAFONE RCOM CDMA
TATA CDMA
Quarterly PMR 0.00% 0.35% 1.01% 0.08% 1.32% 0.48% 0.06% 0.34% 0.11% 0.94%
Quarterly Live 0.00% 0.26% 1.05% 0.07% 1.37% 0.46% 0.03% 0.61% 0.11% 0.41%
Benchmark 2% 2% 2% 2% 2% 2% 2% 2% 2% 2%
0.00%
0.50%
1.00%
1.50%
2.00%
2.50%
TCH Congestion
AIRCEL AIRTEL BSNL VIDEOCON TATA GSM IDEA RCOM GSM VODAFONE RCOM CDMA
TATA CDMA
Quarterly PMR 2.53% 0.36% 1.49% 0.54% 0.83% 0.67% 0.12% 0.74% 0.05% 0.64%
Quarterly Live 2.19% 0.35% 1.60% 0.53% 0.84% 0.67% 0.17% 0.79% 0.06% 0.71%
Benchmark 2% 2% 2% 2% 2% 2% 2% 2% 2% 2%
0.00%
0.50%
1.00%
1.50%
2.00%
2.50%
3.00%
Call Drop Rate
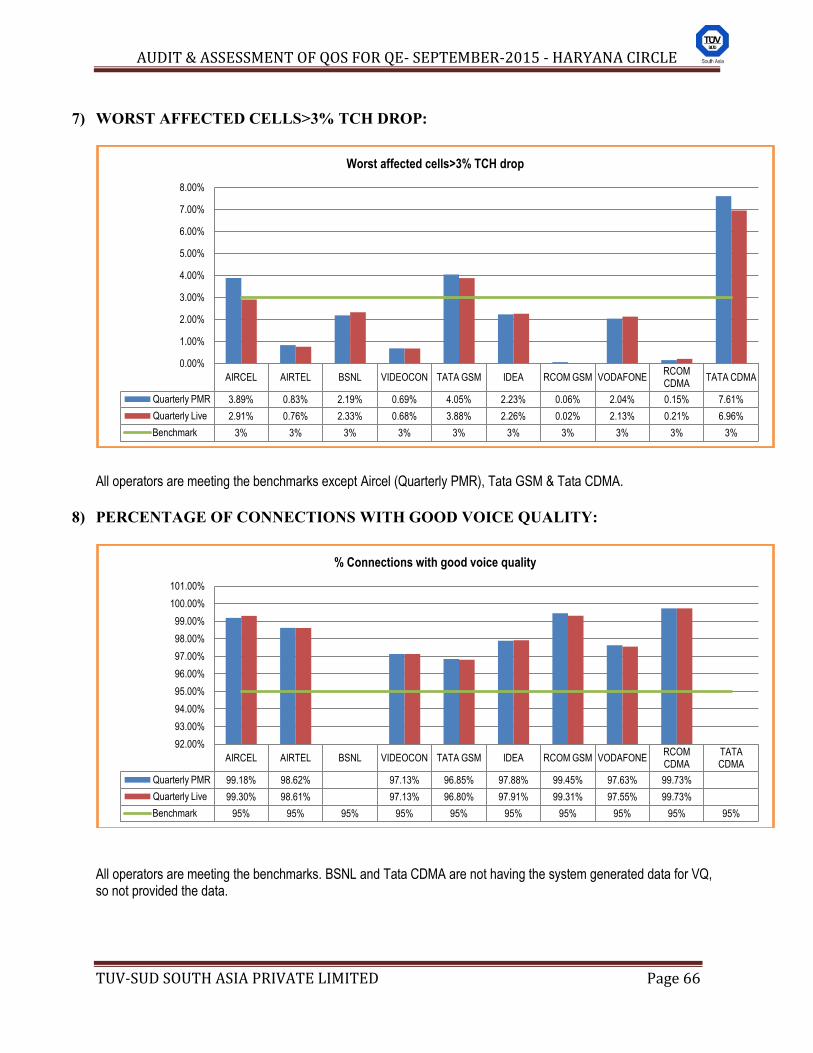
AUDIT & ASSESSMENT OF QOS FOR QE- SEPTEMBER-2015 - HARYANA CIRCLE
TUV-SUD SOUTH ASIA PRIVATE LIMITED Page 66
7) WORST AFFECTED CELLS>3% TCH DROP:
All operators are meeting the benchmarks except Aircel (Quarterly PMR), Tata GSM & Tata CDMA.
8) PERCENTAGE OF CONNECTIONS WITH GOOD VOICE QUALITY:
All operators are meeting the benchmarks. BSNL and Tata CDMA are not having the system generated data for VQ, so not provided the data.
AIRCEL AIRTEL BSNL VIDEOCON TATA GSM IDEA RCOM GSM VODAFONE RCOM CDMA
TATA CDMA
Quarterly PMR 3.89% 0.83% 2.19% 0.69% 4.05% 2.23% 0.06% 2.04% 0.15% 7.61%
Quarterly Live 2.91% 0.76% 2.33% 0.68% 3.88% 2.26% 0.02% 2.13% 0.21% 6.96%
Benchmark 3% 3% 3% 3% 3% 3% 3% 3% 3% 3%
0.00%
1.00%
2.00%
3.00%
4.00%
5.00%
6.00%
7.00%
8.00%
Worst affected cells>3% TCH drop
AIRCEL AIRTEL BSNL VIDEOCON TATA GSM IDEA RCOM GSM VODAFONE RCOM CDMA
TATA CDMA
Quarterly PMR 99.18% 98.62% 97.13% 96.85% 97.88% 99.45% 97.63% 99.73%
Quarterly Live 99.30% 98.61% 97.13% 96.80% 97.91% 99.31% 97.55% 99.73%
Benchmark 95% 95% 95% 95% 95% 95% 95% 95% 95% 95%
92.00%
93.00%
94.00%
95.00%
96.00%
97.00%
98.00%
99.00%
100.00%
101.00%
% Connections with good voice quality

AUDIT & ASSESSMENT OF QOS FOR QE- SEPTEMBER-2015 - HARYANA CIRCLE
TUV-SUD SOUTH ASIA PRIVATE LIMITED Page 67
9. PMR VERIFICATION TABLE:
(i) NETWORK RELATED PARAMETERS:
Name of Service Provider
Parameter BTS
Accumulated Downtime
Worst affected
BTSs due to
downtime
CSSR (Call Setup
Success Rate)
SDCCH / PAGING Channel
congestion
TCH congestion
CDR (Call Drop Rate)
Worst affected cells>3% TCH drop (Call drop)
rate
Connections with good
voice quality
No. of POI’s
having >=0.5% POI congestion
Benchmark ≤ 2% ≤ 2% ≥ 95% ≤ 1% ≤ 2% ≤ 2% ≤ 3% ≥ 95% ≤ 0.5%
AIRCEL Reported 0.15 0.00 99.40 0.00 0.00 2.53 3.89 99.18 0
Verified 0.14% 0.00% 99.40% 0.00% 0.00% 2.53% 3.89% 99.18% 0
AIRTEL Reported 0.09 0.05 98.75 0.18 0.34 0.39 0.84 98.55 0
Verified 0.08% 0.03% 98.78% 0.19% 0.35% 0.36% 0.83% 98.62% 0
BSNL Reported 1.12 1.28 97.56 0.29 1.01 1.50 2.19 97.20 0
Verified 1.12% 1.28% 97.56% 0.30% 1.01% 1.49% 2.19% NP 0
VIDEOCON Reported 0.10 0.21 98.75 0.12 0.08 0.54 0.69 97.13 0
Verified 0.10% 0.19% 98.75% 0.12% 0.08% 0.54% 0.69% 97.13% 0
TATA GSM Reported 0.09 0.16 97.38 0.18 1.32 0.83 4.04 96.85 0
Verified 0.09% 0.16% 97.38% 0.18% 1.32% 0.83% 4.05% 96.85% 0
IDEA Reported 0.00 0.00 99.00 0.38 0.48 0.67 2.23 97.88 0
Verified 0.00% 0.00% 99.01% 0.38% 0.48% 0.67% 2.23% 97.88% 0
RCOM GSM Reported 0.41 0.81 99.72 0.03 0.04 0.16 0.01 99.31 0
Verified 0.47% 0.92% 99.31% 0.01% 0.06% 0.12% 0.06% 99.45% 0
VODAFONE Reported 0.02 0.04 99.66 0.12 0.34 0.74 2.04 97.63 0
Verified 0.02% 0.04% 99.66% 0.12% 0.34% 0.74% 2.04% 97.63% 0
RCOM CDMA
Reported 0.31 0.36 98.46 0.00 0.11 0.05 0.16 99.73 0
Verified 0.31% 0.36% 98.46% 0.00% 0.11% 0.05% 0.15% 99.73% 0
TATA CDMA
Reported 0.07 0.00 96.72 0.00 0.01 0.64 7.22 97.90 0
Verified 0.07% 0.17% 96.72% 0.00% 0.94% 0.64% 7.61% NP 0
The above data is averaged for three months of the quarter ending September-2015. The PMR data provided by the service providers is largely matching with verified (audited) data. However the variation in data
has been indicated by yellow colour. Aircel, Tata GSM and Tata CDMA have not met the benchmark for the parameter “Worst affected cells>3% TCH drop”. Aircel has not met the benchmark for the parameter “Call drop rate”. BSNL and Tata CDMA are not having the system generated data for Voice Quality, so not provided the data.

AUDIT & ASSESSMENT OF QOS FOR QE- SEPTEMBER-2015 - HARYANA CIRCLE
TUV-SUD SOUTH ASIA PRIVATE LIMITED Page 68
(ii) CUSTOMER SERVICE DELIVERY (CSD) RELATED PARAMETER:
Name of Service Provider
Parameter
Metering and billing credibility
- post paid
Metering and billing credibility - pre paid
Resolution of billing /charging
complaints
Resolution of billing /charging
complaints
Period of applying
credit/ waiver/ adjustment to
customer’s account from
the date of resolution of complaints
Accessibility of call centre/
customer care
Percentage of calls
answered by the
operators (voice to
voice) within 90 seconds
%age requests
for Termination / Closure of
service
Time taken for refund of deposits
after closures
Benchmark <= 0.1% <= 0.1% 98% within
4 weeks 100% within
6 weeks
within 1 week of resolution of
complaint >=95% ≥ 95%
100% within <=7days
100% within 60
days
AIRCEL Reported 0.00 0.00 100.00 100.00 100.00 96.81 99.89 100.00 100.00
Verified 0.00% 0.00% 100.00% 100.00% 100.00% 96.81% 99.89% 100.00% 100.00%
AIRTEL Reported 0.02 0.00 100.00 100.00 100.00 100.00 95.22 100.00 100.00
Verified 0.02% 0.00% 100.00% 100.00% 100.00% 99.99% 95.22% 100.00% 100.00%
BSNL Reported 0.14 0.01 100.00 100.00 100.00 100.00 93.43 100.00 100.00
Verified 0.14% 0.01% 100.00% 100.00% 100.00% 100.00% 79.17% 100.00% 100.00%
IDEA Reported 0.05 0.09 100.00 100.00 100.00 99.36 99.51 97.19 98.46
Verified 0.05% 0.09% 100.00% 100.00% 100.00% 99.36% 99.51% 97.19% 98.46%
RCOM (GSM)
Reported 0.08 0.09 100.00 100.00 100.00 99.08 82.57 100.00 100.00
Verified 0.08% 0.09% 100.00% 100.00% 100.00% 99.09% 82.57% 100.00% 100.00%
TATA (GSM)
Reported 0.00 0.00 100.00 100.00 100.00 99.11 94.98 100.00 100.00
Verified 0.00% 0.00% 100.00% 100.00% 100.00% 99.11% 94.98% 100.00% 100.00%
VIDEOCON Reported NA 0.13 100.00 100.00 100.00 100.00 95.61 NA 100.00
Verified NA 0.00% 100.00% 100.00% 100.00% 100.00% 95.61% NA 100.00%
VODAFONE Reported 0.00 0.00 100.00 100.00 100.00 100.00 99.17 100.00 100.00
Verified 0.09% 0.10% 100.00% 100.00% 100.00% 100.00% 99.17% 100.00% 100.00%
RCOM (CDMA)
Reported 0.09 0.09 100.00 100.00 100.00 98.70 98.18 100.00 100.00
Verified 0.09% 0.09% 100.00% 100.00% 100.00% NP 98.18% 100.00% 100.00%
TATA (CDMA)
Reported 0.00 0.00 100.00 100.00 100.00 97.04 98.99 100.00 100.00
Verified 0.00% 0.00% 100.00% 100.00% 100.00% 97.04% 98.99% 100.00% 100.00%
The above data is average for three months of the quarter ending September-2015. The PMR data provided by the service providers is largely matching with verified (audited) data. However the variation in data
has been indicated by yellow colour. BSNL, RCOM GSM and Tata GSM have not met the benchmark for the parameter “% call answered by operators (voice to
voice) within 90 sec”. Idea has not met the benchmark for the parameters “%age requests for Termination / Closure of service and “Time taken for
refund of deposits after closures”. BSNL has not met the benchmark for the parameter “Metering and billing credibility - Post Paid”.