Cable/Telecom & Communications Infrastructure 2020.12.24
86
EQUITY RESEARCH RBC Capital Markets, LLC Jonathan Atkin (Analyst) (415) 633-8589 [email protected] Bora Lee (Analyst) (212) 618-7823 [email protected] Kutgun Maral, CFA (Analyst) (212) 437-9151 [email protected] Michael J. Tang (Associate) (646) 618-6772 [email protected] December 24, 2020 Cable/Telecom & Communications Infrastructure 2020.12.24 Weekly news roundup C-Band auction update. C-band auction bids have reached $69.83B in gross proceeds after 45 rounds of bidding. Bidding is set to resume January 4 after taking a break for the holidays. After 45 rounds, the nationwide price for A block licenses per MHz Pop was $1.21, while BC prices were $1.11 per MHz PoP according to BitPath COO Sasha Javid. New York has commanded the highest total price, standing at around $515M for category A and BC. “Gross proceeds have been driven by surprisingly robust and persistent demand,” wrote Javid. “In Round 36, I suspect that a large bidder pulled back significantly in the largest markets given that all the top 10 markets experienced a drop in demand.” There are 57 participants in the clock phase, though winners won’t be disclosed until the auction ends. T-Mobile, AT&T, Verizon and Dish are all among registered bidders. (Fierce Wireless) FCC update. Outgoing Chairman Ajit Pai will use his last FCC meeting on Jan. 13 to showcase the commission’s work over the past four years. “Serving as chairman of the FCC has been the honor of a lifetime,” Pai wrote in a blog post. “And soon, my time in this position will conclude.” Pai expressed pride in his efforts to increase transparency, and in the agency “show[ing] its work” by sharing ahead of time what the FCC would be voting on. “It’s now routine for the agency to publish the exact text of commission meeting items three weeks in advance of any votes being cast; to include a one-page fact sheet describing in plain English what each item does; and to post a monthly blog from yours truly introducing the agenda in a hopefully engaging way.” For the January meeting, Pai said he has invited FCC bureaus, offices, and task forces to prepare presentations highlighting their accomplishments over the past four years. (Radio World) Verizon update. Verizon is expanding its "Food for Frontline Workers" program to doctors, nurses, first responders and healthcare workers in six cities experiencing high volumes of COVID-19 cases. An estimated 50,000 meals will be delivered during the 2020 holiday season and in January 2021. This program is the continuation of Verizon's initiative that kicked off in April, delivering more than 150,000 meals to frontline workers in cities across the U.S. including New York City. Verizon's expanded initiative will provide meals to healthcare workers and first responders in Milwaukee, Omaha, Minneapolis and Chicago, with additional markets to include Sioux Falls and Los Angeles. "Our 'Food for Frontline Workers' program is a way for us to deliver gratitude and support for first responders, healthcare workers, and to the local business restaurants who have been hit hardest by the pandemic," said Patty Roze, Vice President, Verizon Public Sector. "By putting themselves on the front lines of the response to COVID-19, first responders and healthcare workers have sacrificed their own comfort to care for others. We see the best part of humanity in their selfless acts of heroism." (Company release) AT&T update. AT&T announced that AT&T Mobility and the Communications Workers of America have reached agreements on one-year extensions of two Mobility contracts. The extended Mobility Orange contract covers over 14,000 AT&T Mobility employees in 36 states and the District of Columbia. It goes into effect on February 13, 2021, and expires on February 11, 2022. The extended Mobility Southeast (or Mobility Black) contract covers nearly 10,000 AT&T Mobility employees in CWA District 3 – the Southeast Region, which includes Alabama, Florida, Georgia, Kentucky, Louisiana, Mississippi, North Carolina, South Carolina, Tennessee, and St. Croix, USVI. It goes into effect on February 12, 2022, and expires on February 10, 2023. Until the extended contracts take effect, employees are continuing to work under their current contracts. (Company release) Disseminated: Dec 24, 2020 22:00ET; Produced: Dec 24, 2020 17:52ET Priced as of prior trading day's market close, EST (unless otherwise noted). All values in USD unless otherwise noted. For Required Conflicts Disclosures, see Page 84.
-
Upload
khangminh22 -
Category
Documents
-
view
1 -
download
0
Transcript of Cable/Telecom & Communications Infrastructure 2020.12.24

EQU
ITY
RESE
ARC
H RBC Capital Markets, LLCJonathan Atkin (Analyst)(415) [email protected] Lee (Analyst)(212) [email protected]
Kutgun Maral, CFA (Analyst)(212) [email protected] J. Tang (Associate)(646) [email protected]
December 24, 2020
Cable/Telecom & Communications Infrastructure2020.12.24Weekly news roundupC-Band auction update. C-band auction bids have reached $69.83B in gross proceeds after 45 roundsof bidding. Bidding is set to resume January 4 after taking a break for the holidays. After 45 rounds,the nationwide price for A block licenses per MHz Pop was $1.21, while BC prices were $1.11 per MHzPoP according to BitPath COO Sasha Javid. New York has commanded the highest total price, standingat around $515M for category A and BC. “Gross proceeds have been driven by surprisingly robust andpersistent demand,” wrote Javid. “In Round 36, I suspect that a large bidder pulled back significantlyin the largest markets given that all the top 10 markets experienced a drop in demand.” There are 57participants in the clock phase, though winners won’t be disclosed until the auction ends. T-Mobile,AT&T, Verizon and Dish are all among registered bidders. (Fierce Wireless)
FCC update. Outgoing Chairman Ajit Pai will use his last FCC meeting on Jan. 13 to showcase thecommission’s work over the past four years. “Serving as chairman of the FCC has been the honor ofa lifetime,” Pai wrote in a blog post. “And soon, my time in this position will conclude.” Pai expressedpride in his efforts to increase transparency, and in the agency “show[ing] its work” by sharing aheadof time what the FCC would be voting on. “It’s now routine for the agency to publish the exact textof commission meeting items three weeks in advance of any votes being cast; to include a one-pagefact sheet describing in plain English what each item does; and to post a monthly blog from yours trulyintroducing the agenda in a hopefully engaging way.” For the January meeting, Pai said he has invitedFCC bureaus, offices, and task forces to prepare presentations highlighting their accomplishments overthe past four years. (Radio World)
Verizon update. Verizon is expanding its "Food for Frontline Workers" program to doctors, nurses,first responders and healthcare workers in six cities experiencing high volumes of COVID-19 cases. Anestimated 50,000 meals will be delivered during the 2020 holiday season and in January 2021. Thisprogram is the continuation of Verizon's initiative that kicked off in April, delivering more than 150,000meals to frontline workers in cities across the U.S. including New York City. Verizon's expanded initiativewill provide meals to healthcare workers and first responders in Milwaukee, Omaha, Minneapolisand Chicago, with additional markets to include Sioux Falls and Los Angeles. "Our 'Food for FrontlineWorkers' program is a way for us to deliver gratitude and support for first responders, healthcareworkers, and to the local business restaurants who have been hit hardest by the pandemic," said PattyRoze, Vice President, Verizon Public Sector. "By putting themselves on the front lines of the response toCOVID-19, first responders and healthcare workers have sacrificed their own comfort to care for others.We see the best part of humanity in their selfless acts of heroism." (Company release)
AT&T update. AT&T announced that AT&T Mobility and the Communications Workers of America havereached agreements on one-year extensions of two Mobility contracts. The extended Mobility Orangecontract covers over 14,000 AT&T Mobility employees in 36 states and the District of Columbia. It goesinto effect on February 13, 2021, and expires on February 11, 2022. The extended Mobility Southeast(or Mobility Black) contract covers nearly 10,000 AT&T Mobility employees in CWA District 3 – theSoutheast Region, which includes Alabama, Florida, Georgia, Kentucky, Louisiana, Mississippi, NorthCarolina, South Carolina, Tennessee, and St. Croix, USVI. It goes into effect on February 12, 2022, andexpires on February 10, 2023. Until the extended contracts take effect, employees are continuing towork under their current contracts. (Company release)
Disseminated: Dec 24, 2020 22:00ET; Produced: Dec 24, 2020 17:52ETPriced as of prior trading day's market close, EST (unless otherwise noted).
All values in USD unless otherwise noted.For Required Conflicts Disclosures, see Page 84.

Exhibit 1: RBC Cable/Telecom and Communications Infrastructure Comps Sheet
* AMT excludes preferred stock (series A and B) from the share count and EV. ** P/FCF in this column reflects FCF from maintenance capex. **** GDS debt includes capital leases. The denominator used for Net debt/LQA EBITDA is "underlying adjusted EBITDA." Notes: Multiples treat stock-based compensation as a cash expense; 21 Vianet and Switch are based on consensus estimates; all others RBC Capital Markets estimates. Source: Company reports, RBC Capital Markets estimates, S&P Capital IQ
Telco & Wireless
Price 2W YTD Mkt. Cap. LT Debt Cash Ent. Val. Net Debt/ Div
Company Symbol 12/24/20 % Chg. % Chg. (mil.) (mil.) (mil.) (mil.) LQA EBITDA CY20E CY21E CY20E CY21E Yield CY20E CY21E CY20E CY21E CY20E CY21E CY20E CY21E
AT&T T $28.70 (6.5%) (26.6%) $205,865 $158,878 $9,758 $374,488 2.6x $170,743 $174,266 $54,959 $56,853 7.2% 6.7x 6.4x 7.9x 8.4x 9.1x 9.0x 9.6x 9.3x 1.9x
Verizon VZ $58.87 (2.7%) (4.1%) $243,840 $115,560 $8,983 $351,878 2.4x $128,781 $132,151 $46,903 $48,141 4.3% 7.5x 7.0x 11.8x 13.1x 12.1x 11.8x 12.4x 11.4x 2.6x
T-Mobile TMUS $132.92 1.8% 69.5% $166,549 $69,192 $6,571 $229,170 2.8x $73,804 $77,377 $19,830 $22,806 N/A 11.9x 10.1x NM 38.2x NM 39.3x 27.4x 27.2x 0.6x
Lumen (CenturyLink) LUMN $9.86 (1.7%) (25.4%) $10,699 $32,592 $547 $42,744 3.7x $20,707 $20,321 $8,848 $8,917 10.1% 4.9x 4.6x 4.5x 4.2x 7.1x 7.2x 9.0x 8.4x 6.8x
Telecom Carrier Average (2.3%) 3.4% 2.9x 7.2% 7.8x 7.0x 8.0x 16.0x 9.4x 16.8x 14.6x 14.1x 3.0x
U.S. Treasury Yield - 10 years Spread vs VZ/T: 4.8% 1.0%
Cable Average (ATUS, CHTR, CMCSA) 1.0% 26.4% 4.2x 1.8% 11.2x 10.5x 18.8x 16.4x 35.8x 27.1x 17.1x 15.7x 1.5x
Tower Infrastructure
Price 2W YTD Mkt. Cap. LT Debt Cash Ent. Val. Net Debt/ Div
Company Symbol 12/24/20 % Chg. % Chg. (MM) (mil.) (mil.) (MM) LQA EBITDA CY20E CY21E CY20E CY21E Yield CY20E CY21E CY20E CY21E CY20E CY21E CY20E CY21E
American Tower AMT $218.64 (0.4%) (4.9%) $97,548 $24,782 $1,730 $121,612 4.4x $7,979 $8,635 $5,104 $5,551 2.1% $8.42 $9.30 24.5x 21.2x 26.8x 24.3x 31.8x 28.2x 2.6x
Crown Castle International CCI $154.00 (2.0%) 8.3% $66,066 $19,453 $416 $85,103 5.4x $5,848 $6,160 $3,420 $3,614 3.5% $6.09 $6.71 25.9x 23.6x 26.7x 24.2x NM 46.3x 4.4x
SBA Communications SBAC $275.02 (0.2%) 14.1% $31,271 $10,717 $333 $41,654 7.0x $2,074 $2,199 $1,490 $1,584 0.7% $9.41 $10.27 29.1x 25.6x 31.3x 28.5x 32.2x 30.6x 4.2x
Landmark Infrastructure LMRK $11.24 3.2% (31.5%) $286 $474 $12 $693 9.3x $58 $65 $64 $66 7.1% $1.32 $1.42 10.9x 11.2x 8.5x 8.0x NM 30.0x 3.6x
US Wireless Tower Infrastructure Average (excl. LMRK) (0.9%) 5.9% 5.6x 2.1% 26.5x 23.5x 28.3x 25.7x 32.0x 35.0x 3.7x
Fiber/Bandwidth Providers Price 2W YTD Mkt. Cap. LT Debt Cash Ent. Val. Net Debt/ Div
Company Symbol 12/24/20 % Chg. % Chg. (mil.) (mil.) (mil.) (mil.) LQA EBITDA CY20E CY21E CY20E CY21E Yield CY20E CY21E CY20E CY21E CY20E CY21E CY20E CY21E
Cogent Communications CCOI $59.56 1.3% (9.5%) $2,729 $1,079 $393 $3,414 3.1x $567 $579 $213 $222 4.7% 18.2x 18.0x 45.8x 42.2x 30.1x 28.9x 25.2x 23.9x 5.3x
Uniti Group Inc. UNIT $11.59 5.1% 41.2% $2,698 $5,034 $196 $7,607 6.1x $1,058 $1,088 $817 $858 5.2% 9.3x 8.9x NM 26.9x 7.0x 7.2x 14.5x 14.8x 1.8x
Superloop Limited SLC AUD 1.06 3.4% 8.8% AUD 386 AUD 44 AUD 16 AUD 414 3.5x AUD 116 AUD 129 AUD 17 AUD 21 NA 25.5x 21.0x NM NM NM NM NM NM 0.9x
Megaport Limited MP1 AUD 14.50 10.5% 35.0% AUD 2,228 AUD 21 AUD 167 AUD 2,082 15.1x AUD 71 AUD 104 -AUD 19 -AUD 2 NA NM NM NM NM NM NM NM NM NM
Competitive Bandwidth Average (US only) 3.2% 15.8% 4.6x 5.0% 13.7x 13.5x 45.8x 34.6x 18.5x 18.0x 19.9x 19.4x 3.6x
Revenue (MM) EBITDA (MM) EV/EBITDA
EV/EBITDA
EBITDA (MM)
EBITDA (MM) AFFO Multiple
AFFO/shareRevenue (MM)
Revenue (MM)
2021 EV/EBITDA
/ 2021 EBITDA
growth
2021 EV/EBITDA
/ 2021 EBITDA
growth
2021 EV/EBITDA
/ 2021 EBITDA
growth
P/FCF P/E EV/uFCF
EV/EBITDA AFFO Multiple EV/uFCF
P/FCF EV/uFCF
Cable/Telecom & Communications Infrastructure 2020.12.24
December 24, 2020 2

Exhibit 2: RBC Cable/Telecom and Communications Infrastructure Comps Sheet (continued)
** For NXT, GDS & SWCH recurring FCF is used as a proxy for AFFO. **** GDS debt includes capital leases. The denominator used for Net debt/LQA EBITDA is "underlying adjusted EBITDA." Notes: Multiples treat stock-based compensation as a cash expense; 21 Vianet, Switch and Chindata Group are based on consensus estimates; all others RBC Capital Markets estimates. Source: Company reports, RBC Capital Markets estimates, S&P Capital IQ
Datacenters (excluding REITs)
Price 2W YTD Mkt. Cap. LT Debt Cash Ent. Val. Net Debt/
Company Symbol 12/24/20 % Chg. % Chg. (mil.) (mil.) (mil.) (mil.) LQA EBITDA CY20E CY21E CY20E CY21E CY20E CY21E CY20E CY21E CY20E** CY21E** CY20E CY21E
NEXTDC Limited NXT AUD 12.20 2.6% 99.3% AUD 5,562 AUD 875 AUD 893 AUD 5,545 (0.2x) AUD 223 AUD 271 AUD 111 AUD 148 51.6x 40.5x NM NM NM 54.7x NM NM 1.2x
Chindata Group NasdaqGS:CD $19.09 2.9% 41.4% $764 $669 $518 $915 3.5x $274 $418 NA NA NM NM NM NM NM NM NM NM NM
GDS Holdings ** GDS $91.30 0.4% 77.0% $16,598 $3,392 $919 $19,234 5.6x $877 $1,180 $408 $565 49.3x 36.8x NM NM NM NM NM NM 0.9x
21 Vianet Group NasdaqGS:VNET $32.36 12.9% 346.3% $3,639 $1,160 $832 $4,176 1.5x $738 $958 $199 $268 21.0x 15.6x 2.8x 2.1x 2.8x 2.1x NM NM NM
Switch, Inc. NYSE:SWCH $16.32 3.7% 10.1% $3,976 $1,111 $156 $5,296 4.0x $515 $572 $262 $291 19.9x 18.0x 15.2x 13.7x 17.7x 15.9x NM NM 1.5x
Datacenters (excluding REITs) Average 4.5% 114.8% 2.9x 35.5x 27.7x 9.0x 7.9x 10.3x 24.2x NM NM 1.2x
Datacenter REITS
Price 2W YTD Mkt. Cap. LT Debt Cash Ent. Val. Net Debt/ Div
Company Symbol 12/24/20 % Chg. % Chg. (mil.) (mil.) (mil.) (mil.) LQA EBITDA CY20E CY21E CY20E CY21E Yield CY20E CY21E CY20E CY21E CY20E CY21E CY20E CY21E
CoreSite Realty Corp COR $124.71 5.2% 11.2% $6,072 $1,687 $3 $7,755 5.2x $606 $650 $324 $348 3.9% 25.2x 24.1x 23.6x 22.5x 25.6x 24.5x NM NM 3.3x
CyrusOne Inc. CONE $72.75 8.8% 11.2% $8,761 $3,227 $336 $11,652 5.5x $1,031 $1,118 $538 $590 2.7% 22.7x 21.2x 18.7x 18.0x 19.9x 19.0x NM NM 2.2x
Digital Realty Trust DLR $137.29 5.9% 14.7% $38,650 $13,444 $1,939 $51,469 5.6x $3,870 $4,325 $2,166 $2,384 3.3% 23.9x 22.5x 22.4x 21.1x 24.8x 23.5x NM NM 2.2x
Equinix Inc. EQIX $705.94 2.8% 20.9% $63,195 $12,411 $2,659 $72,946 3.3x $5,994 $6,585 $2,837 $3,150 1.5% 29.3x 26.4x 46.0x 36.0x 33.5x 30.6x NM NM 2.2x
QTS Realty Trust QTS $61.57 5.1% 13.5% $4,477 $1,691 $45 $6,546 6.8x $536 $603 $292 $330 3.1% 24.6x 22.7x 22.2x 21.0x 29.7x 27.1x NM NM 1.8x
Datacenter REITS Average 5.6% 14.3% 5.3x 2.9% 25.1x 23.4x 26.6x 23.7x 26.7x 24.9x NM NM 2.4x
Price 2W YTD Mkt. Cap. Div
INDEX Symbol 12/24/20 % Chg. % Chg. (mil.) Yield CY20E CY21E CY20E CY21E CY20E CY21E
MSCIUSREITINDEX RMZ $1,114.68 (0.3%) (12.8%) $925,042 3.8% $44,829 $45,994 $54.02 $55.42 20.6x 20.1x
AFFO MultipleAFFO/shareAFFO (MM)
EV/uFCF AFFO MultipleFFO MultipleEV/EBITDARevenue (MM) EBITDA (MM)
P/FCFEV/EBITDARevenue (MM) EBITDA (MM) 2021 EV/EBITDA
/ 2021 EBITDA
growth
2021 EV/EBITDA
/ 2021 EBITDA
growth
AFFO Multiple EV/uFCF
Cable/Telecom & Communications Infrastructure 2020.12.24
December 24, 2020 3

Exhibit 3: EV/NTM-EBITDA
Data as of 12/17/2020. Source: Company reports, Capital IQ, RBC Capital Markets estimates
Cable/Telecom & Communications Infrastructure 2020.12.24
December 24, 2020 4

Exhibit 4: EV/TTM-EBITDA
Data as of 12/17/2020. Source: Company reports, Capital IQ, RBC Capital Markets estimates
Cable/Telecom & Communications Infrastructure 2020.12.24
December 24, 2020 5

Exhibit 5: Dividend Yields Tracker
RBOC Dividend Yield Spreads vs. Treasury Yield RBOC Dividend Yields
10 year Treasury 3 Month - ICE LIBOR (USD)
Data as of 12/17/2020. Source: Company reports, Capital IQ, RBC Capital Markets
Cable/Telecom & Communications Infrastructure 2020.12.24
December 24, 2020 6

Exhibit 5: Dividend Yields Tracker (continued)
RLEC Dividend Yields Datacenter REIT Dividend Yields
Tower Dividend Yields Current Sector Yields
Data as of 12/17/2020. Source: Company reports, Capital IQ, RBC Capital Markets
Cable/Telecom & Communications Infrastructure 2020.12.24
December 24, 2020 7

Exhibit 6: Broadband subscribers by platform
Note: Figures include our estimates for pro forma historicals. Includes illustrative metrics for companies not under direct coverage. Includes RBC calculations for commercial subscribers for certain operators. Source: Company reports, press reports, Kagan, RBC Capital Markets estimates
Exhibit 7: Cable and Telco broadband subscribers
Note: Figures include our estimates for pro forma historicals. Includes illustrative metrics for companies not under direct coverage. Includes RBC calculations for commercial subscribers for certain operators. Source: Company reports, press reports, Kagan, RBC Capital Markets estimates
Subscriber figures in 000's 1Q18 2Q18 3Q18 4Q18 1Q19 2Q19 3Q19 4Q19 1Q20 2Q20 3Q20 4Q20E 2018 2019 2020E 2021E
Broadband subscribers by platform
Broadband subscribers
Cable 66,500 67,140 67,893 68,638 69,582 70,123 70,988 71,882 73,179 74,789 76,251 77,201 68,638 71,882 77,201 80,695
Telco 34,373 34,246 34,099 33,950 33,956 33,786 33,551 33,284 33,209 33,035 33,233 33,073 33,950 33,284 33,073 32,828
Total cable + telco broadband subscribers 100,873 101,386 101,992 102,587 103,538 103,909 104,539 105,165 106,388 107,825 109,483 110,274 102,587 105,165 110,274 113,524
Satellite 1,843 1,875 1,917 1,945 1,974 2,002 2,024 2,063 2,106 2,141 2,183 2,222 1,945 2,063 2,222 2,362
Total broadband subscribers 102,716 103,261 103,909 104,532 105,513 105,910 106,563 107,228 108,494 109,966 111,666 112,496 104,532 107,228 112,496 115,886
Cable share (cable + telco) 65.9% 66.2% 66.6% 66.9% 67.2% 67.5% 67.9% 68.4% 68.8% 69.4% 69.6% 70.0% 66.9% 68.4% 70.0% 71.1%
Telco share (cable + telco) 34.1% 33.8% 33.4% 33.1% 32.8% 32.5% 32.1% 31.6% 31.2% 30.6% 30.4% 30.0% 33.1% 31.6% 30.0% 28.9%
Broadband subscribers Y/Y % change
Cable 4.4% 4.6% 4.8% 4.6% 4.6% 4.4% 4.6% 4.7% 5.2% 6.7% 7.4% 7.4% 4.6% 4.7% 7.4% 4.5%
Telco -1.8% -1.5% -1.5% -1.4% -1.2% -1.3% -1.6% -2.0% -2.2% -2.2% -0.9% -0.6% -1.4% -2.0% -0.6% -0.7%
Total cable + telco broadband subscribers Y/Y change 2.2% 2.4% 2.6% 2.6% 2.6% 2.5% 2.5% 2.5% 2.8% 3.8% 4.7% 4.9% 2.6% 2.5% 4.9% 2.9%
Broadband net adds
Cable 908 640 754 744 944 541 864 893 1,298 1,610 1,432 950 3,047 3,242 5,290 3,494
Telco (46) (127) (147) (149) 7 (171) (235) (267) (75) (174) 197 (160) (469) (666) (211) (244)
Total cable + telco broadband net adds 863 513 607 595 950 370 630 626 1,223 1,437 1,629 791 2,578 2,576 5,079 3,250
Broadband net adds Y/Y change
Cable (160) 148 178 (53) 35 (99) 110 149 354 1,069 567 57 113 195 2,048 (1,796)
Telco (3) 101 7 45 52 (44) (88) (118) (81) (3) 432 107 150 (197) 455 (33)
Total cable + telco broadband net adds Y/Y change (162) 249 184 (8) 88 (143) 23 31 272 1,066 999 165 263 (2) 2,503 (1,829)
Subscriber figures in 000's 1Q18 2Q18 3Q18 4Q18 1Q19 2Q19 3Q19 4Q19 1Q20 2Q20 3Q20 4Q20E 2018 2019 2020E 2021E
Total Cable + Telco Broadband Subscribers
Broadband subs
Comcast Corp. 26,249 26,509 26,871 27,222 27,598 27,807 28,186 28,629 29,106 29,429 30,062 30,562 27,222 28,629 30,562 32,028
Charter Communications (PF for TWC, Bright House) 24,355 24,622 24,930 25,259 25,687 25,945 26,325 26,664 27,246 28,096 28,633 28,972 25,259 26,664 28,972 30,377
AT&T (residential + commercial; PF for CT sale) 15,775 15,772 15,747 15,702 15,737 15,698 15,575 15,389 15,315 15,201 15,375 15,266 15,702 15,389 15,266 14,997
Verizon (PF for CTF sale) 6,966 6,956 6,958 6,961 6,973 6,968 6,961 6,956 6,982 6,959 7,069 7,089 6,961 6,956 7,089 7,357
Cox Communications 5,622 5,659 5,663 5,664 5,668 5,689 5,709 5,751 5,817 5,994 6,109 6,151 5,664 5,751 6,151 6,258
CenturyLink (incl. commercial) 5,592 5,501 5,427 5,385 5,368 5,301 5,254 5,207 5,185 5,145 5,059 5,012 5,385 5,207 5,012 4,813
Altice USA (PF for Cablevision, Suddenlink) 4,408 4,417 4,431 4,453 4,490 4,503 4,518 4,525 4,575 4,646 4,702 4,717 4,453 4,525 4,717 4,806
Frontier Broadband Subs (PF for VZ, Northwest sale) 3,580 3,548 3,487 3,420 3,382 3,315 3,249 3,211 3,183 3,142 3,119 3,081 3,420 3,211 3,081 2,951
Mediacom Communications Corp. 1,228 1,251 1,260 1,264 1,288 1,303 1,316 1,328 1,349 1,396 1,425 1,436 1,264 1,328 1,436 1,544
Windstream 1,004 1,007 1,015 1,021 1,032 1,034 1,040 1,049 1,067 1,089 1,102 1,114 1,021 1,049 1,114 1,169
TPG (PF for RCN, Grande, Wave) 897 908 922 931 946 952 962 973 968 1,010 1,031 1,042 931 973 1,042 1,103
Consolidated Comm. (PF for FairPoint and other) 782 784 782 779 781 783 784 784 786 791 792 792 779 784 792 799
WideOpenWest 744 748 755 760 766 764 774 782 798 806 809 812 760 782 812 834
Cable One (PF for NewWave) 729 731 739 742 759 763 771 773 793 838 866 873 742 773 873 969
Atlantic Broadband (PF for Metrocast) 413 420 425 426 430 444 446 451 457 479 492 497 426 451 497 540
Cincinnati Bell (PF for Hawaii) 422 423 425 426 427 426 425 426 428 432 435 435 426 426 435 440
Midcontinent Communications 352 358 365 372 382 380 386 391 400 400 406 410 372 391 410 427
Armstrong Cable Services 262 264 266 266 269 272 275 276 281 285 288 289 266 276 289 299
TDS (telco) 251 255 258 256 257 261 263 262 263 276 282 284 256 262 284 302
Buckeye Broadband 168 170 166 168 171 167 169 170 174 172 174 174 168 170 174 176
TDS (PF for BendBroadband) 157 159 164 167 171 173 175 178 181 184 186 189 167 178 189 197
Blue Ridge Communications 159 161 161 163 166 166 168 170 171 173 175 177 163 170 177 181
GCI Liberty, Inc. 135 134 135 135 134 133 134 136 141 142 142 144 135 136 144 149
Consolidated Communications 116 117 119 120 122 123 125 126 129 132 133 133 120 126 133 139
Service Electric Cable TV 111 112 115 116 118 119 120 122 135 137 138 139 116 122 139 154
Northland Cable Television 70 71 72 68 71 72 73 73 75 78 78 79 68 73 79 82
Shenandoah Telecommunications Co. 65 65 67 68 70 70 74 79 88 90 94 98 68 79 98 116
Vyve Broadband 61 63 65 66 67 67 68 69 73 75 75 75 66 69 75 80
Schurz Communications (PF for Blue Stream) 59 59 61 62 63 62 64 65 67 67 69 69 62 65 69 71
WEHCO Broadband 58 58 59 61 63 63 64 66 68 69 70 71 61 66 71 74
MCTV 43 43 43 45 45 46 46 45 46 48 49 47 45 45 47 47
Zito Media 37 38 39 39 40 40 41 41 42 44 45 44 39 41 44 45
Total cable + telco broadband subs 100,873 101,386 101,992 102,587 103,538 103,909 104,539 105,165 106,388 107,825 109,483 110,274 102,587 105,165 110,274 113,524
Y/Y % change 2.2% 2.4% 2.6% 2.6% 2.6% 2.5% 2.5% 2.5% 2.8% 3.8% 4.7% 4.9% 2.6% 2.5% 4.9% 2.9%
Sequential change in Y/Y % change -19 bps 25 bps 18 bps -2 bps 6 bps -15 bps 1 bps 2 bps 24 bps 102 bps 96 bps 13 bps - - - -
Annual change in Y/Y % change -80 bps -53 bps 2 bps 21 bps 46 bps 6 bps -11 bps -6 bps 11 bps 128 bps 223 bps 234 bps 21 bps -6 bps 234 bps -191 bps
Net adds 864 513 606 595 951 370 630 627 1,223 1,437 1,658 791 2,578 2,578 5,108 3,250
Net adds Y/Y change (162) 249 184 (8) 88 (143) 24 32 271 1,066 1,029 164 263 0 2,530 (1,859)
Cable/Telecom & Communications Infrastructure 2020.12.24
December 24, 2020 8

Exhibit 8: Cable and Telco broadband subscriber net adds
Note: Figures include our estimates for pro forma historicals. Includes illustrative metrics for companies not under direct coverage. Includes RBC calculations for commercial subscribers for certain operators. Source: Company reports, press reports, Kagan, RBC Capital Markets estimates
Subscriber figures in 000's 1Q18 2Q18 3Q18 4Q18 1Q19 2Q19 3Q19 4Q19 1Q20 2Q20 3Q20 4Q20E 2018 2019 2020E 2021E
Total Cable + Telco Broadband Subscribers
Broadband net adds
Comcast Corp. 379 260 363 351 375 209 379 442 477 323 633 500 1,353 1,405 1,933 1,466
Charter Communications (PF for TWC, Bright House) 367 267 308 329 428 258 380 339 582 850 537 339 1,271 1,405 2,308 1,405
AT&T (residential + commercial; PF for CT sale) 56 (3) (25) (45) 35 (39) (123) (186) (74) (114) 174 (109) (17) (313) (123) (269)
Verizon (PF for CTF sale) 7 (10) 2 3 12 (5) (7) (5) 26 (23) 110 20 2 (5) 133 268
Cox Communications 47 37 3 2 3 21 19 42 66 177 114 42 89 87 400 107
CenturyLink (incl. commercial) (70) (91) (74) (42) (17) (67) (47) (47) (22) (40) (86) (47) (277) (178) (195) (199)
Altice USA (PF for Cablevision, Suddenlink) 26 10 14 22 37 13 15 7 50 70 26 15 72 72 162 90
Frontier Broadband Subs (PF for VZ) (43) (32) (61) (67) (38) (67) (66) (38) (28) (41) (23) (38) (203) (209) (130) (130)
Mediacom Communications Corp. 19 23 9 4 24 15 13 12 21 47 29 11 55 64 108 108
Windstream (2) 2 8 6 11 2 6 9 18 22 13 11 14 28 64 55
TPG (PF for RCN, Grande, Wave) 12 12 13 10 15 6 10 11 (5) 42 21 11 47 41 69 61
Consolidated Comm. (PF for FairPoint and other) 2 2 (2) (3) 2 2 1 0 2 5 1 (0) (2) 5 8 7
WideOpenWest 9 4 7 5 6 (2) 10 8 16 8 3 3 24 22 30 22
Cable One (PF for NewWave) 9 3 8 3 17 4 8 3 19 45 28 8 22 32 100 96
Atlantic Broadband (PF for Metrocast) 13 7 5 1 4 14 2 5 6 21 14 5 26 26 46 43
Cincinnati Bell (PF for Hawaii) 3 1 2 1 1 (1) (0) 1 2 5 3 1 7 0 9 5
Midcontinent Communications 5 6 7 6 10 (1) 6 5 8 0 6 5 24 20 19 17
Armstrong Cable Services 2 1 2 0 3 3 3 1 5 4 3 1 6 10 13 10
TDS (telco) 2 4 3 (2) 1 4 2 (1) 2 13 6 3 7 6 22 18
Buckeye Broadband 2 2 (4) 2 3 (3) 2 1 5 (2) 2 0 2 2 5 2
TDS (PF for BendBroadband) 4 3 4 4 4 2 2 3 3 3 2 2 14 10 11 8
Blue Ridge Communications 2 2 0 2 3 1 2 2 1 2 2 1 6 7 6 4
GCI Liberty, Inc. (0) (0) 0 0 (1) (1) 1 2 5 1 1 2 0 1 8 6
Consolidated Communications 2 1 2 1 2 1 1 1 3 3 1 0 6 6 8 5
Service Electric Cable TV 2 1 3 1 2 1 1 1 13 2 1 1 7 5 17 15
Northland Cable Television 2 0 1 (3) 2 1 1 1 2 3 1 0 (0) 5 5 3
Shenandoah Telecommunications Co. 1 0 2 1 2 0 4 4 9 2 4 4 4 11 20 17
Vyve Broadband 1 1 3 0 1 0 1 1 4 2 1 0 5 3 7 4
Schurz Communications (PF for Blue Stream) 1 (0) 2 1 1 (1) 2 1 2 0 2 0 3 2 4 2
WEHCO Broadband 2 0 1 2 2 (0) 1 2 2 1 1 1 5 5 5 3
MCTV 0 (0) 0 2 1 0 0 (1) 1 2 0 (1) 2 1 2 (0)
Zito Media 1 1 1 0 1 1 1 0 1 2 1 (0) 2 2 3 1
Total broadband net adds 863 513 607 595 950 370 630 626 1,223 1,437 1,629 791 2,578 2,576 5,079 3,250
Net adds Y/Y change (162) 249 184 (8) 88 (143) 23 31 272 1,066 999 165 263 (2) 2,503 (1,829)
Cable/Telecom & Communications Infrastructure 2020.12.24
December 24, 2020 9

Exhibit 9: Linear and virtual Pay TV subscribers
Note: Figures include our estimates for pro forma historicals. Includes illustrative metrics for companies not under direct coverage. Includes RBC calculations for commercial subscribers for certain operators. Source: Company reports, press reports, Kagan, RBC Capital Markets estimates
Subscriber figures in 000's 1Q18 2Q18 3Q18 4Q18 1Q19 2Q19 3Q19 4Q19 1Q20 2Q20 3Q20 4Q20E 2018 2019 2020E 2021E
Total Linear + Virtual MVPDs
Video subscribers
Linear video subs
Comcast Corp. 22,261 22,121 22,015 21,986 21,866 21,641 21,404 21,254 20,844 20,367 20,094 19,824 21,986 21,254 19,824 18,511
AT&T (Satell ite + U-verse) 23,902 23,640 23,294 22,903 22,359 21,581 20,418 19,473 18,576 17,690 17,100 16,355 22,903 19,473 16,355 14,142
Charter Communications (PF for TWC, Bright House) 16,739 16,682 16,628 16,606 16,461 16,320 16,245 16,144 16,074 16,168 16,235 16,139 16,606 16,144 16,139 15,528
DISH TV video subs 10,845 10,653 10,286 9,905 9,639 9,560 9,494 9,394 9,012 9,017 9,001 8,801 9,905 9,394 8,801 8,193
Verizon Fios 4,597 4,560 4,497 4,451 4,398 4,346 4,280 4,229 4,145 4,062 4,000 3,937 4,451 4,229 3,937 3,643
Cox Communications 3,604 3,553 3,532 3,510 3,372 3,234 3,177 3,120 3,022 2,923 2,864 2,803 3,510 3,120 2,803 2,461
Altice USA (PF for Cablevision, Suddenlink) 3,546 3,521 3,494 3,480 3,470 3,449 3,417 3,373 3,331 3,296 3,210 3,135 3,480 3,373 3,135 2,900
Frontier (PF) 899 867 838 803 749 705 667 631 594 560 518 487 803 631 487 366
Mediacom Communications Corp. 817 808 793 776 764 747 729 710 693 676 663 644 776 710 644 578
TPG (PF for RCN, Grande, Wave) 461 456 449 442 431 424 414 405 396 379 369 359 442 405 359 315
WideOpenWest 429 420 413 406 398 387 381 374 366 352 328 318 406 374 318 265
Cable One (PF for NewWave) 373 361 349 347 340 328 317 314 303 290 277 274 347 314 274 235
Atlantic Broadband (PF for Metrocast) 321 320 317 313 308 307 313 309 306 312 317 310 313 309 310 312
CenturyLink 221 189 160 134 111 82 61 45 34 24 18 14 134 45 14 5
Windstream 267 257 247 239 227 215 205 195 185 176 167 160 239 195 160 127
Midcontinent Communications 210 206 203 199 195 191 187 182 179 175 171 166 199 182 166 151
Armstrong Cable Services 205 202 198 193 188 185 182 178 174 172 169 164 193 178 164 151
Service Electric Cable TV 170 169 166 166 165 163 162 162 161 158 158 158 166 162 158 154
Cincinnati Bell 192 192 190 189 187 185 182 178 174 174 172 168 189 178 168 158
Blue Ridge Communications 134 133 130 130 130 128 127 127 127 124 124 124 130 127 124 121
Buckeye Broadband 120 119 113 111 108 107 105 101 98 98 96 93 111 101 93 86
GCI Liberty, Inc. 111 108 107 106 103 101 99 91 89 86 84 77 106 91 77 63
TDS (PF for BendBroadband) 101 102 102 103 101 100 98 98 97 94 89 87 103 98 87 76
Consolidated Communications 101 98 96 93 91 90 86 84 83 80 78 76 93 84 76 68
Vyve Broadband 57 56 56 54 52 50 48 47 48 46 43 41 54 47 41 35
Comporium Communications 54 55 55 54 54 53 54 53 47 47 48 46 54 53 46 40
TDS (telco) 51 52 54 54 55 57 58 59 59 62 63 63 54 59 63 68
Schurz Communications (PF for Blue Stream) 42 41 42 41 41 39 38 37 36 34 33 32 41 37 32 27
Shenandoah Telecommunications Co. 46 45 44 44 42 41 48 50 55 54 61 63 44 50 63 75
Zito Media 40 40 39 38 37 36 36 35 33 33 32 31 38 35 31 28
Northland Cable Television 39 37 37 32 31 31 30 29 29 29 28 28 32 29 28 26
MCTV 33 33 32 32 31 31 30 29 28 28 29 28 32 29 28 28
WEHCO Video 31 29 28 28 26 26 24 23 23 23 22 21 28 23 21 19
Total linear MVPD video subs 91,017 90,127 89,004 87,965 86,529 84,938 83,116 81,532 79,422 77,807 76,662 75,026 87,965 81,532 75,026 68,954
Y/Y % change -3.8% -3.8% -3.8% -4.2% -4.9% -5.8% -6.6% -7.3% -8.2% -8.4% -7.8% -8.0% -4.2% -7.3% -8.0% -8.1%
Sequential change in Y/Y % change 3 bps 6 bps -2 bps -39 bps -74 bps -83 bps -86 bps -70 bps -90 bps -18 bps 63 bps -22 bps - - - -
Annual Y/Y % change -110 bps -83 bps -14 bps -32 bps -109 bps -198 bps -282 bps -313 bps -328 bps -264 bps -115 bps -67 bps -32 bps -313 bps -67 bps -11 bps
Net adds (793) (890) (1,123) (1,039) (1,436) (1,592) (1,822) (1,584) (2,111) (1,615) (1,145) (1,636) (3,845) (6,433) (6,507) (6,072)
Net adds Y/Y change 57 97 29 (335) (643) (701) (699) (545) (675) (24) 677 (52) (152) (2,588) (74) 435
vMVPD video subs
DISH - Sling TV (domestic est.) 2,066 2,097 2,112 2,148 2,144 2,182 2,385 2,280 1,988 1,922 2,075 1,920 2,148 2,280 1,920 1,660
AT&T - DIRECTV NOW (excl. trial) 1,418 1,743 1,806 1,526 1,437 1,332 1,133 918 783 717 677 558 1,526 918 558 341
Hulu TV 578 816 1282 1700 2000 2200 2686 3200 3300 3400 3789 4089 1,700 3,200 4,089 5,333
YouTube TV 410 560 760 960 1110 1435 1785 2157 2557 2882 3182 3504 960 2,157 3,504 4,426
PlayStation Vue 580 590 590 590 610 610 610 410 0 0 0 0 590 410 0 0
FuboTV 174 215 245 229 209 194 255 316 287 286 362 438 229 316 438 561
Philo 45 75 110 150 195 245 300 350 500 750 815 875 150 350 875 1,400
Total vMVPD video subs 5,271 6,096 6,905 7,303 7,705 8,197 9,153 9,631 9,416 9,957 10,900 11,384 7,303 9,631 11,384 13,721
Y/Y % change 127.3% 128.2% 97.0% 62.6% 46.2% 34.5% 32.6% 31.9% 22.2% 21.5% 19.1% 18.2% 62.6% 31.9% 18.2% 20.5%
Net adds 779 825 809 399 401 492 956 477 (215) 541 943 484 2,812 2,327 1,753 2,336
Net adds Y/Y change 410 473 (25) (588) (378) (333) 148 79 (617) 49 (13) 7 270 (484) (574) 583
Total Linear + Virtual MVPD video subs 96,287 96,223 95,909 95,269 94,234 93,135 92,269 91,163 88,837 87,763 87,561 86,410 95,269 91,163 86,410 82,675
Y/Y % change -0.7% -0.1% -0.1% -1.1% -2.1% -3.2% -3.8% -4.3% -5.7% -5.8% -5.1% -5.2% -1.1% -4.3% -5.2% -4.3%
Sequential change in Y/Y % change 48 bps 59 bps 0 bps -96 bps -106 bps -108 bps -59 bps -52 bps -142 bps -4 bps 67 bps -11 bps - - - -
Annual Y/Y % change 50 bps 110 bps 122 bps 11 bps -143 bps -309 bps -368 bps -324 bps -359 bps -256 bps -131 bps -90 bps 11 bps -324 bps -90 bps 89 bps
Net adds (14) (65) (314) (640) (1,034) (1,099) (866) (1,106) (2,326) (1,074) (202) (1,152) (1,033) (4,106) (4,753) (3,735)
Net adds Y/Y change 467 570 4 (923) (1,020) (1,034) (552) (466) (1,291) 25 664 (45) 118 (3,073) (648) 1,018
Cable/Telecom & Communications Infrastructure 2020.12.24
December 24, 2020 10

Exhibit 10: Linear and Pay TV subscriber net adds
Note: Figures include our estimates for pro forma historicals. Includes illustrative metrics for companies not under direct coverage. Includes RBC calculations for commercial subscribers for certain operators. Source: Company reports, press reports, Kagan, RBC Capital Markets estimates
Subscriber figures in 000's 1Q18 2Q18 3Q18 4Q18 1Q19 2Q19 3Q19 4Q19 1Q20 2Q20 3Q20 4Q20E 2018 2019 2020E 2021E
Total Linear + Virtual MVPDs
Video net adds
Linear video net adds
Comcast Corp. (96) (140) (106) (29) (121) (224) (238) (149) (409) (477) (273) (270) (371) (732) (1,429) (1,313)
AT&T (Satell ite + U-verse) (187) (262) (346) (391) (544) (778) (1,163) (945) (897) (886) (590) (745) (1,186) (3,430) (3,118) (2,213)
Charter Communications (PF for TWC, Bright House) (111) (57) (54) (22) (145) (141) (75) (101) (70) 94 67 (96) (244) (462) (5) (611)
DISH TV video subs (185) (192) (367) (381) (266) (79) (66) (100) (382) 5 (16) (200) (1,125) (511) (593) (608)
VZ - Fios - PF for Frontier transaction (22) (37) (63) (46) (53) (52) (66) (51) (84) (83) (62) (63) (168) (222) (292) (295)
Cox Communications (51) (51) (21) (22) (138) (138) (58) (56) (98) (100) (63) (61) (144) (390) (321) (341)
Altice USA (PF for Cablevision, Suddenlink) (30) (24) (28) (14) (10) (21) (32) (44) (42) (35) (86) (75) (97) (107) (238) (235)
Frontier~ (PF for VZ 4/1/16 transaction starting 4Q13) (28) (31) (29) (35) (54) (44) (38) (36) (37) (34) (42) (31) (123) (172) (144) (121)
Mediacom Communications Corp. (4) (9) (15) (17) (12) (17) (18) (19) (17) (17) (13) (19) (45) (66) (66) (66)
TPG (PF for RCN, Grande, Wave) (7) (4) (8) (7) (10) (8) (9) (9) (9) (17) (9) (10) (25) (37) (46) (44)
WideOpenWest (8) (9) (7) (7) (8) (11) (6) (7) (8) (14) (24) (10) (31) (32) (56) (53)
Cable One (PF for NewWave) (14) (11) (12) (3) (6) (13) (11) (2) (11) (13) (13) (2) (40) (33) (40) (40)
Atlantic Broadband (PF for Metrocast) 14 (1) (3) (5) (5) (0) 5 (4) (2) 6 6 (7) 5 (4) 2 1
CenturyLink (35) (32) (29) (26) (23) (29) (21) (16) (11) (10) (6) (5) (122) (89) (32) (9)
Windstream (11) (11) (10) (9) (12) (12) (11) (10) (10) (10) (9) (8) (39) (43) (35) (32)
Midcontinent Communications (2) (3) (3) (4) (4) (4) (3) (5) (4) (4) (3) (5) (13) (17) (16) (16)
Armstrong Cable Services (4) (3) (4) (5) (5) (3) (3) (5) (4) (3) (3) (5) (16) (15) (13) (13)
Service Electric Cable TV (2) (2) (3) (0) (0) (3) (0) (1) (0) (3) (0) (1) (6) (4) (4) (4)
Cincinnati Bell 0 0 (2) (1) (2) (2) (3) (4) (4) (0) (2) (4) (3) (11) (10) (10)
Blue Ridge Communications (1) (1) (2) (0) (0) (2) (0) (0) (0) (2) (0) (0) (5) (3) (3) (3)
Buckeye Broadband (0) (1) (6) (2) (3) (1) (3) (4) (4) 0 (2) (3) (10) (10) (8) (8)
GCI Liberty, Inc. (4) (3) (1) (1) (3) (2) (2) (8) (2) (2) (2) (8) (10) (15) (14) (14)
TDS (PF for BendBroadband) (1) 1 1 1 (2) (1) (2) (0) (1) (3) (4) (2) 1 (5) (11) (11)
Consolidated Communications (3) (3) (2) (3) (2) (2) (3) (2) (2) (3) (2) (2) (10) (9) (8) (8)
Vyve Broadband (1) (1) (1) (2) (2) (1) (2) (1) 1 (2) (3) (2) (4) (6) (6) (6)
Comporium Communications 0 0 (0) (0) (0) (1) 1 (1) (6) (1) 1 (1) 0 (1) (6) (6)
TDS (telco) 2 1 2 1 0 2 1 1 1 3 1 1 6 4 5 5
Schurz Communications (PF for Blue Stream) (1) (1) 0 (0) (0) (2) (1) (1) (1) (2) (1) (1) (2) (4) (5) (5)
Shenandoah Telecommunications Co. (1) (1) (1) (0) (1) (1) 7 2 4 (1) 7 2 (3) 7 12 13
Zito Media (0) (0) (0) (1) (1) (0) (0) (1) (1) (0) (0) (1) (3) (3) (3) (3)
Northland Cable Television 0 (1) (1) (5) (1) (0) (1) (1) (0) (0) (1) (1) (7) (2) (2) (1)
MCTV (1) (1) (1) (0) (1) (1) (1) (2) (1) 0 0 (1) (2) (3) (1) (0)
WEHCO Video (1) (1) (1) (1) (2) (0) (2) (1) 0 (0) (2) (1) (4) (4) (2) (2)
Total linear video net adds (793) (890) (1,123) (1,039) (1,437) (1,591) (1,823) (1,582) (2,110) (1,615) (1,149) (1,636) (3,845) (6,433) (6,509) (6,072)
Net adds Y/Y change 58 96 29 (335) (644) (700) (700) (544) (673) (24) 674 (54) (152) (2,588) (77) 438
vMVPD video net adds 29% 8% 9% 10%
DISH - Sling TV (domestic est.) 80 30 15 36 (4) 37 203 (105) (292) (67) 153 (155) 162 132 (360) (260)
AT&T - DIRECTV NOW (excl. trial) 336 325 63 (280) (89) (105) (199) (215) (135) (66) (40) (119) 444 (608) (360) (217)
Hulu TV 166 238 466 418 300 200 486 514 100 100 389 300 1288 1500 889 1244
YouTube TV 100 150 200 200 150 325 350 372 400 325 300 322 650 1197 1347 922
PlayStation Vue 30 10 0 0 20 0 0 (200) (410) 0 0 0 40 (180) (410) 0
FuboTV 42 42 30 (16) (21) (15) 61 61 (28) (1) 76 76 97 86 122 122
Philo 25 30 35 40 45 50 55 50 150 250 65 60 130 200 525 525
Total vMVPD video net adds 779 825 809 399 401 492 956 477 (215) 541 943 484 2,812 2,327 1,753 2,336
Net adds Y/Y change 410 473 (25) (588) (378) (333) 148 79 (617) 49 (13) 7 270 (484) (574) 583
Total Linear + Virtual MVPD video net adds (14) (65) (314) (640) (1,035) (1,098) (867) (1,105) (2,325) (1,074) (206) (1,152) (1,033) (4,106) (4,756) (3,735)
Net adds Y/Y change 468 569 4 (923) (1,021) (1,033) (553) (465) (1,290) 25 661 (47) 118 (3,072) (650) 1,021
Cable/Telecom & Communications Infrastructure 2020.12.24
December 24, 2020 11

Exhibit 11: Wireless Subscriber Trends
Note: Altice, Comcast and Charter postpaid customers used to reflect postpaid phone customers as well. Note: Tables do not include future forecasts for US Cellular Source: Company reports, RBC Capital Markets estimates. Historical periods may not reflect restatements or changes in accounting standards.
Postpaid analysis 1Q18 2Q18 3Q18 4Q18 1Q19 2Q19 3Q19 4Q19 1Q20 2Q20 3Q20 4Q20E 2020E 2021E
Postpaid subscribers and connections, net adds, and churn
Postpaid subscribers (000)
AT&T 76,601 76,543 76,173 76,068 75,737 75,478 75,152 75,207 75,148 74,919 75,969 76,539 76,539 77,416
Sprint 32,119 32,187 32,296 32,605 32,774 33,075 33,348 33,842 34,344
T-Mobile 38,047 39,065 40,082 41,161 42,519 43,538 44,646 45,720 47,811
New TMUS 77,753 79,732 81,132 81,132 86,432
Verizon 111,114 111,622 112,135 113,353 113,407 113,851 114,471 115,698 115,572 115,874 116,249 117,245 117,245 119,096
US Cellular 4,481 4,468 4,466 4,472 4,440 4,414 4,395 4,383 4,359 4,372 4,401
Comcast 381 577 781 1,009 1,236 1,405 1,586 1,791 2,052 2,393 2,580 2,850 2,850 3,686
Charter 21 134 310 518 794 1,082 1,372 1,697 2,060 2,060 3,110
Total postpaid subscribers 262,743 264,462 265,933 268,689 270,247 272,071 274,116 277,435 280,368 276,683 280,628 279,826 279,826 289,740
Postpaid net adds (000)
AT&T 53 73 (231) 15 (207) (146) (217) 135 27 (154) 1,081 570 1,524 877
Sprint 256 39 123 109 309 169 134 273 502
T-Mobile 1,072 1,018 1,017 1,079 1,358 1,019 1,108 1,074 777
New TMUS 1,112 1,979 1,400 5,770 5,300
Verizon 260 531 515 1,220 61 451 601 1,248 (50) 352 553 996 1,851 1,851
US Cellular (37) (13) (2) 6 (32) (26) (19) (12) (26) 12 28
Comcast 196 204 228 227 170 181 204 261 216 126 187 270 799 836
Charter 21 113 176 208 276 288 290 325 363 300 1,278 1,000
Total postpaid net adds 1,800 1,852 1,671 2,769 1,835 1,856 2,087 3,267 1,736 1,773 4,191 3,536 11,222 9,864
Y/Y % change 67.6% 14.5% -1.8% -4.8% 1.9% 0.2% 24.9% 18.0% -5.4% -4.5% 100.8% 8.2% 22.9% -12.1%
Postpaid churn
AT&T 1.06% 1.02% 1.16% 1.23% 1.16% 1.07% 1.19% 1.29% 1.08% 1.05% 0.85% 1.14% 1.03% 1.07%
Sprint 1.78% 1.63% 1.78% 1.85% 1.81% 1.74% 1.87% 1.98% 1.86%
T-Mobile 1.07% 0.95% 1.02% 1.10% 0.99% 0.89% 1.00% 1.12% 1.01%
New TMUS 0.96% 1.08% 1.04% 1.11% 1.00%
Verizon 1.04% 0.97% 1.04% 1.08% 1.12% 1.02% 1.09% 1.13% 1.08% 0.78% 0.89% 1.10% 0.96% 1.08%
US Cellular 1.23% 1.19% 1.29% 1.29% 1.26% 1.23% 1.38% 1.38% 1.21% 0.89% 1.06%
Comcast (est.) 0.30% 0.45% 0.60% 0.75% 0.90% 0.45% 0.45% 0.75% 1.10% 0.90% 1.20% 1.20% 1.11% 1.20%
Charter (est.) 0.00% 0.30% 0.50% 0.80% 0.90% 0.95% 1.00% 1.00% 1.00% 1.00% 1.00% 1.10%
Total postpaid churn 1.16% 1.14% 1.06% 1.16% 1.22% 1.19% 1.10% 1.20% 1.28% 0.91% 0.94% 1.09% 1.03% 1.05%
Y/Y % change (bps) -6 bps -8 bps -1 bps 4 bps 6 bps 5 bps 4 bps 3 bps 6 bps -29 bps -16 bps -10 bps -15 bps 3 bps
Postpaid ARPU ($)
AT&T $47.76 $48.86 $49.91 $49.70 $49.67 $50.05 $50.51 $50.49 $50.63 $49.76 $49.94 $49.95 $50.07 $50.91
Sprint $44.40 $43.55 $43.99 $43.64 $43.25 $42.57 $42.30 $42.02 $41.14
T-Mobile $43.94 $43.51 $43.10 $43.02 $42.55 $42.43 $42.39 $41.84 $41.38
New TMUS $52.88 $43.22 $42.72 $45.02 $41.64
Verizon $41.97 $42.68 $43.10 $42.38 $42.65 $42.86 $43.05 $42.45 $42.38 $41.39 $42.30 $42.79 $42.22 $43.42
US Cellular $44.34 $44.74 $45.31 $45.58 $45.44 $45.90 $46.16 $46.57 $47.23 $46.24 $47.10
Total postpaid ARPU $44.24 $44.66 $45.10 $44.62 $44.54 $44.57 $44.66 $44.20 $43.93 $46.50 $44.11 $44.04 $44.62 $44.03
Y/Y % change -6.8% -5.2% -4.0% -3.5% 0.7% -0.2% -1.0% -1.0% -1.4% 4.3% -1.2% -0.3% 0.3% -1.3%
Postpaid phone analysis 1Q18 2Q18 3Q18 4Q18 1Q19 2Q19 3Q19 4Q19 1Q20 2Q20 3Q20 4Q20E 2020E 2021E
Postpaid phone subscribers, churn, and ARPU
Postpaid phone subscribers (000)
AT&T 63,043 62,930 62,850 62,882 62,830 62,811 62,812 62,915 63,062 62,994 63,184 63,695 63,695 64,947
Sprint 26,813 26,847 26,813 26,787 26,598 26,470 26,379 26,264 25,916
T-Mobile 34,744 35,430 36,204 37,224 37,880 38,590 39,344 40,345 40,797
New TMUS 65,105 65,794 66,494 66,494 69,194
Verizon 89,780 89,967 90,381 91,022 91,066 91,309 91,806 92,567 92,449 92,699 92,940 93,618 93,618 94,864
Total Big Three postpaid phone subscribers 214,380 215,174 216,248 217,915 218,374 219,180 220,341 222,091 222,224 220,797 221,918 223,807 223,807 229,005
Postpaid phone net adds (000)
AT&T (53) 49 67 131 79 74 101 229 163 (151) 645 420 1,077 1,277
Sprint 55 87 (34) (26) (189) (128) (91) (115) (348)
T-Mobile 617 686 774 1,020 656 710 754 1,001 452
New TMUS 253 689 700 1,746 2,700
Verizon (24) 199 295 653 (44) 245 444 791 (68) 173 283 678 1,066 1,246
US Cellular (16) 5 14 20 (14) (11) (2) (20) 3 (11) (2)
Total Big Three postpaid phone net adds 595 1,021 1,102 1,778 502 901 1,208 1,906 199 275 1,617 1,798 3,889 5,223
Y/Y % change 200.5% 18.2% 9.9% -1.3% -15.6% -11.8% 9.6% 7.2% -60.4% -69.5% 33.9% -5.7% -13.9% 34.3%
Total postpaid phone net adds 579 1,026 1,116 1,798 488 890 1,206 1,886 202 264 1,615 1,798 3,889 5,223
Y/Y % change 240.6% 16.2% 8.2% -1.2% -15.7% -13.3% 8.0% 4.9% -58.6% -70.3% 33.9% -4.7% -13.9% 34.3%
Postpaid phone churn
AT&T 0.83% 0.82% 0.93% 1.00% 0.92% 0.86% 0.95% 1.07% 0.86% 0.84% 0.69% 0.92% 0.83% 0.86%
Sprint 1.68% 1.55% 1.73% 1.84% 1.82% 1.78% 1.91% 2.06% 1.89%
T-Mobile 1.07% 0.95% 1.02% 0.99% 0.88% 0.78% 0.89% 1.01% 0.86%
New TMUS 0.80% 0.90% 1.01% 0.99% 0.97%
Verizon 0.80% 0.75% 0.80% 0.82% 0.84% 0.76% 0.82% 0.86% 0.81% 0.51% 0.62% 0.83% 0.69% 0.81%
US Cellular 0.97% 0.92% 1.02% 1.00% 0.99% 0.97% 1.09% 1.11% 0.95% 0.71% 0.88%
Total Big Three postpaid phone churn 0.99% 0.96% 0.90% 0.99% 1.03% 0.99% 0.92% 1.00% 1.09% 0.69% 0.72% 0.91% 0.82% 0.87%
Y/Y % change (bps) -7 bps -5 bps 2 bps 3 bps 4 bps 3 bps 1 bps 1 bps 6 bps -30 bps -19 bps -9 bps -18 bps 5 bps
Postpaid phone ARPU ($)
AT&T $53.33 $54.42 $55.58 $55.28 $55.27 $55.50 $55.89 $55.52 $55.68 $54.47 $54.70 $54.69 $54.88 $55.88
Sprint $50.44 $49.57 $50.16 $50.01 $50.18 $49.87 $50.10 $50.37 $50.20
T-Mobile $46.66 $46.52 $46.17 $46.29 $46.07 $46.10 $46.22 $45.79 $45.80
New TMUS $47.99 $48.55 $48.00 $48.01 $47.18
Verizon
Total postpaid phone ARPU (excl. Verizon) $50.87 $51.16 $51.74 $51.55 $51.48 $51.51 $51.76 $51.46 $51.49 $51.16 $51.57 $51.27 $51.37 $51.42
Y/Y % change -7.0% -6.3% -4.5% -3.2% 1.2% 0.7% 0.0% -0.2% 0.0% -0.7% -0.4% -0.4% -0.4% 0.1%
Cable/Telecom & Communications Infrastructure 2020.12.24
December 24, 2020 12

Exhibit 12: Wireless Financial Trends by Carrier ($M)
Note: Historical periods may not reflect restatements or changes in accounting standards. Source: Company reports, RBC Capital Markets estimates
Wireless industry financial snapshot ($M) 1Q18 2Q18 3Q18 4Q18 1Q19 2Q19 3Q19 4Q19 1Q20 2Q20 3Q20 4Q20E 2020E 2021E
Wireless revenue
Service revenue
AT&T 13,246 13,520 13,828 13,700 13,629 13,824 13,930 13,948 13,968 13,669 13,883 14,087 55,607 57,678
Sprint 5,573 5,460 5,498 5,449 5,409 5,322 5,045 5,195 5,124
T-Mobile 7,806 7,931 8,066 8,189 8,277 8,426 8,583 8,708 8,713
New T-Mobile 13,230 14,139 14,233 55,439 57,410
Verizon 15,402 15,754 15,966 15,898 16,072 16,244 16,398 16,314 16,357 15,948 16,432 16,700 65,437 67,913
Total service revenue 42,027 42,665 43,358 43,236 43,387 43,816 43,956 44,165 44,162 42,847 44,454 45,020 176,483 183,001
Y/Y % change -2.6% -1.0% -0.2% -0.3% 3.2% 2.7% 1.4% 2.1% 1.8% -2.2% 1.1% 1.9% 0.7% 3.7%
Equipment revenue
AT&T 3,905 3,559 3,907 4,856 3,734 3,468 3,771 4,752 3,434 3,480 4,011 5,276 16,201 17,496
Sprint 2,217 2,385 2,671 2,902 2,785 2,579 2,522 2,664 2,452
T-Mobile 2,353 2,325 2,391 2,940 2,516 2,263 2,186 2,875 2,400
New T-Mobile 4,269 4,953 5,034 19,108 19,263
Verizon 5,040 5,044 5,353 6,821 4,931 4,720 5,141 6,771 4,129 3,755 4,112 7,056 19,052 20,806
Total equipment revenue 13,515 13,313 14,322 17,519 13,966 13,030 13,620 17,062 12,415 11,504 13,076 17,366 54,361 57,565
Y/Y % change 24.8% 12.5% 26.8% 7.4% 3.3% -2.1% -4.9% -2.6% -11.1% -11.7% -4.0% 1.8% -5.8% 5.9%
Total wireless revenue
AT&T 17,151 17,079 17,735 18,556 17,363 17,292 17,701 18,700 17,402 17,149 17,894 19,363 71,808 75,173
Sprint 7,790 7,845 8,169 8,351 8,194 7,901 7,567 7,859 7,576
T-Mobile 10,455 10,571 10,839 11,445 11,080 10,979 11,061 11,878 11,113
New T-Mobile 17,671 19,272 19,453 75,085 77,377
Verizon 21,900 22,449 22,973 24,412 22,700 22,682 23,569 25,235 22,565 21,742 22,640 25,864 92,811 96,874
Total wireless revenue 57,296 57,944 59,716 62,764 59,337 58,854 59,898 63,672 58,656 56,562 59,806 64,680 239,704 249,425
Y/Y % change 3.1% 2.4% 5.9% 2.3% 3.6% 1.6% 0.3% 1.4% -1.1% -3.9% -0.2% 1.6% -0.9% 4.1%
Wireless adj. EBITDA (as reported)
AT&T 7,193 7,538 7,631 7,469 7,322 7,770 7,530 7,833 7,817 7,712 7,700 8,069 31,299 32,100
Sprint 2,816 3,318 3,276 3,111 3,131 3,037 2,562 2,535 2,673
T-Mobile 2,956 3,233 3,239 2,970 3,284 3,461 3,396 3,242 3,665
New T-Mobile 7,017 7,129 6,551 27,035 27,679
Verizon 10,477 10,733 10,965 10,381 10,765 10,923 11,042 10,328 11,147 10,977 11,359 10,992 44,475 45,804
Total wireless adj. EBITDA 23,442 24,822 25,111 23,931 24,502 25,191 24,530 23,938 25,302 25,706 26,188 25,612 102,808 105,583
Y/Y % change 7.1% 8.2% 10.0% 13.2% 4.5% 1.5% -2.3% 0.0% 3.3% 2.0% 6.8% 7.0% 4.7% 2.7%
Wireless adj. EBITDA margin
AT&T 41.9% 44.1% 43.0% 40.3% 42.2% 44.9% 42.5% 41.9% 44.9% 45.0% 43.0% 41.7% 43.6% 42.7%
Sprint 36.1% 42.3% 40.1% 37.3% 38.2% 38.4% 33.9% 32.3% 35.3%
T-Mobile 28.3% 30.6% 29.9% 26.0% 29.6% 31.5% 30.7% 27.3% 33.0%
New T-Mobile 39.7% 37.0% 33.7% 36.0% 35.8%
Verizon 47.8% 47.8% 47.7% 42.5% 47.4% 48.2% 46.8% 40.9% 49.4% 50.5% 50.2% 42.5% 47.9% 47.3%
Total wireless adj. EBITDA margin 40.9% 42.8% 42.1% 38.1% 41.3% 42.8% 41.0% 37.6% 43.1% 45.4% 43.8% 39.6% 42.9% 42.3%
Y/Y % change (bps) 153 bps 228 bps 155 bps 369 bps 38 bps -4 bps -110 bps -53 bps 184 bps 265 bps 284 bps 200 bps 229 bps -56 bps
Wireless adj. EBITDA service margin
AT&T 54.3% 55.8% 55.2% 54.5% 53.7% 56.2% 54.1% 56.2% 56.0% 56.4% 55.5% 57.3% 56.3% 55.7%
Sprint 50.5% 60.8% 59.6% 57.1% 57.9% 57.1% 50.8% 48.8% 52.2%
T-Mobile 37.9% 40.8% 40.2% 36.3% 39.7% 41.1% 39.6% 37.2% 42.1%
New T-Mobile 53.0% 50.4% 46.0% 48.8% 48.2%
Verizon 68.0% 68.1% 68.7% 65.3% 67.0% 67.2% 67.3% 63.3% 68.1% 68.8% 69.1% 65.8% 68.0% 67.4%
Total wireless adj. EBITDA service margin 54.3% 55.8% 55.2% 54.5% 53.7% 56.2% 54.1% 56.2% 56.0% 56.4% 55.5% 57.3% 58.3% 57.7%
Y/Y % change (bps) 433 bps 470 bps 432 bps 1048 bps -58 bps 45 bps -113 bps 164 bps 224 bps 21 bps 141 bps 112 bps 227 bps -56 bps
Wireless capex ($M)
AT&T 2,891 2,414 2,539 2,728 2,401 2,490 2,749 2,847 2,339 2,472 2,798 2,987 10,596 10,854
Sprint 681 1,019 1,101 1,242 973 1,027 963 921 798
T-Mobile 1,366 1,629 1,362 1,184 1,931 1,789 1,514 1,157 1,753
New T-Mobile 2,138 3,109 3,477 11,275 13,595
Verizon 2,367 1,650 2,127 2,342 2,044 1,857 2,217 2,835 2,526 2,298 2,193 2,140 9,157 9,306
Total wireless capex 7,305 6,712 7,129 7,496 7,349 7,163 7,443 7,759 7,415 6,908 8,100 8,604 31,028 33,755
Y/Y % change 8.7% -7.3% -0.2% 2.5% 0.6% 6.7% 4.4% 3.5% 0.9% -3.6% 8.8% 10.9% 4.4% 8.8%
Wireless capital intensity (on total revenue)
AT&T 16.9% 14.1% 14.3% 14.7% 13.8% 14.4% 15.5% 15.2% 13.4% 14.4% 15.6% 15.4% 14.8% 14.4%
Sprint 8.7% 13.0% 13.5% 14.9% 11.9% 13.0% 12.7% 11.7% 10.5%
T-Mobile 13.1% 15.4% 12.6% 10.3% 17.4% 16.3% 13.7% 9.7% 15.8%
New T-Mobile 12.1% 16.1% 17.9% 15.0% 17.6%
Verizon 10.8% 7.3% 9.3% 9.6% 9.0% 8.2% 9.4% 11.2% 11.2% 10.6% 9.7% 8.3% 9.9% 9.6%
Total wireless capital intensity 12.7% 11.6% 11.9% 11.9% 12.4% 12.2% 12.4% 12.2% 12.6% 12.2% 13.5% 13.3% 12.9% 13.5%
Y/Y % change (bps) 66 bps -121 bps -73 bps 2 bps -36 bps 59 bps 49 bps 24 bps 26 bps 4 bps 112 bps 112 bps 65 bps 59 bps
Cable/Telecom & Communications Infrastructure 2020.12.24
December 24, 2020 13

Exhibit 13: Telecom and Cable Cross Sector Returns
Data as of 12/17/2020 Source: CapitalIQ
Exhibit 14: Telecom and Cable EV/EBITDA Multiples
Data as of 12/17/2020. Source: CapitalIQ, RBC Capital Markets estimates
Cable/Telecom & Communications Infrastructure 2020.12.24
December 24, 2020 14

Exhibit 15: Winning Bidders of 3.5 GHz Band Auction (Auction 105 - CBRS)
Source: FCC, RBC Capital Markets
Exhibit 16: Winning Bidders of Rural Digital Opportunity Fund Auction (Auction 904)
Source: FCC, RBC Capital Markets
Company Bidding entity Amount Locations % of total bids
LTD Broadband LTD Broadband LLC $1,320,920,719 528,088 14.3%
Charter
CCO Holdings, LLC (Charter
Communications) $1,222,613,870 1,057,695 13.2%
Rural Electric
Cooperative
Consortium
Rural Electric Cooperative
Consortium $1,104,395,953 618,476 12.0%
SpaceX
Space Exploration
Technologies Corp. $885,509,638 642,925 9.6%
Windstream
Windstream Services LLC,
Debtor-In-Possession $522,888,780 192,567 5.7%
Nextlink
AMG Technology Investment
Group LLC $429,228,073 206,136 4.7%
Frontier
Frontier Communications
Corporation, DIP $370,900,833 127,188 4.0%
Resound
Networks Resound Networks, LLC $310,681,609 219,239 3.4%
Starry Connect Everyone LLC $268,851,316 108,506 2.9%
CenturyLink CenturyLink, Inc. $262,367,614 77,257 2.8%
Other - $2,532,310,310 1,442,756 27.4%
Total - $9,230,668,715 5,220,833 100.0%
Cable/Telecom & Communications Infrastructure 2020.12.24
December 24, 2020 15

Exhibit 17: RBC REIT Sectors Performance
Specialized REITs include COR, CONE, DLR, EQIX, and QTS Source: RBC Capital Markets estimates, S&P Capital IQ
Cable/Telecom & Communications Infrastructure 2020.12.24
December 24, 2020 16

Exhibit 18: Short Interest History
Data as of 12/17/2020. Source: CapitalIQ
Company 2 Years Ago 1 Year Ago 6 Months Ago 3 Months Ago Latest
AT&T 70.74 99.57 120.95 112.85 133.10
% Float 1.0% 1.4% 1.7% 1.6% 1.9%T-Mobile 9.13 10.26 16.67 13.19 9.42
% Float 3.0% 3.3% 5.2% 2.4% 1.6%U.S. Cellular 0.60 0.88 0.85 0.73 0.77
% Float 4.1% 5.8% 5.9% 4.9% 5.1%Verizon 43.49 35.33 28.77 30.06 31.52
% Float 1.1% 0.9% 0.7% 0.7% 0.8%
Alaska Communications 0.02 0.02 0.03 1.09 0.33% Float 0.0% 0.0% 0.1% 2.5% 0.8%
Lumen (CenturyLink ) 86.75 107.63 108.43 114.88 104.09% Float 9.1% 10.9% 10.9% 11.6% 10.5%
Cincinnati Bell 3.72 8.88 5.40 5.94 8.70% Float 7.9% 19.8% 12.0% 11.9% 17.5%
Consolidated Communications 12.40 10.44 7.52 7.19 4.23% Float 17.9% 14.9% 10.5% 10.0% 5.9%
TDS 1.58 2.29 1.97 1.43 1.58% Float 1.6% 2.3% 2.0% 1.4% 1.6%
Altice USA 14.44 19.51 34.49 34.79 39.05% Float 4.4% 5.6% 11.3% 11.2% 15.8%
Charter NA 9.70 9.25 8.48 7.45% Float NA 6.4% 6.5% 6.5% 5.9%
Comcast 69.65 77.92 76.96 76.44 85.85% Float 1.5% 1.7% 1.7% 1.7% 1.9%
Dish 13.29 13.18 12.36 11.30 13.04% Float 5.9% 5.6% 5.0% 4.6% 5.3%
American Tower 5.27 4.31 4.01 3.05 4.17% Float 1.2% 1.0% 0.9% 0.7% 0.9%
Crown Castle 8.35 5.71 10.43 6.42 3.56% Float 2.0% 1.4% 2.5% 1.5% 0.8%
SBA Communications 2.64 1.61 1.51 1.31 1.14% Float 2.3% 1.4% 1.4% 1.2% 1.0%
Landmark Infrastructure 0.04 0.06 0.03 0.03 0.04% Float 0.2% 0.3% 0.1% 0.2% 0.2%
CyrusOne 7.01 4.45 5.57 4.60 7.21% Float 6.7% 4.0% 4.9% 4.0% 6.0%
Coresite 1.79 1.42 1.38 0.79 0.75% Float 4.9% 3.8% 3.7% 1.9% 1.8%
Digital Realty 12.78 21.63 12.47 6.95 5.47% Float 6.2% 10.4% 4.7% 2.6% 2.0%
Equinix 1.04 0.93 1.02 1.00 0.75% Float 1.3% 1.1% 1.2% 1.1% 0.8%
GDS 11.24 12.96 14.71 12.70 13.45% Float 22.7% 21.8% 20.5% 14.8% 12.5%
QTS 4.23 8.03 10.48 9.92 8.34% Float 8.4% 14.0% 17.6% 16.3% 13.1%
Switch NA 5.99 5.87 5.33 4.77% Float NA 13.1% 11.1% 7.9% 5.5%
21Vianet 0.55 0.36 1.15 1.99 2.55% Float 1.0% 0.7% 1.7% 2.7% 3.0%
Cogent Communications 2.57 1.62 1.51 0.97 1.24% Float 6.9% 4.4% 4.1% 2.6% 3.3%
GTT 12.03 15.35 10.02 11.61 8.26% Float 39.1% 53.9% 36.8% 50.5% 38.9%
Uniti 12.22 27.23 18.20 15.06 11.70% Float 6.9% 14.3% 9.6% 8.0% 5.6%
Cable/Telecom & Communications Infrastructure 2020.12.24
December 24, 2020 17

Exhibit 19: AT&T and Verizon Spreads vs. 10-yr Treasury (2017-2020)
Data as of 12/17/2020. Source: CapitalIQ
Exhibit 20: AT&T and Verizon Spreads vs. 10-yr Treasury (2015-2020)
Data as of 12/17/2020. Source: CapitalIQ
Cable/Telecom & Communications Infrastructure 2020.12.24
December 24, 2020 18

Exhibit 21: AT&T and Verizon Spreads vs. 10-yr Treasury (2010-2020)
Data as of 12/17/2020. Source: CapitalIQ
Exhibit 22: RBC Wireless Cell Site Addition and Overlay Estimates
Note: Data includes site-equivalents from amendments/overlays, but does not include small-cell or DAS contributions. Source: Company reports, RBC Capital Markets estimates
CARRIER 2010 2011 2012 2013 2014 2015 2016 2017 2018 2019E 2020E Comments
AT&T new sites1,822 2,450 1,200 2,000 3,700 800 630 1,000 800 2,400 2,180
AT&T lease equivalents
from overlays2,200 6,200 4,730 5,200 3,650 2,200 4,100 3,800 4,750 5,300 4,200
T-Mobile new sites2,236 1,000 559 212 450 1,750 2,000 2,150 2,800 1,400 1,500
T-Mobile lease
equivalents from
overlays
1,381 750 2,300 4,000 2,200 2,500 3,200 3,500 4,000 4,550 4,350
Verizon new sites327 1,100 1,400 2,613 3,600 3,950 3,500 3,400 2,200 2,250 2,175
Verizon lease
equivalents from
overlays
2,400 2,500 2,500 2,500 3,750 3,000 3,300 3,600 3,600 3,750 3,450
Sprint new sites230 400 200 100 100 100 100 250 600 250 850
Sprint lease equivalents
added from overlays125 500 2,700 3,000 2,400 2,200 2,000 2,300 3,200 3,600 2,450
TOTAL 21.3K 17.9K 16.8K 19.7K 19.9K 16.5K 18.8K 20K 22K 23.5K 21.2K
On a four-operator standalone basis (absent a Sprint/T-Mobile merger) we expect slightly less
U.S.tower leasing totals in 2020 vs. 2019 due to flat or slightly tapering activity at AT&T and Verizon,
roughly flat activity at T-Mobile, and slightly tapering activity at Verizon.
2020 priorities include FirstNet completion alongside macro-site carrier adds. Our macro site
addition estimate excludes ~200 anticipated high-rent relocation projects. We expected low 30K
carrier adds vs. low 50K in 2019, and ~2800 4T4R deployments.
2020 priorities (standalone, excluding Sprint) include macro sites and 600-MHz deployments
following a slowdown during 4Q19 coverage. Through 3Q19, T-Mobile had added 1,350 sites and
3,800 small cells.
For 2020, we anticipate a roughly flat levels of macro site additions vs. 2019, with a ~40% reduction
in small cell additions (to low 3K) and ~20% reduction in macro carrier adds (to mid 6K), and a
tapering of CBRS/LAA activity (to ~1,500 projects). Our estimates do not include mm-wave 5G
activities.
2020 focus areas (standalone, excluding T-Mobile) include a ramp in macro-site additions, partly to
enhance network density at 2.5 GHz, alongside small-cell deployments (leveraging Altice and Cox,
with a significant mix of strand mounts), and massive MIMO deployment.
Cable/Telecom & Communications Infrastructure 2020.12.24
December 24, 2020 19

Exhibit 23: Network Performance Trends - Rootmetrics
Cable/Telecom & Communications Infrastructure 2020.12.24
December 24, 2020 20

Cable/Telecom & Communications Infrastructure 2020.12.24
December 24, 2020 21

Exhibit 24: Bottom 10 Trending Markets by Carrier (out of top 25 populous markets which have reported 2H20 data)
Source: RBC Capital Markets based on RootMetrics
Exhibit 25: Top 25 Trending Markets Carrier (out of top 25 populous markets which have reported 2H20 data)
Source: RBC Capital Markets based on RootMetrics
Cable/Telecom & Communications Infrastructure 2020.12.24
December 24, 2020 22

Exhibit 26: Network Performance Trends – Opensignal (4Q19)
Source: RBC Capital Markets based on OpenSignal
Average performance (population weighted) in all metros
Parameters (4G) Verizon AT&T Sprint T-Mobile
Availability 96.8 93.5 92.7 95.1
Download 29.4 32.1 26.5 26.6
Upload 9.5 7.0 3.0 8.7
Latency 49.4 43.9 49.7 50.0
video experience 62.1 53.9 59.2 55.2
Leading performance by carriers (No. of metros)
Parameters (4G) Verizon AT&T Sprint T-Mobile
Availability 256 44 22 57
Download 50 173 81 75
Upload 233 49 1 95
Latency 91 47 114 127
video experience 198 13 134 34
Cable/Telecom & Communications Infrastructure 2020.12.24
December 24, 2020 23

Exhibit 27: Datacenter Leasing Tracker
DFT -- New leasing annual rent includes reimbursement for operating expenses. DLR -- New leasing annualized GAAP rent does not include the interconnection bookings signed during the quarter CONE- Excluding cross-connect bookings and the CME acquisition-lease back in 1Q16. QTS - Annual rent is a cash metric. The company reports annual rent net of downgrades. Total In-place annual rent are cash rents excluding reimbursements for metered power. EQIX based on net billable cabinets added in the quarter and average in-place pricing INXN based on net incremental revenue generating space added in the quarter and average in-place pricing Source: Company reports and RBC Capital Markets
Cable/Telecom & Communications Infrastructure 2020.12.24
December 24, 2020 24

Exhibit 28: Datacenter Hyperscale vs. Colocation Leasing Tracker
DLR -- New leasing annualized GAAP rent does not include the interconnection bookings signed during the quarter. CONE -- excluding cross-connect bookings and the CME acquisition-lease back in 1Q16. QTS -- Annual rent is a cash metric. The company also reports annual rent net of downgrades and thus is not directly comparable to other companies that factor downgrades in new signings or churn. Total In-place annual rents are cash rents excluding reimbursements for metered power. EQIX based on net billable cabinets added in the quarter and average in-place pricing INXN based on net incremental revenue generating space added in the quarter and average in-place pricing All EQIX, INXN, CLNY and SWCH signings are classified as colocation (despite occasional multi-MW signings). Source: Company reports and RBC Capital Markets
Exhibit 29: Datacenters – Quarterly Revenue Churn Comparisons
Source: Company reports and RBC Capital Markets estimates for DLR
Hyperscale 1Q18 2Q18 3Q18 4Q18 1Q19 2Q19 3Q19 4Q19 1Q20 2Q20 3Q20 2018 2019 1Q20 2Q20 3Q20
($M Annual GAAP revenue signed) (% of total $M Hyperscale AGR signed)
DLR - Turnkey $42 $78 $50 $22 $31 $41 $53 $53 $58 $92 $46 59% 58% 47% 71% 63%
COR (> 5,000 NRSF) $3 $5 $1 $0 $0 $22 $10 $0 $4 $0 $7 2% 10% 3% 0% 9%
CONE (> 500 kW) $31 $56 $15 $5 $17 $5 $35 $3 $47 $24 $2 33% 20% 38% 19% 3%
QTS (Hyperscale) $11 $0 $6 $3 $3 $5 $9 $18 $15 $13 $18 6% 12% 12% 10% 25%
Total Hyperscale (Traditional REITS)$86 $139 $72 $30 $50 $73 $106 $74 $123 $130 $73 100% 100% 100% 100% 100%
SWCH (Hyperscale) $0 $0 $0 $0 $0 $0 $0 $0 $0 $0 $0
IRM (Datacenter Hyperscale) $0 $0 $0 $0 $0 $0 $8 $0 $5 $29 $11
GDS $82 $82 $76 $89 $65 $85 $90 $93 $92 $193 $99
Total Hyperscale (including GDS) $169 $222 $148 $119 $115 $158 $204 $167 $220 $352 $183
Colocation 1Q18 2Q18 3Q18 4Q18 1Q19 2Q19 3Q19 4Q19 1Q20 2Q20 3Q20 2018 2019 1Q20 2Q20 3Q20
($M Annual GAAP revenue signed) (% of total $M Colocation AGR signed)
DLR - Colocation $6 $7 $10 $10 $7 $8 $7 $8 $8 $22 $29 25% 24% 22% 50% 60%
COR (<= 5,000 NRSF) $4 $6 $5 $4 $7 $5 $5 $7 $8 $3 $6 15% 19% 25% 8% 11%
CONE (<= 500 kW, Enterprise) $8 $6 $9 $13 $8 $6 $9 $7 $10 $10 $6 26% 24% 31% 24% 13%
QTS (Hybrid Colo, 500 kW to 2MW)$11 $13 $12 $9 $8 $15 $9 $9 $7 $8 $8 34% 33% 22% 18% 16%
Total Colocation (Traditional REITS)$29 $33 $36 $36 $29 $34 $30 $31 $33 $44 $49 100% 100% 100% 100% 100%
EQIX $56 $98 $67 $102 $71 $66 $51 $55 $42 $68 $39
INXN $25 $12 $27 $20 $21 $14 $6 NA $10 $15 $25
SWCH $16 $18 $17 $7 $20 $13 $7 $20 $10 $12 $18
IRM (Datacenter) $2 $3 $3 $4 $5 $4 $2 $4 $1 $2 $4
CLNY (Datacenters) $7 $7 $9
Total Colocation $129 $164 $150 $170 $147 $131 $97 $110 $104 $148 $145
1Q19 2Q19 3Q19 4Q19 1Q20 2Q20 3Q20 Prior 4Q-avg Annual 2017 Annual 2018 Annual 2019 YTD 2020
COR 2.7% 2.4% 3.1% 2.9% 3.3% 1.0% 1.9% 2.6% 5.6% 7.6% 11.1% 6.2%
DLR (estimated) 0.7% 1.7% 2.5% 3.3% 0.9% 0.8% 1.5% 1.9% 8.7% 4.5% 8.2% 3.2%
CONE 2.1% 0.6% 1.0% 0.7% 1.0% 1.1% 0.6% 1.0% 3.9% 5.0% 4.4% 2.7%
QTS 1.3% 1.0% 1.1% 1.7% 0.6% 0.5% 1.7% 1.0% 8.4% 5.7% 5.1% 2.8%
EQIX 2.1% 2.4% 2.3% 2.3% 2.4% 2.2% 2.6% 2.3% 9.7% 9.3% 9.0% 7.2%
Average 1.8% 1.6% 2.0% 2.2% 1.6% 1.1% 1.7% 1.7% 6.8% 6.4% 7.6% 4.4%
INXN (company provided) 1.5-2.25%1.5-2.25%1.5-2.25%1.5-2.25%1.5-2.25%1.5-2.25%1.5-2.25% 1.5-2.25% 6-9% 6-9% 6-9% 3-4.5%
GDS 1.0% 0.2% 0.6% 0.2% 0.5% 0.7% NA 0.5% 6.5% 3.6% 2.0% 1.2%
SWCH 0.1% 0.2% 0.1% 0.2% 0.4% 0.2% 0.2% 0.2% 0.9% 0.9% 0.6% 0.8%
IRM (Datacenters) 5.1% 0.7% 2.4% 1.5% 0.5% 0.8% 1.6% 1.3% 3.4% 9.7% 2.9%
CLNY (Datacenters) 2.7% 1.8% 1.0% 2.3% 5.5%
Average 2.1% 0.8% 1.3% 1.0% 1.1% 1.0% 1.2% 1.1% 5.2% 4.2% 5.1% 3.3%
Average - EQIX, INXN 2.1% 2.2% 2.1% 2.1% 2.2% 2.1% 2.3% 2.1% 8.9% 8.7% 8.5% 6.6%
Cable/Telecom & Communications Infrastructure 2020.12.24
December 24, 2020 25

Exhibit 30: Datacenters – Average Pricing on New Leases Signed
** Average wholesale pricing calculation based on QTS, COR, DLR-TKD and CONE. Source: Company reports and RBC Capital Markets
Exhibit 31: Datacenters – Period-End Backlogs of Signed but Not Commenced Leases (Annualized Rent)
Note: Annualized MRR for QTS. Source: Company reports and RBC Capital Markets
Annual $ per SF 1Q19 2Q19 3Q19 4Q19 1Q20 2Q20 3Q20
P4Q
Avg.
DLR (incl. INXN from 2Q20) $109 $116 $130 $132 $122 $93 $175 $119
DLR - Turnkey $137 $138 $122 $134 $117 $117 $157 $123
DLR - Colocation $263 $306 $339 $309 $273 $215 $226 $284
COR $207 $191 $197 $216 $202 $156 $173 $193
CONE $262 $235 $186 $365 $196 $231 $565 $244
QTS - Core business (C1/C2) $477 $544 $404 $465 $388 $548 $390 $451
Avg. Wholesale pricing $/sf $209 $179 $160 $172 $159 $159 $254 $162
Monthly $ per kW 1Q19 2Q19 3Q19 4Q19 1Q20 2Q20 3Q20
P4Q
Avg.
DLR (incl. INXN from 2Q20) $132 $131 $113 $123 $110 $107 $148 $113
DLR - Turnkey $159 $118 $105 $114 $102 $94 $120 $103
DLR - Colocation $274 $312 $295 $256 $285 $234 $218 $268
COR $108 $100 $103 $112 $105 $81 $90 $100
CONE $131 $152 $119 $181 $108 $131 $188 $135
QTS - Core business (C1/C2) $265 $302 $224 $258 $216 $304 $217 $251
SWCH $182 $187 $177 $274 $231 $323 $188 $251
IRM (Datacenters) $112 $117 $104 $170 $113 $81 $104 $117
Avg. Wholesale pricing $/kW $128 $121 $114 $127 $109 $111 $139 $115
Cable/Telecom & Communications Infrastructure 2020.12.24
December 24, 2020 26
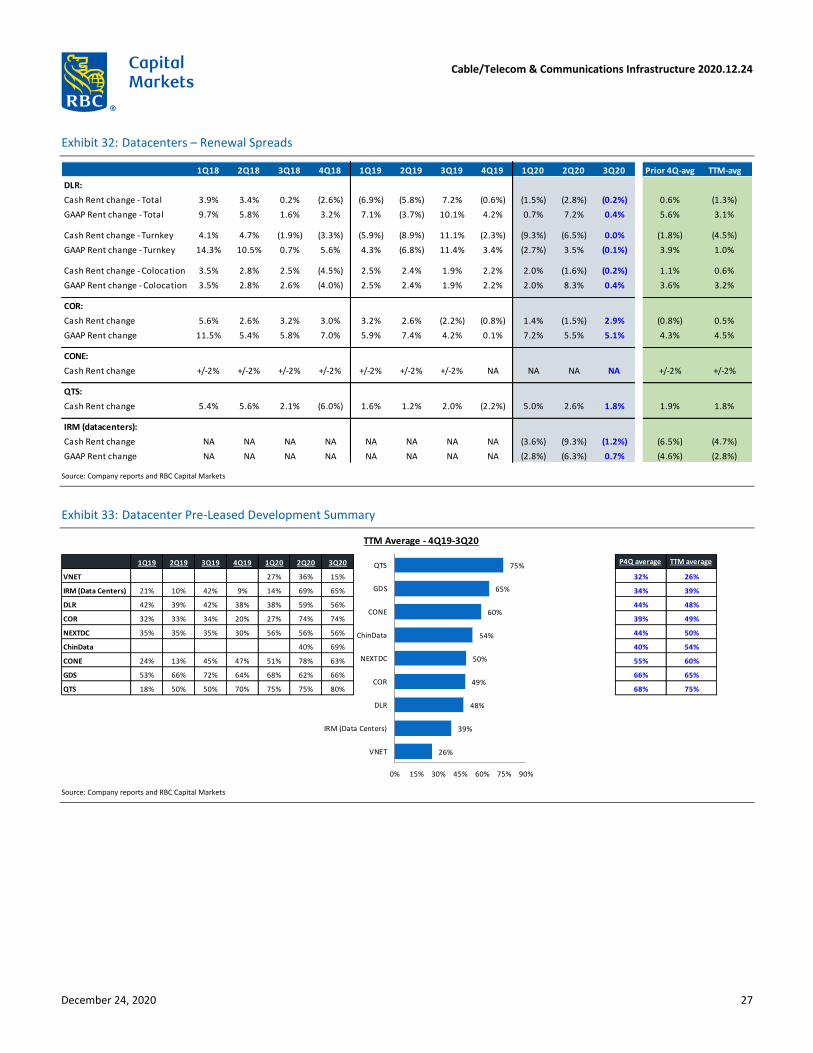
Exhibit 32: Datacenters – Renewal Spreads
Source: Company reports and RBC Capital Markets
Exhibit 33: Datacenter Pre-Leased Development Summary
Source: Company reports and RBC Capital Markets
1Q18 2Q18 3Q18 4Q18 1Q19 2Q19 3Q19 4Q19 1Q20 2Q20 3Q20 Prior 4Q-avg TTM-avg
DLR:
Cash Rent change - Total 3.9% 3.4% 0.2% (2.6%) (6.9%) (5.8%) 7.2% (0.6%) (1.5%) (2.8%) (0.2%) 0.6% (1.3%)
GAAP Rent change - Total 9.7% 5.8% 1.6% 3.2% 7.1% (3.7%) 10.1% 4.2% 0.7% 7.2% 0.4% 5.6% 3.1%
Cash Rent change - Turnkey 4.1% 4.7% (1.9%) (3.3%) (5.9%) (8.9%) 11.1% (2.3%) (9.3%) (6.5%) 0.0% (1.8%) (4.5%)
GAAP Rent change - Turnkey 14.3% 10.5% 0.7% 5.6% 4.3% (6.8%) 11.4% 3.4% (2.7%) 3.5% (0.1%) 3.9% 1.0%
Cash Rent change - Colocation 3.5% 2.8% 2.5% (4.5%) 2.5% 2.4% 1.9% 2.2% 2.0% (1.6%) (0.2%) 1.1% 0.6%
GAAP Rent change - Colocation 3.5% 2.8% 2.6% (4.0%) 2.5% 2.4% 1.9% 2.2% 2.0% 8.3% 0.4% 3.6% 3.2%
COR:
Cash Rent change 5.6% 2.6% 3.2% 3.0% 3.2% 2.6% (2.2%) (0.8%) 1.4% (1.5%) 2.9% (0.8%) 0.5%
GAAP Rent change 11.5% 5.4% 5.8% 7.0% 5.9% 7.4% 4.2% 0.1% 7.2% 5.5% 5.1% 4.3% 4.5%
CONE:
Cash Rent change +/-2% +/-2% +/-2% +/-2% +/-2% +/-2% +/-2% NA NA NA NA +/-2% +/-2%
QTS:
Cash Rent change 5.4% 5.6% 2.1% (6.0%) 1.6% 1.2% 2.0% (2.2%) 5.0% 2.6% 1.8% 1.9% 1.8%
IRM (datacenters):
Cash Rent change NA NA NA NA NA NA NA NA (3.6%) (9.3%) (1.2%) (6.5%) (4.7%)
GAAP Rent change NA NA NA NA NA NA NA NA (2.8%) (6.3%) 0.7% (4.6%) (2.8%)
TTM Average - 4Q19-3Q20
1Q19 2Q19 3Q19 4Q19 1Q20 2Q20 3Q20 P4Q average TTM average
VNET 27% 36% 15% 32% 26%
IRM (Data Centers) 21% 10% 42% 9% 14% 69% 65% 34% 39%
DLR 42% 39% 42% 38% 38% 59% 56% 44% 48%
COR 32% 33% 34% 20% 27% 74% 74% 39% 49%
NEXTDC 35% 35% 35% 30% 56% 56% 56% 44% 50%
ChinData 40% 69% 40% 54%
CONE 24% 13% 45% 47% 51% 78% 63% 55% 60%
GDS 53% 66% 72% 64% 68% 62% 66% 66% 65%
QTS 18% 50% 50% 70% 75% 75% 80% 68% 75%
26%
39%
48%
49%
50%
54%
60%
65%
75%
0% 15% 30% 45% 60% 75% 90%
VNET
IRM (Data Centers)
DLR
COR
NEXTDC
ChinData
CONE
GDS
QTS
Cable/Telecom & Communications Infrastructure 2020.12.24
December 24, 2020 27

Exhibit 34: Datacenters – Replacement Value Math
COR – We assumed critical load capacity based on 150W/SF power density DLR – Critical load capacity is for the Turn-Key Flex & Colocation portfolio CONE – Available critical load capacity QTS – We assumed critical load capacity based on 150W/SF power density for the raised floor Source: Company reports and RBC Capital Markets
Cable/Telecom & Communications Infrastructure 2020.12.24
December 24, 2020 28

Exhibit 35: Datacenter FY-2020 Guidance Tracker
Source: Company reports and RBC Capital Markets
Exhibit 36: Portion of Full-year Consensus Expectations Included in Existing Base Rent and Pending Commencements.
Note: For CONE, COR, DLR, QTS, our analysis is based on the existing uncommenced backlog. * For EQIX we assume that the new retail capacity gets billed within 12 months from completion. ** For EQIX our analysis assumes 8% constant-currency growth to consensus' 2020E recurring revenues expectations. *** For COR, in addition to existing uncommenced backlog we include a $3.5M recurring quarterly retail leasing assumption. Source: Company reports, RBC Capital Markets, and VisibleAlpha for consensus estimates
COR CONEDLR
(incl. INXN)QTS EQIX SWCH GDS 21Vianet ChinData
NXT
(FY21)
Average
(excl. GDS,
21Vianet,
Chindata
and NXT)
Revenue (M) $605 $1,028 $3,863 $534 $5,993 $514 C¥ 5,725 C¥ 4,810 C¥ 1,780 AUD 246
EBITDA (M) $323 $538 $2,163 $291 $2,837 $264 C¥ 2,665 C¥ 1,324 C¥ 840 AUD 128
Core FFO/sh $5.28 $3.85 $6.13 $2.79 - - - - - -
AFFO/sh - - - - $24.50 - - - - -
Capex (M) $250 $950 $2,218 $750 $2,300 $310 C¥ 10,000 C¥ 4,000 C¥ 3,550 AUD 390
Revenue y/y 6% 5% 20% 11% 8% 11% 39% 27% 62% 23% 10%
EBITDA y/y 5% 5% 15% 16% 6% 14% 46% 26% 108% 22% 10%
FFO/sh y/y 4% 6% -8% 6% - - - - - - 2%
AFFO/sh y/y - - - - 7% - - - - - 7%
Capex y/y -38% 8% 64% 116% 11% 1% 95% 217% - -6% 27%
Capex % of revenue 41% 92% 57% 140% 38% 60% 175% 83% 199% 159% 72%
Guidance Change vs. Prior guidance
Revenue (M) $0 $0 $63 $4 $39 $0 C¥ 95 C¥ 10 C¥ 1,780 AUD 0
EBITDA (M) $2 $0 $51 $6 $21 $8 C¥ 55 (C¥ 6) C¥ 840 AUD 0
Core FFO/sh $0.08 $0.02 $0.08 $0.01 - - - - - -
AFFO/sh - - - - $0.22 - - - - -
Capex (M) $0 $50 ($20) $50 $0 ($5) C¥ 0 C¥ 700 C¥ 3,550 AUD 0
3Q20
In-place
Capacity
(SF in 000s /
Cabinets
/SQM)
Under
Construction
(SF in 000s /
Cabinets /SQM)
Under
Construction
% of In-place
Capacity
Pre-leased
Development
% of 2021E Consensus
revenues included in
existing run-rate plus
pending
commencements, as
of 3Q20
Digita l Realty (DLR) 30,918 2,321 8% 56% 37%
Equinix (EQIX, cabinets bi l led) * 307,600 31,725 10% - 52%
Equinix (EQIX, CC growth) ** 307,600 31,725 10% - 78%
Cores i te (COR) 2,761 51 2% 74% 62%
Cores i te (COR) *** 2,761 51 2% 74% 102%
CyrusOne (CONE) 4,471 345 8% 63% 63%
QTS Realty (QTS) 1,514 78 5% 80% 71%
Cable/Telecom & Communications Infrastructure 2020.12.24
December 24, 2020 29

Exhibit 37: Datacenter Energy Sources (2019)
Source: Company reports and RBC Capital Markets
Exhibit 38: Recent Datacenter Financing
Company Date Capital Offering type Amount ($M)
Cost of capital
Details
CONE Sep-20 Senior Notes $400 2.15% Senior notes due 2030 at 98.795% of their face value
EQIX Sep-20 Senior Notes $700 1.00% Senior notes due 2025 at 99.899% of their face value
EQIX Sep-20 Senior Notes $650 1.55% Senior notes due 2028 at 99.909% of their face value
EQIX Sep-20 Senior Notes $500 2.95% Senior notes due 2051 at 99.438% of their face value
QTS Sep-20 Senior Notes $500 3.875% Senior notes due 2028 at 100% of their face value
Stack Sep-20 Securitized notes $325 1.893% To help fund datacenter construction
DLR Sep-20 Senior Notes €300 Floating Floating Rate (EURIBOR plus 0.48%) Guaranteed Notes due Sep. 23, 2022
DLR Sep-20 Senior Notes €750 1.00% Guaranteed Notes due 2032
SWCH Sep-20 Senior Notes $600 3.75% senior unsecured notes due 2028
GDS Aug-20 Equity $390.5 - Issued 19.55M ADS at $20.75 per ADS
DLR Jun-20 Senior Notes €500 1.250% Guaranteed Notes due 2031
Data4 May-20 Equity $200 - Commercial pension fund PFA bought a 20% stake
DigiPlex May-20 Senior notes $63.5 - 2023 Senior Secured Bond
EQIX May-20 Equity $1,500 - 2.25M shares @ $665
Aligned May-20 Credit Facility $575 - Aligned increased its secured credit facility to $575M
COR May-20 Senior Notes $150 3.75% $150 million of 3.75% Senior Notes
DLR 2Q20 Equity $615 NA ATM – 265K shares @$139.49 per share
DLR 1Q20 Equity $37 NA ATM – 4.3M shares @$142.56 per share
Sabey May-20 Securitized notes $800 NA Refinance existing debt and help fund expansion.
MP1 May-20 Equity A$22.5 NA Capital raising under Share purchase plan @A$9.50 per share
NEXTDC May-20 Equity A$191 NA Capital raising under Share purchase plan @A$7.80 per share
MP1 Apr-20 Equity A$50 NA Institutional placement of 5.3M shares @A$9.50 per share
NEXTDC Apr-20 Equity A$672 NA Issuance at A$7.80/share to accelerate growth projects at S3 and elsewhere
Cable/Telecom & Communications Infrastructure 2020.12.24
December 24, 2020 30

Company Date Capital Offering type Amount ($M)
Cost of capital
Details
TierPoint Mar-20
Preferred Equity $320 NA Led by a consortium of new investors: Argo Infrastructure Partners, Wafra, and Macquarie Capital Principal Finance and Existing investors – including Cequel III, Ontario Teachers' Pension Plan, RedBird Capital Partners, The Stephens Group, and Thompson Street Capital Partners
CONE Mar-20 Forward Equity $123 - 1.99M Shares of common stock under ATM for $123M, settlement by March 2021.
QTS Mar-20 Forward Equity $37 - QTS raised an additional $37M of incremental forward equity proceeds
Flexential Feb-20 Senior Notes $250 11.25% Senior Secured Notes due 2024
CONE Jan-20 Senior Notes € 500 1.45% Senior Notes due 2027
DLR Jan-20 Senior Notes $825 1.50% €750 million Guaranteed Notes due 2030
DLR Jan-20 Senior Notes $715 0.63% €650 million Guaranteed Notes due 2025
DLR Jan-20 Senior Notes $330 0.13% €300 million Guaranteed Notes due 2022
MP1 Dec-19 Equity A$62 - Institutional placement of 7.1M shares at $8.70/share
GDS Dec-19 Equity $287 - Issued 6.32M ADS at $45.50 per ADS
CONE Dec-19 Senior Notes $600 2.90% 2.900% senior notes due 2024
CONE Dec-19 Senior Notes $600 3.45% 3.450% senior notes due 2029
CONE 4Q19 Forward Equity $99 - 1.6 million Shares of its common stock for $99M, settlement by November 2020.
Stack Nov-19 Securitized notes $225 - With $225M in new securitized notes, has now raised well over $1 billion
COR Nov-19 Credit Facility $1,150 - Amended, extended and expanded Credit Facility by $100M
DLR Oct-19 Preferred stock $345 5.20% 13.8M shares of 5.200% Series L Cumulative Redeemable Preferred Stock
DLR Oct-19 Senior Notes $550 1.13% €500 million Euro-denominated 1.125% Notes due 2028
Aligned Oct-19 Credit Facility $495.0 - Aligned Energy completed a secured credit facility with Goldman Sachs Bank and CPPIB
QTS Oct-19 Credit Facility $1,750 - Amended, extended and expanded Credit Facility by $180M
CONE Sep-19 Credit Facility $500 - Converted $500M term loan maturing in March 2023 into more attractively priced EUR-denominated debt
Vantage Aug-19 Securitized notes $548 - New securitized notes
Vantage Aug-19 Bank Loan $144 - Project-based construction debt financing from a consortium of banks
EQIX 3Q19 Equity/ATM $99 - Sold 181,194 shares under 2018 ATM program
EQIX 2Q19 Equity/ATM $348 - Sold 722,361 shares under 2018 ATM program
NEXTDC May-19 Senior unsecured A$200 Floating 2022 - Senior unsecured notes (Notes IV) - 3.75% over 3-month BBSW
AirTrunk Apr-19 Debt $332 - SG$450M financing for new Singapore hyperscale datacenter
21Vianet Apr-19 Senior Notes $300 7.88% Senior notes due 2021
CONE Apr-19 Equity $200 - CONE sold 5.7M of GDS shares
COR Apr-19 Senior Notes $200 4.11% Series A Senior Notes due April 17, 2026
COR Apr-19 Senior Notes $200 4.31% Series B Senior Notes due April 17, 2029
CONE Mar-19 Equity/ATM $252 - Sold 4.9M shares through ATM program
GDS Mar-19 Preferred stock $150 - -
GDS 1Q19 Equity $445 - Net proceeds from Equity offering
GDS 1Q19 Senior Debt $337 - New debt financing and refinancing facilities
QTS Feb-19 Equity $322 - 7.7625M shares @$41.50
QTS Feb-19 Equity $110 - 2.75 M shares @$39.84 / Private placement
EQIX Feb-19 Equity $1,242 - 2.985M shares @ $416
Source: Company reports and RBC Capital Markets
Cable/Telecom & Communications Infrastructure 2020.12.24
December 24, 2020 31

Exhibit 39: Tower MLAs
Source: RBC Capital Markets, company sources, and discussions with industry contacts.
Date entered Duration Terms Financial impact to the towerco
AT&T
AMT October 2010 Reset the leases to 2011
•Annual escalator increased from greater than 3% to more than 6%.
•AT&T given the right to deploy at existing RAD centers and enter into
approximately 900 leases at new sites with zero rent through 2016.
Straight-line and reset impacts provided a boost to near-term
revenues and EBITDA, in light of the increased escalator.
AMT September 2019 Multi-year
•Includes C-band amendments;
•Primarily predicated on the overall size of the footprint rather than
equipment calculus; ~$135 million in additional straight-line revenue for 2019.
CCI October 2010 Reset the leases to 2011
•Annual escalator increased from greater than 3% to more than 6%.
•AT&T agreed to utilize AMT’s emerging shared-generator infrastructure at a
minimum number of sites (3,000).
•AT&T given the right to deploy at existing RAD centers and enter into
approximately 900 leases at new sites with zero rent through 2016.
Straight-line and reset impacts provided a boost to near-term
revenues and EBITDA, in light of the increased escalator.
CCI Apr-18 N/A
•Terms not disclosed;
•Per AT&T management comments at the time, “our new Crown Castle
agreement will help us speed this process. The agreement simplifies and
expands our long-term leasing deal for wireless network infrastructure. This
will give us more flexibility as we deploy FirstNet as well as 5G technologies.” N/A
Sprint
AMT 4Q11 10 years •Triggered a higher escalator, whose effect is straight lined;
This MLA slowed American Tower’s reported revenue growth from
Sprint, but also provided greater predictabilty of reported revenue
from this tenant and insulated the company from the effect of iDEN
terminations (to which American Tower had greater exposure than
its peers due to the acquired SpectraSite assets – SpectraSite had
28% exposure to iDEN leases).
SBAC Late 2017
We believe SBAC’s MLA with
Sprint, which expires by the end
of 2019, includes a contracted
leasing revenue run-rate which is
close to being fulfilled.
•We believe the MLA involved minimum commitments, extended the
towerco’s term with that tenant, and provided for longer terms on new leases.
Per management: "During the fourth quarter, we signed a master
lease agreement with Sprint which commits them to amendment
and collocation activity over the next year and a half, while also
extending out the current term on thousands of their existing lease
agreements."
T-Mobile
AMT September 2020 15 years
•Two primary revenue components: (1) Escalator: 3-3.5% for entire term; (2)
Bonus escalator (aka use fee) - amendments and colos: Includes certain #s of
colos/amendments/sites in any given year; Rights are not unltd;
•TMUS is paying a prescribed dollar amount for certain rts in any given period.
The total dollar amount will increase annually, but the growth rate will
moderate given an increasing revenue base.
•Overall churn (multi-yr period) will be ~4% of total property revenue when it
occurs, or ~7% of US property revenue.
•The new agreement enhances T-Mobile’s access to American Tower’s U.S.
sites while locking in synergies and facilitating T-Mobile’s continued rapid,
efficient deployment of broad and deep nationwide 5G.
Based on the MLA, AMT expects to recognize approximately $95
million in additional straight- line revenue for the full year. The MLA
provides for an average non- cancellable term of nearly 15 years on
leases included in the MLA, thereby securing approximately $17
billion in expected incremental contractually committed revenue
over the contract term.
SBAC Spring 2018 Unknown
•Framework for deploying both 2.5 GHz and 600 MHz - pricing, volume,
amendments
•excludes churn and C-band;
•MLA isn't structured with bonus escalators.
•Pricing per site.
Revenue impact from site activity largely occurs ratably with site
activity, per pre-determined triggers identified in the MLA, providing
for a ramp in T-Mobile-derived revenues into 2021.
Verizon
AMT March 2017 1Q22 (RBCe), for holistic portion.
•We believe the MLA entailed a five-year extension to existing leases as well
as revenue certainty with that carrier.
•We believe Verizon’s entitlements include an equipment envelope of up to
30,000 square inches, which can accommodate some of its potential C-band
and requirements. If the MLA is not renewed before YE21, AMT will resume a
la carte pricing with Verizon.
•At least a $100 million benefit to straight-line revenue;
•In light of Verizon’s slower activity during 2018 (as of 3Q18), we
believe American Tower’s organic growth rate in its domestic tower
business has benefited from this MLA as the company’s revenue
growth was, unlike at other tower companies, not affected.
CCI 2018
•Per AT&T management comments at the time,
“our new Crown Castle agreement will help us speed this process. The
agreement simplifies and expands our long-term leasing deal for wireless
network infrastructure. This will give us more flexibility as we deploy FirstNet
as well as 5G technologies.” Terms not disclosed
SBAC N/A
DISH
CCI Nov-20 "Multi-year long term"
•Crown Castle will lease DISH space on up to 20,000 towers. As part of the
agreement, DISH will receive certain fiber transport services and also have the
option to utilize Crown Castle for pre-construction services.
•Based on experiences with other towercos, we believe DISH rents have been
in the $1250-1500 range, and aiming for sub 2% escalators. The entitlements
range from 6,000 to 8,000 square inches.
• CCI is able to recognize revenue once the lease begins, i.e., when
DISH goes on a tower. This is in contrast to past MLAs which were
for pre-exisiting leases and hence, had associated straight-line
revenue adjustments.
• CCI assumes limited activity from DISH in 2021 guidance given
DISH's comments around expected timing of receipt of equipment.
Cable/Telecom & Communications Infrastructure 2020.12.24
December 24, 2020 32

Exhibit 40: Recent Tower Financings
Company Date Capital Offering type Amount ($M)
Cost of capital
Details
AMT Sep-20 Senior Notes $300 3.1% Senior Notes due 2050
AMT Sep-20 Senior Notes $800 1.875% Senior Notes due 2030
AMT Sep-20 Senior Notes €650 1.0% Senior Notes due 2032
AMT Sep-20 Senior Notes €750 0.5% Senior Notes due 2028
AMT Jun-20 Senior Notes $500 1.3% Senior Notes due 2025
AMT Jun-20 Senior Notes $750 2.1% Senior Notes due 2030
AMT Jun-20 Senior Notes $750 3.1% Senior Notes due 2050
CCI Jun-20 Senior Notes $500 1.35% Senior Notes due 2025
CCI Jun-20 Senior Notes $1,100 2.25% Senior Notes due 2031
CCI Jun-20 Senior Notes $900 3.25% Senior Notes due 2051
SBAC May-20 Senior Notes $500 3.875% Senior Notes due 2027
CCI Mar-20 Senior Notes $750 3.3% Senior Notes due 2030
CCI Mar-20 Senior Notes $500 4.15% Senior Notes due 2050
SBAC Jan-20 Senior Notes $1,000 3.875% Senior Notes due 2027
AMT Jan-20 Senior Notes $750 2.4% Senior Notes due 2025
AMT Jan-20 Senior Notes $750 2.9% Senior Notes due 2030
AMT Sep-19 Senior Notes $750 2.75% Senior Notes due 2027
AMT Sep-19 Senior Notes $600 3.7% Senior Notes due 2049
CCI Aug-19 Senior Notes $550 3.1% Senior Notes due 2029
CCI Aug-19 Senior Notes $350 4.0% Senior Notes due 2049
AMT Jun-19 Senior Notes $650 2.95% Senior Notes due 2025
AMT Jun-19 Senior Notes $1,650 3.8% Senior Notes due 2029
CCI Jun-19 Credit Facility $5,000 - Increased commitments by $750M and extended maturity to June 2024
AMT Mar-19 Senior Notes $650 3.375% Senior Notes due 2024
AMT Mar-19 Senior Notes $600 3.95% Senior Notes due 2029
CCI Jan-19 Senior Notes $600 4.3% Senior Notes due 2029
CCI Jan-19 Senior Notes $400 5.2% Senior Notes due 2049
Source: Company reports and RBC Capital Markets
Cable/Telecom & Communications Infrastructure 2020.12.24
December 24, 2020 33

Exhibit 41: Datacenter M&A Tables
Date Acquirer Target Price (M) EBITDA
Multiple
Jun-20 Equinix BCE Inc. (13 Canada datacenters) $750 15.0x
Apr-20 Digital Colony Grupo Folha $300-400 -
Apr-20 Macquarie Infrastructure and Real Assets Airtrunk (Goldman Sachs, TPG Capital, 88% stake) $1,584 31.0x
Apr-20 Vantage Data Centers InfraVia Capital Partners / Next Generation Data (Wales)
- 20-21x
Mar-20 Digital Realty InterXion $8,500.0 21-21.5x
Feb-20 Vantage Data Centers Etix Everywhere - -
Feb-20 Landmark Dividend PayPal datacenter in Phoenix $122.0
Feb-20 Digital Realty Westin Building Exchange, Seattle (49%) $305.0 Mid-5% cap.
Jan-20 Colony Capital DataBank (20% stake) $185.0 17.6x
Dec -19 Future Fund of Australia (Australia's sovereign wealth fund) Canberra Data Centre (CDC, 24.1% stake) - -
Dec -19 Portobello Capital BT (Spain DCs and fiber network assets) - -
Dec-19 Keppel DC REIT Maena KG (Frankfurt DC) $90.8 -
Oct-19 Equinix Axtel Data Centers (Mexico DCs) $175.0 -
Oct-19 ServerFarm 5NINES Global Holdings - -
Sep-19 Mapletree Digital Realty (10 PBB DC's) $175.0 16-16.5x
Sep-19 Mapletree Digital Realty 3 Virginia DC's (80%) $811.0 17-18x
Sep-19 New York Internet (NYI) RDX (Chicago DC) - -
Aug-19 Macquarie Infrastructure Partners Netrality Data Centers - -
Jul-19 ChinData Group (Bain Capital) Bridge Data Centres (Bain Capital) - -
May-19 Bain Capital ChinData (Wangsu Science & Technology Co. Ltd) - -
May-19 Digital Colony Cogeco Peer 1 $720 -
May-19 Asterion Industrial Partners Telefonica’s datacenter portfolio $616.0 18-20x
Apr-19 QTS TCN SIG Telehousing B.V. (2 DCs in Netherlands) $44.0 -
Feb-19 Landmark Dividend Flexential datacenter in Fort Lauderdale, Florida - -
Jan-19 Brookfield Asset Management Inc. DCI Datacenters (Australia) $385.0 19.2x
Jan-19 GI Partners NTT Data's Quincy and Plano DCs - -
Jan-19 Berkshire Partners Teraco Data Environments (Majority Stake) $1000.0 22.0x
Dec-18 Cologix COLO-D (Canada) - -
Dec-18 Vantage Data Centers 4Degrees Colocation (Canada) $200.0 -
Oct-18 NEXTDC APDC $200.0 21.0x
Oct-18 CyrusOne ODATA (10% interest) $12.0 -
Sep-18 Digital Realty / Brookfield Ascenty (Brazil) $1,827.0 21.0x
Jul-18 Strategic IDC Limited Global Switch (25% stake) $2,772.0 34-35x
Jun-18 Brookfield Infrastructure AT&T Datacenter assets $1,100.0 9-10x
Jun-18 Landmark Infrastructure Carter Validus Mission Critical (Milwaukee DC) $21.0 -
Jun-18 Un-named Buyer Carter Validus Mission Critical (Alpharetta DC) $64.0 -
May-18 Iron Mountain EvoSwitch (Dutch DCs) $235.0 14.0x
May-18 Keppel DC REIT Kingsland Data Centre (Singapore) $221.3 -
Apr-18 Carter Validus Mission Critical REIT II Two Datacenters in Sacramento, CA $51.0 -
Mar-18 IPI Partners / Iron Point Partners / Iconiq Capital Infomart San Jose, Hillsboro & Ashburn DCs NA NA
Feb-18 Equinix Infomart Dallas $800.0 33-35x
Cable/Telecom & Communications Infrastructure 2020.12.24
December 24, 2020 34
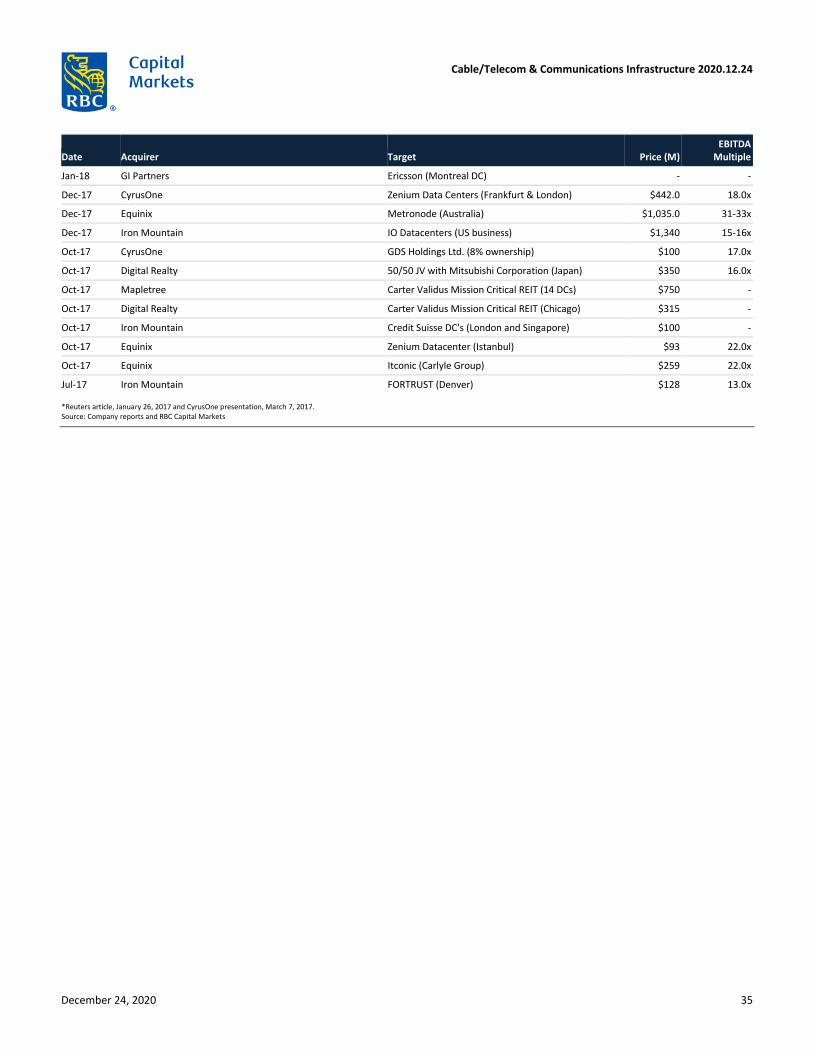
Date Acquirer Target Price (M) EBITDA
Multiple
Jan-18 GI Partners Ericsson (Montreal DC) - -
Dec-17 CyrusOne Zenium Data Centers (Frankfurt & London) $442.0 18.0x
Dec-17 Equinix Metronode (Australia) $1,035.0 31-33x
Dec-17 Iron Mountain IO Datacenters (US business) $1,340 15-16x
Oct-17 CyrusOne GDS Holdings Ltd. (8% ownership) $100 17.0x
Oct-17 Digital Realty 50/50 JV with Mitsubishi Corporation (Japan) $350 16.0x
Oct-17 Mapletree Carter Validus Mission Critical REIT (14 DCs) $750 -
Oct-17 Digital Realty Carter Validus Mission Critical REIT (Chicago) $315 -
Oct-17 Iron Mountain Credit Suisse DC's (London and Singapore) $100 -
Oct-17 Equinix Zenium Datacenter (Istanbul) $93 22.0x
Oct-17 Equinix Itconic (Carlyle Group) $259 22.0x
Jul-17 Iron Mountain FORTRUST (Denver) $128 13.0x
*Reuters article, January 26, 2017 and CyrusOne presentation, March 7, 2017. Source: Company reports and RBC Capital Markets
Cable/Telecom & Communications Infrastructure 2020.12.24
December 24, 2020 35

Exhibit 42: Cloud Outage
Date Service provider Location Comments
14-Sep-20 Microsoft Azure Europe An extended outage due to a cooling incident. The UK South facility was brought offline when multiple chilled water pumps shut down for reasons unknown, forcing Microsoft to bring the rest of the facility to a standstill to stop temperatures rising precipitously.
18-Aug-20 Google UK Equinix suffered a power outage at its LD8 IBX datacentre in Docklands caused by a faulty uninterrupted power supply (UPS) system at the site.
09-Jun-20 IBM Global IBM cloud outage resulted from an external network provider flooding the IBM Cloud network with incorrect routing, resulting in severe congestion of traffic and impacting IBM Cloud services.
08-Apr-20 Google US Outage on Google’s Cloud Platform led to failures at Gmail, Snapchat and the smart home company Nest.
27-Mar-20 Google US Services such as Dataflow, BigQuery and Compute Engine presented elevated error rates, according to the company.
26-Mar-20 Google US Google Cloud Platform went down for just over an hour after it suffered a "significant router failure" in one of its datacenters in Atlanta, which led to network congestion, according to the company's service status page.
24-Mar-20 Microsoft Azure Europe Microsoft Azure had an outage affecting Azure cloud services in Europe and the United Kingdom, resulting in certain service disruptions and issues until March 26th. Microsoft indicated that the outage was related to increased usage levels driven by the COVID-19 pandemic.
17-Mar-20 IBM Cloud US IBM indicated that customers running services hosted at its Dallas data center – including Watson AI, IBM Cloud, and DB2 – were either partially or completely down. The Dallas facility is one of 15 centers for IBM Cloud services in the US.
12-Nov-19 AWS Frankfurt An outage in AWS’s eu-central-1 region impacted certain customers using AWS’s EC2, Relational Database Service, CloudFormation and Auto Scaling products.
11-Nov-19 Google Global Google Cloud had an outage because of an issue with an infrastructure component. The outage lasted for more than two hours and impacted services including, Cloud Dataflow, AppEngine, Compute Engine, Cloud Storage, Dataflow, Dataproc, Pub/Sub, BigQuery, Networking. According to Google, the issue impacted some Google Cloud APIs across us-east1, us-east4 and southamerica-east1, with some APIs impacted globally.
22-Oct-19 Google US Google Cloud had an outage resulting from the cloud networking control plane experiencing failures in programming its virtualised networking stack. As a result, multiple Google Cloud products, including Google Compute Engine and Google Cloud Storage, were unavailable to clients. The issue caused 100 percent packet loss to and from ~20 percent of instances in its US-west1-b region for two-and-a-half hours.
22-Oct-19 AWS US AWS servers were hit by sustained distributed denial-of-service (DDoS) attack that resulted in an eight-hour outage for several AWS customers on the US East Coast.
16-Oct-19 Apple iCloud US According to CRN, Apple's iCloud storage service experienced an outage for some users, while other Apple services were reportedly affected for some users as well.
31-Aug-19 AWS US An Amazon AWS US-EAST-1 datacenter in North Virginia experienced a power failure that led the datacenter's backup generators to kick on, but stopped working after roughly 90 minutes, which led to 7.5% of the EC2 instances and EBS volumes becoming unavailable and later resulting in some EC2 instances and EBS volumes incurring hardware damage and irrecoverability of the data stored on them.
19-Aug-19 Google US Google and its email service, Gmail, experienced issues for thousands of users largely in the U.S.
02-Jul-19 Cloudflare US A bad software deployment resulted in a massive spike in CPU utilization and errors on Cloudflare's network that lasted for 30 minutes.
02-Jul-19 Google US Google Cloud us-east1 datacenters suffer outage due to physical damage to multiple fiber bundles.
24-Jun-19 Verizon US A Verizon BGP (Border Gateway Protocol) error resulted in an outage that impacted Amazon and Facebook and also services including popular chat app Discord, as well as Reddit, Twitch and others.
06-Jun-19 Facebook / WhatsApp
Global Facebook-owned messaging platform WhatsApp experienced a couple of outages on June 6 that affected users globally. Network monitoring company ThousandEyes initially attributed the cause to packet loss at Cogent’s datacenter in the Docklands area of London, which was disputed by Cogent. ThousandEyes later said the packet loss likely occurred in the connection between the networks of Cogent and China Telecom, and that it was the latter that dropped the traffic.
04-Jun-19 CoreSite Boston, US Customers of CoreSite’s Boston datacenter were affected for several hours on Monday night by a communications outage due to damage to fiber used in transmission lines at the center.
02-Jun-19 Google Global Google Cloud had an outage in East Coast that lasted more than four hours and impacted social media companies, such as Snapchat, Vimeo and Discord, that rely on Google Cloud as well as Google's own services, including YouTube, Gmail, Google Search, G Suite, Google Drive, Nest, and Google Docs. Google said the
Cable/Telecom & Communications Infrastructure 2020.12.24
December 24, 2020 36

Date Service provider Location Comments
outage was caused by a configuration change that affected more servers than intended. In an incident report, Google said that YouTube measured a 10 percent drop in global views during the incident, while Google Cloud Storage measured a 30 percent reduction in traffic.
18-May-19 Salesforce.com US Salesforce experienced a significant outage after a faulty database script accidentally gave users broader access to data than intended.
03-May-19 Microsoft (Azure) Australia A name server delegation issue with DNS resolution, impacted network connectivity and downstream impact to Compute, Storage, App Service, AAD, and SQL Database services.
13-Mar-19 Facebook / WhatsApp
Global Facebook suffered a 14-hour outage history. The cause of the 14-hour problem remained unknown, and impacted Facebook, Instagram, WhatsApp and Messenger.
13-Mar-19 Google Global A Google global outage affected its Gmail and Google Drive services
13-Nov-18 Google Global Google's services went down for an hour due to an accidental misconfiguration of the border gateway protocol (BGP), which exchanges routing information amongst internet nodes. News reports claimed that the routing information was accidentally leaked, via a Nigerian service provider and China Telecom
04-Sep-18 Microsoft (Azure) South Central US region
Cooling issue in one part of a datacenter caused a localized spike in temperature resulting in a power outage.
24-Jul-18 Tencent China Tencent Holdings' cloud services went offline following an issue with a broken fiber-optic cable
16-Jul-18 Amazon US Amazon experienced a service disruption during its July 16th Prime Day due to technical issues resulting from excessive demand and traffic volume. The issue extended to AWS users as well.
04-Jul-18 IBM Europe Storage systems in several of IBM's European datacenters went down due to an unspecified "network-related" problem. Impacted IBM cloud regions included AMS01, AMS03, FRA02, FRA04, MIL01.
28-Jun-18 Alibaba Cloud China Alibaba Cloud services went down for 30 minutes due to a malfunction that affected an unknown number of its user base.
19-Jun-18 Microsoft (Azure) Ireland Cooling issues at two Microsoft colocation facilities in Ireland resulted in an 11-hour outage.
10-Jun-18 Microsoft (Azure) West Europe Two storage scale units were affected by an unexpected increase in inter-cluster network latency, resulting in a four-hour outage.
31-May-18 Amazon (AWS) US Amazon Web Services suffered disruption to its operations in the US, with a “power event” affecting one of its cloud datacenters in Northern Virginia, comprising the US-EAST-1 region. Around the same time, minor problems were reported with US-EAST-2, affecting services including EC2 and EFS. A single Availability Zone saw connectivity issues, impacting services like RDS, Redshift, WorkSpaces, EC2 and EBS for approximately 30 minutes.
18-Apr-18 DigiPlex Sweden A gas-based fire suppression system was triggered at the DigiPlex datacenter in Väsby, 30km (18.6 miles) north of Stockholm, taking a data hall occupied by the Nasdaq Nordic stock exchange offline. Helsinki’s Nasdaq Nordic stock exchange was closed until 4pm on Wednesday due to a problem in a DigiPlex datacenter.
02-Mar-18 Amazon (AWS) US Power loss at one of AWS's redundant internet connection points in Virginia, affected AWS customers using Direct Connect in the US-East-1 region.
15-Feb-18 Google US A Google Cloud outage knocked several games offline including ‘Pokemon Go’, ‘Fire Emblem Heroes’
12-Dec-17 UKFast UK A civil contractor accidentally drove a spike through a power main in Manchester, England, cutting off power supply to two of the three buildings on the datacenter campus.
10-Nov-17 OVH France Three of OVH's datacenters in Strasbourg, France went down due to a power outage that lasted 3.5 hours.
12-Oct-17 Google North America
Cloud Storage clients located in the Northeast of North America experienced up to a 10% error rate for a duration of 21 hours and 35 minutes when fetching objects stored in multi-regional buckets in the U.S.
02-Oct-17 Linode Europe Certain hardware and software failures, at a Linode datacenter in Germany led to connectivity issues with its cloud services.
29-Sep-17 Microsoft Europe Accidental release of fire-suppression agent into the datacenter environment in Europe led to a Azure cloud outage
06-Sep-17 IBM US Global load balancer and reverse DNS services fell for 21 hours, because of non-renewal of certain domain names
31-Aug-17 Google US Google Cloud suffers 19 hours of network load balancer issues
28-Aug-17 Google Japan Internet outage in Japan because of a border gateway protocol (BGP) error
19-Aug-17 Fujitsu (Homebush datacenter)
Sydney, Australia
Fujitsu's Australian cloud suffers storage crash, outage for 5 hours
Cable/Telecom & Communications Infrastructure 2020.12.24
December 24, 2020 37

Date Service provider Location Comments
17-Jul-17 Global Switch UK Power outage at Global Switch 2 facility in UK
12-Jul-17 Internap US System wide outage for roughly an hour.
10-Jul-17 Global Switch UK Power outage at Global Switch 2 facility in UK
28-Jun-17 Apple Global ~1% of Apple device owners unable to restore from backup because of iCloud outage.
28-May-17 Microsoft Australia and Japan
The Office 365 service went down in Asia-pacific for several hours this past week. The outage impacted users primarily in Australia and Japan. Systems had to be reset.
28-May-17 British Airways Datacenter
UK Power surge at a company owned datacenter location resulted in a IT failure
26-May-17 Capita UK A technical fault in one of its datacenters resulted in some clients experiencing issues with the availability of their IT service.
22-May-17 Unidentified Datacenter
UK An outage at an unidentified third-party datacenter in the UK, caused by a major telecom failure in the UK
15-May-17 Interactive Melbourne, Australia
Fire resulted in partial shutdown of a datacenter in Port Melbourne
31-Mar-17 Microsoft Japan Microsoft’s Azure cloud services were impacted for several hours on Friday across Japan due to a cooling issue at a datacenter managed by a third party.
22-Mar-17 Microsoft Atlanta, GA Due to severe weather in Atlanta, Georgia, one of the 3rd party peering sites experienced an infrastructure event resulting in loss of cooling. The network equipment in this site started to have increased temperature, and was shutdown to prevent failure. The automated peering load and fail out to a secondary region did not work as expected.
28-Feb-17 Amazon (AWS) US A six hour outage was caused by high error rates with S3 in US-EAST-1 region
27-Jan-17 IBM Worldwide Service outage was due to planned update to the interface
20-Jan-17 Equinix (LD9) UK Equinix experienced a brief loss of resilience at its LD9 IBX due to routine maintenance
08-Jan-17 IBM Brazil Power Outage
22-Nov-16 Microsoft US An unknown issue
15-Nov-16 Memset UK Power Outage
21-Oct-16 AWS, IBM U.S. 2016 Dyn cyberattack
15-Sep-16 Google Global Unspecified technical problem which caused a mass outage for Google’s Apps for Work and Gmail
15-Sep-16 Microsoft Global DNS (domain name system) malfunction
10-Sep-16 Global Switch UK Power fault at the Global Switch 2 datacenter in East London
11-Aug-16 Google U.S. Multiple maintenance updates led to two-hour outage
25-Jul-16 DreamHost U.S. Faulty file servers
20-Jun-16 Amazon (AWS) Europe An external provider outside the AWS network experienced an Internet connectivity issue affecting AWS customers in the EU-WEST-1 Region.
06-Jun-16 Salesforce.com U.S. Resource contention issue
04-Jun-16 Amazon (AWS) / Equinix SY3
Sydney, Australia
Utility failure related to adverse weather resulted in the loss of utility power to multiple AWS sites.
10-May-16 Salesforce.com U.S. A database failure on the NA14 instance
05-May-16 Equinix (LD4) London, UK Faulty UPS
11-Apr-16 Google All regions Google Compute Engine lost external connectivity in all regions for 18 minutes.
02-Mar-16 Salesforce.com Europe Storage hardware failure
29-Jan-16 GitHub - Power outage
14-Jan-16 Jetblue/Verizon Datacenter
U.S. Power failure related to maintenance operation
17-Nov-15 AWS / Telecity London, UK Power outage due to UPS Failure
30-Oct-15 PayPal / eBay Inc. Worldwide Power outage
Cable/Telecom & Communications Infrastructure 2020.12.24
December 24, 2020 38

Date Service provider Location Comments
20-Sep-15 Amazon (AWS) Northern Virginia, U.S.
Issue with metadata service within DynamoDB
20-Aug-15 CoreSite / Equinix (LA2) / Internap
Los Angeles, U.S.
Power outage and loss of Level 3 network connectivity.
25-Jun-15 Alibaba Hong Kong Severed Internet cable running between Hong Kong and the mainland and power outage.
20-May-14 Internap New York, U.S.
Outage at the 111 8th Avenue facility due to a power failure.
Source: Company reports and RBC Capital Markets
Cable/Telecom & Communications Infrastructure 2020.12.24
December 24, 2020 39

Exhibit 43: RBC Towerco Growth Rate Comparisons
* RBC Capital Markets estimates. Notes: (1) AMT rates adjust for straight-line revenue, pass-thru revenue, prepaid amortization revenue, other non-run rate revenue (incl. decommissioning revenue) and FX. A small amount of revenue from managed sites and rooftops remains in the run rate. (2) Reported SBAC same-store growth rates adjust for straight-line revenue, pass-through expense, augmentation capex reimbursement, rooftop/managed business, and non-recurring items. (3) RBC estimates for CCI. Figures for AMT and SBAC are as reported by management. Source: Company reports and RBC Capital Markets estimates
Cable/Telecom & Communications Infrastructure 2020.12.24
December 24, 2020 40

Exhibit 44: Illustration of Sprint/T-Mobile Churn Impact
Note: AFFO estimates are as of 3Q20. Source: Company reports and RBC Capital Markets estimates
AMT CCI SBAC
Offsets and New Projects
Merged Sprint/T-Mobile remaining macrosites 95,000
2022E shares outstanding (M) 448.4 435.9 112.2
2022E AFFO/share (existing model) $10.09 $7.21 $11.19
Number of 2.5GHz overlays 35,000 9,333 9,333 3,733
Incremental monthly amendment per site $650
Tailwind (annualized rent $M) $73 $73 $29
Tailwind (AFFO/share) $0.16 $0.17 $0.26
Number of Low-band overlays 20,000 5,333 5,333 2,133
Incremental monthly amendment per site $650
Tailwind (annualized rent $M) $41.6 $41.6 $16.6
Tailwind (AFFO/share) $0.09 $0.10 $0.15
DISH Buildout
Number of colocations 30,000 8,000 8,000 3,200
Monthly colocation revenue per site $1,300
Tailwind (annualized rent $M) $125 $125 $50
Tailwind (AFFO/share) $0.28 $0.29 $0.44
Tailwind from Sprint/T-Mobile and DISH Buildout $0.53 $0.55 $0.85
Net % tailwind/(headwind) (AFFO/share) from Sprint/T-Mobile 5.3% 7.6% 7.6%
Total S/TMUS sites 110,000
Number of decommissioned sites 25,000
Number of new sites during integration 10,000
Net number of sites that Sprint/T-Mobile terminate 15,000 4,000 4,000 1,600
Merged Sprint/T-Mobile remaining macrosites 95,000
Number of colocatable structures, and AMT/CCI/SBAC share 150,000 27% 27% 11%
Monthly site revenue $3,300
Calculated towerco churn (annualized rent $M) ($158) ($158) ($63)
Headwind (AFFO/share) ($0.35) ($0.36) ($0.56)
% decommissioning headwind (2022E AFFO/share) (3.5%) (5.0%) (5.0%)
Net Impact (AFFO/sh) of T-Mobile/Sprint Integration and Ensuing DISH Buildout $0.18 $0.19 $0.29
Net % Impact of T-Mobile/Sprint Integration and Ensuing DISH Buildout 1.8% 2.6% 2.6%
Cable/Telecom & Communications Infrastructure 2020.12.24
December 24, 2020 41

Exhibit 45: Illustrative C-band Impact
Note: AFFO estimates are as of 3Q20 Source: Company reports and RBC Capital Markets estimates
AMT CCI SBAC
Aggregate impact by Towerco
Number of colocatable structures, and AMT/CCI/SBAC share 150,000 27% 27% 11%
2024E shares outstanding (M) 450.6 438.9 111.8
2024E AFFO/share (existing model) $11.79 $8.08 $13.13
Number of C-band overlays per operator 35,000 9,333 9,333 3,733
Incremental monthly amendment per site $650
# of operators deploying C-band overlays 2
Tailwind (annualized rent, $M) $146 $146 $58
2024 Total revenue $10,063 $7,169 $2,622
% tailwind to total revenue 1.4% 2.0% 2.2%
% Flow-through from to AFFO 100%
Tailwind (AFFO, $M) $146 $146 $58
Tailwind (AFFO/share) $0.32 $0.33 $0.52
% tailwind to AFFO/share 2.7% 4.1% 4.0%
Annual impact by Towerco 2021 2022 2023 2024
Assumptions
Assumed % deployed 10% 30% 30% 30%
Total revenue ($M)
AMT $8,635 $9,037 $9,486 $10,063
CCI $6,160 $6,486 $6,829 $7,169
SBAC $2,199 $2,345 $2,486 $2,622
Tailwind to revenue
AMT $15 $44 $44 $44
CCI $15 $44 $44 $44
SBAC $6 $17 $17 $17
% Tailwind to revenue
AMT 0.2% 0.5% 0.5% 0.4%
CCI 0.2% 0.7% 0.6% 0.6%
SBAC 0.3% 0.7% 0.7% 0.7%
Base AFFO/share 2021 2022 2023 2024
AMT $9.30 $10.09 $10.86 $11.79
CCI $6.71 $7.21 $7.66 $8.08
SBAC $10.27 $11.19 $12.22 $13.13
Tailwind to AFFO/share 2021 2022 2023 2024
AMT $0.03 $0.10 $0.10 $0.10
CCI $0.03 $0.10 $0.10 $0.10
SBAC $0.05 $0.16 $0.16 $0.16
% Tailwind to AFFO
AMT 0.3% 1.0% 0.9% 0.8%
CCI 0.5% 1.4% 1.3% 1.2%
SBAC 0.5% 1.4% 1.3% 1.2%
Cable/Telecom & Communications Infrastructure 2020.12.24
December 24, 2020 42

Exhibit 46: Tillman Towers – 2020 Activity
Source: RBC Capital Markets and company reports
Tillman Infrastructure - Towers by State Tillman Infrastructure - Towers by State
As of 12/08/2020 Change relative to 01/01/2020
# Constructed # Granted Total Constructed Granted Total
AL +67 +39 +106 +36 -7 +29
AR +45 +18 +63 +24 +2 +26
AZ +1 +1 - +1 +1
CO +4 +4 +4 -1 +3
FL +2 +2 - +2 +2
GA +15 +10 +25 +6 -1 +5
IL +9 +11 +20 +5 +3 +8
IN +8 +13 +21 +2 +9 +11
KS +15 +2 +17 +10 -5 +5
KY +60 +22 +82 +6 +15 +21
LA +57 +19 +76 +16 +1 +17
MD +2 +2 - +1 +1
ME +1 +1 - - -
MI +46 +19 +65 +12 +5 +17
MN +1 +2 +3 +1 - +1
MO +34 +41 +75 +21 -5 +16
MS +55 +21 +76 +16 +4 +20
MT +1 +1 +1 - +1
NC +6 +10 +16 +4 -1 +3
NE +1 +1 +1 - +1
ND +2 +1 +3 +2 +1 +3
NM +1 +1 +2 - - -
NY +3 +7 +10 +2 +6 +8
OH +58 +30 +88 +11 - +11
OK +38 +37 +75 +16 -2 +14
PA +7 +7 +14 +3 +1 +4
SC +4 +12 +16 +3 +4 +7
SD +1 +2 +3 +1 +2 +3
TN +29 +20 +49 +11 +1 +12
TX +251 +104 +355 +96 -55 +41
VA +2 +5 +7 +1 +2 +3
WI +7 +17 +24 +7 -3 +4
WV +4 +2 +6 +3 - +3
Grand Total +832 +477 +1,309 +321 -20 +301
Cable/Telecom & Communications Infrastructure 2020.12.24
December 24, 2020 43

Exhibit 47: Uniti Towers – 2020 Activity
Source: RBC Capital Markets and company reports
Uniti- As of 12/08/2020 Change relative to 01/01/2020 Uniti- As of 01/01/2020
State Granted Constructed Total Granted Constructed Total
AL +25 +40 +65 - +10 +10
AR +17 +43 +60 +10 +13 +23
CO +1 +1 - +1 +1
FL +6 +2 +8 +1 +1 +2
GA +6 +19 +25 +2 +1 +3
IA +2 +2 +4 +1 +1 +2
ID +1 +1 - +1 +1
IL +13 +32 +45 - +3 +3
IN +1 +1 - - -
KS +3 +10 +13 -1 +4 +3
KY +11 +27 +38 +8 +9 +17
LA +4 +91 +95 - +8 +8
MI +1 +1 - - -
MN +5 +8 +13 +1 +2 +3
MO +12 +19 +31 +1 +1 +2
MS +15 +31 +46 +14 +5 +19
NC +1 +1 -1 - -1
ND +1 +1 - +1 +1
NE +7 +7 - - -
NJ +1 +1 - - -
NM +2 +2 - - -
NY +1 +1 - +1 +1
OH +12 +12 -1 +1 -
OK +8 +23 +31 +3 +7 +10
PA +5 +5 - +2 +2
SC +5 +5 - +1 +1
SD +5 +5 - +5 +5
TN +1 +13 +14 -1 +3 +2
TX +15 +92 +107 -6 +12 +6
UT +2 +2 -1 +1 -
VA +1 +1 - +1 +1
WI +3 +18 +21 -5 +8 +3
Grand Total +146 +517 +663 +25 +103 +128
Cable/Telecom & Communications Infrastructure 2020.12.24
December 24, 2020 44

Exhibit 48: India Wireless Carriers
Note: Subscriber data as of Sep-20. Source: TRAI and RBC industry contacts, Company reports
Exhibit 49: India Carriers Market Share Trends
Source: TRAI, RBC Capital Markets and company sources
Cable/Telecom & Communications Infrastructure 2020.12.24
December 24, 2020 45

Exhibit 50: India Tower Build Activity
Note: AMT figures exclude the acquisitions of Viom (C2Q16), and VOD (C1Q18) and Idea (C2Q18) portfolios. Source: Bharti Infratel, American Tower, RBC Capital Markets
Exhibit 51: India Towers - Organic Growth Rates
Note: 1Q17 organic growth rate is impacted by the absence of Viom in the prior year run rate. Source: Company sources, RBC Capital Markets
Exhibit 52: Bharti Infratel Standalone and Indus Towers
Source: Bharti Infratel, American Tower
Exhibit 53: Bharti Infratel Consolidated
Source: Bharti Infratel, RBC Capital Markets
Exhibit 54: Brazil Wireless Carriers
Note: Subscriber and cell site data as of 3Q20. Source: Anatel, RBC Capital Markets and company reports
Bharti Infratel (Standalone) Dec-16 Mar-17 Jun-17 Sep-17 Dec-17 Mar-18 Jun-18 Sep-18 Dec-18 Mar-19 Jun-19 Sep-19 Dec-19 Mar-20 Jun-20 Sep-20
Total towers 38,997 39,099 39,211 39,264 39,363 39,523 39,719 39,946 40,192 40,388 40,636 41,050 41,471 42,053 42,339 43,110
New towers built in the quarter 165 102 112 53 99 160 196 227 246 196 248 414 421 582 286 771
Indus Towers Dec-16 Mar-17 Jun-17 Sep-17 Dec-17 Mar-18 Jun-18 Sep-18 Dec-18 Mar-19 Jun-19 Sep-19 Dec-19 Mar-20 Jun-20 Sep-20
Total towers 122,044 122,730 122,920 123,073 122,962 123,639 123,904 124,230 124,069 123,546 123,799 124,692 125,649 126,949 127,291 128,984
New towers built in the quarter 714 686 190 153 (111) 677 265 326 -161 -523 253 893 957 1,300 342 1,693
American Tower India Dec-16 Mar-17 Jun-17 Sep-17 Dec-17 Mar-18 Jun-18 Sep-18 Dec-18 Mar-19 Jun-19 Sep-19 Dec-19 Mar-20 Jun-20 Sep-20
Total towers 57,739 57,687 57,665 57,772 57,789 57,681 67,071 75,500 75,355 74,804 74,388 74,046 73,984 73,633 73,578 73,617
Acquisitions - - - - - 10,238 9,031 - - - - - - - - -
Sales/Adjustments (468) (323) (158) (257) (310) (981) (782) (596) (1,217) (951) (1,105) (1,069) (1,317) (684) (156) (1,097)
New towers built in the quarter 416 301 265 274 202 133 180 451 666 535 763 1,007 966 629 195 979
Ending Balance 57,687 57,665 57,772 57,789 57,681 67,071 75,500 75,355 74,804 74,388 74,046 73,984 73,633 73,578 73,617 73,499
1Q17A 2Q17A 3Q17A 4Q17A 1Q18A 2Q18A 3Q18A 4Q18A 1Q19A 2Q19A 3Q19A 4Q19A 1Q20A 2Q20A 3Q20AAmerican TowerGross organic tenant billings 41.2% 14.6% 12.3% 11.0% 8.9% 8.2% 8.8% 10.6% 12.1% 11.9% 12.1% 14.9% 15.0% 14.6% 12.9%Churn 12.7% 4.5% 3.8% 8.4% 13.6% 18.4% 20.8% 36.0% 40.7% 35.7% 32.2% 23.2% 15.6% 14.2% 13.4%Net organic tenant billings 28.5% 10.1% 8.4% 2.6% (4.7%) (10.2%) (12.0%) (25.5%) (28.5%) (23.8%) (20.1%) (8.4%) (0.7%) 0.4% (0.5%)
Bharti Infratel Standalone Dec-18 Dec-19 Mar-19 Jun-19 Sep-19 Dec-19 Mar-20 Jun-20 Sep-20
Total towers 40,192 41,471 40,388 40,636 41,050 41,471 42,053 42,339 43,110
Sharing factor - period end 1.93x 1.84x 1.89x 1.87x 1.86x 1.84x 1.80x 1.78x 1.78x
Sharing revenue/tower per month INR 83,040 INR 84,593 INR 82,460 INR 85,917 INR 87,669 INR 84,593 INR 84,878 INR 82,899 INR 85,767
Indus Towers - Tower Dec-18 Dec-19 Mar-19 Jun-19 Sep-19 Dec-19 Mar-20 Jun-20 Sep-20
Total towers 124,069 125,649 123,546 123,799 124,692 125,649 126,949 127,291 128,984
Sharing factor - period end 1.86x 1.85x 1.86x 1.87x 1.86x 1.85x 1.85x 1.85x 1.84x
Sharing revenue/tower per month INR 70,237 INR 78,357 INR 71,283 INR 78,061 INR 74,373 INR 78,357 INR 74,640 INR 74,520 INR 75,638
Bharti Infratel Consolidated
(Amount in INR, mns)CY2018 CY2019 C1Q19 C2Q19 C3Q19 C4Q19 C1Q20 C2Q20 C3Q20
Rent 86,009 88,910 21,086 22,606 22,385 22,833 22,513 22,430 23,199
Y-o-Y (4.1%) 3.4% (3.5%) 2.8% 5.6% 8.9% 6.8% (0.8%) 3.6%
Total Revenue1 146,442 146,231 36,003 37,119 36,376 36,733 36,244 35,047 36,952
Y-o-Y 2.1% (0.1%) (1.7%) 1.0% (0.8%) 0.9% 0.7% (5.6%) 1.6%
Names of Major
Facilities-Based Carriers Coverage Owner Nationality
Total Wireless
Subscribers
(in MM) Market Share
2019 Cell
Sites
3Q20 Cell
Sites
Site
additions
(19/18)
Site
additions
2020 YTD
2019
Wireless
Capex
(in R$ MM)
2020E
Wireless
Capex
(in R$ MM)
Vivo National Telefonica Foreign 76.7 33.8% 25,687 26,006 1,645 319 5,727 4,627Claro/Nextel National America Movil Foreign 60.0 26.5% 27,792 32,348 417 4,556 3,526 2,276TIM National Telecom Italia Foreign 51.2 22.6% 24,513 25,146 1,705 633 3,776 3,295
Oi SA National
Telemar, Participacoes,
Portugal Telecom Domestic 36.5 16.1% 18,544 18,875 314 331 7,637 6,873Algar Telecom Regional Independent operator Domestic 2.4 1.0% 710 728 (3) 18 - -
Cable/Telecom & Communications Infrastructure 2020.12.24
December 24, 2020 46

Exhibit 55: Brazil – Cell Sites by Operator
Cell Sites
Net Cell Site Adds by Operator
Source: teleco.co.br, Anatel, RBC Capital Markets
Exhibit 56: Brazil Subscribers by Technology
Source: Anatel, RBC Capital Markets and company reports
Exhibit 57: Brazil Towers - Organic Growth Rates
Source: RBC Capital Markets and company sources
2015 2016 2017 2018 2019 3Q20
Vivo 19,520 20,662 22,471 24,042 25,687 26,006
TIM 17,667 20,092 21,514 22,808 24,513 25,146
Claro 15,666 16,228 18,722 20,269 20,550 20,591
Oi 16,592 17,562 18,148 18,230 18,544 18,875
Nextel 6,152 7,475 7,071 7,106 7,242 11,757
Algar 618 679 701 713 710 728
Sercomtel 49 49 54 50 50 50
Total 76,264 82,747 88,681 93,218 97,296 103,153
2016 2017 2018 2019 2020 YTD
Vivo 1,142 1,809 1,571 1,645 319
TIM 2,425 1,422 1,294 1,705 633
Claro 562 2,494 1,547 281 41
Oi 970 586 82 314 331
Nextel 1,323 (404) 35 136 4,515
Algar 61 22 12 (3) 18
Sercomtel - 5 (4) - -
Total 6,483 5,934 4,537 4,078 5,857
150.7 172.4 191.6 213.1
209.3
174.3
132.8
83.2 47.5
32.3 24.7 29.5 28.4
1.7 4.1 14.6 33.2
52.5
94.8
144.7
149.1
119.1
83.6
52.3 42.2 35.9
- - - - 0.0 2.1 3.3 25.4
60.1
102.2
129.9 153.7 165.4
0%
10%
20%
30%
40%
50%
60%
70%
80%
90%
100%
2008A 2009A 2010A 2011A 2012A 2013A 2014A 2015A 2016A 2017A 2018A 2019A 3Q20A
2G 3G 4G (LTE)
1Q17A 2Q17A 3Q17A 4Q17A 1Q18A 2Q18A 3Q18A 4Q18A 1Q19A 2Q19A 3Q19A 4Q19A 1Q20A 2Q20A 3Q20A
SBA CommunicationsGross organic growth, constant currency 10.7% 10.8% 11.5% 12.0% 10.1% 10.6% 12.9% 12.7% 12.2% 13.6% 12.7% 11.6% 10.8% 10.4% 9.0%
American TowerGross organic tenant billings ~11% ~12% ~13% ~14% ~11% ~11% ~11% ~11% ~10% ~10% ~9%Churn 1.2% 1.5% 1.5% 3.5% 4.0% 4.0% 4.4% 2.5% ~2% ~2% ~2%Net organic tenant billings ~12% ~11% ~9% ~8% ~10% ~10% ~11% ~10% ~7% ~7% ~6% ~9% ~8% ~8% ~7%
Cable/Telecom & Communications Infrastructure 2020.12.24
December 24, 2020 47

Exhibit 58: Mexico Wireless Carriers
Subscriber data as of 3Q20.
Source: RBC Capital Markets and company sources
Exhibit 59: Telesites Portfolio
Source: Telesites, RBC Capital Markets
Exhibit 60: Telesites Financial Trends (MXN, mns)
Source: Telesites, RBC Capital Markets
Exhibit 61: American Tower – Mexico Activity
Source: American Tower, RBC Capital Markets
Exhibit 62: American Tower – Mexico Organic Growth Rates
Source: American Tower, RBC Capital Markets
Wireless Operator Parent % subscriber share
% wireless industry
revenue share Monthly ARPU (MXP)
% ownership of
available spectrum
Telcel America Movil 62.6% 65.3% 152 43.1%
Movistar Telefonica 20.6% 9.0% 78 8.3%
AT&T Mexico AT&T 14.8% 17.9% 145 35.2%
Altan - 0.1% - 13.4%
MVNOs 2.0% 7.7% - -
Cable/Telecom & Communications Infrastructure 2020.12.24
December 24, 2020 48

Exhibit 63: Nigeria Wireless Carriers
*Globacom and 9mobile ARPU reflect RBC estimates for 2019. ** Subscriber data as of 3Q20. Source: NCC, RBC Capital Markets and company reports
Exhibit 64: Nigeria Carriers Market Share Trends
Source: NCC, RBC Capital Markets and company sources
Names of Major Facilities-Based
Carriers Coverage Owner Nationality Status
Total Wireless
Subscribers (M)
C3Q20 Monthly
ARPU (US$)** Market Share*
2019 Capex
(US$, M)
2020 Capex
Estimate (US$, M)
MTN Nigeria Communications National MTN Group Foreign Public 82.6 $3.71 40% $545.4 $680
Globacom Ltd National Conpetro Domestic Private 54.3 $0.77 26% $94.5 -
Airtel Nigeria National Bharti Airtel Foreign Public 55.3 $2.80 27% $205.2 $323
9mobile National
Teleology Nigeria Ltd
(consortium) Domestic Private 12.7 $2.05 6% $10.8 -
Cable/Telecom & Communications Infrastructure 2020.12.24
December 24, 2020 49

Exhibit 65: Tower M&A Tables
Asia M&A
Source: Company data, RBC Capital Markets, TowerXchange
Announced
Date Seller Buyer Country
Transaction Value
(in USD mm) Tower Sites
Per Tower
Valuation
(in USD
000s) TCF Multiple
Jan-20 XL Axiata Centratama Indonesia $125 1,054 $118.9 NA
Jan-20 XL Axiata Protelindo Indonesia $164 1,728 $94.9 NA
Dec-19 Reliance Jio Infratel Consortium - incl. Brookfield India $3,700 130,000 $28.5 NA
Oct-19 Indosat Ooredoo Mitratel, Protelindo Indonesia $451 3,100 $145.5 NA
Jan-19 Mekong Tower Company Ltd. ( MTCL) edotco Laos $1 NA NA NA
2018 PAMEL TPG Myanmar NA NA NA NA
2018 SMI (MIG) KPR Towers Myanmar $11 100 $108.0 NA
2018 Komet Infra Nusantara (KIN) Sarana Menara Nusantara (SMN) Indonesia NA NA NA NA
Dec-18 South East Asia Telecom (Cambodia) Co Ltd. edotco Cambodia NA 325 NA NA
Sep-18 Pan Asia Majestic Eagle TPG Myanmar NA 1,200 $0.0 NA
Apr-18 Indus Tower Bharti Infratel India $10,800 122,962 $87.8 NA
Mar-18 Providence Equity Partners (KIN stake) Protelindo Indonesia $102 1,400 $72.7 NA
2017 PT Sampoerna Telekomunikasi Indonesia (STI) PT Inti Bangun Sejahtera (IBS) Indonesia $31 371 $83.6 NA
2017 Pakistan Mobile Communications Ltd (Jazz) edotco & Dawood Hercules Pakistan $940 13,000 $72.3 NA
2017 Bharti Airtel (Nettle Infrastructure) Secondary sale of Bharti Infratel India $402 39,211 $280.9 NA
2017 Towershare (Tazanite Tower) edotco Pakistan $89 700 $127.0 NA
2017 edotco Kumpulan Wang Persaraan Malaysia $100 NA NA NA
Dec-17 Reliance Communications (RCom) Reliance Jio India $3,750 43,000 NA NA
Nov-17 Vodafone (India) American Tower India $593 10,200 $58.1 NA
Nov-17 Idea Cellular American Tower India $593 9,900 $59.9 NA
Apr-17 Ascend Telecom Infrastructure IDFC Alternatives India $91 5,222 $52.9 NA
Mar-17 Bharti Airtel (11.3% stake in Infratel) Nettle Infrastructure (Bharti India $1,062 90,255 $103.9 NA
Mar-17 Bharti Airtel (10.3% stake in Infratel) KKR/CPPIB consortium India $952 90,255 $102.4 NA
Feb-17 Southern Cross Austereo Axicom (former Crown Castle Australia $10 56 $169.6 NA
2016 edotco Innovation Network Corporation Malaysia $400 NA NA NA
2016 edotco Khazanah Nasional Berhad Malaysia $200 NA NA NA
2016 SMI (MIG) Shining Star Myanmar $13 100 $127.1 NA
2016 VNI (SEATH) OCK Group Vietnam $50 1,972 $25.4 NA
2016 XL Axiata Protelindo Indonesia $250 2,500 $100.0 NA
2016 Crown Castle MIRA-consortium Australia $1,600 1,772 $902.9 NA
Dec-16 Reliance Brookfield India $1,700 43,379 $76.8 NA
2015 KEC International American Tower India $13 381 $34.1 NA
2015 Digicel MTC edotco Myanmar $221 1,250 $235.7 NA
Dec-15 Reliance Communications Tillman Global Holdings and TPG India $3,359 45,000 NA NA
Oct-15 Viom Network American Tower (51% stake) India $1,925 42,200 $89.4 9.9x / 11.5x
Oct-14 PT Telkom Tower Bersama Indonesia $904 4,000 $226.0 NA
Oct-14 XL Axiata PT Solusi Tunas Pratama Indonesia $460 3,500 $131.4 NA
Jun-14 KJS YTL Power International Malaysia $15 309 $48.5 NA
2013 Hutchison STP Indonesia $68 300 $300.2 NA
2012 Hutchison Protelindo Indonesia NA 503 NA NA
2012 PT Central Investindo Protelindo Indonesia NA 152 NA NA
2012 Indosat Tower Bersama Indonesia $519 2,500 $207.6 NA
- Indian Telecom Infrastructure Ltd Ascend Telecom Infrastructure India NA NA NA NA
2012 Reliance Infratel Blackstone and Carlyle India $3,500 50,000 $70.0 NA
2011 Infratel Tower Bersama Indonesia NA 595 NA NA
2010 Essar Telecom Infrastructure American Tower India $432 4,450 $97.1 NA
2010 Viom Network Macquarie / SBI (11%) India $304 37,500 $81.1 NA
2010 Chennai Network Infrastructure Ltd GTL Infrastructure Ltd India NA NA NA NA
2010 Aircel Ltd GTL Infrastructure Ltd India $1,800 17,500 $102.9 NA
2010 Hutchison Protelindo Indonesia $166 1,482 $186.6 NA
2009 Idea Cellular Idea Cellular Infrastructure ltd India NA NA NA NA
2009 Transcend Infrastructure American Tower India $23 327 $70.3 NA
2009 XCEL Telecom Private Ltd American Tower India $170 1,730 $98.3 NA
2009 Reliance Communication Reliance Infratel India NA NA NA NA
2009 Viom Network QTIL India $2,407 18,000 $133.7 NA
2008 Bakrie STP Indonesia $34 543 $62.6 NA
2008 Hutchison Protelindo Indonesia $500 3,692 $135.4 NA
2008 Tata Teleservices 21st Century Infratel Ltd India NA NA NA NA
2008 Swan Telecom BSNL India NA NA NA NA
2007 Idea Cellular Ltd Vodafone Essar Tower Ltd India NA NA NA NA
Cable/Telecom & Communications Infrastructure 2020.12.24
December 24, 2020 50

Exhibit 66: Tower M&A Tables
EMEA M&A
Source: Company data, RBC Capital Markets, TowerXchange
Announced
Date Seller Buyer Country Region
Transaction Value
(in USD mm) Tower Sites
Per Tower
Valuation
(in USD
000s) TCF Multiple
Oct-20 Iliad Cellnex Poland Europe $944 7,000 $134.9 NA
Oct-20 Axion (AMP Capital) Asterion Industrial Partners Spain Europe NA $635 NA NA
Aug-20 Free Senegal Helios Tower Plc Senegal Africa $189 1,220 $154.9 NA
May-20 Eir Phoenix Tower Intl (PTI) Ireland Europe $330 650 $507.7 NA
Apr-20 NOS Towering Cellnex Portugal Europe $409 2,000 $204.4 NA
Mar-20 Bouygues Telecom Phoenix Tower Intl (PTI) France Europe NA 4,000 NA NA
Jun-20 Telefonica Deutschland Holding AG Telxius Germany Europe $1,698 10,080 $168.5 NA
Jan-20 OMTEL Cellnex Portugal Europe $894 3,000 $298.0 NA
Dec-19 3i Infrastructure (93% stake in Wireless
Infrastructure Group)
Brookfield Infrastructure UK Europe $317 2,000 $158.7 NA
Dec-19 3i Infrastructure (93% interest in Wireless
Infrastructure Gp)
Brookfield Infrastructure Partners UK Europe $0 0 $0.0 0.0x
Oct-19 Atlas Tower SBA Communications South Africa Africa $140 889 $157.5 NA
Oct-19 Arqiva Group Cellnex UK Europe $2,444 7,400 $330.2 NA
Sep-19 Cignal Cellnex Ireland Europe $232 546 $424.7 NA
May-19 Iliad (Free) Cellnex France Europe $2,208 5,700 $387.4 NA
May-19 Iliad Cellnex Italy Europe $663 2,200 $301.1 NA
May-19 Salt Cellnex Switzerland Europe $859 2,800 $306.7 NA
May-19 Eaton Towers American Tower Burkina Faso, Ghana, Kenya, Africa $1,850 5,510 $335.8 11.2x
Jul-18 El Towers S.p.A 2i Towers (60% F2i/40% Italy Europe $1,475 3,300 $446.9 NA
2Q18 Private EI Towers Italy Europe $5 17 $302.2 NA
Jun-18 SFR TowerCo (Altice Europe NV) KKR France Europe $2,100 10,198 $411.8 NA
Jun-18 Towers of Portugal (Altice Europe NV) Morgan Stanley Infrastructure Portugal Europe $571 2,961 $257.0 NA
Apr-18 Telkom Kenya American Tower Kenya Africa $172 723 $244.2 NA
Apr-18 Digita Oy (First State Investments) Digital Colony Finland Europe NA 556 NA NA
1Q18 FWA operator Cellnex Italy Europe $4 219 $16.9 NA
1Q18 Private EI Towers Italy Europe $17 94 $186.1 NA
1Q18 Masmovil Cellnex Spain Europe $4 85 $43.5 NA
Feb-18 Bouygues Cellnex France Europe $348 1,000 $348.0 NA
Feb-18 Sanef Cellnex France Europe NA 300 NA NA
4Q17 Freenet Unknown Germany Europe NA 450 NA NA
4Q17 Private EI Towers Italy Europe $20 43 $466.9 NA
Dec-17 Barings LLC 3i Infrastructure UK Europe $589 750 $785.5 NA
Dec-17 TMO NL DT Netherlands Europe $577 1,750 $329.8 NA
Dec-17 Masmovil Cellnex Spain Europe $43 551 $78.8 NA
Oct-17 Vodacom HTA Tanzania Africa $59 1,149 $207.8 NA
3Q17 Private EI Towers Italy Europe $6 17 $354.4 NA
Sep-17 Alitcum Cellnex Netherlands Europe $158 30 $5,274.8 NA
Jul-17 Private Cellnex Netherlands Europe $14 32 $440.8 NA
Jul-17 Bouygues Cellnex France Europe $200 600 $333.0 NA
Jun-17 Wind Cellnex Italy Europe $86 7,500 $115.1 NA
2Q17 Private EI Towers Italy Europe $7 47 $157.8 NA
May-17 Sunrise Cellnex, Swiss Life, DTCP Switzerland Europe $470 2,239 $210.1 NA
Feb-17 Bouygues Cellnex France Europe $588 1,800 $326.7 NA
Feb-17 Bouygues Cellnex France Europe $416 1,200 $346.9 NA
2016 ITAS TIM TDF France Europe NA 420 NA NA
2016 Zantel HTA Tanzania Africa $7 185 $36.2 NA
2016 Shere Group Cellnex UK & Netherlands Europe $462 1,004 $460.3 NA
2016 Bouygues Cellnex France Europe $94 230 $409.1 NA
2016 Bouygues Cellnex France Europe $79 270 $291.8 NA
2016 Protelindo Cellnex Netherlands Europe $128 261 $491.1 NA
2016 Telefonica Telxius Germany Europe $690 2,350 $293.8 NA
2016 Telefonica Telxius Spain Europe NA 11,000 NA NA
2016 Private EI Towers Italy Europe $53 248 $214.4 NA
2016 TEF Telxius Spain Europe $1,277 10,741 $118.9 NA
Dec-16 Antin Infrastructure Partners (FPS American Tower France Europe $726 2,482 $292.5 14.5x
Sep-16 Arcus Cellnex UK Europe $135 540 $249.9 NA
Sep-16 Arcus Cellnex Netherlands Europe $307 464 $661.6 NA
Sep-16 Expresso Telecom Al Karama Towers Senegal Africa NA 450 NA NA
Aug-16 Antin AMP Spain Europe $178 584 $305.5 NA
Jun-16 Not disclosed Cellnex Italy Europe $19 NA NA NM
Jun-16 Gilles Bastard TDF France Europe NA 400 NA NA
Jun-16 Eaton American Tower South Africa Africa NA 300 NA 18.0x
May-16 Airtel HTA DRC Africa $165 967 $170.6 NA
Apr-16 TEF DE Telxius Germany Europe $668 2,359 $283.3 NA
2Q16 WDR American Tower Germany Europe $47 186 $253.0 NA
Mar-16 Airtel American Tower Tanzania Africa $179 1,350 $132.6 NA
Mar-16 TPG Freenet Germany Europe $321 450 $712.5 NA
Jan-16 Lombardy Inwit Italy Europe $9 76 $114.6 NA
Cable/Telecom & Communications Infrastructure 2020.12.24
December 24, 2020 51

Exhibit 67: Tower M&A Tables
LATIN AMERICA/CARIBBEAN TOWER M&A
Source: Company data, RBC Capital Markets, TowerXchange
Announced
Date Seller Buyer Country Region
Transaction Value
(in USD mm) Tower Sites
Per Tower
Valuation
(in USD
000s) TCF Multiple
Nov-20 Oi Highline do Brasil (Digital Colony) Brazil Latin America $200 637 NA NA
Nov-20 Phoenix Tower do Brasil (Blackstone) Highline do Brasil (Digital Colony) Brazil Latin America NA 2,500 NA NA
Jul-20 Tower One Wireless Not specified Mexico Latin America $3 28 $100.0 NA
Jun-20 Telefonica Telxius Germany Europe, Latin America $1,793 10,100 $177.5 0.0x
Jan-20 Grupo Torresur SBA Communications Brazil Latin America $460 1,300 $353.8 14.8x
Jan-20 Entel American Tower Chile, Peru Latin America $772 3,200 $241.3 NA
Dec-19 Telefonica Phoenix Tower Intl (PTI) Colombia Latin America $97 621 $156.2 NA
Dec-19 Telefonica Phoenix Tower Intl (PTI) Ecuador Latin America $225 1,408 $160.0 NA
Nov-19 Telefonica Brasil (Vivo) Telxius Brazil Latin America $154 1,909 $80.6 NA
Feb-19 Uniti Phoenix Tower Intl (PTI) Mexico, Colombia, Nicaragua Latin America $100 500 $200.0 NA
Feb-19 Trilogy International Partners (NuevaTel) Phoenix Tower Intl (PTI) Bolivia Latin America $100 600 $166.7 NA
Feb-19 Uniti Phoenix Tower Intl (PTI) Mexico, Colombia, Nicaragua Latin America $100 500 $200.0 NA
2018 Not disclosed Phoenix Tower Intl (PTI) Guatemala Latin America NA 20 NA NA
Oct-18 Teletorres del Caribe (Altice) Phoenix Tower Intl (PTI) Dominican Republic Caribbean $170 1,039 $163.6 NA
Oct-18 Digicel Phoenix Tower Intl (PTI) Jamaica Caribbean $90 451 $199.6 NA
Jul-18 Telefonica (Telxius) Pontegadea Spain, Germany, Peru, Europe, Latin America $442 16,400 $272.0 NA
Apr-18 Maxcom MXT Capital Partners Mexico Latin America $10 72 $143.1 NA
Feb-18 Digicel Phoenix Tower International French Antilles Caribbean NA 215 NA NA
Feb-18 Millicom (Tigo El Salvador) SBA Communications El Salvador Latin America $145 800 $181.3 NA
Feb-18 Digicel Phoenix Tower Intl (PTI) French West Indies Caribbean NA 215 NA NA
2017 Torres Andinas SBA Communications Colombia/Peru Latin America NA 350 NA NA
2017 CTR SBA Communications Chile Latin America NA 172 NA NA
2017 Not disclosed Torrecom Panama Latin America NA 25 NA NA
Dec-17 Torres Unidas (Berkshire Partners) Andean Tower Partners Peru, Chile, Colombia Latin America NA 1,644 NA NA
Oct-17 Highline do Brasil SBA Communications Brazil Latin America NA 900 NA 17.0x
Oct-17 KIO Networks American Tower Mexico Latin America $500 NA NA NA
3Q17 Alta American Tower Brazil Latin America $56 142 $394.4 NA
3Q17 NA SBA Communications Argentina Latin America NA 35 NA NA
Jul-17 NA Phoenix Tower Colombia/Peru Latin America NA 150 NA NA
2Q17 NA SBA Communications Peru Latin America NA 143 NA NA
Jul-17 Millicom/Colombia Movil (Tigo) American Tower Colombia Latin America $147 1,200 $122.5 NA
Jul-17 Axtel American Tower Mexico Latin America $56 142 $394.4 NA
Jul-17 TIM (Telecom Italia) Brasil American Tower Brazil Latin America $6 54 $112.0 NA
Apr-17 Millicom American Tower Paraguay Latin America $125 1,400 $89.3 NA
Apr-17 Digicel Phoenix Tower El Salvador Latin America NA 202 NA NA
Nov-16 Comunicaciones y Consumos, SA (CyCSA) American Tower Argentina Latin America NA 1,000 NA NA
Nov-16 Network Management Holdings (NMS) Uniti Mexico, Colombia, Nicaragua Latin America $65 359 $181.1 14.8x
Apr-16 Telefonica Telxius Peru Latin America NA 900 NA NA
Apr-16 Telefonica Telxius Chile Latin America $12 328 $35.1 NA
Apr-16 Telefonica Telxius Brazil Latin America $214 1,655 $129.3 NA
Mar-16 Viva Phoenix Tower Dominican Republic Latin America NA 545 NA NA
2015 Amzak/Teletower Phoenix Tower Dominican Republic Latin America NA 190 NA NA
2015 Torresec SBA Communications Ecuador Latin America NA 130 NA NA
Jun-15 Algar Telecom Highline do Brasil Brazil Latin America $21 125 $164.7 NA
Jun-15 T4U Holding Brasil, S.A. Phoenix Tower International Brazil Latin America NA 529 NA NA
Nov-14 TIM (Telecom Italia) American Tower Brazil Latin America $1,200 6,480 $185.2 15.7x
Sep-14 American Tower Phoenix Tower International Panama Latin America NA 60 NA NA
Jun-14 Oi SBA Communications Brazil Latin America $527 1,641 $321.1 15.8x
Jun-14 BR Towers American Tower Brazil Latin America $978 4,630 $211.2 12.1x
2013 Telefónica American Tower Brazil Latin America $20 93 $219.5 NA
2013 Sitesharing BR Towers Brazil Latin America NA 100 NA NA
Dec-13 Oi SBA Communications Brazil Latin America $645 2,007 $321.4 16.3x
Sep-13 Z-Sites Locação de Imóveis American Tower Brazil Latin America $127 236 $538.6 NA
Sep-13 Global Tower Partners American Tower Costa Rica Latin America NA 500 NA NA
Sep-13 Global Tower Partners American Tower Panama Latin America NA 50 NA NA
Aug-13 NII Holdings American Tower Brazil Latin America $343 1,937 $176.9 14.7x
Aug-13 NII Holdings American Tower Brazil Latin America $19 103 $180.6 14.7x
Aug-13 NII Holdings American Tower Brazil Latin America $52 750 $68.9 14.7x
Aug-13 NII Holdings American Tower Mexico Latin America $427 1,473 $289.9 14.7x
May-13 Oi BR Towers Brazil Latin America $251 2,113 $118.8 NA
May-13 Oi Grupo Torresur Brazil Latin America $293 2,113 $138.7 NA
Jul-13 Oi SBA Communications Brazil Latin America $303 2,113 $143.2 10.2x
Jan-13 Axtel American Tower Mexico Latin America $249 883 $281.4 NA
Cable/Telecom & Communications Infrastructure 2020.12.24
December 24, 2020 52

Exhibit 68: Tower M&A Tables
U.S. TOWER M&A
* As per the deal, CCI will have the option to purchase the AT&T towers at the end of the respective lease terms for additional $4.2B, and payments will be due mostly between 2032 and 2048. ** As per the deal, American Tower will have exclusive rights to lease and operate the Verizon towers. The average term of the lease rights is about 28 years. As the leases expire, American Tower will have fixed-price purchase options to acquire these towers based on their anticipated fair market values at the end of the lease terms. Source: Company data, RBC Capital Markets, TowerXchange
Announced
Date Seller Buyer Country Region
Transaction Value
(in USD mm) Tower Sites
Per Tower
Valuation
(in USD
000s) TCF Multiple
Nov-20 Eco-Site Vertical Bridge USA USA NA 600 NA NA
Nov-20 InSite Wireless American Tower USA USA $3,500 3,000 $1,166.7 30.4x
Oct-20 Lendlease Apollo Infrastructure Funds USA USA NA 500 NA NA
Sep-20 CTI Towers Melody Investment Advisors USA USA NA 1,150 NA NA
Aug-20 Cumulus Media Vertical Bridge USA USA $213 250 $852.0 14.3xMay-20 Uniti Group Melody Investment Advisors USA USA $220 500 $440.0 34.0xMar-20 Tower Ventures Holdings Phoenix Tower Intl (PTI) USA USA NA 197 NA NA
Oct-19 AT&T Peppertree Capital USA USA $680 1,000 $680.0 NA2Q19 Grain Management American Tower USA USA $500 400 $1,250.0 NA2Q19 Milestone Towers SBA Communications USA USA NA 77 NA NA
Nov-18 Frontier Communications Everest Infrastructure Partners USA USA $80 95 $842.1 NANA K2 & Branch American Tower USA USA NA 900 NA 20.0xDec-17 City of Akron, OH Everest Infrastructure Partners USA USA $11 15 $733.3 NA
Nov-17 Mediacom Communications CTI Towers USA USA NA 360 NA NA2016 Private Private USA Southeast $6 10 $647.5 30.0x2016 Private Private USA Northeast $3 3 $833.3 26.1x
2016 Private Private USA Midwest $1 1 $550.0 24.0x2016 Private Private USA Mid-Atlantic $3 2 $1,600.0 23.1x2016 Private Private USA Midwest $1 1 $530.0 29.0x2016 Private Private USA Southeast $2 4 $525.0 27.6x
2016 Private Private USA Midwest $15 27 $555.6 22.2x2016 Private Private USA Southeast $21 19 $1,105.3 26.7xDec-16 Verizon (Alltel) American Tower USA USA $120 1,523 $78.7 NA
May-16 Towerco Grain USA USA $244 348 $701.1 27.5xApr-16 Tower Development Corp. Crown Castle USA USA, Puerto Rico $461 336 $1,372.0 20.0xMar-16 Alpha Media LLC Vertical Bridge Holdings, LLC USA USA NA 200 NA NA
Nov-15 Vyve Broadband CTI Towers USA USA NA 120 NA NANov-15 Nsight Towers Vertical Bridge Holdings, LLC USA Midwest NA 200 NA NANov-15 T-Mobile Phoenix Tower International USA USA $140 600 $311.1 NA
Aug-15 Townsquare Media Vertical Bridge USA USA $23 43 $1,039.7 NAApr-15 Quanta Fiber Networks (Sunesys) Crown Castle USA USA $1,000 NA NA NAApr-15 CTI Towers, Inc. InSite Wireless Group, LLC USA USA NA 294 NA NA
Mar-15 CiG Wireless Corp. Vertical Bridge Holdings, LLC USA USA $143 200 $715.0 28.3xJan-15 NTELOS Grain USA USA $35 85 $411.8 15.9xFeb-15 Verizon American Tower ** USA USA $5,060 11,489 $440.4 >21.5x
Dec-14 iHeartMedia, Inc. Vertical Bridge Holdings, LLC USA USA $369 367 $1,005.4 NADec-14 iHeartMedia, Inc. Vertical Bridge Holdings, LLC USA USA $31 44 $704.5 NADec-14 United States Cellular Corporation Vertical Bridge Holdings, LLC USA USA $159 595 $267.2 50.0x
Mar-14 Richland Properties LLC American Tower USA USA $386 60 $6,431.7 12.9xOct-13 AT&T Crown Castle* USA USA $4,850 9,708 $600.0 >20.5xSep-13 Global Tower Partners American Tower USA USA $4,800 5,900 $813.6 19.7x
Sep-12 T-Mobile Crown Castle USA USA $2,500 7,100 $352.1 NAJun-12 TowerCo SBA Communications USA USA $1,450 3,252 $445.9 15.4xFeb-12 Mobilitie SBA Communications USA USA $1,100 2,300 $478.3 14.7x
Dec-11 NextG Networks Crown Castle USA USA $1,000 8,500 $117.6 NAAug-11 NV Energy Global Tower Partners USA USA NA 37 NA NAJun-11 Convergys/Cincinnati SMSA Towers AT&T USA USA $320 NA NA NA
May-11 Leap Wireless Global Tower Partners USA USA NA 130 NA NAApr-11 Central States Tower American Tower USA USA NA 170 NA NAOct-10 Pinebelt Cellular Global Tower Partners USA USA NA 32 NA NA
2010 Horvath Towers SBA Communications USA USA NA NA NA NASep-10 CitySwitch, LLC Global Tower Partners USA USA NA 450 NA NASep-10 Highpointe Group Global Tower Partners USA USA NA NA NA NA
Aug-10 Telefonica Peru American Tower USA USA NA 468 NA NAJul-10 New Path Networks Crown Castle USA USA $115 NA NA NAJun-10 Telefonica Chile American Tower USA USA NA 287 NA NA
Jun-10 Reliance Towers GTL Infastructure USA USA $11,000 50,000 $220.0 NAJun-10 Sierra Nevada Property Management InSite Towers, LLC USA USA NA 40 NA NAJun-10 Robets Towers American Tower USA USA $89 164 $539.6 NA
Mar-10 Wireless Infrastructure Partners PEG Bandwidth USA USA NA NA NA NAFeb-10 (Multiple acquisitions) Day Wireless USA USA NA 30 NA NAFeb-10 Essar Telecom Infrastructure American Tower USA USA $434 4,450 $97.4 NA
Jan-10 Bay Communications SBA Communications USA USA NA 28 NA NAJan-10 Millicom International Cellular Helios Towers Ghana USA USA $50 750 $66.7 NAJan-10 Royal Street Communications Horvath Towers USA USA NA 22 NA NA
Jan-10 Aircell Towers GTL Infastructure USA USA $1,784 30,000 $59.5 NA
Cable/Telecom & Communications Infrastructure 2020.12.24
December 24, 2020 53

Exhibit 69: Fiber-Small Cell M&A
* This deal was subsequently terminated by Cincinnati Bell. Source: Company data, RBC Capital Markets, TowerXchange
Date Announced Acquirer Target
Transaction
value (mils)
EBITDA
Multiple Fiber Route Miles
Per Fiber Route
Mile Valuation
(in US$, '000s) Markets
Oct-20
Abu Dhabi Investment Authority & Saudi
Arabia’s Public Investment Fund (51%
total)
Digital Fibre Infrastructure Trust (51% owner of
Jio Digital Fibre) $1,012 NA 434,960 - India
Nov-20 Everstream Uniti Fiber assets - Northeast $135 NA 5,600 $24 Northeast US (PA, also NY, NJ, MD, DE, VA)
Oct-20 John Hancock Life Insurance Co. Extenet (30% stake) NA NA NA NA Jan-00
Oct-20 EQT Infrastructure V Deutsche Glasfaser (12% stake) NA NA NA NA Germany
Oct-20 I Squared Capital GTT - fiber/datacenter assets $2,150 NA 64,000 $34 Pan-European, North America
Oct-20 InstarAGF (Infra fund) LS Networks NA NA 7,000 NA Oregon, Pacific Northwest
Sep-20 FirstLight Fiber KINBER NA NA 1,800 NA Pennsylvania
Sep-20 Xplornet Communications F6 Networks Inc. NA NA 994 NA Canada - New Brunswick, Nova Scotia
Jul-20 Morgan Stanley Infrastructure Partners
Lightpath Fiber Enterprise (Altice USA) - 49.99%
stake $3,200 14.6x 8,800 $364 New York
Jul-20 Cooperative Network Services (CNS) West Central Transport Group (WCTG) - - 2,500 - Minnesota
Jul-20 APG Group and Fiera Infrastructure Conterra Networks (from Court Square) NA NA 11,100 NA Primarily North Carolina, Texas, Louisiana, and California
Jun-20 IPI Partners
Dark Fiber and Infrastructure (DF&I) -
investment NA NA NA NA Jan-00
Jun-20 FirstLight BestWeb - - 170 - NY (lower Hudson Valley)
Jun-20 FirstLight DFT (certain fiber routes) NA NA NA NA Buffalo metro and Jamestown link (NY)
Jun-20 FirstLight DFT Communications - - - - Western NY
May-20 South Reach Networks Resurgence Infrastructure Group $0 - 120,000 - Florida
May-20 Beanfield Metroconnect Aptum Technologies $181 - 2,113 $86 Canada (Toronto, Montreal)
Apr-20 Everstream Rocket Fiber LLC - - 41 - Detroit-based ISP
Mar-20 Macquarie Infrastructure Partners Cincinnati Bell $2,900 7.0x 17,000 $171 OH, HI
Feb-20 FirstLight (Antin) PrimeLink NA NA NA NA Northeast NY, Montreal
Feb-20 EQT IV (51%) and OMERS (49%)
Deutsche Glasfaser (KKR 70% and Reggeborgh
30%) $2,740
"high-
teens" 18,641 $147 Germany
Feb-20 Beanfield Technologies Openface NA NA 62 NA Montreal
Jan-20 SDC Capital Partners
FatBeam Holdings (51% stake from Coeur
d'Alene) $36 - - -
Metro areas of AZ, ID, MT, NV, OR, WA, WY; Transaction
value for 51% stake
Jan-20 CityFibre FibreNation (TalkTalk Group) $260 - - - Jan-00
Dec-19 Segra (EQT) North State Telecommunications Corp $240 6.6x 3,000 $80 Noth Carolina
Dec-19* Brookfield Infrastructure Partners Cincinnati Bell $2,600 6.4x 17,000 $153 OH, HI
Nov-19 Eurofiber Eurafibre - - 1,243 - France
Nov-19 Altice (SFR subsidiary) Covage $1,109 - - - France
Nov-19 Digital Colony Beanfield Technologies Inc - - 227 - Canada (Toronto, Montreal)
Oct-19 Everstream
DataBank (LightBound fiber assets and CLEC
business) - - 200 - Indianapolis, Indiana
Sep-19 EQT Infrastructure Inexio (Warburg Pincus) $1,100 - 6,214 $177 Germany (Rural)
Aug-19 Grain Management (financial sponsor) Hunter Communications - - 2,011 - Oregon and N. CA
Aug-19 Grain Management (financial sponsor) Summit Vista (dba Summit Broadband) $333 - 1,800 - FL; majority interest
Jun-19 UFINET Netell Telecom - - 1,118 - Brazil (Sao Paulo)
May-19 Great Plains Communications InterCarrier Networks - - 2,037 - IL, IN, St. Louis metro area in Missouri, and KY
May-19 FirstLight Maine Fiber Company - - 1,300 - Maine, border of Canada
May-19 Uniti Southern Fiber Net $6 - - - GA
May-19 EQT Zayo $14,300 11.1x 130,000 $110 US, Europe (France, UK, Ireland)
Apr-19 Horizon Unspecified - Fiber and conduit assets $0 - 1,000 - Downtown Indanapolis, IN
Apr-19 Everstream Arch Fiber Networks - - 55 - St. Louis, Missouri
Mar-19 euNetworks Onstage Online GmbH - - - - Vienna, Austria
Feb-19 Digital Colony Cogeco Peer 1 $574 - 3,000 NM Toronto & Montreal
Jan-19 SDC Capital Partners Summit IG - 20.0x 500 - Northern and Central VA
Jan-19 Uniti Bluebird Network $319 10.4x 6,500 $98 Sale leaseback; Missouri, Kansas, Illinois, and Oklahoma
Jan-19 Vast Broadband NTS Communications - - 2,700 - Select mkts in TX and LA
Jan-19 Hargray Communications Dark Fiber Systems - - 150 - FL (Jacksonville metro)
Jan-19 Hargray Communications USA Communications (AL assets) - - - - AL
Jan-19 Southern Cross Group (financial sponsor) Movistar Mexico (unspecified network assets) - - - - Unspecified network assets
Dec-18 Arvig Enterprises Windstream (MN dk fiber assets) $50 - - - MN
Dec-18 Arvig Enterprises Windstream (NE dk fiber assets) $11 - - - NE
Dec-18 Infracapital (M&G Prudential) SSE Enterprise Telecom (50% stake) $433 - 8,513 $102 UK
Dec-18 Phoenix Tower International Syscom Telecom - - - - US and Canada
Nov-18
Resurgence Infrastructure Group
(Resurgence IG) Strome Fiber Holdings - - - - Southeastern US (Miami-to-Atlanta) fiber route + colo huts
Nov-18 Cable One Clearwave Communications - - 2,400 - Southern Illinois
Sep-18 Broadnet Holding (EQT) GlobalConnect (EQT) - - 14,913 - Norway, Denmark, N. Germany
Sep-18 Independents Fiber Network (CNI) Smart Connect Fiber (OH assets) - - 205 - Southwest Ohio
Aug-18 Algar Telecom CEMIG (Lot 2) $21 - 2,042 $10 Brazil (Northeast and Goias)
Aug-18 American Tower CEMIG (Lot 1) $154 - 3,861 $40 Brazil (Minas Gerais, Rio de Janeiro and Sao Paulo)
Aug-18 Uniti CableSouth Media - assets $31 - 607 $51 Arkansas, Louisiana and Mississippi; Sale leaseback
Aug-18 Conterra Networks Network Communications Telecom - - "several hundred" - East Texas and Northwest Louisiana
Jul-18 Pontegadea
Pontel Participaciones (TEF sub that co-owns
Telxius with KKR) $426 - - -
Pontegadea has bought a 16.65% stake in Pontel
Participaciones, which is the subsidiary of Telefonica that
shares ownership of Telxius with KKR's Taurus Bidco. Pontel
owns 60% of Telxius, and selling just under a sixth of that will
put its ownership at just above the 50% mark.
Jun-18 Grain Management (financial sponsor) Great Plains Communications - - - - Primarily NE (CO, IL, IA, KS, MN, SD, WY)
Jun-18 Enel Ufinet (21% stake) $175 - 30,447 $27 Latin America - Mexico, Chile
Jun-18 ExteNet Systems
Hudson Fiber Network (Tiger Infrastructure
Partners) - - - -
Density in NY/NJ; Owned links to domestic and intl hubs (S.
Korea, Japan, HK, Singapore)
Cable/Telecom & Communications Infrastructure 2020.12.24
December 24, 2020 54

Exhibit 70: Select Cable, Satellite, and Telecom Transactions
Source: FactSet
Exhibit 71: Illustrative Metro Local Dark Fiber Prices ($)
U.S. Europe
U.S. exhibit based on data from Dallas, New York, Miami and Atlanta. Europe exhibit based on data from London and Paris. Average installation charges are approximately $5,000 for U.S. and $2,200 for Europe Source: RBC Capital Markets, Company data
Announcement Date Transaction Status Acquirer Target Target Type Enterprise Value (M) EV/EBITDA
05/23/18 Cancelled Comcast Corp. Twenty-First Century Fox, Inc. Movies/Entertainment $77,464 11.9x
04/29/18 Pending T-Mobile US, Inc. Sprint Corp. Wireless Telecommunications $58,849 5.4x
10/31/16 Complete CenturyLink, Inc. Level 3 Communications, Inc. Major Telecommunications $34,663 13.0x
10/22/16 Complete AT&T, Inc. Time Warner, Inc. Movies/Entertainment $106,262 13.2x
09/17/15 Complete Altice NV Cablevision Systems Corp. Cable/Satellite TV $17,806 9.9x
05/26/15 Complete Charter Communications, Inc. Time Warner Cable, Inc. Cable/Satellite TV $78,209 9.5x
03/31/15 Complete Charter Communications, Inc. Bright House Networks LLC Cable/Satellite TV $10,623 -
02/05/15 Complete Frontier Communications Corp. Verizon Communications, Inc. (CA, FL & TX wireline operations) Wireless Telecommunications $10,500 -
06/16/14 Complete Level 3 Communications, Inc. tw telecom, Inc. Major Telecommunications $7,205 14.0x
05/18/14 Complete AT&T, Inc. DIRECTV Cable/Satellite TV $65,660 8.0x
04/28/14 Cancelled Charter Communications, Inc. Comcast Corp. /Time Warner Cable Systems Ops Cable/Satellite TV $7,300 -
02/13/14 Cancelled Comcast Corp. Time Warner Cable, Inc. Cable/Satellite TV $69,138 8.7x
01/13/14 Cancelled Charter Communications, Inc. /Old/ Time Warner Cable, Inc. Cable/Satellite TV $61,877 7.8x
09/02/13 Complete Verizon Communications, Inc. Cellco Partnership, Inc. Wireless Telecommunications $283,974 -
04/15/13 Cancelled DISH Network Corp. Sprint Nextel Corp. Major Telecommunications $36,051 7.5x
02/12/13 Complete Comcast Corp. NBCUniversal Media LLC Movies/Entertainment $40,178 9.6x
01/08/13 Cancelled DISH Network Corp. Clearwire Corp. Specialty Telecommunications $9,566 nm
12/17/12 Complete Sprint Nextel Corp. Clearwire Corp. Specialty Telecommunications $10,448 nm
10/03/12 Complete MetroPCS Communications, Inc. T-Mobile USA, Inc. Major Telecommunications $6,874 nm
03/20/11 Cancelled AT&T, Inc. T-Mobile USA, Inc. Major Telecommunications $55,550 11.2x
04/22/10 Complete CenturyLink, Inc. Qwest Communications International, Inc. Major Telecommunications $22,335 5.1x
05/13/09 Complete Frontier Communications Corp. Verizon Communications, Inc. (14 US States wireless operations) Wireless Telecommunications $8,580 -
05/04/09 Complete The DIRECTV Group, Inc. Liberty Entertainment, Inc. Cable/Satellite TV $14,686 nm
10/27/08 Complete CenturyTel, Inc. Embarq Corp. Specialty Telecommunications $11,516 4.4x
Cable/Telecom & Communications Infrastructure 2020.12.24
December 24, 2020 55

Exhibit 72: Illustrative Metro Suburb Dark Fiber Prices ($)
U.S.
Exhibit based on data from Plano/Dallas, San Francisco/Santa Clara and Phoenix/Chandler route. Average installation charges are approximately $4,500 for U.S. Note: Price increase in Aug-18 was due to sharp price increase in Santa Clara/San Francisco Route. Pricing of rest of the U.S. routes was largely unchanged. Source: RBC Capital Markets, Company data
Exhibit 73: Illustrative Metro 10G Wavelength Prices ($)
U.S. Europe
Average installation charge of $450 for U.S. and $800 for Europe (Dec 2020). Source: RBC Capital Markets, Company data
Cable/Telecom & Communications Infrastructure 2020.12.24
December 24, 2020 56

Exhibit 74: Illustrative Long-haul 10G Wavelength Prices ($)
U.S. Europe
Average installation charge of $2,000 for U.S. and $1,300 for Europe (Jul 2020). Source: RBC Capital Markets, Company data
Exhibit 75: Spectrum Holdings by Carrier and Bands in Top-25 Markets (MHz)
Source: FCC data, RBC Capital Markets
Cable/Telecom & Communications Infrastructure 2020.12.24
December 24, 2020 57

Exhibit 76: Spectrum Transactions
Source: FCC, RBC Capital Markets, company data
Cable/Telecom & Communications Infrastructure 2020.12.24
December 24, 2020 58

Exhibit 77: Postpaid Rate Plan Comparison – Total Monthly Billings Excluding Current Promotions (service plus device)
Single Smartphone Plan, low user (1 GB) Single Smartphone Plan, heavy user (4 GB)
Two Smartphones, average user (min 3 GB per line) Three Smartphones, average user (min 3 GB per line)
Four Smartphones, average user (min 3 GB per line)
Source: RBC Capital Markets, Company reports
$77 $79
$84
$79 $79 $79 $79 $79 $79 $79 $79 $79 $79
$82 $84 $84 $84 $84 $84 $84 $84 $84 $84 $84 $84 $84
$67 $69 $69 $69 $69 $69 $69 $69 $69 $69 $69
$89
$99 $99
$89 $89 $89 $89 $89 $89 $89 $89 $89 $90
$65
$70
$75
$80
$85
$90
$95
$100
$105
$110
Aug 17Nov 17Mar 18 Oct 18 Dec 18Mar 19July 19 Aug 19Nov 19 Dec 19Mar 20 Jul 20 Nov 20
Single Smartphone Plan, low user (1 GB) - Total Cost (Service Charge + EIP)
AT&T Verizon Sprint T-Mobile
$87 $89
$94
$89 $89 $89 $89 $89 $89 $89
$79
$82 $84 $84
$99 $99 $99
$89 $89
$84 $84
$89
$69
$96
$99 $99
$89 $89 $89 $89 $90
$65
$70
$75
$80
$85
$90
$95
$100
$105
$110
$115
Aug 17 Nov 17 Mar 18 Oct 18 Dec 18 Mar 19 July 19 Aug 19 Nov 19 Dec 19 Mar 20 Jul 20 Nov 20
Single Smartphone Plan 4 GB) - Total Cost (Service Charge + EIP)
AT&T Verizon Sprint T-Mobile
$154
$158
$148
$168 $168 $168 $168 $168 $168 $168 $168 $168 $168
$154
$158 $158 $158 $158 $158 $158 $158 $158 $158 $158 $158
$172
$178 $178
$148 $148 $148 $148 $148 $148 $148 $148 $148
$151
$130
$140
$150
$160
$170
$180
$190
$200
Aug 17 Nov 17 Mar 18 Oct 18 Dec 18 Mar 19 July 19 Aug 19 Nov 19 Dec 19 Mar 20 Jul 20 Nov 20
Two Smartphones, average user (3 GB per line) - Total Cost (Servi. Charge + EIP)
AT&T Verizon Sprint T-Mobile
$223
$233
$208
$231
$237 $237 $237
$232 $232 $232 $232 $232 $232 $232
$202 $202
$211
$218 $218 $208 $208 $208 $208 $208 $208 $208 $208 $208
$218
$228 $228
$193 $193 $193 $193 $193 $193 $193 $193 $193
$196
$185
$195
$205
$215
$225
$235
$245
$255
Aug 17 Nov 17 Mar 18 Oct 18 Dec 18 Mar 19 July 19 Aug 19 Nov 19 Dec 19 Mar 20 Jul 20 Nov 20
Three Smartphones, average user (3 GB per line) - Total Cost (Servi. Charge + EIP)
AT&T Verizon Sprint T-Mobile
$263
$272
$297
$312 $312 $312 $312 $312 $307 $307 $307 $307
$257
$268
$277 $277 $277 $277 $277 $277
$257 $257 $257 $257 $257 $257 $257 $257 $257 $257
$237 $237 $237 $237 $237 $237 $237 $237 $237 $242
$210
$240
$270
$300
$330
Aug 17 Nov 17 Mar 18 Oct 18 Dec 18 Mar 19 July 19 Aug 19 Nov 19 Dec 19 Mar 20 Jul 20 Nov 20
Four Smartphones, average user (3 GB per line) - Total Cost (Servi. Charge + EIP)
AT&T Verizon Sprint T-Mobile
Cable/Telecom & Communications Infrastructure 2020.12.24
December 24, 2020 59

Exhibit 78: Postpaid Rate Plan Comparison – Total Monthly Billings Including Promotions (service plus device)
Single Smartphone Plan, low user (1 GB) Single Smartphone Plan, heavy user (4 GB)
Two Smartphones, average user (min 3 GB per line) Three Smartphones, average user (min 3 GB per line)
Four Smartphones, average user (min 3 GB per line)
Source: RBC Capital Markets, Company reports
$77 $79
$84
$79 $79 $79 $79 $79 $79
$59 $59 $59
$79
$82 $84 $84 $84 $84 $84 $84 $84 $84 $84 $84 $84 $84
$67 $69 $69 $69 $69 $69 $69 $69 $69 $69 $69
$89
$99 $99
$89 $89 $89 $89 $89 $89 $89 $89 $89 $89
$55
$60
$65
$70
$75
$80
$85
$90
$95
$100
$105
$110
Aug 17 Nov 17 Mar 18 Oct 18 Dec 18 Mar 19 July 19 Aug 19 Nov 19 Dec 19 Mar 20 Jul 20 Nov 20
Single Smartphone Plan, low user (1 GB) - Total Cost (Service Charge + EIP)
AT&T Verizon Sprint T-Mobile
$87 $89
$94
$89 $89 $89 $89
$89 $89
$59 $59 $59
$79 $82
$84 $84
$99 $99
$99
$89 $89
$89 $84 $84
$77
$89 $89
$89
$69
$96
$99 $99
$89 $89 $89 $89 $89
$55
$65
$75
$85
$95
$105
$115
Aug 17 Nov 17 Mar 18 Oct 18 Dec 18 Mar 19 July 19 Aug 19 Nov 19 Dec 19 Mar 20 Jul 20 Nov 20
Single Smartphone Plan,(4 GB) - Total Cost (Service Charge + EIP)
AT&T Verizon Sprint T-Mobile
$154
$158
$178
$158 $158
$158 $158
$148
$168 $168 $168 $168 $168 $168 $168 $168 $168 $168
$148
$144
$158 $158 $158 $158 $158 $158 $158 $158 $158 $158 $158
$152
$178 $178
$148
$148 $148 $148 $148 $148 $148 $148
$130
$140
$150
$160
$170
$180
$190
$200
Aug 17 Nov 17 Mar 18 Oct 18 Dec 18 Mar 19 July 19 Aug 19 Nov 19 Dec 19 Mar 20 Jul 20 Nov 20
Two Smartphones, average user (3 GB per line) - Total Cost (Servi. Charge + EIP)
AT&T Verizon Sprint T-Mobile
$223
$233
$208 $208
$208 $208 $208 $208 $208 $208 $208
$231 $237 $237 $237
$232 $232 $232
$222 $222 $222 $222
$202 $202
$171
$188 $188
$208
$188
$188
$188 $188 $188 $188 $188 $188
$218
$228 $228
$193 $193
$193
$193 $193 $193 $193 $193
$193 $178
$155
$175
$195
$215
$235
$255
Aug 17 Nov 17 Mar 18 Oct 18 Dec 18 Mar 19 July 19 Aug 19 Nov 19 Dec 19 Mar 20 Jul 20 Nov 20
Three Smartphones, average user (3 GB per line) - Total Cost (Servi. Charge + EIP)
AT&T Verizon Sprint T-Mobile
$263 $272
$277 $277 $257
$257 $257 $257
$268 $277 $277 $277 $277 $277 $277
$257 $257
$257
$257 $257 $257
$198
$217 $217
$237
$217 $217 $217 $217 $217 $217 $217 $217
$264
$277
$237 $237 $237 $237 $237 $237 $237
$222
$180
$210
$240
$270
$300
$330
Aug 17 Nov 17 Mar 18 Oct 18 Dec 18 Mar 19 July 19 Aug 19 Nov 19 Dec 19 Mar 20 Jul 20 Nov 20
Four Smartphones, average user (3 GB per line) - Total Cost (Servi. Charge + EIP)
AT&T Verizon Sprint T-Mobile
Cable/Telecom & Communications Infrastructure 2020.12.24
December 24, 2020 60

Exhibit 79: Digital Realty + CyrusOne M&A Math
Source: RBC Capital Markets estimates, company filing
Cable/Telecom & Communications Infrastructure 2020.12.24
December 24, 2020 61

Exhibit 80: Digital Realty + CoreSite M&A Math
Source: RBC Capital Markets estimates, company filings
Cable/Telecom & Communications Infrastructure 2020.12.24
December 24, 2020 62

Exhibit 81: Digital Realty + NEXTDC M&A Math
Source: RBC Capital Markets estimates, company filings
Cable/Telecom & Communications Infrastructure 2020.12.24
December 24, 2020 63

Exhibit 82: Potential 2021E FFO/share and AFFO/share Accretion for a Digital Realty and CyrusOne M&A
Note: 100% Equity Financing and 50% Opex synergies realized in year 1. Source: RBC Capital Markets estimates, company filings
Exhibit 83: Potential 2021E FFO/share and AFFO/share Dilution for a Digital Realty and CoreSite M&A
Note: 100% Equity Financing and 50% Opex synergies realized in year 1. Source: RBC Capital Markets estimates, company filings
Cable/Telecom & Communications Infrastructure 2020.12.24
December 24, 2020 64

Exhibit 84: Potential 2021E FFO/share and AFFO/share Dilution for a Digital Realty and NEXTDC M&A
Source: RBC Capital Markets estimates, company filings
Cable/Telecom & Communications Infrastructure 2020.12.24
December 24, 2020 65
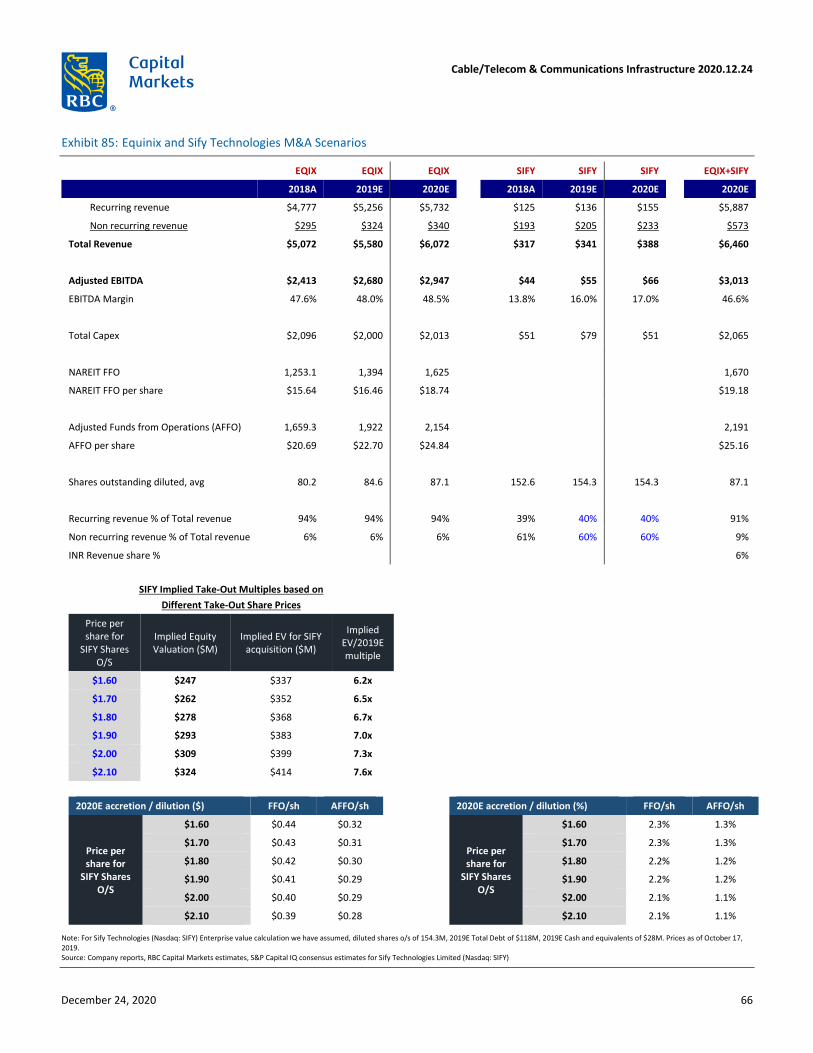
Exhibit 85: Equinix and Sify Technologies M&A Scenarios
EQIX EQIX EQIX SIFY SIFY SIFY EQIX+SIFY
2018A 2019E 2020E 2018A 2019E 2020E 2020E
Recurring revenue $4,777 $5,256 $5,732 $125 $136 $155 $5,887
Non recurring revenue $295 $324 $340 $193 $205 $233 $573
Total Revenue $5,072 $5,580 $6,072 $317 $341 $388 $6,460
Adjusted EBITDA $2,413 $2,680 $2,947 $44 $55 $66 $3,013
EBITDA Margin 47.6% 48.0% 48.5% 13.8% 16.0% 17.0% 46.6%
Total Capex $2,096 $2,000 $2,013 $51 $79 $51 $2,065
NAREIT FFO 1,253.1 1,394 1,625 1,670
NAREIT FFO per share $15.64 $16.46 $18.74 $19.18
Adjusted Funds from Operations (AFFO) 1,659.3 1,922 2,154 2,191
AFFO per share $20.69 $22.70 $24.84 $25.16
Shares outstanding diluted, avg 80.2 84.6 87.1 152.6 154.3 154.3 87.1
Recurring revenue % of Total revenue 94% 94% 94% 39% 40% 40% 91%
Non recurring revenue % of Total revenue 6% 6% 6% 61% 60% 60% 9%
INR Revenue share % 6%
SIFY Implied Take-Out Multiples based on
Different Take-Out Share Prices
Price per share for
SIFY Shares O/S
Implied Equity Valuation ($M)
Implied EV for SIFY acquisition ($M)
Implied EV/2019E multiple
$1.60 $247 $337 6.2x
$1.70 $262 $352 6.5x
$1.80 $278 $368 6.7x
$1.90 $293 $383 7.0x
$2.00 $309 $399 7.3x
$2.10 $324 $414 7.6x
2020E accretion / dilution ($) FFO/sh AFFO/sh 2020E accretion / dilution (%) FFO/sh AFFO/sh
Price per share for
SIFY Shares O/S
$1.60 $0.44 $0.32
Price per share for
SIFY Shares O/S
$1.60 2.3% 1.3%
$1.70 $0.43 $0.31 $1.70 2.3% 1.3%
$1.80 $0.42 $0.30 $1.80 2.2% 1.2%
$1.90 $0.41 $0.29 $1.90 2.2% 1.2%
$2.00 $0.40 $0.29 $2.00 2.1% 1.1%
$2.10 $0.39 $0.28 $2.10 2.1% 1.1%
Note: For Sify Technologies (Nasdaq: SIFY) Enterprise value calculation we have assumed, diluted shares o/s of 154.3M, 2019E Total Debt of $118M, 2019E Cash and equivalents of $28M. Prices as of October 17, 2019. Source: Company reports, RBC Capital Markets estimates, S&P Capital IQ consensus estimates for Sify Technologies Limited (Nasdaq: SIFY)
Cable/Telecom & Communications Infrastructure 2020.12.24
December 24, 2020 66

Exhibit 86: Chinese dual listed stock performance/discount
Source: RBC Capital Markets, Capital IQ
Exhibit 87: Exchange Count by Continent
Source: open-ix
Base date - filing date of HK prospectus Base date - initial media mention of possible HK listingAbsolute performance Absolute performance
1 yr prior 1-week 2-weeks 1-month 3-months 5-months 1-week 2-weeks 1-month 3-months 5-monthsAlibaba NYSE:BABA 24% (0%) 10% 12% 19% 8% (0%) 5% 10% 7% 13%JD.com NasdaqGS:JD 125% (2%) (1%) - - - (1%) 8% 17% - -NetEase NASD:NTES 60% 3% 4% 8% - - 3% 14% 11% - -
Average 70% 0% 4% 10% 19% 8% 0% 9% 13% 7% 13%
Performance relative to NASDAQ Performance relative to NASDAQ1 yr prior 1-week 2-weeks 1-month 3-months 5-months 1-week 2-weeks 1-month 3-months 5-months
Alibaba NYSE:BABA 6% (1%) 7% 9% 5% 11% 1% 2% 6% 4% 4%JD.com NasdaqGS:JD 96% 1% (2%) - - - (3%) 3% 8% - -NetEase NASD:NTES 32% (1%) 2% 1% - - 1% 9% 4% - -
Average 45% (0%) 3% 5% 5% 11% (1%) 5% 6% 4% 4%
Performance rel. to China Internet Index (KBEW) Performance rel. to China Internet Index (KBEW)1 yr prior 1-week 2-weeks 1-month 3-months 5-months 1-week 2-weeks 1-month 3-months 5-months
Alibaba NYSE:BABA 12% 4% 9% 10% 7% 8% (0%) 0% 3% 6% 3%JD.com NasdaqGS:JD 83% (2%) (9%) - - - 1% 4% 12% - -NetEase NASD:NTES 27% (3%) (4%) (8%) - - (3%) (0%) (13%) - -
Average 41% (0%) (2%) 1% 7% 8% (1%) 1% 0% 6% 3%
US issue out/(under) performance rel. to HK issue
1st HK trading day * 1-week 2-weeks 1-month 3-months
Alibaba (4%) (3%) (3%) (2%) (4%)JD.com (6%) (2%) (0%) - -NetEase (9%) 0% 2% - -
Average (6%) (2%) (0%) (2%) (4%)
Note: 1st trading day performance relative to IPO price. Other metrics are relative to close of first day of trading.
Cable/Telecom & Communications Infrastructure 2020.12.24
December 24, 2020 67

Exhibit 88: Port Count by Continent
Source: open-ix
Exhibit 89: Port Count by Global Primary Hub
Source: Open-ix
Cable/Telecom & Communications Infrastructure 2020.12.24
December 24, 2020 68

Exhibit 90: Traffic Capacity by Global Primary Hub (July 2020)
Source: Open-ix
Exhibit 91: Unique ASN by Global Primary Hub (July 2020)
Source: Open-ix
Cable/Telecom & Communications Infrastructure 2020.12.24
December 24, 2020 69

Exhibit 92: Port Count by US Primary Hub (July 2020)
Source: Open-ix
Exhibit 93: Traffic Capacity by US Primary Hub (July 2020)
Source: Open-ix
Cable/Telecom & Communications Infrastructure 2020.12.24
December 24, 2020 70

Exhibit 94: Unique ASN by US Primary Hub (July 2020)
Source: Open-ix
Exhibit 95: Port Count by US Secondary Market (July 2020)
Source: Open-ix
Cable/Telecom & Communications Infrastructure 2020.12.24
December 24, 2020 71

Exhibit 96: Traffic Capacity by US Secondary Market (July 2020)
Source: Open-ix
Exhibit 97: Unique ASN by US Secondary Market (July 2020)
Source: Open-ix
Cable/Telecom & Communications Infrastructure 2020.12.24
December 24, 2020 72

Exhibit 98: COVID-19 response by country
2019
Nominal GDP 1Q20 2Q20
(US$, bns) Q/Q Y/Y Q/Q Y/Y Employee support End date Firm stimulus End date
Germany $3,867 (1.5%) 0.2% (8.9%) (8.9%)
Expanded short-term work
("Kurzarbeit") Mar-22
€50 billion in grants to small business owners and
self-employed persons; grants to help companies
cover fixed costs Dec-20
€2bn of venture capital funding for start-ups Dec-20
France $2,717 (4.8%) (3.7%) (11.5%) (15.2%)
Government pays 70% of wages of
furloughed employees, lowered to
60% in June Mar-22
Postponement of rent and utility payments for
affected microenterprises and SMEs
Been
slowly
phased out
since June
Liquidity support through postponements of social
security and tax payments for companies and
accelerated refund of tax credits (e.g. CIT and VAT);
Been
slowly
phased out
since June
€30 billion for the move to a greener economy, with
money earmarked to renovate buildings to be more
energy-efficient, to boost investments in
environmentally friendly industries and decarbonize
the economy; Dec-22
€35 billion to boost companies' competitiveness
through a €20 billion reduction in taxes on
production and funds to help companies in strategic
sectors scale-up and/or relocate; Dec-22
€35 billion for social and territorial cohesion to
boost youth employment and training. Dec-22
UK $2,828 (1.2%) 0.3% (15.4%) (15.6%)
Government pays 80% of wages of
furloughed employees, lowered to
70% in June (up to a cap of £2,500) Oct-20
The UK government has operated a program under
which it purchases newly issued commercial paper
from eligible companies. The CCFF is unlimited in
size, and available to larger companies. Mar-21
The Term Funding Scheme with additional
incentives for SMEs (TFSME) is offering four-year
funding of at least 10% of the participants' stock of
real economy lending at interest rates at, or very
close to, the Bank of England Base Rate Apr-21
The Coronavirus Large Business Interruption Loan
Scheme (CLBILS) provides a government guarantee
of 80% for banks to make loans of up to £25m to
firms with an annual turnover of more than £45m.
All viable businesses with turnover of more than £45
million per year can apply for up to £25 million of
finance. Firms with a turnover of more than £250
million can apply for up to £50 million of finance.
No stated
deadline
Italy $2,001 (5.2%) (4.6%) (12.3%) (16.5%)
Furloughed employees receive 80% of
wages (up to a cap of EUR 939.89 or
EUR 1,199.72 depending on salary) Oct-20 Grants for SMEs and tax deferrals
No stated
deadline
Labor and social measures (€12 billion) include,
among other things, an extension of the short-time
work program, extensions of the moratorium on
SMEs’ debt repayment and the time to pay back tax
obligations.
No stated
deadline
Until 31 December 2020, SACE S.p.A. issues
guarantees for loans granted to companies of any
size (€200billion of which €30 billion for SMEs). SACE
guarantees between 90% and 70% of the granted
loans’ amount; the guarantees’ amount depends on
the number of companies’ employees in Italy and on
the relative annual turnover (less or more than 5000
employees and until €1,5 billions, between
€1,5billions and €5billions or greater than €5 billion
annual turnover). Certain conditions should be met:
e.g. companies should not approve the distribution
of dividends or the repurchase of shares within 2020
and they must use them for employment expenses,
investments or business activities in Italy. Dec-20
Cable/Telecom & Communications Infrastructure 2020.12.24
December 24, 2020 73

2019
Nominal GDP 1Q20 2Q20
(US$, bns) Q/Q Y/Y Q/Q Y/Y Employee support End date Firm stimulus End date
The Central Fund issues guarantees, free of charge,
to companies with less than 499 employees and in
relation to loans with an amount up to €5 million. Dec-20
Netherlands $909 (1.1%) 2.0% (8.2%) (7.2%)
Government will pay up to 90% of
company's wage bill, depending on
the loss of turnover NA Credit facilities for SMEs.
No stated
deadline
Growth Facility Scheme: The Growth Facility
Scheme, which makes it easier for SMEs to raise
capital Jul-21
Because overhead is also a problem for many
companies and organizations, the Government has
introduced a new scheme, the Overhead
Compensation SMEs (Tegemoetkoming Vaste Lasten
mkb; TVL). This new compensation can be applied
for by SME entrepreneurs working in sectors that
qualify for the current TOGS scheme (Tax-exempt
compensation for Entrepreneurs in Affected Sectors
COVID-19; Tegemoetkoming Ondernemers
Getroffen Sectoren COVID-19; TOGS). Oct-20
Switzerland $705 (2.4%) (1.1%) (8.4%) (9.7%)
Government will reimburse up to 80%
of employee's gross salary NA
CHF8 billion for partial unemployment
compensation
No stated
deadline
CHF1 billion for financial aid to particularly-affected
firms
No stated
deadline
CHF580 million for loan guarantees for SMEs.No stated
deadline
Deferral of social insurance contributions:
Companies affected by the crisis are able to request
to defer the payment of social insurance
contributions temporarily. No late interest is then
levied on instalment payments until 20 September
2020. An adjustment of the usual amount of
advance payments made under these insurances in
the event of a significant drop in the wage bill could
be requested. Moreover, no payment reminders will
be sent until June 2020. These measures also apply
to self-employed persons whose turnover has
dropped. Moreover, employers may temporarily use
their accumulated employer contribution reserves
to pay employer contributions to occupational
pension funds. Sep-20
Immediate assistance in the form of specific
transitional credits: the Confederation has set up a
guarantee program with a volume approx. CHF 60
billion to ensure that affected SMEs (sole
proprietorships, partnerships and legal entities)
obtain transitional bank credits. This program is
based on the existing structures of the guarantee
organizations. Therefore, requests for such credits
could have been made by the Swiss bank where the
requestor has its bank account between 26 March
and 31 July 2020.Jul-20
Turkey $726 (11.1%) 16.0% (3.0%) 1.3%
Short-term work allowances, or TRY
39.24 per day for furloughed
employees Dec-20
A TL100 billion package was announced which
included: reduced/postponed taxes for affected
industries (e.g.. tourism), extension of personal and
corporate income tax filing deadlines, and Turkey
Wealth Fund (TWF) given new rights to buy stakes in
distressed firm. Dec-20
Accommodation tax will not be applied until
November 2020 Nov-20
On June 30 , the short-work allowance system that
provides income support to employees of fully or
partially closed businesses due to force majeure was
extended by one month. VAT on several services
sectors that are affected severely by the coronavirus
pandemic were reduced temporarily till the end of
2020. Dec-20
Cable/Telecom & Communications Infrastructure 2020.12.24
December 24, 2020 74

2019
Nominal GDP 1Q20 2Q20
(US$, bns) Q/Q Y/Y Q/Q Y/Y Employee support End date Firm stimulus End date
VAT on several services sectors that are affected
severely by the coronavirus pandemic were reduced
temporarily till the end of 2020. Dec-20
Spain $1,394 (5.1%) (2.5%) (18.3%) (21.1%)
Government pays 70% of wages of
furloughed employees Sep-20
Expansion of ERTE (furlough scheme) to cover
workers and companies with significant activity
reduction in sectors considered essential Sep-20
Exemptions of social contributions for impacted
companies that maintain employment under the
ERTE (€2.2 billion) Sep-20
Tax payment deferrals for small and medium
enterprises and self-employed for six months, with
the first four months exempt from interest
No stated
deadline
Extension of the deadlines for filing tax returns and
self-assessment to May 30 for SMEs and self-
employed; May-20
Flexibility for SMEs and self-employed to calculate
their income tax and VAT installment payment
based on the actual profit in 2020 Dec-20
No surcharge for late payment of tax debts for
companies obtaining financing through the Instituto
de Crédito Oficial (ICO) Guarantee Lines
No stated
deadline
Russia* $1,701 (15.1%) 1.5% (8.0%) (11.8%)
Short-term work allowances; working
hours may be reduced 30% at 80-90%
of regular pay. Employees only pay
hours worked, while the rest is paid by
the government Sep-20
Interest rate subsidies for SMEs and systemically
important enterprises.
No stated
deadline
Tax deferrals for most affected companies on most
taxes.
No stated
deadline
Deferrals on social contributions for SMEs in
affected sectors for 6 months. Sep-20
Social contributions by SMEs on wages in excess of
the minimum wage permanently reduced;
No stated
deadline
A tax holiday on all taxes (excluding VAT) and social
contributions for Q2 for SMEs, sole proprietors, and
NGOs providing social services; Jun-20
Guaranteed loans to SMEs and affected industriesNo stated
deadline
Poland* $592 (13.4%) 5.8% (5.0%) (4.2%)
Businesses may apply for a three-
month subsidiary of 50-90% of the
minimum wage for each employee NA
Deduction of this year’s losses for 2021 tax
settlement (tax returns for 2019 might be corrected
in order to deduct the losses of 2020 from the 2019
income); Dec-20
Possibility of suspending certain social benefits
obligations during the period of epidemic
emergency
No stated
deadline
Cable/Telecom & Communications Infrastructure 2020.12.24
December 24, 2020 75

2019
Nominal GDP 1Q20 2Q20
(US$, bns) Q/Q Y/Y Q/Q Y/Y Employee support End date Firm stimulus End date
Japan $5,082 (0.5%) (1.1%) (7.6%) (9.0%)
Government of JPY
15,000/day/employee on leave Dec-20
Ministry of Finance (MOF) decided to use loan for
crisis response. Low interest rate loan provided by
Development Bank of Japan (DBJ) . Under this
scheme, there are no upper limit of loan and
Japanese media reported to use by large companies
(e.g. Airline companies, Automotive manufactures
etc.). As of End of July, total lending outstanding
was ¥1,877.6 billion (147 cases)No stated
deadline
Ministry of Finance (MOF) decided to use safety net
loan (loan limit:JPY720million) and loan for crisis
response (loan limit: JPY300million) to support
SMEs. Low interest rate loan provided by
government financial institutions (JFC, Shoko Chukin
Bank etc.).No stated
deadline
Ministry of Finance (MOF) established special loan
program for novel coronavirus. Low interest rate
loan provided by Japan Finance Corporation (JFC)
and Okinawa development finance corporation.
Loan limit is JPY300milion.
No stated
deadline
Ministry of Economy, Trade and Industry (METI)
decided to use safety net guarantee program
(guarantee limit: JPY280 million) and crisis related
guarantee (guarantee limit:JPY280 million) to
support SMEs.
No stated
deadline
HK* $366 (11.1%) (6.5%) (3.6%) (8.1%)
Wage subsidy (50% of monthly wage,
subject to a cap) for six months; and
short-term work allowances NA
Tax and fee reliefs and other one-off relief measures
(HK$79.5 billion or 2.8 percent of GDP) No stated
deadline
Sector-specific relief measures (HK$21 billion or 0.7
percent of GDP)
No stated
deadline
Australia $1,386 0.9% 3.3% (7.6%) (5.9%)
Wage subsidy of
A$1,500/employee/every two weeks Mar-21
Cash flow support to businesses, investment
incentives, and targeted measures for affected
regions and industries (including the HomeBuilder
program supporting the construction industry).
2023-2024
(majority
executed in
2020-2021)
Singapore $372 (0.4%) (2.2%) (16.3%) (18.1%)
Wage subsidy, with levels of support
depending on the sector Mar-21
Enhancement of financing schemes, and additional
support for the self-employed and industries most
directly affected (aviation, tourism, construction,
transportation, arts and culture). No stated
deadline
The authorities have increased their contingencies
funds for unforeseen expenditure needs and also
set aside loan capital of S$20 billion to help
businesses and individuals facing cash flow
challenges with loan obligations and insurance
premium payments.No stated
deadline
Cable/Telecom & Communications Infrastructure 2020.12.24
December 24, 2020 76

*Not seasonally adjusted. GDP growth/contraction is based on seasonally adjusted, nominal GDP unless otherwise noted Source: Government websites, FactSet, IMF, KMPG, Reuters, Japan Times, Whitecase, Accurity, Financial Times, JDSupra
2019
Nominal GDP 1Q20 2Q20
(US$, bns) Q/Q Y/Y Q/Q Y/Y Employee support End date Firm stimulus End date
India* $2,888 3.0% 7.5% (28.5%) (22.6%)
Farmers receive payments through
minimum income support scheme;
Mahatma Gandhi National Rural
Employment Guarantee Act workers
wages increased NA
India’s fiscal support measures can be divided into
two broad categories: (i) direct spending (about 1.7
percent of GDP) and foregone or deferred revenue
(about 0.3 percent of GDP falling due within the
current year); and (ii) below-the-line measures
designed to support businesses and shore up credit
provision to several sectors (about 4.9% of GDP).No stated
deadline
Several measures to ease the tax compliance burden
across a range of sectors have also been announced,
including postponing some tax-filing and other
compliance deadlines, and a reduction in the
penalty interest rate for overdue GST filings.No stated
deadline
Key elements of the business-support package are
various financial sector measures for micro, small,
and medium-sized enterprises and non-bank
financial companies, whereas additional support to
farmers will mainly be in the form of providing
concessional credit to farmers, as well as a credit
facility for street vendors. Agricultural sector
support is mainly for infrastructure development.No stated
deadline
Indonesia $1,120 (2.4%) 3.7% (6.0%) (7.0%)
Employees are entitled to receive full
pay if they are suspected of being
infected or are actually infected with
COVID-19; expanded unemployment
benefits NA
Permanent reductions of the corporate income tax
rate from 25 percent to 22 percent in 2020-21 and
20 percent starting in 2022. In addition to tax and
spending measures, the fiscal packages include
capital injection into SOEs and interest subsidies,
credit guarantees, and loan restructuring funds for
micro, small, and medium enterprises (MSMEs).No stated
deadline
Cable/Telecom & Communications Infrastructure 2020.12.24
December 24, 2020 77

Exhibit 99: F/X Impact Sheet for 4Q20E
Source: Company Reports, RBC Capital Markets estimates
Cable/Telecom & Communications Infrastructure 2020.12.24
December 24, 2020 78

Exhibit 100: F/X impact Sheet for FY2020E
Source: Company Reports, RBC Capital Markets estimates
Cable/Telecom & Communications Infrastructure 2020.12.24
December 24, 2020 79

Recent Industry and Company Developments AT&T update. WarnerMedia has completed its acquisition of You.i TV, a provider of cross-platform development tools for TV and media companies. The company's You.i Engine One enterprise development platform delivers video apps across mobile, tablet, game consoles, streaming devices, set-top boxes, and Smart TVs using a single codebase. The single codebase approach allows developers to build app features and make user experience changes once and then deploy across a variety of devices and operating systems. "The You.i Engine One technology, and the development teams behind it, are best-in-class," said Jason Press, WarnerMedia Executive Vice President of Direct-to-Consumer Technology & Program Management. "The You.i platform will enhance the HBO Max technology stack, increase developer efficiency, and accelerate delivery as we bring HBO Max to consumer devices all around the world." WarnerMedia and other affiliates of AT&T currently utilize You.i TV technology to enable apps for AT&T TV Now, TNT, TBS, truTV, B/R Live, Rooster Teeth, DIRECTV GO in Latin America, WarnerMedia International, and the WarnerMedia RIDE in-car entertainment experience in partnership with AT&T and General Motors. (Company release)
Verizon update. Verizon Business is teaming with Deloitte to co-innovate 5G and mobile edge computing (MEC) solutions. The companies are co-developing a smart factory solution at Verizon's Customer Technology Center in Richardson, TX, that will utilize computer vision and sensor-based detection coupled with MEC to identify and predict quality defects on the assembly line and automatically alert plant engineering and management in near real-time. "By bringing together Verizon's 5G and MEC prowess with Deloitte's deep industry expertise and track record in system integration with large enterprises on smart factories, we plan to deliver cutting-edge solutions that will close the gap between digital business operations and legacy manufacturing environments and unlock the value of the end-to-end digital enterprise," said Tami Erwin, CEO of Verizon Business. "This collaboration is part of Verizon's broader strategy to align with enterprises, startups, universities and government to explore how 5G and MEC can disrupt and transform nearly every industry." (Company release)
CCI 2019 Corporate Sustainability Report. Crown Castle International Corp announced the release of its 2019 Corporate Sustainability Report ("CSR"). "Our lives in the US changed dramatically in 2020 and, as a result, how we connect has evolved," stated Jay Brown, Crown Castle's Chief Executive Officer. "Crown Castle, now more than ever, is committed to building and maintaining the essential communications infrastructure connecting our communities – making them safer, better places to live. We are excited about the enhancements we have made to this year's CSR, and we look forward to continued engagement on this important area of focus." (Company release)
Cogent and BDx partner in Singapore (SIN1) Facility. Big Data Exchange (BDx), a pan-Asian carrier-neutral data center cluster, announced a new partnership with Cogent Communications in the company's Singapore (SIN1) datacenter facility. Acquired by BDx earlier this year, SIN1 is one of the facilities still available to service new customers in capacity-constrained Singapore. SIN1 houses 1,500 racks with a 6 MW power capacity within 14,400 square meters. It has been awarded an UpTime Tier 3 Design Certificate, as well as holding SS564 GreenMark Gold Plus, TVRA, ISO27001 and PCI-DSS certifications. Construction to add four floors and an additional 8 MW of capacity has also started. Upon completion, the SIN1 data center will house a total of 14 MW of capacity, making BDx one of the few data centers still able to service new customers in Singapore. The addition of Cogent as a new carrier in the BDx SIN1 facility will allow BDx customers to benefit from Cogent's footprint, network capabilities and range of services. Cogent is available as a connectivity option to all BDx customers regardless of the type of colocation services they require. "This new agreement with Cogent marks the beginning of a strategic partnership which we look forward to
Cable/Telecom & Communications Infrastructure 2020.12.24
December 24, 2020 80

developing," says Sona Singh, Business Development Director at BDx. "We are proud that Cogent has chosen BDx to partner within the important Singapore market. Together, we offer an even wider range of services for our customers. We are pleased to welcome Cogent into our SIN1 facility and look forward to expanding our partnership in the near future." (Company release)
Digital Realty Earns Nareit's Data Center Sustainability Award for Fourth Consecutive Year. Digital Realty announced it has earned the National Association of Real Estate Investments Trusts (Nareit) "Leader in the Light" award for data center sustainability for the fourth consecutive year. The award honors Nareit member companies that have produced measurable results from the implementation of sustainable business practices. "We are proud to recognize our members who demonstrate leadership in the REIT and publicly traded commercial real estate industry with their vision, innovation and strategy in addressing ESG issues," said Fulya Kocak, senior vice president, ESG issues, Nareit. In 2020, Digital Realty added 154 MWs of renewable energy contracts across its U.S. portfolio, bringing the total executed under long-term contracts to 556 MWs of renewable energy. Last year, the company's renewable energy efforts resulted in 1.25M metric tons of avoided carbon emissions, the equivalent of taking 271,000 cars off the road each year, or the electricity needs of more than 212,000 homes per year. "Accelerating digital transformation has driven rapid growth in data center demand, underscoring the importance of environmental stewardship," said Digital Realty Chief Executive Officer A. William Stein. "We're honored to be recognized by Nareit for the fourth consecutive year, a testament to our consistent track record of setting the standard for responsible business practices. Looking forward, we remain committed to accelerating and expanding our sustainability initiatives and making progress towards our recently announced carbon reduction goals." Digital Realty recently committed to a carbon emissions reduction target with the Science-Based Targets initiative (SBTi). As part of the pledge, Digital Realty has committed to reducing direct emissions by 68% and indirect emissions by 24% by 2030. (Company release)
Landmark Announces Cash Distribution for its 8.00% Series A Preferred Units. Landmark Infrastructure Partners LP announced that the board of directors of its general partner declared a quarterly cash distribution for its 8.00% Series A Cumulative Redeemable Perpetual Preferred Units of $0.500 per Series A Preferred Unit, payable on January 15, 2021, to Series A Preferred Unitholders of record as of January 4, 2021. (Company release)
T-Mobile Selected as State of Texas Telecommunications Relay and Captioned Telephone Services Provider. T-Mobile announced that it has been selected to provide Telecommunications Relay Service (TRS) and Captioned Telephone service (CapTel) in the state of Texas, referred to as Relay Texas. The Public Utilities Commission of Texas (PUCT) renewed its relationship with T-Mobile, effective December 1, 2020, after more than 30 years of history with Sprint, now part of T-Mobile. TRS communications, including Relay Texas, can be accessed by dialing 711 anywhere in the U.S. from any phone and is available 24 hours a day, 365 days a year. "We are excited to continue our wonderful relationship with the great state of Texas, as well as working with the Public Utilities Commission and Relay Texas consumers as we endeavor to improve the quality of life for all," said Mike Ellis, who leads accessibility at T-Mobile. "T-Mobile provides a comprehensive array of accessible communication services to empower people who are Deaf, Hard of Hearing, DeafBlind, Low-Vision or have a Speech Disability that provide functionally equivalent communication options." (Company release)
American Tower Closes InSite Wireless Group Acquisition. American Tower Corporation announced that it has closed its acquisition of InSite Wireless Group, LLC. The total consideration for the transaction, subject to certain post-closing adjustments, was approximately $3.5B, including the assumption or repayment of existing InSite debt, and was
Cable/Telecom & Communications Infrastructure 2020.12.24
December 24, 2020 81

funded by a combination of cash on hand and revolver borrowings. Tom Bartlett, American Tower’s Chief Executive Officer stated, “We are pleased to close this immediately accretive transaction and expect to quickly begin driving new leasing activity on these high-quality, well-located assets. As 5G densification initiatives in the U.S. accelerate and network deployments in international markets continue, we believe we are well positioned to generate attractive, sustainable long-term growth, including on these new sites, while playing a key role in enhancing mobile broadband connectivity.” American Tower expects the assets acquired from InSite to generate approximately $150M in property revenue and approximately $115M in gross margin in 2021. (Company release)
APAC update. 1) Chindata Group has started construction of its first high-end equipment manufacturing industrial base in Hebei Province, China, which will cover the research & development, design and manufacturing of prefabricated modules, flexible intelligent manufacturing, data center modules, equipment modules and professional products. Mr. Alex Ju, Founder and CEO of Chindata Group, said high-end equipment manufacturing is a strategic industry fundamental to the digital age and will propel the iterative product upgrade in the hyperscale data center campuses. Speaking at the groundbreaking ceremony held in Zhangjiakou, Mr. Ju shared that Chindata Group will continue to leverage on the advantage of its business model and master the core technologies in key areas that will improve its innovation capabilities and drive the long-term development of the industry. He believes that Chindata Group will strive to advance equipment manufacturing together with the industrial partners for a better and shared digital society. (Company release) 2) Based on our discussion with industry contacts, datacenter demand in Japan (both Tokyo and Osaka) and Singapore remains strong. We believe DLR is well positioned to see commitments on unleased capacity it has in those markets. As it pertains to GDS, we have heard from industry contacts continued indications that the company continues to evaluate ways to expand beyond China into additional Asian markets, which is in line with comments that GDS management made at our investor conference on May 27th. We note that GDS’ largest stakeholder, STT, owns and operates datacenter businesses elsewhere in the region, which could potentially facilitate the creation of a joint regional datacenter entity with cross-ownership stakes, as just one example of how this expansion could be achieved. In this manner, GDS could continue to serve its large Chinese clients outside of mainland China.
Equinix and GIC JV. Equinix and GIC, Singapore’s sovereign wealth fund, closed a joint venture whereby the JV acquired three sites in Japan for the development and operation of data centers with an opportunity to add more sites at later dates. The data center sites have been acquired and are held by wholly owned subsidiaries of APAC 1 Hyperscale LP, a limited partnership formed and registered under the laws of Singapore, of which Equinix owns a 20% interest and GIC owns an 80% interest. The three sites are located in Tokyo (two data center sites) and Osaka (one data center site). Equinix will provide a number of services, and each of the data centers will be managed and operated by Equinix. The services will include the sales and marketing of the data centers, managing the development of the data centers (and any expansions to those data centers), and facilities management of the data centers. (Company release)
Comcast Launching 10 WiFi-Connected "Lift Zones" In Greater Boston Area. Comcast announced plans to equip 10 different locations in the Boston area with WiFi-connected "Lift Zones" over the next few months. Working with its network of nonprofit partners, Comcast will be providing WiFi coverage at spaces in the City of Boston and beyond that are expected to help thousands of low-income students get online and do their homework. Lift Zones will feature free WiFi provided by Comcast, which allows students to work on laptops simultaneously so they can participate in distance learning. This initiative provides free connectivity inside partner community centers for the next three years. "We know that our
Cable/Telecom & Communications Infrastructure 2020.12.24
December 24, 2020 82

families – youth and their parents – have a fundamental need for access to crucial resources like WiFi Lift Zones, bridging the gap when at-home connectivity may not be available," said William Morales, Commissioner of Boston Centers for Youth & Families (BCYF). "Thanks to Comcast, we look forward to connecting many of our community centers with this super-charged WiFi to provide a dynamic learning environment for our kids." (Company release)
Brazil update. 1) The number of Brazilian smartphone users who subscribe to video streaming services has grown from 45 percent in 2019 to 56 percent in 2020, according to the new Panorama Mobile Time/Opinion Box survey on apps usage in Brazil. Netflix continues to lead with a 76 percent market share, although it is constantly losing share (85% in 2019). Amazon Prime Video is second with 11 percent, followed by Globoplay (3%), Disney+ (1%) and Telecine (1%). (Telecompaper) 2) The WiFi 6E Brazil Coalition has sent a letter to Brazil's National Telecommunications Agency (Anatel), expressing support for the regulatory agency to recommend the unlicensed use of the 6 GHz band, reports Teletime. The Wi-Fi coalition, whose members include Oi, Facebook, Google, Amazon and telecom sector associations such as Abrint, said the regulator's decision will enable widespread broadband connectivity. (Telecompaper, Teletime) 3) American Tower has signed an agreement with Technology Park of Belo Horizonte (BH Tec) for the development of IoT services, reports Telesintese. An IoT reference centre will be in charge of mobilizing developers and those who join will be able to use the LoRaWAN network of American Tower. (Telecompaper, Telesintese)
Nigeria update. Nigeria has extended the timeline for telecoms providers to update SIM card registrations following a meeting on Monday with chief executives of mobile phone companies, the telecoms regulator said. The regulator said it had extended registrations to Jan. 19 from Dec. 30 for providers to add valid National Identification Numbers (NIN) to every SIM card registered in the country. Subscribers without an NIN attached to their SIM cards have until Feb 9, 2021, to register, the regulator said in a statement. It has said SIM cards without a NIN attached will be blocked. Nigeria created the SIM card registration rules in an attempt to stop terrorists and criminals from using unregistered SIMs. (Reuters)
Cable/Telecom & Communications Infrastructure 2020.12.24
December 24, 2020 83

Companies mentionedAmerican Tower Corporation (NYSE: AMT US; $218.65; Outperform)AT&T Inc. (NYSE: T US; $28.69; Sector Perform)Cogent Communications Holdings, Inc. (NASDAQ: CCOI US; $59.56; Sector Perform)Comcast Corporation (NASDAQ: CMCSA US; $50.38; Sector Perform)Crown Castle International Corp. (NYSE: CCI US; $154.00; Outperform)Digital Realty Trust, Inc. (NYSE: DLR US; $137.43; Outperform)DISH Network Corporation (NASDAQ: DISH US; $31.06; Sector Perform)Equinix, Inc. (NASDAQ: EQIX US; $705.94; Outperform)GDS Holdings Limited (NASDAQ: GDS US; $91.30; Outperform)Landmark Infrastructure Partners LP (NASDAQ: LMRK US; $11.24; Sector Perform)T-Mobile US, Inc. (NASDAQ: TMUS US; $132.92; Sector Perform)Verizon Communications Inc. (NYSE: VZ US; $58.84; Sector Perform)
Required disclosuresConflicts disclosuresThis product constitutes a compendium report (covers six or more subject companies). As such, RBC Capital Markets chooses toprovide specific disclosures for the subject companies by reference. To access conflict of interest and other disclosures for thesubject companies, clients should refer to https://www.rbccm.com/GLDisclosure/PublicWeb/DisclosureLookup.aspx?entityId=1.These disclosures are also available by sending a written request to RBC Capital Markets Research Publishing, P.O. Box 50, 200 BayStreet, Royal Bank Plaza, 29th Floor, South Tower, Toronto, Ontario M5J 2W7 or an email to [email protected].
The analyst(s) responsible for preparing this research report received compensation that is based upon various factors, includingtotal revenues of the member companies of RBC Capital Markets and its affiliates, a portion of which are or have been generatedby investment banking activities of the member companies of RBC Capital Markets and its affiliates.
Distribution of ratingsFor the purpose of ratings distributions, regulatory rules require member firms to assign ratings to one of three rating categories- Buy, Hold/Neutral, or Sell - regardless of a firm''s own rating categories. Although RBC Capital Markets'' ratings of Outperform(O), Sector Perform (SP), and Underperform (U) most closely correspond to Buy, Hold/Neutral and Sell, respectively, the meaningsare not the same because our ratings are determined on a relative basis.
Distribution of ratings
RBC Capital Markets, Equity Research
As of 30-Sep-2020
Investment Banking
Serv./Past 12 Mos.
Rating Count Percent Count Percent
BUY [Outperform] 788 52.96 248 31.47
HOLD [Sector Perform] 619 41.60 135 21.81
SELL [Underperform] 81 5.44 11 13.58
Conflicts policyRBC Capital Markets Policy for Managing Conflicts of Interest in Relation to Investment Research is available from us on request.To access our current policy, clients should refer tohttps://www.rbccm.com/global/file-414164.pdfor send a request to RBC Capital Markets Research Publishing, P.O. Box 50, 200 Bay Street, Royal Bank Plaza, 29th Floor, SouthTower, Toronto, Ontario M5J 2W7. We reserve the right to amend or supplement this policy at any time.
Dissemination of research and short-term trade ideas
Cable/Telecom & Communications Infrastructure 2020.12.24
December 24, 2020 84

RBC Capital Markets endeavors to make all reasonable efforts to provide research simultaneously to all eligible clients, havingregard to local time zones in overseas jurisdictions. RBC Capital Markets' equity research is posted to our proprietary websiteto ensure eligible clients receive coverage initiations and changes in ratings, targets and opinions in a timely manner. Additionaldistribution may be done by the sales personnel via email, fax, or other electronic means, or regular mail. Clients may alsoreceive our research via third party vendors. RBC Capital Markets also provides eligible clients with access to SPARC on the Firmsproprietary INSIGHT website, via email and via third-party vendors. SPARC contains market color and commentary regardingsubject companies on which the Firm currently provides equity research coverage. Research Analysts may, from time to time,include short-term trade ideas in research reports and / or in SPARC. A short-term trade idea offers a short-term view onhow a security may trade, based on market and trading events, and the resulting trading opportunity that may be available. Ashort-term trade idea may differ from the price targets and recommendations in our published research reports reflecting theresearch analyst's views of the longer-term (one year) prospects of the subject company, as a result of the differing time horizons,methodologies and/or other factors. Thus, it is possible that a subject company's common equity that is considered a long-term'Sector Perform' or even an 'Underperform' might present a short-term buying opportunity as a result of temporary selling pressurein the market; conversely, a subject company's common equity rated a long-term 'Outperform' could be considered susceptibleto a short-term downward price correction. Short-term trade ideas are not ratings, nor are they part of any ratings system, andthe firm generally does not intend, nor undertakes any obligation, to maintain or update short-term trade ideas. Short-term tradeideas may not be suitable for all investors and have not been tailored to individual investor circumstances and objectives, andinvestors should make their own independent decisions regarding any securities or strategies discussed herein. Please contactyour investment advisor or institutional salesperson for more information regarding RBC Capital Markets' research.For a list of all recommendations on the company that were disseminated during the prior 12-month period, please click on thefollowing link: https://rbcnew.bluematrix.com/sellside/MAR.actionThe 12 month history of SPARCs can be viewed at https://www.rbcinsightresearch.com.
Analyst certificationAll of the views expressed in this report accurately reflect the personal views of the responsible analyst(s) about any and all ofthe subject securities or issuers. No part of the compensation of the responsible analyst(s) named herein is, or will be, directly orindirectly, related to the specific recommendations or views expressed by the responsible analyst(s) in this report.
Third-party-disclaimersThe Global Industry Classification Standard ("GICS”) was developed by and is the exclusive property and a service mark of MSCI Inc. (“MSCI”) and Standard & Poor's Financial ServicesLLC (“S&P”) and is licensed for use by RBC. Neither MSCI, S&P, nor any other party involved in making or compiling the GICS or any GICS classifications makes any express or impliedwarranties or representations with respect to such standard or classification (or the results to be obtained by the use thereof), and all such parties hereby expressly disclaim all warrantiesof originality, accuracy, completeness, merchantability and fitness for a particular purpose with respect to any of such standard or classification. Without limiting any of the foregoing,in no event shall MSCI, S&P, any of their affiliates or any third party involved in making or compiling the GICS or any GICS classifications have any liability for any direct, indirect, special,punitive, consequential or any other damages (including lost profits) even if notified of the possibility of such damages.
RBC Capital Markets disclaims all warranties of originality, accuracy, completeness, merchantability or fitness for a particular purpose with respect to any statements made to the mediaor via social media that are in turn quoted in this report, or otherwise reproduced graphically for informational purposes.
References herein to "LIBOR", "LIBO Rate", "L" or other LIBOR abbreviations means the London interbank offered rate as administered by ICE Benchmark Administration (or any otherperson that takes over the administration of such rate).
Disclaimer
RBC Capital Markets is the business name used by certain branches and subsidiaries of the Royal Bank of Canada, including RBC Dominion Securities Inc., RBCCapital Markets, LLC, RBC Europe Limited, RBC Capital Markets (Europe) GmbH, Royal Bank of Canada, Hong Kong Branch and Royal Bank of Canada, Sydney Branch.The information contained in this report has been compiled by RBC Capital Markets from sources believed to be reliable, but no representation or warranty, expressor implied, is made by Royal Bank of Canada, RBC Capital Markets, its affiliates or any other person as to its accuracy, completeness or correctness. All opinions andestimates contained in this report constitute RBC Capital Markets' judgement as of the date of this report, are subject to change without notice and are providedin good faith but without legal responsibility. Nothing in this report constitutes legal, accounting or tax advice or individually tailored investment advice. Thismaterial is prepared for general circulation to clients and has been prepared without regard to the individual financial circumstances and objectives of persons whoreceive it. The investments or services contained in this report may not be suitable for you and it is recommended that you consult an independent investmentadvisor if you are in doubt about the suitability of such investments or services. This report is not an offer to sell or a solicitation of an offer to buy any securities.Past performance is not a guide to future performance, future returns are not guaranteed, and a loss of original capital may occur. RBC Capital Markets researchanalyst compensation is based in part on the overall profitability of RBC Capital Markets, which includes profits attributable to investment banking revenues.Every province in Canada, state in the U.S., and most countries throughout the world have their own laws regulating the types of securities and other investmentproducts which may be offered to their residents, as well as the process for doing so. As a result, the securities discussed in this report may not be eligible for salein some jurisdictions. RBC Capital Markets may be restricted from publishing research reports, from time to time, due to regulatory restrictions and/ or internal
Cable/Telecom & Communications Infrastructure 2020.12.24
December 24, 2020 85

compliance policies. If this is the case, the latest published research reports available to clients may not reflect recent material changes in the applicable industryand/or applicable subject companies. RBC Capital Markets research reports are current only as of the date set forth on the research reports. This report is not,and under no circumstances should be construed as, a solicitation to act as securities broker or dealer in any jurisdiction by any person or company that is notlegally permitted to carry on the business of a securities broker or dealer in that jurisdiction. To the full extent permitted by law neither RBC Capital Markets norany of its affiliates, nor any other person, accepts any liability whatsoever for any direct, indirect or consequential loss arising from, or in connection with, any useof this report or the information contained herein. No matter contained in this document may be reproduced or copied by any means without the prior writtenconsent of RBC Capital Markets in each instance.
Additional information is available on request.
To U.S. Residents:This publication has been approved by RBC Capital Markets, LLC (member FINRA, NYSE, SIPC), which is a U.S. registered broker-dealer and which acceptsresponsibility for this report and its dissemination in the United States. Any U.S. recipient of this report that is not a registered broker-dealer or a bank acting ina broker or dealer capacity and that wishes further information regarding, or to effect any transaction in, any of the securities discussed in this report, shouldcontact and place orders with RBC Capital Markets, LLC.To Canadian Residents:This publication has been approved by RBC Dominion Securities Inc.(member IIROC). Any Canadian recipient of this report that is not a Designated Institution inOntario, an Accredited Investor in British Columbia or Alberta or a Sophisticated Purchaser in Quebec (or similar permitted purchaser in any other province) andthat wishes further information regarding, or to effect any transaction in, any of the securities discussed in this report should contact and place orders with RBCDominion Securities Inc., which, without in any way limiting the foregoing, accepts responsibility for this report and its dissemination in Canada.To U.K. Residents:This publication has been approved by RBC Europe Limited ('RBCEL') which is authorized by the Prudential Regulation Authority and regulated by the FinancialConduct Authority ('FCA') and the Prudential Regulation Authority, in connection with its distribution in the United Kingdom. This material is not for generaldistribution in the United Kingdom to retail clients, as defined under the rules of the FCA. RBCEL accepts responsibility for this report and its dissemination inthe United Kingdom.To EEA Residents:This material is distributed in the EU by either RBCEL on an authorised cross-border basis, or by RBC Capital Markets (Europe) GmbH (RBC EG) which is authorisedand regulated in Germany by the Bundesanstalt für Finanzdienstleistungsaufsicht (German Federal Financial Supervisory Authority) (BaFin).To Persons Receiving This Advice in Australia:This material has been distributed in Australia by Royal Bank of Canada, Sydney Branch (ABN 86 076 940 880, AFSL No. 246521). This material has been prepared forgeneral circulation and does not take into account the objectives, financial situation or needs of any recipient. Accordingly, any recipient should, before acting onthis material, consider the appropriateness of this material having regard to their objectives, financial situation and needs. If this material relates to the acquisitionor possible acquisition of a particular financial product, a recipient in Australia should obtain any relevant disclosure document prepared in respect of that productand consider that document before making any decision about whether to acquire the product. This research report is not for retail investors as defined in section761G of the Corporations Act.To Hong Kong Residents:This publication is distributed in Hong Kong by Royal Bank of Canada, Hong Kong Branch, which is regulated by the Hong Kong Monetary Authority and theSecurities and Futures Commission (SFC) in Hong Kong, RBC Investment Services (Asia) Limited and RBC Global Asset Management (Asia) Limited, both entitiesare regulated by the SFC. This material is not for general distribution in Hong Kong to persons who are not professional investors (as defined in the Securities andFutures Ordinance of Hong Kong (Cap. 571) and any rules made thereunder.To Singapore Residents:This publication is distributed in Singapore by the Royal Bank of Canada, Singapore Branch, a registered entity licensed by the Monetary Authority of Singapore.This material has been prepared for general circulation and does not take into account the objectives, financial situation, or needs of any recipient. You are advisedto seek independent advice from a financial adviser before purchasing any product. If you do not obtain independent advice, you should consider whether theproduct is suitable for you. Past performance is not indicative of future performance. If you have any questions related to this publication, please contact the RoyalBank of Canada, Singapore Branch. Royal Bank of Canada, Singapore Branch accepts responsibility for this report and its dissemination in Singapore.To Japanese Residents:Unless otherwise exempted by Japanese law, this publication is distributed in Japan by or through RBC Capital Markets (Japan) Ltd. which is a Financial InstrumentsFirm registered with the Kanto Local Financial Bureau (Registered number 203) and a member of the Japan Securities Dealers Association (JSDA) and the FinancialFutures Association of Japan (FFAJ). To EEA Residents: This material is distributed in the EU by either RBCEL on an authorised cross-border basis, or by RBC CapitalMarkets (Europe) GmbH (â��RBC EG) which is authorised and regulated in Germany by the Bundesanstalt für Finanzdienstleistungsaufsicht (German FederalFinancial Supervisory Authority) (BaFin).
.® Registered trademark of Royal Bank of Canada. RBC Capital Markets is a trademark of Royal Bank of Canada. Used under license.Copyright © RBC Capital Markets, LLC 2020 - Member SIPC
Copyright © RBC Dominion Securities Inc. 2020 - Member Canadian Investor Protection FundCopyright © RBC Europe Limited 2020
Copyright © Royal Bank of Canada 2020All rights reserved
Cable/Telecom & Communications Infrastructure 2020.12.24
December 24, 2020 86