
Atomic-scale identification of the active sites of nanocatalysts
37
1 Atomic-scale identification of the active sites of nanocatalysts Yao Yang 1* , Jihan Zhou 1* , Zipeng Zhao 2* , Geng Sun 3* , Saman Moniri 1 , Colin Ophus 4 , Yongsoo Yang 1 , Ziyang Wei 5 , Yakun Yuan 1 , Cheng Zhu 6 , Qiang Sun 7 , Qingying Jia 7 , Hendrik Heinz 6 , Jim Ciston 4 , Peter Ercius 4 , Philippe Sautet 3,5 , Yu Huang 2 , Jianwei Miao 1† 1 Department of Physics & Astronomy and California NanoSystems Institute, University of California, Los Angeles, CA 90095, USA. 2 Department of Materials Science and Engineering, University of California, Los Angeles, CA 90095, USA. 3 Department of Chemical and Biomolecular Engineering, University of California, Los Angeles, Los Angeles, CA 90095, USA. 4 National Center for Electron Microscopy, Molecular Foundry, Lawrence Berkeley National Laboratory, Berkeley, CA 94720, USA. 5 Department of Chemistry and Biochemistry, University of California, Los Angeles, Los Angeles, CA 90095, USA. 6 Department of Chemical and Biological Engineering, University of Colorado at Boulder, Boulder, CO, USA. 7 Department of Chemistry and Chemical Biology, Northeastern University, Boston, MA, USA * These authors contributed equally to this work. † Corresponding author. Email: [email protected] (J.M.) Alloy nanocatalysts have found broad applications ranging from fuel cells to catalytic converters and hydrogenation reactions. Despite extensive studies, identifying the active sites of nanocatalysts remains a major challenge due to the heterogeneity of the local atomic environment. Here, we advance atomic electron tomography to determine the 3D local atomic structure, surface morphology and chemical composition of PtNi and Mo-doped PtNi nanocatalysts. Using machine learning trained by density functional theory calculations, we identify the catalytic active sites for the oxygen reduction reaction from experimental 3D
-
Upload
khangminh22 -
Category
Documents
-
view
1 -
download
0
Transcript of Atomic-scale identification of the active sites of nanocatalysts

1
Atomic-scale identification of the active sites of nanocatalysts
Yao Yang1*, Jihan Zhou1*, Zipeng Zhao2*, Geng Sun3*, Saman Moniri1, Colin Ophus4, Yongsoo
Yang1, Ziyang Wei5, Yakun Yuan1, Cheng Zhu6, Qiang Sun7, Qingying Jia7, Hendrik Heinz6, Jim
Ciston4, Peter Ercius4, Philippe Sautet3,5, Yu Huang2, Jianwei Miao1†
1Department of Physics & Astronomy and California NanoSystems Institute, University of
California, Los Angeles, CA 90095, USA. 2Department of Materials Science and Engineering,
University of California, Los Angeles, CA 90095, USA. 3Department of Chemical and
Biomolecular Engineering, University of California, Los Angeles, Los Angeles, CA 90095, USA.
4National Center for Electron Microscopy, Molecular Foundry, Lawrence Berkeley National
Laboratory, Berkeley, CA 94720, USA. 5Department of Chemistry and Biochemistry, University
of California, Los Angeles, Los Angeles, CA 90095, USA. 6Department of Chemical and Biological
Engineering, University of Colorado at Boulder, Boulder, CO, USA. 7Department of Chemistry
and Chemical Biology, Northeastern University, Boston, MA, USA
*These authors contributed equally to this work.
†Corresponding author. Email: [email protected] (J.M.)
Alloy nanocatalysts have found broad applications ranging from fuel cells to catalytic
converters and hydrogenation reactions. Despite extensive studies, identifying the active sites
of nanocatalysts remains a major challenge due to the heterogeneity of the local atomic
environment. Here, we advance atomic electron tomography to determine the 3D local
atomic structure, surface morphology and chemical composition of PtNi and Mo-doped PtNi
nanocatalysts. Using machine learning trained by density functional theory calculations, we
identify the catalytic active sites for the oxygen reduction reaction from experimental 3D

2
atomic coordinates, which are corroborated by electrochemical measurements. By
quantifying the structure-activity relationship, we discover a local environment descriptor
to explain and predict the catalytic active sites at the atomic level. The ability to determine
the 3D atomic structure and chemical species coupled with machine learning is expected to
expand our fundamental understanding of a wide range of nanocatalysts.
Identification of active sites is crucial for understanding the properties of heterogeneous
catalysts and for rational design of improved catalytic activities (1, 2). Despite significant progress
from various experimental and computational methods (3-8), localization of the active sites of
nanocatalysts remains largely elusive, particularly in multicomponent nanoparticles. This
limitation is mainly due to an incomplete understanding of the three-dimensional (3D) atomic
arrangement of the different constituents and the structural reconstruction driven by catalytic
reactions (7, 9-11). For the electrochemical oxygen reduction reaction (ORR) – a limiting
half-reaction in fuel cells (12), the single-crystal Pt3Ni (111) facet has been demonstrated to exhibit
a very high ORR activity (13). Yet, a fundamental understanding of the catalytic activity of Pt-
alloy nanocatalysts is far more challenging due to the heterogeneity of the catalytic active sites.
Various experiments have indicated that the structural morphology and chemical composition such
as facets, surface concaveness, strain and ligand effects can all play a role in the ORR activity (14-
20). However, correlating the 3D atomic structure and chemical composition with the active sites
of the Pt-alloy nanocatalysts remains a difficult task. On the computational side, density functional
theory (DFT) is a powerful method to predict the ORR activity by incorporating crystal defects
into perfect lattices and using relaxed atomic configurations at the minimum energy states (3, 21).
However, real nanocatalysts neither have perfect crystal lattices nor are always in the minimum
energy states in their active configuration. Here, we applied atomic electron tomography (AET)

3
(22-26) to determine the 3D atomic coordinates of 17 PtNi and Mo-doped PtNi (Mo-PtNi)
nanocatalysts before and after activation. We identified the facets, surface concaveness, structural
and chemical order/disorder, coordination numbers (CN), and bond lengths with unprecedented
3D atomic detail. The experimental 3D atomic coordinates were coupled with DFT-trained
machine learning (ML) to identify the active sites of the nanocatalysts, which were further
validated by electrochemical measurements.
PtNi and Mo-PtNi nanocatalysts with varying Ni concentration were synthesized on carbon
black / nanotubes using an efficient one‐pot approach (Fig. S1, Tables S1 and S2) (20, 27, 28). To
investigate the 3D atomic structure after activation, a fraction of the nanocatalysts were activated
with 30 cycles of cyclic voltammetry. The ORR specific activities of PtNi BA, PtNi AA, Mo-PtNi
BA and Mo-PtNi AA were measured to be 2.9, 4.8, 3.3, 9.3 mA/cm2 at 0.9 VRHE, respectively (Fig.
S2 and Table S3), where AA and BA represent before and after the activation. The increase of the
ORR activity with Mo dopants and the high specific activity of Mo-PtNi AA are consistent with
previous reports (20, 27, 29). AET experiments were performed on 17 nanocatalysts using an
annular dark-field scanning transmission electron microscope (Tables S1, S2 and Figs. S3-6). After
pre-processing, 3D reconstruction, atom tracing and refinement (Fig. S7) (23, 24, 28, 30, 31), the
3D atomic coordinates and chemical species of the 17 nanocatalysts were determined (Fig. 1),
where the pixel size was calibrated by an extended x-ray absorption fine structure measurement
(Table S4) (28). Due to a very small fraction of Mo dopants (1.4% for BA and 0.4% for AA) (11),
AET is presently not sensitive enough to distinguish them from the Ni or Pt atoms (23, 24), but
this limitation will not impact the conclusions of this study.
Figure 1A shows the 3D surface morphology and the chemical composition of four
representative nanocatalysts (PtNi BA, PtNi AA, Mo-PtNi BA and Mo-PtNi AA). Elemental

4
segregation was observed on the surface and in the interior of the nanoparticles (Fig. 1A and B).
The surface layer mainly consists of Pt atoms, forming (100), (110), (111) and high-index facets
(Fig. 1C). From the experimental 3D coordinates, we quantitatively characterized the surface
concaveness, structural and chemical order/disorder, CN, and surface bonds at the single-atom
level (Fig. 1C-H) (28). The 3D atomic structure and the chemical composition of the other 13
nanocatalysts are shown in Figs. S8 and S9. Although the majority of the nanoparticles exhibit an
octahedral morphology, we observed surface concaveness, structural and chemical disorder to
varying degrees in all four types of the nanocatalysts. We found that the Mo dopants and the
activation increase the surface concaveness and the structural disorder (Fig. S10). From the
experimental 3D atomic coordinates, we calculated the mean and the standard deviation of the
surface Pt-Pt bond length to be 2.73±0.12 Å, 2.77±0.16 Å, 2.71±0.19 Å and 2.75±0.19 Å for PtNi
BA, PtNi AA, Mo-PtNi BA and Mo-PtNi AA, respectively (Fig. 2A and B). The slight increase of
the mean surface Pt-Pt bond length after activation is attributed to the loss (leaching) of the surface
and subsurface (that is, the layer below the surface) Ni during the activation.
Next, we analyzed the CN of the surface Pt atoms, where CN = 9 has the highest fraction
for all four types of nanocatalysts (Fig. 2C and D). We also examined the nearest-neighbor Pt and
Ni atoms of each surface Pt atom, termed NNPt and NNNi, respectively. Figure 2C and D shows
the distribution of NNPt and NNNi for the four types of nanocatalysts. The activation shifted the
distribution of NNPt of the nanocatalysts to the right, and the distribution of NNNi to the left. This
observation reveals that activation leached more Ni than Pt atoms from the surface and subsurface.
Figure 2E shows the average surface and subsurface Ni composition for the four types of
nanocatalysts. The activation reduced the surface and subsurface Ni composition by 15.4% and
23.1% for PtNi and by 22.6% and 8.2% for Mo-PtNi, respectively, showing that Mo-PtNi
5
preserved more subsurface Ni atoms during activation. We also observed a correlation between
the subsurface Ni composition and the surface Pt-Pt bond length (Fig. 2F). With the increase of
the subsurface Ni composition, the average surface Pt-Pt bond length decreases for all the four
types of nanocatalysts, indicating that subsurface Ni increases the compressive strain of the surface
Pt sites.
From the experimentally determined 3D atomic coordinates, we used a DFT-trained ML
method to identify the ORR active sites of the nanocatalysts. The ORR takes place mainly through
a four-step electroreduction O2 + 4 (H++e–) → 2H2O, in which OH is an intermediate (23, 24).
Extensive DFT studies reveal that the ORR activity follows the Sabatier principle and that optimal
catalysts have the OH binding energy (BEOH) about 0.1-0.15 eV weaker than that of bulk Pt(111)
(4). As it is computationally impractical to perform DFT calculations for all the surface sites of
the nanocatalysts, we utilized DFT-trained ML to predict the OH binding energy for the
experimentally measured surface Pt sites (28). We first constructed 207 3D PtNi atomic models
each surrounding a surface Pt site with a different local environment. After calculating the BEOH
for the 207 Pt sites by DFT, we randomly chose 134 sites to train the ML method and then used it
to identify the BEOH of the 73 test Pt sites. A quantitative comparison between the DFT calculated
and ML identified BEOH is shown in Fig. S11, indicating that ML accurately predicted the BEOH
with a root mean square error (RMSE) of 0.05 and 0.07 eV per site for the 134 training and 73 test
Pt sites, respectively.
After training and validating the ML method, we applied it to evaluate the ORR activity
for the experimentally measured surface Pt sites of the PtNi AA and Mo-PtNi AA nanocatalysts.
We focused on the activity of the AA nanoparticles because the 3D morphology and structure of
the BA nanoparticles were likely modified by the ORR test performed in 0.1 M HClO4 (7, 9). The

6
ML method was used to estimate the BEOH of the 26,246 surface Pt sites for the 7 PtNi AA and 4
Mo-Pt/Ni AA nanocatalysts. By referring BEOH to the OH binding energy of Pt(111), we derived
the ORR activity for all the surface Pt sites (4, 28, 32, 33). The average catalytic activities of the
PtNi AA and Mo-PtNi AA nanocatalysts agree with the electrochemical measurements (Fig. 3A),
showing the robustness of using DFT-trained ML to identify the ORR activity from the
experimental 3D atomic coordinates. Figure 3B, C and Fig. S12 show the ORR activity map of the
surface Pt sites of the PtNi AA and Mo-PtNi AA nanocatalysts. A striking feature is the difference
of the ORR activity of the surface Pt sites by several orders of magnitude. While the majority of
the surface Pt sites have a very low catalytic activity, there are a very small fraction of highly
active sites (yellow atoms in Fig. 3B and C). Figure 3D-I shows six representative highly active
sites from the PtNi AA and Mo-PtNi AA nanocatalysts, each of which exhibits a distinct 3D local
environment such as different CN, nearby Ni atoms and surface morphology. This observation
indicates that quantitative characterization of the 3D local atomic environment is critical to the
understanding of the active sites of nanocatalysts.
The combination of the experimentally determined 3D atomic coordinates and the ML
results enabled us to perform a comprehensive analysis of the structure-activity relationship and
to identify a descriptor for the surface Pt sites (28), which we termed the local environment
descriptor (LED). LED is dimensionless like the CN and defined as,
LED = NNPt ∙ e−a1∙ε + a2 ∙ CN̅̅ ̅̅ Ni, (2)
where ε =d̅Pt−d0
d0 is the local strain with d̅Pt the average Pt-Pt bond length around a surface Pt site
and d0 the Pt-Pt bond length (2.75 Å) for Pt nanoparticles, CN̅̅ ̅̅ Ni = ∑CN𝑖
Ni
CNmax𝑖 is the generalized CN
of the considered Pt with Ni atoms (3, 34), CN𝑖Ni is the CN of the ith Ni atom, CNmax = 12 is the
7
CN in bulk Pt, a1 and a2 are two fitting constants related to the strain and ligand effects,
respectively. Our quantitative analysis showed that NNPt, d̅Pt and CN̅̅ ̅̅ Ni are more relevant to the
activity of the nanocatalysts than other factors such as surface concaveness, structural and
chemical order/disorder (28). By fitting LED to the BEOH of all the surface Pt sites relative to the
OH binding energy of Pt(111), we obtained a volcano-type activity plot with the peak at LED =
9.7 (Fig. 3J). The RMSE of the fitting is 0.104 eV with a1 = 1.985 and a2 = 1.075. Figure 3K, L
and Fig. S13 show the activity map of the PtNi AA and Mo-PtNi AA nanocatalysts based on LED,
which is in agreement with that identified by the ML method (Fig. 3B, C and Fig. S12).
To gain insight into LED, we considered a simple case. For Pt(111) without strain, we
calculated LED = 9 from Eq. (1), which is on the left-side of the peak of the volcano plot (Fig. 3J).
If a nearest-neighbor surface Pt atom is substituted by a Ni atom, the first term of Eq. (1) decreases
by 1, but the second term increases by a number smaller than 1, making LED smaller than 9. If the
substitutional Ni atom is in the subsurface, the CN of the Ni is 12 and the second term increases
by a number larger than 1 as a2 > 1, making LED larger than 9. Furthermore, compressive strain,
induced by the decrease of the average Pt-Pt bond length, also increases LED . Consequently, with
LED < 9.7, both subsurface Ni and compressive strain increase the ORR activity. When LED
reaches the peak of the volcano plot (LED = 9.7 in Fig. 3J), further increasing the subsurface Ni
and compressive strain reduces the ORR activity. This analysis demonstrates the importance of
balancing the strain and ligand effects to optimize the ORR activity of PtNi nanocatalysts.
Our experimental results reveal the differences of the average surface Pt-Pt bond length
and the standard deviation between the Mo-PtNi AA (2.75±0.19 Å) and PtNi AA (2.77±0.16 Å)
nanocatalysts (Fig. 2A and B), showing that the former has a larger compressive strain than the
latter. Additionally, Mo-PtNi AA preserves more subsurface Ni atoms than PtNi AA (Fig. 2E).
8
According to Eq. (1), both factors increase the LED of Mo-PtNi over PtNi. As the measured and
the ML-identified ORR activity of Mo-PtNi are higher than those of PtNi (Fig. 3A), our
observations indicate that the average activity of the Mo-PtNi AA and PtNi AA nanocatalysts is
situated on the left-side of the peak of the volcano plot (Fig. 3J), which can explain previous
experimental results that a larger concentration of Co or Ni in Pt-alloy nanocatalysts increases the
ORR activity (35, 36). Although we focused on PtNi nanoparticles in this study, LED is in
principle applicable to other bimetallic nanocatalysts.
In conclusion, we determined the 3D local atomic structure and chemical species of PtNi
and Mo-PtNi nanocatalysts before and after activation, and measured the facets, surface
concaveness, structural and chemical order/disorder, CN, and bond lengths with high precision.
From the experimentally measured 3D atomic coordinates, we used a DFT-trained ML method to
identify the active sites of 11 nanocatalysts, which were validated by electrochemical
measurements. We observed that the ORR activity of the surface Pt sites of the nanocatalysts varies
by several orders of magnitude. By performing a quantitative analysis of the structure-activity
relationship, we discovered a descriptor (dubbed LED) to understand the ORR activity of the
nanocatalysts based on the surface, subsurface atomic structure and chemical composition. We
found that the nearest-neighbor surface Pt atoms, the average Pt-Pt bond length and the generalized
CN for Ni neighbors are most relevant to the ORR activity and contribute to LED. The optimal
reactivity is achieved with the right balance between the ligand and strain effects, with subsurface
Ni ligands behaving differently from surface ones. We anticipate that this general method can be
used to measure the 3D local atomic positions, chemical species and surface composition of a wide
range of nanocatalysts for various (electro)chemical reactions and to understand their structure-
activity relationships at the single-atom level.

9
ACKNOWLEDGMENTS: This work was primarily supported by the US Department of Energy
(DOE), Office of Science, Basic Energy Sciences (BES), Division of Materials Sciences and
Engineering under award DE-SC0010378. It was also partially supported by STROBE: A National
Science Foundation Science & Technology Center under grant number DMR 1548924 and the
NSF DMREF under award number DMR-1437263. G.S. and P.S. acknowledge the support by
DOE-BES grant DE-SC0019152. AET experiments were performed with TEAM I at the
Molecular Foundry, which is supported by the Office of Science, Office of Basic Energy Sciences
of the US DOE under contract number DE-AC02-05CH11231. The XAS experiment was
conducted on beamline 8-ID (ISS) of the National Synchrotron Light Source II, which is supported
by the Office of Science, Office of Basic Energy Sciences of the US DOE under contract number
DE-SC0012704.

10
FIGURES
Fig. 1. 3D atomic structure and chemical composition of four representative nanocatalysts
determined by AET. From the experimental atomic coordinates, the 3D surface morphology and
chemical composition (A), elemental segregation in the interior (B), facets (C), surface
concaveness (D), structural order/disorder (E), chemical order/disorder (F), CN (G), and surface
bonds (H) of the nanocatalysts were identified at the single-atom level. For the structural order,
BOO = 1 corresponds to a perfect fcc lattice. For the chemical order, positive and a negative
numbers represent segregation and alloying, respectively.

11
Fig. 2. Quantitative characterization of the four types of nanocatalysts. Distribution of the
surface Pt-Pt bond length for PtNi BA and AA (A), and Mo-PtNi BA and AA (B). Histogram of the
CN, NNPt and NNNi of the surface Pt sites for PtNi BA and AA (C), and Mo-PtNi BA and AA (D).
(E) Histogram of average surface and subsurface Ni composition. (F) Correlation between the
subsurface Ni composition and the surface Pt-Pt bond length.

12
Fig. 3. Identification of the active sites of nanocatalysts. (A) Comparison between the
electrochemically measured ORR activity and the ML-identified activity from the experimental
3D atomic coordinates of PtNi AA and Mo-PtNi AA, where each bar represents a nanocatalyst
and the circle the average activity. The activity of Pt(111) was obtained from DFT as a reference
point. (B and C) The activity distribution of the surface Pt sites of the PtNi AA and Mo-PtNi AA
nanocatalysts shown in the second and fourth row of Fig. 1, respectively, where low activity sites
are defined with the ORR activity smaller than 3% of that of Pt(111). Representative highly active
sites (red crosses) from the PtNi AA (D-F) and Mo-PtNi AA (G-I) nanocatalysts, showing
different 3D local environments. (J) Volcano-type activity plot (red dashed line) obtained by

13
fitting LED with the ML-identified activity of all the surface Pt sites (blue dots), where the peak
is at LED = 9.7. (K and L) The activity distribution of the two PtNi AA and Mo-PtNi AA
nanocatalysts based on LED, respectively, which is in agreement with that identified by ML (B
and C).

14
Supplementary Materials
Materials and Methods
Chemicals and Materials
Platinum(II) acetylacetonate [Pt(acac)2], nickel(II) acetate tetrahydrate [Ni(ac)2·4H2O],
benzyl acid (BA) were purchased from Sigma Aldrich. Molybdenum hexacarbonyl (Mo(CO)6),
carbon nanotube (CNT) was purchased from Alfa Aesar. N, N-Dimethylformamide (DMF),
acetone, isopropanol were purchased from Fisher Scientific. Ethanol was purchased from Decon
Labs, Inc. Vulcan XC-72 carbon black (particle size ~50 nm) was from Cabot Corporation. Water
used was Ultrapure Millipore (18.2 MΩ∙cm).
Sample preparation
Synthesis of Mo-PtNi/C. Vulcan XC-72 carbon black is pretreated in Argon (80% in
volume) and Hydrogen (20% in volume) mixture at 400 C for 4 hours. 80 mg pretreated Vulcan
XC-72 carbon black was dispersed in 60 mL N,N-dimethylformamide (DMF) under
ultrasonication for 30 minutes in a 325 mL pressure bottle. Then 64 mg platinum(II)
acetylacetonate [Pt(acac)2], 32 mg nickel(II) acetate tetrahydrate [Ni(ac)2·4H2O], and 520 mg
benzoic acid were dissolved in 10 mL DMF and were also added into the 325 mL pressure bottle
with carbon black dispersion. After ultrasonication for 5 mins, the pressure bottle with well mixed
solution was directly put into 140 ºC oil bath and then slowly heated to 160 ºC within 2 hrs. The
pressure bottle was kept at 160 ºC for 12 hrs. After 12 hours, 16 mg Pt(acac)2, 8 mg Ni(ac)2·4H2O,
3.2 mg molybdenum(0) hexacarbonyl [Mo(CO)6] were added into the pressure bottle. Then the
pressure bottle was kept in 160 ºC oil bath for 48 hrs. After reaction finished, the catalysts were
collected by centrifugation, then dispersed and washed with isopropanol and acetone mixture.
Then the catalysts were dried in vacuum at room temperature and ready for characterization and
electrochemistry test.
Synthesis of PtNi/C. The preparation of procedure is same as Mo-PtNi/C noted above
except without adding Mo(CO)6.
Synthesis of Mo-PtNi/CNT. The preparation procedure is same as Mo-PtNi/C noted above
except replacing treated Vulcan XC-72 with CNT.
Synthesis of PtNi/CNT. The preparation procedure is same as Mo-PtNi/CNT except without
adding Mo(CO)6.
Electrochemical measurements
A typical catalyst ink was prepared by mixing 2.8 mg of catalyst powder (Mo-PtNi/C,
PtNi/C) with 2 mL of ethanol solution containing 16 μL of Nafion (5 wt%) with 5 min
ultrasonication time. Then, 10 μL of catalyst ink was dropped onto a 5 mm diameter glassy-carbon
electrode (Pine Research Instrumentation). Estimation of Pt loading is based on overall Pt ratio
within catalyst determined by ICP-AES. The ink was dried under an infrared lamp; then the
electrode was ready for electrochemical test.
A three-electrode cell was used to carry out the electrochemical measurements. The
working electrode was a catalyst coated glassy carbon electrode. A Ag/AgCl electrode was used
as the reference electrode. A Pt wire was used as the counter electrode. Cyclic voltammetry (CV)
activation was conducted in a N2 saturated 0.1 M HClO4 solution between 0.05 to 1.1 V vs.

15
reversible hydrogen electrode (RHE) at a sweep rate of 100 mV/s for 30 cycles. Oxygen reduction
reaction (ORR) measurements were conducted in an O2 saturated 0.1 M HClO4 solution at a sweep
rate of 20 mV/s. iR compensation and background subtraction are applied for ORR test curves
following the protocol noted in literature (37). For the ORR measurement without activation, the
prepared working electrode was directly subjected to ORR test in the oxygen saturated electrolyte
without being activated at nitrogen saturated electrolyte via CV scan.
Data acquisition
The PtNi and Mo-PtNi nanoparticles were deposited on to 5-nm-thick silicon nitride
membranes annealed at 520 °C for 9 minutes in vacuum. A set of tomographic tilt series were
acquired from several nanoparticles using the TEAM I microscope. Images were collected at 300
kV in ADF-STEM mode (Table S1 and S2). To minimize sample drift, three to five images per
angle were measured with 3 μs dwell time. To ensure that no structural changes were observed
during the data acquisition, for each nanoparticle, we took the same projection images at zero
degree before, during, and after the acquisition of each tilt series. 9 PtNi and 8 Mo-PtNi
nanoparticles were measured in this work. The total electron dose of each tilt series for all the
nanoparticles were estimated to be between 7.4105 e-/Å2 and 8.5105 e-/Å2 (Table S1 and S2).
Image pre-processing
The image pre-processing consists of the following three steps.
i) Image registration and drift correction. We acquired three to five ADF-STEM images
at every angle of each tilt series. The images at each angle were registered by cross-correlation.
Using first image as a reference, we scanned a cropped region of the subsequent images with a
sub-pixel step size and found the drift for every image. After drift correction, we averaged all the
images at each angle.
ii) Image denoising. The experimental ADF-STEM images have mixed Poisson and
Gaussian noise. A generalized denoising algorithm, termed block-matching and 3D filtering
(BM3D), was used to denoise each averaged image (38). The robustness of BM3D on the AET
data have been proven in our previous studies (23, 24, 30, 31, 39).
iii) Image alignment and background subtraction. The denoised images of each tilt series
were aligned by the center of mass and common line method as described elsewhere (23, 31). After
alignment, a 2D mask was calculated by the Otsu threshold in MATLAB for each image to match
the shape of the nanoparticle. The background was estimated by the discrete Laplacian function in
MATLAB. After background subtraction, all the images of each tilt series were re-aligned by the
center of mass and common line to further reduce the error.
3D image reconstruction and refinement
After image pre-processing, each tilt series was reconstructed by an iterative algorithm,
termed REal Space Iterative REconstruction (RESIRE) (31, 39). From the experimental images,
RESIRE minimized the L2-norm error metric using gradient descent. The jth iteration of the
algorithm consists of the following steps. RESIRE computed a set of images from the 3D object
of the (j-1)th iteration. The difference between the computed and corresponding experimental
images was calculated, from which an error metric was defined to monitor the convergence of the
algorithm. The difference was back projected to real space, yielding the gradient of the 3D
reconstruction. The 3D reconstruction of the jth iteration was updated by combining the gradient
with the reconstruction of the (j-1)th iteration, where positivity was enforced as constrains. As a

16
general algorithm, RESIRE is not sensitive to the initial input. After 200 iterations, a preliminary
3D reconstruction was computed. Based on the preliminary 3D reconstruction, angular refinement
and spatial alignment were performed and background subtraction was re-evaluated. After these
refinement procedures, a final 3D reconstruction was obtained by running 200 iterations of
RESIRE.
Determination of 3D atomic coordinates and chemical species
To increase the precision of atom tracing, we up-sampled each 3D reconstruction by a
factor of three using spline interpolation, from which all the local maxima were identified. Starting
from the highest intensity, we fit each local maximum of a 9×9×9 voxel volume (1.4×1.4×1.4 Å3)
by a 3D polynomial method to locate its center position (23, 24, 31). Each fitted local maximum
was considered as a potential atom only when its distance from the existing potential atoms is
larger than 2 Å. After going through all the local maxima, we obtained a list of potential atoms.
For every potential atom, the integrated intensity of the 9×9×9 voxel volume around the center
position was calculated. A K-mean clustering method was used to classify the non-atoms, Pt and
Ni atoms (31). Due to a small fraction (<1.5%) of Mo atoms in the Mo-PtNi nanoparticles, AET
is currently not sensitive enough to distinguish them from Pt or Ni atoms (27). After excluding the
non-atoms and manually checking all the atoms, we obtained an initial 3D atomic model for each
3D reconstruction.
Due to the missing wedge problem (22), we used local re-classification to reduce the effect
of the intensity variation in different regions of each 3D reconstruction (23). At each atomic
position, we cropped a 7-Å radius sphere and calculated the mean integrated intensity for the Pt or
Ni atom inside the sphere. We then re-classified each atom in the sphere based on the difference
between its integrated intensity and the mean value of the Pt or Ni atom. The procedure was
repeated until there was no further change.
The electron energy loss spectroscopy maps of the nanoparticles show that there are
individual Ni atoms distributed around each nanoparticle (Fig. S1). To evaluate the effect of the
surrounding Ni atoms on the 3D reconstruction, we simulated a PtNi atomic model in an
environment with individual Ni atoms, which used the experimentally determined 3D atomic
distribution for the Pt and Ni atom. After calculating projection images at different tilt angles from
the model, we performed image pre-processing, conducted the 3D reconstruction, traced the atoms,
classified the atomic species and obtained a new 3D atomic model (Fig. S7). We observed that
there is a layer of ghost atoms surrounding the 3D atomic model, which is due to the surrounding
Ni atoms around each nanoparticle (Fig. S7). Based on this result, a layer of ghost atoms was
removed from the experimental 3D atomic model of each nanoparticle.
X-ray absorption spectroscopy (XAS) data collection and analysis. XAS experiments were conducted on the dry powders of the four nanocatalysts studied in this work at the
beamline ISS 8-ID in National Synchrotron Light Source II (NSLS) (Brookhaven National Laboratory, NY. Full range
Pt L3-edge and Ni K-edge spectra were collected on the same electrode in transmission mode at the Pt L3-edge, and/or
Ni K-edge, with a Pt or Ni reference foil positioned between I2 and I3 as a reference. Typical experimental procedures
were utilized with details provided in our previous work (40). The data were processed and fitted using the
Ifeffit−based Athena (41) and Artemis (42) programs. Scans were calibrated, aligned and normalized with background
removed using the IFEFFIT suite (43). The χ(R) were modeled using single scattering paths calculated by FEFF6 (44).
The Pt-Pt bond lengths of the four nanocatalysts were obtained by the extended x-ray absorption fine structure
(EXAFS) fitting (Table S4). The average first-shell Pt-Pt bond lengths were determined by fitting the EXAFS spectra
of dry powders at the Pt L3 and Ni K-edge simultaneously. S02 was fixed at 0.84 and 0.68 for Pt and Ni, respectively
as obtained by fitting the reference foils. Fits were done in R-space, k1,2,3 weighting. 1.2 < R < 3.1 Å and Δk = 3.08 –
17
13.39 Å-1 were used for fitting the Pt L3-edge data, and 1.3 < R < 3.1 Å and Δk = 2.56 – 11.40 Å-1 were used for fitting
the Ni K-edge data. The fitting results of the E0 at the Pt L3 and Ni K edges are 8±2 eV and -6±1 eV, respectively.
Calculation of the coordination number, facet orientation and surface concaveness
We used custom MATLAB scripts to measure the CN, facet orientation and surface
concaveness for all the atomic sites. We defined the nearest-neighbor distance by fitting the valley
of the first and second peak of the pair distribution function for each nanocatalyst. The CN was
obtained by counting the number of the nearest-neighbor sites within the cutoff distance. Each
atom was classified as a surface site if CN < 12 and as an internal site if CN = 12. To find the facet
orientation, we derived a density matrix for each nanocatalyst by convolving the atomic structure
with a 3D Gaussian function ( = 4 Å). For each surface site, a normal vector was calculated by
computing the gradient of the density matrix at that site. By comparing the normal vectors to the
crystallographic directions, we determined the facet orientation of the nanocatalyst. To quantify
the surface concaveness, we estimated the surface curvature for all surface sites by using a
procedure published elsewhere (45).
The normalized local bond orientational order (BOO) parameter
From the 3D atomic model of each nanoparticle, we calculated the local BOO parameters
(Q4 and Q6), which are described elsewhere (31). The Q4 and Q6 order parameters were computed
up to the second shell with a shell radius of 3.5 Å. We then defined the normalized local BOO
parameter as √Q42 + Q6
2/√Q4 fcc 2 + Q6 fcc
2 , where Q4 fcc and Q6 fcc are the Q4 and Q6 values of a
perfect fcc lattice. The normalized BOO parameter is between 0 and 1, where 0 means Q4 = Q6 =
0, and 1 represents a perfect fcc crystal structure.
The chemical order parameter
The chemical order of each nanoparticle was calculated by the pair-wise multicomponent
short-range order parameter (40),
𝛼𝑖𝑗 =𝑝𝑖𝑗 − 𝐶𝑗
𝛿𝑖𝑗 − 𝐶𝑗 (2)
where 𝑝𝑖𝑗 is the probability of finding a j-type atom around an i-type atom in the first nearest
neighbor shell. 𝐶𝑗 is the concentration of j-type atoms in the nanoparticle and 𝛿𝑖𝑗 is the Kronecker
delta function. Since there are primarily Pt and Ni atoms in the nanoparticles, all the 𝛼𝑖𝑗 parameters
are correlated. In this study, we chose 𝛼12 to represent the chemical order parameter. A positive
and a negative 𝛼12 represent segregation and alloying, respectively.
DFT calculations
The DFT calculations were conducted by the VASP package (47-50). The core electrons
were described by the projector-augmented-wave method (51) and the valence states by plane
waves up to 400eV. The exchange-correlation interaction of electrons was defined by the Perdew-
Bruke-Ernzerhof functional (52). Spin-polarized calculations were used throughout this
manuscript for the PtNi nanocatalysts. The Brillouin zone was sampled by a uniform density of
0.19 Å-1 in each reciprocal direction. For isolated clusters, only Γ point was considered. A database
of OH adsorption energies on the surface Pt sites of the PtNi model catalysts were computed by

18
DFT. The database includes diverse 3D atomic models consisting of nanoclusters and slabs. The
nanoclusters of different sizes were built from truncated octahedra, and the slab models were
created from closed-packing surfaces, including fcc(110) surfaces, fcc(100) surfaces and concave
shapes similar to these published elsewhere (3). Ni atoms were introduced by randomly replacing
the Pt atoms. The Ni concentration ranges from 0 to 69.6% in the 3D atomic models and from 0 to
83.9% in the local environment (defined as the atoms within the 6.5 Å radius from an adsorption
site). Different lattice constants were used to represent tensile and compressive strain. In total, the
OH was adsorbed on 207 Pt sites with different Pt CNs, Ni concentration and local environments.
The OH binding energy on the Pt sites (BEOH) was computed by,
BEOH = EOH@Model − EOH − EModel (3)
where EOH@Model is the total electronic energy of the optimized OH adsorbed structure, EOH is the
electronic energy of the OH radical in the gas phase, and EModel is the energy of optimized model
without OH adsorption.
Evaluation of the OH binding energy by DFT-trained ML
To evaluate BEOH for all the surface Pt sites, we used a ML method - the Gaussian process
regression (GPR) (53). The ML-GPR method was trained by the DFT-calculated BEOH, and the
local atomic environment of the Pt sites was characterized by the smooth overlap of atomic
positions (SOAP) approach (54, 55). The cutoff radius of 6.5 Å was selected in SOAP, which was
later validated by the accurate prediction of the ML-GPR method (Fig. S11). The GPR was
implemented by the Python-scikit package (56). The kernel function is defined as normalized
polynomial kernel of the partial power spectrum,
𝐾(𝐝1, 𝐝2) = (𝐝1
T𝐝2
√𝐝1T𝐝1𝐝2
T𝐝2
)
𝜁
(4)
Where 𝐾(𝐝1, 𝐝2) is the kernel function between SOAP descriptors d1 and d2, and ζ is a
hyperparameter. In this study, we chose ζ = 4 by balancing the accuracy and transferability. We
trained the GPR by randomly choosing 134 atomic models and then used the ML method to predict
the BEOH of the remaining 73 atomic models. The RMSE is 0.05 and 0.07 eV per site for the
training and test set, respectively (fig S11). The small REMS values indicate the robustness of the
ML method. After validating DFT-trained ML, we applied it to evaluate the BEOH of the surface
Pt sites of the 7 PtNi AA and 4 Mo-Pt/Ni AA nanocatalysts.
Estimation of the ORR activity based on the OH binding energy
From the ML-identified BEOH, we estimated the ORR activity of each surface Pt site by
calculating ∆BEOH,
∆BEOH = BEOH − BEOH,Pt(111) (5)
where BEOH,Pt(111) is the OH binding energy of Pt(111). As the ORR activity and ∆BEOH are
related to each other by the volcano-type plot (32, 33, 57)), we evaluated the current density of the
ORR oxygen using formulas published elsewhere (32). On the left side of the volcano plot, we
computed the current density of the ORR for the ith surface Pt site (ji) by,

19
𝑘𝑇 ln (𝑗𝑖
𝑗𝑃𝑡(111)) = ΔBEOH,𝑖 (6)
where k is the Boltzmann constant, T the temperature, 𝑗𝑃𝑡(111) the current density of the ORR for
Pt(111), and ΔBEOH,𝑖 the OH binding energy difference (Eq. (5)) for the ith surface Pt site. We
computed the current density of the ORR on the right side of the volcano plot by,
𝑘𝑇ln (𝑗𝑘
𝑗𝑃𝑡(111)) = 0.26 − 0.97 ∙ ΔBEOH,𝑘 (7)
where k represents the kth surface Pt site. Based on Eqs. (6) and (7), the current density of any
surface Pt site is obtained by,
𝑗 = min(𝑗𝑖, 𝑗𝑘) . (8)
Figure 3J shows the ML-identified activity of all the surface Pt sites (blue dots) for the 7 PtNi AA
and 4 Mo-Pt/Ni AA nanocatalysts. We observed that the ORR activity of the various surface Pt
atoms differs by several orders of magnitude (Fig. 3B, C and Fig. S12). The average activity of
these nanocatalysts is in good agreement with the electrochemically measured activity (Fig. 3A
and Fig. S2.
Derivation of the local environment descriptor (LED)
We derived LED by fitting a number of experimentally measured structural and chemical
factors to the ∆BEOH of the surface Pt sites of the 7 PtNi AA and 4 Mo-Pt/Ni AA nanocatalysts.
We took into account the following factors as the fitting variables: the CN, the surface CN, the
sub-surface CN, the average Pt-Pt bond length around each Pt site (d̅Pt), the structure / chemical
order parameter, the nearest-neighbor Pt and Ni atoms of each surface Pt atom (NNPt and NNNi),
the generalized CN (CN̅̅ ̅̅ ), the element-based CN̅̅ ̅̅ (CN̅̅ ̅̅ Pt and CN̅̅ ̅̅ Ni), etc. We examined the 2, 3 and
4 variable LED equations to minimize the RMSE by,
RMSE = √∑ (ΔBEOH,𝑖ML − ΔBEOH,𝑖
Cal )2N
𝑖=1
𝑁 (9)
where ΔBEOH,𝑖ML is the ∆BEOH of the ith surface Pt site obtained by ML, N is the total number of the
surface Pt sites, and ΔBEOH,𝑖Cal = E1 ∗ LED − E0 with E1 and E0 are two fitting constants. For the 2
variable LED equation, we examined LED = a1x1 + a2x2 , where a1 and a2 are two fitting
constants, x1 and x2 are two fitting variables. We obtained the smallest RMSE value of 0.117 eV
by choosing x1 = CN and x2 = e−d̅Pt . For the 3 variable LED equation, we found that LED =
a1x1 ∗ x2 + a2x3 produces the smallest RMSE value of 0.104 eV with x1 = NNPt, x2 = e−d̅Pt
and x3 = CN̅̅ ̅̅ Ni, which is smaller than that of using the form LED = a1x1 ∗ x2 + a2x3. For the 4
variable LED equation, we examined LED = a1x1 ∗ x2 + a2x3 ∗ x4 and LED = a1x1 ∗ x2 +a2x3 + a3x4. After testing all the fitting variables, we obtained the smallest RMSE of 0.104 with
LED = a1x1 ∗ x2 + a2x3. Based on these analyses, we chose the 3 variable LED equation and
revised it to be LED = NNPt ∙ e−a1∙ε + a2 ∙ CN̅̅ ̅̅ Ni, where ε =d̅Pt−d0
d0 and d0 = 2.75 Å is the Pt-Pt
bond length of the Pt nanoparticles. The revision only changed the fitting constants, but not the
20
RMSE. With this LED equation, we have a1 = 1.985, a2 = 1.075, E1 = 0.189, E0 = 0.1703, and
RMSE = 0.104 eV.
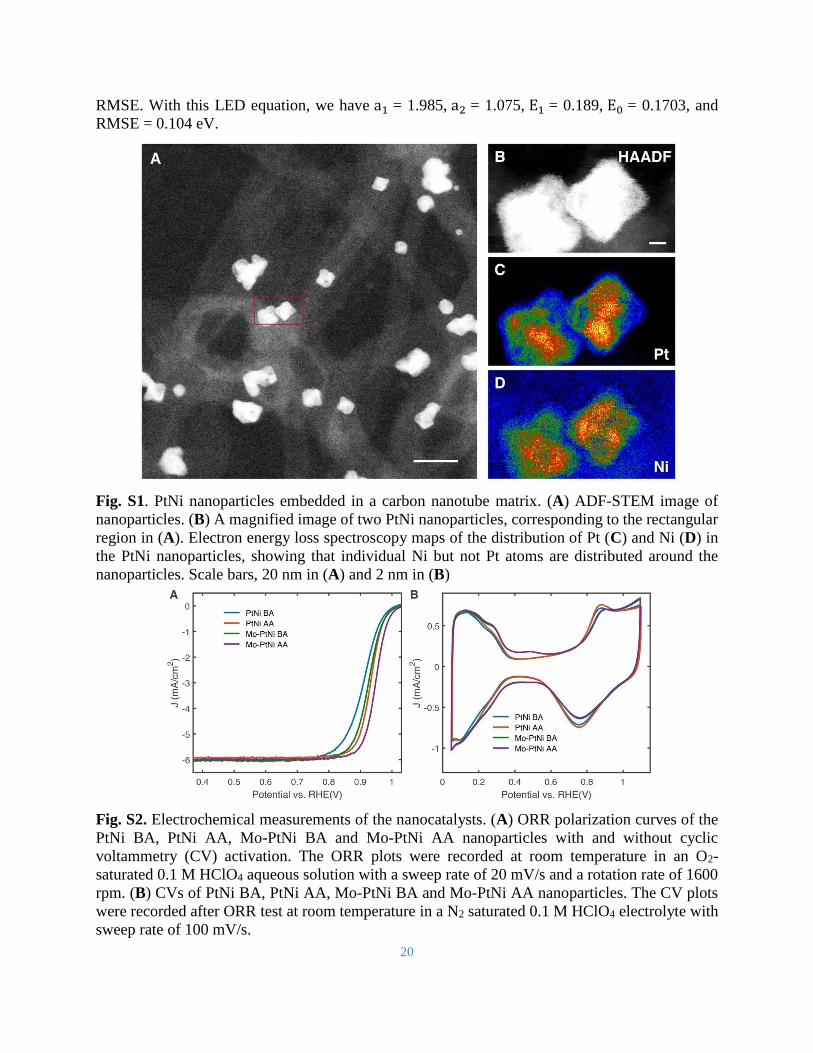
Fig. S1. PtNi nanoparticles embedded in a carbon nanotube matrix. (A) ADF-STEM image of
nanoparticles. (B) A magnified image of two PtNi nanoparticles, corresponding to the rectangular
region in (A). Electron energy loss spectroscopy maps of the distribution of Pt (C) and Ni (D) in
the PtNi nanoparticles, showing that individual Ni but not Pt atoms are distributed around the
nanoparticles. Scale bars, 20 nm in (A) and 2 nm in (B)
Fig. S2. Electrochemical measurements of the nanocatalysts. (A) ORR polarization curves of the
PtNi BA, PtNi AA, Mo-PtNi BA and Mo-PtNi AA nanoparticles with and without cyclic
voltammetry (CV) activation. The ORR plots were recorded at room temperature in an O2-
saturated 0.1 M HClO4 aqueous solution with a sweep rate of 20 mV/s and a rotation rate of 1600
rpm. (B) CVs of PtNi BA, PtNi AA, Mo-PtNi BA and Mo-PtNi AA nanoparticles. The CV plots
were recorded after ORR test at room temperature in a N2 saturated 0.1 M HClO4 electrolyte with
sweep rate of 100 mV/s.

21
Fig. S3. Experimental tomographic tilt series of a PtNi BA nanoparticle (Particle #1), showing 56
ADF-STEM images with a tilt range from -74.3° to +66.4°. The 3D atomic structure and chemical
composition of the nanoparticle are shown in Fig. 1 (1st row). Scale bar, 2 nm.
22
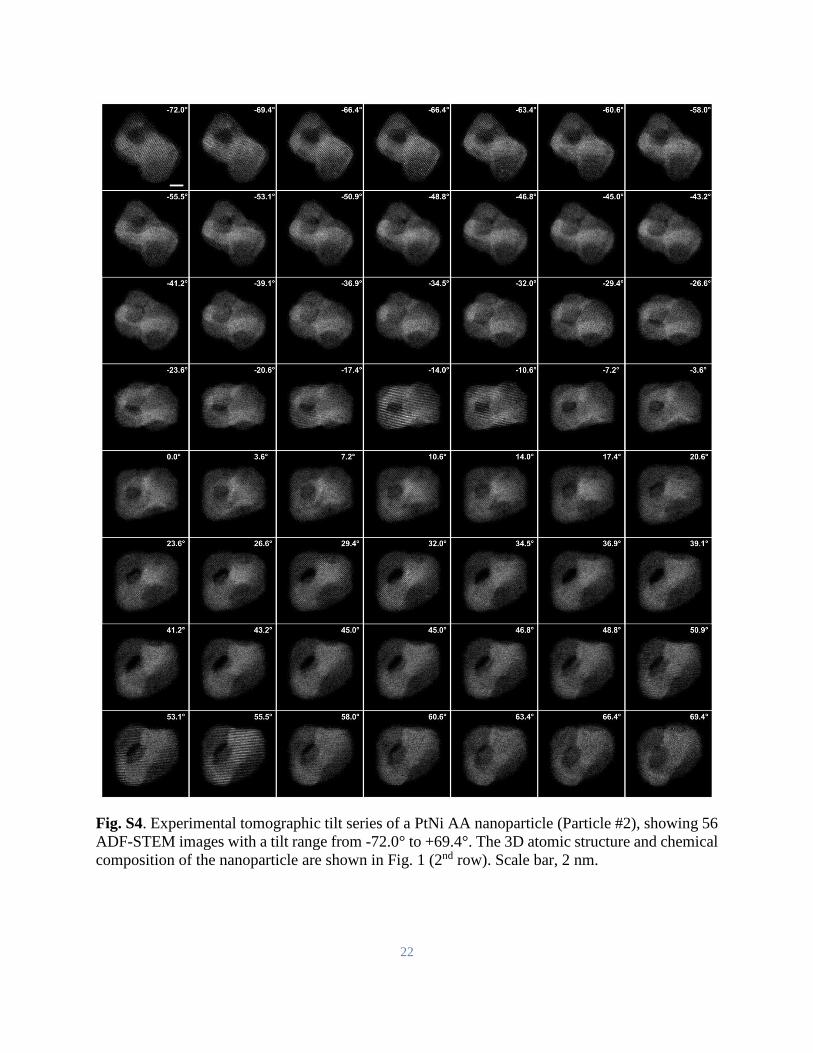
Fig. S4. Experimental tomographic tilt series of a PtNi AA nanoparticle (Particle #2), showing 56
ADF-STEM images with a tilt range from -72.0° to +69.4°. The 3D atomic structure and chemical
composition of the nanoparticle are shown in Fig. 1 (2nd row). Scale bar, 2 nm.

23
Fig. S5. Experimental tomographic tilt series of a Mo-PtNi BA nanoparticle (Particle #3), showing
60 ADF-STEM images with a tilt range from -72.6° to +69.4°. The 3D atomic structure and
chemical composition of the nanoparticle are shown in Fig. 1 (3rd row). Scale bar, 2 nm.
24
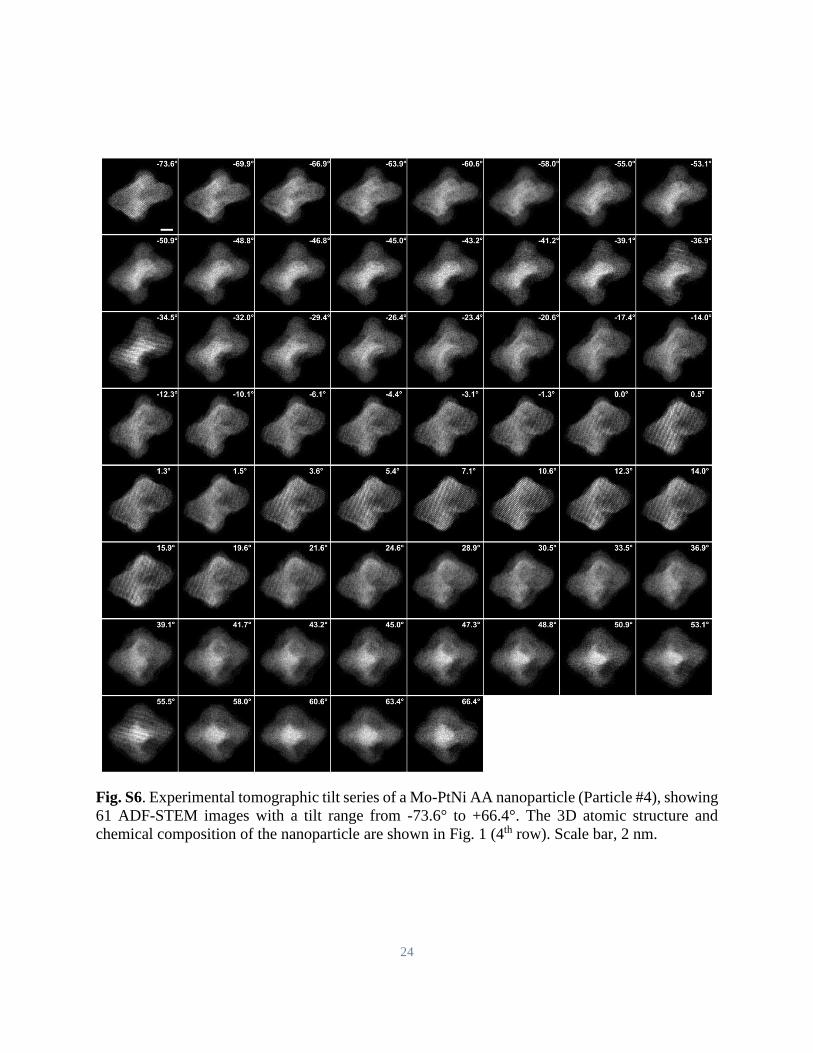
Fig. S6. Experimental tomographic tilt series of a Mo-PtNi AA nanoparticle (Particle #4), showing
61 ADF-STEM images with a tilt range from -73.6° to +66.4°. The 3D atomic structure and
chemical composition of the nanoparticle are shown in Fig. 1 (4th row). Scale bar, 2 nm.

25
Fig. S7. Numerical simulations on the effect of the surrounding Ni atoms on the 3D reconstruction.
(A) A PtNi atomic model in an environment with individual Ni atoms, where the Ni atom density
was estimated from the EELS map. (B) A representative projection image calculated from the
atomic model, in which the yellow boundary represents a 2D mask determined by the Otsu
threshold. (C) The projection image after masking. (D and E) Two representative atomic slices of
the reconstructed model, where the blue dots represent atoms consistent with the original model
and the green dots show a layer of ghost atoms due to the effect of the Ni environment.

26
Fig. S8. 3D atomic structure and the chemical composition of 7 PtNi nanocatalysts determined by
AET. Particles 5-11 correspond to rows 1-7, respectively. From the experimental atomic
coordinates, the 3D surface morphology and chemical composition (A), elemental segregation in
the interior (B), facets (C), surface concaveness (D), structural order/disorder (E), chemical
order/disorder (F), CN (G), and surface bonds (H) of the nanocatalysts were identified at the
single-atom level. For the structural order, BOO = 1 corresponds to a perfect fcc lattice. For the
chemical order, positive and a negative numbers represent segregation and alloying, respectively.

27
Fig. S9. 3D atomic structure and the chemical composition of 6 Mo-PtNi nanocatalysts
determined by AET. Particles 12-17 correspond to rows 1-6, respectively. From the experimental
atomic coordinates, the 3D surface morphology and chemical composition (A), elemental
segregation in the interior (B), facets (C), surface concaveness (D), structural order/disorder (E),
chemical order/disorder (F), CN (G), and surface bonds (H) of the nanocatalysts were identified
at the single-atom level.
28
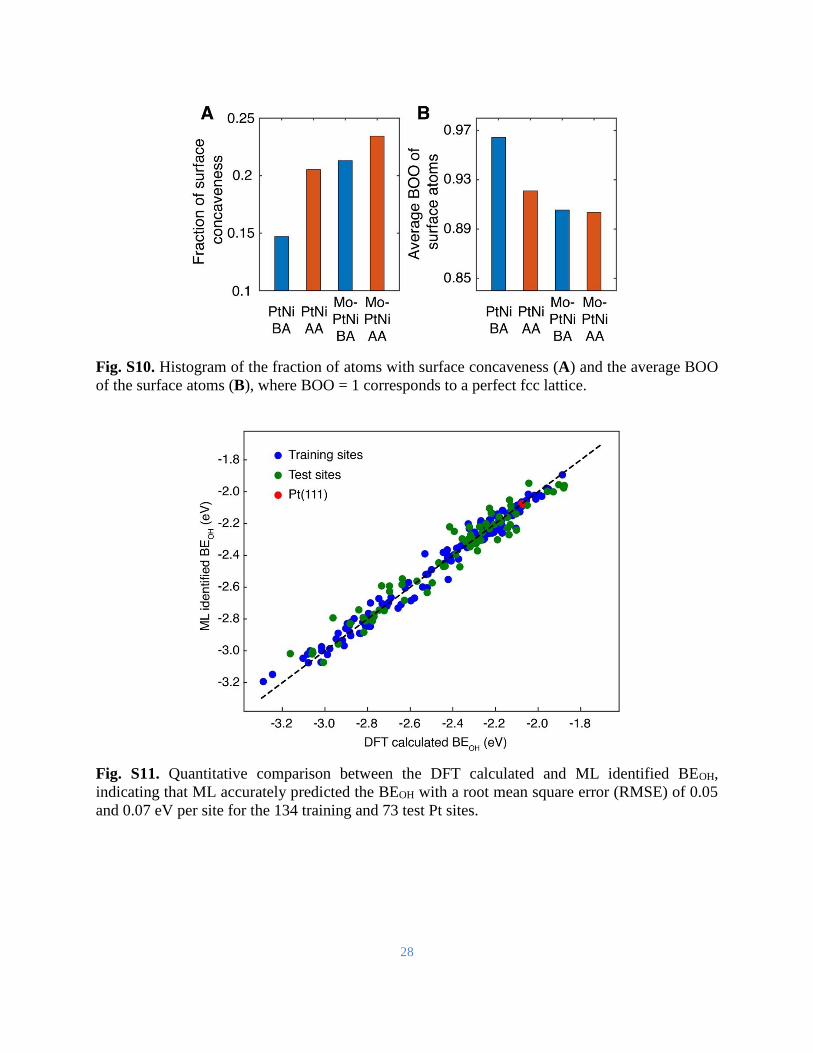
Fig. S10. Histogram of the fraction of atoms with surface concaveness (A) and the average BOO
of the surface atoms (B), where BOO = 1 corresponds to a perfect fcc lattice.
Fig. S11. Quantitative comparison between the DFT calculated and ML identified BEOH,
indicating that ML accurately predicted the BEOH with a root mean square error (RMSE) of 0.05
and 0.07 eV per site for the 134 training and 73 test Pt sites.

29
Fig. S12. The ORR activity distribution of the surface Pt sites of the PtNi AA and Mo-PtNi AA
nanocatalysts, derived by ML using the experimentally measured 3D atomic coordinates as input.
(A-F) Particles 6-11 of PtNi AA, respectively. (G-I) Particles 15-17 of Mo-PtNi AA, respectively.

30
Fig. S13. The ORR activity distribution of the surface Pt sites of the PtNi AA and Mo-PtNi AA
nanocatalysts based on LED. (A-F) Particles 6-11 of PtNi AA, respectively. (G-I) Particles 15-17
of Mo-PtNi AA, respectively. The LED-based activity distribution is consistent with that identified
by ML (Fig. S12.

31
Table S1. AET data collection, processing, reconstruction, refinement and statistics of PtNi and
Mo-PtNi.
Particlea
1
Particle
2
Particle
3
Particle
4
Particle
5
Particle
6
Particle
7
Particle
8
Particle
9
Data collection
and processing
Voltage (kV) 300 300 300 300 300 300 300 300 300
Convergence
semi-angle
(mrad)
17.1 17.1 17.1 17.1 17.1 17.1 17.1 17.1 17.1
Probe size (Å) 0.7 0.7 0.7 0.7 0.7 0.7 0.7 0.7 0.7
Detector inner
angle (mrad) 30 30 30 30 30 30 30 30 30
Detector outer
angle (mrad) 195 195 195 195 195 195 195 195 195
Depth of focus
(nm) 14 14 14 14 14 14 14 14 14
Pixel size (Å) 0.467 0.467 0.467 0.467 0.467 0.467 0.467 0.467 0.467
# of images 56 56 60 61 56 57 55 53 56
Tilt range (°) -74.3° -72.0° -72.6° -73.6° -72.6° -74.3° -72.6° -72.6° -74.3°
66.4° 69.4° 69.4° 66.4° 66.4° 66.4° 69.4° 69.4° 63.4°
Total electron
dose (105 e/Å2) 7.8 7.8 8.4 8.5 7.8 7.9 7.7 7.4 7.8
Reconstruction
Algorithm RESIRE RESIRE RESIRE RESIRE RESIRE RESIRE RESIRE RESIRE RESIRE
Oversampling
ratio 4 4 4 4 4 4 4 4 4
Number of
iterations 200 200 200 200 200 200 200 200 200
Refinement
R1 (%)b 19.41 21.84 14.62 16.74 19.29 22.41 19.81 18.33 22.33
R (%)c 8.00 7.50 6.39 8.16 8.86 7.31 6.77 6.39 7.55
B’ factors (Å2)
Ni atoms 10.76 27.48 10.73 16.44 6.38 10.57 11.34 7.96 10.75
Pt atoms 20.59 35.09 25.70 42.21 14.24 15.31 26.95 25.53 23.94
Statistics
# of atoms
Total 7235 11561 13618 10937 6704 4281 4383 6435 6927
Ni 2184 3239 5241 3588 1877 850 854 1442 1795
Pt 5051 8322 8377 7349 4827 3431 3529 4993 5132
Pt/Ni 2.31 2.57 1.60 2.05 2.57 4.04 4.13 3.46 2.86 a Particles 1-4 correspond to those shown in rows 1-4 in Fig. 1, respectively. Particles 5-11 correspond to rows 1-7
in Fig. S8, respectively. Particles 12-17 correspond to rows 1-6 in Fig. S9, respectively. b The R1 factor is defined as equation 5 in ref. (23). Same in Table S2.
32
c The R factor is defined in equation 4 in ref. (31). Same in Table S2.
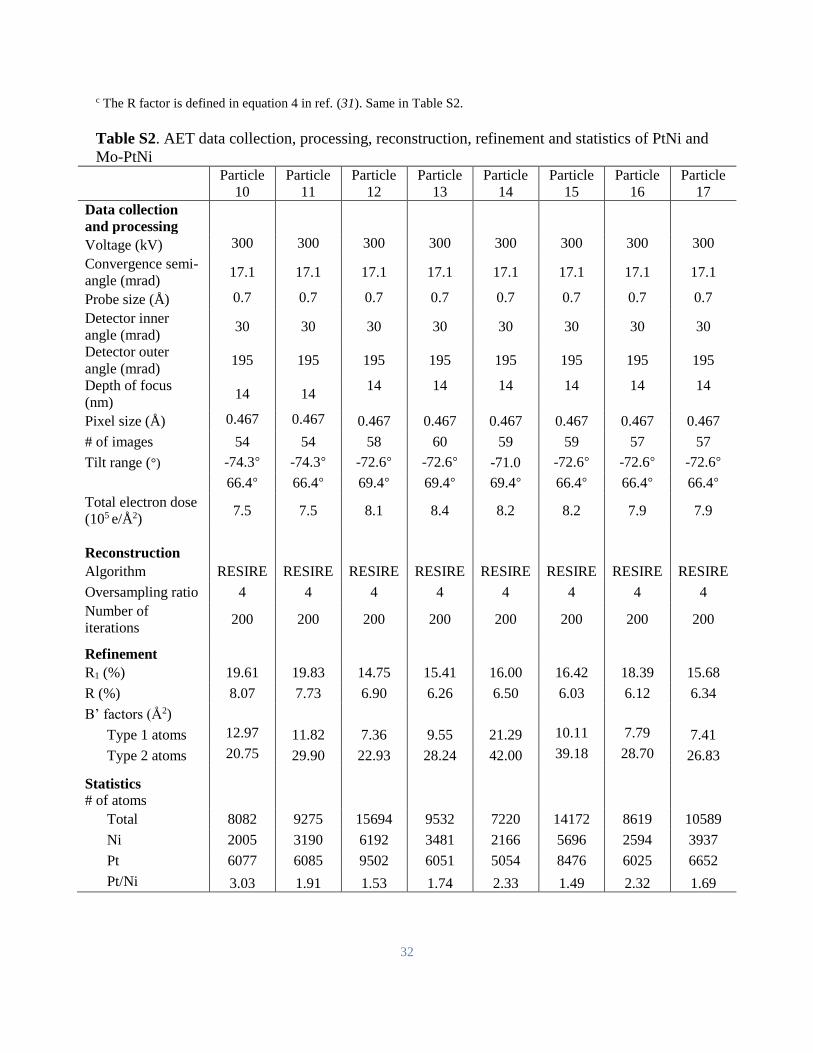
Table S2. AET data collection, processing, reconstruction, refinement and statistics of PtNi and
Mo-PtNi
Particle
10
Particle
11
Particle
12
Particle
13
Particle
14
Particle
15
Particle
16
Particle
17
Data collection
and processing
Voltage (kV) 300 300 300 300 300 300 300 300
Convergence semi-
angle (mrad) 17.1 17.1 17.1 17.1 17.1 17.1 17.1 17.1
Probe size (Å) 0.7 0.7 0.7 0.7 0.7 0.7 0.7 0.7
Detector inner
angle (mrad) 30 30 30 30 30 30 30 30
Detector outer
angle (mrad) 195 195 195 195 195 195 195 195
Depth of focus
(nm) 14 14
14 14 14 14 14 14
Pixel size (Å) 0.467 0.467 0.467 0.467 0.467 0.467 0.467 0.467
# of images 54 54 58 60 59 59 57 57
Tilt range (°) -74.3° -74.3° -72.6° -72.6° -71.0 -72.6° -72.6° -72.6°
66.4° 66.4° 69.4° 69.4° 69.4° 66.4° 66.4° 66.4°
Total electron dose
(105 e/Å2) 7.5 7.5 8.1 8.4 8.2 8.2 7.9 7.9
Reconstruction
Algorithm RESIRE RESIRE RESIRE RESIRE RESIRE RESIRE RESIRE RESIRE
Oversampling ratio 4 4 4 4 4 4 4 4
Number of
iterations 200 200 200 200 200 200 200 200
Refinement
R1 (%) 19.61 19.83 14.75 15.41 16.00 16.42 18.39 15.68
R (%) 8.07 7.73 6.90 6.26 6.50 6.03 6.12 6.34
B’ factors (Å2)
Type 1 atoms 12.97 11.82 7.36 9.55 21.29 10.11 7.79 7.41
Type 2 atoms 20.75 29.90 22.93 28.24 42.00 39.18 28.70 26.83
Statistics
# of atoms
Total 8082 9275 15694 9532 7220 14172 8619 10589
Ni 2005 3190 6192 3481 2166 5696 2594 3937
Pt 6077 6085 9502 6051 5054 8476 6025 6652
Pt/Ni 3.03 1.91 1.53 1.74 2.33 1.49 2.32 1.69

33
Table S3. Electrochemical measurements of the specific activity, mass activity, and
electrochemically active surface area (ECSA) of the four types of the nanocatalysts.
Nanocatalyst Specific Activity
(mA/cm2) Mass Activity
(mA/μgPGM) ECSA
(m2/gPGM)
PtNi BA 2.9 1.1 38
PtNi AA 4.8 1.9 39
Mo-PtNi BA 3.3 1.2 36
Mo-PtNi AA 9.3 3.5 38
Table S4. The Pt-Pt bond lengths of the four nanocatalysts obtained by EXAFS fitting.
PtNi BA PtNi AA Mo-PtNi BA Mo-PtNi AA
Pt-Pt bond length
(Å) 2.708 ± 0.006 2.735 ± 0.004 2.702 ± 0.005 2.724 ± 0.002
References and Notes
1. J. K. Nørskov et al., The nature of the active site in heterogeneous metal catalysis. Chem.
Soc. Rev. 37, 2163-2171 (2008).
2. S. Bhandari, S. Rangarajan, M. Mavrikakis, Combining Computational Modeling with
Reaction Kinetics Experiments for Elucidating the In Situ Nature of the Active Site in
Catalysis. Acc. Chem. Res. 53, 1893-1904 (2020).
3. F. Calle-Vallejo et al., Finding optimal surface sites on heterogeneous catalysts by
counting nearest neighbors. Science 350, 185-189 (2015).
4. A. Kulkarni, S. Siahrostami, A. Patel, J. K. Nørskov, Understanding Catalytic Activity
Trends in the Oxygen Reduction Reaction. Chem. Rev. 118, 2302-2312 (2018).
5. C. Lamberti, A. Zecchina, E. Groppo, S. Bordiga, Probing the surfaces of heterogeneous
catalysts by in situ IR spectroscopy. Chem. Soc. Rev. 39, 4951-5001 (2010).
6. E. de Smit et al., Nanoscale chemical imaging of a working catalyst by scanning
transmission X-ray microscopy. Nature 456, 222-225 (2008).
34
7. L. Jacobse, Y.-F. Huang, M. T. M. Koper, M. J. Rost, Correlation of surface site
formation to nanoisland growth in the electrochemical roughening of Pt(111). Nat. Mater.
17, 277-282 (2018).
8. F. Zaera, Probing Liquid/Solid Interfaces at the Molecular Level. Chem. Rev. 112, 2920-
2986 (2012).
9. C. Cui, L. Gan, M. Heggen, S. Rudi, P. Strasser, Compositional segregation in shaped Pt
alloy nanoparticles and their structural behaviour during electrocatalysis. Nat. Mater. 12,
765-771 (2013).
10. F. Tao et al., Reaction-Driven Restructuring of Rh-Pd and Pt-Pd Core-Shell
Nanoparticles. Science 322, 932-934 (2008).
11. B. Zugic et al., Dynamic restructuring drives catalytic activity on nanoporous gold–silver
alloy catalysts. Nat. Mater. 16, 558-564 (2017).
12. Z. W. Seh et al., Combining theory and experiment in electrocatalysis: Insights into
materials design. Science 355, eaad4998 (2017).
13. V. R. Stamenkovic et al., Improved oxygen reduction activity on Pt3Ni(111) via
increased surface site availability. Science 315, 493-497 (2007).
14. M. Escudero-Escribano et al., Tuning the activity of Pt alloy electrocatalysts by means of
the lanthanide contraction. Science 352, 73-76 (2016).
15. C. Chen et al., Highly Crystalline Multimetallic Nanoframes with Three-Dimensional
Electrocatalytic Surfaces. Science 343, 1339-1343 (2014).
16. J. Greeley et al., Alloys of platinum and early transition metals as oxygen reduction
electrocatalysts. Nat. Chem. 1, 552-556 (2009).
17. P. Strasser et al., Lattice-strain control of the activity in dealloyed core–shell fuel cell
catalysts. Nat. Chem. 2, 454-460 (2010).
18. L. Wang et al., Tunable intrinsic strain in two-dimensional transition metal
electrocatalysts. Science 363, 870-874 (2019).
19. L. Zhang et al., Platinum-based nanocages with subnanometer-thick walls and well-
defined, controllable facets. Science 349, 412-416 (2015).
20. X. Huang et al., High-performance transition metal–doped Pt3Ni octahedra for oxygen
reduction reaction. Science 348, 1230-1234 (2015).

35
21. M. Núñez, J. L. Lansford, D. G. Vlachos, Optimization of the facet structure of
transition-metal catalysts applied to the oxygen reduction reaction. Nat. Chem. 11, 449-
456 (2019).
22. J. Miao, P. Ercius, S. J. Billinge, Atomic electron tomography: 3D structures without
crystals. Science 353, aaf2157 (2016).
23. Y. Yang et al., Deciphering chemical order/disorder and material properties at the single-
atom level. Nature 542, 75-79 (2017).
24. J. Zhou et al., Observing crystal nucleation in four dimensions using atomic electron
tomography. Nature 570, 500-503 (2019).
25. S. Kim et al., Correlating 3D Surface Atomic Structure and Catalytic Activities of Pt
Nanocrystals. Nano Lett. 21, 1175-1183 (2021).
26. J. Lee, C. Jeong, T. Lee, S. Ryu, Y. Yang, Direct Observation of Three-Dimensional
Atomic Structure of Twinned Metallic Nanoparticles and Their Catalytic Properties.
Nano Lett. 22, 665-672 (2022).
27. Q. Jia et al., Roles of Mo Surface Dopants in Enhancing the ORR Performance of
Octahedral PtNi Nanoparticles. Nano Lett. 18, 798-804 (2018).
28. Materials and methods are available as supplementary materials.
29. F. Dionigi et al., Controlling Near-Surface Ni Composition in Octahedral PtNi(Mo)
Nanoparticles by Mo Doping for a Highly Active Oxygen Reduction Reaction Catalyst.
Nano Lett. 19, 6876-6885 (2019).
30. X. Tian et al., Correlating the three-dimensional atomic defects and electronic properties
of two-dimensional transition metal dichalcogenides. Nat. Mater. 19, 867-873 (2020).
31. Y. Yang et al., Determining the three-dimensional atomic structure of an amorphous
solid. Nature 592, 60-64 (2021).
32. V. Viswanathan, H. A. Hansen, J. Rossmeisl, J. K. Nørskov, Universality in Oxygen
Reduction Electrocatalysis on Metal Surfaces. ACS Catal. 2, 1654-1660 (2012).
33. H. A. Hansen, V. Viswanathan, J. K. Nørskov, Unifying Kinetic and Thermodynamic
Analysis of 2 e– and 4 e– Reduction of Oxygen on Metal Surfaces. J. Phys. Chem. C 118,
6706-6718 (2014).
36
34. Y. Nanba, M. Koyama, An Element-Based Generalized Coordination Number for
Predicting the Oxygen Binding Energy on Pt3M (M = Co, Ni, or Cu) Alloy
Nanoparticles. ACS Omega 6, 3218-3226 (2021).
35. C. Wang et al., Correlation Between Surface Chemistry and Electrocatalytic Properties of
Monodisperse PtxNi1-x Nanoparticles. Adv. Funct. Mater. 21, 147-152 (2011).
36. J. D. Lee et al., Tuning the Electrocatalytic Oxygen Reduction Reaction Activity of Pt–
Co Nanocrystals by Cobalt Concentration with Atomic-Scale Understanding. ACS Appl.
Mater. Interfaces 11, 26789-26797 (2019).
37. K. Shinozaki, J. W. Zack, R. M. Richards, B. S. Pivovar, S. S. Kocha, Oxygen Reduction
Reaction Measurements on Platinum Electrocatalysts Utilizing Rotating Disk Electrode
Technique. J. Electrochem. Soc. 162, F1144-F1158 (2015).
38. K. Dabov, A. Foi, V. Katkovnik, K. Egiazarian, Image Denoising by Sparse 3-D
Transform-Domain Collaborative Filtering. IEEE Transactions on Image Processing 16,
2080-2095 (2007).
39. Y. Yuan et al., Three-dimensional atomic packing in amorphous solids with liquid-like
structure. Nat. Mater. 21, 95-102 (2022).
40. Q. Jia et al., Activity Descriptor Identification for Oxygen Reduction on Platinum-Based
Bimetallic Nanoparticles: In Situ Observation of the Linear Composition–Strain–Activity
Relationship. ACS Nano 9, 387-400 (2015).
41. M. Newville, IFEFFIT : interactive XAFS analysis and FEFF fitting. Journal of
Synchrotron Radiation 8, 322-324 (2001).
42. B. Ravel, K. Gallagher, Atomic Structure and the Magnetic Properties of ZrDoped
Sm2Co17. Phys. Scr., 606 (2005).
43. M. Newville, P. Līviņš, Y. Yacoby, J. J. Rehr, E. A. Stern, Near-edge x-ray-absorption
fine structure of Pb: A comparison of theory and experiment. Phys. Rev. B 47, 14126-
14131 (1993).
44. A. L. Ankudinov, B. Ravel, J. J. Rehr, S. D. Conradson, Real-space multiple-scattering
calculation and interpretation of x-ray-absorption near-edge structure. Phys. Rev. B 58,
7565-7576 (1998).
45. M. P. Do Carmo, Differential geometry of curves and surfaces (Second ed.). (Courier
Dover Publications, 2016).

37
46. Q.-J. Li, H. Sheng, E. Ma, Strengthening in multi-principal element alloys with local-
chemical-order roughened dislocation pathways. Nat. Commun. 10, 3563 (2019).
47. G. Kresse, J. Furthmüller, Efficient iterative schemes for ab initio total-energy
calculations using a plane-wave basis set. Phys. Rev. B 54, 11169-11186 (1996).
48. G. Kresse, J. Furthmüller, Efficiency of ab-initio total energy calculations for metals and
semiconductors using a plane-wave basis set. Computational Materials Science 6, 15-50
(1996).
49. G. Kresse, J. Hafner, Ab initio molecular-dynamics simulation of the liquid-metal--
amorphous-semiconductor transition in germanium. Phys. Rev. B 49, 14251-14269
(1994).
50. G. Kresse, J. Hafner, Ab initio molecular dynamics for liquid metals. Phys. Rev. B 47,
558-561 (1993).
51. G. Kresse, D. Joubert, From ultrasoft pseudopotentials to the projector augmented-wave
method. Phys. Rev. B 59, 1758-1775 (1999).
52. J. P. Perdew, K. Burke, M. Ernzerhof, Generalized Gradient Approximation Made
Simple. Phys. Rev. Lett. 77, 3865-3868 (1996).
53. C. E. Rasmussen, in Summer School on Machine Learning. (Springer, 2003), pp. 63-71.
54. L. Himanen et al., DScribe: Library of descriptors for machine learning in materials
science. Comput. Phys. Commun. 247, 106949 (2020).
55. A. P. Bartók, R. Kondor, G. Csányi, On representing chemical environments. Phys. Rev.
B 87, 184115 (2013).
56. F. Pedregosa et al., Scikit-learn: Machine learning in Python. the Journal of machine
Learning research 12, 2825-2830 (2011).
57. J. K. Nørskov et al., Origin of the Overpotential for Oxygen Reduction at a Fuel-Cell
Cathode. J. Phys. Chem. B 108, 17886-17892 (2004).